PL/Profiler Presented by Jan Wieck, OpenSCG Inc.

Peeking into the Black Hole Called PL/PGSQL - the New PL Profiler / Jan Wieck (OpenSCG)
Jan 06, 2017
Welcome message from author
This document is posted to help you gain knowledge. Please leave a comment to let me know what you think about it! Share it to your friends and learn new things together.
Transcript

PL/ProfilerPresented by Jan Wieck, OpenSCG Inc.

What is Profiling?
“In software engineering, profiling (”program pro-filing“,”software profiling“) is a form of dynamicprogram analysis that measures, for example, thespace (memory) or time complexity of a program, theusage of particular instructions, or the frequency andduration of function calls. Most commonly, profilinginformation serves to aid program optimization.”– Wikipedia

Profiling PostgreSQL
• PostgreSQL can collect statistics and producelog information that can be used by tools toproduce profiles.
• System views based on the statistics collector,like pg_stat_user_tables, show counters pertable about the number of sequential scans andindex scans, how many tuples have been lookedup by scan type, how large the tables are etc.
• The extension pg_stat_statements collectsexecution statistics for normalized queries.

Profiling PostgreSQL
• 3rd party products like pgbadger can createextensive reports about which queries consumemost of the time and their frequency, tables,indexes and much more.
• Unfortunately pgbadger requires extremelyaggressive query logging to be enabled in thepostgresql.conf file(log_statement_min_duration=0), which by itselfcan produce more performance problems whenyou already have enough.

Profiling PostgreSQL
• On a side note: very few users perform anyprofiling before they have a really bad problem inproduction.
• This means that once we have a problem, thereis no baseline available to compare the currentbehavior to. How do you tell what is “out ofwhack” when you don’t know what used to be“normal”?

Profiling PostgreSQL
• All of this may work to find and tune problematicqueries.
• The amount of logging often prohibits doing thisin production.

How PL/pgSQL works
• PL/pgSQL is like every other “loadable,procedural language.”
• When a PL function is executed, the fmgr loadsthe language handler and calls it.
• The language handler then interprets thecontens of the pg_proc entry for the function(proargtypes, prorettype, prosrc).

How PL/pgSQL works
• On the first call of a function in a session, the callhandler will “compile” a function statement tree.
• SQL queries in the function are just kept as astring at this point.
• What might look to you like an expression isactually a SELECT query:
my_variable := some_parameter * 100;
How PL/pgSQL works
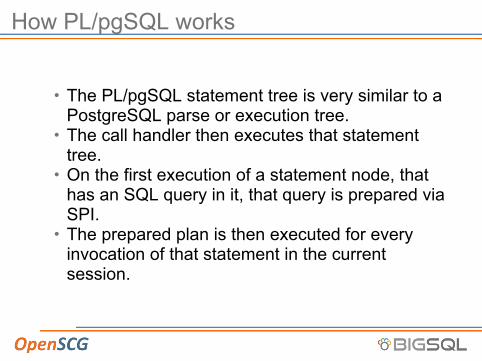
• The PL/pgSQL statement tree is very similar to aPostgreSQL parse or execution tree.
• The call handler then executes that statementtree.
• On the first execution of a statement node, thathas an SQL query in it, that query is prepared viaSPI.
• The prepared plan is then executed for everyinvocation of that statement in the currentsession.

An Example using PL/pgSQL
• The following Example is based on thebenchmarksql schema (TPC-C style)
• Like the pgbench schema (TPC-B style), theTPC-C has a HISTORY table without anyindexes.
• The main difference is that it has more columnsand that the CUSTOMER is identified with a3-column key.
• If we sum up the history of a customer byselecting directly from the HISTORY table, thequery will be logged and accounted for inpg_stat_statements.

Let there be a PL/pgSQL function
CREATE FUNCTION get_customer_balance(p_w_id integer,p_d_id integer,p_c_id integer)
RETURNS numericAS $$DECLARE
v_balance numeric;BEGIN
SELECT INTO v_balance sum(h_amount)FROM bmsql_historyWHERE h_w_id = p_w_idAND h_d_id = p_d_idAND h_c_id = p_c_id;
RETURN v_balance;END;$$ LANGUAGE plpgsql;

And let there be a view using that function
CREATE OR REPLACE VIEW bmsql_problem ASSELECT c_w_id, c_d_id, c_id,
c_balance,get_customer_balance(c_w_id, c_d_id, c_id)
AS sum_history_amountFROM bmsql_customer;

The Problem
• It is obvious that as the history table is growingover time, the performance of that view willdegrade.
• Since the history table does not have an indexcovering h_w_id, h_d_id, h_c_id, we will seesequential scans on bmsql_history inpg_stat_user_tables.
• But how do we find out where those sequentialscans are coming from?

What is captured in the logs
Application
PostgreSQLTCOP
parse, rewrite, plan, execute
This query is loggedlibpq sends querySELECT … FROM bmsql_problem ...
This query is logged
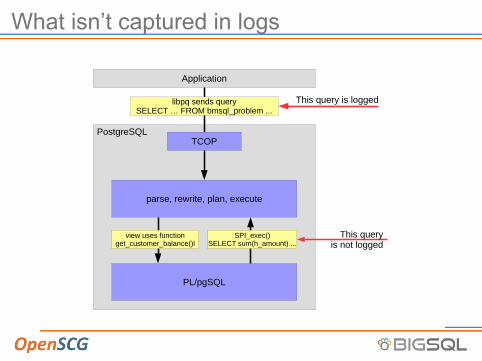
What isn’t captured in logs
Application
PostgreSQLTCOP
parse, rewrite, plan, execute
libpq sends querySELECT … FROM bmsql_problem ...
PL/pgSQL
view uses functionget_customer_balance()l
SPI_exec()SELECT sum(h_amount) ...
This query is logged
This queryis not logged

We can see them somewhere
• pg_stat_statements.track = all
• Like with application queries you will see a“normalized” version.
• It is no fun to hunt down that query in thousandsof lines of PL code.
• auto_explain.log_nested_statements = on
• If you have the disk space for the log and canafford to lose 70% performance.
The Problem
• You will never see the querySELECT sum(h_amount) FROM bmsql_history ...
in the PostgreSQL logs or pg_stat_statements.• This example is trivial and one could easily findthe problem by looking at the view and function.
• In the real world things aren’t that simple.

In the real world …
• Customer database has 1,800 tables with 13,000indexes used by 600 PL/pgSQL functions withtogether over 100,000 lines of code.
• The application is just calling a PL/pgSQLfunction, which can take anywhere frommilliseconds to hours.
• No sequential scans happened.• Our DBAs had been working on this problem forquite a while.

How PL profiler works
• plprofiler consists of two things.• The plprofiler extension loaded into the backend.• The plprofiler command line utility (Python).
• The extension uses the debug instrumentationhooks, added to PostgreSQL in 2006 (8.2).
• The hooks invoke callbacks whenever a functionis entered/exited and whenever processing of aPL statement (node) starts/ends.

How PL profiler works
• Using these callbacks the plprofiler extensioncollects three different statistics:1. Per call stack (call graph) the number of calls,
cumulative time spent and cumulative time spentin all children.
2. Per function the number of calls, the cumulativetime spent in all calls to this function and thelongest time spent in a single call to this function.
3. Per statement the same as per function.• The command line utility is using the extension tocollect data and subsequently turn it into adetailed performance profile.

What is a call graph?
• A call graph is the current stack levels.• Like a backtrace in a debugger (gdb bt).• It shows where the program is executing andhow it got there.
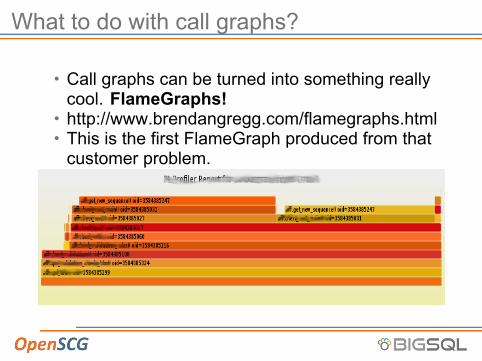
What to do with call graphs?
• Call graphs can be turned into something reallycool. FlameGraphs!
• http://www.brendangregg.com/flamegraphs.html• This is the first FlameGraph produced from thatcustomer problem.

Sorry for the blur
• Sorry for the blur, but I could not show you thesource code anyway. This was to illustrate howthings will look in the real world.
• For a simple example, let us expand on theprevious code of get_customer_balance().
• We create another function that returns the totalsum of the balances of all customers.

Another functionCREATE OR REPLACE FUNCTION total_customer_balance()RETURNS numericAS $$DECLARE
v_balance numeric = 0;v_cust record;
BEGINFOR v_cust IN SELECT c_w_id, c_d_id, c_id
FROM bmsql_customerLOOP
v_balance = v_balance +get_customer_balance(v_cust.c_w_id,
v_cust.c_d_id,v_cust.c_id);
END LOOP;RETURN v_balance;
END;$$ LANGUAGE plpgsql;

Let’s generate a report
• With that in place we execute$ plprofiler run -d bmsql1 \
--command ”select total_customer_balance()” \--output test1.html
• This will connect to the database bmsql1, activatethe plprofiler extension, run the given query andthen produce the test1.html report.

test1.html

test1.html
• By default the report contains details for the top10 functions by “self time”.
• This can be overridden by command line options.• The details can be viewed by clicking on the(show) link of one of the functions.

test1.html

Other functions of the plprofiler
• The plprofiler can not only execute a singlefunction. Instead of using the --command option, the--file option can be used to execute an entire filefull of SQL statements.
• On top of that, version 3 added the ability toprofile an entire application.

Profiling the whole application
• Add plprofiler to shared_preload_libraries.• Use the plprofiler monitor command to captureprofiling data into shared memory.
• Use the plprofiler command line utility togenerate a report.
• Save the collected data into a permanent set thatcan later generate a report and/or be exportedand imported into another system.

How to get it running quickly?
• BigSQL (http://bigsql.org) has included plprofilerversion 3 in the binary distribution.
• The BigSQL Manager (BAM) has a graphicaluser interface for plprofiler.

plprofiler in BAM

plprofiler in BAM

plprofiler in BAM

That is it (for now)
• Questions?

SLIDE TITLE
• SLIDE CONTENT
Related Documents