Pedogenic processes and domain boundaries in a Vertisol climosequence: evidence from titanium and zirconium distribution and morphology Cynthia A. Stiles * , Claudia I. Mora, Steven G. Driese Department of Geological Sciences, The University of Tennessee, Knoxville, TN 37996-1410, USA Received 7 March 2002; accepted 17 February 2003 Abstract The occurrences of titanium (Ti) and zirconium (Zr) within eight Vertisols formed in a climosequence on the Upper Beaumont Formation of the Texas Gulf Coastal Plain were investigated in order to determine processes responsible for Ti and Zr redistribution during pedogenesis. Discontinuities defined by significant shifts in particle size distribution and the content (in volume percent) of Zr are present at 160 to 260 cm depth in each pedon. The discontinuities are interpreted to be functional boundaries, i.e., physico-chemical expressions of pedogenic domains, between an upper soil domain dominated by open-system pedogenesis and a lower, more closed-system domain dominated by chemical weathering. The depth at which the functional boundary occurs is dependent on physical and hydrogeochemical influences, which are largely a function of available water. Soil materials above the discontinuities are slightly coarser textured and enriched in Zr, whereas below the sediments are finer textured and have lower and more constant Zr contents. The Zr is associated almost exclusively with zircon and Zr contents correlate positively to the weight percent sand + coarse silt, with negligible Zr present in the < 20 Am size fraction. By comparison, Ti occurs preferentially in the < 20 Am size fraction and there are no marked discontinuities in Ti contents with depth. Scanning electron microscopy (SEM) of individual zircon and rutile grains show predominantly physical damage to zircons, whereas rutile grains appear to have been affected predominantly by chemical weathering. Thus, different processes dictate Ti and Zr content and distribution in these Vertisols, although both elements are often considered immobile in weathering profiles. Profile volume loss/gain (i.e., soil strain, e), a mass-balance calculation that assumes Zr or Ti immobility during pedogenesis, indicate e Zr values nearly four times greater than e Ti . Large values of 0016-7061/03/$ - see front matter D 2003 Elsevier Science B.V. All rights reserved. doi:10.1016/S0016-7061(03)00105-8 * Corresponding author. Present address: Department of Soil Science, University of Wisconsin-Madison, Madison, WI 53706-1299, USA. Tel.: +1-608-262-0331; fax: +1-608-265-2565. E-mail addresses: [email protected] (C.A. Stiles), [email protected] (C.I. Mora), [email protected] (S.G. Driese). www.elsevier.com/locate/geoderma Geoderma 116 (2003) 279– 299

Welcome message from author
This document is posted to help you gain knowledge. Please leave a comment to let me know what you think about it! Share it to your friends and learn new things together.
Transcript
www.elsevier.com/locate/geoderma
Geoderma 116 (2003) 279–299
Pedogenic processes and domain boundaries in a
Vertisol climosequence: evidence from titanium and
zirconium distribution and morphology
Cynthia A. Stiles*, Claudia I. Mora, Steven G. Driese
Department of Geological Sciences, The University of Tennessee, Knoxville, TN 37996-1410, USA
Received 7 March 2002; accepted 17 February 2003
Abstract
The occurrences of titanium (Ti) and zirconium (Zr) within eight Vertisols formed in a
climosequence on the Upper Beaumont Formation of the Texas Gulf Coastal Plain were investigated
in order to determine processes responsible for Ti and Zr redistribution during pedogenesis.
Discontinuities defined by significant shifts in particle size distribution and the content (in volume
percent) of Zr are present at 160 to 260 cm depth in each pedon. The discontinuities are interpreted to
be functional boundaries, i.e., physico-chemical expressions of pedogenic domains, between an
upper soil domain dominated by open-system pedogenesis and a lower, more closed-system domain
dominated by chemical weathering. The depth at which the functional boundary occurs is dependent
on physical and hydrogeochemical influences, which are largely a function of available water. Soil
materials above the discontinuities are slightly coarser textured and enriched in Zr, whereas below
the sediments are finer textured and have lower and more constant Zr contents. The Zr is associated
almost exclusively with zircon and Zr contents correlate positively to the weight percent
sand + coarse silt, with negligible Zr present in the < 20 Am size fraction. By comparison, Ti
occurs preferentially in the < 20 Am size fraction and there are no marked discontinuities in Ti
contents with depth. Scanning electron microscopy (SEM) of individual zircon and rutile grains
show predominantly physical damage to zircons, whereas rutile grains appear to have been affected
predominantly by chemical weathering. Thus, different processes dictate Ti and Zr content and
distribution in these Vertisols, although both elements are often considered immobile in weathering
profiles.
Profile volume loss/gain (i.e., soil strain, e), a mass-balance calculation that assumes Zr or Ti
immobility during pedogenesis, indicate eZr values nearly four times greater than eTi. Large values of
0016-7061/03/$ - see front matter D 2003 Elsevier Science B.V. All rights reserved.
doi:10.1016/S0016-7061(03)00105-8
* Corresponding author. Present address: Department of Soil Science, University of Wisconsin-Madison,
Madison, WI 53706-1299, USA. Tel.: +1-608-262-0331; fax: +1-608-265-2565.
E-mail addresses: [email protected] (C.A. Stiles), [email protected] (C.I. Mora), [email protected]
(S.G. Driese).
C.A. Stiles et al. / Geoderma 116 (2003) 279–299280
eZr within the upper soil domains are due primarily to sand and coarse silt additions to the Vertisols
and preclude use of Zr as a basis of mass-balance calculations in these soils, despite its relative
chemical stability. By comparison, Ti is generally conserved within the clay-rich soil profiles and is
therefore better suited for mass-balance calculations of volume change and mobile element
translocation during pedogenesis.
D 2003 Elsevier Science B.V. All rights reserved.
Keywords: Vertisols; Mass-balance; Strain; Pedogenic domains
1. Introduction
In weathering profiles, there is an important transition at depth between the open-
system pedogenesis that characterizes surface soils [i.e., those described in standard
USDA-Natural Resource Conservation Service (NRCS) soil surveys] and the relatively
closed system of the deeper soil and underlying regolith from which the soil continues to
form. This transition may, in some cases, be equivalent to a ‘‘lithologic discontinuity’’, a
term used by field pedologists to describe a distinct change in particle-size distribution,
grain morphology, lithologic composition, and/or color, and which is often expressed as
well in the bulk geochemistry of the profile. The term ‘‘functional boundary’’ is here used
to denote compositional differences in weathering profiles, whether they arise from
pedogenic or sedimentological factors. Unfortunately, there are no firm criteria to differ-
entiate between geochemical differences arising from an actual shift in the parent lithology
(i.e., mantled soils) from a weathering front or physical and chemical boundary between
domains of a single soil experiencing different pedogenic processes (Soil Survey Staff,
1998).
Brimhall et al. (1991) recognized two distinct layers in a lateritic bauxite (Jarrahdale,
Western Australia) weathering profile that had previously been described as a sedimento-
logical discontinuity. The upper (superactive) layer was dominated by bioturbation and
downward translocation of authigenic and exotic materials. The lower (subactive) zone
experienced some volume loss resulting from weathering and removal of various
components in solution, however its relatively low permeability limited invasive trans-
location. The functional boundary (‘‘translocation crossover’’; Brimhall et al., 1991)
between layers in these ‘‘old’’ (>1 Ma) soils occurs at around 3.5 m depth. In this example,
the functional boundary in the weathering profile reflected the effects of gross differences
in pedogenic processes acting on a single parent material rather than actual difference in
parent material composition. We introduce the equivalent term ‘‘pedogenic domains’’ for
the upper and lower zones described in Brimhall et al. (1991). Pedogenic domains are used
to describe portions of weathering profiles that experience differing intensities and
mechanisms of pedogenic processing.
Functional boundaries in soil profiles can be identified by the distribution of
‘‘immobile’’ elements in the profile. Immobile elements are residually enriched relative
to the more mobile elements released from soluble mineral phases in leached zones in the
profiles. Both Ti and Zr are commonly considered immobile in weathering environments
owing to the relatively insoluble nature of the detrital minerals in which they are
C.A. Stiles et al. / Geoderma 116 (2003) 279–299 281
concentrated, such as zircon (ZrSiO4) and rutile/anatase (TiO2; Marshall and Haseman,
1942; Jackson and Sherman, 1953). If they are both immobile, the ratio Ti:Zr should
remain constant throughout profile depth. Indeed, Ti:Zr ratios are a proxy for parent
material uniformity (Reheis, 1990; Birkeland, 1999).
Both Ti and Zr can be problematic as immobile index elements because the minerals
containing them may be, in some circumstances, transported or chemically reactive.
Zirconium is almost exclusively associated with detrital zircon, an extremely durable
mineral that can chemically survive numerous recycling events. Small additions of zircon
to the upper portions of a soil, commonly introduced by aeolian or volcanic processes,
can drastically change both the total Zr contents (wt.%) and Zr distribution within soil
profiles (Brimhall et al., 1991). Titanium can occur in a number of phases, both of
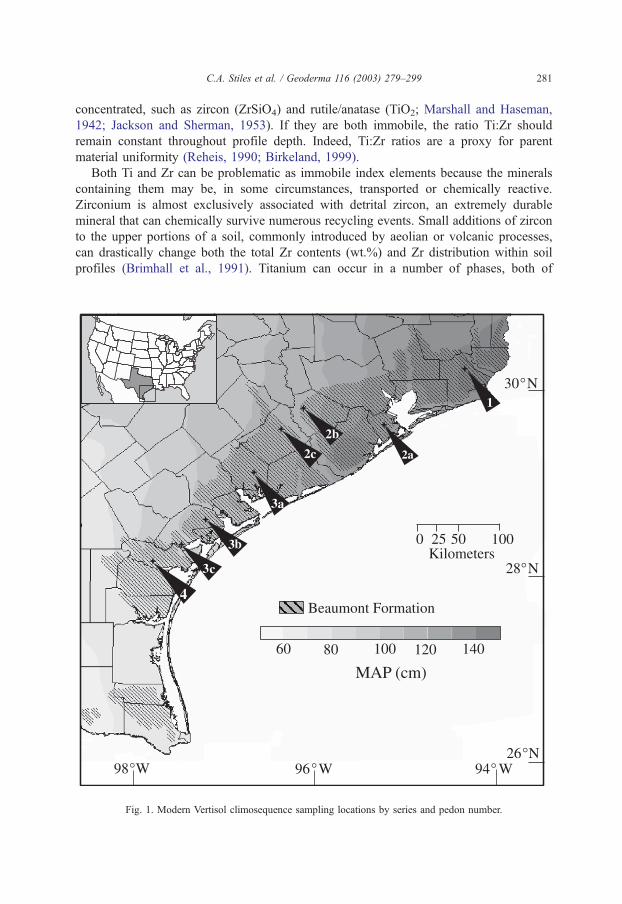
Fig. 1. Modern Vertisol climosequence sampling locations by series and pedon number.
C.A. Stiles et al. / Geoderma 116 (2003) 279–299282
detrital or pedogenic origin (Kaup and Carter, 1987; Fitzpatrick and Chittleborough,
2002). For example, Ti may replace iron (Fe) in hydrous Fe oxyhydroxide phases,
particularly in finer-textured soils, leading to the ‘‘leucoxene’’-weathering phase assem-
blage (most resistant phases or Stage 13; Jackson and Sherman, 1953). Despite the
chemical reactivity of some Ti-bearing detrital phases compared to zircon, Ti is still
generally conserved in the bulk soil matrix, particularly in fine-textured, Fe-enriched
matrices (Driese et al., 2000). Because of their sometimes contrasting behavior, i.e., the
sensitivity of Zr to open-system physical processes and of Ti to relatively conservative
hydrochemical enrichment, these elements may be used not only as a measure of parent
material uniformity, but also as indicators of soil domains dominated by physical or
chemical pedogenic processes.
Within the context of a climosequence of Vertisols from the Texas Gulf Coastal
Plain, the primary objectives of this study are to: (1) delineate Ti and Zr composi-
Table 1
Soil taxonomic, geographic, and climatic data for pedons used in this studya
Series name and U.S. Soil
Taxonomy descriptionbProfile
designationcGeographic
location
Ambient temperature
(jC)Precipitation
(mm)
MATd Highe Lowe MAP Annual deficitf
League
(fine, smectitic,
hyperthermic Oxyaquic
Hapluderts)
LEG 245A
(S00-TX-245-1)
30j02V22WN94j11V36WW
20.1 25.5 14.7 1437 604
Lake Charles
(fine, smectitic,
hyperthermic, Typic
Hapluderts)
LAC 201
(S99-TX-201-1)
LAC 157
(S99-TX-157-1)
LAC 481
(S99-TX-481-1)
29j35V40WN95j04V14WW29j24V12WN95j43V42WW29j22V21WN96j04V22WW
20.6
20.6
21.0
25.8
26.3
25.2
15.4
14.8
16.8
1321
1170
1124
774
866
1019
Laewest
(fine, smectitic,
hyperthermic, Typic
Hapluderts)
LAW 239
(S00-TX-239-1)
LAW 469
(S99-TX-469-1)
LAW 391
(S99-TX-391-1)
28j52V48WN96j24V11WW28j43V12WN96j45V23WW28j28V27WN97j07V00WW
21.0
21.2
21.8
25.2
26.7
27.4
16.8
15.8
16.1
1066
1000
924
1149
1381
1402
Victoria
(fine, smectitic,
hyperthermic Calcic
Haplusterts)
VIC 409
(S99-TX-481-3)
28j06V45WN97j20V55WW
21.8 27.4 16.1 844 1482
a All climate information derived from 50 to 100 years of daily temperature and precipitation data from
nearest Class 1 meteorological recording station to sampling locations; National Climate Data Center, Asheville,
NC.b Detailed information on these soil series is available at http://ortho.ftw.nrcs.usda.gov/osd/osd.html.c Detailed profile descriptions and characterization data are available at http://vmhost.cdp.state.ne.us:96/
METHD.HTML using the soil survey sample number given in parentheses.d Mean annual temperature.e Mean values.f Shown as 0� (MAP� potential evapotranspiration) such that deficits are positive values.
C.A. Stiles et al. / Geoderma 116 (2003) 279–299 283
tional differences with depth; (2) determine the depths to functional boundaries in the
pedons, and (3) assess if the compositional and textural differences between the
superactive (upper) and subactive (lower) units are due strictly to pedogenic processes
or represent actual lithologic differences within profiles. Morphological surveys and
statistical comparison of particle size and compositional trends are used to develop an
interpretive model of Vertisol pedogenesis and to augment considerations for choice of
an appropriate immobile index element for mass-balance calculations in fine-textured
soils.
2. Materials and methods
2.1. Geographic setting and sampling
The climosequence examined in this study developed on a coast-parallel terrace
exposing the upper units of the Pleistocene-age (35 ka) Beaumont Formation, which
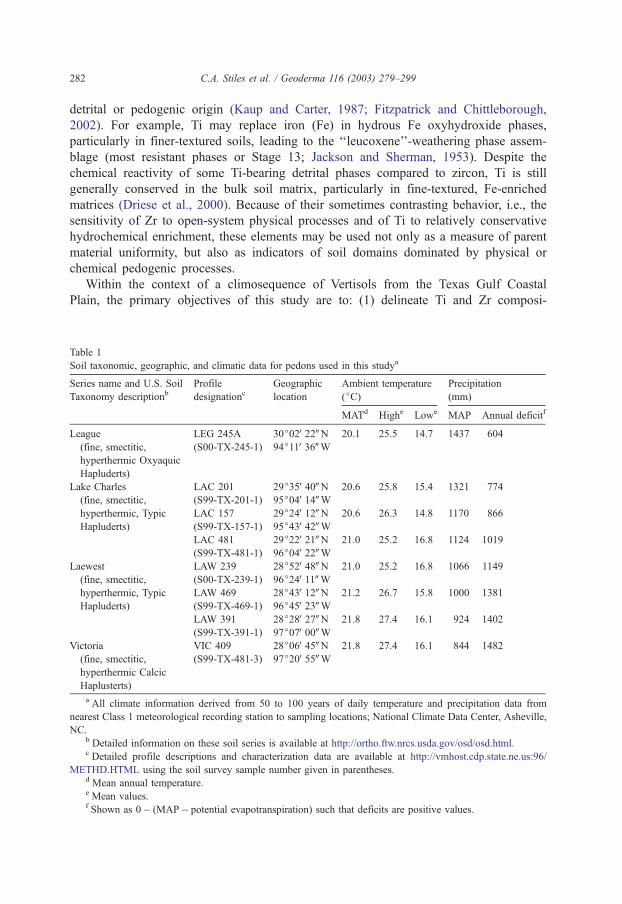
Fig. 2. Ti/Zr ratios for climosequence microlow pedons.
C.A. Stiles et al. / Geoderma 116 (2003) 279–299284
consists of mixed fluvio-deltaic siliciclastic sediments extending from the Louisiana–
Texas border to Mexico (Bernard and LeBlanc, 1965; Blum and Price, 1994; Birdseye
and Aronow, 1991). These deposits are dissected by several rivers flowing into the Gulf
of Mexico. Sampling of younger terraces and reworked soils were avoided through
reconnaissance soil cores, and examination of aerial photos and soil maps. Eight pedons
representing four soil series were used in this study (League, Lake Charles, Laewest, and
Victoria); their MAP values range from 844 to 1437 mm (Fig. 1). Geographic,
taxonomic, and climate information for each location is listed in Table 1. Samples were
recovered from large soil pits (2 m wide, 3–5 m long) that transected microtopographic
features peculiar to Vertisols, also known as ‘‘gilgai’’ microtopography (Lynn and
Williams, 1992), herein referred to as microhighs and microlows. Bulk soil samples
from microtopographic pairs were collected at 10 cm intervals from the surface to the
base of each pit for geochemical analysis, and from each pedogenic horizon for bulk
density measurement.
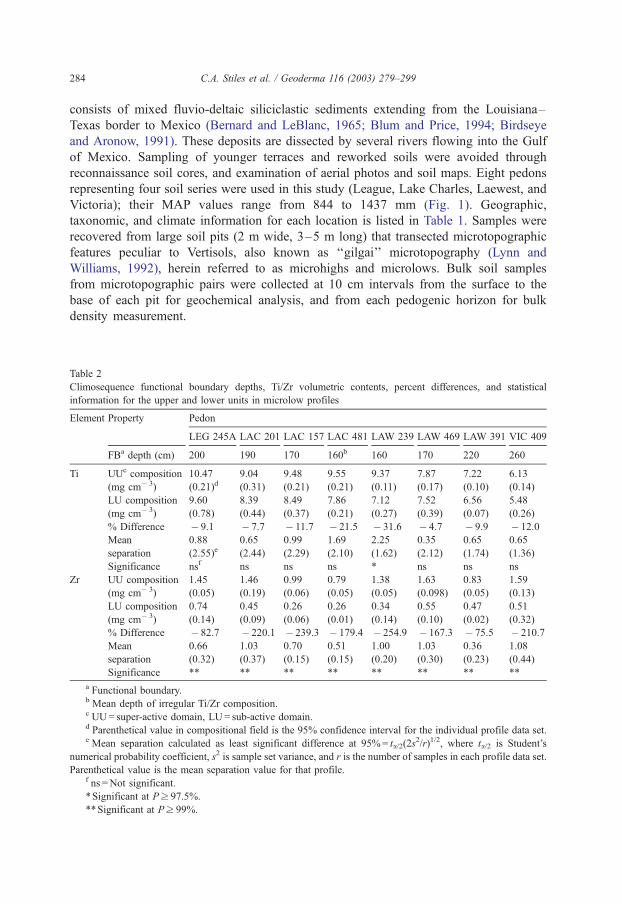
Table 2
Climosequence functional boundary depths, Ti/Zr volumetric contents, percent differences, and statistical
information for the upper and lower units in microlow profiles
Element Property Pedon
LEG 245A LAC 201 LAC 157 LAC 481 LAW 239 LAW 469 LAW 391 VIC 409
FBa depth (cm) 200 190 170 160b 160 170 220 260
Ti UUc composition
(mg cm� 3)
10.47
(0.21)d9.04
(0.31)
9.48
(0.21)
9.55
(0.21)
9.37
(0.11)
7.87
(0.17)
7.22
(0.10)
6.13
(0.14)
LU composition
(mg cm� 3)
9.60
(0.78)
8.39
(0.44)
8.49
(0.37)
7.86
(0.21)
7.12
(0.27)
7.52
(0.39)
6.56
(0.07)
5.48
(0.26)
% Difference � 9.1 � 7.7 � 11.7 � 21.5 � 31.6 � 4.7 � 9.9 � 12.0
Mean
separation
0.88
(2.55)e0.65
(2.44)
0.99
(2.29)
1.69
(2.10)
2.25
(1.62)
0.35
(2.12)
0.65
(1.74)
0.65
(1.36)
Significance nsf ns ns ns * ns ns ns
Zr UU composition
(mg cm� 3)
1.45
(0.05)
1.46
(0.19)
0.99
(0.06)
0.79
(0.05)
1.38
(0.05)
1.63
(0.098)
0.83
(0.05)
1.59
(0.13)
LU composition
(mg cm� 3)
0.74
(0.14)
0.45
(0.09)
0.26
(0.06)
0.26
(0.01)
0.34
(0.14)
0.55
(0.10)
0.47
(0.02)
0.51
(0.32)
% Difference � 82.7 � 220.1 � 239.3 � 179.4 � 254.9 � 167.3 � 75.5 � 210.7
Mean
separation
0.66
(0.32)
1.03
(0.37)
0.70
(0.15)
0.51
(0.15)
1.00
(0.20)
1.03
(0.30)
0.36
(0.23)
1.08
(0.44)
Significance ** ** ** ** ** ** ** **
a Functional boundary.b Mean depth of irregular Ti/Zr composition.c UU= super-active domain, LU= sub-active domain.d Parenthetical value in compositional field is the 95% confidence interval for the individual profile data set.e Mean separation calculated as least significant difference at 95%= ta/2(2s
2/r)1/2, where ta/2 is Student’s
numerical probability coefficient, s2 is sample set variance, and r is the number of samples in each profile data set.
Parenthetical value is the mean separation value for that profile.f ns =Not significant.
*Significant at Pz 97.5%.
**Significant at Pz 99%.
C.A. Stiles et al. / Geoderma 116 (2003) 279–299 285
2.2. Analytical methods
Whole soil samples were oven-dried at 60 jC, ground in a shatterbox, and pressed
powder pellets were used for bulk geochemical analysis using X-ray fluorescence (XRF;
EG&G ORTEC TEFA III, using methods described in Singer and Janitsky, 1986).
Precision for TiO2 and Zr is 0.01 wt.% and 23 mg kg� 1, respectively. Bulk density
was determined by the paraffin-coated air-dried clod method (Blake and Hartge, 1986).
Because significant carbonate content can lower the composite sample weight, elemental
weight percentages were corrected for carbonate content prior to mass-balance calculations
(modified from Soil Survey Staff, 1995). Direct volumetric comparisons are accomplished
by multiplying the wt.% by bulk density. Particle size was analyzed by the pipette method
(Gee and Bauder, 1986) at the National Soil Survey Laboratory in Lincoln, NE. Size
fraction separations of pedons LAC 481 and LAW 239 were made by wet sieving of bulk
samples shaken overnight in buffered Na-hexametaphosphate (10 g/l) solution to separate
the sand fraction (0.05–2 mm). Coarse (20–50 Am), medium to fine (5–20 Am), and very
fine (2–5 Am) silts were separated by centrifugation (Jackson, 1985) and chemically
analyzed by XRF, as described above.
Heavy mineral grains were separated from very fine sand fractions (125–62.5 Am)
above and below the functional boundaries in six microlow profiles using sodium
metatungstate. Zircon and rutile grains were isolated from other heavy minerals based
on their relative relief under the binocular scope, and from each other based on their
different refractive indices. Digital images of at least 25 grains from each sample were
made using a Hitachi S-3500 N scanning electron microscope and surveyed for various
surface features, as described by Darmody (1985) and Tejan-Kella et al. (1990). Two
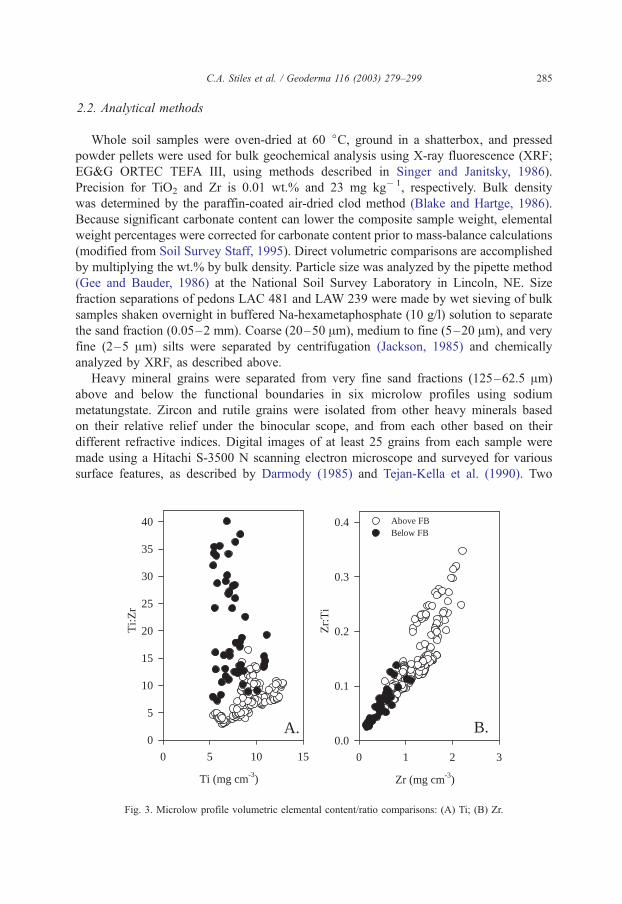
Ti (mg cm-3)
0 5 10 15
Ti:
Zr
0
5
10
15
20
25
30
35
40
A.
Zr (mg cm-3)
0 1 2 3
Zr:
Ti
0.0
0.1
0.2
0.3
0.4 Above FBBelow FB
B.
Fig. 3. Microlow profile volumetric elemental content/ratio comparisons: (A) Ti; (B) Zr.
C.A. Stiles et al. / Geoderma 116 (2003) 279–299286
categories of surface features were utilized as evidence for process: (1) dissolution and
edge attrition, surface roughness and scaling, and oriented or random etch pits as
indicators of hydrogeochemical alteration; (2) percussion marks (conchoidal fracture/
breakage blocks/v-shaped pits), hairline cracks, and edge-rounding/frosting as indicators
of physical transport. Results were tabulated for the profiles as a mean percentage of grains
exhibiting these respective features for each category.
3. Results
3.1. Bulk geochemical analysis
We confine the majority of our discussion to observations from the microlows. General
pedogenic models of Vertisols indicate that seasonal shrink–swell induces physico-
chemical transport along slickenside planes, thereby creating and sustaining elevated
Silt Separate (wt %
)
0
10
20
30
40
50
60
70
80
90
100
Cla
y Se
para
te (w
t %)
0
10
20
30
40
50
60
70
80
90
100
Sand Separate (wt %)0102030405060708090100
Above FBBelow FB
very fine
fine
fine loamy fine silty
coarse loamy coarse siltysandy
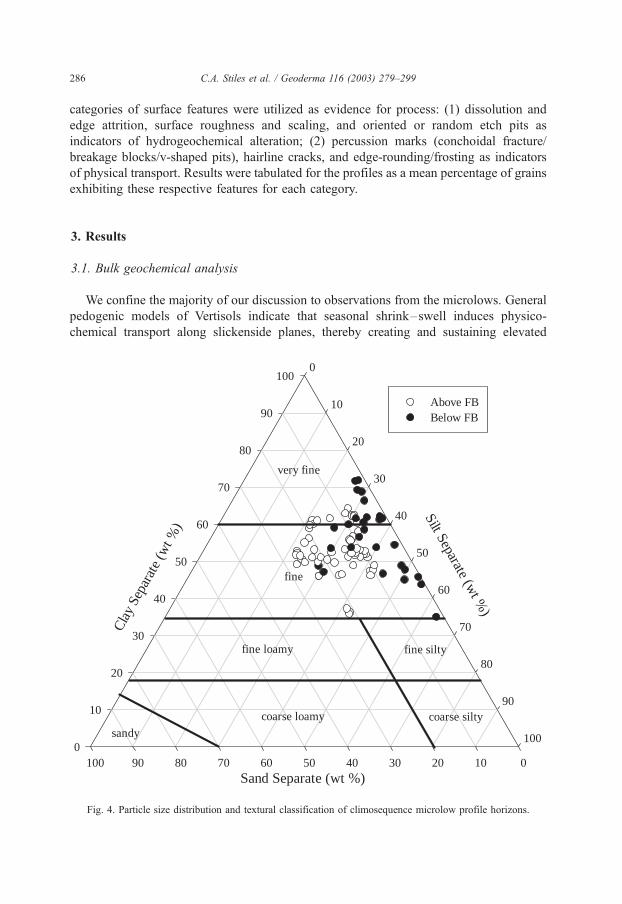
Fig. 4. Particle size distribution and textural classification of climosequence microlow profile horizons.
C.A. Stiles et al. / Geoderma 116 (2003) 279–299 287
microhighs and bowl-like microlows (Lynn and Williams, 1992). Adjacent microlows and
microhighs typically have similar, but not identical, bulk geochemistry and stable isotope
compositions (Stiles, 2001; Miller, 2000) and the depths to the functional boundary in
adjacent microlows and microhighs indicate somewhat contrasting physical and geo-
chemical behavior within the Vertisol microtopographic domains (data not shown here: see
Stiles, 2001). Microhighs are often complicated structurally by thrusting, are better drained
and tend to be depleted in organic matter and enriched in secondary evaporites compared
to adjacent microlows. Microlows have previously been demonstrated to behave as more
physically and chemically closed systems (Wilding et al., 1990; Driese et al., 2000).
Bulk geochemical analysis revealed notable changes in the Ti/Zr volumetric ratio at
depth in each pedon (Fig. 2). Tukey’s w procedure using Studentized range and pair-wise
comparisons of the microlow Ti/Zr values were used to statistically determine the
functional boundary depth between the upper and lower units (Table 2). Mean volumetric
contents of the two elements show that Ti contents do not vary greatly between upper and
lower units (� 4.7% to � 31.6%), confirmed by the mean separation and least significant
difference (LSD) values shown in Table 2. Only the wettest Laewest profile (LAW 239)
showed significance at P < 0.025. By comparison, Zr differences vary from � 75.5% to
� 239.3% between the upper and lower units and are all statistically significant at
P < 0.001 (Table 2).
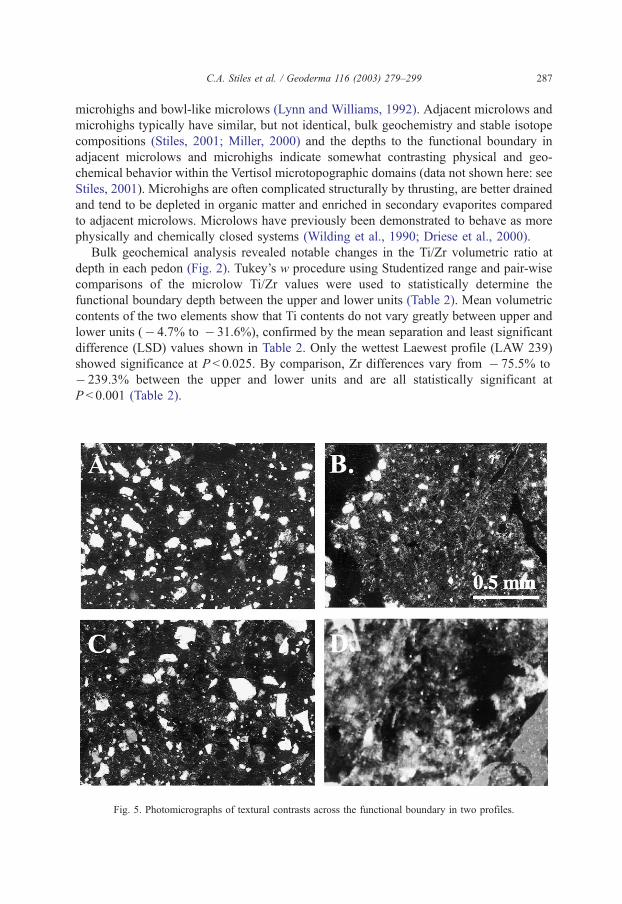
Fig. 5. Photomicrographs of textural contrasts across the functional boundary in two profiles.
C.A. Stiles et al. / Geoderma 116 (2003) 279–299288
The depth and magnitude of the volumetric Ti:Zr shifts differ in each pedon and cannot
be strictly ascribed to climate (i.e., MAP), because the shallowest inflections occur within
soils formed in the intermediate precipitation range (1000–1200 mm MAP) of the
climosequence. These considerable and pervasive differences could be caused either by:
(1) a regional sedimentological discontinuity, or (2) differences resulting from pedogenic
processes. To determine which component more greatly affects the Ti/Zr ratios, element
versus ratio trends were examined. Titanium (Fig. 3A) is relatively insensitive to increases
in the Ti:Zr ratio, even across the functional boundary. In contrast, volumetric Zr content
shows strong correlation with the Zr:Ti ratios (R = 0.926, P < 0.001) for all pedons (Fig.
3B). Volumetric Zr contents in the lower soil domains (below the functional boundary) are
less than those of the upper units. These results indicate that variability in Ti:Zr volumetric
ratios are largely influenced by Zr contents, with Ti behaving more conservatively.
3.2. Particle size distribution and component comparisons
The Vertisol pedons within the climosequence are fine-textured, with clay contents of
35.8–72.6 wt.% (Fig. 4). The sand and coarse silt (SCST) size fractions of these fine-
textured soils contribute significantly to the observed compositional trends and are closely
related to the position of the functional boundary. Sand and silt contents are highest in the
Victoria and drier Laewest pedons (Fig. 1). In all profiles, soil textures tend to coarsen
upward and are significantly finer below the functional boundary (Fig. 4, filled symbols).
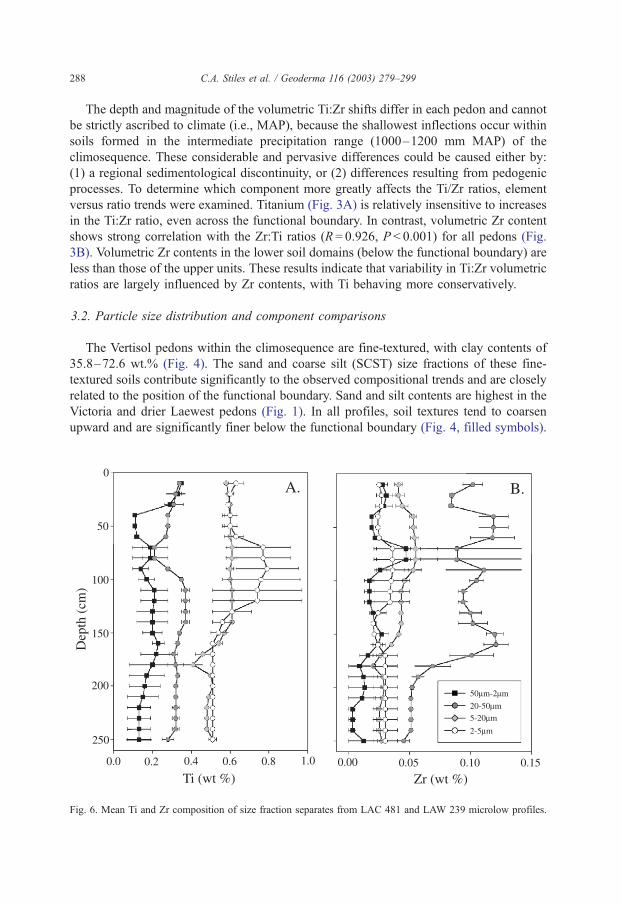
Fig. 6. Mean Ti and Zr composition of size fraction separates from LAC 481 and LAW 239 microlow profiles.
C.A. Stiles et al. / Geoderma 116 (2003) 279–299 289
Micromorphologic differences across the boundary are pronounced between the upper and
lower units (Fig. 5). Photomicrographs show more abundant and coarser-textured quartz
sand grains above the boundary in both profiles (Fig. 5A,C). Similarly, there are
significantly fewer large grains in the lower portions of these profiles (Fig. 5B,D), and
most of the grains are located along voids within the matrix.
Geochemical analyses of the size fractions (Fig. 6) show that Ti tends to be enriched in
the finer fractions ( < 20 Am; Fig. 6A) while Zr is enriched in the coarse silt (20–50 Am),
and is particularly concentrated above the functional boundary in LAW 239 (Fig. 6B).
Trends in LAC 481 are similar to those noted in LAW 239, although intrinsic composi-
tional values are slightly different. Volumetric Zr contents show significant correlation to
the SCST content in each soil series within the climosequence (Fig. 7). Regression
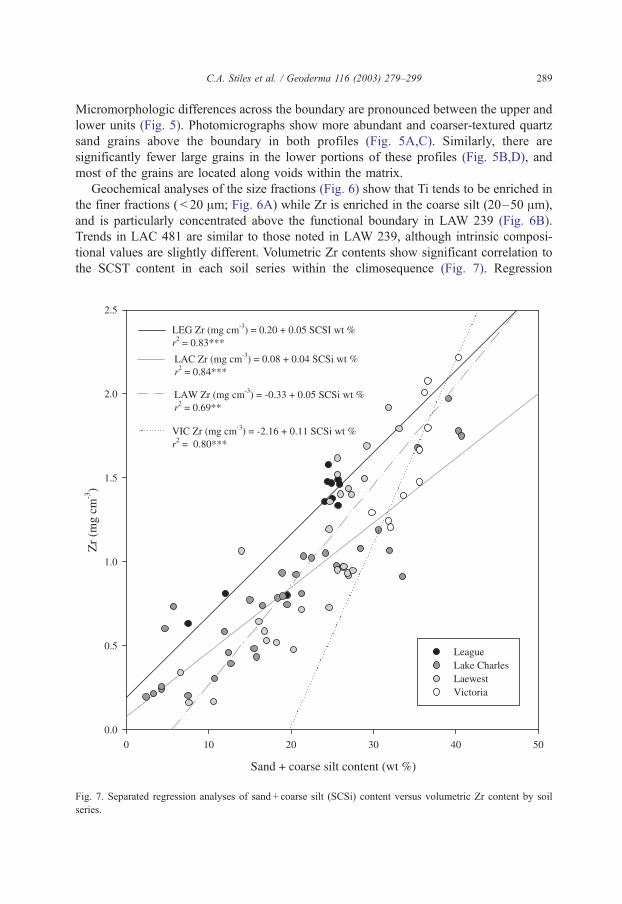
Fig. 7. Separated regression analyses of sand + coarse silt (SCSi) content versus volumetric Zr content by soil
series.
C.A. Stiles et al. / Geoderma 116 (2003) 279–299290
analyses of each soil series show positive correlation of volumetric Zr contents and wt.%
SCST, with r2 values from 0.69 to 0.84 (P < 0.001). The slopes of the series regressions
are steeper in series having relatively low MAP (i.e., Laewest and Victoria series),
indicating a significant increase of Zr with even minor additions to the SCST fraction.
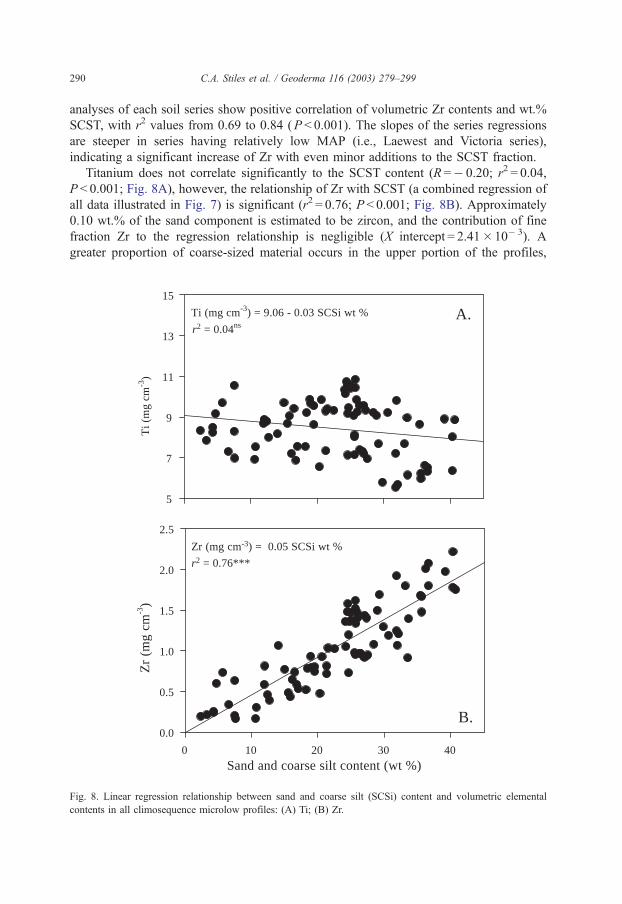
Titanium does not correlate significantly to the SCST content (R =� 0.20; r2 = 0.04,
P < 0.001; Fig. 8A), however, the relationship of Zr with SCST (a combined regression of
all data illustrated in Fig. 7) is significant (r2 = 0.76; P < 0.001; Fig. 8B). Approximately
0.10 wt.% of the sand component is estimated to be zircon, and the contribution of fine
fraction Zr to the regression relationship is negligible (X intercept = 2.41�10� 3). A
greater proportion of coarse-sized material occurs in the upper portion of the profiles,
0 10 20 30 40
0.0
0.5
1.0
1.5
2.0
2.5
Zr (mg cm-3) = 0.05 SCSi wt %
5
7
9
11
13
15
A.
B.
Sand and coarse silt content (wt %)
Ti (mg cm-3) = 9.06 - 0.03 SCSi wt %
r2 = 0.76***
Zr
(mg
cm-3
)T
i (m
g cm
-3)
r2 = 0.04ns
Fig. 8. Linear regression relationship between sand and coarse silt (SCSi) content and volumetric elemental
contents in all climosequence microlow profiles: (A) Ti; (B) Zr.
C.A. Stiles et al. / Geoderma 116 (2003) 279–299 291
suggesting that 20–50 Am zircons are relatively abundant in the upper portion of the
weathering profiles in the climosequence. Lack of correlation between Ti content and
SCST indicates that Ti is rare in the >20 Am fraction, or may have been preferentially
removed. Relatively large amounts of Ti in samples with no SCST (Fig. 8A) further
indicates that most of the Ti occurs in finer texture components.
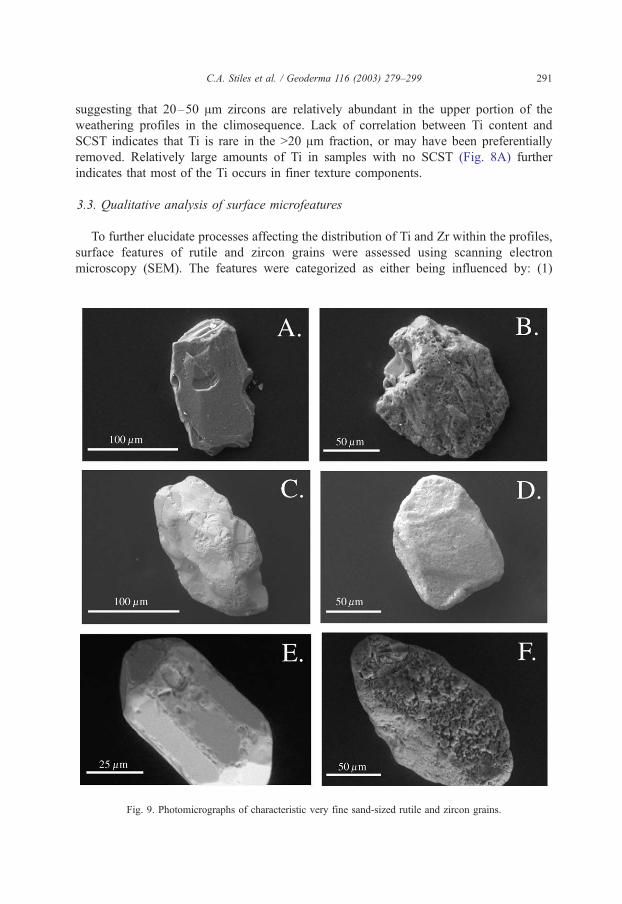
3.3. Qualitative analysis of surface microfeatures
To further elucidate processes affecting the distribution of Ti and Zr within the profiles,
surface features of rutile and zircon grains were assessed using scanning electron
microscopy (SEM). The features were categorized as either being influenced by: (1)
Fig. 9. Photomicrographs of characteristic very fine sand-sized rutile and zircon grains.
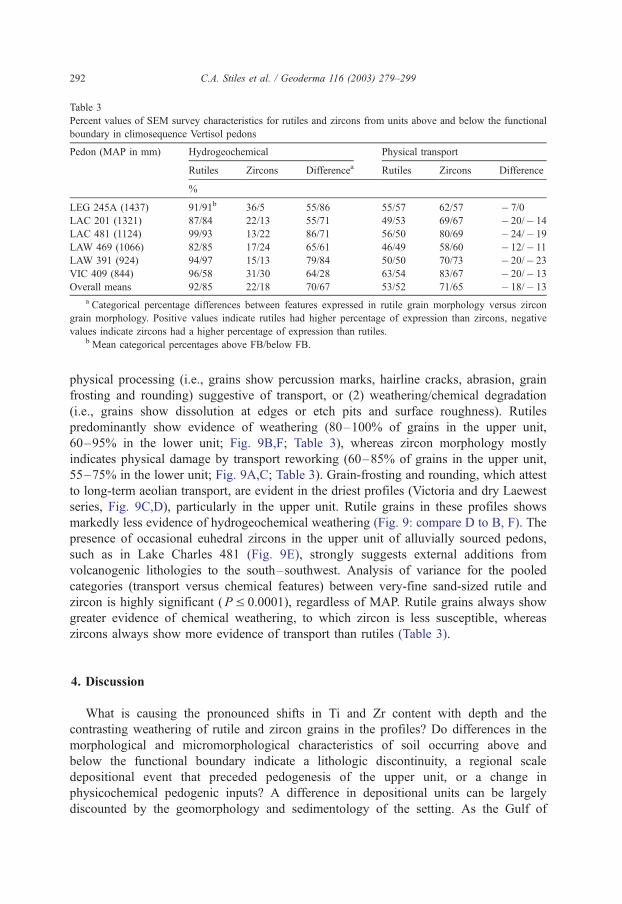
Table 3
Percent values of SEM survey characteristics for rutiles and zircons from units above and below the functional
boundary in climosequence Vertisol pedons
Pedon (MAP in mm) Hydrogeochemical Physical transport
Rutiles Zircons Differencea Rutiles Zircons Difference
%
LEG 245A (1437) 91/91b 36/5 55/86 55/57 62/57 � 7/0
LAC 201 (1321) 87/84 22/13 55/71 49/53 69/67 � 20/� 14
LAC 481 (1124) 99/93 13/22 86/71 56/50 80/69 � 24/� 19
LAW 469 (1066) 82/85 17/24 65/61 46/49 58/60 � 12/� 11
LAW 391 (924) 94/97 15/13 79/84 50/50 70/73 � 20/� 23
VIC 409 (844) 96/58 31/30 64/28 63/54 83/67 � 20/� 13
Overall means 92/85 22/18 70/67 53/52 71/65 � 18/� 13
a Categorical percentage differences between features expressed in rutile grain morphology versus zircon
grain morphology. Positive values indicate rutiles had higher percentage of expression than zircons, negative
values indicate zircons had a higher percentage of expression than rutiles.b Mean categorical percentages above FB/below FB.
C.A. Stiles et al. / Geoderma 116 (2003) 279–299292
physical processing (i.e., grains show percussion marks, hairline cracks, abrasion, grain
frosting and rounding) suggestive of transport, or (2) weathering/chemical degradation
(i.e., grains show dissolution at edges or etch pits and surface roughness). Rutiles
predominantly show evidence of weathering (80–100% of grains in the upper unit,
60–95% in the lower unit; Fig. 9B,F; Table 3), whereas zircon morphology mostly
indicates physical damage by transport reworking (60–85% of grains in the upper unit,
55–75% in the lower unit; Fig. 9A,C; Table 3). Grain-frosting and rounding, which attest
to long-term aeolian transport, are evident in the driest profiles (Victoria and dry Laewest
series, Fig. 9C,D), particularly in the upper unit. Rutile grains in these profiles shows
markedly less evidence of hydrogeochemical weathering (Fig. 9: compare D to B, F). The
presence of occasional euhedral zircons in the upper unit of alluvially sourced pedons,
such as in Lake Charles 481 (Fig. 9E), strongly suggests external additions from
volcanogenic lithologies to the south–southwest. Analysis of variance for the pooled
categories (transport versus chemical features) between very-fine sand-sized rutile and
zircon is highly significant (PV 0.0001), regardless of MAP. Rutile grains always show
greater evidence of chemical weathering, to which zircon is less susceptible, whereas
zircons always show more evidence of transport than rutiles (Table 3).
4. Discussion
What is causing the pronounced shifts in Ti and Zr content with depth and the
contrasting weathering of rutile and zircon grains in the profiles? Do differences in the
morphological and micromorphological characteristics of soil occurring above and
below the functional boundary indicate a lithologic discontinuity, a regional scale
depositional event that preceded pedogenesis of the upper unit, or a change in
physicochemical pedogenic inputs? A difference in depositional units can be largely
discounted by the geomorphology and sedimentology of the setting. As the Gulf of
C.A. Stiles et al. / Geoderma 116 (2003) 279–299 293
Mexico Basin subsides under an increasing sediment load, the marginal fluvio-deltaic
deposits that blanket the Texas Gulf Coast may be depositing coarser material over the
finer-textured (clayey) deposits as part of a complex glacio-eustatic retrogradational
sequence. However, the great thickness of the upper units in the Vertisol profiles (1.6–
2.6 m), the relatively advanced morphological maturity, and temporal limitations make
a major depositional change an unlikely scenario in this relatively low-energy
depositional setting.
4.1. Discerning pedogenic processes
Vertisols along the climosequence are exposed to different levels of physical and
geochemical pedogenic processes and the functional boundary may indicate the relative
influence and intensities of these processes. Vertisols are remarkable for their expres-
sions of physical processing, with characteristic slickensides and microtopographic
differentiation generated and maintained by seasonal shrink–swell mechanisms (Lynn
and Williams, 1992). Seasonal cracking, which occurs more frequently within micro-
lows, creates a solum responsive to meteoric inputs down to the depth of cracking
(Wilding et al., 1990). Microhighs tend to act not only as foci for upward physical
material transport, but the relatively high relief of microhighs may allow them to
physically ‘‘shed’’ materials into the bowl-like depressions of the microlow. Such
microtopographic relief reaches maximum expression in climatic zones experiencing
large seasonal soil-moisture deficits and is relatively subdued in both the wetter and
drier ends of the climosequence (Stiles, 2001).
In wet climates with lower seasonal moisture deficits (i.e., receiving greater amounts of
and more constant delivery of precipitation throughout the year), Vertisol pedogenesis is
strongly influenced by relatively high biotic activity/productivity. Within the climose-
quence, Vertisols with MAP >1300 mm have evidence of extensive bioturbation,
particularly crayfish (Fallicambarus devastator) krotovina. Krotovina extended as deep
as 2 m in the profiles and accumulation of crayfish wastes at the surface was notable in
microlows. High productivity enhances bioturbation and overall elemental cycling,
ameliorating the strictly physical effects of seasonal shrink–swell processes. This assess-
ment was reinforced by strong relationships of mass-balance translocation trends of
biocycled elements such as calcium, magnesium, and potassium with MAP (data not
shown; Stiles, 2001).
Vertisols formed in lower MAP climates with extended periods of soil moisture deficits
have limited slickenside and microtopographic development simply because there is not
enough available soil water, even in the wet season, to generate the necessary clay-
swelling and associated physical forces (Wilding and Tessier, 1988). Cracks form and
remain open for longer periods of time during dry periods, providing ample conduits for
wind-borne dust into the profiles. Aeolian accumulations tend to form a blanket that
thickens over time in most soils (Yaalon, 1987) and are effectively intercalated into
Vertisol cracks. Lower soil moisture also effectively retards mineral weathering, lessens
active transport of coarse fragments, and contributes to sand preservation in the profile.
This argument is supported by the stronger relationship of Zr with SCST (e.g., steeper
slopes of the linear correlations) as MAP decreases (Fig. 7).
C.A. Stiles et al. / Geoderma 116 (2003) 279–299294
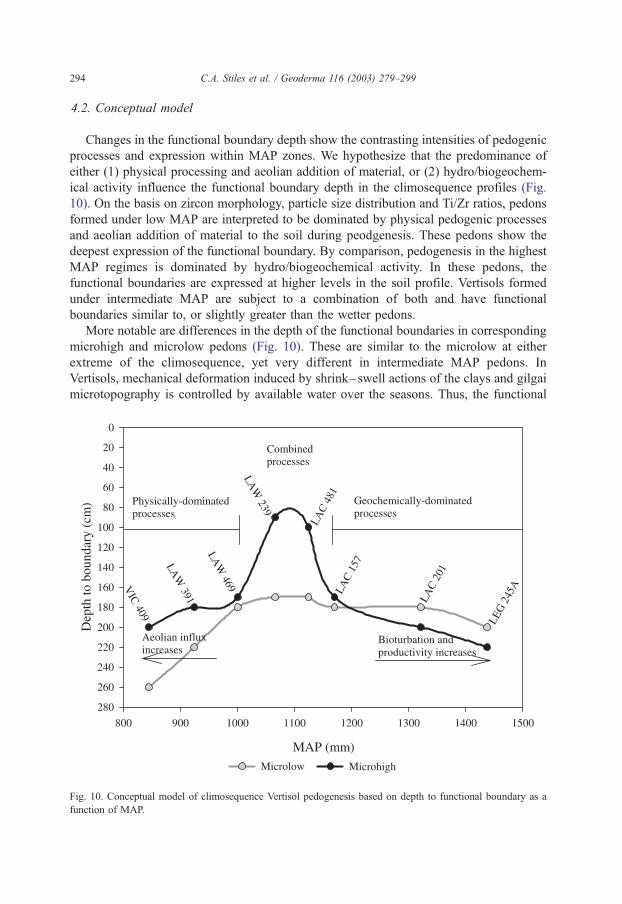
4.2. Conceptual model
Changes in the functional boundary depth show the contrasting intensities of pedogenic
processes and expression within MAP zones. We hypothesize that the predominance of
either (1) physical processing and aeolian addition of material, or (2) hydro/biogeochem-
ical activity influence the functional boundary depth in the climosequence profiles (Fig.
10). On the basis on zircon morphology, particle size distribution and Ti/Zr ratios, pedons
formed under low MAP are interpreted to be dominated by physical pedogenic processes
and aeolian addition of material to the soil during peodgenesis. These pedons show the
deepest expression of the functional boundary. By comparison, pedogenesis in the highest
MAP regimes is dominated by hydro/biogeochemical activity. In these pedons, the
functional boundaries are expressed at higher levels in the soil profile. Vertisols formed
under intermediate MAP are subject to a combination of both and have functional
boundaries similar to, or slightly greater than the wetter pedons.
More notable are differences in the depth of the functional boundaries in corresponding
microhigh and microlow pedons (Fig. 10). These are similar to the microlow at either
extreme of the climosequence, yet very different in intermediate MAP pedons. In
Vertisols, mechanical deformation induced by shrink–swell actions of the clays and gilgai
microtopography is controlled by available water over the seasons. Thus, the functional
Fig. 10. Conceptual model of climosequence Vertisol pedogenesis based on depth to functional boundary as a
function of MAP.
C.A. Stiles et al. / Geoderma 116 (2003) 279–299 295
boundary depth differences between microhighs and microlows from dry to intermediate
to wet MAP Vertisols can be partially explained by morphological variations and
mechanical actions within the profiles. In low MAP Vertisols, gilgai development is
modest (Stiles, 2001). The microlows act as catchment basins for material brought in by
wind or shed from microhighs. Microlows in low MAP Vertisols more effectively capture
the limited rainfall and are therefore ‘‘wetter’’ than corresponding microhighs, resulting in
deeper cracking during the dry season, and a functional boundary in the microlow that is
deeper than the microhigh (Fig. 10). At the middle of the MAP scale, gilgai are most
strongly developed (Stiles, 2001), indicating the importance of physical translocation and
mechanical deformation induced by clay shrink–swell. This, combined with attenuated,
but still active, hydro/biogeochemical activity results in shallow and irregular functional
boundary depths (Figs. 2 and 10). Although these profiles have experienced some level of
aeolian input (Fig. 9E), degradation/eluviation rates appear equivalent to accumulation
rates.
Within the high MAP Vertisols, water is not limiting and the depth of the functional
boundary increases in response to hydro/biogeochemical mechanisms. The presence of
abundant dissolved organic substances contributes to carbonate and salt solubility and
creates favorable conditions for lessivage. At the same time, bioproductivity increases,
producing a positive feedback cycle where recycled material from deeper in the profile is
moved to the surface, producing more abundant organic matter that, in turn, enhances
geochemical transport (Stiles, 2001). Microlows generally have higher organic contents
(Coulombe et al., 1996), and also tend to be habitats for diverse communities of soil-
dwelling fauna. Physical transport of materials to the surface via meso- and macrofauna
(particularly crayfish) tends to disrupt hydrogeochemical trends and attenuates strict
downward-weathering signatures. Thus, at high MAP regimes, the depth to the functional
boundary is shallower in the microlow than the microhigh, where crayfish accumulations
are less subject to intense reworking and accumulation rates slightly exceed erosion.
4.3. Titanium as a mass-balance strain indicator in clay-rich soils
A principle objective for this work is to evaluate which ‘‘immobile’’ element is best to
use for mass-balance analysis in a Vertisol climosequence. Geochemical mass-balance
calculations require identification of an immobile index element to determine residual
enrichments and translocations. Soil strain, defined as:
ei;w ¼ ðqpCi;p=qwCi;wÞ � 1
where ei,w is strain in weathered material w based on immobile element i, q is the soil bulk
density, p is unweathered parent material interval, and C is concentration of immobile
element i in p or w, strain is the basis by which other elements translocations are
determined in mass-balance relationships (Brimhall and Dietrich, 1987).
No element is truly immobile during intense pedogenesis, but only relatively immobile
due to retarded hydrogeochemical or physical processing. Thus, the choice of an immobile
strain element is dependent upon the pedogenic setting. Elements affected by influxes of
exotic material or fluids, such as the Zr–SCST relationship, can only be used when such
C.A. Stiles et al. / Geoderma 116 (2003) 279–299296
accumulations are dynamically balanced with internal processes. Such reasoning also
holds true with elements found in minerals susceptible to hydrogeochemical alteration
such as Ti in rutile. If the pedogenic conditions are such that distribution of the element
does not change, although there may be some redistribution among primary and secondary
phases (i.e., Vertisol fine-fractions), then that element is the strain indicator of choice in
that particular setting. Another reason for using Ti is analytical: XRF-detectable Ti is
always much more abundant than Zr in these soils. Titanium contents are 3–40 times
higher than Zr, with associated instrumental errors of 0.85–2.38% for TiO2, but as much
as 1.85–25.00% for Zr. When used in Vertisol mass-balance calculations, Ti is the
conservative element of choice allowing for maximum depiction of the pedogenic
responses of an element of interest, rather than its relationship to the strain indicator itself.
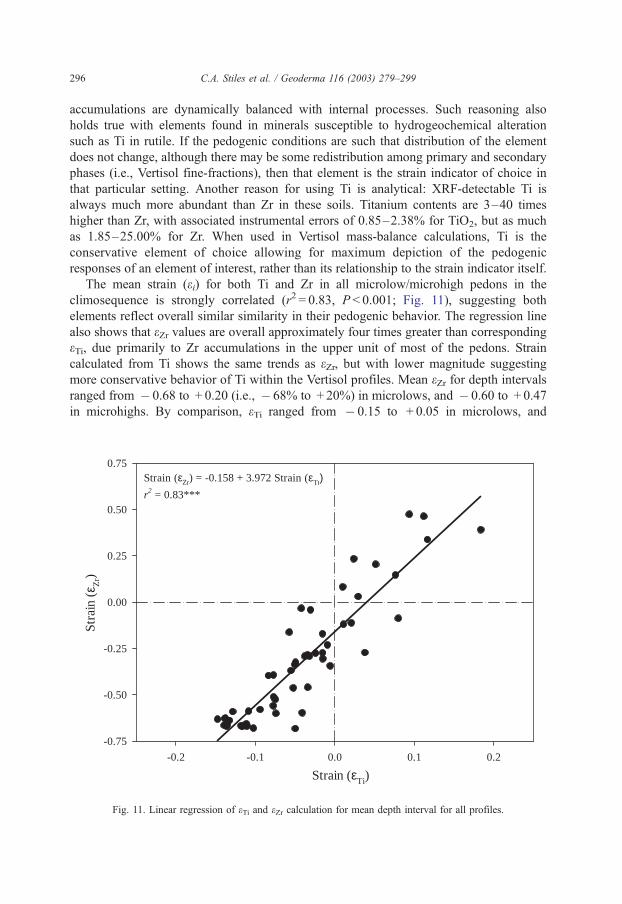
The mean strain (ei) for both Ti and Zr in all microlow/microhigh pedons in the
climosequence is strongly correlated (r2 = 0.83, P < 0.001; Fig. 11), suggesting both
elements reflect overall similar similarity in their pedogenic behavior. The regression line
also shows that eZr values are overall approximately four times greater than corresponding
eTi, due primarily to Zr accumulations in the upper unit of most of the pedons. Strain
calculated from Ti shows the same trends as eZr, but with lower magnitude suggesting
more conservative behavior of Ti within the Vertisol profiles. Mean eZr for depth intervals
ranged from � 0.68 to + 0.20 (i.e., � 68% to + 20%) in microlows, and � 0.60 to + 0.47
in microhighs. By comparison, eTi ranged from � 0.15 to + 0.05 in microlows, and
Strain (εTi)
-0.2 -0.1 0.0 0.1 0.2
Stra
in (
ε Zr)
-0.75
-0.50
-0.25
0.00
0.25
0.50
0.75Strain (εZr) = -0.158 + 3.972 Strain (εTι)r2 = 0.83***
Fig. 11. Linear regression of eTi and eZr calculation for mean depth interval for all profiles.
C.A. Stiles et al. / Geoderma 116 (2003) 279–299 297
� 0.09 to + 0.18 in microhighs, indicating markedly less pronounced volume loss/gain.
The conservative nature of Ti in fine-textured Vertisols makes it a more suitable strain
indicator than Zr, and an indicator that helps quantify pedogenic effects more reliably,
both within and between Vertisol pedons. Thus, it is important to assess the immobility
or internal variations are due entirely to weathering of the parent sediment or are there,
in fact, external factors that may skew the trends.
5. Conclusions
Geochemical and physical evidence delineate a functional boundary in Vertisol pedons,
which indicates a shift in primary pedogenic intensity. Depth to the functional boundary
indicates the relative influence of contrasting pedogenic mechanisms (hydrogeochemical
versus physical) across the climosequence. The functional boundary defines the depth of
the superactive pedogenesis domain in the Vertisols, where external fluxes create a
dynamic open-system. Microscopic (SEM) survey of grain morphology revealed rutile
grains were more weathered relative to zircon, whereas zircons always showed more
physical grain damage indicative of extensive transport. This relationship was expressed
throughout the Vertisol profiles, regardless of the depth of the functional boundary,
although it was slightly more pronounced in zircon features as a function of MAP. There is
typically residual enrichment of Zr and Ti in the upper portions of Vertisols that results
from loss of more mobile elements during pedogenesis. However, the strong correlation of
Zr with the small, but significant, sand and coarse silt fraction in these clay-rich soils,
along with the SEM evidence that many very fine sand-sized zircon grains have been
extensively transported from outside areas, argues that Zr is predominantly an indicator of
physical processes and aeolian input rather than overall weathering during Vertisol
pedogenesis. Despite evidence of minor weathering, Ti is conserved within weathering
clay-rich profiles and is better suited as a closed-system strain indicator to determine
mobile elemental translocation intensity using mass-balance.
The concept of a ‘‘lithologic discontinuity’’ as it applies to U.S. Soil Taxonomy is not
fully defined in terms of pedogenesis, although there are several criteria given by the Soil
Survey for its recognition (Soil Survey Staff, 1998). In some cases, there are true breaks in
the lithologic composition of profiles, but in many cases, lithologic discontinuities may, in
fact, be the translocation crossover described by Brimhall et al. (1991) or the functional
boundary described in this paper. Within the Vertisol climosequence, there are only slight
variations in the initial parent material in which soil begins to form, but over time, open-
system dynamics create a complex lithology characteristic of the soil itself. The depth to
the functional boundary becomes an interpretive tool for Vertisol pedogenesis using both
Ti and Zr as indicators of contrasting pedogenic mechanisms. Within the Texas Gulf Coast
climosequence, the interpretations gained from using this tool are:
(1) All pedons experienced some level of aeolian input;
(2) Hydro/biogeochemical processes dominate wet Vertisols, subduing expression of
shrink–swell phenomenon and slickenside development and microtopographic
differences;
C.A. Stiles et al. / Geoderma 116 (2003) 279–299298
(3) Physical processes dominate the pedogenesis of Vertisols formed in dry climates,
where wind-borne material infiltrates into long-lived seasonal cracks and is only
slowly weathered;
(4) Mid-range MAP Vertisols show the maximum additive interaction between the
physical and hydrogeochemical pedogenic processes and the most extreme differences
in the physical and chemical expression of microtopographic highs and lows.
Acknowledgements
This project was carried out in conjunction with a U.S. Department of Agriculture-
NRCS reevaluation of the Texas Gulf Coast Prairie soil resource area. We are grateful to
NRCS district soil scientists for logistical field support, particularly in selection of
sampling sites. We thank Amy Robinson and Ellen Robey (UT-Knoxville) for sample
preparation and analysis, and Richard Drees and Larry Wilding of Texas A&M University
for additional data and helpful discussion.
References
Bernard, H.A., LeBlanc, R.J., 1965. Resume of the Quaternary geology of the northwestern Gulf of Mexico
province. In: Wright, H.E., Frey, D.G. (Eds.), The Quaternary of the United States. Princeton Univ. Press,
Princeton, NJ, pp. 137–185.
Birdseye, H.A., Aronow, S., 1991. New evidence for a young late Wisconsin age for the Prairie Formation,
Texas, USA. Geol. Soc. Am., Abstr. Program 23, A223.
Birkeland, P.W., 1999. Soils and Geomorphology, 3rd ed. Oxford Univ. Press, New York.
Blake, G.R., Hartge, K.H., 1986. Bulk density. In: Klute, A. (Ed.), Methods of Soil Analysis: Pt. 1. Physical and
Mineralogical Methods, 2nd ed., vol. 9. Soil Sci. Soc. Amer. Agron. Monogr., pp. 363–375.
Blum, M.D., Price, D.M., 1994. Glacio-eustatic and climatic controls on Quaternary alluvial plain deposition:
Texas Coastal Plain. Gulf Coast Assoc. Geol. Soc. Trans. 44, 85–92.
Brimhall, G.H., Dietrich, W.E., 1987. Constitutive mass balance relations between chemical composition, vol-
ume, density, porosity, and strain in metasomatic hydrochemical systems: results on weathering and pedo-
genesis. Geochim. Cosmochim. Acta 51, 567–587.
Brimhall, G.H., Chadwick, O.A., Lewis, C.J., Compston, W., Williams, I.S., Danti, K.J., Dietrich, W.E., Power,
M.E., Hendricks, D., Bratt, J., 1991. Deformational mass transport and invasive processes in soil evolution.
Science 255, 695–702.
Coulombe, C.E., Dixon, J.B., Wilding, L.P., 1996. Mineralogy and chemistry of Vertisols. In: Ahmad, N.,
Mermut, A. (Eds.), Vertisols and Technologies for their Management: Developments in Soil Science, vol.
24. Elsevier, New York, pp. 115–200.
Darmody, R.G., 1985. Weathering assessment of quartz grains: a semi-quantitative approach. Soil Sci. Soc. Am.
J. 49, 1322–1324.
Driese, D.G., Mora, C.I., Stiles, C.A., Joeckel, R.M., Nordt, L.C., 2000. Mass-balance reconstruction of a modern
Vertisol: implications for interpreting the geochemistry and burial alteration of paleo-Vertisols. Geoderma 95,
179–204.
Fitzpatrick, R.W., Chittleborough, D.J., 2002. Titanium and zirconium minerals. In: Dixon, J.B., Schulze,
D.G. (Eds.), Soil Mineralogy with Environmental Applications. Soil Sci. Soc. Amer. Book Series, vol. 7,
pp. 667–690.
Gee, G.W., Bauder, J.W., 1986. Particle-size analysis. In: Klute, A. (Ed.), Methods of Soil Analysis: Pt. 1.
Physical and Mineralogical Methods, 2nd ed., vol. 9. Soil Sci. Soc. Amer. Agron. Monogr., pp. 383–411.
C.A. Stiles et al. / Geoderma 116 (2003) 279–299 299
Jackson, M.L., 1985. Mineral fractionation for soils. In: Jackson, M.L. (Ed.), Soil Chemical Analysis, 2nd ed.,
pp. 101–166. Published by author, Madison, WI.
Jackson, M.L., Sherman, G.D., 1953. Chemical weathering of minerals in soils. Adv. Agron. 5, 219–318.
Kaup, B.S., Carter, B.J., 1987. Determining Ti source and distribution within a Paleustalf by micromorphology,
submicroscopy and elemental analysis. Geoderma 40, 141–156.
Lynn, W.C., Williams, D., 1992. The making of a Vertisol. Soil Surv. Horiz. 33, 45–50.
Marshall, C.E., Haseman, J.F., 1942. The quantitative evaluation of soil formation and development by heavy
mineral studies: a Grundy silt loam profile. Soil Sci. Soc. Am. Proc. 7, 448–453.
Miller, D.L., 2000. Occurrence and stable isotope compositions of soil carbonate and organic matter within a
climatic transect of modern Vertisols along the costal prairie of Texas. MS thesis, The University of Tennes-
see, Knoxville, TN.
Reheis, M.C., 1990. Influence of climate and eolian dust on the major-element chemistry and clay mineralogy of
soils in the northern Bighorn Basin, U.S.A. Catena 17, 219–248.
Singer, M.J., Janitsky, P., 1986. Field and laboratory procedures used in a soil chronosequence study. U.S. Geol.
Surv. Bull. 1648 (16 pp.).
Soil Survey Staff, 1995. Soil Survey Laboratory Information Manual. Soil Survey Invest. Report No. 45, v. 1.0.
U.S. Government Printing Office, Washington, DC. 305 pp.
Soil Survey Staff, P., 1998. Keys to Soil Taxonomy, 8th ed. U.S. Government Printing Office, Washington, DC.
326 pp.
Stiles, C.A., 2001. Pedogenic relationships in a Texas Vertisol climosequence defined by geochemical mass
balance of whole soil and chemistry of iron–manganese nodules. PhD dissertation, The University of
Tennessee, Knoxville, TN.
Tejan-Kella, M.S., Fitzpatrick, R.W., Chittleborough, D.J., 1990. Scanning electron microscope study of zircons
and rutiles from a podzol chronosequence at Cooloola, Queensland, Australia. Catena 18, 11–30.
Wilding, L.P., Tessier, D., 1988. Genesis of Vertisols: shrink–swell phenomena. In: Wilding, L.P., Puentes, R.
(Eds.), Vertisols: Their Distribution, Properties, Classification, and Management. Texas A&M Univ. Print.
Center, College Station, TX, pp. 23–57.
Wilding, L.P., Williams, D., Miller, W., Cook, T., Eswaran, H., 1990. Close interval spatial variability of
Vertisols: a case study in Texas. In: Kimble, J.M. (Ed.), Proceedings of the 6th International Soil Correlation
Meeting (VI ISCOM)—Characterization, Classification, Utilization of Cold Aridisols and Vertisols. USDA
Soil Cons. Serv., Nat. Soil Surv. Center, Lincoln, pp. 232–247.
Yaalon, D.H., 1987. Saharan dust and desert loess: effect on surrounding soils. J. Afr. Earth Sci. 6, 569–571.
Related Documents