Pediatric Nutrition Assessment BY: FARAH HILLOU, MSC, RD INSTRUCTOR IN NUTRITION, DEPARTMENT OF HEALTH SCIENCES, ZAYED UNIVERSITY NUTRITION CONSULTANT E-MAIL: [email protected] INTERNATIONAL PEDIATRIC SUMMIT, DUBAI, 2017

Welcome message from author
This document is posted to help you gain knowledge. Please leave a comment to let me know what you think about it! Share it to your friends and learn new things together.
Transcript

Pediatric Nutrition Assessment
BY: FARAH HILLOU, MSC, RD I N STRUCTOR I N N UT RI T ION, D EPARTMENT O F H EALTH S C I ENCES, ZAY ED U N I VERS I TY N UTRI T ION CONSULTANT E - MAI L : FARAH.HI [email protected]. AE
INTERNATIONAL PEDIATRIC SUMMIT, DUBAI, 2017

Learning Objectives 1. Identify the five components of a pediatric nutrition assessment.
2. Utilize appropriate growth charts for infants and children.
3. Utilize appropriate equations to determine a child’s energy and protein needs.
4. Define pediatric malnutrition (undernutrition) in the hospital setting.
5. Apply concepts of pediatric nutrition assessment in case studies.

NUTRITION ASSESSMENT
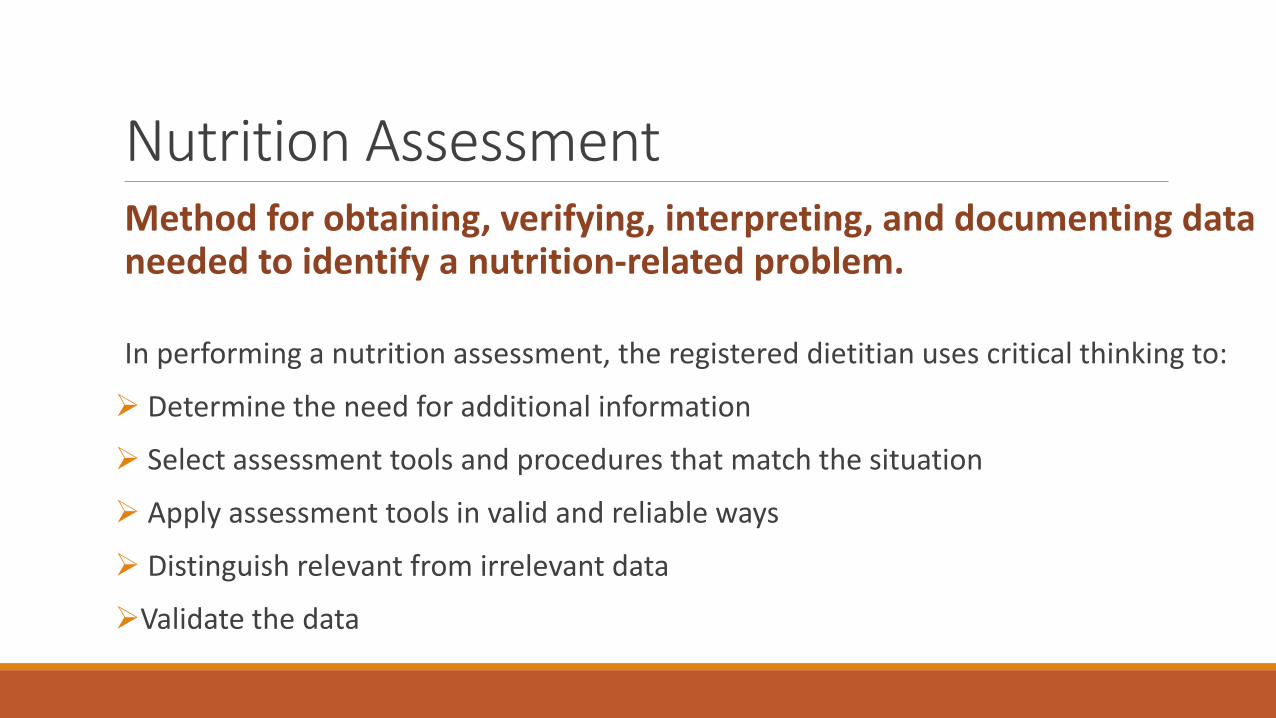
Nutrition Assessment Method for obtaining, verifying, interpreting, and documenting data needed to identify a nutrition-related problem.
In performing a nutrition assessment, the registered dietitian uses critical thinking to:
Determine the need for additional information
Select assessment tools and procedures that match the situation
Apply assessment tools in valid and reliable ways
Distinguish relevant from irrelevant data
Validate the data

Nutrition Assessment Components
Client History
• Current and past information related to personal, medical, family, social history.
Food/Nutrition History
• Intake
• Food/nutrient administration
• Medication and alternative medicine use
• Knowledge/belief/attitudes
• Behavior
• Food availability
• Physical activity
Biochemical Data, Medical Tests and
Procedures
• Laboratory data eg. electrolytes, lipid panel, glucose
• Tests eg. resting metabolic rate; gastric emptying time.
Anthropometric Measurements
• Height
• Weight
• Growth patterns/ percentiles
• Weight history
Nutrition Focused Physical
Examination
• Evaluation of body systems
• Muscle and fat wasting
• Oral health
• Suck/swallow/breathe ability
1 2 3 5 4
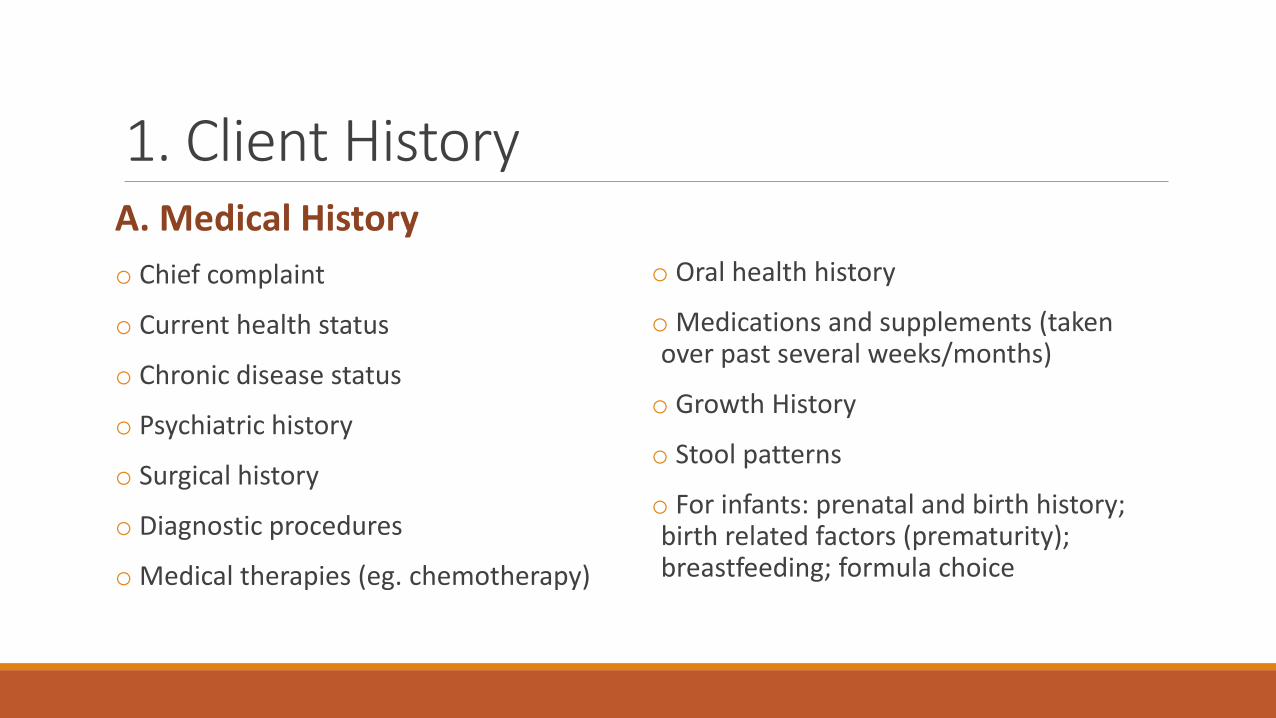
1. Client History A. Medical History
o Chief complaint
o Current health status
o Chronic disease status
o Psychiatric history
o Surgical history
o Diagnostic procedures
o Medical therapies (eg. chemotherapy)
o Oral health history
o Medications and supplements (taken over past several weeks/months)
o Growth History
o Stool patterns
o For infants: prenatal and birth history; birth related factors (prematurity); breastfeeding; formula choice

Corkins, 2015
Common Pediatric Diagnosis and Possible Nutrient Deficiencies
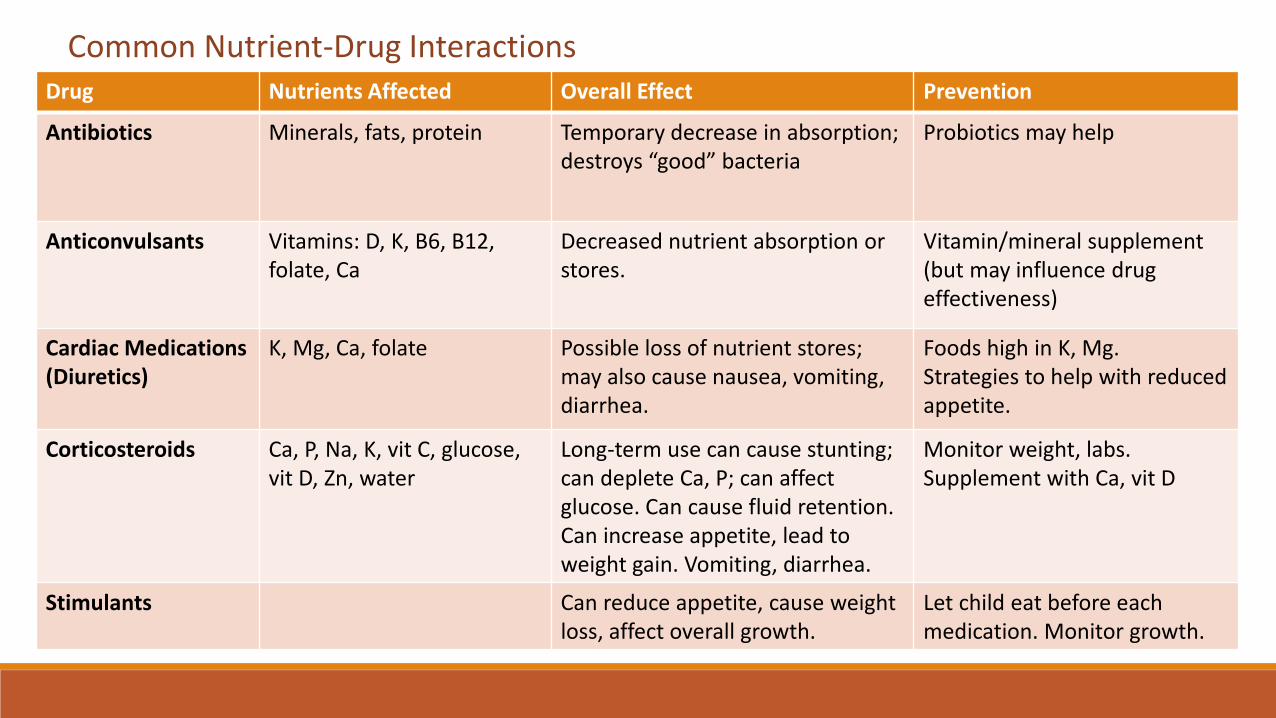
Common Nutrient-Drug Interactions Drug Nutrients Affected Overall Effect Prevention
Antibiotics Minerals, fats, protein Temporary decrease in absorption; destroys “good” bacteria
Probiotics may help
Anticonvulsants Vitamins: D, K, B6, B12, folate, Ca
Decreased nutrient absorption or stores.
Vitamin/mineral supplement (but may influence drug effectiveness)
Cardiac Medications (Diuretics)
K, Mg, Ca, folate Possible loss of nutrient stores; may also cause nausea, vomiting, diarrhea.
Foods high in K, Mg. Strategies to help with reduced appetite.
Corticosteroids Ca, P, Na, K, vit C, glucose, vit D, Zn, water
Long-term use can cause stunting; can deplete Ca, P; can affect glucose. Can cause fluid retention. Can increase appetite, lead to weight gain. Vomiting, diarrhea.
Monitor weight, labs. Supplement with Ca, vit D
Stimulants
Can reduce appetite, cause weight loss, affect overall growth.
Let child eat before each medication. Monitor growth.

1. Client History - cont’d B. Development
o Motor development (WHO milestones in first 2 years of life-6 components)
o Cognitive development (ask caregiver, check medical records)
o Sexual maturation (Tanner stages of pubertal development)
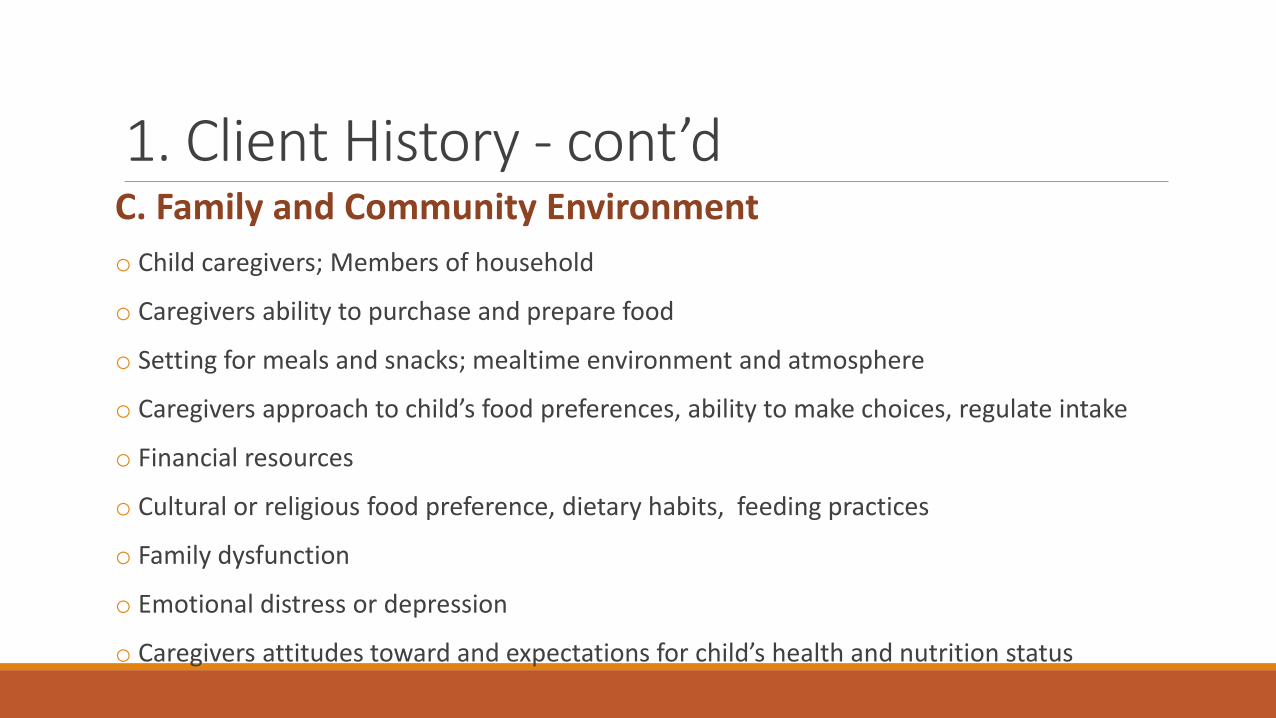
1. Client History - cont’d C. Family and Community Environment
o Child caregivers; Members of household
o Caregivers ability to purchase and prepare food
o Setting for meals and snacks; mealtime environment and atmosphere
o Caregivers approach to child’s food preferences, ability to make choices, regulate intake
o Financial resources
o Cultural or religious food preference, dietary habits, feeding practices
o Family dysfunction
o Emotional distress or depression
o Caregivers attitudes toward and expectations for child’s health and nutrition status
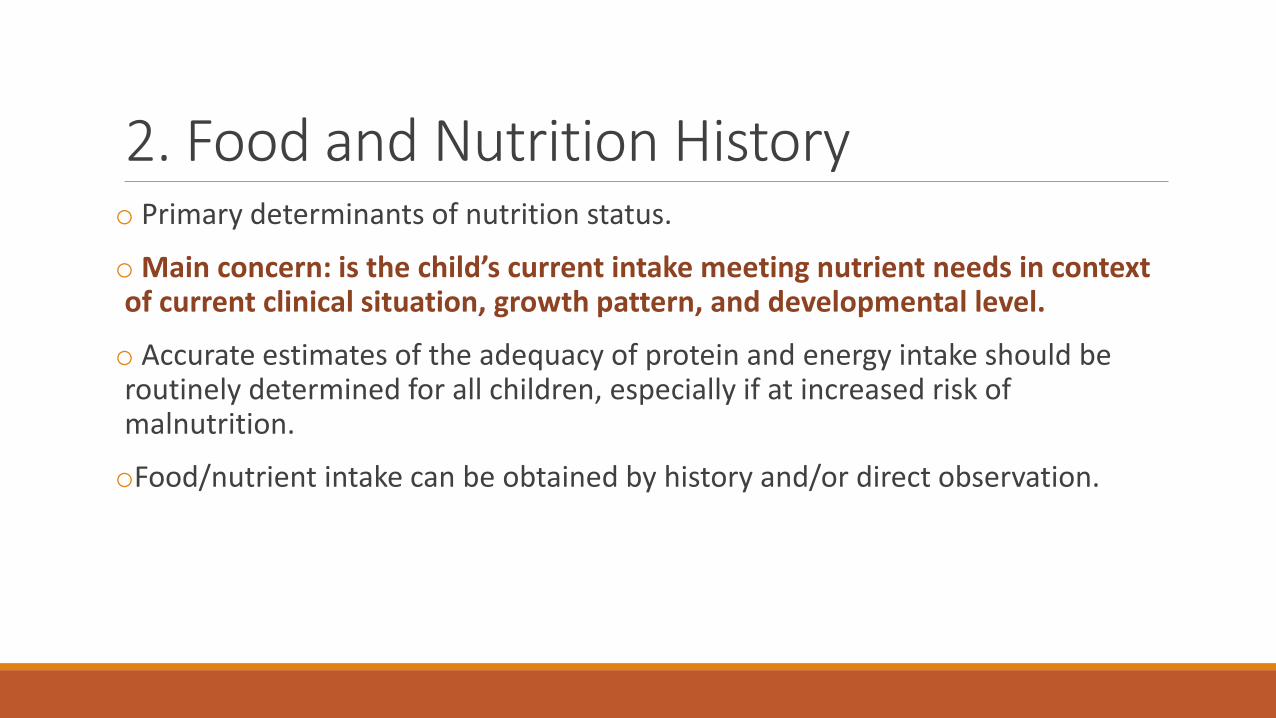
2. Food and Nutrition History o Primary determinants of nutrition status.
o Main concern: is the child’s current intake meeting nutrient needs in context of current clinical situation, growth pattern, and developmental level.
o Accurate estimates of the adequacy of protein and energy intake should be routinely determined for all children, especially if at increased risk of malnutrition.
oFood/nutrient intake can be obtained by history and/or direct observation.
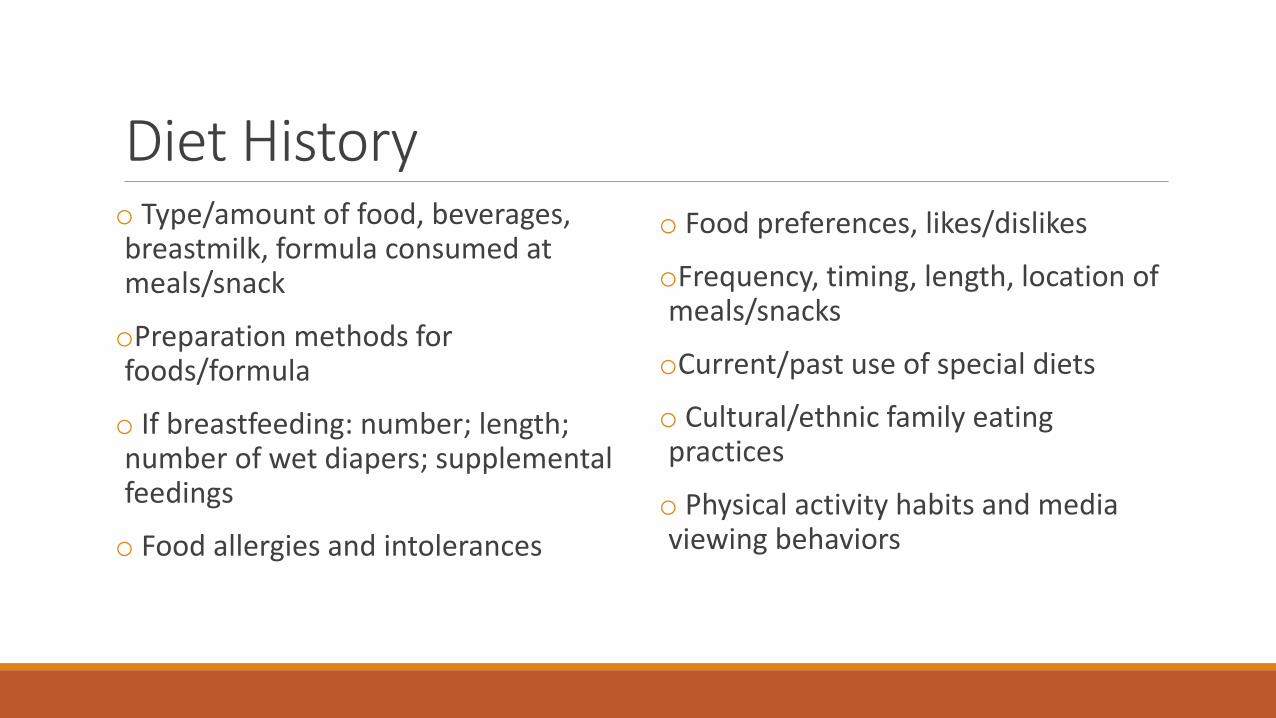
Diet History o Type/amount of food, beverages, breastmilk, formula consumed at meals/snack
oPreparation methods for foods/formula
o If breastfeeding: number; length; number of wet diapers; supplemental feedings
o Food allergies and intolerances
o Food preferences, likes/dislikes
oFrequency, timing, length, location of meals/snacks
oCurrent/past use of special diets
o Cultural/ethnic family eating practices
o Physical activity habits and media viewing behaviors
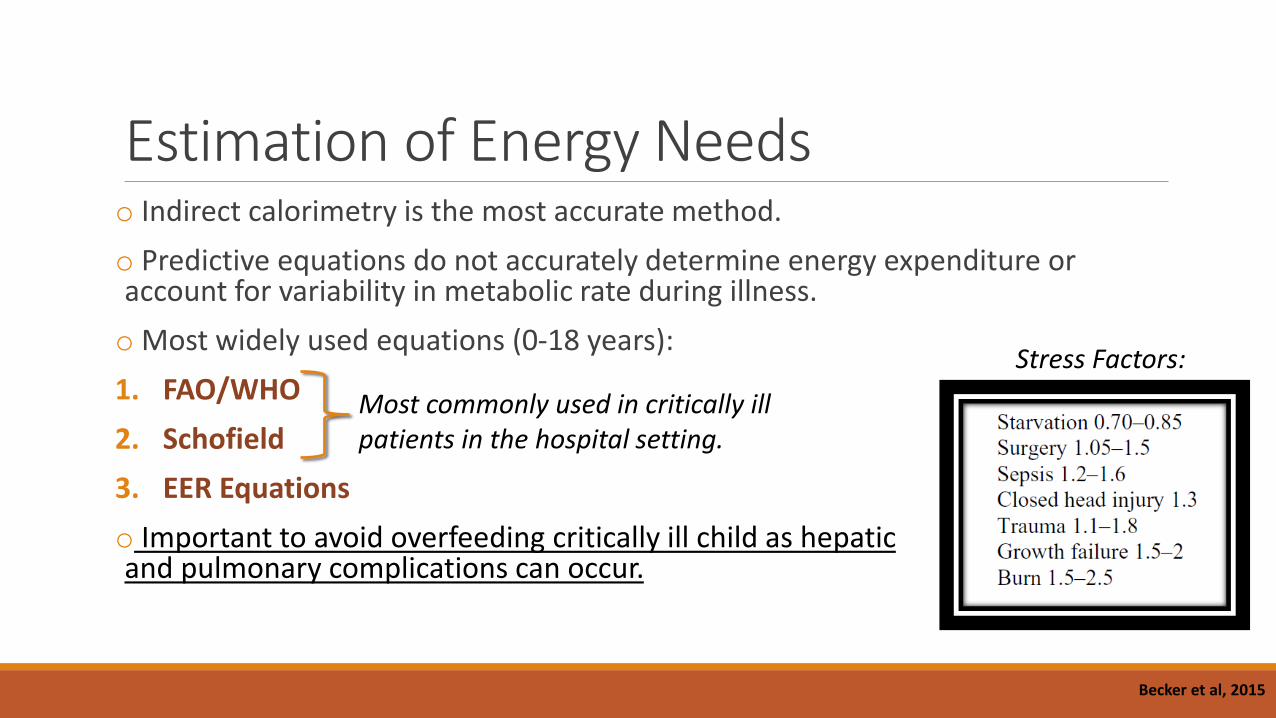
Estimation of Energy Needs o Indirect calorimetry is the most accurate method.
o Predictive equations do not accurately determine energy expenditure or account for variability in metabolic rate during illness.
o Most widely used equations (0-18 years):
1. FAO/WHO
2. Schofield
3. EER Equations
o Important to avoid overfeeding critically ill child as hepatic and pulmonary complications can occur.
Most commonly used in critically ill patients in the hospital setting.
Stress Factors:
Becker et al, 2015
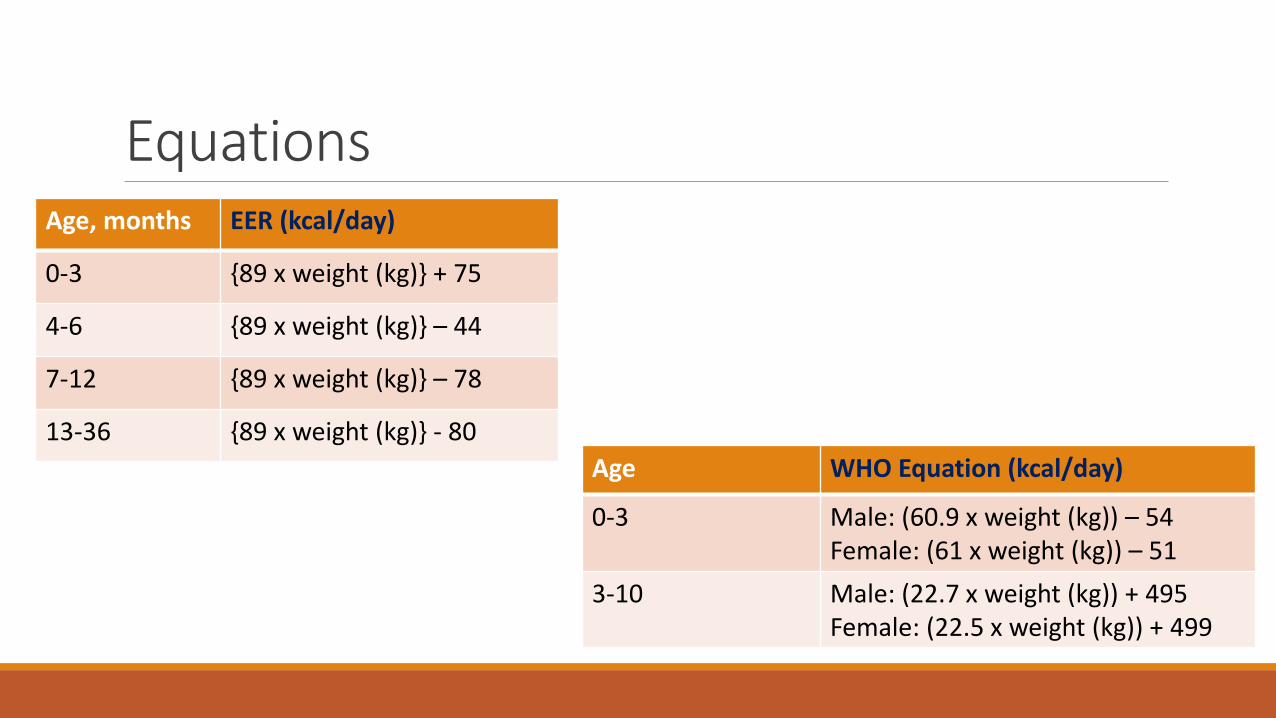
Equations Age, months EER (kcal/day)
0-3 {89 x weight (kg)} + 75
4-6 {89 x weight (kg)} – 44
7-12 {89 x weight (kg)} – 78
13-36 {89 x weight (kg)} - 80
Age WHO Equation (kcal/day)
0-3 Male: (60.9 x weight (kg)) – 54 Female: (61 x weight (kg)) – 51
3-10 Male: (22.7 x weight (kg)) + 495 Female: (22.5 x weight (kg)) + 499
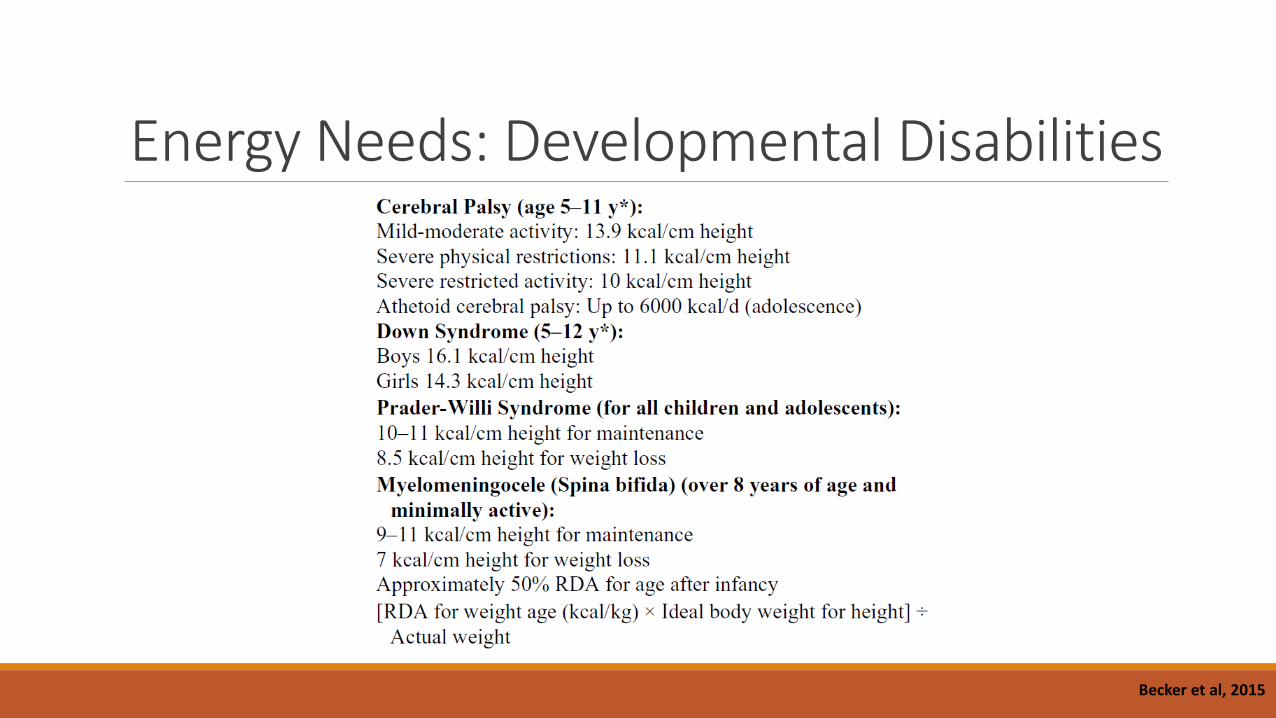
Energy Needs: Developmental Disabilities
Becker et al, 2015
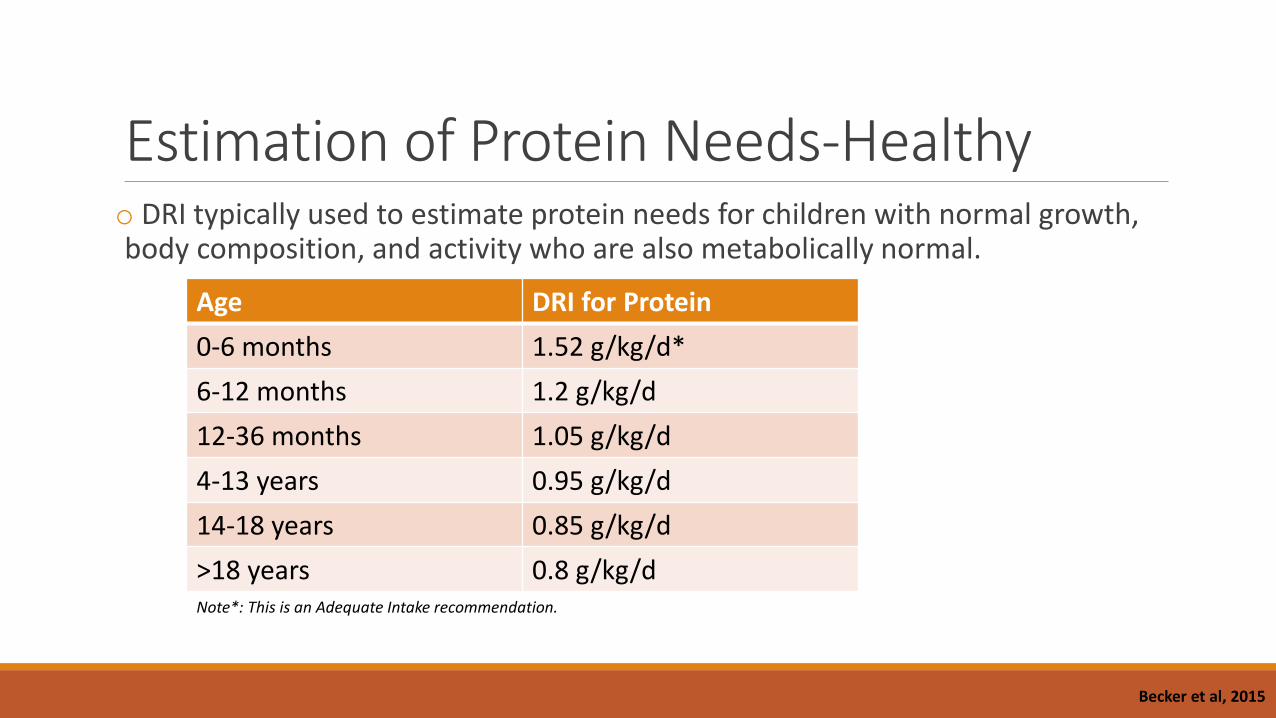
Estimation of Protein Needs-Healthy o DRI typically used to estimate protein needs for children with normal growth, body composition, and activity who are also metabolically normal.
Age DRI for Protein
0-6 months 1.52 g/kg/d*
6-12 months 1.2 g/kg/d
12-36 months 1.05 g/kg/d
4-13 years 0.95 g/kg/d
14-18 years 0.85 g/kg/d
>18 years 0.8 g/kg/d Note*: This is an Adequate Intake recommendation.
Becker et al, 2015

Estimation of Protein Needs-Critically Ill oMust take into account child’s clinical status.
o Some situations require additional protein to achieve positive Nitrogen Balance eg. major surgery, wound healing, infection, catch-up growth.
o Some situations require less protein eg. acute renal failure.
o A.S.P.E.N. Clinical Guidelines - Nutrition Support of the Critically ill Child:
AGE PROTEIN NEEDS
0-2 years 2-3 g/kg/d
2-13 years 1.5-2 g/kg/d
13-18 years 1.5 g/kg/d
To meet increased demands of metabolic stress and spare use of endogenous protein stores.
Becker et al, 2015
Activity 1: Calculate protein needs for a 5 year old boy who is post-operative. His weight is 18 kg.

Estimation for Catch-Up-Growth Peterson’s Failure to Thrive
o Energy Needs: {EER for weight age (kcal/kg) x ideal body weight for height (kg)} / actual weight (kg)
oProtein Needs: {protein required for weight age (g/kg/d) x ideal weight for age (kg)} / actual weight (kg)
Step 1: determine height-age, defined as age at which current height/length would fall at 50th percentile on length/height-for-age growth charts. Step 2: identify weight, for which is the corresponding weight at the 50th percentile for height-age. This is needed to calculate EER.
Activity 2: Calculate the energy needs for catch up growth for a 7 month old boy. Weight: 6.4 kg and height: 66 cm.

Estimation of Fluid Needs
Weight (kg) Fluid Needs
1 – 10 kg 100 ml/kg
11 – 20 kg 1000 ml + 50 ml/kg for each kg above 10kg
Above 20 kg 1500 ml + 20 ml/kg for each kg above 20kg
Holliday – Segar Method
Activity 3: Determine fluid needs for a girl weighing 17kg.
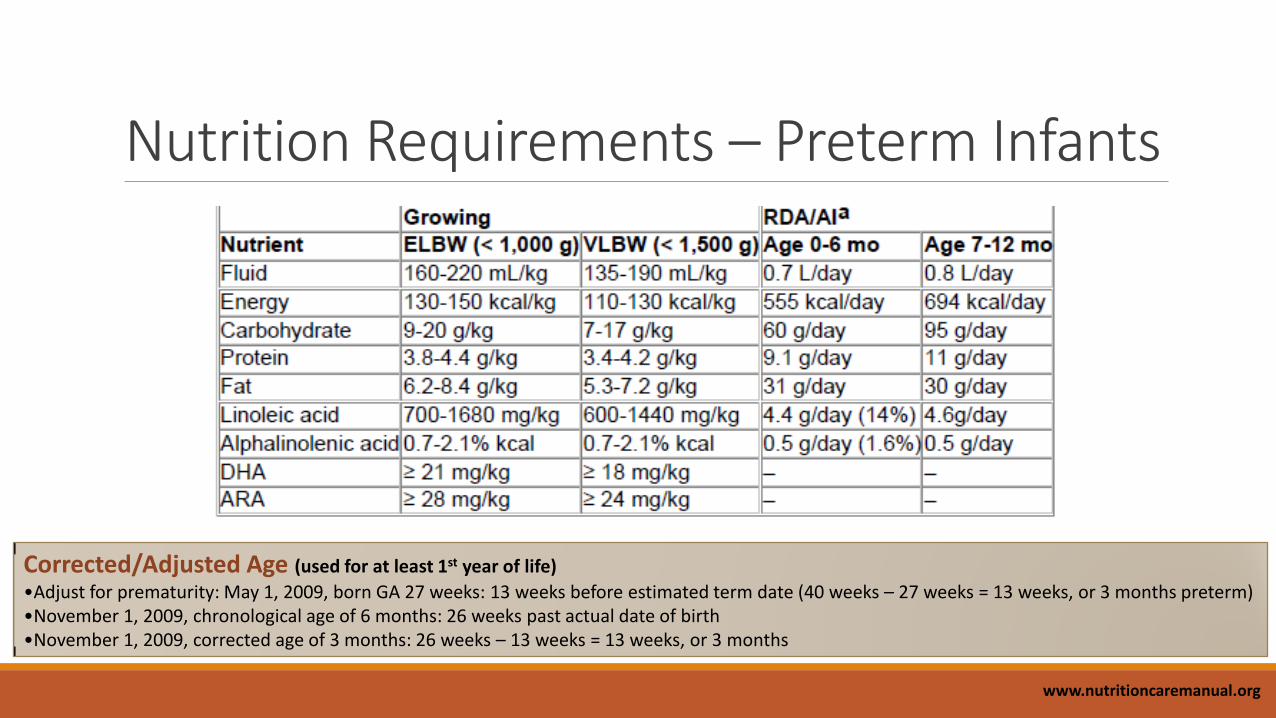
Nutrition Requirements – Preterm Infants
Corrected/Adjusted Age (used for at least 1st year of life)
•Adjust for prematurity: May 1, 2009, born GA 27 weeks: 13 weeks before estimated term date (40 weeks – 27 weeks = 13 weeks, or 3 months preterm) •November 1, 2009, chronological age of 6 months: 26 weeks past actual date of birth •November 1, 2009, corrected age of 3 months: 26 weeks – 13 weeks = 13 weeks, or 3 months
www.nutritioncaremanual.org
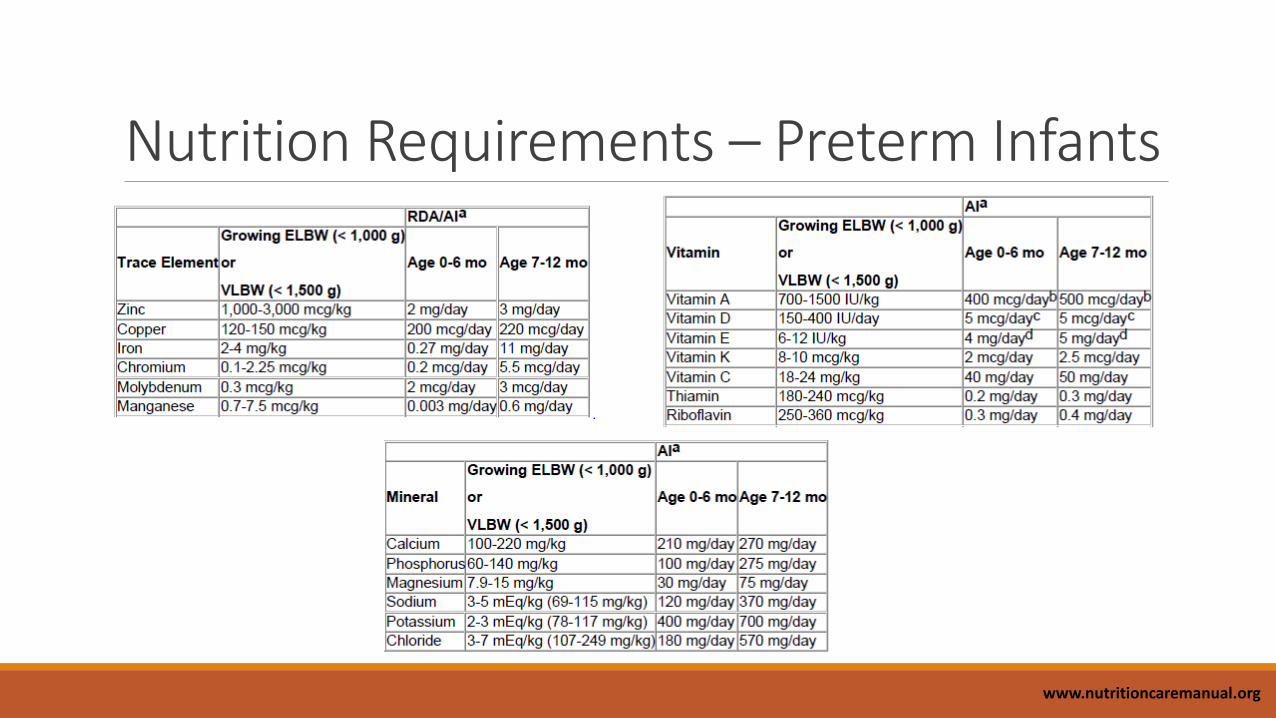
Nutrition Requirements – Preterm Infants
www.nutritioncaremanual.org

3. Biochemical Data; Medical Tests When available, can be used for:
Screening for malnutrition
Evaluation of nutritional status
Diagnosis of insufficient intakes of specific nutrients
Monitoring of nutritional rehabilitation
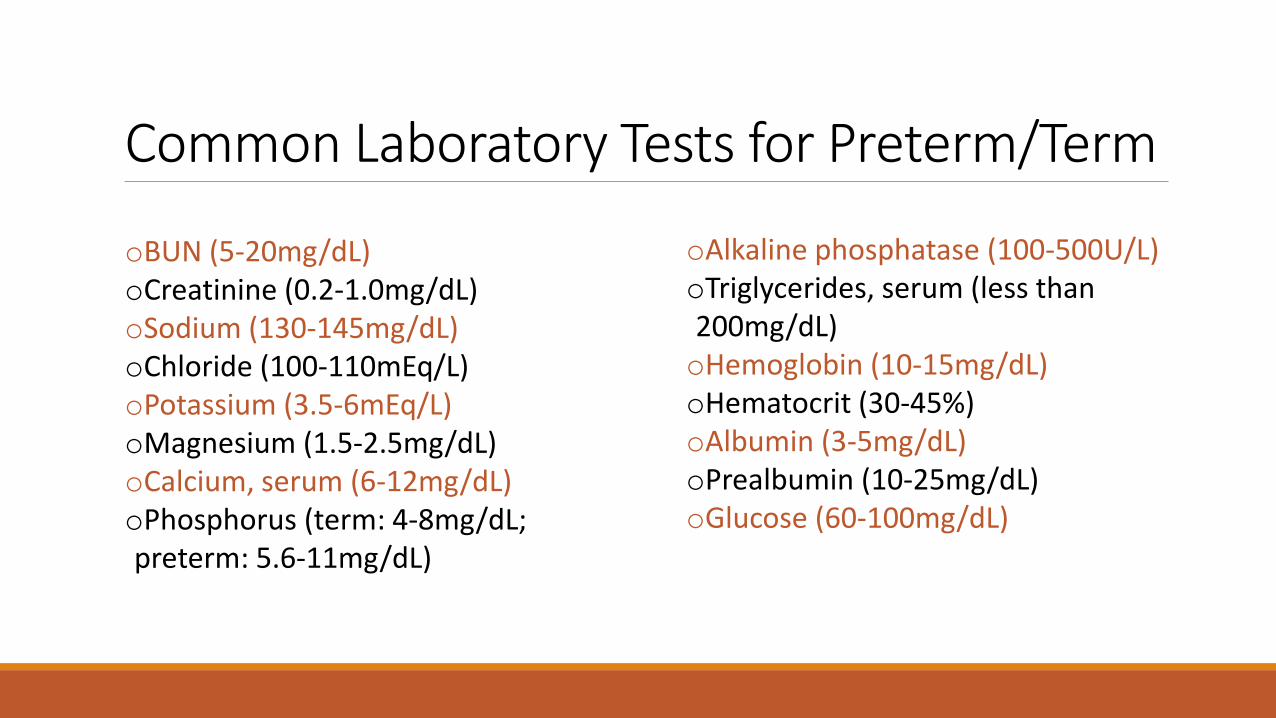
Common Laboratory Tests for Preterm/Term
oBUN (5-20mg/dL) oCreatinine (0.2-1.0mg/dL) oSodium (130-145mg/dL) oChloride (100-110mEq/L) oPotassium (3.5-6mEq/L) oMagnesium (1.5-2.5mg/dL) oCalcium, serum (6-12mg/dL) oPhosphorus (term: 4-8mg/dL; preterm: 5.6-11mg/dL)
oAlkaline phosphatase (100-500U/L) oTriglycerides, serum (less than 200mg/dL) oHemoglobin (10-15mg/dL) oHematocrit (30-45%) oAlbumin (3-5mg/dL) oPrealbumin (10-25mg/dL) oGlucose (60-100mg/dL)
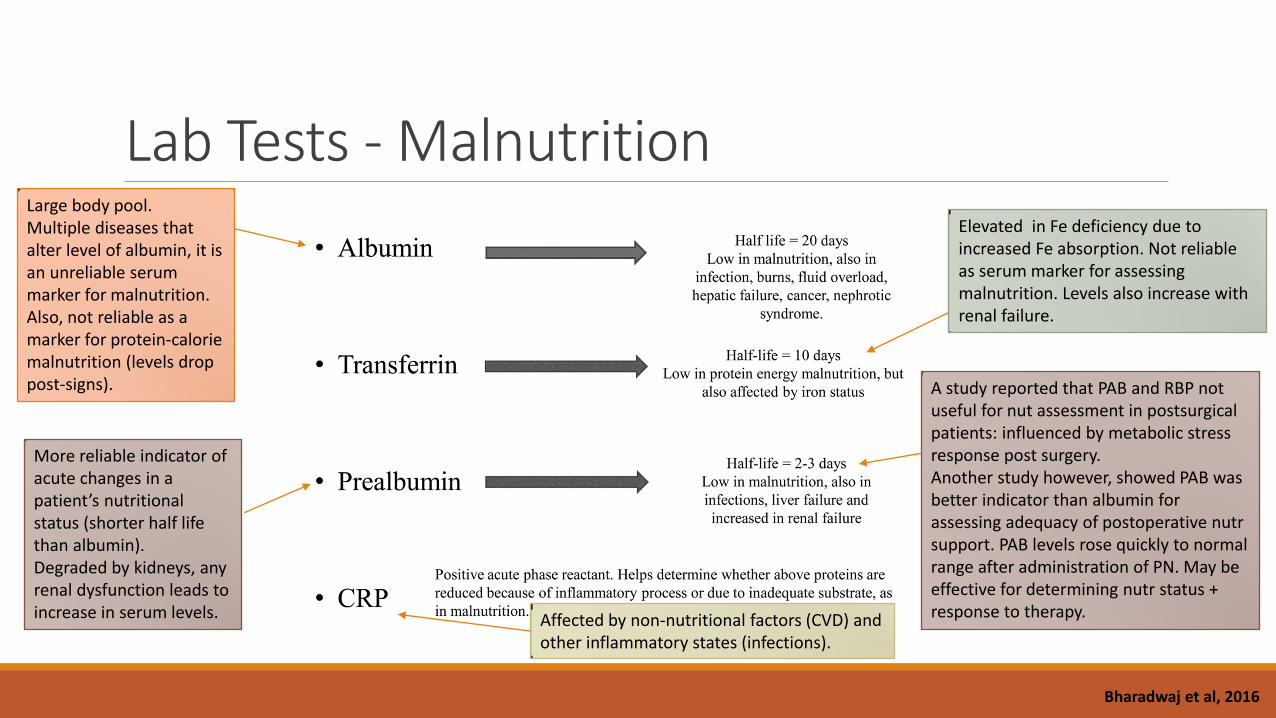
Lab Tests - Malnutrition Large body pool. Multiple diseases that alter level of albumin, it is an unreliable serum marker for malnutrition. Also, not reliable as a marker for protein-calorie malnutrition (levels drop post-signs).
More reliable indicator of acute changes in a patient’s nutritional status (shorter half life than albumin). Degraded by kidneys, any renal dysfunction leads to increase in serum levels.
Elevated in Fe deficiency due to increased Fe absorption. Not reliable as serum marker for assessing malnutrition. Levels also increase with renal failure.
A study reported that PAB and RBP not useful for nut assessment in postsurgical patients: influenced by metabolic stress response post surgery. Another study however, showed PAB was better indicator than albumin for assessing adequacy of postoperative nutr support. PAB levels rose quickly to normal range after administration of PN. May be effective for determining nutr status + response to therapy.
Bharadwaj et al, 2016
Affected by non-nutritional factors (CVD) and other inflammatory states (infections).

Lab Tests - Malnutrition Nitrogen Balance
o Historical gold standard for assessing protein intake.
o A negative nitrogen balance means there is more loss than intake; can be used as a marker for assessing malnutrition.
o Nitrogen balance can be studied by measuring the concentration of urea in the urine.
o Another technique is to calculate the urinary creatinine/height index. Values of 60–80% and 40% indicate mild and severe protein malnutrition, respectively.
o Nitrogen balance: g/d = (protein intake g/d ÷ 6.25 g/d) – (UUN g/d + 4)

4. Anthropometric Assessment o Growth is the primary outcome measure of nutritional status in children. It is defined as an increase in size and the development to maturity.
o Growth velocity is defined as rate of change in weight or length/height over time.
o Must be monitored at regular intervals during childhood and adolescence.
Children <36 months, measures of growth: length for age weight-for-age head circumference-for-age weight-for-length
Children aged 2-20, measures of growth: height-for-age weight-for-age BMI-for-age
Preterm Infants: length for age weight-for-age head circumference-for-
age weight-for-length
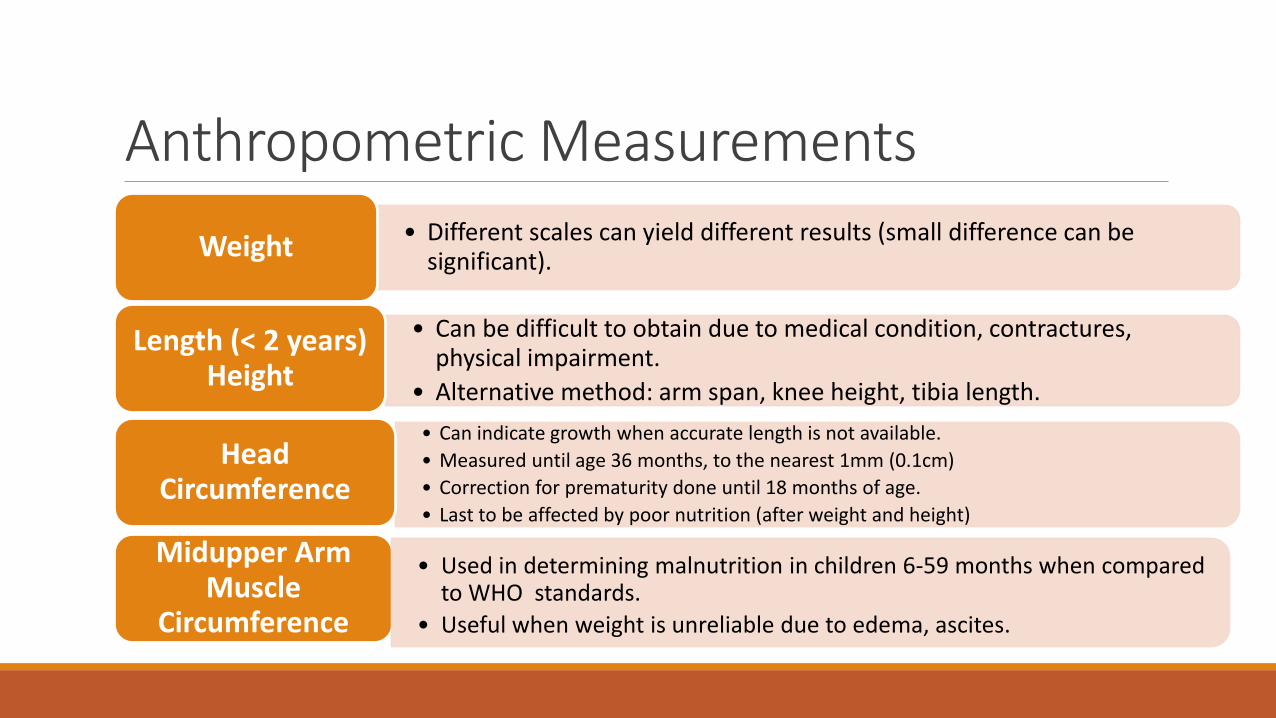
Anthropometric Measurements • Different scales can yield different results (small difference can be
significant). Weight
• Can be difficult to obtain due to medical condition, contractures, physical impairment.
• Alternative method: arm span, knee height, tibia length.
Length (< 2 years) Height
• Can indicate growth when accurate length is not available.
• Measured until age 36 months, to the nearest 1mm (0.1cm)
• Correction for prematurity done until 18 months of age.
• Last to be affected by poor nutrition (after weight and height)
Head Circumference
Midupper Arm Muscle
Circumference
• Used in determining malnutrition in children 6-59 months when compared to WHO standards.
• Useful when weight is unreliable due to edema, ascites.

Nutrition Through the Lifecycle, Ed 5 Understanding Normal and Clinical Nutrition, Ed 8
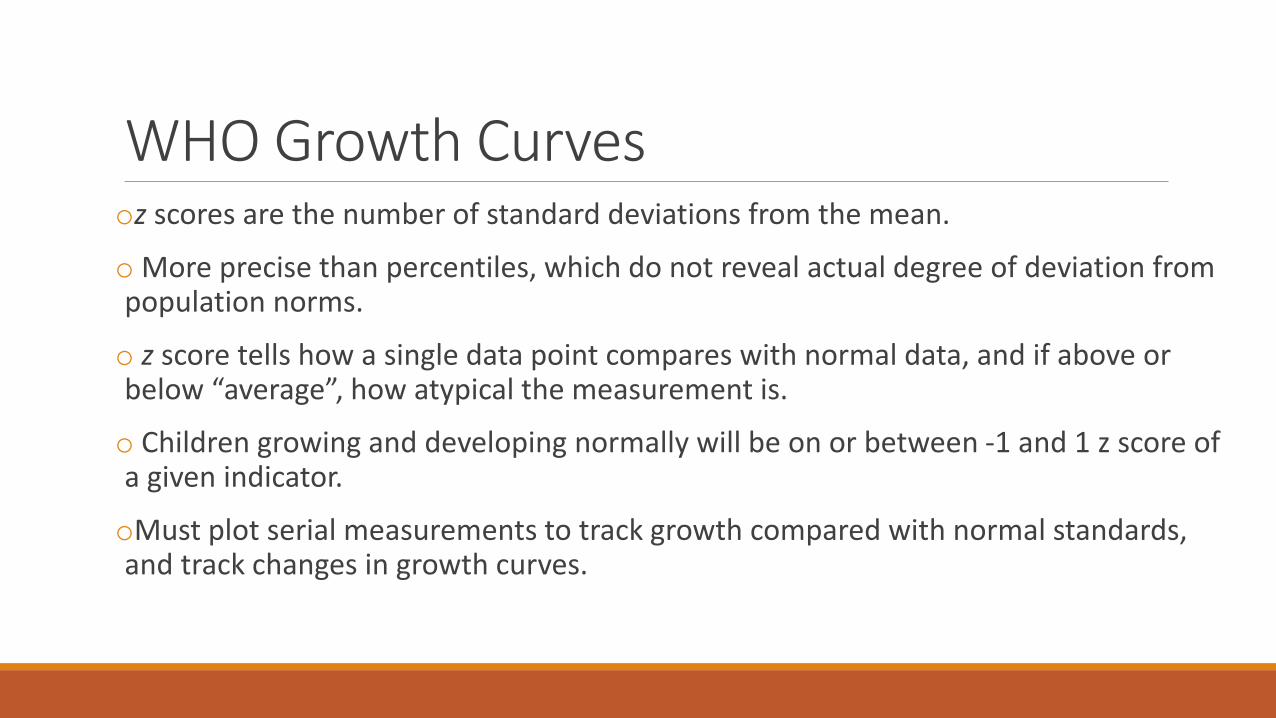
WHO Growth Curves oz scores are the number of standard deviations from the mean.
o More precise than percentiles, which do not reveal actual degree of deviation from population norms.
o z score tells how a single data point compares with normal data, and if above or below “average”, how atypical the measurement is.
o Children growing and developing normally will be on or between -1 and 1 z score of a given indicator.
oMust plot serial measurements to track growth compared with normal standards, and track changes in growth curves.

WHO Growth Curves o A Z-score cut-off point of <-2 SD is used to classify low weight-for-age, low height-for-age and low weight-for-height as moderate and severe undernutrition
o A Z-score cut-off point of <-3 SD defines severe undernutrition.
o The cut-off point of >+2 SD classifies high weight-for-height as overweight.

Degree of Stunting
Degree of Stunting = (actual height (cm) / 50th percentile for height-for-age (cm) x 100
% degree of stunting
Classification
≥ 95% Normal
90 – 94% Mild stunting
85 – 89% Moderate stunting
< 85% Severe stunting
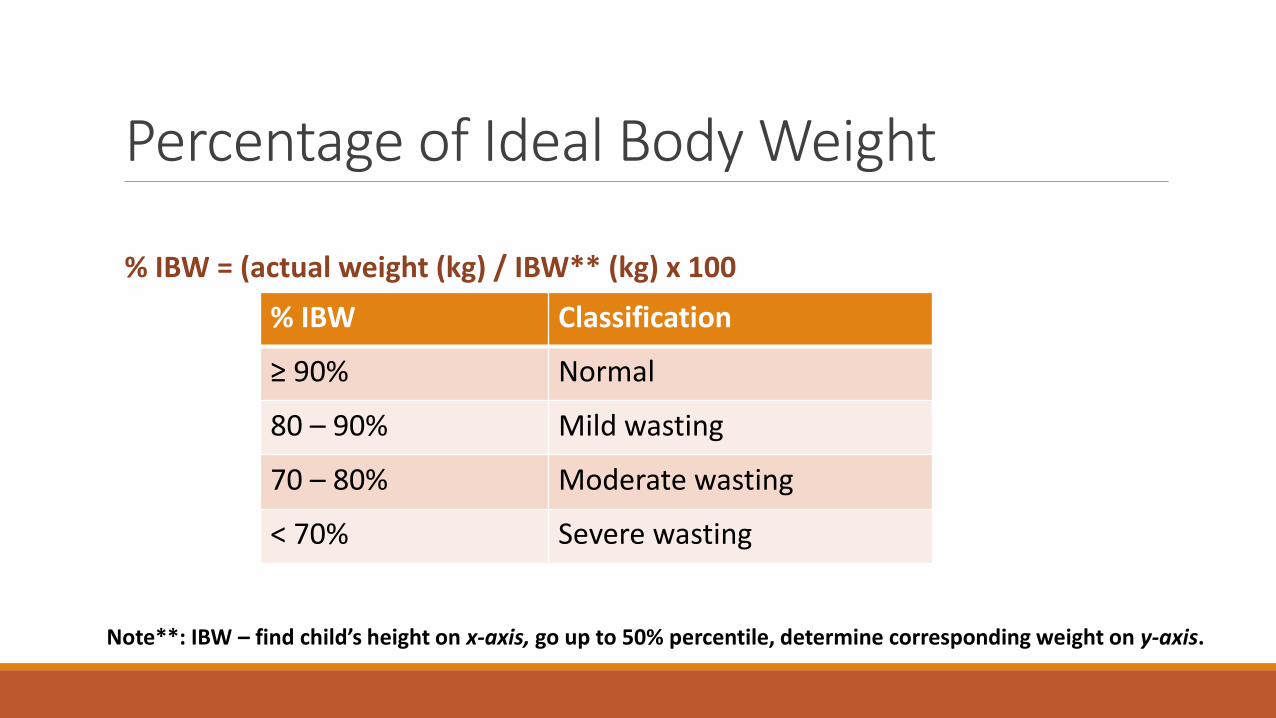
Percentage of Ideal Body Weight
% IBW = (actual weight (kg) / IBW** (kg) x 100
% IBW Classification
≥ 90% Normal
80 – 90% Mild wasting
70 – 80% Moderate wasting
< 70% Severe wasting
Note**: IBW – find child’s height on x-axis, go up to 50% percentile, determine corresponding weight on y-axis.

Unintentional Weight Loss % Weight change = (usual weight – current weight)/usual weight x 100
% weight loss Time frame
2% 1 week
5% 1 month
7.5% 3 months
10% 6 months
5. Nutrition Focused Physical Examination o NFPE is a crucial component of a complete nutrition assessment.
o It identifies or confirms muscle wasting, subcutaneous fat loss, edema and micronutrient deficiencies.
o Many nutrition-related signs and symptoms found during the clinical examination can later be more objectively confirmed with laboratory assessment.
o Dietitians should take responsibility, with help of multidisciplinary team eg. patient’s bedside nurse.

Techniques of: NFPE o Decide how focused your exam will be depending on: history, primary diagnosis, medical status.
o Tools to consider: disposable gloves, small penlight, tape measure, stethoscope, tongue depressors, skin calipers.
o Includes following four components:
1. Inspection
2. Palpation
3. Percussion
4. Auscultation

Inspection
• Visual Exam
• Observe color, shape, texture, symmetry
• NFPE begins with general inspection and proceeds from head to toe order.
Palpation
• Touching/feeling patient to determine texture, temperature, distension, muscle rigidity, hydration of skin, tenderness.
Percussion
• Helps determine solids, fluid, gas in body.
• Performed using examiners fingers to tap on child’s body producing sounds.
Auscultation
• Listening to body sounds through a stethoscope.
• Used most often to determine bowel sounds during abdominal examination.
General Examination
Inspection Palpation Auscultation
Abdominal Examination
Inspection Auscultation Percussion Palpation

Esper, 2015
Steps to Performing a Basic NFPA
Corkins, 2015
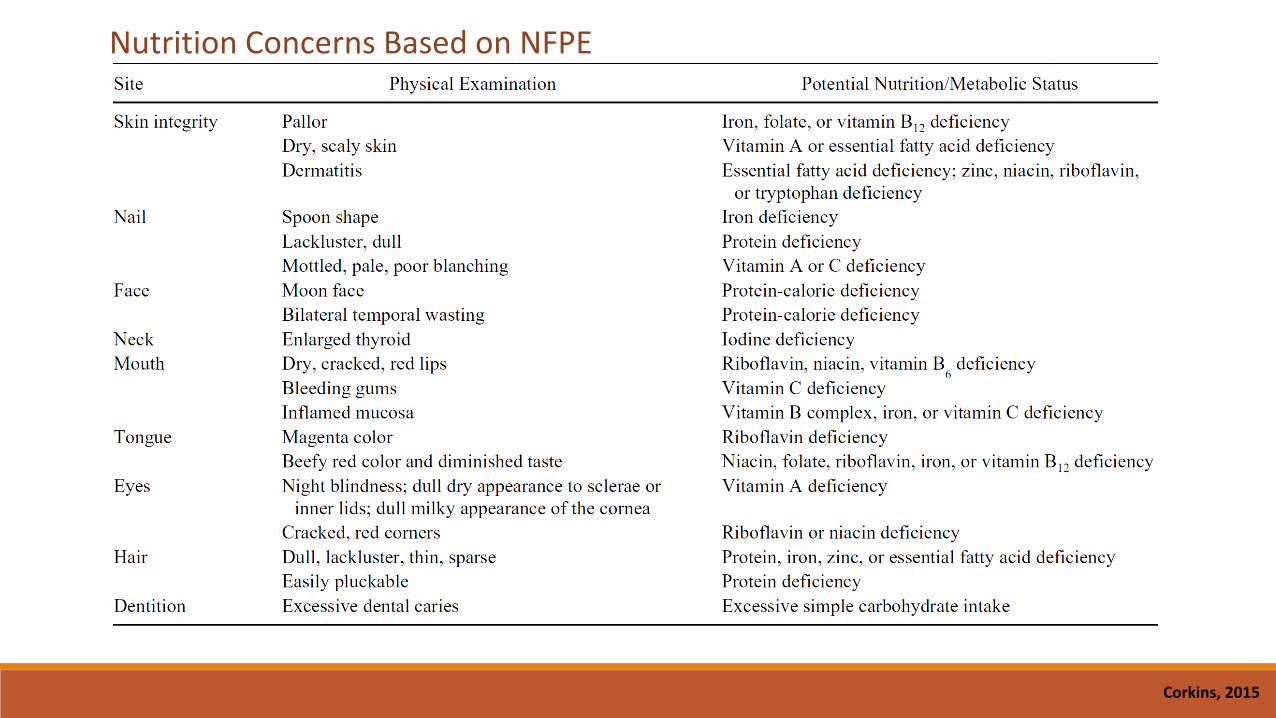
Nutrition Concerns Based on NFPE
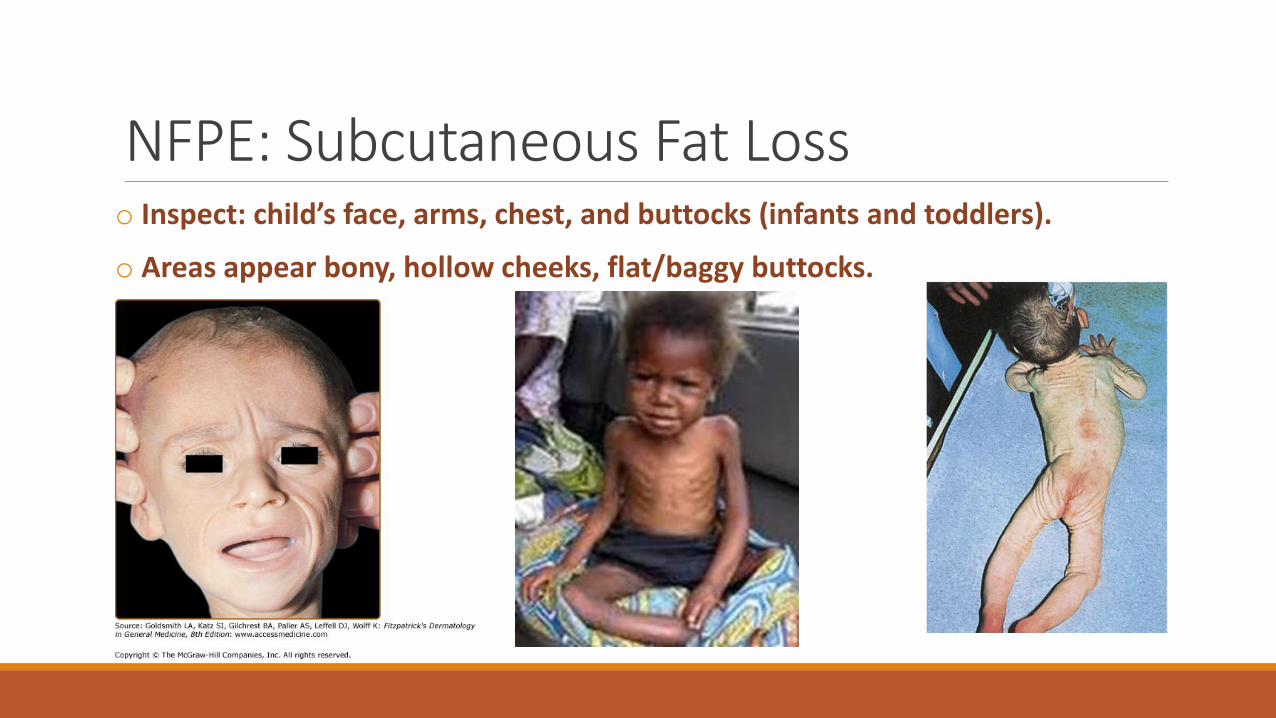
NFPE: Subcutaneous Fat Loss o Inspect: child’s face, arms, chest, and buttocks (infants and toddlers).
o Areas appear bony, hollow cheeks, flat/baggy buttocks.

NFPE: Muscle Mass Loss o Inspect: temple, clavicle, shoulder, scapula, thigh, knee, calf.
o Signs of muscle wasting: protruding bone structures and hollowing of muscle.

NFPE: Edema o Apply firm pressure with thumb into skin over bony surface of the distal anterior surface of the foot, or over the sacrum (for infants and bedridden children). Hold for 5 seconds.
o Observe the depth of the depression and whether it persists after lifting the thumb.
o Edema related to the child’s illness (nephrotic syndrome, CHF) should not be rated as potential malnutrition.
o Assess whether tissue wasting is hidden by fluid retention.
PEDIATRIC MALNUTRITION (Undernutrition)

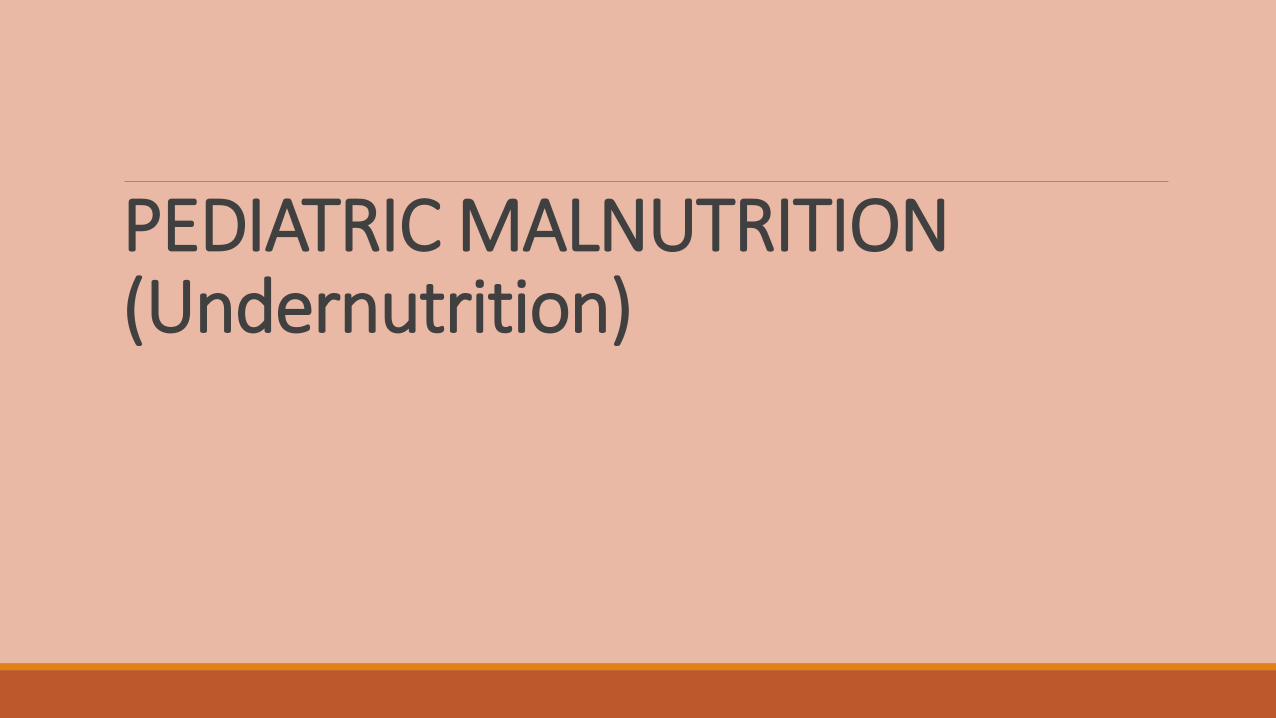
Pediatric Malnutrition/Undernutrition o A.S.P.E.N. have defined pediatric malnutrition as: “an imbalance between nutrient requirement and intake, resulting in cumulative deficits of energy, protein, or micronutrients that may negatively affect growth, development and other relevant outcomes.”
o Malnutrition etiology in developed countries is often a result of chronic illness, trauma, burns, surgery, or congenital anomalies.
o Attributed to:
Nutrient Loss
Increased energy expenditure
Reduced nutrient intake
Altered nutrient utilization
Defining Malnutrition in Hospitalized Children.
Mehta et al, 2013

Acute Vs. Chronic Pediatric Undernutrition o WHO and UNICEF provided diagnostic parameters to characterize level of undernutrition.
o Undernutrition/malnutrition identified using: z score, decline in z score, negative z score.
o Weight is primarily affected during periods of acute undernutrition, while chronic undernutrition manifests as stunting.
o Mild acute undernutrition presents with unintentional weight loss or weight gain velocity below expected.
oSevere acute undernutrition (ages 6-60 months of age) is defined as very low weight-for-age z score less than -3.
oWasting is defined as weight-for-height less than -2 SD.
o Chronic undernutrition or stunting is defined as height-for-age (or length-for-age) less than -2 SD of the median international reference.
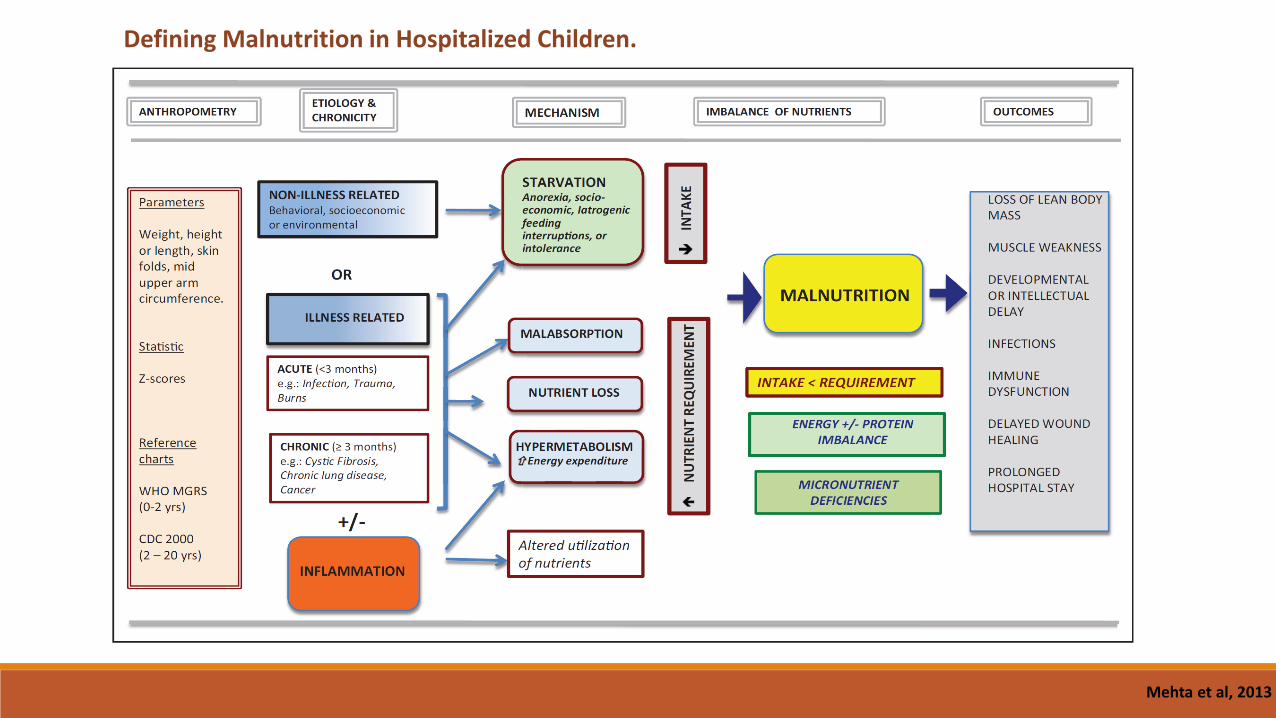
Pediatric Undernutrition Malnutrition Classification: when single data points are available.
Malnutrition Classification: when 2 or more data points are available.
Becker et al, 2015

Pediatric Undernutrition - MUAC o Using MUAC to classify malnutrition (children 6-60 months of age):
Severely malnourished: MUAC < 11.5 cm
Moderately malnourished: 11.5 - 12.4 cm
At risk of malnutrition: 12.5 - 13.4 cm
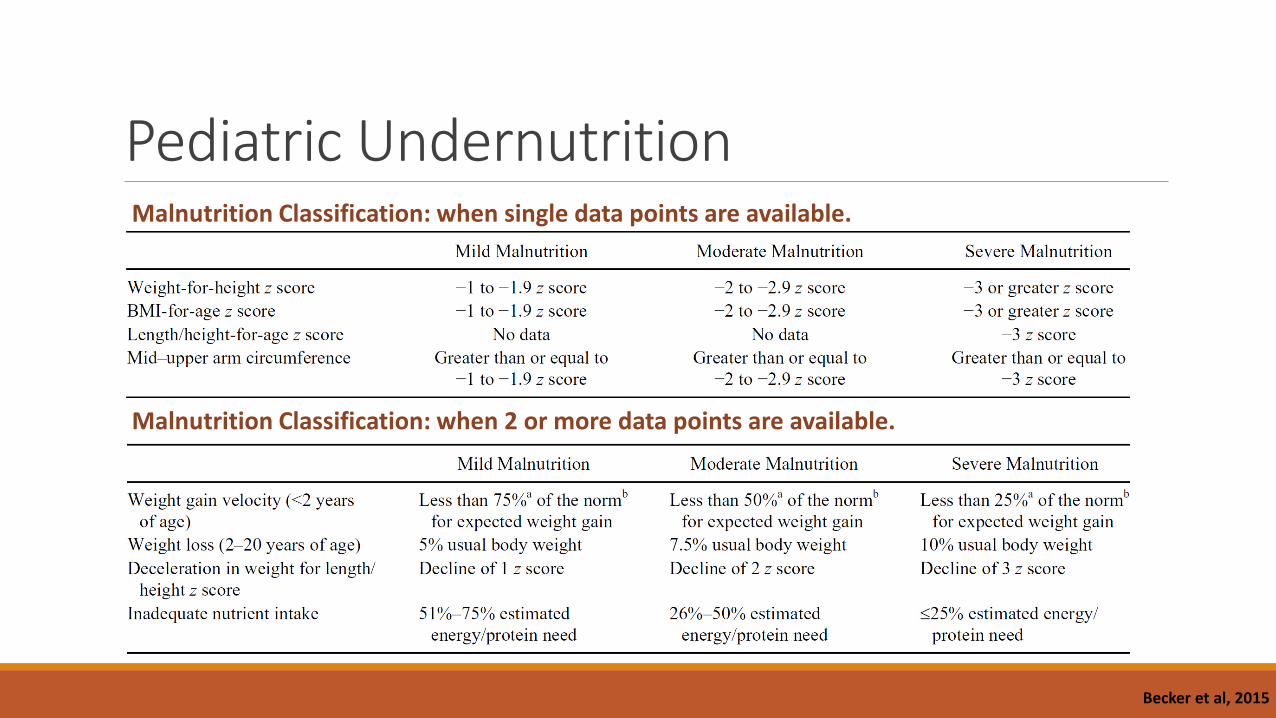
Subjective Global Nutritional Assessment o Used as an assessment tool for children at risk of malnutrition.
oConsidering presence or absence of historical features and physical signs associated with malnutrition, a child’s nutrition status is assigned a global rating of (not a numerical scoring system):
normal/well nourished
moderately malnourished
severely malnourished
Nutrition Focused Medical History: 1. Linear growth 2. Weight relative to length/height 3. Changes in body weight 4. Adequacy of dietary intake 5. Persistent Gastrointestinal Symptoms 6. Functional impairment 7. Metabolic stress
Nutrition Focused Physical Examination: 1. Loss of subcutaneous fat 2. Muscle wasting 3. Edema
ENTERAL NUTRITION

Hamilton et al, 2014
Initiating and Advancing Enteral Nutrition in Pediatric ICU.
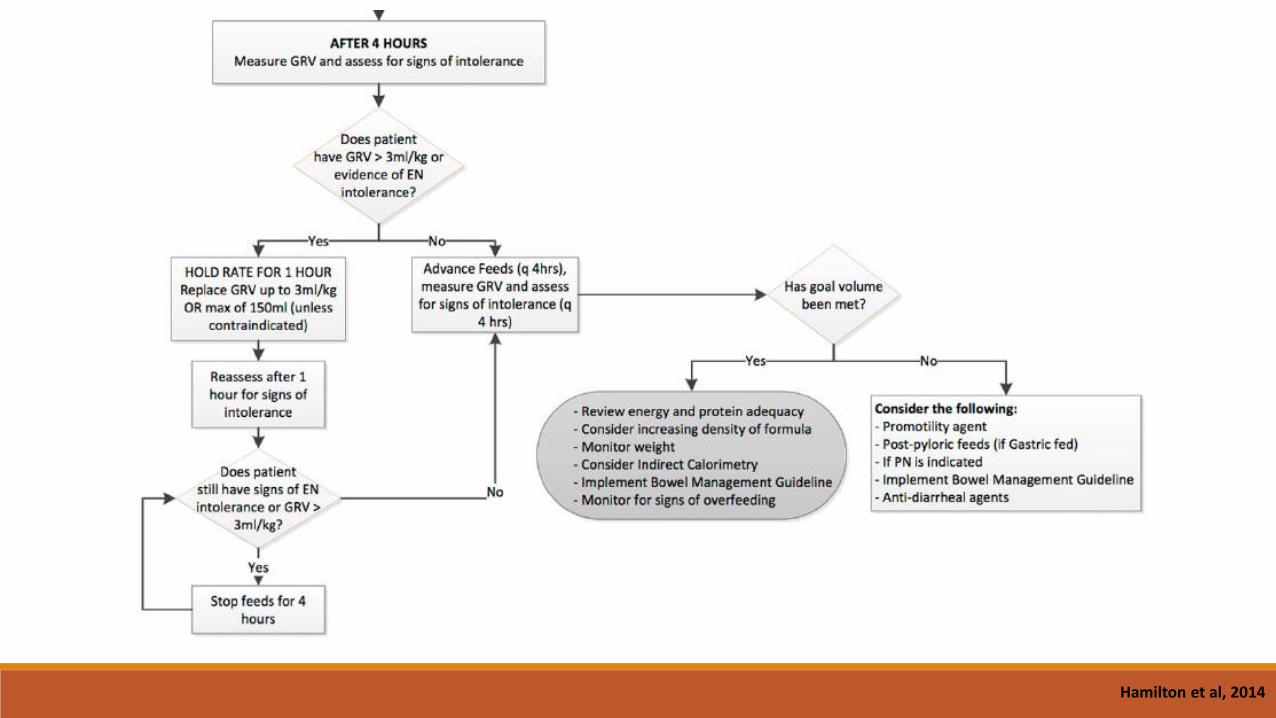
Hamilton et al, 2014

References 1. Bharadwaj S et al. “Malnutrition: laboratory markers vs. nutritional assessment”. Gastroenterology Report. 2016;4(4):272-280.
2. Becker P et al. “Consensus statement of the Academy of Nutrition and Dietetics/American Society for Parenteral and Enteral Nutrition: Indicators recommended for the identification and documentation of pediatric malnutrition (undernutrition)”. Nutr in Clin Pract. 2015;30(1):147-161.
3. Brown JE, Isaacs J, Krinke B, Lechtenberg E, Murtaugh M. “Nutrition through the Life Cylce.” 5th Edition.
4. Corkins KG. “Nutrition-focused physical examination in pediatric patients”. Nutr Clin Practice. 2015;30(2):203-209.
5. Esper DH. “Utilization of nutrition-focused physical assessment in identifying micronutrient deficiencies”. Nut Clin Practice. 2015;30(2):194-202.
6. Hamilton S et al. “A stepwise enteral nutrition algorithm for critically ill children helps achieve nutrient delivery goals.” Pediatr Crit Care Med. 2014;15(7):583-589.
7. Huysentruyt K et al. “Accuracy of nutritional screening tools in assessing the risk of undernutrition in hospitzalided children.” JPGN. 2015;61(2).
8. Leonberg BL. “Pocket Guide to Pediatric Nutrition Assessment”. 2nd Edition. Academy of Nutrition and Dietetics.
9. Maqbool A et al. “Clinical assessment of nutritional status.” Nutr in Pediatrics. 4th Edition. 2008.
10. Mehta NM et al. “Defining pediatric malnutrition: a paradigm shift toward etiology-related definitions”. J Paren Ent Nutr. 2013;37(4):460-481.
11. Pediatric Nutrition Care Manual. https://www.nutritioncaremanual.org/index.cfm
12. Rolfes SR, Pinna K, Whitney E. “Understanding Normal and Clinical Nutrition”. 8th Edition.
13. Secket DJ et al. “How to perform subjective global nutritional assessment in children.” J Acad Nutr Diet. 2012;112:424-431.
14. Vermilyea S et al. “Subjective global nutritional assessment in critically ill children.” J Paren Ent Nutr. 2013;37(5):659-666.

Useful tools

CASE STUDIES and THANK YOU
Related Documents