APPROVED: Kimberly K. Kelly, Major Professor James R. Hall, Minor Professor Paul Lambert, Committee Member Laura Austin, Committee Member Vicki Campbell, Chair of the Department of Psychology James D. Meernik, Acting Dean of the Robert B. Toulouse School of Graduate Studies PEDIATRIC FEEDING DISORDERS: A CONTROLLED COMPARISON OF MULTIDISCIPLINARY INPATIENT AND OUTPATIENT TREATMENT OF GASTROSTOMY TUBE DEPENDENT CHILDREN Sonya L. Cornwell Dissertation Prepared for the Degree of DOCTOR OF PHILOSOPHY UNIVERSITY OF NORTH TEXAS December 2010

Welcome message from author
This document is posted to help you gain knowledge. Please leave a comment to let me know what you think about it! Share it to your friends and learn new things together.
Transcript

APPROVED: Kimberly K. Kelly, Major Professor James R. Hall, Minor Professor Paul Lambert, Committee Member Laura Austin, Committee Member Vicki Campbell, Chair of the Department
of Psychology James D. Meernik, Acting Dean of the
Robert B. Toulouse School of Graduate Studies
PEDIATRIC FEEDING DISORDERS: A CONTROLLED COMPARISON OF
MULTIDISCIPLINARY INPATIENT AND OUTPATIENT TREATMENT
OF GASTROSTOMY TUBE DEPENDENT CHILDREN
Sonya L. Cornwell
Dissertation Prepared for the Degree of
DOCTOR OF PHILOSOPHY
UNIVERSITY OF NORTH TEXAS
December 2010

Cornwell, Sonya L., Pediatric feeding disorders: A controlled comparison of
multidisciplinary inpatient and outpatient treatment of gastrostomy tube dependent
children. Doctor of Philosophy (Health Psychology and Behavioral Medicine), December
2010, 56 pp., 18 tables, 2 figures, references, 50 titles.
The efficacy of multidisciplinary inpatient and outpatient treatment for
transitioning children with severe pediatric feeding disorders from gastrostomy tube
dependency to oral nutrition was investigated utilizing caloric and fluid intakes as an
outcome measure. The study involved 29 children ages 12 months to 5 years of age
with gastrostomy tube dependency. Treatments were provided by speech therapists,
occupational therapist, dietician and psychologist for a 30 day period. Four treatment
groups were evaluated and average intakes compared at 4 observation periods
including pretreatment, initiation of treatment, completion of treatment at 30 days and 4
month follow-up. Children receiving inpatient treatment for feeding disorders evidenced
significant differences in oral caloric intake from pretreatment to discharge than
outpatient treatment (p < .01) and wait list control group (p = .04). Oral caloric intake
from discharge to 4 month follow up yielded no significant differences indicating
treatment gains were maintained. Change in environment and caretaker showed a
significant effect for the inpatient group (d = 1.89). Effects of treatment by age and
weight at 4 month follow up were also analyzed.

ii
Copyright 2010
by
Sonya L. Cornwell

iii
TABLE OF CONTENTS
Page LIST OF TABLES ............................................................................................................ v LIST OF FIGURES .......................................................................................................... vi INTRODUCTION ............................................................................................................. 1
Pediatric Feeding Disorders: Overview of Diagnosis and Treatment Evidence Based Review of Treatments Environment and Caretaker Effects Weight as a Measure of Outcome Effects of Age on Outcome
Summary of Hypotheses METHODS .................................................................................................................... 10
Participants Procedure
Treatment Group 1 (Inpatient Treatment) Treatment Group 2 (Day Treatment) Initial Multidisciplinary Evaluation of Feeding Disorder Multidisciplinary Treatment Observation Periods Data Analysis
RESULTS ...................................................................................................................... 26
Inpatient v. Control (Hypothesis I) G-tube Caloric Intake G-tube Fluid Intake Oral Caloric Intake Oral Fluid Intake
Day Treatment v. Control (Hypothesis 2) G-tube Caloric Intake G-tube Fluid Intake Oral Caloric Intake

iv
Oral Fluid Intake Inpatient v. Day Treatment (Hypothesis 3) Environment/Caretaker Effects (Hypothesis 4) Effects of Age (Hypothesis 5) Follow Up (Hypothesis 6) Weight at Follow Up (Hypothesis 7)
DISCUSSION ................................................................................................................ 50
Hypothesis 1: Control v. Inpatient Hypothesis 2: Control v. Day Treatment Hypothesis 3: Inpatient v. Day Treatment Hypothesis 4: Environment/Caretaker Effects Hypothesis 5: Effects of Age Hypothesis 6: Follow Up Hypothesis 7: Weight at Follow Up
REFERENCES .............................................................................................................. 58

v
LIST OF TABLES
Page
1. Groups and Observation Periods ....................................................................... 25
2. Inpatient v. Control: Descriptive Statistics for G-tube Caloric Intakes ................. 27
3. Inpatient v. Control: Descriptive Statistics for G-tube Fluid Intakes .................... 28
4. Inpatient v. Control: Descriptive Statistics for Oral Caloric Intakes ..................... 29
5. Inpatient v. Control: Descriptive Statistics for Oral Fluid Intakes ........................ 30
6. Day Treatment v. Control: Descriptive Statistics for G-tube Caloric Intakes ....... 31
7. Day Treatment v. Control: Descriptive Statistics for G-tube Fluid Intakes .......... 32
8. Day Treatment v. Control: Descriptive Statistics for Oral Caloric Intakes ........... 33
9. Day Treatment v. Control: Descriptive Statistics for Oral Fluid Intakes .............. 34
10. Repeated Measure Analysis of Variance: G-tube Caloric Intake Inpatient v. Day Treatment ........................................................................................................... 35
11. Pairwise Comparisons of G-tube Caloric Intake: Inpatient v. Day Treatment between Group Differences by Time .................................................................. 36
12. Repeated Measures Analysis of Variance for G-tube Caloric Intake: Time by Treatment ........................................................................................................... 36
13. Repeated Measure Analysis of Variance: G-tube Fluid Intake: Inpatient v. Day Treatment ........................................................................................................... 37
14. Pairwise Comparisons of G-tube Fluid Intake: Inpatient v. Day Treatment between Group Differences by Time .................................................................. 38
15. Repeated Measures Analysis of Variance for G-tube Fluid Intake: Time by Treatment ........................................................................................................... 39
16. Repeated Measure Analysis of Variance of Oral Caloric Intake: Inpatient v. Day Treatment ........................................................................................................... 39
17. Pairwise Comparisons of Oral Caloric Intake: Inpatient v. Day Treatment between Group Differences by Time .................................................................. 40
18. Repeated Measures Analysis of Variance for Oral Caloric Intake: Time by Treatment ........................................................................................................... 41

vi
LIST OF FIGURES
Page
1. Day treatment group. Total percent G-tube Kcal by age in months showed younger age results in greater required G-tube nutrition. (R² = 41) .................... 42
2. Inpatient treatment group. Total percent G-tube Kcal by age in months shows no relationship (R²= 12) ........................................................................................... 43

1
INTRODUCTION
Pediatric Feeding Disorders: Overview of Diagnosis and Treatment
Feeding disorders of infancy and early childhood lack standard diagnostic criteria
and treatment methodology across both medical (Burklow, Phelps, Schultz, McConnell,
& Rudolph, 1998) and psychiatric spectrums (Chatoor, Getson, Menvielle, Brasseaux, &
O’Donnell, et al., 1997) which has been cited as an obstacle to treatment and research
(Chatoor, Ganiban, Harrison, & Hirsch, 2001). Although there are no universally
accepted definitions of common feeding problems (Arts-Rodas & Benoit, 1998;
Lindberg, Bohlin, Hagekull & Palmerus, 1996; Skuse, 1993; Rommel, DeMeyer,
Feenstra & Veereman-Wauters, 2003), it has been estimated that up to 25% of normally
developing infants and up to 80% of those with developmental disabilities are affected
(Chatoor, Hamburger, Fullard, & Rivera, 1994; Lindberg, Bohlin & Hagekull, 1991;
Wolke, Meyer, Ohrt & Riegel, 1995). Feeding resistance is often severe enough to
require enteral feeding for nutritional support (Dellert, Hyams, Treem, & Geertsman,
1993) and may involve a conditioned dysphagia in children (DiScipio, Kaslon, & Ruben,
1978). Distressing experiences involving the mouth, nose, throat and esophagus have
been said to result in behaviors resembling phobic responses seen in posttraumatic
stress and as such has been termed posttraumatic feeding disorder (Chatoor, Conley, &
Dickson, 1988; DiScipio et al., 1978; Griffen, 1979). Such behaviors include arching
backward, squirming, crawling away, crying, gagging, coughing, retching and vomiting
(Benoit & Coolbear 1998). Aversive and avoidant responses to feeding resulting in
feeding problems have been estimated to affect 40% of infants who have had
esophageal surgery (DiScipio et al., 1978) and 4% of those with gastroesophageal

2
reflux who do not have a neurological or craniofacial problem or a history of esophageal
surgery (Dellert et al., 1993). Due to the severity of problems, enteral feeding such as
gastrostomy tube (G-tube) is often initiated for physiologic reasons during a time of
medical crisis or when a child’s nutrition needs cannot be met through oral intake
(Schauster & Dwyer, 1996).
Transition from enteral feeding to oral feeding and establishing normal eating
behavior in children who have required long term G-tube feedings can be very
challenging due to the complex interaction of biological, psychological and
environmental factors which combine to disrupt healthy infant development. Feeding is
a highly integrated, multisystem skill and often one or more contributing systems may
be dysfunctional (Rommel et al., 2003). Therefore, previous attempts to reduce the
disorder to a simple organic/nonorganic dichotomy have been unsuccessful (Bithony,
Junkin, & Michalek, 1989; Budd, McGraw, & Farbisz, 1992). The multifactorial causes
involve a substantial behavioral component (Bonnin, 2006) that regardless of concurrent
physical factors (e.g. cardiorespiratory, metabolic, neurological or structural) includes up
to 85% of children with feeding problems (Burklow et al., 1998). Clinical observations
have revealed that some infants and young children who had undergone traumatic
experiences to the oropharynx or esophagus subsequently refused to eat and
demonstrated severe distress before feeding (Chatoor et al., 1988, Chatoor et al.,
2001). It has been reported that aversive experiences surrounding feeding result in
avoidant responses to eating to escape the anticipated pain, discomfort or intense
anxiety (Arts-Rhodas & Benoit 1998; Benoit, Green, & Arts-Rhodas, 1997; Chatoor et
al., 1988; Hyman, 1994). Due to the significant behavioral component of feeding

3
disorders, behavioral therapy has been established as an empirically supported
treatment of the broad spectrum diagnosis of feeding disorders (Kerwin, 1999).
More specifically, research demonstrating the efficacy of behavioral treatments
on reducing G-tube dependency and increasing oral intake have focused on operant
learning principles due to the multisystem interaction of the biological, psychological and
family system involvement in the onset and maintenance of adaptive mealtime behavior
(Babbitt, Hoch, Coe, Cataldo, & Kelly, et al., 1994; Benoit & Coolbear, 1998; Benoit,
Wang, & Zlotkin, 2000; Byars, Burklow, Ferguson, O’Flaherty, Santoro, & Kaul, 2003).
Behavioral treatments shown efficacious in research include escape extinction (Benoit
et al., 2000) positive and negative reinforcement, shaping, discrimination, fading and
parent training (Babbitt et al., 1994; Benoit & Coolbear, 1998; Byars et al., 2003).
Historically, punishment and reward contingencies alone have shown little influence on
classically conditioned feeding behaviors (Werry & Wollersheim, 1989). However,
systematic desensitization and extinction have been shown to be highly effective with
phobias surrounding food refusal (Babbit et al., 1994; Benoit, 1998, Byars et al., 2003;
Kerwin, 1999). Behavioral treatments involving extinction (i.e. flooding) alone resulted in
47% of patients no longer dependent on tube feeding as compared to 0% in the control
group receiving nutritional counseling alone (Benoit et al., 2000). Studies which utilized
a combination of behavioral techniques including positive and negative reinforcement,
shaping, discrimination, fading, parent training and extinction report from 44% (Byars et
al., 2003) to 86% (Babbitt et al., 1994) of patients taking all nutrition and hydration orally
by discharge. It should be acknowledged that individualized treatment planning is
necessary in a behavioral treatment paradigm. It is also likely that what has been

4
researched and reported are actually interaction effects of multiple components (e.g.,
speech and occupational therapy) that go into successful treatment outcome and not
simply behavioral techniques.
Evidence Based Review of Treatments
Previous research on transitioning gastrostomy tube dependent children to oral
feedings has primarily been single subject designs (Babbitt et al., 1984; Blackman &
Nelson, 1985; Blackman & Nelson, 1987; Farrell, Hagopian & Kurtz, 2001; Gutengag &
Hammer, 2000; Luiselli & Luiselli, 1995) or focused on volume of intake (Babbitt et al.,
1984; Benoit et al., 2000). Although case studies are beneficial, larger group studies
show generalizability of treatment effects to a broader patient population with diverse
medical etiologies and backgrounds. Only one study measured caloric intake as a
treatment variable (Byars et al., 2003) while others focused on volume of intake (Babbitt
et al., 1994) or G-tube removal (Benoit et al., 2000). Utilizing caloric intake provides a
more specific measure as opposed to mass or volume (Byars, 2003). Caloric intake
provides a better assessment of nutrition which can be used to make decisions about
reduction of G-tube feedings. In order to adequately demonstrate the effectiveness and
efficacy of treatment it is necessary to demonstrate specificity along a continuum
(Jacobson, Follette, & Ravenstorf, 1984) rather than the simple dichotomy of G-tube
dependency versus no dependency. Required caloric intake also varies according to
age, height and weight. Thus, accessing each child based on individual need provides a
more accurate measure of the impact of treatments over time.

5
The Cornwell, Kelly and Austin (2010) study of inpatient treatment effects on oral
caloric intake and reduction of G-tube dependency with combined treatments of speech
therapy, occupational therapy, psychology and dieticians has indicated strong treatment
effects for multidisciplinary treatment of G-tube dependent children (N = 40). Results of
t-test calculations of differences between pre treatment gastrostomy tube caloric intake
(M = 703.65kcal., SD = 233.11kcal.) and post treatment gastrostomy tube caloric intake
(M = 211.04kcal., SD = 251.21kcal.) resulted in a significant reduction in gastrostomy
tube dependency, t(39) = 10.94, p < 0.001. Magnitude of the effect of treatment (d =
2.03) and post hoc power (β = 1) on reducing gastrostomy tube dependency were both
very strong.
Results of t-test comparison of differences between pre treatment oral caloric
intake (M = 542.21kcal., SD = 375.05kcal.) and post treatment caloric intake (M =
897.83kcal., SD = 312.27kcal.) indicated a significantly increased post treatment caloric
intake, t(39) = 5.76, p < 0.001. Magnitude of effect of treatment (d = 1.02) and post hoc
power analysis (β = .99) again, were strong. A total of 42.5% of children were taking all
meals and nutritional needs orally at the end of treatment.
The effectiveness of in-patient multidisciplinary treatment of pediatric feeding
disorders and G-tube dependency has been established with optimistically strong
treatment effects in retrospective analysis (Cornwell et al., 2010). No such analysis
exists for outpatient treatment. Although historically both intensive inpatient and
outpatient day treatments are considered influential in transitioning children from G-tube
to oral intake, there are no known controlled studies establishing these treatments as
empirically based. The current prospective study was completed in order to provide

6
further empirical validation of both efficacy and effectiveness of multidisciplinary
inpatient and outpatient treatment of pediatric feeding disorders through controlled
comparative analysis.
Environment and Caretaker Effects
Although the magnitude of effect of treatment was very strong for both increases
in oral calorie consumption (d = 1.02) and decreases in G-tube caloric requirements (d
= 2.03) in the Cornwell et. al. study, the baseline pre treatment caloric measure may
have negatively influenced the true effect of treatment outcome as these numbers are
generally an underestimate of progress. The baseline estimate did not take into
account the increase in oral intake from home to day one to three or the decrease in G-
tube feeds (usually between 120-240ml) that is implemented on admission. The three
day baseline period did not include formal implementation of behavioral therapy, yet
change of environment and controlling parental contingencies likely altered well
established behavior patterns (Chatoor, et al., 1997; Lucarelli, Ambruzzi, Cimino,
D’Olimpio, & Finistrella, 2003). It is well known that many contingencies are built
between the caretaker and the child which serve to maintain adverse behavioral
responses to eating. A reciprocal interchange and sense of trust is needed for
recognizing and responding to infant cues during feeding (Chatoor, 1997; Lobo, 1992;
Satter, 1990). Parent characteristics such as anxiety, depression, psychopathology or
psychosocial stressors can lead to the mother’s inability to read the infant’s cues and to
facilitate calm, successful feedings (Chatoor et al., 1997). The complex combination of
characteristics of the infant and mother can lend to both positive and reciprocal

7
interactions during feeding or develop into conflict and struggle for control (Chatoor et
al., 1997). Environmental obstacles in establishing positive feeding interactions include
poor mealtime routine, developmentally inappropriate seating/food choices, and a
diverse range of family and sociocultural problems (Winters, 2003). Upon inpatient
admission, changes in environment and caretakers likely create a strong effect on
children’s initial responses to eating. In the Cornwell et al. (2010) study, retrospectively,
the effect of environmental change from home to hospital could not be assessed as
data were not collected from the family on oral and G-tube caloric intake prior to
admission. The presented research sought to elucidate environmental and caretaker
effects by analysis of caloric changes from home to hospitalization. It is hypothesized
that change in environment and feeding caretaker will result in significant increases in
oral caloric intake and G-tube reduction at 3 days post admission to the inpatient
feeding program.
Weight as an Outcome Measure
In an inpatient treatment setting the goal is usually not to increase weight but
rather to maintain weight during the intensive treatment. The maintenance of pre
treatment weight signifies a carefully controlled balance of G-tube reduction to oral
consumption. Careful monitoring of caloric intake provides the treatment team with the
specificity necessary to inform nutritional recommendations (Byars, et al., 2003). In an
inpatient setting caloric monitoring by a registered dietician provides the information
necessary for making alterations to G-tube caloric intake. The professional
management and carefully controlled reductions in G-tube calories helps to create a

8
motivational setting for treatment (Linscheid, 1999) which often may not be done safely
or comfortably at home. Systematic and carefully controlled reductions in G-tube
calories may stimulate appetite with subsequent increases in oral caloric intake and
ultimately weight gain.
The analysis of treatment effects on weight in the research by Cornwell et al.
(2010) was in keeping with the treatment goal for maintaining the children’s weight
during transition to oral feedings. Results of the paired sample t-tests showed no
significant difference in pre treatment weight (M = 13.5kg, SD = 3.33kg) and post
treatment weight (M = 13.56kg, SD = 3.0kg), t(39) = 0.279, p = 0.782). This was not
surprising given the 46 day average length of hospitalization.
Assessing effects on growth and development may be more accurately
accomplished through long term follow-up. Byars et al. (2003) used percent of ideal
body weight as an outcome measure and reported weight loss during treatment, with
gains in weight at several months follow-up. In line with the study by Byars et al. (2003),
long term follow up of treatment effects on weight gain at 4 months were completed. It
was hypothesized that the treatment groups would show significant gains in weight at 4
month follow-up.
Effects of Age on Outcome
Cornwell et al. (2010) did not find treatment effects for children less than four
years-old to vary significantly from children over four years. These findings were in
opposition to others, as both age (Illingworth & Lister, 1964) and length of time on G-
tube (Blackman & Nelson, 1985; Linscheid, 1992) have previously been shown to

9
influence treatment outcome. Children who are tube fed for months or years from birth
and then are introduced to oral feeding are at a disadvantage because the usual
developmental transition from reflexive to voluntary, independent feeding may never
have occurred (Blackman & Nelson, 1985; Linscheid, 1992). Age has also been
significantly correlated with an increase in behavioral problems with feeding (Rommel,
et al., 2003). Establishing a relationship between age and treatment effects could
strengthen the argument for earlier intervention. In light of that, the present research
assessed the relationship of age to treatment effect of the comprehensive
multidisciplinary treatment of pediatric feeding disorders. It was hypothesized that
increases in oral intake would be inversely related to age for the treatment groups, with
earlier treatment at younger ages showing stronger treatment effects and thus quicker
transition to oral feedings.
Summary of Hypotheses
Control v. inpatient (Hypothesis 1): Children receiving inpatient treatment for
feeding disorders transition more quickly to oral nutrition by demonstrating significant
increases in oral intake and G-tube reduction than wait list control.
Control v. day treatment (Hypothesis 2): Children receiving outpatient day
treatment for feeding disorders transition more quickly to oral nutrition by demonstrating
significant increases in oral intake and G-tube reduction than wait list control.
Inpatient v. day treatment (Hypothesis 3): Group differences were anticipated
between the intensive inpatient and outpatient treatment groups with the inpatient
10
treatment group showing higher rates of change to oral nutrition than the outpatient day
treatment group.
Environment/caretaker effects (Hypothesis 4): Change in environment and
feeding caretaker result in significant increases in oral caloric intake and G-tube
reduction from home to 3 days post admission to the inpatient feeding program.
Effects of age (Hypothesis 5): Increases in oral intake are inversely related to
age for the treatment groups.
Follow up (Hypothesis 6): The study includes follow-up on treatment effects
across groups over a four month period. It was hypothesized that treatment effects at
follow-up would be maintained from discharge for both inpatient and day treatment
groups.
Weight at follow up (Hypothesis 7): It was hypothesized that both treatment
groups would show significant gains in weight at 4 month follow-up.

11
METHODS
Participants
The sample was a clinic based sample which included children age 15 months to
5 years-old who presented to an intensive feeding program in Dallas, Texas for
evaluation and treatment of gastrostomy tube dependency.
The sample included 22 males and 8 females ages 15 to 65 months (M = 38.5,
SD = 12.76). Demographics by race indicated 73% Caucasian, 10% African American,
10% Hispanic and 7% listed as other. All children were identified with oral motor and
sensory processing deficits as well as a history of avoidant and aversive responses
around mealtime. Each had received previous out patient speech and occupational
therapies but no prior history with psychological services.
The children presented with diverse and complicated co-occurring medical
conditions and histories. The term “co-occurring” is used to further describe the
complexity of medical conditions without implying a known etiology of the feeding
disorder as many of the children presented with multiple medical conditions. Within the
complete sample of 30 children, 54% were premature births ranging from 23 to 36
weeks gestation (M = 33 weeks, SD = 6.2 weeks). Age of onset of difficulties with oral
nutrition resulting in supplemental tube feedings ranged from birth (60%) to 23 months
(M = 3 months, SD = 5 months). 84% of the children presented with a history of
gastrointestinal problems including gastroesophageal reflux disease (GERD) (60%),
food allergies (10%) and 4% with other gastrointestinal problems. Respiratory problems
comprised 73% of the children and included chronic lung disease (CLD) (47%), and
asthma (26%). Congenital problems such as diaphragmatic hernia, hyperplastic lung,
12
intrauterine growth retardation, tracheo-esophageal fistula, tetrology of fallot,
hypoplastic heart, cerebral palsy, cystic fibrosis, and Down syndrome were 27%. The
study was performed with the appropriate approvals of the Internal Review boards for
both the University of North Texas and Baylor Research Institute.
Procedure
Children initially received a multidisciplinary feeding disorders evaluation by
registered dietician, speech therapist, occupational therapist and psychologist. They
were diagnosed with feeding disorder related to medical history and evidenced
significant oral motor and sensory processing problems with subsequent avoidant and
aversive responses to food/drink. Children were then recommended for treatment in
either the outpatient day treatment or inpatient treatment group based on individual
needs and requirements. Children were excluded only if it was determined by the
multidisciplinary team that the child would not benefit from treatment due to safety or
health concerns. The sample was a clinic based sample. Therefore, random assignment
was not performed secondary to medical and thus ethical concerns with provision of the
most optimal treatment available.
Children and their families were recruited for the study until each group contained
10 children for a total of 30 participants.
Treatment Group 1 (Inpatient Treatment)
Children designated for the inpatient treatment group were those identified in the
evaluation as 1) demonstrating at least minimal skills necessary for eating and drinking,

13
2) evidencing a significant behavioral component to food refusal, and 3) parents
consented to intensive inpatient feeding therapy.
Treatment Group 2 (Day Treatment)
Children designated for the day patient treatment group were those who 1) had
limited or no experience with oral intake of food or drink, 2) evidencing of a significant
behavioral component to food refusal, and 3) parents consented to the intensive
outpatient day treatment. Control Group 3 (Wait List). Children in the wait list control
group were evaluated and awaiting treatment for either the day treatment or inpatient
treatment programs.
Initial Multidisciplinary Evaluation of Feeding Disorder
Children in all groups were initially assessed by speech therapist, occupational
therapist, psychologist and dietician in a combined out patient multidisciplinary feeding
disorder assessment. All disciplines were an integral part of the treatment process
including evaluation, treatment planning and implementation. Feeding programming
was contingent upon evaluations from speech and occupational therapists as behaviors
surrounding feeding are often the result of oral motor skills deficits, sensory dysfunction
and sometimes pain. Speech and occupational therapy assessment of skill level served
to guide the types of foods offered (e.g. thin liquids, pureed, soft solids, crunchy). The
treatment team psychologist assessed avoidant and aversive responses and caregiver
contingencies that serve to maintain the established patterns of behavior. Dietician

14
assessed required fluid and nutritional intakes. Recommendations were then developed
into a combined structured feeding protocol
Speech therapy evaluation. Oral motor and oral sensory skills were assessed by
observational evaluation completed by licensed speech therapists. Speech therapists
determined oral motor skills for eating and drinking, oral sensory status and safety of
swallow. A Modified Barium Swallow Study (MBSS) was conducted to assess
dysphagia. In terms of skills, speech therapists assessed range of movement, strength,
coordination, patterns of movement and alignment of the lips, tongue, jaw and cheeks.
Abnormal or inadequate skills which would interfere with the patient’s ability to orally
manipulate food and liquid were identified for treatment. For example, if a patient
exhibited abnormal jaw and tongue patterns, they may have difficulty chewing solids
and forming a cohesive bolus.
Often children who have been exposed to aversive medical treatments or have
experienced oral sensory deprivation due to G-tube feedings exhibit oral sensory
disorders (Arvedson & Brodsky, 2001, p. 297). Therefore, oral sensory evaluation was
crucial to a complete speech therapy evaluation. This part of the evaluation inspected
the patient’s tolerance to textures, consistencies and flavors and the subsequent impact
of oral motor skills and behaviors. Hyposensitive, hypersensitive or sensory defensive
responses were identified. These responses are known to interfere with the patient’s
ability to discriminate oral sensory input accurately and may impair oral motor skills
(Arvedson & Brodsky, 2001, p. 295).
Occupational therapy evaluation. Occupational therapy assessed each child’s
ability to process sensory information and provide an adaptive response through

15
participation in age-appropriate activities (Miller, Anzalone, Lane, Cermak, & Osten,
2007). This was accomplished with both standardized parent report and clinical
observation of self-care skills, and responsivity to tactile, vestibular and proprioceptive
sensory input. The standardized testing, clinical observation and parent/caregiver report
were combined to determine areas of sensory processing difficulties.
Caregiver report was obtained using the Infant/Toddler Sensory Profile (ITSP)
(Dunn & Daniels, 2002) and the Sensory Profile (SP) (Dunn, 1999). The Sensory Profile
is a 125 item caregiver questionnaire which is divided into three main sections: Sensory
Processing, Modulation, and Behavioral and Emotional Responses. Standardization
was reported on a sample of 1,200 children with and without disabilities between the
ages of 3 and 14-years-old. Internal consistency determined by Cronbach’s alpha was
calculated from the normative sample and indicates adequate reliability for Sensory
Processing (α = .63 to .85), Modulation (α =.58 to .83), Behavioral and Emotional
Responses (α = .47 to .89) and Factors (α = .72 to .91) (Dunn, 1999). The
Infant/Toddler Sensory Profile is an edition of the Sensory Profile. It is a 48 item
caregiver questionnaire that measures sensory modulation abilities as reflected in daily
experiences in children ages 7 months to 36 months. The total frequency of behaviors is
calculated for each sensory modulation section: Auditory, Visual, Vestibular, Tactile,
and Oral Sensory. Scores are then grouped into four quadrant scores: Low
Registration, Sensation Seeking, Sensory Sensitivity, and Sensation Avoiding. Internal
consistency estimates of reliability on quadrant scores are acceptable (α = .69 to .85)
and overall validity is good (Dunn & Daniels, 2002).

16
The Test of Sensory Functions in Infants (TSFI) was completed by occupational
therapist. The TSFI provides an overall measure of sensory processing and reactivity in
infants, ages 4 to 18 months. The 24 item assessment includes five subdomains of
sensory processing and reactivity including Reactivity to Tactile Deep Pressure,
Adaptive Motor Functions, Visual-Tactile Integration, Ocular-Motor Control and
Reactivity to Vestibular Stimulation. Interobserver reliability is excellent for the five
subscores (r = .88 to r = .99) and for the total test (r = .95). Test-retest reliabilities
calculated with Pearson product-moment correlation are good for the various subscores
(r = .64 to r = .96) with the exception of Reactivity to Vestibular Stimulation (r = .26).
Validity is reported to be good with infants with delays or regulatory disorder after 10
months of age (DeGangi & Greenspan, 1989).
Dietary evaluation. Nutrition status was assessed using rate of weight gain and
overall growth chart trends (Center for Disease Control, 2000). For example, adequate
weight gain for 2 to 6-year-old boys is 5-6 grams/day and 5-7 grams/day for girls.
Individual considerations including weight, oral intake, age, rate of progress, and phase
in feeding program were considered when deciding to reduce enteral feedings.
Behavioral assessment. Direct observation by licensed pediatric psychologist
was completed while each child was fed or attempted to be fed a meal by the parent or
primary caregiver. Assessment involved a functional analysis of behavior with
identification of probable antecedent and consequent controlling variables. The
determination of strengths, skills, reinforcers, significant others, competing
contingencies and possible problems related to modifying the behavior(s) of interest

17
were considered during behavioral assessment (Gambril, 1977; Mash & Terdal, 1976;
Miller et al., 2001).
Multidisciplinary Treatment
Children in both treatment groups received individual speech and occupational
therapy daily, Monday through Friday for 30 minutes in addition to therapists each
feeding one structured meal. Intensive structured feeding continued throughout the
child’s inpatient admission whereas, this process was disrupted over the weekend for
the day treatment children.
Speech therapy treatment. Once evaluation was complete, speech therapists
analyzed the patient’s oral motor and oral sensory skills and established menus, feeding
utensils, bite size and drinking protocol to be used during meals. Feeding skills were
communicated to the feeding team to ensure consistent reinforcement of expected
skills. These components of the feeding protocol were addressed in speech therapy
sessions which were held daily and separately from the structured meals. Speech
therapy treatment consisted of activities to facilitate increased success in oral feeding.
The four general target areas that the speech therapists addressed during treatment
sessions were increasing oral motor skills, normalizing oral sensitivity, increasing the
volume of foods accepted, and increasing the variety of foods accepted.
Common oral motor deficits addressed are decreased strength, range of motion,
and precision and/or speed of movements involving jaw, lingual, and labial musculature.
Some treatment activities targeting deficits with the jaw included chewing on a variety of
foods (e.g., soft solids, meltable crunchy foods) and oral motor tools (e.g., chewy

18
tubing), using bite blocks to hold sustained closed jaw postures and demonstrating
controlled jaw movements by slowly and rhythmically opening and closing a clothespin
held with the upper and lower central incisors. Various lingual exercises included
resistance exercises in which the participant pushes his or her tongue against a tongue
depressor held by the speech therapist and movement activities in which the participant
demonstrated protrusion, elevation, depression and lateralization of the tongue in
response to a stimulus (e.g., lollipop, tongue depressor, or taste of preferred smooth
food on a spoon). Deficits with labial musculature were addressed through a variety of
movement exercises in which the participant was required to create pressure with the
labial musculature while using an aid (e.g., lollipop, straw, whistle), repeatedly open and
close his or her lips on a tongue depressor, and demonstrate repetitive alternating
protrusion and retraction of the lips.
Speech therapy attempted to normalize oral hypersensitivity in order to increase
the participants’ acceptance of a variety of textures. Oral sensory activities include
providing sensory input to the oral cavity (i.e., tongue, cheeks, roof of mouth, teeth)
through toothettes, Nuk brushes, Nuk brushes with texture (i.e., flavored sugar such as
Pixie Stix), and vibration.
The speech therapists addressed increasing the volume of foods accepted by
slowly increasing the bite size of a preferred food during treatment sessions. To
accomplish this, the speech therapists slowly built up the bite on the participant’s spoon
(the same type of spoon used in meals) at a slow enough rate that the participant did
not consistently refuse. In order to achieve this goal, behavioral treatment strategies
provided by the pediatric psychologist were used during treatment sessions. Once the

19
participant consistently accepted a specific bite size during speech therapy sessions,
this bite size would be required during meal times. The speech therapist also adjusted
the spoon based on the participant’s success. For example, when a participant
successfully accepted full, heaping spoonfuls from a baby spoon, the therapist moved
up to a toddler spoon and again slowly built up the bite size on that spoon.
Speech therapy used the same procedure as above when increasing variety of
foods. If a food was non-preferred, the therapist offered only a dip of that food on the
spoon and slowly moved up to a full spoon based on the participant’s success and
acceptance. In some cases the therapist would mix a preferred food with a small
amount of non-preferred food when after multiple attempts over several therapy
sessions the child did not accept even a dip of the non-preferred food on the spoon.
Once the child accepted a preferred/non-preferred mixture of food, the speech therapist
slowly weaned out the preferred from the mixture. Again, foods were not added to the
menu until it was consistently accepted during speech therapy sessions.
Occupational therapy treatment. Individualized treatments targeting difficulties
with specific sensory input were developed. Treatment focused on sensory integration
interventions designed to enhance the brain’s ability to accept and process sensory
information and ultimately to create an adaptive response (Aryes, 1972). Equipment and
activities used during treatment were designed to help children receive information
through their senses, modulate their nervous system according to the sensory input,
and participate in adaptive responses or the desired task more successfully (Aryes,
1989). These therapeutic activities were provided by occupational therapists for 30
minutes, three to five times weekly. Tactile treatments included brushing and joint

20
compression for reduction of tactile defensiveness. A variety of food and non-food
textures were used for tactile exploration, generally progressing from dry/smooth, to
dry/rough, to wet/smooth, and to wet/mixed. Activities were play-based and the overall
goal was to decrease not only the tactile hypersensitivity, but the negative associations
with food. Vestibular difficulties were addressed with various swinging and balancing
activities. Proprioceptive problems were addressed with activities involving brushing,
join compression and high impact activities to help increase body awareness and calm
the child.
Dietary treatment. To optimize oral caloric intake, food items were calorie
boosted with calorie dense commercial additives and nutrient dense beverages were
encouraged. Tube feedings were transitioned to a continuous overnight schedule to
promote hunger and optimal oral intake. Caloric intake was determined using strict daily
calorie counts. Intake of food, beverages, and calorie boosting items were measured in
grams or milliliters and recorded at each meal. The amount of food consumed and the
ratio of food items to calorie boosters was calculated into the calorie counts. Calorie,
protein, and fluid intake was recorded and used in conjunction with weight trends to
wean tube feedings. As progress was made with increases in oral calories, reductions in
tube feedings were made by decreasing the hours in overnight continuous feeds. This
was a more conservative reduction than attempting equivalence in reduction of G-tube
with amount of increase in oral calories. For example, continuous feedings were
reduced by ending completion time at 3:00 a.m. from 4:00 a.m. as progress was made
in treatment. At a common rate of 150cc per hour this would result in an average
reduction of 200kcal. ranging from 150kcal. to 225kcal.
21
Behavioral treatment. Each individualized behavioral treatment program was
designed to help the child overcome difficulties and move forward by addressing
behaviors that have manifested as a result of the identified deficits and previous
experiences surrounding medical problems. Positive and negative reinforcement and
extinction were the primary behavioral techniques used. Positive reinforcement was
provided when the child’s responses to presentation of food were appropriate meal-time
behaviors. Such behaviors included allowing food in and around the mouth, chewing
and swallowing. Positive reinforcement included (but was not limited to) social praise
and a few seconds time to play with a favorite item or watching a favorite children’s
movie/program. Extinction (i.e. ignoring and not withdrawing the presented item) was
used for aversive responses such as crying, gagging, vomiting, retching, arching
backward or throwing food. Therapists remained neutral in their response to these
behaviors and continued to offer the food for a 25 minute period. After the 25 minute
period the child was told the meal was over and that they may try again at the next
meal. Behavioral treatment was broken into four phases with movement from one phase
to the next dependent upon the child’s progress with oral caloric intake and team
evaluation. Things that either hindered or accelerated treatments were: food accepted
with minimal refusal; volume increased, weight remained stable so that G-tube could be
decreased; and parents were demonstrating the ability to implement that stage of
treatment with minimal cueing.
Phase I (caregiver separation). The focus of this phase of treatment was to begin
changing some of the behavioral habits the child had developed. The focus was not
only feeding behaviors, but the child’s response to limits in general. These patterns are
22
typically well established with caregivers and therefore it was necessary for the
caregivers to observe without the child’s knowledge during the day. Therefore, each
child participated in therapies and feedings during the day without caregiver
involvement. Parents/caregivers began observing feeding sessions and some therapy
sessions from behind a one-way mirror. Observations were done initially with the
psychologist. This started the caregiver training process with explanations provided on
the treatment rationale and underlying philosophy of the behavioral treatments utilized
during the feeding sessions.
Children received 25 minute structured meals every 2 hours daily for a total of 5
meals for the inpatient treatment group and 4 for the day treatment. Behavioral
treatments, menu items, seating and utensils were designed and implemented
according to the combined treatment team assessment and recommendations. Meals
were provided in a special feeding room with a one-way window for parents and other
professional and medical staff to observe. Feeding therapists were licensed speech and
occupational therapists, psychology staff, and trained graduate level therapists in one of
these disciplines. All therapists and any additional feeding staff were trained and
supervised by the licensed psychologist. Medical and nutritional oversights were
provided by the registered dietician, pediatric physician, and nursing staff. All food items
were weighed before and after meals. Daily caloric intakes were calculated and
monitored by a registered dietician. All changes in nutritional intake via G-tube were
assessed as part of a multidisciplinary team process with increases or reductions
prescribed by the physician in charge with on-going monitoring by all team members to
insure adequate nutritional intake and the safety of each child. All necessary G-tube

23
feedings were typically accomplished over night in order to break the contingency of
hunger/satiety with G-tube feedings. Speech therapists initiated oral motor and oral
sensory therapies. Occupational therapists initiated sensory, gross motor and fine motor
therapies.
Phase II (caregiver participation in meals). The focus of this phase of treatment
was to introduce caregivers back into meals. Caregivers were introduced into the meals
once the child adjusted to the routine and began to progress in the feeding sessions.
Caregivers were guided with participation in reinforcement and active ignoring with the
therapist feeding the meal and modeling appropriate feeding techniques and responses.
Disruptions from introduction of the parent/caregiver into the routine were worked
through during this time. For example, this time was spent enhancing positive reciprocal
interactions with appropriate timing of reinforcement such as social praise and playful
activity as well as setting limits and expectations in a therapeutic setting. Caregivers
were encouraged to praise their child verbally and participate in positive reinforcement
of food acceptance with cueing from the feeding therapist. Caregivers also practiced
active ignoring of all avoidant and aversive responses.
Phase III (caregiver feeding). Caregivers began feeding meals during the final
phase of treatment. Caregivers participated in all aspects of feeding including meal
preparation and accompanying the child to the room. The parent was placed in charge
of all aspects of the meal with guidance and cueing as necessary from the therapist.
Therapists continued to provide training and feedback during this time. For example,
parents were given feedback on reciprocal responses and guided in remaining neutral,
not withdrawing food and ignoring avoidant or aversive responses. Parents were also

24
assisted with appropriate timing of reinforcement such as social praise and playful
activity. The focus was to assist the caregiver with the training necessary to transition
the progress with oral intake and reductions in G-tube to the home environment.
Phase IV and discharge (caregiver independence). During the final phase of
treatment, the therapist observes all meals outside of the room through a one way
window. This allowed the caregiver increased independence with the meals in
preparation for discharge. It also removed the stimulus of the therapist which often
resulted with increased refusal. Caregivers were given additional support and guidance
for dealing with the refusal in preparation for handling behavioral difficulties
independently at home. This phase was typically initiated during the final 5 to 7 days of
treatment prior to discharge.
In order to maintain each child’s success, caregivers were encouraged to strictly
follow the program at home for several months following discharge. Caregivers were
also encouraged to contact the psychologist to discuss problems/behaviors that may
arise after the return home. A menu, home protocol and calorie tracking sheet were
provided.
Observation Periods
Time 1 (baseline). Parent/caregiver logged all food and drink for 3 days prior to
the initiation of treatment. The food diaries were assessed by a registered dietician and
caloric and fluid intakes calculated. The caloric and fluid intakes obtained served as a
baseline for the treatment groups.
Time 2 (initial 3 days of treatment). Calorie counts and fluid intakes were

25
assessed for the initial 3 days of treatment. Total percent G-tube and percentage of oral
calorie and fluid intakes were obtained.
Time 3 (discharge). Treatment effects were determined using the average G-tube
and oral calorie and fluid intake from the final 3 days of treatment prior to discharge (i.e.
30 Days)
Time 4 (follow up). Parents/caregivers logged all oral and G-tube food and fluid
for 3 days at 4 months post discharge. The information was provided to the dieticians
and again assessed by individual age and weight requirements.
Table 1
Groups and Observation Periods
Group Time 1 Time 2 Time 3 Time 4
Inpatient/Day Treatment
3 Days Pretreatment
Initial 3 Days of Treatment
Discharge/ Day 30
4 Month Follow Up
Control Evaluation X X 4 Month Follow UP
*Average 3 day oral and G-tube calorie and fluid intakes at each time period.
Data Analysis
All statistical analyses were conducted using Predictive Analytics Software
Statistics (PASW) 18.0. General linear model (GLM) repeated measures analysis of
variance was used for assessing between and within group statistically significant
differences of oral and G-tube calorie and fluid intake and weights. All statistics were
performed using an alpha level set at the .05 confidence level. Estimates of effect size
were determined using partial eta-squared associated with each factor. Nutritional
variables used for data analysis were calculated by first assessing each child’s progress

26
toward the daily caloric requirements for his/her age and weight group. Recommended
daily caloric requirements by age and weight for ages 12 to 36 months were calculated
as 102kcal per kg of weight. For ages 36 months to 5 years-old caloric requirements
were calculated as 90kcal per kg of weight. The specificity of known caloric requirement
by age and weight allowed for accurate calculation of individual nutritional requirements
for each child. For example, a 36 month-old toddler weighing 12.7kg would require
1295.4kcal daily. If the child consumes 500kcal. of the 1295.4kcal at pretreatment,
he/she would be consuming 38.5% of the daily requirement. Consuming the same
number of calories for a 5 year-old child weighing 18.14kg who requires 1632.6kcal.
would result in only 30.6% orally consumed requirements. This will help control for error
in measurement when using raw scores due to variation in age/weight and caloric
needs. Therefore a reliable change for each child was the total percent of increase in
orally consumed daily requirements and percent in G-tube reductions. This was
calculated for each child in the inpatient and day treatment groups at all 4 observation
periods (i.e. pre-admit through follow up) and at evaluation and follow up for the wait list
control group. Thus weight was obtained for each child at each time period.
Analysis of age correlations with treatment effects were conducted with ANOVA
and linear curve estimation for correlations by age and G-tube caloric intakes.

27
RESULTS
Inpatient v. Control (Hypothesis 1)
Initial testing with general linear model (GLM) repeated measure test of group
differences of caloric and fluid intakes for control v. inpatient treatment resulted violation
of assumptions of homogeneity indicated by Box’s test of equality of covariance (p <
.05). One outlier was identified and removed for the final analysis resulting in
assumptions of homogeneity being met (p = .37). Therefore, the inpatient was analyzed
with an n = 9 and control group n = 10 for a total N = 19.
G-tube Caloric Intake
Treatment effects on G-tube caloric intakes at pre treatment (Time 1) and
discharge (Time 3) were analyzed utilizing repeated measures ANOVA. The means and
standard deviations for the inpatient treatment and control groups are presented in
Table 2.
Table 2
Inpatient v. Control: Descriptive Statistics for G-tube Caloric Intakes
Time Period Inpatient Control
n M SD n M SD
Time 1 (3 days pretreatment) 9 90.00 28.13 10 95.33 48.36 Time 2 (initial 3 days treatment) 9 75.77 17.12 X X Time 3 (discharge) 9 35.78 28.658 10 X X Time 4 (follow up) 9 39.38 27.27 10 96.11 22.39
Results showed a significant within subjects treatment effect for time (Wilks’ Lamda =
.62, F (1, 16) = 9.57, p = .007, partial eta squared = .37), and within subjects treatment

28
effect for time by groups (Wilks’ lambda = .72, F(1, 16) = 6.14, p = .025, multivariate
partial eta squared = .27). Between subjects effects for comparison of inpatient
treatment and control groups were also significant, F (1, 9) = 4.66, p = .046, partial eta
squared = .23.
G-tube Fluid Intake
Treatment effects on percentage of G-tube fluid intakes from pre treatment to
(Time 1) and discharge (Time 3) were analyzed with repeated measures ANOVA. The
means and standard deviations for the inpatient treatment and control group are
presented in Table 3. Box’s test of equality of covariance was non significant (p = .49)
indicating that the assumptions for the analysis were met. The results showed a
significant within subject effect in G-tube fluid over time (Wilks’ Lambda = .648, F (1, 16)
= 8.68, p = .009, partial eta squared = .35), but non significant effects for time by group
(Wilks’ Lambda = .94, F(1, 16) = 1.07, p = .31, multivariate partial eta squared = .06).
Between subject effects comparing inpatient treatment and control were also not
significant from pre treatment to discharge, F (1, 16) = 1.25, p = .28, partial eta squared
= .073.
Table 3
Inpatient v. Control: Descriptive Statistics for G-tube Fluid Intakes
Time Period Inpatient Control
n M SD n M SD
Time 1 (3 days pretreatment) 9 79.22 25.93 10 85.33 41.62 Time 2 (initial 3 days treatment) 9 69.78 20.82 X X Time 3 (discharge) 9 50.44 26.72 10 X X Time 4 (follow up) 9 36.00 23.83 10 71.55 21.96

29
Oral Caloric Intake
Repeated measure ANOVA was conducted to compare treatment effects on oral
caloric intakes at pre treatment (Time 1) and after treatment intervention at discharge
(Time3) for inpatient and control. The means and standard deviations are presented in
Table 4. Box’s test of equality of covariance was non significant (p = .06) indicating
assumptions for analysis were met. Results showed a significant effect for within subject
differences over time (Wilks’ Lambda = .61, F (1, 16) = 10.48, p = .006, partial eta
squared = .386), and time by treatment (Wilks’ Lambda = .53, F(1, 16) = 14.24, p =
.002, partial eta squared = .47). Between subjects effects for group comparison resulted
in significant differences between inpatient treatment and control, F (1, 16) = 4.86, p
=.04, partial eta squared = .23.
Table 4
Inpatient v. Control: Descriptive Statistics for Oral Caloric Intakes
Time Period Inpatient Control
n M SD n M SD
Time 1 (3 days pretreatment) 9 20.22 18.37 10 15.22 27.28 Time 2 (initial 3 days treatment) 9 43.00 23.25 X X Time 3 (discharge) 9 58.56 34.39 10 X X Time 4 (follow up) 9 50.57 34.48 10 11.88 27.49
Oral Fluid Intake
Repeated measure ANOVA was conducted to compare treatment effects on oral
fluid intakes from pre treatment (Time 1) and after treatment intervention at discharge
(Time 3). The means and standard deviations for the inpatient treatment and control

30
group are presented in Table 5. Box’s test of equality of covariance was non significant
(p = .07) indicating assumptions for analysis were met. Results showed a non significant
within subjects difference over time in oral fluid intake by time (Wilks’ Lamda = .84, F (1,
16) = 2.86, p = .11, multivariate partial eta squared = .15). Within subjects treatment
effect for time by group resulted in a significant effect for oral fluid intake (Wilks’ Lambda
= .57, F (1, 16) = 12.42, p = .003, multivariate partial eta squared = .43). Between
subjects effects for inpatient compared to control were not statistically significant, F (1,
16) = .175, p = .68. However, observed power for the between subject analysis was
very low (β = .07) and the likelihood of Type II error is high and makes further
interpretation of the statistical results questionable.
Table 5
Inpatient v. Control: Descriptive Statistics for Oral Fluid Intakes
Time Period Inpatient Control
n M SD n M SD
Time 1 (3 days pretreatment) 9 7.55 10.42 10 19.67 27.59 Time 2 (initial 3 days treatment) 9 25.11 17.95 X X Time 3 (discharge) 9 30.44 16.09 10 X X Time 4 (follow up) 9 27.28 14.69 10 11.18 18.18
Day Treatment v. Control (Hypothesis 2)
Analysis of group differences over time was again conducted with Repeated
measure ANOVA in order to compare treatment effects for the day treatment and
control group for oral and G-tube caloric and fluid intakes from pre treatment at Time 1

31
and after treatment intervention at discharge or Time 3. The total participants for this
analysis resulted in a total n = 20 (Control = 10; Day Treatment = 10).
G-tube Caloric Intake
Results of repeated measure ANOVA was conducted to compare treatment
effects on oral caloric intakes at pre treatment (Time 1) and discharge (Time 3). The
means and standard deviations for the day treatment and control group are presented in
Table 6.
Table 6
Day Treatment v. Control: Descriptive Statistics for G-tube Caloric Intakes
Time Period Day Treatment Control
n M SD n M SD
Time 1 (3 days pretreatment) 10 11.50 19.58 10 15.22 27.27 Time 2 (initial 3 days treatment) 10 12.81 17.52 X X Time 3 (discharge) 10 33.16 30.71 10 X X Time 4 (follow up) 10 58.44 53.67 10 11.88 27.49
Box’s test of equality of covariance was non significant (p = .817) indicating
assumptions for analysis were met. Results showed non significant within subjects
effect for time (Wilks’ Lambda = .816, F (1, 17) = 3.84, p = .067, partial eta squared =
.18). Within subject differences in G-tube caloric intakes for time by group were also not
statistically significant (Wilks’ Lambda = .60, F(1, 17) = 6.07, p = .004, partial eta
squared = .40). Tests of between subject effects comparing day treatment and control
G-tube caloric intakes resulted in no statistical difference, F (1, 17) = .022, p = .88,
partial eta squared = .001. Power for this analysis was very low indicating high

32
probability of Type II error and therefore the accuracy of stating that a difference does
not exist is questionable (β = .05).
G-tube Fluid Intake
Results of repeated measure ANOVA analysis of treatment effects on G-tube
fluid intakes at pre treatment (Time 1) and discharge (Time 3) resulted in significant
differences in equality of covariance indicated with Box’s Test (p = .02). Therefore
further analysis was not performed. The means and standard deviations for the day
treatment and control group are presented in Table 7.
Table 7
Day Treatment v. Control: Descriptive Statistics for G-tube Fluid Intakes
Time Period Day Treatment Control
n M SD n M SD
Time 1 (3 days pretreatment) 10 7.90 12.16 10 19.67 27.59 Time 2 (initial 3 days treatment) 10 5.77 11.38 X X Time 3 (discharge) 10 17.50 21.59 10 X X Time 4 (follow up) 10 32.29 36.34 10 11.77 18.18
Oral Caloric Intake
Repeated measure ANOVA was conducted to compare treatment effects on oral
caloric intakes at pre treatment (Time 1) and after treatment intervention at discharge
(Time 3) for day treatment and control. The means and standard deviations are
presented in Table 8. Box’s test of equality of covariance was non significant (p = .298)
indicating assumptions for analysis were met. Results showed a significant effect for

33
within subject differences over time (Wilks’ Lambda = .737, F (1, 17) = 6.07, p = .025,
partial eta squared = .26) and time by group (Wilks’ Lambda = .60, F(1, 17) = 11.29, p =
.004, multivariate partial eta squared = .40). Between subjects effects for group
comparison resulted in no statistical differences between day treatment and control, F
(1, 17) = 5.71, p =.46, partial eta squared =.032. Power for this analysis was low and
therefore probability of Type II error is high (β = .11).
Table 8
Day Treatment v. Control: Descriptive Statistics for Oral Caloric Intakes
Time Period Day Treatment Control
n M SD n M SD
Time 1 (3 days pretreatment) 10 11.50 19.58 10 15.22 27.27 Time 2 (initial 3 days treatment) 10 12.81 17.52 X X Time 3 (discharge) 10 33.16 30.71 10 X X Time 4 (follow up) 10 58.44 53.66 10 11.88 27.49
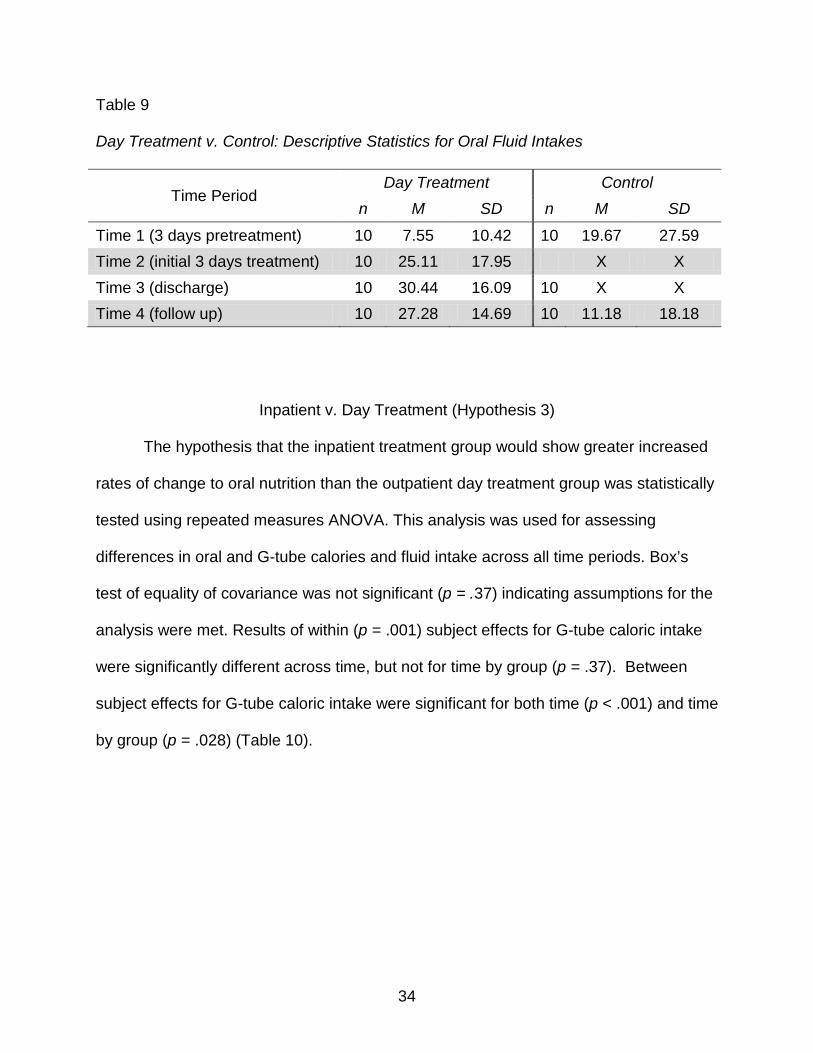
Oral Fluid Intake
Repeated measure ANOVA was conducted to compare treatment effects on oral
fluid intakes from pre treatment (Time 1) and after treatment intervention at discharge
(Time 3). The means and standard deviations for the day treatment and control group
are presented in Table 9. Box’s test of equality of covariance was significant (p = .002)
indicating assumptions for analysis could not be met. Therefore, further analysis was
not performed.
34
Table 9
Day Treatment v. Control: Descriptive Statistics for Oral Fluid Intakes
Time Period Day Treatment Control
n M SD n M SD
Time 1 (3 days pretreatment) 10 7.55 10.42 10 19.67 27.59 Time 2 (initial 3 days treatment) 10 25.11 17.95 X X Time 3 (discharge) 10 30.44 16.09 10 X X Time 4 (follow up) 10 27.28 14.69 10 11.18 18.18
Inpatient v. Day Treatment (Hypothesis 3)
The hypothesis that the inpatient treatment group would show greater increased
rates of change to oral nutrition than the outpatient day treatment group was statistically
tested using repeated measures ANOVA. This analysis was used for assessing
differences in oral and G-tube calories and fluid intake across all time periods. Box’s
test of equality of covariance was not significant (p = .37) indicating assumptions for the
analysis were met. Results of within (p = .001) subject effects for G-tube caloric intake
were significantly different across time, but not for time by group (p = .37). Between
subject effects for G-tube caloric intake were significant for both time (p < .001) and time
by group (p = .028) (Table 10).

35
Table 10
Repeated Measure Analysis of Variance: G-tube Caloric Intake Inpatient v. Day Treatment Source df F η p
Between subjects
Time (T) 1 195.26 .93 *<.001 Group (G) 1 5.89 .28 *.028 G within-
group error 15 (467.583)
Within subjects
T X Kcal 1.49 11.65 .43 *.001 T X G X
Kcal 3 .974 .24
Error (T X Kcal) 45 (825.62) .37
Analysis of difference in treatment effects across the 4 time periods was
conducted utilizing pairwise comparison. Differences in G-tube caloric requirements
between inpatient and the outpatient day treatment group were not significant from
pretreatment (T1) to initiation of treatment (T2) (p = .08). Rates of change in G-tube
caloric requirements were different from pretreatment (T1) to discharge (T3) (p = .001),
and follow-up (T4) (p = .003). Inpatient and day treatment groups also varied
significantly from initiation of treatment (T2) to discharge (T3) (p < .001) and follow-up
(T4) (p = .001). The groups did not vary significantly in their rates of change in G-tube
caloric requirements from discharge (T3) to follow-up (T4) (p = .17) (Table 11).

36
Table 11
Pairwise Comparisons of G-tube Caloric Intake: Inpatient v. Day Treatment between Group Differences by Time
Time Mean Difference Standard Error p
95% Confidence Interval for Difference
Lower Bound
Upper Bound
T1
T2 10.83 5.83 .08 -1.58 23.25
T3 37.16 8.90 *.001 18.18 56.13
T4 52.00 15.01 *.003 19.99 84.00
T2 T3 26.33 5.79 *.000 13.96 38.68
T4 41.17 10.30 *.001 19.21 63.12
T3 T4 14.84 10.31 .17 -7.15 36.84 Pairwise comparison G-tube caloric requirements for the inpatient and day
treatment groups resulted in significant differences within subjects from initiation of
treatment (T2) to discharge (T3) (p < .001). Within subjects contrast was not significant
over time by group (Table 12).
Table 12
Repeated Measures Analysis of Variance for G-tube Caloric Intake: Time by Treatment
Source Time X Kcal df Mean square F η p
Time X Kcal T1 v. T2 1 1988.23 3.46 .19 .08 T2 v. T3 1 11741.57 20.61 .58 *.000 T3 v. T4 1 3731.02 2.07 .12 .17
Time X Kcal X Group T1 v. T2 1 23.06 .04 .003 .84 T2 v. T3 1 2259.45 3.97 .21 .07 T3 v. T4 1 4183.96 2.32 .13 .15
S within-group Error
T1 v. T2 15 574.80 T2 v. T3 15 569.76 T3 v. T4 15 1804.073

37
Repeated measures ANOVA was performed to assess differences in oral and G-
tube fluid intake across all time periods. Box’s test of equality of covariance was not
significant (p = .09) indicating assumptions for the analysis were met. Results of
between subject effects for G-tube fluid requirements were significantly different across
time (p < .01) and group (p = .046). Within subjects differences were significant by time
(p = .01) but not over time by group (p = .75), (Table 13).
Table 13
Repeated Measure Analysis of Variance: G-tube Fluid Intake: Inpatient v. Day Treatment Source df F η p
Between subjects
Time (T) 1 159.07 .91 *<.01 Group (G) 1 4.72 .24 *.046 G within-
group error 15 (520.08)
Within subjects
T X Fluid 1.74 12.16 .45 *<.01 T X G X
Fluid 1.74 .24 .01 .75
Error (T X Fluid) 26 (826.54)
Analysis of difference in treatment effects on G-tube fluid intakes across the 4
time periods was conducted utilizing pairwise comparison. Differences in G-tube fluid
requirements between inpatient and the outpatient day treatment groups varied
significantly from pretreatment (T1) to initiation of treatment (T2) (p = .027); initiation of
treatment (T2) to discharge (T3) (p = .02); and discharge (T3) to follow-up (p = .04)
(Table 14).

38
Table 14
Pairwise Comparisons of G-tube Fluid Intake: Inpatient v. Day Treatment between Group Differences by Time
Time Mean Difference Standard Error p
95% Confidence Interval for Difference
Lower Bound
Upper Bound
T1
T2 3.85 1.58 *.027 .49 7.22
T3 19.57 6.12 *<.01 6.52 32.63
T4 40.91 9.32 *<.01 21.05 60.77
T2 T3 15.72 6.05 *.02 2.82 28.62
T4 37.06 9.14 *<.01 17.57 56.53
T3 T4 21.33 9.69 *.04 .67 41.90 Pairwise comparison of within subjects contrast of G-tube fluid intakes resulted in
significant differences in fluid for each time period (α < .05). Within subjects contrast
were also significant for G-tube fluid by time and group from pretreatment (T1) to
initiation of treatment (T2) (p = .04). There were no significant within subject differences
from initiation of treatment (T2) to discharge (T3) (p = .96); or discharge (T3) to follow-
up (p = .59) (Table 15).
Repeated measures ANOVA was used for assessing differences in oral caloric
intake across all time periods. Three participants declined to provide follow up
information on oral caloric intake. Therefore the analysis was performed with 9 total in
day treatment and 7 inpatient for a total n = 16. Box’s test of equality of covariance was
not significant (p = .67) indicating assumptions for the analysis were met. Results of
within subject effects for G-tube caloric intake were significantly different across time (p
< .01), but did not vary significantly across time by group (p = .11). Between subject

39
effects for G-tube caloric intake were significant for time (p < .01) but not for time by
group (p = .36) (Table 16).
Table 15
Repeated Measures Analysis of Variance for G-tube Fluid Intake: Time by Treatment
Source Time X Fluid df Mean square F η p
Time X Fluid T1 v. T2 1 251.65 5.97 .29 *.03 T2 v. T3 1 4187.660 6.75 .31 *.02 T3 v. T4 1 7710.12 4.85 .24 *.04
Time X Fluid X Group T1 v. T2 1 210.07 4.98 .25 *.04 T2 v. T3 1 1.37 .002 .00 .96 T3 v. T4 1 481.88 .30 .02 .59
S within-group Error
T1 v. T2 15 42.15 T2 v. T3 15 620.55 T3 v. T4 15 1591.07
Table 16
Repeated Measure Analysis of Variance of Oral Caloric Intake: Inpatient v. Day Treatment Source df F η p
Between subjects
Time (T) 1 28.32 .67 *<.01 Group (G) 1 .91 .06 .36 G within-
group error 15 (658.67)
Within subjects
T X Kcal 1.62 9.64 .41 *<.01 T X G X
Kcal 1.62 2.50 .15 .11
Error (T X Kcal) 22.7 (815.99)

40
Analysis of treatment effects in oral caloric intake for the inpatient and day
treatment groups across each time period was performed utilizing pairwise comparison
of within and between group differences. Between group differences resulted in
significant differences in oral caloric intake from pretreatment (T1) to initiation of
treatment (T2) (p < .01); and initiation of treatment (T2) to discharge (T3) (p < .01).
Between subject effects from discharge (T3) to follow-up (T4) indicated no significant
differences between the inpatient and day treatment groups (p = .09) (Table 17).
Table 17
Pairwise Comparisons of Oral Caloric Intake: Inpatient v. Day Treatment between Group Differences by Time
Time Mean Difference Standard Error p
95% Confidence Interval for Difference
Lower Bound
Upper Bound
T1
T2 -12.48 3.49 *<.01 -19.97 -4.98
T3 -23.19 5.30 *<.01 -34.57 -11.80
T4 -38.75 9.37 *<.01 -58.86 -18.64
T2 T3 -10.71 5.20 *.05 -21.86 .44
T4 -26.27 10.31 *.023 -48.38 -4.16
T3 T4 -15.56 8.65 .09 -34.11 2.98 Pairwise comparison of inpatient and day treatment within subjects contrast of
oral caloric intakes resulted in significant differences in oral caloric intake from
pretreatment (T1) to initiation of treatment (T2) (p < .01); and initiation of treatment (T2)
to discharge (T3) (p = .05). There were no significant differences within subjects oral
caloric intake from discharge (T3) to follow-up (T4) (p = .09). Within subjects
differences over time by groups indicated significant differences in oral caloric intakes
41
from pretreatment (T1) to initiation of treatment (T2) (p <.01); but did not vary
significantly by group from initiation of treatment (T2) to discharge (T3) (p = .12) or
discharge (T3) to follow-up (T4) (p= .19) (Table 18).
Table 18
Repeated Measures Analysis of Variance for Oral Caloric Intake: Time by Treatment
Source Time X Kcal df Mean square F η p
Time X Kcal T1 v. T2 1 2453.75 12.76 .48 *<.01 T2 v. T3 1 1806.70 4.24 .23 *.05 T3 v. T4 1 3814.22 3.24 .19 .09
Time X Kcal X Group T1 v. T2 1 2194.50 11.42 .45 *<.01 T2 v. T3 1 1156.07 2.71 .16 .12 T3 v. T4 1 2157.77 1.83 .11 .19
S within-group Error
T1 v. T2 14 192.250 T2 v. T3 14 425.98 T3 v. T4 14 1178.14
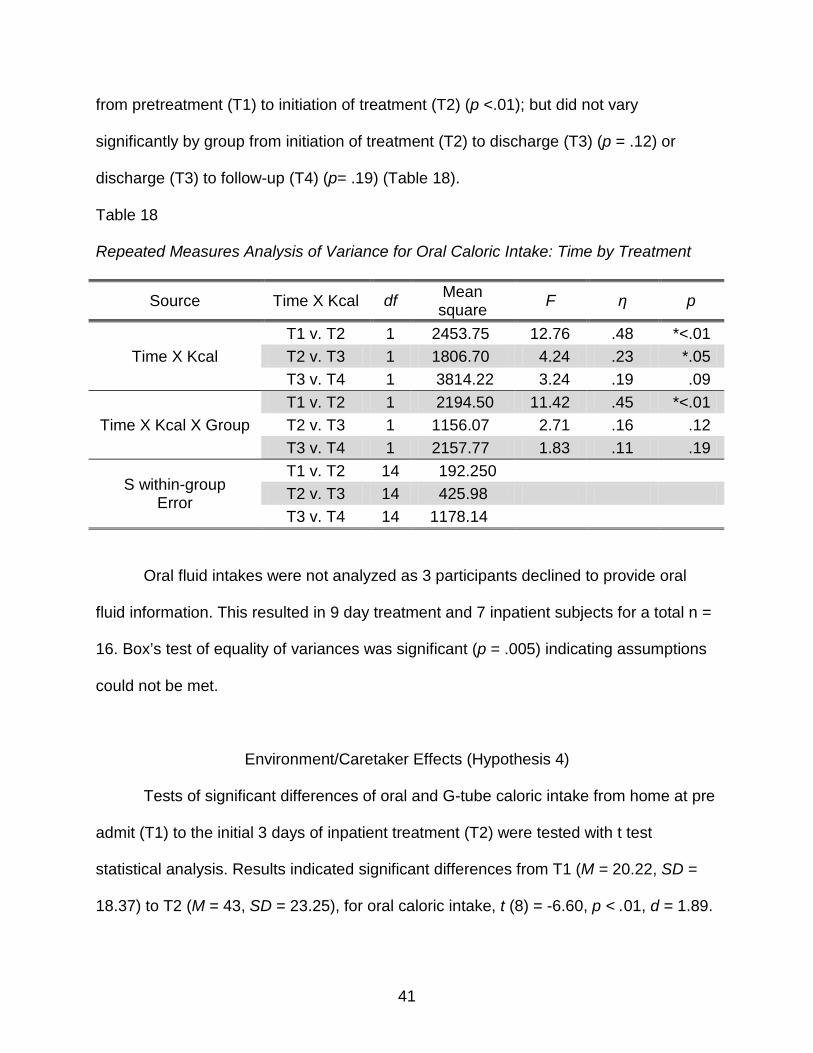
Oral fluid intakes were not analyzed as 3 participants declined to provide oral
fluid information. This resulted in 9 day treatment and 7 inpatient subjects for a total n =
16. Box’s test of equality of variances was significant (p = .005) indicating assumptions
could not be met.
Environment/Caretaker Effects (Hypothesis 4)
Tests of significant differences of oral and G-tube caloric intake from home at pre
admit (T1) to the initial 3 days of inpatient treatment (T2) were tested with t test
statistical analysis. Results indicated significant differences from T1 (M = 20.22, SD =
18.37) to T2 (M = 43, SD = 23.25), for oral caloric intake, t (8) = -6.60, p < .01, d = 1.89.
42
Significant differences were also found in G-tube caloric intake from T1 (M = 90, SD =
28.13) to T2 (M = 75, SD = 17.52), t (8) = 2.15, p = .049, d = .71.
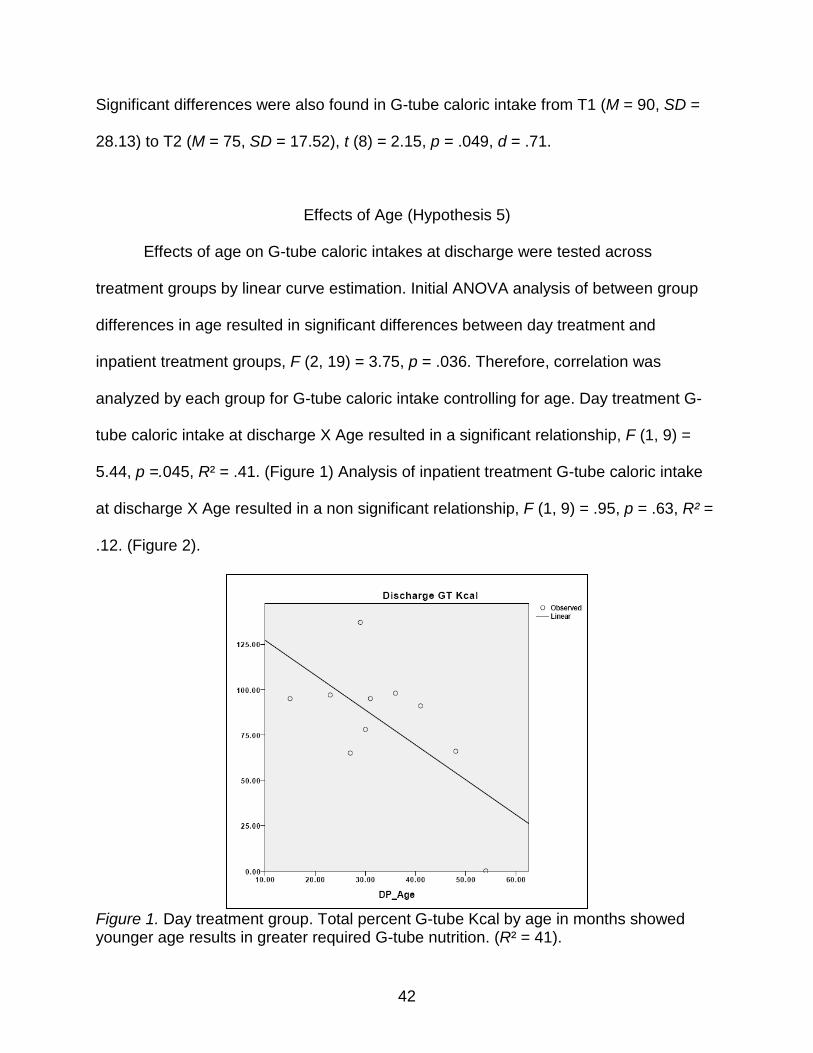
Effects of Age (Hypothesis 5)
Effects of age on G-tube caloric intakes at discharge were tested across
treatment groups by linear curve estimation. Initial ANOVA analysis of between group
differences in age resulted in significant differences between day treatment and
inpatient treatment groups, F (2, 19) = 3.75, p = .036. Therefore, correlation was
analyzed by each group for G-tube caloric intake controlling for age. Day treatment G-
tube caloric intake at discharge X Age resulted in a significant relationship, F (1, 9) =
5.44, p =.045, R² = .41. (Figure 1) Analysis of inpatient treatment G-tube caloric intake
at discharge X Age resulted in a non significant relationship, F (1, 9) = .95, p = .63, R² =
.12. (Figure 2).
Figure 1. Day treatment group. Total percent G-tube Kcal by age in months showed younger age results in greater required G-tube nutrition. (R² = 41).

43
Figure 2. Inpatient treatment group. Total percent G-tube Kcal by age in months shows no relationship (R²= 12).
Follow Up (Hypothesis 6)
Analysis of oral caloric intakes from Time 3 to Time 4 did not result in significant
differences from discharge to the 4 month follow up, F (1, 7) = 3.23, p = .09, parital eta
squared = .18. (Table 16). Results of analysis of G-tube caloric intake at follow up were
also not significant, F (1, 8) = 2.06, p = .17, partial eta squared = .12. (Table 5).
Weight at Follow Up (Hypothesis 7)
Weight at follow up was analyzed using paired samples t-test from Time 1 (pre
treatment) to Time 4 (follow up) for all groups. The inpatient treatment groups showed
significant gains in weight from pre treatment (M = 14.54kg, SD = 2.74kg) to follow up
(M = 15.47kg, SD = 3.19kg), t(7) = 3.80, p = <.01, CI (-1.52kg, -.35). The magnitude of
effect was strong (d = 1.26) The day treatment group also showed significant gains in

44
weight from pre treatment (M = 11.24kgSD = 2.33kg) to follow up (M = 12.28kg, SD =
1.99kg), t(8) = 4.83, p = <.01, CI (-1.53, -.54). The magnitude of effect for the day
treatment group was also strong (d = 1.89). The wait list control group did not result in
significant differences in weight for the 4 month period from Time 1 at evaluation (M =
12.15kg, SD = 1.89kg) to Time 2 at 4 month follow up (M = 12.37kg, SD = 2.29kg), t(8)
= .35, p = .73, CI (-1.64kg, 1.19kg). Cohen’s d indicated very minimal effect (d = .11).

45
DISCUSSION
Hypothesis 1: Control v. Inpatient Treatment
Comparison of treatment effects on increasing oral caloric and fluid intake from
pre treatment through discharge between wait list control and the inpatient treatment
group resulted in significant group differences in oral caloric intake (p = .04). Treatment
effects over time were moderate (.47). Children receiving inpatient treatment for feeding
disorders were shown to transition more quickly to oral nutrition by demonstrating
significant increases in oral intake and G-tube reduction than the wait list control
(Hypothesis 1). Therefore, results indicated that 30 days of intensive inpatient
multidisciplinary treatment is effective with initiating oral caloric intake and reduction of
G-tube dependency. Within group differences also resulted in a moderate treatment
effect (.37) for reduction of G-tube caloric intake and G-tube fluid intake (.35). The same
between groups comparison of G-tube fluid intake resulted in no significant differences.
The children in this sample evidenced minimal change in both oral fluid intake and
reduction in G-tube fluid requirements. Eating and drinking are two separate behaviors
that require different skills. A lack of differences in fluid intake between groups may
indicate that certain physiological deficits, e.g., dysphagia, may exist and require time to
improve.
While gains were made with increased acceptance of oral nutrition, the children
continued to require supplemental enteral nutritional support to maintain adequate
nutrition and hydration for growth. The 30 day treatment period is a relatively short
treatment. In previous retrospective analysis the average inpatient treatment period was
46.4 days and ranged from 15 to 80 days (Cornwell, et al. 2010) and treatment was not

46
related to predetermined treatment (i.e. observation) period. These results are indicative
of a heterogeneous population with varied physiological deficits and medical needs
which respond to treatment at various rates. It is also likely that improvement of
developmental and physiologically based problems impeding progress with oral intake
(such as with oral motor and sensory processing deficits) are more long term issues that
are not adequately measured by caloric and fluid intakes alone.
Hypothesis 2: Control v. Day Treatment
Analysis of treatment effects for children receiving out patient day treatment for
feeding disorders indicated significant within group differences for oral caloric intake
from pretreatment to discharge (p = .004) with moderate treatment effects (.40). Within
group differences in G-tube caloric intake for this time by group were also significantly
different (p = .004) with moderate treatment effects (.40). Analysis of comparison
between day treatment and control was not made due to very low power for the analysis
(β = .11) and therefore problems with Type II error. The day treatment group and wait
list control did not indicate equal covariance with oral fluid or G-tube fluid intake and
therefore these analyses were unable to be performed as well. Although a significant
treatment effect is indicated theses results do not support the initial hypothesis of more
expedient transition to oral nutrition and G-tube reduction than control. An obvious
limitation of the current study was small sample size. Future efficacy studies could
focus on increasing the sample population to accommodate further empirical validation
of treatment effects.

47
Hypothesis 3: Inpatient Treatment v. Day Treatment.
Group differences were anticipated between the intensive inpatient and day
treatment groups with the inpatient treatment group showing higher rates of change to
oral nutrition than the day treatment group. Between subject effects supported
differences across time periods (p = <.01) and treatment group X time in G-tube caloric
intake (p = .028) (Table 8) and G-tube fluid intake (p = .046) (Table 11). Between group
differences for G-tube caloric intake were also found from baseline at T1 to discharge
(T3) and T2 to T3 (p = <.01, )(Table 9); and across all time periods for G-tube fluid (p <.
05) (Table 12).
Groups did not differ in G-tube caloric intake from pre treatment (T1) to initiation
of treatment during the first 3 days (T2) (p = .08) (Table 9). Therefore, children in the
sample were statistically similar in their required enteral nutritional requirements. This is
indicative of treatment recommendations not solely due to a child’s demonstration of the
ability to transition to oral intake as evidenced by increased acceptance of food/drink
and reduced G-tube dependency. Rather treatments were based on a multidisciplinary
assessment of oral motor skills, sensory processing as well as behavioral evaluation of
avoidant and aversive responses. Parent consent to treatment may also have been a
factor regardless of a child’s ability to significantly wean from enteral support. In
addition, G-tube weaning has traditionally been an inpatient treatment process due to
the required medical monitoring of caloric and fluid intake. Careful monitoring of caloric
and fluid intake as well as weight provides the treatment team with the specificity
necessary to inform nutritional recommendations (Byars et al., 2003). This also allows
for necessary alternation to G-tube caloric intake in order to create a motivational

48
setting for treatment (Linscheid, 1999) which often cannot be done safely at home while
receiving outpatient treatments.
Analysis of between inpatient and day treatment group differences of oral caloric
intake resulted in no significant differences indicated in the Time X Group repeated
measure analysis of variance (p .36). However, pairwise comparison of between group
differences indicated strong statistical differences (p < .05) between inpatient and day
treatment groups across treatment observation periods (Table 15). The significant
differences found between groups on G-tube and caloric intakes over time supports the
hypothesis that children receiving inpatient treatment demonstrate increased rates of
change to oral nutrition during treatment than the out patient day treatment group. This
change is likely due to the level of intensity and medical and dietary oversight that is
necessary for carefully balancing oral intake with enteral support. Children receiving
inpatient treatment are also treated 7 days per week rather than a 5 day regimen. From
a behavioral perspective, inpatient treatment allows for a period of separation from
parents and caretakers in order to help the child establish new rules and means of
coping around mealtime and disrupt the many contingencies that are built between the
caretaker and the child which often serve to maintain adverse behavioral responses to
eating.
Hypothesis 4: Environment/Caretaker Effects
The change in environment and caretaker resulted in significant increases in oral
caloric intake (d = 1.89) and G-tube reduction (d = .71) from home (T1) to 3 days post
admission (T2) and initiation of treatment in the inpatient feeding program. These

49
findings indicate a very strong effect for change in environment and caretakers during
mealtime. These results also provide strong evidence of the behavioral component that
regardless of concurrent physical factors, avoidant and aversive behaviors become well
entrenched habits associated with environment and parental contingencies.
Hypothesis 5: Effects of Age
Age at time of treatment was hypothesized to significantly affect treatment
outcomes such that the earlier intervention at a younger age would result in a stronger
treatment effect. Results of G-tube caloric intake at discharge (T3) tested for both
inpatient and day treatment groups indicated a significant relationship with age (R²= 41)
for the day treatment group and no significant relationship for the inpatient treatment
group (R² 12). Graphical analysis of the linear relationship indicated the opposite of the
anticipated results (Figures 1 and 2). Older ages resulted in stronger treatment effects
for G-tube reduction. Therefore the hypothesis that earlier intervention would result in
improved oral intake was not supported. This could be explained by physical growth and
development that lends to increased ability to accept food and drink with minimal to no
difficulty. It is also likely that many medical problems have resolved for the older
children and thus difficulties may be less related to actual physical and developmental
problems and more related to residual habits that persist.
Hypothesis 6: Follow Up on Maintenance of Treatment Effects
Follow up on treatment effects 4 months post treatment (T4) resulted in no
significant differences in oral caloric intake from discharge (T3) to T4 (p = .09). Results

50
of analysis of G-tube caloric intake at follow up were also not significant (p = .17).
Treatment gains at from hospital (T3) to home were effectively maintained at 4 month
follow up (T4). These results show a highly effective treatment for impacting the
behavioral contingencies that serve to sustain the avoidant and aversive responses
during meals that are attached to the child’s home environment.
Hypothesis 7: Weight at Follow Up
The hypothesis that both day treatment and inpatient treatment groups would
show significant gains in weight from pre treatment (T1) to 4 month follow up (T4) was
supported. The magnitude of effect on weight at T4 for the inpatient treatment group
was strong (d = 1.26). The day treatment group also showed significant gains in weight
from T1 to T4 with a strong effect (d = 1.89). The control group did not show significant
gains in weight from T1 to T4 (d =11). Therefore, time alone was not a factor. Rather
weight gains were significantly impacted by the effects of treatment and thus increased
oral consumption and gains in an age appropriate diet. These gains provide optimistic
support of the long lasting health effects of parent education and dietary oversight.
Summary
The efficacy of intensive multidisciplinary treatment of pediatric feeding disorders
was supported by the results of group differences between control and inpatient and
outpatient day treatment groups. Previous research has shown that a multidisciplinary
team approach is essential for assessment and management of feeding disorders of
infancy and early childhood due to combined medical, oral, sensory and behavioral

51
components of pediatric feeding problems (Bonnin et al., 2006; Burklow et al., 1998;
Rommel et al., 2003; Cornwell et al., 2010). Traditionally, speech and occupational
therapy are an integral part of the treatment process, as behaviors surrounding feeding
are often the result of oral motor skills deficits, sensory dysfunction and sometimes pain.
Many habits, often protective in nature, develop from physiological difficulties. Habitual
avoidance and aversive responses to food may interfere with implementing necessary
therapeutic treatments designed to strengthen and improve the physiological deficits
associated with children’s problems with eating. The child’s avoidance of food is often
maintained by well established patterns of child behavior and parental contingencies.
The treatment and ongoing support of pediatric psychology provides behavioral
strategies to help with adjustment and tolerance to treatment, behavioral modification
guidance to therapists and parent education and training. The long lasting benefit of
influencing the parent and child relationship around eating was evidenced by the strong
treatment effects in both weight and maintenance of effects at follow up.
Future research is need to further assess and validate the impact of the addition
of behavioral expertise in guiding the treatment process as well as direct therapeutic
child and family intervention and education. In the present study the pediatric
psychologist acted as a guide for the use of behavior modification principles in therapies
and meals by acting as a consultant to the speech therapist and by working directly with
caregivers to provide education, training and support. Assessing the impact of the
additional psychological intervention can be difficult as one cannot falsely assume that
treatment outcomes can be circumscribed to a single component, discipline or
technique. However, the information is vital as the importance of each component is

52
often called into question in the realms of science, profession, insurance and ethics.
Parceling out the treatment effects of various components or disciplines can be very
difficult outside of a controlled study and is often not feasible due to safety and other
ethical considerations. Analyses of the psychological aspects of treatment are proposed
in order to elucidate the impact of psychology on treatment outcomes. The inability to
tease out the magnitude of treatment effect for each discipline was a limitation to the
present study. Ideally a traditional ABAB design could elucidate the individual effects of
each discipline involved (i.e. ST, OT, Psychology, Dieticians). Although multiple
baselines could address the effect of each individual treatment it is not a feasible option
due to the health and safety concerns. Future consideration should be given to research
designs which assess outcomes in circumstances where the combined treatments are
not available. This type of investigation could provide very valuable information and
insight for the overall treatment process.

53
REFERENCES
Arts- Rodas, D., & Benoit, D. (1998). Feeding problems in infancy and early childhood: Identification and management. Pediatrics and Child Health, 3, 21-27.
Arvedson, J. C., & Brodsky, L. (2001). Pediatric swallowing and feeding: Assessment and management. (3rd ed., pp. 295-297), Publisher: Cengage Delmar Learning.
Aryes, A. J. (1972). Sensory integration and learning disorders. Los Angeles: Western Psychological Services.
Aryes, A. J. (1989). Sensory integration and praxis tests. Los Angeles: Western Psychological Services.
Babbitt, R.L., Hoch, T.A., Coe, D.A., Cataldo, M.F., Kelly, K.J., Stackhouse, C. et al. (1994). Behavioral assessment and treatment of pediatric feeding disorders. Developmental and Behavioral Pediatrics, 15, 278-291.
Benoit, D. & Coolbear, J. (1998). Posttraumatic feeding disorders in infancy: Behaviors predicting treatment outcome. Infant Mental Health Journal, 19, 409-421.
Benoit, D., Green, D., & Art-Rodas, D. (1997). Post-traumatic feeding disorder. Journal of the American Academy of Child and Adolescent Psychiatry, 36, 577-578.
Benoit, D., Wang, E.L., & Zlotkin, S.H. (2000). Discontinuation of enterostomy tube feeding by behavioral treatment in early childhood: A randomized controlled trial. Journal of Pediatrics, 137, 498-503.
Bithony, W., Junkin, J. J., & Michalek., J. (1989). Prospective evaluation of weight gain in both non-organic and organic failure to thrive children: An outpatient trial of a multidisciplinary team intervention strategy. Journal of Developmental and Behavioral Pediatrics, 1, 27-31.
Blackman, J. A., & Nelson, C. L. A. (1985). Reinstituting oral feedings in children fed by gastrostomy tube. Clinical Pediatrics, 24, 434-438.
Bonnin, B., & Claude, A. (2006). Feeding problems of infants and toddlers. Canadian Family Physician, 52, 1247-1251.
Budd, K. McGraw, T., & Farbisz, R. (1992). Psychosocial concomitants of children’s feeding disorders. Journal of Developmental and Behavioral Pediatrics, 17, 81-94.
Burklow, K.A., Phelps, A.N., Schultz, J.R., McConnell, K., & Rudolph, C. (1998). Classifying complex pediatric feeding disorders. Journal of Pediatric Gastroenterology and Nutrition, 27, 143-147.

54
Byars, K.C., Burklow, K.A., Ferguson, K., O’Flaherty, T., Santoro, K., & Kaul, A. (2003). A multicomponent behavioral program for oral aversion in children dependent on gastrostomy feedings. Journal of Pediatric Gastroenterology and Nutrition, 37, 473-480.
Center for Disease Control (2000). Length for age and weight for age profiles. National Center for Chronic Disease Prevention and Health Promotion. http://www.cdc.gov/growthcharts. Updated May, 30, 2001.
Chatoor, I., Conley, C., & Dickson, L. (1988). Food refusal after an incident of choking: A post-traumatic eating disorder. Journal of the American Academy of Child and Adolescent Psychiatry, 27, 105-110.
Chatoor, I., Ganiban, J., Harrison, J. & Hirsch, R. (2001). Observation of feeding in the diagnosis of posttraumatic feeding disorder of infancy. Journal of the American Academy of Child and Adolescent Psychiatry, 40, 595-612.
Chatoor, I., Getson, P., Menvielle, E., Brasseaux, C., O’Donnell, R., & Rivera, Y., et al. (1997). A feeding scale for research and clinical practice to assess mother-infant interactions in the first three years of life. Infant Mental Health Journal, 18, 76-91.
Chatoor, I., Hamburger, E., Fullard, R., & Rivera, R. (1994). A survey of picky eating and pica behaviors in toddlers. Scientific Proceedings of the Annual Meeting of American Academy of Child and Adolescent Psychiatry, 10, 50.
Cornwell, S. L., Kelly, K., & Austin, L. (2010). Pediatric feeding disorders: Effectiveness of multidisciplinary inpatient treatment of gastrostomy tube dependent children. Children’s Health Care. 39, (in press).
DeGangi, G. A., & Greenspan, S. (1989) Test of sensory function in infants. Los Angeles: Western Psychological Services.
Dellert, S.F., Hyams, J.S., Treem, W.R., & Geertsman, M.A. (1993). Feeding resistance and gastroesophageal reflux in infancy. Journal of Pediatric Gastroenterology and Nutrition, 17, 66-77.
Discipio, W.J., Kaslon, K., & Ruben, R.J. (1978). Traumatically acquired conditioned dysphagia in children. Annals of Otolaryngology, 87, 509-514.
Dunn, W. (1999) The sensory profile: User’s manual. San Antonio, TX: Psychological Corporation.
Dunn, W., & Daniels, D. B. (2002). Infant/toddler sensory profile, The Psychological Corporation.
Farrell, D., Hagopian, L., & Kurtz, P. (2001). A hospital and home based behavioral intervention for a child with chronic food refusal and gastrostomy tube dependence. Journal of Developmental and Physical Disabilities, 13, 407-418.

55
Gambril, E.D. (1977). Behavior modification handbook of assessment, intervention, and evaluation. San Francisco: Jossey-Bass.
Griffen, K.M. (1979). Swallowing training for dysphagic patients. Archives of Physical Medicine and Rehabilitation, 55, 467-470.
Gutentag, S., & Hammer, D. (2000). Shaping oral feedings in a gastrostomy tube dependent child in natural settings. Behavior Modification, 24, 395-410.
Hyman, P.E. (1994). Gastroesophageal reflux: One reason why baby won’t eat. Journal of Pediatrics, 125, 103-109.
Illingworth, R. S., & Lister, J. (1964). The critical or sensitive period, with special reference to certain feeding problems in infants and children. Journal of Pediatrics, 65, 834-851.
Jacobson, N., Follette, W., & Ravenstorf, D. (1984). Psychotherapy outcome research: Methods for reporting variability and evaluating clinical significance. Behavior Therapy, 15, 336-352.
Kerwin, M.E. (1999). Empirically supported treatments in pediatric psychology: Severe feeding problems. Journal of Pediatric Psychology, 24, 193-214.
Lindberg, L., Bohlin, G., & Hagekull, B. (1991). Early feeding problems in a normal population. International Journal of Eating Disorders, 10, 395-405.
Lindberg, L., Bohlin, G., Hagekull, B., & Palmerus, K. (1996). Interactions between mothers and infants showing food refusal. Infant Mental Health Journal, 17, 334-347.
Linscheid, T. R. (1999). Commentary: Response to empirically supported treatments for feeding problems. Journal of Pediatric Psychology, 24, 215-216.
Linscheid, T. R. (1992). Eating problems in children. In C. E. Walker & M. C. Roberts (Eds.), Handbook of clinical child psychology, (2nd ed., pp. 451-473). New York: John Wiley & Sons.
Lobo, M. L. (1992). Parent-infant interaction during feeding when the infant has congenital heart disease. Journal of Pediatric Nursing, 7, 97-105.
Lucarelli, L., Ambruzzi, A. M., Cimino, S., D’Olimpio, F., & Finistrella, V. (2003). Feeding disorders in infancy: An empirical study on mother-infant interactions. Minerva Pediatrica, 55, 243-253.
Luiselli, J.K., & Luiselli, T.E. (1995). A behavior analysis approach toward chronic food refusal in children with gastrostomy tube dependency. Topics in Early Childhood Special Education, 15, 1-18.

56
Mash, E. J., & Terdal, L. G. (Eds.) (1976). Behavior therapy assessment. New York: Springer.
Miller, C.K., Burklow, K.A., Santoro, K., Kirby, E., Mason, D., & Rudolph, C.D. (2001). An interdisciplinary team approach to the management of pediatric feeding and swallowing disorders. Children’s Health Care, 30, 201-218.
Miller, L. J., Anzalone, M. E.; Lane, S. J., Cermak, S. A., & Osten, E. T. (2007). Concept evolution in sensory integration: A proposed nosology for diagnosis. American Journal of Occupational Therapy, 61,135-140.
Satter, E. (1990). The feeding relationship: Problems and interventions. Journal of Pediatrics, 117, S181-S189.
Schauster, H., & Dwyer, J. (1996). Transition from tube feedings to feedings by mouth in children: Preventing eating dysfunction. Journal of the American Dietetic Association, 96, 277-282.
Skuse, D. (1993). Identification and management of problem eaters. Archives of Diseases of Childhood, 69, 604-608.
Rommel, N., DeMeyer, A., Feenstra, L., & Veereman-Wauters, G. (2003). The complexity of feeding problems in 700 infants and young children presenting to a tertiary care institution. Journal of Pediatric Gastroenterology and Nutrition, 37, 75-84.
Werry, J. S., & Wollersheim, J. P. (1989). A 20-year overview of behavior therapy. Journal of the American Academy of Child and Adolescent Psychiatry, 28, 1-18.
Winters, N. C. (2003). Feeding problems in infancy and early childhood. Primary Psychiatry, 10, 30-34.
Wolke, D., Meyer, R., Ohrt, B., & Riegel, K. (1995). Co-morbidity of crying and feeding problems with sleeping problems in infancy: Concurrent and predictive associations. Early Development and Parenting, 4, 1-17.
Related Documents