1 Print: 7/09/2012 10:53:00 a.m. Risk in Implementing Lean Practices: Lean manufacturing as a strategic business transformation Prepared for the 6 th National Conference Of the New Zealand Society for Risk Management Inc, Te Papa, Wellington, September 6 th & 7th 2012 1 By Antony Pearce 2,3 & Dirk Pons Abstract The objective of this work is to assist practitioners with the vagaries of Lean implementation. To do this we explore the intersection between strategic risk management and Lean implementation. The research embodies the monitoring and review of risk for Lean business transformation with the application of AS/NZS ISO 31000 and includes a representative case study from the manufacturing sector. Lean manufacturing or Lean management is becoming the standard for systematic productivity and quality improvement. We discuss the intersection of risk and Lean management and the lack in research literature at this juncture. We further illustrate the mutually supportive nature of risk management and Lean. By case study we show how various aspects, methods or tools of Lean may be characterised for benefits and detriments, likelihood and impact. In this way risk management methods can be used to support decisions in the design of the Lean implementation process. The work extends into the organisational factors including culture and maps strategic considerations into the process. The case study illustrates how to analyse these factors for a customised Lean implementation using a risk management framework and presents implications for practitioners. 1 For citation purposes acknowledge this paper as presented for the 6 th National Conference of the New Zealand Society for Risk Management Inc, September 6 th & 7th 2012, available from http://www.risksociety.org.nz. For further developments, publications, or consultation please contact the authors or institute. 2 The principal author, Antony Pearce is a Lean practitioner, researcher, and academic experienced in manufacturing, precision engineering and construction. His interests include: Lean systems and organisational change, business architecture & integrated software solutions, and specialised manufacturing & automation. He is currently researching Lean sustainability and Risk with Dr. Dirk Pons at the University of Canterbury. Antony is himself an academic staff member in the CPIT School of Engineering http://www.linkedin.com/in/antonypearce, [email protected], [email protected] 3 A portion of this work was supported by the Ministry of Science and Innovation Education Funding.

Welcome message from author
This document is posted to help you gain knowledge. Please leave a comment to let me know what you think about it! Share it to your friends and learn new things together.
Transcript

1
Print: 7/09/2012 10:53:00 a.m.
Risk in Implementing Lean Practices:
Lean manufacturing as a strategic business
transformation
Prepared for the 6th National Conference
Of the New Zealand Society for Risk Management Inc,
Te Papa, Wellington, September 6th & 7th 20121
By Antony Pearce2,3 & Dirk Pons
Abstract
The objective of this work is to assist practitioners with the vagaries of Lean implementation. To do
this we explore the intersection between strategic risk management and Lean implementation. The
research embodies the monitoring and review of risk for Lean business transformation with the
application of AS/NZS ISO 31000 and includes a representative case study from the manufacturing
sector. Lean manufacturing or Lean management is becoming the standard for systematic
productivity and quality improvement. We discuss the intersection of risk and Lean management and
the lack in research literature at this juncture. We further illustrate the mutually supportive nature of
risk management and Lean. By case study we show how various aspects, methods or tools of Lean
may be characterised for benefits and detriments, likelihood and impact. In this way risk
management methods can be used to support decisions in the design of the Lean implementation
process. The work extends into the organisational factors including culture and maps strategic
considerations into the process. The case study illustrates how to analyse these factors for a
customised Lean implementation using a risk management framework and presents implications for
practitioners.
1 For citation purposes acknowledge this paper as presented for the 6th National Conference of the New Zealand Society for Risk Management Inc, September 6th & 7th 2012, available from http://www.risksociety.org.nz. For further developments, publications, or consultation please contact the authors or institute.
2 The principal author, Antony Pearce is a Lean practitioner, researcher, and academic experienced in manufacturing, precision engineering and construction. His interests include: Lean systems and organisational change, business architecture & integrated software solutions, and specialised manufacturing & automation. He is currently researching Lean sustainability and Risk with Dr. Dirk Pons at the University of Canterbury. Antony is himself an academic staff member in the CPIT School of Engineering
http://www.linkedin.com/in/antonypearce, [email protected], [email protected]
3 A portion of this work was supported by the Ministry of Science and Innovation Education Funding.

2
Print: 7/09/2012 10:53:00 a.m.
1 Introduction
The objective of this work is to assist practitioners with the vagaries of Lean implementation. To do this we explore the intersection between strategic risk management and Lean implementation. As background we introduce risk and Lean in broad terms. Our research explores the mutual supportive nature of Lean and risk management thinking. In case study we apply the AS/NZS risk framework with a qualitative assessment of Lean methods for necessary prioritisation. The outcomes list specific implications for practitioners and future research.
2 Background
2.1 Risk Management
Risk and strategic risk management are defined in the context of uncertainty, risk, and reliability. There has been some difference regarding definitions in literature (LeRoy & Singell, 1987). Difference stems particularly around the seminal work of Knight (1921) and more recently around risk management standards. In risk management the traditional emphasis is on scenarios where the probability and magnitude of the outcomes are significantly negatively. We are concerned not only in the probability and magnitude of outcome(s) from an undesirable event (Hubbard, 2009, p. 8) but also the desirable. In Lean implementation we are particularly focused on what is desirable in terms of Lean success and sustainability and undesirable in terms of failure of the implementation (Pearce, 2012).
2.1.1 Our Definition
Various standards produced have defined risk in the sense of both negative and positive aspects (e.g. PMI, 2000; ISO/DIS 31000, 2009; PRAM, 1997). Critics of this still agree it beneficial that risk analysis be combined in the overall decision making function of an organisation (Hubbard, 2009, pp. 89–90, 242–244). Using common tools the decision making processes is managed for both the positive and negative outcomes of uncertainty. Although some may call it mutilation of language we prefer to allow for the development of the language its use. Therefore in our work we modify the definition of Hubbard (2009, pp. 10, 27) for positive cases:
• The identification, assessment, and prioritisation of risks followed by coordinated and
economical application of resources to treat the risks appropriately - to maximise the
benefits and minimise the detriments of uncertain outcomes.
This broadens then risk analysis further to general decision analysis. Decision making theory addresses all critical decision making not just mitigating risks in the negative sense (Douglas & Jones, 2007; Doyle & Thomason, 1999; Hansson, 2005). This is in line with the standards (ISO/DIS 31000, 2009; PMI, 2000; PRAM, 1997). Hence risk involves the positive or negative effect of uncertainty on objectives (AS/NZS ISO 31000, 2009).
2.1.2 Historical Background
Risk management a very old idea but as it is used today is essentially post 1960’s. Risk management as a quantitative practice (i.e. more than gut feel) began following the emergence of probability theory and statistics in the 17
th century. From the 18
th century well into the 20
th century risk assessment was practiced in limited insurance,
banking and financial spheres and possibly public health. However methods are now adopted in the large proportion of medium and large-size enterprises. This is for the strategic benefits but also there is the need for compliance. There have been shifts to integrate the technical and financial sides of risk management under the one function. Insurance buying was the early common treatment for risk but is being less relied on than it was in the past. This method did not always meet the need and in some cases other internal methods of control were deemed suitable. In addition to quantitative, qualitative methods of risk analysis exist and both need caution in their application. (Hubbard, 2009, p. 21; Pons, 2009; Surrey, 2012).
2.1.3 Critique: Contemporary Methods and Application
There are various criticisms of risk management methods and their application. One critique of risk methods is the skewing of analysis to support someone’s own cause and self-motive. Examples include oil drilling (Heath & Heath, 2010, p. 89) or building nuclear power stations (Flyvbjerg, Bruzelius, & Rothengatter, 2003) where hidden motives are present. Overweighting of supporting subjective estimates lends to confirmation bias (Nickerson,

3
Print: 7/09/2012 10:53:00 a.m.
1998). Psychological and political reasons are likely to account for the skew towards inaccuracy e.g. optimism bias and pressure for strategic (Flyvbjerg, 2006).
Hubbard (2009, p. 17,18) gives three main causes of failure i.e. “taking risks” in risk management:
“The biggest failure of risk management is that there is almost no experimentally verifiable evidence that
the methods used improve on the assessment and mitigation of risks, especially for the softer (and much
more popular) methods. If the only ‘‘evidence’’ is a subjective perception… then we have no reason to
believe that the risk management method does not have a negative return.”
“Some parts that have been measured don’t work… Since many risk management methods rely on human
judgment, we should consider the research that shows how humans misperceive and systematically
underestimate risks.”
“Some parts that do work aren’t used. There are methods that are proven to work both in controlled
laboratory settings and in the real world, but are not used in most risk management processes…”
Evidence and industry practice suggests that management perceive risk as something intangible and not measureable. Hubbard (2009, p. xi) suggests techniques based on measurements have not been communicated to the wider audience. For accuracy of risk management models there is need for critique of the method itself. “At least I am doing something” is not a good enough excuse, practitioners need to ensure what they do is accurate to the extent that it is relied upon. Severity and especially probability are key concepts to risk analysis and both are difficult to get a grasp of. If the event is common it is easier to estimate. However risk managers rarely are dealing with high frequency low cost risk, but more commonly rare and high consequence events (p. 42). It is difficult to determine how sound a risk method is by intuition.
2.1.4 Various Methods
Methods can be categorised broadly as expert intuition, expert audit, simple stratification methods (basic scales e.g. for heat or risk maps and matrices), weighted scores, traditional financial analysis, calculus of preferences (better but still relying on expert judgement), and finally probabilistic models (e.g. Monte Carlo Analysis). These are listed in order of scientific improvement with progressively less reliance on the experts gut feel up to the last, probabilistic models (Hubbard, 2009). We need to be careful to fully understand the methods used and their pitfalls. Also completeness of assessment is important. Hubbard (2009) makes it clear that consultants of risk management wield and even develop tools with little real understanding of the field. This is similar to many so called Lean consultants.
2.1.5 Utilising Qualitative Methods
Although sound, scientific quantitative methods are ideal some organisations do not have the resources for analysis, or time to source the quantitative data. Although Hubbard (2009) argues against this excuse his argument appears targeted at larger organisations and similarly significant projects. Small organisations may lack resources for the task at hand let alone the risk assessment or costly outsourcing of that task (Goodyer, Murrti, Grigg, & Shekar, 2011; L. C. Hendry, 1998). There are also time restraints to consider. So there needs to be a simpler way of ranking and recognising the threats and opportunities for benefits and detriments and planning to treat them without compounded complicated mathematical models.
Qualitative methods typically rely on expert opinion and intuition to support assessment and decision making process. The scoring style methods we previously discussed fall into this category. Qualitative methods are prone
to misuse and can compound error and decision making (Hubbard, 2009). No doubt the less risky solution is a properly designed Monte Carlo style model, checked against history, verified and double checked with actual measurements. However, we believe qualitative methods have their place with proper care and use of the
variables, not stretching the arithmetic beyond what is reasonably sound (Pons, 2002, 2002; Ross, Davies, & Plunkett, 2005).
Expert opinion is flawed, as particularly obvious in studies of self-estimate (Heath & Heath, 2010, p. 113) however methods can be incorporated to correct through training and calibration tests (Hubbard, 2009, p. 46). Optimism (among other) bias can be corrected with the method of Reference Class Forecasting (Flyvbjerg, 2006). This Nobel prize winning method focuses on how similar other projects performed in the past (see Kahneman, 1997;

4
Print: 7/09/2012 10:53:00 a.m.
Kahneman & Tversky, 1977, 1979), this in effect is striving for an external objective measurement as is essential (Hubbard, 2009; Hubbard & Samuelson, 2009).
2.1.6 AS/NZS ISO 31000 Standard
The body of knowledge on risk has been summarised in the ISO 31000 Standards. The AS/NZS 4360:2004 was used as the first draft for the ISO 3100:2009. The New Zealand rendition (AS/NZS ISO 31000, 2009) has only slight variations from ISO 3100:2009. The standard went through much review and supports “a new, simple way of
thinking about risk and risk management” as well as addressing “inconsistencies and ambiguities that exist
between many different approaches and definitions” (Purdy, 2010). Looking at the entire management system the standard supports not only the design and implementation of risk management processes but its maintenance and improvement.
In addition to unifying terminology the AS/NZS standard gives principles and guidelines for risk management. It does not prescribe the specific tools and methodologies but does guide in general processes, giving points and brief explanations to consider and explore. The standard consists of the principles, the framework, and the process for risk management. The earlier standard, AS/NZS 4360:2004 (the base of the current standard), was supported by the accompanying handbook (ASNZS (2004) HB 436 2004 Risk Management Guidelines). This is still beneficial to reference with the current standard.
AS/NZS ISO31000 Criticisms
The standard does promote a unified language which is beneficial but poses challenge for those who use other unique language (Purdy, 2010; Hubbard, 2009, pp. 88–90). The standards have also come under criticism for not proving or having a measurable improvement on risk (Hubbard, 2009).
2.2 Lean Management, its Principles, and Methods
Lean is a strategy developed for production improvement. This strategy originated in the mass production setting of the automobile industry (specifically Toyota) but is now considered as a thinking that can be applied to change business practice universally (Womack & Jones, 2003) and thus Lean thinking has been called “Lean management” (Emiliani, 2006). The Toyota Production System, from which the Lean concept developed, has been described as “a system for the absolute elimination of waste” (Shingo, 1989, p. 67; Ohno, 1988). When wasteful action is gone the result is that less effort, space and capital is required and lead time is reduced whilst quality increases and the cost of quality decreases (LEI, 2011). Although Lean is often associated with mass production it is a myth that it can only applied to these situation. Lean is criticised for having no contingency or managing variability but these arguments neglect the development of the Lean concepts from the original JIT (Just in time) or TQM (Total Quality Management) and Quality Circle approaches taken earlier (Hines, Holweg, & Rich, 2004). These arguments ignore the successful customisation of Lean principles to a wide variety of business cases.
2.2.1 Waste Elimination with the Respect for humans in a “Fragile” System
Lean functions to facilitate continuous improvement of a process towards perfection by removing waste or wasteful action. It involves considering the purpose of the organisation and how it provides value to the customer. The process by which that value is created is analysed for the removal of waste. Waste is identified by looking at the whole system and product flow rather than local optimums. In a Lean business effort is invested in continuous improvement so that problems occur less frequently or do not reoccur and the system moves towards as state of perfection. This type of system is one of continuous improvement and is a stark contrast to an arrangement where managers and workers alike exert much effort “fire-fighting”, expediting, and fixing problems only at the surface rather than root cause. (Hines, Found, Griffiths, & Harrison, 2008; Womack & Jones, 2003)
In a Lean system the “respect for humans” principle is equally important as the elimination of waste (Emiliani, 2006; Ohno, 1988). Lean is commonly associated with the latter but the former (respect for humans) is more neglected. Lean involves a focus on the people of an organisation, creating a culture that empowers staff at all levels to make innovative changes that improve productivity by reducing wasteful action (muda
4). This creates
4 Because of the roots of lean being in Japanese manufacturing the Japanese words are often used to give strong reference to key lean tools or concepts. Often these words give more meaning than simple English equivalent. Here the Japanese word for waste is referred to i.e. muda. It however implies more than just waste but wasteful action.
5
Print: 7/09/2012 10:53:00 a.m.
dynamic and flexible learning organisations of emergent change (C. Hendry, 1996; Liker, 2004; Pearce, 2012). These principles appear to work synergistically. Efficient and effective communication processes enable collaboration, consensus along with shared vision and engagement (Hines et al., 2008; Liker, 2004).
The term “Fragile” further captures Lean system thinking. “Fragile” was proposed to define the deciphered Toyota Production System but replaced by “Lean” due to its negative connotations (Holweg, 2007; Krafcik, 1988). Fragile defines Lean systems as non-buffered rather than slim. An example is the reduction of inventory and WIP buffers between processes to the extent of one piece flow and Just-in-time production. In these cases a little supply shortage, stock outage, or equipment malfunction can cause the whole production process to halt. This is fragile, and seems negative but actually forces problems (waste) to be eliminated (e.g. root cause analysis). In this way the system is continuously improved. This is the reason one rule of Kanban cards is to review and reduce the buffer size. Also linking processes and establishing flow is advantageous to bring problems to the surface and force continuous improvement.
2.2.2 A Culture Needing Sustainability
Lean management is becoming the standard for systematic productivity improvement. With the explanation above we see Lean is not merely a set of tools and techniques (Kanban, 5S, TPM, SMED and others). Lean can be considered a culture
5 i.e. rather than a mere method (Hallam, Muesel, & Flannery, 2010). Lean is not a tool, set of
tools or a program but a manufacturing strategy now become an enterprise strategy that prescribes a journey of continuous improvement for the process, workshop or enterprise to which it is applied (Womack & Jones, 2003; LEI, 2011; Emiliani, 2006; Schonberger, 2007). When Lean is adopted in traditional manufacturing organisations it requires a widespread organisational change. Due to the neglect of the respect for humans principle with proper change leadership many businesses fail to sustain the necessary Lean practices let alone reach culture-excellence for continuous improvement (Hines et al., 2008; Schmidt, 2011; Womack, 2007; Pearce, 2012).
2.2.3 Process of Continuous Improvement
Lean thinking holds paramount continuous improvement (CI). A major part of CI is the Deming PDSA cycle of Plan, Do, Study (or Check) and ACT (Deming, 1986; Moen & Norman, 2011). The plan involves the objectives questions, predictions and plan for the cycle. The do is the carrying out of the plan. The study is referencing the outcome compared with what was desired or expected from the plan and recording what has been learned. The act decides on what will be done for the next cycle and standardizes on improvement.
2.2.4 Five Principles
PDSA cycles are built into Lean systems to ensure organisational learning till perfection (Hines et al., 2008; Liker, 2004). This is seen in the five principles of Lean originally presented by Womack and Jones (1996; Hines et al., 2008). They are: (1) define value from the customer’s perspective; (2) analyse the core value stream by mapping the processes current state and planning for future state; (4) make material and information flow; (3) as able implement systems that initiate production at the “pull” of customer demand; and (5) repeat with continuous improvement (PDSA) to perfection. The perfection stage links the five principles to PDSA as a cycle of: planning i.e. defining value to identify waste and allow process planning; doing in the implementation of flow and pull using various methods of Lean; study and act in reviewing and repeating the process from the previous baseline until perfection.
2.2.5 Various tools
Lean includes various methods and supporting processes. Figure 1 illustrates the multiplicity of tools available. These are explained in more detail in the appendix table Figure 12 Methods: Selection of Lean and Complementary Methods Risk Analysis Table (Reference Case Shamrock Industries Ltd.). In our research we explore the selection or prioritisation of these methods for the success and sustainability of Lean.
5 This thought and the problem of considering lean as a set of tools only is discussed in more detail throughout this work.

6
Print: 7/09/2012 10:53:00 a.m.
Figure 1 Lean Methods or Tools: A selection of some (not all) of Lean methods
indicating the importance of having a selection criteria and prioritisation method
for implementation.
2.2.6 Integrated Tools and Techniques
Lean methods can be applied alongside others as tools at an operational level. Strategically the five principles of Lean thinking are upheld: defining value from the customer’s perspective, mapping the value stream, flowing value, implementing pull systems and continuously improving with the goal of perfection. However at an operational level a myriad of tools could be used. Traditional TPS/JIT/Lean tools can be used but also technology advancements. In addition the parallel and alternative paradigms like TQC, TOC and Six Sigma can be applied as methods as if they were tools subservient to Lean as the presiding business strategy. It is important to have a strategic understanding of Lean and then the tools at an operational level are used to eliminate waste in the system. (Hines et al., 2004)
2.2.7 A Typical Implementation
A typical Lean implementation involves an initial value stream mapping (VSM) which defines the journey of improvement. Next there is the organising of the house. The organising or cleaning of the house uses implementation of flexible work systems but primarily 5S (sorting, straightening, systematic cleaning, standardizing, and sustaining). 5S is a typical first step in implementing Lean. It easily understood by everyone that organising your workplace can improve productivity. Following this specific tools are provided to improve the processes. These tools are typically standard work, SMED, TPM and Jidoka
6. Following this further advance are
made into higher end connection with supply and demand through JIT pull systems and Heijunka (level scheduling)
6 Single minute exchange of dies (SMED), total productivity maintenance (TPM), and mistake proofing (Jidoka).
Lean Methods
Nemawashi A3
Management
5S
TPM
Kanban
Poka Yoke
JITSMED
5 Whys
Heijunka
Cellular Mfg.
V S Map
Big P. Map
7
Print: 7/09/2012 10:53:00 a.m.
(Rivera & Frank Chen, 2007). This seems well and good as a generic sequence for tool implementation but further tailoring is required. In implementation we must also consider further aspects for sustainability.
2.2.8 Sustainability Model
Lean covers two aspects, culture excellence (or respect for humans) and process excellence (or elimination of waste) (Ohno, 1988; Pearce, 2012; Womack & Jones, 2003). The process aspect incorporates the various tools, methods and techniques that can be implemented for waste elimination and hence productivity improvement. The culture excellence is for the human and strategic side it involves leadership, alignment, behaviour, empowerment and engagement, and is necessary for sustained Lean implementation for operational excellence. The alternative option is a bureaucracy of control and does not lend itself to operational excellence but rather a slow moving, inflexible organisation. Process excellence is fed by and interlinked to culture excellence, each dependent and driven by the other. (Pearce, 2012)
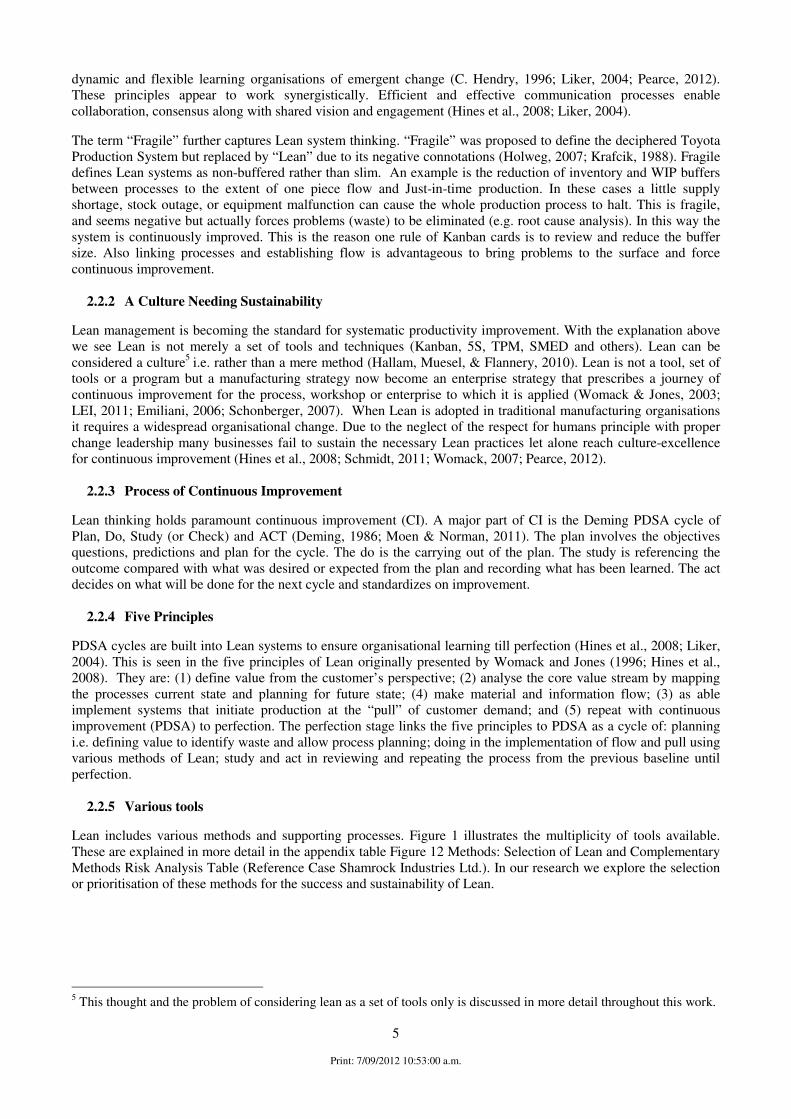
Alternatively this has been described as an iceberg-model. This is seen in Figure 2 Iceberg Model of Hines (2008) showing above the waterline (visible) and below the waterline (invisible and enabling) aspects of a Lean implementation. Typically the below the waterline aspects (Strategy and alignment to strategy, leadership and employee behaviour and engagement) are neglected although crucial to successfully sustaining a Lean implementation. These culture-excellence aspects are neglected with over focus on process improvement and because of this many implementations fail to sustain.
Figure 2 Iceberg Model of Hines (2008) showing above the waterline (visible) and
below the waterline (invisible and enabling) aspects of a Lean implementation.
Typically the below the waterline aspects (Strategy and alignment to strategy,
leadership and employee behaviour and engagement) are neglected although
crucial to successfully sustaining a Lean implementation.
2.3 Risk Management Intersection with Lean Implementation: Little Evidence of Application
Although risk management is being used broadly there are a limited number of research publications linking “Lean” to “Risk” as in the context of this work. We found articles discussing the “benefits” and “detriments” of factors to success (Boyer & Sovilla, 2003) as well as discussions of success factors for Lean and Lean implementation in general (Hines et al., 2008; Liker, 2004; Schmidt, 2011; Womack, 2007), specific considerations for SME’s (Achanga, Shehab, Roy, & Nelder, 2006; Burke & Gaughran, 2007) and other demarcations (Glover, Farris, Van Aken, & Doolen, 2011). Innovative frameworks and manufacturing techniques, e.g. core competency based framework (Parry, Mills, & Turner, 2010) and emergent manufacturing methods (Ahmed, Sawhney, &

8
Print: 7/09/2012 10:53:00 a.m.
Xueping, 2007), have been applied to reduce specific “risks”. We found a comparison between risk and Lean process cycles (Seddigh & Alimohamadi, 2009) and applications in Lean itself have been used to identify and treat uncertainties (risks) in construction projects (Qiu, 2011; Wells, 2010). Process including supply chain focused modelling and simulations have been used to support mitigation of risks (Hallam, 2010; Mahfouz, Shea, & Arisha, 2011; Shukla, Tiwari, Wan, & Shankar, 2010). This helps to “reduce the risks of the implementation process” (Mahfouz et al., 2011). There are also recent studies in supply chain risk comparing large and small enterprises (Thun, Druke, & Hoenig, 2011). However all these works are at the best treatments for maximising benefits and minimising detriments of single, specific aspects of a lean system e.g. specific processes or supply chain. We observe that they did not actually perform any structured risk analysis of an implementation besides this bounded kind of optimization.
The closest links to a risk assessment of Lean implementation was risk and reliability method use, acknowledgement of risk consideration being required for Lean systems, and the use of Program Management. These were:
1. Use of FMEA (failure modes and effects analysis)7 reliability tool (Lombardi, 2011; Sawhney,
Subburaman, Sonntag, Rao, & Capizzi, 2010). 2. Use of Monte Carlo analysis in ship yard process (Kolic, Fafandjel, & RUBEA, 2011). 3. Matching of Lean systems strategy to risk identification. Taking a systems engineering approach to
optimise for risks in the whole. (Justin, 2006) 4. And the use of the Program Management system/ process which came closest to our ideal for a risk
management approach to Lean implementation (Wilson, 2004).
Sawhney et al (2010) found in reliability, as we found in risk in general, that “practical methodologies to improve
the reliability of Lean systems are non-existent”. Their work did develop a “Risk Assessment Value (RAV)” for Lean systems and developed a “modified FMEA for the four critical resources”. It has been suggested to merge Lean thinking and “High reliability” (Smart et al., 2003) to balance the non-buffered, “fragile” nature of Lean (Krafcik, 1988). We believe this can be achieved through risk assessment and management. However there is at best little evidence of steps in that direction.
In summary, reviewing the literature8 we found little to no application of a standardised risk assessment to a Lean
implementation “project”.
Risk management has been used in other similar fields as a support to the decision making process. It is beneficial to consider these applications as examples close or relevant to our area of work.
2.3.1 Immediate Relatives
Most similar fields to Lean are really JIT and Agile manufacturing and a distant cousin, once removed, may be Theory of Constraints. No applications of Agile manufacturing risk management were found and for the others similar results to Lean i.e. limited application of risk assessment and treatment in discrete scenarios only but not a holistic risk management application to implementation of the method (examples: for JIT see Pet-Edwards, Thompson, & Panathula, 1999; for TOC see Ruan & Qin, 2011). Indications are there is little application of a standardised risk assessment to a continuous improvement implementation “project”.
These methodology or strategy implementations (Lean, JIT, Agile, and TOC) are in essence organisational changes. A search for “organisation change risk” goes further than the previous searches. This identifies multiple applications of risk management and related methods to a variety of change projects. To save digressing further we feel this is better classed in project management.
7 “In FMEA, failures are prioritized according to how serious their consequences are, how frequently they occur and
how easily they can be detected. An FMEA also documents current knowledge and actions about the risks of failures for
use in continuous improvement.” (Wikipedia - FMEA, 2012)
8 Searches included four main sources: Google Scholar “http://scholar.google.co.nz” , Sage Publications “online.sagepub.com” , Compendex “www.engineeringvillage2.org” and Science Direct “www.sciencedirect.com”

9
Print: 7/09/2012 10:53:00 a.m.
2.3.2 Risk in Project Management
There is much literature on risk in project management including relevant standards (PMI, 2000; PRAM, 1997). This area is worth mention as Lean implementation is in essence a change project to manage.
2.3.3 Application in Agile and Plan Driven Projects
Similar to our Lean implementation is risk management application to Agile and Plan-driven software development methods. As with Lean production, the methods of Agile and Plan-driven development have shortcomings that are dependent on the situation. These short comings need addressing to minimise chances of failure and maximise opportunities of success. Boehm and Turner (2003) proposed that by risk analysis methods a tailored approach to development could be arrived at i.e. one that enables developers to “enjoy the benefits of both agile and plan-driven
methods, while mitigating many of their drawbacks”. They determined that: “Focusing test effort on the high-risk
parts… can generate project time and effort savings” (Boehm & Turner, 2003). Their approach was to plot critical factors using quantitative and qualitative assessments to form a Polar Home Ground Chart. The closer to the centre the plot is the more suited the project is to an Agile approach. The chart mixes quantitative and qualitative data and hence is essentially a qualitative method, not that dissimilar to a basic scoring method.
3 Gaps in the Body of Knowledge
3.1 Risk Management in General
Our review was specifically for the intersection of risk and Lean and in that sense not a thorough analysis of the Risk management Body of Knowledge (BOK). However, one gap in general risk management BOK is the disparity between the various fields of practice and research (e.g. insurance and finance). Although standards come some way to address this there is a variety of approaches and rigour applied.
Additionally there is a “gap” between research and practitioners. This is seen in the lack of sound methodology used by practitioners. This is similar to our other recent work on Lean sustainability (Pearce, 2012) where consultants wield tools without understanding of the limitations and failure.
The Gap is then that research fields are disconnected from each other and the practitioners from the research and knowledge of proven methods and appropriate techniques.
3.2 Risk Management Non-existent for Lean Projects
Risk analysis and management is seen as being critical to all serious decision making processes. However there has been little to no documented application or study of Risk Assessment in the Lean implementation field. This simplifies our report in one perspective but points to a great gap in the body of knowledge. Besides the risk for an implementation as a whole project there are risks for the various facets and stages. We believe that each aspect should pass through a risk assessment and analysis of some kind to determine treatments necessary.
4 Research Approach
4.1 Objective
The objective of this work was to explore how risk management methods are applicable to and supportive of Lean implementation success.
4.2 Method – Assess Principle Compatibility, Integration and Application
1) As there is little evidence of the merger in literature we answer “to what degree does Lean thinking and risk management thinking align?” Our method was to recast the principles of Lean into those of the risk management standard. This was accomplished in a strategic sense and to the ISO standard principles and framework.
2) Secondly we applied risk management methods to the implementation of Lean in a specific case study. We present how Lean methods can be prioritised for improving implementation success. This demonstrates how Risk Management and Lean can be integrated in the decision making processes of Lean implementation.

10
Print: 7/09/2012 10:53:00 a.m.
5 Research Outcomes
5.1 Compatibility at the Strategic Level
Lean as a strategic business transformation fits with strategic risk management. Lean can be considered as a treatment for strategic risk. Threats can be minimised and opportunities maximised by the application of Lean.
Lean systems work that less effort, space and capital are required and lead time is reduced whilst quality increases and the cost of quality decreases. Whether strategic planning is to maximise the opportunity of more sales or minimise the threat of lost market share delivering more, more timely, and at less cost is a serious treatment of risk and presents a new value proposition to customers.
A common threat in today’s market place is the loss of profit to fierce overseas competition. Lean enterprises find they can compete with cheaper overseas labour markets by continually reducing wasted effort (Chapman-Smith, 2012; Womack & Jones, 2003) i.e. reducing the effort and cost to produce value to the customer. The dynamically changing market place is another risk. Businesses need a dynamic culture of empowered emergent change to respond to the fluctuations in external environment (Burnes, 2005). A culture of dynamic change and enabled learning goes along with Lean and is a treatment for this threat (Burnes, 2005; Hines et al., 2008; Liker, 2004).
Lean also has its own methods for analysis of risk. Techniques like value stream mapping provide a means for identifying opportunities to improve flow and reducing wasted effort. Value stream mapping is analysis of the current state and maps out the treatment as a future state chart for discussion and decision making regarding the appropriate “treatments” to maximise these opportunities. Various other tools also support decision making and treat risks at different levels e.g. five why’s (asking why five times) is a simple root-cause analysis tool for analysing an issue such that the risk of repeating an issue is minimized and preferable eliminated. Total Productive Maintenance is a treatment tool to minimise down time on machinery and identify areas of risk of failure before they occur. These latter examples may seem more trivial however it is clear that Lean methods can be used in identifying opportunities, supporting decisions, and treating risk.
5.2 Integration with the ISO Standard
The risk management thinking as embodied in AS/NZS 3100:2009 can be compared with the contemporary understanding of Lean. Our recasting shows the clear complementary and mutually supporting nature of Lean and risk management as described by the standard. This is particularly with the 2009 standards “greater emphasis and
guidance” on risk management implementation and continuous improvement (AS/NZS ISO 31000, 2009, p. ii). As Lean is the outcome of continuous improvement thinking there is an automatic synergy to the risk management standard based on the same principles.
5.2.1 Complimentary Principles
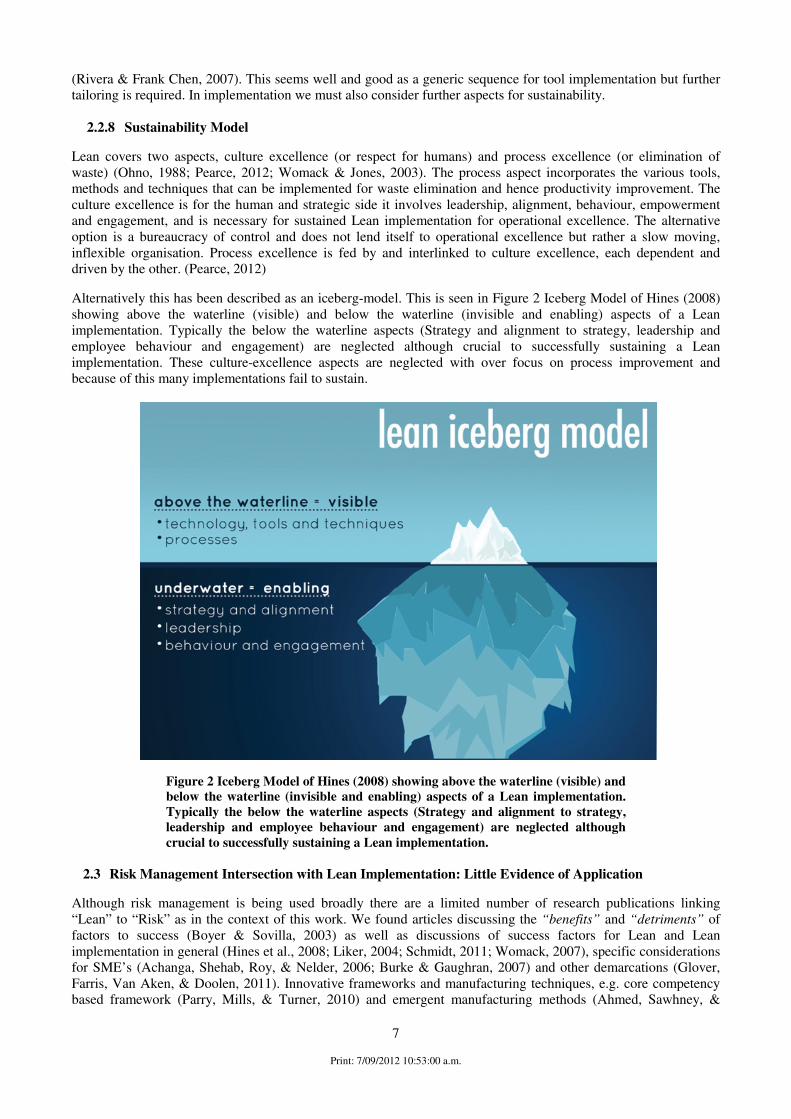
Principles of Lean can be recast alongside those of risk management (AS/NZS ISO 31000, 2009) as in Figure 3. The fit between principles is clearly illustrated. Both Lean and risk management are supportive in focus on “value”. The risk approach protects value and Lean supports this by focusing on providing customer value.
9 The principles
(Figure 3) suggest both Lean and risk should be built as an integral part of the organisational processes and support decision making. The major difference in this chart is the function of risk management is to explicitly address uncertainty, whereas Lean explicitly addresses wasted effort through the optimisation of flow.
10 This however is
not contradictory but merely the different strategic objective of the system. Both are considered systematic and structured. Risk management is based upon the best available information and Lean improvements similarly with the review of current conditions, gathering of available data where necessary and up to date review of value in eyes of the customer. Both implementations are tailored to the organisation, take into account human and cultural factors and aim to be inclusive of the entire system (not compartmentalised or locally focused) and include all stakeholders
9 There is a subtle difference between these, risk management principles could be considered more inward looking where the Lean principle is more outward looking.
10 Lean does address uncertainty, e.g. in demand, however it primarily addresses waste elimination along with the respect for humans principles.
11
Print: 7/09/2012 10:53:00 a.m.
in the processes. Both are dynamic and responsive to change and facilitate continual improvement of the organisation.
Figure 3 Principles of Risk Management (AS/NZS ISO 31000, 2009) besides
recast principles of Lean thinking on the right, showing mutually supportive and
complementary nature of risk management and Lean management.
5.2.2 Framework Compatibility
Lean management concepts are also easily laid over the risk management strategic process (framework) of the AS/NZS standard. In Figure 4 we have the risk management strategic process as the AS/NZS standard and alongside it the equivalent Lean strategic process
11. The Lean concepts are synonymous to those of the risk
management strategic process. The mandate and commitment of the framework is synonymous with management commitment, strategy, leadership and alignment within the organisation. This is made more clear from the detailed definition in the standard (AS/NZS ISO 31000, 2009; cf. Hines et al., 2008). The cycle itself of design, implement monitor and review, and continually improve is a simple PDSA. This cycle came out of the quality and continuous improvement field (Deming, 1986) which are consolidated in Lean thinking. As mentioned the five key principles of Lean (Womack & Jones, 1996) can be shown to relate to the PDSA cycle although possessing specific meaning
11 This in essence is the merging of the Lean iceberg model (Hines, Found, Griffiths, & Harrison, 2008) and the 5 principles of Lean (Womack & Jones, 2003).
1. Creates and protects value
2. Is an integral part of all organisational processes,
3. Is part of decision making,
4. Explicitly addresses uncertainty,
5. Is systematic, structured and timely,
6. Is based on the best available information,
7. Is tailored,
8. Takes human and cultural factors into account,
9. Is transparent and inclusive,
10. Is dynamic, iterative and responsive to change, and
11. Facilitates continual improvement of
organization.
1. Focuses on creating customer value.
2. Integral part of organisations processes and procedures
3. Lean thinking and techniques support decision making.
4. Addresses waste through optimisation of flow
5. Has structured yet dynamic processes and methods
6. Improvements based on review of current conditions and value in eyes of customer.
7. Implementation tailored to the organisation based on key Lean principles.
8. Involves respect for humans and an enabling culture.
9. Inclusive of entire system (not compartmentalised or focused on local efficiencies)
10. Enables dynamic learning organisations of emergent change.
11. Facilitates continuous improvement for perfection.
Lean Summary of Principles Risk Management Principles

12
Print: 7/09/2012 10:53:00 a.m.
to Lean thinking i.e. defining value and planning for the flow of value with as little waste as possible and the goal of perfection in view.
Figure 4 Risk management framework compared with Lean management.
Figure 5 Lean processes overlaid on risk management process as chart from the
AS/NZS standard (AS/NZS ISO 31000, 2009, p. 14).
5.2.3 Risk Management Process Comparison with Lean Process
Lean processes can be laid over the risk management process as in Figure 5. The on-going communication process indicated as key to good risk management is very much a part of continuous improvement and Lean. Toyota
Mandate and
commitment
Design of framework
Monitoring and review of
framework
Implementing
Continual improvement of framework
Study (Review/ Measure)
Act (Continue to perfection)
Plan (Value, VSM)
Management commitment, Leadership, Strategy and Alignment
Lean Management Strategic Process
Continuous
Improvement Continuous
Improvement
Do: (Implement
Flow/ Methods)
Risk Management Strategic Process
(Framework)

13
Print: 7/09/2012 10:53:00 a.m.
developed particularly efficient and effective means of communication to allow consensus and collaboration throughout along with the engagement and input from all staff. Techniques such as A3 management, with the catchball process or nemawashi are described as integral to the TPS and Lean learning organisations (see Hines et al., 2008; Liker, 2004). Establishing the context is synonymous to defining value from the customer’s viewpoint. The context in risk management strictly is both internal and external looking and so in reality crosses with the mapping of the value stream. For simplicity sake we have included VSM in the risk assessment area i.e. looking at the current state and opportunities for improvements to get to a desired future state. In the assessment analysis step we have identified the 5 why’s tool for root cause analysis. Other tools could similarly be used (e.g. fish bone diagram). Evaluation of risk has been overlaid with A3 management. This an A3 sheet for reporting and formulating ideas and passing into the communication process for consensus. Risk treatment is the appropriate application of various Lean methods chosen through the assessment process. The PDSA (or PDCA) cycle is built into the process for monitoring and review.
5.2.4 ISO Standard a Reproduction of a Continuous Improvement or Quality System
It is not surprising that the approach of the risk management standard matches with Lean management. The standard appears to be a reproduction or derivation of the quality and continuous improvement systems of Japanese manufacturing which is very influenced by the Toyota Production Systems the parent to Lean (Holweg, 2007; Womack, Jones, & Roos, 1990).
5.3 Application by Case Study
We believe risk management methods can be used to successfully guide managers through the process of Lean implementation and particularly with the selection of tools or methods. Risk management methods have been proven effective in management of projects. However there is little evidence of their use in Lean projects and guidance is not readily available. We propose to support practitioners in the implementation and organisational change of Lean by setting out an application of risk management to Lean implementation.
In essence we want to codify the expert opinion regarding Lean implementation from the viewpoint of risk management. That is to make the expert opinion available to the non-expert through a representative case study. We chose a local firm Shamrock Industries Ltd. Shamrock has particular needs but the case study brings out implications relative to other operating types.
5.3.1 Representative Company – Shamrock Industries Ltd.
v
Shamrock Industries Ltd. was established in the year 2000. An SME of approximately 20 staff Shamrock possesses an advanced CNC equipped plant, has precision assembly capability and takes pride in project management i.e. providing the full solution including concept and design development, build, commissioning, delivery, and after-sales support. The company’s market sector is progressively more high technology based i.e. medical and other high or clean technology. The company is located in Christchurch and was recently affected by business disruption due to earthquake(s). Initially tool and die manufacturing made up a large proportion of sales however these have dwindled with tooling manufacture largely shifted to Asia. The company was also challenged by recent global downturn. Shamrock lost key local customers but was able to establish new relationships for continued business. It is establishing its reputation in markets nationally and internationally.
Shamrock is essentially a make-to-order and design-build manufacturer specialising in complex parts and assemblies. Typically production is of small to medium size runs, low-volume high-mix.
5.4 Strategic Risk Assessment (PESTEL and SWOT) – Lean a Priority
The Shamrock Industries Advisory Board conducts regular strategic planning workshops. These workshops include scanning for risks. Shamrock uses the common tools of PESTEL and SWOT analysis. This is for environmental scanning and identification of risks in the form of internal strengths and weaknesses and external opportunities and threats.
These analyses previously identified that Lean production is a strategic priority for treatment of the risk in the competitive market place by increasing the value proposition to customers. To compete within the now international market Shamrock needs to show the value of a local supplier by reducing lead time and manufacture
14
Print: 7/09/2012 10:53:00 a.m.
costs, and developing ability to handle demand variability (e.g. achieving flow and eliminating wasted effort including reducing run setups) as well as increasing quality. Lean methods can be used to treat these areas and is therefore a strategic priority.
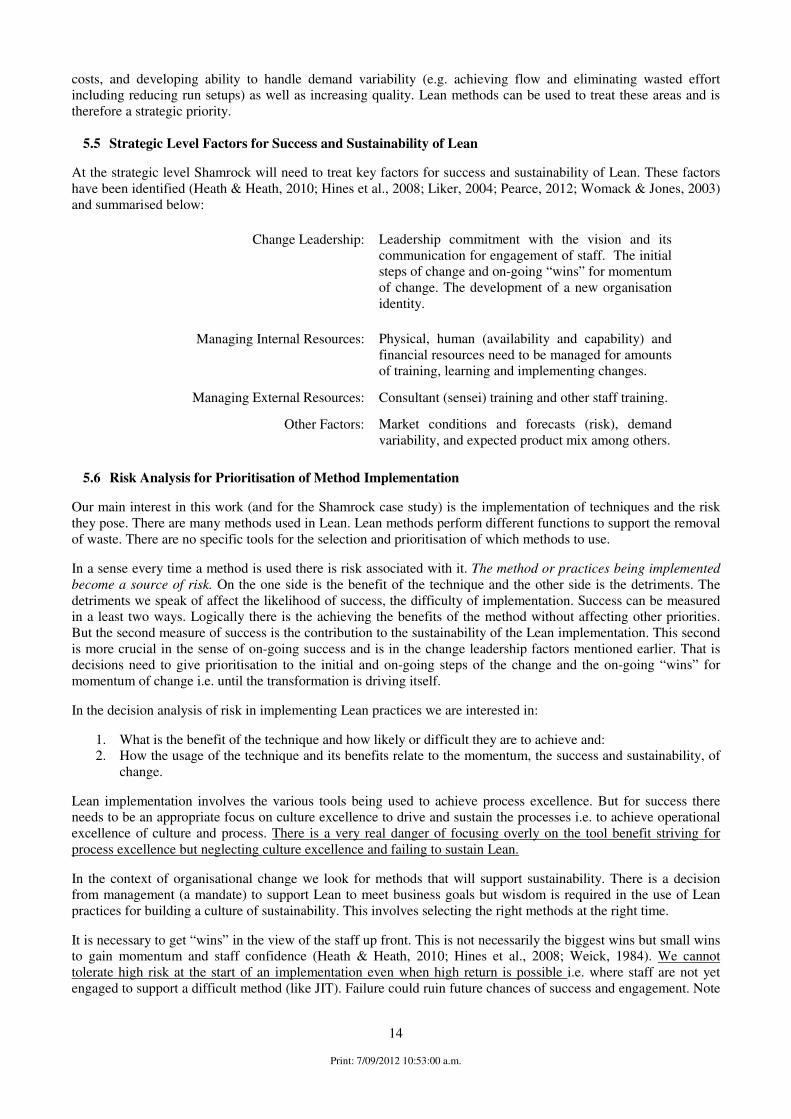
5.5 Strategic Level Factors for Success and Sustainability of Lean
At the strategic level Shamrock will need to treat key factors for success and sustainability of Lean. These factors have been identified (Heath & Heath, 2010; Hines et al., 2008; Liker, 2004; Pearce, 2012; Womack & Jones, 2003) and summarised below:
Change Leadership: Leadership commitment with the vision and its communication for engagement of staff. The initial steps of change and on-going “wins” for momentum of change. The development of a new organisation identity.
Managing Internal Resources: Physical, human (availability and capability) and financial resources need to be managed for amounts of training, learning and implementing changes.
Managing External Resources: Consultant (sensei) training and other staff training.
Other Factors: Market conditions and forecasts (risk), demand variability, and expected product mix among others.
5.6 Risk Analysis for Prioritisation of Method Implementation
Our main interest in this work (and for the Shamrock case study) is the implementation of techniques and the risk they pose. There are many methods used in Lean. Lean methods perform different functions to support the removal of waste. There are no specific tools for the selection and prioritisation of which methods to use.
In a sense every time a method is used there is risk associated with it. The method or practices being implemented
become a source of risk. On the one side is the benefit of the technique and the other side is the detriments. The detriments we speak of affect the likelihood of success, the difficulty of implementation. Success can be measured in a least two ways. Logically there is the achieving the benefits of the method without affecting other priorities. But the second measure of success is the contribution to the sustainability of the Lean implementation. This second is more crucial in the sense of on-going success and is in the change leadership factors mentioned earlier. That is decisions need to give prioritisation to the initial and on-going steps of the change and the on-going “wins” for momentum of change i.e. until the transformation is driving itself.
In the decision analysis of risk in implementing Lean practices we are interested in:
1. What is the benefit of the technique and how likely or difficult they are to achieve and: 2. How the usage of the technique and its benefits relate to the momentum, the success and sustainability, of
change.
Lean implementation involves the various tools being used to achieve process excellence. But for success there needs to be an appropriate focus on culture excellence to drive and sustain the processes i.e. to achieve operational excellence of culture and process. There is a very real danger of focusing overly on the tool benefit striving for process excellence but neglecting culture excellence and failing to sustain Lean.
In the context of organisational change we look for methods that will support sustainability. There is a decision from management (a mandate) to support Lean to meet business goals but wisdom is required in the use of Lean practices for building a culture of sustainability. This involves selecting the right methods at the right time.
It is necessary to get “wins” in the view of the staff up front. This is not necessarily the biggest wins but small wins to gain momentum and staff confidence (Heath & Heath, 2010; Hines et al., 2008; Weick, 1984). We cannot tolerate high risk at the start of an implementation even when high return is possible i.e. where staff are not yet engaged to support a difficult method (like JIT). Failure could ruin future chances of success and engagement. Note

15
Print: 7/09/2012 10:53:00 a.m.
that at the start of an implementation communication is key to impart the vision and break down goals to give critical steps for change.
5.7 Summary of Process According to AS/NZS ISO 31000:2009
We have summarised the approach or Lean Implementation risk assessment according to the principles and guidelines of the AS/NZS standard in the table Figure 6.
Risk Management Process
AS/NZS ISO 31000
Lean Implementation
Application
Set Context Organisational change for productivity improvement by “Lean systems” – reduce wasted activity, increased value to customer – increase profitability. Internal context of resources and staff culture and sustaining the change. External context of market conditions.
Perform Risk Assessment by: (see 1-3)
1 Identification of sources, areas,
impacts, and events.
Lean methods have risk associated with their use, benefits and detriments impacting various areas.
2a Analysis to understand the risk its
causes, sources, (see 2b) and other
pertinent factors,
Qualitative discussion of detriments or risks of sustainability of Lean method (source) or entire Lean implementation in context of the tools and consequences of tool use.
2b consequences and likelihoods,
confidence sensitivity and other
pertinent factors,
Expert-opinion (qualitative) is incorporated as charts. The chart shows our qualitative assessment of likelihood and consequence for
various tools refer Figure 7.
3 Evaluation for assisting the decision
making process including risk tolerance
of parties
In the context of organisational change we look for methods that will support sustainability. There is a decision from management (a mandate) to support Lean to meet business goals but wisdom is required in the Lean implementation for building a culture for sustainability. This involves selecting the right methods at the right time. It is necessary to get “wins” in the view of the staff up front. This is not necessarily the biggest wins but small wins to gain momentum and staff confidence. We cannot tolerate high risk even when high return is possible at the start of an implementation i.e. where staff are not yet engaged to support a difficult method (like JIT). Failure could ruin future chances of success and engagement. Communication at the start of an implementation is key to impart the vision and break down goals to give critical steps for change.
Prescribe Treatment of Risk To maximise benefits and minimise detriments –
increase the positive and decrease the negative
likelihood and consequences.
Treatments we prescribe in general cover the following: Adequate communication with development of new identity for staff; prioritisation of time for business running and improvement activity; and prior conditions met adequately (including previous methods, training of and engagement of staff) for any methods implemented.
Figure 6 Summary of Process for Lean Implementation Risk Management
According to AS/NZS ISO 31000:2009
6 Qualitative Risk Assessment for Decision Making
We chose to use a set of qualitative graphical techniques to represent the risk for Lean implementation. With a risk assessment the success and sustainability factors can be linked to tools and processes as treatments to maximise the benefits (positive outcome risks) and minimise the detriments (negative outcome risks).

16
Print: 7/09/2012 10:53:00 a.m.
We have not set out to merely merge a concept or process of Lean with that of risk management but rather having understood the principles to also apply the tools of risk management for supporting decisions in Lean implementation.
6.1 Qualitative Analysis - Benefits, detriments & treatments with likelihood & impact
Figure 7 Likelihood - Impact Qualitative Assessment Example Plot
Our approach to risk management of Lean methods is to present the common methods for Lean with indication of the benefits, detriments and possible treatments. Along with the analysis of the methods (benefits, detriments and possible treatments) we need to consider likelihood and impact. For this we have adapted the method of Pons (2009). Likelihood and impacts can be plotted on a qualitative scale using available expert opinion. We show an example in Figure 7. The resultant chart aids in identifying where initial wins or low hanging fruit can be targeted. Note that high likelihood (low difficulty) events can be critical even if the immediate impact is not high. Gaining small wins is particularly important at the outset of an implementation to ensure momentum and sustainability (Heath & Heath, 2010; Hines et al., 2008; Weick, 1984).
6.2 Outcome Desired – Codified expert knowledge
The process of decision making can be simplified for practitioners. The chart presents relative risks involved in each method and the relative impact (benefit positively) to be gained with those tools. Notes and the tabulated benefits and detriments can further codify the expert knowledge making it readily available for practitioners.
7 Risk Analysis for Principles and Common Methods
We summarised common Lean principles and methods (tools, techniques and aspects of Lean systems) as available in appendix Figure 11 and Figure 12. We give brief descriptions and list benefits, detriments and treatments (main references -Hines et al., 2008; Liker, 2004; Pearce, 2012; Womack & Jones, 2003). We are not proposing a scoring method, and intentionally have not arranged factors to score against. However we do propose to aid in prompting and supplying some expert opinion for the tools and processes of Lean.
7.1 Prioritising Lean Principles and Higher Order Processes
The higher order principles and processes have been listed for their benefits and detriments according to the criteria on page 14. See appendix Figure 11 Strategic Principles: Lean Key Principles and Higher Order Processes Risk Analysis Table (Reference Case Shamrock Industries Ltd.). The likelihood and impact of these methods is plotted
Impact on
Low
Impact
Medium
Impact
High
Impact
Lik
eli
ho
od
of
Low
Likelihood
High
Likelihood
Medium
Likelihood
Impact - Likelihood Qualitative Assesment
w
X Y
Z
Key
X is a high likelihood
but has low impact
event.
Y is high likelihood
high impact event.
Z is a low likelihood
low impact event.
W is a
Q is a medium
lieklihood medium
impact event.Q

17
Print: 7/09/2012 10:53:00 a.m.
in Figure 8 Strategic Principles: Lean Key Principles and Higher Order Processes Qualitative Assessment of Impact and Difficulty (Likelihood) of Success and Sustainability (Reference Case Shamrock Industries Ltd). Note that we adjusted “Impact – Likelihood” to “Impact – Difficulty” because “difficulty” speaks more true to the implementation process. The difficulty may be high but with excessive treatment the likelihood may become high. We principally refer to difficulty and then secondarily likelihood as a reference to risk probability. This highlights both the benefit of the technique but also the pitfalls of qualitative assessments and room for ambiguity.
Figure 8 Strategic Principles: Lean Key Principles and Higher Order Processes
Qualitative Assessment of Impact and Difficulty (Likelihood) of Success and
Sustainability (Reference Case Shamrock Industries Ltd).
All the principles in this first set are higher level and seen as critical to lean success and sustainability, however it is important to understand the challenges or level of “difficulty” faced. In our representative case we see particular areas of difficulty for Shamrock around process flow e.g. flow and value stream analysis and application of pull systems. This is because of the make-to order nature and complicated processes of their business. This is reflected in the Likelihood – Impact chart for these factors.
In Figure 8 we see the medium level difficulty but high impact of defining value, and having all staff involved in enterprise wide continuous improvement. Defining value is key to understanding what the customer desires and what wasted effort is i.e. what should be eliminated through improvement. The communication process presents the vision of value and continuous improvement to all staff and allows for staff engagement and development of a learning organisation and hence also high impact. This suggests that the big wins for a make-to-order enterprise like Shamrock would be in the culture excellence for continuous improvement and not so heavily in the process flow tools although process improvement would occur as a result.
We would see analysis of the value stream and flow development of medium-high impact. They are still critical to the process of improvement but not as high an impact in Shamrocks case as if we were referencing a high production facility.
Pull is very difficult in Shamrock’s case and would need particular adaption as suggested in the table. Shamrock may need to use pull of order to pull paperwork but push material to the process for flow. This would change where higher quantity production permitted and even temporary or isolated flow lines could be introduced. This principle
Impact on success and sustainability
Low
Impact
Medium
Impact
High
Impact
High
Difficulty
Low
Difficulty
Medium
Difficulty
PULL
CI
All
Staff
VSM
Dif
fici
utl
yo
f su
cce
ss a
nd
sust
ain
ab
ilit
y
FLOW
High
"Likelihood"
Low
"Likelihood"
Com.
process
Define
Value
Lean Strategic Principles: Impact - Difficulty Qualitative Assesment
For Lean Practice Success and Sustainability
culture building
More diffficult but
still necessary.
Pull: Understand
principle, be careful
with tools
Key
CI = Continuous
Improvement
All Staff = All Staff
involved in CI (Kaizen)
VSM= Analysis of Value
Stream
Com. Pro =
Communication process

18
Print: 7/09/2012 10:53:00 a.m.
should not be ignored. It is critical to understand production as the result of customer demand. Application and emphasis would differ from a higher production facility.
7.2 Prioritising Lean Methods
There are many different methods or tools of Lean. See Figure 1 Lean Methods or Tools: A selection of some (not all) of Lean methods indicating the importance of having a selection criteria and prioritisation method for implementation. Without a method of prioritisation decision paralysis could easily creep in (Heath & Heath, 2010, p. 50). Also sustainability with considerations of organisational change are paramount (Hines et al., 2008; Weick, 1984).
We have listed many of the Lean and complimentary methods with their benefits and detriments according to the analysis criteria earlier specified. See appendix Figure 12 Methods: Selection of Lean and Complementary Methods Risk Analysis Table (Reference Case Shamrock Industries Ltd.). The likelihood and impact of these methods is plotted on the chart Figure 9 Methods: Selection of Lean and Complementary Methods Assessment of Impact and Difficulty (Likelihood) of Success and Sustainability (Reference Case Shamrock Industries Ltd).
Figure 9 Methods: Selection of Lean and Complementary Methods Assessment
of Impact and Difficulty (Likelihood) of Success and Sustainability (Reference
Case Shamrock Industries Ltd).
We have not attempted to explain Figure 9 in detail here as it is tentative and illustrative of a reference case only. However the purpose is in identifying “low hanging fruit” for “small wins” to increase chances of sustainability and also on-going decision making. Here the tools more applicable to the make-to-order business are featured in the top right where as the tools for fine improvement of production efficiency, e.g. six-sigma and JIT are in the bottom left as they are difficult to implement in any case but especially make to order job shops and the benefits would be limited. TOC thinking would be rated of much more benefit than six-sigma or JIT in this case. Kanban is positioned at above medium impact and a lower difficulty. This position is not for high end pull production application but for basic production techniques and ordering e.g. consumables.
Of interest is the high impact of ERP in Shamrock’s case. This is something difficult to implement but if implemented right could have great effect at Shamrock. This is particularly because at Shamrock pace production being constrained by flow in the office. ERP implemented right would simplify quoting, planning, purchasing and
Impact on success and sustainability
Low
Impact
Medium
Impact
High
Impact
High
Difficulty
Low
Difficulty
Medium
Difficulty
Lean methods: Impact - Difficulty Qualitative Assesment
For Lean Practice Success and Sustainability
Six-
sigma
JIT
5
Why's
SMEDTPM
High
"Likelihood"
Low
"Likelihood"
5S
Qual
Key
VS = Visual Systems
Qual= Quality tools -
Quality at the Source,
Jidoka and Poka Yoke
SMED= Single Minute
Exchange of Dies/
Reduced Setups
TPM = Total Productive
Maintenance
Kanb - Kanban
JIT = Just In Time
Manufacture
H&T = Heijunka (level
schedule) & Takt time
(pulse)
ERP = Business Systems
Software
TOC = Theory of
Constraints
Dif
fici
utl
yo
f su
cce
ss a
nd
sust
ain
ab
ilit
y
H&T
ERP
TOC
Kanb
VS
Resource needs low,
culture building, give
initial "small wins"
More diffcult,
hold off till
culture built
Last on the list,
exhaust other
avenues first
19
Print: 7/09/2012 10:53:00 a.m.
general data entry requirements which are identified as serious bottlenecks at Shamrock (more so than specific physical production processes) let alone benefits to other business processes and reporting. Shamrock has much to benefit in understanding the holistic nature of its systems and not unconsciously separating productivity and profitability in the factory from productivity in the office.
Shamrock Industries have just embarked on an ERP journey that is somewhat separate from an enterprise wide Lean journey. Because of the difficulty of ERP Implementation our suggestion would be to hold off all other initiatives (except for some higher order principles) until this is well achieved and the resources are freed to focus on other Lean implementation activities. Otherwise failure of both Lean and ERP will occur. This also implies that if they had a clean slate and had not begun implementing ERP it may have been more beneficial to consider some of the simpler tools first. This could have benefited them with further staff engagement and built culture-excellence and staff engagement before implementing ERP with its higher requirements on resources and perceived level of change.
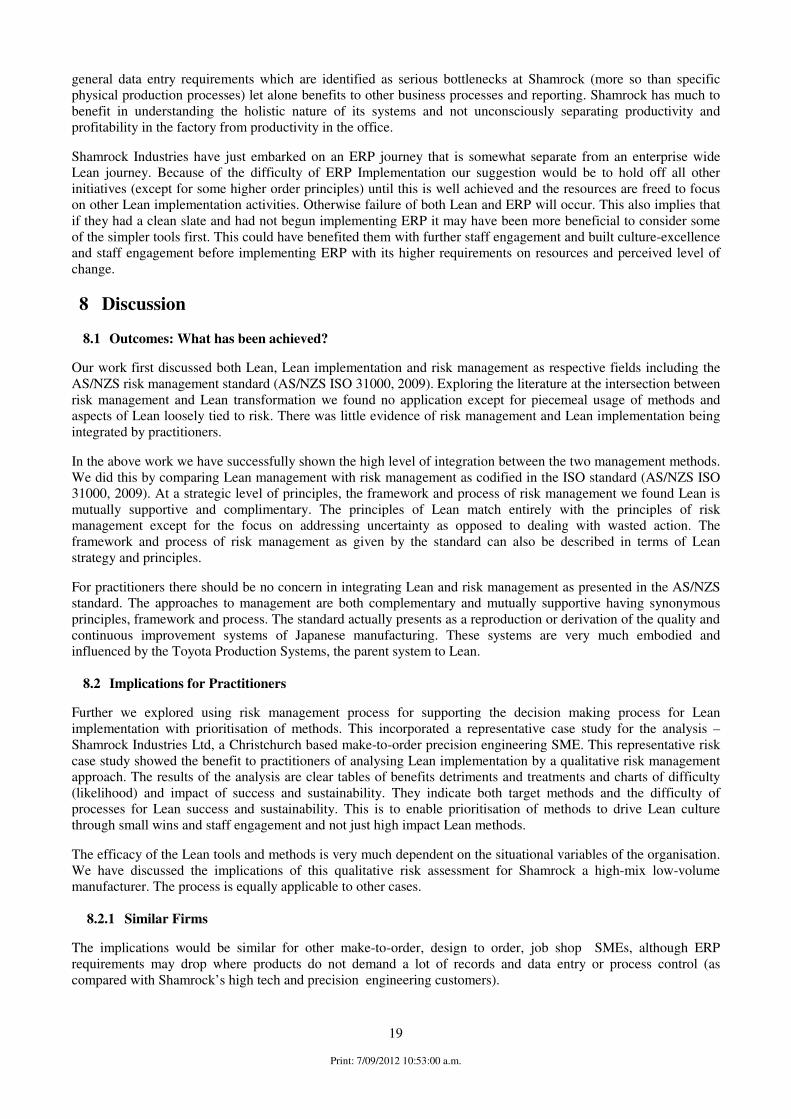
8 Discussion
8.1 Outcomes: What has been achieved?
Our work first discussed both Lean, Lean implementation and risk management as respective fields including the AS/NZS risk management standard (AS/NZS ISO 31000, 2009). Exploring the literature at the intersection between risk management and Lean transformation we found no application except for piecemeal usage of methods and aspects of Lean loosely tied to risk. There was little evidence of risk management and Lean implementation being integrated by practitioners.
In the above work we have successfully shown the high level of integration between the two management methods. We did this by comparing Lean management with risk management as codified in the ISO standard (AS/NZS ISO 31000, 2009). At a strategic level of principles, the framework and process of risk management we found Lean is mutually supportive and complimentary. The principles of Lean match entirely with the principles of risk management except for the focus on addressing uncertainty as opposed to dealing with wasted action. The framework and process of risk management as given by the standard can also be described in terms of Lean strategy and principles.
For practitioners there should be no concern in integrating Lean and risk management as presented in the AS/NZS standard. The approaches to management are both complementary and mutually supportive having synonymous principles, framework and process. The standard actually presents as a reproduction or derivation of the quality and continuous improvement systems of Japanese manufacturing. These systems are very much embodied and influenced by the Toyota Production Systems, the parent system to Lean.
8.2 Implications for Practitioners
Further we explored using risk management process for supporting the decision making process for Lean implementation with prioritisation of methods. This incorporated a representative case study for the analysis – Shamrock Industries Ltd, a Christchurch based make-to-order precision engineering SME. This representative risk case study showed the benefit to practitioners of analysing Lean implementation by a qualitative risk management approach. The results of the analysis are clear tables of benefits detriments and treatments and charts of difficulty (likelihood) and impact of success and sustainability. They indicate both target methods and the difficulty of processes for Lean success and sustainability. This is to enable prioritisation of methods to drive Lean culture through small wins and staff engagement and not just high impact Lean methods.
The efficacy of the Lean tools and methods is very much dependent on the situational variables of the organisation. We have discussed the implications of this qualitative risk assessment for Shamrock a high-mix low-volume manufacturer. The process is equally applicable to other cases.
8.2.1 Similar Firms
The implications would be similar for other make-to-order, design to order, job shop SMEs, although ERP requirements may drop where products do not demand a lot of records and data entry or process control (as compared with Shamrock’s high tech and precision engineering customers).

20
Print: 7/09/2012 10:53:00 a.m.
8.2.2 High Volume – Low Mix Firms
For firms of higher production (high volume, low product mix) we would see more relevance in the emphasis on process flow principles and tools. We have illustrated these and other likely changes by placing arrows overtop of the previous charts, see Figure 10.
Figure 10 Methods and Strategic Principles: Assessment of Impact and Difficulty
(Likelihood) of Success and Sustainability- Changes for "higher" production
volumes in dictated by arrows.
Impact on success and sustainability
Low
Impact
Medium
Impact
High
Impact
High
Difficulty
Low
Difficulty
Medium
Difficulty
PULL
CI
All
Staff
VSM
FLOW
High
"Likelihood"
Low
"Likelihood"
Com.
process
Define
Value
Impact on success and sustainability
Low
Impact
Medium
Impact
High
Impact
High
Difficulty
Low
Difficulty
Medium
Difficulty
Lean methods: Impact - Difficulty Qualitative Assesment
For Lean Practice Success and Sustainability
Six-
sigma
JIT
5
Why's
SMEDTPM
High
"Likelihood"
Low
"Likelihood"
5S
Qual
Key
VS = Visual Systems
Qual= Quality tools -
Quality at the Source,
Jidoka and Poka Yoke
SMED= Single Minute
Exchange of Dies/
Reduced Setups
TPM = Total Productive
Maintenance
Kanb - Kanban
JIT = Just In Time
Manufacture
H&T = Heijunka (level
schedule) & Takt time
(pulse)
ERP = Business Systems
Software
TOC = Theory of
Constraints
H&T
ERP
TOC
Kanb
VS
Resource needs low,
culture building, give
initial "small wins"
Lean Strategic Principles: Impact - Difficulty Qualitative Assesment
For Lean Practice Success and Sustainability
culture building
Key
CI = Continuous
Improvement
All Staff = All Staff
involved in CI (Kaizen)
VSM= Analysis of Value
Stream
Com. Pro =
Communication process
Dif
fici
utl
yo
f su
cce
ss a
nd
sust
ain
ab
ilit
y
Dif
fici
utl
yo
f su
cce
ss a
nd
sust
ain
ab
ilit
y

21
Print: 7/09/2012 10:53:00 a.m.
8.2.3 Beyond Production
We have noted that Lean has been applied effectively beyond manufacturing or production businesses. Although Shamrock Industries is a manufacturing business we observed they had many gains to be made in their administration centre (hence a high priority for ERP). Whether or not the physical transformation of goods took place in their own workshop there was much waste to be eliminated in their office. These Lean office gains illustrate the competitive advantage of Lean beyond manufacturing businesses.
9 Conclusion
The objective of this work was to explore how risk management methods are applicable to and supportive of Lean implementation success. Risk analysis and management is seen as being critical to all serious decision making processes. However there has been little to no documented application or study of Risk Assessment in the Lean implementation field. We have shown that it is possible to integrate risk management and Lean management. We further developed a qualitative method where Lean tools may be prioritised for a specific organisational setting. We applied this method to a case study. The case study provided implications for similar low-volume high-mix manufacturers as well as alternative operation modes (e.g. high-volume low-mix, service organisations and administration). The on-going efficacy of Lean tools and methods is very much dependent on the situational variables of the organisation. We believe that each aspect should pass through a risk assessment and analysis of some kind to determine treatments necessary. Our approach focused on treating Lean failure by prioritising the tools that will not only deliver performance gains but are culture building.
9.1 Limitations and Implications for Further Work
One limitation is that a lack of knowledge regarding Lean and its methods may inhibit completeness of the analysis. We propose a survey of Lean knowledge be conducted. A particular focus would be business professionals but also recent graduates.
This work could be taken further with application to more cases and scientific analysis with further surveys and particularly case-studies. In case studies risk could also be analysed at different stages of implementation to see how decision making priorities would adjust in the time dimension.
10 References
Achanga, P., Shehab, E., Roy, R., & Nelder, G. (2006). Critical success factors for lean implementation within SMEs. Journal of Manufacturing Technology Management, 17(4), 460–471. doi:10.1108/17410380610662889
Ahmed, N., Sawhney, R., & Xueping, L. (2007). A model to manage emergent manufacturing. IIE Annual
Conference and Expo 2007 - Industrial Engineering’s Critical Role in a Flat World, May 19, 2007 - May
23, 2007 (pp. 31–36). Nashville, TN, United states: Institute of Industrial Engineers.
AS/NZS ISO 31000. (2009). AS/NZS ISO 31000:2009 - Risk management — Principles and guidelines on implementation (Joint Australia New Zealand International Standard). Standards New Zealand.
Boehm, B., & Turner, R. (2003). Using risk to balance agile and plan-driven methods. Computer, 36(6), 57 – 66. doi:10.1109/MC.2003.1204376
Boyer, M., & Sovilla, L. (2003). How to identify and remove the barriers for a successful lean implementation. Journal of Ship Production, 19(2), 116–120.
Burke, S., & Gaughran, W. (2007). Developing a framework for sustainability management in engineering SMEs. Robotics and Computer-Integrated Manufacturing, 23(6), 696–703.
Burnes, B. (2005). Complexity theories and organizational change. International Journal of Management Reviews, 7(2), 73–90. doi:10.1111/j.1468-2370.2005.00107.x
Chapman-Smith, B. (2012, June 13). NZ exporter bucks trend of China manufacturing. Otago Daily Times. Retrieved June 23, 2012, from http://www.odt.co.nz/news/business/213041/nz-exporter-bucks-trend-china-manufacturing
Deming, W. E. (1986). Out of the crisis. MIT Press.
Douglas, K., & Jones, D. (2007). How to make better choices. NewScientist, 35–43.
22
Print: 7/09/2012 10:53:00 a.m.
Doyle, J., & Thomason, R. H. (1999). Background to Qualitative Decision Theory. AI Magazine, 20(2), 55. doi:10.1609/aimag.v20i2.1456
Emiliani, M. L. (2006). Origins of lean management in America: The role of Connecticut businesses. Journal of
Management History, 12, 167–184. doi:10.1108/13552520610654069
Flyvbjerg, B. (2006, August). From Nobel Prize to Project Management: Getting Risks Right. Project Management
Journal. Retrieved June 7, 2012, from http://eureka.bodleian.ox.ac.uk/724/
Flyvbjerg, B., Bruzelius, N., & Rothengatter, W. (2003). Megaprojects and Risk: An Anatomy of Ambition. Cambridge University Press.
Glover, W. J., Farris, J. A., Van Aken, E. M., & Doolen, T. L. (2011). Critical success factors for the sustainability of Kaizen event human resource outcomes: An empirical study. International Journal of Production
Economics, 132, 197–213.
Goldratt, E. M., & Cox, J. (2004). The Goal: A Process of Ongoing Improvement (3rd Revised.). North River Pr.
Goodyer, J., Murrti, Y., Grigg, N. P., & Shekar, A. (2011). Lean: insights into SMEs ability to sustain improvement. Retrieved August 31, 2011, from
Hallam, C. R. A. (2010). Lean supply chain management techniques for complex aerospace systems: Using discrete event simulation to mitigate programmatic cost and schedule risk. Portland International Center for
Management of Engineering and Technology - Technology Management for Global Economic Growth,
PICMET ’10, July 18, 2010 - July 22, 2010 (pp. 2565–2573). Phuket, Thailand: IEEE Computer Society.
Hallam, C. R. A., Muesel, J., & Flannery, W. (2010). Analysis of the Toyota Production System and the genesis of six sigma programs: An imperative for understanding failures in technology management culture transformation in traditional manufacturing companies. PICMET ’10 - Portland International Center for Management of Engineering and Technology, Proceedings - Technology Management for Global Economic Growth (pp. 1835–1845). Phuket, Thailand: IEEE Computer Society.
Hansson, S. O. (2005, August 23). Decision Theory - A Brief Introduction. Royal Institute of Technology (KTH), Stockholm.
Heath, C., & Heath, D. (2010). Switch: How to Change Things When Change Is Hard (1st ed.). Crown Business.
Hendry, C. (1996). Understanding and creating whole organizational change through learning theory. Human
Relations, 49(5), 621–641.
Hendry, L. C. (1998). Applying world class manufacturing to make-to-order companies: problems and solutions. International Journal of Operations & Production Management, 18(11), 1086–1100. doi:10.1108/01443579810231679
Hines, P., Found, P., Griffiths, G., & Harrison, R. (2008). Staying Lean - Thriving, Not Just Surviving. Lean Enterprise Research Centre.
Hines, P., Holweg, M., & Rich, N. (2004). Learning to evolve: a review of contemporary lean thinking. International Journal of Operations & Production Management, 24(Copyright 2005, IEE), 994–1011.
Holweg, M. (2007). The genealogy of lean production. Journal of Operations Management, 25, 420–437.
Hubbard, D. W. (2009). The failure of risk management: why it’s broken and how to fix it. John Wiley & Sons Inc.
Hubbard, D. W., & Samuelson, D. A. (2009, October). Understated Risk - Modeling Without Measurements. OR/MS Today - the Institute for Operations Research and the Management Sciences (INFORMS). Retrieved from http://www.orms-today.org/orms-10-09/risk.html
ISO/DIS 31000. (2009). ISO/DIS 31000:2009 - Risk management — Principles and guidelines on implementation. International Organization for Standardization.
Justin, J. E. (2006). Lean systems, complex systems, and risks. 44th AIAA Aerospace Sciences Meeting 2006,
January 9, 2006 - January 12, 2006 (Vol. 16, pp. 11692–11695). Reno, NV, United states: American Institute of Aeronautics and Astronautics Inc.
Kahneman, D. (1997). New Challenges to the Rationality Assumption. Legal Theory, 3(02), 105–124. doi:10.1017/S1352325200000689
Kahneman, D., & Tversky, A. (1977). Intuitive Prediction: Biases and Corrective Procedures. Report sponsored by Defence Advanced Research Projects Agency. Retrieved from http://stinet.dtic.mil/oai/oai?&verb=getRecord&metadataPrefix=html&identifier=ADA047747
23
Print: 7/09/2012 10:53:00 a.m.
Kahneman, D., & Tversky, A. (1979). Prospect Theory: An Analysis of Decision under Risk. Econometrica, 47(2), 263–291. doi:10.2307/1914185
Knight, F. H. (1921). Risk, Uncertainty, and Profit. New York: Kelley and Millman. Inc.
Kolic, D., Fafandjel, N., & RUBEA, R. (2011). Applying lean quality with risk analysis to aid shipyard block assembly decision making. Strojarstvo, 53(2), 73–82.
Krafcik, J. . (1988). The triumph of the lean production system. Sloan Management Review, (Fall)(30(1) 1988/1989), 41–52.
LEI. (2011, August 30). What is Lean. Lean Enterprise Institute. Retrieved August 29, 2011, from http://www.lean.org/WhatsLean/
LeRoy, S. F., & Singell, L. D. (1987). Knight on Risk and Uncertainty. Journal of Political Economy, 95(2), 394–406.
Liker, J. (2004). The Toyota Way (1st ed.). McGraw-Hill.
Lombardi, M. E. (2011). FMEA for Lean Manufacturing. 22nd Annual IEEE/SEMI Advanced Semiconductor
Manufacturing Conference (ASMC 2011), 16-18 May 2011, 22nd Annual IEEE/SEMI Advanced Semiconductor Manufacturing Conference (ASMC 2011) (p. 2 pp.). Piscataway, NJ, USA: IEEE. doi:10.1109/ASMC.2011.5898197
Mahfouz, A., Shea, J., & Arisha, A. (2011). Simulation based optimisation model for the lean assessment in SME: A case study. 2011 Winter Simulation Conference (WSC 2011), 11-14 Dec. 2011, Proceedings of the 2011 Winter Simulation Conference (WSC 2011) (pp. 2403–13). Piscataway, NJ, USA: IEEE. doi:10.1109/WSC.2011.6147950
Moen, R., & Norman, C. (2011, October 1). Evolution of the PDCA Cycle. Associates in Process Improvement, retrieved 1st October 2011. Retrieved from http://pkpinc.com/files/NA01MoenNormanFullpaper.pdf
Nickerson, R. (1998). Confirmation Bias: A Ubiquitous Phenomenon in Many Guises. Review of General
Psychology, 2(2), 175–220.
Ohno, T. (1988). Toyota Production System: Beyond Large-Scale Production (1St ed.). Productivity Press.
Parry, G., Mills, J., & Turner, C. (2010). Lean competence: integration of theories in operations management practice. Supply Chain Management, Supply Chain Manage. (UK), 15(3), 216–26. doi:10.1108/13598541011039974
Pearce, A. (2012). Lean Manufacturing Reasearch: Lean Success and Sustainability in New Zealand SMEs and Lean as an Organisational Change. University of Canterbury - for copy contact:[email protected].
Pet-Edwards, J., Thompson, W. J., & Panathula, P. (1999). A simulation-based risk analysis of a customer-supplier partnership. Proceedings of Industrial Engineering Solutions ’99 Conference, 23-26 May 1999, Industrial Engineering SOLUTIONS ’99 Conference Proceedings (pp. 89–94). Norcross, GA, USA: Inst. Ind. Eng.
PMI. (2000). A guide to the project management body of knowledge (PMBOK guide). Project Management Institute.
Pons, D. (2002, October). Characterise quantitative production data: Part 1 Key Characteristics. University of Canterbury - Learn. Retrieved from http://learn.canterbury.ac.nz
Pons, D. (2009). Working Document: Qualitative risk map: Suggested approach. University of Canterbury.
PRAM. (1997). PRAM: Project Risk Analysis and Management Guide. APM Group Limited.
Purdy, G. (2010). ISO 31000:2009—Setting a New Standard for Risk Management. Risk Analysis, 30(6), 881–886. doi:10.1111/j.1539-6924.2010.01442.x
Qiu, X. (2011). Uncertainty in project management based on lean construction implementation. 2011 International
Conference on Mechatronics and Materials Processing, ICMMP 2011, November 18, 2011 - November
20, 2011, Advanced Materials Research (Vol. 328–330, pp. 194–198). Guangzhou, China: Trans Tech Publications. doi:10.4028/www.scientific.net/AMR.328-330.194
Rivera, L., & Frank Chen, F. (2007). Measuring the impact of Lean tools on the cost-time investment of a product using cost-time profiles. Robot. Comput.-Integr. Manuf., 23(6), 684–689. doi:10.1016/j.rcim.2007.02.013
Ross, A. J., Davies, J. B., & Plunkett, M. (2005). Reliable qualitative data for safety and risk management. Hazards
XVIII, Process Safety and Environmental Protection (Vol. 83, pp. 117–121). Institution of Chemical Engineers. doi:10.1205/psep.04239

24
Print: 7/09/2012 10:53:00 a.m.
Ruan, J., & Qin, S. F. (2011). Modeling a constraint-based design risk management tool: An empirical study for collaborative product design. IEEE International Conference on Industrial Engineering and Engineering
Management, IEEM2011, December 6, 2011 - December 9, 2011, IEEE International Conference on Industrial Engineering and Engineering Management (pp. 974–978). Singapore, Singapore: IEEE Computer Society. doi:10.1109/IEEM.2011.6118061
Sawhney, R., Subburaman, K., Sonntag, C., Rao, P. R. V., & Capizzi, C. (2010). A modified FMEA approach to enhance reliability of lean systems. International Journal of Quality & Reliability Management, Int. J. Qual. Reliab. Manage. (UK), 27(7), 832–55. doi:10.1108/02656711011062417
Schmidt, S. (2011). From hype to ignorance-a review of 30 years of lean production. Proceedings of World
Academy of Science, Engineering and Technology, 73, 1021–1024.
Schonberger, R. J. (2007). Japanese production management: An evolution-With mixed success. Journal of
Operations Management, 25(2), 403–419.
Seddigh, A., & Alimohamadi, B. (2009, August). Lean Implementation into Risk Management Process (Master of Science in Industrial Engineering). University College of Borås Institution for Engineering School. Retrieved from http://bada.hb.se/bitstream/2320/5421/1/Alimohamadi,%20Seddigh.pdf
Shingo, S. (1989). A Study of the Toyota Production System: From an Industrial Engineering Viewpoint (Rev Sub.). Productivity Press.
Shukla, S. K., Tiwari, M. K., Wan, H.-D., & Shankar, R. (2010). Optimization of the supply chain network: Simulation, Taguchi, and Psychoclonal algorithm embedded approach. Computers and Industrial
Engineering, 58, 29–39.
Smart, P. K., Tranfield, D., Deasley, P., Levene, R., Rowe, A., & Corley, J. (2003). Integrating “lean” and “high Reliability” Thinking. Proceedings of the Institution of Mechanical Engineers, Part B: Journal of
Engineering Manufacture, 217(5), 733–739. doi:10.1243/095440503322011489
Surrey, U. of. (2012, June 7). Risk Management History. University of Surrey. Retrieved June 7, 2012, from http://portal.surrey.ac.uk/portal/page?_pageid=823,181134&_dad=portal&_schema=PORTAL
Thun, J.-H., Druke, M., & Hoenig, D. (2011). Managing uncertainty - an empirical analysis of supply chain risk management in small and medium-sized enterprises. International Journal of Production Research, Int. J. Prod. Res. (UK), 49(18), 5511–25. doi:10.1080/00207543.2011.563901
Weick, K. E. (1984). Small wins: Redefining the scale of social problems. American Psychologist, 39(1), 40–49. doi:10.1037/0003-066X.39.1.40
Wells, R. F. (2010). Systemic risk management using lean construction methods. 54th Annual Meeting of the
American Association of Cost Engineers International 2010, June 27, 2010 - June 30, 2010, AACE International Transactions (Vol. 2, pp. 1182–1199). Atlanta, GA, United states: Association for the Advancement of Cost Engineering.
Wikipedia - FMEA. (2012, June 16). Failure mode and effects analysis. Wikipedia, the free encyclopedia. Wikimedia Foundation, Inc. Retrieved from http://en.wikipedia.org/w/index.php?title=Failure_mode_and_effects_analysis&oldid=497258478
Wilson, J. L. (2004). Using program management for successful lean transformation. 4th Annual Lean Management
Solutions Conference 2004, September 12, 2004 - September 16, 2004, 4th Annual Lean Management Solutions Conference 2004, Conference Proceedings (Vol. 2004, p. East Carolina University; Missouri Enterprise; North Carolina State University; Operations Concepts, Inc; University of Kentucky). Los Angeles, CA, United states: Institute of Industrial Engineers.
Womack, J. P. (2007). Moving beyond the tool age [Lean management]. Manufacturing Engineer, 86, 4–5.
Womack, J. P., & Jones, D. T. (1996). Lean Thinking, 1st ed.: Banish Waste and Create Wealth in Your
Corporation (1st ed.). Productivity Press.
Womack, J. P., & Jones, D. T. (2003). Lean Thinking, 2nd Ed.: Banish Waste and Create Wealth in Your
Corporation, Revised and Updated (1st ed. published 1996) (2nd ed.). Free Press.
Womack, J. P., Jones, D. T., & Roos, D. (1990). The Machine That Changed the World. Scribner.
A1
Part B: Appendix
1 Suggested Reading for New Practitioners
The Goal: A Process of Ongoing Improvement, (3rd Revised.)Goldratt, E. M., & Cox, J. (2004). North River Pr.
Lean Thinking - 2nd Ed.: Banish Waste and Create Wealth in Your Corporation, Womack, J. P., & Jones, D. T. (2003). Free Press.
Staying Lean - Thriving, Not Just Surviving. Hines, P., Found, P., Griffiths, G., & Harrison, R. (2008). Lean Enterprise Research Centre.
Switch - How to Change Things When Change Is Hard Heath, C., & Heath, D. (2010). (1st ed.). Crown Business.
2 Risk Management Standard, Further Details
2.1 Management Framework AS/NZS ISO 31000
The framework provides the foundation for the embedding of a risk management culture and assists in application of the process. The top of the framework is mandate and commitment required to drive and sustain the effort. It then drives the design of the framework which is implemented, monitored and reviewed for continual improvement.
The framework design incorporates the organisations internal and external contexts, establishing of policy and accountability. Additionally there is the integration, the embedding of risk management into the organisations processes and allocation of appropriate resources e.g. human, technical and personnel development. Further there is requirement for communication and reporting mechanisms internally and externally. It is apparent that the standard writers are conscious of a change process required for establishing risk management in organisations.
2.2 Risk Management Process AS/NZS ISO 31000
The process is specified to be “integral”, “embedded in culture and practice” and “tailored to the business
processes of the organization” (AS/NZS ISO 31000, 2009, p. 13). Similar to the process reviewed earlier it includes: Establishing the context, Risk assessment and treatment and on-going monitoring and review with communication and consultation. The risk assessment itself is broken into:
1. Identification of sources, areas, impacts, and events. 2. Analysis to understand the risk its causes, sources, consequences and likelihoods, confidence
sensitivity and other pertinent factors, 3. Evaluation for assisting the decision making process including risk tolerance of parties.
Treatment options for modifying the risk(s) can be proposed, reviewed and decided upon after an appropriate understanding of the risk case is gained. Treatments are decided on in terms of costs, benefits and detriments. Naturally all stake holders should be involved where possible. Note the on-going emphasis on communication, monitoring and review.
The process and activities should be traceable. Records and recorded processes and procedures provide a basis for continual improvement, similar to standard procedures in Lean itself (Liker, 2004).
3 Additional Tables
See following pages for definition and qualitative analysis of Lean principles and methods.
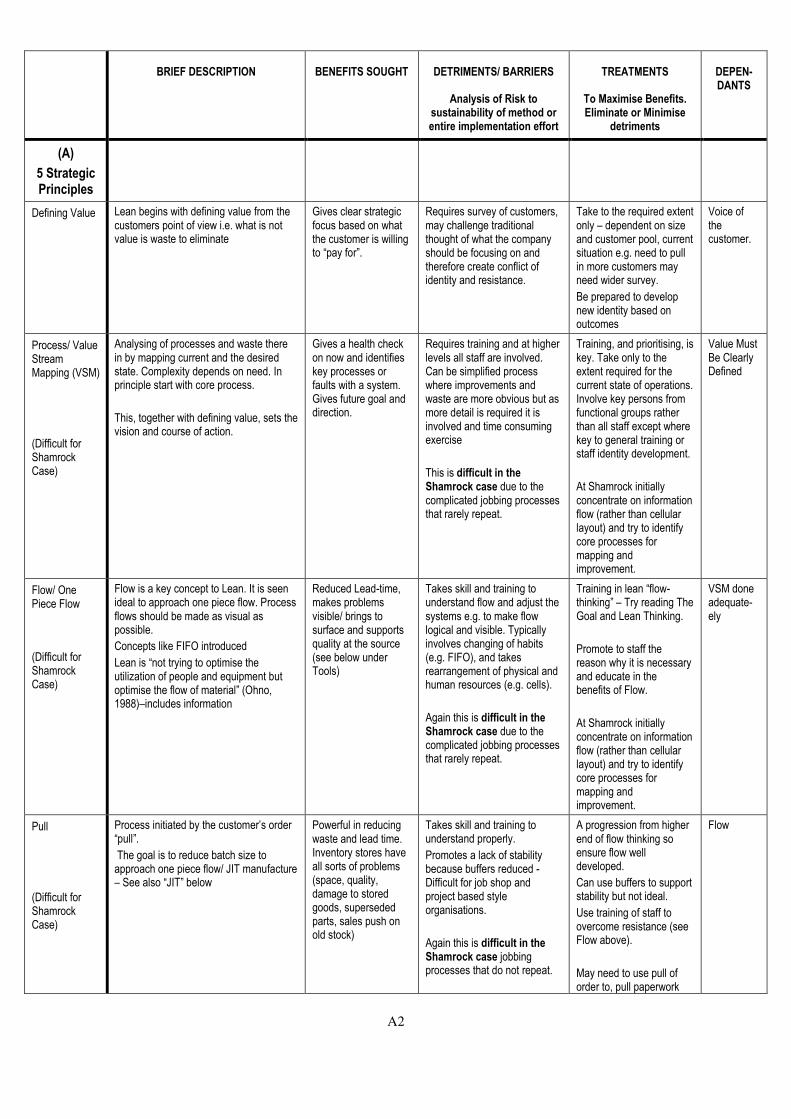
A2
BRIEF DESCRIPTION BENEFITS SOUGHT DETRIMENTS/ BARRIERS
Analysis of Risk to sustainability of method or entire implementation effort
TREATMENTS
To Maximise Benefits. Eliminate or Minimise
detriments
DEPEN-DANTS
(A)
5 Strategic Principles
Defining Value Lean begins with defining value from the customers point of view i.e. what is not value is waste to eliminate
Gives clear strategic focus based on what the customer is willing to “pay for”.
Requires survey of customers, may challenge traditional thought of what the company should be focusing on and therefore create conflict of identity and resistance.
Take to the required extent only – dependent on size and customer pool, current situation e.g. need to pull in more customers may need wider survey.
Be prepared to develop new identity based on outcomes
Voice of the customer.
Process/ Value Stream Mapping (VSM)
(Difficult for Shamrock Case)
Analysing of processes and waste there in by mapping current and the desired state. Complexity depends on need. In principle start with core process.
This, together with defining value, sets the vision and course of action.
Gives a health check on now and identifies key processes or faults with a system. Gives future goal and direction.
Requires training and at higher levels all staff are involved. Can be simplified process where improvements and waste are more obvious but as more detail is required it is involved and time consuming exercise
This is difficult in the Shamrock case due to the complicated jobbing processes that rarely repeat.
Training, and prioritising, is key. Take only to the extent required for the current state of operations. Involve key persons from functional groups rather than all staff except where key to general training or staff identity development.
At Shamrock initially concentrate on information flow (rather than cellular layout) and try to identify core processes for mapping and improvement.
Value Must Be Clearly Defined
Flow/ One Piece Flow
(Difficult for Shamrock Case)
Flow is a key concept to Lean. It is seen ideal to approach one piece flow. Process flows should be made as visual as possible.
Concepts like FIFO introduced
Lean is “not trying to optimise the utilization of people and equipment but optimise the flow of material” (Ohno, 1988)–includes information
Reduced Lead-time, makes problems visible/ brings to surface and supports quality at the source (see below under Tools)
Takes skill and training to understand flow and adjust the systems e.g. to make flow logical and visible. Typically involves changing of habits (e.g. FIFO), and takes rearrangement of physical and human resources (e.g. cells).
Again this is difficult in the Shamrock case due to the complicated jobbing processes that rarely repeat.
Training in lean “flow-thinking” – Try reading The Goal and Lean Thinking.
Promote to staff the reason why it is necessary and educate in the benefits of Flow.
At Shamrock initially concentrate on information flow (rather than cellular layout) and try to identify core processes for mapping and improvement.
VSM done adequate-ely
Pull
(Difficult for Shamrock Case)
Process initiated by the customer’s order “pull”.
The goal is to reduce batch size to approach one piece flow/ JIT manufacture – See also “JIT” below
Powerful in reducing waste and lead time. Inventory stores have all sorts of problems (space, quality, damage to stored goods, superseded parts, sales push on old stock)
Takes skill and training to understand properly.
Promotes a lack of stability because buffers reduced - Difficult for job shop and project based style organisations.
Again this is difficult in the Shamrock case jobbing processes that do not repeat.
A progression from higher end of flow thinking so ensure flow well developed.
Can use buffers to support stability but not ideal.
Use training of staff to overcome resistance (see Flow above).
May need to use pull of order to, pull paperwork
Flow

A3
{See previous page also}
Figure 11 Strategic Principles: Lean Key Principles and Higher Order
Processes Risk Analysis Table (Reference Case Shamrock Industries
Ltd.).
and push material to flow.
Journey to Perfection
Continuous Improvement via PDCA (Plan, do check act cycle) of above steps
Drives continuous improvement
Needs Perseverance/ Sustainability
Build into processes (and culture). Target small wins at the beginning, maintain momentum, and leverage a new staff identity.
Value, VSM, Flow
(B)
Effective Communi-cation Processes
Use of A3 Management, Nemawshi and catchball – i.e. concise reporting and feedback for consensus through simple and effective communication
Consensus reached, staff engaged, vision shared. All contributing to the one goal and vision.
Development of process required –Training in A3 Writing and management. Sustainability and Discipline for communication excess/ getting out of hand
Training, persistence, building into procedures processes and regularity, try weekly meetings, Tailor process to business situation.
(C)
All Staff Kaizen
Lean engages all staff in continuous improvement.
Emergent change from all adding up to significant change. Also positive culture.
Training and engagement of staff required. Meets resistance “not my job description”
Train in techniques and create new identity. Assess whether to remove negative influences among staff

A4
BRIEF DESCRIPTION BENEFITS SOUGHT
DETRIMENTS/ BARRIERS
Analysis of Risk to sustainability of method or entire implementation effort
TREATMENTS
To Maximise Benefits. Eliminate or Minimise
detriments
DEPEND-ANTS
(A)
Lean Methods
5S – Sift, Sort, Sweep, Standardise, Sustain
General organisation, cleanliness, and maintenance.
General efficiency, and basis for on-going improvements
Training required (to low/medium level).
Needs sustainability
Develop new culture and expectation, use visual cues, develop new identity
5 Why’s – root cause analysis
Basic root cause analysis tool, ask Why 5 times. Get to the root of the issue so it does not repeat
Simple effective way of doing root cause analysis and simple way to get people thinking about analysis
Training required (to low level). Once trained if not used and ideas not acted on can be a negative experience, and reason for disinterest and failure inn future.
Find a mechanism to drive root cause analysis of issues/ events and ask why for daily activities. Implement suggestions to get momentum and show commitment (maybe even when not ideal).
Visual Systems
Emphasis on visualisation of flow and systems of control and reporting. Part of 5s, flow and all aspects of Lean.
Visualises processes, make waste visible-
See other aspects e.g. 5s and Flow
See other aspects e.g. 5s and Flow
See other aspects e.g. 5s and Flow
Quality at the Source, Jidoka and Poka Yoke
Quality at source means control is given to the worker at the source of the issue - e.g. on the production line. Jidoka is the respect for humans principle which includes mistake proofing (Poka-Yoke) and in cases extends worker control to even shut down the production line.
Quality problems are not repeated , Engagement of worker,
Training required (to medium/high level).
If ignored - momentum/ morale lost
Make training a priority with key staff and then build training into daily activities
Systems for capturing ideas for poka-yoke and ensuring they get implemented
SMED – Single Minute Exchange of Dies
(Particularly Beneficial to Shamrock)
Reduced setup time for machinery. Only essential internal setups made. External setups preferred to reduce down time.
Setup time down, shorter runs possible and economically viable, enables reduced lead times and ultimately JIT.
(Particularly Beneficial to Shamrock due to short runs)
Training required (to medium/high level). Down time whilst working on improvements.
Make training and kaizen a priority with key staff and then build training into daily activities for others.
Balance and make priorities clear (how much to spend on initiatives versus day job).
Flexible Work Systems
Flexibility of employees and equipment preferred over complicated rigid or automated machinery.
Quick changeover and easily expanded systems, resources where required
Training of staff and their engagement required (to medium level). Loss of specific staff roles and responsibilities.
Communication process for change and benefits. Develop new identity,
TPM - Total Productive Maintenance
Ensuring machines maintained to secure against unnecessary downtime and catastrophic failure – should incorporate continuous improvement also.
Less down time.
Health and safety improved.
Training of staff and their engagement required (to medium-high level).
Skill of staff.
Select right people, train in appropriate skills, and give understanding to staff. (Build new identity)
Kanban Simple tool for replenishment/ pull system. Typically a card (e.g. kanban card) but could be a bin or other identifier that flags for replenishment and specifies details (supplier, qty, location). One rule of kanban is to review its size ( i.e. reduce the buffer towards one piece
Links separated processes together for pseudo flow where ideal flow is not possible.
Needs setup and organisation. Visual systems and no short cuts help to enforce the documented procedures.
5S

A5
flow as part of continuous improvement)
JIT - Just In Time Manufacture.
(Difficult for Shamrock Case)
Goods arrive Just in time for processing or assembly.
WIP and lead time down, quality up.
Lack of stability because buffers removed.
Process takes much planning, training and teething during implementation.
Negative results to culture possible during teething.
Again this is difficult in the Shamrock case with make-to -order jobbing processes.
Suggested to hold finish goods only (in production situations) or push and flow used. Both at pull of order by customer.
Must be well prepared for implementation: Staff training for their understanding and engagement - other process prepared as much as possible - ready for on-going teething internally and with suppliers. – Use pilot and positive staff member willing try. Consider carefully before implementation.
Flow achieved, needs Heijunka (level scheduling)
Heijunka (level schedule) & Takt time (pulse)
(Difficult for Shamrock Case)
Level scheduling is smoothing demand - We include also Takt time here which is easiest understood as average demand in time (e.g. 2 parts per minute or two quotes per day, two invoices per week)
This is key to enable JIT/ one piece flow effectively without excessive idle time or overtime in production.
Difficult in Shamrock scenarios due to high fluctuating demand e.g. job shops make to order and project based manufacture.
Level selling/ marketing. Keeping buffer of finished goods to help (but not parts throughout entire system).
Understand in terms of the specific business and where it is most applicable there.
Flow achieved
(B) Complimentary Methods
Business Systems Software/ Production Control Technology (e.g. ERP)
(Particularly Beneficial to Shamrock)
Interactive IT databases which may incorporate logarithms for scheduling and financial management
Information collaborative reduced data entry and codification of knowledge.
Particularly useful at Shamrock because of high administrative demands on complicated processes and customer requirements
Typically implementation times, culture change, and customisation requirements all extensive. Can be expensive and restrictive.
Ensure the solution is right for your environment (many may be better with simple kanban planning boards and replenishment systems).
Get well prepared and ensure to have the right skill, resources and technical support on hand.
TOC – Theory of Constraints
TOC is in itself a standalone process improvement technique with its own overarching philosophy. It identifies bottlenecks “capacity constrained resources” that need to be targeted to improve flow.
Great for training and supporting flow thinking. Read the book The Goal (Goldratt & Cox, 2004)
Does not implicitly include philosophy and culture of staff engagement and empowerment – typically consultant driven and not sustained as a standalone.
Incorporate for flow training and use as suitable as a complimentary method but be careful to not affect overarching strategy.
Six-sigma Six-sigma is in itself a standalone process improvement technique with its own overarching philosophy. It is most well known as a statistical method of process analysis and improvement,
Fine improvement of processes after basic obvious waste eliminations is
High level training and highly time consuming exercise to use.
Workers can become too
Use and train only as required in the meantime, use VSM and 5 whys for early results.
Other simpler methods exhausted.

A6
{See previous pages}
Figure 12 Methods: Selection of Lean and Complementary Methods
Risk Analysis Table (Reference Case Shamrock Industries Ltd.).
Six-sigma can be applied as a tool within a Lean philosophy
made. narrowly focused on statistical tools when simple problem solving is all that is required.
Related Documents