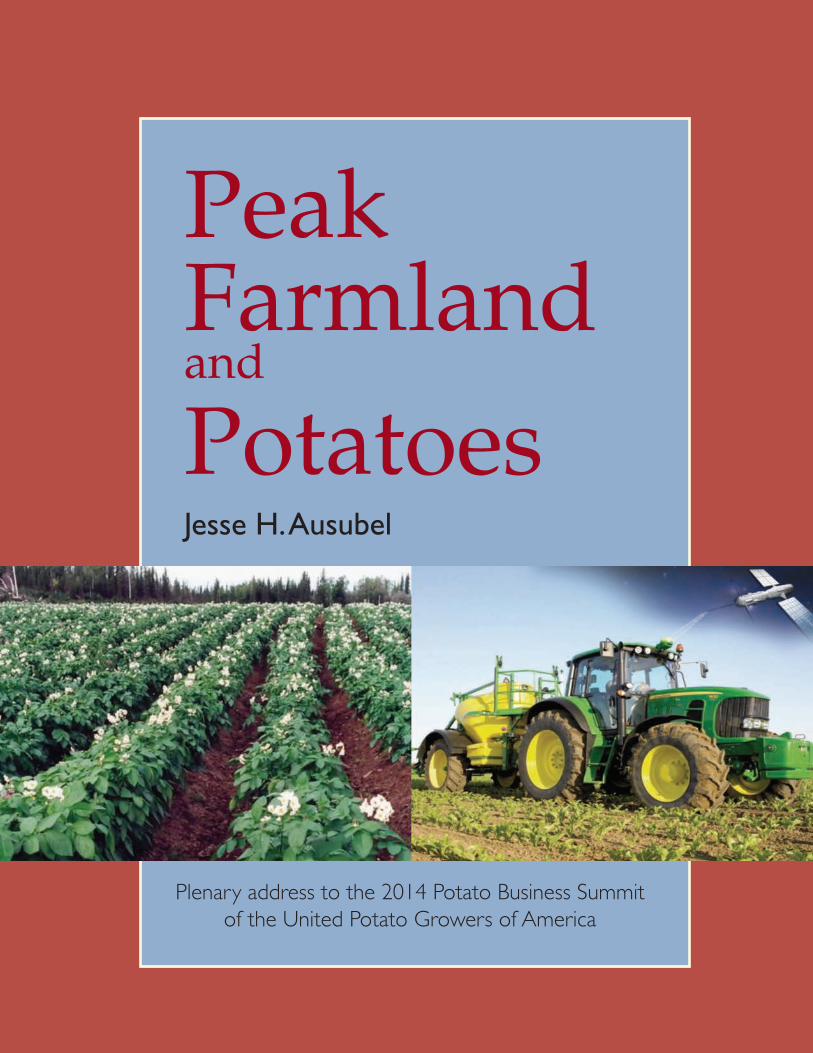
Peak Farmland and Potatoes Jesse H. Ausubel Plenary address to the 2014 Potato Business Summit of the United Potato Growers of America

Welcome message from author
This document is posted to help you gain knowledge. Please leave a comment to let me know what you think about it! Share it to your friends and learn new things together.
Transcript
Peak Farmland and
PotatoesJesse H. Ausubel
Plenary address to the 2014 Potato Business Summit of the United Potato Growers of America

2
Peak Farmland and Potatoes
This essay is based on a plenary address to the 2014 Potato Business Summit of the United Potato Growers of America. Thanks to Jerry Wright for the invitation to participate in the Summit, my close collaborators Paul E. Waggoner (Connecticut Agricultural Experiment Station) and Iddo K. Wernick and Alan S. Curry (Rockefeller University) for their help in preparing this essay, and H. Dale Langford for editorial assistance.
Jesse H. Ausubel is the director of the Program for the Human Environment at The Rockefeller University in New York City, http://phe.rockefeller.edu.
Photo credits
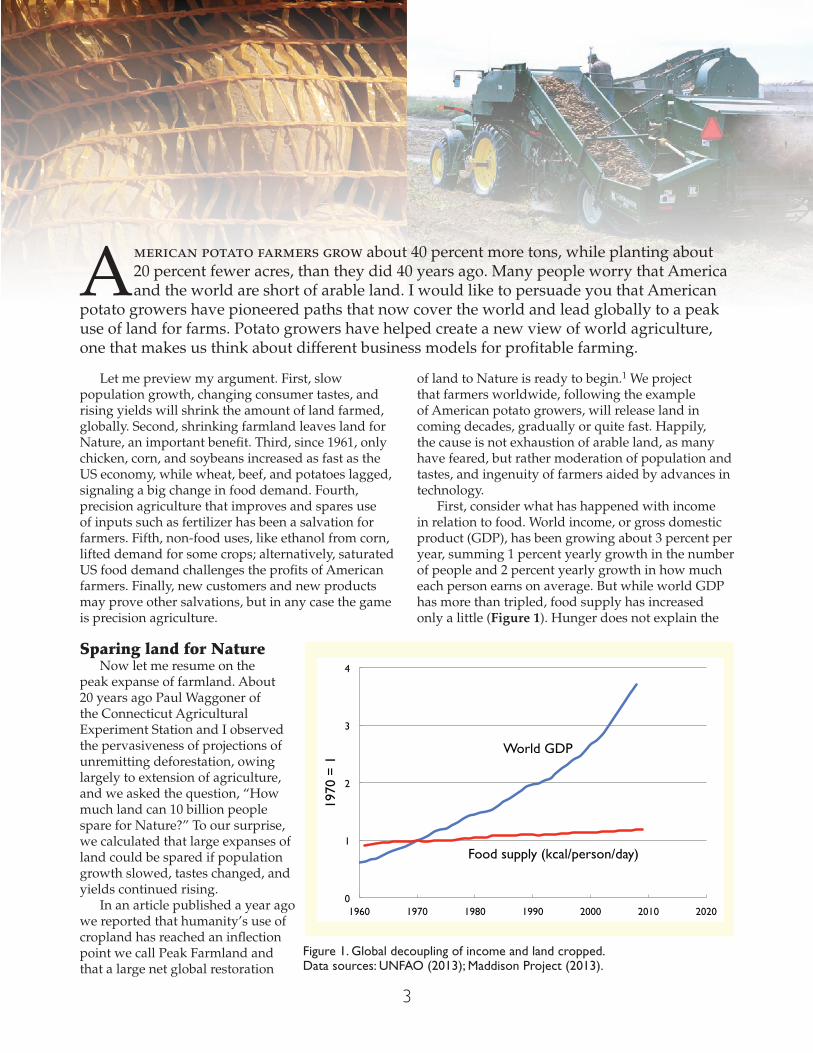
Page 1, left: white potato flowers in field. http://uafcornerstone.net/potato-farm-is-a-thousand-acres-of-happiness/. Photo courtesy of Ebbesson Farms. “Ebbesson Farms potato fields are a work of art in the summer.”Page 1, right image source: Tractor with satellite. http://www.farmdataweb.com/.Page 2, left: Sack of potatoes, public domain.Page 2, right: Potato harvester, Idaho Farm Bureau.Page 11: Potato collage, Wikimedia Commons.
Suggested citation:
Ausubel, Jesse H. 2014. “Peak Farmland and Potatoes.” Plenary address to the 2014 Potato Business Summit of the United Potato Growers of America, San Antonio, 8 January 2014. http://phe.rockefeller.edu/docs/Peak Farmland and Potatoes.pdf.
3
0
1
2
3
4
1960 1970 1980 1990 2000 2010 2020
1970
= 1
Food supply (kcal/person/day)
World GDP
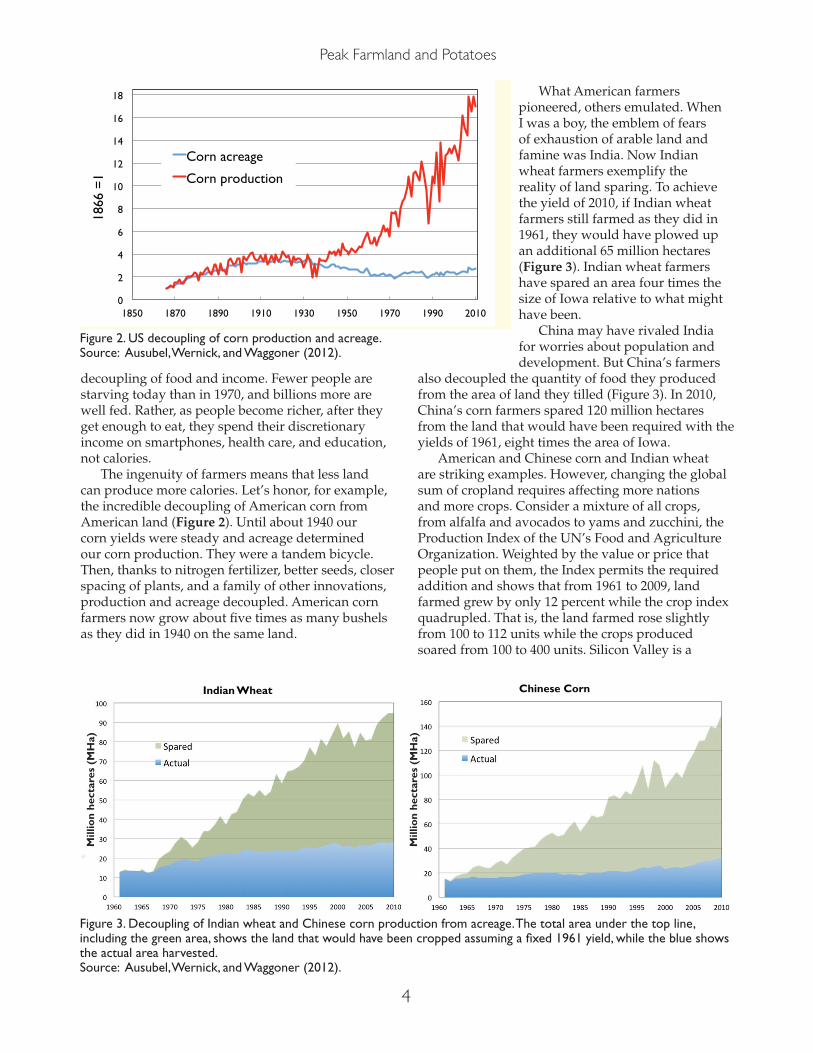
Figure 1. Global decoupling of income and land cropped. Data sources: UNFAO (2013); Maddison Project (2013).
American potato farmers grow about 40 percent more tons, while planting about 20 percent fewer acres, than they did 40 years ago. Many people worry that America and the world are short of arable land. I would like to persuade you that American
potato growers have pioneered paths that now cover the world and lead globally to a peak use of land for farms. Potato growers have helped create a new view of world agriculture, one that makes us think about different business models for profitable farming.
Let me preview my argument. First, slow population growth, changing consumer tastes, and rising yields will shrink the amount of land farmed, globally. Second, shrinking farmland leaves land for Nature, an important benefit. Third, since 1961, only chicken, corn, and soybeans increased as fast as the US economy, while wheat, beef, and potatoes lagged, signaling a big change in food demand. Fourth, precision agriculture that improves and spares use of inputs such as fertilizer has been a salvation for farmers. Fifth, non-food uses, like ethanol from corn, lifted demand for some crops; alternatively, saturated US food demand challenges the profits of American farmers. Finally, new customers and new products may prove other salvations, but in any case the game is precision agriculture.
Sparing land for NatureNow let me resume on the
peak expanse of farmland. About 20 years ago Paul Waggoner of the Connecticut Agricultural Experiment Station and I observed the pervasiveness of projections of unremitting deforestation, owing largely to extension of agriculture, and we asked the question, “How much land can 10 billion people spare for Nature?” To our surprise, we calculated that large expanses of land could be spared if population growth slowed, tastes changed, and yields continued rising.
In an article published a year ago we reported that humanity’s use of cropland has reached an inflection point we call Peak Farmland and that a large net global restoration
of land to Nature is ready to begin.1 We project that farmers worldwide, following the example of American potato growers, will release land in coming decades, gradually or quite fast. Happily, the cause is not exhaustion of arable land, as many have feared, but rather moderation of population and tastes, and ingenuity of farmers aided by advances in technology.
First, consider what has happened with income in relation to food. World income, or gross domestic product (GDP), has been growing about 3 percent per year, summing 1 percent yearly growth in the number of people and 2 percent yearly growth in how much each person earns on average. But while world GDP has more than tripled, food supply has increased only a little (Figure 1). Hunger does not explain the
4
Peak Farmland and Potatoes
decoupling of food and income. Fewer people are starving today than in 1970, and billions more are well fed. Rather, as people become richer, after they get enough to eat, they spend their discretionary income on smartphones, health care, and education, not calories.
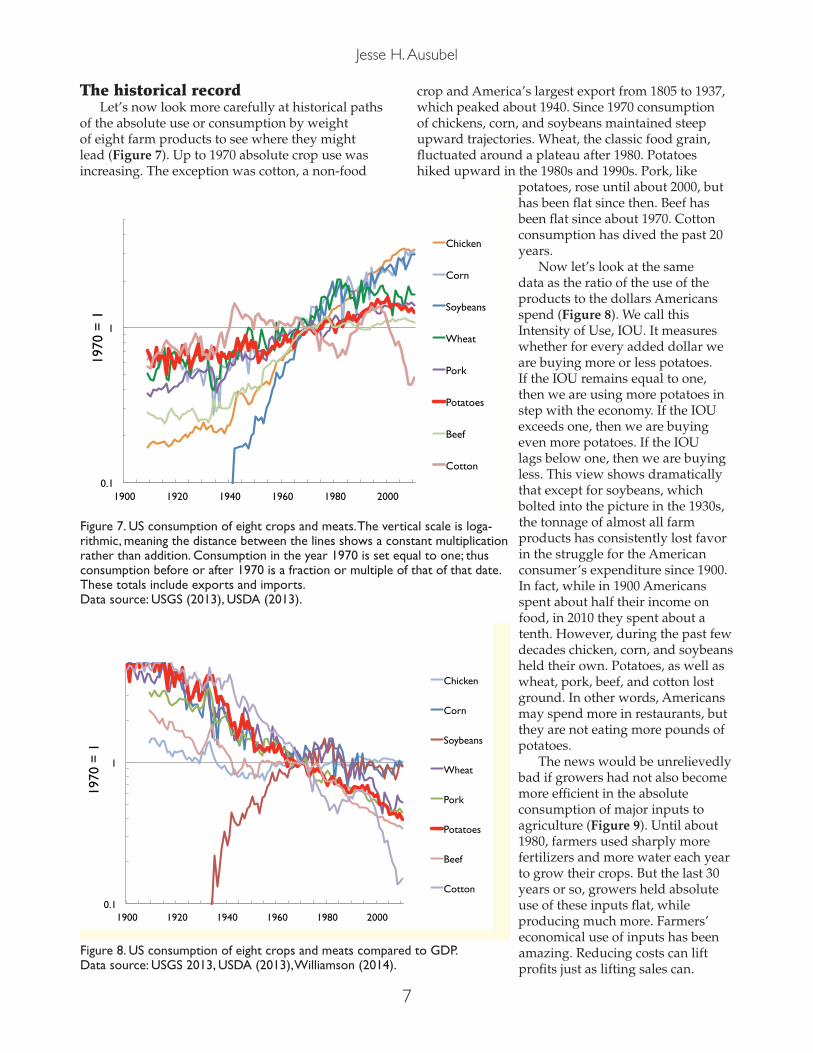
The ingenuity of farmers means that less land can produce more calories. Let’s honor, for example, the incredible decoupling of American corn from American land (Figure 2). Until about 1940 our corn yields were steady and acreage determined our corn production. They were a tandem bicycle. Then, thanks to nitrogen fertilizer, better seeds, closer spacing of plants, and a family of other innovations, production and acreage decoupled. American corn farmers now grow about five times as many bushels as they did in 1940 on the same land.
What American farmers pioneered, others emulated. When I was a boy, the emblem of fears of exhaustion of arable land and famine was India. Now Indian wheat farmers exemplify the reality of land sparing. To achieve the yield of 2010, if Indian wheat farmers still farmed as they did in 1961, they would have plowed up an additional 65 million hectares (Figure 3). Indian wheat farmers have spared an area four times the size of Iowa relative to what might have been.
China may have rivaled India for worries about population and development. But China’s farmers
also decoupled the quantity of food they produced from the area of land they tilled (Figure 3). In 2010, China’s corn farmers spared 120 million hectares from the land that would have been required with the yields of 1961, eight times the area of Iowa.
American and Chinese corn and Indian wheat are striking examples. However, changing the global sum of cropland requires affecting more nations and more crops. Consider a mixture of all crops, from alfalfa and avocados to yams and zucchini, the Production Index of the UN’s Food and Agriculture Organization. Weighted by the value or price that people put on them, the Index permits the required addition and shows that from 1961 to 2009, land farmed grew by only 12 percent while the crop index quadrupled. That is, the land farmed rose slightly from 100 to 112 units while the crops produced soared from 100 to 400 units. Silicon Valley is a
Indian Wheat Chinese Corn
Mill
ion
hect
ares
(M
Ha)
Mill
ion
hect
ares
(M
Ha)
Figure 3. Decoupling of Indian wheat and Chinese corn production from acreage. The total area under the top line, including the green area, shows the land that would have been cropped assuming a fixed 1961 yield, while the blue shows the actual area harvested. Source: Ausubel, Wernick, and Waggoner (2012).
Figure 2. US decoupling of corn production and acreage. Source: Ausubel, Wernick, and Waggoner (2012).
0
2
4
6
8
10
12
14
16
18
1850 1870 1890 1910 1930 1950 1970 1990 2010
1866
=1
Corn acreage
Corn production

5
Jesse H. Ausubel
popular symbol of technological progress, but for me Corn Valley or Potato Valley would be equally valid symbols.
The rising production allowed global daily food supply to grow by more than a quarter from 2,200 to 2,800 kilocalories per person. Without lifting crop production per hectare, farmers would have needed about 3 billion more hectares, approximating the combined land area of the United States, Canada, and China. The expanded cropland would have come at the expense of forest and grassland as well as the wildlife and other environmental goods associated with land left little disturbed.
I celebrate what farmers have done to spare Nature, but of course other actors also affect the amount of land cropped. In my view the main actors are parents changing population, workers changing affluence, consumers changing the diet (more or less calories, more or less meat) and also the portion of crops entering the food supply (corn can fuel people or cars), and farmers changing the crop production per hectare of cropland (yield).
With regard to population, most experts now project slow global growth, 1 percent or less, a sum of declines in Europe, Japan, and even China, and growth in Nigeria, Pakistan, and some other poor nations. Affluence grows variably, but over the long span the rate averages only about 1.5 to 2 percent per year, though workers wish for more and politicians certainly promise more. So, people and their money are likely to demand, in the long run, only 2 to 3 percent more each year.
Affluence and food consumptionA familiar rule wisely states that per capita
consumption of staples does not rise in step with affluence and tempers the rise of food consumption. The most land of course is used for staples, especially wheat, corn, rice, and soy. The response to wealth is caught between the limits of starvation below about 2,000 kilocalories per person per day and obesity near 4,000. We can supersize a market, but not for long.
Meat consumption, more than caloric consumption, rises with affluence. Consumers may spend more in restaurants, and they may eat more meat and spend more per potato, but not eat more pounds of potatoes. Satiation will relieve a considerable portion of upward pressure of population and affluence on cropland expansion. Wallis Simpson, the one-time American Duchess of Windsor, famously remarked, “You can never be too rich or too thin,” and some evidence suggests that style now favors diets leaner in calories and meats.
The second choice for consumers is whether to demand non-food products from land. Historically, non-food agricultural products included cotton and
flax for clothing, hemp for rope, tobacco for smoking, and hay to fuel horses and other farm animals. Farmers are always searching for profitable crops.
During the most recent 15 years, the rise of crop production surprised me by fast outdistancing the improvement of food supply. Hearing the clamor against ethanol subsidies in the US and expanding palm oil plantations in the tropics, and knowing the expense and water consumption of alcohol distillation, I foresee a fall in non-food crops or perhaps only a moderate rate of increase. That does allow a considerable but steady production of biofuel. And rum, bourbon, and vodka.
Swelling yield, shrinking farmlandCan the remarkable rise of yields and fall of land
area farmed per unit of crop production continue? A comparison of the years between 1961 and 2010 and the more recent interval 1995 and 2010 displays a reassuring continuation of the rising yields and sparing of cropland. In 2013, the National Corn Growers Association reported that corn farmer David Hula in Virginia grew a record 454 bushels per acre.2 Wow! Comparably, in 1970, the average North American potato farm yielded 216 cwt per acre. Today in some areas, growers produce 880 cwt per acre.
Globally, I conservatively project a yield growth for all crops of about 1.7 percent per year, a little slower than global corn growers the past 30 years and a little faster than the 1.5 percent growth of US potato yields. Annual improvement of 1.7 percent sustained to 2060 would multiply world production per area by 2.3 times. For corn, the average global yield in 2060 would resemble the average US yield in 2010.
Despite some cautions, for Nature a clear, hopeful view of sparing land remains (Figure 4). With conservative assumptions, the world outlook is a net reduction in use of arable land in about 50 years totaling 10 times the area of Iowa, and shrinking global cropland to the level of 1960. If electric or natural gas vehicles win in the market and spoil the car market for corn, soy, and sugar cane, the drop could be much larger. Land prices as well as land farmed might fall.
To summarize, our analyses over the past 20 years witness food production decoupling from land. For millennia food production tended to grow in tandem with land used for crops. Now land for food is flat. I believe humanity now stands at peak use of farmland, and the 21st century will see release of vast areas of land, hundreds of millions of hectares, many Iowas, for Nature. With this background, let’s look how potatoes compete for the US market.
Potato growers compete head to head with all other growers of food (Figure 5). In 2011, you

6
Peak Farmland and Potatoes
grew 13 million tons of potatoes. The 314 million tons of corn and 84 million tons of soybeans overshadow the 54 million tons of wheat and dwarf the smaller tonnages of rice and meats, as well as potatoes.
But the productivity of potato growers exceeds that implied by the tons. You grow four to five times as many tons per acre as corn growers grow corn. For calories, the ratio is smaller, but still from the perspective of acres saved, potatoes are a deeply green crop. Pure starch may be white, but I consider potato starch green. Your land sparing makes the potato an ecological champion.
A dynamic view shows how fast GDP and eight agricultural food products rose on average during the half century from 1961 to 2011 (Figure 6). Notably, chicken outpaced GDP, meaning that people added chicken to their meals faster than affluence rose, probably a consequence of the low price of chicken and its efficient conversion of costly feed to meat. The tons of cereal grains and soybean meal that go into poultry are not “chicken feed.”
In fact, the multipurpose crop, soybeans, rose about as fast as GDP, and corn, of which nearly half the crop was converted to ethanol for fuel, also rose swiftly. The staples of potatoes and wheat and high protein beef and pork lagged behind GDP.
0.0%
0.5%
1.0%
1.5%
2.0%
2.5%
3.0%
3.5%
4.0%
GDP Chicken Soybeans Corn Rice Pork Wheat Beef Potatoes
%/y
ear
Figure 6. How fast US GDP and tons of eight crops and meats rose on average from 1961 to 2011. Data source: UNFAO (2013).
0.0
0.5
1.0
1.5
2.0
2.5
3.0
3.5
Potatoes Maize Soybeans Wheat Chicken Beef Pork Rice
Hun
dred
mill
ion
tons
Figure 5. Selected US crops and meats produced 2011. Data sources: US Bureau of the Census (1975, 2012).
0
200
400
600
800
1000
1200
1400
1600
1800
1960 1980 2000 2020 2040 2060M
illio
n he
ctar
es (
MH
a) data 1961-2009
Projection 2010-60 (base case)
Projection 2010-60 (alternative)
Figure 4. The gradual actual rise of global arable land 1961 to 2009 to the present peak and projections to 2060. The sharper drop assumes, for example, diminishing preference for biofuels and/or meat. Source: Ausubel, Wernick, and Waggoner (2012).
7
Jesse H. Ausubel
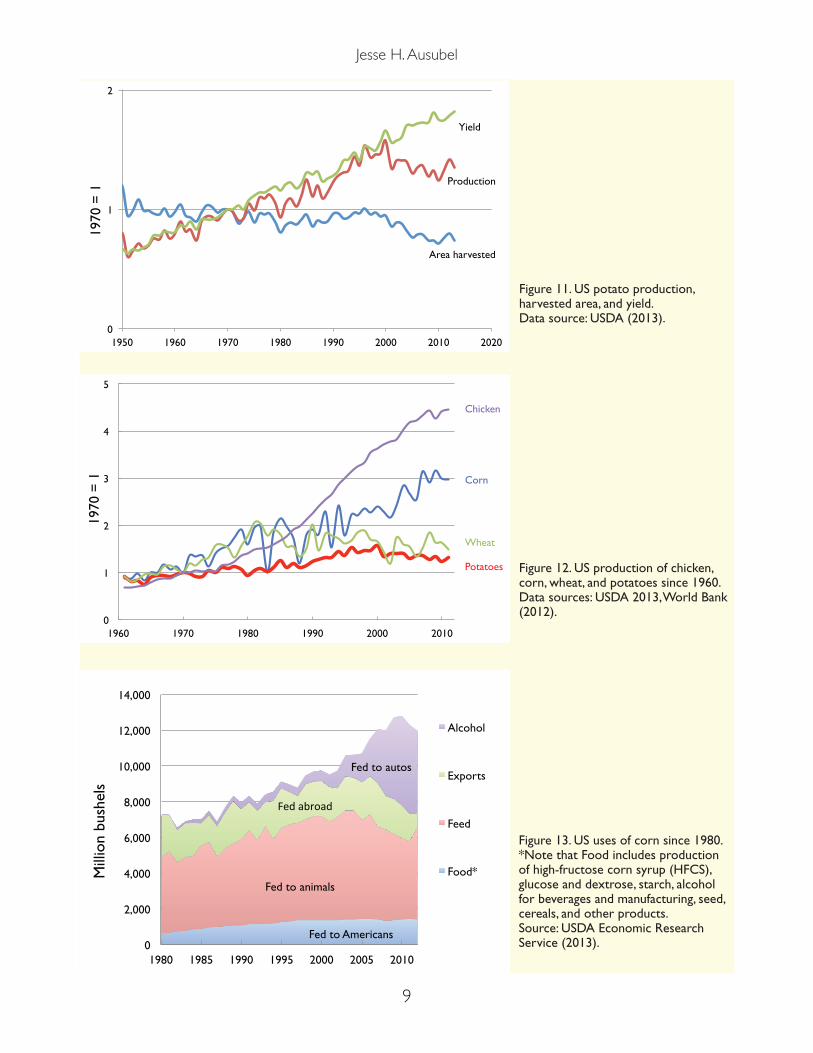
The historical recordLet’s now look more carefully at historical paths
of the absolute use or consumption by weight of eight farm products to see where they might lead (Figure 7). Up to 1970 absolute crop use was increasing. The exception was cotton, a non-food
crop and America’s largest export from 1805 to 1937, which peaked about 1940. Since 1970 consumption of chickens, corn, and soybeans maintained steep upward trajectories. Wheat, the classic food grain, fluctuated around a plateau after 1980. Potatoes hiked upward in the 1980s and 1990s. Pork, like
potatoes, rose until about 2000, but has been flat since then. Beef has been flat since about 1970. Cotton consumption has dived the past 20 years.
Now let’s look at the same data as the ratio of the use of the products to the dollars Americans spend (Figure 8). We call this Intensity of Use, IOU. It measures whether for every added dollar we are buying more or less potatoes. If the IOU remains equal to one, then we are using more potatoes in step with the economy. If the IOU exceeds one, then we are buying even more potatoes. If the IOU lags below one, then we are buying less. This view shows dramatically that except for soybeans, which bolted into the picture in the 1930s, the tonnage of almost all farm products has consistently lost favor in the struggle for the American consumer’s expenditure since 1900. In fact, while in 1900 Americans spent about half their income on food, in 2010 they spent about a tenth. However, during the past few decades chicken, corn, and soybeans held their own. Potatoes, as well as wheat, pork, beef, and cotton lost ground. In other words, Americans may spend more in restaurants, but they are not eating more pounds of potatoes.
The news would be unrelievedly bad if growers had not also become more efficient in the absolute consumption of major inputs to agriculture (Figure 9). Until about 1980, farmers used sharply more fertilizers and more water each year to grow their crops. But the last 30 years or so, growers held absolute use of these inputs flat, while producing much more. Farmers’ economical use of inputs has been amazing. Reducing costs can lift profits just as lifting sales can.
0.1
1
1900 1920 1940 1960 1980 2000
1970
= 1
Chicken
Corn
Soybeans
Wheat
Pork
Potatoes
Beef
Cotton
Figure 7. US consumption of eight crops and meats. The vertical scale is loga-rithmic, meaning the distance between the lines shows a constant multiplication rather than addition. Consumption in the year 1970 is set equal to one; thus consumption before or after 1970 is a fraction or multiple of that of that date. These totals include exports and imports. Data source: USGS (2013), USDA (2013).
0.1
1
1900 1920 1940 1960 1980 2000
1970
= 1
Chicken
Corn
Soybeans
Wheat
Pork
Potatoes
Beef
Cotton
Figure 8. US consumption of eight crops and meats compared to GDP. Data source: USGS 2013, USDA (2013), Williamson (2014).

8
Peak Farmland and Potatoes
Above all, you have been substituting information for material inputs through precision agriculture while sparing use of energy, nitrogen, and other materials. Precision agriculture includes improved weather forecasts, seeds, spacing of plants, applications of herbicides and pesticides, precision irrigation, and GIS-based machinery, all integrated by farmers working smarter. Basically the strategy for high yields is more information going into agriculture, that is, more bits, not more gallons or tons. Reducing losses through improved storage and processing also spares land. The land spared can be devoted to other crops, become habitat for wildlife, or, for those who worry about climate change, more trees to store carbon.
Importantly, sparing land usually means sparing water. Water weighs heavily in potatoes. A great achievement of Americans during the past 30 plus years is to hold national water withdrawals flat (Figure 10). During this interval our population rose by 80 million, the economy measured by GDP multiplied two and a half times, and tons of corn and soybeans rose 300 percent, wheat 60 percent, and potatoes 25 percent. Growers get more value from each gallon of water. In the West, of course, water is especially precious, and incentives to spare even more water remain strong.
We can summarize the impressive achievement of potato famers as steeply rising yields, sparing land, and lifting total production (Figure 11).
Now let’s try to understand the difference between the group of products that rose fast, such as chickens and corn, and those that rose slowly or plateaued, such as wheat and potatoes (Figure 12). In addition to chicken’s noted efficiency at converting feed to meat, we also have seen the decline of beef and flattening of pork production. Basically chickens have come out on top in the meat pecking order, thanks to efficient growers and clever products, such as wings and tenders.
Corn growers’ strategy has been to find new and often indirect markets. Americans eat directly only the thin blue slice at the bottom (Figure 13). Most goes into cattle, pigs, and recently, cars. I wonder if king corn will follow the trail of king cotton, and lose non-food markets to cheaper synthetics and perhaps meat markets to changing tastes. And what becomes of those dedicated acres?
0.1
1
10
1940 1960 1980 2000
Total waterwithdrawal
Water intensityof use
Figure 10. Total US water withdrawals, 1940 to 2010. Agricultural consumption of water has been flat since about 1975 while yield increases for corn and soybeans exceeded 300%, wheat 60%, and potatoes 25%. Data source: USGS (2013), and Williamson (2014).
0.1
1
1900 1920 1940 1960 1980 2000
1970
= 1
Nitrogen (Ammonia)
Potash
Phosphate Rock
Water
Cropland
Figure 9. US consumption of five agricultural inputs. More efficient and precise use of inputs shaves cost and raises profit. Data source: USGS (2013), USDA (2013).
9
Jesse H. Ausubel
0
1
2
1950 1960 1970 1980 1990 2000 2010 2020
1970
= 1
Area harvested
Production
Yield
Figure 11. US potato production, harvested area, and yield. Data source: USDA (2013).
0
1
2
3
4
5
1960 1970 1980 1990 2000 2010
1970
= 1
Chicken
Corn
Wheat
Potatoes Figure 12. US production of chicken, corn, wheat, and potatoes since 1960. Data sources: USDA 2013, World Bank (2012).
0
2,000
4,000
6,000
8,000
10,000
12,000
14,000
1980 1985 1990 1995 2000 2005 2010
Mill
ion
bush
els
Alcohol
Exports
Feed
Food*Fed to animals
Fed to autos
Fed to Americans
Fed abroad
Figure 13. US uses of corn since 1980. *Note that Food includes production of high-fructose corn syrup (HFCS), glucose and dextrose, starch, alcohol for beverages and manufacturing, seed, cereals, and other products. Source: USDA Economic Research Service (2013).
10
Peak Farmland and Potatoes
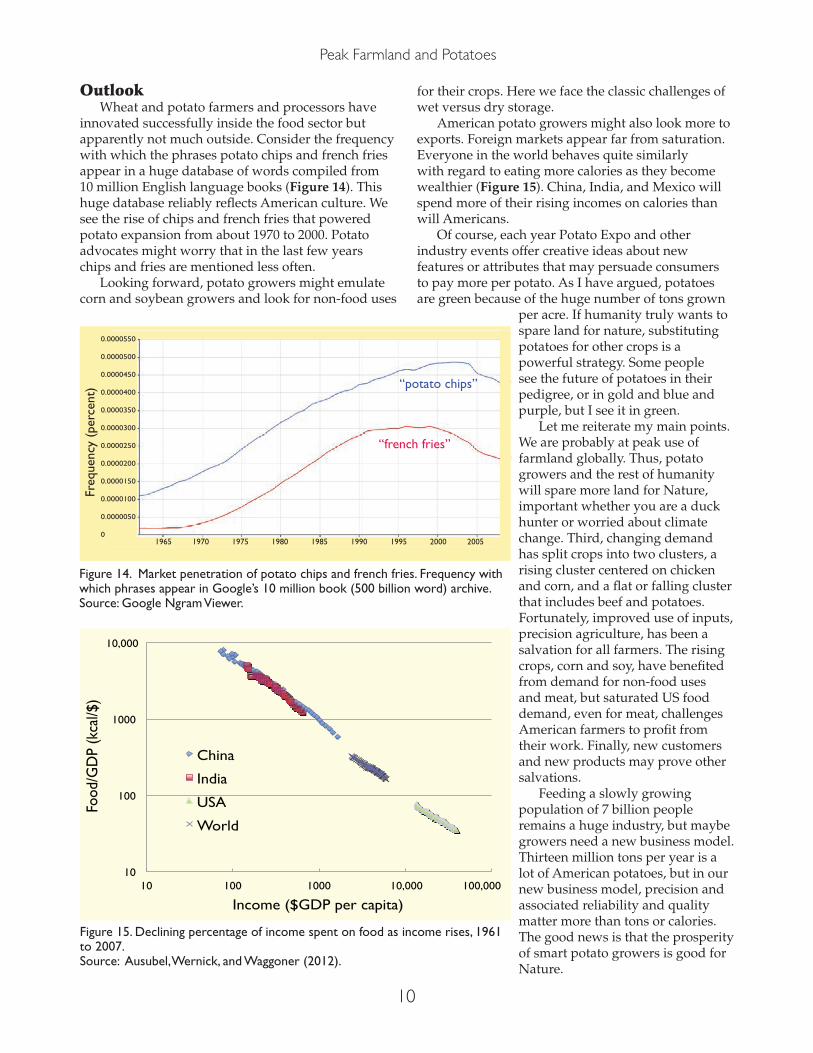
OutlookWheat and potato farmers and processors have
innovated successfully inside the food sector but apparently not much outside. Consider the frequency with which the phrases potato chips and french fries appear in a huge database of words compiled from 10 million English language books (Figure 14). This huge database reliably reflects American culture. We see the rise of chips and french fries that powered potato expansion from about 1970 to 2000. Potato advocates might worry that in the last few years chips and fries are mentioned less often.
Looking forward, potato growers might emulate corn and soybean growers and look for non-food uses
for their crops. Here we face the classic challenges of wet versus dry storage.
American potato growers might also look more to exports. Foreign markets appear far from saturation. Everyone in the world behaves quite similarly with regard to eating more calories as they become wealthier (Figure 15). China, India, and Mexico will spend more of their rising incomes on calories than will Americans.
Of course, each year Potato Expo and other industry events offer creative ideas about new features or attributes that may persuade consumers to pay more per potato. As I have argued, potatoes are green because of the huge number of tons grown
per acre. If humanity truly wants to spare land for nature, substituting potatoes for other crops is a powerful strategy. Some people see the future of potatoes in their pedigree, or in gold and blue and purple, but I see it in green.
Let me reiterate my main points. We are probably at peak use of farmland globally. Thus, potato growers and the rest of humanity will spare more land for Nature, important whether you are a duck hunter or worried about climate change. Third, changing demand has split crops into two clusters, a rising cluster centered on chicken and corn, and a flat or falling cluster that includes beef and potatoes. Fortunately, improved use of inputs, precision agriculture, has been a salvation for all farmers. The rising crops, corn and soy, have benefited from demand for non-food uses and meat, but saturated US food demand, even for meat, challenges American farmers to profit from their work. Finally, new customers and new products may prove other salvations.
Feeding a slowly growing population of 7 billion people remains a huge industry, but maybe growers need a new business model. Thirteen million tons per year is a lot of American potatoes, but in our new business model, precision and associated reliability and quality matter more than tons or calories. The good news is that the prosperity of smart potato growers is good for Nature.
10
100
1000
10,000
10 100 1000 10,000 100,000
Food
/GD
P (k
cal/$
)
Income ($GDP per capita)
China
India
USA
World
Figure 15. Declining percentage of income spent on food as income rises, 1961 to 2007. Source: Ausubel, Wernick, and Waggoner (2012).
“french fries”
“potato chips”
1965 1970 1975 1980 1985 1990 1995 2000 2005
0.0000550
0.0000500
0.0000450
0.0000400
0.0000350
0.0000300
0.0000250
0.0000200
0.0000150
0.0000100
0.0000050
0
Freq
uenc
y (p
erce
nt)
Figure 14. Market penetration of potato chips and french fries. Frequency with which phrases appear in Google’s 10 million book (500 billion word) archive.Source: Google Ngram Viewer.

11
Jesse H. Ausubel
Notes1. Ausubel, J.H., I.K. Wernick, and P.E. Waggoner. “Peak Farmland and the Prospect for Land Sparing,”
Population and Development Review 38(Supplement): 217–238, 2012. http://phe.rockefeller.edu/docs/Peak%20Farmland%202013.pdf.
2. “New corn record: NCGA announces 454 BPA yield,” The Progressive Farmer, 20 December 2013. http://farmindustrynews.com/david-hula-breaks-corn-yield-world-record.
SourcesAusubel, J.H., I.K. Wernick, and P.E. Waggoner.
2012. “Peak farmland and the prospect for land sparing,” Population and Development Review 38 (Supplement): 217–238.
Maddison Project. 2013. Groningen Growth and Development Centre, University of Groningen. http://www.ggdc.net/maddison/maddison-project/home.htm (accessed 2/2/14).
United Nations Food and Agriculture Organization (UNFAO). 2013. FAOStat database. FAOStat provides time-series and cross sectional data relating to food and agriculture for some 200 countries. Accessed 2/2/14 at http://faostat.fao.org/site/452/default.aspx (for population), http://faostat.fao.org/site/339/default.aspx (for production), http://faostat.fao.org/site/609/default.aspx#ancor (for food supply), http://faostat.fao.org/site/612/default.aspx#ancor (for crop PIN), http://faostat.fao.org/site/377/default.aspx#ancor (for land).
United States Bureau of the Census. 1975. “Acreage, production, price, and stocks for selected crops,” Series K 502–516 in Historical Statistics of the United States, Colonial Times to 1970. Washington, DC: US Government Printing Office. http://www2.census.gov/prod2/statcomp/documents/Ct1970p1-01.pdf (accessed 2/2/14).
United States Bureau of the Census. 2012. Statistical Abstract of the United States. Web site of US Bureau of the Census, statistics from the eighteenth century to the present, http://www.census.gov/prod/www/abs/statab.html (accessed 2/2/14).
United States Department of Agriculture (USDA). 2013. Web site of the National Agriculture Statistics Service, http://www.nass.usda.gov/ (accessed 2/2/14).
United States Department of Agriculture (USDA). 2013. Web site of the Economic Research Service, http://www.ers.usda.gov/ (accessed 2/2/14).
United States Geological Survey (USGS), Mineral Information Division. 2013. US Geological Survey Data Series 140 (Supersedes Open-File Report 01-006) Historical Statistics for Mineral and Material Commodities in the United States, http://minerals.usgs.gov/ds/2005/140/#data.
Williamson, S.H. 2014. “What was the U.S. GDP then?” MeasuringWorth. http://www.measuringworth.org/usgdp/ (accessed 2/3/14).
World Bank. 2012. World Databank. http://databank.worldbank.org/ddp/home.do?Step=1&id=4# (accessed 2/2/14).
Related Documents