Draft for Comments. September 11, 2007 Peace, Progress and Prosperity in the Northeastern Region: Vision 2020 Volume I M. Govinda Rao Rita Pandey Alakesh Barua Manoj Pant Anuradha Bhasin Gautam Naresh Research Associates C. G. Hariprasad. Monica Jaitley. Sambit Rath. Santosh K. Das. Shailender K. Hooda. V. K. Priya. National Institute of Public Finance and Policy, New Delhi.

Welcome message from author
This document is posted to help you gain knowledge. Please leave a comment to let me know what you think about it! Share it to your friends and learn new things together.
Transcript
Draft for Comments. September 11, 2007
Peace, Progress and Prosperity in the Northeastern Region: Vision 2020
Volume I
M. Govinda Rao Rita Pandey
Alakesh Barua Manoj Pant
Anuradha Bhasin Gautam Naresh
Research Associates
C. G. Hariprasad. Monica Jaitley. Sambit Rath.
Santosh K. Das. Shailender K. Hooda.
V. K. Priya.
National Institute of Public Finance and Policy, New Delhi.
ii
Contents
Preface iii Acronyms v I.. A Summary and a Starting Point. 1 a. Introduction. 1 b. Vision 2020: Ushering in Peace and Prosperity 3 c. Challenges and Strategy. 4 II. Northeastern Region: Economic, Social and Demographic Profile 6 III. Progress to Peace and Prosperity. 12 a. Catching up with the rest of the country 12 b. Structural transformation 13 c. Poverty Alleviation. 16 d. Harnessing resources for the benefit of the people 16 e. Human development and capacity building 17 f. Strengthening infrastructure 18 g. Creating a centre for trade and commerce 19 h. Effective governance: establishing peace and harmony 20 IV. Realising the Vision: The New Development Strategy 21 a. Components of development strategy 21 b. Participatory development 23 c. Building capacity for participatory development 28 d. Strengthening infrastructure and connectivity 30 e. Raising resources for development 33 f. Creating responsive administration 35 V. Converting Dreams into Reality 37 References 38
iii
Preface
History, geography and politics factors have contrived to cast the Northeastern region a far away land, remote, isolated and surrounded by intimidating and unsympathetic environment. Despite richly endowed in resources, the region has slipped into the category of what is called “backward” and “lagging”. If the partition of the country made it a remote frontier connected to the mainland by a narrow 22 km Siliguri corridor and caused economic, social and political isolation, tendency to assert independent “nationalities” and identities from rising ethno-cultural consciousness of various groups has led to a climate of violence, lawlessness and insurgency. Te climate of inhospitable neighbourhood and pressures from unregulated migration form neighbouring countries – particularly Bangladesh, have added to the tension. Unresponsive administration and weak governance systems have only added fuel to the fire. All the above and remoteness from the markets combined with poor infrastructure and weak governance have shied away the private investments creating a stagnant economy.
People of the region would like to have peace and progress towards prosperity and happiness. They too aspire to see themselves as a peaceful, strong and confident region. They would also like to march on the path of economic, social and cultural progress. They would like to see every family in the region having opportunities for a secure living and future with dignity and self respect. Moving far away from the dependency syndrome, where the people have to seek and look up to the gratis from the distant land, the people in the region would like to acquire confidence and capabilities to shape their own destinies. They would like to enjoy their freedoms – freedom from hunger and poverty, freedom of choice in their avocations and income earning and spending decisions and political, economic and social freedoms in the larger sense of the term without any fear or favour. They would like to achieve economic prosperity and engage in global competition while retaining their distinct and rich regional and ethnic identities.
All these require a vision and a development strategy to realise it. Therefore, the department of the Northeastern Region entrusted the task of preparing the Vision 2020 document for the region to NIPFP. The document was required to draw up the design and implementation strategy for progressing towards peace and prosperity. The formulation of the vision was to be done on the basis of the aspirations of the people of the region. The document was required to set clear goals, identify the challenges and reforms in policies and institutions required to reach the goals. This document attempts to detail the people’s vision of development of the region.
In preparing the Vision document, the study team was fortunate to have had the benefit of the enormous work by various scholars concerned committed to the development of the region and concerned about the unfortunate history and geo-politics that led to the seclusion and stagnation. The Vision document has had the benefit of the detailed work undertaken by the Northeastern Council (NEC) which surveyed 40000 households in the region to understand the aspirations of the people and identify the measures needed to remedy the situation. Shri,. Mani Shankar Aiyer, Hon’ble Minister
iv
for the Northeastern Region, took very keen interest in this project in not only constituting the steering committee comprising of eminent group of persons but also by attending the meetings of the committee to present his own views. The team was fortunate to have had the benefit of guidance from the Steering Committee Chaired by Mr. B. G. Verghese in undertaking the task of preparing the Vision document. His vast knowledge and experience and deep understanding of history and geo-politics of the region and its peoples have helped the team in its task through constant interactions with him. He ungrudgingly spared substantial amount of his time for not only in providing guidance and advice, but also to meticulously commenting on an earlier draft of the report. Different members of the Committee helped the study team greatly through interactions in the meetings and by providing written views on the goals, challenges, and strategies. The team has had the benefit of interactions with different stakeholders in the various meetings held in the northeast to elicit their views. The details of our interactions with the stakeholders are given in the Annexure. We would like to express our gratitude to all the persons who have contributed to the formulation of this Vision document.
National Institute of Public Finance and Policy
v
Acronyms
DONER - department of Northeastern region. GDP – Gross Domestic Product. GSDP – Gross State Domestic Product. HALC – Hynniewtrep Achik Liberation Council MDG – Millennium Development Goals. NSS – National Sample Survey. NER - Northeastern Region. NEC - Northeastern Council. NLFT – National Liberation Front of Tripura. NPOP - National Programme for Organic Production. PRI – Panchayati Raj Institution. RTA – Right to Information Act. ULFA – United Liberation Front of Assam. VAT – Value Added Tax. .
1
Peace, Progress and Prosperity in the Northeast: Vision 2020
I. A Summary and a Starting Point.
(a) Introduction:
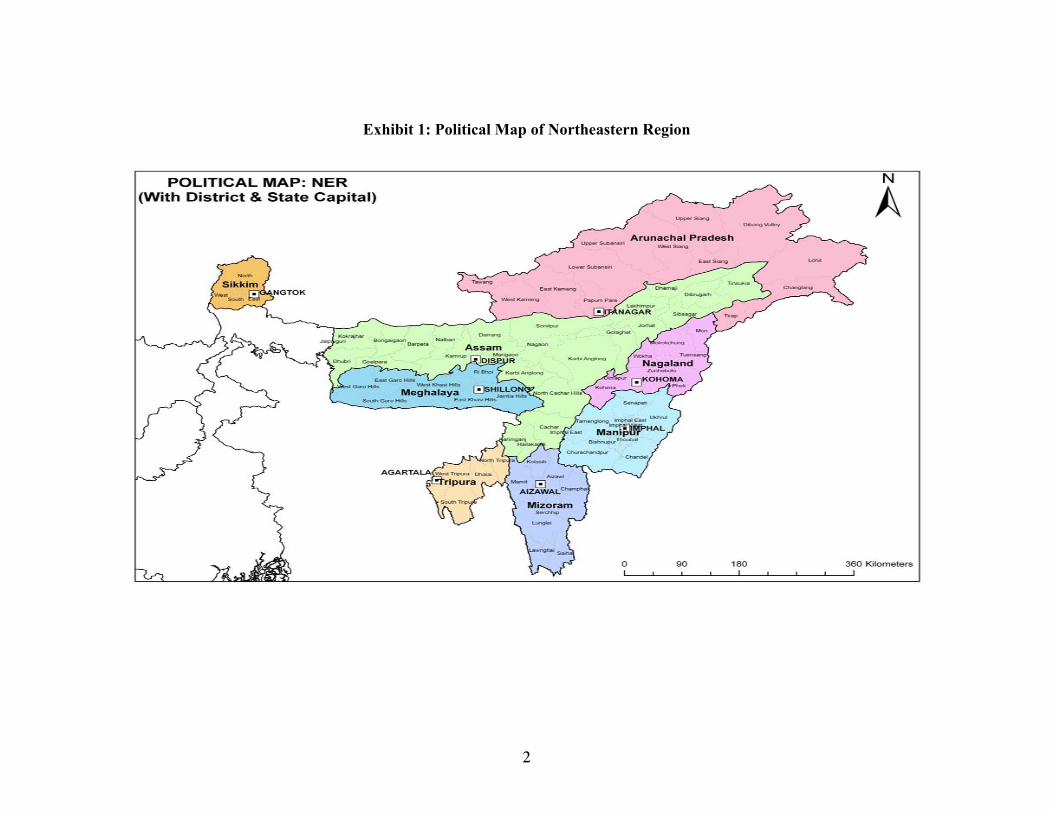
India’s Northeastern region is a beautiful land. The region stretches down from the
foothills of the Himalayas in the eastern range and is surrounded by Bangladesh, Bhutan,
China and Myanmar (Map 1). It includes the seven sisters - Arunachal Pradesh, Assam,
Manipur, Meghalaya, Mizoram, Nagaland and Tripura along with a small and beautiful
cousin in the Himalayan fringes namely, Sikkim. Vergese (2004; p. 1) describes the
region as a “rainbow country: extraordinarily diverse and colourful, mysterious when
seen through parted clouds, a distant and troubled frontier for all too many”. Rich in
natural resources and a treasure house of floral and faunal bio–diversity, the region was a
gateway to East and Southeast Asia before independence. Marked by diversities in
customs, cultures, traditions and languages, the region has over 200 of the 635 tribal
groups in the country speaking a variety or Tibeto – Burman languages and dialects with
a strong tradition of social and cultural identity.
Troubled by history and geo-politics, the Northeast has remained one of the most
backward regions of the country. The colonial administration treated it as “non-regulated
areas”, and declared it as a “backward tract”, “excluded areas” and “partially excluded
areas” (Sachdeva, 2000). The trauma of partition of the country in 1947 not only took the
region backwards by 30 years, but also placed hurdles on the future economic progress.
It isolated the region from the remote heartland, sealed both land and sea routes for
commerce and trade and made it virtually land-locked, isolated and secluded. It
distanced the mainland India by confining connectivity to the heartland through a narrow
22 Km wide Siliguri corridor, made it inaccessible to the private sector investment with
98 per cent of the boundary of the region connecting to international borders. It blocked
the arteries of transport and communication by inland water, road and railways and
closed access to the sea port. The trauma of partition was in severing access to traditional
markets and the gateway to the East and South East Asia – Chittagong in East Pakistan
2
Exhibit 1: Political Map of Northeastern Region
3
which eventually became Bangladesh. The seclusion and the dissatisfaction provided a
fertile breeding ground for armed insurgencies. The perennial dependence for resources
on the central government and the patronising culture to placate the region created a
culture of dependency, the subsidy syndrome and the rent seeking behaviour associated
with government contracts. The problem was further complicated by weak governance.
On the whole, governments became ineffective and often, remote from the people, and
development and welfare took a back seat.
b. Vision 2020: Ushering in peace and prosperity for the people:
Developmental vision, if it has to be realised should be based on the needs and
aspirations of the people. The past experience of planning from above has not had the
desired outcomes. It is the people and stakeholders of the region who should have
ownership for the vision, the development strategy to realise the vision should be
participatory and based on the resources of the region. We are fortunate to have had the
benefit of a comprehensive report prepared by the Northeastern Council (NEC) based on
a survey of 40000 households detailing the developmental aspirations of the people and
listing the focus areas and strategy for the development of the region1. We have
supplemented this with our own understanding gained by interactions with various
stakeholders during our field visits to NER states and the contribution by the very
knowledgeable members of the Steering committee. Besides these, we have also based
our analysis on the enormous amount of work done by various scholars who have been
concerned with the problems and development of the region.
People of the region are tired of insurgency, lack of governance and stagnation.
They have an ambitious vision. By 2020, they aspire to see their region emerge peaceful,
strong and confident and ready to engage itself with the global economy. They would like
to march on the path of economic, social and cultural progress towards prosperity and
wellbeing. They would like to see every family in the region having opportunities for a
secure living with dignity and self respect. Moving far away from the dependency
syndrome, where the people have to seek and look up to the gratis from the distant land,
the people in the region would like to acquire the capabilities and self confidence to 1 Draft Report, Vision NER: 2020, NEC, 2006.
4
shape their own destinies. They would like to enjoy their freedoms – freedom from
hunger and poverty, freedom of exercising choice in their avocations and income earning
and spending decisions and political, economic and social freedoms in the larger sense of
the term without any fear or favour. They would like to achieve economic prosperity
and engage in global competition while retaining their distinct and rich regional and
ethnic identities. They would like to have peace, and achieve stable and sustained
progress and prosperity in a participatory frame.
© Challenges and Strategy:
The challenge to ensuring peace and progressing towards prosperity in the region
is formidable. The differences between the country and the region in terms of various
developmental outcomes, productivities and the capacity of the people and institutions
are large and growing has to be bridged. Even within the region, there are vast
differences, particularly between the populations living in the hills and plains. The
development strategy for the various tribes in the region will have to be evolved in their
own setting. Given the complexity of the task, augmenting investment to accelerate
growth of the region is only a part of the story. The success of transforming the
investments into developmental outcomes requires variety of strategic initiatives.
We have put forward a strategy for encompassing (inclusive) development of the
region comprising of five interdependent components to meet the challenge of realising
the vision which are: (i) participatory development articulated through grass-roots
planning in which focus should be to develop the sectors and sub-sectors with
comparative advantage; (ii) augmenting the capacity of the people to participate
productively in the economic activities and creation and development of the institutions
to design and implement developmental programmes as desired by the people; (iii)
augmenting infrastructure, particularly connectivity and transport infrastructure to
facilitate two-way movement of people and goods within the region and outside and open
up markets for the produce in the region, attract private investments and create greater
employment opportunities and choice for the people of the region; (iv) ensuring adequate
flow of resources for public investments in infrastructure, implementing a framework for
private participation in augmenting infrastructure and creating an enabling environment
5
for the flow of investments to harness the physical resources of the region for the welfare
of the people; and (v) transforming the governance by providing a secure, responsive and
market friendly environment including protecting the property rights of the investors and
ensuring a corruption free administration. Protecting the rights of the tribals for the use
of land and forest resources is particularly important to ensure a sense of belonging and
security to them.
The road from the backward, disconnected and anarchic situation to progress and
prosperity is long and arduous. The road has to be trekked, for, the unity and integrity of
the country depends on the peace and prosperity of the region. In what follows we trace
the terrain to understand the enormity of the task. The next section presents the starting
point of the analysis is the current state of development of the region and the analysis of
the problems faced. This is followed by the detailed projection of the vision of
development to achieve peace and prosperity in quantitative and qualitative terms.
Section IV presents the magnitude of the challenges to achieve the goals. The strategy
for meeting the challenges are presented in Section V and the final section presents a
perspective of the vision of development of the region.
6
II. Northeastern Region: Economic, Social and Demographic Profile.
Conceptually, the Northeastern region covers the area on the north and east of the
narrow Siliguri corridor and comprises of the eight states mentioned earlier2. The eight
states located in India’s north-east cover an area of 255000 sq. kms constituting 7.9
percent of total geographical area, but as per the 2001 census, only 39 million or about
3.8 percent of the total population of the country live in the region. Over 68 per cent of
the population of the region lives in the state of Assam alone. The density of population
varies from 13 per sq. km in Arunachal Pradesh to 340 in Assam. The predominant hilly
terrain in all the states except Assam is a host to overwhelming proportion of tribal
population ranging from 19.3 per cent in Assam to 94.5 per cent in Mizoram. There are
over 200 of about 635 tribal communities. The region is predominantly rural with over
80 per cent of the population living in the countryside. According to the 2001 Census,
the literacy rate of the population in the region at 68.5 per cent and female literacy rate at
61.5 were higher than the country’s average of 64.8 per cent and 53.7 per cent
respectively. Of course, there are significant variations in the literacy rates among the
different states with Assam, Arunachal Pradesh and Meghalya below the country
average. More importantly, the literacy rate has not translated in terms of higher
employability or productivity.
Richly endowed with natural resources, the region is identified as one of the
world's biodiversity hotspots; it hosts species-rich tropical rain forests, supports a diverse
flora and fauna and several crop species. The forest cover in the region constitutes 52 per
cent of the total geographical area. Thus, a large part of the area of the region is used to
providing global public goods, and this limits the availability of arable land and enhances
the cost of delivering public services to the sparse population. Similarly, reserves of
petroleum and natural gas in the region constitute a fifth of the country's total potential,
but the region hardly gets any benefit from it. The region is covered by the mighty
Ganga - Brahmaputra – Meghna river systems and small rivulets. However, water has 2 Conceptually the region should also include North Bengal. The Darjeeling – Gorkha Hills Council Area (DGHA) and therefore Verghese (2007) argues that it should be given “Observer” status or “Associate” membership of the Northeastern Council.
7
been a source of misery rather than a resource. Geographically, apart from Brahmaputra,
Barak and Imphal valleys and some flat lands in between the hills of Meghalaya and
Tripura, the remaining two-thirds area of the region consists of hilly terrain.
The rich endowment of resources was accompanied by a fascinating history of
prosperity and progress. The large river systems and small rivulets provided a means of
livelihood for the vast majority of the population in the valleys and plains. Driven by
expanding global trade and investment and triggered by innovations, the region was in
the forefront of development almost 150 years ago. The expanding global trade was
conducted through the sea route through Chittagong, network of inland waterways, and
land transportation through road and railways. In fact, the railway network between
Dibrugarh and Chittagong was one of the earliest projects in India implemented by the
British in the late 19th century. If the road to the north from Gangtok and Agartala
established the ‘Silk Route’ for trade with China, the port town of Chittagong served as
the gateway for global trade. The natural transportation route through East Bengal not
merely reduced the physical distance but brought emotional closeness as well to make
even the far off Manipur to participate in the independence movement. The rapid spread
of tea gardens following the first garden in 1835 and the export of the first consignment
of tea to London in 1838 ensured employment and prosperity to the people. The
discovery of oil in Makum and establishment of a refinery in Digboi in 1890 laid the
foundation for the development of undivided Assam. The zeal of the missionaries was
largely responsible for spreading literacy.
At the stroke of midnight on August, 1947, India gained independence and with
this brought the trauma of partition to the Northeastern Region. The unnatural
bifurcation of the boundaries that followed the partition changed the entire economic
landscape of the region completely. The partition of the country virtually disconnected
the region from the mainland and the only connectivity was provided by the narrow 22
km Siliguri corridor. Almost 4500 kms or 98 per cent the boundary of the northeast
constitutes international borders with China and Bhutan in the north, Myanmar in the east
and Bangladesh in the south and west. The geo-political isolation of the region from the
country combined with economic insulation has caused immense structural damage to the
8
NER economy. The partition made the system virtually land-locked and blocked the
natural transportation routes and severed market access to the region.
Political fragmentation of the region, quest for ethnic and regional identity and
nationalism, ideological motivations and more recently religious fundamentalism have
fomented a climate of insurgency in several parts of the Northeastern region. The
tendency has been aided by the dissatisfaction with the hegemonic domination and
frustration with lack of development. The difficult terrain and dense forest cover and
open borders with Myanmar and Bangladesh – all these factors have provided a
congenial environment for fomenting insurgency in the region. There are six major
insurgent groups in the region and a number of other minor and splinter factions. The
important insurgency groups are: Naga (Nagaland – Manipur areas), Meitei (Imphal
valley), Bodo (Lower Assam), ULFA (Assam), HALC (Meghalaya) and NLFT (Tripura).
Not surprisingly, the standard of living of the people in the region as measured by
per capita Gross State Domestic product (GSDP) has lagged significantly behind the rest
of the country. At Rs. 18027 in 2004-05, it was less than the all-state average of Rs.
25968 by 31 per cent. Interestingly, the available information shows that at the time of
independence per capita income in the undivided state of Assam was higher than the
national average by 4 per cent. However, as the growth rate of per capita GSDP lagged
behind the rest of the country, the difference narrowed down and by the late 1960s, the
per capita income in the region had fallen behind. With the ushering of market based
economic reforms, the differences in the growth rates in per capita GSDP between the
region and the country increased further. During the period, 1990-91 to 2004-05, on
average, while the aggregate GSDP of all states in constant prices increased at 6 per cent
per year, the corresponding growth in the region was 4.4 per cent. Similarly, the region’s
growth rate of per capita income (2.5 per cent) lagged behind the average growth rate of
the country (4 per cent) during the period by 1.5 percentage points. Not surprisingly, the
difference in the per capita incomes between the country and the region has steadily
diverged. In 1990-91, the region’s per capita income in current prices was lower than the
country average by 20 per cent and this difference increased to 31 per cent by 2004-05.
9
The aggregate picture painted above, however, hides vast differences among the
states. In the region, except for Mizoram, Nagaland and Sikkim which recorded
marginally higher growth rate than the country average, per capita income levels in all
other states were lower by varying magnitudes. Assam, the largest among the
Northeastern states had the lowest per capita income at Rs. 15661 which was lower than
the country average by 40 per cent. Furthermore, even in the three states with per capita
income levels higher than the national average, much of the income generated was in the
public administration sector. In fact, the share of income generated by the public
administration sector at 10.6 per cent was significantly higher in the region than in the
country (6.3 per cent). It was over 17 per cent in Arunachal Pradesh, Manipur and
Sikkim. This underlines the overwhelming dependence of the population on the
government for generating incomes and lack of productive economic activities in
primary, secondary and tertiary sectors of the economy.
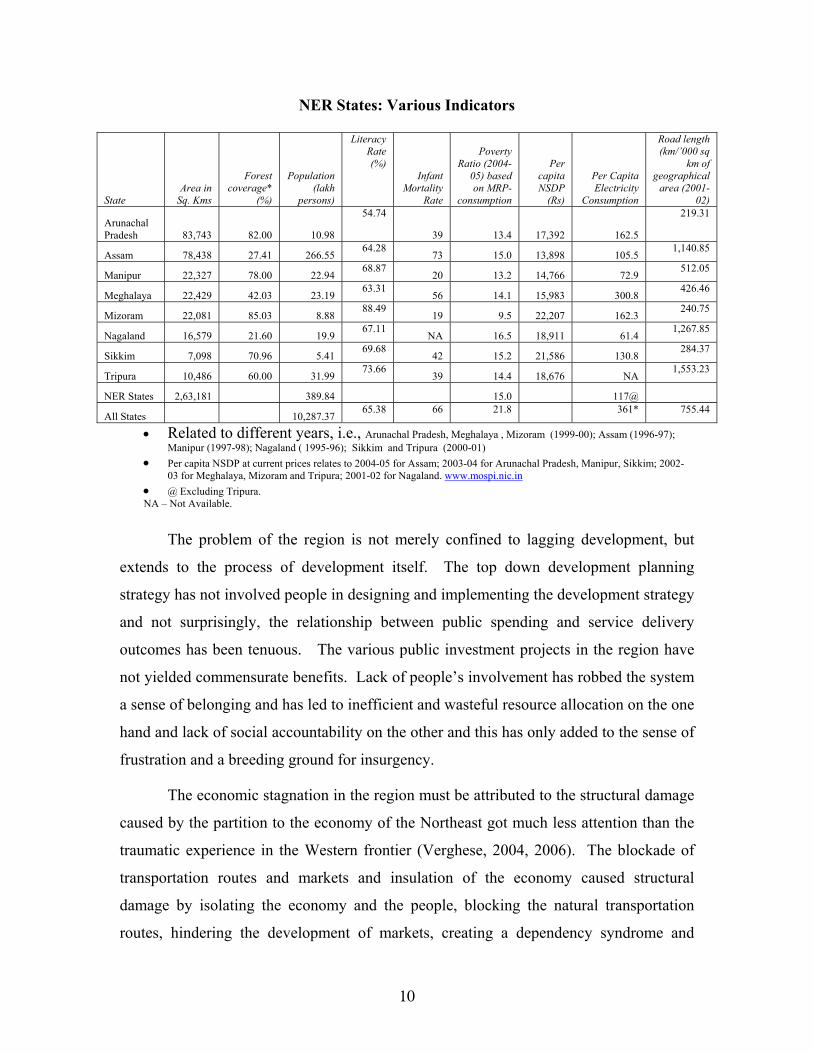
The region lags behind the country not only in per capita GSDP but also in many
other development indicators as well. People do not have access to basic services in
adequate measures. The standard development indicators such as road length, access to
healthcare and power consumption in the region are below the national average (Table 1).
The region generates less than 8 per cent of its 63257 Mw of hydroelectric power
generation potential and the per capita power consumption in the region at 117 Kwh is
less than a third of the national average (373 Kwh). In Manipur and Nagaland, the per
capita power consumption is as low as 73 Kwh and 61 Kwh respectively and in Assam, it
is 104 Kwh. The literacy rate in the region is high, but the capacity of the population to
engage in productive economic activities is low. The incidence of poverty in the region
is high and the official income – poverty measure does not accurately reflect the
deprivation. The usual calorific headcount measure of poverty estimated on the basis of
National Sample Survey (NSS) consumption surveys in Assam does not reflect the
deprivation in the hill regions of the Northeast. Besides unrepresentative sampling,
admittedly, the calorie requirement in these areas is higher and the area is also
handicapped by higher cost of living than the plains.
10
NER States: Various Indicators
State Area in
Sq. Kms
Forest coverage*
(%)
Population (lakh
persons)
Literacy Rate (%)
Infant Mortality
Rate
Poverty Ratio (2004-
05) based on MRP-
consumption
Per capita NSDP
(Rs)
Per Capita Electricity
Consumption
Road length (km/’000 sq
km of geographical
area (2001-02)
Arunachal Pradesh 83,743 82.00 10.98
54.74
39 13.4 17,392 162.5
219.31
Assam 78,438 27.41 266.55 64.28
73 15.0 13,898 105.5 1,140.85
Manipur 22,327 78.00 22.94 68.87
20 13.2 14,766 72.9 512.05
Meghalaya 22,429 42.03 23.19 63.31
56 14.1 15,983 300.8 426.46
Mizoram 22,081 85.03 8.88 88.49
19 9.5 22,207 162.3 240.75
Nagaland 16,579 21.60 19.9 67.11
NA 16.5 18,911 61.4 1,267.85
Sikkim 7,098 70.96 5.41 69.68
42 15.2 21,586 130.8 284.37
Tripura 10,486 60.00 31.99 73.66
39 14.4 18,676 NA 1,553.23
NER States 2,63,181 389.84 15.0 117@
All States 10,287.37 65.38 66 21.8
361* 755.44
• Related to different years, i.e., Arunachal Pradesh, Meghalaya , Mizoram (1999-00); Assam (1996-97); Manipur (1997-98); Nagaland ( 1995-96); Sikkim and Tripura (2000-01)
• Per capita NSDP at current prices relates to 2004-05 for Assam; 2003-04 for Arunachal Pradesh, Manipur, Sikkim; 2002-03 for Meghalaya, Mizoram and Tripura; 2001-02 for Nagaland. www.mospi.nic.in
• @ Excluding Tripura. NA – Not Available.
The problem of the region is not merely confined to lagging development, but
extends to the process of development itself. The top down development planning
strategy has not involved people in designing and implementing the development strategy
and not surprisingly, the relationship between public spending and service delivery
outcomes has been tenuous. The various public investment projects in the region have
not yielded commensurate benefits. Lack of people’s involvement has robbed the system
a sense of belonging and has led to inefficient and wasteful resource allocation on the one
hand and lack of social accountability on the other and this has only added to the sense of
frustration and a breeding ground for insurgency.
The economic stagnation in the region must be attributed to the structural damage
caused by the partition to the economy of the Northeast got much less attention than the
traumatic experience in the Western frontier (Verghese, 2004, 2006). The blockade of
transportation routes and markets and insulation of the economy caused structural
damage by isolating the economy and the people, blocking the natural transportation
routes, hindering the development of markets, creating a dependency syndrome and
11
spreading the culture of rent seeking and insurgency. This not only took the economy
backwards by over a quarter century but also caused the structural retrogression and
government spending propelled economic growth. With poor penetration of the markets
and development not based on the resources of the region, the planning process hardly
created any scope for developing forward and backward linkages with the economy.
The development strategy imposed from above did not allow the virtuous cycle of growth
from a strong interaction of multiplier – accelerator process, but resulted in the significant
spillover of the spending and created a strong culture of rent seeking and free-riding
behaviour. The weak administrative capacity of the state has resulted in very high rates
of return for armed insurgency and the widespread incidence of roving banditry has
proved to be a major deterrent on the participation of the private sector in economic
activities3. The capacity of the institutions of market as well as governance in the region
is weak and unresponsive. The poor incentive structure caused by policies and
institutions has further contributed to the adverse impact on the development process.
Lack of market access, poor infrastructure and connectivity combined with the
climate if insurgency has created inhospitable climate for investments. The collection of
“taxes” or “roving banditry” (a la Olson) by various insurgency groups has created a
sense of insecurity and has taken away the incentive for the people in the region to save
and invest and has created a dampener for the private investment from outside the region.
The initiative by the Central and state governments to accelerate development through
various plans has not had the desired results either. The system is full of leakages,
perverse incentives towards economically productive initiatives and rent seeking
behaviour.
3 Mancur Olson, in his incisive analysis has brought out the structure of incentives for saving, investment and growth under different political institutions. Under roving banditry, there is no incentive for saving, investment and growth, but when this is replaced by (through the invisible hand) stationary bandits (dictatorship), the institution is congenial to economic growth though, it may not involve the majority. He argues that encompassing growth is possible only under democracy. See Olson ( 1993)
12
III. Progress to Peace and Prosperity:
Given the rich endowment of resources and social and cultural heritage, the
people of the region have a right to aspire to achieve peace and prosperity, eradicate
poverty and develop a sense of belonging and harmony while maintaining their distinct
identities. By 2020, they would like to catch up with the rest of the country and to
contribute to the country’s affluence by becoming a prosperous part of India. They
would like to see every family in the region entitled to sufficient food, clothing and
shelter. They would like to harness the abundant of natural resources of the region in a
sustainable manner for the welfare of the people of the region. They would like to see
opportunities for the youth to participate in gainful economic activities to create wealth
and enjoy a high quality of life.
(a) Catching up with the rest of the country:
Improving the standard of living of the people would require sustained increases
in per capita income levels and its fair distribution among people of different states,
communities, groups within the region. In quantitative terms, by 2020, the people in the
region should have living standards comparable to the people in the rest of the country.
Given that the income levels in the region are lower than the country average by over 30
per cent and that the region has lagged behind the country, catching up with the country
by 2020 would require significant acceleration in the growth performance in the region.
The task has been made even more formidable with Indian economy reaching a higher
growth path with the GDP in Indian economy estimated to grow at close to 8 per cent per
year during the Tenth Plan period (2002-2007).
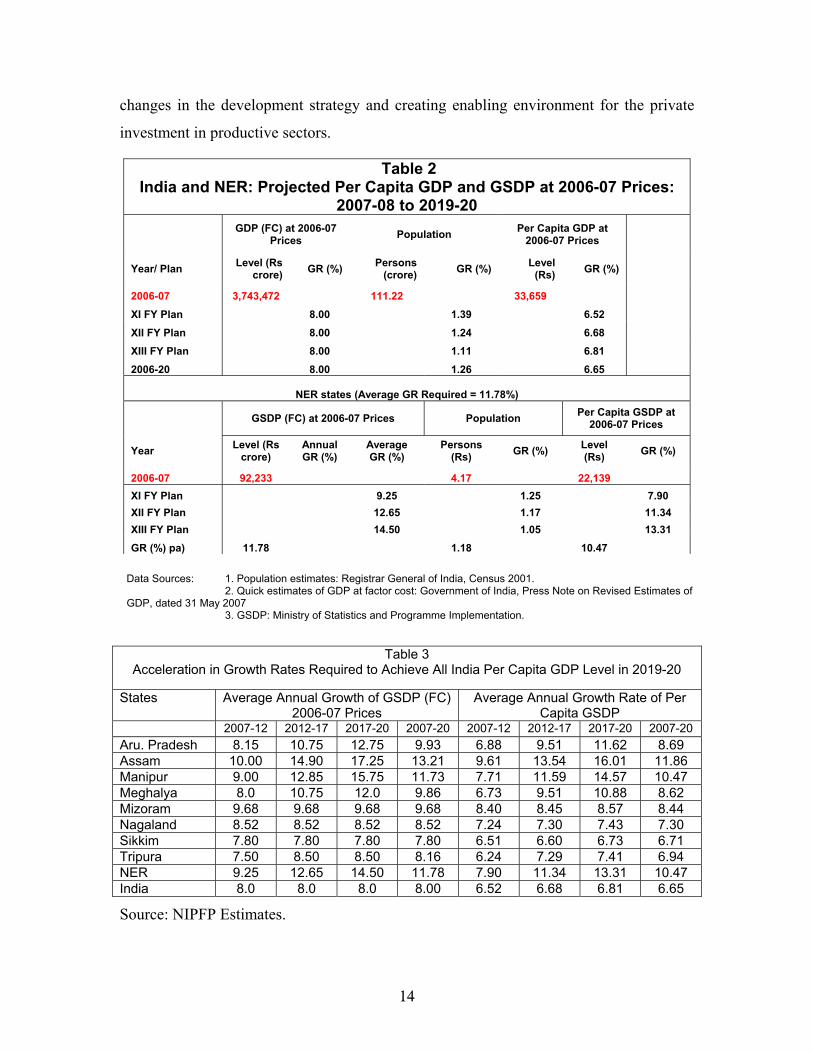
The continued growth of Indian economy at 8 per cent per year from 2004-05 to
2020 would, on average, increase per capita Income at about 6.5 per cent (Table 2). As
over the period, the population growth is expected to decelerate, the per capita income
growth is expected to accelerate from 6.5 per cent in the 11th Plan period (2007-2012) to
6.8 per cent during the period of the 13th Plan (2017-2022). Thus, by 2020, the per capita
income in Indian economy is expected to be about Rs. 78000 at 2006-07 prices or about
USD 2000 at the prevailing exchange rate. To reach this level of income, during the
13
period from 2006-07 to 2019-20, the GSDP in the Northeastern region will have to grow
at 11.8 per cent per year on an average or at 10.5 percent in per capita terms (figure 1).
The process should be put in place expeditiously to accelerate the growth process
in the region. However, it would be unrealistic to expect that the growth rate of per
capita income will accelerate from 4.6 per cent recorded during 2000-04 to 10.5 per cent
immediately. It is therefore, necessary to break the period into three Plan periods and set
the targets to steadily accelerate the growth rate in a phased manner to achieve the
desired target per capita income growth rate of 10.5 per cent during the period. An
illustrative scheme of phasing out is shown in Table 2 according to which the growth rate
of per capita GSDP should accelerate from the average of 4.6 per cent during 2000-04 to
7.9 per cent during the 11th Plan (2007-12), 11.34 per cent during the 12th Plan (2012-17)
and 13.31 per cent during the 13th Plan (2017-22). The changes required in the
development strategy, reforms in policies and institutions, capacity building in people
and institutions, creation of market friendly environment and required achieve this
acceleration will all be discussed later in the document.
(b) Structural transformation:
Acceleration in the growth process region requires changes in the structure of the
economies of the various states in the region. The growth rates required to catch up with
the per capita GDP of the country in different states is summarised in Table 3. The
increase in the growth rate required to catch up with the country varies from State to
state. Analysis shows that Assam, the largest state in the region which contributes to
GSDP is also the most lagging and it should accelerate its GSDP growth to an annual rate
of 13.2 per cent and its per capita GSDP has to increase at 11.9 per cent during the period
2006-20. Similarly, Manipur has to accelerate its growth of GSDP to 11.7 per cent.
Every state in the region except Sikkim has to grow faster than the country average.
Acceleration in the growth in most of the Northeastern states calls for structural
changes in these economies. In most of the economies, income from public
administration constitutes a major source and the government sector dominates the
economic scene. Acceleration in economic growth will have to come from the
agriculture, manufacturing ad non-government service sectors. This calls for significant
14
changes in the development strategy and creating enabling environment for the private
investment in productive sectors.
Table 2 India and NER: Projected Per Capita GDP and GSDP at 2006-07 Prices:
2007-08 to 2019-20
GDP (FC) at 2006-07 Prices Population Per Capita GDP at
2006-07 Prices Year/ Plan Level (Rs
crore) GR (%) Persons (crore) GR (%) Level
(Rs) GR (%) 2006-07 3,743,472 111.22 33,659 XI FY Plan 8.00 1.39 6.52 XII FY Plan 8.00 1.24 6.68 XIII FY Plan 8.00 1.11 6.81 2006-20 8.00 1.26 6.65
NER states (Average GR Required = 11.78%)
GSDP (FC) at 2006-07 Prices Population Per Capita GSDP at
2006-07 Prices
Year Level (Rs crore)
Annual GR (%)
Average GR (%)
Persons (Rs) GR (%) Level
(Rs) GR (%)
2006-07 92,233 4.17 22,139 XI FY Plan 9.25 1.25 7.90 XII FY Plan 12.65 1.17 11.34 XIII FY Plan 14.50 1.05 13.31 GR (%) pa) 11.78 1.18 10.47
Data Sources: 1. Population estimates: Registrar General of India, Census 2001. 2. Quick estimates of GDP at factor cost: Government of India, Press Note on Revised Estimates of GDP, dated 31 May 2007 3. GSDP: Ministry of Statistics and Programme Implementation.
Table 3 Acceleration in Growth Rates Required to Achieve All India Per Capita GDP Level in 2019-20
States Average Annual Growth of GSDP (FC)
2006-07 Prices Average Annual Growth Rate of Per
Capita GSDP 2007-12 2012-17 2017-20 2007-20 2007-12 2012-17 2017-20 2007-20 Aru. Pradesh 8.15 10.75 12.75 9.93 6.88 9.51 11.62 8.69 Assam 10.00 14.90 17.25 13.21 9.61 13.54 16.01 11.86 Manipur 9.00 12.85 15.75 11.73 7.71 11.59 14.57 10.47 Meghalya 8.0 10.75 12.0 9.86 6.73 9.51 10.88 8.62 Mizoram 9.68 9.68 9.68 9.68 8.40 8.45 8.57 8.44 Nagaland 8.52 8.52 8.52 8.52 7.24 7.30 7.43 7.30 Sikkim 7.80 7.80 7.80 7.80 6.51 6.60 6.73 6.71 Tripura 7.50 8.50 8.50 8.16 6.24 7.29 7.41 6.94 NER 9.25 12.65 14.50 11.78 7.90 11.34 13.31 10.47 India 8.0 8.0 8.0 8.00 6.52 6.68 6.81 6.65
Source: NIPFP Estimates.
15
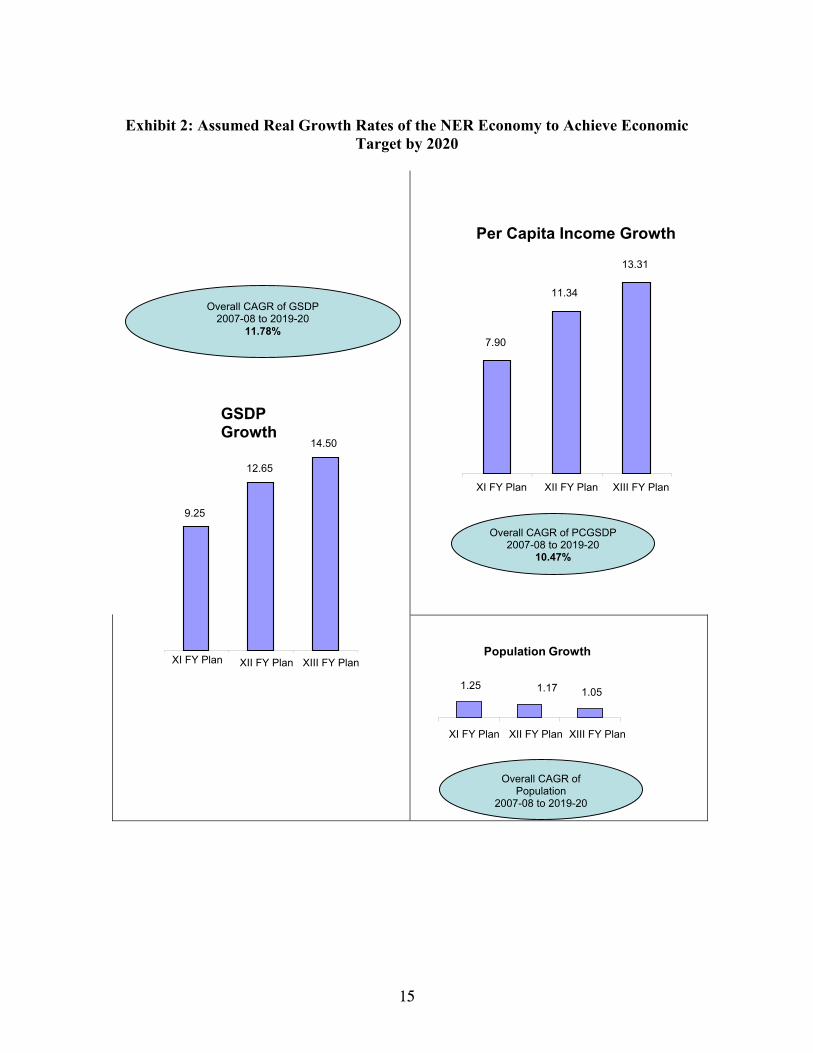
Exhibit 2: Assumed Real Growth Rates of the NER Economy to Achieve Economic Target by 2020
Per Capita Income Growth
7.90
11.34
13.31
XI FY Plan XII FY Plan XIII FY Plan
GSDP Growth
9.25
12.65
14.50
XI FY Plan XII FY Plan XIII FY PlanPopulation Growth
1.25 1.17 1.05
XI FY Plan XII FY Plan XIII FY Plan
Overall CAGR of Population
2007-08 to 2019-20
Overall CAGR of PCGSDP 2007-08 to 2019-20
10.47%
Overall CAGR of GSDP 2007-08 to 2019-20
11.78%
16
(c) Poverty Alleviation:
The vision of the people is to banish poverty from the region by 2020. The
estimated poverty ratio using the mixed recall period in the region in 2004-05 was 17 per
cent which was lower than the all-India poverty ratios of 22 per cent, but the measure is
beset with several problems and is not reliable. Besides inadequate sample size for the
States other than Assam in the National Sample Survey, this general measure does not
take account the specific consumption requirements and higher cost of living of the
region adequately. Empowering people with capabilities to ensure adequate food,
clothing shelter so that every family gains freedom from hunger and lead a healthy life
and participate productively in the growth process. This too requires structural changes in
the region from the government dominated economies and economic structures shaped by
planning from above to the ones based on participatory planning and private sector
participation in the growth process.
Economic and social empowerment of the people calls for people-centric
development. The goal should be to ensure access to basic social services necessary to
achieve the Millennium Development Goals (MDG) in the medium term. Access to basic
services such as education, healthcare enables human development, enhances people’s
capabilities in the region and provides them freedom of various types including freedom
from hunger and freedom of choice in employment. The people-centric development
should also ensure not only opportunities for productive employment, but also enough
security through proper coverage under various anti-poverty interventions and micro-
credit schemes for self-help groups.
(d). Harness the resources for the benefit of the people:
The vision of prosperity for the people requires participatory development by
harnessing the resources of the region. The region is rich in resources and these include
natural resources from land and water, mineral resources, forest, the people and the
savings of the region translated into deposits in commercial banks. The people would
like to see the large river systems which have become the source of misery tamed and
converted into a source of wealth. They would like to see the mineral wealth to generate
17
opportunities to increase employment and incomes for themselves. They would like to
harness the vast hydroelectric energy potential and use the comparative advantage to
expand economic activities in the region. They would like to see that the Global public
goods they provide through the vast forest cover is recognised and given adequate
compensation. They would like to overcome their saving – investment deficit by
increasing the credit – deposit ratio through generation of economic activities in the
region.
Participatory development in agriculture will have to adopt different approach in
the hill regions and the plains. Using resources of the region for development will
strengthen the backward linkages. In the hill regions, the approach should be should be
make a progression from Jhum to settled cultivation and through reforestation, tree
farming, horticulture, and organic farming and smallholder plantations. In contrast, in the
plains, the strategy should be to enhance land productivity by increasing crop intensity,
better use of water resources and balanced use of organic manures and chemical
fertilizers to make up for deficiencies in the soil. Manufacturing sector focus based on
the resources of the region, particularly agro-based manufacturing should help to create
productive employment opportunities. The enormous hydroelectric power potential and
mineral wealth that exists in the region could be used to create comparative advantage for
the private sector participation in manufacturing activity.
(e) Human development and capacity building:
An important component of people’s Vision 2020 is to achieve a high level of
human development. Achieving high standards in education and health status is as much
a goal in itself as it is a means to enrich the quality of living of the people. Educated and
healthy population is an asset to any society and the people of the region would like to
see all the people to achieve a high health status and all their children well educated.
Human development contributes to welfare. Human development enhances
“capabilities”, increases productivity of the population and enhances incomes and
wellbeing of population.
An important aspect of human development is building capacity of the population.
Health and education are important contributors to improvement in productivity.
18
Capacity development is necessary for changing productivity in the primary sector, to
impart robustness to the growth in manufacturing and to increase the contribution from
non-government service sectors. The ability of the region to harness the resources for
sustainable development requires significant private initiatives and investment as well.
An important pre-condition for private investment is the availability of skilled workforce.
Besides, a concomitant development strategy based on the resources of the region is the
development of a strong indigenous group of small entrepreneurs. This requires
significant initiative towards capacity development in the region. Although the literacy
level in the region is high, significant initiatives are necessary in skill development.
Capacity development is important as much to the institutions as it is to the
people. Most of the economic activities in the region are government dependent and as
very high proportions of the resources of the states in the region come from the Central
transfers, the development has been transfer dependent. This has made the economy
dormant and both markets for factors and products inactive. Often the non-development
of the markets in the region is seen as an indication of market failure calling for more
government intervention. Indeed, government intervention is necessary to nurse the
market institutions and create conditions for them to grow and perform the task of
intermediation.
(f). Strengthening infrastructure:
The people in the envision having state of the art infrastructure not only to
enhance the quality of life but also to dictate the pace of economic activity and nature and
quality of economic growth. Quality of living of the people as much as the pace of
economic activity depends on the state of infrastructure. The infrastructure deficit is a
major deficit in the region and acceleration in economic growth and its emergence as an
important powerhouse depends on how fast this deficit is overcome. The lack of
connectivity has virtually segregated and isolated the region not only from the rest of the
country and world but also within itself. Poor density of road and railways transportation
within the region has not only rendered mobility difficult but also has hindered the
development of markets. The region has tremendous potential generating hydroelectric
19
power, but the actual generation is less than 8 per cent of the potential. The region is
poorly linked by air transportation and sea routes have been blocked.
Improving connectivity is an important precondition for social and economic
mobility and market integration. The “remoteness” of the region, and both road and rail
transportation bottlenecks have made the region “distant” from the mainland as the only
transportation route is through the roundabout narrow Siliguri corridor. Inland
waterways, which were important means of transportation, have all but vanished due to
the complexities in the political and economic relationship with Bangladesh. Blocking of
access to Chittagong port and the land route through Bangladesh territory has closed the
sea transportation route altogether.
The problem of connectivity is not only between the region, the mainland and the
rest of the world; there is no physical connectivity between different states within the
region itself. With various insurgency groups operating in different parts of the region,
land transportation within the region has become hazardous. Air inter-connectivity
between different states in the region is extremely poor. The location of hub in Kolkata
has resulted in connection to even the neighbouring state through Kolkata with enormous
cost in terms time, effort and money. It is important to locate the hub at Guwahati to
reduce the turnaround time within the region.
A critical element in improving connectivity is diplomacy and improvement in
border infrastructure and trade facilitation between the neighbouring countries,
particularly China and Bangladesh. Diplomatic initiatives could regain access to the
Chittagong port. Extension of rail network to the Chittagong could significantly reduce
the transportation time and cost. Diplomatic initiatives could also help to open access to
inland waterways with to provide better connectivity to the region.
(g). Creating a Centre for Trade and Commerce:
People in the region are tired of segregation and segmentation. Achieving
economic and social integration of the region is an important dream they would like to
realise in the medium term. They would like the region to become an important hub of
trade and commerce and an economic bridge to East and Southeast Asia. Opening up the
trade routes open up economic opportunities for the region and accelerate the growth
20
process. The region can regain its place as an important source of flourishing trade with
East and Southeast Asia through land (the silk) route to China and Myanmar and through
the sea port from Chittagong and Calcutta. Recent initiatives in improving the relations
with the neighbouring countries, particularly the MOU with Myanmar restoring border
trade and more importantly, the Ganga treaty with Bangladesh, have kindled hopes of
resurgence of the region and people hope to see flourishing international commerce in the
years to come.
(h). Effective Governance: Establishing Peace and Harmony:
People’s vision of development is not complete without mentioning their earnest
desire for peace and harmony – free from insurgencies. Without peace, progress is not
possible. The insurgency has taken a heavy toll of people’s progress and happiness in the
region. Governance is weak and there is widespread leakage – of revenues that should
have accrued to public exchequer, of expenditures on various development schemes due
to rent seeking of various kinds, of large amounts through rigging of contracts.
Insurgency has dampened private investments in potentially productive sectors. The
widespread practice of parallel tax collections, random extortion, kidnapping and similar
acts which may be characterised as “roving banditry” has robbed the region of incentives
to save and undertake productive economic activities. The climate that is created is one
of gaining access to easy money and this has weaned the youth away from taking
initiative and hard work in productive spheres. People of the region are tired of
insurgencies and poor governance systems. They would like the peace to return to their
lives, leakages to be stopped and development to take precedence.
21
IV. Realising the Vision: The New Development Strategy.
The challenge of accelerating development in the Northeastern region to realise
the Vision is formidable and the road to peace and prosperity is long and arduous.
Realising people’s vision requires participatory development strategy. The High Level
Commission appointed by the Prime Minister in its report submitted in 1997 has
suggested that there are four basic deficits confronting the Northeast: a basic needs
deficit; an infrastructure deficit; a resource deficit and a two–way deficit of understanding
with the rest of the country. To this should be added the governance deficit (India, 1997).
The challenge is to overcome these deficits for which there has to be paradigm shift in the
development strategy supplemented by reforms in policies and institutions including
capacity building and strengthening governance.
(a) Components of development strategy:
This calls for a complete change in the planning process to design and implement
people-centric development and focus on harnessing the natural resources of the region.
Only such a strategy can ensure inclusive development and help to banish poverty and
ensure a reasonable standard of living for every family in the region. Participatory
development requires capacity development of people as well as institutions. Education
and skill development should be the cornerstone for progress and prosperity and
encompassing development of the region. Another important element of the strategy is
the development is the creation of enabling environment for market based development.
The most important component of enabling environment is the establishment of peace,
law and order and institutional framework for ensuring property rights. Equally
important is the need to provide state of the art infrastructure. In particular, providing
connectivity both within the region and with the rest of the world is extremely important
to open up the markets and for ensuring mobility of goods and people. The fortunes of
the people of the region is inextricably intertwined with that of the people of Bangladesh
and there is much to be gained by braking the trade barriers and enabling access to the
see port inland waterways. Above all, many of the problems of the region are due to
weak governance. This has contributed to the rent seeking and “easy money” culture,
created a law and order situation weaned away investments.
22
The five components of the strategy are: (i) participatory development strategy
articulated through grass-roots planning to harness the natural resource advantage of the
region. Encompassing development in agriculture require increasing crop intensity,
enhance productivity and expand fisheries development to ensure food security to the
people and make a transition to high value agriculture including organic farming
wherever feasible. In manufacturing sectors, agro-based processing and focussing on the
resources of the region and sectors with comparative advantage should be the priority.
Similarly, the region should be opened to the expansion of non-governmental service
sectors based on the comparative advantage. (ii) Capacity development is critical to
participatory development strategy. Capacity development of the people to participate
productively in economic activities and creation and development of the institutions to
design and implement developmental programmes as desired by the people is, therefore,
a priorit5y area of action. (iii) The infrastructure in the region is abysmal and despite
having vast power generation potential, the consumption of electricity in the region is
much below the national average. Therefore, augmenting infrastructure, particularly
connectivity and transport infrastructure is an important precondition for development
and to attract private investment into the region. Connectivity is crucial for mobility of
people as much as movement of goods into the region and export of the output of the
region to the outside world. Improvement in intra-regional connectivity is as important
as it is to the rest of the world. (iv) An important deficit in the region, as pointed out
above, is the resources deficit. Augmenting infrastructure requires significant investment
in infrastructure and a considerable portion of this has to come from central and state
governments. This calls for significant increase in the Central government’s allocation
for infrastructure in the region as much as more efficient use of funds. Ensuring adequate
resources for public investments in infrastructure, implementing a framework for private
participation in augmenting infrastructure and creating an enabling environment for the
flow of investments to harness the physical resources of the region for the welfare of the
people are the important issues to be addressed on a priority basis. (v) Equally important
component of the strategy is transforming the governance by providing a secure,
responsive and market friendly environment including protection of property rights of the
investors and ensuring a corruption free administration. Protecting the rights of the
23
tribals for the use of land and forest resources is particularly important to ensure a sense
of belonging and security to them. Strengthening governance includes resolving
insurgencies and putting an end to the leakages in the system – the widespread “roving
banditry” from a parallel tax system, extortions and “informal trade”.
The implementation of the five components of the strategy is, by no means,
simple and straight forward nor are they independent of each other. Their close
interdependence implies that they have to be calibrated simultaneously. Given the large
number of stake holders, variety of groups demanding various concessions and the
international dimension mired in diplomatic tangles, the issue has to be addressed
delicately with both carrot and stick. The details of the five-fold strategy are spelt out in
Volume II. In what follows, some essential elements of the strategy are laid out.
(b) Participatory development.
(i) grass-roots planning
The realization of people’s vision of development requires a paradigm shift in the
planning process – from the one in which investment allocations are imposed from above
to the one determined according to the needs and requirements of the people. The
detailed methodology of such a grass-roots planning is spelt out in general terms in a
recent report of the Planning Commission (India, 2006). Planning process should start
at the village level in rural areas and ward level in urban areas where basic social and
physical infrastructure requirements of the people to be implemented should be selected
for implementation based on the priorities and preferences of the people and this should
be built upwards at block, district and municipal levels. The centrality of local
governments – panchayats in villages and municipalities in urban areas is critical to
planning at the grass-roots level. The District Planning Committee (DPC) besides
consolidation and coordination should add the district level infrastructure requirements.
These have to be consolidated and additional requirements relating to the inter-district
infrastructure added at the State level. The plans thus prepared should be consolidated at
the NER level along with the infrastructure requirements added for the region as a whole.
The grass-roots planning approach involves the people in the planning process
and ensures both efficiency and accountability in its implementation. It takes into
24
account the needs and resources of the region and works out a strategy to harness the
resources in a sustainable manner. The approach should be used to draw up sustainable
plans for each of the productive sectors – agriculture and allied activities, manufacturing
and services, as also for the provision of social services. The strategy will help to
generate productive employment in the region. With people of the region being involved
in the development and traditional institutions activated and beneficiaries made
stakeholders, it would help to ensure greater responsiveness and social accountability.
The people-centric plan for the provision of services should take into account the
basic needs of the people including education and skill development, healthcare, water
supply and sanitation and plan to fulfil them in a phased manner. Ironically, as far back
as July 10, 1996, the Chief Ministers of different States in the NER set a number of
important goals to be achieved with a span of 10 years, but no action plan was initiated to
that end. The goals include coverage of the entire population with safe drinking water,
primary healthcare, primary education, provision of public housing to all shelterless
families, extension of mid-day meal programme for all schools, connecting all villages
and habitation with roads, and streamlining the public distribution with a focus on the
poor. These are basic amenities and services required to build “capabilities” among the
people and will be a priority under the people–centric development.
(ii) Strategy for the primary sector:
Participatory development is based on harnessing the natural resources of the
region and therefore, would give priority to the primary sector in the development
process. Over 86 per cent of the population in the region resides in the villages and
therefore, encompassing development in the region is possible only with the development
of agriculture and allied activities. Presently, of about 40 lakh hectares under cultivation,
39 lakh or over 97 per cent is under foodgrains production. At about 1520 Kg/hectare,
the land productivity is very low in the region. Despite vast potential, only 20 per cent of
the net sown area is under irrigation. Almost 95 per cent of the region’s soil is acidic
with pH value below 5.6. In the hills, the practice of Jhum cultivation has contributed to
lower productivity and unsustainable agriculture.
25
The target should be to increase foodgrains production in the NER to 75 lakh MT
in 2010, 87 lakh MT by 2015 and 110 lakh MT in 2020 and this requires accelerating the
growth rate to 2 per cent in the first phase, 3 percent in the second and 4 per cent in the
third. This implies increasing the productivity of land to 1570Kgs/ha in the first phase,
1610 kgs/ha in the second phase and 1650 kgs/ha in the third.
The people based approach to development in the agricultural sector should adopt
separate strategy of development in the plains and in hill areas. In the plains, attempt
should be to increase crop intensity both by better utilisation of irrigation potential and
cultivation of short duration crops. Increasing land area in the plains (about 1.5 million
ha) under double cropping to 25 per cent in a phased manner would considerably enhance
the land productivity. Adoption of improved technology such as expanding area under
High Yielding Varieties (HYV) of seeds, balanced use of organic manure and chemical
fertilizers and pesticides, appropriate measures to balance the soil condition to reduce
acidity in land are some of the measures needed. It is also important to expand area
under cultivation from the prevailing 17.8 lakh/ha to 25 lakh/ha by bring under
cultivation the cultivable waste land and the areas developed under the command area
development.
The agricultural development strategy can not be uniform for plains and hills.
With significant area of the region covered by hills in which a large number of socio-
ethnic groups inhabit, the strategy should be to wean them away from Jhum cultivation
and provide them capacity to engage in productive and sustainable livelihood systems.
The area under horticultural crops can be extended to wasteland done by There is
tremendous potential for growing horticultural crops in the hills and the success of the
programme depends on the development of rural infrastructure including marketing, cold
storage and processing of the horticultural produce. There should also be extensive
extension service, provision of seeds, inputs and seedlings. The NEC estimates that if the
programme is taken up on a mission mode and with the provision of complementary
infrastructure and services, it is possible to increase the acreage under fruit crops by 50
per cent from the present level of 4 lakh hectares to 6 lakh hectares and increase the
production of fruit crops from the prevailing 40 lmt to 60 lmt by 2020. The high fertility
of the virgin land in hill areas of the region is conducive for the introduction of organic
26
farming in horticultural crops under the National Programme for Organic Production
(NPOP). It would be useful to tie up with private sector companies both to introduce
organic farming and to market the products. It is also important to encourage formation
of self-help groups of fruit, vegetable and flower growers, arrange facilities for training
and micro-finance support.
The people of the region are predominantly non-vegetarians and the production of
meat and eggs in the region is inadequate to meet the demand. Thus, there is a significant
deficit and the region has to import about 50 per cent of milk consumption and over 87
per cent of consumption of egg and as the demand for these products increases with
population, the shortfall will increase over time. The deficit indicates the vast potential
that exits for giving a big thrust to animal husbandry in the region which would increase
productive employment as well as incomes. Similarly, despite the network of large and
small river systems, the region is significantly deficient in the availability of fish for
consumption. The region is deficient in fish production by 55 per cent and has top
important this from outside. Thrust to pisciculture with marketing and storage
infrastructure could create significant employment earning opportunities.
Thrust to agricultural and allied activities requires significant governmental
initiatives in terms of providing rural infrastructure and extension. Building of extensive
rural road network is necessary to increase mobility of people as well as movement of
goods. Electrification of the villages is necessary for increasing the crop intensity and
spreading of rural industrialisation. Extension service both for production and marketing
is critical and this requires a significant upgradation. Establishing a network of cold
storage facilities, information centres and organising the marketing and financial support
through self help groups would have to be initiated in a large scale.
(iii) Strategy for the manufacturing sector:
The participatory development approach requires the development of the
manufacturing sector based on the resources of the region. Agro-processing industries
will have play and important role in the emerging scenario. Horticultural crops need
processing support and it would be necessary to tie up with the corporate sector for the
processing and marketing of fruits and vegetables including organic products. Similarly,
27
there is considerable scope for expanding the food processing industries. Other important
include expansion of handloom and handicrafts, which, at present is the sector providing
the largest employment after agriculture. In particular, there is considerable scope for the
expansion of sericulture as the climate of the northeast is congenial for the expansion of
silk industry. It is important to modernise the sector and help the producers with modern
designs, financial support and marketing assistance including exports.
There are about 181 large and medium scale industries in the region and over 70
per cent of them are in Assam. Most of the units are resource based – oil and gas and
wood based industries. The significant deposits of limestone in Meghalaya and
Arunachal Pradesh can be used for building medium sized cement industries by using the
available deposits of natural gas in the region. It is also important to augment the
production of use the huge hydroelectric potential in the region and the power situation
can be an important factor in industrialisation of the region.
(iv). Strategy for the services sector:
The participatory approach to accelerate growth in the service sector will have to
focus on the development of non-governmental services and its interaction with
agriculture and manufacturing sectors. The most important sector to be developed in the
region is tourism. The potential for generating income and employment in the tourism
sectors is the greatest. With moderate climate for most parts of the years, scenic
splendour, robust and varied cultural attractions, the tourism presents a significant
opportunity for expansion. The focus, however, should be high value tourism which will
require close collaboration with the private sector hospitality industry and building high
quality infrastructure and promotion. Holding annual music and dance carnival in
different parts of NER and making it a national and international festival could be an
important tourist attraction. Similarly, Bihu festival and Assam and Dusshera festival in
Manipur can be an important tourist attraction that should be promoted and publicised.
Hill tourism, skiing, river rafting and adventure tourism are some of the important
activities that need to be focussed on. There should be a number of tourism circuits in
various parts of the region, depending on the relative attractions and the experiences they
28
present. Considerable initiative to build capacity in hospitality business will have to be
undertaken to gainful employment to the people of the region.
Other important activities in the services sector that present opportunity for
development include financial sector including banking and insurance and the
information technology industry. This, however, requires a significant capacity building,
reorientation in the education system towards mathematics and science and creating
conditions for the information technology companies to operate in the region. Some of
the information technology companies have found a significant potential for sourcing
employees in the region and it is important to create favourable conditions for their
operation. This would, however, require significant initiative at expanding education and
capacity building.
© Building Capacity for Participatory Development:
Capacity development is a critical part of participatory development. Structural
transformation of the economy has to be done by the people and this can not be achieved
without building capacity in them. Capacity development will have to be
multidimensional and should deal with the human resource requirements for the
expanding economy in primary, manufacturing and service sectors.
Capacity building in the primary sector will have to focus on providing skills and
training for improved agricultural practices. Adoption of improved agricultural practices
in the plains requires capacity building through agricultural extension services to raise
high yielding short duration crop varieties. In the hills, weaning away the population
away from shifting cultivation and development of horticultural crops and organic
farming requires considerable capacity building. As the agricultural sector is transformed
from subsistence to commercial farming, significant capacity building will have to be
done in adopting improved practices and marketing the products.
In general, as mentioned earlier, the literacy rate is high in the region, but this has
not translated into employability in productive occupations. NER has a large pool of
literates, but a very small pool of people with employable skills. There also appears to be
a reluctance to enter into self-employment ventures, perhaps because of the lack of any
such tradition in most of the NER states, so that those who do are first-generation
29
entrepreneurs. This is evident from the slow response to various proposals for self-
employment initiated by the central and state governments. However, the region has a
large base of very talented people and with training, they can be gainfully employed,
amongst others in agro-processing, IT sector, paramedical, biotech, aviation,
entertainment and hospitality industries.
The youth in the region have very limited opportunities to expanding their
horizons and reach their potential. There are very few higher educational institutions and
focus of the institutions is to prepare the youth for routine government jobs rather than
any creative initiatives. Indeed, the NEC has taken the initiative to constitute
Northeastern Regional Educational Council (NREC) for a holistic development of
education in the region. The NERC is planning a 15 year perspective plan. It will do
well to emphasise technical subjects such as engineering, mathematics, science,
information technology and bio-chemistry. It is equally important to initiate measures at
qualitative improvement in the education system.
While there is a tendency to focus on general subjects in the education system, the
vocational education does not find the required focus. Skill development is extremely
important for providing productive employment opportunities in the manufacturing and
tertiary sectors and creating a pool of employable skilled personnel would be an
attraction for private investments. Expansion in the hospitality industry which has a great
potential in the region requires a large number of persons trained in hospitality business.
In fact, as the employability of the people increases, private sector will come in to
provide the required skills. Proper regulation of the quality of education imparted and
ensuring access to such vocational educations through proper financial support,
particularly loans from the banking sector could be a useful means of increasing
employment and incomes in the region.
Focus on other aspects of human development is equally important for capacity
development and most important among is the provision of basic healthcare to the
population. Health indicators in the region show significant improvements over the
years. Nevertheless, there is considerable scope for improvements in the health and
nutrition status of the region especially for children and women. Shortage of medical
30
specialists and lack of tertiary facilities in several of the states needs to be addressed, as
well as the high incidence of AIDS, cancer, malaria, and other diseases. There are wide
gaps in rural-urban provisioning of basic services; and immediate attention needs to be
paid to the unsustainable, untrammelled development of most the region’s cities
especially in the hill areas.
An important part of capacity building is the promotion of general awareness of
the country and its peoples in the region through increased social interactions. This
would require promotion of sports and cultural exchanges within the Northeastern region
as also between the region and the rest of the country. The rich cultural heritage of the
region should be taken advantage of by engaging the youth in creative activities while
promoting two-way understanding with to the rest of the country. Holding annual music
and dance carnival in different parts of the NER with competitions organised at district,
state and regional levels would involve the youth in a creative activities. This could be
an important tourist attraction and made into a national and international tourist festival
which should be well publicised to bring in large number of tourists with chartered
flights. Similarly, increased sports activity including regular inter-district, inter-state and
regional level competition would engage the youth in creative activity. This would, inter
alia, require significant upgradation in sports infrastructure.
(d) Strengthening Infrastructure and Connectivity:
The vision of peace and prosperity can not be realised without building a network
of connectivity and providing the world class infrastructure. Providing connectivity is
the most important measure necessary for the resurgence of the NER. Creation of a
common market is necessary for the region to develop as an entity and realise the goals to
achieving peace and prosperity (Barua, 2005). Faster movement of goods and people at a
lower cost is essential to provide impetus to economic activity. It helps the development
of the markets, reduces exploitation by the middlemen and enables the people in remote
areas to earn their livelihoods by marketing their products at a better price. In the context
of NER, it is necessary to inter-link potential growth centres, promote tourism, connect to
the border trade points and support economic and defence needs. It helps better social
interaction of the people of different states in the region and promotes understanding and
31
harmony. It also helps the law and order to reach areas affected by insurgency to provide
safety and security to protect property rights necessary for the functioning of market
economy. All these are necessary for attracting private investments required for the
development of the region.
The biggest constraint in the NER has been the poor state of infrastructure, in
particular, roads, railways and power. At 66 km/100 sq. km area, the road length in the
region is lower than that of the country (75 km/sq.km area) and the quality of the road in
the region is extremely poor. The total railway track length in the entire region is 2592
kms and the broad gauge length is confined to the track in Assam only. The inland
waterways in Brahmaputra and smaller river in Kolodyne in Mizoram and Barak Valley
of Assam have become non-functional after the partition. Air connectivity to the region
is extremely poor. Three of the state capitals do not have airports. The feeder service
from Delhi/Kolkata/Guwahati to the state capitals where t5he airports exist is poor.
Often, even the intra-regional movements have to be through Kolkata which is expensive
in terms of both time and money.
Realising the vision of peace and prosperity through participatory growth strategy
can not be realised unless significant initiative is taken to improve connectivity. Given
the difficult terrain and strategic situation of the region, the road density should be
increased to more than the national average of 75km/100 sq.kms and the quality of the
roads should be improved significantly to make them motorable. The Central Master
Plan for the road connectivity in the region should be executed at a faster pace and
completed by 2015 and sub-divisional headquarters should be connected through all-
weather roads. National highways must be upgraded to 4 lanes. The rail projects under
construction must be completed by 2010 and more trains must be introduced to the
region, particularly from Guwahati to New Jalpaiguri. Extension of railway line upto
Sabroom can provide better connectivity to the Chittagong port. A detailed plan should
be prepared and implemented for connecting all state capitals in the region with a broad
gauge rail line by 2020. Air connectivity must be improved by shifting the hub to
Guwahati. The 9 old airstrips in different parts of the region should be developed into
commercial use and a regional air service should be started with its base at Guwahati or a
32
reliable private airline can be given subsidy to start the regional service between different
state capitals until it becomes economically viable.
Activating the inland waterways and providing access to the sea port requires
significant diplomatic initiatives with Bangladesh. The focus should be to have a
common market with Bangladesh. Indeed, with the threat of terrorism looming large and
as a number of terrorist groups are suspected to be operating from Bangladesh, a
complete change in the mindset from both the sides would be necessary. It is not easy to
break the ice, but both the sides should realise that there are significant gains to be had
from the common market. Access to the Chittagong port and opening up of the inland
water route could lead to economic resurgence of the region. In fact, Chittagong port is
only 75 kms from Sabroom in Tripura and could become an important gateway to East
Asian countries. The construction of the bridge across 110 metre wide Feni River and
helping Bangladesh to modernise the Chittagong port can go a long way in creating
confidence and goodwill and promote greater cooperation for the benefit of the peoples
of Bangladesh as well as of Northeastern India. Bangladesh will have access to Indian
market and the prevailing irritation regarding the unfavourable balance of trade could be
overcome considerably. Besides, people to people contact could bring in grater
understanding and social harmony.
Infrastructure and connectivity could support the ‘Look East’ policy (LE) and
provide impetus to trade with the Eastern part of the globe. Although the policy has been
in place sine the mid-nineties, not much has been done. The essential principle of this
policy has been that the NER shares 98 per cent of its borders with the neighbouring
countries of Bhutan, Nepal, China, Bangladesh and Myanmar. Therefore, forging
economic links with these countries, particularly the larger countries of Bangladesh,
China and Myanmar is important for the development of the NER. Therefore, since the
late 1990s, India has taken a number of measures to expand its trade with East Asia.
Apart from economic and trade related factors, closer link with Bangladesh and Myanmar
are crucial to the issue of controlling insurgency in the NER states. On the other hand,
China is a vital economic hotspot in the world today and needs to be factored into both
economic and foreign policy of the country. The ethnic linkage of people of the NER
33
states with the people of Bangladesh and Myanmar goes back to 300 years and therefore,
people would feel comfortable with closer linkage.
Despite improvements in infrastructure linkages at points like Moreh, very little
trade benefits seem to accrue to the NER states. This is probably due to the fact that
existing trade agreements (like the one with Myanmar) are restrictive towards trade in
agricultural products. This is also true of agreements on border trade with Bangladesh
and China (via Nathu La pass). Yet, it is in these products that the potential for export-
import exists for the NER in the near future. On the other hand, Sikkim is likely to
benefit as a ‘transit location’ for border trade with China, but this may not bring in
significant dividends to other NER states.
The Prime Minister of India, during the SAARC summit in May 2007 has
announced that duty free regime with the least developed SAARC countries from 2008.
This is an important measure and calls for immediate follow up to ensure its smooth
implementation. The most important and immediate initiative required is the significant
upgradation of infrastructure in the borders to facilitate trade and ensure faster movement
of goods to and from neighbouring countries. In fact, facilities such as approach roads,
telecommunication facilities, electricity, weighbridges, customs/immigration posts and
bonded warehouses should be taken up on a priority basis. Initially, facility should be
provided to the private initiatives to start restaurants, petrol bunks, repair stations, banks,
cyber cafes, convenience stores and repair stations. In fact, this should be taken up at
both sides of the borders in the case of Bangladesh, Bhutan and Nepal through persuasion
with and assistance to these countries as the border infrastructure bottleneck at wither
side could hinder the movement of goods.
(e) Raising Resources for Development
Critical to the issue of implementing development strategy to realise the vision of
peace and prosperity to the region is the issue of raising the required resources for
development. Indeed, much of the investments will have to come in from the private
sector and the government will have to create the enabling environment for private
initiative in economic activities. That includes controlling insurgency, improving
34
governance, creating the world class infrastructure and developing the capacity in the
people to participate in economic activities.
In creating the enabling environment, therefore, public expenditure has to play an
important role and the state governments will have to significantly enhance the level of
spending on development and also improve the efficiency of delivery systems. Provision
of basic needs such as elementary and secondary education, basic healthcare, water
supply and sanitation, anti-poverty interventions, housing and ensuring law and order are
important and the state governments will have to allocate the required resources for the
purpose.
The analysis of state finances in the region shows that the dependence of the NER
on subventions from the centre is overwhelming. Thus, fluctuations in the central
transfers add to the volatility in spending at state levels. This also creates a patronage
syndrome, increases mutual suspicion and reduces social accountability. Analysis shows
that in 2005-06 the contribution of own revenue in the region is just about 20 per cent of
their total revenues and the remaining is received as tax devolution and grants from the
central government. In fact, when Assam is excluded, the share of own revenue to total
revenue falls to just about 11 per cent. On the other hand, much larger proportion of the
incomes of the people in the region is taken by the insurgent groups as “taxes” and
extortions. Thus, while the people continue to pay much larger proportion of their
incomes as taxes to the government as well as to the insurgent groups, the government
receives only a small proportion of this.
Augmenting the standards of public services such as education, healthcare, water
supply, sanitation, housing and building a network of village and district roads and state
highways would require significant commitment of additional resources by the
governments. Furthermore, increasing the irrigation potential and harnessing the water
resources would require substantial public investments. It is important that the states in
the region should mobilise additional resources from tax and non-tax revenue bases
assigned to them. At present, tax – GSDP ratio in every one of the states in the region is
much below the national average of 7 per cent. Own tax to GSDP ratio ranged from 1.0
to 2.5 percent except in the states in the region except in Sikkim (6.5), Assam (4.8), and
35
Meghalaya (3.36). With the introduction of Value Added Tax (VAT), the buoyancy of
tax revenues is likely to improve. More importantly, immediate measures to strengthen
the tax administration and institute a modern information system could enhance revenue
productivity.
Revenue increases from the states’ own sources, though important and necessary
will not bring in the large volume of resources necessary to provide the required levels of
public services and infrastructure. There is a significant need to augment infrastructure
spending directly by the central government for building national highways, rail network,
airports and ensuring access to the sea route. This is a major challenge and the resources
with the NEC will not be adequate. Given the strategic importance of the region and
given the paramount importance in peace and prosperity, the Central government will
have to allocate much higher proportion of the resources for strengthening infrastructure
in the region.
The Shukla Commission has estimated overall investment requirements for basic
minimum services and infrastructure at Rs. 22758 crores during the mid 1990s. It has
recommended overall the creation of a non-lapsable central pool with an annual accrual
of Rs. 1500 crores (India, 1997). However, the actual investment during the last few
years has been less than a third of this amount, thus adding to the backlog further. If the
growth rate has to be accelerated to 11.5 per cent, the amount of investment requirement
in the region is staggering and much of the investment will have to come from the private
sector. For this to materialise, creation of enabling environment is critical.
(f) Creating a Responsive Administration:
Creating a responsive administration is critical to creating an enabling
environment. Responsive administration has both proactive and reactive aspects. The
protection of property rights is the most important precondition for the development of
markets. Creating a legal framework, implementation machinery to maintain law and
order and an effective and expeditious judicial system are essential components of this
incentive system. Equally important is responsive administration to create an appropriate
policy and institutional environment in terms of providing land, expeditious mechanism
to issue all licenses and clearances, facilitating the availability of land for setting up
36
enterprises, providing electricity and water connection and granting necessary clearances
while ensuring compliance with the required regulatory system (such as environmental
clearance). Another facet of good governance is providing a corruption free
administration.
The most important aspect of responsive administration is ensuring peace in the
region. Peace and development go hand in hand and therefore, ensuring law and order
should be the priority. The Northeast (except Sikkim) for the last several decades had
been constantly under the shadow of ethnic violence and terrorism of numerous forms.
The impact of continuous violent upsurges and absence of law and order have had
formidable impact on the performance of the economy, which has created a sense of
uncertainty and insecurity in the minds of prospective entrepreneurs. Clearly, in creating
a syndrome of underdevelopment, the law and order situation in the Northeast has had an
important role. Indeed, there is a view that fast development would solve the problem of
insurgency. Creating productive employment opportunities to the youth would be an
important way to wean them away from unlawful activities. However, insurgency and
development can not be dealt with sequentially; they have to be tackled simultaneously.
Thus, the strategy for realising the NER Vision 2020 should focus on establishing peace
in the region while simultaneously adopting strategies to accelerative the pace of
economic growth and making the growth process encompassing.
Providing a corruption free and responsive administration in the region is a major
challenge that has to be faced for the resurgence of Northeast. The media and non-
governmental organisations will have to play an important role of diligence and vigilance
in ensuring this. The Right to Information (RTI) Act is an important instrument to
demand accountability. Another important way to improve governance is effect
decentralised public service delivery. Despite the constitutional recognition to local
governments in rural and urban areas, the effective governance in the region still remains
with the state government. NER has the tradition of decentralise service provision and it
is important to strengthen the traditional institutions of local governance as well as
Panchayat Raj Institutions (PRI) in different states of the region. Activating these
institutions will help to impart efficiency in public service delivery and improve social
accountability.
37
V. Converting Dreams into Reality:
The vision of achieving peace and prosperity outlined above is eminently feasible
but by no means easy. Realising the vision requires mobilisation of people. People
based development strategy, infrastructure development, building capacity, responsive
administration and governance will attract significant investments and open up avenues
for the development of the region. Acceleration in the growth of agricultural sector will
benefit over 80 per cent of the people who reside in rural habitations. Capacity
development of the people should help them to take advantage of the expansion in
manufacturing and services sectors. The strategy of development outlined in the
document, thus, can promote encompassing development of the region to realise the
vision of achieving peace and prosperity.
The five components of the strategy described in the previous paragraphs are
interdependent and therefore, need to be designed and implemented concurrently. Peace
will bring in development dividends and vice versa. Development requires infrastructure
and capacity development. Similarly connectivity can dampen insurgency. All these
can be done only when there is an accommodating environment for which responsive
administration is necessary.
The formulation of the five year plans should take into account the overall vision
outlined in the document and adopt the development strategy to implement them. We
have lost opportunities in the past and any further delay in adopting integrated
development strategy will only delay the development of the region further and alienate
the people even more. It is hoped that the document will bring into focus the vision of
peace and prosperity to the Northeastern Region. It is hoped that the 11th Plan will
initiate operationalising the strategy to realise people’s dream.
38
References
1. Barua, Alokesh (ed), (2005) India’s North-East: Development Issues in a Historical
Perspective, Manohar Publications, New Delhi.
2. India (2006), Report of the Committee on Grass-roots Planning (Chairman: V.
Ramachandran), Ministry of Panchayati Raj, Government of India.
3. Olson, Mancur ( 1993), Dictatorship, Democracy and Development, The American
Political Science Review, Vol. 876, No. 3 (September) pp. 567-576.
4. Sachdeva, Gulshan (2000), Economy of the North-East: Policy, Present Conditions
and Future Possibilities, Konarak Publishers, New Delhi.
5. Sen, Amartya (1999), Development as Freedom, Oxford University Press, Oxford:
Oxford University Press.
6. Thomas, Joshua, C., (2006), Engagement and Development: India’s Northeast and
Neighbouring Countries, Akansha Publishing House, New Delhi
7. Verghese, B. G.. (2004), India’s Northeast Resurgent, Konarak Publishers, New Delhi
(Fourth Edition).
8. Verghese, B. G. (2006), “Unfinished Business in Northeast”, in Joshua Thomas
(2006).
9. Verghese, B. G. (2007), “Northeast Vision 2020: An Overview”, The paper submitted
to the NE Steering Group.
Draft for Comments, September 11, 2007
Peace, Progress and Prosperity in the Northeastern Region: Vision 2020
Volume II
M. Govinda Rao Rita Pandey
Alokesh Barua Manoj Pant
Anuradha Bhasin Gautam Naresh
Research Assistance:
Santosh Kumar Das C. G. Hariprasad
Shailender K. Hooda Monica Jaitly V. K. Priya Sambit Rath
National Institute of Public Finance and Policy, New Delhi
Contents
Section I: People-Based Approach to Development: Developing
Sectors with Comparative Advantage Chapter 1 : Agriculture 1 Chapter 2 : Industry 11 Chapter 3 : Services 19
Section II: Building Capacity: Policies and Institutions Chapter 4 : Human development 24 Chapter 5 : Manpower planning and employment 50
Section III: Enabling Market Development Chapter 6 : Infrastructure and connectivity 56 Chapter 7 : Trade and look east policy 67
Section IV: Resources for Development Chapter 8 : Public finances for development 76 Chapter 9 : Enabling private sector participation 82
Section V: Transforming Governance Chapter 10 : Governance and security 87 Chapter 11 : Grassroots planning and decentralised service delivery 94
Tables and Annexures
1
List of Charts and Figures
Chapter 1 1.1 Growth Rates of Agriculture in the Northeast, 1993-94 to 2002-03 1.2 Dependency Index (Non-Dairy, Non- Meat Food Products), 2003-04 1.3 Dependency Index for Meat and Diary Products Chapter 2 2.1 No. of Small-Scale Units in North East States, 2001-02 2.2 Bamboo Growing Area 2.3 Handicrafts in the NER as Per Handloom Census, 1995-96 Chapter 3 3.1 Tourism - Carrying Capacity of NER States, 2003 Chapter 4 4.1 Essential Facilities in Schools 4.2 Higher Secondary Schools with Laboratory and Computer Facilities 4.3 Proportion of Trained Teachers 4.4 Underweight Children aged 3 and Under 4.5 Proportion of Immunized Children (12- 23 months) 4.6 Proportion of Women who are Anemic 4.7 Households with Access to Toilets and Safe Drinking Water 4.8 Per Capita Consumption of Electricity
Chapter 7
7.1 Shares of India's Exports to Major Regions
7.2 Shares of India's Imports from Major Regions
Chapter 8
8.1 NER State: Average Composition of Receipts of Two Sub-periods
8.2 NER State Average Composition of Sources of Revenue
8.3 NER State-wise Average Contribution of Major Sources of Receipts
Chapter 9 9.1 Ratio of Public Sector to Private Sector Employment
2
List of Boxes Chapter 1 1.1 A Centre of Excellence for Horticulture in Meghalaya Chapter 2 2.1 Promoting Vertical Integration of Industrial Production Between Hills and Plains 2.2 Land as a Constraining Factor for Industrialisation 2.3 Bamboo-Based Industrial Activity 2.4 Handicrafts and Handlooms Chapter 3 3.1 Emerging Areas: A Case Study of the Music Industry in Nagaland
Chapter 4
4.1 The Importance of Social Audit: Communitisation of Education in Nagaland
4.2 Managing PHCs through Trusts 4.3 Communitisation: An Innovative Health Intervention 4.4 Improving Specialty Medical Care in Nagaland through Telemedicine 4.5 Nagaland’s Water Communitisation Experiment
Chapter 5
5.1 Private-Public Collaboration in Job-Oriented Technical Training IT Entrepreneurs Training Programme in Aizawl
5.2 Focus on Some Professions Chapter 6
6.1 Appropriate Technology in Power: A Case Study from the North East
Chapter 8
8.1 Issues Related to Compensation from Forest Conservation
Chapter 9
9.1 Private-Public Collaboration in Job-Oriented Technical Training
Chapter 11
11.1 Communitisation and Resurgence of Naga Social Capital
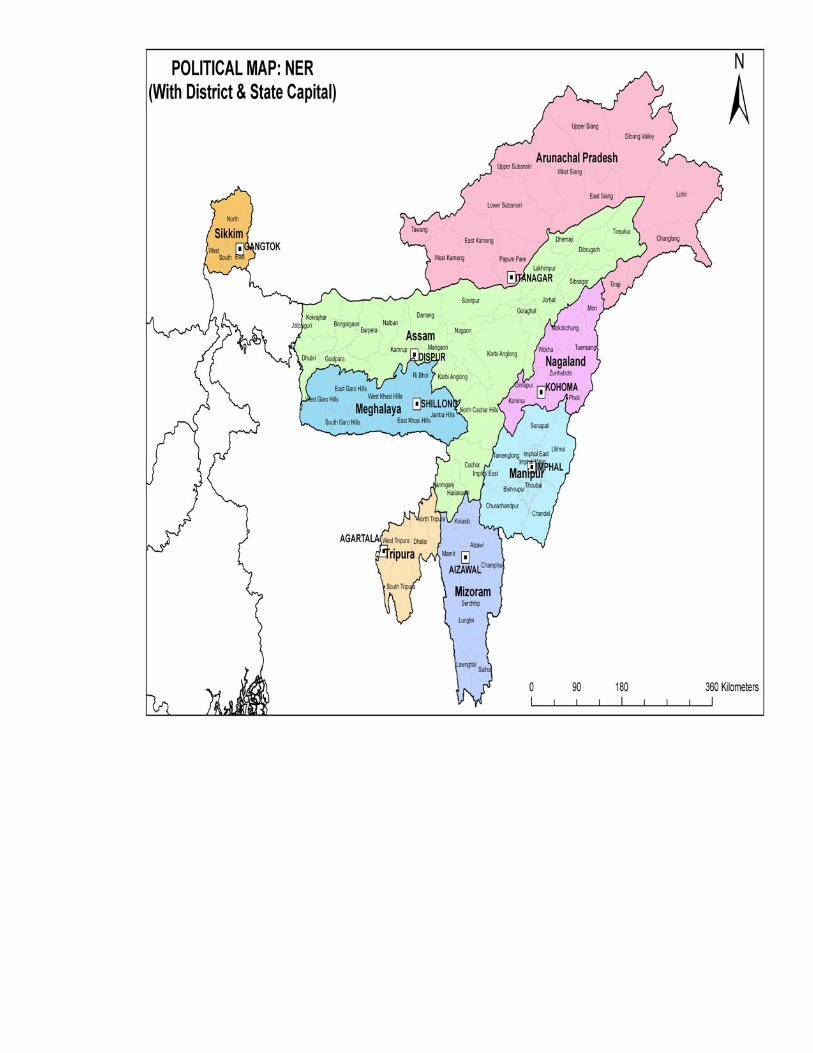
SECTION I
A PEOPLE-BASED APPROACH TO DEVELOPMENT
DEVELOPING SECTORS WITH COMPARATIVE ADVANTAGE
Section I
A People-Based Approach to Development
Developing Sectors with Comparative Advantage A development vision for the northeast region (NER) of the country must focus on improving economic conditions for the poorest, through the creation of economic growth opportunities. With about two-thirds of the population eking out an existence from subsistence farming, this growth will require a structural change in the region’s economy over the next twenty years or so. The historical trajectory of all subsistence economies shows that this structural change must involve a shift in employment opportunities from agricultural activities to the industrial and service sectors. A people-based approach to development thus must identify both short-run (five-year) and long-run (twenty-year) strategies for those areas which will increase employment opportunities, lead to an improvement in income-generating capacities and foster the development of a common market. In agriculture the immediate requirement would be the creation of opportunities that encourage farmers to move from farming for self-consumption to a more market-based form of production. This will also lay the foundation for the emergence of a strong agro-based industry sector, with its own employment and income-generating potential. The greatest benefits will accrue to agricultural communities when cultivation is focused on those crops in which the NER states have a comparative advantage. At the same time, the shift from subsistence farming to cash-crop farming will expose farmers, who have been risk-averse for decades, to the vagaries of a market they do not yet understand. The strategy will be two-fold: to nudge farmers to specialise in those crops in which the region has a comparative advantage and, at the same time, identifying and easing constraints to market-based production of agricultural crops so as to reduce the risks of market exposure. With the emergence of more high-value farming in agriculture, productivity increases will free up more people for employment in other areas in industry and services. The natural constraints that hill areas face in developing large, heavy industry, limits industrial activities to those based on resources available in the region. With the mix of hill and the plain areas in the northeast, industrial activity can be developed to capitalise on the significant synergies that exist between these two regions. The strong dominance of services in the national economy and exports makes it imperative that the NER also develop its potential in this emerging area. Apart from the employment potential of sectors such as tourism, with its high multiplier effects on the rest of the economy, there are other service areas in which northeast residents have a comparative advantage, if their skills-base is augmented suitably. The hill areas of the NER are not labour-abundant, so service-sector growth in these states will be led by activities based on a relatively small but skilled labour supply. The nature of the NER economies thus calls for a strategy that focuses on a few thrust areas, rather than a thinly spread smattering of resources over a wide range of activities. These thrust areas will in turn drive the development of the rest of the economy.
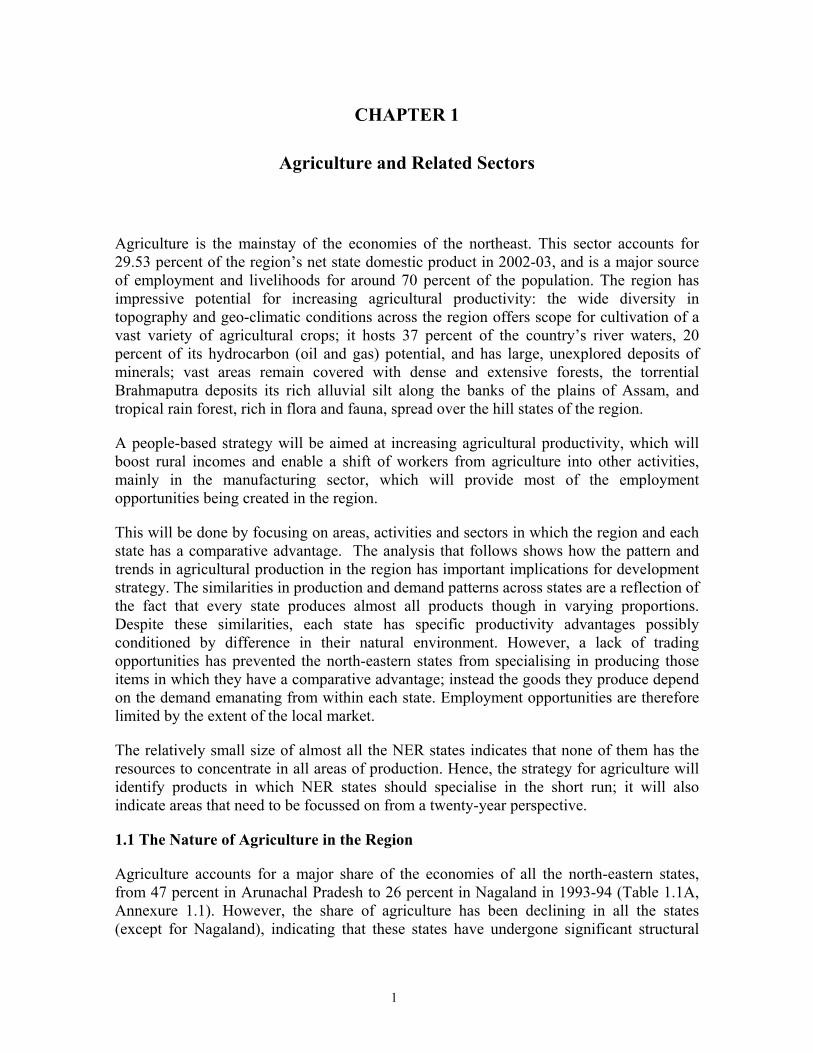
1
CHAPTER 1
Agriculture and Related Sectors
Agriculture is the mainstay of the economies of the northeast. This sector accounts for 29.53 percent of the region’s net state domestic product in 2002-03, and is a major source of employment and livelihoods for around 70 percent of the population. The region has impressive potential for increasing agricultural productivity: the wide diversity in topography and geo-climatic conditions across the region offers scope for cultivation of a vast variety of agricultural crops; it hosts 37 percent of the country’s river waters, 20 percent of its hydrocarbon (oil and gas) potential, and has large, unexplored deposits of minerals; vast areas remain covered with dense and extensive forests, the torrential Brahmaputra deposits its rich alluvial silt along the banks of the plains of Assam, and tropical rain forest, rich in flora and fauna, spread over the hill states of the region.
A people-based strategy will be aimed at increasing agricultural productivity, which will boost rural incomes and enable a shift of workers from agriculture into other activities, mainly in the manufacturing sector, which will provide most of the employment opportunities being created in the region.
This will be done by focusing on areas, activities and sectors in which the region and each state has a comparative advantage. The analysis that follows shows how the pattern and trends in agricultural production in the region has important implications for development strategy. The similarities in production and demand patterns across states are a reflection of the fact that every state produces almost all products though in varying proportions. Despite these similarities, each state has specific productivity advantages possibly conditioned by difference in their natural environment. However, a lack of trading opportunities has prevented the north-eastern states from specialising in producing those items in which they have a comparative advantage; instead the goods they produce depend on the demand emanating from within each state. Employment opportunities are therefore limited by the extent of the local market.
The relatively small size of almost all the NER states indicates that none of them has the resources to concentrate in all areas of production. Hence, the strategy for agriculture will identify products in which NER states should specialise in the short run; it will also indicate areas that need to be focussed on from a twenty-year perspective.
1.1 The Nature of Agriculture in the Region
Agriculture accounts for a major share of the economies of all the north-eastern states, from 47 percent in Arunachal Pradesh to 26 percent in Nagaland in 1993-94 (Table 1.1A, Annexure 1.1). However, the share of agriculture has been declining in all the states (except for Nagaland), indicating that these states have undergone significant structural
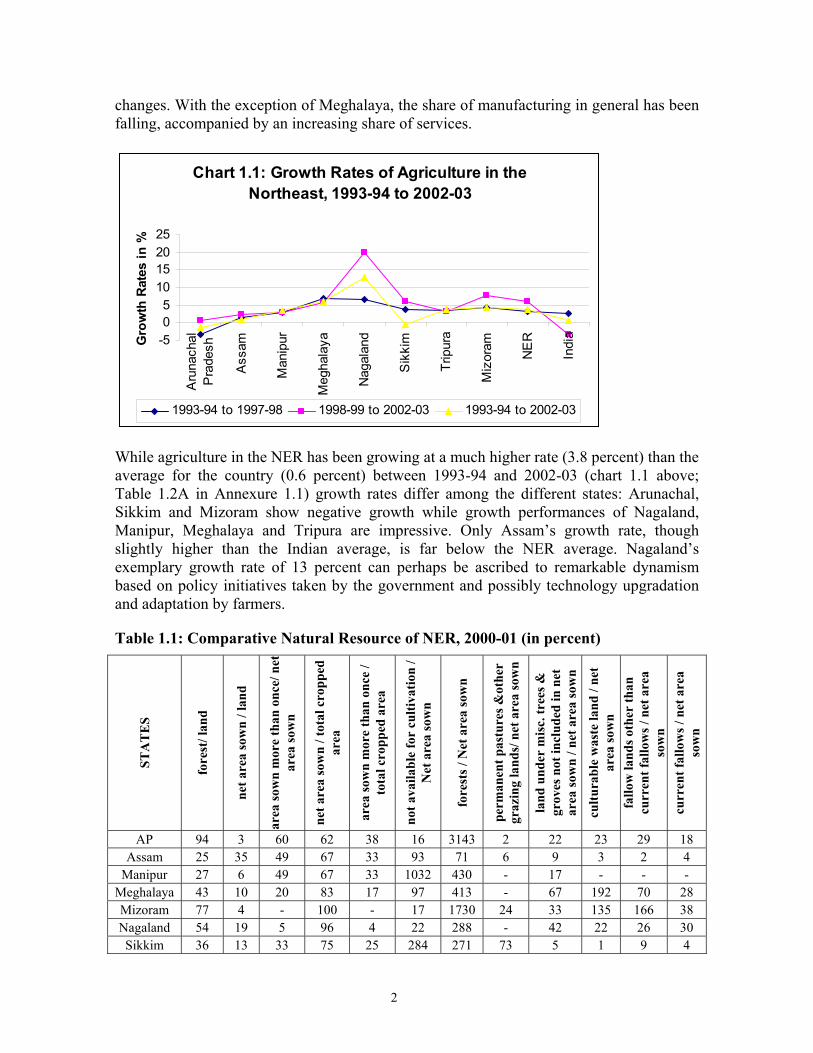
2
changes. With the exception of Meghalaya, the share of manufacturing in general has been falling, accompanied by an increasing share of services.
Chart 1.1: Growth Rates of Agriculture in the Northeast, 1993-94 to 2002-03
-505
10152025
Aru
nach
alP
rade
sh
Ass
am
Man
ipur
Meg
hala
ya
Nag
alan
d
Sik
kim
Trip
ura
Miz
oram
NE
R
Indi
aGro
wth
Rat
es in
%
1993-94 to 1997-98 1998-99 to 2002-03 1993-94 to 2002-03
While agriculture in the NER has been growing at a much higher rate (3.8 percent) than the average for the country (0.6 percent) between 1993-94 and 2002-03 (chart 1.1 above; Table 1.2A in Annexure 1.1) growth rates differ among the different states: Arunachal, Sikkim and Mizoram show negative growth while growth performances of Nagaland, Manipur, Meghalaya and Tripura are impressive. Only Assam’s growth rate, though slightly higher than the Indian average, is far below the NER average. Nagaland’s exemplary growth rate of 13 percent can perhaps be ascribed to remarkable dynamism based on policy initiatives taken by the government and possibly technology upgradation and adaptation by farmers.
Table 1.1: Comparative Natural Resource of NER, 2000-01 (in percent)
STA
TE
S
fore
st/ l
and
net a
rea
sow
n / l
and
area
sow
n m
ore
than
onc
e/ n
et
area
sow
n
net a
rea
sow
n / t
otal
cro
pped
ar
ea
area
sow
n m
ore
than
onc
e /
tota
l cro
pped
are
a
not a
vaila
ble
for
culti
vatio
n /
Net
are
a so
wn
fore
sts /
Net
are
a so
wn
perm
anen
t pas
ture
s &ot
her
graz
ing
land
s/ n
et a
rea
sow
n
land
und
er m
isc.
tree
s &
grov
es n
ot in
clud
ed in
net
ar
ea so
wn
/ net
are
a so
wn
cultu
rabl
e w
aste
land
/ ne
t ar
ea so
wn
fallo
w la
nds o
ther
than
cu
rren
t fal
low
s / n
et a
rea
sow
n cu
rren
t fal
low
s / n
et a
rea
sow
n
AP 94 3 60 62 38 16 3143 2 22 23 29 18 Assam 25 35 49 67 33 93 71 6 9 3 2 4
Manipur 27 6 49 67 33 1032 430 - 17 - - - Meghalaya 43 10 20 83 17 97 413 - 67 192 70 28 Mizoram 77 4 - 100 - 17 1730 24 33 135 166 38 Nagaland 54 19 5 96 4 22 288 - 42 22 26 30 Sikkim 36 13 33 75 25 284 271 73 5 1 9 4
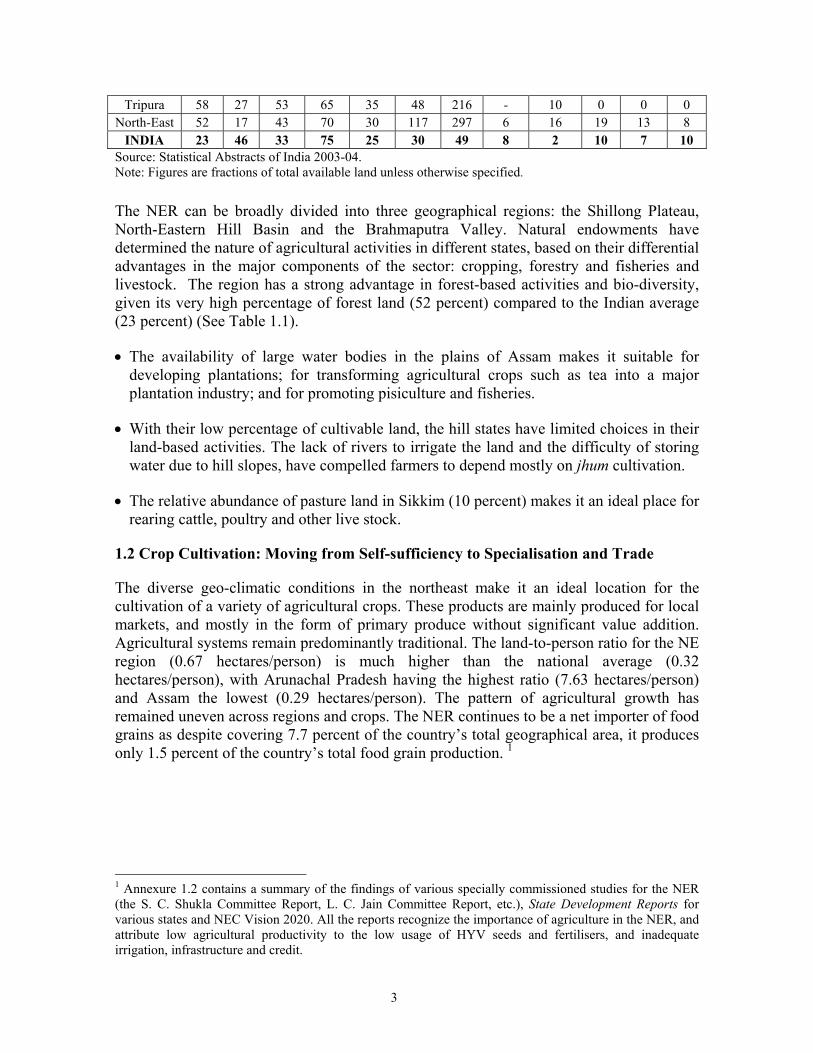
3
Tripura 58 27 53 65 35 48 216 - 10 0 0 0 North-East 52 17 43 70 30 117 297 6 16 19 13 8
INDIA 23 46 33 75 25 30 49 8 2 10 7 10 Source: Statistical Abstracts of India 2003-04. Note: Figures are fractions of total available land unless otherwise specified.
The NER can be broadly divided into three geographical regions: the Shillong Plateau, North-Eastern Hill Basin and the Brahmaputra Valley. Natural endowments have determined the nature of agricultural activities in different states, based on their differential advantages in the major components of the sector: cropping, forestry and fisheries and livestock. The region has a strong advantage in forest-based activities and bio-diversity, given its very high percentage of forest land (52 percent) compared to the Indian average (23 percent) (See Table 1.1).
• The availability of large water bodies in the plains of Assam makes it suitable for developing plantations; for transforming agricultural crops such as tea into a major plantation industry; and for promoting pisiculture and fisheries.
• With their low percentage of cultivable land, the hill states have limited choices in their land-based activities. The lack of rivers to irrigate the land and the difficulty of storing water due to hill slopes, have compelled farmers to depend mostly on jhum cultivation.
• The relative abundance of pasture land in Sikkim (10 percent) makes it an ideal place for rearing cattle, poultry and other live stock.
1.2 Crop Cultivation: Moving from Self-sufficiency to Specialisation and Trade
The diverse geo-climatic conditions in the northeast make it an ideal location for the cultivation of a variety of agricultural crops. These products are mainly produced for local markets, and mostly in the form of primary produce without significant value addition. Agricultural systems remain predominantly traditional. The land-to-person ratio for the NE region (0.67 hectares/person) is much higher than the national average (0.32 hectares/person), with Arunachal Pradesh having the highest ratio (7.63 hectares/person) and Assam the lowest (0.29 hectares/person). The pattern of agricultural growth has remained uneven across regions and crops. The NER continues to be a net importer of food grains as despite covering 7.7 percent of the country’s total geographical area, it produces only 1.5 percent of the country’s total food grain production. 1
1 Annexure 1.2 contains a summary of the findings of various specially commissioned studies for the NER (the S. C. Shukla Committee Report, L. C. Jain Committee Report, etc.), State Development Reports for various states and NEC Vision 2020. All the reports recognize the importance of agriculture in the NER, and attribute low agricultural productivity to the low usage of HYV seeds and fertilisers, and inadequate irrigation, infrastructure and credit.
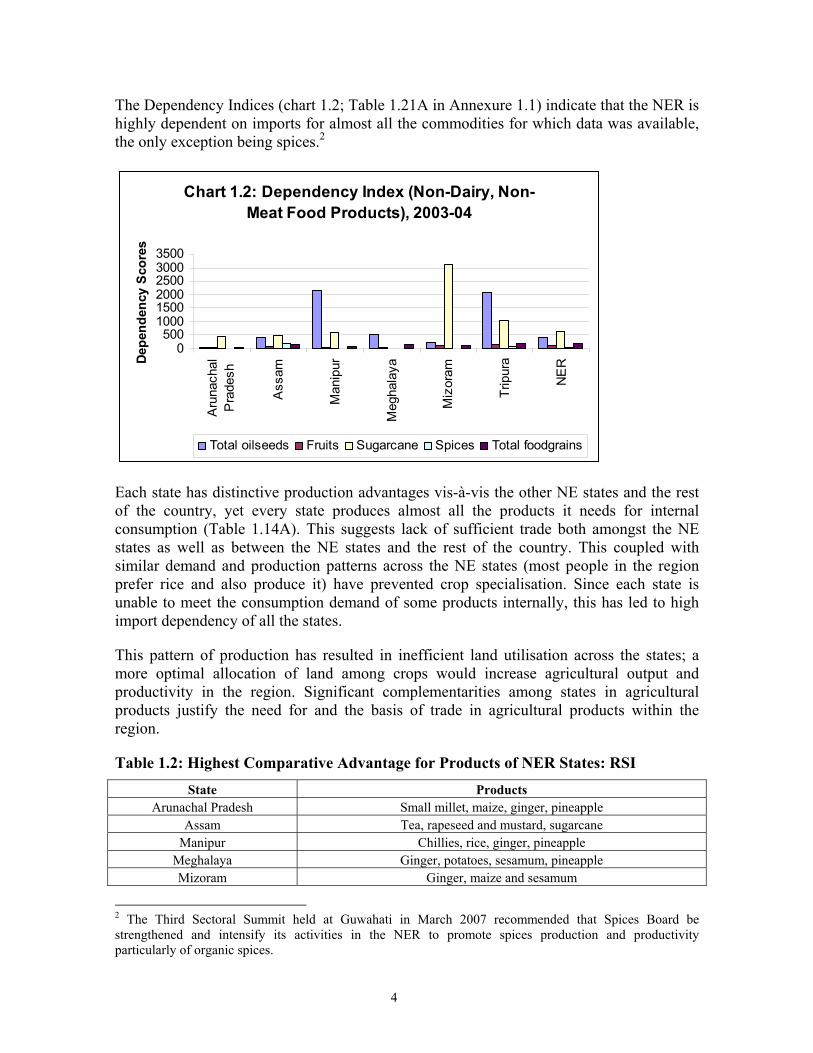
4
The Dependency Indices (chart 1.2; Table 1.21A in Annexure 1.1) indicate that the NER is highly dependent on imports for almost all the commodities for which data was available, the only exception being spices.2
Chart 1.2: Dependency Index (Non-Dairy, Non-Meat Food Products), 2003-04
0500
100015002000250030003500
Aru
nach
alP
rade
sh
Ass
am
Man
ipur
Meg
hala
ya
Miz
oram
Trip
ura
NE
RDepe
nden
cy S
core
s
Total oilseeds Fruits Sugarcane Spices Total foodgrains
Each state has distinctive production advantages vis-à-vis the other NE states and the rest of the country, yet every state produces almost all the products it needs for internal consumption (Table 1.14A). This suggests lack of sufficient trade both amongst the NE states as well as between the NE states and the rest of the country. This coupled with similar demand and production patterns across the NE states (most people in the region prefer rice and also produce it) have prevented crop specialisation. Since each state is unable to meet the consumption demand of some products internally, this has led to high import dependency of all the states.
This pattern of production has resulted in inefficient land utilisation across the states; a more optimal allocation of land among crops would increase agricultural output and productivity in the region. Significant complementarities among states in agricultural products justify the need for and the basis of trade in agricultural products within the region.
Table 1.2: Highest Comparative Advantage for Products of NER States: RSI
State Products Arunachal Pradesh Small millet, maize, ginger, pineapple
Assam Tea, rapeseed and mustard, sugarcane Manipur Chillies, rice, ginger, pineapple
Meghalaya Ginger, potatoes, sesamum, pineapple Mizoram Ginger, maize and sesamum
2 The Third Sectoral Summit held at Guwahati in March 2007 recommended that Spices Board be strengthened and intensify its activities in the NER to promote spices production and productivity particularly of organic spices.
5
Nagaland Small millet, maize Sikkim Maize, ginger, potatoes Tripura Natural rubber, coconut, bananas, pineapple
By identifying crops in which different states have a comparative advantage, resources can be concentrated and efforts could be made to promote their cultivation at least in the short run. Different models are used by economists to determine comparative advantages of different states in crop production.3 Based on these, the specialisation patterns that are best suited to the different states are indicated in Table 1.2. Each state demonstrates certain production advantages: Arunachal in small millets, Assam in tea4, Meghalaya in ginger, Mizoram in ginger, Manipur in chillies, Nagaland in small millets and maize, Tripura in natural rubber5 and Sikkim in maize.6
1.3 Horticulture: The Next Stage in Development
The strategy for agriculture which envisions a shift in farming from subsistence to cash-crop farming will lead to the expansion of what is now a nascent horticulture sector. Since farmers are naturally risk-averse, effecting changes in their cropping patterns will not be easy, unless gains from doing so are clearly demonstrated. With funds from the central government Horticulture Mission, states like Mizoram, Sikkim and Meghalaya have established Centres of Excellence in Horticulture which have begun to successfully spread the idea of fruit and vegetable cultivation among farmers (see box 1.1).
Box 1.1: A Centre of Excellence for Horticulture in Meghalaya
The Centre is promoting the cultivation of a gamut of products from flowers (anthurium), to fruit (strawberries) and vegetables (cucumbers). They have especially been encouraging farmers in the cultivation of anthuriums, providing support at all stages of cultivation, with the result that these flowers are grown in abundance by farmers on the slopes around Aizawl and in the East Garo Hills of Meghalaya.
In Mizoram and Meghalaya, these Centres act as an interface between the farmer and the private flower distributor, Zopar, who provides farmers with flower pods from Holland (which are more pest-
3 Specialisation patterns and comparative advantages of the different states have been analysed with the help of four indices: the regional specialisation index (RSI), national specialization index (NSI) in various agricultural crops, the consumption (demand) intensities for different crops and comparative advantages in various crops for each state and the country. See Annexure 1.3 for more details. 4 The Sectoral Summit at Guwahati in March 2007 recommended the introduction of a transport subsidy of Rs. 1.50 per kg. for tea exported directly from ICD, Amingaon, Assam, and that more mini-factories be set up. The Tea Board will also develop a separate logo for Assam Orthodox Tea. The Summit also recommended that the Assam Government issue ‘possession certificates’ to small tea growers to enable them to register with the Tea Board. 5 The Third Sectoral Summit held at Guwahati in March 2007 recommended that the Rubber Board fund area expansion and rejuvenation of sick plantations and introduce technology for increasing productivity; also that it address location-specific agro-management and processing issues and maintain and support nurseries run by gram panchayats and SHGs. 6 Sikkim does not form part of this analysis, as its links are mainly with the Siliguri railhead, rather than with the other NER states.
6
resistant and to avoid patent violation). Local varieties are also developed for the national market. Specially fabricated greenhouses are set up with drip-irrigation facilities to allow the plants (roses, anthuriums, etc.) to grow until ready for cutting. Cut flowers are taken to the plant for pruning and precision stem-cutting before export. The stems are kept in a cold storage till packed for export, and have to reach the buyer within 24 hours to retain any value. The Agricultural Processed Food Products Export Development Authority (APEDA) provides a subsidy for transporting the consignment from the farm till the airport for export, apart from the other general incentives on international freight.
With an expanding local and foreign market for anthuriums, present production is expected to increase rapidly in the coming years. It has proved to be such a remunerative source of income that the number of cultivators has increased from a mere 24 in 2002 to more than 200 growers in 2004 in Meghalaya. While acting as a demonstration for farmers, the Centre also takes in plants, vegetables and fruits (strawberries) from farmers and conducts quality control, and helps with their export. Zopar also buys these products directly from farmers but the Centre monitors the prices on the Net to ensure farmers receive a ‘fair’ price.
While the main market for floriculture appears to be outside the country, there are also sales in Guwahati, Kolkata and Delhi. In fact, flowers are first sold in the domestic market unless the produce is already committed for export. Fruits and vegetables are mainly sold in the domestic market. There is also some evidence that some farmers are switching from producing paddy to producing strawberries as the basic terrace farming is quite conducive to growing strawberries.
In the coming months, both Mizoram and Meghalaya are likely to produce and export other floriculture products, including roses, leather-leaf ferns, lilium, birds of paradise, etc. Horticulture is expected to become a major source of revenue in these states, although this is highly dependent on the necessary infrastructure being available to growers.
Source: Field Trip Visit by the Study Team to the Centre for Excellence
While the economics of floriculture and horticulture seems very appealing, the real issue is that farmers are dependent on the intermediary role played by the government, without which they would be ill-equipped to handle the highly capital-intensive process. Once again, as in the case of all cash crops, it is crucial that the marketing network and infrastructure are in place. At present marketing is being handled by a private body, but it is possible that states form a federated body which will facilitate inter-state movement and marketing of fruits, vegetables and flowers.7
1.4 Forestry and Other Natural Resources: Significant Unexplored Potential
Forests play an important role in people’s lives in the northeast, their share in the geographical area of the region being twice as high as in the country (Table 1.1). Even so, the region as a whole produces less than the national average of forest-based products (Table 1.4A in Annexure 1.1) and in fact, the share of forestry has been declining for most
7 This needs to be explored given the lack of faith producers have in the existing body NEREMAC after the fiasco of the crash in the ginger prices last year.
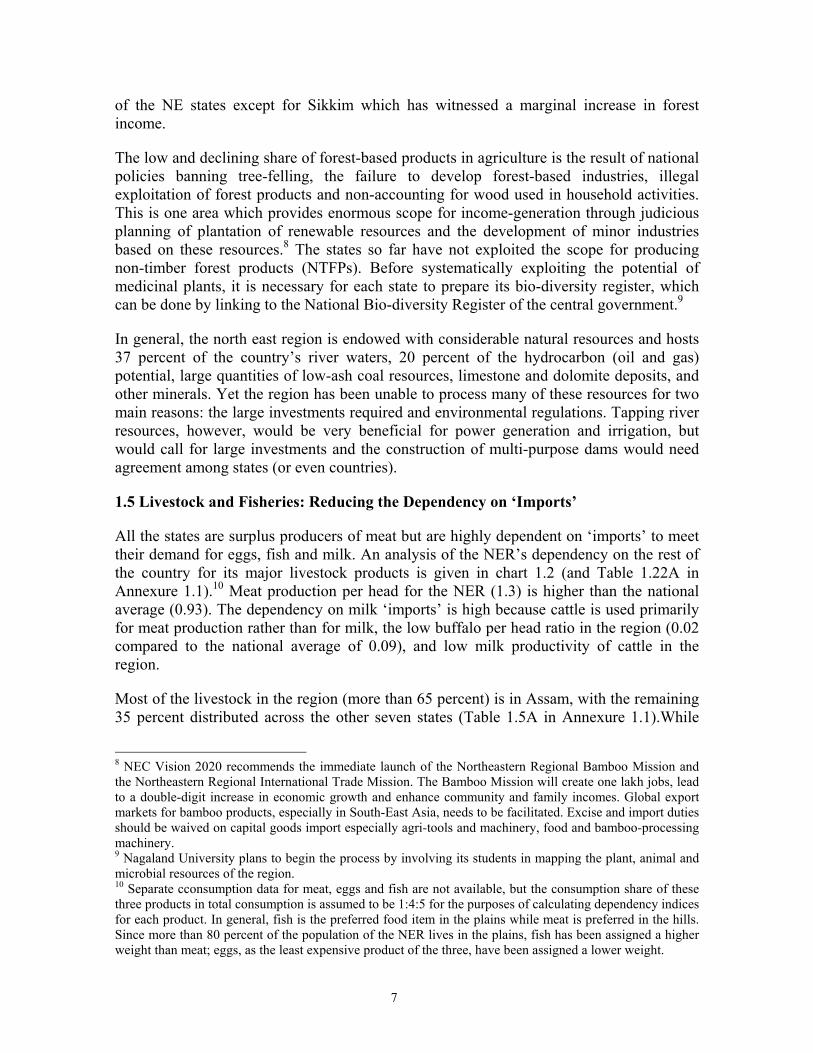
7
of the NE states except for Sikkim which has witnessed a marginal increase in forest income.
The low and declining share of forest-based products in agriculture is the result of national policies banning tree-felling, the failure to develop forest-based industries, illegal exploitation of forest products and non-accounting for wood used in household activities. This is one area which provides enormous scope for income-generation through judicious planning of plantation of renewable resources and the development of minor industries based on these resources.8 The states so far have not exploited the scope for producing non-timber forest products (NTFPs). Before systematically exploiting the potential of medicinal plants, it is necessary for each state to prepare its bio-diversity register, which can be done by linking to the National Bio-diversity Register of the central government.9
In general, the north east region is endowed with considerable natural resources and hosts 37 percent of the country’s river waters, 20 percent of the hydrocarbon (oil and gas) potential, large quantities of low-ash coal resources, limestone and dolomite deposits, and other minerals. Yet the region has been unable to process many of these resources for two main reasons: the large investments required and environmental regulations. Tapping river resources, however, would be very beneficial for power generation and irrigation, but would call for large investments and the construction of multi-purpose dams would need agreement among states (or even countries).
1.5 Livestock and Fisheries: Reducing the Dependency on ‘Imports’
All the states are surplus producers of meat but are highly dependent on ‘imports’ to meet their demand for eggs, fish and milk. An analysis of the NER’s dependency on the rest of the country for its major livestock products is given in chart 1.2 (and Table 1.22A in Annexure 1.1).10 Meat production per head for the NER (1.3) is higher than the national average (0.93). The dependency on milk ‘imports’ is high because cattle is used primarily for meat production rather than for milk, the low buffalo per head ratio in the region (0.02 compared to the national average of 0.09), and low milk productivity of cattle in the region.
Most of the livestock in the region (more than 65 percent) is in Assam, with the remaining 35 percent distributed across the other seven states (Table 1.5A in Annexure 1.1).While
8 NEC Vision 2020 recommends the immediate launch of the Northeastern Regional Bamboo Mission and the Northeastern Regional International Trade Mission. The Bamboo Mission will create one lakh jobs, lead to a double-digit increase in economic growth and enhance community and family incomes. Global export markets for bamboo products, especially in South-East Asia, needs to be facilitated. Excise and import duties should be waived on capital goods import especially agri-tools and machinery, food and bamboo-processing machinery. 9 Nagaland University plans to begin the process by involving its students in mapping the plant, animal and microbial resources of the region. 10 Separate cconsumption data for meat, eggs and fish are not available, but the consumption share of these three products in total consumption is assumed to be 1:4:5 for the purposes of calculating dependency indices for each product. In general, fish is the preferred food item in the plains while meat is preferred in the hills. Since more than 80 percent of the population of the NER lives in the plains, fish has been assigned a higher weight than meat; eggs, as the least expensive product of the three, have been assigned a lower weight.
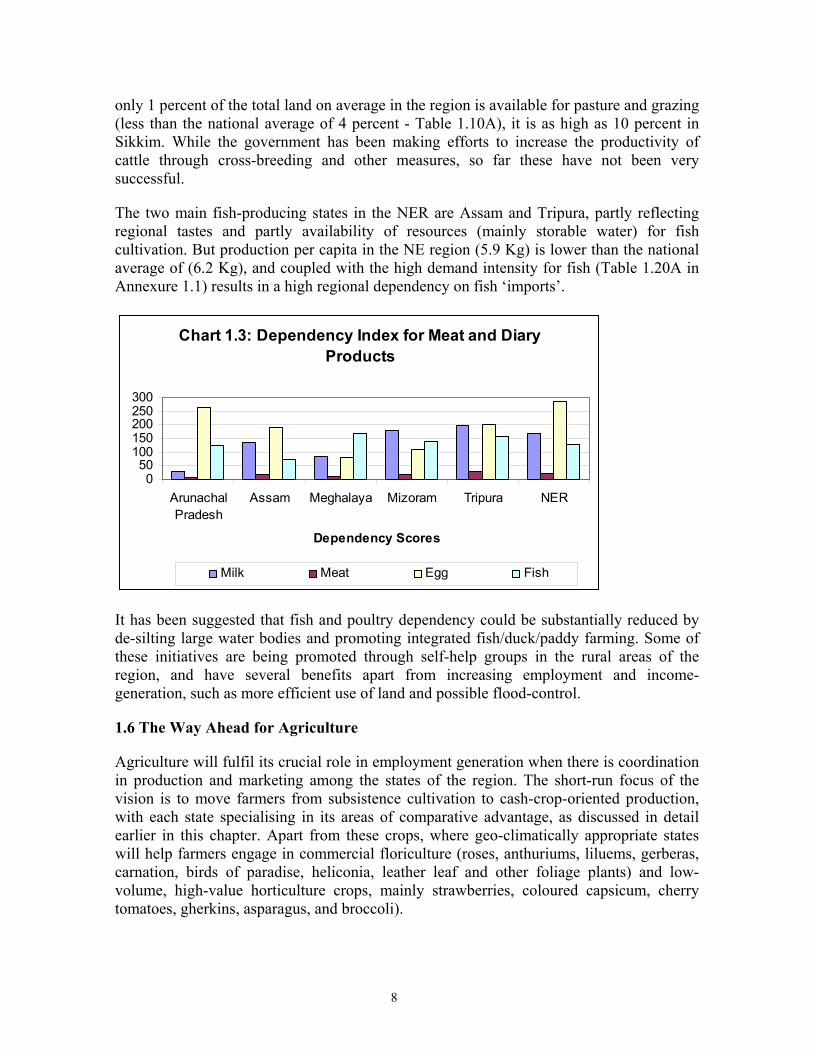
8
only 1 percent of the total land on average in the region is available for pasture and grazing (less than the national average of 4 percent - Table 1.10A), it is as high as 10 percent in Sikkim. While the government has been making efforts to increase the productivity of cattle through cross-breeding and other measures, so far these have not been very successful.
The two main fish-producing states in the NER are Assam and Tripura, partly reflecting regional tastes and partly availability of resources (mainly storable water) for fish cultivation. But production per capita in the NE region (5.9 Kg) is lower than the national average of (6.2 Kg), and coupled with the high demand intensity for fish (Table 1.20A in Annexure 1.1) results in a high regional dependency on fish ‘imports’.
Chart 1.3: Dependency Index for Meat and Diary Products
050
100150200250300
ArunachalPradesh
Assam Meghalaya Mizoram Tripura NER
Dependency Scores
Milk Meat Egg Fish
It has been suggested that fish and poultry dependency could be substantially reduced by de-silting large water bodies and promoting integrated fish/duck/paddy farming. Some of these initiatives are being promoted through self-help groups in the rural areas of the region, and have several benefits apart from increasing employment and income-generation, such as more efficient use of land and possible flood-control.
1.6 The Way Ahead for Agriculture
Agriculture will fulfil its crucial role in employment generation when there is coordination in production and marketing among the states of the region. The short-run focus of the vision is to move farmers from subsistence cultivation to cash-crop-oriented production, with each state specialising in its areas of comparative advantage, as discussed in detail earlier in this chapter. Apart from these crops, where geo-climatically appropriate states will help farmers engage in commercial floriculture (roses, anthuriums, liluems, gerberas, carnation, birds of paradise, heliconia, leather leaf and other foliage plants) and low-volume, high-value horticulture crops, mainly strawberries, coloured capsicum, cherry tomatoes, gherkins, asparagus, and broccoli).
9
States and farmers will only successfully be induced to specialise in a few agricultural products when inter-state trade takes off, so the strategy in the short run will need to concentrate on its promotion. This will depend crucially on efforts to ease constraints on natural resources such as land and labour, and on the free movement of goods within the region.
• Easing Constraints on Natural Resources
The use of productive resources to the fullest potential will need to be promoted by easing constraints on land. The abundance of natural resources overall in the region masks the significantly differing proportions in which these resources exist across states (Table 1.1). Some states are liberally endowed with forest land, others have very little; some states have no land available for cultivation (Arunachal Pradesh), some have plenty (65 percent in Manipur).
The low availability of land in most of the NER states especially the hill areas suggests a focus on those agricultural activities where land use is minimum. In addition, the scarcity of labour in these states would mean that activities should ideally be capital-intensive agriculture and agro-based industries, such as plant nurseries, floriculture, fruits, ginger and turmeric and processing of these products. The situation however is very different for Assam and Tripura where population densities are high (in fact, higher than the national average for Assam), which must target relieving labour from agriculture by developing employment opportunities in industry.
Efforts could also be made to increase the land available for agricultural production. A shift from traditional slash and burn methods (jhum) to modern technology-based farming in the hill states would reduce fallow land in these areas.11 Also, the hill areas have significant areas of cultivable wasteland, which could be made cultivable.
• Facilitating the Movement of Goods
There needs to be greater connectivity among and between the states- especially the hill states - in terms of roads, railways and air, not only between the states but also within the states. There is hardly any rail connectivity, and some states such as Arunachal, Sikkim and Meghalaya have no air connectivity. Poor transport facilities severely limit the scope of trade and specialization particularly in agricultural products which are bulky and perishable (this is dealt with in greater depth in the section on infrastructure).
• Creating a Marketing Framework: The Cluster Based Approach
The highly perishable nature of agricultural goods becomes an issue when there are several small farmers and little inter-state coordination. Farmers will need some support in marketing their products if they are to be induced to make the shift to cash crop production. Further, unless states coordinate their production and storage plans, excessive production can lead to a market crash as happened recently in the case of ginger production 11 NEC Vision 2020 recommends making the NER marginally surplus in food production by introducing integrated modern agricultural methods and developing agriculture horizontally and vertically.
10
in some of the NER states. The large demand for food items created by the ‘captive markets’ of the region, such as the army and security forces, could be tapped into to expand the regional market.
The short-run development approach will be cluster-based to realize greater economies of scale and specialisation. For this, the cultivated area of the state should be divided into crop-wise clusters based on comparative advantages, with each cluster defined as a Crop Development and Marketing Unit (CDMU) which emphasises on the marketing aspects of the cluster. Collection centres will need to be set up near the clusters, which will have linkages with clusters in other regions, to promote economical linkages with the wholesale market. Marketing intervention especially for horticultural produce, with a full compliment of post-harvest infrastructure and market network, is fundamental. These CMDUs would be given appropriate managerial and financial flexibility for assisting producers realise reasonable profits from their efforts.
Establishment of a cold-chain along major arterial highways is critical if the region is to exploit its rich horticulture potential and market these products to the rest of the country. The operation of the cold chain could be based on a PPP model or on a lease-basis with private entrepreneurs.
• A Longer-Term Vision
In the longer run, states will attempt to move people out of primary agriculture into less land- and labour-intensive areas such as horticulture, dairy farming and forestry-based non-timber products, such as medicinal plants. Some steps in this direction have already been initiated in horticulture in Sikkim and Mizoram, and for bamboo in Assam, Meghalaya and Nagaland. These sectors are, however, highly capital-intensive in terms of requirements of dedicated transport corridors and specialized storage facilities (more in the chapter on infrastructure).
The long-term vision can only become a reality when states coordinate their strategies in marketing, trade etc. Without this no state would have a sufficient volume of production to cater to the outside markets. 12
12 In some cases Sikkim might well be considered an outlier to the general principle of joint strategizing.
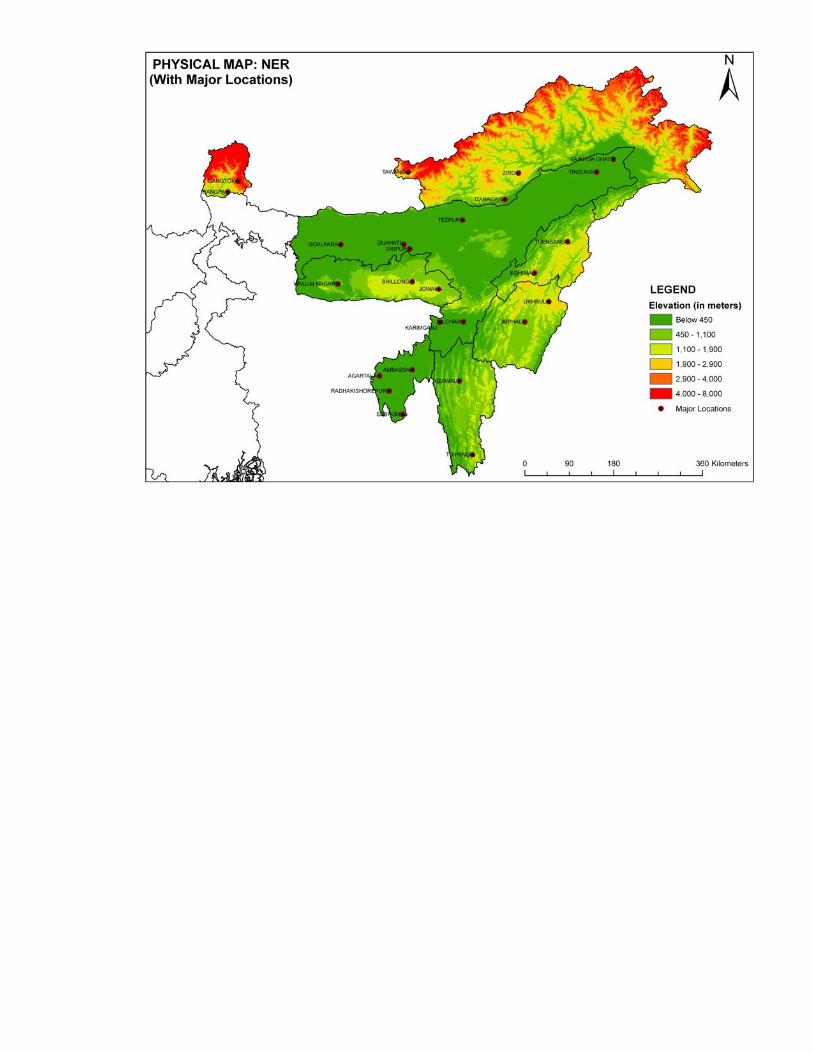
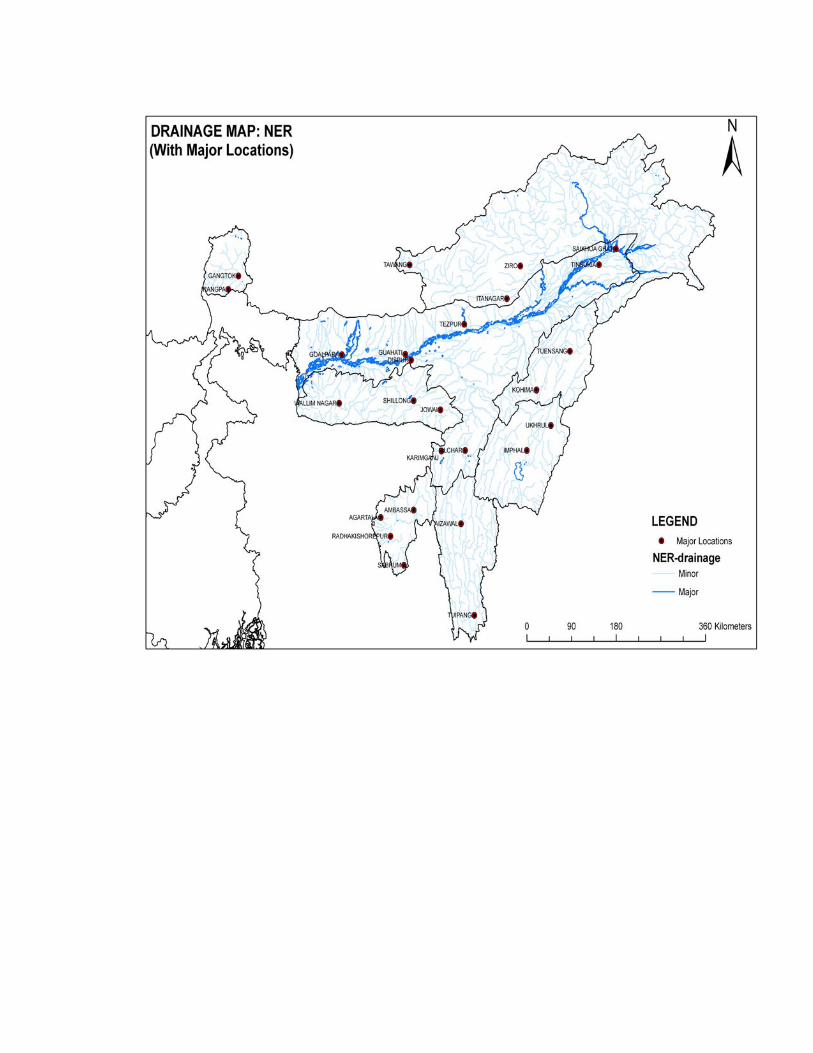
11
CHAPTER 2
Manufacturing Sector
Growth and progress are invariably associated with an increase in the relative importance of manufacturing, along with a relative decline in agricultural production.1 The larger the share of manufacturing in NSDP, the higher the per capita income of an economy. So far, industrialization has not taken off in the northeast where manufacturing still forms an insignificant proportion of NSDP in the region (4.7 percent in 1993-94) compared to the national average (17 percent), and further, has been decreasing between 1993-94 and 2002-03. The poor performance of manufacturing in the region appears to be a prime cause of the relatively poor growth rates of the region.
Among the northeastern states, Assam emerges as the industrial ‘hub’ of the region: it is the largest industrialized state, accounting for nearly 77 percent of total NER industrial output, and almost 90 percent of the industrial output of registered manufacturing. In contrast, the unregistered sector2 is relatively evenly distributed across the region, which clearly indicates that the different northeastern states have distinct strengths and advantages in handicrafts and other small-scale industry. However, small-scale industries could not play any significant role in the development of the NE region.
2.1 Large Industries
There is very little large-scale manufacturing in the region (Table 2.4A).3 The units that exist are based on locally available resources and on optimal plant sizes that are not very large. The large-scale industries functioning in the region are mainly in the areas of mining and quarrying, food processing, spinning and weaving, pulp and paper, wine and malt, bidis, cigars and cigarettes, printing, bleaching and dying, wool spinning, wooden products, footwear, fertilisers and chemicals, insulated wires and cables and drugs and medicines (Table 2.18A in Annexure 2.2)
Despite the availability of the basic raw materials in the region, large-scale industries such as petrochemicals, cement, steel and sugar have not come up in the region. For example, there is abundance of lime stone (in Meghalaya and Assam) but not a single large cement factory in the region. Assam has the largest oil reserves (non-off-shore) but the state has no large manufacturing unit for petrochemical products. Conversely, industries like insulated wires and cables have emerged in the NER, although there are no known reserves of copper. The location of these activities could be explained in terms of domestic demand distribution cost which justifies the setting up of a plant.
1 Kubo et al. 2 The unregistered sector generally comprises small-scale industries including handicrafts. 3 Based on Summary Results, Factory Sector, Annual Survey of Industries, Central Statistical Organization.
12
Assam has emerged as the industrial hub of the region, followed by Tripura, which surprisingly does not have any rubber manufacturing plants even though it is the country’s second largest producer of rubber. The main factors attracting industry into these two states are the population size and density which makes them relatively large markets for industrial goods, as well as a good source of skilled and unskilled labour supply. Since most of the industries located in these states are highly labour intensive, the hill areas are at a major disadvantage on this count. Other equally important factors are uninterrupted power supply, warehousing and, of course, Assam’s location at the juncture of the NER states, which enables industries to be connected through the major road and railway networks with the rest of India. Locating industries at the junction minimizes distribution costs to other states of the NER.
Greater integration among the states of the region would have many advantages for industrialization in the region (see box 2.1). A major constraint to this kind of co-operation among states is the absence of a good transport network connecting the states and production centers within a state to a large collection center, which is necessary to guarantee an adequate and reliable supply of raw materials to industry.
However, market failures and the lack of sufficient inducement to invest are probably bigger constraints to vertical integration of industry. Without a proper industrialization strategy for the region and some inter-governmental planning, the market cannot play its role in facilitating integration, which crucially depends on a well-developed transport network, free mobility of goods and services across the state and security of life and property.
Box 2.1: Promoting Vertical Integration of Industrial Production
Between the Hills and Plains
Vertically integrating the hill states with the industrial hub in the plains would promote a degree of industrialization in these states. The wide variety of fruits, vegetables and forest goods produced by the hill states offers excellent potential for vertical integration with processing units located in the plains. For example, fruit processing industry could be set up based on fruit (say, pineapples) produced in large quantities in Nagaland and Meghalaya. The initial raw material processing, such as juice extraction or slicing would be more economically located near the source, since initial processing reduces bulk and consequently transport costs. The next stages of processing such as bottling, packaging and marketing, which are highly labour-intensive could be located in the industrial ‘hub.’
Similarly, the initial stages of rubber processing could be done in Tripura (the second largest producer of rubber in the country), while the manufacture of various rubber products could be located near the distribution network.
2.2 Small Industries
The relatively higher labour-intensity of small-scale industry (SSIs) gives it a crucial role in reducing poverty and unemployment. However, only 3 percent of the small-scale units in the country are located in the northeast (Table 2.5A Annexure 2.1), of which more than
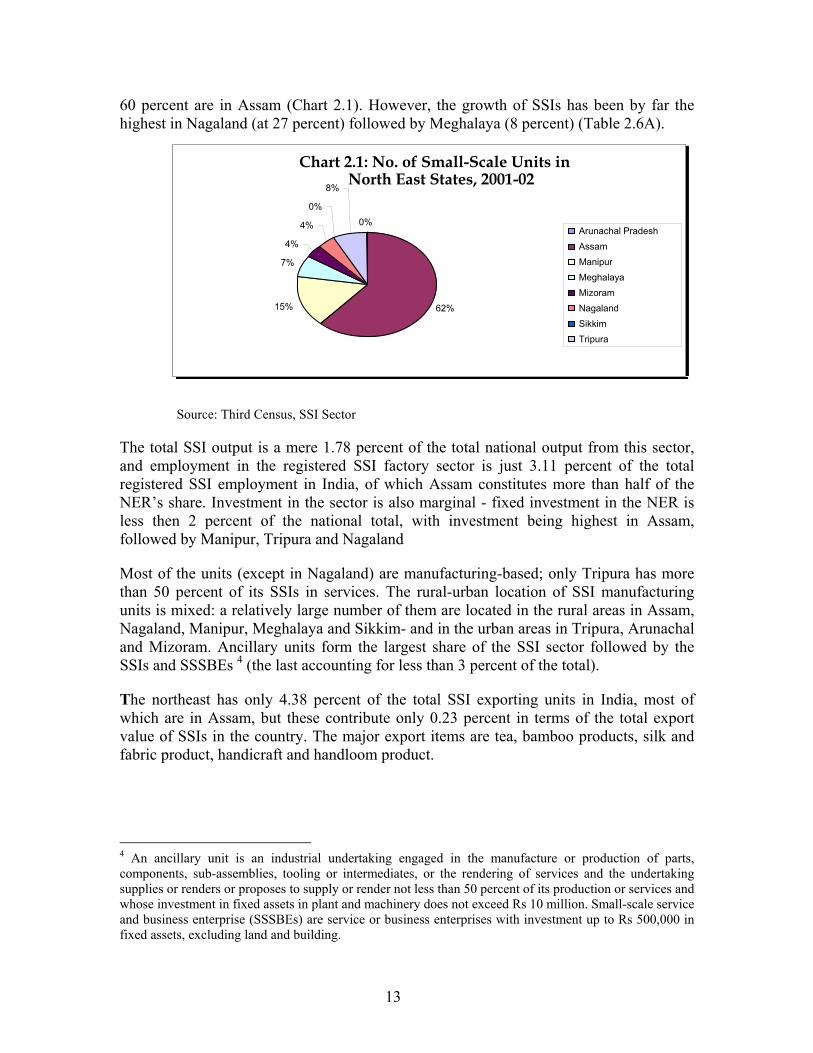
13
60 percent are in Assam (Chart 2.1). However, the growth of SSIs has been by far the highest in Nagaland (at 27 percent) followed by Meghalaya (8 percent) (Table 2.6A).
Source: Third Census, SSI Sector
The total SSI output is a mere 1.78 percent of the total national output from this sector, and employment in the registered SSI factory sector is just 3.11 percent of the total registered SSI employment in India, of which Assam constitutes more than half of the NER’s share. Investment in the sector is also marginal - fixed investment in the NER is less then 2 percent of the national total, with investment being highest in Assam, followed by Manipur, Tripura and Nagaland
Most of the units (except in Nagaland) are manufacturing-based; only Tripura has more than 50 percent of its SSIs in services. The rural-urban location of SSI manufacturing units is mixed: a relatively large number of them are located in the rural areas in Assam, Nagaland, Manipur, Meghalaya and Sikkim- and in the urban areas in Tripura, Arunachal and Mizoram. Ancillary units form the largest share of the SSI sector followed by the SSIs and SSSBEs 4 (the last accounting for less than 3 percent of the total).
The northeast has only 4.38 percent of the total SSI exporting units in India, most of which are in Assam, but these contribute only 0.23 percent in terms of the total export value of SSIs in the country. The major export items are tea, bamboo products, silk and fabric product, handicraft and handloom product.
4 An ancillary unit is an industrial undertaking engaged in the manufacture or production of parts, components, sub-assemblies, tooling or intermediates, or the rendering of services and the undertaking supplies or renders or proposes to supply or render not less than 50 percent of its production or services and whose investment in fixed assets in plant and machinery does not exceed Rs 10 million. Small-scale service and business enterprise (SSSBEs) are service or business enterprises with investment up to Rs 500,000 in fixed assets, excluding land and building.
Chart 2.1: No. of Small-Scale Units inNorth East States, 2001-02
0%
62%15%
7%
4%
4%
0%
8%
Arunachal PradeshAssamManipurMeghalayaMizoramNagaland
Sikkim Tripura
14
2.3 The Way Ahead for Industries
Industry will play an important role in absorbing surplus labour from land, once farming moves to cash-crop cultivation. For this, the region will develop industry based on the resources available in the region. The focus of industrial policy in the region needs to shift from supply-related inducements to industry (tax incentives and so on) to creating preconditions that will give rise to market forces, which will automatically encourage industrial activity in the region. The region is rich in a variety of natural resources; its literacy rate is very high; it has a large English speaking population; very high female participation in the work force and is close to several international markets. Once investment flows gather momentum, then the catalytic role of policies such as tax benefits, easy credits, and so on would come into play.
• Synchronisation of State Industrial Policies
Realising this vision will call for a syncronisation of state industrial policies, taking into account parameters from other states.5 A common industrial policy framework at this juncture would be premature as the NER has not yet evolved into a meaningful economic and administrative entity. However, it is important that state policies are formulated so that they are efficient and optimal from the point of view of the region as a whole. For example, it would not be efficient for every state to have a cement industry if the optimal size dictates only one plant in the region. While location of a plant and the promotion of vertical or horizontal specialisation within an industry are ideally determined by market forces, in the absence of functioning markets, some government intervention will be needed through a synchronization of policies among states.
Further, policy needs to shift its focus from providing incentives (such as easy credit facilities, tax holidays, export promotion parks and capital investment subsidies) to easing the infrastructural and fundamental bottlenecks to production and marketing. State-specific policies have failed to have a significant effect on industry because they are oriented towards increasing supply in the region. The real problem is the lack of ‘effective demand’ from the people, which enables industry to produce on a profitable scale. Therefore, incentives have not given rise to an upsurge in entrepreneurial activities or inflows of private capita, as demand for the product within the state is insufficient to reap minimum profits and marketing networks are almost non-existent.
• A Cluster-Based Approach to Industry
Manufacturing enjoys economies of scale, so a large home market is necessary for the growth of manufacturing activities in a region. The clustering effect is crucial for manufacturing as these give rise to various forms of ‘externalities.’ For example, each processing unit of an industry provides a market for another industry; the cluster formation also encourages the creation of a pool of skilled labour. In fact, the absence of such clusters is a prime cause of high labour costs in the region.
5 The current state industrial policies and common industrial policy for the NER lack a synchronisation in policies among all the states (see Annexure 2.3).
15
However, there is a lot of scope for the development of industries based on local raw materials. This will call for a very well-developed transport network in the region. The poor inter- and intra-state connectivity has worked against the formation of such industrial clusters. Other factors that need to be taken care of are ensuring an adequate supply of power, a skilled labor force and risk-bearing lonable funds.
• Creating the Environment for Market Forces
Governments will need to ensure some pre-conditions for well-developed market forces to emerge, which eventually give rise to a proliferation of industry. Free mobility of goods and services in the region would be helped by providing speedy connectivity (by road, train or other means) within as well as between states and efficient modes of communication.
An important issue in the northeast relates to the security of life and property. Lack of proper law-enforcing mechanism within a state may cause market failures or in other words prevent the emergence of markets. Law and order across the states, which calls for a joint-security management approach developed by all the states together, rather than the present disjointed-security systems.
The emergence of a market in the region will also call for greater transparencies in resource-sharing policies including land. Restrictive land laws and common property rights in many states in the region have deterred investors from the region (box 2.2).6 Other pre-requisites for the emergence of markets are enhancement of banking and other financial intermediaries in the states, and the provision of adequate good quality power to industries.
6 The state industrial policy resolutions of various states are silent of the issues of land.
Box 2.2: Land as a Constraining Factor for Industrialization The large-scale community ownership of land in many hill states has hampered theemergence of a market-based economy in these areas. In Meghalaya, for example, thegovernment owns a miniscule 4 percent of the land (Sreerajan); in Manipur, privatelands are better developed than those owned by the government.(Sachdeva). Thus,while industrial policy resolutions in these states propose leasing lands for setting upindustry, the non-availability of individually owned land remains a major hurdle toindustrialization in the NER. The states have followed different paths in dealing with this issue depending on theconstitutional rights accorded to their respective communuities: In Meghalaya, forexample, the state can take over land for developmental purposes if it is the ‘tribalinterest.’ State governments have to clearly spell out the different ways in whichentrepreneurs and enterprises can safely and legally acquire land for industrialactivity.
16
2.4 Industry Based on Local Resources: Adding Value within the Region
As we mentioned above, the geo-political structure of the region suggests that industrial development be based on locally available resources such as natural gas and petrochemicals, bamboo, natural rubber, tea, and horticultural products. A people-centric strategy for development would be to add as much value to these resources within the region, rather than marketing the raw material to the rest of the country. This would create more jobs and enhance income-generation, in addition to promoting industrialisation within the region.
A planned exploitation of agriculture and allied sectors, such as tea and bamboo could provide the necessary boost to manufacturing and self-employment (see box 2.3). For example, the tea industry plays an important role in the economic activities of the NER. The NER is the world’s largest tea-growing region (with a 16 percent share), and the largest producer and exporter of tea in India (with a share of 55 percent).7 Over the years, the value of tea exports has been declining; the focus could be to process tea within the region.
It would be prudent to focus on those products that would reduce dependence on imports from outside the NER and provide competitive advantage in exports out of the NER. It would be very helpful for the small manufacturers to grow with the help of captive markets. Steps should be taken to provide necessary supplies to the large captive markets like Army. Small manufacturers can supply necessary manufacturing, food and beverage products to the huge demand due to the presence of strong army in the region.
Box 2.3: Bamboo-Based Industrial Activity
Bamboo is an integral part of the socio-cultural and economic traditions of the region, with an important role in shaping the economies of the NE by providing huge employment opportunity. Around 50 percent of country’s bamboo resources are in the NE states, 14 percent of which is in Mizoram where bamboo forests cover almost half the geographical area of the state (Chart 2.2; Table 2.17A in Annexure 2.1). Assam has the most bamboo stock, followed by Manipur, Mizoram and Arunachal Pradesh
7 NEC data bank
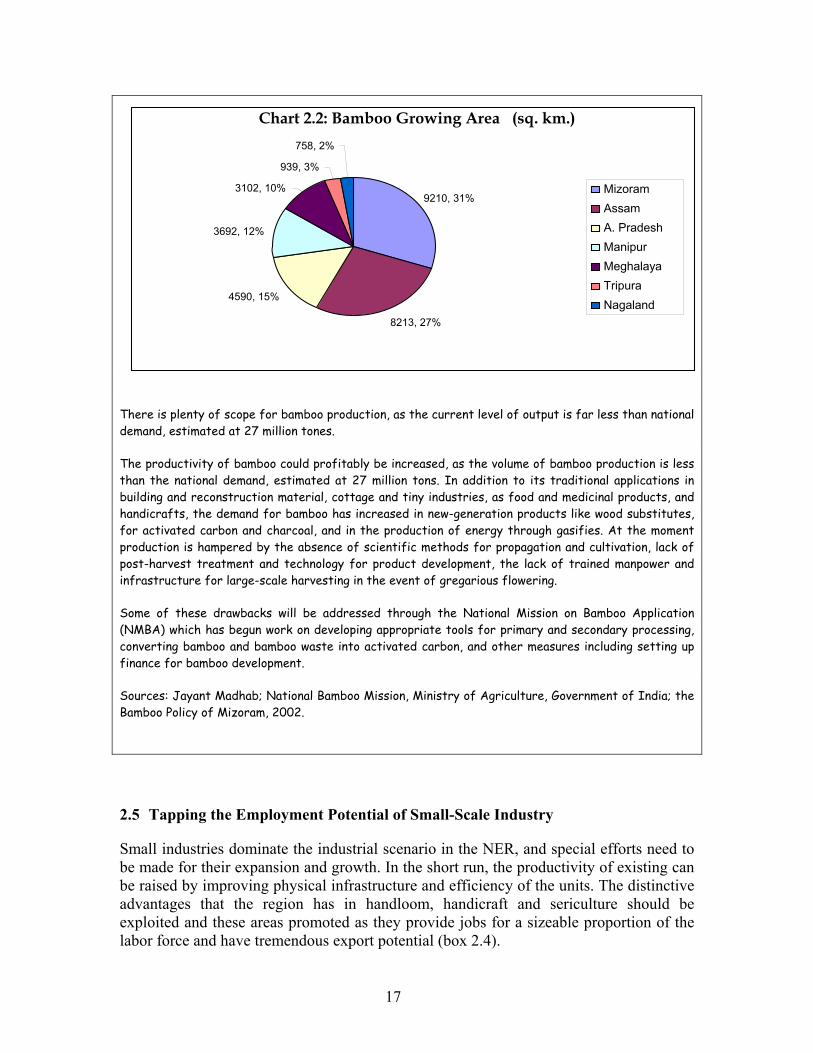
17
There is plenty of scope for bamboo production, as the current level of output is far less than national demand, estimated at 27 million tones.
The productivity of bamboo could profitably be increased, as the volume of bamboo production is less than the national demand, estimated at 27 million tons. In addition to its traditional applications in building and reconstruction material, cottage and tiny industries, as food and medicinal products, and handicrafts, the demand for bamboo has increased in new-generation products like wood substitutes, for activated carbon and charcoal, and in the production of energy through gasifies. At the moment production is hampered by the absence of scientific methods for propagation and cultivation, lack of post-harvest treatment and technology for product development, the lack of trained manpower and infrastructure for large-scale harvesting in the event of gregarious flowering.
Some of these drawbacks will be addressed through the National Mission on Bamboo Application (NMBA) which has begun work on developing appropriate tools for primary and secondary processing, converting bamboo and bamboo waste into activated carbon, and other measures including setting up finance for bamboo development.
Sources: Jayant Madhab; National Bamboo Mission, Ministry of Agriculture, Government of India; the Bamboo Policy of Mizoram, 2002.
2.5 Tapping the Employment Potential of Small-Scale Industry
Small industries dominate the industrial scenario in the NER, and special efforts need to be made for their expansion and growth. In the short run, the productivity of existing can be raised by improving physical infrastructure and efficiency of the units. The distinctive advantages that the region has in handloom, handicraft and sericulture should be exploited and these areas promoted as they provide jobs for a sizeable proportion of the labor force and have tremendous export potential (box 2.4).
Chart 2.2: Bamboo Growing Area (sq. km.)
9210, 31%
8213, 27%
4590, 15%
3692, 12%
3102, 10% 939, 3%
758, 2%
Mizoram Assam A. Pradesh Manipur Meghalaya Tripura Nagaland
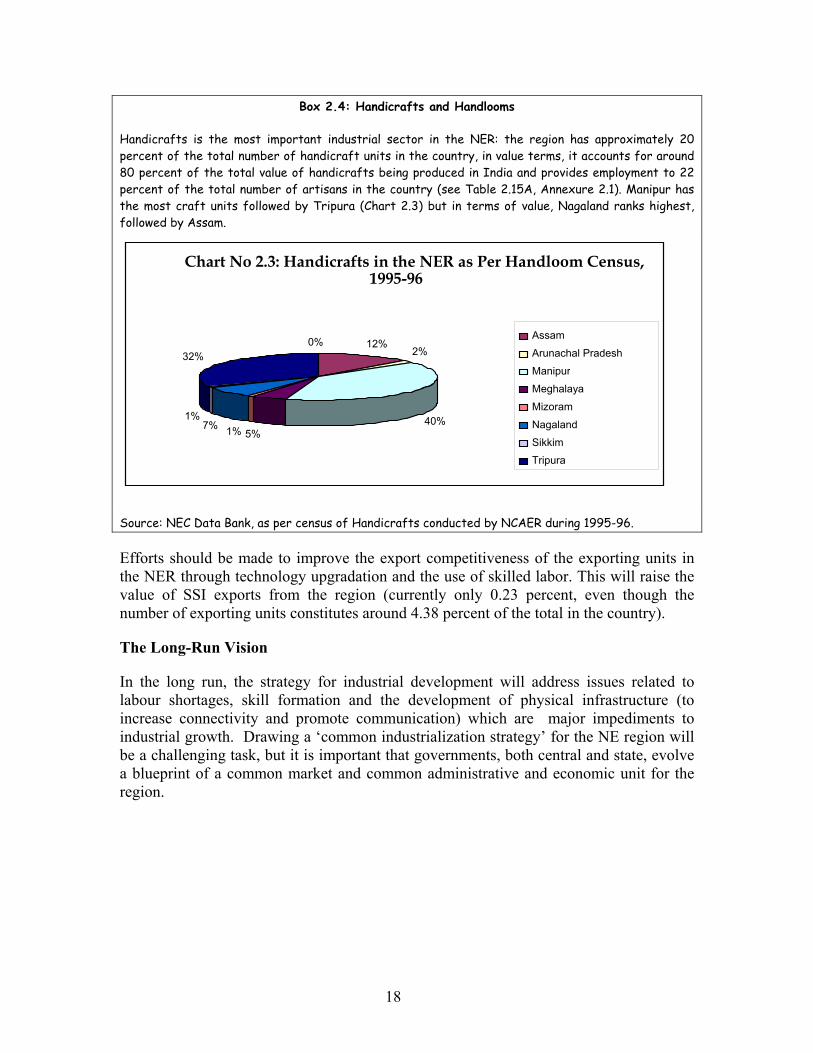
18
Box 2.4: Handicrafts and Handlooms
Handicrafts is the most important industrial sector in the NER: the region has approximately 20 percent of the total number of handicraft units in the country, in value terms, it accounts for around 80 percent of the total value of handicrafts being produced in India and provides employment to 22 percent of the total number of artisans in the country (see Table 2.15A, Annexure 2.1). Manipur has the most craft units followed by Tripura (Chart 2.3) but in terms of value, Nagaland ranks highest, followed by Assam.
Source: NEC Data Bank, as per census of Handicrafts conducted by NCAER during 1995-96.
Efforts should be made to improve the export competitiveness of the exporting units in the NER through technology upgradation and the use of skilled labor. This will raise the value of SSI exports from the region (currently only 0.23 percent, even though the number of exporting units constitutes around 4.38 percent of the total in the country).
The Long-Run Vision
In the long run, the strategy for industrial development will address issues related to labour shortages, skill formation and the development of physical infrastructure (to increase connectivity and promote communication) which are major impediments to industrial growth. Drawing a ‘common industrialization strategy’ for the NE region will be a challenging task, but it is important that governments, both central and state, evolve a blueprint of a common market and common administrative and economic unit for the region.
Chart No 2.3: Handicrafts in the NER as Per Handloom Census,1995-96
0% 12%2%
40%5%1% 7% 1%
32%
Assam
Arunachal Pradesh
Manipur
Meghalaya Mizoram
Nagaland Sikkim
Tripura
19
CHAPTER 3
Services Sector
The emergence of a strong services sector is essential for a region’s economic progress and prosperity. As agricultural production becomes more oriented towards the market, productivity increases will mean that workers move out of the sector in search of employment opportunities elsewhere. The concomitant development of services is important to expand employment opportunities available to people displaced from land-based activities. The low land-intensity of services makes them ideal thrust areas for growth, especially in the hill states of the northeast region where land is at a premium. Already some of the hill states have very successfully expanded their tourism activities, and in the process generated employment and income both directly and indirectly. Finally, the modernisation of agriculture proposed for the NER itself depends on the emergence of a number of related services.
The services sector has doubled in real terms in almost every state (Tables 3.1A and 3.2A in Annexure 3.1), the main areas of growth being trade, hotels and restaurants, and public administration, with real estate gaining importance in Assam, Nagaland and Meghalaya in recent years.1 The growth in trade, hotels and restaurants and real estate indicates growing private sector activity.2
The fastest growing sector has been public administration (except for Nagaland and Meghalaya), reflecting the common malaise that, outside agriculture, the government has become the main employer in these states. Central grants maintained public expenditure in the states, while insurgency, over the last decade in particular, restricted the growth of other service sectors. Security considerations have also limited the extent to which expenditure on public administration can be reduced. The banking sector is virtually non-existent in most of these states, although some activity has emerged in Arunachal Pradesh, Assam, Meghalaya and Sikkim.
3.1 Banking
The low-level of economic activity in the region has led to stagnation in the offtake of credit in most NER states. The low spread of banking services is directly related to the subsistence nature of the agricultural economy and the relative lack of industrial economic activity. Micro-finance organizations are ideal agents to disburse small loans.3 A beginning
1 ‘Other services’ have also emerged as important, but no breakdown for this category is available. This sector actually includes a number of services like education, (covered in another chapter), but it would be instructive to see the change in the relative importance of these components over time. 2 Field visits indicated that in Dimapur (Nagaland) the price of real estate has gone up from Rs. 8,000 per acre in the mid-1980s to Rs. 4,35,000 per acre in 2003 reflecting the increased demand for land with economic growth. 3Field visits by the research team to the NER also indicated that most farmers seem to need small loans (of Rs. 50,000 to 60,000) which scheduled banks are not able to advance, given the cost of administration.
20
has been made by NEDFI advancing some loans to NGOs operating in hill areas, which were too remote to make it profitable for NEDFI. Hence, particularly in the remote hill areas, intermediaries like NBFIs or NGOs can play a crucial role getting small loans to farmers and small-scale industries.
The credit-deposit ratio (CD) has been consistently low across the states compared to the national average. In Assam and Tripura this ratio has remained the same since the mid-1990s. The CD ratio for Manipur was highest in 1996-97 (around 59 percent) but has declined since (to around 41 percent in 2004-05). Only Meghalaya, Sikkim and Mizoram have seen an increase since 1999-2000, with the ratio almost tripling for Meghalaya and doubling for Sikkim and Mizoram. In Sikkim, in particular, increased banking activity is quite visible4 (Table 3.4A in Annexure 3.1).
Box 3.1: Emerging Areas: A Case Study of the Music Industry in Nagaland
The Government of Nagaland declared 2004-05 the Year of Youth Empowerment, and constituted a special task force for music in August, 2004. This team drew on the experiences of the members, drawn from diverse professional backgrounds sharing a common passion for music, to suggest and formulate policies conducive for the promotion of music as an industry by the state government. A special cell was set up in the Department of Youth Resources and Sports, Nagaland in August 2006, to carry forward the agenda to integrate and promote activities that would spur the growth of the interdependent professional skills that operate within, and on the fringes of the music industry.
A Centre of Excellence for Music and Performing Arts will be set up within the Science College Campus, Jotsoma, with impressive infrastructure including seminar halls for multi-disciplinary activities; a recording studio for audio-visual productions; an auditorium, library, archives, and data bank so scholars can access information.
Capacity-building of Naga musicians have taken the form of exposure to performances in Delhi and other parts of the country, and training in vocal and instrumental music for the academic session 2007-08 at various institutes in Delhi, Bangalore and Kolkata (with the help of private individuals). The annual Hornbill Festival in Kohima has become an important event for local and foreign talent-spotting. The Roots Festival was held across the NER in May 2007 and promoted intra-state interactions.
This has spurred the emergence of professional support activities, with recording houses such as the Aries Music and Sound Foundation, Dimapur; Studio 29, Dimapur; Clef Ensemble, Kohima and Highland Dawn Media, Kohima for audio visual productions, becoming very active in the state. The Dream Café, Kohima has become a hub for young people and promotes interactions with musicians and professionals from all walks of life. Music is poised to become a major industry in the state, growing from its current annual generation of Rs. 3.5 crore to Rs 300 crore by 2020.
Source: From the Music Task Force for Nagaland
Discussion with officials from the refinance bank for the region, NEDFI, confirmed this as small loans (for industrial or horticultural purposes) were too expensive for NEDFI to administer 4 While only a few public sector banks were functioning in 2000-01, recent field trips showed that almost all the private banks have increased their presence significantly. In both Meghalaya and Sikkim field trips by the research team showed significant tourist activity which usually drives banking networks.
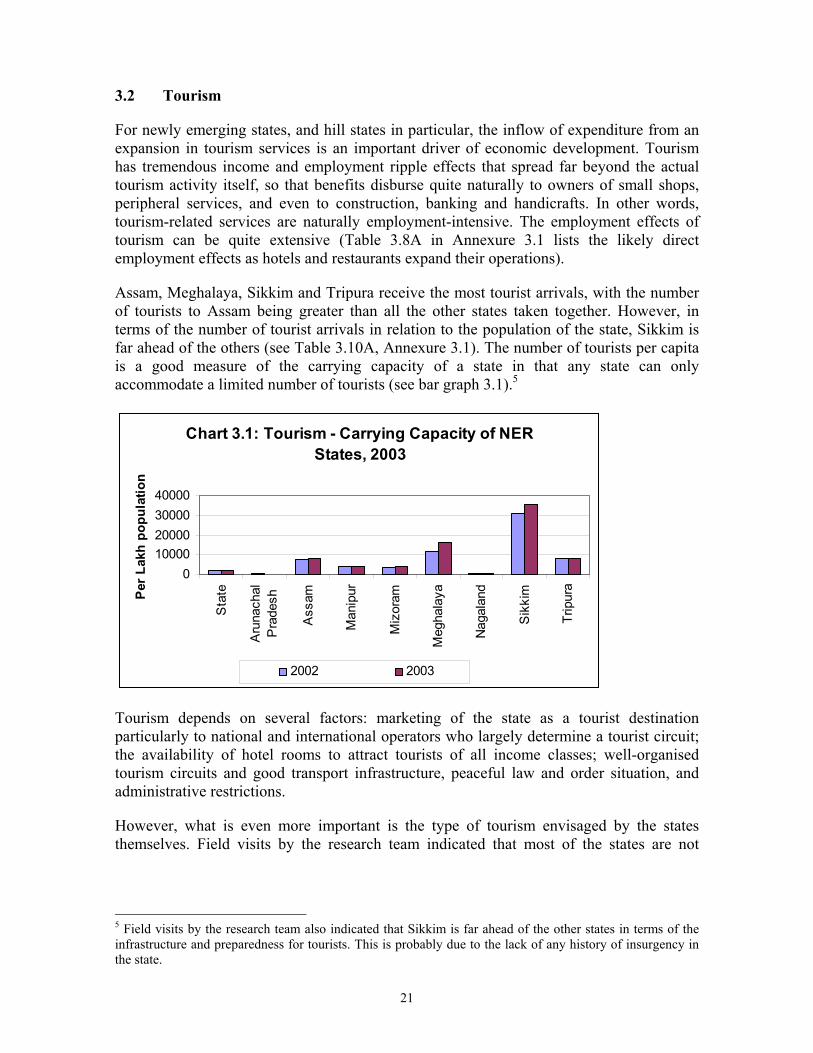
21
3.2 Tourism
For newly emerging states, and hill states in particular, the inflow of expenditure from an expansion in tourism services is an important driver of economic development. Tourism has tremendous income and employment ripple effects that spread far beyond the actual tourism activity itself, so that benefits disburse quite naturally to owners of small shops, peripheral services, and even to construction, banking and handicrafts. In other words, tourism-related services are naturally employment-intensive. The employment effects of tourism can be quite extensive (Table 3.8A in Annexure 3.1 lists the likely direct employment effects as hotels and restaurants expand their operations).
Assam, Meghalaya, Sikkim and Tripura receive the most tourist arrivals, with the number of tourists to Assam being greater than all the other states taken together. However, in terms of the number of tourist arrivals in relation to the population of the state, Sikkim is far ahead of the others (see Table 3.10A, Annexure 3.1). The number of tourists per capita is a good measure of the carrying capacity of a state in that any state can only accommodate a limited number of tourists (see bar graph 3.1).5
Chart 3.1: Tourism - Carrying Capacity of NER States, 2003
010000200003000040000
State
Arunachal
Pradesh
Assam
Manipur
Mizoram
Meghalaya
Nagaland
Sikkim
Tripura
Per
Lak
h po
pula
tion
2002 2003
Tourism depends on several factors: marketing of the state as a tourist destination particularly to national and international operators who largely determine a tourist circuit; the availability of hotel rooms to attract tourists of all income classes; well-organised tourism circuits and good transport infrastructure, peaceful law and order situation, and administrative restrictions.
However, what is even more important is the type of tourism envisaged by the states themselves. Field visits by the research team indicated that most of the states are not
5 Field visits by the research team also indicated that Sikkim is far ahead of the other states in terms of the infrastructure and preparedness for tourists. This is probably due to the lack of any history of insurgency in the state.
22
looking at conventional tourists.6 Sikkim, given the low carrying capacity of the state with a population today of just over 6.5 lakh (assuming population growth rate of 3.5 percent since 2001) is emphasizing adventure tourism on its rivers. Mizoram recognizes the importance of outside tour operators in bringing in tourists and is trying to work out joint ventures between its local tour operators and bigger agencies outside the NER. Hence, any attempt to develop tourism must carefully identify the kind of tourist activity a state wants to encourage.
While marketing of the state is crucial, what is even more critical is marketing of the region as tour operators normally operate on tourist sectors which do not necessarily correspond to geographical state boundaries. Thus it is important to look at the region as a whole, offering tourist packages that cut across state boundaries. For this, coordination would be needed among states in terms of inter-state movements, hotel linkages, and so on, which could be facilitated by a federated body of state representatives which would work in conjunction with tour operators.
Most of the states (with the possible exception of Sikkim, Meghalaya and Assam) are not geared for conventional tourism in terms of available infrastructure of hotels and guest houses (Tables 3.12A and 3.13A in Annexure 3 which show that tourist accommodation in most NER states is far lower than the national level).7 This was also evident from field trips to these states.8 In many states (with the possible exceptions of Sikkim and Assam) the state may have to take the lead in setting up hotels, as high fixed costs deter private investors. The ideal model would be a public partnership with private operators who would run the hotels on a long-lease basis.9 This would also get around the restrictions on land use and sale in most hill states. Tourism in the NER states will also depend on the available transport infrastructure. While this is considered in detail in the chapter on infrastructure, tourism development would call for a strong emphasis on intra-state linkages. The states of the NER are linked to each other, both by air and rail, almost exclusively through Guwahati, and this constraint to tourist circuit and planning of transport infrastructure will need to be addressed in the tourism strategy.
Finally, on the administrative front the ILP system is still in operation in practice in states like Nagaland, Mizoram, Manipur and Arunachal. While it is not strictly enforced in Mizoram and Nagaland, formal relaxation is even more important. The ILP is strictly administered in Arunachal, but the procedure for acquiring a permit in Guwahati is cumbersome even for domestic tourists. In addition, some states are still subject to RAP and PAP clearances on security grounds. The restrictive nature of these permits makes it
6 In Nagaland, for example, there seems to be an interest in eco-tourism and model villages are being developed which are also horticultural centres. In addition, the infrastructure provision is to a certain extent decentralized as tourism is also being put under the Communitisation program of the state 7 The Fourth Sectoral Summit at Gangtok on 27-28 April 2007 suggested this shortage of rooms be addressed through the development of dharamshalas, one-room accommodation, low-cost, budget hotels, and youth hostels along rivers and near cemetries. 8 Thus, for example, even Kohima, the capital of Nagaland has only 300 rooms across all levels, the quality of most being unacceptable for tourists. This has hampered the location of major international or national industrial fairs and seminars in the state. 9 This procedure was followed in the setting up of Kohima’s main hotel, Japfu, about 15 years ago. It provides the best accommodation in Kohima even today.
23
difficult to attract foreign tourists. If security restrictions are necessary, the process of acquisition will have to be eased.
3.3 Vision 2020
The Vision for this sector will take off from recommendations of earlier committees that have worked on development strategies for the NER (see Annexures 3.2 and 3.3). In tourism, the federated body - the Northeast Tourism Development Corporation – proposed to coordinate tourism activities in the NER would be most effective if it links up with private tour operators, who have a strong influence on tourist movement. There is no doubt that easing the Restricted Area Permit and Inner Line Permits will greatly improve tourist flows to the region. Domestic tourism is a function not just of air connectivity but also road and rail links, and the development of the latter two are particularly important due to cost factors and their larger carrying capacity. In contrast, the plan to develop Guwahati as an international airport has failed to take off because it was based on a supply side approach (the assumption that the supply of a facility will create demand for it) rather than an analysis of the demand for various tourism services.
The recommendations for banking are based on the low spread of banking and NEDFI’s inability to service small loans, particularly important for small agricultural producers. The extension of NEDFI activities to remote areas via non-banking financial intermediaries or well-established NGOs in these areas would greatly ease the credit availability to these groups. As in tourism, it is necessary to focus on the demand side of banking services.
3.4 Recommendations
• A federated body of the NER states will identify sites that will form part of a tourist circuit which will be developed in coordination with tourist agencies.
• Infrastructure (accommodation, connectivity) related to the tourist circuits and to other forms of tourism in the NER will be developed appropriately.
• In the short run, states that have the natural resources could concentrate on developing their adventure and eco-tourism potential given the deficiency of infrastructure.
• In banking, the immediate need is to expand the availability of credit to farmers and entrepreneurs. Given the remoteness of hill areas this will require taking banking to the people. NEDFI can work with non-banking financial intermediaries (NBFIs) and NGOs to access people located in smaller villages and hamlets. NEDFI can provide refinance to these agencies.
SECTION II
BUILDING CAPACITY: POLICIES AND INSTITUTIONS
Section II
Building Capacity: Policies and Institutions A people-centric vision of development will be founded on building capabilities both human and institutional, so that people themselves become agents of change and growth. Thus progress in the northeast will require the creation of preconditions such as equipping people, in terms of skills, education, and health, and the basic amenities, to contribute to and benefit from the region’s development. Education provides the underpinning to any vision of the NER. One of the most basic components of human development, it impacts on the welfare of almost everyone in the region; in fact, the lack of quality education limits the growth process itself. Further, a focus on children and youth is vital in this region with its substantial ‘young’ population. The strategy will be to raise the standard of education in the NER and the skills and knowledge base of school and college students to equip them to compete at the national level for further studies or employment, or engage effectively in entrepreneurial activity. The vision for the region will call for a vast improvement in the quality of education instruction, infrastructure and facilities at all levels, calling for a shift from monitoring quantitative to qualitative outcomes so that efforts to increase enrolment are strongly supported by efforts to improve learning levels and performance. An improvement in the health status of the NER is desirable, both as an end in itself, and as a fundamental requirement for raising productivity within the region. The vision for health will be realised by raising access to quality health care for everyone, especially children and women, and moving from curative to preventive measures. An improvement in the quality and range of services offered by public facilities will be buttressed by efforts from private providers and successful innovative techniques from other parts of the country. Good basic services are fundamental to building capabilities, and are thus pre-conditions for development. The vision would be to improve living conditions and increase access to amenities and employment opportunities (especially non-farm employment) in the rural areas, so that rural-urban disparities are reduced. At the same time, growth will be planned so that urban centres develop in a managed fashion, appropriate regulation is enforced, and services are developed to keep pace with existing and projected demand. People will be equipped with the skills and knowledge to expand the employment choices open to them. At the same time, it is important that opportunities for employment outside the traditional avenues are expanded to absorb the job seekers. Growth in employment is a crucial objective of development and growth, as it ensures people’s well-being and reduces poverty on a sustained basis. The basically agrarian nature of the north east economies, coupled with the low level of investment in industry and services have limited the avenues for employment especially for youth. With falling agricultural productivity and a virtual clamp down on public employment, which was a major avenue for employment in the past, there is a need for an expanding of economic activities which create a demand for various skills which will facilitate the shift to a high-growth surplus economy. This will be accompanied by the appropriate development of human capital essentially an enhancement of employable skills, through appropriately designed vocational training, and an increased supply of good quality professional education.
24
CHAPTER 4
Human Development and Basic Services
This chapter looks at some of the main components of human development – access to education, health and basic necessities in the region, highlighting the constraints to the provision of regionally balanced and universal access to these services in the northeast. The first section (4.1) analyses the education scenario; section 4.2 examines the health status of the NER, while the final section (4.3) deals with basic services in the region. Each section articulates the ideal or vision, followed by an examination of the status and gaps in provisioning, and a discussion of the issues and constraints to realising this ideal situation. An analysis of these gives rise to the recommendations, which include inputs from the steering committee, NEC Vision 2020, and other reports on these issues.
4.1 Education
Education provides the underpinning to any vision of the NER. One of the most basic components of human development, it impacts on the welfare of almost everyone in the region; in fact, the lack of quality education limits the growth process itself. Further, a focus on children and youth is vital in this region with its substantial ‘young’ population. Recent population growth in many of the NER states has meant that a substantial proportion of the population is younger than 14 years; in Arunachal Pradesh and Meghalaya, accounting for as much as 40 and 42 per cent of the state population, respectively. In its broadest sense, education will be the critical input to empower these young people with the ability to expand their life choices.
The past decade has seen visible improvement in overall educational attainment of several of the north-eastern states: male and female literacy rates have increased (table 4.1A), and so have school enrolments (table 4.2A) and school infrastructure. Much of the progress in enrolment can be attributed to the expansion in the number of schools over the last decade, especially at the secondary level (see table 4.10A, Annexure 4.1) in the Annexure to this chapter). Recruitment of teachers has kept pace with the expansion in school infrastructure, as indicated by the very favourable average pupil-teacher ratios across NER states, which is far lower than the national average (see table 4.16A in Annexure 4.1). Progress is also being made in increasing enrolment and retention in elementary schools through the Sarva Shiksha Abhiyan (SSA - Education for All) which was introduced in a staggered manner among the northeastern states since 2001-02.
Despite the expansion of educational infrastructure and impressive literacy rates and pupil-teacher ratios in the region, the standard of education in the NER is generally low, and the skills and knowledge base of school and college graduates has not equipped them to compete at the national level for further studies or employment, or engage effectively
25
in entrepreneurial activity. The vision for the region will call for a vast improvement in the quality of education instruction, infrastructure and facilities at all levels.
Schooling: Towards Universal Education
While school enrolments have been increasing, it is still low in some states: enrolment in all grades in Nagaland, for example, is far lower than the national average (at 18.1 per cent in grades IX to XII against the national average of 38.9 per cent) (table 4.2A in Annexure 4.2). The success in increasing school enrolment is dampened by dropout rates, which are higher across the NER than the national average (apart from Manipur), and have actually increased in Meghalaya and Mizoram since 1992-93 (table 4.5A in Annexure 4.2). Even in Mizoram with almost 90 per cent literacy, only one-fourth of children originally enrolled complete high school.
Some of the main reasons cited for non-attendance (tables 4.6A and 4.7A) include economic deprivation (an important reason why males in particular do not attend an educational institution), the burden of household work (for females across the region), and distance from school (especially for rural children in Arunachal). Jhum cultivation, still prevalent in the region, involves all the able-bodied workers in the family, and could be a major reason for non-enrolment in rural areas, especially Meghalaya, Mizoram, Nagaland and Tripura where ‘working to supplement household income’ was cited as more important in the rural areas.
Unfortunately the ‘other’ reasons for non-attendance listed in the NSS survey have not been specified; this would an invaluable policy input, as it accounts for the vast majority of non-enrolment in Nagaland and Sikkim. Studies in other regions have shown that absent teachers, poor teaching quality, curricula unrelated to life experiences and most importantly, lack of basic facilities influence school attendance. The absence of drinking water and toilet facilities deter students (especially girls) from coming to school, as do poor achievement levels - children who fall behind with their schoolwork are likely to lose interest in their studies and eventually leave the school system.
Schooling for All: Reaching out to all Children
• Access to schools is still a problem especially in remote areas with scattered habitations, such as Arunachal, where almost half (48 per cent) the rural habitations do not have a primary school within one kilometre, and only 31.2 per cent have upper-primary school facilities within three kilometres (table 4.12A).
• Special attention needs to be given to school enrolment and quality of education in the areas under the Sixth Schedule, where Autonomous District Councils establish, construct and manage primary schools. High dropout in the higher grades (table 4.4A) means that special attention needs to be given to the quality of teaching in the early years. Well-monitored anganwadis and non-formal education centers especially in interior and inaccessible villages will help recruit learners early into the formal system, and enable children to begin school at the appropriate age. Alternative ways of bringing schooling to children of peripatetic workers are being explored in the
26
region. One successful initiative is the Mobile Teacher programme initiated by the SSA in Mizoram to reach children of jhum farmers in the western hills. Here, the teacher brings schooling to the children – to where they live and work. He cycles to the shifting settlements, carrying his blackboard, teaching supplies, and textbooks and teaches local children in their own surroundings. This scheme has been fairly successful in bringing some basic education to children who have been out of the school system.
• The mid-day meal (MDM) scheme: While this has been a proven method to increase attendance in other parts of the country, the effective functioning of the MDM scheme in the northeast is constrained by the physical terrain, which adds to transportation costs, the paucity of manpower to implement the programme (often implemented by the school teacher alone) and the absence of monitoring, to ensure children receive nutritious food. Increased community involvement, either through SHGs formed by mothers of school-going children in the locality, the Village Education Committees, or other local bodies in the preparation or supervision would improve the quality of meals and their delivery. Low wages currently hamper implementation; and hiring cooks and helpers under the National Rural Employment Guarantee Scheme could be an enticement to get helpers at minimum wages for at least 100 days.1
• Secondary school expansion: By 2010, the demand for secondary education is expected to ‘sky rocket’ across the country, buttressed by the successful efforts of the SSA in promoting universal elementary education. The targeted gross enrolment ratio by the end of the Eleventh Plan is 75 per cent for classes IX-X, a massive thrust, which will require careful planning. In the very short term this will call for an assessment of educational needs, physical infrastructure, human resources, academic inputs and effective monitoring.
School Facilities
Learning takes place best in well-lit and well-maintained schoolrooms, in schools where children can visit a clean toilet, drink clean water, and have good play facilities, many of which are lacking in the schools in the region (chart 4.1 below, table 4.13A). These also play an important role in student retention and teacher retention. The medium-term goal should be to ensure there schools have enough classrooms, basic necessities such as water and toilets and facilities such as sports equipment, libraries, laboratories, etc. Schools are ideal nurturing ground for instilling in children clean and healthy habits, but this is possible only when water and toilet facilities exist. As states move towards universalisation of primary, and eventually secondary education, the proposed increase in enrolment is only going to increase the demand for these essentials.
1 This was one of the recommendations of the Sectoral Summit on Education in August, 2007 as workers in the MDM scheme are paid below-minimum wage.
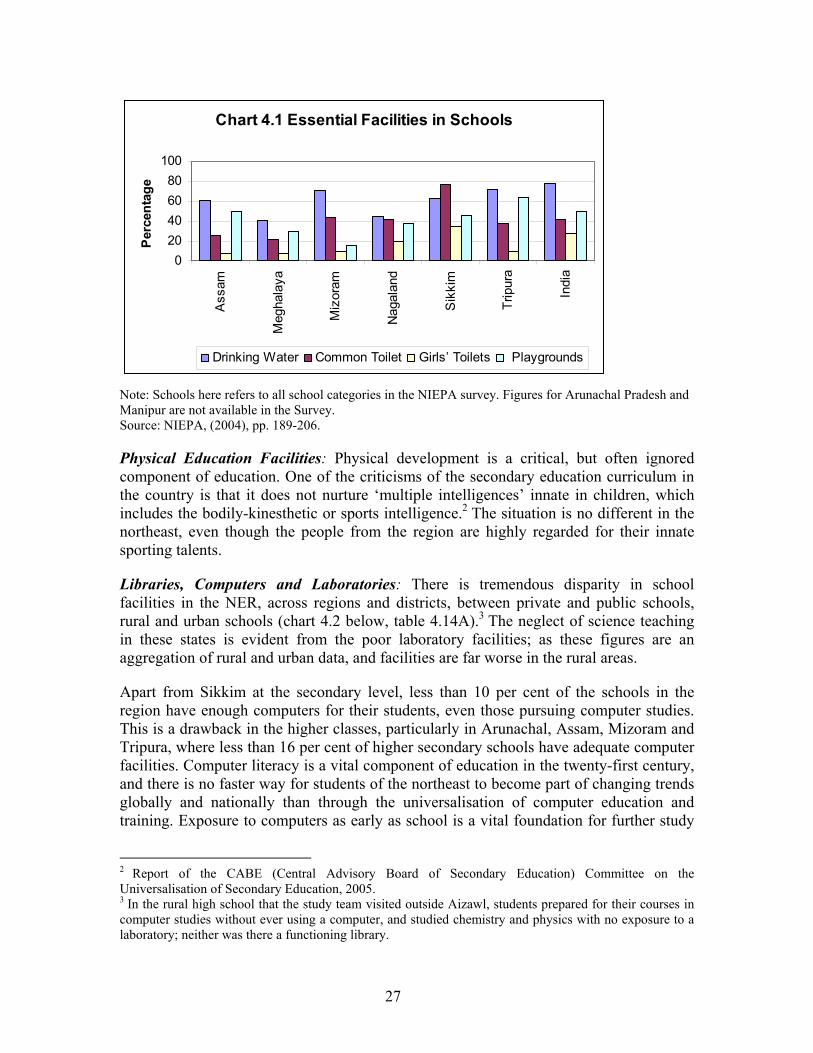
27
Chart 4.1 Essential Facilities in Schools
020406080
100
Ass
am
Meg
hala
ya
Miz
oram
Nag
alan
d
Sik
kim
Trip
ura
Indi
a
Per
cent
age
Drinking Water Common Toilet Girls’ Toilets Playgrounds
Note: Schools here refers to all school categories in the NIEPA survey. Figures for Arunachal Pradesh and Manipur are not available in the Survey. Source: NIEPA, (2004), pp. 189-206.
Physical Education Facilities: Physical development is a critical, but often ignored component of education. One of the criticisms of the secondary education curriculum in the country is that it does not nurture ‘multiple intelligences’ innate in children, which includes the bodily-kinesthetic or sports intelligence.2 The situation is no different in the northeast, even though the people from the region are highly regarded for their innate sporting talents.
Libraries, Computers and Laboratories: There is tremendous disparity in school facilities in the NER, across regions and districts, between private and public schools, rural and urban schools (chart 4.2 below, table 4.14A).3 The neglect of science teaching in these states is evident from the poor laboratory facilities; as these figures are an aggregation of rural and urban data, and facilities are far worse in the rural areas.
Apart from Sikkim at the secondary level, less than 10 per cent of the schools in the region have enough computers for their students, even those pursuing computer studies. This is a drawback in the higher classes, particularly in Arunachal, Assam, Mizoram and Tripura, where less than 16 per cent of higher secondary schools have adequate computer facilities. Computer literacy is a vital component of education in the twenty-first century, and there is no faster way for students of the northeast to become part of changing trends globally and nationally than through the universalisation of computer education and training. Exposure to computers as early as school is a vital foundation for further study
2 Report of the CABE (Central Advisory Board of Secondary Education) Committee on the Universalisation of Secondary Education, 2005. 3 In the rural high school that the study team visited outside Aizawl, students prepared for their courses in computer studies without ever using a computer, and studied chemistry and physics with no exposure to a laboratory; neither was there a functioning library.
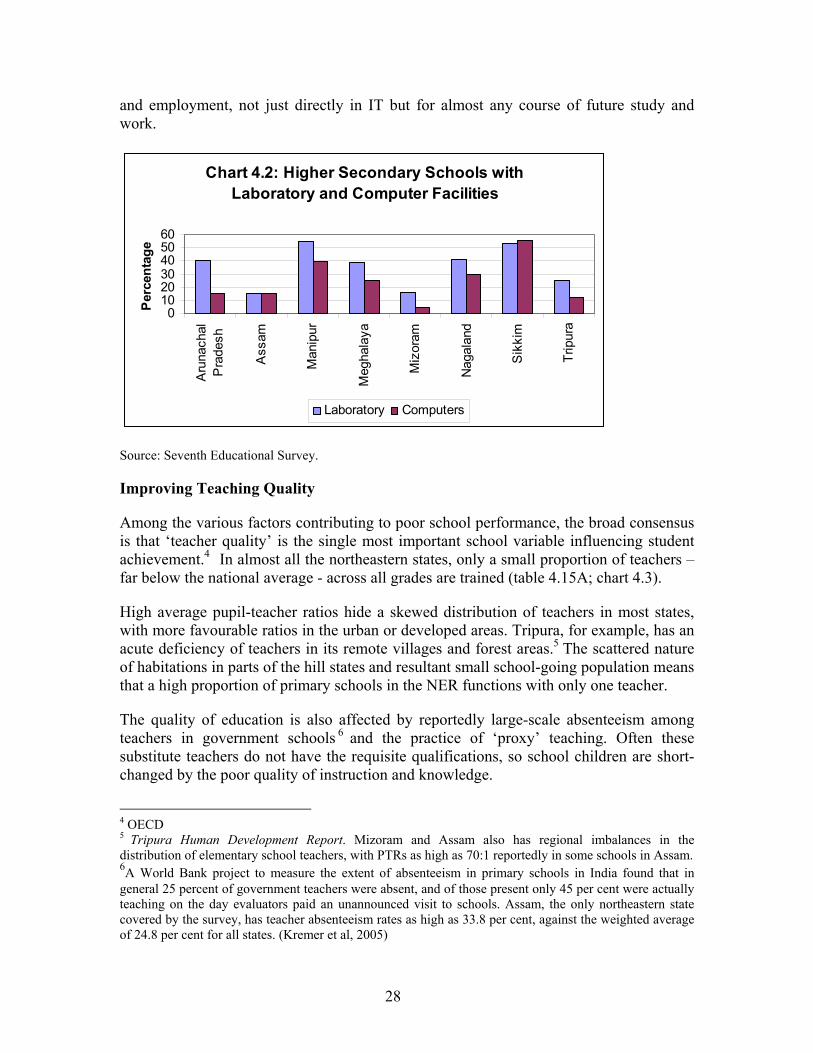
28
and employment, not just directly in IT but for almost any course of future study and work.
Chart 4.2: Higher Secondary Schools with Laboratory and Computer Facilities
0102030405060
Aru
nach
alP
rade
sh
Ass
am
Man
ipur
Meg
hala
ya
Miz
oram
Nag
alan
d
Sik
kim
Trip
ura
Per
cent
age
Laboratory Computers
Source: Seventh Educational Survey.
Improving Teaching Quality
Among the various factors contributing to poor school performance, the broad consensus is that ‘teacher quality’ is the single most important school variable influencing student achievement.4 In almost all the northeastern states, only a small proportion of teachers – far below the national average - across all grades are trained (table 4.15A; chart 4.3).
High average pupil-teacher ratios hide a skewed distribution of teachers in most states, with more favourable ratios in the urban or developed areas. Tripura, for example, has an acute deficiency of teachers in its remote villages and forest areas.5 The scattered nature of habitations in parts of the hill states and resultant small school-going population means that a high proportion of primary schools in the NER functions with only one teacher.
The quality of education is also affected by reportedly large-scale absenteeism among teachers in government schools 6 and the practice of ‘proxy’ teaching. Often these substitute teachers do not have the requisite qualifications, so school children are short-changed by the poor quality of instruction and knowledge.
4 OECD 5 Tripura Human Development Report. Mizoram and Assam also has regional imbalances in the distribution of elementary school teachers, with PTRs as high as 70:1 reportedly in some schools in Assam. 6A World Bank project to measure the extent of absenteeism in primary schools in India found that in general 25 percent of government teachers were absent, and of those present only 45 per cent were actually teaching on the day evaluators paid an unannounced visit to schools. Assam, the only northeastern state covered by the survey, has teacher absenteeism rates as high as 33.8 per cent, against the weighted average of 24.8 per cent for all states. (Kremer et al, 2005)
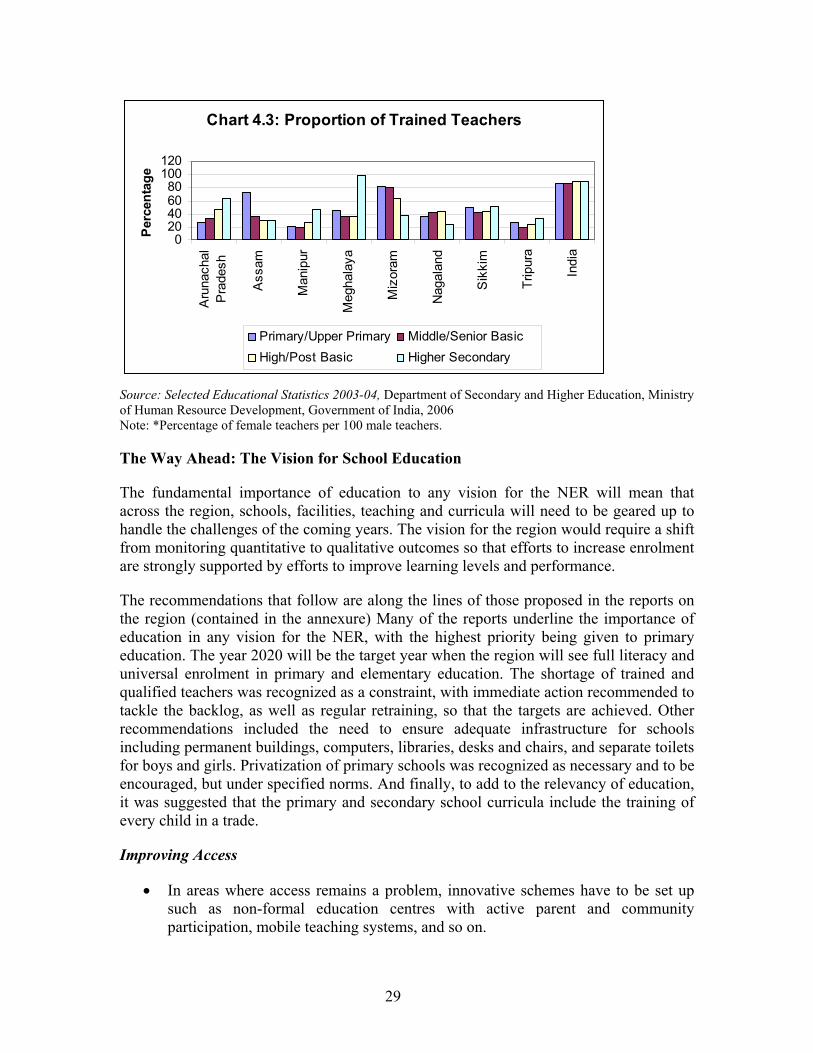
29
Chart 4.3: Proportion of Trained Teachers
020406080
100120
Aru
nach
alP
rade
sh
Ass
am
Man
ipur
Meg
hala
ya
Miz
oram
Nag
alan
d
Sik
kim
Trip
ura
Indi
a
Perc
enta
ge
Primary/Upper Primary Middle/Senior BasicHigh/Post Basic Higher Secondary
Source: Selected Educational Statistics 2003-04, Department of Secondary and Higher Education, Ministry of Human Resource Development, Government of India, 2006 Note: *Percentage of female teachers per 100 male teachers.
The Way Ahead: The Vision for School Education
The fundamental importance of education to any vision for the NER will mean that across the region, schools, facilities, teaching and curricula will need to be geared up to handle the challenges of the coming years. The vision for the region would require a shift from monitoring quantitative to qualitative outcomes so that efforts to increase enrolment are strongly supported by efforts to improve learning levels and performance.
The recommendations that follow are along the lines of those proposed in the reports on the region (contained in the annexure) Many of the reports underline the importance of education in any vision for the NER, with the highest priority being given to primary education. The year 2020 will be the target year when the region will see full literacy and universal enrolment in primary and elementary education. The shortage of trained and qualified teachers was recognized as a constraint, with immediate action recommended to tackle the backlog, as well as regular retraining, so that the targets are achieved. Other recommendations included the need to ensure adequate infrastructure for schools including permanent buildings, computers, libraries, desks and chairs, and separate toilets for boys and girls. Privatization of primary schools was recognized as necessary and to be encouraged, but under specified norms. And finally, to add to the relevancy of education, it was suggested that the primary and secondary school curricula include the training of every child in a trade.
Improving Access
• In areas where access remains a problem, innovative schemes have to be set up such as non-formal education centres with active parent and community participation, mobile teaching systems, and so on.
30
• Given persistently high dropout rates, the functioning of various government incentives and schemes to retain children in school need to be reviewed, and even restructured so that they are effectively targeted.
• Secondary school infrastructure has to keep pace with this planned growth, either through new secondary schools, adding secondary sections in existing elementary schools, opening additional sections in existing high schools, or even by running more than one shift where feasible in existing secondary schools.
• Higher dropout rates at the secondary level call for hostel facilities to be set up in middle and secondary schools, especially in areas with dispersed low-density habitations, with careful monitoring of the quality of services and security, especially for girls
• Based on the assumption that the presence of female teachers in schools helps the enrolment of girls, there should be a special drive to recruit women teachers, especially in Arunachal Pradesh and Assam where the proportion of female teachers is far below the national average (table 4.15A in Annexure 4.1).
• Special attention needs to be given to the quality of teaching in the tribal areas. The Sarva Shiksha Abhiyan (SSA) could work with state education departments to raise the level of education imparted to school children in these areas.
Improving Facilities
• Norms on infrastructure and facilities in secondary schools should be generally equivalent to those for the Kendriya Vidyalayas. Central assistance is available for improving computer facilities through the ICT@Schools programme, aimed at enabling computer-aided education for students in government and government-aided schools
• Sports and physical activity have to form an intrinsic part of the curriculum to allow students to explore and develop the full extent of their abilities. In hilly areas, schools could organize regular visits to areas where schoolchildren can engage in physical exercise. Many states like Nagaland and Manipur have a long tradition of indigenous games and sports, and special programmes could be set up to revive, nurture and promote these traditions among young people.
Quality Teaching
One of the most important tasks of short-term strategy would be to substantially improve the quality of teacher inputs in schools. The emphasis will shift from hiring teachers to ensuring that children receive an education from a well-qualified, dedicated teaching force trained in the most recent teaching methods, in sync with the specific needs of the region, using up-to-date relevant material and curricula.
31
• Recruitment and Deployment: A body to regulate appointments could ensure that recruitment is a transparent process, based on qualifications and experience. Better incentives, facilities, and even security in some situations could motivate teachers to shift to villages where they are most needed. The absence of provision for renting accommodation in some remote pockets makes it imperative that adequately equipped teachers’ quarters are constructed in these areas. Village panchayats and other village-based bodies can help in the recruitment of teachers in areas which face difficulties in hiring teachers,7 but recruitment has to be based on a proper assessment of their qualifications and potential for training.
• Training: The enormous backlog of untrained teachers at all levels in the region can only be effectively tackled through the distance mode of teaching. NCERT is developing a comprehensive module for this, and states are identifying good teachers to be trained by experts as master trainers for the rest of the teaching force. While initial training is proposed to be carried out at institutions, there is a strong case for training large numbers of teachers through distance-learning courses developed by IGNOU and other professionals in the field. Training needs will have to be assessed routinely to make sure teachers get the training they need.
• Focus on good science and maths teaching: In the short run, there could be a drive to recruit good maths and science teachers at all levels from outside the region, as these subjects need a solid foundation in the lower grades. In the medium term, good in-service training materials need to be developed perhaps with inputs from science faculty from universities in the NER, to address the issue of improved teaching in these fields.8
• Some of the training will be tailored to addressing state-specific issues such as multi-grade teaching in a single classroom,9 creating teacher attitudes to tackle diversity in classrooms, and interacting sensitively with minority groups such as tribal children.
• Professionalisation needs to be introduced in the teaching profession and promoted through incentives for teachers to improve their qualifications, such as better pay scales and increments, and more fellowships. A regional framework which allows school teachers in the region to share their experiences and learn from each other could promote an enthusiasm and professionalism in the profession.
7 This was also one of the recommendations at the Sectoral Summit on Education on August 20, 2007. 8 The recently instituted North Eastern Regional Educational Council (NEREC) will give priority to the quality of science and mathematics, which will include orientiation training to primary school teachers. It is helping translate science and maths books into local languages. To promote IT education, it will collaborate with ERNET India to set up high-speed links in ten universities to promote acccess to Internet, E-Journals and distance learning. 9 Despite norms stipulating that schools have at least two teachers, up to 15 per cent of schools in Assam and 14 per cent in Meghalaya have only one teacher NIEPA (2005) p. 56
32
Local Monitoring
Whichever method is used to hire teachers, some form of local monitoring is essential to improve teacher attendance and, in fact, all areas of school performance. Successful educational outcomes have been linked with increased accountability of teachers to local communities (box 4.1) Schools can build on the strong community-based structures in the NER and find ways to shift accountability to parents, the community and other representative organizations, such as school managing committees (SMCs), VECs and panchayats. Most communities need some amount of capacity building to improve their management skills and to enable them to act as pressure groups to ensure that the physical, social and academic environment in schools is of the best possible standard.
Box 4.1: The Importance of Social Audit:
Communitisation of Education in Nagaland
The Nagaland Government experiment in ‘communitisation of education’ builds on the strong social ties within villages to improve the quality of primary schooling in the state. The village community owns and is authorized to develop the public elementary schools within the village. ‘Communitised’ villages set up a village education committee (VEC) to act as the legal local authority for managing elementary education in the village. The VEC has the authority to monitor teacher attendance (and take punitive action such as docking salaries for prolonged absences), and make major financial decisions (such as expenditure on textbooks, school furniture, building repairs) through access to public funds. It can arrange for inter-school utilisation of teachers and recommend substitute teacher to fill long-term vacancies.
This daily participatory monitoring has yielded success: a significant improvement in teachers’ attendance in 80 per cent of schools has led in turn to an improvement in students’ attendance in almost all schools. Enrolment and academic performance have also improved, and parents are demonstrating an increased confidence in the public school system: in Chingmei village of Tuensang district, the local private boarding school, which was popular among most parents, had to close down after communitisation of the public school. Communities demonstrate an increased sense of ownership of the school system by contributing material and labour to repair local school buildings, footpaths and school grounds, by giving students free tuitions in the evenings, and encouraging dropouts to re-enrol in the system.
Making Learning more Relevant: Meeting the Region’s Special Needs
• Vocational Training in Schools: The focus on relevant, job-oriented education requires more emphasis on co-curricular activities aimed at skill enhancement. The introduction of newer vocational streams even as early as classes XI and XII could familiarise students with possible vocations and enable them to make more informed judgements about higher education choices.10
10 The National Curriculum Framework (2005) has suggested that Vocational Education and Training (VET) be implemented in Mission Mode, involving the establishment of separate VET institutions and centres from the level of village clusters and blocks to sub-divisional/ districts, towns and metropolitan areas.
33
• Incorporating Local Material: Linking learning to local experiences would make education more relevant and raise retention rates. Some states have already begun preparing materials and orienting teaching towards local environments to supplement standard textbooks. In a major move to enhance science teaching based on local knowledge, the Nagaland University plans to involve school students in mapping the plant, animal and microbial resources of the region.
• Addressing Region-Specific Needs: Curricula and teaching material need to be developed to address issues prevalent in the NER such as the high proportion of single-classroom schools, where teachers have to teach in a multi-grade environment, the myriad dialects and languages prevalent in the region, and strengthening science and math teaching in the region.
• Vocational and Job Counselling: Appropriate guidance and student counselling reduce school drop-out (by improving performance), promote career development and instil in students the right attitudes towards studies and work. Full-time school counsellors could be appointed at the different levels within the school system, and counselling needs to become an intrinsic part of pre-service teacher training.
Involving Private Entities
• Private provisioning could help supplement government efforts to universalise education, especially at the secondary school where the migration out of the public school system is already fairly high (table 4.11A). Private schools are more in demand as they are considered more accountable for students’ performance, which clearly indicates that people are willing to pay for what they perceive as better quality.
• The establishment of well-managed private boarding schools within the region, perhaps funded by local private companies, (along the lines of Assam Valley School outside Guwahati) would help strengthen links within the region as well have ripple effects on income and employment generation.
• Other school-related functions could be outsourced to private agencies. They could, for example, ‘adopt’ a school to improve specific facilities such as the library, laboratories, computer infrastructure, or sports facilities. Computer education could be entirely outsourced to the private sector which can provide equipment and teaching for a fee, relieving public schools of the burden of hiring permanent teachers and investing in costly infrastructure.
However, irrespective of the extent to which private funding can supplement public provision of education, the government will continue to be ultimately responsible for ensuring that education reaches all children in the region.
4.1.2 Higher Education: College and Vocational Training
The vision for higher education would be to equip young people in the NER with skills and knowledge to expand their life choices – whether it is to pursue the profession of
34
their choice, to engage in business, explore a talent – within their state or outside. As the Jain Committee Report points out the central objective of education should be skill building and development of entrepreneurship. The rising tide of drug use and other substance abuse, insurgency-related activity and other social ills in the region have been attributed to the limited educational and employment avenues for the youth. In addition, human resources of a high quality are necessary to realize the developmental vision for NER 2020.
Higher education in the region is characterized by being ‘single-track’, focusing on general education, and within that a major concentration in the arts (table 4.17A) – over 70 per cent of the three lakh students enrolled in colleges are in the arts,11 which bears testimony to the assertion that the standard of science teaching is poor in the region).
Each of the northeastern states now has a central university, which as autonomous entities, can chart their own growth and development plans, and several professional colleges are planned for the region over the next few years. This expansion in the supply of ‘choices’ has to be accompanied by a considerable improve in their quality of the offerings.12 Thousands of students from the Northeast go to other parts of the country for higher studies,13 both because of the lack of professional education as well as the level of instruction and curricula in colleges and universities in the region, both of which affect their potential for employment.
The vast amount of funding that goes towards students’ study and accommodations in universities outside the state can be viewed as ‘leakages’ from the NER economy, but this needs to be weighed against the costs and problems related to setting up education facilities of comparable quality within the region. It should also be noted that sending students out of the region for higher education helps promote national integration. Students who return, come with fresh new ideas, and those who remain outside the region encourage the rest to end their insularity from the rest of the country.
The Vision for Higher Education
Higher education infrastructure in the region has focused largely on producing college graduates in the arts and social sciences, who have looked to the government for employment. With the saturation of this avenue, recent years have seen large-scale unemployment among the youth, which has over time fuelled social disruptions. The emphasis in higher education needs to shift to building professional skills and developing entrepreneurial capacity and skills among younger people. The high proportion of people of school-going age means that the pressure on college seats within the NER is only going to increase.
11 From the Sectoral Summit on Education 12 From various SDRs and HDRs. For example in Nagaland, less than 5 percent of the students got a first class in the arts and law streams while less than 10 percent pass in first class in science and commerce (Nagaland HDR). 13 For example, in 2001, estimates from the Directorate of Higher and Technical Education, showed that of the 24,000 Naga students enrolled in higher studies, nearly 10,000 students were studying outside the state.
35
Noting that vocational training, entrepreneurial skills and the basic grounding in mathematics and science among students in the NER were weak, the recommendation was to shift the focus from setting up more ‘run-of-the-mill’ universities, by the centre or state governments. With inputs from the vice chancellors from universities in the region, each of the existing universities in the northeast would set up a centre of excellence with area studies and language departments relevant to the region. Networks of training centres would be set up in every state relating to the languages, cultures and issues of South-east Asia and China and to teach languages of the region to scholars from other countries
The central objective of higher education should be skill building and development of entrepreneurship and for this I.T.I.s and polytechnics would be upgraded. The importance of agriculture in the region and need to raise productivity would require strengthening of the Assam Agricultural University, Jorhat, and expanding the number of seats for NE students in post-graduate agricultural institutions elsewhere in the country. Well-staffed and equipped vocational training centres would be set up for basic skills but also for new livelihoods such as tourism.
The expansion in the supply of higher-level education needs to clearly focus on one of three areas of training: Those which fuel the development of the region, those in globally expanding professions, or areas which focus on ‘core competencies’ of the people in the region.
1. College Courses that Fuel the Development of the Region
• The expansion in central universities in the NER presents an ideal opportunity to gear higher education towards creating value in the region. One way would be to focus on emerging areas elated to the region’s needs: Bio-Resource Development, Culture and Peace Studies, and languages of neighbouring countries.14
• At the same time, higher-level courses are needed in areas necessary to fuel the expansion proposed for the region in areas such as horticulture (floriculture, bamboo, silk), agro-based sciences (biotechnology, patent awareness, organic farming, water conservation, veterinary sciences, and seismology), agro-based industries (medicinal plants, food processing), tourism and teacher training.
• Existing college and university courses need to be strengthened and made more relevant and current; infrastructure - libraries, laboratories, and classrooms will need to be upgraded.
• The proposed expansion of higher education will call for well-qualified faculty especially in newer disciplines. One way to expose students to good teaching would
14 As suggested by the Steering Committee, each university could be assisted to become a national centre of excellence in areas such as languages (Burmese, Tibetan, Chinese, Thai, Nepalese, Japanese), and Area Studies (ASEAN, SE Asian History and Literature, Tribal Studies, Chinese studies). This will in turn help spread the languages and culture of the NER to scholars and visitors from other countries.
36
be through open (or distance) learning courses, which have the advantage of being a need-based, technology-oriented curriculum which allows intensive hands-on training, and regular evaluation, and frequent curriculum up-gradation.
• State funding for students living and studying in universities and colleges in other parts of the country has to be properly targeted so that the base of beneficiaries is expanded in the region.
2. Training that Taps into Opportunities created by Global Trends
The ‘mainstreaming’ of young people from NER into the larger national and global economy will require equipping them with directly employable skills in professions that are expanding worldwide, the most obvious ones being in the IT and ITES sectors, but also in engineering, nursing, and in the hospitality industry (see chapter 5 for a detailed discussion).
• Such institutes must be set up by private agencies, either in partnership with state governments such as the Manipal Group of Karnataka (as Sikkim Manipal Univerisity of Health, Medical and Technological Sciences), or in collaboration with well-recognised, experienced private training providers from other states; hospitality training (ITC and Radisson), fashion design and technology (National Institute of Fashion Technology, Pearl Academy, Shrishti in Bangalore and the National Institute of Design in Ahmedabad), medical and nursing (Manipal, Vellore).15
3. Capitalises on the Region’s Innate Talents and Interests: Employment opportunities are expanding, mostly outside the region for now, in areas in which people of the NER have an innate talent and interest: fashion technology and product design, airlines industry, sports and physical fitness, and music, or based on indigenous materials, such as bamboo, silk, traditional textiles, and so on. The formation of regional institutes, such as the North East Institute of Fashion Technology, North East Institute of Design, and so on, would allow an exchange of knowledge and technology within the region, and showcasing it outside.
4.2 Health
The vision is based on an overall improvement in the health status of the NER, both as an end in itself, and as a fundamental requirement for raising productivity and growth within the region. This will require raising access to quality health care for everyone, especially for children and women, tackling the major health issues in the region (AIDS, cancer, alcoholism), and raising awareness about nutrition, environmental sanitation, and disease prevention and control measures. The low use of existing facilities will be tackled by improving the quality and range of services offered both by the public and private facilities, by involving other agencies, and putting in place innovative techniques that have worked in other parts of the country.
15 This list is only indicative.
37
The region has witnessed declining infant mortality rates (comparing very favourably with national averages – since 1981, Manipur has had the lowest IMR in the country), an increase in child immunisation, and increasing life expectancies in almost all states. Many states have set up impressive public health infrastructure through a network of hospitals, primary health centres, primary health sub-centres, and community health centres. In fact, apart from Assam and Tripura, there is a surplus of primary and community health centres in the rural areas (see table 4.19A).
Despite the physical expansion of health care facilities, access to quality health services remains low in remote areas as well as urban areas, especially for women and children. People still need to travel long distances to consult doctors or specialist, or to access diagnostic or therapeutic treatment; there is a shortage of trained medical staff at almost every level; and a lack of supplementary infrastructure such as roads and environmental sanitation which exacerbate health issues.
Public health policy in NER will have three objectives: to direct financial resources towards ensuring good health services in areas where private investment is unlikely to go; to create an environment conducive to attracting and retaining private health providers, with some incentives to enter certain areas, such as smaller towns; and protect consumers by enforcing regulation of private health care
Providing Healthcare for All
High averages in most states mask major variation in health services across states, between urban and rural areas, in hilly terrain, and so on. In some instances this is because of lopsided provisioning (as in Arunachal, where 87.5 per cent of the general and district hospitals are located in the urban areas), in others because of the absence of transportation links with health centres.
As in many states, primary health care provided in the NER is generally poor in quality, inaccessible and unavailable,16 (perhaps with the exception of Mizoram, which appears to have a well-functioning system which people have faith in). Rural public health care services are especially abysmal with high levels of absenteeism, shortages of skilled medical and para-medical staff, an absence of medicines and supplies and inadequate supervision and monitoring (see tables 4.22A and 4.23A).
• Low use of Facilities: Even when facilities exist, people do not make full use of them, for various reasons – preference for traditional health services or private providers, poor quality of care, lack of facilities, supplies and medical staff.17 Thus, the mere existence of infrastructure is not necessarily positively correlated with an improvement in health conditions of the population. This has important policy implications: building healthcare centres is not sufficient to raise health standards in
16 From various HDRs and SDRs 17 National-level data shows that even when free, poor and rural populations often prefer to pay for private and traditional healers, rather than visit public health centers. Low institutional births in the NER indicate that the trend is the same in this region (table 6.14).
38
the region: awareness and willingness among people are as important, as is the quality of service offered.
• Dependence on Non-Traditional Providers: Many people in the region have greater faith in the vast network of indigenous medical practitioners (IMPs) who have been dispensing health advice for decades. In states such as Nagaland and Sikkim they continue to reach out to the majority of the villages, and are even part of the public health system. Apart from people’s intrinsic faith in these systems of medicine, IMPs have the convenience of easy accessibility, as they often live in the village, they can be consulted at all hours, unlike the more restricted hours of heath centres and doctors.
• Lack of Tertiary Care: There is an overall lack of modern medical diagnostic and therapeutic aids in the existing facilities even in urban areas, and severe shortage of medical specialists, especially in the hill states. The few laboratories and ancillary diagnostic facilities that exist especially in Arunachal Pradesh, Manipur and Nagaland, are fairly primitive. Patients with serious ailments or complications, or requiring advanced investigations have to travel outside the state, to Guwahati, Kolkata or Delhi, for treatment. The costs of reimbursing medical expenses for government employees to the public exchequer are very high, not to mention the out-of-pocket expenses of non-governmental patients. 18 Whether it is lack of funds, general apathy, corruption or distances that creates an absence of supplies and staff at public health facilities, the outcome is that many people now avoid using the existing public health facilities (see chart 1) even among the poor families.
Focusing on Child and Maternal Health
Although infant mortality rates (IMRs) have decreased overall, they are still higher than the national average in some states (table 4.20A). Surprisingly few children have been vaccinated against diseases in spite of high female literacy rates and favourable sex ratios in the region. Most worryingly, child malnutrition is on the rise in five of the eight NER states and female anaemia levels are high (charts 4.4 to 4.6).
Rural women, especially in remote and inaccessible areas have some of the poorest health indicators. The maternal mortality ratio (MMR)19 has been declining in Assam (the only NE state for which data is available from the SRS) but at 490 is still far higher than the already high national rate of 301.20 While there has been an increase in institutional births across the country, over 50 per cent of births in the NER (apart from Mizoram) take place outside an institution (table 4.21A). The situation is particularly serious in Nagaland, where barely one in ten babies is born in an institution. 21
18 The cost of reimbursing government employees for treatment was estimated at Rs 20 crore annually in Nagaland (Nagaland HDR), added to this is the non-reimbursed costs of non-government patients. 19 the number of maternal deaths per 100,000 live births 20 From 2001-03 Special Survey of Deaths using RHIME (representative, re-sampled, routine household interview of mortality with medical evaluation) from http://www.censusindia.net/ Maternal_Mortality_in_India_1997-2003.doc 21 There is a clear correlation between the proportion of non-institutional deliveries and neonatal and infant mortality rates. Kerala has the lowest NMR, with 95.7 per cent institutional delivery rate, and the
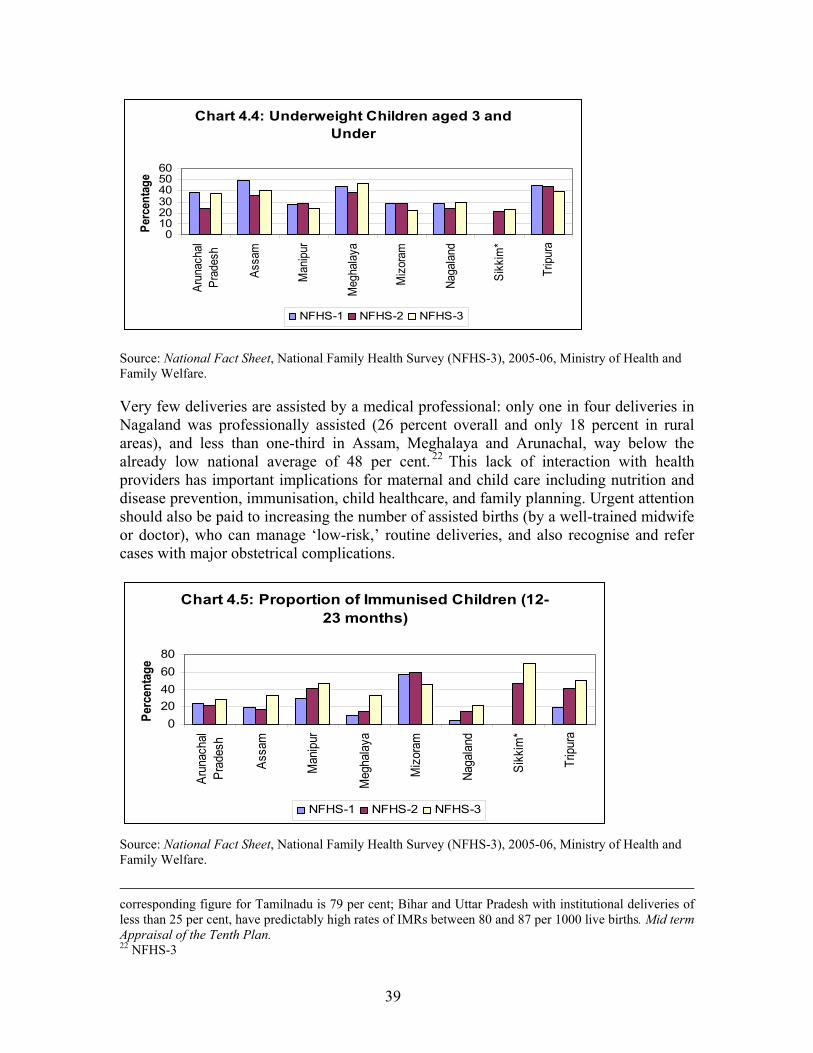
39
Chart 4.4: Underweight Children aged 3 and Under
0102030405060
Arun
acha
lPr
ades
h
Assa
m
Man
ipur
Meg
hala
ya
Miz
oram
Naga
land
Sikk
im*
Trip
ura
Perc
enta
ge
NFHS-1 NFHS-2 NFHS-3
Source: National Fact Sheet, National Family Health Survey (NFHS-3), 2005-06, Ministry of Health and Family Welfare.
Very few deliveries are assisted by a medical professional: only one in four deliveries in Nagaland was professionally assisted (26 percent overall and only 18 percent in rural areas), and less than one-third in Assam, Meghalaya and Arunachal, way below the already low national average of 48 per cent. 22 This lack of interaction with health providers has important implications for maternal and child care including nutrition and disease prevention, immunisation, child healthcare, and family planning. Urgent attention should also be paid to increasing the number of assisted births (by a well-trained midwife or doctor), who can manage ‘low-risk,’ routine deliveries, and also recognise and refer cases with major obstetrical complications.
Chart 4.5: Proportion of Immunised Children (12-23 months)
020406080
Arun
acha
lPr
ades
h
Assa
m
Man
ipur
Meg
hala
ya
Miz
oram
Naga
land
Sikk
im*
Trip
ura
Perc
enta
ge
NFHS-1 NFHS-2 NFHS-3
Source: National Fact Sheet, National Family Health Survey (NFHS-3), 2005-06, Ministry of Health and Family Welfare.
corresponding figure for Tamilnadu is 79 per cent; Bihar and Uttar Pradesh with institutional deliveries of less than 25 per cent, have predictably high rates of IMRs between 80 and 87 per 1000 live births. Mid term Appraisal of the Tenth Plan. 22 NFHS-3
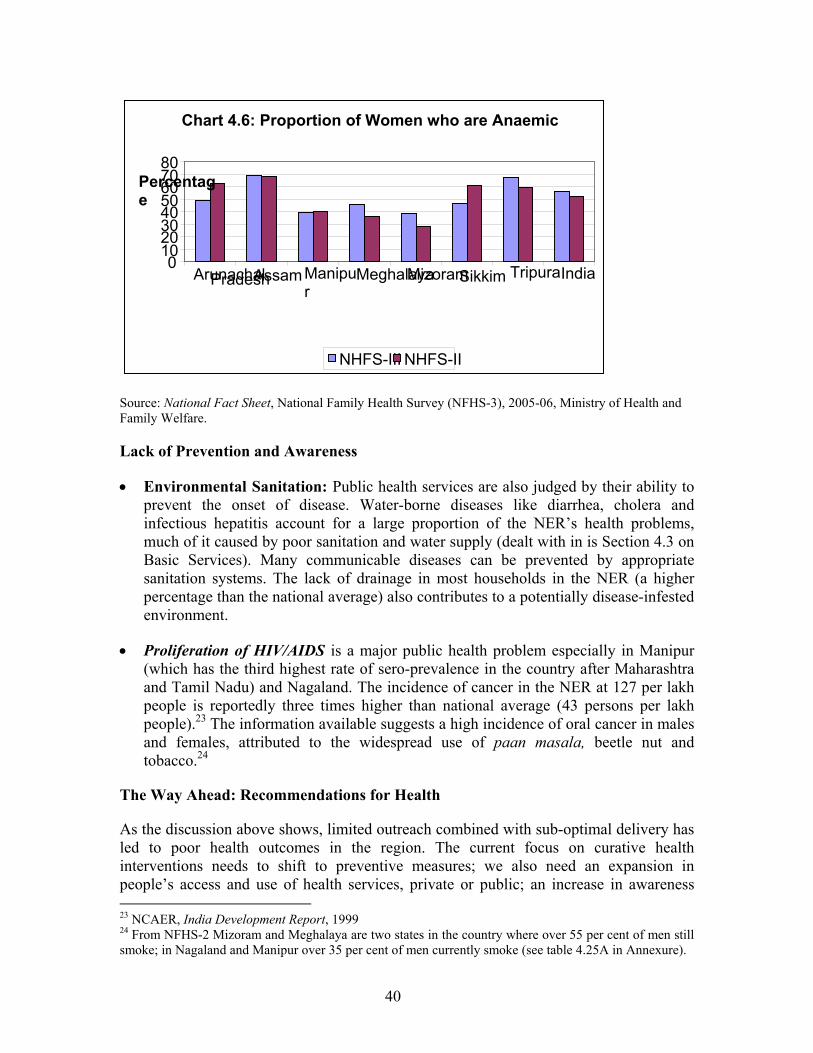
40
Source: National Fact Sheet, National Family Health Survey (NFHS-3), 2005-06, Ministry of Health and Family Welfare.
Lack of Prevention and Awareness
• Environmental Sanitation: Public health services are also judged by their ability to prevent the onset of disease. Water-borne diseases like diarrhea, cholera and infectious hepatitis account for a large proportion of the NER’s health problems, much of it caused by poor sanitation and water supply (dealt with in is Section 4.3 on Basic Services). Many communicable diseases can be prevented by appropriate sanitation systems. The lack of drainage in most households in the NER (a higher percentage than the national average) also contributes to a potentially disease-infested environment.
• Proliferation of HIV/AIDS is a major public health problem especially in Manipur (which has the third highest rate of sero-prevalence in the country after Maharashtra and Tamil Nadu) and Nagaland. The incidence of cancer in the NER at 127 per lakh people is reportedly three times higher than national average (43 persons per lakh people).23 The information available suggests a high incidence of oral cancer in males and females, attributed to the widespread use of paan masala, beetle nut and tobacco.24
The Way Ahead: Recommendations for Health
As the discussion above shows, limited outreach combined with sub-optimal delivery has led to poor health outcomes in the region. The current focus on curative health interventions needs to shift to preventive measures; we also need an expansion in people’s access and use of health services, private or public; an increase in awareness 23 NCAER, India Development Report, 1999 24 From NFHS-2 Mizoram and Meghalaya are two states in the country where over 55 per cent of men still smoke; in Nagaland and Manipur over 35 per cent of men currently smoke (see table 4.25A in Annexure).
Chart 4.6: Proportion of Women who are Anaemic
01020304050607080
Arunachal PradeshAssamManipur
MeghalayaMizoramSikkim TripuraIndia
Percentage
NHFS-III NHFS-II
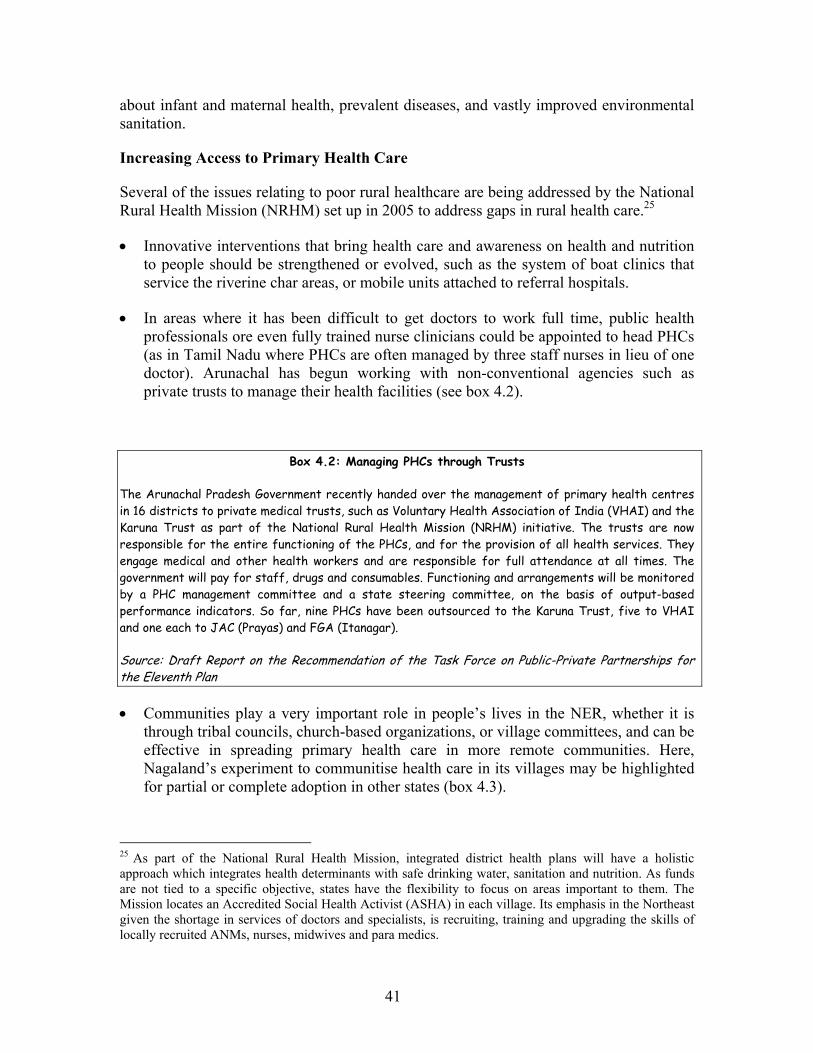
41
about infant and maternal health, prevalent diseases, and vastly improved environmental sanitation.
Increasing Access to Primary Health Care
Several of the issues relating to poor rural healthcare are being addressed by the National Rural Health Mission (NRHM) set up in 2005 to address gaps in rural health care.25
• Innovative interventions that bring health care and awareness on health and nutrition to people should be strengthened or evolved, such as the system of boat clinics that service the riverine char areas, or mobile units attached to referral hospitals.
• In areas where it has been difficult to get doctors to work full time, public health professionals ore even fully trained nurse clinicians could be appointed to head PHCs (as in Tamil Nadu where PHCs are often managed by three staff nurses in lieu of one doctor). Arunachal has begun working with non-conventional agencies such as private trusts to manage their health facilities (see box 4.2).
Box 4.2: Managing PHCs through Trusts
The Arunachal Pradesh Government recently handed over the management of primary health centres in 16 districts to private medical trusts, such as Voluntary Health Association of India (VHAI) and the Karuna Trust as part of the National Rural Health Mission (NRHM) initiative. The trusts are now responsible for the entire functioning of the PHCs, and for the provision of all health services. They engage medical and other health workers and are responsible for full attendance at all times. The government will pay for staff, drugs and consumables. Functioning and arrangements will be monitored by a PHC management committee and a state steering committee, on the basis of output-based performance indicators. So far, nine PHCs have been outsourced to the Karuna Trust, five to VHAI and one each to JAC (Prayas) and FGA (Itanagar).
Source: Draft Report on the Recommendation of the Task Force on Public-Private Partnerships for the Eleventh Plan
• Communities play a very important role in people’s lives in the NER, whether it is through tribal councils, church-based organizations, or village committees, and can be effective in spreading primary health care in more remote communities. Here, Nagaland’s experiment to communitise health care in its villages may be highlighted for partial or complete adoption in other states (box 4.3).
25 As part of the National Rural Health Mission, integrated district health plans will have a holistic approach which integrates health determinants with safe drinking water, sanitation and nutrition. As funds are not tied to a specific objective, states have the flexibility to focus on areas important to them. The Mission locates an Accredited Social Health Activist (ASHA) in each village. Its emphasis in the Northeast given the shortage in services of doctors and specialists, is recruiting, training and upgrading the skills of locally recruited ANMs, nurses, midwives and para medics.
42
Box 4.3: Communitisation: An Innovative Health Intervention
At primary health care levels Nagaland’s experiment with communitisation of health care is proving successful. The management and maintenance of health facilities by the village community has improved staff attendance, and ensured that salaries are disbursed on time, medicines are available, and services are in line with community needs. The experiment has worked because it has engendered a sense of ownership of the facilities: each household contributes Rs 10 for maintenance of the facilities; villagers organize cleanliness drives and have donated community-built houses for sub-centres and staff quarters; and in some villages private medical practitioners volunteer their services on fixed days at the health facility. In Khuzama village, villagers had begun cultivating vegetables on community land to raise funds to supplement the stock of medicines and medical supplies.
Source: Nagaland HDR, field visits
• Give their reach into remote villages, traditional healing practices should be integrated into the health care framework by providing IMPs a platform for their practice, and orienting and training them to address health priorities in the region at all levels - sub-centre, PHC and CHC. Community health NGOs and doctors could work with IMPs to fill in the scientific gaps in treatment so that these systems become more in sync with today’s needs and environments. Some form of licensing of IMPs will be needed to ensure the quality of services provided. This will have additional benefits on the environment by helping preserve traditional medicinal knowledge systems, and protect and conserve the region’s biodiversity.
• Health Insurance: The NRHM also has health insurance for vulnerable groups to reduce their expenses when visiting a government hospital, 26 and expand the use of government hospitals. However, given the few hospitals in the rural areas of the region, hospitalisation-based health insurance may not be the solution. Here, providing insurance for out-patient care and transport would be a reasonable option. This could be outsourced to a credible NGO in this region on a pilot basis. Micro-health insurance can also be promoted through self-help groups (SHGs) as one of the main reasons SHG members take loans is to meet medical expenses.
• The low doctor-to-population ratio in the region has been attributed to the low proportion of medical colleges in the region (which has only 3 per cent of the medical seats in the country27). An increase in the number of seats within the region is called for, either by expanding the capacity of existing medical colleges, or setting up new colleges with private partnerships. The location of new medical colleges outside urban areas would add an impetus to overall health services in more remote areas, and also encourage medical students to move away from their urban
Involving Private Provision of Health Services 26 People incur expenses even when they visit a public hospital (NSSO 60th Round). 27 Source Background Papers - Report - National Commission on Macroeconomics and Health, 2005. From the Report of the Task Force on Medical Education for the National Rural Health Mission, Ministry of Health and Family Welfare Government of India.
43
Apart from the unsustainable burden on the government, it is clear that users themselves are seeking choices beyond the public health system (table 4.24A). As much as 25 per cent of people below the poverty line depend on private hospital facilities for their health needs,28 indicating that apart from the need to enhance the quality of public services, people are willing to pay for good health facilities. The private sector is already engaged in the NER either in partnership with state governments or alone at all levels of health care: by managing public health facilities, running major tele-medicine units within a public hospital (see box 4.4), providing laboratory and blood screening services at the secondary and tertiary levels (Tripura) or operating a full-fledged hospital within a medical college (Sikkim Manipal University).
Some caution has to be exercised in the rapid expansion of private services to fill the vacuum of public provisioning in the absence of any controls, as this has often resulted in substandard services to people. Ideally the private sector would function within the overall health policy framework for each state to achieve shared health outcomes. Regulation on private healthcare across the country has had limited efficacy, and the northeast is no exception. Some states have passed legislation related to this, but of greater importance is the state governments’ ability and interest in enforcing regulation, to protect people’s rights.
Box 4.4: Improving Specialty Medical Care in Nagaland through Telemedicine
Telemedicine could be the answer to two major impediments to top-quality healthcare in the northeast: the remoteness of most areas and the almost complete absence of medical specialisation. Given the poor quality and out-datedness of the medical facilities in the state, patients invariably had to go outside for medical intervention. To fill this void that Apollo Hospitals Group recently set up the Telemedicine Centre at the Naga Hospital in Kohima in collaboration with Marubeni India Pvt. Ltd. The Naga Hospital is now telemedically linked with the Indraprastha Apollo Hospitals at Delhi, allowing medical practitioners in Kohima to access expert advice from specialists, transfer medical records and images and even get real-time assistance for complex procedures being undertaken in Nagaland.
By significantly raising the level of medical facilities available in Kohima and negating the need for locals to travel for treatment, the new Centre has drastically reduced medical expenses. Video-conferencing-based medical programmes in the telemedical facility also allow doctors practicing in Nagaland to upgrade their skills.
Sources: Apollo Website and Nagaland Human Development Report
However, it is important to note is that whatever the public-private mix of finance and provisioning, the government is eventually responsible for making available essential health services to poor people, in as efficient, effective and equitable a manner as possible.
Prevention and Spreading Awareness
28 Source: Pearson, M
44
Many health interventions such as improving child health and maternal care, environmental sanitation and the prevention of the spread of HIV/AIDS, and cancer will call for in creasing people’s knowledge on the importance of environmental santation, taking preventive actions such as immunisation, and so on. Television and radio should be used as much as possible to spread awareness on prevention measures, nutritional practices, home counselling and other .
• Poor child and maternal health can be tackled through giving health care providers (traditional birth attendants, ANMs, MPWs, anganwadi workers, etc.) the training to impart good infant and young child feeding practices during ante- and postnatal check-ups (this is another good reason to increase institutional interaction with rural people).
• The aim should be to provide all dwelling units with sanitation facilities and adequate water supply by 2010 (dealt with in greater detail in the section in basic needs).
• The role of NGOs and religious organisations are actively adressing the proliferation of HIV/AIDS needs to be highlighted, well defined and coordinated within the overall public policy framework so that they work in consonance with the government departments. For this they will need support from the government in the form of skills building and perhaps even finances.
• This needs to be tackled in various ways: through all possible agencies to intensify efforts to educate people on the negative outcomes of drug abuse and its treatment,29 mainstream HIV care and support into the PHC system; establish treatment and post-care centres for recovering addicts (including reintegration interventions such as vocational training, counselling, and mainstreaming them). At the state level, one of the most important tasks is to check cross-border drug trafficking.
4.3 Basic Services
This section looks at some of the basic factors that are fundamental to quality of life and livelihoods in the region. Good sanitation and drainage, clean water, electricity and permanent housing structures are now considered necessities and pre-conditions for development. States have made efforts to increase the reach of these services, but there are still large gaps and thousands of households still do not have these necessities. Poor access to amenities in rural areas coupled with the lack of non-farm employment opportunities has propelled people to move to urban centres. Increasing urbanization along with the expansion of the administrative sector over the past decade have in almost every state resulted in untrammelled, unplanned urban growth, pressures on urban amenities, with serious implications for environmental and economic sustainability of these towns.
29 The recommendation is to use diverse channels – the postal network, village kiosks, e-choupals, retail outlets, the local barber, cobbler, dhobi and paanwala - along with marketing networks of FMCGs to disseminate health-related information and health products (from the Eleventh Plan Report on PPPs in Healthcare, Planning Commission)
45
This section first looks at the ‘quality of life’ indicators in the NER (sanitation, sewage and waste disposal, water supply and electricity), and then analyses the pattern of urban development that is taking place. The vision would be to improve living conditions and increase access to amenities and employment opportunities (especially non-farm employment) in the rural areas, so that the rural-urban disparities, so stark in the region, are reduced.
• Basic Services: Sanitation and Sewage Disposal
By national standards, NER states have done fairly well in providing households with toilet facilities in their dwellings (table 4.32A), but there are still large disparities between rural and urban supply. Drainage continues to be a problem (table 4.32A) both in the rural and urban areas. The lack of sanitation, poor systems of sewage and disposal of solid waste (and lack of safe drinking water) are among the main reasons for poor health and high morbidity levels (further elaborated in the section above on health).
• Basic Services: Water Supply
While the supply of good quality water to the NER has increased over the last 20 years, the proportion of households which have access in all states, apart from Arunachal, is still below the national average (table 4.31A). Rural water coverage is particularly poor in Manipur, Meghalaya and Mizoram, where less than 30 per cent of households have access to safe water. A higher proportion (than the national average) of both urban and rural residents in the NER has to ‘fetch water from far away’ (table 4.32A). Interestingly, the urban areas of the northeast are less fortunate in basic services when compared with the national averages (the urban deprivation index for several NER states is higher than the national index – table 4.32A), while the rural deprivation index for almost all the NER states is better than the national average.
The slippage in water provisioning between 1991 and 2001 in states like Manipur and Sikkim exposes a major problem in this area, which is not asset creation, but the critical need to sustain the schemes through appropriate maintenance mechanisms. High maintenance costs, which state governments are increasingly finding difficult to meet have resulted in an erosion of the ground covered in giving access.
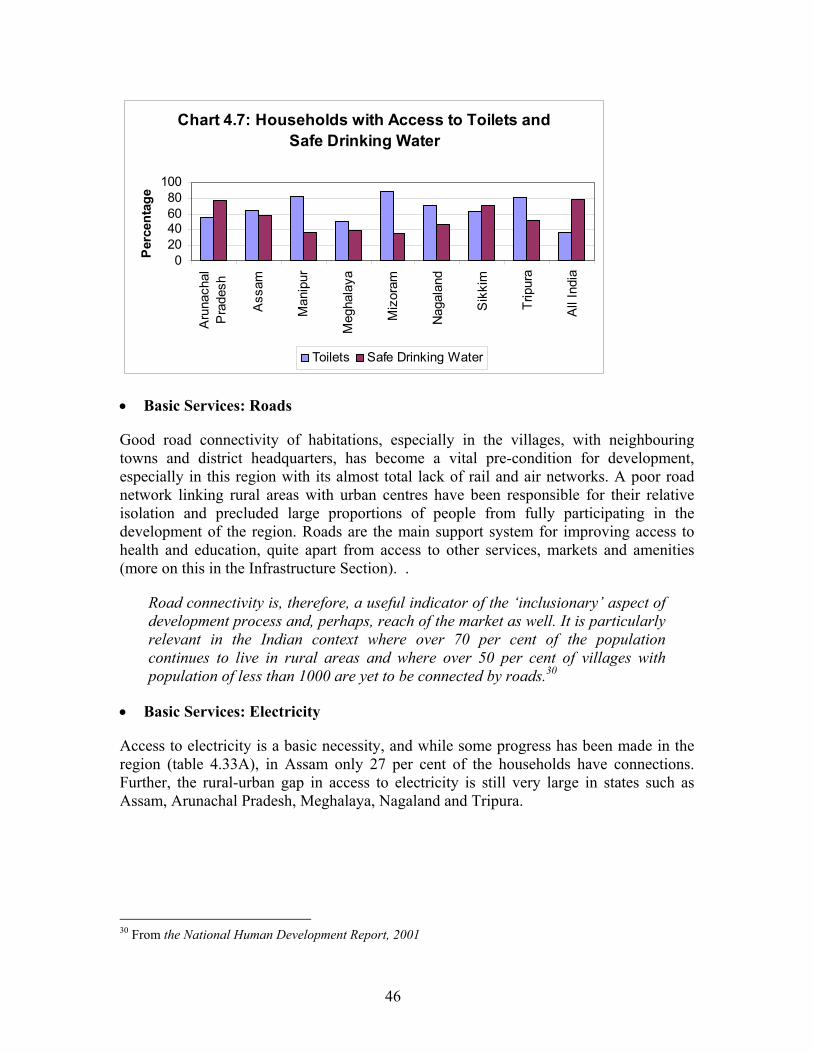
46
Chart 4.7: Households with Access to Toilets and Safe Drinking Water
020406080
100
Aru
nach
alP
rade
sh
Ass
am
Man
ipur
Meg
hala
ya
Miz
oram
Nag
alan
d
Sik
kim
Trip
ura
All
Indi
a
Per
cent
age
Toilets Safe Drinking Water
• Basic Services: Roads
Good road connectivity of habitations, especially in the villages, with neighbouring towns and district headquarters, has become a vital pre-condition for development, especially in this region with its almost total lack of rail and air networks. A poor road network linking rural areas with urban centres have been responsible for their relative isolation and precluded large proportions of people from fully participating in the development of the region. Roads are the main support system for improving access to health and education, quite apart from access to other services, markets and amenities (more on this in the Infrastructure Section). .
Road connectivity is, therefore, a useful indicator of the ‘inclusionary’ aspect of development process and, perhaps, reach of the market as well. It is particularly relevant in the Indian context where over 70 per cent of the population continues to live in rural areas and where over 50 per cent of villages with population of less than 1000 are yet to be connected by roads.30
• Basic Services: Electricity
Access to electricity is a basic necessity, and while some progress has been made in the region (table 4.33A), in Assam only 27 per cent of the households have connections. Further, the rural-urban gap in access to electricity is still very large in states such as Assam, Arunachal Pradesh, Meghalaya, Nagaland and Tripura.
30 From the National Human Development Report, 2001
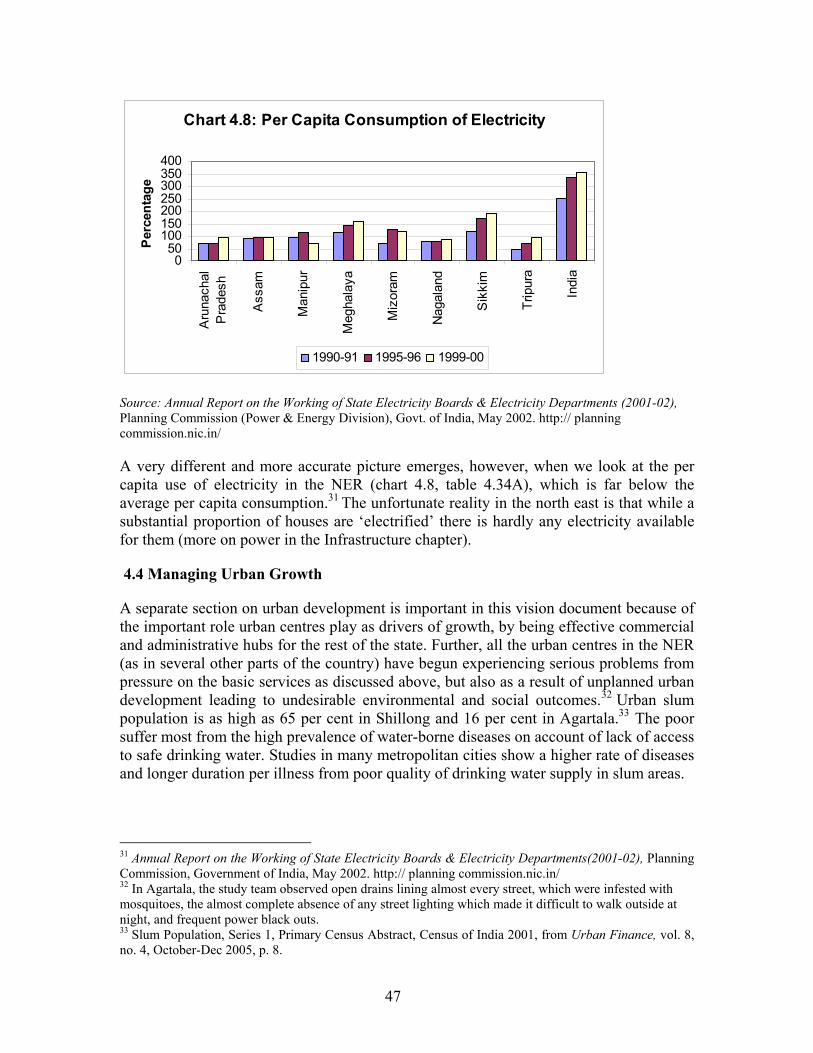
47
Chart 4.8: Per Capita Consumption of Electricity
050
100150200250300350400
Aru
nach
alP
rade
sh
Ass
am
Man
ipur
Meg
hala
ya
Miz
oram
Nag
alan
d
Sik
kim
Trip
ura
Indi
a
Per
cent
age
1990-91 1995-96 1999-00
Source: Annual Report on the Working of State Electricity Boards & Electricity Departments (2001-02), Planning Commission (Power & Energy Division), Govt. of India, May 2002. http:// planning commission.nic.in/
A very different and more accurate picture emerges, however, when we look at the per capita use of electricity in the NER (chart 4.8, table 4.34A), which is far below the average per capita consumption.31 The unfortunate reality in the north east is that while a substantial proportion of houses are ‘electrified’ there is hardly any electricity available for them (more on power in the Infrastructure chapter).
4.4 Managing Urban Growth
A separate section on urban development is important in this vision document because of the important role urban centres play as drivers of growth, by being effective commercial and administrative hubs for the rest of the state. Further, all the urban centres in the NER (as in several other parts of the country) have begun experiencing serious problems from pressure on the basic services as discussed above, but also as a result of unplanned urban development leading to undesirable environmental and social outcomes.32 Urban slum population is as high as 65 per cent in Shillong and 16 per cent in Agartala.33 The poor suffer most from the high prevalence of water-borne diseases on account of lack of access to safe drinking water. Studies in many metropolitan cities show a higher rate of diseases and longer duration per illness from poor quality of drinking water supply in slum areas.
31 Annual Report on the Working of State Electricity Boards & Electricity Departments(2001-02), Planning Commission, Government of India, May 2002. http:// planning commission.nic.in/ 32 In Agartala, the study team observed open drains lining almost every street, which were infested with mosquitoes, the almost complete absence of any street lighting which made it difficult to walk outside at night, and frequent power black outs. 33 Slum Population, Series 1, Primary Census Abstract, Census of India 2001, from Urban Finance, vol. 8, no. 4, October-Dec 2005, p. 8.
48
The Way Ahead for Basic Services/Urban and Rural Development: Recommendations
Various reports have suggested ways to improve basic services in NER, all based on the accepted view that development in the region will only be possible if there is a vast improvement in the quality of overall infrastructure, and services (see Annexures for a summary of these). Our recommendations reiterate most of these suggestions
Basic Services
The expansion of basic services itself creates a large amount of employment. Direct employment is created by the actual setting up of these labor-intensive activities; the presence of these services will attract industry and commerce, which in turn create indirect employment.
The newly introduced concept of a PURA (see annexure 4.3), by improving rural services and employment opportunities, presents a possible solution to rapid urbanisation.
• Communities working with NGOs, community-based organisations, church-based organizations, or panchayati raj institutions are the most effective agents for delivery of service. The swajaldhara scheme, being implemented in various parts of the region, involves water users’ associations or PRIs in the implementation and maintenance of water supply. A similar experiment is being initiated in Nagaland (see box 4.7).34 Cost-based user charges can be extended to other services as well, such as electricity, at least in the urban areas initially. Apart from enhancing funds for expansion of services, it will also make people aware of the resources they are using and promote their more judicious use
• A beginning to the recovery of user charges for services will be made through the involvement of communities to manage water supply (see box 4.5) and the implementation of the Jawaharlal Nehru National Urban Renewal Mission (JNNURM) (see chapter 11 on Grassroots Planning for more details).
Box 4.5: Nagaland’s Water Communitisation Experiment
Village communities in Nagaland are being made responsible for water maintenance as part of the communitisation process. Before this, the PHE departments were responsible for thefts, leakages, waste, distribution, and so on. With communitisation, users are responsible for acquiring the land for catchments and installations, designing schemes to suit their needs, sharing the costs (5-20 per cent of the total), implementing the scheme (clearing forests where needed, and taking up civil works) and, after commissioning, taking over its operation and maintenance. Maintenance costs will be borne by consumers through their own efforts at resource mobilisation by levying a fee on users at a government-approved rate.
Communitisation of water is a demand-driven approach: users come to the government agency for technical support related to water supply. The PHE Department will supply and install the water pipes
34 The Shukla Committee has several valid recommendations related to transparency and monitoring of schemes (see Annexure to this chapter).
49
and service reservoirs, help in scheme selection designs and evaluation to ensure sustainability of the investment, and ensure effective integration of the project components in the village. It will train Village Watsan (water and sanitation) Committees on maintenance, basic repairs, revenue collection, and resource mobilisation through workshops, seminars, posters, and audio-visual publicity.
Source: Water Communitisation in Nagaland, Department of Public Health Engineering, Government of Nagaland
Managing Urban Development
• Urban development, such as it is in the northeast, has been skewed spatially with its focus on capital cities, such as Imphal, Gangtok and so on, to the neglect of other towns in the states, such as district headquarters. This has led to the migration of people to the capital not only from rural areas, but also from smaller urban centres.35 It is important to develop infrastructure and services in the capitals as well as smaller cities so they do not disintegrate into ‘ghost towns’ with deteriorating civic amenities.
• Many of the problems related to urban development in the northeast require urgent attention, and fortunately the imminent implementation of the JNNURM has persuaded many of the state governments in the northeast to begin instituting safeguards against further haphazard growth and unregulated construction, to levying some modicum of recovery charges for essential services, and to involve residents in the planning and implementation of development by the setting up of elected urban local bodies.
• Much of the traffic congestion in the small hill capitals such as Gangtok, Aizawl and Kohima results from government activity. The speedy implementation and use of e-governance could facilitate video-conferencing and telephone conference calls, and minimize the need for travel within the city. But the longer-term solution being implemented in Aizawl (and already in place in Guwahati) is the relocation of government offices and departments away from the main city centre.
• Most urban centres in the hills have no public transport system within the city, and are serviced by mini-cabs or shared taxis. The introduction of mini-buses, capable of carrying 10-15 passengers, perhaps through private-public partnerships, would have a beneficial effect on vehicular decongestion and air pollution.
• There are few playgrounds for children or green areas for residents to exercise, and these need to be built into any plans for urban areas.
• Buildings can be constructed keeping in mind the traditional cultural aesthetics of the region or state, and using materials locally available, which would be more appropriate and instill in people a pride in their heritage. A beginning could be made by building government offices along these lines, which would have an excellent demonstration effect.
35 In Nagaland, the migration is also from smaller towns to Kohima and Dimapur (Nagaland Human Development Report).
Chapter 5
Manpower Planning and Employment
Employment growth is a crucial objective of development and growth, as it ensures people’s well-being and reduces poverty on a sustained basis. Creating job opportunities is challenge faced by the development strategy of any state/region but more so in the NER states. The economies are mostly agrarian in nature, with very low levels of industrial activity, and significantly dependent on ‘imports’ from outside the region.
Public administration has become the propelling force behind income growth. The region witnessed rapid expansion of employment within government in the 1980s and 1990s in response to the formation of new states and the necessity to establish administrative machinery, and possibly to compensate for the lack of private investment (Table 5.2A). The share of employment in the public sector is as high as 96.8 percent in Manipur in 20011. However, this cannot be sustained for long as is becoming evident from widening of the gap between per capita GSDP in the region and the average per capita GDP for the country as a whole.
Two essential elements of any strategy for increasing employment opportunities are: (i) expanding economic activities to raise the demand for different skills which will facilitate the shift to a high-growth surplus economy; and (ii) human capital development – an enhancement of employable skills, important for increasing the efficiency and allocation of resources.
5.1 Employment and Population Dynamics
The NER has a significantly young population,2 which reiterates the need for careful manpower planning and employment generation over the next few years. Employment generation has undergone a crisis of sorts in the aftermath of the freeze on public sector jobs in the last plan period, but surprisingly rising unemployment and underemployment occurs concomitantly with high wage rates, especially in the hill states
The region is still very dependent on agriculture for employment both in the rural and urban areas, with 75-88 per cent of jobs still concentrated in this sector. The high dependence on agriculture in the hill states is consistent with presence of significant unused cultivable area in these states indicating that the farm sector still has the potential to provide livelihoods.3 However, declining productivity in agriculture calls for some degree of government intervention in creating livelihood opportunities in the region.4 As in the rest of the country, there has been a steep decline in the number of cultivators and an increase in the number of agricultural labourers in the 1990s, the situation in the NER is 1 S Chattopadhyay (2006). 2 As much as 17 percent of the population is in the 20-29 age group and 10 percent in the 15-19 age group. See Table 5.1A 3 Chapter 1, and NEDFI, January 2003. 4 Chapter 1, and NEDFI, January 2003.
51
problematic as livelihood opportunities are limited in both farm and non-farm employment (Table 5.10A). But, the growth in the number of other workers indicates some improvement in the non-farm employment scenario in the 1990s.
There has been a sectoral shift in the nature of jobs being created in states like Assam, Sikkim and Tripura, with a lower than national average dependence on agriculture (Table 5.9A), indicated by the gradual increase in the rural tertiary sector and rural landless workers. In the urban areas, the share of tertiary workers is high for all the north-eastern states, with Tripura topping the list (89.3 percent) followed by Meghalaya, the lowest being Mizoram at 55 percent (also the most urbanised state in the region).
The long-term shift in the structure of employment in rural areas shows that the share of people in self-employment has improved between 1999-2000 and 2004-05, and the share of casual labour has reduced in all NER states especially Assam, Sikkim, and Nagaland. This is an encouraging trend and consistent with the trends in employment growth in these states and a growth in the share of workers in the rural tertiary sector in Assam and Sikkim during the same period. A similar trend is observed in urban areas during the same period except in Assam and Meghalaya where self-employment has fallen, the share of regular employment has increased, and casualisation of labour has increased marginally in Assam. (Tables 5.11A (a) and (b)).
Growth of employment opportunities declined in the 1990s in the north-eastern states although at a lower rate than the national average. In 1999-2000 unemployment declined marginally for Assam, Arunachal Pradesh and Tripura, while it increased in Manipur, Meghalaya, Mizoram, Nagaland and Sikkim. The incidence has been highly skewed towards urban areas and among women (Table 5.12A (a)).
Rising unemployment and underemployment has been accompanied by high and rising wages (Tables 5.13A (a) and (b)). Average daily wages for casual workers in public and non-public works show a consistent increase during 1999-2005 and are substantially higher than the national average. Underemployment with high wages presents a paradoxical situation. High wages5 could be a serious constraint to private investment especially from outside the NER given that regulations and local conditions in some of the hill states restrict the free inflow of labour6.
5.2 The Way Ahead: Recommendations for Manpower Planning
A vision that emphasises building capacities within the region would enhance job opportunities, and the potential for employment. The focus of the strategy would then be to on developing human capital and expanding economic activity to boost employment in the region.
• Developing Human Capital
5 Two different explanations can be put for this trend: In Assam, Tripura and Sikkim which have less cultivable land than the other NER states, it is possible that construction and services sectors have created jobs in the rural areas. Second, given that land is ‘surplus’ in the hill states and the use of fertiliser is low; a large proportion of the returns to agriculture are appropriated as returns to labour. These returns set the opportunity cost of labour. 6 Strikes on non-Assamese labour in Assam appear to be a manifestation of this.
52
There is widespread evidence that education has a positive impact on labour productivity. Studies have shown that the spread of technology depends on the learning potentials and motivation that are linked to the development of formal schooling, with a causal link from education to economic growth. While NER states have shown impressive progress in terms of literacy, the next target will be to raise the quality of education and reorient it to have a greater focus on creating skills in demand in the region and outside, as well as to boost entrepreneurial abilities in people (this is discussed in greater detail in the chapter on education).
Vocational Subjects in Secondary Schools: While there has been a temptation in many economies to vocationalise secondary schools, a more cautious approach is required in view of the empirical evidence that shows that many who studied vocational subjects eventually entered jobs unrelated to their training7. Such evidence coupled with the high unit-cost of vocationalising the curriculum (scale diseconomies), favours the more conservative policy of emphasising general skills, with the introduction of selective vocational courses at the secondary level (to equip people for jobs such as welder, fitter, surveyor, electrician, tailor, chef, and so on.)
Emphasis on Job-Based Vocational Training: Facilitating the college- or school-to-work transition may help alleviate the unemployment situation in the region to a great extent. This can be done through a good vocational education and training (VET) programme to equip people with tradable skills.8 VET programmes prepare students for occupations in agriculture, artisan trades, crafts, small and medium enterprises, the latter geared at those planning to set up their own businesses, which would include entrepreneurship development and some ICT training to enable them to manage all the functions of their enterprise.
Planning for vocational training in the NER would require identification of training courses and their contents in line with the current and potential (near future) demand in the market; and making provisions for quality training.
• Potential employers are best positioned to track technological developments in different occupations and to assess demand for specific skills. Further private firms could help in identifying manpower, developing sector-wise skill profiles, identifying courses, developing competency-based curricula and learning materials. They can also provide experts who conduct the training, as well as the space and tools on which people can be trained, and help with placements. This may be also be done in collaboration with state governments as in Mizoram (box 5.1).
• Talented poor students could be assisted with well-targeted scholarships and loans.
• As the goal is to increase employment, institutes will need to have a strong job placement focus, by developing links with private industry, or make available information on government schemes for setting up their own enterprises.
7 Given a natural preference for secure government job in most NER states this is probably also the case in this region. In the absence of a placement profile of vocational schools this can not be verified. 8 VET has been emphasised in the Approach Paper to the Eleventh Plan.
53
Box 5.1: Private-Public Collaboration in Job-Oriented Technical Training IT Entrepreneurs Training Programme in Aizawl
A major new initiative between the government of Mizoram and private IT companies is bringing international-level training and business development to unemployed people in the state. A partnership between the IT Cell of the Government of Mizoram and New Horizons India (a US-based company) the IT Entrepreneurs Training Centre and Prometric Testing Centre was set up at Aizawl in 2005. The Centre provides employment-related training and skills to young, educated unemployed people in an environment equipped with the latest IT technology. The first batch of 200 students were inducted in September 2006, for a two-year course, which includes training in software development and business communication, that will equip them to set up their own business ventures. NEC will fund training for 400 such candidates over a period of two years.
New Horizons will also set up a prometric testing centre at Aizawl to allow students to apply for certification from international companies like Microsoft, Oracle, and Cisco, which will expand employment opportunities outside the state and even internationally. The government pays the certification fees for the first attempt, to encourage students to apply for certification.
The training also supports self-employment among graduates. The Cell is setting up an IT Resource Centre where graduates will be given space and access to infrastructure and support to operate small IT consultancy firms, or other small businesses or to apply for other jobs online, so that they need not invest in IT infrastructure.
Source: Field visit by the study team to the IT Cell, Planning and Programme Implementation Department, Government of Mizoram, Aizawl
• Nagaland University plans to participate directly in the region’s development by being part of the project on “Providing Urban Amenities in Rural Areas” (PURA).9 One of the mandates of the programme is to create world-class vocational training institutions in construction, carpentry, welding, computer maintenance and services, and ITES.
• The existing network of ITIs and polytechnics in the region needs to be expanded, to raise the skills base. This can be done by strengthening existing courses, upgrading them for higher-level training and expanding training to cover trades correlated to the technical skills needed by the region, in coordination with the NER’s new industrial policy. Training courses have to be more dynamic and incorporate training on new technologies so that graduates from these institutes can compete outside the region, and even globally. Given the lack of a modern industrial base in the region, linkages may need to be developed with industries outside the NER for internships and employment.
• An avenue for promoting employable skills among youth is the community polytechnic, typically a wing of an existing polytechnic, which promotes rural and community development through the application of science and technology in its immediate surroundings, using the infrastructure of the polytechnic. At present 19 community polytechnics function in the region.
• This ambitious plan for upgrading the technical foundations of people will call for a large number of trainers. A regional training institute could be set up to train and
9 See Annexure 4.2 for details on PURA.
54
certify skilled workers to become trainers. These trainers can then set up a network of institutes with certification from the apex training institute.
An Expansion in the Supply of Professional Education
• Well-established autonomous technical institutes from the rest of the country such as the Indian Institute of Fashion Technology and Manipal Foundation could be encouraged to open centres in NER.10 Their presence will provide existing training facilities with healthy competition as well a chance to raise the quality of their instruction. Further, there is a synergy between some of the strengths and talents of the region and rising global and national demand for qualified professionals in these areas. The promotion of these professions could be the focus of professional higher education in the NER (see box 5.2).
Box 5.2: Focus on Some Professions
• Nursing: The current global shortage of nurses in developed countries such as the United States, United Kingdom and Australia is expected to increase exponentially over the next few years, especially with the ‘greying’ of their populations. Already these countries have a substantial number of foreign-trained nurses working in their health systems, and the shortfall is estimated to be 275,000 in the US by 2010 and 53,000 in the UK by 2011.11 Nursing training within the country is best-established in Kerala which has 200 nursing schools, mostly run by private entities. Graduates from these colleges have been much in demand within the country and abroad, but the Kerala nursing colleges no longer have the capacity to meet this demand. With the excellent reputation of nurses from the NER, there has to be a focus on expanding facilities within the NER for nursing (and other allied health professionals). At present, nursing training is offered in several north-eastern states, but could be expanded to all hospitals that can support the training. Collaboration with private nursing training colleges across the country would help provide the qualified trainers needed for this expansion.
• Fashion: This is another rapidly emerging field as products by Indian designers are increasingly in demand in the larger cities in India and abroad. Fashion, textiles, design are areas well-suited to the talents and abilities of women and men in the NER, especially Mizoram and Nagaland, who have already shown an aptitude for supplying innovatively woven textiles to markets abroad and within the country.
• Hospitality: Already hotels and restaurants in the major cities in the country are increasingly being staffed by people from the Northeast, who display an innate aptitude, talent and interest for this line of work. Professional training in the hospitality industry will equip them to move up the ladder to management positions.
• Airlines: The expansion and proliferation of private airlines in the country has led to the large-scale recruitment of personnel at all levels – management, flight attendants, ground staff, baggage handlers, and so on. Increasingly, the new hires especially in the service departments are being recruited from the NER, and three stewardess training institutes have already begun functioning in Guwahati, Assam.
10 This list is only indicative. 11 Aiken, Linda H., James Buchan, Julie Sochalski, Barbara Nichols, Mary Powell (2004) ‘Trends in International Nurse Migration,’ Health Affairs, posted May, 21, 2004 http://www.medscape.com /viewarticle /475466_2 accessed May 31, 2007.
55
• While English is the intended medium of instruction and assessment in several secondary and high schools, some of the graduates from schools in the region find it difficult to make the transition to study and work outside their states by the lack of practice in spoken English. One suggestion12 was to set up regional language centres in the main cities where students could practise their English and Hindi-speaking skills. In this context, the use of interactive radio instruction and computer-aided learning would also help.
• Expanding Economic Activity to Boost Employment
While this is discussed in greater detail in chapters 1, 2 and 3 which analyse the sectoral basis for the expansion of activity in the north east, there are a few others which maximise employment generation, especially for workers released from land. These include land-based activities – agriculture, horticulture, social forestry, agro-based industrialisation – offer ample potential in NER. The forest resources of this region can support and sustain industries if they are used according to a working plan, which most of the states have yet to develop.
Further, several states are rich in mineral resources (Assam, Arunachal Pradesh, Tripura, Nagaland and Meghalaya) but these have only been substantially exploited in Meghalaya and Assam. These resources support an urban industrial base creating opportunities for many, and in addition have spillover effects on the rural areas through ancillary activities.
Besides providing the enabling physical infrastructure for the expansion of activities that create jobs, governments will need to make widely available information about feasibility, accessibility, markets and finance. Some part of the infrastructure can be provided through public employment schemes. At the same time government should make efforts to create a favourable environment for private investment to supplement its efforts. Strategies to give a push to public investment in critical infrastructure and to attract private investment in industry and agriculture are discussed in the relevant chapters in the report.
The central government plans to go in for bamboo plantation over 6 million hectare during the next ten years under its National Mission on Bamboo Technology and Trade Development. An enabling framework is all that is required to realise this potential (this is discussed in detail in chapter 2).
• Integrating local markets and opening up markets in neighbouring countries by increasing connectivity would provide the much-needed thrust to employment growth. Development of labour markets would however require easing entry restrictions, and emphasis on skill development.
• It would be prudent to focus on production based on locally available raw material, which would add value within the region, reduce transport costs, and help states exploit their comparative advantages.
12 From the Sectoral Summit on Education in August in Delhi.
SECTION III
ENABLING MARKET DEVELOPMENT
Section III
Enabling Market Development A crucial element of the vision outlined for the northeast will be the expansion and development of markets so that the natural and human resources of the region are optimally utilized. A progressive development strategy cannot be based solely on an expansion of activities through funds from the central government, as has been the past trend. However, the sectoral focus presented in the first section and strengthening of human capacities and institutions are not sufficient to place the northeast on the path to progress and prosperity: it is as important to strengthen marketing links within the region, with the rest of the country and with its neighbours. The first section of this report has shown how, in the long-run, the NER must function as a single common market to facilitate the expansion of the market for any product or service. At present, the growth of a cash- and market-based economy is limited by the small size of the market. A common market in the region would crucially depend not only on production the production of goods and services, but on the effective and efficient distribution of these among the constituents of the NER. This distribution is clearly dependent on the inter- and intra-state connectivity of the states, which in turn relies on the quality of transport, power and telecommunication infrastructure of the region. An analysis of the current position of major infrastructure in the states will form the basis of the analysis of the gaps in provision, projected requirements over the next five to twenty years, the potential for expansion and how the expansion is to be affected. The northeast region is also constrained from expanding markets to the rest of the country because of high transportation costs stemming from its tenuous ‘chicken-neck’ connection with the rest of the country, which restricts the extent of land-based commerce. On the other hand, the region has a long border, 98 percent of which it shares with five countries and it would be reasonable to expect markets to expand as India’s trade and cultural links strengthen with these countries. The ‘Look East’ Policy has been an important cornerstone of the Indian government’s plans for the northeast, but with increasing globalization and the expanding presence of China in the region, it is time to address constraints to the expansion of trade between the NER with its neighbouring countries. Infrastructure, connectivity and the ‘Look East’ policy are thus the focus of this section which presents another dimension of the Vision 2020 for the NER.
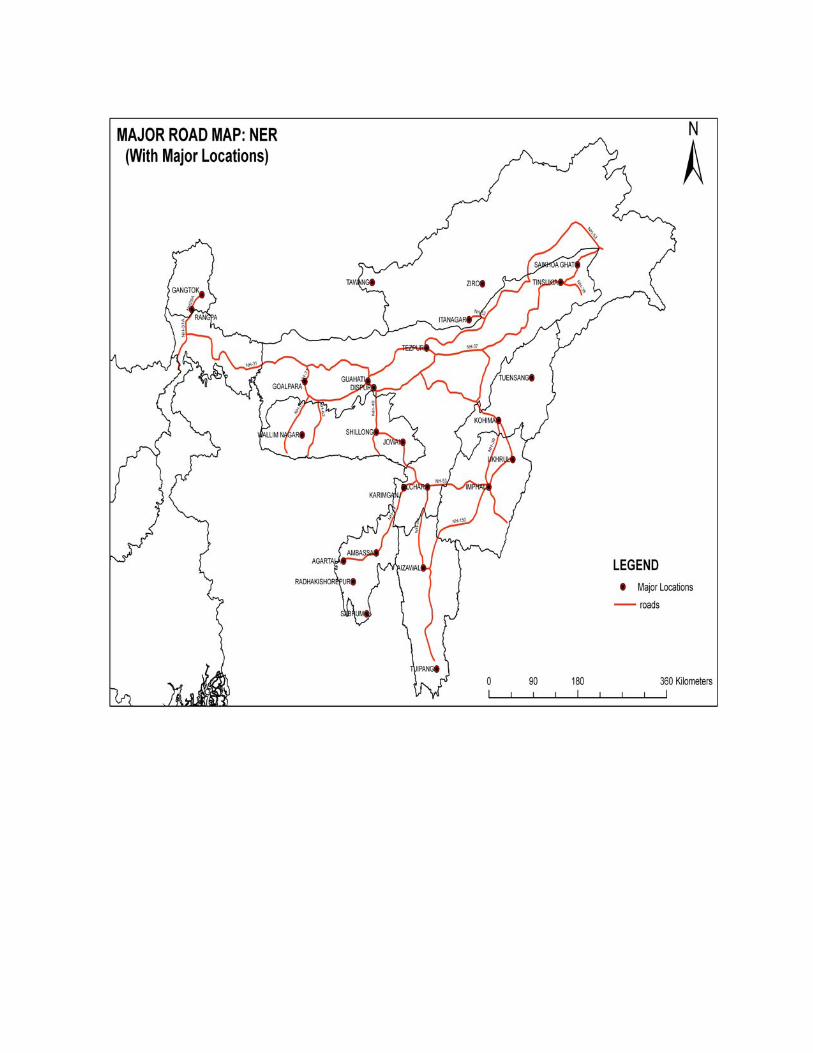
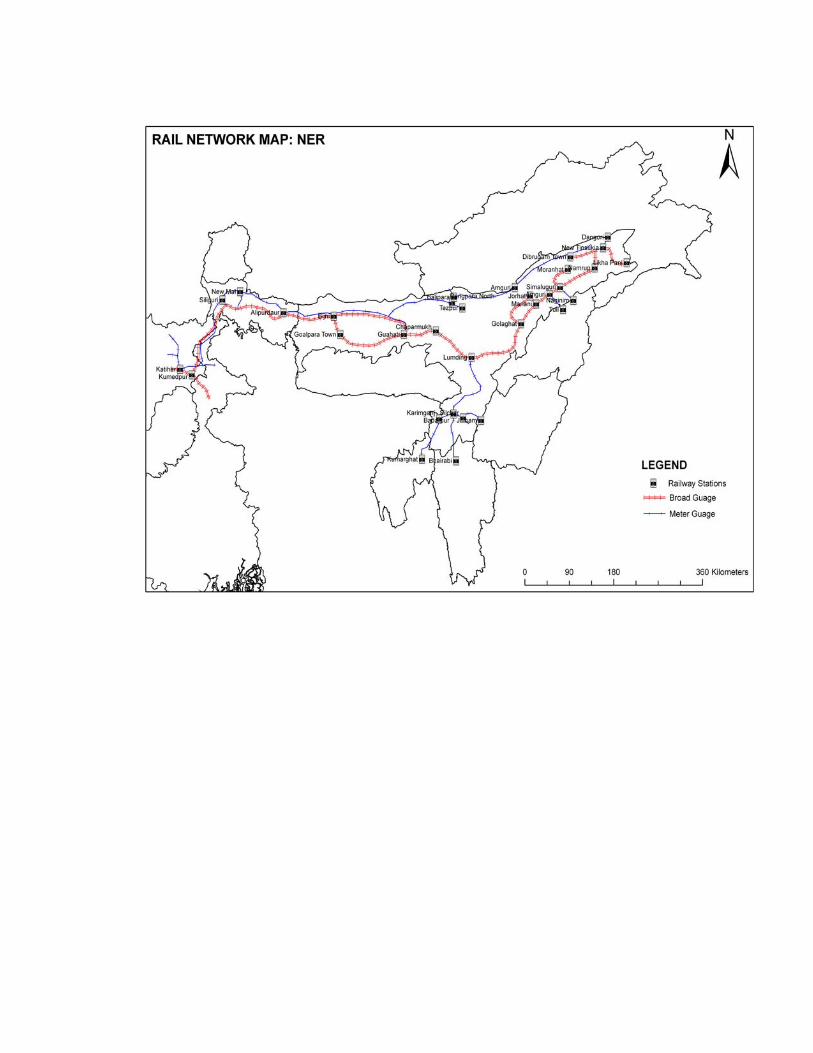
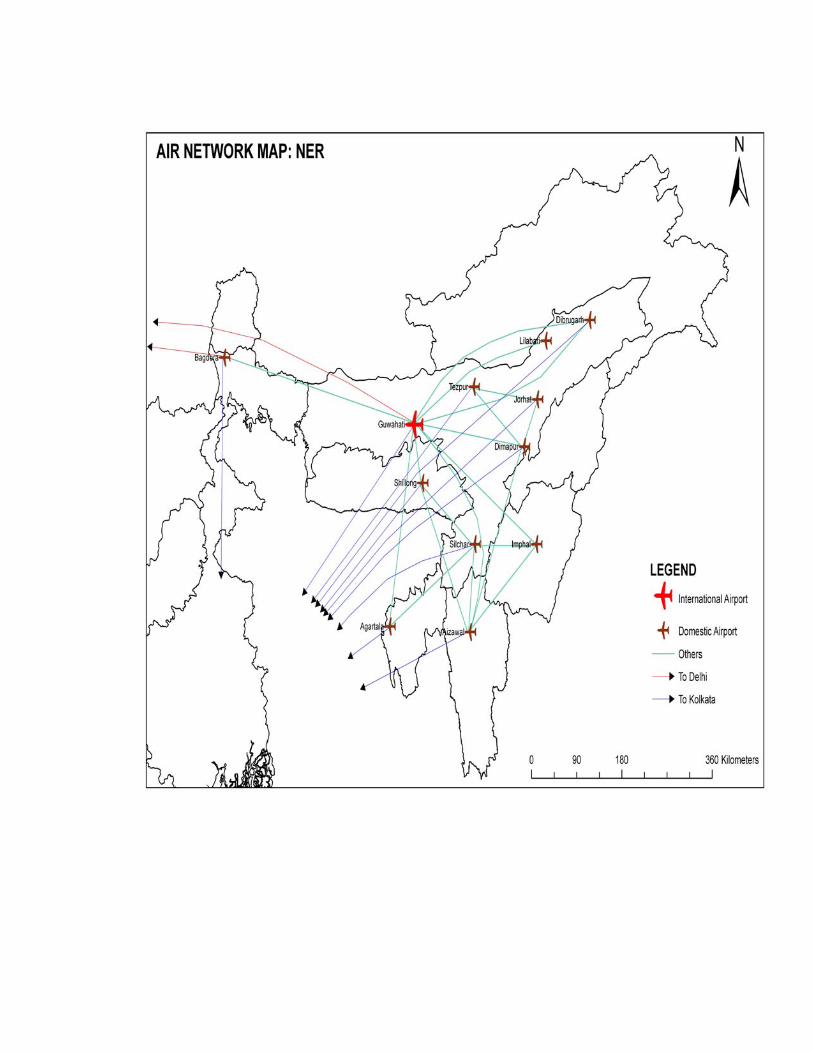
CHAPTER 6
Infrastructure and Connectivity
Infrastructure development is a fundamental pre-requisite for realising any vision of progress and for promoting market development in the northeast. In fact, none of the other areas in the economy, whether it is health and education, or industry and services, are capable of expansion if basic infrastructure is not expanded and improved in the region. Thus, apart from delivering essential services that improve the quality of life and livelihoods, it is crucial to the very progress and prosperity of the region.
Depending upon the function, infrastructure may be classified into the following broad categories:
• Transport and communication infrastructure: roads, railways, ports, post offices, telephone exchanges and networks;
• Power infrastructure: power generation station, transmission networks;
• Agronomic and agro-marketing infrastructure: canals, tube wells, irrigation facilities, fertiliser distribution points, HYV seed distribution shops, warehouses and cold storage facilities;
• Industry-related infrastructure: factories; and
• Infrastructure relating to provision of public amenities: education, health, sanitation.
This chapter looks at infrastructure related to transport, communications and power (the categories electricity, gas, water supply, construction, transport, storage and communication). Clearly, infrastructure plays a very important role for all the North Eastern states as its share in net state domestic product (NSDP) ranges from 7 percent to 28 percent for the region (Table 6.1A, Annexure 6.1) between 1993-94 and 2002-03. The share of infrastructure has been continuously rising for all the NER states over time (except for Mizoram where the share of infrastructure declined from 18 percent in 1990-81 to 12 percent in 2002-03). The share of infrastructure for Nagaland is the highest at 28 percent in 2002-03. Infrastructure in the northeast as a whole (except for Arunachal and Assam) was growing at a significantly higher rate than the national average (Table 6.2A, Annexure 6.1). The only exceptions are Arunachal and Assam.
6.1 Transport
Transport infrastructure is of great importance in the region to strengthen its integration with the rest of the country and its neighbours, as well as transport goods more effectively
57
within and out of the region. It is a vital input into the proposed shift from subsistence agriculture to cash-crop based farming, as well as the planned development of industry and the service sector. Most of the area of the region is hilly and undulating with low population densities, accompanied by low per area production of goods. In such terrain rail, air and inland waterways are not cost-effective ways to provide connectivity, so roads are the dominant infrastructure for connectivity and transportation.
6.1.1 Roads A comparison of the road network of the region with the network in the rest of the country indicates that the road network per capita is significantly higher in the NER relative to the rest of the country (columns 2, 4 and 6 in Table 6.3A, Annexure 6.1). This is an expected outcome given the hilly terrain and the low density of population, however, road length per unit area is higher only in Assam, Nagaland and Tripura, not in the other hill states. Since this would have been a more accurate indicator of the ease of movement of passenger and freight traffic one can conclude that road infrastructure is relatively deficient in the NER states. This is particularly true for the hill states as other modes of travel are either too expensive or difficult to provide.
It would be also useful to look at the classification of roads as this has implications for funding of road development schemes (Table 6.4A; Annexure 6.1). Most previous studies have by and large looked at development of either state roads or national highways.1 In most states, village and district roads are the dominant category. These are particularly important for facilitating intra-state movement of people and freight.2 The low level of inter-state trading of food grains and other commodities makes it important to focus on developing these roads within the broad category of state roads.3
State governments have been also been asking repeatedly for converting state highways into national highways.4 (See Table 6.5A, Annexure 6.1 for a list of national highways in the NER states). Some of these demands are justified. For, example, the East-West highway demanded by Arunachal is crucial, as at present one cannot travel from one district to another in the state without exiting into Assam.5 Without the development of an internal highway, activities like tourism and private transport cannot take off. Tourists (or freight traffic) would have to repeatedly pay entry/exit taxes as they move from one district of Arunachal to another. A major issue in road infrastructure especially in the hill states is one of maintenance: with no internal resources and small state plans (especially in the hill areas), the expansion in the road network will mean that maintenance will take up a larger
1 See, for example, the Shukla Commission Report (1997) for an excellent compilation of planned development of road network as per requests of the state governments. 2 This point was also stressed in a meeting between study team and officials in Meghalaya, who pointed out that central work on roads was very slow. The officials also pointed to the need for road connectivity between the Garo, Jainti and Khasi hills under the National Highways programmel; a Shillong Bypass has also become crucial, as traffic has begun choking the capital of Meghalaya. 3 Officials of Arunachal in a meeting with the study team detailed the severe problem of road connectivity within the state, in which 76 percent of villages are not connected by roads. NER states have been asking for a revisal of the criteria for fund allocation under the Prime Minister Grameen Sadak Yojna (PMGSY). 4 See, for example, Shukla Commission report. 5 This point was also strongly emphasized by the Arunachal authorities in meetings with the field trip teams.
58
and larger share of states’ resources. Internal roads are already falling into disrepair in most places.6
While individual state-level road building plans are many, there is need for an integrated plan for the NER as a whole which includes both inter- and intra-state linkages. Some planning in this direction is already evident in the creation of a 7,616 km. network of inter- and intra-state road network under the Special Accelerated Road Development Program announced a few months back.
6.1.2 Rail
In general, rail is the best method of mass transportation in the country, but rail networks are generally difficult and expensive to set up in hill areas, which accounts for the absence of railway lines in Arunachal Pradesh, Manipur, Meghalaya, and Mizoram. Tripura and Nagaland have railway routes in their plain areas, while Assam has a large railway network. Even so, the track density in terms of both population and area even in the plains areas of the northeast is much lower than the national average. (Table 6.6A, Annexure 6.1).
The increase in the density of tracks per lakh of population is only marginal or non-existent in most of the states compared to an almost five-fold increase at the national level. Even the increase witnessed in the plains of Assam is much lower than the national average. It may also be noted that most of the states have no rail line within the state connecting them to any major rail junction.7 Finally, while there has been some conversion of metre-gauge to broad-gauge, Assam still has a large number of single-track routes which cannot accommodate any increase in rail frequencies.
There are some obvious short-run projects which need completion at the earliest. For example, the Bogibeel rail bridge across the Brahmaputra was commissioned in 1996 as a ten-year project but work began only in 2002. This rail-cum-road bridge has implications for connectivity not only for Assam but for Arunachal and Meghalaya.8 Similarly, there is urgent need for a rail link inside Sikkim. The more important issue from the long-run point of view is strategic planning that will develop the rail network with the aim of increasing inter-state connectivity. In addition, rail connectivity has to be integrated with developments in the other avenues of transport being proposed for the NER as a whole9.
6 For example, NH52 from Guwahati to Itanagar showed signs of extreme wear and tear due to erosion. This is probably an annual event, occurring when the Brahmaputra overflows its banks, yet, no attempt appears to have been made to improve the technology used to deal with the erosion. 7 In the field trips, states like Sikkim and Arunachal, which have no alternate access to the rest of the country, noted that movement outside their state is crucially dependent on the law and order situation in adjoining states. Local disturbances in neighbouring states can severely disrupt bulk supplies carried by rail. As noted in the Sixth Sectoral Summit of the NEC, while the railways have drawn up a plan to bring the rail lines to each state, the funding pattern and time deadlines need to be clearly specified. 8 See the Shukla Commission Report, 1997. 9 “Perspective of Inland Water Development in the North East”, Background paper No.7, The Inland Water Authority of India, March 2006.
59
6.1.3 Air
Air connectivity is generally useful for high-end passenger traffic and high-value freight (such as plants, flowers, valuable documents, etc.). In general air connectivity is also expensive in the hilly areas because of the terrain, which is the reason for the paucity of airports in other hill areas in the country: most have versions of a helipad. In the NER, air travel has been made possible by central subsidies for air travel to and from the NER (excluding Assam). Despite this, air connectivity was extremely unreliable prior to 2002 as the limited traffic made the use of Boeing jets uneconomical and led to irregular flight schedules. However, since 2002 the introduction of smaller ATR planes has made flights within NER somewhat more reliable though Kolkata still seems to be the hub rather than Guwahati. On the other hand, Guwahati seems to more the natural hub for air traffic within the NER. At present only Meghalaya and Sikkim have no full-fledged airports probably due their proximity to Guwahati and West Bengal, respectively.
Air traffic in the NER accounts for less than 1 percent of all traffic in the top 46 airports in India (Table 6.7A; Annexure 6.1). In fact, barring airports in Assam, only Agartala (Tripura) and Imphal (Manipur) are in the top 46 airports list, probably because of limited alternative access to both the latter states. On the other hand, Sikkim has no airport as the heavy tourist traffic for Gangtok comes via the rail head at Siliguri or the airport at Bagdogra. What is even more problematic in the NER is that there no direct connectivity between state capitals and all movements have to be via Guwahati. In fact, in some cases one may actually have to fly from one state to the other via Kolkata. Any attempts to build airports in the NER states must grapple with the twin issues of cost of travel and rationalisation of air routes.10
6.1.4 Inland Water transport
Until the construction of roads, the rivers of Brahmaputra and the rivers of the Barak Plains were the commonly used medium of transport. During British rule, as the tea industry grew, these rivers became important carriers of trade. The NER has about 3,839 kilometres of navigable river routes, with the Brahmaputra having the longest navigable stretch in the region (Table 6.8A, Annexure 6.1). Other important rivers are the Buridhing, Katakhal, Subansiri, Disang, Gangagdar, etc. Most of the waterways in the NER are in Assam, and are used for ferry, commercial and rescue services, and as a crew-training centre. Most of the cargo is transported on the Brahmaputra and consists manly of tea, coal, bamboo, rice, jute, sugar and urea (Table 6.9A, Annexure 6.1).
The movement of cargo on Brahmaputra has grown from 29,414 tones in 1996-97 to 7,91,522 tones in 2003-04 (Table 6.10A, Annexure 6.1). Most of the ferry services are in Assam.
10 Ibid.
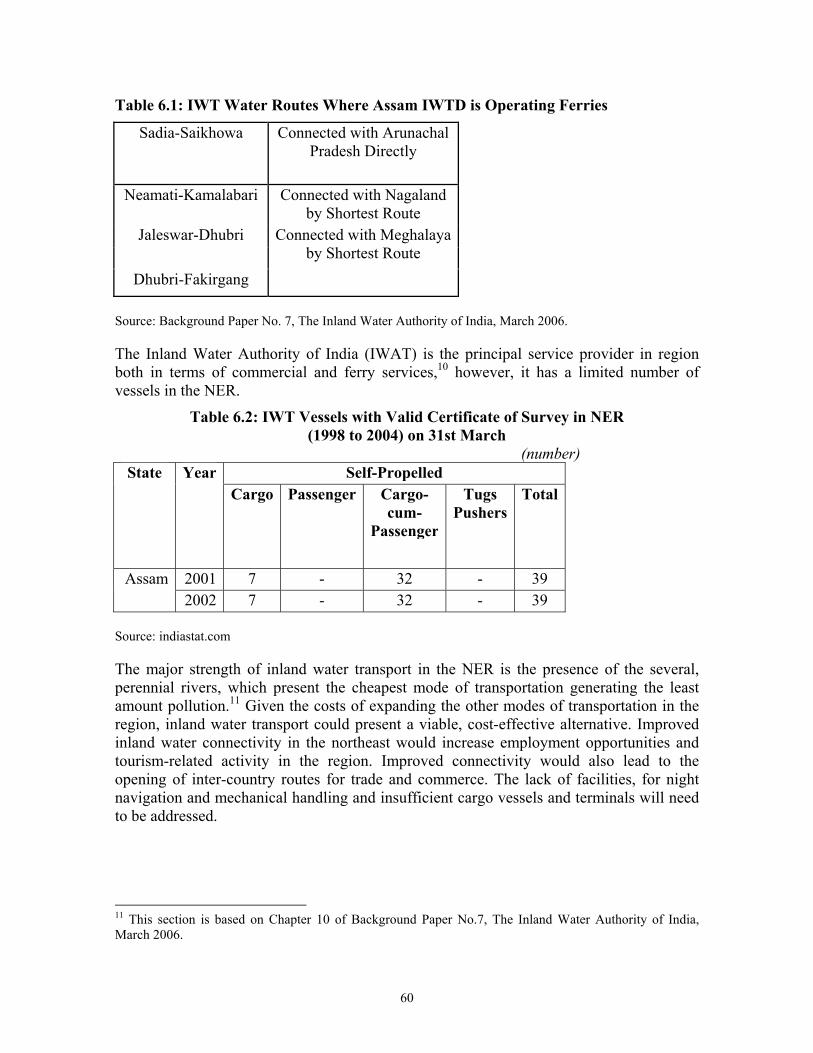
60
Table 6.1: IWT Water Routes Where Assam IWTD is Operating Ferries
Sadia-Saikhowa Connected with Arunachal Pradesh Directly
Neamati-Kamalabari Connected with Nagaland by Shortest Route
Jaleswar-Dhubri
Dhubri-Fakirgang
Connected with Meghalaya by Shortest Route
Source: Background Paper No. 7, The Inland Water Authority of India, March 2006.
The Inland Water Authority of India (IWAT) is the principal service provider in region both in terms of commercial and ferry services,10 however, it has a limited number of vessels in the NER.
Table 6.2: IWT Vessels with Valid Certificate of Survey in NER (1998 to 2004) on 31st March
(number) Self-Propelled State Year
Cargo Passenger Cargo-cum-
Passenger
Tugs Pushers
Total
2001 7 - 32 - 39 Assam 2002 7 - 32 - 39
Source: indiastat.com
The major strength of inland water transport in the NER is the presence of the several, perennial rivers, which present the cheapest mode of transportation generating the least amount pollution.11 Given the costs of expanding the other modes of transportation in the region, inland water transport could present a viable, cost-effective alternative. Improved inland water connectivity in the northeast would increase employment opportunities and tourism-related activity in the region. Improved connectivity would also lead to the opening of inter-country routes for trade and commerce. The lack of facilities, for night navigation and mechanical handling and insufficient cargo vessels and terminals will need to be addressed.
11 This section is based on Chapter 10 of Background Paper No.7, The Inland Water Authority of India, March 2006.
61
Recommendations include:
• Developing a fairway to Pandu and the necessary infrastructure for full-time navigation;
• Developing the Aricha–Dhulian–Rajsahi–Dacca route for navigation to reduce the distance and time between Kolkata and the north-east.
• Declaring the Barak river between Karimganj and Lakhipur a national waterway, so that it can be developed on priority
• Developing river routes through Gumati-Meghana to explore the trade opportunity between Tripura and Bangladesh.
• Developing Tizu-Chindwini-Irrawady to promote trade between Nagaland and Myanmar.
• Developing the tributaries of the Brahmaputra like Dhansisri, Subansiri, and Lohit.
• Public-private partnerships for the development of fairways and infrastructure.
The development of IWT has been limited both by the lack of funds and the insurmountable nature of the Brahmaputra.12 However, the newly constituted Brahmaputra Board should make an attempt at integrating IWT in the general framework of connectivity in the NER, as IWT has implications not only for Assam but for other land-locked states like Arunachal.
6.2 Power
Almost every north-eastern state is deficit in power, which is important given the nascent state of industrial and other economic activities based on power in the region. (Table 6.12A, Annexure 6.1). These figures hide the fact that while Arunachal is supposed to be self-sufficient in power it actually imports power from Assam, also a deficit state.13 All the states need to develop their internal transmission grids to avoid incurring wasteful expenditure on wheeling power from the central grid. Basically, the NER states need to determine how they will transmit power within their states before estimating the amount of power they would sell to the national grid. Power consumption has remained virtually stagnant in most of the states over a period of about ten years (Table 6.13A, Annexure 6.1), with the exception of Meghalaya and Sikkim (which had an almost 200 percent increase). In Manipur power consumption has actually declined and is stagnant in Assam. This probably reflects the differential growth in economic activity in the NER states documented elsewhere in this report.
12 Ibid. 13 In discussion with the study team, officials indicated that the lack of an internal grid in Arunachal prevents the evacuation of surplus power from one part of the state to another. Plans for a state transmission grid have been submitted to DONER and approval is awaited.
62
At present the states are not in a position to generate enough power even for their own requirements, even though power generation has increased substantially in every state after 1996-97. However, generation seems to be stagnant after 1999-2000 (Table 6.14A, Annexure 6.1). States like Meghalaya are in fact identifying less power-intensive areas like high-level tourism, IT sectors, horticulture and so on as thrust areas in their industrial policy rather than large industrial projects.14
For the future, ambitious plans have been drawn up for making the NER not only self-sufficient in power but also the ‘power house’ for the rest of the country. As can be expected the main source of power is likely to be hydel and the focus state would be Arunachal,15 even though in Assam, the power supply source has changed dramatically in 2006 from thermal to hydel 16 (Table 6.15A; Annexure 6.1).
In addition, since power projects are highly capital intensive, most of the commissioned projects are (or would be) in the ventral sector or under private partnership (PPP mode). Table 6.16A (see Annexure 6.1) gives the break up of installed capacity in the NER by type of ownership as on Aug. 2006. It shows the increasing role of the centre in power generation in the NER states mainly implemented through NEEPCO. In Assam, for example, the big jump in 2006 relative to 2005 is entirely due to capacity created in central power projects.
As noted in the Pasighat Declaration, the total power potential in the NER is about 50,000 MW. According to NEC Vision 2020 the estimated hydro-power potential of Arunachal is around 50,000 MW. The state is expected to generate an additional 22,584 MW hydel power by 2020 in 166 hydel projects, of which only 88 MW is to be created under state projects, the rest under will be under central and private projects. In the Twelfth Plan alone 15,251 MW of additional power is to be generated. Finally, about 42 percent of the additional power is to be generated by private hydel projects.
The ambitious power generation plan will take care of the requirements of the NER states, as they are entitled to free 12 percent of power generated from central projects. However, from the long-run point of view, four problems need to be addressed. First, the large number of hydel projects envisaged for Arunachal is likely to come up against the compensatory afforestation requirement of the National Working Plan Code under the Forest Conservation Act, 1980.17 Given the large forest cover of the state, this afforestation will have to be done elsewhere, and issue that needs to be addressed now and not at the project stage. Second, while the state prefers ‘run-of-the-river’ projects, Assam has been asking for dams which also mitigate its flood problems.18 Third, hydel power (particularly in the hills of the NER) is crucially dependent on rainfall, which has been erratic in recent
14 The officials of the Meghalaya government admitted that large scale industrial plans for the state (cement, steel, minerals etc) are not presently considered given the severe power constraint. In fact, captive power has to be shown before approval of private projects in mineral exploration. 15 Discussion with officials in the field trips indicated that there is some move to go back to thermal power because of the unreliability of hydel sources. 16 See, for example, the Pasighat Declaration, January 2007. 17 The lower Subansiri dam has already encountered some objections from the wildlife authorities. 18 See the World Bank study.
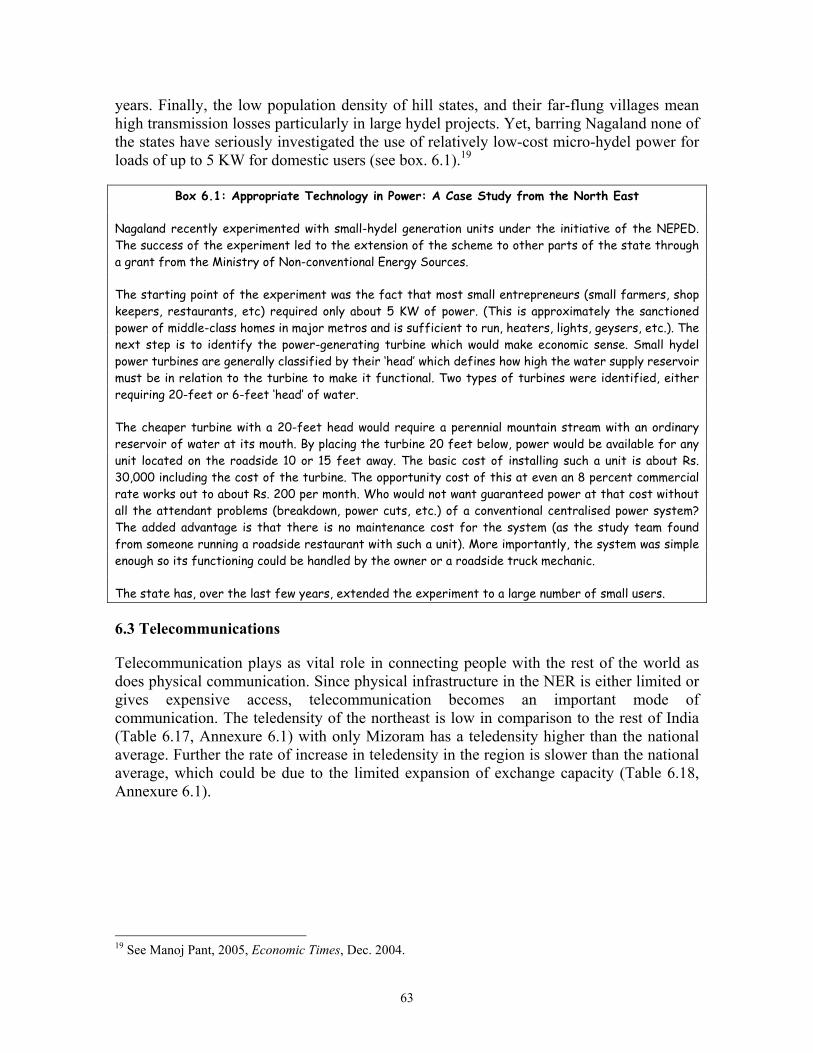
63
years. Finally, the low population density of hill states, and their far-flung villages mean high transmission losses particularly in large hydel projects. Yet, barring Nagaland none of the states have seriously investigated the use of relatively low-cost micro-hydel power for loads of up to 5 KW for domestic users (see box. 6.1).19
Box 6.1: Appropriate Technology in Power: A Case Study from the North East
Nagaland recently experimented with small-hydel generation units under the initiative of the NEPED. The success of the experiment led to the extension of the scheme to other parts of the state through a grant from the Ministry of Non-conventional Energy Sources.
The starting point of the experiment was the fact that most small entrepreneurs (small farmers, shop keepers, restaurants, etc) required only about 5 KW of power. (This is approximately the sanctioned power of middle-class homes in major metros and is sufficient to run, heaters, lights, geysers, etc.). The next step is to identify the power-generating turbine which would make economic sense. Small hydel power turbines are generally classified by their ‘head’ which defines how high the water supply reservoir must be in relation to the turbine to make it functional. Two types of turbines were identified, either requiring 20-feet or 6-feet ‘head’ of water.
The cheaper turbine with a 20-feet head would require a perennial mountain stream with an ordinary reservoir of water at its mouth. By placing the turbine 20 feet below, power would be available for any unit located on the roadside 10 or 15 feet away. The basic cost of installing such a unit is about Rs. 30,000 including the cost of the turbine. The opportunity cost of this at even an 8 percent commercial rate works out to about Rs. 200 per month. Who would not want guaranteed power at that cost without all the attendant problems (breakdown, power cuts, etc.) of a conventional centralised power system? The added advantage is that there is no maintenance cost for the system (as the study team found from someone running a roadside restaurant with such a unit). More importantly, the system was simple enough so its functioning could be handled by the owner or a roadside truck mechanic.
The state has, over the last few years, extended the experiment to a large number of small users.
6.3 Telecommunications
Telecommunication plays as vital role in connecting people with the rest of the world as does physical communication. Since physical infrastructure in the NER is either limited or gives expensive access, telecommunication becomes an important mode of communication. The teledensity of the northeast is low in comparison to the rest of India (Table 6.17, Annexure 6.1) with only Mizoram has a teledensity higher than the national average. Further the rate of increase in teledensity in the region is slower than the national average, which could be due to the limited expansion of exchange capacity (Table 6.18, Annexure 6.1).
19 See Manoj Pant, 2005, Economic Times, Dec. 2004.
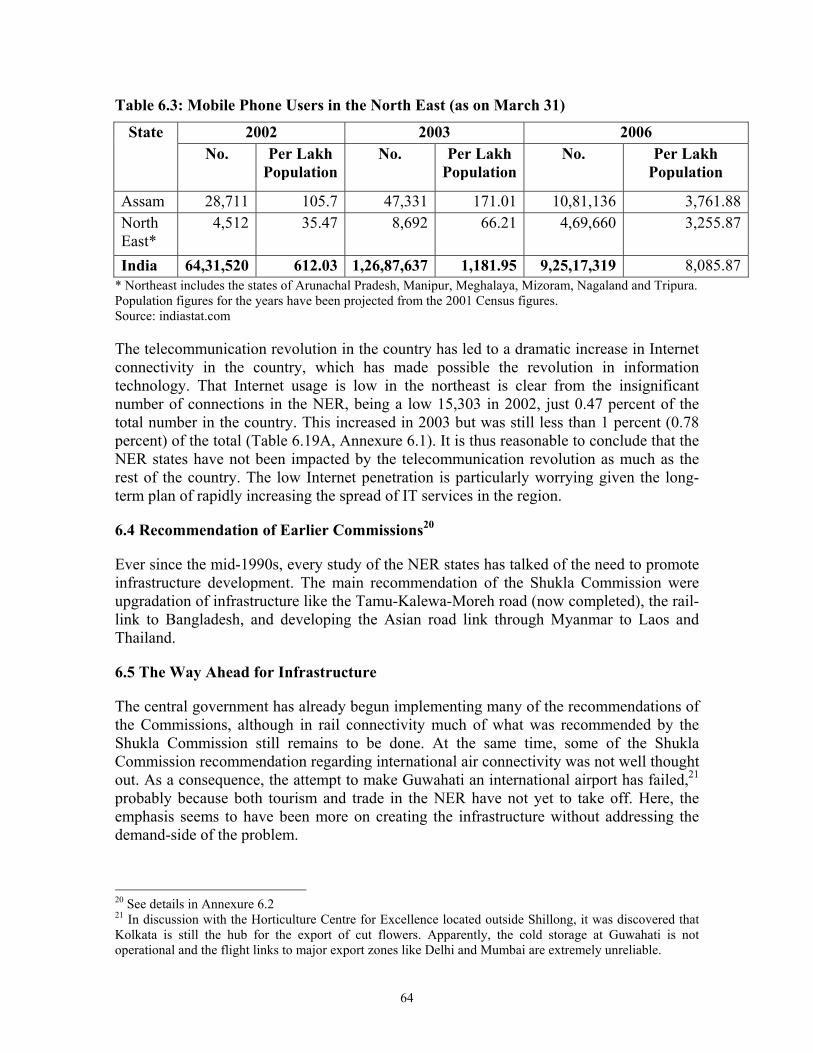
64
Table 6.3: Mobile Phone Users in the North East (as on March 31)
2002 2003 2006 State No. Per Lakh
Population No. Per Lakh
Population No. Per Lakh
Population
Assam 28,711 105.7 47,331 171.01 10,81,136 3,761.88North East*
4,512 35.47 8,692 66.21 4,69,660 3,255.87
India 64,31,520 612.03 1,26,87,637 1,181.95 9,25,17,319 8,085.87* Northeast includes the states of Arunachal Pradesh, Manipur, Meghalaya, Mizoram, Nagaland and Tripura. Population figures for the years have been projected from the 2001 Census figures. Source: indiastat.com
The telecommunication revolution in the country has led to a dramatic increase in Internet connectivity in the country, which has made possible the revolution in information technology. That Internet usage is low in the northeast is clear from the insignificant number of connections in the NER, being a low 15,303 in 2002, just 0.47 percent of the total number in the country. This increased in 2003 but was still less than 1 percent (0.78 percent) of the total (Table 6.19A, Annexure 6.1). It is thus reasonable to conclude that the NER states have not been impacted by the telecommunication revolution as much as the rest of the country. The low Internet penetration is particularly worrying given the long-term plan of rapidly increasing the spread of IT services in the region.
6.4 Recommendation of Earlier Commissions20
Ever since the mid-1990s, every study of the NER states has talked of the need to promote infrastructure development. The main recommendation of the Shukla Commission were upgradation of infrastructure like the Tamu-Kalewa-Moreh road (now completed), the rail-link to Bangladesh, and developing the Asian road link through Myanmar to Laos and Thailand.
6.5 The Way Ahead for Infrastructure
The central government has already begun implementing many of the recommendations of the Commissions, although in rail connectivity much of what was recommended by the Shukla Commission still remains to be done. At the same time, some of the Shukla Commission recommendation regarding international air connectivity was not well thought out. As a consequence, the attempt to make Guwahati an international airport has failed,21 probably because both tourism and trade in the NER have not yet to take off. Here, the emphasis seems to have been more on creating the infrastructure without addressing the demand-side of the problem.
20 See details in Annexure 6.2 21 In discussion with the Horticulture Centre for Excellence located outside Shillong, it was discovered that Kolkata is still the hub for the export of cut flowers. Apparently, the cold storage at Guwahati is not operational and the flight links to major export zones like Delhi and Mumbai are extremely unreliable.
65
No vision for the NER is implementable without major improvements in the infrastructure. Thus, any attempt to pose the NER as an integrated economic entity will be meaningless till inter- and intra-state connectivity is ensured, particularly via road and rail links. Even more important, the development of infrastructure in the northeast must now be viewed from the standpoint of the region as a whole, rather than as a component of the five-year plans of any state. As recommended by earlier studies, an integrated transport network for the NER as a whole must be drawn up keeping in mind the long-term trade and production plans for the region.
Earlier sections in this report have noted the absence of a private sector (with the exception of Sikkim) in the hill states in particular. With insurgency now abating in the hill areas, a vision for the NER will involve the private sector, but this will require the state to play a leading role. Hence, for example, while the PPP mode may well work in power and telecommunication, these are unlikely to take off in road infrastructure: the low levels of existing traffic in the region would not justify PPP models. Hence, the NER will have to be granted exceptions from the use of PPP in state highway projects. 22
The development of infrastructure will need to be done mainly by the central government rather than state governments. Developments in the power already bear this out. In the case of roads, the nature of the terrain in the hill areas makes infrastructure development particularly expensive. Here, too, the centre must play a leading role as maintenance expenditure would swallow up the small budgets of the hill states, especially as the road network expands. There is some evidence that state roads are already falling into disrepair.
Finally, telecommunications infrastructure in the NER lags far behind the rest of the country. This infrastructure is particularly important given the difficulty of physical communication in the hill areas. Apart from allowing greater national and international integration for people of the region, most earlier studies have pointed to the need for the NER states (particularly in the hilly areas) to promote their IT sectors. As the IT industry moves from the metros of the country to outlying areas, NER states are considered the next most likely destination, given the high rates of literacy, large pool of educated people, and dust-free environments of the states in the region.
To conclude, any vision for the infrastructure development in the NER must factor in not only the need for creating a unified economic zone in the NER over the next ten to fifteen years but also the need to ensure connectivity from the point of view of national security.
Recommendations
• Much of the infrastructure spending in the NER would have to be done by the central government; PPP models such as Build-Operate-Transfer (BOT) being implemented in other states are unlikely to succeed here.
• Power is the single most important constraint to economic growth of the NER states. In the long run, the planned development of Arunachal as the ‘hydel capital’ of the NE
22 Similar concerns were expressed in the Sixth Sectoral Summit of the NEC.
66
makes sense, however, environmental and other concerns need to be sorted out before appraisal, not after DPRs are in place.
• In the short run, say five years, targeted generation should be lowered to 5,000 MW (double the present capacity of the NE) to eliminate power constraints to the economic development of NER. In addition, international transmission grids are the biggest priority in all the states.
• In the immediate future, the hill areas could substantially meet consumer demands in far-flung areas via micro-hydel projects. The Ministry of Non-Conventional Energy Sources (MNES) could be approached for appropriate subsidies.
• In planning road networks under the SARDP particular attention should be given to roads within states as these are crucial to both creating a unified NER market and improving tourist activity.
• The suggestions on rail connectivity made at the Sectoral Summit of the NEC are valid. However, the funding pattern and source of funds must be specified upfront or the planned network will remain a pipe dream. Logically, the planned extensions of existing lines to states by 2010 should be tackled first, and connectivity of state capitals dealt with in the subsequent five years.
• Air connectivity in the NER remains an issue, due to inability to determine the hub which has remained Kolkata by default. Guwahati is the natural hub but it should be possible to link state capitals directly to each other through the use of air taxis.
• In the long run, the NER can benefit greatly from the IT revolution, if telecommunications infrastructure is developed along the lines followed by the rest of the country.
• More attention could be given to inland water routes as a method of connectivity within the region.
CHAPTER 7
Trade and Look East Policy
No vision for the NER is complete without a discussion of Trade and the Look East Policy. While it is not easy to date the exact emergence of the central government’s ‘Look East’ (LE) policy it would be reasonable to infer that it was more or less part of the official policy officially launched in 1991. The basic logic for the policy stems from the landlocked nature of the NER states, and their long international border. The NER states share 98 percent of their border with Bhutan, China, Myanmar and Bangladesh while only a narrow 2 percent makes up the ‘chicken-neck’ linking them with the rest of India. It is this tenuous geographical link with the country that leads to the high transport cost of supplies to and from the rest of the country. This has been the logic for the transport subsidy given in all the industrial policies for the NER states.
The LE policy then emerges as an important factor in promoting economic ties of the NER states with its neighbors. Further, given the close geographical proximity of the NER states with the neighbouring countries it is not surprising that the people of this region share cultural ties with the residents of these countries. Finally, strengthening Indian relations with its South Asian neighbors and China are now an important part of India’s foreign policy. Hence, in discussing the implications of the policy for the NER we will consider the cultural, security, administrative and economic dimensions that drive the policy before looking at its implications for trade and development of the NER.
7.1. Cultural Dimensions
The cultural links between the NER states and the residents of the neighbouring countries have developed over more than two hundred years of intermingling following several regional wars involving Manipur, Assam, Myanmar (then Burma) and Thailand.1 Today, the NER states of Arunachal Pradesh, Mizoram, Manipur and Nagaland share a 1,643 km long border with Myanmar. Not surprisingly, the people of Nagaland, Manipur and Assam today have strong ethnic links with the Myanmarese and even the Thais.2
Most of the people living in Arunachal Pradesh are either of Tibetan or Thai-Burmese origin. Another 15 percent of the population are immigrants, including 30,000 Bangladeshi and Chakma expatriates, and immigrants from other parts of India, notably Assam and Nagaland.3 Towards the north, the history of Sikkim involved a series of wars involving China, Bhutan and Nepal. In 1791, China sent troops to support Sikkim and defend Tibet against the Gurkhas. In a more recent development, Tripura was heavily affected by the partition of India and the majority of the population now comprises Hindu Bengalis, many
1 http://en.wikipedia.org/wiki/Manipur 2 Thiyyam Bharat 3 Hunter, William Wilson.
68
of whom came as refugees from East Pakistan after independence in 1947. Tripura thus has a strong ethnic link with Bangladesh and shares the longest border with that country. However, armed conflict in Tripura has been a problem since the end of the 1970s as an aftermath of 1971 Indo-Pak war.4
7.2 Security dimensions
The brief historical outline above indicates that the NER came into being not only through domestic political upheavals involving disputes among the NER states but also through major foreign policy challenges for the country. The first challenge originated during the 1971 war for liberation of East Pakistan, which resulted in the creation of Bangladesh, but was followed by a large influx of Bangladesh refugees into the border areas of NER.5 In Assam, in particular the influx of refugees from Bangladesh has created major political problems. At the same time, India has tried to promote relations with Bangladesh as part of various SAARC initiatives. For the Indian subcontinent, promotion of harmonious relations among the partners of SAARC is as much a security imperative as an economic compulsion.6 However, recently Bangladesh has not responded very positively to Indian requests for trade facilitation for access to Chittagong port for the NER states. Some people fear that Pakistan via the ISI is fomenting trouble in this region using Bangladesh as a base.7 Hence, politically the border issues with Bangladesh are a political trouble point.
There are some concerns about China’s increasing influence in the sub-continent8. China’s aggression during the 1962 war with India created border problems in Arunachal, and even today China does not openly accept areas like Tawang in northwest Arunachal as part of India. Diplomatic pinpricks on border issues have again recurred in recent months. Hence, Arunachal is a crucial part of India’s security concerns. While relations with the military regime in Myanmar are stable, the growing economic links of that country with China gives rise to border concerns for India.9 However, India has made some headway in obtaining a sea-link for NER states in Myanmar, which also plays an important role in helping India deal with some of the extremist outfits operating in the NER states.10
7.3 Economic developments in LE policy
The LE policy has tried to promote commercial links between NER states and the neighbouring countries to try and break the economic and geographic isolation of this region from the rest of the country. In particular, the emphasis has been on promoting trade links, and the following sections will look at some of the measures taken in the context of trade with Myanmar, Bangladesh and China. (The analysis is based on quantitative information given in Annexure 7.1).
4 Palit, P.K. (2004); and Bhattacharjee, P.R. (1994) 5 Das, Singh and Thomas, p. 310. 6 Ibid. 7 Ibid. 8 Ibid. 9 See, AEDR (1998). 10 Sanajaoba (2003)
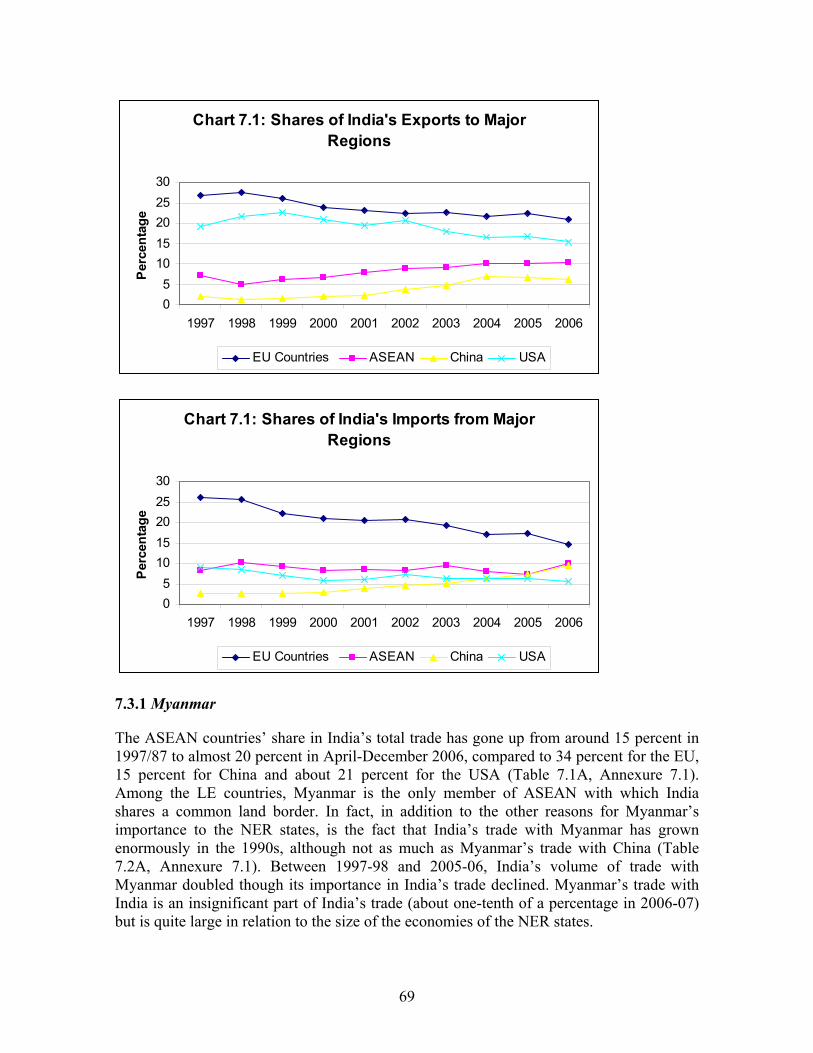
69
Chart 7.1: Shares of India's Exports to Major Regions
05
1015202530
1997 1998 1999 2000 2001 2002 2003 2004 2005 2006
Per
cent
age
EU Countries ASEAN China USA
Chart 7.1: Shares of India's Imports from Major Regions
05
1015202530
1997 1998 1999 2000 2001 2002 2003 2004 2005 2006
Per
cent
age
EU Countries ASEAN China USA
7.3.1 Myanmar
The ASEAN countries’ share in India’s total trade has gone up from around 15 percent in 1997/87 to almost 20 percent in April-December 2006, compared to 34 percent for the EU, 15 percent for China and about 21 percent for the USA (Table 7.1A, Annexure 7.1). Among the LE countries, Myanmar is the only member of ASEAN with which India shares a common land border. In fact, in addition to the other reasons for Myanmar’s importance to the NER states, is the fact that India’s trade with Myanmar has grown enormously in the 1990s, although not as much as Myanmar’s trade with China (Table 7.2A, Annexure 7.1). Between 1997-98 and 2005-06, India’s volume of trade with Myanmar doubled though its importance in India’s trade declined. Myanmar’s trade with India is an insignificant part of India’s trade (about one-tenth of a percentage in 2006-07) but is quite large in relation to the size of the economies of the NER states.
70
As far as the major trade items are concerned, India’s exports to Myanmar consist mainly of cement, cycles, drugs and pharmaceuticals, auto-parts and accessories and cotton yarn. Major items entering India are blankets, electronic goods, betel nuts, pulses, teak, groundnuts, iron scrap, gold, silver and precious stones. It is important to remember that internationally Myanmar is one of the few countries which can supply tur dal which is an item of mass consumption in India, where the domestic production is insufficient.
The post-cold war foreign policy calculus of India in general and the LE policy in particular has created an enabling environment which can break the land-locked condition of NER by opening it to the markets of the neighbouring countries across the border, establishing joint-venture enterprises and bringing cross-border investments for the development of infrastructure, manufacturing and services. The LE policy acquires special significance in the light of cross-country initiatives for economic cooperation like the Bay of Bengal Initiative for Multi-sectoral Technical and Economic Cooperation (BIMSTEC) and Mekong-Ganga Cooperation (MGC).
Some important infrastructure initiatives have also been launched to promote NER trade with neighbouring countries. The Asian Highway Link, Asian Railway Network and a Natural Gas Pipeline Grid — projects under active consideration of BIMSTEC — have tremendous implications in removing the communication isolation of NER. While NER will have access to the Asian Highway through the Imphal-Tamu feeder road, the railway systems of India and Myanmar are planned to be linked at the Dibrugarh railhead, which will give the NER access to Asian Railway Network. India has already constructed a road in 2001 in Myanmar linking the township of Tamu with the railhead at Kalemyo which connects Mandalay, the commercial hub of Myanmar. There is a proposal to construct a 1,360 km Trilateral Highway from Moreh (India) to Mae Sot (Thailand) through Bagan (Myanmar). The detail project report on this is under progress (Strategic Digest: 2004). With the signing of India-Thailand Free Trade Agreement (2003), the steady rise in two-way trade with Myanmar and spectacular growth in Sino-Indian trade, the prospect of NER becoming a hub for transit trade is only brightening.
However, one must add that there is a perception that the LE thrust has not yet produced any perceptible tangible benefits for the NER11. The opening of border trade with Myanmar, through the provision of the Indo-Myanmar Border Trade Agreement (1994), has not had any major impact on the regional economy,12 as India’s ASEAN trade continues to be conducted mainly through the sea route. The continental land route via NER-Myanmar-Thailand is not yet considered safe and cost-effective. Moreover India and Myanmar have also agreed to open four checkpoints for increasing trade between the two countries. These include the Pangsau Pass, Paletwa, Lungwa-anyong and Pangsha-Pangnyo. There has been one significant downside to India’s trade links with Myanmar. According to the Annual Report, 2001, of the International Narcotics Control Bureau, the 1,643-km Indo-Myanmar border has been utilised as a transit point between the Golden 11 This was the conclusion reached by a number of participants at a symposium held in Mizoram in November, 2006. See ‘Proceedings of the Eighth Annual Conference of the North East Economic Association”, Deptt. of Economics, Mizoram University, Aizawl, Mizoram, Nov, 2006. See, for example. J.K. Patnaik in the same volume. 12 Das (2000)
71
Triangle and the Golden Crescent. Some studies have argued that the mismatch between India and Myanmar’s trade statistics is large due to the drug trade.13
7.3.2 Bangladesh
India’s exports to Bangladesh are dominated by agricultural commodities and basic textiles although, in recent years, machinery and transport equipment have been gaining importance (Table 7.3A in Annexure 7.1). However, the volume of exports is still very small in relation to India’s total trade. As noted above, Bangladesh has had a consistently unfavorable trade balance with India due to an insufficiently diversified export basket (Table 7.4A, Annexure 7.1). Inland-water trade between India and Bangladesh is important in linking not only Assam but states like Arunachal to Bangladesh. Water-borne trade is more important than land trade with Bangladesh (from a comparison of Tables 7.4A and 7.5A, Annexure 7.1). There are urgent and longstanding concerns in Bangladesh arising from the perennial, large bilateral trade deficit with India, and from the large volumes of informal imports (see Annexure 7.2) accounting for 15-50 percent of Bangladesh’s imports from India across the land border to avoid Bangladesh import duties (see Annexure 7.2).
These concerns have been particularly acute on the Bangladesh side in the context of discussions between the two governments of the possibility of a bilateral free trade agreement along the lines of the India-Sri Lanka FTA. Due to size disparity, the trading relationship between the two countries is far less significant for India than it is for Bangladesh, nevertheless, closer economic integration with Bangladesh is seen as a very important way of reducing the economic and political isolation of the seven Indian eastern and north eastern states from the rest of the country. Under SAFTA, the preferential tariffs agreed in the various rounds of SAPTA (which so far has been largely ineffective in generating much intra-regional trade) will continue, but a number of ambitious new objectives have been enunciated. These include the eventual elimination of tariffs and non-tariff barriers on trade between the members, the harmonisation of customs procedures and documentation, the facilitation of banking relationships, and cooperation and improvements in the infrastructure for regional trade and cross-border investments.
7.3.3 China
China’s economic importance in world trade and as one of India’s major trade partners has been growing.14 It is a measure of the growing trade between the two countries that border trade is now to be resumed formally between the two countries via the Nathu La Pass in Sikkim. The road from Gangtok to Nathu la is being expanded to accommodate container traffic, and infrastructure is being developed at the trade mart at Sherathang the Sikkim Government. Development of infrastructure at Nathu la is being financed by the central
13 See AEDR (1998). 14 Mining and quarrying, metal and metal products, chemicals and chemical products, textiles, clothing and leather, food, beverages and tobacco, agriculture and hunting , machinery and equipment, coke, petroleum products and nuclear fuel, electrical and electronic equipment, precision instruments, motor vehicles and other transport equipment, wood and wood products, forestry and fishing products and rubber and plastic products are some of the principal items in Sino-Indian trade in recent years (see Table 8.6A, Annexure 8.1 for details)
72
government (Rs. 18.88 crore during 2006-07, of which the Department of Commerce has provided Rs. 2.16 crore), the Ministry of Home Affairs and DONER (Rs. 7.74 crore and Rs. 9.08 crore, respectively. A study on the various aspects of border trade through Nathu la has been conducted by NCAER and is under examination for appropriate action.15
7.4. Recommendations of Previous Studies
Ever since the mid-1990s, every study of the NER states has talked of the need to pursue the LE policy. The Shukla Commission also dealt with this in some detail, its main recommendations being upgradation of infrastructure like the Tamu-Kalewa-Moreh road (now completed), the rail link to Bangladesh, developing the Asian road link through Myanmar to Laos and Thailand, etc. However, while recognizing the existence of transit trade it suggests the establishment of production facilities for medicinal products, bicycles, and so on in the NER in a Special Economic Zone (SEZ). The issue is whether the NER can move beyond mere transit point for such goods from other parts of the country.
In another set of studies,16 participants from various states of the NER discuss the possibility of the NER becoming a common market like the European Union. While the usual infrastructure linkages are stressed one of the participants noted that ‘India can hardly look eastward without also looking at the North East Region!’ (p. 9). The presenters at the symposium posed the important issue of lack of land linkages within the NER, which is recognized as a major constraint to the development of the ‘common market’ in the NER.
7.5. The Way Ahead and Vision 2020
Various political, economic and cultural factors have gone towards the making of the LE policy for the north-east. To give effect to the policy a large number of administrative measures have been taken in recent years to promote NER trade. The recommendations of various studies to develop infrastructure at Moreh and open up other trade points has also seen considerable progress. Yet, despite this so far the LE policy has not delivered any concrete economic gains to the NER states. To look at the place of the LE policy in the long-term calculus of the NER states it is important to understand some important principles governing trade between countries, the basic premise being that it is companies/individuals who conduct trade and not governments.
The most common form of trade between geographically contiguous areas is border trade, already taking place between the NER states and bordering countries and is in fact formalised in the agricultural trade under the Indo-Myanmar trade agreement. Typically, border trade is (at an organised level) in commodities where transport costs are high in relation to the final price of the product (examples of such products are timber, cement, coal and other minerals, etc). This trade would take place naturally and the state needs to only facilitate it administratively and via road and rail infrastructure.
15 NCAER 16 ‘Proceedings of the Eighth Annual Conference of the North East Economic Association” (2006).
73
However, for the majority of items traded internationally, transport costs account for only about 5 percent of the final price. In fact, estimates by UNCTAD show that in most cases trade barriers (formal and informal) are more restrictive for trade than transport costs.17 Hence, there is a limit to overland trade promotion via the NER states and it is not surprising that most Indo-Bangladesh trade is conducted via West Bengal given the insecurity of trading via the NER states.18 A transport subsidy given to NER states is unlikely to overcome this problem. In fact, troubled relations in Manipur has made even the relatively more developed Moreh trading post relatively redundant, to the extent that informal trade will need greater incentives to convert to legal trade and formal trade is unlikely to divert via Manipur in place of West Bengal. Coal/limestone trade has sustained the trade link between Meghalaya and Bangladesh,19 but it is debatable how long ‘rat-hole’ mining in Meghalaya will be sustainable given environmental concerns in the NER in general.
Promoting trade between the NER states and the neighbouring countries then requires going beyond the calculations of ‘geographical contiguity’ and looking at those commodities in which the NER states have a comparative advantage in an economic sense. Here two main points need to be made. First, there are a few agricultural items in which the NER states have a comparative advantage vis-à-vis the rest of the country (see chapter 1 on Agriculture). The NER states can actively consider trading these items only when their own domestic surpluses become sufficient, and domestic surpluses are constrained by the lack of marketing due to uncoordinated production efforts of the individual states. This is particularly true in the case of fruits and vegetables. Second, it is debatable that NER trade with neighbouring countries is always more profitable (and hence more likely) than with the mainland. Many growth centres like Kolkata, Delhi and Mumbai offer economically larger markets than those of Bangladesh and Myanmar. This is already showing up in the nascent floriculture industries of the NER where exports are mainly to Guwahati, Kolkata and Delhi and even to Holland at the international level.20
Third, the dynamics of trade in agricultural products is somewhat different from the dynamics of trade in industrial goods. Trade in agricultural items is generally of the inter-industry variety since product differentiation is not easy while trade in industrial goods admits of so-called ‘intra-industry” trade. 21 In agricultural items the excess demand in the NER states for items like meat, meat products and fish make them potentially important import items, so supplies from neighbouring states are likely to be cost-effective. However, this is largely ruled out by the restrictions on such trade, for example, in the Indo-Myanmar trade agreement. Further, the trade pattern of Indo-Myanmar and Indo-Bangladesh trade indicates that the demand of both Myanmar and Bangladesh is largely for industrial items such as processed foods and drinks (including animal foods), miscellaneous mineral and manufactured goods, textile fibers, textiles and clothing, and machinery and transport equipment. The NER states are unlikely to generate any production capacity for export in the relevant items in the near future (see the chapter on Industry). While there is a good 17 UNCTAD (2005) Review of Maritime Transport, Geneva. 18 Chaudhari, S.K 19 http://www.ide.go.jp/English/Publish/Jrp/pdf/jrp_133_05.pdf. 20 See Box 1 in the Chapter on Agriculture. 21 Krugman and Obstfeld (2000).
74
possibility for exports of agro-processing industries and floriculture-based industries, it is debatable that the best markets for these lie in the adjoining countries. Hence, the immediate need seems to be to promote trade in basic agricultural commodities (rice, fish, pulses, etc.).
Booming trade relations with China are reflected in the urgency to make free border-trade via the Nathu La Pass a reality. The caveats offered earlier in the case of border trade apply with equal force here. However, since the only NER state involved is Sikkim, its potential benefits from being a ‘transit’ point are likely to be substantial.22
In summary, the kind of trade being promoted is important: whether it is border trade or ‘regular’ trade. In border trade, benefits which would accrue to the NER states from storage, customs, and tourism, which are typical for such ‘transit’ states. In addition, there are likely to be significant advantages of trade in agricultural items as these are normally perishable items. However, for these benefits to accrue, the restrictions imposed on agricultural trade (a feature of all RTAs entered into by India) must be relaxed. In the context of border trade, in the longer term there are possibilities of increased trade in items like timber products, cement, steel and coal for which industrial capacities in the NER will have to be built up near the location of mineral resources.
In the case of ‘non-border trade’ items, the current state of industrial activity suggests that the maximum scope is for trade in agro-processing and floriculture. However, here policy cannot promote only trade with neighbors as this may be quite unprofitable. In addition, trade with the ‘further east’ countries of ASEAN will require massive investment in infrastructure (example, air connectivity) which is still lacking. Perhaps the best way to promote trade under the LE policy is to create the infrastructure and let the traders decide the direction of trade.
Finally, in the context of the LE policy, it is important to note that attempts to promote trade with neighbouring countries without promoting trade within the region are unlikely to succeed. Here the issue of intra-state road linkages is crucial.
Recommendations
• To increase border trade in agriculture and heavy industrial goods it is necessary to remove current restrictions on border trade via Moreh, Nathu La and other entry points.
• The LE policy has important security dimensions. There is urgent need to promote interaction with neighboring countries through sports, music and other cultural activities.
• In the case of neighboring countries which are members of WTO, formal request for trade facilitation would improve trade access for NER states.
22 Discussion of the field trip team with officials indicated that this is all that is being looked for.

75
• In the longer term, industrial output of the NER should cater to the demand for industrial goods in the neighboring countries. This is particularly important for border trade in items like cement, coal, timber and steel.
• To facilitate trade it is essential to activate existing land-customs stations (LCs) and to provide a secure transport corridor for traders.
SECTION IV
FINANCIAL RESOURCES FOR DEVELOPMENT
2
Section IV
Financial Resources for Development
The ambitious vision for the north east aimed at raising income levels in the region to projected national levels will call for an expansion in financial resources currently available. This will take place, as discussed in earlier chapters, through the focused development of thrust areas based on comparative advantages, and building capacities and institutions through expanding social and physical infrastructure
Finances for realizing the vision will come from public and private sources, to supplement the critical paucity of finances currently available within the northeastern states. New avenues will need to be explored to raise resources. Internally, states can provide some of the fiscal space for economic development through improving the performance of public sector units, domestic market borrowings and accessing grants and loans from the central government. Restructuring state government expenditures will also help release funds for developmental purposes. In general, sound public finances in terms of raising taxes and improving the management of public expenditures are themselves helpful in raising economic growth and lowering poverty levels.
An enabling environment is an important pre-condition to attract private funds – fundamental to realising the vision. Elements of such an environment are good governance within the region, greater transparency in the financial and trading systems, and as importantly easing the barriers to ***. Economic growth and social well-being are the foremost priorities in any developing economy. If good governance is in place with conducive governmental policies, private sector (domestic or outside – out of region whether national or international) may contribute in the process of development of the region.
These vital, but very different avenues for financing the path to progress and prosperity will be the subject matter of the following two chapters. Chapter 9 discusses the scope for augmenting resources from public finances, exploring the various components of state contributions and avenues for central funds which would be most effective in the region. Chapter 10 deals with the scope for private participation in various areas of the development strategy and ways in which to operationalise it.
CHAPTER 8
Public Finances for Development
Public finances form the core of the development vision of any economy, especially in the northeast where private investment has not been forthcoming for a variety of geo-political reasons. While it is true that the NER states cannot be expected to become financially self-reliant in the medium term, good fiscal health1 is imperative to sustainable development and growth of the region. These states have the potential for sustainable growth leading to an expansion in employment opportunities and improved quality of life; fiscal discipline will only accelerate this process, if states exhibit the will to take some hard measures.
All the NER states are special category states2 an can use up to 20 per cent of the central assistance for non-plan (revenue) expenditure. Other measures have been taken to augment funds to fuel development in the region.3 However, despite substantial central transfers to reduce inter-regional inequality, the economic performance of much of the NER has been comparatively poor. The insurgency problem in some states and recurring floods in parts of the region absorb much of the financial resources meant for development purposes.
To achieve the goals of the vision envisioned for the region by 2020, the NER states will have to find ways to fund development, especially infrastructure, in a big way through the following channels: internal resources if they can raise the funds, and (2) external sources.
8.1 Internal Resources
The sources of internal resources are: the revenue from the state’s own taxes and non-taxes, internal borrowings, and through the recovery of loans. These, however, contribute only about one-third (34 per cent) of total receipts4 though this varies across states and years (Table 8.1A). In this pool of funds, the share of states’ own tax receipts5 were only about 11.41 per cent. The state-wise percentage share of own taxes in total receipts was extremely
1 Good fiscal health is a situation in which the state is capable of generating fiscal surpluses to spend on capital projects; of absorbing (and returning with interest) outside funds in developmental activities, and of implementing its economic policies. 2 All the states in the country are classified either as special category states (of which there are 11) and non-special category states. Special category states receive plan funds from the centre, 90 per cent in the form of grants and 10 per cent as loans; the other states receive 70 per cent as loans and 30 per cent as grants 3 Concerned with the issues of the development of this area, in January 2000 the Prime Minister announced an Agenda for Socio-Economic Development of the NER states (Annexure 8.1). The Agenda covers all aspects of development - roads and bridges, power plants, centres for IT education. Based on the Special Development Policy package for NER states for various sectors, specific schemes and programmes have been modified to earmark 10 per cent of the outlay for this region. 4 Average of 2000-01 to 2004-05. 5 Taxes include: 1.Taxes on income (agricultural income tax, taxes on professions, trades, callings and employment; 2. Taxes on property and capital transactions (land revenue, stamps and registration fees, urban immovable property tax); 3. Taxes on commodities and services [sales tax (now VAT) (state sales tax, central sales tax, sales tax on motor spirit and lubricants, surcharge on sales tax, receipts of turnover tax, other receipts), state excise, taxes on vehicles, taxes on goods and passengers, taxes and duties on electricity, entertainment tax, other taxes and duties].
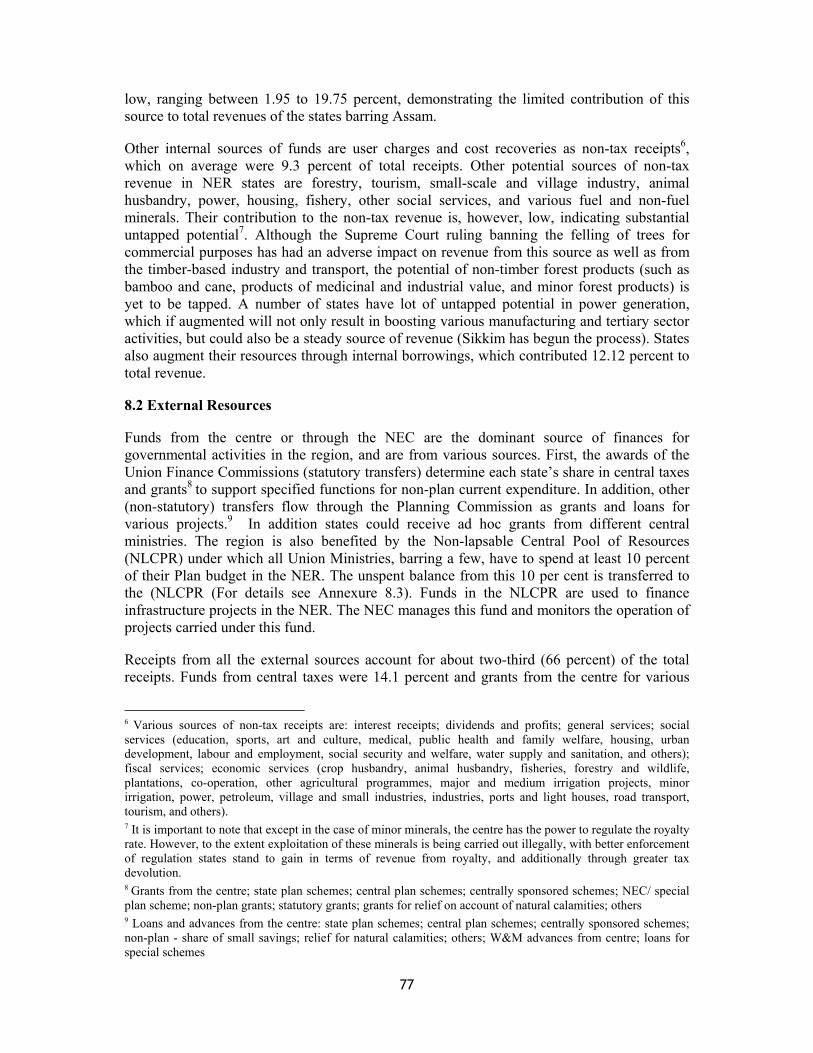
77
low, ranging between 1.95 to 19.75 percent, demonstrating the limited contribution of this source to total revenues of the states barring Assam.
Other internal sources of funds are user charges and cost recoveries as non-tax receipts6, which on average were 9.3 percent of total receipts. Other potential sources of non-tax revenue in NER states are forestry, tourism, small-scale and village industry, animal husbandry, power, housing, fishery, other social services, and various fuel and non-fuel minerals. Their contribution to the non-tax revenue is, however, low, indicating substantial untapped potential7. Although the Supreme Court ruling banning the felling of trees for commercial purposes has had an adverse impact on revenue from this source as well as from the timber-based industry and transport, the potential of non-timber forest products (such as bamboo and cane, products of medicinal and industrial value, and minor forest products) is yet to be tapped. A number of states have lot of untapped potential in power generation, which if augmented will not only result in boosting various manufacturing and tertiary sector activities, but could also be a steady source of revenue (Sikkim has begun the process). States also augment their resources through internal borrowings, which contributed 12.12 percent to total revenue.
8.2 External Resources
Funds from the centre or through the NEC are the dominant source of finances for governmental activities in the region, and are from various sources. First, the awards of the Union Finance Commissions (statutory transfers) determine each state’s share in central taxes and grants8 to support specified functions for non-plan current expenditure. In addition, other (non-statutory) transfers flow through the Planning Commission as grants and loans for various projects.9 In addition states could receive ad hoc grants from different central ministries. The region is also benefited by the Non-lapsable Central Pool of Resources (NLCPR) under which all Union Ministries, barring a few, have to spend at least 10 percent of their Plan budget in the NER. The unspent balance from this 10 per cent is transferred to the (NLCPR (For details see Annexure 8.3). Funds in the NLCPR are used to finance infrastructure projects in the NER. The NEC manages this fund and monitors the operation of projects carried under this fund.
Receipts from all the external sources account for about two-third (66 percent) of the total receipts. Funds from central taxes were 14.1 percent and grants from the centre for various
6 Various sources of non-tax receipts are: interest receipts; dividends and profits; general services; social services (education, sports, art and culture, medical, public health and family welfare, housing, urban development, labour and employment, social security and welfare, water supply and sanitation, and others); fiscal services; economic services (crop husbandry, animal husbandry, fisheries, forestry and wildlife, plantations, co-operation, other agricultural programmes, major and medium irrigation projects, minor irrigation, power, petroleum, village and small industries, industries, ports and light houses, road transport, tourism, and others). 7 It is important to note that except in the case of minor minerals, the centre has the power to regulate the royalty rate. However, to the extent exploitation of these minerals is being carried out illegally, with better enforcement of regulation states stand to gain in terms of revenue from royalty, and additionally through greater tax devolution. 8 Grants from the centre; state plan schemes; central plan schemes; centrally sponsored schemes; NEC/ special plan scheme; non-plan grants; statutory grants; grants for relief on account of natural calamities; others 9 Loans and advances from the centre: state plan schemes; central plan schemes; centrally sponsored schemes; non-plan - share of small savings; relief for natural calamities; others; W&M advances from centre; loans for special schemes
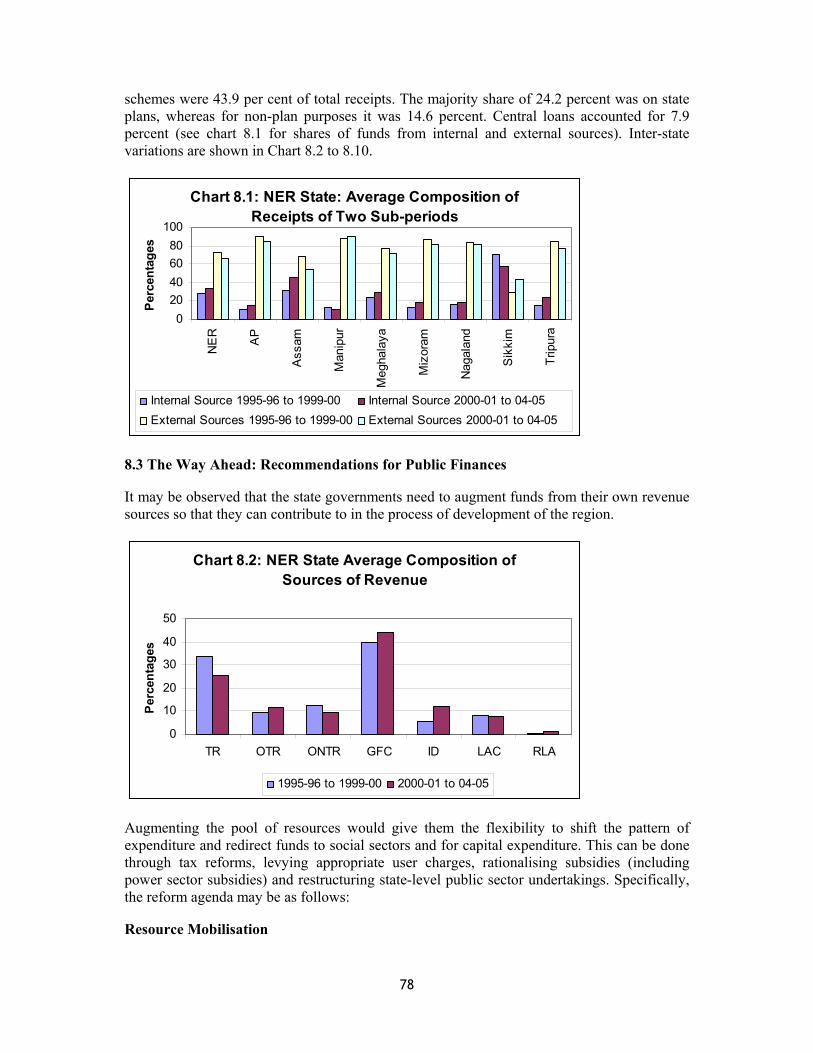
78
schemes were 43.9 per cent of total receipts. The majority share of 24.2 percent was on state plans, whereas for non-plan purposes it was 14.6 percent. Central loans accounted for 7.9 percent (see chart 8.1 for shares of funds from internal and external sources). Inter-state variations are shown in Chart 8.2 to 8.10.
Chart 8.1: NER State: Average Composition of Receipts of Two Sub-periods
020406080
100N
ER
AP
Ass
am
Man
ipur
Meg
hala
ya
Miz
oram
Nag
alan
d
Sik
kim
Trip
ura
Per
cent
ages
Internal Source 1995-96 to 1999-00 Internal Source 2000-01 to 04-05External Sources 1995-96 to 1999-00 External Sources 2000-01 to 04-05
8.3 The Way Ahead: Recommendations for Public Finances
It may be observed that the state governments need to augment funds from their own revenue sources so that they can contribute to in the process of development of the region.
Chart 8.2: NER State Average Composition of Sources of Revenue
0
10
20
30
40
50
TR OTR ONTR GFC ID LAC RLA
Per
cent
ages
1995-96 to 1999-00 2000-01 to 04-05
Augmenting the pool of resources would give them the flexibility to shift the pattern of expenditure and redirect funds to social sectors and for capital expenditure. This can be done through tax reforms, levying appropriate user charges, rationalising subsidies (including power sector subsidies) and restructuring state-level public sector undertakings. Specifically, the reform agenda may be as follows:
Resource Mobilisation
79
• Reform of the tax system: Computerisation and the adoption of modern techniques of tax administration, including self-assessment and a selective audit of taxpayers would go a long way in imparting efficiency and generating substantial revenues.
• Reforms in the systems of cost recovery and levying user charges would improve collections and minimise inefficiencies, including leakages in the provision of services. Here, the involvement of local communities in managing services such as water supply, has had a beneficial effect on the maintenance of assets, as well as in recovering costs.
• Compensation for forest conservation: Forests deliver a multitude of ecosystem benefits, some of which are local or regional (such as protection from land slides, soil erosion, and local climate and watersheds) and at least two are global benefits in terms of carbon sequestration to mitigate climate change issues, and protection of bio-diversity.10
Box 9.1: Issues Related to Compensation from Forest Conservation
In principle, the global benefits of forests should motivate at least some partial payments from organisations such as the Global Environment Facility. The Clean Development Mechanism (CDM) under the Kyoto Protocol is a similarly applicable institutional arrangement to capture these benefits in the form of financial flows. However, several tricky questions related to ‘baseline’ and ‘additionality’ arise. For an area to qualify for CDM funding, it must be demonstrated that it has not had forests since 1990. The issue of additionality arises because donor countries wonder whether the forests ‘saved’ simply replace other forests that are cut down or whether the forests would have been left standing anyway. For these reasons, avoided deforestation is not an eligible option for the CDM whereas afforestation and reforestation are. This has major implications for the NER. First, afforestation can only be pursued in areas which have not been forested or defined as forested for at least 50 years. Second, in order to be eligible for reforestation, areas cannot have had forests after 1990. Land areas that are suitable for CDM reforestation are therefore those that are not forested or do not include degraded forests. This however needs to be explored further as the rules of these arrangements are still evolving.
Expenditure Management
The ambitious development strategy proposed for the northeast will only be possible if capital expenditure is increased, expenditure efficiency improves and revenue expenditure falls. The appropriate management of government expenditure would release funds that can be used to finance many of the activities proposed for the region. Some of the ways states can manage their expenditure are:
• Subsidies which have not served their objectives or have become irrelevant in the present context should be repealed.
• Self-help groups (SHGs) and co-operatives can be co-opted to serve as effective mechanisms for the delivery of many social services, maintenance of the assets, and cost recovery through the levy of user charges.
• Reforms in debt and cash management would be another strategy tool to make expenditure management more efficient.
10 In discussions with state officials during the study team’s field visits, the potential for using the vast forest reserves for the region for carbon finance came up in at least three states. However, there seems to be a lack of clarity on this issue.
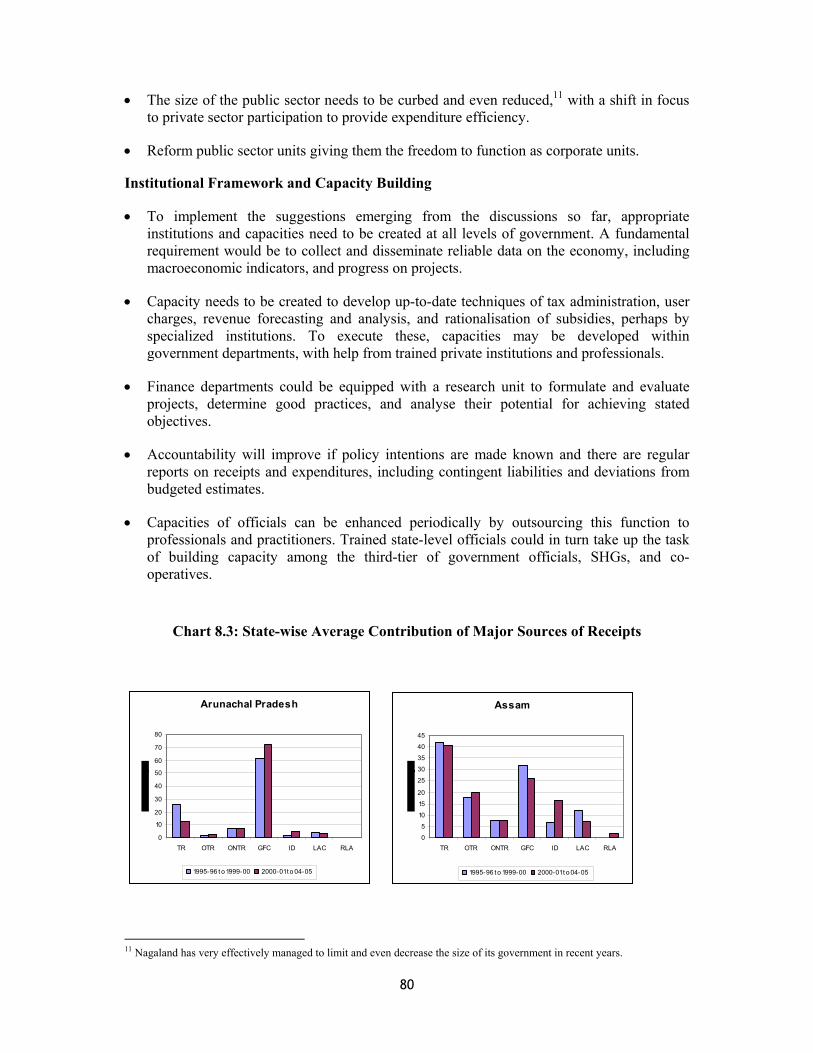
80
• The size of the public sector needs to be curbed and even reduced,11 with a shift in focus to private sector participation to provide expenditure efficiency.
• Reform public sector units giving them the freedom to function as corporate units.
Institutional Framework and Capacity Building
• To implement the suggestions emerging from the discussions so far, appropriate institutions and capacities need to be created at all levels of government. A fundamental requirement would be to collect and disseminate reliable data on the economy, including macroeconomic indicators, and progress on projects.
• Capacity needs to be created to develop up-to-date techniques of tax administration, user charges, revenue forecasting and analysis, and rationalisation of subsidies, perhaps by specialized institutions. To execute these, capacities may be developed within government departments, with help from trained private institutions and professionals.
• Finance departments could be equipped with a research unit to formulate and evaluate projects, determine good practices, and analyse their potential for achieving stated objectives.
• Accountability will improve if policy intentions are made known and there are regular reports on receipts and expenditures, including contingent liabilities and deviations from budgeted estimates.
• Capacities of officials can be enhanced periodically by outsourcing this function to professionals and practitioners. Trained state-level officials could in turn take up the task of building capacity among the third-tier of government officials, SHGs, and co-operatives.
Chart 8.3: State-wise Average Contribution of Major Sources of Receipts
Arunachal Pradesh
0
10
20
30
40
50
60
70
80
TR OTR ONTR GFC ID LAC RLA
1995-96 t o 1999-00 2000-01 t o 04-05
Assam
0
5
10
15
20
25
30
35
40
45
TR OTR ONTR GFC ID LAC RLA
1995-96 t o 1999-00 2000-01 t o 04-05
11 Nagaland has very effectively managed to limit and even decrease the size of its government in recent years.
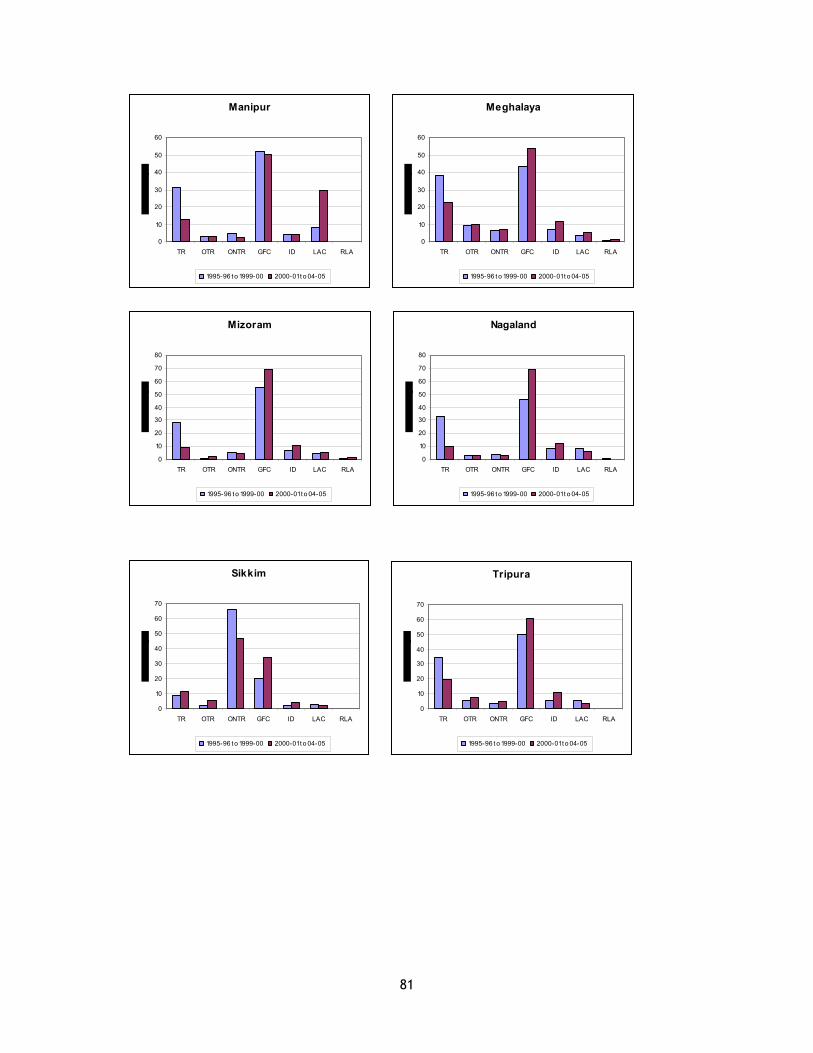
81
Manipur
0
10
20
30
40
50
60
TR OTR ONTR GFC ID LAC RLA
1995-96 t o 1999-00 2000-01 t o 04-05
Meghalaya
0
10
20
30
40
50
60
TR OTR ONTR GFC ID LAC RLA
1995-96 t o 1999-00 2000-01 t o 04-05
Mizoram
0
10
20
30
40
50
60
70
80
TR OTR ONTR GFC ID LAC RLA
1995-96 t o 1999-00 2000-01 t o 04-05
Nagaland
0
10
20
30
40
50
60
70
80
TR OTR ONTR GFC ID LAC RLA
1995-96 t o 1999-00 2000-01 t o 04-05
Sikkim
0
10
20
30
40
50
60
70
TR OTR ONTR GFC ID LAC RLA
1995-96 t o 1999-00 2000-01 t o 04-05
Tripura
0
10
20
30
40
50
60
70
TR OTR ONTR GFC ID LAC RLA
1995-96 t o 1999-00 2000-01 t o 04-05
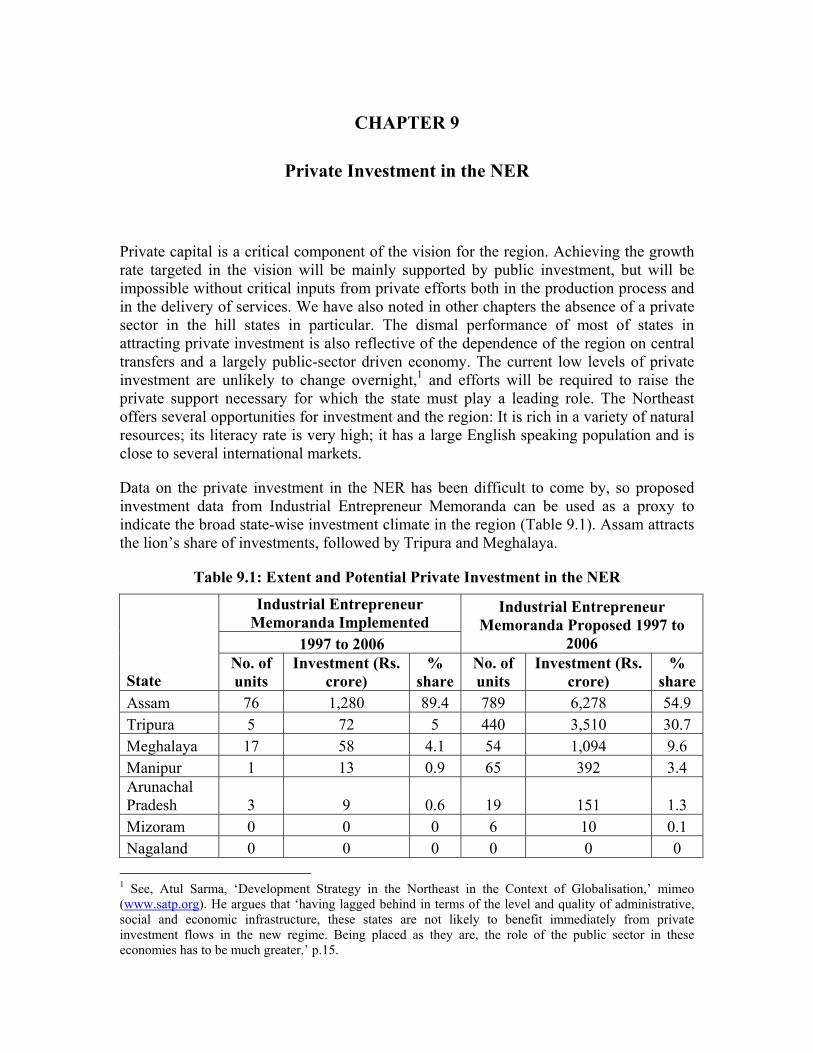
CHAPTER 9
Private Investment in the NER
Private capital is a critical component of the vision for the region. Achieving the growth rate targeted in the vision will be mainly supported by public investment, but will be impossible without critical inputs from private efforts both in the production process and in the delivery of services. We have also noted in other chapters the absence of a private sector in the hill states in particular. The dismal performance of most of states in attracting private investment is also reflective of the dependence of the region on central transfers and a largely public-sector driven economy. The current low levels of private investment are unlikely to change overnight,1 and efforts will be required to raise the private support necessary for which the state must play a leading role. The Northeast offers several opportunities for investment and the region: It is rich in a variety of natural resources; its literacy rate is very high; it has a large English speaking population and is close to several international markets.
Data on the private investment in the NER has been difficult to come by, so proposed investment data from Industrial Entrepreneur Memoranda can be used as a proxy to indicate the broad state-wise investment climate in the region (Table 9.1). Assam attracts the lion’s share of investments, followed by Tripura and Meghalaya.
Table 9.1: Extent and Potential Private Investment in the NER
Industrial Entrepreneur Memoranda Implemented
1997 to 2006
Industrial Entrepreneur Memoranda Proposed 1997 to
2006
State No. of units
Investment (Rs. crore)
% share
No. of units
Investment (Rs. crore)
% share
Assam 76 1,280 89.4 789 6,278 54.9 Tripura 5 72 5 440 3,510 30.7 Meghalaya 17 58 4.1 54 1,094 9.6 Manipur 1 13 0.9 65 392 3.4 Arunachal Pradesh 3 9 0.6 19 151 1.3 Mizoram 0 0 0 6 10 0.1 Nagaland 0 0 0 0 0 0
1 See, Atul Sarma, ‘Development Strategy in the Northeast in the Context of Globalisation,’ mimeo (www.satp.org). He argues that ‘having lagged behind in terms of the level and quality of administrative, social and economic infrastructure, these states are not likely to benefit immediately from private investment flows in the new regime. Being placed as they are, the role of the public sector in these economies has to be much greater.’ p.15.
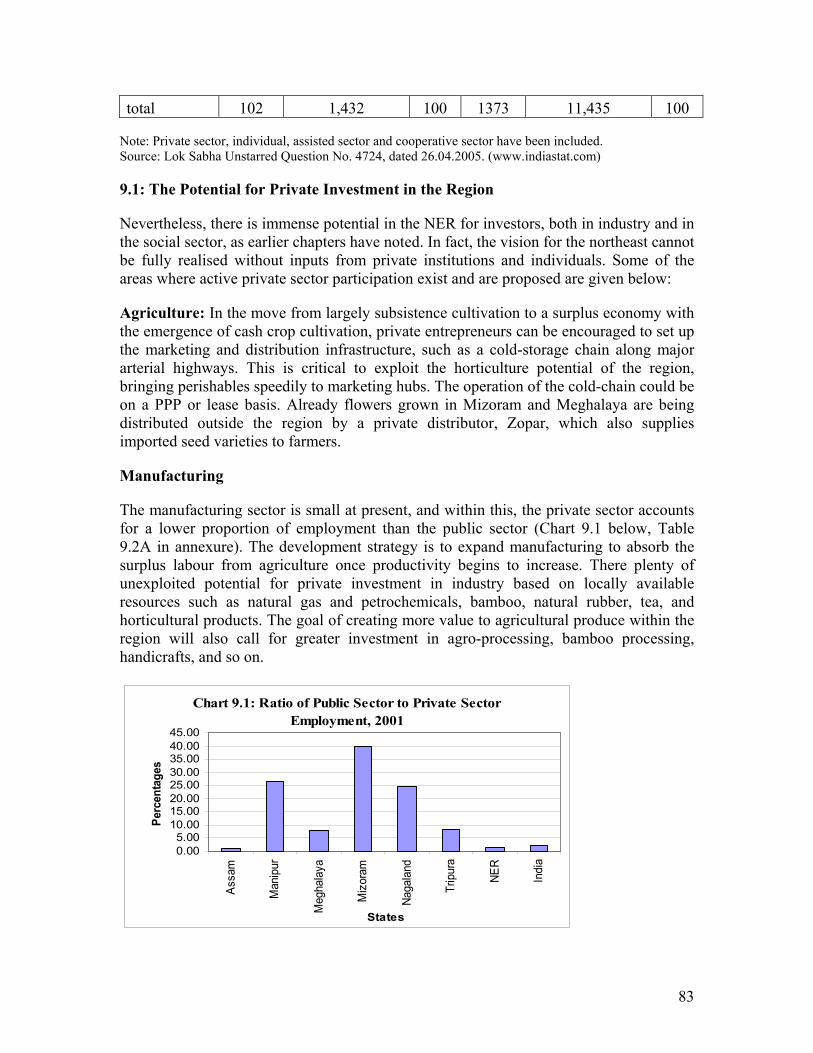
83
total 102 1,432 100 1373 11,435 100 Note: Private sector, individual, assisted sector and cooperative sector have been included. Source: Lok Sabha Unstarred Question No. 4724, dated 26.04.2005. (www.indiastat.com)
9.1: The Potential for Private Investment in the Region
Nevertheless, there is immense potential in the NER for investors, both in industry and in the social sector, as earlier chapters have noted. In fact, the vision for the northeast cannot be fully realised without inputs from private institutions and individuals. Some of the areas where active private sector participation exist and are proposed are given below:
Agriculture: In the move from largely subsistence cultivation to a surplus economy with the emergence of cash crop cultivation, private entrepreneurs can be encouraged to set up the marketing and distribution infrastructure, such as a cold-storage chain along major arterial highways. This is critical to exploit the horticulture potential of the region, bringing perishables speedily to marketing hubs. The operation of the cold-chain could be on a PPP or lease basis. Already flowers grown in Mizoram and Meghalaya are being distributed outside the region by a private distributor, Zopar, which also supplies imported seed varieties to farmers.
Manufacturing
The manufacturing sector is small at present, and within this, the private sector accounts for a lower proportion of employment than the public sector (Chart 9.1 below, Table 9.2A in annexure). The development strategy is to expand manufacturing to absorb the surplus labour from agriculture once productivity begins to increase. There plenty of unexploited potential for private investment in industry based on locally available resources such as natural gas and petrochemicals, bamboo, natural rubber, tea, and horticultural products. The goal of creating more value to agricultural produce within the region will also call for greater investment in agro-processing, bamboo processing, handicrafts, and so on.
Chart 9.1: Ratio of Public Sector to Private Sector Employment, 2001
0.005.00
10.0015.0020.0025.0030.0035.0040.0045.00
Assa
m
Man
ipur
Meg
hala
ya
Miz
oram
Naga
land
Trip
ura
NER
Indi
a
States
Percentages
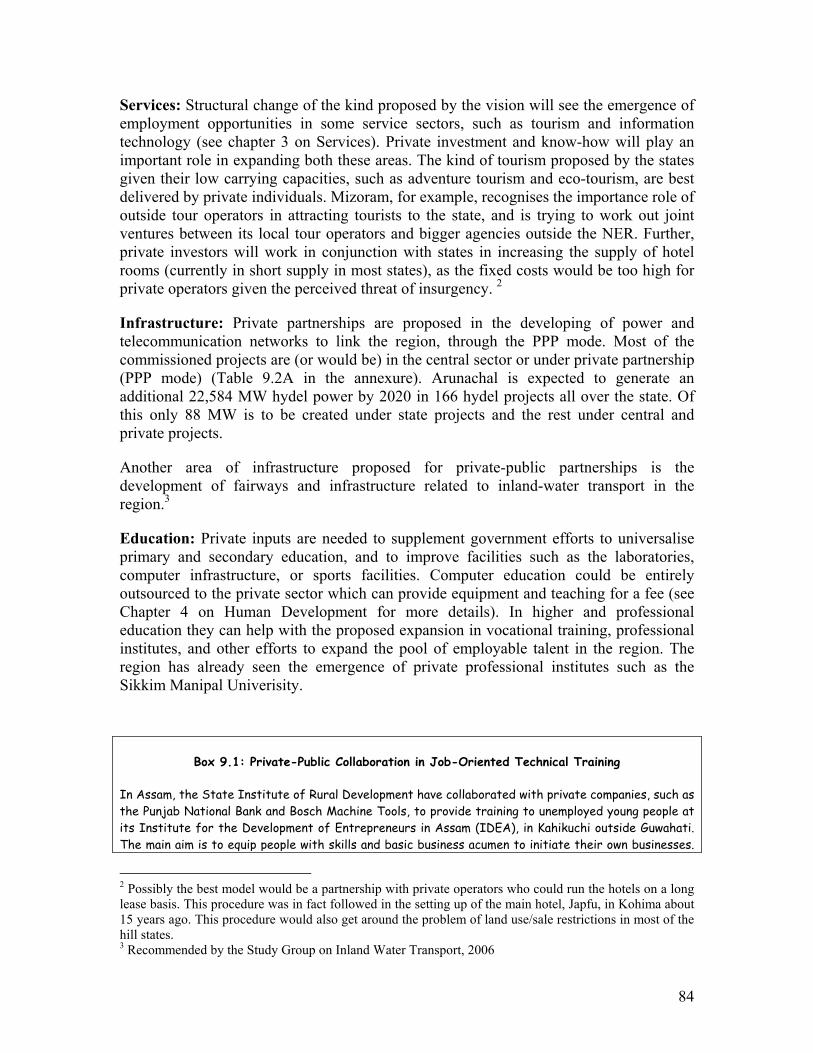
84
Services: Structural change of the kind proposed by the vision will see the emergence of employment opportunities in some service sectors, such as tourism and information technology (see chapter 3 on Services). Private investment and know-how will play an important role in expanding both these areas. The kind of tourism proposed by the states given their low carrying capacities, such as adventure tourism and eco-tourism, are best delivered by private individuals. Mizoram, for example, recognises the importance role of outside tour operators in attracting tourists to the state, and is trying to work out joint ventures between its local tour operators and bigger agencies outside the NER. Further, private investors will work in conjunction with states in increasing the supply of hotel rooms (currently in short supply in most states), as the fixed costs would be too high for private operators given the perceived threat of insurgency. 2
Infrastructure: Private partnerships are proposed in the developing of power and telecommunication networks to link the region, through the PPP mode. Most of the commissioned projects are (or would be) in the central sector or under private partnership (PPP mode) (Table 9.2A in the annexure). Arunachal is expected to generate an additional 22,584 MW hydel power by 2020 in 166 hydel projects all over the state. Of this only 88 MW is to be created under state projects and the rest under central and private projects.
Another area of infrastructure proposed for private-public partnerships is the development of fairways and infrastructure related to inland-water transport in the region.3
Education: Private inputs are needed to supplement government efforts to universalise primary and secondary education, and to improve facilities such as the laboratories, computer infrastructure, or sports facilities. Computer education could be entirely outsourced to the private sector which can provide equipment and teaching for a fee (see Chapter 4 on Human Development for more details). In higher and professional education they can help with the proposed expansion in vocational training, professional institutes, and other efforts to expand the pool of employable talent in the region. The region has already seen the emergence of private professional institutes such as the Sikkim Manipal Univerisity.
Box 9.1: Private-Public Collaboration in Job-Oriented Technical Training
In Assam, the State Institute of Rural Development have collaborated with private companies, such as the Punjab National Bank and Bosch Machine Tools, to provide training to unemployed young people at its Institute for the Development of Entrepreneurs in Assam (IDEA), in Kahikuchi outside Guwahati. The main aim is to equip people with skills and basic business acumen to initiate their own businesses.
2 Possibly the best model would be a partnership with private operators who could run the hotels on a long lease basis. This procedure was in fact followed in the setting up of the main hotel, Japfu, in Kohima about 15 years ago. This procedure would also get around the problem of land use/sale restrictions in most of the hill states. 3 Recommended by the Study Group on Inland Water Transport, 2006
85
Trainers from private companies provide two-week training in improved design and production in handicrafts (with a focus on bamboo-based crafts), cluster-based horticulture development (especially vegetable cultivation), the use of machine tools, and others to groups of students.
Health: The private sector is already engaged in the NER in working with state governments or alone at the tertiary, secondary and primary levels of health care: by managing public health facilities, running major tele-medicine units within a public hospital (see Chapter 4 on human development), providing laboratory and blood screening services at the secondary and tertiary levels (Tripura), and operating a full-fledged hospital within a medical college (Sikkim Manipal University).
9.2 Enabling Private Investment: The Way Ahead
Enabling private investment in the region will call for a shift from the current incentive-based policies which focus on providing incentives such as easy credit facilities, tax holidays, export promotion parks and capital investment subsidies. Inflows of private capital are more likely to be enticed by the availability of critical inputs like power and other enabling infrastructure, sufficient demand within the region for an entrepreneur to reap minimum profits and functioning marketing networks. An important issue in the north east relates to the question of security of life and property; the lack of proper law-enforcing mechanisms within a state may cause market failures or in other words the non-emergence of markets. Similar problems may result from land laws and existence of age-old common property rights in many states in the region. The emergence of a market in the region will also call for greater transparencies in resource-sharing policies including land. Other pre-requisites for the emergence of markets are enhancement of banking and other financial intermediaries in the states.
• Land for Private Investment
The region is subject to myriad land tenure systems; while acquiring land to set up an enterprise is not difficult in some parts, in some states people from outside cannot legally buy or lease land. Land is owned by the community, so no individual transactions can take place. Private investment in these areas is practically non-existent, but becoming more important as the development process gathers momentum. Thus, while industrial policy resolutions in these states propose leasing lands for setting up industry, the non-availability of individually owned land remains a major hurdle to industrialization in the NER.
States have followed different paths in dealing with this issue depending on the constitutional rights accorded to their respective communities: in Meghalaya, for example, the state can take over land for developmental purposes if it is the ‘tribal interest.’ State governments have to clearly spell out the different ways in which entrepreneurs and enterprises can safely and legally acquire land for industrial activity.
86
• Expanding the Supply of Skilled Labour
Much of the region is labour-scarce, and in these areas, the increase in economic activities could exacerbate the problem of labour shortages. The shortages are especially acute in the area of skilled workers, as the paucity of training facilities and the quality of instruction in the region has so far not equipped people for skilled work in factories.4 The region needs to open up to outside labour to allow economic development to take place, and at the same time enhance and update the quality of training being offered. Another related concern is the apparently high wage rates in the region, which has deterred private investment, especially in labour-intensive activities.
• Improving Enabling Infrastructure: Connectivity, Power and les for
The lack of market-enabling infrastructure in the region has been well documented. The emergence of markets is vital for private investment, and this can only happen with speedy connectivity (by road, train or other means) and efficient modes of communication. Some degree of inter-governmental planning is important to develop well-coordinated infrastructure that will enable the large-scale transport of inputs and finished products to market hubs and from there to final consumers. The issue of power and financial infrastructure is also discussed in the chapters on Manufacturing and Infrastructure.
• Ensuring a Secure Environment
An important issue in the northeast relates to the security of life and property. Lack of proper law-enforcing mechanism within a state may cause market failures or in other words prevent the emergence of markets. Law and order across the states, which calls for a joint-security management approach developed by all the states together, rather than the present disjointed-security systems.
4 During a field visit to industrial enterprises in the Bodhjungnagar Industrial Growth Centre outside Agartala, the study team was informed that a major hurdle to setting up the industry was the lack of skilled manpower in the state. Initially, the mangers had to bring skilled workers in from outside Tripura, but are now hiring local ITI graduates who may not have the skills but display an aptitude and potential for training
SECTION V
TRANSFORMING GOVERNANCE
Section V
Transforming Governance
Realising the main targets of the vision envisaged for the northeast will be based on a centralised governance and security system for the region. Thus a supra-state government will need to evolve, which is an economic decision-making entity involving the agents of various governmental departments of each of the NE states. In the absence of such an over-arching economic entity, the northeast vision may be difficult to operationalise in an effective manner. The government already plays a major role in the northeastern economies – through its activities in social sectors like health, education, basic necessities, and transport and determining policies and regulatory measures, with far-reaching implications for growth and social welfare. The current trend in a globalised world is for minimal governmental intervention, and a shift in its role from producer of goods and provider of services to an enabler and facilitator in a market-based system. In the northeast, however, the limited extent of state’s own resources and the low level of private investment, mean that direct government intervention will continue to provide many of the pre-conditions needed to usher in a market economy. The state also has a crucial role in ensuring law, order and security in the northeast, crucial to the well-being of people, apart from ensuring the functioning of the market system. The ultimate goal would be to unify the northeast states into a large economic unit with uniform rules, regulations and the privileges so that the states can reap the benefits of scale economies, at present absent in almost all of these small states. This will allow the emergence of competitive new production hubs, based on local resources; and propel the region towards trade-led growth and industrialisation, which is at the heart of India’s Look East policy. For most effective delivery of services, planning will be based on the strong participatory, community-centric tradition of local administration in the northeast. Development plans and schemes that involve people at the grassroots levels, and place the community at the centre are more likely to be sustainable. The following chapters will focus on the need to transform governance in various ways in the northeast, so that the vision can be operationalised to bring progress and prosperity to the region.
CHAPTER10
Governance and Security
Governance and security should assume central importance in any development agenda for the northeast region. Experience in the region has shown that neither civilian democracies nor military regimes have been able to successfully shun violence from the region. The only long-run solution is rapid economic progress, but this is difficult in a politically unstable environment. This is the crux of the issue of underdevelopment in the NER, as will be discussed later in this chapter. The problem arises partly from the complete failure on the part of mainstream India to assimilate the region and partly from diversities within the region itself. The region is inhabited by diverse communities with different ethno-linguistic origins, religious beliefs and tribal practices, cultural ethos and inherited heritages and above all an irreconcilable historical past. Their interests are often in conflict with each other and their aspirations are not easily reducible to any common denominator. For this what is necessary is a rise of legitimate sub-nationalism which may perhaps unite the region into a collective unity of economic and political interests. Unless this is achieved, political instability is bound to arise.
The question of governance therefore should be posed in a somewhat broader perspective in the context of the northeast. It is not sufficient to club all the states into one group – say, northeast – it is also necessary to be able to create a unified economic and political vision for the northeast. It is indeed a difficult task to be achieved. One possible way might be through increasing interdependences amongst the state by means of greater economic unification of the region. A necessary prerequisite for such unification is synchronisation of development policies of the states. What is needed to be emphasized is that without a centralised approach to governance, it is not possible to achieve permanent peace in this region. And unless there is permanent peace, no development efforts will ever bear any fruit. What it essentially means is that a northeast political vision must precede a northeast economic vision.
Governance in a somewhat narrower sense implies imposition and execution of a system of rules and regulations which can provide law and order in a society that can ensure security of life and private property rights of the people. In playing this role a government can be exclusive, in the sense that it can perform this role independently of people at large. However, in a modern democratic society a government also has to play many inclusive roles, which means it has to depend on the cooperation as well as participation of the people in administering its functions. For instance, a government has to play the role of a prime mover of development in a society where market forces may be unable to generate progress for good reasons. A well-know example is that under the market mechanism there is an under-supply of public goods such as the means of
88
communication, water and power, education and health, etc., maintenance of forests and common property and various other social utilities. Moreover, a modern welfare state has a moral responsibility to ensure a degree of social, economic and political justice in society. Equity is generally taken as the ethical objective that every welfare government should try to achieve. Hence, the state (synonymous with the government) is morally bound to adopt certain optimal redistribution policies in society. To perform such roles efficaciously, the state has to mobilise resources through taxation and cost-recovery policies. While the efficiency of the government is determined by its ability to mobilise the maximum amount of resources on the one hand, its success as a provider of good governance depends on its ability to redistribute the benefits optimally to its subjects.
Besides the maintenance of law and order, a government of a welfare state plays an important role in the economy – it runs public enterprises, handles social sectors like health and education, etc., and determines policies and regulatory measures, with far- reaching implications for growth and social welfare. Of course, the present trend in a globalised world demands least governmental intervention in an economy, with its role being limited as far as possible to enabler and facilitator in a market-based system. However, in the context of the northeast where state’s ability to generate resources are limited and private initiatives are almost absent, direct governmental intervention is necessary.
10.1: Governance, Law & Order and Security
The basic foundation of the market-driven development path is based on the assumption of the existence of an efficient market system. However, for an efficient market to exist certain basic pre-conditions need to be fulfilled. A primary requirement for a market to function properly is that there is proper law and order such that any transaction can be carried out in the market without any fear or coercion. The second important pre-condition for markets to function is the presence of well-defined property rights. In the absence of either of these two conditions, either the market fails to exist or it functions wrongly.
In the discussion of the development alternatives in the context of the NER this crucial point is often ignored. In several of the NER states, for many commodities markets do not exist, either due to extortions and fear of life and property (consequence of extremism) or because of the absence of well defined private property rights (land, for example).
10.2 The NER Law and Order Syndrome
The NER (except Sikkim) for the last several decades had been constantly under the shadow of ethnic violence and terrorism of innumerable forms. In Mizoram, the Peace Accord signed in 1986 between the central government and Pu Laldenga, the Mizo
89
leader, had ended these activities, after being home to Asia's longest running insurgency. Beginning with the Naga insurgency in 1956, such insurgency activities have been continuing and expanding unabatedly all over the region. Each of the seven states in the region today has one or the other form of insurgency. There were about 15 major groups in the region that have been banned by the centre. If the smaller groups are included, this number may exceed 40. Over the last decade, at least 11,000 people, including security forces, civilians and militants, have been killed in insurgency-related violence in the four major states of Assam, Manipur, Nagaland and Tripura. A majority of these outfits were formed in the 1980s or early 1990s. The rise of these outfits and extremism has often been viewed as the result of neglect by New Delhi, but there are others who regard these insurgencies as nothing but money-making enterprises. The outcome is the very poor law and order and security situation in most of the region.
The continuous violent upsurges and absence of law and order have had a formidable impact on the performance of the economy. For one, it had created a sense of uncertainty and insecurity in the minds of economic agents who take decisions regarding production and investment within the region. Unfortunately, in the policy debate on growth and development of the region, the possible impact of uncertainty and insecurity about life and property has not been given the emphasis it deserves. Most economists taking pride in their deterministic growth models tend to focus on savings as the main constraint to growth. In reality, there is no dearth of money in the NER region, though its own propensity to save may not be sufficient. There are substantial transfers of development funds from the centre to the region as every Ministry has earmarked 10 percent of the budget exclusively for NER development. The economy’s slow pace of growth has been attributed by some economists1 to insurgency. The following quotation from a recent document published by the Planning Commission (1997) clearly reveals the state of law and order in the region:
While significant progress in infrastructure development has been made in recent years, other developments have overtaken it and negate whatever cost advantage infrastructure development may have given. How much of a burden corruption of all kinds and extortion by different underground groups impose on transport cost even within the region has been documented by Sachdeva (2000). A moving truck load of goods from Moreh to Dimapur, a distance of 316 km, costs Rs 50,000. Part of these charges may be due to the fact that the truck was carrying illegally traded goods. Yet the number of “tax collectors” is likely to collect something from trucks carrying legally traded goods too. These “taxes” must act as a significant disincentive to any one thinking of setting up an industry in the North-East to meet North-East demand. This refers to Manipur and Nagaland. The situation in Assam is much better. We have noted that carrying a truck from Guwahati to Kolkata over a distance of 1,100 km costs Rs 22,000. Yet the high
1 For instance, Professor Atul Sarma (2005) has mentioned four other economic factors along with insurgency that are responsible for limiting growth in the NER. These factors are: initial conditions, infrastructure lags, market imperfections and indifferent government.
90
transport costs in other NE States restrict market reach of industries located in Assam. Traders claim that to move a truck from Imphal to Guwahati (487 km) costs Rs 35,000.”2
The above is an example of the absence of law and order (or market) in the NER, and a clear case of government failure, itself an important cause of market failure.
10.3 Incidences of the Absence of Law and Order: Evidence from the States.
The NER (except Sikkim) has very high incidence of cognizable crimes under the Indian Penal Code (IPC) per one lakh of population. The number of such crimes is in the NER is higher than the corresponding figures for the country as a whole except in the case of theft (Table 10.1). It further reveals that the incidence of murder per lakh population in Manipur, Meghalaya, Arunachal Pradesh and Tripura was nearly the national figure in 2003. The trend also appears to be increasing for most of the NER states. Although, the incidence of dacoity and robbery has been declining over time, it is still well above the corresponding figure for the entire country. Only Sikkim has lower cognizable crimes per lakh of population compared to the all-India figure.
Second, we consider the case of violence caused by terrorism, which have been increasing over the years3 (Table 10.2). In 2001, 23.13 percent of the total terrorist incidences in India took place alone in this region, which has increased to 27 percent in 2005 and further to 29.4 percent in 2006. Among the NER states barring Sikkim and Mizoram, the incidence of terrorism is highest in Manipur and lowest in Mizoram. Manipur, Assam and Nagaland are the most terrorist-affected states in the region. Assam shows the highest number of civilians killed due to terrorist violence, which was around 11 percent of the total civilians killed in India in 2001 due to terrorism. The number of civilians killed though has declined marginally in 2006; the number of security forces killed has increased in the NER to the corresponding figure for India.
The number of extremists killed due to terrorism was highest in Assam in 2003, while the number of terrorists arrested is highest in Tripura in the same year (Table 10.3). However, in 2004 Manipur has the highest number of terrorists being killed as well as arrested. The most terrorist-ridden states in the region are Assam, Tripura, Nagaland and Manipur.
In Table 10.4 we can see the number of violent incidents caused by terrorism of the organizations like the ULFA, NDFB and KLO up to the year of 2002. Though it shows
2 From State Development Report, Assam 3 For the data on terrorist activities in the country given in the Statistical Abstract India gives for the states of J & K, NE states and the Naxal affected states.
91
some decline in case of ULFA, it recent years for which data are not available the terrorist activities have increased manifold in Assam and Manipur.
The rise in terrorism has had impact on the strength of the police force being maintained in these NE states. The number of police per 100 sq. km. has increased sharply over the years in all these states (Table 10.5). An important point to be noted is that the four states, namely, Assam, Manipur, Tripura and Nagaland, have higher number of police force per 100 square kilometer as well as per lakh of population in comparison to the national figure in 1981. Although the number of police per lakh of population has declined for both India as well as for these NE states, yet the numbers are still higher for the NER states except in 1990 when only Nagaland has higher than the national figures. In case of the number of IPC cases per civil police, except for Assam the rest of the NE states show lower figures in comparison to the national figure.
In Table 10.6 we provide information on the expenditure on total police force and police training per one lakh of population. It can be seen from the Table 10.6 that in the NER states this number is higher than the national figure. Among the NE states, although Assam spends a lower amount in comparison to the other NE states, its expenditure is still higher than the national figure. Police expenditure per lakh of population is higher in Nagaland, Mizoram and Sikkim comparison to the other NE states. Similarly, Nagaland and Mizoram spend much more in comparison to the other states in police training. It is therefore clear that a huge amount of resources is being diverted for policing.
It is quite evident from the above analysis that the law and order and security situation is quite vulnerable in the NER states. While Manipur is under the army rule at present, there is a cease-fire in Assam and Nagaland. The cease-fire in Nagaland has been fairly effective in maintaining peace and order, but the situation in Assam is getting increasingly tense in the recent past. The situation in Tripura is also no different. Thus, in such a politically volatile situation developmental activities are hindered by the fear psychosis. This is amply reflected in the economic performance of all the states whether one looks at their GDP growth, industrial growth or per capita income growth. Clearly, the success of developmental policies crucially depend on the prior existence of law and order in these states.
10.4 Views of Various NER Committee Reports on Law and Order
Earlier committee reports (Shukla Committee and Jain Committee) on NER have ignored this crucial issue in their analysis of the developmental requirements for these states. The State Development Reports also have not discussed the issue of governance, although they emphasize the issues of decentralisation, involvement of women in governing institutions, transparency in the functioning of the local governments, etc. Only the NEC Vision 2020 recommends the introduction of a police outpost in each village in Assam,
92
along with decentralisation and transparency, but does not deal with issues of militancy and law and order.
10.5 Causality between Insurgency and Development
As argued above, underdevelopment is caused by insurgency and terrorism and therefore all developmental efforts will be in vain, unless political volatility is controlled. Thus, the development vision for the NER region should focus on the primary requirement of law and order in these states. However, there is an alternative view which maintains that insurgency is the cause of underdevelopment, in which case the vision would be to hasten the pace of development to solve the problems of insurgency in the long run. However, some economists believe that the causality may even run in both ways. That is, insurgency and unemployment resulting from poor economic development feed on each other. Thus, poor economic performance results in insurgency and hence the solution of insurgency lies in the achievement of rapid economic progress of the region. If this can be taken as a legitimate position then perhaps one need not worry too much about the insurgency, which would be solved by achieving faster growth.
And indeed, commonality of such a view can also be found in the writings of professional economists4 as well as in the official position on long-term approaches to solve the problems of insurgency in the NER. The current official position on the solution also advocates rapid economic development. As a logical conclusion of this line of argument, the NER is cast today in India’s Look East Policy paradigm.
There is however a serious flaw in the above argument. It still does not answer the question: what is the mechanism that drives economic growth in the region? In the absence of any credible alternative to market system, profit signals provide the chief motivation for capital accumulation and growth. For this to happen markets need to exist, but in a politically volatile situation where insurgency and terrorism become the normal rule of life, markets are unlikely to exist or provide the right signals. As a consequence, private capital does not flow into the region in search of investment opportunities - in fact, there is a reverse flow of financial capital out of the region. To quote a well-known economist from the region:
……..due to inhospitable investment environment, savings arising in the region gets outlet into the more investment friendly region. This largely explains very low credit-deposit ratio in NER states. Such asymmetrical market integration - a large inflow of goods into and outflow of savings from the region- has impeded the pace of growth in the region.
4 For example, see Gulshan Sachdeva, “North-Eastern Economy: New Policy Options” in Barua (2005).
93
Thus, insurgency continuously hampers the economic performance of the region, so rapid economic development is not possible without a proper strategic and security policy by the central government.
Under the prevailing circumstances profit-seeking private investment is unlikely to flow into the region and therefore public investment has to play a more pro-active role in boosting the rate of economic growth. In particular, public investment must be made on such activities as creation of infrastructure such as roads, bridges, railway coverage, power generation, proper drainage system, flood control and water harvesting, irrigation - both minor as well as major, drinking water, hotels and transport facilities – airport construction in inaccessible areas, reliable and fast-moving public transport. The creation of such infrastructure can raise agricultural productivity which is a sine qua non for rapid growth through industrialisation. Without increasing income-generating possibilities in the rural sectors of the economy the necessary forward and backward linkages for industrialisation cannot be created. Thus public investment alone will help creation of an enclave which will be exploited by the private agencies from outside the region5. The nineteenth century saw massive trade and investment in the plantation sector of Assam, but the tea industry had no linkages with the rural economy; it developed as an enclave and hence rapid investment and export growth had no impact on the earning potentials of the rest of the economy.
Thus the role of the states would be to ensure certain basic minimum pre-requisites:
• Free and unhindered mobility of goods and services (infrastructure) across the region as well as within the region;
• Well-defined property rights; and
• Law and order and security of life, such that markets can function and reflect the true scarcity costs of goods and factors.
5 Dr. Hiren Gohain thus argued that development and decolonization are the two sides of the same coin. The only way to decolonize the economy is by creating income earning possibilities in the rural economy. See Hiren Gohain, “Development and Decolonization” in Alokesh Barua ed. India’s North-east: Developmental Issues in a Historical Perspective, Manohar-CSH publication, New Delhi.
CHAPTER 11
Grassroots Planning and Decentralised Service Delivery
Economic development is not only an outcome of the amount of funds allocated to different sectors, it vitally depends on how plans are actually implemented. Planning for development in this region has traditionally been done by local communities, so the ‘bottom-up’ approach would be the preferred route for service delivery, which is line with the 73rd and 74th Amendments to the Constitution. Decentralisation is a complex and multifaceted concept that involves the shifting of fiscal, political, and administrative tasks to lower levels of government.1 This hastens decision making, but more importantly gives people ‘voice’ in the projects and schemes assigned to their localities and ‘ownership’ of the public assets created. Local governments are more likely to work efficiently by mobilising available resources in their localities to fulfill the targets (Mishra, 2000).
Grassroots Planning
Two constitutional provisions are applicable in the NER with regard to grassroots governance: the 73rd and 74th Constitution Amendment Act (CAA) 1992 covers part of the areas, and applies to rural and urban local governments, respectively, while tribal areas are under the Sixth Schedule.2 Under the Sixth Schedule there is no concept of municipal governance, though urban centres exist, since it is based on the traditional tribal institution of self-rule for schedule tribes (for details see Annexure 11.1, on provisions related to the CAA and Sixth Schedule).
Under the Sixth Schedule, Autonomous District Councils (ADCs) have wide-ranging powers including making laws and planning for the development of their areas. At the unit level, village councils (VCs) constitute village development committees (VDCs) to for development activities. VC members verify whether projects initiated by the government have been completed.
1 Decentralisation has three elements: (1) financial decentralisation: the transfer of financial resources through grants and tax-raising powers to sub-national units of governments; (2) administrative decentralisation, where the functions performed by the central government are transferred to geographically distinct administrative units; and (3) political decentralisation where powers are devolved to elected local governments. 2 The Sixth Schedule applies to parts of Assam, Mizoram and Tripura and the entire state of Meghalaya. Earlier, Arunachal Pradesh was also part of the Sixth Schedule and administered by the Governor of Assam as the agent of the President. Now, almost all of Assam (barring two districts covered by the Sixth Schedule), Arunachal Pradesh, Manipur and Sikkim have passed legislation bringing local bodies under the CAA (i.e., three-tier Panchayati Raj system and Nagarpalikas).
95
There are three institutions involved in the planning process at the grassroots level, namely, the panchayati raj institutions (PRIs), urban local bodies (ULBs) and district planning committees (DPCs). The PRIs and ULBs prepare plans for economic development and welfare in their areas. States have to constitute a DPC to integrate plans for the PRIs and ULBs, and as a monitoring and facilitating body.3 DPCs have not been constituted in Arunachal Pradesh, Assam and Tripura, and in two out of four districts in Manipur.
Female participation is well over one-third in the region and in each state it was over one-third. In Arunachal Pradesh, schedule tribes were 100 percent, whereas they were 30.6 percent in Sikkim. In Tripura, the representation of schedule castes was 26.3 per cent, representation of schedule caste was 18.6 percent. (Tables 11.1A, 11.2A and 11.3A)
11.1 Service Delivery
A rationale for decentralisation is that it can generate financial efficiency and quality gains by devolving resources and decision-making powers to local governments for the delivery of services. It may ensure adequate provision of services4, social and economic infrastructure,5 basic to development (Chapter 4 has more on Basic Services). Some services are mainly of a local nature and the sole responsibility of the third-level government. Here again the functional domain under CAA and Sixth Schedule may vary.
11.1.1 Rural Areas
Local governments in the rural areas have to both plan and execute various functions. While these are not clearly defined for ADCs, VCs and ULBs; but listed for PRIs in Table 11.4A. Apart from Sikkim, where all the 29 functions associated with funds and functionaries have been transferred, the status in other states is far from satisfactory.
Effective devolution of funds, functions and functionaries is critically based on activity mapping, which is how different levels of PRIs would share responsibilities related to a particular function. It would decide the requirements of matching funds and functionaries.
3 The main functions of the DPC are consolidation of plans prepared by panchayats and municipalities in the district; preparation of a draft development plan for the district; conducting an objective SWOT (strengths, weaknesses, opportunities and threats) analysis for the district, although this element is missing in various parts of the region. 4 Services relate to health, education, drinking water and sanitation typically provided by local governments. 5 Local governments are also given responsibility for a range of other public services, such as infrastructure in the form of roads and bridges, public buildings, and housing.
96
• Activity Mapping is key to the effective devolution of functions to panchayats. The states are at various stages of implementation and coverage (table 11.4A), and some are under consideration by the government. Since activity mapping is the trigger for the devolution of finances and functionaries, states have to expedite its operationalisation. The activity mapping by distribution of functions into district Panchayats, intermediate Panchayats and village Panchayats is shown in Table 11.6A - it is a model for education, which may be replicated for other functions.
• Devolution of Funds to Match Activity Mapping: The Kolkata Round Table suggests that devolution of finances to the three tires of the PRI system should be patterned on activity mapping. The essential steps in this direction are for state governments to undertake a detailed analysis of their annual budgets both non-plan and plan, with a view to separating out the allocations that would need to be transferred to panchayats in accordance with the activities devolved to them.
11.1.2 Urban Areas
Urbanisation in the NER is above the national average. As the city governments provide better and more efficient services, they attract more people within their fold creating additional demands on these services, until the quality of urban services ultimately begins to decline under the pressure.
The urban issues are unique depending on the size, location, age and economic activities of the cities. The state of urban centres in the northeast make it clear that they need planning for both existing and forecasted growth. Urban planning is concerned with reconstruction and renewal, transport, environmental factors, congestion, and so on.
The recently initiated Jawaharlal Nehru National Urban Renewal Mission (JNNURM) is an important step in addressing these issues (for details see Annexure 11.2). It applies to the capitals of all the eight northeastern states, and its aim is to encourage reforms and fast-track development. It plans to do this through improving the efficiency of urban infrastructure and service delivery mechanisms, community participation, and accountability of urban local bodies (ULBs) and parastatal agencies towards citizens.
There are 139 ULBs in the North East of all types, covering a population of 6,031,883 and area of 1,915 sq km., but it does not cover all the towns in which there is no municipal system, such as the urban clusters in Arunachal Pradesh, Mizoram and Sikkim (table 11.7A).
97
11.2.3 Communitisation
The northeast has several examples of successful decentralisation, and Nagaland’s experience has been documented in earlier chapters (see also Box 11.1). It is good example for effective service delivery system through people participation. More functions of local nature may be included in this management system adapted to local conditions.
Box 11.1: Communitisation and Resurgence of Naga Social Capital
“Once the whole State is brought under the Communitisation programme, it would be model for the whole country to follow”.
- The President of India, Dr. A.P.J. Abdul Kalam during his visit to the Communitised Khuzama
Village in Nagaland on October 26, 2002.
Government of Nagaland has enacted Nagaland Communitisation of Public Institutions and Service (NCPIS) Act, 2002 enlarging the scope of community participation in development and welfare programmes in areas such as education, health, power, rural water supply, rural tourism, roads, forest, sanitation, rural childcare, etc. Earlier, since 1963, only elementary education, health service and electricity management was under Communitisation scheme. This is a partnership between Government and the people through delegation of management responsibilities to the community so that the performance of the public utilities improves. The communities responsibilities include checking attendance of staff, repair and maintenance works, purchase of books/medicines, receiving funds from the Government for salaries of the staff and disbursing the same after operating the principles of ‘No Work, No Pay’. The watchwords are: Trust, Training and Transfer of Power and Resources. For an impact assessment of this experiment in the context of elementary education, grass-root health services and electricity management, see Government of Nagaland (2004b).
Government of Nagaland, 2004 a & b.
11.2.4 Issues
The different forms of third-tier governance in the region have raised issues on integrating non-Sixth Schedule areas with Sixth Schedule areas.6 There is little data on
6 The Union Finance Commission showed its concerns while making awards to the states for third-tier governments. Perhaps the fiscal transfers to the ADCs remain ad hoc in the absence of a formal mechanism. For example, the first State Finance Commission report of Manipur does not mention ADCs in their scheme of fiscal relations.
98
local bodies under the Sixth Schedule7 which makes it difficult to analyse their functioning and efficacy. The advantages of implementation of CAA for rural and urban local bodies are clearly documented, but it is difficult to envisage how tribal communities would benefit with the replacement of their traditional systems of self-rule without knowing how they function. The autonomous bodies functioning in the region need to become more transparent and accountable in their system of local governance. Needless to say, whatever system is in place, overall equity with efficiency must prevail.
One of the major issues is integration of central policies for rural and urban development, which differ in their functional domain and governance. The observations explicitly made by two recent Finance Commissions are of interest and concern over its inability to integrate its awards with local bodies under the Sixth Schedule and CAA.
Another issue is that transparency is important to analyse the impact and deficiencies of activities. Information generation and flow to the grassroots level is essential. Most information does not reach down to people, so it is difficult to account and monitor resource use. The Sixth Schedule provides for this mechanism under Article 244(2)8.
11.2.5 Reform Options
The NER is a mix of traditional and modern strands of local governance. There is some hope that, with appropariate provisions and without disturbing local tradition, the Sixth Schedule areas can be integrated with the rest of the region, so that the whole country has a single system of local governance. However some of following measure may make all local governments more accountable and transparent (other recommendations related to this are in Annexure 11.4A).
• All NER states should be given all opportunities to expand local governance according to the CAA. This should be done with respect to their unique traditions, without tampering with their essential rights and giving each state the chance to use its own nomenclature for such systems of governance which will have local acceptance. It may be remembered that their traditional institutions have been the outcome of time-tested evolution of self-rule.
7 Surprisingly, while local bodies, particularly those in the rural areas covered by the CAA find a place in the Ministry of Panchayati Raj the most recent publication, The State of Panchayats in India; there is no mention of local bodies under the Sixth Schedule. 8 Regarding management of local funds of the district council, the Governor may make rules for the management of the District Fund, or, as the case may be, the Regional Fund and for the procedures for the payments to the funds, withdrawal of moneys there them, custody of money and so on. The accounts of the District Council or, as the case may be, the Regional Council have to be maintained in a prescribed form. The CAG can audit the accounts of the District and Regional Councils, report on these accounts.
99
• Civil society can be engaged in evaluating the quality of services to increase accountability and improve service delivery.
• The use of Information and Communication Technology (ICT) may improve monitoring efforts of delivery through local governments with greater transparency in government processes, openness to the public, streamlining of procurement procedures which will help DPCs to plan better.
• Sufficient revenues are needed to meet funding requirements for service delivery, which may be constrained due to design problems, lack of buoyancy, or poor collection practices. The optimal revenue depends on the capacity of local governments to manage their own finances, the nature of the services provided and priority given to using central revenues as a tool for mitigating regional inequalities. Rao and Rao (2007, see Annexure 11.3A) have listed the number of sources provided in the Acts of various states. The question is not the how many types of resources are used but how effectively they are used.
• Key to the process is expediting the transfer of functions, functionaries and funds. Transfer of functions has to be based on the principle of subsidiarity and any task that can be done by a lower level should not move to higher level.
• Systemic measures are needed to cap, reduce and eventually eliminate the scope for corruption
• Transparency is called for in the transactions of local governments
• Formal audit through procedures recommended by the CAG and the Institute of Public Accounts
• Need for the activation of standing committees so that decision-making is dispersed appropriately.
• Activation of the local government, preferably by statutorily endowing them with the duty of approving all projects, programmes and plans and authorising the issue of utilisation certificates by its bureaucracy.
• The constitution of ward sabhas to facilitate participate social audit.
• The convening of mahila sabhas prior to meetings of ward sabhas and gram sabhas.
100
• Invoking the Right To Information (RTI) Act, and associating public-spirited NGOs, to make local governments truly a People’s Parliament with the checks and balances, advice and consent on which depends the success of the democratic functioning of an elected executive authority.
11.2.6 Conclusions
Grassroots level planning is people’s participation in decision making and delivery of services. It will not only address expenditure inefficiency but will also reduce inequity in provision of services and developmental projects thereby reducing resentment due to uneven development and level of basic services. Thus, the actual process of decentralisation (that is, devolution of functions and commensurate funds, functionaries, and tax powers) to the third tier of the government, in any form, is a must. However, good governance with transparent policies and administrative procedures is crucial at this level also. This should result from strengthening local institutions (without encroaching on them) through capacity building of functionaries, installing proper mechanisms for monitoring and performance reporting, and appropriate incentives to reward good performance to bring accountability into the system.
BIBLIOGRAPHY General References Central Statistical Organisation (CSO), National Accounts Statistics Central Statistical Organisation Statistical Abstract, various issues, Ministry of Statistics and Programme Implementation, Government of India, www.mospi.nic.in. Government of Arunachal Pradesh (2006), Arunachal Pradesh Human Development Report (Summary). Government of Assam (2003), Assam Human Development Report, Department of Planning and Development Government of Nagaland (2004), Nagaland Human Development Report, Department of Planning and Coordination Institute of Development Studies, Tripura Development Report (Draft), Lucknow University. NEDFI, NEDFI Databank Quarterly, various issues National Institute of Public Finance and Policy (NIPFP): ‘State Development Report of Mizoram’ (Draft) by NIPFP, March 2007. North Eastern Council, ‘Draft Vision 2020 Sector-Wise Suggestions (People’s Vision)’ 2006 Planning Commission (1990), Report of the Committee on Clause Seven of Assam Accord, Economic Development of Assam Planning Commission (2001), National Human Development Report, Government of India Planning Commission (2002) Tenth Five-Year Plan, Government of India Planning Commission (2007) Approach to the Eleventh Five-Year Plan, Government of India Ministry of Finance (2007) Economic Survey, 2006-07, Government of India. Planning Commission (1997), Report of the Shukla Committee on Transforming the North East, Government of India. Planning Commission: Assam Development Report, Government of India Reserve Bank of India, Handbook of the Indian Economy, various years United Nations Development Programme (UNDP) (2001) Sikkim Human Development Report Verghese B. G. (1996), India’s Northeast Resurgent, (Ethnicity, Insurgency, Governance and Development). Delhi, Konark Publishers
Websites
Central Statistical Organisation (CSO) Website: http://www.mospi.nic.in/cso_test1.htm
Indiastat.com. The North Eastern Council website: http://necouncil.nic.in/. NEDFI Data Bank, http://databank.nedfi.com/ www.censusindia.net/results/index.html (26-11-1999 for old series and as on 23-2-2006 for new series). Chapter 1: Agriculture Ahluwalia, M. S. (2002) ‘State-level Performance under Economic Reforms in India’ in Anne Krueger (ed.) Economic Policy Reforms and the Indian Economy, Chicago: University of Chicago Press. Barah, B. C and A.K. Neog (2005) ‘An Analysis of Resource Endowment and Economic Management (A Study of North-Eastern India).’In Alokesh Barua (ed) India’s North-East–Developmental Issues in a Historical Perspective, Delhi: Manohar, p. 285. Barua, Alokesh and Arindam Bandopadhyay (2005) ‘Structural Change, Economic Growth and Regional Disparity in the North-East: Regional and National Perspectives’. In Alokesh Barua (ed) India’s North-East – Developmental Issues in a Historical Perspective, Delhi: Manohar, p. 239. Das, S. K., and A. Barua (1996) ‘Regional Inequalities, Economic Growth and Liberalisation: A Case Study of the Indian Economy,’ Journal of Development Studies, vol. 32, no. 3, pp. 364-91. Das, S. K and Monica Das (2005) ‘Convergence in Consumption Behaviour: A North-East Perspective’. In Alokesh Barua (ed) India’s North-East – Developmental Issues in a Historical Perspective, Delhi: Manohar, p.331. Mizoram University Symposium (2006) ‘Proceeding of the Eighth Annual Conference of the Northeast Economic Association,’ (ed), Lianzela, Thangchungnunga and Vanlalchhawna, Department of Economics, Mizoram University, Aizawl, November 16-17, 2006. Chapter 2: Manufacturing Barua, A and Arindam Bandopadhyay (2005), “Structural Change, Economic Growth and Regional Disparity in the North East: Regional and National Perspective”. In A. Barua (ed) ‘India’s North East: Developmental Issues in a Historical Perspectives’, New Delhi:Manohar. Central Statistical Organisation (CSO), Summary Result, Factory Sector, Annual Survey of Industries, various issues. Kubo, Y., J.D. Melo, S. Robinson and M. Syrquin (1998): “Independence and Industrial Structure”, Industrialization and Growth: A Comparative Study, A World Bank Research Publication.
Madhab, J. (2003), 'The Green Gold: Under Exploited Wealth of the North East India', Dialogue October - December, 2003, Volume 5 No. 2. Reserve Bank of India, (2004) The Handbook of Statistics on Indian Economy 2003-04. Sachdeva, G. (2005) ‘North Eastern Economy: New Policy Options’ in Alokesh Barua (ed), India’s North East: Developmental Issues in a Historical Perspective” Delhi: Manohar. Sreerajan (2001), Perspectives on Development in Meghalaya, State Institute of Rural Development Publication (SIRD), Meghalaya. Websites http://agricoop.nic.in/bamboo/bamboomission.htm: Ministry of Agriculture, National Bamboo Mission, Government of India, http://www.apind.gov.in/directorofindustries.html
http://arunachalpradesh.nic.in/department.htm Government of Arunachal Pradesh, Department of Industry and Textiles;
http://www.bambootech.org/
http://mizoram.gov.in/department/ecostats.php: Government of Mizoram, Department of Economic and Statistics
http://industriesassam.nic.in/index.asp
http://megindustry.nic.in
http://www.smallindustryindia.com/ssiindia/census/sumryres.htm: Ministry of Micro, Small & Medium Enterprises, Third Census, SSI Sector, 2001-02, Government of India;
http://sikkimindustries.nic.in/intro.htm: Government of Sikkim, Department of Commerce and industry;
http://tripura.nic.in/industry/industry.htm: Government of Tripura, Department of Industries and Commerce
Chapter 3: Services Ahluwalia, M. S., (2002) ‘State-level Performance under Economic Reforms in India’ in Anne Krueger (ed.) Economic Policy Reforms and the Indian Economy, Chicago: University of Chicago Press. Barah, B. C and A.K., Neog (2005) ‘An Analysis of Resource Endowment and Economic Management: A Study of North-Eastern India’ in Alokesh Barua (ed) India’s North-East – Developmental Issues in a Historical Perspective, Delhi: Manohar, p. 285. Barua, Alokesh and Arindam Bandopadhyay (2005) ‘Structural Change, Economic Growth and Regional Disparity in the North-East: Regional and National Perspectives.’ in Alokesh Barua (ed) India’s North-East – Developmental Issues in a Historical Perspective, Delhi: Manohar, p. 239.
Das, S. K, and Monica Das (2005) ‘Convergence in Consumption Behaviour: A North-East Perspective.’ in Alokesh Barua (ed) India’s North-East – Developmental Issues in a Historical Perspective, Delhi: Manohar, p.331. Das, S. K., and A. Barua (1996) ‘Regional Inequalities, Economic Growth and Liberalisation: A Case Study of the Indian Economy,’ Journal of Development Studies, vol. 32, no. 3, pp. 364-91. Department of Tourism, Tourism Statistics, various issues, Government of India Pant, Manoj, ‘An Alternative Strategy of Development for North-East India’, Project sponsored by International Development Research Council for India (IDRC), Canada. Reserve Bank of India (2006): Report of the Committee on Financial Sector Plan for North Eastern Region, July. ---------------------------: Half-Yearly Return on Advances to Priority Sectors, Rural Planning & Credit Department --------------------------Reserve Bank of India Bulletin, June 2006. Chapter 4: Human Development and Basic Services Aiken, Linda H., James Buchan, Julie Sochalski, Barbara Nichols, Mary Powell (2004) ‘Trends in International Nurse Migration,’ Health Affairs, posted May, 21, 2004 http://www.medscape.com /view article /475466_2 accessed May 31, 2007. Department of Public Health Engineering, Government of Nagaland, Water Communitisation in Nagaland. Government of India, Twelfth Finance Commission Report, based on Houses, Household Amenities, and Assets, RGI, 2001. Government of Nagaland, Directorate of School Education, VEC Speaks: Feedback from the Village Education Committees. India Sarva Shiksha Abhiyan (SSA) First Joint Review Mission State Report: Tripura (January 26-February 3, 2005). Kremer, Michael, K. Muralidharan, N. Chaudhury, J. Hammer, F. H. Rogers, ‘Teacher Absence in India: A Snapshot,’ Journal of the European Economic Association 3 (2-3): 658-667, 2005. http://go.worldbank.org/6LB90O9R00. Ministry of Health and Family Welfare, National Commission on Macroeconomics and Health 2005. Background Papers from the Report of the Task Force on Medical Education for the National Rural Health Mission. Government of India Ministry of Health and Family Welfare, Bulletin on RHS 2006. Ministry of Human Resource Development, Education in India, 1992-93, Vol. 1(5), Department of Education, Government of India.
-----------------------------------Annual Reports, various issues, Department of Planning and Education, . ----------------------------------Selected Educational Statistics, various years, Department of Secondary and Higher Education, Government of India National Institute of Educational Planning and Administration (NIEPA) (2005), Elementary Education in India: Where Do We Stand? Analytical Report 2004, New Delhi, pp. 189-206. National Council for Applied Economic Research (NCAER) (2004), East India Human Development Report, Delhi: Oxford University Press. National Council for Education Research and Training (NCERT) (2002) Seventh All-India Education Survey. National Sample Survey Organisation (NSSO) 61st Round (July 2004-June 2005) Employment and Unemployment; NSS Report No: 517, ‘Status of Education and Vocational Training in India, 2004-05’. OECD: Teachers Matter: Attracting, Developing and Retaining Effective Teachers, OECD Publishing, http://www.oecd.org/dataoecd/39/47/34990905.pdf Pearson, M., Impact and Expenditure Review, Part II Policy Issues. (2002) Department for International Development, UK Government, from the ‘Draft Report on the Recommendations of the Task Force on Public-Private Partnerships for the Eleventh Plan.’ Planning Commission (2002), Annual Report on the Working of State Electricity Boards & Electricity Departments (2001-02), Government of India http:// planningcommission.nic.in. ---------------------------(2007) Eleventh Plan Report on Public-Private Partnerships in Healthcare. Government of India ---------------------------(2007) , Draft Report on the Recommendation of the Task Force on Public-Private Partnerships for the Eleventh Plan. Pratham (2007) The Annual Status of Education Report (ASER), Rural, 2006 (Provisional), Delhi: Pratham Resource Centre. Report of the CABE (Central Advisory Board of Secondary Education) Committee on the Universalisation of Secondary Education, 2005. Sharma, Abhijit (2006) ‘Microfinance: Hope for the Poor’ Yojana vol. 50, December, New Delhi. University Grants Commission, University Development in India, 1995-96 to 2000-01, Information and Statistics Bureau New Delhi. Websites http://www.righttofoodindia.org/data/rtf06focusreportabridged.pdf (FOCUS Report) Educationforallinindia.com (Sarva Shiksha Abhiyan, DISE and DPEP)
http://www.nfhsindia.org/ (National Family and Health Survey of India) Ministry of Health and Family Welfare and International Institute for Population Sciences (IIPS). http://mohfw.nic.in/NRHM/NRHM(National%20Rural%20Health%20Mission).html National Rural Health Mission. http://www.rchindia.org/data.htm. Reproductive and Child Health (RCH Chapter 5 Manpower Planning and Employment Center for Monitoring the Indian Economy (CMIE), November, 2001. Chattopadhyay, S. (2006) ‘An Analytical Study of Fiscal Reforms in Manipur,’ Manpower Journal, Vol. XXXXI, No. 2, Delhi. Directorate General of Employment and Training, Employment Review various years. National Sample Survey Organisation (Reports 409, 458 and 515), Rounds 50th, 55th and 61st, Employment and Unemployment Situation in India, 1993-94, 1999-2000, 2004-2005. S Chattopadhyay (2006) ‘An Analytical Study of Fiscal Reforms in Manipur’ in Manpower Journal, Vol. XXXXI, No. 2, Delhi. Chapter 6: Infrastructure Manoj Pant, Economic Times, December 2004. World Bank (2006) The Inland Water Authority of India, Background Papers, March 2006. Websites powermin.nic.in Ministry of Power, Government of India. Chapter 7: Trade and the Look East Policy Association for Environment and Development Research (AEDR) (1999) ‘Nagaland, A Trade Model of Growth,’ Delhi. Bakht, Z. (1996) Cross-Border Illegal Trade in Bangladesh: Composition, Trends and Policy Issues, Bangladesh Institute of Development Studies (BIDS), Dhaka. Bakht, Z. and Binayak Sen (2002) Border Trade in the South Asian Growth Quadrangle (Bangladesh, Bhutan, India and Nepal), Bangladesh Institute of Development Studies, May. Bhagwati, J. (1982). ‘Alternative Theories of Illegal Trade: Economic Consequences and Statistical Detection.’ Weitwirstschfliches, Vol. XVII. Bhattacharjee, P.R. (1994) Economic Transition in Tripura, Delhi: Vikas Publishing House. Chaudhari, S.K. (1995). ‘Cross- Border Trade between India and Bangladesh’. National Council of Applied Economic Research (NCAER), New Delhi, working paper No. 58.
Ministry of Commerce (2002). Report of the Committee on Informal Cross-Border Trade, Government of India, July. Gurudas Das, N. Bijoy Singh and C.J. Thomas (eds) (2005) Indo-Myanmar Border Trade: Status, Problems and Potentials, New Delhi: Akansha. Hunter, William Wilson A Statistical Account of Assam: 1840-1900, London: Trubner & Co. Mizoram University Symposium, “Proceeding of the Eighth Annual Conference of the Northeast Economic Association”, (Ed), Lianzela, Thangchungnunga and Vanlalchhawna, Department of Economics, Mizoram University, Aizawl, November 16-17, 2006. Sanajaoba, N. Manipur - A British Anthology Vol. I, Akansha Publishing House. NCAER: ‘Trade Promotion Initiatives in the North Eastern Region’ also available at http://commerce.nic.in/annual2006-07/html/chapter12.html Krugman, P. and M. Obstfeld, (2000) International Economics: Theory and Policy, Singapore: Addison Wesley Longman. Palit, P.K. (2004) History of Religion in Tripura, Kaveri Books. Pohit, Sanjib, and Nisha Taneja (2000). ‘India’s Informal Trade with Bangladesh and Nepal: An Informal Assessment,’ Working Paper No. 58, Indian Council for Research on International Economic Relations, New Delhi. Rahman, A. and Razzaque. (1998). Informal Border Trade between Bangladesh and India: An Empirical Study in Selected Areas, The Asia Foundation. Rashid, M. Rehan and Tanveer Abbas (2003). Problems in Trade Finance between North East India and Bangladesh, Dhaka: South Asia Enterprise Development Facility (SEDF). Thiyam Bharat. ‘Indo-Myanmar Trade and the Economy of Manipur’, available at http://www.manipuronline.com/Economy/November2005/manipurmyanmartrade03_3.html UNCTAD, Review of Maritime Transport, 2005, Geneva. World Bank (1995) India and Bangladesh: Prospects for Economic Cooperation. Private Sector Development and Finance Division, South Asia Country Department I, Washington D.C. --------------------(2006) India-Bangladesh Bilateral Trade and Potential Free Trade Agreement, Bangladesh Development Series, Paper no. 13, Poverty Reduction and Economic Management Unit, Washington D.C. Websites http://commerce.nic.in/eidb/ergnent.asp Department of Commerce, Export Import Data Bank, http://en.wikipedia.org/wiki/Manipur http://en.wikipedia.org/wiki/Mizoram
http://en.wikipedia.org/wiki/sikkim http://www.ide.go.jp/English/Publish/Jrp/pdf/jrp_133_05.pdf Chapter 8: Public Finances for Development Comptroller and Auditor General (CAG) (2006), Audit Report (Commercial) 2005-06. Reserve Bank of India: State Finances-A Study of Budgets, various issues Reserve Bank of India Report of the Advisory Committee on Ways and Means Advances to State Governments. Ministry of Finance (2004), Report of Twelfth Finance Commission, Government of India Chapter 9 Enabling Private Sector Participation Sarma, Atul, ‘Development Strategy in the Northeast in the Context of Globalisation,’ mimeograph (www.satp.org). Chapter 10 Governance and Security Atul Sarma, ‘Why the Northeastern States Continue to Decelerate,’ unpublished, 2005. Barua, Alokesh (2005) ‘Introduction’ in Alokesh Barua (ed.) India’s North-east: Developmental Issues in a Historical Perspective”, Delhi: Manohar. Gohain, Hiren, ‘Development and Decolonisation’ in Alokesh Barua (ed.) India’s North-east: Developmental Issues in a Historical Perspective” Delhi: Manohar. Government of India (2002). National Commission to Review the Working of the Constitution (NCRWC), Ministry of Law, Justice and Company Affairs. http://lawmin.nic.in/ncrwc/finalreport.htm Government of Nagaland, (2004): VEC Speak. Directorate of School Education Sachdeva, Gulshan (2005) ‘North-Eastern Economy: New Policy Options’ in Alokesh Barua (ed) “India’s North-east: Developmental Issues in a Historical Perspective” Delhi: Manohar. Chapter 6 Grassroots Planning and Decentralized Service Delivery Bohra, O.P. (2006) ‘Fiscal Decentralisation and Local Governments in the North-East States: A Comparative Study of Local Institutions in North-East States’ in Manpower Journal, vol. XXXXI, No. 2. April-June, pp. 189-223. Government of Nagaland (2004), Communitisation and Resurgence of Naga Social Capital, Department of Planning and Coordination an UNICEF, Delhi.
Institute of Social Sciences (2000) Status of Panchayati Raj in the States and Union Territories of India, Delhi: Concept Publishing Company. ------------------------------(2007) Panchayat Raj Update, January. Population Foundation of India Ministry of Panchayati Raj (2006) Report of the Expert Group on Planning at the Grassroots Level: An Action Programme for the Eleventh Five-Year Plan. Government of India. ----------------------------------(2006): ‘The State of the Panchayats: A Mid-Term Review and Appraisal’, vols. II, III, Government of India. Rao, M.G., and U.A.V. Rao. (2007) ‘Expanding the Resource Envelope of Panchayats: Augmenting Own Revenues,’ paper submitted at the National Seminar on Panchayat-Level Resource Mobilisation and Efficient Fiscal Transfer, Ministry of Panchayati Raj, Government of India, at National Institute of Public Finance and Policy, New Delhi, July 6-7. United Nations (2007): Decentralisation Community. Solution Exchange: An Initiative of the United Nations in India. http://www.solutionexchange-un.net.in/index.htm
1
ABBREVIATIONS ADC: Autonomous District Council
AEZ: Agri-Export Zone
AIDS: Acquired Immuno-Deficiency Syndrome
APEDA: Agricultural Processed Food Products Export development
ASEAN: Association of South-East Asian Nations
ASI: Annual Survey of Industries
ASIDE: Assistance to States for Infrastructure development for Exports
BRO: Border Roads Organisation
CAA: Constitutional Amendment Act
CDR Credit-Deposit Ratio
CDM: Clean Development Mechanism
CDMU: Crop Development and Marketing Unit
CIBS: Critical Infrastructure Balance Scheme
CSO: Central Statistical Organisation
CWC: Central Warehousing Corporation
DGFT: Director-General Foreign Trade
DI: Dependency Index
DIC: District Industrial Center
DIM: Demand Intensity Measure
DRDA: District Rural Development Agency
EDF: Export Development Fund
EU: European Union
GDP: Gross Domestic Product
GSDP: Gross State Domestic Products
ICT: Information Communication Technology
IGNOU: Indira Gandhi National Open University
IMP: Indigenous Medical Practitioner
IMR: Infant Mortality Rate
IPC: Indian Penal Code
IT: Information technology
ITES: Information Technology-Enabled Services
IWAI: Inland Waterways Authority of India
IWT: Inland Water Transport
2
IWTT: Indian Water Transit and Trade
JNNURM: Jawaharlal Nehru National Urban Renewal Mission
KLO: Kamtapuri Liberation Organisation
L/C: Letter of Credit
LCS: Land Customs Station
LE Policy: Look East Policy
MDM: Mid-Day Meal
MMR: Maternal Mortality Rate
NBFIs: Non-Banking Financial Intermediaries
NCERT: National Council of Education Research and Training
NDFB: National Democratic Front of Bodoland
NEC: North Eastern Council
NEDFI: North Eastern Development Finance Corporation
NEEPCO: North Eastern Electric Power Corporation
NEIIPP: North East Industrial and Investment Promotion Policy
NER: North East Region
NFCF: Net Fixed Capital Formation
NFHS: National Family Health Survey
NGO: Non-Governmental Organisation
NIC: National Industrial Classification
NLCPR: Non-Lapsable Central Pool of Resources
NMBA: National Mission on Bamboo Applications
NRHM: National Rural Health Mission
NSDP: Net State Domestic Product
NTDC: Northeast Tourism Development Corporation
NTFPs: Non-Timber Forest Products
OGL: Open General License
PHC: Primary Health Centre
PRI: Panchayati Raj Institution
PURA: Providing Urban Amenities In Rural Areas
RSI: Regional Specialisation Index
SC: Schedule Caste
SHG: Self-Help Group
SME: School Management Committee
SSA: Sarva Shiksha Abhiyan
3
SSI: Small-Scale Industry
SSSBEs: Small-Scale Services and Business Enterprises
ST: Scheduled Tribe
STC: State Trading Corporation
STOL: Short Take-off-and-Landing
ULB: Urban Local Body
ULFA: United Liberation Front of Assam
VC: Village Council
VDC: Village Development Committee
VEC: Village Education Committee
VET: Vocational education Training
1
List of Tables and Annexures Chapter 1: Tables
1.1A Sectoral Shares in NSDP
1.2A Rates of Agriculture in the Northeast, 1993-94 to 2002-03
1.3A Share of Agricultural Products, Forestry and Fishing in Agriculture
1.4A Forest Production, 2001-02
1.5A Livestock Production
1.6A Ratio of Livestock to Population
1.7A Fish Production, 2003-04
1.8A Growth of the Primary Sector, 1993-94 to 2002-03
1.9A Mineral Production in NE States, 2003-04
1.10A Ratio of Mineral Production to Geographic Area
1.11A Coal Reserves, 2000-01
1.12A Mineral Production, 1998-99 to 2000-01
1.13A State-Wise Major Mineral Resources, 2000-01
1.14A Major Crops Cultivated
1.15A Highest Comparative Advantage for Products of NER States: RSI
1.16A NSI: Highest Comparative Advantage of Products of NE States
1.17A Relative Productivity of Principal Crops in the NER in 2003-04.
1.18A Regional Specialisation Index (RSI) for NE states, 2003-04
1.19A National Specialisation Index (NSI) for NE States, 2003-04
1.20A Demand Intensity Measure (DSI)
1.21A Dependency Index (DI), 2003-04
1.22A Dependency Index for Milk, Meat, Egg & Fish
Chapter 2: Tables
2.1A Share of Manufacturing in NSDP, 1993-94 to 2002-03
2.2A Growth of Manufacturing, 1993-94 to 2002-03
2.3A Registered and Unregistered Sectors, 2003-04
2.4A Employment, Output and NFCF in Registered Manufacturing 2002-03
2.5A Small-Scale Industries (SSIs), 2001-02
2.6A Growth in SSIs, 1997-98 to 2002-03
2.7A Distribution of Small Scale Industries (SSIs) Across Activities, 2001-02
2.8A Distribution of SSIs, Ancillaries and Service/Business Enterprises,
2001-02
2
2.9A Gross Output and Employment in Small-Scale Industry, 2001-02
2.10A Distribution of Fixed Investment in Small-Scale Industry, 2001-02
2.11A Sick and Incipient Sick Units in Small-Scale Industry, 2001-03
2.12A Exporting Units among Small-Scale Industry, 2001-02
2.13A Value of Exports in Small-Scale Industry, 2001-02
2.14A Tea Industry, 2000-2004
2.15A Handicrafts in the NE States, 1995-96
2.16A Distribution of Handlooms in NER, 1995-96
2.17A Bamboo Resources of the Northeast
2.18A NIC 98 - 3 Digit Industries in the NE states
2.19A (a) Large-Scale Industry in Assam
1.19A (b) Large Scale Industry in Manipur
1.19A © Large Scale Industry in Meghalaya
1.19A (d) Large Scale Industry in Nagaland
1.19A (e) Large Scale Industry in Tripura
1.20A Trend of SSI Growth in the NER from 1997-98 to 2002-03
1.21A Major Small-Scale Industry in the Northeast
1.22A State wise Major Craft Group in NE states
1.23A Artisan Households Dependant on Handloom and Handicrafts
as a Source of Livelihood
Chapter 3: Tables
3.1A Share of Services in NSDP
3.2A Components of Net State Domestic Product at Factor Cost by Industry of
Origin
3.3A Services Sector Components in Total Services
3.4A Credit Deposit Ratios, 1997-98 to 2004-05
3.5A Credit-Deposit Ratio: NER States Relative to India
3.6A Distribution of Outstanding Advances of Scheduled Commercial Banks
to Agriculture, 2004 and 2005
3.7A Distribution of Outstanding Advances of Scheduled Commercial Banks,
2004 and 2005
3.8A Employment in Hotels and Restaurants
3.9A Tourist Attractions and Tourist Arrivals
3.10A Tourists Per Lakh Population
3
3.11A Recognized Travel Agencies, Tour Operators, 2000
3.12A Approved Hotels and Rooms, December 31, 2005
3.13A Low Budget Hotels (February 2002)
Chapter 4: Tables Tables 4A: Education 4.1A Trends in Literacy Rates, 1991-2001
4.2A Gross Enrolment Ratio# in NER 2003-04
4.3A Gross Enrolment Ratio for Scheduled Caste (SC) Students (2004-05)
4.4A Gross Enrolment Ratio for Scheduled Tribe (ST) Students (2004-05)
4.5A Drop-Out Rates in Classes I-X
4.6A Reasons for Not Attending any Education Institution by Gender, 2004
4.7A Reasons for Not Attending any Educational Institution:
Rural-Urban, 2004
4.8A Primary and Upper Primary School Performance, 2003-04 and 2004-05
4.9A Performance in Class XII CBSE Examination by Region and Gender
4.10A Expansion in the Number of Schools, 1993-2002
4.11A Private vs. Public Schools in the NER 2005
4.12A Access to Rural Schools: 2002
4.13A Essential Facilities in Schools 2004
4.14A Laboratory and Computer Facilities in Secondary and Higher
Secondary Schools
4.15A Proportion of Trained Teachers and Ratio of Female Teachers
4.16A Female/Male Teacher Ratio and Pupil-Teacher Ratio, 2003-04
4.17A College Enrolment by Subject Stream (General), 2000-01
4.18A Progress on Communitisation of Elementary Education in Nagaland
Tables 4B: Health 4.19A Supply of Rural Health Infrastructure, 2005
4.20A Trends in Infant Mortality Rate, 1992-2006
4.21A Women Availing of Antenatal Care and Institutional Deliveries,
(1992-2006)
4.22A Specialists at CHCs (Sept. 2005)
4.23A Supply of Equipment and Staff at PHCs
4.24A Public and Household Health Expenditure, 2004-05
4
4.25A Lifestyle Health-Related Indicators, 1998-99
4.26A Children’s Nutritional Status and Immunisation
4.27A Anaemia in Children (6-35 months)
4.28A Anaemia (Ever-married and Pregnant Women)
Table 4C: Basic Services 4.29A Housing Conditions in the Northeast
4.30A Households with Access to Toilet Facilities
4.31A Households’ Access to Safe Drinking Water: Tap, Handpump, Tubewell
4.32A Distribution of Households by Deprivation: 2001 4.33A Households with Electricity Connections
4.34A Per Capita Consumption of Electricity
4.35A Change in Urban Population, 1981-2001
4.36A SHG-Bank Linkages in the NER: March 2005
Chapter 5: Tables
5.1A Population by Age Groups (2001)
5.2A Employment in the Organized Sector
5.3A Growth in Employment, 1983-1994 and 1994-2000
5.4A Labour Force Participation Rates
5.5A Workforce Participation Rates
5.6A Changing Composition of Workforce (% of Total Population)
5.7A (a) Number of Usually Working (Principal) Persons (15 years and above)
who Sought or were Available for Alternative Work per 100 Usually
Working (principal) Persons (15 years and above)
5.7A (b) Number of Usually Working (Principal) Persons (15 years and above)
who Sought or were Available for Alternative Work per 100 Usually
Working (principal) Persons (15 years and above)
5.8A (a) Number of Usually Working (Principal) Persons (15 years and above)
who Sought or were Available for Additional Work per 100 Usually
Working (principal) Persons (15 years and above)
5.8A (b) Number of Usually Working (Principal) Persons (15 years and above)
who Sought or were Available for Additional Work per 100 Usually
5
Working (principal) Persons (15 years and above)
5.9A Sectoral Distribution of Workers (2001)
5.10A Distribution of Workers as Cultivators, Agricultural Labourers and Other
Workers
5.11A (a) Distribution of Usually Employed by Category of Employment (Rural)
5.11A (b) Distribution of Usually Employed by Category of Employment (Urban
5.12A (a) Unemployment in NER States
5.12A (b) Principal Status Unemployment Rate among the Youth (15-29 years) for
NER (Percentage)
5.12A © Principal Status Unemployment Rate among the Youth (15-29 years) for
NER (Percentage)
5.13A (a) Average Daily Wages for Rural Casual Workers Engaged in Public Works
5.13A (b) Average Daily Wages for Rural Casual Workers in Non-Public* Works
5.14A Distribution of Usually Working People in the Principal and Subsidiary
Status (Urban)
5.15A Distribution of Usually Working Persons in the Principal and Subsidiary
Status by Broad Industry Category
* Chapter 6: Tables 6.1A Shares of Infrastructure Sector of NER States
6.2A Growth Rates of Infrastructure of NER, 1993-94 to 2002-03
6.3A State-wise Road Length per 100 Square Kilometres of Area and Per Lakh
of Population in NER
6.4A Types of Road in NER
6.5A Details of National Highways in NER
6.6A State-wise Density of Rail Routes in NER
6.7A Domestic Traffic (Aircraft Movements) at Top 46 Airports in NER
6.8A Total and Navigable Length of Important Rivers in NER
6.9A Major Identified Cargo Routes for NW-2
6.10A Cargo Moved on Brahmaputra in India (in Tones)
6.11A Details of Ferry Service in NER
6.12A State wise Demand/Supply of Power in NER
6.13A State wise Total Energy Consumption by Ultimate Consumers in NER,
6
1997-1998 to 2004-2005
6.14A State wise Electricity Generation and Consumption
6.15A State wise Installed Capacity in NER
6.16A Capacity by State, Central and Private Sources, August 31, 2006
6.17A State wise Teledensity in NER
6.18A State wise Telephone Exchanges in NER, 1998-99 to 2000-01
6.19A State-wise Number of Internet Subscribers in NER
Chapter 7: Tables 7.1A India’s Trade with ASEAN, China, EU and USA
7.2A India’s trade with Myanmar
7.3A India’s Exports to Bangladesh 2003/04 (from Indian export statistics)
7.4A India’s Trade with Bangladesh
7.5A Indian Water Transit and Trade (IWTT) between Bangladesh and India
(2000-2001 to 2005-2006)
7.6A India’s Trade with China
7.7A India’s Informal Trade with Bangladesh, 2002: Bangladesh Imports from
India
7.8A Commodity Composition of Informal Trade, India-Bangladesh (2002)
Chapter 8: Tables 8.1A Averages Composition of Receipts of NER State Chapter 9: Tables 9.1A Employment in the Organised Sector 9.2A Installed Capacity Chapter 10: Tables
10.1A Incidence of Cognizable Crime under IPC per Lakh Population in NER:
1981 to 2003
10.2A State-wise Number of Incidents of Terrorist Violence in NER: 2004 to 2006
10.3A Status of Militancy in NER States of India: 2003 to 2004
7
10.4A Number of Violent Incidents Committed by ULFA, NDFB and KLO
10.5A Strength of Police Force in NER: 1981 to 2003
10.6A State-wise Police Expenditure and Training Expenditure per one lakh
population in NER: 2000-01 to 2004-05
Chapter 11: Tables
11.1A Composition and Number of Local Governments in NER States
11.2A Number and Structure of Local Governments of ULBs in NER States
11.3A Status of Elected Panchayat Representatives at All Levels as on 01.12.2006
11.4A No of Department/subject transferred and yet to be transferred to
Panchayat
11.5A NER States: Status of Activities Mapping of PRI
11.6A Activity Mapping Distribution of Functions
11.7A Number and Structure of Local Governments of ULBs in NER States
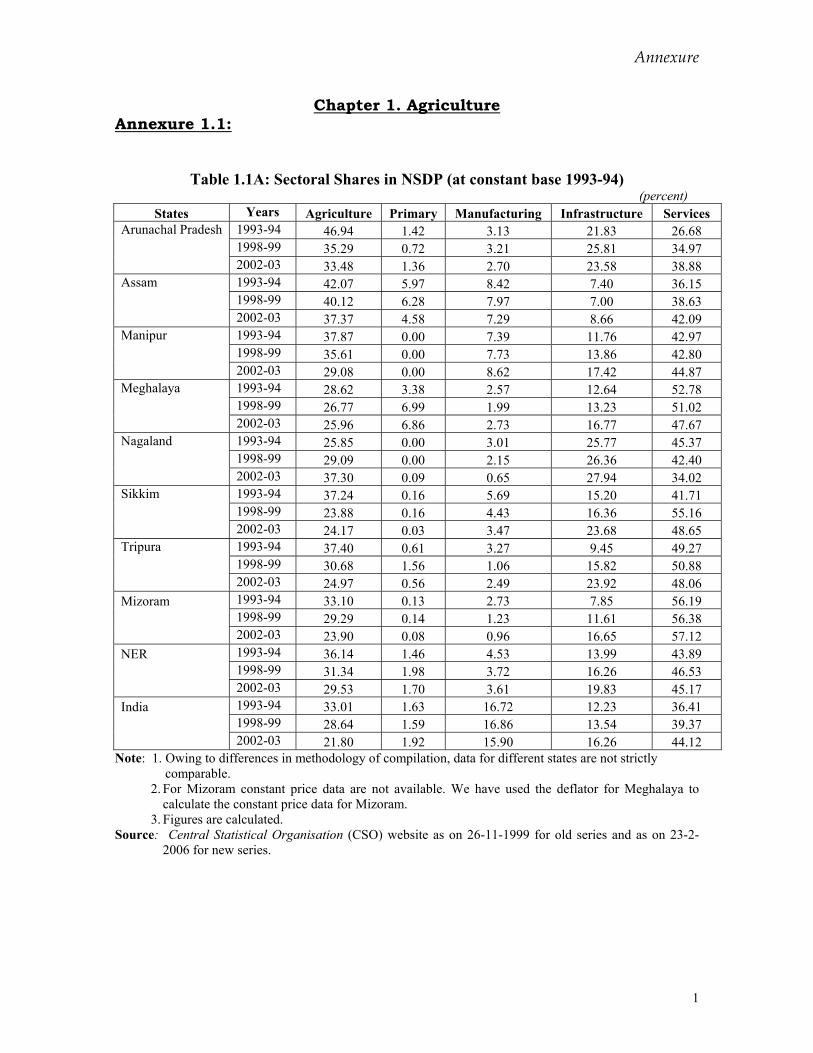
Annexure
1
Chapter 1. Agriculture Annexure 1.1:
Table 1.1A: Sectoral Shares in NSDP (at constant base 1993-94) (percent)
States Years Agriculture Primary Manufacturing Infrastructure Services Arunachal Pradesh 1993-94 46.94 1.42 3.13 21.83 26.68 1998-99 35.29 0.72 3.21 25.81 34.97 2002-03 33.48 1.36 2.70 23.58 38.88 Assam 1993-94 42.07 5.97 8.42 7.40 36.15 1998-99 40.12 6.28 7.97 7.00 38.63 2002-03 37.37 4.58 7.29 8.66 42.09 Manipur 1993-94 37.87 0.00 7.39 11.76 42.97 1998-99 35.61 0.00 7.73 13.86 42.80 2002-03 29.08 0.00 8.62 17.42 44.87 Meghalaya 1993-94 28.62 3.38 2.57 12.64 52.78 1998-99 26.77 6.99 1.99 13.23 51.02 2002-03 25.96 6.86 2.73 16.77 47.67 Nagaland 1993-94 25.85 0.00 3.01 25.77 45.37 1998-99 29.09 0.00 2.15 26.36 42.40 2002-03 37.30 0.09 0.65 27.94 34.02 Sikkim 1993-94 37.24 0.16 5.69 15.20 41.71 1998-99 23.88 0.16 4.43 16.36 55.16 2002-03 24.17 0.03 3.47 23.68 48.65 Tripura 1993-94 37.40 0.61 3.27 9.45 49.27 1998-99 30.68 1.56 1.06 15.82 50.88 2002-03 24.97 0.56 2.49 23.92 48.06 Mizoram 1993-94 33.10 0.13 2.73 7.85 56.19 1998-99 29.29 0.14 1.23 11.61 56.38 2002-03 23.90 0.08 0.96 16.65 57.12 NER 1993-94 36.14 1.46 4.53 13.99 43.89 1998-99 31.34 1.98 3.72 16.26 46.53 2002-03 29.53 1.70 3.61 19.83 45.17 India 1993-94 33.01 1.63 16.72 12.23 36.41 1998-99 28.64 1.59 16.86 13.54 39.37 2002-03 21.80 1.92 15.90 16.26 44.12
Note: 1. Owing to differences in methodology of compilation, data for different states are not strictly comparable.
2. For Mizoram constant price data are not available. We have used the deflator for Meghalaya to calculate the constant price data for Mizoram.
3. Figures are calculated. Source: Central Statistical Organisation (CSO) website as on 26-11-1999 for old series and as on 23-2-
2006 for new series.
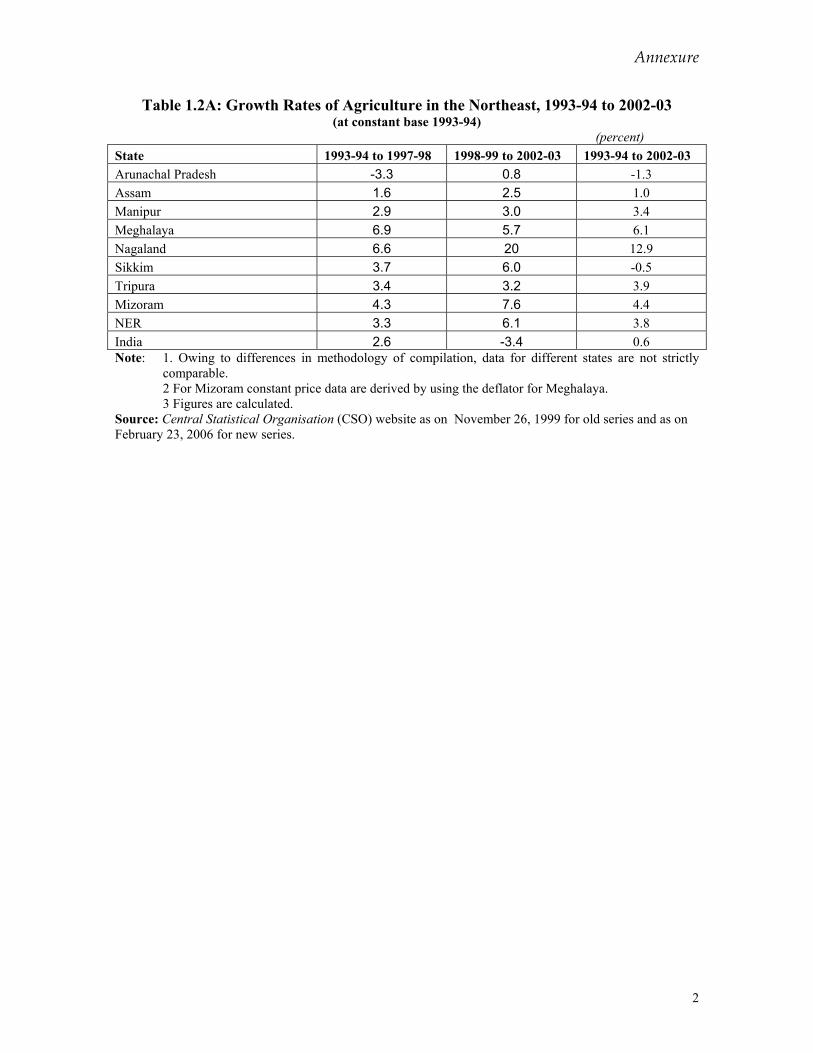
Annexure
2
Table 1.2A: Growth Rates of Agriculture in the Northeast, 1993-94 to 2002-03 (at constant base 1993-94)
(percent) State 1993-94 to 1997-98 1998-99 to 2002-03 1993-94 to 2002-03 Arunachal Pradesh -3.3 0.8 -1.3 Assam 1.6 2.5 1.0 Manipur 2.9 3.0 3.4 Meghalaya 6.9 5.7 6.1 Nagaland 6.6 20 12.9 Sikkim 3.7 6.0 -0.5 Tripura 3.4 3.2 3.9 Mizoram 4.3 7.6 4.4 NER 3.3 6.1 3.8 India 2.6 -3.4 0.6 Note: 1. Owing to differences in methodology of compilation, data for different states are not strictly
comparable. 2 For Mizoram constant price data are derived by using the deflator for Meghalaya. 3 Figures are calculated.
Source: Central Statistical Organisation (CSO) website as on November 26, 1999 for old series and as on February 23, 2006 for new series.
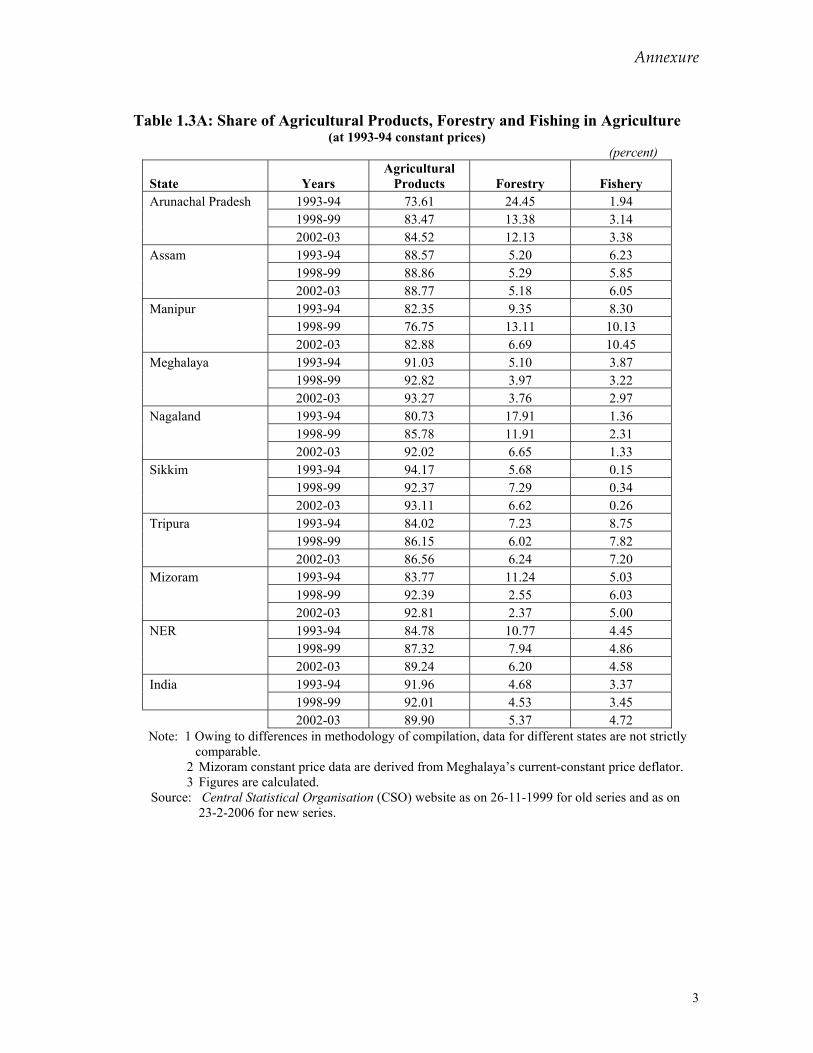
Annexure
3
Table 1.3A: Share of Agricultural Products, Forestry and Fishing in Agriculture
(at 1993-94 constant prices) (percent)
State Years Agricultural
Products Forestry Fishery Arunachal Pradesh 1993-94 73.61 24.45 1.94 1998-99 83.47 13.38 3.14 2002-03 84.52 12.13 3.38 Assam 1993-94 88.57 5.20 6.23 1998-99 88.86 5.29 5.85 2002-03 88.77 5.18 6.05 Manipur 1993-94 82.35 9.35 8.30 1998-99 76.75 13.11 10.13 2002-03 82.88 6.69 10.45 Meghalaya 1993-94 91.03 5.10 3.87 1998-99 92.82 3.97 3.22 2002-03 93.27 3.76 2.97 Nagaland 1993-94 80.73 17.91 1.36 1998-99 85.78 11.91 2.31 2002-03 92.02 6.65 1.33 Sikkim 1993-94 94.17 5.68 0.15 1998-99 92.37 7.29 0.34 2002-03 93.11 6.62 0.26 Tripura 1993-94 84.02 7.23 8.75 1998-99 86.15 6.02 7.82 2002-03 86.56 6.24 7.20 Mizoram 1993-94 83.77 11.24 5.03 1998-99 92.39 2.55 6.03 2002-03 92.81 2.37 5.00 NER 1993-94 84.78 10.77 4.45 1998-99 87.32 7.94 4.86 2002-03 89.24 6.20 4.58 India 1993-94 91.96 4.68 3.37 1998-99 92.01 4.53 3.45 2002-03 89.90 5.37 4.72
Note: 1 Owing to differences in methodology of compilation, data for different states are not strictly comparable.
2 Mizoram constant price data are derived from Meghalaya’s current-constant price deflator. 3 Figures are calculated.
Source: Central Statistical Organisation (CSO) website as on 26-11-1999 for old series and as on 23-2-2006 for new series.
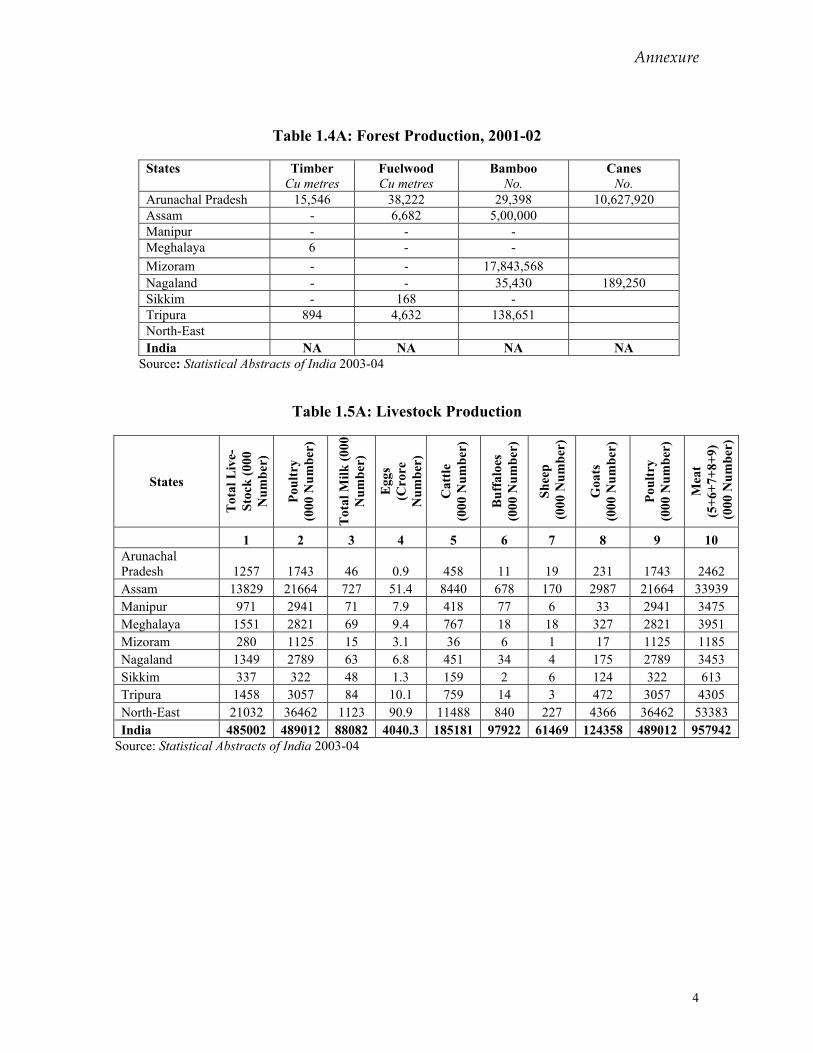
Annexure
4
Table 1.4A: Forest Production, 2001-02
States Timber Cu metres
Fuelwood Cu metres
Bamboo No.
Canes No.
Arunachal Pradesh 15,546 38,222 29,398 10,627,920 Assam - 6,682 5,00,000 Manipur - - - Meghalaya 6 - - Mizoram - - 17,843,568 Nagaland - - 35,430 189,250 Sikkim - 168 - Tripura 894 4,632 138,651 North-East India NA NA NA NA
Source: Statistical Abstracts of India 2003-04
Table 1.5A: Livestock Production
States
Tot
al L
ive-
Stoc
k (0
00
Num
ber)
Poul
try
(0
00 N
umbe
r)
Tot
al M
ilk (0
00
Num
ber)
Egg
s (C
rore
N
umbe
r)
Cat
tle
(000
Num
ber)
Buf
falo
es
(000
Num
ber)
Shee
p (0
00 N
umbe
r)
Goa
ts
(000
Num
ber)
Poul
try
(0
00 N
umbe
r)
Mea
t (5
+6+7
+8+9
) (0
00 N
umbe
r)
1 2 3 4 5 6 7 8 9 10 Arunachal Pradesh 1257 1743 46 0.9 458 11 19 231 1743 2462 Assam 13829 21664 727 51.4 8440 678 170 2987 21664 33939 Manipur 971 2941 71 7.9 418 77 6 33 2941 3475 Meghalaya 1551 2821 69 9.4 767 18 18 327 2821 3951 Mizoram 280 1125 15 3.1 36 6 1 17 1125 1185 Nagaland 1349 2789 63 6.8 451 34 4 175 2789 3453 Sikkim 337 322 48 1.3 159 2 6 124 322 613 Tripura 1458 3057 84 10.1 759 14 3 472 3057 4305 North-East 21032 36462 1123 90.9 11488 840 227 4366 36462 53383 India 485002 489012 88082 4040.3 185181 97922 61469 124358 489012 957942
Source: Statistical Abstracts of India 2003-04
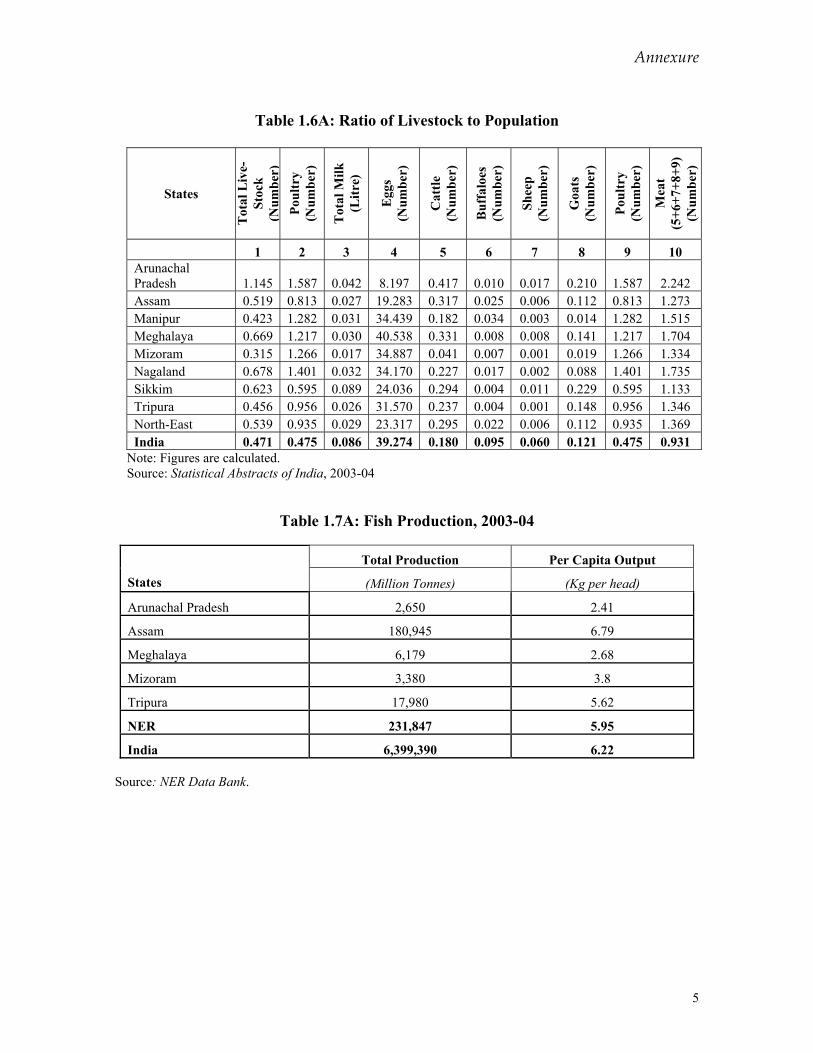
Annexure
5
Table 1.6A: Ratio of Livestock to Population
States
Tot
al L
ive-
Stoc
k (N
umbe
r)
Poul
try
(N
umbe
r)
Tot
al M
ilk
(Litr
e)
Egg
s (N
umbe
r)
Cat
tle
(Num
ber)
Buf
falo
es
(Num
ber)
Shee
p
(Num
ber)
Goa
ts
(Num
ber)
Poul
try
(N
umbe
r)
Mea
t (5
+6+7
+8+9
) (N
umbe
r)
1 2 3 4 5 6 7 8 9 10 Arunachal Pradesh 1.145 1.587 0.042 8.197 0.417 0.010 0.017 0.210 1.587 2.242 Assam 0.519 0.813 0.027 19.283 0.317 0.025 0.006 0.112 0.813 1.273 Manipur 0.423 1.282 0.031 34.439 0.182 0.034 0.003 0.014 1.282 1.515 Meghalaya 0.669 1.217 0.030 40.538 0.331 0.008 0.008 0.141 1.217 1.704 Mizoram 0.315 1.266 0.017 34.887 0.041 0.007 0.001 0.019 1.266 1.334 Nagaland 0.678 1.401 0.032 34.170 0.227 0.017 0.002 0.088 1.401 1.735 Sikkim 0.623 0.595 0.089 24.036 0.294 0.004 0.011 0.229 0.595 1.133 Tripura 0.456 0.956 0.026 31.570 0.237 0.004 0.001 0.148 0.956 1.346 North-East 0.539 0.935 0.029 23.317 0.295 0.022 0.006 0.112 0.935 1.369 India 0.471 0.475 0.086 39.274 0.180 0.095 0.060 0.121 0.475 0.931
Note: Figures are calculated. Source: Statistical Abstracts of India, 2003-04
Table 1.7A: Fish Production, 2003-04
Total Production Per Capita Output
States (Million Tonnes) (Kg per head)
Arunachal Pradesh 2,650 2.41
Assam 180,945 6.79
Meghalaya 6,179 2.68
Mizoram 3,380 3.8
Tripura 17,980 5.62
NER 231,847 5.95
India 6,399,390 6.22 Source: NER Data Bank.
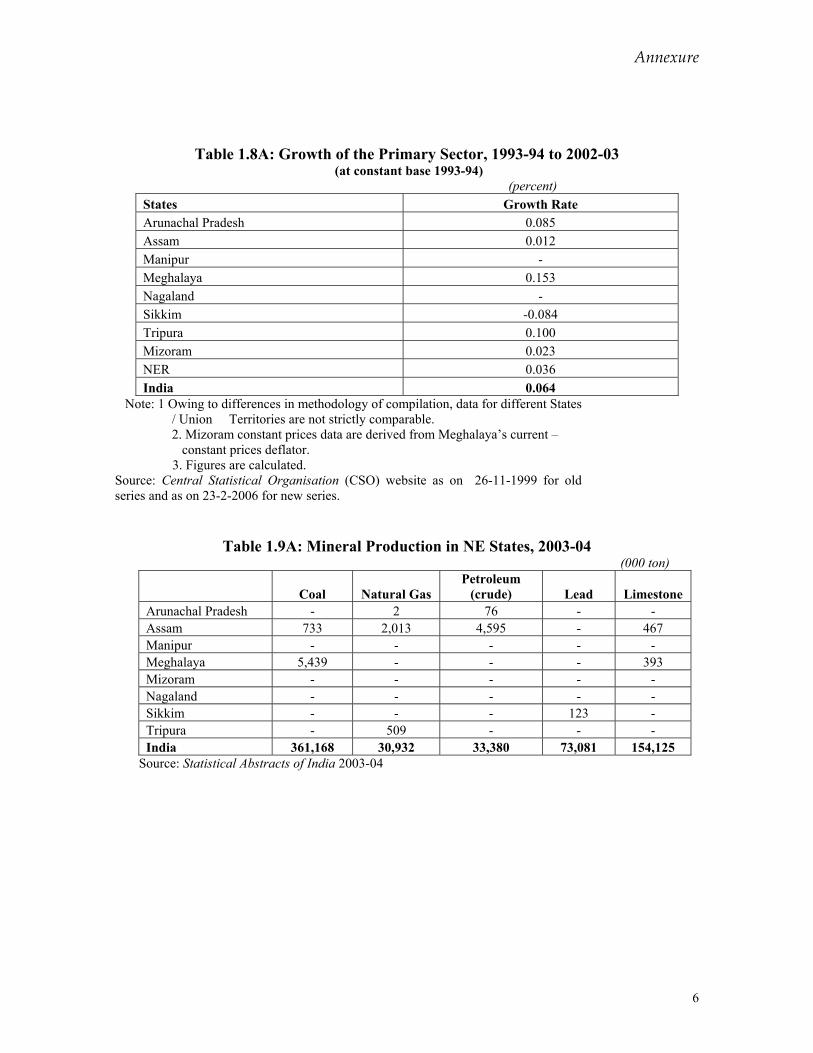
Annexure
6
Table 1.8A: Growth of the Primary Sector, 1993-94 to 2002-03 (at constant base 1993-94)
(percent) States Growth Rate Arunachal Pradesh 0.085 Assam 0.012 Manipur - Meghalaya 0.153 Nagaland - Sikkim -0.084 Tripura 0.100 Mizoram 0.023 NER 0.036 India 0.064
Note: 1 Owing to differences in methodology of compilation, data for different States / Union Territories are not strictly comparable. 2. Mizoram constant prices data are derived from Meghalaya’s current – constant prices deflator.
3. Figures are calculated. Source: Central Statistical Organisation (CSO) website as on 26-11-1999 for old series and as on 23-2-2006 for new series.
Table 1.9A: Mineral Production in NE States, 2003-04
(000 ton)
Coal Natural Gas Petroleum
(crude) Lead Limestone Arunachal Pradesh - 2 76 - - Assam 733 2,013 4,595 - 467 Manipur - - - - - Meghalaya 5,439 - - - 393 Mizoram - - - - - Nagaland - - - - - Sikkim - - - 123 - Tripura - 509 - - - India 361,168 30,932 33,380 73,081 154,125
Source: Statistical Abstracts of India 2003-04
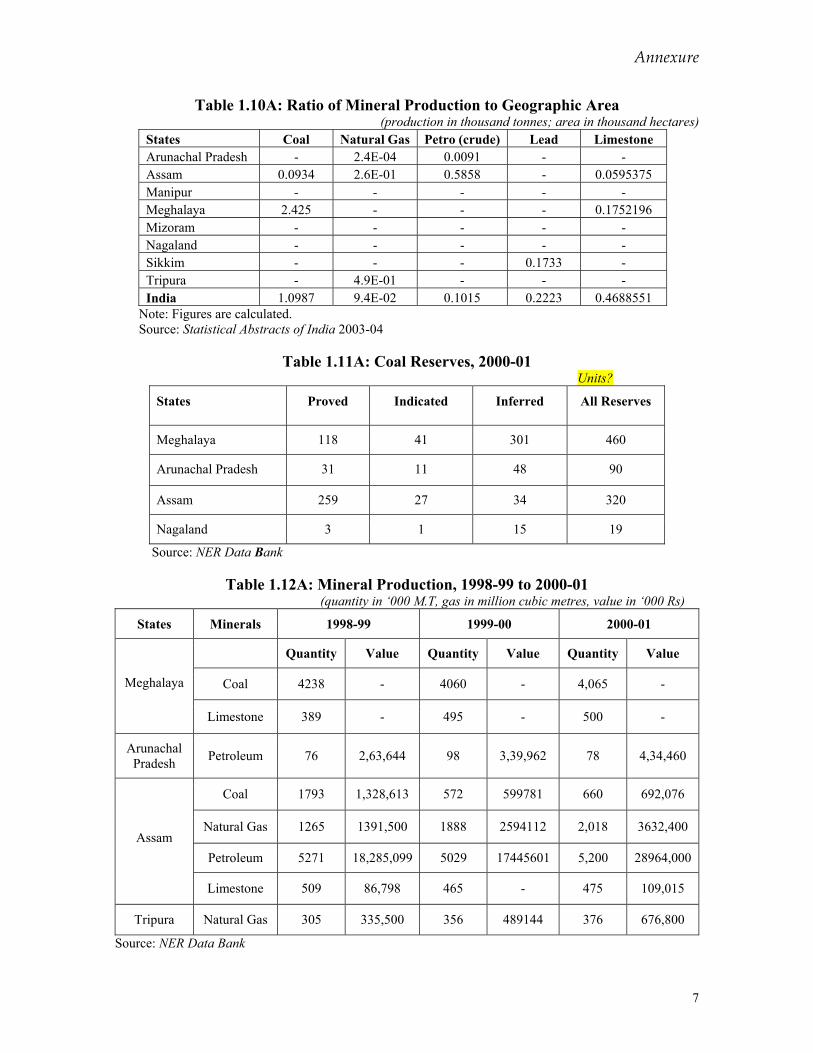
Annexure
7
Table 1.10A: Ratio of Mineral Production to Geographic Area (production in thousand tonnes; area in thousand hectares)
States Coal Natural Gas Petro (crude) Lead Limestone Arunachal Pradesh - 2.4E-04 0.0091 - - Assam 0.0934 2.6E-01 0.5858 - 0.0595375 Manipur - - - - - Meghalaya 2.425 - - - 0.1752196 Mizoram - - - - - Nagaland - - - - - Sikkim - - - 0.1733 - Tripura - 4.9E-01 - - - India 1.0987 9.4E-02 0.1015 0.2223 0.4688551
Note: Figures are calculated. Source: Statistical Abstracts of India 2003-04
Table 1.11A: Coal Reserves, 2000-01 Units?
States Proved Indicated Inferred All Reserves
Meghalaya 118 41 301 460
Arunachal Pradesh 31 11 48 90
Assam 259 27 34 320
Nagaland 3 1 15 19
Source: NER Data Bank
Table 1.12A: Mineral Production, 1998-99 to 2000-01 (quantity in ‘000 M.T, gas in million cubic metres, value in ‘000 Rs)
States Minerals 1998-99 1999-00 2000-01
Quantity Value Quantity Value Quantity Value
Coal 4238 - 4060 - 4,065 - Meghalaya
Limestone 389 - 495 - 500 -
Arunachal Pradesh Petroleum 76 2,63,644 98 3,39,962 78 4,34,460
Coal 1793 1,328,613 572 599781 660 692,076
Natural Gas 1265 1391,500 1888 2594112 2,018 3632,400
Petroleum 5271 18,285,099 5029 17445601 5,200 28964,000 Assam
Limestone 509 86,798 465 - 475 109,015
Tripura Natural Gas 305 335,500 356 489144 376 676,800
Source: NER Data Bank
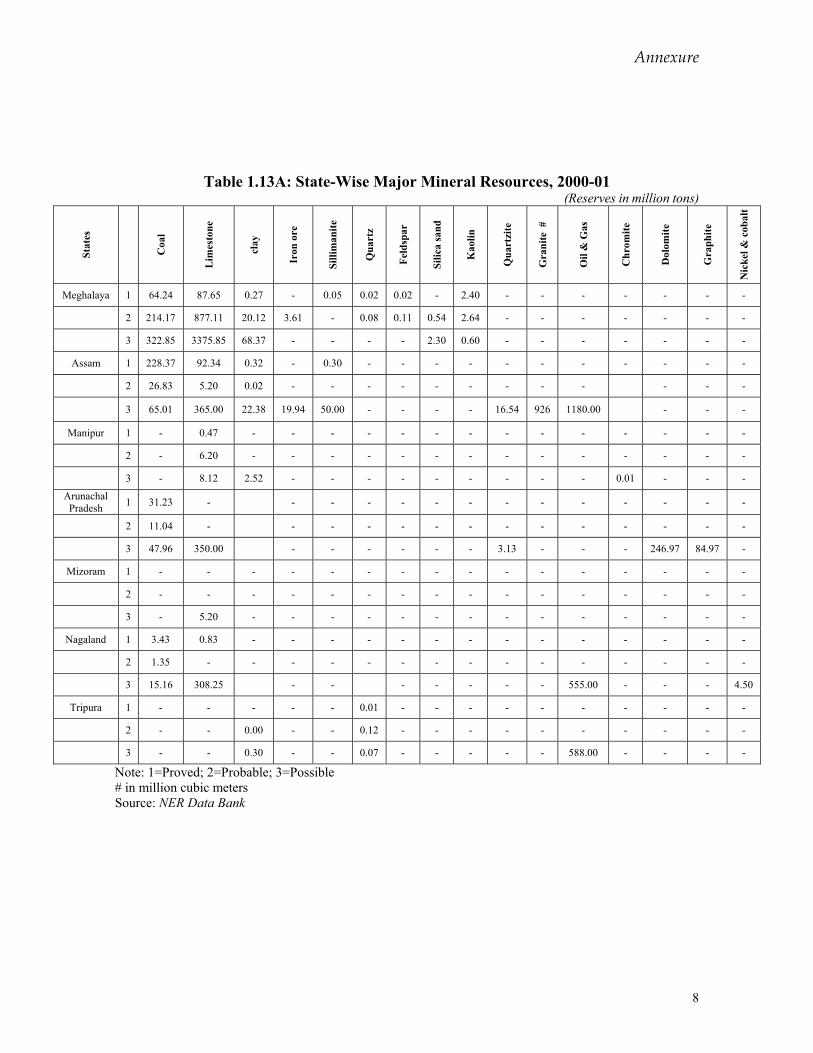
Annexure
8
Table 1.13A: State-Wise Major Mineral Resources, 2000-01 (Reserves in million tons)
Stat
es
Coa
l
Lim
esto
ne
clay
Iron
ore
Silli
man
ite
Qua
rtz
Feld
spar
Silic
a sa
nd
Kao
lin
Qua
rtzi
te
Gra
nite
#
Oil
& G
as
Chr
omite
Dol
omite
Gra
phite
Nic
kel &
cob
alt
Meghalaya 1 64.24 87.65 0.27 - 0.05 0.02 0.02 - 2.40 - - - - - - -
2 214.17 877.11 20.12 3.61 - 0.08 0.11 0.54 2.64 - - - - - - -
3 322.85 3375.85 68.37 - - - - 2.30 0.60 - - - - - - -
Assam 1 228.37 92.34 0.32 - 0.30 - - - - - - - - - - -
2 26.83 5.20 0.02 - - - - - - - - - - - -
3 65.01 365.00 22.38 19.94 50.00 - - - - 16.54 926 1180.00 - - -
Manipur 1 - 0.47 - - - - - - - - - - - - - -
2 - 6.20 - - - - - - - - - - - - - -
3 - 8.12 2.52 - - - - - - - - - 0.01 - - -
Arunachal Pradesh 1 31.23 - - - - - - - - - - - - - -
2 11.04 - - - - - - - - - - - - - -
3 47.96 350.00 - - - - - - 3.13 - - - 246.97 84.97 -
Mizoram 1 - - - - - - - - - - - - - - - -
2 - - - - - - - - - - - - - - - -
3 - 5.20 - - - - - - - - - - - - - -
Nagaland 1 3.43 0.83 - - - - - - - - - - - - - -
2 1.35 - - - - - - - - - - - - - - -
3 15.16 308.25 - - - - - - - 555.00 - - - 4.50
Tripura 1 - - - - - 0.01 - - - - - - - - - -
2 - - 0.00 - - 0.12 - - - - - - - - - -
3 - - 0.30 - - 0.07 - - - - - 588.00 - - - -
Note: 1=Proved; 2=Probable; 3=Possible # in million cubic meters Source: NER Data Bank
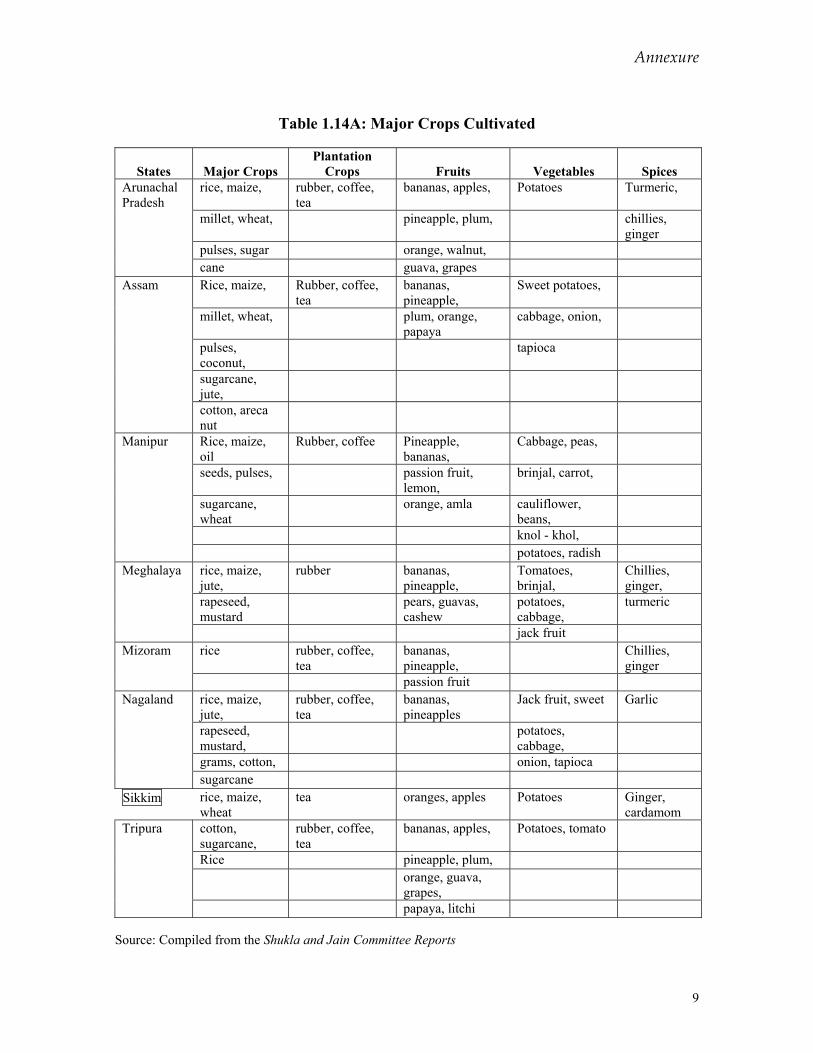
Annexure
9
Table 1.14A: Major Crops Cultivated
States Major Crops Plantation
Crops Fruits Vegetables Spices Arunachal Pradesh
rice, maize, rubber, coffee, tea
bananas, apples, Potatoes Turmeric,
millet, wheat, pineapple, plum, chillies, ginger
pulses, sugar orange, walnut, cane guava, grapes Assam Rice, maize, Rubber, coffee,
tea bananas, pineapple,
Sweet potatoes,
millet, wheat, plum, orange, papaya
cabbage, onion,
pulses, coconut,
tapioca
sugarcane, jute,
cotton, areca nut
Manipur Rice, maize, oil
Rubber, coffee Pineapple, bananas,
Cabbage, peas,
seeds, pulses, passion fruit, lemon,
brinjal, carrot,
sugarcane, wheat
orange, amla cauliflower, beans,
knol - khol, potatoes, radish Meghalaya rice, maize,
jute, rubber bananas,
pineapple, Tomatoes, brinjal,
Chillies, ginger,
rapeseed, mustard
pears, guavas, cashew
potatoes, cabbage,
turmeric
jack fruit Mizoram rice rubber, coffee,
tea bananas, pineapple,
Chillies, ginger
passion fruit Nagaland rice, maize,
jute, rubber, coffee, tea
bananas, pineapples
Jack fruit, sweet Garlic
rapeseed, mustard,
potatoes, cabbage,
grams, cotton, onion, tapioca sugarcane Sikkim rice, maize,
wheat tea oranges, apples Potatoes Ginger,
cardamom Tripura cotton,
sugarcane, rubber, coffee, tea
bananas, apples, Potatoes, tomato
Rice pineapple, plum, orange, guava,
grapes,
papaya, litchi Source: Compiled from the Shukla and Jain Committee Reports
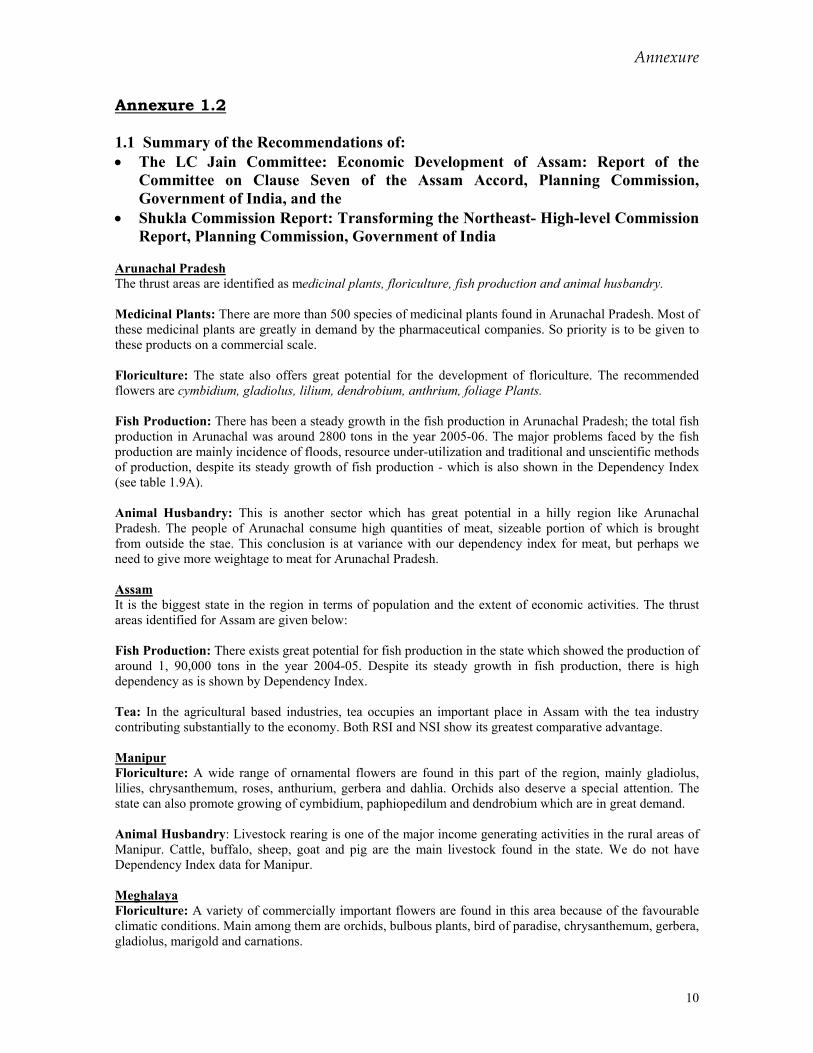
Annexure
10
Annexure 1.2
1.1 Summary of the Recommendations of: • The LC Jain Committee: Economic Development of Assam: Report of the
Committee on Clause Seven of the Assam Accord, Planning Commission, Government of India, and the
• Shukla Commission Report: Transforming the Northeast- High-level Commission Report, Planning Commission, Government of India
Arunachal Pradesh The thrust areas are identified as medicinal plants, floriculture, fish production and animal husbandry.
Medicinal Plants: There are more than 500 species of medicinal plants found in Arunachal Pradesh. Most of these medicinal plants are greatly in demand by the pharmaceutical companies. So priority is to be given to these products on a commercial scale.
Floriculture: The state also offers great potential for the development of floriculture. The recommended flowers are cymbidium, gladiolus, lilium, dendrobium, anthrium, foliage Plants.
Fish Production: There has been a steady growth in the fish production in Arunachal Pradesh; the total fish production in Arunachal was around 2800 tons in the year 2005-06. The major problems faced by the fish production are mainly incidence of floods, resource under-utilization and traditional and unscientific methods of production, despite its steady growth of fish production - which is also shown in the Dependency Index (see table 1.9A).
Animal Husbandry: This is another sector which has great potential in a hilly region like Arunachal Pradesh. The people of Arunachal consume high quantities of meat, sizeable portion of which is brought from outside the stae. This conclusion is at variance with our dependency index for meat, but perhaps we need to give more weightage to meat for Arunachal Pradesh.
Assam It is the biggest state in the region in terms of population and the extent of economic activities. The thrust areas identified for Assam are given below:
Fish Production: There exists great potential for fish production in the state which showed the production of around 1, 90,000 tons in the year 2004-05. Despite its steady growth in fish production, there is high dependency as is shown by Dependency Index.
Tea: In the agricultural based industries, tea occupies an important place in Assam with the tea industry contributing substantially to the economy. Both RSI and NSI show its greatest comparative advantage. Manipur Floriculture: A wide range of ornamental flowers are found in this part of the region, mainly gladiolus, lilies, chrysanthemum, roses, anthurium, gerbera and dahlia. Orchids also deserve a special attention. The state can also promote growing of cymbidium, paphiopedilum and dendrobium which are in great demand.
Animal Husbandry: Livestock rearing is one of the major income generating activities in the rural areas of Manipur. Cattle, buffalo, sheep, goat and pig are the main livestock found in the state. We do not have Dependency Index data for Manipur. Meghalaya Floriculture: A variety of commercially important flowers are found in this area because of the favourable climatic conditions. Main among them are orchids, bulbous plants, bird of paradise, chrysanthemum, gerbera, gladiolus, marigold and carnations.
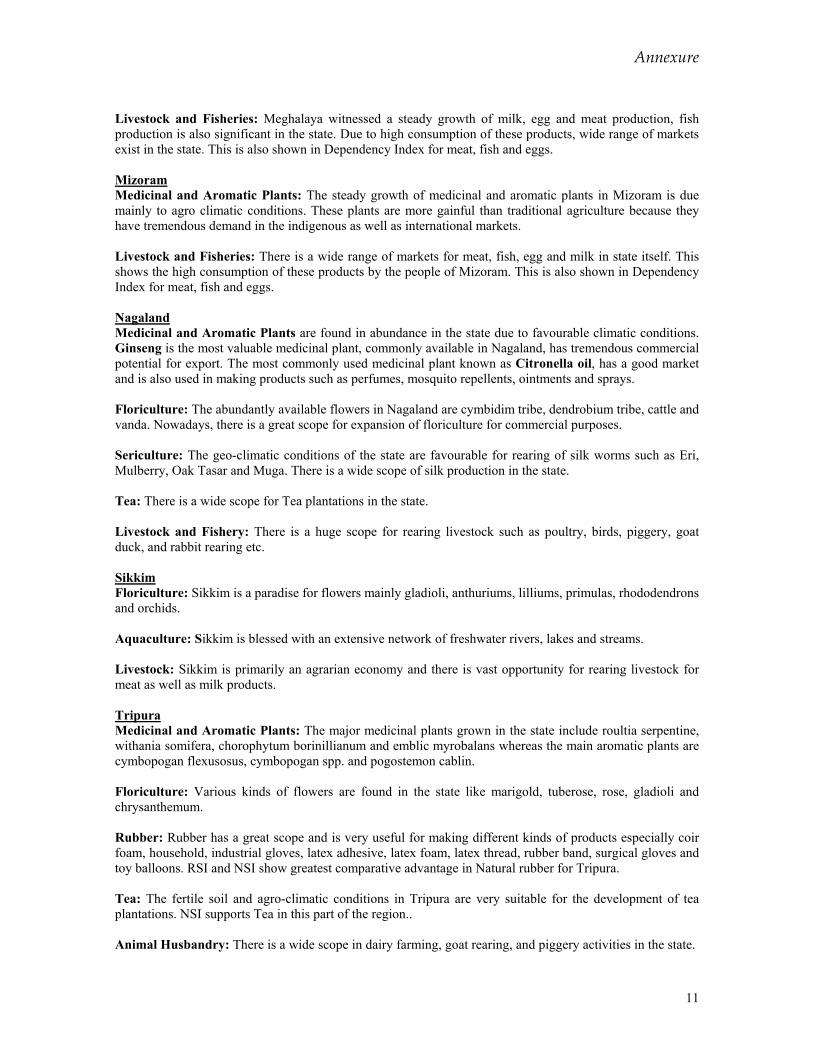
Annexure
11
Livestock and Fisheries: Meghalaya witnessed a steady growth of milk, egg and meat production, fish production is also significant in the state. Due to high consumption of these products, wide range of markets exist in the state. This is also shown in Dependency Index for meat, fish and eggs. Mizoram Medicinal and Aromatic Plants: The steady growth of medicinal and aromatic plants in Mizoram is due mainly to agro climatic conditions. These plants are more gainful than traditional agriculture because they have tremendous demand in the indigenous as well as international markets.
Livestock and Fisheries: There is a wide range of markets for meat, fish, egg and milk in state itself. This shows the high consumption of these products by the people of Mizoram. This is also shown in Dependency Index for meat, fish and eggs. Nagaland Medicinal and Aromatic Plants are found in abundance in the state due to favourable climatic conditions. Ginseng is the most valuable medicinal plant, commonly available in Nagaland, has tremendous commercial potential for export. The most commonly used medicinal plant known as Citronella oil, has a good market and is also used in making products such as perfumes, mosquito repellents, ointments and sprays.
Floriculture: The abundantly available flowers in Nagaland are cymbidim tribe, dendrobium tribe, cattle and vanda. Nowadays, there is a great scope for expansion of floriculture for commercial purposes.
Sericulture: The geo-climatic conditions of the state are favourable for rearing of silk worms such as Eri, Mulberry, Oak Tasar and Muga. There is a wide scope of silk production in the state.
Tea: There is a wide scope for Tea plantations in the state.
Livestock and Fishery: There is a huge scope for rearing livestock such as poultry, birds, piggery, goat duck, and rabbit rearing etc. Sikkim Floriculture: Sikkim is a paradise for flowers mainly gladioli, anthuriums, lilliums, primulas, rhododendrons and orchids.
Aquaculture: Sikkim is blessed with an extensive network of freshwater rivers, lakes and streams.
Livestock: Sikkim is primarily an agrarian economy and there is vast opportunity for rearing livestock for meat as well as milk products. Tripura Medicinal and Aromatic Plants: The major medicinal plants grown in the state include roultia serpentine, withania somifera, chorophytum borinillianum and emblic myrobalans whereas the main aromatic plants are cymbopogan flexusosus, cymbopogan spp. and pogostemon cablin. Floriculture: Various kinds of flowers are found in the state like marigold, tuberose, rose, gladioli and chrysanthemum.
Rubber: Rubber has a great scope and is very useful for making different kinds of products especially coir foam, household, industrial gloves, latex adhesive, latex foam, latex thread, rubber band, surgical gloves and toy balloons. RSI and NSI show greatest comparative advantage in Natural rubber for Tripura.
Tea: The fertile soil and agro-climatic conditions in Tripura are very suitable for the development of tea plantations. NSI supports Tea in this part of the region..
Animal Husbandry: There is a wide scope in dairy farming, goat rearing, and piggery activities in the state.
Annexure
12
1.2 Northeast Council (NEC) Draft Vision 2020 on Agriculture and Allied Sectors
• Objective to make region marginally surplus in food production by introducing integrated modern agricultural methods and develop agriculture horizontally and vertically.
• Create efficient service centers for farming. • Land reforms. • Horticulture on massive scale, more area under horticulture. • Create efficient market infrastructure thru a regional master plan. • Self help groups used as tools of change in this sector. • By 2020 production of meat, milk and egg be raised to 2.26lakh MT, 2 MT and 3500 millions
respectively. • Fisheries
1. Raise production of fish to 12.14 lakh MT to ensure per capita availability of 21 KG/person /year by 2020.
2. Increase area to 11.53 ha of water under fishery by 2020. 3. Maximum area of reservoir and unregistered beels and swamps be utilized for fishery. 4. Promote culture of MAHSEER for insitu conservation as well as enhanced production. 5. Exploit riverine stretch (about 2000 KM) for fisheries. 6. Eco-hatcheries at district level. 7. Est. fish producers Co-operative society/ farmers club for high production and marketing. 8. Double area under forest fishery by 2020.
• Sericulture
1. 2.35 lakh hectares of wasteland suitable for sericulture brought under it. 2. Two clusters of 200 ha. /300 m farmers set up in each district by 2020. 3. Sericulture development mission with special central grant. 4. Raise production level of seri to 5,063 MT. 5. Generation of family income of Rs. 580 crore under Eri and and about Rs. 1,100 crore
under Muga per annum by 2020.
• Mission Mode 1. Immediately launch Northeastern Regional Bamboo Mission and Northeastern Regional
International Trade Mission. The Bamboo Mission will create one lakh jobs, lead to double-digit rise in economic growth and enhancement of community and family income.
2. Global export network for bamboo products particulary in relation to South East Asian markets. 3. Border trade infrastructure and roads to connect the 17 functional land customs stations in the
region needs to be developed. 4. Proper air cargo complex in LGB airport be opened with domestic transshipment arrangement
in Kolkata/ Delhi. 5. Three product specific SEZ in NER. 6. NERITraM and concerned states jointly take up programme for creating minimum
infrastructure facilities in all states for sound production base for exportable goods locally thru small enterprises.
7. New transport subsidy package for all items exported from NER to provide air, rail and inland transport subsidy from any part of NE up to port of transshipment be introduced.
8. Incentives to local entrepreneurs for setting up agro horticultural processing units having export potential.
9. Excise/ import duty waivers on capital goods import especially agricultural tools and machinery food and bamboo processing machinery.
10. Two more agri export zones in NER to be developed into comprehensive free enclave. 11. North eastern regional export development fund under NERETraM to be created for border
trade and related infrastructure.
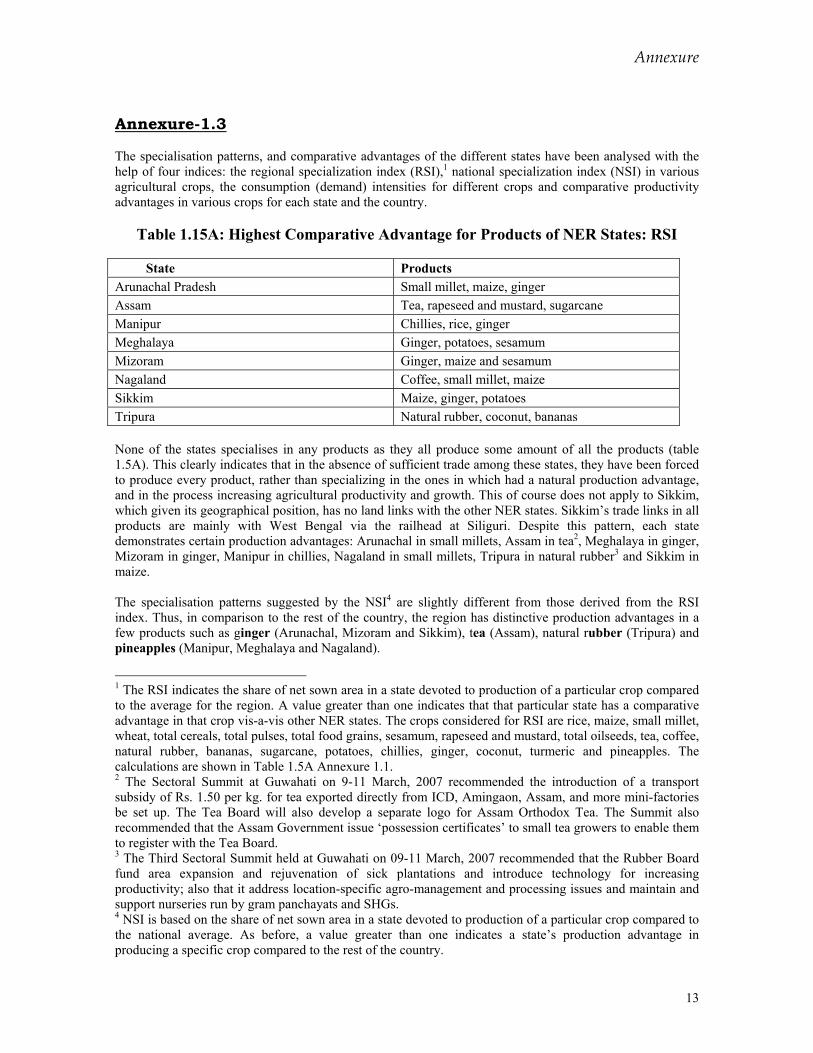
Annexure
13
Annexure-1.3 The specialisation patterns, and comparative advantages of the different states have been analysed with the help of four indices: the regional specialization index (RSI),1 national specialization index (NSI) in various agricultural crops, the consumption (demand) intensities for different crops and comparative productivity advantages in various crops for each state and the country.
Table 1.15A: Highest Comparative Advantage for Products of NER States: RSI
State Products Arunachal Pradesh Small millet, maize, ginger Assam Tea, rapeseed and mustard, sugarcane Manipur Chillies, rice, ginger Meghalaya Ginger, potatoes, sesamum Mizoram Ginger, maize and sesamum Nagaland Coffee, small millet, maize Sikkim Maize, ginger, potatoes Tripura Natural rubber, coconut, bananas None of the states specialises in any products as they all produce some amount of all the products (table 1.5A). This clearly indicates that in the absence of sufficient trade among these states, they have been forced to produce every product, rather than specializing in the ones in which had a natural production advantage, and in the process increasing agricultural productivity and growth. This of course does not apply to Sikkim, which given its geographical position, has no land links with the other NER states. Sikkim’s trade links in all products are mainly with West Bengal via the railhead at Siliguri. Despite this pattern, each state demonstrates certain production advantages: Arunachal in small millets, Assam in tea2, Meghalaya in ginger, Mizoram in ginger, Manipur in chillies, Nagaland in small millets, Tripura in natural rubber3 and Sikkim in maize. The specialisation patterns suggested by the NSI4 are slightly different from those derived from the RSI index. Thus, in comparison to the rest of the country, the region has distinctive production advantages in a few products such as ginger (Arunachal, Mizoram and Sikkim), tea (Assam), natural rubber (Tripura) and pineapples (Manipur, Meghalaya and Nagaland).
1 The RSI indicates the share of net sown area in a state devoted to production of a particular crop compared to the average for the region. A value greater than one indicates that that particular state has a comparative advantage in that crop vis-a-vis other NER states. The crops considered for RSI are rice, maize, small millet, wheat, total cereals, total pulses, total food grains, sesamum, rapeseed and mustard, total oilseeds, tea, coffee, natural rubber, bananas, sugarcane, potatoes, chillies, ginger, coconut, turmeric and pineapples. The calculations are shown in Table 1.5A Annexure 1.1. 2 The Sectoral Summit at Guwahati on 9-11 March, 2007 recommended the introduction of a transport subsidy of Rs. 1.50 per kg. for tea exported directly from ICD, Amingaon, Assam, and more mini-factories be set up. The Tea Board will also develop a separate logo for Assam Orthodox Tea. The Summit also recommended that the Assam Government issue ‘possession certificates’ to small tea growers to enable them to register with the Tea Board. 3 The Third Sectoral Summit held at Guwahati on 09-11 March, 2007 recommended that the Rubber Board fund area expansion and rejuvenation of sick plantations and introduce technology for increasing productivity; also that it address location-specific agro-management and processing issues and maintain and support nurseries run by gram panchayats and SHGs. 4 NSI is based on the share of net sown area in a state devoted to production of a particular crop compared to the national average. As before, a value greater than one indicates a state’s production advantage in producing a specific crop compared to the rest of the country.
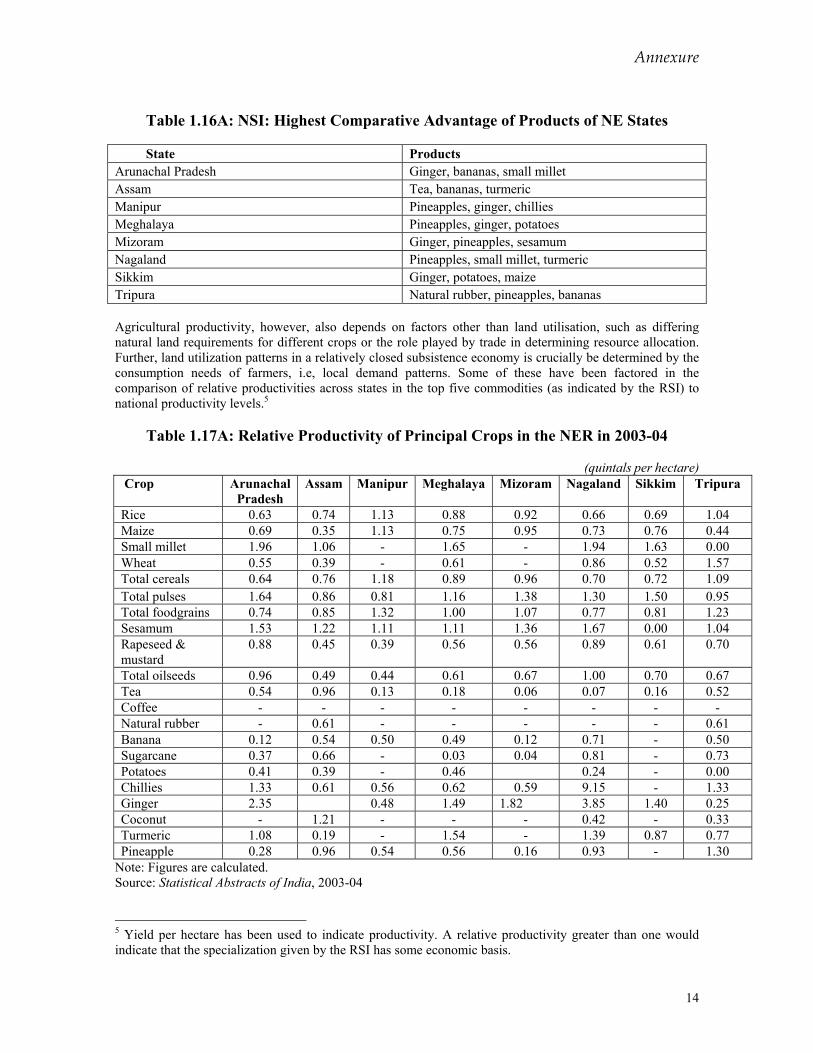
Annexure
14
Table 1.16A: NSI: Highest Comparative Advantage of Products of NE States
State Products
Arunachal Pradesh Ginger, bananas, small millet Assam Tea, bananas, turmeric Manipur Pineapples, ginger, chillies Meghalaya Pineapples, ginger, potatoes Mizoram Ginger, pineapples, sesamum Nagaland Pineapples, small millet, turmeric Sikkim Ginger, potatoes, maize Tripura Natural rubber, pineapples, bananas
Agricultural productivity, however, also depends on factors other than land utilisation, such as differing natural land requirements for different crops or the role played by trade in determining resource allocation. Further, land utilization patterns in a relatively closed subsistence economy is crucially be determined by the consumption needs of farmers, i.e, local demand patterns. Some of these have been factored in the comparison of relative productivities across states in the top five commodities (as indicated by the RSI) to national productivity levels.5
Table 1.17A: Relative Productivity of Principal Crops in the NER in 2003-04
(quintals per hectare) Crop Arunachal
Pradesh Assam Manipur Meghalaya Mizoram Nagaland Sikkim Tripura
Rice 0.63 0.74 1.13 0.88 0.92 0.66 0.69 1.04 Maize 0.69 0.35 1.13 0.75 0.95 0.73 0.76 0.44 Small millet 1.96 1.06 - 1.65 - 1.94 1.63 0.00 Wheat 0.55 0.39 - 0.61 - 0.86 0.52 1.57 Total cereals 0.64 0.76 1.18 0.89 0.96 0.70 0.72 1.09 Total pulses 1.64 0.86 0.81 1.16 1.38 1.30 1.50 0.95 Total foodgrains 0.74 0.85 1.32 1.00 1.07 0.77 0.81 1.23 Sesamum 1.53 1.22 1.11 1.11 1.36 1.67 0.00 1.04 Rapeseed & mustard
0.88 0.45 0.39 0.56 0.56 0.89 0.61 0.70
Total oilseeds 0.96 0.49 0.44 0.61 0.67 1.00 0.70 0.67 Tea 0.54 0.96 0.13 0.18 0.06 0.07 0.16 0.52 Coffee - - - - - - - - Natural rubber - 0.61 - - - - - 0.61 Banana 0.12 0.54 0.50 0.49 0.12 0.71 - 0.50 Sugarcane 0.37 0.66 - 0.03 0.04 0.81 - 0.73 Potatoes 0.41 0.39 - 0.46 0.24 - 0.00 Chillies 1.33 0.61 0.56 0.62 0.59 9.15 - 1.33 Ginger 2.35 0.48 1.49 1.82 3.85 1.40 0.25 Coconut - 1.21 - - - 0.42 - 0.33 Turmeric 1.08 0.19 - 1.54 - 1.39 0.87 0.77 Pineapple 0.28 0.96 0.54 0.56 0.16 0.93 - 1.30
Note: Figures are calculated. Source: Statistical Abstracts of India, 2003-04
5 Yield per hectare has been used to indicate productivity. A relative productivity greater than one would indicate that the specialization given by the RSI has some economic basis.
Annexure
15
An analysis of the results of the table show that the RSI depicting the patterns of land utilization roughly corresponds to the specialization patterns by productivity advantages. Thus, all the states for which data is available have a relative yield advantage in small millets, pulses (except Manipur and Assam), sesamum (except Nagaland) and ginger (except Manipur). In some cases there are divergences from the RSI results. First, Arunachal and Meghalaya have very low relative productivity of wheat although they have a high area specialization. This is also true for tea in Assam6, chillies in Manipur, and rubber in Tripura (even though Tripura is the largest rubber growing area after Kerala). These exceptions are the results of three quite unrelated forces: subsistence nature of farming, history, and the cost of conversion from one crop to another. The first factor was already emphasized in our earlier observation that some of the area specialisation seems to be dictated more by subsistence requirements in the absence of very little trade among the states of the NER. The second factor and also partly the third may explain the case of tea in Assam. Similarly, forest conservation policies may prevent conversion of natural rubber growing fields to growing of other agricultural crops. Except for Tripura, none of the other states have shown better relative productivity in the production of pine apple.
Interestingly, the demand preferences of all the states are similar: rice, cereals (except Meghalaya and Mizoram), meat, fish, eggs and vegetables (except for Arunachal, Manipur and Meghalaya). This data can be used to infer possible trade especially among the states with exports of items where demand intensity is low relative to national average and imports in the other items.7 It is also instructive to investigate the demand side of this sector (Demand Intensity Index, See Annexure 1.3). In general, for any state demand is more diversified than production with the excess demand constituting import and the excess supply export8.
Inspection of the Demand Intensity indices (DII) in Table 1.8A (see Annexure 1.1) reveals the extent to which demand preferences in the NER states diverges from the national average. The same information is obtained more directly by calculation of the Dependency Index (DI, See Annexure 1.3) for the states which we define as the ratio of consumption share to production share. The DI indices given in Table 1.9A (Annexure 1.1) indicate that the NER is highly dependent on imports for almost all the commodities for which we could get data. The only exception is spices9. However, there are variations across states which indicate that there is a reasonable scope for trade among the states of the NER. For example, while the NER has high dependency on maize this is not true for states like Arunachal, Assam, Manipur and Meghalaya which could profitably export maize to the other states. Similarly, Assam, Manipur and Meghalaya could be net exporters of fruits to the other states. 1.1 Regional Specialisation Index (RSI) To see how the different states of the NER have specialized in different product lines, a Regional Specialisation Index (RSI) is constructed. It is expected that the variation in the availability of resources and scope for trade should drive certain patterns of specialization. And this pattern being determined by market
6 This is due to the fact that old tea plantations are still maintained in Assam. 7 The People’s Vision recommends a new transport subsidy for all items exported from NER which will introduce a air, rail and inland transport subsidy from any part of NE up to port of transshipment be introduced. 8 The Third Sectoral Summit at Guwahati on 9-11 March, 2007 recommended that APEDA operationalise four Agriculture Export Zones (AEZs) by December 2007: one in Tripura for pineapples, two in Sikkim for ginger, orchids and cherry peppers and one in Assam for fresh and processed ginger. 9 The Third Sectoral Summit held at Guwahati on 09-11 March, 2007 recommended that the Spices Board be strengthened, to intensify its activities in the NER to promote spices production and productivity, particularly of organic spices. Investments by the Spices Board are to be increased commensurate with the proposed intensified programmes in the region.
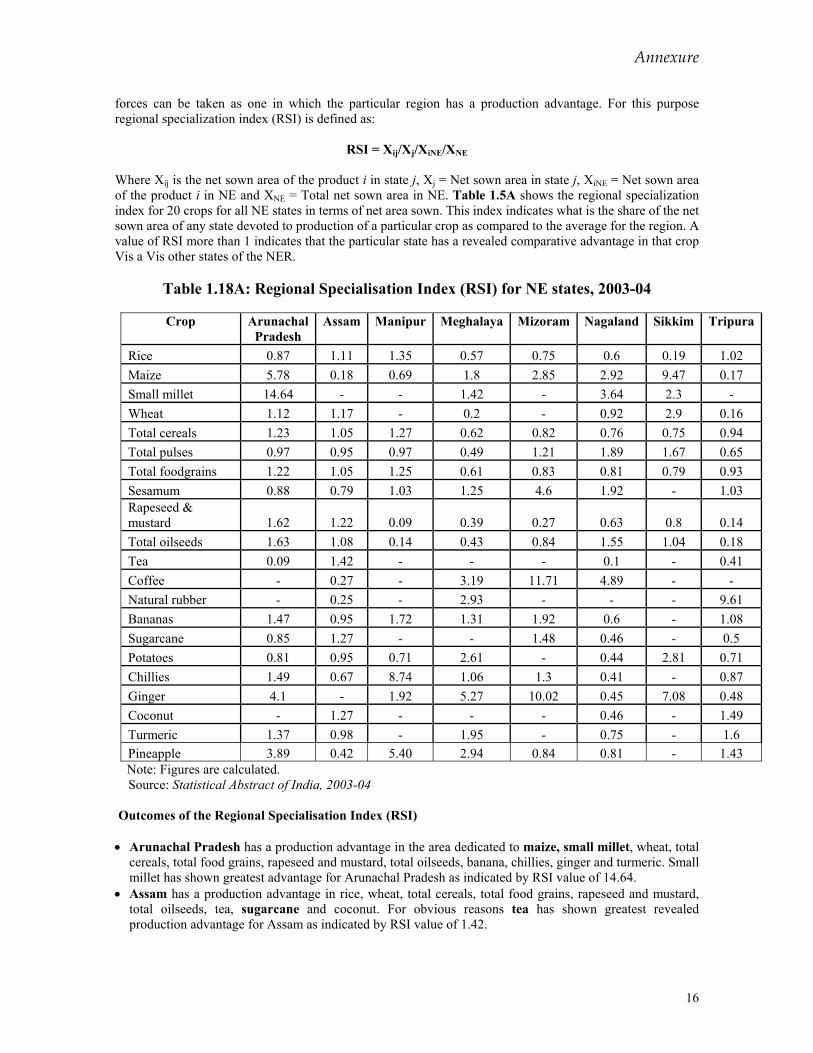
Annexure
16
forces can be taken as one in which the particular region has a production advantage. For this purpose regional specialization index (RSI) is defined as:
RSI = Xij/Xj/XiNE/XNE
Where Xij is the net sown area of the product i in state j, Xj = Net sown area in state j, XiNE = Net sown area of the product i in NE and XNE = Total net sown area in NE. Table 1.5A shows the regional specialization index for 20 crops for all NE states in terms of net area sown. This index indicates what is the share of the net sown area of any state devoted to production of a particular crop as compared to the average for the region. A value of RSI more than 1 indicates that the particular state has a revealed comparative advantage in that crop Vis a Vis other states of the NER.
Table 1.18A: Regional Specialisation Index (RSI) for NE states, 2003-04
Crop Arunachal
Pradesh Assam Manipur Meghalaya Mizoram Nagaland Sikkim Tripura
Rice 0.87 1.11 1.35 0.57 0.75 0.6 0.19 1.02 Maize 5.78 0.18 0.69 1.8 2.85 2.92 9.47 0.17 Small millet 14.64 - - 1.42 - 3.64 2.3 - Wheat 1.12 1.17 - 0.2 - 0.92 2.9 0.16 Total cereals 1.23 1.05 1.27 0.62 0.82 0.76 0.75 0.94 Total pulses 0.97 0.95 0.97 0.49 1.21 1.89 1.67 0.65 Total foodgrains 1.22 1.05 1.25 0.61 0.83 0.81 0.79 0.93 Sesamum 0.88 0.79 1.03 1.25 4.6 1.92 - 1.03 Rapeseed & mustard 1.62 1.22 0.09 0.39 0.27 0.63 0.8 0.14 Total oilseeds 1.63 1.08 0.14 0.43 0.84 1.55 1.04 0.18 Tea 0.09 1.42 - - - 0.1 - 0.41 Coffee - 0.27 - 3.19 11.71 4.89 - - Natural rubber - 0.25 - 2.93 - - - 9.61 Bananas 1.47 0.95 1.72 1.31 1.92 0.6 - 1.08 Sugarcane 0.85 1.27 - - 1.48 0.46 - 0.5 Potatoes 0.81 0.95 0.71 2.61 - 0.44 2.81 0.71 Chillies 1.49 0.67 8.74 1.06 1.3 0.41 - 0.87 Ginger 4.1 - 1.92 5.27 10.02 0.45 7.08 0.48 Coconut - 1.27 - - - 0.46 - 1.49 Turmeric 1.37 0.98 - 1.95 - 0.75 - 1.6 Pineapple 3.89 0.42 5.40 2.94 0.84 0.81 - 1.43 Note: Figures are calculated.
Source: Statistical Abstract of India, 2003-04 Outcomes of the Regional Specialisation Index (RSI) • Arunachal Pradesh has a production advantage in the area dedicated to maize, small millet, wheat, total
cereals, total food grains, rapeseed and mustard, total oilseeds, banana, chillies, ginger and turmeric. Small millet has shown greatest advantage for Arunachal Pradesh as indicated by RSI value of 14.64.
• Assam has a production advantage in rice, wheat, total cereals, total food grains, rapeseed and mustard, total oilseeds, tea, sugarcane and coconut. For obvious reasons tea has shown greatest revealed production advantage for Assam as indicated by RSI value of 1.42.
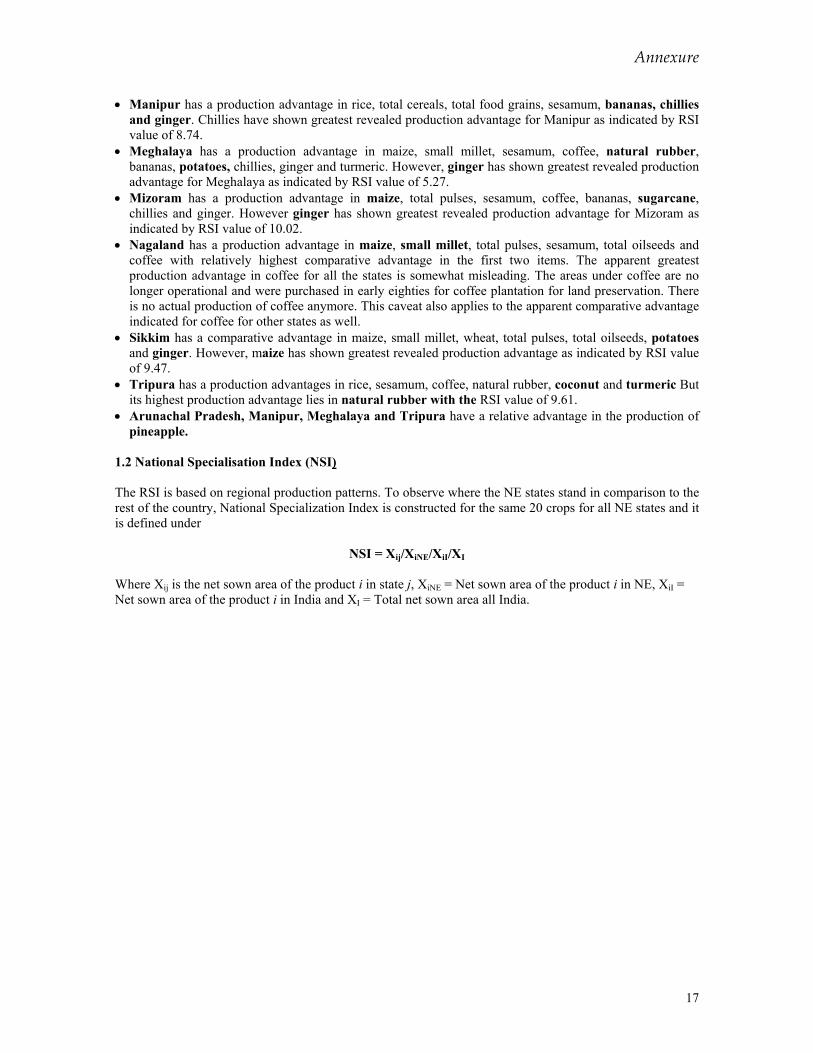
Annexure
17
• Manipur has a production advantage in rice, total cereals, total food grains, sesamum, bananas, chillies and ginger. Chillies have shown greatest revealed production advantage for Manipur as indicated by RSI value of 8.74.
• Meghalaya has a production advantage in maize, small millet, sesamum, coffee, natural rubber, bananas, potatoes, chillies, ginger and turmeric. However, ginger has shown greatest revealed production advantage for Meghalaya as indicated by RSI value of 5.27.
• Mizoram has a production advantage in maize, total pulses, sesamum, coffee, bananas, sugarcane, chillies and ginger. However ginger has shown greatest revealed production advantage for Mizoram as indicated by RSI value of 10.02.
• Nagaland has a production advantage in maize, small millet, total pulses, sesamum, total oilseeds and coffee with relatively highest comparative advantage in the first two items. The apparent greatest production advantage in coffee for all the states is somewhat misleading. The areas under coffee are no longer operational and were purchased in early eighties for coffee plantation for land preservation. There is no actual production of coffee anymore. This caveat also applies to the apparent comparative advantage indicated for coffee for other states as well.
• Sikkim has a comparative advantage in maize, small millet, wheat, total pulses, total oilseeds, potatoes and ginger. However, maize has shown greatest revealed production advantage as indicated by RSI value of 9.47.
• Tripura has a production advantages in rice, sesamum, coffee, natural rubber, coconut and turmeric But its highest production advantage lies in natural rubber with the RSI value of 9.61.
• Arunachal Pradesh, Manipur, Meghalaya and Tripura have a relative advantage in the production of pineapple.
1.2 National Specialisation Index (NSI) The RSI is based on regional production patterns. To observe where the NE states stand in comparison to the rest of the country, National Specialization Index is constructed for the same 20 crops for all NE states and it is defined under
NSI = Xij/XiNE/XiI/XI
Where Xij is the net sown area of the product i in state j, XiNE = Net sown area of the product i in NE, XiI = Net sown area of the product i in India and XI = Total net sown area all India.
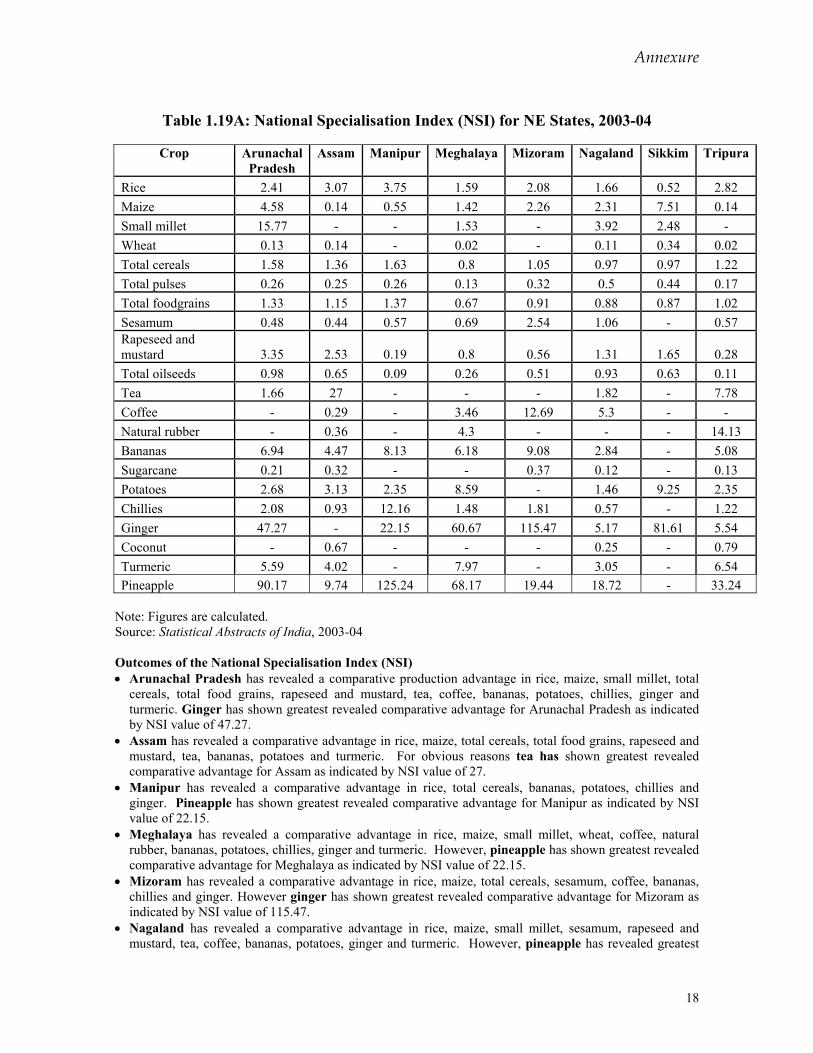
Annexure
18
Table 1.19A: National Specialisation Index (NSI) for NE States, 2003-04
Crop Arunachal
Pradesh Assam Manipur Meghalaya Mizoram Nagaland Sikkim Tripura
Rice 2.41 3.07 3.75 1.59 2.08 1.66 0.52 2.82 Maize 4.58 0.14 0.55 1.42 2.26 2.31 7.51 0.14 Small millet 15.77 - - 1.53 - 3.92 2.48 - Wheat 0.13 0.14 - 0.02 - 0.11 0.34 0.02 Total cereals 1.58 1.36 1.63 0.8 1.05 0.97 0.97 1.22 Total pulses 0.26 0.25 0.26 0.13 0.32 0.5 0.44 0.17 Total foodgrains 1.33 1.15 1.37 0.67 0.91 0.88 0.87 1.02 Sesamum 0.48 0.44 0.57 0.69 2.54 1.06 - 0.57 Rapeseed and mustard 3.35 2.53 0.19 0.8 0.56 1.31 1.65 0.28 Total oilseeds 0.98 0.65 0.09 0.26 0.51 0.93 0.63 0.11 Tea 1.66 27 - - - 1.82 - 7.78 Coffee - 0.29 - 3.46 12.69 5.3 - - Natural rubber - 0.36 - 4.3 - - - 14.13 Bananas 6.94 4.47 8.13 6.18 9.08 2.84 - 5.08 Sugarcane 0.21 0.32 - - 0.37 0.12 - 0.13 Potatoes 2.68 3.13 2.35 8.59 - 1.46 9.25 2.35 Chillies 2.08 0.93 12.16 1.48 1.81 0.57 - 1.22 Ginger 47.27 - 22.15 60.67 115.47 5.17 81.61 5.54 Coconut - 0.67 - - - 0.25 - 0.79 Turmeric 5.59 4.02 - 7.97 - 3.05 - 6.54 Pineapple 90.17 9.74 125.24 68.17 19.44 18.72 - 33.24
Note: Figures are calculated. Source: Statistical Abstracts of India, 2003-04 Outcomes of the National Specialisation Index (NSI) • Arunachal Pradesh has revealed a comparative production advantage in rice, maize, small millet, total
cereals, total food grains, rapeseed and mustard, tea, coffee, bananas, potatoes, chillies, ginger and turmeric. Ginger has shown greatest revealed comparative advantage for Arunachal Pradesh as indicated by NSI value of 47.27.
• Assam has revealed a comparative advantage in rice, maize, total cereals, total food grains, rapeseed and mustard, tea, bananas, potatoes and turmeric. For obvious reasons tea has shown greatest revealed comparative advantage for Assam as indicated by NSI value of 27.
• Manipur has revealed a comparative advantage in rice, total cereals, bananas, potatoes, chillies and ginger. Pineapple has shown greatest revealed comparative advantage for Manipur as indicated by NSI value of 22.15.
• Meghalaya has revealed a comparative advantage in rice, maize, small millet, wheat, coffee, natural rubber, bananas, potatoes, chillies, ginger and turmeric. However, pineapple has shown greatest revealed comparative advantage for Meghalaya as indicated by NSI value of 22.15.
• Mizoram has revealed a comparative advantage in rice, maize, total cereals, sesamum, coffee, bananas, chillies and ginger. However ginger has shown greatest revealed comparative advantage for Mizoram as indicated by NSI value of 115.47.
• Nagaland has revealed a comparative advantage in rice, maize, small millet, sesamum, rapeseed and mustard, tea, coffee, bananas, potatoes, ginger and turmeric. However, pineapple has revealed greatest
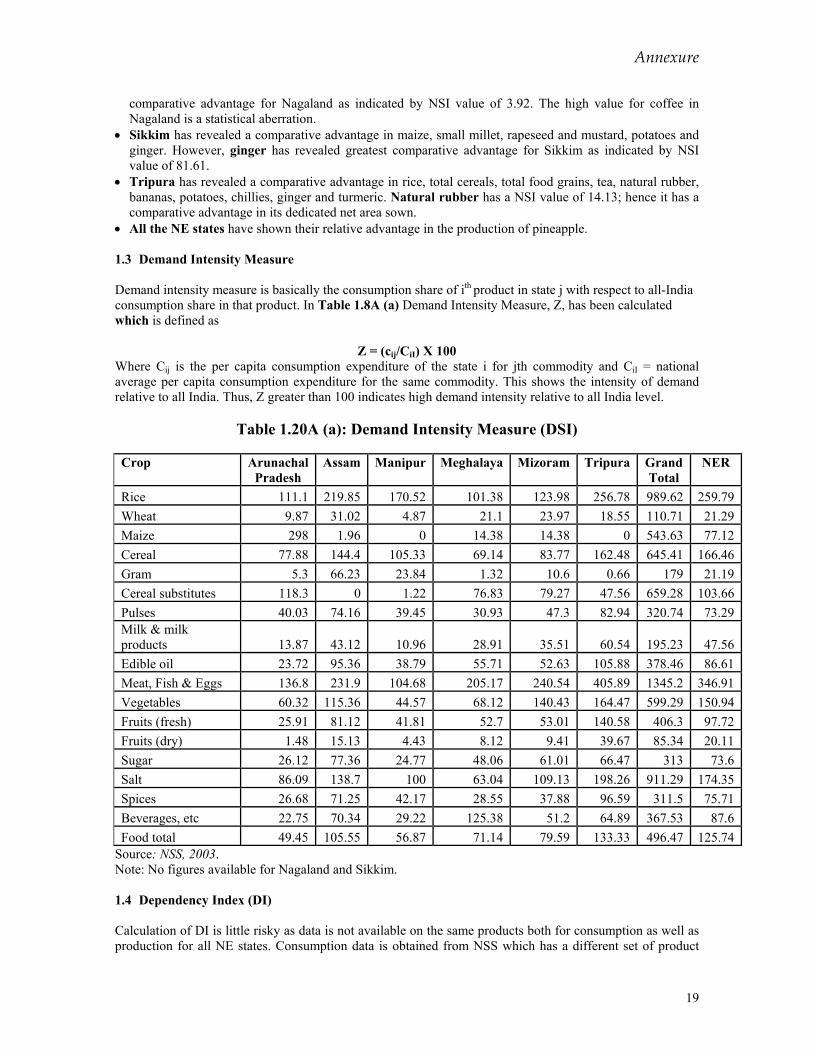
Annexure
19
comparative advantage for Nagaland as indicated by NSI value of 3.92. The high value for coffee in Nagaland is a statistical aberration.
• Sikkim has revealed a comparative advantage in maize, small millet, rapeseed and mustard, potatoes and ginger. However, ginger has revealed greatest comparative advantage for Sikkim as indicated by NSI value of 81.61.
• Tripura has revealed a comparative advantage in rice, total cereals, total food grains, tea, natural rubber, bananas, potatoes, chillies, ginger and turmeric. Natural rubber has a NSI value of 14.13; hence it has a comparative advantage in its dedicated net area sown.
• All the NE states have shown their relative advantage in the production of pineapple. 1.3 Demand Intensity Measure Demand intensity measure is basically the consumption share of ith product in state j with respect to all-India consumption share in that product. In Table 1.8A (a) Demand Intensity Measure, Z, has been calculated which is defined as
Z = (cij/CiI) X 100 Where Cij is the per capita consumption expenditure of the state i for jth commodity and CiI = national average per capita consumption expenditure for the same commodity. This shows the intensity of demand relative to all India. Thus, Z greater than 100 indicates high demand intensity relative to all India level.
Table 1.20A (a): Demand Intensity Measure (DSI)
Crop Arunachal
Pradesh Assam Manipur Meghalaya Mizoram Tripura Grand
Total NER
Rice 111.1 219.85 170.52 101.38 123.98 256.78 989.62 259.79Wheat 9.87 31.02 4.87 21.1 23.97 18.55 110.71 21.29Maize 298 1.96 0 14.38 14.38 0 543.63 77.12Cereal 77.88 144.4 105.33 69.14 83.77 162.48 645.41 166.46Gram 5.3 66.23 23.84 1.32 10.6 0.66 179 21.19Cereal substitutes 118.3 0 1.22 76.83 79.27 47.56 659.28 103.66Pulses 40.03 74.16 39.45 30.93 47.3 82.94 320.74 73.29Milk & milk products 13.87 43.12 10.96 28.91 35.51 60.54 195.23 47.56Edible oil 23.72 95.36 38.79 55.71 52.63 105.88 378.46 86.61Meat, Fish & Eggs 136.8 231.9 104.68 205.17 240.54 405.89 1345.2 346.91Vegetables 60.32 115.36 44.57 68.12 140.43 164.47 599.29 150.94Fruits (fresh) 25.91 81.12 41.81 52.7 53.01 140.58 406.3 97.72Fruits (dry) 1.48 15.13 4.43 8.12 9.41 39.67 85.34 20.11Sugar 26.12 77.36 24.77 48.06 61.01 66.47 313 73.6Salt 86.09 138.7 100 63.04 109.13 198.26 911.29 174.35Spices 26.68 71.25 42.17 28.55 37.88 96.59 311.5 75.71Beverages, etc 22.75 70.34 29.22 125.38 51.2 64.89 367.53 87.6Food total 49.45 105.55 56.87 71.14 79.59 133.33 496.47 125.74
Source: NSS, 2003. Note: No figures available for Nagaland and Sikkim. 1.4 Dependency Index (DI) Calculation of DI is little risky as data is not available on the same products both for consumption as well as production for all NE states. Consumption data is obtained from NSS which has a different set of product
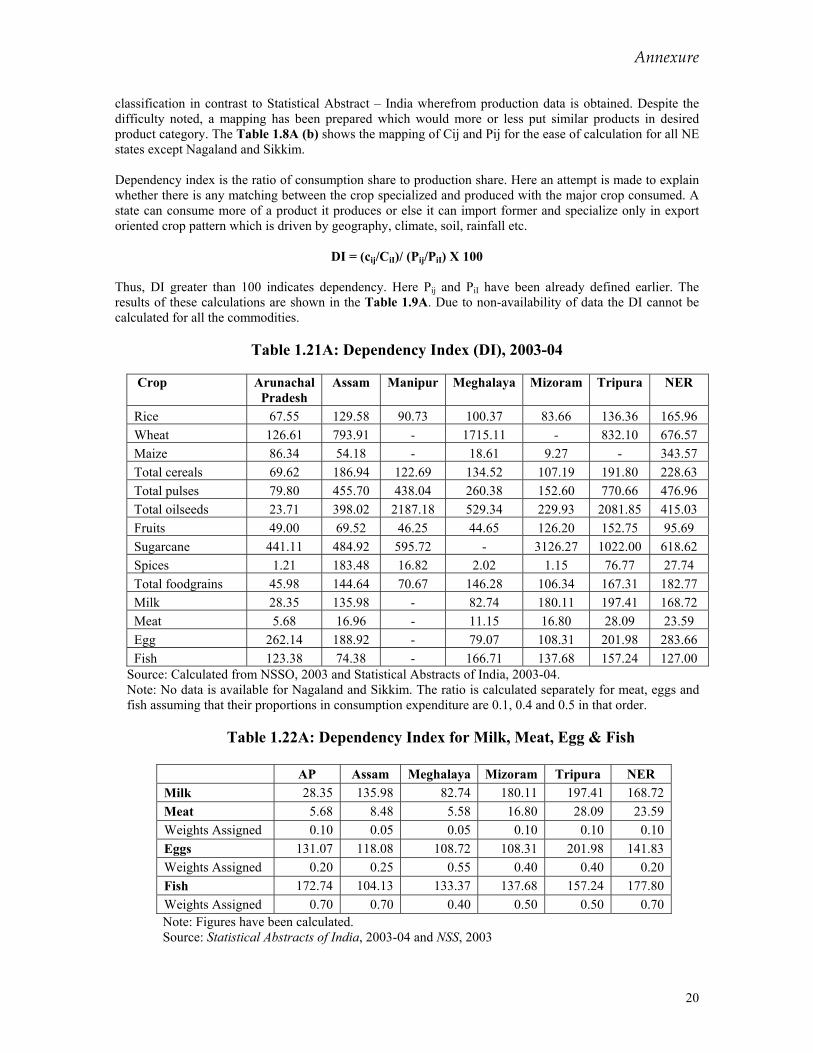
Annexure
20
classification in contrast to Statistical Abstract – India wherefrom production data is obtained. Despite the difficulty noted, a mapping has been prepared which would more or less put similar products in desired product category. The Table 1.8A (b) shows the mapping of Cij and Pij for the ease of calculation for all NE states except Nagaland and Sikkim. Dependency index is the ratio of consumption share to production share. Here an attempt is made to explain whether there is any matching between the crop specialized and produced with the major crop consumed. A state can consume more of a product it produces or else it can import former and specialize only in export oriented crop pattern which is driven by geography, climate, soil, rainfall etc.
DI = (cij/CiI)/ (Pij/PiI) X 100 Thus, DI greater than 100 indicates dependency. Here Pij and PiI have been already defined earlier. The results of these calculations are shown in the Table 1.9A. Due to non-availability of data the DI cannot be calculated for all the commodities.
Table 1.21A: Dependency Index (DI), 2003-04
Crop Arunachal Pradesh
Assam Manipur Meghalaya Mizoram Tripura NER
Rice 67.55 129.58 90.73 100.37 83.66 136.36 165.96 Wheat 126.61 793.91 - 1715.11 - 832.10 676.57 Maize 86.34 54.18 - 18.61 9.27 - 343.57 Total cereals 69.62 186.94 122.69 134.52 107.19 191.80 228.63 Total pulses 79.80 455.70 438.04 260.38 152.60 770.66 476.96 Total oilseeds 23.71 398.02 2187.18 529.34 229.93 2081.85 415.03 Fruits 49.00 69.52 46.25 44.65 126.20 152.75 95.69 Sugarcane 441.11 484.92 595.72 - 3126.27 1022.00 618.62 Spices 1.21 183.48 16.82 2.02 1.15 76.77 27.74 Total foodgrains 45.98 144.64 70.67 146.28 106.34 167.31 182.77 Milk 28.35 135.98 - 82.74 180.11 197.41 168.72 Meat 5.68 16.96 - 11.15 16.80 28.09 23.59 Egg 262.14 188.92 - 79.07 108.31 201.98 283.66 Fish 123.38 74.38 - 166.71 137.68 157.24 127.00
Source: Calculated from NSSO, 2003 and Statistical Abstracts of India, 2003-04. Note: No data is available for Nagaland and Sikkim. The ratio is calculated separately for meat, eggs and fish assuming that their proportions in consumption expenditure are 0.1, 0.4 and 0.5 in that order.
Table 1.22A: Dependency Index for Milk, Meat, Egg & Fish
AP Assam Meghalaya Mizoram Tripura NER
Milk 28.35 135.98 82.74 180.11 197.41 168.72 Meat 5.68 8.48 5.58 16.80 28.09 23.59 Weights Assigned 0.10 0.05 0.05 0.10 0.10 0.10 Eggs 131.07 118.08 108.72 108.31 201.98 141.83 Weights Assigned 0.20 0.25 0.55 0.40 0.40 0.20 Fish 172.74 104.13 133.37 137.68 157.24 177.80 Weights Assigned 0.70 0.70 0.40 0.50 0.50 0.70 Note: Figures have been calculated. Source: Statistical Abstracts of India, 2003-04 and NSS, 2003

Annexure
21
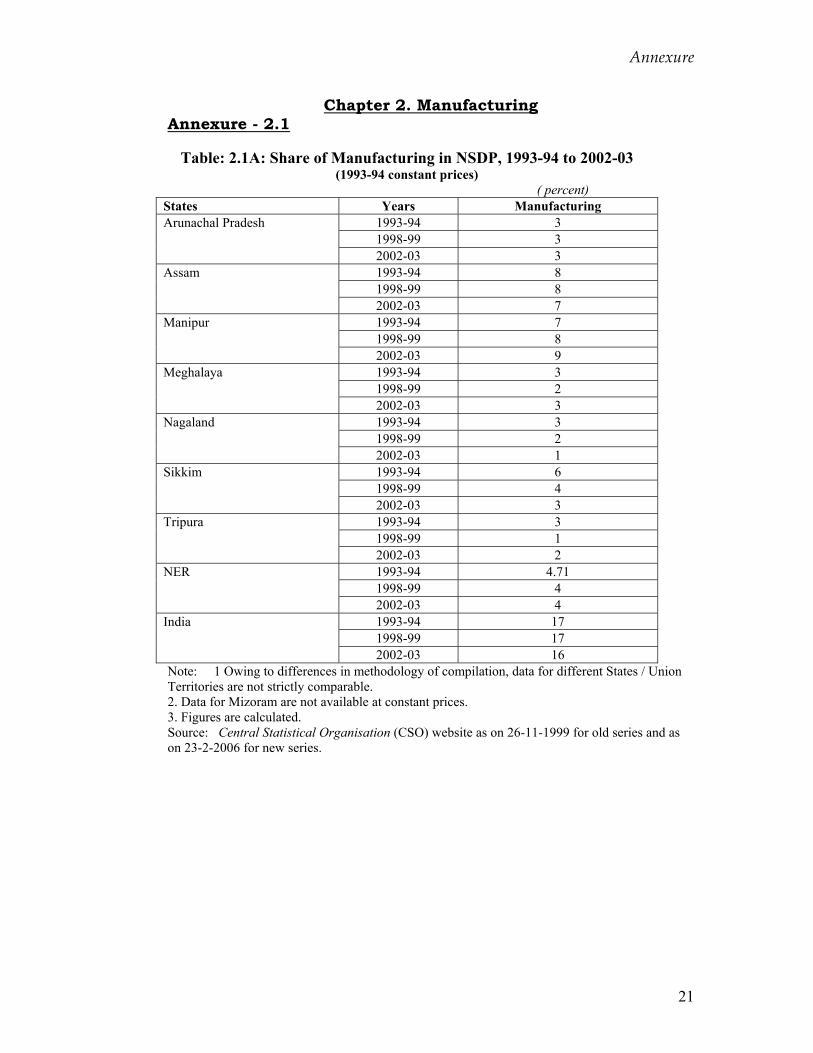
Annexure
21
Chapter 2. Manufacturing Annexure - 2.1
Table: 2.1A: Share of Manufacturing in NSDP, 1993-94 to 2002-03
(1993-94 constant prices) ( percent)
States Years Manufacturing Arunachal Pradesh 1993-94 3 1998-99 3 2002-03 3 Assam 1993-94 8 1998-99 8 2002-03 7 Manipur 1993-94 7 1998-99 8 2002-03 9 Meghalaya 1993-94 3 1998-99 2 2002-03 3 Nagaland 1993-94 3 1998-99 2 2002-03 1 Sikkim 1993-94 6 1998-99 4 2002-03 3 Tripura 1993-94 3 1998-99 1 2002-03 2 NER 1993-94 4.71 1998-99 4 2002-03 4 India 1993-94 17
1998-99 17 2002-03 16
Note: 1 Owing to differences in methodology of compilation, data for different States / Union Territories are not strictly comparable. 2. Data for Mizoram are not available at constant prices. 3. Figures are calculated. Source: Central Statistical Organisation (CSO) website as on 26-11-1999 for old series and as on 23-2-2006 for new series.
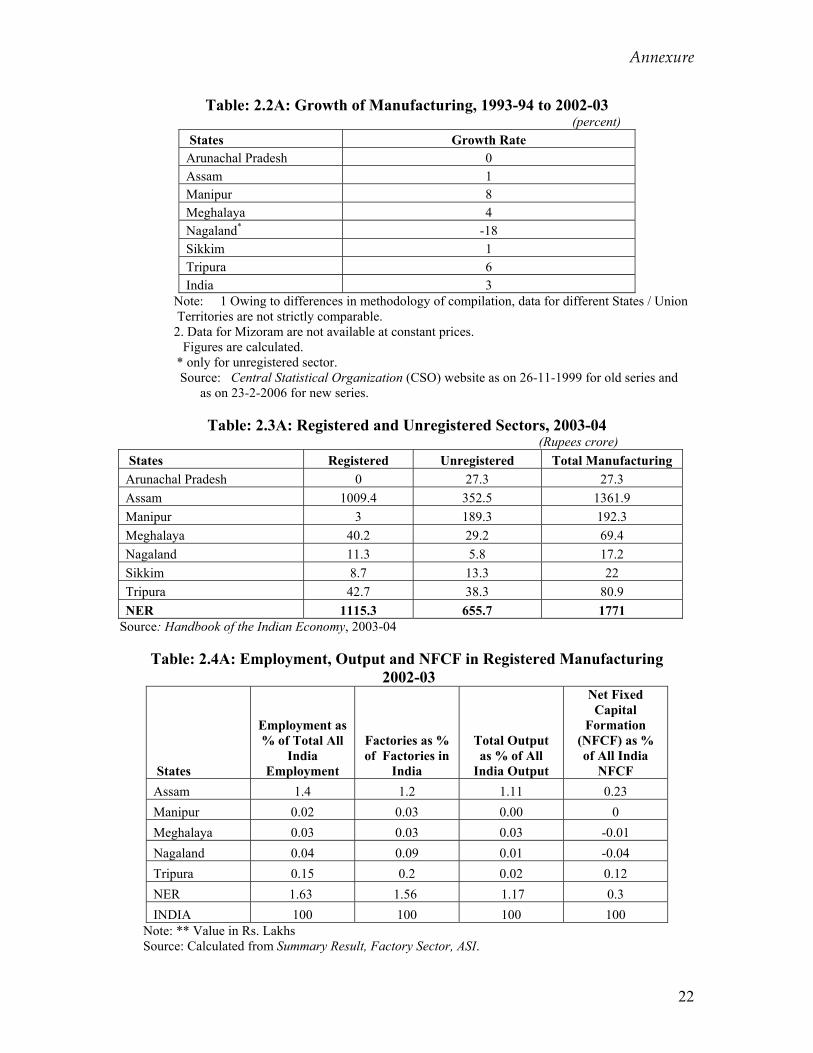
Annexure
22
Table: 2.2A: Growth of Manufacturing, 1993-94 to 2002-03 (percent)
States Growth Rate Arunachal Pradesh 0 Assam 1 Manipur 8 Meghalaya 4 Nagaland* -18 Sikkim 1 Tripura 6 India 3
Note: 1 Owing to differences in methodology of compilation, data for different States / Union Territories are not strictly comparable. 2. Data for Mizoram are not available at constant prices.
Figures are calculated. * only for unregistered sector. Source: Central Statistical Organization (CSO) website as on 26-11-1999 for old series and as on 23-2-2006 for new series.
Table: 2.3A: Registered and Unregistered Sectors, 2003-04
(Rupees crore) States Registered Unregistered Total Manufacturing Arunachal Pradesh 0 27.3 27.3 Assam 1009.4 352.5 1361.9 Manipur 3 189.3 192.3 Meghalaya 40.2 29.2 69.4 Nagaland 11.3 5.8 17.2 Sikkim 8.7 13.3 22 Tripura 42.7 38.3 80.9 NER 1115.3 655.7 1771
Source: Handbook of the Indian Economy, 2003-04
Table: 2.4A: Employment, Output and NFCF in Registered Manufacturing 2002-03
States
Employment as % of Total All
India Employment
Factories as % of Factories in
India
Total Output as % of All
India Output
Net Fixed Capital
Formation (NFCF) as % of All India
NFCF Assam 1.4 1.2 1.11 0.23 Manipur 0.02 0.03 0.00 0 Meghalaya 0.03 0.03 0.03 -0.01 Nagaland 0.04 0.09 0.01 -0.04 Tripura 0.15 0.2 0.02 0.12 NER 1.63 1.56 1.17 0.3 INDIA 100 100 100 100
Note: ** Value in Rs. Lakhs Source: Calculated from Summary Result, Factory Sector, ASI.
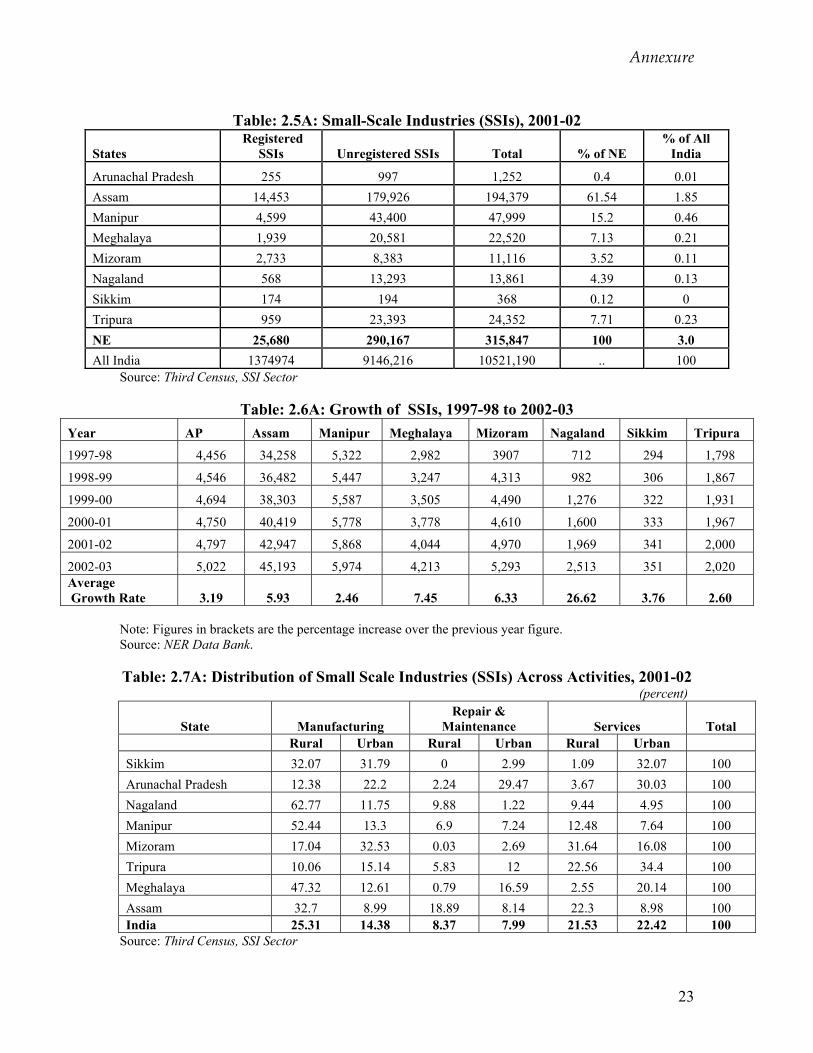
Annexure
23
Table: 2.5A: Small-Scale Industries (SSIs), 2001-02
States Registered
SSIs Unregistered SSIs Total % of NE % of All
India
Arunachal Pradesh 255 997 1,252 0.4 0.01 Assam 14,453 179,926 194,379 61.54 1.85 Manipur 4,599 43,400 47,999 15.2 0.46 Meghalaya 1,939 20,581 22,520 7.13 0.21 Mizoram 2,733 8,383 11,116 3.52 0.11 Nagaland 568 13,293 13,861 4.39 0.13 Sikkim 174 194 368 0.12 0 Tripura 959 23,393 24,352 7.71 0.23 NE 25,680 290,167 315,847 100 3.0 All India 1374974 9146,216 10521,190 .. 100
Source: Third Census, SSI Sector
Table: 2.6A: Growth of SSIs, 1997-98 to 2002-03 Year AP Assam Manipur Meghalaya Mizoram Nagaland Sikkim Tripura
1997-98 4,456 34,258 5,322 2,982 3907 712 294 1,798
1998-99 4,546 36,482 5,447 3,247 4,313 982 306 1,867
1999-00 4,694 38,303 5,587 3,505 4,490 1,276 322 1,931
2000-01 4,750 40,419 5,778 3,778 4,610 1,600 333 1,967
2001-02 4,797 42,947 5,868 4,044 4,970 1,969 341 2,000
2002-03 5,022 45,193 5,974 4,213 5,293 2,513 351 2,020 Average Growth Rate 3.19 5.93 2.46 7.45 6.33 26.62 3.76 2.60
Note: Figures in brackets are the percentage increase over the previous year figure. Source: NER Data Bank. Table: 2.7A: Distribution of Small Scale Industries (SSIs) Across Activities, 2001-02 (percent)
State Manufacturing Repair &
Maintenance Services Total Rural Urban Rural Urban Rural Urban Sikkim 32.07 31.79 0 2.99 1.09 32.07 100 Arunachal Pradesh 12.38 22.2 2.24 29.47 3.67 30.03 100 Nagaland 62.77 11.75 9.88 1.22 9.44 4.95 100 Manipur 52.44 13.3 6.9 7.24 12.48 7.64 100 Mizoram 17.04 32.53 0.03 2.69 31.64 16.08 100 Tripura 10.06 15.14 5.83 12 22.56 34.4 100 Meghalaya 47.32 12.61 0.79 16.59 2.55 20.14 100 Assam 32.7 8.99 18.89 8.14 22.3 8.98 100 India 25.31 14.38 8.37 7.99 21.53 22.42 100
Source: Third Census, SSI Sector
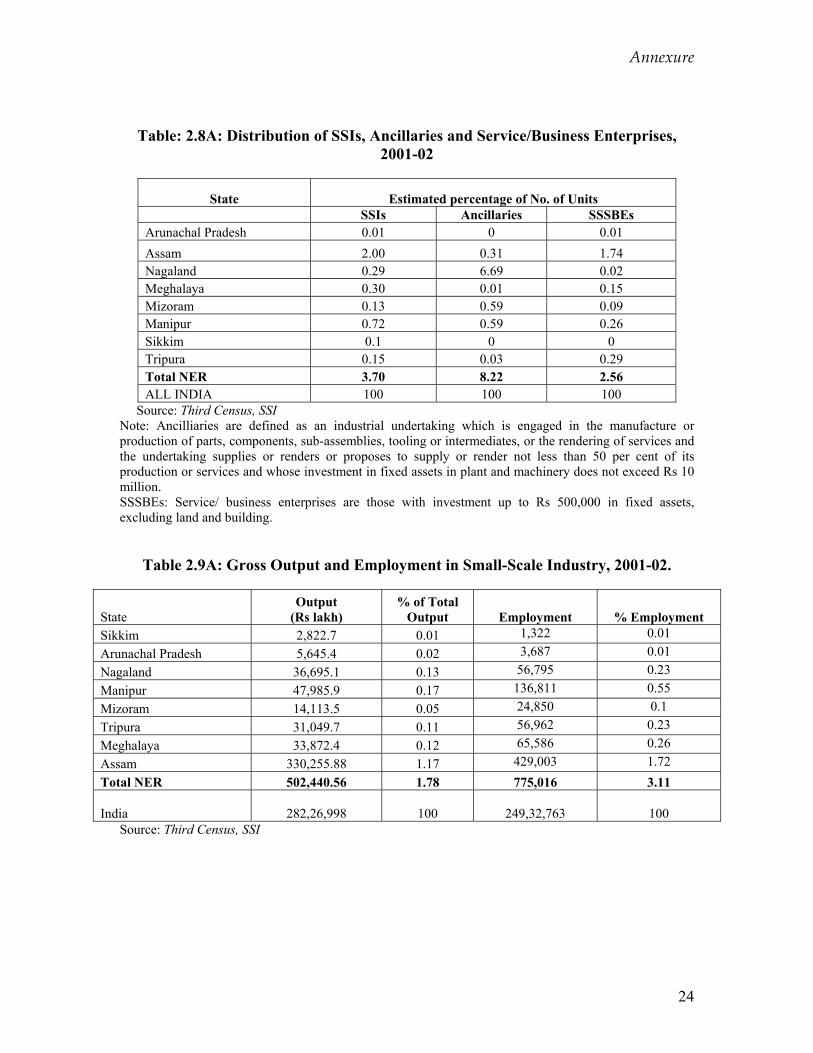
Annexure
24
Table: 2.8A: Distribution of SSIs, Ancillaries and Service/Business Enterprises, 2001-02
State Estimated percentage of No. of Units SSIs Ancillaries SSSBEs
Arunachal Pradesh 0.01 0 0.01 Assam 2.00 0.31 1.74 Nagaland 0.29 6.69 0.02 Meghalaya 0.30 0.01 0.15 Mizoram 0.13 0.59 0.09 Manipur 0.72 0.59 0.26 Sikkim 0.1 0 0 Tripura 0.15 0.03 0.29 Total NER 3.70 8.22 2.56 ALL INDIA 100 100 100
Source: Third Census, SSI Note: Ancilliaries are defined as an industrial undertaking which is engaged in the manufacture or production of parts, components, sub-assemblies, tooling or intermediates, or the rendering of services and the undertaking supplies or renders or proposes to supply or render not less than 50 per cent of its production or services and whose investment in fixed assets in plant and machinery does not exceed Rs 10 million. SSSBEs: Service/ business enterprises are those with investment up to Rs 500,000 in fixed assets, excluding land and building.
Table 2.9A: Gross Output and Employment in Small-Scale Industry, 2001-02.
State Output
(Rs lakh) % of Total
Output Employment % Employment Sikkim 2,822.7 0.01 1,322 0.01 Arunachal Pradesh 5,645.4 0.02 3,687 0.01 Nagaland 36,695.1 0.13 56,795 0.23 Manipur 47,985.9 0.17 136,811 0.55 Mizoram 14,113.5 0.05 24,850 0.1 Tripura 31,049.7 0.11 56,962 0.23 Meghalaya 33,872.4 0.12 65,586 0.26 Assam 330,255.88 1.17 429,003 1.72 Total NER 502,440.56 1.78 775,016 3.11
India 282,26,998 100
249,32,763
100 Source: Third Census, SSI
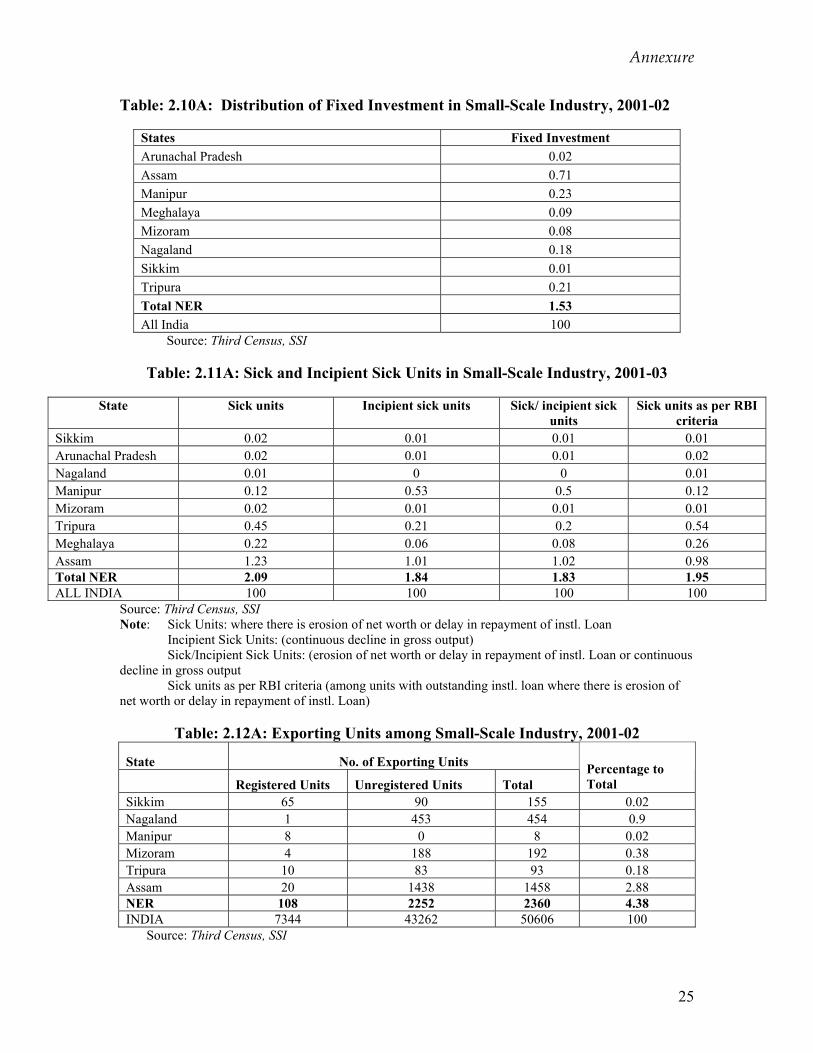
Annexure
25
Table: 2.10A: Distribution of Fixed Investment in Small-Scale Industry, 2001-02
States Fixed Investment Arunachal Pradesh 0.02 Assam 0.71 Manipur 0.23 Meghalaya 0.09 Mizoram 0.08 Nagaland 0.18 Sikkim 0.01 Tripura 0.21 Total NER 1.53 All India 100
Source: Third Census, SSI
Table: 2.11A: Sick and Incipient Sick Units in Small-Scale Industry, 2001-03
State Sick units Incipient sick units Sick/ incipient sick units
Sick units as per RBI criteria
Sikkim 0.02 0.01 0.01 0.01 Arunachal Pradesh 0.02 0.01 0.01 0.02 Nagaland 0.01 0 0 0.01 Manipur 0.12 0.53 0.5 0.12 Mizoram 0.02 0.01 0.01 0.01 Tripura 0.45 0.21 0.2 0.54 Meghalaya 0.22 0.06 0.08 0.26 Assam 1.23 1.01 1.02 0.98 Total NER 2.09 1.84 1.83 1.95 ALL INDIA 100 100 100 100
Source: Third Census, SSI Note: Sick Units: where there is erosion of net worth or delay in repayment of instl. Loan
Incipient Sick Units: (continuous decline in gross output) Sick/Incipient Sick Units: (erosion of net worth or delay in repayment of instl. Loan or continuous
decline in gross output Sick units as per RBI criteria (among units with outstanding instl. loan where there is erosion of
net worth or delay in repayment of instl. Loan)
Table: 2.12A: Exporting Units among Small-Scale Industry, 2001-02
State No. of Exporting Units
Registered Units Unregistered Units Total Percentage to Total
Sikkim 65 90 155 0.02 Nagaland 1 453 454 0.9 Manipur 8 0 8 0.02 Mizoram 4 188 192 0.38 Tripura 10 83 93 0.18 Assam 20 1438 1458 2.88 NER 108 2252 2360 4.38 INDIA 7344 43262 50606 100
Source: Third Census, SSI
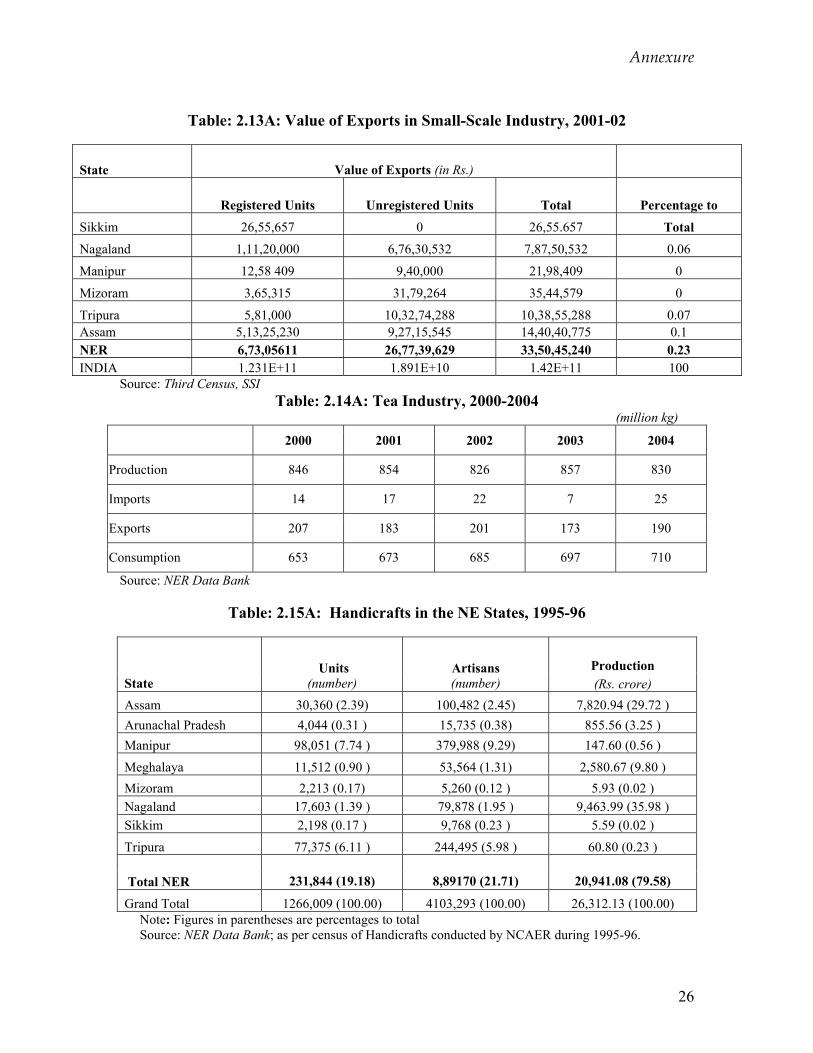
Annexure
26
Table: 2.13A: Value of Exports in Small-Scale Industry, 2001-02
State Value of Exports (in Rs.)
Registered Units Unregistered Units Total Percentage to
Sikkim 26,55,657 0 26,55.657 Total Nagaland 1,11,20,000 6,76,30,532 7,87,50,532 0.06
Manipur 12,58 409 9,40,000 21,98,409 0
Mizoram 3,65,315 31,79,264 35,44,579 0
Tripura 5,81,000 10,32,74,288 10,38,55,288 0.07 Assam 5,13,25,230 9,27,15,545 14,40,40,775 0.1 NER 6,73,05611 26,77,39,629 33,50,45,240 0.23 INDIA 1.231E+11 1.891E+10 1.42E+11 100
Source: Third Census, SSI Table: 2.14A: Tea Industry, 2000-2004
(million kg)
2000 2001 2002 2003 2004
Production 846 854 826 857 830
Imports 14 17 22 7 25
Exports 207 183 201 173 190
Consumption 653 673 685 697 710
Source: NER Data Bank
Table: 2.15A: Handicrafts in the NE States, 1995-96
Production State
Units (number)
Artisans (number) (Rs. crore)
Assam 30,360 (2.39) 100,482 (2.45) 7,820.94 (29.72 ) Arunachal Pradesh 4,044 (0.31 ) 15,735 (0.38) 855.56 (3.25 ) Manipur 98,051 (7.74 ) 379,988 (9.29) 147.60 (0.56 )
Meghalaya 11,512 (0.90 ) 53,564 (1.31) 2,580.67 (9.80 ) Mizoram 2,213 (0.17) 5,260 (0.12 ) 5.93 (0.02 ) Nagaland 17,603 (1.39 ) 79,878 (1.95 ) 9,463.99 (35.98 ) Sikkim 2,198 (0.17 ) 9,768 (0.23 ) 5.59 (0.02 )
Tripura 77,375 (6.11 ) 244,495 (5.98 ) 60.80 (0.23 ) Total NER 231,844 (19.18) 8,89170 (21.71) 20,941.08 (79.58)
Grand Total 1266,009 (100.00) 4103,293 (100.00) 26,312.13 (100.00) Note: Figures in parentheses are percentages to total Source: NER Data Bank; as per census of Handicrafts conducted by NCAER during 1995-96.
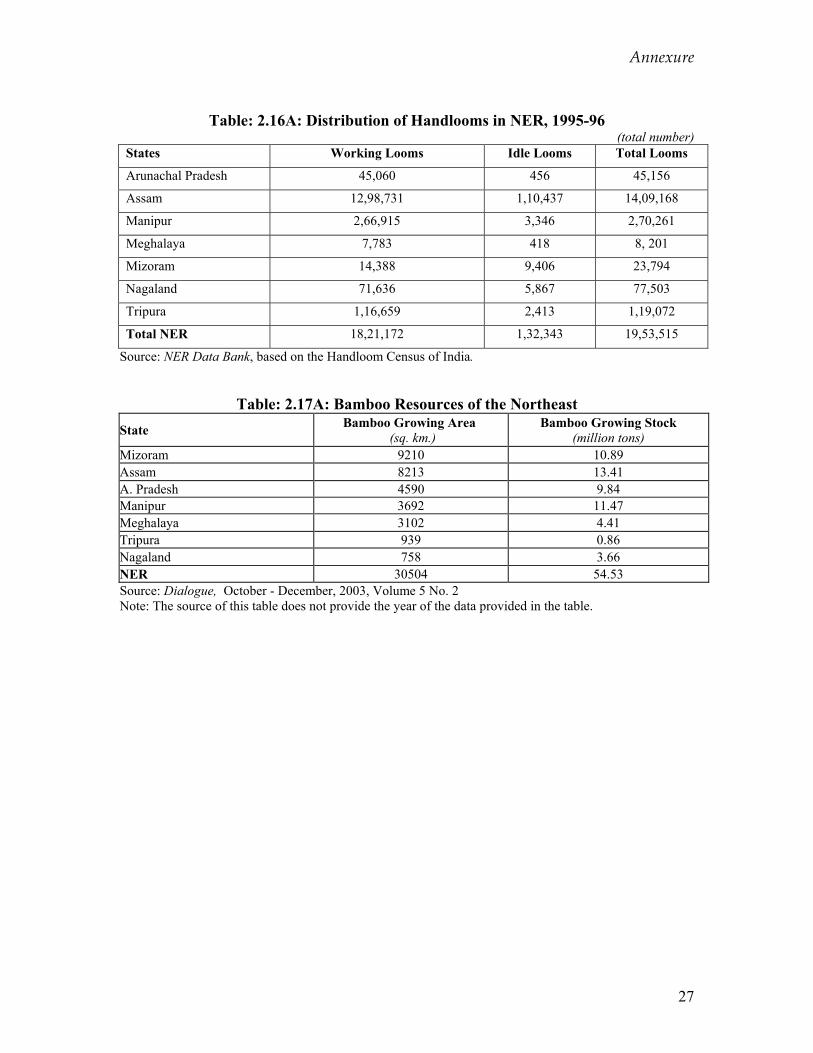
Annexure
27
Table: 2.16A: Distribution of Handlooms in NER, 1995-96
(total number) States Working Looms Idle Looms Total Looms
Arunachal Pradesh 45,060 456 45,156
Assam 12,98,731 1,10,437 14,09,168
Manipur 2,66,915 3,346 2,70,261
Meghalaya 7,783 418 8, 201
Mizoram 14,388 9,406 23,794
Nagaland 71,636 5,867 77,503
Tripura 1,16,659 2,413 1,19,072
Total NER 18,21,172 1,32,343 19,53,515
Source: NER Data Bank, based on the Handloom Census of India.
Table: 2.17A: Bamboo Resources of the Northeast State Bamboo Growing Area
(sq. km.) Bamboo Growing Stock
(million tons) Mizoram 9210 10.89 Assam 8213 13.41 A. Pradesh 4590 9.84 Manipur 3692 11.47 Meghalaya 3102 4.41 Tripura 939 0.86 Nagaland 758 3.66 NER 30504 54.53 Source: Dialogue, October - December, 2003, Volume 5 No. 2 Note: The source of this table does not provide the year of the data provided in the table.
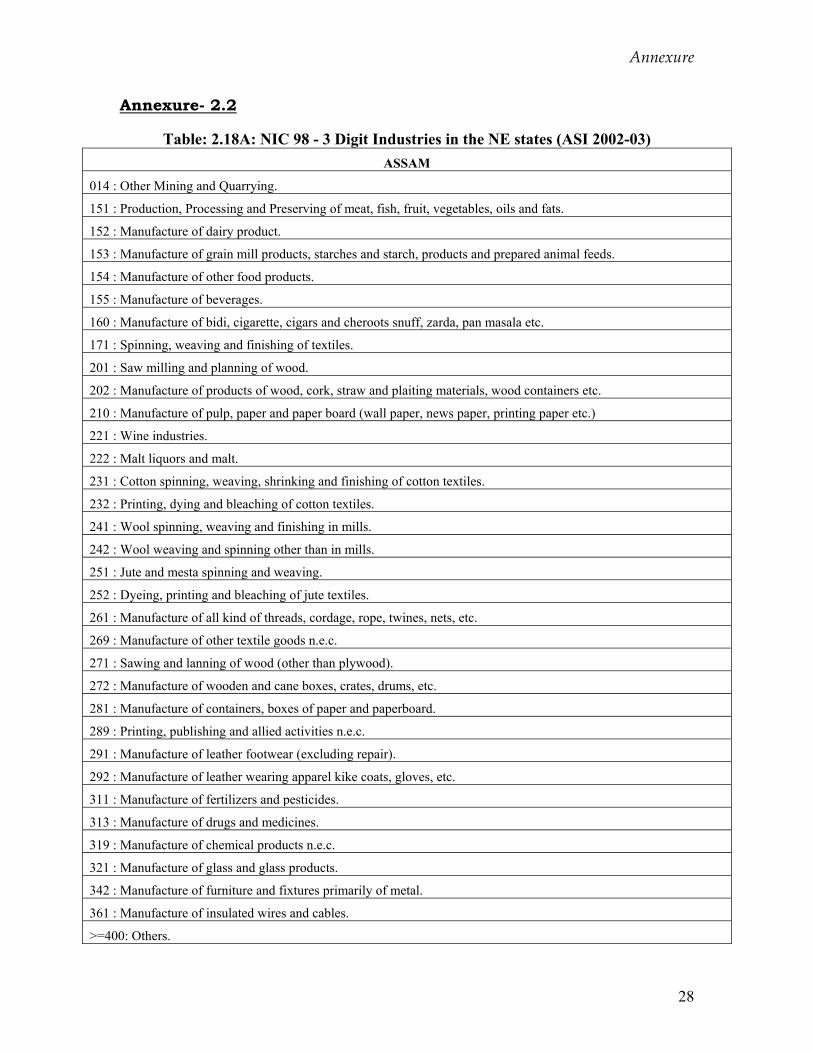
Annexure
28
Annexure- 2.2
Table: 2.18A: NIC 98 - 3 Digit Industries in the NE states (ASI 2002-03) ASSAM
014 : Other Mining and Quarrying.
151 : Production, Processing and Preserving of meat, fish, fruit, vegetables, oils and fats.
152 : Manufacture of dairy product.
153 : Manufacture of grain mill products, starches and starch, products and prepared animal feeds.
154 : Manufacture of other food products.
155 : Manufacture of beverages.
160 : Manufacture of bidi, cigarette, cigars and cheroots snuff, zarda, pan masala etc.
171 : Spinning, weaving and finishing of textiles.
201 : Saw milling and planning of wood.
202 : Manufacture of products of wood, cork, straw and plaiting materials, wood containers etc.
210 : Manufacture of pulp, paper and paper board (wall paper, news paper, printing paper etc.)
221 : Wine industries.
222 : Malt liquors and malt.
231 : Cotton spinning, weaving, shrinking and finishing of cotton textiles.
232 : Printing, dying and bleaching of cotton textiles.
241 : Wool spinning, weaving and finishing in mills.
242 : Wool weaving and spinning other than in mills.
251 : Jute and mesta spinning and weaving.
252 : Dyeing, printing and bleaching of jute textiles.
261 : Manufacture of all kind of threads, cordage, rope, twines, nets, etc.
269 : Manufacture of other textile goods n.e.c.
271 : Sawing and lanning of wood (other than plywood).
272 : Manufacture of wooden and cane boxes, crates, drums, etc.
281 : Manufacture of containers, boxes of paper and paperboard.
289 : Printing, publishing and allied activities n.e.c.
291 : Manufacture of leather footwear (excluding repair).
292 : Manufacture of leather wearing apparel kike coats, gloves, etc.
311 : Manufacture of fertilizers and pesticides.
313 : Manufacture of drugs and medicines.
319 : Manufacture of chemical products n.e.c.
321 : Manufacture of glass and glass products.
342 : Manufacture of furniture and fixtures primarily of metal.
361 : Manufacture of insulated wires and cables.
>=400: Others.
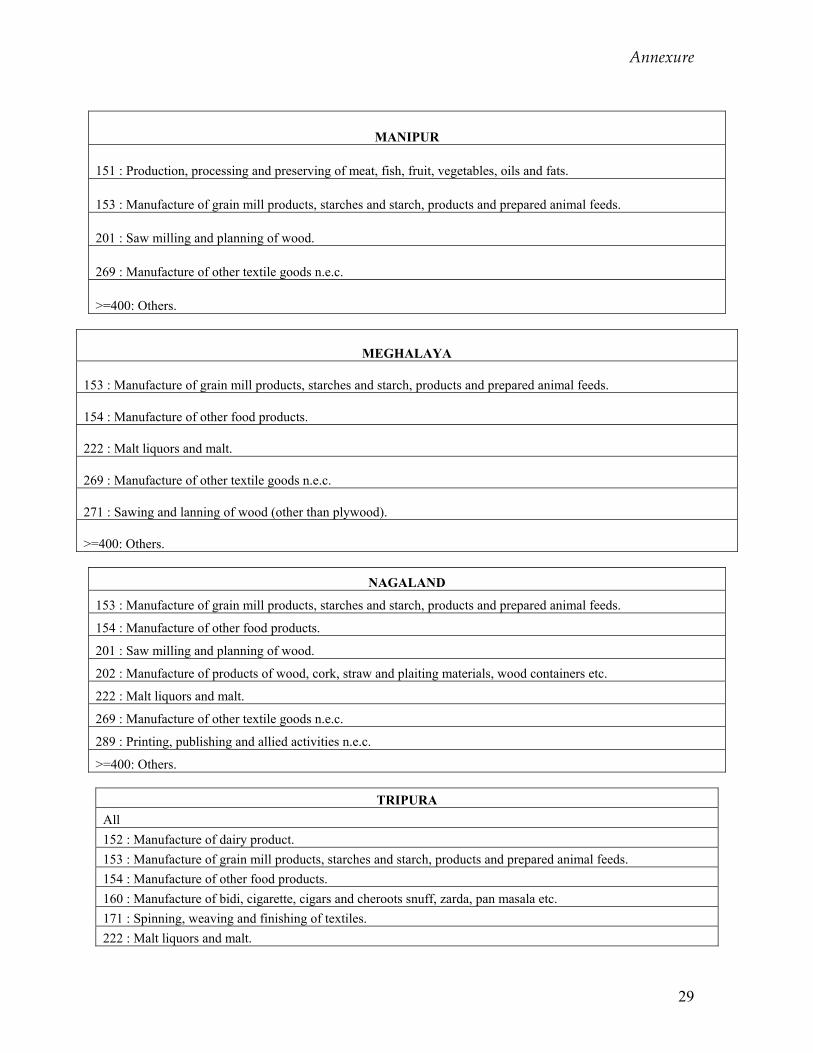
Annexure
29
MANIPUR
151 : Production, processing and preserving of meat, fish, fruit, vegetables, oils and fats.
153 : Manufacture of grain mill products, starches and starch, products and prepared animal feeds.
201 : Saw milling and planning of wood.
269 : Manufacture of other textile goods n.e.c.
>=400: Others.
MEGHALAYA
153 : Manufacture of grain mill products, starches and starch, products and prepared animal feeds.
154 : Manufacture of other food products.
222 : Malt liquors and malt.
269 : Manufacture of other textile goods n.e.c.
271 : Sawing and lanning of wood (other than plywood).
>=400: Others.
NAGALAND
153 : Manufacture of grain mill products, starches and starch, products and prepared animal feeds.
154 : Manufacture of other food products.
201 : Saw milling and planning of wood.
202 : Manufacture of products of wood, cork, straw and plaiting materials, wood containers etc.
222 : Malt liquors and malt.
269 : Manufacture of other textile goods n.e.c.
289 : Printing, publishing and allied activities n.e.c.
>=400: Others.
TRIPURA All 152 : Manufacture of dairy product. 153 : Manufacture of grain mill products, starches and starch, products and prepared animal feeds. 154 : Manufacture of other food products. 160 : Manufacture of bidi, cigarette, cigars and cheroots snuff, zarda, pan masala etc. 171 : Spinning, weaving and finishing of textiles. 222 : Malt liquors and malt.
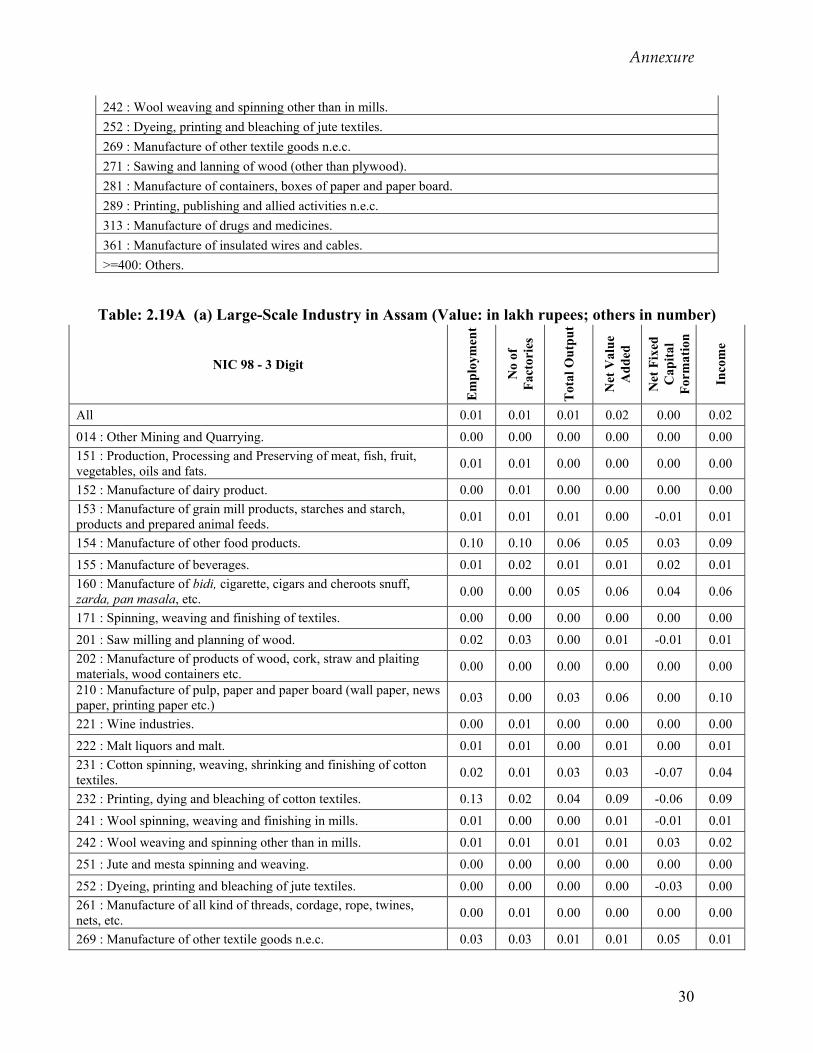
Annexure
30
242 : Wool weaving and spinning other than in mills. 252 : Dyeing, printing and bleaching of jute textiles. 269 : Manufacture of other textile goods n.e.c. 271 : Sawing and lanning of wood (other than plywood). 281 : Manufacture of containers, boxes of paper and paper board. 289 : Printing, publishing and allied activities n.e.c. 313 : Manufacture of drugs and medicines. 361 : Manufacture of insulated wires and cables. >=400: Others.
Table: 2.19A (a) Large-Scale Industry in Assam (Value: in lakh rupees; others in number)
NIC 98 - 3 Digit
Em
ploy
men
t
No
of
Fact
orie
s
Tot
al O
utpu
t
Net
Val
ue
Add
ed
Net
Fix
ed
Cap
ital
Form
atio
n
Inco
me
All 0.01 0.01 0.01 0.02 0.00 0.02 014 : Other Mining and Quarrying. 0.00 0.00 0.00 0.00 0.00 0.00 151 : Production, Processing and Preserving of meat, fish, fruit, vegetables, oils and fats. 0.01 0.01 0.00 0.00 0.00 0.00
152 : Manufacture of dairy product. 0.00 0.01 0.00 0.00 0.00 0.00 153 : Manufacture of grain mill products, starches and starch, products and prepared animal feeds. 0.01 0.01 0.01 0.00 -0.01 0.01
154 : Manufacture of other food products. 0.10 0.10 0.06 0.05 0.03 0.09 155 : Manufacture of beverages. 0.01 0.02 0.01 0.01 0.02 0.01 160 : Manufacture of bidi, cigarette, cigars and cheroots snuff, zarda, pan masala, etc. 0.00 0.00 0.05 0.06 0.04 0.06
171 : Spinning, weaving and finishing of textiles. 0.00 0.00 0.00 0.00 0.00 0.00
201 : Saw milling and planning of wood. 0.02 0.03 0.00 0.01 -0.01 0.01 202 : Manufacture of products of wood, cork, straw and plaiting materials, wood containers etc. 0.00 0.00 0.00 0.00 0.00 0.00
210 : Manufacture of pulp, paper and paper board (wall paper, news paper, printing paper etc.) 0.03 0.00 0.03 0.06 0.00 0.10
221 : Wine industries. 0.00 0.01 0.00 0.00 0.00 0.00 222 : Malt liquors and malt. 0.01 0.01 0.00 0.01 0.00 0.01 231 : Cotton spinning, weaving, shrinking and finishing of cotton textiles. 0.02 0.01 0.03 0.03 -0.07 0.04
232 : Printing, dying and bleaching of cotton textiles. 0.13 0.02 0.04 0.09 -0.06 0.09
241 : Wool spinning, weaving and finishing in mills. 0.01 0.00 0.00 0.01 -0.01 0.01 242 : Wool weaving and spinning other than in mills. 0.01 0.01 0.01 0.01 0.03 0.02 251 : Jute and mesta spinning and weaving. 0.00 0.00 0.00 0.00 0.00 0.00
252 : Dyeing, printing and bleaching of jute textiles. 0.00 0.00 0.00 0.00 -0.03 0.00 261 : Manufacture of all kind of threads, cordage, rope, twines, nets, etc. 0.00 0.01 0.00 0.00 0.00 0.00
269 : Manufacture of other textile goods n.e.c. 0.03 0.03 0.01 0.01 0.05 0.01
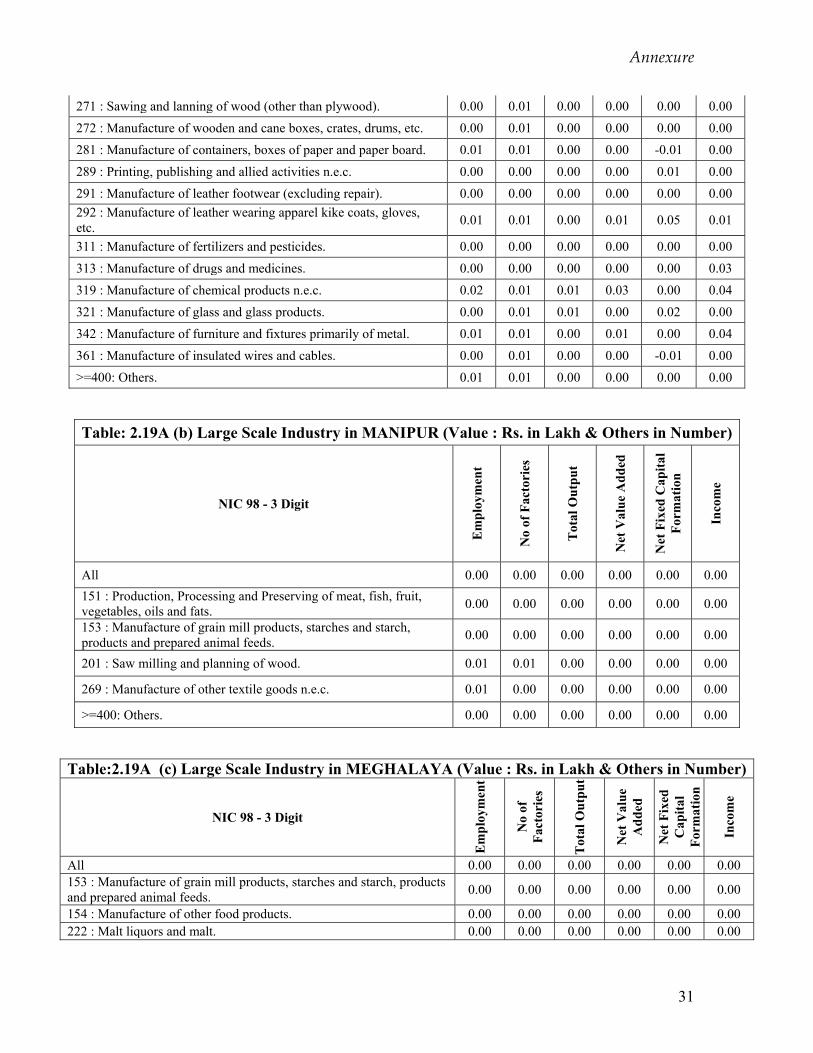
Annexure
31
271 : Sawing and lanning of wood (other than plywood). 0.00 0.01 0.00 0.00 0.00 0.00 272 : Manufacture of wooden and cane boxes, crates, drums, etc. 0.00 0.01 0.00 0.00 0.00 0.00 281 : Manufacture of containers, boxes of paper and paper board. 0.01 0.01 0.00 0.00 -0.01 0.00
289 : Printing, publishing and allied activities n.e.c. 0.00 0.00 0.00 0.00 0.01 0.00 291 : Manufacture of leather footwear (excluding repair). 0.00 0.00 0.00 0.00 0.00 0.00 292 : Manufacture of leather wearing apparel kike coats, gloves, etc. 0.01 0.01 0.00 0.01 0.05 0.01
311 : Manufacture of fertilizers and pesticides. 0.00 0.00 0.00 0.00 0.00 0.00 313 : Manufacture of drugs and medicines. 0.00 0.00 0.00 0.00 0.00 0.03
319 : Manufacture of chemical products n.e.c. 0.02 0.01 0.01 0.03 0.00 0.04 321 : Manufacture of glass and glass products. 0.00 0.01 0.01 0.00 0.02 0.00 342 : Manufacture of furniture and fixtures primarily of metal. 0.01 0.01 0.00 0.01 0.00 0.04
361 : Manufacture of insulated wires and cables. 0.00 0.01 0.00 0.00 -0.01 0.00 >=400: Others. 0.01 0.01 0.00 0.00 0.00 0.00
Table: 2.19A (b) Large Scale Industry in MANIPUR (Value : Rs. in Lakh & Others in Number)
NIC 98 - 3 Digit
Em
ploy
men
t
No
of F
acto
ries
Tot
al O
utpu
t
Net
Val
ue A
dded
Net
Fix
ed C
apita
l Fo
rmat
ion
Inco
me
All 0.00 0.00 0.00 0.00 0.00 0.00 151 : Production, Processing and Preserving of meat, fish, fruit, vegetables, oils and fats. 0.00 0.00 0.00 0.00 0.00 0.00
153 : Manufacture of grain mill products, starches and starch, products and prepared animal feeds. 0.00 0.00 0.00 0.00 0.00 0.00
201 : Saw milling and planning of wood. 0.01 0.01 0.00 0.00 0.00 0.00
269 : Manufacture of other textile goods n.e.c. 0.01 0.00 0.00 0.00 0.00 0.00
>=400: Others. 0.00 0.00 0.00 0.00 0.00 0.00
Table:2.19A (c) Large Scale Industry in MEGHALAYA (Value : Rs. in Lakh & Others in Number)
NIC 98 - 3 Digit
Em
ploy
men
t
No
of
Fact
orie
s
Tot
al O
utpu
t
Net
Val
ue
Add
ed
Net
Fix
ed
Cap
ital
Form
atio
n
Inco
me
All 0.00 0.00 0.00 0.00 0.00 0.00 153 : Manufacture of grain mill products, starches and starch, products and prepared animal feeds. 0.00 0.00 0.00 0.00 0.00 0.00
154 : Manufacture of other food products. 0.00 0.00 0.00 0.00 0.00 0.00 222 : Malt liquors and malt. 0.00 0.00 0.00 0.00 0.00 0.00
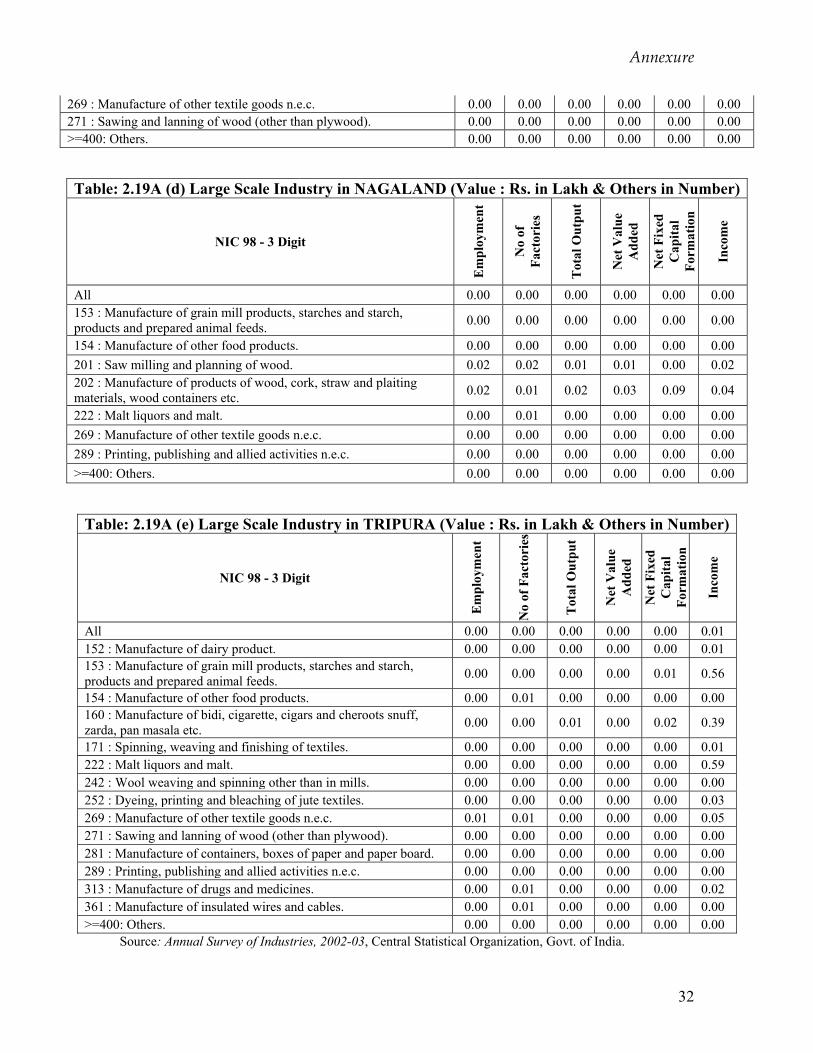
Annexure
32
269 : Manufacture of other textile goods n.e.c. 0.00 0.00 0.00 0.00 0.00 0.00 271 : Sawing and lanning of wood (other than plywood). 0.00 0.00 0.00 0.00 0.00 0.00 >=400: Others. 0.00 0.00 0.00 0.00 0.00 0.00
Table: 2.19A (d) Large Scale Industry in NAGALAND (Value : Rs. in Lakh & Others in Number)
NIC 98 - 3 Digit
Em
ploy
men
t
No
of
Fact
orie
s
Tot
al O
utpu
t
Net
Val
ue
Add
ed
Net
Fix
ed
Cap
ital
Form
atio
n
Inco
me
All 0.00 0.00 0.00 0.00 0.00 0.00 153 : Manufacture of grain mill products, starches and starch, products and prepared animal feeds. 0.00 0.00 0.00 0.00 0.00 0.00
154 : Manufacture of other food products. 0.00 0.00 0.00 0.00 0.00 0.00 201 : Saw milling and planning of wood. 0.02 0.02 0.01 0.01 0.00 0.02 202 : Manufacture of products of wood, cork, straw and plaiting materials, wood containers etc. 0.02 0.01 0.02 0.03 0.09 0.04
222 : Malt liquors and malt. 0.00 0.01 0.00 0.00 0.00 0.00 269 : Manufacture of other textile goods n.e.c. 0.00 0.00 0.00 0.00 0.00 0.00 289 : Printing, publishing and allied activities n.e.c. 0.00 0.00 0.00 0.00 0.00 0.00 >=400: Others. 0.00 0.00 0.00 0.00 0.00 0.00
Table: 2.19A (e) Large Scale Industry in TRIPURA (Value : Rs. in Lakh & Others in Number)
NIC 98 - 3 Digit
Em
ploy
men
t
No
of F
acto
ries
Tot
al O
utpu
t
Net
Val
ue
Add
ed
Net
Fix
ed
Cap
ital
Form
atio
n
Inco
me
All 0.00 0.00 0.00 0.00 0.00 0.01 152 : Manufacture of dairy product. 0.00 0.00 0.00 0.00 0.00 0.01 153 : Manufacture of grain mill products, starches and starch, products and prepared animal feeds. 0.00 0.00 0.00 0.00 0.01 0.56
154 : Manufacture of other food products. 0.00 0.01 0.00 0.00 0.00 0.00 160 : Manufacture of bidi, cigarette, cigars and cheroots snuff, zarda, pan masala etc. 0.00 0.00 0.01 0.00 0.02 0.39
171 : Spinning, weaving and finishing of textiles. 0.00 0.00 0.00 0.00 0.00 0.01 222 : Malt liquors and malt. 0.00 0.00 0.00 0.00 0.00 0.59 242 : Wool weaving and spinning other than in mills. 0.00 0.00 0.00 0.00 0.00 0.00 252 : Dyeing, printing and bleaching of jute textiles. 0.00 0.00 0.00 0.00 0.00 0.03 269 : Manufacture of other textile goods n.e.c. 0.01 0.01 0.00 0.00 0.00 0.05 271 : Sawing and lanning of wood (other than plywood). 0.00 0.00 0.00 0.00 0.00 0.00 281 : Manufacture of containers, boxes of paper and paper board. 0.00 0.00 0.00 0.00 0.00 0.00 289 : Printing, publishing and allied activities n.e.c. 0.00 0.00 0.00 0.00 0.00 0.00 313 : Manufacture of drugs and medicines. 0.00 0.01 0.00 0.00 0.00 0.02 361 : Manufacture of insulated wires and cables. 0.00 0.01 0.00 0.00 0.00 0.00 >=400: Others. 0.00 0.00 0.00 0.00 0.00 0.00
Source: Annual Survey of Industries, 2002-03, Central Statistical Organization, Govt. of India.
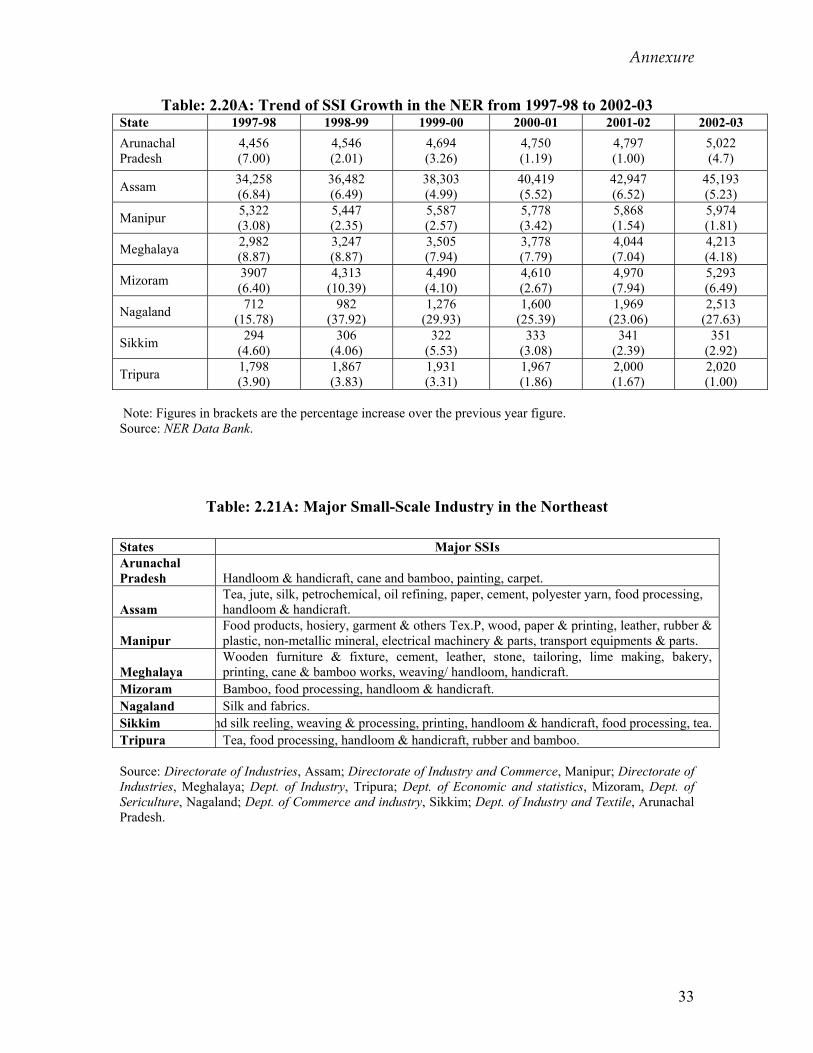
Annexure
33
Table: 2.20A: Trend of SSI Growth in the NER from 1997-98 to 2002-03 State 1997-98 1998-99 1999-00 2000-01 2001-02 2002-03 Arunachal Pradesh
4,456 (7.00)
4,546 (2.01)
4,694 (3.26)
4,750 (1.19)
4,797 (1.00)
5,022 (4.7)
Assam 34,258 (6.84)
36,482 (6.49)
38,303 (4.99)
40,419 (5.52)
42,947 (6.52)
45,193 (5.23)
Manipur 5,322 (3.08)
5,447 (2.35)
5,587 (2.57)
5,778 (3.42)
5,868 (1.54)
5,974 (1.81)
Meghalaya 2,982 (8.87)
3,247 (8.87)
3,505 (7.94)
3,778 (7.79)
4,044 (7.04)
4,213 (4.18)
Mizoram 3907 (6.40)
4,313 (10.39)
4,490 (4.10)
4,610 (2.67)
4,970 (7.94)
5,293 (6.49)
Nagaland 712 (15.78)
982 (37.92)
1,276 (29.93)
1,600 (25.39)
1,969 (23.06)
2,513 (27.63)
Sikkim 294 (4.60)
306 (4.06)
322 (5.53)
333 (3.08)
341 (2.39)
351 (2.92)
Tripura 1,798 (3.90)
1,867 (3.83)
1,931 (3.31)
1,967 (1.86)
2,000 (1.67)
2,020 (1.00)
Note: Figures in brackets are the percentage increase over the previous year figure. Source: NER Data Bank.
Table: 2.21A: Major Small-Scale Industry in the Northeast
Source: Directorate of Industries, Assam; Directorate of Industry and Commerce, Manipur; Directorate of Industries, Meghalaya; Dept. of Industry, Tripura; Dept. of Economic and statistics, Mizoram, Dept. of Sericulture, Nagaland; Dept. of Commerce and industry, Sikkim; Dept. of Industry and Textile, Arunachal Pradesh.
States Major SSIs Arunachal Pradesh Handloom & handicraft, cane and bamboo, painting, carpet.
Assam Tea, jute, silk, petrochemical, oil refining, paper, cement, polyester yarn, food processing, handloom & handicraft.
Manipur Food products, hosiery, garment & others Tex.P, wood, paper & printing, leather, rubber & plastic, non-metallic mineral, electrical machinery & parts, transport equipments & parts.
Meghalaya Wooden furniture & fixture, cement, leather, stone, tailoring, lime making, bakery, printing, cane & bamboo works, weaving/ handloom, handicraft.
Mizoram Bamboo, food processing, handloom & handicraft. Nagaland Silk and fabrics. Sikkim nd silk reeling, weaving & processing, printing, handloom & handicraft, food processing, tea. Tripura Tea, food processing, handloom & handicraft, rubber and bamboo.
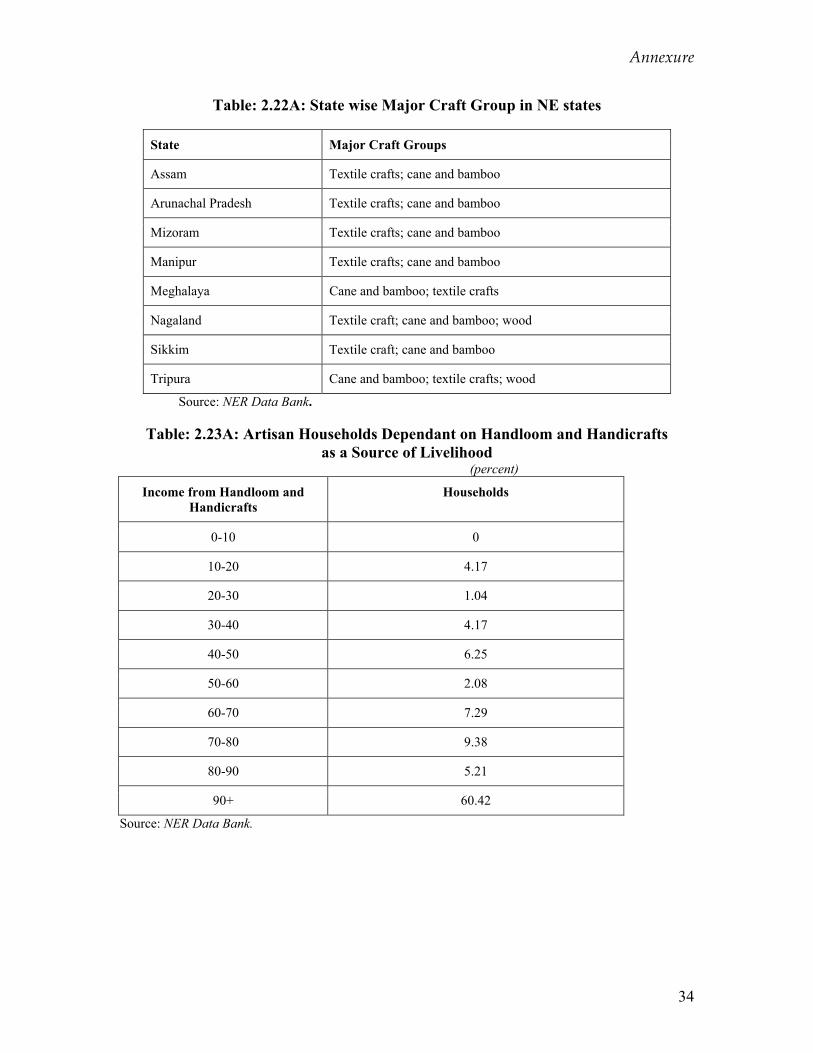
Annexure
34
Table: 2.22A: State wise Major Craft Group in NE states
State Major Craft Groups
Assam Textile crafts; cane and bamboo
Arunachal Pradesh Textile crafts; cane and bamboo
Mizoram Textile crafts; cane and bamboo
Manipur Textile crafts; cane and bamboo
Meghalaya Cane and bamboo; textile crafts
Nagaland Textile craft; cane and bamboo; wood
Sikkim Textile craft; cane and bamboo
Tripura Cane and bamboo; textile crafts; wood
Source: NER Data Bank.
Table: 2.23A: Artisan Households Dependant on Handloom and Handicrafts as a Source of Livelihood
(percent)
Income from Handloom and Handicrafts
Households
0-10 0
10-20 4.17
20-30 1.04
30-40 4.17
40-50 6.25
50-60 2.08
60-70 7.29
70-80 9.38
80-90 5.21
90+ 60.42
Source: NER Data Bank.
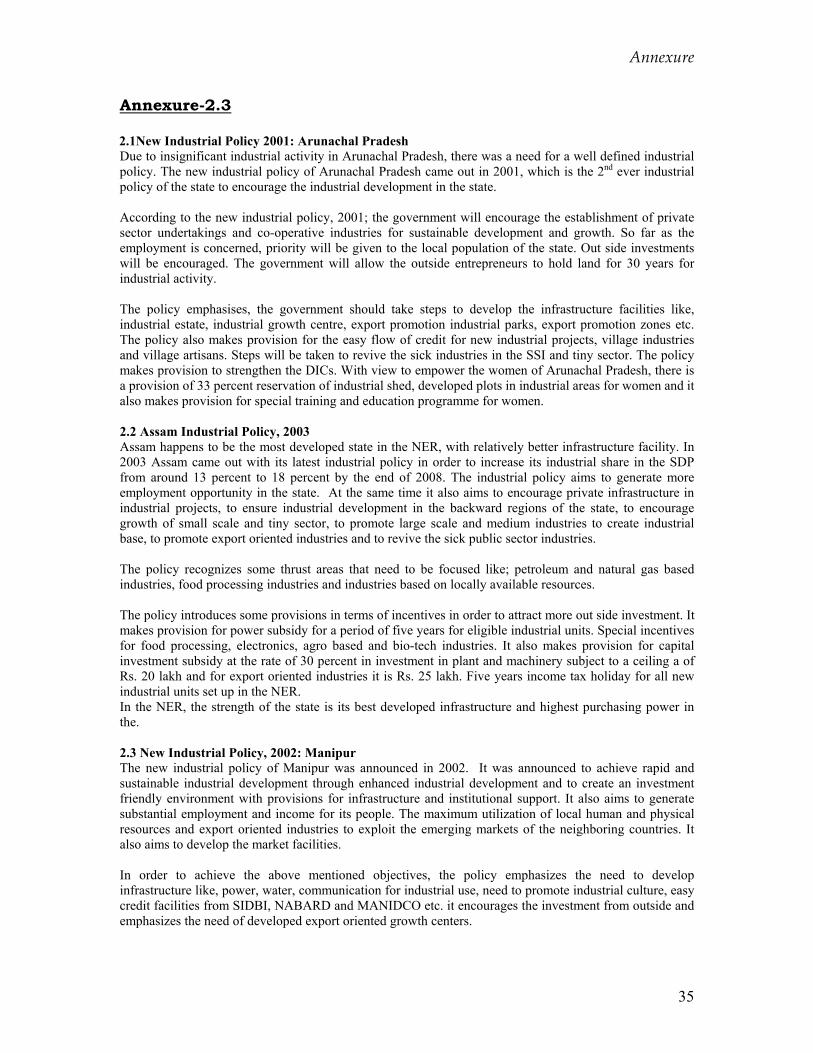
Annexure
35
Annexure-2.3
2.1New Industrial Policy 2001: Arunachal Pradesh Due to insignificant industrial activity in Arunachal Pradesh, there was a need for a well defined industrial policy. The new industrial policy of Arunachal Pradesh came out in 2001, which is the 2nd ever industrial policy of the state to encourage the industrial development in the state. According to the new industrial policy, 2001; the government will encourage the establishment of private sector undertakings and co-operative industries for sustainable development and growth. So far as the employment is concerned, priority will be given to the local population of the state. Out side investments will be encouraged. The government will allow the outside entrepreneurs to hold land for 30 years for industrial activity. The policy emphasises, the government should take steps to develop the infrastructure facilities like, industrial estate, industrial growth centre, export promotion industrial parks, export promotion zones etc. The policy also makes provision for the easy flow of credit for new industrial projects, village industries and village artisans. Steps will be taken to revive the sick industries in the SSI and tiny sector. The policy makes provision to strengthen the DICs. With view to empower the women of Arunachal Pradesh, there is a provision of 33 percent reservation of industrial shed, developed plots in industrial areas for women and it also makes provision for special training and education programme for women. 2.2 Assam Industrial Policy, 2003 Assam happens to be the most developed state in the NER, with relatively better infrastructure facility. In 2003 Assam came out with its latest industrial policy in order to increase its industrial share in the SDP from around 13 percent to 18 percent by the end of 2008. The industrial policy aims to generate more employment opportunity in the state. At the same time it also aims to encourage private infrastructure in industrial projects, to ensure industrial development in the backward regions of the state, to encourage growth of small scale and tiny sector, to promote large scale and medium industries to create industrial base, to promote export oriented industries and to revive the sick public sector industries. The policy recognizes some thrust areas that need to be focused like; petroleum and natural gas based industries, food processing industries and industries based on locally available resources. The policy introduces some provisions in terms of incentives in order to attract more out side investment. It makes provision for power subsidy for a period of five years for eligible industrial units. Special incentives for food processing, electronics, agro based and bio-tech industries. It also makes provision for capital investment subsidy at the rate of 30 percent in investment in plant and machinery subject to a ceiling a of Rs. 20 lakh and for export oriented industries it is Rs. 25 lakh. Five years income tax holiday for all new industrial units set up in the NER. In the NER, the strength of the state is its best developed infrastructure and highest purchasing power in the. 2.3 New Industrial Policy, 2002: Manipur The new industrial policy of Manipur was announced in 2002. It was announced to achieve rapid and sustainable industrial development through enhanced industrial development and to create an investment friendly environment with provisions for infrastructure and institutional support. It also aims to generate substantial employment and income for its people. The maximum utilization of local human and physical resources and export oriented industries to exploit the emerging markets of the neighboring countries. It also aims to develop the market facilities. In order to achieve the above mentioned objectives, the policy emphasizes the need to develop infrastructure like, power, water, communication for industrial use, need to promote industrial culture, easy credit facilities from SIDBI, NABARD and MANIDCO etc. it encourages the investment from outside and emphasizes the need of developed export oriented growth centers.
Annexure
36
The industrial policy finds that development of tourism related industry remains an important area so it makes provision to develop the tourism related industry in the state. The policy also provides some incentives in terms of exemption of local sales tax, power subsidy, interest subsidy, and transport and capital subsidy. The investment strengths of the state are, Second-lowest industrial power tariff in the country; most villages are electrified and high degree of irrigation. 2.4 New Industrial Policy, 2002: Mizoram The new industrial policy of Mizoram was announced in 2002 with a view to accelerate the industrial growth of the state with a suitable mechanism to attract more investment for the growth of capital formation. It also aims to make the industrial labor skilled with the help of training programmes. It aims to promote the production of textile industry including sericulture, handloom and handicraft sector with the help of new designs. The 2002 industrial policy also aims to develop the bamboo industries with the help of optimum utilization of bamboo resources of Mizoram. The policy recognizes following thrust areas for concentrated development, electronics and IT, bamboo based product, food processing industry, handloom and handicraft industries. In order to attract more investment the policy provides fiscal incentives, provision for development of infrastructure etc. The investment strength of the state is, literate and cheap labor force and high proportion of urban population. 2.5 Industrial Policy, 1997: Meghalaya In 1997, Meghalaya came up with a comprehensive industrial policy with a view to generate employment opportunities, balanced growth all over the state through promotion of village and small scale industries, development of infrastructure for setting up of industrial areas, growth centre and export promotion industrial parks. The policy aims to revive the sick units with a comprehensive revival package and also aims to promote export oriented, agro based, mineral based and horticulture based units as thrust areas. In order to achieve the above objectives, the policy provides subsidy provision for both small scale and large scale industries. It makes provision for state capital investment subsidy, interest subsidy, power subsidy, sales tax exemption and exemption from stamp duty. 2.6 Industrial policy, 1996: Sikkim Un order to achieve faster industrial development and generation of adequate employment opportunities through self-employment, Sikkim announced a comprehensive industrial policy in 1996. The policy aims to create a conducive atmosphere for industrial growth, to maintain the Green State image while promoting industrial activities and steps to revive sick units. It also aims to promote the agro based industries through proper linkage between agriculture and agro based industry, promotion of traditional handloom, handicrafts with adequate technology, raw materials and marketing network skill development. In order to ensure balanced regional growth, the policy aims to promote Khadi, Village, cottage, and tiny, small and ancillary industries. The policy also aims to develop tourism sector, development of basic infrastructure and development of Sikkim as a major centre for manufacture & marketing of tea. Finally the policy aims to simplify the procedures and open up Sikkim with a view to attract both internal and outside investors. To achieve the above objectives, the policy outlines some important strategies. It identifies some thrust areas like, Agro-based industries, Floriculture, Animal Husbandry and Diary Products, Handloom, Handicrafts and Village Industries, Tourism, Electronic and Software etc for concentrated development. The policy announces some incentives like, fiscal incentives, development of marketing system, Creation of Single Window Agency, rehabilitation package for the sick industries, establishment of industrial estates and growth centers and special provisions for rural and traditional industries. 2.7 Industrial Policy 2000: Nagaland
Annexure
37
The Industrial Policy 2000 of Nagaland was announced to achieve sustained industrial development and to enable the entrepreneurs to generate substantial income and employment. The policy identifies some thrust areas like food processing industries, tourism industries, agro-forest based industries, mineral based industries, sericulture, bio-tech industries, handloom & handicrafts etc for comprehensive industrial development. The policy announces some major incentives to attract outside investment in the state. It provides power subsidy, exemption of stamp duty, manpower subsidy, special incentive for 100% export oriented units etc. other than this the industrial units are also eligible to get the Central Government incentives as per the new industrial policy for NER. 2.8 Industrial Policy: Tripura Industrial policy recognized some thrust area that need to be developed. These are natural gas, food processing, rubber, tea, handicraft and tourism. The policy recognizes its location as a major advantage factor for industrialization. It’s very much well connected with Kolkata and Chittogong (Bangladesh). It provides capital investment subsidy, transport cost subsidy, exemption of sales tax, and income tax exemption for five years. 2.9. Recommendations of Various Committees The government appointed L.C Jain committee for development of Assam and Shukla Committee for policy recommendations for over all development of the region. In 1997 the Government of India also came out with an industrial policy for the NER. We discuss briefly the summary recommendations of various reports for industrial development of the NER. 2.9.1 The L.C. Jain Committee Recommendations, 1990. The Jain committee came out with some important recommendations for industrial development of Assam. The committee recommended for the promotion of petrochemical based downstream units, to strengthen the handloom and sericulture industry through creation of adequate spinning and processing capacity, provision of raw materials and to strengthen R & D activities etc. The committee also recommends improving and reviving the state public enterprises and special compensatory schemes to be introduced to attract private investment, entrepreneurial talent and professional managers. 2.9.2 The Shukla Commission Recommendation, 1997 The Shukla Commission has recommended establishment of a design bureau with the help of the National Institute of Design, Ahmedabad for varieties of textiles and crafts in the NER. It has also recommended taking steps to promote adequate marketing network for handicraft and handloom products. The commission also recommended promoting export processing and special economic zones with all necessary infrastructures at suitable location at the NER. 2.10 Government of India, New Industrial Policy for NER, 1997 In 1997 the Ministry of Industry announced a new industrial policy for the NER. The policy provides number of incentives for industrial development in the NER. For development of industrial infrastructure, the policy provides entire expenditure on the growth centers, subject to a ceiling of Rs.15.0 cores.1 The policy also makes provision for 15% capital investment subsidy on plant & machinery subject to a maximum of Rs. 30.00 lakh and 3% Interest Subsidy on working capital loan for 10 years. The policy also announces, the transport subsidy scheme will be extended for a period of 7 years and 10 years tax holiday i.e.; exemption of excise duty & income tax for units operating in the growth centers. For the development of small-scale sector, weavers service centers (WSCs) in NE region and Indian Institute of Handloom Technology at Guwahati would be suitably strengthened to provide technology and training support to the weavers. It also makes provision of setting up of market complexes and permanent exhibition facilities in the NER. 1 Earlier, Rs. 10 crore was provided as central assistance and the rest of the amount to be raised by the State Government.
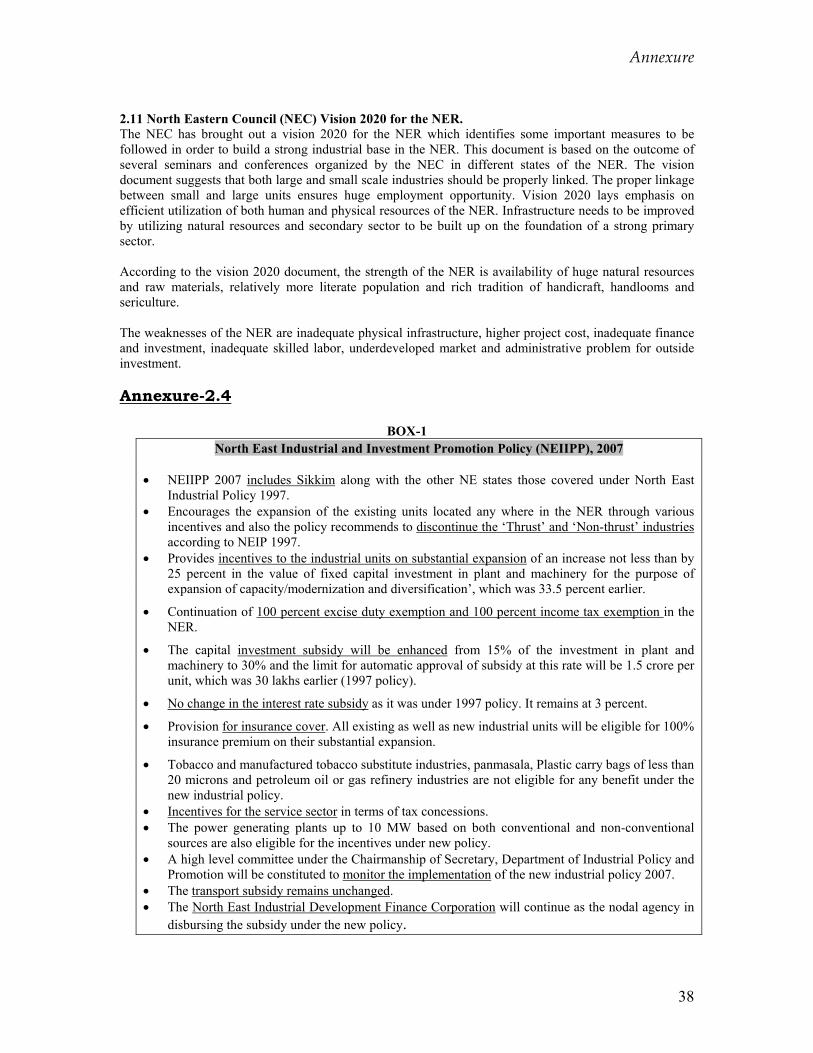
Annexure
38
2.11 North Eastern Council (NEC) Vision 2020 for the NER. The NEC has brought out a vision 2020 for the NER which identifies some important measures to be followed in order to build a strong industrial base in the NER. This document is based on the outcome of several seminars and conferences organized by the NEC in different states of the NER. The vision document suggests that both large and small scale industries should be properly linked. The proper linkage between small and large units ensures huge employment opportunity. Vision 2020 lays emphasis on efficient utilization of both human and physical resources of the NER. Infrastructure needs to be improved by utilizing natural resources and secondary sector to be built up on the foundation of a strong primary sector. According to the vision 2020 document, the strength of the NER is availability of huge natural resources and raw materials, relatively more literate population and rich tradition of handicraft, handlooms and sericulture. The weaknesses of the NER are inadequate physical infrastructure, higher project cost, inadequate finance and investment, inadequate skilled labor, underdeveloped market and administrative problem for outside investment. Annexure-2.4
BOX-1 North East Industrial and Investment Promotion Policy (NEIIPP), 2007
• NEIIPP 2007 includes Sikkim along with the other NE states those covered under North East
Industrial Policy 1997. • Encourages the expansion of the existing units located any where in the NER through various
incentives and also the policy recommends to discontinue the ‘Thrust’ and ‘Non-thrust’ industries according to NEIP 1997.
• Provides incentives to the industrial units on substantial expansion of an increase not less than by 25 percent in the value of fixed capital investment in plant and machinery for the purpose of expansion of capacity/modernization and diversification’, which was 33.5 percent earlier.
• Continuation of 100 percent excise duty exemption and 100 percent income tax exemption in the NER.
• The capital investment subsidy will be enhanced from 15% of the investment in plant and machinery to 30% and the limit for automatic approval of subsidy at this rate will be 1.5 crore per unit, which was 30 lakhs earlier (1997 policy).
• No change in the interest rate subsidy as it was under 1997 policy. It remains at 3 percent.
• Provision for insurance cover. All existing as well as new industrial units will be eligible for 100% insurance premium on their substantial expansion.
• Tobacco and manufactured tobacco substitute industries, panmasala, Plastic carry bags of less than 20 microns and petroleum oil or gas refinery industries are not eligible for any benefit under the new industrial policy.
• Incentives for the service sector in terms of tax concessions. • The power generating plants up to 10 MW based on both conventional and non-conventional
sources are also eligible for the incentives under new policy. • A high level committee under the Chairmanship of Secretary, Department of Industrial Policy and
Promotion will be constituted to monitor the implementation of the new industrial policy 2007. • The transport subsidy remains unchanged. • The North East Industrial Development Finance Corporation will continue as the nodal agency in
disbursing the subsidy under the new policy.
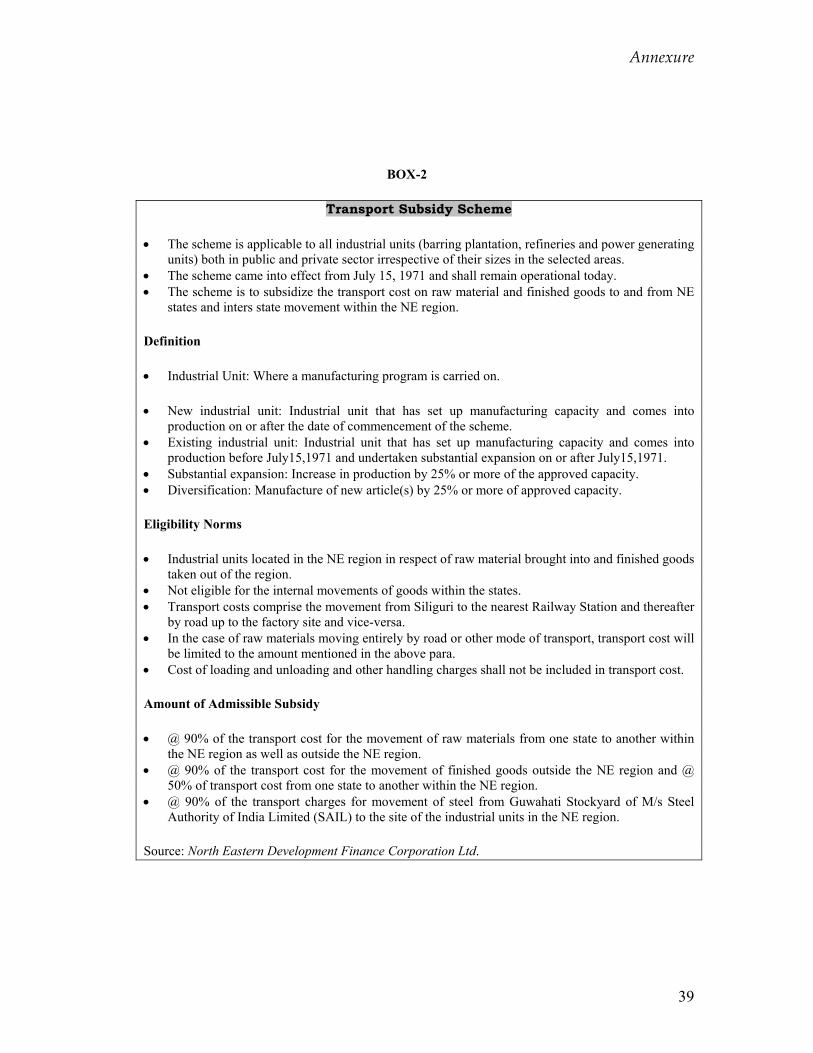
Annexure
39
BOX-2
Transport Subsidy Scheme
• The scheme is applicable to all industrial units (barring plantation, refineries and power generating units) both in public and private sector irrespective of their sizes in the selected areas.
• The scheme came into effect from July 15, 1971 and shall remain operational today. • The scheme is to subsidize the transport cost on raw material and finished goods to and from NE
states and inters state movement within the NE region.
Definition
• Industrial Unit: Where a manufacturing program is carried on.
• New industrial unit: Industrial unit that has set up manufacturing capacity and comes into production on or after the date of commencement of the scheme.
• Existing industrial unit: Industrial unit that has set up manufacturing capacity and comes into production before July15,1971 and undertaken substantial expansion on or after July15,1971.
• Substantial expansion: Increase in production by 25% or more of the approved capacity. • Diversification: Manufacture of new article(s) by 25% or more of approved capacity.
Eligibility Norms
• Industrial units located in the NE region in respect of raw material brought into and finished goods taken out of the region.
• Not eligible for the internal movements of goods within the states. • Transport costs comprise the movement from Siliguri to the nearest Railway Station and thereafter
by road up to the factory site and vice-versa. • In the case of raw materials moving entirely by road or other mode of transport, transport cost will
be limited to the amount mentioned in the above para. • Cost of loading and unloading and other handling charges shall not be included in transport cost.
Amount of Admissible Subsidy
• @ 90% of the transport cost for the movement of raw materials from one state to another within the NE region as well as outside the NE region.
• @ 90% of the transport cost for the movement of finished goods outside the NE region and @ 50% of transport cost from one state to another within the NE region.
• @ 90% of the transport charges for movement of steel from Guwahati Stockyard of M/s Steel Authority of India Limited (SAIL) to the site of the industrial units in the NE region.
Source: North Eastern Development Finance Corporation Ltd.
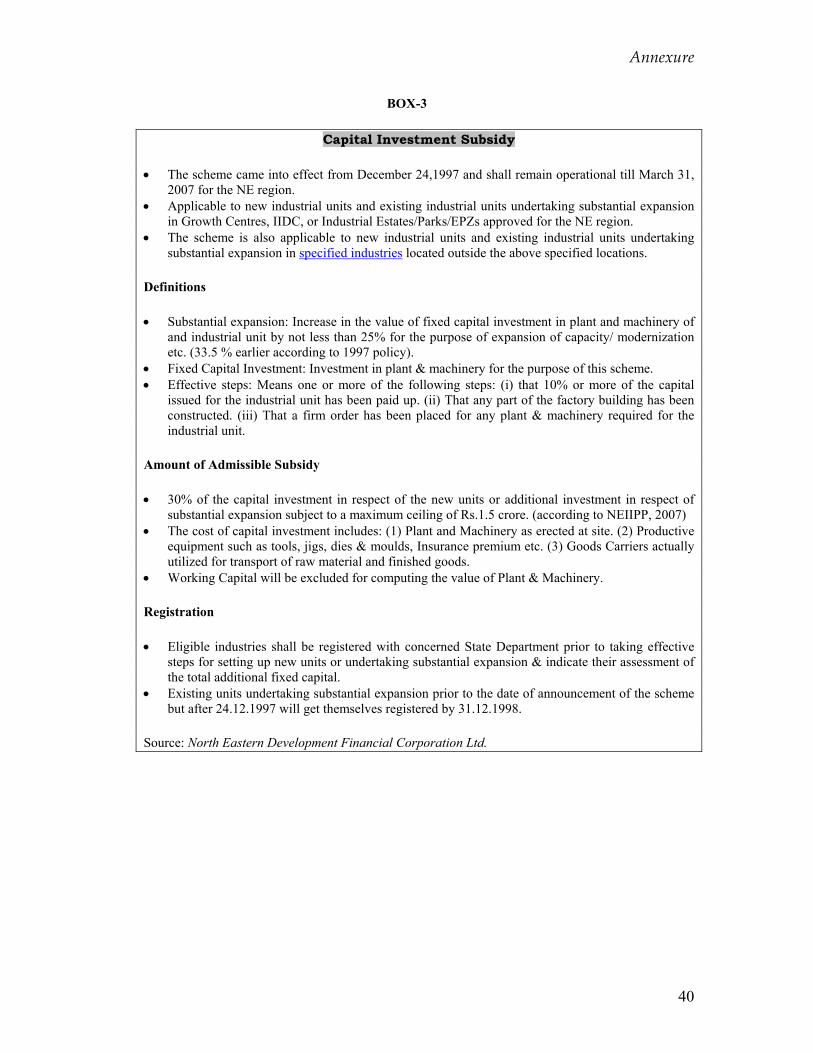
Annexure
40
BOX-3
Capital Investment Subsidy
• The scheme came into effect from December 24,1997 and shall remain operational till March 31, 2007 for the NE region.
• Applicable to new industrial units and existing industrial units undertaking substantial expansion in Growth Centres, IIDC, or Industrial Estates/Parks/EPZs approved for the NE region.
• The scheme is also applicable to new industrial units and existing industrial units undertaking substantial expansion in specified industries located outside the above specified locations.
Definitions
• Substantial expansion: Increase in the value of fixed capital investment in plant and machinery of and industrial unit by not less than 25% for the purpose of expansion of capacity/ modernization etc. (33.5 % earlier according to 1997 policy).
• Fixed Capital Investment: Investment in plant & machinery for the purpose of this scheme. • Effective steps: Means one or more of the following steps: (i) that 10% or more of the capital
issued for the industrial unit has been paid up. (ii) That any part of the factory building has been constructed. (iii) That a firm order has been placed for any plant & machinery required for the industrial unit.
Amount of Admissible Subsidy
• 30% of the capital investment in respect of the new units or additional investment in respect of substantial expansion subject to a maximum ceiling of Rs.1.5 crore. (according to NEIIPP, 2007)
• The cost of capital investment includes: (1) Plant and Machinery as erected at site. (2) Productive equipment such as tools, jigs, dies & moulds, Insurance premium etc. (3) Goods Carriers actually utilized for transport of raw material and finished goods.
• Working Capital will be excluded for computing the value of Plant & Machinery.
Registration
• Eligible industries shall be registered with concerned State Department prior to taking effective steps for setting up new units or undertaking substantial expansion & indicate their assessment of the total additional fixed capital.
• Existing units undertaking substantial expansion prior to the date of announcement of the scheme but after 24.12.1997 will get themselves registered by 31.12.1998.
Source: North Eastern Development Financial Corporation Ltd.
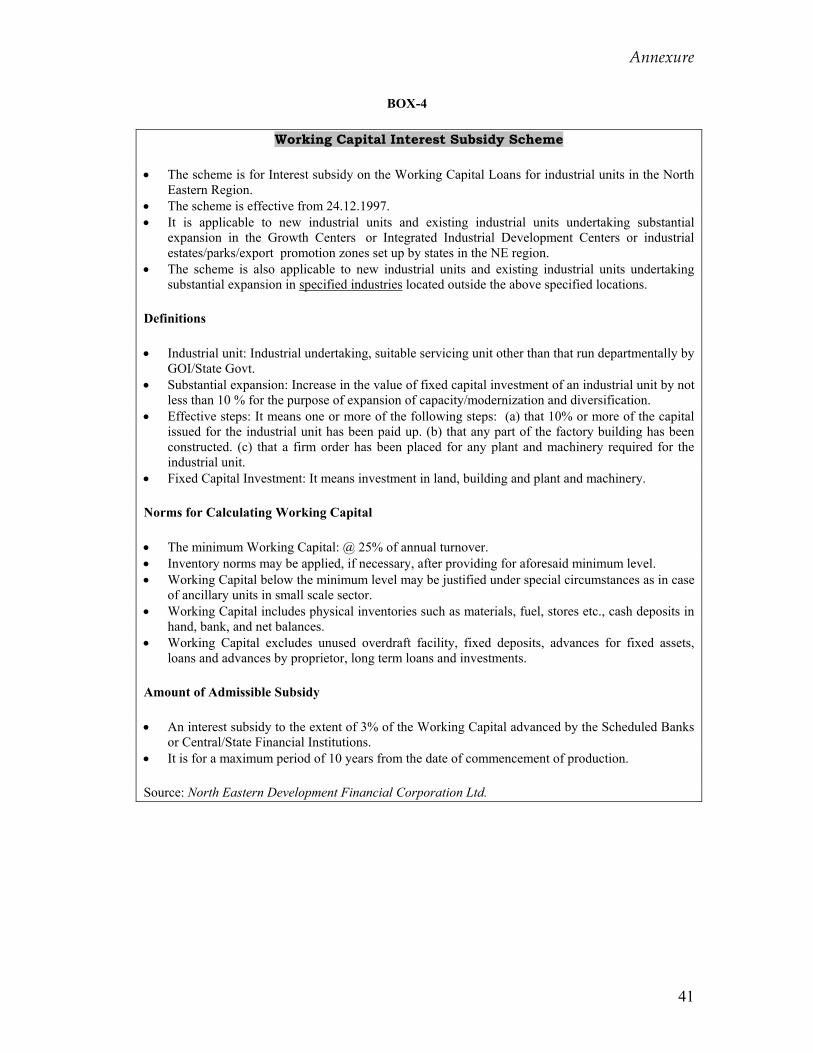
Annexure
41
BOX-4
Working Capital Interest Subsidy Scheme
• The scheme is for Interest subsidy on the Working Capital Loans for industrial units in the North Eastern Region.
• The scheme is effective from 24.12.1997. • It is applicable to new industrial units and existing industrial units undertaking substantial
expansion in the Growth Centers or Integrated Industrial Development Centers or industrial estates/parks/export promotion zones set up by states in the NE region.
• The scheme is also applicable to new industrial units and existing industrial units undertaking substantial expansion in specified industries located outside the above specified locations.
Definitions
• Industrial unit: Industrial undertaking, suitable servicing unit other than that run departmentally by GOI/State Govt.
• Substantial expansion: Increase in the value of fixed capital investment of an industrial unit by not less than 10 % for the purpose of expansion of capacity/modernization and diversification.
• Effective steps: It means one or more of the following steps: (a) that 10% or more of the capital issued for the industrial unit has been paid up. (b) that any part of the factory building has been constructed. (c) that a firm order has been placed for any plant and machinery required for the industrial unit.
• Fixed Capital Investment: It means investment in land, building and plant and machinery.
Norms for Calculating Working Capital
• The minimum Working Capital: @ 25% of annual turnover. • Inventory norms may be applied, if necessary, after providing for aforesaid minimum level. • Working Capital below the minimum level may be justified under special circumstances as in case
of ancillary units in small scale sector. • Working Capital includes physical inventories such as materials, fuel, stores etc., cash deposits in
hand, bank, and net balances. • Working Capital excludes unused overdraft facility, fixed deposits, advances for fixed assets,
loans and advances by proprietor, long term loans and investments.
Amount of Admissible Subsidy
• An interest subsidy to the extent of 3% of the Working Capital advanced by the Scheduled Banks or Central/State Financial Institutions.
• It is for a maximum period of 10 years from the date of commencement of production.
Source: North Eastern Development Financial Corporation Ltd.
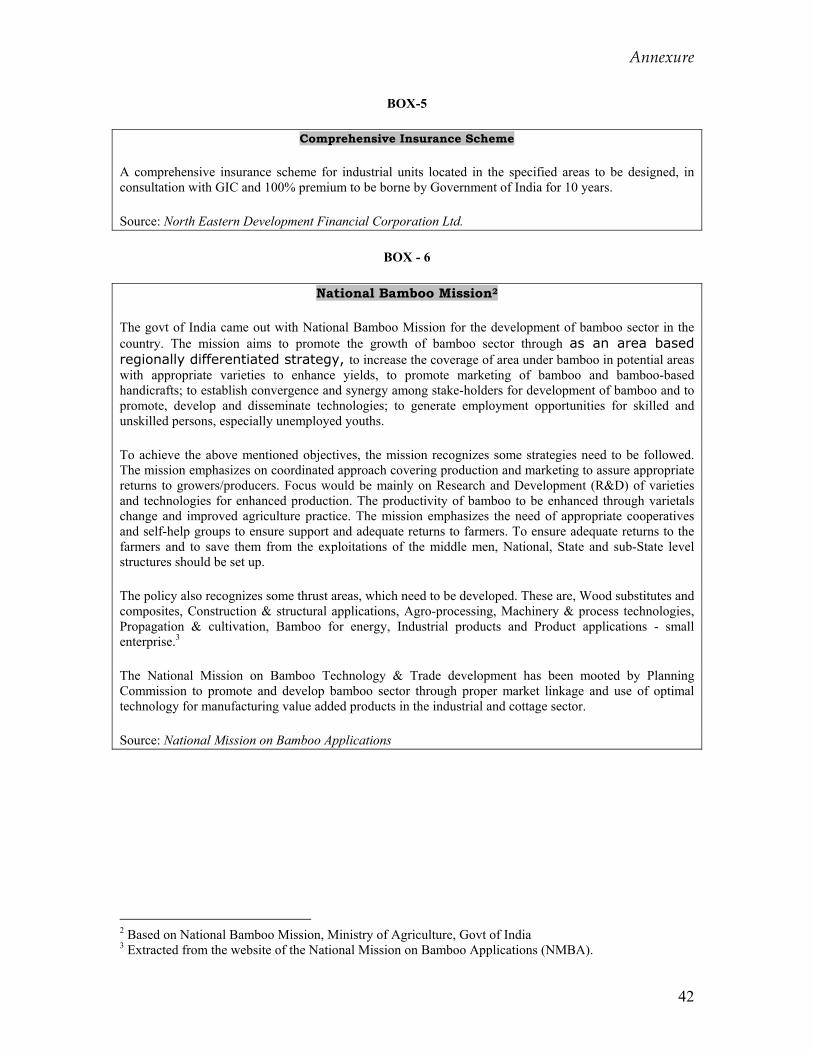
Annexure
42
BOX-5
Comprehensive Insurance Scheme
A comprehensive insurance scheme for industrial units located in the specified areas to be designed, in consultation with GIC and 100% premium to be borne by Government of India for 10 years.
Source: North Eastern Development Financial Corporation Ltd.
BOX - 6
National Bamboo Mission2
The govt of India came out with National Bamboo Mission for the development of bamboo sector in the country. The mission aims to promote the growth of bamboo sector through as an area based regionally differentiated strategy, to increase the coverage of area under bamboo in potential areas with appropriate varieties to enhance yields, to promote marketing of bamboo and bamboo-based handicrafts; to establish convergence and synergy among stake-holders for development of bamboo and to promote, develop and disseminate technologies; to generate employment opportunities for skilled and unskilled persons, especially unemployed youths.
To achieve the above mentioned objectives, the mission recognizes some strategies need to be followed. The mission emphasizes on coordinated approach covering production and marketing to assure appropriate returns to growers/producers. Focus would be mainly on Research and Development (R&D) of varieties and technologies for enhanced production. The productivity of bamboo to be enhanced through varietals change and improved agriculture practice. The mission emphasizes the need of appropriate cooperatives and self-help groups to ensure support and adequate returns to farmers. To ensure adequate returns to the farmers and to save them from the exploitations of the middle men, National, State and sub-State level structures should be set up.
The policy also recognizes some thrust areas, which need to be developed. These are, Wood substitutes and composites, Construction & structural applications, Agro-processing, Machinery & process technologies, Propagation & cultivation, Bamboo for energy, Industrial products and Product applications - small enterprise.3
The National Mission on Bamboo Technology & Trade development has been mooted by Planning Commission to promote and develop bamboo sector through proper market linkage and use of optimal technology for manufacturing value added products in the industrial and cottage sector.
Source: National Mission on Bamboo Applications
2 Based on National Bamboo Mission, Ministry of Agriculture, Govt of India 3 Extracted from the website of the National Mission on Bamboo Applications (NMBA).
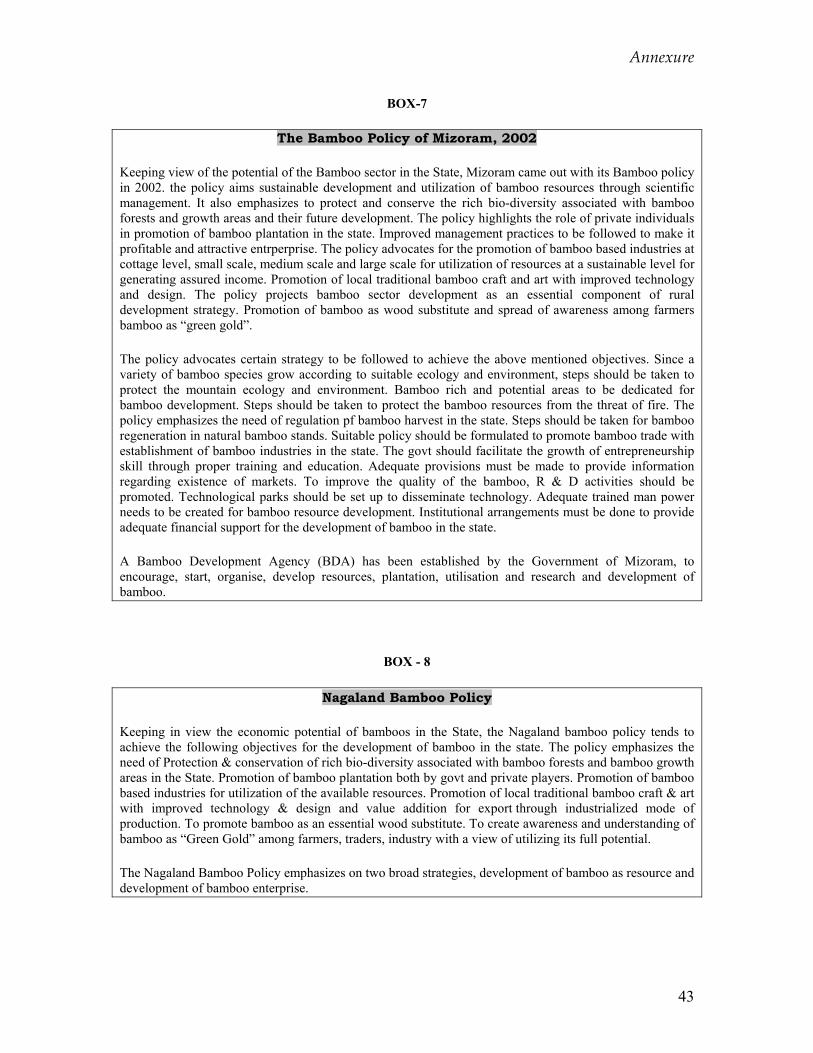
Annexure
43
BOX-7
The Bamboo Policy of Mizoram, 2002
Keeping view of the potential of the Bamboo sector in the State, Mizoram came out with its Bamboo policy in 2002. the policy aims sustainable development and utilization of bamboo resources through scientific management. It also emphasizes to protect and conserve the rich bio-diversity associated with bamboo forests and growth areas and their future development. The policy highlights the role of private individuals in promotion of bamboo plantation in the state. Improved management practices to be followed to make it profitable and attractive entrperprise. The policy advocates for the promotion of bamboo based industries at cottage level, small scale, medium scale and large scale for utilization of resources at a sustainable level for generating assured income. Promotion of local traditional bamboo craft and art with improved technology and design. The policy projects bamboo sector development as an essential component of rural development strategy. Promotion of bamboo as wood substitute and spread of awareness among farmers bamboo as “green gold”.
The policy advocates certain strategy to be followed to achieve the above mentioned objectives. Since a variety of bamboo species grow according to suitable ecology and environment, steps should be taken to protect the mountain ecology and environment. Bamboo rich and potential areas to be dedicated for bamboo development. Steps should be taken to protect the bamboo resources from the threat of fire. The policy emphasizes the need of regulation pf bamboo harvest in the state. Steps should be taken for bamboo regeneration in natural bamboo stands. Suitable policy should be formulated to promote bamboo trade with establishment of bamboo industries in the state. The govt should facilitate the growth of entrepreneurship skill through proper training and education. Adequate provisions must be made to provide information regarding existence of markets. To improve the quality of the bamboo, R & D activities should be promoted. Technological parks should be set up to disseminate technology. Adequate trained man power needs to be created for bamboo resource development. Institutional arrangements must be done to provide adequate financial support for the development of bamboo in the state.
A Bamboo Development Agency (BDA) has been established by the Government of Mizoram, to encourage, start, organise, develop resources, plantation, utilisation and research and development of bamboo.
BOX - 8
Nagaland Bamboo Policy
Keeping in view the economic potential of bamboos in the State, the Nagaland bamboo policy tends to achieve the following objectives for the development of bamboo in the state. The policy emphasizes the need of Protection & conservation of rich bio-diversity associated with bamboo forests and bamboo growth areas in the State. Promotion of bamboo plantation both by govt and private players. Promotion of bamboo based industries for utilization of the available resources. Promotion of local traditional bamboo craft & art with improved technology & design and value addition for export through industrialized mode of production. To promote bamboo as an essential wood substitute. To create awareness and understanding of bamboo as “Green Gold” among farmers, traders, industry with a view of utilizing its full potential.
The Nagaland Bamboo Policy emphasizes on two broad strategies, development of bamboo as resource and development of bamboo enterprise.
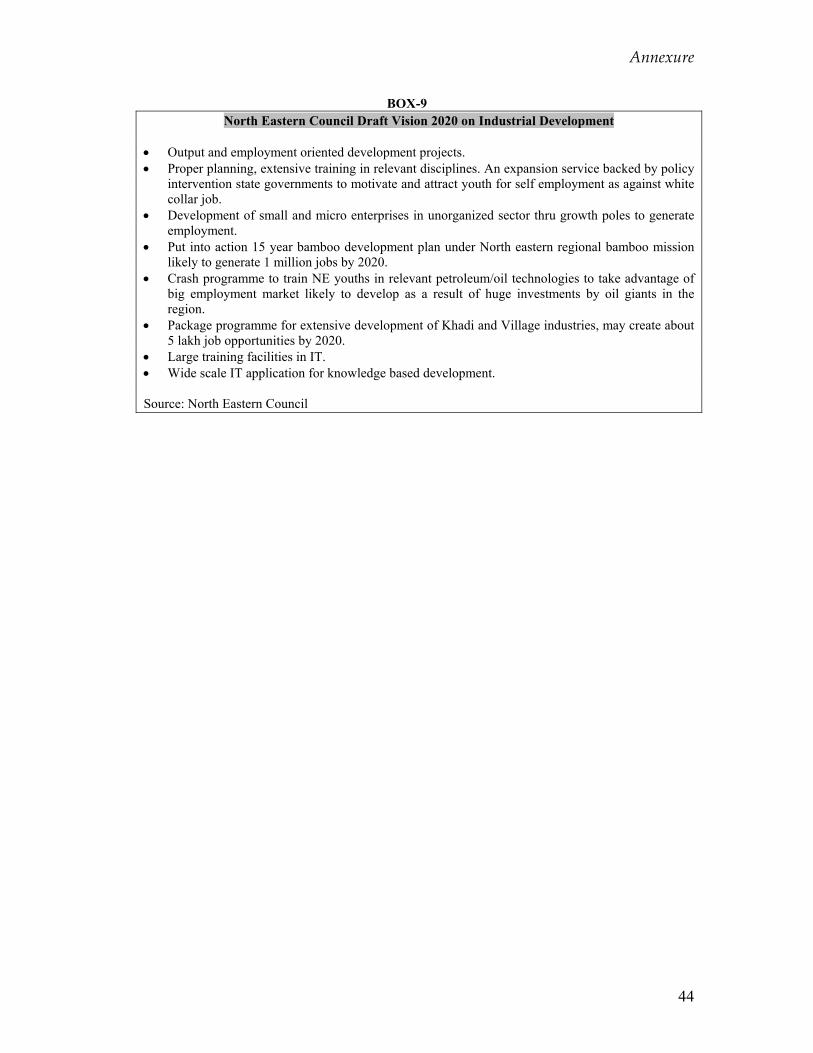
Annexure
44
BOX-9 North Eastern Council Draft Vision 2020 on Industrial Development
• Output and employment oriented development projects. • Proper planning, extensive training in relevant disciplines. An expansion service backed by policy
intervention state governments to motivate and attract youth for self employment as against white collar job.
• Development of small and micro enterprises in unorganized sector thru growth poles to generate employment.
• Put into action 15 year bamboo development plan under North eastern regional bamboo mission likely to generate 1 million jobs by 2020.
• Crash programme to train NE youths in relevant petroleum/oil technologies to take advantage of big employment market likely to develop as a result of huge investments by oil giants in the region.
• Package programme for extensive development of Khadi and Village industries, may create about 5 lakh job opportunities by 2020.
• Large training facilities in IT. • Wide scale IT application for knowledge based development. Source: North Eastern Council
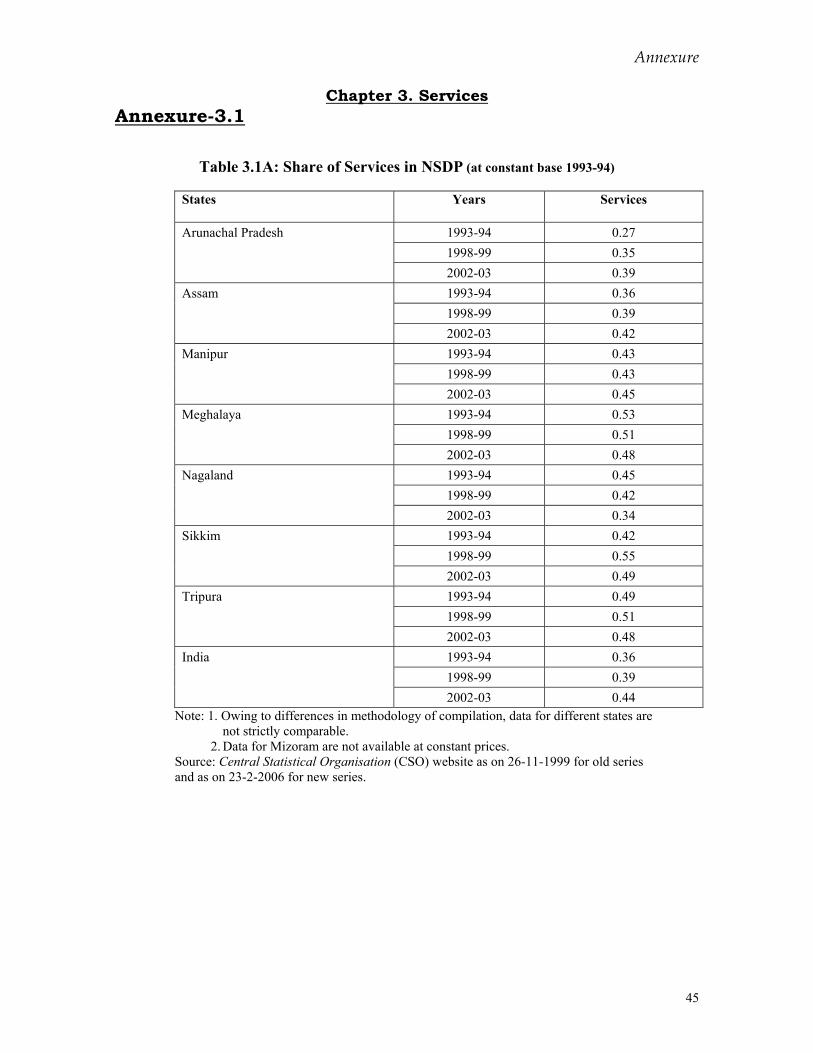
Annexure
45
Chapter 3. Services Annexure-3.1
Table 3.1A: Share of Services in NSDP (at constant base 1993-94)
States Years Services
Arunachal Pradesh 1993-94 0.27 1998-99 0.35 2002-03 0.39 Assam 1993-94 0.36 1998-99 0.39 2002-03 0.42 Manipur 1993-94 0.43 1998-99 0.43 2002-03 0.45 Meghalaya 1993-94 0.53 1998-99 0.51 2002-03 0.48 Nagaland 1993-94 0.45 1998-99 0.42 2002-03 0.34 Sikkim 1993-94 0.42 1998-99 0.55 2002-03 0.49 Tripura 1993-94 0.49 1998-99 0.51 2002-03 0.48 India 1993-94 0.36 1998-99 0.39 2002-03 0.44
Note: 1. Owing to differences in methodology of compilation, data for different states are not strictly comparable.
2. Data for Mizoram are not available at constant prices. Source: Central Statistical Organisation (CSO) website as on 26-11-1999 for old series and as on 23-2-2006 for new series.
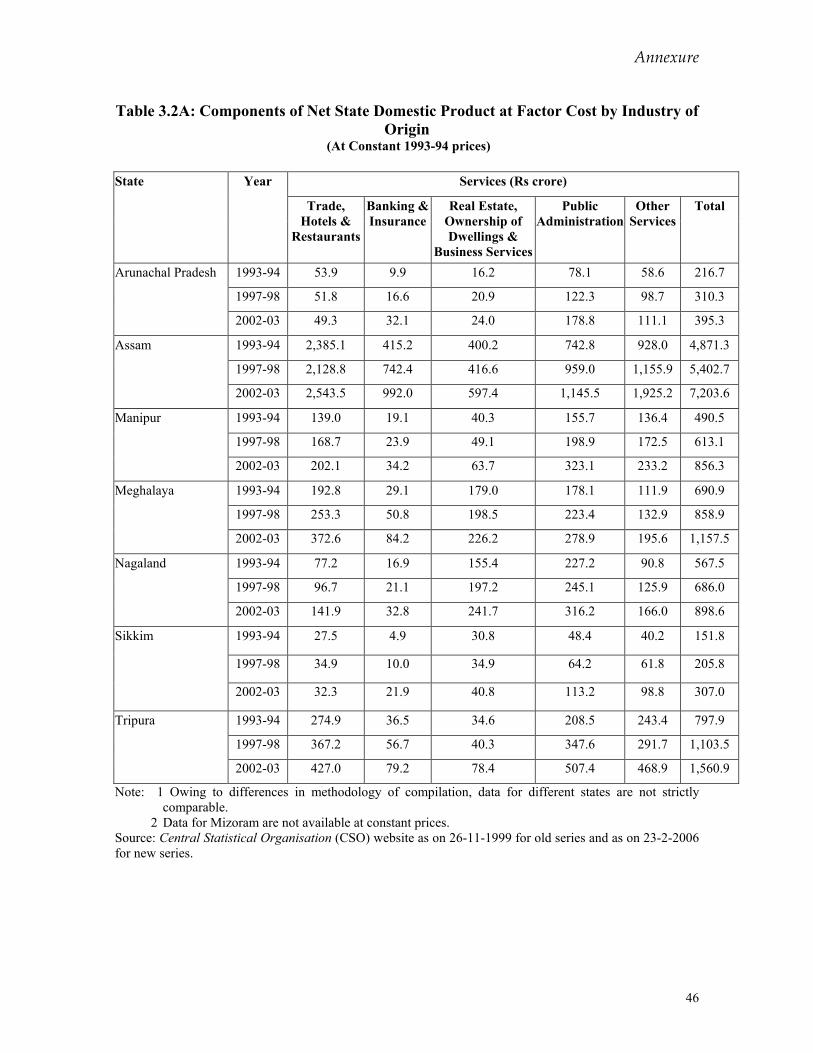
Annexure
46
Table 3.2A: Components of Net State Domestic Product at Factor Cost by Industry of
Origin (At Constant 1993-94 prices)
Services (Rs crore) State Year
Trade, Hotels &
Restaurants
Banking & Insurance
Real Estate, Ownership of Dwellings &
Business Services
Public Administration
Other Services
Total
Arunachal Pradesh 1993-94 53.9 9.9 16.2 78.1 58.6 216.7
1997-98 51.8 16.6 20.9 122.3 98.7 310.3
2002-03 49.3 32.1 24.0 178.8 111.1 395.3
Assam 1993-94 2,385.1 415.2 400.2 742.8 928.0 4,871.3
1997-98 2,128.8 742.4 416.6 959.0 1,155.9 5,402.7
2002-03 2,543.5 992.0 597.4 1,145.5 1,925.2 7,203.6
Manipur 1993-94 139.0 19.1 40.3 155.7 136.4 490.5
1997-98 168.7 23.9 49.1 198.9 172.5 613.1
2002-03 202.1 34.2 63.7 323.1 233.2 856.3
Meghalaya 1993-94 192.8 29.1 179.0 178.1 111.9 690.9
1997-98 253.3 50.8 198.5 223.4 132.9 858.9
2002-03 372.6 84.2 226.2 278.9 195.6 1,157.5
Nagaland 1993-94 77.2 16.9 155.4 227.2 90.8 567.5
1997-98 96.7 21.1 197.2 245.1 125.9 686.0
2002-03 141.9 32.8 241.7 316.2 166.0 898.6
Sikkim 1993-94 27.5 4.9 30.8 48.4 40.2 151.8
1997-98 34.9 10.0 34.9 64.2 61.8 205.8
2002-03 32.3 21.9 40.8 113.2 98.8 307.0
Tripura 1993-94 274.9 36.5 34.6 208.5 243.4 797.9
1997-98 367.2 56.7 40.3 347.6 291.7 1,103.5
2002-03 427.0 79.2 78.4 507.4 468.9 1,560.9
Note: 1 Owing to differences in methodology of compilation, data for different states are not strictly comparable.
2 Data for Mizoram are not available at constant prices. Source: Central Statistical Organisation (CSO) website as on 26-11-1999 for old series and as on 23-2-2006 for new series.
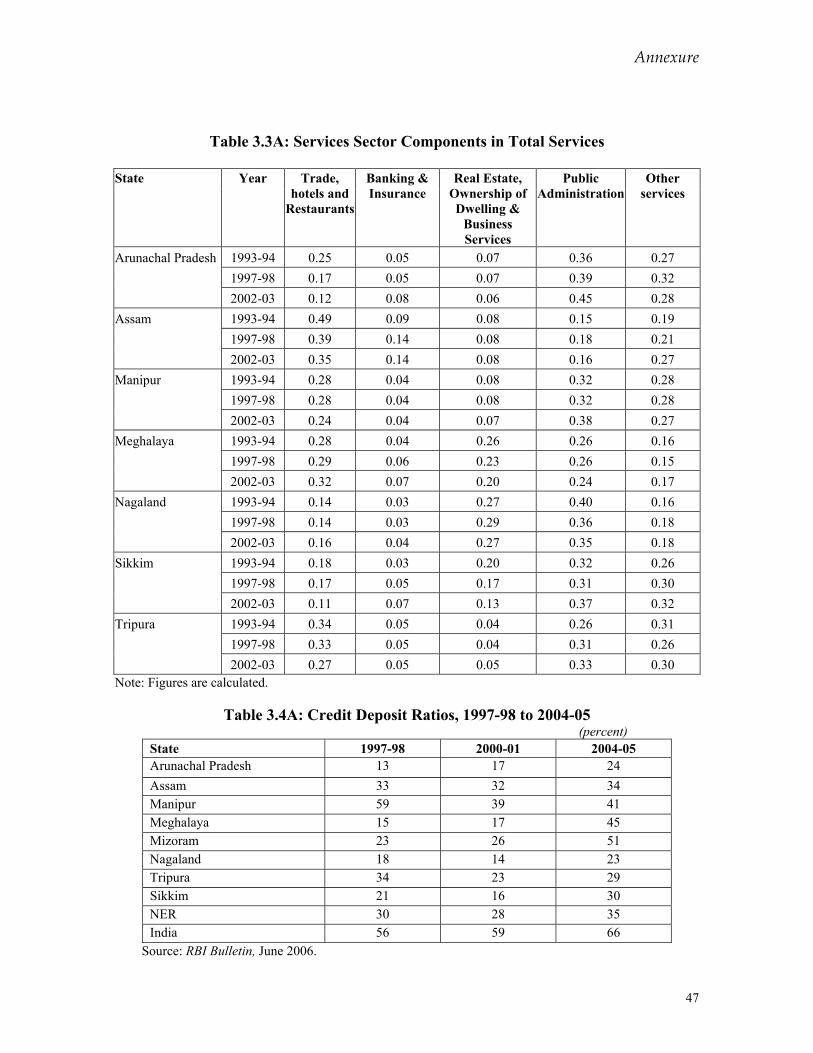
Annexure
47
Table 3.3A: Services Sector Components in Total Services
State Year Trade, hotels and
Restaurants
Banking & Insurance
Real Estate, Ownership of Dwelling &
Business Services
Public Administration
Other services
Arunachal Pradesh 1993-94 0.25 0.05 0.07 0.36 0.27 1997-98 0.17 0.05 0.07 0.39 0.32 2002-03 0.12 0.08 0.06 0.45 0.28 Assam 1993-94 0.49 0.09 0.08 0.15 0.19 1997-98 0.39 0.14 0.08 0.18 0.21 2002-03 0.35 0.14 0.08 0.16 0.27 Manipur 1993-94 0.28 0.04 0.08 0.32 0.28 1997-98 0.28 0.04 0.08 0.32 0.28 2002-03 0.24 0.04 0.07 0.38 0.27 Meghalaya 1993-94 0.28 0.04 0.26 0.26 0.16
1997-98 0.29 0.06 0.23 0.26 0.15 2002-03 0.32 0.07 0.20 0.24 0.17
Nagaland 1993-94 0.14 0.03 0.27 0.40 0.16 1997-98 0.14 0.03 0.29 0.36 0.18 2002-03 0.16 0.04 0.27 0.35 0.18 Sikkim 1993-94 0.18 0.03 0.20 0.32 0.26 1997-98 0.17 0.05 0.17 0.31 0.30 2002-03 0.11 0.07 0.13 0.37 0.32 Tripura 1993-94 0.34 0.05 0.04 0.26 0.31
1997-98 0.33 0.05 0.04 0.31 0.26 2002-03 0.27 0.05 0.05 0.33 0.30
Note: Figures are calculated.
Table 3.4A: Credit Deposit Ratios, 1997-98 to 2004-05 (percent)
State 1997-98 2000-01 2004-05 Arunachal Pradesh 13 17 24 Assam 33 32 34 Manipur 59 39 41 Meghalaya 15 17 45 Mizoram 23 26 51 Nagaland 18 14 23 Tripura 34 23 29 Sikkim 21 16 30 NER 30 28 35 India 56 59 66
Source: RBI Bulletin, June 2006.
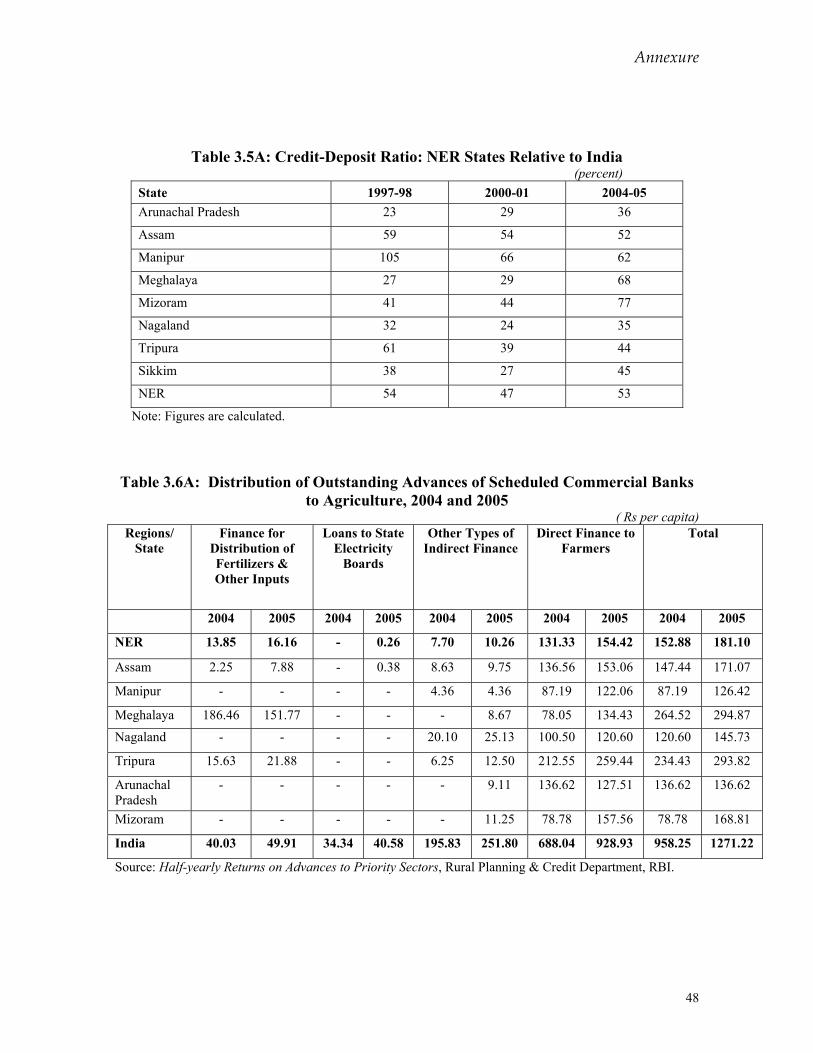
Annexure
48
Table 3.5A: Credit-Deposit Ratio: NER States Relative to India (percent)
State 1997-98 2000-01 2004-05 Arunachal Pradesh 23 29 36
Assam 59 54 52
Manipur 105 66 62
Meghalaya 27 29 68
Mizoram 41 44 77
Nagaland 32 24 35
Tripura 61 39 44
Sikkim 38 27 45
NER 54 47 53
Note: Figures are calculated.
Table 3.6A: Distribution of Outstanding Advances of Scheduled Commercial Banks to Agriculture, 2004 and 2005
( Rs per capita) Regions/
State Finance for
Distribution of Fertilizers & Other Inputs
Loans to State Electricity
Boards
Other Types of Indirect Finance
Direct Finance to Farmers
Total
2004 2005 2004 2005 2004 2005 2004 2005 2004 2005
NER 13.85 16.16 - 0.26 7.70 10.26 131.33 154.42 152.88 181.10
Assam 2.25 7.88 - 0.38 8.63 9.75 136.56 153.06 147.44 171.07
Manipur - - - - 4.36 4.36 87.19 122.06 87.19 126.42
Meghalaya 186.46 151.77 - - - 8.67 78.05 134.43 264.52 294.87
Nagaland - - - - 20.10 25.13 100.50 120.60 120.60 145.73
Tripura 15.63 21.88 - - 6.25 12.50 212.55 259.44 234.43 293.82
Arunachal Pradesh
- - - - - 9.11 136.62 127.51 136.62 136.62
Mizoram - - - - - 11.25 78.78 157.56 78.78 168.81
India 40.03 49.91 34.34 40.58 195.83 251.80 688.04 928.93 958.25 1271.22
Source: Half-yearly Returns on Advances to Priority Sectors, Rural Planning & Credit Department, RBI.

Annexure
49
Table 3.7A: Distribution of Outstanding Advances of Scheduled Commercial Banks, 2004 and 2005
( Rs per capita) Region/ State Advances to
Small-Scale Industries
Loans for setting up of Industrial
Estates
Advances to Road & Water Transport
Operators
Total
2004 2005 2004 2005 2004 2005 2004 2005 NER 117.22 178.79 - 0.51 47.97 44.89 165.19 224.19
Assam 123.80 147.81 - 0.75 46.89 40.89 170.32 189.45 Manipur 104.63 117.70 - - 17.44 21.80 122.06 139.50 Meghalaya 146.63 625.32 - - 86.25 112.13 232.88 737.44 Nagaland 115.58 185.93 - - 30.15 35.18 145.73 221.10 Tripura 93.77 131.28 - - 68.77 59.39 162.54 190.67 Arunachal Pradesh
63.75 109.29 - - 45.54 27.32 100.19 136.62
Mizoram 112.54 450.16 - - 56.27 67.52 168.81 517.68 India 692.20 811.67 1.46 2.91 83.90 95.37 777.55 909.95 Source: Rural Planning and Credit Department, RBI.
Table 3.8A: Employment in Hotels and Restaurants
(number of people)
State Own-Account Enterprises
Establishments Total
Arunachal Pradesh 823 4,740 5,563
Assam 18,186 56,020 74,206
Manipur 4,400 3,169 7,569
Meghalaya 4,430 11,767 16,197
Mizoram 1,635 1,706 3,341
Nagaland 1,301 4,179 5,480
ikkim 593 1,809 2,402
Tripura 5,172 3,634 8,806
India 1,082,749 1,686,576 2,769,325
Note: OAE: Own-Account Enterprises Source: Hotel and Restaurant Enterprises Survey – 1999.
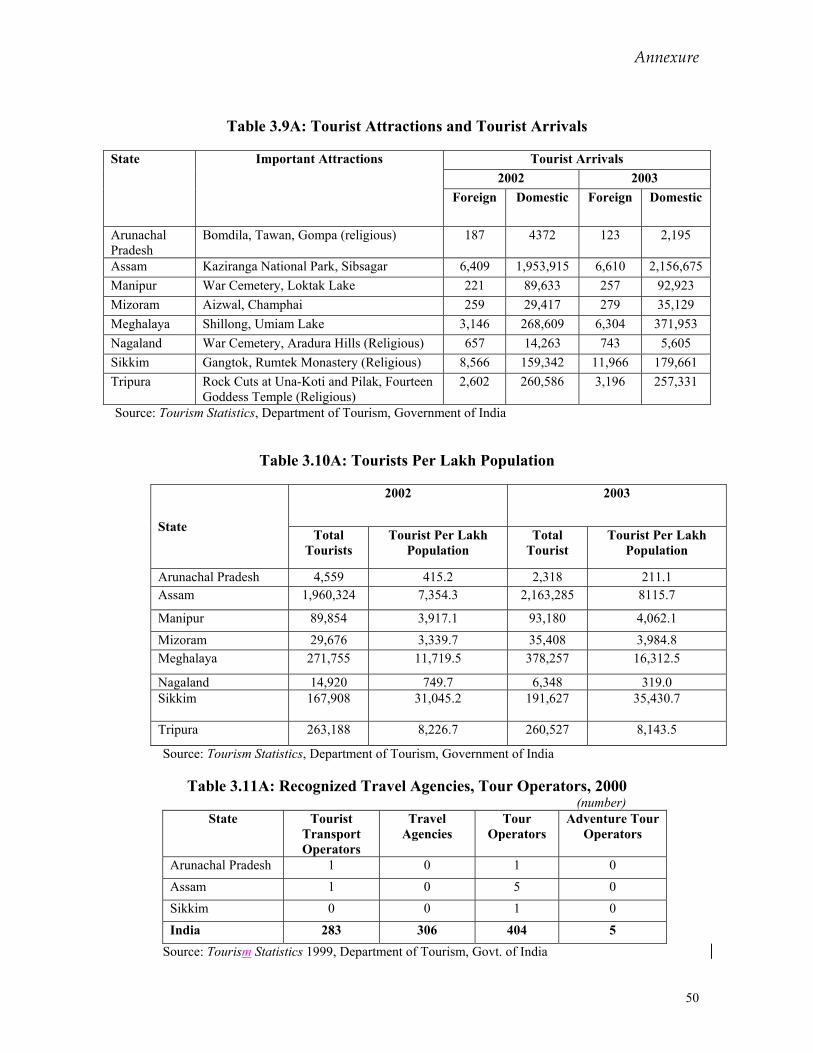
Annexure
50
Table 3.9A: Tourist Attractions and Tourist Arrivals
Tourist Arrivals 2002 2003
State Important Attractions
Foreign Domestic Foreign Domestic
Arunachal Pradesh
Bomdila, Tawan, Gompa (religious) 187 4372 123 2,195
Assam Kaziranga National Park, Sibsagar 6,409 1,953,915 6,610 2,156,675 Manipur War Cemetery, Loktak Lake 221 89,633 257 92,923 Mizoram Aizwal, Champhai 259 29,417 279 35,129 Meghalaya Shillong, Umiam Lake 3,146 268,609 6,304 371,953 Nagaland War Cemetery, Aradura Hills (Religious) 657 14,263 743 5,605 Sikkim Gangtok, Rumtek Monastery (Religious) 8,566 159,342 11,966 179,661 Tripura Rock Cuts at Una-Koti and Pilak, Fourteen
Goddess Temple (Religious) 2,602 260,586 3,196 257,331
Source: Tourism Statistics, Department of Tourism, Government of India
Table 3.10A: Tourists Per Lakh Population
2002 2003
State Total Tourists
Tourist Per Lakh Population
Total Tourist
Tourist Per Lakh Population
Arunachal Pradesh 4,559 415.2 2,318 211.1 Assam 1,960,324 7,354.3 2,163,285 8115.7
Manipur 89,854 3,917.1 93,180 4,062.1 Mizoram 29,676 3,339.7 35,408 3,984.8 Meghalaya 271,755 11,719.5 378,257 16,312.5
Nagaland 14,920 749.7 6,348 319.0 Sikkim 167,908 31,045.2 191,627 35,430.7
Tripura 263,188 8,226.7 260,527 8,143.5
Source: Tourism Statistics, Department of Tourism, Government of India
Table 3.11A: Recognized Travel Agencies, Tour Operators, 2000 (number)
State Tourist Transport Operators
Travel Agencies
Tour Operators
Adventure Tour Operators
Arunachal Pradesh 1 0 1 0 Assam 1 0 5 0 Sikkim 0 0 1 0 India 283 306 404 5
Source: Tourism Statistics 1999, Department of Tourism, Govt. of India
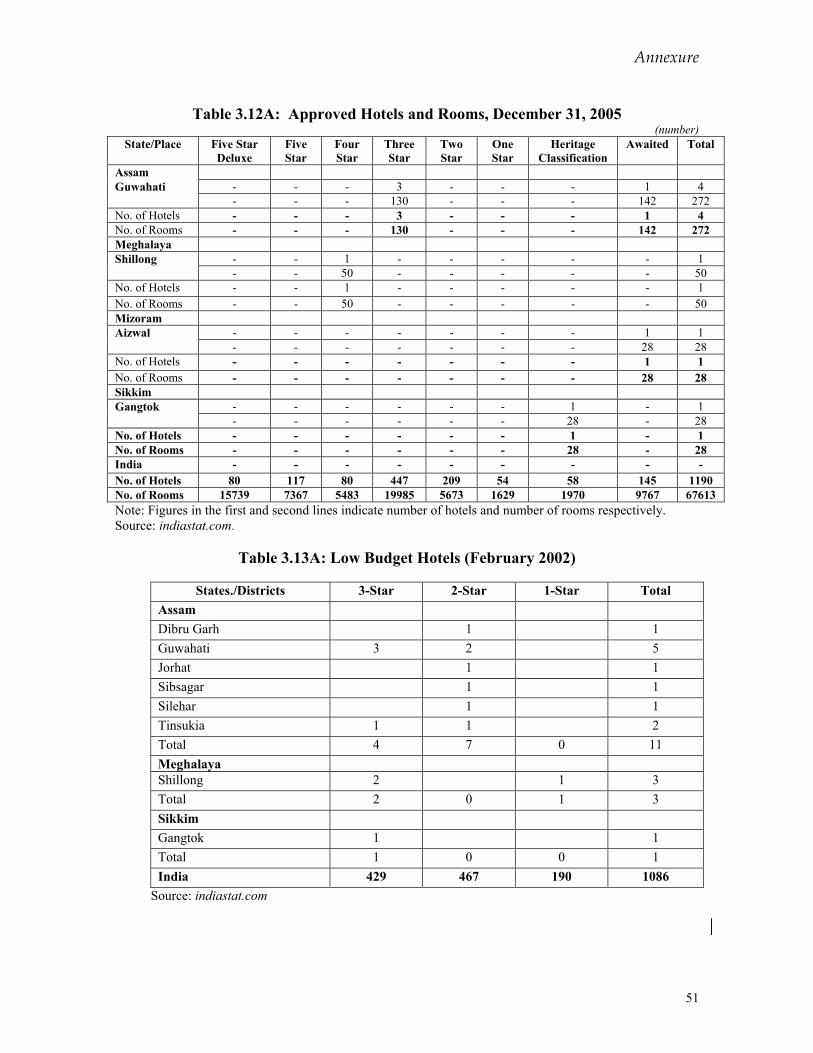
Annexure
51
Table 3.12A: Approved Hotels and Rooms, December 31, 2005
(number) State/Place Five Star
Deluxe Five Star
Four Star
Three Star
Two Star
One Star
Heritage Classification
Awaited Total
Assam - - - 3 - - - 1 4 Guwahati - - - 130 - - - 142 272
No. of Hotels - - - 3 - - - 1 4 No. of Rooms - - - 130 - - - 142 272 Meghalaya
- - 1 - - - - - 1 Shillong - - 50 - - - - - 50
No. of Hotels - - 1 - - - - - 1 No. of Rooms - - 50 - - - - - 50 Mizoram
- - - - - - - 1 1 Aizwal - - - - - - - 28 28
No. of Hotels - - - - - - - 1 1 No. of Rooms - - - - - - - 28 28 Sikkim
- - - - - - 1 - 1 Gangtok - - - - - - 28 - 28
No. of Hotels - - - - - - 1 - 1 No. of Rooms - - - - - - 28 - 28 India - - - - - - - - - No. of Hotels 80 117 80 447 209 54 58 145 1190 No. of Rooms 15739 7367 5483 19985 5673 1629 1970 9767 67613 Note: Figures in the first and second lines indicate number of hotels and number of rooms respectively. Source: indiastat.com.
Table 3.13A: Low Budget Hotels (February 2002)
States./Districts 3-Star 2-Star 1-Star Total Assam Dibru Garh 1 1 Guwahati 3 2 5 Jorhat 1 1 Sibsagar 1 1 Silehar 1 1 Tinsukia 1 1 2 Total 4 7 0 11 Meghalaya Shillong 2 1 3 Total 2 0 1 3 Sikkim Gangtok 1 1 Total 1 0 0 1 India 429 467 190 1086
Source: indiastat.com
Annexure
52
Annexure 3.2:
3.1 Main Recommendations on Banking and Tourism of the Shukla Committee1 Tourism The Committee recommended the establishment of a Northeast Tourism Development Corporation which, along with the NEC and various state tourism departments would prepare plans for the development of tourist sites and related infrastructure in the region. It emphasised the need for an international airport in Guwahati, and suggested that steps should be taken to attract foreign tourism through special international packages in consultation with neighbouring countries like Bangladesh, Bhutan, Nepal, Myanmar and Thailand. More tourists will be encouraged to visit these states if the Restricted Area Permit (RAP) Regimes are relaxed, and if it becomes simpler to acquire Inner Line Permits, which should be issued at all major tourist offices, railheads, airports and state entry gates along with national highways. Low-budget tours should be promoted for trekkers, campers and young people, and special holiday railway concession could be introduced during the festival seasons. Chartered flights should be allowed to function for NE package tours. Special advertising campaigns targeting tourists could be initiated by tourist offices, travel agencies and airlines. Banking On banking, the recommendation was to improve the credit-deposit (CD) ratio, making industrial finance part of priority sector lending, cross-subsidizing interest rates and reintroducing capital investment subsidy in the region. The government, RBI and all the all-India financial institutes should provide adequate fund to enable the newly established North-eastern Development Financial Corporation to perform its role effectively in the region, and state governments should make all efforts to create an investor friendly environment to attract more private capital. 3.2 Recommendations of the State Development Reports on Tourism and Banking2 Most of the SDRs of the NE states (Assam, Tripura, Sikkim and Manipur) recognise tourism as an important sector for the region, which needs to be developed to enhance income generation. The emphasis should be on eco-tourism, and other sustainable forms such as adventure, village and rural tourism. All the states recognise the importance of government and private sector participation in tourism development. Assam gives importance to the involvement of local people in the development of tourism, rural tourism in particular. The role of NGOs in the development of rural tourism has been highlighted in the state of Sikkim. Assam development report recommended providing fiscal incentives to private entrepreneurs for marketing of the potential tourist places. All NE states lays emphasis on the improvement of tourism related infrastructure and relaxation of permit system in the region. Sikkim development report recommends opening up the Nathu La Pass to boost tourism in the region. Assam and Tripura give importance to improving the security scenario of the region to attract more tourists. Most of the states lay emphasis on the formulation of policies for promotion of environmentally sustainable tourism in the region. Regarding development of banking sector, all most all states recognize low CD ratio is a matter of concern. So steps should be taken to attract more deposit and low interest rate credit should be provided for priority sector to improve the credit deposit ratio of the region. In order to attract more deposits, Tripura development report recommends initiating lucrative schemes in the state. State development reports also recommend introducing e-banking and tele-banking in the region.
1 The Shukla Committee Report, 1997. 2 Based on Assam, Tripura, Sikkim and Manipur State Development Reports.
Annexure
53
3.3 Recommendations of the Report of the Committee on Financial Sector Plan for North Eastern Region3 The Committee had stressed the need to improve infrastructure, creating a favourable investment climate, focusing on a few sectors of strategic advantage for development and encouraging a favourable credit culture. The Committee recommended that banks may draw up plans to provide at least 50 new households per branch each month for the next four years with a deposit account (with option to the household of opening such account as a “no frills” account). Taking into account the balances maintained in such accounts over a period, the bank may offer small overdrafts or General Credit Cards (GCC) against such accounts and other products in terms of the extant Reserve Bank guidelines so that banking habit is actively promoted in the region. If the branch has opened an account of a SHG, then the number of members of the Self Help Groups (SHG) will be reckoned as the number of households covered. Banks could introduce a pilot project in the rural and semi urban areas closest to the bank branches in the first instance by customizing simple deposit and credit products to suit the needs of the households of these villages and then improve upon the product and extend them to other areas. A model application form including form for attesting Know Your Customer (KYC) through simplified procedure has been suggested by the Committee. The Committee had stressed the importance of adequate groundwork and creation of awareness amongst the clientele as also the bank staff and intermediaries before embarking on a large-scale financial inclusion programme. Presently, fifty per cent of credit outstanding under GCC up to Rs. 25,000 will be eligible for being treated as indirect agriculture financing. In order to encourage flow of credit through GCC, the Committee had recommended that 100 per cent of advance under GCC at rural and semi urban branches in the NER may be treated as priority sector. The Committee would like to draw attention to the RBI guidelines for offering one time settlement for existing borrowers up to Rs. 25000/- whose loans have become overdue to enable them to get a fresh chance to access bank credit and maintain a good credit record in future. The committee suggested enhancing the capacities of existing branches of commercial banks, regional rural banks and cooperative banks, increasing recourse to bank/SHG linkage programmes, using the business correspondent/business facilitator model and extensive use of IT-based solutions which facilitate offsite banking. Taking the minimum branch needs into account, the Committee has identified 19 centres for opening of branches by March 2007 by specified banks. The position may be reviewed in the State Level Bankers Committee (SLBC) to be held in the first quarter of 2007-08 to decide on further centres for branch expansion. The RBI's current branch licensing policy encourages banks to open branches in rural and semi-urban areas especially in under-banked districts. Taking into account the large number of such areas in the region, the Committee recommends that, for the NER, RBI may consider an automatic approval scheme for any bank wanting to open branches in such areas in the region. For other areas in the NER also, applications may be considered favourably. New branch proposals from RRBs can be cleared expeditiously by the Empowered Committee (EC) in terms of the instructions issued by Reserve Bank on June 13, 2006. Reserve Bank had issued guidelines in January 2006, enabling banks to use registered societies, cooperatives, section 25 companies, trusts or post offices as business correspondents. In the NER, considering the time, distance and cost for a customer to reach a bank branch, especially in remote areas, the Committee believed that banks can use this model effectively for increasing their outreach. Ideally, for the NER, local community based organizations (CBOs) like Village Development Boards (VDBs), Anchal Samitis etc. may be used as business correspondents. The State level task forces have identified some organizations that could be used as business
3 Report of the Committee on Financial Sector Plan for North Eastern Region, RBI, July 2006.
Annexure
54
correspondents. Banks could also identify well-respected local persons like a schoolteacher, postman, primary health worker or retired official to act as business facilitators or relationship managers. These facilitators can handle all aspects of sourcing clients, marketing the bank’s products and helping recovery but cannot undertake any cash transactions. While banks may pursue the well proven intelligent interpretation of traditional concepts of credit assessment, credit utilization, asset verification, inspection, security, etc, there is a need to upscale the operations through SHGs, especially for providing working capital and investment credit. National Bank for Agriculture and Rural Development (NABARD) may review its guidelines for this purpose if required and also allow refinance for banks financing Micro Finance Institutions (MFIs) in the NER. A part of the Micro Finance Equity Fund of NABARD may be specifically earmarked and utilised for NER. The Committee had suggested a performance measurement matrix based on parameters reflecting the efforts for promoting financial inclusion. This matrix may be used for performance budgeting, performance appraisal and performance based incentives as suggested by the Committee.
Given the improving mobile connectivity in the region, the Committee strongly recommends the use of IT based solutions for increasing outreach. Apart from greater use of Automated Teller Machines (ATMs) including mobile ATMs, debit and credit cards, there are various models using smart cards and mobile payments for carrying out banking transactions from non-branch locations. The Committee recommended that the Development and Research in Banking Technology (DRBT) may prepare a pilot project for testing in a select area in the NER by December 2006 and based on experience, this project can be rolled out in other places. Individual banks operating in the region may prepare an IT plan, branch-wise for each State with emphasis on actual IT based service the bank will provide. The number of customers who will be assisted should be estimated to measure the effort that the bank will invest on customer interfaces, staff and consumer education, and incentives for the customer and the branch staff for promoting the use of IT in banking. Action in this regard may be initiated by all the banks in NER immediately and completed within six months. For RRBs, assistance may be provided by DRBT. Reserve Bank, Guwahati may allocate specific responsibility to the different branches (including RRB branches) for providing need based forex facilities at these centres and arrange for special training for the branch staff. Banks may link up with insurance companies for providing insurance products suitable to the NER. Banks would also be able to market insurance linked deposit and credit products as part of their efforts for financial inclusion. The Committee recommends that Insurance Regulatory and Development Authority (IRDA) may advise the insurers to customize products that could be publicised as a part of the campaign for financial inclusion. Similarly, Securities and Exchange Board of India (SEBI) should enable increasing reach of the Depository Participants and mutual funds in the region. Increasing access to the capital markets would also result gradually in the equity funding for projects in the region. The NER typically relies on cash as the predominant means of payment. The topography of the region and logistics pose unique challenges to currency management. Of the 169 currency chests in the region, 89 are small with limited storage capacity. The existing network of chests in the region may be strengthened and upgraded, where required. Reserve Bank may consider and allow RRBs to have currency chests on a special footing having regard to the fact that in many areas they are the only banks. Many of the RRBs may not be able to defray the security cost fully. The State Governments could meet such cost as in most cases where the currency chests are used predominantly for government transactions. Reserve Bank may also consider defraying a part of the cost of installation of chests for RRBs. Central security forces may be deployed to facilitate smoother inter-state movement of treasure. SLBC convenor banks may take necessary steps to provide adequate staff at branches in the region so that the mechanism for handling cash transactions can be strengthened. Where some subvention is felt necessary, proposals may be sent
Annexure
55
by SLBC convenor banks to Reserve Bank. Reserve Bank may encourage banks to forward innovative proposals for more efficient cash management in the region. The Committee noted that transfer of funds within the region and from/to the region takes an inordinately long time. The payment system’s dependence on currency is partly due to the delay and cost involved in transfer of funds through the banking system in the region. The following recommendations were, therefore, made for enhancing the efficiency of the payment system in the region: • SBI may initiate steps for computerisation of the remaining eight non-computerised Clearing
Houses in the North East to be completed within six months. • Opening of clearing houses in the five districts without such a facility and having five or more
banks. • Bharat Sanchar Nigam Limited (BSNL), the largest service provider of connectivity in the
region, may take steps for improvement of connectivity for leapfrogging to e-banking. • Reserve Bank should follow up with SBI and other banks in the region for introduction of
Automated Clearing House (ACH) before end of March 2007 with the settlement at Guwahati.
• Reserve Bank to pursue with SBI for introduction of Electronic Clearing Service (ECS) facility within six months in all the Clearing Houses in State capitals to enable the government payments and receipts through ECS.
• All the bank branches in NER with commercial transactions should be Real Time Gross
Settlement System (RTGS) enabled within six months. • A plan for implementing smart card/mobile based solutions on an open standard platform to be
accessed by all banks may be prepared by DRBT and a pilot project in a suitable area may be tested within six months.
• Major banks operating in the region may identify a dedicated branch for encouraging
entrepreneurs who want to make investments in agro-processing, agro-based industries and SME sector. Such branches may be equipped with staff and systems for helping the entrepreneurs in preparation of project reports and identifying their capacity building needs.
• Small Industries Development Bank of India (SIDBI) in association with major banks in the
region, may set up a dedicated SME debt fund to provide co-finance up to 25 per cent of project cost to first time entrepreneurs, where a bank is willing to provide the required funds. The fund may have experts from the region and outside as members.
• SIDBI and North Eastern Development Financial Institution (NEDFi) may prepare bankable
projects in the SME sector and disseminate the same as these could be used by potential entrepreneurs. Such schemes should also cover the handloom and handicraft sectors.
• SIDBI, NEDFi and NABARD as also major banks may sponsor Rural Development and Self-
Employment Training Institute (RUDSETIs) for training the entrepreneurs in the SME including industry related small business services sector.
Annexure
56
• SIDBI and NEDFi may identify marketing outlets for various industries in the region and provide assistance for display and marketing of the products.
• SIDBI/NEDFi/NABARD may sponsor Rural Industries Programmes (RIPs) in areas having
identified clusters and in areas having concentration of other on farm economic activities for training of weavers, artisans, small entrepreneurs, etc.
• Credit Information Bureau of India Limited (CIBIL) may disseminate credit record of
borrowers in the NER among the financial institutions in the region to enable the banks to have ready access to the credit history of borrowers in the region. The banks / financial institutions may supply new borrowers’ records expeditiously to CIBIL so that the data base may be kept updated.
• NABARD may identify and support strategic investments in horticulture, bamboo
processing/products, fisheries, poultry, animal husbandry, honey production/marketing and organic farming.
• SIDBI may open counselling wings at all State capitals for first time entrepreneurs. Role of NEDFi may be reviewed with a view to repositioning it as a development financial institution for long-term finance and equity support for industry and services sector.
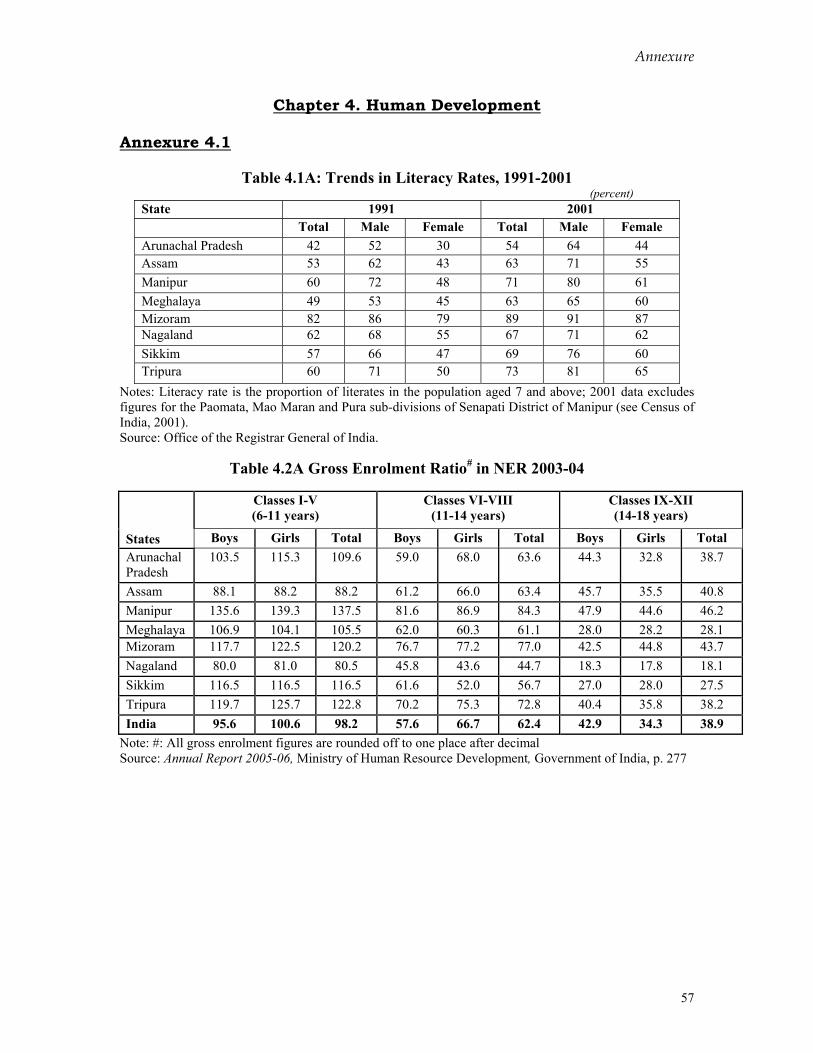
Annexure
57
Chapter 4. Human Development
Annexure 4.1
Table 4.1A: Trends in Literacy Rates, 1991-2001 (percent)
State 1991 2001 Total Male Female Total Male Female
Arunachal Pradesh 42 52 30 54 64 44 Assam 53 62 43 63 71 55 Manipur 60 72 48 71 80 61 Meghalaya 49 53 45 63 65 60 Mizoram 82 86 79 89 91 87 Nagaland 62 68 55 67 71 62 Sikkim 57 66 47 69 76 60 Tripura 60 71 50 73 81 65
Notes: Literacy rate is the proportion of literates in the population aged 7 and above; 2001 data excludes figures for the Paomata, Mao Maran and Pura sub-divisions of Senapati District of Manipur (see Census of India, 2001). Source: Office of the Registrar General of India.
Table 4.2A Gross Enrolment Ratio# in NER 2003-04
Classes I-V (6-11 years)
Classes VI-VIII (11-14 years)
Classes IX-XII (14-18 years)
States Boys Girls Total Boys Girls Total Boys Girls Total Arunachal Pradesh
103.5 115.3 109.6 59.0 68.0 63.6 44.3 32.8 38.7
Assam 88.1 88.2 88.2 61.2 66.0 63.4 45.7 35.5 40.8 Manipur 135.6 139.3 137.5 81.6 86.9 84.3 47.9 44.6 46.2 Meghalaya 106.9 104.1 105.5 62.0 60.3 61.1 28.0 28.2 28.1 Mizoram 117.7 122.5 120.2 76.7 77.2 77.0 42.5 44.8 43.7 Nagaland 80.0 81.0 80.5 45.8 43.6 44.7 18.3 17.8 18.1 Sikkim 116.5 116.5 116.5 61.6 52.0 56.7 27.0 28.0 27.5 Tripura 119.7 125.7 122.8 70.2 75.3 72.8 40.4 35.8 38.2 India 95.6 100.6 98.2 57.6 66.7 62.4 42.9 34.3 38.9
Note: #: All gross enrolment figures are rounded off to one place after decimal Source: Annual Report 2005-06, Ministry of Human Resource Development, Government of India, p. 277
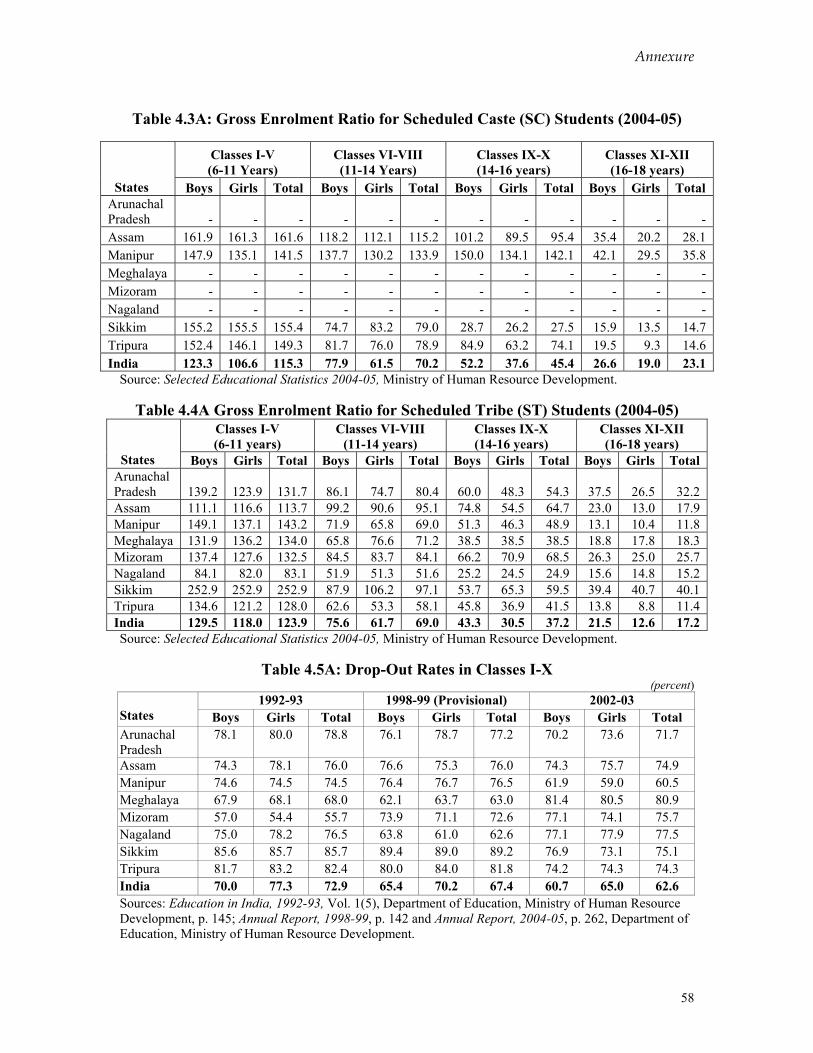
Annexure
58
Table 4.3A: Gross Enrolment Ratio for Scheduled Caste (SC) Students (2004-05)
Classes I-V (6-11 Years)
Classes VI-VIII (11-14 Years)
Classes IX-X (14-16 years)
Classes XI-XII (16-18 years)
States Boys Girls Total Boys Girls Total Boys Girls Total Boys Girls Total Arunachal Pradesh - - - - - - - - - - - - Assam 161.9 161.3 161.6 118.2 112.1 115.2 101.2 89.5 95.4 35.4 20.2 28.1 Manipur 147.9 135.1 141.5 137.7 130.2 133.9 150.0 134.1 142.1 42.1 29.5 35.8 Meghalaya - - - - - - - - - - - - Mizoram - - - - - - - - - - - - Nagaland - - - - - - - - - - - - Sikkim 155.2 155.5 155.4 74.7 83.2 79.0 28.7 26.2 27.5 15.9 13.5 14.7 Tripura 152.4 146.1 149.3 81.7 76.0 78.9 84.9 63.2 74.1 19.5 9.3 14.6 India 123.3 106.6 115.3 77.9 61.5 70.2 52.2 37.6 45.4 26.6 19.0 23.1
Source: Selected Educational Statistics 2004-05, Ministry of Human Resource Development.
Table 4.4A Gross Enrolment Ratio for Scheduled Tribe (ST) Students (2004-05) Classes I-V (6-11 years)
Classes VI-VIII (11-14 years)
Classes IX-X (14-16 years)
Classes XI-XII (16-18 years)
States Boys Girls Total Boys Girls Total Boys Girls Total Boys Girls Total Arunachal Pradesh 139.2 123.9 131.7 86.1 74.7 80.4 60.0 48.3 54.3 37.5 26.5 32.2 Assam 111.1 116.6 113.7 99.2 90.6 95.1 74.8 54.5 64.7 23.0 13.0 17.9 Manipur 149.1 137.1 143.2 71.9 65.8 69.0 51.3 46.3 48.9 13.1 10.4 11.8 Meghalaya 131.9 136.2 134.0 65.8 76.6 71.2 38.5 38.5 38.5 18.8 17.8 18.3 Mizoram 137.4 127.6 132.5 84.5 83.7 84.1 66.2 70.9 68.5 26.3 25.0 25.7 Nagaland 84.1 82.0 83.1 51.9 51.3 51.6 25.2 24.5 24.9 15.6 14.8 15.2 Sikkim 252.9 252.9 252.9 87.9 106.2 97.1 53.7 65.3 59.5 39.4 40.7 40.1 Tripura 134.6 121.2 128.0 62.6 53.3 58.1 45.8 36.9 41.5 13.8 8.8 11.4 India 129.5 118.0 123.9 75.6 61.7 69.0 43.3 30.5 37.2 21.5 12.6 17.2 Source: Selected Educational Statistics 2004-05, Ministry of Human Resource Development.
Table 4.5A: Drop-Out Rates in Classes I-X (percent)
1992-93 1998-99 (Provisional) 2002-03 States Boys Girls Total Boys Girls Total Boys Girls Total Arunachal Pradesh
78.1 80.0 78.8 76.1 78.7 77.2 70.2 73.6 71.7
Assam 74.3 78.1 76.0 76.6 75.3 76.0 74.3 75.7 74.9 Manipur 74.6 74.5 74.5 76.4 76.7 76.5 61.9 59.0 60.5 Meghalaya 67.9 68.1 68.0 62.1 63.7 63.0 81.4 80.5 80.9 Mizoram 57.0 54.4 55.7 73.9 71.1 72.6 77.1 74.1 75.7 Nagaland 75.0 78.2 76.5 63.8 61.0 62.6 77.1 77.9 77.5 Sikkim 85.6 85.7 85.7 89.4 89.0 89.2 76.9 73.1 75.1 Tripura 81.7 83.2 82.4 80.0 84.0 81.8 74.2 74.3 74.3 India 70.0 77.3 72.9 65.4 70.2 67.4 60.7 65.0 62.6 Sources: Education in India, 1992-93, Vol. 1(5), Department of Education, Ministry of Human Resource Development, p. 145; Annual Report, 1998-99, p. 142 and Annual Report, 2004-05, p. 262, Department of Education, Ministry of Human Resource Development.
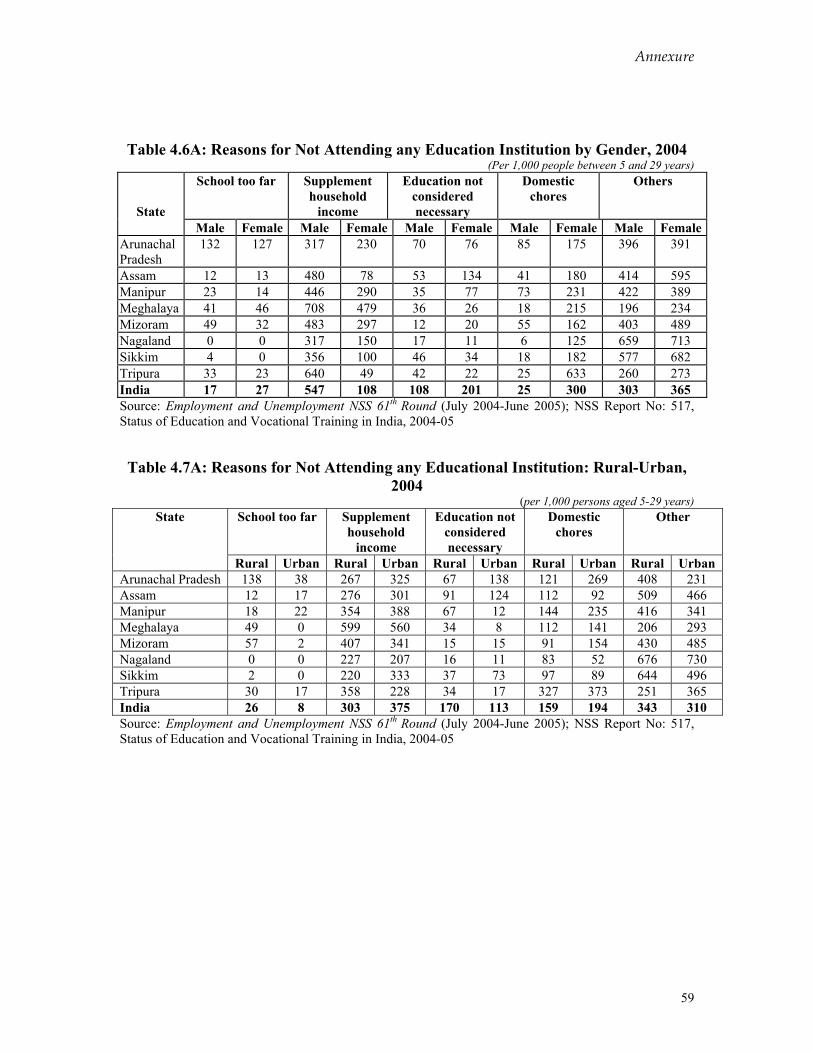
Annexure
59
Table 4.6A: Reasons for Not Attending any Education Institution by Gender, 2004 (Per 1,000 people between 5 and 29 years)
School too far Supplement household
income
Education not considered necessary
Domestic chores
Others
State Male Female Male Female Male Female Male Female Male Female
Arunachal Pradesh
132 127 317 230 70 76 85 175 396 391
Assam 12 13 480 78 53 134 41 180 414 595 Manipur 23 14 446 290 35 77 73 231 422 389 Meghalaya 41 46 708 479 36 26 18 215 196 234 Mizoram 49 32 483 297 12 20 55 162 403 489 Nagaland 0 0 317 150 17 11 6 125 659 713 Sikkim 4 0 356 100 46 34 18 182 577 682 Tripura 33 23 640 49 42 22 25 633 260 273 India 17 27 547 108 108 201 25 300 303 365 Source: Employment and Unemployment NSS 61th Round (July 2004-June 2005); NSS Report No: 517, Status of Education and Vocational Training in India, 2004-05 Table 4.7A: Reasons for Not Attending any Educational Institution: Rural-Urban,
2004 (per 1,000 persons aged 5-29 years)
School too far Supplement household
income
Education not considered necessary
Domestic chores
Other State
Rural Urban Rural Urban Rural Urban Rural Urban Rural Urban Arunachal Pradesh 138 38 267 325 67 138 121 269 408 231 Assam 12 17 276 301 91 124 112 92 509 466 Manipur 18 22 354 388 67 12 144 235 416 341 Meghalaya 49 0 599 560 34 8 112 141 206 293 Mizoram 57 2 407 341 15 15 91 154 430 485 Nagaland 0 0 227 207 16 11 83 52 676 730 Sikkim 2 0 220 333 37 73 97 89 644 496 Tripura 30 17 358 228 34 17 327 373 251 365 India 26 8 303 375 170 113 159 194 343 310 Source: Employment and Unemployment NSS 61th Round (July 2004-June 2005); NSS Report No: 517, Status of Education and Vocational Training in India, 2004-05
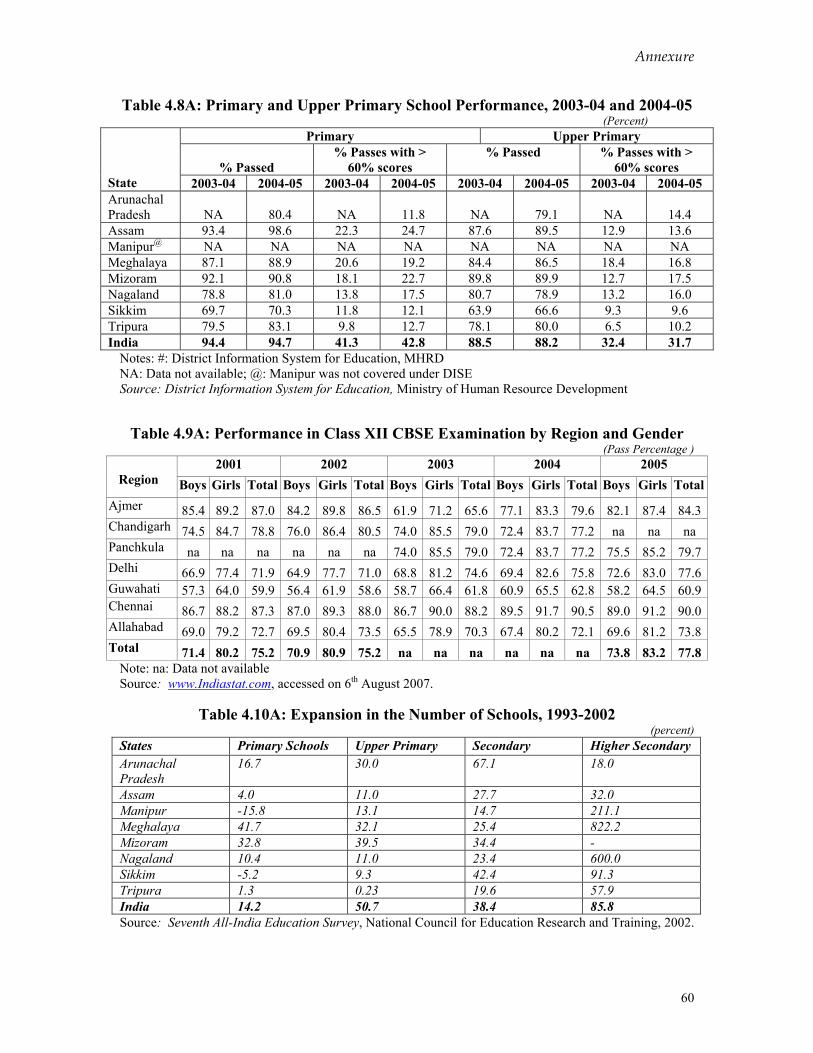
Annexure
60
Table 4.8A: Primary and Upper Primary School Performance, 2003-04 and 2004-05 (Percent)
Primary Upper Primary
% Passed % Passes with >
60% scores % Passed % Passes with >
60% scores State 2003-04 2004-05 2003-04 2004-05 2003-04 2004-05 2003-04 2004-05 Arunachal Pradesh NA 80.4 NA 11.8 NA 79.1 NA 14.4 Assam 93.4 98.6 22.3 24.7 87.6 89.5 12.9 13.6 Manipur@ NA NA NA NA NA NA NA NA Meghalaya 87.1 88.9 20.6 19.2 84.4 86.5 18.4 16.8 Mizoram 92.1 90.8 18.1 22.7 89.8 89.9 12.7 17.5 Nagaland 78.8 81.0 13.8 17.5 80.7 78.9 13.2 16.0 Sikkim 69.7 70.3 11.8 12.1 63.9 66.6 9.3 9.6 Tripura 79.5 83.1 9.8 12.7 78.1 80.0 6.5 10.2 India 94.4 94.7 41.3 42.8 88.5 88.2 32.4 31.7
Notes: #: District Information System for Education, MHRD NA: Data not available; @: Manipur was not covered under DISE Source: District Information System for Education, Ministry of Human Resource Development
Table 4.9A: Performance in Class XII CBSE Examination by Region and Gender
(Pass Percentage ) 2001 2002 2003 2004 2005
Region Boys Girls Total Boys Girls Total Boys Girls Total Boys Girls Total Boys Girls TotalAjmer 85.4 89.2 87.0 84.2 89.8 86.5 61.9 71.2 65.6 77.1 83.3 79.6 82.1 87.4 84.3Chandigarh 74.5 84.7 78.8 76.0 86.4 80.5 74.0 85.5 79.0 72.4 83.7 77.2 na na na Panchkula na na na na na na 74.0 85.5 79.0 72.4 83.7 77.2 75.5 85.2 79.7Delhi 66.9 77.4 71.9 64.9 77.7 71.0 68.8 81.2 74.6 69.4 82.6 75.8 72.6 83.0 77.6Guwahati 57.3 64.0 59.9 56.4 61.9 58.6 58.7 66.4 61.8 60.9 65.5 62.8 58.2 64.5 60.9Chennai 86.7 88.2 87.3 87.0 89.3 88.0 86.7 90.0 88.2 89.5 91.7 90.5 89.0 91.2 90.0Allahabad 69.0 79.2 72.7 69.5 80.4 73.5 65.5 78.9 70.3 67.4 80.2 72.1 69.6 81.2 73.8Total 71.4 80.2 75.2 70.9 80.9 75.2 na na na na na na 73.8 83.2 77.8
Note: na: Data not available Source: www.Indiastat.com, accessed on 6th August 2007.
Table 4.10A: Expansion in the Number of Schools, 1993-2002 (percent)
Source: Seventh All-India Education Survey, National Council for Education Research and Training, 2002.
States Primary Schools Upper Primary Secondary Higher Secondary Arunachal Pradesh
16.7 30.0 67.1 18.0
Assam 4.0 11.0 27.7 32.0 Manipur -15.8 13.1 14.7 211.1 Meghalaya 41.7 32.1 25.4 822.2 Mizoram 32.8 39.5 34.4 - Nagaland 10.4 11.0 23.4 600.0 Sikkim -5.2 9.3 42.4 91.3 Tripura 1.3 0.23 19.6 57.9 India 14.2 50.7 38.4 85.8
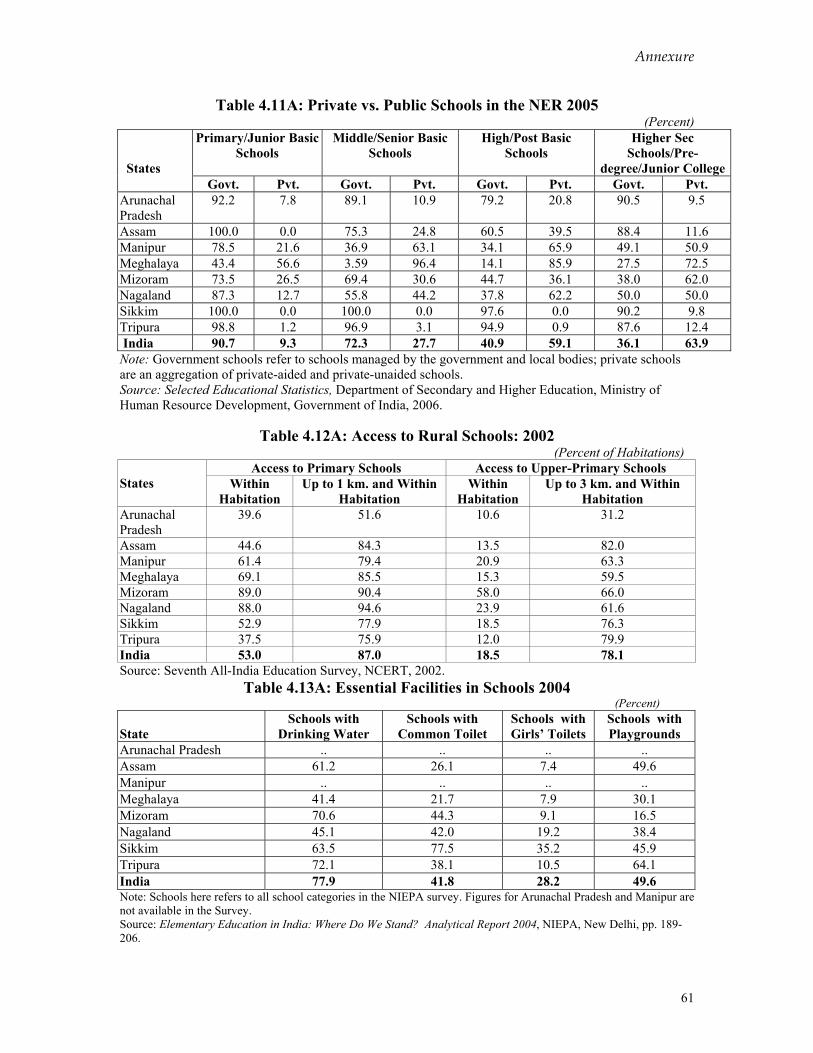
Annexure
61
Table 4.11A: Private vs. Public Schools in the NER 2005 (Percent)
Primary/Junior Basic Schools
Middle/Senior Basic Schools
High/Post Basic Schools
Higher Sec Schools/Pre-
degree/Junior College States
Govt. Pvt. Govt. Pvt. Govt. Pvt. Govt. Pvt. Arunachal Pradesh
92.2 7.8 89.1 10.9 79.2 20.8 90.5 9.5
Assam 100.0 0.0 75.3 24.8 60.5 39.5 88.4 11.6 Manipur 78.5 21.6 36.9 63.1 34.1 65.9 49.1 50.9 Meghalaya 43.4 56.6 3.59 96.4 14.1 85.9 27.5 72.5 Mizoram 73.5 26.5 69.4 30.6 44.7 36.1 38.0 62.0 Nagaland 87.3 12.7 55.8 44.2 37.8 62.2 50.0 50.0 Sikkim 100.0 0.0 100.0 0.0 97.6 0.0 90.2 9.8 Tripura 98.8 1.2 96.9 3.1 94.9 0.9 87.6 12.4 India 90.7 9.3 72.3 27.7 40.9 59.1 36.1 63.9 Note: Government schools refer to schools managed by the government and local bodies; private schools are an aggregation of private-aided and private-unaided schools. Source: Selected Educational Statistics, Department of Secondary and Higher Education, Ministry of Human Resource Development, Government of India, 2006.
Table 4.12A: Access to Rural Schools: 2002 (Percent of Habitations)
Access to Primary Schools Access to Upper-Primary Schools States Within
Habitation Up to 1 km. and Within
Habitation Within
Habitation Up to 3 km. and Within
Habitation Arunachal Pradesh
39.6 51.6 10.6 31.2
Assam 44.6 84.3 13.5 82.0 Manipur 61.4 79.4 20.9 63.3 Meghalaya 69.1 85.5 15.3 59.5 Mizoram 89.0 90.4 58.0 66.0 Nagaland 88.0 94.6 23.9 61.6 Sikkim 52.9 77.9 18.5 76.3 Tripura 37.5 75.9 12.0 79.9 India 53.0 87.0 18.5 78.1 Source: Seventh All-India Education Survey, NCERT, 2002.
Table 4.13A: Essential Facilities in Schools 2004 (Percent)
State
Schools with Drinking Water
Schools with Common Toilet
Schools with Girls’ Toilets
Schools with Playgrounds
Arunachal Pradesh .. .. .. .. Assam 61.2 26.1 7.4 49.6 Manipur .. .. .. .. Meghalaya 41.4 21.7 7.9 30.1 Mizoram 70.6 44.3 9.1 16.5 Nagaland 45.1 42.0 19.2 38.4 Sikkim 63.5 77.5 35.2 45.9 Tripura 72.1 38.1 10.5 64.1 India 77.9 41.8 28.2 49.6 Note: Schools here refers to all school categories in the NIEPA survey. Figures for Arunachal Pradesh and Manipur are not available in the Survey. Source: Elementary Education in India: Where Do We Stand? Analytical Report 2004, NIEPA, New Delhi, pp. 189-206.
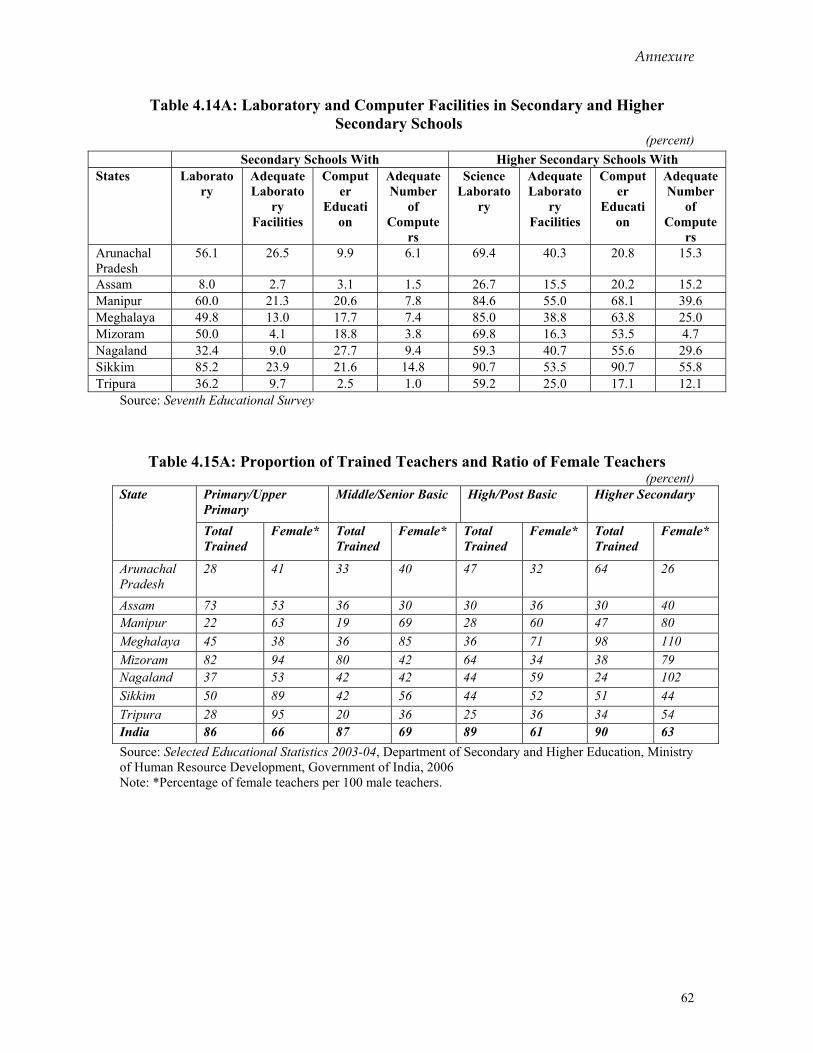
Annexure
62
Table 4.14A: Laboratory and Computer Facilities in Secondary and Higher Secondary Schools
(percent)
Source: Seventh Educational Survey
Table 4.15A: Proportion of Trained Teachers and Ratio of Female Teachers (percent)
Primary/Upper Primary
Middle/Senior Basic High/Post Basic Higher Secondary State
Total Trained
Female* Total Trained
Female* Total Trained
Female* Total Trained
Female*
Arunachal Pradesh
28 41 33 40 47 32 64 26
Assam 73 53 36 30 30 36 30 40 Manipur 22 63 19 69 28 60 47 80 Meghalaya 45 38 36 85 36 71 98 110 Mizoram 82 94 80 42 64 34 38 79 Nagaland 37 53 42 42 44 59 24 102 Sikkim 50 89 42 56 44 52 51 44 Tripura 28 95 20 36 25 36 34 54 India 86 66 87 69 89 61 90 63 Source: Selected Educational Statistics 2003-04, Department of Secondary and Higher Education, Ministry of Human Resource Development, Government of India, 2006 Note: *Percentage of female teachers per 100 male teachers.
Secondary Schools With Higher Secondary Schools With States Laborato
ry Adequate Laborato
ry Facilities
Computer
Education
Adequate Number
of Compute
rs
Science Laborato
ry
Adequate Laborato
ry Facilities
Computer
Education
Adequate Number
of Compute
rs Arunachal Pradesh
56.1 26.5 9.9 6.1 69.4 40.3 20.8 15.3
Assam 8.0 2.7 3.1 1.5 26.7 15.5 20.2 15.2 Manipur 60.0 21.3 20.6 7.8 84.6 55.0 68.1 39.6 Meghalaya 49.8 13.0 17.7 7.4 85.0 38.8 63.8 25.0 Mizoram 50.0 4.1 18.8 3.8 69.8 16.3 53.5 4.7 Nagaland 32.4 9.0 27.7 9.4 59.3 40.7 55.6 29.6 Sikkim 85.2 23.9 21.6 14.8 90.7 53.5 90.7 55.8 Tripura 36.2 9.7 2.5 1.0 59.2 25.0 17.1 12.1
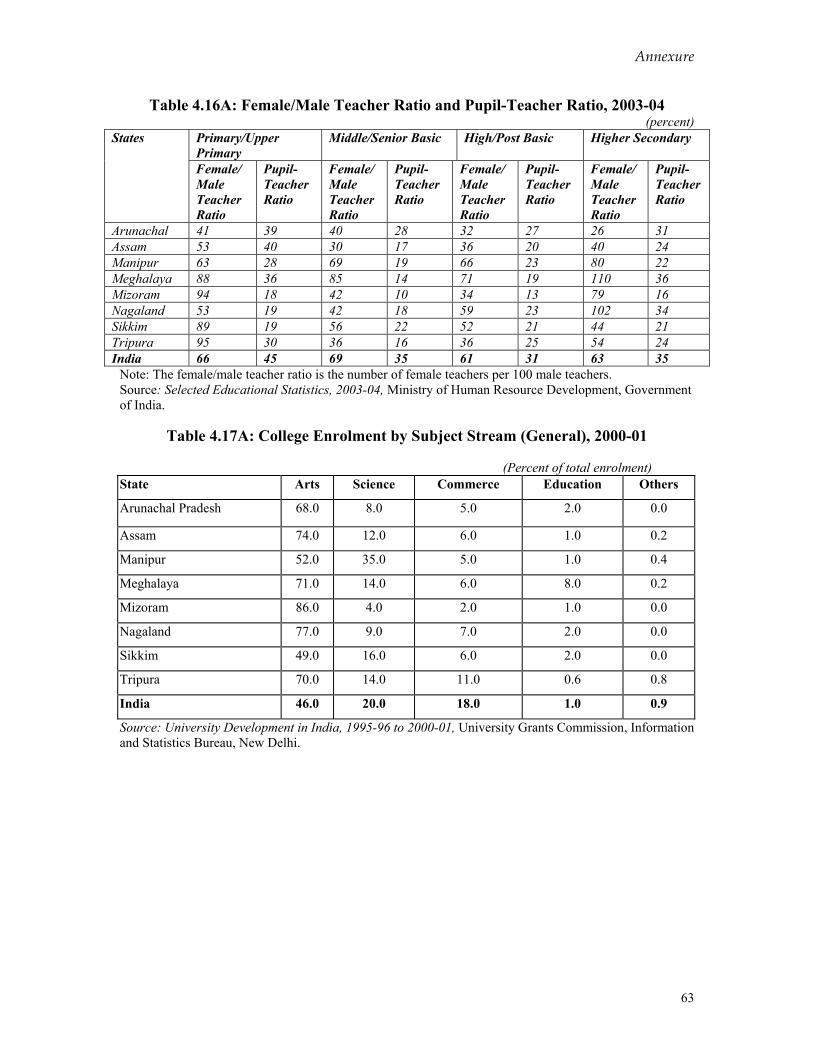
Annexure
63
Table 4.16A: Female/Male Teacher Ratio and Pupil-Teacher Ratio, 2003-04 (percent)
Primary/Upper Primary
Middle/Senior Basic High/Post Basic Higher Secondary States
Female/ Male Teacher Ratio
Pupil-Teacher Ratio
Female/ Male Teacher Ratio
Pupil-Teacher Ratio
Female/ Male Teacher Ratio
Pupil-Teacher Ratio
Female/ Male Teacher Ratio
Pupil-Teacher Ratio
Arunachal 41 39 40 28 32 27 26 31 Assam 53 40 30 17 36 20 40 24 Manipur 63 28 69 19 66 23 80 22 Meghalaya 88 36 85 14 71 19 110 36 Mizoram 94 18 42 10 34 13 79 16 Nagaland 53 19 42 18 59 23 102 34 Sikkim 89 19 56 22 52 21 44 21 Tripura 95 30 36 16 36 25 54 24 India 66 45 69 35 61 31 63 35
Note: The female/male teacher ratio is the number of female teachers per 100 male teachers. Source: Selected Educational Statistics, 2003-04, Ministry of Human Resource Development, Government of India.
Table 4.17A: College Enrolment by Subject Stream (General), 2000-01
(Percent of total enrolment)
State Arts Science Commerce Education Others
Arunachal Pradesh 68.0 8.0 5.0 2.0 0.0
Assam 74.0 12.0 6.0 1.0 0.2
Manipur 52.0 35.0 5.0 1.0 0.4
Meghalaya 71.0 14.0 6.0 8.0 0.2
Mizoram 86.0 4.0 2.0 1.0 0.0
Nagaland 77.0 9.0 7.0 2.0 0.0
Sikkim 49.0 16.0 6.0 2.0 0.0
Tripura 70.0 14.0 11.0 0.6 0.8
India 46.0 20.0 18.0 1.0 0.9
Source: University Development in India, 1995-96 to 2000-01, University Grants Commission, Information and Statistics Bureau, New Delhi.
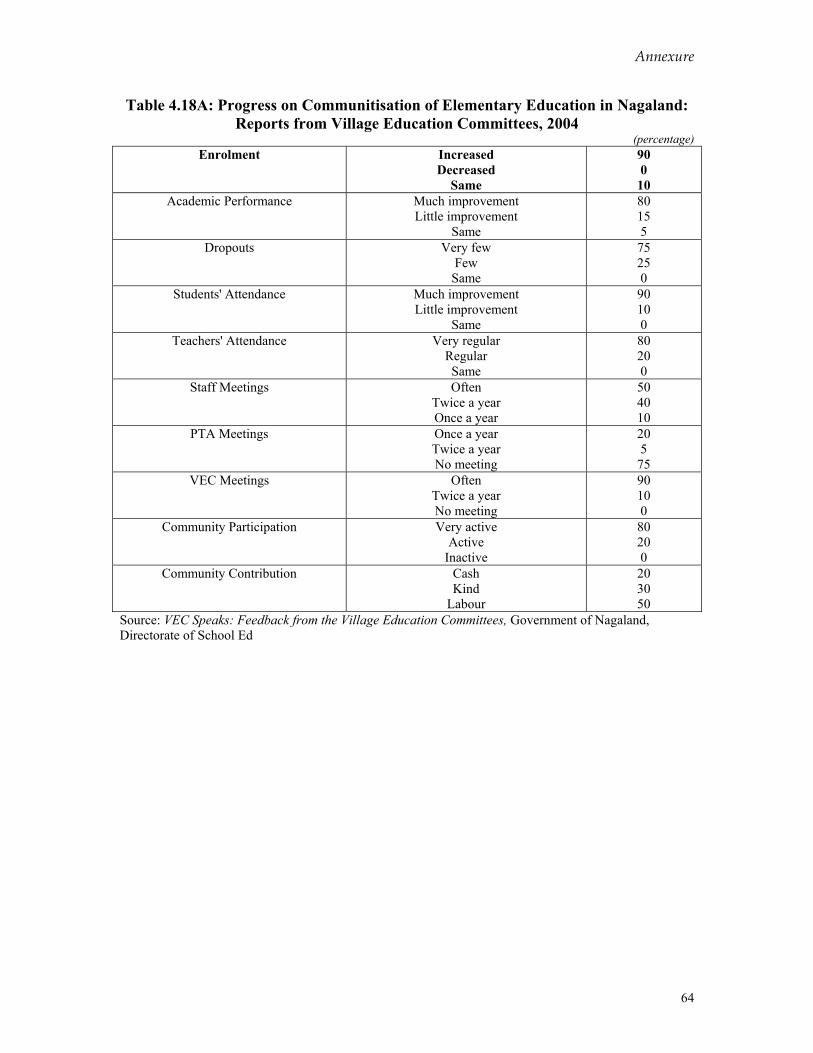
Annexure
64
Table 4.18A: Progress on Communitisation of Elementary Education in Nagaland: Reports from Village Education Committees, 2004
(percentage) Enrolment Increased
Decreased Same
90 0
10 Academic Performance Much improvement
Little improvement Same
80 15 5
Dropouts Very few Few Same
75 25 0
Students' Attendance Much improvement Little improvement
Same
90 10 0
Teachers' Attendance Very regular Regular Same
80 20 0
Staff Meetings Often Twice a year Once a year
50 40 10
PTA Meetings Once a year Twice a year No meeting
20 5
75 VEC Meetings Often
Twice a year No meeting
90 10 0
Community Participation Very active Active
Inactive
80 20 0
Community Contribution Cash Kind
Labour
20 30 50
Source: VEC Speaks: Feedback from the Village Education Committees, Government of Nagaland, Directorate of School Ed
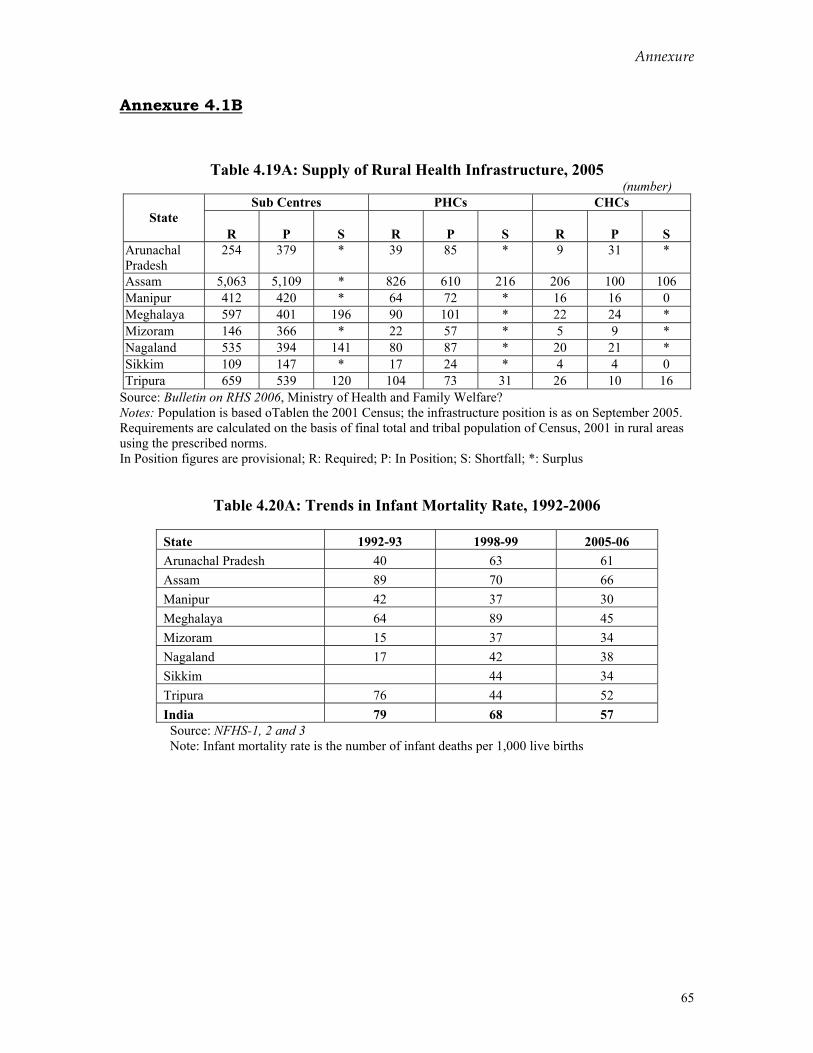
Annexure
65
Annexure 4.1B
Table 4.19A: Supply of Rural Health Infrastructure, 2005 (number)
Sub Centres PHCs CHCs State
R
P
S
R
P
S
R
P
S Arunachal Pradesh
254 379 * 39 85 * 9 31 *
Assam 5,063 5,109 * 826 610 216 206 100 106 Manipur 412 420 * 64 72 * 16 16 0 Meghalaya 597 401 196 90 101 * 22 24 * Mizoram 146 366 * 22 57 * 5 9 * Nagaland 535 394 141 80 87 * 20 21 * Sikkim 109 147 * 17 24 * 4 4 0 Tripura 659 539 120 104 73 31 26 10 16
Source: Bulletin on RHS 2006, Ministry of Health and Family Welfare? Notes: Population is based oTablen the 2001 Census; the infrastructure position is as on September 2005. Requirements are calculated on the basis of final total and tribal population of Census, 2001 in rural areas using the prescribed norms. In Position figures are provisional; R: Required; P: In Position; S: Shortfall; *: Surplus
Table 4.20A: Trends in Infant Mortality Rate, 1992-2006
State 1992-93 1998-99 2005-06 Arunachal Pradesh 40 63 61 Assam 89 70 66 Manipur 42 37 30 Meghalaya 64 89 45 Mizoram 15 37 34 Nagaland 17 42 38 Sikkim 44 34 Tripura 76 44 52 India 79 68 57
Source: NFHS-1, 2 and 3 Note: Infant mortality rate is the number of infant deaths per 1,000 live births
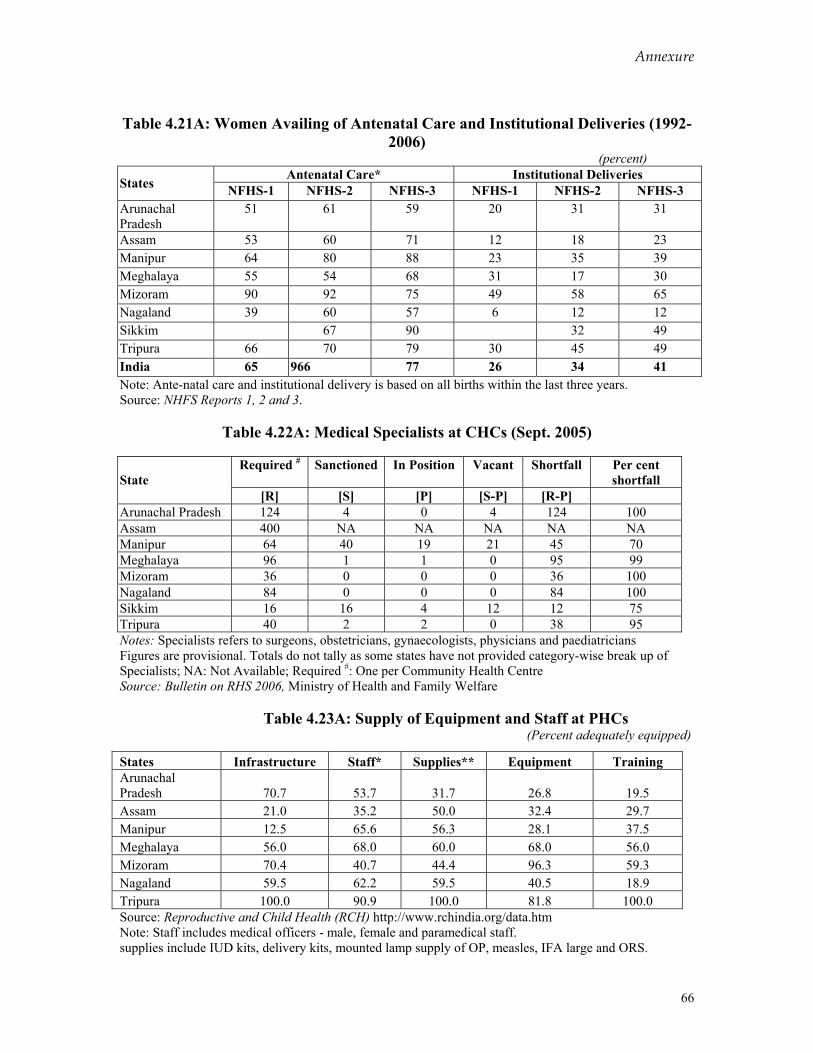
Annexure
66
Table 4.21A: Women Availing of Antenatal Care and Institutional Deliveries (1992-
2006) (percent)
Antenatal Care* Institutional Deliveries States NFHS-1 NFHS-2 NFHS-3 NFHS-1 NFHS-2 NFHS-3 Arunachal Pradesh
51 61 59 20 31 31
Assam 53 60 71 12 18 23 Manipur 64 80 88 23 35 39 Meghalaya 55 54 68 31 17 30 Mizoram 90 92 75 49 58 65 Nagaland 39 60 57 6 12 12 Sikkim 67 90 32 49 Tripura 66 70 79 30 45 49 India 65 966 77 26 34 41 Note: Ante-natal care and institutional delivery is based on all births within the last three years. Source: NHFS Reports 1, 2 and 3.
Table 4.22A: Medical Specialists at CHCs (Sept. 2005)
Required # Sanctioned In Position Vacant Shortfall Per cent
shortfall State
[R] [S] [P] [S-P] [R-P] Arunachal Pradesh 124 4 0 4 124 100 Assam 400 NA NA NA NA NA Manipur 64 40 19 21 45 70 Meghalaya 96 1 1 0 95 99 Mizoram 36 0 0 0 36 100 Nagaland 84 0 0 0 84 100 Sikkim 16 16 4 12 12 75 Tripura 40 2 2 0 38 95 Notes: Specialists refers to surgeons, obstetricians, gynaecologists, physicians and paediatricians Figures are provisional. Totals do not tally as some states have not provided category-wise break up of Specialists; NA: Not Available; Required #: One per Community Health Centre Source: Bulletin on RHS 2006, Ministry of Health and Family Welfare
Table 4.23A: Supply of Equipment and Staff at PHCs
(Percent adequately equipped)
Source: Reproductive and Child Health (RCH) http://www.rchindia.org/data.htm Note: Staff includes medical officers - male, female and paramedical staff. supplies include IUD kits, delivery kits, mounted lamp supply of OP, measles, IFA large and ORS.
States Infrastructure Staff* Supplies** Equipment Training Arunachal Pradesh 70.7 53.7 31.7 26.8 19.5 Assam 21.0 35.2 50.0 32.4 29.7 Manipur 12.5 65.6 56.3 28.1 37.5 Meghalaya 56.0 68.0 60.0 68.0 56.0 Mizoram 70.4 40.7 44.4 96.3 59.3 Nagaland 59.5 62.2 59.5 40.5 18.9 Tripura 100.0 90.9 100.0 81.8 100.0
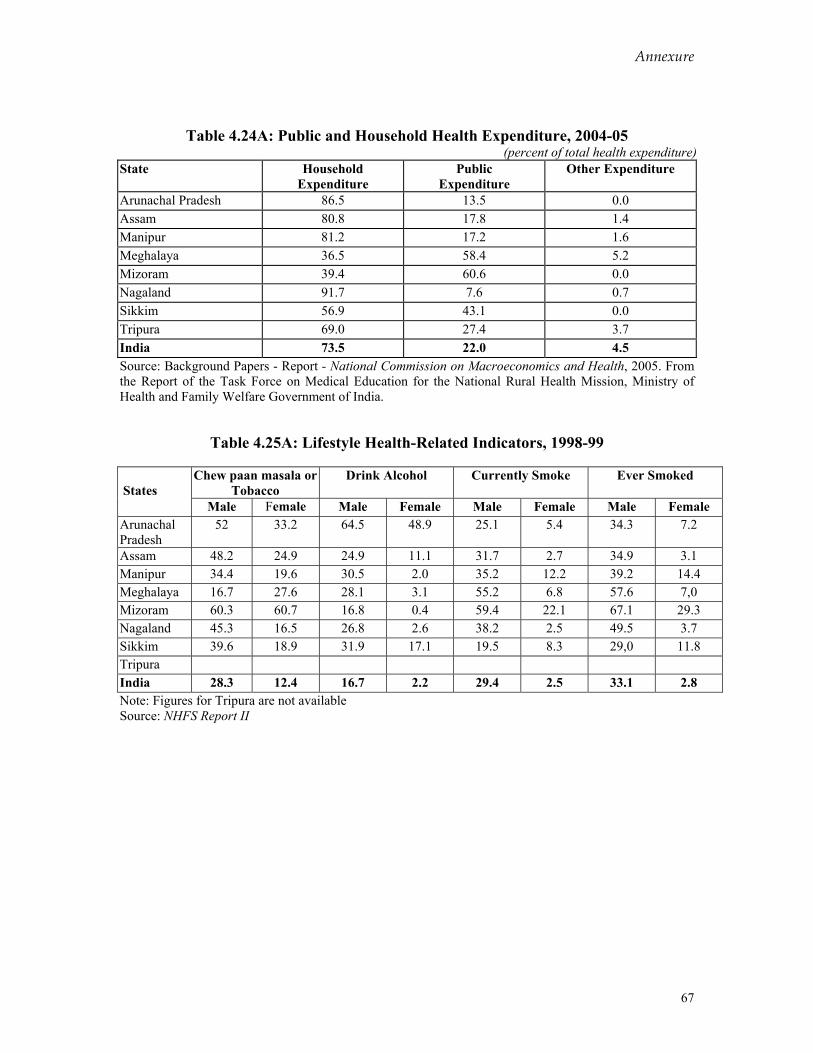
Annexure
67
Table 4.24A: Public and Household Health Expenditure, 2004-05 (percent of total health expenditure)
State Household Expenditure
Public Expenditure
Other Expenditure
Arunachal Pradesh 86.5 13.5 0.0 Assam 80.8 17.8 1.4 Manipur 81.2 17.2 1.6 Meghalaya 36.5 58.4 5.2 Mizoram 39.4 60.6 0.0 Nagaland 91.7 7.6 0.7 Sikkim 56.9 43.1 0.0 Tripura 69.0 27.4 3.7 India 73.5 22.0 4.5 Source: Background Papers - Report - National Commission on Macroeconomics and Health, 2005. From the Report of the Task Force on Medical Education for the National Rural Health Mission, Ministry of Health and Family Welfare Government of India.
Table 4.25A: Lifestyle Health-Related Indicators, 1998-99
Chew paan masala or Tobacco
Drink Alcohol Currently Smoke Ever Smoked States
Male Female Male Female Male Female Male Female Arunachal Pradesh
52 33.2 64.5 48.9 25.1 5.4 34.3 7.2
Assam 48.2 24.9 24.9 11.1 31.7 2.7 34.9 3.1 Manipur 34.4 19.6 30.5 2.0 35.2 12.2 39.2 14.4 Meghalaya 16.7 27.6 28.1 3.1 55.2 6.8 57.6 7,0 Mizoram 60.3 60.7 16.8 0.4 59.4 22.1 67.1 29.3 Nagaland 45.3 16.5 26.8 2.6 38.2 2.5 49.5 3.7 Sikkim 39.6 18.9 31.9 17.1 19.5 8.3 29,0 11.8 Tripura India 28.3 12.4 16.7 2.2 29.4 2.5 33.1 2.8 Note: Figures for Tripura are not available Source: NHFS Report II
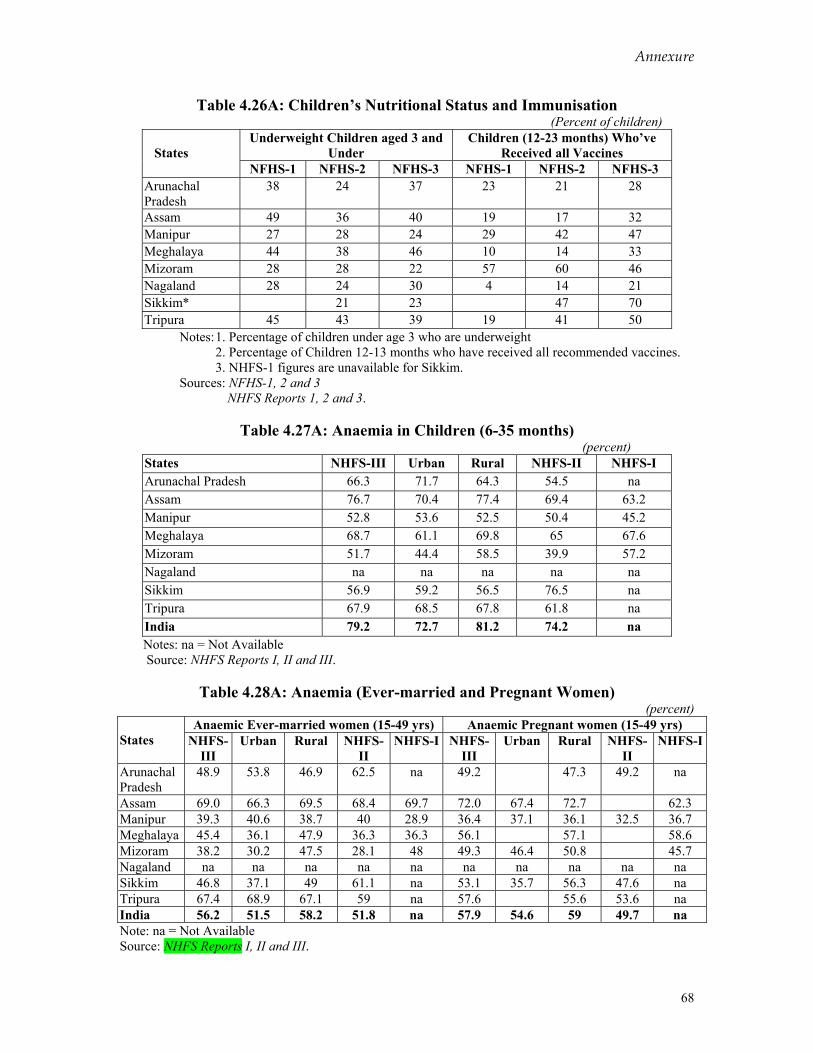
Annexure
68
Table 4.26A: Children’s Nutritional Status and Immunisation (Percent of children)
Underweight Children aged 3 and Under
Children (12-23 months) Who’ve Received all Vaccines
States
NFHS-1 NFHS-2 NFHS-3 NFHS-1 NFHS-2 NFHS-3 Arunachal Pradesh
38 24 37 23 21 28
Assam 49 36 40 19 17 32 Manipur 27 28 24 29 42 47 Meghalaya 44 38 46 10 14 33 Mizoram 28 28 22 57 60 46 Nagaland 28 24 30 4 14 21 Sikkim* 21 23 47 70 Tripura 45 43 39 19 41 50
Notes: 1. Percentage of children under age 3 who are underweight 2. Percentage of Children 12-13 months who have received all recommended vaccines. 3. NHFS-1 figures are unavailable for Sikkim.
Sources: NFHS-1, 2 and 3 NHFS Reports 1, 2 and 3.
Table 4.27A: Anaemia in Children (6-35 months)
(percent) States NHFS-III Urban Rural NHFS-II NHFS-I Arunachal Pradesh 66.3 71.7 64.3 54.5 na Assam 76.7 70.4 77.4 69.4 63.2 Manipur 52.8 53.6 52.5 50.4 45.2 Meghalaya 68.7 61.1 69.8 65 67.6 Mizoram 51.7 44.4 58.5 39.9 57.2 Nagaland na na na na na Sikkim 56.9 59.2 56.5 76.5 na Tripura 67.9 68.5 67.8 61.8 na India 79.2 72.7 81.2 74.2 na
Notes: na = Not Available Source: NHFS Reports I, II and III.
Table 4.28A: Anaemia (Ever-married and Pregnant Women) (percent)
Anaemic Ever-married women (15-49 yrs) Anaemic Pregnant women (15-49 yrs) States NHFS-
III Urban Rural NHFS-
II NHFS-I NHFS-
III Urban Rural NHFS-
II NHFS-I
Arunachal Pradesh
48.9 53.8 46.9 62.5 na 49.2 47.3 49.2 na
Assam 69.0 66.3 69.5 68.4 69.7 72.0 67.4 72.7 62.3 Manipur 39.3 40.6 38.7 40 28.9 36.4 37.1 36.1 32.5 36.7 Meghalaya 45.4 36.1 47.9 36.3 36.3 56.1 57.1 58.6 Mizoram 38.2 30.2 47.5 28.1 48 49.3 46.4 50.8 45.7 Nagaland na na na na na na na na na na Sikkim 46.8 37.1 49 61.1 na 53.1 35.7 56.3 47.6 na Tripura 67.4 68.9 67.1 59 na 57.6 55.6 53.6 na India 56.2 51.5 58.2 51.8 na 57.9 54.6 59 49.7 na Note: na = Not Available Source: NHFS Reports I, II and III.
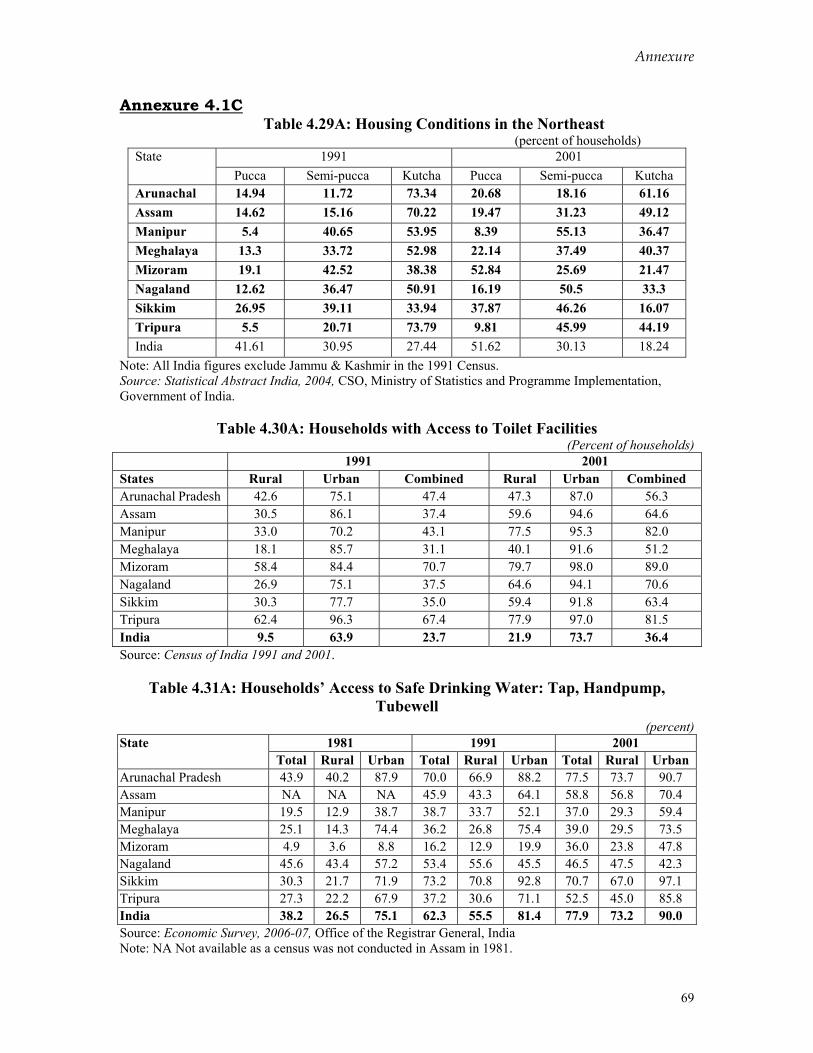
Annexure
69
Annexure 4.1C Table 4.29A: Housing Conditions in the Northeast
(percent of households) 1991 2001 State
Pucca Semi-pucca Kutcha Pucca Semi-pucca Kutcha Arunachal 14.94 11.72 73.34 20.68 18.16 61.16 Assam 14.62 15.16 70.22 19.47 31.23 49.12 Manipur 5.4 40.65 53.95 8.39 55.13 36.47 Meghalaya 13.3 33.72 52.98 22.14 37.49 40.37 Mizoram 19.1 42.52 38.38 52.84 25.69 21.47 Nagaland 12.62 36.47 50.91 16.19 50.5 33.3 Sikkim 26.95 39.11 33.94 37.87 46.26 16.07 Tripura 5.5 20.71 73.79 9.81 45.99 44.19 India 41.61 30.95 27.44 51.62 30.13 18.24
Note: All India figures exclude Jammu & Kashmir in the 1991 Census. Source: Statistical Abstract India, 2004, CSO, Ministry of Statistics and Programme Implementation, Government of India.
Table 4.30A: Households with Access to Toilet Facilities (Percent of households)
1991 2001 States Rural Urban Combined Rural Urban Combined Arunachal Pradesh 42.6 75.1 47.4 47.3 87.0 56.3 Assam 30.5 86.1 37.4 59.6 94.6 64.6 Manipur 33.0 70.2 43.1 77.5 95.3 82.0 Meghalaya 18.1 85.7 31.1 40.1 91.6 51.2 Mizoram 58.4 84.4 70.7 79.7 98.0 89.0 Nagaland 26.9 75.1 37.5 64.6 94.1 70.6 Sikkim 30.3 77.7 35.0 59.4 91.8 63.4 Tripura 62.4 96.3 67.4 77.9 97.0 81.5 India 9.5 63.9 23.7 21.9 73.7 36.4 Source: Census of India 1991 and 2001.
Table 4.31A: Households’ Access to Safe Drinking Water: Tap, Handpump, Tubewell
(percent) 1981 1991 2001 State
Total Rural Urban Total Rural Urban Total Rural Urban Arunachal Pradesh 43.9 40.2 87.9 70.0 66.9 88.2 77.5 73.7 90.7 Assam NA NA NA 45.9 43.3 64.1 58.8 56.8 70.4 Manipur 19.5 12.9 38.7 38.7 33.7 52.1 37.0 29.3 59.4 Meghalaya 25.1 14.3 74.4 36.2 26.8 75.4 39.0 29.5 73.5 Mizoram 4.9 3.6 8.8 16.2 12.9 19.9 36.0 23.8 47.8 Nagaland 45.6 43.4 57.2 53.4 55.6 45.5 46.5 47.5 42.3 Sikkim 30.3 21.7 71.9 73.2 70.8 92.8 70.7 67.0 97.1 Tripura 27.3 22.2 67.9 37.2 30.6 71.1 52.5 45.0 85.8 India 38.2 26.5 75.1 62.3 55.5 81.4 77.9 73.2 90.0 Source: Economic Survey, 2006-07, Office of the Registrar General, India Note: NA Not available as a census was not conducted in Assam in 1981.
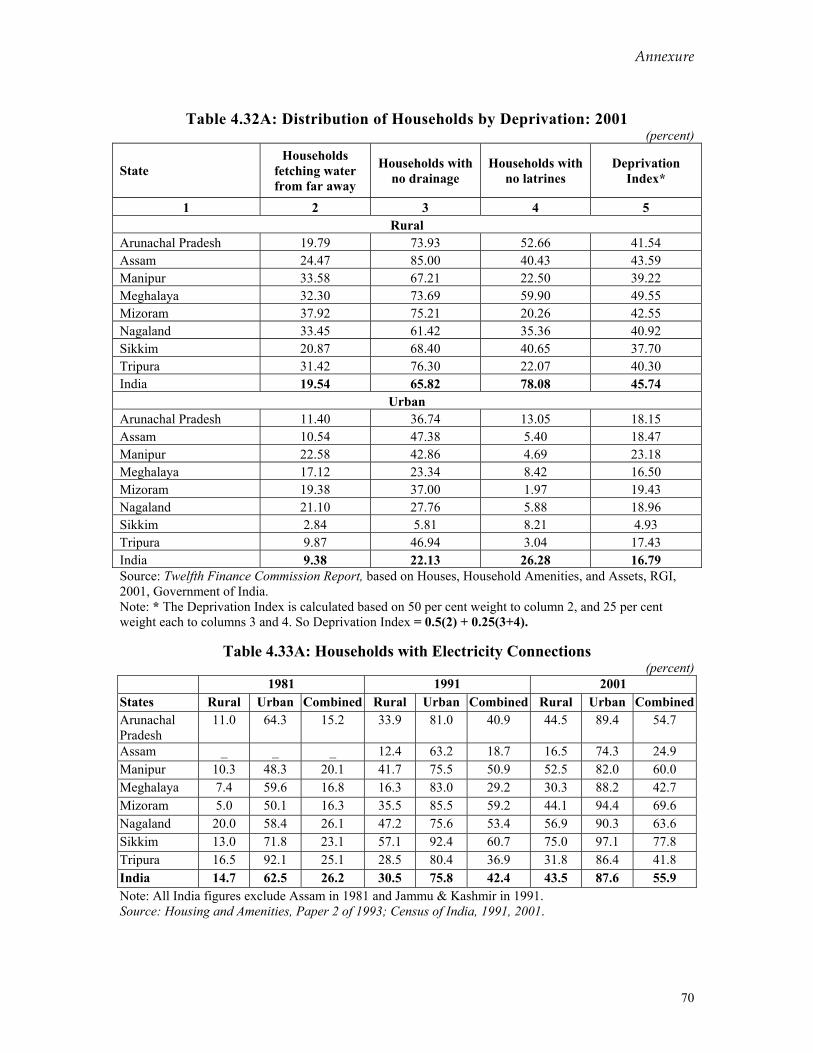
Annexure
70
Table 4.32A: Distribution of Households by Deprivation: 2001
(percent)
State Households
fetching water from far away
Households with no drainage
Households with no latrines
Deprivation Index*
1 2 3 4 5 Rural
Arunachal Pradesh 19.79 73.93 52.66 41.54 Assam 24.47 85.00 40.43 43.59 Manipur 33.58 67.21 22.50 39.22 Meghalaya 32.30 73.69 59.90 49.55 Mizoram 37.92 75.21 20.26 42.55 Nagaland 33.45 61.42 35.36 40.92 Sikkim 20.87 68.40 40.65 37.70 Tripura 31.42 76.30 22.07 40.30 India 19.54 65.82 78.08 45.74
Urban Arunachal Pradesh 11.40 36.74 13.05 18.15 Assam 10.54 47.38 5.40 18.47 Manipur 22.58 42.86 4.69 23.18 Meghalaya 17.12 23.34 8.42 16.50 Mizoram 19.38 37.00 1.97 19.43 Nagaland 21.10 27.76 5.88 18.96 Sikkim 2.84 5.81 8.21 4.93 Tripura 9.87 46.94 3.04 17.43 India 9.38 22.13 26.28 16.79 Source: Twelfth Finance Commission Report, based on Houses, Household Amenities, and Assets, RGI, 2001, Government of India. Note: * The Deprivation Index is calculated based on 50 per cent weight to column 2, and 25 per cent weight each to columns 3 and 4. So Deprivation Index = 0.5(2) + 0.25(3+4).
Table 4.33A: Households with Electricity Connections (percent)
1981 1991 2001 States Rural Urban Combined Rural Urban Combined Rural Urban CombinedArunachal Pradesh
11.0 64.3 15.2 33.9 81.0 40.9 44.5 89.4 54.7
Assam _ _ _ 12.4 63.2 18.7 16.5 74.3 24.9 Manipur 10.3 48.3 20.1 41.7 75.5 50.9 52.5 82.0 60.0 Meghalaya 7.4 59.6 16.8 16.3 83.0 29.2 30.3 88.2 42.7 Mizoram 5.0 50.1 16.3 35.5 85.5 59.2 44.1 94.4 69.6 Nagaland 20.0 58.4 26.1 47.2 75.6 53.4 56.9 90.3 63.6 Sikkim 13.0 71.8 23.1 57.1 92.4 60.7 75.0 97.1 77.8 Tripura 16.5 92.1 25.1 28.5 80.4 36.9 31.8 86.4 41.8 India 14.7 62.5 26.2 30.5 75.8 42.4 43.5 87.6 55.9 Note: All India figures exclude Assam in 1981 and Jammu & Kashmir in 1991. Source: Housing and Amenities, Paper 2 of 1993; Census of India, 1991, 2001.
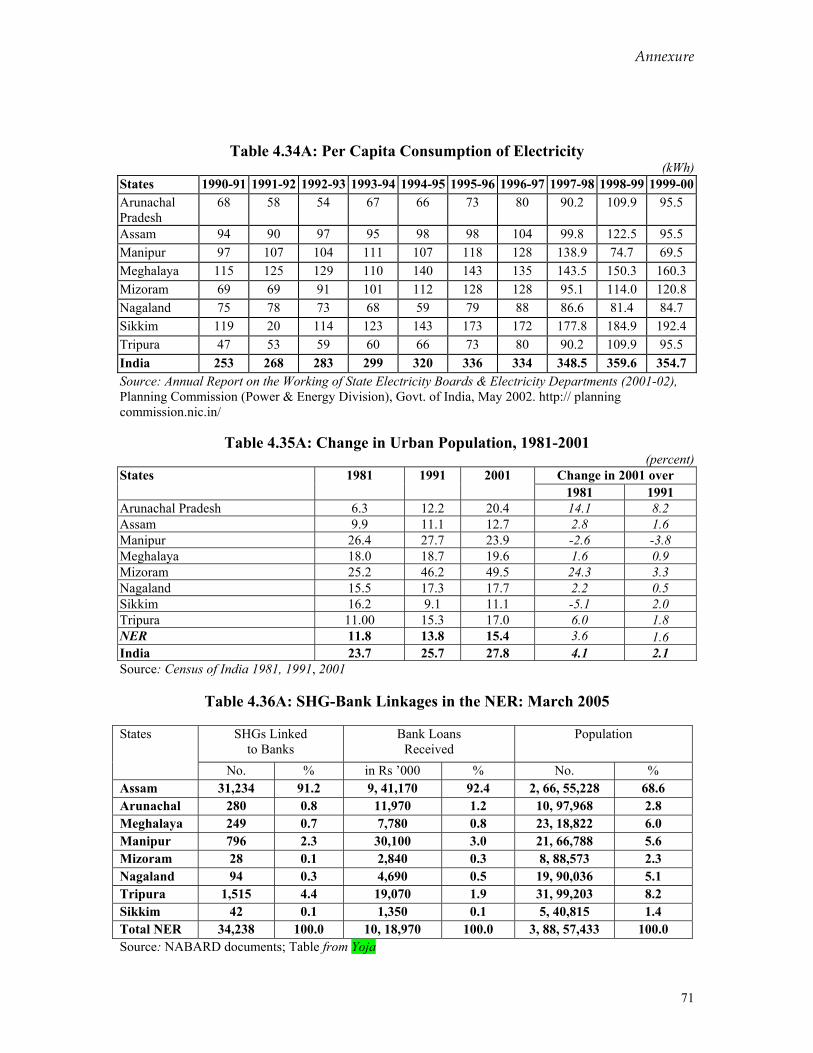
Annexure
71
Table 4.34A: Per Capita Consumption of Electricity (kWh)
States 1990-91 1991-92 1992-93 1993-94 1994-95 1995-96 1996-97 1997-98 1998-99 1999-00Arunachal Pradesh
68 58 54 67 66 73 80 90.2 109.9 95.5
Assam 94 90 97 95 98 98 104 99.8 122.5 95.5 Manipur 97 107 104 111 107 118 128 138.9 74.7 69.5 Meghalaya 115 125 129 110 140 143 135 143.5 150.3 160.3 Mizoram 69 69 91 101 112 128 128 95.1 114.0 120.8 Nagaland 75 78 73 68 59 79 88 86.6 81.4 84.7 Sikkim 119 20 114 123 143 173 172 177.8 184.9 192.4 Tripura 47 53 59 60 66 73 80 90.2 109.9 95.5 India 253 268 283 299 320 336 334 348.5 359.6 354.7 Source: Annual Report on the Working of State Electricity Boards & Electricity Departments (2001-02), Planning Commission (Power & Energy Division), Govt. of India, May 2002. http:// planning commission.nic.in/
Table 4.35A: Change in Urban Population, 1981-2001 (percent)
Change in 2001 over States 1981 1991 2001 1981 1991
Arunachal Pradesh 6.3 12.2 20.4 14.1 8.2 Assam 9.9 11.1 12.7 2.8 1.6 Manipur 26.4 27.7 23.9 -2.6 -3.8 Meghalaya 18.0 18.7 19.6 1.6 0.9 Mizoram 25.2 46.2 49.5 24.3 3.3 Nagaland 15.5 17.3 17.7 2.2 0.5 Sikkim 16.2 9.1 11.1 -5.1 2.0 Tripura 11.00 15.3 17.0 6.0 1.8 NER 11.8 13.8 15.4 3.6 1.6 India 23.7 25.7 27.8 4.1 2.1 Source: Census of India 1981, 1991, 2001
Table 4.36A: SHG-Bank Linkages in the NER: March 2005
SHGs Linked
to Banks Bank Loans
Received Population States
No. % in Rs ’000 % No. % Assam 31,234 91.2 9, 41,170 92.4 2, 66, 55,228 68.6 Arunachal 280 0.8 11,970 1.2 10, 97,968 2.8 Meghalaya 249 0.7 7,780 0.8 23, 18,822 6.0 Manipur 796 2.3 30,100 3.0 21, 66,788 5.6 Mizoram 28 0.1 2,840 0.3 8, 88,573 2.3 Nagaland 94 0.3 4,690 0.5 19, 90,036 5.1 Tripura 1,515 4.4 19,070 1.9 31, 99,203 8.2 Sikkim 42 0.1 1,350 0.1 5, 40,815 1.4 Total NER 34,238 100.0 10, 18,970 100.0 3, 88, 57,433 100.0 Source: NABARD documents; Table from Yoja
Annexure
72
Annexure 4.2 Human Development 4.1 Recommendations from Other Reports Various reports have suggested ways to improve basic services in NER, all based on the accepted view that development in the region will only be possible if there is a vast improvement in the quality of overall infrastructure, and services. A brief description of the main recommendations in these areas follows. From the Shukla Commission Report, 1997: Services • State governments should raise resources up to 15 per cent of the allocations made by the Planning
Commission for Basic Minimum Services. • For ensuring transparency, suitably publish full details about the schemes to be taken up, their location,
estimated expenditure, and those responsible for the works so that local communities and beneficiaries become fully aware of the flow of funds as well as the schedule of implementation. Transparency will ensure greater accountability and prevent leakage.
• An effective monitoring system will have to be worked out from the block up to state administration with systematic and periodic reviews. The State Plans Division of the Planning Commission should also help states set up or strengthen similar units.
• A mechanism will have to be found to relate credible assurances of maintenance of assets to the release of funds for new schemes. One way could be to stipulate that absence of proof of maintenance of assets already created will result in a proportionate reduction in the funds to be released for new schemes in the following year.
From the Shukla Commission Report Urbanisation and Spatial Planning • Master plans must be prepared/ reviewed for all state capitals, larger towns and potential growth
centres with expert assistance. This is all the more necessary in the fragile hills where unregulated construction, high-rises and lack of infrastructure have degraded the urban environment and caused serious traffic and sanitation problems.
• In cases of urban expansion or potential township development around new airports, railheads, industrial centres and other growth poles such as the Shillong satellite town, Lengpui airport (Mizoram), and Nangalbibra (East Garo Hills), the government should freeze land prices and any new construction within a given radius. This will ensure urban standards and enable the state to retain the capital appreciation of land through betterment. This will provide a source of funding through regulated sales for approved purposes and preclude land speculation designed to fill private coffers.
• The Imphal Capital plan that has been prepared should be carefully evaluated and funded in phases. • The Assam Rifles are reportedly to evacuate the remaining portion of the Kangla Fort premises in the
heart of Imphal. The Fort is a hallowed Meitei heritage site which should be restored as a centre of Meitei culture and history as may be determined by a special committee. This project should be assisted through a core grant from the Centre
• The same should be done for Gargaon, the ancient Ahom capital near Nazira, and Sibsagar in Assam and other heritage/historic sites These places recall the pride and glory of the Northeast.
NEC Vision 2020: Overall Northeast Region • Villagers and communities to be involved in the design, review and implementation of rural
development plans through SHGs and other representative groups in addition to PRIs and district council/village councils.
4.2 PURA: Reducing the Rural-Urban Divide in the NER A recent scheme, PURA (Providing Urban Amenities in a Rural Areas) aims to promote regionally balanced growth by helping villages develop and exploit their comparative advantages. To be implemented through the Ministry of Rural Development, the strategy will provide physical connectivity among the clusters through good roads and transport; electronic connectivity through tele-communication with high bandwidth fiber-optic cables and wireless and Internet kiosks to link rural and urban environments; and knowledge connectivity through education, vocational training for farmers, artisans and craftsmen and
Annexure
73
entrepreneurship programmes. These three connectivities will result in economic connectivity through the initiation of enterprises, supported by banks, micro credit organisations and marketing of the products. • Each PURA cluster will reinforce agriculture, emphasize areas like agro processing, development of
rural crafts, dairy, silk production and fishing based on the competitive advantage of the region. to enhance non-farm rural revenue. The rural economy should be driven by renewable energies such as solar, wind, bio-fuel and conversion of municipal waste into power, so development is sustainable.
• Two types of PURA have been proposed for the NER, based on terrain and population. The plains PURA would have 20,000-1,00,000 people and be clustered into economic systems of 20 to 30 villages. Hill PURAs would have smaller populations of 7,500-15,000 people, in a cluster of 30 to 100 villages or hamlets. In Manipur, for example, 15 PURA clusters are envisaged. Each PURA cluster will cost about Rs 100 crore (~$20 million).
• Employment will initially be created during the initial phases of construction and setting up, but will have to be planned for in a sustainable long-run manner in employment and self-employment opportunities in nationally competitive small enterprises in agro-processing, manufacturing and services. If the industrial/business parks are marketed well, they can generate employment in the supporting sectors for about 10,000 people in the cluster.
• PURA enterprises can also undertake management of schools, health care units, vocational training centres, chilling plants, silos and building a market, banking system and the regional business or industrial units. PURA enterprises should not be based on bureaucratic support, but should focus on raising their efficiency to the extent they are able to compete with others. This new PURA enterprise needs partners from the bank, educational institutions, the government and also the private entrepreneurs. Educational institutions can train the entrepreneurs for managing the PURA in affiliated colleges of Manipur University and the banks can provide loans to the entrepreneurs for creating and running PURAs as a business proposition.
Source: From the President of India’s Vision for 2017 in NE: Address at the Inauguration of he Conference on Development of East and Northeast India – Strategic Issues in a National Perspective, Kolkata, May 17, 2007; and from his speech at Manipur University
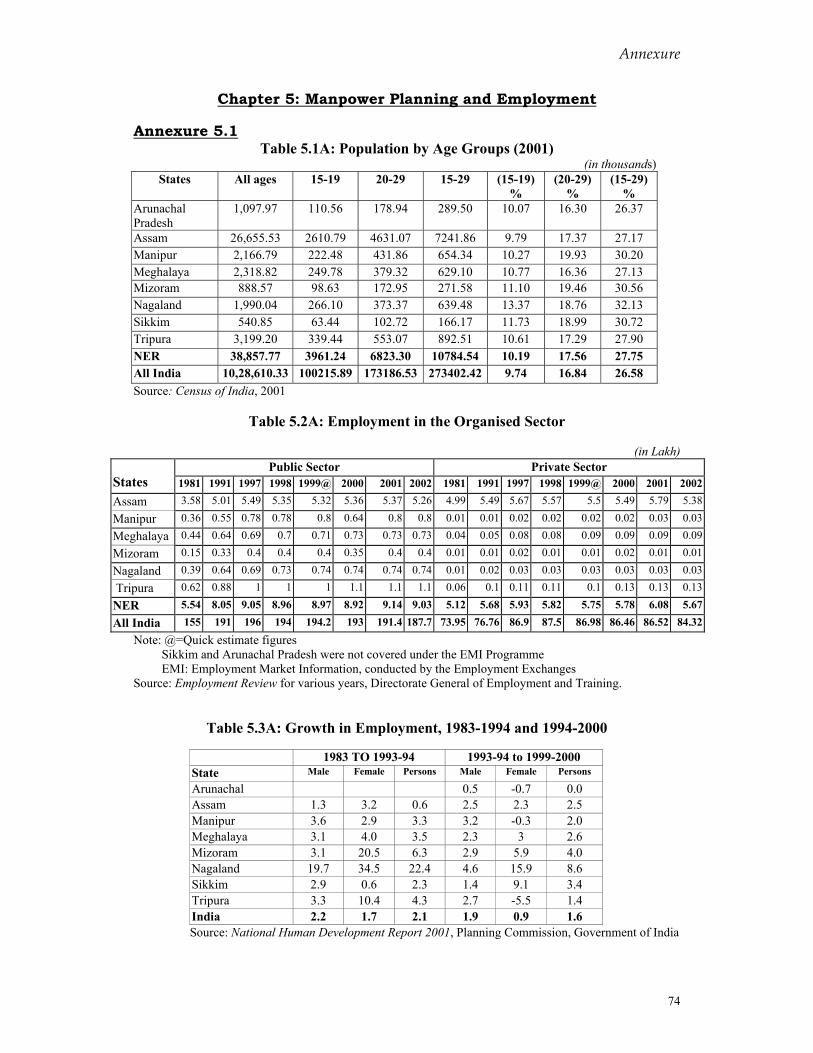
Annexure
74
Chapter 5: Manpower Planning and Employment
Annexure 5.1 Table 5.1A: Population by Age Groups (2001)
(in thousands) States All ages 15-19 20-29 15-29 (15-19)
% (20-29)
% (15-29)
% Arunachal Pradesh
1,097.97 110.56 178.94 289.50 10.07 16.30 26.37
Assam 26,655.53 2610.79 4631.07 7241.86 9.79 17.37 27.17 Manipur 2,166.79 222.48 431.86 654.34 10.27 19.93 30.20 Meghalaya 2,318.82 249.78 379.32 629.10 10.77 16.36 27.13 Mizoram 888.57 98.63 172.95 271.58 11.10 19.46 30.56 Nagaland 1,990.04 266.10 373.37 639.48 13.37 18.76 32.13 Sikkim 540.85 63.44 102.72 166.17 11.73 18.99 30.72 Tripura 3,199.20 339.44 553.07 892.51 10.61 17.29 27.90 NER 38,857.77 3961.24 6823.30 10784.54 10.19 17.56 27.75 All India 10,28,610.33 100215.89 173186.53 273402.42 9.74 16.84 26.58 Source: Census of India, 2001
Table 5.2A: Employment in the Organised Sector
(in Lakh)
Public Sector Private Sector States 1981 1991 1997 1998 1999@ 2000 2001 2002 1981 1991 1997 1998 1999@ 2000 2001 2002Assam 3.58 5.01 5.49 5.35 5.32 5.36 5.37 5.26 4.99 5.49 5.67 5.57 5.5 5.49 5.79 5.38
Manipur 0.36 0.55 0.78 0.78 0.8 0.64 0.8 0.8 0.01 0.01 0.02 0.02 0.02 0.02 0.03 0.03
Meghalaya 0.44 0.64 0.69 0.7 0.71 0.73 0.73 0.73 0.04 0.05 0.08 0.08 0.09 0.09 0.09 0.09
Mizoram 0.15 0.33 0.4 0.4 0.4 0.35 0.4 0.4 0.01 0.01 0.02 0.01 0.01 0.02 0.01 0.01
Nagaland 0.39 0.64 0.69 0.73 0.74 0.74 0.74 0.74 0.01 0.02 0.03 0.03 0.03 0.03 0.03 0.03
Tripura 0.62 0.88 1 1 1 1.1 1.1 1.1 0.06 0.1 0.11 0.11 0.1 0.13 0.13 0.13
NER 5.54 8.05 9.05 8.96 8.97 8.92 9.14 9.03 5.12 5.68 5.93 5.82 5.75 5.78 6.08 5.67
All India 155 191 196 194 194.2 193 191.4 187.7 73.95 76.76 86.9 87.5 86.98 86.46 86.52 84.32Note: @=Quick estimate figures
Sikkim and Arunachal Pradesh were not covered under the EMI Programme EMI: Employment Market Information, conducted by the Employment Exchanges
Source: Employment Review for various years, Directorate General of Employment and Training.
Table 5.3A: Growth in Employment, 1983-1994 and 1994-2000
1983 TO 1993-94 1993-94 to 1999-2000 State Male Female Persons Male Female Persons
Arunachal 0.5 -0.7 0.0 Assam 1.3 3.2 0.6 2.5 2.3 2.5 Manipur 3.6 2.9 3.3 3.2 -0.3 2.0 Meghalaya 3.1 4.0 3.5 2.3 3 2.6 Mizoram 3.1 20.5 6.3 2.9 5.9 4.0 Nagaland 19.7 34.5 22.4 4.6 15.9 8.6 Sikkim 2.9 0.6 2.3 1.4 9.1 3.4 Tripura 3.3 10.4 4.3 2.7 -5.5 1.4 India 2.2 1.7 2.1 1.9 0.9 1.6 Source: National Human Development Report 2001, Planning Commission, Government of India
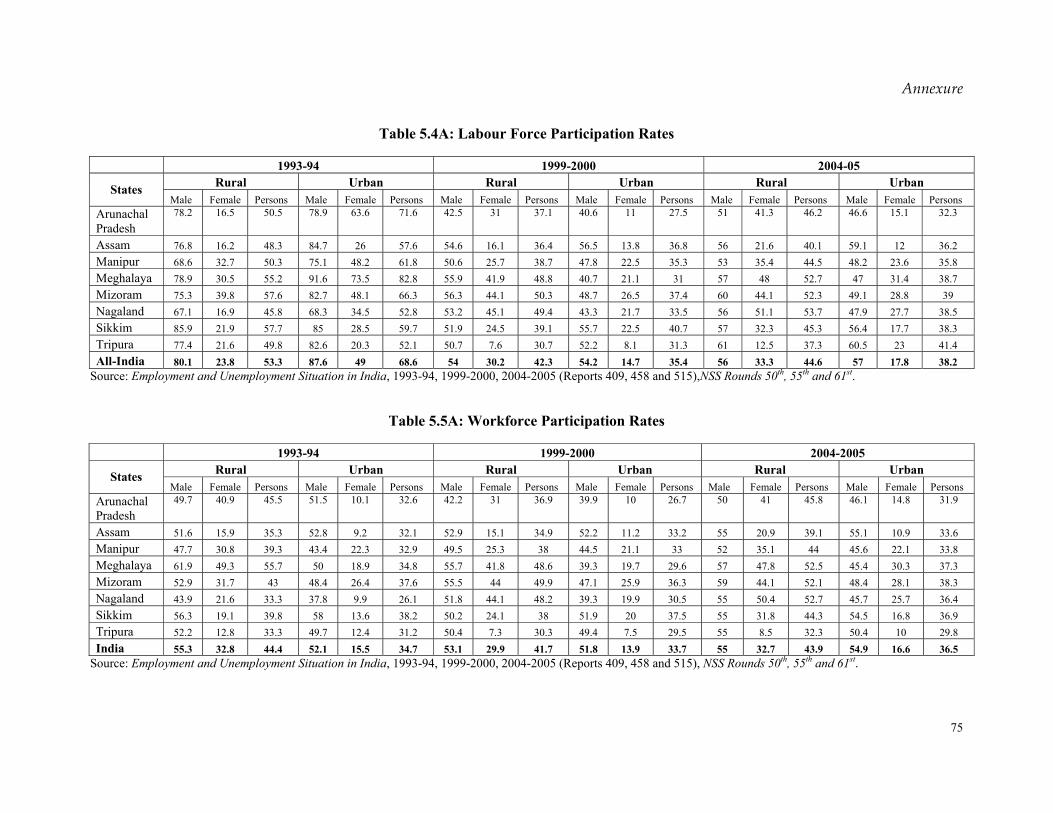
Annexure
75
Table 5.4A: Labour Force Participation Rates 1993-94 1999-2000 2004-05
Rural Urban Rural Urban Rural Urban States Male Female Persons Male Female Persons Male Female Persons Male Female Persons Male Female Persons Male Female Persons
Arunachal Pradesh
78.2 16.5 50.5 78.9 63.6 71.6 42.5 31 37.1 40.6 11 27.5 51 41.3 46.2 46.6 15.1 32.3
Assam 76.8 16.2 48.3 84.7 26 57.6 54.6 16.1 36.4 56.5 13.8 36.8 56 21.6 40.1 59.1 12 36.2 Manipur 68.6 32.7 50.3 75.1 48.2 61.8 50.6 25.7 38.7 47.8 22.5 35.3 53 35.4 44.5 48.2 23.6 35.8 Meghalaya 78.9 30.5 55.2 91.6 73.5 82.8 55.9 41.9 48.8 40.7 21.1 31 57 48 52.7 47 31.4 38.7 Mizoram 75.3 39.8 57.6 82.7 48.1 66.3 56.3 44.1 50.3 48.7 26.5 37.4 60 44.1 52.3 49.1 28.8 39 Nagaland 67.1 16.9 45.8 68.3 34.5 52.8 53.2 45.1 49.4 43.3 21.7 33.5 56 51.1 53.7 47.9 27.7 38.5 Sikkim 85.9 21.9 57.7 85 28.5 59.7 51.9 24.5 39.1 55.7 22.5 40.7 57 32.3 45.3 56.4 17.7 38.3 Tripura 77.4 21.6 49.8 82.6 20.3 52.1 50.7 7.6 30.7 52.2 8.1 31.3 61 12.5 37.3 60.5 23 41.4 All-India 80.1 23.8 53.3 87.6 49 68.6 54 30.2 42.3 54.2 14.7 35.4 56 33.3 44.6 57 17.8 38.2
Source: Employment and Unemployment Situation in India, 1993-94, 1999-2000, 2004-2005 (Reports 409, 458 and 515),NSS Rounds 50th, 55th and 61st.
Table 5.5A: Workforce Participation Rates
1993-94 1999-2000 2004-2005
Rural Urban Rural Urban Rural Urban States Male Female Persons Male Female Persons Male Female Persons Male Female Persons Male Female Persons Male Female Persons
Arunachal Pradesh
49.7 40.9 45.5 51.5 10.1 32.6 42.2 31 36.9 39.9 10 26.7 50 41 45.8 46.1 14.8 31.9
Assam 51.6 15.9 35.3 52.8 9.2 32.1 52.9 15.1 34.9 52.2 11.2 33.2 55 20.9 39.1 55.1 10.9 33.6 Manipur 47.7 30.8 39.3 43.4 22.3 32.9 49.5 25.3 38 44.5 21.1 33 52 35.1 44 45.6 22.1 33.8 Meghalaya 61.9 49.3 55.7 50 18.9 34.8 55.7 41.8 48.6 39.3 19.7 29.6 57 47.8 52.5 45.4 30.3 37.3 Mizoram 52.9 31.7 43 48.4 26.4 37.6 55.5 44 49.9 47.1 25.9 36.3 59 44.1 52.1 48.4 28.1 38.3 Nagaland 43.9 21.6 33.3 37.8 9.9 26.1 51.8 44.1 48.2 39.3 19.9 30.5 55 50.4 52.7 45.7 25.7 36.4 Sikkim 56.3 19.1 39.8 58 13.6 38.2 50.2 24.1 38 51.9 20 37.5 55 31.8 44.3 54.5 16.8 36.9 Tripura 52.2 12.8 33.3 49.7 12.4 31.2 50.4 7.3 30.3 49.4 7.5 29.5 55 8.5 32.3 50.4 10 29.8 India 55.3 32.8 44.4 52.1 15.5 34.7 53.1 29.9 41.7 51.8 13.9 33.7 55 32.7 43.9 54.9 16.6 36.5
Source: Employment and Unemployment Situation in India, 1993-94, 1999-2000, 2004-2005 (Reports 409, 458 and 515), NSS Rounds 50th, 55th and 61st.
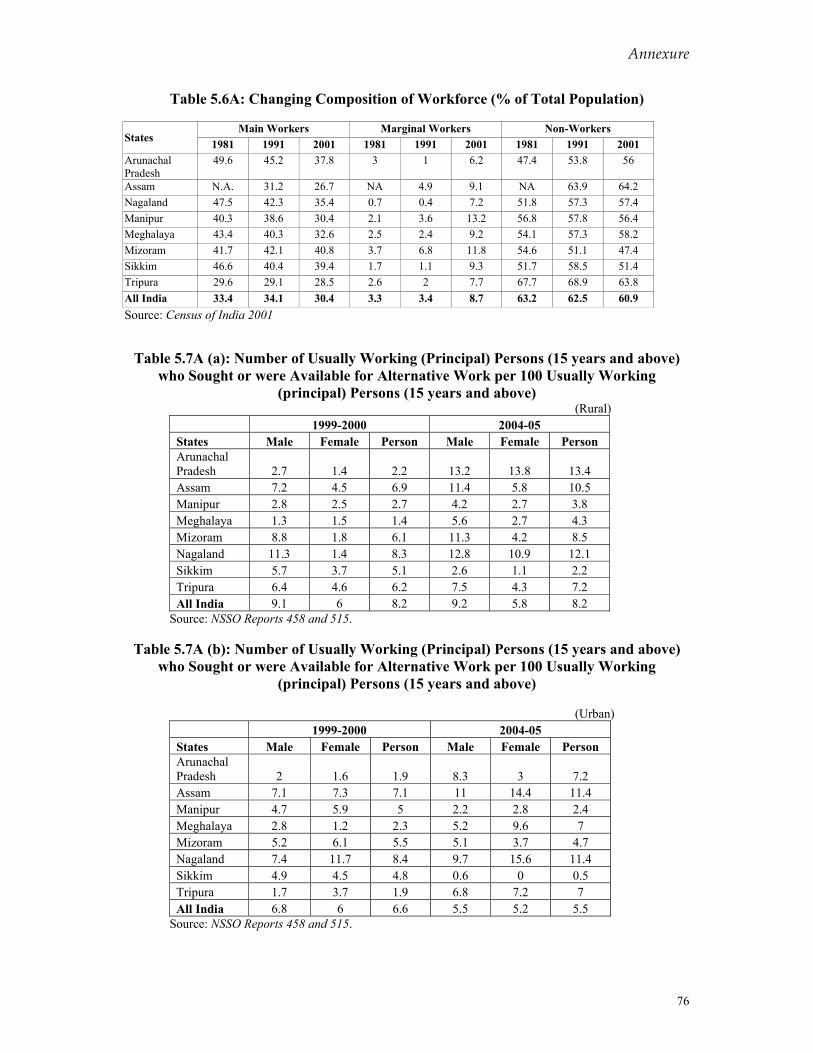
Annexure
76
Table 5.6A: Changing Composition of Workforce (% of Total Population)
Main Workers Marginal Workers Non-Workers States 1981 1991 2001 1981 1991 2001 1981 1991 2001 Arunachal Pradesh
49.6 45.2 37.8 3 1 6.2 47.4 53.8 56
Assam N.A. 31.2 26.7 NA 4.9 9.1 NA 63.9 64.2 Nagaland 47.5 42.3 35.4 0.7 0.4 7.2 51.8 57.3 57.4 Manipur 40.3 38.6 30.4 2.1 3.6 13.2 56.8 57.8 56.4 Meghalaya 43.4 40.3 32.6 2.5 2.4 9.2 54.1 57.3 58.2 Mizoram 41.7 42.1 40.8 3.7 6.8 11.8 54.6 51.1 47.4 Sikkim 46.6 40.4 39.4 1.7 1.1 9.3 51.7 58.5 51.4 Tripura 29.6 29.1 28.5 2.6 2 7.7 67.7 68.9 63.8 All India 33.4 34.1 30.4 3.3 3.4 8.7 63.2 62.5 60.9 Source: Census of India 2001
Table 5.7A (a): Number of Usually Working (Principal) Persons (15 years and above) who Sought or were Available for Alternative Work per 100 Usually Working
(principal) Persons (15 years and above) (Rural)
1999-2000 2004-05 States Male Female Person Male Female Person Arunachal Pradesh 2.7 1.4 2.2 13.2 13.8 13.4 Assam 7.2 4.5 6.9 11.4 5.8 10.5 Manipur 2.8 2.5 2.7 4.2 2.7 3.8 Meghalaya 1.3 1.5 1.4 5.6 2.7 4.3 Mizoram 8.8 1.8 6.1 11.3 4.2 8.5 Nagaland 11.3 1.4 8.3 12.8 10.9 12.1 Sikkim 5.7 3.7 5.1 2.6 1.1 2.2 Tripura 6.4 4.6 6.2 7.5 4.3 7.2 All India 9.1 6 8.2 9.2 5.8 8.2
Source: NSSO Reports 458 and 515.
Table 5.7A (b): Number of Usually Working (Principal) Persons (15 years and above) who Sought or were Available for Alternative Work per 100 Usually Working
(principal) Persons (15 years and above)
(Urban) 1999-2000 2004-05 States Male Female Person Male Female Person Arunachal Pradesh 2 1.6 1.9 8.3 3 7.2 Assam 7.1 7.3 7.1 11 14.4 11.4 Manipur 4.7 5.9 5 2.2 2.8 2.4 Meghalaya 2.8 1.2 2.3 5.2 9.6 7 Mizoram 5.2 6.1 5.5 5.1 3.7 4.7 Nagaland 7.4 11.7 8.4 9.7 15.6 11.4 Sikkim 4.9 4.5 4.8 0.6 0 0.5 Tripura 1.7 3.7 1.9 6.8 7.2 7 All India 6.8 6 6.6 5.5 5.2 5.5
Source: NSSO Reports 458 and 515.
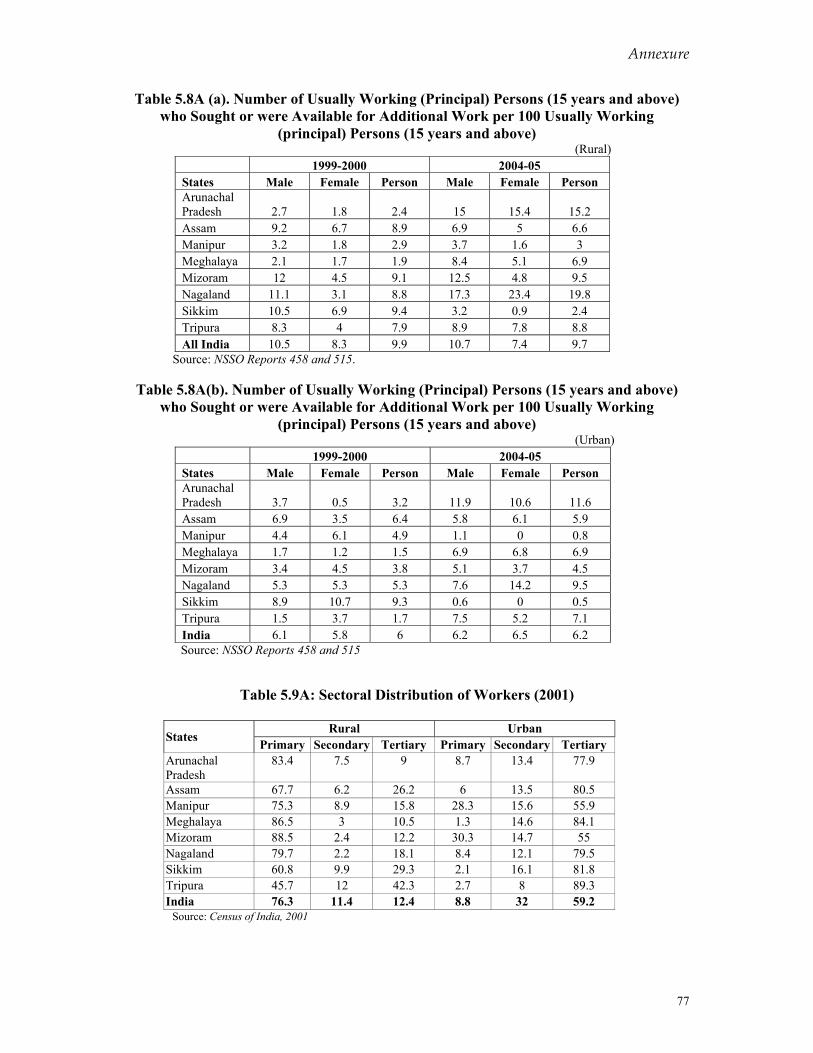
Annexure
77
Table 5.8A (a). Number of Usually Working (Principal) Persons (15 years and above) who Sought or were Available for Additional Work per 100 Usually Working
(principal) Persons (15 years and above) (Rural)
1999-2000 2004-05 States Male Female Person Male Female Person Arunachal Pradesh 2.7 1.8 2.4 15 15.4 15.2 Assam 9.2 6.7 8.9 6.9 5 6.6 Manipur 3.2 1.8 2.9 3.7 1.6 3 Meghalaya 2.1 1.7 1.9 8.4 5.1 6.9 Mizoram 12 4.5 9.1 12.5 4.8 9.5 Nagaland 11.1 3.1 8.8 17.3 23.4 19.8 Sikkim 10.5 6.9 9.4 3.2 0.9 2.4 Tripura 8.3 4 7.9 8.9 7.8 8.8 All India 10.5 8.3 9.9 10.7 7.4 9.7
Source: NSSO Reports 458 and 515.
Table 5.8A(b). Number of Usually Working (Principal) Persons (15 years and above) who Sought or were Available for Additional Work per 100 Usually Working
(principal) Persons (15 years and above) (Urban)
1999-2000 2004-05 States Male Female Person Male Female Person Arunachal Pradesh 3.7 0.5 3.2 11.9 10.6 11.6 Assam 6.9 3.5 6.4 5.8 6.1 5.9 Manipur 4.4 6.1 4.9 1.1 0 0.8 Meghalaya 1.7 1.2 1.5 6.9 6.8 6.9 Mizoram 3.4 4.5 3.8 5.1 3.7 4.5 Nagaland 5.3 5.3 5.3 7.6 14.2 9.5 Sikkim 8.9 10.7 9.3 0.6 0 0.5 Tripura 1.5 3.7 1.7 7.5 5.2 7.1 India 6.1 5.8 6 6.2 6.5 6.2 Source: NSSO Reports 458 and 515
Table 5.9A: Sectoral Distribution of Workers (2001)
Rural Urban States Primary Secondary Tertiary Primary Secondary Tertiary Arunachal Pradesh
83.4 7.5 9 8.7 13.4 77.9
Assam 67.7 6.2 26.2 6 13.5 80.5 Manipur 75.3 8.9 15.8 28.3 15.6 55.9 Meghalaya 86.5 3 10.5 1.3 14.6 84.1 Mizoram 88.5 2.4 12.2 30.3 14.7 55 Nagaland 79.7 2.2 18.1 8.4 12.1 79.5 Sikkim 60.8 9.9 29.3 2.1 16.1 81.8 Tripura 45.7 12 42.3 2.7 8 89.3 India 76.3 11.4 12.4 8.8 32 59.2 Source: Census of India, 2001
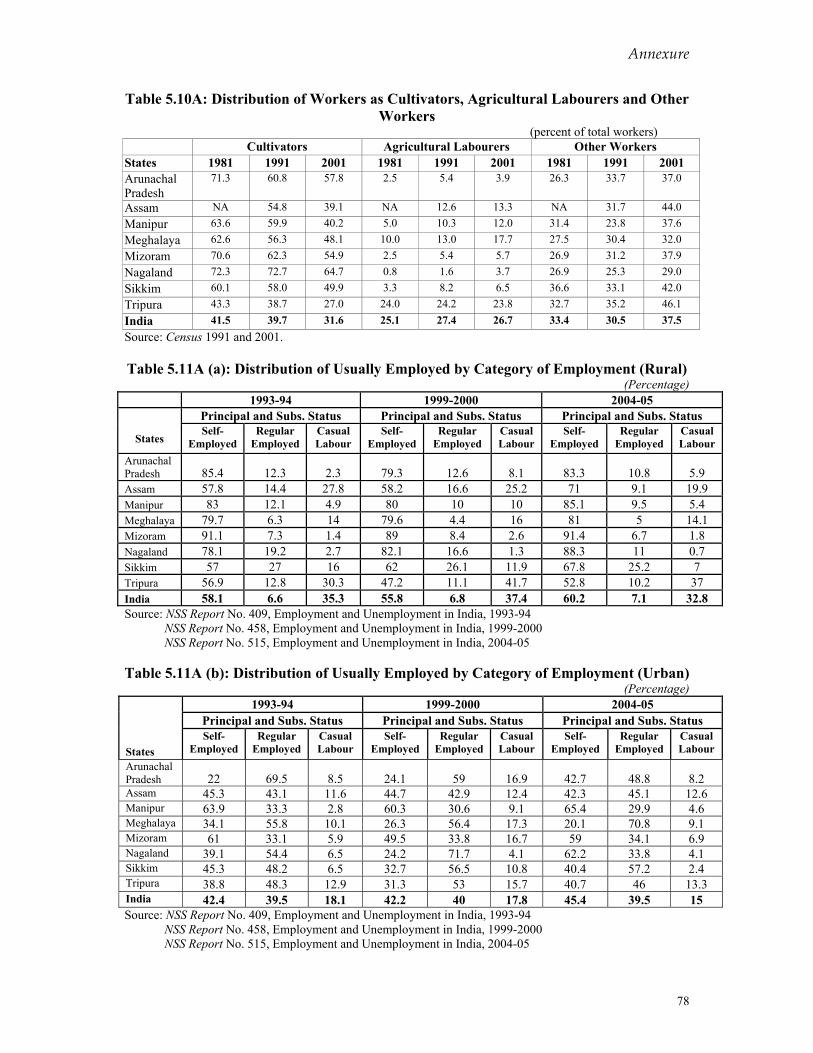
Annexure
78
Table 5.10A: Distribution of Workers as Cultivators, Agricultural Labourers and Other Workers
(percent of total workers) Cultivators Agricultural Labourers Other Workers
States 1981 1991 2001 1981 1991 2001 1981 1991 2001 Arunachal Pradesh
71.3 60.8 57.8 2.5 5.4 3.9 26.3 33.7 37.0
Assam NA 54.8 39.1 NA 12.6 13.3 NA 31.7 44.0 Manipur 63.6 59.9 40.2 5.0 10.3 12.0 31.4 23.8 37.6 Meghalaya 62.6 56.3 48.1 10.0 13.0 17.7 27.5 30.4 32.0 Mizoram 70.6 62.3 54.9 2.5 5.4 5.7 26.9 31.2 37.9 Nagaland 72.3 72.7 64.7 0.8 1.6 3.7 26.9 25.3 29.0 Sikkim 60.1 58.0 49.9 3.3 8.2 6.5 36.6 33.1 42.0 Tripura 43.3 38.7 27.0 24.0 24.2 23.8 32.7 35.2 46.1 India 41.5 39.7 31.6 25.1 27.4 26.7 33.4 30.5 37.5 Source: Census 1991 and 2001. Table 5.11A (a): Distribution of Usually Employed by Category of Employment (Rural)
(Percentage) 1993-94 1999-2000 2004-05
Principal and Subs. Status Principal and Subs. Status Principal and Subs. Status
States Self-
Employed Regular
Employed Casual Labour
Self- Employed
Regular Employed
Casual Labour
Self- Employed
Regular Employed
Casual Labour
Arunachal Pradesh 85.4 12.3 2.3 79.3 12.6 8.1 83.3 10.8 5.9 Assam 57.8 14.4 27.8 58.2 16.6 25.2 71 9.1 19.9 Manipur 83 12.1 4.9 80 10 10 85.1 9.5 5.4 Meghalaya 79.7 6.3 14 79.6 4.4 16 81 5 14.1 Mizoram 91.1 7.3 1.4 89 8.4 2.6 91.4 6.7 1.8 Nagaland 78.1 19.2 2.7 82.1 16.6 1.3 88.3 11 0.7 Sikkim 57 27 16 62 26.1 11.9 67.8 25.2 7 Tripura 56.9 12.8 30.3 47.2 11.1 41.7 52.8 10.2 37 India 58.1 6.6 35.3 55.8 6.8 37.4 60.2 7.1 32.8 Source: NSS Report No. 409, Employment and Unemployment in India, 1993-94 NSS Report No. 458, Employment and Unemployment in India, 1999-2000 NSS Report No. 515, Employment and Unemployment in India, 2004-05
Table 5.11A (b): Distribution of Usually Employed by Category of Employment (Urban)
(Percentage) 1993-94 1999-2000 2004-05
Principal and Subs. Status Principal and Subs. Status Principal and Subs. Status
States Self-
Employed Regular
Employed Casual Labour
Self- Employed
Regular Employed
Casual Labour
Self- Employed
Regular Employed
Casual Labour
Arunachal Pradesh 22 69.5 8.5 24.1 59 16.9 42.7 48.8 8.2 Assam 45.3 43.1 11.6 44.7 42.9 12.4 42.3 45.1 12.6 Manipur 63.9 33.3 2.8 60.3 30.6 9.1 65.4 29.9 4.6 Meghalaya 34.1 55.8 10.1 26.3 56.4 17.3 20.1 70.8 9.1 Mizoram 61 33.1 5.9 49.5 33.8 16.7 59 34.1 6.9 Nagaland 39.1 54.4 6.5 24.2 71.7 4.1 62.2 33.8 4.1 Sikkim 45.3 48.2 6.5 32.7 56.5 10.8 40.4 57.2 2.4 Tripura 38.8 48.3 12.9 31.3 53 15.7 40.7 46 13.3 India 42.4 39.5 18.1 42.2 40 17.8 45.4 39.5 15 Source: NSS Report No. 409, Employment and Unemployment in India, 1993-94 NSS Report No. 458, Employment and Unemployment in India, 1999-2000 NSS Report No. 515, Employment and Unemployment in India, 2004-05
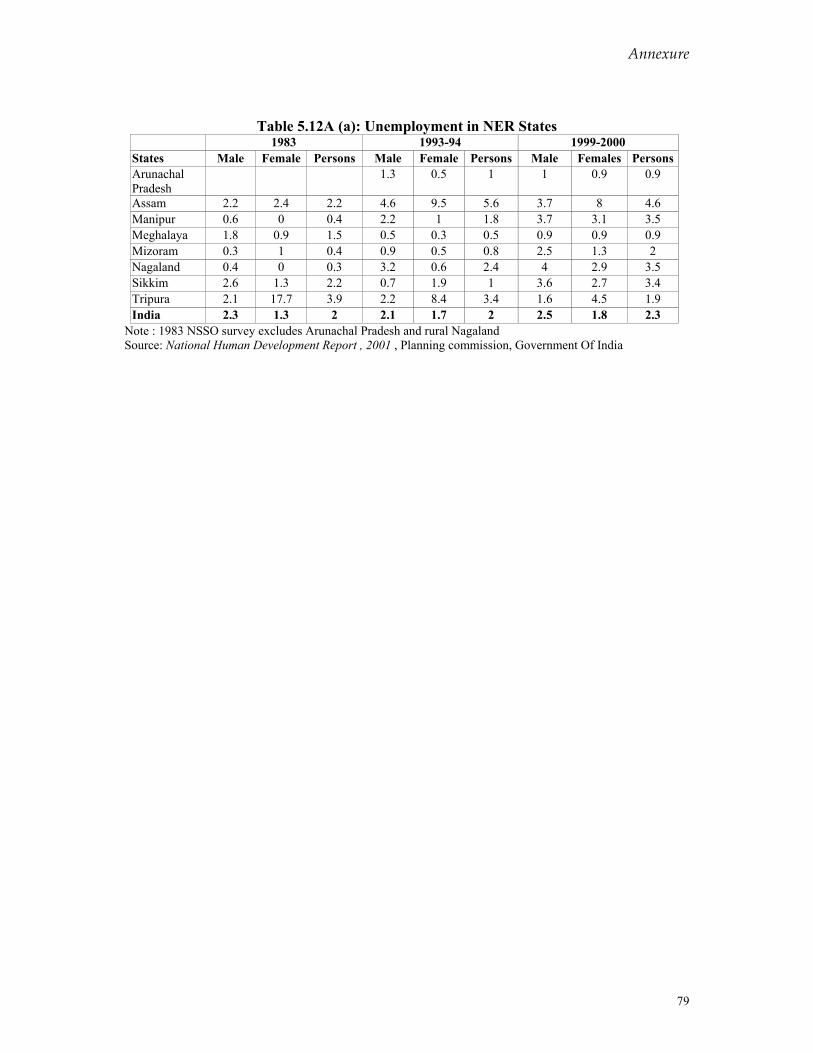
Annexure
79
Table 5.12A (a): Unemployment in NER States 1983 1993-94 1999-2000
States Male Female Persons Male Female Persons Male Females PersonsArunachal Pradesh
1.3 0.5 1 1 0.9 0.9
Assam 2.2 2.4 2.2 4.6 9.5 5.6 3.7 8 4.6 Manipur 0.6 0 0.4 2.2 1 1.8 3.7 3.1 3.5 Meghalaya 1.8 0.9 1.5 0.5 0.3 0.5 0.9 0.9 0.9 Mizoram 0.3 1 0.4 0.9 0.5 0.8 2.5 1.3 2 Nagaland 0.4 0 0.3 3.2 0.6 2.4 4 2.9 3.5 Sikkim 2.6 1.3 2.2 0.7 1.9 1 3.6 2.7 3.4 Tripura 2.1 17.7 3.9 2.2 8.4 3.4 1.6 4.5 1.9 India 2.3 1.3 2 2.1 1.7 2 2.5 1.8 2.3
Note : 1983 NSSO survey excludes Arunachal Pradesh and rural Nagaland Source: National Human Development Report , 2001 , Planning commission, Government Of India
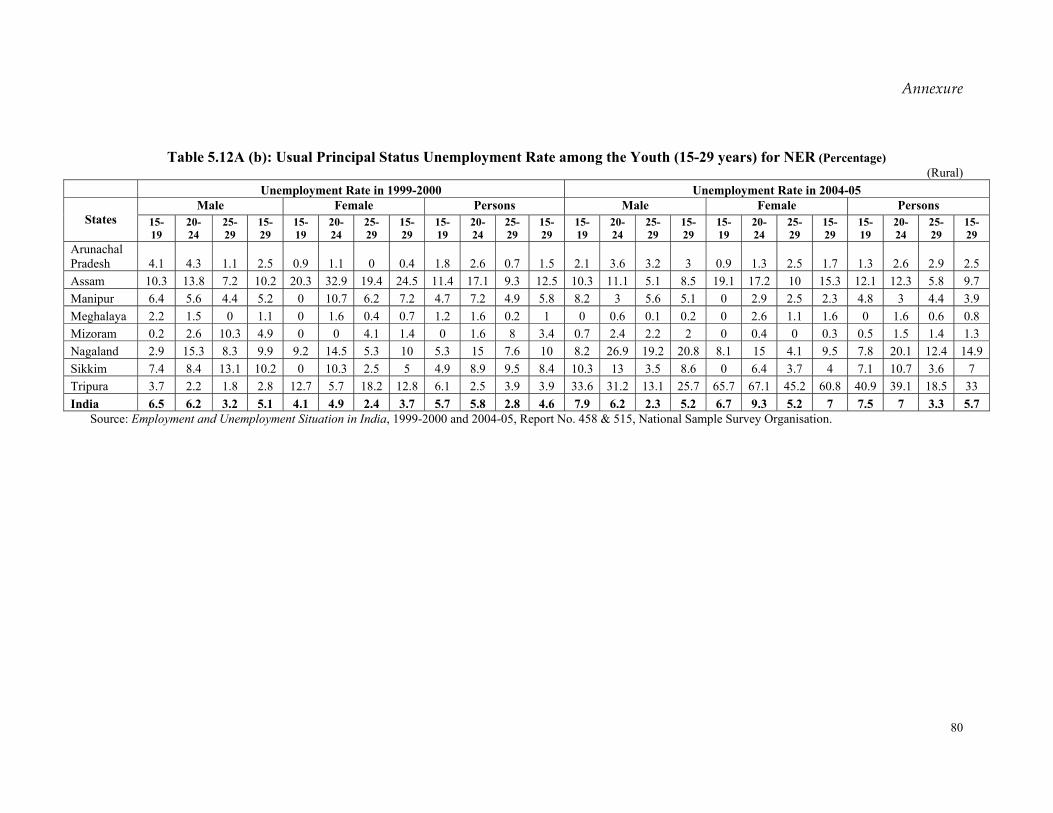
Annexure
80
Table 5.12A (b): Usual Principal Status Unemployment Rate among the Youth (15-29 years) for NER (Percentage)
(Rural) Unemployment Rate in 1999-2000 Unemployment Rate in 2004-05
Male Female Persons Male Female Persons States 15-
19 20-24
25-29
15-29
15-19
20-24
25-29
15-29
15-19
20-24
25-29
15-29
15-19
20-24
25-29
15-29
15-19
20-24
25-29
15-29
15-19
20-24
25-29
15-29
Arunachal Pradesh 4.1 4.3 1.1 2.5 0.9 1.1 0 0.4 1.8 2.6 0.7 1.5 2.1 3.6 3.2 3 0.9 1.3 2.5 1.7 1.3 2.6 2.9 2.5 Assam 10.3 13.8 7.2 10.2 20.3 32.9 19.4 24.5 11.4 17.1 9.3 12.5 10.3 11.1 5.1 8.5 19.1 17.2 10 15.3 12.1 12.3 5.8 9.7 Manipur 6.4 5.6 4.4 5.2 0 10.7 6.2 7.2 4.7 7.2 4.9 5.8 8.2 3 5.6 5.1 0 2.9 2.5 2.3 4.8 3 4.4 3.9 Meghalaya 2.2 1.5 0 1.1 0 1.6 0.4 0.7 1.2 1.6 0.2 1 0 0.6 0.1 0.2 0 2.6 1.1 1.6 0 1.6 0.6 0.8 Mizoram 0.2 2.6 10.3 4.9 0 0 4.1 1.4 0 1.6 8 3.4 0.7 2.4 2.2 2 0 0.4 0 0.3 0.5 1.5 1.4 1.3 Nagaland 2.9 15.3 8.3 9.9 9.2 14.5 5.3 10 5.3 15 7.6 10 8.2 26.9 19.2 20.8 8.1 15 4.1 9.5 7.8 20.1 12.4 14.9 Sikkim 7.4 8.4 13.1 10.2 0 10.3 2.5 5 4.9 8.9 9.5 8.4 10.3 13 3.5 8.6 0 6.4 3.7 4 7.1 10.7 3.6 7 Tripura 3.7 2.2 1.8 2.8 12.7 5.7 18.2 12.8 6.1 2.5 3.9 3.9 33.6 31.2 13.1 25.7 65.7 67.1 45.2 60.8 40.9 39.1 18.5 33 India 6.5 6.2 3.2 5.1 4.1 4.9 2.4 3.7 5.7 5.8 2.8 4.6 7.9 6.2 2.3 5.2 6.7 9.3 5.2 7 7.5 7 3.3 5.7
Source: Employment and Unemployment Situation in India, 1999-2000 and 2004-05, Report No. 458 & 515, National Sample Survey Organisation.
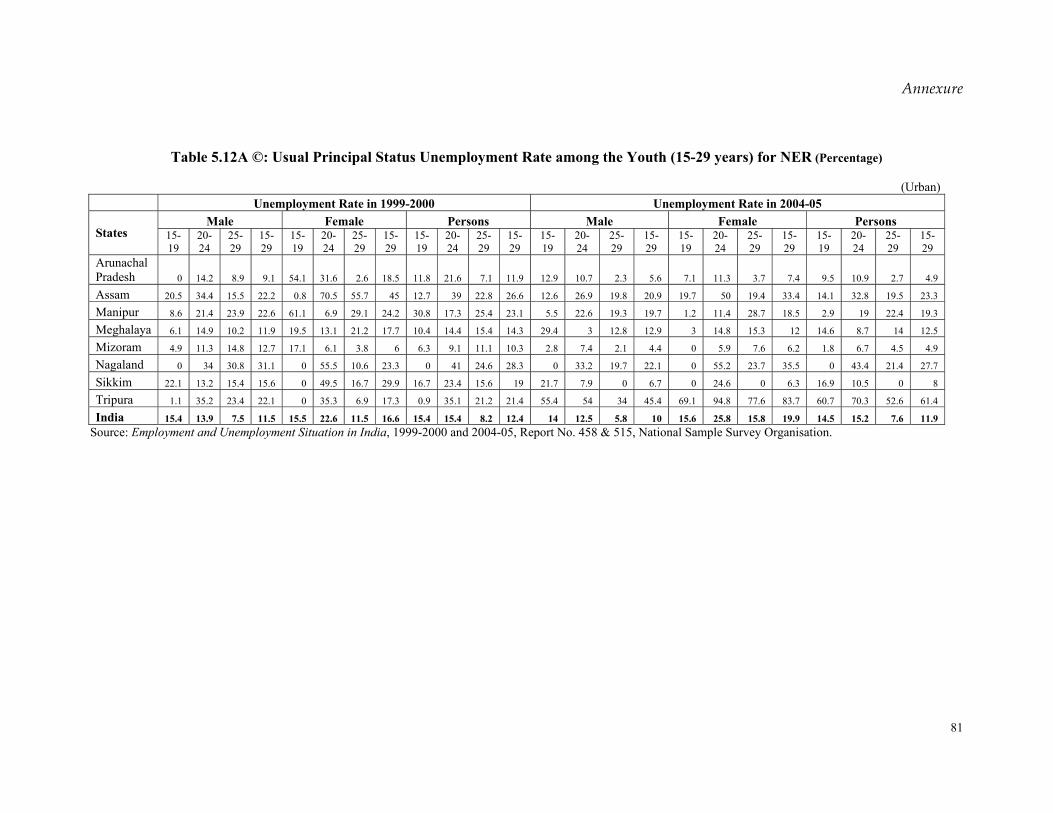
Annexure
81
Table 5.12A ©: Usual Principal Status Unemployment Rate among the Youth (15-29 years) for NER (Percentage)
(Urban)
Unemployment Rate in 1999-2000 Unemployment Rate in 2004-05 Male Female Persons Male Female Persons
States 15-19
20-24
25-29
15-29
15-19
20-24
25-29
15-29
15-19
20-24
25-29
15-29
15-19
20-24
25-29
15-29
15-19
20-24
25-29
15-29
15-19
20-24
25-29
15-29
Arunachal Pradesh 0 14.2 8.9 9.1 54.1 31.6 2.6 18.5 11.8 21.6 7.1 11.9 12.9 10.7 2.3 5.6 7.1 11.3 3.7 7.4 9.5 10.9 2.7 4.9
Assam 20.5 34.4 15.5 22.2 0.8 70.5 55.7 45 12.7 39 22.8 26.6 12.6 26.9 19.8 20.9 19.7 50 19.4 33.4 14.1 32.8 19.5 23.3
Manipur 8.6 21.4 23.9 22.6 61.1 6.9 29.1 24.2 30.8 17.3 25.4 23.1 5.5 22.6 19.3 19.7 1.2 11.4 28.7 18.5 2.9 19 22.4 19.3
Meghalaya 6.1 14.9 10.2 11.9 19.5 13.1 21.2 17.7 10.4 14.4 15.4 14.3 29.4 3 12.8 12.9 3 14.8 15.3 12 14.6 8.7 14 12.5
Mizoram 4.9 11.3 14.8 12.7 17.1 6.1 3.8 6 6.3 9.1 11.1 10.3 2.8 7.4 2.1 4.4 0 5.9 7.6 6.2 1.8 6.7 4.5 4.9
Nagaland 0 34 30.8 31.1 0 55.5 10.6 23.3 0 41 24.6 28.3 0 33.2 19.7 22.1 0 55.2 23.7 35.5 0 43.4 21.4 27.7
Sikkim 22.1 13.2 15.4 15.6 0 49.5 16.7 29.9 16.7 23.4 15.6 19 21.7 7.9 0 6.7 0 24.6 0 6.3 16.9 10.5 0 8
Tripura 1.1 35.2 23.4 22.1 0 35.3 6.9 17.3 0.9 35.1 21.2 21.4 55.4 54 34 45.4 69.1 94.8 77.6 83.7 60.7 70.3 52.6 61.4
India 15.4 13.9 7.5 11.5 15.5 22.6 11.5 16.6 15.4 15.4 8.2 12.4 14 12.5 5.8 10 15.6 25.8 15.8 19.9 14.5 15.2 7.6 11.9 Source: Employment and Unemployment Situation in India, 1999-2000 and 2004-05, Report No. 458 & 515, National Sample Survey Organisation.
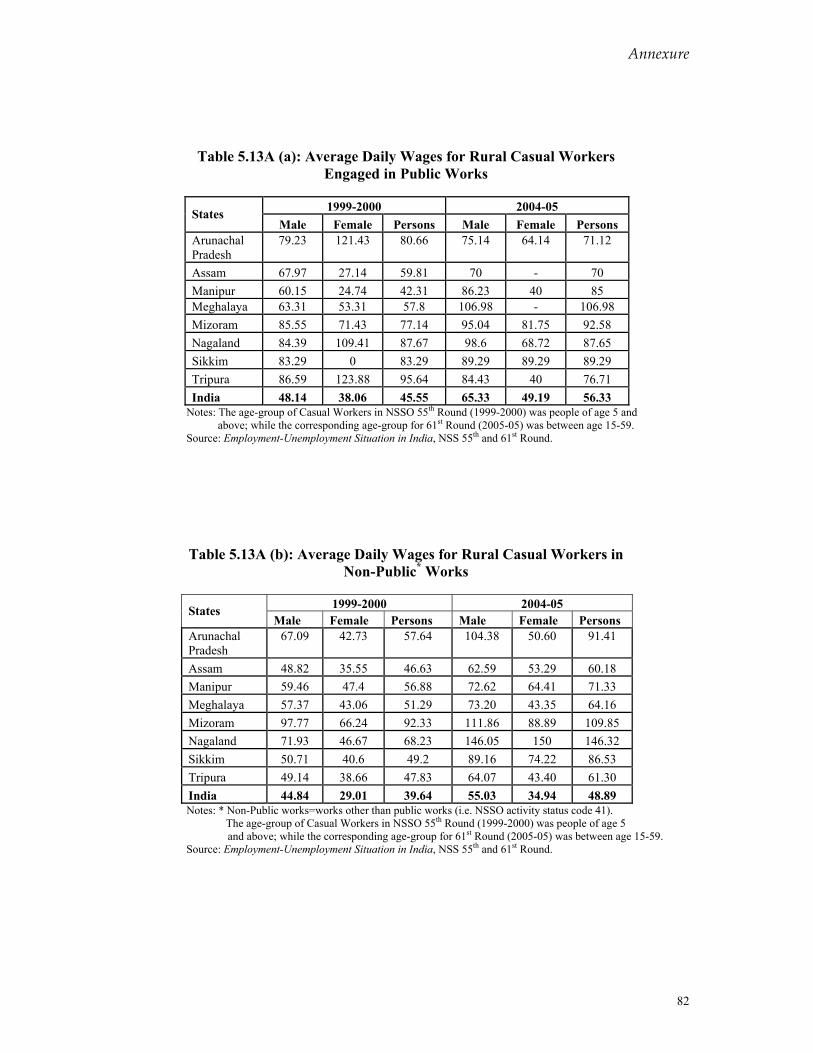
Annexure
82
Table 5.13A (a): Average Daily Wages for Rural Casual Workers Engaged in Public Works
1999-2000 2004-05 States
Male Female Persons Male Female Persons Arunachal Pradesh
79.23 121.43 80.66 75.14 64.14 71.12
Assam 67.97 27.14 59.81 70 - 70 Manipur 60.15 24.74 42.31 86.23 40 85 Meghalaya 63.31 53.31 57.8 106.98 - 106.98 Mizoram 85.55 71.43 77.14 95.04 81.75 92.58 Nagaland 84.39 109.41 87.67 98.6 68.72 87.65 Sikkim 83.29 0 83.29 89.29 89.29 89.29 Tripura 86.59 123.88 95.64 84.43 40 76.71 India 48.14 38.06 45.55 65.33 49.19 56.33
Notes: The age-group of Casual Workers in NSSO 55th Round (1999-2000) was people of age 5 and above; while the corresponding age-group for 61st Round (2005-05) was between age 15-59.
Source: Employment-Unemployment Situation in India, NSS 55th and 61st Round.
Table 5.13A (b): Average Daily Wages for Rural Casual Workers in Non-Public* Works
1999-2000 2004-05 States
Male Female Persons Male Female Persons Arunachal Pradesh
67.09 42.73 57.64 104.38 50.60 91.41
Assam 48.82 35.55 46.63 62.59 53.29 60.18 Manipur 59.46 47.4 56.88 72.62 64.41 71.33 Meghalaya 57.37 43.06 51.29 73.20 43.35 64.16 Mizoram 97.77 66.24 92.33 111.86 88.89 109.85 Nagaland 71.93 46.67 68.23 146.05 150 146.32 Sikkim 50.71 40.6 49.2 89.16 74.22 86.53 Tripura 49.14 38.66 47.83 64.07 43.40 61.30 India 44.84 29.01 39.64 55.03 34.94 48.89 Notes: * Non-Public works=works other than public works (i.e. NSSO activity status code 41).
The age-group of Casual Workers in NSSO 55th Round (1999-2000) was people of age 5 and above; while the corresponding age-group for 61st Round (2005-05) was between age 15-59.
Source: Employment-Unemployment Situation in India, NSS 55th and 61st Round.
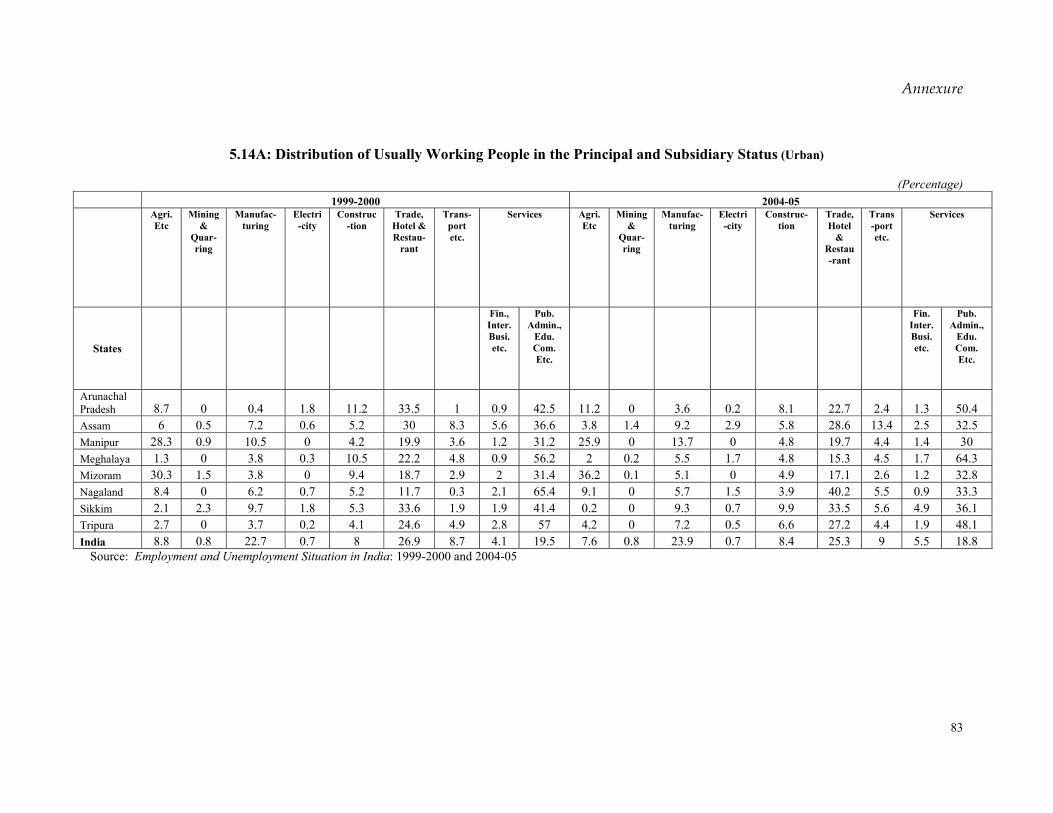
Annexure
83
5.14A: Distribution of Usually Working People in the Principal and Subsidiary Status (Urban)
(Percentage)
1999-2000 2004-05
Agri. Etc
Mining &
Quar-ring
Manufac-turing
Electri-city
Construc-tion
Trade, Hotel & Restau-
rant
Trans-port etc.
Services Agri. Etc
Mining &
Quar-ring
Manufac-turing
Electri-city
Construc-tion
Trade, Hotel
& Restau-rant
Trans-port etc.
Services
States
Fin., Inter. Busi. etc.
Pub. Admin.,
Edu. Com. Etc.
Fin. Inter. Busi. etc.
Pub. Admin.,
Edu. Com. Etc.
Arunachal Pradesh 8.7 0 0.4 1.8 11.2 33.5 1 0.9 42.5 11.2 0 3.6 0.2 8.1 22.7 2.4 1.3 50.4 Assam 6 0.5 7.2 0.6 5.2 30 8.3 5.6 36.6 3.8 1.4 9.2 2.9 5.8 28.6 13.4 2.5 32.5 Manipur 28.3 0.9 10.5 0 4.2 19.9 3.6 1.2 31.2 25.9 0 13.7 0 4.8 19.7 4.4 1.4 30 Meghalaya 1.3 0 3.8 0.3 10.5 22.2 4.8 0.9 56.2 2 0.2 5.5 1.7 4.8 15.3 4.5 1.7 64.3 Mizoram 30.3 1.5 3.8 0 9.4 18.7 2.9 2 31.4 36.2 0.1 5.1 0 4.9 17.1 2.6 1.2 32.8 Nagaland 8.4 0 6.2 0.7 5.2 11.7 0.3 2.1 65.4 9.1 0 5.7 1.5 3.9 40.2 5.5 0.9 33.3 Sikkim 2.1 2.3 9.7 1.8 5.3 33.6 1.9 1.9 41.4 0.2 0 9.3 0.7 9.9 33.5 5.6 4.9 36.1 Tripura 2.7 0 3.7 0.2 4.1 24.6 4.9 2.8 57 4.2 0 7.2 0.5 6.6 27.2 4.4 1.9 48.1 India 8.8 0.8 22.7 0.7 8 26.9 8.7 4.1 19.5 7.6 0.8 23.9 0.7 8.4 25.3 9 5.5 18.8
Source: Employment and Unemployment Situation in India: 1999-2000 and 2004-05
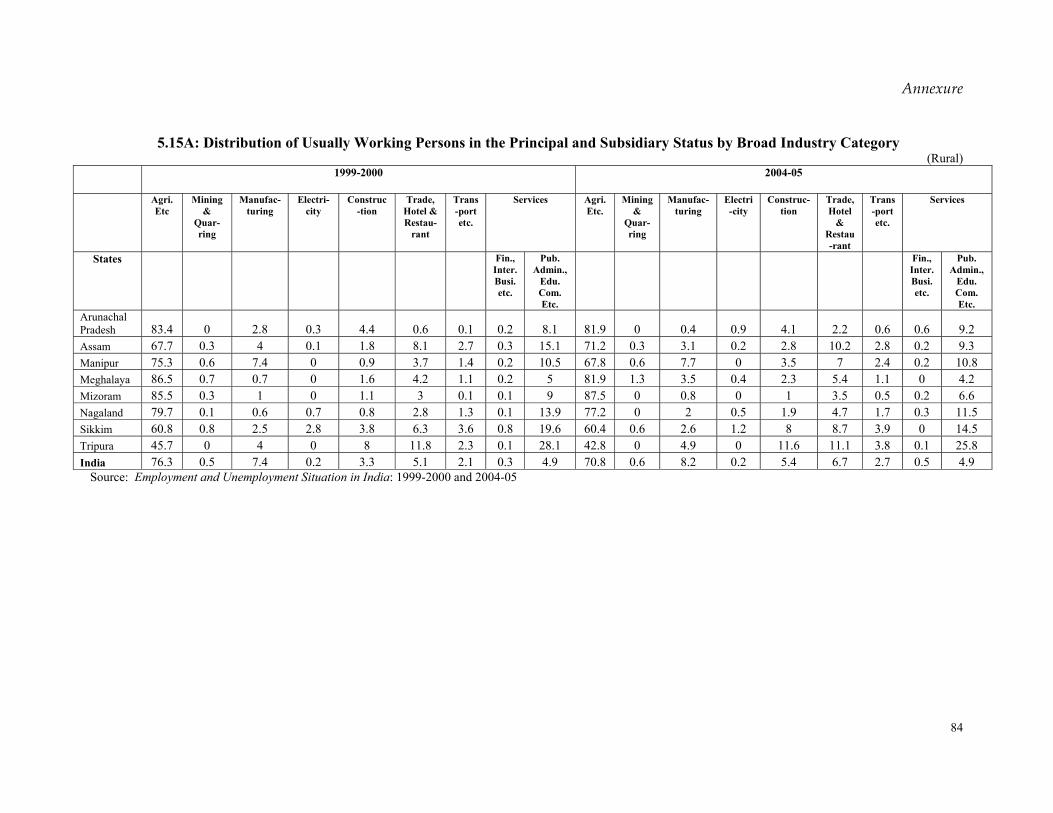
Annexure
84
5.15A: Distribution of Usually Working Persons in the Principal and Subsidiary Status by Broad Industry Category (Rural)
1999-2000 2004-05
Agri. Etc
Mining &
Quar-ring
Manufac-turing
Electri-city
Construc-tion
Trade, Hotel & Restau-
rant
Trans-port etc.
Services Agri.Etc.
Mining &
Quar-ring
Manufac-turing
Electri-city
Construc-tion
Trade, Hotel
& Restau-rant
Trans-port etc.
Services
States Fin., Inter. Busi. etc.
Pub. Admin.,
Edu. Com. Etc.
Fin., Inter. Busi. etc.
Pub. Admin.,
Edu. Com. Etc.
Arunachal Pradesh 83.4 0 2.8 0.3 4.4 0.6 0.1 0.2 8.1 81.9 0 0.4 0.9 4.1 2.2 0.6 0.6 9.2 Assam 67.7 0.3 4 0.1 1.8 8.1 2.7 0.3 15.1 71.2 0.3 3.1 0.2 2.8 10.2 2.8 0.2 9.3 Manipur 75.3 0.6 7.4 0 0.9 3.7 1.4 0.2 10.5 67.8 0.6 7.7 0 3.5 7 2.4 0.2 10.8 Meghalaya 86.5 0.7 0.7 0 1.6 4.2 1.1 0.2 5 81.9 1.3 3.5 0.4 2.3 5.4 1.1 0 4.2 Mizoram 85.5 0.3 1 0 1.1 3 0.1 0.1 9 87.5 0 0.8 0 1 3.5 0.5 0.2 6.6 Nagaland 79.7 0.1 0.6 0.7 0.8 2.8 1.3 0.1 13.9 77.2 0 2 0.5 1.9 4.7 1.7 0.3 11.5 Sikkim 60.8 0.8 2.5 2.8 3.8 6.3 3.6 0.8 19.6 60.4 0.6 2.6 1.2 8 8.7 3.9 0 14.5 Tripura 45.7 0 4 0 8 11.8 2.3 0.1 28.1 42.8 0 4.9 0 11.6 11.1 3.8 0.1 25.8 India 76.3 0.5 7.4 0.2 3.3 5.1 2.1 0.3 4.9 70.8 0.6 8.2 0.2 5.4 6.7 2.7 0.5 4.9
Source: Employment and Unemployment Situation in India: 1999-2000 and 2004-05
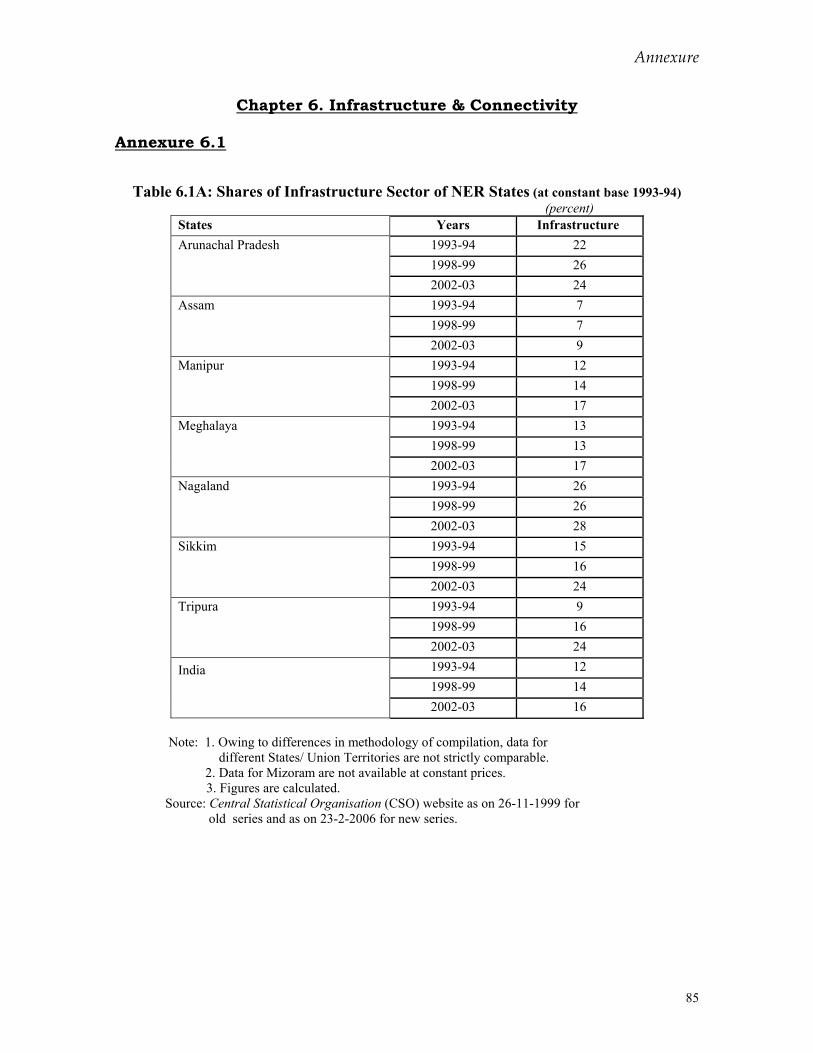
Annexure
85
Chapter 6. Infrastructure & Connectivity Annexure 6.1
Table 6.1A: Shares of Infrastructure Sector of NER States (at constant base 1993-94) (percent)
States Years Infrastructure Arunachal Pradesh 1993-94 22
1998-99 26
2002-03 24 Assam 1993-94 7
1998-99 7
2002-03 9 Manipur 1993-94 12
1998-99 14
2002-03 17 Meghalaya 1993-94 13
1998-99 13
2002-03 17 Nagaland 1993-94 26
1998-99 26
2002-03 28 Sikkim 1993-94 15
1998-99 16
2002-03 24 Tripura 1993-94 9
1998-99 16
2002-03 24
India 1993-94 12
1998-99 14
2002-03 16 Note: 1. Owing to differences in methodology of compilation, data for different States/ Union Territories are not strictly comparable. 2. Data for Mizoram are not available at constant prices.
3. Figures are calculated. Source: Central Statistical Organisation (CSO) website as on 26-11-1999 for old series and as on 23-2-2006 for new series.
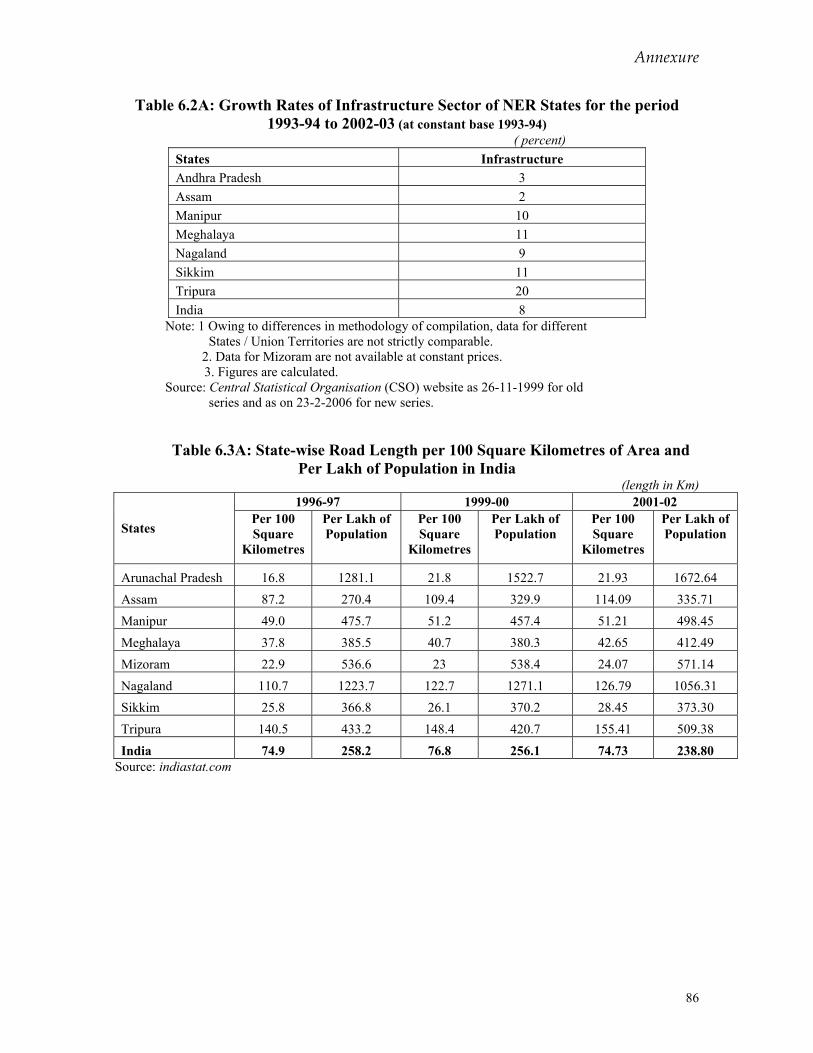
Annexure
86
Table 6.2A: Growth Rates of Infrastructure Sector of NER States for the period 1993-94 to 2002-03 (at constant base 1993-94)
( percent) States Infrastructure Andhra Pradesh 3 Assam 2 Manipur 10 Meghalaya 11 Nagaland 9 Sikkim 11 Tripura 20 India 8
Note: 1 Owing to differences in methodology of compilation, data for different States / Union Territories are not strictly comparable. 2. Data for Mizoram are not available at constant prices.
3. Figures are calculated. Source: Central Statistical Organisation (CSO) website as 26-11-1999 for old series and as on 23-2-2006 for new series.
Table 6.3A: State-wise Road Length per 100 Square Kilometres of Area and
Per Lakh of Population in India (length in Km)
1996-97 1999-00 2001-02
States Per 100 Square
Kilometres
Per Lakh of Population
Per 100 Square
Kilometres
Per Lakh of Population
Per 100 Square
Kilometres
Per Lakh of Population
Arunachal Pradesh 16.8 1281.1 21.8 1522.7 21.93 1672.64 Assam 87.2 270.4 109.4 329.9 114.09 335.71 Manipur 49.0 475.7 51.2 457.4 51.21 498.45 Meghalaya 37.8 385.5 40.7 380.3 42.65 412.49 Mizoram 22.9 536.6 23 538.4 24.07 571.14 Nagaland 110.7 1223.7 122.7 1271.1 126.79 1056.31 Sikkim 25.8 366.8 26.1 370.2 28.45 373.30 Tripura 140.5 433.2 148.4 420.7 155.41 509.38 India 74.9 258.2 76.8 256.1 74.73 238.80
Source: indiastat.com
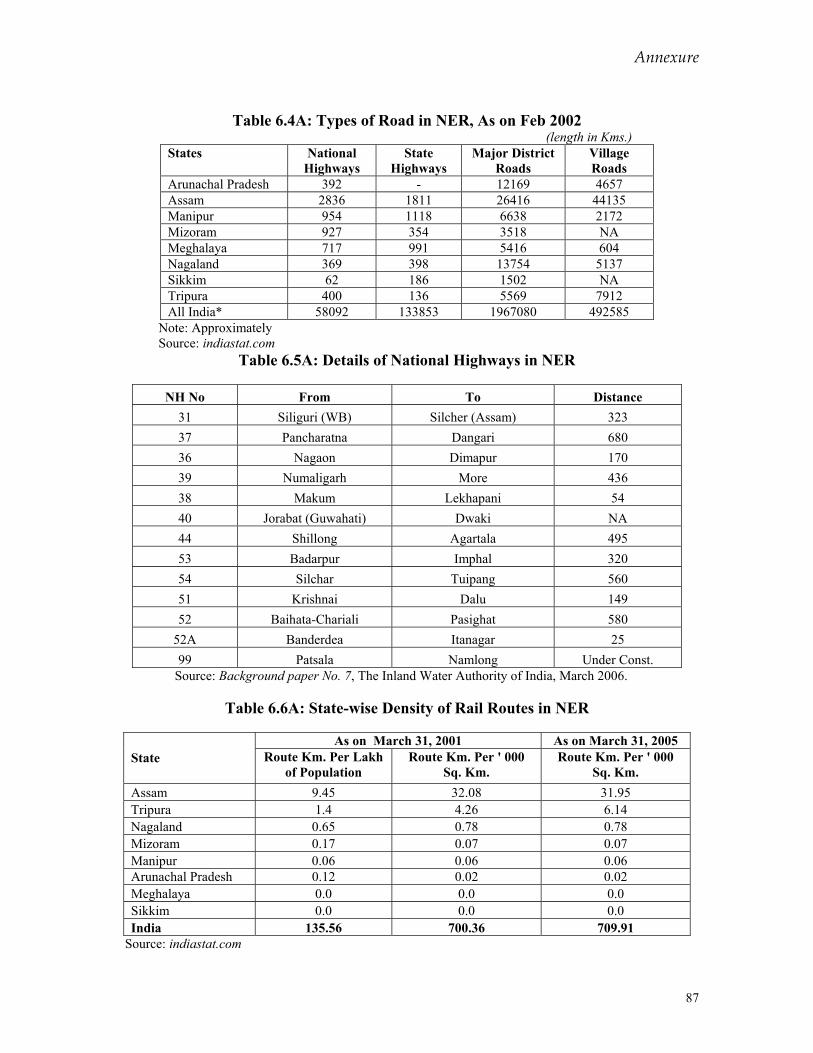
Annexure
87
Table 6.4A: Types of Road in NER, As on Feb 2002
(length in Kms.) States National
Highways State
Highways Major District
Roads Village Roads
Arunachal Pradesh 392 - 12169 4657 Assam 2836 1811 26416 44135 Manipur 954 1118 6638 2172 Mizoram 927 354 3518 NA Meghalaya 717 991 5416 604 Nagaland 369 398 13754 5137 Sikkim 62 186 1502 NA Tripura 400 136 5569 7912 All India* 58092 133853 1967080 492585
Note: Approximately Source: indiastat.com
Table 6.5A: Details of National Highways in NER
NH No From To Distance 31 Siliguri (WB) Silcher (Assam) 323 37 Pancharatna Dangari 680 36 Nagaon Dimapur 170 39 Numaligarh More 436 38 Makum Lekhapani 54 40 Jorabat (Guwahati) Dwaki NA 44 Shillong Agartala 495 53 Badarpur Imphal 320 54 Silchar Tuipang 560 51 Krishnai Dalu 149 52 Baihata-Chariali Pasighat 580
52A Banderdea Itanagar 25 99 Patsala Namlong Under Const.
Source: Background paper No. 7, The Inland Water Authority of India, March 2006.
Table 6.6A: State-wise Density of Rail Routes in NER
As on March 31, 2001 As on March 31, 2005 State Route Km. Per Lakh
of Population Route Km. Per ' 000
Sq. Km. Route Km. Per ' 000
Sq. Km. Assam 9.45 32.08 31.95 Tripura 1.4 4.26 6.14 Nagaland 0.65 0.78 0.78 Mizoram 0.17 0.07 0.07 Manipur 0.06 0.06 0.06 Arunachal Pradesh 0.12 0.02 0.02 Meghalaya 0.0 0.0 0.0 Sikkim 0.0 0.0 0.0 India 135.56 700.36 709.91
Source: indiastat.com
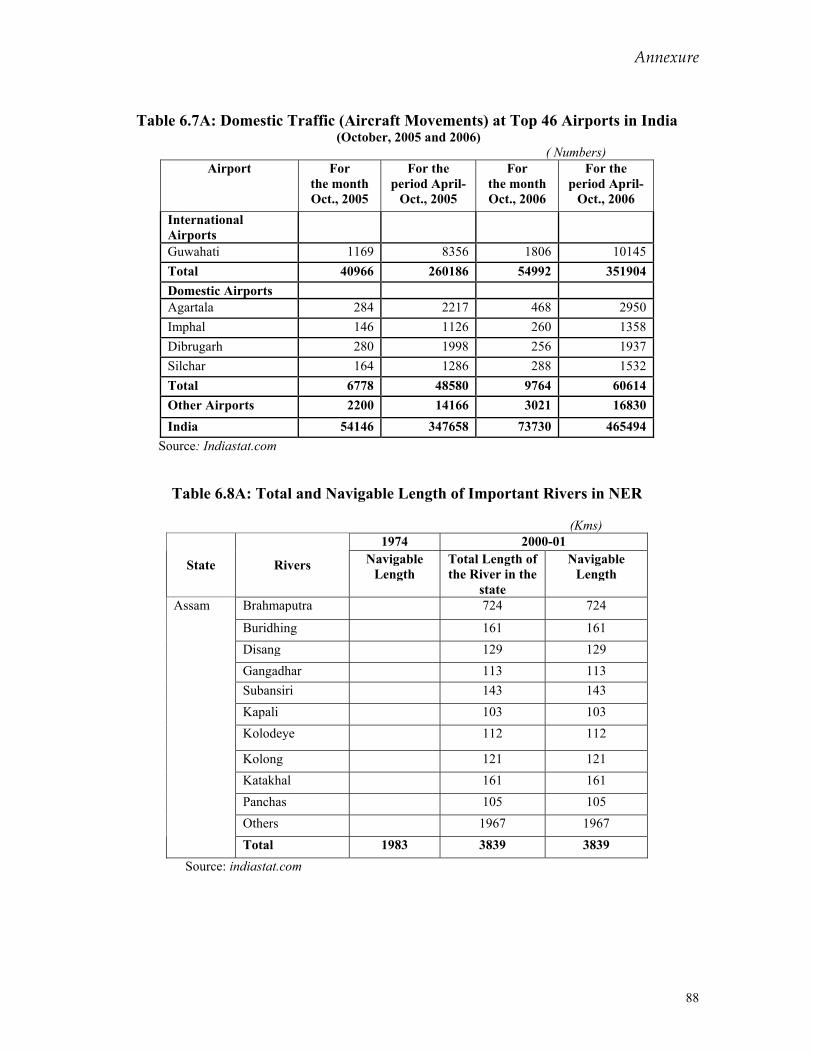
Annexure
88
Table 6.7A: Domestic Traffic (Aircraft Movements) at Top 46 Airports in India
(October, 2005 and 2006) ( Numbers)
Airport For the month Oct., 2005
For the period April-
Oct., 2005
For the month Oct., 2006
For the period April-
Oct., 2006 International Airports
Guwahati 1169 8356 1806 10145 Total 40966 260186 54992 351904 Domestic Airports Agartala 284 2217 468 2950 Imphal 146 1126 260 1358 Dibrugarh 280 1998 256 1937 Silchar 164 1286 288 1532 Total 6778 48580 9764 60614 Other Airports 2200 14166 3021 16830 India 54146 347658 73730 465494
Source: Indiastat.com
Table 6.8A: Total and Navigable Length of Important Rivers in NER
(Kms)
1974 2000-01
State Rivers Navigable Length
Total Length of the River in the
state
Navigable Length
Brahmaputra 724 724
Buridhing 161 161 Disang 129 129 Gangadhar 113 113 Subansiri 143 143 Kapali 103 103 Kolodeye
112 112
Kolong 121 121 Katakhal 161 161 Panchas 105 105 Others 1967 1967
Assam
Total 1983 3839 3839 Source: indiastat.com
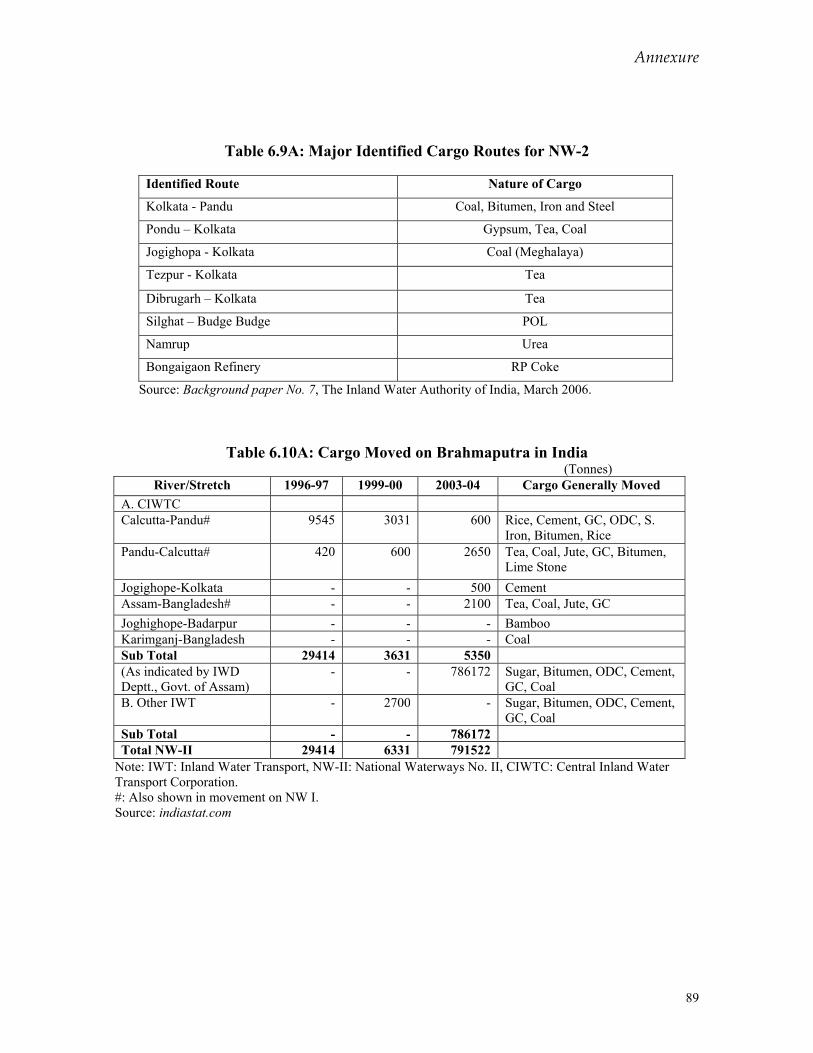
Annexure
89
Table 6.9A: Major Identified Cargo Routes for NW-2
Identified Route Nature of Cargo
Kolkata - Pandu Coal, Bitumen, Iron and Steel
Pondu – Kolkata Gypsum, Tea, Coal
Jogighopa - Kolkata Coal (Meghalaya)
Tezpur - Kolkata Tea
Dibrugarh – Kolkata Tea
Silghat – Budge Budge POL
Namrup Urea
Bongaigaon Refinery RP Coke
Source: Background paper No. 7, The Inland Water Authority of India, March 2006.
Table 6.10A: Cargo Moved on Brahmaputra in India (Tonnes)
River/Stretch 1996-97 1999-00 2003-04 Cargo Generally Moved A. CIWTC Calcutta-Pandu# 9545 3031 600 Rice, Cement, GC, ODC, S.
Iron, Bitumen, Rice Pandu-Calcutta# 420 600 2650 Tea, Coal, Jute, GC, Bitumen,
Lime Stone Jogighope-Kolkata - - 500 Cement Assam-Bangladesh# - - 2100 Tea, Coal, Jute, GC Joghighope-Badarpur - - - Bamboo Karimganj-Bangladesh - - - Coal Sub Total 29414 3631 5350 (As indicated by IWD Deptt., Govt. of Assam)
- - 786172 Sugar, Bitumen, ODC, Cement, GC, Coal
B. Other IWT - 2700 - Sugar, Bitumen, ODC, Cement, GC, Coal
Sub Total - - 786172 Total NW-II 29414 6331 791522
Note: IWT: Inland Water Transport, NW-II: National Waterways No. II, CIWTC: Central Inland Water Transport Corporation. #: Also shown in movement on NW I. Source: indiastat.com
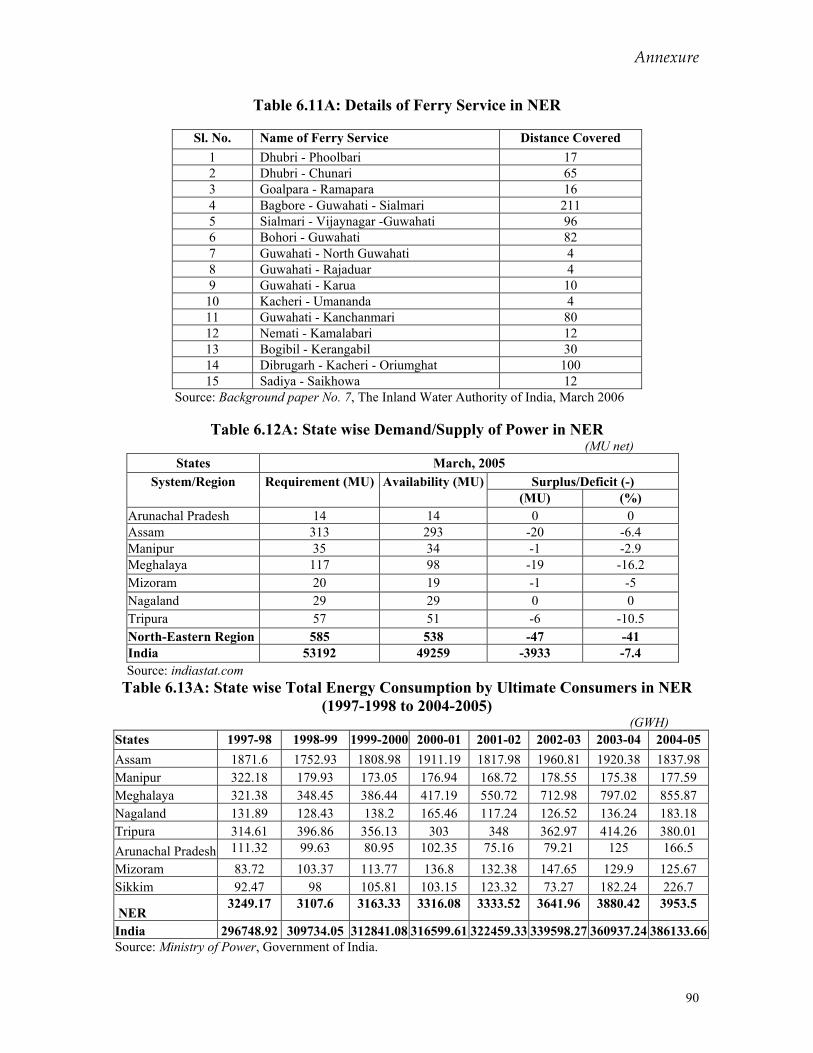
Annexure
90
Table 6.11A: Details of Ferry Service in NER
Sl. No. Name of Ferry Service Distance Covered 1 Dhubri - Phoolbari 17 2 Dhubri - Chunari 65 3 Goalpara - Ramapara 16 4 Bagbore - Guwahati - Sialmari 211 5 Sialmari - Vijaynagar -Guwahati 96 6 Bohori - Guwahati 82 7 Guwahati - North Guwahati 4 8 Guwahati - Rajaduar 4 9 Guwahati - Karua 10
10 Kacheri - Umananda 4 11 Guwahati - Kanchanmari 80 12 Nemati - Kamalabari 12 13 Bogibil - Kerangabil 30 14 Dibrugarh - Kacheri - Oriumghat 100 15 Sadiya - Saikhowa 12
Source: Background paper No. 7, The Inland Water Authority of India, March 2006
Table 6.12A: State wise Demand/Supply of Power in NER (MU net)
States March, 2005 Surplus/Deficit (-) System/Region Requirement (MU) Availability (MU)
(MU) (%) Arunachal Pradesh 14 14 0 0 Assam 313 293 -20 -6.4 Manipur 35 34 -1 -2.9 Meghalaya 117 98 -19 -16.2 Mizoram 20 19 -1 -5 Nagaland 29 29 0 0 Tripura 57 51 -6 -10.5 North-Eastern Region 585 538 -47 -41 India 53192 49259 -3933 -7.4 Source: indiastat.com
Table 6.13A: State wise Total Energy Consumption by Ultimate Consumers in NER (1997-1998 to 2004-2005)
(GWH) States 1997-98 1998-99 1999-2000 2000-01 2001-02 2002-03 2003-04 2004-05 Assam 1871.6 1752.93 1808.98 1911.19 1817.98 1960.81 1920.38 1837.98 Manipur 322.18 179.93 173.05 176.94 168.72 178.55 175.38 177.59 Meghalaya 321.38 348.45 386.44 417.19 550.72 712.98 797.02 855.87 Nagaland 131.89 128.43 138.2 165.46 117.24 126.52 136.24 183.18 Tripura 314.61 396.86 356.13 303 348 362.97 414.26 380.01 Arunachal Pradesh 111.32 99.63 80.95 102.35 75.16 79.21 125 166.5 Mizoram 83.72 103.37 113.77 136.8 132.38 147.65 129.9 125.67 Sikkim 92.47 98 105.81 103.15 123.32 73.27 182.24 226.7
NER 3249.17 3107.6 3163.33 3316.08 3333.52 3641.96 3880.42 3953.5
India 296748.92 309734.05 312841.08 316599.61 322459.33 339598.27 360937.24 386133.66Source: Ministry of Power, Government of India.
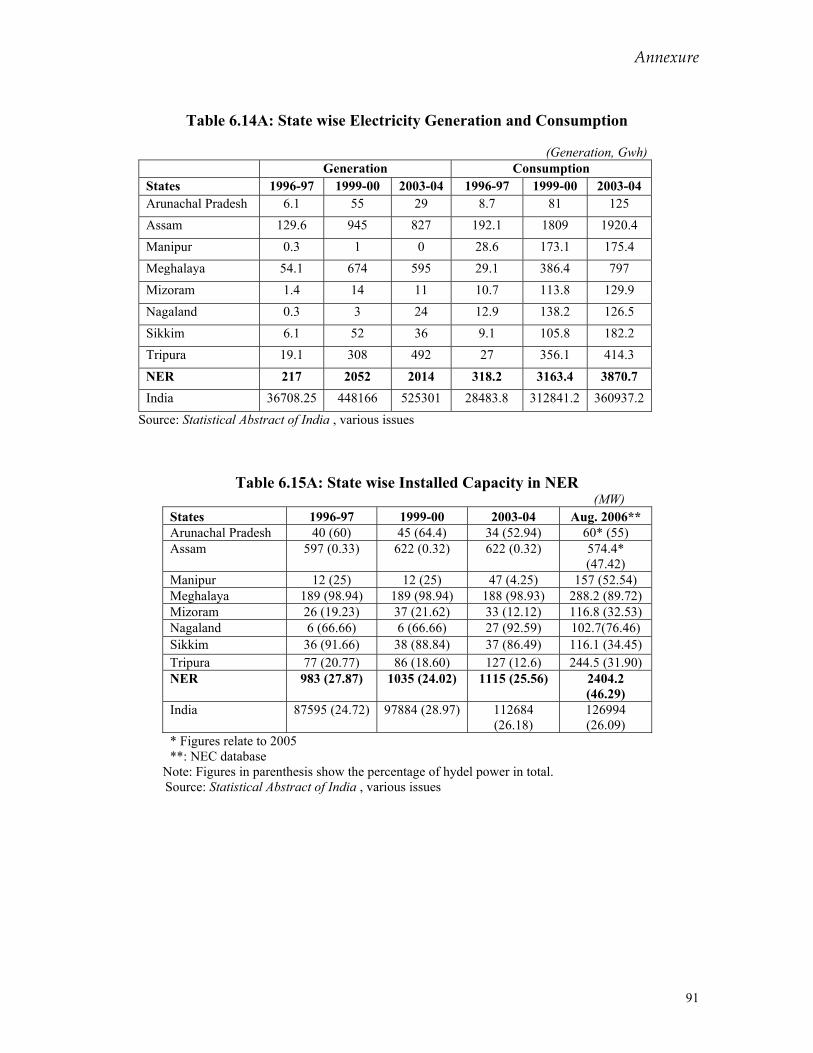
Annexure
91
Table 6.14A: State wise Electricity Generation and Consumption
(Generation, Gwh)
Generation Consumption States 1996-97 1999-00 2003-04 1996-97 1999-00 2003-04 Arunachal Pradesh 6.1 55 29 8.7 81 125 Assam 129.6 945 827 192.1 1809 1920.4 Manipur 0.3 1 0 28.6 173.1 175.4 Meghalaya 54.1 674 595 29.1 386.4 797 Mizoram 1.4 14 11 10.7 113.8 129.9 Nagaland 0.3 3 24 12.9 138.2 126.5 Sikkim 6.1 52 36 9.1 105.8 182.2 Tripura 19.1 308 492 27 356.1 414.3 NER 217 2052 2014 318.2 3163.4 3870.7 India 36708.25 448166 525301 28483.8 312841.2 360937.2
Source: Statistical Abstract of India , various issues
Table 6.15A: State wise Installed Capacity in NER (MW)
States 1996-97 1999-00 2003-04 Aug. 2006** Arunachal Pradesh 40 (60) 45 (64.4) 34 (52.94) 60* (55) Assam 597 (0.33) 622 (0.32) 622 (0.32) 574.4*
(47.42) Manipur 12 (25) 12 (25) 47 (4.25) 157 (52.54) Meghalaya 189 (98.94) 189 (98.94) 188 (98.93) 288.2 (89.72) Mizoram 26 (19.23) 37 (21.62) 33 (12.12) 116.8 (32.53) Nagaland 6 (66.66) 6 (66.66) 27 (92.59) 102.7(76.46) Sikkim 36 (91.66) 38 (88.84) 37 (86.49) 116.1 (34.45) Tripura 77 (20.77) 86 (18.60) 127 (12.6) 244.5 (31.90) NER 983 (27.87) 1035 (24.02) 1115 (25.56) 2404.2
(46.29) India 87595 (24.72) 97884 (28.97) 112684
(26.18) 126994 (26.09)
* Figures relate to 2005 **: NEC database
Note: Figures in parenthesis show the percentage of hydel power in total. Source: Statistical Abstract of India , various issues
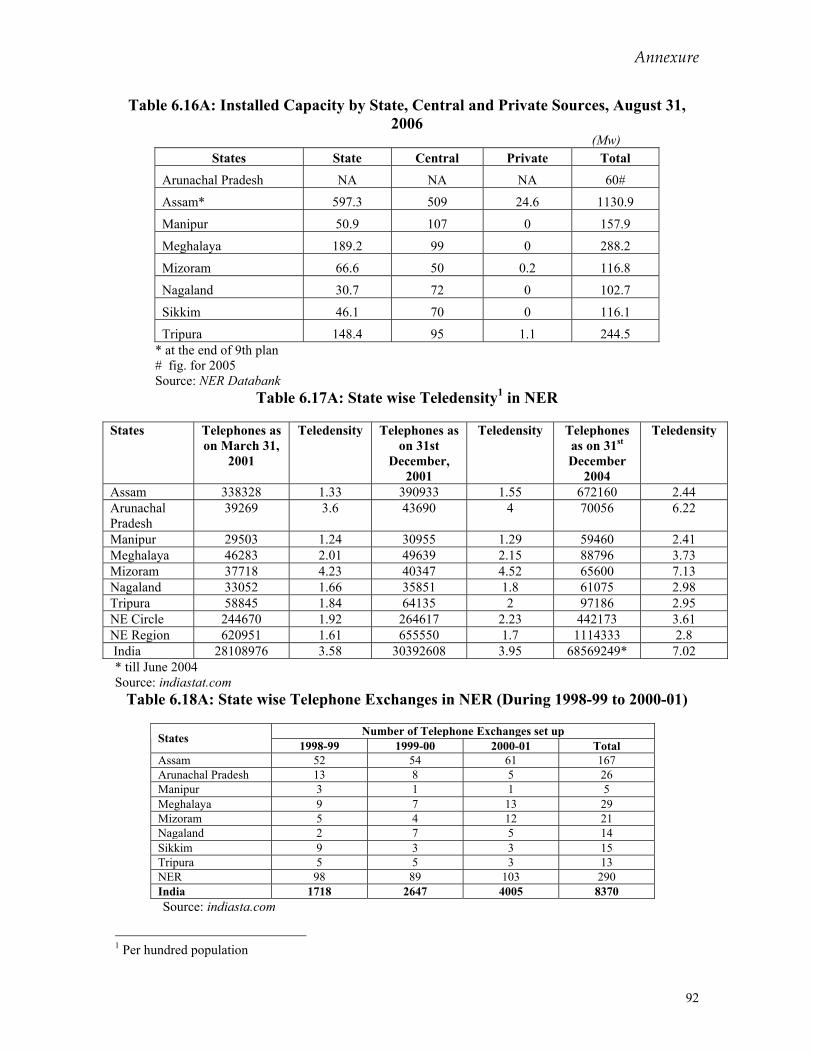
Annexure
92
Table 6.16A: Installed Capacity by State, Central and Private Sources, August 31, 2006
(Mw) States State Central Private Total
Arunachal Pradesh NA NA NA 60#
Assam* 597.3 509 24.6 1130.9
Manipur 50.9 107 0 157.9
Meghalaya 189.2 99 0 288.2
Mizoram 66.6 50 0.2 116.8
Nagaland 30.7 72 0 102.7
Sikkim 46.1 70 0 116.1
Tripura 148.4 95 1.1 244.5 * at the end of 9th plan # fig. for 2005 Source: NER Databank
Table 6.17A: State wise Teledensity1 in NER
States Telephones as on March 31,
2001
Teledensity Telephones as on 31st
December, 2001
Teledensity Telephones as on 31st December
2004
Teledensity
Assam 338328 1.33 390933 1.55 672160 2.44 Arunachal Pradesh
39269 3.6 43690 4 70056 6.22
Manipur 29503 1.24 30955 1.29 59460 2.41 Meghalaya 46283 2.01 49639 2.15 88796 3.73 Mizoram 37718 4.23 40347 4.52 65600 7.13 Nagaland 33052 1.66 35851 1.8 61075 2.98 Tripura 58845 1.84 64135 2 97186 2.95 NE Circle 244670 1.92 264617 2.23 442173 3.61 NE Region 620951 1.61 655550 1.7 1114333 2.8 India 28108976 3.58 30392608 3.95 68569249* 7.02 * till June 2004 Source: indiastat.com
Table 6.18A: State wise Telephone Exchanges in NER (During 1998-99 to 2000-01)
Number of Telephone Exchanges set up States 1998-99 1999-00 2000-01 Total Assam 52 54 61 167 Arunachal Pradesh 13 8 5 26 Manipur 3 1 1 5 Meghalaya 9 7 13 29 Mizoram 5 4 12 21 Nagaland 2 7 5 14 Sikkim 9 3 3 15 Tripura 5 5 3 13 NER 98 89 103 290 India 1718 2647 4005 8370 Source: indiasta.com
1 Per hundred population
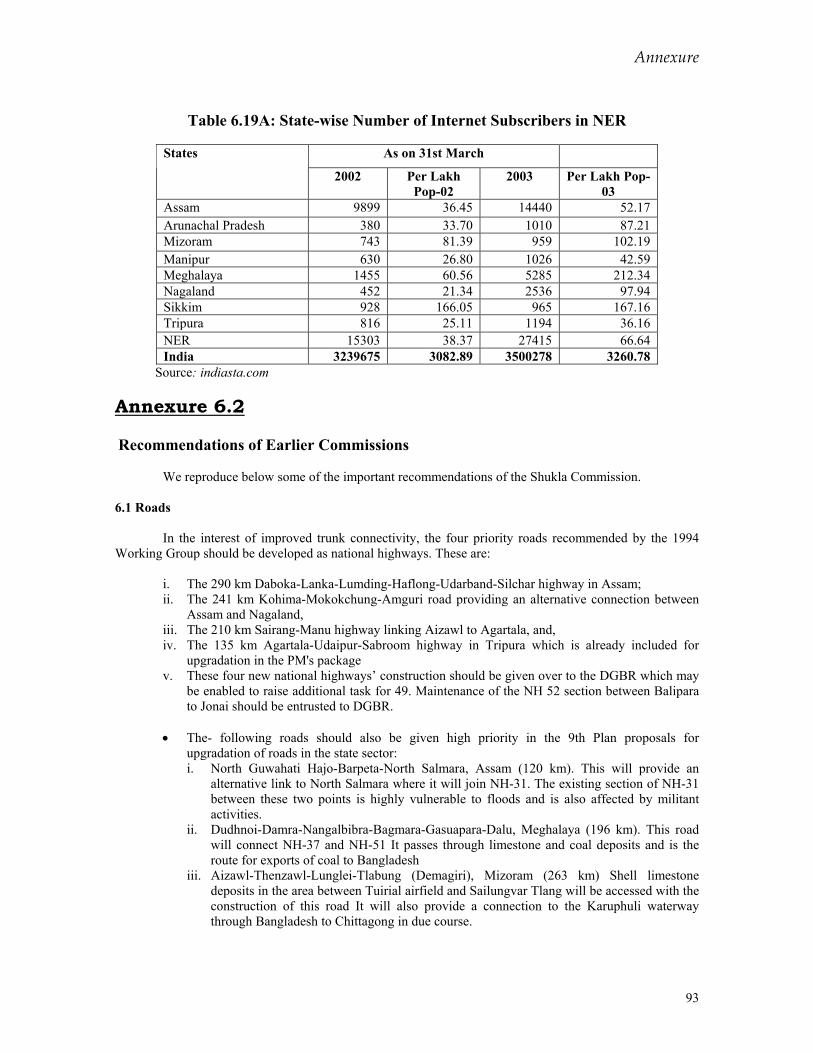
Annexure
93
Table 6.19A: State-wise Number of Internet Subscribers in NER
As on 31st March States
2002 Per Lakh Pop-02
2003 Per Lakh Pop-03
Assam 9899 36.45 14440 52.17 Arunachal Pradesh 380 33.70 1010 87.21 Mizoram 743 81.39 959 102.19 Manipur 630 26.80 1026 42.59 Meghalaya 1455 60.56 5285 212.34 Nagaland 452 21.34 2536 97.94 Sikkim 928 166.05 965 167.16 Tripura 816 25.11 1194 36.16 NER 15303 38.37 27415 66.64 India 3239675 3082.89 3500278 3260.78
Source: indiasta.com Annexure 6.2
Recommendations of Earlier Commissions
We reproduce below some of the important recommendations of the Shukla Commission.
6.1 Roads
In the interest of improved trunk connectivity, the four priority roads recommended by the 1994 Working Group should be developed as national highways. These are:
i. The 290 km Daboka-Lanka-Lumding-Haflong-Udarband-Silchar highway in Assam; ii. The 241 km Kohima-Mokokchung-Amguri road providing an alternative connection between
Assam and Nagaland, iii. The 210 km Sairang-Manu highway linking Aizawl to Agartala, and, iv. The 135 km Agartala-Udaipur-Sabroom highway in Tripura which is already included for
upgradation in the PM's package v. These four new national highways’ construction should be given over to the DGBR which may
be enabled to raise additional task for 49. Maintenance of the NH 52 section between Balipara to Jonai should be entrusted to DGBR.
• The- following roads should also be given high priority in the 9th Plan proposals for
upgradation of roads in the state sector: i. North Guwahati Hajo-Barpeta-North Salmara, Assam (120 km). This will provide an
alternative link to North Salmara where it will join NH-31. The existing section of NH-31 between these two points is highly vulnerable to floods and is also affected by militant activities.
ii. Dudhnoi-Damra-Nangalbibra-Bagmara-Gasuapara-Dalu, Meghalaya (196 km). This road will connect NH-37 and NH-51 It passes through limestone and coal deposits and is the route for exports of coal to Bangladesh
iii. Aizawl-Thenzawl-Lunglei-Tlabung (Demagiri), Mizoram (263 km) Shell limestone deposits in the area between Tuirial airfield and Sailungvar Tlang will be accessed with the construction of this road It will also provide a connection to the Karuphuli waterway through Bangladesh to Chittagong in due course.
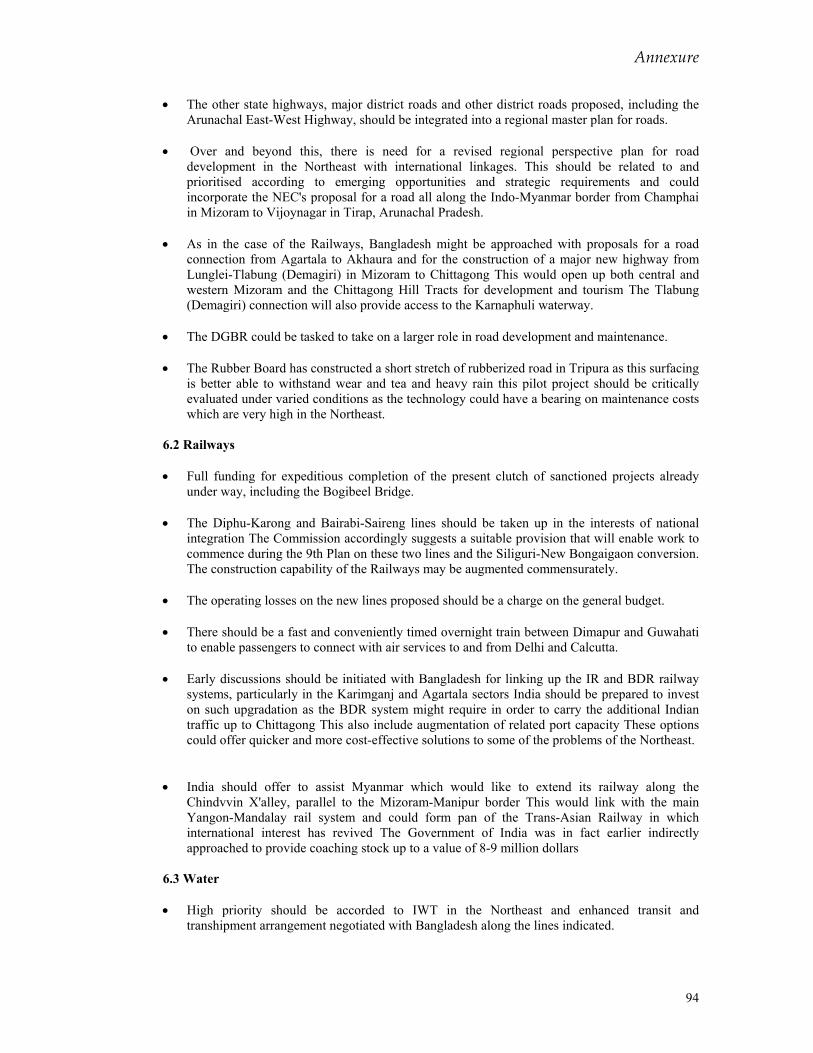
Annexure
94
• The other state highways, major district roads and other district roads proposed, including the Arunachal East-West Highway, should be integrated into a regional master plan for roads.
• Over and beyond this, there is need for a revised regional perspective plan for road
development in the Northeast with international linkages. This should be related to and prioritised according to emerging opportunities and strategic requirements and could incorporate the NEC's proposal for a road all along the Indo-Myanmar border from Champhai in Mizoram to Vijoynagar in Tirap, Arunachal Pradesh.
• As in the case of the Railways, Bangladesh might be approached with proposals for a road
connection from Agartala to Akhaura and for the construction of a major new highway from Lunglei-Tlabung (Demagiri) in Mizoram to Chittagong This would open up both central and western Mizoram and the Chittagong Hill Tracts for development and tourism The Tlabung (Demagiri) connection will also provide access to the Karnaphuli waterway.
• The DGBR could be tasked to take on a larger role in road development and maintenance.
• The Rubber Board has constructed a short stretch of rubberized road in Tripura as this surfacing
is better able to withstand wear and tea and heavy rain this pilot project should be critically evaluated under varied conditions as the technology could have a bearing on maintenance costs which are very high in the Northeast.
6.2 Railways
• Full funding for expeditious completion of the present clutch of sanctioned projects already
under way, including the Bogibeel Bridge. • The Diphu-Karong and Bairabi-Saireng lines should be taken up in the interests of national
integration The Commission accordingly suggests a suitable provision that will enable work to commence during the 9th Plan on these two lines and the Siliguri-New Bongaigaon conversion. The construction capability of the Railways may be augmented commensurately.
• The operating losses on the new lines proposed should be a charge on the general budget. • There should be a fast and conveniently timed overnight train between Dimapur and Guwahati
to enable passengers to connect with air services to and from Delhi and Calcutta. • Early discussions should be initiated with Bangladesh for linking up the IR and BDR railway
systems, particularly in the Karimganj and Agartala sectors India should be prepared to invest on such upgradation as the BDR system might require in order to carry the additional Indian traffic up to Chittagong This also include augmentation of related port capacity These options could offer quicker and more cost-effective solutions to some of the problems of the Northeast.
• India should offer to assist Myanmar which would like to extend its railway along the
Chindvvin X'alley, parallel to the Mizoram-Manipur border This would link with the main Yangon-Mandalay rail system and could form pan of the Trans-Asian Railway in which international interest has revived The Government of India was in fact earlier indirectly approached to provide coaching stock up to a value of 8-9 million dollars
6.3 Water
• High priority should be accorded to IWT in the Northeast and enhanced transit and
transhipment arrangement negotiated with Bangladesh along the lines indicated.
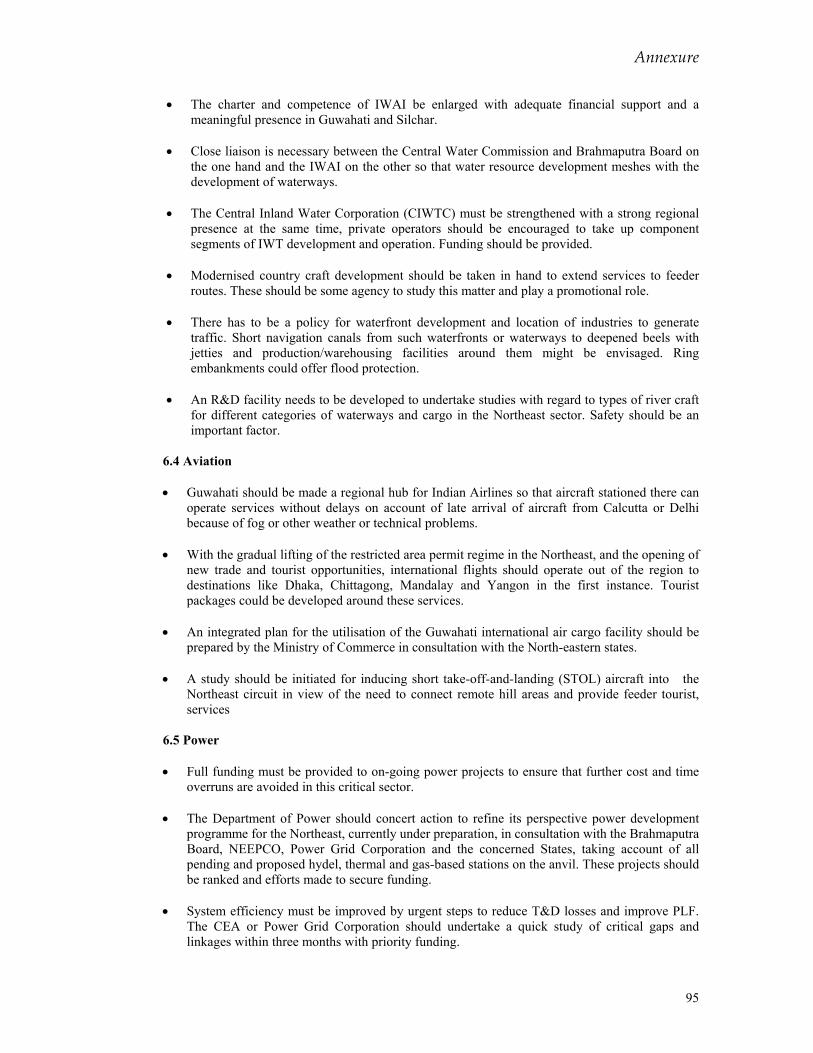
Annexure
95
• The charter and competence of IWAI be enlarged with adequate financial support and a meaningful presence in Guwahati and Silchar.
• Close liaison is necessary between the Central Water Commission and Brahmaputra Board on
the one hand and the IWAI on the other so that water resource development meshes with the development of waterways.
• The Central Inland Water Corporation (CIWTC) must be strengthened with a strong regional
presence at the same time, private operators should be encouraged to take up component segments of IWT development and operation. Funding should be provided.
• Modernised country craft development should be taken in hand to extend services to feeder
routes. These should be some agency to study this matter and play a promotional role. • There has to be a policy for waterfront development and location of industries to generate
traffic. Short navigation canals from such waterfronts or waterways to deepened beels with jetties and production/warehousing facilities around them might be envisaged. Ring embankments could offer flood protection.
• An R&D facility needs to be developed to undertake studies with regard to types of river craft
for different categories of waterways and cargo in the Northeast sector. Safety should be an important factor.
6.4 Aviation
• Guwahati should be made a regional hub for Indian Airlines so that aircraft stationed there can
operate services without delays on account of late arrival of aircraft from Calcutta or Delhi because of fog or other weather or technical problems.
• With the gradual lifting of the restricted area permit regime in the Northeast, and the opening of
new trade and tourist opportunities, international flights should operate out of the region to destinations like Dhaka, Chittagong, Mandalay and Yangon in the first instance. Tourist packages could be developed around these services.
• An integrated plan for the utilisation of the Guwahati international air cargo facility should be
prepared by the Ministry of Commerce in consultation with the North-eastern states. • A study should be initiated for inducing short take-off-and-landing (STOL) aircraft into the
Northeast circuit in view of the need to connect remote hill areas and provide feeder tourist, services
6.5 Power
• Full funding must be provided to on-going power projects to ensure that further cost and time
overruns are avoided in this critical sector. • The Department of Power should concert action to refine its perspective power development
programme for the Northeast, currently under preparation, in consultation with the Brahmaputra Board, NEEPCO, Power Grid Corporation and the concerned States, taking account of all pending and proposed hydel, thermal and gas-based stations on the anvil. These projects should be ranked and efforts made to secure funding.
• System efficiency must be improved by urgent steps to reduce T&D losses and improve PLF.
The CEA or Power Grid Corporation should undertake a quick study of critical gaps and linkages within three months with priority funding.
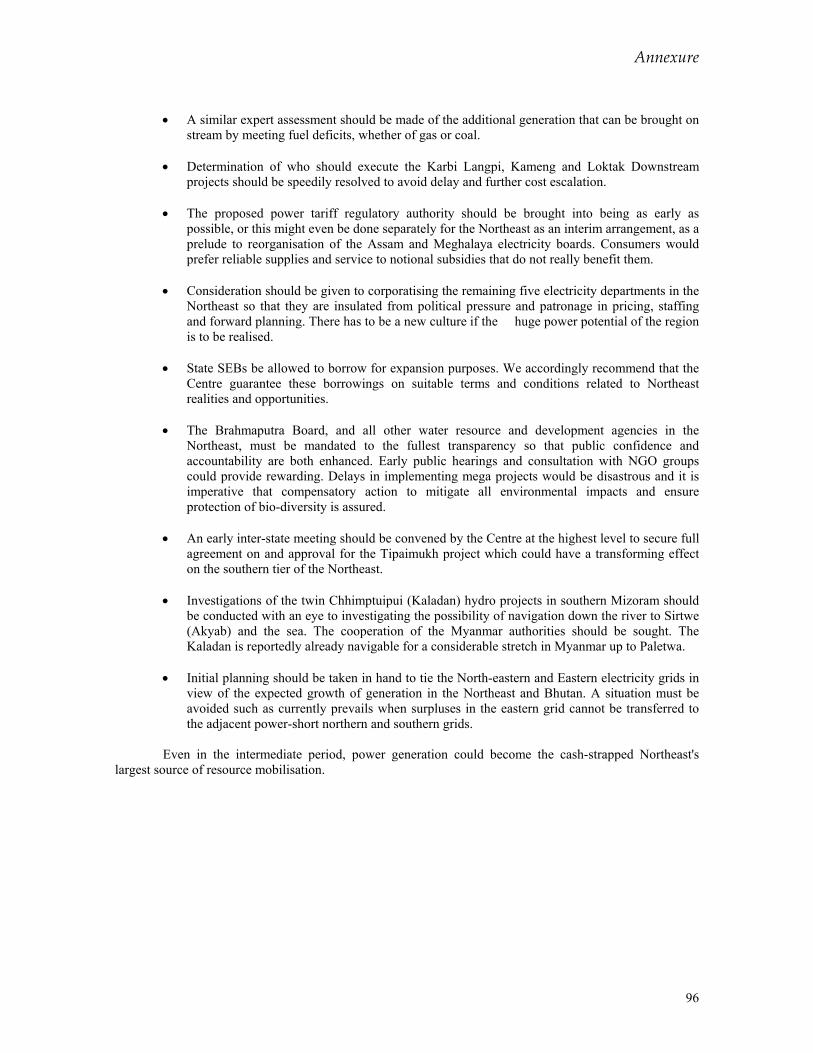
Annexure
96
• A similar expert assessment should be made of the additional generation that can be brought on
stream by meeting fuel deficits, whether of gas or coal. • Determination of who should execute the Karbi Langpi, Kameng and Loktak Downstream
projects should be speedily resolved to avoid delay and further cost escalation. • The proposed power tariff regulatory authority should be brought into being as early as
possible, or this might even be done separately for the Northeast as an interim arrangement, as a prelude to reorganisation of the Assam and Meghalaya electricity boards. Consumers would prefer reliable supplies and service to notional subsidies that do not really benefit them.
• Consideration should be given to corporatising the remaining five electricity departments in the
Northeast so that they are insulated from political pressure and patronage in pricing, staffing and forward planning. There has to be a new culture if the huge power potential of the region is to be realised.
• State SEBs be allowed to borrow for expansion purposes. We accordingly recommend that the
Centre guarantee these borrowings on suitable terms and conditions related to Northeast realities and opportunities.
• The Brahmaputra Board, and all other water resource and development agencies in the
Northeast, must be mandated to the fullest transparency so that public confidence and accountability are both enhanced. Early public hearings and consultation with NGO groups could provide rewarding. Delays in implementing mega projects would be disastrous and it is imperative that compensatory action to mitigate all environmental impacts and ensure protection of bio-diversity is assured.
• An early inter-state meeting should be convened by the Centre at the highest level to secure full
agreement on and approval for the Tipaimukh project which could have a transforming effect on the southern tier of the Northeast.
• Investigations of the twin Chhimptuipui (Kaladan) hydro projects in southern Mizoram should
be conducted with an eye to investigating the possibility of navigation down the river to Sirtwe (Akyab) and the sea. The cooperation of the Myanmar authorities should be sought. The Kaladan is reportedly already navigable for a considerable stretch in Myanmar up to Paletwa.
• Initial planning should be taken in hand to tie the North-eastern and Eastern electricity grids in
view of the expected growth of generation in the Northeast and Bhutan. A situation must be avoided such as currently prevails when surpluses in the eastern grid cannot be transferred to the adjacent power-short northern and southern grids.
Even in the intermediate period, power generation could become the cash-strapped Northeast's
largest source of resource mobilisation.
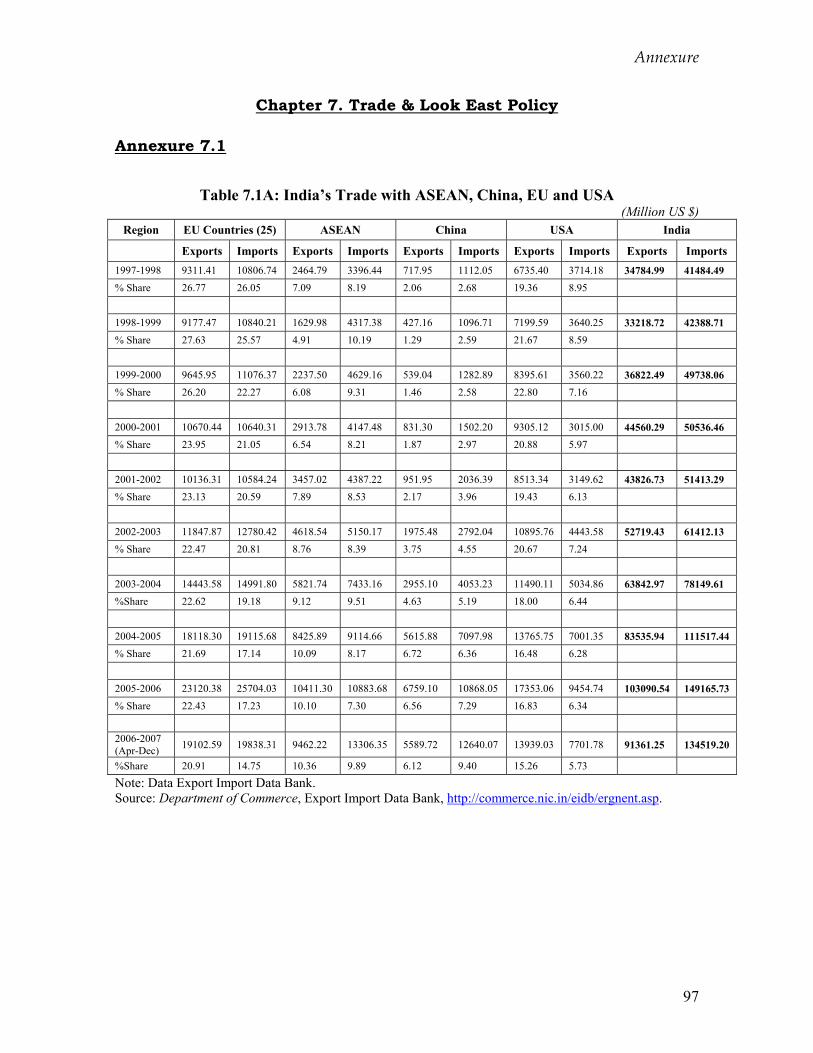
Annexure
97
Chapter 7. Trade & Look East Policy Annexure 7.1
Table 7.1A: India’s Trade with ASEAN, China, EU and USA
(Million US $) Region EU Countries (25) ASEAN China USA India
Exports Imports Exports Imports Exports Imports Exports Imports Exports Imports 1997-1998 9311.41 10806.74 2464.79 3396.44 717.95 1112.05 6735.40 3714.18 34784.99 41484.49 % Share 26.77 26.05 7.09 8.19 2.06 2.68 19.36 8.95 1998-1999 9177.47 10840.21 1629.98 4317.38 427.16 1096.71 7199.59 3640.25 33218.72 42388.71 % Share 27.63 25.57 4.91 10.19 1.29 2.59 21.67 8.59 1999-2000 9645.95 11076.37 2237.50 4629.16 539.04 1282.89 8395.61 3560.22 36822.49 49738.06 % Share 26.20 22.27 6.08 9.31 1.46 2.58 22.80 7.16 2000-2001 10670.44 10640.31 2913.78 4147.48 831.30 1502.20 9305.12 3015.00 44560.29 50536.46 % Share 23.95 21.05 6.54 8.21 1.87 2.97 20.88 5.97 2001-2002 10136.31 10584.24 3457.02 4387.22 951.95 2036.39 8513.34 3149.62 43826.73 51413.29 % Share 23.13 20.59 7.89 8.53 2.17 3.96 19.43 6.13 2002-2003 11847.87 12780.42 4618.54 5150.17 1975.48 2792.04 10895.76 4443.58 52719.43 61412.13 % Share 22.47 20.81 8.76 8.39 3.75 4.55 20.67 7.24 2003-2004 14443.58 14991.80 5821.74 7433.16 2955.10 4053.23 11490.11 5034.86 63842.97 78149.61 %Share 22.62 19.18 9.12 9.51 4.63 5.19 18.00 6.44 2004-2005 18118.30 19115.68 8425.89 9114.66 5615.88 7097.98 13765.75 7001.35 83535.94 111517.44 % Share 21.69 17.14 10.09 8.17 6.72 6.36 16.48 6.28 2005-2006 23120.38 25704.03 10411.30 10883.68 6759.10 10868.05 17353.06 9454.74 103090.54 149165.73 % Share 22.43 17.23 10.10 7.30 6.56 7.29 16.83 6.34 2006-2007 (Apr-Dec) 19102.59 19838.31 9462.22 13306.35 5589.72 12640.07 13939.03 7701.78 91361.25 134519.20
%Share 20.91 14.75 10.36 9.89 6.12 9.40 15.26 5.73
Note: Data Export Import Data Bank. Source: Department of Commerce, Export Import Data Bank, http://commerce.nic.in/eidb/ergnent.asp.
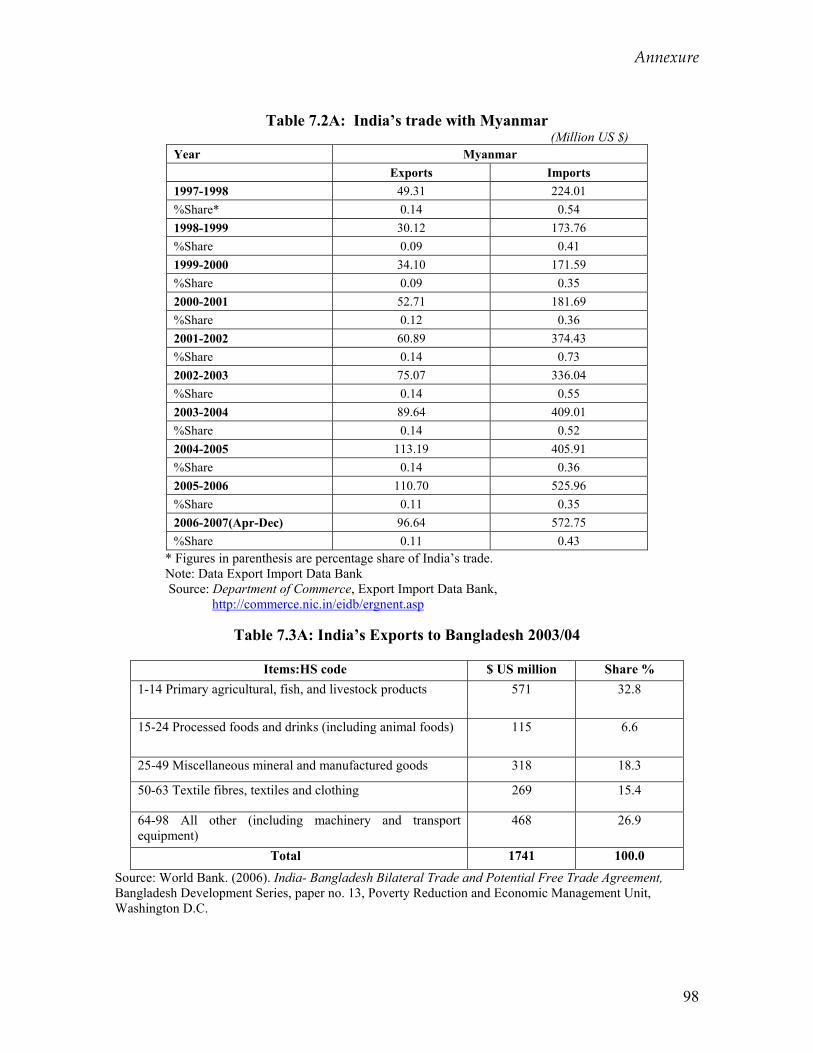
Annexure
98
Table 7.2A: India’s trade with Myanmar
(Million US $) Year Myanmar
Exports Imports 1997-1998 49.31 224.01 %Share* 0.14 0.54 1998-1999 30.12 173.76 %Share 0.09 0.41 1999-2000 34.10 171.59 %Share 0.09 0.35 2000-2001 52.71 181.69 %Share 0.12 0.36 2001-2002 60.89 374.43 %Share 0.14 0.73 2002-2003 75.07 336.04 %Share 0.14 0.55 2003-2004 89.64 409.01 %Share 0.14 0.52 2004-2005 113.19 405.91 %Share 0.14 0.36 2005-2006 110.70 525.96 %Share 0.11 0.35 2006-2007(Apr-Dec) 96.64 572.75 %Share 0.11 0.43
* Figures in parenthesis are percentage share of India’s trade. Note: Data Export Import Data Bank Source: Department of Commerce, Export Import Data Bank, http://commerce.nic.in/eidb/ergnent.asp
Table 7.3A: India’s Exports to Bangladesh 2003/04
Items:HS code $ US million Share %
1-14 Primary agricultural, fish, and livestock products 571 32.8
15-24 Processed foods and drinks (including animal foods) 115 6.6
25-49 Miscellaneous mineral and manufactured goods 318 18.3
50-63 Textile fibres, textiles and clothing 269 15.4
64-98 All other (including machinery and transport equipment)
468 26.9
Total 1741 100.0
Source: World Bank. (2006). India- Bangladesh Bilateral Trade and Potential Free Trade Agreement, Bangladesh Development Series, paper no. 13, Poverty Reduction and Economic Management Unit, Washington D.C.
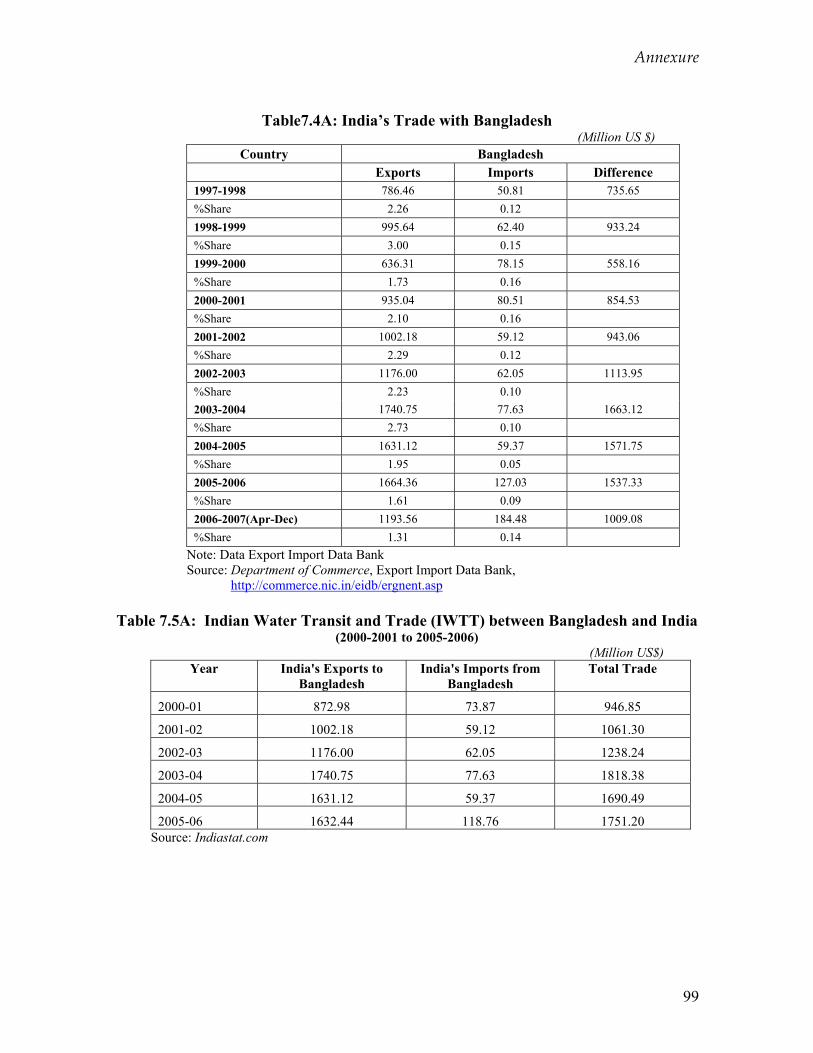
Annexure
99
Table7.4A: India’s Trade with Bangladesh
(Million US $) Country Bangladesh
Exports Imports Difference 1997-1998 786.46 50.81 735.65 %Share 2.26 0.12 1998-1999 995.64 62.40 933.24 %Share 3.00 0.15 1999-2000 636.31 78.15 558.16 %Share 1.73 0.16 2000-2001 935.04 80.51 854.53 %Share 2.10 0.16 2001-2002 1002.18 59.12 943.06 %Share 2.29 0.12 2002-2003 1176.00 62.05 1113.95 %Share 2.23 0.10 2003-2004 1740.75 77.63 1663.12 %Share 2.73 0.10 2004-2005 1631.12 59.37 1571.75 %Share 1.95 0.05 2005-2006 1664.36 127.03 1537.33 %Share 1.61 0.09 2006-2007(Apr-Dec) 1193.56 184.48 1009.08 %Share 1.31 0.14
Note: Data Export Import Data Bank Source: Department of Commerce, Export Import Data Bank,
http://commerce.nic.in/eidb/ergnent.asp Table 7.5A: Indian Water Transit and Trade (IWTT) between Bangladesh and India
(2000-2001 to 2005-2006) (Million US$)
Year India's Exports to Bangladesh
India's Imports from Bangladesh
Total Trade
2000-01 872.98 73.87 946.85
2001-02 1002.18 59.12 1061.30
2002-03 1176.00 62.05 1238.24
2003-04 1740.75 77.63 1818.38
2004-05 1631.12 59.37 1690.49
2005-06 1632.44 118.76 1751.20 Source: Indiastat.com
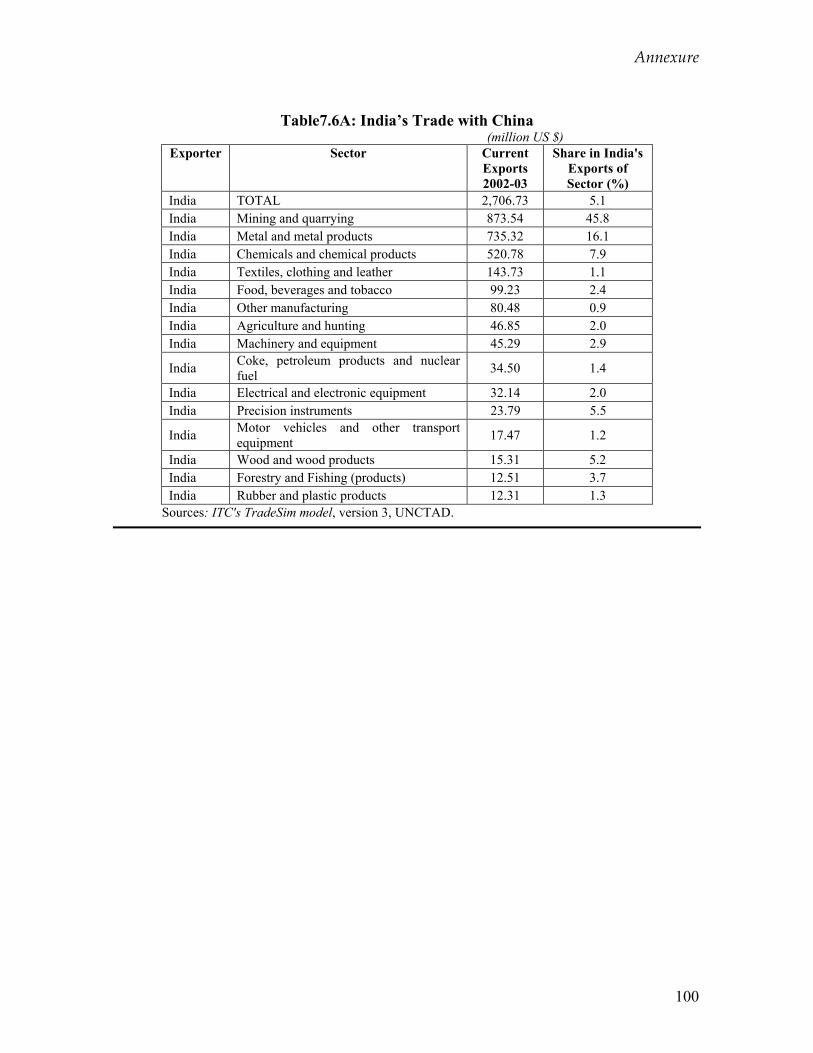
Annexure
100
Table7.6A: India’s Trade with China
(million US $) Exporter Sector Current
Exports 2002-03
Share in India's Exports of Sector (%)
India TOTAL 2,706.73 5.1 India Mining and quarrying 873.54 45.8 India Metal and metal products 735.32 16.1 India Chemicals and chemical products 520.78 7.9 India Textiles, clothing and leather 143.73 1.1 India Food, beverages and tobacco 99.23 2.4 India Other manufacturing 80.48 0.9 India Agriculture and hunting 46.85 2.0 India Machinery and equipment 45.29 2.9
India Coke, petroleum products and nuclear fuel 34.50 1.4
India Electrical and electronic equipment 32.14 2.0 India Precision instruments 23.79 5.5
India Motor vehicles and other transport equipment 17.47 1.2
India Wood and wood products 15.31 5.2 India Forestry and Fishing (products) 12.51 3.7 India Rubber and plastic products 12.31 1.3
Sources: ITC's TradeSim model, version 3, UNCTAD.
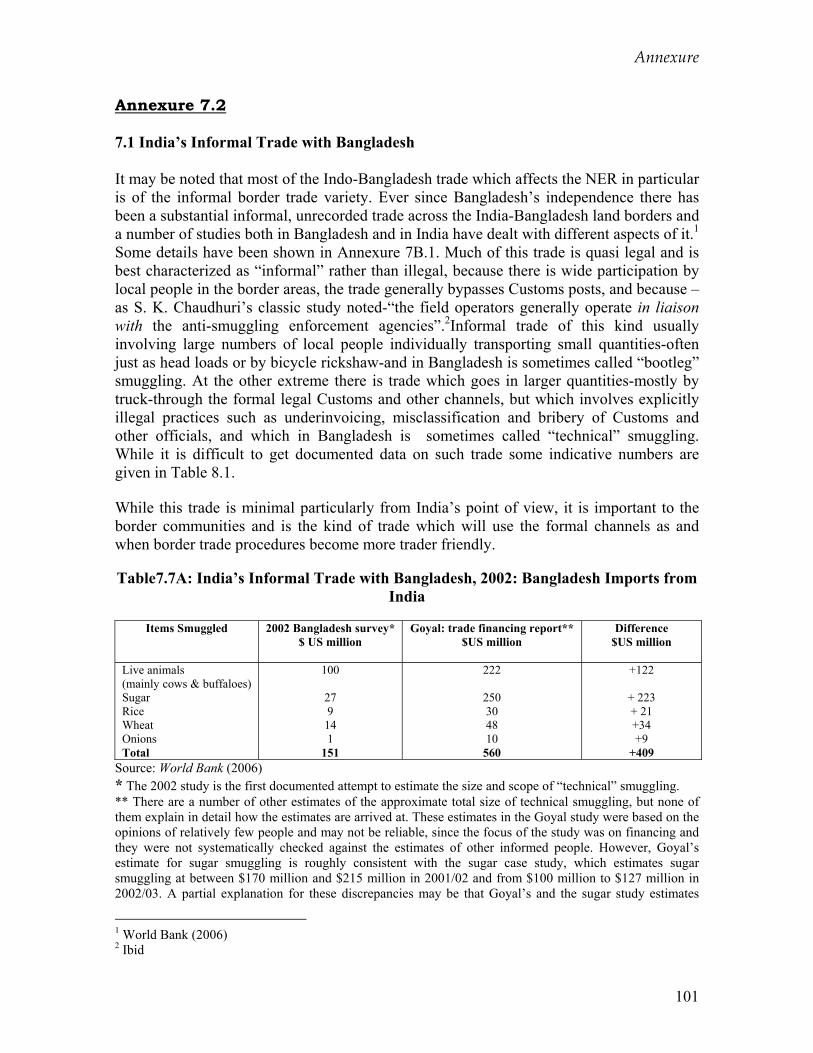
Annexure
101
Annexure 7.2
7.1 India’s Informal Trade with Bangladesh It may be noted that most of the Indo-Bangladesh trade which affects the NER in particular is of the informal border trade variety. Ever since Bangladesh’s independence there has been a substantial informal, unrecorded trade across the India-Bangladesh land borders and a number of studies both in Bangladesh and in India have dealt with different aspects of it.1 Some details have been shown in Annexure 7B.1. Much of this trade is quasi legal and is best characterized as “informal” rather than illegal, because there is wide participation by local people in the border areas, the trade generally bypasses Customs posts, and because –as S. K. Chaudhuri’s classic study noted-“the field operators generally operate in liaison with the anti-smuggling enforcement agencies”.2Informal trade of this kind usually involving large numbers of local people individually transporting small quantities-often just as head loads or by bicycle rickshaw-and in Bangladesh is sometimes called “bootleg” smuggling. At the other extreme there is trade which goes in larger quantities-mostly by truck-through the formal legal Customs and other channels, but which involves explicitly illegal practices such as underinvoicing, misclassification and bribery of Customs and other officials, and which in Bangladesh is sometimes called “technical” smuggling. While it is difficult to get documented data on such trade some indicative numbers are given in Table 8.1. While this trade is minimal particularly from India’s point of view, it is important to the border communities and is the kind of trade which will use the formal channels as and when border trade procedures become more trader friendly. Table7.7A: India’s Informal Trade with Bangladesh, 2002: Bangladesh Imports from
India
Items Smuggled
2002 Bangladesh survey* $ US million
Goyal: trade financing report** $US million
Difference $US million
Live animals (mainly cows & buffaloes) Sugar Rice Wheat Onions Total
100
27 9 14 1
151
222
250 30 48 10
560
+122
+ 223 + 21 +34 +9
+409 Source: World Bank (2006) * The 2002 study is the first documented attempt to estimate the size and scope of “technical” smuggling. ** There are a number of other estimates of the approximate total size of technical smuggling, but none of them explain in detail how the estimates are arrived at. These estimates in the Goyal study were based on the opinions of relatively few people and may not be reliable, since the focus of the study was on financing and they were not systematically checked against the estimates of other informed people. However, Goyal’s estimate for sugar smuggling is roughly consistent with the sugar case study, which estimates sugar smuggling at between $170 million and $215 million in 2001/02 and from $100 million to $127 million in 2002/03. A partial explanation for these discrepancies may be that Goyal’s and the sugar study estimates
1 World Bank (2006) 2 Ibid
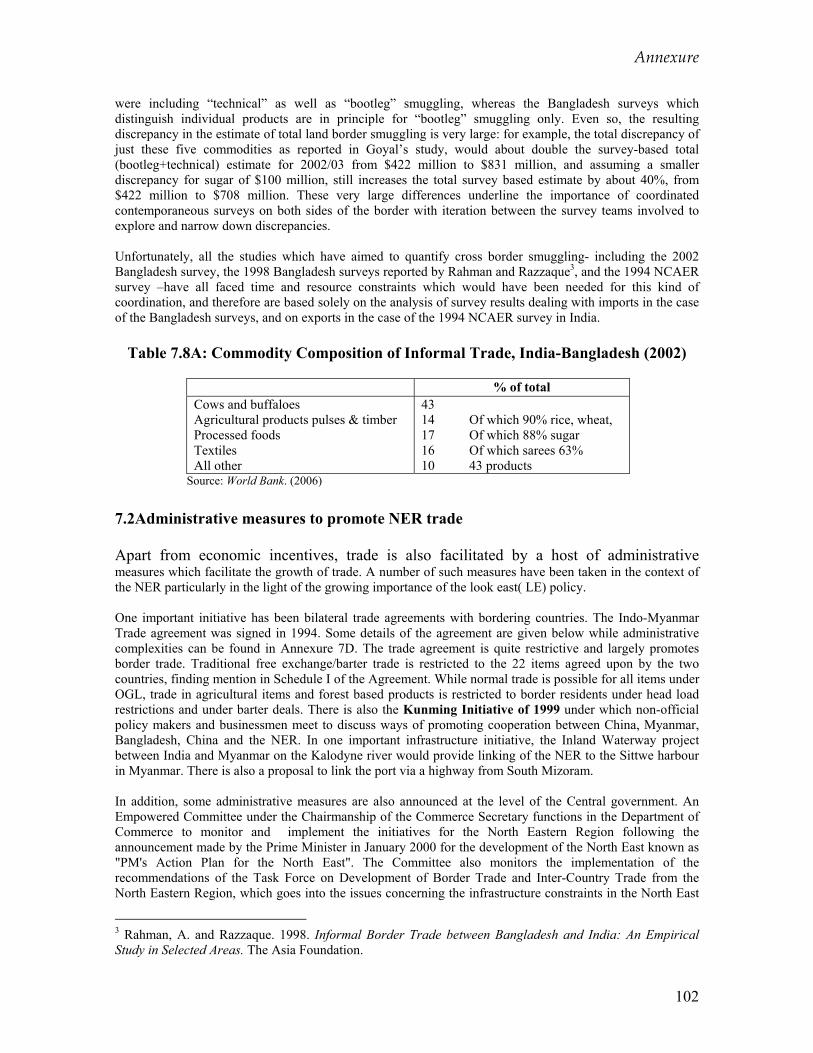
Annexure
102
were including “technical” as well as “bootleg” smuggling, whereas the Bangladesh surveys which distinguish individual products are in principle for “bootleg” smuggling only. Even so, the resulting discrepancy in the estimate of total land border smuggling is very large: for example, the total discrepancy of just these five commodities as reported in Goyal’s study, would about double the survey-based total (bootleg+technical) estimate for 2002/03 from $422 million to $831 million, and assuming a smaller discrepancy for sugar of $100 million, still increases the total survey based estimate by about 40%, from $422 million to $708 million. These very large differences underline the importance of coordinated contemporaneous surveys on both sides of the border with iteration between the survey teams involved to explore and narrow down discrepancies. Unfortunately, all the studies which have aimed to quantify cross border smuggling- including the 2002 Bangladesh survey, the 1998 Bangladesh surveys reported by Rahman and Razzaque3, and the 1994 NCAER survey –have all faced time and resource constraints which would have been needed for this kind of coordination, and therefore are based solely on the analysis of survey results dealing with imports in the case of the Bangladesh surveys, and on exports in the case of the 1994 NCAER survey in India.
Table 7.8A: Commodity Composition of Informal Trade, India-Bangladesh (2002)
% of total Cows and buffaloes Agricultural products pulses & timber Processed foods Textiles All other
43 14 Of which 90% rice, wheat, 17 Of which 88% sugar 16 Of which sarees 63% 10 43 products
Source: World Bank. (2006)
7.2Administrative measures to promote NER trade Apart from economic incentives, trade is also facilitated by a host of administrative measures which facilitate the growth of trade. A number of such measures have been taken in the context of the NER particularly in the light of the growing importance of the look east( LE) policy. One important initiative has been bilateral trade agreements with bordering countries. The Indo-Myanmar Trade agreement was signed in 1994. Some details of the agreement are given below while administrative complexities can be found in Annexure 7D. The trade agreement is quite restrictive and largely promotes border trade. Traditional free exchange/barter trade is restricted to the 22 items agreed upon by the two countries, finding mention in Schedule I of the Agreement. While normal trade is possible for all items under OGL, trade in agricultural items and forest based products is restricted to border residents under head load restrictions and under barter deals. There is also the Kunming Initiative of 1999 under which non-official policy makers and businessmen meet to discuss ways of promoting cooperation between China, Myanmar, Bangladesh, China and the NER. In one important infrastructure initiative, the Inland Waterway project between India and Myanmar on the Kalodyne river would provide linking of the NER to the Sittwe harbour in Myanmar. There is also a proposal to link the port via a highway from South Mizoram. In addition, some administrative measures are also announced at the level of the Central government. An Empowered Committee under the Chairmanship of the Commerce Secretary functions in the Department of Commerce to monitor and implement the initiatives for the North Eastern Region following the announcement made by the Prime Minister in January 2000 for the development of the North East known as "PM's Action Plan for the North East". The Committee also monitors the implementation of the recommendations of the Task Force on Development of Border Trade and Inter-Country Trade from the North Eastern Region, which goes into the issues concerning the infrastructure constraints in the North East
3 Rahman, A. and Razzaque. 1998. Informal Border Trade between Bangladesh and India: An Empirical Study in Selected Areas. The Asia Foundation.
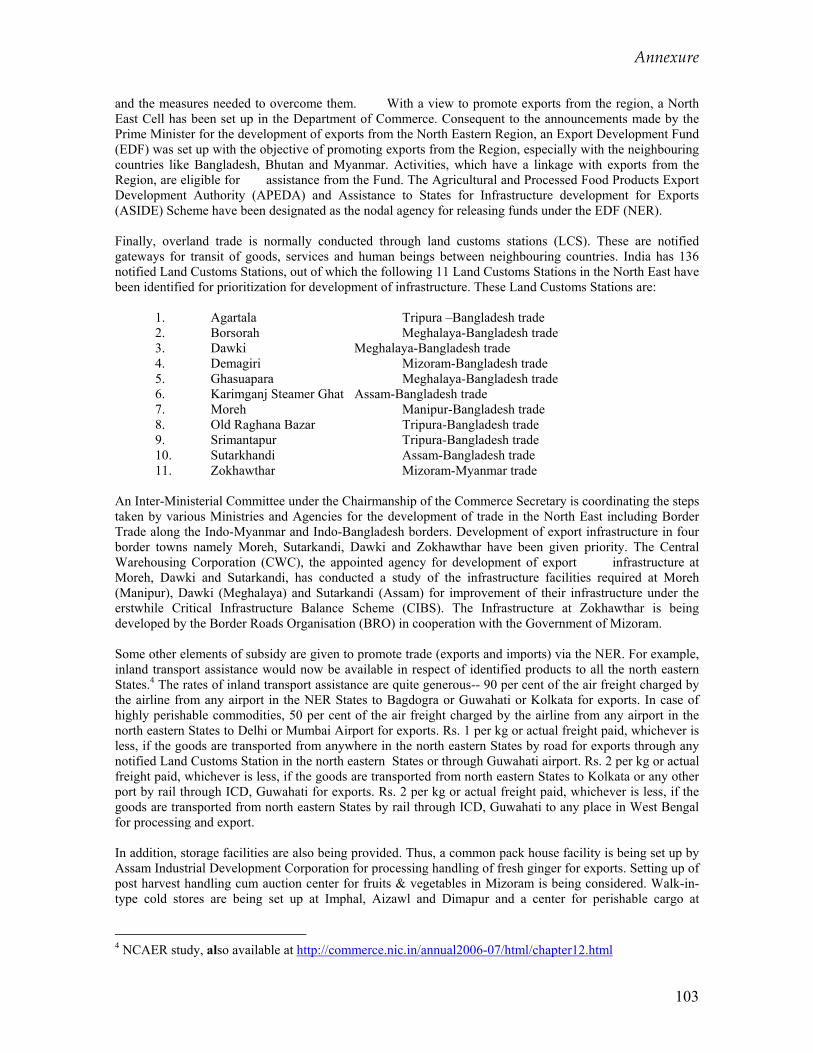
Annexure
103
and the measures needed to overcome them. With a view to promote exports from the region, a North East Cell has been set up in the Department of Commerce. Consequent to the announcements made by the Prime Minister for the development of exports from the North Eastern Region, an Export Development Fund (EDF) was set up with the objective of promoting exports from the Region, especially with the neighbouring countries like Bangladesh, Bhutan and Myanmar. Activities, which have a linkage with exports from the Region, are eligible for assistance from the Fund. The Agricultural and Processed Food Products Export Development Authority (APEDA) and Assistance to States for Infrastructure development for Exports (ASIDE) Scheme have been designated as the nodal agency for releasing funds under the EDF (NER). Finally, overland trade is normally conducted through land customs stations (LCS). These are notified gateways for transit of goods, services and human beings between neighbouring countries. India has 136 notified Land Customs Stations, out of which the following 11 Land Customs Stations in the North East have been identified for prioritization for development of infrastructure. These Land Customs Stations are: 1. Agartala Tripura –Bangladesh trade 2. Borsorah Meghalaya-Bangladesh trade 3. Dawki Meghalaya-Bangladesh trade 4. Demagiri Mizoram-Bangladesh trade 5. Ghasuapara Meghalaya-Bangladesh trade 6. Karimganj Steamer Ghat Assam-Bangladesh trade 7. Moreh Manipur-Bangladesh trade 8. Old Raghana Bazar Tripura-Bangladesh trade 9. Srimantapur Tripura-Bangladesh trade 10. Sutarkhandi Assam-Bangladesh trade 11. Zokhawthar Mizoram-Myanmar trade An Inter-Ministerial Committee under the Chairmanship of the Commerce Secretary is coordinating the steps taken by various Ministries and Agencies for the development of trade in the North East including Border Trade along the Indo-Myanmar and Indo-Bangladesh borders. Development of export infrastructure in four border towns namely Moreh, Sutarkandi, Dawki and Zokhawthar have been given priority. The Central Warehousing Corporation (CWC), the appointed agency for development of export infrastructure at Moreh, Dawki and Sutarkandi, has conducted a study of the infrastructure facilities required at Moreh (Manipur), Dawki (Meghalaya) and Sutarkandi (Assam) for improvement of their infrastructure under the erstwhile Critical Infrastructure Balance Scheme (CIBS). The Infrastructure at Zokhawthar is being developed by the Border Roads Organisation (BRO) in cooperation with the Government of Mizoram. Some other elements of subsidy are given to promote trade (exports and imports) via the NER. For example, inland transport assistance would now be available in respect of identified products to all the north eastern States.4 The rates of inland transport assistance are quite generous-- 90 per cent of the air freight charged by the airline from any airport in the NER States to Bagdogra or Guwahati or Kolkata for exports. In case of highly perishable commodities, 50 per cent of the air freight charged by the airline from any airport in the north eastern States to Delhi or Mumbai Airport for exports. Rs. 1 per kg or actual freight paid, whichever is less, if the goods are transported from anywhere in the north eastern States by road for exports through any notified Land Customs Station in the north eastern States or through Guwahati airport. Rs. 2 per kg or actual freight paid, whichever is less, if the goods are transported from north eastern States to Kolkata or any other port by rail through ICD, Guwahati for exports. Rs. 2 per kg or actual freight paid, whichever is less, if the goods are transported from north eastern States by rail through ICD, Guwahati to any place in West Bengal for processing and export.
In addition, storage facilities are also being provided. Thus, a common pack house facility is being set up by Assam Industrial Development Corporation for processing handling of fresh ginger for exports. Setting up of post harvest handling cum auction center for fruits & vegetables in Mizoram is being considered. Walk-in-type cold stores are being set up at Imphal, Aizawl and Dimapur and a center for perishable cargo at
4 NCAER study, also available at http://commerce.nic.in/annual2006-07/html/chapter12.html
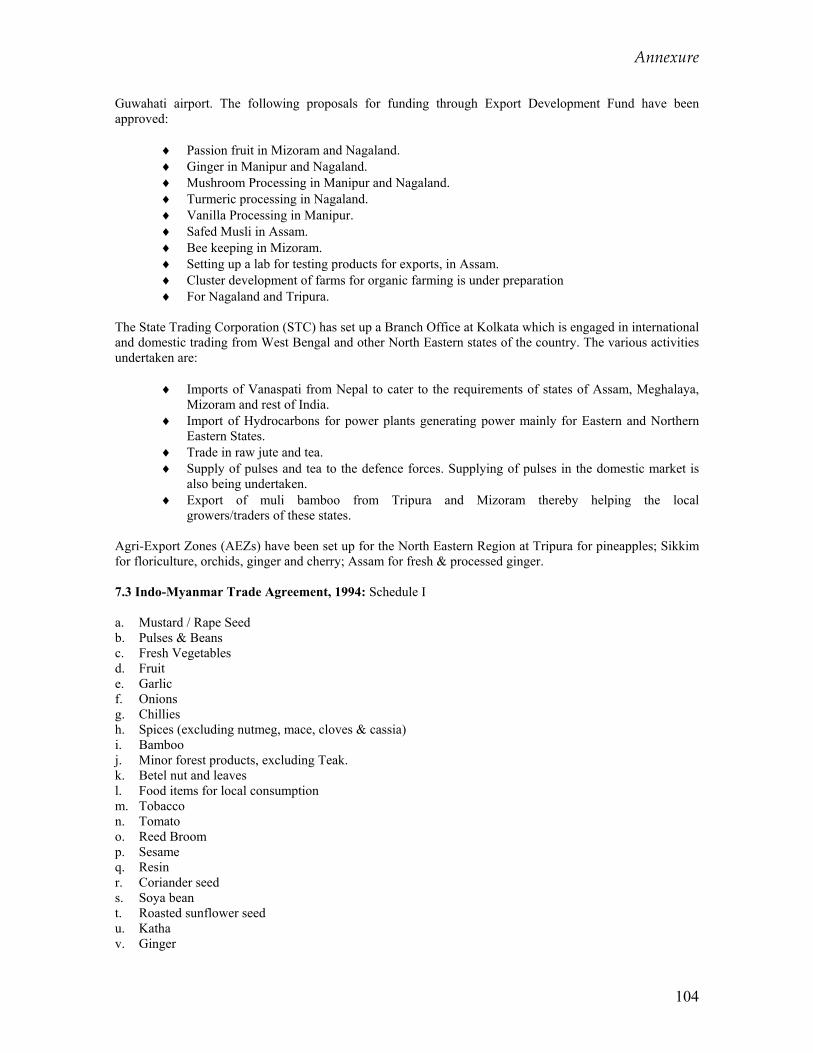
Annexure
104
Guwahati airport. The following proposals for funding through Export Development Fund have been approved:
♦ Passion fruit in Mizoram and Nagaland. ♦ Ginger in Manipur and Nagaland. ♦ Mushroom Processing in Manipur and Nagaland. ♦ Turmeric processing in Nagaland. ♦ Vanilla Processing in Manipur. ♦ Safed Musli in Assam. ♦ Bee keeping in Mizoram. ♦ Setting up a lab for testing products for exports, in Assam. ♦ Cluster development of farms for organic farming is under preparation ♦ For Nagaland and Tripura.
The State Trading Corporation (STC) has set up a Branch Office at Kolkata which is engaged in international and domestic trading from West Bengal and other North Eastern states of the country. The various activities undertaken are:
♦ Imports of Vanaspati from Nepal to cater to the requirements of states of Assam, Meghalaya, Mizoram and rest of India.
♦ Import of Hydrocarbons for power plants generating power mainly for Eastern and Northern Eastern States.
♦ Trade in raw jute and tea. ♦ Supply of pulses and tea to the defence forces. Supplying of pulses in the domestic market is
also being undertaken. ♦ Export of muli bamboo from Tripura and Mizoram thereby helping the local
growers/traders of these states. Agri-Export Zones (AEZs) have been set up for the North Eastern Region at Tripura for pineapples; Sikkim for floriculture, orchids, ginger and cherry; Assam for fresh & processed ginger. 7.3 Indo-Myanmar Trade Agreement, 1994: Schedule I a. Mustard / Rape Seed b. Pulses & Beans c. Fresh Vegetables d. Fruit e. Garlic f. Onions g. Chillies h. Spices (excluding nutmeg, mace, cloves & cassia) i. Bamboo j. Minor forest products, excluding Teak. k. Betel nut and leaves l. Food items for local consumption m. Tobacco n. Tomato o. Reed Broom p. Sesame q. Resin r. Coriander seed s. Soya bean t. Roasted sunflower seed u. Katha v. Ginger
Annexure
105
Traditional exchange will consist of items listed in the Schedule I above and will have a value limit of up to US $ 1000. This exchange will be limited to ethnic or indigenous people residing within 40 km on either side of the international border. Trade will be conducted under a simplified documentation, without GR formalities as prescribed by the Reserve Bank of India. Barter Mechanism, or trade under the barter system of up to US $ 20,000 with GR formalities, vide the Director General Foreign Trade (DGFT) Public Notice, PN No. 289(PN) 92-97. Under this system traders will have to possess an IEC number allotted by the DGFT (Commerce Ministry). The items that can be traded /bartered has been restricted to the 22 items listed in Schedule I. Trade in the above modes shall take place only by way of head loads or non-motorized transport. Imports form Myanmar shall precede export from India to Myanmar. There will be no monetary transaction under barter trade agreement although consignments must be invoiced in US Dollars and should not exceed US $ 20,000 per transaction – Authority: RBI AP (DIR Series) Circular No. 17 dated 16 Oct 2000. Normal Trade, as envisaged in Article III of the Indo-Myanmar Trade Agreement will be conducted in freely convertible currencies under the Letter of Credit system (L/C) as per the Exim Policy guidelines of the Commerce Ministry. Any item falling under the Open General License (OGL) of the Exim Policy can be traded under this method. Possession of an IEC number is a basic necessity. Customs duties and Cess will be chargeable as per the Customs Tariff Act 1975, read with other Allied Acts. Currently, for imports a rate of duty of 5 % ad valorem is applicable on all the items specified in Schedule I., vide Ministry of Finance Notifications 9/1995 and 24/2002. For more details the Deputy Commissioner of Customs Aizawl Customs Division may be consulted. Only Cess is currently chargeable on exports from India to Myanmar on some of the items mentioned in the said Schedule I. Exchange or Barter in items other than the agreed 22 items will be liable to seizure/ confiscation under the Customs Act 1962. Travel-Pass holders (To be issued by the Government of Mizoram in consultation with the Ministry of Home affairs) eligible for Foreign Exchange will also be eligible for a baggage allowance along the lines permitted across the Indo-Nepal Border, i.e. goods of third Country origin will be chargeable to duty at the prevailing rates applicable to baggage items. The General Free allowance will not be available to Travel-pass holders. Used personal effects will however be eligible for duty free clearance as per the prevailing Baggage Rules, 1978, as amended from time to time. All Export-Import undertaken in the Border trade will, as usual, be covered by proper Customs Documents as prescribed for the purpose of International Trade.
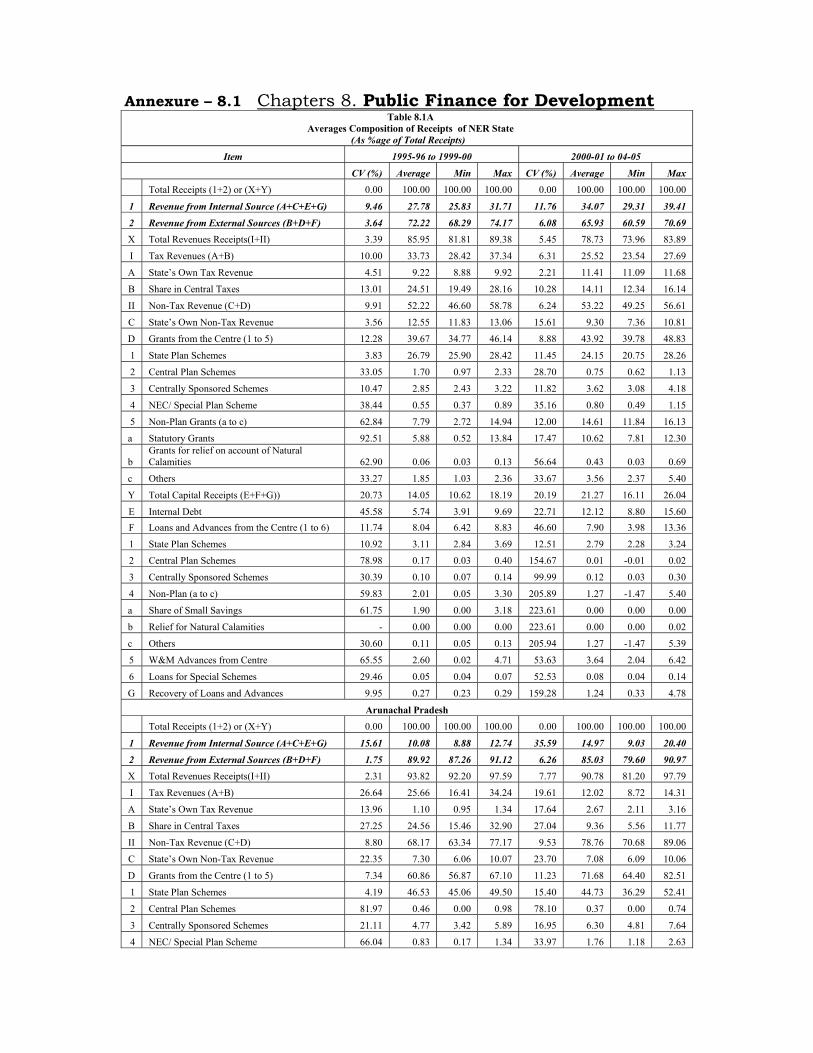
Annexure – 8.1 Chapters 8. Public Finance for Development Table 8.1A
Averages Composition of Receipts of NER State (As %age of Total Receipts)
Item 1995-96 to 1999-00 2000-01 to 04-05
CV (%) Average Min Max CV (%) Average Min Max Total Receipts (1+2) or (X+Y) 0.00 100.00 100.00 100.00 0.00 100.00 100.00 100.00
1 Revenue from Internal Source (A+C+E+G) 9.46 27.78 25.83 31.71 11.76 34.07 29.31 39.41
2 Revenue from External Sources (B+D+F) 3.64 72.22 68.29 74.17 6.08 65.93 60.59 70.69 X Total Revenues Receipts(I+II) 3.39 85.95 81.81 89.38 5.45 78.73 73.96 83.89
I Tax Revenues (A+B) 10.00 33.73 28.42 37.34 6.31 25.52 23.54 27.69
A State’s Own Tax Revenue 4.51 9.22 8.88 9.92 2.21 11.41 11.09 11.68
B Share in Central Taxes 13.01 24.51 19.49 28.16 10.28 14.11 12.34 16.14
II Non-Tax Revenue (C+D) 9.91 52.22 46.60 58.78 6.24 53.22 49.25 56.61
C State’s Own Non-Tax Revenue 3.56 12.55 11.83 13.06 15.61 9.30 7.36 10.81
D Grants from the Centre (1 to 5) 12.28 39.67 34.77 46.14 8.88 43.92 39.78 48.83
1 State Plan Schemes 3.83 26.79 25.90 28.42 11.45 24.15 20.75 28.26
2 Central Plan Schemes 33.05 1.70 0.97 2.33 28.70 0.75 0.62 1.13
3 Centrally Sponsored Schemes 10.47 2.85 2.43 3.22 11.82 3.62 3.08 4.18
4 NEC/ Special Plan Scheme 38.44 0.55 0.37 0.89 35.16 0.80 0.49 1.15
5 Non-Plan Grants (a to c) 62.84 7.79 2.72 14.94 12.00 14.61 11.84 16.13
a Statutory Grants 92.51 5.88 0.52 13.84 17.47 10.62 7.81 12.30
b Grants for relief on account of Natural Calamities 62.90 0.06 0.03 0.13 56.64 0.43 0.03 0.69
c Others 33.27 1.85 1.03 2.36 33.67 3.56 2.37 5.40
Y Total Capital Receipts (E+F+G)) 20.73 14.05 10.62 18.19 20.19 21.27 16.11 26.04
E Internal Debt 45.58 5.74 3.91 9.69 22.71 12.12 8.80 15.60 F Loans and Advances from the Centre (1 to 6) 11.74 8.04 6.42 8.83 46.60 7.90 3.98 13.36
1 State Plan Schemes 10.92 3.11 2.84 3.69 12.51 2.79 2.28 3.24
2 Central Plan Schemes 78.98 0.17 0.03 0.40 154.67 0.01 -0.01 0.02
3 Centrally Sponsored Schemes 30.39 0.10 0.07 0.14 99.99 0.12 0.03 0.30
4 Non-Plan (a to c) 59.83 2.01 0.05 3.30 205.89 1.27 -1.47 5.40
a Share of Small Savings 61.75 1.90 0.00 3.18 223.61 0.00 0.00 0.00
b Relief for Natural Calamities - 0.00 0.00 0.00 223.61 0.00 0.00 0.02
c Others 30.60 0.11 0.05 0.13 205.94 1.27 -1.47 5.39
5 W&M Advances from Centre 65.55 2.60 0.02 4.71 53.63 3.64 2.04 6.42
6 Loans for Special Schemes 29.46 0.05 0.04 0.07 52.53 0.08 0.04 0.14
G Recovery of Loans and Advances 9.95 0.27 0.23 0.29 159.28 1.24 0.33 4.78
Arunachal Pradesh Total Receipts (1+2) or (X+Y) 0.00 100.00 100.00 100.00 0.00 100.00 100.00 100.00
1 Revenue from Internal Source (A+C+E+G) 15.61 10.08 8.88 12.74 35.59 14.97 9.03 20.40
2 Revenue from External Sources (B+D+F) 1.75 89.92 87.26 91.12 6.26 85.03 79.60 90.97 X Total Revenues Receipts(I+II) 2.31 93.82 92.20 97.59 7.77 90.78 81.20 97.79
I Tax Revenues (A+B) 26.64 25.66 16.41 34.24 19.61 12.02 8.72 14.31
A State’s Own Tax Revenue 13.96 1.10 0.95 1.34 17.64 2.67 2.11 3.16
B Share in Central Taxes 27.25 24.56 15.46 32.90 27.04 9.36 5.56 11.77
II Non-Tax Revenue (C+D) 8.80 68.17 63.34 77.17 9.53 78.76 70.68 89.06
C State’s Own Non-Tax Revenue 22.35 7.30 6.06 10.07 23.70 7.08 6.09 10.06
D Grants from the Centre (1 to 5) 7.34 60.86 56.87 67.10 11.23 71.68 64.40 82.51
1 State Plan Schemes 4.19 46.53 45.06 49.50 15.40 44.73 36.29 52.41
2 Central Plan Schemes 81.97 0.46 0.00 0.98 78.10 0.37 0.00 0.74
3 Centrally Sponsored Schemes 21.11 4.77 3.42 5.89 16.95 6.30 4.81 7.64
4 NEC/ Special Plan Scheme 66.04 0.83 0.17 1.34 33.97 1.76 1.18 2.63
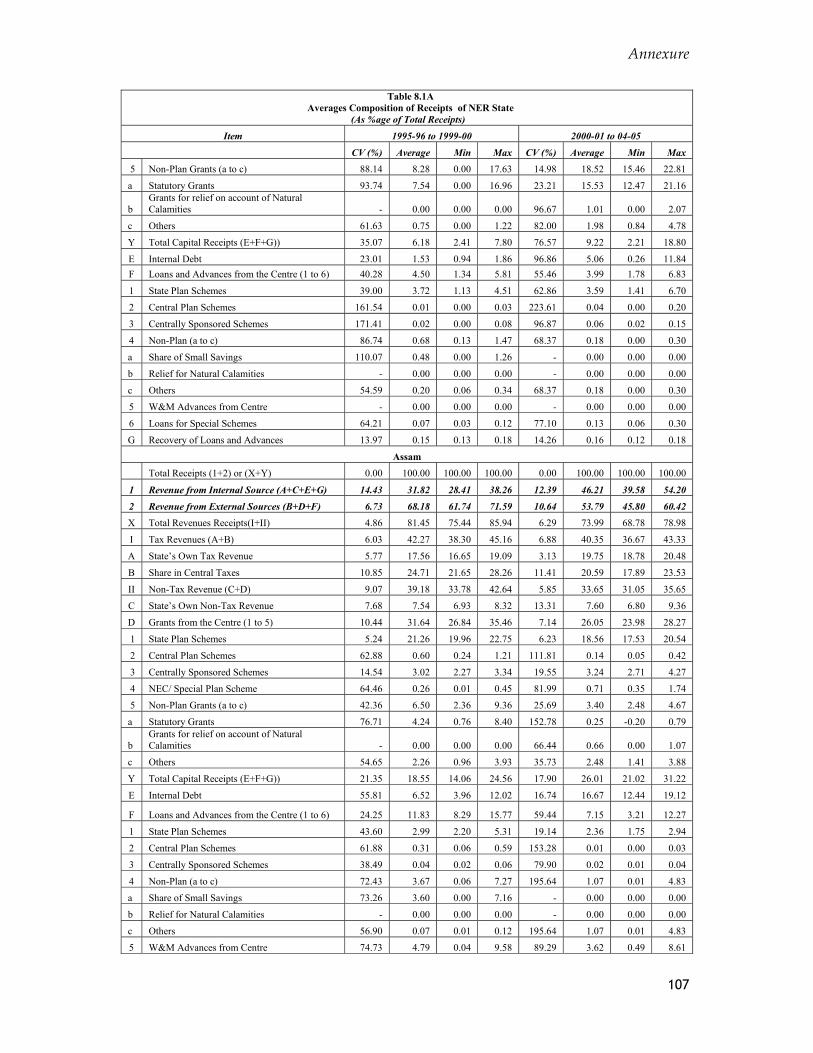
Annexure
107
Table 8.1A Averages Composition of Receipts of NER State
(As %age of Total Receipts)
Item 1995-96 to 1999-00 2000-01 to 04-05
CV (%) Average Min Max CV (%) Average Min Max 5 Non-Plan Grants (a to c) 88.14 8.28 0.00 17.63 14.98 18.52 15.46 22.81
a Statutory Grants 93.74 7.54 0.00 16.96 23.21 15.53 12.47 21.16
b Grants for relief on account of Natural Calamities - 0.00 0.00 0.00 96.67 1.01 0.00 2.07
c Others 61.63 0.75 0.00 1.22 82.00 1.98 0.84 4.78
Y Total Capital Receipts (E+F+G)) 35.07 6.18 2.41 7.80 76.57 9.22 2.21 18.80
E Internal Debt 23.01 1.53 0.94 1.86 96.86 5.06 0.26 11.84 F Loans and Advances from the Centre (1 to 6) 40.28 4.50 1.34 5.81 55.46 3.99 1.78 6.83
1 State Plan Schemes 39.00 3.72 1.13 4.51 62.86 3.59 1.41 6.70
2 Central Plan Schemes 161.54 0.01 0.00 0.03 223.61 0.04 0.00 0.20
3 Centrally Sponsored Schemes 171.41 0.02 0.00 0.08 96.87 0.06 0.02 0.15
4 Non-Plan (a to c) 86.74 0.68 0.13 1.47 68.37 0.18 0.00 0.30
a Share of Small Savings 110.07 0.48 0.00 1.26 - 0.00 0.00 0.00
b Relief for Natural Calamities - 0.00 0.00 0.00 - 0.00 0.00 0.00
c Others 54.59 0.20 0.06 0.34 68.37 0.18 0.00 0.30
5 W&M Advances from Centre - 0.00 0.00 0.00 - 0.00 0.00 0.00
6 Loans for Special Schemes 64.21 0.07 0.03 0.12 77.10 0.13 0.06 0.30
G Recovery of Loans and Advances 13.97 0.15 0.13 0.18 14.26 0.16 0.12 0.18
Assam Total Receipts (1+2) or (X+Y) 0.00 100.00 100.00 100.00 0.00 100.00 100.00 100.00
1 Revenue from Internal Source (A+C+E+G) 14.43 31.82 28.41 38.26 12.39 46.21 39.58 54.20
2 Revenue from External Sources (B+D+F) 6.73 68.18 61.74 71.59 10.64 53.79 45.80 60.42 X Total Revenues Receipts(I+II) 4.86 81.45 75.44 85.94 6.29 73.99 68.78 78.98
I Tax Revenues (A+B) 6.03 42.27 38.30 45.16 6.88 40.35 36.67 43.33
A State’s Own Tax Revenue 5.77 17.56 16.65 19.09 3.13 19.75 18.78 20.48
B Share in Central Taxes 10.85 24.71 21.65 28.26 11.41 20.59 17.89 23.53
II Non-Tax Revenue (C+D) 9.07 39.18 33.78 42.64 5.85 33.65 31.05 35.65
C State’s Own Non-Tax Revenue 7.68 7.54 6.93 8.32 13.31 7.60 6.80 9.36
D Grants from the Centre (1 to 5) 10.44 31.64 26.84 35.46 7.14 26.05 23.98 28.27
1 State Plan Schemes 5.24 21.26 19.96 22.75 6.23 18.56 17.53 20.54
2 Central Plan Schemes 62.88 0.60 0.24 1.21 111.81 0.14 0.05 0.42
3 Centrally Sponsored Schemes 14.54 3.02 2.27 3.34 19.55 3.24 2.71 4.27
4 NEC/ Special Plan Scheme 64.46 0.26 0.01 0.45 81.99 0.71 0.35 1.74
5 Non-Plan Grants (a to c) 42.36 6.50 2.36 9.36 25.69 3.40 2.48 4.67
a Statutory Grants 76.71 4.24 0.76 8.40 152.78 0.25 -0.20 0.79
b Grants for relief on account of Natural Calamities - 0.00 0.00 0.00 66.44 0.66 0.00 1.07
c Others 54.65 2.26 0.96 3.93 35.73 2.48 1.41 3.88
Y Total Capital Receipts (E+F+G)) 21.35 18.55 14.06 24.56 17.90 26.01 21.02 31.22
E Internal Debt 55.81 6.52 3.96 12.02 16.74 16.67 12.44 19.12
F Loans and Advances from the Centre (1 to 6) 24.25 11.83 8.29 15.77 59.44 7.15 3.21 12.27
1 State Plan Schemes 43.60 2.99 2.20 5.31 19.14 2.36 1.75 2.94
2 Central Plan Schemes 61.88 0.31 0.06 0.59 153.28 0.01 0.00 0.03
3 Centrally Sponsored Schemes 38.49 0.04 0.02 0.06 79.90 0.02 0.01 0.04
4 Non-Plan (a to c) 72.43 3.67 0.06 7.27 195.64 1.07 0.01 4.83
a Share of Small Savings 73.26 3.60 0.00 7.16 - 0.00 0.00 0.00
b Relief for Natural Calamities - 0.00 0.00 0.00 - 0.00 0.00 0.00
c Others 56.90 0.07 0.01 0.12 195.64 1.07 0.01 4.83
5 W&M Advances from Centre 74.73 4.79 0.04 9.58 89.29 3.62 0.49 8.61
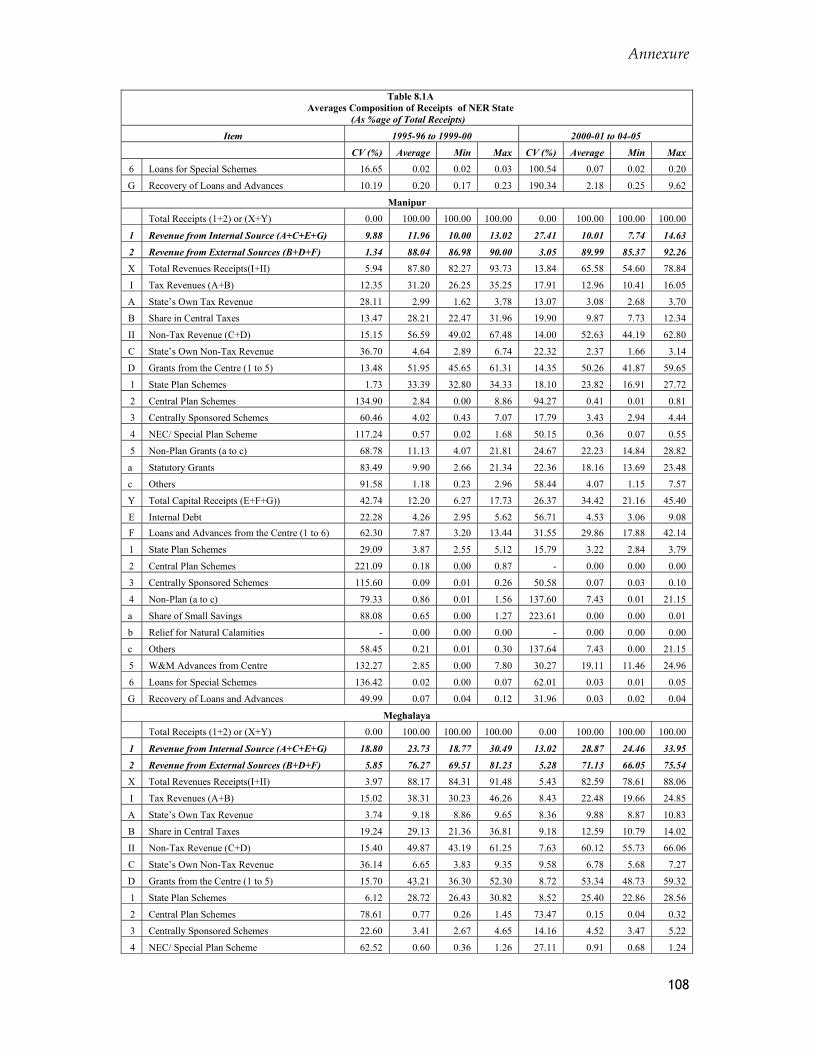
Annexure
108
Table 8.1A Averages Composition of Receipts of NER State
(As %age of Total Receipts)
Item 1995-96 to 1999-00 2000-01 to 04-05
CV (%) Average Min Max CV (%) Average Min Max 6 Loans for Special Schemes 16.65 0.02 0.02 0.03 100.54 0.07 0.02 0.20
G Recovery of Loans and Advances 10.19 0.20 0.17 0.23 190.34 2.18 0.25 9.62
Manipur Total Receipts (1+2) or (X+Y) 0.00 100.00 100.00 100.00 0.00 100.00 100.00 100.00
1 Revenue from Internal Source (A+C+E+G) 9.88 11.96 10.00 13.02 27.41 10.01 7.74 14.63
2 Revenue from External Sources (B+D+F) 1.34 88.04 86.98 90.00 3.05 89.99 85.37 92.26 X Total Revenues Receipts(I+II) 5.94 87.80 82.27 93.73 13.84 65.58 54.60 78.84
I Tax Revenues (A+B) 12.35 31.20 26.25 35.25 17.91 12.96 10.41 16.05
A State’s Own Tax Revenue 28.11 2.99 1.62 3.78 13.07 3.08 2.68 3.70
B Share in Central Taxes 13.47 28.21 22.47 31.96 19.90 9.87 7.73 12.34
II Non-Tax Revenue (C+D) 15.15 56.59 49.02 67.48 14.00 52.63 44.19 62.80
C State’s Own Non-Tax Revenue 36.70 4.64 2.89 6.74 22.32 2.37 1.66 3.14
D Grants from the Centre (1 to 5) 13.48 51.95 45.65 61.31 14.35 50.26 41.87 59.65
1 State Plan Schemes 1.73 33.39 32.80 34.33 18.10 23.82 16.91 27.72
2 Central Plan Schemes 134.90 2.84 0.00 8.86 94.27 0.41 0.01 0.81
3 Centrally Sponsored Schemes 60.46 4.02 0.43 7.07 17.79 3.43 2.94 4.44
4 NEC/ Special Plan Scheme 117.24 0.57 0.02 1.68 50.15 0.36 0.07 0.55
5 Non-Plan Grants (a to c) 68.78 11.13 4.07 21.81 24.67 22.23 14.84 28.82
a Statutory Grants 83.49 9.90 2.66 21.34 22.36 18.16 13.69 23.48
c Others 91.58 1.18 0.23 2.96 58.44 4.07 1.15 7.57
Y Total Capital Receipts (E+F+G)) 42.74 12.20 6.27 17.73 26.37 34.42 21.16 45.40
E Internal Debt 22.28 4.26 2.95 5.62 56.71 4.53 3.06 9.08 F Loans and Advances from the Centre (1 to 6) 62.30 7.87 3.20 13.44 31.55 29.86 17.88 42.14
1 State Plan Schemes 29.09 3.87 2.55 5.12 15.79 3.22 2.84 3.79
2 Central Plan Schemes 221.09 0.18 0.00 0.87 - 0.00 0.00 0.00
3 Centrally Sponsored Schemes 115.60 0.09 0.01 0.26 50.58 0.07 0.03 0.10
4 Non-Plan (a to c) 79.33 0.86 0.01 1.56 137.60 7.43 0.01 21.15
a Share of Small Savings 88.08 0.65 0.00 1.27 223.61 0.00 0.00 0.01
b Relief for Natural Calamities - 0.00 0.00 0.00 - 0.00 0.00 0.00
c Others 58.45 0.21 0.01 0.30 137.64 7.43 0.00 21.15
5 W&M Advances from Centre 132.27 2.85 0.00 7.80 30.27 19.11 11.46 24.96
6 Loans for Special Schemes 136.42 0.02 0.00 0.07 62.01 0.03 0.01 0.05
G Recovery of Loans and Advances 49.99 0.07 0.04 0.12 31.96 0.03 0.02 0.04
Meghalaya Total Receipts (1+2) or (X+Y) 0.00 100.00 100.00 100.00 0.00 100.00 100.00 100.00
1 Revenue from Internal Source (A+C+E+G) 18.80 23.73 18.77 30.49 13.02 28.87 24.46 33.95
2 Revenue from External Sources (B+D+F) 5.85 76.27 69.51 81.23 5.28 71.13 66.05 75.54 X Total Revenues Receipts(I+II) 3.97 88.17 84.31 91.48 5.43 82.59 78.61 88.06
I Tax Revenues (A+B) 15.02 38.31 30.23 46.26 8.43 22.48 19.66 24.85
A State’s Own Tax Revenue 3.74 9.18 8.86 9.65 8.36 9.88 8.87 10.83
B Share in Central Taxes 19.24 29.13 21.36 36.81 9.18 12.59 10.79 14.02
II Non-Tax Revenue (C+D) 15.40 49.87 43.19 61.25 7.63 60.12 55.73 66.06
C State’s Own Non-Tax Revenue 36.14 6.65 3.83 9.35 9.58 6.78 5.68 7.27
D Grants from the Centre (1 to 5) 15.70 43.21 36.30 52.30 8.72 53.34 48.73 59.32
1 State Plan Schemes 6.12 28.72 26.43 30.82 8.52 25.40 22.86 28.56
2 Central Plan Schemes 78.61 0.77 0.26 1.45 73.47 0.15 0.04 0.32
3 Centrally Sponsored Schemes 22.60 3.41 2.67 4.65 14.16 4.52 3.47 5.22
4 NEC/ Special Plan Scheme 62.52 0.60 0.36 1.26 27.11 0.91 0.68 1.24
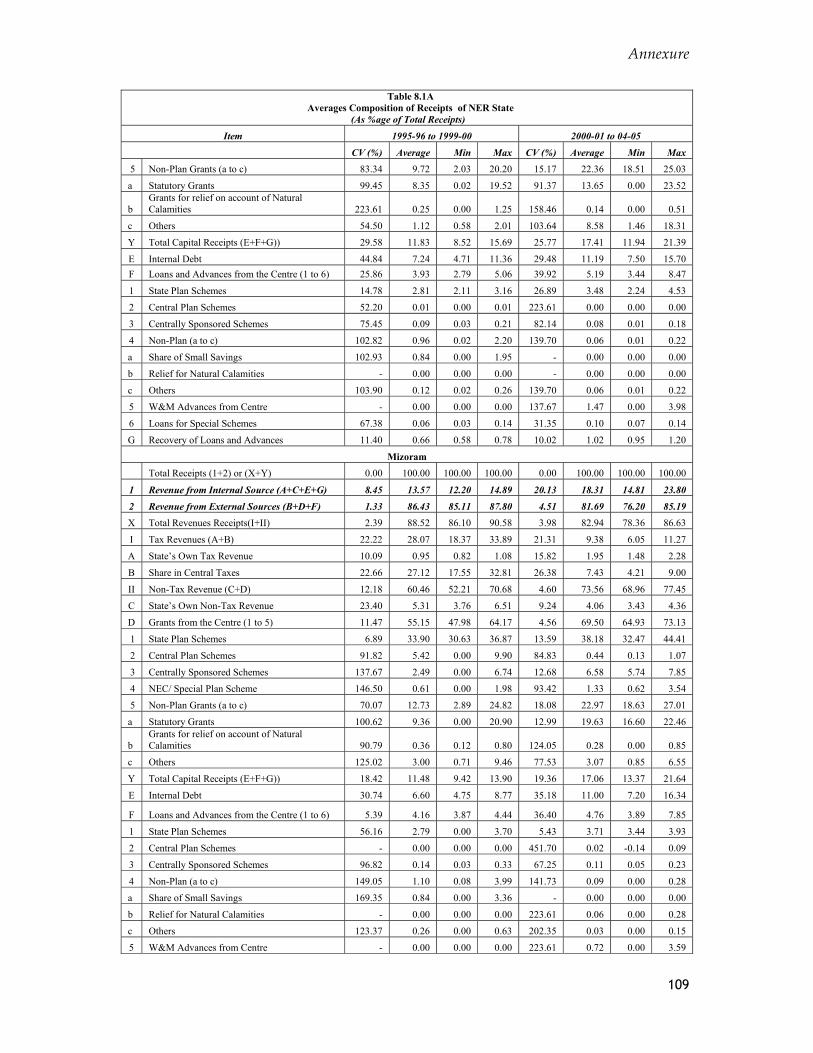
Annexure
109
Table 8.1A Averages Composition of Receipts of NER State
(As %age of Total Receipts)
Item 1995-96 to 1999-00 2000-01 to 04-05
CV (%) Average Min Max CV (%) Average Min Max 5 Non-Plan Grants (a to c) 83.34 9.72 2.03 20.20 15.17 22.36 18.51 25.03
a Statutory Grants 99.45 8.35 0.02 19.52 91.37 13.65 0.00 23.52
b Grants for relief on account of Natural Calamities 223.61 0.25 0.00 1.25 158.46 0.14 0.00 0.51
c Others 54.50 1.12 0.58 2.01 103.64 8.58 1.46 18.31
Y Total Capital Receipts (E+F+G)) 29.58 11.83 8.52 15.69 25.77 17.41 11.94 21.39
E Internal Debt 44.84 7.24 4.71 11.36 29.48 11.19 7.50 15.70 F Loans and Advances from the Centre (1 to 6) 25.86 3.93 2.79 5.06 39.92 5.19 3.44 8.47
1 State Plan Schemes 14.78 2.81 2.11 3.16 26.89 3.48 2.24 4.53
2 Central Plan Schemes 52.20 0.01 0.00 0.01 223.61 0.00 0.00 0.00
3 Centrally Sponsored Schemes 75.45 0.09 0.03 0.21 82.14 0.08 0.01 0.18
4 Non-Plan (a to c) 102.82 0.96 0.02 2.20 139.70 0.06 0.01 0.22
a Share of Small Savings 102.93 0.84 0.00 1.95 - 0.00 0.00 0.00
b Relief for Natural Calamities - 0.00 0.00 0.00 - 0.00 0.00 0.00
c Others 103.90 0.12 0.02 0.26 139.70 0.06 0.01 0.22
5 W&M Advances from Centre - 0.00 0.00 0.00 137.67 1.47 0.00 3.98
6 Loans for Special Schemes 67.38 0.06 0.03 0.14 31.35 0.10 0.07 0.14
G Recovery of Loans and Advances 11.40 0.66 0.58 0.78 10.02 1.02 0.95 1.20
Mizoram Total Receipts (1+2) or (X+Y) 0.00 100.00 100.00 100.00 0.00 100.00 100.00 100.00
1 Revenue from Internal Source (A+C+E+G) 8.45 13.57 12.20 14.89 20.13 18.31 14.81 23.80
2 Revenue from External Sources (B+D+F) 1.33 86.43 85.11 87.80 4.51 81.69 76.20 85.19 X Total Revenues Receipts(I+II) 2.39 88.52 86.10 90.58 3.98 82.94 78.36 86.63
I Tax Revenues (A+B) 22.22 28.07 18.37 33.89 21.31 9.38 6.05 11.27
A State’s Own Tax Revenue 10.09 0.95 0.82 1.08 15.82 1.95 1.48 2.28
B Share in Central Taxes 22.66 27.12 17.55 32.81 26.38 7.43 4.21 9.00
II Non-Tax Revenue (C+D) 12.18 60.46 52.21 70.68 4.60 73.56 68.96 77.45
C State’s Own Non-Tax Revenue 23.40 5.31 3.76 6.51 9.24 4.06 3.43 4.36
D Grants from the Centre (1 to 5) 11.47 55.15 47.98 64.17 4.56 69.50 64.93 73.13
1 State Plan Schemes 6.89 33.90 30.63 36.87 13.59 38.18 32.47 44.41
2 Central Plan Schemes 91.82 5.42 0.00 9.90 84.83 0.44 0.13 1.07
3 Centrally Sponsored Schemes 137.67 2.49 0.00 6.74 12.68 6.58 5.74 7.85
4 NEC/ Special Plan Scheme 146.50 0.61 0.00 1.98 93.42 1.33 0.62 3.54
5 Non-Plan Grants (a to c) 70.07 12.73 2.89 24.82 18.08 22.97 18.63 27.01
a Statutory Grants 100.62 9.36 0.00 20.90 12.99 19.63 16.60 22.46
b Grants for relief on account of Natural Calamities 90.79 0.36 0.12 0.80 124.05 0.28 0.00 0.85
c Others 125.02 3.00 0.71 9.46 77.53 3.07 0.85 6.55
Y Total Capital Receipts (E+F+G)) 18.42 11.48 9.42 13.90 19.36 17.06 13.37 21.64
E Internal Debt 30.74 6.60 4.75 8.77 35.18 11.00 7.20 16.34
F Loans and Advances from the Centre (1 to 6) 5.39 4.16 3.87 4.44 36.40 4.76 3.89 7.85
1 State Plan Schemes 56.16 2.79 0.00 3.70 5.43 3.71 3.44 3.93
2 Central Plan Schemes - 0.00 0.00 0.00 451.70 0.02 -0.14 0.09
3 Centrally Sponsored Schemes 96.82 0.14 0.03 0.33 67.25 0.11 0.05 0.23
4 Non-Plan (a to c) 149.05 1.10 0.08 3.99 141.73 0.09 0.00 0.28
a Share of Small Savings 169.35 0.84 0.00 3.36 - 0.00 0.00 0.00
b Relief for Natural Calamities - 0.00 0.00 0.00 223.61 0.06 0.00 0.28
c Others 123.37 0.26 0.00 0.63 202.35 0.03 0.00 0.15
5 W&M Advances from Centre - 0.00 0.00 0.00 223.61 0.72 0.00 3.59
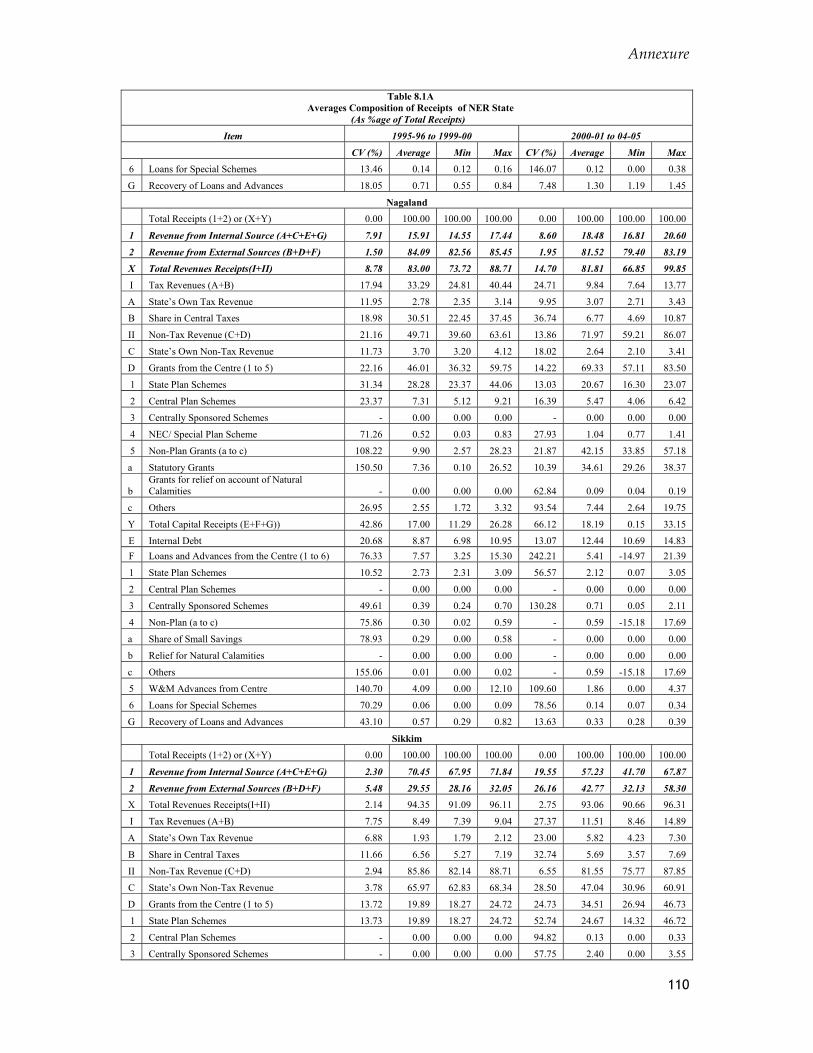
Annexure
110
Table 8.1A Averages Composition of Receipts of NER State
(As %age of Total Receipts)
Item 1995-96 to 1999-00 2000-01 to 04-05
CV (%) Average Min Max CV (%) Average Min Max 6 Loans for Special Schemes 13.46 0.14 0.12 0.16 146.07 0.12 0.00 0.38
G Recovery of Loans and Advances 18.05 0.71 0.55 0.84 7.48 1.30 1.19 1.45
Nagaland Total Receipts (1+2) or (X+Y) 0.00 100.00 100.00 100.00 0.00 100.00 100.00 100.00
1 Revenue from Internal Source (A+C+E+G) 7.91 15.91 14.55 17.44 8.60 18.48 16.81 20.60
2 Revenue from External Sources (B+D+F) 1.50 84.09 82.56 85.45 1.95 81.52 79.40 83.19
X Total Revenues Receipts(I+II) 8.78 83.00 73.72 88.71 14.70 81.81 66.85 99.85
I Tax Revenues (A+B) 17.94 33.29 24.81 40.44 24.71 9.84 7.64 13.77
A State’s Own Tax Revenue 11.95 2.78 2.35 3.14 9.95 3.07 2.71 3.43
B Share in Central Taxes 18.98 30.51 22.45 37.45 36.74 6.77 4.69 10.87
II Non-Tax Revenue (C+D) 21.16 49.71 39.60 63.61 13.86 71.97 59.21 86.07
C State’s Own Non-Tax Revenue 11.73 3.70 3.20 4.12 18.02 2.64 2.10 3.41
D Grants from the Centre (1 to 5) 22.16 46.01 36.32 59.75 14.22 69.33 57.11 83.50
1 State Plan Schemes 31.34 28.28 23.37 44.06 13.03 20.67 16.30 23.07
2 Central Plan Schemes 23.37 7.31 5.12 9.21 16.39 5.47 4.06 6.42
3 Centrally Sponsored Schemes - 0.00 0.00 0.00 - 0.00 0.00 0.00
4 NEC/ Special Plan Scheme 71.26 0.52 0.03 0.83 27.93 1.04 0.77 1.41
5 Non-Plan Grants (a to c) 108.22 9.90 2.57 28.23 21.87 42.15 33.85 57.18
a Statutory Grants 150.50 7.36 0.10 26.52 10.39 34.61 29.26 38.37
b Grants for relief on account of Natural Calamities - 0.00 0.00 0.00 62.84 0.09 0.04 0.19
c Others 26.95 2.55 1.72 3.32 93.54 7.44 2.64 19.75
Y Total Capital Receipts (E+F+G)) 42.86 17.00 11.29 26.28 66.12 18.19 0.15 33.15
E Internal Debt 20.68 8.87 6.98 10.95 13.07 12.44 10.69 14.83 F Loans and Advances from the Centre (1 to 6) 76.33 7.57 3.25 15.30 242.21 5.41 -14.97 21.39
1 State Plan Schemes 10.52 2.73 2.31 3.09 56.57 2.12 0.07 3.05
2 Central Plan Schemes - 0.00 0.00 0.00 - 0.00 0.00 0.00
3 Centrally Sponsored Schemes 49.61 0.39 0.24 0.70 130.28 0.71 0.05 2.11
4 Non-Plan (a to c) 75.86 0.30 0.02 0.59 - 0.59 -15.18 17.69
a Share of Small Savings 78.93 0.29 0.00 0.58 - 0.00 0.00 0.00
b Relief for Natural Calamities - 0.00 0.00 0.00 - 0.00 0.00 0.00
c Others 155.06 0.01 0.00 0.02 - 0.59 -15.18 17.69
5 W&M Advances from Centre 140.70 4.09 0.00 12.10 109.60 1.86 0.00 4.37
6 Loans for Special Schemes 70.29 0.06 0.00 0.09 78.56 0.14 0.07 0.34
G Recovery of Loans and Advances 43.10 0.57 0.29 0.82 13.63 0.33 0.28 0.39
Sikkim Total Receipts (1+2) or (X+Y) 0.00 100.00 100.00 100.00 0.00 100.00 100.00 100.00
1 Revenue from Internal Source (A+C+E+G) 2.30 70.45 67.95 71.84 19.55 57.23 41.70 67.87
2 Revenue from External Sources (B+D+F) 5.48 29.55 28.16 32.05 26.16 42.77 32.13 58.30 X Total Revenues Receipts(I+II) 2.14 94.35 91.09 96.11 2.75 93.06 90.66 96.31
I Tax Revenues (A+B) 7.75 8.49 7.39 9.04 27.37 11.51 8.46 14.89
A State’s Own Tax Revenue 6.88 1.93 1.79 2.12 23.00 5.82 4.23 7.30
B Share in Central Taxes 11.66 6.56 5.27 7.19 32.74 5.69 3.57 7.69
II Non-Tax Revenue (C+D) 2.94 85.86 82.14 88.71 6.55 81.55 75.77 87.85
C State’s Own Non-Tax Revenue 3.78 65.97 62.83 68.34 28.50 47.04 30.96 60.91
D Grants from the Centre (1 to 5) 13.72 19.89 18.27 24.72 24.73 34.51 26.94 46.73
1 State Plan Schemes 13.73 19.89 18.27 24.72 52.74 24.67 14.32 46.72
2 Central Plan Schemes - 0.00 0.00 0.00 94.82 0.13 0.00 0.33
3 Centrally Sponsored Schemes - 0.00 0.00 0.00 57.75 2.40 0.00 3.55
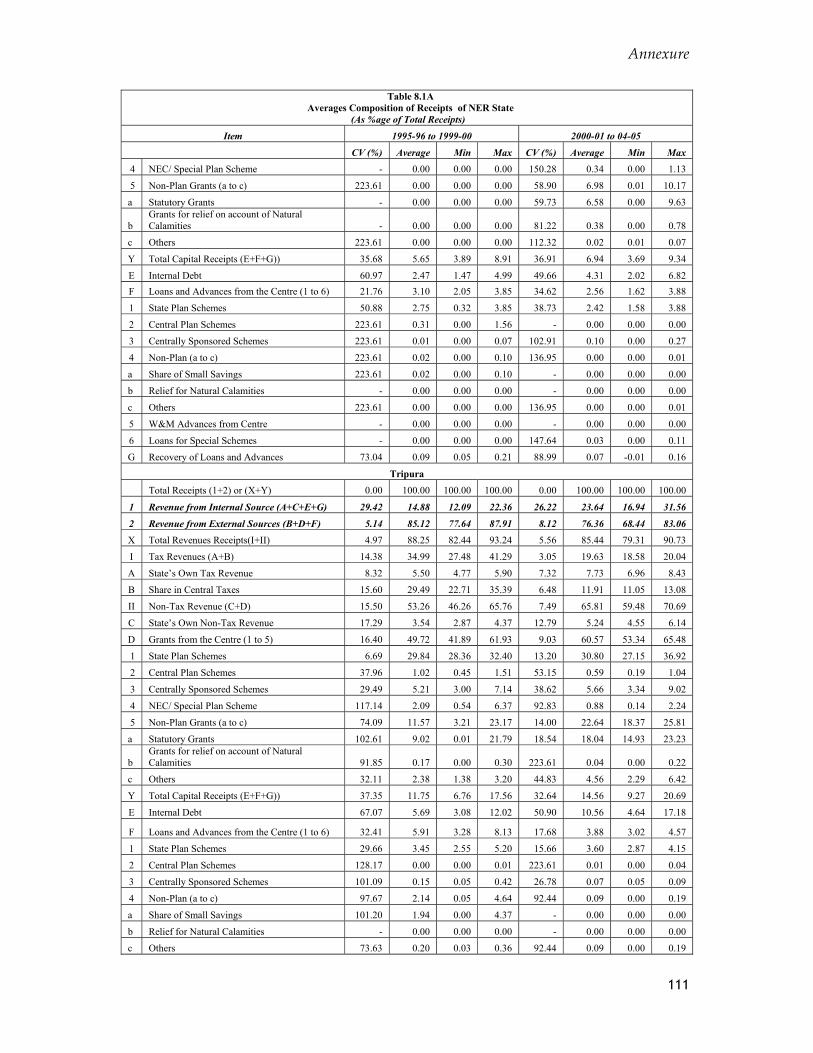
Annexure
111
Table 8.1A Averages Composition of Receipts of NER State
(As %age of Total Receipts)
Item 1995-96 to 1999-00 2000-01 to 04-05
CV (%) Average Min Max CV (%) Average Min Max 4 NEC/ Special Plan Scheme - 0.00 0.00 0.00 150.28 0.34 0.00 1.13
5 Non-Plan Grants (a to c) 223.61 0.00 0.00 0.00 58.90 6.98 0.01 10.17
a Statutory Grants - 0.00 0.00 0.00 59.73 6.58 0.00 9.63
b Grants for relief on account of Natural Calamities - 0.00 0.00 0.00 81.22 0.38 0.00 0.78
c Others 223.61 0.00 0.00 0.00 112.32 0.02 0.01 0.07
Y Total Capital Receipts (E+F+G)) 35.68 5.65 3.89 8.91 36.91 6.94 3.69 9.34
E Internal Debt 60.97 2.47 1.47 4.99 49.66 4.31 2.02 6.82 F Loans and Advances from the Centre (1 to 6) 21.76 3.10 2.05 3.85 34.62 2.56 1.62 3.88
1 State Plan Schemes 50.88 2.75 0.32 3.85 38.73 2.42 1.58 3.88
2 Central Plan Schemes 223.61 0.31 0.00 1.56 - 0.00 0.00 0.00
3 Centrally Sponsored Schemes 223.61 0.01 0.00 0.07 102.91 0.10 0.00 0.27
4 Non-Plan (a to c) 223.61 0.02 0.00 0.10 136.95 0.00 0.00 0.01
a Share of Small Savings 223.61 0.02 0.00 0.10 - 0.00 0.00 0.00
b Relief for Natural Calamities - 0.00 0.00 0.00 - 0.00 0.00 0.00
c Others 223.61 0.00 0.00 0.00 136.95 0.00 0.00 0.01
5 W&M Advances from Centre - 0.00 0.00 0.00 - 0.00 0.00 0.00
6 Loans for Special Schemes - 0.00 0.00 0.00 147.64 0.03 0.00 0.11
G Recovery of Loans and Advances 73.04 0.09 0.05 0.21 88.99 0.07 -0.01 0.16
Tripura Total Receipts (1+2) or (X+Y) 0.00 100.00 100.00 100.00 0.00 100.00 100.00 100.00
1 Revenue from Internal Source (A+C+E+G) 29.42 14.88 12.09 22.36 26.22 23.64 16.94 31.56
2 Revenue from External Sources (B+D+F) 5.14 85.12 77.64 87.91 8.12 76.36 68.44 83.06 X Total Revenues Receipts(I+II) 4.97 88.25 82.44 93.24 5.56 85.44 79.31 90.73
I Tax Revenues (A+B) 14.38 34.99 27.48 41.29 3.05 19.63 18.58 20.04
A State’s Own Tax Revenue 8.32 5.50 4.77 5.90 7.32 7.73 6.96 8.43
B Share in Central Taxes 15.60 29.49 22.71 35.39 6.48 11.91 11.05 13.08
II Non-Tax Revenue (C+D) 15.50 53.26 46.26 65.76 7.49 65.81 59.48 70.69
C State’s Own Non-Tax Revenue 17.29 3.54 2.87 4.37 12.79 5.24 4.55 6.14
D Grants from the Centre (1 to 5) 16.40 49.72 41.89 61.93 9.03 60.57 53.34 65.48
1 State Plan Schemes 6.69 29.84 28.36 32.40 13.20 30.80 27.15 36.92
2 Central Plan Schemes 37.96 1.02 0.45 1.51 53.15 0.59 0.19 1.04
3 Centrally Sponsored Schemes 29.49 5.21 3.00 7.14 38.62 5.66 3.34 9.02
4 NEC/ Special Plan Scheme 117.14 2.09 0.54 6.37 92.83 0.88 0.14 2.24
5 Non-Plan Grants (a to c) 74.09 11.57 3.21 23.17 14.00 22.64 18.37 25.81
a Statutory Grants 102.61 9.02 0.01 21.79 18.54 18.04 14.93 23.23
b Grants for relief on account of Natural Calamities 91.85 0.17 0.00 0.30 223.61 0.04 0.00 0.22
c Others 32.11 2.38 1.38 3.20 44.83 4.56 2.29 6.42
Y Total Capital Receipts (E+F+G)) 37.35 11.75 6.76 17.56 32.64 14.56 9.27 20.69
E Internal Debt 67.07 5.69 3.08 12.02 50.90 10.56 4.64 17.18
F Loans and Advances from the Centre (1 to 6) 32.41 5.91 3.28 8.13 17.68 3.88 3.02 4.57
1 State Plan Schemes 29.66 3.45 2.55 5.20 15.66 3.60 2.87 4.15
2 Central Plan Schemes 128.17 0.00 0.00 0.01 223.61 0.01 0.00 0.04
3 Centrally Sponsored Schemes 101.09 0.15 0.05 0.42 26.78 0.07 0.05 0.09
4 Non-Plan (a to c) 97.67 2.14 0.05 4.64 92.44 0.09 0.00 0.19
a Share of Small Savings 101.20 1.94 0.00 4.37 - 0.00 0.00 0.00
b Relief for Natural Calamities - 0.00 0.00 0.00 - 0.00 0.00 0.00
c Others 73.63 0.20 0.03 0.36 92.44 0.09 0.00 0.19
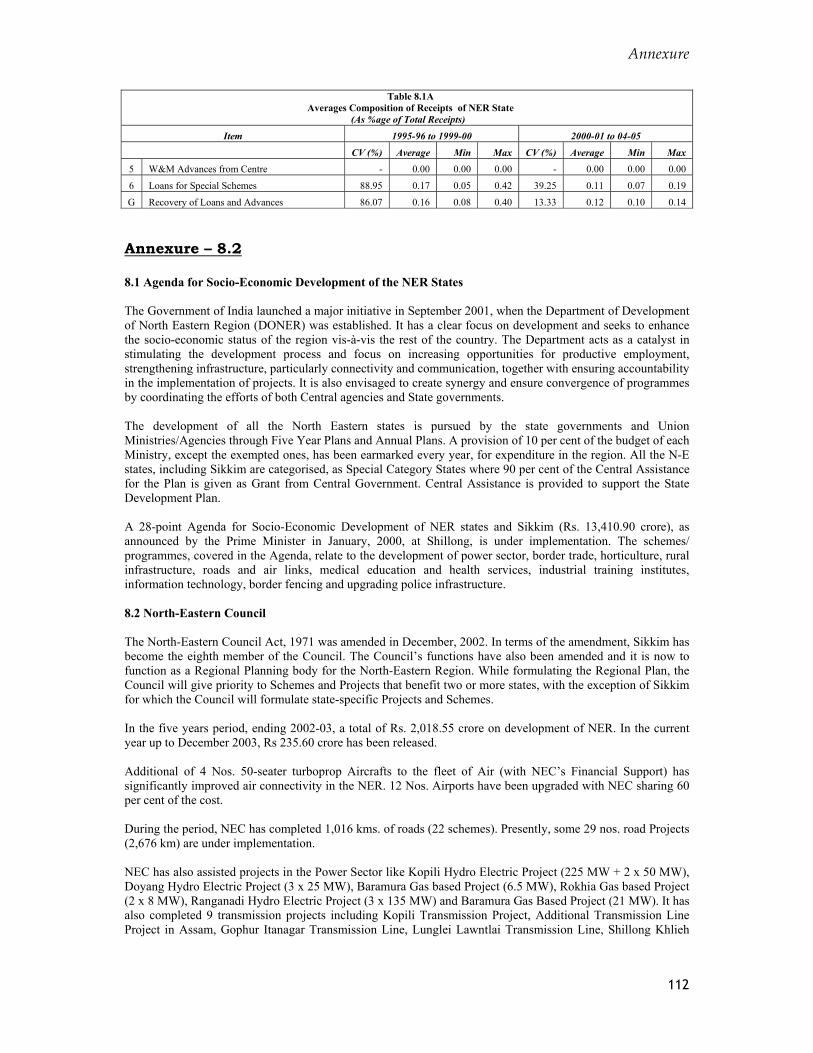
Annexure
112
Table 8.1A Averages Composition of Receipts of NER State
(As %age of Total Receipts)
Item 1995-96 to 1999-00 2000-01 to 04-05
CV (%) Average Min Max CV (%) Average Min Max 5 W&M Advances from Centre - 0.00 0.00 0.00 - 0.00 0.00 0.00
6 Loans for Special Schemes 88.95 0.17 0.05 0.42 39.25 0.11 0.07 0.19
G Recovery of Loans and Advances 86.07 0.16 0.08 0.40 13.33 0.12 0.10 0.14
Annexure – 8.2 8.1 Agenda for Socio-Economic Development of the NER States The Government of India launched a major initiative in September 2001, when the Department of Development of North Eastern Region (DONER) was established. It has a clear focus on development and seeks to enhance the socio-economic status of the region vis-à-vis the rest of the country. The Department acts as a catalyst in stimulating the development process and focus on increasing opportunities for productive employment, strengthening infrastructure, particularly connectivity and communication, together with ensuring accountability in the implementation of projects. It is also envisaged to create synergy and ensure convergence of programmes by coordinating the efforts of both Central agencies and State governments.
The development of all the North Eastern states is pursued by the state governments and Union Ministries/Agencies through Five Year Plans and Annual Plans. A provision of 10 per cent of the budget of each Ministry, except the exempted ones, has been earmarked every year, for expenditure in the region. All the N-E states, including Sikkim are categorised, as Special Category States where 90 per cent of the Central Assistance for the Plan is given as Grant from Central Government. Central Assistance is provided to support the State Development Plan.
A 28-point Agenda for Socio-Economic Development of NER states and Sikkim (Rs. 13,410.90 crore), as announced by the Prime Minister in January, 2000, at Shillong, is under implementation. The schemes/ programmes, covered in the Agenda, relate to the development of power sector, border trade, horticulture, rural infrastructure, roads and air links, medical education and health services, industrial training institutes, information technology, border fencing and upgrading police infrastructure.
8.2 North-Eastern Council The North-Eastern Council Act, 1971 was amended in December, 2002. In terms of the amendment, Sikkim has become the eighth member of the Council. The Council’s functions have also been amended and it is now to function as a Regional Planning body for the North-Eastern Region. While formulating the Regional Plan, the Council will give priority to Schemes and Projects that benefit two or more states, with the exception of Sikkim for which the Council will formulate state-specific Projects and Schemes.
In the five years period, ending 2002-03, a total of Rs. 2,018.55 crore on development of NER. In the current year up to December 2003, Rs 235.60 crore has been released.
Additional of 4 Nos. 50-seater turboprop Aircrafts to the fleet of Air (with NEC’s Financial Support) has significantly improved air connectivity in the NER. 12 Nos. Airports have been upgraded with NEC sharing 60 per cent of the cost.
During the period, NEC has completed 1,016 kms. of roads (22 schemes). Presently, some 29 nos. road Projects (2,676 km) are under implementation.
NEC has also assisted projects in the Power Sector like Kopili Hydro Electric Project (225 MW + 2 x 50 MW), Doyang Hydro Electric Project (3 x 25 MW), Baramura Gas based Project (6.5 MW), Rokhia Gas based Project (2 x 8 MW), Ranganadi Hydro Electric Project (3 x 135 MW) and Baramura Gas Based Project (21 MW). It has also completed 9 transmission projects including Kopili Transmission Project, Additional Transmission Line Project in Assam, Gophur Itanagar Transmission Line, Lunglei Lawntlai Transmission Line, Shillong Khlieh
Annexure
113
Riati Transmission Line, Reactors at Samaguri and Marjani, Kohima Doyang Transmission Line and the Ranganadi and Doyang Transmission systems.
NEC plans to initiate additional 5 projects during the X Plan including the Baramura Gas based Thermal Project (21 MW), Lakwa Waste Heat Recovery Project (38 MW), Korbi Nangpi (2 x 50 MW) and Bairabi Hydro Electric Project (2 x 40 MW). It also proposes to undertake construction of power transmission and distribution lines, (132 x 11 KVA and 133 x 11 KVA). Tele-Medicine Network is being set-up through NEC to provide state-of-the-art, specially health-care facilities to a large number of patients using Information & Communications Technology to connect Regional Medical Institutes and District Hospitals with expert consultants in different parts of the country. The project will cover all state and district headquarters in 3 phases.
8.3 Non-Lapsable Central Pool of Resources (NLCPR) The NER has essentially depended on central funding for development works. All the States in the NER are Special Category States whose Development Plans are centrally financed on the basis of 90 percent grant and 10 percent loan. Further, the Special Category States are allowed to use up to 20 percent of the Central Assistance for non-plan expenditure.
Despite the fact that the per capita plan outlays of the NER states have, over a period of time, been considerably higher than the national average, the states still rank significantly below the national average insofar as the development of infrastructure is concerned. In terms of per capita State Domestic Product or other development indices, such as power, length of roads or hospital beds, the NER ranks well below the national average. Though the literacy levels are higher than the national average, vocational training and entrepreneurial skills remain weak areas.
As the benefits of economic development have yet to steadily accrue to the region, efforts have been initiated in this direction in the recent past through various supportive measures. In October 1996, the then Prime Minister announced "New Initiatives for North Eastern Region" and stipulated that at least 10 percent of the Budget(s) of the Central Ministries/ Department will be earmarked for the development of NER states.” A preliminary exercise undertaken by the Planning Commission in consultation with the various Ministries/ Department revealed that the expenditure on the NER by some Union Ministries during 1997-98 fell short of the stipulated 10 percent of the GBS for that year. Planning Commission thereafter explored the possibility of creating a Central Pool of Resources for the NER out of the unspent amount of stipulated 10 percent of GBS to support infrastructure development projects in the NER.
A proposal was mooted by the Planning Commission to the Cabinet for constitution of such a Central Pool of Resources. The Cabinet approved the approach, in principle, on 15th December 1997, observing that the creation of the Central Resources Pool would require Parliamentary approval and would have to await constitution of the Twelfth Lok Sabha. The Central Pool therefore, could not be constituted in 1997-98.
Following the Lok Sabha elections earlier in the year 1998, the matter relating to creation of the Central Pool of Resources was pursued in consultation with the Ministry of Finance. The Prime Minister convened a Meeting of the Chief Ministers of the NER states on 8th May 1998 when, inter alia, it was indicated that a Non-lapsable Central Pool of Resources (NLCPR) for the funding of specific projects in these states would be created. The relevant paragraph from the Prime Minister's speech reads as under:
"We are examining the feasibility of creating a Central Pool of Resources (CPR) which, in turn, will give critical additional support for an accelerated implementation of projects in the entire region. This pool, created from the unspent balance of the allocated expenditure of 10 percent of the budgets of the concerned Central Ministries, could well amount to around Rs.1500 crore annually."
This commitment of the Government was also reflected in the Speech of the Finance Minister while presenting the Union Budget for the year, 1998-99. The relevant paragraphs from the Budget Speech are reproduced below:
"Furthermore, it has been decided that a non-lapsable Central Resources Pool will be created for deposit of funds from all Ministries where the plan expenditure on the North Eastern Region is less than 10 per cent of the total plan allocation of the Ministry. The difference between 10 per cent of the allocation and the actual expenditure incurred on the North
Annexure
114
Eastern Region will be transferred to the Central Pool, which will be used for funding specific programmes for economic and social upliftment of the North Eastern States."
Further, as part of the budget proposals 1998-99, it was announced that: "It has been decided that all Central Ministries/Departments should earmark at least 10 percent of their budget for specific programme of development in the North Eastern Region. To the extent of shortfall in the utilization of this provision by any Ministry/Department (except some exempted ones) according to this norm, the amount would be transferred to a new Reserve Fund in the Public Account titled 'Central Resource Pool for development of North Eastern Region'. Presently, a token provision of Rs.1 crore is being made for transfer to the fund. In Budget 1997-98, such short provision was assessed to be about Rs.1,600 crore. A similar exercise for analyzing the provisions in Central Plan specific to the North Eastern Region in Budget 1998-99 would be carried out and the Resources Pool would be enhanced at Revised Estimates stage to the extent of shortfall from the 10 percent norm."
The Union Budget 1998-99 was voted and passed by Parliament. With that, the Non-lapsable Central Pool of Resources was constituted with approval of Parliament. In the conference of Governors and Chief Ministers of the NER states held in January 2000 at Shillong the Prime Minister stated the objectives of the Non-lapsable Central Pool of Resources. The relevant paragraph from Prime Minister's Speech is:
"My Government has also created a pool of non-lapsable funds for the North-East and Sikkim. This pool, meant for funding development projects in these States, will fill the resource gap in creation of new infrastructure, which is a top priority concern of the Union Government.…"
The broad objective of the NLCPR scheme is to ensure speedy development of infrastructure in the NER by increasing the flow of budgetary financing for new infrastructure projects/schemes in the Region. Both physical and social infrastructure sectors such as irrigation and flood control, power, roads and bridges, education, health, water supply and sanitation - are considered for providing support under the this Pool, with projects in physical infrastructure sector receiving priority.
Funds from the NLCPR can be released for state sector as well as Central sector projects/ schemes. However the funds available under this Pool are not meant to supplement the normal Plan programmes either of the state governments or Union Ministries/ Departments/ Agencies.
8.4 Institutional Arrangement to Administer the NLCPR Funds During the year, the institutional arrangements for administering the NLCPR have been streamlined. The guidelines to administer the Pool have been revised. The Committee to administer the NLCPR has been reconstituted. The reconstituted Committee is headed by Secretary, Ministry of Development of NER and has representation from Ministries of Finance, Home Affairs and Planning Commission. Financial Advisor to the Ministry of Development of NER has been included as a member. Representatives of Union Ministry/ Departments, whose proposals are to be considered in a particular sitting for funding under NLCPR, are also invited.
For identification of projects under NLCPR, states are asked to submit a prioritized list of projects. The earlier practice of receiving projects throughout the year directly from the various state departments concerned has been stopped. Now the Planning and Development Department of the state concerned is the nodal department for NLCPR and that department is DoNER's interface with all other departments of the state. The priority accorded by the state to the projects in the 'priority list' is only a suggestive and the Committee scrutinizes the projects in the lists in order to identify and finally retain the suitable projects for detailed examination. In examining the priority, the committee is, inter-alia, guided by considerations such as:
(a) Projects of economic infrastructure is given priority; (b) In the social sector, priority to drinking water supply and other health and sanitation projects; (c) Projects in Autonomous district Council (VI Schedule of the Constitution) is given priority; (d) Past performance of a state in implementing projects in the particular sectors to which the projects
belong is also considered; (e) The overall utilisation and absorption of funds by a particular state in the past years also guide the
overall quantum of projects to be undertaken for that state in a year.

Annexure
115
Detailed Project Report(s) for such retained projects are then prepared by the state concerned. These project proposals are thereafter examined in consultation with the concerned Central Ministry/ Department. The recommendations/ views, thus received are place before the Committee to administer the NLCPR, which considers the proposal and accords approval.
After approval of the Committee, funds are sanctioned and released by the Ministry of Development of NER on submission of an implementation schedule. Subsequent releases are made only after receipt of Utilisation Certificate of earlier releases.
Major Projects
1. Itanagar Water Supply Scheme in Arunachal Pradesh The project started on March 31, 1999. The cost of the project is Rs. 14.50 crore. Out of this, NLCPR contribution is Rs. 10.59 crore. The project has been completed and commissioned on June 17, 2001. The present capacity of the project is 7 MLD, which is sufficient to cater the need of the local population. For the first time, the treated drinking water ahs become available to the residents of Itanagar town.
2. Samridha Krishak Yojana in Assam This Scheme started in October 1999, for installation of one lakh shallow tube wells in the state. The Government of India supported the project under NCLPR to the extent of Rs. 70.47 crore out of the total cost of Rs. 221.21 crore. The remaining cost of the project was met from NABARD (Rs. 76.67 crore) and from the beneficiaries (Rs. 74.07 crore). The project has covered 18 districts in Assam. The project had been completed in March, 2002. Additional gross area brought under irrigation by shallow tube wells is 5 lakh hectares. Production of paddy has increased 11.5 per cent of total paddy production and additional production of non-paddy rabi crop has increased 6.9 per cent of the gross production. About 1,89,000 nos. of additional employment opportunities have been created in the state by the scheme.
3. Greater Shillong Water Supply Scheme in Meghalaya The project was started since 1997. The estimated cost is Rs. 95.04 crore. The scheme was initiated by the state government from the State Plan Resources and by raising LIC loans. Rs. 77.09 crore has been incurred on the project. Out of this, Rs. 23.29 crore has been released under NLCPR. The project is expected to be completed shortly.
4. Thermal Power Project at Bairabi in Mizoram The project started during 2001-02. The cost of the project is Rs. 85.95 crore to be entirely met under NLCPR. Rupees 75.31 crore has already been released. The project is expected to be completed shortly. The project would able to meet the peek demand on completion.
5. Thermal Power Project at Rokhia in Tripura (Unit VII) The project started during 1999-2000. The cost of the project is Rs. 85.17 crore. The entire cost of the project has been met under NLCPR. The project has been commissioned in September, 2002, within the stipulated time period.
6. Thermal Power Project at Rokhia in Tripura (Unit VIII) The project has been recommended for sanction under NLCPR in November 2003. The project cost is Rs 80.94 crore. The project has contributed to a large extent to minimise the gap of power demand in the state. Advocacy and capacity building for the region has also been a special focus of the Department.
7. Other Initiatives for Development of the Region 487 block level Community Information Centres (CICs) have been set up to connect the Region via V-Sat with the rest of the world. The towns and cities of Itanagar, Tinsukhia, Dimapur, Shillong, Silchar and Guwahati have been connected to Kolkata by Optical Fibre Cable network.
• Out of 450 kms extension planned this year, 300 kms has already been completed; • Conversion work to broad gauge has been taken up from December, 2002, in New Jalpaiguri to
New Bongaigaon section; • The Prime Minister laid the foundation stone for Bogibeel Bridge over river Brahmaputra near
Dibrugarh on April 21, 2002 (Project cost Rs. 1,771.26 crore);
Annexure
116
• Rail link between Kumarghat and Manu in Tripura has been made operational; • Work at Naga Hospital resumed at the intervention of DONER; • Negotiations have been started with private hospitals for operationalisation of Dimapur Referral
hospital; and • Environmental clearance has been received for Myntdu-Leshka HEP Meghalaya.
Training programmes have been arranged for youth in association with Department of Information Technology (NIC & DOEACC), Indian Institute of Entrepreneurship, National Institute of Fashion Technology (NIFT) and SEWA etc. 8.5 Scope for Carbon Trading in NER Since the NER is gifted with a large forest cover, this form of income generation should be explored as much as possible. Forests deliver a multitude of ecosystem benefits, some of which are local or regional (e.g., protection against land slides, from soil erosion, and of local climate and watersheds) and at least two are global benefits in terms of carbon sequestration to mitigate climate change problems, and the protection of bio-diversity. During our meetings with the state officials one of the points that came up in at least three states relates to perception about the potential for carbon finance in the forest sector of the NER. It appears there is a lack of clarity on this issue. In principle, the global benefits of forests should motivate at least some partial payments from organizations such as Global Environment Facility. The Clean Development Mechanism (CDM) under the Kyoto Protocol is a similarly applicable institutional arrangement to capture these benefits in the form of financial flows. However, several tricky questions related to ‘baseline’ and ‘additionality’ arises. To qualify for CDM assistance, the most important requirement relates to the nature of land use prior to 1990. For an area to qualify for CDM funding, it must be demonstrated that it has not had forests since 1990. The issue of additionality arises because donor countries wonder whether the forests ‘saved’ simply replace the other forests that are cut down or whether the forests would have been left standing anyway. Due to this, avoided deforestation is not an eligible option for the CDM whereas afforestation and reforestation are. This has major implications for the NER. First, afforestation can only be pursued in areas which have not been forests or defined as forests for at least 50 years. Second, in order to be eligible for reforestation, areas cannot have had forests after 1990. Land areas that are suitable for CDM reforestation are therefore those that are not forested or do not include degraded forests. This however needs to be pursued and explored further as certain rules of such arrangements are still evolving. Given that there is a trade-off between commercial and conservation benefits of forests, from even the national perspective NER should explore the possibility of resource transfers from the central government for the spillover benefits generated from forest conservation/ opportunity cost of forest conservation. Estimation of these would however require detailed data which are hard to obtain. In this context, it may be noted that the greatest gain in carbon storage and biodiversity, potentially would come from protecting mature marginal frontier forests that would have been harvested without the offset payment. Therefore, payments to protect the full forest are not necessary because the volume at risk is mainly the forests at the margin. This however, should not be taken to underplay the socio-economic logic behind the idea of ‘compensation for conservation’. Compensation should be paid because forest rich states are also the forest dependent states. Loss of revenue from resources they possess affects them in two ways. One, they hardly like to budget for maintaining and enhancing their forest resources as it is not profitable any more besides revenue compression leads to cuts in vital developmental expenditures. Two, since it is the poorest that bear the burden of conservation since their lives are crucially linked to both resources and services the forests provides, social and economic inequities widen and often find expression in extremism.
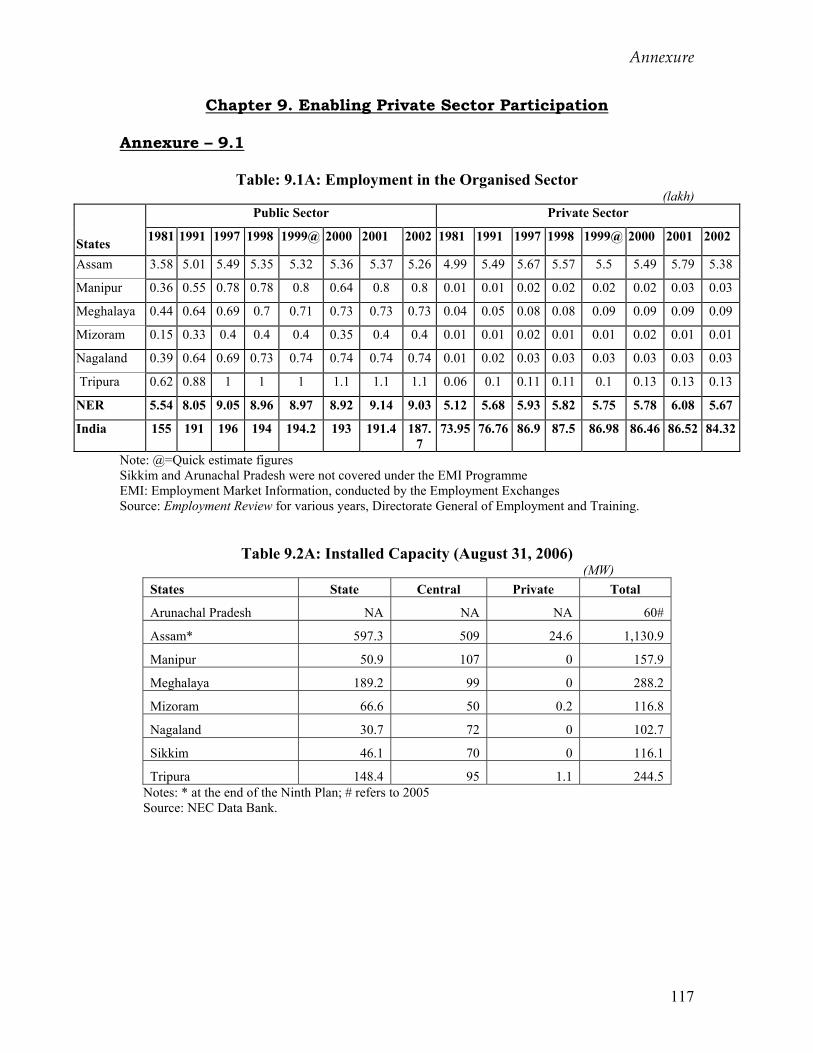
Annexure
117
Chapter 9. Enabling Private Sector Participation Annexure – 9.1
Table: 9.1A: Employment in the Organised Sector
(lakh) Public Sector Private Sector
States 1981 1991 1997 1998 1999@ 2000 2001 2002 1981 1991 1997 1998 1999@ 2000 2001 2002
Assam 3.58 5.01 5.49 5.35 5.32 5.36 5.37 5.26 4.99 5.49 5.67 5.57 5.5 5.49 5.79 5.38
Manipur 0.36 0.55 0.78 0.78 0.8 0.64 0.8 0.8 0.01 0.01 0.02 0.02 0.02 0.02 0.03 0.03
Meghalaya 0.44 0.64 0.69 0.7 0.71 0.73 0.73 0.73 0.04 0.05 0.08 0.08 0.09 0.09 0.09 0.09
Mizoram 0.15 0.33 0.4 0.4 0.4 0.35 0.4 0.4 0.01 0.01 0.02 0.01 0.01 0.02 0.01 0.01
Nagaland 0.39 0.64 0.69 0.73 0.74 0.74 0.74 0.74 0.01 0.02 0.03 0.03 0.03 0.03 0.03 0.03
Tripura 0.62 0.88 1 1 1 1.1 1.1 1.1 0.06 0.1 0.11 0.11 0.1 0.13 0.13 0.13
NER 5.54 8.05 9.05 8.96 8.97 8.92 9.14 9.03 5.12 5.68 5.93 5.82 5.75 5.78 6.08 5.67
India 155 191 196 194 194.2 193 191.4 187.7
73.95 76.76 86.9 87.5 86.98 86.46 86.52 84.32
Note: @=Quick estimate figures Sikkim and Arunachal Pradesh were not covered under the EMI Programme EMI: Employment Market Information, conducted by the Employment Exchanges Source: Employment Review for various years, Directorate General of Employment and Training.
Table 9.2A: Installed Capacity (August 31, 2006) (MW)
States State Central Private Total
Arunachal Pradesh NA NA NA 60#
Assam* 597.3 509 24.6 1,130.9
Manipur 50.9 107 0 157.9
Meghalaya 189.2 99 0 288.2
Mizoram 66.6 50 0.2 116.8
Nagaland 30.7 72 0 102.7
Sikkim 46.1 70 0 116.1
Tripura 148.4 95 1.1 244.5 Notes: * at the end of the Ninth Plan; # refers to 2005 Source: NEC Data Bank.
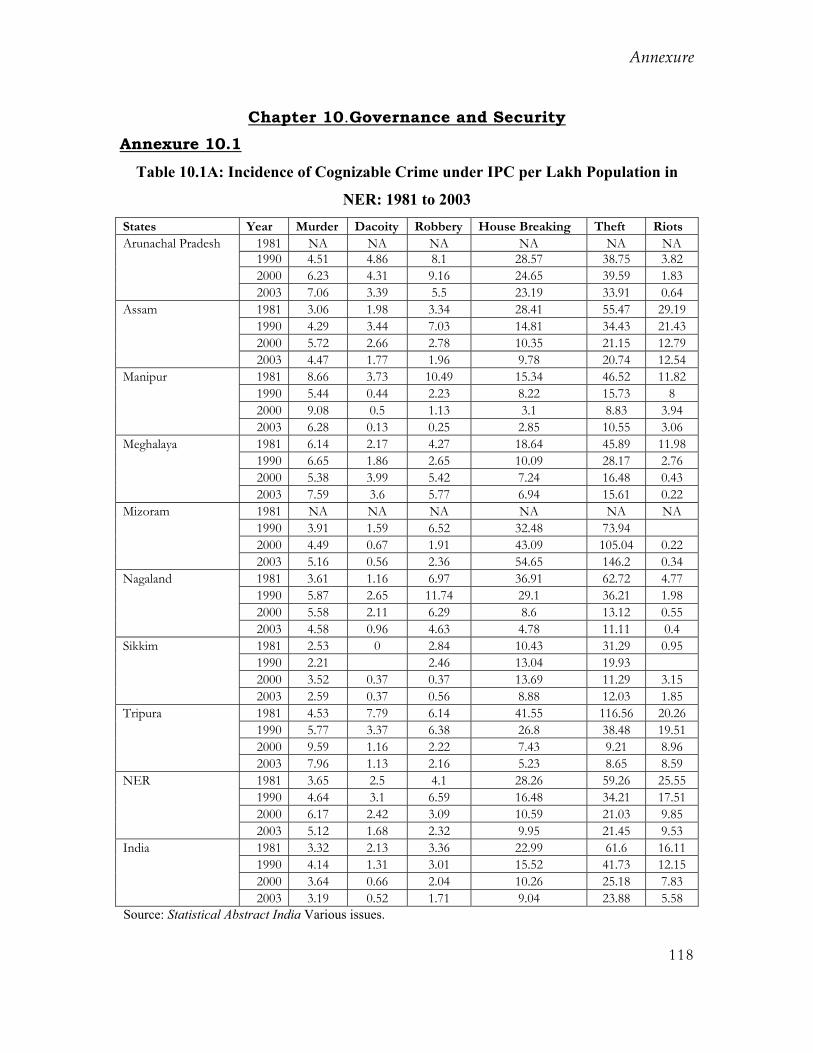
Annexure
118
Chapter 10.Governance and Security Annexure 10.1
Table 10.1A: Incidence of Cognizable Crime under IPC per Lakh Population in
NER: 1981 to 2003 States Year Murder Dacoity Robbery House Breaking Theft Riots Arunachal Pradesh 1981 NA NA NA NA NA NA 1990 4.51 4.86 8.1 28.57 38.75 3.82 2000 6.23 4.31 9.16 24.65 39.59 1.83 2003 7.06 3.39 5.5 23.19 33.91 0.64 Assam 1981 3.06 1.98 3.34 28.41 55.47 29.19 1990 4.29 3.44 7.03 14.81 34.43 21.43 2000 5.72 2.66 2.78 10.35 21.15 12.79 2003 4.47 1.77 1.96 9.78 20.74 12.54 Manipur 1981 8.66 3.73 10.49 15.34 46.52 11.82 1990 5.44 0.44 2.23 8.22 15.73 8 2000 9.08 0.5 1.13 3.1 8.83 3.94 2003 6.28 0.13 0.25 2.85 10.55 3.06 Meghalaya 1981 6.14 2.17 4.27 18.64 45.89 11.98 1990 6.65 1.86 2.65 10.09 28.17 2.76 2000 5.38 3.99 5.42 7.24 16.48 0.43 2003 7.59 3.6 5.77 6.94 15.61 0.22 Mizoram 1981 NA NA NA NA NA NA 1990 3.91 1.59 6.52 32.48 73.94 2000 4.49 0.67 1.91 43.09 105.04 0.22 2003 5.16 0.56 2.36 54.65 146.2 0.34 Nagaland 1981 3.61 1.16 6.97 36.91 62.72 4.77 1990 5.87 2.65 11.74 29.1 36.21 1.98 2000 5.58 2.11 6.29 8.6 13.12 0.55 2003 4.58 0.96 4.63 4.78 11.11 0.4 Sikkim 1981 2.53 0 2.84 10.43 31.29 0.95 1990 2.21 2.46 13.04 19.93 2000 3.52 0.37 0.37 13.69 11.29 3.15 2003 2.59 0.37 0.56 8.88 12.03 1.85 Tripura 1981 4.53 7.79 6.14 41.55 116.56 20.26 1990 5.77 3.37 6.38 26.8 38.48 19.51 2000 9.59 1.16 2.22 7.43 9.21 8.96 2003 7.96 1.13 2.16 5.23 8.65 8.59 NER 1981 3.65 2.5 4.1 28.26 59.26 25.55 1990 4.64 3.1 6.59 16.48 34.21 17.51 2000 6.17 2.42 3.09 10.59 21.03 9.85 2003 5.12 1.68 2.32 9.95 21.45 9.53 India 1981 3.32 2.13 3.36 22.99 61.6 16.11 1990 4.14 1.31 3.01 15.52 41.73 12.15 2000 3.64 0.66 2.04 10.26 25.18 7.83 2003 3.19 0.52 1.71 9.04 23.88 5.58 Source: Statistical Abstract India Various issues.
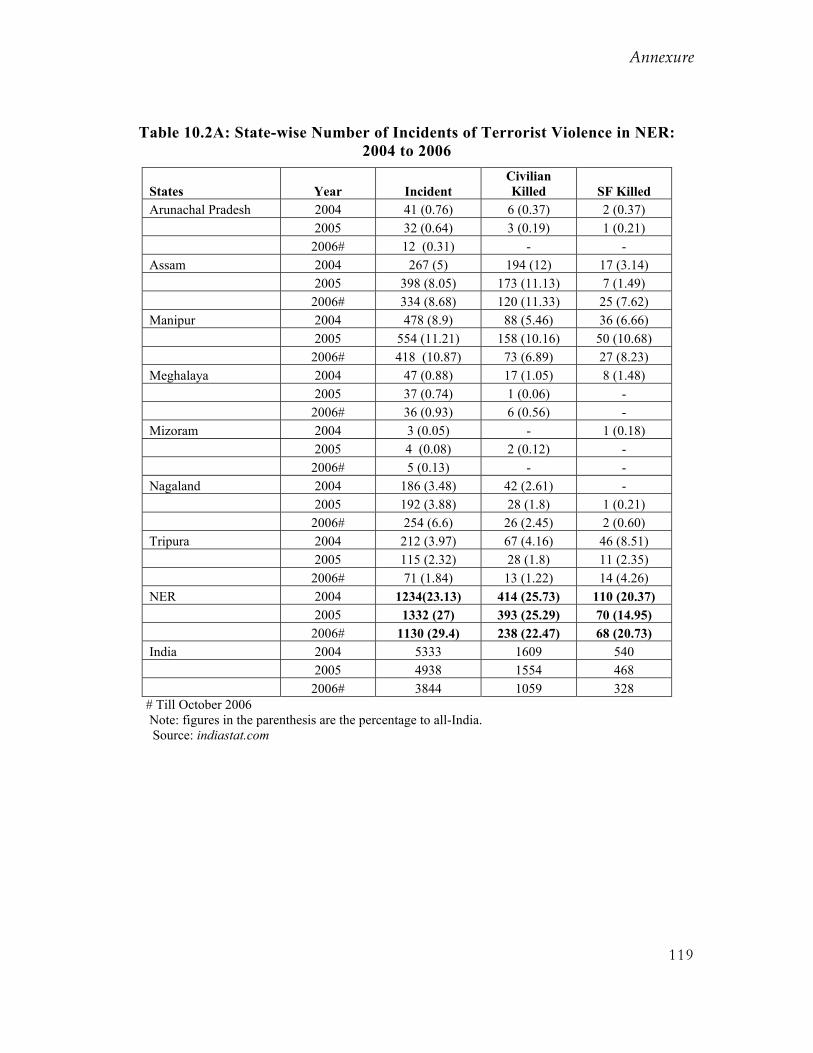
Annexure
119
Table 10.2A: State-wise Number of Incidents of Terrorist Violence in NER: 2004 to 2006
States Year Incident Civilian Killed SF Killed
Arunachal Pradesh 2004 41 (0.76) 6 (0.37) 2 (0.37) 2005 32 (0.64) 3 (0.19) 1 (0.21) 2006# 12 (0.31) - - Assam 2004 267 (5) 194 (12) 17 (3.14) 2005 398 (8.05) 173 (11.13) 7 (1.49) 2006# 334 (8.68) 120 (11.33) 25 (7.62) Manipur 2004 478 (8.9) 88 (5.46) 36 (6.66) 2005 554 (11.21) 158 (10.16) 50 (10.68) 2006# 418 (10.87) 73 (6.89) 27 (8.23) Meghalaya 2004 47 (0.88) 17 (1.05) 8 (1.48) 2005 37 (0.74) 1 (0.06) - 2006# 36 (0.93) 6 (0.56) - Mizoram 2004 3 (0.05) - 1 (0.18) 2005 4 (0.08) 2 (0.12) - 2006# 5 (0.13) - - Nagaland 2004 186 (3.48) 42 (2.61) - 2005 192 (3.88) 28 (1.8) 1 (0.21) 2006# 254 (6.6) 26 (2.45) 2 (0.60) Tripura 2004 212 (3.97) 67 (4.16) 46 (8.51) 2005 115 (2.32) 28 (1.8) 11 (2.35) 2006# 71 (1.84) 13 (1.22) 14 (4.26) NER 2004 1234(23.13) 414 (25.73) 110 (20.37) 2005 1332 (27) 393 (25.29) 70 (14.95) 2006# 1130 (29.4) 238 (22.47) 68 (20.73) India 2004 5333 1609 540 2005 4938 1554 468 2006# 3844 1059 328
# Till October 2006 Note: figures in the parenthesis are the percentage to all-India. Source: indiastat.com
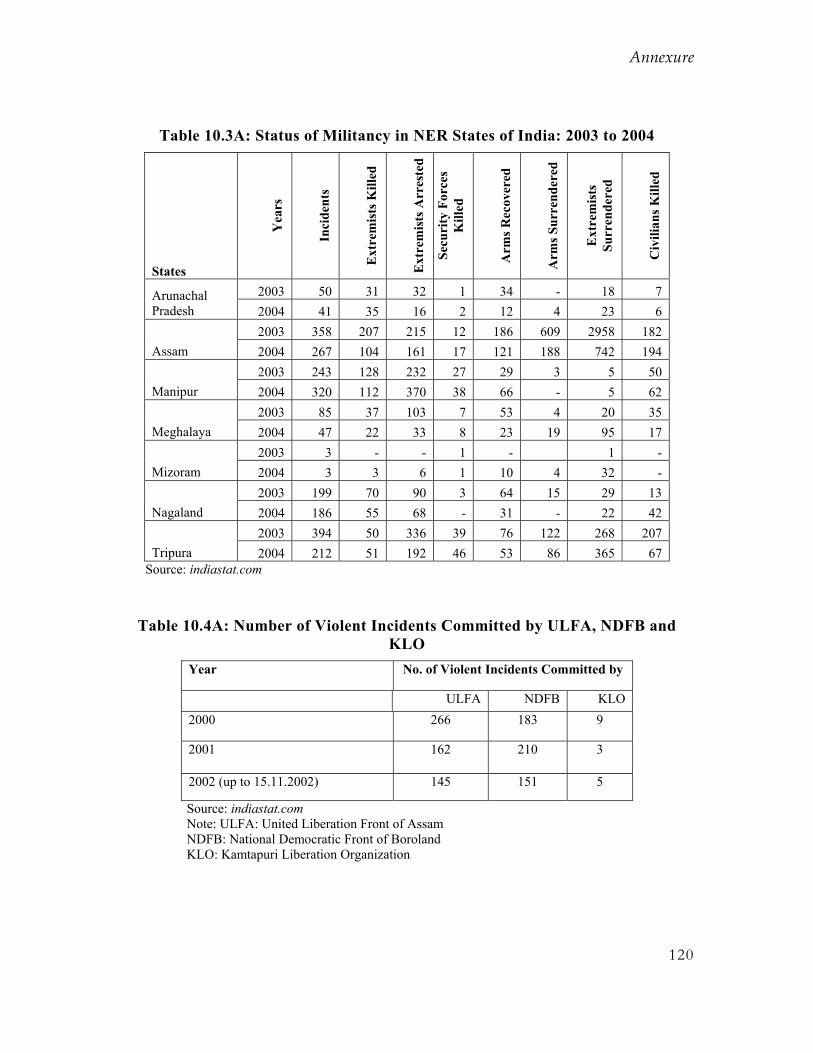
Annexure
120
Table 10.3A: Status of Militancy in NER States of India: 2003 to 2004
States Y
ears
Inci
dent
s
Ext
rem
ists
Kill
ed
Ext
rem
ists
Arr
este
d
Secu
rity
For
ces
Kill
ed
Arm
s Rec
over
ed
Arm
s Sur
rend
ered
Ext
rem
ists
Su
rren
dere
d
Civ
ilian
s Kill
ed
2003 50 31 32 1 34 - 18 7 Arunachal Pradesh 2004 41 35 16 2 12 4 23 6
2003 358 207 215 12 186 609 2958 182 Assam 2004 267 104 161 17 121 188 742 194
2003 243 128 232 27 29 3 5 50 Manipur 2004 320 112 370 38 66 - 5 62
2003 85 37 103 7 53 4 20 35 Meghalaya 2004 47 22 33 8 23 19 95 17
2003 3 - - 1 - 1 - Mizoram 2004 3 3 6 1 10 4 32 -
2003 199 70 90 3 64 15 29 13 Nagaland 2004 186 55 68 - 31 - 22 42
2003 394 50 336 39 76 122 268 207 Tripura 2004 212 51 192 46 53 86 365 67
Source: indiastat.com
Table 10.4A: Number of Violent Incidents Committed by ULFA, NDFB and KLO
Year No. of Violent Incidents Committed by
ULFA NDFB KLO 2000 266 183 9
2001 162 210 3
2002 (up to 15.11.2002) 145 151 5
Source: indiastat.com Note: ULFA: United Liberation Front of Assam NDFB: National Democratic Front of Boroland KLO: Kamtapuri Liberation Organization
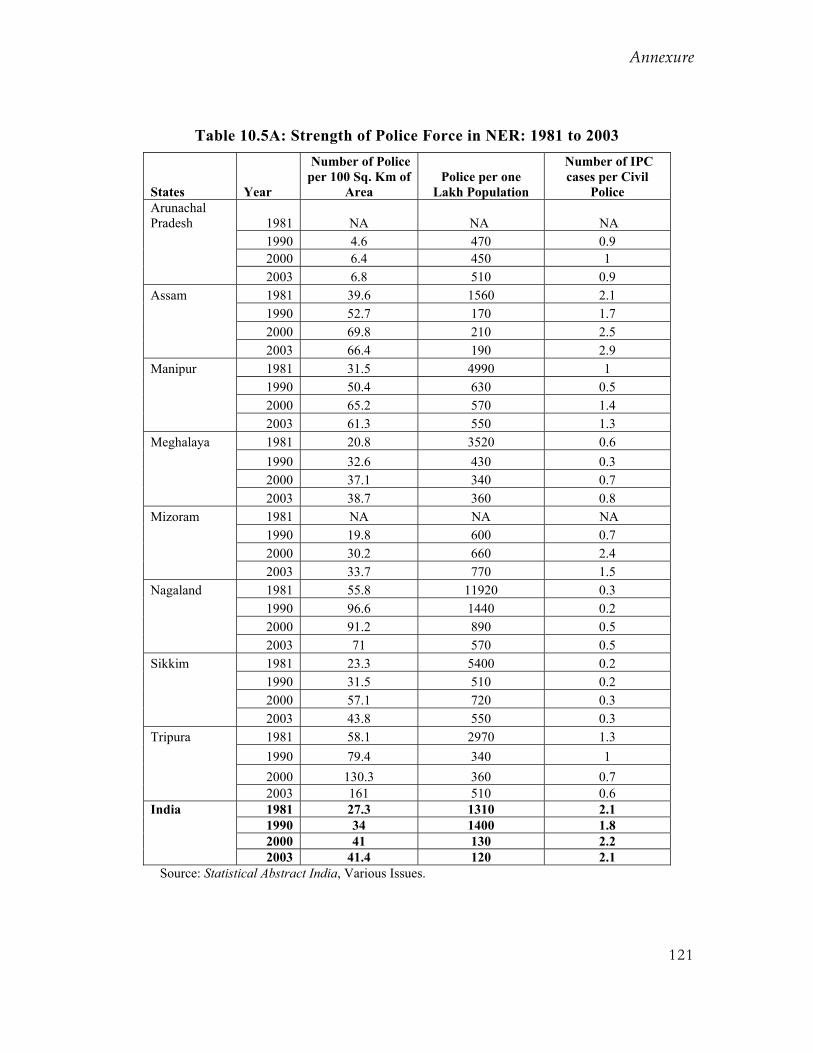
Annexure
121
Table 10.5A: Strength of Police Force in NER: 1981 to 2003
States Year
Number of Police per 100 Sq. Km of
Area Police per one
Lakh Population
Number of IPC cases per Civil
Police Arunachal Pradesh 1981 NA NA NA 1990 4.6 470 0.9 2000 6.4 450 1 2003 6.8 510 0.9 Assam 1981 39.6 1560 2.1 1990 52.7 170 1.7 2000 69.8 210 2.5 2003 66.4 190 2.9 Manipur 1981 31.5 4990 1 1990 50.4 630 0.5 2000 65.2 570 1.4 2003 61.3 550 1.3 Meghalaya 1981 20.8 3520 0.6 1990 32.6 430 0.3 2000 37.1 340 0.7 2003 38.7 360 0.8 Mizoram 1981 NA NA NA 1990 19.8 600 0.7 2000 30.2 660 2.4 2003 33.7 770 1.5 Nagaland 1981 55.8 11920 0.3 1990 96.6 1440 0.2 2000 91.2 890 0.5 2003 71 570 0.5 Sikkim 1981 23.3 5400 0.2 1990 31.5 510 0.2 2000 57.1 720 0.3 2003 43.8 550 0.3 Tripura 1981 58.1 2970 1.3 1990 79.4 340 1 2000 130.3 360 0.7 2003 161 510 0.6 India 1981 27.3 1310 2.1 1990 34 1400 1.8 2000 41 130 2.2 2003 41.4 120 2.1
Source: Statistical Abstract India, Various Issues.
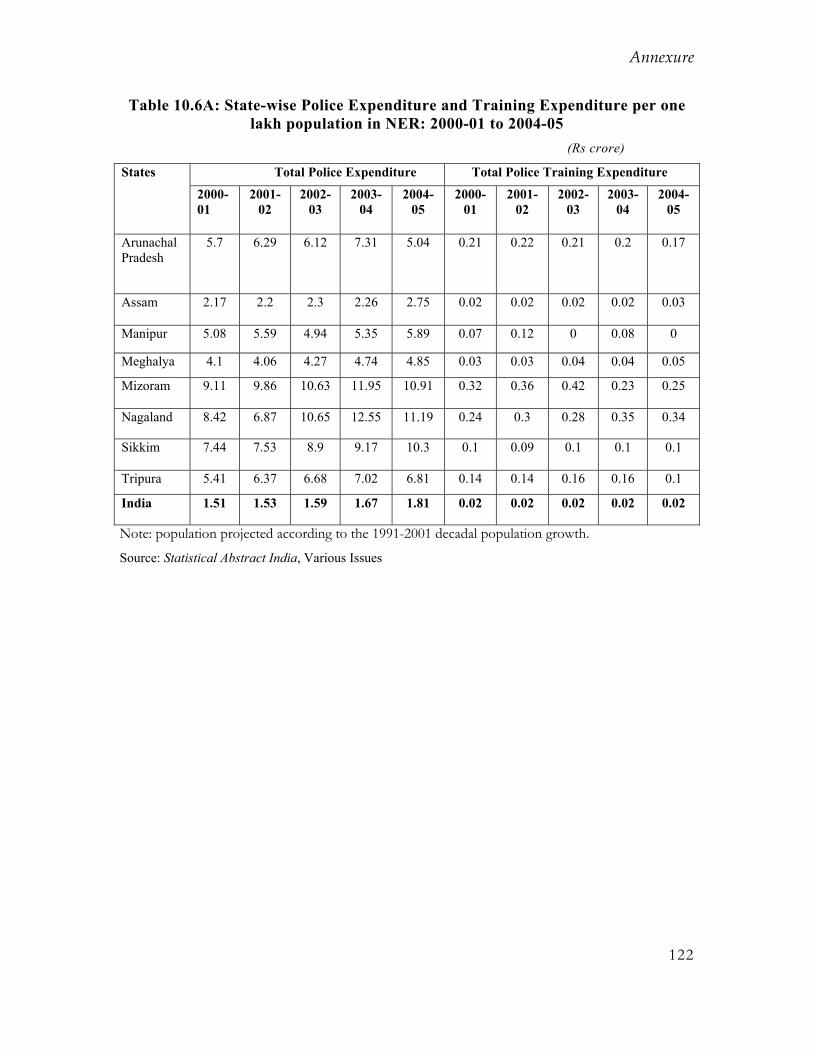
Annexure
122
Table 10.6A: State-wise Police Expenditure and Training Expenditure per one lakh population in NER: 2000-01 to 2004-05
(Rs crore)
Total Police Expenditure Total Police Training Expenditure States
2000-01
2001-02
2002-03
2003-04
2004-05
2000-01
2001-02
2002-03
2003-04
2004-05
Arunachal Pradesh
5.7 6.29 6.12 7.31 5.04 0.21 0.22 0.21 0.2 0.17
Assam 2.17 2.2 2.3 2.26 2.75 0.02 0.02 0.02 0.02 0.03
Manipur 5.08 5.59 4.94 5.35 5.89 0.07 0.12 0 0.08 0
Meghalya 4.1 4.06 4.27 4.74 4.85 0.03 0.03 0.04 0.04 0.05
Mizoram 9.11 9.86 10.63 11.95 10.91 0.32 0.36 0.42 0.23 0.25
Nagaland 8.42 6.87 10.65 12.55 11.19 0.24 0.3 0.28 0.35 0.34
Sikkim 7.44 7.53 8.9 9.17 10.3 0.1 0.09 0.1 0.1 0.1
Tripura 5.41 6.37 6.68 7.02 6.81 0.14 0.14 0.16 0.16 0.1
India 1.51 1.53 1.59 1.67 1.81 0.02 0.02 0.02 0.02 0.02
Note: population projected according to the 1991-2001 decadal population growth.
Source: Statistical Abstract India, Various Issues
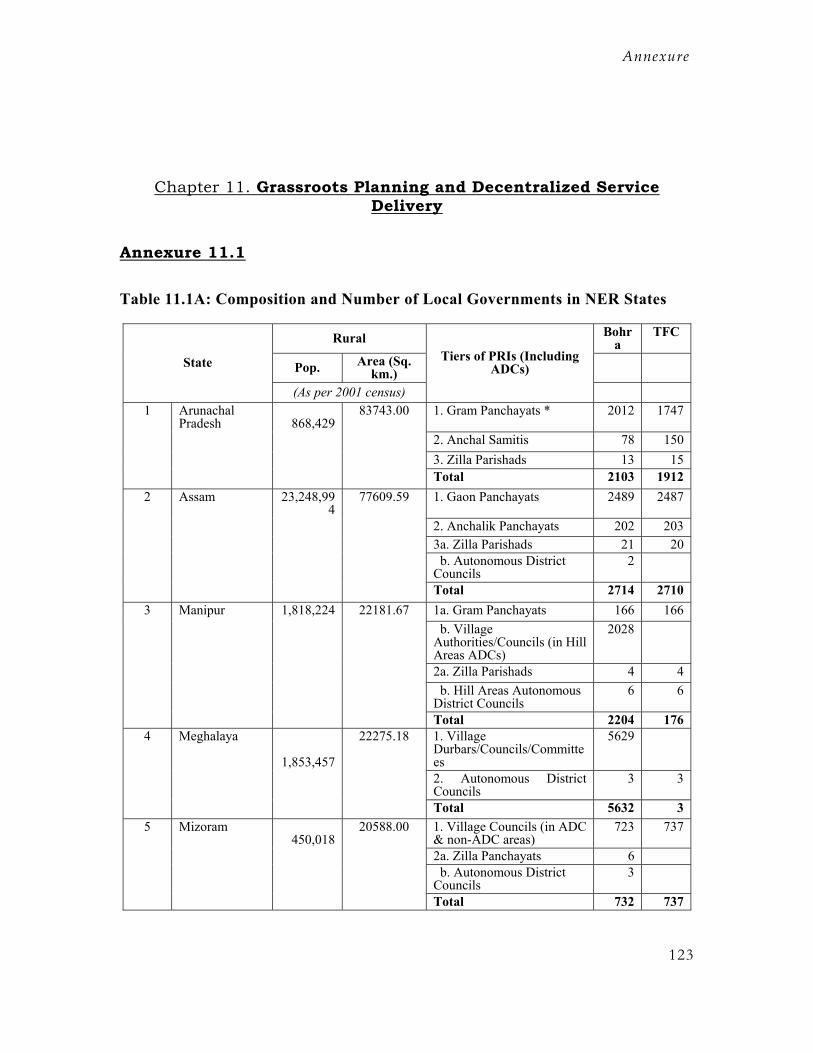
Annexure
123
Chapter 11. Grassroots Planning and Decentralized Service Delivery
Annexure 11.1
Table 11.1A: Composition and Number of Local Governments in NER States
Rural Bohra
TFC
Pop. Area (Sq. km.)
State
(As per 2001 census)
Tiers of PRIs (Including ADCs)
1 Arunachal
Pradesh 868,429 83743.00 1. Gram Panchayats * 2012 1747
2. Anchal Samitis 78 150 3. Zilla Parishads 13 15 Total 2103 1912 2 Assam 23,248,99
4 77609.59 1. Gaon Panchayats 2489 2487
2. Anchalik Panchayats 202 203 3a. Zilla Parishads 21 20
b. Autonomous District
Councils 2
Total 2714 2710 3 Manipur 1,818,224 22181.67 1a. Gram Panchayats 166 166
b. Village Authorities/Councils (in Hill Areas ADCs)
2028
2a. Zilla Parishads 4 4
b. Hill Areas Autonomous
District Councils 6 6
Total 2204 176 4 Meghalaya
1,853,457
22275.18 1. Village Durbars/Councils/Committees
5629
2. Autonomous District
Councils 3 3
Total 5632 3 5 Mizoram
450,018 20588.00 1. Village Councils (in ADC
& non-ADC areas) 723 737
2a. Zilla Panchayats 6
b. Autonomous District
Councils 3
Total 732 737
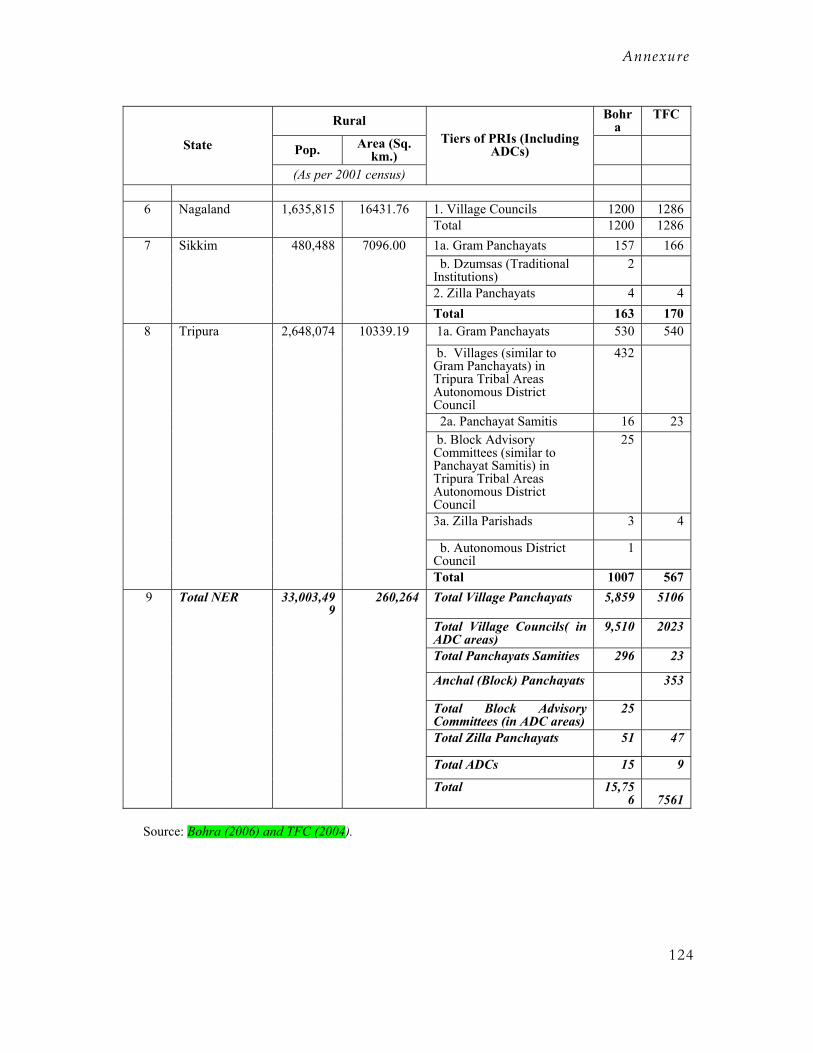
Annexure
124
Rural Bohra
TFC
Pop. Area (Sq. km.)
State
(As per 2001 census)
Tiers of PRIs (Including ADCs)
6 Nagaland 1,635,815 16431.76 1. Village Councils 1200 1286 Total 1200 1286 7 Sikkim 480,488 7096.00 1a. Gram Panchayats 157 166
b. Dzumsas (Traditional Institutions)
2
2. Zilla Panchayats 4 4 Total 163 170 8 Tripura 2,648,074 10339.19 1a. Gram Panchayats 530 540 b. Villages (similar to
Gram Panchayats) in Tripura Tribal Areas Autonomous District Council
432
2a. Panchayat Samitis 16 23 b. Block Advisory
Committees (similar to Panchayat Samitis) in Tripura Tribal Areas Autonomous District Council
25
3a. Zilla Parishads 3 4
b. Autonomous District Council
1
Total 1007 567 9 Total NER 33,003,49
9 260,264 Total Village Panchayats 5,859 5106
Total Village Councils( in ADC areas)
9,510 2023
Total Panchayats Samities 296 23
Anchal (Block) Panchayats 353
Total Block Advisory Committees (in ADC areas)
25
Total Zilla Panchayats 51 47
Total ADCs 15 9
Total 15,756 7561
Source: Bohra (2006) and TFC (2004).

Annexure
125
Table11.2A: Number and Structure of Local Governments of ULBs in NER States
Urban Population Area (Sq.km.)State
(As per 2001 census) Levels of ULB Numbe
(Boha)r Numbe (TFC)
1 Arunachal Pradesh 222,688 0.00 ULBs do not exist. Municipal Corporations 1 1 Municipalities 28 28 Town Panchayats 50 54
2
Assam
3,389,413
828.41
Total 79 83 Municipal Councils 7 9 Nagar Panchayats 21 18 Small Town Committee 1
3
Manipur
570,410
145.33
Total 28 28 4 Meghalaya 452,612 153.82Municipalities 6 6
Municipal Councils* 2 5
Mizoram
441,040
493.00 Town Panchayats* 4
ULBs do not exist
6 Nagaland 352,621 147.24Town Committees 9 9 7 Sikkim 60,005 0.00 ULBs do not exist
Municipality 1 1 Nagar Panchayats 12 12
8
Tripura
543,094
146.81 Total 13 13
Municipal Corporations 1 1 Municipalities 35 34 Municipal Councils 9 10 Small Town Committee 10 Nagar Panchayats 96 84
Total
6,031,883
1,915
All ULBs 141 139 Note:* Proposed to be set-up. Source:1. State governments/ SFC reports, for number of ULBs. 2. Census 1991 and 2001, for Population and Area
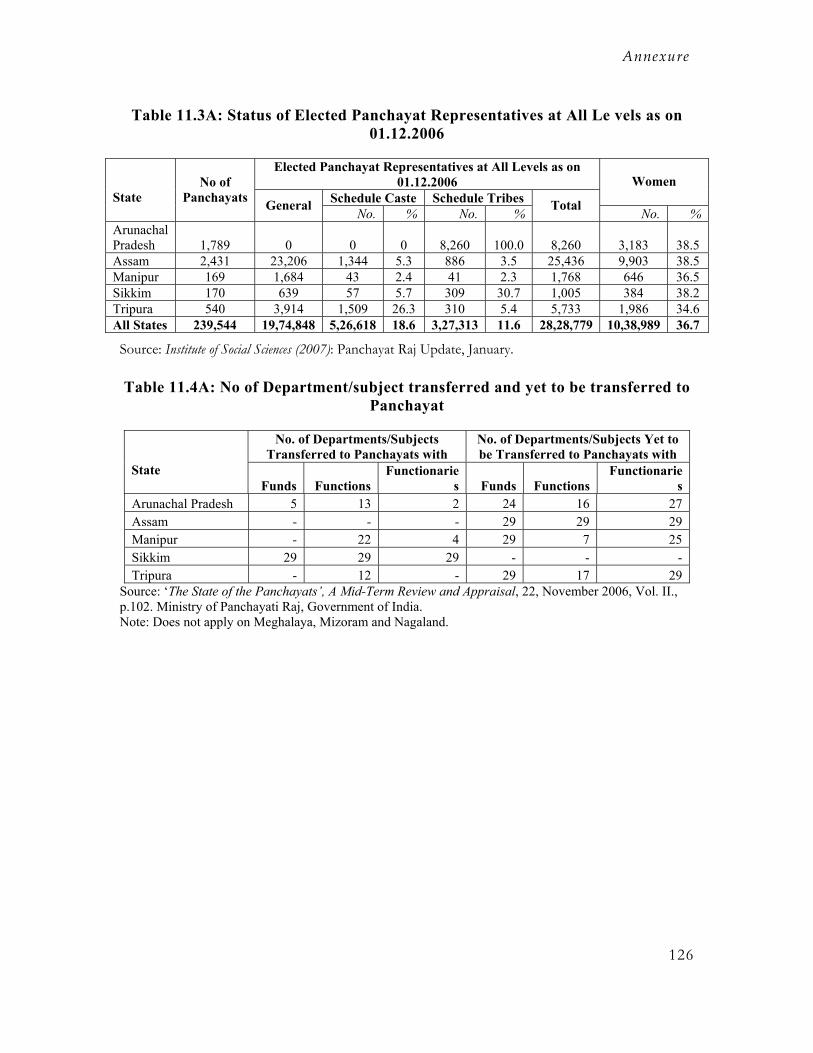
Annexure
126
Table 11.3A: Status of Elected Panchayat Representatives at All Le vels as on 01.12.2006
Elected Panchayat Representatives at All Levels as on 01.12.2006
Schedule Caste Schedule Tribes Women
State No of
Panchayats General No. % No. % Total No. % Arunachal Pradesh 1,789 0 0 0 8,260 100.0 8,260 3,183 38.5 Assam 2,431 23,206 1,344 5.3 886 3.5 25,436 9,903 38.5 Manipur 169 1,684 43 2.4 41 2.3 1,768 646 36.5 Sikkim 170 639 57 5.7 309 30.7 1,005 384 38.2 Tripura 540 3,914 1,509 26.3 310 5.4 5,733 1,986 34.6 All States 239,544 19,74,848 5,26,618 18.6 3,27,313 11.6 28,28,779 10,38,989 36.7
Source: Institute of Social Sciences (2007): Panchayat Raj Update, January.
Table 11.4A: No of Department/subject transferred and yet to be transferred to Panchayat
No. of Departments/Subjects Transferred to Panchayats with
No. of Departments/Subjects Yet to be Transferred to Panchayats with
State Funds Functions
Functionaries Funds Functions
Functionaries
Arunachal Pradesh 5 13 2 24 16 27 Assam - - - 29 29 29 Manipur - 22 4 29 7 25 Sikkim 29 29 29 - - - Tripura - 12 - 29 17 29
Source: ‘The State of the Panchayats’, A Mid-Term Review and Appraisal, 22, November 2006, Vol. II., p.102. Ministry of Panchayati Raj, Government of India. Note: Does not apply on Meghalaya, Mizoram and Nagaland.
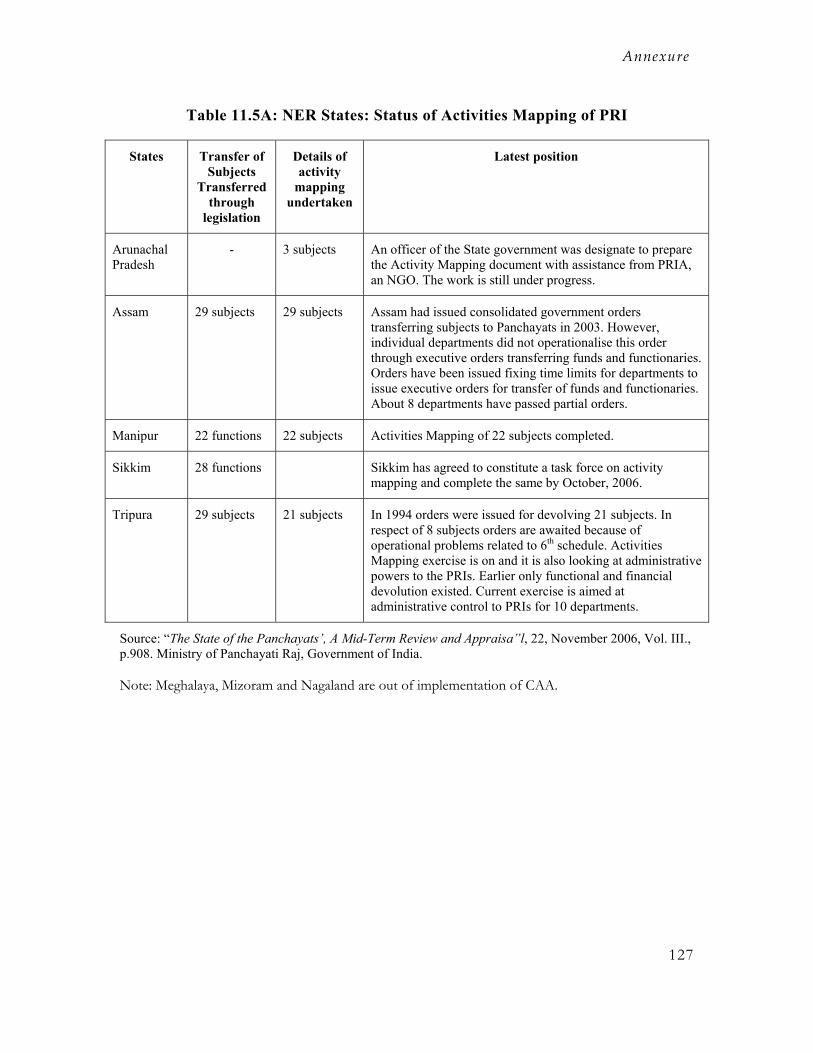
Annexure
127
Table 11.5A: NER States: Status of Activities Mapping of PRI
States Transfer of Subjects
Transferred through
legislation
Details of activity
mapping undertaken
Latest position
Arunachal Pradesh
- 3 subjects An officer of the State government was designate to prepare the Activity Mapping document with assistance from PRIA, an NGO. The work is still under progress.
Assam 29 subjects 29 subjects Assam had issued consolidated government orders transferring subjects to Panchayats in 2003. However, individual departments did not operationalise this order through executive orders transferring funds and functionaries. Orders have been issued fixing time limits for departments to issue executive orders for transfer of funds and functionaries. About 8 departments have passed partial orders.
Manipur 22 functions 22 subjects Activities Mapping of 22 subjects completed.
Sikkim 28 functions Sikkim has agreed to constitute a task force on activity mapping and complete the same by October, 2006.
Tripura 29 subjects 21 subjects In 1994 orders were issued for devolving 21 subjects. In respect of 8 subjects orders are awaited because of operational problems related to 6th schedule. Activities Mapping exercise is on and it is also looking at administrative powers to the PRIs. Earlier only functional and financial devolution existed. Current exercise is aimed at administrative control to PRIs for 10 departments.
Source: “The State of the Panchayats’, A Mid-Term Review and Appraisa”l, 22, November 2006, Vol. III., p.908. Ministry of Panchayati Raj, Government of India.
Note: Meghalaya, Mizoram and Nagaland are out of implementation of CAA.
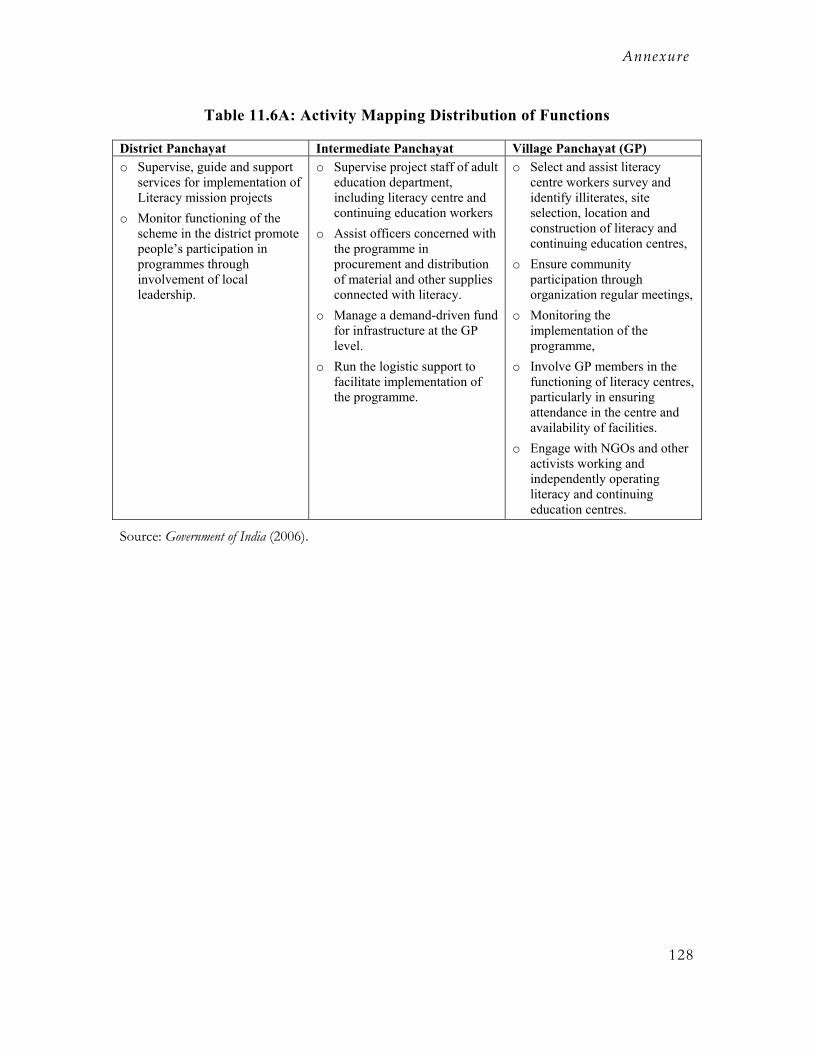
Annexure
128
Table 11.6A: Activity Mapping Distribution of Functions
District Panchayat Intermediate Panchayat Village Panchayat (GP) o Supervise, guide and support
services for implementation of Literacy mission projects
o Monitor functioning of the scheme in the district promote people’s participation in programmes through involvement of local leadership.
o Supervise project staff of adult education department, including literacy centre and continuing education workers
o Assist officers concerned with the programme in procurement and distribution of material and other supplies connected with literacy.
o Manage a demand-driven fund for infrastructure at the GP level.
o Run the logistic support to facilitate implementation of the programme.
o Select and assist literacy centre workers survey and identify illiterates, site selection, location and construction of literacy and continuing education centres,
o Ensure community participation through organization regular meetings,
o Monitoring the implementation of the programme,
o Involve GP members in the functioning of literacy centres, particularly in ensuring attendance in the centre and availability of facilities.
o Engage with NGOs and other activists working and independently operating literacy and continuing education centres.
Source: Government of India (2006).
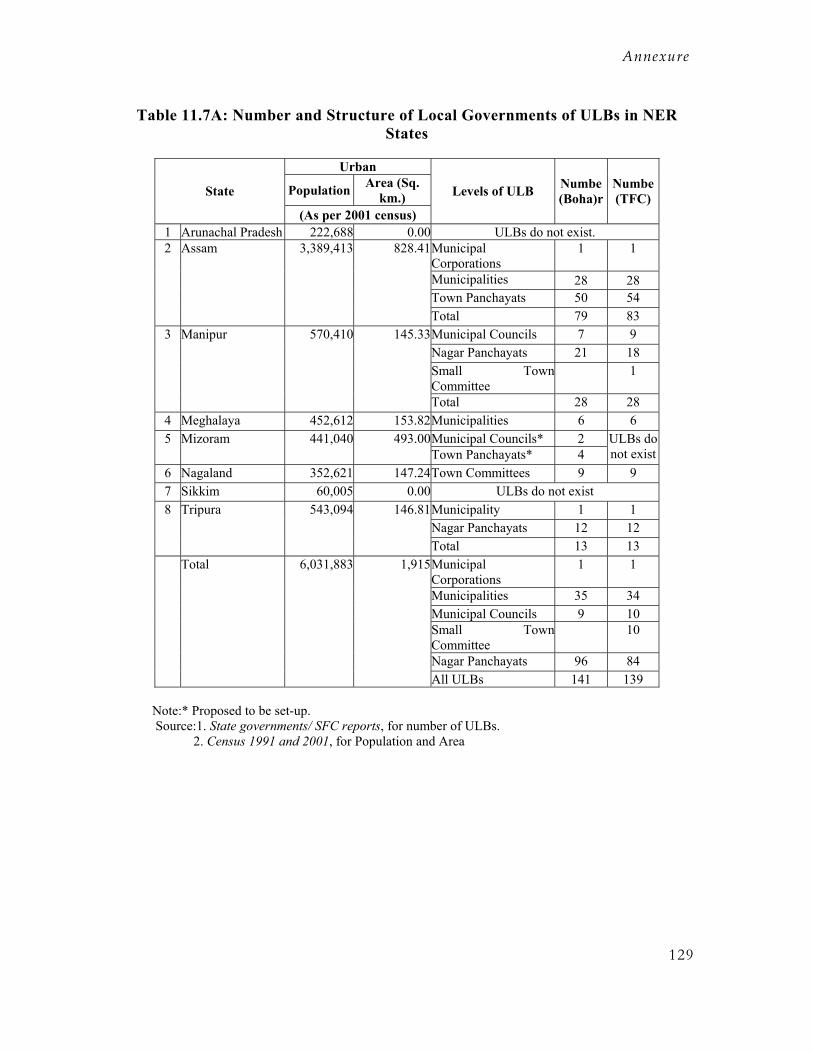
Annexure
129
Table 11.7A: Number and Structure of Local Governments of ULBs in NER States
Urban
Population Area (Sq. km.) State
(As per 2001 census)
Levels of ULB Numbe (Boha)r
Numbe (TFC)
1 Arunachal Pradesh 222,688 0.00 ULBs do not exist. Municipal Corporations
1 1
Municipalities 28 28 Town Panchayats 50 54
2
Assam
3,389,413
828.41
Total 79 83 Municipal Councils 7 9 Nagar Panchayats 21 18 Small Town Committee
1
3
Manipur
570,410
145.33
Total 28 28 4 Meghalaya 452,612 153.82Municipalities 6 6
Municipal Councils* 2 5
Mizoram
441,040
493.00 Town Panchayats* 4
ULBs do not exist
6 Nagaland 352,621 147.24Town Committees 9 9 7 Sikkim 60,005 0.00 ULBs do not exist
Municipality 1 1 Nagar Panchayats 12 12
8
Tripura
543,094
146.81 Total 13 13
Municipal Corporations
1 1
Municipalities 35 34 Municipal Councils 9 10 Small Town Committee
10
Nagar Panchayats 96 84
Total
6,031,883
1,915
All ULBs 141 139 Note:* Proposed to be set-up. Source:1. State governments/ SFC reports, for number of ULBs. 2. Census 1991 and 2001, for Population and Area
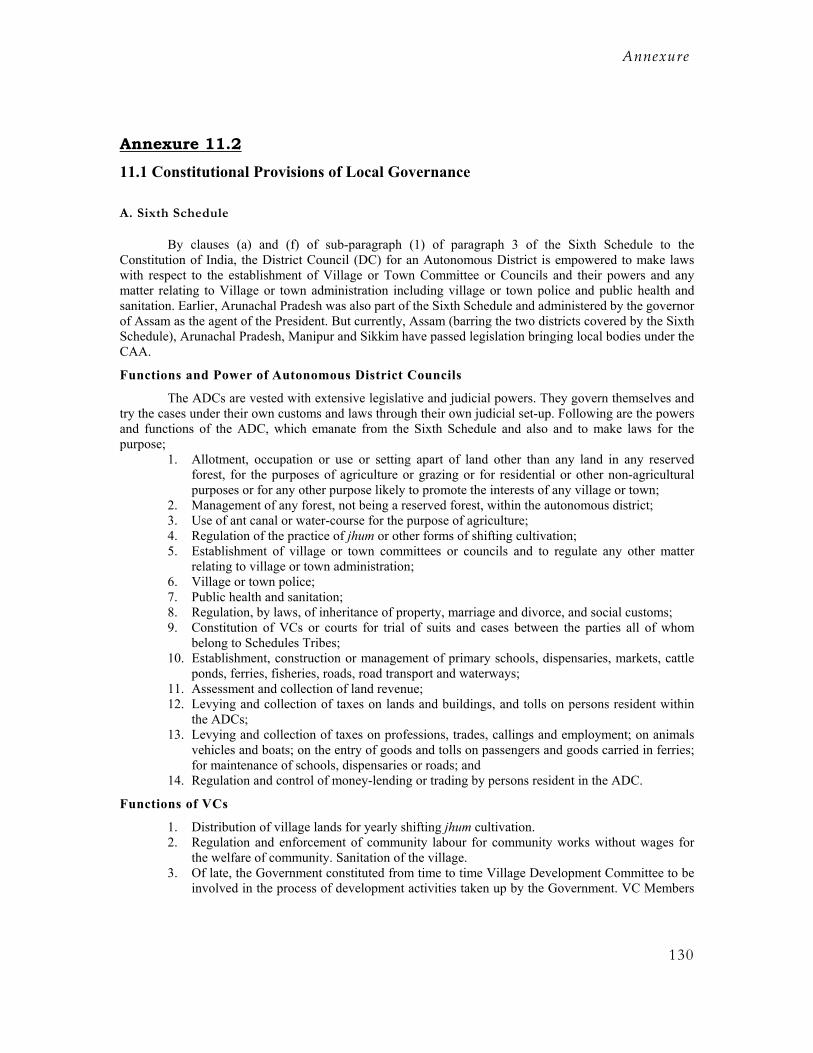
Annexure
130
Annexure 11.2 11.1 Constitutional Provisions of Local Governance
A. Sixth Schedule
By clauses (a) and (f) of sub-paragraph (1) of paragraph 3 of the Sixth Schedule to the Constitution of India, the District Council (DC) for an Autonomous District is empowered to make laws with respect to the establishment of Village or Town Committee or Councils and their powers and any matter relating to Village or town administration including village or town police and public health and sanitation. Earlier, Arunachal Pradesh was also part of the Sixth Schedule and administered by the governor of Assam as the agent of the President. But currently, Assam (barring the two districts covered by the Sixth Schedule), Arunachal Pradesh, Manipur and Sikkim have passed legislation bringing local bodies under the CAA.
Functions and Power of Autonomous District Councils
The ADCs are vested with extensive legislative and judicial powers. They govern themselves and try the cases under their own customs and laws through their own judicial set-up. Following are the powers and functions of the ADC, which emanate from the Sixth Schedule and also and to make laws for the purpose;
1. Allotment, occupation or use or setting apart of land other than any land in any reserved forest, for the purposes of agriculture or grazing or for residential or other non-agricultural purposes or for any other purpose likely to promote the interests of any village or town;
2. Management of any forest, not being a reserved forest, within the autonomous district; 3. Use of ant canal or water-course for the purpose of agriculture; 4. Regulation of the practice of jhum or other forms of shifting cultivation; 5. Establishment of village or town committees or councils and to regulate any other matter
relating to village or town administration; 6. Village or town police; 7. Public health and sanitation; 8. Regulation, by laws, of inheritance of property, marriage and divorce, and social customs; 9. Constitution of VCs or courts for trial of suits and cases between the parties all of whom
belong to Schedules Tribes; 10. Establishment, construction or management of primary schools, dispensaries, markets, cattle
ponds, ferries, fisheries, roads, road transport and waterways; 11. Assessment and collection of land revenue; 12. Levying and collection of taxes on lands and buildings, and tolls on persons resident within
the ADCs; 13. Levying and collection of taxes on professions, trades, callings and employment; on animals
vehicles and boats; on the entry of goods and tolls on passengers and goods carried in ferries; for maintenance of schools, dispensaries or roads; and
14. Regulation and control of money-lending or trading by persons resident in the ADC.
Functions of VCs
1. Distribution of village lands for yearly shifting jhum cultivation. 2. Regulation and enforcement of community labour for community works without wages for
the welfare of community. Sanitation of the village. 3. Of late, the Government constituted from time to time Village Development Committee to be
involved in the process of development activities taken up by the Government. VC Members
Annexure
131
are included in the Committee. They have to verify that the projects have actually been undertaken.
As regards the functional domain under CAA, it is wider compared to as given under Sixth Schedule. It may be noted that out of the list of Eleventh Schedule only rural housing (item no. 10), drinking water (item no. 11), rural electrification including distribution of electricity (item no. 14), and health and sanitation (item no. 23) are under VCs.
B. 73rd & 74th Amendments to the Constitution of India
The Constitution of India has inserted two indicative lists of functions, which may be assigned to the grass root level governments by their respective states. These lists are not mandatory and restrictive. Additions and deletions is the prerogative of respective legislatures guided by traditions and public demands.
Powers, authority and responsibilities of Panchayats: These powers are covered under Article 243G of the Constitution of India. The state may endow the Panchayats with such powers and authority to enable them to function as institutions of self-government and such law may contain provisions for the devolution of powers and responsibilities upon Panchayats, at the appropriate level, subject to such conditions as may be specified therein, with respect to-
1. The preparation of plans for economic development and social justice; 2. The implementation of schemes for economic development and social justice as may be
entrusted to them including those in relation to the matters listed in the Eleventh Schedule. Powers to impose taxes by, and Funds of, the Panchayats: These powers are covered under
Article 243H of the Constitution of India. The state may – 1. Authorise a Panchayat to levy, collect and appropriate such taxes, duties, tolls and fees in
accordance with such procedure and subject to such limits; 2. Assign to a Panchayat such taxes, duties, tolls and fees levied and collected by the State
government for such purposes and subject to such conditions and limits; 3. Provide for making such grant-in-aid to the Panchayats from the Consolidated Fund of the
state; and 4. Provide for constitution of such Funds for crediting all moneys received, respectively, by or
on behalf of the Panchayats and also for the withdrawal of such moneys there from. Powers, authority and responsibilities of Municipalities, etc: These powers are covered under
Article 243W of the Constitution of India. The state may endow 1. The Municipalities with such powers and authority to enable them to function as institutions
of self-government and such law may contain provisions for the devolution of powers and responsibilities upon Municipalities, at the appropriate level, subject to such conditions as may be specified therein, with respect to - the preparation of plans for economic development and social justice; and The implementation of schemes for economic development and social justice as may be entrusted to them including those in relation to the matters listed in the Twelfth Schedule.
2. The Committees with such powers and authority as may be necessary to enable them to carry out the responsibilities conferred upon them including those in relation to the matters listed in the Twelfth Schedule.
Powers to impose taxes by, and Funds of, the Municipalities: These powers are covered under Article 243H of the Constitution of India. The state may –
1. Authorise a Municipalities to levy, collect and appropriate such taxes, duties, tolls and fees in accordance with such procedure and subject to such limits;
2. Assign to a Municipalities such taxes, duties, tolls and fees levied and collected by the State government for such purposes and subject to such conditions and limits;
3. Provide for making such grant-in-aid to the Municipalities from the Consolidated Fund of the state; and
Annexure
132
4. Provide for constitution of such Funds for crediting all moneys received, respectively, by or on behalf of the Municipalities and also for the withdrawal of such moneys there from.
Functional Domain of Local Governments under CAA
XI Schedule for PRIs
Serial-wise functions are: (1). Agriculture, including agricultural extension; (2). Land improvement, implementation of land reforms, land consolidation and soil conservation; (3). Minor irrigation, water management and watershed development; (4). Animal husbandry, dairying and poultry; (5). Fisheries; (6). Social forestry; (7). Minor forest produce; (8). Small-scale industries; (9). Khadi, village and cottage industries; (10). Rural housing; (11). Drinking water; (12). Fuel and fodder; (13). Roads, culverts, bridges, ferries, waterways and other means of communication; (14). Rural electrification including distribution of electricity; (15). Non-conventional energy sources; (16). Poverty alleviation programme; (17). Education including primary and secondary schools; (18). Technical training and vocational education; (19). Adult and non-formal education; (20). Libraries; (21). Cultural activities; (22). Market and fairs; (23). Health and sanitation, including hospitals, primary health centers and dispensaries; (24). Family welfare; (25). Women and child development; (26). Social welfare including welfare of the handicapped and mentally retarded; (27). Welfare of the weaker sections, and in particular of the scheduled castes and tribes; (28). Public distribution system; and (29). Maintenance of community assets.
XII Schedule for Urban Local Bodies
Serial-wise functions are: (1). Urban planning including town planning; (2). Regulation of land use and construction of buildings; (3). Planning of economic and social development; (4). Roads and bridges; (5). Water supply for domestic, industrial and commercial purposes; (6). Public health, sanitation conservancy and solid waste management; (7). Fire services; (8). Urban forestry, protection of the environment and promotion of ecological aspects; (9). Safeguarding the interests of weaker sections of society, including the handicapped and mentally retarded; (10). Slum improvement and up gradation; (11). Urban poverty alleviation; (12). Provision of urban amenities and facilities such as parks, gardens, playgrounds; (13). Promotion of cultural, educational and aesthetic aspects; (14). Burial and burial grounds, cremations, cremation grounds and electric crematorium; (15). Cattle ponds, prevention of cruelty to animals; (16). Vital statistics including registration of births and deaths.; (17). Public amenities including street lighting, parking lots, bus stops and public conveniences; and (19). Regulation of slaughter houses and tanneries
Constitution of District Planning Committees
Constitution of District Planning Committees (DPC) by the States has been made mandatory as per the Article 243ZD of the Indian Constitution inserted through the 74th Amendment. District Planning Committee is a monitoring and facilitating body, and need not be engaged in executing any plans or projects by itself.
In the NER States, the District Planning Committees have not been constituted in Arunachal Pradesh, Assam and Tripura. Manipur constituted it in 2 districts out of 4 districts. Adhyaksha (Chairperson) of DP is chairperson. They have been constituted in Sikkim too.
The main functions of the DPC are - Consolidation of plans prepared by the Panchayats and Municipalities in the district. - Preparation of a draft development plan for the district as a whole. - Conducting an objective SWOT (Strengths, Weaknesses, Opportunities and Threats) analysis
for the district. Resource Raising Powers of PRIs and ULBs
The CAA does not specify any list of taxes or non-taxes by which these bodies can fill their funds. However, the states can assign certain taxes of local nature to them like property tax, vehicle tax, entertainment tax, profession tax, etc. But their fiscal relation is dependent on the acceptable recommendations of the state finance commission.
Annexure
133
Finance Commission
(1) The Finance Commission constituted under article 243-I & Y shall also review the financial position of the Panchayats and Municipalities and make recommendations to the Governor as to - (a) the principles which should govern -
(i) the distribution between the state and the Panchayats and Municipalities of the net proceeds of the taxes, duties, tolls and fees leviable by the state, which may be divided between them under this Part and the allocation between the Municipalities at all levels of their respective shares of such proceeds;
(ii) the determination of the taxes, duties, tolls and fees which may be assigned to, or appropriated by the Panchayats and Municipalities;
(iii) the grants-in-aid to the Panchayats and Municipalities from the Consolidated Fund of the state;
(b) the measures needed to improve the financial position of the Panchayats and Municipalities;
(c) any other matter referred to the Finance Commission by the Governor in the interests of sound finance of the Panchayats and Municipalities.
(2) The Governor shall cause every recommendation made by the Commission under this article together with an explanatory memorandum as to the action taken thereon to be laid before the Legislature of the state.
Functions of Autonomous District Councils under Sixth Schedule
Under Article 244(2) and 275(1), it has endowed upon ADCs with the following functional domain. The District Councils and / or Regional Councils to make laws with regard to (a). the allotment, occupation or use, or the setting apart, of land, other than any land which is a reserved forest for the purposes of agriculture or grazing or for residential or other non-agricultural purposes or for any other purpose likely to promote the interests of the inhabitants of any village or town; (b). the management of any forest not being a reserved forest; (c). the use of any canal or water-course for the purpose of agriculture; (d) the regulation of the practice of jhum or other forms of shifting cultivation; (e). the establishment of village or town committees or councils and their powers; (f). any other matter relating to village or town administration, including village or town police and public health and sanitation; (g). the appointment or succession of Chiefs or Headmen; (h). the inheritance of property; (i). marriage and divorce; and (j). social customs.
The ADCs are also conferred with the powers under the Code of Civil Procedure, 1908, and the Code of Criminal Procedure, 1898, and on certain courts and officers for the trial of certain suits, cases and offences for the trial of suits or cases arising out of any law in force in any autonomous district or region being a law specified in that behalf by the Governor, or for the trial of offences punishable with death, transportation for life, or imprisonment for a term of not less than five years under the Indian Penal Code or under any other law for the time being applicable to such district or region, confer on the District Council or the Regional Council having authority over such district or region or on courts constituted by such District Council or on any officer appointed in that behalf by the Governor, such powers under the Code of Civil Procedure, 1908, or, as the case may be, the Code of Criminal Procedure, 1898, as he deems appropriate, and thereupon the said Council, Court or officer shall try the suits, cases or offences in exercise of the powers so conferred.
The District Council of an autonomous district may make regulations for the regulation and control of money-lending or trading within the district by persons other than Scheduled Tribes resident in the district. Such regulations may (a). prescribe that no one except the holder of a licence issued in that behalf shall carry on the business of money-lending; (b). prescribe the maximum rate of interest which may be charged or be recovered by a money-lender; (c). provide for the maintenance of accounts by money-lenders and for the inspection of such accounts by officers appointed in that behalf by the District Council; and (d). prescribe that no person who is not a member of the Scheduled Tribes resident in the district shall carry on wholesale or retail business in any commodity except under a licence issued in that behalf by the District Council:
Powers of the District Council
Annexure
134
The ADC may establish, construct, or manage primary schools, dispensaries, markets, cattle pounds, ferries, fisheries, roads, road transport and waterways in the district and may, with the previous approval of the Governor, make regulations for the regulation and control thereof and, in particular, may prescribe the language and the manner in which primary education shall be imparted in the primary schools in the district. They may be entrusted either conditionally or unconditionally to that Council or to its officer’s functions in relation to agriculture, animal husbandry, community projects, co-operative societies, social welfare, village planning or any other matter to which the executive power of the state extends.
Resource Raising Powers of ADCs’
Under sixth Schedule the ADCs are empowered with certain resource-raising powers. (1) It is limited to land within such region and the District Council for an autonomous district in
respect of all lands within the district except those which are in the areas under the authority of Regional Councils, if any, within the district, shall have the power to assess and collect revenue in respect of such lands in accordance with the principles for the time being followed by the Government of the State in assessing lands for the purpose of land revenue in the State generally. It shall have power to levy and collect taxes on lands and buildings, and tolls on person resident within such areas.
(2) The District Council for an autonomous district shall have the power to levy and collect all or any of the following taxes within such district, that is to say- (a) taxes on professions, trades, callings and employments; (b) taxes on animals, vehicles and boats; (c) taxes on the entry of goods into a market for sale therein, and tolls on passengers and goods
carried in ferries; and (d) taxes for the maintenance of schools, dispensaries or roads.
In addition, licences or leases for the purpose of prospecting for, or extraction of, minerals are also included to their resources. Such share of the royalties accruing each year from licences or leases for the purpose of prospecting for, or the extraction of, minerals granted by the state government in respect of any area within an autonomous district as may be agreed upon between the state government of the and the District Council of such district shall be made over to that District Council.
The organizations that can bring out effective solutions jointly or singly are Central government, UN agencies, international donor agencies, non-governmental organizations (NGO), and local representational bodies (both rural and urban). Bringing all the developmental agencies operating in the district on a single platform in order to provide an opportunity to listen to each other and identify the development potential of the district and devise suitable strategies for the development of the district.
Annexure
135
11.2 Jawaharlal Nehru National Urban Renewal Mission (JNNURM) I. Need for Development of the Urban Sector 1. Background
(1) Need for Urban Sector Development: According to the 2001 census, India has a population of 1027 million with approximately 28per cent or 285 million people living in urban areas. As a result of the liberalization policies adopted by the Government of India is expected to increase the share of the urban population may increase to about 40 per cent of total population by the year 2021. It is estimated that by the year 2011, urban areas would contribute about 65 per cent of gross domestic product (GDP). However, this higher productivity is contingent upon the availability and quality of infrastructure services. Urban economic activities are dependent on infrastructure, such as power, telecom, roads, water supply and mass transportation, coupled with civic infrastructure, such as sanitation and solid waste management.
(2) Investment Requirements in the Urban Sector: It is estimated that over a seven-year period, the Urban Local Bodies (ULBs)1 would require a total investments of Rs. 1,20,536 crores. This includes investment in basic infrastructure and services, that is, annual funding requirement of Rs. 17,219 crores. It is well recognised that in order to fructify these investments, a national level initiative is required that would bring together the State Governments and enable ULBs catalyse investment flows in the urban infrastructure sector.
(3) Need for National-Level Reform-Linked Investments: There is a need to integrate the reform initiatives and scale up the effort to catalyse investment in urban infrastructure across States in the country. There is a felt need to set up an initiative that will provide reformlinked assistance to State Governments and ULBs in the country.
(4) Need for Sustainable Infrastructure Development: Another crucial aspect requiring immediate attention is that physical infrastructure assets created in urban areas have generally been languishing due to inadequate attention and/or improper O&M. The fiscal flows to the sector have laid emphasis only on the creation of physical assets. Not much effort has been made either to manage these assets efficiently or to achieve self-sustainability. It is therefore necessary that a link be established between asset creation and management, as both are important components for ensuring sustained service delivery. This is proposed to be secured through an agenda of reforms.
(5) Need for Efficiency Enhancement: Concurrent with statutory reforms, such as the enactment of a model municipal law, reduction in stamp duty, repeal of the Urban Land (Ceiling and Regulation) Act, 1976 (ULCRA) etc, there is an urgent need to take measures to enhance efficiencies in urban service deliveries.
2. Rationale for the JNNURM
(1) National Common Minimum Programme of the Government of India: The National Common Minimum Programme attaches the highest priority to the development and expansion of physical infrastructure. Accordingly, it is proposed to take up a comprehensive programme of urban renewal and expansion of social housing in towns and cities, paying attention to the needs of slum dwellers.
(2) Commitment to Achieving the Millennium Development Goals: The Millennium Development Goals commit the international community, including India, to an expanded vision of development as a key to sustaining social and economic progress. As a part of its commitment to meet the Millennium Development Goals, the Government of India proposes to: (i) facilitate investments in the urban sector; and (ii) strengthen the existing policies in order to achieve these goals.
Annexure
136
(3) Need for a Mission-led Initiative: Since cities and towns in India constitute the second largest urban system in the world, and contribute over 50 per cent of the country’s GDP, they are central to economic growth. For the cities to realise their full potential and become effective engines of growth, it is necessary that focused attention be given to the improvement of infrastructure.
II. Jawaharlal Nehru National Urban Renewal Mission 1. The Mission Mission Statement: The aim is to encourage reforms and fast track planned development of identified cities. Focus is to be on efficiency in urban infrastructure and service delivery mechanisms, community participation, and accountability of ULBs/ Parastatal agencies towards citizens. 2. Objectives of the Mission (1) The objectives of the JNNURM are to ensure that the following are achieved in the urban sector;
(a) Focussed attention to integrated development of infrastructure services in cities covered under the Mission;
(b) Establishment of linkages between asset-creation and asset-management through a slew of reforms for long-term project sustainability;
(c) Ensuring adequate funds to meet the deficiencies in urban infrastructural services; (d) Planned development of identified cities including peri-urban areas, outgrowths and urban
corridors leading to dispersed urbanisation; (e) Scale-up delivery of civic amenities and provision of utilities with emphasis on universal access to
the urban poor; (f) Special focus on urban renewal programme for the old city areas to reduce congestion; and (g) Provision of basic services to the urban poor including security of tenure at affordable prices,
improved housing, water supply and sanitation, and ensuring delivery of other existing universal services of the government for education, health and social security.
3. Scope of the Mission The Mission shall comprise two Sub- Missions, namely:
(1) Sub-Mission for Urban Infrastructure and Governance: This will be administered by the Ministry of Urban Development through the Sub- Mission Directorate for Urban Infrastructure and Governance. The main thrust of the Sub-Mission will be on infrastructure projects relating to water supply and sanitation, sewerage, solid waste management, road network, urban transport and redevelopment of old city areas with a view to upgrading infrastructure therein, shifting industrial and commercial establishments to conforming areas, etc.
(2) Sub-Mission for Basic Services to the Urban Poor: This will be administered by the Ministry of Urban Employment and Poverty Alleviation through the Sub-Mission Directorate for Basic Services to the Urban Poor. The main thrust of the Sub-Mission will be on integrated development of slums through projects for providing shelter, basic services and other related civic amenities with a view to providing utilities to the urban poor.
4. Strategy of the Mission The objectives of the Mission shall be met through the adoption of the following strategy:
(1) Preparing City Development Plan: Every city will be expected to formulate a City Development Plan (CDP) indicating policies, programmes and strategies, and financing plans.
Annexure
137
(2) Preparing Projects: The CDP would facilitate identification of projects. The Urban Local Bodies (ULBs) / parastatal agencies will be required to prepare Detailed Project Reports (DPRs) for undertaking projects in the identified spheres. It is essential that projects are planned in a manner that optimises the life-cycle cost of projects. The life-cycle cost of a project would cover the capital outlays and the attendant O&M costs to ensure that assets are in good working condition. A revolving fund would be created to meet the O&M requirements of assets created, over the planning horizon. In order to seek JNNURM assistance, projects would need to be developed in a manner that would ensure and demonstrate optimisation of the life-cycle costs over the planning horizon of the project.
(3) Release and Leveraging of Funds: It is expected that the JNNURM assistance would serve to catalyse the flow of investment into the urban infrastructure sector across the country. Funds from the Central and State Government will flow directly to the nodal agency designated by the State, as grants-in-aid. The funds for identified projects across cities would be disbursed to the ULB/Parastatal agency through the designated State Level Nodal Agency (SLNA) as soft loan or grant-cum-loan or grant. The SLNA / ULBs in turn would leverage additional resources from other sources.
(4) Incorporating Private Sector Efficiencies: In order to optimise the life-cycle costs over the planning horizon, private sector efficiencies can be inducted in development, management, implementation and financing of projects, through Public Private Partnership (PPP) arrangements.
5. Duration of the Mission The duration of the Mission would be seven years beginning from the year 2005-06. Evaluation of the experience of implementation of the Mission would be undertaken before the commencement of Eleventh Five Year Plan and if necessary, the program calibrated suitably. 6. Expected Outcomes of the JNNURM On completion of the Mission period, it is expected that ULBs and parastatal agencies will have achieved the following:
(1) Modern and transparent budgeting, accounting, financial management systems, designed and adopted for all urban service and governance functions
(1) City-wide framework for planning and governance will be established and become operational (2) All urban residents will be able to obtain access to a basic level of urban services (3) Financially self-sustaining agencies for urban governance and service delivery will be established,
through reforms to major revenue instruments (4) Local services and governance will be conducted in a manner that is transparent and accountable
to citizens (5) E-governance applications will be introduced in core functions of ULBs/Parastatal resulting in
reduced cost and time of service delivery processes. III. Assistance under JNNURM 1. Financial Assistance under JNNURM The Government of India has proposed substantial assistance through the JNNURM over the seven-year period. During this period, funds shall be provided for proposals that would meet the Mission’s requirements2. Under JNNURM financial assistance will be available to the ULBs and parastatal agencies which could deploy these funds for implementing the projects themselves or through the special purpose vehicles (SPVs) that may be expected to be set up. Assistance under JNNURM is additional central assistance, which would be provided as grant (100 per cent central grant) to the implementing agencies. Further, assistance from JNNURM is expected to facilitate further investment in the urban sector. To this
Annexure
138
end, the implementing agencies are expected to leverage the sanctioned funds under JNNURM to attract greater private sector investments through PPP that enables sharing of risks between the private and public sector. 2. Areas of Assistance under JNNURM
(1) Assistance for Capacity Building, City Development Plan (CDP), Detailed Project Reports (DPRs), Community Participation, Information, Education and Communication (IEC)
(a) The JNNURM will provide assistance for the above-stated components with a provision of 5
per cent of the total central assistance or the actual requirement, which ever is less. In addition, not more than 5 percent of the Central grant or the actual requirement, whichever is less may be used for Administrative and Other Expenses (A&OE) by the States For capacity building, ULBs and parastatal agencies could engage consultants, in consultation with the SLNA, and seek reimbursement from the Ministry of Urban Development (MoUD) of the Mnistry of Urban Employment and Poverty Alleviation (MoUEPA).
(2) Investment Support Component
(b) Investment support will be provided to implementing agencies on a project-specific basis for eligible sectors and projects proposed to be undertaken in eligible cities subject to approval of the Central Sanctioning and Monitoring Committee (CSMC) of MoUD/ MoUEPA. As part of the process for seeking investment support, each ULB seeking assistance from the JNNURM would be required to prepare a CDP that shall inter alia include strategy to 2 Refer Section IV: Eligible Cities, Sectors and Projects implement reforms, city-level improvements and an investment plan to address the infrastructure needs in a sustainable manner. Assistance under investment support can be deployed in the following forms:
1) Enhancing Resource Availability: The JNNURM assistance can be used to leverage
additional resources available with the ULBs in addition to their existing resources and transfers from the State. These resources could be utilised for capital investment and O&M investments in a project.
2) Enhancing Commercial Viability of Projects: In respect of projects, which are not commercially viable on a stand-alone basis, assistance under the JNNURM may be sought for enhancing project viability. This assistance could be in the nature of viability gap support to projects.
3) Ensuring Bankability of Projects: Cash flows of infrastructure projects having long gestation periods are susceptible to variations in cash flows, rendering a project non-bankable. To enhance predictability of underlying cash-flows, credit enhancement mechanisms such as establishing liquidity support mechanisms, up-front debt-service reserve facility, deep discount bonds, contingent liability support and equity support are required in order to make the projects bankable. The JNNURM assistance could therefore be used for funding such support mechanisms.
IV. Eligible Cities, Sectors and Projects 1. Cities Eligible for Assistance under the JNNURM (1) Eligible Cities: The JNNURM shall give assistance for infrastructure development in the eligible cities/ Urban Agglomerations (UAs) (refer Annex) across States in the country. These cities/ UAs have been selected based as per the following criteria: The cities should have elected bodies in position.
Annexure
139
2. Sectors and Projects Eligible for Assistance under the Sub-Mission Directorate for Urban Infrastructure and Governance The sectors and projects eligible for JNNURM assistance would be as follows:
(1) Urban renewal, that is, redevelopment of inner (old) city areas [including widening of narrow streets, shifting of industrial and commercial establishments from non-conforming (inner city) areas to conforming (outer city) areas to reduce congestion, replacement of old and worn out pipes by new and higher capacity ones, renewal of the sewerage, drainage, and solid waste disposal system etc.] ;
(2) Water supply (including desalination plants) and sanitation. (3) Sewerage and solid waste management. (4) Construction and improvement of drains and storm water drains. (5) Urban transportation including roads, highways, expressways, MRTS, and metro projects. (6) Parking lots and spaces on PPP basis. (7) Development of heritage areas (8) Prevention and rehabilitation of soil erosion and landslides only in cases of special category States
where such problems are common; and (9) Preservation of water bodies.
Distribution of selected 63 cities is as follows: A. Cities/ UAs with 4 million plus population as per 2001 census - 07 B. Cities/ UAs with 1 million plus but less than 4 million population as per 2001 census - 28 C. Selected Cities/ UAs (State Capitals and other cities/ UA of religious/ historic and tourist
importance) - 28 NOTE: Land cost will not be financed except for acquisition of private land for schemes and projects in the North Eastern States and hilly States, namely Himachal Pradesh, Uttaranchal and Jammu and Kashmir 3. Sectors and Projects Eligible for Assistance under the Sub-Mission Directorate for Basic Services to the Urban Poor. The sectors and projects eligible for JNNURM assistance in eligible cities would be as follows:
(1) Integrated development of slums, housing and development of infrastructure projects in (1) slums in the identified cities;. (2) Projects involving development, improvement, and maintenance of basic services to the urban
poor. (3) Slum improvement and rehabilitation of projects. (4) Projects on water supply, sewerage, drainage, community toilets, and baths etc. (5) Projects for providing houses at affordable cost for slum dwellers, urban poor, economically
weaker sections (EWS) and lower income group (LIG) categories. (6) Construction and improvement of drains and storm water drains. (7) Environmental improvement of slums and solid waste management. (8) Street lighting. (9) Civic amenities like community halls, child care centres etc. (10) Operation and Maintenance of assets created under this component. (11) Convergence of health, education and social security schemes for the urban poor
NOTE: Land cost will not be financed except for acquisition of private land for schemes and projects in the North Eastern States and hilly States, namely Himachal Pradesh, Uttaranchal and Jammu and Kashmir.
Annexure
140
4. Inadmissible Components for JNNURM Assistance Projects pertaining to the following are not eligible for JNNURM assistance:
(1) Power (2) Telecom (3) Health (4) Education (5) Wage employment programme and staff components. (6) Creation of fresh employment opportunities
V. Agenda of Reforms The thrust of the JNNURM is to ensure improvement in urban governance and service delivery so that ULBs become financially sound and sustainable for undertaking new programmes. It is also envisaged that, with the charter of reforms that are followed by the State governments and ULBs, a stage will be set for PPPs. The agenda of reforms is given in the section below. The National Steering Group (NSG) may add additional reforms to identified reforms. A Memorandum of Agreement (MoA) between States/ULBs/Parastatal agencies and the Government of India, a prerequisite for accessing the Central assistance, would spell out specific milestones to be achieved for each item of reform. All mandatory and optional reforms shall be completed within the Mission period. 1. Mandatory Reforms (1) Mandatory Reforms at the Level of ULBs, and Parastatal Agencies
1. Adoption of modern accrual-based double entry system of accounting in ULBs and parastatal agencies.
2. Introduction of a system of e-governance using IT applications, such GIS and MIS for various services provided by ULBs and parastatal agencies.
3. Reform of property tax with GIS. It becomes a major source of revenue for ULBs and arrangements for its effective implementation so that collection efficiency reaches at least 85 per cent within next seven years.
4. Levy of reasonable user charges by ULBs and Parastatals with the objective that the full cost of O&M or recurring cost is collected within the next seven years. However, cities and towns in the North East and other special category States may recover only 50 per cent of O&M charges initially. These cities and towns should graduate to full O&M cost recovery in a phased manner.
5. Internal earmarking, within local bodies, budgets for basic services to the urban poor. 6. Provision of basic services to the urban poor including security of tenure at affordable prices,
improved housing, water supply and sanitation. Delivery of other existing universal services of the government for education, health and social security is ensured.
(2) Mandatory Reforms at the Level of States
(a) Implementation of decentralisation measures as envisaged in 74th Constitutional Amendment Act. The State should ensure meaningful association and engagement of ULBs in planning the function of parastatal agencies as well as the delivery of services to the citizens.
(b) *Repeal of ULCRA. (c) *Reform of Rent Control Laws balancing the interests of landlords and tenants. (d) Rationalisation of Stamp Duty to bring it down to no more than 5 per cent within next seven years. (e) Enactment of the Public Disclosure Law to ensure preparation of medium-term fiscal plan of
ULBs and parastatal agencies and release of quarterly performance information to all stakeholders.
Annexure
141
(f) Enactment of the Community Participation Law to institutionalise citizen’s participation and introduce the concept of the Area Sabha in urban areas.
(g) Assigning or associating elected ULBs with “city planning function”. Over a period of seven years, transferring all special agencies that deliver civic services in urban areas to ULBs and creating accountability platforms for all urban civic service providers in transition.
* Note: In respect of people oriented schemes relating to water supply and sanitation, the under-mentioned State levelmandatory reforms may be taken as optional reforms b) Repeal of Urban Land Ceiling and Regulation Act (c) Reform of Rent Control Act 2. Optional Reforms (common to States, ULBs and Parastatal Agencies) The following optional reforms are expected to be undertaken by ULBs, parastatal agencies and State governments:
a. Revision of bye-laws to streamline the approval process for construction of buildings, development of site etc.
b. Simplification of legal and procedural frameworks for conversion of land from agricultural to non-agricultural purposes.
c. Introduction of Property Title Certification System in ULBs. d. Earmarking at least 20-25 per cent of developed land in all housing projects (both public and
private agencies) for EWS and LIG category with a system of cross subsidisation. e. Introduction of computerised process of registration of land and property. f. Revision of byelaws to make rain-water harvesting mandatory in all buildings and adoption of
water conservation measures. g. Byelaws for reuse of recycled water. h. Administrative reforms i.e. reduction in establishment costs by adopting the Voluntary Retirement
Scheme (VRS), not filling posts falling vacant due to retirement etc., and achieving specified milestones in this regard.
i. Structural reforms. j. Encouraging PPP.
Note: Cities under the JNNURM will have the freedom to opt for any two reforms from the optional category in each year of implementation. Category C* - Cities/ UAs with less than one million population (1) Guwahati, (2) Itanagar, (3) Jammu, (4) Raipur, (5) Panaji, (6) Shimla, (7) Ranchi, (8) Thiruvananthapuram, (9) Imphal, (10) Shillong, (11) Aizawl, (12) Kohima, (13) Bhubaneshwar, (14) Gangtok, (15) Agartala, (16) Dehradun, (17) Bodhgaya, (18) Ujjain, (19) Puri, (20) Ajmer-Pushkar, (21) Nainital, (22) Mysore, (23) Pondicherry, (24) Chandigarh, (25) Srinagar, (26) Mathura, (27) Haridwar, (28) Nanded Category - A Mega Cities/ UAs (1) Delhi, (2) Greater Mumbai, (3) Ahmedabad, (4) Bangalore, (5) Chennai, (6) Kolkata, (7) Hyderabad List of Identified Cities Eligible for JNNURM * The National Steering Group (NSG) may consider addition or deletion of cities/ UAs/towns under Category C (other than State capitals) based on the suggestions received from State Governments. The total number of cities under the Mission shall, however, remain around 60.
Annexure
142
Category B - Million plus Cities/ UAs (1) Patna, (2) Faridabad, (3) Bhopal, (4) Ludhiana, (5) Jaipur, (6) Lucknow, (7) Madurai, (8) Nashik, (9) Pune, (10) Cochin, (11) Varanasi, (12) Agra, (13) Amritsar, (14) Vishakhapatnam, (15) Vadodara, (16) Surat, (17) Kanpur, (18) Nagpur, (19) Coimbatore, (20) Meerut, (21) Jabalpur, (22) Jamshedpur, (23) Asansol, (24) Allahabad, (25) Vijayawada, (26) Rajkot, (27) Dhanbad, and (28) Indore
Annexure
143
11.3 Revenue Sources Available to Various Local Governments as Per Different Panchayat Acts in India
The sources available to various local governments as per different Acts in India have been
compiled by Rao and Rao (2007). It is as follows: List of Tax Base: Property tax; Professional tax; Tool on vehicles for use of road/ bridge/ ferry
etc.; Tax on vehicle other than motor vehicle as defined in the Motor Vehicle Act 1988; Tax on non-agriculture land (land tax/ cess); Tax on fairs and festivals and other entertainment not being a tax on payment for admission to any entertainment; Pilgrim tax; Tax on entertainment including cinematograph shows; Tax on entertainment excluding cinematograph shows; Tax on commercial crops/ produce; Tax on cultivable land for specific purpose; Tax on agriculture land lying fallow; Tax on advertisement; Special tax on houses towards repair and maintenance, extension and improvements of water or drainage works or lighting of public street etc.; Special tax in lieu of community service; Tax on village produce sold in the village by weight, measurement or nos.; and Octori goods (entering local area for consumption, use or sale therein)
List of Revenue from State Duties/ Rent/ Auction/ Lease of Land & Property: Surcharge on stamp duty (sale, exchange or gift of immovable property, Mortgage of immovable property, lease of immovable property; Cess on land revenue collected by state government; Land conversion cess; Betterment levy on land; Additional duty/ levy on all payments for admission to any entertainment; Registration of marriage at the Panchayat; Right to operate market, ferries, fisheries & pounds; Auction of trees on road side; Income from endowments and trust under the control of Panchayats; Rent from public market including slaughter house, land and buildings owned by Panchayat; Seigniorage fee on material other than major and minor minerals quarried in the village; Rent for use of communal land/ buildings under the control of Panchayat; Education cess as percentage of property tax or land tax; Cess on excess vacant land as percentage of property tax; Fees from cattle grazing on land belonging to the Panchayat; Rent for the use of chops, stalls pens or stand in public markets; and Rent from erecting temporary sheds on land belonging to the Panchayat
Cess for Specific Services Rendered: General water rate/ tax; Piped water supply; Street lighting rate/ tax; and Street cleaning/ sanitation/ drainage/ conservancy
User Charges: Fees for the supply of water from wells and tanks for purposes other than domestic use and cattle; Fee for cleaning a cess pool; Fire protection services; Sanitation arrangements at places of worship/ fair/ pilgrimage; Sanitation provided for private latrines, urinals and cesspits; and Public halting where adequate facilities are made for vehicle (includes hand cart, cycle, cycle-rickshaw, cart drawn by animal, two-wheeler, motor cars, mini-bus, tempo, trekker, mini-lorry, bus, lorry)
License Fees: License for opening of private market; License to operate private slaughter house; License to butchers; License to rearing pigs and dogs; Trade license for dangerous and offensive trade and factory; License fee for grant of permission for use of machinery or manufacture plant driven by electrical power, steam water, or mechanical; License fee for brokers, commission agents, weight men and measurers; License to run private cart-stand; and License to run private tutorials not being recognized education institutions
List of Revenue from Fee: Fees for cattle brought for sale in any market; Market fee on persons who expose their goods for sale in any market place; Copying fees; Fees for plaint and petitions in suit and cases before the Nyapanchayat; Fees for sanction of building plan; Fees for erecting temporary erections in public streets; Fees for inspection of Panchayat record; Fees for registration of tube well fitted with motor driven pumps set and installed for irrigation for commercial purpose; Fee on visitors to fairs etc; Community cattle sheds; and Fee for registering of tube well fitted with motor-driven pumps set and installed for irrigation for commercial purpose
Revenue for Fines & Penalties: Fines for the contraventions of the provisions of the Act, whether specifically provided; Compounding of offences; and Penalties for contravention of the provisions of Panchayat Raj Act & Rules.
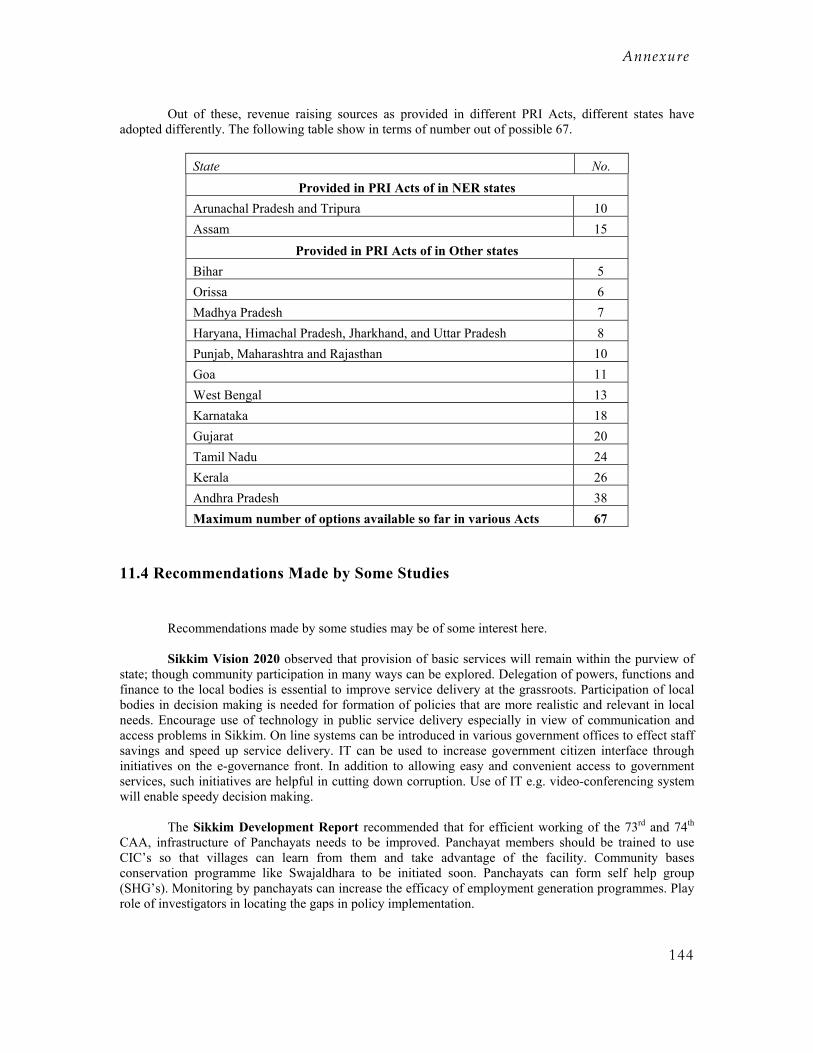
Annexure
144
Out of these, revenue raising sources as provided in different PRI Acts, different states have adopted differently. The following table show in terms of number out of possible 67.
State No. Provided in PRI Acts of in NER states
Arunachal Pradesh and Tripura 10 Assam 15
Provided in PRI Acts of in Other states Bihar 5 Orissa 6 Madhya Pradesh 7 Haryana, Himachal Pradesh, Jharkhand, and Uttar Pradesh 8 Punjab, Maharashtra and Rajasthan 10 Goa 11 West Bengal 13 Karnataka 18 Gujarat 20 Tamil Nadu 24 Kerala 26 Andhra Pradesh 38 Maximum number of options available so far in various Acts 67
11.4 Recommendations Made by Some Studies
Recommendations made by some studies may be of some interest here. Sikkim Vision 2020 observed that provision of basic services will remain within the purview of
state; though community participation in many ways can be explored. Delegation of powers, functions and finance to the local bodies is essential to improve service delivery at the grassroots. Participation of local bodies in decision making is needed for formation of policies that are more realistic and relevant in local needs. Encourage use of technology in public service delivery especially in view of communication and access problems in Sikkim. On line systems can be introduced in various government offices to effect staff savings and speed up service delivery. IT can be used to increase government citizen interface through initiatives on the e-governance front. In addition to allowing easy and convenient access to government services, such initiatives are helpful in cutting down corruption. Use of IT e.g. video-conferencing system will enable speedy decision making.
The Sikkim Development Report recommended that for efficient working of the 73rd and 74th
CAA, infrastructure of Panchayats needs to be improved. Panchayat members should be trained to use CIC’s so that villages can learn from them and take advantage of the facility. Community bases conservation programme like Swajaldhara to be initiated soon. Panchayats can form self help group (SHG’s). Monitoring by panchayats can increase the efficacy of employment generation programmes. Play role of investigators in locating the gaps in policy implementation.
Annexure
145
On local decentralisation and governance issues, Assam State Development Report has observed
that local governments especially in rural areas are not very well developed. They are very poor compared to other states; both urban and rural local governments play a relatively insignificant role in provision of local services. In addition to low levels of spending by local governments in both rural and urban areas, most of the spending is on non-developmental items including staff salaries and other administrative expenses. Local governments generate negligible resources in rural areas. Even by ULBs meagre resources are generated. Weak local governments, lacking powers, functions and resources result in poor pace of development and adversely affect poverty alleviation. Benefits of rural development programmes are reaching undeserving classes. Therefore, reform local government machinery to improve availability of trained staff either transfer own staff or make new recruitment locally. Work on accounts and establishment may be computerised and work carried out by technical competent staff to allow downsizing. Develop training infrastructure and train technical staff. Done through induction courses and regular refresher courses. Train local staff so as to make them more supportive of the community action programmes.
Mizoram Development Report (2007) takes note of the Government of India’s (2002)
recommendation for careful steps to be taken to devolve political powers through the intermediate and local-level traditional political organisations, provided their traditional practices carried out in a modern world do not deny legitimate democratic rights to any section in their contemporary society. To begin with, the subjects given under the Sixth Schedule and those mentioned in the Eleventh and Twelfth Schedules could be entrusted to the DCs and ADCs. The system of in-built safeguards in the Sixth Schedule should be maintained and strengthened for the minority and micro-minority groups while empowering them with greater responsibilities and opportunities, for example, through the process of Central funding for Plan expenditure instead of routing all funds through the state Governments. The North Eastern Council (NEC) can play a central role here by developing a process of public education on the proposed changes, which would assure communities about protection of their traditions and also bring in gender representation and give voice to other ethnic groups.
Specifically to improve the functioning of ADCs, Chakraborty (2006) has suggested to reduce
administrative expenses of the ADCs by restricting the numbers of members and employees; wind up the State Government offices in the ADCs relating to the subjects entrusted to them; entrust only those functions which they can undertake or carry out without much additional administrative costs; prioritise schemes of agricultural and horticultural development and agro-based industries; empower VCs and involve them in preparation of village-based development-plans and in implementation of the same. Plans for the ADCs should be prepared village-wise in consultation with the respective VCs and the plan-grants should go to the concerned VCs for implementation of such Village-based or Village-wise micro-development schemes; introduce Panchayati Raj and Nagarpalika institutions in the autonomous districts by withdrawing the exemption given in various Articles. 243M(1) and 243ZC(1) of the Constitution; and introduce direct funding of developmental schemes as well as to share the administrative costs on the part of the Central Government by making suitable amendment in Article 275(1) of the Constitution as the state is fully inhabited by the Scheduled Tribes only.
The report of NEC (2006) on NER Vision 2020, which is the vision and aspirations of the
people, has also made following recommendations on governance: • Need is of a responsive, committed, transparent and efficient administration. • Capacity building for e-governance as mentioned in the CMP. • Planning Commission to provide special assistance to the State of NER to enable them to
strengthen/improve project formulation, execution, evaluation and monitoring system. • NEC to have a cell of expert professional in core sector through outsourcing to assist the
states in developing an efficient system. • Excessive bureaucratic interference, which inhibits flow of private investment, should be
avoided.
Annexure
146
• Centre to provide adequate financial resources for development in the core sectors of the region’s economy. CMP promises that “all NER states will be given special assistance to upgrade and expand infrastructure”.
The increasing complexity of the urban sector and the relative weakness of sector institutions
points to the need for more careful preparation of projects, including more emphasis on institutional aspects to maximize project benefits and increase sustainability. The strategy calls for more in-depth sector analysis and focus on policy and institutional issues, which in turn requires more emphasis on capacity building. It should be out of sight that grave challenges of sustainable urban development are staring how the quality of life may be improved, urban poverty can be mitigated which is proving to be more serious compared to rural poverty, and protection of urban environment.
Related Documents