A special supplement to Kappan magazine September 2015 e 47th Annual PDK / Gallup Poll TESTING DOESN’T MEASURE UP FOR AMERICANS OF THE PUBLIC’S ATTITUDES TOWARD THE PUBLIC SCHOOLS

pdkpoll47_2015
Dec 14, 2015
The 47th Annual PDK/Gallup Poll of the Public’s Attitudes Toward the Public Schools
Welcome message from author
This document is posted to help you gain knowledge. Please leave a comment to let me know what you think about it! Share it to your friends and learn new things together.
Transcript

a special supplement to Kappan magazine september 2015
Th e 47th Annual pDK/Gallup poll
testing Doesn’t measure up
for americans
Th e 47 Annual pDK/Gallup poll/Gallup poll/oF THe pUBLIC’S ATTITUDeS ToWArD THe pUBLIC SCHooLS
K2 PDK/Gallup Poll September 2015
Team
Joan RichardsonEditor-in-chiEf
Gregory A. PattersonManaging Editor/ contEnt
Carol BucheriManaging Editor/ dEsign & production
William J. BushawValerie J. CalderonpdK/gallup poll co-dirEctors
Joan RichardsonWilliam J. BushawWritErs
Patrick MitchellcrEativE dirEction
Christopher BowersdEsignEr
Modus OperandiDesign/USdEsign consultants
Catalogtreeinfographics
USPS 429-840 ISSN 0031-7217
September 2015 V97 N1
Published by PDK Inter-national, 320 W. Eighth Street, Suite 216, P.O. Box 7888, Bloomington, IN 47407-7888, eight times per year, September to May with a combined December/January issue. Subscription prices avail-able at kappanmagazine.org. Periodicals postage paid at Bloomington, Ind., and additional mailing offices.postmaster: Send address changes to Phi Delta Kappan, P.O. Box 7888, Bloomington, IN 47407-7888.PrINtED IN U.S.A.©2015 by Phi Delta Kappa International. All rights reserved.Publications Mail Agreement PM# 41450540return undeliverable Canadian addresses to P.O. Box 2600, Mississauga, ON 4t 0A8.
WhaT’s InsIde
Testing doesn’t measure up for Americansstudent engagement at school and whether students feel hopeful about their future are better factors to consider when evaluating schools.
Common Core out of favor
Americans endorse choice
Americans love their local schoolsTesting lacks
public support
Americans prefer state, not federal, control.
hispanics and whites opposed having teachers use the common core in instruction. More blacks favored using the common core than opposed its use.
americans accept choice and charters as part of the education landscape, but they don’t want to use public money to pay for private school attendance.
the schools closest to our homes get the highest grades; the ones nationally, the lowest.
president obama’s approval is up slightly, but americans trust their states more as decision makers in education.
Blacks and hispanics said standardized test results could be helpful in improving schools and are very important measures of school quality.
PLUs:
What’s new in this year’s poll 4Too much testing? 6How should we use standardized tests? 12Use the poll to listen to your community 16Local schools better than schools nationally 20Get the kids vaccinated! 24Money makes a difference at schools 26Follow the data to frame new questions 28
CO
VEr
: ©
SIM
ON
JA
rr
Att
/CO
rB
IS
Phi DeltaKappan
Untitled-1 1 7/27/15 8:44 AM
v97 n1 pdkpoll.org K3
Testing Doesn’t Measure Up for AmericansaMEricans looK BEyond tEsting WhEn thEy EvaluatE schools
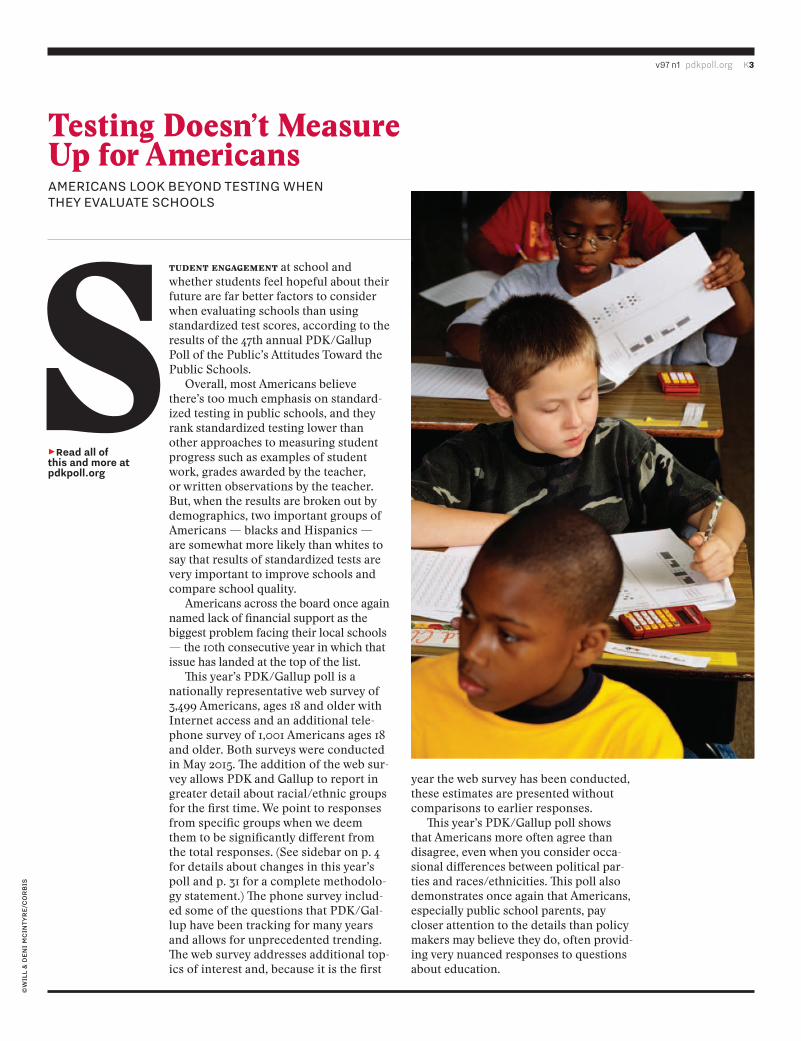
tudent engagement at school and whether students feel hopeful about their future are far better factors to consider when evaluating schools than using standardized test scores, according to the results of the 47th annual PDK/Gallup Poll of the Public’s Attitudes Toward the Public Schools.
Overall, most Americans believe there’s too much emphasis on standard-ized testing in public schools, and they rank standardized testing lower than other approaches to measuring student progress such as examples of student work, grades awarded by the teacher, or written observations by the teacher. But, when the results are broken out by demographics, two important groups of Americans — blacks and Hispanics — are somewhat more likely than whites to say that results of standardized tests are very important to improve schools and compare school quality.
Americans across the board once again named lack of financial support as the biggest problem facing their local schools — the 10th consecutive year in which that issue has landed at the top of the list.
This year’s PDK/Gallup poll is a nationally representative web survey of 3,499 Americans, ages 18 and older with Internet access and an additional tele-phone survey of 1,001 Americans ages 18 and older. Both surveys were conducted in May 2015. The addition of the web sur-vey allows PDK and Gallup to report in greater detail about racial/ethnic groups for the first time. We point to responses from specific groups when we deem them to be significantly different from the total responses. (See sidebar on p. 4 for details about changes in this year’s poll and p. 31 for a complete methodolo-gy statement.) The phone survey includ-ed some of the questions that PDK/Gal-lup have been tracking for many years and allows for unprecedented trending. The web survey addresses additional top-ics of interest and, because it is the first
year the web survey has been conducted, these estimates are presented without comparisons to earlier responses.
This year’s PDK/Gallup poll shows that Americans more often agree than disagree, even when you consider occa-sional differences between political par-ties and races/ethnicities. This poll also demonstrates once again that Americans, especially public school parents, pay closer attention to the details than policy makers may believe they do, often provid-ing very nuanced responses to questions about education.
3Read all of this and more at pdkpoll.org
©W
Ill
& D
ENI
MC
INty
rE/
CO
rB
IS

K4 PDK/Gallup Poll September 2015
for more details about the methodology of the poll, please see the methodology statement on p. 31 of this report.
Does changing from the telephone to the
web affect the poll results?
shifting from the telephone to a web poll limits our ability to do year-to-year comparisons ex-cept for the questions that have always been asked via telephone. following the guidance from gallup, pdK is not comparing 2015 web responses to telephone responses from previ-ous years. When we provide comparisons, we are comparing only telephone responses.
“Estimates derived from the 2015 web survey should not be compared directly to estimates derived from prior telephone surveys because these differences are at least partially a result of the differences in the data collection mode,” said gallup methodologist stephanie Kafka.
When you look at the poll tables, please look for the notations indicating whether the table is from a web poll or a telephone poll. We are adding this detail to ensure that there is no confusion about the source of the information.
why Does the way you ask the questions
make a Difference in the responses?
public opinion researchers say this is a com-monly known issue in polling known as the mode effect.
respondents in our web-based poll received an email inviting them to take the poll. they were able to decide when to take the sur-vey. they also could take a break, save their responses, and return later to complete the questionnaire. When they looked at the ques-tion on their computer screens, they saw the question plus all of the possible answers — except for the open-ended questions to which they had to supply their own answers.
“When a respondent sees response catego-ries visually, they’re much more likely to gravi-tate toward the middle,” Kafka said. “When they hear the same items, they’re more likely to latch on to the ends.”
robert shapiro, professor of political science at columbia university, agreed, even using some of the same language that Kafka used to describe the phenomenon. “online, they tend to moderate their responses. they tend to gravitate toward the middle. on the phone, they’re rushed. Even if the caller is talking quite slowly, it’s still one question after the other,” he said.
Does one moDe proviDe more accurate
responses than another?
Both methodologies let gallup researchers collect data from a representative sample so both are accurate. however, they should not be compared directly with one another because of the mode effect. the telephone survey is representative of all u.s. adults, and the web survey is representative of all u.s. adults with internet access, so slight differ-ences exist between the populations in these two surveys. however, despite these slight differences, researchers theorize that the differences in estimates derived from each of the two studies are largely attributable to the mode in which they were conducted rather than the populations covered, since the popu-lations are very similar.
WhaT’s neW In ThIs year’s PoLL?In the past, the PDK/Gallup poll was done exclusively
by telephone. this year, we used a multimode
design. We did a telephone poll of 1,000 adults ages
18 and over that included five key questions chosen
after analyzing four decades of PDK/Gallup polling.
this will allow us to continue examining trends for
those five questions. In addition, we also fielded an
Internet survey with members of Gallup’s randomly
recruited Gallup Panel. this survey included inter-
views with 3,499 adults ages 18 and over. this new
survey allowed us to report about specific sectors of
the population including:
3Public school parents,
3Political party membership or leanings, and
3Black, Hispanic, and white respondents.
v97 n1 pdkpoll.org K5
Among other findings of this year’s report:3Americans split on whether parents
should have the right to excuse their child from taking a standardized test, but a majority of public school parents said they would not excuse their own child from such an exam.3A majority of Americans oppose
using standardized test scores in teacher evaluations.3A majority of public school parents
oppose having teachers in their commu-nity use the Common Core State Stan-dards to guide what they teach.
3Half or less of public school students are receiving a high-quality education, according to a majority of Americans surveyed, a response that is consistent among blacks, whites, and Hispanics.3Only about one in five Americans be-
lieves the federal government should play a role in holding schools accountable, paying for schools, deciding the amount of testing in schools, or deciding what textbooks and materials should be used in schools. Instead, Americans put greater trust in the states with slightly more indi-cating that local authorities should select textbooks and teaching methods.
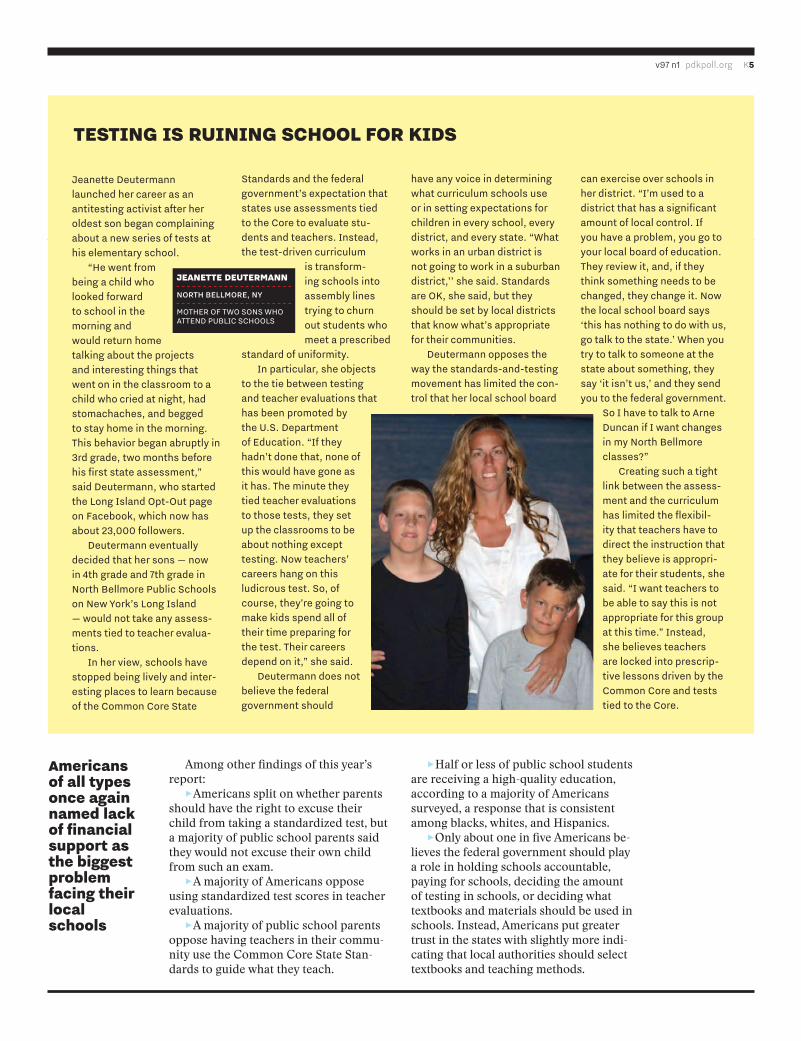
Jeanette deutermann launched her career as an antitesting activist after her oldest son began complaining about a new series of tests at his elementary school.
“he went from being a child who looked forward to school in the morning and would return home talking about the projects and interesting things that went on in the classroom to a child who cried at night, had stomachaches, and begged to stay home in the morning. this behavior began abruptly in 3rd grade, two months before his first state assessment,” said deutermann, who started the long island opt-out page on facebook, which now has about 23,000 followers.
deutermann eventually decided that her sons — now in 4th grade and 7th grade in north Bellmore public schools on new york’s long island — would not take any assess-ments tied to teacher evalua-tions.
in her view, schools have stopped being lively and inter-esting places to learn because of the common core state
standards and the federal government’s expectation that states use assessments tied to the core to evaluate stu-dents and teachers. instead, the test-driven curriculum
is transform-ing schools into assembly lines trying to churn out students who meet a prescribed
standard of uniformity.in particular, she objects
to the tie between testing and teacher evaluations that has been promoted by the u.s. department of Education. “if they hadn’t done that, none of this would have gone as it has. the minute they tied teacher evaluations to those tests, they set up the classrooms to be about nothing except testing. now teachers’ careers hang on this ludicrous test. so, of course, they’re going to make kids spend all of their time preparing for the test. their careers depend on it,” she said.
deutermann does not believe the federal government should
have any voice in determining what curriculum schools use or in setting expectations for children in every school, every district, and every state. “What works in an urban district is not going to work in a suburban district,’’ she said. standards are oK, she said, but they should be set by local districts that know what’s appropriate for their communities.
deutermann opposes the way the standards-and-testing movement has limited the con-trol that her local school board
can exercise over schools in her district. “i’m used to a district that has a significant amount of local control. if you have a problem, you go to your local board of education. they review it, and, if they think something needs to be changed, they change it. now the local school board says ‘this has nothing to do with us, go talk to the state.’ When you try to talk to someone at the state about something, they say ‘it isn’t us,’ and they send you to the federal government.
so i have to talk to arne duncan if i want changes in my north Bellmore classes?”
creating such a tight link between the assess-ment and the curriculum has limited the flexibil-ity that teachers have to direct the instruction that they believe is appropri-ate for their students, she said. “i want teachers to be able to say this is not appropriate for this group at this time.” instead, she believes teachers are locked into prescrip-tive lessons driven by the common core and tests tied to the core.
TesTIng Is rUInIng schooL for kIds
JeaneTTe deUTermann
NOrtH BEllMOrE, Ny
MothEr of tWo sons Who attEnd puBlic schools
americans of all types once again named lack of financial support as the biggest problem facing their local schools
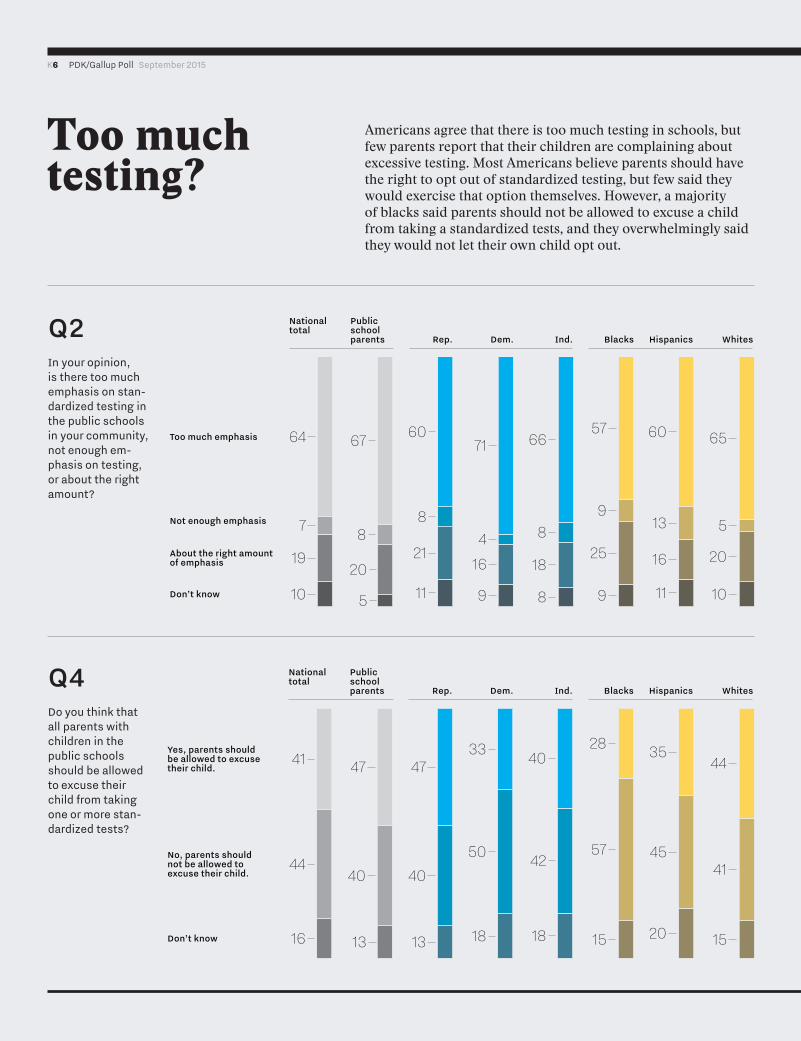
Too much testing?
Americans agree that there is too much testing in schools, but few parents report that their children are complaining about excessive testing. Most Americans believe parents should have the right to opt out of standardized testing, but few said they would exercise that option themselves. However, a majority of blacks said parents should not be allowed to excuse a child from taking a standardized tests, and they overwhelmingly said they would not let their own child opt out.
K6 PDK/Gallup Poll September 2015
65
5
20
10
60
13
16
11
57
9
25
9
66
8
18
8
71
416
9
60
8
21
11
67
8
20
5
64
7
10
19
Too much emphasis
Not enough emphasis
About the right amount of emphasis
Don’t know
Nationaltotal
Public school parents Rep. Dem. Ind. Blacks Hispanics Whites
44
41
15
35
45
20
28
57
15
40
42
18
33
50
18
47
40
13
47
40
13
41
44
16
Yes, parents should be allowed to excuse their child.
No, parents should not be allowed to excuse their child.
Don’t know
Nationaltotal
Public school parents Rep. Dem. Ind. Blacks Hispanics Whites
Q2in your opinion, is there too much emphasis on stan-dardized testing in the public schools in your community, not enough em-phasis on testing, or about the right amount?
Q4do you think that all parents with children in the public schools should be allowed to excuse their child from taking one or more stan-dardized tests?
3 Percentages may not equal 100 due to rounding.
21
15
6
24
10
4
18
6
12
27
9
6
15
12
6
20
15
5
21
15
6
19
24
15
32
21
9
26
19
18
12
25
22
23
27
16
20
25
15
18
24
16
Strongly disagree
4
Strongly agree
3
2
Don’t know
Public school parents Rep. Dem. Ind. Blacks Hispanics Whites
34
54
12
28
65
7
21
75
5
43
55
3
26
63
11
34
55
12
31
59
10
Yes, I would excuse my child.
No, I would not excuse my child.
Don’t know
Public school parents Rep. Dem. Ind. Blacks Hispanics Whites
Q8My child complains about taking too many standardized tests.
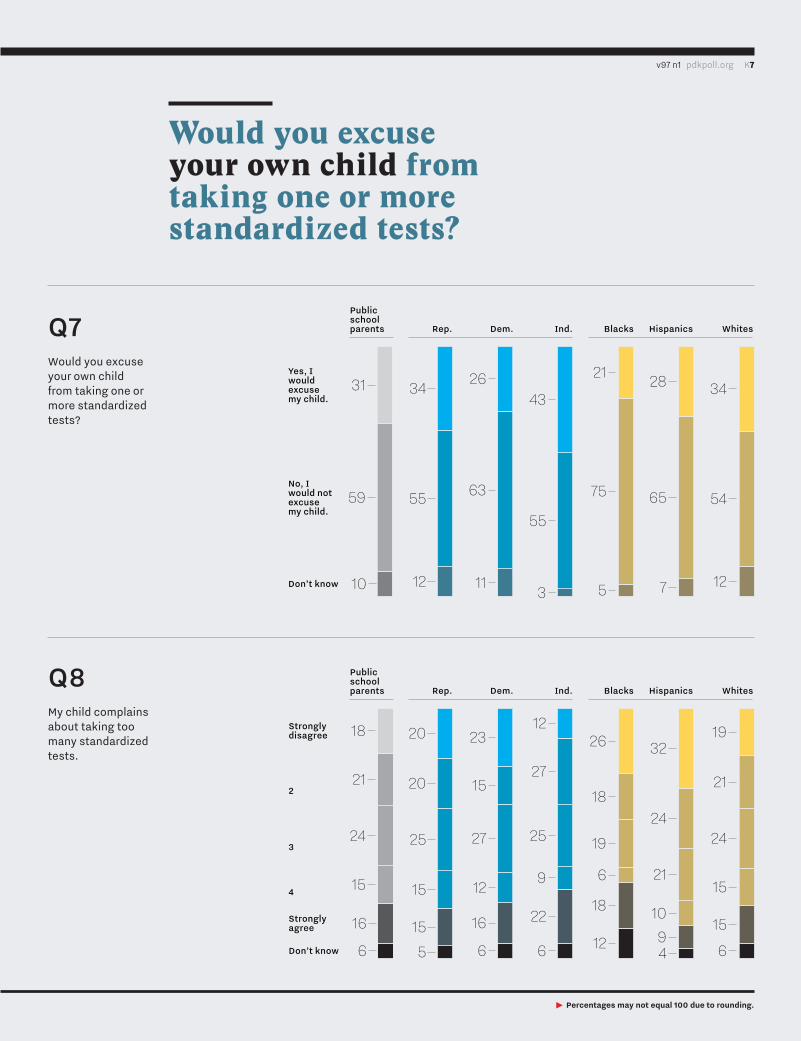
Q7Would you excuse your own child from taking one or more standardized tests?
Would you excuse your own child from taking one or more standardized tests?
v97 n1 pdkpoll.org K7

K8 PDK/Gallup Poll September 2015
n the last year, the grassroots opt-out movement, which allows parents to refuse to have their child take a stan-dardized test, has shown the extreme response to testing in some areas of the country, particularly New York. Even though opting out has not caught on nationwide, that does not mean that Americans or public school parents are undecided about standardized testing. As this year’s poll shows, many do not like the increasing emphasis on testing.
In 1970, Americans showed support for testing. When we asked Americans that year if they wanted students in their local schools to take national tests so their educational achievement could be compared with students in other commu-nities — 75% said yes.
finDings
3A strong majority (about eight in 10) of Americans believe how engaged students are with their classwork and their level of hope for the future are very important for measuring the effective-ness of the public schools in their com-munity. Fewer rated the percentage of graduates attending college and getting a job right after high school as very im-portant. Testing came in last as a measure of effectiveness with just 14% of public school parents rating test scores as very important, making it the last in the list of options.364% of Americans and a similar
proportion of public school parents said there is too much emphasis on standard-ized testing in the public schools in their community with just 7% believing there’s not enough.3When asked what ideas were most
important for improving public schools in their community from a list of five op-
tions, testing ranked last in importance once again. But one-third of blacks and Hispanics rated testing as very important. Blacks are more likely than whites (28% versus 11%) to say that student scores on standardized tests are very important in measuring the effectiveness of schools. 3When asked to select from four
approaches that would provide the most accurate picture of a public school stu-dent’s academic progress, standardized testing was again at the bottom of the list when compared with three other indica-tors of progress.3Americans split on whether parents
should be allowed to excuse their child from taking one or more standardized tests: 41% said yes, 44% said no. A major-ity of blacks said parents should not be able to excuse their child from taking a standardized test.3A majority of public school parents
said they would not excuse their own child from taking a standardized test; nearly one-third said they would excuse their own child. Nearly three-quarters of blacks said they would not excuse their own child. 3Americans are ambivalent about
Testing lacks public supportMEasurE EngagEMEnt and studEnt hopE to dEtErMinE school EffEctivEnEss
I
parents and their children rally against testing and urge other families to opt out in prospect park, brooklyn, n.y. parents objected to the time needed for test prep and tying teacher evaluations to test results.
a majority of public school parents said they would not excuse their own child from taking a standardized test. (continued on page k10)
©r
ICH
Ar
D l
EVIN
E/D
EMO
tIx/
CO
rB
IS

v97 n1 pdkpoll.org K9
77
69
38
27
14
78
81
75
39
31
14
80
82
79
54
37
28
77
77
68
47
34
23
79
77
68
34
25
11
79
How engagedstudents are with theirclasswork
The % of students whofeel hopefulabout theirfuture
% of studentswho graduatefrom high school
% of high school graduates who go to college or community college
% of graduateswho get jobs immediately after completinghigh school
Scores that studentsreceive on standardizedtests
Nationaltotal 2015
Public school parents Blacks Hispanics Whites
Q1 HOW IMPORTANT DO YOU THINK EACH OF THE FOLLOWING IS FOR MEASURING THE EFFECTIVENESS OF THE PUBLIC SCHOOLS IN YOUR COMMUNITY? (% WHO SAID “VERY IMPORTANT”)
65
20
5
10
60
13
16
11
57
9
25
9
66
8
8
18
71
416
9
60
8
21
11
67
8
20
5
64
7
19
10
Too much emphasison testing
Not enoughemphasison testing
About the right amountof emphasison testing
Don’t know
Rep. Dem. Ind. Blacks Hispanics Whites
Q2 IN YOUR OPINION, IS THERE TOO MUCH EMPHASIS ON STANDARDIZED TESTING IN THE PUBLIC SCHOOLS IN YOUR COMMUNITY, NOT ENOUGH EMPHASIS ON TESTING, OR ABOUT THE RIGHT AMOUNT?
Public sch.parents
Nationaltotal 2015
67
61
45
19
95
66
67
49
19
97
71
59
26
19
95
68
61
60
14
95
66
54
41
22
95
Quality of the teachers
Expectations for what students should learn
Effectiveness of the principals
How much money the schools have to spend
Using tests to measure what students have learned
Nationaltotal 2015
Public school parents Rep. Dem. Ind.
78
68
66
30
94
73
57
48
29
96
64
60
41
15
95
Blacks Hispanics Whites
Q5 THERE ARE MANY IDEAS ABOUT HOW TO IMPROVE THE QUALITY OF PUBLIC SCHOOLS. HOW IMPORTANT ARE THE FOLLOWING IDEAS FOR IMPROVING PUBLIC SCHOOLS IN YOUR COMMUNITY? (% WHO SAID “VERY IMPORTANT”)
38
21
15
39
16
36
19
38
22
15
4037
18
22
37
16
22
38
16
21 20
26
22
24
18
2725
14
26232526
Examples of the student's work
Scores on standardized achievement tests
Grades awarded by the teacher
Written observations by the teacher
Public sch.parents Rep. Dem. Ind. Blacks Hispanics Whites
Q3 IN YOUR OPINION, WHICH OF THE FOLLOWING APPROACHES WOULD PROVIDE THE MOST ACCURATE PICTURE OF A PUBLIC SCHOOL STUDENT'S ACADEMIC PROGRESS? SELECT ALL THAT APPLY.
Nationaltotal 2015
41
44
16
47
40
13
47
40
13
40
42
18
33
50
18
28
57
15
35
45
20
44
41
15
Yes, parents should be allowed to excuse their child.
No, parents should not be allowed to excuse their child.
Don’t know
Rep. Dem. Ind. Blacks Hispanics Whites
Q4 DO YOU THINK THAT ALL PARENTS WITH CHILDREN IN THE PUBLIC SCHOOLS SHOULD BE ALLOWED TO EXCUSE THEIR CHILD FROM TAKING ONE OR MORE STANDARDIZED TESTS?
Public sch.parents
Nationaltotal 2015
3 Percentages may not equal 100 due to rounding.

K10 PDK/Gallup Poll September 2015
the importance of comparing test scores for students in their local schools with students in other school districts, states, and nations. Nearly one-third of blacks said using standardized tests to compare their local schools with schools in other districts and other states is “very impor-tant;” only 15% of whites said the same.355% of Americans and 61% of public
school parents oppose including student scores on standardized tests as part of teacher evaluations.3Only 16% of public school parents
strongly agreed that their child com-plains about taking too many standard-ized tests. Just 9% of Hispanic parents strongly agreed that their children complained about too many tests.
Yes, I wouldexcuse mychild.
No, I wouldnot excusemy child.
Don’t know
Q7 WOULD YOU EXCUSE YOUR OWN CHILD FROM TAKING ONE OR MORE STANDARDIZED TESTS?
31
59
10
Public sch.parents
34
55
12
Rep.
26
63
11
Dem.
43
55
3
Ind.
21
75
5
Blacks
28
65
7
Hispanics
34
54
12
Whites
18
24
18
21
22
22
16
21
18
19
26
18
17
24
18
Knowing how students in your community’s schools compare to students in other school districts
Knowing how students in your community’s schools compare to students in other states
Knowing how students in your community’s schools compare to students in other countries
Nationaltotal 2015
P.S. parents Rep. Dem. Ind.
34
34
31
29
34
29
15
21
15
Blacks Hispanics Whites
Q6 HOW IMPORTANT IS IT FOR YOU TO KNOW HOW THE STUDENTS IN YOUR COMMUNITY'S SCHOOLS PERFORM ON STANDARDIZED TESTS COMPARED WITH STUDENTS IN OTHER SCHOOL DISTRICTS? HOW IMPORTANT IS IT FOR YOU TO KNOW HOW STUDENTS IN YOUR STATE PERFORM ON STANDARDIZED TESTS COMPARED WITH STUDENTS IN OTHER STATES? HOW IMPORTANT IS IT FOR YOU TO KNOW HOW STUDENTS IN THIS COUNTRY PERFORM ON STANDARDIZED TESTS, SUCH AS THE PROGRAM FOR INTERNATIONAL STUDENT ASSESSMENT (PISA), COMPARED WITH STUDENTS IN OTHER COUNTRIES? (% WHO SAID “VERY IMPORTANT”)
Stronglydisagree
2.00
3.00
4.00
Strongly agree
Don’t know
Q8 ON A FIVE-POINT SCALE, WHERE 5 MEANS STRONGLY AGREE AND 1 MEANS STRONGLY DISAGREE, PLEASE THINK ABOUT YOUR LEVEL OF AGREEMENT WITH THE FOLLOWING STATEMENT: MY CHILD COMPLAINS ABOUT TAKING TOO MANY STANDARDIZED TESTS.
18
24
21
15
16
6
26
19
18
6
12
18
Blacks
32
21
24
94
10
Hispanics
19
24
21
15
615
WhitesPublic sch.parents
3 Percentages may not equal 100 due to rounding.
v97 n1 pdkpoll.org K11
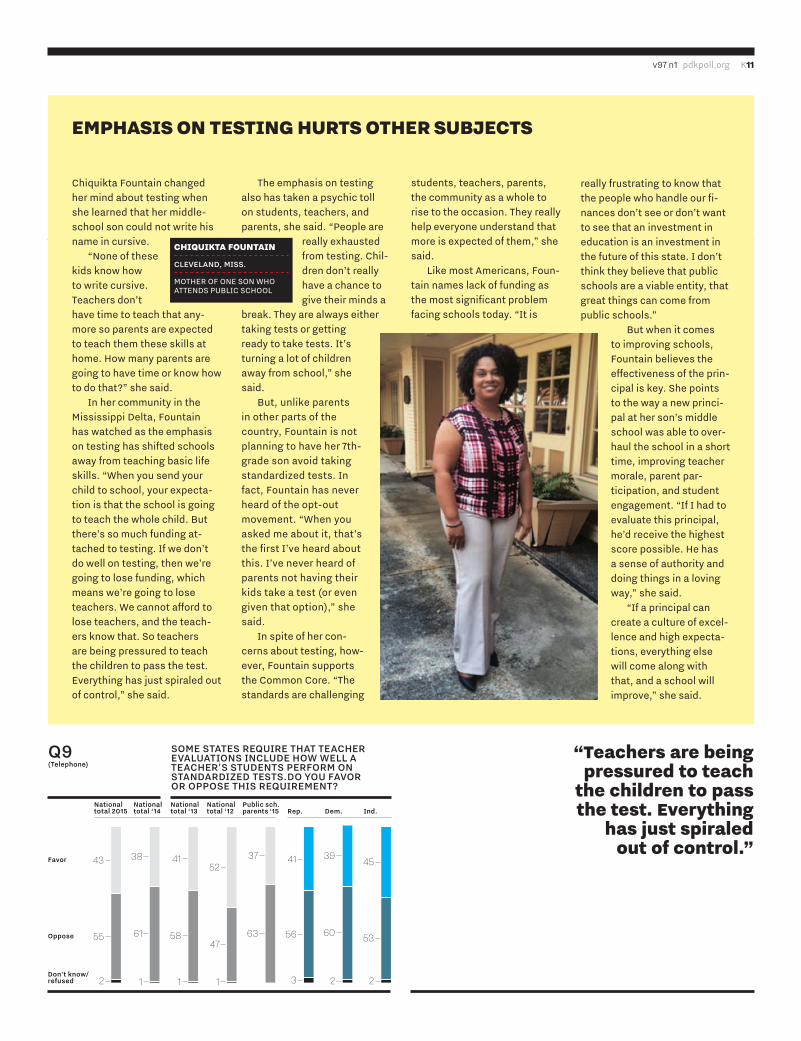
chiquikta fountain changed her mind about testing when she learned that her middle-school son could not write his name in cursive.
“none of these kids know how to write cursive. teachers don’t have time to teach that any-more so parents are expected to teach them these skills at home. how many parents are going to have time or know how to do that?” she said.
in her community in the Mississippi delta, fountain has watched as the emphasis on testing has shifted schools away from teaching basic life skills. “When you send your child to school, your expecta-tion is that the school is going to teach the whole child. But there’s so much funding at-tached to testing. if we don’t do well on testing, then we’re going to lose funding, which means we’re going to lose teachers. We cannot afford to lose teachers, and the teach-ers know that. so teachers are being pressured to teach the children to pass the test. Everything has just spiraled out of control,” she said.
the emphasis on testing also has taken a psychic toll on students, teachers, and parents, she said. “people are
really exhausted from testing. chil-dren don’t really have a chance to give their minds a
break. they are always either taking tests or getting ready to take tests. it’s turning a lot of children away from school,” she said.
But, unlike parents in other parts of the country, fountain is not planning to have her 7th-grade son avoid taking standardized tests. in fact, fountain has never heard of the opt-out movement. “When you asked me about it, that’s the first i’ve heard about this. i’ve never heard of parents not having their kids take a test (or even given that option),” she said.
in spite of her con-cerns about testing, how-ever, fountain supports the common core. “the standards are challenging
students, teachers, parents, the community as a whole to rise to the occasion. they really help everyone understand that more is expected of them,” she said.
like most americans, foun-tain names lack of funding as the most significant problem facing schools today. “it is
really frustrating to know that the people who handle our fi-nances don’t see or don’t want to see that an investment in education is an investment in the future of this state. i don’t think they believe that public schools are a viable entity, that great things can come from public schools.”
But when it comes to improving schools, fountain believes the effectiveness of the prin-cipal is key. she points to the way a new princi-pal at her son’s middle school was able to over-haul the school in a short time, improving teacher morale, parent par-ticipation, and student engagement. “if i had to evaluate this principal, he’d receive the highest score possible. he has a sense of authority and doing things in a loving way,” she said.
“if a principal can create a culture of excel-lence and high expecta-tions, everything else will come along with that, and a school will improve,” she said.
chIqUIkTa foUnTaIn
ClEVElAND, MISS.
MothEr of onE son Who attEnds puBlic school
emPhasIs on TesTIng hUrTs oTher sUbJecTs
43
55
2
38
61
1
41
58
1
41
56
3
52
47
1
39
60
2
45
53
2
37
63
Favor
Oppose
Don’t know/refused
Nationaltotal 2015
Nationaltotal ‘14
Nationaltotal ‘13
Nationaltotal ‘12
Public sch. parents ‘15 Rep. Dem. Ind.
SOME STATES REQUIRE THAT TEACHER EVALUATIONS INCLUDE HOW WELL A TEACHER'S STUDENTS PERFORM ON STANDARDIZED TESTS.DO YOU FAVOR OR OPPOSE THIS REQUIREMENT?
(Telephone)Q9 “Teachers are being
pressured to teach the children to pass the test. everything
has just spiraled out of control.”

K12 PDK/Gallup Poll September 2015
Americans have mixed feelings about tests. Tests are “somewhat important” in improving the quality of public schools and the scores that students receive on tests are “somewhat important” in evaluating whether schools are effective. But most Americans said test scores should not be used to evaluate teachers.
How should we use standardized tests?
There are many ideas about how to improve the quality of public schools.
How important are the following ideas for improving public schools in your community?
1 12
26
50
151
78
19
41
29
3
9
18
42
30
6
24
47
22
8
30
46
14
8
24
48
19
10
20
51
19
7
25
48
191
Not at all important
Not very important
Somewhat important
Very important
Don’t know
Nationaltotal
Public school parents Rep. Dem. Ind. Blacks Hispanics WhitesQ5E
using tests to measure what students have learned
(A variety of options were listed.)

v97 n1 pdkpoll.org K13
3 Percentages may not equal 100 due to rounding.
How importantdo you think each of the following is for measuring the
Some states require that teacher evaluations include how well a teacher’s students perform on standardized tests. Do you favor or oppose this requirement?
effectiveness of the public schools in your community?(A variety of options were listed.)
2
14
29
44
112
11
26
38
23
2
8
19
44
28
1
13
33
38
142
14
29
43
12
15
27
43
133
17
26
42
141
13
28
43
142
Not at all important
Not very important
Somewhat important
Very important
Don’t know
Nationaltotal
Public school parents Rep. Dem. Ind. Blacks Hispanics Whites
2
45
53
2
39
60
2
41
56
3
37
63
43
55
Favor
Oppose
Don’t know /Refused
Nationaltotal
Publicschoolparents Rep. Dem. Ind.
Q1Fscores that students receive on standardized tests
Q9(telephone)
K14 PDK/Gallup Poll September 2015
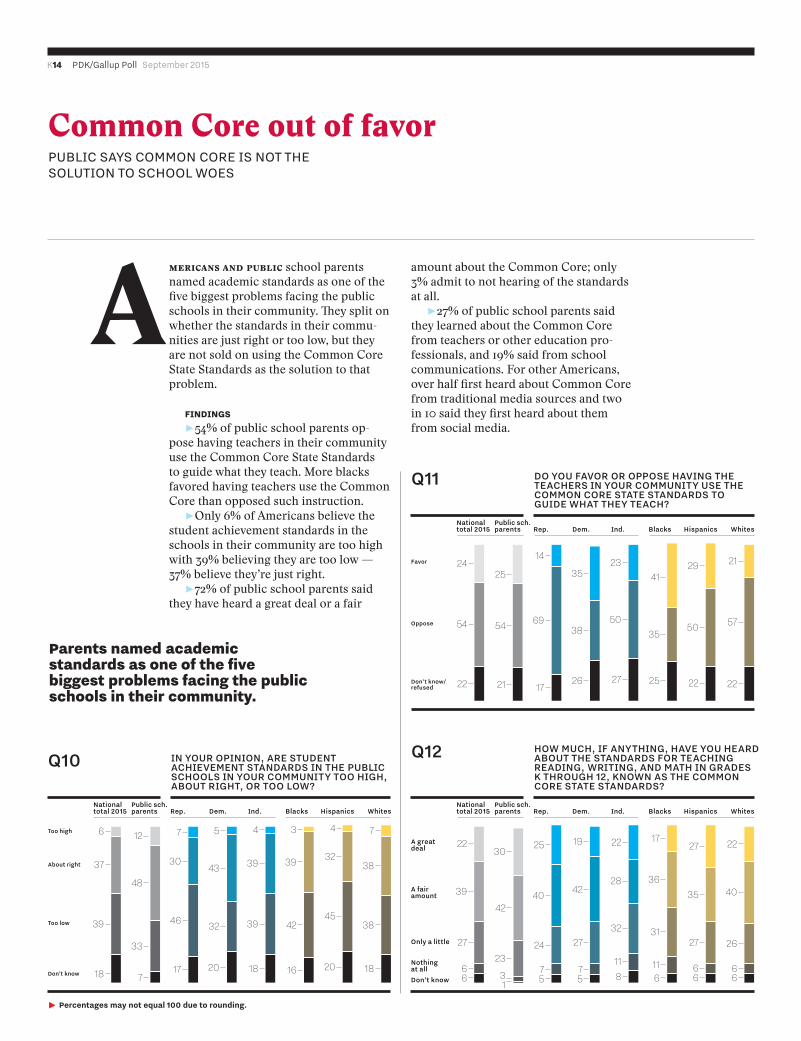
Common Core out of favorpuBlic says coMMon corE is not thE solution to school WoEs
Americans and public school parents named academic standards as one of the five biggest problems facing the public schools in their community. They split on whether the standards in their commu-nities are just right or too low, but they are not sold on using the Common Core State Standards as the solution to that problem.
finDings
354% of public school parents op-pose having teachers in their community use the Common Core State Standards to guide what they teach. More blacks favored having teachers use the Common Core than opposed such instruction. 3Only 6% of Americans believe the
student achievement standards in the schools in their community are too high with 39% believing they are too low — 37% believe they’re just right.372% of public school parents said
they have heard a great deal or a fair
amount about the Common Core; only 3% admit to not hearing of the standards at all.327% of public school parents said
they learned about the Common Core from teachers or other education pro-fessionals, and 19% said from school communications. For other Americans, over half first heard about Common Core from traditional media sources and two in 10 said they first heard about them from social media.
24
54
25
54
14
69
41
35
35
38
29
50
21
57
23
50
22 21 172526 22 2227
Favor
Oppose
Don’t know/refused
Rep. Dem. Ind. Blacks Hispanics Whites
Q11 DO YOU FAVOR OR OPPOSE HAVING THE TEACHERS IN YOUR COMMUNITY USE THE COMMON CORE STATE STANDARDS TO GUIDE WHAT THEY TEACH?
Public sch.parents
Nationaltotal 2015
6
37
39
12
48
33
7
30
4
39
5
43
3
39
4
32
7
38
3839
46
18 717 18
32 4245
18201620
Too high
About right
Too low
Don’t know
Rep. Dem. Ind. Blacks Hispanics Whites
Q10 IN YOUR OPINION, ARE STUDENT ACHIEVEMENT STANDARDS IN THE PUBLIC SCHOOLS IN YOUR COMMUNITY TOO HIGH, ABOUT RIGHT, OR TOO LOW?
Public sch.parents
Nationaltotal 2015
22
39
27
30
42
3
25
40
24
22
32
19
42
17
36
27 22
26
403528
2366
17
11
2731
27
66
66
1168
755
A great deal
A fair amount
Only a little
Nothing at all
Don’t know
Rep. Dem. Ind. Blacks Hispanics Whites
Q12 HOW MUCH, IF ANYTHING, HAVE YOU HEARD ABOUT THE STANDARDS FOR TEACHING READING, WRITING, AND MATH IN GRADES K THROUGH 12, KNOWN AS THE COMMON CORE STATE STANDARDS?
Public sch.parents
Nationaltotal 2015
3 Percentages may not equal 100 due to rounding.
Parents named academic standards as one of the five biggest problems facing the public schools in their community.

v97 n1 pdkpoll.org K15
concerns about school fund-ing launched lisa litvin into education advocacy. “once you hook into one issue, they all open up,” she said.
now her focus is on the common core and testing. she doesn’t like much of what she hears about either one of them.
“one of the first things i heard about the common core was that new york was adopting it while it was being drafted and before it had been piloted. We just went full on into this and to me, that was very troubling,” said litvin, who lives in hastings-on-hud-son, north of new york city.
But ultimately what concerned her most was the testing tied to the common core. “i’m not against testing. But to be effective, a test has to test what a student has been taught. you have to be able to see the questions after the fact. test results have to come back to the school so teach-ers, students, and parents can learn from them, and the test results can’t have high stakes attached to them,” she said. the tests tied to the common
core do not meet those stan-dards, she said.
parents should have the right to refuse to have their child take a standardized test that fails to meet these stan-dards, she said. however, her daughter — a junior at a public
high school — will take the common core regents exam because it is tied to a high school graduation
requirement.litvin said alarm bells went
off when she learned that teachers would be evaluated in part on the results of these new exams. “When we heard about grading teachers on the test, it was obvious to us what would happen: teachers would spend disproportionate time on tested subjects, more time on test preparation, and the cur-riculum would be narrowed.”
scores from standardized tests should not be part of any teacher’s evaluation or tenure determination. “teachers are being made the targets for everything that’s wrong with schools,” she said.
she said renewable indi-vidual contracts will eventually
replace tenure, but now is not the time to move in that direc-tion. “We need to repair our relationship with teachers. We need to restore respect for the profession of teaching. they’re doing what’s right, but they’re being made the scapegoats for everything that’s wrong with america. they’re not bring-ing home Wall street money; they’re just trying to do right by our kids. We have to stop hammering them so much.
they deserve much better than that,” she said.
litvin also sees charter schools as a political effort that’s threatening traditional public schools in her state and elsewhere. “charter schools have become something that wasn’t really intended. they were supposed to be incuba-tors for new ideas in teaching, with successful ideas being brought back to the tradi-tional schools. But, instead,
in our state, they’re becoming a per-manent alternative to public schools.” litvin worries that increasing emphasis on charter schools threatens fund-ing for traditional public schools. “our schools have been underfunded for five to six years. the money that’s going to support charter schools is coming right out of what would have gone to the traditional public schools. i have a big problem with that kind of mechanism.”
common core Too mUch, Too earLy
LIsa LITvIn
HAStINGS-ON-HUDSON, Ny
MothEr of onE daughtEr Who attEnds puBlic school and onE son in collEgE
24
33
13
20
10
26
11
20
30
16
18
27
19
17
26
12
25
11
20
33 32
11
31
612
Teachers or other education professi-onals
School commun-ication (such as, a web site or newsletter)
Friends, neighbors, or relatives
Television, newspapers or radio
Social media (such as Facebook or Twitter)
Nationaltotal 2015
Public sch. parents Blacks Hispanics Whites
Q13 HOW DID YOU FIRST HEAR ABOUT THE COMMON CORE STATE STANDARDS? SELECT ALL THAT APPLY.
“right now, teachers are being made the targets for
everything that’s wrong with schools.”

K16 PDK/Gallup Poll September 2015
now that you have access to the wealth of insights from the 47th annual PDK/Gallup Poll of the Pub-lic’s Attitudes Toward the Public Schools, what’s the best way to use the findings to engage your community? Used wisely, these findings can be a powerful tool that helps you take the pulse of your own community. And in the process, you can build understanding and support for your own priorities . . . or learn through listening that you may need to shift gears to respond to your community.
act on what you hearHere are three ways to use the survey data as a starting point for learning more about your com-munity: 3Localize the poll (or parts of it), and use the
results to see how your community compares to national averages and recent trends.3Conduct robust conversations to get a more in-
depth look at how parents, educators, and commu-nity members think about issues that matter most. 3Use small-group conversations to push the
results further, to see how people respond after get-ting additional information about an issue. There are always competing viewpoints and perspectives when it comes to school reforms. As a district or school leader, knowing the extent to which various perspectives resonate with your stakeholders can be very helpful.
Whatever approach you take, make sure you are clear about how you will use the information you gather: 3let participants know at the front end how you
will use what you hear. “Public engagement builds, informs, and deepens local conversations around issues with the aim of developing broad support for action [emphasis added],” says the Annenberg Institute for School Reform. You aren’t effectively engaging the public until you tie public input to action.
3make sure to close the loop a week or two after engaging with the community. Report back to participants and the community at large. Tell them what you learned and how you plan to use the information. If you don’t take this crucial step, the public may believe you were only going through the motions of two-way engagement. Nothing dampens willingness to participate (and enthusiasm for ac-tion) like believing that community input winds up in some black hole inside the system.
1. Localize the poll.This is the least resource-intensive approach. Cre-ate a local poll based on relevant sections of the national one. Is testing a hot issue in your commu-nity? Use questions 1-9. What about the Common Core? Use questions 10-13. When you get your local results, see how your community compares to the national data. What does that suggest in terms of additional outreach needed to explain your poli-cies, and what does it indicate about possible modi-fications you might want to make to the policies?
Conducting the survey can be fast and easy. If you have survey administration tools, use them. Or take advantage of online surveys such as Survey Monkey. Asking respondents to identify their racial/ethnic group also would let you know if im-portant populations have distinctive concerns that you might need to address.
Enlist the help of your principals and groups such as your teachers and parent associations to administer the survey with their staff and/or mem-bers.
2. conduct community conversations.To better learn about your stakeholders’ under-standing of and perspectives on key issues, orga-nize a listening session. These sessions can range in size from 10-person focus groups to 100-plus-per-son community forums. For example, several years ago, we worked with a handful of state school board associations to organize a series of local forums
USe THe poLL To LISTen To yoUr CoMMUnITyBy Adam Kernan-Schloss
v97 n1 pdkpoll.org K17
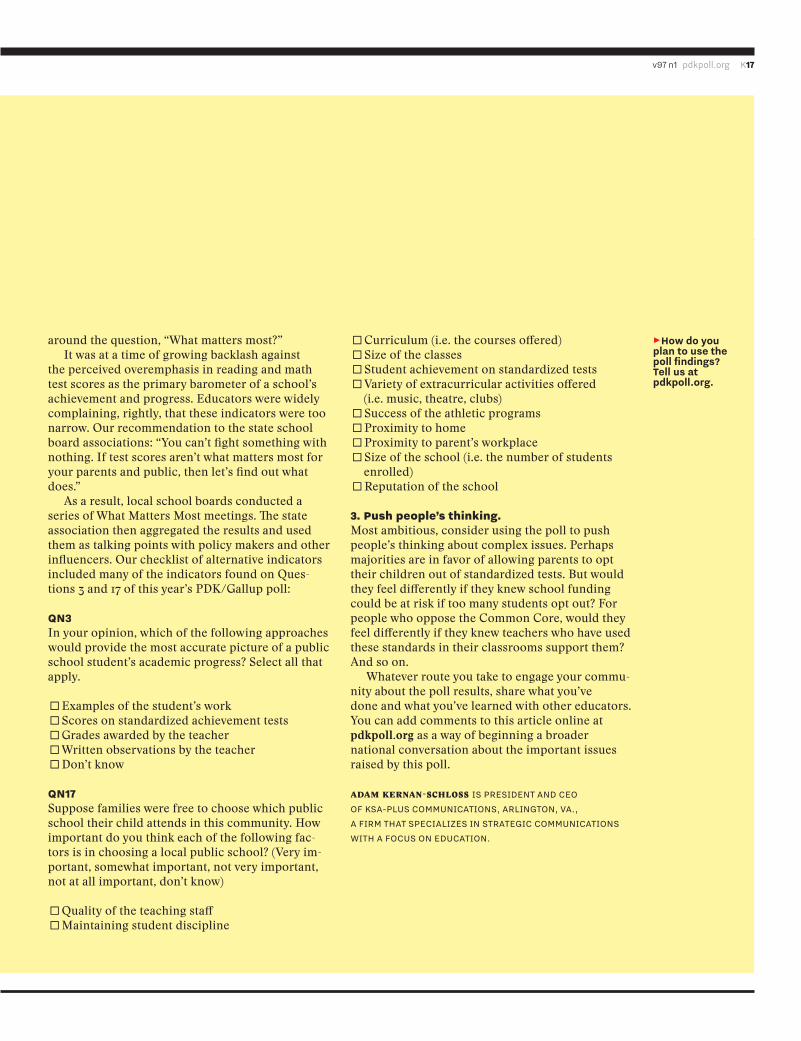
around the question, “What matters most?” It was at a time of growing backlash against
the perceived overemphasis in reading and math test scores as the primary barometer of a school’s achievement and progress. Educators were widely complaining, rightly, that these indicators were too narrow. Our recommendation to the state school board associations: “You can’t fight something with nothing. If test scores aren’t what matters most for your parents and public, then let’s find out what does.”
As a result, local school boards conducted a series of What Matters Most meetings. The state association then aggregated the results and used them as talking points with policy makers and other influencers. Our checklist of alternative indicators included many of the indicators found on Ques-tions 3 and 17 of this year’s PDK/Gallup poll:
qn3In your opinion, which of the following approaches would provide the most accurate picture of a public school student’s academic progress? Select all that apply.
PExamples of the student’s workPScores on standardized achievement testsPGrades awarded by the teacherPWritten observations by the teacherPDon’t know
qn17Suppose families were free to choose which public school their child attends in this community. How important do you think each of the following fac-tors is in choosing a local public school? (Very im-portant, somewhat important, not very important, not at all important, don’t know)
PQuality of the teaching staffPMaintaining student discipline
PCurriculum (i.e. the courses offered)PSize of the classesPStudent achievement on standardized testsPVariety of extracurricular activities offered
(i.e. music, theatre, clubs)PSuccess of the athletic programsPProximity to homePProximity to parent’s workplacePSize of the school (i.e. the number of students
enrolled)PReputation of the school
3. Push people’s thinking.Most ambitious, consider using the poll to push people’s thinking about complex issues. Perhaps majorities are in favor of allowing parents to opt their children out of standardized tests. But would they feel differently if they knew school funding could be at risk if too many students opt out? For people who oppose the Common Core, would they feel differently if they knew teachers who have used these standards in their classrooms support them? And so on.
Whatever route you take to engage your commu-nity about the poll results, share what you’ve done and what you’ve learned with other educators. You can add comments to this article online at pdkpoll.org as a way of beginning a broader national conversation about the important issues raised by this poll.
adam kernan-schloss is prEsidEnt and cEo
of Ksa-plus coMMunications, arlington, va.,
a firM that spEcializEs in stratEgic coMMunications
With a focus on Education.
USe THe poLL To LISTen To yoUr CoMMUnITy
3How do you plan to use the poll findings? Tell us at pdkpoll.org.
K18 PDK/Gallup Poll September 2015
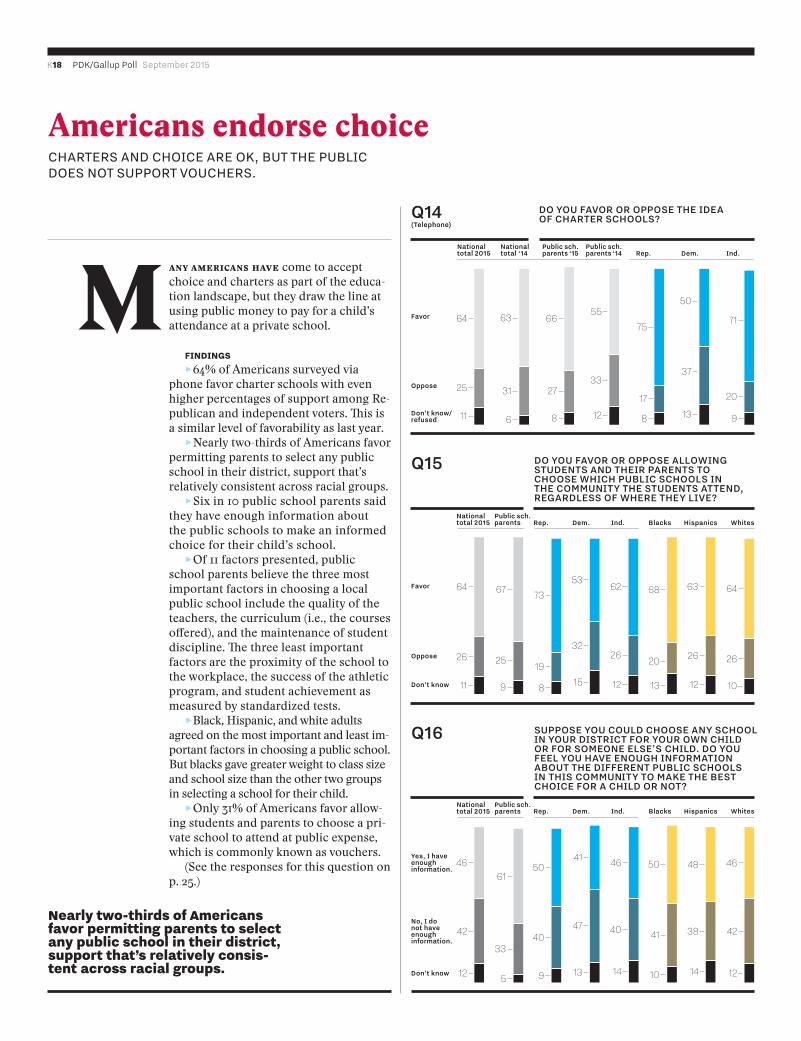
Americans endorse choicechartErs and choicE arE oK, But thE puBlic doEs not support vouchErs.
M any americans have come to accept choice and charters as part of the educa-tion landscape, but they draw the line at using public money to pay for a child’s attendance at a private school.
finDings
364% of Americans surveyed via phone favor charter schools with even higher percentages of support among Re-publican and independent voters. This is a similar level of favorability as last year.3Nearly two-thirds of Americans favor
permitting parents to select any public school in their district, support that’s relatively consistent across racial groups.3Six in 10 public school parents said
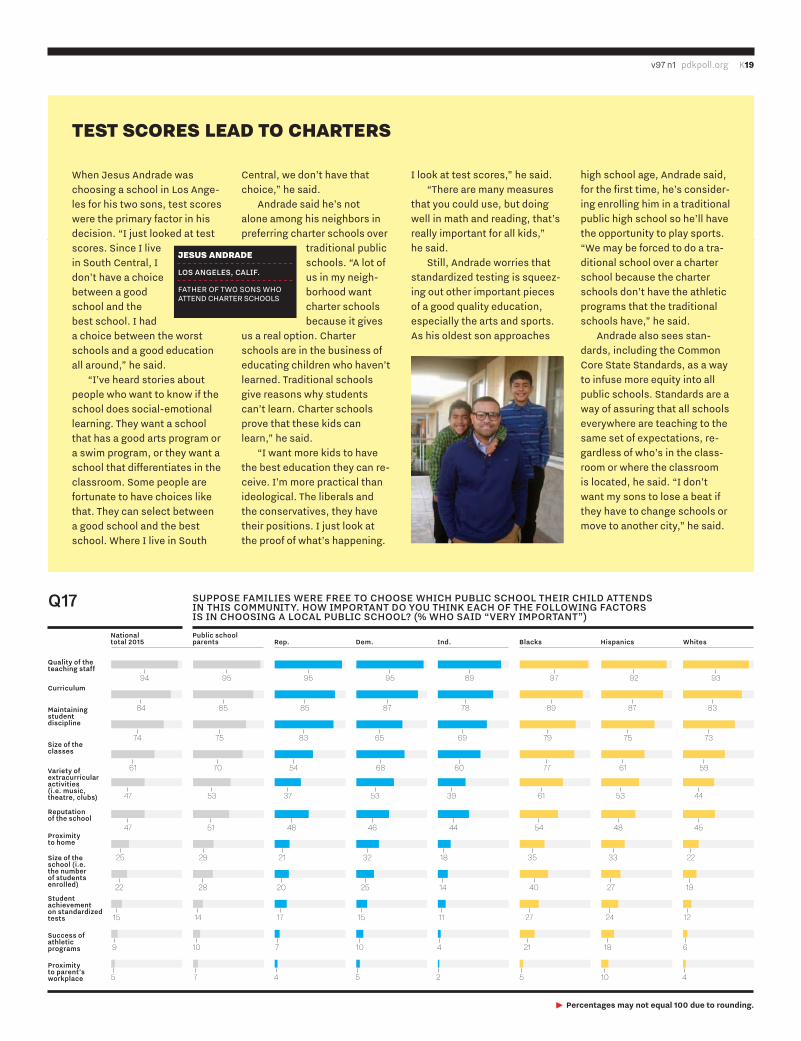
they have enough information about the public schools to make an informed choice for their child’s school. 3Of 11 factors presented, public
school parents believe the three most important factors in choosing a local public school include the quality of the teachers, the curriculum (i.e., the courses offered), and the maintenance of student discipline. The three least important factors are the proximity of the school to the workplace, the success of the athletic program, and student achievement as measured by standardized tests.3Black, Hispanic, and white adults
agreed on the most important and least im-portant factors in choosing a public school. But blacks gave greater weight to class size and school size than the other two groups in selecting a school for their child. 3Only 31% of Americans favor allow-
ing students and parents to choose a pri-vate school to attend at public expense, which is commonly known as vouchers.
(See the responses for this question on p. 25.)
64
25
11
63
31
6
66
27
8
75
17
8
55
33
12
50
37
13
71
20
9
Favor
Oppose
Don’t know/refused
Nationaltotal 2015
Nationaltotal ‘14
Public sch. parents ‘14
Public sch. parents ‘15 Rep. Dem. Ind.
DO YOU FAVOR OR OPPOSE THE IDEA OF CHARTER SCHOOLS?
(Telephone)Q14
64
26
10
63
26
12
68
20
13
62
26
12
53
15
32
19
73
8
67
25
9
64
11
26
Favor
Oppose
Don’t know
Nationaltotal 2015 Rep. Dem. Ind. Blacks Hispanics Whites
Q15 DO YOU FAVOR OR OPPOSE ALLOWING STUDENTS AND THEIR PARENTS TO CHOOSE WHICH PUBLIC SCHOOLS IN THE COMMUNITY THE STUDENTS ATTEND, REGARDLESS OF WHERE THEY LIVE?
Public sch.parents
46
42
12
48
38
14
50
41
10
46
40
14
41
13
4740
50
9
61
33
5
46
12
42
Yes, I haveenoughinformation.
No, I do not haveenough information.
Don’t know
Rep. Dem. Ind. Blacks Hispanics Whites
Q16 SUPPOSE YOU COULD CHOOSE ANY SCHOOL IN YOUR DISTRICT FOR YOUR OWN CHILD OR FOR SOMEONE ELSE'S CHILD. DO YOU FEEL YOU HAVE ENOUGH INFORMATION ABOUT THE DIFFERENT PUBLIC SCHOOLS IN THIS COMMUNITY TO MAKE THE BEST CHOICE FOR A CHILD OR NOT?
Public sch.parents
Nationaltotal 2015
nearly two-thirds of americans favor permitting parents to select any public school in their district, support that’s relatively consis-tent across racial groups.
v97 n1 pdkpoll.org K19
When Jesus andrade was choosing a school in los ange-les for his two sons, test scores were the primary factor in his decision. “i just looked at test scores. since i live in south central, i don’t have a choice between a good school and the best school. i had a choice between the worst schools and a good education all around,” he said.
“i’ve heard stories about people who want to know if the school does social-emotional learning. they want a school that has a good arts program or a swim program, or they want a school that differentiates in the classroom. some people are fortunate to have choices like that. they can select between a good school and the best school. Where i live in south
central, we don’t have that choice,” he said.
andrade said he’s not alone among his neighbors in preferring charter schools over
traditional public schools. “a lot of us in my neigh-borhood want charter schools because it gives
us a real option. charter schools are in the business of educating children who haven’t learned. traditional schools give reasons why students can’t learn. charter schools prove that these kids can learn,” he said.
“i want more kids to have the best education they can re-ceive. i’m more practical than ideological. the liberals and the conservatives, they have their positions. i just look at the proof of what’s happening.
i look at test scores,” he said.“there are many measures
that you could use, but doing well in math and reading, that’s really important for all kids,” he said.
still, andrade worries that standardized testing is squeez-ing out other important pieces of a good quality education, especially the arts and sports. as his oldest son approaches
high school age, andrade said, for the first time, he’s consider-ing enrolling him in a traditional public high school so he’ll have the opportunity to play sports. “We may be forced to do a tra-ditional school over a charter school because the charter schools don’t have the athletic programs that the traditional schools have,” he said.
andrade also sees stan-dards, including the common core state standards, as a way to infuse more equity into all public schools. standards are a way of assuring that all schools everywhere are teaching to the same set of expectations, re-gardless of who’s in the class-room or where the classroom is located, he said. “i don’t want my sons to lose a beat if they have to change schools or move to another city,” he said.
TesT scores Lead To charTers
JesUs andrade
lOS ANGElES, CAlIF.
fathEr of tWo sons Who attEnd chartEr schools
94 95 95 95 89
Quality of the teaching staff
Curriculum
Maintaining student discipline
Size of the classes
Variety of extracurricular activities (i.e. music, theatre, clubs)
Reputation of the school
Proximity to home
Size of the school (i.e. the number of students enrolled)
Student achievement on standardized tests
Success of athletic programs
Proximity to parent’s workplace
Nationaltotal 2015
Public school parents Rep. Dem. Ind.
97 92 93
84 85 85 87 78 89 87 83
74 75 83 65 69 79 75 73
61 70 54 68 60 77 61 59
47 51 48 46 44 54 48 45
25 29 21 32 18 35 33 22
22 28 20 25 14 40 27 19
15 14 17 15 11 27 24 12
9 10 7 10 4 21 18 6
47 53 37 53 39 61 53 44
5 7 4 5 2 5 10 4
Blacks Hispanics Whites
Q17 SUPPOSE FAMILIES WERE FREE TO CHOOSE WHICH PUBLIC SCHOOL THEIR CHILD ATTENDS IN THIS COMMUNITY. HOW IMPORTANT DO YOU THINK EACH OF THE FOLLOWING FACTORS IS IN CHOOSING A LOCAL PUBLIC SCHOOL? (% WHO SAID “VERY IMPORTANT”)
3 Percentages may not equal 100 due to rounding.

K20 PDK/Gallup Poll September 2015
Americans have long believed that their local schools are better than the schools in someone else’s community. Overall, they’re pretty pessimistic about how many children across the country are getting a high-quality education.
Local schools better than schools nationally
4
37
5
40
7
40
14
43
851
38
94
11
34
77
15
33
14
27
41
14
14
29
13
31
A
B
Don’t know/refused
Fail
D
C
Nationaltotal
Publicschoolparents Rep. Dem. Ind.
18
3
50
19
7
154
48
17
10
114
47
25
9
21
2
54
154
21
3
49
17
84 6 5 5 2
A
B
Don’t know/refused
Fail
D
C
Nationaltotal
Publicschoolparents Rep. Dem. Ind.
48
1
38
2
44
7
46
52
44
42
26
1943
37
22
22
27
1 1
24
23
28
22
A
B
Don’t know/refused
FailD
C
Nationaltotal
Publicschoolparents Rep. Dem. Ind.
Q18students are often given the grades a, B, c, d, and fail to denote the quality of their work. suppose the public schools themselves in your community were graded in the same way. What grade would you give the public schools here — a, B, c, d, or fail? (telephone)
Q19using the a, B, c, d, and fail scale again, what grade would you give the school your oldest child attends? (telephone)
Q20how about the public schools in the nation as a whole? What grade would you give the public schools, nationally — a, B, c, d, or fail? (telephone)
Q19 Q20
Q18
v97 n1 pdkpoll.org K21v97 n1 pdkpoll.org K21
3 Percentages may not equal 100 due to rounding.
using the a, B, c, d, fail scale again, what grade would you give the school your oldest child attends?
What grade would you give the public schools here — a, B, c, d, or fail?
how about the public schools in the nation as a whole? What grade would you give the public schools nationally — a, B, c, d, or fail?
1985
1986
198
7
1988
1989
199
0
199
1
199
2
199
3
199
4
199
5
199
6
199
7
199
8
199
9
200
0
200
1
200
2
200
3
200
4
200
5
200
6
200
7
200
8
200
9
2010
2011
2012
2013
2014
A
B
A
B
C
DFail
Don’tknow
A
B
CD
Fail
Don’tknow
C
DFail
Don’tknow
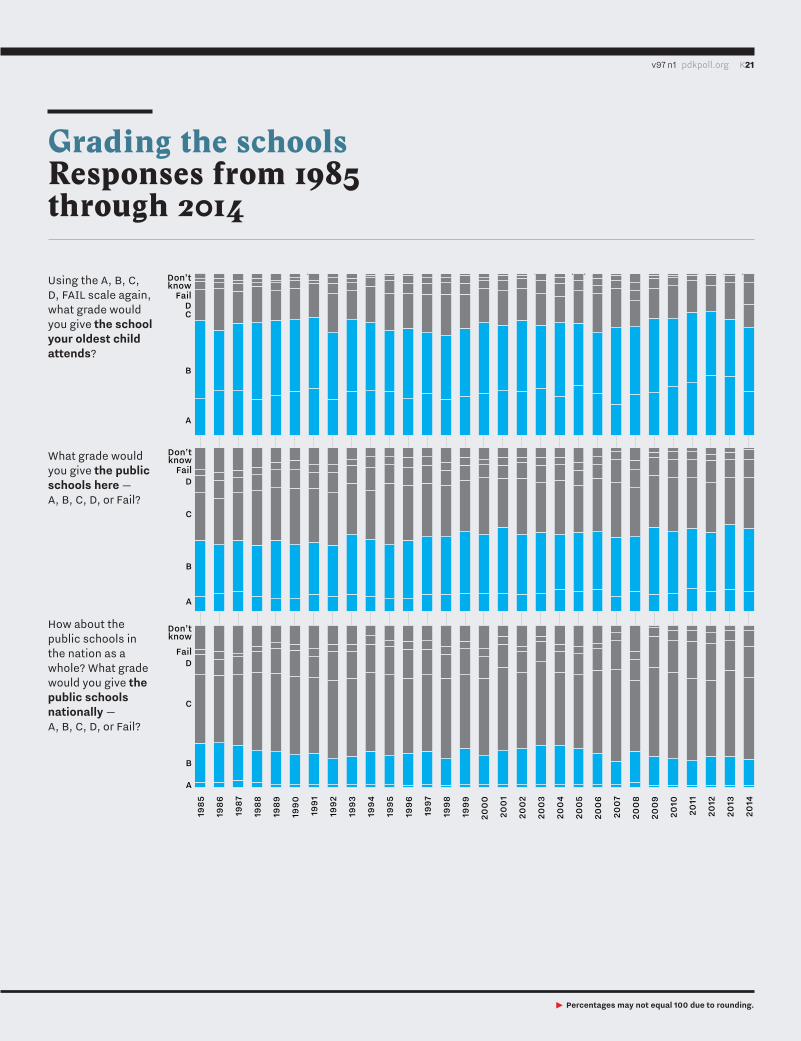
Grading the schools responses from 1985 through 2014

K22 PDK/Gallup Poll September 2015
Americans love their local schoolslacK of financial support tops thE list of proBlEMs facing local schools
Americans consistently give the highest grades to the schools that are closest to them and that they may have more experience with and the lowest grades to the schools farthest away, a pattern that has held across 40 years of the PDK/Gal-lup poll.
The single most enduring question in the PDK/Gallup poll is this: Grade the schools in your community using A, B, C, D, or Fail to denote the quality of their work. We also ask Americans to use the same approach to grade the nation’s schools, and we ask public school par-ents to grade the school that their oldest child attends. To maintain trend data, these three questions were asked this year via telephone polling of 1,001 adults.
In another remarkably consistent response, Americans once again named lack of financial support as the biggest problem facing schools in their com-munities. We always ask this open-ended question first so responders won’t be influenced by other questions in the poll, and we do not provide prompts.
finDings
3This year, 51% of Americans gave schools in their own community a grade of either A or B; only 4% gave their schools a failing grade. What’s most interesting is how consistent these grades have been during the last 10 years. Since 2005, the percentage range of A’s and B’s has gone as low as 45% and as high as 53%. In fact, the variance in the grades has not changed much even over the last 25 years. This is a remarkable finding when you consider the multitude of reports questioning the quality of American education. 3This year’s larger web-based poll
gave us the opportunity to learn for the first time how blacks, Hispanics, and whites would grade their community’s schools: Only 23% of blacks gave their schools A’s or B’s; among Hispanics, 31%.
3Similarly, while lower, the grades that Americans assign to the nation’s schools also are consistent over the past 10 years. This year’s percentage of A’s and B’s is 21%, up from 17% last year. In the last 10 years, the percentage of A’s and B’s has been as high as 22% and as low as 16%. So while Americans view the quality of the nation schools lower than schools in their own community, they do not necessarily perceive an overall decline in the nation’s schools.3During the last 10 years, we see the
greatest variance in how public school parents grade the school that their oldest child attends. Over the years, grades from public school parents have been as low as 64% of A’s and B’s and as high as 77%. This year, 70% of public school parents gave the school attended by their oldest child either an A or a B.3Lack of financial support for schools
has been at the top of Americans’ list of the biggest problems facing their local schools for 10 years — and by a wide margin. Making the top five list of problems this year are concerns about standards and testing.3Blacks, Hispanics, and whites all
named lack of financial support as the biggest problem. Lack of parental support/interest rated high among all groups as a problem for schools.3Nearly two-thirds of Americans
believe that 50% or fewer public school students in this country are receiving a high-quality education. These data are similar for blacks, Hispanics, and whites.3By far, of factors studied, Ameri-
cans believe teacher quality is the most important factor to improve the quality of the public schools, followed by establishing expectations for what students should learn (i.e., academic standards) and employing effective school principals. Fewest (19%) say using tests is a very important way to improve schools.
americans once again named lack of financial support as the biggest problem facing schools in their com-munities.
v97 n1 pdkpoll.org K23
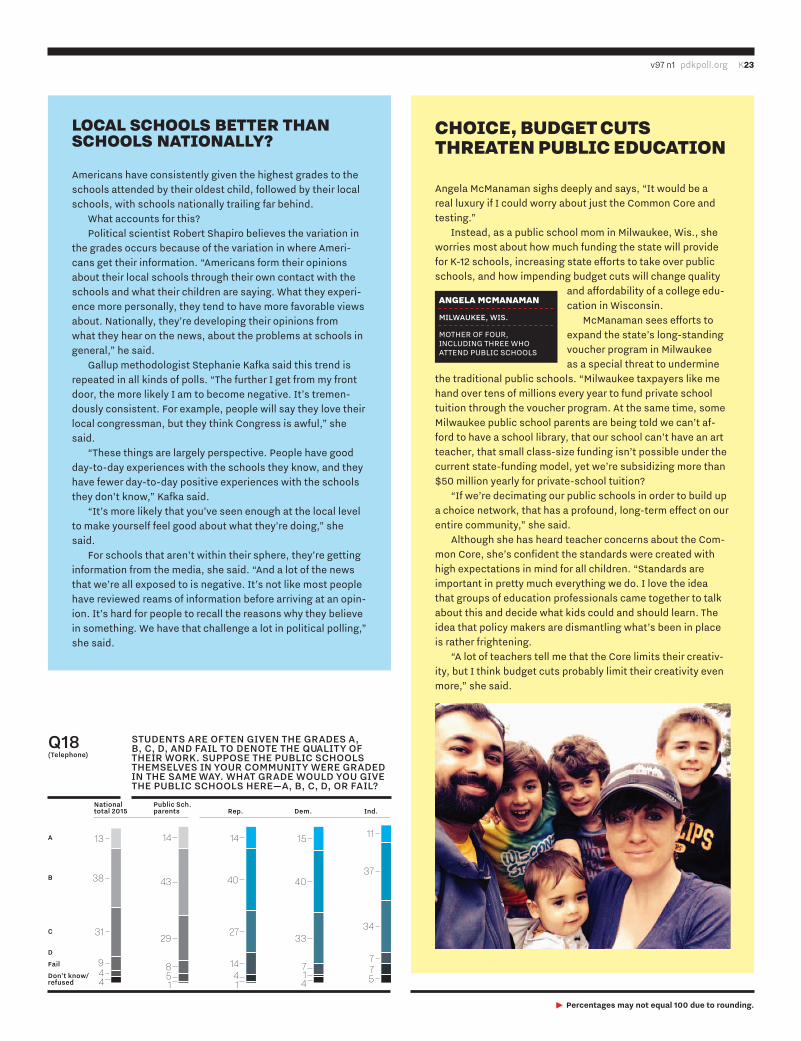
angela McManaman sighs deeply and says, “it would be a real luxury if i could worry about just the common core and testing.”
instead, as a public school mom in Milwaukee, Wis., she worries most about how much funding the state will provide for K-12 schools, increasing state efforts to take over public schools, and how impending budget cuts will change quality
and affordability of a college edu-cation in Wisconsin.
McManaman sees efforts to expand the state’s long-standing voucher program in Milwaukee as a special threat to undermine
the traditional public schools. “Milwaukee taxpayers like me hand over tens of millions every year to fund private school tuition through the voucher program. at the same time, some Milwaukee public school parents are being told we can’t af-ford to have a school library, that our school can’t have an art teacher, that small class-size funding isn’t possible under the current state-funding model, yet we’re subsidizing more than $50 million yearly for private-school tuition?
“if we’re decimating our public schools in order to build up a choice network, that has a profound, long-term effect on our entire community,” she said.
although she has heard teacher concerns about the com-mon core, she’s confident the standards were created with high expectations in mind for all children. “standards are important in pretty much everything we do. i love the idea that groups of education professionals came together to talk about this and decide what kids could and should learn. the idea that policy makers are dismantling what’s been in place is rather frightening.
“a lot of teachers tell me that the core limits their creativ-ity, but i think budget cuts probably limit their creativity even more,” she said.
choIce, bUdgeT cUTs ThreaTen PUbLIc edUcaTIon
angeLa mcmanaman
MIlWAUKEE, WIS.
MothEr of four, including thrEE Who attEnd puBlic schools
LocaL schooLs beTTer Than schooLs naTIonaLLy?
americans have consistently given the highest grades to the schools attended by their oldest child, followed by their local schools, with schools nationally trailing far behind.
What accounts for this?political scientist robert shapiro believes the variation in
the grades occurs because of the variation in where ameri-cans get their information. “americans form their opinions about their local schools through their own contact with the schools and what their children are saying. What they experi-ence more personally, they tend to have more favorable views about. nationally, they’re developing their opinions from what they hear on the news, about the problems at schools in general,” he said.
gallup methodologist stephanie Kafka said this trend is repeated in all kinds of polls. “the further i get from my front door, the more likely i am to become negative. it’s tremen-dously consistent. for example, people will say they love their local congressman, but they think congress is awful,” she said.
“these things are largely perspective. people have good day-to-day experiences with the schools they know, and they have fewer day-to-day positive experiences with the schools they don’t know,” Kafka said.
“it’s more likely that you’ve seen enough at the local level to make yourself feel good about what they’re doing,” she said.
for schools that aren’t within their sphere, they’re getting information from the media, she said. “and a lot of the news that we’re all exposed to is negative. it’s not like most people have reviewed reams of information before arriving at an opin-ion. it’s hard for people to recall the reasons why they believe in something. We have that challenge a lot in political polling,” she said.
13
38
31
14
43
8
14
40
27
11
34
15
4037
29
5944 1
14 7
33
75
714
41
A
B
C
D
Fail
Don’t know/refused
(Telephone)
Nationaltotal 2015
Public Sch.parents Rep. Dem. Ind.
Q18 STUDENTS ARE OFTEN GIVEN THE GRADES A, B, C, D, AND FAIL TO DENOTE THE QUALITY OF THEIR WORK. SUPPOSE THE PUBLIC SCHOOLS THEMSELVES IN YOUR COMMUNITY WERE GRADED IN THE SAME WAY. WHAT GRADE WOULD YOU GIVE THE PUBLIC SCHOOLS HERE—A, B, C, D, OR FAIL?
3 Percentages may not equal 100 due to rounding.

K24 PDK/Gallup Poll September 2015
26
38
21
41
20
48
30
38
26
36
29 25 273129
7 8 6 5 7
Less thanor equal to 25%
26% - 50%
51% - 75%
More than 75%
Nationaltotal 2015
Public Sch.parents Blacks Hispanics Whites
Q21 WHAT PERCENTAGE OF PUBLIC SCHOOL STUDENTS IN THIS COUNTRY DO YOU BELIEVE RECEIVE A HIGH-QUALITY EDUCATION TODAY?
318
50
415
48
106
411
47
25
3
49
2
21
54
21
1719
47
171582
45
95
A
B
C
D
Fail
Don’t know/refused
(Telephone)
Nationaltotal 2015
Public Sch. parents Rep. Dem. Ind.
Q20 HOW ABOUT THE PUBLIC SCHOOLS IN THE NATION AS A WHOLE? WHAT GRADE WOULD YOU GIVE THE PUBLIC SCHOOLS, NATIONALLY—A, B, C, D,OR FAIL?
28
44
22
24
46
52
22
44
27
26
19
37
3848
23
42
422
31
21
71
A
B
C
D
Fail
Don’t know/refused
(Telephone)
Nationaltotal 2015
Public Sch. parents Rep. Dem. Ind.
Q19 USING THE A, B, C, D, AND FAIL SCALE AGAIN, WHAT GRADE WOULD YOU GIVE THE SCHOOL YOUR OLDEST CHILD ATTENDS?
3 Percentages may not equal 100 due to rounding.
W ith vaccination so much in the news during the last school year, we decided to check American views on that question. We learned that Americans in all catego-
ries overwhelmingly said that all children should be vaccinated before they attend public schools.
Get the kids vaccinated!aMEricans agrEEd that all childrEn should BE vaccinatEd BEforE thEy attEnd puBlic schools.
83
107
83
98
87
66
83
98
94
34
13
80
7
83
710
84
79
Yes
No
Don’t know
Rep. Dem. Ind. Blacks Hispanics Whites
Q22 DO YOU THINK STUDENTS SHOULD BE REQUIRED TO HAVE CERTAIN VACCINATIONS BEFORE THEY ARE ALLOWED TO ATTEND A PUBLIC SCHOOL IN YOUR COMMUNITY?
Public sch.parents
Nationaltotal 2015
v97 n1 pdkpoll.org K25
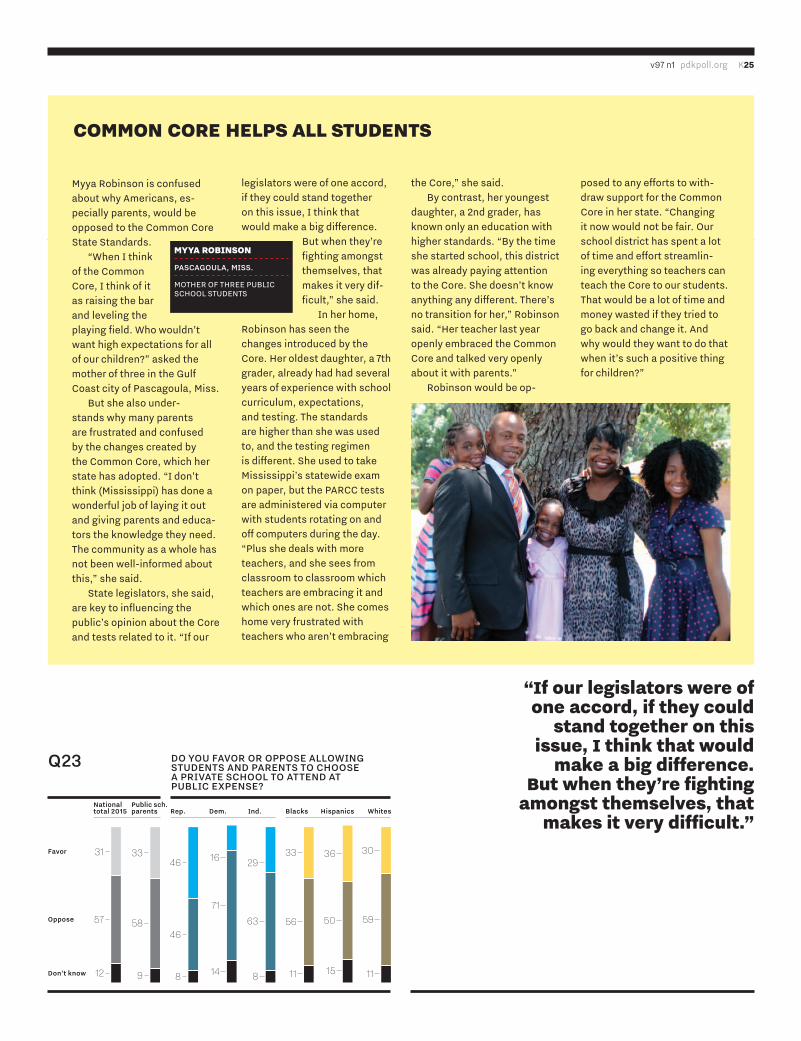
Myya robinson is confused about why americans, es-pecially parents, would be opposed to the common core state standards.
“When i think of the common core, i think of it as raising the bar and leveling the playing field. Who wouldn’t want high expectations for all of our children?” asked the mother of three in the gulf coast city of pascagoula, Miss.
But she also under-stands why many parents are frustrated and confused by the changes created by the common core, which her state has adopted. “i don’t think (Mississippi) has done a wonderful job of laying it out and giving parents and educa-tors the knowledge they need. the community as a whole has not been well-informed about this,” she said.
state legislators, she said, are key to influencing the public’s opinion about the core and tests related to it. “if our
legislators were of one accord, if they could stand together on this issue, i think that would make a big difference.
But when they’re fighting amongst themselves, that makes it very dif-ficult,” she said.
in her home, robinson has seen the changes introduced by the core. her oldest daughter, a 7th grader, already had had several years of experience with school curriculum, expectations, and testing. the standards are higher than she was used to, and the testing regimen is different. she used to take Mississippi’s statewide exam on paper, but the parcc tests are administered via computer with students rotating on and off computers during the day. “plus she deals with more teachers, and she sees from classroom to classroom which teachers are embracing it and which ones are not. she comes home very frustrated with teachers who aren’t embracing
the core,” she said.By contrast, her youngest
daughter, a 2nd grader, has known only an education with higher standards. “By the time she started school, this district was already paying attention to the core. she doesn’t know anything any different. there’s no transition for her,” robinson said. “her teacher last year openly embraced the common core and talked very openly about it with parents.”
robinson would be op-
posed to any efforts to with-draw support for the common core in her state. “changing it now would not be fair. our school district has spent a lot of time and effort streamlin-ing everything so teachers can teach the core to our students. that would be a lot of time and money wasted if they tried to go back and change it. and why would they want to do that when it’s such a positive thing for children?”
common core heLPs aLL sTUdenTs
myya robInson
PASCAGOUlA, MISS.
MothEr of thrEE puBlic school studEnts
“If our legislators were of one accord, if they could
stand together on this issue, I think that would
make a big difference. but when they’re fighting
amongst themselves, that makes it very difficult.”
30
59
11
36
50
15
33
56
11
29
63
8
16
14
71
46
46
8
33
58
9
31
12
57
Favor
Oppose
Don’t know
Rep. Dem. Ind. Blacks Hispanics Whites
Q23 DO YOU FAVOR OR OPPOSE ALLOWING STUDENTS AND PARENTS TO CHOOSE A PRIVATE SCHOOL TO ATTEND AT PUBLIC EXPENSE?
Public sch.parents
Nationaltotal 2015
K26 PDK/Gallup Poll September 2015
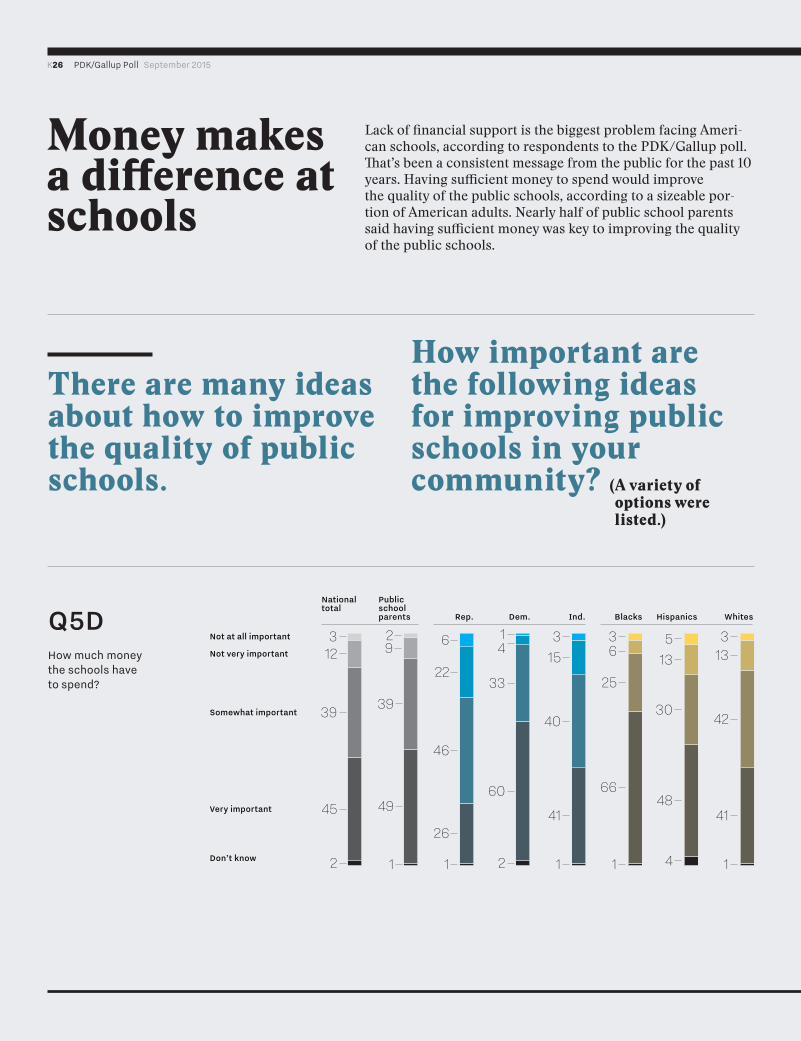
Money makes a difference at schools
Lack of financial support is the biggest problem facing Ameri-can schools, according to respondents to the PDK/Gallup poll. That’s been a consistent message from the public for the past 10 years. Having sufficient money to spend would improve the quality of the public schools, according to a sizeable por-tion of American adults. Nearly half of public school parents said having sufficient money was key to improving the quality of the public schools.
There are many ideas about how to improve the quality of public schools.
How important are the following ideas for improving public schools in your community?
313
42
41
1
513
30
48
4
36
25
66
1
315
40
1
41
14
33
60
2
6
22
46
26
1
29
39
49
1
312
45
39
2
Not at all important
Not very important
Somewhat important
Very important
Don’t know
Nationaltotal
Public school parents Rep. Dem. Ind. Blacks Hispanics WhitesQ5D
how much money the schools have to spend?
( A variety of options were listed.)

3 Percentages may not equal 100 due to rounding.
for the past 10 years, lack of financial support has topped the list of the biggest problems facing american schools.
for the first time, the pdK/gallup poll is able to re-port differences in the biggest prob-lems identified by blacks, whites, and hispanics.
lack of money for schools has been among the biggest problems named by poll respon-dents during every poll since 1969.
2
3
3
3
5
4
11
6
1061
3
75
25
7
66
27
3
11
8
53
52
24
4
23
6
Lack of financial support
Testing / regulations
Parents / lack of support / lack of interest
Overcrowded schools
Standards / quality of education
Lack of discipline / more control of behaviors
Nationaltotal
Public school parents Rep. Dem. Ind.
63
7
9
7
27
124
24
1
22
8
7 765 784 9782
Lack of financial support
Testing / regulations
Parents / lack of support / lack of interest
Overcrowded schools
Standards / quality of education
Better, up-to-date equipment
Lack of discipline / more control of behaviors
Difficulty getting good teachers
Blacks Hispanics Whites
BiggestProblem(Phone)
BiggestProblem(Web)
What do you
think are the biggest problems that the public schools of
your community must deal with? please provide up to three problems.
these responses were collected in this year’s web poll.
K28 PDK/Gallup Poll September 2015
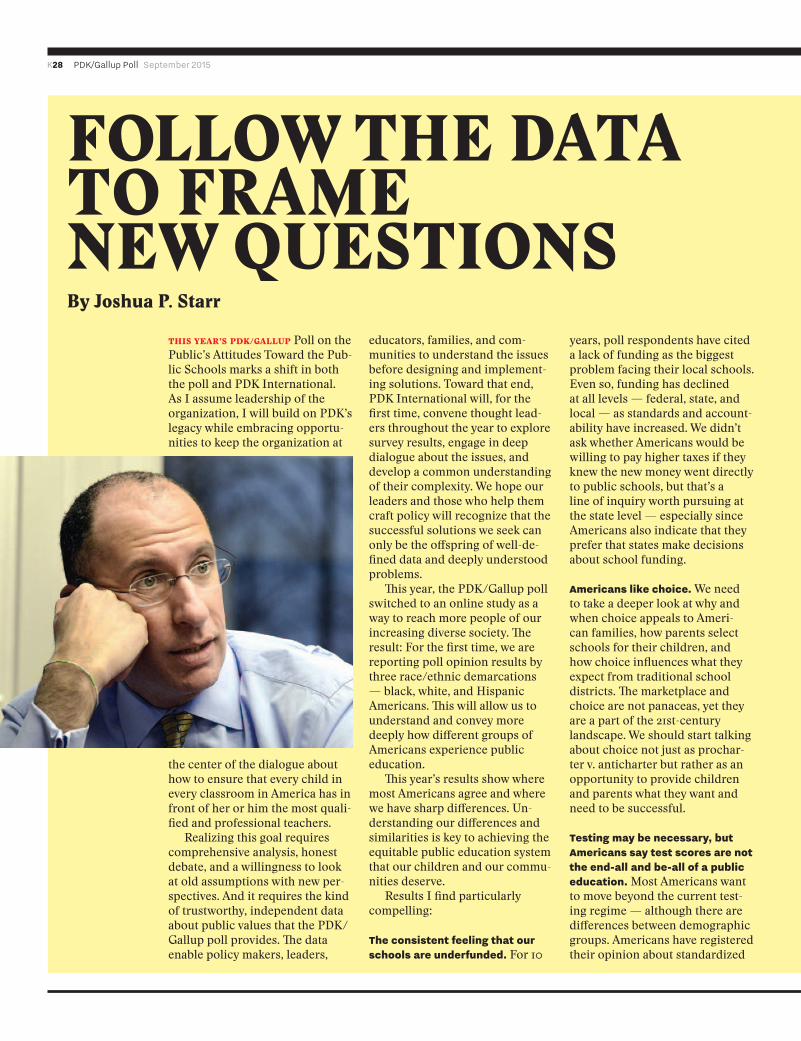
this year’s pdk/gallup Poll on the Public’s Attitudes Toward the Pub-lic Schools marks a shift in both the poll and PDK International. As I assume leadership of the organization, I will build on PDK’s legacy while embracing opportu-nities to keep the organization at
the center of the dialogue about how to ensure that every child in every classroom in America has in front of her or him the most quali-fied and professional teachers.
Realizing this goal requires comprehensive analysis, honest debate, and a willingness to look at old assumptions with new per-spectives. And it requires the kind of trustworthy, independent data about public values that the PDK/Gallup poll provides. The data enable policy makers, leaders,
educators, families, and com-munities to understand the issues before designing and implement-ing solutions. Toward that end, PDK International will, for the first time, convene thought lead-ers throughout the year to explore survey results, engage in deep dialogue about the issues, and develop a common understanding of their complexity. We hope our leaders and those who help them craft policy will recognize that the successful solutions we seek can only be the offspring of well-de-fined data and deeply understood problems.
This year, the PDK/Gallup poll switched to an online study as a way to reach more people of our increasing diverse society. The result: For the first time, we are reporting poll opinion results by three race/ethnic demarcations — black, white, and Hispanic Americans. This will allow us to understand and convey more deeply how different groups of Americans experience public education.
This year’s results show where most Americans agree and where we have sharp differences. Un-derstanding our differences and similarities is key to achieving the equitable public education system that our children and our commu-nities deserve.
Results I find particularly compelling:
The consistent feeling that our schools are underfunded. For 10
years, poll respondents have cited a lack of funding as the biggest problem facing their local schools. Even so, funding has declined at all levels — federal, state, and local — as standards and account-ability have increased. We didn’t ask whether Americans would be willing to pay higher taxes if they knew the new money went directly to public schools, but that’s a line of inquiry worth pursuing at the state level — especially since Americans also indicate that they prefer that states make decisions about school funding.
americans like choice. We need to take a deeper look at why and when choice appeals to Ameri-can families, how parents select schools for their children, and how choice influences what they expect from traditional school districts. The marketplace and choice are not panaceas, yet they are a part of the 21st-century landscape. We should start talking about choice not just as prochar-ter v. anticharter but rather as an opportunity to provide children and parents what they want and need to be successful.
Testing may be necessary, but americans say test scores are not the end-all and be-all of a public education. Most Americans want to move beyond the current test-ing regime — although there are differences between demographic groups. Americans have registered their opinion about standardized
FoLLoW THe DATA To FrAMe neW qUeSTIonSBy Joshua p. Starr

v97 n1 pdkpoll.org K29
mericans have become increasingly sensitive to who makes decisions about what happens in local schools.
Although U.S. presidents had little involvement in education when this poll began in 1969, we now routinely ask Americans to rate the performance of the president relative to the public schools. This year, we learned that the public is still generally wary of both the president and federal influence. Americans prefer having their states as decision makers in education, not the federal government.
finDings
3After receiving a lower rating last year, President Obama’s performance in support of the public schools rebounded
a bit this year with 37% of Americans giv-ing him a grade of A or B.3Black respondents on the web survey
grade Obama’s performance on educa-tion higher than other Americans, with 55% awarding him A’s and B’s on his education policies.3More Americans say state authori-
ties, versus local or federal, should be responsible for holding schools account-able, paying for schools, and determining the amount of testing in schools, while slightly more Americans said local units of government, generally school boards, should be responsible for selecting textbooks and teaching methods. Only one in five Americans believe the federal government should play a role in any of these four areas.
testing, but we need to dissect their beliefs: Does their antipathy toward testing concern just state standard-ized tests, or do they also object to national tests such as Advanced Placement, SAT, and/or ACT? What is the role of teacher-created tests? If test scores are not the right evalu-ation tool, then how do Americans want us to measure each child’s progress?
americans were consistent in stating that teacher quality is of paramount importance. This finding is consistent with research on school improvement and benchmarks to in-ternational systems, which portends well for our country. The difficulty is shifting policies to support teacher quality. If teacher quality is the No. 1 issue, then we must engage in nonideological, collaborative debate about policies and practices that increase teacher quality. That also requires that we abandon certain policies and practices that don’t increase teacher quality and refocus on our many shared interests. No issue is more important.
This year’s results offer many new findings, affirmation of consistent attitudes, and interesting nuggets for further exploration. As always, the 2015 PDK/Gallup poll provides both a unique opportunity to understand how Americans think about public education and a challenge to policy makers to hear and heed what they are saying.
joshua p. starr is cEo of
pdK intErnational.
Americans prefer state, not federal, control thE puBlic is still Wary of thE prEsidEnt and fEdEral influEncE on schools.
A
President obama’s performance in support of the public schools rebounded a bit this year with 37% of
americans giving him a grade of a or b.

K30 PDK/Gallup Poll September 2015
doug Wells evaluates schools more on whether teachers and principals are engaging kids in learning than what scores kids get on a standardized test.
“When i see a school or a principal or a district that’s trying meaning-fully to engage families and kids, i have the feeling that’s a situation where the kids are going to thrive more. When schools and districts are paying attention to that, they’re much more likely to attend to what kids need to be successful,” said Wells, whose daughter attends a public high school in portland, ore.
that puts Wells in line with public school parents across the country who rated hope and engagement far higher than other measures of school quality, especially standardized testing.
Wells has had more ac-cess to a variety of public schools than many parents. for three years, he chaired oregon’s Quality Education commission. from numerous school visits, he learned that “family engagement is a great
bellwether for schools that are moving the dial for kids.
“the attitude of the princi-pal and the teachers, that just tells you so much. intuitively, i can tell pretty quickly if i’m
talking to a great educator, some-one who’s doing all that they can to help kids be suc-cessful.
his experiences as a parent have convinced him that much of the hand-wring-ing about student responses to high-stakes testing is misplaced.
“My daughter is a great example of a kid who does well on her report card but does not do well on standard-ized tests. she has bad test anxiety so she does not do well in that situa-tion. as a parent of my child, i can’t support something that creates that kind of anxiety, but as a proponent of a quality system,
i don’t want to throw out the baby with the bath water.
“testing has told us a lot about what we’re doing well and what we’re not doing well. that’s good. there are a lot of problems with how we do it, but it’s too simplistic to say that we test too much or that people should be able to opt their kids out of testing. i don’t think we can leave things up to individual teachers. that will work some of the time but not all of the time,
especially with lower-income families or typically under-represented families. they fail when we do that,” he said.
“our public school poli-cies need to be nuanced and kid-focused — not sweeping ’tests are bad’ or ’we need more money’ — but a more nuanced discussion about how we can make our system more effective for our kids and families,’’ he said.
Wells also challenges the idea that kids are more anxious about standard-ized tests than unit exams or pop quizzes. pointing to his daughter, he said, “she worries much more about the test in her his-tory class or her algebra class than one of these standardized tests. When you’re in high school, every quiz, every test feels like a high-stakes test. she feels much more like those affect her life.
“We look at her report card, and we talk with her about her grades. But we don’t really talk with her about the results of the state assessment,” he said.
engagIng kIds Is key To schooL qUaLITy
doUg WeLLs
POrtlAND, OrE.
fathEr of onE daughtEr Who attEnds puBlic school
A
B
C
D
Fail
Don’t know/refused
A
B
C
D
Fail
Don’t know/refused
PRESIDENT OBAMA IS CONTINUING HIS SECOND TERM IN OFFICE. HOW WOULD YOU GRADE HIS PERFORMANCE IN SUPPORT OF PUBLIC SCHOOLS USING THE A, B, C, D, OR FAIL SCALE?
(Telephone)Q24
(Web)Q25
9
28
24
15
20
4
Nationaltotal 2015
12
33
26
11108
Nationaltotal ‘09
23
24
9
25
18
2
Public sch. parents ‘15
15
29
25
47
2
Rep. ‘15
36
152
18
20
9
Rep. ‘09
24
19
46
713
Dem. ‘09
36
19
68
14
17
Blacks
14
8
24
15
21
19
Hispanics
134
34
18
18
14
WhitesInd. ‘09
31
9
13
13
26
8
Ind. ‘15
21
5
34
16
6
18
17
55
193
24
Dem. ‘15
22
5
16
29
27
2
Nationaltotal ‘14
vaccine
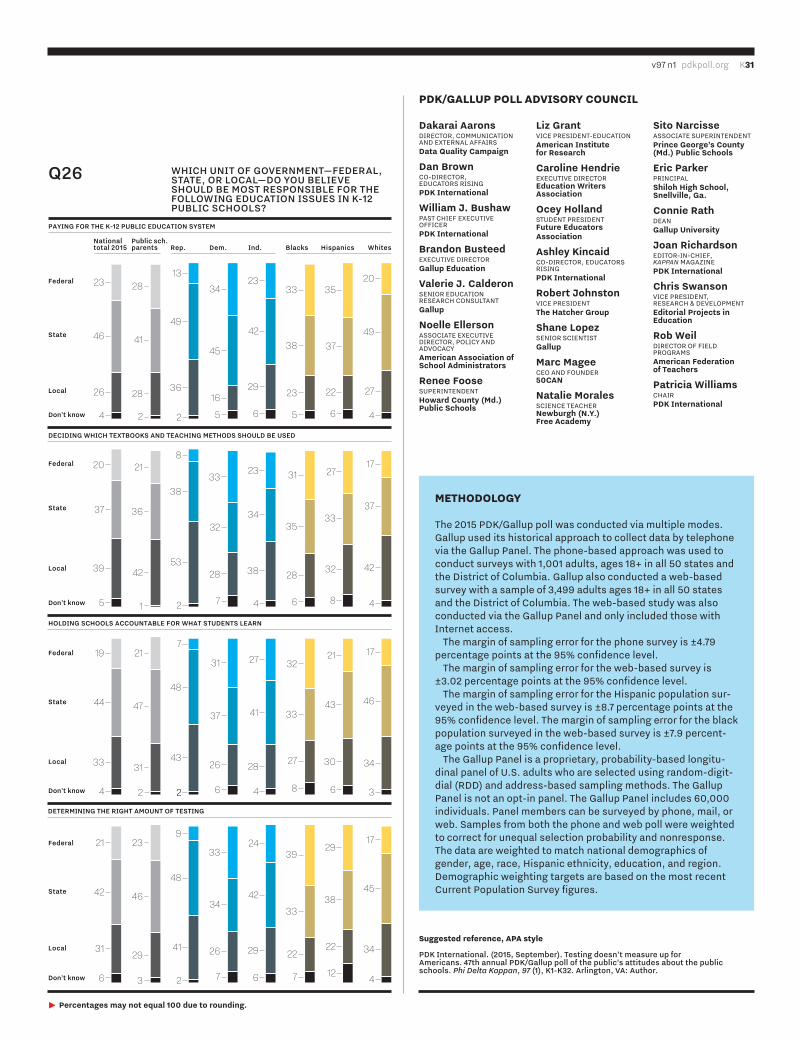
v97 n1 pdkpoll.org K31
Dakarai AaronsdirEctor, coMMunication and ExtErnal affairsData Quality Campaign
Dan Brownco-dirEctor, Educators risingPDK International
William J. Bushawpast chiEf ExEcutivE officErPDK International
Brandon BusteedExEcutivE dirEctorGallup Education
Valerie J. CalderonsEnior Education rEsEarch consultantGallup
Noelle EllersonassociatE ExEcutivE dirEctor, policy and advocacyAmerican Association of School Administrators
Renee FoosesupErintEndEntHoward County (Md.) Public Schools
Liz GrantvicE prEsidEnt-EducationAmerican Institute for Research
Caroline HendrieExEcutivE dirEctorEducation Writers Association
Ocey HollandstudEnt prEsidEntFuture Educators Association
Ashley Kincaidco-dirEctor, Educators risingPDK International
Robert JohnstonvicE prEsidEntThe Hatcher Group
Shane LopezsEnior sciEntistGallup
Marc MageecEo and foundEr50CAN
Natalie MoralessciEncE tEachErNewburgh (N.Y.) Free Academy
Sito NarcisseassociatE supErintEndEntPrince George’s County (Md.) Public Schools
Eric ParkerprincipalShiloh High School, Snellville, Ga.
Connie RathdEanGallup University
Joan RichardsonEditor-in-chiEf, Kappan MagazinEPDK International
Chris SwansonvicE prEsidEnt, rEsEarch & dEvElopMEntEditorial Projects in Education
Rob WeildirEctor of fiEld prograMsAmerican Federation of Teachers
Patricia WilliamschairPDK International
methoDology
the 2015 pdK/gallup poll was conducted via multiple modes. gallup used its historical approach to collect data by telephone via the gallup panel. the phone-based approach was used to conduct surveys with 1,001 adults, ages 18+ in all 50 states and the district of columbia. gallup also conducted a web-based survey with a sample of 3,499 adults ages 18+ in all 50 states and the district of columbia. the web-based study was also conducted via the gallup panel and only included those with internet access.
the margin of sampling error for the phone survey is ±4.79 percentage points at the 95% confidence level.
the margin of sampling error for the web-based survey is ±3.02 percentage points at the 95% confidence level.
the margin of sampling error for the hispanic population sur-veyed in the web-based survey is ±8.7 percentage points at the 95% confidence level. the margin of sampling error for the black population surveyed in the web-based survey is ±7.9 percent-age points at the 95% confidence level.
the gallup panel is a proprietary, probability-based longitu-dinal panel of u.s. adults who are selected using random-digit-dial (rdd) and address-based sampling methods. the gallup panel is not an opt-in panel. the gallup panel includes 60,000 individuals. panel members can be surveyed by phone, mail, or web. samples from both the phone and web poll were weighted to correct for unequal selection probability and nonresponse. the data are weighted to match national demographics of gender, age, race, hispanic ethnicity, education, and region. demographic weighting targets are based on the most recent current population survey figures.
3 Percentages may not equal 100 due to rounding.
Rep. Dem. Ind. Blacks Hispanics Whites
Q26 WHICH UNIT OF GOVERNMENT—FEDERAL, STATE, OR LOCAL—DO YOU BELIEVE SHOULD BE MOST RESPONSIBLE FOR THE FOLLOWING EDUCATION ISSUES IN K-12 PUBLIC SCHOOLS?
DECIDING WHICH TEXTBOOKS AND TEACHING METHODS SHOULD BE USED
PAYING FOR THE K-12 PUBLIC EDUCATION SYSTEM
DETERMINING THE RIGHT AMOUNT OF TESTING
HOLDING SCHOOLS ACCOUNTABLE FOR WHAT STUDENTS LEARN
23
46
26
28
41
28
13
49
36
23
29
34
45
33
38
35
37
20
27
4942
4 2 2 616 23 22
4655
20
37
39
21
36
42
8
38
53
23
38
33
32
31
35
27
33
17
42
3734
5 1 2 4
28 28 32
4867
19
44
33
21
47
31
7
48
43
27
28
31
37
32
33
21
43
17
34
4641
4 2 2 4
26 27 30
36862
21
42
31
23
46
29
9
48
41
24
29
33
34
39
33
29
38
17
34
4542
6 3 2 6
26 2222
41277
Federal
State
Local
Don’t know
Federal
State
Local
Don’t know
Federal
State
Local
Don’t know
Federal
State
Local
Don’t know
Public sch.parents
Nationaltotal 2015
pDk/gallup poll aDvisory council
suggested reference, apa style
PDK International. (2015, September). testing doesn’t measure up for Americans. 47th annual PDK/Gallup poll of the public’s attitudes about the public schools. Phi Delta Kappan, 97 (1), K1-K32. Arlington, VA: Author.
Read more results from this year’s PDK/Gallup poll
Join the conversation by posting comments
Download a PDF of this report
Download the charts and data from this year’s report
Link to the PDK/Gallup poll archive
GeT SoCIAL WITH US
Follow poll news on Twitter #pdkpollFollow us at Facebook/pdkintl
Th ere’s more to come at
pdkpoll.org