UNITED NATIONS SECRETARIAT ESA/STAT/441/2/41A/L.3 Department of Economic and Social Affairs 10 February 2013 Statistics Division English only ________________________________________________________________________________ United Nations Workshop on Integrating a Gender Perspective into Statistics 4 – 7 December 2012 Kampala, Uganda Report of the Workshop 1 Prepared by United Nations Statistics Division 1 This document is being reproduced without formal editing.

Welcome message from author
This document is posted to help you gain knowledge. Please leave a comment to let me know what you think about it! Share it to your friends and learn new things together.
Transcript

UNITED NATIONS SECRETARIAT ESA/STAT/441/2/41A/L.3
Department of Economic and Social Affairs 10 February 2013
Statistics Division English only
________________________________________________________________________________
United Nations Workshop on Integrating a Gender Perspective into Statistics
4 – 7 December 2012
Kampala, Uganda
Report of the Workshop 1
Prepared by
United Nations Statistics Division
1 This document is being reproduced without formal editing.

2
Table of Contents
Introduction ..................................................................................................................................................3
Opening session ............................................................................................................................................4
Session 1. Develop a coherent and comprehensive plan for the production of gender statistics...............5
Session 2. Integrating a gender perspective in health statistics...................................................................8
Session 3: Integrating a gender perspective in statistics on work................................................................9
Session 4. Integrating a gender perspective in poverty statistics...............................................................10
Session 5. Integrating a gender perspective in statistics on environment .................................................11
Session 6. Integrating a gender perspective into data collection: an overview .........................................12
Session 7. Violence against Women surveys ..............................................................................................13
Session 8. Time Use Surveys .......................................................................................................................15
Session 9. Population and Housing Censuses: Use of census data for gender statistics and gender analysis
....................................................................................................................................................................18
Session 10. Analysis and presentation of gender statistics: an overview...................................................21
Session 11. ECA Initiatives on Gender Statistics .........................................................................................21
Conclusions and recommendations............................................................................................................23
Annex 1. List of participants........................................................................................................................27
Annex 2. Agenda .........................................................................................................................................30

3
Introduction
1. A regional workshop to strengthen the capacity of national statisticians to produce gender
statistics and to discuss the newly developed UN manual: Gender Statistics – a Manual for
Integrating a Gender Perspective into Statistics was held from 4 to 7 December 2012 in Kampala,
Uganda. The workshop was organized by the United Nations Statistics Division (UNSD) and hosted
by the Uganda Bureau of Statistics (UBOS). Representatives from the National Statistical Offices of
Ethiopia, Ghana, Kenya, Malawi, Mauritius, Nigeria, Tanzania, Uganda, Zambia and Zimbabwe and
from UNSD, UNFPA (United Nations Population Fund), UNECA (United Nations Economic
Commission for Africa) and African Development Bank attended the meeting. The list of
participants is attached (Annex 1).
2. Specific key objectives of the workshop included: (a) strengthen the capacity of national
statisticians to apply international concepts and methods for obtaining gender statistics; (b)
promote the integration of a gender perspective into national statistical systems with the aim of
improving the availability and quality of gender statistics; (c) share good practices of producing
gender statistics among national statistical offices; and (d) receive feedback from participants on
the UN gender statistics manual and the training modules developed.
3. The workshop covered the following topics:
Session 1: Develop a coherent and comprehensive plan for the production of gender statistics
Session 2: Integrating a gender perspective into health statistics
Session 3: Integrating a gender perspective into statistics on work
Session 4: Integrating a gender perspective into poverty statistics
Session 5: Integrating a gender perspective into statistics on environment
Session 6: Integrating a gender perspective into data collection: an overview
Session 7: Violence against Women surveys
Session 8: Time Use surveys
Session 9: Population and Housing Censuses: Use of census data for gender statistics and gender
analysis
Session 10: Analysis and presentation of gender statistics: an overview
Session 11: ECA initiatives on gender statistics
4. The agenda of the meeting is attached in Annex 2.

4
Opening session
5. The workshop was opened by the Executive Director of UBOS, Mr. Ben Paul Mungyereza, on
behalf of the Government of Uganda. An opening statement and objectives of the meeting were
delivered by Ms. Francesca Grum, on behalf of UNSD.
6. Mr. Ben Paul Mungyereza (UBOS) highlighted the significance of the workshop for the National
Statistical Offices in the region. He noted that gender statistics are gaining visibility and importance
in the African countries. The recently concluded “Africa Statistics Week” was celebrated under the
theme “Making Every Man and Woman Count”, with particular focus on engendering statistics for
better development outcomes. He also reminded the participants that Kampala is the home of
“Kampala City Group on gender statistics”, an initiative launched by the African Development Bank
and UNECA in October 2009 to provide a forum where African stakeholders could discuss issues
related to the development of gender statistics, Poverty Reduction Strategy Papers (PRSPs), and the
monitoring of the Millennium Development Goals (MDGs). Furthermore, he stressed the
importance of gender statistics in capturing disparities, inequalities and unfairness in access to
resources within the context of poverty reduction and development in developing countries. In that
regard, he encouraged participants to view various aspects of gender statistics within the global
context of the MDGs and the review currently taking place to ensure sustainable development
outcomes post 2015.
7. Finally, Mr. Mungyereza summarized the state of development of gender statistics in African
countries. Most National Statistical Offices (NSOs) have undergone a process of gender
mainstreaming over the last years, however progress has varied from country to country. In many
NSOs there is limited appreciation and monitoring of gender issues; men and women are still
measured as a homogeneous group, despite having national gender policies in place; and there are
inconsistencies in definitions, concepts and methods used to obtain gender statistics. In this
context, he commended the UN Statistics Division for the newly developed manual on integrating a
gender perspective into national statistics.
8. Ms. Francesca Grum delivered an opening statement on behalf of the UN Statistics Division
(UNSD). She congratulated the Uganda Bureau of Statistics for an excellent job in preparing and
hosting the meeting and welcomed the participants. She pointed out that gender statistics are key
for evidence-based policy making, for monitoring trends in reducing gender inequalities and
progress in women’s empowerment. However, there is still a lack of adequate data and an urgent
need to improve statistical systems to ensure the full mainstreaming of gender into all stages of
data production. In this context, and as mandated by the UN Statistical Commission, the UN
Statistics Division has developed a new Manual to assist countries in their efforts to improve gender
statistics. Gender Statistics - A Manual for Integrating a Gender Perspective into Statistics focuses on
three critical dimensions to obtain relevant and reliable gender statistics: (1) the need for a
comprehensive coverage of gender issues in data production; (2) ensuring the integration of a
gender perspective into all data collections; and (3) improvement of dissemination and
presentation of gender statistics.
9. Ms. Grum informed the participants that the workshop is a first of a series dedicated to gender
statistics that uses as support the new manual. In that regard, lessons learnt and feedback gathered
from representatives of the African statistical community is particularly valuable for the

5
improvement of the manual and the training modules developed. She also stressed the importance
of the workshop as an opportunity to share and learn from each other experiences and identify
strategies to accelerate the process of mainstreaming gender into national statistics.
10. Mr. Ralph Hakkert (UNFPA) introduced the new manual developed by UNFPA and one of the
support materials used during the workshop, Guide on Gender Analysis of Census Data. The Guide is
meant to serve as a tool for statisticians in NSOs, possibly in collaboration with academic or
research institutions, national ministries responsible for gender equality, and women’s
empowerment and gender advocates. Mr. Hakkert described the content of the manual, pointing
out to the value added of multiple examples incorporated for all the topics covered. He also
highlighted the role of the manual in improving the capacity of countries to produce more analytical
gender monographs based on census data through: (1) production of non-standard tabulations; (2)
construction of more elaborate indicators; (3) combination of census data with data from other
sources; and (4) multivariate analysis.
Session 1. Develop a coherent and comprehensive plan for the production of gender statistics
11. An Overview of gender statistics, presented by UNSD, summarized the progress in gender
statistics since the Beijing Platform for Action in 1995; introduced and refreshed general concepts in
gender statistics; and emphasized the process of gender mainstreaming in all statistical fields and at
all stages of data production. First, it was noted the mixed progress in gender statistics since Beijing
Platform for Action. Overall, the availability of gender statistics has increased, mainly due to
improved dissemination of sex-disaggregated statistics; more household surveys conducted in the
less developed regions; and better use of administrative sources in the more developed regions.
However, quality gender statistics are still lacking in many countries, especially on topics such as
poverty; time use; violence against women; and environment. In some countries data are not
collected; or are collected based on old concepts and measurement that do not take into account
gender differences and gender biases. Also, data collected are often not adequately disseminated.
In many instances, gender statistics are not disaggregated enough to allow the identification of
population groups where gender issues are more pronounced; and they are not commonly
integrated in regular outputs prepared by NSOs, such as analytical reports or databases.
12. Second, it was pointed out that confusion between “sex” and “gender” and between “sex-
disaggregated data” and “gender statistics” still persists among producers and users of gender
statistics. “Sex” refers to biological differences, while “gender” refers to socially constructed
differences in attributes and opportunities associated with being female or male and the social
interactions and relationships (including power relationships) between women and men. In
statistics, “sex” is an individual characteristic commonly recorded in censuses, surveys or
administrative sources. It is used as primary characteristic of disaggregation, classification or
crosstabulation of data obtained at the level of a population group. “Gender” and “gender differences”
in a population group are revealed based on analysis of sex-disaggregated data and /or qualitative
information. Furthermore, gender statistics are more than sex-disaggregated data. They take into
account gender issues; are based on concepts and definitions that adequately reflect the diversity

6
of women and men and capture all aspects of their lives; and data collection methods used are
designed to prevent gender biases in the data.
13. Third, the presentation introduced the concept of gender mainstreaming into national statistics
by contrasting two models of production of gender statistics. In the first model, the production of
gender statistics is conceived as an “Add-on” to the regular statistical activities in an NSO and it is
reduced to compilation and dissemination of existing sex-disaggregated data. In this case, there is
little control over the gender issues that can be covered; the methods of data collection may not be
gender sensitive; and the products of dissemination may be perceived as “for women’s advocates
only”. In the second model, gender is “mainstreamed” in all statistical fields and at all stages of data
production. In this second case, the coverage of gender issues is decided from the stage of planning
of data collection; the concepts and methods of data collection are chosen to be gender-sensitive;
and the dissemination of gender statistics are incorporated in regular publications or databases,
therefore they reach a wider audience. This model ensures a more sustainable production of
gender statistics, and improved quality of data produced by national statistical systems. Finally, the
presentation summarized the implications of gender mainstreaming at organizational level,
including: leadership and political will at all levels; specification of formal requirements of gender
statistics in the national statistical legislation; cooperation between users and producers of
statistics; collaboration of NSOs with other institutions for developing and improving concepts and
methods; training of statisticians; and re-focus of activities and position of gender units and gender
focal points within the national statistical systems.
14. Results of the Global Review of Gender Statistics Programmes, carried out in 2011 by the UN
Statistics Division in collaboration with the UN Regional Commissions, were presented by UNSD.
The presentation summarized findings for 126 countries in the world and 33 countries in Africa. Five
topics were covered: institutional arrangements; addressing users’ needs; legal framework;
production of gender statistics; and gender mainstreaming in the national statistics. The
presentation highlighted potential institutional challenges in achieving a sustainable production of
gender statistics in African countries and worldwide. For example, most countries in the African
region have no dedicated budget for gender statistics and only a part of them benefit from ad-hoc
funds. Often, the tasks covered by gender focal points or gender units are confined to answering
requests for gender statistics, and involve mere compilation and dissemination of gender statistics. Just
a few countries in the region and in the world have defined and fully achieved the objective of
gender mainstreaming in national statistics.
15. Furthermore, it was shown that only some sources of data are well developed and exploited for
gender statistics. For instance, most countries in the African region and in the world have
conducted and used as sources for gender statistics population censuses and household surveys,
including demographic and health surveys, labour force surveys, or living standard surveys. Most
countries have also used administrative sources of data on education for the production of gender
statistics. However, involvement of other sources of data remains limited. Violence against women
surveys, time use surveys, and agricultural censuses and surveys are utilized for the production of
gender statistics only in some countries. Also, with the exception of education and, in a few cases,
health sources of data, use of administrative sources for gender statistics remains limited. All these
constraints have a negative impact on the availability of gender statistics in the region and in the
world. In particular, gender statistics in emerging areas of interest, including on unpaid work and
satellite accounts, ICT, media, and entrepreneurship, are not produced on a regular basis.

7
16. Ethiopia Central Statistical Agency presented key gender statistics and indicators made available
in the Gender Statistical Handbook, a publication produced by the country for the first time in 2012.
Aspects of gender inequality and trends were highlighted with regard to population, education,
health, work, decision-making, and crime. The statistics showed, for example, lower enrolment
rates for girls than for boys in rural areas; higher HIV prevalence for women than for men; lower
economic participation rates for women than for men; a significant gender pay gap for government
employees to the disadvantage of women; underrepresentation of women in positions of power
and decision-making; and overrepresentation of men among reported crime offenders.
17. Uganda Bureau of Statistics (UBOS) presented the institutional and organizational framework
for the production of official gender statistics in the country. Aspects covered included: (a)
specification of gender within the UBOS mandate of producing quality statistics, and within the Plan
for National Statistical Development; (b) the role of the Gender Statistics Unit in supporting gender
mainstreaming in national statistics; and (c) the role of coordinating committees (within the
national statistical system and within the Bureau of Statistics) in promoting the production and use
of gender statistics. The presentation highlighted several types of activities that ensure the
development of gender statistics in Uganda: training for gender statistics stakeholders; seminars for
increasing gender awareness among the UBOS staff; ongoing work on identifying an inventory of
gender statistics for data users; regular meetings of the coordinating committees for gender
statistics; and a participatory gender audit conducted to (a) assess the current stage of the
integration of gender in the production of national statistics and (b) identify further steps for
improvement. Finally, the presentation stressed operational challenges and technical constraints in
the production of gender statistics, such as lack of support for gender statistics; inadequate funding;
inadequate knowledge of gender statistics needs at the level of data users; ineffective prioritization
for the gender statistics production needs; lack of harmonized concepts and definitions in gender
statistics; not clearly defined scope of gender statistics; and lack of methodological guidelines for in-
depth analysis of gender statistics.
18. Discussions following the presentations of the first session revealed that countries in the region
have different levels of development of gender statistics and mainstreaming of gender in national
statistics: while some countries have already integrated a gender dimension into many of their
statistical processes, in other countries activities related to gender statistics are limited to
compilation of data disaggregated by sex.
19. A strong dialogue between data producers and data users was viewed by all participants as a
key element in producing gender statistics, particularly with regard to identifying gender issues and
formulating gender-relevant policy questions. However, there are challenges in establishing a
functional relationship between statisticians and data users, such as inadequate knowledge of
gender statistics needs at the level of potential users, or inadequate prioritization of data needs.
20. Activities currently undertaken by NSOs aim to reach all potential users. Nevertheless, the
general public remains the most difficult to reach type of user. This is particularly important, since
gender statistics have a significant role to play in reducing gender stereotypes and changing cultural
and social attitudes related to the status of women. In this context, the meeting stressed the need
to raise awareness on gender issues, and disseminate gender statistics and results of data analysis
through different channels such as advocacy campaigns, talk shows, and press conferences. The
media, in particular, has to be adequately involved, to ensure that key results are not
misinterpreted and/or misrepresented.

8
Session 2. Integrating a gender perspective in health statistics
21. The presentation on Integrating a gender perspective into health statistics by UNSD
emphasized, at the beginning, the difference between biological issues and social and gender issues
in health. Women and men’s health concerns differ because of both biological and socio-economic
factors. Overall, men have a greater biological vulnerability. For women, some of the major health
risks are directly linked to pregnancy and delivery, and many others are associated with women’s
reproductive biology. On the socio-economic and cultural side, women and men tend to hold
specific roles and responsibilities in society and in the family, resulting in gender differences in life
style, nutrition, exposure to diseases, seeking care, and receiving treatment.
22. Furthermore, the presentation covered four health related topics: child health and nutrition;
maternal health; mortality and causes and death; and HIV and AIDS. The participants were
reminded the general steps in developing gender statistics, from identification of gender issues to
data needed to address those gender issues, and assessment of sources of data in terms of existing
coverage of gender issues and use of gender-sensitive concepts and methods. The four elements –
gender issues, data needed, sources of data, and measurement issues - were presented for each of
the topics covered.
23. The presentation also illustrated with data on infant and child mortality, some challenges in
estimating the gender gap in health in countries with incomplete civil registration, an issue common
to many countries in sub-Saharan Africa. In this context, three factors determine observed sex
differentials in child mortality data: greater biological vulnerability for boys (therefore parity should
not be used as a standard in deciding on gender gap); smaller sex differences at higher levels of
mortality, as reflected by historical trends in the more developed regions and current situation in
sub-Saharan Africa; and data quality issues and sex bias in underreporting of births and deaths.
Thus, before interpreting observed sex differences in terms of gender gap (or lack of), it is
recommended that the analysis takes into account more sources of data; trends over time; and
additional health-dimensions such as nutrition, immunization or curative health.
24. Malawi National Statistical Office focused its presentation on major sources of data for gender
and health in the country. Demographic and health surveys (including DHS and MICS), conducted
every few years in Malawi since 1992, are the main source for health gender statistics. Some
examples of gender statistics and indicators produced based on the latest DHS survey and shown
during the presentation referred to child mortality, vaccinations, HIV prevalence and HIV
awareness. It was pointed out that one of the drawbacks of the demographic and health surveys is
that they may cover only issues related to women and children, leaving out male-specific issues. In
some instances, the surveys are based on women only samples. The presentation also introduced
two types of administrative sources, recently set up in Malawi, with potential use for health gender
statistics. The Health Management Information System (established in 2002) collects information
related to vital statistics, child, maternal and reproductive health, and has a component of disease
surveillance. The National Registration Bureau (set up in 2007 to establish the National Registration
and Identification System for Malawi) focuses on (a) registering children within 6 weeks of birth,
and (b) integrating the information on birth registration into immunization and antenatal care
programmes. However, there are challenges in producing quality gender statistics based on
administrative sources. Limited skilled human resources and lack of technical resources (i.e.
computers) impede on completeness, quality, and timeliness of data entered into the system.

9
25. After presentations, the participants were divided into two groups and required to complete an
exercise. The exercise consisted in preparing a table on gender issues, data needed and sources of
data for the topic “health risk factors”, following the models shown during the UNSD presentation
for other health topics. The content of the table was discussed at length within the two groups and
presented to the meeting by the rapporteur of each group.
Session 3: Integrating a gender perspective in statistics on work
26. The presentation Integrating a gender perspective into work statistics by UNSD covered four
topics: labour force participation; employment conditions; reconciliation of work and family life;
and child work. For each topic there were shown main gender issues, data needed, sources of data,
and gender-related conceptual and measurement issues. The gender perspective in data analysis
and presentation was also noted. The presentation detailed three main strategies for improving
gender statistics on work. First, it is important to ensure better coverage of gender issues related to
work by extending data collection and dissemination from labour force participation, employment
and unemployment, to detailed employment conditions, family-work balance, and time use.
Second, more disaggregated gender statistics can facilitate the understanding of gender differences
in work, including by individual characteristics such as educational attainment; family characteristics
or other variables indicative of the life cycle; household characteristics and contextual variables. In
that regard, examples of data analysis and presentation were given. Finally, the presentation
insisted on the improvement of quality of gender statistics and statistics on work in general, by
preventing underreporting and misclassification of economic activities and employment conditions,
in particular for those work activities more often associated with women or men.
27. Zimbabwe National Statistics Agency presented gender statistics produced based on the 2011
Labour Force and Child Labour Survey and covered in the Gender Fact Sheet, a publication produced
after every major census or survey in the country. Gender issues related to labour force
participation, employment conditions, and child work were identified and illustrated with data. It
was shown, for example, that labour force participation rates have been lower for women than for
men in all age groups; and that youth unemployment rates have remained higher for women than
for men. Gender disparities in employment conditions were also emphasized. Women represent a
minority in managerial occupations; technical and associate professionals; clerical support workers;
craft and related trades workers; and plant and machine operators. They are also less likely than
men to be paid employees (either permanent or on a temporary basis). On the other hand, women
are more likely than men to be own account workers and be involved in work activities in own
households; and they are slightly overrepresented in informal employment. Gender issues and
gender statistics in child work were also highlighted by the presentation. For example, in both rural
and urban areas and in all regions of the country, 5-17 year-old girls are more involved in care
activities than boys of the same age.

10
Session 4. Integrating a gender perspective in poverty statistics
28. The presentation on Integrating a Gender perspective in poverty statistics by UNSD was
structured around four strategies to improve the availability and quality of gender statistics in the
area of poverty. First, it was stressed the importance of using detailed types of female- and male-
headed households in obtaining more relevant household-level statistics on poverty. It was shown
that female-headed households and male-headed households are heterogeneous categories,
varying widely in terms of demographic and economic composition, and a higher vulnerability of
female-headed households cannot be generalized. However, when analysis is focused on more
homogeneous categories of female- and male-headed households, there is a clearer pattern of
higher poverty associated with certain types of female-headed households. Examples were given on
poverty of households of lone parents with children by sex of the parent; and female and male one-
person households. The need to use clear criteria in identifying the head of household – during data
collection and at the stage of data analysis - was also highlighted. It was shown that different
criteria for identifying the head lead to different sets of households with different poverty rates.
29. Second, it was explained that disaggregation of household-level poverty data by sex of the
household members gives only a poor measure of gender gap in poverty, mainly because
intrahousehold inequality is not taken into account, and women who are poor but live in non-poor
households are not counted among the estimated poor. Some differences in poverty counts might
appear in households with higher share of women, especially older women, because earnings per
capita tend to be lower due to women’s lower participation in the labour market and women’s
lower level of earnings during work or after retirement. Therefore it is expected that resulted sex
differences are heavily influenced by country-specific living arrangements and ageing factors. As a
result, countries with greater sex differences by this standard, would be countries from the more
developed region.
30. Third, it was acknowledged that a broader concept of poverty is more effective in highlighting
issues of gender-based intrahousehold inequality and economic dependency of women on men.
This approach corresponds to a shift in thinking poverty, from poverty as economic resources to
avoid deprivation to poverty as actual level of deprivation, not only in terms of food and clothing,
but also in areas such as education and health. In this case, the statistics needed are measured at
individual level and may refer to education, health, time use, participation in intrahousehold
decision-making, social exclusion, or subjective evaluation of access to food and clothing.
Furthermore, individual-level statistics on access to income and especially cash income, property
ownership, and access to credit, can illustrate the economic autonomy of women (or lack of).
However, in many countries such data tend to be collected at the level of the household or
agricultural holding, and can be analyzed only for female- and male-headed households or holdings,
drastically diminishing the potential for gender analysis.
31. Finally, there were given examples of use of social statistics disaggregated by poverty or wealth
status to highlight the gendered experience of poverty. Poverty affects women and men in different
ways, as illustrated by data on school attendance, violence against women, or participation of
women in intrahousehold decision-making. It was shown that gender disparities, overburden of
women with work or violence, and lack of decision-making power tend to be more severe in the
poorer segments of the population.

11
32. Mauritius Central Statistical Office gave an overview of national gender issues and gender
statistics in areas of population and family; education; labour force; violence against women; and
decision-making, for the main part of the presentation. For example, with regard to population and
families, there were shown increasing sex differences in life expectancy between women and men;
declining rates of marriage and increasing rates of divorce (with more divorces being initiated by
women); and an overrepresentation of women among the widowed, divorced and separated.
Gender disparities were highlighted for other areas of life as well. In school, girls tend to
outperform boys in examinations related to primary and secondary education, particularly at the
primary level. On the labour market, although women have been less economically active than
men, female activity rates have increased while male activity rates have decreased in the last two
decades. The employment structure by sector has undergone significant changes mainly for
women, from a predominance in the industry to a predominance in the services sector. The
movement from the lower to the higher occupational groups was also more noticeable for women.
Nevertheless, employed women tend to earn lower income than men and the pay gap has
increased in the last decade. Power and decision-making remains the area least accessible to
women in Mauritius. The representation of women in government has increased, but their share
remains only slightly above a third of all senior positions. Moreover, women continue to be a small
minority among parliamentarians and ministers. Finally, the last part of the presentation covered
general methodological aspects related to poverty measurement based on household income or
expenditure.
33. In the discussions following the presentations, the meeting noted that the inclusion of non-
consumption indicators in the chapter on poverty in the new UN manual on gender statistics could
promote their use among countries. The meeting also recommended to strengthen NSOs’ capacity
to measure poverty based on non-consumption indicators.
34. The last part of the session was dedicated to a group exercise on gender and poverty. The
exercise simulated the situation in which an analytical report on poverty is prepared by an NSO and
a gender perspective needs to be integrated in the report. In this context, the participants,
organized in two working groups, were required to prepare an outline of topics to be addressed
from a gender perspective and to identify main indicators that need to be analyzed from a gender
perspective. The results of the exercise were presented in front of the meeting.
Session 5. Integrating a gender perspective in statistics on environment
35. The presentation Integrating a gender perspective into environment statistics by UNSD focused
on types of statistics needed to illustrate the two-way interactions between gender and the
environment: (a) the impact of the environment on the lives of women and men and (b) the
involvement of women and men in the management of the environment. First, participants were
reminded that environmental conditions have a differentiated impact on the lives of women and
men due to existing gender inequality and gender-specific roles and expectations. Therefore data
needed to illustrate this gender-environment interaction have to cover two dimensions: (1) the
environmental conditions creating a burden on the lives of people (such as poor infrastructure,
periods of droughts, floods, or areas affected by deforestation or desertification); and (2) the social

12
impact at the individual level of women and men (such as involvement in and time use for specific
work activities affected by the environment; and diseases and deaths due to unsafe environmental
conditions and events). Examples of sources of data, statistics, and their analysis and presentation
were given for three topics: (a) water and firewood collection; (b) indoor smoke from solid fuels;
and (c) natural disasters. The presentation also highlighted the unique role of time use surveys in
revealing women and men’s time burden associated with poor infrastructure and natural
environmental conditions.
36. Finally, gender issues, data needed and sources of data were presented with regard to the
management of the environment. The issues covered referred to the participation of women and
men in positions of high-level decision-making related to the environment; formal training in
programmes related to the environment; and sustainable consumption and environmentally-
friendly behaviour such as recycling, saving water, saving energy, or using public transportation.
37. During discussions, the participants pointed out the high demand for statistics and gender
statistics on the environment and climate change by policy makers and other data users. In this
context, the meeting acknowledged the usefulness of the Manual on Integrating a Gender
Perspective into Statistics in providing guidance to NSOs on gender issues in environment, related
data needs and possible data sources. The participants recognized that some environmental data
useful for gender analysis are traditionally collected in censuses and surveys, but not properly
analyzed and disseminated, particularly from a gender perspective. The meeting further
recommended collaboration of NSOs with environment research institutes to ensure these data are
exploited properly and to strengthen NSOs’ capacity to measure and monitor environmental
aspects, including from a gender perspective.
Session 6. Integrating a gender perspective into data collection: an overview
38. An Overview of integrating a gender perspective into data collection presented by UNSD
summarized several gender-specific aspects of data collection in censuses and surveys: (a)
involvement of gender specialists in setting out the objectives of surveys or censuses; (b) reviewing
of data collection tools from previous censuses or surveys from a gender perspective, including the
use of re-interview surveys as an important tool for assessing the adequacy of questionnaires and
training materials; (c) gender-sensitive design of the questionnaires; (d) design of manuals free of
gender biases and inclusive of gender-balanced examples; (e) careful consideration of samples,
units of enumeration, and units of data collection, so that women experiences are adequately
reflected in the statistics obtained, especially in agricultural censuses and surveys; (f) adequate
selection and training of interviewers and supervisors to prevent underreporting, particularly when
data collection concerns sensitive topics; and (g) advertising of the census to equally reach out
women and men and prevent sex-bias in undercounting and underreporting.
39. The session continued with a Global review of the 2010 round of the population and housing
censuses, by UNSD. The 2010 World Programme on Population and Housing Censuses, launched in
2005, has had a high country participation. More than 192 countries or areas have already carried
out a census, and 36 more have scheduled a census by 2014. The presentation highlighted main

13
innovations in the 2010 census round, related to (a) census methods to obtain data; and (b) use of
advanced technologies. In terms of census methods to obtain data, many countries, especially
countries from Europe and North America, are moving from traditional direct enumeration through
face-to-face interviews toward use of additional or mixed modes of data collection, such as paper-
based self-enumeration, self-enumeration through the Internet, telephone interview, and interview
using PDAs. Many countries are also investigating or using alternative sources of data for compiling
key census statistics. Use of existing registers and administrative records, through record-linking,
has become increasingly common, especially in Europe. Also, more countries are using continuous
or ad-hoc sample surveys to supplement census data.
40. In terms of advanced technologies, GIS (Geographic Information System) and Global Positioning
System (GPI) are most widely used. Other technologies have also been involved, enabling countries
to release faster their results. For data collection, many countries have used hand-held digital
devices, such as PDA, tablet computers, the Internet and CATI. For data capture, many countries
have replaced manual data entry with refined scanning technology (OMR, OCR or ICR). Census data
have been disseminated by a wider variety of media, including CD-ROM/DVD, static web pages, on-
line databases, and GIS web-based mapping tools. Nevertheless, countries are also facing new
challenges in conducting censuses. For example, many countries need assistance and training to
utilize the new technologies. Furthermore, investments in modern technologies, as well as use of
multiple languages, or large publicity campaigns have increased the census budget significantly.
41. Finally, the presentation lay out the next steps in the development of the census programme. At
country level, the importance of analysis of data quality, including the use of post-enumeration
surveys, was reiterated. At global level, the next steps underlined included: (a) a cost-benefit
analyses of census operations; (b) a comprehensive assessment of the experiences and challenges
in the 2010 round of censuses; and (c) revisions of the UN Principles and Recommendations for
Population and Housing Censuses.
Session 7. Violence against Women surveys
42. The presentation Measuring violence against women, by UNSD, focused on obtaining data on
violence against women through dedicated surveys. At first, it introduced the new manual
produced by UNSD, Guidelines for Producing Statistics on Violence against Women: Statistical
Surveys. The manual, mandated by the UN Statistical Commission, covers at length data collection
through population-based surveys, and takes stock of the work undertaken by the Friends of the
Chair group for indicators on Violence against Women. The core indicators on violence against
women were explained in detail. Their construction, for instance, takes into account the most
common forms of violence against women (physical, sexual, psychological, and economic), the
recall period (in the past 12 months and during lifetime), and the relationship with the perpetrator
(intimate partner or other relationships). Severity of violence and frequency of violence are also
recommended to be taken into consideration for indicators on physical and sexual violence. Age,
marital status, and other individual characteristics of the respondents/victims and the perpetrators
are also important for tabulation, construction of indicators and analysis of violence against
women. Female genital mutilation was also introduced as a topic of interest in particular contexts,
especially in African countries.

14
43. The presentation further highlighted the definition and measurement of the most common
forms of violence measured through sample surveys. First, it illustrated the wide range of questions
on specific acts of violence needed to adequately capture the extent of violence. It also showed the
role of introductory questions, specific wording, and specific sequencing of questions in facilitating
the disclosure of sensitive information. For example, asking about specific individual acts of violence
should be used instead of the general term of “violence”; questions should be ordered from more
minor to more severe violence acts so that respondents are “eased in”; stigmatizing terms such as
“rape” and “violence” should be avoided; and introductions should precede the questions on
violence. It is crucial that these issues are reflected in the questionnaire design.
44. Moreover, training of the interviewers and ethical considerations in violence against women
surveys were stressed as key elements in ensuring the safety of respondents and interviewers, as well as
in obtaining reliable statistics. For example, an important issue in training is rising awareness with
regard to the topic of violence and its extreme sensitivity; impact of violence on victims; and gender
issues at personal and community level. Strategies for facilitation of disclosure and addressing
confidentiality and safety issues are also important and include: encouraging participation in the
survey and creating a climate that promotes disclosures of sensitive survey questions; interviewing
techniques for building rapport with respondents; developing skills to detect when respondents are
at risk of being overheard and re-schedule interviews accordingly; how to identify and respond
appropriately to emotional trauma by referring respondents to resources in the local community;
how to identify emotional reactions in interviewers themselves that result from working on this
topic; and development of skills to manage and reduce stress.
45. Central Statistical Office of Zambia introduced the three main sources of data on violence
against women in the country and presented some of the statistics obtained. Data on violence
against women are collected through (a) a module on domestic violence included in the Zambia
Demographic and Health Survey; (b) the Zambia Sexual Behaviour Survey; and (c) the Gender-based
Violence Survey. Four topics were covered in the statistics presented: prevalence of physical,
sexual, and emotional violence; violence during pregnancy; help-seeking behaviour; and property
grabbing. It was shown, for example, the high prevalence of violence in Zambia across all categories
of female population analyzed, with only small variations by age group, residence, and education.
The proportion of women who sought help is limited, at less than half of all women who
experienced violence. Similar to other countries, violence by intimate partner is most prevalent;
and the violence experienced during pregnancy is significant.
46. During discussions, the meeting commended the new Guidelines for the Production of Statistics
on Violence against Women for providing detailed information on how to measure sexual, physical,
psychological and economic violence in population-based surveys. The participants acknowledged
the important role of the special features of these surveys, such as questionnaire design, training of
interviewers and ethical considerations, in dealing with the particularly sensitive topic of violence.
The meeting also recognized the importance of undertaking dedicated surveys to measure violence
against women rather than a module attached to other surveys to ensure that all those special
features are considered and respected. However, the participants noted that countries in the
African region have collected data on violence against women mainly through dedicated modules in
DHS. The meeting recommended the UN to promote the use of dedicated surveys to measure
violence against women and to assist countries in their efforts to strengthen their statistical
capacity on that regard. While countries gain know-how and secure funds for violence against

15
women surveys, Macro International should be consulted to ensure consistency between the DHS
module they propose on domestic violence and the UN Guidelines.
47. The participants indicated that culture and habits remain the major challenge for the
elimination of violence against women in the region. The meeting, however, acknowledged that
being able to adequately assess the extent of the problem through indicators such as prevalence,
severity and frequency of violence is an important and indispensable step to inform policies and
achieve the goal of eradicating violence against women.
Session 8. Time Use Surveys 48. The presentation Integrating a gender perspective into time use statistics by UNSD overviewed
the Time Use surveys; emphasized the relevance of time use data for gender statistics; discussed
methods related to valuing time in satellite accounts; and highlighted methods of preventing
gender bias in time use statistics. It was shown that Time Use surveys have been conducted in the
majority of developed countries and about a third of developing countries. The surveys are
conducted on average at seven-year interval in the developed countries and nine-year interval in
the developing countries. Compared to other statistics, time use statistics are the least produced in
the world and in the African region.
49. Time use statistics are quantitative summaries of how individuals allocate their time over a
specified period and their production is related to two key issues: the labour-leisure tradeoff; and
the measurement of non-market activities, including for satellite accounts. Time use data are
collected through two main types of survey instruments: “stylized questionnaire” and “24 hour
diary”. It was pointed out that although a diary-based survey involves higher financial cost and
technical requirements, it represents an improved tool for data collection on time use, including
from a gender perspective.
50. The presentation further highlighted the role of time use data in addressing key gender issues. It
was shown that time use statistics can be used to measure participation in unpaid work activities
that are outside the operational boundary of SNA and therefore not covered by conventional labour
statistics. Examples of such activities are: (a) unpaid domestic services for own final use within
household – cleaning, cooking, do-it-yourself decoration; (b) unpaid caregiving services to
household members – child care, adult care; and (c) community services and help to other
households – volunteering, repairs of dwellings. Measuring unpaid work is crucial in making the
contribution of women to the economy and society more visible. Women, more often than men, tend
to be involved and spend a great amount of time in unpaid work in the home and community. When
only cash transactions are taken into account in measuring the economic production, a large portion of
women’s work remains unaccounted for, as illustrated in the presentation with the example of
measuring unpaid work in New Zealand.
51. The role of time use data in satellite accounts was also emphasized. The system of National
Accounts recommends the use of supplementary accounts for nonmarket activities, thus making the
measurement of domestic production more complete and comparable across countries. Two
approaches in estimating the money value of household time were presented. In the opportunity
cost approach, the time spent on doing unpaid work is valued as potential time non-spent on the

16
labour market regardless of the activity. In the market price approach, the time used for unpaid
activities is valued as if it was done by a professional. These approaches were illustrated with the
example of satellite accounts in the Philippines.
52. Moreover, the presentation emphasized the issue of gender bias in time use statistics. It was
shown that recording of simultaneous activities prevents underreporting of some types of activities
done in parallel with others, such as unpaid domestic activities, that are more often associated with
one of the sexes. Contextual variables, which describe the context and the conditions within which
an activity takes place, are crucial in distinguishing among different types of activities, such as paid
or unpaid work, also relevant from a gender perspective. Finally, the classification of activities can
play a role in the quality of gender statistics in time use. The classification needs to be detailed
enough to identify separately activities mainly undertaken by women or by men. In that respect, it
is important that the classification is oriented to measuring unpaid work and setting up satellite
accounts. An example of such a classification is ICATUS, developed by UN as a trial version in 2005,
and currently in progress toward finalization.
53. Ghana Statistical Services gave a comprehensive presentation of the Time Use Survey
conducted in the country in 2009 and highlighted the statistics obtained from a gender perspective.
It was shown that efforts to develop time use surveys in Ghana can be traced back to the 1998
UNECA regional conference “African Women and Economic Development: Investing in Our Future”.
One of the key actions proposed by that conference referred to the production of information on
time use across formal, informal and unpaid work and the integration of a gender perspective in
national accounting systems by conducting time use surveys.
54. The 2009 Ghana Time Use Survey had the objective of measurement and analysis of the time
spent in a 24-hour period by individuals aged 10 years and older on all activities including paid
work, unpaid work, and non-productive activities (leisure activities). Data were collected at
household and individual level based on two questionnaires. The household questionnaire covered
(a) demographic and socio-economic characteristics of the household members; (b) housing
characteristics; (c) household assets and use of social services; and (d) household expenditures. The
individual questionnaire consisted of an individual diary questionnaire administered to household
members of 10 years and older. Face-to-face interviews were used for data collection. The
information from the two questionnaires could be linked through the ID number of all eligible
household members. Time use activities were classified based on the International Classification of
Activities for Time Use Statistics (ICATUS) developed by the United Nations Statistics Division into 15
main groups of activities covering SNA productive activities, non-SNA productive activities, and non-
productive activities. The statistics obtained capture the full participation of women and men in the
economic and development process and are the basis for the development of a satellite account of
household production and a gender-aware macroeconomic model for Ghana.
55. The presentation further illustrated the analysis of time use data obtained. Three main
indicators were used to identify time use patterns for women and men: the average time spent in
various activities; the participation rate of the population in these activities; and the time spent by
the persons involved in the activities. A standard set of variables for disaggregation was used to
explore these patterns among different groups: urban/rural areas; age group; marital status;
employment status; educational attainment; household composition; and the day of the week. All
these variables were further disaggregated by sex, given the importance of gender in shaping time
use.

17
56. The statistics presented showed significant gender differences in time use in Ghana. For
example, on average, men participate more and spend more time on SNA productive activities and
learning activities; while women participate more and spend more time on unpaid non-SNA
productive activities. Among the SNA productive activities, work for household providing services
for income and work for household non-primary production were more often performed by
women, while activities in the formal sector work and work for household primary production were
more often performed by men. Women, and especially girls and younger women were more
involved in water collection, while men and especially adult men were more involved in fuel
collection. Among the unpaid non-SNA work activities, domestic services for own use and care for
household members were more often performed by and had a higher time burden for women;
while volunteer work for community services and help to other households were more often
performed by and had a higher time burden for men.
57. Tanzania National Bureau of Statistics presented the latest available time use statistics obtained
in the country. Data collection on time use was based on a module included in the 2006 Integrated
Labour Force Survey, within a project advocated by the Tanzania Gender & Networking Programme
and supported by the Poverty Eradication Division of the Vice President’s Office. Methods of data
collection involved face-to-face interviews administered to household members age five and above.
Time use activities were classified based on ICATUS, with the major groups of activities being: SNA
activities; extended SNA activities; and non-work activities.
58. The results of the survey showed that the burden of unpaid work in Tanzania is large and mostly
borne by women. Largest gender differences in time use were observed for activities related to
household management and maintenance, and care of household members, for which women
allocate much more time than men. Gender differences were also observed with regard to SNA
work activities, and especially activities related to employment for establishment, where men
contribute more. However, overall, women contributed a larger share of total work time than men.
The presentation further elaborated on time use for water collection and fuel collection. In
Tanzania, women are more involved in water collection and spend more time on this task than men
do. Women in rural areas are most affected, as the burden of water collection is higher than in the
urban areas. As expected, carrying of the water is most needed in the poorest households, and
significantly higher proportions of women in those households are burdened by this activity.
Fetching fuel wood is also more often done by women than by men; but men spend on average
more time than women in this activity.
59. In the discussions following the presentations, the meeting recognized the importance and
usefulness of Time Use Surveys. It was emphasized that statistics on time use provide crucial
information on women and men’s paid and unpaid work and their contribution to society and
economy, evidence that can be used for policy making. Furthermore, it was noted that ICATUS, the
UN Trial International Classification of Activities for Time Use Statistics, is the classification used in
the region, and the meeting was informed by UNSD about its revision and expected completion in
2013. The participants also discussed the diary component and the minimum age of the
respondents in time use surveys/modules. It was noted that the respondents need to be old enough
to be able to evaluate time and answer questions without help. Finally, the meeting discussed
strategies to improve the response rate of time use surveys. It was noted that in the Tanzanian
experience, incentives such as bed nets resulted in better response rates.

18
Session 9. Population and Housing Censuses: Use of census data for gender statistics and gender analysis 60. The presentation Use of census data for gender statistics and gender analysis by UNFPA
introduced the new manual on gender analysis produced by UNFPA and focused on four elements
for improving the capacity of countries to produce more analytical gender census monographs: (1)
production of non-standard tabulations; (2) construction of more elaborate indicators that can be
used in policy making; (3) combination of census data with data from other sources, such as poverty
surveys; and (4) multivariate analysis of census data using techniques such as linear or logistic
regressions.
61. The presentation first highlighted main advantages and limitations in using censuses as sources
of data for gender statistics and gender analysis. For example, one of the advantages of using
censuses is the possibility of obtaining sex-disaggregated data at the most disaggregated level
possible, thus providing insights into the private and community spheres, and furnishing the basic
information for local advocacy and policy. Censuses can also provide essential background
information allowing for further research on women and men, girls and boys. Limitations were also
noted. Census data are often limited in scope and depth. Sensitive topics, topics requiring specific
skills of the interviewers and more specialized training, as well as topics that would increase greatly
the burden of respondents are preferred to be left for other data collection programmes. Examples
of topics included in the censuses only by some countries but interesting from a gender perspective
were also given. Examples of some of these topics are: the matrix of family relationships between
household members; age at first marriage; age at first live birth for women; polygamous unions;
maternal mortality; reasons for migration; remittances; and individual-level ownership of land and
housing. Examples of topics that are generally not feasible for coverage in censuses referred to gender-
based violence, including female genital mutilation, distribution of resources within the household, and
time use.
62. Furthermore, the presentation explained and illustrated the processing and analysis of census
data that would result in more in-depth analytical gender monographs. Examples given dealt with
five topics out of the twelve covered in the new UNFPA manual. These selected topics were:
fertility, sex ratios, marital status, households and families, and disability.
63. For instance, with regard to fertility, it was shown that most national statistical offices prepare
tabulations on the average number of children by age category of the mother. These data are
necessary for estimating fertility levels and patterns (ASFRs/TFRs). A step further would be to
disaggregate data by sex of the children born thus allowing for the computation of sex ratios at
birth, an important indicator of discrimination of girls, especially in Asian countries. Also, giving
more details on the distribution by number of children ever born would allow the analysis of
childlessness by age category and preferably by marital status category. This is a major gender issue
in many parts of the world, including Africa. Finally, the combination of information on children
ever born and children born in the last twelve months by sex allows for analysis of sex selection (a
major gender issue in some Asian countries) in relationship with birth order and the sex of the
previously born children.
64. The presentation also highlighted the need to include in census tabulations important
covariates that can explain some of the differences observed between women and men. For
example, differences in marital status for women and men with disabilities may be explain by
differences in the age structure of female and male population. Women tend to live longer than

19
men, therefore they are more likely to become disabled at older ages and, also, more likely to be
widowed. In this case, it is important that the variable age category is taken into account in the
tabulations. It was further stressed that some of the gender-related improvements in tabulation of
data have to be decided from the stage of designing the census questionnaire. For example, an
analysis of marital status from a gender perspective would benefit from a detailed range of
statuses, such as (a) single (never married); (b) married (first marriage); (c) remarried following
widowhood; (d) remarried following divorce/annulment; (e) separated (including deserted); (f)
divorced; and (g) widowed. This classification of marital status allows for some interesting gender-
related analysis, such as quantifying the propensity of widowed or divorced men and women to
remarry. Furthermore, it was pointed out that gender analysis remains limited when only
tabulations are used. Different characteristics can co-vary with the phenomenon under observation
and tabulations alone cannot give a measure of the influence of each characteristic when
controlling for the others. The direction of the relationship between the explaining variable and the
variable to be explain may also change when controlling for other characteristics.
65. The presentation also included a section on indicators that can be constructed with census data.
Examples of various types of indicators were given, such as percentage distribution indicators and
ratio indicators. In addition, a distinction between standardized and non-standardized indicators
was made. It was shown, as an example, how standardizing for differences in age structure
between female and male population can change sex differences in disability indicators and lead to
more meaningful analysis. Disability-free life expectancy was also showcased as addressing the
interrelationships between ageing, gender and disability. It was shown that disability-free life
expectancy can be calculated with or without adjusting for sex differences in life tables, depending
whether specific policy questions require either estimating the prevalence of disability by sex or
estimating the need for care for each sex, respectively.
66. The significance and the calculation of the indicator singulate mean age at marriage (SMAM)
were also presented. An exercise based on this indicator required the participants, organized in two
groups, to evaluate three modalities of estimating age differences at marriage between spouses (an
important gender indicator). The indicator can be computed: (a) directly, by asking for the date or
the age of women and men at the time of their first marriage; (b) using the SMAM of women and
men; and (c) using the difference between the ages of married women and married men.
67. Two strategies of integrating data from different sources were covered in the presentation:
construction of proxy variables and statistical matching. The construction of proxy variables consists
in developing regression or other multivariate model based on survey data and using explanatory
variables that are common to the survey and the census, to predict the value of the variable to be
included in the census database. The census value of the variable is then constructed by using the
same equation on the explanatory variables as found in the census. In the statistical matching or
“data borrowing” approach, one uses the variables that are common to the census and the survey
to construct a measure of similarity or distance between individual cases of the census or survey
files. Each individual case found in the census is then matched to its closer neighbor in the survey
file.
68. Furthermore, the presentation reviewed the concept of “head of household”, and exemplified
the role of multivariate analysis in understanding the links between poverty, female- and male-
headship, and the composition of a household. It was pointed out that the definition of “head of
household” is vague, including in the Principles and Recommendations for Population and Housing

20
Censuses, Rev. 2. At least five different concepts of head of household have been applied in
censuses: (a) main breadwinner; (b) householder; (c) main authority; (d) reference person; and (e)
questionnaire respondent. Moreover, focusing on female- and male-headed households in poverty
analysis may limit or mislead the gender analysis. Gender inequality taking place at the intra-
household level is not taken into account. Also, due to lack of uniformity in defining the head of the
household, there are limited possibilities for cross-country comparisons and analysis. Furthermore,
focusing on female-headed households may lead to narrowed and biased policy priorities that may
fail to affect and reshape the embedded structures of gender inequality found in the home, the
labour market and other institutions. The presentation reiterated the conclusions of the earlier
session on poverty, with regard to the use of clear criteria in identifying the head of the household
and the need for further disaggregation of female- and male-headed households by characteristics
of the household members. An example from the 2008 census in Cambodia was shown to illustrate
the wide range of household compositions found under the labels of female- and male-headed
households. Further examples showed the role of multivariate analysis in understanding the links
between poverty, female- and male-headship, and the household composition.
69. Malawi National Statistical Office presented the Malawi Gender Thematic Report, one of the
several reports produced based on data collected in the 2008 Population Census. Other sources of
data were also used for the report. The 2008 census results were compared with those from
previous censuses and combined with additional data from the 2004 Malawi Demographic and
Health Survey. The presentation showed sex and gender disparities with regard to several topics
and across different population groups. Topics covered population composition, marriage, fertility,
child mortality, life expectancy, school attendance, literacy, and educational attainment. Household
headship, and ownership of housing and household assets by female- and male-headed households
were also covered. Explanatory variables used in the tabulations and analysis referred to
urban/rural residence, age groups, educational attainment and educational attainment of mother
for variables concerning children. One of the gender issues highlighted, for example, referred to
early marriage for women and adolescent fertility. It was shown that the population groups most at
risk were women living in rural areas and women with no education. The link between child
mortality and education of the mother was also illustrated, showing lower infant and under-five
mortality rates for more educated mothers. Other statistics shown addressed the issue of gender
inequality in access to education and other resources. For example, female school attendance rates
are slightly lower than male rates; and the proportion of women with no education is much higher
than the proportion of men, both in urban and rural areas. However, disparities in literacy by age
cohort are narrowing and younger generations of women and men have similar levels of literacy.
70. Kenya National Bureau of Statistics presented the Gender Dimensions Monograph prepared
based on the 2009 Population and Housing Census. The Monograph shows the status of women and
men and the progress in achieving gender equality goals across several dimensions: demographic
characteristics; education; labour force; household and housing amenities; and persons with
disabilities. For example, data on demographic characteristics are exploited from a lifecycle
perspective, highlighting aspects such as age at first marriage, age at first birth, fertility, mortality,
and migration. Aspects related to changes in living conditions and human development due to
population growth, migration and urbanization are also covered in the Monograph. Educational and
economic characteristics figure prominently in the Monograph, and the presentation illustrated
with statistics some of the gender differences in access to education and employment. It was
shown, for example, that the gender gap tends to be greater at the secondary and higher levels of

21
education, where the number of women remains lower than the number of men. The lower
employment-to-population ratios for women than for men were also shown. Finally, household-
level data such as ownership of land, livestock and other household assets are analysed and
presented in the Monograph by characteristics of the head of household, including sex, marital
status, and economic status.
71. During the discussions, the participants recognized the limited capacity of national statistical
offices in the region to carry out multivariate analysis and exploit census data through integration of
multiple data sources. It was also acknowledged that national statistical offices need to (a)
strengthen their relationships with research institutions to ensure proper exploitation of their
census data from a gender perspective; and (b) build statistical capacity for gender-relevant analysis
of data, including census data. The participants also welcomed the establishment of a minimum set
of gender indicators by the Inter-Agency and Expert Group on Gender Statistics to guide countries
in their efforts to produce harmonized gender statistics and internationally comparable indicators.
Session 10. Analysis and presentation of gender statistics: an overview 72. The presentation From raw data to easily understood gender statistics by UNSD focused on
several points. First, it summarized key concepts presented in the previous days, including the
distinction between “sex” and “gender” in the area of statistics, and the distinction between “sex-
disaggregated data” and “gender statistics”. Second, the participants were reminded the structure
of a basic table for analysis of gender statistics and the two basic types of distributions relevant for
gender statistics: (a) distribution of each sex by selected characteristic; and (b) sex distribution
within the selected characteristic. For each type of distribution it was shown (a) the use in
calculating certain gender indicators, and (b) specific charts to present the data. Third, the
presentation illustrated the use of graphs and tables in conveying main messages resulted from
data analysis. The examples given highlighted the importance of focusing on a limited number of
messages for each chart or table (usually related to a gender issue); design elements to facilitate
comparisons between women and men; clarity and simplicity of the visual presentation; and
consistency in presenting statistics on women and men.
Session 11. ECA Initiatives on Gender Statistics 73. In the last session of the workshop, UNECA introduced the Africa Programme on Gender
Statistics. The presentation pointed out that efforts to develop gender statistics in the African
region have been often uncoordinated, on an ad-hoc basis, or focused on disconnected projects,
leading to duplication of work and ineffective use of scarce resources. As a result, the capacity of
countries to inform and monitor gender-related policies and programmes remains limited. In
response to this challenge, Africa Programme on Gender Statistics has been developed as a
common programme on gender statistics in the region. Its overall objective is the increase in
availability of timely, up-to-date and comparable gender statistics in the region. Stakeholders
involved include regional organizations and development groups, such as UNECA, African

22
Development Bank, AFRISTAT, as well as UN and other global agencies such as UN Women, UNDP,
UNFPA, UNICEF, WHO, World Bank and OECD. Within this framework, a five-year plan of action for
2012-2016 has been developed to cover four categories of activities; (1) partnership and regional
coordination; (2) capacity building and research; (3) data reporting, storage and dissemination; and
(4) advocacy. Examples of strategic activities designed to ensure a successful implementation of the
programme are: (a) coordination and monitoring of the programme at regional level; (b) stimulating
political commitment at national level to provide legal, institutional, and financial support for the
development of gender statistics programmes; (c) regular review of national gender statistics
programmes, including the development of a monitoring and evaluation framework; (d) training,
knowledge sharing and advisory services; (e) creating mechanisms for efficient reporting, storage
and dissemination of gender statistics; and (e) promoting quantitative and methodological research
on gender issues.

23
Conclusions and recommendations 74. The meeting expressed its appreciation to the Uganda Bureau of Statistics for hosting the
workshop and for extending its hospitality to the participants, as well as to the UN Statistics Division
for organizing and conducting the workshop.
75. The meeting recognized the importance and timeliness of the publications presented during the
workshop: (a) the new UNSD Manual on Integrating a Gender Perspective into Statistics, (b) the
UNSD Guidelines for the Production of Statistics on Violence against Women, and (c) the
UNFPA/UNSD/UN Women Guide on Gender Analysis of Census Data as reference materials covering
harmonized concepts, definitions and methods in their respective areas; addressing current
methodological needs of NSOs; and ensuring the production of internationally comparable gender
statistics.
76. The first part of the workshop (sessions 1 to 5) reviewed the main concepts related to gender
statistics and gender mainstreaming in the regular activities of the NSOs and further focused on two
“traditional” topics – health and work, and two “emerging” topics - poverty and environment. The
meeting recognized the importance of properly identifying for each topic of interest: (a) the gender
issues/gender-relevant policy questions, (b) the data needed to address/inform them; (c) the
related data sources; and (d) the measurement issues.
77. The meeting took note of the different levels of development of gender statistics and
mainstreaming of gender in national statistics among countries represented at the meeting: while
some countries have already integrated a gender dimension into many of their statistical processes,
in other countries activities related to gender statistics are limited to compilation and dissemination
of data disaggregated by sex.
78. The meeting stressed the importance of establishing a strong dialogue between data producers
and data users, particularly for identifying gender issues and formulating gender-relevant policy
questions. It was also pointed out that the general public remains the most difficult to reach type of
user. This group of users is particularly important, since gender statistics have a significant role to
play in reducing gender stereotypes and changing cultural and social attitudes related to the status
of women. In this context, the meeting stressed the need to raise awareness on gender issues and
disseminate gender statistics and results of data analysis through different channels such as
advocacy campaigns, talk shows, TV, and press conferences. It was emphasized that the media has
to be adequately involved, to ensure that key results are not misinterpreted and/or
misrepresented.
79. Issues specific to the topics of health, work, poverty, and environment (covered in the first part
of the workshop) were noted by the meeting, as follows.
80. The distinction between biological issues and social and gender issues in health and the
challenges in measuring the gender gap in health in the context of countries with limited civil
registration were particularly emphasized.
81. The issue of complementing conventional labour statistics with statistics on unpaid work based
on time use data, as well as the importance of taking into account sex bias in underreporting of
economic activities were highlighted.

24
82. The meeting noted that poverty in Africa is mainly measured at the household level and gender
is addressed mainly through comparisons between female- and male- headed households. As a
result, gender differences in poverty levels and related risk factors are difficult to assess. In this
context, the meeting emphasized the need to disaggregate the female- and male- headed
households, including by relevant characteristics of the household, in order to better explain the
relationship between gender and poverty.
83. The meeting discussed the importance of using individual-level data in addition to household-
level data to measure poverty and gender inequality within the household and recommended the
use of non-consumption indicators, such as: (1) education (e.g. school attendance); (2) time use
(e.g. time spent on leisure activities, time spent on household chores); (3) health (e.g.
immunization, expenditure on health, subjective health status); (4) social exclusion (e.g. political
participation, social network); (5) participation in intrahousehold decision-making (e.g. on how
income is used); and (6) subjective evaluation of access to food and clothing (such as measures of
food insecurity). In many countries, these data are already available. The non-consumption
indicators are also important in assessing the gendered experience of poverty; and the access to
property and other economic resources. The meeting noted that the inclusion of non-consumption
indicators in the chapter on poverty in the Manual on Integrating a Gender Perspective into
Statistics could promote their use among countries. The meeting also recommended to strengthen
NSOs’ capacity to measure poverty based on non-consumption indicators.
84. The meeting noted that the production of gender relevant statistics on environment including
its impact on the lives of women and men is still minimal (mainly covering data on access to
improved water and sanitation and indoor smoke from solid fuels), despite the high demand of
environmental and climate change statistics by policy makers and other data users. The meeting
pointed out that some environmental data useful for gender analysis are traditionally collected in
censuses and surveys, but they are not properly analyzed and disseminated. The meeting
recommended collaboration of NSOs with environment research institutions to ensure these data
are exploited properly and to strengthen NSOs’ capacity to measure and monitor environmental
factors, including from a gender perspective.
85. The meeting recognized the usefulness of the Manual on Integrating a Gender Perspective into
Statistics in providing guidance to NSOs on gender issues in environment, related data needs and
possible data sources.
86. The second part of the workshop (sessions 6 to 8) focused on integrating a gender perspective
into data collection, and covered general issues, violence against women surveys, and time use
surveys. Aspects specific to the topics covered were noted by the meeting, as follows.
87. The meeting commended the new UN Guidelines for the Production of Statistics on Violence
against Women for providing detailed information on how to measure sexual, physical,
psychological and economic violence in population-based surveys and discussed the role of special
features of these surveys (such as, the questionnaire design, training of interviewers and ethical
considerations) in adequately addressing the sensitive topic of violence.
88. The meeting recognized the importance of undertaking dedicated surveys to measure violence
against women rather than a module attached to other surveys to ensure that all those special
features are considered and respected.

25
89. However, the meeting noted that countries in the African region have collected gender-based
surveys and domestic violence surveys on the basis of dedicated modules in DHS.
90. The meeting recommended the UN to promote the use of dedicated surveys to measure
violence against women and to assist countries in their efforts to strengthen their statistical
capacity on this regard. While countries gain know-how and secure funds for violence against
women surveys, Macro International should be consulted to ensure the DHS module they propose
on domestic violence is in line with the UN Guidelines.
91. The meeting emphasized that culture and habits will be major challenges for the elimination of
violence against women in the region. The meeting, however, acknowledged that being able to
assess the extent of the problem (the magnitude of violence) through indicators such as prevalence,
severity and frequency is an important and indispensable step to inform policies and achieve the
goal of eradicating violence against women.
92. The meeting recognized the importance and usefulness of Time Use Surveys (TUS) to provide
evidence for policy making, particularly on time spent by women and men on unpaid work and their
overall contribution to society and economy.
93. The meeting took note that only a few countries in the African region have conducted a TUS and
even fewer have conducted it more than once. While some countries have conducted a dedicated
TUS (e.g. Ghana 2009), others have used a module on time use attached to a Labour Force Survey
(e.g. Tanzania 2006). Having noted that ICATUS, the UN Trial International Classification of Activities
for Time Use Statistics, is the classification used in the region, the meeting was informed by UNSD
about its revision and expected completion in 2013.
94. The meeting discussed the diary component and the minimum age of the target population (5,
7, 10 years old) for the TUS. The meeting noted that the respondents should be old enough to be
able to evaluate time and answer questions without help.
95. The meeting discussed strategies to improve the response rate of TUS and noted that providing
incentives, such as bed nets, to respondents resulted in better response rates (Tanzania).
96. The third part of the workshop (sessions 9 and 10) focused on data analysis and presentation
and in particular, on use of census data for gender statistics and gender analysis. The meeting noted
the following aspects.
97. The meeting took note of the importance of census data for measuring gender issues,
particularly when additional relevant tabulations are produced and in-depth data analysis, including
multivariate analysis, is undertaken to ensure a proper understanding of gender inequality in its
many dimensions.
98. The meeting also acknowledged that NSOs in the region have limited capacity to carry out
multivariate analysis and integration of multiple data sources.
99. The meeting proposed that NSOs (a) strengthen their relationships with social science research
institutions to ensure proper exploitation of their census data from a gender perspective; and (b)
build statistical capacity for gender-relevant analysis of data, including census data.
100. The meeting welcomed the establishment of a minimum set of gender indicators by the
Inter-Agency and Expert Group on Gender Statistics to guide countries in their efforts to produce
harmonized gender statistics and internationally comparable gender indicators.
26
101. The meeting acknowledged the importance of undertaking data analysis and of
disseminating/communicating the results together with targeted storylines to ensure key messages
reach different users.
Kampala, 7 December 2012

27
Annex 1. List of participants
No. Country / Organization Contact Person Information
1. ETHIOPIA Mr. Endashaw BEDASSO
Statistician
Central Statistical Agency of Ethiopia
P. O. Box 1143
Addis Ababa, Ethiopia
2. GHANA Ms. Bernice Serwah OFOSU-BAADU
Senior Statistician
Ghana Statistical Service
P. O. Box 1098
Accra, Ghana
3. KENYA
Ms. Rosemary Uside KONGANI
Senior Statistics Officer
Kenya National Bureau of Statistics
Nyayo House, 17th Floor
P. O. Box 30266
00100 Nairobi GPO, Kenya
4. MALAWI Mr. Kingsley MANDA
Senior Assistant Statistician
National Statistical Office
P. O. Box 333
Zomba, Malawi
5. MAURITIUS Ms. Salima Banon NUNHUCK
Statistician
Statistics Mauritius
1st Floor, LIC Building
President John Kennedy Street
Port Louis, Mauritius
6. NIGERIA Mr. Isaiah Egbua OKORO
Prinicipal Statistical Officer
National Bureau of Statistics (NBS)
Plot 762, Independence Avenue
Central Business District, P.M.B. 127
Garki, Abuja, Nigeria
7. TANZANIA Ms. Sylvia MEKU
Principal Statistician
National Bureau of Statistics
Kivukoni Front
P.O. Box 796
Dar-es-Salaam, United Republic of Tanzania

28
No. Country / Organization Contact Person Information
8. UGANDA Mr. Ben Paul Mungyereza
Executive Director
Uganda Bureau of Statistics (UBOS)
Statistics House
Plot 9 Colville Street
P.O. Box 7186
Kampala, Uganda
9. UGANDA Ms. Jane MAGOOLA Yoyeta
Uganda Bureau of Statistics (UBOS)
Statistics House
Plot 9 Colville Street
P.O. Box 7186
Kampala, Uganda
10. UGANDA Ms. Pamela NABUKHONZO
Uganda Bureau of Statistics (UBOS)
Statistics House
Plot 9 Colville Street
P.O. Box 7186
Kampala, Uganda
11. UGANDA Ms. Rachel NAMBOOZE
Uganda Bureau of Statistics (UBOS)
Statistics House
Plot 9 Colville Street
P.O. Box 7186
Kampala, Uganda
12. UGANDA Ms. Stella NASSOLO
Uganda Bureau of Statistics (UBOS)
Statistics House
Plot 9 Colville Street
P.O. Box 7186
Kampala, Uganda
13. ZAMBIA Ms. Cecilia MUNJITA
Senior Gender Analyst
Central Statistical Office
P. O. Box 31908
Lusaka 10101, Zambia
14. ZIMBABWE Mr. Tinashe Enock MWADIWA
Education and Gender Statistics Manager
Zimbabwe National Statistic Agency (ZIMSTAT)
P. O. Box CY 342, Causeway
263 Harare, Zimbabwe
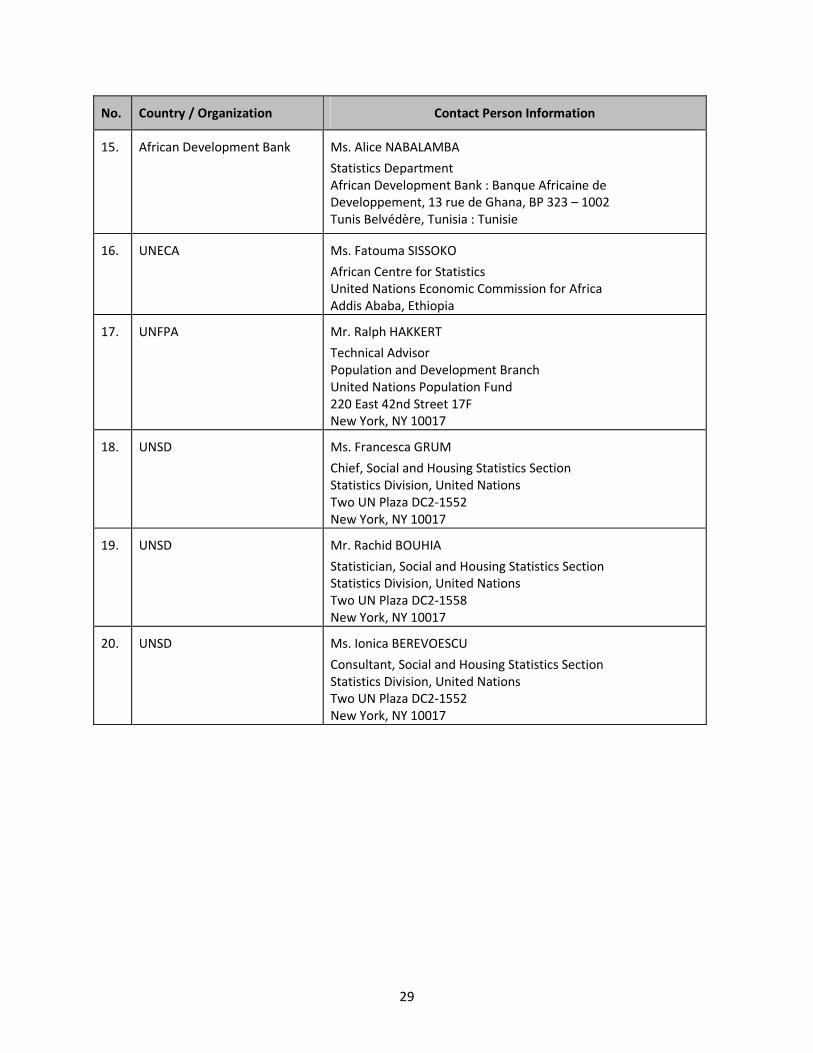
29
No. Country / Organization Contact Person Information
15. African Development Bank Ms. Alice NABALAMBA
Statistics Department
African Development Bank : Banque Africaine de
Developpement, 13 rue de Ghana, BP 323 – 1002
Tunis Belvédère, Tunisia : Tunisie
16. UNECA Ms. Fatouma SISSOKO
African Centre for Statistics
United Nations Economic Commission for Africa
Addis Ababa, Ethiopia
17. UNFPA Mr. Ralph HAKKERT
Technical Advisor
Population and Development Branch
United Nations Population Fund
220 East 42nd Street 17F
New York, NY 10017
18. UNSD Ms. Francesca GRUM
Chief, Social and Housing Statistics Section
Statistics Division, United Nations
Two UN Plaza DC2-1552
New York, NY 10017
19. UNSD Mr. Rachid BOUHIA
Statistician, Social and Housing Statistics Section
Statistics Division, United Nations
Two UN Plaza DC2-1558
New York, NY 10017
20. UNSD Ms. Ionica BEREVOESCU
Consultant, Social and Housing Statistics Section
Statistics Division, United Nations
Two UN Plaza DC2-1552
New York, NY 10017

30
Annex 2. Agenda
DAY 1: TUESDAY, 04 DECEMBER 2012
TIME TOPIC
9:00 – 9:30 Registration and welcome
9:30 – 10:00 Opening Session
• Opening remarks (UBOS, UNSD)
• Introduction/Objectives of the meeting and logistics (UNSD)
10:00 – 11:00
Session 1: Develop a coherent and comprehensive plan for the
production of gender statistics
Presentations
1. Overview of gender statistics: why, what, for whom and how (UNSD)
2. Global Review of Gender Statistics Programmes (UNSD)
3. Discussion
11:00 – 11:30 Tea Break
11:30 – 12:15 Countries’ experience in integrating gender into national statistics
1. Country experience: Uganda
2. Country experience: Ethiopia
3. Discussion
12:15 – 12:30 Conclusions on session 1
12:30 – 14:00 Lunch Break
14:00 – 15:00
Session 2: Integrating a gender perspective in health statistics
Presentations
1. Bringing gender issues into health statistics (UNSD)
2. Country experience: Malawi
3. Discussion
15:00 – 15:45
Session 3: Integrating a gender perspective in statistics on work
Presentations
1. Bringing gender issues into statistics on work (UNSD)
2. Country experience: Zimbabwe
3. Discussion
15:45 – 16:15 Tea Break
16:15 – 17:15 Group exercise
17:15 – 17:30 Conclusions on sessions 2 and 3

31
DAY 2: WEDNESDAY, 05 DECEMBER 2012
TIME TOPIC
9:00 – 10:30
Session 4: Integrating a gender perspective in poverty statistics
Presentations
1. Bringing gender issues into poverty statistics (UNSD)
2. Country experience: Mauritius
3. Discussion
10:30 – 11:00
Session 5: Integrating a gender perspective in statistics on
environment
Presentation
1. Bringing gender issues into statistics on environment (UNSD)
2. Discussion
11:00 – 11:30 Tea Break
11:30 – 12:30 Group exercise
12:30 – 14:00 Lunch Break
14:00 – 14:30 Conclusions on Sessions 4 and 5
14:30 – 15:00
Session 6: Integrating a gender perspective into data collection: an
overview
Presentation
1. Overview (UNSD)
2. Discussion
15:00 – 16:15
Session 7: Violence against women surveys
Presentations
1. Guidelines for Producing Statistics on Violence Against Women (UNSD)
2. Country experience: Zambia
3. Country experience: Kenya
4. Discussion
16:15 – 16:45 Tea Break
16:45 – 17:15 Conclusions on sessions 6 and 7

32
DAY 3: THURSDAY, 06 DECEMBER 2012
TIME TOPIC
9:00 – 10:15
Session 8: Time use surveys
Presentations
1. Time Use Surveys and gender statistics (UNSD)
2. Country experience: Ghana
3. Country experience: Tanzania
4. Discussion
10:15 – 10:30 Conclusions on session 8
10:30 – 11:00 Tea Break
11:00 – 12:30
Session 9: Population and Housing censuses: Use of census data for
gender statistics and gender analysis
Presentations
1. Strengths and weaknesses of the use of census data (UNFPA)
2. Tabulation of census data (UNFPA)
3. Limitations on the kinds of conclusions that can be drawn from census
tabulations (UNFPA)
4. Country experience : Malawi
12:30– 14:00 Lunch Break
14:00 – 15:45
Session 9 (cont’d)
Presentations (UNFPA)
1. Types of indicators that can be constructed with census data
2. Comparison of census indicators with similar indicators from other
sources
3. Country experience : Kenya
15:45– 16:15 Tea Break
16:15 – 17:15 Group exercise
17:15 – 17:30 Conclusions

33
DAY 4: FRIDAY, 07 DECEMBER 2012
TIME TOPIC
9:00 – 10:45
Session 9 (cont’d)
Presentations (UNFPA)
4. Multivariate analyses
5. Selected substantive analyses
10:45– 11:15 Tea Break
11:15 – 12:15 Group exercise
12:15 – 12:30 Conclusions on session 9
12:30 – 14:00 Lunch Break
14:00 – 14:30
Session 10: Analysis and presentation of gender statistics: an overview
Presentation
1. From raw data to easily understood gender statistics (UNSD)
14:30 – 16:00
Session 11: ECA initiatives on Gender Statistics
Presentation
1. Africa Programme on Gender Statistics (UNECA)
2. Discussion
16:00– 16:30 Tea Break
16:30 – 17:00 Conclusions
1. Conclusions and Recommendations (UNSD)
2. Plenary discussion
Related Documents