TANDEM COMPUTERS A Census of Tandem System Availability Between 1985 and 1990 Jim Gray Technical Report 90.1 January 1990 Part Number: 33579

Welcome message from author
This document is posted to help you gain knowledge. Please leave a comment to let me know what you think about it! Share it to your friends and learn new things together.
Transcript

TANDEM COMPUTERS A Census of Tandem System Availability Between 1985 and 1990 Jim Gray Technical Report 90.1 January 1990 Part Number: 33579

A Census of Tandem System Availability Between 1985 and 1990 Jim Gray Technical Report 90.1 January 1990 Part Number: 33579
A Census of Tandem System Availability Between 1985 and 1990 Jim Gray
Tandem Computers Inc. 19333 Vallco Parkway, Cupertino, CA. 95014
Tandem Technical Report 90.1 (Part Number 33579)
January 1990
Abstract: Tandem computer systems are designed to be single-fault tolerant. This paper takes a census of customer system outages reported to Tandem. The census shows a clear improvement in the reliability of hardware and maintenance. It indicates that now (1989) software is the majority source of reported system outages (62%), followed by system operations (15%). This is a dramatic shift from the statistics in 1985. Even discounting systematic under-reporting of operations and environmental outages, the conclusion is clear: hardware faults and hardware maintenance are no longer a major source of outages. As the other components of the system become increasingly reliable, software necessarily becomes the dominant cause of outages. Achieving higher-availability will require improvements in software quality, and software-fault tolerance, and will require simpler operations, and operations-fault tolerance.
Table of Contents
Introduction 1 What is a Tandem System? 2 Tandem Early Warning Reports (EWRs) 3 EWR data 4 Why Did Maintenance Get so Much Better? 6 Why Did Hardware Get so Much Better? 7 Why Did Operations Not Improve? 7 Why Did Software Not Improve? 8 Other Interesting Statistics. 9 The Experience of a Specific Customer 10 Relating Customer Data To EWR Data 13 Summary and Conclusions 14 Acknowledgments 15 References 15 Glossary 16 Appendix 1: EWR SQL Database 18
DISCLAIMER: This paper is not an official Tandem statement on fault-tolerance. Rather it documents the author's research on the topic. The views expressed herein are the author's, and are not necessarily shared by Tandem Computers Inc.

1
Introduction Tandem builds single fault tolerant computers. These computers have better availability than conventional systems, but they do fail occasionally. It is interesting to see why they fail, and also to observe the trends in failure modes. Fault-tolerant systems must deal with faults in all areas: environmental faults, operations faults, maintenance faults, software faults, and hardware faults. If a system has perfect hardware and software, but is difficult to operate, difficult to maintain, and has no protection against power failure, the system will fail frequently (typically once every three months). As this study shows, there have been substantial improvements in all these areas over the last five years -- but the improvements have been more dramatic in some areas than in others. A "correct" study would perform a census of a statistically significant subset of customers. Outages are a rare event for most customers, so a statistical sample would have to study the operator logs of several hundred customers over a period of several years. Such a study is beyond my resources. There are several sources of system outage reports easily available to me:
• A database of time and materials used for hardware repair work done by field personnel (this database is used for dispatching and accounting purposes).
• A database of diagnostic and repair work done on returned field replaceable units (FRUs). This is also a tracking and accounting database.
• A database of software bug reports, called Tandem Problem Reports (TPRs), used to track the progress of bug fixes.
• An electronic bulletin board which describes customer problems. This bulletin board is intended to inform Tandem executives of problems at customer sites. Consequently each entry is called an Early Warning Report (EWR).
Of all these databases, only EWRs capture the entire spectrum of outages, including environmental failures, operations mistakes, application failures, maintenance mistakes, as well as the more prosaic hardware and software faults. For this reason, I chose EWRs as the vehicle for estimating the causes of outages, and for evaluating trends in system outages. I have been reading these reports since late 1984. I analyzed the reports at year end of 1985, 1987, and 1989. The 1985 study was documented in [Gray]. The 1987 study was never published, but was presented at several conferences and was the basis of [Horst]. This paper summarizes those studies and reports on the trends they indicate.

2
What is a Tandem System? A Tandem system typically consists of four processors, twelve discs, a few hundred terminals and their communications gear. The "terminals" might be gas pumps or other point-of-sale terminals, robots in an automated warehouse, bar-code readers in an automated factory, automated-teller machines (ATMs), or form-processing terminals doing tasks ranging from hospital data entry, police or ambulance dispatching, electronic mail, order entry and processing, etc. Small systems typically consist of two processors, six discs, and about one hundred terminals, while large systems typically have sixteen processors, one hundred discs, and thousands of terminals. System prices (excluding terminals) range from 50K$ to 20M$. Given this huge spread, a factor of 200, between big and little systems, it must seem strange to lump system outages together. System outages are the key metric because Tandem systems are designed to be single-fault tolerant; at least two faults should be required to cause a system outage. One could normalize the outage severity:
DURATION x #PROCESSORS x PROCESSOR_SPEED so a short outage on a small system would be treated as less significant than a long outage on a big system. Alternatively, one could focus on outages of production systems, and exclude systems being installed, developed, relocated, or maintained. The database allows both these refinements; but, such refinements quickly lead to an explosion of data. The attitude here is: fault-tolerance, outage-intolerance. The focus is on why systems fail rather than in the consequences of the outage. The goal is to reduce all causes and forms of outage. So this report treats all outages alike; and focuses on outages rather than on tolerated faults. Another confounding variable is the shifting product mix over the five-year interval. When the study began, most hardware modules were delivering one year mean time between failures. At the end of the measurement period, new hardware was ten times more reliable. This period saw a transition from MSI to VLSI, from removable discs to sealed units, and a tenfold reduction in cabling and connectors as we moved from SMD to fiber optics. Much of the old hardware has not been retired. Therefore the old equipment makes a disproportionate contribution to the fault statistics. If the old hardware is only 10% of the installed base, it will still contribute over 50% of the outages. Similarly, the software base grew by a factor of three (measured as lines-of-code). No attempt was made to segregate these outages, rather they are all lumped together. The heterogeneity of systems is a reality which each vendor and customer must deal with. Despite this heterogeneity, some trends do emerge when the data is examined over this five-year period.

3
Tandem Early Warning Reports (EWRs) Each outage of a Tandem system should generate an Early Warning Report (EWR). Unfortunately, this is not always the case. Many environmental and operations outages are never reported to Tandem. We believe that outages caused by maintenance, by hardware, or by Tandem software are generally reported; but that outages induced by application software are under-reported. This under-reporting is difficult to quantify, and is reconsidered later when analyzing the outage history of a particular customer. Early Warning Reports are typically written by a Tandem employee close to the situation: the account representative, the software support person (analyst), or hardware support person (customer engineer). The report begins with some standard information: customer name, system number, system type, software version, cause, and duration of outage. Then follows a free-text description of the situation and customer attitude. These reports range from a few paragraphs to twenty pages. If the situation persists, there will be one or more update reports until the case is closed. Cases involve only one customer. But a case may involve many systems at many sites. A particular case has one or more reports, and a report describes one or more faults: situations where a component did not behave correctly. Some faults give rise to outages: a denial of service. The definition of outage is not precise; if most of the system is available to most clients, then it is usually considered available. But there have been cases where the unavailability of a single communications line, or even very bad response time, have been declared system outages. The definition of system outage is left to the customer; the EWR has a field asking: "Did the customer regard his system as down?". If the answer to this question is "yes", the EWR reports one or more outages. The sequence of faults that cause a system outage is called a fault chain. To give a fault chain example, if a software bug halts a processor, that is the first fault in the chain. The system will try to move all processing out of the faulted processor to other processors. If this works, there is no outage and fault-tolerance has masked the fault. Now the operator tries to get a picture of the processor state (a dump), so Tandem can diagnose and fix the bug. He then restarts the processor and it rejoins the system. If the operator makes a mistake during this procedure, e.g. if he restarts a functioning processor, then that is a second fault in the chain. Faults are categorized as: all: Any reported fault -- whether it was implicated in an outage or not. implicated fault: Any fault related to an outage (in a fault chain containing an outage). fatal fault: The first non-tolerated fault in a fault chain; in other words, the first fault in the fault
chain to cause an outage. The number of fatal faults equals the number of system outages. If the hardware fails, and the software masks the failure, there is no fatal fault. If the software fails to mask the hardware fault, the software fault is the fatal fault.
Counts of all three fault categories are reported here. Fatal faults are the most critical because they cause outages. Once a system enters an outage state, the chance of further faults is much increased. The analysis here focuses on fatal faults. In summary, customer situations give rise to cases which may have many early warning reports. The cases report chains of faults which may produce system outages. The end of the paper has a glossary of these terms.

4
EWR data As of late 1989, about three reports arrive each day. About two of these are new cases. The reports are analyzed in bulk at year-end. It takes about an hour to understand, categorize, and record each case. The 5MB of EWRs for 1989 boiled down to about 2MB of text and .2MB of structured information. For comparison, Tolstoy's War and Peace is about 2MB. The EWR statistics integrated over five years give impressive numbers: approximately seven thousand customer years, thirty thousand system years, eighty thousand processor years, and over two hundred thousand disc years. The summary information for the three periods is:
Table 1: Summary EWR Data 1985 1987 1989
Customers 1000 1300 2000 EWR Customers ? ? 267
Outage Customers 176 205 164 Systems 2400 6000 9000
Processors 7,000 15,000 25,500 Discs 16,000 46,000 74,000 Cases 305 227 501
Reports 491 535 766 Faults 592 609 892
Outages 285 294 438 System MTBF 8 years 20 years 21 years
The number of customers and systems changed during the reporting period, so the mid-point of the period is reported. The customer and system numbers are accurate to 10%. Tandem's customer file had over 5,000 entries in 1989. Often "customers" are sites of a larger application system, (e.g. the Singapore node of a network). This study aggregates customers into corporate groups, like US Navy, New York Stock Exchange, etc., rather than individual departments or sites. Tandem has built about 13,000 systems. The number of systems reported here excludes retired systems, internal systems, and Unix systems. The previous study [Gray] discounted outages caused by beta-test software and outages of systems which were not configured with fault-tolerant hardware (mirrored discs). Such outages comprise less than 5% of the total and so the subtraction was not significant; there is more than a 5% error in the reporting process. In addition, previous studies subtracted outages caused by "infant" software or hardware. This infant-subtraction was significant, about 30% of all outages both in 1985 and 1989 were due to a few troublesome products. There will always be infants in the field, so it is unfair to subtract them from the statistics. Hence, the numbers reported here include all error-prone software and hardware -- there is no subtraction of beta-test software, or of non-fault-tolerant systems. Interestingly enough, in 1985 the infants were mostly hardware, in 1987 infants were split between hardware and software, and in 1989 most of the infants were in software. By 1989, when hardware was implicated, the culprit was often firmware (i.e. software).

5
Table 1 shows that cases, reports, faults, and outages all increased over the period. But during this period the number of systems grew even more rapidly, so the outages per system actually decreased. Put another way, the mean time between reported system failure increased from 8 years to about 20 years. Recall that there is under-reporting of environmental, operations, and application faults. So the actual system failure rates are considerably worse. But the trend to lower failure rates is unmistakable. Interesting trends emerge when faults are analyzed by category. The broad categories are: software (application and vendor), hardware (vendor), maintenance (typically by the vendor), operations (management of the system), environment (power, facilities, comm lines), and process (the infrastructure that supports the system such as software distribution, project management, etc.). Given this decomposition, the census of various kinds of faults by year is summarized in Table 2.
Table 2: Faults by year by cause. Outages by Fatal Fault by Implicated Fault All Faults
year 1985 1987 1989 1987 1989 1989 software 96 114 272 135 297 515 hardware 82 66 29 106 77 157
maintenance 53 37 22 42 28 28 operations 25 35 66 49 86 27
environment 17 28 26 37 27 103 process ? ? 0 ? 9 61 unknown 12 14 23 17 23 21
total 285 294 438 386 538 892
Tables 1 and 2 have the raw data and are included because it is frustrating to extract numbers from graphs. Figures 2 and 3 display the information graphically. Figure 2 shows the basic trends: system outages per 1000 years (per millennium) improved by a factor of two by 1987 and then held steady. Most of the improvement came from improvements in hardware and maintenance, which together shrank from 50% of the outages to under 10%. By contrast, operations grew from 9% to 15% of outages. Software's share of the problem got much bigger during the period, growing from 33% to more than 60% of the outages.

6
unknown environment operations maintenance hardware software
0102030405060708090
100
1985 1987 1989
% of Outages by Fatal Fault
Perc
ent
0
20
40
60
80
100
120
1985 1987 1989
Outages/1000 System Years by Fatal Fault
Syst
em o
utag
es
Figure 2: Graphs showing the declining frequency of outages by cause, and showing the relative contribution of each fault category to system outages. It shows a shift from hardware and maintenance as the main cause of outages. Now software, and to a lesser extent operat-ions, are the main causes of outage. Under-reporting of environment and operations outages should be considered when reading these graphs.
Figure 2 seems to say that operations and software got worse; that is not true. Figure 3 shows that software and operations MTBF stayed about constant, while the other fault sources improved considerably.
0
50100150200250300350400450
1985 1987 1989
software
hardware
maintenance
operationsenvironment
total
Mean Time to System Failure (years) by Cause
Com
pone
nt M
TB
F (y
ears
)
Figure 3: Graph showing the trend in mean-time to system failure by fatal cause. Note that software and operations held about constant while hardware, maintenance and environment improved dramatically.

7
I cannot explain the reported improvement in environment. There is extreme underreporting in this area since Tandem executives do not need to be warned that the customer had a power outage -- recall that EWR stands for Early Warning Report. Certainly, Tandem systems tolerate environmental problems better than they used to -- but as the study of a particular customer shows in a later section, virtually no environmental problems are reported as EWRs unless special support is required from Tandem (e.g. fire, flood, earthquake, etc.). Why Did Maintenance Get so Much Better? The improvement in maintenance is both impressive and real. Two forces improved maintenance: technology and design. Discs give the best example of both forces. In 1985, each disc had to be serviced once a year. This involved powering down the disc, replacing an air filter, adjusting the power system and sometimes adjusting head alignment. In addition, the typical 1985 disc created one unscheduled service call per year to repair it. This created a huge workload for customer engineers (32,000 tasks per year in 1985), and created many opportunities for mistakes. In addition, the disc cabinets and connectors were not designed for maintenance -- everything was awkward, and special tools were required. If this had not changed, Tandem customer engineers would now be performing 150,000 of these tasks per year: 175 full-time people just doing the fault-prone task of disc maintenance. Instead, current Tandem discs have no scheduled maintenance, use no tools (only thumb screws), and have fiber-optic connectors which reduced cabling and connectors by a factor of twenty. All field replaceable units have built-in self-test, and light-emitting diodes which indicate correct operation. In addition, disc MTBF has risen from 8,000 hours to over 100,000 hours (observed) since 1985. Disc controllers and power supplies have experienced similar dramatic improvements. The net result: the disc population has grown by a factor of five while the absolute number of outages induced by disc maintenance has shrunk by a factor of four: a 2000% improvement. Virtually all the reported disc maintenance problems were with the "old" discs (ones sold prior to 1986), or were incident to installing new discs. This is just one example of how technology and design changes have improved the maintenance picture. Since 1985, the size of Tandem's customer engineering staff has held almost constant, and has been able to shift its focus from maintenance to installation -- even while the installed base has tripled. Why Did Hardware Get so Much Better? Since the Tandem system is single-fault tolerant, two hardware faults are required for hardware to cause a reported outage. In the 1989 period, there were well over ten thousand hardware faults, but only 29 resulted in a reported outage -- the vast majority were masked by the software. The MTBF of a duplexed pair goes up as the square of the MTBF of the individual modules [von Neumann], so minor changes in module MTBF can have a dramatic effect on system MTBF. As mentioned above, processor, disc, connector, and controller MTBF improved by a factor of ten over the period -- due to the shift to VLSI, non-removable discs, and fiber optics. This should give a factor of 100 improvement in the MTBF of pairs. In fact, only a nine-fold improvement was observed. The three obvious reasons for the shortfall are: (1) there are still many "old" boxes out there with the old MTBF, (2) installation is still not fool-proof, and (3) failures are not independent. The first item alone can explain the entire shortfall. The trend is clear: hardware designers have done a wonderful job -- hardware caused only 4% of the reported outages.
8
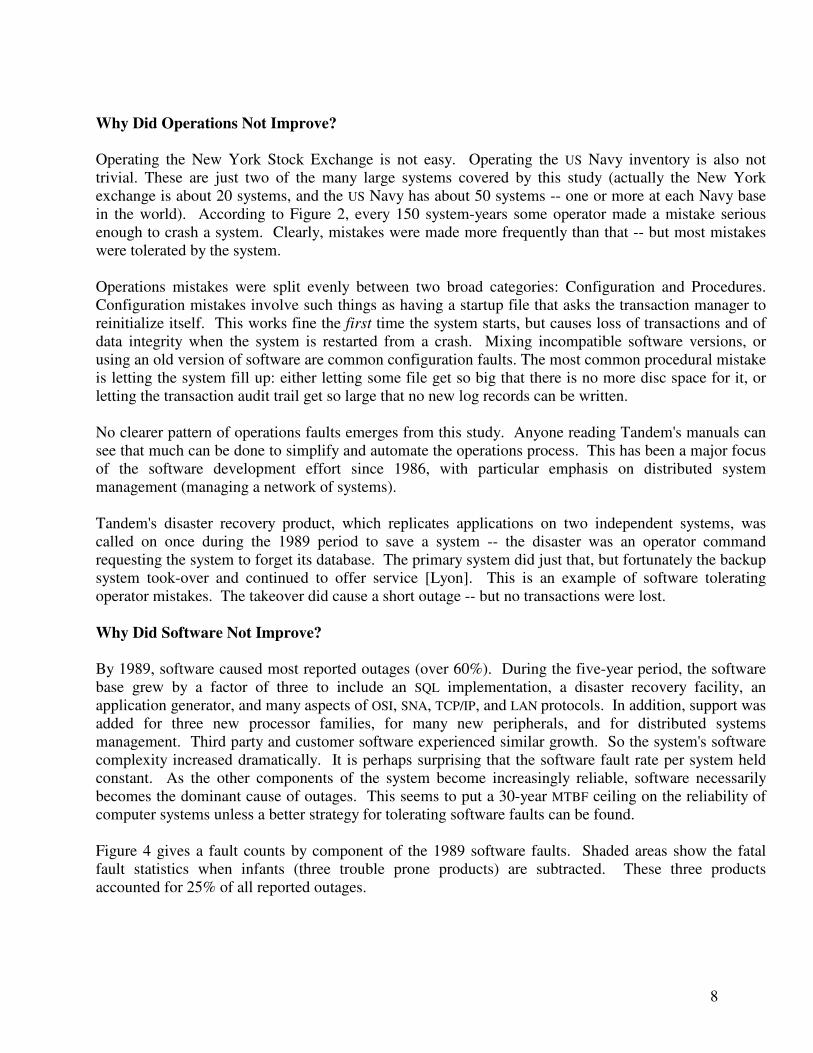
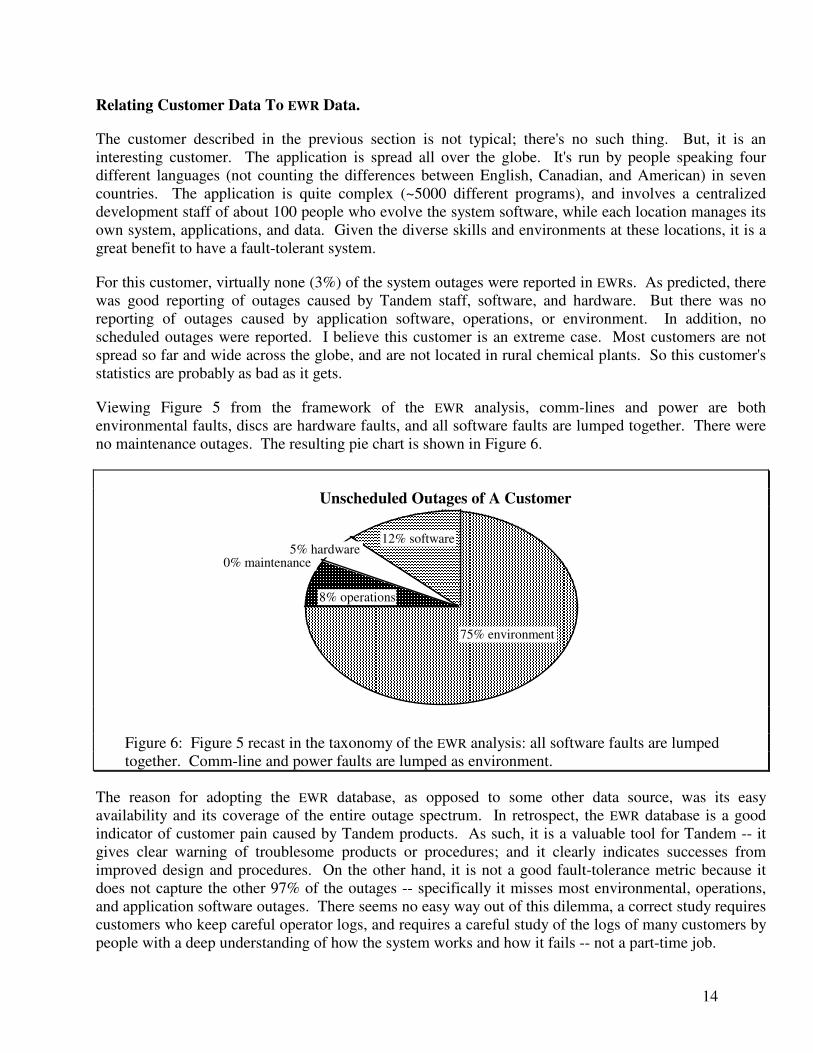
Why Did Operations Not Improve? Operating the New York Stock Exchange is not easy. Operating the US Navy inventory is also not trivial. These are just two of the many large systems covered by this study (actually the New York exchange is about 20 systems, and the US Navy has about 50 systems -- one or more at each Navy base in the world). According to Figure 2, every 150 system-years some operator made a mistake serious enough to crash a system. Clearly, mistakes were made more frequently than that -- but most mistakes were tolerated by the system. Operations mistakes were split evenly between two broad categories: Configuration and Procedures. Configuration mistakes involve such things as having a startup file that asks the transaction manager to reinitialize itself. This works fine the first time the system starts, but causes loss of transactions and of data integrity when the system is restarted from a crash. Mixing incompatible software versions, or using an old version of software are common configuration faults. The most common procedural mistake is letting the system fill up: either letting some file get so big that there is no more disc space for it, or letting the transaction audit trail get so large that no new log records can be written. No clearer pattern of operations faults emerges from this study. Anyone reading Tandem's manuals can see that much can be done to simplify and automate the operations process. This has been a major focus of the software development effort since 1986, with particular emphasis on distributed system management (managing a network of systems). Tandem's disaster recovery product, which replicates applications on two independent systems, was called on once during the 1989 period to save a system -- the disaster was an operator command requesting the system to forget its database. The primary system did just that, but fortunately the backup system took-over and continued to offer service [Lyon]. This is an example of software tolerating operator mistakes. The takeover did cause a short outage -- but no transactions were lost. Why Did Software Not Improve? By 1989, software caused most reported outages (over 60%). During the five-year period, the software base grew by a factor of three to include an SQL implementation, a disaster recovery facility, an application generator, and many aspects of OSI, SNA, TCP/IP, and LAN protocols. In addition, support was added for three new processor families, for many new peripherals, and for distributed systems management. Third party and customer software experienced similar growth. So the system's software complexity increased dramatically. It is perhaps surprising that the software fault rate per system held constant. As the other components of the system become increasingly reliable, software necessarily becomes the dominant cause of outages. This seems to put a 30-year MTBF ceiling on the reliability of computer systems unless a better strategy for tolerating software faults can be found. Figure 4 gives a fault counts by component of the 1989 software faults. Shaded areas show the fatal fault statistics when infants (three trouble prone products) are subtracted. These three products accounted for 25% of all reported outages.
9
Software Faults by Broad Category
0
50
100
150
200
250
comm data base OS appl other unknown
All faults Minus Infants
faul
ts
Fatal faults Figure 4: Histograms of software faults reported in 1989. There is underreporting of app-lication
software faults. The first bar shows all reported faults. The second shows all faults which caused an outage (fatal faults), and third shows the pattern of fatal faults when three error-prone software products are removed from the statistics.
Figure 4 shows that many software faults (over 40%) were indeed tolerated by the system (did not cause an outage). The actual ratio is much higher, since tolerated faults rarely cause customer complaints, and so rarely generated an EWR. As reported in [Gray], the process pair mechanism seems to mask more than 99% of all software faults in system processes. In addition, the transaction mechanism masks many application software faults. So the situation is not hopeless -- software quality and tolerance of software faults can be improved. A reasonable goal is to try to build a system with a 100-year MTBF. Allowing software 50% of the outages, implies a 200-year software MTBF -- a seven-fold improvement in software quality or software-fault tolerance.

10
Other Interesting Statistics. There is a wealth of information in the EWR database. Hardware, maintenance, and software outages have a mean time to repair (MTTR) of 4 hours with a median of 1 hour, while operations outages have a MTTR of 10 hours and environmental outages have a MTTR of 18 hours. In all cases, the outage distributions have very high variance (have long and flat tails), so the difference between the median and mean is substantial. Once a system has been down for several hours the distribution begins to look flat: it could be fixed in the next hour, or it could take a day more to fix. Another interesting statistic is the length of fault chains. One might think that in a single-fault tolerant system, almost all chains are of length two. Chains of length one represent cases where the fault is not tolerated. Chains of length three represent three faults within the repair window, a rare event. In fact, for the 1986-1987 period, 20% of the chains were of length one. These chains were caused by disaster (fire, flood,...), by non-fault-tolerant hardware configurations, and by operations disasters. In additional 20% of fault chains were of length three or more -- one was of length eight. There are several causes of long fault chains. The system is designed to tolerate all single faults, but it tolerates some multiple faults. A chain of length three results when two faults are tolerated and the third fault is fatal. The length of fault chains is exaggerated because once a system starts failing, it is in jeopardy. Human error rates are relatively high; recovery procedures are complex, and are often not well-tested. Recovery software suffers from similar complexity and limited testing. Latent faults further increase the chance of multiple faults -- if the system has many latent faults, then a double fault may well turn into a triple fault. To end on a positive note, fault-tolerance works most of the time. Most Tandem customers reported no outages in the five-year period surveyed (see Table 1). The fault-tolerant software masked most hardware faults, and tolerated many software and operations faults. There is under-reporting, but it is common to meet a customer who has never had an unscheduled outage -- or to meet one who was surprised when he did indeed have an outage. At present, I believe well-managed production systems experience an unscheduled outage about once every four years. Extremely well-managed systems -- ones with disaster backup, careful procedures, and so on -- will do much better than the four-year figure. Clearly, fault-tolerance is working -- four years is an order of magnitude better than the comparable figure for a conventional system.

11
The Experience of a Specific Customer In 1984, I was involved in the initial design of a customer application, and thereafter adopted the customer as a reality check. Since 1986, they have kindly sent me their operator logs each week. I analyzed the operator logs for the period June 1986 to December 1987. This covered 937 system-weeks or 18 system years. The customer is a division of an international chemicals manufacturer. The division converted their entire operation to Tandem equipment in 1984. The application manages order entry, inventory control, workflow scheduling, and the actual manufacture of the chemicals. One interesting fact: it costs about 15$/gallon to dispose of waste chemicals, so there is a real incentive to mix waste chemicals into a saleable product. Much of the sophistication and benefit of the application derives from picking an optimal set of formulae, so the plants have no "waste". They have thirteen sites: one each in Canada, England, France, Italy, and Mexico; the rest are spread around the continental United States. One site has both a production system and a development system so there are fourteen nodes in the network -- these nodes have about 54 processors and 124 discs. The system has not grown or changed much since 1985 -- some processors and discs have been upgraded to newer models, but the basic application has not changed much. The international nodes were added in 1986. The application uses Tandem's Encompass transaction management system, the Expand networking system, and the Transfer time-staged-delivery system to manage the flow of information among the nodes. There are some surprises in the operator logs of this customer: the operators recorded 199 system outages, a 4-week MTBF -- 1000 times worse than the 20-year MTBF reported in the previous section! 26% of these outages were caused by power failures. If the power fails, the factory stops; so the customer does not have uninterruptible power supplies for the computers. The system's ability to continue processing after a power failure is an important asset to this customer. There were eight power failures exceeding the 2-hour power buffer inherent in all Tandem systems. The average system outage due to power failures was 50-minutes; the median was 30 minutes. All studies show environment to be the most serious cause of outages (75% in Figure 6). This customer has no environmental protection (uninterruptible power supplies), and is located in some fairly hostile environments. Nevertheless, power failures are a problem for everyone -- in urban Northern Europe the rate is one per three years with an average duration 20 minutes, but in most of Europe and North America the rate is two per year with an average duration of 2.5 hours [Tullis], [Reuter]. So anyone interested in high availability should have emergency power. Similar remarks apply to redundant communications links. There were 22 system outages related to data communications equipment: the consequent system MTBF was 10 months, with a minimum duration of 2 hours and an average duration of 6 hours. The maximum comm outage was 66 hours. These outages were concentrated in Houston Texas, where there are serious electrical storms and flooding. Over one third (37%) of the outages were scheduled to install new software or to reorganize the database. Subsequent to this study, Tandem introduced online database reorganization software. Online reorganization reduces operator tasks, because it involves only issuing a command (no tape handling),

12
and will improve this customer's system availability by 25% since it can be done while the data is in use. But, for this customer, such outages are scheduled in advance and so do not constitute an availability issue. There were 99 unscheduled outages giving a 10-week MTBF. Vendor hardware and software caused relatively few (7%) of these outages -- the Tandem equipment delivered a 2.5-year MTBF. There were two Tandem-caused software outages -- both caused by a bug in a new disc server (DP2). Both outages were reported to Tandem. There were five outages caused by disc failures! Two of these outages were double disc failures and were reported as EWRs. The other three disc outages happened on discs that were not mirrored, so the customer did not complain to Tandem, and no EWR was filed. The discs owned by this customer are of an old type, rated at one-year MTBF. This customer saw approximately that failure rate. He subsequently bought more modern discs. The unscheduled operations outages all centered around the need to archive files before the discs fill up. In eight cases, the operators did not empty the discs in time; so service was interrupted while the operator moved data to archive storage. There were ten outages due to application software. No outages related to maintenance. The total pie chart of unscheduled outages is given in Figure 5.
Unscheduled Outages of A Customer
53% power
22% com lines
10% application software
operations
Tandem software
8%
disc5% 2%
97% un-reported
outages
Figure 5: A pie chart of the sources of 99 unscheduled outages experienced by a customer over 18
system-years based on the customer's operator logs. The highlighted wedge shows the fraction of outages induced by the vendor. The background wedge shows the outages not reported by EWRs, indicating the magnitude of under-reporting of environmental, operations, and application software outages -- none of these outages were reported! The unreported hardware outages relate to failures of unmirrored discs.
Figure 5 shows that the EWR statistics give an optimistic picture of system outages: under-reporting was drastic, the system MTBF was 2.5 months, not twenty years. The system gracefully recovered from power outages and so masked half these failures. Communication line outages were serious. Subsequently, the customer installed a high-bandwidth communication net and these problems have all but disappeared. The system had application software and operations problems as well. Even

13
discounting these problems -- the vendor created 7% of the outages: 3% from unmirrored discs, 2% from mirrored discs, and 2% from a software bug in a new disc server. The disc problems were due to antique discs (vintage 1984). The software problems were real. In sum, the fault-tolerant system offered a 2.5 year MTBF -- discounting the antique discs it would have been a 9-year MTBF. This brackets the 4-year MTBF estimate for a well-managed modern system.
Why is this customer happy? His NonStop system is not especially reliable. Well, two things make the customer happy: the system masks most faults, and the vendor creates almost no problems. Without disc mirroring, the antique discs would have caused 90 other outages and a one-month MTBF -- so disc mirroring saved the customer considerable pain. Without battery protection from power-fail, the operators and users would have manually cold-started the system 106 times: instead the system just paused and when power returned it continued processing. In addition, the customer does not view power fails as a computer problem, because the factory stops too. Many other hardware faults were masked. Viewed from that perspective the system has a 5 month MTBF. So, the customer has a relatively trouble-free system. That's why he's happy.
14
Relating Customer Data To EWR Data.
The customer described in the previous section is not typical; there's no such thing. But, it is an interesting customer. The application is spread all over the globe. It's run by people speaking four different languages (not counting the differences between English, Canadian, and American) in seven countries. The application is quite complex (~5000 different programs), and involves a centralized development staff of about 100 people who evolve the system software, while each location manages its own system, applications, and data. Given the diverse skills and environments at these locations, it is a great benefit to have a fault-tolerant system. For this customer, virtually none (3%) of the system outages were reported in EWRs. As predicted, there was good reporting of outages caused by Tandem staff, software, and hardware. But there was no reporting of outages caused by application software, operations, or environment. In addition, no scheduled outages were reported. I believe this customer is an extreme case. Most customers are not spread so far and wide across the globe, and are not located in rural chemical plants. So this customer's statistics are probably as bad as it gets.
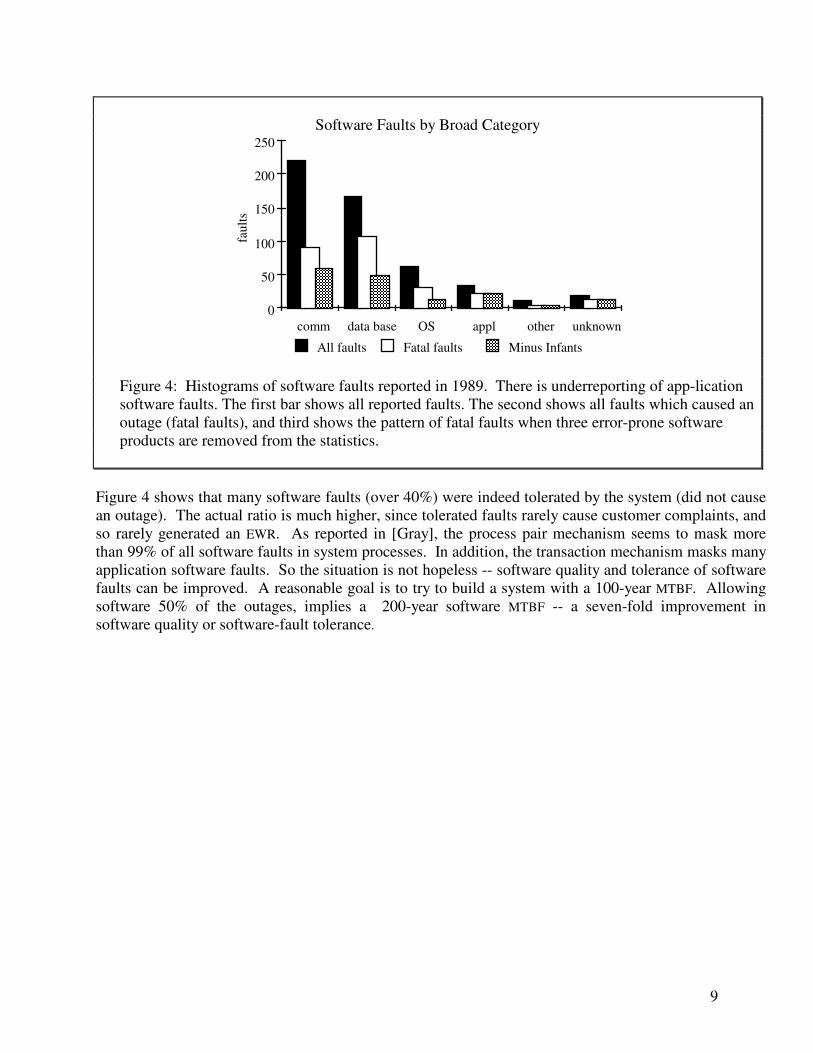
Viewing Figure 5 from the framework of the EWR analysis, comm-lines and power are both environmental faults, discs are hardware faults, and all software faults are lumped together. There were no maintenance outages. The resulting pie chart is shown in Figure 6.
Unscheduled Outages of A Customer
75% environment
8% operations
0% maintenance5% hardware
12% software
Figure 6: Figure 5 recast in the taxonomy of the EWR analysis: all software faults are lumped together. Comm-line and power faults are lumped as environment.
The reason for adopting the EWR database, as opposed to some other data source, was its easy availability and its coverage of the entire outage spectrum. In retrospect, the EWR database is a good indicator of customer pain caused by Tandem products. As such, it is a valuable tool for Tandem -- it gives clear warning of troublesome products or procedures; and it clearly indicates successes from improved design and procedures. On the other hand, it is not a good fault-tolerance metric because it does not capture the other 97% of the outages -- specifically it misses most environmental, operations, and application software outages. There seems no easy way out of this dilemma, a correct study requires customers who keep careful operator logs, and requires a careful study of the logs of many customers by people with a deep understanding of how the system works and how it fails -- not a part-time job.

15
Summary and Conclusions Fault-tolerant systems have better availability than conventional systems, but they do fail occasionally. Tandem Early Warning Reports (EWRs) give a good indication of outages caused by Tandem software, hardware, and maintenance. Unfortunately they do not indicate the frequency of outages caused by application software, operations, or environment. For one customer, these were 97% of all outages (see Figure 5). The EWR data does show some clear trends: hardware faults and maintenance faults have virtually disappeared as causes of outages -- together they cause less than 12% of reported outages, five times less than the software outage rate. The actual percentage is even lower because of under-reporting of outages in other areas. All evidence points to one conclusion: maintenance and hardware are a minor cause of system outages -- software is indeed masking most such faults. On the other hand, the reported software outage rate has held about constant, while the software base has grown by a factor of three. This is laudable, but at present software seems to have a 30-year mean time to system outage. This puts a ceiling on system availability. This statistic also does not include time for scheduled outages. Scheduled outages for software upgrades, for reconfiguration, or for data reorganization are usually recorded as operations outages. Such outages are really a hidden form of software outage -- true high-availability software would allow such tasks to be done online, while transactions are accessing the data. At present, Tandem software allows many forms of online maintenance, installation, reconfiguration, and reorganization, without disrupting service. But significant gaps remain. For example, a system outage is required to install most system software. Future disaster recovery software may provide a way to upgrade software online [Lyon]. Operations is a significant cause of outages, second only to software outages in the EWRs, and third after software and environment in the one customer study. To state the obvious: operators are people, they will not be less faulty in the future. The only option is to simplify, or eliminate operator tasks. Configuration must become automatic, routine tasks must be automated. Someday, software will mask almost all hardware and maintenance faults, will eliminate almost all operations tasks, and will mask environmental faults by replicating systems at different sites. When that day comes, only software faults will be left -- billions and billions of them! We are surprisingly far along this path already. I am skeptical of plans to build perfect software; rather I hope that mechanisms to contain and tolerate software faults will help mask them. It seems reasonable to try to build systems with a 100-year MTBF. This will require a seven-fold improvement in software MTBF. Software-fault containment via processes, and software-fault masking with process pairs and transactions may be the keys to tolerating software faults, and may give the necessary seven-fold improvement in software MTBF.

16
Acknowledgments Andrea Borr, Pat Helland, Franco Putzolu, Praful Shah, Robert Shaw, Hans Jorge Zeller gave valuable advice on presenting this material, and pointed out many areas where the ideas and conclusions could be improved. Bob Horst was especially helpful in the past and in this study -- both in challenging my assumptions and conclusions, and in providing insights and interpretations of some of these statistics. Jim Christen, Jim Hilinski, and Joe Lombardi have generously relayed the operator logs of a Tandem customer each week for the last four years. References [Avizienis] Avizienis, A., "Software Fault Tolerance", Proc. 1989 IFIP World Computer Conference,
Aug 1989, San Francisco, CA., IFIP Press. [Grady] Grady, R., "Dissecting Software Failures", Hewlett-Packard Journal, April 1989, pp 57-63.
Hewlett-Packard, Cupertino, CA. [Gray 1985] Gray, J., "Why Do Computers Stop and What Can Be Done About It?", Tandem TR85.7,
June 1985, Tandem Computers, Cupertino, CA. [Lyon] Lyon, J., "Tandem's Remote Data Facility", To appear in Proceedings of CompCon 90, Feb.
1990, San Francisco, CA., IEEE Press. [Horst] Horst, R., Gray, J., "Learning from Field Experience with Fault Tolerant Systems", Proceedings
of International Workshop on Hardware Fault Tolerance in Multiprocessors, University of Illinois, Urbana IL, June 19-20, 1989, pp 77-79.
[Reuter] Reuter, A. private communication on the power-failure rates of various European countries. [Tullis] Tullis, N. "Powering Computer-Controlled Systems: AC or DC?", Telesis, V11.1, pp. 8-14, Bell
Northern Research, 1984. [von Neumann] von Neumann, J., "Probabilistic Logics and the Synthesis of Reliable Organisms From
Unreliable Components", Automata Studies, Princeton University Press, 1956.

17
Glossary Applications: Software not written by Tandem: this includes customer software as well as third-party
software packages. Bug: A software error which, when encountered, becomes a software fault. Bug fix: A new software version which repairs some software bug. Case: A collection of Early Warning Reports (EWRs) which all relate to a particular problem at a
particular customer. The case may involve multiple outages at multiple systems at multiple sites. For reporting reasons, cases are terminated at the end of each quarter and a new case begun if the problem persists.
Comm: Data communications hardware (phone lines) or software (e.g SNA). Customer: An entity which operates Tandem equipment. Tandem, the largest single consumer of
Tandem equipment, is not counted as a customer. Large customers, like the United States, are viewed in smaller units, like the Treasury Department, United States Navy, etc. In general, customers are aggregated at a very coarse granularity.
Database: When used as a fault category, this includes all software to support database applications including data storage and retrieval, database utilities, archiving software, transaction protection software, and transaction processing monitors.
Disaster: A major environmental failure such as fire, flood, storm, earthquake, or sabotage. Early Warning Report (EWR): An electronic mail message sent by a Tandem employee near the
customer to Tandem executives to warn them of a customer problem. Frequent faults or an outage are both considered problems. But there are many other kinds of problems.
Environment: Physical resources outside the Tandem system. This includes external power, air conditioning, common carrier data communications lines, and physical facilities. It also includes external issues like weather, fire, earthquake, insurrection, and sabotage.
Hardware: Computing equipment including terminals, communications controllers, processors, memories, discs, tapes, printers, cables, connectors, power supplies, and battery backup power. Excluded are software and environment. Notably common carrier communications lines, microcode, uninterruptible power supplies, and air conditioning are not considered hardware. See also SOFTWARE and ENVIRONMENT.
Fault: Behavior different from the specified behavior. A power failure is a fault. A software failure is a fault. See also LATENT FAULT, FAULT CHAIN, FATAL FAULT, and OUTAGE.
Fault chain: A sequence of faults related to a single outage. In a single-fault tolerant system, all fault chains should be of length two or more: this broke and then that broke.
Fault tolerance: The ability to tolerate or mask faults. Typically systems are designed and rated as n-fault-tolerant for some number n. Tandem systems are designed to be single-fault tolerant, meaning that they are designed to mask most single faults within a repair window. If two faults occur within the repair window, then the fault may not be tolerated.
Implicated fault: Any fault in a fault chain containing an outage. See also FAULT CHAIN, FATAL FAULT, and OUTAGE.
Installed System Database (ISDB): An internal Tandem database which records its customers and their use of Tandem hardware and software.
Latent Fault: A fault which happened much earlier than it was discovered. All software faults are latent faults, dead-on-arrival spares are latent faults.
Maintenance: For the purposes of this study, maintenance means hardware maintenance of equipment in the field and explicitly excludes software maintenance (bug fixes). Installation of software

18
bug fixes is included under operations (if it works), and outages caused by incorrect bug fixes are charged to software outages.
Mean Time Between Failures (MTBF): The average time between failures. Mean Time To Repair (MTTR): The average time to repair and restart a system -- the average duration
of an outage. Operations: The configuration process of installing new software, configuring the hardware and
software (sysgen), and the procedures to keep the system operating; for example, performing archive dumps, and restarting failed systems.
OS: Operating system software. Outage: The denial of service to end users. This is subjective. If 50% of the database is available to
50% of the users, is it available? The customer decides when a system fault is a system outage. See also FAULT.
Fatal fault: The first non-tolerated fault in a fault chain; in other words, the first fault in the chain to cause an outage. The number of fatal faults equals the number of system outages. Every fatal fault is also an implicated fault. A power failure is a fatal fault if it is not masked by an uninterruptible power supply (UPS). If the UPS is present but fails, then the UPS failure is the fatal fault. See also FAULT CHAIN, FATAL FAULT,and OUTAGE.
Process: Everything else, that is everything but software, hardware, maintenance, operations, and environment. This includes things like the personality of the salesman, the speed at which bugs are fixed by the vendor, the quality of vendor training, and whether or not the next release is on schedule.
Product: For the purposes of this study, broad Tandem software or hardware product categories. For example, all discs are treated as the DISC product, all processors plus memory are treated as the CPU product. On the other hand, problem products (ones with many outages) are each given a separate category.
Site: A customer location or place. A customer with a distributed system can have many sites, and a site can have many systems. See also SYSTEM.
Software: Computer programs including microcode, disc and communications controller firmware, workstation software, and the full collection of Tandem and customer host software.
System: A node of a Tandem network. In 1989, a typical system consisted of four processors, sixteen discs, and several hundred terminals.

19
Appendix 1: The EWR Database Prior to 1989, a combination of spreadsheets and edit files was used to analyze the EWR data. This was adequate in early 1985, when about one hundred cases were reported (in a seven month period). This was cumbersome in 1987 which dealt with 490 outages. So, the 1989 EWR data was entered into an SQL database. The schema for the database is depicted below. The SQL data definition statements for the database along with brief comments on each field are included below.
customer nick_name number + ISDB data
CUSTOMER case_no customer quarter os reports text
CASEcase_no line text
CASE TEXT
system + ISDB data
SYSTEM
case_no chain index type subtype sys_stat system outage product text
FAULT
type subtype text
TYPE
product PRODUCT
Installed Systems Database (ISDB)
PRODUCTSCONFIG
SITESETC...
Figure 1: The schema for the SQL database describing EWRs. The circled tables are extracts of Tandem's Installed Systems Database (ISDB). The tables on the right represent the EWR data that extends the ISDB data.
Tandem maintains an Installed Systems Database (ISDB) which tracks all its customers and their systems. Wherever possible, ISDB terminology has been used and that database was extended to include EWR data. In particular, the ISDB CUSTOMER table was extracted, capturing the customer name and number. This was augmented with a nick_name field, a short name commonly used for the customer. For example, NASD is the nick name for the National Association of Securities Dealers. Similar comments apply to the SYSTEM table -- system numbers are ISDB system numbers. CASE is a table with one record for each case. Recall that a case applies to a problem at a customer. The case may involve many reports and many faults. For reporting reasons, cases end on quarter boundaries. If the problem persists, a new case is begun. Each case record carries a unique case number (case_no),

20
the version of software running on the system, the number of reports included in this case, and a one-line text description of the problem. CASETEXT is the raw text of the reports, with electronic mail distribution lists removed. Each report line is a separate record. All reports of a case are concatenated in chronological order within CASETEXT. The FAULT table is the hub of this database. It contains a description of each reported fault. Each fault has some index in some fault chain of some case -- this is the record key. The fault has a type (environment, operations, maintenance, software, hardware), and a subtype (e.g. power) The listing of the types and subtypes appears at the end of the paper. Each fault record tells the system number and system status (install, development, production, hardware upgrade, software upgrade, off-line maintenance). If the fault caused an outage, the outage duration (minutes) is recorded. The product involved in the fault, along with a one-line description of the fault, are also recorded in the record. The TYPE and PRODUCT tables are present for referential integrity checking and are described in data definition statements below.

21
-- case item master (casetext and fault are item detail) -- each case is a collection of reports within a quarter relating to one -- customer site's problem. A case can have many faults and each fault -- involves some system each ewr update is merged into the case to form -- a body of text recorded in casetext CREATE TABLE case (case_no integer, -- case integer id customer char(35), -- customer ISDB name quarter char(4), -- calendar Q: eg 89Q1 start date, -- first report of case closed date, -- date case closed os char(3), -- Operating System version reports integer, -- # ewrs in this case text varchar(80), -- short summary of case PRIMARY KEY(case_no)); -- FOREIGN KEY customer REFERENCES customer, -- Text of reports associated with a case. CREATE TABLE casetext (case_no integer, -- case integer id line integer, -- line number of text text varchar(80), -- text from case report PRIMARY KEY (case_no,line)); -- FOREIGN KEY case_no REFERENCES case, -- list of faults involved in a case CREATE TABLE fault (case_no integer, -- case integer id chain integer, -- fault chain #: 1, 2, index integer, -- index in chain type char(1), -- fault type(see types) subtype char(1), -- subtype of fault ("") sys_stat char(1), -- system status system integer, -- system # in fault outage integer, -- duration in minutes product char(10), -- name of product text varchar(50), -- short summary of fault PRIMARY KEY (case_no,chain,index)); -- FOREIGN KEY case_no REFERENCES case, -- FOREIGN KEY (type,subtype) REFERENCES type, -- FOREIGN KEY system REFERENCES system, -- FOREIGN KEY product REFERENCES product, -- system status must be: I: Install M: offline maintenance -- D: Development P: Production -- U: Upgrade (hardware upgrade) -- S: Software upgrade -- list of products and associated development organizations CREATE TABLE product (name char(10), -- product name org char(4), -- org owning product PRIMARY KEY (name)); -- list of customers from ISDB, along with nick names. CREATE TABLE customer (cust char(10), -- cust id from isdb customer char(35), -- long isdb name nick_name char(15), -- short name (e.g. SIAC) PRIMARY KEY (cust)); -- list of systems mentioned in EWRs CREATE TABLE system (system integer, -- ISDB sys serial # customer char(35), -- customer name PRIMARY KEY (system)); -- FOREIGN KEY customer REFERENCES customer,

22
-- list of types and subtypes of faults, plus text explanation. CREATE TABLE type (type char(1), -- major category (e.g software) subtype char(1), -- minor category (e.g. database) text varchar(50), -- category explanation PRIMARY KEY (type,subtype)); Fault types: These are the fault types and their meaning.
Environment EA air conditioning EF fire EH halon EL lightening & storm EM maintenance EP power EQ quake ES sabotage ET telephone lines EW flood
Hardware HC communications controllers and lines HD discs, tapes, and controllers HP processors, memory, power HS spare parts HT terminals, printers, workstations,... HW cables & wiring
Maintenance MC communications controllers and lines MD discs, tapes, printers and controllers MF facilities (power, cooling, lights,...) MP processors, memory, power
Operations OC configuration OI install OL overflow of system limits (files full,...) OM move OP procedures OU upgrade
Process P3 third party software house is messing up PA poor analyst support PB too many bugs or bug fixes too slow PC poor ce support PE poor education PM poor marketing support from corporate PP inadequate spares/ delays in ship PS poor sales, account control PT announced software not meeting schedules
Software S software (details unknown) SA customer application SC communications SD data base, recovery, transactions, archive SL languages and tools SM microcode SO operating system SP publications/documentation SS software house application / tool
Related Documents