OIO 0 Ground Freezing Effects on Soil Erosion of Army Training Lands Part 2: Overwinter Changes to Tracked-Vehicle Ruts, Yakima Training Center, Washington Jonathan J. Halvorson, Donald K. McCool, Larry G. King, and Lawrence W. Gatto July 1998 ,a, ,4 NaC 00O ___=b~ a=: 11~

Welcome message from author
This document is posted to help you gain knowledge. Please leave a comment to let me know what you think about it! Share it to your friends and learn new things together.
Transcript

OIO
0 Ground Freezing Effects onSoil Erosion of Army Training LandsPart 2: Overwinter Changes to Tracked-VehicleRuts, Yakima Training Center, WashingtonJonathan J. Halvorson, Donald K. McCool, Larry G. King, andLawrence W. Gatto July 1998
,a, ,4 NaC00O
___=b~
a=:
11~
Abstract: Two areas were monitored at the Yakima Train- side ruts and 4 MPa inside ruts at 10- to 1 5-cm depth,ing Center (YTC) in central Washington to measure and decreased by 10-38% outside ruts and by 39-48%changes in M1A2 Abrams (M1) tank-rut surface geom- inside ruts at the 30-cm depth. Soil bulk density wasetry, and in- and out-of-rut saturated hydraulic conduc- similar in and out of ruts from 0- to 2.5-cm depth, andtivity (Kfs), soil penetration resistance (SPR), and bulk below 2.5 cm it was generally higher in ruts formed ondensity over the 1995-1996 winter. Profile meter data moist soil, with highest values between 1 0- and 20-cmshow that rut cross-sectional profiles smoothed signifi- depth. Conversely, density in ruts formed on dry soil wascantly and that turning ruts did so more than straight similar to out-of-rut density at all depths. This infor-ruts. Rut edges were zones of erosion and sidewall mation is important for determining impacts of tank rutsbases were zones of deposition. Kfs values were simi- on water infiltration and soil erosion, and for modifyinglar in and out of ruts formed on soil with 0-5% water the Revised Universal Soil Loss Equation (RUSLE) andby volume, but were lower in ruts formed on soil with the Water Erosion Prediction Project (WEPP) models toabout 15% water. Mean SPR was similar in and out of more accurately predict soil losses on Army trainingruts from 0- to 5-cm depth, increased to 2 MPa out- lands.
How to get copies of CRREL technical publications:
Department of Defense personnel and contractors may order reports through the Defense Technical Information Center:DTIC-BR SUITE 09448725 JOHN J KINGMAN RDFT BELVOIR VA 22060-6218Telephone 1 800 225 3842E-mail [email protected]
msorders@dtic~milWW http://www.dtic.mil/
All others may order reports through the National Technical Information Service:NTIS5285 PORT ROYAL RDSPRINGFIELD VA 22161Telephone 1 703 487 4650
1 703 487 4639 (TDD for the hearing-impaired)E-mail [email protected] http://www.fedworld.gov/ntis/ntishome.html
A complete list of all CRREL technical publications is available fromUSACRREL (CECRL-IB)72 LYME RDHANOVER NH 03755-1 290Telephone 1 603 646 4338E-mail [email protected] mil
For Information on all aspects of the Cold Regions Research and Engineering Laboratory, visit our World Wide Web site:http:I/www.crre1.usace.army. mI
PREFACE
This report was prepared by Dr. Jonathan J. Halvorson, Biological Systems andEngineering, Washington State University, Pullman; Dr. Donald K. McCool, U.S.Department of Agriculture-Agriculture Research Service, Pullman, Washington;Dr. Larry G. King, Washington State University, Pullman; and Lawrence W. Gatto,Geological Sciences Division, Research and Engineering Directorate, U.S. ArmyCold Regions Research and Engineering Laboratory, Hanover, New Hampshire.Funding for this research was provided by the Office of the Chief of Engineers,CERD-M, through the 6.1 Environmental Quality Technology Program, Conserva-tion Pillar, BT-EC-B10 Project, Soil Frodibility and Runoff Frosivity Due to Soil Freezingand Thawing.
The authors thank Maureen Kestler and Sally Shoop for technically reviewingthe manuscript of this report, William Bowe, Russell Fitzgerald, Paul Mutch, andChristopher Pannkuk for field assistance, and Peter Nissen at Yakima TrainingCenter for assistance in coordinating field work.
The contents of this report are not to be used for advertising or promotionalpurposes. Citation of brand names does not constitute an official endorsement orapproval of the use of such commercial products.
ii
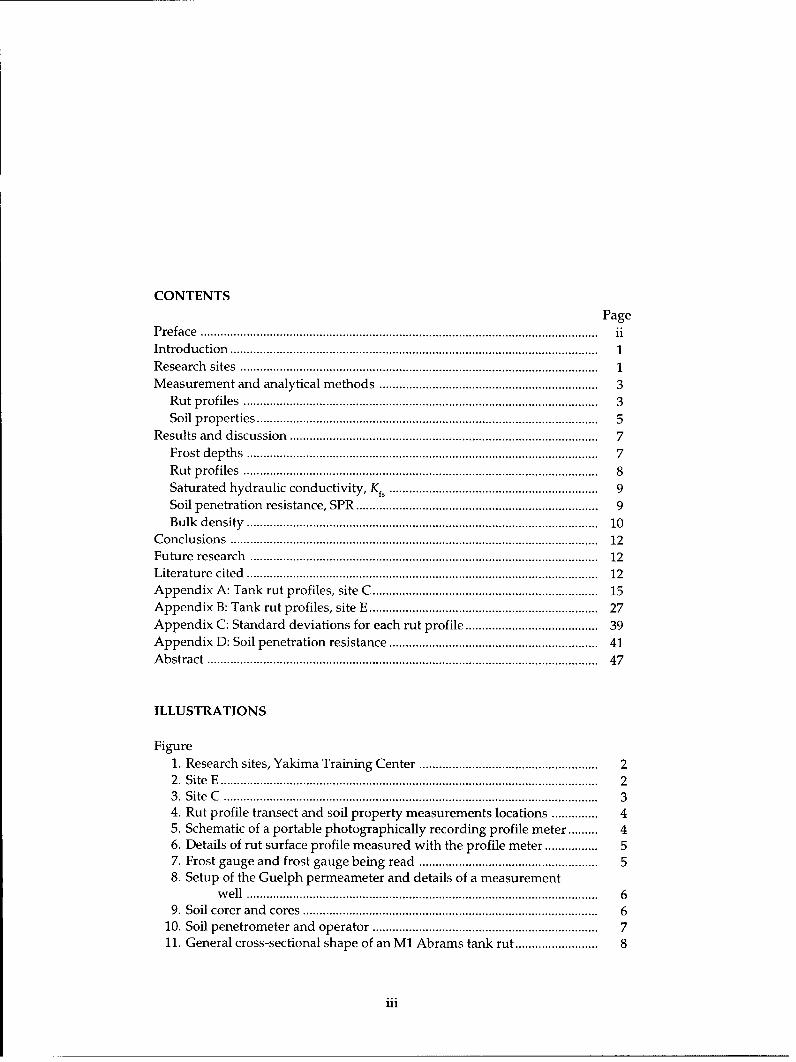
CONTENTS
PagePreface ........................................................................................................................ iiIntroduction ........................................................................................................... 1Research sites ........................................................................................................ 1M easurem ent and analytical m ethods ................................................................. 3
Rut profiles ........................................................................................................... 3Soil properties ....................................................................................................... 5
Results and discussion ............................................................................................ 7Frost depths .......................................................................................................... 7Rut profiles ........................................................................................................... 8Saturated hydraulic conductivity, Kf ............................................................... 9Soil penetration resistance, SPR ........................................................................ 9Bulk density ........................................................................................................ 10
Conclusions ............................................................................................................... 12Future research ....................................................................................................... 12Literature cited ........................................................................................................ 12A ppendix A : Tank rut profiles, site C ................................................................. 15Appendix B: Tank rut profiles, site E .................................................................... 27A ppendix C: Standard deviations for each rut profile ...................................... 39Appendix D : Soil penetration resistance ............................................................. 41Abstract ...................................................................................................................... 47
ILLUSTRATIONS
Figure1. Research sites, Yakim a Training Center ...................................................... 22. Site E .................................................................................................................. 23. Site C ............................................................................................................... 34. Rut profile transect and soil property measurements locations .............. 45. Schematic of a portable photographically recording profile meter ......... 46. Details of rut surface profile measured with the profile meter ................ 57. Frost gauge and frost gauge being read ...................................................... 58. Setup of the Guelph permeameter and details of a measurement
w ell .......................................................................................................... 69. Soil corer and cores ......................................................................................... 6
10. Soil penetrom eter and operator .................................................................... 711. General cross-sectional shape of an M1 Abrams tank rut ......................... 8
iii

Figure Page
12. Average soil penetrometer resistances ±95% confidence intervals forp rofile location s ..................................................................................... 10
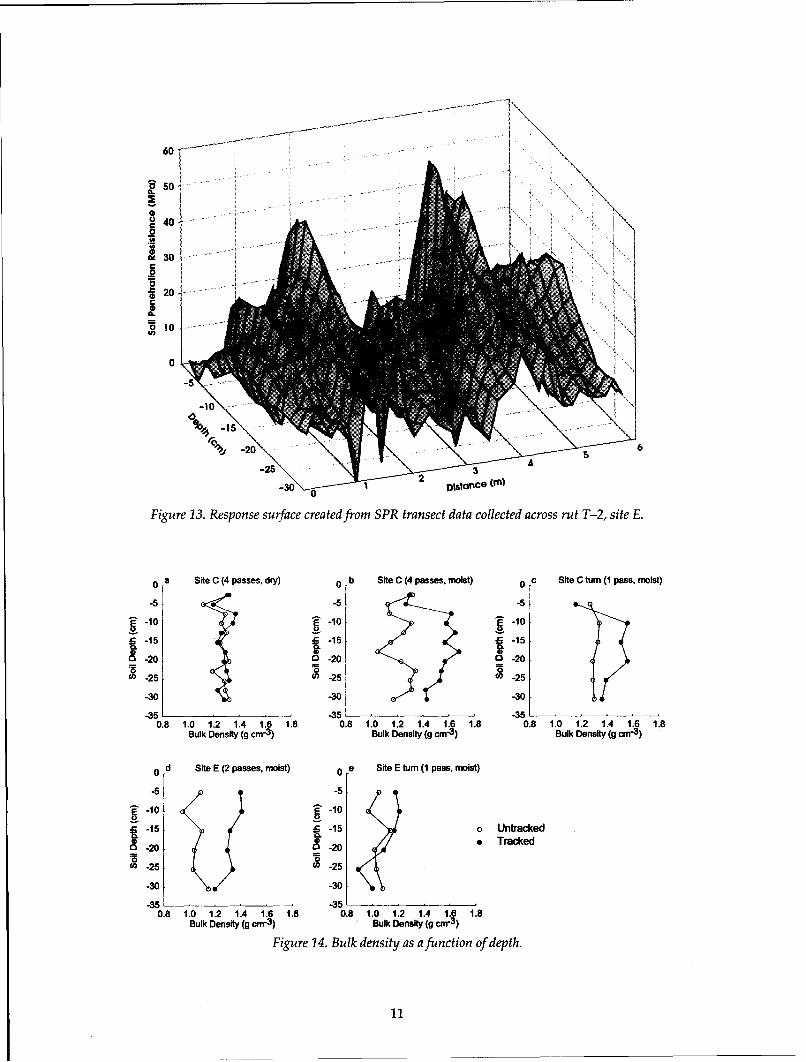
13. Response surface created from SPR transect data collected acrossru t T - 2, site E .......................................................................................... 11
14. Bulk density as a function of depth ............................................................. 11
TABLES
Table1. Data on TVIM ruts that we measured ......................................................... 32. Snow and frost dep th ...................................................................................... 73. Field saturated hydraulic conductivity, Kf, measured 1-3 May 1996 ..... 9
Ground Freezing Effects on Soil Erosion of Army Training LandsPart 2: Overwinter Changes to Tracked-Vehicle Ruts,
Yakima Training Center, Washington
JONATHAN J. HALVORSON, DONALD K. MCCOOL,LARRY G. KING, AND LAWRENCE W. GATTO
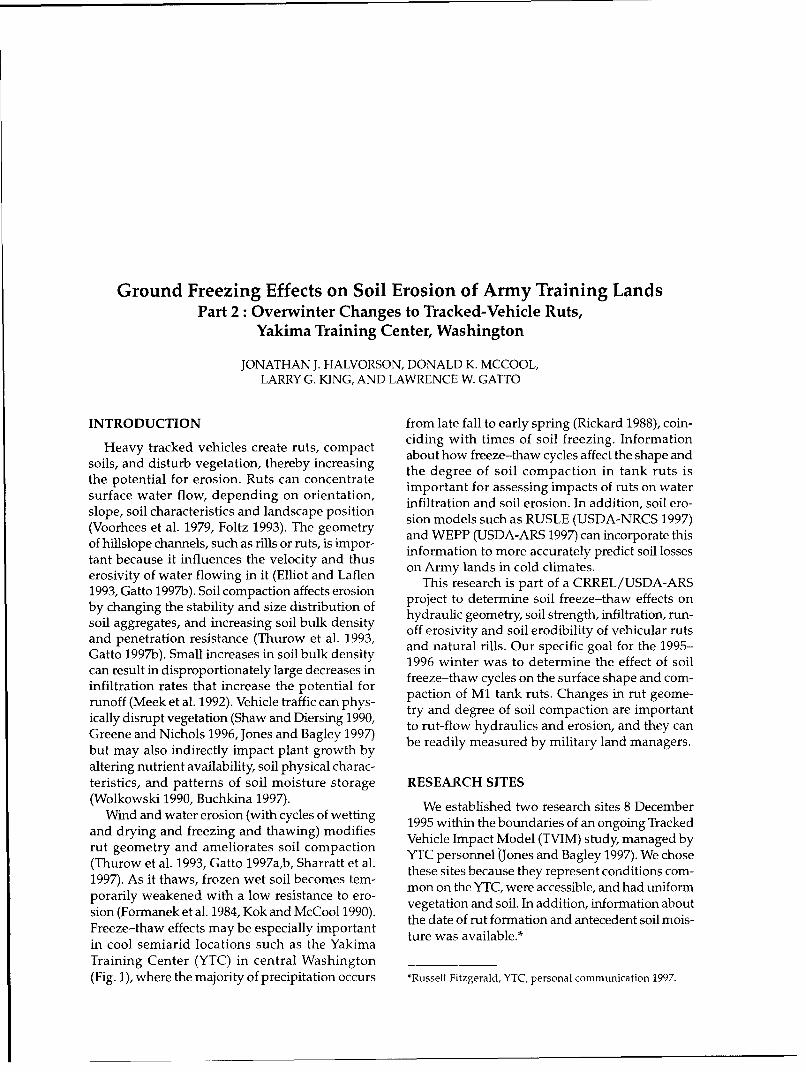
INTRODUCTION from late fall to early spring (Rickard 1988), coin-
Heavy tracked vehicles create ruts, compact ciding with times of soil freezing. Information
soils, and disturb vegetation, thereby increasing about how freeze-thaw cycles affect the shape and
the potential for erosion. Ruts can concentrate the degree of soil compaction in tank ruts isgon orientation, important for assessing impacts of ruts on water
surface water flow, dependingdscapeientation infiltration and soil erosion. In addition, soil ero-slope, soil characteristics and landscape position sion models such as RUSLE (USDA-NRCS 1997)
(Voorhees et al. 1979, Foltz 1993). The geometry and WEPP (USDA-ARS 1997) can incorporate this
of hillslope channels, such as rills or ruts, is impor- information to more accurately predict soil losses
tant because it influences the velocity and thus
erosivity of water flowing in it (Elliot and Laflen on Army lands in cold climates.
1993, Gatto 1997b). Soil compaction affects erosion This research is part of a CRREL/USDA-ARS
by changing the stability and size distribution of project to determine soil freeze-thaw effects on
soil aggregates, and increasing soil bulk density hydraulic geometry, soil strength, infiltration, run-
and penetration resistance (Thurow et al. 1993, off erosivity and soil erodibility of vehicular ruts
Gatto 199bt). Small increases in soil bulk density and natural rills. Our specific goal for the 1995-cantresulto i997b). dispoincrates oly bla derenesity 1996 winter was to determine the effect of soilcan result in disproportionately large decreases in freeze-thaw cycles on the surface shape and com-infiltration rates that increase the potential for pcino ltn us hne nrtgoe
runoff (Meek et al. 1992). Vehicle traffic can phys- paction of M1 tank ruts. Changes in rut geome-
ically disrupt vegetation (Shaw and Diersing 1990, try and degree of soil compaction are importantGreee ad Nihol 196, JnesandBagly 197) to rut-flow hydraulics and erosion, and they can
Greene and Nichols 1996, Jones and Bagley 1997) be readily measured by military land managers.
but may also indirectly impact plant growth by
altering nutrient availability, soil physical charac-teristics, and patterns of soil moisture storage RESEARCH SITES(Wolkowski 1990, Buchkina 1997). We established two research sites 8 December
Wind and water erosion (with cycles of wetting 1995 within the boundaries of an ongoing Trackedand drying and freezing and thawing) modifies Vehicle Impact Model (TVIM) study, managed byrut geometry and ameliorates soil compaction YTC personnel Tones and Bagley 1997). We chose(Thurow et al. 1993, Gatto 1997ab, Sharratt et al. tC person e Joes a ndBae17W cose1997). As it thaws, frozen wet soil becomes tem- ths s b the represen cnditionsicommon on the YTC, were accessible, and had uniformporarily weakened with a low resistance to ero- vegetation and soil. In addition, information aboutsion (Formanek et al. 1984, Kok and McCool 1990). the date of rut formation and antecedent soil mois-Freeze-thaw effects may be especially important ture was available.*in cool semiarid locations such as the YakimaTraining Center (YTC) in central Washington(Fig. 1), where the majority of precipitation occurs *Russell Fitzgerald, YTC, personal communication 1997.

46'56'
The YTC encmpase ante aE a ove 130,
L of the rasYTC
Yakima° 0 5 miles
4 o 0120'28' 119,55,
Figure 1. Researchi sites, Yakiiia Trabibigy Ceniter.
The YTC encompasses an area over 130,000 B•ha in the Columbia basin of south-central Wash- "ington (Fig. 1). The region is part of the shrub-steppe, the largest of the grassland regions in
North America (Rogers and Rickard 1988). Soils :are typically loess overlying basalt, and the cli-mate is characterized as semiarid, temperate,and continental with cold, wet winters and hotdry summers (Rickard 1988, Jones and Bagley1997). o
Site E (Fig. 2), at about 450-m altitude, receives , :s"about 20 cm of precipitation annually. The soilsand vegetation are typical for central Washing-ton state: shrub-steppe consisting of deep silty Iclay-loam soils (Drysel, Meloza-Roza; fine,montmorillonitic, mesic Xeric Camborthids) on Figure 2. Site E.
2
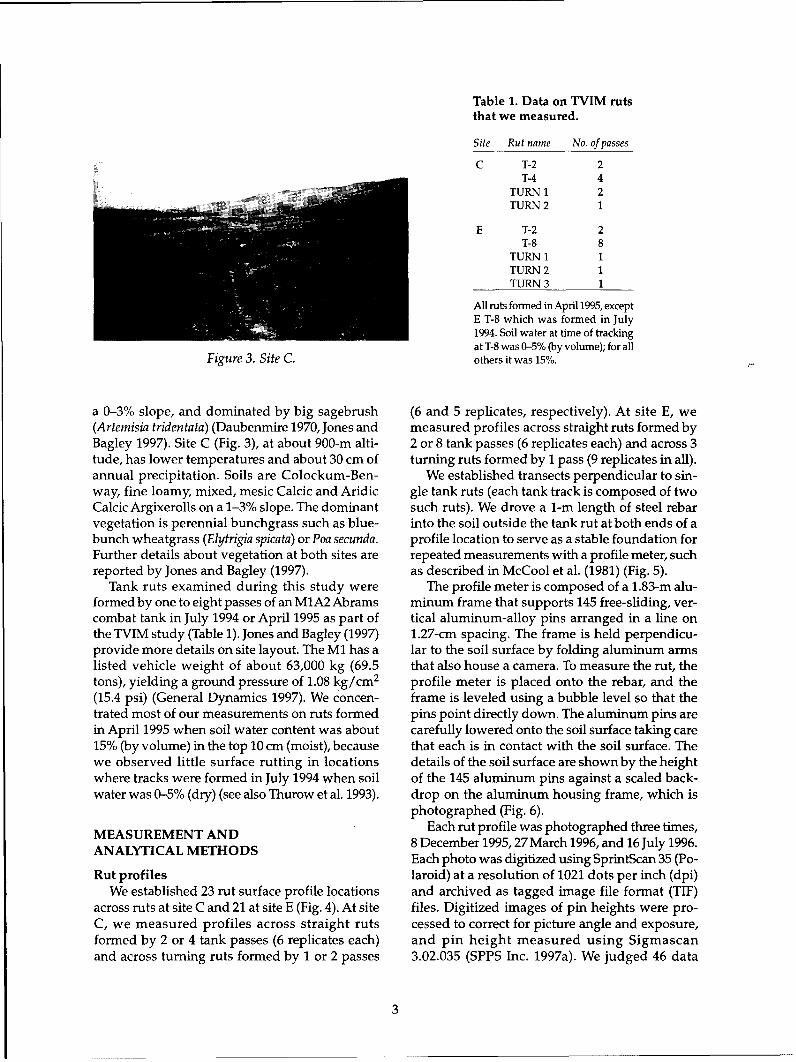
Table 1. Data on TVIM rutsthat we measured.
Site Rut name No. of passes
C T-2 2T-4 4
TURN 1 2TURN 2 1
E T-2 2T-8 8
TURN 1 1TURN 2 1TURN 3 1
All ruts formed in April 1995, exceptE T-8 which was formed in July1994. Soil water at time of trackingat T-8 was 0-5% (by volume); for all
Figure 3. Site C. others it was 15%.
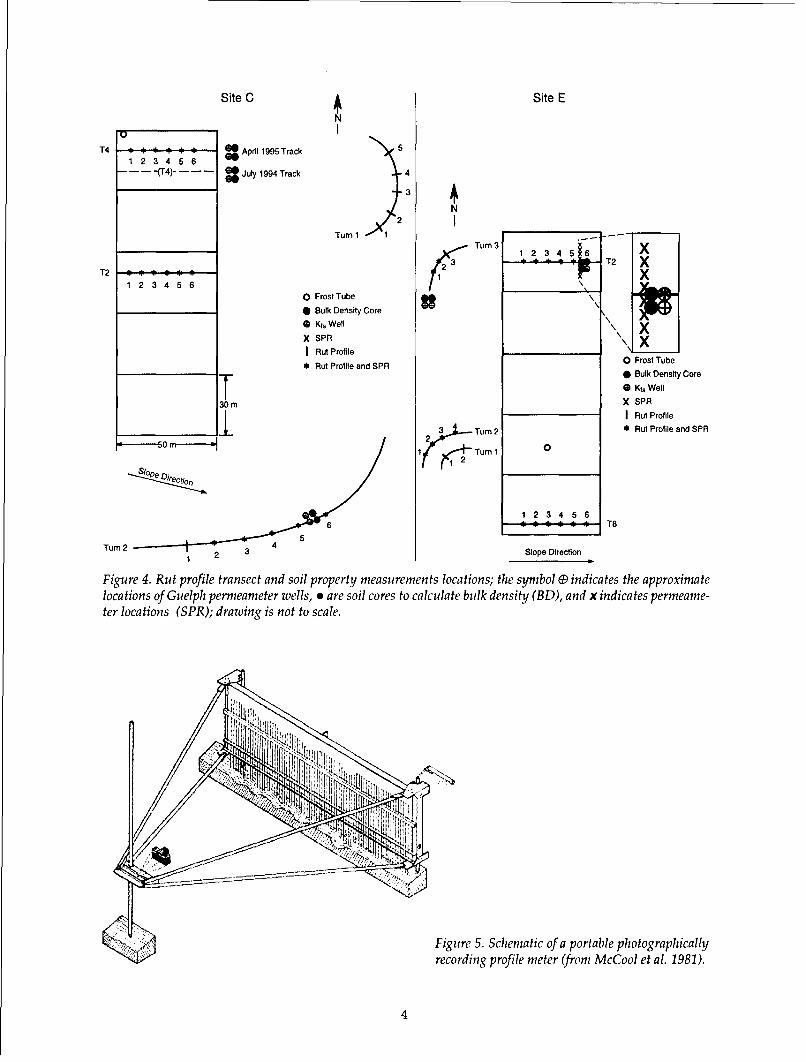
a 0-3% slope, and dominated by big sagebrush (6 and 5 replicates, respectively). At site E, we(Artemisia tridentata) (Daubenmire 1970, Jones and measured profiles across straight ruts formed byBagley 1997). Site C (Fig. 3), at about 900-m alti- 2 or 8 tank passes (6 replicates each) and across 3tude, has lower temperatures and about 30 cm of turning ruts formed by 1 pass (9 replicates in all).annual precipitation. Soils are Colockum-Ben- We established transects perpendicular to sin-way, fine loamy, mixed, mesic Calcic and Aridic gle tank ruts (each tank track is composed of twoCalcic Argixerolls on a 1-3% slope. The dominant such ruts). We drove a 1-m length of steel rebarvegetation is perennial bunchgrass such as blue- into the soil outside the tank rut at both ends of abunch wheatgrass (Elytrigia spicata) or Poa secunda. profile location to serve as a stable foundation forFurther details about vegetation at both sites are repeated measurements with a profile meter, suchreported by Jones and Bagley (1997). as described in McCool et al. (1981) (Fig. 5).
Tank ruts examined during this study were The profile meter is composed of a 1.83-m alu-formed by one to eight passes of an MIA2 Abrams minum frame that supports 145 free-sliding, ver-combat tank in July 1994 or April 1995 as part of tical aluminum-alloy pins arranged in a line onthe TVIM study (Table 1). Jones and Bagley (1997) 1.27-cm spacing. The frame is held perpendicu-provide more details on site layout. The M1 has a lar to the soil surface by folding aluminum armslisted vehicle weight of about 63,000 kg (69.5 that also house a camera. To measure the rut, thetons), yielding a ground pressure of 1.08 kg/cm2 profile meter is placed onto the rebar, and the(15.4 psi) (General Dynamics 1997). We concen- frame is leveled using a bubble level so that thetrated most of our measurements on ruts formed pins point directly down. The aluminum pins arein April 1995 when soil water content was about carefully lowered onto the soil surface taking care15% (by volume) in the top 10 cm (moist), because that each is in contact with the soil surface. Thewe observed little surface rutting in locations details of the soil surface are shown by the heightwhere tracks were formed in July 1994 when soil of the 145 aluminum pins against a scaled back-water was 0-5% (dry) (see also Thurow et al. 1993). drop on the aluminum housing frame, which is
photographed (Fig. 6).Each rut profile was photographed three times,
MEASUREMENT AND 8 December 1995, 27 March 1996, and 16 July 1996.ANALYTICAL METHODS Each photo was digitized using SprintScan 35 (Po-
Rut profiles laroid) at a resolution of 1021 dots per inch (dpi)We established 23 rut surface profile locations and archived as tagged image file format (TIF)
across ruts at site C and 21 at site E (Fig. 4). At site files. Digitized images of pin heights were pro-C, we measured profiles across straight ruts cessed to correct for picture angle and exposure,formed by 2 or 4 tank passes (6 replicates each) and pin height measured using Sigmascanand across turning ruts formed by 1 or 2 passes 3.02.035 (SPPS Inc. 1997a). We judged 46 data
3
Site C 4 Site EN
T4 ~April 1995 Track
- - -("4)- . - July 1994 Track 4
N
2Tumi
123456 X
T2 T2 X
1 2 3 4 5 6 \\,
O Frost Tube \* Bulk Density Core
* Kts Well
X SPR \\ X
I Rut Profile I
* Rut Profile and SPR 0 Frost Tube
- Bulk Density Core
* Kfs Well
30 rn X SPRI Rut Profile
3 Turn 2 * Rut Profile and SPR'-----50 m---•I#1Turn 1 0
slope D ~~m
1234566 •T8
5Turn 24 1 2 3 Slope Direction
Figure 4. Rut profile transect and soil property measurements locations; the symbol GD indicates the approximatelocations of Guelph permeameter wells, * are soil cores to calculate bulk density (BD), and x indicates permeame-ter locations (SPR); drawing is not to scale.
"Figure 5. Schematic of a portable photographicallyrecording profile meter (from McCool et al. 1981).
4
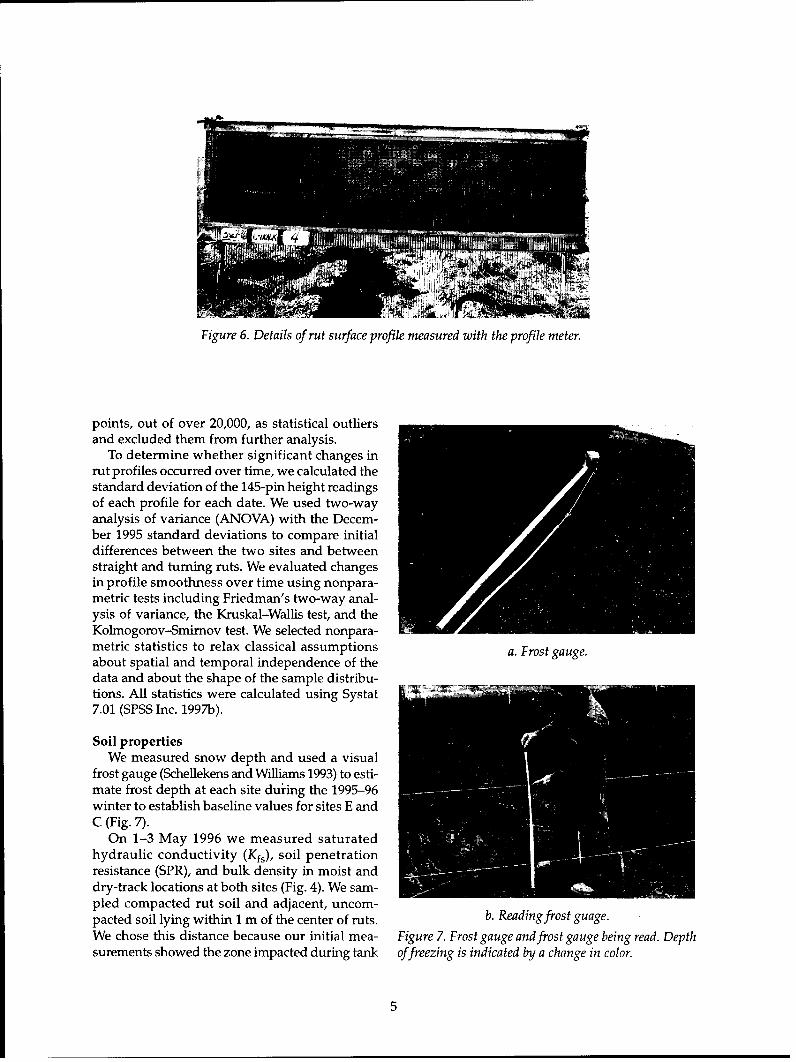
Figure 6. Details of rut surface profile measured with the profile meter.
points, out of over 20,000, as statistical outliersand excluded them from further analysis.
To determine whether significant changes inrut profiles occurred over time, we calculated thestandard deviation of the 145-pin height readingsof each profile for each date. We used two-wayanalysis of variance (ANOVA) with the Decem-ber 1995 standard deviations to compare initialdifferences between the two sites and betweenstraight and turning ruts. We evaluated changesin profile smoothness over time using nonpara-metric tests including Friedman's two-way anal-ysis of variance, the Kruskal-Wallis test, and theKolmogorov-Smirnov test. We selected nonpara-metric statistics to relax classical assumptions a. Frost gauge.about spatial and temporal independence of thedata and about the shape of the sample distribu-tions. All statistics were calculated using Systat7.01 (SPSS Inc. 1997b).
Soil propertiesWe measured snow depth and used a visual
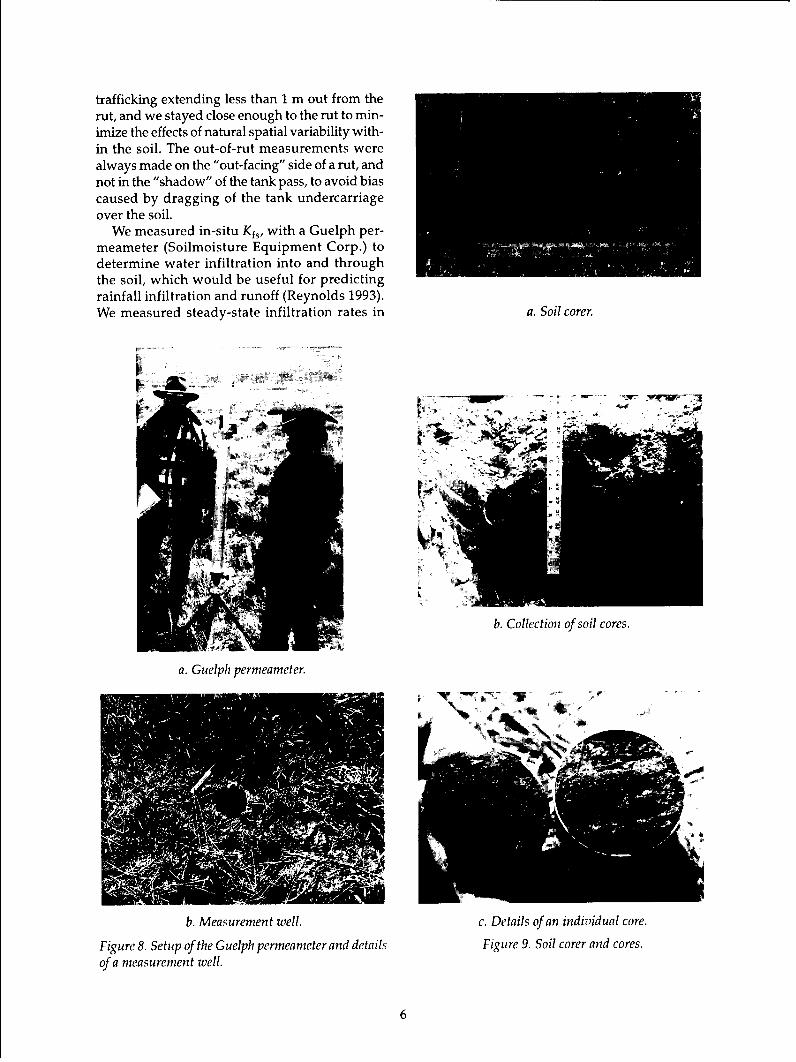
frost gauge (Schellekens and Williams 1993) to esti-mate frost depth at each site duhing the 1995-96winter to establish baseline values for sites E andC (Fig. 7).
On 1-3 May 1996 we measured saturatedhydraulic conductivity (Kfs), soil penetrationresistance (SPR), and bulk density in moist anddry-track locations at both sites (Fig. 4). We sam-pled compacted rut soil and adjacent, uncom-pacted soil lying within 1 m of the center of ruts. b. Reading frost guage.
We chose this distance because our initial mea- Figure 7. Frost gauge and frost gauge being read. Depthsurements showed the zone impacted during tank offreezing is indicated by a change in color.
5
trafficking extending less than 1 m out from therut, and we stayed close enough to the rut to min-imize the effects of natural spatial variability with-in the soil. The out-of-rut measurements werealways made on the "out-facing" side of a rut, andnot in the "shadow" of the tank pass, to avoid biascaused by dragging of the tank undercarriageover the soil.
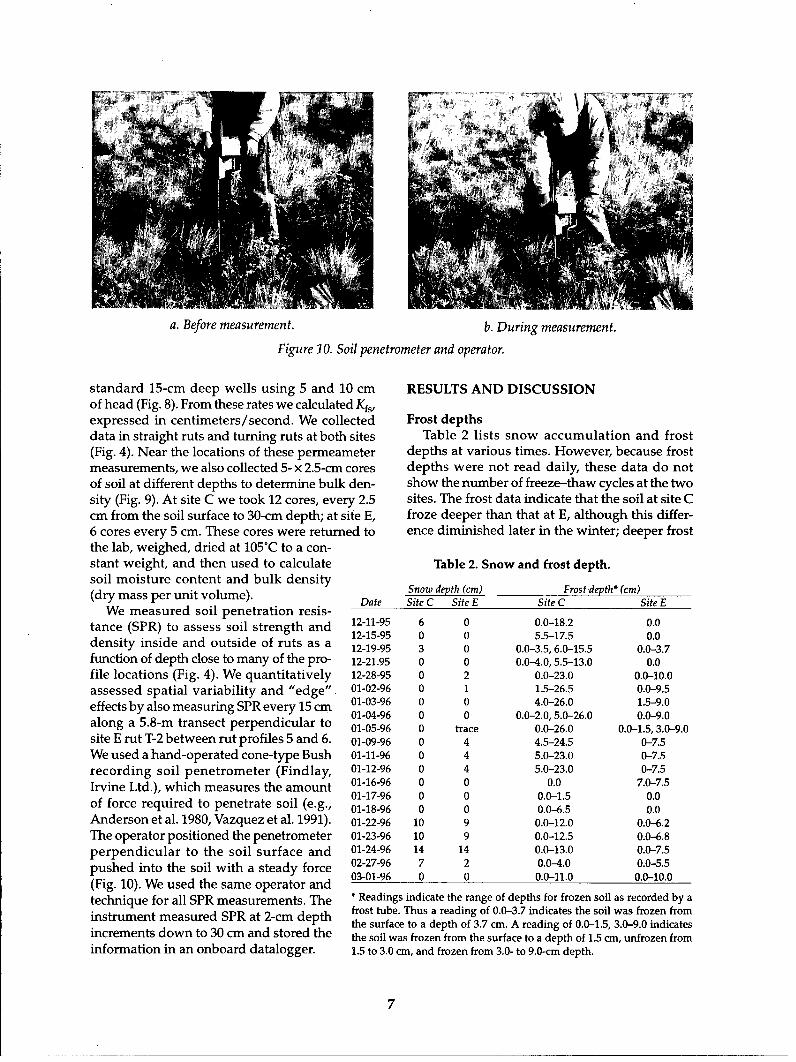
We measured in-situ Kfs, with a Guelph per-meameter (Soilmoisture Equipment Corp.) todetermine water infiltration into and throughthe soil, which would be useful for predictingrainfall infiltration and runoff (Reynolds 1993).We measured steady-state infiltration rates in a. Soil corer.
WO<
b. Collection of soil cores.
a. Guelph permeameter.
b. Measurement well. c. Details of an individual core.
Figure 8. Setup of the Guelph permeameter and details Figure 9. Soil corer and cores.
of a measurement well.
6
- ----- 1
a. Before measurement. b. During measurement.
Figure 10. Soil penetrometer and operator.
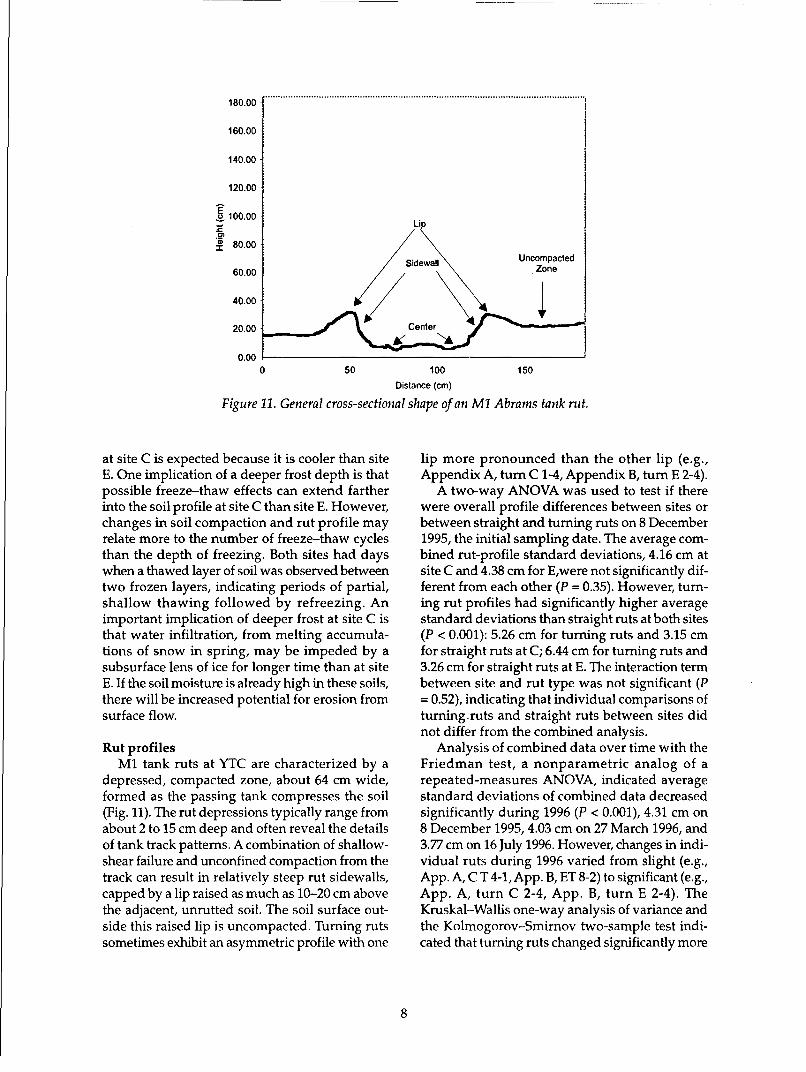
standard 15-cm deep wells using 5 and 10 cm RESULTS AND DISCUSSIONof head (Fig. 8). From these rates we calculated Kfs,expressed in centimeters/second. We collected Frost depthsdata in straight ruts and turning ruts at both sites Table 2 lists snow accumulation and frost(Fig. 4). Near the locations of these permeameter depths at various times. However, because frostmeasurements, we also collected 5- x 2.5-cm cores depths were not read daily, these data do notof soil at different depths to determine bulk den- show the number of freeze-thaw cycles at the twosity (Fig. 9). At site C we took 12 cores, every 2.5 sites. The frost data indicate that the soil at site Ccm from the soil surface to 30-cm depth; at site E, froze deeper than that at E, although this differ-6 cores every 5 cm. These cores were returned to ence diminished later in the winter; deeper frostthe lab, weighed, dried at 105°C to a con-stant weight, and then used to calculate Table 2. Snow and frost depth.soil moisture content and bulk density Snow depth (cm) Frost depth* (cm)(dry mass per unit volume). Date Site C Site E Site C Site E
We measured soil penetration resis-tance (SPR) to assess soil strength and 12-11-95 6 0 0.0-18.2 0.012-15-95 0 0 5.5-17.5 0.0density inside and outside of ruts as a 12-19-95 3 0 0.0-3.5, 6.0-15.5 0.0-3.7function of depth close to many of the pro- 12-21.95 0 0 0.0-4.0, 5.5-13.0 0.0file locations (Fig. 4). We quantitatively 12-28-95 0 2 0.0-23.0 0.0-10.0assessed spatial variability and "edge" 01-02-96 0 1 1.5-26.5 0.0-9.5effects by also measuring SPR every 15 cm 01-03-96 0 0 4.0-26.0 1.5-9.0
01-04-96 0 0 0.0-2.0, 5.0-26.0 0.0-9.0along a 5.8-m transect perpendicular to 01-05-96 0 trace 0.0-26.0 0.0-1.5, 3.0-9.0site E rut T-2 between rut profiles 5 and 6. 01-09-96 0 4 4.5-24.5 0-7.5We used a hand-operated cone-type Bush 01-11-96 0 4 5.0-23.0 0-7.5recording soil penetrometer (Findlay, 01-12-96 0 4 5.0-23.0 0-7.5
Irvine Ltd.), which measures the amount 01-16-96 0 0 0.0 7.0-7.501-17-96 0 0 0.0-1.5 0.0
of force required to penetrate soil (e.g., 01-18-96 0 0 0.0-6.5 0.0
Anderson et al. 1980, Vazquez et al. 1991). 01-22-96 10 9 0.0-12.0 0.0-6.2The operator positioned the penetrometer 01-23-96 10 9 0.0-12.5 0.0-6.8perpendicular to the soil surface and 01-24-96 14 14 0.0-13.0 0.0-7.5
pushed into the soil with a steady force 02-27-96 7 2 0.0-4.0 0.0-5.5
(Fig. 10). We used the same operator and 03-01-96 0 0 0.0-11.0 0.0-10.0
technique for all SPR measurements. The * Readings indicate the range of depths for frozen soil as recorded by a
instrument measured SPR at 2-cm depth frost tube. Thus a reading of 0.0-3.7 indicates the soil was frozen fromthe surface to a depth of 3.7 cm. A reading of 0.0-1.5, 3.0-9.0 indicates
increments down to 30 cm and stored the the soil was frozen from the surface to a depth of 1.5 cm, unfrozen from
information in an onboard datalogger. 1.5 to 3.0 cm, and frozen from 3.0- to 9.0-cm depth.
7
180.00
160.00
140.00
120.00
1, 100.00 Lip
S80.00Sidewall Uncompacted
60.00 Zone
40.00
20.00 Center 1
0.000 50 100 150
Distance (cm)
Figure 11. General cross-sectional shape of an M1 Abrams tank rut.
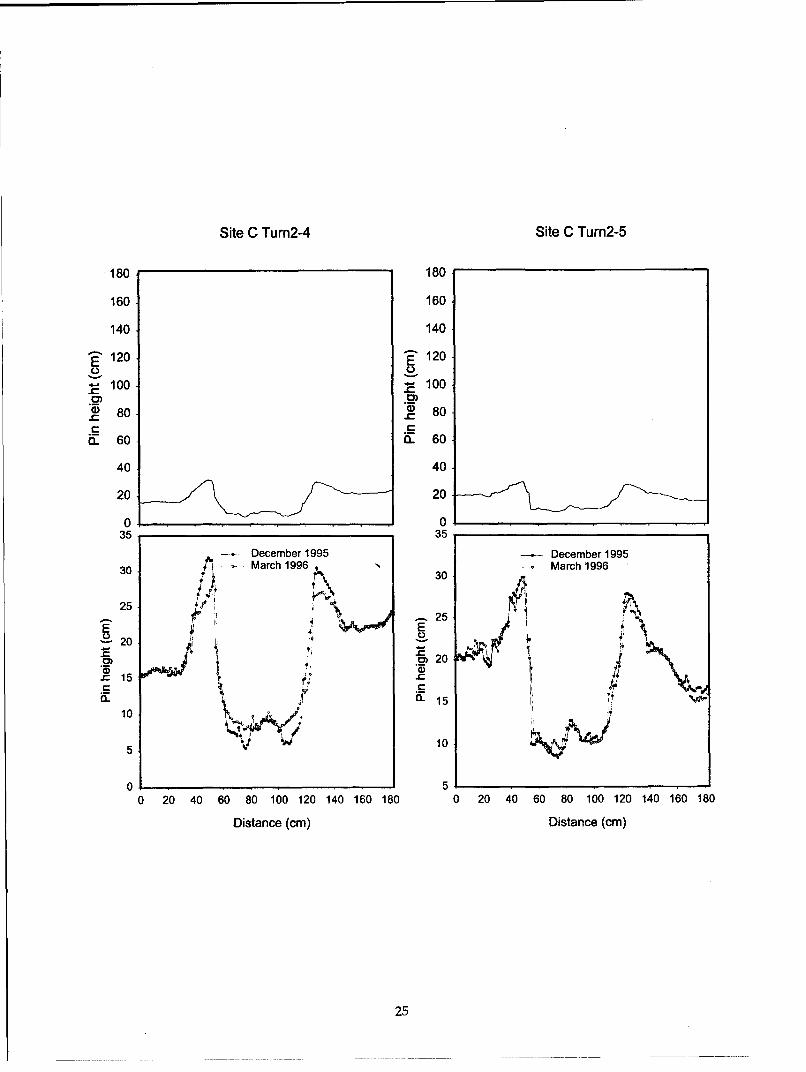
at site C is expected because it is cooler than site lip more pronounced than the other lip (e.g.,E. One implication of a deeper frost depth is that Appendix A, turn C 1-4, Appendix B, turn E 2-4).possible freeze-thaw effects can extend farther A two-way ANOVA was used to test if thereinto the soil profile at site C than site E. However, were overall profile differences between sites orchanges in soil compaction and rut profile may between straight and turning ruts on 8 Decemberrelate more to the number of freeze-thaw cycles 1995, the initial sampling date. The average com-than the depth of freezing. Both sites had days bined rut-profile standard deviations, 4.16 cm atwhen a thawed layer of soil was observed between site C and 4.38 cm for E,were not significantly dif-two frozen layers, indicating periods of partial, ferent from each other (P = 0.35). However, turn-shallow thawing followed by refreezing. An ing rut profiles had significantly higher averageimportant implication of deeper frost at site C is standard deviations than straight ruts at both sitesthat water infiltration, from melting accumula- (P < 0.001): 5.26 cm for turning ruts and 3.15 cmtions of snow in spring, may be impeded by a for straight ruts at C; 6.44 cm for turning ruts andsubsurface lens of ice for longer time than at site 3.26 cm for straight ruts at E. The interaction termE. If the soil moisture is already high in these soils, between site and rut type was not significant (Pthere will be increased potential for erosion from = 0.52), indicating that individual comparisons ofsurface flow. turning.ruts and straight ruts between sites did
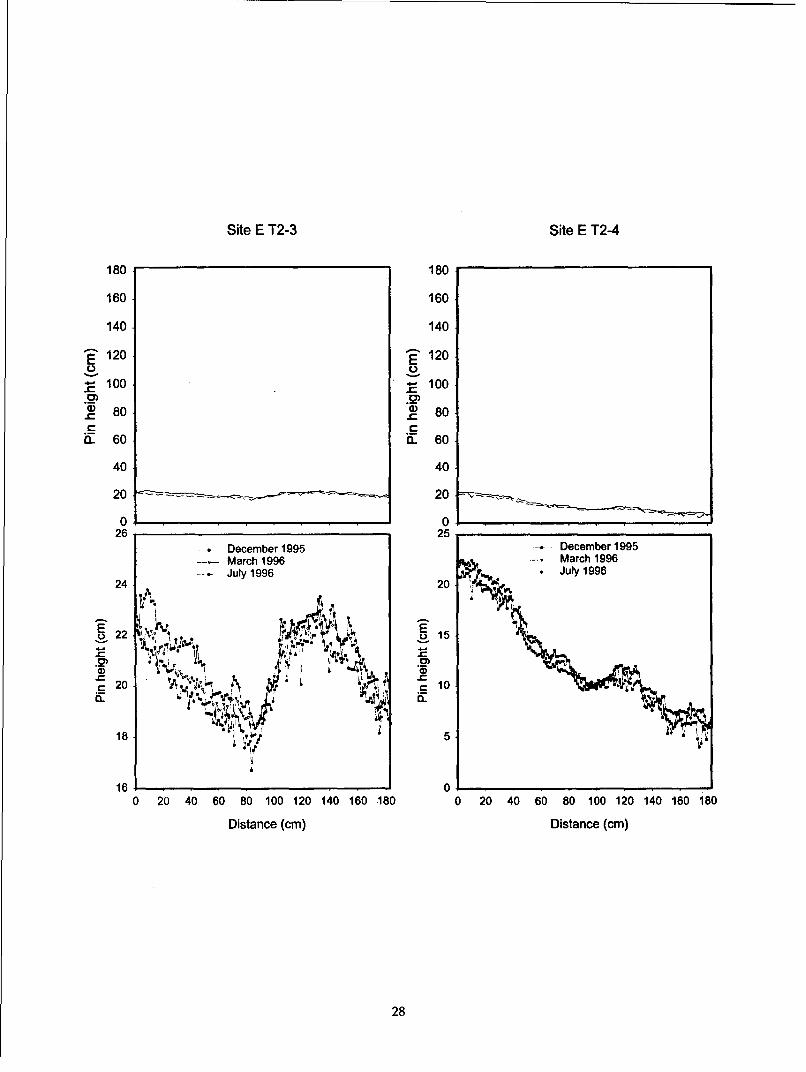
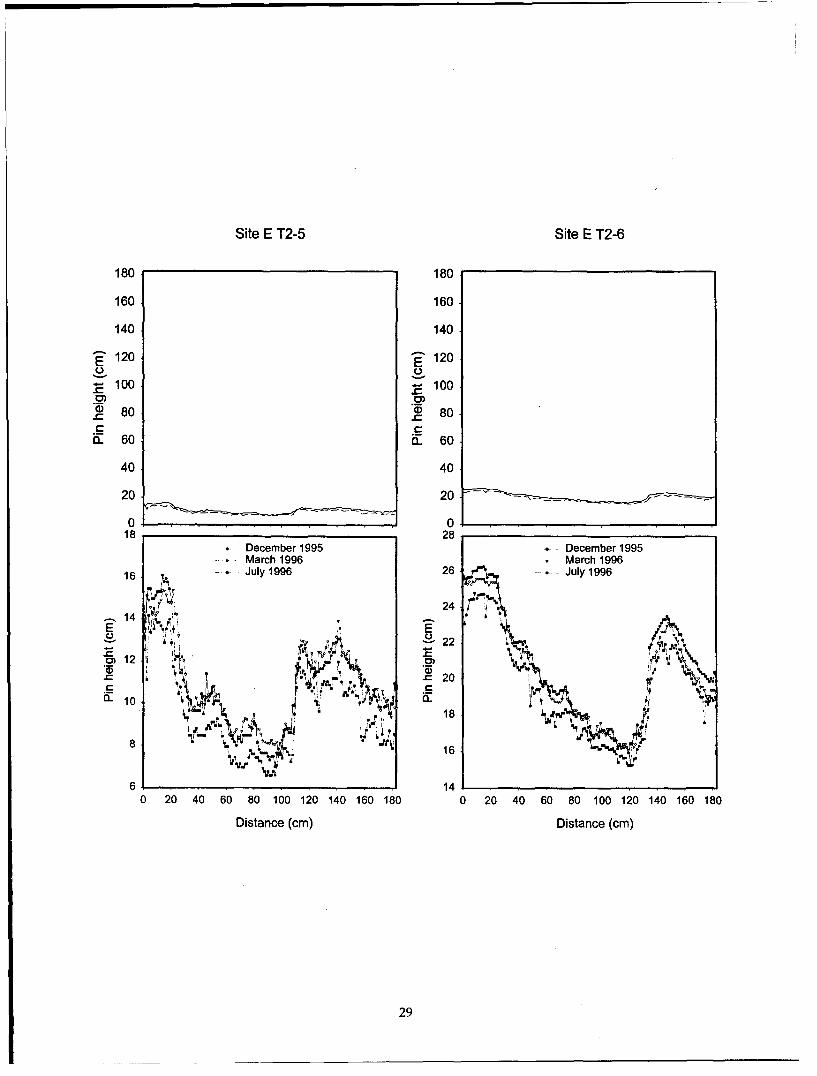
not differ from the combined analysis.Rut profiles Analysis of combined data over time with the
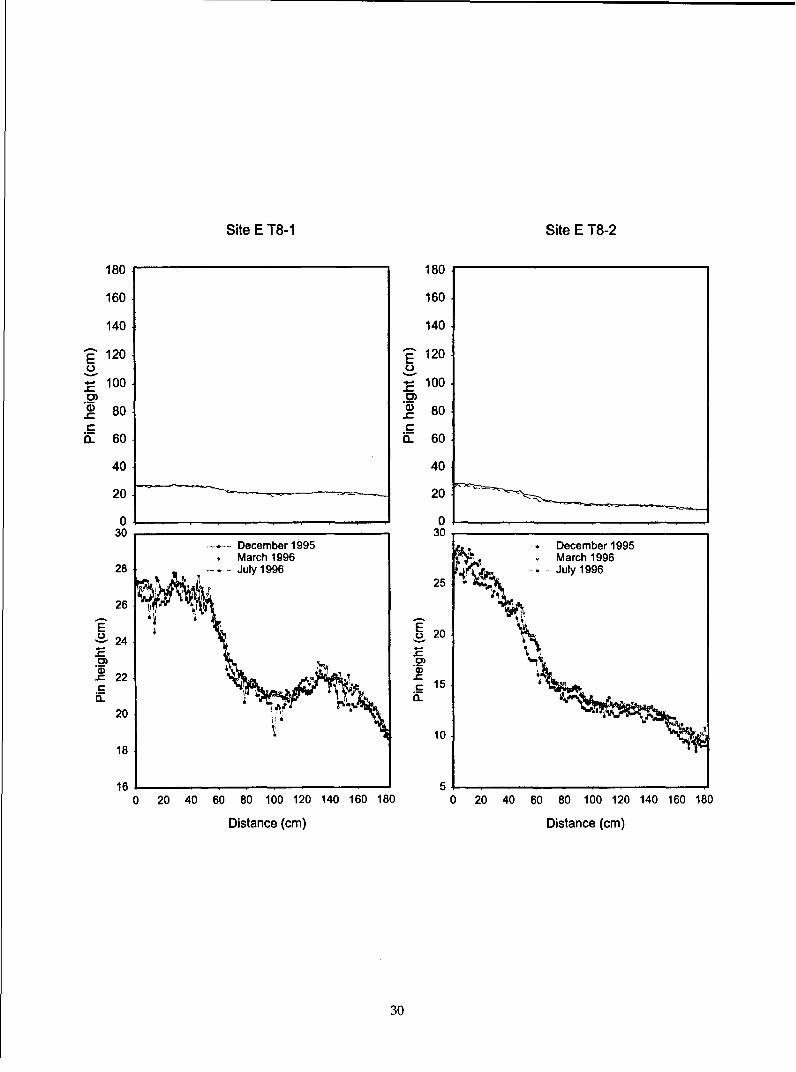
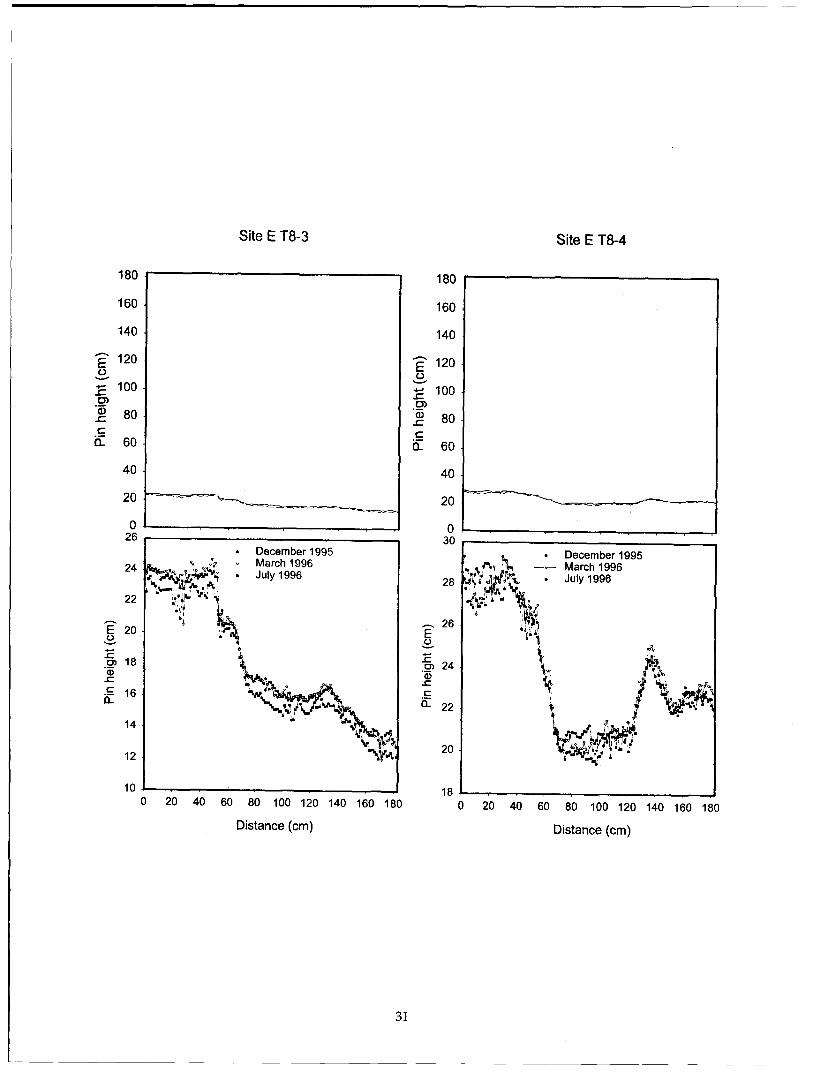
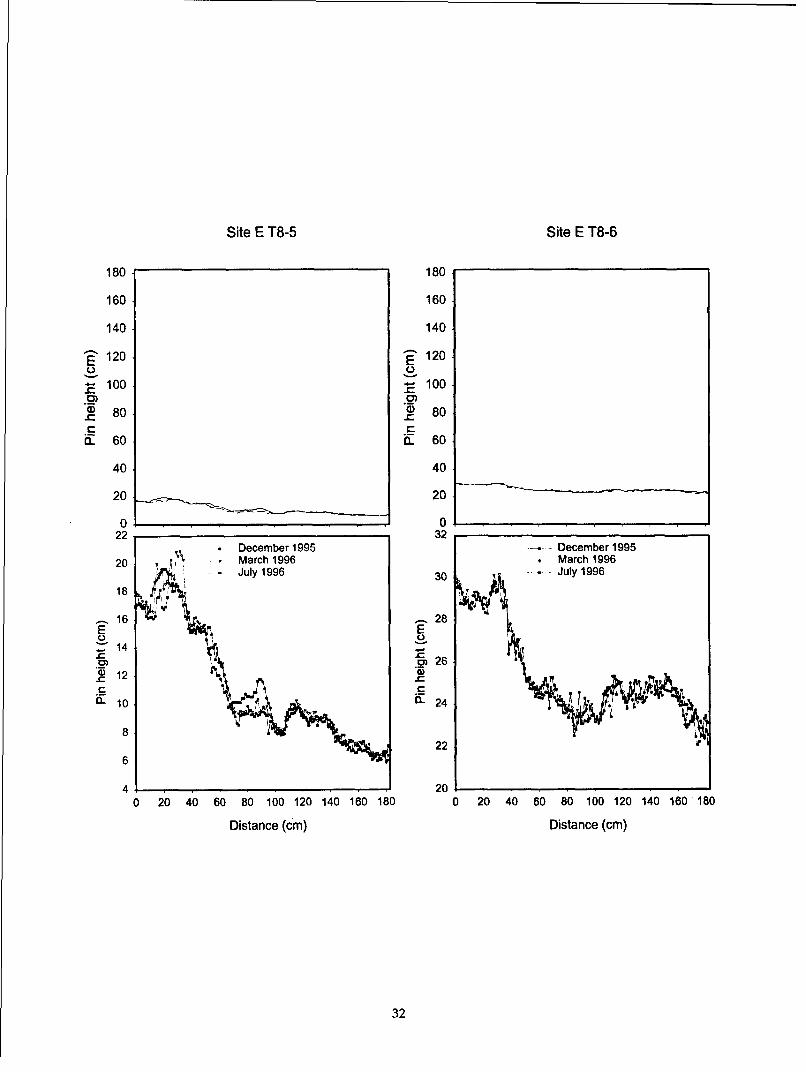
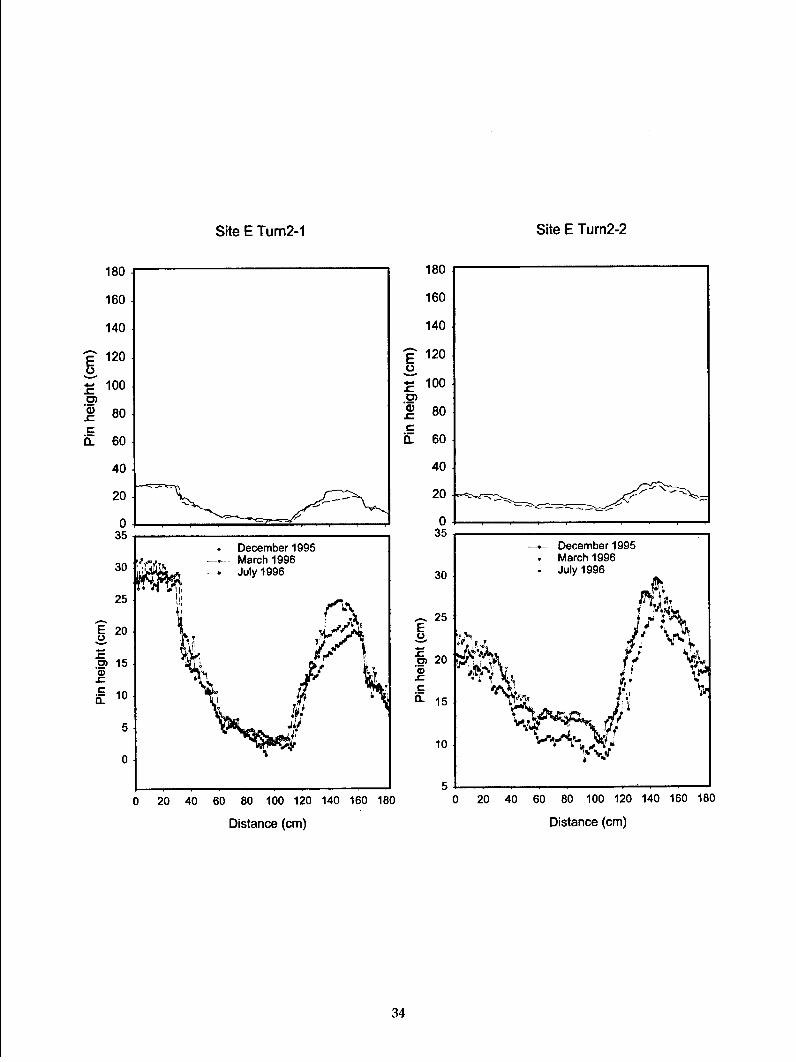
M1 tank ruts at YTC are characterized by a Friedman test, a nonparametric analog of adepressed, compacted zone, about 64 cm wide, repeated-measures ANOVA, indicated averageformed as the passing tank compresses the soil standard deviations of combined data decreased(Fig. 11). The rut depressions typically range from significantly during 1996 (P < 0.001), 4.31 cm onabout 2 to 15 cm deep and often reveal the details 8 December 1995, 4.03 cm on 27 March 1996, andof tank track patterns. A combination of shallow- 3.77 cm on 16 July 1996. However, changes in indi-shear failure and unconfined compaction from the vidual ruts during 1996 varied from slight (e.g.,track can result in relatively steep rut sidewalls, App. A, C T 4-1, App. B, ET 8-2) to significant (e.g.,capped by a lip raised as much as 10-20 cm above App. A, turn C 2-4, App. B, turn E 2-4). Thethe adjacent, unrutted soil. The soil surface out- Kruskal-Wallis one-way analysis of variance andside this raised lip is uncompacted. Turning ruts the Kolmogorov-Smirnov two-sample test indi-sometimes exhibit an asymmetric profile with one cated that turning ruts changed significantly more
8

than straight ruts (P < 0.01). In other words, turn- Table 3. Field saturated hydraulic conductivity,ing ruts with the greatest amount of initial distur- Kfs, measured 1-3 May 1996. Locations shown inbance (highest average standard deviations in Figure 4.
December 1995) had the highest decrease in stan- Out-of-rut Kf In-ru fs
dard deviation over time. Much of this initial Plot* (cm/sec) (cm/sec)
smoothing appeared to originate from rapid ero-
sion of thin edges of asymmetric rut lips and sub- Plot C, Ml, x4, moist, straight 4.14x IW-4 1.52x10-sequent infilling of the compacted channels near Plot C, Ml, x4, dry, straight 4.68xlO-4 4.04x10⁻⁴the center of the ruts. Plot C, M1, xl, moist, turn 4.29x10 4 2.22x10⁻⁶
Plot E, Ml, x2, moist, straight 1.86xlO-4 2.09x10⁴As suggested above, changes in profile did not Plot E, M1, xl, moist, turn 1.91x10- 3 3.79x10⁴
occur uniformly within the same rut. In general,the greatest changes in rut surface microrelief, * Plot nomenclature syntax is in the form of plot, vehicle
during 1996, occurred at the highest or lowest type, number of passes, antecedent soil moisture at time of
elevations of the rut profile (e.g., App. A, turn C tracking, and track path. Location notes refer to the mapelevtios o therutproile e~g, Ap. A tun C shown in Figure 4.
2-4). A net loss of profile height was most often
measured at the rut lip. In contrast, the base of thesidewalls of the ruts were the zones of depositionor infilling. Little change was detected along thesteep sidewalls. However, the profile meter Saturated hydraulic conductivity, Kfsrecords only profile changes that lie in an unob- Table 3 shows that soil compacted by the tankstructed vertical pin path. Careful field inspection can have a reduced Kfs relative to the adjacentshowed that soil slumping sometimes resulted in untrafficked soil. However, how much Kfs isconcave or undercut rut sidewall geometry not reduced appears to be influenced by the amountdetectable with this instrument. of soil moisture at the time of tracking. For a loca-
Our profile measurements revealed inter- and tion where tracks had been formed on moist soilintra-plot variability in rut shape and depth; this at site C, the Kfs inside a rut was less than half thatvariability was not clearly correlated with the measured in adjacent uncompacted soil. Con-number of vehicle passes. Such variability sug- versely, at a location where tracks had beengests that rut formation is strongly influenced by formed on dry soil, the in-rut and out-of-rut Kfssoil variables and antecedent soil moisture. was nearly identical. The Kfs rate measured out-
Another important source of rut surface vari- side a turning rut was comparable to values out-ability is related to soil surface conditions and side the two straight ruts, but Kfs was muchsoil moisture at the time of measurement. We lower inside the turning rut than in straight ruts.collected initial readings on 8 December 1995, This suggests that the shearing and verticalwhen soil was locally frozen and partially snow forces generated during tank turning decreasecovered. Soil was near field capacity during our the potential for subsequent water movement innext readings on 27 March 1996. The third set the soil more than when a tank is moving straight.of readings was collected on 16 July 1996 when Our measurements suggest Kfs is more spa-the soil surface contained 0-5% water and tially variable at site E than site C. The highest rateshrink-swell cracks were evident. Accurate mea- of Kfs (1.91 x 10⁻³ cm/sec) was recorded in uncom-surements require that the profile-meter support pacted soil on a small ridge less than 100 m frombars remain horizontally and vertically stable and a location, where the uncompacted value was anthat the reading pins rest exactly on the soil sur- order of magnitude less (1.86 x 10⁻⁴ cm/sec).face. Thus apparent changes in profile-meter mea- However, like site C, the Kfs observed at site E wassurements at a specific pin location may result lower inside a turning rut than out of rut. Unlikefrom actual changes of the rut profile but will also site C, little difference in Kfs was observed betweenreflect other mechanisms, such as frost heave or a straight rut and adjacent uncompacted soil, sug-shrinking and swelling due to wetting-drying gesting tank coinpaction did not affect potentialcycles, that shift the reference position (upright for water movement at this location.rebars). Also, the profile-meter pins may penetrateextremely dry, loose or wet soil and introduce a Soil penetration resistance, SPRerror into the profile readings. We observed this We observed similar in-rut and out-of-rut pat-phenomenon in July 1996 for measurements in terns of average penetrometer readings at bothextremely dry soil at site E (see App. B). sites. Average SPR was low near the surface,
9
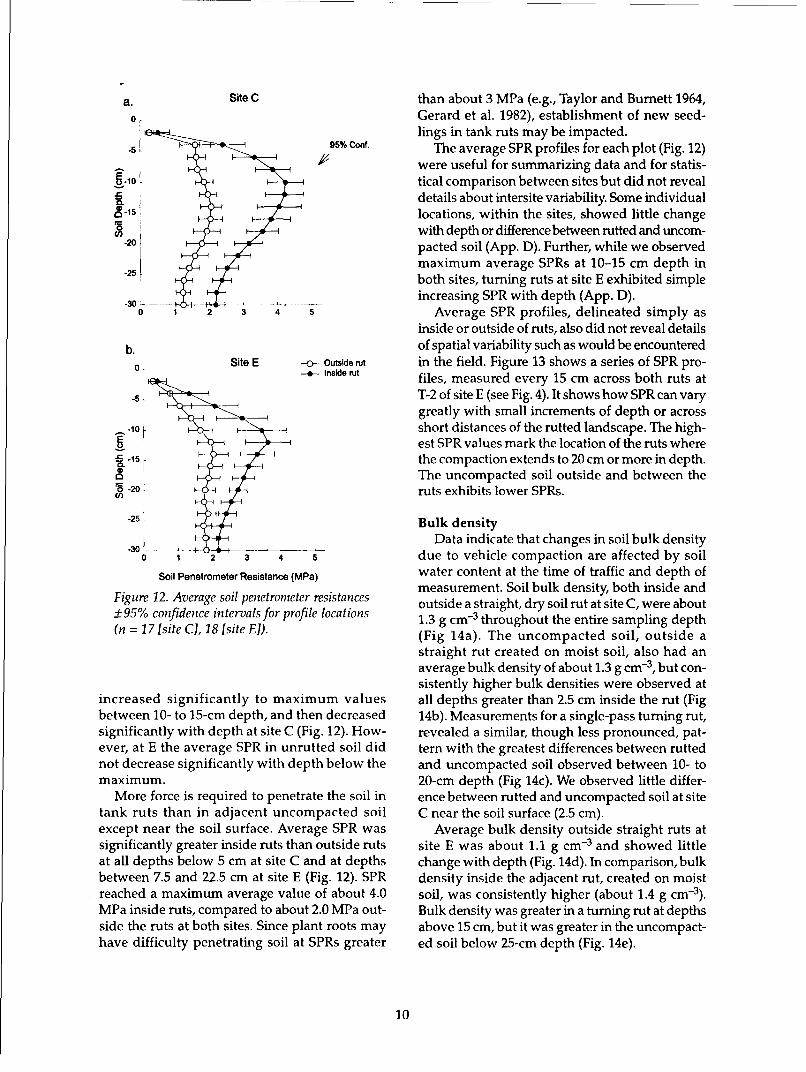
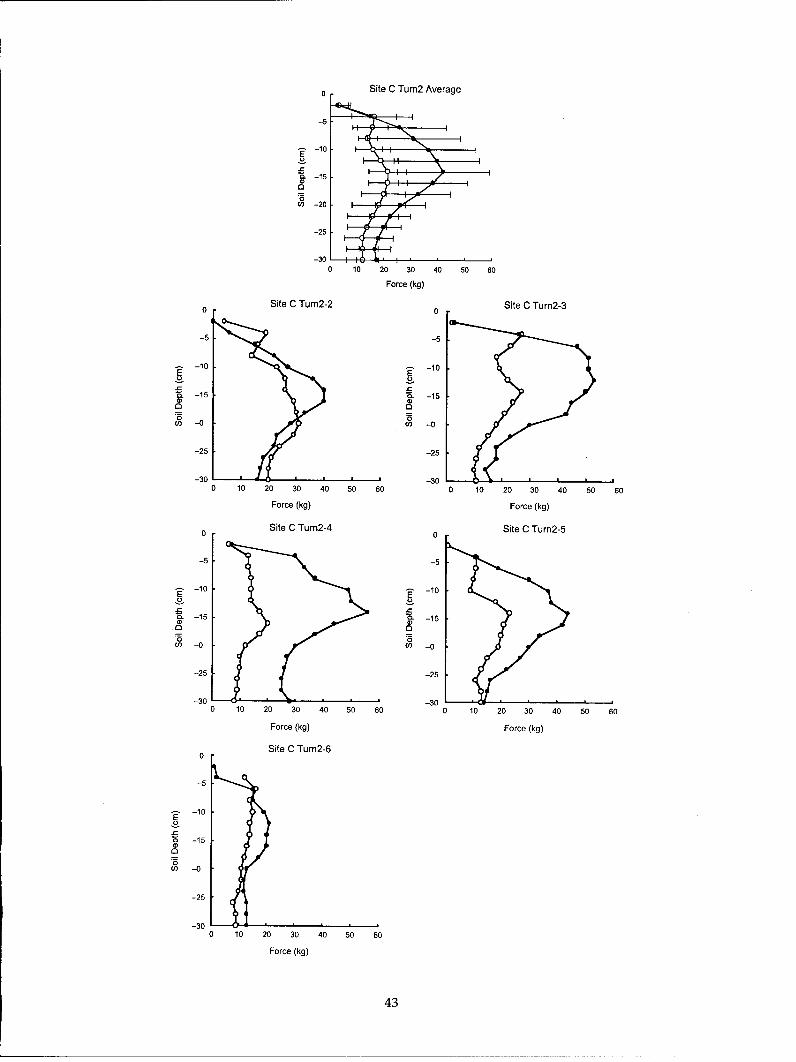
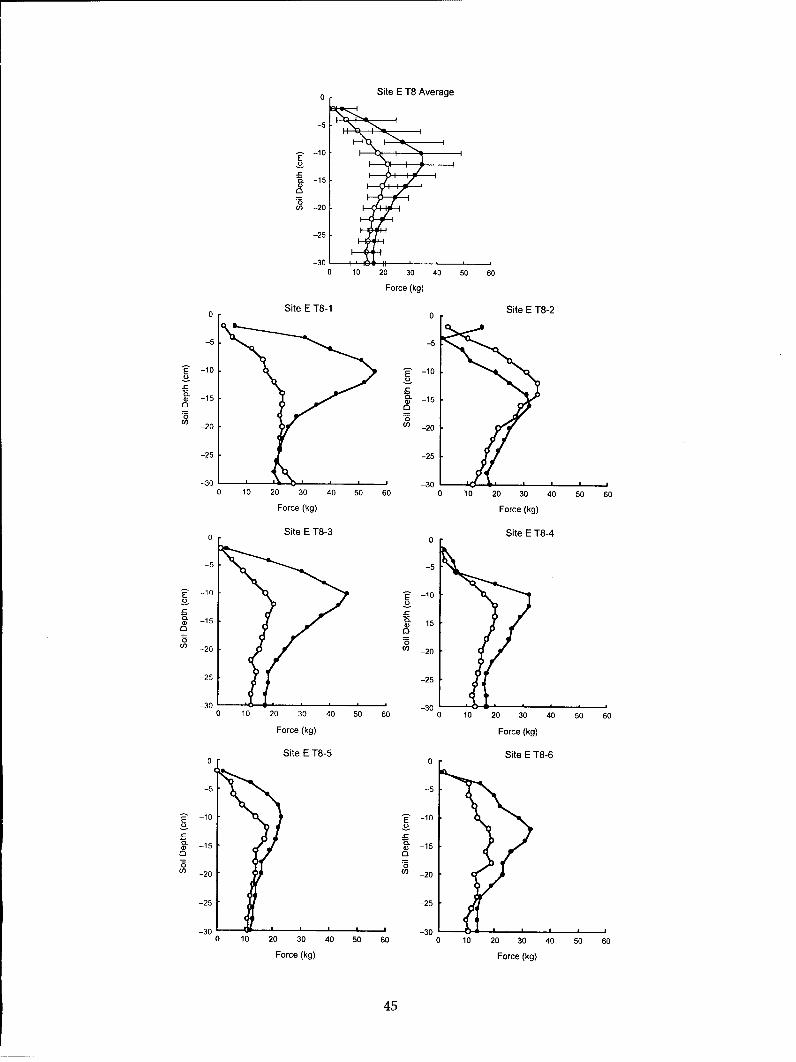
a. Site C than about 3 MPa (e.g., Taylor and Burnett 1964,0 Gerard et al. 1982), establishment of new seed-
95% lings in tank ruts may be impacted.so The average SPR profiles for each plot (Fig. 12)
were useful for summarizing data and for statis--1 !tical comparison between sites but did not reveal
details about intersite variability. Some individual-5 ° locations, within the sites, showed little change
with depth or difference between rutted and uncom-[201 •pacted soil (App. D). Further, while we observed
maximum average SPRs at 10-15 cm depth in.25, both sites, turning ruts at site E exhibited simple-30 .increasing SPR with depth (App. D).
0 1 2 5 sAverage SPR profiles, delineated simply asinside or outside of ruts, also did not reveal details
b. of spatial variability such as would be encountered0. Site E -o- Outside rut in the field. Figure 13 shows a series of SPR pro-
S+ Inside rut files, measured every 15 cm across both ruts at5-s T-2 of site E (see Fig. 4). It shows how SPR can vary
greatly with small increments of depth or across-10 i short distances of the rutted landscape. The high-
est SPR values mark the location of the ruts where-15 the compaction extends to 20 cm or more in depth.
S-20The uncompacted soil outside and between the•o -2o ruts exhibits lower SPRs.
-25 Bulk density
Data indicate that changes in soil bulk density-30o 1 2 3 4 s due to vehicle compaction are affected by soil
Soil Penetrometer Resistance (MPa) water content at the time of traffic and depth ofmeasurement. Soil bulk density, both inside and
Figure 12. Average soil penetrometer resistancesmesren.Sibukdstybohnieadoutside a straight, dry soil rut at site C, were about
±95% confidence intervals for profile locations 1.3 g cm- 3 throughout the entire sampling depth(n = 17 [site C], 18 [site E]). (Fig 14a). The uncompacted soil, outside a
straight rut created on moist soil, also had anaverage bulk density of about 1.3 g cm- 3, but con-sistently higher bulk densities were observed at
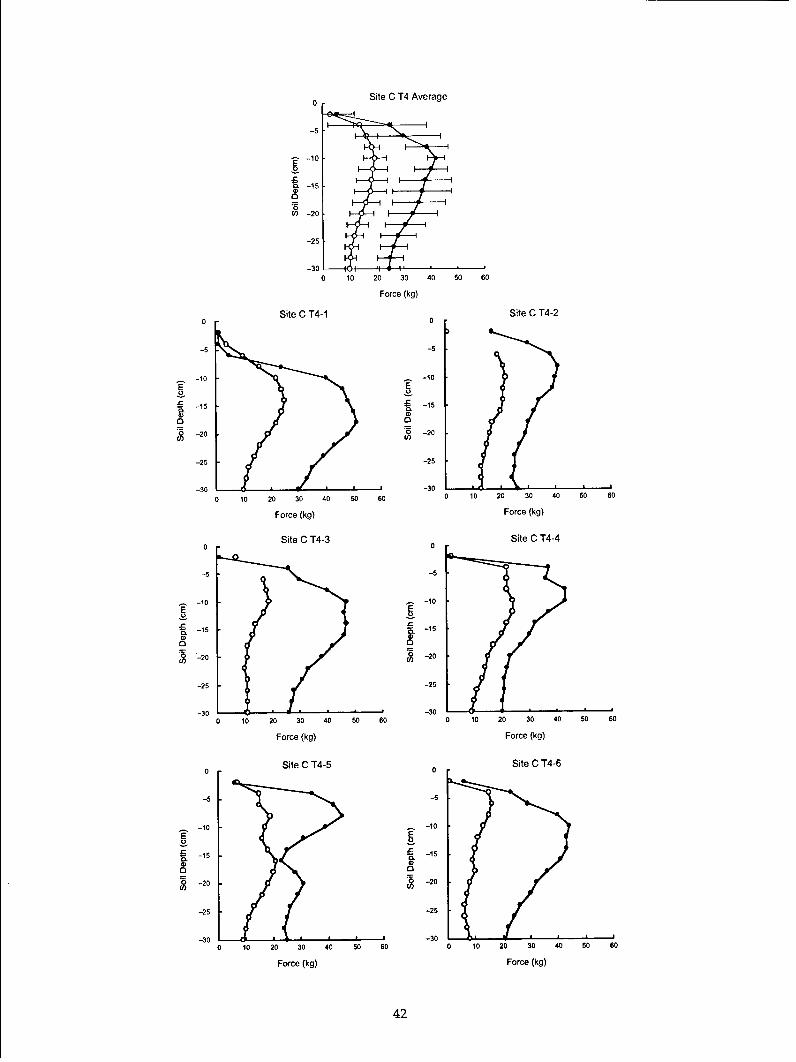
increased significantly to maximum values all depths greater than 2.5 cm inside the rut (Figbetween 10- to 15-cm depth, and then decreased 14b). Measurements for a single-pass turning rut,significantly with depth at site C (Fig. 12). How- revealed a similar, though less pronounced, pat-ever, at E the average SPR in unrutted soil did tern with the greatest differences between ruttednot decrease significantly with depth below the and uncompacted soil observed between 10- tomaximum. 20-cm depth (Fig 14c). We observed little differ-
More force is required to penetrate the soil in ence between rutted and uncompacted soil at sitetank ruts than in adjacent uncompacted soil C near the soil surface (2.5 cm).except near the soil surface. Average SPR was Average bulk density outside straight ruts atsignificantly greater inside ruts than outside ruts site E was about 1.1 g cm- 3 and showed littleat all depths below 5 cm at site C and at depths change with depth (Fig. 14d). In comparison, bulkbetween 7.5 and 22.5 cm at site E (Fig. 12). SPR density inside the adjacent rut, created on moistreached a maximum average value of about 4.0 soil, was consistently higher (about 1.4 g cm-3).MPa inside ruts, compared to about 2.0 MPa out- Bulk density was greater in a turning rut at depthsside the ruts at both sites. Since plant roots may above 15 cm, but it was greater in the uncompact-have difficulty penetrating soil at SPRs greater ed soil below 25-cm depth (Fig. 14e).
10
60-
40
30
0
-5 55
-2 -26 -0
en-2 -23 25~
-30 -0~ -0Dstnc
Biure 13Despnset surac cm-3)do Bulk Densiy dat collcte acosBulk T-esite (gc. 3
0 d ieC( ase.dy j Site E (2 passes, moist) 0 C Site C turn (1 pass, moist)
-5 -5
~-g -1 ~-to0-15 -15 o 1ntace
0.0
Wn -25W -2-5
-30- -30 3
-35 -4 -35-0.8 1.0 1.2 1.4 1ý . . 10 12 I 1.6 1.8 0.8 1.0 1.2 1.4 1.6 1.8
Bulk Density (g cmr 3) Bulk Density (g cur3)BukDniy( r)
0 d SieE(2pasesFigure 14 Bul deSity as atuncin (pasmofidpth
-5 -5

CONCLUSIONS We also need laboratory-based experiments toprovide basic information about the impacts of
Data collected from 8 December 1995 to 16 July soil moisture on soil compaction, freeze-thaw1996 document the general smoothing of tank rut deformation, and the effects of thawing on soilgeometry over the seven-month period. How- erodibility. In light of the results of this pilot study,ever, large variation in the amount of smoothing future work at the YTC should be directedobserved between individual tank ruts suggests towards testing the hypothesis that ameliorationthat the initial degree of soil compaction by tanks of compacted soil in ruts occurs at different ratesis variable, and subsequent impacts of freeze- in the soil profile and its corollary that the ratesthaw cycles vary from rut to rut with greatest of soil change are not linear.smoothing observed in deepest ruts.
The degree of compaction by tanks seems to berelated to soil moisture content at the time of LITERATURE CITEDtracking. We observed comparatively more soil Anderson, G., J.D. Pidgeon, H.B. Spencer, andpenetration resistance, higher bulk density, and R. Parks (1980) A new hand-held recording pene-lower hydraulic conductivity inside ruts at depths trometer for soil studies. Journal of Soil Science, 31:greater than about 2.5-5 cm when the tracks had 279-296.been formed on moist soil. In contrast, we observed Buchkina, N.P. (1997) Impacts of tracked vehicleslittle difference between rutted and uncompacted on properties of tundra soils. In Proceedings of thesoil when tracks were formed in dry soil. International Symposium on Physics, Chemistry,
Our findings also imply that soil is less com- and Ecology of Seasonally Frozen Soils, Fairbanks,pacted by tanks at the surface than deeper in the Alaska, June 10-12, 1997 (I.K. Iskandar et al., Ed.).profile or that surface compaction does not persist. USA Cold Regions Research and EngineeringLess compaction may occur at the soil surface, if Laboratory, Special Report 97-10.water content is relatively low compared to deeper Daubenmire, R. (1970) Steppe vegetation ofin the profile at the time of tracking. Alternatively, Washington. Washington Agricultural Experi-compacted soil near the surface may be more ment Station, College of Agriculture, Washingtonstrongly affected by forces such as wind, and wet- State University, Pullman, Washington, Technicalting-drying and freeze-thaw cycles that fluctuate Bulletin 62.with higher frequency and amplitude at the soil Elliot, W.J., and J.M. Laflen (1993) A process-surface. based rill erosion model. Transactions of the Amer-
Variation in the degree of compaction through- ican Society of Agricultural Engineers, 36: 65-72.out the soil profile has important implications for Foltz, R.B. (1993) Sediment processes in wheelpotential erosion and its prediction, because sur- ruts on unsurfaced forest roads. Ph. D. Disserta-face conditions will not resemble the compacted tion, University of Idaho.soil beneath it. Site managers might underestimate Formanek, G.E., D.K. McCool, and R.I. Papen-environmental damage or potential erosion based dick (1984) Freeze-thaw and consolidation effectson the condition of the surface soil. Alternatively, on strength of a wet silt loam. Transactions of thethe relatively uncompacted top few centimeters American Society of Civil Engineers, 27: 1749-1752.may significantly offset some of the impacts of Gatto, L.W. (1997a) Freeze-thaw effects on thecompaction on water infiltration and runoff, hydrologic characteristics of rutted and com-
pacted soils. In Proceedings of the International Sym-
FUTURE RESEARCH posium on Physics, Chemistry, and Ecology of Sea-sonally Frozen Soils, Fairbanks, Alaska, June 10-12,
Future research efforts should focus on sever- 1997 (I.K. Iskandar et al., Ed.). USA Cold Regionsal issues. We need to expand our basic knowledge Research and Engineering Laboratory, Specialabout the particulars of soil freezing and thawing Report 97-10.at the Yakima Training Center, including charac- Gatto, L.W. (1997b) Ground freezing effects onterization of the number and degree of freeze- soil erosion of army training lands. Part 1: Initialthaw events, the relative importance of freeze- test results. USA Cold Regions Research andthaw events compared to other soil modifying Engineering Laboratory, Special Report 97-15.processes such as rainfall, and the spatial and tem- General Dynamics (1997) General Dynamicsporal variability of freeze-thaw as affected by Land Systems home page. URL: http://www.microclimate, landscape position, or soil depth. gdls.com/
12

Gerard, C.J., P. Sexton, and G. Shaw (1982) Phys- Sharratt, B., S.W. Voorhee, and G. McIntosh (1997)ical factors influencing soil strength and root Amelioration of soil compaction by freezing andgrowth: Mechanical impedance, tillage implica- thawing. In Proceedings of the International Sympo-tions. Agronomy Journal, 74: 875-879. sium on Physics, Chemistry, and Ecology of Season-Greene, T.A., and T.J. Nichols (1996) Effects of allyFrozen Soils, Fairbanks, Alaska, June 10-12,1997long-term military training traffic on forest vege- (I.K. Iskandar et al., Ed.). USA Cold Regionstation in central Minnesota. Northern Journal of Research and Engineering Laboratory, SpecialApplied Forestry, 13: 157-163. Report 97-10.Kok, H., and D.K. McCool (1990) Quantifying Shaw, R.B., and V.E. Diersing (1990) Trackedfreeze-thaw-induced variability of soil strength. vehicle impacts on vegetation at the Pinon Can-Transactions of the American Society of Agricultural yon maneuver site, Colorado. Journal of Environ-Engineers, 33: 501-506. mental Quality, 19: 234-243.Jones, D. S., and C.E. Bagley (1997) Tracked mil- SPPS Inc. (1997a) Sigmascan 3.02.035. SPPS Inc.,itary vehicle impacts on three vegetation commu- Chicago, Illinois.nities at Yakima Training Center, Washington: SPPS Inc. (1997b) Systat 7.0. SPPS Inc., Chicago,Results for the 1994-1996 study period. Colorado Illinois.State University, Center for Ecological Manage- Taylor, H.M., and E. Burnett (1964) Influence ofment of Military Lands, TPS 97-4. soil strength on the root-growth habits of plants.McCool, D.K., M.G. Dossett, and S.J. Yecha Soil Science, 98: 174-180.(1981) A portable rill meter for field measurement Thurow, T.L., S.D. Warren, and D.H. Carlsonof soil loss. In Proceedings of the Florence Sympo- (1993) Tracked vehicle effects on the hydrologicsium: Measurement, Erosion and Sediment Transport, characteristics of central Texas rangeland. Trans-June 1981. IAHS Publication no. 133. actions of the American Society of Agricultural Engi-Meek, B.D., E.R. Rechel, L.M. Carter, and W.R. neers, 36: 1645-1650.DeTar (1992) Bulk density of a sandy loam: Traf- USDA-ARS (1997) Water Erosion Predictionfic, tillage, and irrigation-method effects. Soil Sci- Project (WEPP) Version 97.3. U.S. Departmentence Society of America Journal, 56: 562-565. of Agriculture, Agriculture Research Service,Reynolds, W.D. (1993) Saturated hydraulic con- National Soil Erosion Research Laboratory, Pur-ductivity: Field measurement. In Soil Sampling due University, West Lafayette, Indiana.Methods of Analysis (M.R. Carter, Ed.). Canadian USDA-NRCS (1997) Revised Universal Soil LossSociety of Soil Science, Boca Raton, Florida: Lewis Equation (RUSLE) Version 3.1.0, June 1997. U.S.Publishers, p. 599-605. Department of Agriculture, Natural ResourcesRickard, W.H. (1988) Climate of the Hanford site. Conservation Service, Technology InformationIn Shrub-Steppe, Balance and Change in a Semi-Arid Systems Division, Fort Collins, Colorado.Terrestrial Ecosystem (W.H. Rickard, L.E. Rogers, Vazquez, L.D., L. Myhre, E.A. Hanlon, and R.N.B.E. Vaughan, and S.E Liebetrau, Ed.). New York: Gallaher (1991) Soil penetrometer resistance andElsevier, p. 13-21. bulk density relationships after long-term no till-Rogers, L.E., and W.H. Rickard (1988) Introduc- age. Communications in Soil Science Plant Analysis,tion: Shrub-steppe lands. In Shrub-Steppe, Balance 22: 2101-2117.and Change in a Semi-Arid Terrestrial Ecosystem Voorhees, W.B., R.A. Young, and L. Lyles (1979)(W.H. Rickard, L.E. Rogers, B.E. Vaughan, and S.E Wheel traffic considerations in erosion research.Liebetrau, Ed.). New York: Elsevier, p. 1-12. Transactions of the American Society of AgriculturalSchellekens, EJ., and P.J. Williams (1993) Depth Engineers, 22: 786-790.of frost penetration. In Soil Sampling Methods Wolkowski, R.P. (1990) Relationship betweenof Analysis (M.R. Carter, Ed.). Canadian Society wheel-traffic-induced soil compaction, nutrientof Soil Science. Boca Raton, Florida: Lewis Pub- availability, and crop growth: A review. Journal oflishers, p. 807-814. Production Agriculture, 3: 460-469.
13
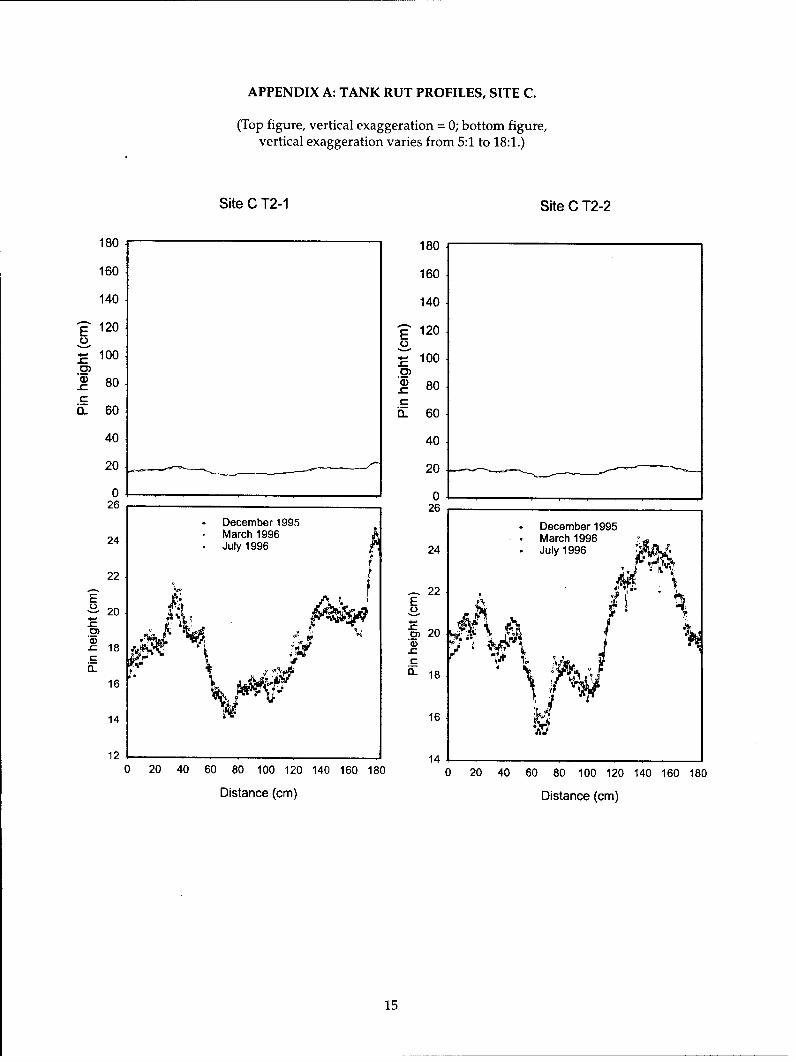
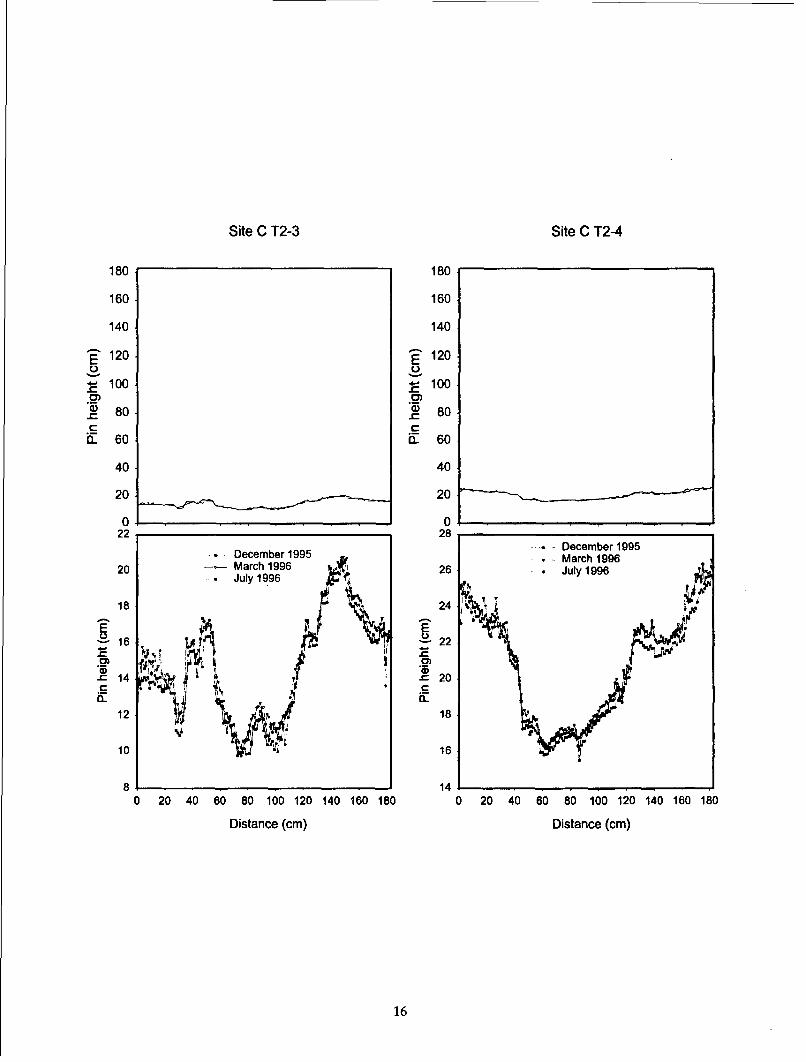
APPENDIX A: TANK RUT PROFILES, SITE C.
(Top figure, vertical exaggeration = 0; bottom figure,vertical exaggeration varies from 5:1 to 18:1.)
Site C T2-1 Site C T2-2
180 180
160 160
140 140
"120 120E E
100 10080
-80 80
_60 n" 60
40 40
20 - 20
0 026 26December 1995 December1995March 1996 March 1996
24 July 1996 24 July 1996
22
202
.c18
14 1
12 140 20 40 60 80 100 120 140 160 180 0 20 40 60 80 100 120 140 160 180
Distance (cm) Distance (cm)
15
Site C T2-3 Site C T2-4
180 180
160 160
140 140
120 1 120
- 100 100
CCS80 • 80
n 60 - 60
40 40
20 20
0 022 28
D 199 December 1995,December 1995 March 1996
20 -- March 1996 26 . July 1996July 1996
,, 0.a18 2
• 16 t 22
14 f ' j' ' 200-
12 18
10 16
814
0 20 40 60 80 100 120 140 160 180 0 20 40 60 80 100 120 140 160 180
Distance (cm) Distance (cm)
16

Site C T2-5 Site C T2-6
180 180
160 160
140 140
120- 120= -1- 1002)• .0)
oa 80. 80C C-E 60 FL 60
40 40
20 - 20
0 028 30
December 1995 .. December 199526 March 1996 March 1996
- July 1996 -.- Marc 1996i. 28 - i
28 July 1996
24
E 22 l02
200
C~ 18
1622
14
12 200 20 40 60 80 100 120 140 160 180 0 20 40 60 80 100 120 140 160 180
Distance (cm) Distance (cm)
17

Site C T4-1 Site C T4-2
180 180
160 160
140 140
'E 120 E 120
- 100o 100
(D 80 -80C
" 60 d" 60
40 40
20 v 20
0 030 30
December 1995 December 199528 March 1996 28 March19962 July 1996 28 July 1996
26
24 .24
20 22a)C_
20
16
14 18
12 160 20 40 60 80 100 120 140 160 180 0 20 40 60 80 100 120 140 160 180
Distance (cm) Distance (cm)
18

Site C T4-3 Site C T4-4
180 180
160 160
140 140
"120 120E E
100 , 100
C 80 a 80
if 60 -.. 60
40 40
20 20
0 028 32
December 1995 ' December 199526 March 1996 30 March 1996
July 1996 . July 1996
24 28 ,1
E 22 * E 26
o~20o•20 ,24 _PA2
CE 18 *22
16 20
14 18r
12 160 20 40 60 80 100 120 140 160 180 0 20 40 60 80 100 120 140 160 180
Distance (cm) Distance (cm)
19

Site C T4-5 Site C T4-6
180 180
160 160
140 140
120. 120
100 - 100.0 .0)
S80 80C Cd" 60 d 60
40 40
20 20
0 030 30
- December 1995 . December 1995March 1996 28 March 1996
28 July 1996 July 1996
Y! 26
E E 24
,- I, 2P24 p 022
.~20
" 22 a
18
2016
18 140 20 40 60 80 100 120 140 160 180 0 20 40 60 80 100 120 140 160 180
Distance (cm) Distance (cm)
20

Site C Turn1-1 Site C Turnl-2
180 180
160 160
140 140
120 120
100 1002C)
S80 80C .d" 60 "60
40 40
20 20 iN
0 0 ..30 28
• December 1995 26 December 199528 . March 1996 26.March 1996
26,July 1996 July 199626 24
~24 2
Z22. 2
15
18.20 16
16
FS
(L 18 E
1416 1
14 10
12 80 20 40 60 80 100 120 140 160 180 0 20 40 60 80 100 120 140 160 180
Distance (cm) Distance (cm)
21

Site C Turn1-3 Site C Turn1-4
180 180
160 160
140 140
"120 "120120
10100 100
880~80.
C C
"60 0- 60
40 40
20. 20,
0 030 30
December 1995 --.- December 1995March 1996 March 1996
25 ..-- July 1996 25 July 1996
20 E~
15 15
C . 10 a - 10
0 0o"_._.
0 20 40 60 80 100 120 140 160 180 0 20 40 60 80 100 120 140 160 180
Distance (cm) Distance (cm)
22

Site C Turn 1-5 Site C Turn2-1
180 180
160 160
140 140
120 120E E
100 100~) 80
S80 • 80C: C
i- 60 i_60
40 40
20 j\20
0 030 24
December 1995 December 1995March 1996 22 March 1996 T,'
25 .- July 1996 ,
20
t- 15 ,, 4
EE 18 :'.) 20
.,,.• . ...16IPI
C15 .1
)~ 12
10 10
5 8L0 20 40 60 80 100 120 140 160 180 0 20 40 60 80 100 120 140 160 180
Distance (cm) Distance (cm)
23

Site C Turn2-2 Site C Turn2-3
180 180
160 160
140 140
S 120 120o U
E 100 _ 100
S80 80Cn 60 d" 60
40 40
20 20
0 0... ...30 24
December 1995 22 * December 1995 IVA25 March 1996 20..... March 1996
20
20 18
U ~16
15 16
1 04 08 0 1014 6 18 12 04 080101014 8
01
14
Distance (cm) Distance (cm)
24
Site C Turn2-4 Site C Turn2-5
180 180
160 160
140 140
-E 120. 1200.
100- 100
S80 .D 80CC
" 60 6: 60
40 40
20 20
0 035 35
December 1995 December 1995
30 I March 1996 30 March 1996
25 .-.,25
25
-E E
.r-- 15
10
5 i% ry10
0 50 20 40 60 80 100 120 140 160 180 0 20 40 60 80 100 120 140 160 180
Distance (cm) Distance (cm)
25

Site C Turn2-6
180
160
140
E 120100
.0m 80
. 60
40
20
03028 December 1995
SMarch *996
24
o22
g)20
. 18
16
14
12
100 20 40 60 80 100 120 140 160 180
Distance (cm)
26
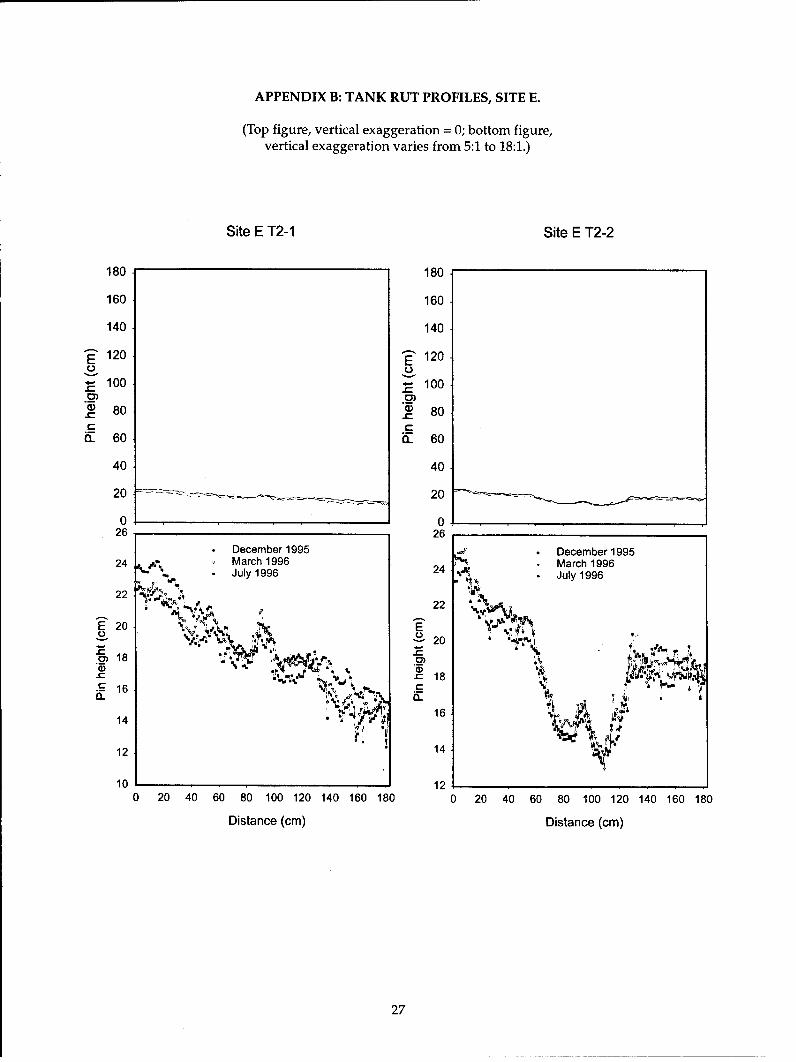
APPENDIX B: TANK RUT PROFILES, SITE E.
(Top figure, vertical exaggeration = 0; bottom figure,vertical exaggeration varies from 5:1 to 18:1.)
Site E T2-1 Site E T2-2
180 180
160 160
140 140
120 120E E
100 1002) 01S80 a, 80
_60 E 60
40 40
20 •- ---- • -- -- - .. .2 - - --- 20
0 026 26
December 1995 . December 199524 , March 1996 24 % March 1996
July1996 July 1996
22* 22
E 20 0E ,*
18 *6
""' i , ,r18
.~16 * A
14 VV1
12 14, '
10 120 20 40 60 80 100 120 140 160 180 0 20 40 60 80 100 120 140 160 180
Distance (cm) Distance (cm)
27
Site E T2-3 Site E T2-4
180 180
160 160
140 140
S120 120o (.
-,"100 t- .- 100
._ 0 . 0
S80 I 80C C
i5 60 d" 60
40 40
20 -...- .. - -- - 20
0 026 25
- December 1995 December 1995March 1996 March 1996
S .. July 1996,. July 199624 20
22 15
20 C r- 10
18 5N t ý
,t
16 00 20 40 60 80 100 120 140 160 180 0 20 40 60 80 100 120 140 160 180
Distance (cm) Distance (cm)
28
Site E T2-5 Site E T2-6
180 180
160 160
140 140
120 120E E
10 o 100.0)0ID 80 80
-60 if 60
40 40
20 20 -...
0 018 28
December 1995 December 1995March 1996 .. March 1996
16 -- ° July 1996 26 --... July 1996
14 • 24
4140 20 40 60 80 100 120 140 160 180 0 20 40 60 80 100 120 140 160 180
Distance (cm) Distance (cm)
29
Site E T8-1 Site E T8-2
180 180
160 160
140 140
"120 120
100.lo S100 .T 100
S80 - 80C
n 60 " 60
40 40
20 -20
0 030 30
December 1995 December 1995March 1996 March 1996
28 .. - July 1996 ie . July 199625
024 E-20-
.- 22.C_ 15
20
1018
16 50 20 40 60 80 100 120 140 160 180 0 20 40 60 80 100 120 140 160 180
Distance (cm) Distance (cm)
30
Site E T8-3 Site E T8-4
180 180
160 160
140 140
S120 120
100 100
S80 80
n 60 O 60
40 40
20 20
0 026 30December 1995 December 1995
24 March 1996 11ýy March 1996July 1996 28 July 1996
22 ,,, -
E 20 E
14- 0 t
12 - V 1 20_ _ _ _ _ __ _ _ _ _ _ _
10 180 20 40 60 80 100 120 140 160 180 0 20 40 60 80 100 120 140 160 180
Distance (cm) Distance (cm)
31
Site E T8-5 Site E T8-6
180 180
160 160
140 140
120 120
- 100 - 100._' .2'
ID 80 80
E 60 & 60
40 40
20 20
0 022 32
. December 1995 . December 199520-* March 1996 * March 1996
July 1996 30 --- Jl1918
16 . 28E E
•'14
_ 26~12
0.. 10 • 24
822
6
4 200 20 40 60 80 100 120 140 160 180 0 20 40 60 80 100 120 140 160 180
Distance (cm) Distance (cm)
32

Site E Turn1-1 Site E Turnl-2
180 180
160 160
140 140
120 120C,.) to
100 100
- 80 ' 80
0- 60 d 60
40 40
20 -720 -
0 035 30
December 1995 December 1995March 1996 March 1996
30 July.1996 July 199625
25
U 20 -20
- 15 W-t- c 15
10 ~
10
0o 50 20 40 60 80 100 120 140 160 180 0 20 40 60 80 100 120 140 160 180
Distance (cm) Distance (cm)
33
Site E Turn2-1 Site E Turn2-2
180 180
160 160
140 140
S120 120P 0
S80 - 80CR" 60 E 60
40 40
20 -- 20 -- -- - - -
0 -0
35 35December 1995 .... December 1995
30 March 1996 March 199630 - o July 1996 30 July 1996
25
E 20 25
S15 20 •
CI CI10
51
0 60
510 20 40 60 80 100 120 140 160 180 0 20 40 60 80 100 120 140 160 180
Distance (cm) Distance (cm)
34

Site E Turn2-3 Site E Turn2-4
180 180
160 160
140 140
120 120
,- 100 *-, 100
S80 80t- C
d " 60 d " 60
40 40
20 20 - ------
0 030 303 December 1995 3 December 1995. March 1996 r March 1996. July 1996 * " July 1996
25 25
o20 0 20 $" Ip
- -.,I!t -i
15 1
10 ~ 10
5 5 10 20 40 60 80 100 120 140 160 180 0 20 40 60 80 100 120 140 160 180
Distance (cm) Distance (cm)
35
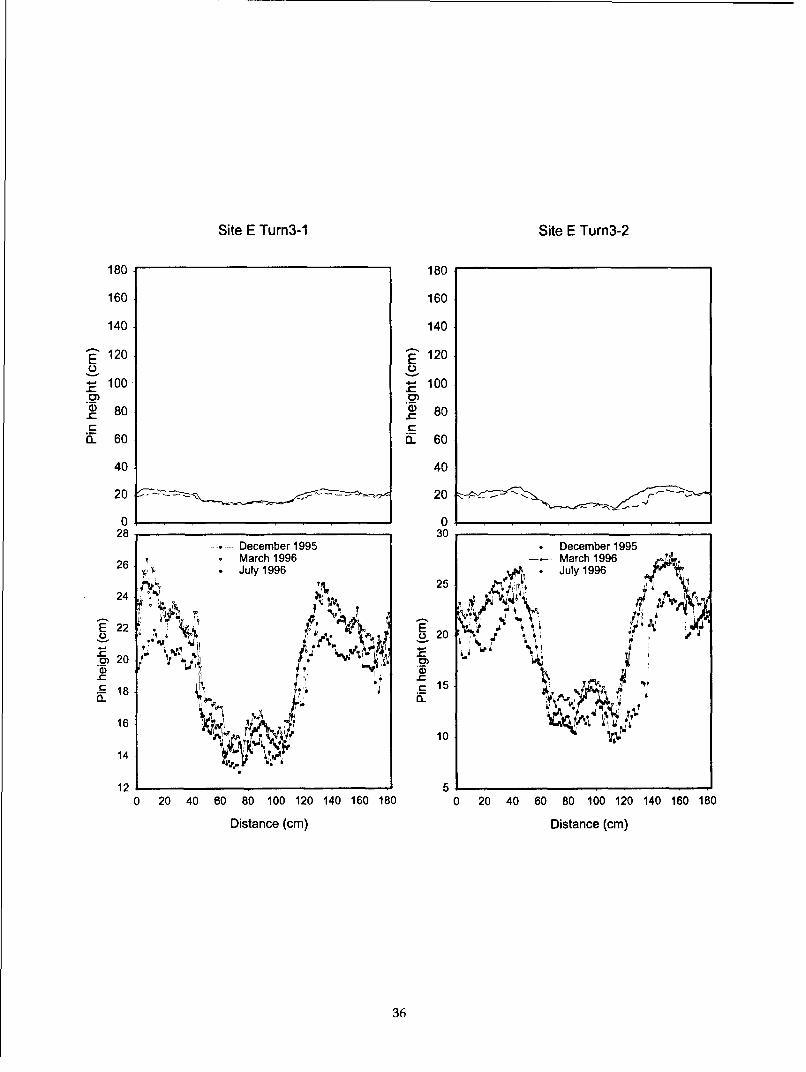
Site E Turn3-1 Site E Turn3-2
180 180
160 160
140 140
120 120o E)
100. 100
S80 80
n 60 d: 60
40 40
20 - - .. 20 . . . . .
0 028 30
December 1995 December 19952 March 1996 March 199626 1 July 1996 I July 1996
25
E 22 E2o2020
C18 9.c15
14 101
12 50 20 40 60 80 100 120 140 160 180 0 20 40 60 80 100 120 140 160 180
Distance (cm) Distance (cm)
36
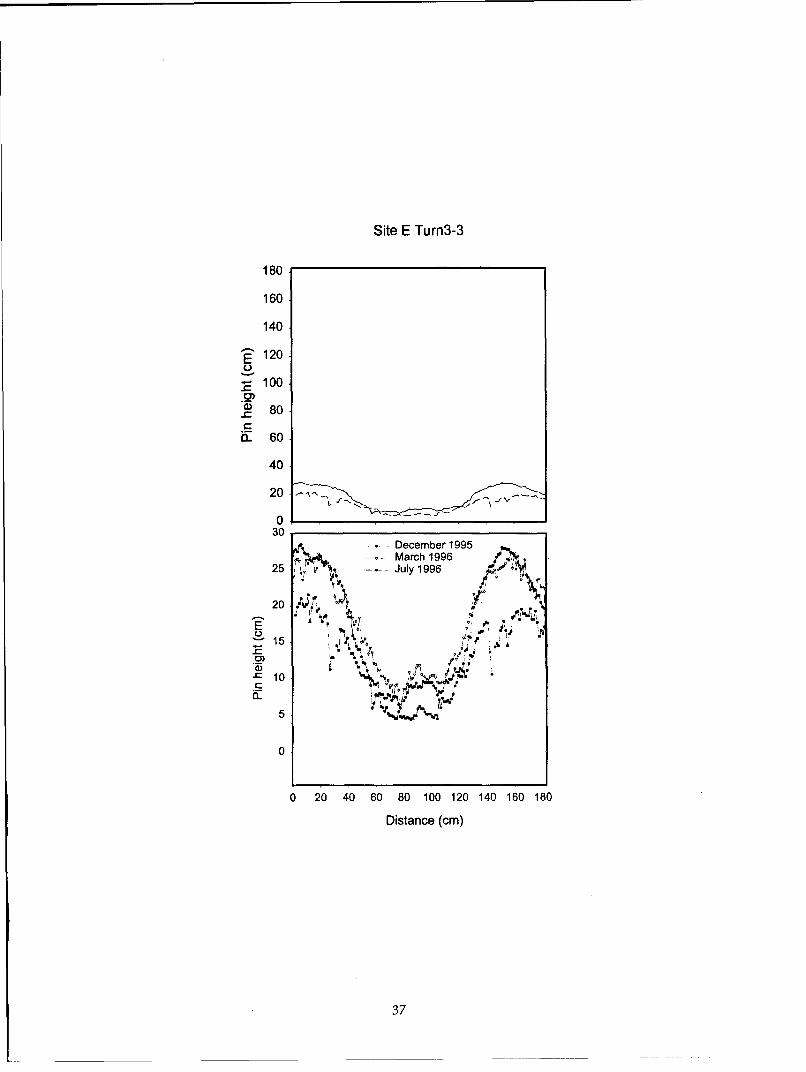
Site E Turn3-3
180
160
140
E 120
100._'S80
F. 60
40
20
030
December 1995.. March 1996 /.",
25 July 1996
20 2 4
15 J6'
10
5
0
0 20 40 60 80 100 120 140 160 180
Distance (cm)
37

APPENDIX C: STANDARD DEVIATIONS FOR EACH RUT PROFILE (N = 145).
Std. dev. Std. dev.(in.) (cm)*
Dec. Mar. July Dec. Mar. JulySite Treatment Rep 1995 1996 1996 1995 1996 1996
C T2 1 0.89 0.84 0.86 2.27 2.14 2.19C T2 2 0.94 0.88 0.88 2.40 2.24 2.23C T2 3 1.18 1.09 1.11 3.00 2.78 2.82C T2 4 1.23 1.21 1.16 3.11 3.07 2.94C T2 5 1.27 1.66 1.16 3.22 4.21 2.94C T2 6 0.77 0.70 0.64 1.95 1.78 1.63C T4 1 1.74 1.66 1.60 4.42 4.21 4.07C T4 2 1.47 1.47 1.47 3.74 3.72 3.74C T4 3 1.62 1.61 1.60 4.11 4.08 4.05C T4 4 1.34 1.29 1.28 3.40 3.29 3.25C T4 5 1.12 1.12 1.05 2.86 2.84 2.67C T4 6 1.30 1.29 1.31 3.30 3.28 3.33C TURN1 1 1.47 1.41 1.46 3.73 3.57 3.71C TURN1 2 1.56 1.55 1.44 3.96 3.95 3.66C TURN1 3 2.19 2.17 2.17 5.56 5.52 5.50C TURN1 4 2.20 2.30 2.32 5.59 5.84 5.90C TURN1 5 1.99 1.90 2.11 5.06 4.82 5.36C TURN2 1 1.47 1.50 0.00 3.73 3.82 0.00C TURN2 2 2.74 2.28 0.00 6.97 5.78 0.00C TURN2 3 1.92 1.88 0.00 4.88 4.79 0.00C TURN2 4 3.07 2.57 0.00 7.81 6.53 0.00C TURN2 5 2.37 2.25 0.00 6.02 5.71 0.00C TURN2 6 1.80 1.74 0.00 4.56 4.43 0.00
* Outliers excluded.
Std. dev. Std. dev.(in.) (cm)*
Dec. Mar. July Dec. Mar. JulySite Treatment Rep 1995 1996 1996 1995 1996 1996
E T2 1 1.02 1.03 1.00 2.59 2.61 2.53E T2 2 1.20 1.13 1.10 3.04 2.87 2.80E T2 3 0.57 0.56 0.59 1.44 1.41 1.49E T2 4 1.94 1.91 1.90 4.92 4.84 4.81E T2 5 0.89 0.83 0.83 2.25 2.10 2.10E T2 6 1.20 1.15 1.11 3.04 2.92 2.83E T8 1 1.06 1.04 1.04 2.69 2.65 2.64E T8 2 2.37 2.29 2.26 6.02 5.82 5.73E T8 3 1.50 1.58 1.50 3.82 4.02 3.82E T8 4 1.20 1.14 1.14 3.05 2.91 2.89E T8 5 1.63 1.72 1.58 4.13 4.37 4.01E T8 6 0.84 0.86 0.87 2.12 2.19 2.21E TURN1 1 2.92 2.67 2.46 7.41 6.77 6.26E TURN1 2 2.17 1.97 1.86 5.51 4.99 4.74E TURN2 1 3.60 3.55 3.46 9.15 9.02 8.79E TURN2 2 2.15 2.03 2.03 5.45 5.15 5.15E TURN2 3 2.17 2.06 1.99 5.51 5.22 5.07E TURN2 4 1.89 1.68 1.64 4.80 4.27 4.16E TURN3 1 1.45 1.33 1.17 3.68 3.39 2.98E TURN3 2 2.08 1.94 1.89 5.29 4.93 4.80E TURN3 3 3.13 2.65 2.15 7.94 6.73 5.46
* Outliers excluded.
39
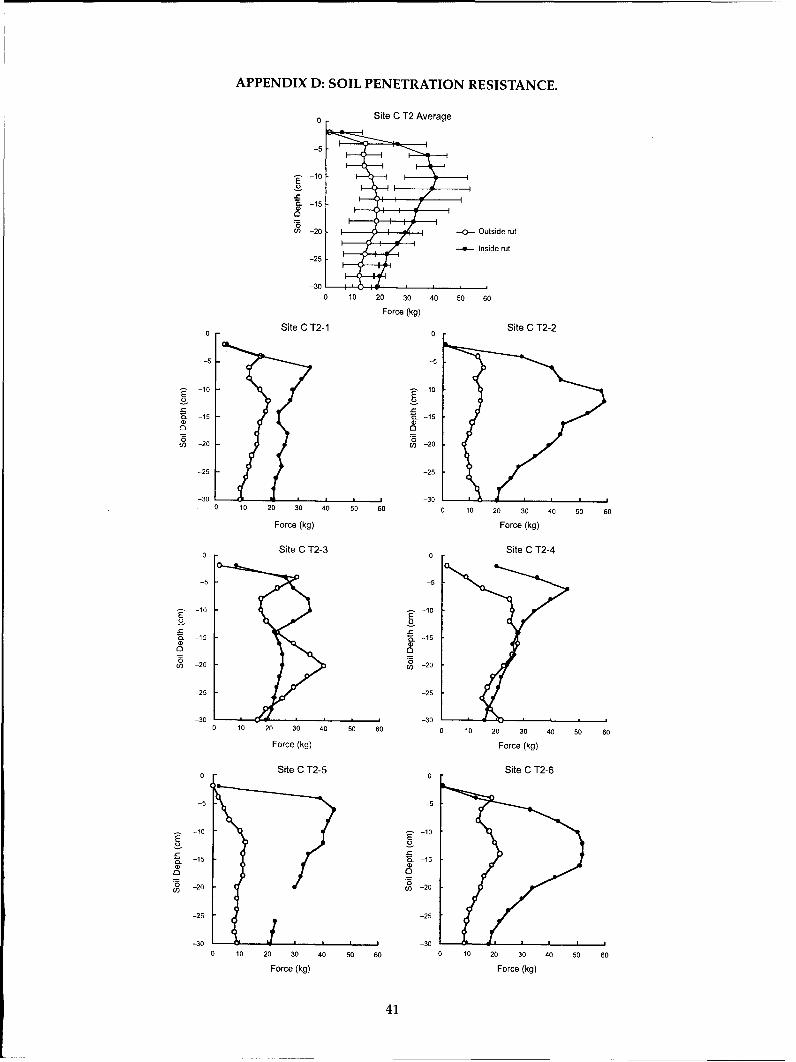
APPENDIX D: SOIL PENETRATION RESISTANCE.
Site C T2 Average
-10
E -15
a -i
0)
V) -20 --- Outside rut
Inside rut-25
-300 10 20 30 40 50 60
Force (kg)
Site C T2-1 Site C T2-200
-5-5
-15 - -15
O 0o o
Cl) -20 - -20
-25 -25
-30 -30 L0 10 20 30 40 50 60 0 10 20 30 40 50 60
Force (kg) Force (kg)
Site C T2-3 Site C T2-4
-5 -5
-10 -10
a -15 • -15
0U) 20C,) -20
-25 -25
-30 -300 10 20 30 40 50 60 0 10 20 30 40 50 60
Force (kg) Force (kg)
Site C T2-5 Site C T2-6
10 -0
a -5 -5
-10 (n -20
-25 -25
-3 LL_ I -300 10 20 30 40 50 60 10 20 30 40 50 60
Force (kg) Force (kg)
41
Site C T4 Average
-5
E -10
• -15
(n -20
-25
-300 10 20 30 40 50 60
Force (kg)
Site C T4-1 Site C T4-20 0
-5 -5
-10 -10E E
-15 E -15C Ck
CO -20 -20
-25 -25
-30 -30
0 10 20 30 40 50 60 0 10 20 30 40 50 60
Force (kg) Force (kg)
Site C T4-3 Site C T4-40 0
-5 -5
-10~ -10
E EU U-15 -15
CDC
'-20 -20
-25 -25
-30 -300 10 20 30 40 so 60 0 10 20 30 40 so 60
Force (kg) Force (kg)
Site C T4-5 Site C T4-6
S-0 -0
-5 -5
-10 1
-i -15 -15
o CL
-20 -20
-25 -25
-30 -300 10 20 30 40 50 60 0 10 20 30 40 50 60
Force (kg) Force (kg)
42
0 Site C Turn2 Average
-5-10
0U) -20
-25
-300 10 20 30 40 50 60
Force (kg)
0 Site C Turn2-2 0 Site C Turn2-3
-5 -5
-10 -10
0 0wo -0 CO -0
-25 -25
-30 L-30L- L L0 10 20 30 40 50 60 0 10 20 30 40 50 60
Force (kg) Force (kg)
0Site C Turn2-4 0Site C Turn2-5
-5 -5
-~-10 -10
0~-15 0 1.
o 0CO -0 Co( -0
-25 -25
-30 -30-30 10 20 30 40 50 60 0 10 20 30 40 50 60
Force (kg) Force (kg)
Site C Turn2-60
-5
-~-10
.-- 15
0CO -0
-25
-300 10 20 30 40 50 600
Force (kg)
43

Site E T2 Average
-5
- 10
•. -15
0
v -20 I
-25
-300 10 20 30 40 50 60
Force (kg)
Site E T2-1 Site E T2-2
-5 -5
-10 -10
0~-25 -215
30 V. -
-30 -300 10 20 30 40 50 60 0 10 20 30 40 50 60
Force (kg) Force (kg)
Site E T2-3 Site E T2-40 0
-5 -5
E -10 -10o_ /CL-is -is
00
C -20 / -20
-25 -25
-30 -300 10 20 30 40 50 60 0 10 20 30 40 50 60
Force (kg) Force (kg)
Site E T2-5 Site E T2-60 0
-5 -5
-10 -10
U) -20 (n -20U U
-25 -25
-30 -30 W.
0 10 20 30 40 50 60 0 10 20 30 40 50 60
Force (kg) Force (kg)
44
Site E T8 Average
-5
-10
0 -15CD
u) -20
-25
-300 10 20 30 40 50 60
Force (kg)
0 Site E T8-1 Site E T8-2
-5 -5
E -10 -10
CL -Z15 a 15
-20 O -20
-25 -25
-30 -300 10 20 30 40 50 60 0 10 20 30 40 50 60
Force (kg) Force (kg)
Site E T8-3 Site E T8-4
-5 -5
E -10 -10
-15 -,1501 e0
-20 -20
-25 -25
-30 -300 10 20 30 40 50 60 0 10 20 30 40 50 60
Force (kg) Force (kg)
Site E T8-5 Site E T8-6
-5 -5
-10 -10
-15 U) 15
CO -20 Cn -20
-25 -25
-30 - -300 10 20 30 40 50 60 0 10 20 30 40 50 60
Force (kg) Force (kg)
45

0 Site E Turn Average
-5
-10
5t
C -15C)
0U) -20
-25
-30 110 10 20 30 40 50 60
Force (kg)
Site E Turn2-1 Site E Tum2-2
-5 -5
-10 -10E E'E -1 ' -15
o 0
w -20 C -20
-25 -25
-30 -30
0 10 20 30 40 50 60 0 10 20 30 40 50 60
Force (kg) Force (kg)
Site E Turn2-3 Site E Turn2-400
-5 -5
-10 -10
00
V) -20 EO -20
-25 -25
-30 -300 10 20 30 40 50 60 0 10 20 30 40 50 60
Force (kg) Force (kg)
Site E Tum3-1 Site E Tum3-2
-5 -5o C
S-15 "E -15
S-20 -20
-25 -25
-30 -300 10 20 30 40 50 60 0 10 20 30 40 50 60
Force (kg) Force (kg)
46

Form ApprovedREPORT DOCUMENTATION PAGE OMB No. 0704-0188
Public reporting burden for this collection of information is estimated to average 1 hour per response, including the time for reviewing instructions, searching existing data sources, gathering and
maintaining the data needed, and completing and reviewing the collection of information. Send comments regarding this burden estimate or any other aspect of this collection of information,including suggestion for reducing this burden, to Washington Headquarters Services, Directorate for Information Operations and Reports, 1215 Jefferson Davis Highway, Suite 1204, Arlington,VA 22202-4302, and to the Office of Management and Budget, Paperwork Reduction Project (0704-0188), Washington, DC 20503.
1. AGENCY USE ONLY (Leave blank) 2. REPORT DATE 3. REPORT TYPE AND DATES COVEREDIJuly 19981
4. TITLE AND SUBTITLE 5. FUNDING NUMBERS
Ground Freezing Effects on Soil Erosion of Army Training LandsPart 2: Overwinter Changes to Tracked-Vehicle Ruts, Yakima Training Center,Washington
6. AUTHORS
Jonathan J. Halvorson, Donald K. McCool, Larry G. King, andLawrence W. Gatto
7. PERFORMING ORGANIZATION NAME(S) AND ADDRESS(ES) 8. PERFORMING ORGANIZATION
1) Washington State University, Biological Systems and Engineering, Pullman, Wash. 99164 REPORT NUMBER
2) U.S. Department of Agriculture, Agriculture Research Service, Pullman, Wash. 99164 Ci3) U.S. Army Cold Regions Research and Engineering Laboratory, 72 Lyme Road, Special Report 98-8
Hanover, N.H. 03755-1290
9. SPONSORING/MONITORING AGENCY NAME(S) AND ADDRESS(ES) 10. SPONSORING/MONITORINGAGENCY REPORT NUMBER
Office of the Chief of EngineersWashington, D.C. 20314-1000
11. SUPPLEMENTARY NOTESFor conversion of SI units to non-SI units of measurement, consult ASTM Standard E380-93, Standard Practice for Use of theInternational System of Units, published by the American Society for Testing and Materials, 1916 Race St., Philadelphia, Pa.19103.
12a. DISTRIBUTION/AVAILABILITY STATEMENT 12b. DISTRIBUTION CODE
Approved for public release; distribution is unlimited.
Available from NTIS, Springfield, Virginia 22161.
13. ABSTRACT (Maximum 200 words)
Two areas were monitored at the Yakima Training Center (YTC) in central Washington to measure changes inM1A2 Abrams (Ml) tank-rut surface geometry, and in- and out-of-rut saturated hydraulic conductivity (Kfs),soil penetration resistance (SPR), and bulk density over the 1995-1996 winter. Profile meter data show that rutcross-sectional profiles smoothed significantly and that turning ruts did so more than straight ruts. Rut edgeswere zones of erosion and sidewall bases were zones of deposition. Kfs values were similar in and out of rutsformed on soil with 0-5% water by volume, but were lower in ruts formed on soil with about 15% water. MeanSPR was similar in and out of ruts from 0- to 5-cm depth, increased to 2 MPa outside ruts and 4 MPa inside rutsat 10- to 15-cm depth, and decreased by 10-38% outside ruts and by 39-48% inside ruts at the 30-cm depth. Soilbulk density was similar in and out of ruts from 0- to 2.5-cm depth, and below 2.5 cm it was generally higher inruts formed on moist soil, with highest values between 10- and 20-cm depth. Conversely, density in ruts formedon dry soil was similar to out-of-rut density at all depths. This information is important for determining impactsof tank ruts on water infiltration and soil erosion, and for modifying the Revised Universal Soil Loss Equation(RUSLE) and the Water Erosion Prediction Project (WEPP) models to more accurately predict soil losses onArmy training lands.
14. SUBJECT TERMS 15. NUMBER OF PAGES
Erosion Penetration resistance Water infiltration 48
Freeze-thaw Tank-rut surface geometry Yakima Training Center 16. PRICE CODE
17. SECURITY CLASSIFICATION 18. SECURITY CLASSIFICATION 19. SECURITY CLASSIFICATION 20. LIMITATION OF ABSTRACT
OF REPORT OF THIS PAGE OF ABSTRACT
UNCLASSIFIED UNCLASSIFIED UNCLASSIFIED UL
NSN 7540-01-280-5500 Standard Form 298 (Rev. 2-89)Prescribed by ANSI Std. Z39-18298-102
Related Documents