Welcome message from author
This document is posted to help you gain knowledge. Please leave a comment to let me know what you think about it! Share it to your friends and learn new things together.
Transcript

This report is part of the work of the IEA Energy Conservation in Buildings & Community Systems Programme.
Annex V Air Infiltration and Ventilation Centre
Document AIC-PROC-9-88-1 ISBN 0 946075 40 9
Participants in this task:
Price: f 30.00 Sterling Distribution: Unrestricted
Additional copies of this report may be obtained from:
Belgium, Canadh, Denmark, Federal Republic of Air Infiltration and Ventilation Centre Germany, Finland, Italy, Netherlands, New Zealand,
~;~;;;~v~~t~;;~~r~cience Park Norway, Sweden, Switzerland, United Kingdom and sir willi,, L~~~~ ~~~d United States of America. Coventry CV4 7EZ
Great Britain


9th AlVC Conference
Effective Ventilation
(held at Novotel Hotel, Gent, Belgium
12 - 15 September 1988)
Proceedings
Volume 1
cc) Copyright Oscar Faber Partnership 1989.
All property rights, including copyright are vested in the Operating Agent (Oscar Faber Consulting Engineers) on behalf of the International Energy Agency.
In particular, no part of this publication may be reproduced, stored in a retrieval system or transmitted in any form or by any means, electronic, mechanical, photocopying, recording or otherwise, without the prior written permission of the Operating Agent.
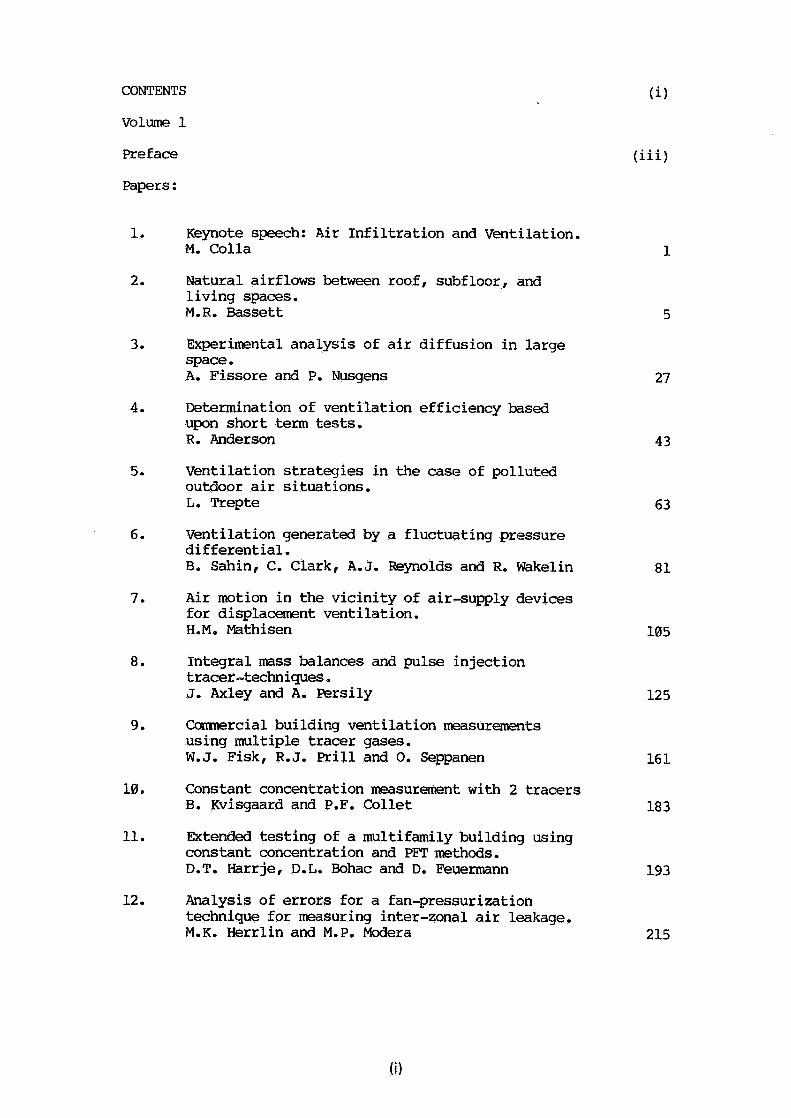
CONTENTS
Volume 1
Preface
(i)
(iii)
Papers :
1. Keynote speech: Air Infiltration and Ventilation. M. Colla
2. Natural airflows between roof, subfloor, and living spaces. M.R. Bassett
3 . Experimental analysis of air diffusion in large space. A, Fissore and Po Nusgens
4 Determination of ventilation efficiency based upon short term tests. R, Anderson
5. Ventilation strategies in the case of polluted outdoor air situations. L. Trepte
6. ventilation generated by a fluctuating pressure differential. B, Sahin, C. Clark, A.J. Reynolds and R. Wakelin
7. Air motion in the vicinity of air-supply devices for displacement ventilation. H.M. Mathisen
8. Integral mass balances and pulse injection tracer-techniques. J. Axley and A. Persily
9. Carmercial building ventilation measurements using multiple tracer gases. W.J. Fisk, R.J. Prill and 0. Seppanen
10. Constant concentration measurement with 2 tracers B. Kvisgaard and P.F. Collet
11. Extended testing of a multifamily building using constant concentration and PFT methods. D.T. Harrje, D.L. Bohac and D. Feuermann
12. Analysis of errors for a fan-pressurization technique for measuring inter-zonal air leakage. M.K. Herrlin and M.P. Modera
The use of a guarded zone pressurization technique to measure air flow permeabilities of a multi-zone building. J.M. Furbringer, C. Roecker, C-A Roulet
Air leakage between apartments. P. Levin
Air infiltration induced by heating appliances. G.V. Fracastoro and M. Masoero
Indoor formaldehyde levels in energy-efficient homes with mechanical ventilation systems. M. Riley and P. Piersol 28 3
Recirculation of air in dwellings. W.F. de Gids and J.C. Phaff
Effective ventilation in offices - the occupant's perspective. I.D. Griffiths, J.W. Huber and A.P. Baillie 311
A ventilation concept for future dwelling-houses, M. Luoma and R. Kohonen 329
Natural ventilation for a Crown court: developing statistical assessment techniques at the design stage. M.D.A.E.S. Perera, R.R. Walker and R.G. Tull 34 3
Market analysis of sensors for the use in demand controlled ventilating systems, W, Raatschen 361
ventilation design for a bus station. M.J. Holmes and T. Salusbury
ventilation and air quality in Belgian buildings: a state of the art. P. Wouters, D. LVHeureux, P. Voordecker and R. Bossicard

PREFACE
International Energy Agency
In order to strengthen cooperation in the vital area of energy policy, an Agreement on an International Energy Programme was formulated among a number of industrialised countries in November 1974. The International Energy Agency (IEA) was established as an autonomous body within the Organisation for Economic Cooperation and Development (OECD) to administer that agreement. Twenty-one countries are currently members of the IEA, with the Commission of the European Communities participating under a special arrangement,
As one element of the International Energy Programme, the Participants undertake cooperative activities in energy research, development, and demonstration. A number of new and improved energy technologies which have the potential of making significant contributions to our energy needs were identified for collaborative efforts. The IEA Committee on Energy Research and Development (CRD), ass~sted by a small Secretariat staff, coordinates the energy research, development, and demonstration programme.
Energy Conservation in Buildings and Community Systems
As one element of the Energy Programme, the IEA encourages research and development in a number of areas related to energy. In one of these areas, energy conservation in buildings, the IEA is encouraging various exercises to predict more accurately the energy use of buildings, including comparison of existing computer programmes, building monitoring, comparison of calculation methods, as well as air quality and inhabitant behaviour studies.
The Executive Committee
Overall control of the R&D programme "Energy Conservation in Buildings and Communi ty ~ ~ s t e m s " is maintained by an Executive Committee, which not only monitors existing projects but identifies new areas where collaborative effort may be beneficial. The Executive Committee ensures all projects fit into a predetermined strategy without unnecessary overlap or duplication but with effective liaison and communication.
Annex V Air Infiltration and Ventilation Centre
The IEA Executive Committee (Building and Community Systems) has highlighted areas where the level of knowledge is unsatisfactory and there was unanimous agreement that infiltration was the area about which least was known. An infiltration group was formed drawing experts from most progressive countries, their long term aim to encourage joint lnternational research and increase the world pool of knowledge on infiltration and ventilation. Much valuable but sporadic and uncoordinated research was already taking place and after some initial groundwork the experts group recommended to their executive the formation of an Air Infiltration and Ventilation Centre. This recommendation was accepted and proposals for its establishment were invited internationally.

The aims o f t h e Centre a re t h e s tandard i sa t i on o f techniques, t h e v a l i d a t i o n o f models, t h e cata logue and t r a n s f e r o f in format ion, and the encouragement o f research. It i s intended t o be a review body f o r c u r r e n t world research, t o ensure f u l l d isseminat ion o f t h i s research and, based on a knowledge o f work a l ready done, t o g i ve d i r e c t i o n and f i r m bas is f o r f u t u r e research i n t h e P a r t i c i p a t i n g Countr ies.
The P a r t i c i p a n t s i n t h i s task are Belgium, Canada, Denmark, Federal Republ ic o f Germany, Finland, Netherlands, New Zealand, Norway, Sweden, Switzerland, Un i ted Kingdom and the Un i ted Sta tes o f America.
EFFECTIVE VENTILATION
9th AIVC Conference, Gent, Belgium 12-15 September, 1988
Paper 1 - Keynote Speech
Air Infiltration and Ventilation
M. COLLA
Belgian Secretary of State for Science Policy Welenschsbeleid Regentlaan 40 1000 Brussels Belgium

Mr. Marcel Colla Secretary of State for Science Policy, Belgium
It is with pleasure that I have accepted the offer to close today the first working session of the 9th Conference of the Air Infiltration and Ventilation Centre of the International Energy Agency. As Secretary of State, responsible for Science Policy, it is also an honour to havethe opportunity to do so, let's admit it in front of a highly scientific audience. It is indeed important that Policy makers and Scientists meet each other regularly.
I don't have to convince you, I suppose, of the importance of Air lnfiltration and Ventilation in the energy balance of dwellings in particular and therefore in the overall energy budget of our countries. The creation of your Centre, the growing interest for your work and the discussions during Conference prove this sufficiently.
It is however a good opportunity to stress the role your Centre has played in our own national efforts on this subject. As you probably know, the National R.D. Programme on Energy, created and directed by my Department since 1975, has recognised at the start of its third phase (1982-1987) the important scientific effort that was necessary to cover the gap existing at that time in our knowledge on the subject. In the programme an important budget was therefore allocated to ventilation research, at the Belgian Building Research Institute.
More important however, to cover the gap, was the step to join the Air Infiltration and Ventilation Centre in 1983. It permitted almost immediately to start our own research in the best conditions, taking advantage especially of the experience of the Centre in measurement - and evaluation methodologies and in calculation tools. Once again this was a good example, for a small country like Belgium, of the importance of international research collaboration in which I strongly believe. Therefore I think we have to continue to support this kind of research, be it in the framework of the EC and/or the International Energy Agency : scientist must travel, not only for pleasure but to exchange ideas and methodologies, confrontate theories and share results to the benefit of the entire community.
This ventilation area also shows the necessity of multi- disciplinarity; too often scientists isolate themselves and their results in the mist of their own vocabulary.
Ventilation is an area related to marly others, which may not be neglected by the technicians. Belgium was therefore very happy to have taken, a few years ago, the leadership of an I.E.A. task in that field ("Human behaviour and ventilation"). Although difficult in starting and working out, this research came recently to an end but has shown very interesting results. It was maybe one of our most valuable contributions to the area which interests you.
In the recent past, the decreasing of oil prices has been for Belgium, like other countries, an easy alibi to cut down the research efforts in the energy conservation field. I regretthat only a few activities have been saved from this new storm. I am happy today that the ventilation related research was one of them, that our contribution to I.E.A. has been preserved and that even some new actions were undertaken as proves our recent commitment to a new I.E.A. task on "Air flow patterns in buildings". However, I believe that this
minimum effort must be extended again, to preserve our evaluation and research capacities in the field, to offer a minimum continuity, which is indispensable in all research work and especially in research that underlines policymaking. I therefore have the intention to convince my colleagues to restart a new national effort in energy- research. We will of course take advantage of the results of the National R.D. Programme on Energy and take profit of the experience that has been built up. It finally means that a new effort must be imbedded in existing and new demands, as for example the environment requirements. Energy and energy research is not something that stands on its own; it must be part of our global reflexion on building construction, on industrial productivity, and on new social developments. It means that this research must be, more than in the past, directed to policymaking work: we cannot prepare a decision on the construction of a new electricity plant or on the volume of a gas agreement if we don't know how much the building and industry sectors will consume in the next decades and therefore we need your technological input : what kind of solutions will you offer us for, let us say, the ventilation of the building of the year 2000, or for the rehabilitation of the existing building stock. And important : what will your solution cost, what will it save, how will it be accepted by the public and the building sector, ... So many interesting questions where science and political decision have to meet. In that way, I will continue to assimilate your work because I believe it is vital, because I believe that Rational Use of Energy is a fundamental element for our energy policy.
Since the oil prices decreased recently, private energy consumption for building heating has risen again significantly: people have rediscovered, I'm afraid an energy consuming behaviour: too little was invested in structural modifications, in the improvement of the heating systems, in the definition and setting-up of better ventilation strategies : it shows the weakness of our effort but also the urgent necessity to prepare the future in a more efficient way. Therefore, we must preserve and enlarge our scientific potential and our evaluation capacity of the past and the future. Therefore also, we must multiply our effort of dissemination of the research work. The public, the industrial sectors, the policymakers askfor an objective view on the problems, based on scientific work, especially in the energy field. It is our role to continue to support the realisation and dissemination of objective and accurate information. Your Air lnfiltration and Ventilation Centre is a good example of how it can be done : sampling and analysing the available research efforts, publishing reports, discussing the research in highly scientific congresses like this one : the response to all these steps shows the usefulness of the process and the efficiency of the way you do it. Let my short speech therefore be a message of support to the work of this Conference and to the efforts you all undertake.
I thank you for your attention.


EFFECTIVE VENTILATION
9 t h AIVC Conference, Gent, Belgium 12-15 September, 1988
Paper 2
Natural Airflows between Roof, Subfloor, and Living Spaces
Building Research Associa.tiotl of New Zealand Private Bag Porirua New Zealand

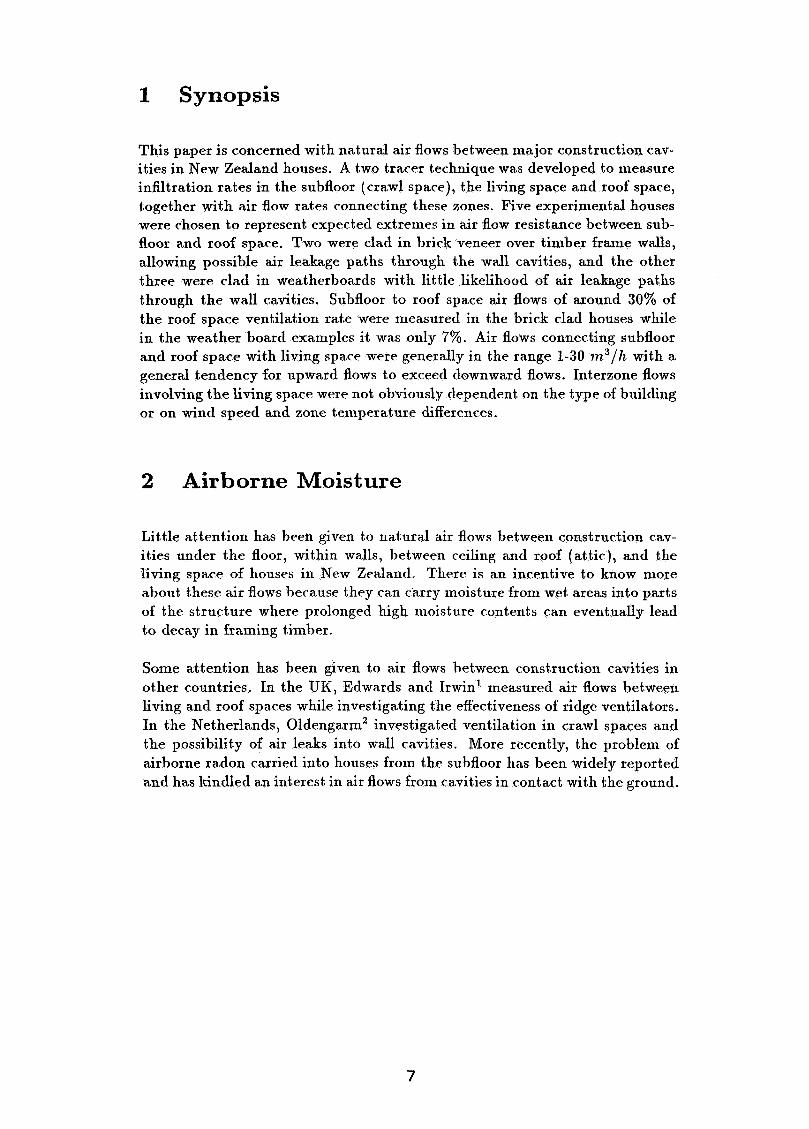
1 Synopsis
This paper is concerned with natural air flows between niajor construction cav- ities in New Zealand houses. A t-wo tracer technique was developed to measure infiltration rates in the subfloor (crawl space), the living space and roof space, together with air flow rates connecting these zones. Five experimental houses were chosen to represent expected extremes in air flow resistance between sub- floor and roof space. Two were clad in brick veneer over timber franie walls, allowing possible air leakage paths through the wall cavities, and the other three were clad in weatherboards wit.h little likelihood of air leakage paths t,hrough the wall cavities. Subfloor to roof space air flows of around 30% of the roof space ventilation rate were nreasured in the brick clad houses while in the weather boarcl exaxnples it was only 7%. Air flows connecting subfloor and roof space with living space were generally in the range 1-30 m3/h with a general tendency for upward flows to exceed downward flows. Interzone flows involving the living space were not obviously clependent on the type of building or on wind speed and zone t.e~nperature differences.
Airborne Moisture
Little attention has been given to natural air flows between construc.tion cav- ities uncler the floor, within walls, between ceiling and roof (attic), and the living space of houses in New Zeala.nt1. There is an incentive to lcnow more about these air flows because they can ckrry moisture from wet areas into parts of the structure where prolonged high xnoisture content.s can eventually lead t.o clecay in framing timber.
Some attention has been given to air flows hetween c.onstruction cavities in other countries. In the UK, Edwards and Irwin1 nieasurecl air flows between living and roof spaces while investigating the effectiveness of ridge ventilators. In the Netherlands, Oldengarm2 investigated ventilation in crawl spaces and the possibility of air leaks into wall cavitries. More recently, the problem of airborne radon carried into houses from the subfloor has been widely reported and has kindled an interest. in air flows froin cavities in contact with the ground.
An unusually high incidence of roof space condensation problems has occurred in masonry veneer houses in the south of New Zealand. This has been linked to air flows carrying subfloor moisture through inadequately sealed wall cavities into the roof space. Covering the ground with a vapour barrier was found by Trethowen and Middlemass3 to more reliably cure the problem than sealing the wall cavities; thus indicating that other flow paths may be present.
Evaporation rates from the ground in the subfloor (crawl space) have been mea- sured under New Zealand houses by Abbott4 and found to be little different from that of a free water surface. Even when the subfloor soil is apparently dry, evaporation rates in the range 150 to 250 g/m2day were normal. This translates to about 20 kg/da.y of ~noisture which would have to be removed by subfloor ventilation from under a 100 172' house. Trethowens has already indi- cated that at least 10 air changes/h of subfloor ventilation would be necessary to reduce the condensation hazard of air leaks into the roof space in masonry veneer houses without ground cover.
Experimental Houses
Five experiment a1 houses were chosen tro represent expected extremes in air flow resistance connecting subfloor and roof spaces. They were all fully fur- nished but unoccupied houses, rented while their owners were on holiday. Two were brick veneer houses with wall cavities potentially open at roof and floor level. The other three were weatherboard houses, with little likelihood of air leakage paths up the stud cavities.
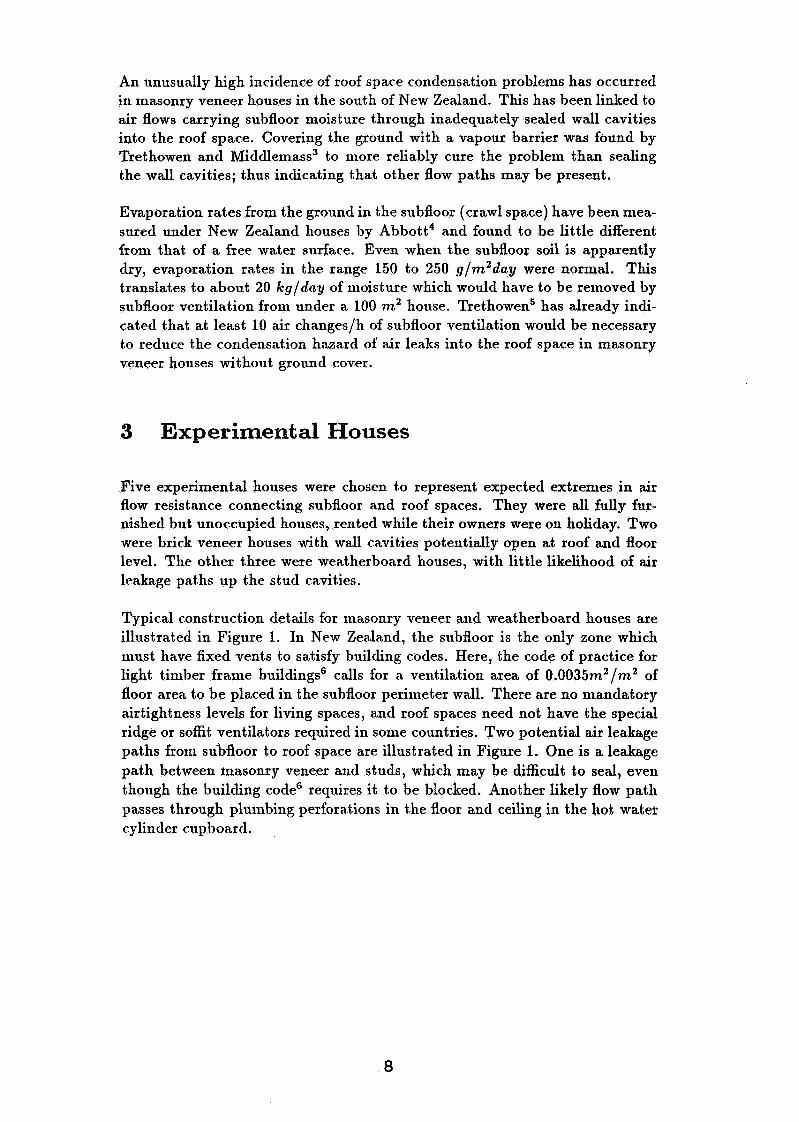
Typical construction details for masonry veneer and weatherboard houses are illustrated in Figlire 1. In New Zealand, the subfloor is the only zone which must have fixed vents to satisfy building codes. Here, the code of practice for light timber frame buildings6 calls for a ventilation area of 0.0035m2/nz2 of floor area to be placed in the subfloor perimeter wall. There are no mandatory airtightness levels for living spaces, and roof spaces need not have the special ridge or soffit ventilators required in some countries. Two potential air leakage paths fro~xi subfloor to roof space are illustrated in Figure 1. One is a leakage path between masonry veneer and studs, which may be difficult to seal, even though the building code6 requires it to be blocked. Another likely flow path passes through plulnbing perf~ra~tions in the floor and ceiling in the hot water cylinder cupboard.
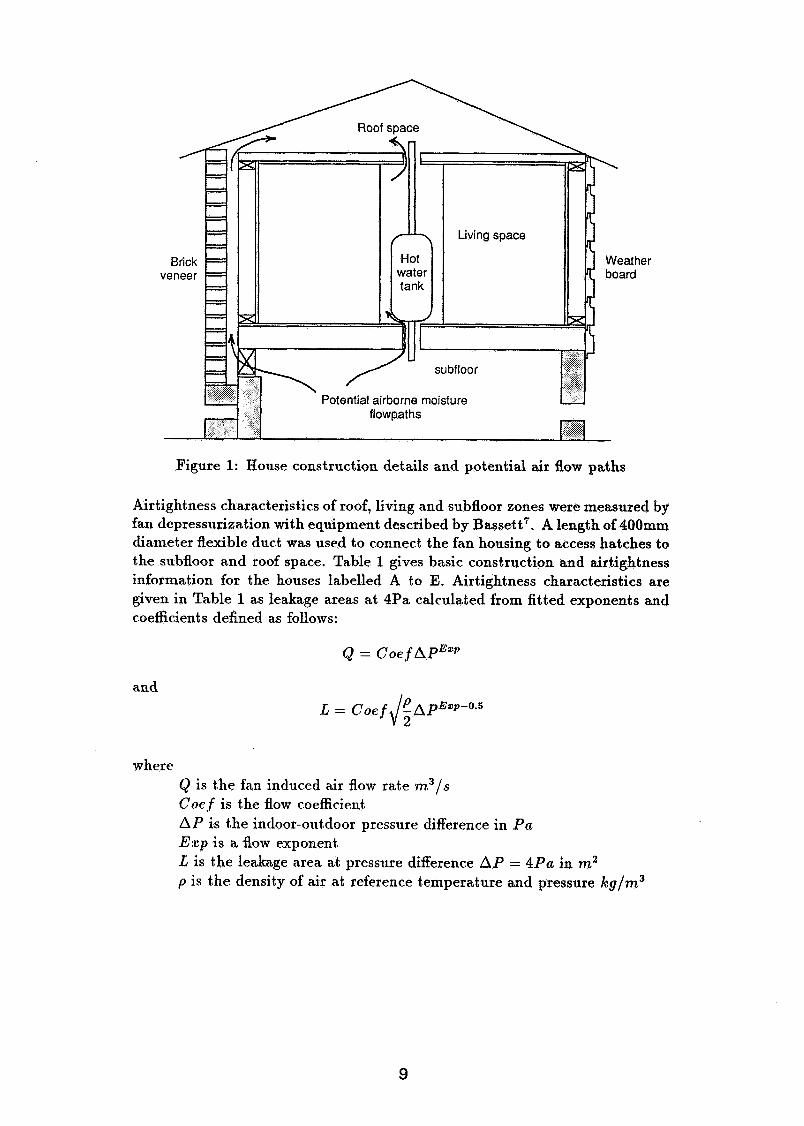
Figure 1: House construction details and potential air flow paths
Airtightness characteristics of roof, living and subfloor zones were measured by fan depressurization with equipment described by Bassettr. A length of 400mm diameter flexible duct was used to connect the fan housing to access hatches to the subfloor and roof space. Table 1 gives basic construction and airtightness information for the houses labelled A to E. Airtightness characteristics are given in Table 1 as leakage areas at 4Pa calculated from fitted exponents and coefficients defined as follows:
and L = Coe JeAP~=P-o .6 2
where Q is the fan induced air flow rate ~ n . ~ / . s Coef is the flow coefficient, A P is the indoor-outdoor pressure difference in P a E z p is a flow exponent. L is the leakage area at pressure difference A P = 4Pa in m 2 p is the density of air at reference temperature and pressure Icg/m3
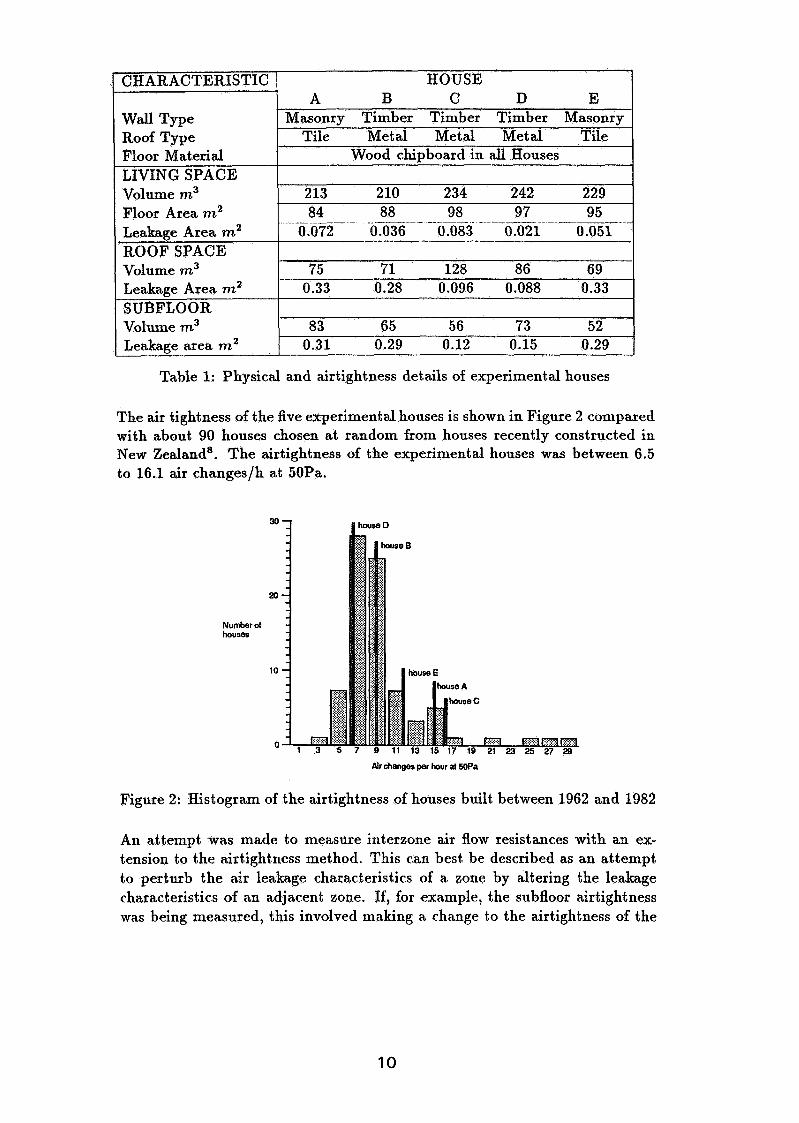
Table 1: Physical and airtightness details of experimental houses
CHARACTERISTIC HOUSE
The air tightness of the five experimental houses is shown in Figure 2 compared with about 90 houses chosen at random from houses recently constructed in New ZealandB. The airtightness of the experinlental houses was between 6.5 to 16.1 air changes/h at 50Pa.
Wall Type Roof Type Floor Material LIVING SPACE Volume m3 Floor Area m2 Leakage Area m2
Number of houses
A B C D E Masonry Timber Timber Timber Masonry
Tile Metal Metal Metal Tile Wood chipboard in all Houses
213 210 234 242 229 84 88 98 9 7 95
. . -- - - - . -- - - -. -. -. - - - - -- - - - - - . . - -- . - 0.072 0.036 0.083 0.021 -- 0.051 --
Air changes per hour at 50Pa
Figure 2: Histogram of the airtightness of houses built between 1962 and 1982
ROOF SPACE
An attempt was made to measure interzone air flow resistances with an ex- tension to the airtightness method. This can best be described as an attempt to perturb the air leakage characteristics of a zone by altering the leakage characteristics of an adjacent zone. If, for example, the subfloor airtightness was being measured, this involved making a change to the airtightness of the
Volume m3 Leakage Area m2 SUBFLOOR Volu~ne m3 Leakage area m2
-- 75 7 1 128 86 69 0.33 0.28 0.096 0.088 0.33
83 65 56 73 52 0.31 0.29 0.12 0.15 0.29

roof space and looking for a change in the apparent airtightness characteristics of the subfloor. If removing the nlanhole cover in the ceiling influenced the subfloor airtightness, then the linking air flow resistance could, in principle, be determined. Airtightness tests at each house were carried out systematically to look for measurable linking air flow resistances, but in all but one case (the leakage path between subfloor and roof space in house A) no significant resis- tances could be resolved. This established that the linking air flow resistances between zones were in general much higher than the resistance to outside, and that tracer gas techniques would be required for their investigation.
A Multi Tracer Technique
A system based around a micro computer controlled gas chromatograph has been developed for measuring infiltration rates in two zones at the same time as flow rates between the zones. A comprehensive description is given in references and a brief outline is given below;
4.1 Mode of Operation
The main components of the fully automated system are shown schematically in Figure 3.
weather
release
t
Figure 3: Schematic of automated gas chromatograph
Gas chromatograph and detector
I Disc drive
Data acquisition and control unit HP 3497A
- - - I
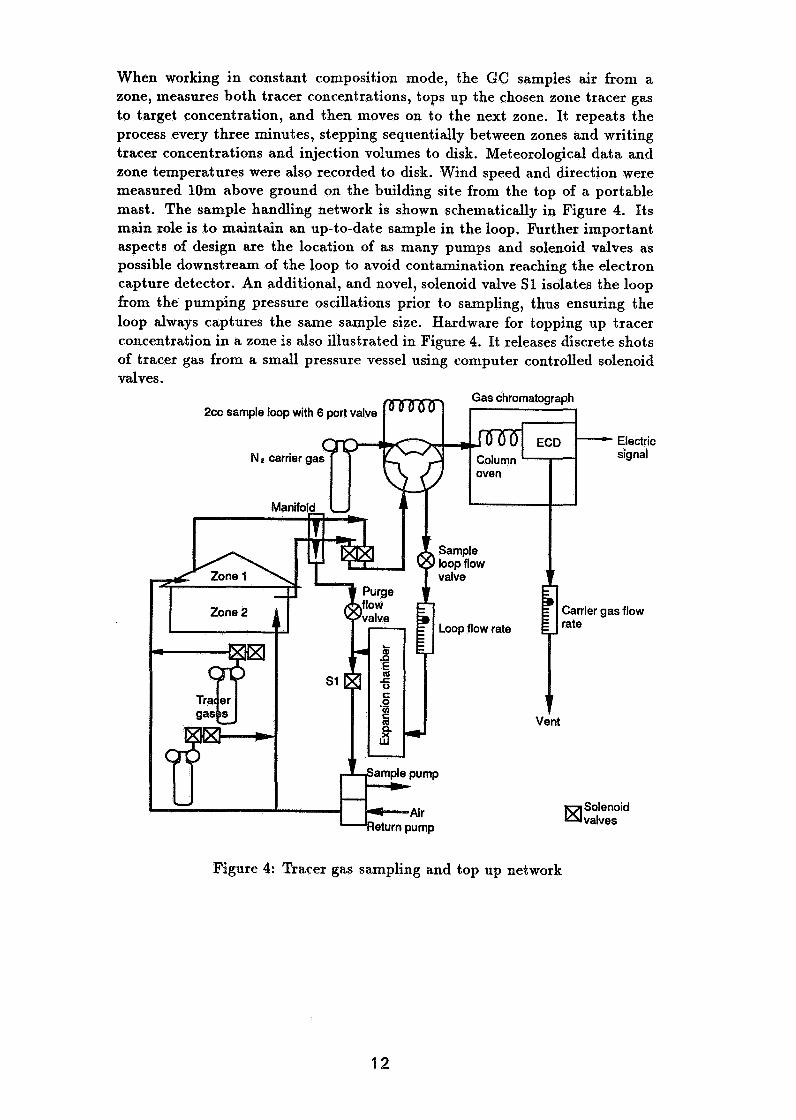
When working in constant composition mode, the GC samples air from a zone, measures both tracer concentrations, tops up the chosen zone tracer gas to target concentration, and then moves on to the next zone. It repeats the process every three minutes, stepping seqnentially between zones and writing tracer concentrations and injection volunies to disk. Meteorological data and zone temperatures were also recorded to disk. Wind speed and direction were measured 10m above ground on the building site from the top of a portable mast. The sample handling network is shown schematically in Figure 4. Its main role is to maintain an up-to-date sample in the loop. Further important aspects of design are the location of as many pumps and solenoid valves as possible downstream of the loop to avoid contamination reaching the electron capture detector. An additional, and novel, solenoid valve S1 isolates the loop from the pumping pressure oscillations prior to sampling, thus ensuring the loop always captures the same sample size. Hardware for topping up tracer concentration in a zone is also illustrated in Figure 4. It releases discrete shots of tracer gas from a small pressure vessel using computer controlled solenoid valves.
2cc sample loop with 6 port valve
Figure 4: Tracer gas sampling and top up network
4.2 Tracer gases
Freon-12 (CCZ2F2) and SF6 concentrations were detected with an electron cap- ture detector after separation in a 2 rn long molecular sieve column at 100°C. Retention times were 75s, 100s and 120s for SF6, CCZ2F2, and O2 respectively. Peak areas were determined by integration and working concentration ranges were 1-60 ppb for SF' and 200-1500 ppb for CC12F2. Each tracer was sent to the appropriate zone and discharged at two or three places by a network of small bore tubes connected to the return air pump. Further mixing was achieved within each zone with portable fans. These were arranged carefully to avoid adding to infiltration driving pressures. On several occasions, infil- tration rates were shown to be insensitive to changes in mixing arrangements.
5 Analysis
Transforming measured tracer concentrations and injection rates into air flows was carried out with a method similar to that outlined by Pereralo. The development is outlined below with the assumptions of uniform mixing within each zone and a unique tracer injected into each zone.
Nomenclature Qij is the air flow rate from zone i to zone j in m 3 / h . Qio is the air flow from zone i to outside in m 3 / h T/: is the volume of zone i in m.3 Cij is the concentration of tracer i in zone j in units ppb G; is the release rate of tracer i in zone i in units ppblh is the rate of change of concentration of tracer i
in the ith zone in units ppb/ h.
If the outflow of air from zone i is Si then:
Where 6;j is the Kronecker delta function Sij= 1 for i = j
= O f o r i # j
The mass balance of the ith tracer in the ith zone requires the following:
If tracer gas concentrations outside are very small, then:
There are a further ( N - 1) mass balance equations for the other tracer gases in zone i that take the forin:
With the number of zones and tracers both equal to N there will now be N2 equations. There are, however, (N2 - N ) linking air flows and 2N flows to and from outside. Solving for all the air flows using measured Cij , ci , and G; requires a further N equations which follow by requiring the bulk flow of air into each zone to equal the outward flows.
Inter zone air flows were measured in this study using two tracers released into two zones. In this cases the tracer mass balance equations for zone 1 take the form:
-ciisi + CizQzi = K ( ~ 1 1 - GI)
-C21S1 + c 2 2 Q 2 1 = 0
Or in matrix form
From S1 and QZ1, QO1 can be calculated and the process repeated for zone 2.
A computer program was developed to calculate air flows for the general N zone N tracer problem using the method of Gaussian elimination for solving the linear set of niass balance equations. Because all the concentration mea- surements were not made at the same time, a simultaneous set of Cc and dii had to be calculated. First, the discrete tracer concentrations were transformed into a smoothed single. valued funct,ion using a third degree polynomial inter- polating procedure. Then the tracer release term was similarly smoothed and interpolated after being expressed in units ppb lh using the following equation:
Where 6; has units of ppblh N, is the nunrber of shots of tracer released in time interval A T V, is the volume of tracer released in each shot (cc)
C; is the tracer gas concentration (molefraction) is the volume of zone i m3
AT is the time interval between tracer gas top up in h
6 Zone Infiltration Rates
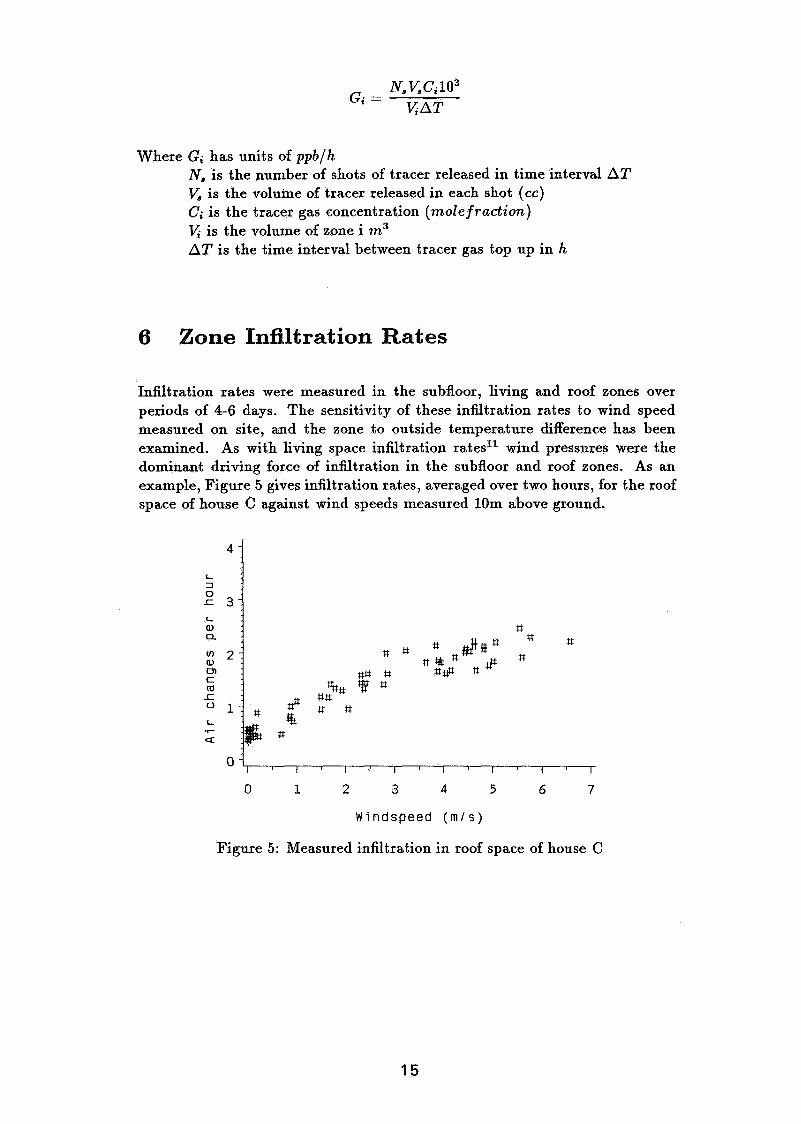
Infiltration rates were ~neasured in the subfloor, living and roof zones over periods of 4-6 days. The sensitivity of these infiltration rates to wind speed measured on site, and the zone to outside temperature difference has been examined. As with living space infiltration rates1' wind pressures were the dominant driving force of infiltration in the subfloor and roof zones. As an example, Figure 5 gives infiltration rates, averaged over two hours, for the roof space of house C against wind speeds measured 10m above ground.
Windspeed ( m l s )
Figure 5: Measured infiltration in roof space of house C
Infiltration rates in subfloors and roof spaces can be expressed in air changes- /hour but it would be unrealistic to expect the mixing process that took place during rneasureriient to be present normally. In fact, some forni of plug flow between the windward and lee sides of the building would be expected in the subfloor. In roof spaces the pattern of flow is more uncertain because the location of the rnain leakage openings in relation to pressure coefficients on the roof are unknown.
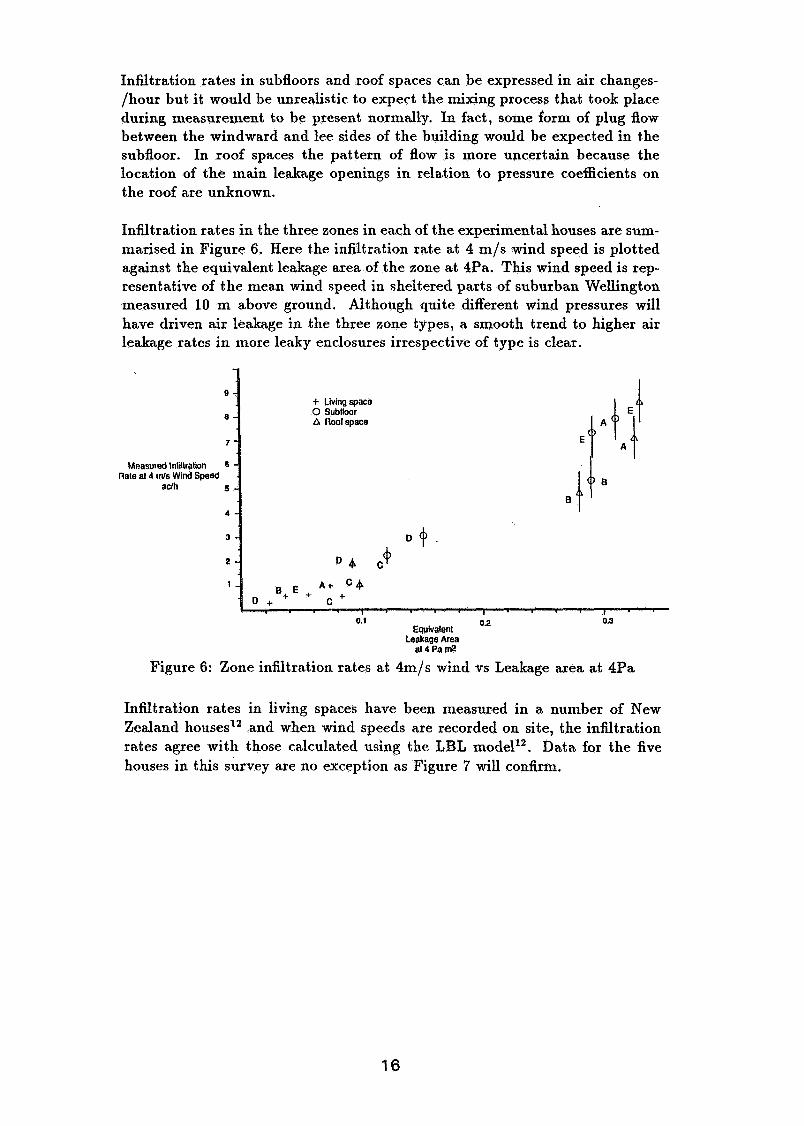
Infiltration rates in the three zones in each of the experimental houses are surn- marised in Figure 6. Here the infiltration rate at 4 m/s wind speed is plotted against the equivalent leakage area of the zone at 4Pa. This wind speed is rep- resentative of the mean wind speed in sheltered parts of suburban Wellington measured 10 m above ground. Although quite different wind pressures will have driven air leakage in the three zone types, a sniooth trend to higher air leakage rates in niore leaky enclosures irrespective of type is clear.
Measured Inlillration Rale a14 rnls Wind Speed
ac/h
+ Livirg space 0 Subllwr A Roof space
0.1 0.2 0.3 Equivalent
Leakage Area a t 4 P a d
Figure 6: Zone infiltration rates at 41111s wind vs Leakage area at 4Pa
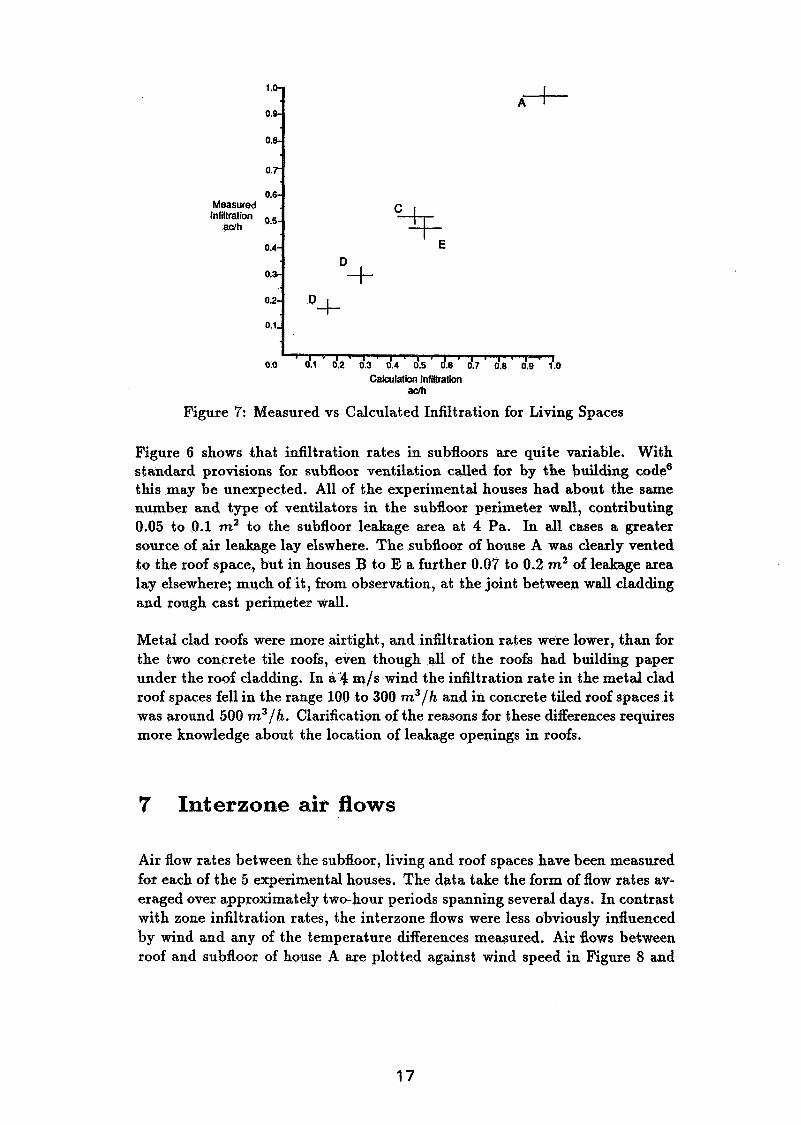
Infiltration rates in living spaces have been measured in a number of New Zealand houses12 and when wind speeds are recorded on site, the infiltration rates agree with those calculated using the LBL nlodelr2. Data for the five houses in this survey are no exception as Figure 7 will confirm.
Measured Infiltration
ac/h
I , 0.0 d.1 d.2 d.3 d.4
Calculation Infiltration a&
Figure 7: Measured vs Calculated Infiltration for Living Spaces
Figure 6 shows that infiltration rates in subfloors are quite variable. With standard provisions for subfloor ventilation called for by the building code6 this may be unexpected. All of the experimental houses had about the same number and type of ventilators in the subfloor perimeter wall, contributing 0.05 to 0.1 m2 to the subfloor leakage area at 4 Pa. In all cases a greater source of air leakage lay elswhere. The subfloor of house A was clearly vented to the roof space, but in houses B to E a further 0.07 to 0.2 m2 of leakage area lay elsewhere; much of it, from observation, at the joint between wall cladding and rough cast perimeter wall.
Metal clad roofs were more airtight, and infiltration rates were lower, than for the two concrete tile roofs, even though all of the roofs had building paper under the roof cladding. In a 4 m/s wind the infiltration rate in the metal clad roof spaces fell in the range 100 to 300 m3/h and in concrete tiled roof spaces it was around 500 m3/h. Clarification of the reasons for these differences requires more knowledge about the location of leakage openings in roofs.
7 Interzone air flows
Air flow rates between the subfloor, living and roof spaces have been measured for each of the 5 experiment a1 houses. The data take the form of flow rates av- eraged over approximately two-hour periods spanning several days. In contrast with zone infiltration rates, the interzone flows were less obviously influenced by wind and any of the temperature differences measured. Air flows between roof and subfloor of house A are plotted against wind speed in Figure 8 and
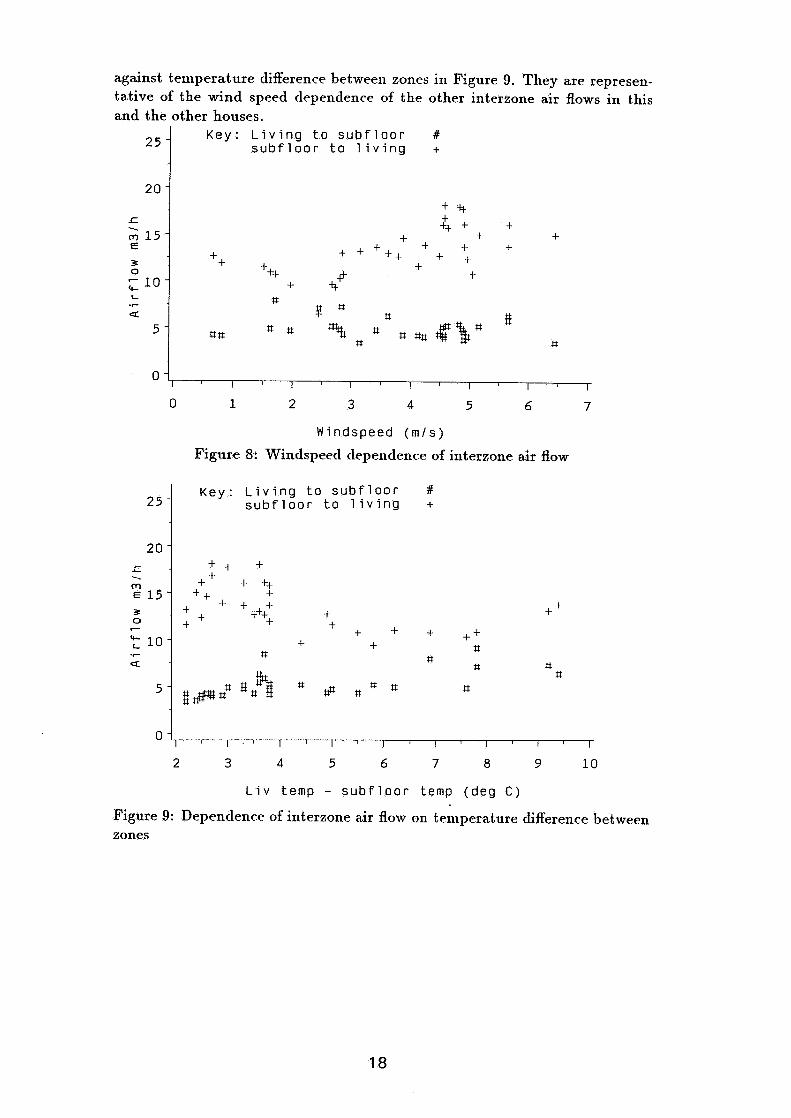
against temperature difference between zones in Figure 9. They are represen- tative of the wind speed dependence of the other interzone air flows in this
Windspeed ( m l s )
Figure 8: Windspeecl depende~~ce of interzone a.ir flow
and the other houses.
K e y : L i v i n g t o s u b f l o o r # s u b f l o o r t o l i v i n g +
25 -
20 -
f . m 15- E
3 0 - 1 0 - 4- C .r
Q
5 -
L i v temp - s u b f l o o r temp ( d e g C )
K e y : L i v i n g t o s u b f l o o r # s u b f l o o r t o l i v i n g +
+ tt $+ + +
+ + + + + + + + + t
++ + + + + ++ # + + tt #
P # # tt # n t l m% St q . # # $ k a #
Figure 9: Dependence of interzone air flow on temperature difference between zones
7.1 Paths for Subfloor to Roof Space Air Flows
Air flows between subfloor and roof space can potentially be driven by a variety of pressure differences in different partrs of the building. Because wind pressure coefficients on pitched roof surfaces are niostly negative, it. might be anticipated that air will travel up from living and subfloor areas. In addition, there are possible stack flow processes which could, for example, be driven in wall cavities warmed by the sun, or in hot water cylinder cupboards which have leaks around plulnbi~ig where it passes through the floor and ceiling. The living space may also be a significant path for subfloor to roof space air flows. In all these situations, the most likely flow direction is upward.
No attempt was made to measure directly the components of subfloor to roof space air flows through the living space using tracer gases. However, ventilating the living space was found to have little effect on subfloor to roof space tracer gas flows in several houses. In acldit,ion, a flow rate passing through the living space consistent with interzone air flows involving the living space has been calculated as follows. With the subfloor, living space and roof space defined as zones 1, 2 ancl 3 respectively, a.ncl the concentra.tion of air originating from the subfloor air in zones 1, 2 a.ncl 3 defined as Cl, C2 and C3 respectively, the ~nass balance of subfloor air in t.he living space requires:
where S2 is the total outflow of air fro111 zone 2 . Normally Q32C3 < < Q12C1 and the concentration of subfloor air in the subfloor C1 = 1 and therefore
If the flow rate of subfloor air into the roof spac.e passing through the living space is Q;,:
Calculated and ~neasured values of G);, were only around 5% of measured Q13 in brick veneer houses A and E, and between 15 to 40% in weatherboard houses B to D. Significant flowpaths linking subfloor to roof space that do not involve the living space were clearly present in all of the experimental houses.
A quite different pattern of interzone air flows was seen in the two types of house in this survey. In weatherboard-clad houses the subfloor to roof space flows were almost an order of magnitude smaller than those in the two brick veneer examples. The living spaces were in contrast about equally coupled to the roof and subfloor zones in all but one house.
7.2 Weat herboard houses
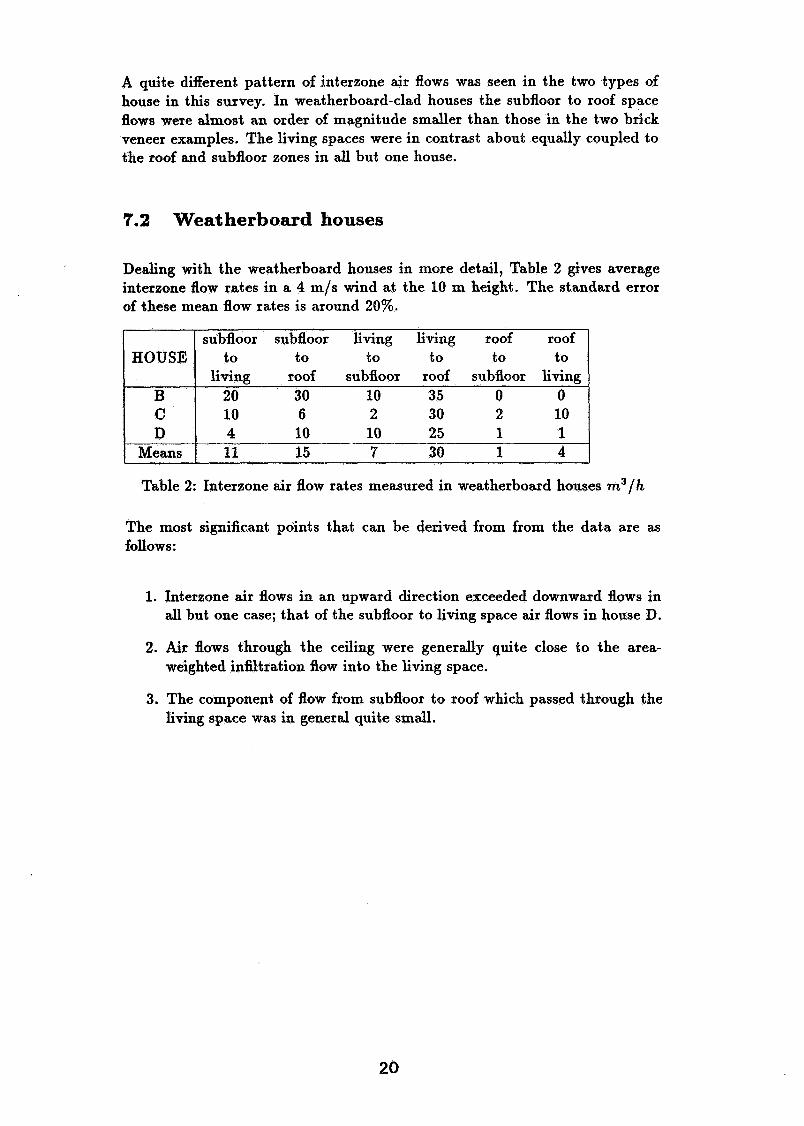
Dealing with the weatherboard houses in more detail, Table 2 gives average interzone flow rates in a 4 m/s wind at the 10 m height. The standard error of these mean flow rates is around 20%.
Table 2: Interzone air flow rates measured in weatherboard houses m3/h
HOUSE
B C D
Means
The most significant points that can be derived from from the data are as follows:
subfloor subfloor living living roof roof t o t o t o to to to
living roof subfloor roof subfloor living 20 30 10 35 0 0 10 6 2 30 2 10 4 10 10 25 1 1 -- 11 15 7 30 1 4
1. Interzone air flows in an upward direction exceeded downward flows in all but one case; that of the subfloor to living space air flows in house D.
2. Air flows through the ceiling were generally quite close to the area- weighted infiltration flow into the living space.
3. The component of flow from subfloor to roof which passed through the living space was in general quite small.

7.3 Brick Veneer Houses
Inter zone air flows at 4m/s wind speed are given in Table 3 for the two brick veneer houses A and E. While they share the characteristic of high air flows in the direction of subfloor to roof space, they differ in that the living space of house A was more closely coupled to the roof space. The coupling between
Table 3: Interzone air flow rates measured in brick veneer houses in m3/h (* flow rate not adequately defined)
HOUSE
A E
subfloor and roof space in houses A and E is clearly quite similar with very large upward air flows and strongly suppressed downward flows. The interzone air flows involving living space of house E are similar to those in the weatherboard houses. This has to be expected because similar materials and construction details are involved in the living space internal lining. The locations of leakage openings that lead to higher air flows between roof and living spaces in house A are unknown.
subfloor subfloor living living roof roof to to to to t o t o
living roof subfloor roof subfloor living 20 190 90 0 30 * 14 135 5 50 0 8
7.4 Differences in interzone air' flow characteristics
The main differences between the examples of brick-clad and weatherboard- clad houses are as follows:
1. Subfloor and roof spaces were found to be more closely coupled in the brick veneer houses. A small fraction (5%) of the connecting air flow passed through the living space. In house A a connection through the wall cavities was established using airtightness techniques but in house E the link could not be measured with this method.
2. Similar construction methods used to enclose the living space would lead us to expect similar flows involving the living space. With the exception of house A this was confirmed.
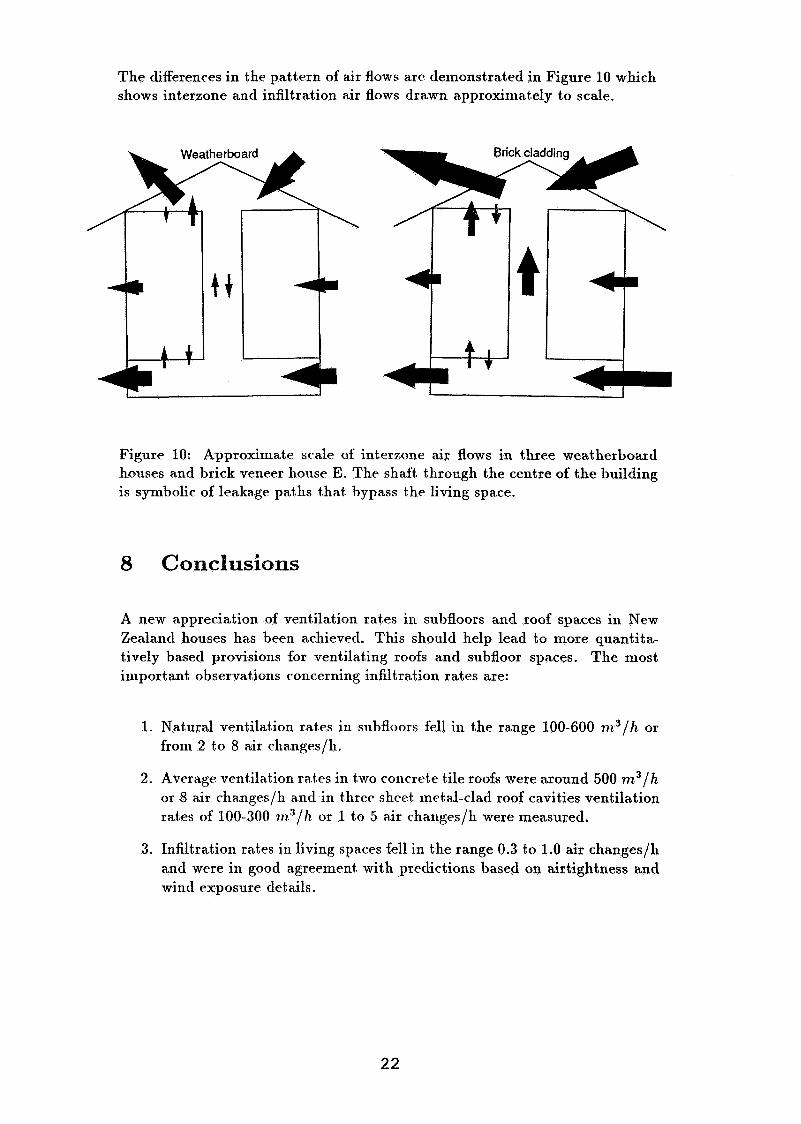
The differences in the pattern of air flows are demonstrated in Figure 10 which shows interzone and infiltration air flows drawn approxi~nately to scale.
Figure 10: Approximate scale of interzone air flows in three weatherboard houses and brick veneer honse E. The shaft t.hrough the centre of the building is synlbolic of leakage paths that bypass the living space.
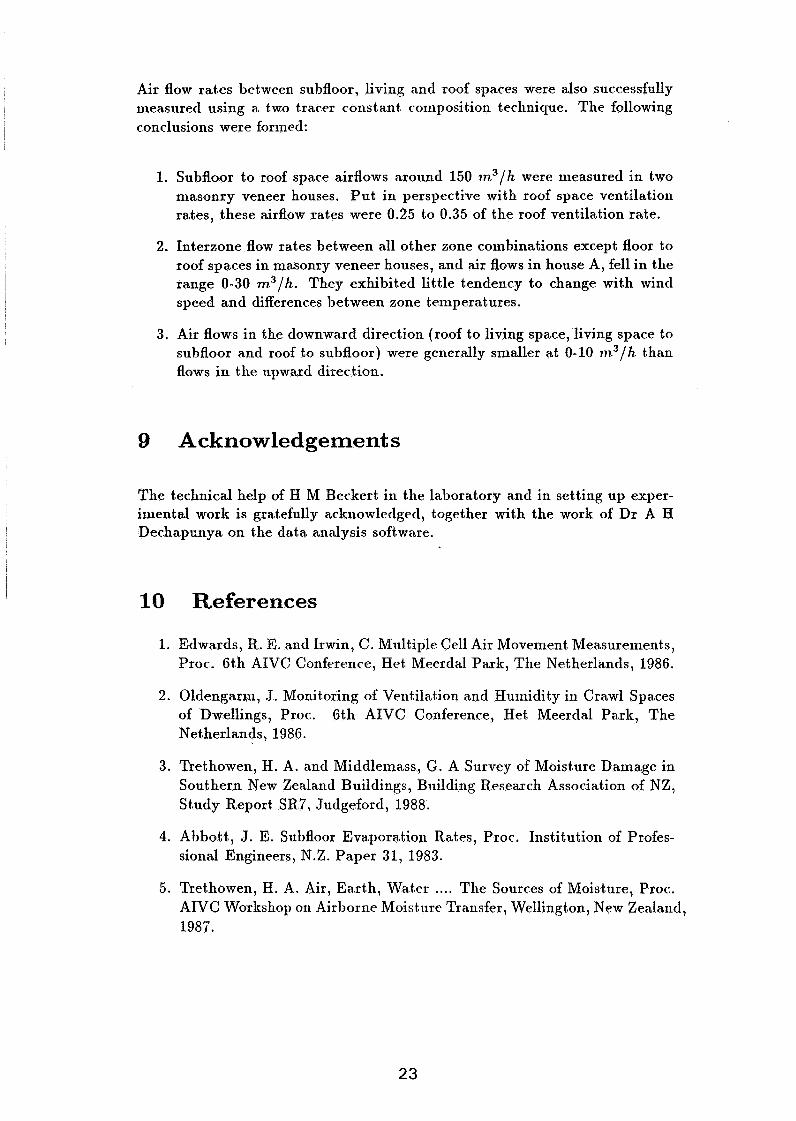
8 Conclusions
A new appreciation of ventilation rates in subfloors and roof spaces in New Zealand houses has been achieved. This should help lead to Inore quantita- tively based provisions for ventilating roofs and subfloor spaces. The most ixnportant observations concerning infiltration rates are:
1. Nat,urd ventilation rates in snhfloors fell in the range 100-600 nz3/l1. or from 2 to 8 air cha.nges/h.
2. Average ventila.tion ra.tes in two c0ncret.e tile roofs were around 500 n13/h or 8 air cha.nges/h and in three sheet znetal-clad roof cavities ventilation rates of 100-300 i i ~ ' / h or 1 to 5 air changes/h were measured.
3. Infiltration rates in living spaces fell in the range 0.3 to 1.0 air changeslh a.ncl were in goocl agreement. with predictions based on airtightness and wind exposure details.
Air flow rates between subfloor, living and roof spaces were also successfully measurecl using a two tracer const.ant coniposition technique. The following conclusions were formed:
1. Subfloor to roof space airflows around 150 7n3/h were measured in two niasonry veneer houses. Put in perspective with roof space ventilation rates, these airflow rates were 0.25 to 0.35 of the roof ventilation rate.
2. Interzone flow rates between all other zone coxnbinations except floor to roof spaces in niasonry veneer houses, and air flows in house A, fell in the range 0-30 m3/h . They exhibited little tendency to change with wind speed and differences between zone temperatures.
3. Air flows in the downward direction (roof to living space, living space to suhfloor and roof to subfloor) were generally smaller a t 0-10 na"h. than flows in the upward direction.
9 Acknowledgements
The technical help of H M Beckert in the laboratory and in setting up exper- imental work is gratefully acknowleclged, together with the work of Dr A H Dechapunya on the data analysis software.
10 References
1. Edwards, R. E. and Irwin, C. Multiple Cell Air Move~lient Measurements, Proc. 6th AIVC Conference, Het Meerclal Park, The Netherlands, 1986.
2. Oldengarm, J . Monitoring of Ventilation and Hu~nidity in Crawl Spaces of Dwellings, Proc. Gth AIVC Conference, Het Meerdal Park, The Netherlands, 1986.
3. Trethowen, H. A. and Midcllemass, G. A Survey of Moisture Damage in Sout.hern New Zealand Buildings, Building Research Association of NZ, Stsudy Report SR.7, Judgeford, 1988.
4. Abbott, J. E. Subfloor Evaporation Rates, Proc. Institutio~i of Profes- sional Engineers, N.Z. Paper 31, 1983.
5. Trethowen, H. A. Air, Earth, Water .... The Sources of Moisture, Proc. AIVC Worlrshop on Air1)orxie Moisture Transfer, Wellington, New Zealand, 1987.

6. New Zealand Standard NZS3604 Code of Practice for Light Timber Frame Buildings not requiring Specific Design, Standards Association of New Zealand, Wellington, 1981.
7. Bassett, M. Preliminary Survey of Airtightness Levels in New Zealand Houses, Proc Institution of Professional Engineers, N.Z. Vo1.2, July 1984.
8. Synergy Applied Research Ltd, Air Tightness Levels in Auckland and Christchurch Homes, New Zealand Energy Research and Development Committee, Publication P87, 1986.
9. Bassett, M. R. and Beckert,H. M. Infiltration in Houses - Measured and Calculated. In Preparation.
10. Perera, M. D. A. E. S. Review of Techniques for Measuring Ventilation Rates in Multi-Celled Buildings. Proc. E.C. Contractors Meeting on Natural Ventilation, Brussels September 1982.
11. Bassett, M. The Infiltration Component of Ventilation in New Zealand Houses. Proc. 6th AIVC Conference, Het Meerdal Park, The Nether- lands, 1986.
12. Bassett, M. Air Infiltration in New Zealand Houses, Proc. 4th AIVC Conference, Elm Switzerland, 1983.
13. Sherman, M. H. and Grimsrud, D. T. Infiltration-Pressurization Corre- lation : Simplified Physical Modeling. ASHRAE Transactions Vo1.86, Part 2, 1980.
Discussion
W. Fisk(Lawrence Berkeley Laboratory, USA) You mentioned that covering the soil prevented moisture problems. Are you referring to placing plastic sheets over the soil or other methods? Is the cover over the soil air tight?
M. Bassett(Bui1ding Research Association of New Zealand) The vapour barrier placed over the ground was a polyethylene sheet, It was not made airtight at joints or at the perimeter.
M. Sherman (Iawrence Berkeley Laboratory, USA) Wood members have an enormous potential to store and release moisture. Many potential moisture problems are averted because of this capacity to absorb, and subsequent thermal cycling. The conditions you describe appear to indicate that the magnitude of the source (i.e. ground moisture) is so large that neither storage in materials nor (reasonable) ventilation can solve the problem. Does this mean that source control is the only reasonable mitigation strategy?
M.Bassett (Building Research Association of New Zealand) Source control with a vapour barrier over the ground was the most effective remedial measure tried in existing houses, but at the construction stage it may be easier to block leakage paths through the wall cavities. Only a small fraction of brick veneer houses have this particular roofspace condensation problem, so in most cases ventilation and storage deal with the moisture from the subfloor.
0. Nielsen (Ministry of Housing and Building, Denmark) How do you define a house with a moisture problem? For example must there be visible moulds on surfaces?
M.Bassett (Building Research Association of New Zealand) Houses have a moisture problem when the occupants consider there is a problem. Typically these include condensation, moulds, musty smells and, only occasionally, interstitial condensation resulting in decay in framing and lining materials. Moisture problems do however rank as the most comon reason for unsatisfactory house performance in New Zealand,
M. Liddament (AIVC, Warwick, UK) Can you explain how the houses are ventilated in New Zealand and if any method of ventilation is used to minimise moisture problems?
M-Bassett (Building Research Association of New Zealand) There is no comnon use of either passive or mechanical ventilation in New Zealand houses, although range hoods are now quite popular. Ventilation is provided by window opening, which of course is quite variable. A reasonable level of space heating is also an essential part of indoor moisture control, and there are many different methods of heating employed in New Zealand houses.
M, Liddament (AIVC, Warwick, UK) Have you investigated pollutants other than moisture in these houses?
M.Bassett (Building Research Association of New Zealand) There have been scnne pollutant concentration surveys in New Zealand houses for radon and formaldehyde. In most houses we consider moisture to be the pollutant requiring the highest ventilation rate (around 1 air change per hour) . P, Charlesworth (AIVC, Warwick, UK) You have indicated that the leaks around the hot water tank area are of special interest in your work. Could you elaborate upon this subject?
M.Bassett (Building Research Association of New Zealand) The m n o r m a l driving forces of infiltrating outdoor air, wind speed and temperature differences. For this reason we looked for regions in the building where there might be constant stack pressure differences, One of these was the region around the hot water tank.
D, Harrje (Princeton University, USA) Referring to Fig, 10, does the central vertical arrow in the brick clad house represent flow behind the brick cladding, and is this the reason for higher crawlspace flows?
M.Bassett (Building Research Association of New Zealand) For the houses in this survey the air flow between crawlspace and roofspace in brick veneer houses (150 m3/h) is about 10 times higher than that in weatherboard houses. The only structural differences we see, which could explain this, are in the wall cavity area. However 150 m3/h is small compared to the differences in crawlspace ventilation rates measured in the 5 houses surveyed.
EFFECTIVE VENTILATION
9th AIVC Conference, Gent, Belgium 12-15 September, 1988
P a p e r 3
EXPERIMENTAL ANALYSIS OF AIR DIFFUSION IN LARGE SPACE
ADELQUI FISSORE AND PIERRE NUSGENS
UNIVERSITY OF LIEGE LABORATORY OF THERMODYNAMICS Rue Eenest Solvay, 21 - bat C3 B-4000 Liege. BELGIUM
Synopsis
An experimental study in reduced scale model for ventilation inside a sheep-fold has been studied. The ventilating system consist of two slots in opposite side walls and one in the roof, Two-dimensional jet are generated by the wind effect and temperature difference acting upon the sheep-fold. The jets generate several low pressure zones in the sheep-fold and these zones in term produce the deflection to the jet flow, The position of these zones in the space change dramatically even with a little variation of the thermal and dynamic boundary condition and therefore the movement of air in the space change due to this unstable phenomenon.
The flow pattern, have been studied in function of different parameters such as Archimedes number, Reynolds number, flow rate for every inlet, velocity profile and turbulence in the inlet, situation of exhaust and length of the air inlet (slot ) in relation to length of the wall.
It has been found that the main factors governing the air circulation are: relationships between the flow rates of the two inlets, relationship between the length of the slot and the length of the wall and the Archimedes number. However the mean velocity in the occupation zone is not very much affected by the above factors.
In conclusion we estimate that this ventilation system by considering its low cost is suitable for this kinds of application. However, disadvantage may occur when a low pressure zone is formed between the inlet and the roof which could result a short-circuit in air flow.
List of symbols
Ar : Archimedes number. B : Length of the slot. [ m ] H : Length of the wall. [ m 1 Lr : Distance of jet attachment point from the wall I m I N : Number of nodes used to describe the studied zone R : Radius of curvature of the jet Re : Reynolds number Re c : Critical Reynolds number SD : Dimensionless space standard deviation of mean
velocity Ui : Mean velocity in each point in the occupation
zone [ m/s I Urn : Dimensionless mean velocity in the ocupation zone Uma : Dimensionless maximum velocity in the occupation
zone UO : Velocity at the inlet [ m/s 1
1.- Introduction
In recent years, it is becoming more and more important to achieve good performance in all economic aspects; among others, animal production is in one of these race. The purpose of the agriculture climatisation of animal production is to control certain parameters of the internal environment , so as to maintain the animals healthy . These parameters are generally: concentration of different gasious contaminent, humidity, velocity and temperature of air.
For this purpose it is interesting to increase the understanding of air movement in a large enclosure by means of the simplist ventilation system, i.e. two dimensional jets from a slot at the side walls . This system arrangement can also be useful for industrial applications.
In this paper the results of an experimental work in a reduced scale model of sheep fold are presented in which the air flow pattern and velocity field for different parameters such as :Achimedes number, Reynolds number , velocity profiles and turbulence at the inlet, relationships between flow rate for each inlet and other parameters for the identification of micro-climate are studied. It has been found in this study that the temperature difference between the inside and outside is small due to the low heating load in the building and therefore, the wind effect acting upon this building becomes very important.
2 . - Building and model description:
The real sheep-fold in Sart-Tilman, Liege is taken for this study. This construction is 20 meters long, occupied by 200 sheep with heat emission rate approximately 6 0 W each. In this paper only the heat emission from animals and uniformately distribued on the floor, is considered. Of course, the position of the heat source also influences the air flow patterns, but this aspect is not taken into account in this paper.
Similarity rules
It is not possible to follow all the non-dimensional numbers derived from the Navier-Stokes equation of fluid mechanics in experiment. For this reason, with practical recommendation from reference [I], [2] and [3] the following similarity rules are applied:
Isothermal test a) Geometric similarity b) Re in model = Re in prototype
If Re > Re c the only condition is geometric similarity
Non isothermal test
a) Geometric similarity b) Ar in model = Ar in prototype c) Re > Re c
As the main interest is to know the air flow in the enclosure, heat losses through walls has been excluded for this study. Also the concept of local modelling is applied and the study is focused on the internal zone.
The test facility
Figure 1 shows the 1/3 scale model of the real site sheep-fold of Sart-Tilman built for this study in the Laboratory of Thermodynamic, University of Liege. The effect of ventilation, mainly resulted from wind, is produced by 2 ventilators for to keep the same pressure inside and outside of this model so as to minimize the infiltration effect. The heat emission from animals are simulated by heating carpets on the floor of the model.
In this model 3 different air inlet conditions of velocity profile and turbulent intensity can be studied ( turbulence intensities are 2%, 5% and 10% ) The studies of these air inlet conditions will give knowledge to the further evaluation of the design of air inlets .
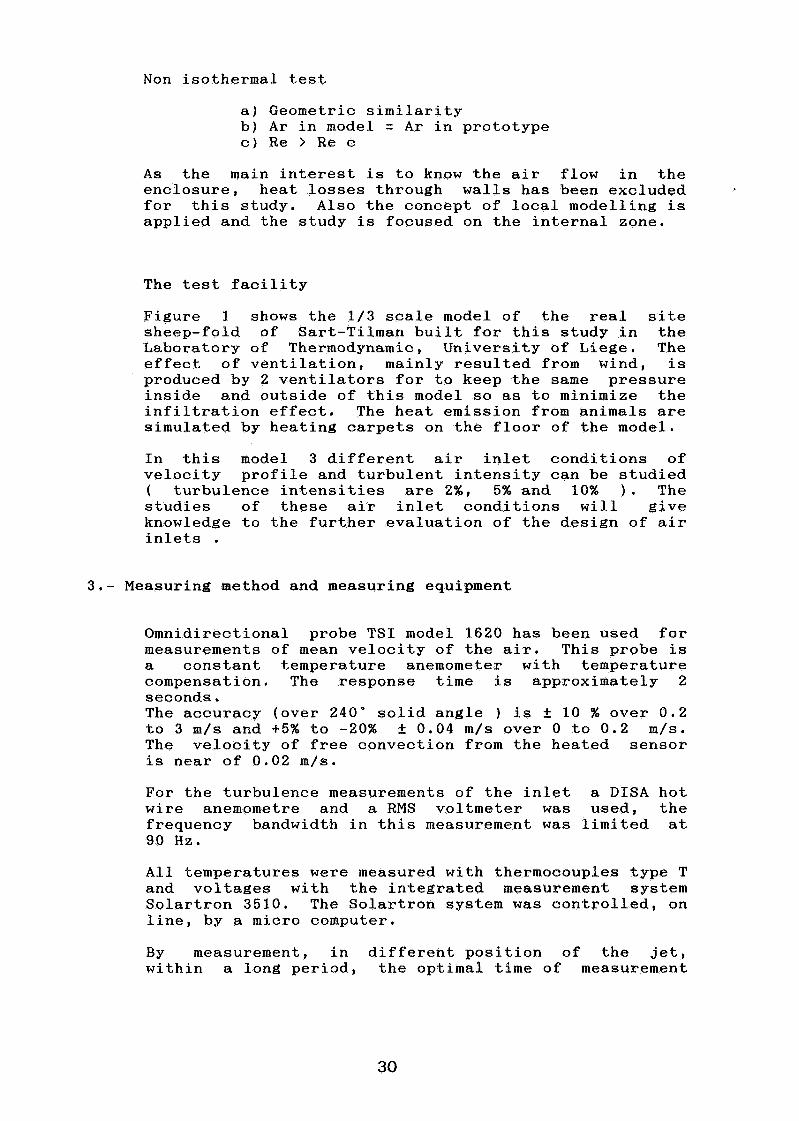
3.- Measuring method and measuring equipment
Omnidirectional probe TSI model 1620 has been used for measurements of mean velocity of the air. This probe is a constant temperature anemometer with temperature compensation. The response time is approximately 2 seconds. The accuracy (over 240" solid angle ) is 2 10 % over 0.2 to 3 m/s and +5% to -20% + 0.04 m/s over 0 to 0.2 m/s. The velocity of free convection from the heated sensor is near of 0.02 m/s.
For the turbulence measurements of the inlet a DISA hot wire anemometre and a RMS voltmeter was used, the frequency bandwidth in this measurement was limited at 90 Hz.
All temperatures were measured with thermocouples type T and voltages with the integrated measurement system Solartron 3510. The Solartron system was controlled, on line, by a micro computer,
By measurement, in different position of the jet, within a long period, the optimal time of measurement
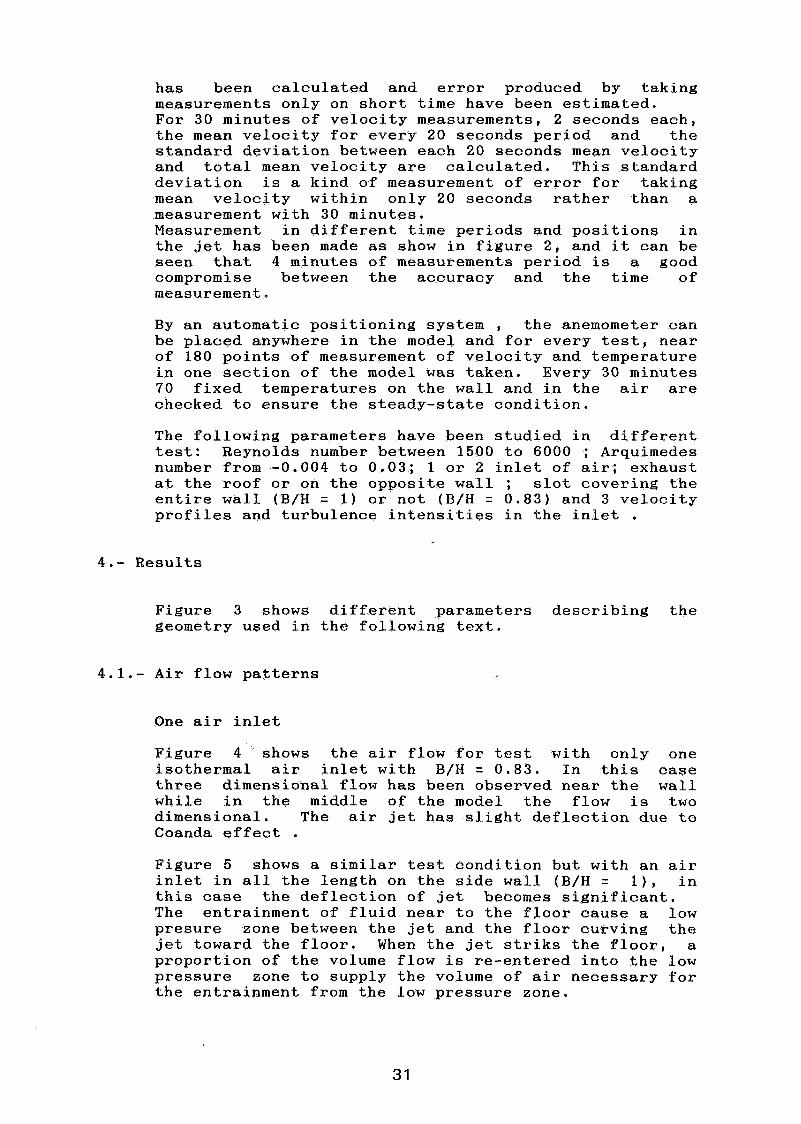
has been calculated and error produced by taking measurements only on short time have been estimated. For 30 minutes of velocity measurements, 2 seconds each, the mean velocity for every 20 seconds period and the standard deviation between each 20 seconds mean velocity and total mean velocity are calculated. This standard deviation is a kind of measurement of error for taking mean velocity within only 20 seconds rather than a measurement with 30 minutes. Measurement in different time periods and positions in the jet has been made as show in figure 2, and it can be seen that 4 minutes of measurements period is a good compromise between the accuracy and the time of measurement.
By an automatic positioning system , the anemometer can be placed anywhere in the model and for every test, near of 180 points of measurement of velocity and temperature in one section of the model was taken. Every 30 minutes 70 fixed temperatures on the wall and in the air are checked to ensure the steady-state condition.
The following parameters have been studied in different test: Reynolds number between 1500 to 6000 ; Arquimedes number from -0.004 to 0.03; 1 or 2 inlet of air; exhaust at the roof or on the opposite wall ; slot covering the entire wall (B/H = 1) or not (B/H = 0.83) and 3 velocity profiles and turbulence intensities in the inlet .
4.- Results
Figure 3 shows different parameters describing the geometry used in the following text.
4.1.- Air flow patterns
One air inlet
Figure 4 shows the air flow for test with only one isothermal air inlet with B/H = 0.83. In this case three dimensional flow has been observed near the wall while in the middle of the model the flow is two dimensional. The air jet has slight deflection due to Coanda effect . Figure 5 shows a similar test condition but with an air inlet in all the length on the side wall (B/H = I), in this case the deflection of jet becomes significant. The entrainment of fluid near to the floor cause a low presure zone between the jet and the floor curving the jet toward the floor. When the jet striks the floor, a proportion of the volume flow is re-entered into the low pressure zone to supply the volume of air necessary for the entrainment from the low pressure zone.
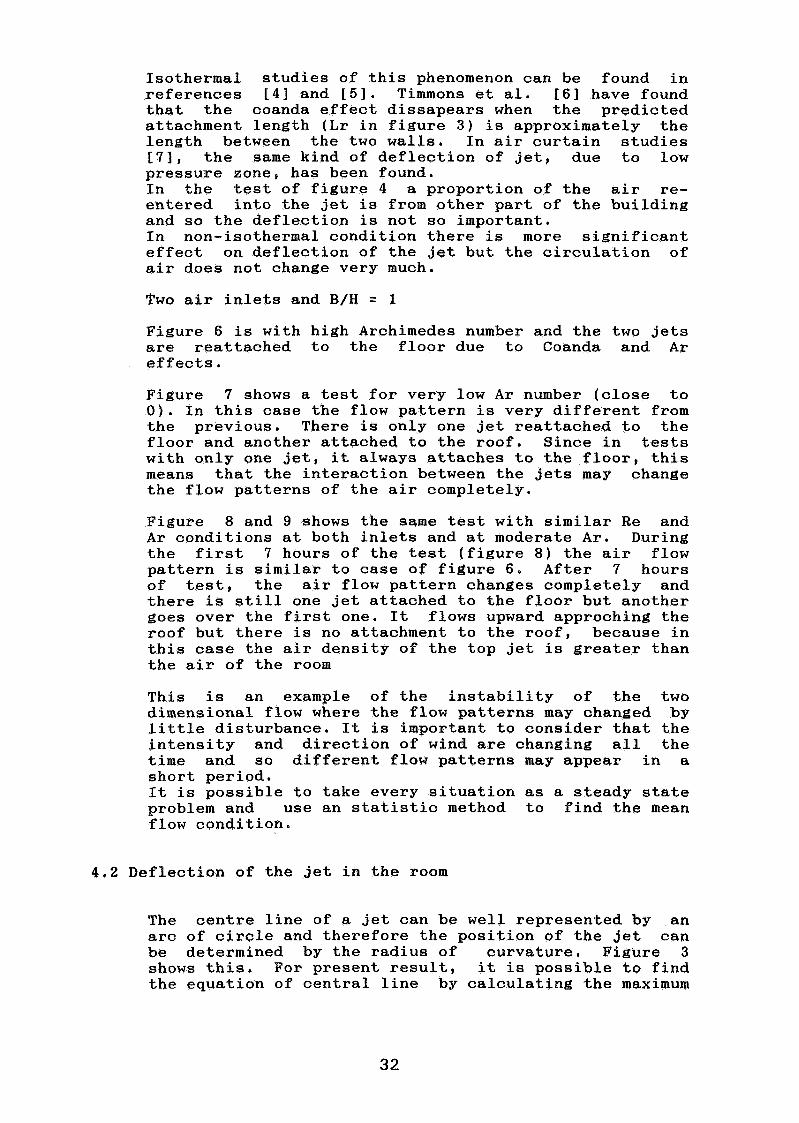
Isothermal studies of this phenomenon can be found in references C41 and [ 5 1 . Timmons et ale [61 have found that the coanda effect dissapears when the predicted attachment length (Lr in figure 3) is approximately the length between the two walls. In air curtain studies 171, the same kind of deflection of jet, due to low pressure zone, has been found. In the test of figure 4 a proportion of the air re- entered into the jet is from other part of the building and so the deflection is not so important, In non-isothermal condition there is more significant effect on deflection of the jet but the circulation of air does not change very much.
Two air inlets and B/H = 1
Figure 6 is with high Archimedes number and the two jets are reattached to the floor due to Coanda and Ar effects.
Figure 7 shows a test for very low Ar number (close to 0). In this case the flow pattern is very different from the previous. There is only one jet reattached to the floor and another attached to the roof. Since in tests with only one jet, it always attaches to the floor, this means that the interaction between the jets may change the flow patterns of the air completely.
Figure 8 and 9 shows the same test with similar Re and Ar conditions at both inlets and at moderate Ar. During the first 7 hours of the test (figure 8) the air flow pattern is similar to case of figure 6. After 7 hours of test, the air flow pattern changes completely and there is still one jet attached to the floor but another goes over the first one. It flows upward approching the roof but there is no attachment to the roof, because in this case the air density of the top jet is greater than the air of the room
This is an example of the instability of the two dimensional flow where the flow patterns may changed by little disturbance. It is important to consider that the intensity and direction of wind are changing all the time and so different flow patterns may appear in a short period. It is possible to take every situation as a steady state problem and use an statistic method to find the mean flow condition.
4.2 Deflection of the jet in the room
The centre line of a jet can be well represented by an arc of circle and therefore the position of the jet can be determined by the radius of curvature. Figure 3 shows this. For present result, it is possible to find the equation of central line by calculating the maximum
velocity for different vertical velocity profile.
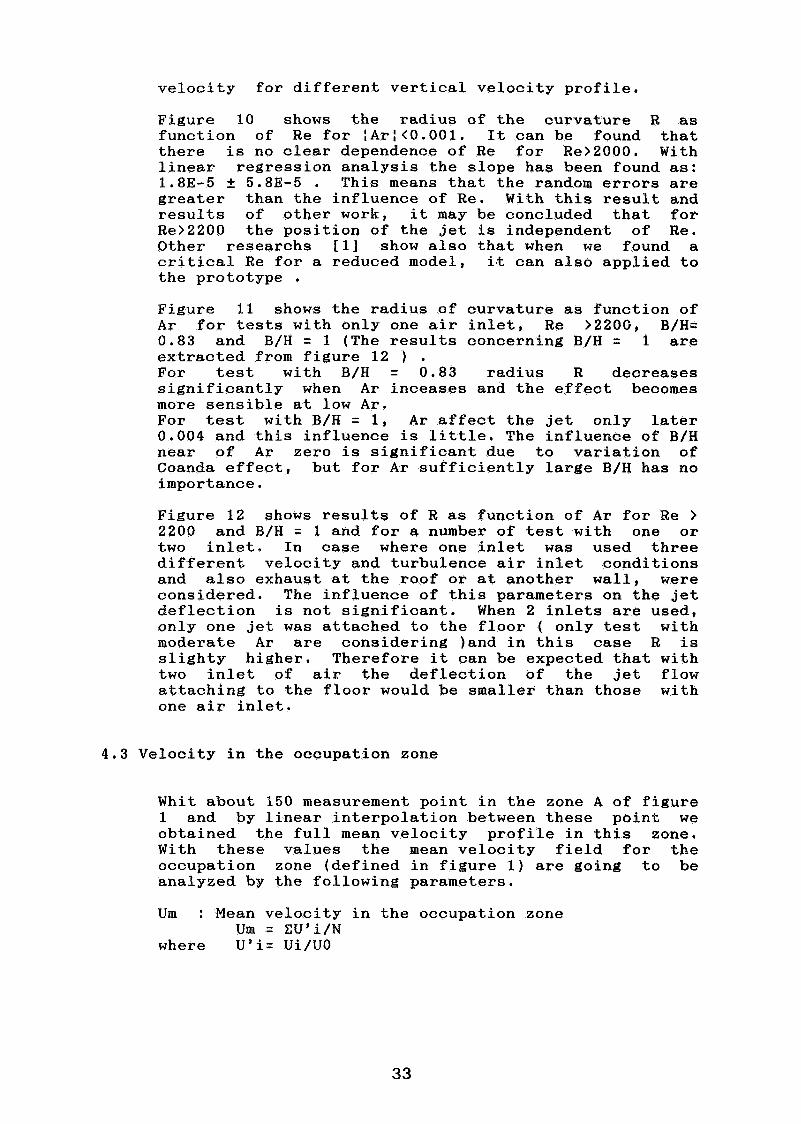
Figure 10 shows the radius of the curvature R as function of Re for :Ar:<0.001. It can be found that there is no clear dependence of Re for Re>2000. With linear regression analysis the slope has been found as: 1.8E-5 2 5.83-5 . This means that the random errors are greater than the influence of Re. With this result and results of other work, it may be concluded that for Re>2200 the position of the jet is independent of Re. Other researchs [I] show also that when we found a critical Re for a reduced model, can also applied to the prototype . Figure 11 shows the radius of curvature as function of Ar for tests with only one air inlet, Re >220G, B/H= 0.83 and B/H = 1 (The results concerning B/H = 1 are extracted from figure 12 ) . For test with B/H 0.83 radius R decreases significantly when Ar inceases and the effect becomes more sensible at low Ar. For test with B/H = 1, Ar affect the jet only later 0.004 and this influence is little. The influence of B/H near of Ar zero is significant due to variation of Coanda effect, but for Ar sufficiently large B/H has no importance.
Figure 12 shows results of R as function of Ar for Re > 2200 and B/H = 1 and for a number of test with one or two inlet. In case where one inlet was used three different velocity and turbulence air inlet conditions and also exhaust at the roof or at another wall, were considered. The influence of this parameters on the jet deflection is not significant. When 2 inlets are used, only one jet was attached to the floor ( only test with moderate Ar are considering )and in this case R is slighty higher. Therefore it can be expected that with two inlet of air the deflection of the jet flow attaching to the floor would be smaller than those with one air inlet.
4.3 Velocity in the occupation zone
Whit about 150 measurement point in the zone A of figure 1 and by linear interpolation between these point we obtained the full mean velocity profile in this zone. With these values the mean velocity field for the occupation zone (defined in figure 1) are going to be analyzed by the following parameters,
Urn : Mean velocity in the occupation zone Urn = CU'i/N
where U'i= Ui/UO
S D : spatial standard deviation of mean velocity. Give an idea of the homogeneity of the velocity in the occupation zone.
S D = d(C(U'i-Ui)"/N)
Uma : Maximum mean velocity in the occupation zone
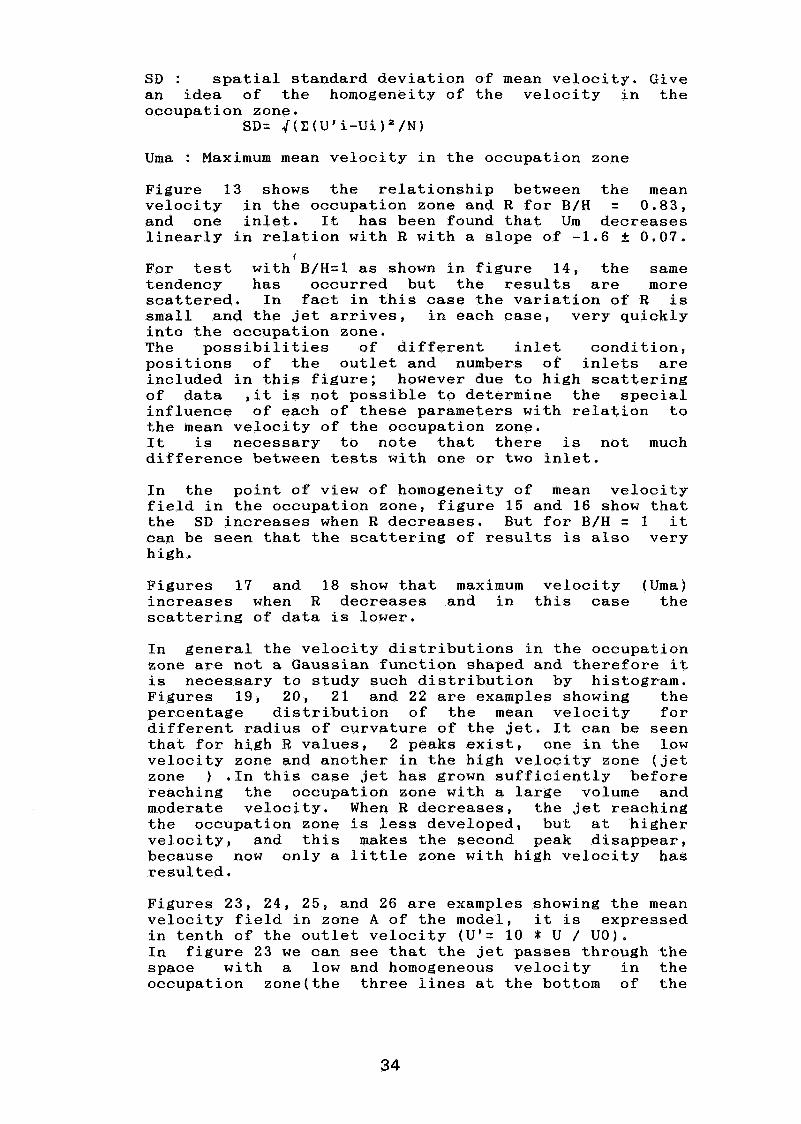
Figure 13 shows the relationship between the mean velocity in the occupation zone and R for B/H 0.83, and one inlet. It has been found that Um decreases linearly in relation with R with a slope of -1.6 4 0.07.
(
For test with B/H=l as shown in figure 14, the same tendency has occurred but the results are more scattered. In fact in this case the variation of R is small and the jet arrives, in each case, very quickly into the occupation zone. The possibilities of different inlet condition, positions of the outlet and numbers of inlets are included in this figure; however due to high scattering of data ,it is not possible to determine the special influence of each of these parameters with relation to the mean velocity of the occupation zone, It is necessary to note that there is not much difference between tests with one or two inlet.
In the point of view of homogeneity of mean velocity field in the occupation zone, figure 15 and 16 show that the S D increases when R decreases. But for B/H = 1 it can be seen that the scattering of results is also very high.
Figures 17 and 18 show that maximum velocity (Uma) increases when R decreases and in this case the scattering of data is lower.
In general the velocity distributions in the occupation zone are not a Gaussian function shaped and therefore it is necessary to study such distribution by histogram. Figures 19, 20, 21 and 22 are examples showing the percentage distribution of the mean velocity for different radius of curvature of the jet. It can be seen that for high R values, 2 peaks exist, one in the low velocity zone and another in the high velocity zone (jet zone ) ,In this case jet has grown sufficiently before reaching the occupation zone with a large volume and moderate velocity. When R decreases, the jet reaching the occupation zone is less developed, but at higher velocity, and this makes the second peak disappear, because now only a little zone with high velocity has resulted,
Figures 23, 24, 25, and 26 are examples showing the mean velocity field in zone A of the model, it is expressed in tenth of the outlet velocity (U'= 10 * U / UO), In figure 23 we can see that the jet passes through the space with a low and homogeneous velocity in the occupation zone(the three lines at the bottom of the
figure represent the occupation zone), In figure 24 with R=0.3 the jet passes through the occupation zone at high velocity . Figure 25 is for test with 2 inlets at Archimedes number close to 0 , it can be seen that the influence of the second jet in the occupation zone is not high and this results in a velocity field in the occupation zone similar to the test with only one inlet, Figure 26 shows a test with 2 inlets at high Archimedes number .
5 , - Discussion and conclusions
Optimal values and estimated error for the time of integration of the velocity measurement has been found experimentally. These values agree in general with analysis of autocorrelation [ 8 1 , but a detailed comparison is not possible due to low frequency of velocity measurements.
In general, due to two dimensional characteristic of the flow, there is a formation of low pressure zones , Whether exist or not of these zones makes the air movement in the model change completely without sensitive changes of other conditions. It produces a unstable flow; Timmons (4) found also bistable flows for some geometries in a similar problem. The instability problem and the fact of different time constants for the air and walls result that temperatures in walls are not directly in relation with instantaneous flow and it depends on mean flow pattern in long time.
The changing external condition (wind), results in various highly different internal air movement and it is very difficult to estimate the actual flow condition in the real building . Considering heat load conditions, wind velocity and heat capacity of walls and ground, the air movement in the inside can be considered as a mean weighted value of the following particular situations: one air inlet and the jet deflected to the occupation zone; two air inlet with one jet deflected to the occupation zone and another deflected towards the roof and two air inlet in which both jets are deflected to the occupation zone, The exact position of the jet depends mainly of Archimedes number.
No much differences in mean velocity of the occupation zone have been found for different air flow patterns studied where at least one jet is deflected to the occupation zone but the mean velocity becomes smaller if B/H z 1 and Ar closed to zero.
All situations studied above, give good mean velocity in the occupation zone, for sheep need; only when R is very small some high velocity may occur in a very little zone in the space.
In the most cases, except for quite different flow rates in two inlets and at low Ar, the jet came directly into the occupation zone and we have a very good ventilation efficiency.
To decrease the length of inlet in relation to length of the wall at Archimedes number close to zero, plays a role unfavorable to the point of view of ventilation , this effect would become less and less when Ar increases. It is beneficial to have this effect if we can sacrifice a little the ventilate efficiency to decrease the mean velocity in the occupation zone.
It has been found that the velocity profile and turbulence intensity at inlet (given by the design of this one ) have very little influence for the determination of the internal micro-climate in this kind of ventilation system. It has also been verified that the position of air exhaust does not affect much the flow conditions in the occupation zone but is possible to have a "short- circuit" of fresh air which flow directly from the inlet to the exhaust in the roof when a low pressure zone is present between the jet and the roof.
References.
1.- MIERZWINSKI S. "Some exeriences in air distribution research", in procedings of the meeting ROOM VENT 87, Stockholm . 1987
2.- KLOBUT, K. SEPPANEN, 0. MAJANEN, A. "Air-exchange efficiency in a scale model test" Procedings of ROOM VENT 87, Stockholm . 1987
3.- TOGARI, S. and HAYAKAWA, S . "Scale model experiment of air distribution in the large space of the shinkokugikan sumo wrestling arena". procedings of ROOM VENT 87, Stockholm . 1987.
4.- BOURQUE, C. and NEWMAN, B. G. "Reattachment of a two-dimentional, incompressible jet to an adjacent flat plate". The Aeronautical Quartely, vol XI, August 1960, pp 201-232.
5 . - SAWYER, R . A. "The flow due to a two-dimensional jet issuing parallel to a flat plate", Journal of Fluid Mechanics, 9(4)9 1960, pp 543-561 .
6.- TIMMONS et al. "Experimental and numerical study of air movements in slot ventilated enclosures ", ASHRAE Trans. 86 part 1 ,1980 pp 221-240 .
7.- HAYES, F. C. and STOECKET, W. F a "Heat transfer characteristics of the air curtain ", ASHRAE Trans. 75 part 2 , 1969, pp 153-167.
8.- TENNEKES, H. and LUMLEY, J. L. "A first course in turbulence ", The Massachusetts Institute of Technology, Massachusetts, 1972,
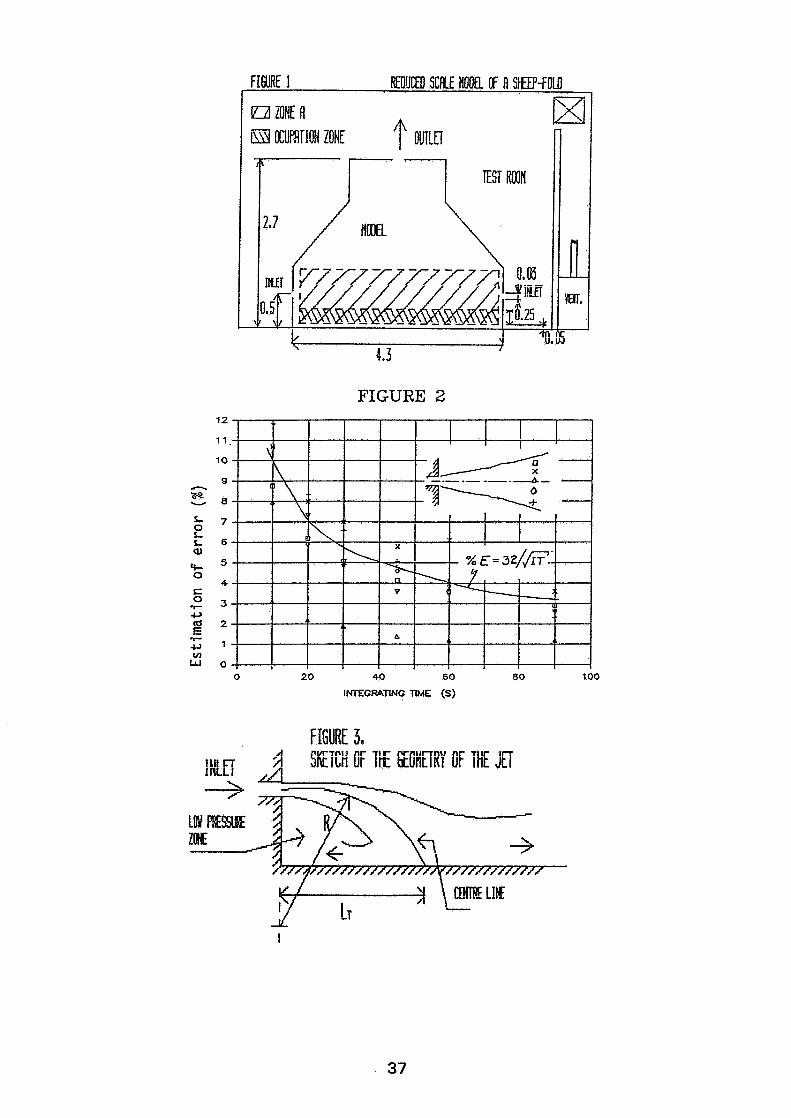
FIGURE 2
0 20 40 60 80 100
IMEGRATING TIME (S)
FIGURE 3,

FIGURE 5 FIGURE 6.
FIGURE 7. fir =0 As l=lXlR Ro2=2400
FIGURE 8 Ael=25W L2=2600 FIGURE 9, ' Rr l=0.005 flr2=0,005
FIRST 7 HOIJRS' RFTER 7 HOURS
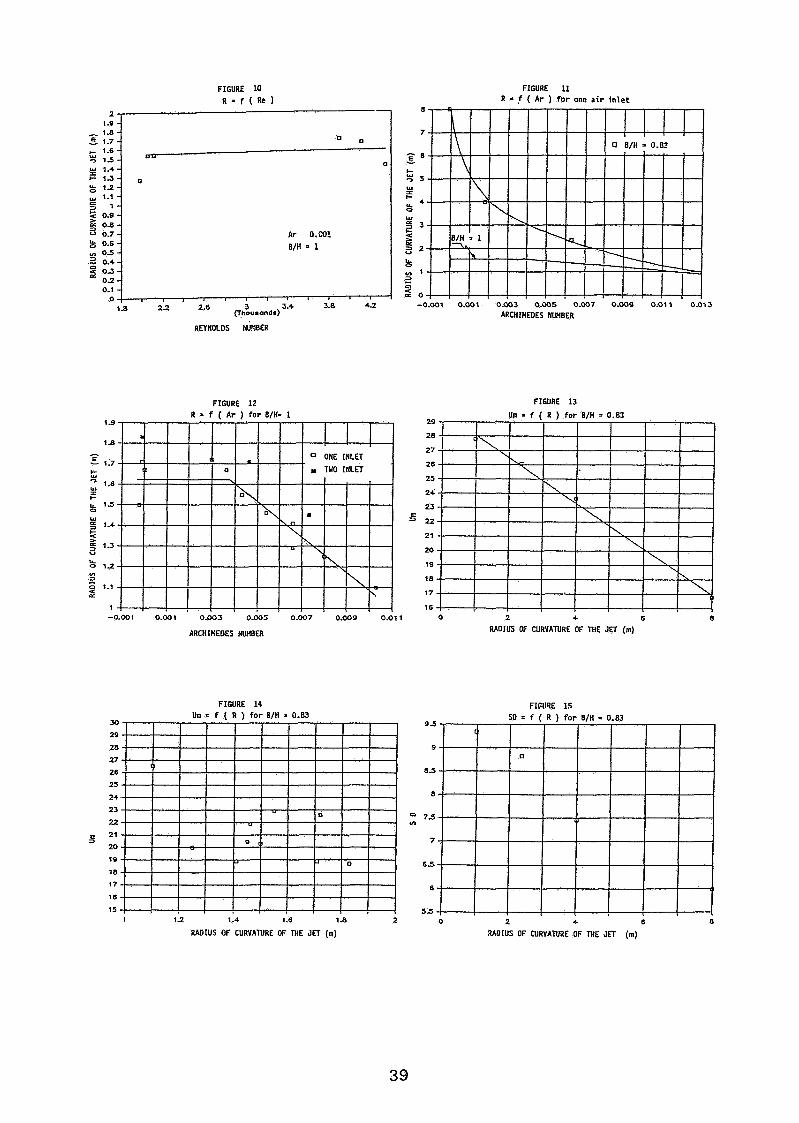
FIGURE 10 ~ = f ( R e )
- 1a-j E 1.7 - + 1.6 - Y 9 1 5 - w 1.4- E 1 3 -
1 3 - , 1.1 - P 2 1 - z 0.9 - g o a - 0 0.7 - 3 0.6 - = 0 5 - L. 0.4 - 9 0 3 - 0:
0 9 -
REYNOLOS NIhBER
FIGURE 11 R - f ( A r ) f o r one a i r i n l e t
FIGURE 12 R = f I A r 1 f o r B/H- 1
-0.001 0-001 0.003 0.005 0.007 0.Wg 0.01 1
ARCHIMEOES W B E R
ARCHIMEDES NUMBER
FIGURE 13
Un = f ( R ) f o r B/H = 0.83 29
28
27
26
25
24
23
22
21
20
19
18
17
16 0 2 4 6 8
RADIUS OF CURVATURE OF M E JET (m)
FIGURE 14 FIFl lRE I S Um = f ( R ) f o r B/H = 0.83
30
29
28 9
27
26 8 5
25
24 8
23
22 7 5
V1
3 2' 7 20
19 6 5 18
17 6
16
15 5.5 1 1.2 1.4 1.6 1.8 2 0 2 4 6 8
RADIUS OF CURVANRE OF THE JET (m) RADIUS OF CURVATURE OF THE JET (m)
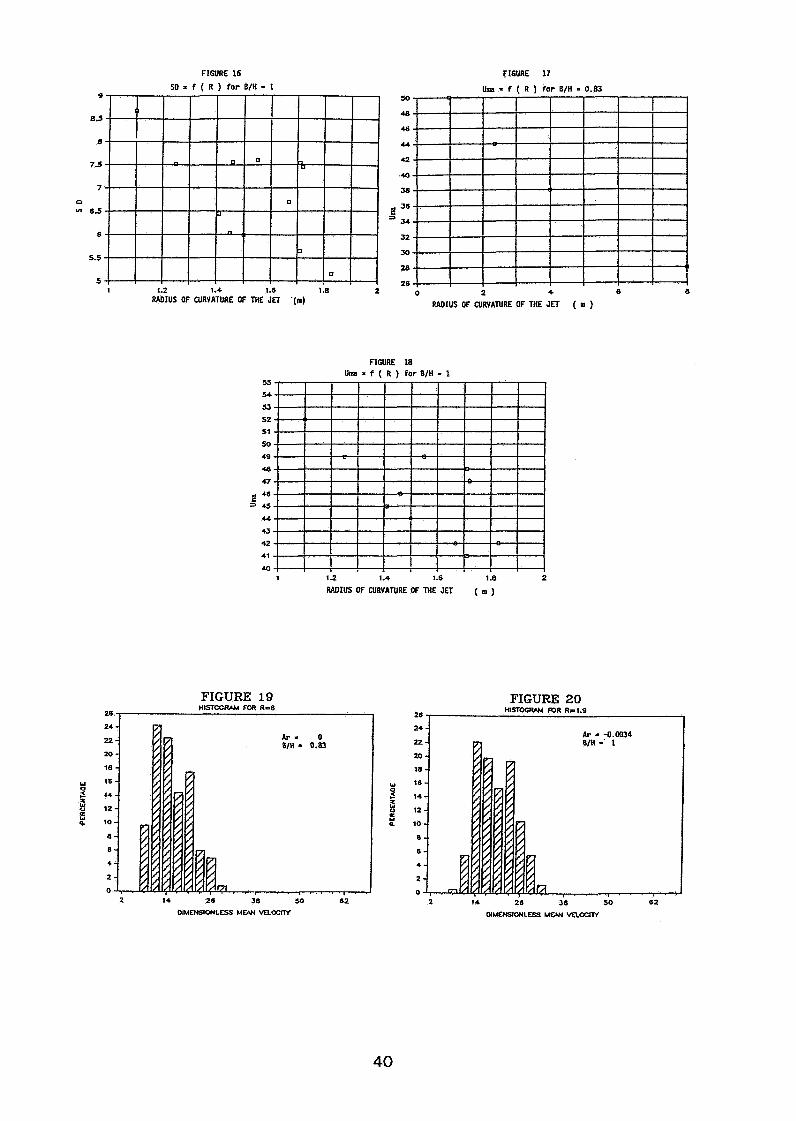
FIGURE 16 FIGURE 17
SO = f ( R ) for B/H - 1 urpa = f ( R ) for B/H - 0.83 9 5 0 - -
8 5 48
46
I I I 1 1 I I 0
5 , 1 1.2 1.4 1.6 1.8 2 0 2 4 8 8
RADIUS OF CURYATURE OF THE JET '(m) RAOIUS OF CURYATURE OF THE JET ( )
FIGURE 18 Uma = f ( R ) far B/H = 1
55
54
53
52
51
50
49
48
47
P 46
9 45
44
43
42
41
40 1 1 2 1.4 1.6 1 3 2
RADIUS OF CURVATURE OF THE JET ( m )
FIGURE 19 HlSTCCRA4 FOR R-6
I
FIGURE 20 26 , HISTOUW4 FOR R-1.9
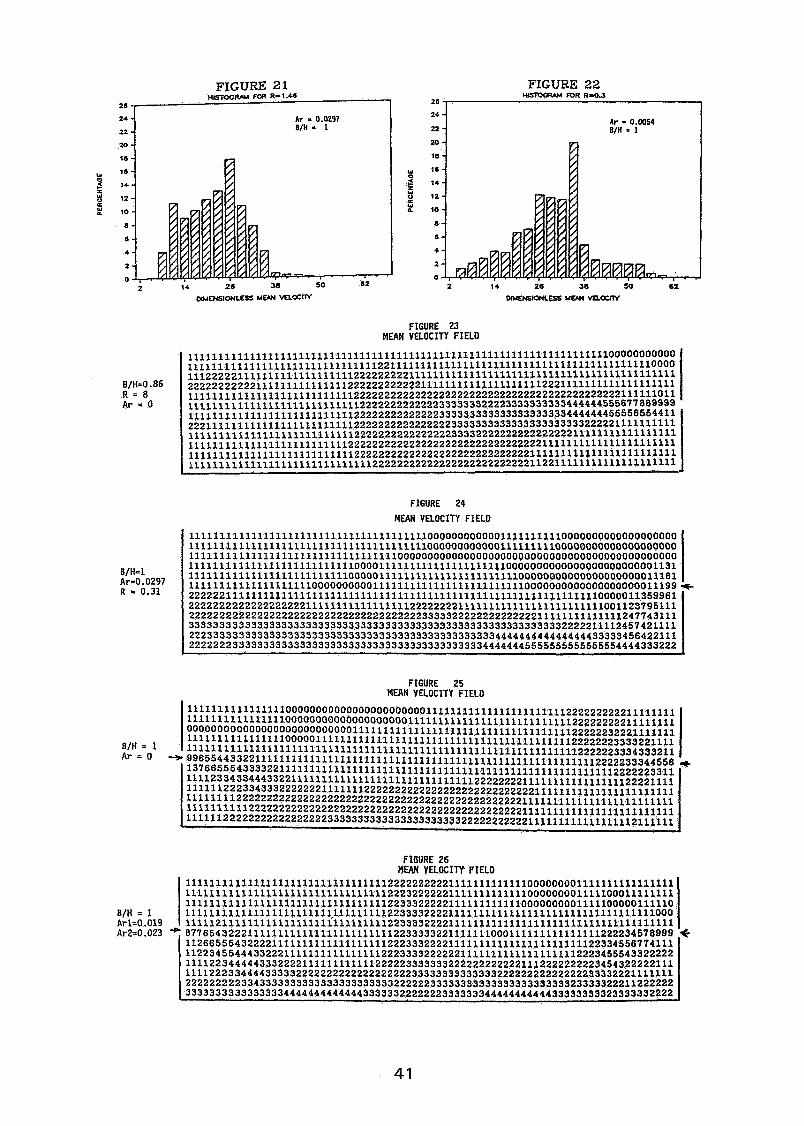
FIGURE 21 FIGURE 22 H I S T O W FOR R d 3
26 26
24 24 A r - 0.0054
22 22
20 20
I8 18
W w 16
14 2 14
I 12 8 12 W % 10 a 10
8 8
s 6
4 4
2 2
0 0 2 14 26 M
FIGURE 23 MEAN VELOCITY FIELD
FIGURE 24
GIEAN VELOCITY F I EL0
FIGURE 25 MEAN VELOCITY FIELD
FIGURE 26 MEAN VELOCITY FIELD
11111111111111111111111111111111122222222221111111111111000000001111111111111111 11111111111111111111111111111111122232222221111111111111000000001111100011111111 11111111111111111111111111111111122333222221111111111110000000001111100000111110 11111111111111111111111111111111122333322221111111111111111111111111111111111~0~ i1i1i2iii1iiii1iii1iiiiiiiiiiiii12233332222iiiiiiiiiiiiiiiiiiiiiiiiiiiiiiiiiiiii 8776543222111111111111111111111111223333322111111100011111111111111122223457899~ 11266555432222111111111111111111122233322221111111111111111111111122334556774111 112234554443322211111111111111112223333222222111111111111111111122234555433222~2 11112234444433322221111111111112222233333332222222222221112222222223454322222111 1111222334444333332222222222222222222333333333333332222222222222223333222111111~ 22222222233433333333333333333333332222223333333333333333333333323333322211222222 33333333333333334444444444444333333222222233333334444444444433333333323333332222
Discussion
Paper 3
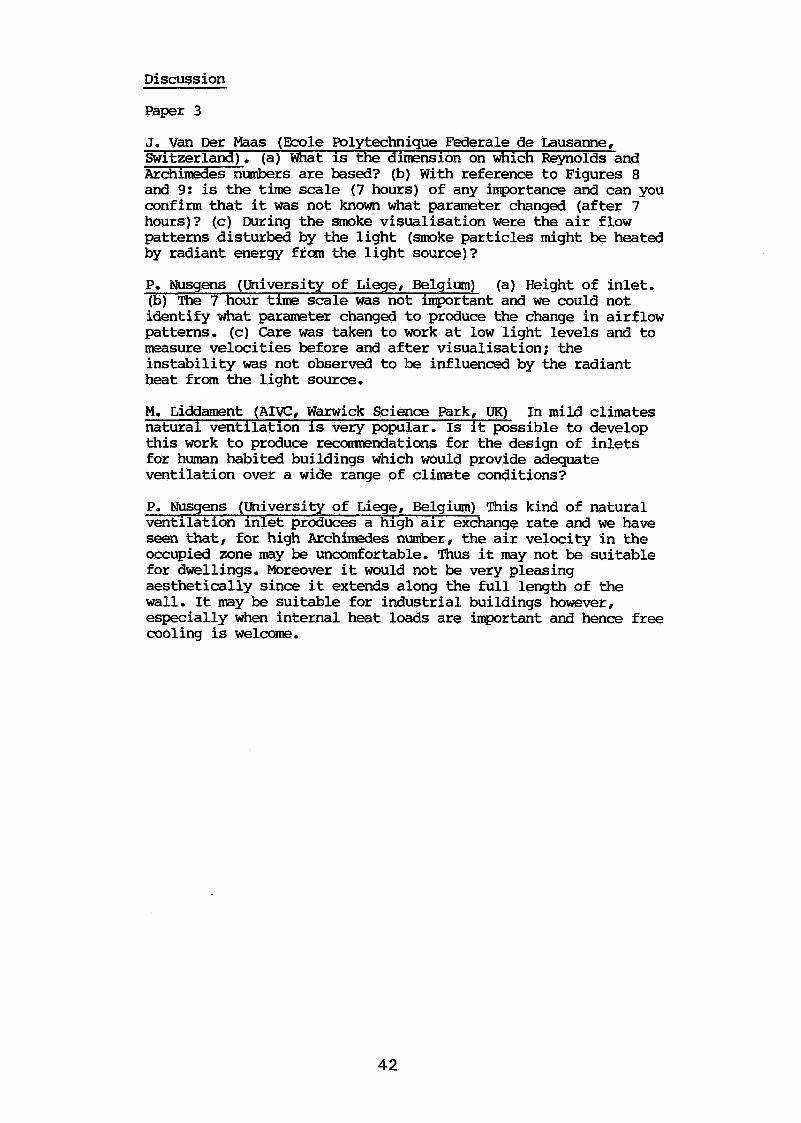
J, Van Der Maas (Ecole Polytechnique Federale de Iausanne, Switzerland). (a) What is the dimnsion on which Reynolds and ArchMes numbers are based? (b) With reference to Fiqures 8 and 9: is the time scale (7 hours) of any importance a& can you confirm that it was not known what parameter changed (after 7 hours)? (c) During the smoke visualisation were the air flow patterns disturbed by the light (smoke particles might be heated by radiant energy from the light source)?
P. Nusgens (University of Liege, Belgium) (a) Height of inlet. (b) The 7 hour time scale was not important and we could not identify what parameter changed to produce the change in airflow patterns, (c) Care was taken to work at low light levels and to measure velocities before and after visualisation; the instability was not observed to be influenced by the radiant heat from the light source.
Me Liddament (AIVC, Warwick Science Park, UK) In mild climates natural ventilation is very popular. Is it possible to develop this work to produce reammendations for the desian of inlets for human habited buildings which would provide aaequate ventilation over a wide range of climate conditions?
P. Nusgens (University of Liege, Belgium) This kind of natural ventilation inlet produces a high air exchange rate and we have seen that, for high Archides number, the air velocity in the occupied zone may be uncomfortable. Thus it may not be suitable for dwellings. Moreover it would not be very pleasing aesthetically since it extends along the full length of the wall, It may be suitable for industrial buildings however, especially when internal heat loads are important and hence free cooling is welcome.
EFFECTIVE VENTILATION
9 th A I V C Conference, Gent, Belgium 12-15 September, 1988
Paper 4
DETERMINATION OF VENTILATION EFFICIENCY BASED UPON
SHORT TERM TESTS
Ren Anderson System Integration Technology Leader Solar Energy Research lnstltute 1617 Cole Blvd. Golden, Co 80401 USA
SYNOPS l S
A short term testing methodology is developed to evaluate the performance of ventilation systems with respect to control of indoor air pollutants. Two ef- ficiency measures, displacement efficiency and removal efficiency, are defined based upon analysis of mass transport Into and out of a specifled control volume. The displacement efficiency measures the ability of the ventilatlon system to supply ventilation air to a room without short-clrcultlng to the return duct. The removal efficiency measures the ability of the ventila- tion system to remove indoor pollutants from a room before they mix with room air. Both efficiencies are based upon short term measurements taken during the time that one volume change Is supplied by the ventila- tion system to the room. Because these efficiency measures are based upon control volume analysis, they have well defined limits as t-m that can be used to calibrate experimental measurements. These new e f - flclency measures are applied to the analysis of a cel ling based ventilation system and comparisons are made wlth age of alr and pollutant removal effective- ness concepts.
L IST OF SYMBOLS
c concentration (kg/m3) Q ventilation rate (m3/s) q volumetric pollutant source strength (m3/s) sa air stratiflcatlon factor, nondlmenslonal,
equation ( 7 ) sp pollutant stratlficatlon factor, nondimenslonal
equatlon (12) V room volume (m3)
Greek
n d average room dlspiacement efficiency nondimensional, Figure 5
r\r average room removal efficiency nondimensional Figure 12
n p Pollutant del lvery efficiency, nondimensional, equation ( 9 ) .
1' nominal room volume replacement time, V/Q (s)

Subscripts
ent entrainment o condition at t=O in supply out return s poi lutant source oz occupied zone
Superscripts
I I oca 1 re1 relative, (locai)/(overail average) oz occupied zone average
l NTRODUCT i ON
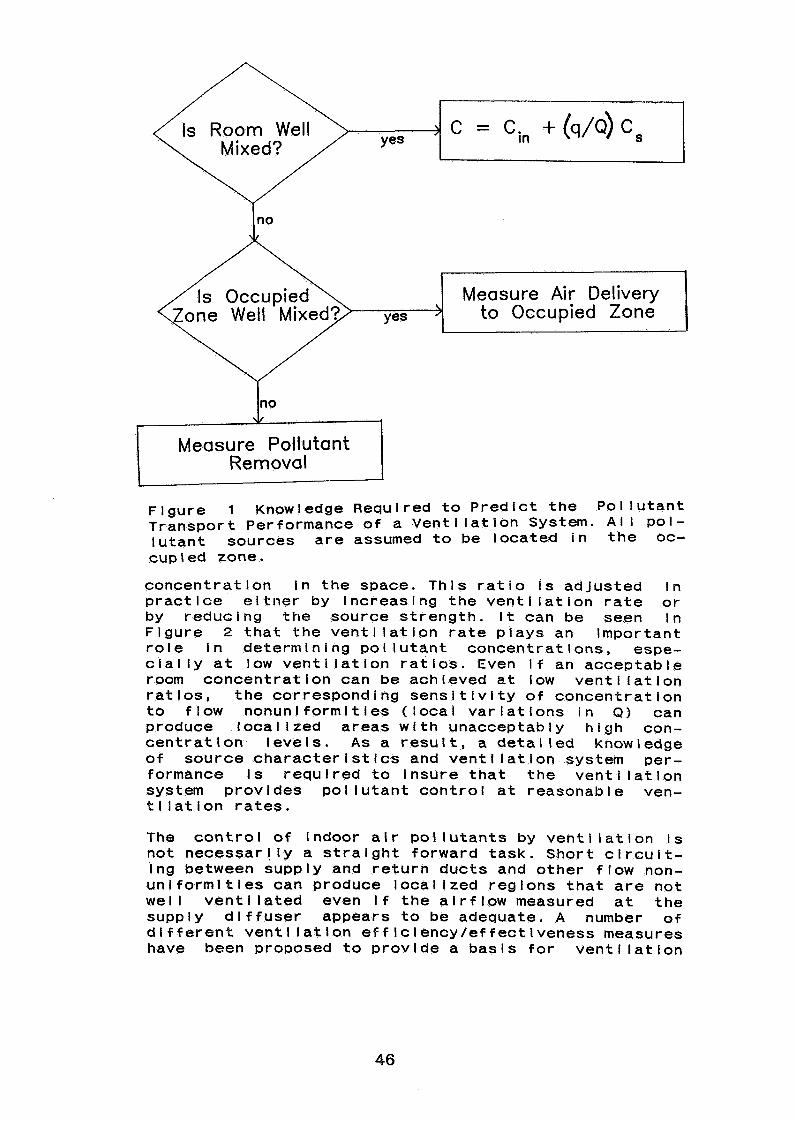
increased awareness of the potential health risks as- sociated with indoor air pollutants has stimulated interest in Improving our understanding of how ventila- tion air is distributed and how pollutants are transported In buildings. The task of predicting the pollutant transport produced by venti iation systems is not a simple one. Pollutant transport depends in general upon bui lding geometry, pollutant source characteristics, and thermo/fluid boundary conditions such as flow rate, thermal stratification, duct loca- tion, and diffuser characteri'stics. If the air in the room is we1 i mixed, then the concentration can be predicted based upon knowledge of the room ventilation rate, the pollutant source strength, and the concentra- tion in the supply air (Figure 1). in situations where the well mixed assumption does not apply, one must determine in addltion the percentage of ventilation adr that is supplied to the occupied zone and the percent- age of the pollutant source that is directly removed by the ventilation system before mixing wlth air in the occupied zone . A flow chart showing the level of detail that is required for various situations is in- cluded In Figure 1 .
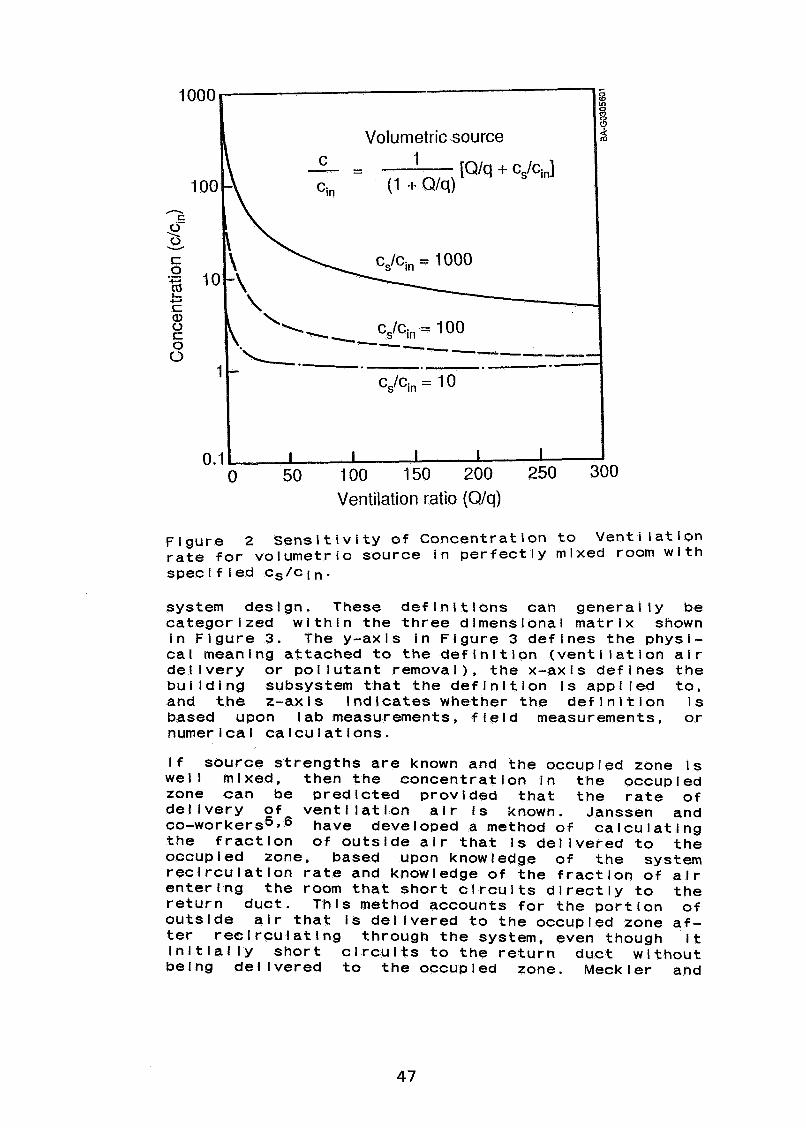
The mitigation of Indoor alr quality problems depends upon maintaining an adequate balance between ventila- tlon rate and pollutant source strength . This balance is shown graphically in Figure 2 for the case of a volumetric source in a perfectly mixed room. The horizontal axis is the ratio of ventliation flow rate to source flow rate and the vertical axis is the con- centratlon of room concentration to Inlet concentration. For a fixed source concentration cs, the magnitude of the ventilation ratio Q/q determines the
I Measure Air Delivery 1 (Zone Well ' Mixed?) yes 7 to Occupied Zone 1
Measure Pollutant Removal
Figure 1 Knowledge Required to Predict the Pol iutant Transport Performance of a Ventilation System. Ai 1 poi- lutant sources are assumed to be located in the oc- cupied zone.
concentration in the space. This ratio is adjusted in practice eitner by increasing the ventl lation rate or by reducing the source strength. it can be seen in Figure 2 that the ventiiation rate plays an important role in determining pollutdnt concentrations, espe- cially at low ventilation ratios. Even i f an acceptable room concentration can be achieved at low venti iation ratios, the corresponding sensitivity of concentration to flow nonuniformities (local variations in Q ) can produce localized areas with unacceptably hi g h con- centration levels. As a result, a detailed knowledge of source characteristics and ventllation system per- formance is required to insure that the ventilation system provides pol lutant control at reasonable ven- tilation rates.
The control of Indoor air pollutants by ventilation is not necessarily a straight forward task. Short circuit- ing between supply and return ducts and other flow non- uniformities can produce localized regions that are not well ventilated even I f the airflow measured at the supply diffuser appears to be adequate. A number of different ventllation efficiency/effectlveness measures have been proposed to provide a basis for venti iation
Ventilation ratio (Qlq)
'5 D 0 r: 0
Volumetric source 6
a, 0 t c,lc,, = I00 S 1 -*-.-. --------____ . -
Figure 2 Sensitivity of Concentration to Ventilation rate for volumetric source in perfectly mixed room with specified cs/cin.
0.1
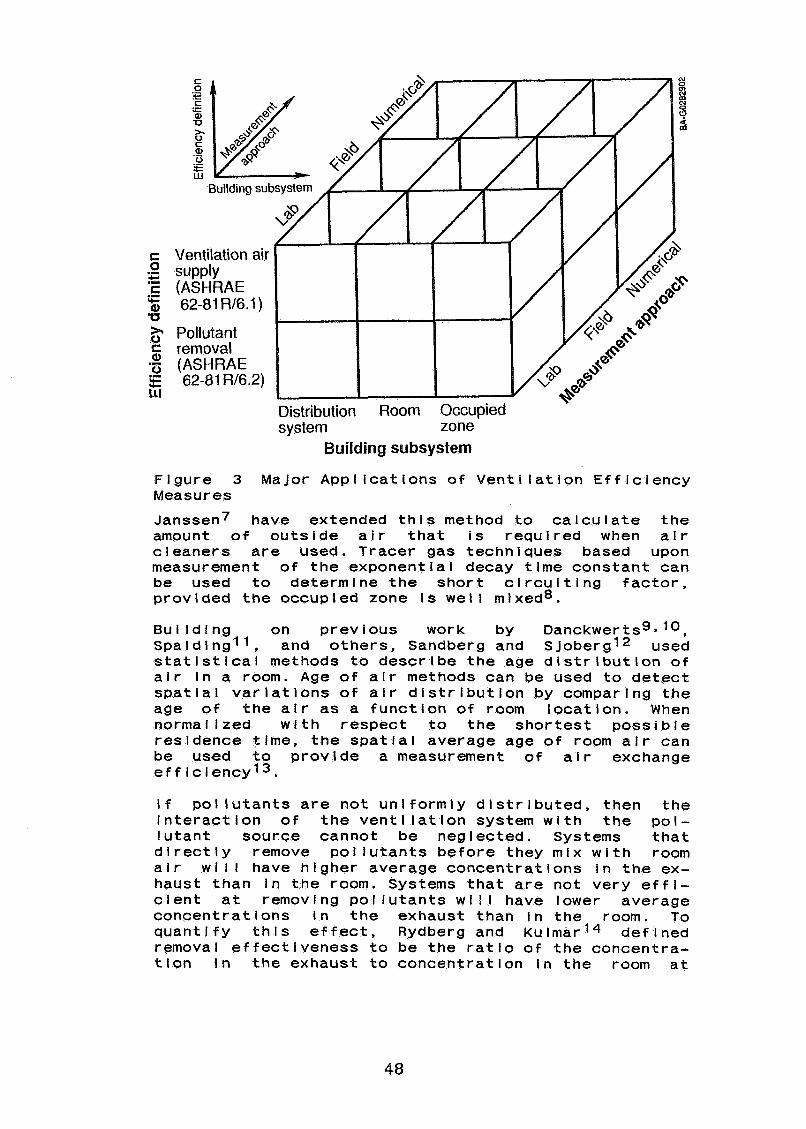
system design. These deflnitlons can generally be categorized within the three dimensional matrix shown in Figure 3. The y-axis in Figure 3 defines the physi- cal meaning attached to the definition (ventllatlon air dei ivery or pollutant removal), the x-axis defines the building subsystem that the definition is applied to, and the z-axis Indicates whether the definition is based upon lab measurements, field measurements, or numerical calculations.
c,lc,, = 10
- I I I I I
If source strengths are known and the occupied zone Is well mixed, then the concentration in the occupied zone can be predicted provided that the rate of dei ivery of venti iation air is known. Janssen and c o - ~ o r k e r s ~ ~ ~ have developed a method of calculating the fraction of outside air that Is del ivered to the occupied zone, based upon knowledge of the system recircuiatlon rate and knowledge of the fractlon of air enterlng the room that short circults directly to the return duct. This method accounts for the portion of outside air that is delivered to the occupied zone af- ter recirculating through the system, even though it initially short circuits to the return duct without being del ivered to the occupied zone. Meckier and
0 50 100 150 200 250 300
Distribution Room Occupied system zone
Building subsystem
Flgure 3 Major Applications of Ventilation Efficiency Measures
~ a n s s e n ~ have extended thls method to calculate the amount of outside air that is required when air cleaners are used. Tracer gas techniques based upon measurement of the exponential decay time constant can be used to determine the short clrcultlng factor, provided the occupied zone is well mixed8.
Bui ldlng on previous work by ~anckwerts~.~O, spaldlngll, and others, Sandberg and sjoberg12 used statistical methods to describe the age distributlon of alr in a room. Age of air methods can be used to detect spatial varlatlons of air dlstributlon by comparing the age of the air as a function of room location. When normalized with respect to the shortest possible residence tlme, the spatial average age of room air can be used to provide a measurement of air exchange efficiency13.
I f pollutants are not uniformly distributed, then the lnteractlon of the vent1 latlon system with the pol- lutant sour.ce cannot be neglected. Systems that dlrectly remove pollutants before they mix with room air will have higher average concentrations In the ex- haust than in the room. Systems that are not very effi- cient at removing pollutants will have lower average concentratlons in the exhaust than In the room. To quantify thls effect, Rydberg and ~ u l m a r l ~ defined removal effectiveness to be the ratlo of the concentra- tion In the exhaust to concentration In the room at
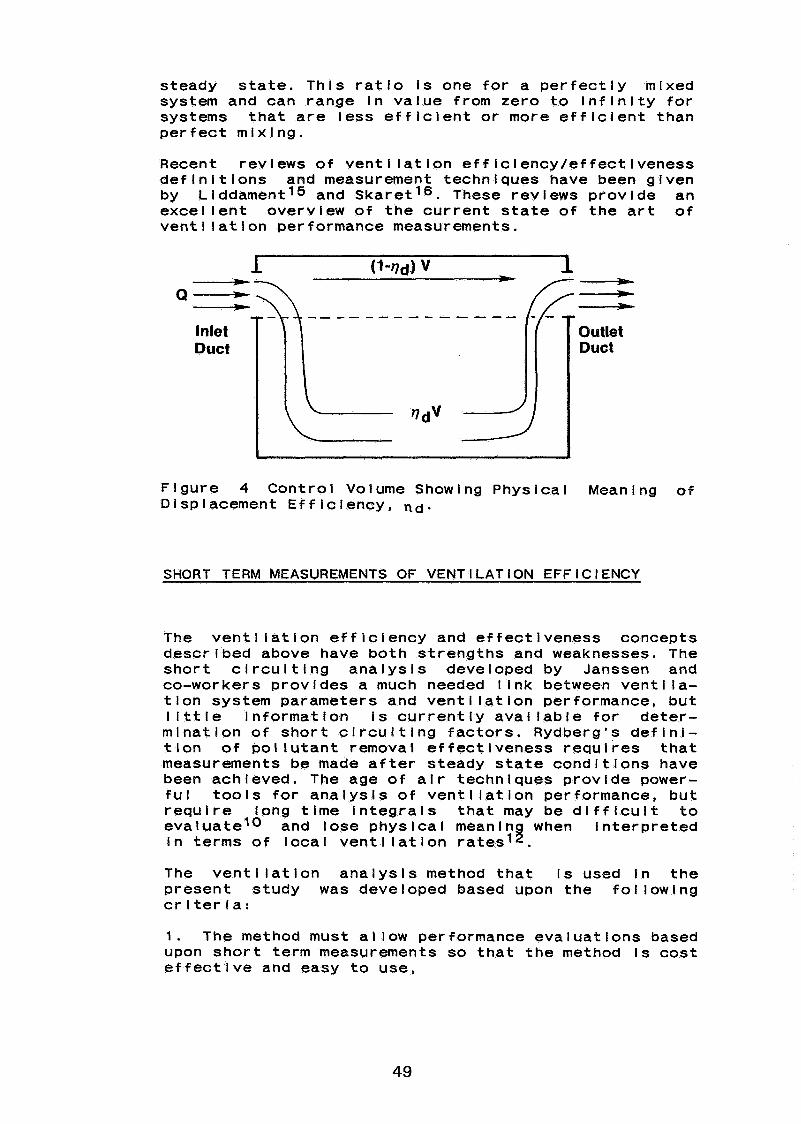
steady state. This ratio is one for a perfectly mixed system and can range in value from zero to infinity for systems that are less efficient or more efficient than perfect mixing.
Recent reviews of venti lation efficiency/effectiveness definitions and measurement techniques have been given by ~iddamentl~ and skaret16. These reviews provide an excellent overview of the current state of the art of ventl iation performance measurements.
____F_ ___j)
Q- - - - Inlet Outlet Duct Duct
Figure 4 Control Volume Showing Physical Meaning of Displacement Efficiency, nd.
SHORT TERM MEASUREMENTS OF VENTILATION EFFICIENCY
The ventilation efflclency and effectiveness concepts described above have both strengths and weaknesses. The short circuiting analysis developed by Janssen and co-workers provides a much needed link between venti ia- tlon system parameters and venti lation performance, but little information is currently available for deter- mination of short circuiting factors. Rydberg's defini- tion of pollutant removal effectiveness requlres that measurements be made after steady state conditions have been achieved. The age of air techniques provlde power- ful tools for analysis of ventilation performance, but require long time integrals that may be difficult to evaluatelo and lose physical meanln when interpreted 9! In terms of local venti lation rates1 . The venti iation analysis method that is used In the present study was developed based upon the foilowlng criteria:
1. The method must allow performance evaluations based upon short term measurements so that the method Is cost effective and easy to use,
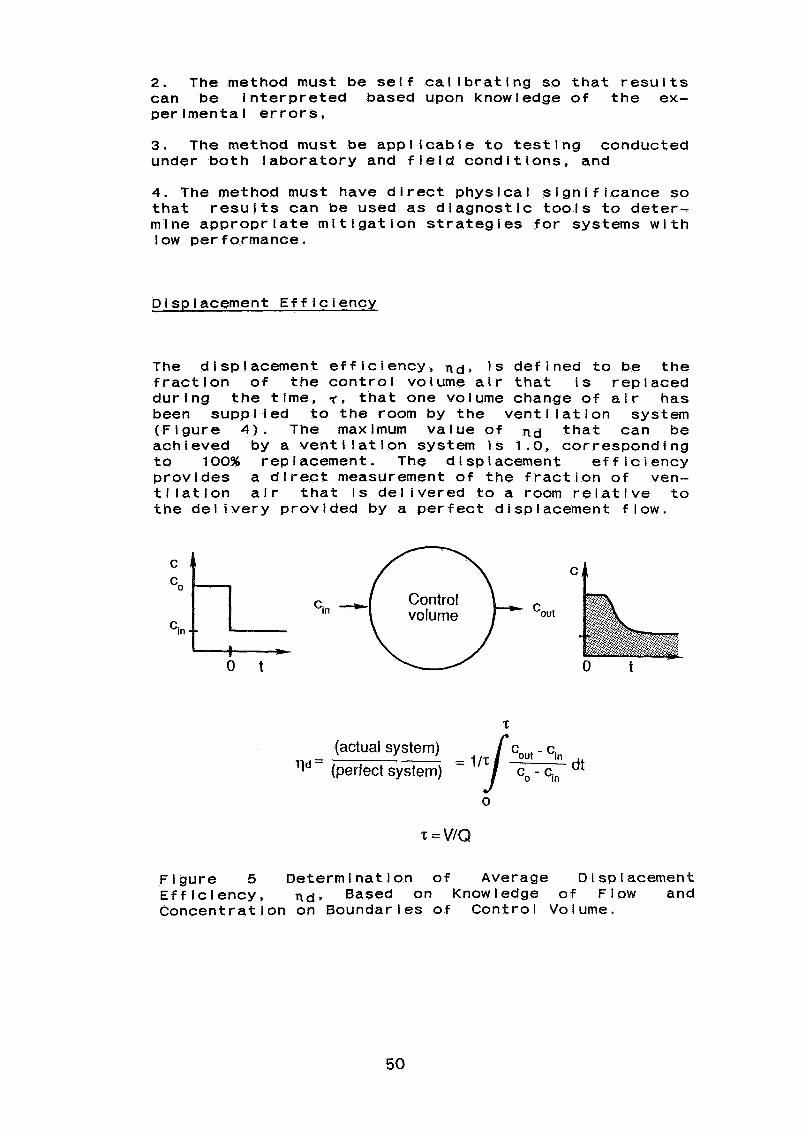
2. The method must be self calibrating so that results can be interpreted based upon knowledge of the ex- perimental errors,
3. The method must be applicable to testing conducted under both laboratory and field conditions, and
4. The method must have direct physical significance so that results can be used as diagnostic tools to deter- mine appropriate mitigation strategies for systems with low performance.
Displacement Efficiency
The displacement efficiency, nd, is defined to be the fraction of the control volume air that is replaced during the time, T , that one volume change of air has been suppi ied to the room by the ventilation system (Figure 4). The maximum value of nd that can be achieved by a ventilation system is 1.0, corresponding to 100% replacement. The displacement efficiency provides a direct measurement of the fraction of ven- tilation air that is delivered to a room relative to the delivery provided by a perfect displacement flow.
'in
(actual system) = l / T J Gout - 'in dt
'Id = (perfect system) '0 - 'in
Figure 5 Determination of Average Displacement Efficiency, nd, Based on Knowledge of Flow and Concentratlon on Boundaries of Control Volume.
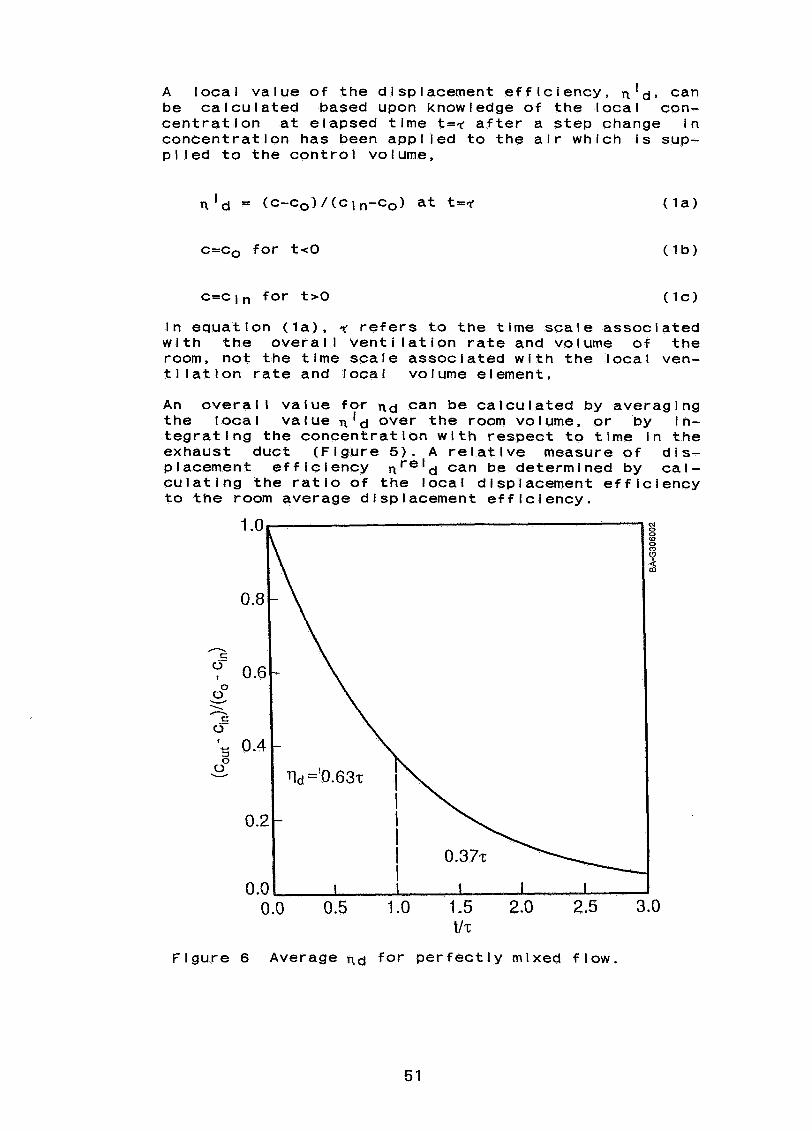
A loca l value o f the displacement e f f i c i e n c y , n ld , can be ca l cu la ted based upon knowledge o f the loca l con- c e n t r a t i o n a t elapsed t ime t=y a f t e r a step change i n concent ra t ion has been app l ied t o the a i r which i s sup- p l i e d t o the con t ro l volume,
c=cO fo r t < O (1b)
I n equat ion ( l a ) , 2 r e f e r s t o the t ime sca le associated w i t h t h e o v e r a l l v e n t i l a t i o n r a t e and volume o f the room, no t the t lme sca le associated w i t h the loca l ven- t i l a t i o n r a t e and loca l volume element.
A n o v e r a l l va lue f o r nd can be ca lcu la ted by averaging the l oca l value n l d over the room volume, o r by in- t e g r a t i n g the concent ra t ion w i t h respect t o t ime i n the exhaust duct (F igure 5 ) . A r e l a t i v e measure o f d i s - placement e f f i c i e n c y n r e l d can be determined by c a l - c u l a t i n g the r a t i o o f the local displacement e f f i c i e n c y t o t h e room average displacement e f f i c i e n c y .
tl?;
Figure 6 Average nd f o r p e r f e c t l y mixed f low.
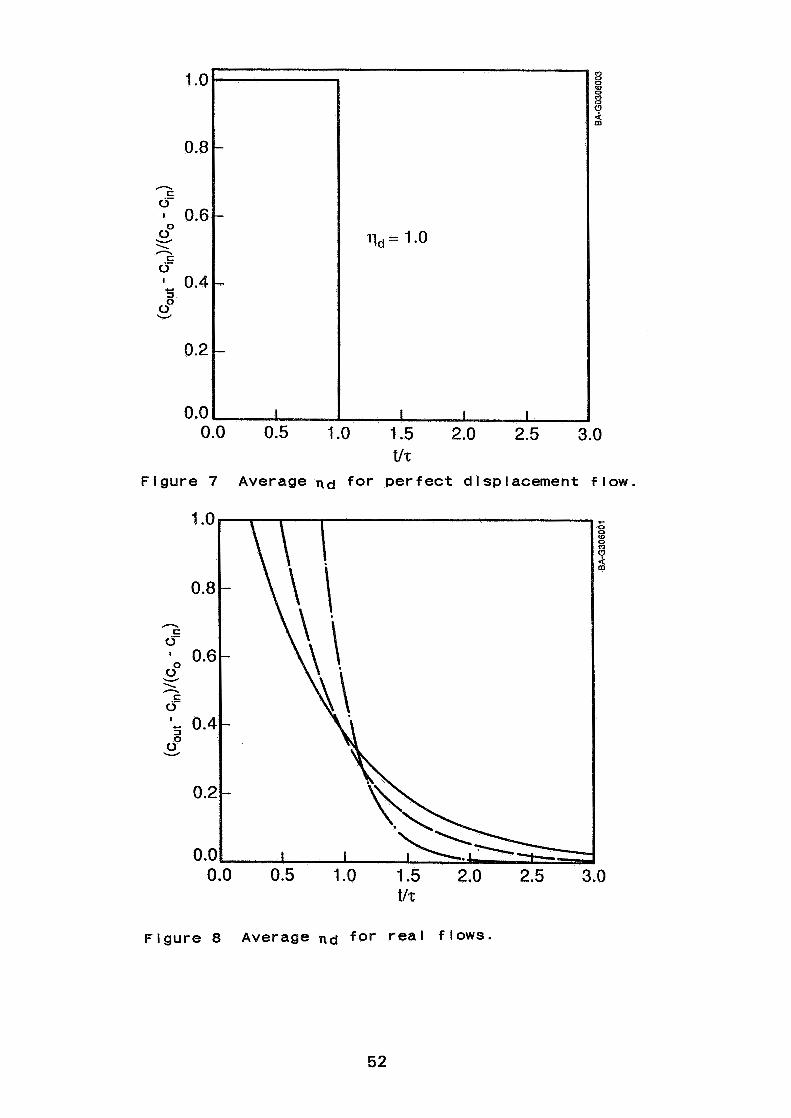
t1.r; Figure 7 Average nd for perfect displacement flow.
t/'t
Figure 8 Average nd for real flows.

imiting values of nd for perfectly mixed and perfect isplacement flows are shown in Figures 6 and 7. Real lows include a combination of displacement and mixing,
with the displacement fraction being determined primarily by the time of fllght between the supply dif- fuser and exhaust duct (Figure 8). Values of nd can also be calculated for room subvolumes. The displacement efficiency is the ef- f i c i ency obta i ned by averag i ng n I d over the occup i ed zone. It Is important to note that the integral ap- proach shown In Figure 5 can not be used to calculate local values of nd unless the local time history of concentration and veloclty distributions are known.
If the integral method of caiculatlng nd is extended to the upper limit t*, It is equivalent to the definition of local age of air13,17*18 divided by T . The theoreti- cal limiting value of the integral as t* is 1.0. When nd measurements are belng used in field studies, this limiting value can be used during initial calibration tests to determine the errors associated with un- specified Interzonal airflows and infiltration. If these sources of error are too large, they can be cor- rected for or control led.
Us i ng nd Measurements to Calculate Flow Short Circulting
One of the primary problems associated with the model- ing of HVAC system performance Is determinlng the frac- tion of alr provided at the supply diffuser that is ac- tually deilvered to a given room location. Muitizone mixing models have been used by several authors to dif- ferentiate between performance In different room s u b v o l ~ m e s ~ * ~ 9 ~ ~ 0 . In this section a modified two zone analysis wi l I be used to demonstrate the relationship between nd and short clrcuiting between the supply and return ducts in celllng based systems (Figure 4) where the return duct is located In the Jet mixing zone.
Because one of the primary obJectlves of diffuser design is to provide adequate mixing of the venti latlon Jet before It enters the occupied zonee1, it Is con- venient to dlvide the room into two zones: the Jet mixing zone wlth volume V-Voz, and the occupied zone wlth volume Voz. The Jet produces mixlng by entraining air from the occupied zone at the rate Qent. By con- tinuity, this I s also the rate at which alr Is suppi led to the occupied zone. If (V-Voz)/(Q+Qent) < c Vo,/Qent then a steady state approximation can be appl led to the Jet mixing zone, resulting in a concentration at th$ return duct equal to
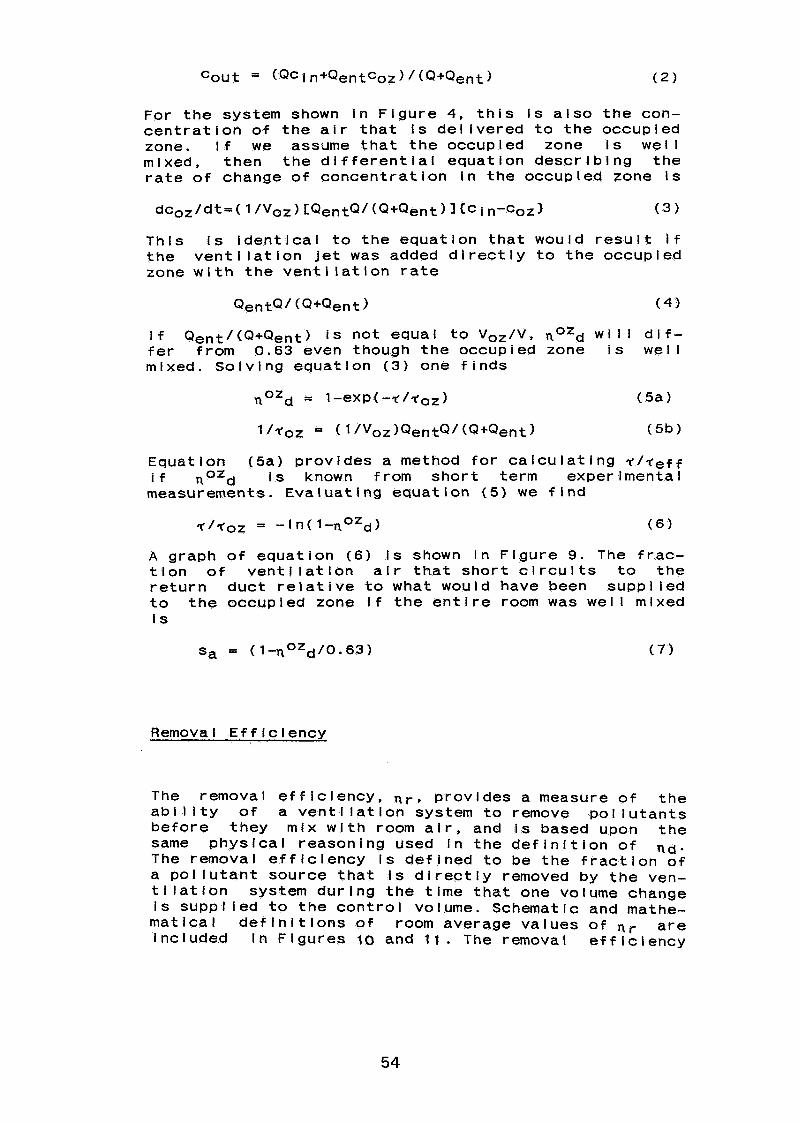
For the system shown in Figure 4, this is also the con- centration of the air that is delivered to the occupied zone. If we assume that the occupied zone is well mixed, then the differential equation describing the rate of change of concentration in the occupied zone is
This is identical to the equation that would result if the ventilation jet was added directly to the occupied zone with the ventilation rate
if Qent/(Q+Qent) is not equal to Voz/V, noZd W I l l dif- fer from 0.63 even though the occupied zone i s well mixed. Solving equation (3) one finds
Equation (5a) provides a method for calculating ~ / ~ ~ f f
if nozd is known from short term experimental measurements. Evaluating equation (5) we find
A graph of equation (6) is shown in Figure 9. The frac- tion of ventilation air that short circuits to the return duct relative to what would have been supplied to the occupied zone if the entire room was well mixed i s
Removal Efficiency
The removal efficiency, nr, provides a measure of the ablllty of a ventilation system to remove pollutants before they mix with room air, and is based upon the same physical reasoning used in the definition of nd. The removal efficiency is defined to be the fraction of a pollutant source that is directly removed by the ven- tilation system during the time that one voiume change is supplied to the control voiume. Schematic and mathe- matical definitions of room average values of n r are included In Figures 1 0 and 1 1 . The removal efficiency
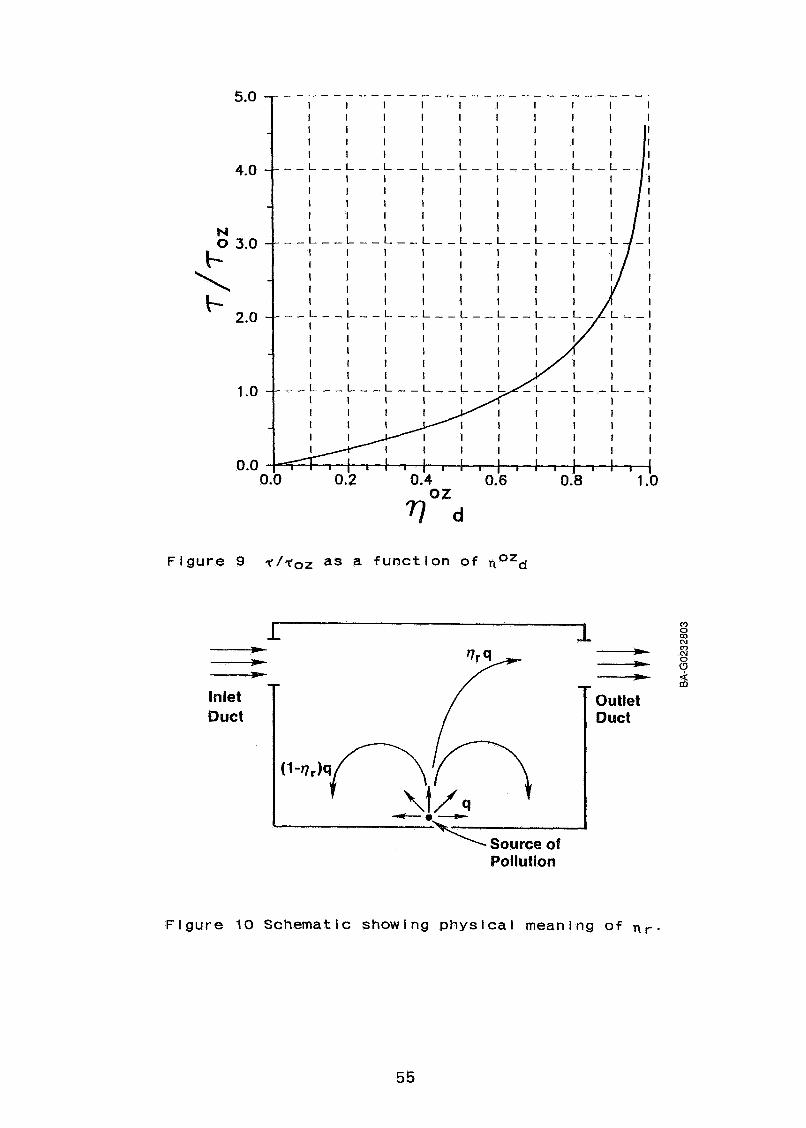
Figure 9 T/T~, as a function of
m 0 m CU
___t - z - p - m Inlet Outlet Duct Duct
Pollution
Figure 10 Schematic showing physical meaning of n r .
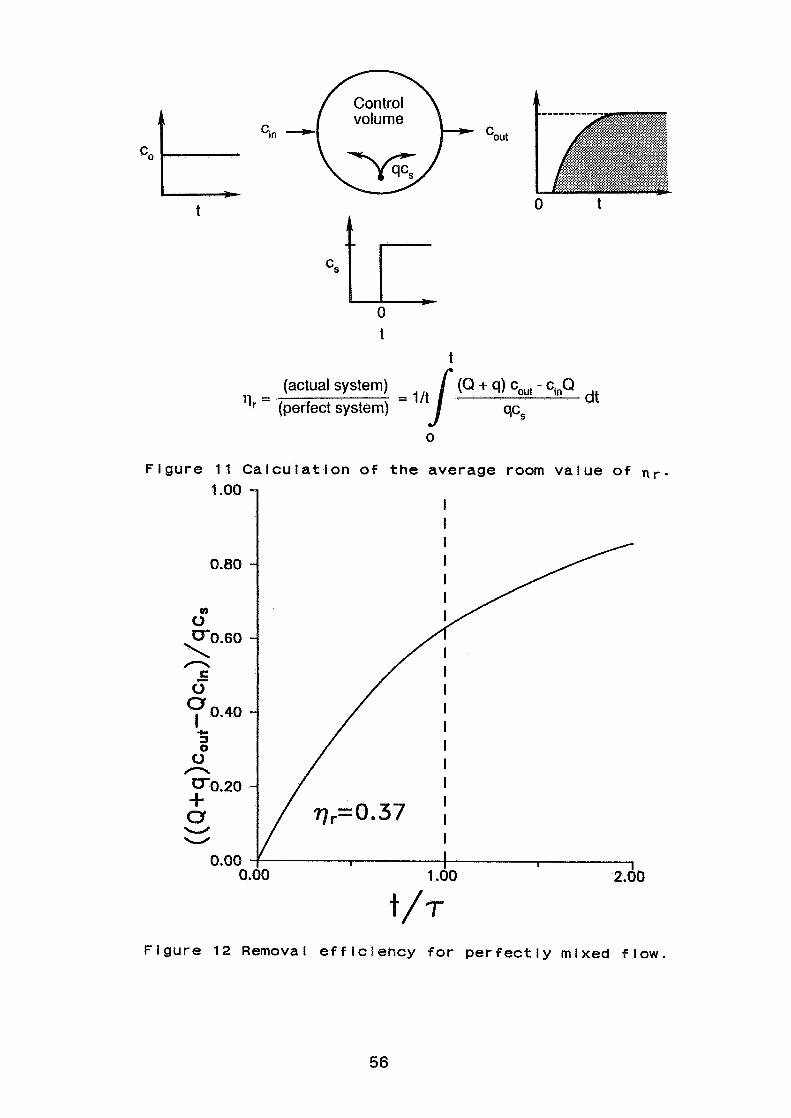
gure
(actual system) = l / t i (Q + 4) Gout - cinQ
= (perfect system) dt
qcs 0
1 1 Calculation of the average room value of n
Figure 12 Removal efficiency for perfectly mixed flow.
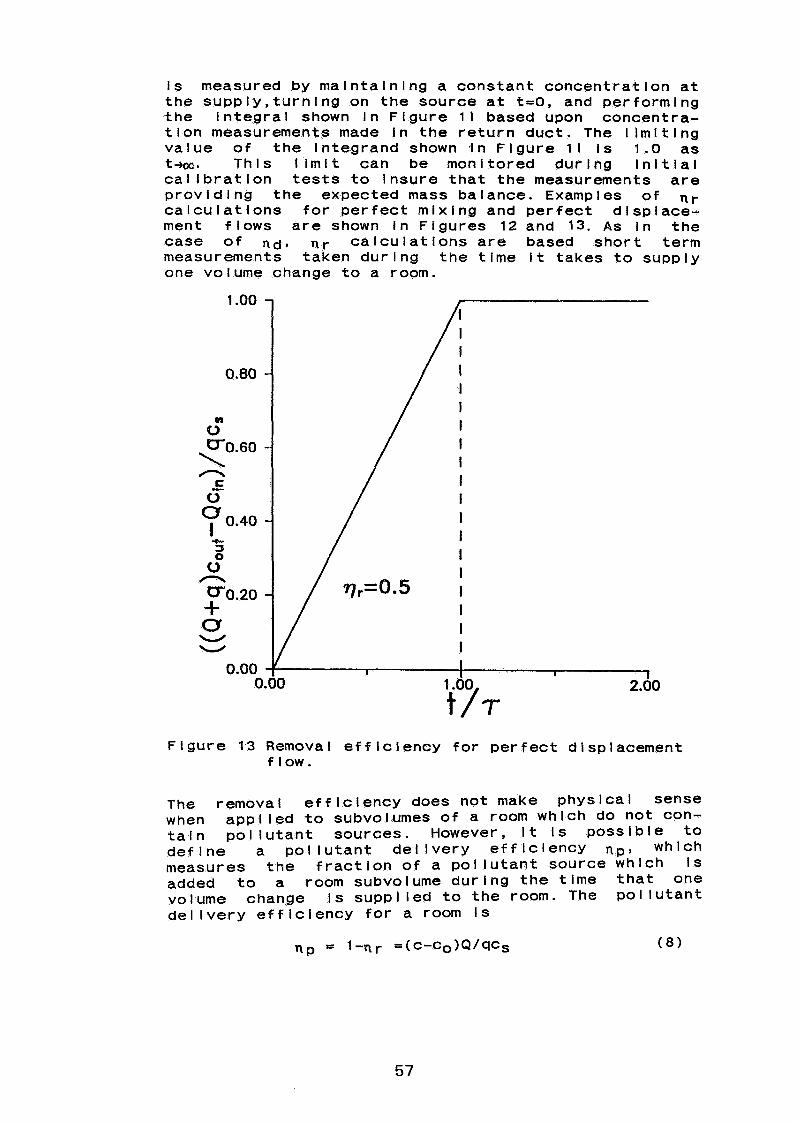
i s measured by main ta in ing a constant concentrat ion a t the supp iy , turn ing on the source a t t=O, and performing the i n teg ra l shown i n F igure 1 1 based upon concentra- t i o n measurements made I n the r e t u r n duct . The i i m i t l n g value o f the integrand shown ,in F igure 1 1 i s 1.0 as t+w. This l i m i t can be monitored dur ing i n i t i a l ca l l b r a t i o n t e s t s t o insure t ha t the measurements a re p rov id i ng the expected mass balance. Examples o f nr c a l c u l a t i o n s f o r pe r fec t mix ing and per fec t displace- ment f lows a re shown i n Figures 12 and 13. A s I n the case o f TI r c a l c u l a t i o n s a re based shor t term measuremen:!' taken dur lng the t ime i t takes t o supply one volume change t o a room.
F igure 13 Removal e f f i c i e n c y f o r pe r fec t displacement f low.
The removal e f f i c i e n c y does not make physical sense when appi led t o subvolumes o f a room which do not con- t a i n p o l l u t a n t sources. However, i t i s poss ib le t o de f i ne a p o l l u t a n t d e l i v e r y e f f i c i e n c y np, which measures the f r a c t i o n o f a pol i u tan t source which i s added t o a room subvolume dur ing the t ime t h a t one volume change i s suppi led t o the room. The p o l l u t a n t d e l i v e r y e f f i c i e n c y f o r a room i s
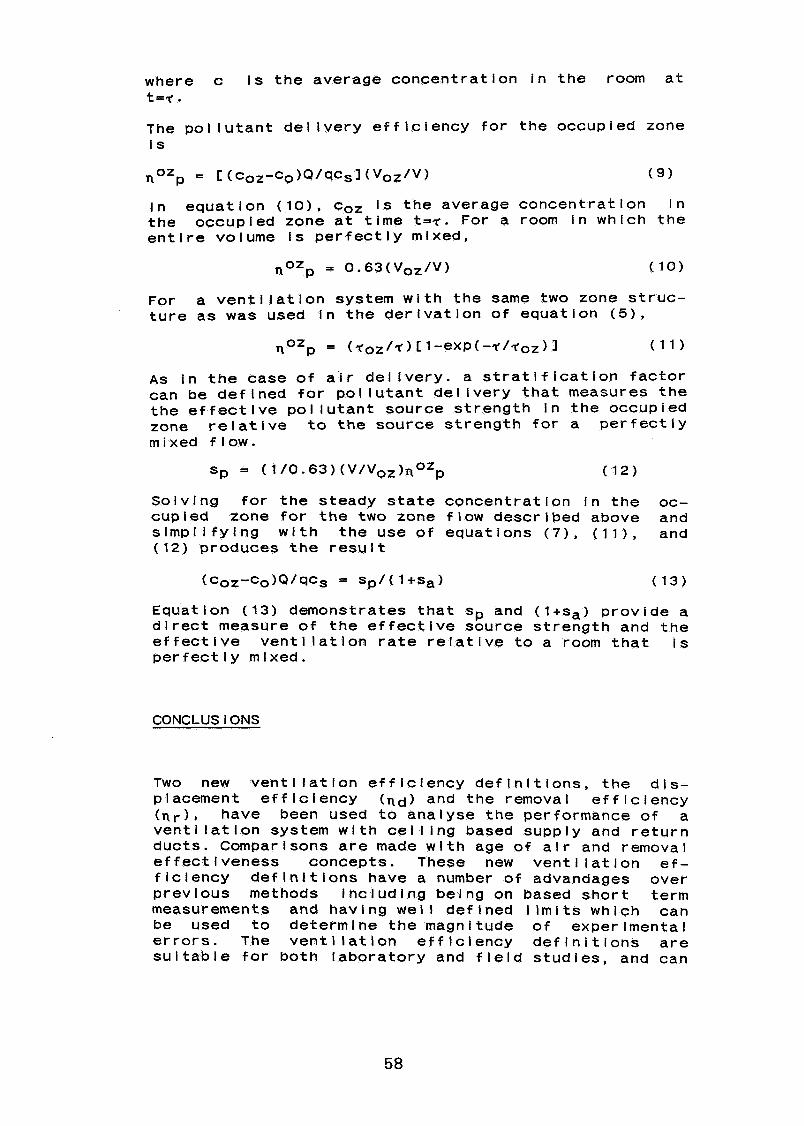
where c is the average concentration in the room at t=l..
The pol lutant delivery efficiency for the occupied zone I s
In equation (lo), coz is the average concentration In the occupied zone at time t = ~ . For a room in which the entire volume is perfectly mixed,
For a ventilation system with the same two zone struc- ture as was used in the derivation of equation ( 5 ) ,
As in the case of air delivery. a stratification factor can be defined for pollutant delivery that measures the the effective pol iutant source strength in the occupied zone relative to the source strength for a perfectly mixed flow.
Solving for the steady state concentration in the oc- cupied zone for the two zone flow described above and simplifying wlth the use of equations (7), ( 1 1 ) , and (12) produces the result
Equation (13) demonstrates that sp and (l+sa) provide a direct measure of the effective source strength and the effective ventilation rate relative to a room that is perfectly mixed.
CONCLUS l ONS
Two new ventilation efficiency definitions, the dis- placement efficiency (nd) and the removal efficiency (nr) , have been used to anaiyse the performance of a venti iation system with ceiling based supply and return ducts. Comparisons are made with age of air and removal effectiveness concepts. These new ventilation ef- ficiency deflnitlons have a number of advandages over previous methods including being on based short term measurements and having well defined llmlts which can be used to determine the magnitude of experimental errors. The ventliatlon efflclency definitions are suitable for both laboratory and field studles, and can

be interpreted in terms of effective ventilatlon rates and pollutant source strengths, thereby providing direct physical insight into ventilation system performance.
REFERENCES
1 . NERO, A. V., "Controlling Indoor Air Pollution", Scientific American 258, May, 1988, pp42-48.
2. STERLING, E. AND STERLING, H., "The Impacts ofDIfferent Ventilation Levels and Florescent LightingTypes on Building Illness: An Experimental Studyn,Canadian Journal of Public Health, - 74,1983, ~~385-392.
3. MORRIS, R. H., "Indoor Air Pollution: Airborne Vi ruses and Bacteria", Heating/Piping/Air Condition-ing, February, 1986, pp59-68.
4. BRUNDAGE, J. F . , SCOTT, R. M., LEDNAR, W. M., SMITH,D. W., AND MILLER, R. N., "Building-Associated Risk of Febrile Acute Respiratory Diseases in Army Train-ees", Journal American Medical Association,%, 1988, ~~2108-2112.
5 JANSSEN, J. E.,HILL,T. J.,WOOD, J. E., MALDONADO, E. A. B . , "Ventilation for Control of lndoor Air Quality: a Case Study", Environment International, 8,1982, ~~489-496.
6. JANSSEN, J. E., "Ventilation Stratification and Air Mixing", lndoor Air Vol. 5, Buildings, Ventilation and Thermal Climate, Swedish Council for Building Research,l984, pp43-48.
7. MECKLER, M. AND JANSSEN, J. E., "Use of Air Cleaners to Reduce Outdoor Air Requirements", in proceedings of ASHRAE IAQ 88, 1988, pp130-147.
8. WOODS, J . E., "Procedure for Determining Ventilation Efficiency", private communlcation, June 26,1988.
9. DANCKWERTS, P. V., "Contineous Flow Systems. Dlstrlbutlon of Residence Times", Chemical Engineering Sclence, 2 , 1957, ppl-18.
10. DANCKWERTS, P. V., "Local Residence Times in Contineous-flow Systems", Chemical Engineering Science, 9, 1958,pp78-79. -
1 1 . SPALDING, D. B., "A Note On Mean Residence Times in Steady Flows of Arbitrary Complexity", Chemical Engineering Science,g, 1958, pp74-77.
12. SANDBERG,M. AND SJOBERG,M., "The Use of Moments for Assessing Air Quality In Ventilated Rooms", Building and Envlronment,~, 1983, pp181-197.
13. SEPPANEN, O., "Ventilation Efficiency in Practice", in proceedlngs of ASHAE Conference lAQ86,Managlng Indoor Air for Health and Energy Conservation,l986, ~~559-567.
14. RYDBERG,!. AND KULMAR, E., "Ventilationens Effektlvltet vid Olika Placeriingar av lnblasnings - Och Utsugnlngsoppnlngarna", VVS No. 3, Stockholm, Sweden, 1947.
15. LIDDAMENT, M. W., "A Review and Bibliography of Ventl latlon Effectiveness - Definitions, Measurement, Design and Calculation", Air Infiltration and Ventllatlon Centre, Technical note 21, 1987.
16. SKARET, E., " A Survey of Concepts of Ventilation Effectiveness", SINTEF, report STF15 A4057,1984.
17. OFFERMAN, F. J., "Ventilation Effectiveness and ADP l Measurements of a Forced Air Heat i ng SystemW,ASHRAE Transactions, - 94 9 1988.
18. FISK, W. J., PRILL, R. J., SEPPANEN, O., "Commercial Bul lding Ventilation Measurements Using Multiple Tracer Gases", in prodeedings 9th AlVC Conference, Effective Ventl latlon, 1988.
19. SANDBERG, M., "What is Ventilation Efficiency?", Bullding and Environment, - 16, 1981, pp123-135.
20. SKARET,E. AND MATHISON, H. M., "Ventilation Efficiency", Environment International, - 8, 1982, pp473-481 . 21. INT-HOUT, D. AND WEED. J. 8.. "Throw: The Air Dlstrlbutlon Quantlfler", ASHRAE Transactions, 94, 1988.

Discussion
Paper 4
D. Harrje (~rinceton University, USA) Would you place recirculation in perspective with relation to short circuiting, perfect mixing and displacement flow, when in many cases 4/5 of supply air may be recirculated?
R. Anderson (Solar Energy Research Institute, USA) The work by Janssen and Woods referenced in the paper makes it possible to determine an "effective" short circuiting value for the ventilation system, as a function of the room short circuiting level and the recirculation rate. Because part of the short circuited air is re-supplied to the room, systems with high recirculation proportions are less sensitive to short circuiting at the room level than systems which use 100% outside air. Additional research is required to compare the relative performance of displacement and mixing systems that use recirculation, but it seems clear that recirculation will tend to smooth out concentration non-uniformities in both cases.
R. Grot (National Bureau of Standards (USA) (a) How often is ventilation effectiveness important - is this a real or imaginary problem? (b) How rigorous were the similarity relationships which you used for your scale tests?
R. Anderson (Solar Energy Research Institute, USA) (a) An adequate balance between ventilation and indoor air quality is required to maintain acceptable indoor air quality. The objective of ventilation efficiency analysis is to produce a quantitative measure of ventilation performance with respect to air delivery and pollutant removal. Measurements to date suggest that there are significant variations in performance as a function of ventilation system design. (b) Our scale experiments exactly reproduce the flows in a full scale room with the same boundary conditions during isothermal tests. Ventilation jet and source buoyancy effects are modelled with an accuracy of +/-I0 to 20%, During our tests we did not attempt to model thermal sources, such as heaters.
W. Raatschen (Dornier Systems, W. Germany) (a) Is there a difference between your definition of displacement efficiency and the comnonly defined "air exchange efficiency" (Sandberg, Skaret etc.)? (b) How can you draw conclusions from measuring tracer gas concentrations in the exhaust on the concentrations in the occupied zone? Don't you obtain information about the whole volume of air passing through the room?
R. Anderson (Solar Energy Research Institute, USA) (a) Yes. Displacement efficiency is based upon control volume analysis over the time that one volume change is supplied to the control volume. Air exchange efficiency is the ratio of local age of air to the age of air for a perfect displacement system. (b) Conclusions about the occupied zone were based upon local concentration distributions, Concentration measurements taken in the exhaust were used to determine room average values.
W. Fisk (Lawrence Berkeley Laboratory, USA) Your ventilation efficiency definitions are attractive because the practising engineer may be able to understand them. Have you thought about procedures for measuring these parameters in real comnercial buildings, where the nominal time constant is not known in advance? There are usually multiple air handling units and air flow may vary with time.
R. Anderson (Solar Energy Research Institute, USA) Our ventilation efficiency analysis requires knowledge of the ventilation rate, which can be measured using standard pressure drop or anemometry techniques. The efficiency measurements have well defined limits that can be used to determine the magnitude of experimental error. As with any experimental measurement, the errors are expected to be larger in the field than in the laboratory.

EFFECTIVE VENTILATION
9 t h AIVC Conference, Gent, Belgium 12-15 September, 1988
Paper 5
VENTILATION STRATEGIES IN THE CASE OF POLLUTED OUTDOOR AIR SITUATIONS
Lutz Trepte
Dornier-System GmbH Postfach 13 60, 0-7990 F r ied r i chsha fen 1 Federal Republ ic o f Germany

S Y N O P S I S
I n f o r m e r t i m e s o u t d o o r a i r was i m p l i c i t l y equated
w i t h f r e s h a i r as i t was assumed t h a t t h e m i x i n g
and r a r e f a c t i o n p rocess i n v o l v e d w i t h v e n t i l a t i o n
wou ld a lways l e a d t o an improvement o f i n d o o r a i r
q u a l i t y . R e c e n t l y , however, t h i s assumpt ion o f
" c l e a n " o u t d o o r a i r q u i t e f r e q u e n t l y p r o v e d t o be
wrong. The s i t u a t i o n becomes d i s q u i e t i n g when t h e
c o n c e n t r a t i o n o f p o l l u t a n t s l i k e s u l f u r d i o x i d e ,
ca rbon monoxide, hyd roca rbons and t h e l i k e , 9n
o u t d o o r a i r i s h i g h e r t h a n i n i n d o o r a i r , s i n c e i n
t h i s case, v e n t i l a t i o n no l o n g e r makes any sense.
The s i t u a t i o n becomes c r i t i c a l when p o l l u t a n t con-
c e n t r a t i o n i n o u t d o o r a i r reaches a l e v e l w h i c h
reduces t h e w e l l - b e i n g o f t h e persons l i v i n g i n a
b u i l d i n g o r even i n v o l v e s h e a l t h r i s k s as a r e s u l t
o f a i r change ( i n t h e f o r m o f i n f i l t r a t i o n o r ven-
t i l a t i o n ) between b u i l d i n g i n t e r i o r ( i n t e r n a l
e n v i r o n m e n t ) and o u t s i d e env i ronmen t .
Examples o f such s i t u a t i o n s a r e smog, t h e a f t e r -
e f f e c t s o f t h e n u c l e a r power p l a n t a c c i d e n t i n
Tshernoby l , t h e escape and d i s p e r s i o n o f chemica l
subs tances a f t e r t r a n s p o r t a t i o n a c c i d e n t s , and
o t h e r h a r m f u l i n c i d e n t s . There i s a p r e s s i n g need
t o r e f l e c t on t h e p o t e n t i a l t y p e and e f f e c t o f
such e v e n t s and t o d e v e l o p t e c h n i c a l , o p e r a t i o n a l
and o r g a n i z a t i o n a l measures .which must be t a k e n
w i t h mechan ica l v e n t i l a t i o n u n i t s i n t h e case o f
p o l l u t e d o u t d o o r a i r s i t u a t i o n s . I n t h e F e d e r a l
R e p u b l i c o f Germany, commi t tee 3816 o f t h e V D I
V e r e i n Deu tscher I n g e n i e u r e , ( A s s o c i a t i o n o f Ger-
man E n g i n e e r s ) , "RLT-Anlagen b e i b e l a s t e t e n AuRen-
l u f t s i t u a t i o n e n " (Mechanic v e n t i l a t i o n i n t h e case
of p o l l u t e d o u t d o o r a i r s i t u a t i o n s ) was e s t a b -
l i c h e d w i t h t h e aim o f f o c u s i n g on t h i s s u b j e c t .
In the case of polluted outdoor air situations,
pollutants, as a result of infiltration or venti-
lation, infiltrate the building interior via mech-
anical ventilation units or leaks on the building.
Time depending concentration of these pollutants
in outdoor and indoor air, as a rule, develops
quite differently. To avoid health risks, tech-
nical measures like fi1 tering, catalytic elimi-
nation of pollutants and the like, oper- ational
(e.g. switch-off of ventilation units in the o f
high pol 1 utant concentration in outdoor air;
switch-on when the outdoor level has dropped below
the indoor level, etc.) and organizational mea-
sures (forecasts including preventive measures
like emission reduction through vehicle traffic
restriction, etc.) must be considered and combined
in practical application. A pol luted outdoor air
situation is present when a ventilation process
leads t o the intake of pollutants in the interior
and to t h e enrichment of these pollutants to an
unacceptably high concentration. The definition o f
the term "unacceptably high concentration" could
be defined, for instance, in accordance with t h e
MAK* values. The measures t o recommend will prima-
rily depent o n the specitic outdoor air situation,
type and quality (leaks) o f the building, and t h e
type of mechanical ventilation unit in use.
* maximum allowable concentration at workplaces,
recommendations in the Federal Republic o f
Germany
1. POLLUTED OUTDOOR A I R SITUATIONS
Measures d e s i g n e d t o c o u n t e r a c t t h e a d v e r s e e f -
f e c t s o f p o l l u t e d o u t d o o r a i r s i t u a t i o n s v i a me-
c h a n i c a l v e n t i l a t i o n u n i t s p r i m a r i l y depend on t h e
t y p e o f s i t u a t i o n . The f o l l o w i n g f o u r c a t e - g o r i e s
a r e d i s c r i m i n a t e d :
1. Normal case : R e g i o n a l d i f f e r e n c e s i n o u t d o o r
a i r c o m p o s i t i o n have o n l y a m i n o r e f f e c t on t h e
o u t d o o r r a t e r e q u i r e d f o r v e n t i l a t i o n
2. M e t e o r o l o g i c a l i n c i d e n c e : Temporary i n v e r s i o n
s i t u a t i o n causes smog
3. A c c i d e n t s , e.g. r e l e a s e o f c h e m i c a l s u b s t a n c e s -
d u r i n g t r a f f i c a c c i d e n t
4. I n c r e a s e d e m i s s i o n s l i m i t e d i n t h e t i m e and
r e g i o n
I n v i e w o f t h e s u b j e c t t o c o v e r , c a t e g o r i e s 2 and
3 a r e p a r t i c u l a r l y i n t e r e s t i n g . A smog s i t u a t i o n
i n 1962 i n Germany i n t h e f e d e r a l s t a t e o f N o r t h
Rh ine -Wes tpha l i a c a u s i n g 156 a d d i t i o n a l
c a s u a l t i e s , e v e n t u a l l y t r i g g e r e d s o - c a l l e d smog
d e c r e e s w h i c h a r e v a l i d i n s e v e r a l s t a t e s . These
smog d e c r e e s i n c l u d e e m i s s i o n - r e d u c i n g measures
b u t do n o t p r o v i d e any i n f o r m a t i o n on how t o u s e
m e c h a n i c a l v e n t i l a t i o n u n i t s i n such a case.
R e c e n t l y , s e v e r a l such i n c i d e n t s were r e p o r t e d ,
e.g. t h e r e l e a s e o f t o x i c gas c l o u d s d u r i n g t h e
p r o d u c t i o n o r t r a n s p o r t a t i o n o f c h e m i c a l
s u b s t a n c e s as a r e s u l t o f l e a k s o r wrong sys tem
h a n d l i n g . T h i s i s b u t one example o f a w i d e
s p e c t r u m o f p o s s i b l e i n c i d e n t s .
C a t e g o r i e s 1 and 4 w i l l o n l y p l a y a m i n o r r o l e .
R e g i o n a l l y v a r y i n g c a r b o n d i o x i d e c o n c e n t r a t i o n s ,
f o r i n s t a n c e , a r e a l s o measures unde r no rma l c i r -
cumstances . T h i s has o n l y a m i n o r e f f e c t on t h e
outdoor air rate which is needed to maintain
carbon dioxide concentration in indoor air below a
defined value. Category 4 comprises incidents in
which polluted emissions are limited in time and
region, e.g. higher traffic volumes in the centre
of cities.
Apart from meteorological and geographic con-
straints, the dispersion mechanisms and
interaction between outside environment and
interior, the necessary measures depend on the
following parameters:
i) related to the incident
a) duration of effect
b) time-related development of effects (type
and development of effect augmentation and
decrease),
c) area (number of inhabitants) affected by
the incident,
d ) type of pollutants,
e) intensity of effect (e.g. immission in
P P ~ ) - ii) related to the object
a) type and operating mode of the mechanical
ventilation unit,
b ) air change (tightness of building, meteo-
rological effect, effect of the mechanical
ventilation unit),
c) type and utilization of the building and
behaviour of occupants.
The items indicated under ii), especially a) and
b), in conjunction with i ) make evident that dif-
ferent types of building must be discriminated to
address the problem:
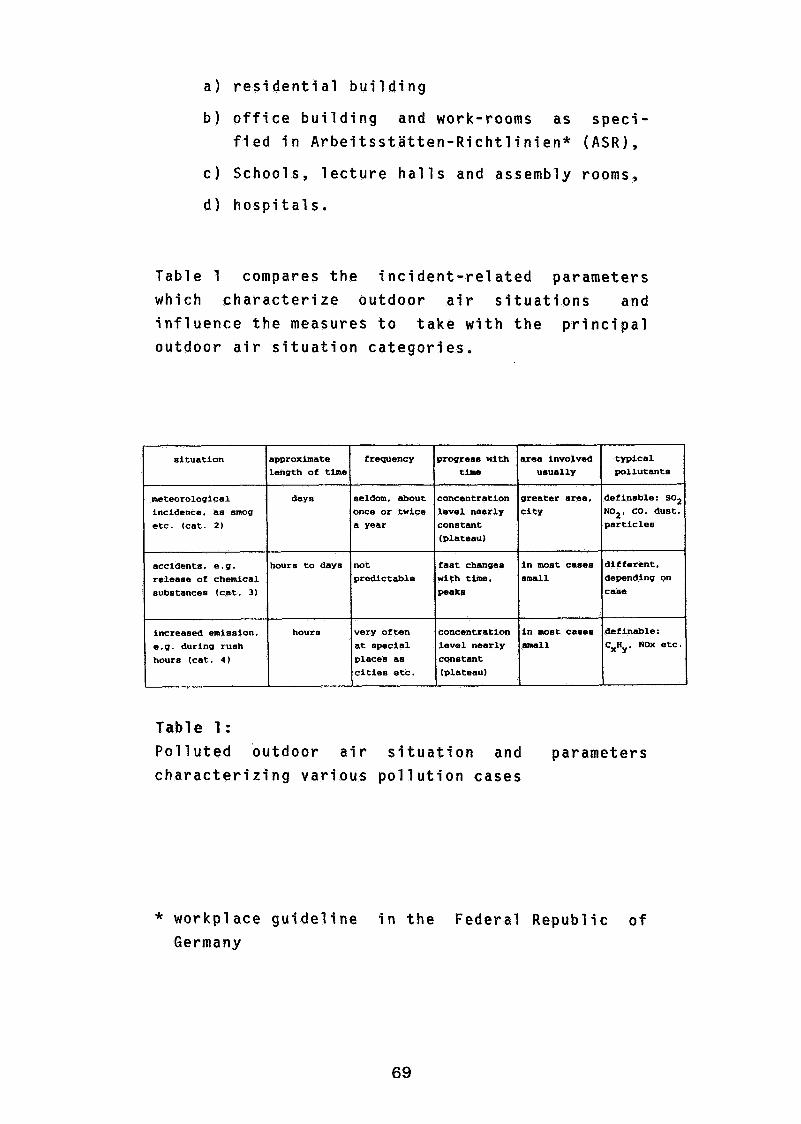
a) residential building
b) office building and work-rooms as speci- fied in A r b e i t s s t a t t e n - R i c h t l i n i e n * (ASR),
c) Schools, lecture halls and assembly rooms,
d) hospitals.
Table 1 compares the incident-related parameters which characterize outdoor air situations and influence the measures to take with the principal outdoor air situation categories.
Table 1 : Polluted outdoor air situation and parameters characterizing various pollution cases
* workplace guideline in the Federal Republic of Germany
typical p~llutante
definable: SO2
NO2. CO. dust. particles
different.
depending on case
definable: cXny. NOX etc.
situation
meteorological
incidence. as smog
etc. (cat. 2)
accidents, e.g.
release of chemical
substancee (cat. 3)
increased emission.
e.g. during rush
hours (cat. 0
frequency
8eldom. about
once or twice
a year
not
predictable
very often
at special
places as
cities etc.
approximate
length of time
days
hours to days
hours
progress with time
concentration
level nearly
constant
(plateau)
faat changes
with time.
peaks
concentration
level nearly
constant
(plateau)
area involved
usually
greater area,
city
in most cases
small
in moat casee
small
2. AIR QUALITY, RELATION BETWEEN O U T D O O R A N D INDOOR
AIR QUALITY
The commonly a p p l i e d c r i t e r i o n t o i n d o o r a i r q u - a l i t y i s s t i l l c a r b o n d o i x i d e c o n c e n t r a t i o n ( C o p ) . P e t t e n k o f e r ( 1 ) recommended 0 .1 % by vo lume a s t h e max. a l l o w a b l e l i m t f o r i n d o o r a i r . I t i s t r u e t h a t - we know by now t h a t c a r b o n d i o x i d e i s a good i n d i - c a t o r o f body o d o u r s and h a s t h e r e f o r e b e e n i n - c o r p o r a t e d w i t h some j u s t i f i c a t i o n i n many i n - t e r n a t i o n a l s t a n d a r d s , b u t P e t t e n k o f e r a l r e a d y a d v o c a t e d 1 3 0 y e a r s ago t h a t a i r q u a l i t y c o u l d b e d e s c r i b e d much b e t t e r u s i n g t h e p o r t i o n s o f c h e m i - c a l a n d , i n p a r t i c u l a r , o r g a n i c f o r e i g n m a t t e r . D e s p i t e t h e s e e a r l y f i n d i n g s we s t i l l d o n o t h a v e a g e n e r a l l y a p p l i c a b l e and r e c o g n i z e d m e a s u r e o f a s - s e s s m e n t . A t t h e time o f P e t t e n k o f e r , no a p p r o - p r i a t e , o r a t l e a s t no r e l i a b l e m e a s u r e m e n t t ech- n i q u e s f o r o r g a n i c compounds w e r e a v a i l a b l e . T o d a y , i t i s r a t h e r t h e m u l t i t u d e o f c h e m i c a l s u b s t a n c e d e t e r m i n e d and, t o a l a r g e e x t e n t , t h e i g n o r a n c e o f t h e i r medium- and l o n g - t e r m e f f e c t s on human o r g a n - ism w h i c h h a m p e r s t h e d e t e r m i n a t i o n o f d e f i n e d s u b - s t a n c e s a n d maximum v a l u e s . Recommenda t ions f o r t h e h a n d l i n g o f m e c h a n i c a l v e n t i l a t i o n u n i t s i n t h e c a s e o f p o l l u t e d o u t d o o r a i r s i t u a t i o n s c a n o n l y b e r e a s o n a b l y s u b s t a n t i a t e d when d e s i r e d i n d o o r a i r s i t u a t i o n s a r e c l e a r l y d e f i n e d .
A procedure i n line with MIK* values ( Z ) , MAK values ( 3 ) , biologische Arbeitsplatztoleranzwerte** ( B T L ) or resulting from the Gefahrstoffverord- nung*** ( 4 ) , would be conceivable. These recommend- ed values, however, refer to situations or groups of persons who are not affected at all or only to a minor degree by this subject. As long as terms like "recommended, desired, or acceptable indoor air quality" are not defined the maxim in the case of polluted outdoor air situations must be to maintain pollutant concentration in indoor air distinctly below pollutant concentration in outdoor air. Pol- lutant concentration, in fact, should be so low that no health hazards are expected for risk groups (e.g. persons suffering from cardiac/circulatory diseases, chronic respiratory diseases, and the 1 i ke) or sensitive groups (senior persons, babies,etc.)
Infiltration and ventilation always leads to an exchange between outdoor and indoor air. In the case of polluted outdoor a'ir situations, pollutant concentration in indoor air will rise the faster and higher . the higher pollutant concentration is in outdoor air,
. the higher air change n per hour is as a result of infiltration and/or ventilation, and
. the more effective the mixing is of polluted out- door air with indoor air ("ventilation effi- ciency" ) .
* maximum immission concentration ** biological workplace tolerances *** hazardous material regul ationsin the Federal
Republic of Germany
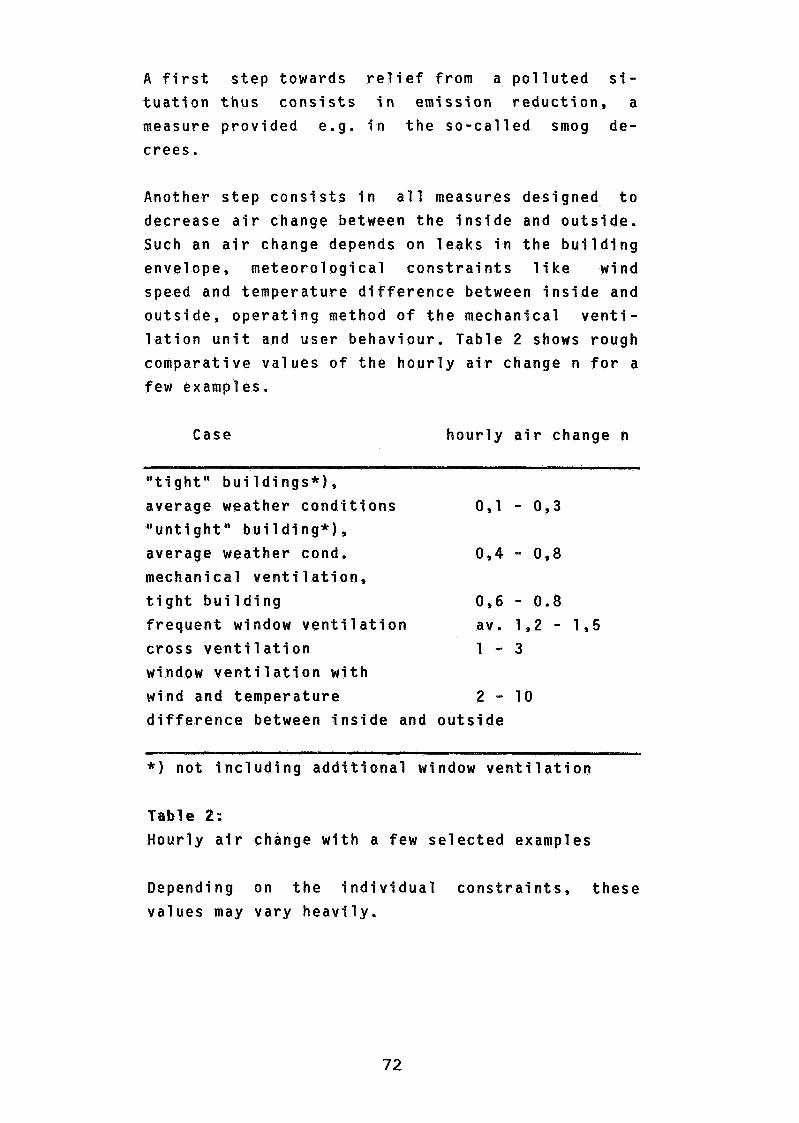
A f i r s t s t e p towards r e l i e f f r o m a p o l l u t e d s i -
t u a t i o n t h u s c o n s i s t s i n e m i s s i o n r e d u c t i o n , a
measure p r o v i d e d e.g. i n t h e s o - c a l l e d smog de-
c rees .
Another s t e p c o n s i s t s i n a l l measures des igned t o
decrease a i r change between t h e i n s i d e and o u t s i d e .
Such an a i r change depends on l e a k s i n t h e b u i l d i n g
enve lope, m e t e o r o l o g i c a l c o n s t r a i n t s l i k e w i n d
speed and t e m p e r a t u r e d i f f e r e n c e between i n s i d e and
o u t s i d e , o p e r a t i n g method o f t h e mechan ica l v e n t i -
l a t i o n u n i t and u s e r b e h a v i o u r . Tab le 2 shows r o u g h
c o m p a r a t i v e v a l u e s o f t h e h o u r l y a i r change n f o r a
few examples.
Case h o u r l y a i r change n
" t i g h t " b u i l d i n g s * ) ,
average wea the r c o n d i t i o n s 0 , l - 0,3
" u n t i g h t " b u i l d i n g * ) ,
average wea the r cond. 0,4 - 0,8
mechan ica l v e n t i l a t i o n ,
t i g h t b u i l d i n g 0,6 - 0.8
f r e q u e n t window v e n t i l a t i o n av. 1,2 - 1 , 5 c r o s s v e n t i l a t i o n 1 - 3
window v e n t i l a t i o n w i t h
w ind and t e m p e r a t u r e 2 - 10
d i f f e r e n c e between i n s i d e and o u t s i d e
--
*) n o t i n c l u d i n g a d d i t i o n a l window v e n t i l a t i o n
Tab le 2:
H o u r l y a i r change w i t h a few s e l e c t e d examples
Depending on t h e i n d i v i d u a l c o n s t r a i n t s , t h e s e
v a l u e s may v a r y h e a v i l y .
An approx imate v a l u e i s t h a t , w i t h s i m p l e h o u r l y a i r change , p o l l u t a n t c o n c e n t r a t i o n i n i n d o o r a i r r e a c h e s t h e o u t d o o r a i r c o n c e n t r a t i o n l e v e l a f t e r approx. 4 t o 5 h o u r s , on t h e assumpt ion t h a t t h e p o l l u t a n t had n o t been p r e s e n t i n t h e i n d o o r a i r when t h e a i r change took p l a c e . Given an a i r change of 0 , 5 h - ' and t h e same assumpt ion , t h e v a l u e i s 8 hours and w i t h an a i r change o f 0 ,1- I i t i s between 30 and 40 h o u r s .
In p r a c t i c e , c o n d i t i o n s , however, a r e q u i t e d i f f e - r e n t , a d s o r p t i o n and d e s o r p t i o n p r o c e s s e s p l a y a r o l e , p o l l u t a n t c o n c e n t r a t i o n i n i n d o o r a i r , a s a r u l e , i s n o t z e r o and c e r t a i n p o l l u t a n t s o u r c e s a r e a l s o p r e s e n t i n a b u i l d i n g . As a r e s u l t , p o l l u t a n t c o n c e n t r a t i o n i n i n d o o r a i r may we l l r i s e beyond t h e o u t d o o r a i r l e v e l ( 5 ) .
In most c a s e s o f p o l l u t e d o u t d o o r a i r s i t u a t i o n s , t h e p o l l u t a n t c o n c e n t r a t i o n i n i n d o o r a i r w i l l r i s e a s a f u n c t i o n o f a i r change w i t h o u t d o o r a i r ( f i g . 1 ) . The lower t h e a i r change t h e s lower i s t h e r i s e i n i n d o o r a i r c o n c e n t r a t i o n . In t h e c a s e o f smog s i t u a t i o n s , f o r i n s t a n c e , c o n c e n t r a t i o n i n t h e o u t d o o r a i r w i l l remain a t much t h e same l e v e l t h r o u g h o u t s e v e r a l days ( t l - t Z ) . A t t g t h e recom- mended c o n c e n t r a t i o n l imi t i n i n d o o r a i r c o u l d be exceeded. A t t 4 i n d o o r and o u t d o o r c o n c e n t r a t i o n i s t h e same. From t5 onward, o u t d o o r a i r c o n c e n t r a t i o n f a l l s below t h e recommended l i m i t . B a s i c a l l y , t h e v e n t i l a t i o n e f f e c t becomes e f f e c t i v e from t4 onward ( improved i n d o o r a i r th rough a i r c h a n g e ) , and from t 6 o n w a r t , i n d o o r a i r once a g a i n c o m p l i e s w i t h
r e c q u i r e m e n t s .
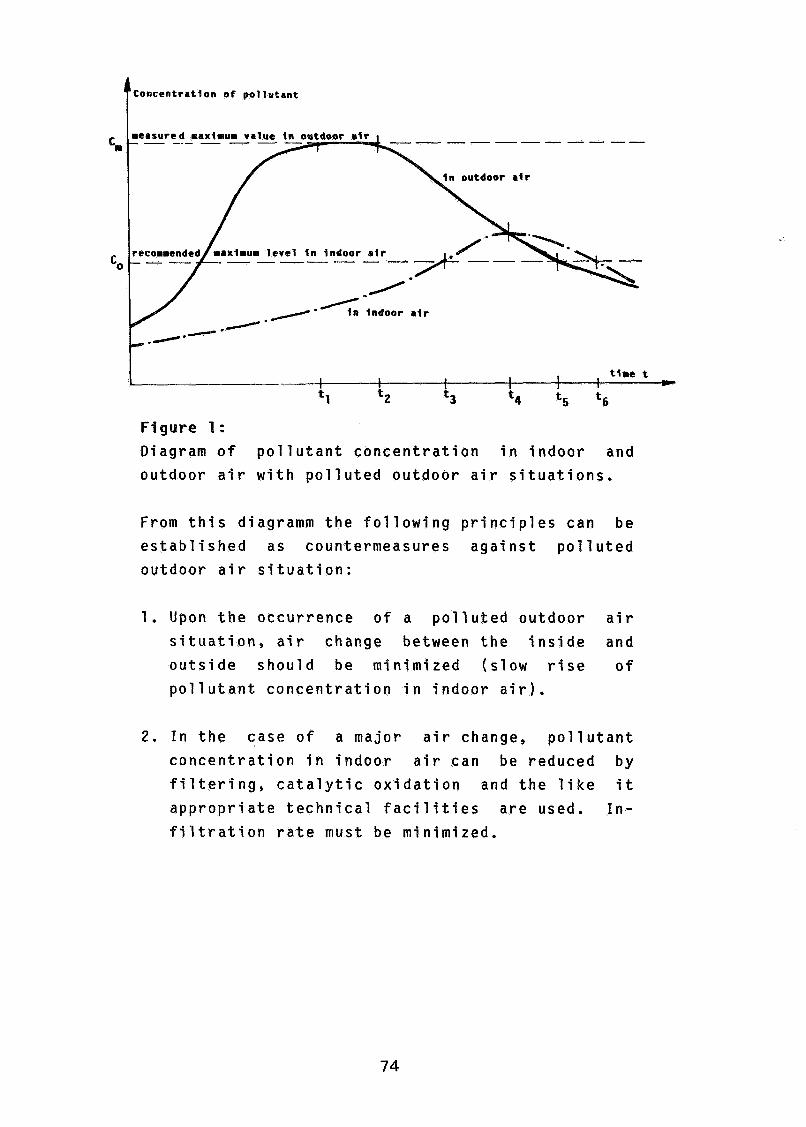
t Concentration o f pol lutant
maxlaua value I n - - - ----------
outdoor a i r
Irecommended/maxlmum level i n indoor a1 r 1. e' -------- .0=-----
/ *
.'- a - I n l n d o o r a i r
F igure 1:
Diagram o f p o l l u t a n t c o n c e n t r a t i o n i n i n d o o r a n d o u t d o o r a i r w i t h p o l l u t e d o u t d o o r a i r s i t u a t i o n s .
From t h i s d i ag ramm t h e f o l l o w i n g p r i n c i p l e s c a n b e
e s t a b l i s h e d a s c o u n t e r m e a s u r e s a g a i n s t p o l l u t e d o u t d o o r a i r s i t u a t i o n :
1 . Upon t h e o c c u r r e n c e o f a p o l l u t e d o u t d o o r a i r s i t u a t i o n , a i r c h a n g e b e t w e e n t he i n s i d e a n d o u t s i d e s h o u l d be m i n i m i z e d ( s l o w r i s e o f p o l l u t a n t c o n c e n t r a t i o n i n i n d o o r a i r ) .
2. I n t h e c a s e o f a m a j o r a i r c h a n g e , p o l l u t a n t c o n c e n t r a t i o n i n i n d o o r a i r c a n b e r e d u c e d b y f i l t e r i n g , c a t a l y t i c o x i d a t i o n and t h e l i k e i t
a p p r o p r i a t e t e c h n i c a l f a c i l i t i e s a r e u s e d . I n - f i l t r a t i o n r a t e m u s t b e m i n i m i z e d .
The interval between t3 and t6 should be mini- mized to prevent that the recommended maximum values are exceeded. This interval, if it occurs at all in the case concerned, can be reduced by performing intense ventilation (high air change) only after outdoor air concentration has dropped below the recommended maximum value. It can also be reduced by delaying tj as long as possible (see items 1 and 2).
4. The smaller the difference t2 -tl and the lower the maximum value Cm of pollutant concentration in outdoor air, the smaller is the probability that pollutant concentration in indoor air will exceed Co.
3. TECHNICAL MEASURES
Accordingly, recommendations for the design and operation of mechanical ventilation units in the case of polluted outdoor air situations depend on a variety of conditions and parameters (especial ly section 2). Generalizations are only conditionally admissible even though it would be in line with prevention efforts and aversion of hazards to design and structure clear and unambiguous action catalogues which could be immediately applicable in practice in the case of a polluted air situation. The following statements can be made without anticipation the results of VDI committee 3816 "RTL-Anlagen bei belasteten AuBenluftsituationen":
1. In the case of a polluted outdoor air situation, any emissions inside which as immission in the outdoor air contribute to the polluted outdoor air situation, should be avoided or reduced. In smog periods this would mean, amongst others,
that smoking and the operation of open fire-
places like gas stoves and furnaces in rooms
should, at least, be reduced. They are CO
sources whose contribution to increased CO
concentration has been proved (5).
In the case of polluted outdoor air situation,
air chage between inside and outside should be
reduced as far as possible and allowable. This
means: switching off mechanical ventilation
units, closing the windows, and the like. Such
measures are particularly recommended for brief
polluted outdoor air situations. The associated
rise o f C02 level, indoor air humidity and other
factors above the normally applicable criteria
(e.g. Pettenkofer number) must and should be
accepted.
3. In the case of extended polluted outdoor air
situations, the measures indicated in 2. should
be complemented by filtering or other types of
separation (e.g. scrubbing of SO2) or elimina-
tion o f the pollutants. A descriptive example is
the filtering of radioactive aerosols and dust
foll owing the Tshernobyl accident which, how-
ever, entails the problem of appropriate filter
disposal .
The filters commonly instal led in mechanical
ventilation units, however, do not retain gase
matter. Special filters would have to be pro-
vided for gaseous matter. For such measures to
be useful, however, it would be necessary for
the building envelope to present no leaks and
f o r t h e s u p p l y a i r t o a c t u a l l y r u n v i a t h e a d d i -
t i o n a l equ ipmen t . A t t e n t i o n mus t be p a i d t o t h e
f a c t t h a t t h e s c r u b b e r s used i n m e c h a n i c a l ven-
t i l a t i o n u n i t s a r e n o t o p t i m i z e d f o r SOp p r e c i -
p i t a t i o n .
4. I n t h e case o f p o l l u t e d o u t d o o r a i r s i t u a t i o n s ,
t h e c i r c u l a t e d a i r vo lume mus t be s t e p p e d up.
Minimum r e q u i r e m e n t s posed t o i n d o o r a i r qua-
l i t y m u s t be o b s e r v e d (6).
CONCLUDING REMARKS
Time i s r i p e f o r r e s e a r c h e r s and e n g i n e e r s t o i n -
c r e a s i n g l y d i r e c t t h e i r e f f o r t s , a p a r t f r o m t h e
o u t d o o r e n v i r o n m e n t , t o t h e p r o b l e m s o f i n d o o r a i r
qua1 i t y and i n d o o r a i r f 1 ow. Ou tdoo r e n v i r o n m e n t
and i n t e r i o r a r e c o r r e l a t e d v i a s e v e r a l o p e r a t i o n
mechanisms so t h a t t h e y c a n n o t be s t u d i e d as s e -
p a r a t e e n t i t i e s . V a r i o u s i n c i d e n t s and even a c c i -
d e n t s i n t h e r e c e n t p a s t make i t n e c e s s a r y t o de-
v e l o p and p r o p o s e measures w h i c h mus t be t a k e n i n
t h e c a s e o f p o l l u t e d o u t d o o r a i r s i t u a t i o n s . T h i s
paper i s d e s i g n e d t o p r o v i d e an o v e r v i e w o f t h e
p e n d i n g p r o b l e m s and t h e approaches t o t a k e . O f
c o u r s i t i s i m p o r t a n t t o a v o i d a n y t h i n g t h a t may
l e a d t o p o l l u t e d o u t d o o r a i r s i t u a t i o n s . The va -
r i o u s measures d i s c u s s e d , b a s i c a l l y demand con-
t i n u o u s o u t d o o r and i n d o o r a i r measurements i n
o r d e r t o imp lemen t an op t imum s t r a t e g y . I n p r a c -
t i c a l a p p l i c a t i o n , however, such an e x p e n d i t u r e i s
o n l y f e a s i b l e t o a l i m i t e d degree . S imp le , c l e a r
and e f f e c t i v e measures a r e c a l l e d f o r .
The a u t h o r w i s h e s t o acknowledge a l l p a r t i c i p a n t s
o f t h e V D I c o m m i t t e e 3 8 1 6 "RLT-Anlagen b e i be-
l a s t e n d e n A u R e n l u f t s i t u a t i o n e n " .
The work has been s u p p o r t e d by t h e P r o j e c t Manage-
ment f o r B i o l o g y , E c o l o g y and Energy (PBE) o f K F A
J u e l i c h GmbH on b e h a l f o f t h e F e d e r a l M i n i s t e r y f o r
R e s e s r c h and T e c h n o l o g y (BMFT) , Bonn.
5 . REFERENCES
1. Pettenkofer, MK. ~ b e r den Luftwechsel in Wohngebauden, Munchen 1858
2. Maximale Immissionswerte, Richtlinie VDI 2309, Jan. 1983 Maximale Immissionskonzentration (MIK), Organische Verbindung, VDI 2306, 1966 Maximale Immissionswerte, Richtlinie VDI 2310, Sept. 1974 until March 1984
3. Maximale Arbeitspl atzkonzentration (MAK), MAK-Wertliste der Deutschen Forschungsge- meinschaft, Koln 1983
4. Gefahrstoffverordnung-GefStoffV, BGBl/S. 1470, Aug. 1986
5. Seifert, B. Vergleich der innerhalb und auBerhalb geschlos- sener Raume auftretenden Konzentrationen anorga- nischer und organischer Verbindungen, in "Luft- qualitat i n Innenraumen", Eds, K. Aurand et al., Stuttgart-New York 1982
6 . Trepte, L. et al. IEA-Annex IX Minimum Ventilation Rates, Final Report of Working Phases I and 11, Uh1d.-Muhlhofen, Fed. Rep. of Germany, November 1987
Discussion
Paper 5
0,Nielsen (Ministry of Housing & Building, Denmark) When outdoor pollution is heavy ventilation should be minimised and a higher C02 accepted. What limits would you suggest under these conditions?
L. Trepte (Dornier System W H , W. Germany) The dominant basis for the German ventilation standards is to limit C02 concentration to a maximum of 1000 ppn. MIK and MAK values give higher values (for industrial exposure). In the case of special polluted outdoor situations (e-g. smog) when the risk to people is higher, an acceptance of higher C02 levels might be recomnended, in accordance with the guidelines mentioned above, up to now there are no defined reammendations for smog, although an upper limit of 2500 ppn might be acceptable. Lower ventilation rates might also lead to complaints of dour . W, De Gids (TNO Division of Technology for Society, Holland) Are the indoor concentration levels for chemicals already established in Germany?
L. Trepte (Dornier System W H , W. Germany) JW, not within the ventilation standards, although there are recomnendations for some substances such as formaldehyde: the Federal Health Office has set a limit at 0.1ppn. For other cases, such as workshops, we have limiting values defined by "maximum allowable concentrat ions" (MAK-Werte) and "biological workplace tolerancess1 (BTL-Werte) for exposure to chemicals during the normal working day (typically 8 hours/day). However we do need a definition for "acceptable indoor air quality" (for the office environment),
EFFECTIVE VENTILATION
9 th A I V C Conference, Gent, Belgium 12-15 September, 1988
Paper 6
VENTILATION GENERATED BY A FLUCTUATING PRESSURE DIFFERENTIAL
B SAHIN , C CLARK ', A J REYNOLDS R WAKELIN
Brunel Un ive rs i t y K i ngston Lane Uxbri dge, Middl esex UB8 3PH, England
1 - Department o f Mechanical Engineering 2 - Department o f Manufacturing and Engineering Systems

1. SYNOPSIS
V e n t i l a t i o n p r o d u c e d by f l u c t u a t i n g p r e s s u r e d i f f e r e n c e s a c r o s s a b u i l d i n g a p p e a r s t o have r e c e i v e d l i t t l e a t t e n t i o n . Such f l u c t u a t i o n s a r e p r o d u c e d by g u s t i n e s s o f t h e wind o r t u r b u l e n c e i n t h e f l o w a r o u n d a b u i l d i n g .
An e x p e r i m a n t a l s t u d y h a s been p e r f o r m e d on a l a b o r a t o r y model t o i n v e s t i g a t e u n s t e a d y f l o w s t h r o u g h a p e r t u r e s s i m u l a t i n g t h o s e i n t h e f a b r i c o f a b u i l d i n g . I n d e p e n d e n t v a r i a b l e s i n v e s t i g a t e d were t h e mean p r e s s u r e d i f f e r e n c e ( 5 ) a c r o s s t h e a p e r t u r e and t h e a m p l i t u d e ( k0 ) a n d f r e q u e n c y ( f ) of a s u p e r i m p o s e d f l u c t u a t i n g p r e s s u r e d i f f e r e n c e t o g i v e PC'I) = 6 t + o s l n ~ n F t . The r e l a t i v e a m p l i t u d e ( ) , / f i ) r a n g e c o v e r e d was 0 . 2 t o 0.97 and t h e f r e q u e n c y r a n g e was 0 .02 t o 0.6 Hz. A number of a p e r t u r e g e o m e t r i e s h a s b e e n i n v e s t i g a t e d .
Measurements w e r e made o f i n s t a n t a n e o u s p r e s s u r e d i f f e r e n c e across t h e a p e r t u r e , a i r f l o w r a t e i n t o t h e plenum chamber s u p p l y i n g t h e a p e r t u r e and v e l o c i t y o f a i r i s s u i n g f rom t h e a p e r t u r e . The r e l a t i o n s h i p between p r e s s u r e d i f f e r e n c e a n d f l o w was c h a r a c t e r i s e d by a d i s c h a r g e c o e f f i c i e n t , (Cd) . Cd v a l u e s b a s e d upon t h e i n s t a n t a n e o u s measu remen t s were p l o t t e d t h r o u g h o u t a f l o w c y c l e f o r e a c h o p e r a t i n g c o n d i t i o n . T h i s p roduced a Cd l o o p , t h e s i z e o f which d e p e n d e d u p o n p,/$ a n d t h e S t r o u h a l number . T ime-averaged f l o w s w e r e c h a r a c t e r i s e d by two Cd v a l u e s , b a s e d upon r o o t mean p r e s s u r e d i f f e r e n c e and t h e mean p r e s s u r e d i f f e r e n c e , r e s p e c t i v e l y . Measured v a l u e s o f Cd were c o m p a r e d w i t h t h e r e s u l t s o f a t h e o r e t i c a l a n a l y s i s w h i c h p r e d i c t e d s u c c e s s f u l l y t h e g e n e r a l f e a t u r e s o b s e r v e d .
2 LIST OF SYMBOLS 2 A - cross-sectional area (m )
C - coefficient of contraction C Cd - discharge coefficient
'ds - discharge coefficient for steady flow
C - skin-friction coefficient
diameter of circular cross-section aperture (m) fluctuation frequency (Hz ) , = a/2n . friction factor distance from vena-contracta to end of
aperture (m)
length of aperture (m)
inertial equivalent length (m), see equation 2.
mass (kg
pressure ( a)
mean pressure ( P a )
amplitude of fluctuating component of pressure
( P a )
r - space coordinate in radial direction
R - relative flow rate amplitude (= Gfi ) R - characteristic gas constant (kJ/kg K)
g R - relative pressure amplitude ( = P /pm) P 3O 7 St - Strouhal number (St = fD/v =COD /8V) * St - modified Strouhal number ( = St b/~)
time (s)
absolute temperature (K)
velocity (m/s) 3
volume flow rate (m /s) 3
mean volume flow rate (m /s) amplitude of fluctuating component of flow rate
3 (m /s) space coordinate in axial direction
non-uniformity coefficients, see equation 8.
ratio of gas specific heats 3
density (kg/m ) 2 skin-friction (N/m ) 1
radian frequency (s- )
3. INTRODUCTION
An aspect of building ventilation which is still not well understood is the effects of fluctuations in the external pressure. These fluctuations arise from gustiness of the wind approaching a building and unsteadiness in the separated flows around it.
The effective ventilation rate through an aperture will depend upon its geometry and upon the frequency of pressure fluctuations and on the ratio of their amplitude to the mean differential across the aperture. The relationship between a fluctuating pressure differential and flow through a plane aperture has been investigated by Earles and Zarek (1963), Karim and Rashidi (1972), and Mohammad and Mottram (1981), in relation to pulsating flow measurement with an orifice-meter. Because this relationship is non-linear, published work has concentrated mainly on the correction factors required to allow a correct mean flow rate to be inferred from a measured fluctuating pressure differential.
The broad objective of the present work was to look at the pressure dif ference/flow real tionship in more detail, both experimentally and theoretically. To date, investigations have been restricted to regular pressure pulsations of simple-harmonic form but without flow reversal.
EXPERIMENTAL STUDY
4.1 Test-rig and instrumentation
Experimental studies were carried out using the purpose built rig shown in Fig. 1 into which a variety of aperture geometries representative of those occurring in buildings can readily be introduced. This apparatus provides for the superimposition upon a mean differential of pressure , variations of the frequencies and amplitudes typical of those likely to arise in the field. It was designed to permit modifications to allow representation of (a) flow reversal during the cycle of pressure variation and (b) a cross-flow on one or both sides of the aperture.
The inset in Fig. 1 shows the method used to produce a periodic fluctuation in the pressure generated by a constant speed fan: a motor driven disc rotates at constant speed about a point (marked + ) eccentric to the centre of a circular aperture
(marked a ) . By c h a n g i n g t h e s p e e d o f r o t a t i o n a n d t h e d e g r e e o f e c c e n t r i c i t y a v a r i e t y o f f l u c t u a t i o n s c a n b e g e n e r a t e d a b o u t a mean p r e s s u r e d i f f e r e n t i a l be tween t h e plenum chamber and a t m o s p h e r e .
A i r p a s s e s i n t o t h e plenum f r o m a p l a s t i c t u b e o f d i a m e t e r 55mm which c o n t a i n s s c r e e n s and a f l o w s t r a i g h t e n e r t o improve t h e q u a l i t y o f f l o w b e f o r e f l o w measurement . T h i s is a c h i e v e d u s i n g a v e l o c i t y t r a n s d u c e r ( T S I , model 1610-13) which was c a l i b r a t e d a g a i n s t a ser ies o f s t a n d a r d o r i f i c e meters w h i c h were i n t r o d u c e d i n t o t h e s u p p l y t u b e w e l l u p s t r e a m o f t h e t r a n s d u c e r . T h i s p r o v i d e d a r e l a t i o n s h i p be tween t r a n s d u c e r s i g n a l and volume f l o w ra te i n t o t h e plenum chamber .
P r e s s u r e w i t h i n t h e plenum is measured w i t h a s i n g l e - e n d e d t r a n s d u c e r (Gaeltec, model 3 C T ) . O u t f l o w f r o m t h e a p e r t u r e is t o a t m o s p h e r e , so t h e measu red p r e s s u r e is a l s o t h e p r e s s u r e d i f f e r e n t i a l across t h e a p e r t u r e . The d i s c h a r g e c o e f f i c i e n t f o r t h e a p e r t u r e u n d e r t es t w a s c a l c u l a t e d f r o m i n s t a n t a n e o u s v a l u e s o f p r e s s u r e d i f f e r e n c e , A p , and f l o w , u s i n g :
V e l o c i t y m e a s u r e m e n t s were a l s o made a t t h e a p e r t u r e o u t f l o w and v e l o c i t y c o e f f i c i e n t s d e t e r m i n e d , b u t t h e s e r e s u l t s a r e n o t r e p o r t e d h e r e . A l l d a t a w e r e d i g i t i s e d and s t o r e d i n a mic rocompu te r f o r s u b s e q u e n t p r o c e s s i n g .
4.2 R e s u l t s
R e s u l t s a r e p r e s e n t e d f o r 3 a p e r t u r e g e o m e t r i e s a l l o f c i r c u l a r c r o s s - s e c t i o n , w i t h d i a m e t e r , D = 25mm. The f i r s t is a p l a n e squa re -edged o r i f i c e ; t h e o t h e r t w o a r e o f c y l i n d r i c a l f o r m w i t h l e n g t h L t o g i v e L/D = 1 and 1 0 , r e s p e c t i v e l y . T e s t s were c a r r i e d o u t f o r i n e r t i a d o m i n a t e d f l o w s w i t h mean f l o w . R e y n o l d s n u m b e r s i n t h e r a n g e 7 , 0 0 0 t o 2 4 , 0 0 0 a n d f l u c t u a t i o n f r e q u e n c i e s f o r m 0.02 t o 0.6 Hz.
F i g u r e 2 s h o w s t h e v a l u e s o f t h e d i s c h a r g e c o e f f i c i e n t s u n d e r s t e a d y f l o w c o n d i t i o n s , f o r t h e t h r e e a p e r t u r e g e o m e t r i e s , a s f u n c t i o n s o f t h e volume f l o w t h r o u g h t h e a p e r t u r e . The a n t i c i p a t e d v a r i a t i o n s i n C a t low Reyno lds numbers , a r e shown i n F i g 2 and t h e s a a r e s u c c e e d e d by g e n e r a l l y more u n i f o r m v a l u e s a t h i g h e r Reyno lds numbers . Note t h a t t h e r e a t t a c h m e n t a n d p r e s s u r e r e c o v e r y a c h i e v e d i n t h e s h o r t t u b e (L/D = 1) i n c r e a s e t h e f l o w a c h i e v e d f o r a p a r t i c u l a r
p r e s s u r e d i f f e r e n t i a l by some 25 p e r c e n t , i n c o m p a r i s o n w i t h t h e f l o w t h r o u g h a s i m p l e o r i f i c e . The o u t f l o w t h r o u g h t h e l o n g t u b e ( L / D = 1 0 ) is a l s o g r e a t e r t h a n t h a t t h r o u g h a s i m p l e o r i f i c e , f o r a s p e c i f i c d r i v i n g p r e s s u r e , a l t h o u g h f r i c t i o n i n t h e t u b e h a s r e d u c e d t h e o u t f l o w s f r o m t h e s h o r t - t u b e v a l u e s .
T h e s i m p l e s t m o d e l l i n g o f non - s t eady f l o w t h r o u g h t h e s e a p e r t u r e s is, o f c o u r s e , t h e h y p o t h e s i s t h a t t h e c u r v e s o f F i g u r e 2 a r e a c c u r a t e l y t r a c e d d u r i n g e a c h c y c l e . The r e s u l t s o f t h i s i n v e s t i g a t i o n c a n m o s t r e a d i l y b e p r e s e n t e d a s p r o c e s s p a t h s i n t h e p l a n e Cd v s d r i v i n g p r e s s u r e or f l o w r a t e .
F i g u r e 3 d i s p l a y s t r a c e s r e p r e s e n t i n g t h e t h r e e v a r i a b l e s measu red i n t h e non - s t eady f l o w t e s t s . A s w o u l d b e e x p e c t e d , i n v i ew o f t h e smooth a r e a v a r i a t i o n p r o v i d e d b y t h e i n t e r r u p t e r d i s c i n t h e i n l e t p i p e , t h e v a r i a t i o n s o f t h e t h r e e q u a n t i t i e s are r e l a t i v e l y smooth , w i t h t h e p r e s s u r e waveform b e i n g a p p r o x i m a t e l y s i n u s o i d a l . S i g n a l n o i s e a r i s e s f rom some d i s t u r b a n c e s w i t h i n t h e f l o w , m e c h a n i c a l v i b r a t i o n t r a n s m i t t e d f r o m t h e f a n and i n s t r u m e n t a t i o n e l e c t r o n i c s .
F i g u r e 4 shows t h e e f f e c t o f f r e q u e n c y f o r t h e l o n g t u b e ( L / D = 1 0 ) o n t h e v a l u e s o f C p l o t t e d a g a i n s t d r i v i n g p r e s q u r e t h r o u g h o u t t h e f l a w c y c l e . The d r i v i n g p r e s s u r e , p , c o m p r i s e s a mean and ha rmon ic component , v i z : p = p + p s i n w t . A t a p e r t u r e o u t l e t t h e p r e s s u r e is atmospheric, t h u s t h e d r i v i n g p r e s s u r e is a l so t h e p r e s s u r e d i f f e r e n c e a c r o s s t h e a p e r t u r e . The r a t i o of f l u c t u a t i n g p r e s s u r e component a m p l i t u d e t o mean p r e s s u r e Rp w a s h e l d c o n s t a n t a t a p p r o x i m a t e l y 1, f o r t h e tests i n F i g . 4. The r e s u l t s f o r t h e t w o lower f r e q u e n c i e s ( F i g 4 a and b ) d i s p l a y a n i n t e r e s t i n g f e a t u r e , namely, t h a t t h e v a l u e s o f C, f o r h i g h p r e s s u r e d i f f e r e n t i a l s , s a y , 250 t o 350 Pa (C, = 0.77) are h i g h e r t h a n t h e c o r r e s p o n d i n g s t e a d y - f l o w v a l u e s f o r t h e l o n g - t u b e c a s e shown i n ~ i ~ u r e 2 (Cd = 0 . 7 5 ) .
A s w o u l d b e e x p e c t e d , t h e v a r i a t i o n s o f C d e p a r t more m a r k e d l y f r o m a u n i f o r m v a l u e a s t h g f r e q u e n c y o f t h e f l o w f l u c t u a t i o n i n c r e a s e s . However, e v e n a t t h e lowest f r e q u e n c y c o n s i d e r e d , 0 . 0 5 H z , t h e r e are d e p a r t u r e s f r o m t h e n e a r - s t e a d y - s t a t e v a l u e . Note t h a t t h e l o n g - t u b e s t e a d y - s t a t e v a l u e s p r e s e n t e d i n F i g y r e 2 show no s i g n i f i c a n t v a r i a t i o n i n t h e f l o w r a n g e V >, 3 l/s, c o r r e s p o n d i n g t o p >/ 40 Pa. Hence, t h e r e s p o n s e f o r low p r e s s u r e d i f f e r e n t i a l s mus t b e a t t r i b u t e d t o some e f f e c t of n o n - s t e a d i n e s s , e i t h e r i n t h e f l o w i t s e l f or i n t h e i n s t r u m e n t a t i o n s y s t e m .
F i g u r e s 5 ( a ) t o ( d l show t h e e f f e c t o f a p r o g r e s s i v e i n c r e a s e i n t h e a m p l i t u d e o f t h e imposed p r e s s u r e v a r i a t i o n ( R r a n g e f rom 0.16 t o 0 . 9 3 ) . F o r
P
t h e l o w e s t a m p l i t u d e ( F i g u r e 5 ( a ) ) t h e v a l u e o f t h e d i s c h a r g e c o e f f i c i e n t r e m a i n s s e n s i b l y c o n s t a n t t h r o u g h o u t e a c h c y c l e , and t h r o u g h o u t t h e t h r e e c y c l e s c o n s i d e r e d . The mean v a l u e o f Cd i s , h o w e v e r , a l i t t l e h i g h e r ( 0 . 7 7 c o m p a r e d w i t h 0 . 7 5 ) t h a n t h e s t e a d y - s t a t e v a l u e o f F i g u r e 2.
The measurements o f F i g u r e s 5 ( b ) and ( c ) a r e less c l o s e l y bunched f o r any one c y c l e a n d , what is more, d i s p l a y a d e g r e e o f v a r i a b i l i t y f rom o n e c y c l e t o t h e n e x t . F i n a l l y , t h e r e s u l t s f o r t h e h i g h e s t a m p l i t u d e , F i g u r e 5 ( d ) , are w i d e l y s p r e a d , a l t h o u g h t h e c y c l e - t o - c y c l e v a r i a t i o n is o n l y modera te .
F i g u r e s 6 ( a ) t o ( c ) p r e s e n t v a r i a t i o n s o f t h e d i s c h a r g e c o e f f i c i e n t f o r c l o s e l y s i m i l a r p r e s s u r e v a r i a t i o n s imposed a c r o s s t h e t h r e e a p e r t u r e g e o m e t r i e s . I n e a c h c a s e t h e v a l u e s o f Ca have been n o r m a l i s e d by d i v i s i o n by a v a l u e o f Ca r e p r e s e n t a t i v e o f s t e a d y , h i g h Reynolds-number f l o w , t h e v a l u e s c h o s e n b e i n g 0.62 f o r t h e o r i f i c e , 0.76 f o r t h e s h o r t t u b e c o n f i g u r a t i o n , and 0.74 f o r t h e l o n g t u b e . A s migh t b e e x p e c t e d , t h e r e s u l t s f o r t h e o r i f i c e p l a t e and s h o r t - t u b e are r a t h e r s im i l a r , a l t h o u g h t h e v a r i a t i o n i n C a round t h e c y c l e is somewhat less f o r t h e s h o r t - t u b a . The v a r i a t i o n i n t h e d i s c h a r g e c o e f f i c i e n t is c o n s i d e r a b l y g r e a t e r when t h e l o n g t u b e i s a f f i x e d a t t h e e x i t . T h i s b e h a v i o u r c a n b e a s c r i b e d t o t h e enhanced role o f i n e r t i a , t h e c o n s i d e r a b l e column of a i r i n mot ion w i t h i n t h e t u b e p o s s e s s i n g a 'memory' o f t h e p r e s s u r e d i f f e r e n t i a l s p e r t a i n i n g e a r l i e r i n t h e c y c l e . The t h e o r e t i c a l a n a l y s i s which f o l l o w s d e v e l o p s t h i s i d e a i n a more e x p l i c i t f a s h i o n .
5 THEORY
T h e m o d e l c o n s i d e r e d is shown i n F i g . 7 . I t c o n s i s t s o f a l a r g e r e s e r v o i r i n which a f l u c t u a t i n g p r e s s u r e (pi ( t ) ) d r i v e s a f l o w ( V ( t ) ) t h r o u g h a n a p e r t u r e of c r o s s - s e c t i o n a l a r e a A, . Downstream o f t h e o p e n i n g t h e p r e s s u r e is p, and may a l so f l u c t u a t e , a l t h o u g h i t was h e l d c o n s t a n t i n t h e tes ts r e p o r t e d h e r e .
The p r e s s u r e d i f f e r e n c e / f l o w r e l a t i o n s h i p f o r t h e f l o w g e o m e t r i e s i n v e s t i g a t e d e x p e r i m e n t a l l y c a n be c h a r a c t e r i s e d by a d i s c h a r g e c o e f f i c i e n t , C
d 8 T h i s
c o e f f i c i e n t is d e f i n e d i n t h e u s u a l way as:- b
a n d is t a k e n t o a p p l y t o b o t h s t e a d y a n d u n s t e a d y ( b a s e d o n i n s t a n t a n e o u s v a l u e s ) f l o w s .
Two cases a r e c o n s i d e r e d : a p l a n e a p e r t u r e ( o r i f i c e ) a s shown i n F i g . 7 a and a c y l i n d r i c a l a p e r t u r e which is assumed l o n g enough fo r i n t e r n a l f l o w r e a t t a c h m e n t t o o c c u r ( F i g . 7 b ) . W h i l s t t h e r e a r e f e a t u r e s i n common, t h e two c a s e s are t r e a t e d s e p a r a t e l y , f o r c l a r i t y . I n b o t h cases r e s u l t s a r e d e r i v e d f o r i n s t a n t a n e o u s and a v e r a g e d d i s c h a r g e c o e f f i c i e n t s i n t e r m s of p r e s c r i b e d s i n g l e ha rmon ic f l o w w a v e f o r m s . T h e f l o w p a t h l e n g t h s t h r o u g h t h e a p e r t u r e s are s m a l l compared w i t h t h e f l o w p u l s a t i o n w a v e l e n g t h s ; a c c o r d i n g l y t h e f l o w is t r e a t e d a s i n c o m p r e s s i b l e .
5 .1 ( a ) P l a n e A p e r t u r e ( O r i f i c e , ~ i g ~ 7 a ) .
The t h e o r e t i c a l r e s u l t s f o r C is d e r i v e d as f o l l o w s : i n i t i a l l y , c o n s i d e r i n g t h a f l o w t o b e i n v i s c i d , t h e e q u a t i o n o f m o t i o n is:-
I t is assumed t h a t v c a n be w r i t t e n as +/A, w h e r e A i s t h e l o c a l f l o w Z c r o s s - s e c t i o n , w h i c h is assumed t o b e t i m e i n v a r i a n t , I n t e g r a t i o n w i t h r e s p e c t t o z b e t w e e n s t a t i o n s 1 ( r e s e r v o i r ) a n d 2 ( v e n a c o n t r a c t a ) y i e l d s : -
- & air +v2(i+ $) - ( 2 ) (t- B)/e - A, x.t- 2 (C, A,)~
2
& is d e f i n e d as A , J ~ / A and t h e c o e f f i c i e n t k is i n t r o d u c e d t o allow for t r i c t i o n a l e f f e c t s i n t h e f l o w . C, is t h e c o e f f i c i e n t o f c o n t r a c t i o n a t t h e v e n a - c o n t r a c t a . E l i m i n a t i n g p -p be tween e q u a t i o n s (1) a n d ( 2 ) p r o d u c e s t h e r e su l t ; -
F o r s t e a d y f l o w t h i s r e d u c e s to:
S o m e i n s i g h t i n t o t h e d e p e n d e n c e o f C u p o n p a r a m e t e r s o f t h e f l o w c a n b e o b t a i n e d by a s s u d i n g a p e r i o d i c f l o w o f t h e form:-
I t s h o u l d be n o t e d , however , t h a t i n o u r l a b o r a t o r y model tests t h e a p p l i e d p r e s s u r e d i f f e r e n c e , p, -p, , was made t o b e o f s i n u s o i d a l fo rm. The f l o w waveform is p r e s c r i b e d f o r t h e t h e o r e t i c a l model i n o r d e r t o allow a n o a n a l y t i c a l s o l u t i o n f o r C&
S u b s t i t u t i o n f o r V i n t o e q u a t i o n ( 3 ) t h e n y i e l d s : -
4 ZESt*cos~~t + - (i+ R s i n c ~ t ) ~
. - w h e r e R=V, /$. The u s e o f - r e s u l t s i n a m o d i f i e d S t r o u h a l number, st* = o ; ) ~ & /+. F o r t h e e x p e r i m e n t a l s t u d y , t h e o r d i n a r y ~ t r o s h a l n u m b e r , S t = f D / v is u s e d . The t w o p a r a m e t e r s a r e r e l a t e d a s f o l l o w s : Sir*= S t L/D.
T h i s r e s u l t a l lows t h e c a l c u l a t i o n o f C v a l u e s t h r o u g h o u t a f l o w c y c l e . The d e g r e e o f v a % i a t i o n t h r o u g h o u t a c y c l e g i v e s a n i n d i c a t i o n o f t h e errors t h a t w o u l d a r i s e f r o m u s i n g t h e s t e a d y f l o w v a l u e o f t h e d i s c h a r g e c o e f f i c i e n t (Cbs 1, t h e r e b y t r e a t i n g t h e f l o w a s q u a s i - s t e a d y . Forming t h e r a t i o C a /Cds f a c i l i t a t e s c o m p a r i s o n be tween a p e r t u r e s o f d i f f e r i n g geome t ry , a s w a s shown f o r t h e e x p e r i m e n t a l r e s u l t s i n F ig .6 . The t h e o r e t i c a l r e s u l t s a r e shown i n F i g . 8 and were o b t a i n e d by r e - a r r a n g i n g e q u a t i o n ( 5 ) t o g i v e : -
5.1 ( b ) C y l i n d r i c a l A p e r t u r e ( F i g . 7 b )
The p r e s s u r e d i f f e r e n c e be tween s t a t i o n 1 and t h e v e n a c o n t r a c t a (v) c a n be w r i t t e n i n t h e same fo rm a s e q u a t i o n (2):-
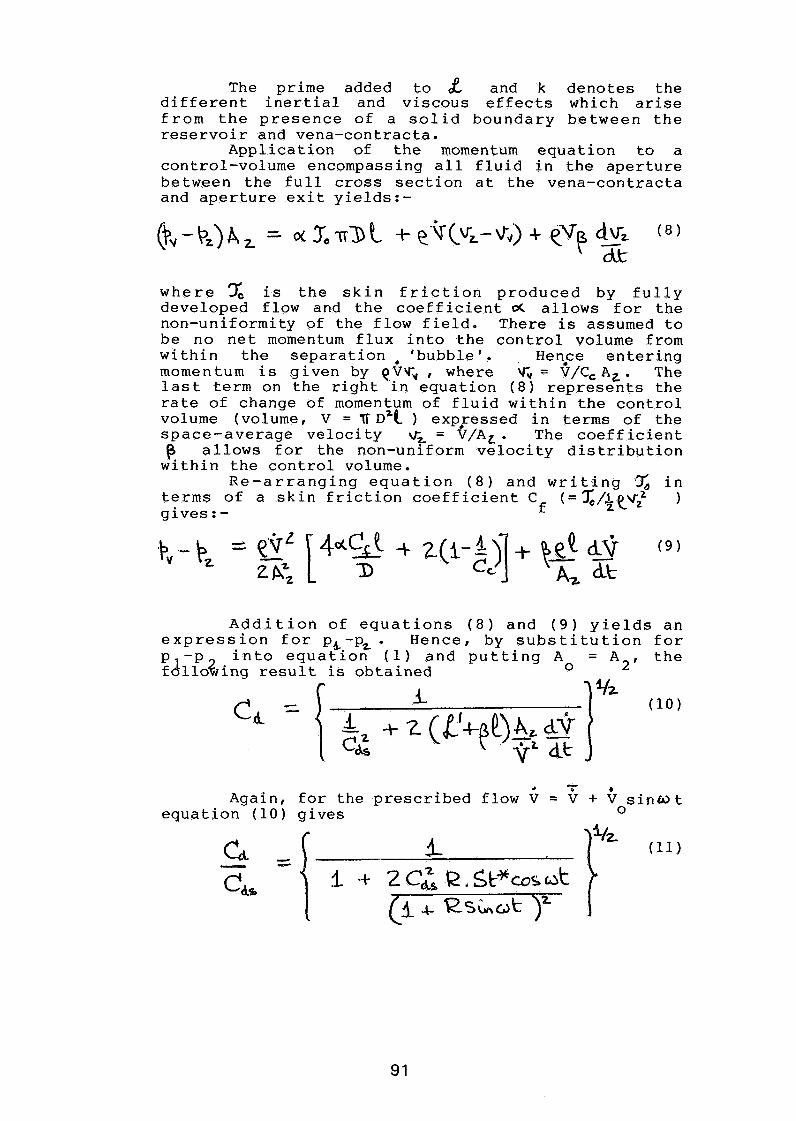
The p r i m e added t o % and k d e n o t e s t h e d i f f e r e n t i n e r t i a l and v i s c o u s e f f e c t s w h i c h a r i s e f r o m t h e p r e s e n c e o f a s o l i d b o u n d a r y b e t w e e n t h e r e s e r v o i r and v e n a - c o n t r a c t a .
A p p l i c a t i o n of t h e momentum e q u a t i o n t o a c o n t r o l - v o l u m e encompass ing a l l f l u i d i n t h e a p e r t u r e b e t w e e n t h e f u l l cross s e c t i o n a t t h e v e n a - c o n t r a c t a and a p e r t u r e e x i t y i e l d s : -
w h e r e 7, is t h e s k i n f r i c t i o n p r o d u c e d b y f u l l y d e v e l o p e d f l o w and t h e c o e f f i c i e n t & a l l o w s f o r t h e n o n - u n i f o r m i t y o f t h e f l o w f i e l d . T h e r e is assumed t o b e n o n e t momentum f l u x i n t o t h e c o n t r o l volume f rom w i t h i n t h e s e p a r a t i o n a ' b u b b l e ' . Henace e n t e r i n g momentum is g i v e n by QVV, , where $ = V/C, AZ . The l a s t t e r m o n t h e r i g h t i n e q u a t i o n ( 8 ) r e p r e s e n t s t h e r a t e o f c h a n g e o f momentum o f f l u i d w i t h i n t h e c o n t r o l volume (vo lume, V = B ~~1 ) e ~ p ~ r e s s e d i n terms o f t h e s p a c e - a v e r a g e v e l o c i t y v+ = V/Az. The c o e f f i c i e n t
allows f o r t h e non-unl f o r m v e l o c i t y d i s t r i b u t i o n w i t h i n t h e c o n t r o l volume.
R e - a r r a n g i n g e q u a t i o n ( 8 ) a n d w r i t i n g .% i n terms o f a s k i n f r i c t i o n c o e f f i c i e n t C ( = ~ / & ~ v ~ ) g i v e s : - f
A d d i t i o n o f e q u a t i o n s ( 8 ) a n d ( 9 ) y i e l d s a n e x p r e s s i o n f o r pS-p, . H e n c e , by s u b s t i t u t i o n f o r p - p i n t o e q u a t i o n (1) a n d p u t t i n g A = A*, t h e f d l l o t r i n g r e s u l t is o b t a i n e d o
- Aga in , f o r t h e p r e s c r i b e d f l o w = + s i n & t
e q u a t i o n ( 1 0 ) g i v e s o
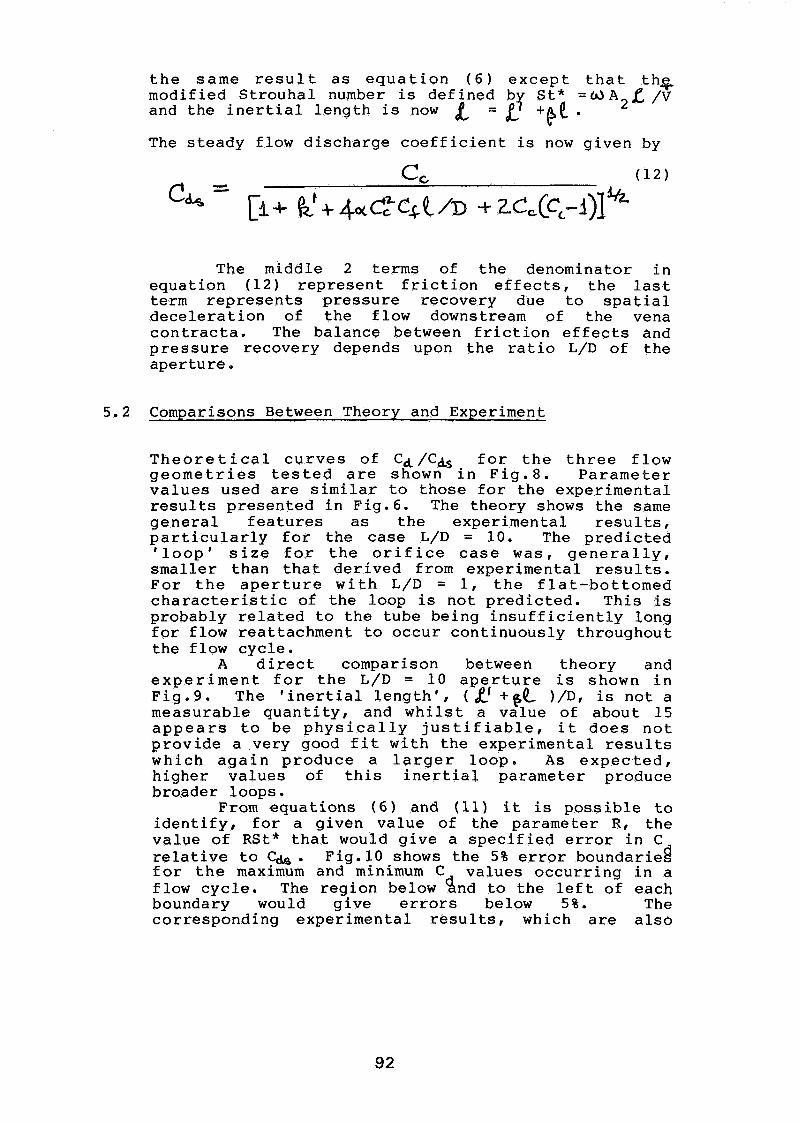
t h e s a m e r e s u l t a s e q u a t i o n ( 6 ) e x c e p t t h a t t h s m o d i f i e d S t r o u h a l number is d e f i n e d b S t * = W A 2 L /V Y and t h e i n e r t i a l l e n g t h is now = k +e(. The s t e a d y f low d i s c h a r g e c o e f f i c i e n t is now g i v e n by
The midd le 2 t e r m s of t h e denominator i n e q u a t i o n ( 1 2 ) r e p r e s e n t f r i c t i o n e f f e c t s , t h e l a s t term r e p r e s e n t s p r e s s u r e r e c o v e r y due t o s p a t i a l d e c e l e r a t i o n of t h e f l o w downstream of t h e vena c o n t r a c t a . The b a l a n c e between f r i c t i o n e f f e c t s and p r e s s u r e r e c o v e r y depends upon t h e r a t i o L/D o f t h e a p e r t u r e .
5.2 Comparisons Between Theory and Experiment
T h e o r e t i c a l c u r v e s o f Cd/C& f o r t h e t h r e e f l o w g e o m e t r i e s t e s t e d a r e shown i n F i g . 8 . P a r a m e t e r v a l u e s used a r e s i m i l a r t o t h o s e f o r t h e e x p e r i m e n t a l r e s u l t s p r e s e n t e d i n F ig .6 . The t h e o r y shows t h e same g e n e r a l f e a t u r e s a s t h e e x p e r i m e n t a l r e s u l t s , p a r t i c a l a r l y f o r t h e c a s e L/D = 10. The p r e d i c t e d ' l o o p ' s i z e f o r t h e o r i f i c e c a s e w a s , g e n e r a l l y , s m a l l e r t h a n t h a t d e r i v e d from e x p e r i m e n t a l r e s u l t s . F o r t h e a p e r t u r e w i t h L / D = 1, t h e f l a t - b o t t o m e d c h a r a c t e r i s t i c o f t h e l o o p is n o t p r e d i c t e d . T h i s is p r o b a b l y r e l a t e d t o t h e t u b e b e i n g i n s u f f i c i e n t l y long f o r f l o w r e a t t a c h m e n t t o o c c u r c o n t i n u o u s l y t h r o u g h o u t t h e f l o w c y c l e .
A d i r e c t compar ison between t h e o r y and e x p e r i m e n t f o r t h e L / D = 1 0 a p e r t u r e is shown i n F i g . 9 . The ' i n e r t i a l l e n g t h ' , ( 9' + & D is n o t a m e a s u r a b l e q u a n t i t y , and w h i l s t a v a l u e of a b o u t 1 5 a p p e a r s t o b e p h y s i c a l l y j u s t i f i a b l e , i t d o e s n o t p r o v i d e a v e r y good f i t w i t h t h e e x p e r i m e n t a l r e s u l t s w h i c h a g a i n p r o d u c e a l a r g e r l o o p . A s e x p e c t e d , h i g h e r v a l u e s of t h i s i n e r t i a l p a r a m e t e r produce b r o a d e r l o o p s .
From e q u a t i o n s ( 6 ) and (11) it is p o s s i b l e t o i d e n t i f y , f o r a g i v e n v a l u e of t h e p a r a m e t e r R , t h e v a l u e of RSt* t h a t would g i v e a s p e c i f i e d e r r o r i n C r e l a t i v e t o C b . Fig.10 shows t h e 5% error b o u n d a r i e e f o r t h e maximum and minimum C v a l u e s o c c u r r i n g i n a f low c y c l e . The r e g i o n below grid to t h e l e f t o f e a c h boundary would g i v e errors below 5%. The c o r r e s p o n d i n g e x p e r i m e n t a l r e s u l t s , which a r e a l s o
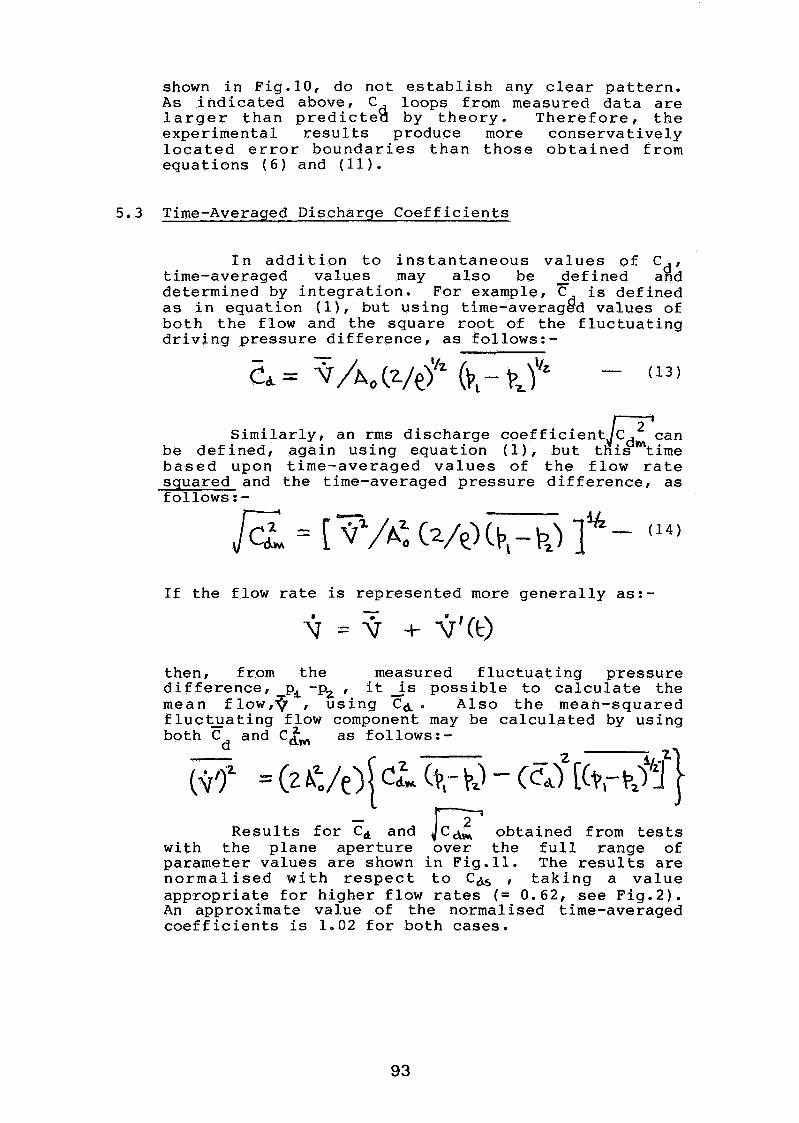
shown i n F ig .10 , d o n o t e s t a b l i s h a n y c lear p a t t e r n . A s i n d i c a t e d a b o v e , C loops f r o m measu red d a t a a r e l a r g e r t h a n p r e d i c t e a b y t h e o r y . T h e r e f o r e , t h e e x p e r i m e n t a l r e s u l t s p r o d u c e more c o n s e r v a t i v e l y l o c a t e d e r r o r b o u n d a r i e s t h a n t h o s e o b t a i n e d f r o m e q u a t i o n s ( 6 ) and (11).
5.3 Time-Averaged D i s c h a r g e C o e f f i c i e n t s
I n a d d i t i o n t o i n s t a n t a n e o u s v a l u e s o f C d , t ime-ave raged v a l u e s may a l s o b e - d e f i n e d and d e t e r m i n e d by i n t e g r a t i o n . F o r example , C is d e f i n e d a s i n e q u a t i o n ( I ) , b u t u s i n g t ime-averag$d v a l u e s o f b o t h t h e f l o w and t h e s q u a r e r o o t o f t h e f l u c t u a t i n g d r i v i n g p r e s s u r e d i f f e r e n c e , as f o l l o w s : -
S i m i l a r l y , a n r m s d i s c h a r g e c o e f f i c i e n t [ z t c a n b e d e f i n e d , a g a i n u s i n g e q u a t i o n ( I ) , b u t t h i s t i m e b a s e d u p o n t i m e - a v e r a g e d v a l u e s o f t h e f l o w r a t e s q u a r e d and t h e t ime-ave raged p r e s s u r e d i f f e r e n c e , a s f o l l o w s : -
If t h e f l o w r a t e is r e p r e s e n t e d more g e n e r a l l y as : -
t h e n , f rom t h e measu red f l u c t u a t i n g p r e s s u r e d i f f e r e n c e , p, -pZ , it A is p o s s i b l e t o c a l c u l a t e t h e m e a n flow,^ , u s i n g Ca. A l s o t h e m e a n - s q u a r e d f l u c t j a t i n g f l o w component may b e c a l c u l a t e d by u s i n g b o t h Cd and c&, a s f o l l o w s : -
2 R e s u l t s f o r ? and Jcdr ' o b t a i n e d f r o m tests
w i t h t h e p l a n e a p e r t u r e o v e r t h e f u l l r a n g e o f p a r a m e t e r v a l u e s are shown i n F ig .11 . The r e s u l t s a r e n o r m a l i s e d w i t h r e s p e c t t o C h , t a k i n g a v a l u e a p p r o p r i a t e f o r h i g h e r f l o w rates (= 0.62, see F i g . 2 ) . An a p p r o x i m a t e v a l u e o f t h e n o r m a l i s e d t ime-ave raged c o e f f i c i e n t s is 1.02 f o r b o t h c a s e s .
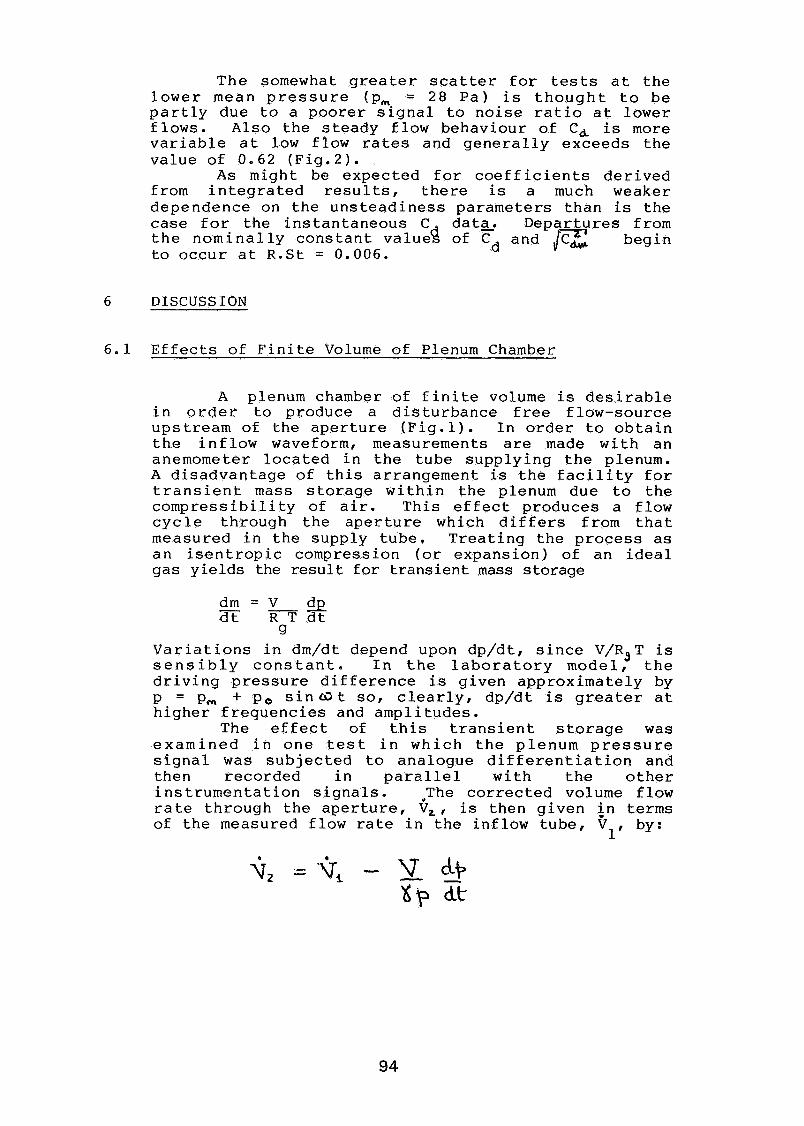
T h e somewhat g r e a t e r s c a t t e r f o r tes ts a t t h e lower mean p r e s s u r e (p, = 28 P a ) is t h o u g h t t o b e p a r t l y d u e t o a p o o r e r s i g n a l t o n o i s e r a t i o a t lower f l o w s . A l s o t h e s t e a d y f l o w b e h a v i o u r o f CA is more v a r i a b l e a t l o w f l o w r a t e s and g e n e r a l l y e x c e e d s t h e v a l u e o f 0.62 ( F i g . 2 ) .
A s m i g h t be e x p e c t e d f o r c o e f f i c i e n t s d e r i v e d f rom i n t e g r a t e d r e s u l t s , t h e r e is a much weake r d e p e n d e n c e on t h e u n s t e a d i n e s s p a r a m e t e r s t h a n is t h e c a s e f o r t h e i n s t a n t a n e o u s C d a t a . D e p a r t u r e s f rom t h e n o m i n a l l y c o n s t a n t v a l u e 2 o f Cd a n d b e g i n t o o c c u r a t R.St = 0.006.
6 DISCUSSION
6 . 1 E f f e c t s o f F i n i t e Volume of Plenum Chamber
A plenum chamber o f f i n i t e volume is d e s i r a b l e i n o r d e r t o p r o d u c e a d i s t u r b a n c e f r e e f l o w - s o u r c e u p s t r e a m o f t h e a p e r t u r e ( F i g . 1) . I n o r d e r t o o b t a i n t h e i n f l o w waveform, measu remen t s a r e made w i t h a n anemometer l o c a t e d i n t h e t u b e s u p p l y i n g t h e plenum. A d i s a d v a n t a g e o f t h i s a r r a n g e m e n t is t h e f a c i l i t y f o r t r a n s i e n t mass s t o r a g e w i t h i n t h e plenum d u e t o t h e c o m p r e s s i b i l i t y o f a i r . T h i s e f f e c t p r o d u c e s a f l o w c y c l e t h r o u g h t h e a p e r t u r e which d i f f e r s f r o m t h a t m e a s u r e d i n t h e s u p p l y t u b e . T r e a t i n g t h e p r o c e s s a s a n i s e n t r o p i c c o m p r e s s i o n (or e x p a n s i o n ) o f a n i d e a l g a s y i e l d s t h e r e s u l t f o r t r a n s i e n t mass s t o r a g e
V a r i a t i o n s i n dm/dt depend upon d p / d t , s i n c e V/RST is s e n s i b l y c o n s t a n t . I n t h e l a b o r a t o r y m o d e l , t h e d r i v i n g p r e s s u r e d i f f e r e n c e is g i v e n a p p r o x i m a t e l y by p = p, + p, s i n a t so, c l e a r l y , d p / d t is g r e a t e r a t h i g h e r f r e q u e n c i e s and a m p l i t u d e s .
The e f f e c t o f t h i s t r a n s i e n t s t o r a g e was e x a m i n e d i n o n e t e s t i n w h i c h t h e p l e n u m p r e s s u r e s i g n a l w a s s u b j e c t e d t o a n a l o g u e d i f f e r e n t i a t i o n and t h e n r e c o r d e d i n p a r a l l e l w i t h t h e o t h e r i n s t r u m e n t a t i o n s i g n a l s . The c o r r e c t e d volume f l o w ra te t h r o u g h t h e a p e r t u r e , G,, is t h e n g i v e n i n terms o f t h e measu red f l o w r a t e i n t h e i n f l o w t u b e , V by:
1'
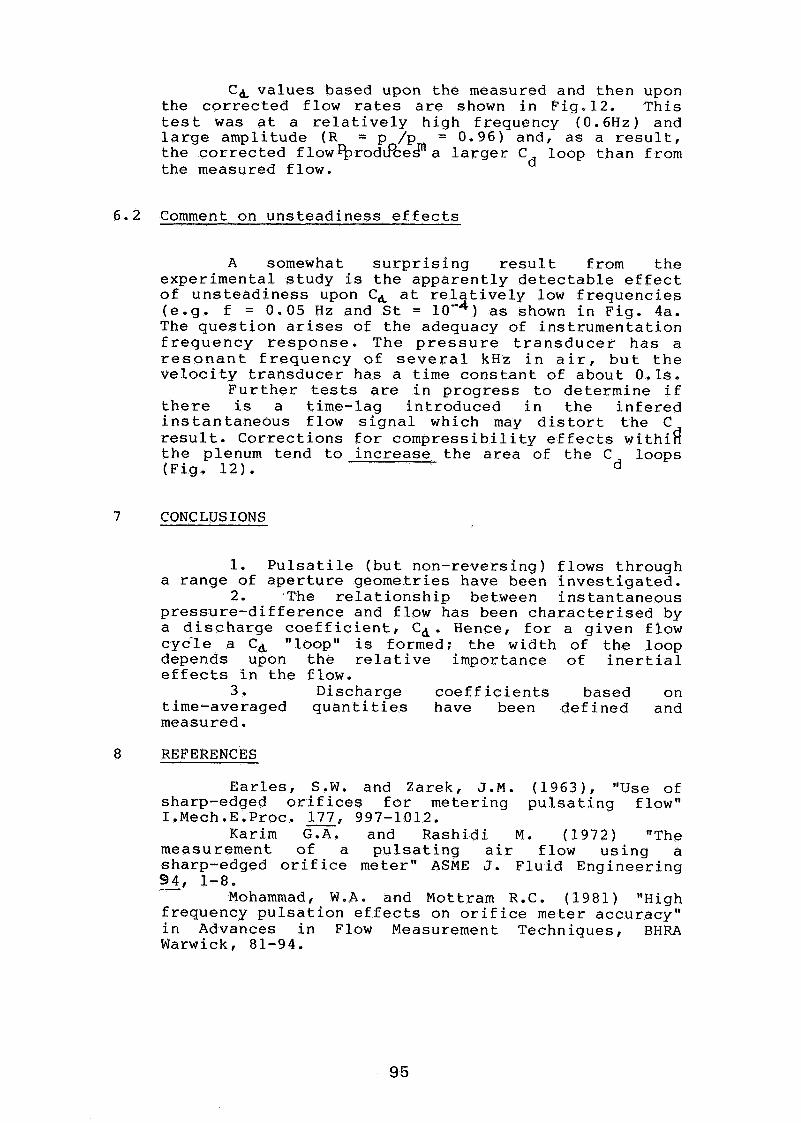
Cd, v a l u e s b a s e d upon t h e measu red and t h e n upon t h e c o r r e c t e d f l o w ra tes are shown i n F ig .12 . T h i s t e s t w a s a t a r e l a t i v e l y h i g h f r e q u e n c y (0 .6Hz) and l a r g e a m p l i t u d e ( R = p /p = 0 . 9 6 ) a n d , as a r e s u l t , t h e c o r r e c t e d flow%rod&!ce$ a l a r g e r C l o o p t h a n f rom t h e m e a s u r e d f l o w .
d
6.2 Comment on u n s t e a d i n e s s e f f e c t s
A somewhat s u r p r i s i n g r e s u l t f r o m t h e e x p e r i m e n t a l s t u d y is t h e a p p a r e n t l y d e t e c t a b l e e f f e c t o f u n s t e a d i n e s s upon Cd a t r e l a t i v e l y l o w f r e q u e n c i e s ( e . g . f = 0 . 0 5 Hz and S t = as shown i n F i g . 4a . The q u e s t i o n a r i ses o f t h e a d e q u a c y o f i n s t r u m e n t a t i o n f r e q u e n c y r e s p o n s e . T h e p r e s s u r e t r a n s d u c e r h a s a r e s o n a n t f r e q u e n c y o f s e v e r a l kHz i n a i r , b u t t h e v e l o c i t y t r a n s d u c e r h a s a t i m e c o n s t a n t o f a b o u t 0 .1s .
F u r t h e r tes ts are i n p r o g r e s s t o d e t e r m i n e i f t h e r e is a t i m e - l a g i n t r o d u c e d i n t h e i n f e r e d i n s t a n t a n e o u s f l o w s i g n a l w h i c h may d i s t o r t t h e C r e s u l t . C o r r e c t i o n s f o r c o m p r e s s i b i l i t y e f f e c t s w i t h i d t h e p l enum t e n d t o i n c r e a s e t h e area o f t h e C l o o p s ( F i g , 1 2 ) . d
7 CONCLUSIONS
1. P u l s a t i l e ( b u t n o n - r e v e r s i n g ) f l o w s t h r o u g h a r a n g e o f a p e r t u r e g e o m e t r i e s h a v e b e e n i n v e s t i g a t e d .
2. The r e l a t i o n s h i p be tween i n s t a n t a n e o u s p r e s s u r e - d i f f e r e n c e a n d f l o w h a s b e e n c h a r a c t e r i s e d by a d i s c h a r g e c o e f f i c i e n t , Cd. Hence , f o r a g i v e n f l o w c y c ' l e a Cb " l o o p " is fo rmed ; t h e w i d t h o f t h e l o o p d e p e n d s upon t h e r e l a t i v e i m p o r t a n c e o f i n e r t i a l e f f e c t s i n t h e f l o w .
3 . D i s c h a r g e c o e f f i c i e n t s b a s e d o n t i m e - a v e r a g e d q u a n t i t i e s h a v e been d e f i n e d a n d m e a s u r e d .
REFERENCES
Earles, S.W. and Z a r e k , J . M . ( 1 9 6 3 ) , " U s e o f sha rp -edged o r i f i c e s f o r m e t e r i n g p u l s a t i n g f l o w " 1.Mech.E.Proc. 177 , 997-1012. -
K a r i m G.A. and R a s h i d i M . ( 1 9 7 2 ) "The m e a s u r e m e n t o f a p u l s a t i n g a i r f l o w u s i n g a sha rp -edged o r i f ice meter" ASME J. F l u i d E n g i n e e r i n g 9 4 , 1-8. --
Mohammad, W.A. and Mottram R.C. ( 1 9 8 1 ) "High f r e q u e n c y p u l s a t i o n e f f e c t s on o r i f ice meter a c c u r a c y f ' i n Advances i n Flow Measurement T e c h n i q u e s , BHRA Warwick, 81-94.
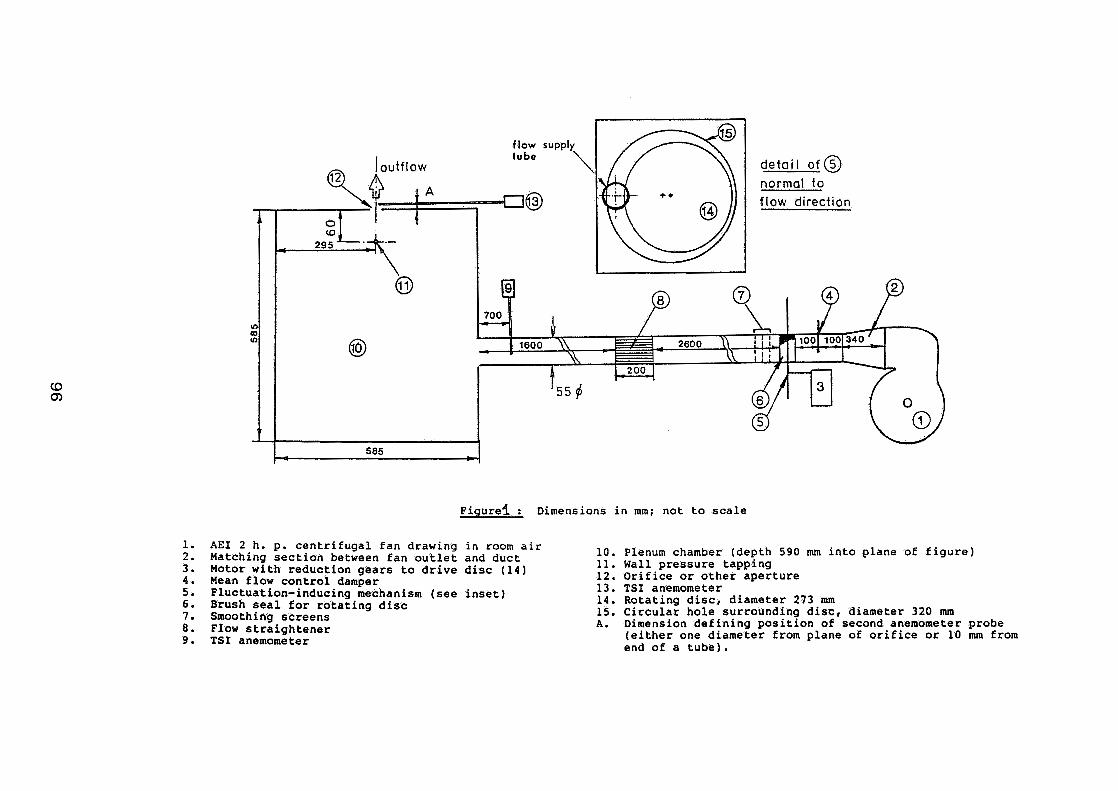
AEI 2 h. p. centrifugal fan drawing in room air Matching section between fan outlet and duct Motor with reduction gears to drive disc (14) Mean flow control damper Fluctuation-inducing mechanism (see inset) Brush seal for rotating disc Smoothing screens Plow straightener TSI anemometer
10. Plenum chamber (depth 590 mm into plane of figure) 11. Wall pressure tapping 12, Orifice or other aperture 13. TSI anemometer 14. Rotating disc, diameter 273 nun 15. Circular hole surrounding disc, diameter 320 mm A. Dimension defining position of second anemometer probe
(either one diameter from plane of orifice or 10 mm from end of a tube).
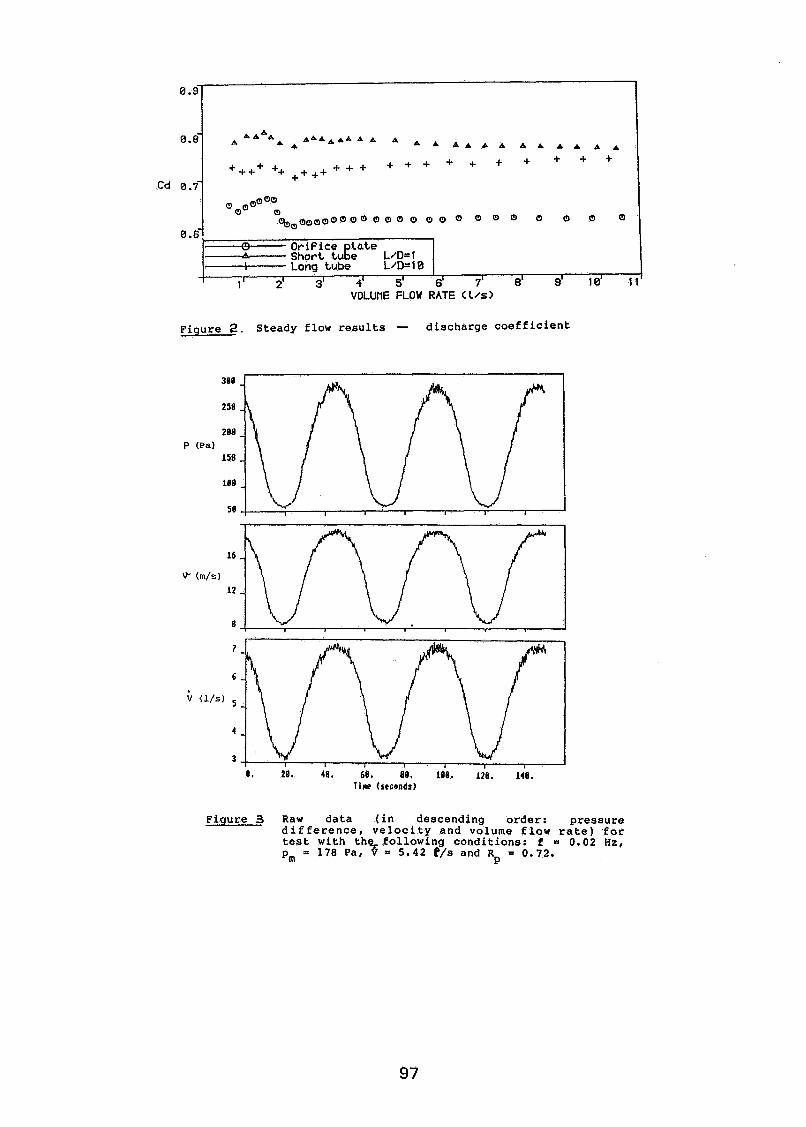
0.67 -
"----- Orif ice late Short tu&e L/D=1 Long tube L/D=10
1' 2' 3' 4' 5' 6' 7' 8' 9' 1 @I 1 1 VOLUnE FLOW RATE < l/s )
F i g u r e 2 . Steady f l o w r e s u l t s - d i s c h a r g e c o e f f i c i e n t
Tire (seconds)
7
6
b (1,s) 5 4 -
3
F i g u r e 3 Raw d a t a ( i n d e s c e n d i n g o r d e r : p r e s s u r e d i f f e r e n c e , v e l o c i t y and volume f l o w r a t e ) f o r test w i t h t h f o l l o w i n g c o n d i t i o n s : f = 0 . 0 2 Hz, pm = 178 Pa, (b = 5 . 1 2 t/s and % = 0 . 7 2 .
\[bq[ I I I 1 I 1
8. 20. 40. 68. 00. tee. ue. 140.
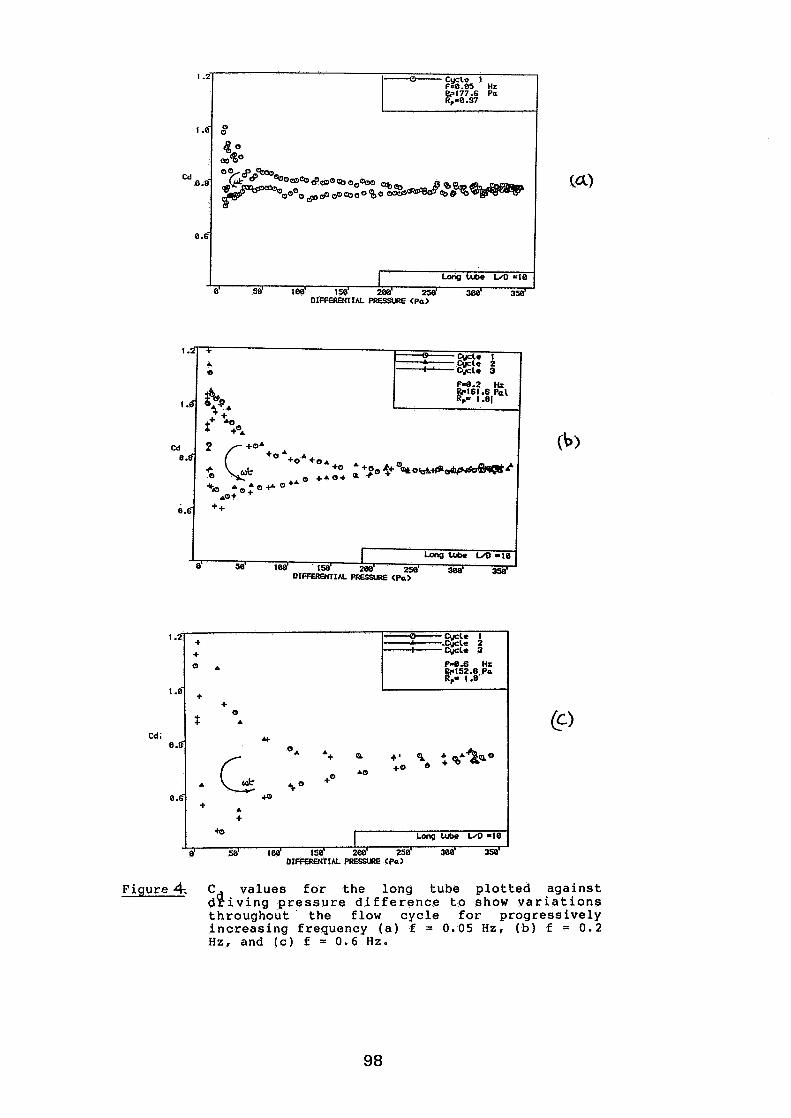
- 1.2 C y c l e 1
W177.6 Pa
e-l]l DIFFERWTIN PRESSURE <Pa>
F i g u r e 4 C v a l u e s f o r t h e l o n g t u b e p l o t t e d a g a i n s t d % i v i n g p r e s s u r e d i f f e r e n c e t o show v a r i a t i o n s t h r o u g h o u t t h e f l o w c y c l e f o r p r o g r e s s i v e l y i n c r e a s i n g f r e q u e n c y ( a ) f = 0 .05 H Z f ( b ) f = 0 .2 H Z f and ( c ) f = 0.6 Hz.
- - Qcle I , 1 e 2
Qcle 3
f-0.6 Hz ClS2.B.Pa R,= 1 .e
1.1
+ Q A
1.6
Cd; e .6
e .d
-
+ + + "A
4
Q A A + a +' A 0
+ s* : 8 ~ 9 ~ ~ AG +O +Q
+ A
+ +o I Lonp tube L a -10
e1 5 d led 1sJ 2m8 258' 3ee8 3san DIFFERWTIN PRESSURE (Pa)
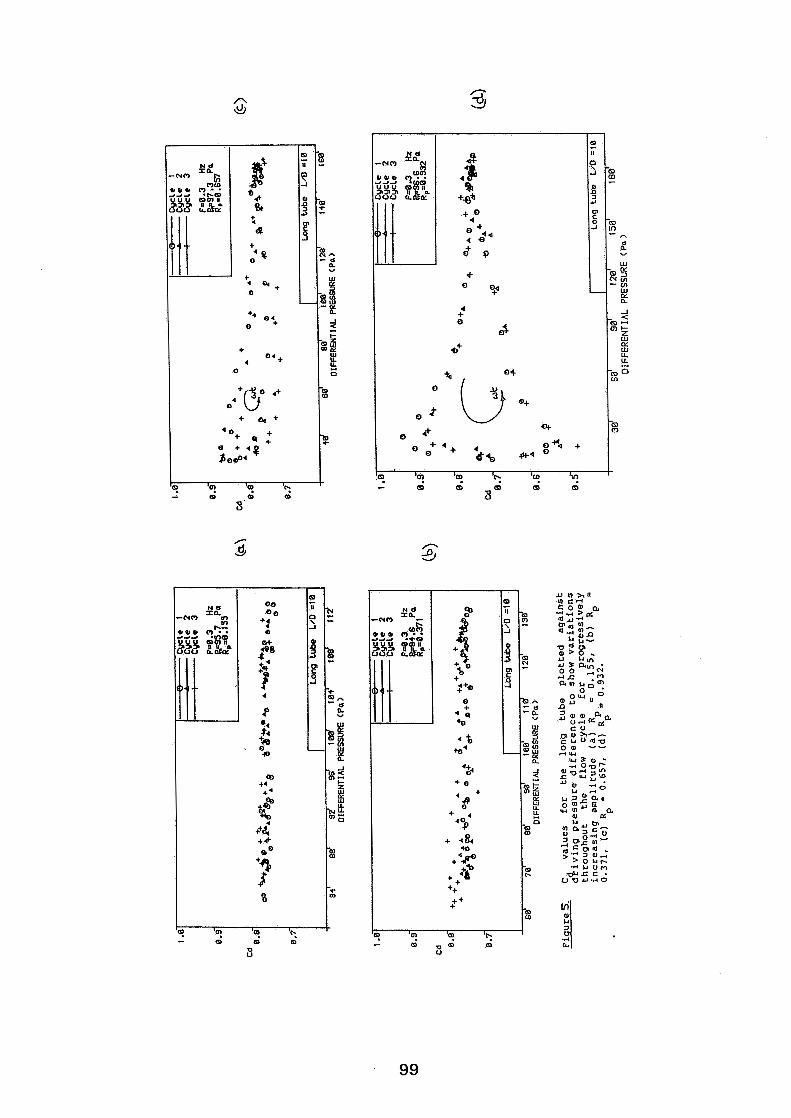
- m m m 0
3 U
5 s 5
I -. - z p a
=! - I- - z
zp U1 :: Ei
m a
-m i-
i;$i UUU tb IY f + ','a
+ ' O ' +
-CD m -
- 6J
L" A
d b " W
-6J 3 2 g
UI CL a -I
-g 2 lu lx W u
tL, -6J 0 w
m m
u u u ?'O?
i2ai f +," a +
4 ed4 $ 9
+ O b
i;
a 8 Q Q CD '9 I"?
m - II
5 D 3 P,
P 0 _I
-_
+4 0 . 0 +
+ 0 4 +
0
o *+e + - + '+
* m +.;+ b 08'
? I? "? '2
: a 4c
3
a 2 a ' bas Q+
4% 0 *
a,..+ 4 *4 + &+ e4
? I? '2 i. -
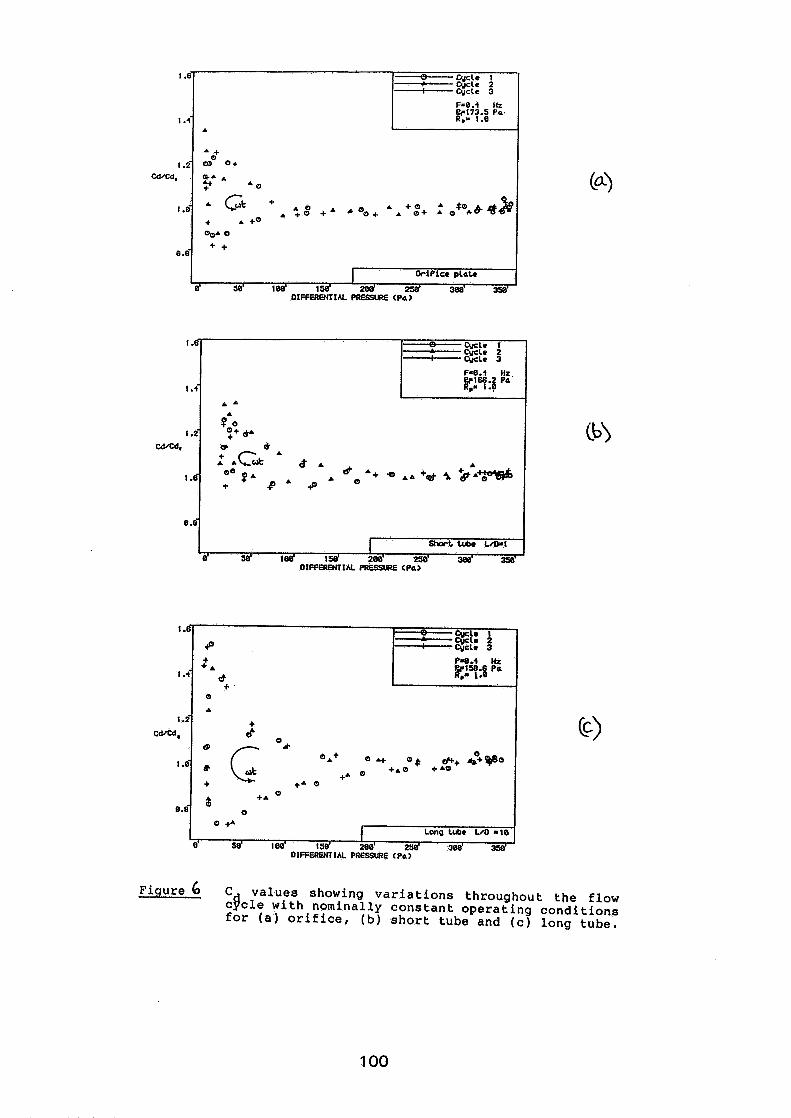
I Short i A h ml
58' lee' lse' 2m' 25a' 300' 3W6 OIFFWENTIN PRESSURE <Pa>
1 .6-
1 .4
1.2- Cd/Cd,
1.0-
e .e'
Figure 6 C values showing variations throughout the flow Cfcle with nominally constant operating conditions for ( a ) orifice, (b) short tube and ( c ) long tube.
DIHEREMIN <pa>
A
I .2-
Cdlcd,
C y c l e 1 -Cycle 2 - Cycle 3
F-8.4 Hz r$!?L; Pa.
0
A
8 .+
'0' o +
@ A A
i' A 0
A GC + A A + O D + A boa+ A A + g + :o*oA&#&
+ A +" o,,r 0
+ +
I O r i P l u p lak
e' se' tee' 15e' 2s# 3WS m'
* "A+
+ A @ o., a".*.
O 4 "* + A "
+A +* 0
d; + A " 0.6 0
0 +r I Long tube L/0 = 10
0' 50' 100' 150' 200' 2W 300' DIFFERENTIAL PRESSURE <Pa>
3sd
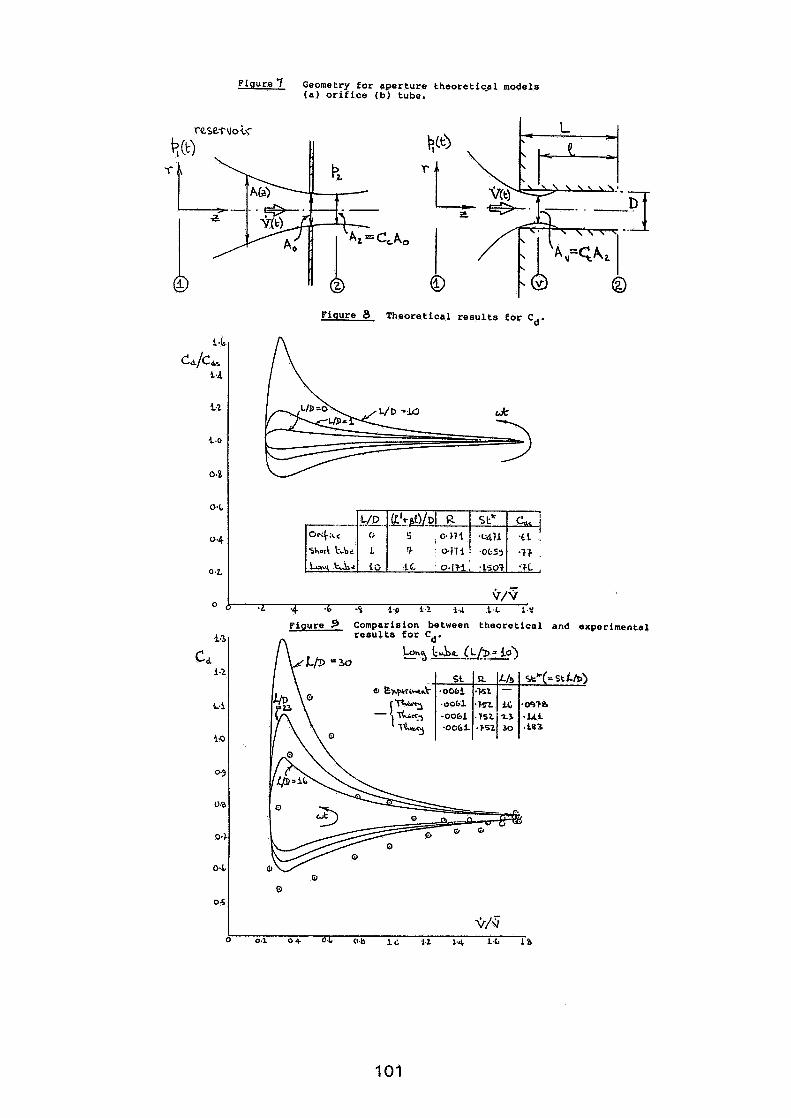
Figure 7 Geometry f o r aperture theoretic.al models ( a ) o r i f i c e ( b ) tube.
Figure 8 Theore t i ca l r e s u l t s f o r Cd.
Figure 4 Comparision between theore t i ca l and expa
i.3 r e s u l t s f o r Cd.
CCL kh3 (LL?AQ) 15
Gi
1.0
0.9
0.0
0.).
0.6
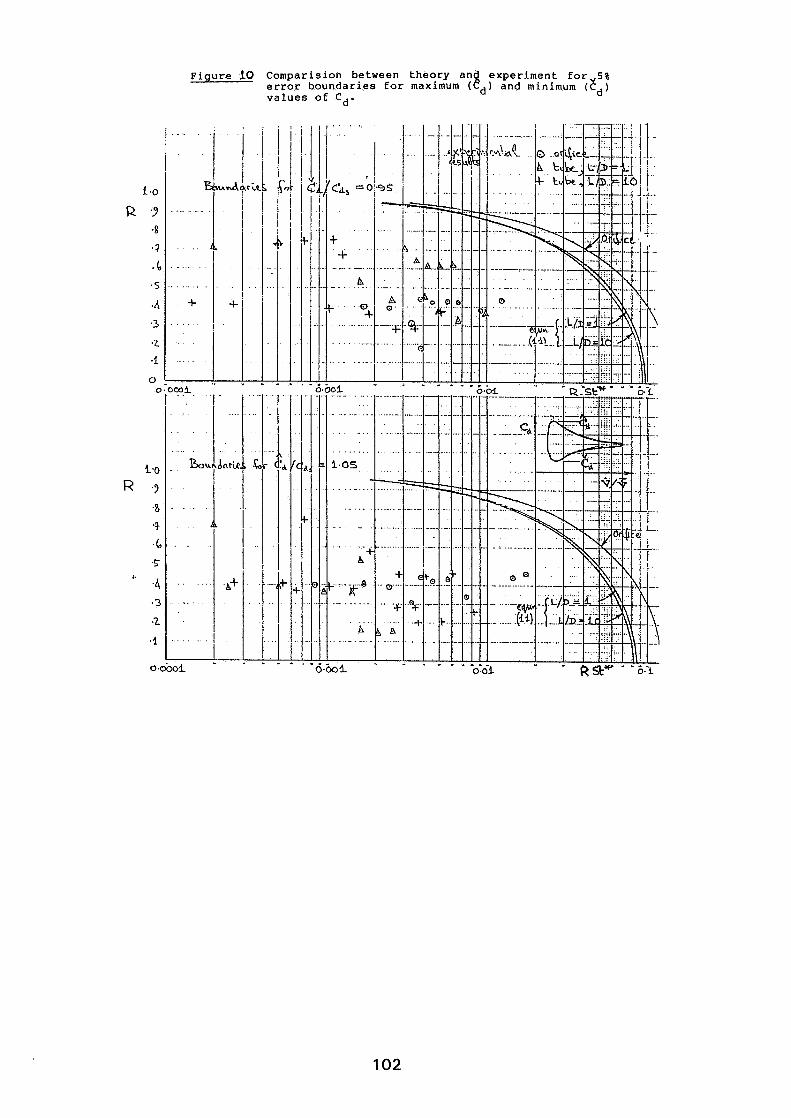
Figure 10 Comparision between theory an experiment for 5 % error boundaries for maximum ( & I and minimum (Ed) values of Cd.
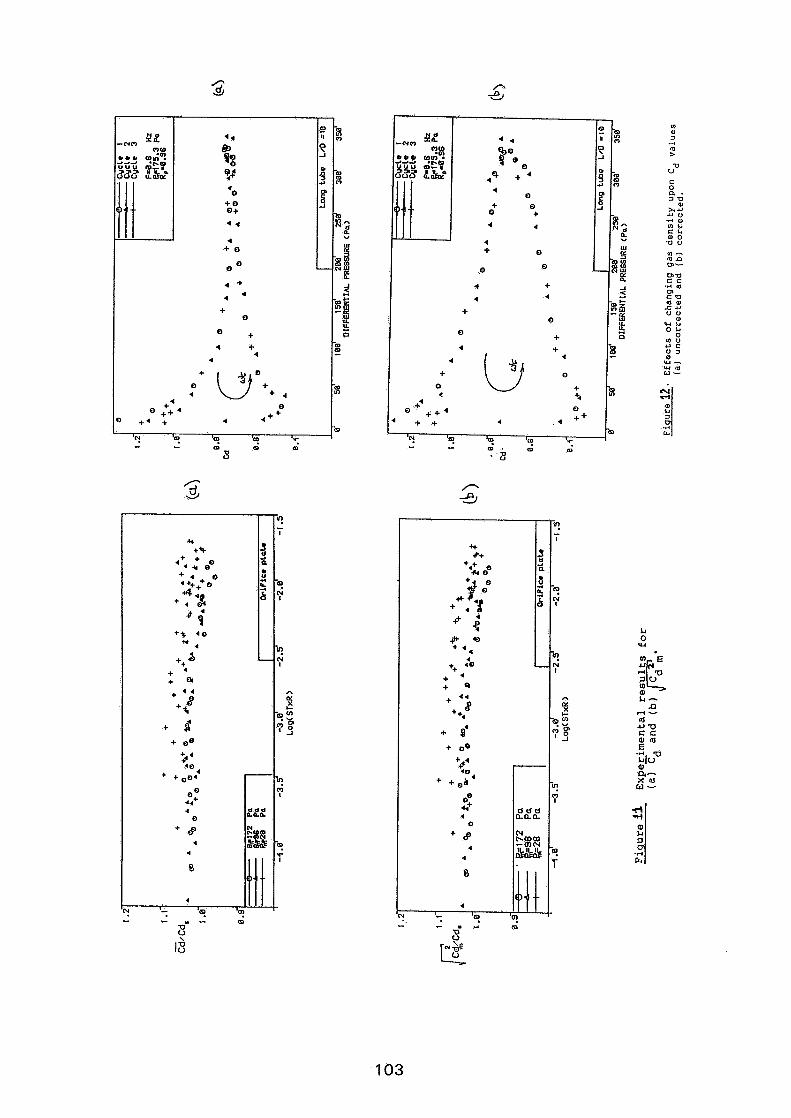
Pi2 -(Yo nu coo su;'? - 8 2 4 yuu
3 z 4 4
0 0
3 : m w m z 2 5 UI
-2P E -1 < -
22 - Ki U. LL - a
rn Z
I"
m
z 0
-I
/i ; OO; 4Q +
0 0
. B
n 3 D 6 -1
4 + 4 4
+ 0
0 + 4 +
+ 0 4 u " . a
0 + ~ + + 4 o 4 + + 4 . 4 ++
'c! - I=! - '2 m . m
't m
Discussion
Paper 6
M. Bassett (BRANZ) This analysis could have application to airtlows through rainscreen claddings. Here it is desirable to know airflow rates through ventilation openings at a range of wind pressure frequencies. Has this been undertaken or contarcplated?
B. Sahin (Brunel University, UK) Thankyou for your question - no, we have not considered the application of this work to rainscreen cladding. I would be-grateful if you could advise where we can obtain details of the geometry of this cladding and hence, any possible applications of the work.
EFFECTIVE VENTILATION
9 t h AIVC Conference, Gent, Belgium 12-15 September, 1988
Paper 7
A I R MOTION IN THE VICINITY OF AIR-SUPPLY DEVICES FOR DISPLACEMENT
VENTILATION
HANS MARTIN MATHISEN
SINTEF, D i v i s i o n o f Appl i e d Thermodynamics, 7034 Trondheim, Norway

ABSTRACT
In displacement ventilation systems, air flow rates, temperature and the design of the air supply device strongly influence the parameters which decide the thermal comfort. This paper reviews experiments and theoretical models which show the connection between t.hese parameters. It is indicated that the Archimedes number of the supply air is the parameter which decides the air velocity in the area close to the floor. (The Archimedes number is the ratio between buoyancy and inertia forces). The width and shape of the air supply device has also been varied, and a porous media has been used on the inlet area of the air supply device.
The results show that it is possible to remove considerable amounts of excess heat from a room without exceeding the limits for thermal comfort. Comparisons with commercial elements indi- cate that the design of the device is of minor importance as long as the air flow is horizontal and the perforation ratio of holes is high enough.
INTRODUCTION
During the last few years there has been a lot of work done on developing efficient ventilating systems, i.e. systems which remove contaminants and excess heat with a minimum use of air and energy. In this work the displacement ventilation system has proved to be the most efficient system for the removal of most kinds of contaminants and excess heat, both in industrial and comfort ventilation.
Displacement ventilation, Figure 1 , is secured by supplying the ventilation air at a temperature that is always Lower than the air temperature in the zone of occupation. The necessary heating of the room is usually provided by the use of panel heaters under the windows. Close to the heat sources in the room the air will rise upwards due to buoyancy. Often contaminants are relea- sed from these heat sources, for instance people. Then the con- taminants will be transported towards the ceiling, where the exhaust opening is placed. The height of the lower zone depends on how much air is suplied. More air means that the rising warm air can be feeded with fresh air to a higher level before it must recirculate and feed itself. In this way the air in the room will be stratified with a lower zone with fresh air, and a upper zone with contaminated air.
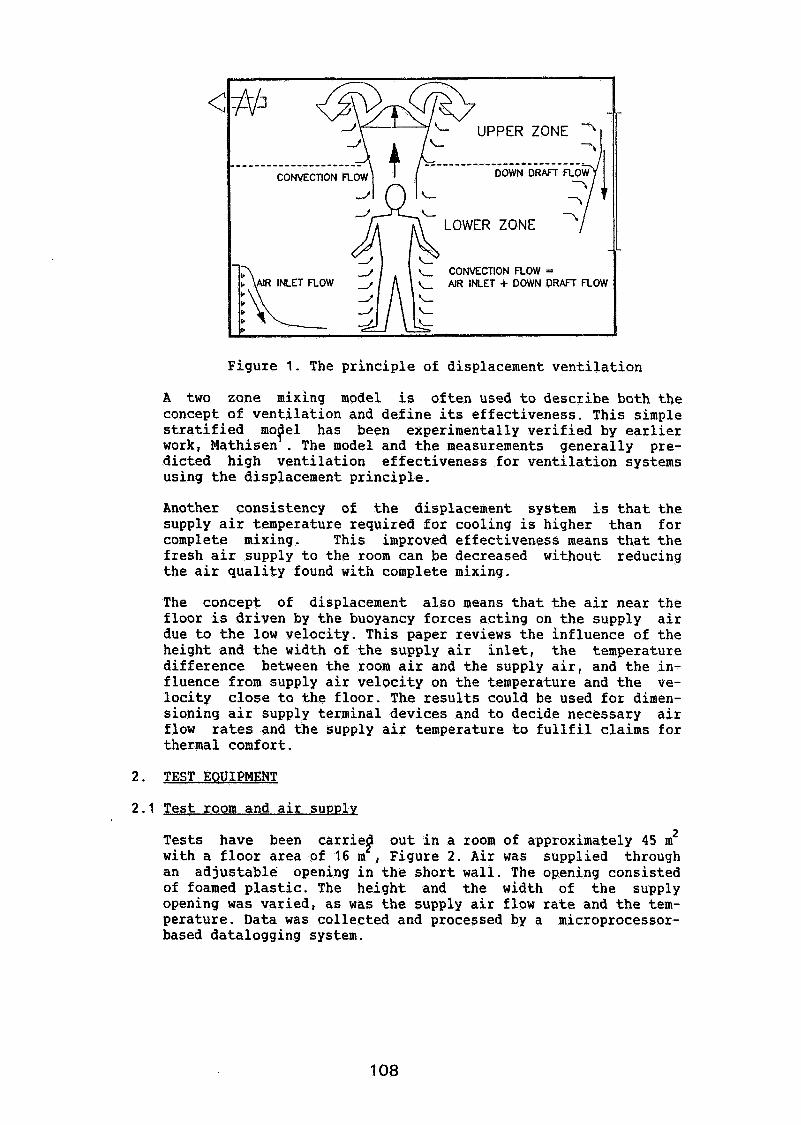
CONVECTION ROW
LOWER ZONE
CONVECTION ROW = AIR INLET + DOWN DRAFT ROW
Figure 1. The principle of displacement ventilation
A two zone mixing model is often used to describe both the concept of ventilation and define its effectiveness. This simple stratified mopel has been experimentally verified by earlier work, Mathisen . The model and the measurements generally pre- dicted high ventilation effectiveness for ventilation systems using the displacement principle.
Another consistency of the displacement system is that the supply air temperature required for cooling is higher than for complete mixing. This improved effectiveness means that the fresh air supply to the room can be decreased without reducing the air quality found with complete mixing.
The concept of displacement also means that the air near the floor is driven by the buoyancy forces acting on the supply air due to the low velocity. This paper reviews the influence of the height and the width of the supply air inlet, the temperature difference between the room air and the supply air, and the in- fluence from supply air velocity on the temperature and the ve- locity close to the floor. The results could be used for dimen- sioning air supply terminal devices and to decide necessary air flow rates and the supply air temperature to fullfil claims for thermal comfort.
2. TEST EQUIPMENT
2.1 Test room and air suvvly
Tests have been carriep out in a room of approximately 45 m2 with a floor area of 16 m , Figure 2. Air was supplied through an adjustable opening in the short wall. The opening consisted of foamed plastic. The height and the width of the supply opening was varied, as was the supply air flow rate and the tem- perature. Data was collected and processed by a microprocessor- based datalogging system.
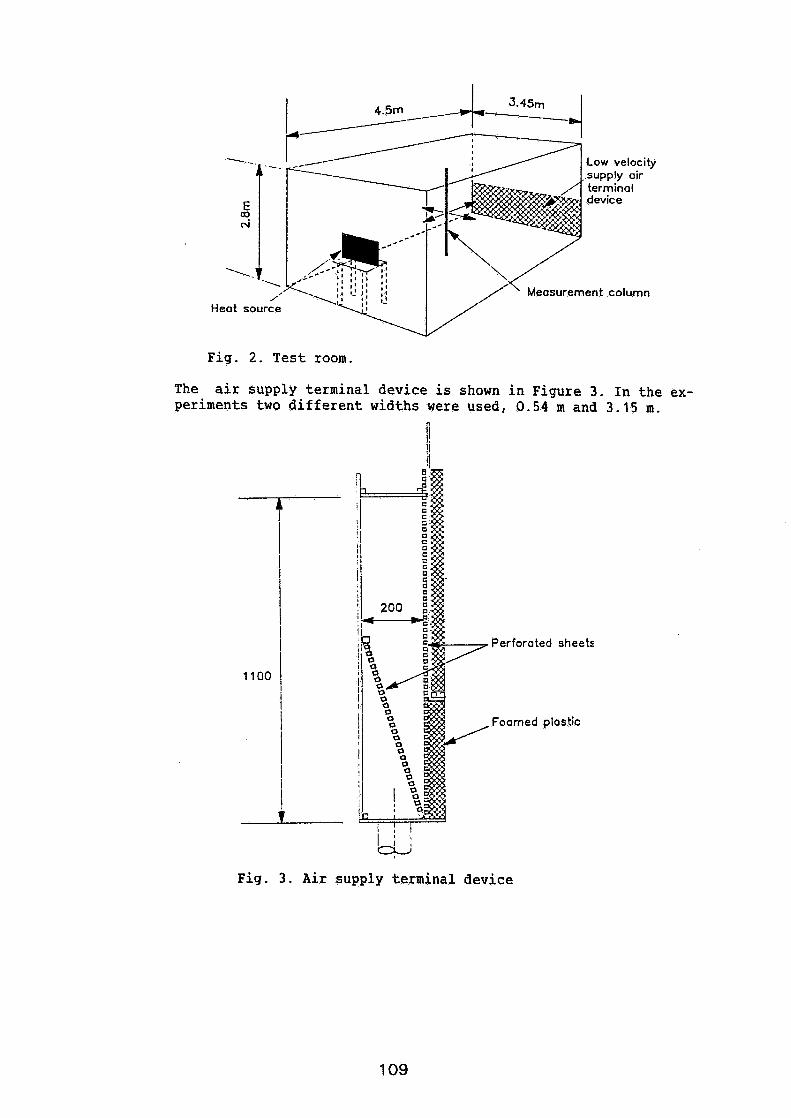
1- .-_ Low velocity ,supply air terminal
51 device
'-.- -\
A' Measurement column Heot source
The peri
F i g . 2 . Test room.
. In the ex- 3 .15 m.
F i g . 3 . Air supply terminal device
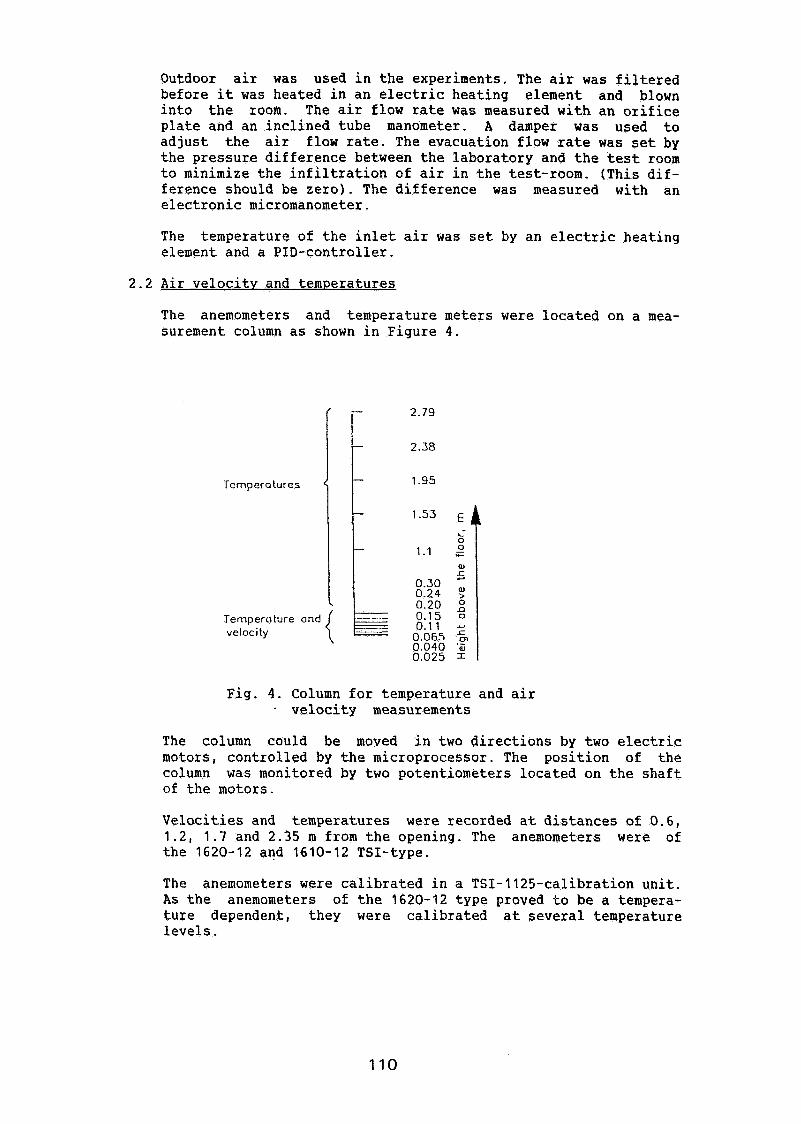
Outdoor air was used in the experiments. The air was filtered before it was heated in an electric heating element and blown into the room. The air flow rate was measured with an orifice plate and an inclined tube manometer. A damper was used to adjust the air flow rate. The evacuation flow rate was set by the pressure difference between the laboratory and the test room to minimize the infiltration of air in the test-room. (This dif- ference should be zero). The difference was measured with an electronic micromanometer.
The temperature of the inlet air was set by an electric heating element and a PID-controller.
2.2 Air velocity and temperatures
The anemometers and temperature meters were located on a mea- surement column as shown in Figure 4.
I i 2.79
2.38
Tcrnperaturcs 1.95
Temperc~ture and velocity
Fig. 4. Column for temperature and air velocity measurements
The column could be moved in two directions by two electric motors, controlled by the microprocessor. The position of the column was monitored by two potentiometers located on the shaft of the motors.
Velocities and temperatures were recorded at distances of 0.6, 1.2, 1.7 and 2.35 m from the opening. The anemometers were of the 1620-12 and 1610-12 TSI-type.
The anemometers were calibrated in a TSI-1125-calibration unit. As the anemometers of the 1620-12 type proved to be a tempera- ture dependent, they were calibrated at several temperature levels.
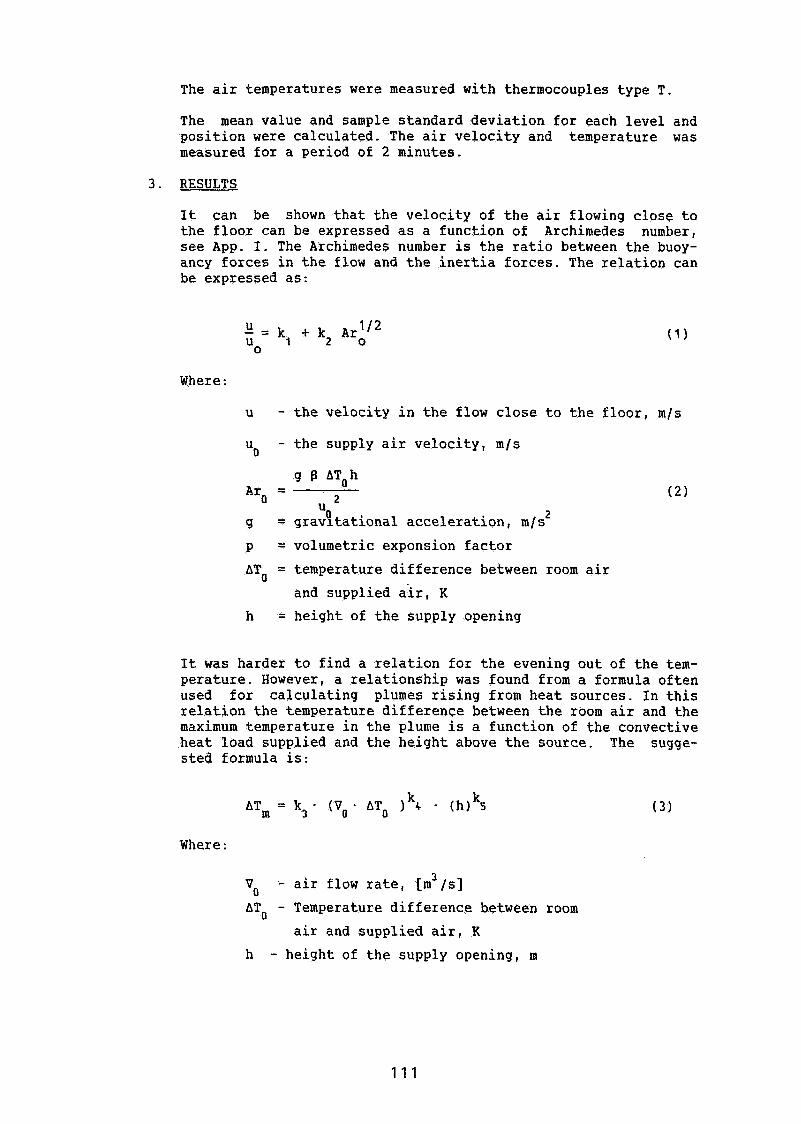
The air temperatures were measured with thermocouples type T.
The mean value and sample standard deviation for each level and position were calculated. The air velocity and temperature was measured for a period of 2 minutes.
3. RESULTS
It can be shown that the velocity of the air flowing close to the floor can be expressed as a function of Archimedes number, see App. I. The Archimedes number is the ratio between the buoy- ancy forces in the flow and the inertia forces. The relation can be expressed as:
Where :
u - the velocity in the flow close to the floor, m/s
u - the supply air velocity, m/s 0
- g B AToh Aro -
2 ( 2 ) u
0 g = gravitational acceleration, m/s 2
p = volumetric exponsion factor
ATo = temperature difference between room air
and supplied air, K
h = height of the supply opening
It was harder to find a relation for the evening out of the tem- perature. However, a relationship was found from a formula often used for calculating plumes rising from heat sources. In this relation the temperature difference between the room air and the maximum temperature in the plume is a function of the convective heat load supplied and the height above the source. The sugge- sted formula is:
Where :
V - air flow rate, [m3 /s] ATo - Temperature difference between room
air and supplied air, K
h - height of the supply opening, m
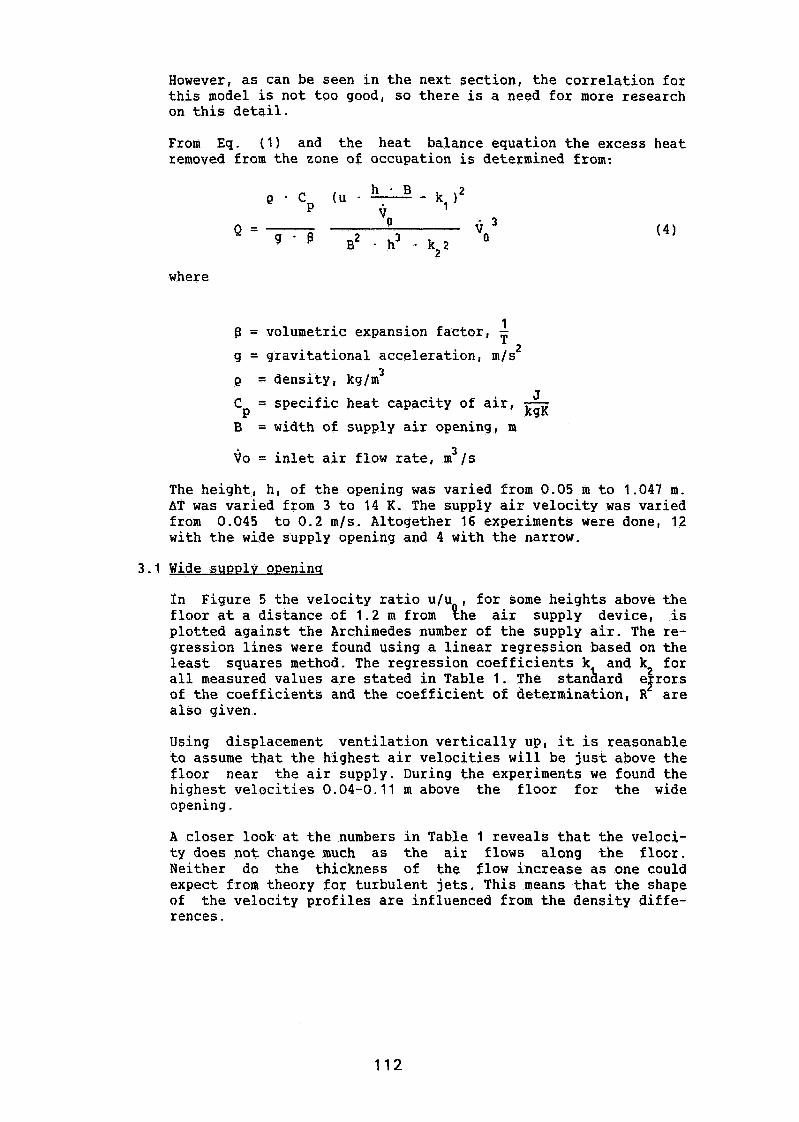
However, as can be seen in the next section, the correlation for this model is not too good, so there is a need for more research on this detail.
From Eq. ( 1 ) and the heat balance equation the excess heat removed from the zone of occupation is determined from:
where
1 fl = volumetric expansion factor, - 2 g = gravitational acceleration, m/s
e = density, kglm 3
J C~
= specific heat capacity of air, - kgK
B = width of supply air opening, m
3 vo = inlet air flow rate, m /s
The height, h, of the opening was varied from 0.05 m to 1.047 m. AT was varied from 3 to 14 K. The supply air velocity was varied from 0.045 to 0 . 2 m/s. Altogether 16 experiments were done, 12 with the wide supply opening and 4 with the narrow.
3 . 1 Wide supply o~eninq
In Figure 5 the velocity ratio u/u , for some heights above the floor at a distance of 1 . 2 m from the air supply device, is plotted against the Archimedes number of the supply air. The re- gression lines were found using a linear regression based on the least squares method. The regression coefficients k and k2 for all measured values are stated in Table 1. The stanhard efrors of the coefficients and the coefficient of determination, R are also given.
Using displacement ventilation vertically up, it is reasonable to assume that the highest air velocities will be just above the floor near the air supply. During the experiments we found the highest velocities 0 . 0 4 - 0 . 1 1 m above the floor for the wide opening.
A closer look at the numbers in Table 1 reveals that the veloci- ty does not change much as the air flows along the floor. Neither do the thickness of the flow increase as one could expect from theory for turbulent jets. This means that the shape of the velocity profiles are influenced from the density diffe- rences.
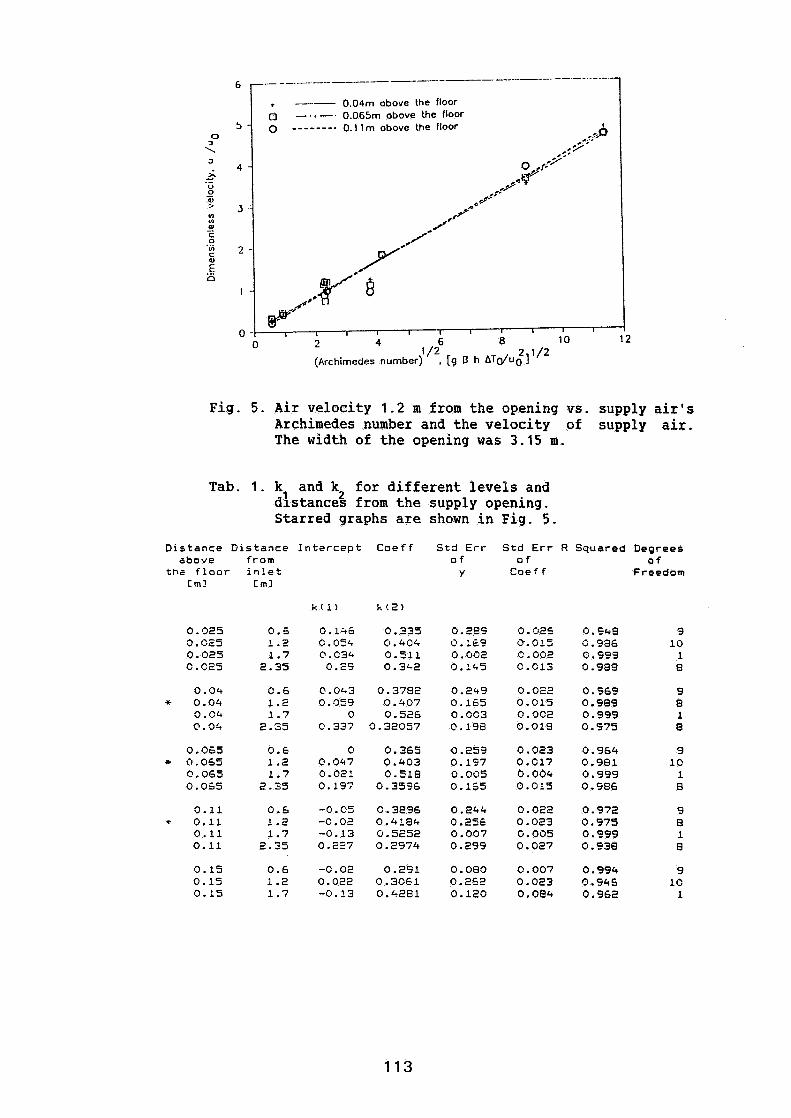
Fig. 5. Air velocity 1.2 m from the opening vs. supply air's Archimedes number and the velocity of supply air. The width of the opening was 3.15 m.
5 -
4 -
3 -
2 -
1 -
0 -
Tab. 1. k, and k2 for different levels and distances from the supply opening. Starred graphs are shown in Fig. 5.
, 0.04rn above the floor -.--. 0.0651~1 above the floor
0 -------. 0.1 1 rn above the floor .?$ . *. -
,::y
0 ,sqP
*.R' .:- ,,/*+w
J
Y*'-- 8'. 8
0
yA: , , , 2 4 6 8 10 12
D i s t a n c e D i s t a n c e I n t e r c e p t C o e f f S t d Err S t d E r r R S q u a r e d Degrees a b o v e f r o m o f o f o f
t h s f l o o r i n l e t Y C o e f f F r e e d o m C m l c m l
2 1/2 (Archimedes number;/2. [g P h b T d u O 1

Fig. 6 shows the temperature evening out 0.04 m above the floor 1.2 m from the inlet vs. height of the supply opening and the supply air velocity.
The graph shown was found by linearizing Eq. 3 and using multi- ple linear regression. Results from other calculations are shown in Table 2, as are also standard errors of the coeffisients (for the lineari ed quation), and the coeffisient of multiple deter- % 5 mination, R . R varies between 0.7 and 0.8. That means that 70-80% of the measured values could be explained by the model.
0-1 I I I , , , , , , , , I I I , 4 0 0.4 0.8 1.2 1.6 2 2.4 2.8 3.2
(Thousands)
Fig. 6. Temperature difference against supply air flow rate times ATo, and height of supply opening. ATm- temperature difference between a point 1 . 1 m and 0.040 m above the floor. The width of the opening was 3 .15 m.
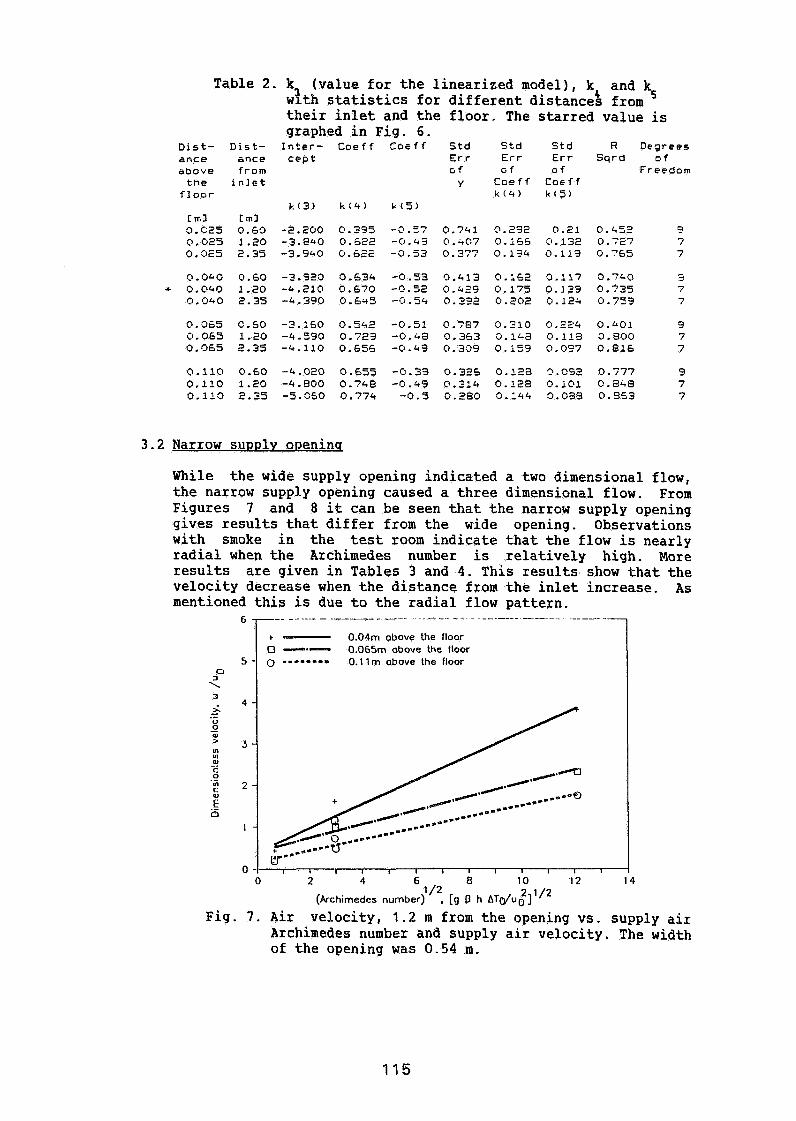
Table 2. k (value for the linearized model), kl and kS wtth statistics for different distances from their inlet and the floor. The starred value is graphed in Fig. 6.
Dist- D i s t - I n t e r - C o e f f t o e f f S t d S t d S t d R Degrees a n c e ence c e p t E r r E r r E r r S q r d o f above f r o m G f G f o f Freedom
t h e i n l e t y C o c f f C o e f f f l o ~ r k ( 4 ) k ( 5 )
k ( 3 ) k ( 4 ) k(5) C m3 C m3 0.C25 0.60 -2.200 0.355 -0.57 0.741 0.232 0.21 0.452 9 0.025 1.20 -3.e40 0.622 -0.43 0.-+07 0.i65 0.132 0 . 7 7 7 0.C)t5 2.35 -3.940 0.622 -0.53 0.377 0.134 0.113 Om765 7
3.2 Narrow supply o~eninq
While the wide supply opening indicated a two dimensional flow, the narrow supply opening caused a three dimensional flow. From Figures 7 and 8 it can be seen that the narrow supply opening gives results that differ from the wide opening. Observations with smoke in the test room indicate that the flow is nearly radial when the Archimedes number is relatively high. More results are given in Tables 3 and 4. This results show that the velocity decrease when the distance from the inlet increase. As mentioned this is due to the radial flow pattern.
6 --- - ---- - - - - 1
t - 0.04m obove the floor 0 -*- 0.065m obove the floor 0 -------- 0.1 l m obove the floor
o 2 4 6 a 1 0 12 1 4 1 /2 2 1/2
(&chimedes number) , [g D h bTO/u0 ]
Fig. 7. Air velocity, 1.2 m from the opening vs. supply air Archimedes number and supply air velocity. The width of the opening was 0.54 m.
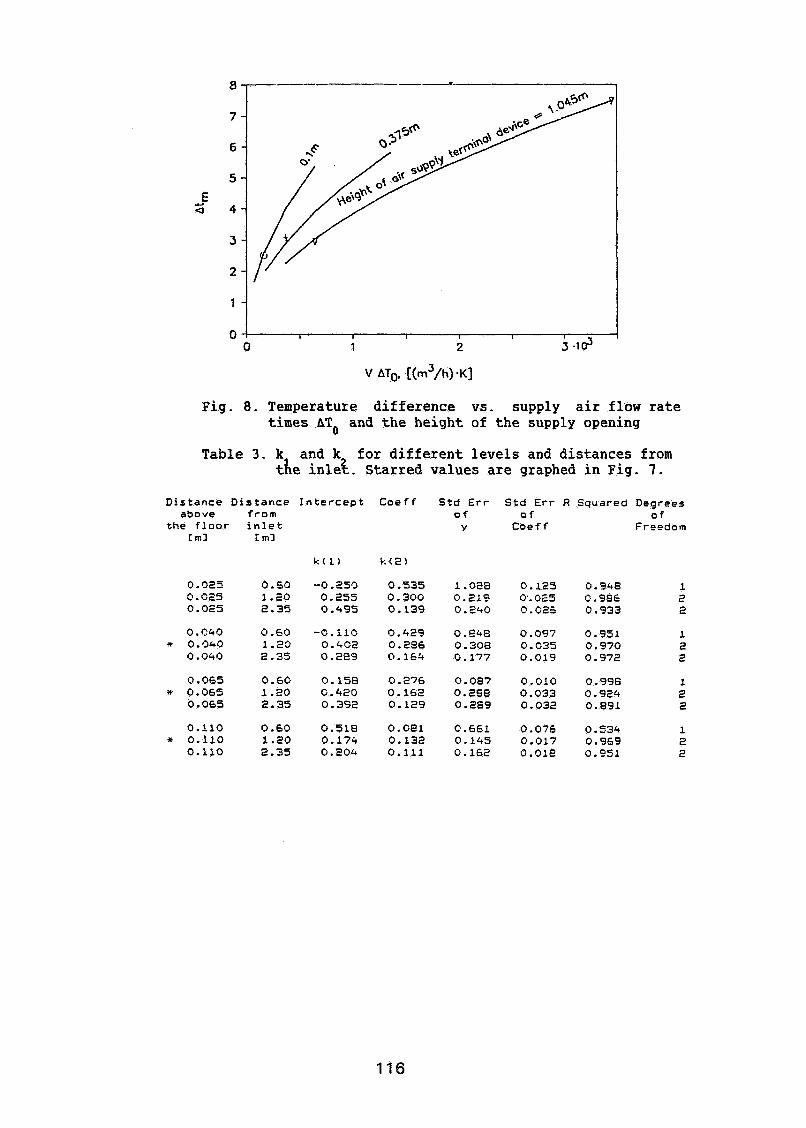
Fig. 8. Temperature difference vs. supply air flow rate times ATo and the height of the supply opening
Table 3. k and k for different levels and distances from the inlet. Starred values are graphed in Fig. 7.
D i s t a n c e D i s t a n c e I n t e r c e p t C o e f f S t d Err S t d Err R Squared D e g r e e s above f r o m o f o f o f
t h e f l o o r i n l e t Y Coe f f Freedom r m3 E m3
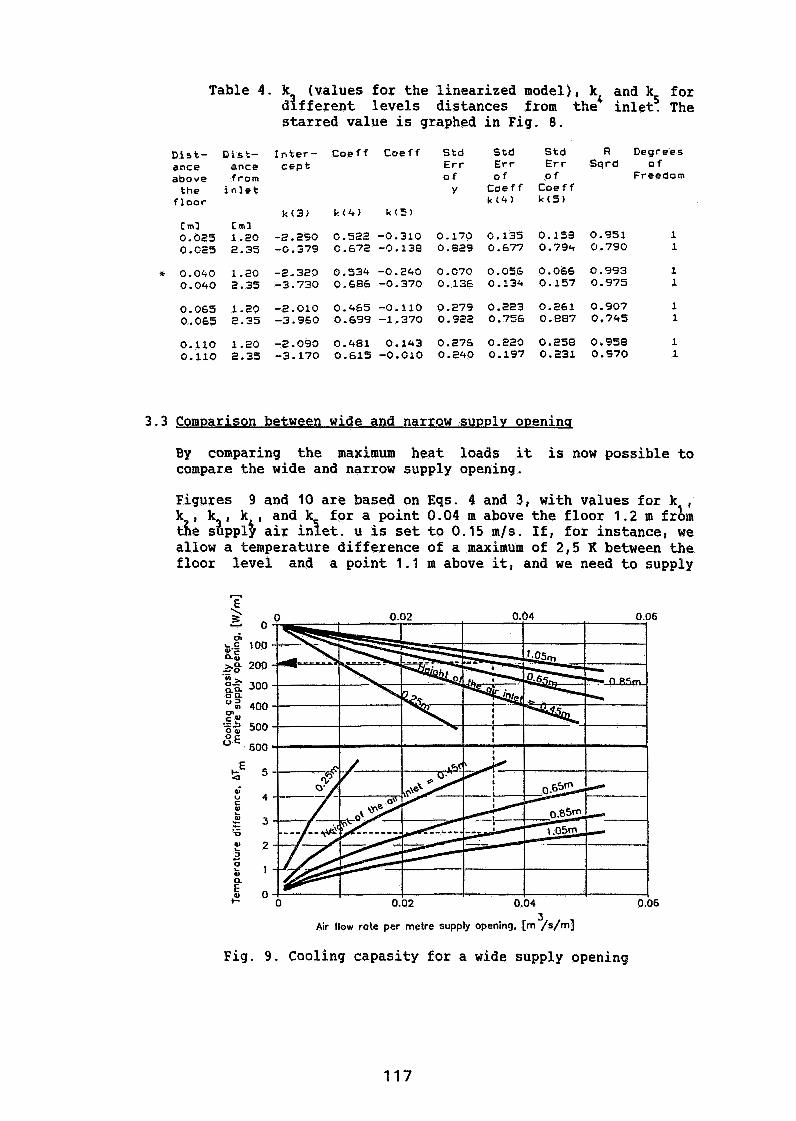
Table 4. k3 (values for the linearized model), k4 and k5 for different levels distances from the inlet. The starred value is graphed in Fig. 8.
Dist- Dist- ance ance above from
t h e i n l e t f loor
Inter- cep t
k(3)
-2.250 -0.579
-2.323 -3.730
-2.010 -3.960
-2.093 -3.170
Coeff Coeff Std Err 0 f
Y
0.170 0.629
O.C7@ 0.136
0.279 0.922
0.275 0.240
Std Err 0 f
t oe f f k ( 4 )
0.135 0.677
0.056 0.13k
0.223 0.756
0.220 0.197
Std Err 0 f
t o e f f k ( 5 )
0.153 0.794
0.066 0.157
0.261 0.887
0.258 0.231
R Degrees Sqrd o f
Freedom
3.3 Com~arison between wide and narrow suv~ly o~eninq
By comparing the maximum heat loads it is now possible to compare the wide and narrow supply opening.
Figures 9 and 10 are based on Eqs. 4 and 3, with values for k,, k , k3, k,, and k for a point 0.04 m above the floor 1.2 m from the supply air inlet. u is set to 0.15 mls. ~ f , for instance, we allow a temperature difference of a maximum of 2,5 K between the floor level and a point 1.1 m above it, and we need to supply
3 Air flow rote per metre supply opening. [m /s/m]
Fig. 9. Cooling capasity for a wide supply opening
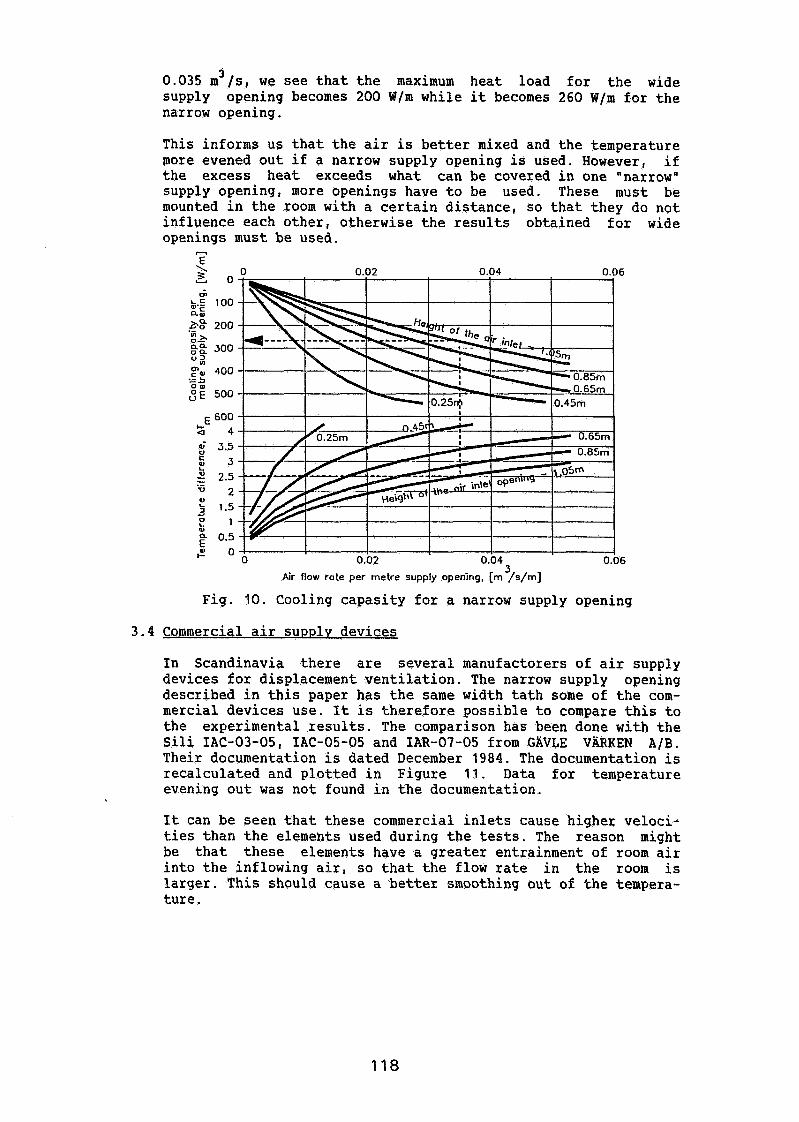
3 0.035 m Is, we see that the maximum heat load for the wide supply opening becomes 200 W/m while it becomes 260 W/m for the narrow opening.
This informs us that the air is better mixed and the temperature more evened out if a narrow supply opening is used. However, if the excess heat exceeds what can be covered in one "narrow" supply opening, more openings have to be used. These must be mounted in the room with a certain distance, so that they do not
wide
J Air flow rote per metre supply opening. [rn /s/rn]
Fig, 10. Cooling capasity for a narrow supply opening
3 .4 Commercial air suppl~ devices
In Scandinavia there are several manufactorers of air supply devices for displacement ventilation. The narrow supply opening described in this paper has the same width tath some of the com- mercial devices use. It is therefore possible to compare this to the experimental results. The comparison has been done with the Sili IAC-03-05, IAC-05-05 and IAR-07-05 from GAVLE VARKEN A/B. Their documentation is dated December 1984. The documentation is recalculated and plotted in Figure 11. Data for temperature evening out was not found in the documentation.
It can be seen that these commercial inlets cause higher veloci- ties than the elements used during the tests. The reason might be that these elements have a greater entrainment of room air into the inflowing air, so that the flow rate in the room is larger. This should cause a better smoothing out of the tempera- ture.
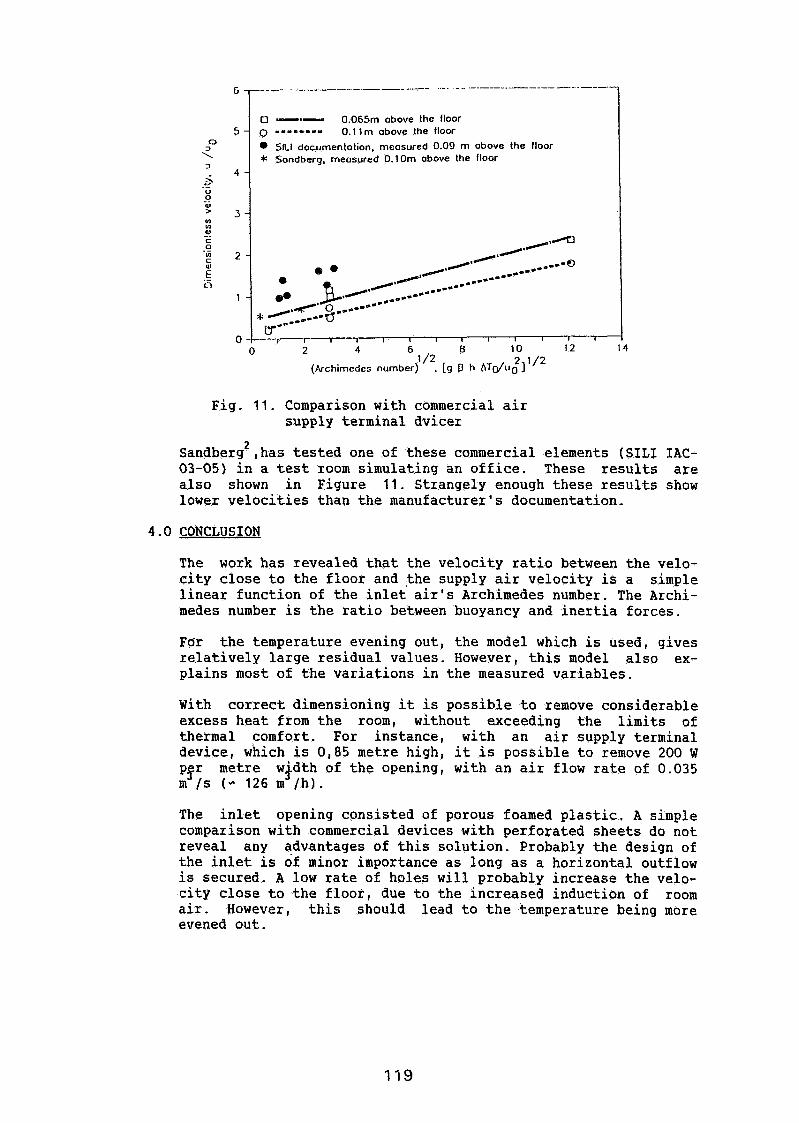
-.- 0.065rn obove the floor 0 --"-0 0.1 lrn obove the floor
SILI documentotion. rneosured 0.09 m obove the floor * Sondberg, rneosured O.1Orn obove the floor
Fig. 11. Comparison with commercial air supply terminal dvicer
sandbag2 , has tested one of these commercial elements ( SILI IAC- 03-05) in a test room simulating an office. These results are also shown in Figure 11. Strangely enough these results show lower velocities than the manufacturer's documentation.
4.0 CONCLUSION
The work has revealed that the velocity ratio between the velo- city close to the floor and the supply air velocity is a simple linear function of the inlet air's Archimedes number. The Archi- medes number is the ratio between buoyancy and inertia forces.
Far the temperature evening out, the model which is used, gives relatively large residual values. However, this model also ex- plains most of the variations in the measured variables.
With correct dimensioning it is possible to remove considerable excess heat from the room, without exceeding the limits of thermal comfort. For instance, with an air supply terminal device, which is 0,85 metre high, it is possible to remove 200 W
pfr metre width of the opening, with an air flow rate of 0.035 m /S ( * 126 m /h).
The inlet opening consisted of porous foamed plastic. A simple comparison with commercial devices with perforated sheets do not reveal any advantages of this solution. Probably the design of the inlet is of minor importance as long as a horizontal outflow is secured. A low rate of holes will probably increase the velo- city close to the floor, due to the increased induction of room air. However, this should lead to the temperature being more evened out.
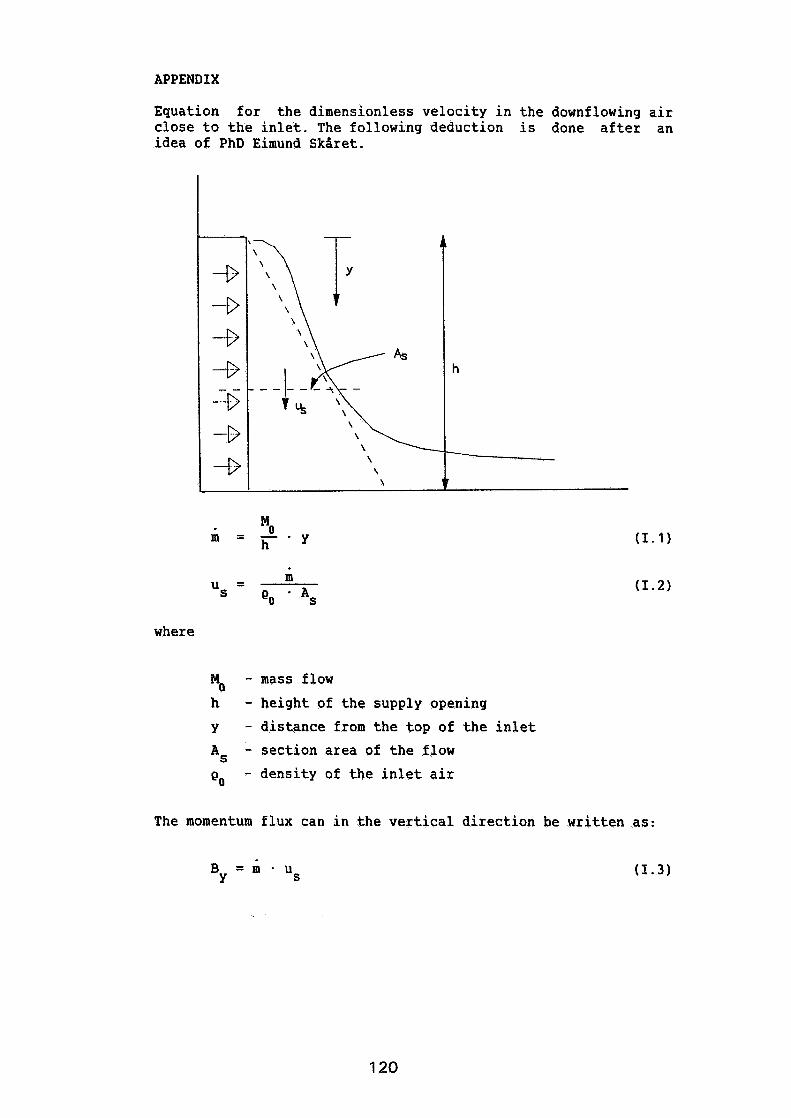
APPENDIX
Equation for the dimensionless velocity in the downflowing air close to the inlet. The following deduction is done after an idea of PhD Eimund Skaret.
where
Mo - mass flow h - height of the supply opening y - distance from the top of the inlet
As - section area of the flow Qo - density of the inlet air
The momentum flux can in the vertical direction be written as:
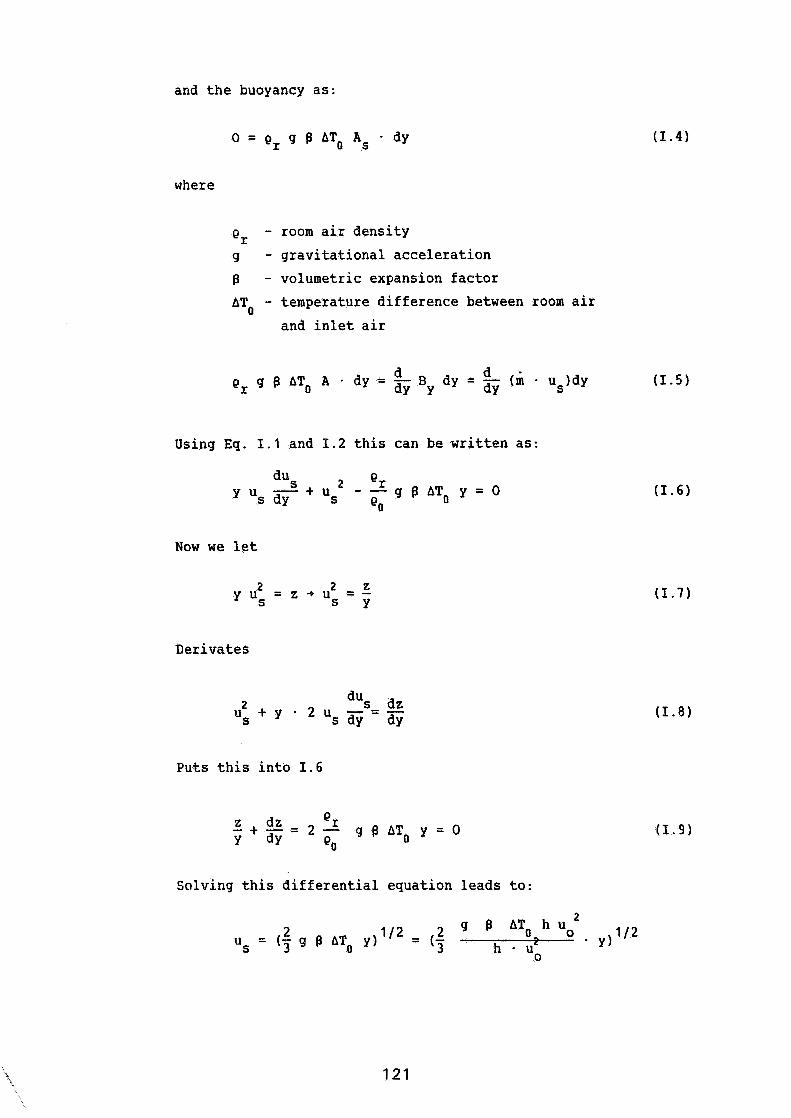
and the buoyancy as:
where
Qr - room air density g - gravitational acceleration $ - volumetric expansion factor ATo - temperature difference between room air
and inlet air
Using Eq. 1.1 and 1.2 this can be written as:
Now we let
Derivates
Puts this into 1.6
Solving this differential equation leads to:
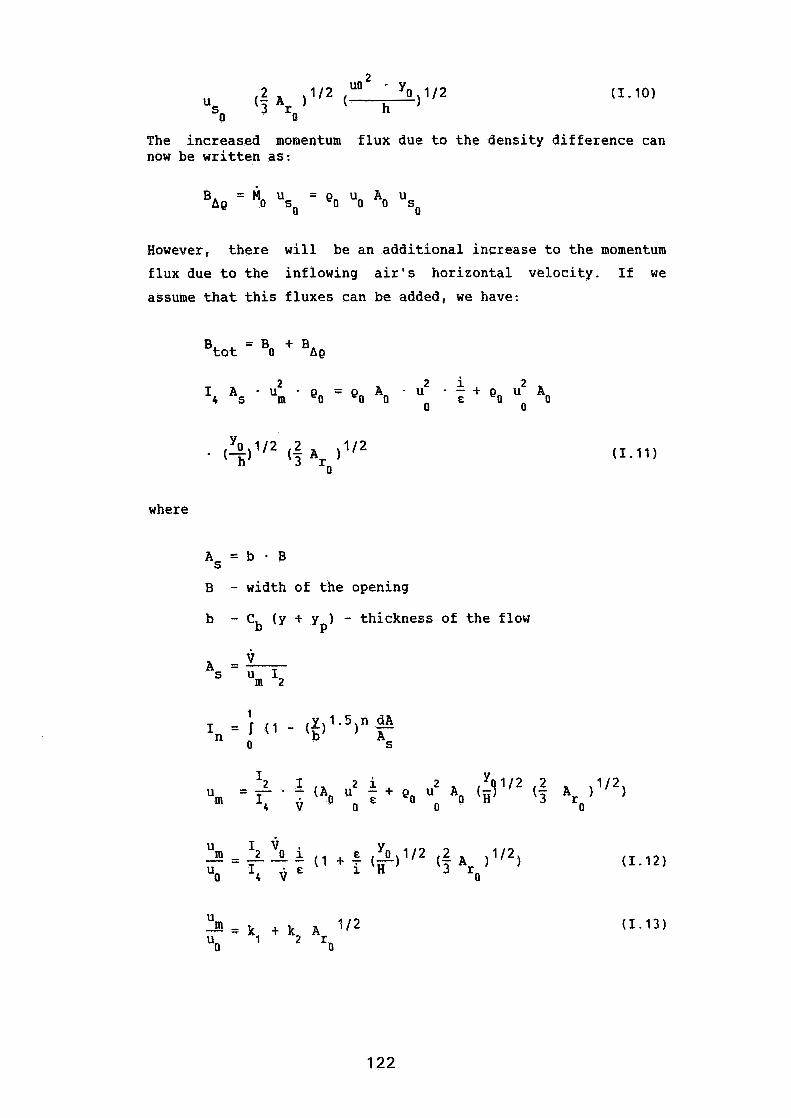
(I. 10)
The increased momentum flux due to the density difference can now be written as:
However, there will be an additional increase to the momentum
flux due to the inflowing air's horizontal velocity. If we
assume that this fluxes can be added, we have:
where
A s = b - B
B - width of the opening
b - Cb (y + yp) - thickness of the flow
REFERENCES
1. MATHISEN, H.M., SKARET, E. "Ventilation efficiency, Part 4, Displacement ventilation in small rooms". SINTEF 15 A84047, Trondheim, 1983.
2. SANDBERG, M. "Systems with air for both heating and cooling. Temperature- and velocity distribution in closed office rooms". (In Swe- dish). M:18, SIB, Gavle, Sweden 1988.
3. Documentation from Gavle Verken A/B on the SILI-System. 1984
Discussion
Paper 7
W. De Gids (TNO Division of Technology for Society, Holland) Did you study the influence of moving room occupants?
H.M. Mathisen (SINTEE', Trondheim, Norway) The effect of moving people has been studied in earlier work by others, we have not published anything on this. It can be observed by using smoke visualisation or tracer gas that when a person enters a room some mixing of the room air occurs, but after a few minutes the situation becames stable once more. However with displacement ventilation it is not possible for the ventilation efficiency to be lower than for a complete mixing situation.
J. Van Der Maas (Ecole Polytechnique Federale de Lausanne, Switzerland) -tion (3) which deals with temperature distribution in your paper confuses me because of (a) the units and (b) the absek of the heat load and the presence of the height of the inlet (h). Could you provide same information on the origin of this equation?
H.M. Mathisen (SINTEF, Trondheim, Norway) -tion (3) is empirically derived, Several models have been tried and, up to now, this is the one which gives the best fit to measured values. However in the measurements taken there has been found to be a quite strong correlation between h and V0. A simpler model which gives nearly the same fit to the measured values is to set the ratio MZn to DTo to be a constant.
P. Appleby (Paul Appleby Chartered Engineer, Norwich, UK) Have you measured the volume flow rate of air above each occupant and - - related this to the supply air volume flow rate at the displacement panels?
H.M. Mathisen (SINTEF, Trondheim, Norway) No, This is a very important question, because this is needed in order to size the
A typical supply flow rate of about 50 m3/h per person is suggested.
EFFECTIVE VENTILATION
9th AIVC Conference, Gent, Belgium 12-15 September, 1988
Paper 8
INTEGRAL MASS BALANCES AND PULSE INJECTION TRACER TECHNIQUES
J. AXLEY AND A. PERSILY
National Bureau of Standards Gaithersburg, MD 20899 U.S.A.
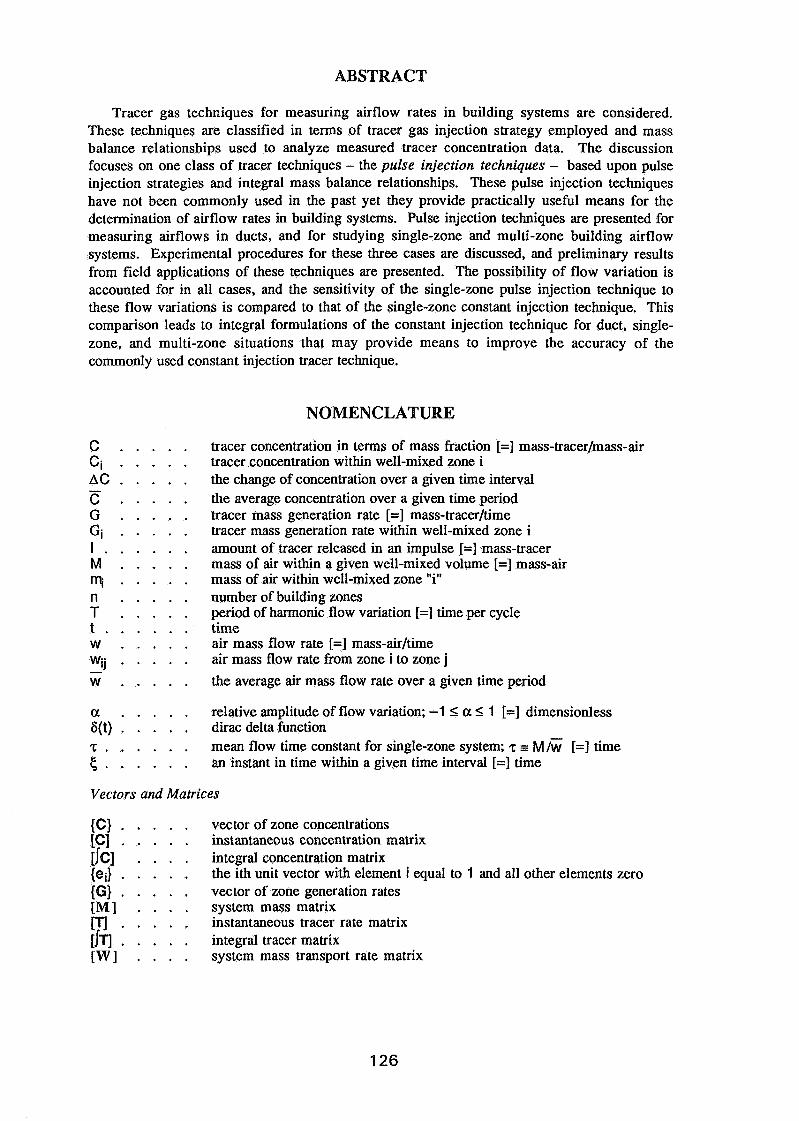
ABSTRACT
Tracer gas techniques for measuring airflow rates in building systems are considered. These techniques are classified in terms of tracer gas injection strategy employed and mass balance relationships used to analyze measured tracer concentration data. The discussion focuses on one class of tracer techniques - the pulse injection techniques - based upon pulse injection strategies and integral mass balance relationships. These pulse injection techniques have not been commonly used in the past yet they provide practically useful means for the determination of airflow rates in building systems. Pulse injection techniques are presented for measuring airflows in ducts, and for studying single-zone and multi-zone building airflow systems. Experimental procedures for these three cases are discussed, and preliminary results from field applications of these techniques are presented. The possibility of flow variation is accounted for in all cases, and the sensitivity of the single-zone pulse injection technique to these flow variations is compared to that of the single-zone constant injection technique. This comparison leads to integral formulations of the constant injection technique for duct, single- zone, and multi-zone situations that may provide means to improve the accuracy of the commonly used constant injection tracer technique.
NOMENCLATURE
C C i AC - C G G i I . M m, n T t . W
Wij - W
tracer concentration in terms of mass fraction [=I mass-tracerlmass-air tracer concentration within well-mixed zone i the change of concentration over a given time interval the average concentration over a given time period tracer mass generation rate [=I mass-tracerltime tracer mass generation rate within well-mixed zone i amount of tracer released in an impulse [=I mass-tracer mass of air within a given well-mixed volume [=] mass-air mass of air within well-mixed zone "i" number of building zones period of harmonic flow variation [=I time per cycle time air mass flow rate [=I mass-airltime air mass flow rate from zone i to zone j the average air mass flow rate over a given time period
a . . . . . relative amplitude of flow variation; -1 5 a I 1 [=I dimensionless 6(t) . . . . . dirac delta function z . . . . . . mean flow time constant for single-zone system; z E M / i [=] time 6 . . . . . . an instant in time within a given time interval [=I time
Vectors and Matrices
{C} . . . . . vector of zone concentrations [C] . . . . . instantaneous concentration matrix [JCI . . . . integral concentration matrix {ei} . . . . . the ith unit vector with element i equal to 1 and all other elements zero {G} . . . . . vector of zone generation rates [MI . . . . system mass matrix m . . . . . instantaneous tracer rate matrix [h . . . . . integral tracer matrix [ W ] . . . . system mass transport rate matrix
[ r ] = [ I V f I 1 [ ~ ] steady flow system state matrix
Following subscripts identify well-mixed zones with "0" used to identify, specifically, the exterior environment. Following superscripts are used to identify data sets. Leading superscripts are used to identify tracer species.
INTRODUCTION
Indoor air quality and energy use in buildings are both closely related to airflow into, out of, and within a building system. Consequently, indoor air quality and building energy analysis both depend critically upon obtaining complete and detailed information about these airflows. In some special cases these flows will be substantially determined by the design of the HVAC system, but, more often, due to uncertainties in the actual performance of the HVAC system, additional uncertainties in envelope infiltration, and the inherently complex nature of inter-zone airflows, these flows will be unknown. In these cases one may attempt to determine these flows using network flow analysis methods [Walton 85, Axley 871 or, for existing buildings, using tracer gas measurement techniques.
Perera [82] and Lagus [85] provide comprehensive reviews of existing tracer gas techniques for measuring airflows in buildings. This paper reconsiders these tracer techniques from the point of view of integral mass balance relationships. In this section we classify tracer techniques by the tracer gas injection strategy employed to excite the building airflow system and by the form of the mass balance relations used to reduce measured tracer concentration data to determine flows. It is argued that the tracer techniques based upon integral mass balance relations - integral tracer techniques - have been largely ignored and need to be studied more thoroughly. We then focus consideration on one class of techniques based upon integral mass balance relations, the pulse injection techniques. A second integral tracer technique, the constant injection integral technique, is briefly presented in a subsequent section and a third technique, the constant concentration integral technique, is presently under consideration by the authors.
Tracer Injection Strategy Tracer gas techniques attempt to determine building airflow rates from the measured tracer
concentration response of building airflow systems to carefully controlled injections of tracer gases. Inasmuch as the tracer injection strategy employed largely determines the capability and accuracy of a given tracer gas technique, these techniques can be classified by injection strategy. Presently, three injection strategies are commonly used;
1 . decay: a suitable amount of tracer gas is injected into the building system to establish a uniform concentration within the system (i.e., an initial condition) and the ensuing concentration decay response is measured,
2. constant injection: tracer gas is injected at a constant rate and the resulting concentration response is measured (often with the expectation that practically steady state conditions exist), and
3. constant concentration: tracer gas is injected under instrumental control in an attempt to realize a constant and uniform tracer concentration throughout the building system.
Mass Balance Relations The tracer gas concentration response to a given injection strategy may be described by
mass balance equations that relate tracer concentrations to airflows. It is through these mass balance relations that one is able to estimate airflows from measured concentration data. These mass balance relations may be formulated in either an instantaneous form, which, for the multi-
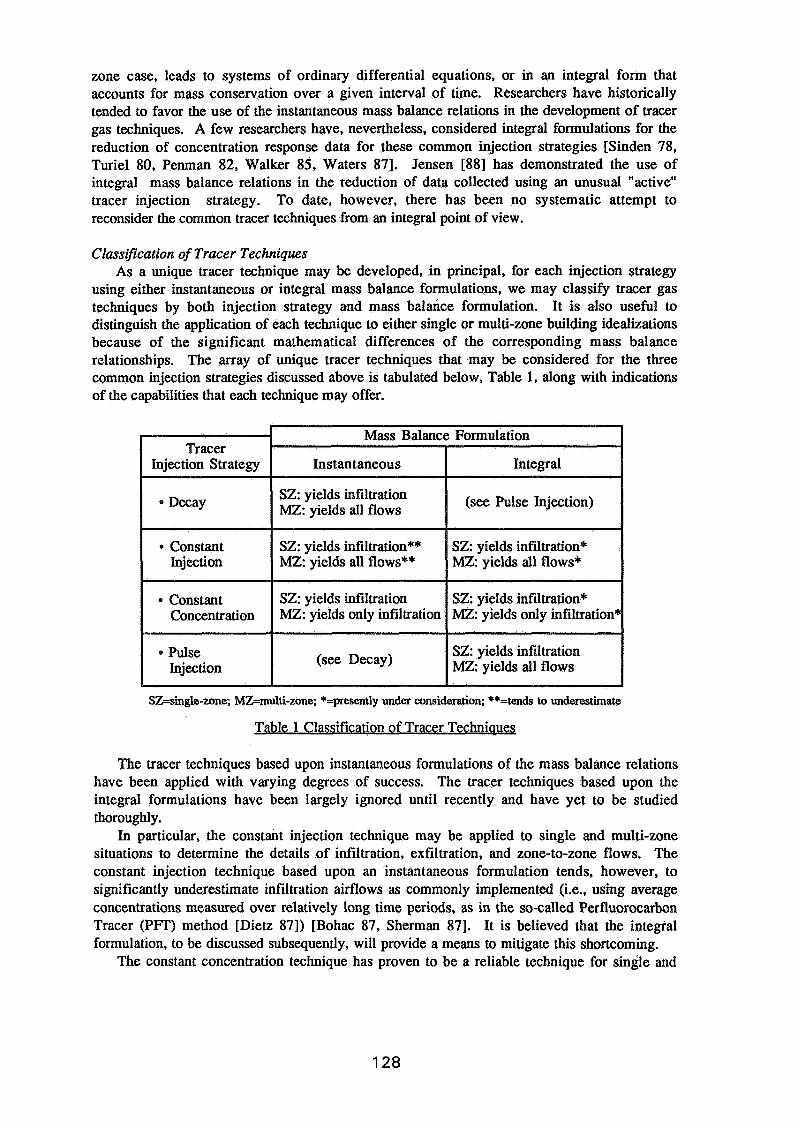
zone case, leads to systems of ordinary differential equations, or in an integral form that accounts for mass conservation over a given interval of time. Researchers have historically tended to favor the use of the instantaneous mass balance relations in the development of tracer gas techniques. A few researchers have, nevertheless, considered integral formulations for the reduction of concentration response data for these common injection strategies [Sinden 78, Turiel 80, Penman 82, Walker 85, Waters 871. Jensen [88] has demonstrated the use of integral mass balance relations in the reduction of data collected using an unusual "active" tracer injection strategy. To date, however, there has been no systematic attempt to reconsider the common tracer techniques from an integral point of view.
Classification of Tracer Techniques As a unique tracer technique may be developed, in principal, for each injection strategy
using either instantaneous or integral mass balance formulations, we may classify tracer gas techniques by both injection strategy and mass balance formulation. It is also useful to distinguish the application of each technique to either single or multi-zone building idealizations because of the significant mathematical differences of the corresponding mass balance relationships. The array of unique tracer techniques that may be considered for the three common injection strategies discussed above is tabulated below, Table 1, along with indications of the capabilities that each technique may offer.
SZ=single-zone; MZ-multi-zone; *=presently under consideration; **=tends to underestimate
Table 1 Classification oTracerchniques
The tracer techniques based upon instantaneous formulations of the mass balance relations have been applied with varying degrees of success. The tracer techniques based upon the integral formulations have been largely ignored until recently and have yet to be studied thoroughly.
In particular, the constant injection technique may be applied to single and multi-zone situations to determine the details of infiltration, exfiltration, and zone-to-zone flows. The constant injection technique based upon an instantaneous formulation tends, however, to significantly underestimate infiltration airflows as commonly implemented (i.e., using average concentrations measured over relatively long time periods, as in the so-called Perfluorocarbon Tracer (PFI') method [Dietz 871) [Bohac 87, Sherman 871. It is believed that the integral formulation, to be discussed subsequently, will provide a means to mitigate this shortcoming.
The constant concentration technique has proven to be a reliable technique for single and
multi-zone situations providing accurate determinations of outdoor airflow rates into the building zones [Sandberg 851, but does not provide any information regarding zone-to-zone airflows. When based upon an instantaneous formulation this technique requires careful control of the tracer injection rates that is realized using relatively sophisticated instrumental devices. It is believed that the integral formulation of the constant concentration technique, presently under consideration by the authors, will provide a means to implement this technique without the need for such careful, and therefore expensive, control.
The decay technique may be used to effectively determine infiltration airflows in buildings that behave as single-zone systems. It has also been applied to determine the details of infiltration, exfiltration, and zone-to-zone flows in buildings that behave as multi-zone systems. Several multi-zone decay techniques based upon instantaneous formulations have been considered including techniques based upon;
a) the measurement of both concentration responses and their first time derivatives [Sinden 78, Perera 82, Walker 851,
b) the consideration of the tracer gas response at times corresponding to a maximum concentration in one of the building zones (where the time derivative of concentration vanishes) [Dick 491, and
c) the intermediate determination of the system eigenmodes, assuming real-valued eigenvalues (i.e., inverse time constants) and nondegenerate eigenmodes (i.e., describing concentration response time histories as the sum of exponential decays) [Sinden 781, using, in some instances, Prony analysis [I'Anson 82, Irwin 851 to realize this determination.
Difficulties in measuring the first time derivative of concentration response have limited the success of the first approach [Sinden 78, Walker 851. The authors simulated the application of the second approach for three and four zone cases, but it appeared that the approach was not well-conditioned enough to warrant further consideration. The third approach has yet to be applied to buildings that behave as more than four-zone systems and falters on the assumption of a nondegenerate system having real-valued eigenvalues; examples of systems that may demonstrate both degeneracy and imaginary eigenvalues have been presented [Sinden 78, Lawrance 87, Waters 871. Most multi-zone decay techniques rely on data collected very soon after the tracer gas injection. For this data to be reliable, the tracer gas injection must be well- mixed in each of the target zones. This is often a very difficult initial condition to achieve, and the accuracy of the results will be degraded by deviations from these assumed initial conditions.
Pulse Injection Technique In this paper we shall consider the pulse injection technique, that was presented by
Walker as the decay integral method [Walker 851 and further developed by Afonso and his colleagues [Afonso 86a, 86b, 86~1. This technique is based upon a tracer injection strategy of separate, short-duration, pulse injections of tracer into each zone of the building system and the application of integral mass balance equations to the reduction of the measured concentration response data.
Pulse excitations of flow systems are commonly used in the chemical process industry to determine dynamic characteristics of chemical process systems [Wen 75, Nauman 83, Westerterp 841 and Sandberg has described similar applications for buildings [Sandberg 83, 841. The use of pulse excitation here is closer, however, to the tracer injection strategy suggested by Dick to extend decay methods to multi-zone problems [Dick 491. In fact, the pulse injection technique may be considered to be an integral formulation of Dick's multi-zone decay technique. Although decay techniques employ pulse injections to establish initial concentrations, they have not used data collected during the time interval of the pulse to solve for airflows. In the pulse injection techniques we may choose to use data collected during the


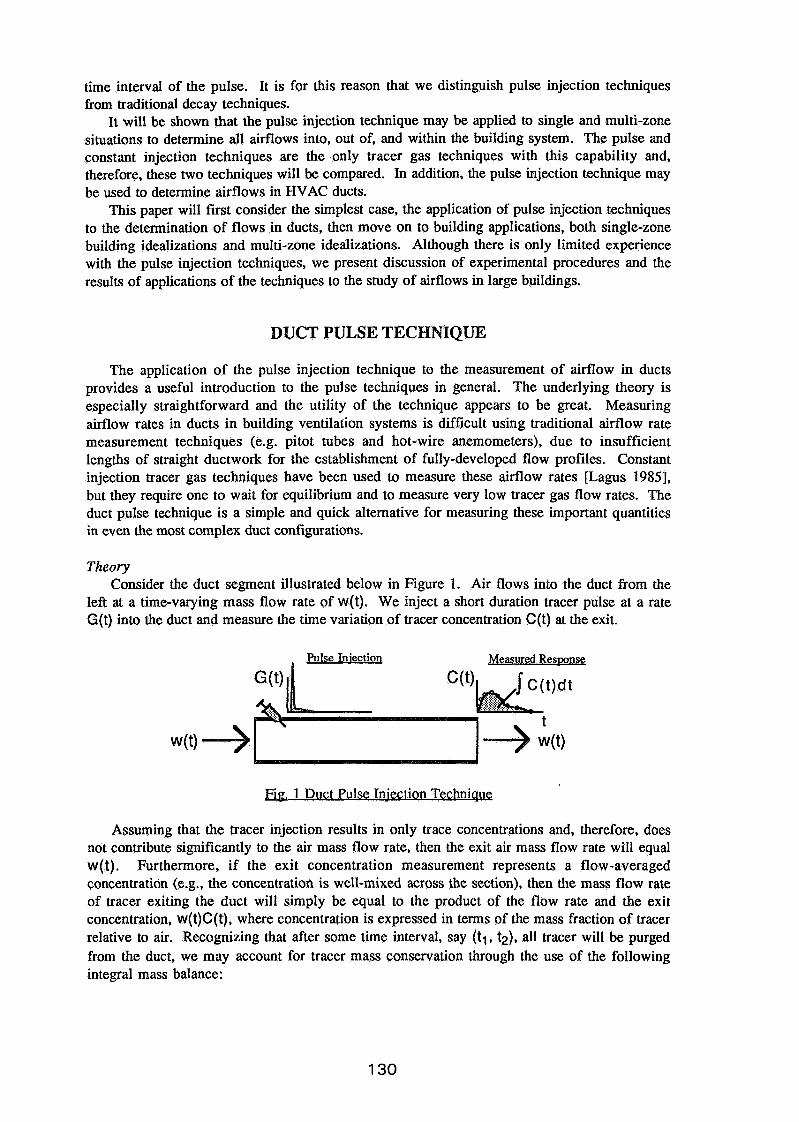
time interval of the pulse. It is for this reason that we distinguish pulse injection techniques from traditional decay techniques.
It will be shown that the pulse injection technique may be applied to single and multi-zone situations to determine all airflows into, out of, and within the building system. The pulse and constant injection techniques are the only tracer gas techniques with this capability and, therefore, these two techniques will be compared. In addition, the pulse injection technique may be used to determine airflows in HVAC ducts.
This paper will first consider the simplest case, the application of pulse injection techniques to the determination of flows in ducts, then move on to building applications, both single-zone building idealizations and multi-zone idealizations. Although there is only limited experience with the pulse injection techniques, we present discussion of experimental procedures and the results of applications of the techniques to the study of airflows in large buildings.
DUCT PULSE TECHNIQUE
The application of the pulse injection technique to the measurement of airflow in ducts provides a useful introduction to the pulse techniques in general. The underlying theory is especially straightforward and the utility of the technique appears to be great. Measuring airflow rates in ducts in building ventilation systems is difficult using traditional airflow rate measurement techniques (e.g. pitot tubes and hot-wire anemometers), due to insufficient lengths of straight ductwork for the establishment of fully-developed flow profiles. Constant injection tracer gas techniques have been used to measure these airflow rates [Lagus 19851, but they require one to wait for equilibrium and to measure very low tracer gas flow rates. The duct pulse technique is a simple and quick alternative for measuring these important quantities in even the most complex duct configurations.
Theory Consider the duct segment illustrated below in Figure 1. Air flows into the duct from the
left at a time-varying mass flow rate of ~ ( t ) . We inject a short duration tracer pulse at a rate G(t) into the duct and measure the time variation of tracer concentration C(t) at the exit.
Pulse Iniection Measured Resmnse
F ~ P 1 Duct Pulse Iniection Techniaug
Assuming that the tracer injection results in only trace concentrations and, therefore, does not contribute significantly to the air mass flow rate, then the exit air mass flow rate will equal w(t). Furthermore, if the exit concentration measurement represents a flow-averaged concentration (e.g., the concentration is well-mixed across the section), then the mass flow rate of tracer exiting the duct will simply be equal to the product of the flow rate and the exit concentration, w(t)C(t), where concentration is expressed in terms of the mass fraction of tracer relative to air. Recognizing that after some time interval, say (tl, t2), all tracer will be purged from the duct, we may account for tracer mass conservation through the use of the following integral mass balance:
which simply asserts that the tracer mass leaving the duct segment must equal the amount injected.
We may apply the integral mean value theorem to the expression on the left, as the concentration variation does not involve a sign change, and simplify to obtain the governing equation for the duct pulse injection tracer technique:
In words, we may determine the air mass flow rate that occurred at some time, 5, during the time interval (tl , t2) by simply computing the ratio of the mass of tracer injected to the integral of the concentration response downstream from the tracer. Clearly if the air mass flow rate is constant, the determination will yield this constant value. If the air mass flow rate changes very little during the interval, then w(5) should be a good estimate of the average flow rate during that interval.
Experimental Procedures In applying the duct pulse technique to an actual length of duct there are several practical
experimental considerations. The most important issues are knowing the mass of tracer that is injected and obtaining an accurate determination of the concentration integral. Since one only requires the integral of the G(t), the actual injection profile is irrelevant. It is only important to know the injection mass. This mass can be measured before or during the injection, but it is crucial that all of the tracer gas is injected into the duct.
The duct pulse measurement technique requires only the determination of the integral of the concentration at the downstream measurement point, not the concentration time history. The determination of this integral relies on more than just accurate measurement of tracer gas concentrations. The concentration in the duct, at the point of measurement, must be varying only along the length of the duct, not across the duct cross-section. Otherwise, the integral must be based on a cross-sectional average concentration. A multi-point injection across a duct cross-section, as opposed to a single point injection, can assist in achieving a uniform concentration across the cross-section at the concentration measurement point.
Because the concentration response will be relatively short-lived, it will be difficult to determine the concentration integral from numerical integration of the concentration data unless one's concentration measuring equipment has a high sampling frequency and covers a wide range of measurable concentrations. Therefore, it is advantageous to determine the concentration integral through the measurement of the average tracer gas concentration at the measurement point. This average concentration can be determined by filling an appropriate air sample container, beginning well before the pulse is injected and continuing until the pulse is completely purged from the duct. The concentration integral simply equals the average concentration multiplied by the length of the time over which the sample container is filled.
In applying this technique to a particular system there will always be some initial uncertainty in the amount of tracer gas that should be injected into the ductwork. The primary requirement is that the average concentration in the air sample container is in the accurately measurable range of one's tracer gas concentration measurement equipment. Meeting this
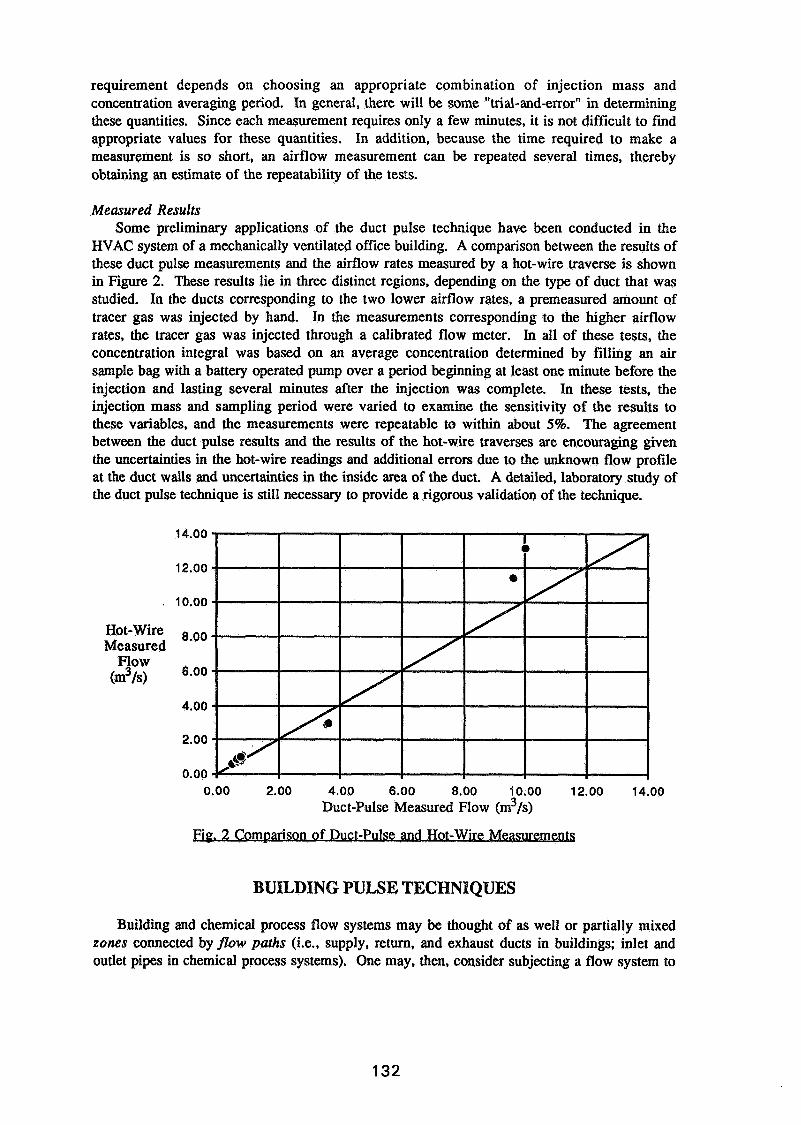
requirement depends on choosing an appropriate combination of injection mass and concentration averaging period. In general, there will be some "trial-and-error" in determining these quantities. Since each measurement requires only a few minutes, it is not difficult to find appropriate values for these quantities. In addition, because the time required to make a measurement is so short, an airflow measurement can be repeated several times, thereby obtaining an estimate of the repeatability of the tests.
Measured Results Some preliminary applications of the duct pulse technique have been conducted in the
HVAC system of a mechanically ventilated office building. A comparison between the results of these duct pulse measurements and the airflow rates measured by a hot-wire traverse is shown in Figure 2. These results lie in three distinct regions, depending on the type of duct that was studied. In the ducts corresponding to the two lower airflow rates, a premeasured amount of tracer gas was injected by hand. In the measurements corresponding to the higher airflow rates, the tracer gas was injected through a calibrated flow meter. In all of these tests, the concentration integral was based on an average concentration determined by filling an air sample bag with a battery operated pump over a period beginning at least one minute before the injection and lasting several minutes after the injection was complete. In these tests, the injection mass and sampling period were varied to examine the sensitivity of the results to these variables, and the measurements were repeatable to within about 5%. The agreement between the duct pulse results and the results of the hot-wire traverses are encouraging given the uncertainties in the hot-wire readings and additional errors due to the unknown flow profile at the duct walls and uncertainties in the inside area of the duct. A detailed, laboratory study of the duct pulse technique is still necessary to provide a rigorous validation of the technique.
Hot-Wire Measured
Flow (m3/s)
0.00 2.00 4.00 6.00 8.00 10.00 12.00 14.00 Duct-Pulse Measured Flow (m3/s)
2 Comuanson of Duct-Pulse and Hot-Wire Measurements
BUILDING PULSE TECHNIQUES
Building and chemical process flow systems may be thought of as well or partially mixed zones connected by flow paths (i.e., supply, return, and exhaust ducts in buildings; inlet and outlet pipes in chemical process systems). One may, then, consider subjecting a flow system to
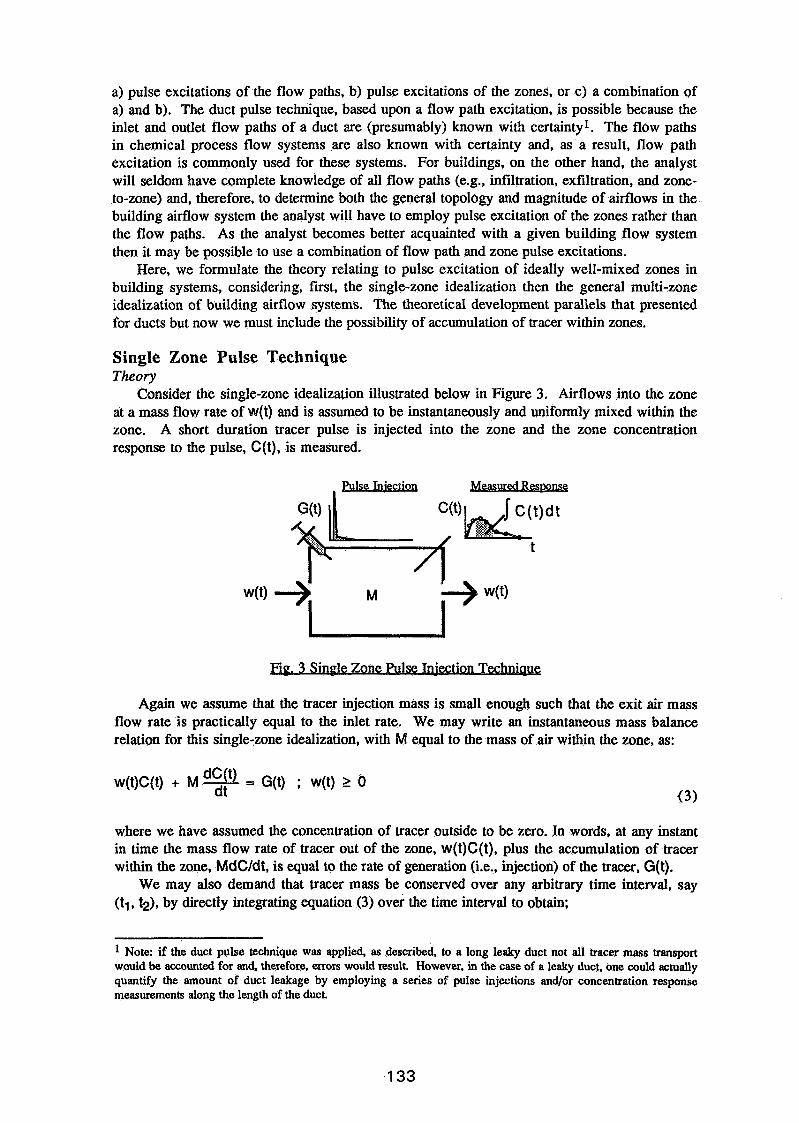
a) pulse excitations of the flow paths, b) pulse excitations of the zones, or c) a combination of a) and b). The duct pulse technique, based upon a flow path excitation, is possible because the inlet and outlet flow paths of a duct are (presumably) known with certaintyl. The flow paths in chemical process flow systems are also known with certainty and, as a result, flow path excitation is commonly used for these systems. For buildings, on the other hand, the analyst will seldom have complete knowledge of all flow paths (e.g., infiltration, exfiltration, and zone- to-zone) and, therefore, to determine both the general topology and magnitude of airflows in the building airflow system the analyst will have to employ pulse excitation of the zones rather than the flow paths. As the analyst becomes better acquainted with a given building flow system then it may be possible to use a combination of flow path and zone pulse excitations.
Here, we formulate the theory relating to pulse excitation of ideally well-mixed zones in building systems, considering, first, the single-zone idealization then the general multi-zone idealization of building airflow systems. The theoretical development parallels that presented for ducts but now we must include the possibility of accumulation of tracer within zones.
Single Zone Pulse Technique Theory
Consider the single-zone idealization illustrated below in Figure 3. Airflows into the zone at a mass flow rate of w(t) and is assumed to be instantaneously and uniformly mixed within the zone. A short duration tracer pulse is injected into the zone and the zone concentration response to the pulse, C(t), is measured.
Pulse Injection Measured Res~onse
3 Single Zone Pulse In-iection Techni
Again we assume that the tracer injection mass is small enough such that the exit air mass flow rate is practically equal to the inlet rate. We may write an instantaneous mass balance relation for this single-zone idealization, with M equal to the mass of air within the zone, as:
where we have assumed the concentration of tracer outside to be zero. In words, at any instant in time the mass flow rate of tracer out of the zone, w(t)C(t), plus the accumulation of tracer within the zone, MdCIdt, is equal to the rate of generation (i.e., injection) of the tracer, G(t).
We may also demand that tracer mass be conserved over any arbitrary time interval, say (tl, t2), by directly integrating equation (3) over the time interval to obtain;
1 Note: if the duct pulse technique was applied, as described, to a long leaky duct not all tracer mass transport would be accounted for and, therefore. errors would result. However, in the case of a leaky duct, one could actually quantify the amount of duct leakage by employing a series of pulse injections andlor concentration response measurements along the length of the duct.
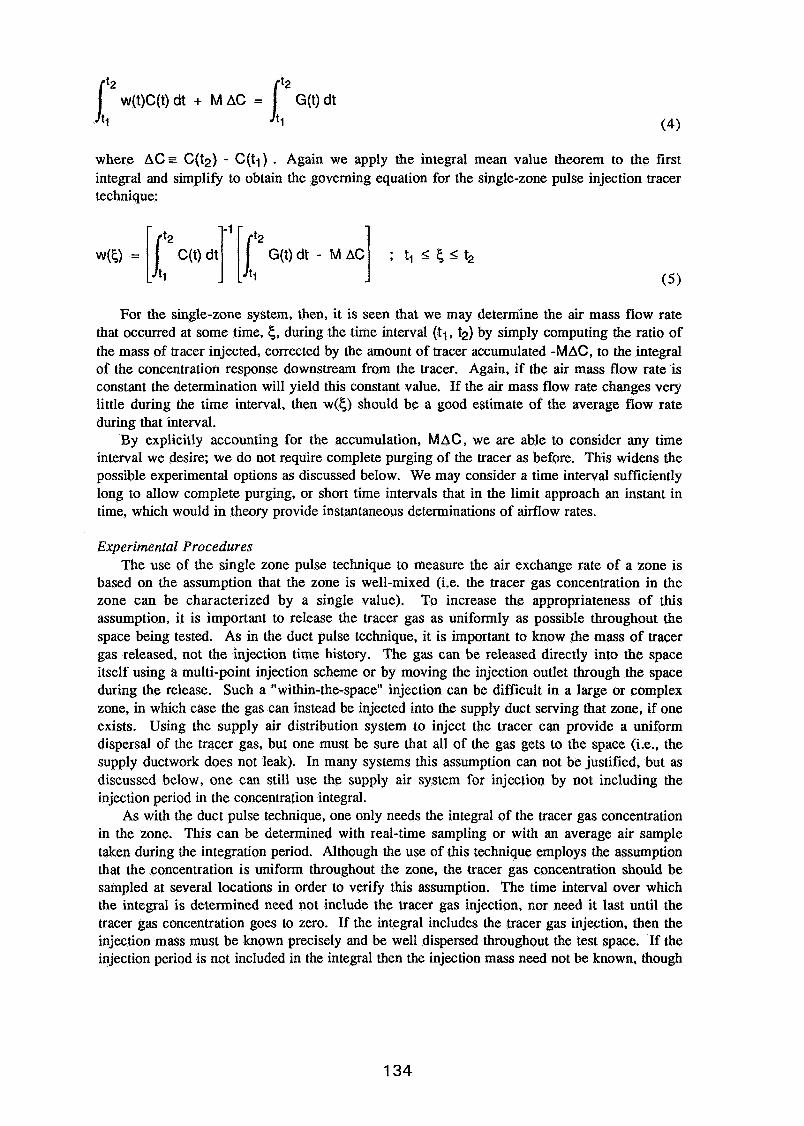
where AC = C(t2) - C(tl) . Again we apply the integral mean value theorem to the first integral and simplify to obtain the governing equation for the single-zone pulse injection tracer technique:
For the single-zone system, then, it is seen that we may determine the air mass flow rate that occurred at some time, 5, during the time interval (tl, t2) by simply computing the ratio of the mass of tracer injected, corrected by the amount of tracer accumulated -MAC, to the integral of the concentration response downstream from the tracer. Again, if the air mass flow rate is constant the determination will yield this constant value. If the air mass flow rate changes very little during the time interval, then w(c) should be a good estimate of the average flow rate during that interval.
By explicitly accounting for the accumulation, MAC, we are able to consider any time interval we desire; we do not require complete purging of the tracer as before. This widens the possible experimental options as discussed below. We may consider a time interval sufficiently long to allow complete purging, or short time intervals that in the limit approach an instant in time, which would in theory provide instantaneous determinations of airflow rates.
Experimental Procedures The use of the single zone pulse technique to measure the air exchange rate of a zone is
based on the assumption that the zone is well-mixed (i.e. the tracer gas concentration in the zone can be characterized by a single value). To increase the appropriateness of this assumption, it is important to release the tracer gas as uniformly as possible throughout the space being tested. As in the duct pulse technique, it is important to know the mass of tracer gas released, not the injection time history. The gas can be released directly into the space itself using a multi-point injection scheme or by moving the injection outlet through the space during the release. Such a "within-the-space" injection can be difficult in a large or complex zone, in which case the gas can instead be injected into the supply duct serving that zone, if one exists. Using the supply air distribution system to inject the tracer can provide a uniform dispersal of the tracer gas, but one must be sure that all of the gas gets to the space (i.e., the supply ductwork does not leak). In many systems this assumption can not be justified, but as discussed below, one can still use the supply air system for injection by not including the injection period in the concentration integral.
As with the duct pulse technique, one only needs the integral of the tracer gas concentration in the zone. This can be determined with real-time sampling or with an average air sample taken during the integration period. Although the use of this technique employs the assumption that the concentration is uniform throughout the zone, the tracer gas concentration should be sampled at several locations in order to verify this assumption. The time interval over which the integral is determined need not include the tracer gas injection, nor need it last until the tracer gas concentration goes to zero. If the integral includes the tracer gas injection, then the injection mass must be known precisely and be well dispersed throughout the test space. If the injection period is not included in the integral then the injection mass need not be known, though

it needs to be controlled such that the concentration within the zone is in the measurable range of the tracer gas detector. The integral of G(t) in equation (5) will equal zero, but the value of MAC will be large due to the significant tracer gas concentration at t=tl.
The duration of the integration period involves a trade off between one's ability to accurately measure low concentrations and one's knowledge of the zone mass M. During the tail of the concentration response, the tracer concentrations will be very low and may be difficult to measure accurately. One can avoid this source of error in the integral by choosing t2 to be a time when the concentrations are still within a range that can be accurately determined. In this case, the term MAC may be significant, and if it is, an accurate knowledge of M will be important. The importance of knowing M accurately depends on the relative magnitudes of the integral of G(t) and of MAC.
If the concentration response to the pulse is very short lived, corresponding to a high air exchange rate, then one should employ an average concentration to determine the integral. This averaging should begin well before the tracer gas injection and continue until the concentration within the zone has decreased to essentially zero. This approach enables the determination of the air exchange rate of a single zone based on a single air sample of the average concentration, but one must be certain that the tracer gas concentration is zero at t=t2 . If it is not, then an additional air sample must be taken at this time to compute the MAC term. This approach enables the low-cost determination of single zone air exchange rates with on-site air sampling and off-site tracer gas concentration analysis
Measured Results Afonso et. al. [Afonso 86, 871 report the results of single zone pulse tests conducted in a
laboratory test facility in which the airflow rate into the zone was measured with nozzles. Four tests were conducted at four different supply airflow rates into the zone. The measurements of the space air exchange rate were generally repeatable within 3%, and the agreement with the supply aifflow rates measured with the nozzle ranged from 10 to 17%. The values calculated from the pulse tests were always less than the measured airflow rates, probably due to air leakage from the supply ducts. In these experiments, the room mass M was treated as an unknown and was solved for by evaluating equation (5) both before and after the tracer gas injection.
Comparison of Single-Zone Pulse and Constant Injection Techniques The pulse and constant injection techniques can both be used to determine the air exchange
rate of a single well-mixed zone. A pulse measurement will generally last only a few building time constants (inverse of the air exchange rate), while the constant injection technique has been applied for periods from several days to several weeks. In both cases, the effect of variations in the air exchange rate during the measurement period will affect the results of the measurements. The discussion below examines these effects of flow variation in comparing the pulse and constant injection techniques.
Theory: Constant Injection Technique Consider, now, for purposes of comparison, a well-mixed zone subjected to a constant
injection of tracer as illustrated below in Figure 4. We may again apply the instantaneous and integral mass balance relations presented
above, equations (3) and (5), with G(t) = Go . If the airflow remains steady then eventually a steady state response will be achieved:
C(t -+ -) = constant ; dC(t 4-)
d t = 0 ; w(t) = steady
and by the instantaneous mass balance, equation (3). we obtain:
G o ; w(t) = steady W(t) = C(t -, -)
This expression is the basis of the constant injection technique; flow is estimated by the quotient of the constant injection rate divided by the steady state concentsation.
Constant Iniection
Measured Res~onse: Steady Flow
Measured B-se: UnSt&v Flow t
F ~ P 4 Sin~le-Zone Constant Iniection Technias
In many practical situations, however, the flow will seldom be constant long enough to achieve a steady state response, therefore, it has become common practice to use average concentration measurements, in place of the steady state value, in equation (7) to estimate airflows. The time intervals over which these average measurements are made range, typically, from a single day to several weeks. Early on it had been hoped that the use of average concentration measurements in equation (7) would provide acceptable approximations of the mean airflow occurring over the averaging time interval, but more recently it has been shown that this approximation may significantly underestimate the mean flow [Bohac 87, Sherman 871. The question remains, then, if this approximation does not provide an estimate of the mean flow, what estimate does it provide?
From the integral mass balance relation, equation (S) , with G(t) = Go, we may obtain the following expression:
where c i s the mean concentration measured over the interval (tl, t2). Equation (8) defines the basis of an alternate constant injection tracer technique, discussed below, that we designate as the integral constant injection technique.
For averaging intervals on the order of days to weeks M(AC/At) will generally be negligibly small and thus we may presume that:
Thus, it is seen that the approximation using average concentration measurements yields an estimate of flow that occurred at some time, 5, during the averaging interval which, in general, will not equal the mean value. Ironically the constant injection technique, as practically applied using long-term averages, is actually an "integral technique" rather than an "instantaneous technique" as originally presented.
Harmonic Flow Variation By employing the integral mean value theorem we have derived governing equations for
both the pulse injection and constant injection technique that account for flow variation. The results, equations (5), (8) and (9), leave, however, much to be desired from a practical point of view. Although they provide a rigorous estimate of flow that occurred at some time, 5, during the integration time interval, that time is unknown and the results provide no information regarding how the flow estimate relates to the actual flow variation.
We may gain some insight into the affect of flow variation about a mean value on both the pulse injection and constant injection techniques by considering the special case of harmonic flow variation:
where w is the mean flow, a is the amplitude of flow variation, and T is the period of the variation. Substituting equation (10) into equation (3) and solving we obtain expressions for the concentration time histories for both injection strategies.
Pulse Injection Response: For an impulse injection of tracer (i.e., a very short duration, relative to the system time constant, pulse) of amount I:
we obtain:
c(t) = ( - ) exp ( -- - (&:)sin - (?:I) where T is the system time constant under the mean flow conditions, T s (M 1 w 1. This equation describes a decay response that includes an oscillatory component as illustrated in Figures 5 and 6. The difference between the responses in Figures 5 and 6 is that the former corresponds to the flow rate assuming its maximum value at t = 0 (i.e., a = 1.0), while Figure 6 corresponds to the minimum airflow rate at t = 0 (i.e., a = - 1.0).
Constant Injection Response: For constant injection, G(t) = Go , we obtain:
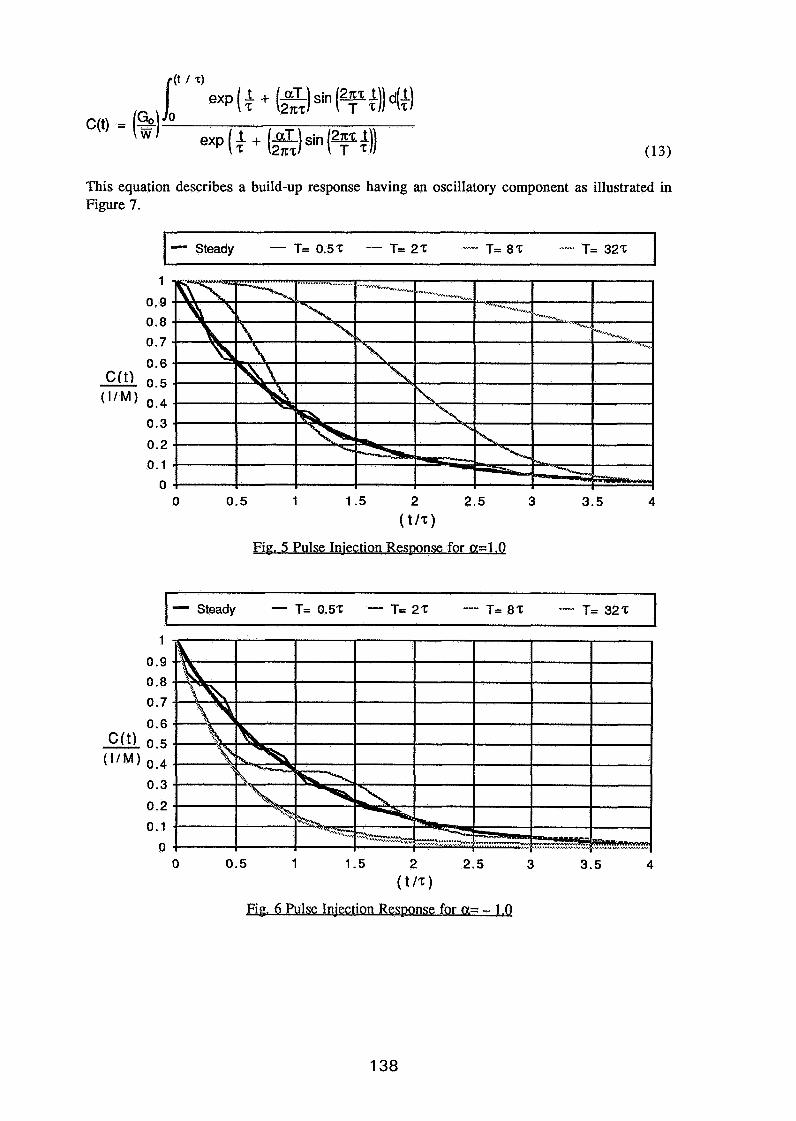
This equation describes a build-up response having an oscillatory component as illustrated in Figure 7.
-.I Steady - T= 0.52 - T= 22 - T= 8 T ...... T= 322
Fin. 5 Pulse Tniectiwn Res~onse for a=l.Q
Steady - T= 0.52 - T= 22 - T= 82 - T= 322
Fip. 6 Pulse Injection Res~onse for a= - l.Q
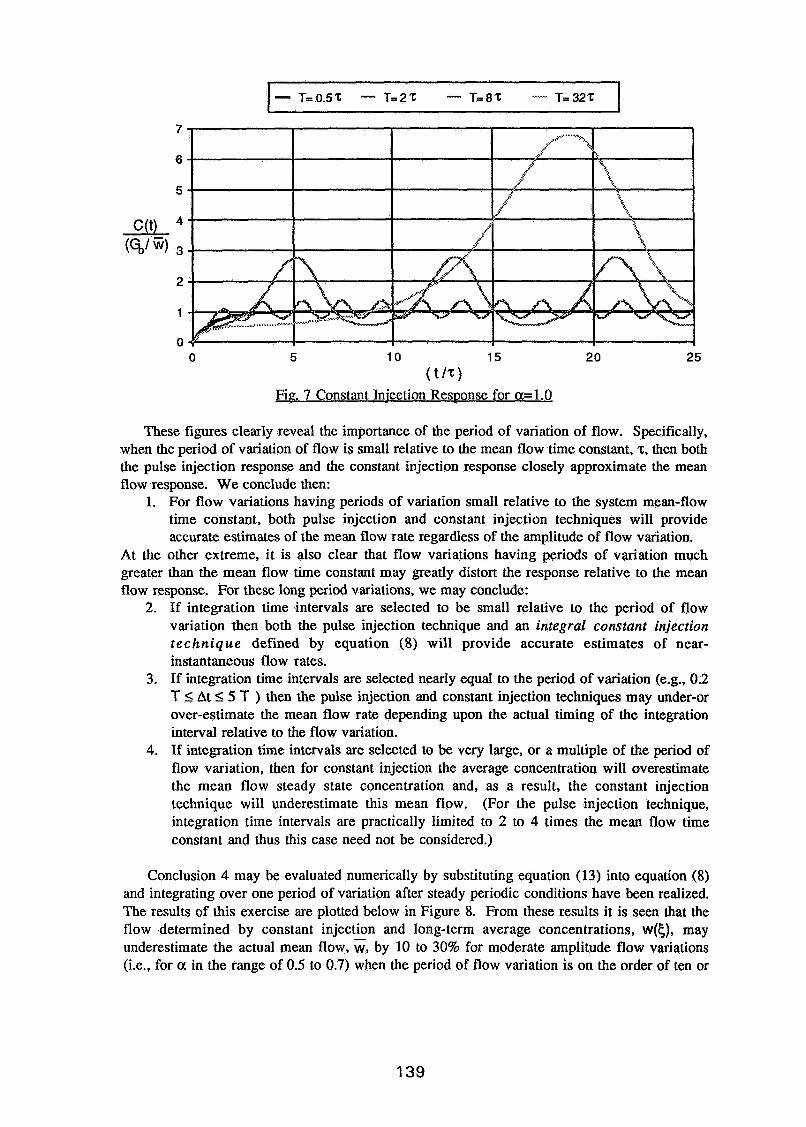
Fig. 7 Constant Injection Response for a=1.0
These figures clearly reveal the importance of the period of variation of flow. Specifically, when the period of variation of flow is small relative to the mean flow time constant, z, then both the pulse injection response and the constant injection response closely approximate the mean flow response. We conclude then:
1. For flow variations having periods of variation small relative to the system mean-flow time constant, both pulse injection and constant injection techniques will provide accurate estimates of the mean flow rate regardless of the amplitude of flow variation.
At the other extreme, it is also clear that flow variations having periods of variation much greater than the mean flow time constant may greatly distort the response relative to the mean flow response. For these long period variations, we may conclude:
2. If integration time intervals are selected to be small relative to the period of flow variation then both the pulse injection technique and an integral constant injection technique defined by equation (8) will provide accurate estimates of near- instantaneous flow rates.
3. If integration time intervals are selected nearly equal to the period of variation (e.g., 0.2 T I At 5 5 T ) then the pulse injection and constant injection techniques may under-or over-estimate the mean flow rate depending upon the actual timing of the integration interval relative to the flow variation.
4. If integration time intervals are selected to be very large, or a multiple of the period of flow variation, then for constant injection the average concentration will overestimate the mean flow steady state concentration and, as a result, the constant injection technique will underestimate this mean flow. (For the pulse injection technique, integration time intervals are practically limited to 2 to 4 times the mean flow time constant and thus this case need not be considered.)
Conclusion 4 may be evaluated numerically by substituting equation (13) into equation (8) and integrating over one period of variation after steady periodic conditions have been realized. The results of this exercise are plotted below in Figure 8. From these results it is seen that the flow determined by constant injection and long-term average concentrations, w(c), may underestimate the actual mean flow, w, by 10 to 30% for moderate amplitude flow variations (i.e., for a in the range of 0.5 to 0.7) when the period of flow variation is on the order of ten or
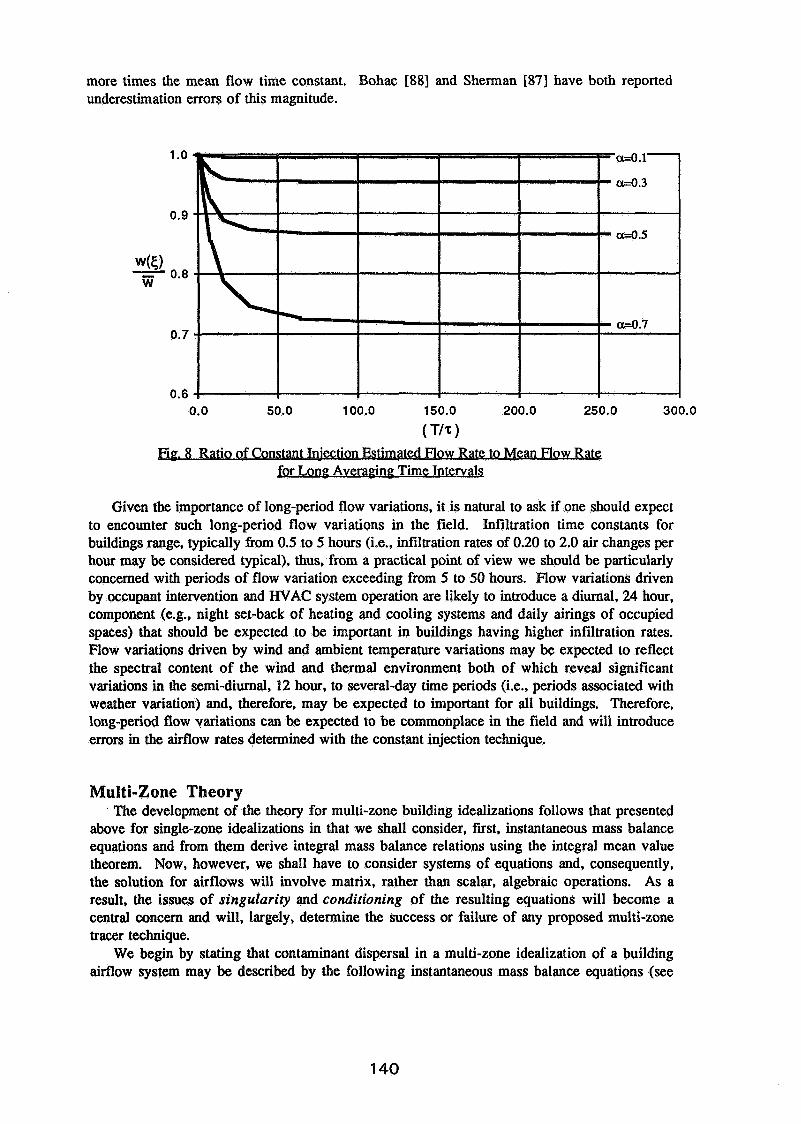
more times the mean flow time constant. Bohac [88] and Sherman [87] have both reported underestimation errors of this magnitude.
0.0 50.0 100.0 150.0 200.0 250.0 300.0
( TI= 8 Ratio of Constant Injection Estimated Flow Rate to Mean How R@
for Long Averagin~ Time Intervals
Given the importance of long-period flow variations, it is natural to ask if one should expect to encounter such long-period flow variations in the field. Infiltration time constants for buildings range, typically from 0.5 to 5 hours (i.e., infiltration rates of 0.20 to 2.0 air changes per hour may be considered typical), thus, from a practical point of view we should be particularly concerned with periods of flow variation exceeding from 5 to 50 hours. Flow variations driven by occupant intervention and HVAC system operation are likely to introduce a diurnal, 24 hour, component (e.g., night set-back of heating and cooling systems and daily airings of occupied spaces) that should be expected to be important in buildings having higher infiltration rates. Flow variations driven by wind and ambient temperature variations may be expected to reflect the spectral content of the wind and thermal environment both of which reveal significant variations in the semi-diurnal, 12 hour, to several-day time periods (i.e., periods associated with weather variation) and, therefore, may be expected to important for all buildings. Therefore, long-period flow variations can be expected to be commonplace in the field and will introduce errors in the airflow rates determined with the constant injection technique.
Multi-Zone Theory The development of the theory for multi-zone building idealizations follows that presented
above for single-zone idealizations in that we shall consider, first, instantaneous mass balance equations and from them derive integral mass balance relations using the integral mean value theorem. Now, however, we shall have to consider systems of equations and, consequently, the solution for airflows will involve matrix, rather than scalar, algebraic operations. As a result, the issues of singularity and conditioning of the resulting equations will become a central concern and will, largely, determine the success or failure of any proposed multi-zone tracer technique.
We begin by stating that contaminant dispersal in a multi-zone idealization of a building airflow system may be described by the following instantaneous mass balance equations (see
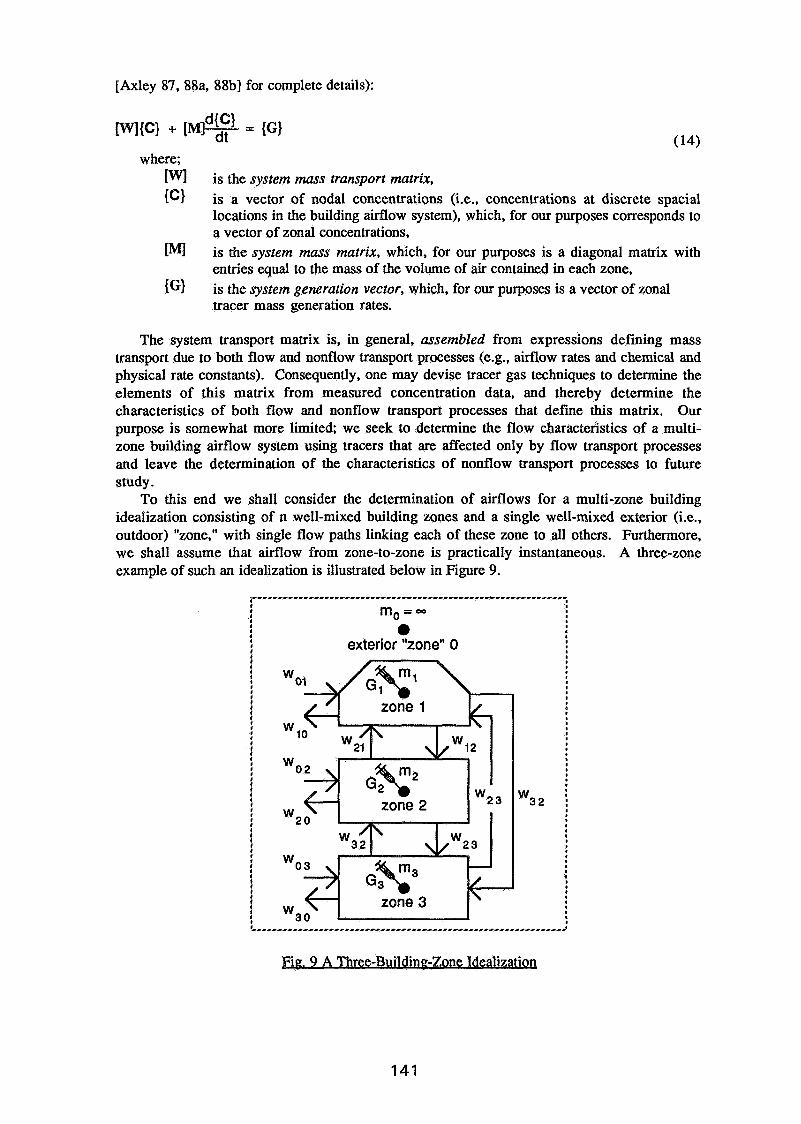
[Axley 87, 88a, 88b] for complete details):
[w]{C) + [MI- = {G} dt where;
[VV] is the system mass transport matrix, {C} is a vector of nodal concentrations (i.e., concentrations at discrete spacial
locations in the building airflow system), which, for our purposes corresponds to a vector of zonal concentrations,
[M] is the system mass matrix, which, for our purposes is a diagonal matrix with entries equal to the mass of the volume of air contained in each zone,
{GI is the system generation vector, which, for our purposes is a vector of zonal tracer mass generation rates.
The system transport matrix is, in general, assembled from expressions defining mass transport due to both flow and nonflow transport processes (e.g., airflow rates and chemical and physical rate constants). Consequently, one may devise tracer gas techniques to determine the elements of this matrix from measured concentration data, and thereby determine the characteristics of both flow and nonflow transport processes that define this matrix. Our purpose is somewhat more limited; we seek to determine the flow characteristics of a multi- zone building aifflow system using tracers that are affected only by flow transport processes and leave the determination of the characteristics of nonflow transport processes to future study.
To this end we shall consider the determination of airflows for a multi-zone building idealization consisting of n well-mixed building zones and a single well-mixed exterior (i.e., outdoor) "zone," with single flow paths linking each of these zone to all others. Furthermore, we shall assume that airflow from zone-to-zone is practically instantaneous. A three-zone example of such an idealization is illustrated below in Figure 9.
I
1 m,=- 1
I 1 0 I
exterior "zone" 0 : !
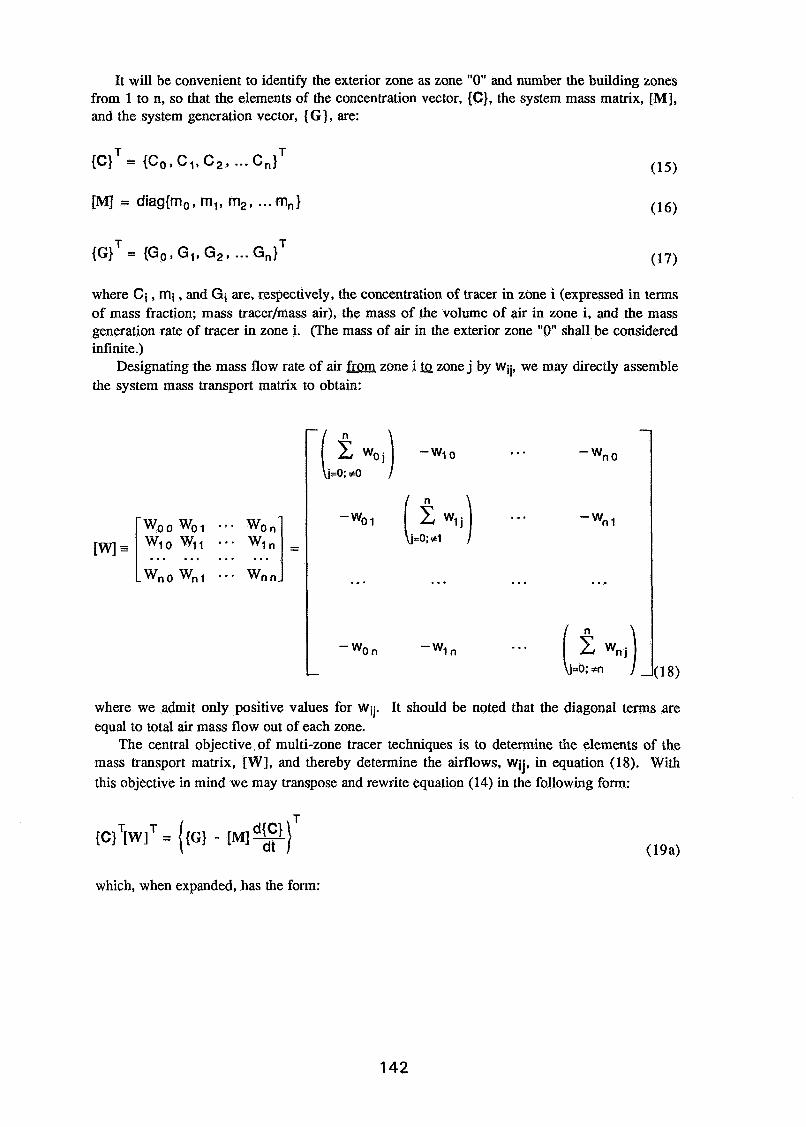
It will be convenient to identify the exterior zone as zone "0" and number the building zones from 1 to n, so that the elements of the concentration vector, {C}, the system mass matrix, [MI, and the system generation vector, {GI, are:
where Ci , mi , and Gi are, respectively, the concentration of tracer in zone i (expressed in terms of mass fraction; mass tracer/mass air), the mass of the volume of air in zone i, and the mass generation rate of tracer in zone i. (The mass of air in the exterior zone "0" shall be considered infinite.)
Designating the mass flow rate of air from zone i &J zone j by Wii, we may directly assemble the system mass transport matrix to obtain:
where we admit only positive values for Wij. It should be noted that the diagonal terms are equal to total air mass flow out of each zone.
The central objective of multi-zone tracer techniques is to determine the elements of the mass transport matrix, [W], and thereby determine the airflows, Wii, in equation (18). With this objective in mind we may transpose and rewrite equation (14) in the following form:
which, when expanded, has the form:
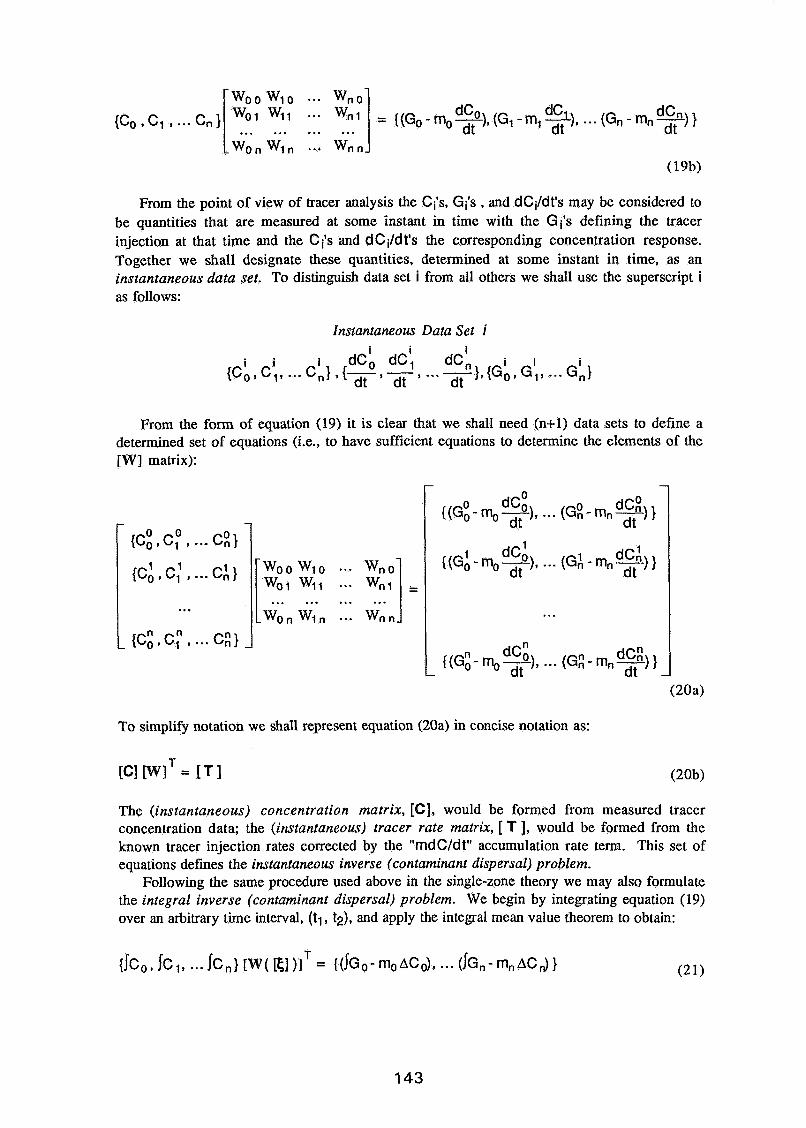
woo w10 .-- {Co , c, , - - a c n 1 ~ C O ~ C I dCn /"' W" ... 2~1 = {(GomoT),(G1-mix), ...( Gn-mnx)} . . . . . . . . . . . .
From the point of view of tracer analysis the Ci's, Gi's , and dCi/dt's may be considered to be quantities that are measured at some instant in time with the Gi's defining the tracer injection at that time and the C i's and d Ci/d t's the corresponding concentration response. Together we shall designate these quantities, determined at some instant in time, as an instantaneous data set. To distinguish data set i from all others we shall use the superscript i as follows:
Instantaneous Data Set i
From the form of equation (19) it is clear that we shall need (n+l) data sets to define a determined set of equations (i.e., to have sufficient equations to determine the elements of the [W] matrix):
{c: , c,' , ... C A I WOO WIO
. . . . . . W0l w11
... Won WI n
To simplify notation we shall represent equation (20a) in concise notation as:
The (instantaneous) concentration matrix, [C], would be formed from measured tracer concentration data; the (instantaneous) tracer rate matrix, [ T 1, would be formed from the known tracer injection rates corrected by the "mdC/dt" accumulation rate term. This set of equations defines the instantaneous inverse (contaminant dispersal) problem.
Following the same procedure used above in the single-zone theory we may also formulate the integral inverse (contaminant dispersal) problem. We begin by integrating equation (19) over an arbitrary time interval, ( t l , t2), and apply the integral mean value theorem to obtain:

where we have introduced the short-hand notation:
Here, we must introduce a separate unknown time, 5, for each element of the mass transport matrix:.
In the integral formulation the Icj's, I G ~ , ACj's, and, now, the cij which depend upon the nature of the measured data, constitute a data set. As before, to distinguish one data set, i, from all others we shall use a superscript i as follows:
Integral Data Set i i i i i i i
{JC;, j c1 , ... JC;}, {AC:, A C ~ , .-• AC;}, { h 0 , J G ~ , - - - I ~ n l 9 [ E I
If (n+l) integral data sets are collected satisfying the condition:
then, and only then, we may assemble a system of equations to determine the elements of the mass transport matrix as:
To simplify notation we shall represent equation (24a) in concise notation as:
The integral concentration matrix, [Ic], would be formed from measured tracer concentration data; the integral tracer matrix, [IT], would be formed from the known tracer injection amounts corrected by the "mAC" accumulation term. This set of equations defines the integral inverse (contaminant dispersal) problem.
It must be emphasized that the formulation of the integral inverse problem depends critically on the condition imposed by the integral mean value theorem, equation (23). In practical
- { (IG: - rno AC~) , . . . (IG:! - mn A C ~ )
-
{(~GA - rno AC~) , . . . (~GA - mn AC;) }
... - ( (1~: - mO~C:), ..- (1~ : - mnAc;)} -
{JCLIC~~ . . . IC : I
{ c , c . . . c A
. . {Ic:, ICY , --• Ic:} A
- ~ o o ~ o ..a wno
... w.1 I... . . . . I - - - WonNn ... Wnn
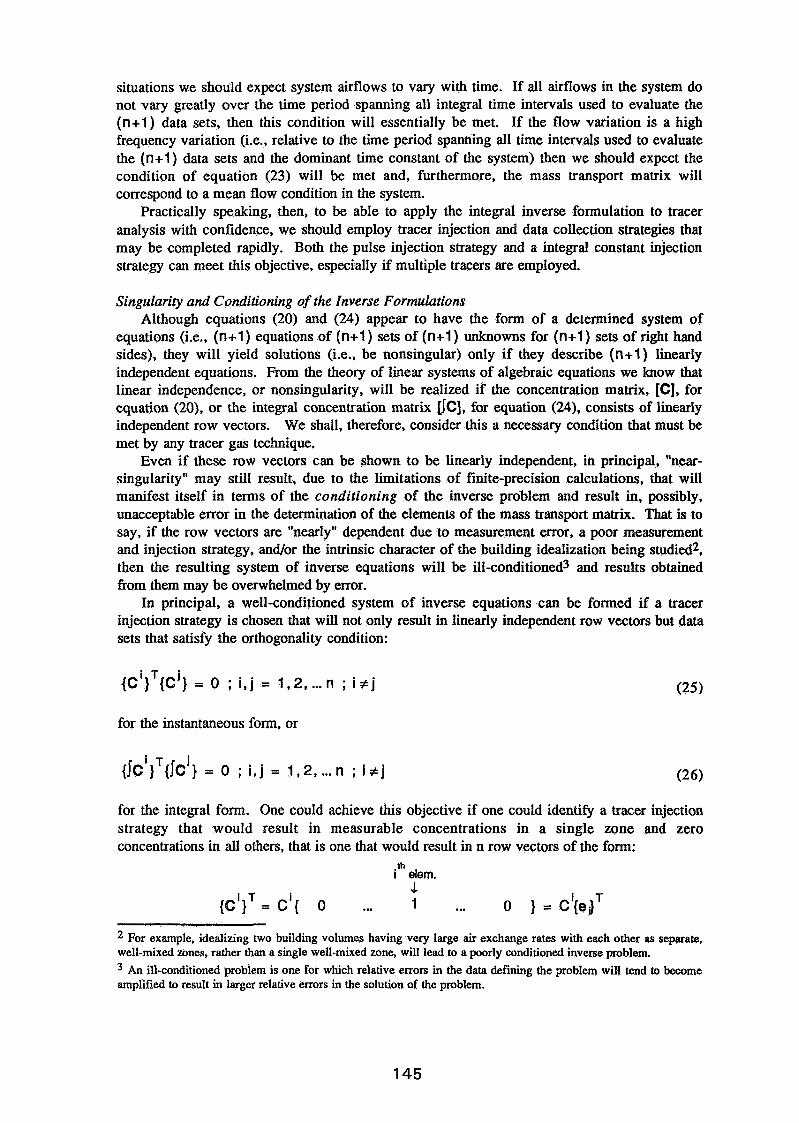
situations we should expect system airflows to vary with time. If all airflows in the system do not vary greatly over the time period spanning all integral time intervals used to evaluate the (n+l) data sets, then this condition will essentially be met. If the flow variation is a high frequency variation (i.e., relative to the time period spanning all time intervals used to evaluate the (n+l) data sets and the dominant time constant of the system) then we should expect the condition of equation (23) will be met and, furthermore, the mass transport matrix will correspond to a mean flow condition in the system.
Practically speaking, then, to be able to apply the integral inverse formulation to tracer analysis with confidence, we should employ tracer injection and data collection strategies that may be completed rapidly. Both the pulse injection strategy and a integral constant injection strategy can meet this objective, especially if multiple tracers are employed.
Singularity and Conditioning of the Inverse Formulations Although equations (20) and (24) appear to have the form of a determined system of
equations (i.e., (n+l ) equations of (n+l ) sets of (n+l ) unknowns for (n+l ) sets of right hand sides), they will yield solutions (i.e., be nonsingular) only if they describe (n+l) linearly independent equations. From the theory of linear systems of algebraic equations we know that linear independence, or nonsingularity, will be realized if the concentration matrix, [C], for equation (20), or the integral concentration matrix [IC], for equation (24). consists of linearly independent row vectors. We shall, therefore, consider this a necessary condition that must be met by any tracer gas technique.
Even if these row vectors can be shown to be linearly independent, in principal, "near- singularity" may still result, due to the limitations of finite-precision calculations, that will manifest itself in terms of the conditioning of the inverse problem and result in, possibly, unacceptable error in the determination of the elements of the mass transport matrix. That is to say, if the row vectors are "nearly" dependent due to measurement error, a poor measurement and injection strategy, and/or the intrinsic character of the building idealization being studied2, then the resulting system of inverse equations will be ill-conditioned3 and results obtained from them may be overwhelmed by error.
In principal, a well-conditioned system of inverse equations can be formed if a tracer injection strategy is chosen that will not only result in linearly independent row vectors but data sets that satisfy the orthogonality condition:
for the instantaneous form, or
for the integral form. One could achieve this objective if one could identify a tracer injection strategy that would result in measurable concentrations in a single zone and zero concentrations in all others, that is one that would result in n row vectors of the form:
2 For example, idealizing two building volumes having very large air exchange rates with each other as separate, well-mixed zones, rather than a single well-mixed zone, will lead to a poorly conditioned inverse problem.
An ill-conditioned problem is one for which relative errors in the data defining the problem will tend to become amplified to result in larger relative errors in the solution of the problem.

for the instantaneous case, or: th
i elem.
for the integral case, where Ci and I c ~ are scalars and {ei} is a vector with a unit value for element i and zero values elsewhere. (For conditions of steady flow the orthogonality conditions of equations (25) and (26) would be met by utilizing the system eigenvectors, but steady flow conditions will not in general prevail and the analyst will, in any event, have no a priori knowledge of these eigenvectors.)
It will not, in general, be possible to achieve this end. One may, however, approach this goal practically by exciting each zone with an individual tracer injection so that, presumably, the concentration response in the excited zone will be greater than that in all others. This strategy must be considered fundamental to any multi-zone tracer gas technique, and has been used as the basis of the multi-zone constant injection tracer technique and the pulse injection technique.
Conservation of Air Mass Flow Regrettably, one zone, the exterior "zone", which will be involved in all real building
idealizations, can not be excited by tracer injection (due to its practically infinite volume it tends to act as a constant concentration sink) and, therefore, in applying the individual zone injection strategy, we will find ourselves short by one data set. By demanding, however, the conservation of total air mass flow we may obtain this needed (n+l)th equation.
The conservation of total mass flow may be conveniently realized by recognizing that the mass concentration for air in all zones is unity and unchanging. The instantaneous data set for air alone is:
air d -- air c i = l ; d t
- 0 ; G i = O
and, the integral data set for air alone:
air air air .I C i = 1At A C i = O ; I G i = 0 ; At = (tz-tl)
Using these data sets we obtain the first of the required (n+l) equations:
for the instantaneous form of the inverse analysis equations, and
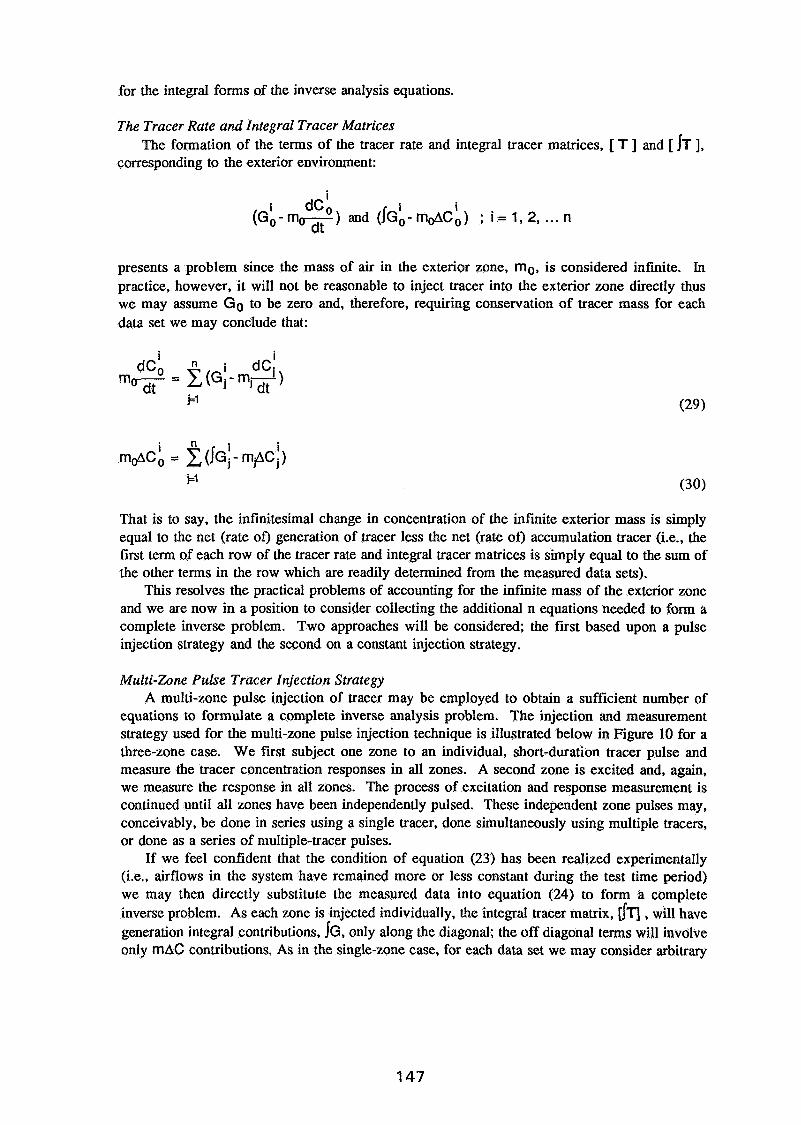
for the integral forms of the inverse analysis equations.
The Tracer Rate and Integral Tracer Matrices The formation of the terms of the tracer rate and integral tracer matrices, [ T ] and [ JT 1,
corresponding to the exterior environment:
i ~ C O i i (GL-rn-) and (IG,-m&cO) ; i = l , 2 . ... n
presents a problem since the mass of air in the exterior zone, mo, is considered infinite. In practice, however, it will not be reasonable to inject tracer into the exterior zone directly thus we may assume G o to be zero and, therefore, requiring conservation of tracer mass for each data set we may conclude that:
That is to say, the infinitesimal change in concentration of the infinite exterior mass is simply equal to the net (rate of) generation of tracer less the net (rate of) accumulation tracer (i-e., the first term of each row of the tracer rate and integral tracer matrices is simply equal to the sum of the other terms in the row which are readily determined from the measured data sets).
This resolves the practical problems of accounting for the infinite mass of the exterior zone and we are now in a position to consider collecting the additional n equations needed to form a complete inverse problem. Two approaches will be considered; the first based upon a pulse injection strategy and the second on a constant injection strategy.
Multi-Zone Pulse Tracer Injection Strategy A multi-zone pulse injection of tracer may be employed to obtain a sufficient number of
equations to formulate a complete inverse analysis problem. The injection and measurement strategy used for the multi-zone pulse injection technique is illustrated below in Figure 10 for a three-zone case. We first subject one zone to an individual, short-duration tracer pulse and measure the tracer concentration responses in all zones. A second zone is excited and, again, we measure the response in all zones. The process of excitation and response measurement is continued until all zones have been independently pulsed. These independent zone pulses may, conceivably, be done in series using a single tracer, done simultaneously using multiple tracers, or done as a series of multiple-tracer pulses.
If we feel confident that the condition of equation (23) has been realized experimentally (i.e., airflows in the system have remained more or less constant during the test time period) we may then directly substitute the measured data into equation (24) to form a complete inverse problem. As each zone is injected individually, the integral tracer matrix, TI , will have generation integral contributions, IG, only along the diagonal; the off diagonal terms will involve only mAC contributions. As in the single-zone case, for each data set we may consider arbitrary
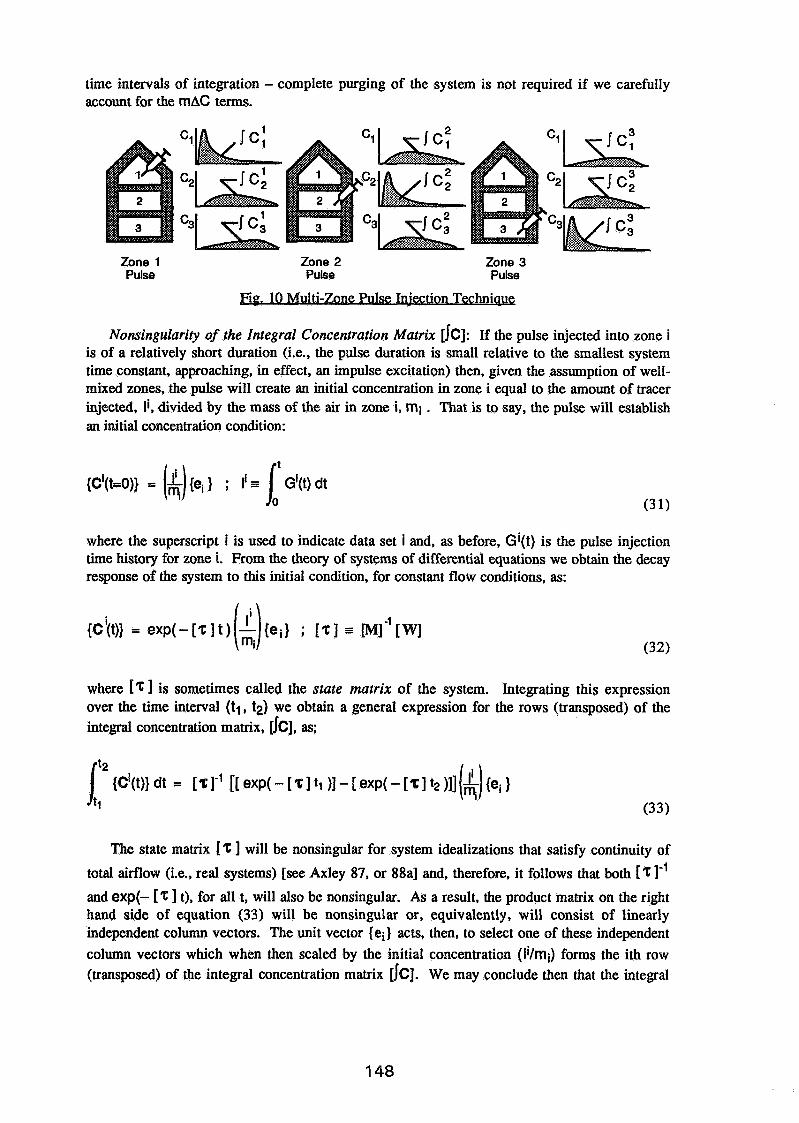
time intervals of integration - complete purging of the system is not required if we carefully account for the mAC terms.
Zone 1 Pulse
Zone 2 Pulse
Zone 3 Pulse
HE. 10 Multi-Zone Pulse Injection Techniaue
Nonringularity of the Integral Concentration Matrix [JC]: If the pulse injected into zone i is of a relatively short duration (i.e., the pulse duration is small relative to the smallest system time constant, approaching, in effect, an impulse excitation) then, given the assumption of well- mixed zones, the pulse will create an initial concentration in zone i equal to the amount of tracer injected, li, divided by the mass of the air in zone i, mi . That is to say, the pulse will establish an initial concentration condition:
where the superscript i is used to indicate data set i and, as before, Gi(t) is the pulse injection time history for zone i. From the theory of systems of differential equations we obtain the decay response of the system to this initial condition, for constant flow conditions, as:
i
{ci(t)} = e x p - ) e i mi ; [ z ] s [M]'[w]
where 1% 1 is sometimes called the state matrix of the system. Integrating this expression over the time interval (tl, t2) we obtain a general expression for the rows (transposed) of the integral concentration matrix, [k] , as;
The state matrix [Z 1 will be nonsingular for system idealizations that satisfy continuity of
total airflow (i.e., real systems) [see Axley 87, or 88al and, therefore, it follows that both [ 1.' and exp(- [ 'C ] t), for all t, will also be nonsingular. As a result, the product matrix on the right hand side of equation (33) will be nonsingular or, equivalently, will consist of linearly independent column vectors. The unit vector (ei) acts, then, to select one of these independent column vectors which when then scaled by the initial concentration (li/mi) forms the ith row (transposed) of the integral concentration matrix [Ic]. We may conclude then that the integral
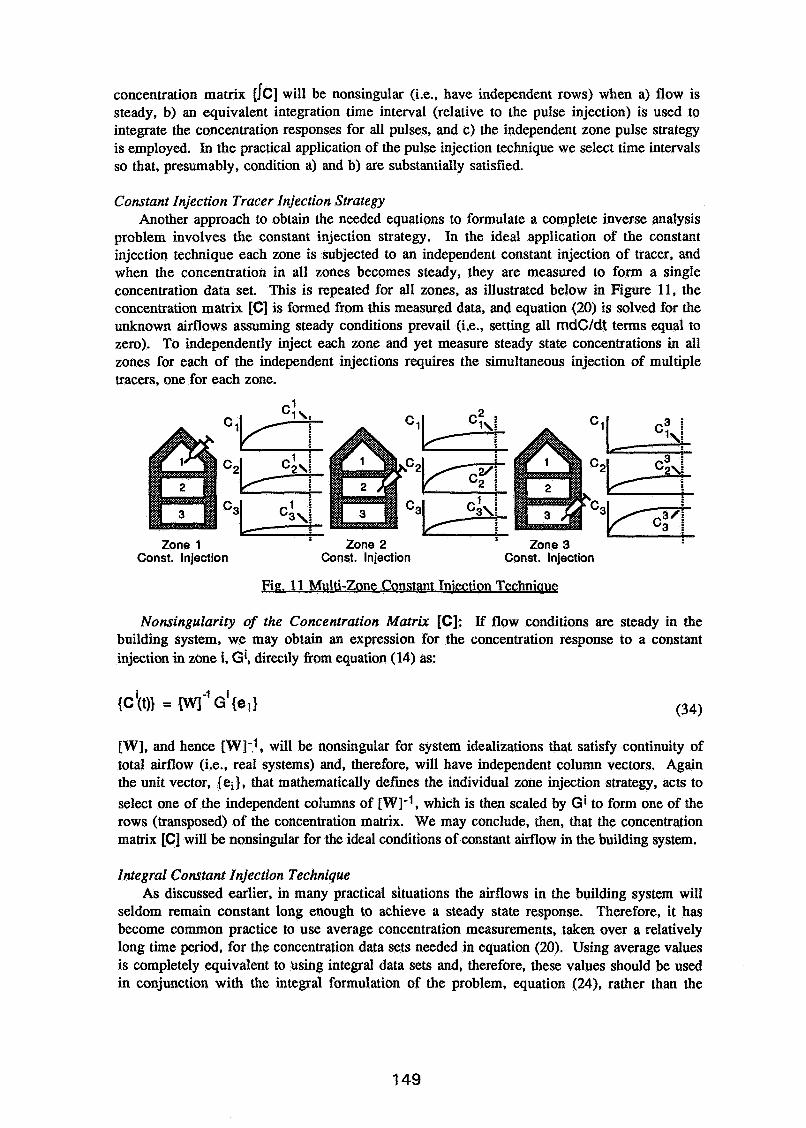
concentration matrix [fC] will be nonsingular (i.e., have independent rows) when a) flow is steady, b) an equivalent integration time interval (relative to the pulse injection) is used to integrate the concentration responses for all pulses, and c) the independent zone pulse strategy is employed. In the practical application of the pulse injection technique we select time intervals so that, presumably, condition a) and b) are substantially satisfied.
Constant Injection Tracer Injection Strategy Another approach to obtain the needed equations to formulate a complete inverse analysis
problem involves the constant injection strategy. In the ideal application of the constant injection technique each zone is subjected to an independent constant injection of tracer, and when the concentration in all zones becomes steady, they are measured to form a single concentration data set. This is repeated for all zones, as illustrated below in Figure 11, the concentration matrix [C] is formed from this measured data, and equation (20) is solved for the unknown airflows assuming steady conditions prevail (i.e., setting all mdC1dt terms equal to zero). To independently inject each zone and yet measure steady state concentrations in all zones for each of the independent injections requires the simultaneous injection of multiple tracers, one for each zone.
Zone 1 Zone 2 r
Zone 3 Const. Injection Const. Injection Const. Injection
Be. 11 Multi-Zone Constant 1ni.ection Techniaue
Nonsingularity of the Concentration Matrix [C]: If flow conditions are steady in the building system, we may obtain an expression for the concentration response to a constant injection in zone i, Gi, directly from equation (14) as:
[W], and hence [W]-1, will be nonsingular for system idealizations that satisfy continuity of total airflow (i.e., real systems) and, therefore, will have independent column vectors. Again the unit vector, {ei), that mathematically defines the individual zone injection strategy, acts to select one of the independent columns of [W]-1, which is then scaled by Gi to form one of the rows (transposed) of the concentration matrix. We may conclude, then, that the concentration matrix [C] will be nonsingular for the ideal conditions of constant airflow in the building system.
Integral Constant Injection Technique As discussed earlier, in many practical situations the airflows in the building system will
seldom remain constant long enough to achieve a steady state response. Therefore, it has become common practice to use average concentration measurements, taken over a relatively long time period, for the concentration data sets needed in equation (20). Using average values is completely equivalent to using integral data sets and, therefore, these values should be used in conjunction with the integral formulation of the problem, equation (24), rather than the
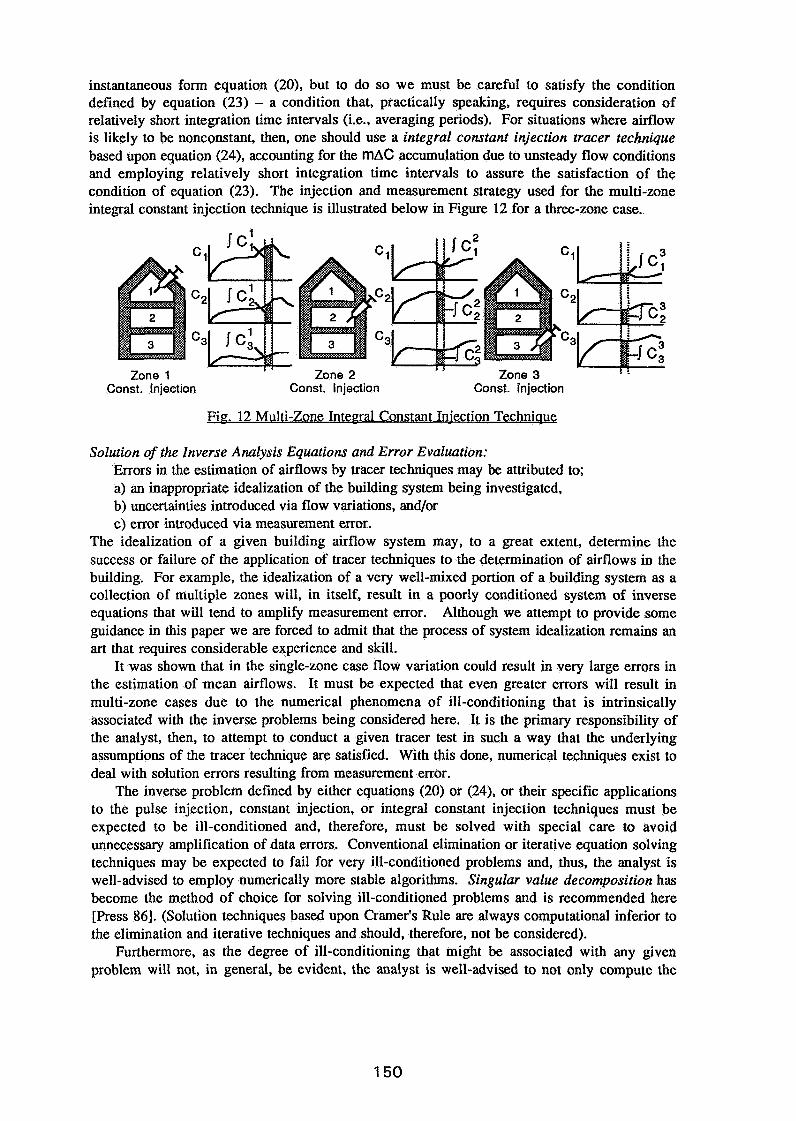
instantaneous form equation (20). but to do so we must be careful to satisfy the condition defined by equation (23) - a condition that, practically speaking, requires consideration of relatively short integration time intervals (i.e., averaging periods). For situations where airflow is likely to be nonconstant, then, one should use a integral constant injection tracer technique based upon equation (24), accounting for the mAC accumulation due to unsteady flow conditions and employing relatively short integration time intervals to assure the satisfaction of the condition of equation (23). The injection and measurement strategy used for the multi-zone integral constant injection technique is illustrated below in Figure 12 for a three-zone case.
Zone 1 Const. Injection Const. Injection Const. Injection
Fig. 12 Multi-Zone Internal Constant Injection Techniaue
Solution of the Inverse Analysis Equations and Error Evaluation: Errors in the estimation of airflows by tracer techniques may be attributed to; a) an inappropriate idealization of the building system being investigated, b) uncertainties introduced via flow variations, and/or c) error introduced via measurement error.
The idealization of a given building airflow system may, to a great extent, determine the success or failure of the application of tracer techniques to the determination of airflows in the building. For example, the idealization of a very well-mixed portion of a building system as a collection of multiple zones will, in itself, result in a poorly conditioned system of inverse equations that will tend to amplify measurement error. Although we attempt to provide some guidance in this paper we are forced to admit that the process of system idealization remains an art that requires considerable experience and skill.
It was shown that in the single-zone case flow variation could result in very large errors in the estimation of mean airflows. It must be expected that even greater errors will result in multi-zone cases due to the numerical phenomena of ill-conditioning that is intrinsically associated with the inverse problems being considered here. It is the primary responsibility of the analyst, then, to attempt to conduct a given tracer test in such a way that the underlying assumptions of the tracer technique are satisfied. With this done, numerical techniques exist to deal with solution errors resulting from measurement error.
The inverse problem defined by either equations (20) or (24), or their specific applications to the pulse injection, constant injection, or integral constant injection techniques must be expected to be ill-conditioned and, therefore, must be solved with special care to avoid unnecessary amplification of data errors. Conventional elimination or iterative equation solving techniques may be expected to fail for very ill-conditioned problems and, thus, the analyst is well-advised to employ numerically more stable algorithms. Singular value decomposition has become the method of choice for solving ill-conditioned problems and is recommended here [Press 861. (Solution techniques based upon Crarner's Rule are always computational inferior to the elimination and iterative techniques and should, therefore, not be considered).
Furthermore, as the degree of ill-conditioning that might be associated with any given problem will not, in general, be evident, the analyst is well-advised to not only compute the
solution to the inverse problem; but also compute (and report) a measure of error associated with the solution. D'Ottavio [871 and Walker [85] have discussed error analysis techniques relating to the solution of both the constant injection technique and the pulse injection technique (Walker's decay integral method); their results apply here as well. Three error estimation techniques are offered; a) error estimation based upon perturbation analysis of systems of linear equations involving vector and matrix norms, b) error estimation based upon Monte Carlo error analysis, and c) error estimation based upon first order error analysis using Taylor expansions. The first approach provides an upper-bound error estimation. As this approach is sensitive to the scaling of the inverse equations, D'Ottavio employed optimal scaling of the equations, based upon scaling individual equations by the inverse of their row Euclidean norm, in conjunction with this approach to provide a (near) minimum upper bound error estimation.
Central to perturbation analysis of systems of linear equations is the so-called condition number, which, in simple terms, provides an upper bound estimate of the ratio of the maximum relative solution error to the maximum relative data error (i.e., an error amplification factor). Thus, reporting the condition number of the concentration matrix, [C], (integral concentration matrix [IC] ) provides one means to characterize the error associated with the solution of a given problem. This condition number is conveniently computed as a by-product of singular value decomposition.
Application of the Multi-Zone Pulse Injection Technique Measurement Method
The pulse techniques presented above provide flexible tools for the determination of building airflow rates, however, their successful application in a particular building requires the user to understand the building and its systems. Based on this understanding the user develops an "idealization" of the building as a series of zones and formulates the pulse experiment in order to determine specific airflow rates between these zones. This process of applying the pulse technique to a particular building consists of qualitative and quantitative aspects. The method begins with a qualitative analysis of the building layout and the ventilation system equipment and zoning, The major zones and system airflow paths of the building are identified, and the existence of unexpected or undesired airflows due to envelope leakage, poor system performance or inadequate separation between zones are investigated. A qualitative airflow diagnosis, using hand-held instrumentation (e.g. anemometers), "smoke-sticks", or tracer gas pulses, can serve to further elucidate the building's airflow characteristics. For example, exhaust airflows may be verified as such or shown to be not flowing in the expected direction. In addition, certain airflows may be shown to be zero, and need not be included in the idealization.
Based on the qualitative analysis and the particular airflows that the experimenter is interested in, a system or subsystem idealization of the building is developed. This idealization consists of a series of well-mixed zones connected by airflow paths. The idealization need not include every airflow and every zone in the building. In fact, such an all-inclusive model of a building will generally be unmanageably complex from an experimental point of view and involve the determination of more airflow rates than are necessarily of interest. In certain circumstances, a selected subsystem of the building can be investigated, providing information without consideration of the rest of the building.
Once the building idealization has been developed, the quantitative experimental analysis of this system is conducted. One must define tracer gas injection and air sampling strategies, in conjunction with one's data collection and analysis approaches. The injection strategy includes the manner in which the tracer will be delivered to each zone, the amount of tracer to be injected and a means for determining this amount, and the timing of the injections into the various zones. The air sampling strategy includes the number and location of air sampling points in each zone, and the manner in which they will be sampled (real-time monitoring or container averaging).
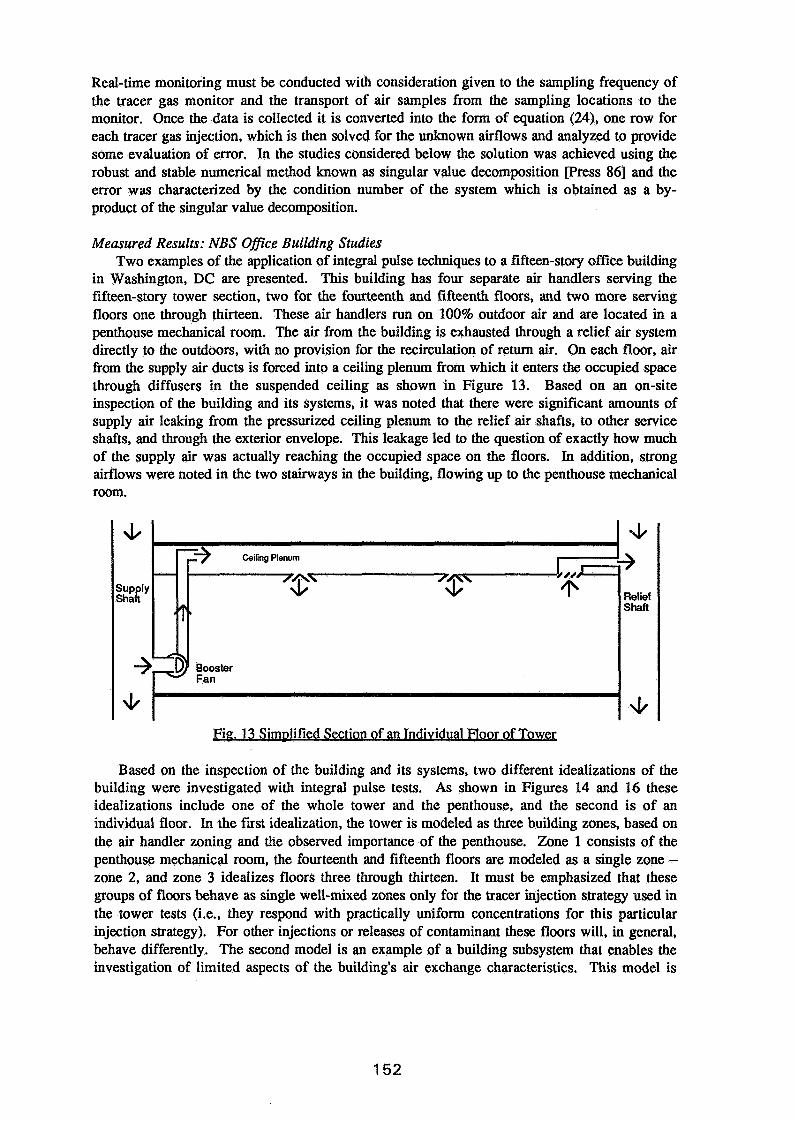
Real-time monitoring must be conducted with consideration given to the sampling frequency of the tracer gas monitor and the transport of air samples from the sampling locations to the monitor. Once the data is collected it is converted into the form of equation (24), one row for each tracer gas injection, which is then solved for the unknown airflows and analyzed to provide some evaluation of error. In the studies considered below the solution was achieved using the robust and stable numerical method known as singular value decomposition [Press 861 and the error was characterized by the condition number of the system which is obtained as a by- product of the singular value decomposition.
Measured Results: NBS Ofice Building Studies Two examples of the application of integral pulse techniques to a fifteen-story office building
in Washington, DC are presented. This building has four separate air handlers serving the fifteen-story tower section, two for the fourteenth and fifteenth floors, and two more serving floors one through thirteen. These air handlers run on 100% outdoor air and are located in a penthouse mechanical room. The air from the building is exhausted through a relief air system directly to the outdoors, with no provision for the recirculation of return air. On each floor, air from the supply air ducts is forced into a ceiling plenum from which it enters the occupied space through diffusers in the suspended ceiling as shown in Figure 13. Based on an on-site inspection of the building and its systems, it was noted that there were significant amounts of supply air leaking from the pressurized ceiling plenum to the relief air shafts, to other service shafts, and through the exterior envelope. This leakage led to the question of exactly how much of the supply air was actually reaching the occupied space on the floors. In addition, strong airflows were noted in the two stairways in the building, flowing up to the penthouse mechanical room.
Fig. 13 Simolified Section of an Individual Floor of Tower
Based on the inspection of the building and its systems, two different idealizations of the building were investigated with integral pulse tests. As shown in Figures 14 and 16 these idealizations include one of the whole tower and the penthouse, and the second is of an individual floor. In the first idealization, the tower is modeled as three building zones, based on the air handler zoning and tlie observed importance of the penthouse. Zone 1 consists of the penthouse mechanical room, the fourteenth and fifteenth floors are modeled as a single zone - zone 2, and zone 3 idealizes floors three through thirteen. It must be emphasized that these groups of floors behave as single well-mixed zones only for the tracer injection strategy used in the tower tests (i.e., they respond with practically uniform concentrations for this particular injection strategy). For other injections or releases of contaminant these floors will, in general, behave differently. The second model is an example of a building subsystem that enables the investigation of limited aspects of the building's air exchange characteristics. This model is
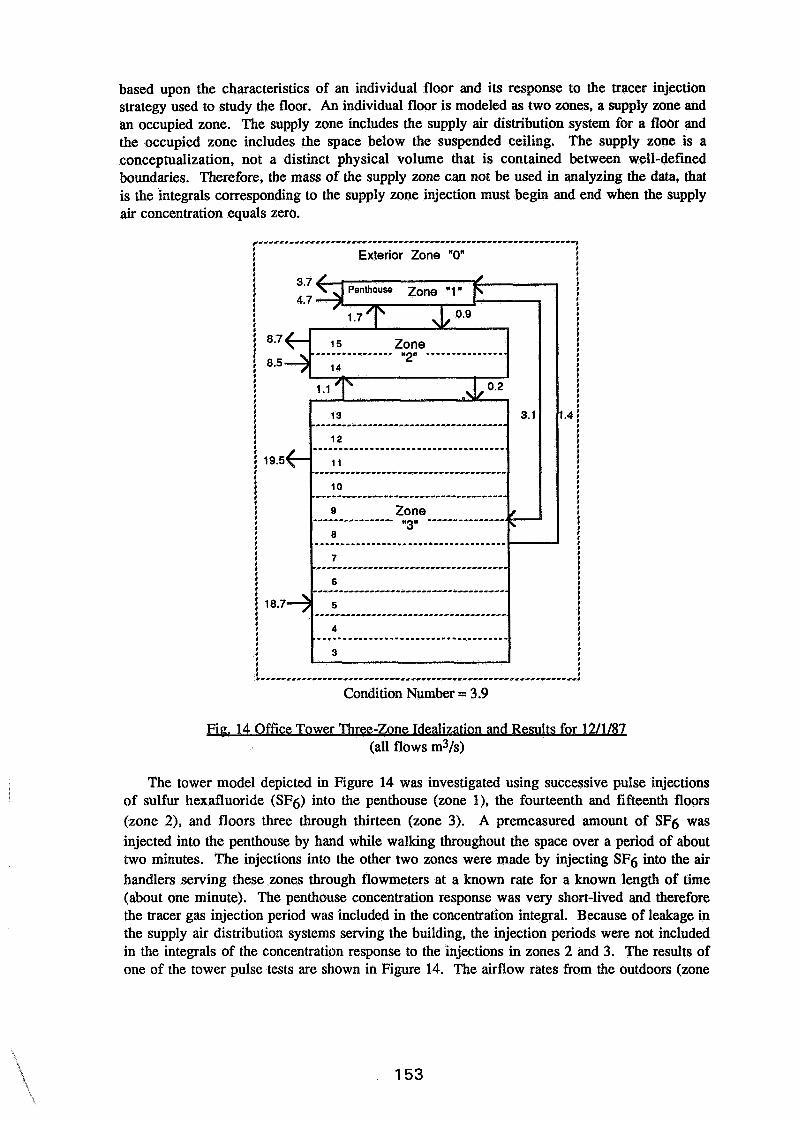
based upon the characteristics of an individual floor and its response to the tracer injection strategy used to study the floor. An individual floor is modeled as two zones, a supply zone and an occupied zone. The supply zone includes the supply air distribution system for a floor and the occupied zone includes the space below the suspended ceiling. The supply zone is a conceptualization, not a distinct physical volume that is contained between well-defined boundaries. Therefore, the mass of the supply zone can not be used in analyzing the data, that is the integrals corresponding to the supply zone injection must begin and end when the supply air concentration equals zero.
f'*--CC'CCCCC-*CC*C~-------e*~------*-e-----w--------*------**l
! Exterior Zone "0" I
I
! I
,--------------***-------*--**-*----*-**--------
Condition Number = 3.9
Fia. 14 Office Tower Three-Zone Idealization and Results for 121118~ (all flows m3is)
The tower model depicted in Figure 14 was investigated using successive pulse injections of sulfur hexafluoride (SFg) into the penthouse (zone I), the fourteenth and fifteenth floors (zone 2), and floors three through thirteen (zone 3). A premeasured amount of SF6 was injected into the penthouse by hand while walking throughout the space over a period of about two minutes. The injections into the other two zones were made by injecting SF6 into the air handlers serving these zones through flowmeters at a known rate for a known length of time (about one minute). The penthouse concentration response was very short-lived and therefore the tracer gas injection period was included in the concentration integral. Because of leakage in the supply air distribution systems serving the building, the injection periods were not included in the integrals of the concentration response to the injections in zones 2 and 3. The results of one of the tower pulse tests are shown in Figure 14. The airflow rates from the outdoors (zone
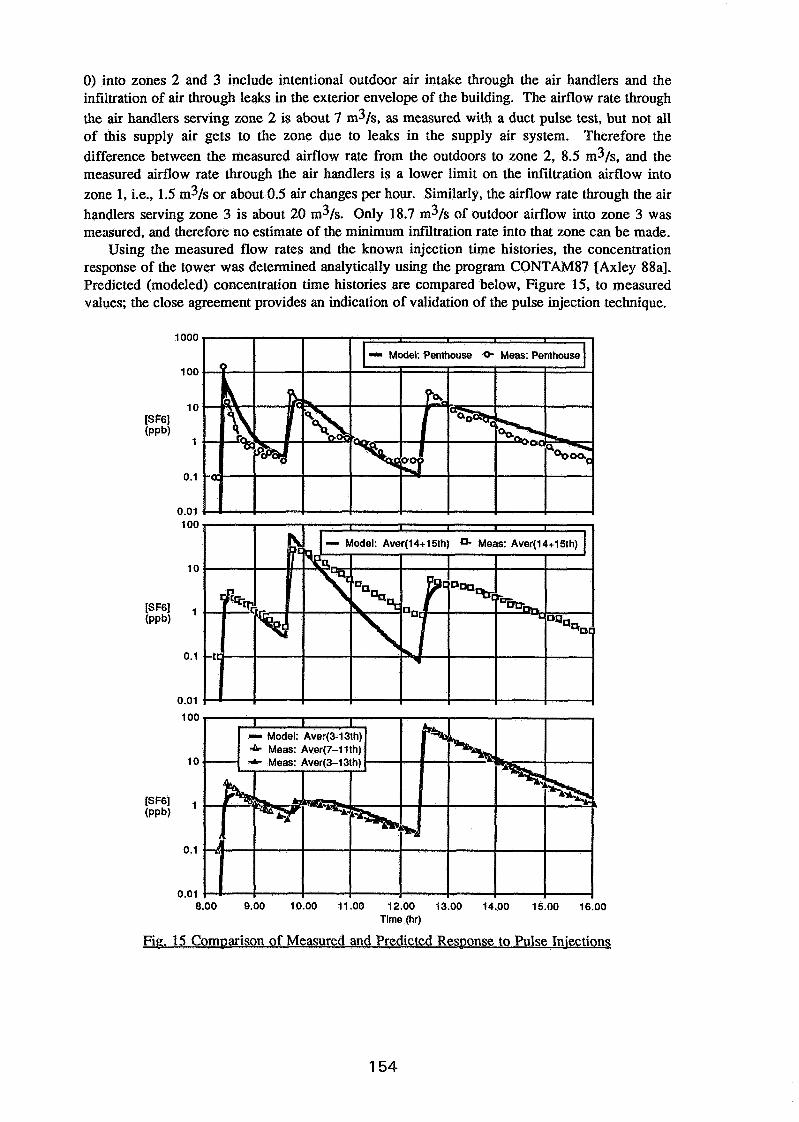
0) into zones 2 and 3 include intentional outdoor air intake through the air handlers and the infiltration of air through leaks in the exterior envelope of the building. The airflow rate through the air handlers serving zone 2 is about 7 m3/s, as measured with a duct pulse test, but not all of this supply air gets to the zone due to leaks in the supply air system. Therefore the difference between the measured airflow rate from the outdoors to zone 2, 8.5 m3/s, and the measured airflow rate through the air handlers is a lower limit on the infiltration airflow into zone 1, i.e., 1.5 m3/s or about 0.5 air changes per hour. Similarly, the airflow rate through the air handlers serving zone 3 is about 20 m3/s. Only 18.7 m3/s of outdoor airflow into zone 3 was measured, and therefore no estimate of the minimum infiltration rate into that zone can be made.
Using the measured flow rates and the known injection time histories, the concentration response of the tower was determined analytically using the program CONTAM87 [Axley 88al. Predicted (modeled) concentration time histories are compared below, Figure 15, to measured values; the close agreement provides an indication of validation of the pulse injection technique.
.b Meas: Aver(7-11 th)
10 9.00 10.00 11.00 12.00 13.00 14.00 15.00 16.00 Time (hr)
Fip. 15 Com~arison of Measured and Predicted Res~onse to Pulse Injections
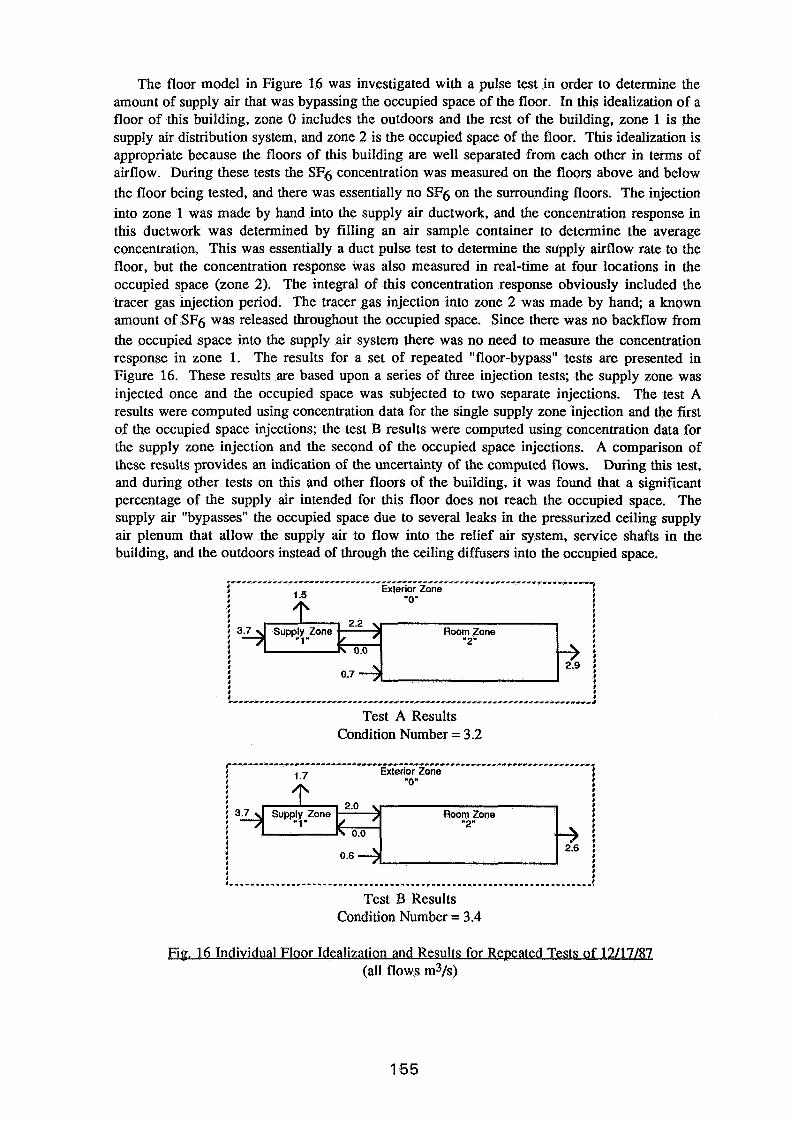
The floor model in Figure 16 was investigated with a pulse test in order to determine the amount of supply air that was bypassing the occupied space of the floor. In this idealization of a floor of this building, zone 0 includes the outdoors and the rest of the building, zone 1 is the supply air distribution system, and zone 2 is the occupied space of the floor. This idealization is appropriate because the floors of this building are well separated from each other in terms of airflow. During these tests the SF6 concentration was measured on the floors above and below the floor being tested, and there was essentially no SF6 on the surrounding floors. The injection into zone 1 was made by hand into the supply air ductwork, and the concentration response in this ductwork was determined by filling an air sample container to determine the average concentration. This was essentially a duct pulse test to determine the supply airflow rate to the floor, but the concentration response was also measured in real-time at four locations in the occupied space (zone 2). The integral of this concentration response obviously included the tracer gas injection period. The tracer gas injection into zone 2 was made by hand; a known amount of SF6 was released throughout the occupied space. Since there was no backflow from the occupied space into the supply air system there was no need to measure the concentration response in zone 1. The results for a set of repeated "floor-bypass" tests are presented in Figure 16. These results are based upon a series of three injection tests; the supply zone was injected once and the occupied space was subjected to two separate injections. The test A results were computed using concentration data for the single supply zone injection and the first of the occupied space injections; the test B results were computed using concentration data for the supply zone injection and the second of the occupied space injections. A comparison of these results provides an indication of the uncertainty of the computed flows. During this test, and during other tests on this and other floors of the building, it was found that a significant percentage of the supply air intended for this floor does not reach the occupied space. The supply air "bypasses" the occupied space due to several leaks in the pressurized ceiling supply air plenum that allow the supply air to flow into the relief air system, service shafts in the building, and the outdoors instead of through the ceiling diffusers into the occupied space.
.------------------------------------*---------*---*--------*--*------ + Exterior Zone I 1.5 '0' ?
i 4' ?
?
Room Zone ?
"2" ?
?
?
i ? : -,,,-,,,,,,,,,,,,,*-*---- * --- --*------*------*-------*-*-----; Test A Results
Condition Number = 3.2
r"""""""'""----***-*---*-----*-.-------*--**-.--------**-------* Exterior Zone I
i
i ? ?
?
?
I j ?
?
! ?
Test B Results Condition Number = 3.4
Fig. 16 Individual Floor Idealization and Results for Repeated Tests of 12/17/87 (all flows m31s)
CONCLUSION
The pulse injection tracer techniques, based on integral mass balance formulations, provide useful tools for studying building airflow systems. The duct pulse application provides a rapid and convenient means of measuring airflows in ducts. The building pulse applications are capable of determining airflow rates in multi-zone building systems in relatively short time periods (i.e., time periods on the order of the dominant system time constants), and can be employed with a single tracer gas. Pulse injection determinations of airflow rates may be expected to be relatively insensitive to variations in airflow rates, and the analysis of data from field studies to date indicate that the multi-zone pulse injection technique may be expected to yield relatively well-conditioned equations. In the multi-zone pulse injection technique, as in all multi-zone tracer gas techniques, the manner in which the building airflow system is idealized as a series of inter-connected zones is pivotal in obtaining a well-conditioned system of equations and, thereby, reasonable estimates of the system airflow rates.
The development of the pulse injection techniques has implications for other tracer gas measurement approaches. Integral mass balance relations should be applied to existing tracer injection strategies to provide alternate formulations and, possibly, to identify strategies of minimizing errors in the determination of airflow rates. An integral formulation of the constant injection technique, which, in principal, should avoid some of the problems of the technique as commonly used, was presented and should be considered further. The pulse injection techniques themselves require additional study in both laboratory and field settings to more completely examine sources of errors and to better establish experimental procedures for their practical application.
REFERENCES
Afonso, C.F.A., Maldonado, E.A.B.. & Skilret. E., "A Single Tracer-gas Method to Characterize Multi-room Air Exchanges," Energy and Buildings, Vol. 9, Elsevier Sequoia, The Netherlands, 1986, pp. 273-280
Afonso, C.F.A.. & Maldonado, E.A.B.. "A Tracer-Gas Procedure for the Simultaneous Evaluation of Effective Volumes and Multizone AirfIows." Proceed. 3rd International Congress on Building Energy Management, Lausme, Switmland, Sept., 1987
Afonso, C.F.A., Maldonado, E.A.B., & Skilret, E., "Measuring Indoor Air Movement: An Essential Task to Characterize Indoor Air Quality," Proceed. IAQ '86, ASHRAE, Atlanta, GA, Apr., 1986, pp. 592-601Axley. James, 1 NBSIR 87-3661. CBT, National Bureau of Standards, Gaithersburg, MD, Oct. 87
Axley, James, Indoor Mo- NBSIR 87-3661, CBT, National Bureau of Standards, Gaithersburg, MD, October.. 87
Axley. James, Toward a G- Method for P w ~n B w . . . . . . Air Ou-e III Re-. NBSIR 88-3814, CBT, National Bureau of Standards,
Gaithersburg, MD, June.. 88 Axley, James, (submitted for publication to Building and
Environment, May 1988) Bohac, D., Harrje, D.T., & Homer, G.S., "Field Study Comparisons of Constant Concentration and PFT Infiltration
Measurements," Proceed. of 8th AIVC Confer., Uberliigen, Germany, Sept., 1987 Dick, J.B., "Experimental Studies in Natural Ventilation of Houses," Journal of the Institute of Heating and
Ventilating Engineers, England, Dec., 1949, pp. 421-466 Dietz, R.N., Goodrich, R.W.. Cote, E.A., & Wieser. R.F., "Detailed Description and Performance of a Passive
Perfluorocarbon Tracer System for Building Ventilation and Air Exchange Measurements,"- . . of ASTM Special Technical Publication 904, Trechsel. H.R., Trechsel, H.R., & Lagus, P.L., Editors, ASTM, Phil., PA, 1986
D'Ottavio. T.W., Senum, G.I., & Dietz, R.N., "Error Analysis Techniques for Perfluorcarbon Tracer Derived Multimne Ventialtion Rates," BNL 39867, Brookhaven National Laboratory, June, 1987
I'Anson, S.J., Irwin, C., & Howarth, A.T., "Air Flow Measurement Using Three Tracer Gases," Building and Environment, Pergamon Press, Great Britain, Vol. 12, No. 4 1982, pp.245-252
Irwin, C., Edwards, R.E., & Howarth, A.T., "The Measurement of Airflows Using a Rapid Response Tracer Gas Technique," Building Services Engineering Research and Technology, Vol. 6, No. 4,1985, pp. 146-152
Jensen, L., "Determination of Flows and Volumes in Multiple Cell Systems." IEAA AIVC Newletter, Vol. 9, No. 2, Berkshk, hgiand Feb., 1988, pp. 4-6
Lagus, P. & Persily, A.K., "A Review of Tracer-Gas Techniques for Measuring Airflows in Buildings." ASHRAE Transactions, Vol. 91, Pt. 2,1985, pp. 1075-1087
Lawrance, G.V. & Waters, J.R., "Measurements of Infiltration and Air Movement in Five Large Single-Cell Buildings," Proc. 8th AIVC Confer., Uberlingen, Germany, Sept., 1987, pp. 2.1-2.18
Nauman, E.B. & Buffham, B.A., 7 Flow S- John Wiley & Sons, NY, 1983 Penman, J.M. & Rashid, A.A.M., "Experimental Determination of Air-flow in a Naturally Ventilated Room Using
Metabolic Carbon Dioxide," Building and Environment, Pergamon Press, Great Britain. Vol. 17. No. 4 1982 Perera, M.D.A.E.S., "Review of Techniques for Measuring Ventilation Rates in Multi-Celled Buildings," Pmc. of
EEC Contractors Meeting on Natural Ventilation, Brussels, Sept., 1982 Press, W.H., Flannery, B.P., Teukolsky, S.A., & Vetterling, W.T., -s: The &j of S e . . . -. Cambridge University Press. Cambridge. 1986
Sandberg, M., "The Use of Moments for Assessing Air Quality in Ventilated Rooms," Building and Environment, Vol. 18, No. 4, Pergamon Press, Great Britain, 1983 pp. 181-1978
Sandberg, M.. 'The Multi-Chamber Theory Reconsidered from the Viewpoint of Air Quality Studies," Building and Environment, Vol. 19, No. 4, Pergamon Press, Great Britain, 1984 pp. 221-233
Sandberg, M. & Blomqvist, C., "A Quantitative Estimate of the Accuracy of Tracer Gas Methods for the Determination of the Ventilation Flow Rate in Buildings,", Building and Environment, Vol. 20, No. 3, Pergamon Press, Great Britain. 1985, pp. 139-150
Sherman, M.H., "Variation-Induced Bias in Passive Ventilation Measurement," LBL-23088, Lawrence Berkeley Lab. U.C., Berkeley, CA, 1987
Sinden, F.W., "Multi-Chamber Theory of Aii Infiltration," Building and Environment, Vol. 13, Pergamon Press. Great Britain, 1978 pp. 21-28
Turiel, I. & Rudy, J., -w of V- . . , Lawrence Berkeley Lab, LBL 10496, UC-95d. EEB-Vent 80-15, Berkeley, CA., 1980
Walker, R.R., "Interpretation and Error Analysis of Multiple-Tracer Gas Measurements to Determine Air Movements in a House," Proc. 6th AIVC Confer., Supplemental Proceedings: Ventilation Strategies and Measurement Techniques, Het Meerdal. Park. Netherlands, 1985
Walton, G.N., Estimatin~ Interroom Contaminant Movements, NBSIR 85-3229,U.S. DOC. NBS, Gaithersburg, MD, August, 1985
Waters, J.R. & Sim ons, M.W., "The Evaluation of Contaminant Concentrations and Air Flows in a Multizone Model of a Building,"Building and Environment, Vol. 22, No. 4, Pergamon F'ress, Great Britain, 1987 pp. 305-315
Wen, C.Y., & Fan, L.T., Models for Flow Svstems and Chemical Reactors, Marcel Dekker, Inc., NYW, 1975 Westerterp, K.R., van Swaaji, W.P.M., & Beenackers, A.A.C.M., -Chemical Reactor Desim and O~eratioq, John Wiley
& Sons, New York, 1984
Discussion
Paper 8
C-A. Roulet (Ecole Polytechnique Federale de Lausanne, Switzerland) You claim that your interestinq development applied to multizon; buildings leads- to well conditioned equations-- (a) Which norm did you use in your example? (b) Is the low condition number you achieved typical or exceptional?
J. Axley, National Bureau of Standards, USA (a) The condition number was computed by singular value decomposition of the system of integral mass balance equations; the condition number is the ratio of the highest to lowest singular values. Importantly also, the equations were scaled by flow euclidean norm to produce a near minimum determination of the condition nunher. (b) Regrettably we have had little experience of applying the pulse injection technique to real buildings. In principle however we know that the conditioning of the system will depend upon: (i) the geometry of the building air distribution system (e.g. zone volumes and flow path topology) (ii) the idealisation of the building (iii) the tracer injection strategy employed, and, to a lesser extent (iv) errors introduced in measurement. It is possible to give many examples of systems that may be expected to be very ill-conditioned. Any building system idealisation involving 2 or more zones that have very large interzonal flows must be expected to be very ill-conditioned. In general increasing the number of zones in a given building idealisation will directly lead to greater ill-conditioning. Finally, if the analyst is not careful to independently excite each zone then he would expect to produce a data set that leads to very ill-conditioned equations.
M. Sherman (Lawrence Berkeley Laboratory, USA) The ill-conditioning of the multizone equation can cause both an amplification of random errors and a bias in the system - in fact physically impossible results can occur. However, by using the covariance matrix of the data it is possible to improve the estimates of the flow matrix, A principle value decomposition will separate those quantities that are well determined from those that are not. We at LBL have been working on these issues and the results are to be published in the literature.
M, Sherman (Lawrence Berkeley Laboratory, USA) It is important to note that any formalism which involves the integration of tracer concentration is subject to systematic underprediction as referred to in the paper, the pulse technique is no exception. However the shorter the integration time and the more constant the air change rate the less the bias. Thus the short (1/2 to 1 hour) time used in the pulse method will result in a much smaller bias than, for example the PFT technique. Could you comnt on the three time constants involved in these systems?

J. Axley, National Bureau of Standards, USA Time constants for this system were computed usinq the estimated airflows reported in ~ i ~ . 14. As I recall these time constants were approxi&tely 1.2, 0.7 and 0.2 hours and are revealed directly in the concentration time histories shown in Fig.15. As also evidenced by Fig.15 data was collected for a period of 2 to 3 hours for each pulse injection. Numerical investigations indicated however that only the data taken from the first hour of these concentration time histories was needed to compute flows accurately (SF6 concentration data below 1 ppm was not used).

EFFECTIVE VENTILATION
9 th AIVC Conference, Gent, Belgium 12-15 September, 1988
P a p e r 9
COMMERCIAL BUILDING VENTILATION MEASUREMENTS USING MULTIPLE TRACER GASES
WILLIAM J. FISK, RICHARD J. PRILL, AND OLLI SEPPANENl
Indoor Environment Program Lawrence Berkeley Laboratory One Cyclotron Road, MS 90/3058 Berkeley, CA 94720 U.S.A.
10n sabbatical from Helsinki University of Technology Hclsinki, Finland

SYNOPSIS
A unique multiple tracer experimental system has been developed and utilized within commercial buildings to monitor ventilation rates, air exchange efficiency, ages of air (at multiple indoor locations), flow rates of supply and outside air, and percent outside air in supply airstreams. The multiple tracer technique also makes i t possible to determine the fractions of a ir a t a monitoring .point that entered the building through a particular air handler and by inflltratlon. To label the incoming air, a distinct tracer gas is injected a t a constant rate into each outside air or supply airstream. Cart-mounted gas chromatographs a re placed in mechanical rooms and monitor tracer gas concentrations versus time in the major airstreams of the air handlers. Small "local samplers" placed a t various indoor locations are utilized to monitor local ages of air. Age distribution theory is applied to determine ages of air; however, the standard methods of applying this theory a re modified to process the multiple tracer data. The experimental system, methods of data analysis and the results of studies in both a twelve-story building and a complex of three interconnected two-story office buildings are presented. Rates of outside air supply per occupant were comparable to or above the minimum rate of 10 11s-occupant specified in the d ra f t revised version of the ASHRAE ventilation standard. Within regions of these buildings that are served by a single a i r handler that supplies a mixture of outside and recirculated indoor air, the measured ages of air varied by 30% or less from the region-average age. Monitoring at different heights above floor level provided no evidence of either a short-circuiting or displacement flow pattern within rooms. The age of air varied more substantially between physically isolated regions of a building, regions served by different air handlers, and over time. In the complex of three buildings, air exchange efficiency values were close to 0.5 suggesting relatively uniform mixing of a ir in regions served by a single air handler. In the other building, air was supplied and removed from physical- ly-separated regions, and the air exchange efficiency was 0.7.
Researchers in the U.S. have reported the results of measuring the nominal ventilation rate, i.e., outside air supply rate per unit building volume, in approximately 50 U.S. commercial b~ildings.1~2 The nominal ventilation rate, and parameters that can be derived from the nominal ventilation rate, are sufficient for characterizing the rate of ventilation only in buildings where the air is thoroughly mixed. Data that indicate the extent to which air is mixed in conlmercial buildings are largely unavailable. Mixing may dcpend on building size, internal configuration, the number and type of air handlers, and numerous other factors. When the indoor air is not fully mixcd, indoor air quality and building energy consumption are influenced by such factors as local ventilation rates or ages of air, the extent and direction of interzonal air flow, the pattern of air flow between locations of air supply and removal, and the associated values of a ir exchange efficiency. We have obtained this detailed information on ventilation as wcll as more traditional information on building ventilation by labeling each airstream of entering outside air with a distinct tracer gas, appropriate monitoring of tracer gas concentrations, and specific procedures of data analysis. We describe our technical approach, methods of evaluating the data, and the results from two buildings.
2.0 TECHNTCAL APPROACH
2.1 Tracer Dccay
A tracer gas decay is the most common method of monitoring ventilation within large buildings. Ideally, the indoor a i r is unifornlly labeled with a tracer gas a t some point in time (so that tracer conccntrations a r e nearly identical throughout the building) a n d tracer gas concentrations a re measured as a funct ion of time as they decrease (dccay) because of the entry of tracer-free outside air. Sandbergs and others have described data analysis procedures fo r determining nominal and local ages of a i r (where "local" refers to a location wi thin the building), local ventilation rates, and a i r exchange efficiencies f rom the tracer gas data when a single tracer gas is employed. There a r e limitations to the information obtained f rom a tracer gas decay; fo r example, a tracer decay conducted with a single tracer gas does no t provide information o n interzonal a i r flow. I n addit ion, in many large buildings with multiple a i r handling units (AHUs), obtaining satisfactory init ial mixing of the tracer gas with the indoor a i r is very difficult1 -- i n such instances, local ages of air , local ventilation rates, and a i r exchange efficiencies values cannot be determined.
2.2 Multiple Tracer Step-up
This research e f fo r t is based largely on another tracer gas technique called a multiple tracer step-up. Each stream of outside a i r that enters the building through a n A H U is labeled uniformly with a distinct tracer gas by injecting the traccr gas into this airstream a t a constant rate. Traccr gas concentrations a r e monitored as a function of time in the major ducts of the AHUs and, if suff ic ient monitoring equipment is available, in othcr exhaust airstreams such as bathroom exhausts. Injcction is continued until concentrations in the return/exhaust ducts and in other exhaust ducts a rc stable (i.e., no longer increasing more than f ive to ten percent per hour). T h e time-average and steady state tracer concentrations of all the tracer gases a r e monitored a t numerous locations within the occupied space. This multiple tracer step-up technique is usually impractical in buildings with more than three or four outside a i r intakes because of limitations in the number of tracer gases and limited monitoring equipment.
Many AHUs d o not contain a n outside a i r duct -- instead the outside a i r passes through the outside a i r dampers a n d immediately into a mixing box where mixing between the outside a i r and rccirculated indoor a i r occurs (see Fig. 1). I n this type of AHU, a tracer gas is usually injectcd into the supply a i rs t ream (the mixture of outsidc and rccirculatcd air). If thc outside a i r and recirculatcd a i r mix thoroughly, this mcthod is functionally identical t o injccting tracer dircctly into the strcam of outsidc air ; although a slightly d i f fc rcn t nlcthod of data analyscs is rcquircd.
2.3 Monitoring System
Thc traccr gases, sul fur hexafluoride (SF6) and four halocarbons [bromotri- f luoromethane (R-13B1), chloropentafluoron~cthane (R-115), d ic l~lorodif luo- romcthane (R-12), and 1,2 -dichlorotetrafluoroethane (R-114)], were selectcd based on a consideration of toxicity, cost, and the ease of si l~lultaneous measuremcnts of tracer gas concentrations with a single instrurncnt. Maximum traccr gas concentrations a re approxinlatcly 200 parts per billion (ppb) f o r SF6, 500 ppb for R-13B1, and 1000 ppb for the other tracers. These traccr gases nlay decompose, yielding toxic deconlposition products, if they pass through a flarnc or burning tobacco, or contact a vcry hot surface (e.g., clectric rcsistancc heating element). Based on our recent cxpcrimcntal studies a n d calculations* traccr gas decomposition should not be a problcm in typical con~mcrcia l buildings if tracer gas conccntrations a re limited to the maximum valucs notcd above and there a rc not unusual sourccs of traccr decomposition. Howcvcr, we suggcst fu r thc r studics of this issue beforc thcsc traccrs arc uscd a t much highcr conccntrations in occupied buildings.
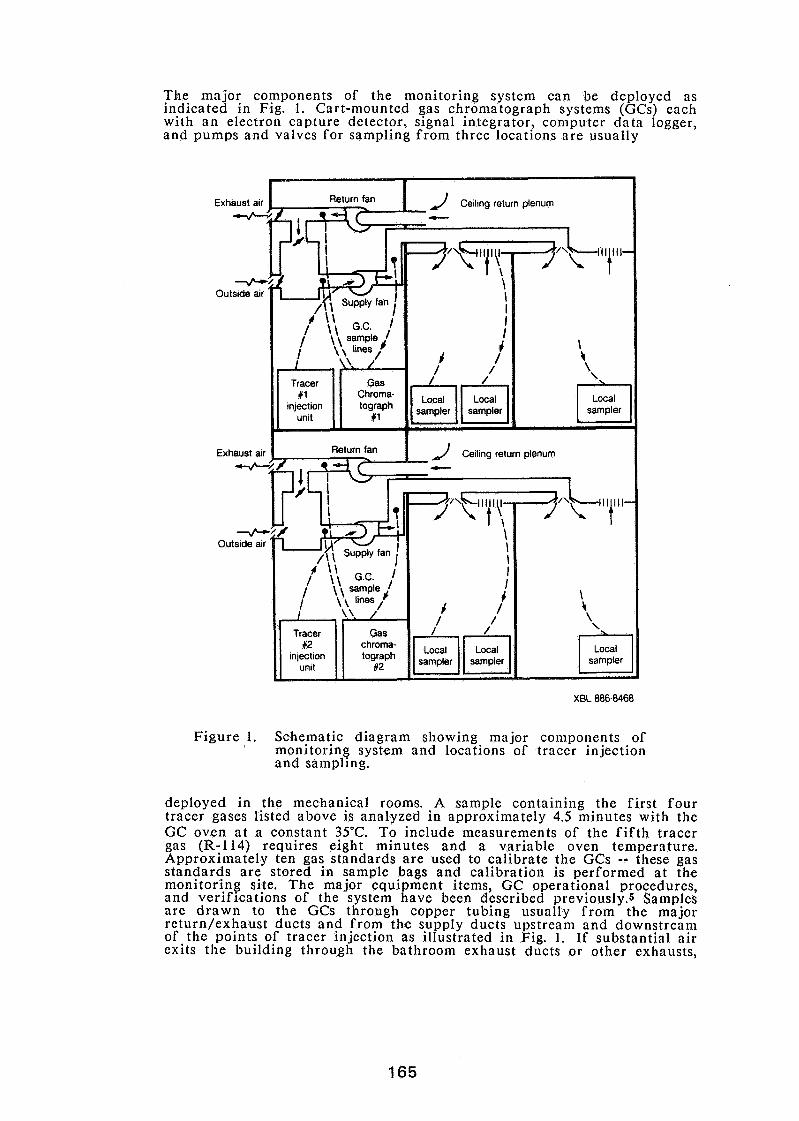
T h e major components of the monitoring system can be deployed as indicated in Fig. 1. Cart-mounted gas chromatograph systems (GCs) each with a n electron capture dctector, signal integrator, computer da ta logger, and pumps and valvcs fo r sampling f r o m three locations a r e usually
XBL 886-8468
Figure 1. Schematic diagram showing major conlponcnts of monitoring system and locations of traccr injection and sampling.
deployed i n the mechanical rooms. A sample containing the first four traccr gases listed above is analyzed in approximately 4.5 minutcs with the GC oven a t a constant 35°C. T o include measurements of the f i f t h tracer gas (R-114) requires eight minutes and a variable oven temperature. Approximately ten gas standards a re used to calibrate the GCs -- these gas s tandards a re stored in sample bags and calibration is performed a t the monitoring site. T h e major equipment items, G C operational procedures, and verifications of thc system have been describcd previously.5 Samplcs a re d r a w n to the GCs through copper tubing usually f rom the major rcturn/exhaust ducts and f rom the supply ducts upstrcam and downstream of the points of tracer injection as illustrated in Fig. 1. If substantial a i r cxits the building through the bathroom exhaust ducts or other exhausts,
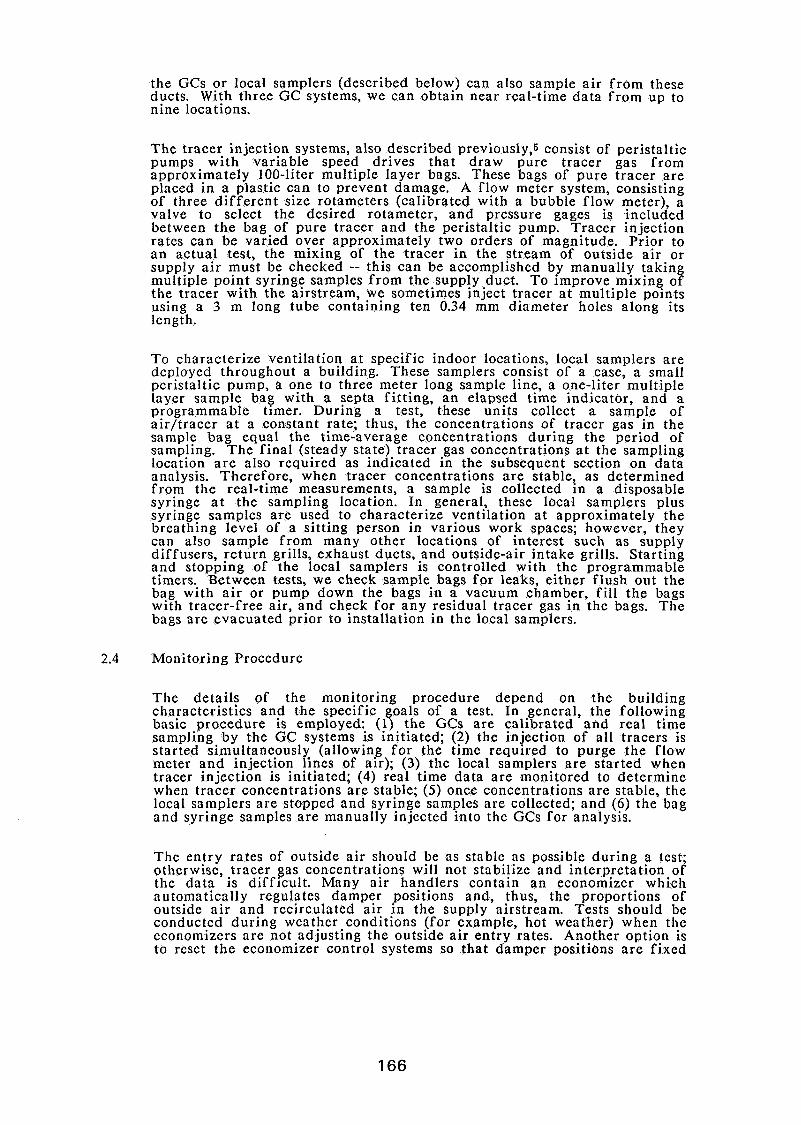
the GCs or local samplers (described below) can also sample air f rom these ducts. With three GC systems, we can obtain near real-time data from up to nine locations.
The tracer injection systems, also described previously,s consist of peristaltic pumps with variable speed drives that draw pure tracer gas from approximately 100-liter multiple layer bags. These bags of pure tracer are placed in a plastic can to prevent damage. A flow meter system, consisting of three different size rotameters (calibrated with a bubble flow meter), a valve to select the desired rotameter, and pressure gages is included between the bag of pure tracer and the peristaltic pump. Tracer injection rates can be varied over approximately two orders of magnitude. Prior to a n actual test, the mixing of the tracer in the stream of outside air or supply a i r must be checked -- this can be accomplished by manually taking multiple point syringe samples from the.supp!y duct. To improve mixing of the tracer with the airstream, we sometimes Inject tracer a t multiple points using a 3 m long tube containing ten 0.34 mm diameter holes along its length.
To characterize ventilation a t specific indoor locations, local samplers a re dcployed throughout a building. These samplers consist of a case, a small pcristaltic pump, a one to three meter long sample line, a one-liter multiple layer sample bag with a septa fitting, a n elapsed time indicator, and a programmable timer. Durlng a test, these units collect a sample of air/tracer a t a constant rate; thus, the concentrations of tracer gas in the sample bag equal the time-average concentrations during the period of sampling. The final (steady state) tracer gas concentrations a t the sampling location a re also required as indicated in the subsequent section on data analysis. Therefore, when tracer concentrations are stable, as determined from the real-time measurements, a sample is collected in a disposable syringe a t the sampling location. In general, these local samplers plus syringe samples are used to characterize yentilation a t approximately the breathing level of a sitting person in varlous work spaces; however, they can also sample from many other locations of interest such as supply diffusers, return grills, exhaust ducts, and outside-air intake grills. Starting and stopping of the local samplers is controlled with the programmable timers. Between tests, we check sample bags for leaks, either flush out the bag with a i r or pump down the bags in a vacuum chamber, fi l l the bags with tracer-free air, and check for any residual tracer gas in the bags. The bags are evacuated prior to installation in the local samplers.
2.4 Monitoring Procedure
The details of the monitoring procedure depend on the building characteristics and the specific goals of a test. In general, the following basic procedure is employed: (1) the GCs are calibrated and real time sampling by the GC systems is initiated; (2) the injection of all tracers is started simultaneously (allowing for the time required to purge the flow mcter and injection lines of air); (3) the local samplers are started when tracer injection is initiated; (4) real time data are monitored to determine when tracer concentrations are stable; (5) once concentrations are stable, the local samplers are stopped and syringe samples are collected; and (6) the bog and syringe samples are manually injected into the GCs for analysis.
The cntry rates of outside air should be as stable as possible during a test; otherwise, tracer gas concentrations will not stabilize and interpretation of the data is difficult. Many air handlers contain an economizer which automatically regulates damper positions and, thus, the proportions of outside air and recirculated air in the supply airstream. Tests should be conductcd during weather conditions (for example, hot weather) when the economizers are not adjusting the outside air entry rates. Another option is to rcsct the economizer control systems so that damper positions a re fixed
during the tcst. Wc usually t ry to conduct tests with dampers in thc minimum outsidc a i r and 100°/o outside a i r positions. In addit ion, opcrablc windows and doors to outside should be closcd dur ing a tcst, part icularly when a n evaluation of the mcchanically-supplicd vcntilation is dcsircd.
3. DATA EVALUATION
3.1 Single-tracer Step-up
Standard equations bascd on the application of age distribution theory3 to a i r wi thin buildings can be utilizcd if a building has only one AHU, the inf i l t ra t ion ra te is small compared to the ra te of mechanical vcntilation, and a single traccr step-up technique is employed. For example, the local age (LA) of a samplc of a i r a t location 1, wherc age is the amount of t ime elapscd sincc the a i r cntcrcd the building, can bc computed using tllc equation -
whcre t rcfcrs to time since the s tar t of tracer injcction, C , ( t ) is the traccr conccntration a t t ime t , and C , ( a ) is the steady-state tracer concentration. The reciprocal of the local age of a i r exiting the building equals the nominal vcntilation ratc3, i.e., outside a i r ent ry rate per unit building volumc, which is often called the a i r exchange rate.
With a single traccr stcp-up, calculations similar to thosc dcscribcd in the ncxt section, can bc uscd to dctcrmine sclectcd a i r f low ratcs, thc pcrccnt of outsidc a i r in the supply airstrcam, a n d the fraction of a i r a t a location that cntcrs by infiltration.
3.2 Multiplc Traccr Stcp-up
3.2.1 Norncnclature
An cxtensive system of nomenclature is required to dcscribe the mcthods of analysis of multiple tracer data. T h e primary variablcs a rc as follows:
C = t racer gas concentration;
C Q f f = cffcctivc concentration of tracer gas in strcam of outsidc air;
L A = local age of a traccr or of air labclcd by tllc traccr;
A? = volun~ctr ic traccr injcction ratc;
P = perccnt of outsidc a i r in thc supply airstream;
Q = f l o w r a t c o f a i r ;
I/ = volume of building or zone;
z = fraction of air sample that entered through a particular AHU or by infiltration; and
€a = a i r exchange efficiency.
The primary variables may require up to three indices. For example, consider the variable C(i,l,t), where:
i = a traccr. or. A H U code: 1 = SF6,. 2 = R- 13B 1, 3 = R-115, 4 = R-12, I N F = ~nfl l t ra t ion, T = total, l.e., all traccrs plus infiltration; i also rcfers to the AHU into which tracer i is injected;
1 = location S; = supply duct of A H U i,
Oi = outside air "duct" of A H U i,
Ri = return/cxhaust "duct" of AHU i,
RCi = recirculation "duct" of AHU i,
Mi = mixture of return and outside air in A H U i upstream of the point of tracer gas injection;
Ei = cxhaust "duct" of A H U i;
Zonc = a zonc of a building; and
t = timc since start of injcction ( t = when traccr concentrations havc rcachcd stcady-statc and t = is the average with respect to time between t = 0 and t = m).
Whcrc possible, one or more of the indiccs are omitted, for example, Z and LA are not a function of time and, if flow ratcs are stable, Q is only a function of location.
3.2.2 Standard A H U Information
Assurlling that traccrs are injcctcd into thc supply airstrenrns as illustrated in Fig. 1 and that traccr gas concentrations in the outslde air are negligible, air flow ratcs and pcrccnt outside air can be computcd with thc following cquotions which arc bascd on simple mass balances:
~ ( 0 , ) = P(s,)Q(s,)/ l oo%, a n d (4)
In some AHUs, accurate measurement of tracer as concentrations in the mixture of outside and recirculated air is dif f icult because these two airstreams may not mix fully prior to passing through the supply fan. Drawing a sample from multiple locations within the mixed airstream can improve measurement accuracy.
3.2.3 Sources of Air
To calculate the fraction of a sample of air that entered the building through each air handler or by infiltration, one must first determine the effective concentration of tracer gas in each entering stream of outside air. This effective outside-air tracer concentration is the concentration that would result if the tracer was actually injected into the outside air. Assuming tracer injection as illustrated in Fig. 1, the effective outside air concentration is determined from the equation
If tracer is actually injected into the stream of outside air and the resulting tracer concentration is measured, the effective concentration simply equals the measured concentration.
The fraction [Z(i,l)] of the air within an air sample (collected a t location 1 and a t time infinity) that entered the building through a particular AHU is indicated by the ratio
If Z(i,l) equals unity, all of the air a t location 1 must have entered through AHU i. A value of Z(i , l ) less than unity indicates that some of the air entcrcd through another AHU or by infiltration. The fraction of the air that entercd by infiltration Z(INF,I) is
The uncertainty in measured values of Z(1NF I) can be considerable because this parameter is typically based on the difference between unity and an imperfectly known number or sum with a value close to unity. In addition, if the tracer gas concentrations a t location I have not reached steady-state, despite stable exhaust and return concentrations, Z(INF,Z) will be overestimated.
3.2.4 Age of Air
The total a e of air a t a location should be determined by summing the products o f all individual sees and the correspondin4 values of Z. However, we do not obtain any information on the age of alr that enters by infiltration since this air is not labeled with a tracer gas. Thus, the following approximate equation is used to compute the total local age [LA(T,I)I
Implicit in Eqn. 9, is an assumption that the age of air that entered by infiltration equals the weighted (by Z) average age of air that enters through the AHUs. In most instances, this assumption should cause only small errors in the total local age of air.
When real time data are collected a t location I, the local age of the air supplied by a particular AHU, LA(i,I) in Eqn. 9, is determined by the integration given in Eqn. 1. When a local sampler and final syrin e sample are employed, the sampler "performs" the integration and the ollowing equation is used
f
where t (-) is the time when the sampler operation is terminated and C(i,l,i) C(i,l,") equal the concentrations of tracer in the bag and syringe samples, respectively.
3.2.5 Local Ventilation Rate
A local ventilation rate can be defined to be the reciprocal of the local age of air. This parameter does not contain new information but may be more readily accepted since many in the ventilation field are familiar with ventilation rates and unfamiliar with ages of air. If the air within the building is thoroughly mixed, the local ventilation rate equals the nominal ventilation rate.
3.2.6 Air Exchange Efficiency
Various parameters are used to indicate the effectiveness or efficiency of ventilation based on the data obtained with tracer gases.38 The air exchange efficiency6 E, is based on a ratio of the nominal building or zone ventilation time constant [V/Q(O)], i.e., the reciprocal of the nominal air exchange rate, to the spatial average age of all air within the building or zone, designated <LA(T,ZONE)>, i.e.,
The nominal time constant equals the age of a i r exhausted f rom the building or zone3, LA(T,E), and the age of a i r within the building is estimated by averaging the age measured a t a f in i t e number of mcasurcments; thus, the following equation is used
A higher age in the a i r that exits the building compared to the age of a i r in the occupied regions of the building is generally desirable since "older" a i r is likely to contain a higher concentration of pollutants. T h e factor of two in the denominators of Eqns. 11 a n d 12 causes t h e a i r exchange efficiency to equal 0.5 when the indoor a i r is perfectly mixed. T h e theoretical upper limit of this parameter is unity f o r a perfect displacement (piston-like) f low betwecn the location of a i r supply and removal. T h e numerator of Eqn. 12 should, i n theory, equal the average age of a i r that exists the building. In many large buildings, a i r may exit via several routes such as the main A H U rcturn/exhaust ducts, bathroom exhausts, other exhausts, and exfil trat ion. Monitoring in every exhaust stream may be impractical; thus, the local age of a i r exhausted must be estimated using the best information obtainable. The age in the denominator of Eqn. 11, i.e., the spatial average (mcan) age of a i r within a building, can be computed using only rncasurements of tracer concentration in the exhausted airs; however, we d o not use this method of calculation because, in a previous investigation,s measurements of this mean age were significantly less precise than rncasurements of local age.
4.0 MEASUREMENT ACCURACY
We have not determined the accuracy of our measurements of all the parameters described in the previous section. Measurement accuracy will dcpcnd on both the accuracy of Individual measurements and the validity of the assumptions that underlie the data analysis ( fo r example, the assumptions of a stable outside a i r f low ra te and that outside a i r and recirculated air mix fully). A few comments can be provided on measurement accuracy. In a previous study (and we have improved GC calibration procedurcs since this study), data f rom thc d i f fc ren t tracer gases yicldcd the same local age of a i r within 10°/o. Whcn thc traccrs wcrc used i n a wcll mixcd chamber with a known (physically-measurcd) vcntilation rate, the maximum deviation bctwccn thc known and trac- er-gas-bascd vcntilation rates was 12%. Finally, d i f fc ren t local samplers deployed a t thc samc location generally yield the same local agc within approxirnatcly 5%.
5.0 RESULTS FROM TWO BUILDINGS
5.1 Building A
Building A is an off ice building with twelve stories plus a basemcnt and 213 of f i ce workcrs. This building is owncd by a county wi thin California and was constructed in 1962. The total floor arca, excluding the basement, a largc first-floor mccting room, and exterior stairwells, is approximately 4450 m2 with cach floor approximatcly 34 m long and 13 m wide. Windows cannot be opcncd by thc occupants. T h e layout of the major AHUs is shown in Fig. 2. Onc main AHU, dcsignatcd AHU2, scrvcs floors 1 through
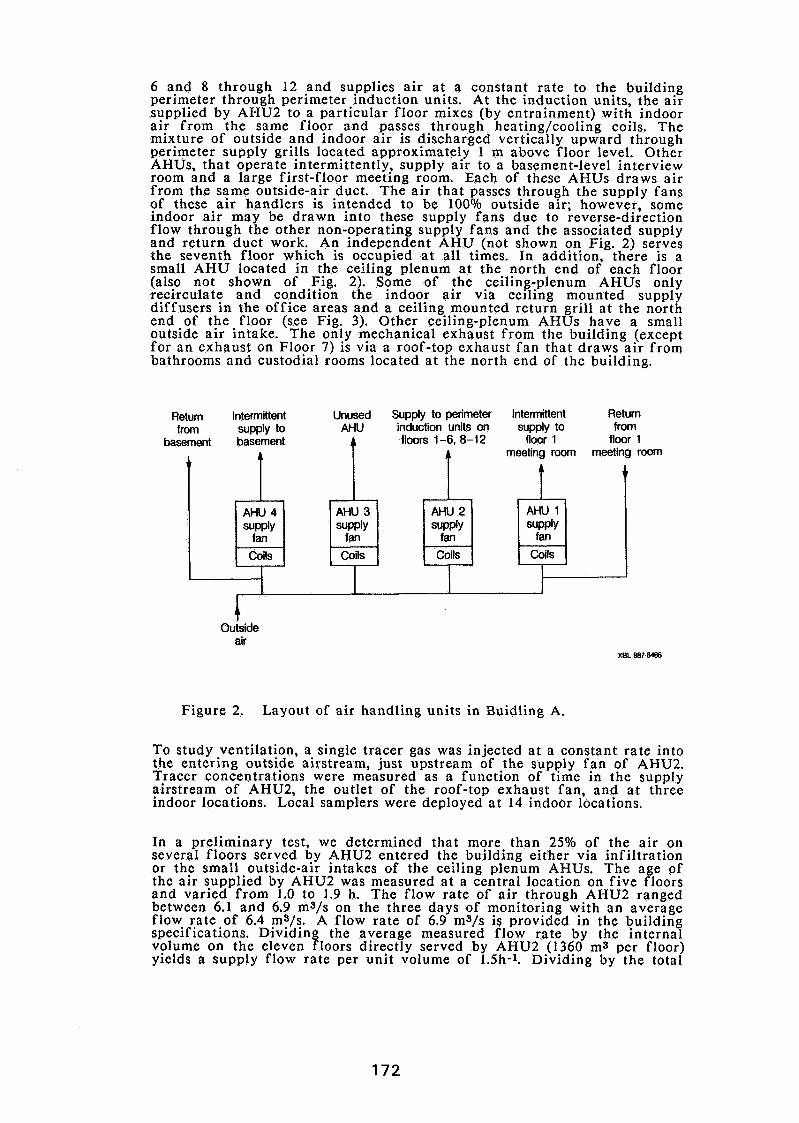
6 and 8 through 12 and supplies air a t a constant rate to the building perimeter through perimeter induction units. At the induction units, the air supplied by AHU2 to a particular floor mixes (by entrainment) with indoor air from the same floor and passes through heating/cooling coils. The mixture of outside and indoor air is discharged vertically upward through perimeter supply grills located approximately 1 m above floor level. Other AHUs, that operate intermittently, supply air to a basement-level interview room and a large first-floor meeting room. Each of these AHUs draws air from the same outside-air duct. The air that passes through the supply fans of these a i r handlers is intended to be 100% outside air; however, some indoor a i r may be drawn into these supply fans due to reverse-direction flow through the other non-operating supply fans and the associated supply and return duct work. An independent AHU (not shown on Fig. 2) serves the seventh floor which is occupied a t all times. In addition, there is a small AHU located in the ceiling plenum a t the north end of each floor (also not shown of Fig. 2). Some of !he ceiling-plenum AHUs only recirculate and condition the indoor an- via celling mounted supply diffusers in the office areas and a ceiling mounted return grill a t the north end of the floor (see Fig. 3). Other ceiling-plenum AHUs have a small outside air intake. The only mechanical exhaust from the building (except for an exhaust on Floor 7) is via a roof-top exhaust fan that draws a i r from bathrooms and custodial rooms located a t the north end of the building.
Figure 2. Layout of air handling units in Buidling A.
Retum Intermittent Unused Supply to perimeter Intermittent Return from supply to M U induction units on supply to from
basement basement A floors 1-6,8-12 floor 1 floor 1
To study ventilation, a single tracer gas was injected a t a constant rate into the entering outside airstream, just upstream of the supply fan of AHU2. Tracer concentrations were measured as a function of time in the supply airstream of AHU2, the outlet of the roof-top exhaust fan, and a t three indoor locations. Local samplers were deployed a t 14 indoor locations.
4 !I
In a preliminary test, we determined that more than 25% of the air on several floors served by AHU2 entered the building either via infiltration or the small outside-air intakes of the ceiling plenum AHUs. The age of the air supplied by AHU2 was measured at a central location on five floors and varied from 1.0 to 1.9 h. The flow rate of a ir through AHU2 ranged between 6.1 and 6.9 ms/s on the three days of monitoring with an average flow rate of 6.4 ms/s. A flow rate of 6.9 ms/s is provided in the building specifications. Dividing the average measured flow rate by the internal volume on the eleven floors directly served by AHU2 (1360 ms per floor) yields a supply flow rate per unit volume of 1.5h-1. Dividing by the total
A meeting room meeting room
t I AHU 1 SUPP~Y
fan Coils
I I
Outside air
XBL 687.e4e6
AHU 2 supply
fan Coils
AHU 4 supply
fan Coils
AHU 3 supply
fan
Coils
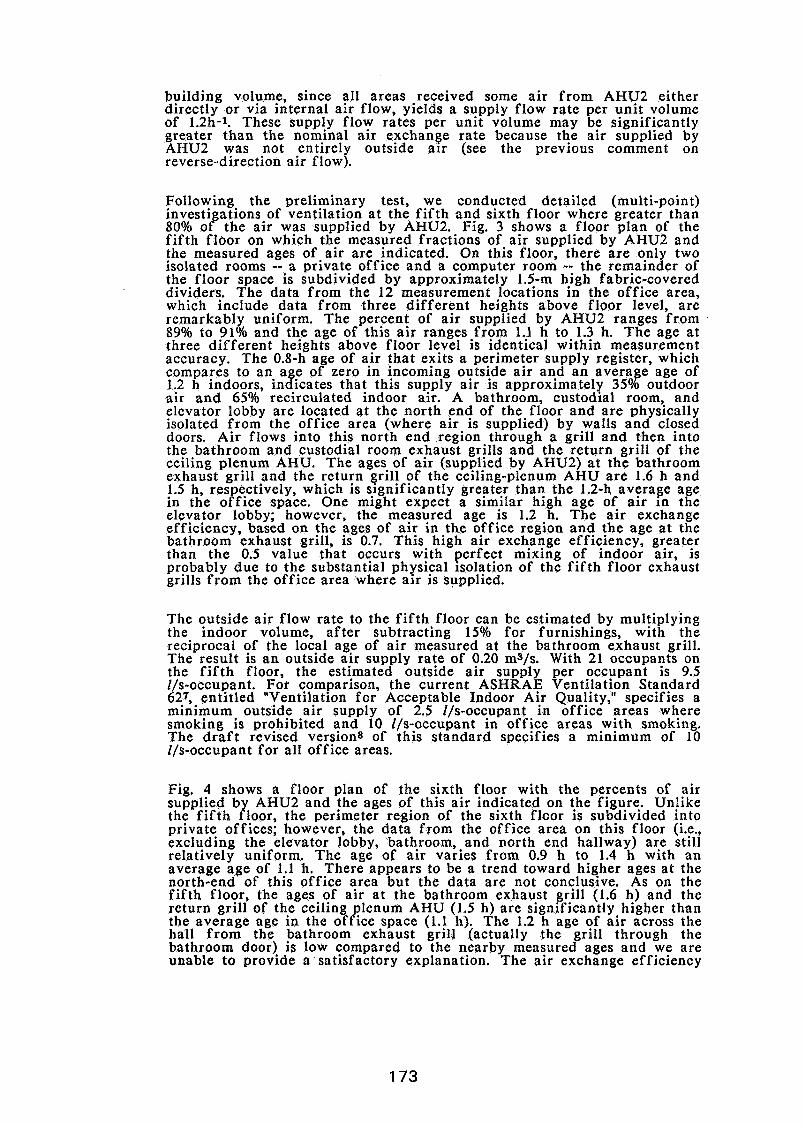
building volume, since all areas received some air from AHU2 either directly or via internal air flow, yields a supply flow rate per unit volume of 1.2h-1. These supply flow rates per unit volume may be significantly greater than the nominal air exchange rate because the air supplied by AHU2 was not entirely outside alr (see the previous comment on reverse-direction air flow).
Following the preliminary test, we conducted detailed (multi-point) investi ations of ventilation at the f if th and sixth floor where greater than tk 80% o the air was supplied by AHU2. Fig. 3 shows a floor plan of the fifth floor on which the measured fractions of air supplied by AHU2 and the measured ages of air are indicated. On this floor, there are only two isolated rooms -- a private office and a computer room -- the remainder of the floor space is subdivided by approximately 1.5-m high fabric-covered dividers. The data from the 12 measurement locations in the office area, which include data from three different heights above floor level, are remarkably uniform. The percent of air supplied by AHU2 ranges from 89% to 91% and the age of this air ranges from 1.1 h to 1.3 h. The age a t three different heights above floor level is identical within measurement accuracy. The 0.8-h age of air that exits a perimeter supply register, which compares to an age of zero in incoming outside air and an avera e age of 1.2 h indoors, indicates that this supply air is approximately 3599. outdoor air and 65% recirculated indoor air. A bathroom, custodial room, and elevator lobby are located at the north end of the floor and are phys~cally isolated from the office area (where air is supplied) by walls and closed doors. Air flows into this north end region through a grill and then into the bathroom and custodial room exhaust grills and the return grill of the ceiling plenum AHU. The ages of air (supplied by AHU2) a t the bathroom exhaust grill and the return grill of the ceiling-plenum AHU are 1.6 h and 1.5 h, respectively, which is significantly greater than the 1.2-h averape age in the office space. One might expect a similar high age of air in the elevator lobby; however, the measured age is 1.2 h. The air exchange efficiency, based on the ages of air in the office region and the age at the bathroom exhaust grill, is 0.7. This high air exchange efficiency, greater than the 0.5 value that occurs with perfect mixing of indoor air, is probably due to the substantial physical isolation of the f i f th floor exhaust grills from the office area where air is supplied.
The outside air flow rate to the f i f th floor can be estimated by multiplying the indoor volume, after subtracting 15% for furnishings, with the reciprocal of the local age of air measured at the bathroom exhaust grill. The result is an outside air supply rate of 0.20 ms/s. With 21 occupants on the f i f th floor, the estimated outside air supply per occupant is 9.5 11s-occupant. For comparison, the current ASHRAE Ventilation Standard 627, entitled "Ventilation for Acceptable Indoor Air Quality," specifies a minimum outside air supply of 2.5 11s-occupant in office areas where smoking is prohibited and 10 11s-occupant in office areas with smoking. The draf t revised versions of this standard specifies a minimum of 10 l/s-occupant for all off ice areas.
Fig. 4 shows a floor plan of the sixth floor with the percents of air supplied b AHU2 and the ages of this air indicated on the figure. Unlike the f i f th r loor, the perimeter region of the sixth floor is subdivided into private offices; however, the data from the office area on this floor (i.e., excluding the elevator lobby, bathroom, and north end hallway) are still relatively uniform. The age of air varies from 0.9 h to 1.4 h with an average age of 1.1 h. There appears to be a trend toward higher ages at the north-end of this office area but the data are not conclusive. As on the fifth floor, the ages of air at the bathroom exhaust grill (1.6 h) and the return grill of the ceiling plenum AHU (1.5 h) are significantly higher than the average age in the office space (1.1 h). The 1.2 h age of air across the hall from the bathroom exhaust grill (actually the grill through the bathroom door) is low compared to the nearby measured ages and we are unable to provide a satisfactory explanation. The air exchange efficiency

of 0.7 is the same as on the f i f t h floor. Again, this high a i r exchange cfficicncy is probably due to the substantial physical isolation of the exhaust grills f rom thc off ice area.
The ra te of outside a i r supply to the sixth floor and the outside a i r f low pcr occupant wcre estimated in the manner described previously -- the rcsults a r e 0.20 m3/s and 9.5 11s-occupant.
XBL 886-8469
Figure 3. Plan vicw of f i f t h f loor of Building A showing the fractions and ages of a i r supplied by AHU2.
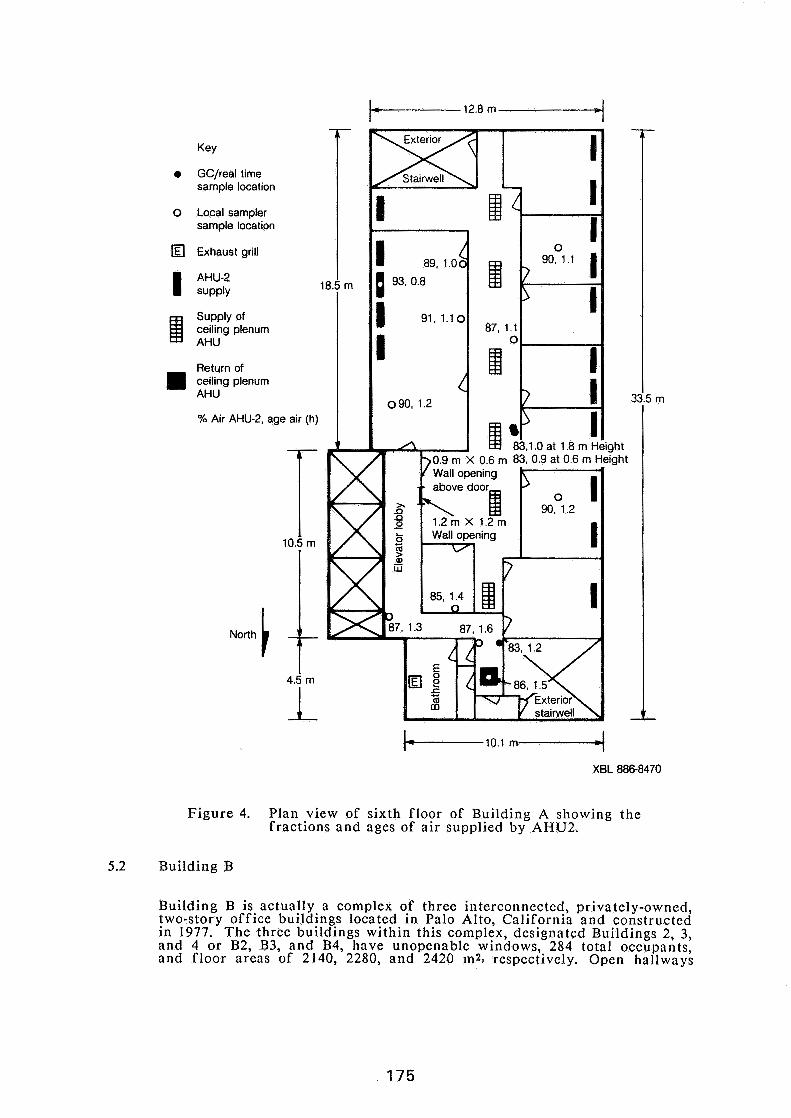
e GC/real time sample location
0 Local sampler sample location
fl Exhaust grill
ceiling plenum 4 ::Iy Of
::;K;$nurn AHU
% Air AHU-2, age air (h)
10.5 m
North 1 XBL 886-8470
Figure 4. Plan view of sixth floor of Building A showing the fractions a n d ages of a i r supplied by AHU2.
5.2 Building B
Building B is actually a complex of three intcrconnectcd, privately-owncd, two-story office buildings located in Palo Alto, California and constructed in 1977. T h e threc buildings within this cornplcx, dcsignated Buildings 2, 3, and 4 o r B2, B3, and B4, have unopcnablc windows, 284 total occupants, and floor areas of 2140, 2280, and 2420 m2# rcspcctivcly. Open hallways
connect the second floor of B2 with the first floor of B3 and the second floor of B3 with the first floor of B4. Each building is highly subdivided into one-to-three person private offices -- there are few open areas or cubicles. One variable air volume (VAV) AHU serves B2 and B3 and a different VAV AHU serves B4. The AHUs have the general configuration shown in Fig. 1. Air is supplied through circular ceiling-mounted diffusers and returned through return grills in the suspended ceiling (the return a i r passes through the plenum above the suspended ceiling). Virtually every office has both a supply diffuser and return grill. Each AHU has a simple economizer system so that either a minimum amount or 100% outside air is supplied to the building depending on the outdoor temperature. Separate exhaust fans draw air a t a constant rate from the bathrooms and one print room and exhaust this air to outside.
Ventilation was studied on three days during a period of hot weather when the economizer systems set the dampers so that a minimum amount of outdoor a i r was drawn into the buildings (i.e., recirculation of indoor air was maximized). A different tracer was injected upstream of each supply fan and tracer concentrations were monitored as a function of time a t the locations indicated schematically in Fig. 1. Local samplers were deployed a t 13 indoor locations including perimeter offices, interior offices, and the hallway that connects B3 and B4.
Table 1 provides the measured (at mid-afternoon) flow rates of the supply and outside airstreams, the same flow rates normalized by building volumes, the percents of outside air in the supply airstreams % OA), and the outside air flow rates per occupant for the complex o$ three buildings. The measured supply flow rates on August 3 a re within 6% of the flow rates given in the specifications for the AHUs. On the other days, supply flow rates were lower, possible due to milder weather. The % OA varies between 17% and 31°/0. In the B4 AHU, the % OA is relatively constant; thus, the total supply of outside air to B4 appears to decrease (and increase) with the supply a i r flow rate. The previously described ASHRAE ventilation standards do not specify a minimum % OA but instead a minimum flow rate of outside air per occupant. The measured outside air entry rates per occupant i n the Building B complex of 16 to 19 l/s-occupant are substantially above the rates specified in the current and draf t revised version of ASHRAE Standard 62. However, the occupant density is low, approximately four occupants per 100 m2 floor area, compared to the 7.5 occupant per 100 m2 floor area value listed in the ASHRAE standard for design purposes if actual occupancy cannot be predicted.
Approximately 75% of the air in B2 and B3 entered (from outside) through the AHU that serves these buildings, 5 to 10% of the air entered through the B4 AHU, and 15 to 25% of the air entered by infiltration. Approximately, 90% to 95% of the air in B4 was supplied by the B4 AHU with the remaining air entering via infiltration and through the B2 and B3 AHU. Thus, the flow rates of air between B4 and adjoining B3 wcre small compared to the rates of outside air entry.
Due to the low rate of interzonal air flow, considering B4 as one zone and B2 and B3 (denoted B2/B3) as another zone, each zone contained only a single tracer gas at sufficicntly high concentrations for accurate calcula- tions of age of air. Therefore, the ages of air in B2/B3 are based only on thc tracer gas injcctcd into the B2/B3 AHU and the ages of air in B4 are based only on the tracer gas injected into the B4 AHU. (Very similar, but possibly lcss accuratc, ages of air rcsu!t if concentrations of both tracer gascs arc uscd to conlpute cach age.) Wlthin cach zone, the measured local agcs of a i r vary by 25% or less from the average local age. However, we n~onitored a t only thirteen indoor locations and probably did not determine maximum and m~nimum ages of air. The highest measured age of a ir is in the hallway that connects B3 and B4. On August 7, the age of a ir was monitorcd a t both thc breathing level and ceiling-level return grill of Room
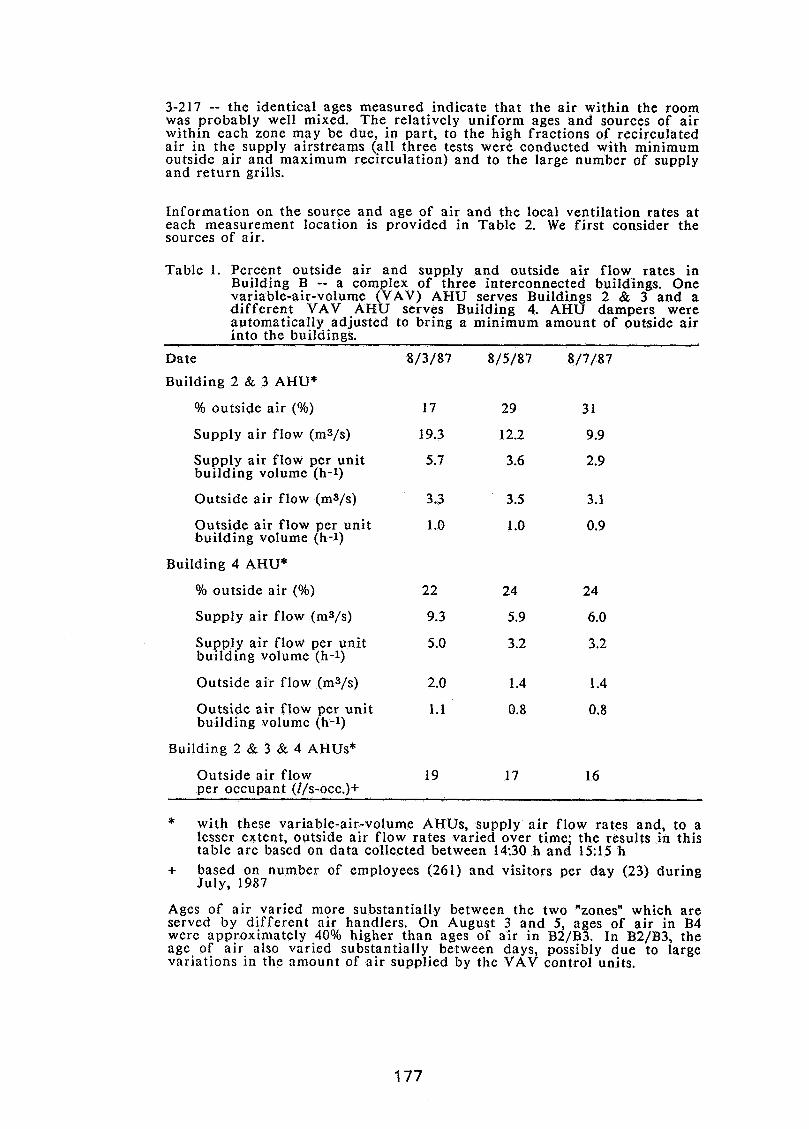
3-217 -- the identical ages measured indicate that the air within the room was probably well mixed. The relatively uniform ages and sources of a ir within each zone may be due, in part, to the high fractions of recirculated air in the supply airstreams (all three tests were conducted with minimum outside air and maximum rec~rculation) and to the large number of supply and return grills.
Information on the source and age of air and the local ventilation rates a t each measurement location is provided in Table 2. We first consider the sources of air.
Table 1. Percent outside air and supply and outside air flow rates in Building B -- a complex of three interconnected buildings. One variable-air-volume (VAV) AHU serves Buildings 2 & 3 and a different VAV AHU serves Building 4. AHU dampers were automatically adjusted to bring a minimum amount of outside air into the buildings.
Date 8/3/87 8/5/87 8/7/87
Building 2 & 3 AHU*
% outside air (Oh) 17 29 3 1
Supply air flow (ms/s) 19.3 12.2 9.9
Supply air flow per unit 5.7 3.6 2.9 building volume (h-1)
Outside air flow (rns/s) 3.3 3.5 3.1
Outside air flow per unit 1 .O 1 .O 0.9 building volume (h-1)
Building 4 AHU*
% outside air (9'0)
Supply air flow (rns/s) 9.3 5.9 6.0
Supply air flow per unit 5.0 3.2 3.2 building volume (h-1)
Outside air flow (rns/s) 2.0 1.4 1.4
Outside air flow per unit 1.1 0.8 0.8 building volume (h-1)
Building 2 & 3 & 4 AHUs*
Outside air flow 19 17 16 per occupant (11s-occ.)+
* with these variable-air-volume AHUs, supply air flow rates and, to a lesser extent, outside air flow rates varied over time; the results in this table are based on data collected between 14:30 h and 15:15 h
+ based on number of employees (261) and visitors per day (23) during July, 1987
Ages of a ir varied more substantially between the two "zones" which are servcd by different air handlers. On August 3 and 5, ages of a ir in B4 wcrc approximately 40% higher than ages of a ir in B2/B3. In B2/B3, the age of a ir also varicd substantially between days, possibly due to large variations in the amount of air supplied by the VAV control units.
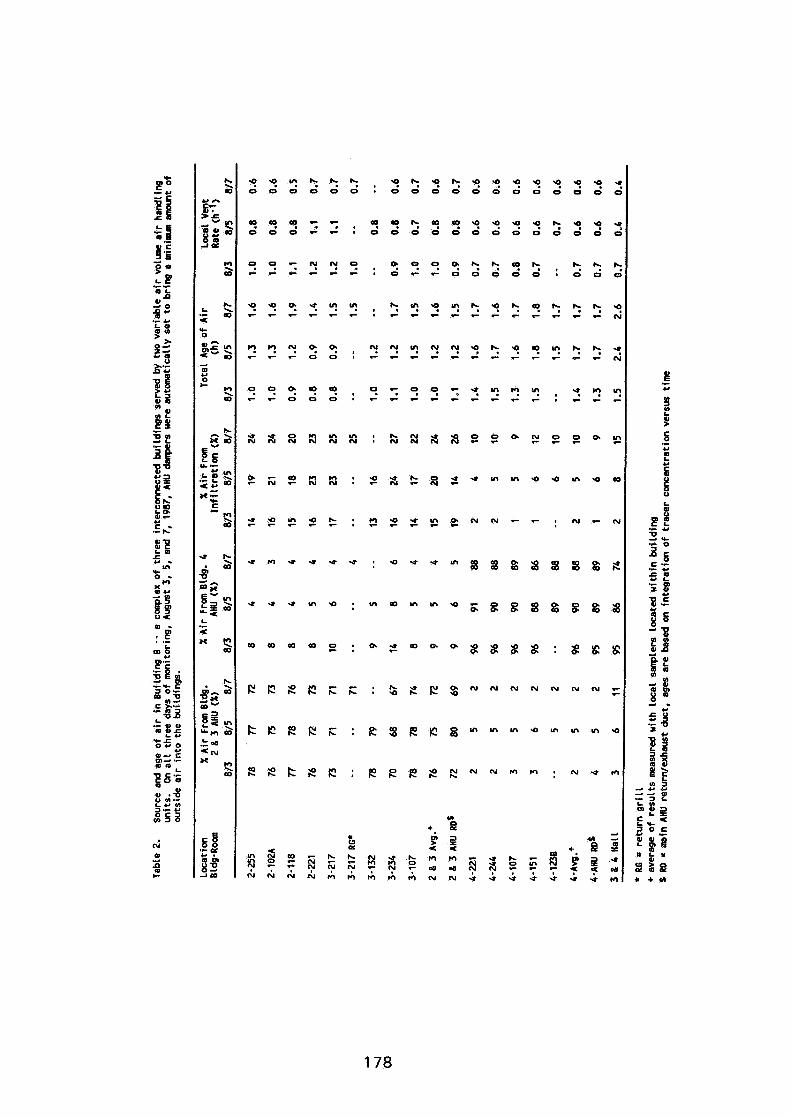
T h e agcs of a i r in the return/exhaust ducts were always wi thin 10% of the corresponding average local age within the zones, ylelding a i r exchange efficiency values identical (within estimated measurcment accuracy) to the 0.5 value that occurs with complete mixing of the indoor air.
5.0 CONCLUSIONS
A unique multiple tracer monitoring system, together with some new methods of data analysis, have proven useful f o r detailed studies of venti lat ion within commercial buildings. Tradit ional information, such as f low rates of a i r in the a i r handling units can be obtained as well as informat ion on the sources and ages of a i r a t multiple indoor locations, the amounts of infi l trat ion and interzonal a i r flow, and the a i r exchange efficiency. T h e results of investigations in two buildings a r e presented. Rates o f outside a i r supply per occupant were comparable to or above the minimum rates specified in ASHRAE Standard 62. Within regions of these buildings that a re served by a single a i r handler that supplies a mixture of outdoor and recirculated indoor air , the measured ages and sources of a i r varied by 30% or less f r o m the region-average values. Monitoring a t d i f fe ren t heights above floor level providcd no evidence of ei ther short circuit ing or displacen~ent f low patterns within a room; howcver, the a i r supplied t o these rooms was always a mixture of outdoor and recirculated air. Age of a i r varied more substantially between physically-isolated regions of a building (e.g., d i f fe ren t floors with no mechanical recirculation bctwcen the floors) a n d between regions served by d i f fe ren t a i r handlers. In one complex of buildings, a i r exchange efficiency values were close to 0.5, suggesting relatively uniform mixing of the indoor a i r in regions served by a single a i r handler. In another building, a i r was supplied a n d removed f rom physically-isolated regions, a n d the a i r exchange efficiency was 0.7. Monitoring (currently underway) in addit ional buildings is required before general conclusions can be d rawn regarding thcse aspccts of ventilation in conlmcrcial buildings.
Dr. Jchuda Binenboym, Hossein Kaboli, Brian Weber, and A1 Robb contributed to the dcveloprnent and evaluation of the multiple tracer nlcasurcmcnt system.
This work was supported by the Assistant Secretary f o r Conservation and Rcncwable Energy, Off ice of Buildings and Comnlunity Systems, Building Systems Division of the U.S. Department of Energy under contract No. DE-AC03-76SF00098.
7.0 REFERENCES
1. T U R K , B.H. ct AL. "Indoor a i r quality and ventilation measurcmcnts in 38 Pacific Northwest co~llnlcrcial buildings, V o l u n ~ e 1: measurement rcsults and interpretation" Lawrcncc Berkclcy Laboratory Report, LBL-22315, Bcrkclcy, CA 1987
2. PERSILY, A.K. and GROT, R.A. "Vcntila tion mcasurcmcnts in large off ice buildings" ASHRAE Trans. 91, Part 2A, 1985, pp 488-502
3. SANDBERG, M. and SJOBERG, M. "The use of moments fo r assessing a i r quality in ventilated rooms" Building and Environment 18, 1983, pp 181-197
4. INDOOR ENVIRONMENT PROGRAM "FY 1987 annual report" Lawrence Berkeley Laboratory Report, in draft , Berkeley, CA, 1988
5. FISK, W.J. e t AL. "Multi-tracer system for measuring ventilation rates and ventilation efficiencies in large mechanically-ventilated buildings" Proceedings of the 6th AIC Conference, September 16-19, 1985, Het Meerdal, Netherlands. Published by the Air Infiltration and Ventilation Centre. Berkshire. Great Britain.
6. SANDBERG, M. and SKARET, E. "Air exchange and ventilation efficiency" Nordic Ventilation Group, Available from the Swedish Institute for Building Research, Gavle, Sweden, 1985. (in Swedish)
7. ASHRAE "Standard 62-1981: ventilation fqr acceptable indoor air quality" The American Society of Heating, Refrigerating, and Air Conditioning Engineers, Inc. Atlanta, GA, 1981
8. ASHRAE "Standard 62-198113: ventilation for acceptable indoor air quality, public review draft." The American Society of Heating, Refrigerating, and Air Conditioning Engineers, Inc. Atlanta, GA. July, 1986.
Discussion
Paper 9
M. Holmes (Arup &search and Developnent, London, UK) It is 'interesting that your building A (induction system) is typical of the type that can give rise to sick buildings in the UK - was this the reason for the study? Could you also give an idea of how long it takes to set up and carry out a test on a building of this type?
W.J. Fisk (Lawrence Berkeley Laboratory, USA) The building was chosen because it was available and because it has a ventilation system which is not comnon in the US. In building B, which is more camplex than building A, approximately one man-week was required to set up instrumentation and perform some preliminary checks, A single test requires about 7 - llhours of effort by two people, however data collection occurs for only about 3 - 4 nominal time constants. Another couple of man-days are required to ramve equipment.
M. Sherman (Lawrence Berkeley Laboratory, USA) (a) Your data seemed to suggest that the variation of ventilation rate over time is small. Is this correct? (b) If ventilation rates are reasonably constant is it possible to make the same type of measurements with single tracer gas equipnent by making repeated tests in different configurations?
W. J. Fisk (Lawrence Berkeley Laboratory, USA) (a) Ekcept for indicating the ventilation rates on different days, I did not provide data on ventilation rate as a function of time. In building A the mechanical system does not regulate the rate of supply of outside air, and in building B the systems were continually supplying a minimum amount of outside air because of the hot weather. It is possible that some variations did occur however, but they were not investigated. In the general case ventilation rates may vary substantially with time due to operation of economiser systems. (b) I would not recamnend repeated use of a single tracer gas in different configurations because: (i) the time required to conduct such tests would be excessive (ii) ventilation rates or air flow patterns might vary between the different single-tracer tests and cause the investigations to draw incorrect conclusions.
R. Anderson (Solar Energy Research Institute, USA) Your measurements in building A suggest that the flow is locally well mixed, with an overall plug flow pattern between supply and exhaust which results in a high air exchange efficiency. In your opinion will this system provide better air quality than building B which has local exhausts and a lower value of air exchange efficiency?
W.J. Fisk (Lawrence Berkeley Laboratory, USA) In building A the age of air in the office areas on a floor where occupants spend the greatest amount of tine is lower than it would be if the air on the entire floor was perfectly mixed. Thus the flow patterns in building A should improve the air quality in the office area. However measurements of ventilation rates and airflow patterns do not directly indicate air quality, hence I have no way of comparing the air quality in the two buildings.
EFFECTIVE VENTILATION
9 t h AIVC Conference, Gent, Belgium 12-15 September, 1988
Paper 10
CONSTANT CONCENTRATION PIEASUREPIENT WITH 2 TRACERS
BJBRN KVISGAARD B r u e l & K j ~ r 2850 Naerum, D e n m a r k
P.F. COLLET T e c h n o l o g i c a l I r ~ s t i t u t e 2630 TBstrup, Derlmarlr

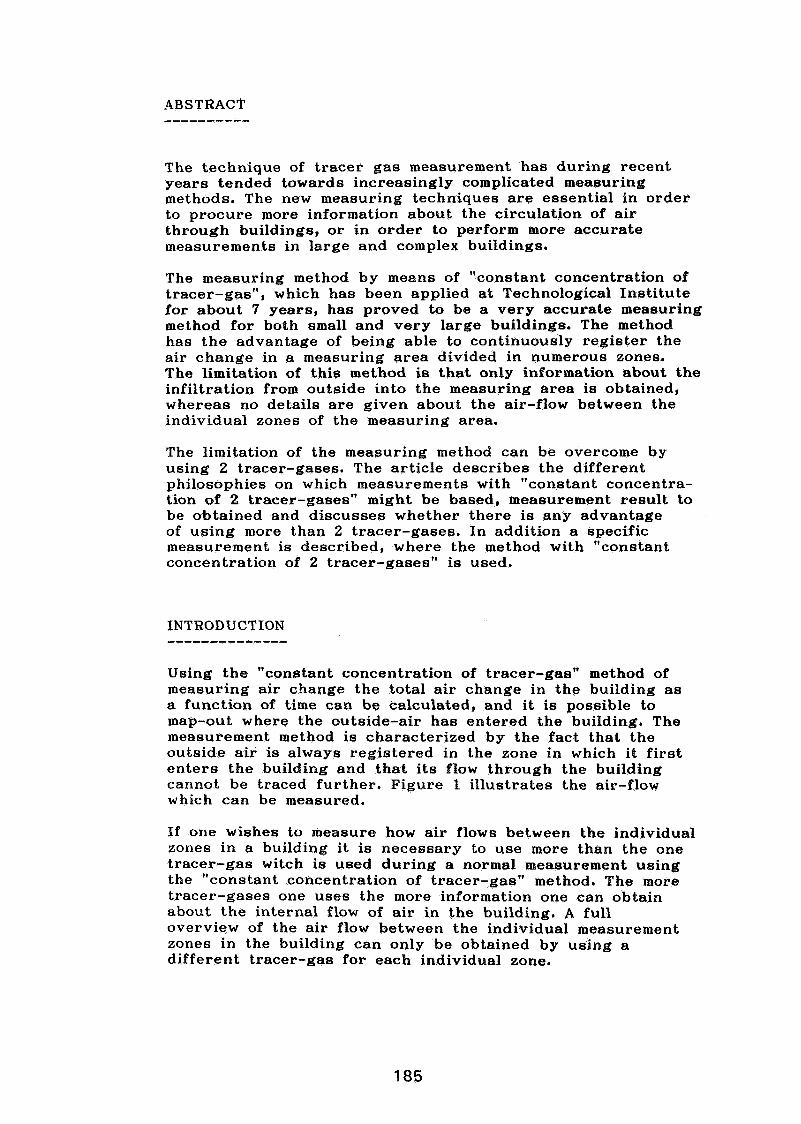
ABSTRACT ----------
The technique of tracer gas measurement has during recent years tended towards increasingly complicated measuring methods. The new measuring techniques a re essential in order to procure more information about the circulation of air through buildings, o r in order to perform more accurate measurements in large and complex buildings.
The measuring method by means of "constant concentration of tracer-gas", which has been applied at Technological Institute for about 7 years, has proved to be a very accurate measuring method for both small and very large buildings. The method has the advantage of being able to continuously register the air change in a measuring area divided in numerous zones. The limitation of this method is that only information about the infiltration from outside into the measuring area is obtained, whereas no details a re given about the air-flow between the individual zones of the measuring area.
The limitation of the measuring method can be overcome by using 2 tracer-gases. The article describes the different philosophies on which measurements with "constant concentra- tion of 2 tracer-gases" might be based, measurement result to be obtained and discusses whether there is any advantage of using more than 2 tracer-gases. In addition a specific measurement is described, where the method with "constant concentration of 2 tracer-gases" is used.
INTRODUCTION
Using the "constant concentration of tracer-gas" method of measuring air change the total air change in the building a s a function of time can be calculated, and i t is possible to map-out where the outside-air has entered the building. The measurement method i s characterized by the fact that the outside air is always registered in the zone in which it f i rs t enters the building and that i t s flow through the building cannot be traced further. Figure 1 illustrates the air-flow which can be measured.
If one wishes to measure how air flows between the individual zones in a building it i s necessary to use more than the one tracer-gas witch is used during a normal measurement using the "constant concentration of tracer-gas" method. The more tracer-gases one uses the more information one can obtain about the internal flow of air in the building, A full overview of the air flow between the individual measurement zones in the building can only be obtained by using a different tracer-gas for each individual zone.
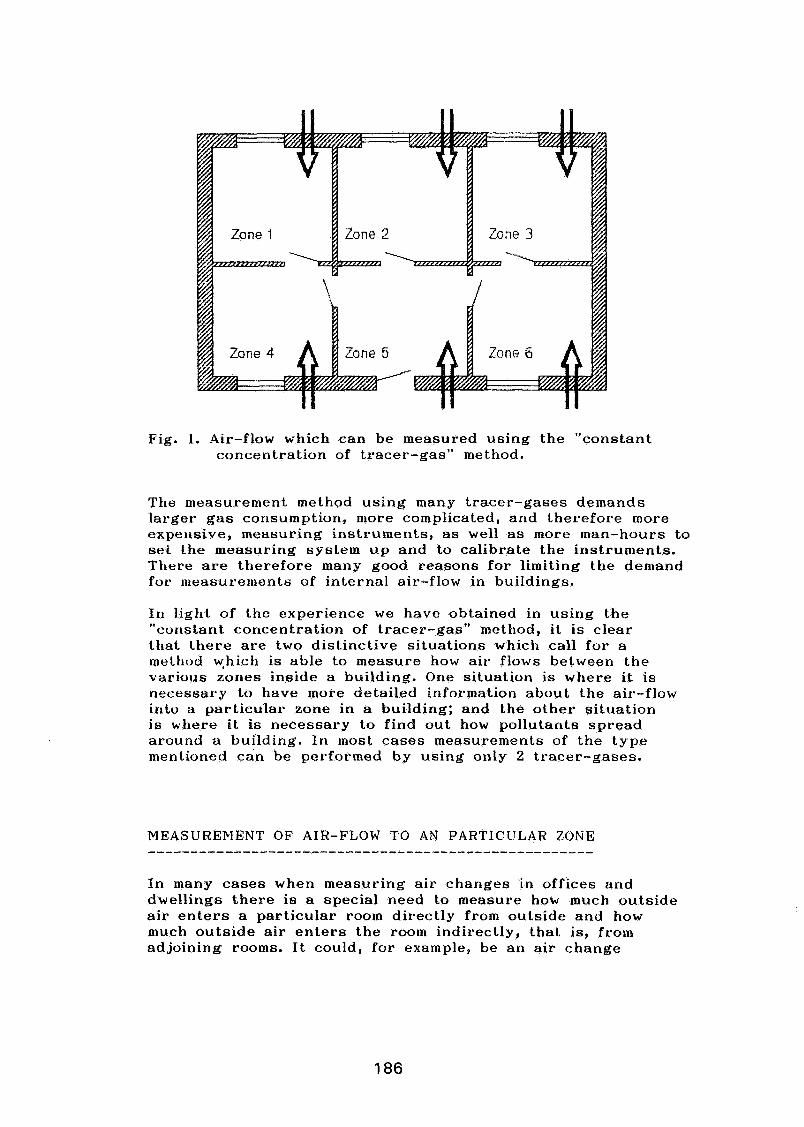
Zone 1 j Zone 2
Fig. 1. Air-flow which can be measured using the "constant corlcen tration of tracer-gas" method.
The nieasurenlent method using many tracer-gases demands larger g a s consumption, more complicated, and therefore more expet~sive, measuring instruments, a s well a s more man-hours to sei the measuring system u p and to calibrate the instruments. There a r e therefore many good reasons for limiting the denland for nieasurements of internal air-flow in buildings.
In light of the experience w e have obtained in using the "cotistant corkcentration of tracer-gas" mettiod, it is clear that there a r e two distinctive situations which call for a niettlod w,hich is able to measure how air flows between the various zones inside a building. One situation i s where i t is necessary to have inore detailed information about the air-flow i r~ tv a particular zone in a building; and the o ther situation i s where i t i s necessary t o find out how pollutarits spread around a building. In most cases measurements of the type mentioned can be performed by using only 2 tracer-gases.
MEASUREMENT OF AIR-FLOW TO A N PARTICLTLAR ZONE ....................................................
In many cases when measuring a i r changes in offices and dwellings the re i s a special need to measure how much outside a i r e n t e r s a particular room directly from outside and how much outside air e n t e r s the room indirectly, that is, from adjoining rooms. I t could, for example, be a n air change
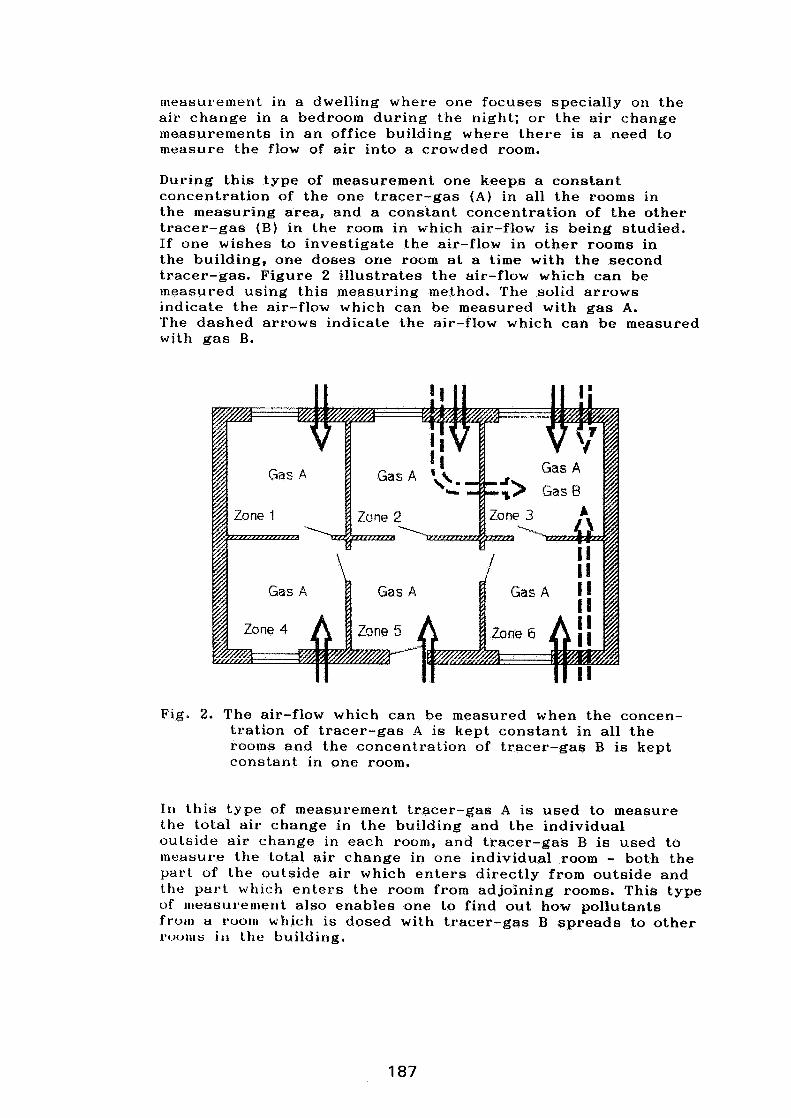
ineasurement in a dwelling where one focuses specially on the air change in a bedroom dur ing the night; o r the air change measurements in a n office building where there is a need to measure the flow of a i r into a crowded room.
During th is type of measurement one keeps a constant concentration of the one tracer-gas ( A ) in all the rooms in the measuring area, and a constant concentration of the other tracer-gas ( B ) in the room in which air-flow is being studied. If one wishes to investigate the air-flow in o the r rooms in the building, one doses one room a t a time with the second tracer-gas. Figure 2 i l lustrates the air-flow which can be measured using this measuring method. The solid arrows indicate the air-flow which can be measured with gas A. The dashed arrows indicate the air-flow which can be measured with g a s B.
Fig. 2. The air-flow which can be measured when the concen- tration of tracer-gas A i s kept constant in all the rooms and the concentration of tracer-gas B i s kept constant in one room.
I n th is type of measurement tracer-gas A i s used to measure t h e total a i r change in the building and the individual outside a i r change in each room, and tracer-gas B i s used to measure the total a ir change in one individual room - both the part of the outside air which en te r s directly from outside and the patst which en te r s the room from adjoining rooms. This type of rl~easut-entent also enables one to find ou t how pollutants fr+orn u t*oo~e which i s dosed with tracer-gas B s p r e a d s to other I . U ~ I I I S i i r llte building.
MEASURING THE SPREAD OF POLLUTANTS ........................................
When the spread of pollutants is being studied i t i s necessary to measure the concentration of the pollutant in all the roonltr a s well as the air change in the polluted area, the air change in the clean (non-polluted) area and the air-flow between these two areas. If all these parameters a re measured it is possible to evaluate the pollution problem and find out if pollution is best limited by reducing emission of the pollutant, increasing ventilation in the polluted area, increasing ventilation in the clean area or by improving the separation between the polluted area and the non-polluted area.
Pollution mapping and control as described above i s not only a good tool i n industrial environments but can also be used in office and home environments. The method can, for example, be used to s tudy radon pollution. Radon diffuses upward through the soil from underground sources and pollutes the crawl-space beneath the floorboards in buildings and eventually pollutes the air in the living areas of these buildings.
When measuring the spread of a pollutant the tracer-gas A is kept a t a constant concentration in all the rooms which a r e polluted and tracer-gas B i s kept a t a constant concentration in all the other rooms (clean rooms) in the measuring area. Figure 3 illustrates the air-flow which can be measured using this method. The solid arrows indicate the air-flow which can be measured with gas A. The dashed arrows indicate the air-flow which can be measured with gas B.
Fig. 3. The air-flow which can be measured when the concentra- tion of tracer-gas A is kept constant in the polluted rooms and the concentration of tracer-gas B is kept constant in the clean rooms.
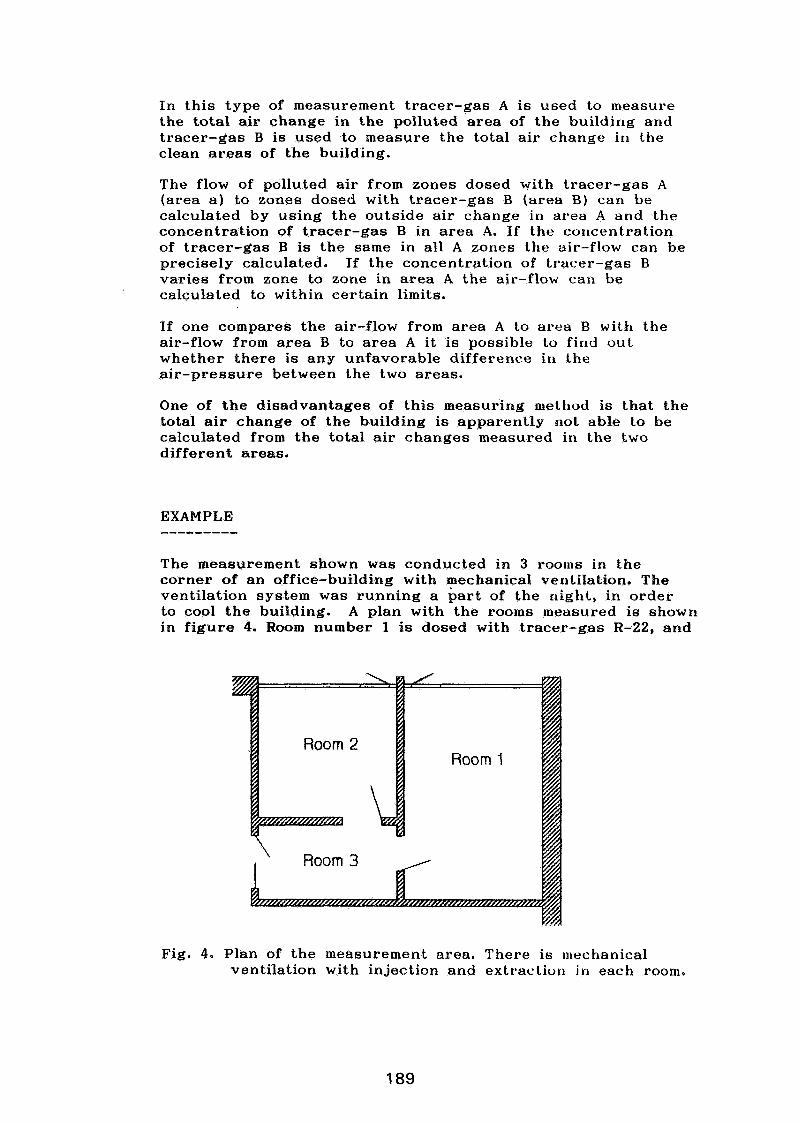
In this type of measurement tracer-gas A is used to measure the total air change in the polluted area of the building and tracer-gas B is used to measure the total air change in the clean areas of the building.
The flow of polluted air from zones dosed with tracer-gas A (area a ) to zones dosed with tracer-gas B (area 3 ) can be calculated by using the outside air change in area A and the concentration of tracer-gas B in area A. If the corlcentration of tracer-gas B is the same in all A zones the air-flow can be precisely calculated. If the concentration of tracer-gas B varies from zone to zone in area A the air-flow car1 be calculated to within certain limits.
If one compares the air-flow from area A to area B with the air-flow from area B to area A it is possible to find out whether there is any unfavorable difference in the air-pressure between the two areas.
One of the disadvantages of this measuring method is that the total a i r change of the building is apparently not able to be calculated from the total air changes measured in the two different areas.
EXAMPLE
The measurement shown was conducted in 3 roolns in the corner of an office-building with mechanical venlila tion. The ventilation system w a s running a hart of the night, in order to cool the building. A plan with the rooms rtleusured i s shown in f igure 4. Room number 1 is dosed with tracer-gas R-22, and
I Room 3 A
Fig. 4. Plan of the measurement area. There is ~ilechanical ventilation with injection and extrac tiori i n each room.

F i g . 5. Measured air-change in the 3 rooms.
room 1 - - room 2
\ ' $ ' .,.\ room 7 r -j 1
"1. /' .,/' \
1 \ -. /' i, -.-- target
8 - j -4- L - . . - - - J - r l I T ' i ~ l ! l ~ n
18 2Q 22 24 3 A 6 hour -
Fig. 6. eorlcentration of tracer-gas R-22 in the 3 r o o m s .
- I 1 I 1 I I I 1
18 20 22 24 2 4 6 hour
Fig. 7. Concentration of tracer-gas SF6 in t h e 3 rooms.
room 2 and 3 i s dosed with SF6. Figure 5 shows the slet~suretl a i r -change r a t e in t h e 3 rooms, and f igure 6 and 7 show t h e concentration of t h e t racer-gases in the rooms.
If we look a t the airflow dur ing the night , it is seen ttial t he re i s almost no flow from room 2 and 3 into roour 1. Irr lkrt! opposite direction there i s a flow vn app. 70 1113 e a c h t ~ r , l ~ ~ - .
The "constant concentration" nheasut-emenl ~ ~ ~ e t t ~ u l l usirkg 2 t racer-gases i s a very efficient tool for con tiriuously u~easur ing the a i r change and internal air-flow it1 build i r~gs . The advantages of the method is tha t one car1 perfor111 ~~leasure tnents in buildings which a r e in use, and that o n e can per.fot.u~ measurements in buildings which a r e divided inlo rlutuerous zones. The disadvantage of the method i s t ha t when using 2 11-acer-gases one can only measure the air-flow ac ross one iriclividual boundary in the building a t a time. If one wishes Lo lneasure the air-flow across all boundaries in ti
buildirlg a t the same time, i t is necessary to use the nleasuremer~t method where each zone is dosed with a different t racer-gas. This measurement method also has a disadvantage, in tha l t he number of rooms in which measurement can be perforuled cannot be g rea te r than the number of t racer-gases wh ich car1 be handled by the measuring equipment being used.
If one compare the two measurement method it must be con- cluded tha t the nleasurements performed using the "constant coricet~trat ior~ with 2 t racers" is t he most flesible method, while the nieasurements performed with rnore ttlarl 2 t racer - gases g ives more detailed information about the internal air-flow in buildings.

E F F E C T I V E VENTILATION
9 th A I V C C o n f e r e n c e , G h e n t , B e l g i u m 1 2 - 15 S e p t e m b e r 1988
'Paper 11
EXTENDED T E S T I N G O F A M U L T I F A M L Y BUILDING USING CONSTANT CONCENTRATION AND P F T METHODS
DAVID T. HARRJE, DAVID L. BOHAC AND DANIEL F'EUERMANN
C e n t e r for E n e r g y and E n v i r o n m e n t a l S t u d i e s T h e E n g i n e e r i n g Q u a d r a n g l e P r i n c e ton U n i v e r s i t y P r i n c e ton N J 08544 USA

SYNOPSIS
More than two months of detailed test data have been gathered using modified constant concentration tracer gas techniques for a six- story, 60 apartment, multifamily building. Weather, and interior conditions in the building were part of the data set. Because of occupant effects, large changes in air exchange rates were observed, often over short time periods. The test apartment allowed us to evaluate the influences of weather alone with the added feature to employ controlled window openings. Detailed air exchange information in the test apartment, those apartments above and below, and those on either side are presented. These same zones were also measured independently by perfluorocarbon tracer methods. Comparisons are made between the information obtained by the two methods and it is pointed out how the methods complement each other.
INTRODUCTION
As air infiltration measurements are applied to more complex buildings, there are important choices to be made with regard to the detail of the measurements and the cost of the procedures. Two quite different air exchange measurement methods are the constant concentration tracer (CCTG) and approaches using perfluorocarbon tracers"' in special ways. This paper describes testing these two air exchange measurement systems in a six-story, 60 apartment, multifamily building which is located in Asbury Park, New Jersey.
The test building is shown in cross section in Figure 1, and was chosen for these test series because of the previously obtained detailed information on energy use through several years of monitoring, and the ability to obtain a research apartment in the building. The energy monitoring was aided by the use of powerline carrier and microcomputer technology, with the data acquisition system monitored directly via telephone modem from our laboratory 60 km away7. The same telephone communications approach was used for the monitoring of the CCTG equipment.
Naturally, there is a great difference in the detail of the information obtained using the CCTG and PFT approaches. The paper will illustrate these differences and capabilities of the two approaches pointing out how they can complement each other.
EMPLOYING THE CCTG SYSTEM:
Because of the physical size of the CCTG equipment and the fact that to maintain the equipment it is necessary to provide both tracer gas and carrier gas bottles on a weekly basis, a dedicated research apartment was absolutely necessary to carry out the studies. Besides housing the tracer gas equipment this also allowed one to control window openings thereby covering those
8 closed window conditions seldom found in the occupied apartments .

Building A
Section A-A
Figure 1 - Lwnley Homes multifamily apartment building showing A and B wings and apartment arrangements.
Differences between occupied and unoccupied apartments are easily seen in Figure 2. Here the test apartment exhibits very low infiltration rates averaging approximately 0.17 air changes per hour. A typical occupied apartment during that time period covers a wide range of air exchange rates (up to 15 ACH) and averages 1.5 ACH, an order of magnitude higher than the closed window testing (Previous blower door testing placed the apartments in the 3.0 ACH at 50 pascals range, which would have predicted closed window air exchange rates of about 0.15 for single family residential testing). Figure 2 points out that with window openings the building is operating far from optimal based upon ventilation rate, which should be in the 0.35-0.5 ACH range.
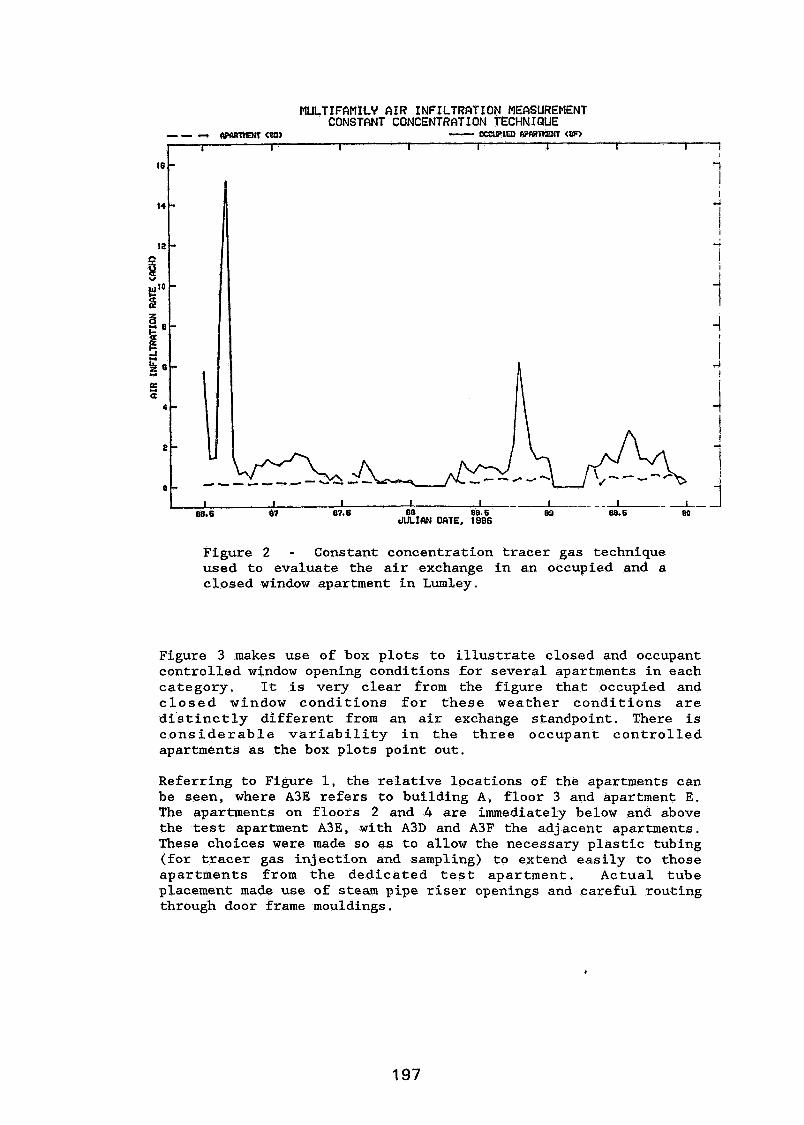
MULTIFAMILY AIR INFILTRRTION MEASUREMENT CONSTANT CONCENTRATION TECHNIQUE - - - WamENT <8B> - w 1 m R P ~ (w>
I I I 1 I I 1 I I 1 I
t t I I I 88.6 B7 B7.B 88 89 88.6 80 JULIRN OCITE, t"9.8"~
Figure 2 - Constant concentration t racer gas technique used to evaluate the a i r exchange i n an occupied and a closed window apartment i n Lumley.
Figure 3 makes use of box p lo ts t o i l l u s t r a t e closed and occupant controlled window opening conditions fo r several apartments i n each category. I t is very c lear from the figure tha t occupied and c l o s e d window condi t ions f o r these weather cond i t ions a r e d i s t i n c t l y d i f fe rent from an a i r exchange standpoint. There is c o n s i d e r a b l e v a r i a b i l i t y i n t h e t h r e e occupant c o n t r o l l e d apartments as the box plots point out,
Referring to Figure 1, the re la t ive locations of the apartments can be seen, where A3E refers to building A , f loor 3 and apartment E. The apartments on f loors 2 and 4 are immediately below and above the t e s t apartment A3E, with A3D and A3F the adjacent apartments. These choices were made so as t o allow the necessary p l a s t i c tubing (for t r ace r gas inject ion and sampling) to extend eas i ly to those apartments from t h e dedica ted t e s t apartment. Actual tube placement made use of steam pipe r i s e r openings and careful routing through door frame mouldings.
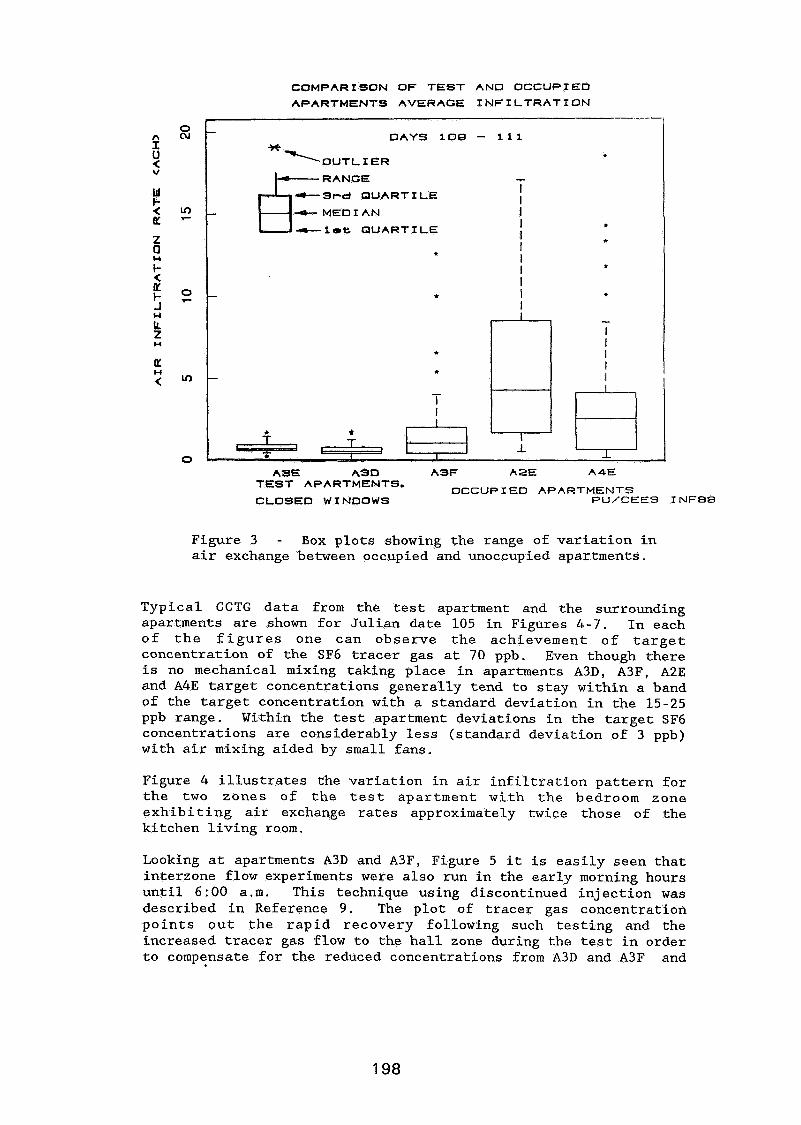
C O M P A R I S O N O F TEST A N D O C C U P I E D
A P A R T M E N T S A V E R A G E INFILTRATION
0 AS€ A S D A 3 F A 2 E A 4 E
D A Y S 1 0 9 - 1 1 1
*
-Srd QUARTILE
.4-- M E 0 I A N
-let QUARTILE
TEST APARTMENTS. O C C U P I E D A P A R T M E N T S CLOSED WI N D O W S PU/CEES INFBB
Figure 3 - Box plots showing the range of variation in air exchange between occupied and unoccupied apartments.
Typical CCTG data from the test apartment and the surrounding apartments are shown for Julian date 105 in Figures 4-7. In each of the figures one can observe the achievement of target concentration of the SF6 tracer gas at 70 ppb. Even though there is no mechanical mixing taking place in apartments A3D, A3F, A2E and A4E target concentrations generally tend to stay within a band of the target concentration with a standard deviation in the 15-25 ppb range. Within the test apartment deviations in the target SF6 concentrations are considerably less (standard deviation of 3 ppb) with air mixihg aided by small fans.
Figure 4 illustrates the variation in air infiltration pattern for the two zones of the test apartment with the bedroom zone exhibiting air exchange rates approximately twice those of the kitchen living room.
Looking at apartments A3D and A3F, Figure 5 it is easily seen that interzone flow experiments were also run in the early morning hours until 6:00 a.m. This technique using discontinued injection was described in Reference 9. The plot of tracer gas concentration points out the rapid recovery following such testing and the increased tracer gas flow to the hall zone during the test in order to compensate for the reduced concentrations from A3D and A3F and
)I
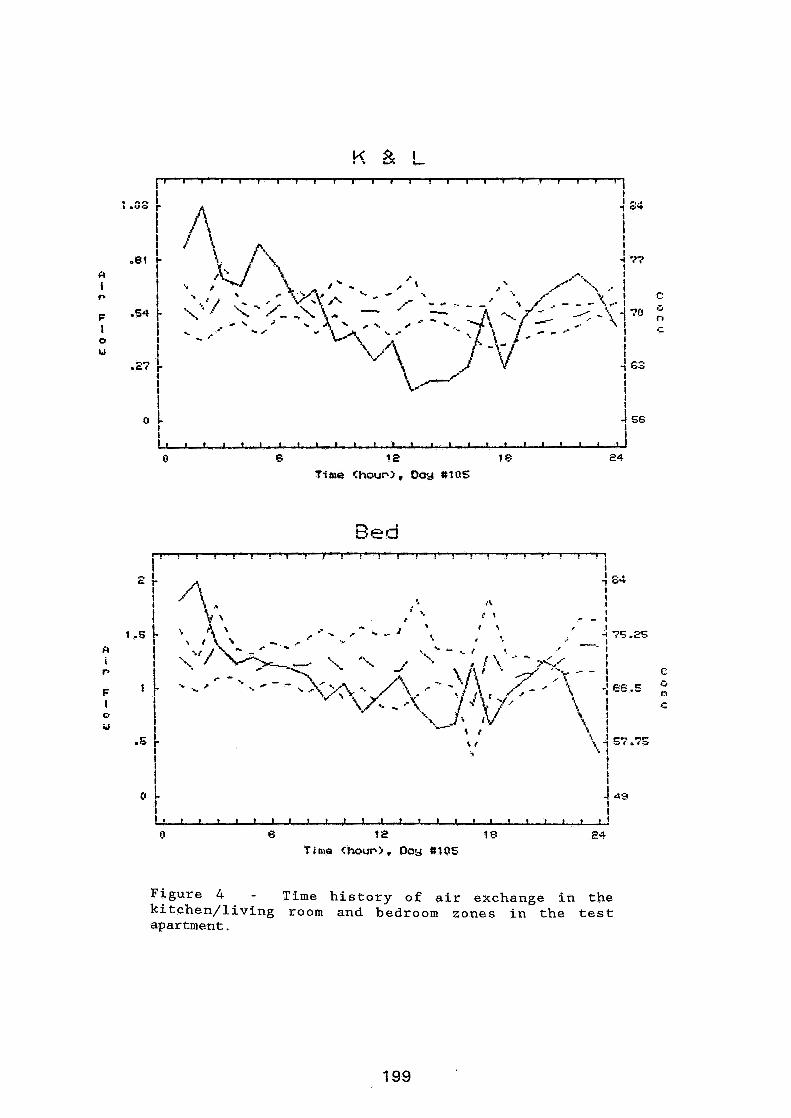
Bed I , . . f . . . !
t ? t . , . . . . . . . ? . . . . . i . ' 1 I
n I 1
I / \ .. 1
I f, r i
I
I b a ? I
I
\ - - I
- r * * .- 8 1 4 , '. I
r .. i
-. I ' , .' -- 1 I I I
.- - .- I . - e m -
1
t 'r
\ t ., I
I I
9 1% 7 I I
f 1
I. I I 1 , , 1 , , , , , , ,
i l l f l ) ) l l l
t I I * * I
a 6 12 / EI 24
Time Chou~), Day # I 0 5
Figure 4 - Time history of air exchange in the kitchen/living room and bedroom zones in the test apartment.
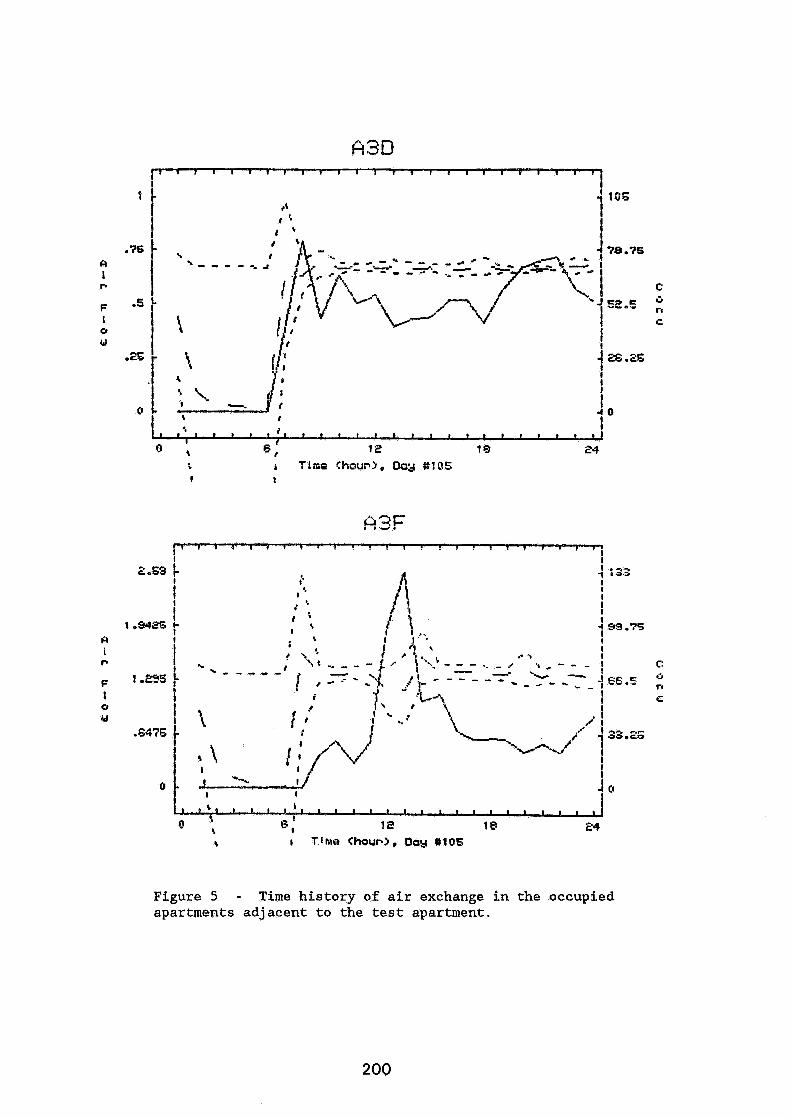
Figure 5 - Time his tory of a i r exchange i n the occupied apartments adjacent to the t e s t apartment.
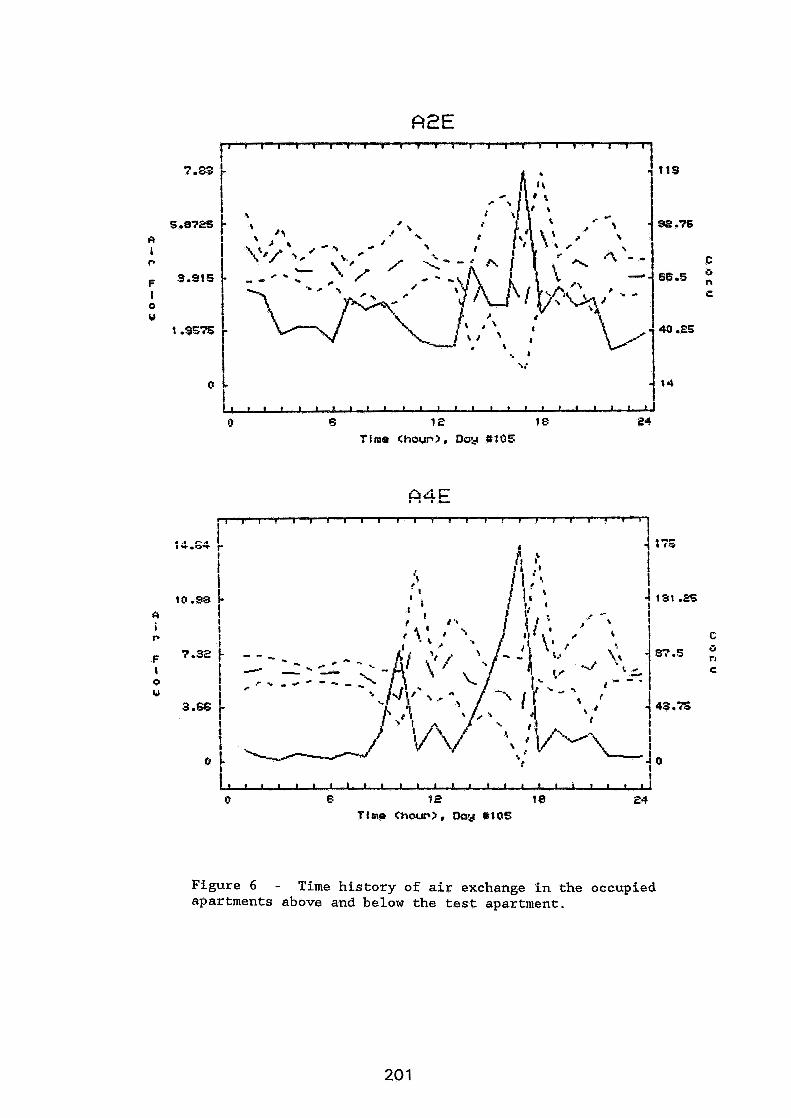
l l l ' l l l l l f l l l l l l ~ ~ ~ ~ ~ I l l l l ~ I
7.83 1
C
C C I - se.5
C
I
1.9576 \ ' s 4
I '.: a l
1 1 1 1 1 ~ 1 , , * 1 , 1 , 1 ) , ) 1 1 1 , 1 I I
0 6 12 15 i?4
Time Chau~S, Day #!05
l l l l . ( l l , l l I
l r l I 1 ? ~ l l l l , l . ,
1 I I I r 4 175
l' 5 !
i I .f 1 3 1 .i?5
1 I t ,\ I i C
C P . - . P C
r
t t
~ 1 1 1 1 , , 1 ( 1 1 1 ( 1 1 ) t 1 1 1 1 ~ ~ ( )
0 8 1 2 1 P e4 Time Chou~), Dog #105
Figure 6 - Time his tory of a i r exchange i n the occupied apartments above and below the t e s t apartment.
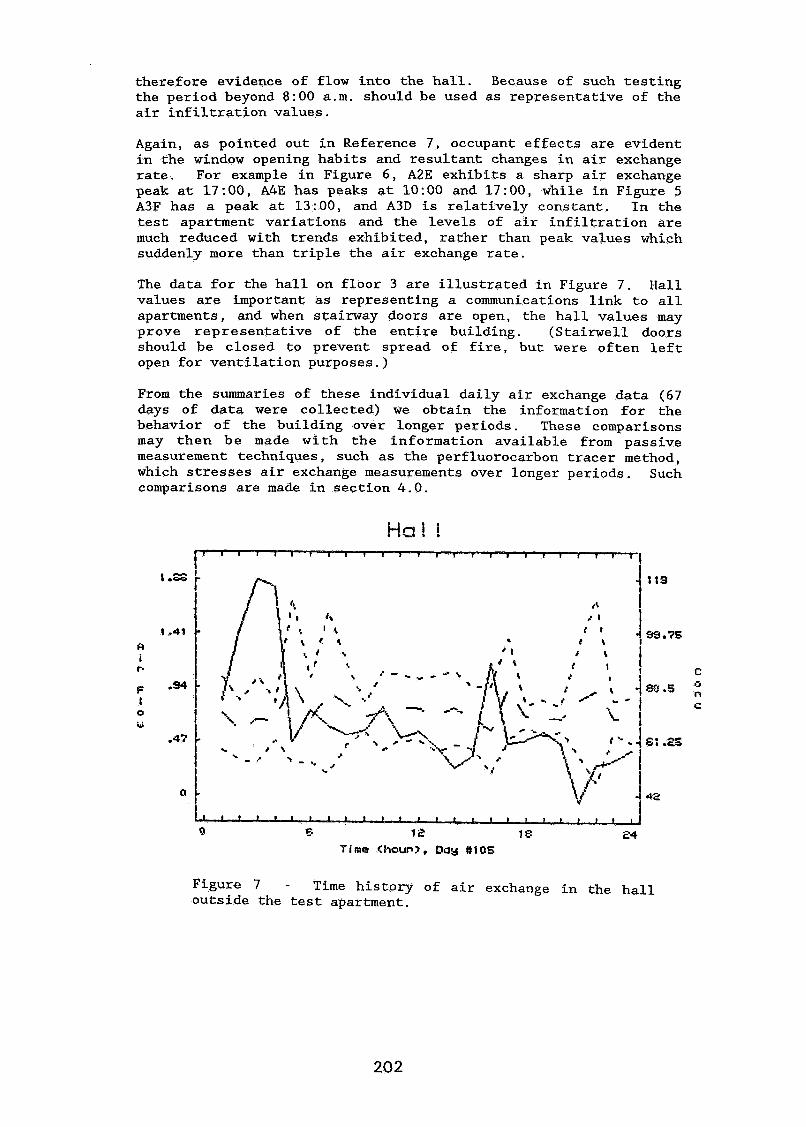
therefore evidence of flow into the hall. Because of such testing the period beyond 8:00 a.m. should be used as representative of the air infiltration values.
Again, as pointed out in Reference 7, occupant effects are evident in the window opening habits and resultant changes in air exchange rate. For example in Figure 6, A2E exhibits a sharp air exchange peak at 17:00, A4E has peaks at 10:OO and 17:00, while in Figure 5 A3F has a peak at 13:00, and A3D is relatively constant. In the test apartment variations and the levels of air infiltration are much reduced with trends exhibited, rather than peak values which suddenly more than triple the air exchange rate.
The data for the hall on floor 3 are illustrated in Figure 7. Hall values are important as representing a communications link to all apartments, and when stairway doors are open, the hall values may prove representative of the entire building. (Stairwell doors should be closed to prevent spread of fire, but were often left open for ventilation purposes.)
From the summaries of these individual daily air exchange data (67 days of data were collected) we obtain the information for the behavior of the building over longer periods. These comparisons may then be made with the information available from passive measurement techniques, such as the perfluorocarbon tracer method, which stresses air exchange measurements over longer periods. Such comparisons are made in section 4.0.
Time Chou~), Day #I05
Figure 7 - Time history of air exchange in the hall outside the test apartment.
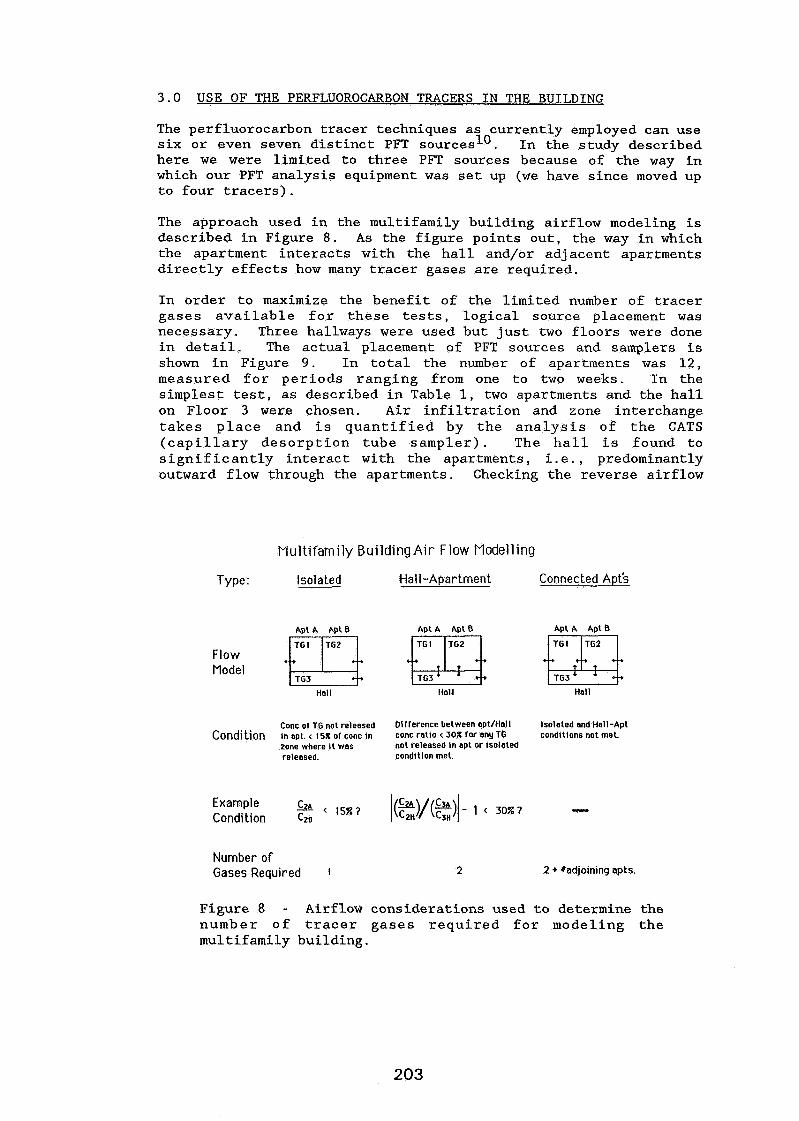
3.0 USE OF THE PERFLUOROCARBON TRACERS IN THE BUILDING
The perfluorocarbon tracer techniques as currently employed can use 10 six or even seven distinct PFT sources In the study described
here we were limited to three PFT sources because of the way in which our PFT analysis equipment was set up (we have since moved up to four tracers).
The approach used in the multifamily building airflow modeling is described in Figure 8. As the figure points out, the way in which the apartment interacts with the hall and/or adjacent apartments directly effects how many tracer gases are required.
In order to maximize the benefit of the limited number of tracer gases available for these tests, logical source placement was necessary. Three hallways were used but just two floors were done in detail. The actual placement of PFT sources and samplers is shown in Figure 9. In total the number of apartments was 12, measured for periods ranging from one to two weeks. In the simplest test, as described in Table 1, two apartments and the hall on Floor 3 were chosen. Air infiltration and zone interchange takes place and is quantified by the analysis of the CATS (capillary desorption tube sampler). The hall is found to significantly interact with the apartments, i. e. , predominantly outward flow through the apartments. Checking the reverse airflow
Yiultifamily Building Air Flow Modelling
Type:
Flow Model
Isolated
~ p t A A P ~ a a Hall
Hall-Apartment Connected Apt's
Conc of TG not released Difference between apt/Hall lsolated and Hall-Apt Condition ~n apt < 15% of conc in conc rat10 < 30X for any TG cond~tions not met.
zone where I t was not released in apt or isolated released. cond~tlon met
A P ~ A Apta npt A npt a
Example < 1 5 % ~ l($)/(%)l-l<30%? - Condition Czs
Number of Gases Required I 2 2 + *adjoining apts.
Hall Hall
TG1
Figure 8 - Airflow considerations used to determine the number of tracer gases required for modeling the multifamily building.
TG2
3 + ::
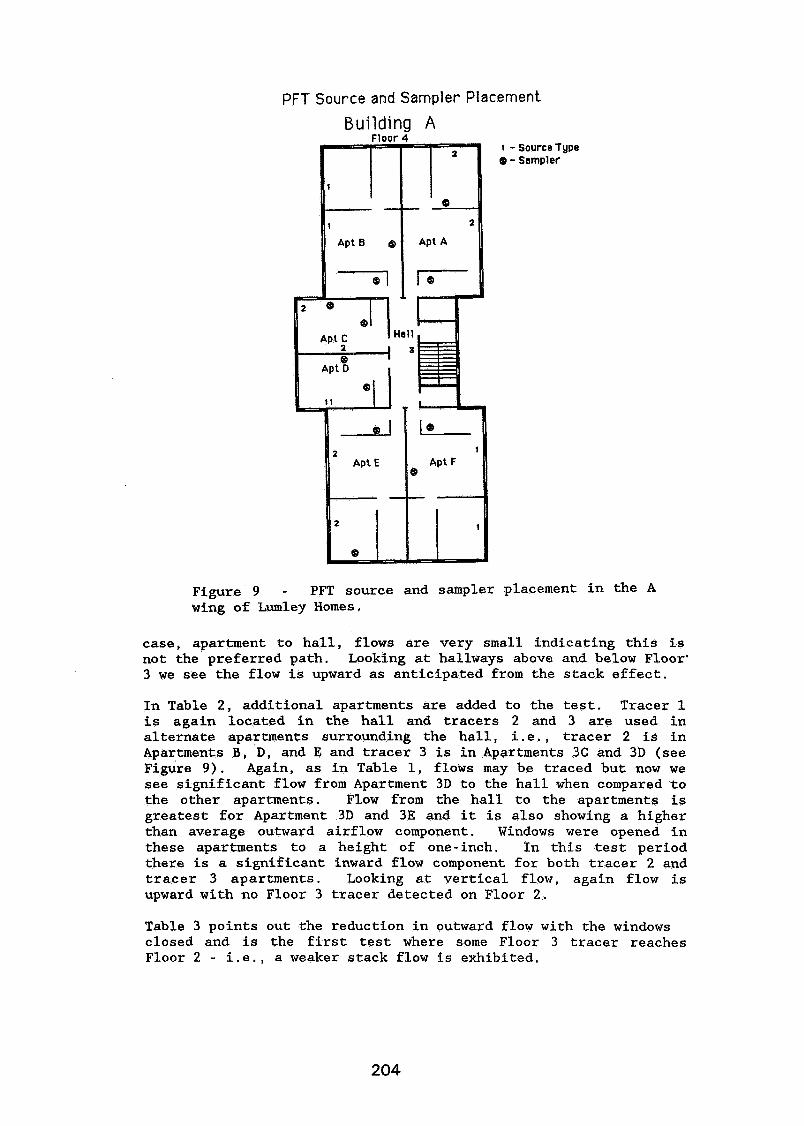
PFT Source and Sampler Placement
Building A Source Type Sampler
Figure 9 - PFT source and sampler placement in the A wing of Lumley Homes.
case, apartment to hall, flows are very small indicating this is not the preferred path. Looking at hallways above and below Floor' 3 we see the flow is upward as anticipated from the stack effect.
In Table 2, additional apartments are added to the test. Tracer 1 is again located in the hall and tracers 2 and 3 are used in alternate apartments surrounding the hall, i.e., tracer 2 is in Apartments B, D, and E and tracer 3 is in Apartments 3C and 3D (see Figure 9). Again, as in Table 1, flows may be traced but now we see significant flow from Apartment 3D to the hall when compared to the other apartments. Flow from the hall to the apartments is greatest for Apartment 3D and 3E and it is also showing a higher than average outward airflow component. Windows were opened in these apartments to a height of one-inch. In this test period there is a significant inward flow component for both tracer 2 and tracer 3 apartments. Looking at vertical flow, again flow is upward with no Floor 3 tracer detected on Floor 2.
Table 3 points out the reduction in outward flow with the windows closed and is the first test where some Floor 3 tracer reaches Floor 2 - i.e., a weaker stack flow is exhibited.
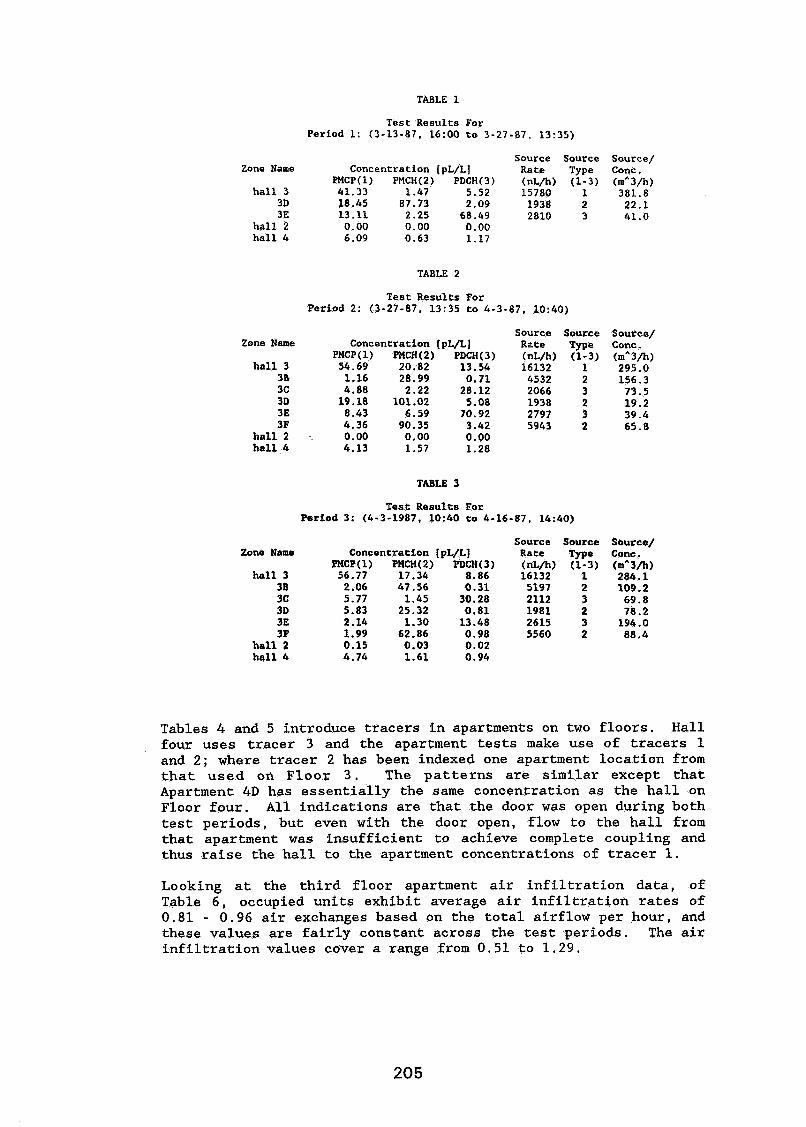
TABLE 1
Test Results For Period 1: (3-13-87, 16:OO to 3-27-87, 13:35)
Source Source Source/ Zone Name Concentration [pL/L] Rate Type Conc.
PMCP(1) PMCH(2) PDCH(3) (nL/h) (1-3) (mA3/h) hall 3 41.33 1.47 5.52 15780 1 381.8
3D 18.45 87.73 2.09 1938 2 22.1 3E 13.11 2.25 68.49 2810 3 41.0
hall 2 0.00 0.00 0.00 hall 4 6.09 0.63 1.17
TABLE 2
Test Results For Period 2: (3-27-87. 13:35 to 4-3-87, 10:40)
Zone Name
hall 3 38 3C 3D 3E 3F
hall 2 .. hall 4
Concentration [pL/L] PMCP(1) PMCH(2) PDCH(3) 54.69 20.82 13.54 1.16 28.99 0.71 4.88 2.22 28.12 19.18 101.02 5.08 8.43 6.59 70.92 4.36 90.35 3.42 0.00 0.00 0.00 4.13 1.57 1.28
Source Rzte (nL/h) 16132 4532 2066 1938 2797 5943
Source Type (1-3) 1 2 3 2 3 2
Zone Name
hall 3 311 3C 3D 3E 3F
hall 2 hall 4
TABLE 3
Test Results For Period 3: (4-3-1987. 10:40 to 4-16-87, 14:40)
Concentration [pL/L] PHCP(1) PMCH(2) PDCH(3) 56.77 17.34 8.86 2.06 47.56 0.31 5.77 1.45 30.28 5.83 25.32 0.81 2.14 1.30 13.48 1.99 62.86 0.98 0.15 0.03 0.02 4.74 1.61 0.94
Source Rate (nL/h) 16132 5197 2112 1981 2615 5560
Source Trpe (1-3) 1 2 3 2 3 2
Source/ Conc . (mA3/h) 295.0 156.3 73.5 19.2 39.4 65.8
Source/ Conc . (mA3/h) 284.1 109.2 69.8 78.2 194.0 88.4
Tables 4 and 5 introduce tracers in apartments on two floors. Hall four uses tracer 3 and the apartment tests make use of tracers 1 and 2; where tracer 2 has been indexed one apartment location from that used on Floor 3. The patterns are similar except that Apartment 4D has essentially the same concentration as the hall on Floor four. All indications are that the door was open during both test periods, but even with the door open, flow to the hall from that apartment was insufficient to achieve complete coupling and thus raise the hall to the apartment concentrations of tracer 1.
Looking at the third floor apartment air infiltration data, of Table 6, occupied units exhibit average air infiltration rates of 0.81 - 0.96 air exchanges based on the total airflow per hour, and these values are fairly constant across the test periods. The air infiltration values cover a range from 0.51 to 1.29.
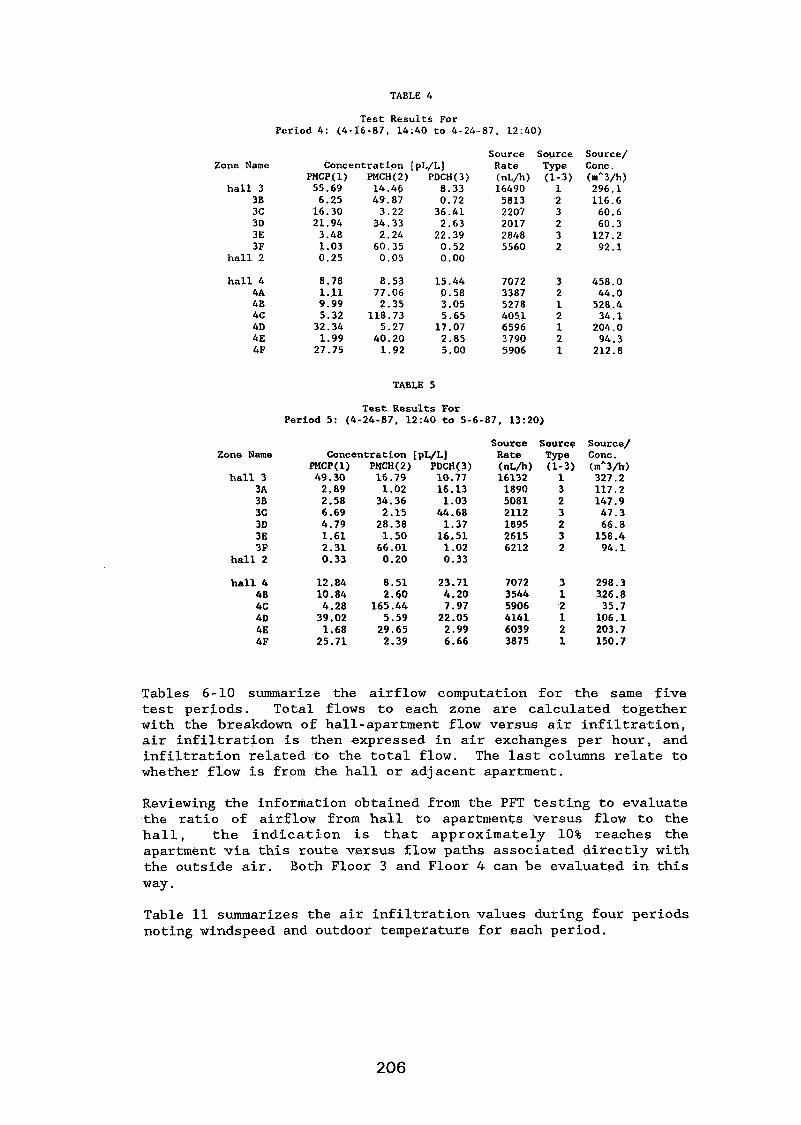
Test Results For Period 4: (4-16-87, 14:40 to 4-24-87, 12:40)
Zone Name
hall 3 3B 3C 3D 3E 3F
hall 2
hall 4 4A 48 4C 4D 4E 4F
Zone Name
hall 3 3A 38 3C 3D 3E 3F
hall 2
hall 4 48 4C 4D 4E 4F
Concentration [pL/L] PMCP(1) PMCH(2) PDCH(3) 55.69 14.46 8.33 6.25 49.87 0.72 16.30 3.22 36.41 21.94 34.33 2.63 3.48 2.24 22.39 1.03 60.35 0.52 0.25 0.05 0.00
8.78 8.53 15.44 1.11 77.06 0.58 9.99 2.35 3.05 5.32 118.73 5.65 32.34 5.27 17.07 1.99 40.20 2.85 27.75 1.92 5.00
Source Source Rate Type (nL/h) (1-3) 16490 1 5813 2 2207 3 2017 2 2848 3 5560 2
TABLE 5
Test Results For Period 5: (4-24-87, 12:40 to 5-6-87, 13:20)
Concentration [pL/L] PMCP(1) PMCH(2) PDCH(3) 49.30 16.79 10.77 2.89 1.02 16.13 2.58 34.36 1.03 6.69 2.15 44.68 4.79 28.38 1.37 1.61 1.50 16.51 2.31 66.01 1.02 0.33 0.20 0.33
12.84 8.51 23.71 10.84 2.60 4.20 4.28 165.44 7.97 39.02 5.59 22.05 1.68 29.65 2.99 25.71 2.39 6.66
Source Source Rate Type (nL/h) (1-3) 16132 1 1890 3 5081 2 2112 3 1895 2 2615 3 6212 2
Source/ Conc . (mA3/h) 296.1 116.6 60.6
Source/ Conc . (mA3/h) 327.2 117.2 147.9 47.3 66.8 158.4 94.1
Tables 6-10 summarize the airflow computation for the same five test periods. Total flows to each zone are calculated together with the breakdown of hall-apartment flow versus air infiltration, air infiltration is then expressed in air exchanges per hour, and infiltration related to the total flow. The last columns relate to whether flow is from the hall or adjacent apartment.
Reviewing the information obtained from the PFT testing to evaluate the ratio of airflow from hall to apartments versus flow to the hall, the indication is that approximately 10% reaches the apartment via this route versus flow paths associated directly with the outside air. Both Floor 3 and Floor 4 can be evaluated in this way.
Table 11 summarizes the air infiltration values during four periods noting windspeed and outdoor temperature for each period.
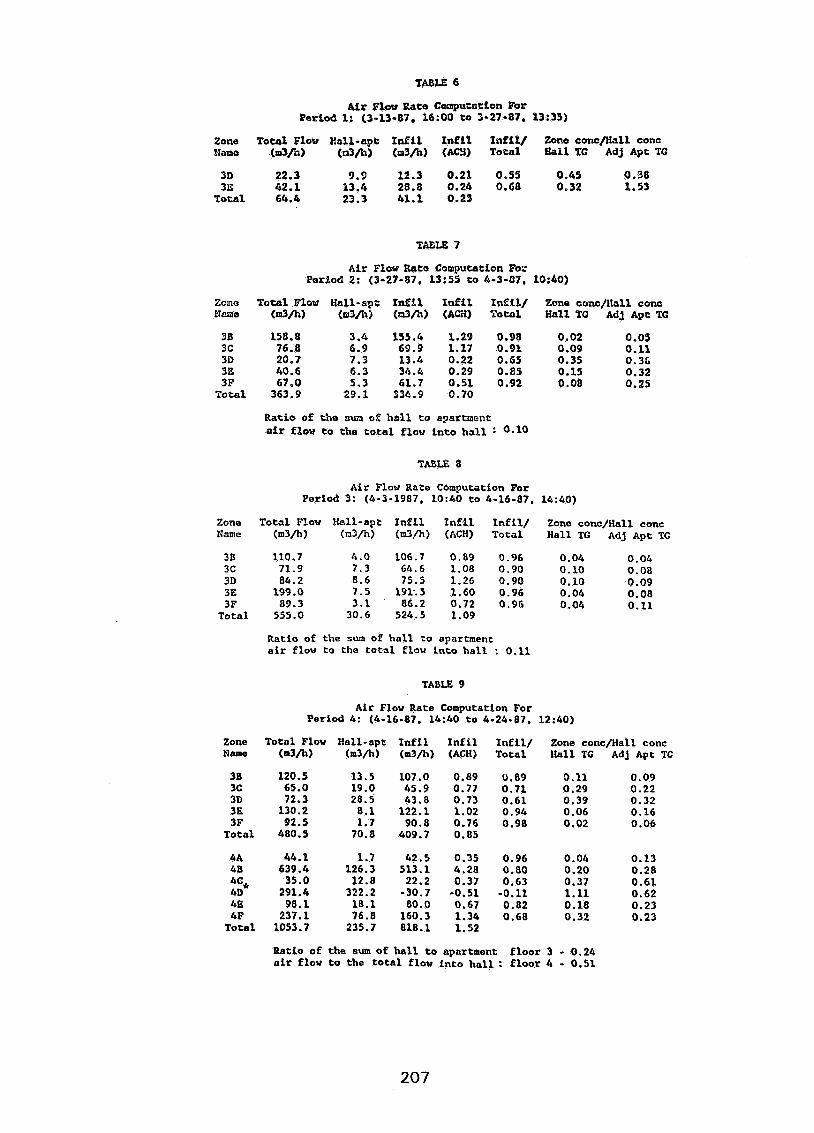
TABLE 6
A i r Flow Rate Ccmpuzatfon For Period 1: (3-13-87, 16:OO t o 3-27-87. 13:35)
Zone Total Flow Hall-apt I d i l I n f i l I n f i l / Zom concflall conc Name <&/h) (&/la) (s3/h) (AC3) Total Hall TG Adj Apt TG
31) 22.3 9.9 12.3 0.21 0.55 0.45 0.38 315 42.1 13.4 28.8 0.24 0.68 0.32 1.53
Total 64.6 23.3 41.1 0.23
Afr Flow Bate Computation For PorPod 2: (3-27-87, 13:55 to 4-3-07. 10:40)
Zone Total Flow Hall-apt I n f i l I n f i l Inki l / Zone conc/?lall conc Hme <d/h) (m3/h) (n3/h) (Am) Total Hall TG A d j A p t TG
38 158.8 3.4 155.4 1.29 0.98 0.02 0.05 3C 76.8 6.9 69.9 1.17 0.91 0.09 0.11 3D 20.7 7.3 13.4 0.22 0.65 0.35 0.38 3E 40.6 6.3 34.4 0.29 0.85 0.15 0.32 3P 67.0 5.3 61.7 0.51 0.92 0.08 0.25
Total 363.9 29.1 334.9 0.70
Ratio of the sun .of h a l l t o apartaeat a i r faow to the toea1 flow in to h a l l : 0.10
TABLE 8
A i r Flow Rate Compueation For Period 3: (4-3-1987, lO:40 to 4-16-87, 14:40)
Zone Total Flow Hall-apt InfPl InfPL I n f i l l Zone conc/Hal1 conc Name (m3/h) (n3/h) (a3/h) (ACH) Total Hall TG Adj ~ p t TG
38 110.7 4.0 106.7 0.89 0.96 0.04 0.04 3C 71.9 7.3 64.6 1.08 0.90 0.10 0.08 3D 84.2 8.6 75.5 1.26 0.90 0.10 0.09 3E 199.0 7.5 19V.S 1.60 0.96 0.04 0.08 3F 89.3 3.1 86.2 0.72 0.96 0.04 0.11
Total 555.0 30.6 524.5 1.09
Ratio of the sum of h a l l t o apartment a i r flow t o tho t o t a l flow Lnto h a l l : 0.11
TABLE 9
A i r Flow Rate Computation For Period 4: (4-16-87, 14:40 t o 4-24-87. 12:40)
Zone Total Flow Hall-apt I n f i l I n f i l I n f i l / Zone conc/Hall conc Name (m3/h) (m3/h) (m3/h) (ACH) Total Hall TC Adj Apt TG
38 3C 3D 3E 3F
Total
4A 48
3 4E 4F
Total
Ratio of the sum of hal l t o apartment Floor 3 - 0.24 a i r flow t o the t o t a l flow into h a l l : f loor 4 - 0.51
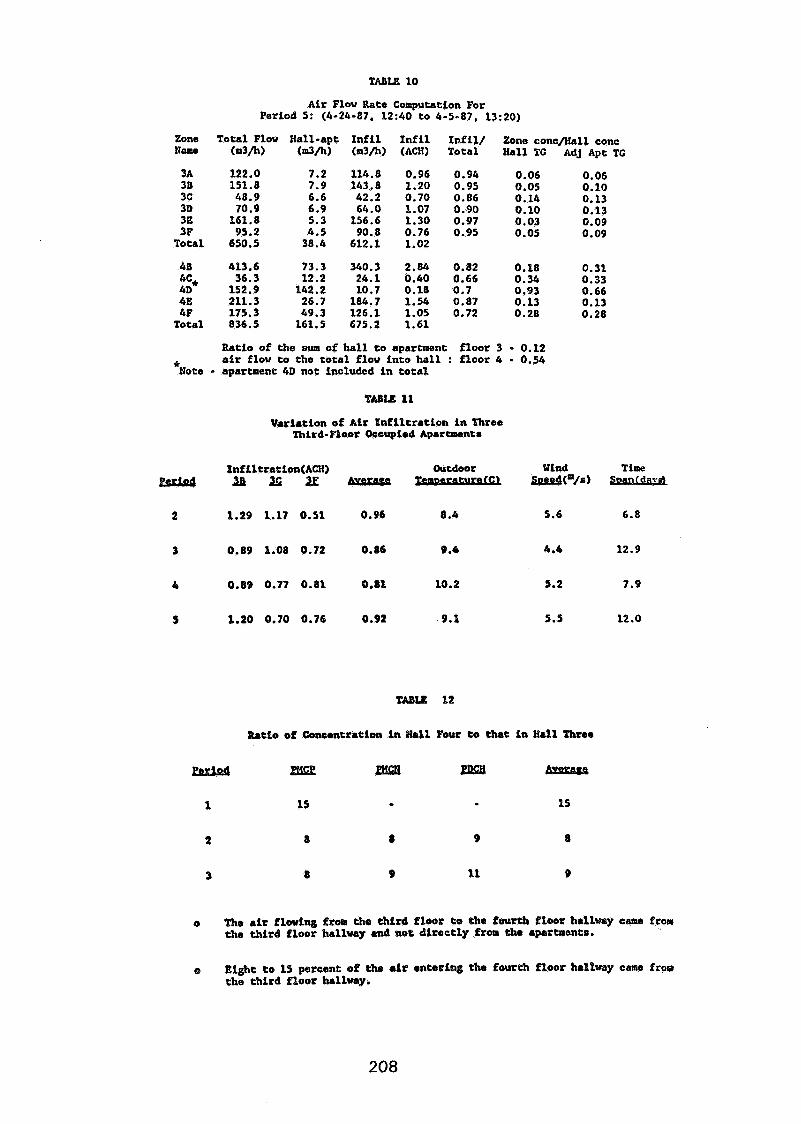
TABLE 10
zone Name
Total
4E 4%' Total
Air Flow Rate Computation For Period 5: (4-24-87, 12:40 to 4-5-87. 13:20)
Total Flov Hall-apt Infil Infil fnfil/ Zone concflall conc (m3/h) (m3/h) (m3lh) (ACH) Total Hall TC Adj Apt TG
122.0 7.2 114.8 0.96 0.94 0.06 0.06 151.8 7.9 143.8 1.20 0.95 0.05 0.10 48.9 6.6 42.2 0.70 0.86 0.14 0.13 70.9 6.9 64.0 1.07 0.90 0.10 0.13 161.8 5.3 156.6 1.30 0.97 0.03 0.09 95.2 4.5 90.8 0.76 0.95 0.05 0.09 650.5 38.4 612.1 1.02
413.6 73.3 340.3 2.84 0.82 0.18 0.31 36.3 12.2 24.1 0.40 0.66 0.34 0.33 152.9 142.2 10.7 0.18 0.7 0.93 0.66 211.3 26.7 184.7 1.54 0.87 0.13 0.13 175.3 49.3 126.1 1.05 0.72 0.28 0.28 836.5 161.5 675.2 1.61
Ratio of the sum of hall to apartment floor 3 - 0.12 * air flow to the total flow into hall : floor 4 - 0.54 Note - apartment 4D not included in total
Variation of Air Infiltration in Three Third-Floor Occupied Apartments
Inflltration(ACH) outdoor Wind Time PsFiad tB s JT bwn&s spLeP("'/~) s%?&&X&
Ratio of Concentration in H.11 Four to that in Hall Three
a Th. air flowing from tha third floor to UIe fourth floor hallway came from the third floor hallway and not directly from rh. apartments.
o Eight to 15 percent of the a&? entering the fourth floor hallway came from the third f loot hallvay.
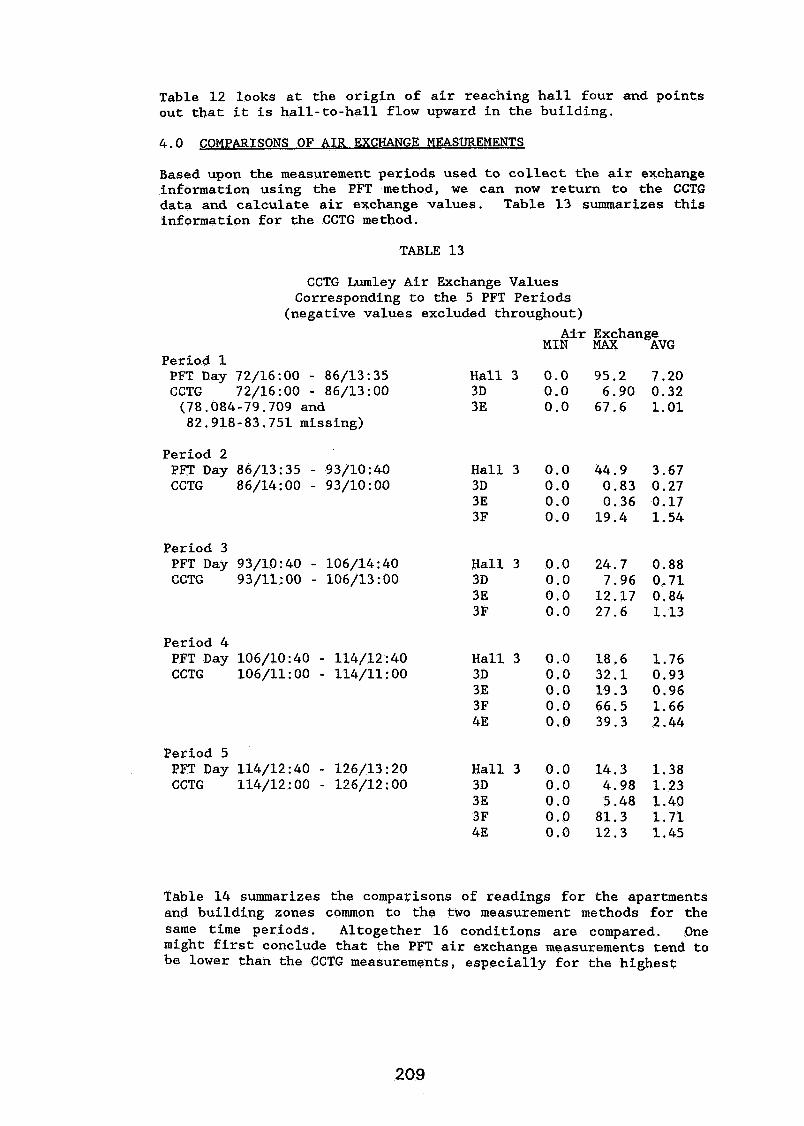
Table 12 looks at the origin of air reaching hall four and points out that it is hall-to-hall flow upward in the building.
4.0 COMPARISONS OF AIR EXCHANGE MEASUREMENTS
Based upon the measurement periods used to collect the air exchange information using the PFT method, we can now return to the CCTG data and calculate air exchange values. Table 13 summarizes this information for the CCTG method.
TABLE 13
CCTG Lwnley Air Exchange Values Corresponding to the 5 PFT Periods
(negative values excluded throughout)
Air Exchange MIN MAX AVG
Period 1 PFT Day 72/16:00 - 86/13:35 CCTG 72/16:00 - 86/13:00 (78.084-79.709 and 82.918-83.751 missing)
Period 2 PFT Day 86/13:35 - 93/10:40 CCTG 86/14:00 - 93/10:00
Period 3 PFT Day 93/10:40 - 106/14:40 CCTG 93/11:00 - 106/13:00
Period 4 PFT Day 106/10:40 - 114/12:40 CCTG 106/11:00 - 114/11:00
Period 5 PFT Day 114/12:40 - 126/13:20 CCTG 114/12:00 - 126/12:00
Hall 3 0.0 95.2 7.20 3D 0.0 6.90 0.32 3E 0.0 67.6 1.01
Hall 3 0.0 44.9 3.67 3D 0.0 0.83 0.27 3E 0.0 0.36 0.17 3 F 0.0 19.4 1.54
Hall 3 0.0 24.7 0.88 3D 0.0 7.96 0.71 3 E 0.0 12.17 0.84 3 F 0.0 27.6 1.13
Hall 3 0.0 18.6 1.76 3D 0.0 32.1 0.93 3 E 0.0 19.3 0.96 3 F 0.0 66.5 1.66 4E 0.0 39.3 2.44
Table 14 summarizes the comparisons of readings for the apartments and building zones common to the two measurement methods for the same time periods. Altogether 16 conditions are compared. One might first conclude that the PFT air exchange measurements tend to be lower than the CCTG measurements, especially for the highest
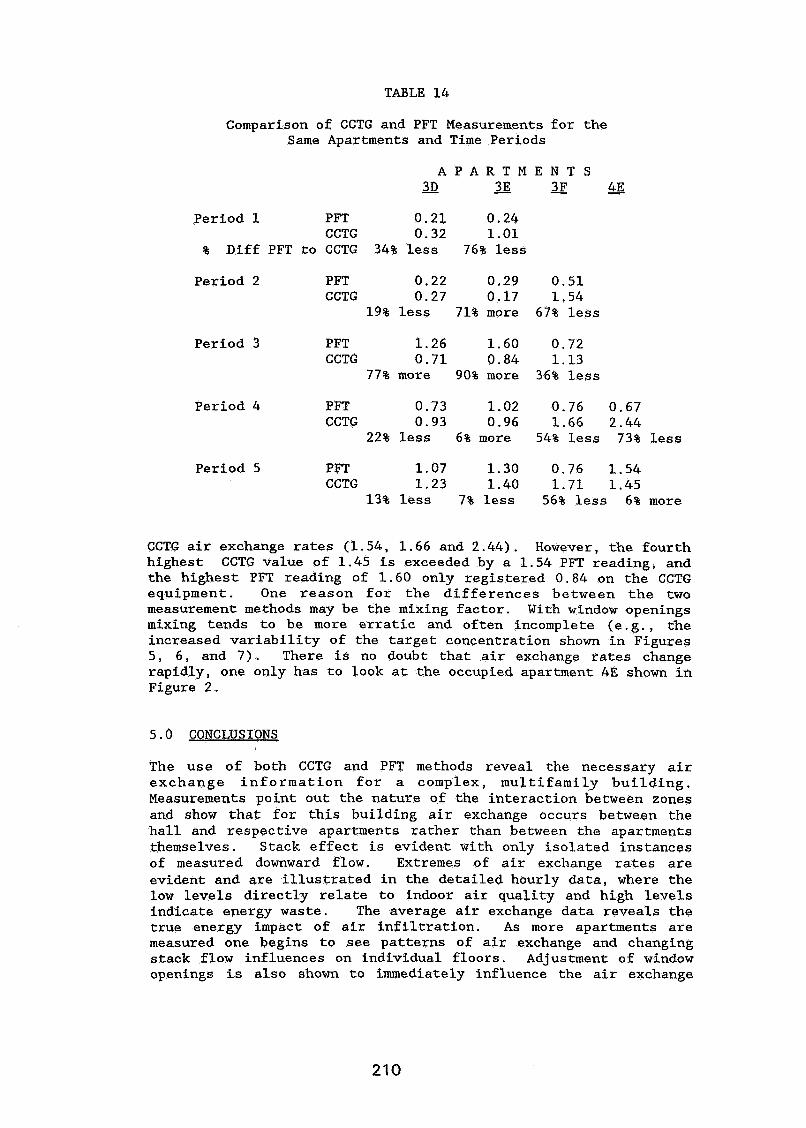
TABLE 14
Comparison of CCTG and PFT Measurements f o r t he Same Apartments and Time Periods
A P A R T M E N T S 3 D - - 3E - 3F - 4E
Period 1 PFT 0.21 0.24 CCTG 0.32 1 .01
% Diff PFT t o CCTG 34% l e s s 76% l e s s
Period 2 PFT 0.22 0.29 0.51 CCTG 0.27 0.17 1.54
19% l e s s 71% more 67% l e s s
Period 3 PFT 1.26 1.60 0.72 CCTG 0.71 0.84 1 .13
77% more 90% more 36% l e s s
Period 4 PFT 0.73 1.02 0.76 0.67 CCTG 0.93 0.96 1.66 2.44
22% l e s s 6% more 54% l e s s 73% l e s s
Period 5 PFT 1.07 1.30 0.76 1.54 CCTG 1 .23 1.40 1 .71 1.45
13% l e s s 7% l e s s 56% l e s s 6% more
CCTG a i r exchange r a t e s (1.54, 1.66 and 2.44). However, t h e four th highest CCTG value of 1.45 i s exceeded by a 1.54 PFT reading, and t he h ighes t PFT reading of 1.60 only reg i s te red 0.84 on t he CCTG equipment. One r ea son f o r t h e d i f f e r e n c e s between the two measurement methods may be the mixing fac tor . With window openings mixing tends t o be more e r r a t i c and of ten incomplete ( e . g . , t h e increased v a r i a b i l i t y of t he t a r g e t concentration shown i n Figures 5 , 6 , and 7 ) . There i s no doubt t h a t a i r exchange r a t e s change rapidly , one only has t o look a t t he occupied apartment 4E shown in Figure 2.
5 .0 CONCLUSIONS
The u se of both CCTG and PFT methods reveal the necessary a i r exchange i n f o r m a t i o n f o r a complex, m u l t i f a m i l y b u i l d i n g . Measurements point out the nature of the in te rac t ion between zones and show t h a t f o r t h i s bui lding a i r exchange occurs between t he h a l l and respect ive apartments ra ther than between the apartments themselves. Stack e f f e c t is evident with only i so l a t ed ins tances of measured downward flow. Extremes of a i r exchange r a t e s a r e evident and a r e i l l u s t r a t e d i n the de ta i l ed hourly da ta , where t he low l eve l s d i r e c t l y r e l a t e t o indoor a i r qua l i ty and high l e v e l s indicate energy waste. The average a i r exchange da ta reveals t h e t rue energy impact of a i r i n f i l t r a t i o n . A s more apartments a r e measured one begins t o see pa t te rns of a i r exchange and changing s tack flow influences on individual f l oo r s . Adjustment of window openings i s a l so shown t o immediately influence the a i r exchange
rate. One would have hoped for better agreement between the CCTG and PFT measurements on the same apartments, however, the differences point out how important complete mixing is to measurement procedures, and to obtaining accurate air exchange information.
ACKNOWLEDGEMENTS
The authors wish to thank the U.S. Department of Energy for the support for this research which is presently funded through Lawrence Berkeley Laboratory. We wish to acknowledge both the Systems and Services Divisions of DOE for the support of measurement system development and the actual field testing. The PFT work of Russel Dietz and his associates at BNL, and their assistance throughout our study, has helped to make the project possible. At Princeton, we wish to thank Tony Love11 and Ben Bolker for their work on the programming and analysis associated with the PFT and CCTG systems. At Lurnley homes, the help of the Asbury Park Housing Authority which allowed the establishment of the test apartment and interfacing with the occupants is gratefully acknowledged.
REFERENCES
1. CHARLESWORTH, P., "Air Exchange Rates and Air Tightness Measurement Techniques- An Applications Guide", AIVC University of Warwick Science Park, Coventry, UK, Document AIC-AG-2-88, 1988.
2. HARRJE, D.T., DUTT, G.S., BOHAC, D.L., and GADSBY, K.J., "Documenting Air Movements and Air Infiltration in Multicell Buildings Using Various Tracer Techniques", ASHRAE Transactions, Vol. 91, Pt 2, 1985.
3. BOHAC, D.L., "The Use of a Constant Concentration Tracer Gas System to Measure Ventilation in Buildings, Princeton University Center for Energy and Environmental Studies, Report No. 205, 1986 (292 pages) .
4. DIETZ, R.N., GOODRICH, R.W., and COTE, E.A., "Performance of a Passive Perfluorocarbon Tracer System for Building Ventilation and Air Exchange Measurement ; , ASTM Svm~osium - Measured Air Leakape Performance of Buildings, - (Eds. Trechsel, H. R.) and Lagus, P.L.) ASTM STP 904, 1986.
5. DIETZ, R.N., D'OTTAVIO, T.W., and GOODRICH, R.W., "Multizone Infiltration Measurements in Homes and Buildings Using a Passive Perf luorocarbon Tracer Method". ASHRAE Transactions Vol. 91, Part 2, 1985.
6. BOHAC, D.L., HARRJE, D.T., and HOMER, G.S., "Field Study Comparisons of Constant Concentration and PFT Infiltration Measurements", Proceedings - of the 8th AIVC Conference - Ventilation Technologv Research and Application, Supplement AIVC-PROC-8-5-87, 1987, pp. 47-62.
7. HARRJE, D.T., DECICCO, J.M., and KIRKPATRICK, D.L., "Optimizing Building Control Strategies Using Short-Term Energy and Comfort Monitoring", Clima 2000, W S Messe , Copenhagen, 1985, pp. 7-12.
8. HARRJE, D.T., and KEMPTON, W.M., 'Ventilation, Air Infiltration and Building Occupant Behaviortt, Proceedinps - of the 7th AIVC Conference - Occupant Interaction with Ventilation Svstems, Document AIC-PROC-7-86, AIVC, Bracknell, Berkshire, Great Britain, 1986, pp. 2.1-2.16.
9. BOHAC, D.L., and W E , D.T., "The Use of Modified Constant Concentration Techniques to Measure Infiltration and Interzone Air Flows:, Proceedings of the 8th AIVC Conference - Ventilation Technologv - Research and Aa~lication Great Britain, 1987, AIVC Document AIC-PROC-8-87 (Supplement).
lO.DIETZ, R.N., "Overview of Tracer Technology Instrumentation for Short-Term and Real-Time Building Ventilation Determination, AIVA Measurement Techniaues Workshop - Proceedings and Biblio~raphv, -
University of Warwick Science Park, Coventry, UK, Document AIC- TN-24-88, 1988, pp. 101-141.
Discussion
Paper 11
J. Van Der Maas (Ecole ~olytechnique Federale de Lausanne, Switzerland) Is it true, as suggested in the Figure comparing PET and CCTG data, that in the case of inccnnplete mixinq the effects of PFT and CCPG are opposite and that therefore-these are complementary methods giving the potential to discard "incamplete mixing" data points?
D. Harrje (Princeton University) If all PFT samplers and sources were identically placed to the CCTG sampling and injection tubes, we would anticipate that mixing effects would be the same. However restrictions as to where the CCTG tubing could be run in the occupied apartments and the fact that multiple sources of the PET gases were required to supply sufficient tracer, made the layout of source and sampling points different for PFT and CCTG. Hence mixing effects can be different between systans and between apartments.
M, Bassett (Building Research Association of New Zealand) Can you briefly outline your PET system and give some indication of set-up and operational costs?
Do Harrje (Princeton University) The version of the PFT system we use at Princeton is modelled after the Brookhaven Laboratory's airborne unit - the unit used to measure power plant seeded PFT in the study of acid rain. The table-top version used in our laboratory costs.approximately $20,000 for the gas chromatographic equipment and $12,000 for the special rack to hold samplers, the heating controls for energising the rack and the microcomputer to operate the entire system. The system has used three or four tracer gases with 8 minutes per analysis required for each tracer sampler (CATS) .

EFFECTIVE VENTILATION
9th AIVC Conference, Gent, Belgium 12-15 September, 1988
P a p e r 1 2
ANALYSIS OF ERRORS FOR A FAN-PRESSURIZATION TECHNIQUE FOR MEASURING INTER-ZONAL AIR LEAKAGE
MAGNUS K. HERRLIN AND MARK P. MOD ERA^ Division of Building Services Engineering Royal Institute of Technology S-10044 Stockholm Sweden
lied Science Division Lawrence Berkeley Laboratory Berkeley, California, U.S.A.

ABSTRACT The problem of predicting air flows in a multi-zone building has received considerable attention in the past ten years. An important issue identified by this work was the lack of reliable measurements of the flow resistances between the zones of such buildings. This report analyzes the uncertainties associated with a fan-pressurization technique for measuring the inter- zonal leakage (inverse flow resistance) in a multi-zone building. The tech- nique involves two blower doors, one in each of the two zones between which the leakage is being measured. The evaluation of the technique is based upon simulations using MOVECOMP, a multizone infiltration and ventilation simulation program, which is used to determine what data would be recorded when using the procedure in a multi-family building under typical wind conditions using typical fan pressurization equipment. These simulations indicate that wind-induced uncertainties in the deter- mined leakage parameters do not exceed 10% for windspeeds lower than 5 m/s, but that pressure and flow measurement uncertainties raise leakage parameter uncertainties above 40% at any wind speed. By performing additional simulations, the sensitivity of our results to the subtleties of the measurement protocol and the assumed test conditions are examined. These examinations highlight the importance of using an appropriate refer- ence for the pressure difference across the primary-zone envelope, as well as the importance of improving the precision this measurement.
INTRODUCTION The problem of predicting air flows in a multi-zone building has received considerable attention in the past ten years. An important issue identified by this work was the lack of reliable measurements of the flow resistances between the zones of such buildings (Feustel 1987). Several multi-zone leakage measurement techniques have been tried over the past several years, some of which determine only the Effective Leakage Area (ELA) of the inter-zonal path, while others determine both the flow coefficient and flow exponent needed in power-law models of crack flow. One technique used six blower doors simultaneously to measure the total envelope leakage area of a six-unit building, and used single-zone blower- door measurements to measure the total leakage area of each apartment, which in combination were used to determine the split between exterior- envelope and inter-zonal leakage (Modera 1985). Modera used data taken with this technique in a multi-zone infiltration model by apportioning the inter-zonal leakage area by surface area, and assuming a constant flow exponent. Another technique used two blower doors simultaneously to

measure each inter-zonal flow path, measuring the flow required to main- tain several nominal differential pressures across the primary zone with and without pressurizing the secondary zone to the same pressure. With this technique, the leakage area of the primary zone could be determined with and without the inter-zonal path, or the flows at each nominal pressure differential could be subtracted and used to obtain the flow exponent and coefficient of the inter-zonal path (Diamond 1986). In general, multi-zone leakage measurements are acknowledged to have large uncertainties compared to single-zone leakage measurements. This increased uncertainty has been attributed to a number of effects, most not- ably the fact that any uncertainties in the measured blower-door flow rates are compounded by the flow subtractions used in multi-zone techniques, and also the fact that multi-zone buildings are usually taller than single- family residences and are therefore subjected to higher windspeeds. We therefore decided to compare the effects of wind with the effects of flow and pressure measurement uncertainties on multi-zone leakage measure- ments made with a two blower-door technique. However, due to the con- siderable expense, logistical difficulties, and the uncontrolled nature of field experiments, we decided to evaluate the these uncertainties using a detailed multizone air-flow network model.
MULTI-ZONE MEASUREWNT TECHNIQUE The multizone leakage measurement technique that we examined utilizes two blower doors, one in each of the zones adjacent to the leakage path being measured. The technique is to maintain a constant indoor-outdoor pressure differential in one zone (e.g. 50 Pa), while simultaneously varying the pressure in the second zone. Thus, for a series of differential pressures (e.g. between 0 and 50 Pa) between the primary and secondary zones, the flow rates required to maintain the constant pressure differential across the primary zone are recorded. This technique was chosen because of two potential advantages it has over the techniques that have been examined in the past. First, because the primary zone is kept at a constant large pres- sure differential, the effects of wind on the measured flow should be reduced. Also, because the pressure differential across the leakage path is measured directly, the sensitivity to uncertainties in the measured pressure differentials should be reduced. Assuming that the flow from the primary zone to adjacent zones and out- side is maintained constant, the flow through the fan pressurizing the pri- mary zone can be expressed as:
where:
QP is yle total flow into the primary zone (i.e. measured by the fan) [m Is1 9
Q,,,, is the flow from primary zone to outside and t all zones except 8 the secondary zone (assumed to be constant) [m Is], k ~ 6
is the flow coefficient o $ the leakage path between the primary and secondary zones [m /s pan],
ap i j is the pressure difference between the primary and secondary zones [Pa], and
nij is the flow exponent of the leakage path between the primary and secondary zones [dimensionless].
Equation 1 relates the fan flow to the leakage-path pressure differential via three parameters, Q,,,, k,, and n,,. Thus, by performing a non-linear search for the three parameters based upon a series of pressure- difference/fan-flow pairs, both the flow exponent and coefficient are obtained.
In addition to Equation 1, there are a number of methodology options associated with using this technique, many of which have significant impli- cations for the uncertainty associated with the leakage characteristics determined. The options which have to be addressed by any examination of the technique include: what pressure differential to maintain across the primary zone, how to choose the outside pressure upon which to base the pressure differential across the primary zone, how to specify the leakage conditions of the adjacent zones (i.e. open or closed windows), how many pressure-differential/fan-flow pairs to use for a measurement, and what operator technique and instrumentation to assume for obtaining the pressure-differential/fan-flow pairs. The reference technique examined was chosen based upon a combination of uncertainty-reduction and practical- application considerations. The chosen configuration uses 50 P a as the pressure differential (due to practical limitations of fan size), uses a pressure-averaging probe covering the three exterior surfaces of the pri- mary zone for the outside pressure (to reduce uncertainty), assumes that the windows and doors of adjacent zones are closed during the test (based upon the practical difficulties associated with having all windows in an apartment building open at the same time), and uses six pressure- differential/fan-flow pairs (to conform with customary measurement prac- tices). To gauge the sensitivity of our results to these assumptions, the

effects of each of these choices on measurement uncertainty are examined individually a t a typical wind condition. In addition, to obtain each pressure-flow pair it is assumed that the operator adjusts the fan flow so as to maintain the 50 Pa primary-zone pressure differential and then records the fan-flow and inter-zone pressure differential simultaneously. It is further assumed that the observed pressures are not affected by windspeed fluctuations at frequencies hig er than 0.25 Hz (period < 4 sec), or at fre- 8 quencies lower than 1.67 x 10- Hz (period > 10 min).
TEST CONDITIONS As for any simulation-based study, a number of decisions had to be made early-on in choosing the conditions under which to examine the technique. These conditions included: the type of building, the choice of primary zone, the choice of leakage path, the total and inter-zonal leakage levels, the degree of shielding, and the type of wind. The effects of these uncer- tainties on the determination of the leakage characteristics can be be included in the simulations in a manner similar to that used for the wind. The reference set of test conditions chosen and the reference technique described above are summarized in Table I.
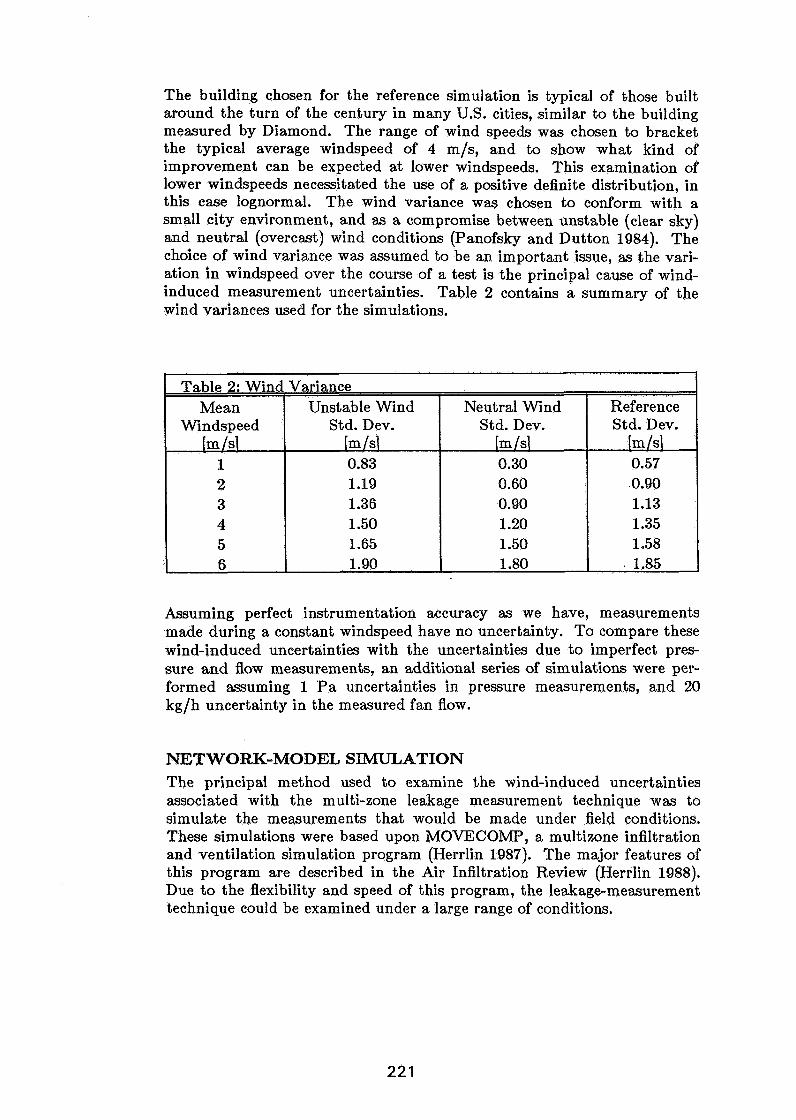
The building chmen for the reference simulation is typical of those built around the turn of the century in many U.S. cities, similar to the building measured by Diamond. The range of wind speeds was chosen to bracket the typical average windspeed of 4 m/s, and to show what kind of improvement can be expected at lower windspeeds. This examination of lower windspeeds necessitated the use of a positive definite distribution, in this case lognormal. The wind variance was chosen to conform with a small city environment, and as a compromise between unstable (clear sky) and neutral (overcast) wind conditions (Panofsky and Dutton 1984). The choice of wind variance was assumed to be an important issue, as the vari- ation in windspeed over the course of a test is the principal cause of wind- induced measurement uncertainties. Table 2 contains a summary of the wind variances used for the simulations.
Assuming perfect instrumentation accuracy as we have, measurements made during a constant windspeed have no uncertainty. To compare these wind-induced uncertainties with the uncertainties due to imperfect pres- sure and flow measurements, an additional series of simulations were per- formed assuming 1 Pa uncertainties in pressure measurements, and 20 kg/h uncertainty in the measured fan flow.
Table 2: Wind Variance
PISETWORK-MODEL SIMULATION The principal method used to examine the wind-induced uncertainties associated with the multi-zone leakage measurement technique was to simulate the measurements that would be made under field conditions. These simulations were based upon MOVECOMP, a multizone infiltration and ventilation simulation program (Herrlin 1987). The major features of this program are described in the Air Infiltration Review (Herrlin 1988). Due to the flexibility and speed of this program, the leakage-measurement technique could be examined under a large range of conditions.
Reference Std. Dev.
[m /s\ -
0.57 0.90 1.13 1.35 1.58
. 1.85
Neutral Wind Std. Dev.
[m /sl 0.30 0.60 0.90 1.20 1 .50 1.80
Mean Windspeed
Im /sl 1 2 3 4 5 6
Unstable Wind Std. Dev.
(m /sl 0.83 1.19 1.36 1 .50 1.65 1.90
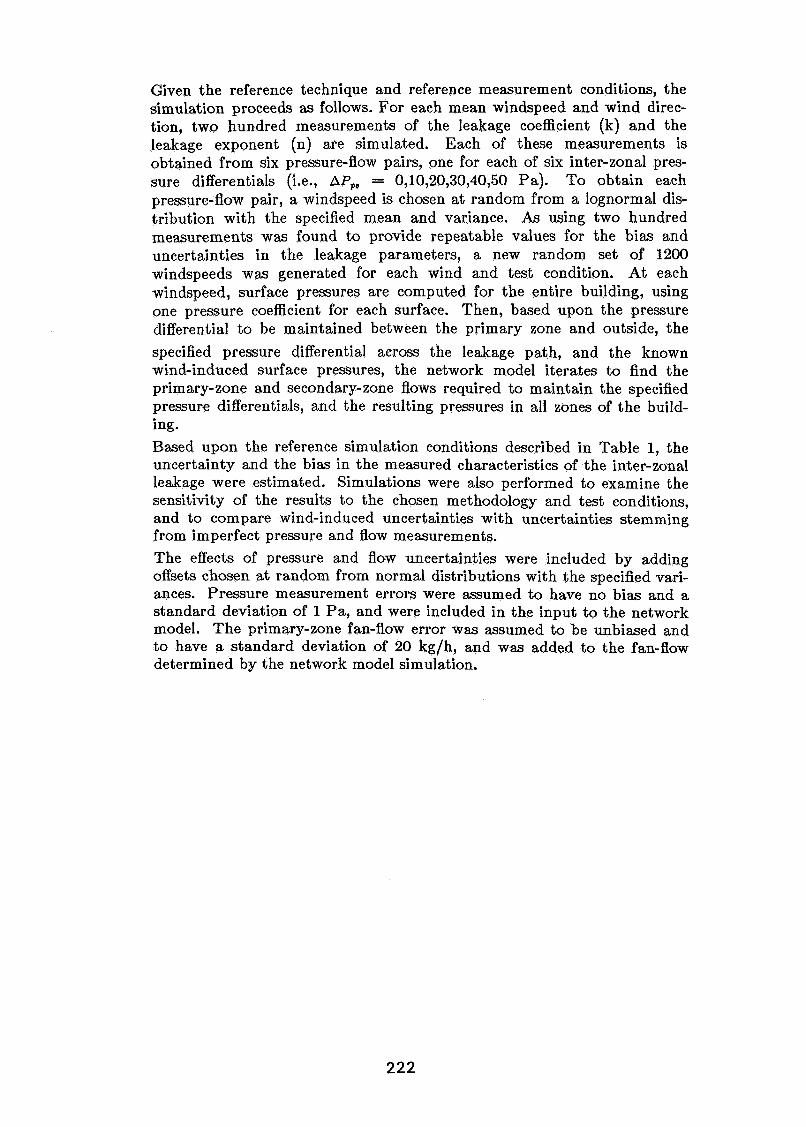
Given the reference technique and reference measurement conditions, the simulation proceeds as follows. For each mean windspeed and wind direc- tion, two hundred measurements of the leakage coefficient (k) and the leakage exponent (n) are simulated. Each of these measurements is obtained from six pressure-flow pairs, one for each of six inter-zonal pres- sure differentials (i.e., AP,, = 0,10,20,30,40,50 Pa). To obtain each pressure-flow pair, a windspeed is chosen at random from a lognormal dis- tribution with the specified mean and variance. As using two hundred measurements was found to provide repeatable values for the bias and uncertainties in the leakage parameters, a new random set of 1200 windspeeds was generated for each wind and test condition. At each windspeed, surface pressures are computed for the entire building, using one pressure coefficient for each surface. Then, based upon the pressure differential to be maintained between the primary zone and outside, the specified pressure differential across the leakage path, and the known wind-induced surface pressures, the network model iterates to find the primary-zone and secondary-zone flows required to maintain the specified pressure differentials, and the resulting pressures in all zones of the build- lng. Based upon the reference simulation conditions described in Table 1, the uncertainty and the bias in the measured characteristics of the inter-zonal leakage were estimated. Simulations were also performed to examine the sensitivity of the results to the chosen methodology and test conditions, and to compare wind-induced uncertainties with uncertainties stemming from imperfect pressure and flow measurements. The effects of pressure and flow uncertainties were included by adding offsets chosen a t random from normal distributions with the specified vari- ances. Pressure measurement errors were assumed to have no bias and a standard deviation of 1 Pa, and were included in the input to the network model. The primary-zone fan-flow error was assumed to be unbiased and to have a standard deviation of 20 kg/h, and was added to the fan-flow determined by the network model simulation.
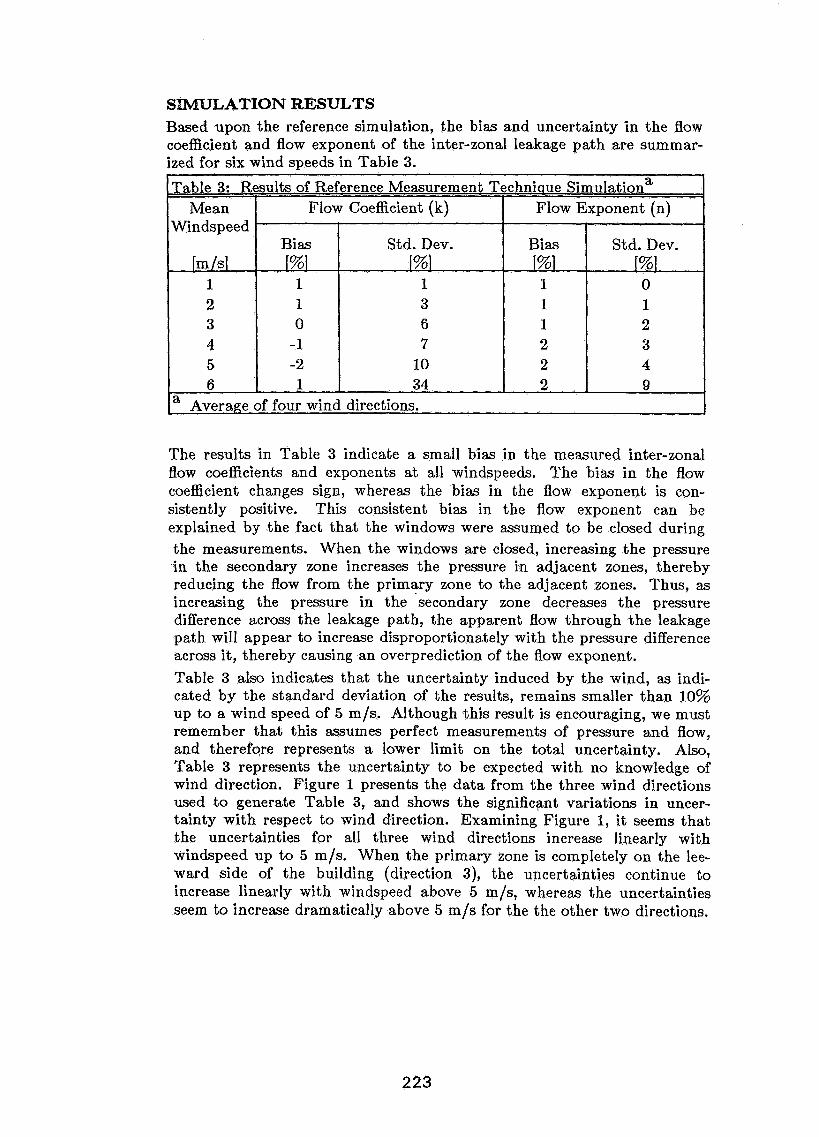
SIMULATION RESULTS Based upon the reference simulation, the bias and uncertainty in the flow coefficient and flow exponent of the inter-zonal leakage path are summar- ized for six wind speeds in Table 3.
The results in Table 3 indicate a small bias in the measured inter-zonal flow coefficients and exponents at all windspeeds. The bias in the flow coefficient changes sign, whereas the bias in the flow exponent is con- sistently positive. This consistent bias in the flow exponent can be explained by the fact that the windows were assumed to be closed during
Table 3: Results of Reference Measurement Technique simulationa
the measurements. When the windows are closed, increasing the pressure in the secondary zone increases the pressure in adjacent zones, thereby reducing the flow from the primary zone to the adjacent zones. Thus, as increasing the pressure in the secondary zone decreases the pressure difference across the leakage path, the apparent flow through the leakage path will appear to increase disproportionately with the pressure difference across it, thereby causing an overprediction of the flow exponent.
Mean Windspeed
[m /sl 1 2 3 4 5 6
Table 3 also indicates that the uncertainty induced by the wind, as indi- cated by the standard deviation of the results, remains smaller than 10% up to a wind speed of 5 m/s. Although this result is encouraging, we must remember that this assumes perfect measurements of pressure and flow, and therefore represents a lower limit on the total uncertainty. Also, Table 3 represents the uncertainty to be expected with no knowledge of wind direction. Figure 1 presents the data from the three wind directions used to generate Table 3, and shows the significant variations in uncer- tainty with respect to wind direction. Examining Figure 1, it seems that the uncertainties for all three wind directions increase linearly with windspeed up to 5 m/s. When the primary zone is completely on the lee- ward side of the building (direction 3), the uncertainties continue to increase linearly with windspeed above 5 m/s, whereas the uncertainties seem to increase dramatically above 5 m/s for the the other two directions.
a Average of four wind directions.
Flow Coefficient (k)
Bias
I%! 1 1 0
-1 -2 1
Flow Exponent (n)
Std. Dev.
I%) 1 3 6 7
10 34
Bias T%1 1 1 1 2 2 2
Std. Dev. I%l 0 1 2 3 4 9
Uncertainty in k versus Windspeed
Windspeed [m/s]
--a- Wind parallel to common wall - o - Wind towards primary zone - - - a-- - Wind towards secondary zone
Figure 1. Uncertainty (scatter) in the measured leakage coefficient of the common wall between two apartments as a function of windspeed for three different wind directions (based upon refer- ence simulation).
This indicates that the wind-induced uncertainty cannot be assumed to simply scale with windspeed or with the dynamic pressure of the wind, but rather must also depend upon other factors. One potential factor is the interaction of the pressurization of the primary and secondary zones, the non-linearity of the building leaks, and the wind-induced surface pressures. A more careful examination of the raw simulation results indicated that the flow exponent and flow coefficient were negatively correlated. This correlation is illustrated in Figure 2, which is a scatter plot of the flow coefficient, k, versus the flow exponent, n, for the reference simulation con- ditions a t a windspeed of 4 m/s. The negative sign of the correlation stems from the fact that the bulk of the measurements are made a t pres- sures around 25 Pa, whereas the flow coefficient lc is equivalent to the leak- age (flow) a t 1 Pa. Thus, excluding any correlated bias in the pressure and flow measurements, an increase in the determined exponent translates into a decrease in the determined flow coefficient.
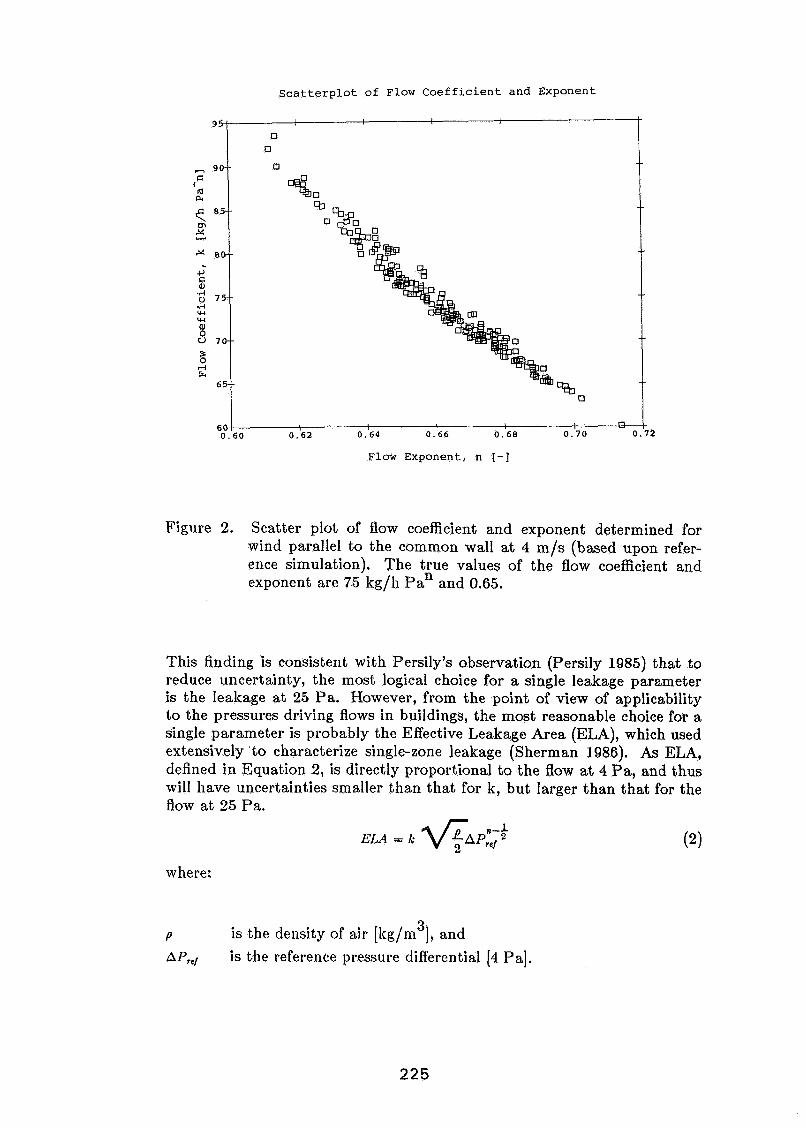
Scatterplot of Flow Coefficient and Exponent
n 6 0.60 0.62 0 .'64 0.66 0.68 0.70 0.72
Flow Exponent, n [ - I
Figure 2. Scatter plot of flow coefficient and exponent determined for wind parallel to the common wall at 4 m/s (based upon refer- ence simulation). The true values of the flow coefficient and exponent are 75 kg/h pan and 0.65.
This finding is consistent with Persily's observation (Persily 1985) that to reduce uncertainty, the most logical choice for a single leakage parameter is the leakage at 25 Pa. However, from the point of view of applicability to the pressures driving flows in buildings, the most reasonable choice for a single parameter is probably the Effective Leakage Area (ELA), which used extensively to characterize single-zone leakage (Sherman 1986). As ELA, defined in Equation 2, is directly proportional to the Aow at 4 Pa, and thus will have uncertainties smaller than that for k, but larger than that for the flow a t 25 Pa.
n - f ELA = k PreZ
where:
P 3 is the density of air [kg/m 1, and
APT, is the reference pressure differential [4 Pa].
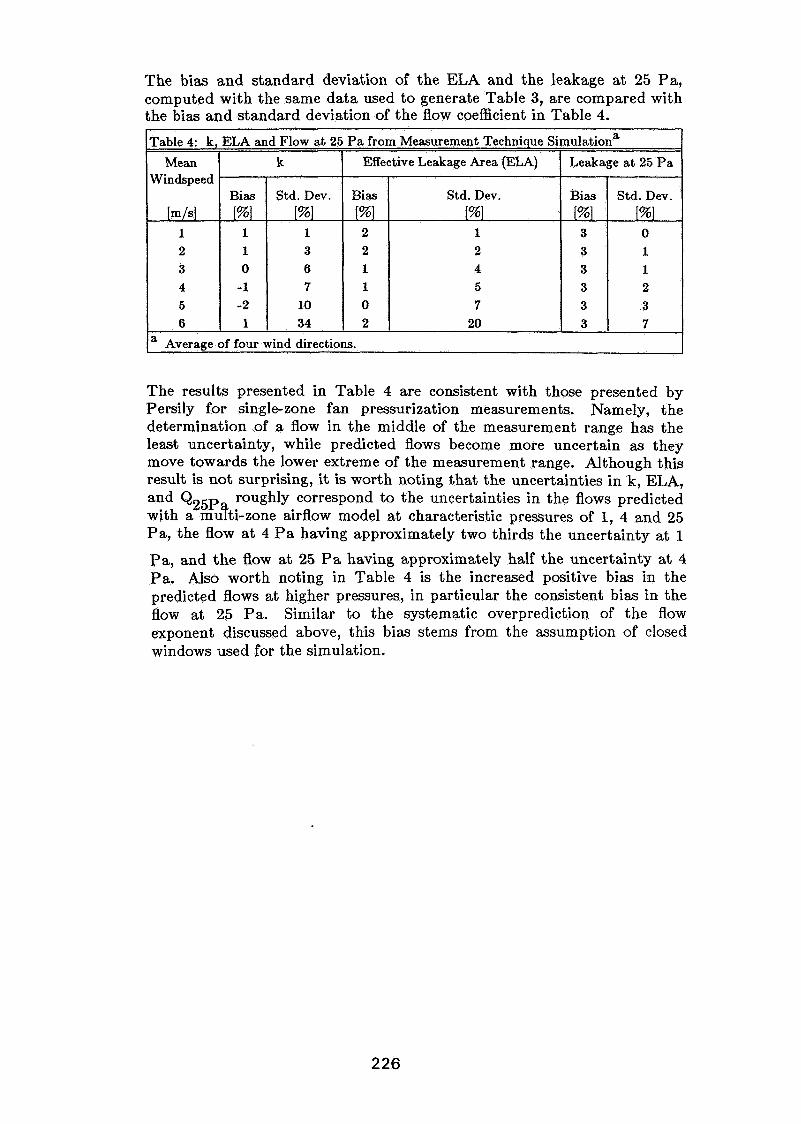
The bias and standard deviation of the ELA and the leakage a t 25 Pa, computed with the same data used to generate Table 3, are compared with the bias and standard deviation of the flow coefficient in Table 4.
The results presented in Table 4 are consistent with those presented by Persily for single-zone fan pressurization measurements. Namely, the determination of a flow in the middle of the measurement range has the least uncertainty, while predicted flows become more uncertain as they move towards the lower extreme of the measurement range. Although this result is not surprising, i t is worth noting that the uncertainties in k, ELA,
and Q 2 5 ~ roughly correspond to the uncertainties in the flows predicted with a rnuyti-zone airflow model at characteristic pressures of 1, 4 and 25 Pa, the flow at 4 P a having approximately two thirds the uncertainty at 1
Pa, and the flow at 25 Pa having approximately half the uncertainty at 4 Pa. Also worth noting in Table 4 is the increased positive bias in the predicted flows at higher pressures, in particular the consistent bias in the flow at 25 Pa. Similar to the systematic overprediction of the flow exponent discussed above, this bias stems from the assumption of closed windows used for the simulation.
Table 4: k, ELA and Flow at 25 Pa from Measurement Technique simulationa
Mean Winds peed
m s
1 2 3
4 5 6
a Average of four wind directions.
Effective Leakage Area (EM) k
Bias
[%I 2 2 1 1 0 2
Leakage at 25 Pa
Bias
[%I 1 1 0
- 1 -2 1
Std. Dev.
[%] 1 2 4
5 7
20
Bias
[%I 3 3
3
3
3
3
Std. Dev.
[%I 1 3
6 7
10 34
Std. Dev.
[%I 0 1 1 2 3
7
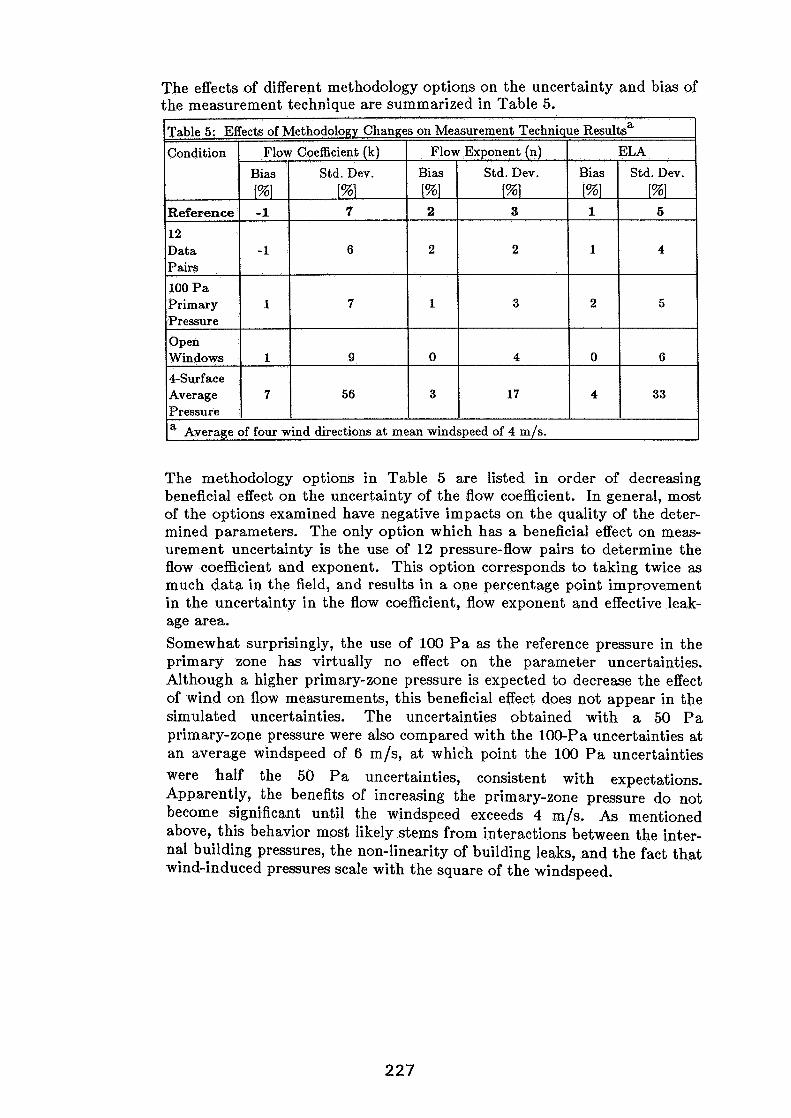
The methodology options in Table 5 are listed in order of decreasing beneficial effect on the uncertainty of the flow coefficient. In general, most of the options examined have negative impacts on the quality of the deter- mined parameters. The only option which has a beneficial effect on meas- urement uncertainty is the use of 12 pressure-flow pairs to determine the flow coefficient and exponent. This option corresponds to taking twice as much data in the field, and results in a one percentage point improvement in the uncertainty in the flow coefficient, flow exponent and effective leak- age area.
The effects of different methodology options on the uncertainty and bias of the measurement technique are summarized in Table 5.
Table 5: Effects of Methodology Changes on Measurement Technique ~esults"
Somewhat surprisingly, the use of 100 P a as the reference pressure in the primary zone has virtually no effect on the parameter uncertainties. Although a higher primary-zone pressure is expected to decrease the effect of wind on flow measurements, this beneficial effect does not appear in the simulated uncertainties. The uncertainties obtained with a 50 P a primary-zone pressure were also compared with the 100-Pa uncertainties at an average windspeed of 6 m/s, at which point the 100 P a uncertainties were half the 50 P a uncertainties, consistent with expectations. Apparently, the benefits of increasing the primary-zone pressure do not become significant until the windspeed exceeds 4 m/s. As mentioned above, this behavior most likely stems from interactions between the inter- nal building pressures, the non-linearity of building leaks, and the fact that wind-induced pressures scale with the square of the windspeed.
Average of four wind directions at mean windspeed of 4 m/s.
Condition
Reference
12 Data Pairs
100 Pa Primary Pressure
Open Windows
4-Surface Average Pressure a
ELA Flow Exponent (n)
Bias
[% ] 1
1
2
0
4
Bias
[%] 2
2
1
0
3
Std. Dev.
[%] 5
4
5
6
33
Flow Coefficient (k) Std. Dev.
[%I 3
2
3
4
17
Bias
[%] -1
- 1
1
1
7
Std. Dev.
[%] 7
6
7
9
56
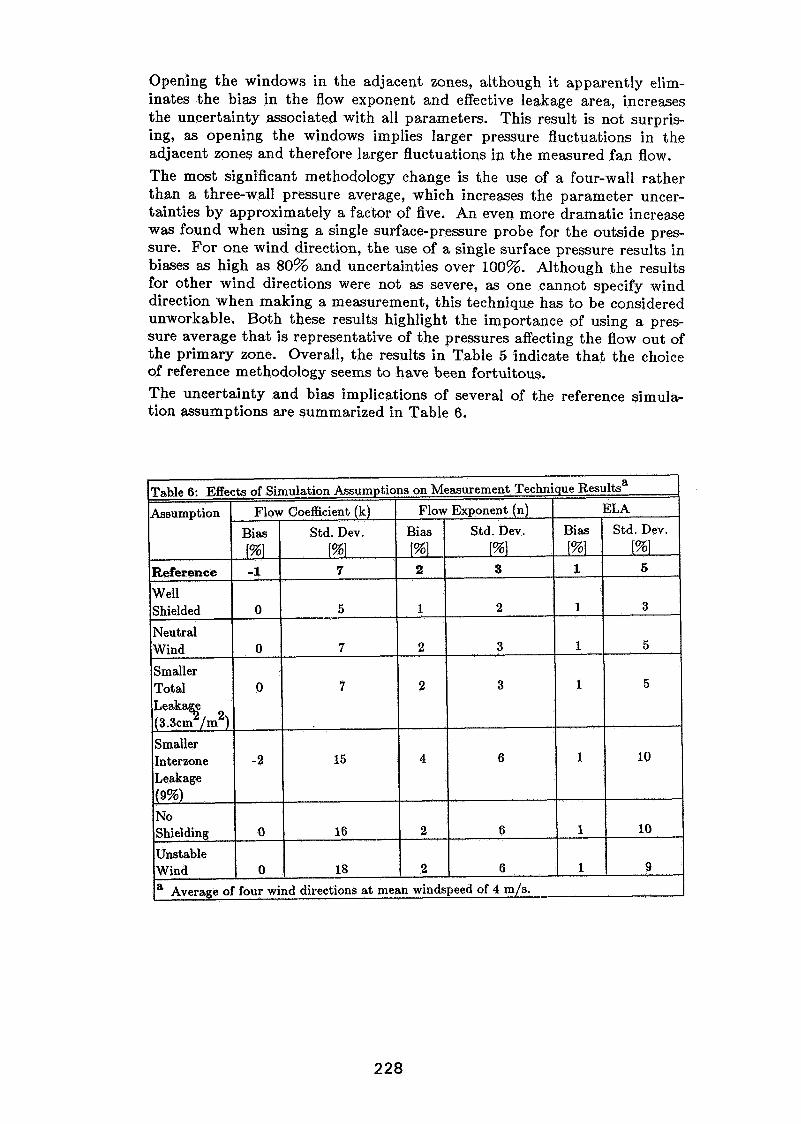
Opening the windows in the adjacent zones, although it apparently elim- inates the bias in the flow exponent and effective leakage area, increases the uncertainty associated with all parameters. This result is not surpris- ing, as opening the windows implies larger pressure fluctuations in the adjacent zones and therefore larger fluctuations in the measured fan flow. The most significant methodology change is the use of a four-wall rather than a three-wall pressure average, which increases the parameter uncer- tainties by approximately a factor of five. An even more dramatic increase was found when using a single surface-pressure probe for the outside pres- sure. For one wind direction, the use of a single surface pressure results in biases as high as 80% and uncertainties over 100%. Although the results for other wind directions were not as severe, as one cannot specify wind direction when making a measurement, this technique has to be considered unworkable. Both these results highlight the importance of using a pres- sure average that is representative of the pressures affecting the flow out of the primary zone. Overall, the results in Table 5 indicate that the choice of reference methodology seems to have been fortuitous. The uncertainty and bias implications of several of the reference simula- tion assumptions are summarized in Table 6.
Table 6: Effects of Simulation Assumptions on Measurement Technique ~esults"
a Average of four wind directions at mean windspeed of 4 m/s.
Assumption
Reference
Well Shielded
Neutral Wind
Smaller Total L e a k a ~ (3.3cm /m ) 2
Smaller Interzone Leakage (9%)
No Shielding Unstable Wind
Bias [%] 1
1
1
1
1
1
1
ELA Std. Dev.
[%I 6
3
5
5
10
10
9
Flow
Bias [%] 2
1
2
2
4
2
2
Exponent (n) Std. Dev.
[% ] 3
2
3
3
6
6
6
Flow
Bias [%] -1
0
0
0
-2
0
0
Coefficient (k) Std. Dev.
[%] 7
5
7
7
15
16
18

Similar to Table 5, the simulation assumptions in Table 6 are listed in order of decreasing beneficial effect on the uncertainty of the flow coefficient. Also similar to Table 5, the results in Table 6 indicate that the choice of reference simulation was fortuitous, apparently corresponding to a lower limit on the uncertainties to be expected. The only improvement in measurement uncertainty occurs by assuming that the building was well shielded from the wind. Somewhat surprisingly, going from average wind variance to neutral wind variance does not have a significant effect on the measurement uncertainty. This result, combined with the significant increase in uncertainty associated with assuming unstable wind, seems to indicate that the effects of wind turbulence on measurement uncertainty do not scale linearly with turbulence intensity, but rather result from complex interactions between the internal building pressures, the non-linearity of building leaks, and the fact that wind-induced pressures scale with the square of the windspeed. The non-linear dependence of measurement uncertainty on the pressure variations is further illustrated by the significant increases in uncertainty associated with assuming that the building is unshielded.
Not surprisingly, the determined biases and uncertainties in the measured parameters do not depend on the absolute level of leakage in the building (remember we are not including instrumentation uncertainties), but do show approximately linear dependence on the relative size of the leakage path being measured. This latter result indicates a constant absolute uncertainty in the parameters being determined. To put the wind-induced leakage measurement uncertainties into perspec- tive, several simulations of measurements made with flow and pressure uncertainties were performed. The results of these simulations, based upon the uncertainties specified above, are presented in Table 7.
Table 7: Effects of Flow and Pressure Measurement Uncertainties on Measurement Technique ~esu l t s "
Assumption
Reference a t4m/s Reference plus Flow and Pressure Uncertainty at 4 m/s Reference plus Flow and Pressure Uncertainty at 1 m/s a Average of four wind directions.
Flow Coefficient (k) Bias 1%1
-1
23
16
Std. Dev. 1%1
7
64
63
Flow Exponent (n) Bias 1%1
2
2
3
ELA Std. Dev.
1%1
3
25
23
Bias 1%1
1
12
8
Std. Dev. 1%1
5
42
42
The results in Table 7 point out the importance of uncertainties in meas- urements of pressure differentials and fan flows. Compared to the refer- ence simulation, the addition of these measurement uncertainties increases the leakage parameter uncertainties by approximately a factor of eight. Table 7 also indicates a large positive bias in k and ELA resulting from the addition of measurement uncertainties.
DISCUSSION The demonstrated importance of pressure and flow measurement uncer- tainties for producing accurate measurements of interzonal leakage is prob- ably the key finding of this report. Due to the significance of this finding, additional simulations were performed to separate the effects of pressure and flow uncertainties. These simulations indicated that pressure measure- ments were a more important source of uncertainty and bias in the meas- ured leakage parameters. These results imply that techniques for reducing measurement uncertainty, particularly pressure measurement uncertainty, will have significant impacts on leakage-parameter uncertainty. As the chosen uncertainties in pressure and flow measurements represent typical values for existing leakage-measurement equipment, there are a number of uncertainty-reduction techniques which could be applied. For example, the use of well-calibrated electronic pressure measurement equipment could reduce pressure measurement uncertainties by almost a factor of ten. Further improvement could be potentially be obtained by using time aver- aged (or filtered) pressure and flow measurements, or by using multiple pressure transducers rather than a single averaging probe to determine an average primary-zone pressure differential.
Pressure and flow measurement uncertainties, in addition to increasing uncertainty, also induced a significant positive bias in the measured flow coefficients and leakage areas. As the observed bias can have important implications, and because the use of different random samples indicated the need for a larger sample size, the causes and potential means of miti- gating this bias will be a topic for future investigation.
The final discussioil point concerns the distributions of errors in the meas- ured leakage parameters, which in general were found to be normal. The exceptions occurred a t high uncertainties, in particular those associated with windspeeds above 5 m/s, and those obtained for the flow coefficient when including measurement errors. In both cases the error distributions were found to be positively skewed. This result indicates that the well- developed error analysis techniques for normal distributions cannot be gen- erally used for analyzing field leakage measurements.
CONCLUSIONS Several conclusions can be drawn based upon the results presented in this report. First, we feel that the simulations used to examine the proposed fan pressurization technique for measuring inter-zonal leakage proved to be an invaluable tool. Besides providing meaningful estimates of the expected field performance of the technique, the simulations provided quantitative analyses of the relative importance of various methodology options. The results of these simulations can thus be used to design a selective (i.e., economically-viable) experimental effort to test the proposed technique, and can serve as a yardstick for comparing alternative measurement tech- niques. The simulations also provided a clear separation between the contributions of measurement uncertainties and wind-induced uncertainties to the overall uncertainty in the measured leakage parameters. Perhaps the most significant findings based upon this study are the demonstrated importance of the choice of outdoor pressure reference for the primary zone, and the demonstrated importance of improving the accuracy of pressure and flow measurements. On the one hand, using a &face pressure average improves measurement uncertainty by a factor of five compared to using a four-face pressure average or a single-face pressure. On the other hand, including pressure and flow measurement uncertainties produces an eight-fold increase in leakage parameter uncertainty. The simulations demonstrate that at windspeeds below 6 m/s, the uncertainties associated with the described inter-zonal leakage measurement technique are predominantly caused by imperfect pressure and flow measurements. Up to 5 m/s the uncertainties due to the wind remain smaller than lo%, whereas the uncer- tainties stemming from imperfect measurements push the uncertainty above 40%. Based upon this demonstrated importance of pressure and flow uncertainties, the use of signal enhancement and scatter-reduction techniques are recommended. Specific techniques, such as temporal averaging or filtering of pressure signals, which were specifically not con- sidered, may play an important role in reigning in the presently unaccept- able leakage-parameter uncertainties.
REFERENCES
R.C. Diamond, M.P. Modera, H.E. Feustel, "Ventilation and Occupant Behavior in Two Apartment Buildings", Lawrence Berkeley Laboratory, LBL-21862, Presented at the 7th AIC Conference, Stratford-upon-Avon, UI(, September 1986.
H.E. Feustel, "A Simplified Model for Predicting Air Flow in Multizone Structures", February 1987, submitted to Building and Environment, Lawrence Berkeley Laboratory Report LBL-22325.
M.K. Herrlin, "Luftstromning i byggnader - en berakningsmodell", Divi- sion of Building Services Engineering, Royal Institute of Technology, Stockholm, Sweden, May 1087.
M.K. Herrlin, "MOVECOMP - A Multizone Infiltration and Ventilation Simulation Program", Air Infiltration Review, Volume 9, No. 3, Air Infiltration and Ventilation Center, Bracknell, England, May 1988.
M.P. Modera, J.T. Brunsell, R.C. Diamond, "Improving Diagnostics and Energy Analysis for Multi-Family Buildings: A Case Study," Proceedings of ASHRAE/DOE Conference, Thermal Performance of the Exterior Envelopes of Buildings 111, Clearwater, FL, December 1985.
H.A. Panofsky, J.A. Dutton, Atmospheric Turbulence, John Wiley & Sons, New York, 1984.
A.K. Persily, R.A. Grot, "Accuracy in Pressurization Data Analysis", ASHRAE Trans. 91(II), 1985.
M.H. Sherman, "Exegesis of Proposed AS- Standard 119: Air Leak- age Performance for Detached Single-Family Residential Buildings", Proceedings of BTECC/DOE Symposium, Guidelines for Air Infiltration, Ventilatio9t and Moisture Transfer, Fort Worth, TX, December 1986, Lawrence Berkeley Laboratory Report LBL-21040.
EFFECTIVE VENTILATION
9th AIVC Conference, Gent, Belgium 12-15 September, 1988
Paper 13
THE USE OF A GUARDED ZONE PRESSURIZATION TECHNIQUE TO MEASURE AIR FLOW PERMEABILITIES
OF A MULTI-ZONE BUILDING
J.-M. ~ R R R I N G E R C. ROECKER C.-A. ROULET
Labratoire d'Energie Solaire et de Physique du Bitirnent Ecole Polytechnique FU(5rale CH - 1015 Lausanne
SYNOPSIS
In the past few years, research efforts have been made to acquire accurate knowledge about infiltration and ventilation in multi-zone buildings. By this way, a wide variety of modelling techniques have been developed which suffer of a lack of satisfactory validations.
The purpose of this work is to set up a data bank of high quality measurements which will serve to cany out an empirical validation of multi-zone air infiltration programs. Among other data, a complete set of air flow permeabilities of a well known experimental midsize building will be included to this bank.
We use the guarded zone pressurization technique for the purpose of measuring this set. The system is made of two computer controlled fans which automatically pressurize the different rooms of the building. Pressures and air flows are sampled and gathered during the overall experiment which runs generally over one night. Values of the corresponding permeabilities are calculated from these data through a mean square fit.
An overview of the procedure used to measure these permeabilities as well as a description of the experimental equipment developed for this purpose, is presented in this paper. The measured permeabilities and a discussion of their values, are also be given.
LIST OF SYMl3OLS
measured air flow, [m3 h-11 air flow to outside, [m3 h-l] lateral flow, that is air flow to neighbouring zone j = 1 at east and j = 2 at west, [m3 h-11 airflow to the staircase pressure difference across a given element, [Pa] pressure difference between the guarded zone and the guarding zone, pa] experience matrix Mit = 1 if flow i is measured in experience t exfiltration coefficient connecting room s and the outside node, [m3 h-1 Pa-"] exfiltration coefficient connecting room s and the staircase node, [m3 h-1 Pa-"] exfiltration coefficient connecting room s and rwrm s' exponent, [-I leakage at 50 [Pa], [m3 h-11 leakage area, [cm2]
INTRODUCTION
Any detailed thermal analysis of a building should include inter-zone coupling in particular considering inter-zone air movements. While single zone description of the building seems to be satisfactory for static modeling, the prediction of thermal dynamic behaviour requires a multizone description of air movements [I].
The recently developed codes of air infiltration process take into account the permeability distribution and need an empirical validation with appropriate sets of measurements [2]. For this purpose we have decided to constitute a data bank for validation [3].
External and internal climate conditions and tracer gas measurements are taken simultaneously on the LESO building [4]. In addition, we present in this paper some pressurization measurements on the principal elements of the envelope and internal walls of this building.
For these measurements, we have used a guarded zone technique for which we have developed the Mage automatic measurement System.
This work is part of the Swiss ERL-project (Energierelevante Luftstriimungen in Gebauden) which is an important air infiltration research project [S].
THE GUARDED ZONE TECHNIOUE
The simple pressurization of a single room in a multiroom structure (fig. la) requires, at a given pressure difference APi, a measured air flow QM so that :
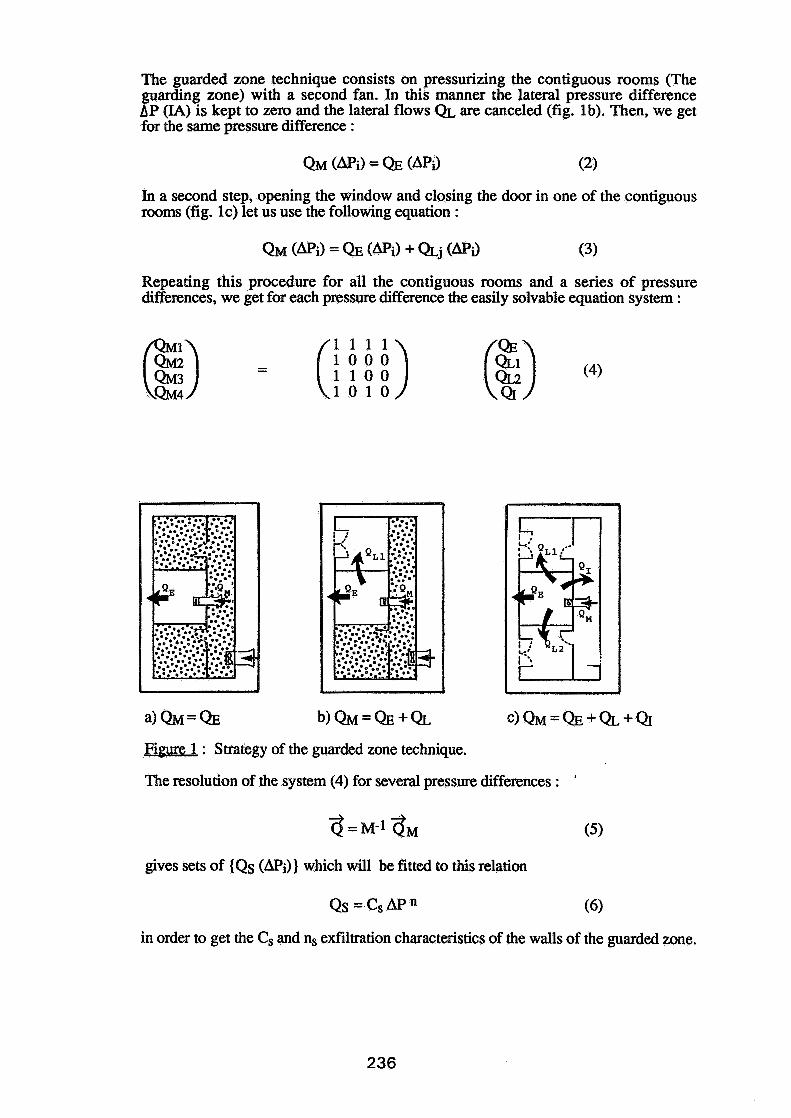
The guarded zone technique consists on pressurizing the contiguous rooms (The guarding zone) with a second fan. In this rnanner the lateral pressure difference AP (IA) is kept to zero and the lateral flows QL are canceled (fig. lb). Then, we get for the same pressure difference :
In a second step, opening the window and closing the door in one of the contiguous rooms (fig. lc) let us use the following equation :
Repeating this procedure for all the contiguous rooms and a series of pressure differences, we get for each pressure difference the easily solvable equation system :
a)&=% ~ ) Q M = Q E + & C)&=QE+QL+QI
&re 1 : Strategy of the guarded zone technique.
The resolution of the system (4) for several pressure differences : '
gives sets of (Qs (APi)) which will be fitted to this relation
Qs=CSAPn (6)
in order to get the Cs and ns exfiltration characteristics of the walls of the guarded zone.
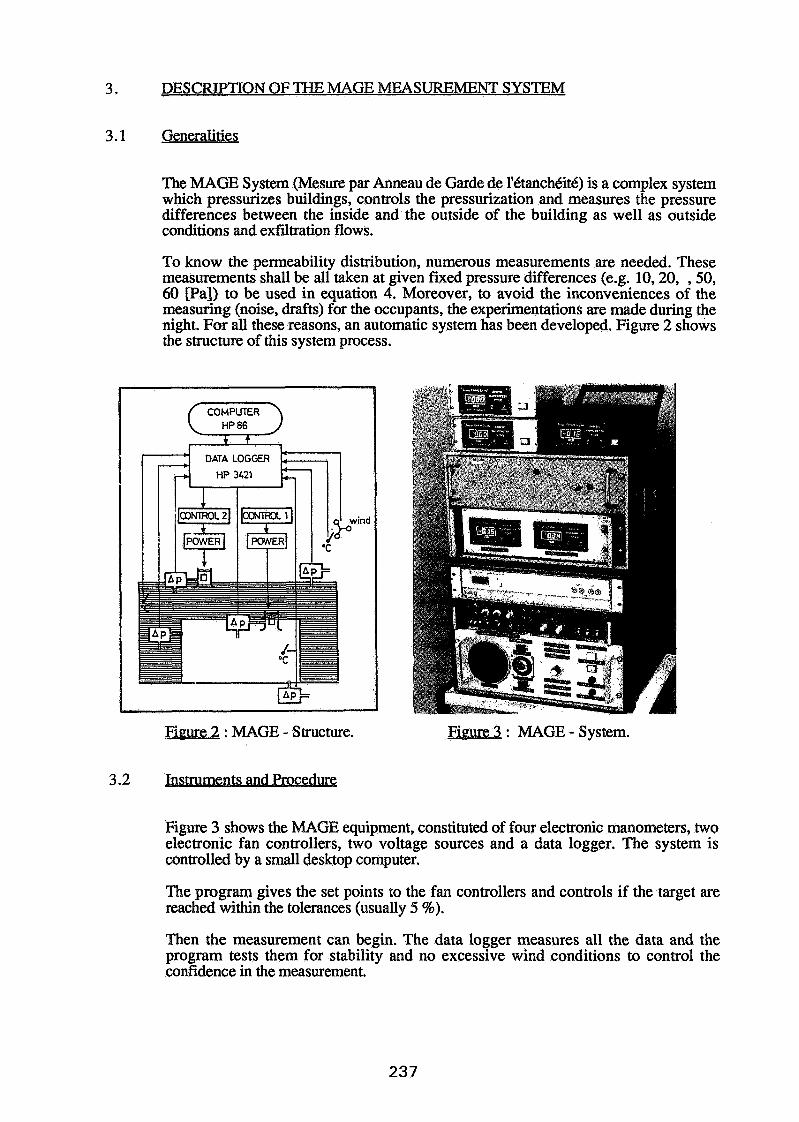
3. DESCRIPTION OF THE MAGE MEASUREMENT SYSTEM
3.1 Generalities
The MAGE System (Mesure par Anneau de Garde de l'ktanchkite) is a complex system which pressurizes buildings, controls the pressurization and measures the pressure differences between the inside and the outside of the building as well as outside conditions and exfiltration flows.
To know the permeability distribution, numerous measurements are needed. These measurements shall be all taken at given fixed pressure differences (e.g. 10,20, ,50, 60 [Pa]) to be used in equation 4. Moreover, to avoid the inconveniences of the measuring (noise, drafts) for the occupants, the experimentations are made during the night. For all these reasons, an automatic system has been developed. Figure 2 shows the structure of this system process.
m e 2 : MAGE - Structure. : MAGE - System.
Figure 3 shows the MAGE equipment, constituted of four electronic manometers, two electronic fan controllers, two voltage sources and a data logger. The system is controlled by a small desktop computer.
The program gives the set points to the fan controllers and controls if the target are reached within the tolerances (usually 5 %).
Then the measurement can begin. The data logger measures all the data and the program tests them for stability and no excessive wind conditions to control the confidence in the measurement.
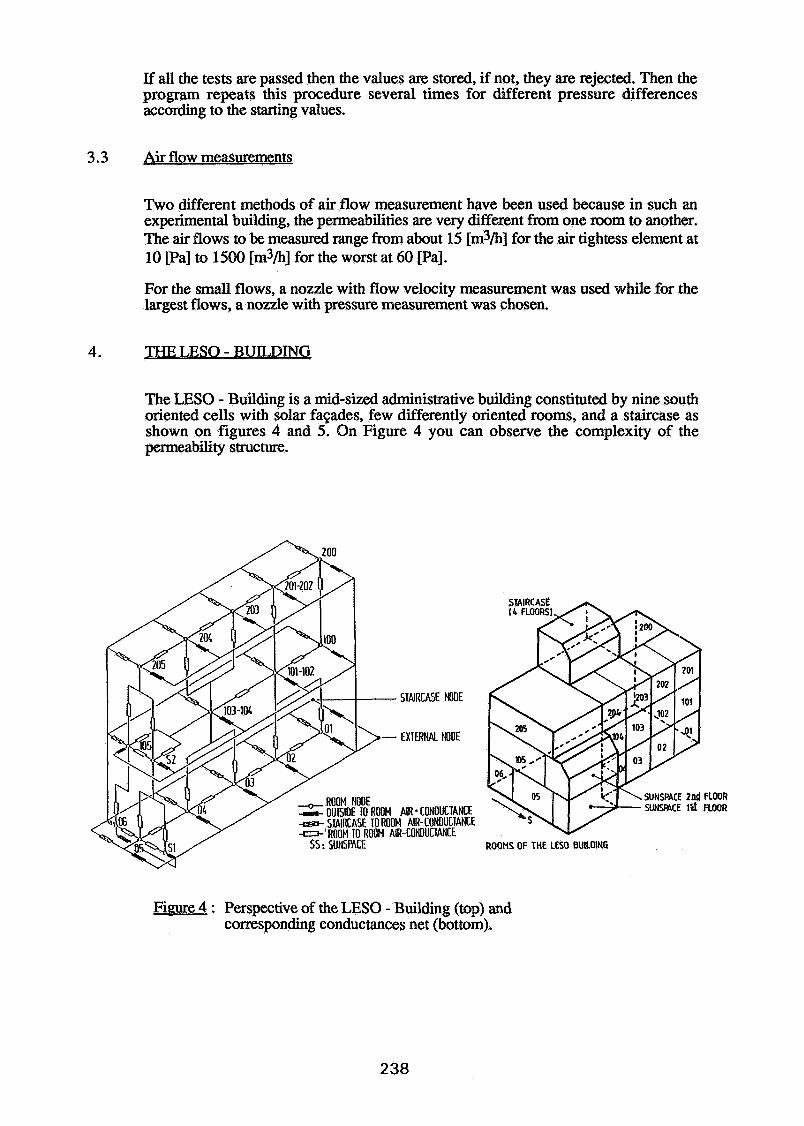
If all the tests are passed then the values are stored, if not, they are rejected. Then the program repeats this procedure several times for different pressure differences according to the starting values.
3.3 Air flow measurements
Two different methods of air flow measurement have been used because in such an experimental building, the permeabilities are very different from one mom to another. The air flows to be measured range from about 15 [m3/h] for the air tightess element at 10 pa] to 1500 [m3/h] for the worst at 60 [Pa].
For the small flows, a nozzle with flow velocity measurement was used while for the largest flows, a nozzle with pressure measurement was chosen.
4. THE LESO - BUILDING
The LESO - Building is a mid-sized administrative building constituted by nine south oriented cells with solar fasades, few differently oriented rooms, and a staircase as shown on figures 4 and 5. On Figure 4 you can observe the complexity of the permeability structure.
ROOMS OF THE LESO BUILDING
Figure 4 : Perspective of the LESO - Building (top) and corresponding conductances net (bottom).
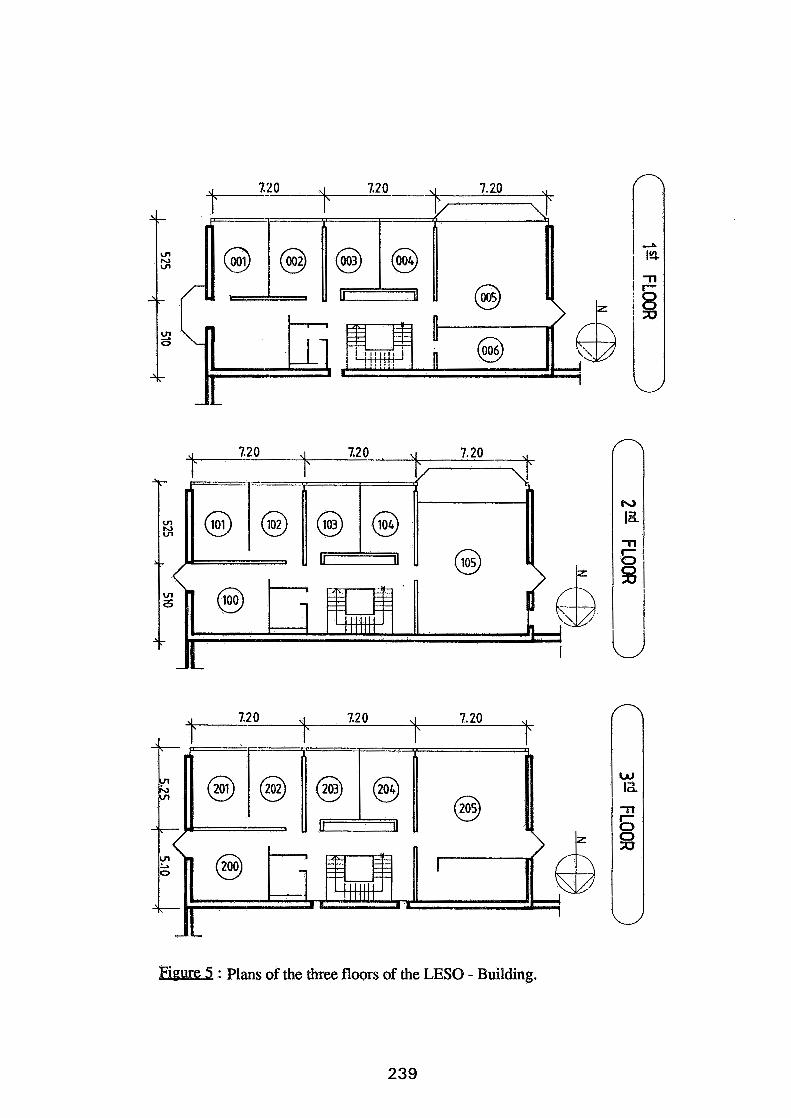
: Plans of the three floors of the LESO - Building.
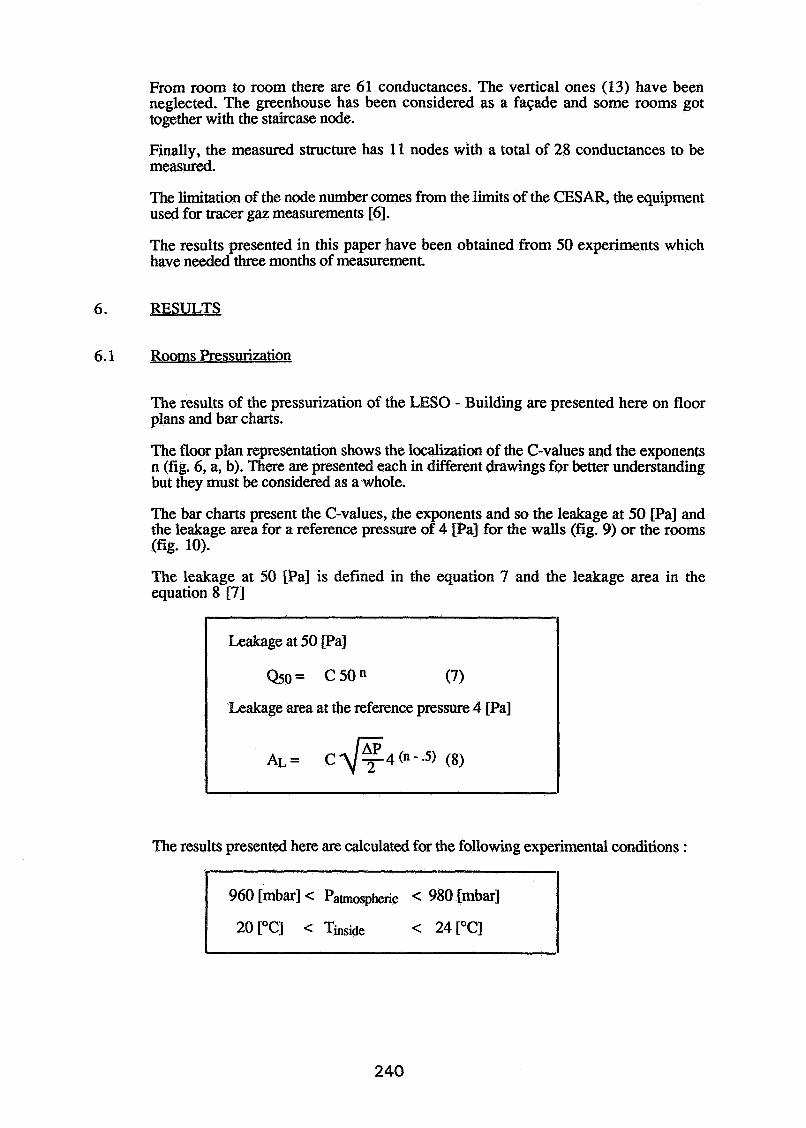
From room to room there are 61 conductances. The vertical ones (13) have been neglected. The greenhouse has been considered as a fagade and some rooms got together with the staircase node.
Finally, the measured structure has 11 nodes with a total of 28 conductances to be measured.
The limitation of the node number comes from the limits of the CESAR, the equipment used for tracer gaz measurements [6].
The results presented in this paper have been obtained from 50 experiments which have needed three months of measurement.
6. RESULTS
6.1 Rooms Pressurization
The results of the pressurization of the LESO - Building are presented here on floor plans and bar charts.
The floor plan representation shows the localization of the C-values and the exponents n (fig. 6, a, b). There are presented each in different drawings for better understanding but they must be considered as a whole.
The bar charts present the C-values, the exponents and so the leakage at 50 [Pa] and the leakage area for a reference pressure of 4 [Pa] for the walls (fig. 9) or the rooms (fig. 10).
The leakage at 50 [Pa] is defined in the equation 7 and the leakage area in the equation 8 [7]
Leakage at 50 [Pa]
Qso= C50n (7)
Leakage area at the reference pressure 4 [Pa]
The results presented here are calculated for the following experimental conditions :
960 [mbar] < Patmospheric < 980 [mbar]
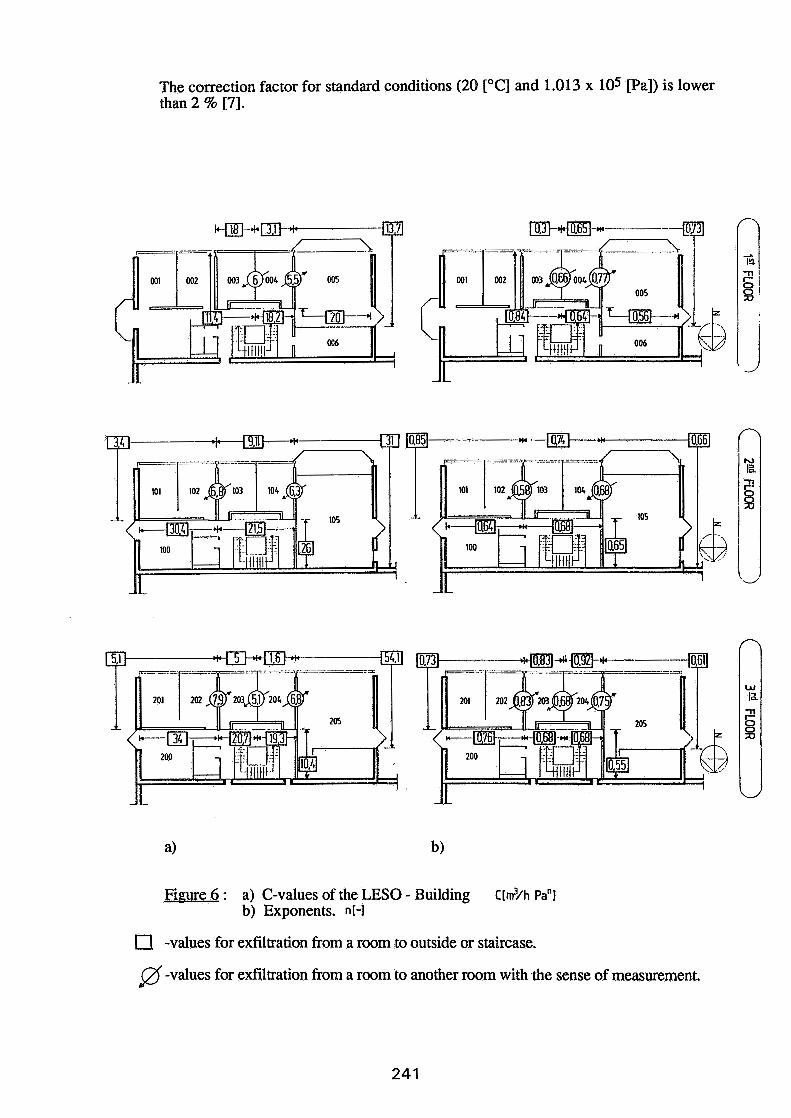
The correction factor for standard conditions (20 [ O C ] and 1.013 x 10⁵ [Pa]) is lower than 2 % [7].
Figure 6 : a) C-values of the LESO - Building c [rn3/h Pa"] b) Exponents. n[-I
a -values for exfiltration from a room to outside or staircase.
@'-values for exfiltration from a room to another room with the sense of measurement.
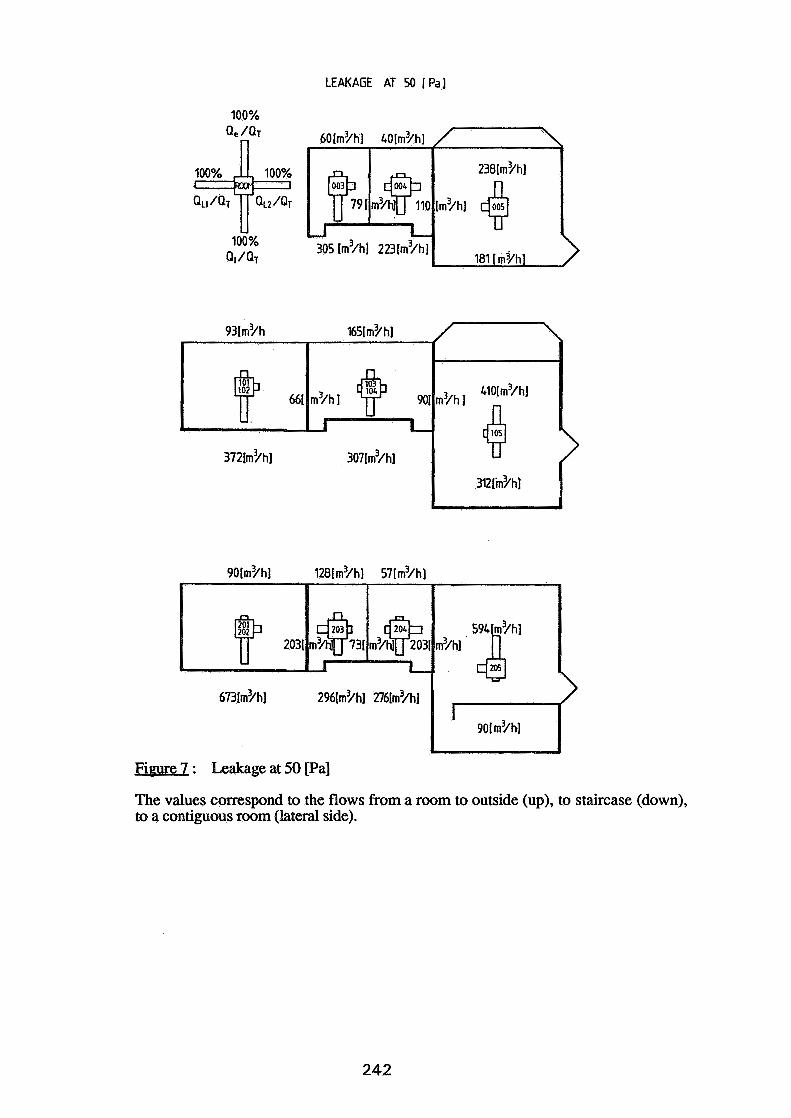
LEAKAGE AT 50 I Pa I
Figure 7 : Leakage at 50 [Pa]
The values correspond to the flows from a room to outside (up), to staircase (down), to a contiguous room (lateral side).
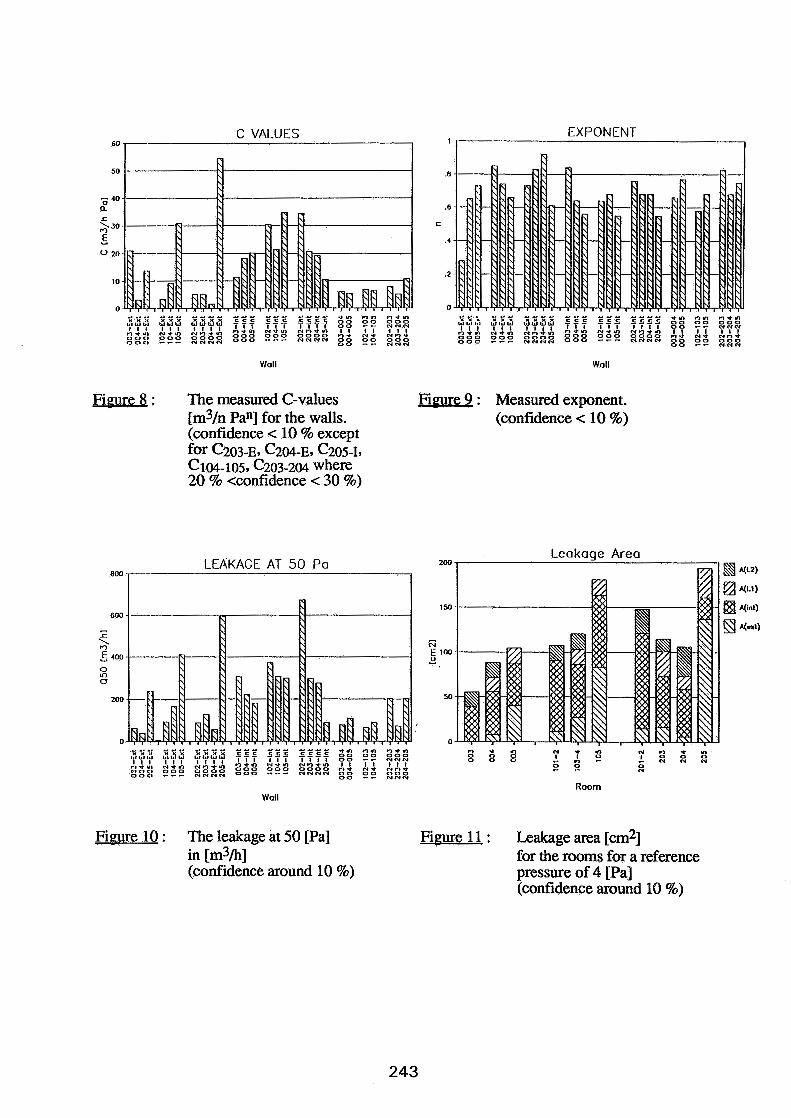
60 1- C VALUES EX130NENT
I I , I
. . I". ""I ""I' -..- "" Y " " Y ,, ,, ,,, $ 6 ~ 6 , s ~ 3 ~ 6 6 f f f s s r s r c r
1 1 1 1 1 1 1 88 ZZZRBRB ,!,&A ,!,&A ,!,,!,&A 2 x 2 NO+, u 1 1 H I ggg naaa ooo 000 --- 0000 NNNN g~ $ 5 gag NNN
Wall Wal l
Fimre 8 : The measured C-values Figure 9 : Measured exponent. [m3/n Pan] for the walls. (confidence < 10 %) (confidence < 10 % except for c203-~, c204-~1 c205-1, C104-105, C203-204 where 20 % <confidence < 30 %)
LEAKAGE AT 50 Pa
"Or--
--..* " " """" ""' "-" *-.," ,, ,, ,,, 6,:~ 666 C ~ J J f f f r s s s s r s oo ,.!,Lib ,!,&A ,!,A&,!, m + n ~ + n ~ o + n ooc, ooo oooo ooo 00" aazs sg A & A A & 000 - - - NNNN OO0
00 00 000
NNN
Wall
Figure 10 : The leakage at 50 [Pa] in [m3/h] (confidence around 10 %)
200 Leakage Area
Figure 1 1 : Leakage area [cm2] for the rooms for a reference pressure of 4 [Pa] (confidence around 10 %)
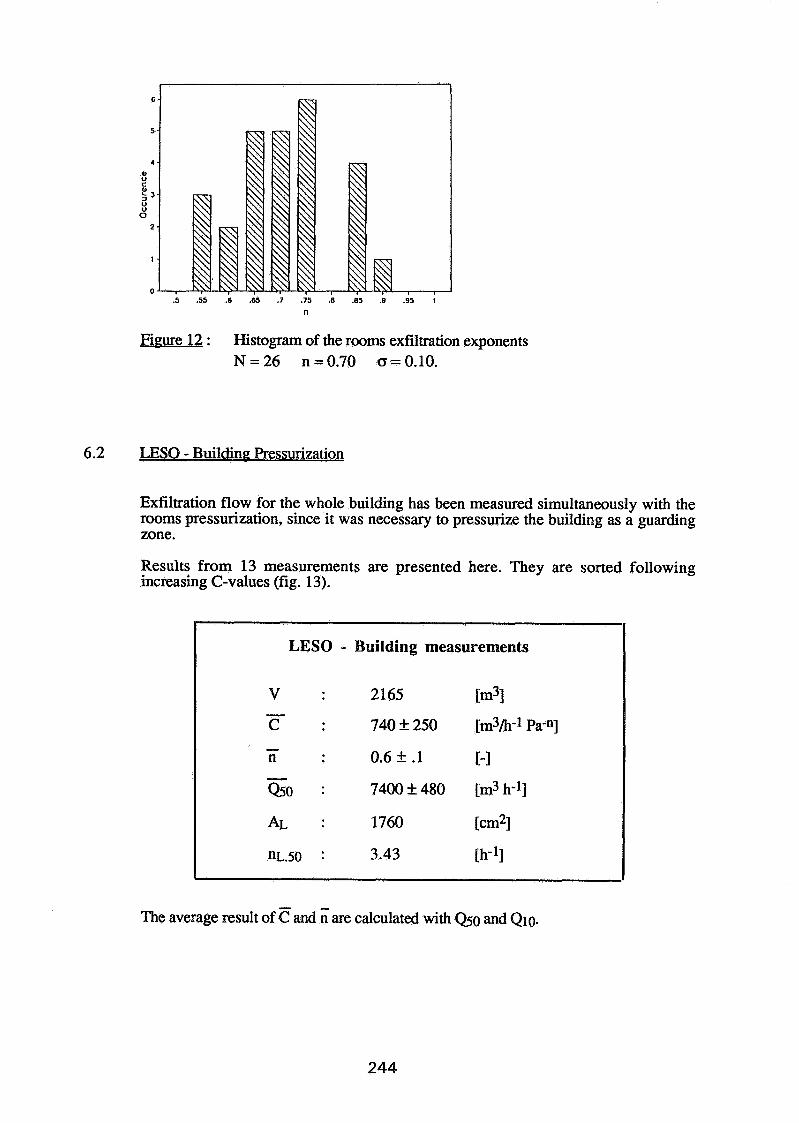
Figure 12 : Histogram of the rooms exfiltration exponents N = 2 6 n=0.70 o=0.10.
6.2 LESO - Building Pressurization
Exfiltration flow for the whole building has been measured simultaneously with the rooms pressurization, since it was necessary to pressurize the building as a guarding zone.
Results from 13 measurements are presented here. They are sorted following increasing C-values (fig. 13).
LESO - Building measurements
The average result of Sand n are calculated with Q0 and Qlo.
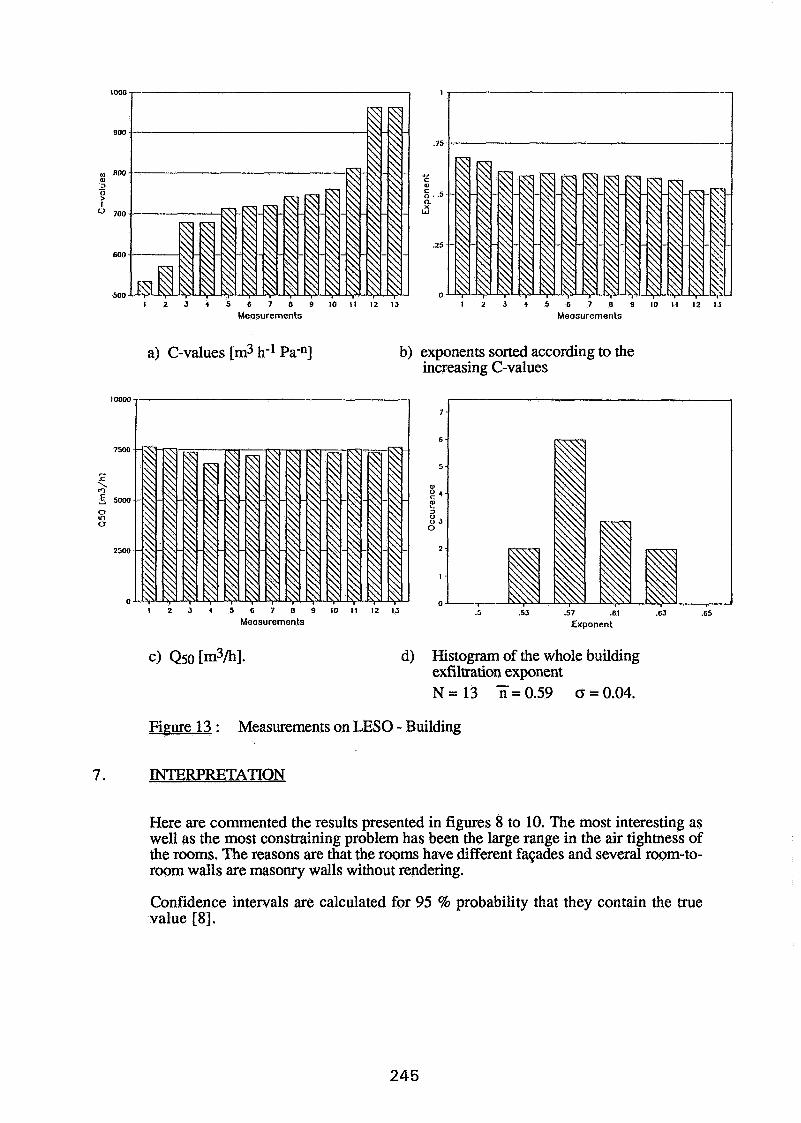
900 .75
BOO ..#
w C - o 5 . .a I n
" 700 W
.25 600
500 0 1 2 J 4 5 6 7 B S 1 0 1 1 I Z 1 3 1 2 3 4 5 6 7 8 9 1 0 1 1 1 2 1 . 5
Measurements Measurements
a) C-values [m3 h-I Pa-"] b) exponents sorted according to the increasing C-values
10000 -, I I I
Measurements Exponent
d) Histogram of the whole building exfiltration exponent N = 13 ii= 0.59 o = 0.04.
Figure 13 : Measurements on LESO - Building
7. INTERPRETATION
Here are commented the results presented in figures 8 to 10. The most interesting as well as the most constraining problem has been the large range in the air tightness of the rooms. The reasons are that the rooms have different faqades and several room-to- room walls are masonry walls without rendering.
Confidence intervals are calculated for 95 % probability that they contain the true value [8].
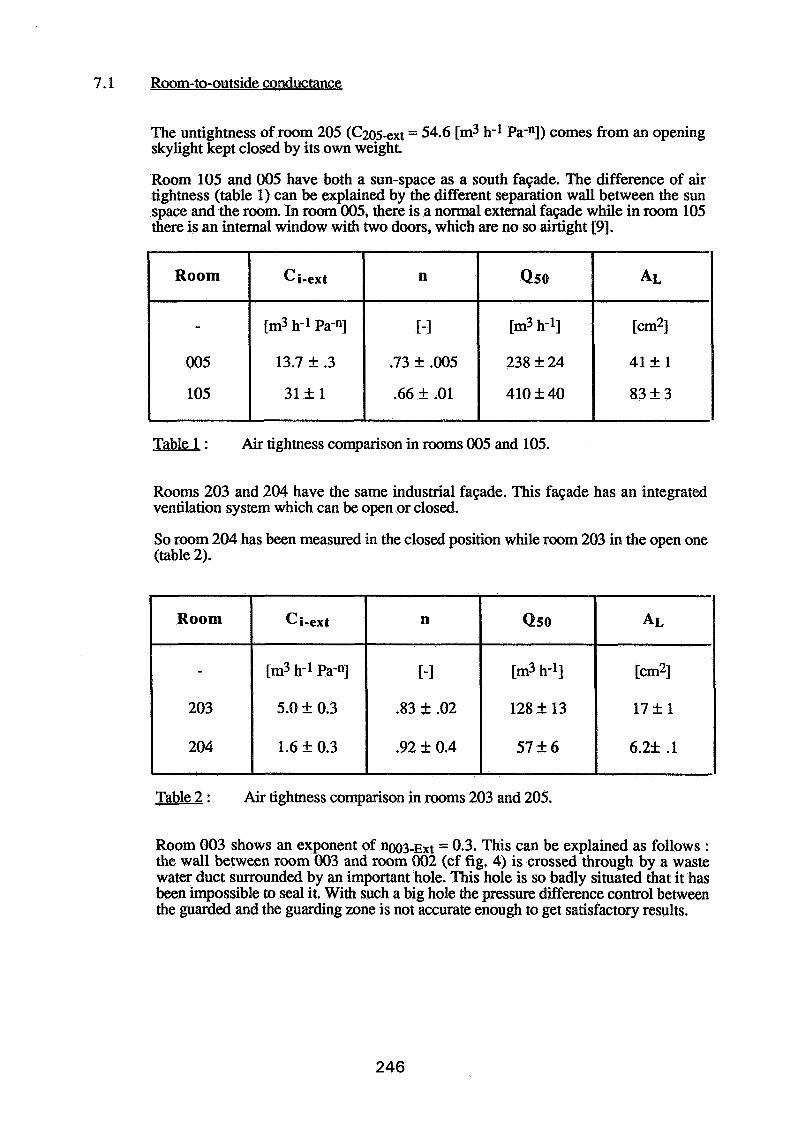
Room-to-outside conductance
The untightness of room. 205 = 54.6 [m3 h-1 Pa-"]) comes from an opening skylight kept closed by its own weight.
Room 105 and 005 have both a sun-space as a south fagade. The difference of air tightness (table 1) can be explained by the different separation wall between the sun space and the room. In room 005, there is a normal external fagade while in room 105 there is an internal window with two doors, which are no so airtight 191.
Table 1 : Air tightness comparison in rooms 005 and 105.
Rooms 203 and 204 have the same industrial fagade. This fagade has an integrated ventilation system which can be open or closed.
So room 204 has been measured in the closed position while room 203 in the open one (table 2).
Table 2 : Air tightness comparison in rooms 203 and 205.
Room 003 shows an exponent of n 0 0 3 - ~ ~ t = 0.3. This can be explained as follows : the wall between room 003 and room 002 (cf fig. 4) is crossed through by a waste water duct surrounded by an important hole. This hole is so badly situated that it has been impossible to seal it. With such a big hole the pressure difference control between the guarded and the guarding zone is not accurate enough to get satisfactory results.
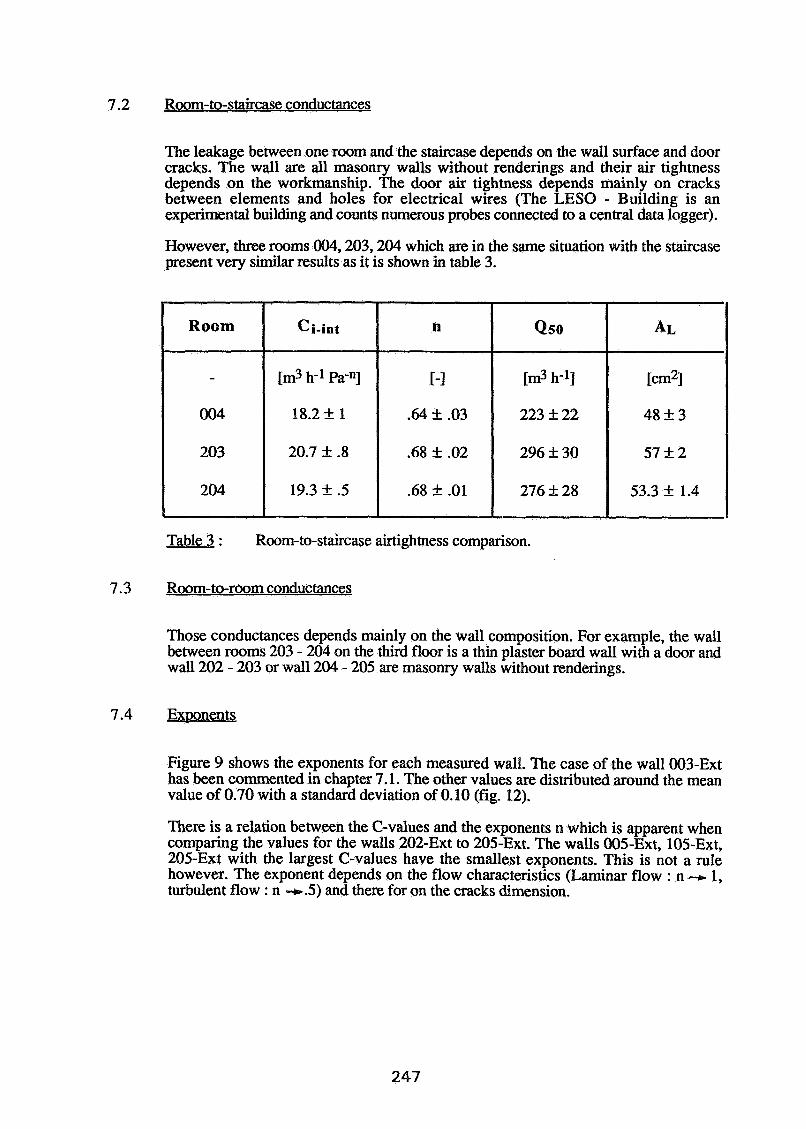
Room-to-staircase conductances
The leakage between one room and the staircase depends on the wall surface and door cracks. The wall are all masonry walls without renderings and their air tightness depends on the workmanship. The door air tightness depends mainly on cracks between elements and holes for electrical wires (The LESO - Building is an experimental building and counts numerous probes connected to a central data logger).
However, three rooms 004,203,204 which are in the same situation with the staircase present very similar results as it is shown in table 3.
Table 3 : Room- to-staircase airtightness comparison.
7.3 Room-to-room conductances
Those conductances depends mainly on the wall composition. For example, the wall between rooms 203 - 204 on the third floor is a thin plaster board wall with a door and wall 202 - 203 or wall 204 - 205 are masonry walls without renderings.
Figure 9 shows the exponents for each measured wall. The case of the wall 003-Ext has been commented in chapter 7.1. The other values are distributed around the mean value of 0.70 with a standard deviation of 0.10 (fig. 12).
There is a relation between the C-values and the exponents n which is apparent when comparing the values for the walls 202-Ext to 205-Ext. The walls 005-Ext, 105-Ext, 205-Ext with the largest C-values have the smallest exponents. This is not a rule however. The exponent depends on the flow characteristics (Laminar flow : n -c 1, turbulent flow : n -.5) and there for on the cracks dimension.
7.5 Air tightness distribution
Figure 7 shows how the leakage is distributed for each room. The bars represent the ratio of a given flow at 50 [Pa] (Qext, QL &I, Q L ~ ) and the total flow of the room (QT = Qext + QI + &I + &2).
For each room, except the rooms 005,105 and 205, the wall with the largest leakage is the north wall connected to the staircase. This is mainly due to leakage through the doors. Rooms 005, 105 and 205 have very untight fa~ades as well as much larger surfaces of the external walls than of the wall in contact with the staircase.
Figure 11 shows the total leakage areas for every room, except for room 003 where the external wall leakage area cannot be calculated since the measured exponent of this wall is inferior to .5 (see chapter 7.1).
7.6 LESO - Building air tightness
The pressurization of the whole LESO - Building shows a relation between C-value and the exponent n. 13 measurements was obtained for different situations and they are shown in fig. 13.a and 13.b.
The stability of Q50 is evident when looking at fig. 13.c since the C-value change with a ratio of 1 to 2 from the minimum to the maximum value.
The dispersion of results have many possible causes, like the mixed influence between the permeability and wind direction, the position of probes, the fact that peoples live in the building and change its state, etc. But this shows overall that the monozone pressurization of a large volume is not a precise measurement to estimate the leakage at low pressure. The air leakage at 50 [Pa], Q50, and the corresponding air renewal NL,~o are anyhow interesting values because of their stability.
CONCLUSION
The results given here show the Mage usefulness. It would have been tedious and even impossible to measure elements permeability of such a complicated structure by sealing walls or with advanced single fan pressurization [lo].
Mage results are high quality results when the leakage between the measured and the guarding zones is not too large. They have confidence intervals around 10 % while usual results have confidence around 25 % [I]. They will serve as input data in order to validate air flow simulation programs.
Mage results quality could be increased by using one or two more manometers, in order to have a better control on the outside pressure of the corner rooms. Better flow meter with a very large range (15 [m3 h-11 to 1500 [m3 h-11) would allow to pressurize every rooms up to 80 [Pa] and to use an experimental planning of better quality.
9. ACKNOWLEDGEMENTS
The LESO inhabitants had to accept noise, obstructed stairs and passages and even closed doors sometimes. The authors will here apologize them and acknowledge for understanding.
This research is supported by the National Energy Research Fond (NEFF) credit No 339.1.
10. REFERENCES
I11 A. Roldan, F. Allard, G. Achard, "Influence des infiltrations et des transferts ahuliques entre pi5ces sur la charge thermique d'un bdtiment multizone" ICBEM'87 Proceedings, vol. 111, EPFL, Lausanne, Switzerland, 1987
I21 H.E. Feustel, J.-L. Scartezzini "Development and validation of a simplified multizone infiltration model" ICBEM'87 Proceedings, vol. 111, EPFL, Lausanne, Switzerland, 1987
I31 J.-L. Scartezzini, J.-M. Fiirbringer, C.-A. Roulet "Data needs for purpose of air infiltration computer code validation" 8th AIVC Conference Proceedings, Uberlingen, RFA, 1987
[41 R. Compagnon, J.-M. Fiirbringer, C. Roecker, C.-A. Roulet "Nouveaux d6veloppements de deux mCthodes de mesures aCrauliques dans les bdtiments" Energieforschung im Hochbau, ETH-Zurich, Switzerland, 1988
I51 Status Seminar "Forschungsprogramrn : Energierelevante LuftsMmungen in Gebauden" Winterthur, Switzerland, 1987 (in French and German)
[GI J.-L. Scartezzini, C.-A. Roulet, 0. Jolliet "Continuous air renewal measurements in different inhabited buildings" 6th AIC Conference, proceedings, 1985
171 Norme IS0 (Draft) "Measurement of building air tightness using fan pressurization" Lausanne, Switzerland, 1987
181 A.K. Persily, R. Grot "Accuracy in pressurization data analyzis" ASHRAE Technical Bulletin, Infiltration air leakage, June 1985
191 J.-L. Scartezzini, A. Faist, J.-B. Gay "Experimental comparison of a sunspace and a water hybrid solar device using the LESO test facility". Solar Energy, vol. 38 No 5, pp 355-366, 1987
1101 P. Wouters, D. L'Heureux, P. Noordecker "Advanced single fan pressurization" CSTC Brussels, Belgium, 1988

EFFECTIVE VENTILATION
9th A I V C Conference, Gent, Belgium 12-15 September, 1988
Paper I 4
A I R LEAKAGE BETWEEN APARTMENTS
PER LEVIN
The Royal Institute of Technology Energy Conservation in Buildings Group - EHUB S-100 44 Stockholm, Sweden

1. SYNOPSIS
Air leakage through the building envelope is of great importance for the energy use of a building. However, from an indoor air quality standpoint, the size of interior leaks in e.g. multifamily buildings could be important as e.g. a source of pollution.
Using the standardised Fan Pressurization test method, it is not possible to separate interior leaks from leaks in the building envelope. One way to separate these leaks is to simultaneously depressurise (or pressurise) adjacent apartments to the same pressure and thereby eliminating interior leakage. The difference from the standardised measurement then represents the interior leakage. By adding one adjacent apartment at a time, leakage curves for the different building components could be established.
Results from measurements in three apartments show interior leaks to be between 12 and 36 % of total leakage at 50 Pa. Because the apartments are airtight to begin with, 0.45 to 0.90 airchanges per hour at 50 Pa, the interior leakages in absolute numbers are very small and sensitive to inaccuracies in the measurements. Only a few component leakages showed a meaningful curvefit. Vertical leaks were found to be bigger than horizontal, probably owing to more penetrations in floor structures for building services.
Pressure differences between apartments in a range of 5-15 Pa have been measured as an effect of operating the mechanical kitchen ventilation. At a 10 Pa pressu5e difference, air flow between apartments of 4-15 m /h could be seen from the measured leakage curves. If these comparatively small air flows during limited periods of time cause any problems with odours, pollutants etc. should depend on the conditions in the adjacent apartments.
Glazed courtyards are at the moment a popular feature in new and remodeled Scandinavian buildings. Very little data is available on airtightness and air infiltration regarding these courtyards. For design calculations only rough estimates are used. Air leakage of the glazed courtyard in the Suncourt building was found to be greater than expected, 4.5 airchanges per hour at 50 Pa or about 15 m /hm leaking surface area. The average design air infiltration rate during operating conditions of 0.2 airchanges per hour might therefore be exceeded.
2. BACKGROUND
For energy use reasons, air leaks to the outside are important. Interior leaks do not normally affect the energy use but could be important from an indoor air quality standpoint.
New Swedish houses are generally made with comparati- vely low air infiltration levels and continuously operating mechanical ventilation. The level of airtightness in building envelopes is governed by requirements in the Swedish Building Cod? and controlled by the Fan Pressurization Test method.
For multifamily buildings of Shree storeys or more, the present requirement (SBN 80 ) on total air leakage is 1.0 airchanges per hour at a 50 Pa pressure difference. This value concerns only leaks to the outside and the average of depressurization and pressurization. Interior leaks e,g. between apartments are not governed by this code. Also, when performing a standardised Fan Pressurization test according to the Swedish Standard, no correction for interior leaks is made. The only conclusion that could be drawn from a measurement is if the result is fulfilling the requirements in the code. If the result is too high, it could not be stated whether a significant part of the leaks are to the inside. As Fan Pressurization tests are performed in practice, interior leaks are included in the result and the apartments are made to fulfil the requirement including interior leaks.
In the new edition of the Swedish Building Code, which hopefully will be released before the end of this year, the' airtightness requirements will2 be given in the form of air leakage at 50 Pa per m of envelope area. The envelope area is defined as area exposed to outside air. Thus the area of a crawlspace floor structure should be included but not the area of a slab on grage. The allowed leakage at 5 9 Pa2will probably be 3 m /hm2 for dwellings and 6 m /hm for other buildings. This will be a more stringent requirement than in the previous code for most new dwellings.
There exist very limited data on interior leakage, which is a drawback when developing multicell infiltration models which attempts to calculate the airflow between rooms or apartments, This paper shows the results of an effort to measure interior leaks in new Swedish apartment buildings. Measurements of interior leaks have been performed in the Suncourt and Bodbet j anten Puildings, which are included in the Stockholm Project . The Suncourt building is also the
Swedish contribution to IEA Annex VIII - Passive and Hybrid Solar Low Energy Buildings.
AIR LEAKAGE MEASUREMENT TECHNIQUE
The standardised airtightness measurements in Sweden with the Fan Pressurization method gives the total leakage of the measurement enclosure. There is no standard how to consider leaks between e.g. apartments. In order to separate interior leaks from exterior, additional measurements must be performed.
The method chosen for this study, was the multiple fan pressurization technique. Starting with a corner apartment, a standardised pressurization test was performed giving a value on total leakage. Measurements were made at 10 to 50 Pa in steps of 10 Pa and a curve fit to the power law equation, q=c*dpn, was made. To eliminate the interior leakage through party walls and floors, the test was repeated together with one or more adjacent apartments. An extra manometer was used for each tested adjacent apartment to control that no pressure difference and thereby no air flow occured between the apartments. Up to three apartments were tested at the same time. In this study, only depressurization was used. The resulting flow curves between the apartments could be calculated as differences between the results of different measurement configurations.
With the presently used manual controls, the zero pressure difference between apartments could be maintained with a + 1 Pa accuracy. The equipment used was calibrated to an accuracy of 5% in airflow measurements.
4. BRIEF HOUSE DESCRIPTION AND RESULTS
The Suncourt building contains 71 apartments, of which 50 have entrances through a glazed courtyard, see Figure 1. Floors and party walls are of casted concrete and the exterior curtain walls are prefabricated elements with a wood frame and polyurethane foam insulation. The apartments have forced air heating system and mechanical supply and exhaust ventilation.
The apartments in the Suncourt building are very airtight, between 0.45 to 0.90 airchanges per hour at
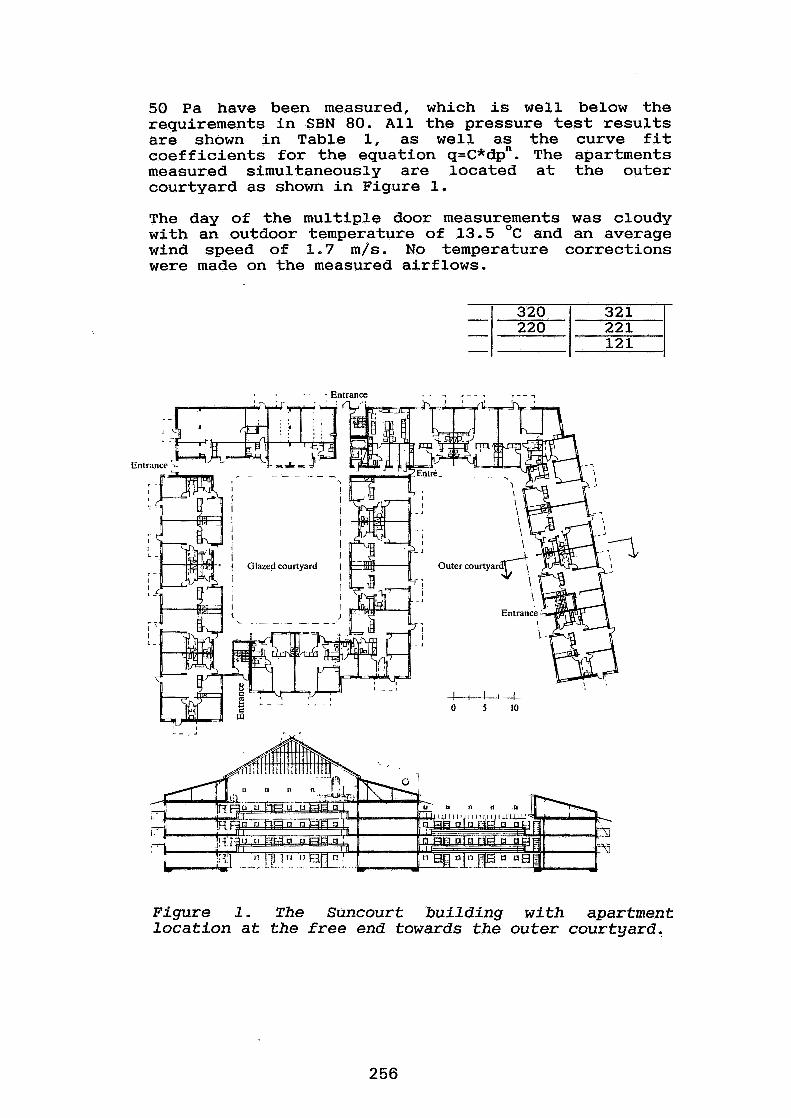
50 Pa have been measured, which is well below the requirements in SBN 80. All the pressure test results are shown in Table 1, as well as the curve fit coefficients for the equation q=c*dpn. The apartments measured simultaneously are located at the outer courtyard as shown in Figure 1.
The day of the multiple door measurements was cloudy with an outdoor temperature of 13.5 OC and an average wind speed of 1.7 m/s. No temperature corrections were made on the measured airflows.
Entrance
n n n
F i g u r e 1. T h e Suncour t b u i l d i n g w i t h apar tmen t l o c a t i o n a t the free end towards the o u t e r c o u r t y a r d .
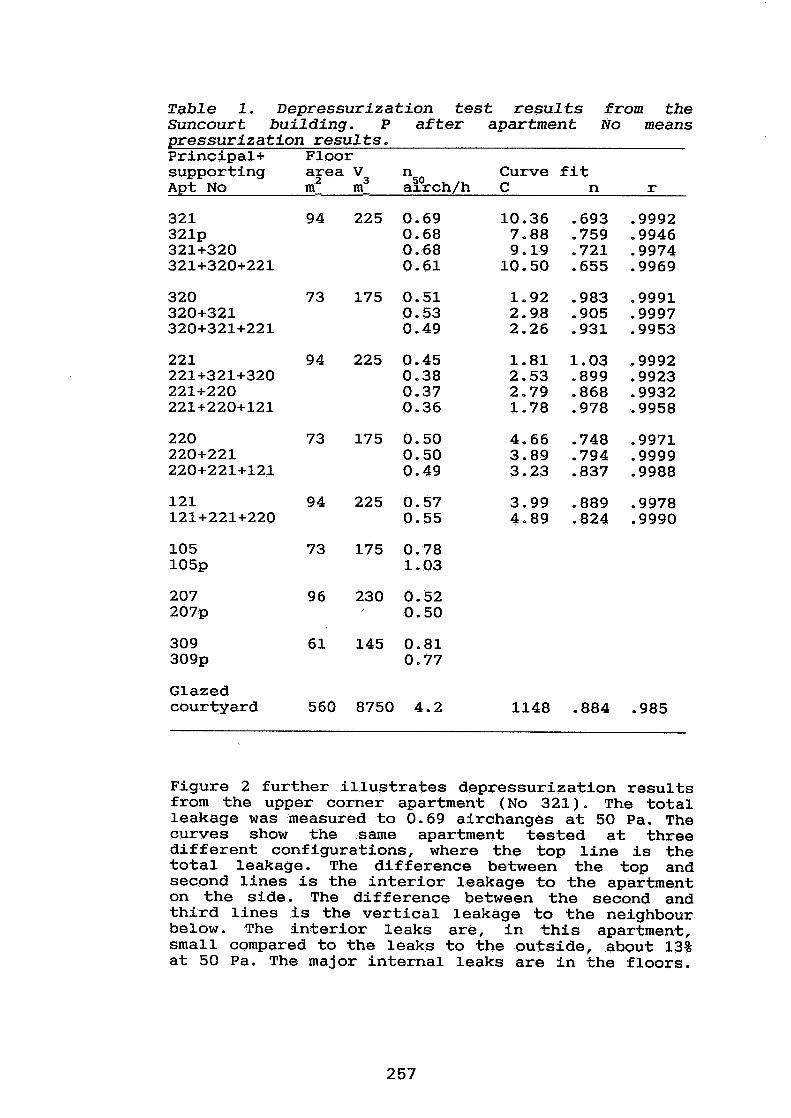
Table 1. Depressurization test results from the Suncourt building, P after apartment No means pressurization results. Principal+ Floor supporking a ~ e a V3 n Curve fit Apt No m 2- a%Orch/h C n r
Glazed courtyard 560 8750 4.2 1148 .884 .985
Figure 2 further illustrates depressurization results from the upper corner apartment (No 321). The total leakage was measured to 0.69 airchanges at 50 Pa. The curves show the same apartment tested at three different configurations, where the top line is the total leakage. The difference between the top and second lines is the interior leakage to the apartment on the side. The difference between the second and third lines is the vertical leakage to the neighbour below. The interior leaks are, in this apartment, small compared to the leaks to the outside, about 13% at 50 Pa. The major internal leaks are in the floors.
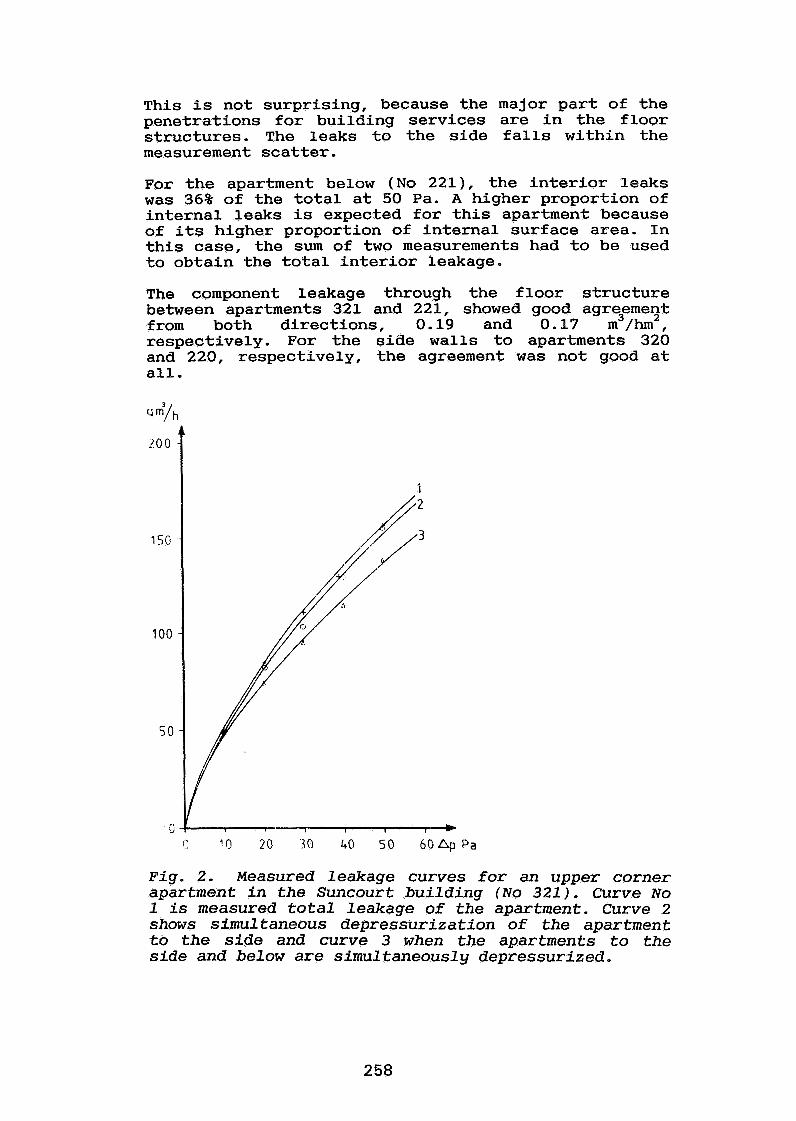
This is not surprising, because the major part of the penetrations for building services are in the floor structures. The leaks to the side falls within the measurement scatter.
For the apartment below (No 221), the interior leaks was 36% of the total at 50 Pa. A higher proportion of internal leaks is expected for this apartment because of its higher proportion of internal surface area. In this case, the sum of two measurements had to be used to obtain the total interior leakage.
The component leakage through the floor structure between apartments 321 and 221, showed good agrefrme~t from both directions, 0.19 and 0.17 m /hm , respectively. For the side walls to apartments 320 and 220, respectively, the agreement was not good at all.
LOO
150
100
5 0
J
Fig. 2. Measured l e a k a g e curves f o r an upper corner apartment i n the Suncour t b u i l d i n g ( N o 3 2 1 ) . Curve N o 1 i s measured t o t a l l e a k a g e o f the apartment . Curve 2 shows s imu l taneous d e p r e s s u r i z a t i o n o f the apartment t o the side and c u r v e 3 when the apar tments t o the s i d e and be low a r e s i m u l t a n e o u s l y d e p r e s s u r i z e d .
In order to measure the leakage of the glazed courtyard, two equipments were used in parallell. The result at 50 Pa is extrapolated from 22 Pa, which was the highest pressure reached, The leakage was higher than expected, about 4.2 airchanges/h at 50 Pa. If the 50 Pa leakage fs givided by surface area, the result is about 15 m /hm , which is very high compared to the new building code. The wind speed was between
0 2-5 m/s, outdoor temperature 15 C and courtyard 0 temperature 23 C at the day of the measurements.
4.2 Bodbet j anten building
The Bodbetjanten building is made with a different concept. The apartments have mechanical exhaust ventilation and a hydronic heating system. The party walls and floors are made of prefabricated concrete elements. The exterior walls are also made by prefabricated concrete elements with outside mineral wool insulation and a brick facade.
The depressurization test results for a bottom corner apartment are shown in Table 2, as well as curve fit coefficients for the equation q=c*dpn. The interior leaks were measured to about 16% of the total airflow at 50 Pa. Also in this house, vertical leaks seems to be bigger than the horizontal leaks.
The weather was sunny with an outdoor temperature of about 20 OC and almost no wind.
Table 2. Depressurization test results from the bottom corner a2artment in the3 Bodbetjanten building (Floor area 83 m , Volume 199 m ) Principal+ supporting n Curve fit apartments a%"rch/h C n r
Bottom corner 0.90 6.41 .85 ,9979 +side apt 0.87 5.75 -87 .9985 +side and above apts 0.79 2.58 1-05 .9952
5. DISCUSSION
Interior leaks between apartments has been found to be between 12 and 36% of the total leakage for three apartments in Suncourt and Bodbetjanten buildings. The used techniques for building construction and building services systems are common in new Swedish multifamily buildings.
Absolute numbers on compon9nt leakage was found in the order of 0.02-1.6 m /hm at 50 Pa. These numbers are small compared to the building code value for external walls.
The measurements in the apartments have, with a few exceptions, given reasonable results and curve fits. However, when using differences in the measurements trying to obtain leakage curves, most results show meaningless correlations. The interior leaks in this buildings are comparatively small and thus sensitive to measurement. errors. These measurements were performed in occupied apartments, which limited the apartment configuration and the access time to one day.
This type of multiple fan pressurization equipment measurements are not easy to perform in practice. The zero pressure difference between apartments is often difficult and time consuming to obtain. The interior leaks could be small compared to the flow to the outside and sensitive to small pressure differences and changes in windspeed and wind direction. One other potential error in the measurements could be caused by that a pressure drop develops from adjacent apartments to the outside when measuring the total leakage and thereby underestimating the interior leakage.
Future work with interior leakage should include repeated measurements at different outdoor conditions with different strategies in order to find the optimal method and a reliable error analysis.
The pressure difference between inside and outside during operating conditions in new Swedish apartment buildings depends on the type and adjustment of the mechanical ventilation system, envelope airtightness and outdoor conditions. For a so called "balanced" system with mechanical exhaust and supply ventilation (ES), the pressure difference is small. Buildings with exhaust ventilation system (E) normally operates with a greater negative pressure inside. Internal overpressure should be avoided in cold climates to prevent condensation damages in the building structure. Therefore, the ES ventilation systems are
normally designed with the exhaust fan flows 10-30% bigger than the supply fan air flows.
Measured gressure differences on a calm day with about 22 C temperature difference between in- and outdoors in a sample of apartments in the Suncourt building (ES system) varied between internal overpressure of about 2 Pa to internal underpressure of 5 Pa. However, if the kitchen exhaust flow was set to full speed, it resulted in a depressurization of the apartments ranging between 4-15 Pa. For the Bodbetjanten building apartment (E system), the normal operating negative pressure was about 15-20 Pa. With the kitchen ventilation on full speed, the pressure difference was 30-35 Pa.
A pressure difference between apartments of about 5- 15 Pa could be caused by turning the kitchen ventilation on full speed in one apartment, when adjacent apartments operates in normal conditions. A 10 Pa pressure difference between apartments corres~onds to an internal air flow in the range of 4-15 m /h, according to the leakage curves.
An airflow of 15 m3/h is about the same size as the total supply air to many bedrooms. Interior leakage could possibly explain some odour problems experienced in new apartment buildings. If an apartment is next to a garage, pollutants of a more severe kind might enter the apartment. On the other hand, the airchange rate is higher and the time periods comparatively short when the kitchen fan operates in full speed.
6. CONCLUSIONS
Results from measurements in three apartments show interior leaks to be between 12 and 36 % of total leakage at 50 Pa. Because the apartments are airtight to begin with, 0.45 to 0.90 airchanges per hour at 50 Pa, the interior leakages in absolute numbers are very small and sensitive to inaccuracies in the measurements. Only a few component leakages showed a meaningful curvefit. Vertical air leakage was found to be bigger than horizontal, probably owing to the penetrations in floor structures for building services.
Pressure differences between apartments in a range of 5-20 Pa have been measured as an effect of operating the mechanical kitchen ventilation. At a 10 Pa pressure difference, airflow between apartments of 4- 15 m3/h could be seen from the measured leakage
curves. If these comparatively small air flows during limited periods of time cause any problems with odours, pollutants etc. should depend on the conditions in the adjacent apartments.
Air leakage of the glazed courtyard in the Suncourt building was found to be greater than expepteq, 4.2 airchanges per hour at 50 Pa or about 15 m /hm . The design average air infiltration rate during operating conditions of 0.2 airchanges per hour might therefore be exceeded.
7. REFERENCES
(1) Thermal insulation - Determination of airtight- ness of buildings. Swedish Standard SS 02 15 51, Stockholm 1980.
(2) Swedish Building Code, SBN 1980, The National Swedish Board for Physical Planning and Building, Stockholm 1980.
(3) Elmroth, A., et. al., The Stockholm project. New Energy Efficient Multi-Unit Buildings, A Full Scale Development Project. CLIMA 2000 - conference, August 25-30, Copenhagen 1985.
Discussion
Paper 14
P. Hartmann (EZ4PA Duebendorf, Switzerland) You talk about the changes in the Swedish building code from n50 values to leakage values per m2 of shell area: (a) What are the reasons? (b) Are there any new requirements for local leakage values and/or inter-apartment leakage?
P. kvin (Royal Institute of Technology, Stockholm, Sweden) (a) The reason is to make the airtightness requirenrrent the same for exposed building envelopes. he-n50 value -gives different requirements depending on location, foundation type and shape, so that apartments and single family houses would have different requirements, (b) No, and no methods have yet been proposed, although same handbooks are under preparation which may clarify this issue,
W. De Gids (TNO Division of Technology for Society, Holland) How is the building envelope area defined in the new Swedish building regulations? For example in the case of atria, Is the internal wall to the atrium part of the building envelope?
P, kvin (Royal ~nstitute of Technology, Stockholm, Sweden) It will depend on whether the atrium is heated or not.
D. Harrje (Princeton University, USA) You have mentioned the dour problem, which is related to internal leakage. Can you prove a correlation between odour transfer and location (of sources of odours and occupants) in the building?
P. kvin (Royal Institute of Technology, Stockholm, Sweden) We may learn more on this matter when we evaluate further the occupant interviews.
P, Charlesworth (AIVC, Warwick Science Park, UK) All the apartments tested met the Swedish air leakage standard. Have any "leaky" apartments (which do not meet the code) been tested?
P. Levin (Royal Institute of Technology, Stockholm, Sweden) Not with this multiple-equipnent technique.

EFFECTIVE VENTILATION
9th AIVC Conference, Gent, Belgium 12-15 September, 1988
AIR INFILTRATION INDUCED BY HEATING APPLIANCES
GIAN VINCENZO FRACASTORO (I), MARC0 MASOERO (2)
(1) Univereit& della Basilicata, Via Nazario Sauro 85 85100 POTENZA (Italy)
( 2 ) Politecnico di Torino, Coreo Duca degli Abruzzi 24 10129 TORINO (Italy)
Infiltration heat losses due to heating appliances located within the living space are normally evaluated by reducing the conversion efficiency of the boiler, with no consideration for the fluid dynamic interaction between boiler, chimney and building. Purpose of this work is to develop a simplified mathematical model of the overall (building + boiler + chimney) system, suitable to calculate the pressure distribution and air flow rate in the building induced by the simultaneous effect of natural forces and the exhaust system.
Inside pressure and air flows across the envelope, through the boiler, the draft diverter, and the stack are calculated by means of a steady-state model.
Results are presented as a parametric analysis which points out the dependence of air infiltration rates on factors such as envelope permeability and weather conditions, and the dependence of stack flow rate on weather parameters.
LLST 9B SZMBPLS
A ACH Ast
= area of envelope component (m2 = air changes per hour (h)-1 = ratio between stoichiometric air and fuel mass
flow rates = flue gases speed in the stack (m/s) = permeability coefficient (m3/(h.m2 .Pan)) = wind pressure coefficient = atmospheric boundary layer thickness (m) = gravity acceleration, equal to 9.81 m/sz = reference height = useful height of the stack ( m ) = lower heating value of fuel (kJ/kg) = internal air flow resistance = mass flow rate (kg/s) = infiltration flow exponent = air pressure (Pa) = boiler infiltration loss = volume air flow (m3/s) = excess air = ratio between mass flow rate in the stack and in
the flue = absolute temperature (K) = time (8) = wind speed (m/s) = building volume (mc) = height (m) = boundary layer exponent = equivalent flow friction coefficient in the
stack = specific mass of air (kg/mc)

Indices ------- b - - e - - f - - i - - in - - out = Pn - - 8 - - W - -
in the boiler/flue external, building fuel indoor incoming outgoing neutral level in the stack at the weather station
1. ------------ INTRODUCTION
The study of air infiltration induced by heating appliances is one of the typical "second approximationw problems which have been recently investigated, following the great impulse of research in the building physics area during the last decade. It is, nonetheless, a problem which deserves some attention, due to the increasing number of individual heating systems being installed within the living spaces, and to the growing interest in the areas of ventilation and indoor air quality.
A thorough analysis of the problem requires a model capable of taking into account simultaneously the air infiltration induced by natural forces and the behaviour of the boiler plus exhaust system.
Calculation procedures and standards for the design of chimneys have been developed since a long time in several countries, e.g., by CSTB in France /1/ and by DIN in Germany /2/. Recent research work in the field focuses on experimental testing (see for example Angle- sio et al. , and on the dynamic behaviour of branched chimneys (Andreini et al., / 4 / ) .
The problem of evaluating the use of indoor air as combustion air in terms of boiler infiltration losses was first analysed by Chi and Kelly / 5 / , and Kelly et al. 161.
The thermal performance of open fireplaces was investigated from the experimental and theoretical point of view by Modera and Sonderegger / 7 / . An experimental analysis of the interactions between a chimney and a building under the effect of external forces (wind, temperature difference) was presented by Shaw and Brown 8 Further theoretical and experimental work was done by Shaw and Kim /9/.
This paper analyses the interaction between air in- filtration and the boiler plus exhaust system using a simplified model, suitable for analysing the sens'itivity

of the phenomenon to a number of parameters, such as wind speed, air temperature, building permeability, etc.
A large fraction of the individual boilers located in- doors, except the so-called "balanced draft systemsw, make use of indoor air for combustion. Moreover, the use of draft divertere -- which causes an extra infiltration rate -- is becoming more and more common for their ability to decrease the flue gas dew point, and for safety reasons, because in case of reverse flow they prevent the extinction of the combustion flame by the flue gases.
In central systems draft regulators are used, which are able to decrease the chimney draft to the point where draft is balanced by flow resistances, thus allowing a better matching between boiler and chimney even when the stack is oversized. Moreover, as pointed out by Kunz 1 0 such devices allow, in the off-period of the burner, the ventilation of the stack and therefore the evaporation of condensate.
E4TBEM4TLGBL MPPEL
The model adopted is described in detail in a previous paper by Fracastoro and Pagani /11/, where it was used to derive a simplified procedure to calculate natural air infiltration in buildings.
The building envelope is subdivided into a number of elementary areas of variable height and width equal to the width of the faqade and the pressure difference is calculated across each area. Then, assuming the air permeability of each elementary area is known, the air flow rate is calculated and summed up over the whole envelope. The condition that the incoming air flow rate i8 equal to the outgoing flow rate allows to determine the internal pressure.
The model does not take into account turbulence-induced ventilation, and the lower floor and upper ceiling are supposed to be perfectly airtight.
The external pressure on the faqade is calculated by the following formula
where the pressure coefficients Cp are those indicated by Wise /12/, assumed constant over the entire fa~ade. The wind velocity varies with height according to the law proposed by Shaw and Tamura, 1131:
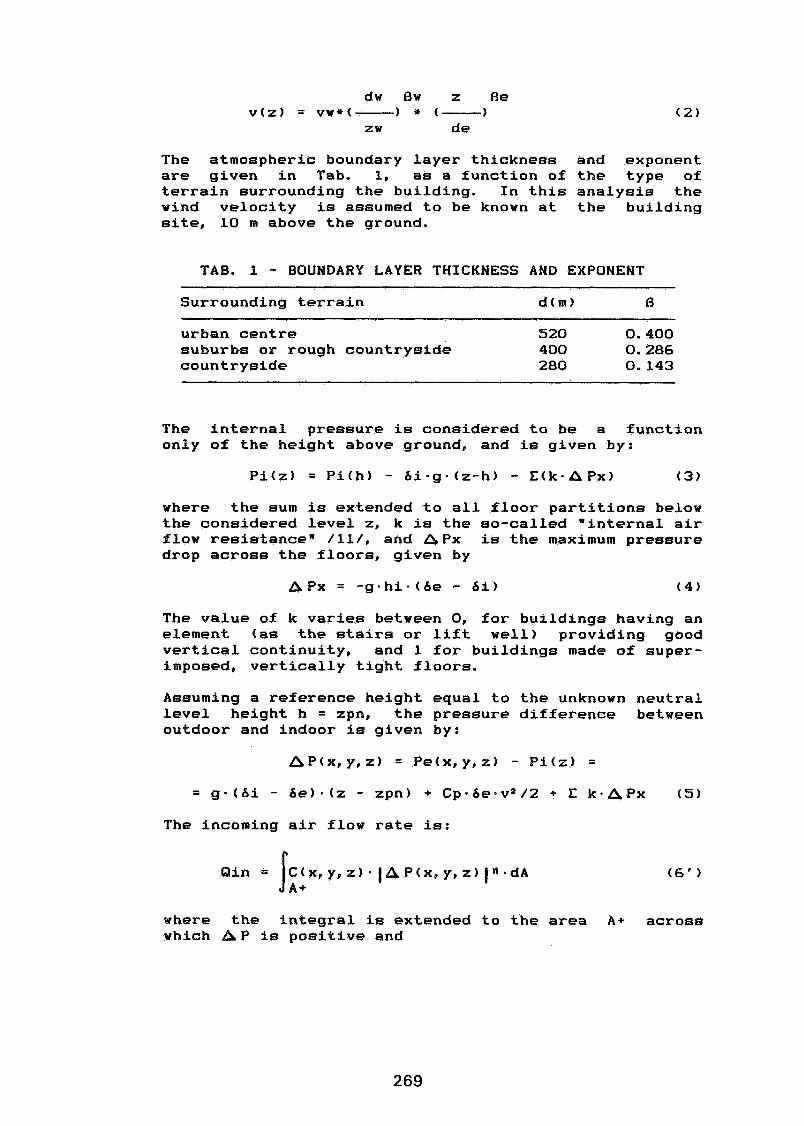
The atmospheric boundary layer thickness and exponent are given in Tab. 1, as a function of the type of terrain surrounding the building. In this analysis the wind velocity is assumed to be known at the building site, 10 m above the ground.
TAB. 1 - BOUNDARY LAYER THICKNESS AND EXPONENT Surrounding terrain d(m) 0
urban centre 520 0.400 suburbs or rough countryside 400 0.286 countryside 280 0.143
The internal pressure is considered to be a function only of the height above ground, and is given by:
where the sum is extended to all floor partitions below the considered level z, k is the so-called "internal air flow resistance" Ill/, and O P x is the maximum pressure drop across the floors, given by
A P x = -g.hi-(be - di) (4
The value of k varies between 0, for buildings having an element (as the stairs or lift well) providing good vertical continuity, and 1 for buildings made of super- imposed, vertically tight floors.
Assuming a reference height equal to the unknown neutral level height h = zpn, the pressure difference between outdoor and indoor is given by:
The incoming air flow rate is:
where the integral is extended to the area A + across which A P is positive and
Qout = C ( x , y, 2 ) [A P(x, y, z) In-dA J A-
extended to the area A- across which A P is negative.
By imposing the continuity equation
Q = Qin = Qs + Qout ( 7
where Qs is the volume air flow exfiltrating through the stack, calculated as shown in the next sections, the neutral level height zpn is determined, together with the corresponding value of Q, or ACH = 3600=Q/V.
Boiler and exhaust E Y E ~ E ~ ~hsracterigfic~ A typical hot water individual heating system consists of a gas-fired boiler coupled to the exhaust system, including the flue, the draft diverter and the stack. The draft diverter connects the stack with the ambient in which the boiler is located. The flue and the stack are respectively the portions of the exhaust system upstream and downstream of the draft diverter. Hence, the chimney and the boiler are actually uncoupled from the fluid dynamics standpoint.
During the boiler on-period the flue gas mass flow rate in the boiler and flue may be considered constant, both for natural draft and forced draft boilers. The equation relating the flue gas mass flow rate mb to the fuel mass flow rate mf, the stoichiometric air Ast, and the excess air R is:
During the boiler off-period the air flow rate is no longer constant, being determined by the mechanical equilibrium between the available pressure drop across the stack and the friction pressure loss. The available pressure drop depends in turn on the temperature of the air in the stack, which varies with time. In order to determine the air flow during the off-period, the temperature transient in the chimney plus boiler system should therefore be analysed; such aspect is not yet implemented in the model presented in this paper.
When a draft diverter is adopted, if the gas flow rate corresponding to the gas temperature in the stack is higher than the flow rate in the boiler, an extra flow of air (at ambient temperature) is drawn into the stack through the draft diverter. The dilution of the flue gases with ambient air lowers the average gas temperature in the stack, therefore reducing the stack draft until a different equilibrium condition is
reached. The ratio of the mass flow rate in the stack to the mass flow rate in the flue is defined as:
Hence, the volumetric flow rate exfiltrating through the stack is:
The value of Sr depends on the construction features of the boiler and chimney and on the flue gas temperature. Sr is also influenced by the actual internal pressure value, which in turn depends on the external pressure field described by Eq. (1).
Typical values of Sr for individual gas boilers commonly adopted in Italy range between 2 and 2.5.
In order to compare different boilers it may be useful to express the infiltration heat loss induced by the boiler in terms of boiler losses, i.e., as a fraction of the available heat of combustion. The "boiler infiltration loss" is given by the following expression:
where the two integrals are extended over time t, com- prehensive of an integer number of on-off cycles.
In this section the calculation of pressures, temper- atures and gas flow rates in the boiler, flue, draft diverter and stack is presented.
Basically two different situations may occur with respect to the pressure distribution, i. e. :
i) the natural draft boiler in which the slight under- pressure of the combustion chamber (with respect to ambient) determines the flow of combustion air;
ii) the forced draft boiler, in which the burner is equipped with a fan controlling the combustion air flow.
The outdoor pressure Pe(zb) at the boiler level (z = z b ) in the undisturbed zone is assumed as the reference value in the pressure calculation. It is also assumed
that the flue gas pressure at the chimney outlet (elevation z = zb + hu) equals the outdoor air pressure at the same elevation Pe(zb + hu). This fact implies that the discharge gas pressure is not influenced by the local wind speed. Two alternative paths may be followed to determine the pressure drop
Following the external path, this is equal to the hydro- static drop
Alternatively, b Pe may be calculated along the path "outside-inside-stack base-stack outletn.
The difference between the reference pressure and indoor pressure Pi(zb) at the boiler level is indicated as:
The difference between the indoor pressure Pi(zb) and the pressure at the base of the stack Pf(zb)
depends on the characteristics of the boiler: for a forced draft boiler A P b can be assumed equal to zero, as the pressure losses in the boiler are balanced by the pressure head of the burner's blower, while for a natural draft boiler A P b assumes a positive value.
The flue gas pressure difference A P f between the stack base and outlet is given by the sum of two terms, i.e. :
i) the "hydrostatic" pressure difference
ii) the friction losses
A P w = fl*-ds.c2/2 (16)
where the R* coefficient includes the effect of both distributed and concentrated flow resistances, as well as the effect of the kinetic term.
Therefore:
The following equation may be written by equalizing the two pressure drops
OPhyd,e = A P a + A P b + A P W + ~ p h ~ d , ~ (18)
In the latter equation, the known terms are APhyd,e and, in the case of forced draft boilers, the term APb, which can be taken equal to zero. The unknown terms are D Pa, A Pw and APhyd,s; the two latter terms are a function of the gas speed c and density As, given that the chimney constructive and geometric characteristics are assigned; the gas density As is in turn a function of temperature Ts.
Applying the continuity and the energy equations to the draft diverter, and assuming that air and flue gases have equal specific heat, it is found that:
As a first approximation, if the thermal losses of the flue gas are neglected, the temperature Ts also represents the average value in the stack.
2.4 Overall a_ga&ys_&g
The overall solution of the problem is obtained with the following procedure:
i. As an initial guess it is assumed Ts = Tb ii. The neutral plane elevation is initially taken at
the mid height of the building; this is equivalent to imposing an initial value of &Pa.
iii.The gas speed c is calculated from equation (10) and the mass flow rate ms is determined from the contin- uity equation.
iv. The new value of temperature Ts is calculated from equation (19) and the process is repeated from point iii. onwards until convergence is attained.
v. A check is made on the building air flows, until the continuity equation ( 7 ) is satisfied. Otherwise, the position of the neutral plane is modified, i.e. the elevation is moved upwards if Qin < (Qout+Qs) and viceversa, and the calculation is repeated from point ii. until convergence.
Results may be presented in terms of the ratio between the number of air changes with and without chimney:
ACH(w chimney)
ACH(w/o chimney)
Alternatively, if emphasys is placed on boiler perform- ance, the boiler infiltration loss Pi may be calculated from the infiltration rate. The relationship between Pi and the number of air changes (ACH) is given by:
GALGYLATZQ!! HVPQTHBSBS AND APPLZCATION EXAMPLE
In this preliminary phase of the work, a parametric investigation has been performed in order to analyse the sensitivity of the results with respect to some of the most significant parameters (air permeability and weather parameters 1.
As a first example, a two-storey detached house having a square 12 m x 12 m plan, with a forced draft gas boiler on the ground floor was considered. A constant value of the stack cross section, determined according to standard DIN 4705, was assumed. The characteristic data of the building, boiler and exhaust system are summarized in Table 2. Permeability was supposed to be uniform over the entire envelope.
The pressure difference across the building envelope is plotted in Fig. 1 ( A = windward faqade, C = leeward faqade, B = side faqades) with (y) and without (n) exhaust system in the living space; wind direction is assumed perpendicular to faqades A and C. The exhaust system produces a decrease of the internal pressure, corresponding to an increase of A P across all faqades.
Two types of analyses have been performed: the first investigating the influence of the exhaust system on the air infiltration rate of the building; the second analysing the influence of weather parameters on the exhaust system operation.
Results of the former analysis are expressed in terms of the ratio of air changes in the building with chimney to air changes in the same building without chimney, as a function of wind speed and outdoor temperature (see Fig. 2), and wind speed and average envelope permeability (see Fig. 3). As it could be expected, the ratio decreases with increasing wind velocity and temperature difference, and becomes practically independent of outdoor temperature for wind speeds exceeding 4 m/s. Also, the ratio shows a strong dependence on the building permeability, even at high wind speeds.
Results of the latter analysis are shown in Fig. 4, where the variation of factor Sr is reported as a function of wind speed and temperature difference. Sr decreases with increasing wind speed due to wind depressurization of the building; Sr decreases also with decreasing outdoor-indoor temperature differences, due to the reduction of stack draft.
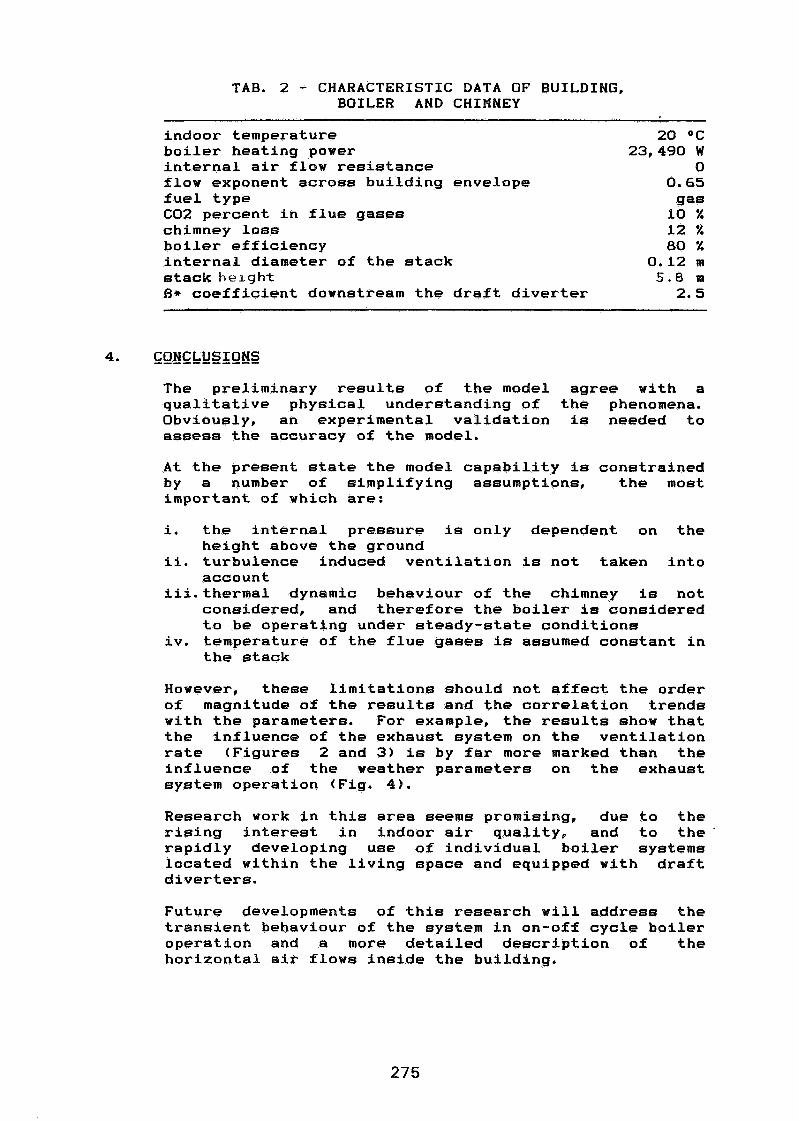
TAB. 2 - CHARACTERISTIC DATA OF BUILDING, BOILER AND CHIMNEY
- -
indoor temperature boiler heating power internal air flow resistance flow exponent across building envelope fuel type C02 percent in flue gases chimney loss boiler efficiency internaa diameter of the stack stack h e l g h t R* coefficient downstream the draft diverter
The preliminary results of the model agree with a qualitative physical understanding of the phenomena. Obviously, an experimental validation is needed to assess the accuracy of the model.
At the present state the model capability is constrained by a number of simplifying assumptions, the most important of which are:
i. the internal pressure is only dependent on the height above the ground
ii. turbulence induced ventilation is not taken into account
iii.therma1 dynamic behaviour of the chimney is not considered, and therefore the boiler is considered to be operating under steady-state conditions
iv. temperature of the flue gases is assumed constant in the stack
However, these limitations should not affect the order of magnitude of the results and the correlation trends with the parameters. For example, the results show that the influence of the exhaust system on the ventilation rate (Figures 2 and 3) is by far more marked than the influence of the weather parameters on the exhaust system operation (Fig. 4 ) .
Research work in this area seems promising, due to the rising interest in indoor air quality, and to the ' rapidly developing use of individual boiler systems located within the living space and equipped with draft diverters.
Future developments of this research will address the transient behaviour of the system in on-off cycle boiler operation and a more detailed description of the horizontal air flows inside the building.
5. BEFEBENCES
CSTB "R9gles et processus de calcul des cheminees fonctionnant en tirage natureln. Paris, dbcembre 1975.
DIN Standard n. 4705 Part I and I1 "Berechnung von Schorsteinabmessungen", 1979.
ANGLESIO, P., CARDINALE, N., CARUSO, C. "Sviluppi della ricerca italiana sulla progettazione e sulle prestazioni energetiche dei caminin. L, Teymgt_l'gn&ge, January 1988.
ANDREINI, P.A., BUCCI, G., ROTA, G. "Aspetti tecnici e normativi del dimensionamento dei camini collettivi ramificatin. LB T!?E!!Q&EG~&GG, January 1988.
CHID 3. , KELLY, G. E. "A method for estimating the seasonal performanoe of residential gas and oil-fired heating systemsn. ASHRAE Trans., T-78-1 No. 3, pp. 405-421. ------ ------ KELLY, G. E., CHI, J., KUKLEWICZ, M. E. "Recommended testing and calculating procedures for determining the seasonal performance of residential central furnaces and boilersn. National Bureau of Standards, NBSIR 78-1543, 1978, Washington.
HODERA, M. P., SONDEREGGER, R. C. "Determination of in-situ performance of fire- placesm. Lawrence Berkeley Laboratory Report LBL- 10701. August 1980.
SHAW, C. Y. and BROWN, W. C. nEffect of a gas furnace chimney on the air leakage characteristic of a two-storey detached housen Prn~eeginae 3x4 AIC Conhe~e~se, London, U. K., September 1982, pp. 12.1 - 12.13. SHAW, C. Y. and KIM, A. "Performance of passive ventilation systems in a two-storey house" Proceediqgg s$h 4ZC Ggqfpyencg, Reno, Nevada, USA, pp. 11.1 - 11.27. KUNZ. W. "Carnini per impianti di riscaldamento ad alto rendi- mento. Aspetti teorici e sperimentaliu. Lg Tt'rmo- gecnica, January 1988.
FRACASTORO, G. V. e PAGANI, R. "Un modello sintetico per il calcolo delle infiltra- zioni d'aria*. &a Termotg~nica, Febbraio 1988.
12. WISE, A. F. E. "Ventilation of buildings". Proceedings gf Cpgfz erence Heat Transfer i33&ldings, Dubrovnik, 1977.
.3. SHAW, C.Y., TAMURA, G. T. "The calculation of air infiltration rates by wind and stack action for tall buildingsn. _ASHBAE Ti'aksL 1977, Part 2.
This work has been partially funded by CNR-PFE 2 under a research grant on "Natural and mechanical ventilation in buildings" for 1987.
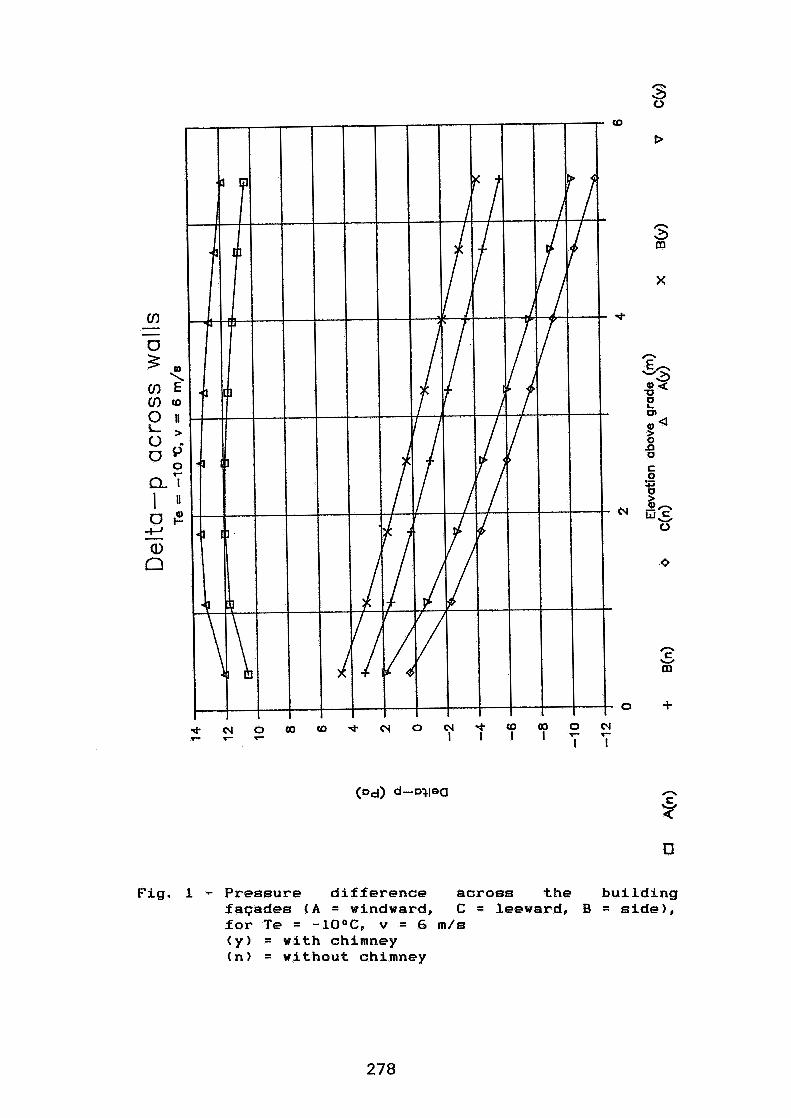
Fig. 1 - Pressure difference across the building fagades ( A = windward, C = leeward, B = side), for Te = -lO°C, v = 6 m/s (y) = with chimney (n) = without chimney

Z'L C'L P* L S'L 9'L
L'L
L'Z
z'z i3 I
E'Z *'Z
S'Z 9.2
L'Z 8'2
6'Z E
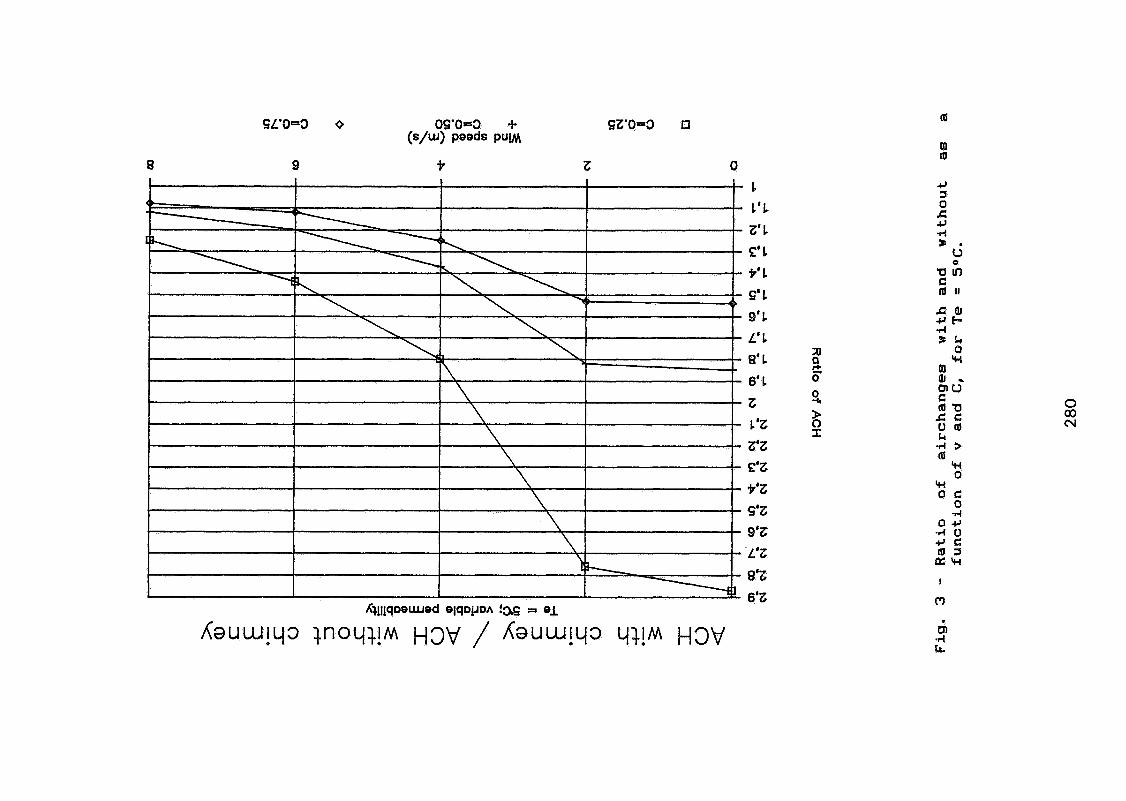
L
L'L Z'L C'L
P'L S'L 9'1
L'L
8'L 3 6'L 5 z S L'Z R I Z'Z E'Z P'Z S'Z
9'z L'Z
8'2 6'2
&!l[q~slliJ9d 9iqDyDA fag = 91
Aauuy3 JnoyqM H ~ Q / Aauu !y~ ~ J ! M H ~ Q
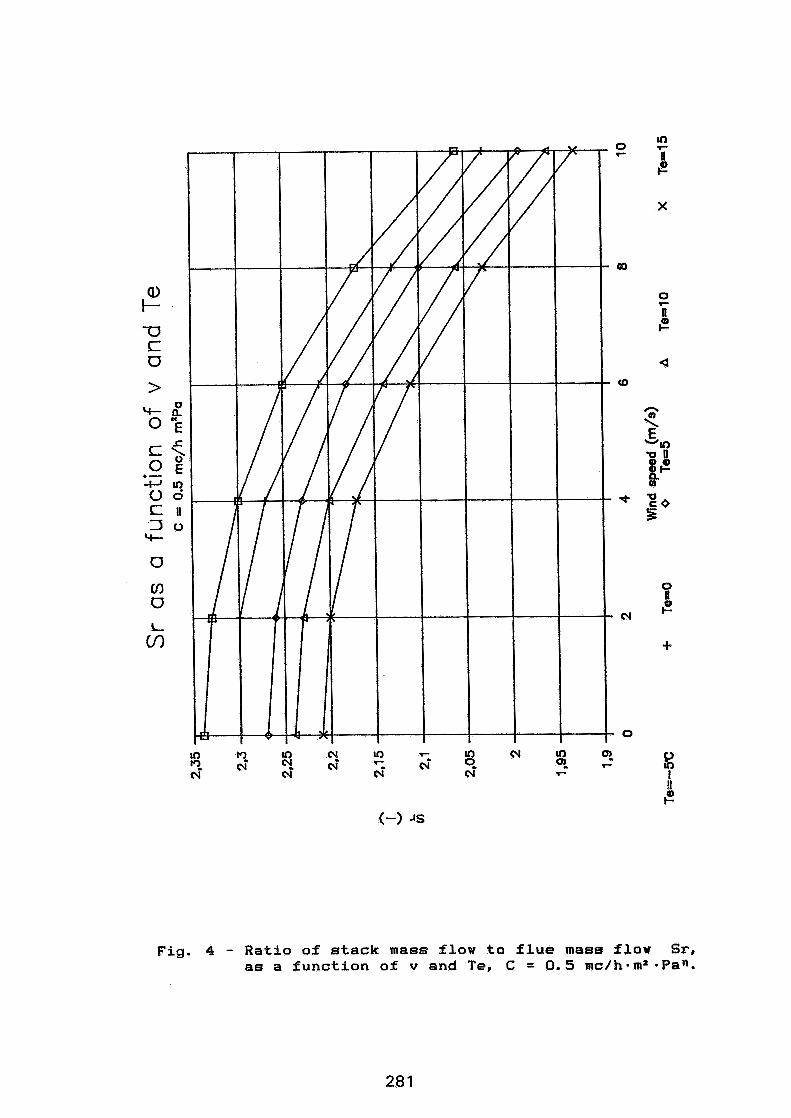
Fig. 4 - Ratio of stack mass flow to flue mass flow Sr, as a function of v and Te, C = 0.5 mc/h*m2 *Pan.
Discussion
Paper 15
0. Nielsen (Ministry of Housing and Building, Denmark) (a) Have m o b l e m s associated with combustion gases back-flowing through the draft diverter? (b) I presume draft diverters are only used on boilers with atmospheric burners.
M, Masoero (Politecnico di Torino, Italy) (a) The problem has been investiqated only recently. To solve it, Italgas (the largest gas distribution company in Italy) is developing a device which interrupts gas flow to the burner under the dictates of a temperature sensor at the diverter, (b) Draft diverters are compulsory on individual gas boilers with atmospheric burners, but are also used on forced air burners with the fan downstream of the draft diverter.
W, De Gids (TNO Division of Technology for Society, Holland) A problem associated with flow diverters is that imnediately after the burner ignites there is an emission of NOx into the space.
R. Walker (Building Research Station, Garston, UK) (a) Could you tell me what expression you used to relate indoor-outdoor pressure differences to air leakage? (b) You may find it useful to scale data by 1/(DT)1/2 in order to remove the dependence on DT . M. Masoero (Politecnico di Torino, Italy) (a) The usual expression:Q = C A IDpln was used (see equations (6') and (6") in the paper).
D. Harrje (Princeton University, USA) Besides the air infiltration implications of your work it is also important to consider the soil gas and radon which may be drawn from the basement crawlspace due to the negative pressure (set up by boiler operation). If a warm air system is used there are further considerations with regard to supply and exhaust balance, which would also affect the basement area pressure,
EFFECTIVE VENTILATION
9 t h AIVC Conference, Gent, Belgium 12-15 September, 1988
Paper 16
II.IDOOR FORIIALDEHYGE LEVELS I N ENERGY -EFFICIENT HOllES WITH llECHANICAL VENTILATION SYSTEtlS
; I . RILEY' and P. PIER SOL^ IENERGY, HINES AND RESOURCES CANADA
460 O'Connor S t , Ottawa, Canada KIA OE4
2 0 ~ ~ ~ ~ ~ ~ RESEARCH FOUNDATION Sheridan Park Research Community Ili s s i ssauga, Canada L5K 1B3

Mechanical ventilation systems have been adopted in airtight energy- efficient houses in Canada to provide fresh air, remove moisture and indoor pollutants and provide a comfortable environment for the home-occupants. Homes constructed under the R-2000 Home Program are equipped with mechanical ventilation with heat recovery. Since 1984, the performance of approximately 700 R-2000 Homes has been monitored on an annual basis. This monitoring has included the measurement of indoor levels of formaldehyde and the documentation of ventilation system operation. Levels of formaldehyde in the initial years of the program averaged 0.069 parts per million (ppm). Formaldehyde originates from urea formaldehyde resin which is used in the manufacture of many household furnishings and building products. After revisions to the R-2000 Home ventilation guidelines which then stipulated fresh air distribution in addition to a total fresh air supply capacity (0.5 ach), the average level of formaldehyde has decreased to 0.045 ppm in the most recent years. Since the decrease of formaldehyde levels with increased age of home was not observed, this decrease has been attributed to the revisions to the ventilation guidelines. Details of the ventilation guidelines, the type of ventilation systems used, and the air quality results are presented.
1.0 INTRODUCTION
Mechanical ventilation systems are required for homes built under the R-2000 Super Energy-Efficient Home Program in Canada. The intent of these mechanical ventilation systems is to provide fresh air, remove moisture and indoor pollutants and provide a comfortable environment for the home occupants. The R-2000 Home Program Design and Installation Guidelines for Ventilation systems' outline requirements for a continuous supply of ventilation air to dilute and control contaminants produced within the home and an additional capacity for periods of higher humidity or contaminant source strength. An overview of these guidelines has been previously presented2.
in 1983 a monitoring program commenced that included air quality and ventilation testing of approximately 300 initial demonstration R-2000 Homes and a sample of conventionally built homes. This monitoring program has been conducted annually since 1983 during the Canadian heating season, mid-November through to mid-April. The program has also been expanded to an additional 400 R-2000 Homes
built subsequent to the initial 1983-1984 period. The initial demonstration R-2000 Homes have been monitored each year inorder to determine how they perform with time. The subsequent R-2000 homes have been monitored to determine whether homes constructed by new builders to the program perform the same as the initial demonstration homes. Conventional homes were monitored as controls for comparative purposes.
One of the objectives of the monitoring program is to obtain information on the ventilation and air quality characteristics of R-2000 Homes in order to determine whether they comply with the program criteria and recognized standards or guidelines, and how they compare with a sample of conventionally built homes. Included in this monitoring has been the measurement of the airflow rates of the installed ventilation systems, average airchange rates and indoor air quality.
2.0 VENTll ATlON SYSTEMS
The mechanical ventilation systems in these energy-efficient homes are balanced systems with heat recovery. These systems are operated continuously inorder to provide ventilation to these airtight homes which must meet a criterion of 1.5 air changes per hour (ach) at a 50 Pa pressure differential. There are two basic ventilation systems; those in houses with forced air heating and those in houses without forced air heating such as baseboard heating.
In the forced air systems (Figure I ) , the heat recovery ventilator (HRV) discharges fresh air to a return air register of the forced air system closest to the furnace. The furnace fan is run at low speed continuous to distribute fresh air throughout the house. Dedicated duct work is used to exhaust stale air from bathrooms, kitchen, laundry room, and utility rooms. The stale air exhaust duct discharges through the HRV to the outside.
For baseboard heated houses, the fresh air ductwork from the HRV supplies fresh air to bedrooms, living rooms, dining rooms, basement and rooms without exhausts. Similar to the forced air houses, dedicated duct work is used to exhaust stale air from bathrooms, kitchen, laundry room and utility rooms. Again, stale air discharges through the HRV to the outside.
3.0 FORMALDEHYDE MONITORING PROGRAM
Indoor air quality has been monitored for formaldehyde, radon, and nitrogen dioxide in approximately 700 R-2000 Homes plus approximately 70 conventional homes. The field monitoring activities were carried out by technicians from Energy, Mines and Resources Canada (EMR) regional offices in 10 provinces and two territories in Canada. Individuals from each office were trained in air quality testing for formaldehyde, radon, and nitrogen dioxide and in the measurement of airflows and ventilation rates in homes. A comprehensive monitoring manual was prepared for the field technicians on all aspects of the monitoring program, including administrative procedures, occupant liaison, questionnaire completion, air quality monitoring procedures, and ventilation system testing. Laboratory and field support was provided by regional engineering firms and several laboratories in Canada and the United States.
Formaldehyde was monitored in 1983-84 with passive diffusion badges and then in subsequent years with passive diffusion tubes. Chamber tests indicate that the diffusion tube monitor used from 1985 to 1988 normally will measure approximately 10% to 20% higher than the badge3. Formaldehyde levels taken with the badge in 1983-84 have been increased by 15% based on the chamber tests to make them comparable to the result's of subsequent years.
The monitors were installed in the homes by EMR regional office technicians and were removed and forwarded by the home owners after seven days to a laboratory for analysis. Formaldehyde levels were measured in a main floor living area such as a family room or living room and in the master bedroom. In all instances, sampling periods were for 7-days.
4.0 FORMALDEHYDE MONITORING RESULTS
Average levels of formaldehyde in both the R-2000 Homes and the conventional homes were below the guideline of 0.10 parts per million (ppm). The mean levels in the R-2000 Homes decreased from 0.069 ppm in 1983-84 to less than 0.05 ppm in 1986-87 and 1987-88. Results are presented in Table 1 and Figure 3. During the monitoring of the initial demonstration homes in the 1983-84 period, measurements were conducted with the mechanical ventilation system operating as installed. Based on other observations made at
the time of measurement, this meant that a large portion of the ventilation systems were not operating as required. In 1985, measures were taken to ensure that HRVs were balanced properly and were capable of delivering the required airflow capacity. In 1986, the corrective measures were completed. New revisions to the ventilation guidelines in 1986 also required a minimum continuous flow.
The mean formaldehyde levels in 1983-84 and 1984-85 were 0.069 pprn and 0.068 ppm, respectively. Standard deviations were 0.029 and 0.027 pprn in 1983-84 and 1984-85, indicating a wide range of levels. In 1984-85 values ranged from 0.015 to 0.14 ppm, with approximately 9% of the homes with values greater than the guideline of 0.10 ppm. The frequency histogram in Figure 3 illustrates this range of levels. In 1986-87 and 1987-88 the levels of formaldehyde decreased to 0.045 ppm. The standard deviations also decreased to 0.017 and 0.016 pprn in 1986-87 and 1987-88, respectively. The histograms in Figure 3 for 1986-87 and 1987-88 illustrate the change in the range of formaldehyde levels measured. Less than one percent of the homes measured in these later two years had levels greater than the 0.1 pprn guideline.
During the program 77 new conventional homes without ventilation systems were monitored for formaldehyde as controls, Table 1 and Figure 4. The majority of these measurements were made during the 1983-84 period. For all the conventional homes monitored from 1983-84 to 1986-87, the mean level was 0.069 pprn and the standard deviation was 0.033 ppm. Seventeen percent of these 77 homes had formaldehyde levels of greater than 0.1 ppm. These values are similar to the R-2000 levels in the initial years but greater than the present levels encountered in the R-2000 Homes.
As previously mentioned, the R-2000 Homes have two basic ventilation system designs. Analysis of the air quality data indicates that the measured formaldehyde levels did not differ from one system to the other. When the ventilation systems are operating properly, the levels measured, Table 2, are the same for the two systems. The first readings in the initial demonstration homes, 0.066 pprn for forced air and 0.070 pprn for basebosard, were taken prior to revisions to the ventilation guidelines and are typical of those measured in the 1983-84 and 1984-85 periods. Presently, formaldehyde levels in both the initial homes and the subsequent homes for both baseboard and forced systems are similar.
Initially, a new product containing urea formaldehyde resin will emit somewhat higher levels of formaldehyde gas. The emission rate will decrease to a lower level over time. Comparisons were made between older and newer R-2000 Homes to determine whether the lower indoor levels of the later years were a result of such a time-related decrease, or whether this decrease was related to more effective ventilation. Figure 5 presents histograms for formaldehyde conducted in 1986-87 in two'groups of homes built a few years apart. Ninety homes were three to four years old and 66 homes were one to two years old. There is not a significant difference between the mean formaldehyde levels measured in those homes which were three to four years old, 0.044 ppm, and those which were one to two years old, 0.046 ppm. This trend differs from decreases found by It is believed that the low levels of formaldehyde measured in these homes are approaching the lower limit attainable in the new generation of energy-efficient housing. Levels of less than 0.02 pprn are rarely experienced798s9 in even older houses. At levels below 0.05 pprn the introduction of sources such as new furniture which contains urea formaldehyde resin materials can have a measurable impact on the indoor formaldehyde levels.
lnorder to further investigate which factors influence formaldehyde levels in these energy-efficient homes with mechanical ventilation systems a study was conducted on a smaller set of homes. Formaldehyde sources and factors such as tobacco smoking, building materials and furnishings containing urea-formaldehyde resin, indoor temperature and humidity and the adequacy of ventilation were studied in a sample of 35 R-2000 Homes. These 35 homes had formaldehyde levels ranging from 0.023 pprn to 0.088 ppm. It was determined that indoor temperatures greater than 2I0C, indoor humidity greater than 50% RH, new furnishings and/or recent renovations, tobacco smoking, and HRVs that operate at less than 80% of the flow required by the R-2000 technical airflow requirements could, in combination, raise formaldehyde levels above a base level of 0.04 ppm. These findings are summarized in Table 3 and in the following.
For homes with mechanical ventilation systems which were properly installed, operated and maintained then:
(i) formaldehyde levels were less than 0.05 pprn when there no major sources and low to moderate indoor temperature and humidity, or when there is one major source or high indoor temperature and humidity; and

( i i ) formaldehyde levels were greater than 0.05 pprn when there were two or more major sources and high indoor temperature and humidity.
For homes with mechanical ventilation systems which were improperly installed, operated and poorly maintained then:
( i ) formaldehyde levels were less than 0.05 pprn when there were no major sources and low to moderate indoor temperature and humidity; and
( i i ) formaldehyde levels were greater than 0.05 pprn when there were one or more major sources or high indoor temperature and humidity.
As previously mentioned, measurements were taken in a main floor living area and the master bedroom. The monitoring data was analyzed to determine if a variation existed between levels in the living area and the bedroom. On average, levels of formaldehyde were the same in the two areas monitored even when the ventilation systems were not operating as required. These similar levels may be because the formaldehyde sources are evenly distributed throughout the homes. Formaldehyde is also a gas and as such should mix well and disperse throughout the homes by diffusion and ventilation transfer. A summary of monitoring results are presented in Table 4. Data for livingrooms and bedrooms for the last readings in the initial demonstration R-2000 Homes are presented in Figure 8 to illustrate the relationship between the levels in the different rooms.
In addition to evaluating the formaldehyde levels in smokers and no-smokers homes in the set of 35 homes, national data was also analyzed. Nationally the levels for these two groups were the same. For 74 smokers homes the mean formaldehyde level was 0.047 pprn and for 214 non-smokers homes the mean level was 0.046 ppm.
5.0 CONCLUSIONS
The results of this monitoring program indicate that energy-efficient housing with mechanical ventilation systems have indoor formaldehyde levels comparable to, or lower than, conventional housing. The ventilation systems, if properly installed and operated should maintain formaldehyde levels well below 0.1 pprn in houses with low to moderate sources of formaldehyde. Pollutant source
strength, not ventilation, is the predominant parameter in determing indoor pollutant levels. If a home has new urea formaldehyde containing furnishings, high indoor temperature and humidity and an HRV not providing adequate airflow these factors may, in combination, result in formaldehyde levels approaching or exceeding guideline comfort levels.
ACNOWLEDGEMENTS
The authors would like to acknowledge the contribution of Teresa Flowman in performing many statistical evaluations of the monitoring data.
REFERENCES
1. R-2000 Home Program Design and Installation Guidelines for Ventilation Systems, R-2000 Home Program, Energy, Mines and Resources Canada, November 1986.
2. Riley, M.A., An Overview of the R-2000 Home Program Design and Installation Guidelines for Ventilation Systems, Paper 13, Ventilation Technology - Research and Application, 8th AlVC Conf., Uberlingen, Federal Republic of Germany, Sept. 1987.
3. AQRI, Air Quality Research International, Performance of PF-1 and Dupont Passive Formaldehyde Monitors in AQRI Test Atmosphere Chamber, prepared for the UFFl Center, Corporate and Consumer Affairs, Canada.
4. Health and Welfare Canada, Exposure Guidelines for Residential Indoor Air Quality, A Report of the Federal-Provincial Advisory Committee on Environment and Occupational Health, April 1987.
5. Reiland, P., M. McKinstry and P. Thor, Preliminary Formaldehyde Testing Results for the Residential Standards Demonstration Program, Office of Conservation, Bonneville Power Administration, U.S. Dept. of Energy, Aug. 1985.
6. Figley, D.A., and J.T. Makohon, Measured Formaldehyde Levels and Ventilation Rates in Mobile Homes, Preprint 88-74.2, APCA 81 st Annual Meeting, Dallas TX, June 1988.
7. Grimsrud, D.T., B.H. Turk, 1. Harrison, R.J. Prill, A Comparison of Indoor Alr Quality in Pacific Northwest Existing and New Energy Efficient Homes, presented at the 79th Annual Meeting APCA, Minneapolis MN, June 1987.
8. Sexton, K., L.A. Lui and M.X. Petreas, Formaldehyde Concentrations Inside Private Residences: A Mail Out Approach to Indoor Air Quality Monitoring, Journal of the APCA, Vol. 36(6), June 1986, ~698-704.
9. Scheuneman, E. and G. Wilson, Air Quality Results for Tightened Houses, presented at ASHRAE IAQ '86, Atlanta 1986.
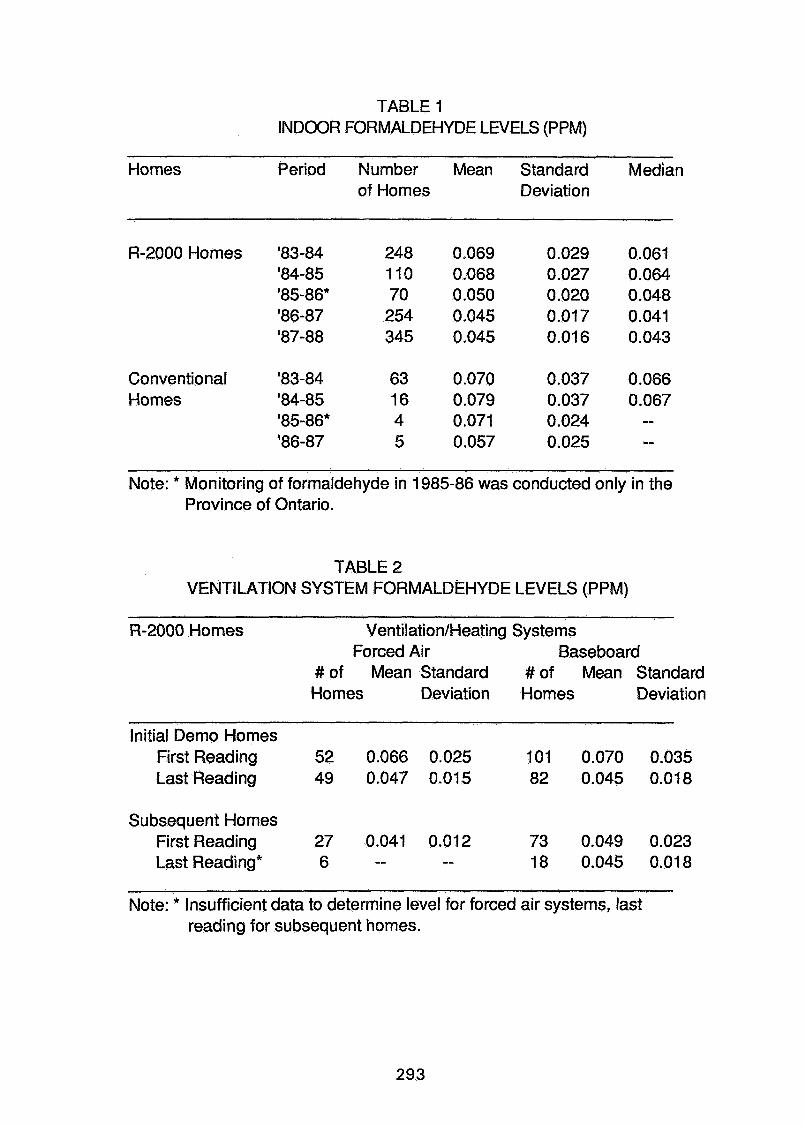
TABLE 1 INDOOR FORMALDEHYDE LEVELS (PPM)
- - --
Homes Period Number Mean Standard Median of Homes Deviation
R-2000 Homes '83-84 248 0.069 0.029 0.061 '84-85 110 0.068 0.027 0.064 '85-86* 70 0.050 0.020 0.048 '86-87 254 0.045 0.017 0.041 '87-88 345 0.045 0.01 6 0.043
Conventional '83-84 63 0.070 0.037 0.066 Homes '84-85 16 0.079 0.037 0.067
'85-86* 4 0.071 0.024 -- '86-87 5 0.057 0.025 --
Note: * Monitoring of formaldehyde in 1985-86 was conducted only in the Province of Ontario.
TABLE 2 VENTILATION SYSTEM FORMALDEHYDE LEVELS (PPM)
R-2000 Homes VentilationIHeating Systems Forced Air Baseboard
# of Mean Standard # of Mean Standard Homes Deviation Homes Deviation
Initial Demo Homes First Reading 52 0.066 0.025 101 0.070 0.035 Last Reading 49 0.047 0.015 82 0.045 0.018
Subsequent Homes First Reading 27 0.041 0.012 73 0.049 0.023 Last Reading* 6 -- -- 18 0.045 0.018
Note: * Insufficient data to determine level for forced air systems, last reading for subsequent homes.
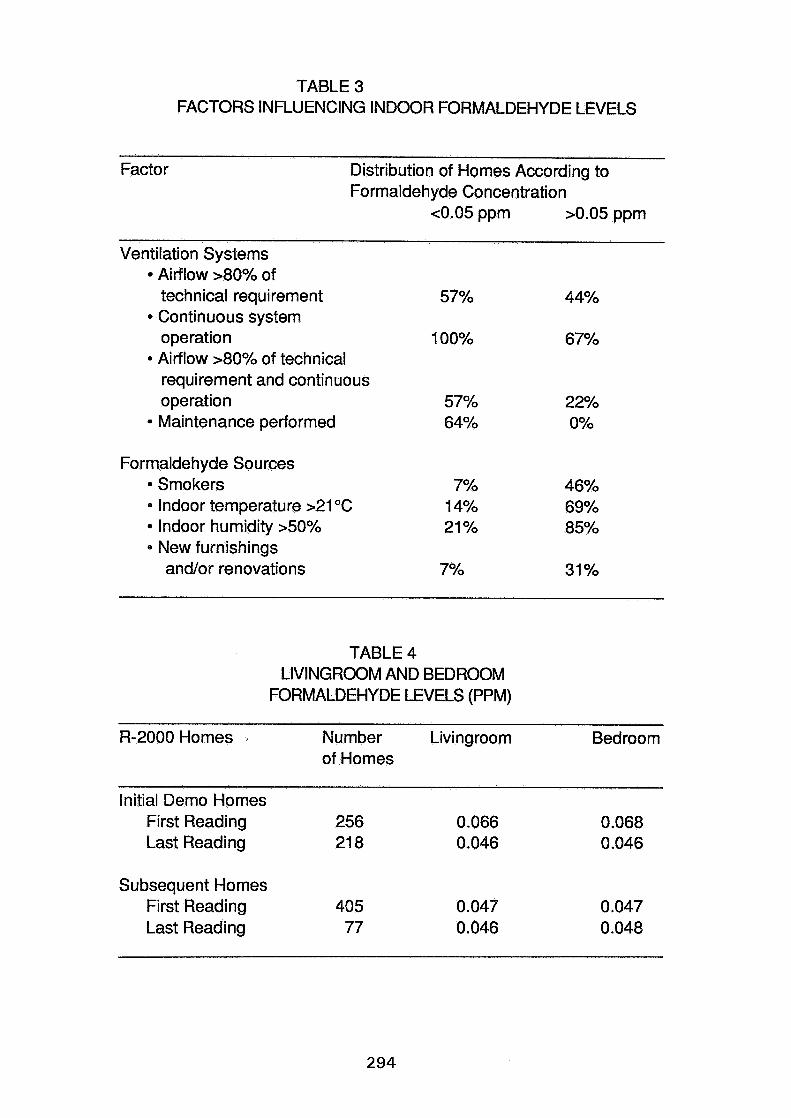
TABLE 3 FACTORS INFLUENCING INDOOR FORMALDEHYDE LEVELS
Factor Distribution of Homes According to Formaldehyde Concentration
~ 0 . 0 5 ppm >0.05 ppm
Ventilation Systems * Airflow >80% of
technical requirement * Continuous system
operation * Airflow >80% of technical
requirement and continuous operation
a Maintenance performed
Formaldehyde Sources Smokers
* Indoor temperature >21 O C * Indoor humidity >50%
New furnishings andlor renovations
TABLE 4 LIVINGROOM AND BEDROOM
FORMALDEHYDE LEVELS (PPM)
R-2000 Homes Number Living room Bedroom of Homes
Initial Demo Homes First Reading 256 0.066 0.068 Last Reading 21 8 0.046 0.046
Subsequent Homes First Reading 405 0.047 0.047 Last Reading 77 0.046 0.048
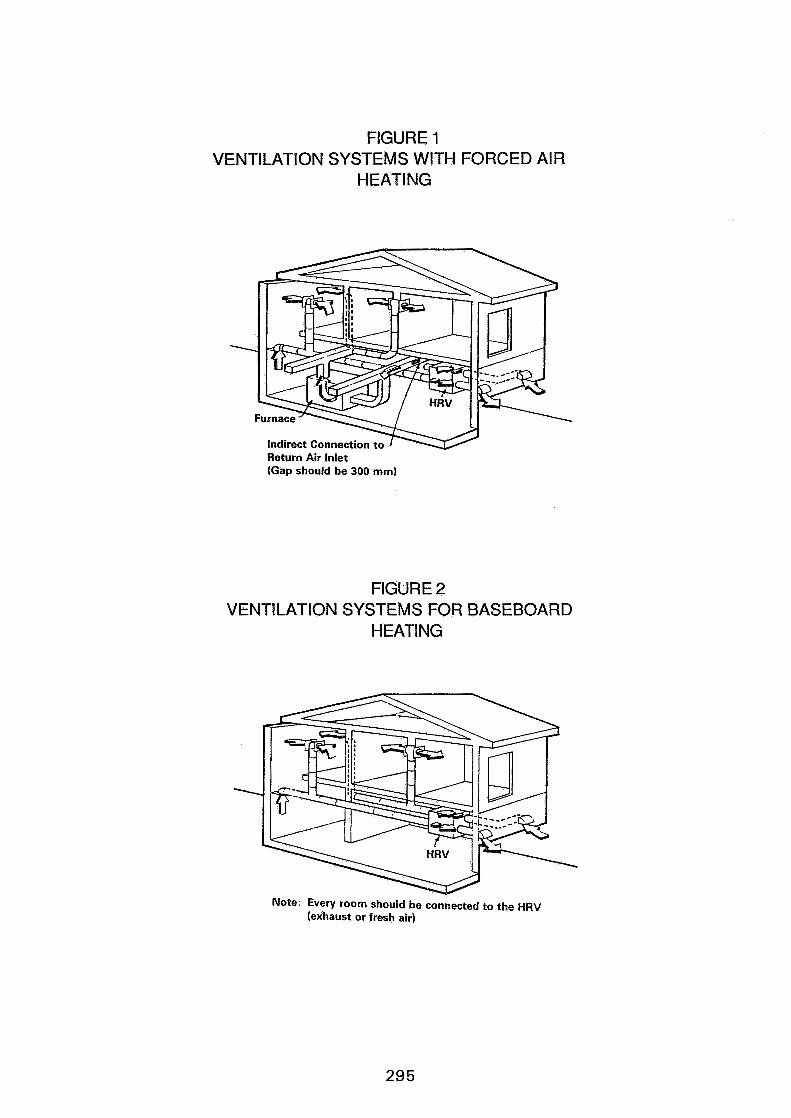
FIGURE 1 VENTILATION SYSTEMS WITH FORCED AIR
HEAT1 NG
Indirect Connection to Return Air Inlet (Gap should be 300 mm)
FIGURE 2 VENTILATION SYSTEMS FOR BASEBOARD
HEATING
Note: Every room should be connected to the HRV (exhaust or fresh air)
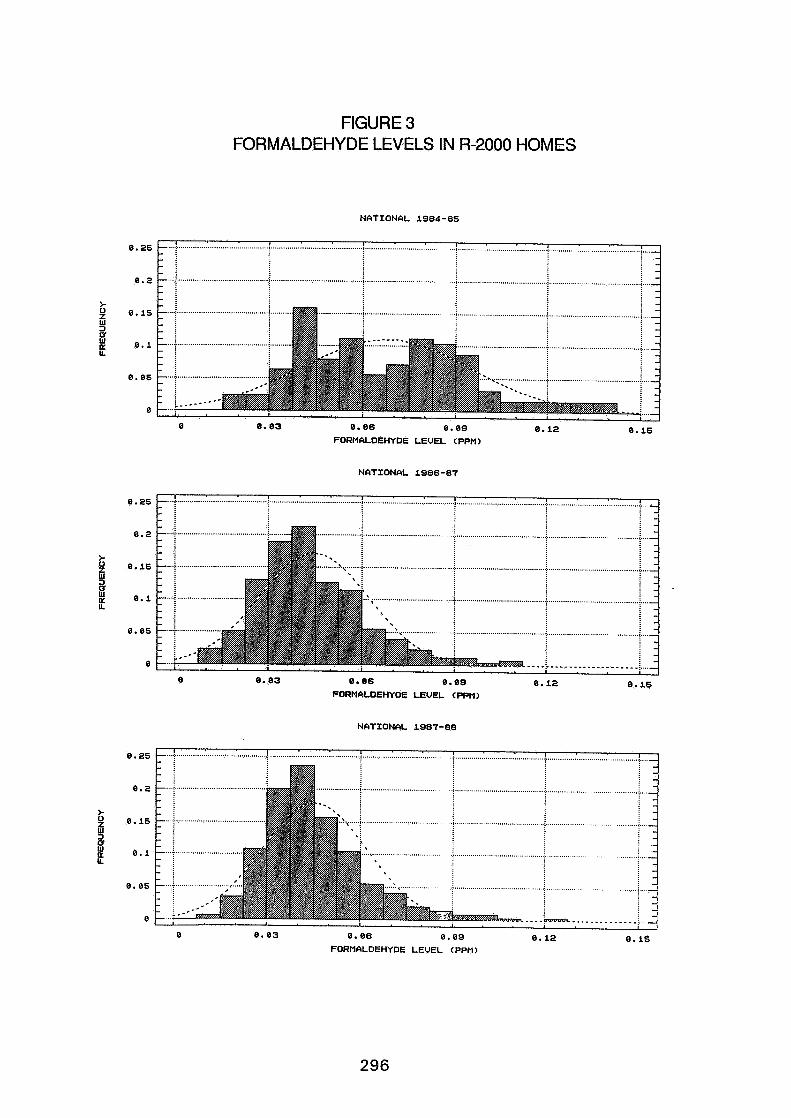
FIGURE 3 FORMALDEHYDE LEVELS IN R-2000 HOMES
N A T I O N A L 1984-86
0 0 . 0 3 0 .06 0 .09 0 . 1 2 0 . 1 5 FORMALDEHYDE L E V E L (PPM)
N A T I O N A L 1986-87
FORMCILDEHYDE L E V E L (PPM)
N A T I O N A L 1987-88
0 0 . 0 3 0 .06 8 . 0 9 0 . 1 2 0 . 1 5 FORMALDEHYDE L E V E L (PPH)
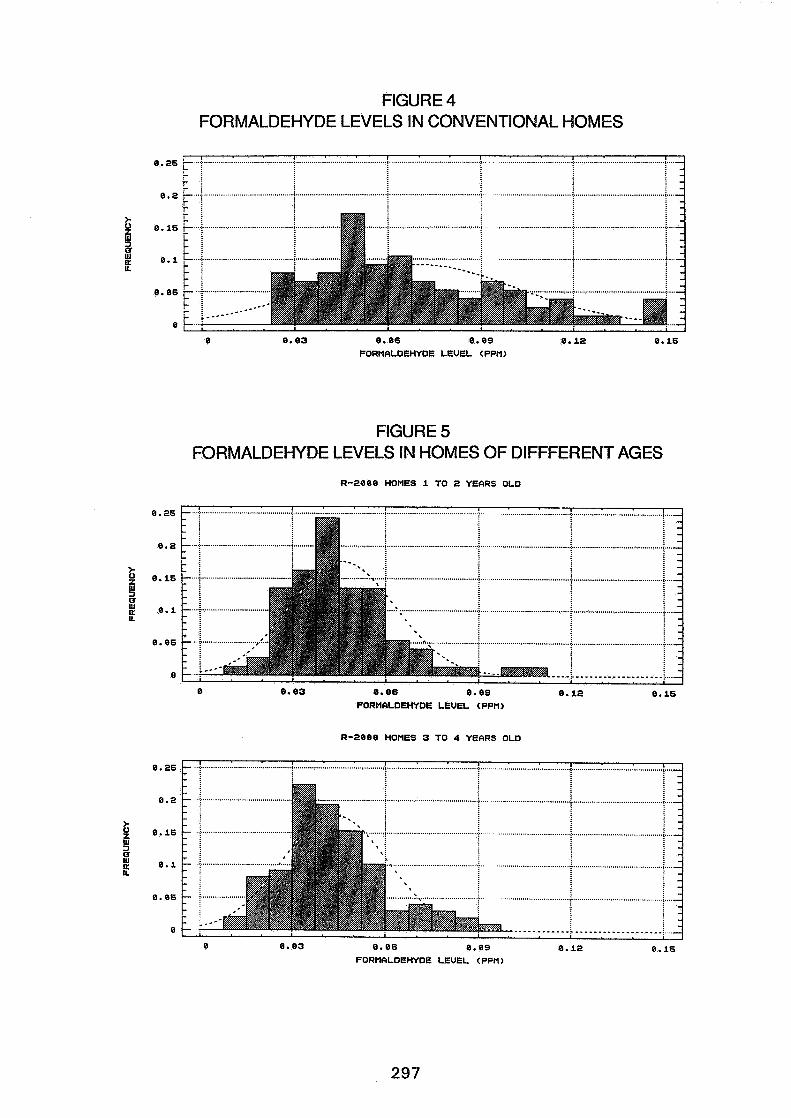
FIGURE 4 FORMALDEHYDE LEVELS IN CONVENTIONAL HOMES
0.03 0.06 8.09 0.12 0.16
FORMALDEHYDE LEVEL <PPM>
FIGURE 5 FORMALDEHYDE LEVELS IN HOMES OF DIFFFERENT AGES
R-2000 HOMES 1 TO 2 YEARS OLD
R-2000 HOMES 3 TO 4 YEARS OLD
0.03 0.06 0.09 0.12
FORMALDEHYDE LEVEL (PPM)
Discussion
Paper 16
C-A. Roulet (Ecole Polytechnique Federale de Lausanne, Switzerland) Do you have any information on the air change rate of the R-2000 buildinqs before and after the application of the - - - Ventilation Rules?
M. Riley (Ehergy, Mines and Resources, Ottawa, Canada) We did undertake PFT air change rate sampling and issued a report on average air change rates in early R-2000 homes. One can assume that the air change rate in new homes was similar to the mechanical ventilation rate specified (0.3 to 0.4 per hour).
D. Harrje (Princeton University, USA) What about the question of maintenance which, according to your results, varied significantly between groups of homes?
M. Riley (Ehergy, Mines and Resources, Ottawa, Canada) We are very interested in the issue of maintenance versus the performance of the ventilation system, but have not had the tine to examine this in detail. Although we have looked at the mould and fungi growth in poorly maintained system,
W. Fisk (Lawrence Berkeley Laboratory, USA) Have you studied the seasonal variations in formaldehyde concentrations in these houses? If so, what are the results?
M, Riley (Energy, Mines and Resources, Ottawa, Canada) We have done some limited studies of seasonal variations. Generally the results indicate higher levels during periods of high outside humidity and temperature, such as those found in the sumner.
P. Hartmann (EMPA Duebendorf, Switzerland) You show a decrease in formaldehyde concentration in new R-2000 homes. Is it Proven that there is no significant change in the production or - manufacture of particle boards during recent times?
M. Riley (Ehergy, Mines and Resources, Ottawa, Canada) We have no evidence of any change in the particle boards being used in R-2000 homes. In addition, when ventilation systems are not being operated correctly, levels return to those found in earlier studies.
R. Grot (National Bureau of Standards (USA) (a) The age data which you presented agrees with laboratory data on pressed wood products which we have collected. There is very little decay after an initial rapid decay (3 months) caused by the release of free formaldehyde. (b) Formaldehyde is stored and released by many building materials, such as gypsum (just like moisture),
therefore a building does not rapidly respond to formaldehyde transients, nor does the formaldehyde concentration change rapidly after changes in ventilation rate - this explains why transient operation of ventilation cannot effectively control formaldehyde levels.
M. Riley (Energy, Mines and Resources, Ottawa, Canada) (a) Your work confirms our results. We had assumed that there would be a steady decline in levels, based on research conducted by others, (b) This is correct. We were using 7 day passive samplers which dampen the effect of short-term fluctuations in formaldehyde levels due to emissions such as smoking,
P. Hartmann (ENPA Duebendorf, Switzerland) You described overall formaldehyde levels in R-2000 buildings. Can you indicate a typical split between the sources of formaldehyde: background, particle board, furniture, smokers etc.?
M. Riley (Energy, Mines and Resources, Ottawa, Canada) I don't have a detailed split, but recent work at our Flair homes project would seem to indicate that the building itself is the major source, followed by furnishings.
W. De Gids (TNO Division of Technology for Society, Holland) What measures did you take to reduce formaldehyde levels in the R-2000 homes in which concentrations exceeded 0.1 ppm?
M. Riley (Energy, Mines and Resources, Ottawa, Canada) Initially we adjusted the ventilation systems to address most problems. Recent problems are mostly due to high source emissions, such as new painting or carpeting. These have normally been reduced by rapid reduction in emission rates in the subsequent months.
W. Raatschen (Dornier Systems QnbH, W. Germany) (a) What facility do occupants have to control their ventilation system? Is it purely on/off control? (b) Can they control individual roams? (c) What basic ventilation rate can you recomnend (i.e. with no occupants present) to dilute non-human related contaminants, such as formaldehyde?
M. Riley (Energy, Mines and &sources, Ottawa, Canada) (a) The "continuousw mode is usually set by the installer, but can be varied by changing fan speed via a speed controller or by adjusting dampers. In addition most systems have a high speed (boost) mode of operation. (b) Some systems offer good control over individual room ventilation rates by adjustment of grille outlets. In most cases however control is limited because of poor design. (c) Generally a level of 0.3 to 0.4 air changesfiour keep concentrations at a satisfactory level, This applies specifically to Canadian climate and house construction.
0. Nielsen (Ministry of Housing and Building, Denmark) Typically, what is the outdoor concentration of formaldehyde found in Canadian cities?
Me Riley (Ehergy, Mines and Resources, Ottawa, Canada) We have not measured outdoor concentrations coincident with our indoor measurements. This was not practicable for the time of year (late winter) when measurements were being made. It is my understanding that levels are typically very low ((0.02 ppn). It should be noted that mst new houses are in suburban areas, not in high density downtown areas.
EFFECTIVE VENTILATION
9th AIVC Conference, Gent, Belgium 12-15 September, 1988
Paper 17
RECIRCULATION OF AIR IN DWELLINGS
Differences in concentrations between rooms in dwellings due to the ventilation system,
W.F. de GIDS, J.C. PHAFF
TNO Division of Technology for Society P.O. Box 217, 2600 AE Delft Netherlands
SUMMARY
The Dutch Standard NEN 1087 "Ventilation of dwellings", Requirements, is at this moment under review. A statement is made that outside air is required as fresh air for bedrooms. Bathroom, kitchen, W.C. and livingroom are allowed to be ventilated with air from other rooms. During the last years air heating systems became more popular. These systems have in its most simple form recirculation of air from the livingroom to the bedrooms. The requirement of fresh outside air for bedrooms can only be reached with these systems when selective recirculation takes place. During the reviewing process of the standard, TNO has carried out some studies to investigate the differences in concentrations of contaminants in dwellings due to different ventilation and heating systems. Measurements and calculations have been made in a lot of conditions to reconsider the requirement of pure outside air for bedrooms. In this investigation the following aspects were studied; * what pollutant is the most important with respect to
recirculation, * what concentrations may be expected under several weather
conditions and living habits, * what is the influence of staying different hours of time in
different rooms (i.e. housewife versus baby) etcetera Field measurements in two dwellings and calculations with the TNO Ventilation model (VENTCON) were compared. The main conclusions of these studies are: * Particles of sigaret smoke can be seen as the most important
contaminant in houses specially considering childrens bedrooms. * Leeward sided bedrooms can receive contaminated air from the
living under certain weather conditions and living habits. * Due to an effective window opening (large open casement windows) occupants can minimize these contaminant levels.
* There are no significant differences in doses (=concentration multiplied by occupation time) in houses with natural ventilation or mechanical exhaust and air heating systems who can be seen as balanced ventilation systems
* Babies are more exposed to contaminants from the living then housewives in both houses with natural ventilation or mechanical exhaust and houses with air heating systems
* There is a very good correlation between the measured and calculated concentrations of contaminants
* Simple measures in the air heating installation can give occupants the possibility to ventilate their house with outside air only, which can be a necessity in the case of sick or sensitive people.
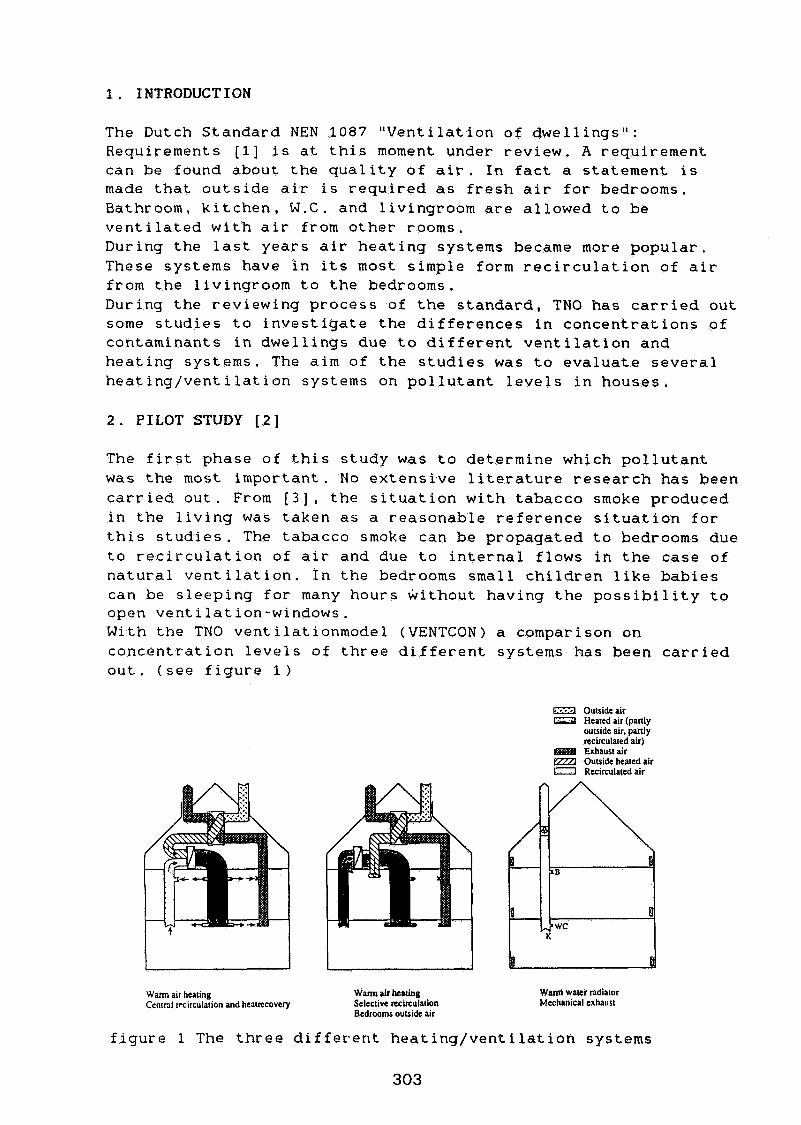
1. INTRODUCTION
The Dutch Standard NEN 1087 "Ventilation of dwellings": Requirements [1] is at this moment under review. A requirement can be found about the quality of air. In fact a statement is made that outside air is required as fresh air for bedrooms. Bathroom, kitchen, W.C. and livingroom are allowed to be ventilated with air from other rooms. During the last years air heating systems became more popular. These systems have in its most simple form recirculation of air from the livingroom to the bedrooms. During the reviewing process of the standard, TNO has carried out some studies to investigate the differences in concentrations of contaminants in dwellings due to different ventilation and heating systems. The aim of the studies was to evaluate several heating/ventilation systems on pollutant levels in houses.
2. PILOT STUDY [2]
The first phase of this study was to determine which pollutant was the most important. No extensive literature research has been carried out. From ( 3 1 , the situation with tabacco smoke produced in the living was taken as a reasonable reference situation for this studies. The tabacco smoke can be propagated to bedrooms due to recirculation of air and due to internal flows in the case of natural ventilation. In the bedrooms small children like babies can be sleeping for many hours without having the possibility to open ventilation-windows. With the TNO vent i lat ionmodel (VENTCON) a comparison on concentration levels of three different systems has been carried out. (see figure 1 )
E E 3 Outside air CZJ Heated air (panly
ouu~de air, panly recirculated air) Exhaust air
a;?l Outside heated air 0 Recirculated air
Warm air heating Warm air heating Cen~nl rrc~rculation and heamcovety Selective recirculation
Bedrooms outside air
Warm water radiator Mechanical exhaust
figure 1 The three different heating/ventilation systems

Thise study pilot was carried without taking into account the use of the ventilation provisions by the occupants.
The infiltration and mechanical ventilation levels and the particle concentrations in the rooms of the houses were calculated. The calculations have been made for a single family dwelling under a variety of weather conditions (see figure 2). On the basis of this results the time weighted average concentrations for five types of persons were determined. The five types of persons are defined as persons who are staying different hours in the several rooms of the house. The production of tabacco smoke was simulated in the living. The effects of sedimentation of the particles were neglected. The results of this study are summerised in table 1.
TABLE 1 Time weighted average concentrations of particles pg/m3
type heating/ventilation system of person warmwater airheat ing
radiator central with recirculation mech. exhaust
baby 12 16
child 2-6 y 33 20
child 6-13 y 13 9
housewife 45 23
man 26 13
From this figures can be seen that the particle concentrations due to smoking are for the different persons in the same order of magnitude. The concentrations are even a bit higher in the case of mechanical exhaust ventilation system. Nevertheless some people argued that this results were only based on calculations.
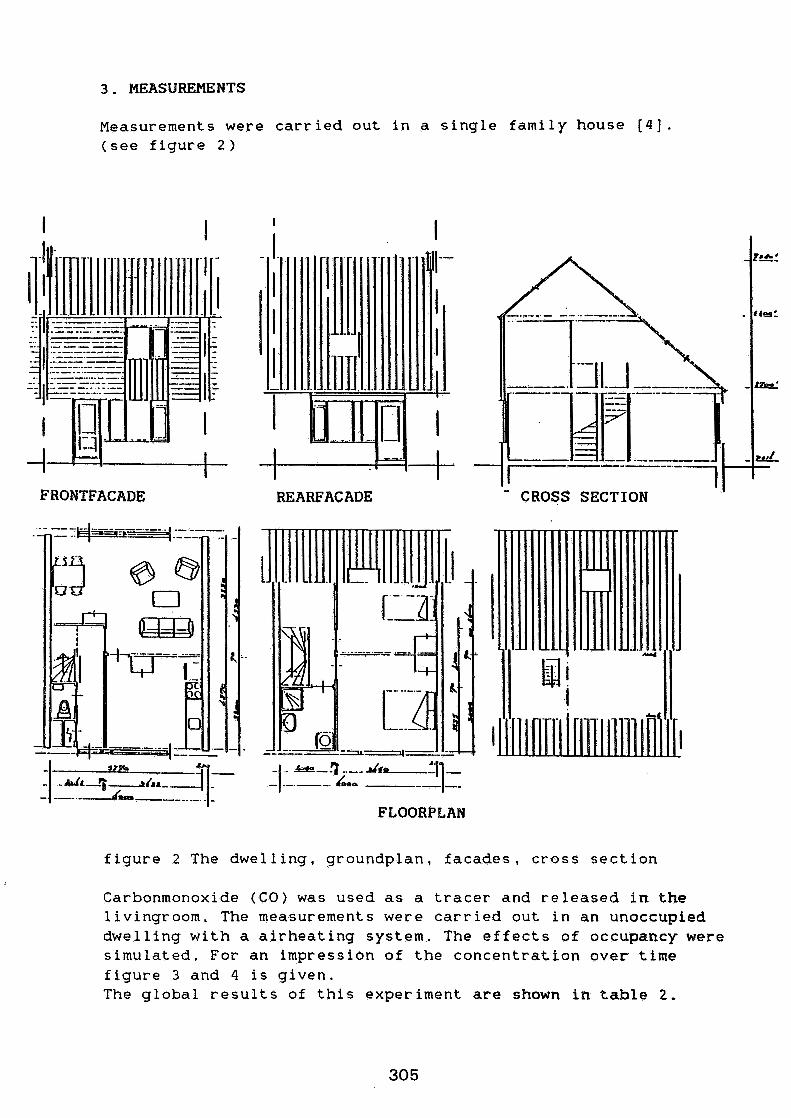
3 . MEASUREMENTS
Measurements were carried out in a single family house [4]. (see figure 2)
FRONTFACADE REARFACADE
-I - k S 3 L . 7 ..-- d f L - q - - --.--. dm* -- -- ' 1
FLOORPLAN
- CROSS SECTION - 1
figure 2 The dwelling, groundplan, facades, cross section
Carbonmonoxide (CO) was used as a tracer and released in the livingroom. The measurements were carried out in an unoccupied dwelling with a airheating system. The effects of occupancy were simulated. For an impression of the concentration over time figure 3 and 4 is given. The global results of this experiment are shown in table 2 ,
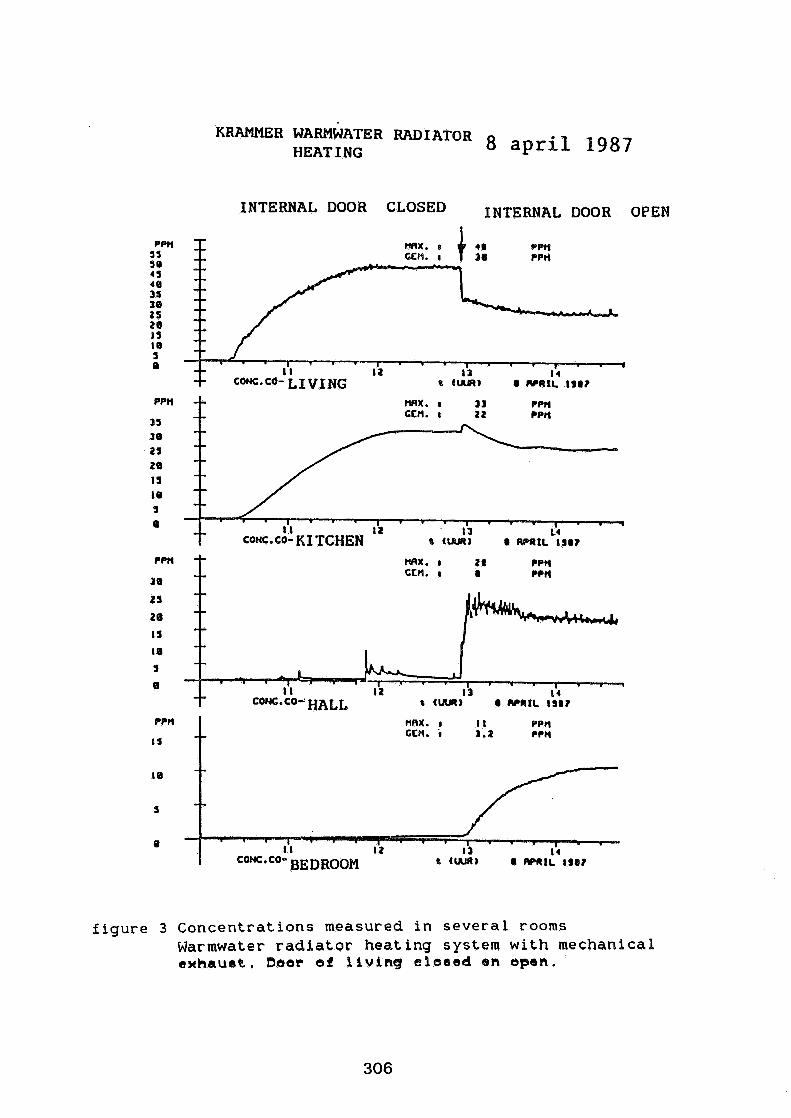
K R A M M ~ R WARMWATER RADIATOR 8 april 1987 HEAT I NG
INTERNAL DOOR CLOSED INTERNAL DOOR OPEN
mx. I 2a r p n ccn. I 8 WII
2 
2 la
IS
1 9
0
MAX. 4 I I PPfl GEM. i 1.1 PPH
figure 3 Concentrations measured in several rooms Warmwater radiator heating s y s t e m with mechanical axhausC, baar ef l i v i n g c l a s e d en open.
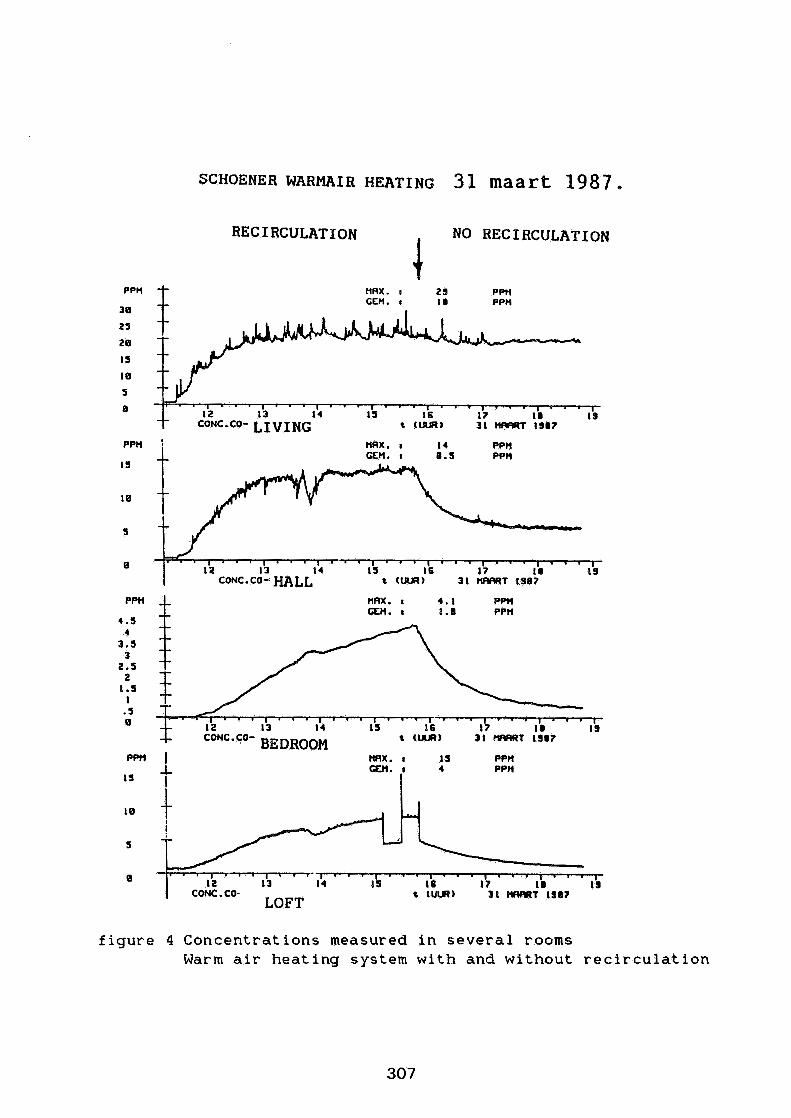
RECIRCULATION I
NO REC I RCULAT I ON
HRX. I
t t ¶ P W
GEH. I 18 PPH
HRX, r I4 PPH
1s CEH. I 8. S PPH
10
s
0 l ' . ' l ' . . , ' . . ~ . . . l 19
31 rWSRT 1987
PPH n~tx. I 4 .1 PM m. I 1 - 8 PPI(
tmx. I IS PPH a. t 4
I ppti
figure 4 Concentrations measured in several rooms Warm air heating system with and without recirculation
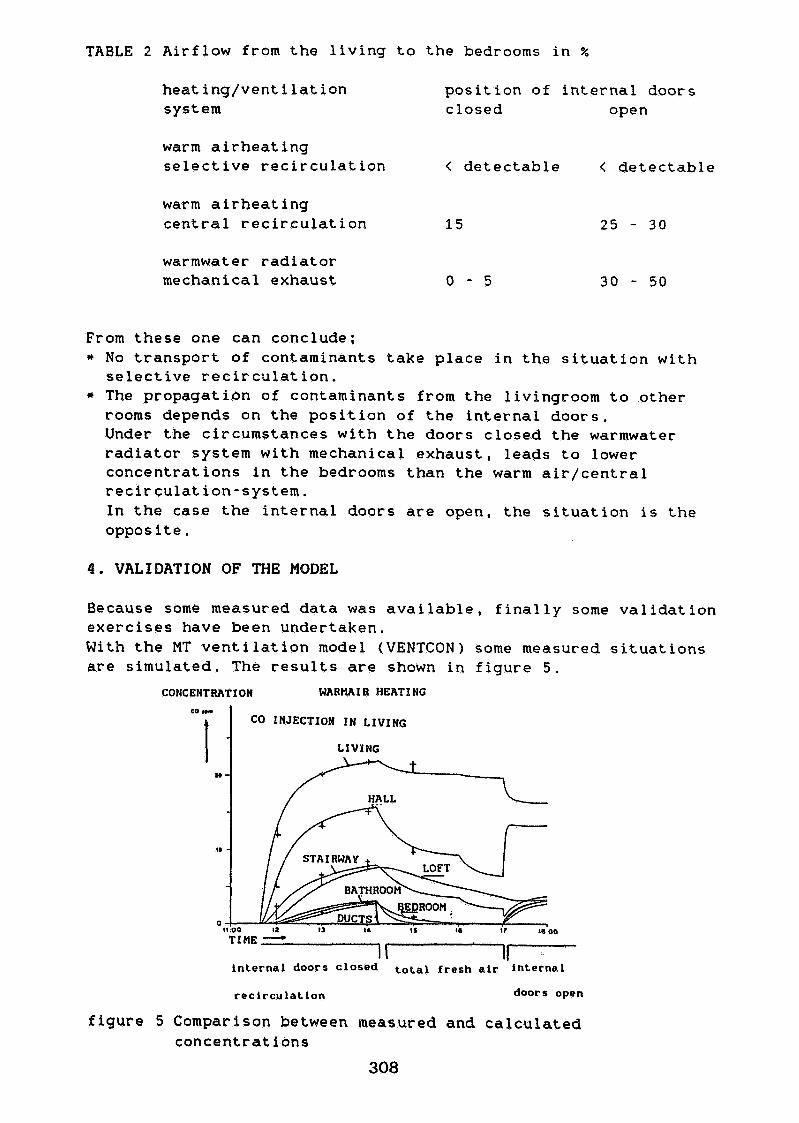
TABLE 2 Airflow from the living to the bedrooms in %
heating/ventilation system
position of internal doors closed open
warm airheating selective recirculation < detectable < detectable
warm airheating central recirculation 15
warmwater radiator mechanical exhaust
From these one can conclude; * No transport of contaminants take place in the situation with selective recirculation.
* The propagation of contaminants from the livingroom to other rooms depends on the position of the internal doors. Under the circumstances with the doors closed the warmwater radiator system with mechanical exhaust, leads to lower concentrations in the bedrooms than the warm air/central recirculation-system. In the case the internal doors are open, the situation is the opposite.
4 . VALIDATION OF THE MODEL
Because some measured data was available, finally some validation exercises have been undertaken. With the MT ventilation model (VENTCON) some measured situations are simulated. The results are shown in figure 5.
CONCENTRATION WARMAIR HEATING
' I CO INJECTION IN LIVING LIVING
I / HALL L,-
TIME - 7-7 -.
internal doors closed total fresh air internal
reclrcuiation doors open
figure 5 Comparison between measured and calculated concentrations
308
5 . CONCLUSIONS
The concentration levels in bedrooms of contaminants produced in the living are highly dependent on the use of internal doors.
Different heating/ventilation systems can produce the same levels of concentrations throughout the house.
The exposed doses of people in the house are dependent on their time of occupation in different rooms.
A warm air heating system with selective recirculation does not cause any transport of contaminants from the living to the bedrooms.
Models can predict concentrations levels to evaluate indoor air quality problems.
There is no evidence that the heating/ventilation system is the dominating factor in the propagation of contaminants through the dwelling.
6 . REFERENCES
[11 NEN 1087 (Dutch standard) Ventilation in dwellings, Requirements NNI, Ri jswi jk, 1975
[2] Knol1.B. Toelaatbaarheid van het recirculeren van lucht uit de woonkamer naar de s laapkamer s . IMG-TNO, Delft ,1985
[3] Trepte,L. IEA Annex IX Minimum ventilation rates Dornier , Friedrichshafen, 1983
[4] Phaff,J.C Recirculatie in woningen MT-TNO, Delft, 1987
Discussion
R. Anderson (Solar Ehergy Research Institute, USA) On the basis of your work, would you say that the mixing produced by occupant behaviour and natural convection is of the saxre order of magnitude as the mixiing produced by the ventilation system?
We De Gids (TNO Division of Technology for Society, Holland) Our findings so far suggest that this is true.
J. Uyttenbroeck (Belgian Building Research Institute) (a) What is the meaninq of open and closed indoor doors? (b) Is it possible to obtain the desired camfort level in a living room with the doors open?
We De Gids (TNO Division of Technology for Society, Holland) "Closed door" means that althouqh the door is shut air can still pass around it via the gaps that remain. (b) No, and particularly not with a radiator system.
P. kvin (Royal Institute of Technology, Stockholm, Sweden) (a) For the "exhaust ventilationw system what provisions were made for supply of air? (b) Could the leaks be assumed to be evenly distributed, to avoid short circuiting? (c) What is the level of airtightness of the building?
W. De Gids (TNO Division of Technology for Society, Holland) Provision for supply air followed the Dutch standard which stipulates openings of 100 to 140 cm2 for bedrooms, (b) The air leakage is not evenly distributed, although there is no evidence that there is much difference between facades. Roof and floors are more airtight than walls. (c) We based our calculations on an airtightness n50 of 10 to 12, Our field measurements showed that same houses are much tighter than this, with n50 of 1 to 4.
D, Harrje (Princeton University, USA) (a) It is very important to determine where the occupants are at various times during the day, and how pollutant exposure can be minimised. (b) Since warm air systens tend to spread the pollutant load, why aren't we seeing a more uniform distribution with doors open than when closed?
W. De Gids (TNO ~ivision of Technology for Society, Holland) (a) Yes, the time:dose relationship determines the overall exposure, We have yet to study individual exposure profiles. (b) Not all roams have balanced flows and equivalent dilution from system air.

EFFECTIVE VENTILATION
9 t h AIVC Conference, Gent, Belgium 12-15 September, 1988
Paper 18
EFFECTIVE VENTILATION IN OFFICES - THE OCCUPANT'S PERSPECTIVE
I.D. GRIFFITHS, J.W. HUBER, A.P. BAILLIE
Department of Psychology University of Surrey Guildford, GU2 5XH United Kingdom

SYNOPSIS
Air quality and draught avoidance are fairly important to office staff; consequently, the occupant's perspective should be taken into account when assessing the relative merits of different methods of ventilation in office buildings. Environmental comfort ratings and a variety of other judgements were collected in interviews with 169 staff in two air-conditioned and three naturally ventilated office buildings. Comparison of the two building types showed that air conditions were judged to be less satisfactory in the air-conditioned buildings, and that these buildings also had a higher rate of reported 'building sickness' symptoms. However, the differences, although statistically significant, were small in magnitude. Furthermore, while a quarter of all staff interviewed in the air-conditioned buildings made unfavourable comments about the air-conditioning, evidence is reported which suggests that it is the absence of openable windows which is the basis of people's negative attitudes, rather than beliefs about unsatisfactory air quality. One building had air- conditioning designed to provide localised control in the form of supply outlets which could be shut off when air was not required. This design, however, was associated with the lowest recorded satisfaction with air conditions, primarily because the conditioned air was experienced as a cold draught.
Air-conditioning or-.natural ventilation?
Building design pursues a multiplicity of objectives; aaong them, energy efficiency and comfort are of major importance. Given the tendency in recent years for new office buildings to be air- conditioned, attempts to reduce fuel costs have been predominantly met by new technological means, such as more efficient plant and energy management systems. Hodern offices also tend to be predominantly of open-plan design and for this type of layout air- conditioning seems to be the first choice for space-conditioning. This approach to design can be characterised by its artificiality in that it attempts to exclude the impact of ambient conditions (Hawkesl) and it assumes that occupant comfort is best met by a constant and uniform environment. Specific parameters such as temperature are set by building services personnel; the degree of local control available to staff is usually very restricted or non-existent. This fully engineered approach to space conditioning is justified by a belief that employees would only disturb the finely tuned system and that they do not care about the energy implications of their behaviour. However, the use of air-conditioning in offices may not be without negative
consequences for staff; it has been linked by some re earchers to the 'b ilding sickness syndrome' (e.g. Pinnegan et al.'; Robertson et 1 . this is a syndrome of minor health complaints, such as headaches and dry throats, associated with building occupancy.
Moreover, it is clear from informal communication with office staff that air-conditioning is frequently viewed in a negative light, with a variety of ills being attributed to it. It would therefore be useful to assess whether these complaints are restricted to a disaffected minority who have failed to adapt to technological change in buildings, or whether air-conditioned buildings do in fact give rise to wide-spread dissatisfaction. Thus this paper addresses the following question: is natural ventilation the most effective approach from the occupants' point of view, or is air conditioning equally effective? An attempt will be made to try and provide some initial answers to this question by examining relevant data from a small number of buildings.
These data were collected in the course of a two and a half year study designed to evaluate the success, as judged by occupants, of buildings with passive solar features; interviews and questionnaires were used to provide a broad evaluation of environmental comfort, with special emphasis being given to thermal comfort. While data from a variety of building types have been assembled, only the data from office buildings will be utilised in this paper. This part of the database provides a good opportunity to assess the impact of air-conditioning on office staff because the office sample consists of both air-conditioned and naturally ventilated buildings; some of these are conventional in that they were not designed as passive solar buildings, but nonetheless provide a useful comparison because of their high degree of glazing. Of particular interest from a design point of view is the fact that one of the buildings in the sample (Building A in Table 1) has an air-conditioning system in which air is supplied to the office space through twist air outlets located in the floor; these can be shut down by the occupant when air is not required.
2. RESEARCH DESIGN
2.1 The office sample
The data on which the analysis is based are derived from staff in five off ice buildings, two with air-conditioning and three naturally ventilated. All the buildings are in southern England. Brief descriptions of the buildings, together with the number of staff interviewed in each are given in Table 1. All interviews were carried out in the autumn of 1987 and winter 1987/88. In each building staff were selected for inclusion in the survey by means of a quota designed to ensure proper coverage of the following physical and social variables: all orientations of the building, floor level, distance from the nearest window, different levels of
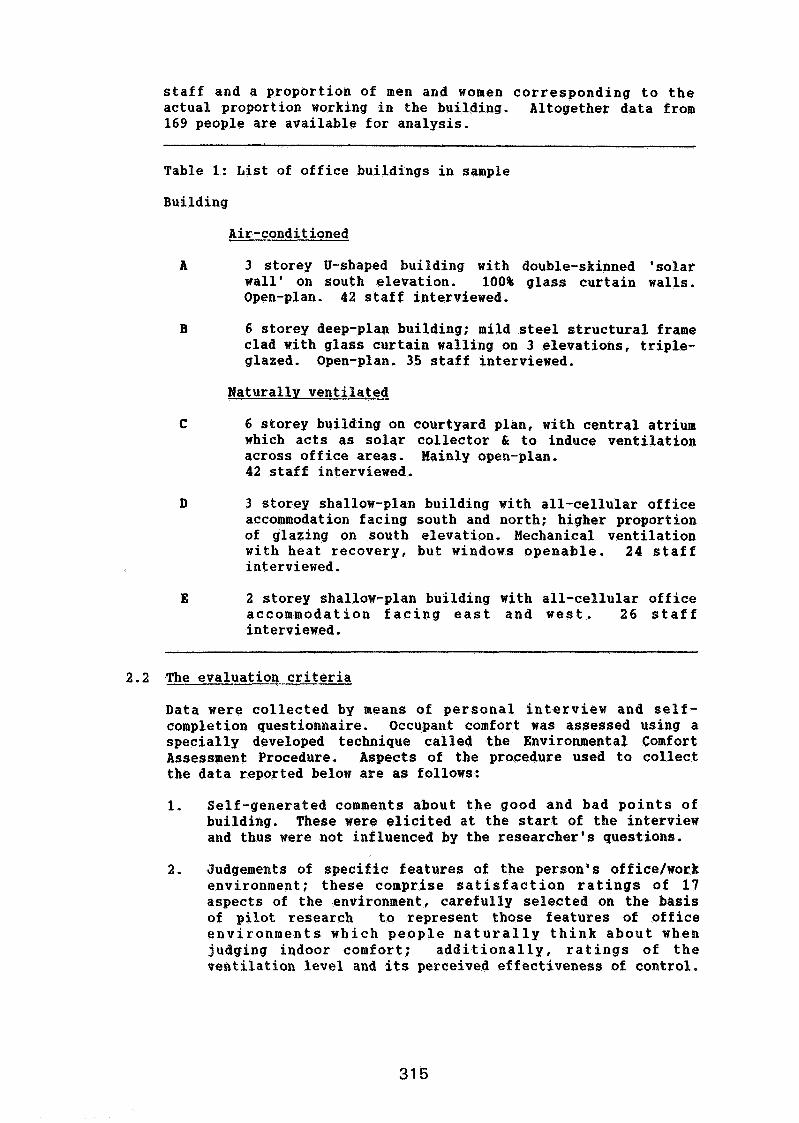
staff and a proportion of men and women corresponding to the actual proportion working in the building. Altogether data from 169 people are available for analysis.
Table 1: List of office buildings in sample
Building
Air-conditioned
A 3 storey U-shaped building with double-skinned 'solar wall' on south elevation. 100% glass curtain walls. Open-plan. 42 staff interviewed.
B 6 storey deep-plan building; mild steel structural frame clad with glass curtain walling on 3 elevations, triple- glazed. Open-plan. 35 staff interviewed.
Naturally ventilated
6 storey building on courtyard plan, with central atrium which acts as solar collector & to induce ventilation across office areas. Mainly open-plan. 42 staff interviewed.
3 storey shallow-plan building with all-cellular office accommodation facing south and north; higher proportion of glazing on south elevation. Mechanical ventilation with heat recovery, but windows openable. 24 staff interviewed.
E 2 storey shallow-plan building with all-cellular office accommodation facing east and west. 26 staff interviewed.
2.2 The evaluation criteria
Data were collected by means of personal interview and self- completion questionnaire. Occupant comfort was assessed using a specially developed technique called the Environmental Comfort Assessment Procedure. Aspects of the procedure used to collect the data reported below are as follows:
1. Self-generated comments about the good and bad points of building. These were elicited at the start of the interview and thus were not influenced by the researcher's questions.
2. Judgements of specific features of the person's officelwork environment; these comprise satisfaction ratings of 17 aspects of the environment, carefully selected on the basis of pilot research to represent those features of office environments which people naturally think about when judging indoor comfort; additionally, ratings of the ventilation level and its perceived effectiveness of control.
3. A measure of general satisfaction with the office as a whole. This consists of three items which are 'facet-free* in the sense of not referring to any specific aspect of the office (e.g, 'all things considered, I am very satisfied with my office') rated on a 7-point Likert agree-disagree scale. There are both theoretical and empirical reasons for supposing that a scale constructed from such items measures general affect associated with a building which is not entirely a function of what a person feels about its specific features .
4. Ratings of 3 ventilation related aspects of the building as a whole. Three items were used (e.g. this building is badly ventilated), rated on a 7-point Likert agree-disagree scale.
5. The incidence of seven minor symptoms associated with the building sickness syndrome. The reported symptoms were summed to provide an overall score for each individual.
The judgements thus have two distinct foci: most are concerned with the person's immediate work environment which is of course the most salient part of the building from a subjective point of view; some judgements, however, relate to the building as a whole.
3. RESULTS.
3.1 Relative importance of air conditions
Before comparing the five buildings on the basis of the available criteria, it is worth asking how important to people are those aspects of an off ice which are most likely to be affected by the ventilation system present. This question can be answered by examining the importance ratings made by the whole sample of each of the 17 aspects; these ratings were made prior to the ratings of satisfaction. The importance ratings were made on an eleven point scale ranging from 0 (aspect of no importance whatsoever) to 10 (aspect of utmost importance); these ratings thereby express the demands people make of their work surroundings. The mean importance rating received by each of the 17 aspects is shown in Table 2, together with the percentage of people rating each aspect as being of some importance to them (ratings greater than 5). The three aspects likely to be influenced by the type of ventilation system present are shown in bold in Table 2. Avoiding draughts and having fresh air have mean importance ratings of 7.70 and 7.59 respectively, indicating that they are both regarded as being of medium importance; relative humidity received a mean rating of 6.25, indicating that aspect is considered to be of lesser importance by the average person.
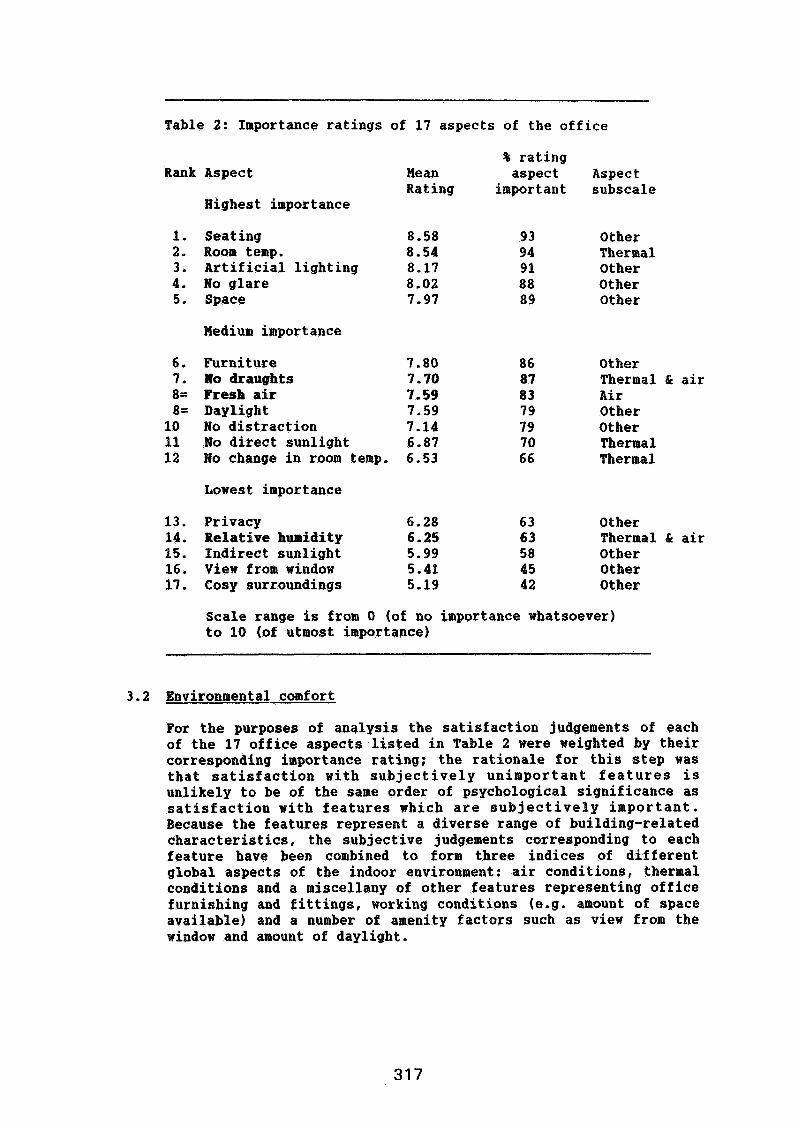
Table 2: Importance ratings of 17 aspects of the office
% rating Rank Aspect Mean aspect Aspect
Rating important subscale Highest importance
1. Seating 8.58 9 3 Other 2. Room temp. 8.54 94 Thermal 3. Artificial lighting 8.17 9 1 Other 4. No glare 8.02 88 Other 5. Space 7.97 8 9 Other
Medium importance
6. Furniture 7.80 86 Other 7. Llo draughts 7.70 87 Thermal & air 8= Fresh air 7.59 8 3 Air 8= Daylight 7.59 79 Other
10 No distraction 7.14 7 9 Other 11 No direct sunlight 6-87 70 Thermal 12 No change in room temp, 6.53 6 6 Thermal
Lowest importance
13. Privacy 6.28 6 3 Other 14. Relative humidity 6 25 63 Thermal & air 15. Indirect sunlight 5.99 58 Other 16. View from window 5.41 45 Other 17. Cosy surroundings 5.19 4 2 Other
Scale range is from 0 (of no importance whatsoever) to 10 (of utmost importance)
3.2 Environmental comfort
For the purposes of analysis the satisfaction judgements of each of the 17 office aspects listed in Table 2 were weighted by their corresponding importance rating; the rationale for this step was that satisfaction with subjectively unimportant features is unlikely to be of the same order of psychological significance as satisfaction with features which are subjectively important. Because the features represent a diverse range of building-related characteristics, the subjective judgements corresponding to each feature have been combined to form three indices of different global aspects of the indoor environment: air conditions, thermal conditions and a miscellany of other features representing office furnishing and fittings, working conditions (a.g. amount of space available) and a number of aaenity factors such as view from the window and amount of daylight.

The far right-hand column in Table 2 indicates which index each of the 17 office aspects contributes to; item analysis shows that each of the indices formed by their constituent items forms a statistically acceptable scale. The air conditions scale correlates .07 (N.S.) with the thermal scale, and .42 (p<.001) with the 'other factors' scale. The satisfaction scores for all 17 aspects have also been summed to yield a measure of overall environmental fit; this assesses the extent to which the physical work environment as a whole meets the requirements placed upon it by members of staff. The total scores derived from each of the indices have been divided by the number of constituent items to produce a common range.
Tables 3 and 4 show how the air-conditioned and naturally ventilated buildings in the sample compare in terms of the four environmental comfort indices. Table 3 shows that staff satisfaction (mean score = -1.63, indicating that the average person is dissatisfied) with air conditions in two air-conditioned buildings, both considered together, is significantly lower than in the three naturally ventilated buildings considered
Table 3: Building types compared on environmental comfort criteria
Building type
Air-condit. Mean values
Nat. vent.. Hean values
Overall Air Therm, Other environ. aspects aspects aspects fit
Scale range is from -50 (completely dissatisfied) to 50 (completely satisfied).
** & * Indicate that mean value for the 2 building types are significantly different at the 1% & 5% levels respectively.
together (mean score = 7.27) . There are no differences between the two types of building in staff satisfaction with the thermal environment and 'other' aspects (working conditions and amenity factors). Nonetheless, the overall environmental fit tor the average person in the air-conditioned buildings is significantly lower than in the naturally ventilated buildings; the mean scores are 7.50 and 11.77 respectively. Table 4 provides a breakdown by building of the scores shown in Table 3; in this and in all other data tables, the buildings labelled A to E correspond to the buildings briefly described in Table 1. Table 4 shows which buildings differ significantly from each other on the various criteria using the Scheffe test of a posteriori comparisons; it shows that air-conditioned Building A received a significantly lower mean satisfaction rating of air conditions than did naturally ventilated Building E. 'Other' aspects in air-
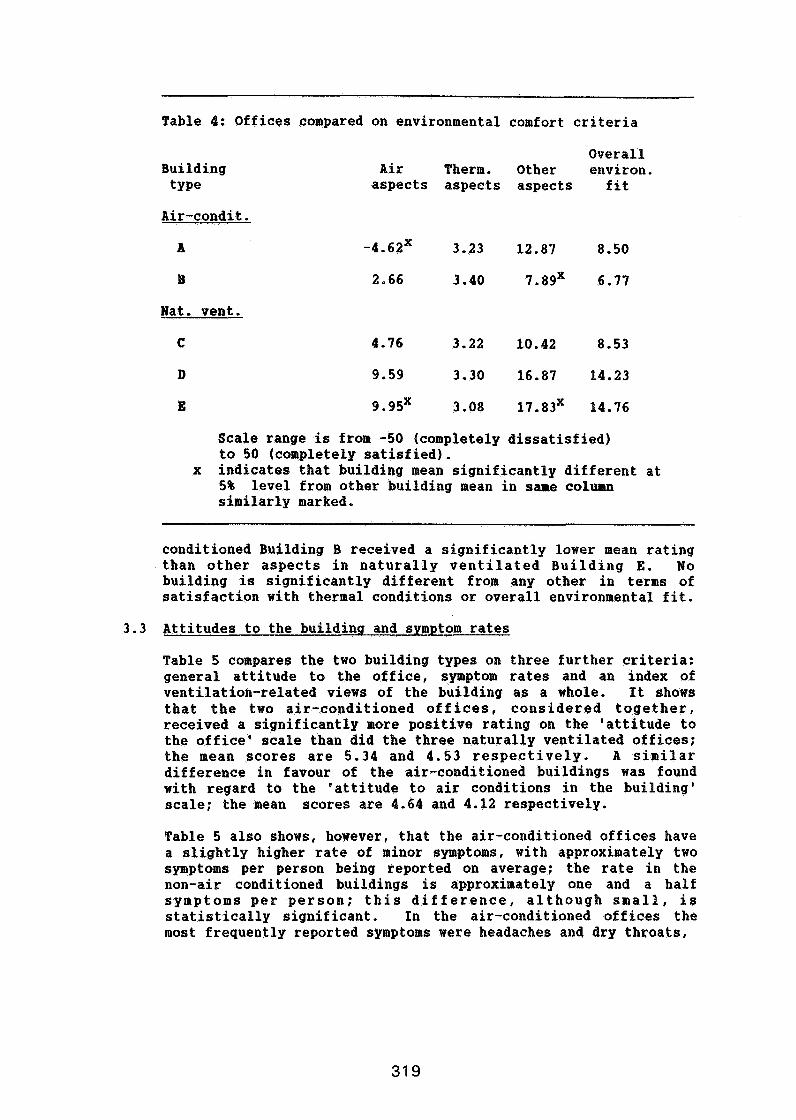
Table 4: Offices compared on environmental comfort criteria
Building type
Overall Air Therm. Other environ. aspects aspects aspects fit
Nat. vent,
Scale range is from -50 (completely dissatisfied) to 50 (completely satisfied).
x indicates that building mean significantly different at 5% level from other building mean in same column similarly marked.
conditioned Building B received a significantly lower mean rating than other aspects in naturally ventilated Building E. No building is significantly different from any other in terms of satisfaction with thermal conditions or overall environmental fit.
3.3 Attitudes to the building and symptom rates
Table 5 compares the two building types on three further criteria: general attitude to the office, symptom rates and an index of ventilation-related views of the building as a whole. It shows that the two air-conditioned offices, considered together, received a significantly more positive rating on the 'attitude to the office' scale than did the three naturally ventilated offices; the mean scores are 5.34 and 4 . 5 3 respectively. A similar difference in favour of the air-conditioned buildings was found with regard to the 'attitude to air conditions in the building' scale; the mean scores are 4.64 and 4.12 respectively.
Table 5 also shows, however, that the air-conditioned offices have a slightly higher rate of minor symptoms, with approximately two symptoms per person being reported on average; the rate in the non-air conditioned buildings is approximately one and a half symptoms per person; this difference, although small, is statistically significant. In the air-conditioned offices the most frequently reported symptoms were headaches and dry throats,
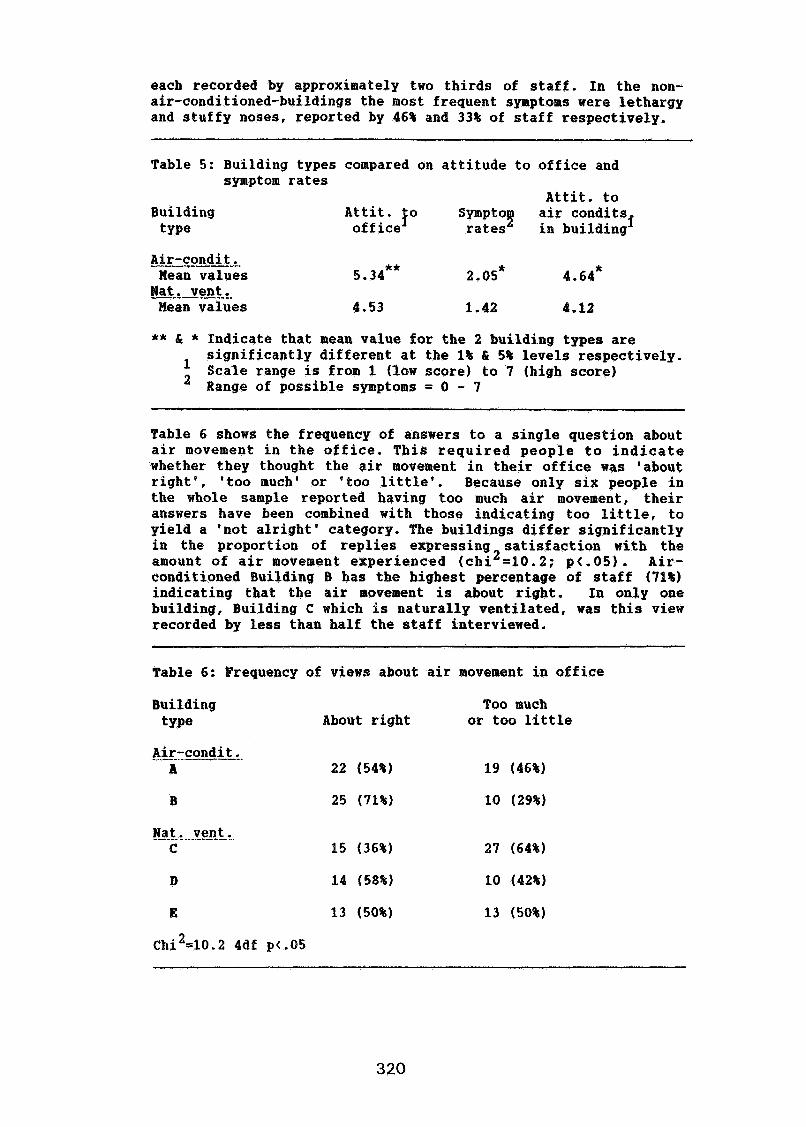
each recorded by approximately two thirds of staff. In the non- air-conditioned-buildings the most frequent syaptors were lethargy and stuffy noses, reported by 46% and 33% of staff respectively.
Table 5: Building types compared on attitude to office and symptom rates
Attit. to Building Attit. to Symptof air condits type off ice rates in building 1
Air-condi t .. Mean values
Mat. vent, Mean values
** & * Indicate that mean value for the 2 building types are significantly different at the 1% & 5% levels respectively. Scale range is from 1 (low score) to 7 (high score) Range of possible symptoms = 0 - 7
Table 6 shows the frequency of answers to a single question about air movement in the office. This required people to indicate whether they thought the air movement in their office was 'about right', 'too much' or 'too little'. Because only six people in the whole sample reported having too much air movement, their answers have been combined with those indicating too little, to yield a 'not alright' category. The buildings differ significantly in the proportion of replies expressing satisfaction with the amount of air movement experienced (chi2=10. 2; p < - 0 5 ) . Air- conditioned Building B has the highest percentage of staff (71%) indicating that the air movement is about right. In only one building, Building C which is naturally ventilated, was this view recorded by less than half the staff interviewed.
Table 6: Frequency of views about air movement in office
Building type
Too much About right or too little
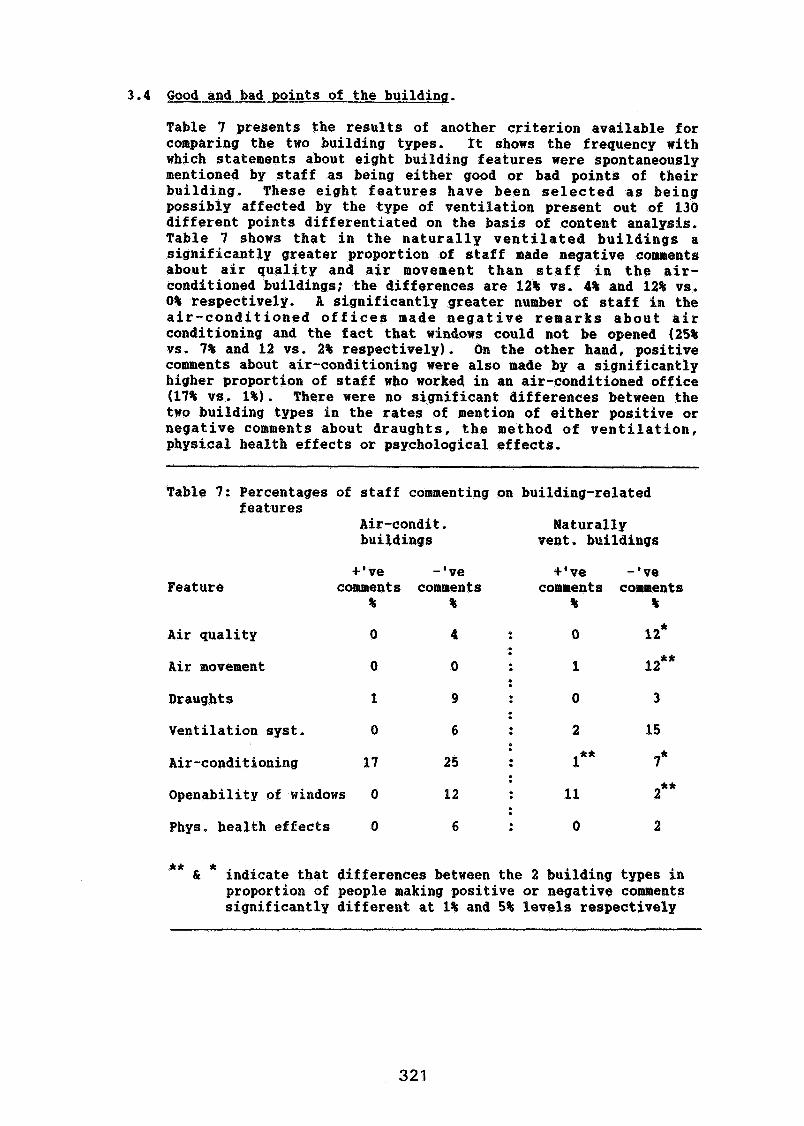
3.4 Good and bad points of the building.
Table 7 presents the results of another criterion available for comparing the two building types. It shows the frequency with which statements about eight building features were spontaneously mentioned by staff as being either good or bad points of their building. These eight features have been selected as being possibly affected by the type of ventilation present out of 130 different points differentiated on the basis of content analysis. Table 7 shows that in the naturally ventilated buildings a significantly greater proportion of staff made negative coments about air quality and air movement than staff in the air- conditioned buildings; the differences are 12% vs. 4% and 12% vs. 0% respectively. A significantly greater number of staff in the air-conditioned offices made negative remarks about air conditioning and the fact that windows could not be opened (25% vs. 7% and 12 vs. 2% respectively). On the other hand, positive comments about air-conditioning were also made by a significantly higher proportion of staff who worked in an air-conditioned office (17% vs . 1%) . There were no significant differences between the two building types in the rates of mention of either positive or negative comments about draughts, the method of ventilation, physical health effects or psychological effects.
Table 7: Percentages of staff commenting on building-related features
Air-condit. Naturally buildings vent. buildings
Feature + * ve -'ve +*ve -'ve
comments comments comments comments 45 % % %
Air quality 0 4 0
Air movement
Draughts
Ventilation syst. 0 6 2
Air-conditioning
Openability of windows 0 12 11
Phys. health effects 0 6 0
** * f indicate that differences between the 2 building types in
proportion of people making positive or negative comments significantly different at 1% and 5% levels respectively
4. DISCUSSIOH
Data have been presented in the form of occupant judgements of a variety of building-related features and conditions in offices which night be affected by the method of ventilation present; as far as air conditions are concerned, it is clear from Table 2 that having fresh air and avoiding draughts are requirements which the average occupant regards as fairly important. The data provide a representative picture of occupant satisfaction in two air- conditioned and three naturally ventilated offices. With regard to evaluating the relative effectiveness of these two methods of ventilation the limited number of buildings providing data for the analyses reported in the previous section clearly limits the conclusions which can be drawn. Nonetheless, the first indications are that air-conditioning in office buildings is not, or at least need not be, a source of numerous problems giving rise to widespread dissatisfaction.
Occupant satisfaction with air conditions in the two air- conditioned offices, considered together, was significantly lower than that in the three naturally ventilated offices. A posteriori comparisons of the individual means shows that it is Building A which is responsible for the marked difference with the best of the naturally ventilated buildings. It is worth noting that the air conditions mean score for Building A is the only criterion in Table 4 to have a negative value, indicating that the occupants in Building A were, on average, dissatisfied with the air conditions in their offices. Inspection of the data relating to the three items making up this scale reveals that these occupants were particularly dissatisfied with the perceived freshness of the air and the presence of draught. The other criterion which the air- conditioned offices score significantly less well on is the overall rate of building sickness symptoms. However, the differences on both these criteria, although statistically significant, are small; thus, from a practical point of view they should not give rise to immediate concern. Nonetheless, the incidence of most frequent symptoms in both types of building 4" about twice that reported by other studies (e.g. Finnegan et al. ,
3 Robertson et al. 1 .
It is worth noting that while both air-conditioned buildings received lower ratings with regard to air conditions than the three naturally ventilated offices, there is overlap on the 'other' aspects ratings and environmental fit scores; Building A received a mean rating of 'other' aspects which is as good as that received by Building C, and it's mean environmental fit score is also as good as that received by Building C. The data suggest that the particularly low rating of air conditions in Building A is to some degree compensated for by the relatively positive view its occupants take on average of 'other' aspects. Supporting this interpretation is the finding that satisfaction with the office as a whole was significantly higher in the air-conditioned offices despite the lower satisfaction with the air conditions.
Table 7 shows a significantly higher incidence of negative comments about air-conditioning expressed by staff in the air- conditioned buildings; this indicates that these people are very aware of this aspect of their working environment, and have negative views about it; why might this be so? An answer is suggested by the overall pattern of spontaneously expressed comments shown in Table 7. Even though the most frequently expressed negative comment in air-conditioned offices (made by 25% of staff) was about the air-conditioning, the majority of negative comments about air quality and air movement were expressed by people working in naturally ventilated offices. This suggests that some additional attribute or consequence is at least partly responsible for the negativism people express about air- conditioning. What it might be is suggested by the fact that the second most frequent negative comment made by staff in air- conditioned offices concerned the 'openability' of windows, referring to the absence of openable windows. In contrast, 'openability' was the positive feature most frequently mentioned by staff in naturally ventilated offices, meaning that they regarded having windows they could open as one of their building's good points.
This suggests that what people particularly dislike about air- conditioning is the loss of one potential means of control they have over indoor conditions when they can open windows, This interpretation is supported by the fact that 45% of staff in the two air-conditioned buildings perceived themselves to have no control over ventilation, whereas only 3% of staff in naturally ventilated offices held that view. The psychological literature in general shows that control is a very significant psychological dimension; similar indications can be found in the building science literature; for example, Sterling and sterling4 found that the rate of building sickness symptoms was lower in buildings with openable windows.
The idea that it is the absence of openable windows which leads people to dislike air-conditioning rather than necessarily adverse air conditions is further supported by two other results. First, it is clear from the pattern of answers shown in Table 6 that while the buildings differ considerably in terms of satisfaction with air movement, the differences are not directly associated with presence or absence of air-conditioning. Second, there is the finding that attitudes to ventilation-related aspects of the building as a whole were, on average, somewhat more favourable in the two air-conditioned buildings.
It is clear, however, that the absence of openable windows is not a shortcoming for all staff in the air-conditioned buildings. Table 7 shows that working in an air-conditioned environment is associated with a significantly higher rate of favourable as well as unfavourable comments.
In addition to enabling a comparison to be made of two methods of ventilation, the results reported above can be used to evaluate the success of the air-conditioning system in Building A; this is of interest because its design represents a bold attempt to
provide occupants with a degree of localised control not present in more conventional air-conditioning systems, as installed in Building B for example. The air flow from the floor outlet can be shut off when not required. Furthermore, the outlet is designed to create a miniature vortex which entrains the local air to provide a zone of conditioned air where it is wanted,
Given the importance of localised control to people, it might be predicted that the air-conditioning system in Building A would produce a higher level of satisfaction than that in Building B. However, this is not the case; the two buildings are virtually indistinguishable in terms of the evaluation criteria reported above. One exception can be found in Table 6 which shows that a higher proportion of people in Building A than Building B were dissatisfied with the amount of air movement in their office. This provides a clue as to why the air-conditioning in Building A did not find more favour with occupants. While carrying out the survey in Building A, the researchers were struck by the number unfavourable comments about the floor outlets that staff made incidentally while being interviewed. fn particular, people complained that they experienced the air being blown from the floor vents as draughts which were uncomfortable at foot level, Fanger and christensen' have demonstrated experimentally that turbulent air flow is more uncomfortable than laminar air flow.
It is therefore evident that designers of air-conditioning should seek to reduce rather than increase turbulent air flow. However, the fact that women also complained that the outlets were unsafe for wearers of high-heeled shoes suggests that designers should also take into account how their designs might affect the use of space by occupants. The researchers also gained the impression that it was management policy in Building A not to encourage the staff to adjust the floor vents. Thus it is likely that the success of any given design is to some extent contingent upon the information management gives its staff about the building they occupy.
Zn comparing the relative effectiveness as judged by occupants of air-conditioning and natural ventilation, he results of this study support the claim by Griffiths et al.' that research into the subjective impacts of the indoor environment must take complex interrelationships into account if substantial progress is to be made. By using a broad range of multidimensional measures this study has been able to show that dissatisfaction with air conditions does not necessarily result in overall dissatisfaction with an office, possibly because the dissatisfaction is compensated by other aspects of the work environment. This type of approach is required because people react to their surroundings as a complex whole, and not simply in terms of single factors which might be of interest to building scientists.

The research reported in this paper was funded by the Commission of the European Communities.
REFERENCES
1. Hawkes, D. The theoretical basis of comfort in the 'selective' control of environments. Energy and-Buildings, 1982, 5, 127-134.
2. Pinnegan, M.J., Pickering, C.A.C. and Burge, P.S. The sick building syndrome: prevalence studies. The British Medical Journal, 8th. December 1984, 289, 1573-1575.
3. Robertson, A.S, Burge, P.S., Hedge, A * , Sims, J., Gill, F.S., Finnegan, M., Pickering, C.A.C. and Dalton, G. Comparison of health problems related to work and environmental measurements in two office buildings with different ventilation systems. The British Hedical Journal, 10th. August 1985, 291, 373-376.
4. Sterling, E,M, and Sterling, T.D. Health and comfort problems in air conditioned office buildings. Second International Congress on Building Energy Management. Iowa, USA, 1983.
5. Fanger, P.O. and Christensen, N.K. Perception of draught in ventilated spaces. Ergonomics, 1986, 29, No. 2, 215-235.
6. Griffiths, I.D. Huber, J.W. and Baillie, A.P, Integrating the environment. In W. Palz (ed.) 1987 EuroDean Conference on Architecture. Bedford: Stephens & Assoc., 1987.
Discussion
Paper 18
P. Charlesworth (AIVC, Warwick Science Park, UK) Is there a direct link between "importance" and dissatisfaction? e.g. Do people in cramped conditions rate "space" high, and people away from windows rate "daylight" high?
A.P, Baillie (University of Surrey, UK) We have examined this important question for only 2 office buildings so far. The results showed that for most criteria, importance and satisfaction ratings were not correlated, although for two or three (egg. room temperature) there were low correlations, but no greater than 0.35.
3. Van Der Maas (Ecole ~olytechnique Federale de Lausa~e, Switzerland) An important psychological aspect is the ability of an occupant to influence his environment, egg. by window opening. Has any system been devised which allows occupants to change local tgnperature and air changes as controlled by the HVAC system as a substitute for window opening? What were the results?
A.P. Baillie (University of Surrey, UK) Yes, there are buildings with HVAC systems which provide occupants with same degree of control: we have studied one such building in the City of London, but have yet to analyse the results,
P, Harhnn (E1MPA Duebendorf, Switzerland) Which physical parameters (temperature, comfort, plant conditions etc.) did you measure: (a) in all office buildings (b) in same cases only?
A.P. Baillie (University of Surrey, UK) The following were measured in all 5 office buildings described in the paper: (i) air temperature (ii) radiant temperature (iii) air flow (iv) relative humidity. These took the form of spot measurements at the person's desk. The following were also measured: (v) distance of desk from nearest window (vi) ratio of window to floor area (vii) floor area available to each occupant (viii) distance to nearest co-worker.
D.J. Croome (University of Eteading, UK) (a) How does this study evaluate interactive responses, for example to fresh air and temperature? (b) Were there any differences between: (i) the lighting systems (ii) the sound levels (iii) the average air temperatures? (c) What were the floor to ceiling heights in each office, and the volume and floor area per person?
A.P. Baillie (University of Surrey, UK) (a) Given the broad range of subjective factors measured, multivariate statistical analysis will b;! carried out to determine whether or not satisfaction with roam temperature depends in part on the Level of satisfaction with other aspects of the environment, e.g. perceived
effectiveness of control of temperature and visual attractiveness of office decor. (b) No information was collected concerning the lighting system or sound levels. Radiant and air temperatures only were measured on a spot basis at each respondent's desk at the time of the interview, (c) Floor to ceiling heights were not measured. Floor areas per person were masured but we have yet to examine whether this variable is correlated with any satisfaction variables. There was however considerable variation in floor area available to each person interviewed.
M. Holmes (Arup Research and Developnent , Iondon, UK) I believe buildinq C is in Basinqstoke, If so, did the fact that the occupanEs had recently-moved f ram an air conditioned building have an influence on them, I also understand that occupation levels are greater than originally specified at the design stage, and that more partitioning has been introduced, which may restrict cross flows. Did you observe this?
A.P. Baillie (University of Surrey, UK) Building C is in Basingstoke. The experience of their recent move from an adjacent building certainly coloured people's cements about what they believed to be good and bad parts of the new building. Likewise it is true that occupation levels were higher than the original design, We have yet to assess whether or not this partially accounts for lower satisfaction with "other aspectsw (of which space is a part) in building C. It was also our impression that extensive use of relatively high partitions restricted cross-ventilation, but we cannot demonstrate that. The relatively low level of satisfaction with air conditions could also be partly caused by failure to open windows when required, due to poor window design.
C-A. Roulet (Ekole ~olytechnique Federale de Lausanne, Switzerland) There is a Gemn study which shows clearly that people do not like climatised (air conditioned) buildinqs, Also - -
Fanger has shown that maintenance and cleaning of the r&hanical ventilation systems have a great influence on indoor air quality of climatised buildings. Do you have any information on cleanliness of the installations in your buildings?
A,P. Baillie (University of Surrey, UK) Only the efficiency of the filters used and the frequency with which they have been replaced. Our impression was that the air conditioning systems in buildings A and B were relatively well maintained.
P, Appleby (Paul Appleby Chartered Engineer, Norwich, UK) In your list of parameters and their relative importance to occupants: (a) was the wording your own or suggested to the occupants? (b) how can the occupants make an assessment of fresh air rate? This is possible with openable windows, but only manifests itself with air conditioned or mechanically ventilated buildings by the dilution of contaminants and the resultant air purity and odour level - perhaps dour level would be a more useful parameter.
A.P. Baillie (University of Surrey, UK) (a) The wording is ours, based on extensive pilot research, i.e. we became aware of how people themselves described the aspects. (b) Perceived freshness of the air was rated. Yes, dour level would be an important aspect. We have obtained ratings of odour level for each building as a whole, being one of three aspects assessed to give a picture of overall air conditions.
J. Uyttenbroeck (Belgian Building Research Institute) Why did you not include suestions concernins the acoustic environment? The choice betwein openable windows-and air conditioning frequently revolves around noise.
A.P. Baillie (University of Surrey, UK) We did not consider the influence of outdoor noise, only distraction caused by the activities of other people- in the office, e.g. makingm telephone calls. The main reason that satisfaction with outdoor noise levels was not assessed was to restrict the number of aspects evaluated. We also anticipated (rightly as it turned out) that all the office buildings surveyed would be either in relatively quiet locations or would be well insulated acoustically due to the presence of double or triple glazing.
EFFECTIVE VENTILATION
9th AIVC Conference, Gent, Belgium 12-15 September, 1988
Paper 19
L U P R , MARLANNA AND KoHCWN, REIJO
Technical Research Centre of Finland L a b o r a t o r y of Heating and Ventilating L&ptWehenkuja 3 SF-02150 Espoo, Finland

SYNOPSIS
To avoid the dm- and p m b l ~ that occur in today's ventilation systems a ventilation concept for future dwelling- housesisunderdsvelapnent, T h e c x u x e p t ~ t o t h e w a y o f living and buil- in the future. The real li- functions are cbsen to design principles, that's why the system has to be capable of operating at varying air fluw rates. The building in the future is based on a hierarcical modulated system, in which fran a snall set of standard cxmpments can be assembled versatile alternatives. A system designation adaptable to the new bui1dix-q system is under dsvelapnent.
There are witbut dispute marry lacks in the performance of ventilation. These lacks have caused resistance against mechanical ventilation. On the other hand, mre requirements are imposed on the incbor air, including the possibility of the inhabitant to control ventilation aamdhg to his likes and habits. The mre control we want the mre technique is needed.
In order to imprwe and develop the present ventilation systems to meet the increasing -ts the problans and faults of the present systems were analyzed. Information and experiences were gathered frun the occupants mainly thro;ugh demmkration projects financied by the Ministry of Trade and Indusky . Based on the analysis of the operational faults and developnent needs arose the research project "Ventilation systems of the future dwelling-buses" . The aim of the project is to develop ventilation systems that fit to the way of living and building in the future.
2. PROBLEMS OF TODAY'S VENTILATION SYSTEMS
The nw>st typical lacks in the demnstration buildings equipped w i t h mechanical exhaust ventilation prwed to be draught, stuffiness of i m b m air, spreading of dburs inside the flat and between flats and condensation problems in the constructions. Mechanical extract ventilation system is quite usual in the building stock in Finland (e.g. it covers 60 % of the blocks of flats), It's not possible to say in general, hob usual the abwe mentioned pmblems are, because the examined material was small.
The cunplaints in the demonstration buildings equipped with mechanical supply and exhaust ventilation or air heating concerned mainly noise, spreacEng of odours inside the flats and the difficulties in use and main-. The amount of residencies equipped w i t h mechanical supply aMJ. exhaust ventilation system
The satisracbry operation of the ventilation system depends also on the characteristics of the ~ c t i o n s especially on tbs internal and the external tightness of the building, For example An multi-storey blocks of flats the air leakages through the intxmndiate floors can't be avoided only by the means of the prasfllre differencies or air flaws of the ductwork. Huwever, ventilatim system merely is blaimed easily for odrJur or condensation problems.
For example, ths prerequisities for satisfactory operation of the mchmical supply and exhaust ventilation system in a multi- storey block of flats are according to - calculations /1/ the follawing : - ths pressure difference over the termindL devicas is
over 100 Pa - the ratio between supply and extract air flow rates is 0,8 - -Uls air leakage number of the b u i l w envelope is mailer than 0,5 l/h - the air leakage of the inkrmdiate floors at the pressure dif fer&nce of 50 Pa is abut 0,l l/d - the air leakage of the staircase doors is about 2 l/s at the pressum difference of 50 Pa.
3. THE REI(XJIREMNl'S SET ON THE VENTILATION SYS!EPE OF THE FUTURE
3.1 Climate
Fran the ventilation point of view, the outdoor air temperature is the mclst important meteorological factor. The outdoor air temperature influences on dimensioning the aparatus, the need of capasity and energy consmption mnclusively. Ventilation system that are developed for the mild climate countries don't usually aperate energy efficiently in the Finnish climate conditions.
There are heating and cooling loads in the buildings in Finland. The outdoor air temperature Changes frun about -30 "C to +30°C. Tha special characteristics of the climate is that outdoor air can be used for cooling nearly always in the sumner.
The big temperature difference between outdoor and indoor air at win* t i m e causes big pressure diffemmies between the floors and insids the ventilation system. The big pressure differencies changetheairflawsfnthebuilmUremorethehigherthe building is.
3.2 Social developnent
The residencies are myre cramped in Finland than in the other Nordic countries. A s a re- to that has been given that the
Firms value the bus ing less than other naticnalities, the buildirg secto;r hasn't been capable oil amwerig to the charging c&lemmk, ~ r e s i ~ e g a r e o w n s d b y t h e ~ t s a n d t h e repayable times of the loans are short. Anyway, the residential spacimsnessisesthatedtograwfrcm28d p e r p e r s m t o 3 5 d per person by the year 2000. The bigger residential spaciousness makes it pxsible to prmdde e.g. the kitchens and bathrooms w i t h better facilities*
The work-lng hmrs of single persons will becane shorter. The shorter work ing hrxrrs will not lead to increase in actual leisure time, butthe f r e e t i m e w i l l b e u s e d m a i n l y t o ~ ~ household management. The imxease in household management is due to increasing qualitative rqukments and increase in the piraperty to be taken care of,
Xn the year 1986 a Finnish pilot study /2/ was mnpleted, the goal of which was to identify future needs and -ts for the develapnent of building HVAC and electrical systems, The study was carried cut by intend- experts in different fields (research scien-, designers, manufacturers, building contractors, architects, social scientists and sociologists).
As a result it was ccacluded that new needs and -ts focus especially in s b r k d q contruction time, raising quality and hpmchg energy management. bbreomr the results einphasized individual m@remmts of occupants, and the influence of indoor air on health and mnfort of the occupants.
3.3 Building technology
The basic pmblem in building technology is to solve the ocrrtplicated interactive mtradiction between the -ts: qwility, dceability, flexibility and emmny. Waditionally the v i e w has been that industrialized production can lead to eccavmical result, but with the loss in quality and flexibility.
Ths solutions are developed in many research pmjects at the building sector in Finland (fig. 1). In one of the research projects there is a new modulated Neraxtdcal building system (TAT) under developnent /3/* The technical realization of the ecananic pmdwtion is mechanised and autanatized productim of strucrtures in the factory and rapid erection of structures at the building site. In the f i m k h i q phase both mechanical and handwak is used to get a personal look tq the building w h i c h else is produced by the industrialized building system.
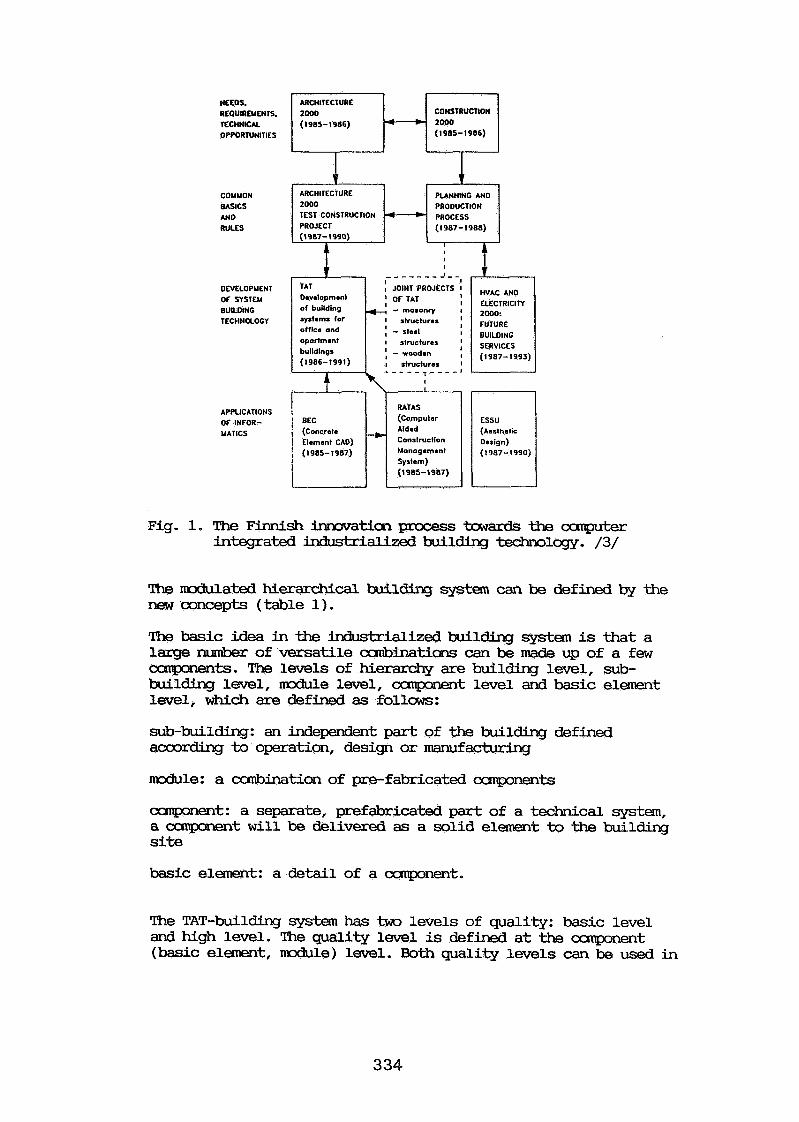
ARCHITECTURE I I CONSTRUCTION I NEEDS. REQUIREUENTS. TECHNICK OPPORNNITIES
COUUON BASICS AND RULES
DEVELOPUENT OF SYSTEM BUILDING TECHNOLOGY
APPLICATIONS OF INFOR- MATICS
Development o f building systems for off ice and apartment buildings (1986-1991)
t t
- - - - - - - J - -
I JOINT PROJECTS I I I - masonry I
slructures ' - ateel I
s l ~ c t u r e r 1 : - wooden structures I
i (Concrete ! Element CAO) 1 (1 985-1987)
PLANNING AN0 PRODUCTION PROCESS ($987-19~8)
ARCHITECTURE ZWO TEST CONSTRUCTION PROJECT (1987-1 990)
RATAS (Computer Aided Construction Uanogement System) (1915-1 987)
I I I I
- HVAC AN0 ELECTRlClrY 2000: FUTURE BUILDING SERVICES (1 987- 1993)
(Aasthetic Design) (1987-1990)
Fig. 1. The Finnish int-wvation process towards the aaputer integrated industrialized building technology. /3/
The lrodulated hierarchical building system can be defined by the new 'concepts ( table 1 ) . The basic idea in the industrialized building system is that a large rurmber of versatile cabinations can be made up of a few amponen*. The levels of hierarchy are building level, sub- building level, rrodule level, ccmponent level and basic element level, w h i c h are defined as follows:
sub-building: an independent part of the buil- defined according to operation, design or manufacturing
mdule: a canbination of --fabricated cmpnents
amponent : a separate, prefabricated part of a technical system, a cunpnent will be delivered as a solid element to the building site
basic element: a detail of a ccmponent.
The TAT-building system has t w o levels of quality: basic level and high level. The quality level is defined at the canpnent (basic element, mdule) level. Both quality levels can be used in
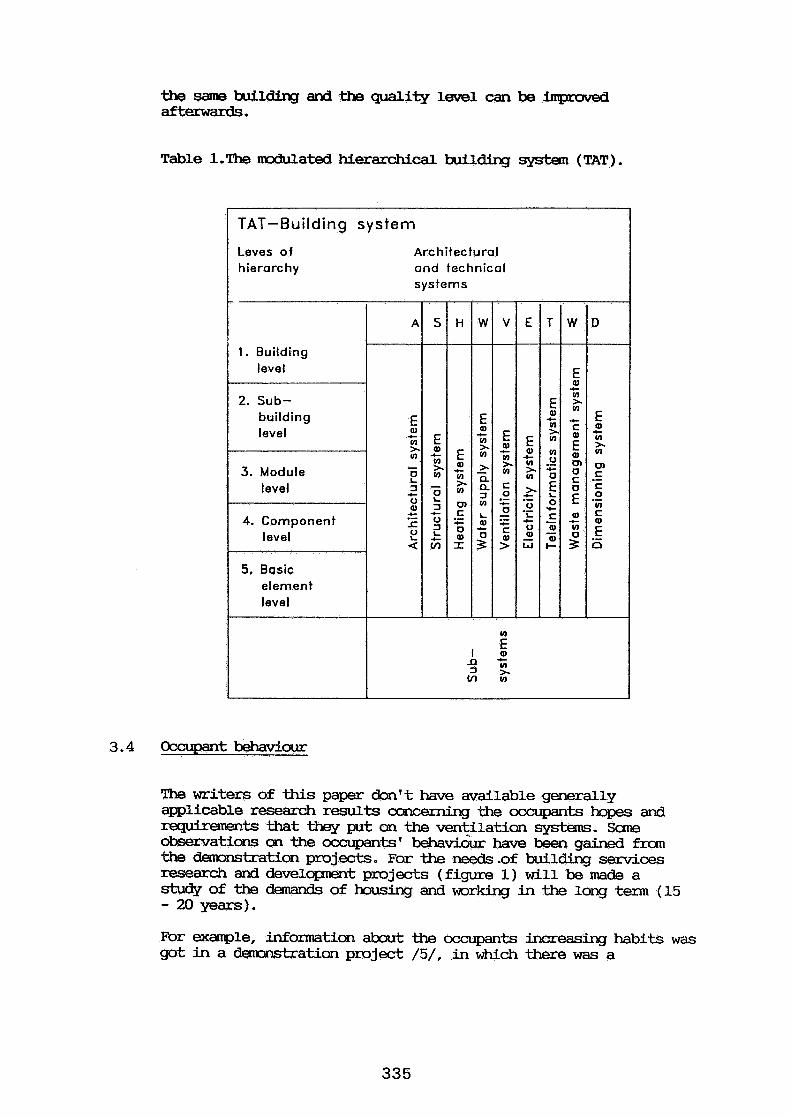
the same buildiq and the quality 1-1 can be impraved aftmxmrds.
Table 1.The modulated hieramhical building System (TAT).
3.4 Occupant behaKLour
Leves of Architectural hierarchy and technical
systems
The writers of this paper don't have available generally applicable research results a m w m h g the occupants bpes and -ts that they put on the ventilation systems. Sane ti cons on the owupants' behavik have been gained f m the demonstration projects. For the needs .of buil- services research and developnent projects (figure 1) will be made a study of the demands of housing and working in the long term (15 - 20 years).
For example, infomation about the occupants increasing habits was got in a demonstration project / 5 / , in w h i c h there was a
: j, 2 3 E Vl n
u ~ + v
c , O . : ; ( U c
1. Building level
2. Sub- building level
3. Module level
4. Component level
5. Basic element level
E $ 2
- f
+ l 2
E (U
t;
- 0 1 3 % (U .- 5
E 2 ;
Y .m
E (U
t gg' --
c
-2 n
E
s t;
n
g g g - 5 0
( U -
E PI + n t +
t : t ;
E s o E
o
E
a " ' +
0 -
A S H W V E T W D
l E E 2 - 2 1 %
4.5 v ' ( U ' ; ; . z t ;
s ~ G Z S ~ G E ~ E
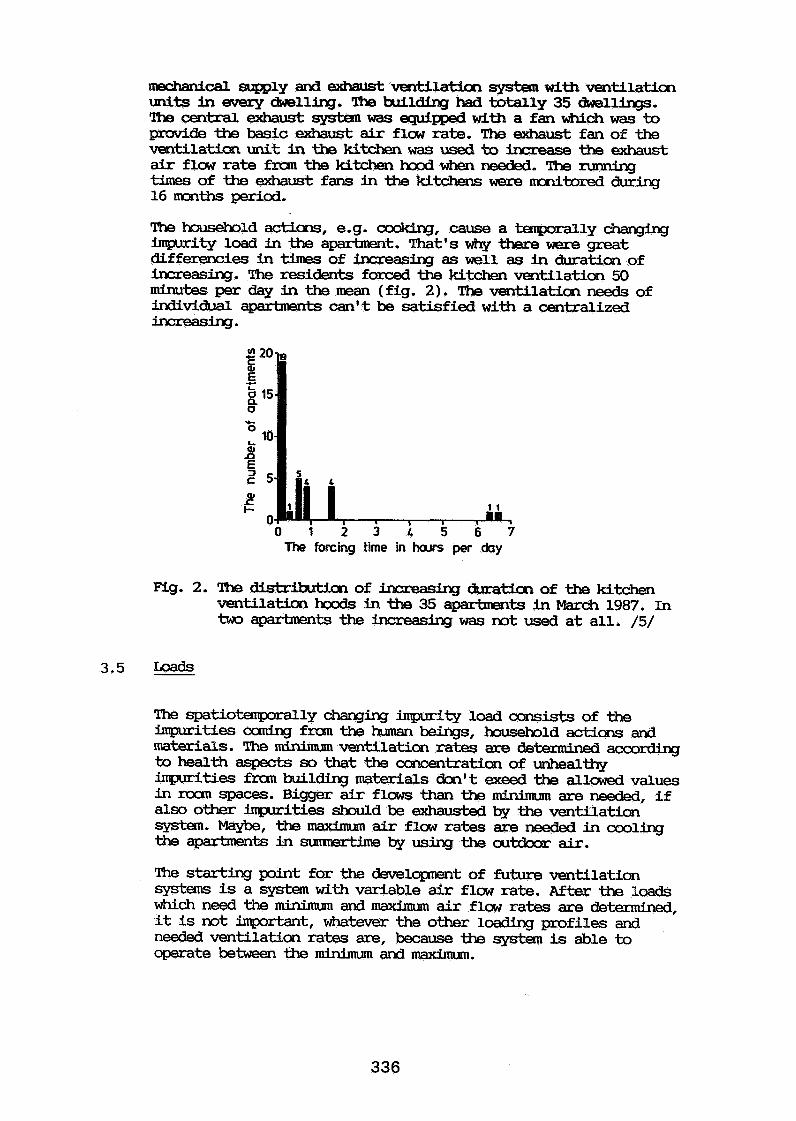
mechaniGal supply and exhaust vlentilatian system w i t h ventilation units in every dwelling. The building had totally 35 dwellings. ThecentrdLexhaustsystemwasequippedwithafanwNGhwastn pruvide the basic exhaust air flaw rate. The exhaust fan of the v e n t i l a t i o n m i t i n t h s M t c h e n w a s u s e d t o i n c = r e a s e t h e ~ airflawratefnrnthekitchenhoodwhenmeded. Thenmning t i m e s 0 f t h e e x h a U s t f a n s i n t h e M t c h e n s ~ ~ ~ d u r i n g 16 mths period.
The household actions, e-g. ccddng, cause a tenparally changing hjp~~ity load in the apartment. That's why were great differencies in times of increasing as well as in duration of increasing. The residents forced the kitchen ventilation 50 minutes per day in the mean (fig. 2) . The ventilation needs of individual aprtments can't be satisfied with a centralized increasing.
The forcing time in hours per day
Fig. 2. The distrilxtim of in=reaSing duration of tbe kitchen ventilatim hoods in the 35 aparbmnts in March 1987. In two apmhents the haeasing was m t used at all. /5/
3.5 Loads
The spatiotenporally changing impurity load consists of the impurities a m h g fran the human beings, household actions and materials. The minimum ventilatim rates are detemined according to health aspects so that the amcentration of unhealthy impurities frun building materils don't exeed the allawed values inman spaces. Bigger air flaws thantheminimumareneeded, if also other inpurities should be exhausted by the ventilation system. Maybe, the maximum air flow rates are needed in cooling theapartmentsinsmmrWwbyusingthewMbarair.
The starting point for the develapment of EutUre ventilation systems is a system w i t h variable air flaw rate. After the loads w h i c h need the minimum and maximum air flow rates are determined, it is not important, whatever the other loading profiles and nseded ventilation rates are, because the system is able to operate bebeen -the m . and maximum.
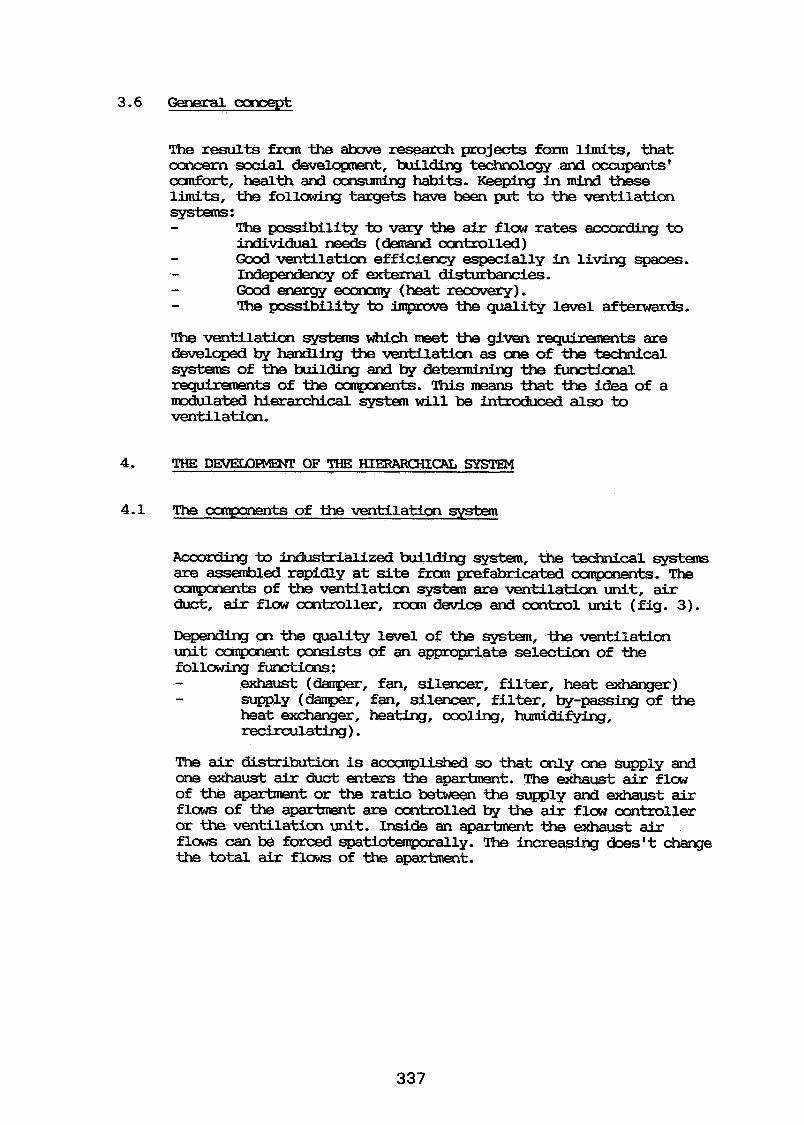
The results fram the abave research projects form limits, that concern social dmmlqmmt, building techmlcgy and -ts' canfor t , health and cooslrming habits. Keeping in mind these limits, ths f o l l ~ targets have been put to the ventilatim systems: - The possibility to vary the air flaw rates to
individual needs (dew& controlled) - Good ventilation efficiency especially in living spaces. - In&- of extemal disturbamies. - - - ==m ecoau=my (heat recovlery).
The possibility to impmm the quality level afterwards.
The ventilation systenrs which meet the given rquhmmts are developed by handling ths ventilatim as ons of the technical s y s i x m s o f t h s b u i l ~ a n d b y ~ ~ t h e ~ ~ -ts of the ampments. This means that the idea of a modulated hierdcal system will be intxduced also to ventilation.
4. THE DE3lEm- OF THE HIERARCHICAL S Y S m
4.1 The ccqmmts of the ventilation system
According to industrialized building system, W technical systems a m assembled rapidly at site fnm prefabricated canpments. The capnents of the ventilation system are ventilation unit, air duct, air flaw CQsltroller, roan chvi68 and cxmt-sol unit (fig. 3).
Depending cn the quality level of the system, the ventilation Wt cmpnent cansists of an a w i a t e selection of the follcrwing j3mctiOns: - exhaust (damper, fan, sileracer, filter, heat W e r ) - supply (damper, fan, silencer, filter, by-passing of the
heat exchanger, heating, cooling, humidifyhg, recirculating) .
The air distribution is accunplished so that only one supply and one exhaust air duct enters the apartment. The exhaust air flow of the aparbnent or ths ratio between the supply and exhaust air flows of the apartmmt are codltmlled by the air flow contsOller or the ventilation unit. Inside an apartment the exhaust air flows can be forced spatiotenprally. The increasing does' t change the total air flaws of the apartment.
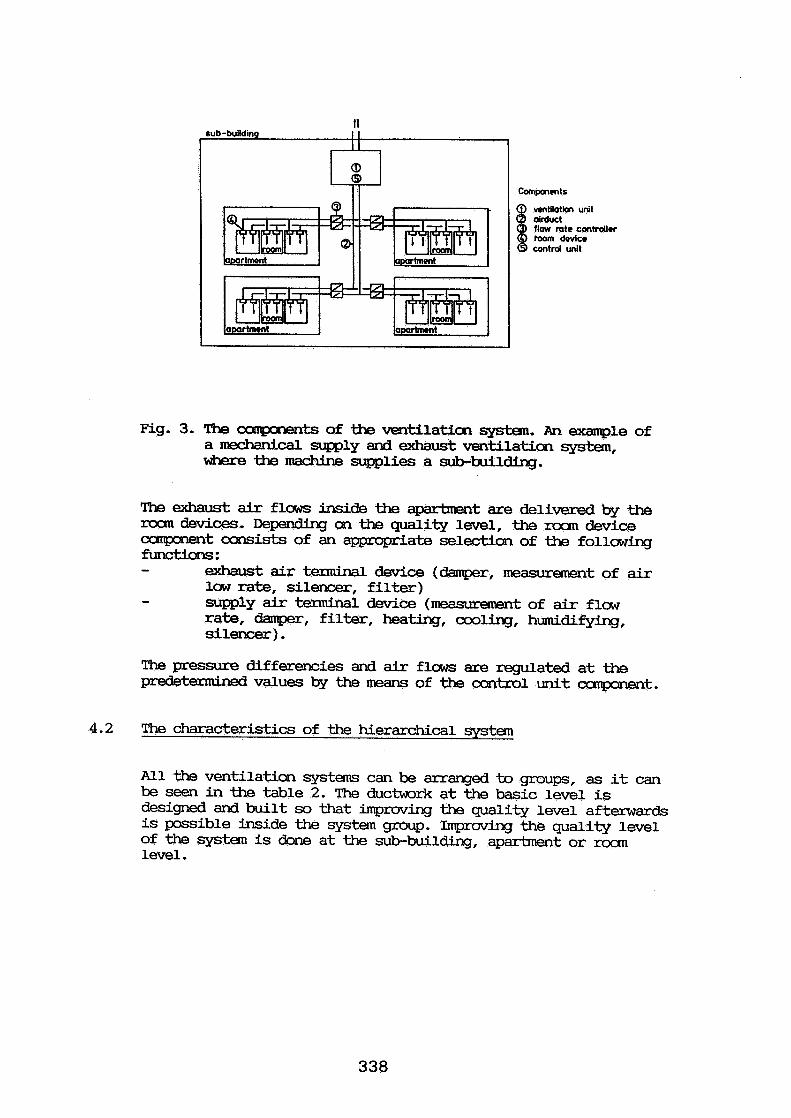
sub -bulldin
Components
wntbtbl unit oirduct tlmv mte cmtmlla thorn device contml unit
Fig. 3. The -tS of the ventilaticxl, system. A n exanple of a mechanical supply and exhaust ventilation system, where the machine supplies a sub-building.
The exhaust air flaws inside the apartment are delivered by the room devices. Depndi.ng on the quality level, the roan device mqpnent consists of an appropriate selection of the foilwing functio~ls: - exhaust air terminal device (damper, measurement of air
low rate, silencer, filter) - supply air terminal device (measurement of air flaw rate, damper, filter, heating, cmolirx~, humidifying, silencer).
The pressma differencies and air flaws are regulated at the prede- values by the means of the control unit canponent.
4.2 The characteristics of the hierarchical system
All the ventilation systems can be arranged to groups, as it can be seen in the table 2. The ductwork at the basic level is designed and built so that improving the quality level afterwards is pssible inside the system group. Imp rov ing the quality level of the system is done at the sub-building, apartment or roam level.
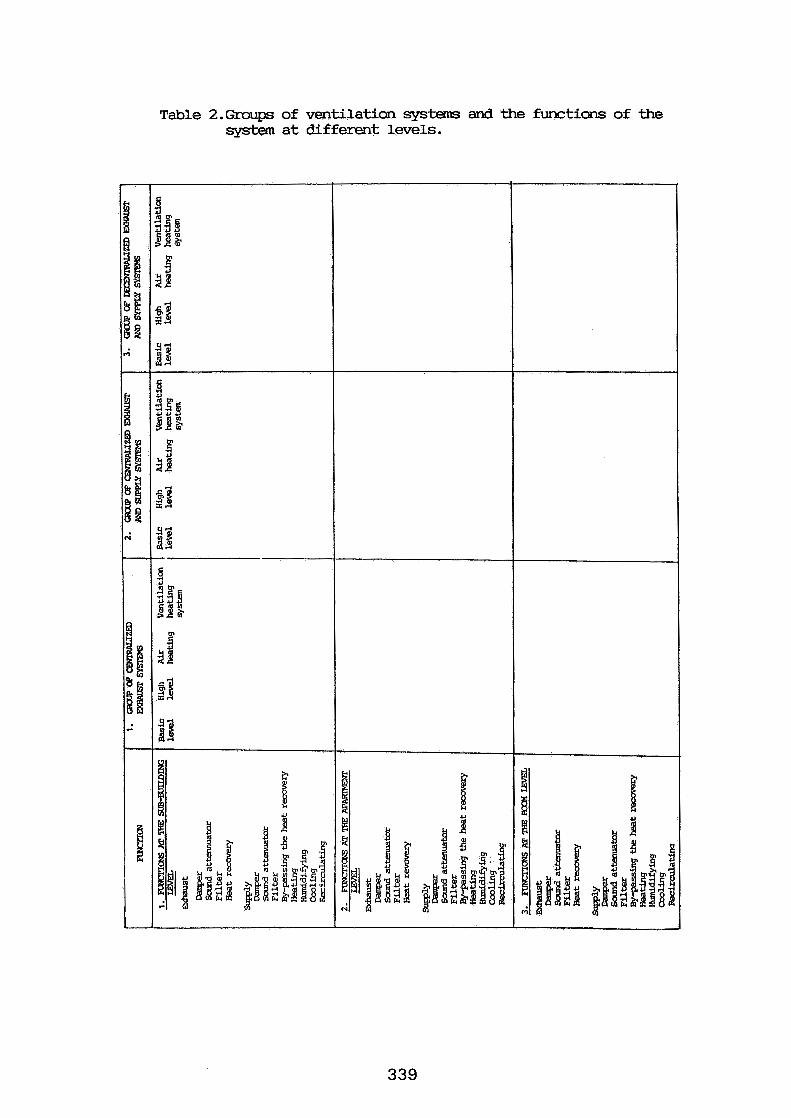
Table 2.Groups of ventilation systems and the functions of the system at different levels.
The ventilatim systems of the future dwelling-buses have to to -the way of living,housing and building in the future.
The operational disbrbancies in the todary's ventilation systems, SUGhastheqxeadhgof odoursinsidethe-ts, stuffy W air and cmdersation on skm&mes refer to the fact, that the ventilation Systems are not capable of exhausting the impurities that cune frun the real household actions. That is because tha local air flow rates are tmo small and the occupant has no possibility to adjust t-htm more appropriate.
Ths key to the solution is a ventilation system w i t h variable air flows, in which the ducts, fans and terminal devices are designed to operate at varying air flows. This kind of ventilation system has been simulated by calculaticms, and it is possible to create tables, with w h i c h the dirnensim of the systems will be easy and rapid in practica in the future.
The buildhg ~ 1 o g y R&D projects in Finland focus on new capme& based Lxlilding system, in w h i c h bigger and more refined pfabAcated stsucanss are ccme&ed at site. The goal of the whole building secbr should be to make the technical systems tatally mtible. The ventilation kanch itself will also benefit fran ths ecarxmic, qualitative ardi serviceability aspects of #8 canpcnent building.
1. HEIKKINEN, JI, ~ R l W A , T., LUOMA, MI, SALCMAA, H., "Fault aperations and susceptibility tx~ disturbing f a h ~ s of ventilatim systems" The T e c h i c a l Research Centre of Finland, R e s e a r c h Notes 737. Espoo 1987. 127 p. + app. 25 pa in Finnish
2. "HVAC and Electricity 2000, Pilot study" The Minktxy of Trade and Industty, The Department of Ehergy, Series D: 131. HelsinM 1987. 138 p. in Finnish
3. SARJA, A., "Finnish amstmction research in the face of k a m m ' s challenges" Fixmish Civil Ehgheechg 1988/3. Special Issue for 13th IABSE -, H e l s i n k i 1988. s.131-141. in English
'" Industrialized l3uilding Technology for the 1990' s" 13 th IABSE Clxgmss, June 6-10, 1988, Helsinki. C X x q r e ~ Repart p. 951-955. in wlish
5. HE-, J. , "Ventilation units in each flat in a residential building" The Technical Rssearch Centre of Finland, Notes 824. Ekgm 1988. 88 p. + app. 14 p. in Finnish
Discussion
Paper 19
P. Hartmann (EMPA Duebendorf, Switzerland) You explain the requirements for future ventilation systems. What kind of heating systems will be cambined with these systems?
M. Luama (Technical Research Centre of Finland) The system can be separate (radiators) or it can be combined with ventilation (air heating). The systems under developnent will mainly not include heating.
G. Gottschalk (Institute fur Energietechnik, Zurich, Switzerland) Are you planning to adapt the components of Finnish heatinq and ventilation systems to be controlled £ram a central computer - i.e. the "smart home" concept? It might open new perspectives for energy management and optimised operation,
M. Luoma (Technical Research Centre of Finland) "The ventilation concept for future dwelling houses" research project concentrates on the technical components and operation of the ventilation systems. In this phase control by computer has not been developed.
C-A. Roulet (Ecole Polytechnique Federale de husanne, Switzerland) Which kind of "roam device" do you plan to use to allow the occupants to change air flow rate?
Me Luama (Technical Research Centre of Finland) There are some adjustable roam devices available. The principle of operation involves adjustment of opening size. A more advanced ltroom device" operates with a new cascade control method (see paper by Rolf Holmberg: Spatiotenporal control of mechanical exhaust air ventilation). This device is not yet romnercially available.
W, Raatschen (Dornier Systems QnbH, W. Germany) What ventilation rates are used in Finland to remove contaminants released by building materials and how have they evolved?
M. Luama (Technical Research Centre of Finland) A ventilation rate of 0.5 air changehour is needed to evacuate the contaminants released from the building materials. It is based on measurements and calculations.
EFFECTIVE VENTILATION
9th AIVC Conference, Gent, Belgium 12-15 September, 1988
Paper 20
NATURAL VENTILATION FOR A CROWN COURT: DEVELOPING STATISTICAL ASSESSMENT TECHNIQUES AT THE DESIGN STAGE
M.D.A.E.S. PERERA, R.R. WALKER AND R.G. TULL
Building Research Establishment UK Department of the Environment Garston Watford U.K.

The ventilation performance of a proposed naturally-ventilated court-room was predicted and assessed on a statistical basis with regard to the local meteorological conditions. Summertime ventilation was to be provided via an underfloor duct and controllable vents at roof levels, under the action of wind and buoyancy forces.
Wind pressure coefficients expected on the external facade of the building were obtained from wind tunnel measurements on a scale model. Treating the court-room as a single cell, a computer prediction program was used to determine ventilation flows into the building for various configurations of ventilation openings, and a range of meteorological conditions and internal temperatures. For each wind direction, ventilation flows versus windspeed were presented in a convenient compressed form, in which the temperature dependence was removed.
A new approach was developed to predict the statistical occurrence of design ventilation levels by using the above results with correlated frequency distributions of the local meteorological data.
1. INTRODUCTION
A Law Courts Complex, comprising of several Crown Courts and one County Court, is to be built at a site in Canterbury, and a requirement for this project is that, if possible, court-rooms are naturally ventilated and air conditioning is avoided.
The system for naturally ventilating the court-rooms depends primarily on introducing fresh air through underfloor ducts and venting contaminated air out through high level vents, under the action of stack and wind pressures. Design objectives require this system to provide the necessary fresh air for summertime conditions. Fresh air ventilation recluirements are set at 1000 m3/hr and 2000 m3/hr for conditions representing average and full court-room occupancy patterns respectively.
The coniplexity of the building layout makes it very difficult, if not impossible, to use existing desipt puides1*2 to predict whether the court-rooms will be adequately ventilated. Computer models are therefore required. Computer prediction requires two major items of input data - leakage characteristics of the building fabric and the distribution of wind pressures on its external facade. If computer prediction is carried out with the intentional openings (vents, windows and ducts) opened, then it is possible to restrict input data to those components and neglect 'background' leakage through cracks etc.
Tabulated values of surface pressures are available for simple 1)rrilding forms1*3. For more complex buildings, however, an individual wind ti~anel test is needed. Within such a test, the buildings and the surroundings need to be modelled as faithfully as possible and then tested in a silnulated airflow which represents that flowing over the corresponding full-scale terrain.
This paper begins by describing a wind tunnel test to measure surface wind pressures on a model of the proposed court complex. A slingle-cell computer prediction program then uses these n~easurements to determine ventilation flows into a typical court-room for various configurations of ventilation openings over a wide range of meteorological conditions and internal temperatures. It is shown that for each wind direction, ventilation flows versus windspeed can be presented in a convenient compressed form (an example is given), in which the temperature dependence is removed.
The paper concludes by describing a new approach developed to predict the statistical occurrence of design ventilation levels by considering tlie frequency distribution of the local meteorological data.
2. WIND TUNNEL TESTS
It is generally accepted that if the air flow in the wind tunnel conforms to certain conditions, then
- the pattern of flow, - the distribution of wind speeds around a properly scaled model, and - the distribution of wind pressures on the external surface of the model
will be siniilar to that around a full-scale developn~ent.
The conditions required for this to be met are that: - there should be an increase in velocity with height in the airstream similar to that of the atn~ospheric boundary layer (ABL) flowing over a terrain similar to that of the site under consideration, and - there should be a distribution of scales of turbulence in the wind tunnel airstream similar to that on full scale with the size of the turbulent eddies reduced to match the model size.
Figure I shows a schematic view of the 2.00 ni x 1.25 m BRE Environn~ental Wind Tunnel (EWT). In the EWT, a 1 :250 length scale suburban boundary layer was simulated using a bi-planar grid and a saw-tooth fence to start the required layer and then letting it develop over eight metres of roughelled surface. The simulated boundary layer then flows over and around the model which is placed on the turntable in tlie working area.
Constraints, such as the amount of detail that needed to be modelled, required the model to be a 1 : 150th representation ot full-scale. The existing boundary-layer siiiiulation was considered to be adequate, on the grounds that averaged pressures (in which we are interested) do not vary substantially with changes in length scales.
The modrl or the court complex (containing 47 surface pressure tappings) together with outlying builtlings in its near vicinity was mounted on a 1.75 ni diameter turntable. This was placed in the wind tunnel and rotated under computer control to simulate different wind directions.
All pressures measured were referenced to the dynamic pressure, PD, of the airstream measured at a location well upstream of the model under test. The height of the reference location was chosen by considering the anemometer height of the nearest n~eteorological station. This was set at a height of 12 cm (18 m full scale) representing the anemometer mast height at the meteorological station at Manston, 20 km ENE of Canterbury.
The pressure PD in Pascals (Pa) is related to the wind tunnel reference velocity, Uref in mls, by the relationship
where tlie density of air, p = 1.225 kg/m3.
Pressures, P, measured at various surface pressure ports are then nornlalised by PD to give tlie surface pressure coefficients, Cp, such that
A valid assumption for this model, with well-defined edges where wind separates, is that the pressure coefficients so evaluated are independent of windspeeds used in subsequent calculations. This independence allows us to calculate any other pressure P corresponding to a velocity U by using the equation,
For this series of tests. the reference wind speed was set to about 6.5 m/s. The modelling procedure allows us to choose the velocity scaling as I : 1 so that windspeeds in the wind t~lnriel are eqr~ivalent to those nt full scale. With the lengtli scale of 1 : 150, tlie time scale is also 1 : 150.
Each pressure port was connected (under computer control) to a pressure transducer and the resulting analogue signal was digitised at a rate of 512 samples/sec for a 60-sec period. Each of the pressure ports therefore yielded for processing about 30,000 raw data values for every incident wind direction tested. On-line analysis computed each 60-second mean value together with other statistical information. It shoi~ld be noted that the I-minute mean values correspond to 150-minute averages in full scale.
After each test run, the turntable was rotated to a new wind direction and the above tests repeated. In all, tests were carried out at the 12 principal wind directions from O0 to 330°N in steps of 30°.
3. VENTILATION PREDICTION
A conlputer program was written which comprised of equations (Appendix) relating the airflow through each type of ventilatior~ opening to the pressure difference across each opening. These pressure differences depend on the wind speed and direction and on the pressure coefficients exterior to the opening, and also on the temperature difference between the air in the room and that outside. The room air pressure is the unknown parameter to be found. l'hc computer prograni uses an iterative procedure to repeatedly calculate tlie airflows through each of the openings until mass balance is satisfied for a unique choice of internal air pressure.
Figure 2 shows a sectional schematic drawing of one of the court-rooms used to derive the model. It consists of an underfloor duct, two mid-level windows on opposite faces and four high-level vents on each face of a podium-like structure. Though nlany open/closed combinations were tested, the configuration discr~ssetl in this paper relates to tlie case where both the windows and the windward vent are closed. 'The 'windward vent' is interpreted as the one for wliich the normal to its outward face is within 45O of the direction from which the wind is blowing.
It is necessary to compute the ventilation flow for wind blowing from each direction for a range of windspeeds and differences in air temperature between inside and outside of the court. To avoid generating a large and unnlanageable set of data, the results need to be presented in a conlpressed form, in wllicll the temperature deyendance has been removed, without any loss in generality.
For each wind direction, all this information can be collapsed415, and the tenlperature dependence removed, by scaling both the ventilation flow Qv and the windspeed U by the factor I I J (T~ -To), where Ti and To are the internal and outside air temperatures respectively. This approach was validated, over the current range of interest, for both Qv
and the flow Qd through the duct. Results for the latter are shown in Figure 3a and it also should be noted that Qd is the likeliest source of ventilatio~i to the occupied region.
Figure 3b shows a selection of results for Qd, for 90° intervals, to include the only example for which there is a risk of stagnation of flow in the duct. Generally ventilation supplied via the duct is in excess of 2300 m3/hr for all temperatures. The exception occurs for wind from direction 210° (SSW).
A 10C temperature difference enables the requirement for part occupancy to be met for windspeeds less than approximately 5.2 mls, and up to approximately 3.4 mls for full occupancy. When the temperature difference is between 3 - 4OC, both requirements are met for windspeeds up to around 10 mls.
4. STATISTICAL ASSESSMENT
The ventilation prediction carried out above, though specific to the court-room, makes no reference, however, to the local climatic conditions expected at the site. To assess whether or not adequate ventilation would be available in these court-rooms, further refinement of the results is necessary.
This was accomplished by combining the expected climatic conditions at the Chaucer site with the ventilation characteristics of the proposed ventilation configuration for the court-rooms, to give a statistical measure of how often various levels of ventilation could be expected. The results were further refined by constraining the analysis to the occupied hours between 0900 to 1800 hrs during the SpringlSummer months.
A measure of the climatic conditions at the site was obtained from the nearest meteorological station - Mar~ston. Manston station lies on an airfield characteristic of open countryside terrain while the Canterbury site is more representative of a rural terrain with scattered windbreaks. This change of terrain means that wind speeds at the site wor~ltl be reduced in comparison to that measured at Manston. ~alculations~ indicate that windspeeds at the site would be 83% of that experienced at Manston.
For the period considered, Figure 4.a shows the percentage frequency of occurrence of wind direction at Canterbury. Though there is no dominant direction, there is a higher occurrence of winds from both NNE and from the SW. Average windspeed for the site is estimated as 5.6 m/s from Figure 4.b Similarly, the average outside air temperature is estimated as 17OC from Figure 4.c.
The ventilation performance of the court-roonls is determined hoth by wind pressure and buoyancy forces. Therefore, it is necessary to know the joint occurrence of both windspeed and outside air temperature. Consequently, the percentage occurrences of windspeed versus outside air temperature for each of the 30° sector wind directions was obtained for Manston, as shown in Table 1, for the example of northerly winds. Subsequently, windspeeds were corrected for Canterbury as discussed earlier.
Provided the internal temperature, Ti, of the court-room is decided, or can be maintained, it is a simple matter to determine the duct flow. Qd, for a given choice of windspeed U and outside air temperature, To corresponding to the values given in the joint occurrence table (e.g. Table 1). The duct flow is computed from empirical fifth-order polynomials, shown below, which are curve-fits to the duct flow results:
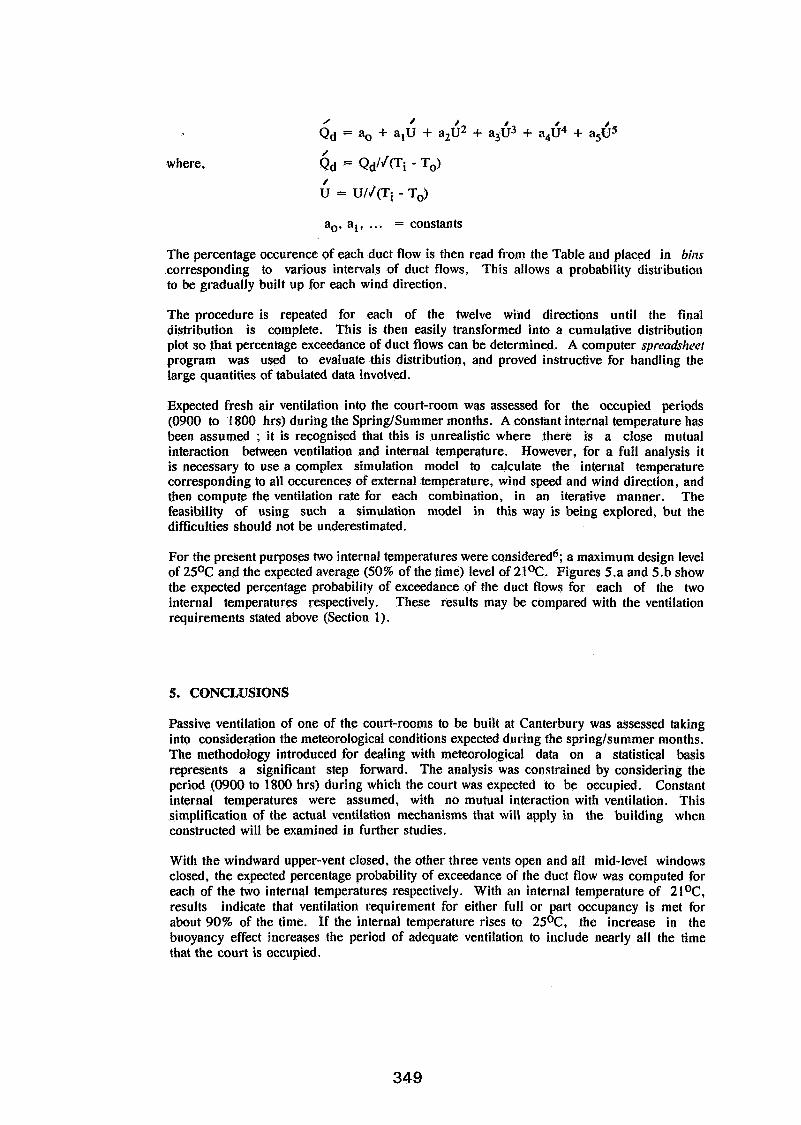
where,
a,, al, . .. = constants
The percentage occurence of each duct flow is then read fro111 the Table and placed in birzs corresponding to various intervals of duct flows. This allows a probability distribution to be gradually built up for each wind direction.
The procedure is repeated for each of the twelve wind directions until the final distribution is complete. This is then easily transformed into a cumulative distribution plot so that percentage exceedance of duct flows can be determined. A computer spreadslzcer program was used to evaluate this distribution, and proved instructive for handling the large quantities of tabulated data involved.
Expected fresh air ventilation into the court-room was assessed for the occupied periods (0900 to 1800 hrs) during the SpringISummer months. A constant internal temperature has been assumed ; it is recognised that this is unrealistic where there is a close mutual interaction between ventilation and internal temperature. However, for a full analysis it is necessary to use a complex simulation model to calculate the internal temperature corresponding to all occurences of external temperature, wind speed and wind direction, and then compute the ventilation rate for each combination, in an iterative manner. The feasibility of using such a simulation model in this way is being explored, but the difficulties should not be underestimated.
For the present purposes two internal temperatures were considered6; a maximum design level of 25OC and the expected average (50% of the time) level of 21°C. Figures 5.a and 5.b show the expected percentage probability of exceedance of the duct flows for each of the two internal temperatures respectively. These results may be compared with the ventilation requirements stated above (Section 1).
5. CONCLUSIONS
Passive ventilation of one of the court-rooms to be built at Canterbury was assessed taking into consideration the meteorological conditions expected during the springlsumn~er months. The methodology introduced for dealing with meteorological data on a statistical basis represents a significant step forward. The analysis was constrained by considering the period (0900 to 1800 hrs) during which the court was expected to be occupied. Constant internal temperatures were assumed, with no mutual interaction with ventilation. This simplification of the actual ventilation mechanisms that will apply in the building when constructed will be examined in further studies.
With the windward upper-vent closed, the other three vents open and all mid-level windows closed, the expected percentage probability of exceedance of the duct flow was computed for each of the two internal temperatures respectively. With an internal temperature of 21%. results indicate that ventilation requiren~ent for either full or part occupancy is met for about 90% of the time. If the internal temperature rises to 25OC, the increase in the buoyancy effect increases the period of adequate ventilation to include nearly all the time that the court is occupied.
ACKNOWLEDGEMENTS
Thanks are due to Dr P R Warren for suggesting the approach to data-compression regarding temperature, and to J O'Dowd for initial help with the computing. The work described here has been carried out by the Building Research Establishment of the Department of the Environment as part of the research programme for the Property Services Agency (PSA).
REFERENCES
1 . British Standards Institute, Code of Practice for Design of Buildings: Ventilation Principles and Designing for Natural Ventilation, BS 5925, (1980).
2. CIBS, Guide A4: Air Infiltration, The Chartered Institute of Building Services, London (1976).
3. Liddament, M W, Air Infiltration Calculation Techniques - An Applications Guide, Air Infiltration Centre, Bracknell (1986).
4. Warren, P R and Webb, B C, The relationship between tracer gas and pressurisation techniques in dwellings, Proceedings of the 1st AIC Conference on Infiltration Measurement Techniques, held in London (1980).
5. Warren, P Rand Webb. B C, Ventilation ~neasurements in housing, Proceedings of the CIBS Syn~posium on Natural Ventilation by Design, held at BRE, Garston (December 1980).
6. Pinney, A, Private communication, unpublished internal BRE report (1987).
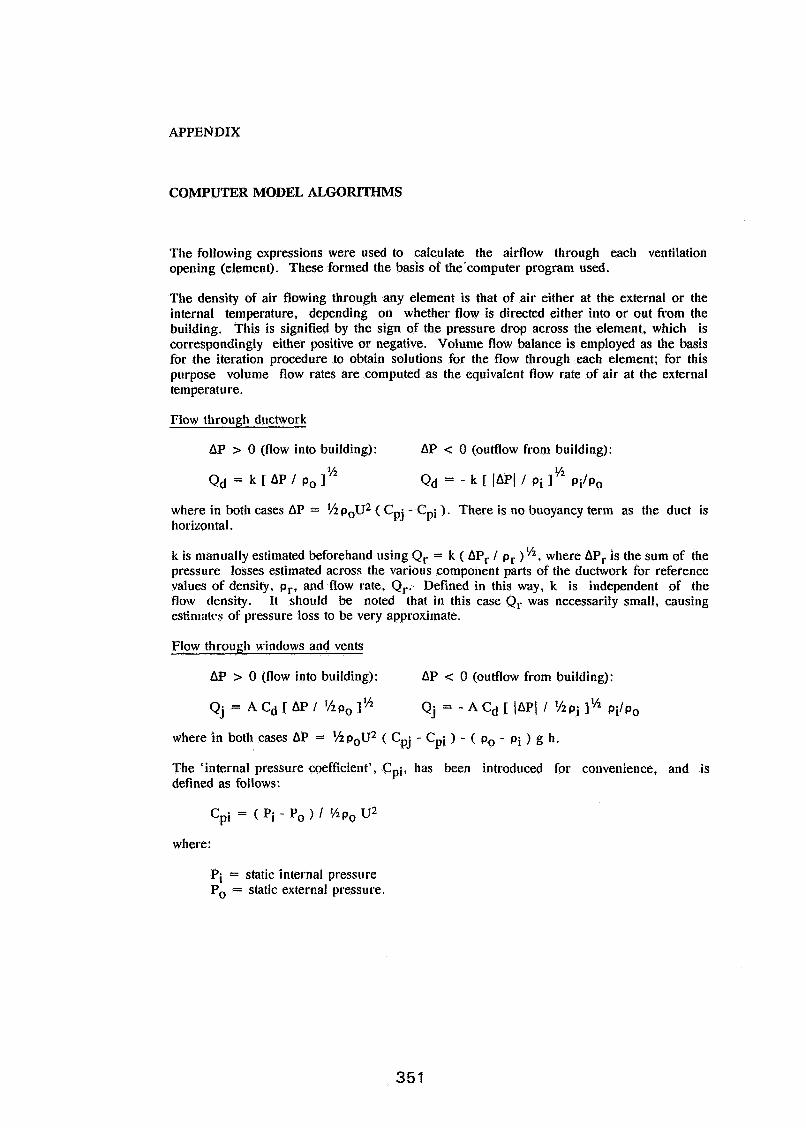
APPENDIX
COMPUTER MODEL ALGORITHMS
Tlie following expressions were used to calci~late the airflow through each ventilation opening (element). These formed the basis of the.computer program used.
The density of air flowing through any element is that of air either at the external or the internal temperature, depending on whether flow is directed either into or out from the building. This is signified by the sign of the pressure drop across the element, which is correspondingly either positive or negative. Volun~e flow balance is employed as the basis for the iteration procedure to obtain solutions for the flow through each element; for this purpose volume flow rates are computed as the equivalent flow rate of air at the external temperature.
Flow through ductwork
AP > 0 (flow into building): AP < 0 (outflow from building):
where in both cases AP = '/t p0U2 ( Cpj - Cpi 1. There is no buoyancy term as the duct is horizontal.
k is nlanually estimated beforehand using Qr = k ( APr / p, )%, where APr is the sum of the pressure losses estimated across the various component parts of the ductwork for reference values of density, p,, and flow rate, Qr.- Defined in this way, k is independent of the flow density. It should be noted that in this case Q, was necessarily small, causing estin1att.s of pressure loss to be very approximate.
Flow through windows and vents
AP > 0 (flow into building): AP < 0 (outflow from building):
where in both cases AP = 'hpoU2 ( Cpj - Cpi - ( p0 - Pi g h.
The 'internal pressure coefficient', Cpi, has been introduced for convenience, and is defined as follows:
where:
Pi = static internal pressure Po = static external pressure.
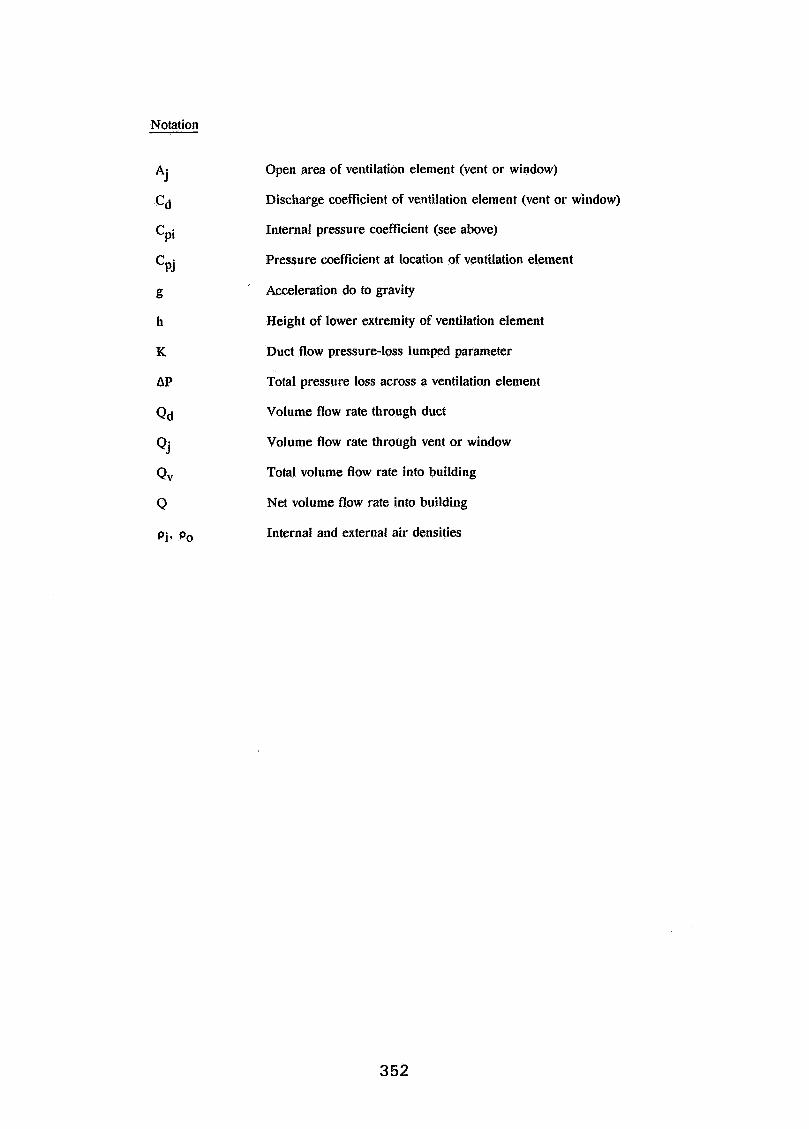
Notation
Open area of ventilation element (vent or window)
Discharge coefficient of ventilation element (vent or window)
Internal pressure coefficient (see above)
Pressure coefficient at location of ventilation element
Acceleration do to gravity
Height of lower extremity of ventilation element
Duct flow pressure-loss lumped parameter
Total pressure loss across a ventilation elenient
Volume flow rate through duct
Volume flow rate through vent or window
Total volume flow rate into building
Net volume flow rate into building
Internal and external air densities
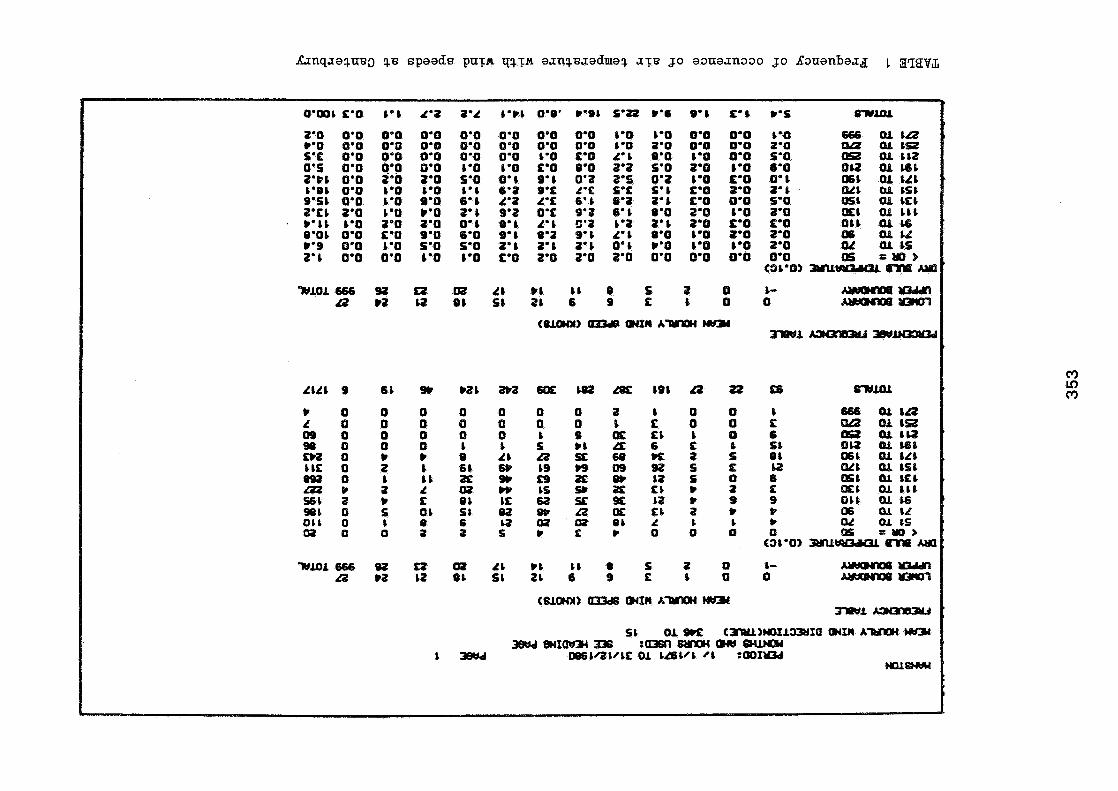
0'00L S'O L'L
0'0 0'0 0.0 C'O 0.0 0.0 S'S 0'0 0'0 0.s 0'0 0.0 3'Pb 0'0 2'0 L'OL 0'0 L'O 9-51 0'0 b'O a s 2 0 I;*O C b'O 2'0 e*ob 0.0 F'O C'9 0.0 boo 2') 0.0 0'0
0'0 0'0 0'0 0'0 0'0 Leo L'O 0'0 0'0 L-0 0*0 0'0 0'0 0'0 0'0 8'0 3'0 0'0 0'0 Z'O 0.0 0-0 0.0 8.0 roo r o t 0.0 L-o 0-0 s0o 0'0 b'O I 'O S'O 0'0 2.3 SwO 2.0 t-0 6.0 2-0 soo O * L 9-c o*a 2.s 0.2 1.0 roo oat 4'0 L ' L 6 9's l 't S'S S'L S'O Z'O t ' L 9'0 6') 4'2 L'S 6'1 0'1 Z'L C'O 0'0 5'0 C'O 2.C 9'2 0's 9'2 6'L 0'0 2'0 b'O 3'0 - -
2.0 o - b e-S 4-1 c*z re2 2.r 2.0 roo roo 9'0 6'0 9'L 0'7 9'1 L'L 0'0 L'O 0'0 2'0 S'O S.0 2') 2') 2') 0") C'O 6'0 LOO 2'0
2 b 0 0 b C E O 0 s 0s SL b 0 6 a 6 S b S L W K i C S 0 ) 0 9 9 2 s L: LE W L 2 5 0 6 x SL P 3 s
ra t 9 9 [K 1 a e c Ob L b L C t o o 0 0
C3b'O)
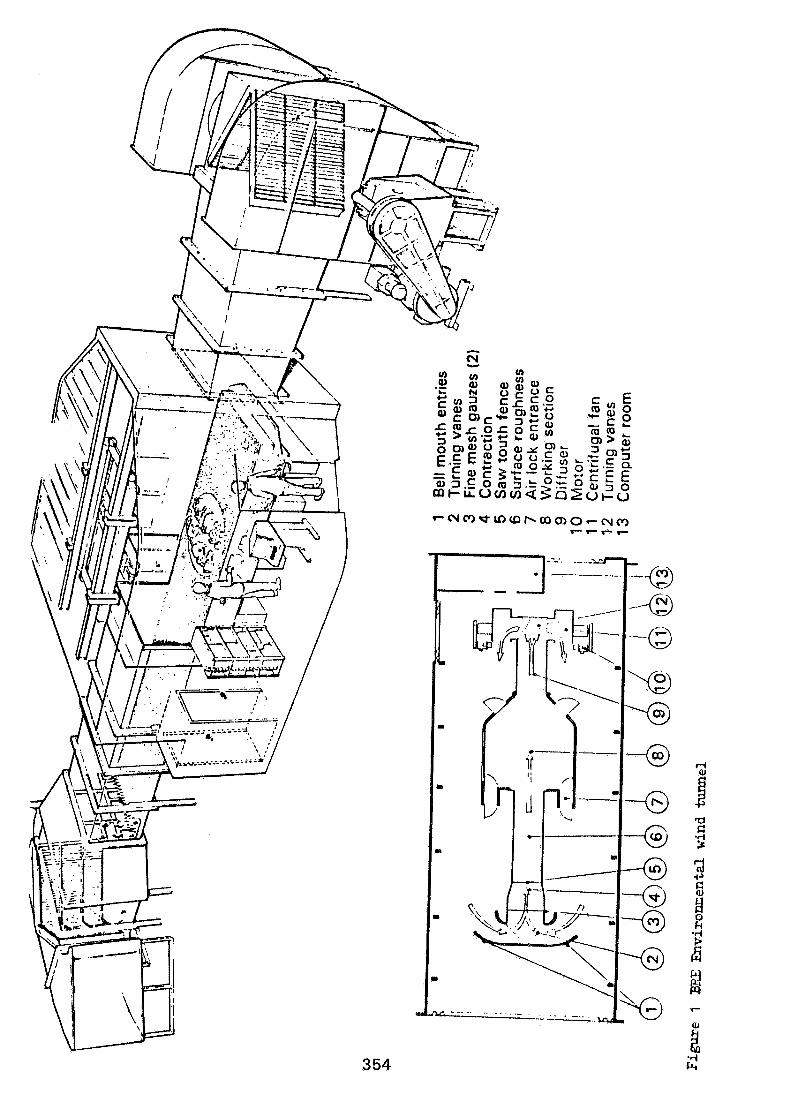
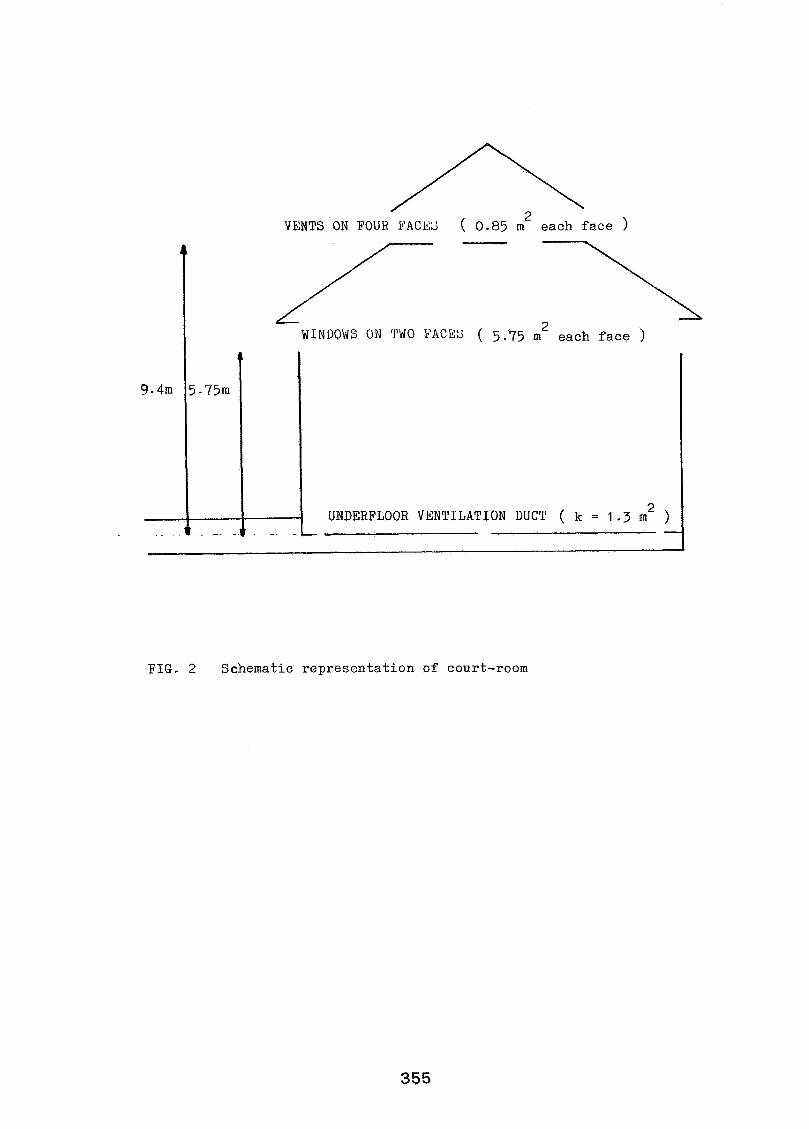
L VENTS ON FOUR P A C K ( 0.85 m each face )
UNDERFLOOR VENTILATION DUCT ( k = 1.3 m2
FIG. 2 Schematic representation of court-room
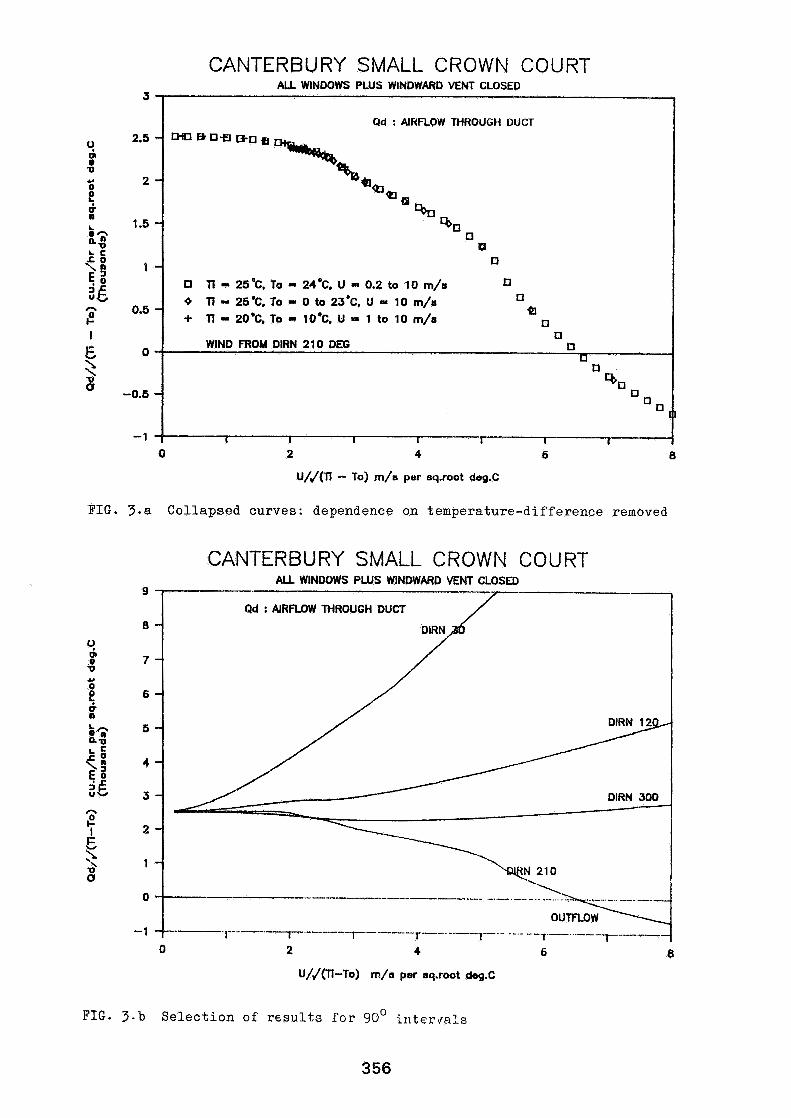
ti- '=; L C cx E 3 2g
CANTERBURY SMALL CROWN COURT AU WINDOWS PLUS WINDWARD VENT CLOSED
3 1
U/J(ll - To) rn/a per sq.root d8g.C
2 .5 -
2 -
1.5 -
1 -
0.5 -
0
-0.5 -
-1
0
FIG. 3.a Collapsed curves: dependence on temperature-difference removed
Qd : AIRROW THROUGH DUCT
~ ~ ~ f l t + o t ]
a %
40 0 u D
0 TI - 2 5 ' ~ . To - 2 4 ' ~ . U 1. 0.2 to 1 0 m/s q
O Ti - 25%. To 0 0 to 23.C. U = 10 m/s n + 77 - 20%, To = 10°C. U = 1 to 10 m/s
a 0
WIND FROM DlRN 210 DEG n U
n 4,
0
I I I I I I I
CANTERBURY SMALL CROWN COURT AU WINDOWS P U S WINDWARD VENT CLOSED
9
Qd : AIRFLOW TNROUGH DUCT 8 -
% 0 v
7 -
Q
a -------.---.---..-- -. I -.-
I- ------- ,--. ---r--..---- - - - -7---. ..----. 0 2 4 6 a
2 4 6 0
U//(Tl-To) m/a per sq.root d8g.C
FIG. 3 . b Selection of results for 90' interfals
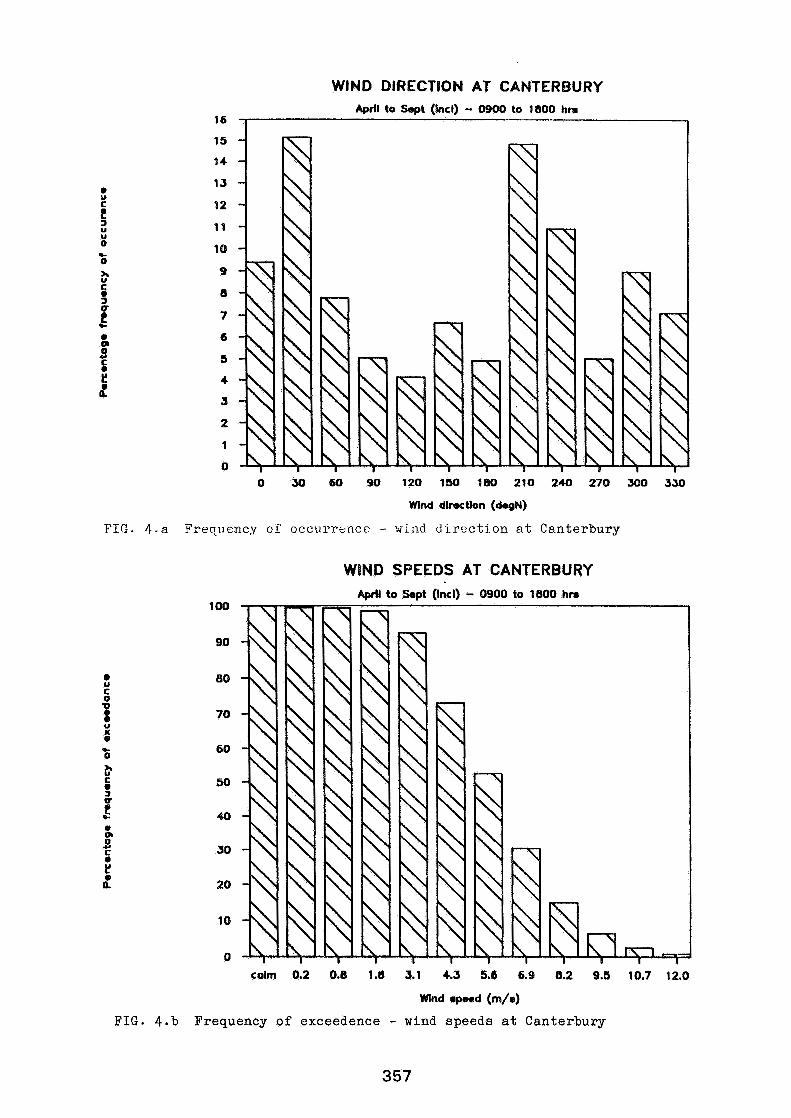
WIND DIRECTION AT CANTERBURY Apdl to SIpt (Incl) - 0900 to 1800 hm
I
0 50 60 90 120 150 180 210 240 270 300 330
WInd dlmctlon (degN)
FIG. 4.a Freq11cnc.y of occcurr.&ncc - uFad c!i.rection a t Canterbury
calm 0.2 0.8 1.8 3.1 4.3 5.6 6.9 6.2 9.5 10.7 12.0
Wlnd 8pmd (m/r)
FIG. 4.b Frequency of exceedence - wind speeds a t Canterbury
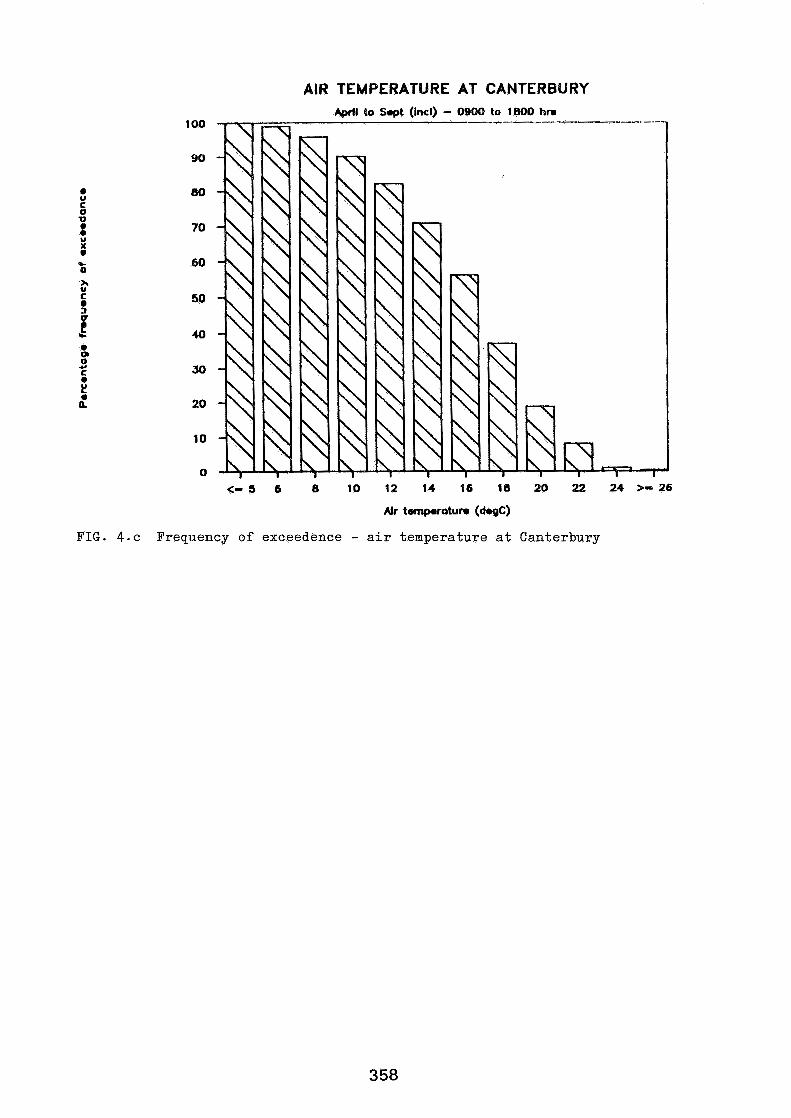
AIR TEMPERATURE AT CANTERBURY
FIG. 4.c Frequency of exceedence - air temperature at Canterbury
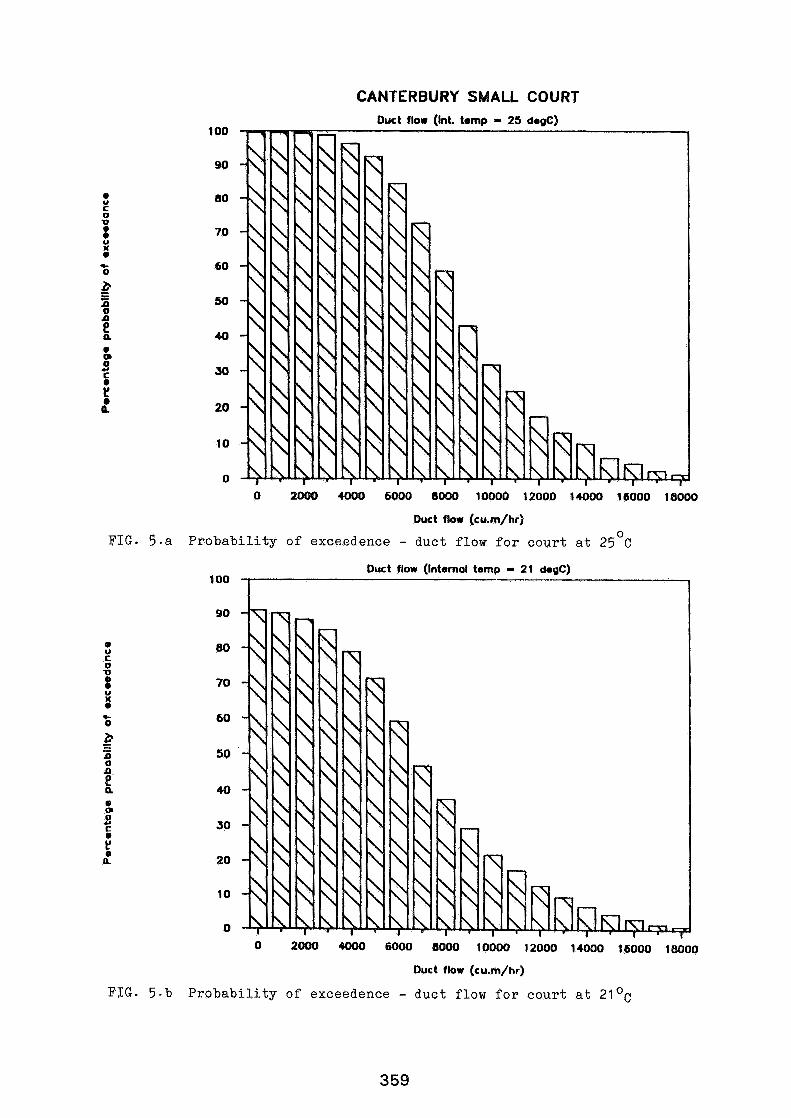
FIG. 5.a
CANTERBURY SMALL COURT
Probab
Duct flow (Internal temp - 21 degC) 100 1
Duct flow (cu.m/hr)
FIG. 5 - b P r o b a b i l i t y of exceedence - duct flow f o r c o u r t a t 21 OC
Discussion
Paper 20
C-A. Roulet (Ecole Blytechnique Federale de Iausanne, Switzerland) Do you plan to verify your computations with tracer gas measuranents?
R. Walker (~uilding Research Station, Garston, UK) Yes, we plan to follow up our predictions with measurements - the court has not yet been built.
EFFECTIVE VENTILATION
9th AIVC Conference, Gent, Belgium 12-15 September, 1988
Paper 2 1
MARKET ANALYSIS OF SENSORS FOR THE USE IN DEMAND CON-
TROLLED VENTILATING SYSTEMS
WILLIGERT RAATSCHEN
Dornier System GmbH Dept . MTES-AIVC Postfach 1360 0-7990 Friedrichshafen

ABSTRACT
In the framework of a project of the International Energy Agency (IEA) , IEA-Annex XVIII - Demand Controlled Ventilating (DCV) Systems, which started in fall 1987, a review of the state of the art of already existing DCV systems and devices has been under- taken by all participating countries. This paper is concerned with air quality sensors which may be suitable to control air quality on demand.
The dominant contaminants are not only variing in different kinds of buildings (dwellings, schools, stores etc.) but also from room to room due to different ways of utilizing the spaces. Climatic and environmental differences will have a further impact on the DCV system.
In this context contaminants are discussed which have a dominant regime and impact on indoor air quality and which cannot be avoided by controlling the source. These are humidity, odours (indicator e.g. carbon dioxide GO,), fumes, and tobacco smoke.
The working principles of various sensors are outlined and possi- bilities of application discussed.
1. INTRODUCTION
In the past and especially at this time efforts are to be seen to control the air exchange rate on demand particularly in buildings and rooms which have high fluctuations in occupancy, i.e. schools, theatres, assembly halls, kindergartens and office rooms. Although mechanical ventilation systems are common in those buildings, practical application of Demand Controlled Ventilating (DCV) Systems are rarely to be seen. Most DCV systems are in a research state. Often questions arise about what con- taminants should be monitored and controlled for what kind of building and usage, where to measure the concentration, and what the benefits are.
Especially calculations on return-of-investment often turn out to be fatal for a DCV system, because the analysing equipment for the gases to detect are very expensive. But before one talks about energy savings, the main objective of a DCV system is to
supply occupants with an adequate quality of air and the building fabric with an atmosphere which is not harmful to it (moisture damages). The above stated topics are under discussion in the IEA-Annex 18 working group.
In this paper we are only concerned with the contaminants, which can practically be monitored in DCV systems and about reliable and low cost analysing devices, we'll call sensors to measure concentrations of contaminants as accurate as necessary and as cheap as possible.
2. WHAT CONTAMINANTS SHOULD BE MEASURED AND CONTROLLED
The final report of the IEA-Annex IX "Minimum Ventilation Ratesw /1/ gives an overview about the various pollutants of indoor air. From this whole bulk of gases and particles we can avoid most of them by controlling the source, i.e, avoiding special building materials, paints and cleaning fluids. By that we mean formalde- hyde, organics, microorganisms, particulates (except tobacco smoke) and also Radon where one may have to take additional actions.
The participating countries in the IEA-Annex 18 work group agreed also on to exclude combustion products of open fire-places. The remaining contaminants are also the main pollutants of con- cern listed in /1/ p. 179, table 11.1. These are water vapor, body odor and tobacco smoke.
2.1 Water Vapor
Occupants are sensitive to humidities below 30 % r.h, because of the dry out of the respiratory tract. They are not very sensitive to humidities between 30 and 100 % r.h. But high humidities are harmful to the building fabric. The level of humidity we should keep in a DCV system as a function of room temperature, k-value of exterior walls, and material properties of the interior wall surfaces will be the output of the IEA-Annex 14 working group, where the final report will be available in 1990. Although final results are of great interest the absolute value of r.h. is not of essential importance for this topic. Here we generally talk about possibilities to measure humidity with sensors and to con- trol the humidity of the interior air. The finally defined thres- hold value can then be adjusted.
Body Odor
It has been proofed by several authors, collected in /1/ that there is quite a good relationship between the respiration pro- duct CO, of humans and their production of body odor. Therefore, controlling CO, with a DCV system means, keeping body odor at a tolerable level. It has to be emphasized, that here only the occupant related CO, production is of importance and value. Many tolerable CO, levels have been reported in the past,'which range between 600 and 2000 ppm. Unfortunately it is not always clear if this concentration means absolute 60, concentration (including atmospheric CO, content) or only CO, production caused by humans. For a first guideline table la gives some recommendations.
The next question, if GO, concentration in the air is measured, is how much does the ambient CO, concentration vary with time, location and environmental impacts. Because CO, is not harmful to humans in the ambient concentration range, it was of minor impor- tance in the past. Therefore it has been continously measured over years only at some special places (usually weather sta- tions). But there are continously measured data available from South-Germany from 14 locations including heavy industrialized areas. Table 2 gives ambient annual mean CO, levels for various towns.
We can summarize from that, that the ambient CO, level in Germany varies between 350 and 450 ppm. As proposed threshold limits for human generated CO, varies a lot according to table 1 outdoor fluctuations of 100 ppm are of minor importance. I.e., for human generated GO, it is sufficient to measure only the indoor concen- tration with an offset of the average ambient CO, concentration. Therefore, one way to track body odor is to use a CO, sensor. Another way is: odors mostly consist of non-oxidized gases. There are various sensors on the market which react on non-oxi- dized gases. Companies often offer them as air quality sensors. There is a responds of those sensors due to odors. But how well this relationship is established has not been proofed yet.
2.3 Tobacco Smoke
Wanner /2/ proposed 1983 to use the increase in CO due to tobacco smoke as a measure. This increase should be kept below 1-2 ppm. In his recently published paper in /1/ be didn't stick to the CO level as an indicator for tobacco smoke. Looking at the ambient CO level table 3 indicates, that only in rural areas we get a fairly low and constant level, whereas we see great impacts due to traffic and industrialization in towns. Therefore, a detection of a tobacco smoke induzed CO increase of 1-2 ppm is only possible with simultaneously monitoring the ambient level, which increases investment costs. To perform such a measurement in the required accuracy, high cost IR-analyses have to be used. There are no sensors on the market yet, which measure CO with an accuracy of 0.5 ppm in a range between 0-20 ppm selectively. For CO-sensors on the market the lowest detectable CO concentration is - 30 ppm.
In conclusion, to use a CO sensor as an indicator for tobacco smoke is not appropriate.
As tobacco smoke consists of more than thausand constituents, also non-oxidyzed gases, there is a significant response also to see from those semiconductor sensors we already discussed in chapter 2.2 to detect odors. To use them also for detection of tobacco smoke seems to be more appropriate and worth to check out.
3. WORKING PRINCIPLES OF SENSORS
The following characteristics of a specific sensor technology are based on product information and various references about sensors and not on own experience.
3.1 Rel. Humidity:
For the measurement of rel. humidity hair and polyethylen-stripe hygrometers, capacitive and semiconductor sensors, and lithium cloride sensors are mainly in use.
Hair hygrometers change their length for about 2 % for a humidity change from 0 to 100 % r.h.. Also other hygroscopic materials like silk, cotton and synthetic materials are in use; A disadvan- tage is the necessity of recalibration and for elasticity reasons the placement of the hygrometer in humid air. Hysteresis is be- tween 2-5 %. The length change of the sensor stripe often works on a PT 100-Potentiometer to give the required analogous electric output signal.
They use a humidity sensitive folio which is placed between 2 electrodes. A change in relative humidity will cause a capicity change. Additional electronics (beside the sensor) is needed to get an analogous output signal in Ohm, Ampere or Volt. Lineariza- tion and temperature compensation is often necessary. Capacitive humidity sensors are depending on accuracy and response time fairly cheap. Unfortunately they are sensitive to contaminated air (dust, organics).
An electrode is placed on a plastic ground plate and covered with a hygroscopic layer, where the conductivity changes with humidi- ty. The result is a change of the electric current. This sensor type should have high accuracy and short response times, no recalibration or maintenance.
Uses thermodynamic equilibrium between humid air and a salt solu- tion. The lithium cloride solution absorbs so much water from the air ti1 the total pressure of the solution is the same as the partial pressure of water vapor in the air. Accuracy %s between 1-3 %
3.2 Carbondioxide, CO,
To measure CO, in air selectively with a sensor, all designed sensors use infrared ( I R ) ab: ~rption. There are actually only two t3pes of CO, sensors available at this time.
3.2.1 Bbsf ea~usf i~-GQ,-Seas~x
The sensor consists of a light source, an infrared filter, a cell, and a microphone. A filter in front of the light source takes care that only the wave lengths according to the absorption spectrum of 60, can enter the cell with the room air. In the cell the CO, molecules absorp the infrared light as a function of their concentration. The absorbed energy increases the vibration energy of the molecules, which leads to more pulses between mole- cules. The generated acoustic field is measured by a microphone and transformed with a scoring electronic unit. Long term experi- ence does not exist at that time, but a calibration checking is recommended every 1.5 years.
Light is emitted through a cell, reflected at a mirror and received by a special detector, which sends the signal to a microprocessor. The microprocessor does a height and temperature correction and produces an analogous output signal.
Cross sensitivities of both sensors are fairly small. Accuracy is between 10 and 100 ppm. Response times are about 3 min.
3.3 Mixed Gas Sensors
For controlling air quality in buildings, homogenous metal-oxide semiconductor sensors and catalytic gas sensors are in use.
They consist of pure metaloxide compounds (n-type: SnO,, ZnO, ZiO,, Fe,O,; p-type: CuO, NiO, COO) where the total conductivity changes due to the reaction of reactive gases with chemisorbed oxygen at the surface. The n-type sensors react on combustible (non-oxidized) gases like CO, QCn and alcohols. Also most human generated odors belong to that group and are detected. The sen- sors are heated up to 100-500°C. The structure of the semi-conductor layer can be threefold poly cristalline, thin-layer technic, mono crystalline. Polycrystal- line sensors are mainly made on Sn0,-basis. Advantages are simple
production and universal application. Disadvantages are response times of some minutes, high cross sensitivities to air humidity and long term drift. Also using thin-layer technic response times are in the range of some minutes with a fairly high influence of humidity. The advan- tage of the thin layer is the high sensitivity to simple gases like H,S, CO, NO,, CH, and C,H,OH. Cross sensitivities can be avoided by variation of the working temperature. But reproducibi- lity and long term stability is yet not satisfying enough.
Most sensors are in a developing state. Obtained results indicate good and reproducible quantitative properties, Only disadvantage are the high costs
Tables 4a-e show the results of a sensor-market analysis. Listed are only the main features of the sensors or of the whole measur- ing device (sensor + additional electronics). Further information can be requested at the companies, from which addresses are listed in table 4f.
Discussion:
How well sensors work in practise and how well they are suited to control the specific contaminant has to be investigated next. There has been performed a lot of sensor testing in various com- panies which look for nacked sensors to add the necessary elec- tronics to sell but unfortunately these results have not been published and valuable information is not accessible. It is necessary to test sensors under defined conditions in the future. To guarantee a good indoor air quality on one hand and to keep investment costs at a minimum on the other hand it is essential to investigate contaminant dispersal and the dominant pollutant in the room and in the whole building to answer questions about what, where and how many sensors have to be installed /4/,
Summary
Contaminants to control iaq are - depending on the type of building - humidity, carbon dioxide as indicator for body odor, and tobacco smoke. The various working principles are briefly outlined. The sensors are tab Jized and characterized according to company specification.

References:
/1/ N.N. Minimum Ventilation Rates, IEA-Annex IX, final report of working phase I+II, Nov. 87, ISBN 3-921213-87-8
/2/ N.N. Minirmun Ventilation Rates, IEA-Annex IX, final report Aug . 1983, p28
/3/ N.N. Statistische Berichte, Statistisches Landesamt Baden-Wiirttemberg Artikel-Nr. 3611 87008 vom 02.12.1987
/ 4 / Raaatschen, W.; Trepte, L.: Humidity Controlled Ventilating Systems, Proceedings of the ASTM Symposium April 17-18, 1989 Atlanta (GA) , submitted for publication
/5/ N.N. Umwelt 1/82
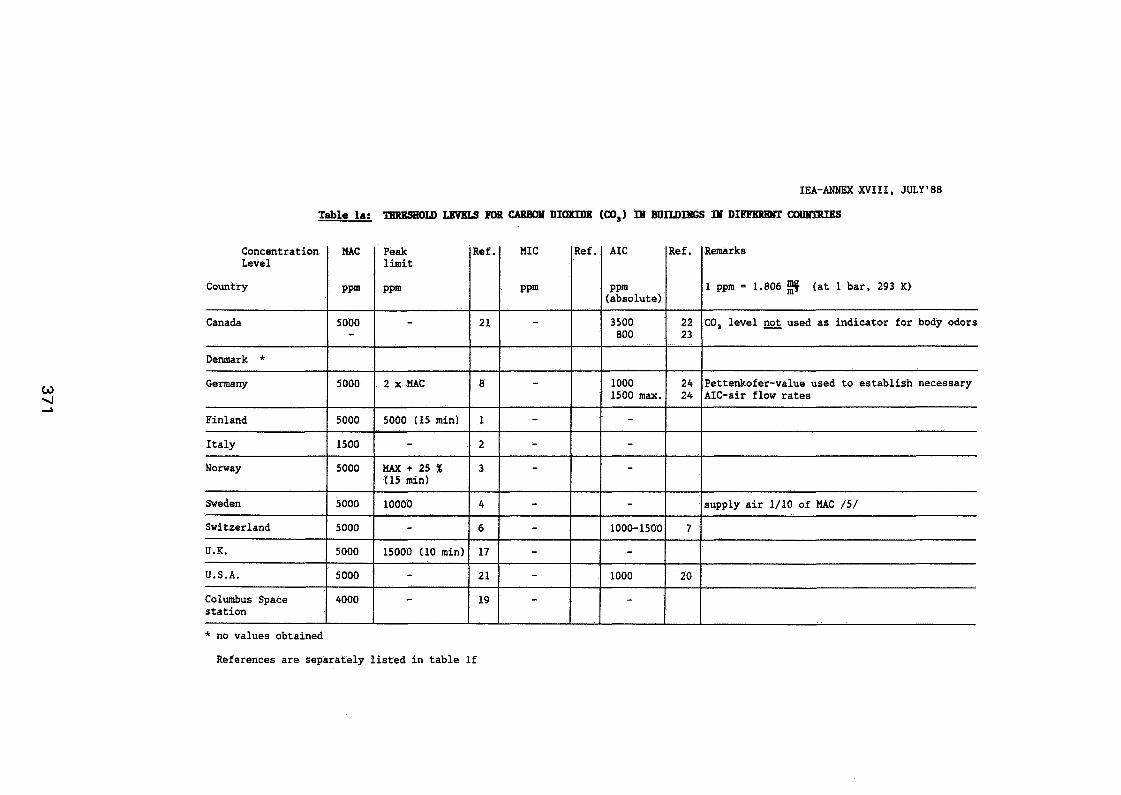
IEA-ANNEX XVIII, JULY'88
Table la: TRRESlDLD LEVELS POB CARBON DIOXIDE (0,) M BUILDMGS IY DI-
* no values obtained References are separately listed in table If
Concentration Level
Country
Canada
Denmark * Germany
Finland
Italy
Norway
Sweden
Switzerland
U.K.
U.S.A.
Columbus Space station
Ref. AIC
PPm (absolute)
3500 800
1000 1500 max.
- -
-
-
1000-1500
-
1000
-
MIC
PPm
-
-
- -
-
- - - -
-
MAC
PPm
5000 -
5000
5000
1500
5000
5000
5000
5000
5000
4000
Ref.
22 23
24 24
7
20
Peak limit
PPm
-
2 x M A C
5000 (15 min)
- MAX + 25 % (15 min)
10000
- 15000 (10 min)
- -
Remarks
1 ppm = 1.806 3 (at 1 bar, 293 K)
CO, level not used as indicator for body odors
Pettenkofer-value used to establish necessary AIC-air flow rates
supply air 1/10 of MAC /5/
Ref.
21
8
1
2
3
4
6
17
21
19

eauwAouua/~opo lo zasuwa uwql laqao saaajga uo paswq :anls~ auylapmng
loaA w aauo Aluo papaaaxa aq 01 aq8no a n ~ 8 ~ sTq7 : ~ I W
/S/ 3VW 30 OT/1 JT8 ATddns
()I E6Z '189 1 Zw) & 6bI.1 = T
s ~ l = a i (
02
Z'L
01
Z'L
ZZ'OZ
'Z~II~
-
- TI
-
z
Z 1
- - -
2-1
11
rudd
~ I V
6
I'J~III
-
-
- aSwsa~w q fZ-L
- - - -
1aaA 1 lo$ 01
'4 9Z 203 01 qZ/T 103 Ef
- rudd
3 1 ~
81
01
OZ
LT
9
Cr
E
z
I
8
1 Z
Ie3ax(
-
(SlnOq 8) 6 (-'noq 1) 92 ( U P OE) ES ( U P SS'I) L8
(UTm ST 1 009
(UTS 01) OD*
- 001
(UTw S1) % 05+
- ( U V ST) SL
aS8xa~w (UTw OE) 3W x Z
ST) 009
add
m"TT waa 1
0s
0s
05
OE
SE
SE
OE
OE
OE
05
rudd
m 1
s a u w ~ d q ~
OHM
v's'n
'r-n
pu8TlazlTMS
W P JaS
i i w ~ o ~
AT@a1
PuvIuTd
L U R U U ~
* Yl-W wpaue3
Xllun03
P a l uoravaauaauo3
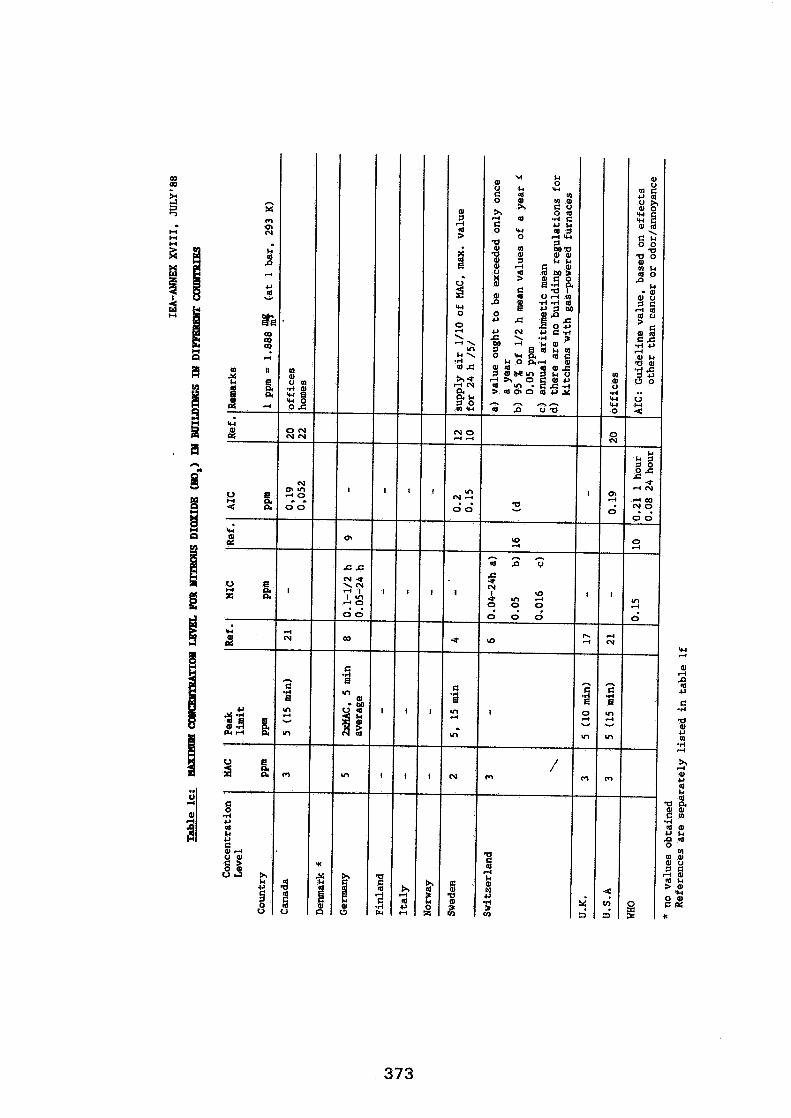
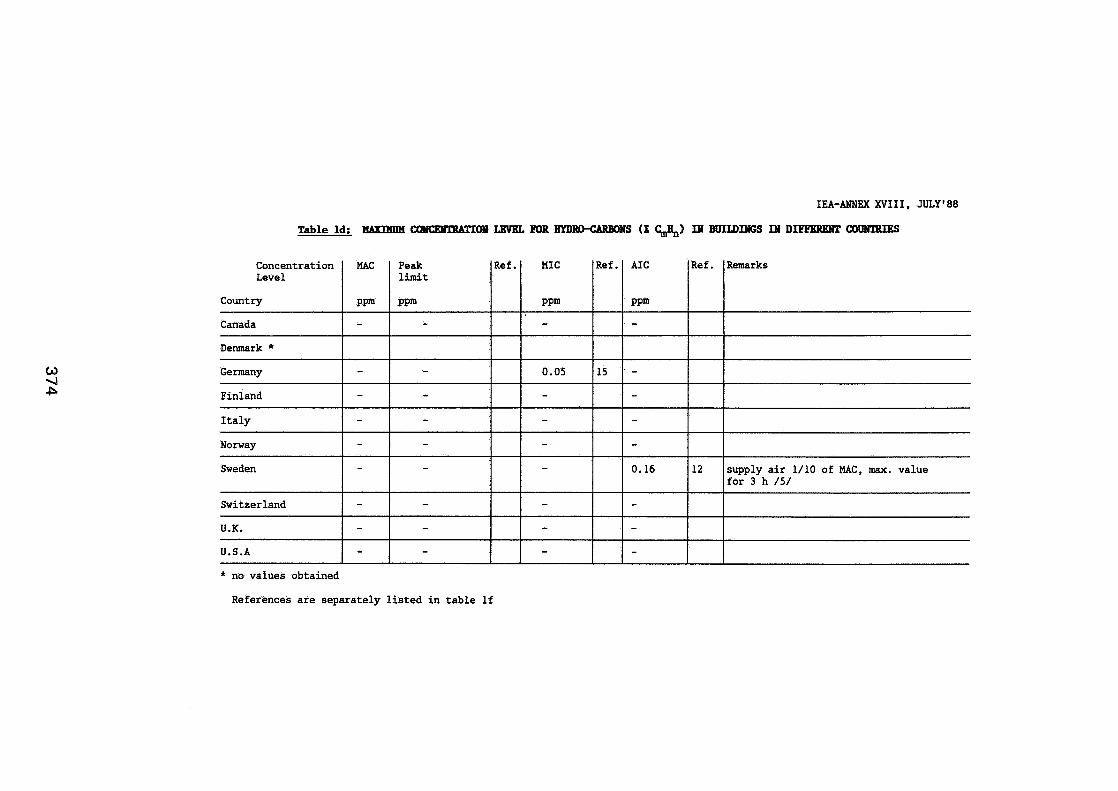
IEA-ANNEX XVIII, JULY'88
Table Id: IfAXIHW -QY LEVEL FOR E Y D R O M S (L (in#) M BUILDMGS M DI- C O W l X I B
* no values obtained
References are separately listed in table If
Remarks
supply air 1/10 ofMAC.max. value for 3 h /5/
Concentration Level
Country
Canada
Denmark *
Germany
Finland
Italy
Norway
Sweden
Switzerland
U.K.
U.S.A
Ref. MAC
PPm
-
- - - -
-
- - -
Ref.
15
MIC
PPm
-
0.05
-
-
- -
- - -
Peak limit
PPm
-
-
-
- - -
- -
-
AIC
PPm
-
-
-
- - 0.16
- -
-
Ref.
12
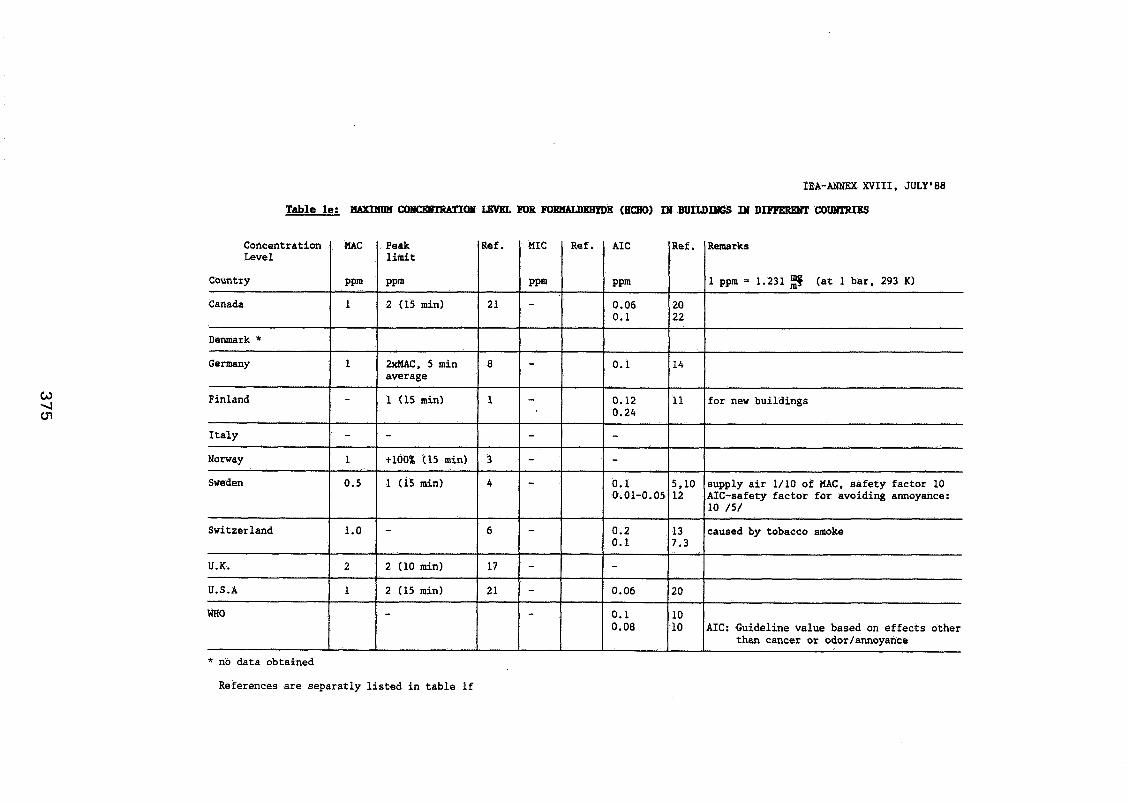
IEA-ANNEX XVIII, JULY'88
Table le: IWEHUM -OM LEVEL FOR FONMQM)II (HCW)) M BUILDIYGS lN DIFPEREIIT cOWlRIB
* no data obtained
References are separatly listed in table If
Concentration Level
Country
Canada
Denmark * Germany
Finland
Italy
Norway
Sweden
Switzerland
U.K.
U.S.A
WHO
Ref.
21
8
1
3
4
6
17
21
MAC
PPm
1
1
-
- 1
0.5
1.0
2
1
Peak limit
PPm
2 (15 min)
2xMAC. 5 min average
1 (15 minl
- +loo% (15 min)
l ( 1 5 m i . n )
-
2 (10 min)
2 (15 min)
-
MIC
PPm
-
-
-
-
- -
-
-
-
-
Ref. AIC
PPm
0.06 0.1
0.1
0.12 0.24
- -
0.1 0.01-0.05
0.2 0.1
-
0.06
0.1 0.08
Ref.
20 22
14
11
5.10 12
13 7.3
20
10 10
Remarks
1 ppm = 1.231 3 (at 1 bar. 293 K)
for new buildings
supply air 1/10 of MAC. safety factor 10 AIC-safety factor for avoiding annoyance: 10 /5/
caused by tobacco smoke
AIC: Guideline value based on effects other than cancer or odor/annoyance
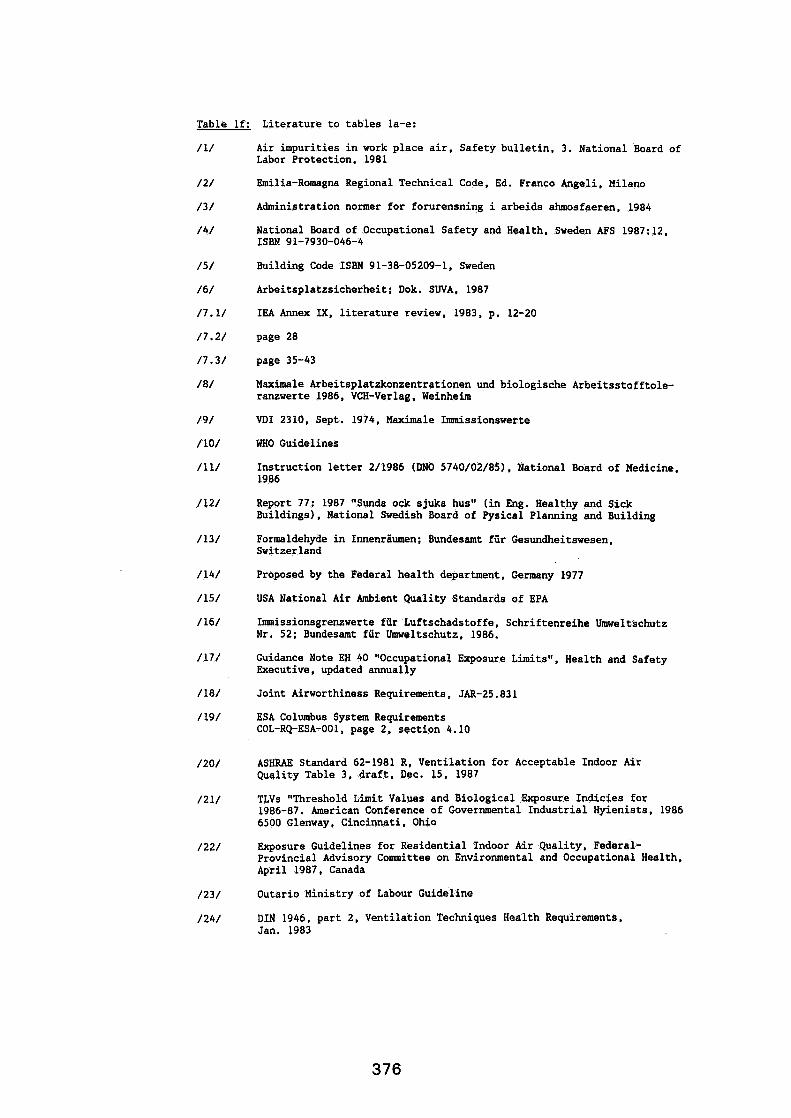
Table If: Literature to tables la-e:
/1/ Air impurities in work place air. Safety bulletin. 3. National Board of Labor Protection. 1981
/2/ Emilia-Romagna Regional Technical Code. Ed. Franco Angeli, Milano
/3/ Administration nomer for forurensning i arbeids ahmosfaeren, 1984
/4/ National Board of Occupational Safety and Health, Sweden AFS 1987:12, ISBN 91-7930-046-4
/5/ Building Code ISBN 91-38-05209-1, Sweden
/6/ Arbeitsplatzsicherheit; Dok. SUVA, 1987
/7.1/ IEA Annex IX. literature review. 1983, p. 12-20
/7.2/ page 28
/7.3/ page 35-43
/8/ Maximale Arbeitsplatzkonzentrationen und biologische Arbeitsstofftole- ranzwerte 1986, VCH-Verlag. Weinheim
/9/ M I 2310. Sept. 1974. Maximale Imissionswerte
/ lo/ WHO Guidelines
/11/ Instruction letter 2/1986 (DNO 5740/02/85), National Board of Medicine, 1986
/ 12/ Report 77: 1987 "Sunda ock sjuka hus" (in Eng. Healthy and Sick Buildings), National Swedish Board of Pysical Planning and Building
/13/ Formaldehyde in Innenriiumen; Bundesamt fiir Gesundheitswesen. Switzerland
/14/ Proposed by the Federal health department, Germany 1977
/15/ USA National Air Ambient Quality Standards of EPA
/16/ Imissionsgrenzwerte fiir Luftschadstoffe, Schriftenreihe Umweltschutz Nr. 52; Bundesamt fiir Umweltschutz, 1986.
/17/ Guidance Note EH 40 "Occupational Exposure Limits", Health and Safety Executive, updated annually
/ 18/ Joint Airworthiness Requirements, JAR-25.831
/ 19/ ESA Columbus System Requirements COL-RQ-ESA-001, page 2. section 4.10
/20/ ASHRAE Standard 62-1981 R, Ventilation for Acceptable Indoor Air Quality Table 3, draft, Dec. 15, 1987
/21/ TLVs "Threshold Limit Values and Biological Exposure Indicies for 1986-87. American Conference of Governmental Industrial Hyienists. 1986 6500 Glenway, Cincinnati, Ohio
/22/ Exposure Guidelines for Residential Indoor Air Quality, Federal- Provincial Advisory Committee on Environmental and Occupational Health, April 1987, Canada
/23/ Outario Ministry of Labour Guideline
/24/ DIN 1946, part 2, Ventilation Techniques Health Requirements, Jan. 1983
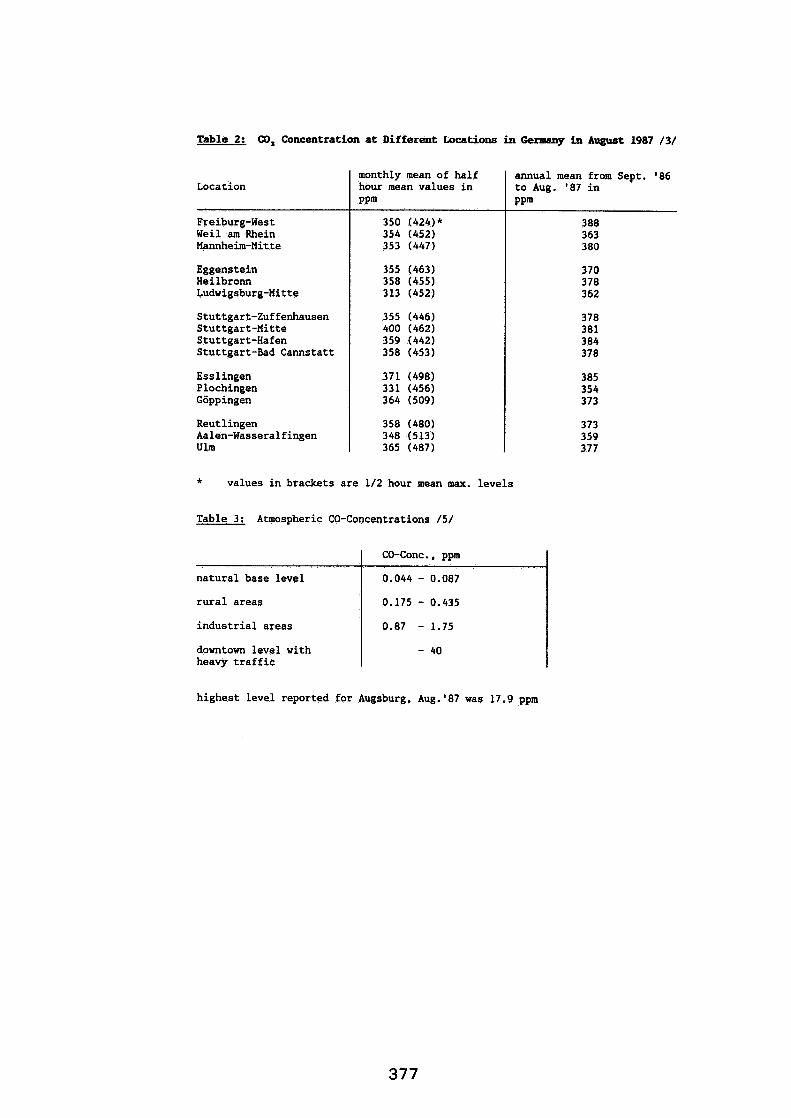
Table 2: CO, Concentration at Different Locations in Germany in August 1987 /3/
Location
Freiburg-West Weil am Rhein Mannheim-Mitte
Eggenstein Heilbronn Ludwigsburg-Mitte
Stuttgart-Zuffenhausen Stuttgart-Mitte Stuttgart-Hafen Stuttgart-Bad Cannstatt
Ess 1 ingen Plochingen Goppingen
Reutlingen Aalen-Wasseralfingen Ulm
monthly mean of half annual mean from Sept. '86 hour mean values in to Aug. '87 in
350 (424)" 354 (452) 353 (447) 3 80
* values in brackets are 1/2 hour mean max. levels
Table 3: Atmospheric CO-Concentrations /5/
rural areas 1 0.175 - 0.435 I natural base level
industrial areas 1 0.87 - 1.75 I
60-Conc., ppm
0.044 - 0.087
downtown level with I - 40 heavy traffic
highest level reported for Augsburg, Aug.'87 was 17.9 ppm
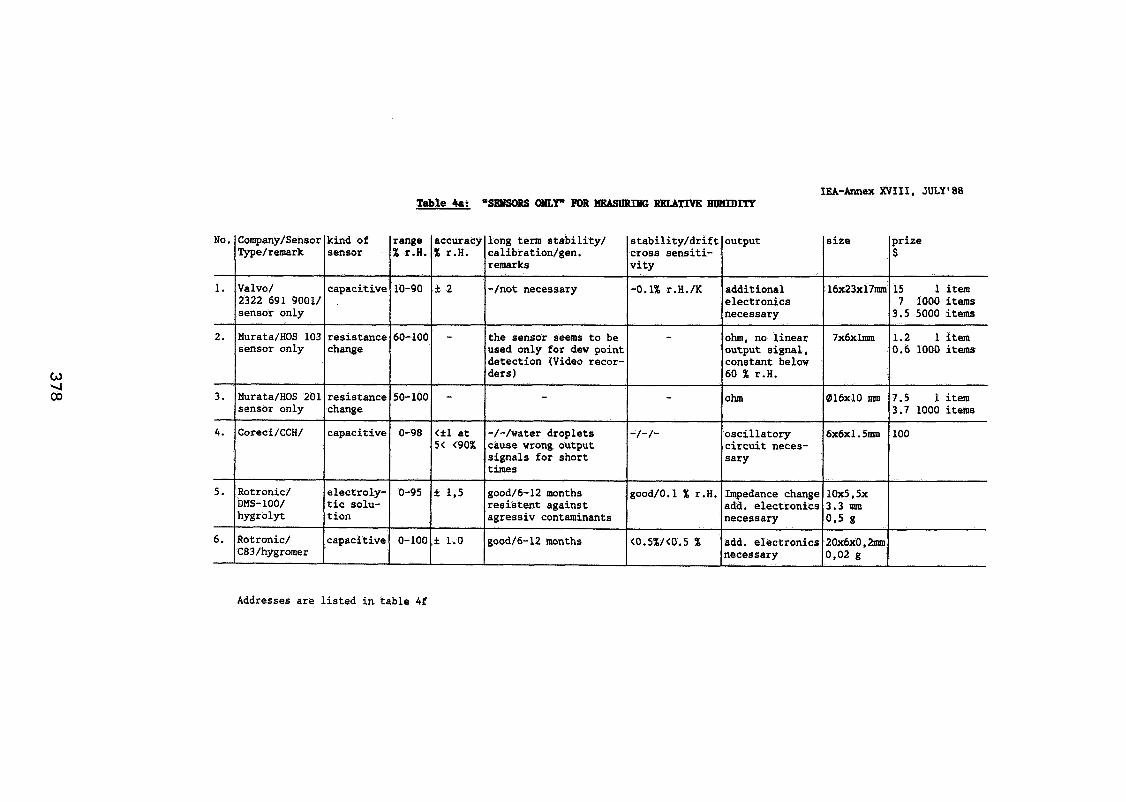
IBA-Annex XVIII , 3ULY' 88 Table 4a: sSBYSORS WLY" FOR MiMUMNG RgLancvg WmDITY
Addresses are listed in table 4f
No.
1.
2.
3.
4.
5.
6.
Company/Sensor Type/remark
Valvo/ 2322 691 9001/ sensor only
Murata/HOS 103 sensor only
Murata/HOS 201 sensor only
Coreci/CCH/
Rotronic/ DMS-100/ h ~ g r o l ~ t
Rotronic/ C83/hygromer
kind of sensor
capacitive .
resistance change
resistance change
capacitive
electroly- tic solu- tion
capacitive
range % r.H.
10-90
60-100
50-100
0-98
0-95
0-100
accuracy % r.H.
+ 2
-
-
<fl at 5< <90%
rt 1.5
f 1.0
long term stability/ calibratiodgen. remarks
-/not necessary
the sensor seems to be used only for dew point detection (Video recor- ders)
-
-/-/water droplets cause wrong output signals for short times
good/6-12 months resistent against agressiv contaminants
good/6-12 months
stability/drift cross sensiti- vity
-0.1% r.H./K
-
-
-/-/-
good/O.l % r.H.
<0.5%/<0.5 %
output
additional electronics necessary
ohm,nolinear output signal, constant below 60 % r.H.
ohm
oscillatory circuit neces- sary
Impedance change add. electronics necessary
add. electronics necessary
size
16x23x17mm
7x6xlm
016x10 mm
6x6x1.5m
1 0 ~ 5 . 5 ~ 3.3 m 0,s g
2 0 x 6 ~ 0 . ~ 0,02 g
prize $
15 1 item 7 1000 items
3.5 5000 items
1.2 litem 0.6 1000 items
7.5 1 item 3.7 1000 items
100
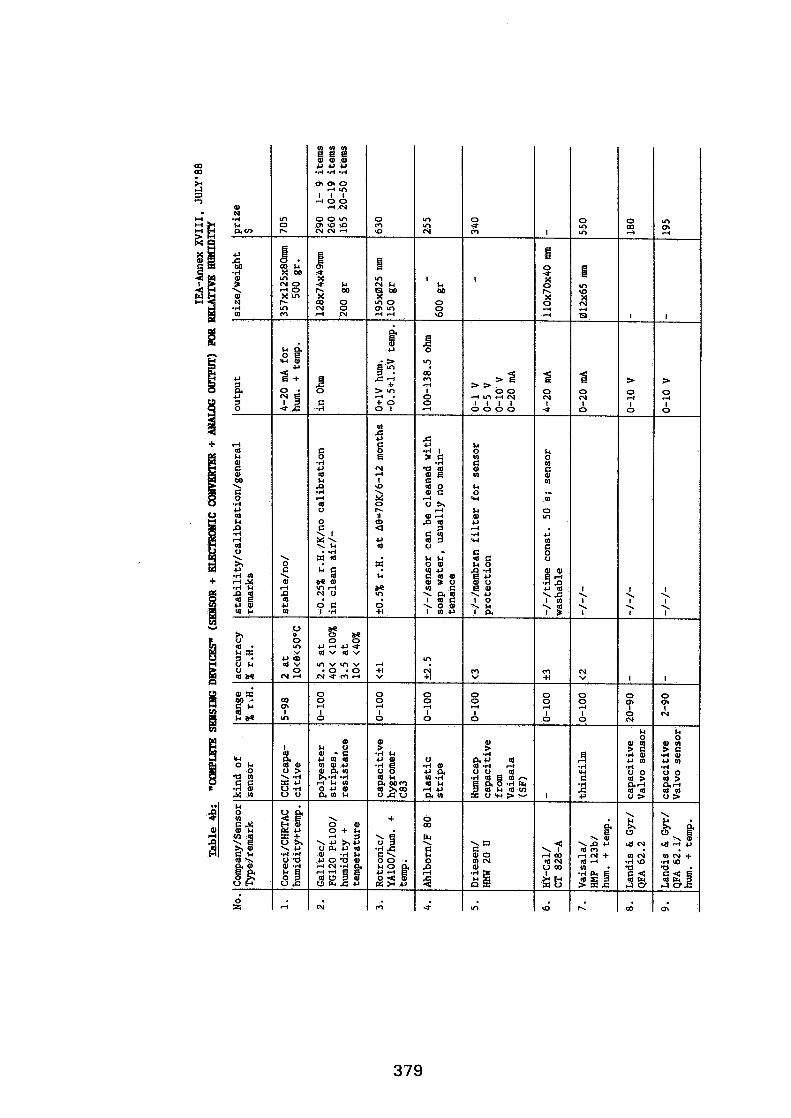
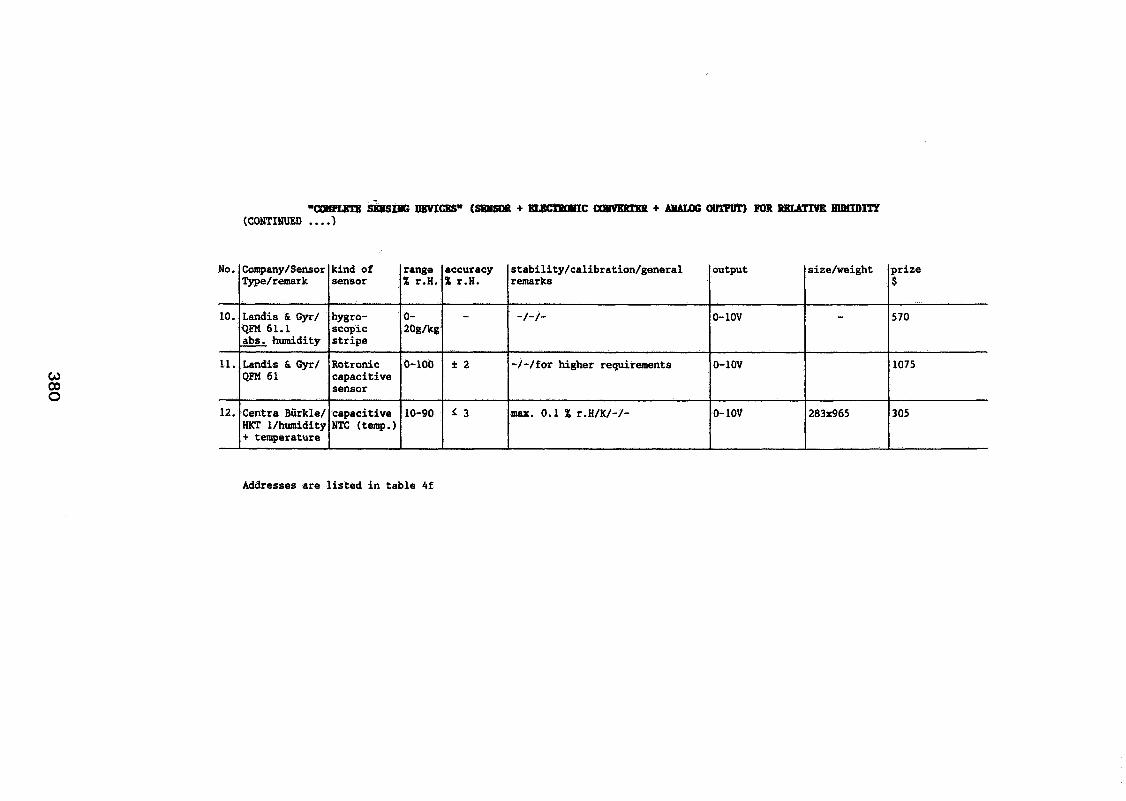
'CUMPIWIS~PDSIVGDBYIC~S- ~ S I P I S Q I L + ~ C ~ + ~ o U l T u r ) KtREUBIdRVBIimIDIlY (CONTINUED . . . . I
Addresses are listed in table 4f
No.
10.
11.
12.
Company/Sensor Type/remark
Landis & Gyr/ QFM 61.1
humidity
Landis h Gyr/ QFH 61
Centra Biirkle/ HKT l/humidity + temperature
kind of sensor
hygro- scopic stripe
Rotronic capacitive sensor
capacitive NTC (temp.
range % r.H.
0- 2Og/kg
0-100
10-90
accuracy % r.H.
-
f 2
3
stability/calibration/general remarks
-/-/-
-/-/for higher requirements
max. 0.1 % r.H/K/-/-
prize $
570
1075
305
output
0- 1OV
0-10V
0-10V
size/weight
-
283x965
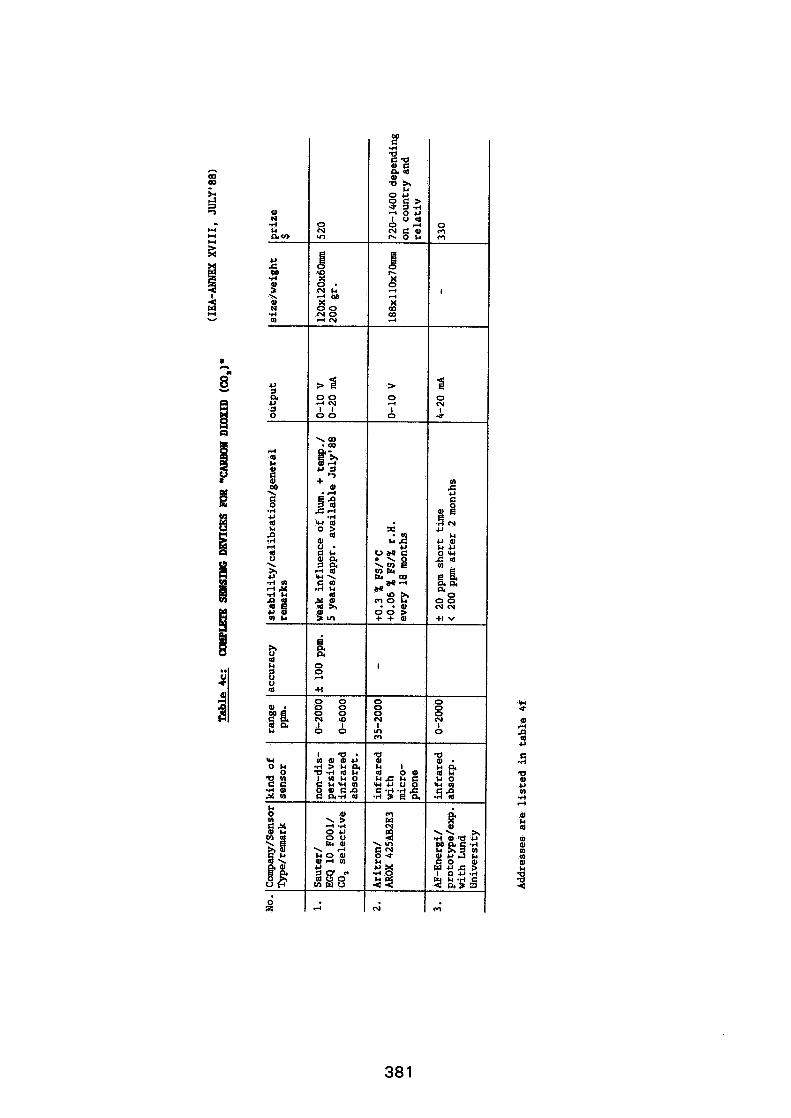
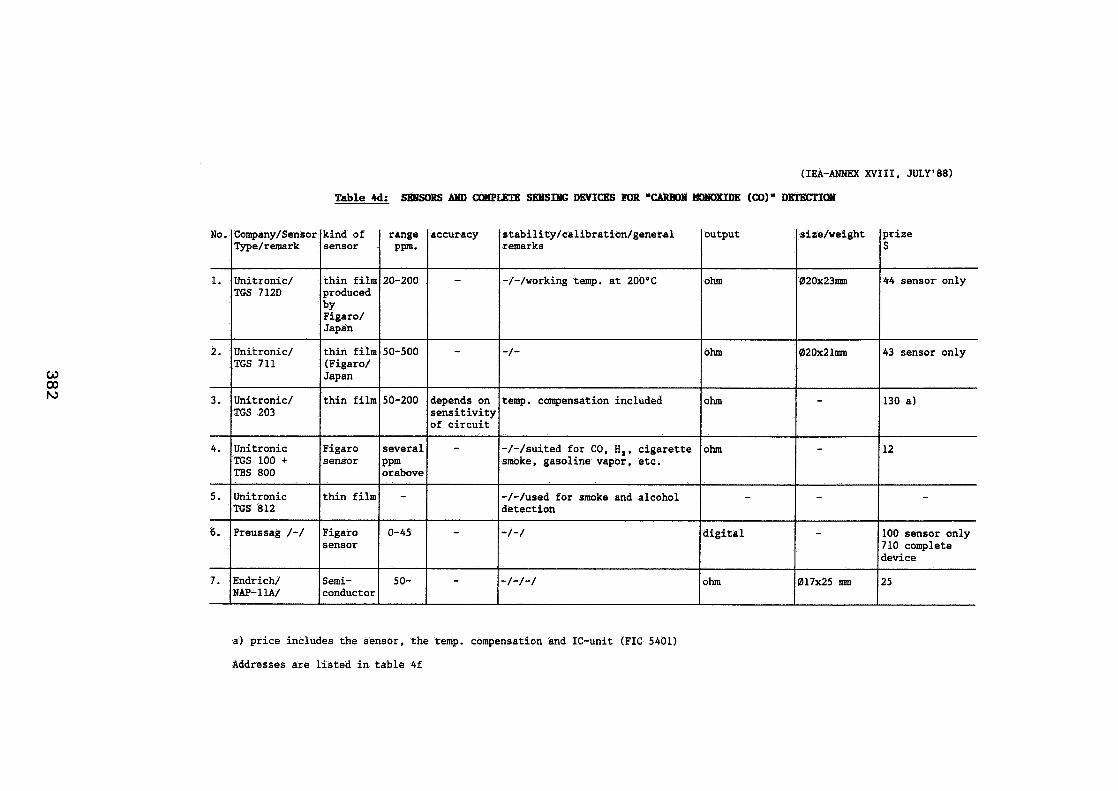
(IEA-ANNEX XVIII. JULY188)
Table M: SKUSOBS AUD COMPLETE SEUSIIG DEVICES FOR "CARBON HNOXIDE (CO)" DElEtTIW
a) price includes the sensor, the temp. compensation and IC-unit (FIC 5401)
Addresses are listed in table 4f
prize s
44 sensor only
43 sensor only
130 a)
12
-
100 sensor only 710 complete device
25
No.
1.
2.
3 .
4.
5.
6 .
7.
accuracy
-
-
depends on sensitivity of circuit
-
-
-
Company/Sensor Type/remark
Unitronic/ TGS 712D
Unitronic/ TGS 711
Unitronic/ TGS 203
Unitronic TGS 100 + TBS 800
Unitronic TGS 812
Preussag /-/
Endrich/ NAP- 11A/
stability/calibration/general remarks
-/-/working temp. at 200°C
-1-
temp. compensation included
-/-/suited for CO, H,, cigarette smoke, gasoline vapor, etc.
-/-/used for smoke and alcohol detection
-1-1
-/-I-/
kind of sensor
thin film produced by Figaro/ Japan
thin film (Figaro/ Japan
thin film
Figaro sensor
thin film
Figaro sensor
Semi- conductor
output
ohm
ohm
ohm
ohm
-
digital
ohm
range PPm.
20-200
50-500
50-200
several ppm orabove
-
0-45
50-
size/weight
02Ox23m
020x2 l m
-
-
-
-
017x25 m
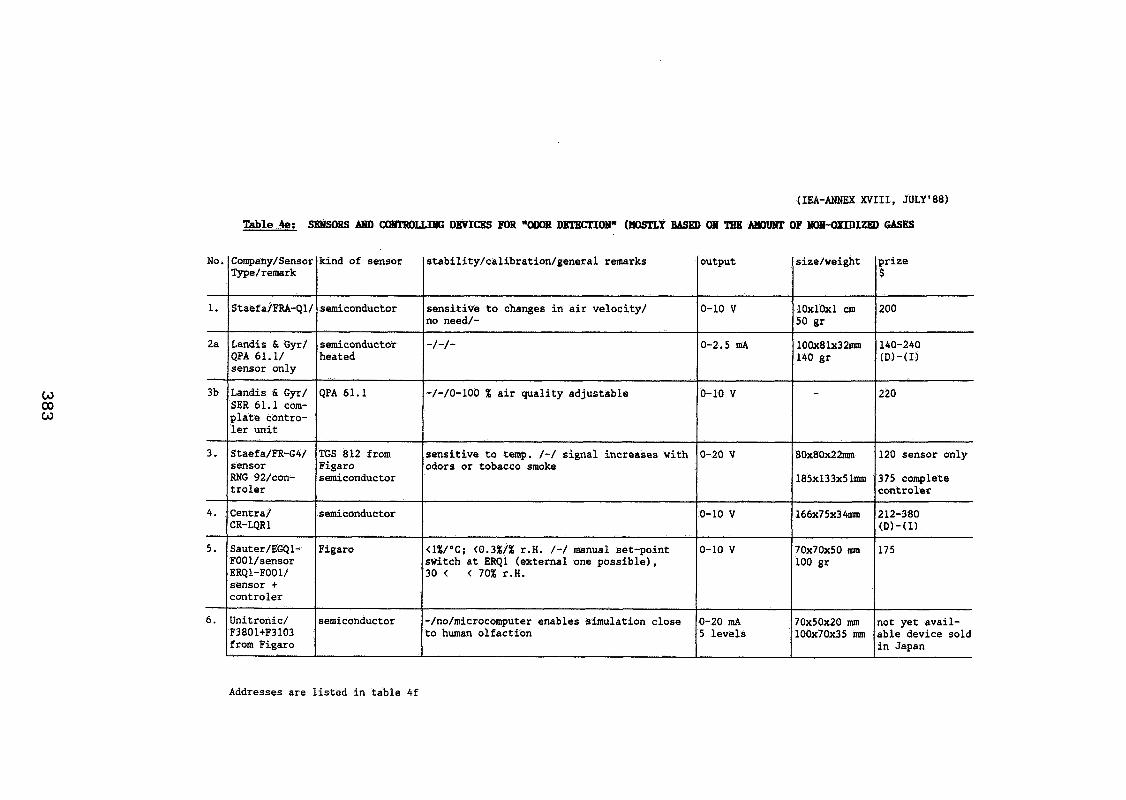
(IEA-ANNEX XVIII , JULY' 88)
Table 4e: SKUSORS AUD CXBEROLLIK; DEVICES FOR 'ODOR DETECl'IW" (MOSTLY BA!XO OB TIIR IIIYIIMI: OF HWOXIDIZED
Addresses are listed in table 4f
No.
1.
2a
3b
3.
4.
5.
6.
Company/Sensor Type/remark
Staefa/FRA-Q1/
Landis h. Gyr/ QPA 61.1/ sensor only
Landis & Gyr/ SER 61.1 com- plate contro- ler unit
Staefa/FR-G4/ sensor lU?G 92/con- troler
Centra/ CR-LQR1
Sauter/EGQl- FOOl/sensor ERQ1-Fool/ sensor + controler
Unitronic/ F3801+F3103 from Figaro
kind of sensor
semiconductor
semiconductor heated
QPA 61.1
TGS 812 from Figaro semiconductor
semiconductor
Figaro
semiconductor
stability/calibration/general remarks
sensitive to changes in air velocity/ no need/-
-/-/-
-/-/0-100 % air quality adjustable
sensitive to temp. /-/ signal increases with odors or tobacco smoke
<l%/"C; <0.3%/% r.H. /-/ manual set-point switch at ERQl (external one possible), 3 0 < <70%r.H.
-/no/microcomputer enables simulation close to human olfaction
prize $
200
140-240 (D)-(I)
220
120 sensor only
375 complete controler
212-380 (Dl-(1)
175
not yet avail- able device sold in Japan
output
0-10 V
0-2.5 mA
0-10 V
0-20 V
0-10 V
0-10 V
0-20 mA 5 levels
size/weight
10x10~1 cm 50 gr
lOOx81x32mm 140 gr
-
8Ox80x22mm
185xl33x51mm
166x75x34mm
70x70~50 mm 100 gr
70x50~20 mm 100x70~35 mm
IEA-Annex X V I I I , J u l y ' 8 8
Tab le 4f: Addresses of senso r companies
AF
Ah1 b o r n
AF-Energ i Malmo
A h l b o r n M+R, E i c h e n f e l d s t r . 1-3, P.O. Box 1260, 0 -81 50 Hol z k i r c h e n 08024-5019
Andros
A r i t r o n
Cen t ra
Co rec i
D r i e s e n
Gal 1 t e c
HY-Cal
Land i s&Gyr
Mura ta
Preussag
R o t r o n i c
Sau te r
Siemens
S t a e f a
Un i t r o n i c
Andros, USA
A r i t r o n AG, Lohwiss -S t r .30 ,CH- 8123 Ebmat ingen 01-9803381 V o g t l e Malanca, V i a B a t t a g l i a , 1 -40 M i l a n o
C e n t r a - B u r k l e GmbH, P.O. Box 1164, 0-7036 Schonaich, 07031-557-01
C o r e c i GmbH, P.O. Box 1570, D-7830 Emmendingen, 07641 -8365
Dr iesen+Kern , P.O. Box 1126, D-2000 Tangs ted t , 04109-6633
G a l l t e c GmbH, B o s c h s t r . 4, 0-7031 Bondo r f , 07457-81 58
HY-Cal E n g i n e e r i n g , 9650 T e l s t a r Ave, E l Monte, C a l i f o r n i a 91731-3093, USA
Land is&Gyr , F r i e s s t r a R e 20-24, 0-6000 F r a n k f u r t 60, 069- 4002-0 Land i s&Gyr, V i a Rondoni 1, Mi l a n o , 02-4248 LandishGyr , Baa rma t t e , CH-6300 Zug, 042-334545
Mura ta E r i e E l e c t r o n i c GmbH, K r e u z s t e i n s t r . l A , D-8500 Nurnberg 52, 0911-66870
Preussag AG, P.O. Box 1260, 0-2060 Bad O ldes l oe , 04531-8030
R o t r o n i c AG, B a d e n e r s t r . 435, CH-8040 Z u r i c h , 01-4971111
Sau te r Cumulus GmbH, Hans-Bun te -S t r .15 , 0-7800 F r e i b u r g , 0761-5105-0 Sau te r , I m Surinam, CH-4016 Base l , 061-695 55 55
Swedish r e p r e s e n t a t i v e i s Nissmo AB
S t a e f a C o n t r o l System GmbH, Humbo lds t r . 30, 0-7022 Le in fe lden -Ech te rd ingen , 0711-7987-0 S t a e f a C o n t r o l Systems. L a u b i s r u t i s t r . 5 0 CH-8712 S tae fa , 01-9286111
U n i t r o n i c GmbH, T a l s t r . 172, 0-7024 F i l d e r s t a d t , 0711-704011
Val vo Valvo, P.O. Box 106323, 0-2000 Hamburg 1, 040-3296-556
Vai s a l a V a i s a l a , P . O . Box 26, SF-00421 H e l s i n k i
EFFECTIVE VENTILATION
9th AIVC Conference, Gent, Belgium 12-15 September, 1988
P a p e r 22
VENTILATION DESIGN FOR A BUS STATION
M. J. Holmes and T. Salusbury
Ove A m p and Partners 13 Fitzroy Street London W1P 6BQ
SYNOPSIS
The paper presents the development of a vent i la t ion scheme f o r a large bus s t a t i on and passenger interchange i n Bilbao, Spain. The main objective of t he design was t o ensure t h a t po l lu t ion f ree conditions could be achieved within an enclosed waiting a rea t ha t opened up on t o , and was surrounded by, a semi-enclosed pick-up space, where there could be large number of buses with t h e i r engines running. I n i t i a l thoughts were t o use natural ven t i la t ion , a rch i tec tura l and other constra ints made t h i s impossible so mechanical ven t i la t ion became necessary. The appl icat ion of a multi-cell ven t i la t ion model t o determine a i r movements within t h e whole s t a t i on , including an assessment of the a b i l i t y of the system t o prevent exhaust fumes enter ing v i a open doors is described. This i s followed by a discussion of t he r e su l t s of wind tunnel tests on a 1:400 scale model t o determine pressure coef f ic ien ts and l i k e l y pol lutant l eve ls i n t h e s e m i - covered areas occupied by buses. The r e su l t of these s tud ies was the presentation of the design scheme t o the c l i e n t , and we a r e looking forward t o h i s response which should be avai lable by the t i m e of t h e Conference.
1. INTRODUCTION
The provision of comfortable conditions within a building is the everyday task of the building services engineer. There a r e occasions when circumstances make t h i s more than routine. These occur when the conditioned space i s so prest igious t h a t no r i s k s can be taken o r conversely when there is l i t t l e need t o s a t i s f y the usual demands f o r comfort bu t t h e space must still be acceptable f o r l imited periods. I n the f i r s t case published data can be used t o specify design conditions' 111, and the appropriate p lan t designed and specified. The solut ion may be expensive but the design br ie f demands t h i s approach, There i s an intermediate f i e l d , a na tura l ly vent i la ted and heated building, f o r example, where it is possible t o pred ic t t he l i ke ly range comfort conditions, and so specify a f a i l u r e ra te . An approach t o t h i s design problem was described by Holmes E21 a t the 6 t h AIC Conference. There i s however, not much guidance ava i lab le when designing on the 'edge' of comfort, t h a t is perhaps f o r t rans i to ry space such a s a waiting area. The occupants can be expected t o be dressed f o r outside conditions, but c l e a r l y do not expect t h e waiting space t o be q u i t e l i k e outside. The objective here is probably t o aim f o r thermal conditions t h a t w i l l not cause ser ious complaints, How t o assign a l i m i t is ra ther more d i f f i c u l t . Accepting t h a t t i g h t control of t h e thermal environment is not t h e main objective, it is necessary t o consider the qua l i ty of the a i r within t he space. Perhaps t h i s need not be of concern i n a t r ans i to ry region. Natural ven t i la t ion should suff ice . I f however, there a r e major po l lu tan ts i n adjacent areas t h e problem becomes a l i t t l e more in te res t ing . In addit ion, i f there a r e off i c e s and res taurants nearby where c l ea r ly reasonable comfort standards a r e necessary the design is fur ther complicated. This paper is concerned with t h a t scenario.
The bus s t a t i on described here is p a r t of a major proposed redevelopment i n the centre of Bilbao (located i n t he Viscaya region of North Spain), t he Abando Passenger Interchange. The proposal evolved through the need f o r a new bus s t a t i on and a ra t iona l i sa t ion of the ex is t ing railway system along the r i v e r frontage i n cen t ra l Bilbao. The most su i tab le site was iden t i f i ed a s the land a t present occupied by the ex is t ing RENFE railway s t a t i on and s idings Architects, S t i r l i n g Wiford and Associates w e r e appointed a s pro jec t a r ch i t ec t s t o develop the pro jec t through concept t o scheme stage (1: 200) , the s tage where calculat ions of the type described i n t h i s paper a r e appropriate.
Ove Arup & Partners Internat ional Ltd were appointed i n 1985 a s consulting transportation, s t ruc tu ra l and building services engineers and were involved with the design of the pro jec t u n t i l July 1987 when t h e i r proposals were presented with those of the a rch i tec t t o the c l i e n t , the Bizkaiko Foru Aldundia. The basic plan was the creation a new plaza i n the centre of the site with pedestrian access from four arcades l inking the new and o ld towns of Bilbao v ia a footbridge across the r i v e r (see Figure 1).
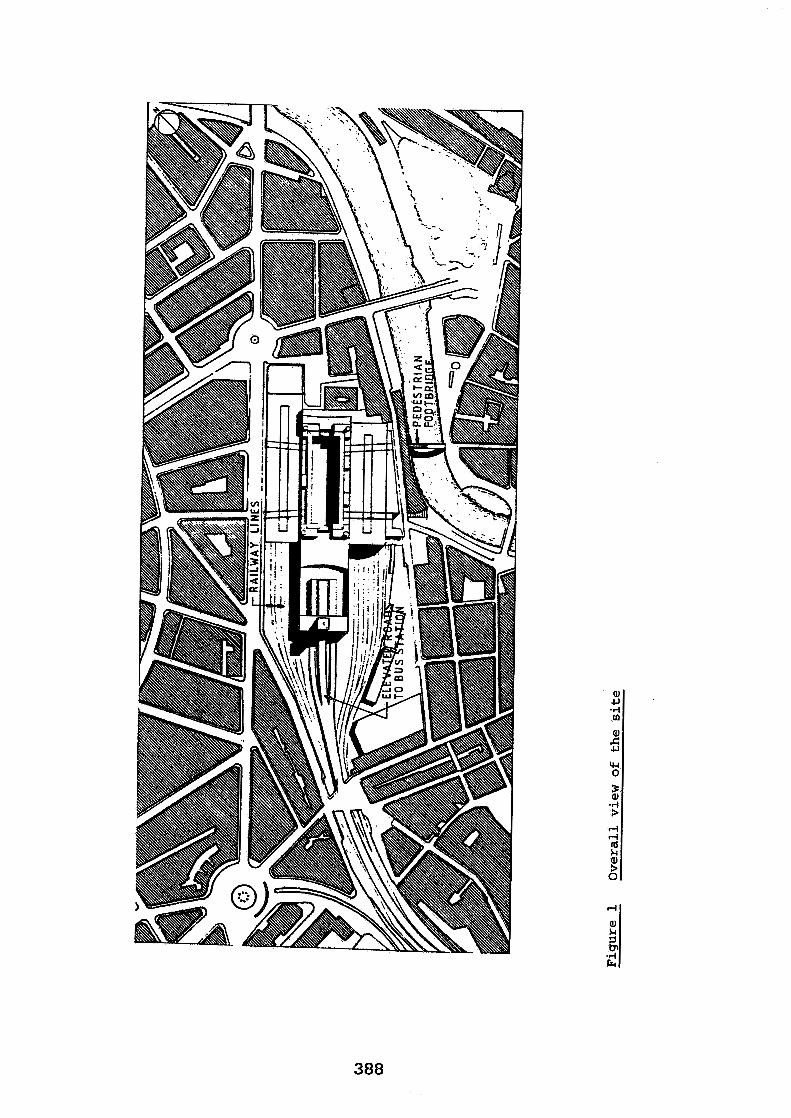

The entrances t o the new bus s t a t i on and railway s t a t i on a r e s i t ua t ed a t each end of t he plaza with covered car / taxi drop-off po in ts and 400 car parking spaces located i n th ree basements, below the plaza. In addit ion, there is an underground service road around t h e perimeter of t h e basement c a r park f o r the de l ivery of parcels t o the bus s t a t i o n and the general servicing of t h e plaza buildings. The interchange contains waiting, refreshment and administration areas , each of which has spec i f ic environmental requirements. It has already been suggested t h a t spec i a l care needs t o be taken when occupied areas a r e surrounded by pol lutants . The approach employed f o r the design t o scheme s tage is described i n t h i s paper, which is i n s i x main sections.
1. General description of bus s ta t ion . 2. Design objectives - how the design conditions were
specified. 3. Design Options - prac t i ca l ways t o achieve t h e design
objective. 4. Analysis of t he design - methods used t o prove the
design. 5 . Description of t he computer program. 6. Conclusions.
It is important t o r e a l i s e t h a t design is a complex process and of ten i t e r a t i ve . That is, ea r ly decisions may have t o be changed i n . t h e l i g h t of l a t e r s tudies , which could i n tu rn a f f e c t t he r e s u l t of those studies. Because of t h i s it is not possible t o describe the evolution of t he design without reference t o what a t the time would have been fu ture work. In addit ion the paper is an attempt to describe what w a s done, and not t o give an analysis of a la rge number of options, which i n most cases a r e meaningless t o t h e reader. It is a l so hoped t h a t t he paper demonstrates the p r a c t i c a l use of ven t i la t ion theory
General description of the Bus S ta t ion
The proposed new bus terminus (Figure 1) comprises a suburban bus s t a t i o n a t ground leve l and an external interurban bus s t a t i o n located above, on the roof of t he suburban s ta t ion . The bus s t a t i o n is flanked by railway t racks on each of i t s long sides. Access t o the bus s t a t i on is v i a an elevated roadway from which coaches pass up t o t he interurban bus s t a t i on and l o c a l buses pass down t o ground l eve l and en te r the suburban bus s t a t i on on the shor t s ide opposite t o t h a t used by passengers entering from the plaza. These loca l buses pass around a covered roadway which i s open on one s ide and surrounds the suburban passenger waiting concourse, Figure 2. There a r e twelve bus stands and passengers board and a l i g h t through three doors located between t h e roadway and t h e waiting area adjacent t o each stand.
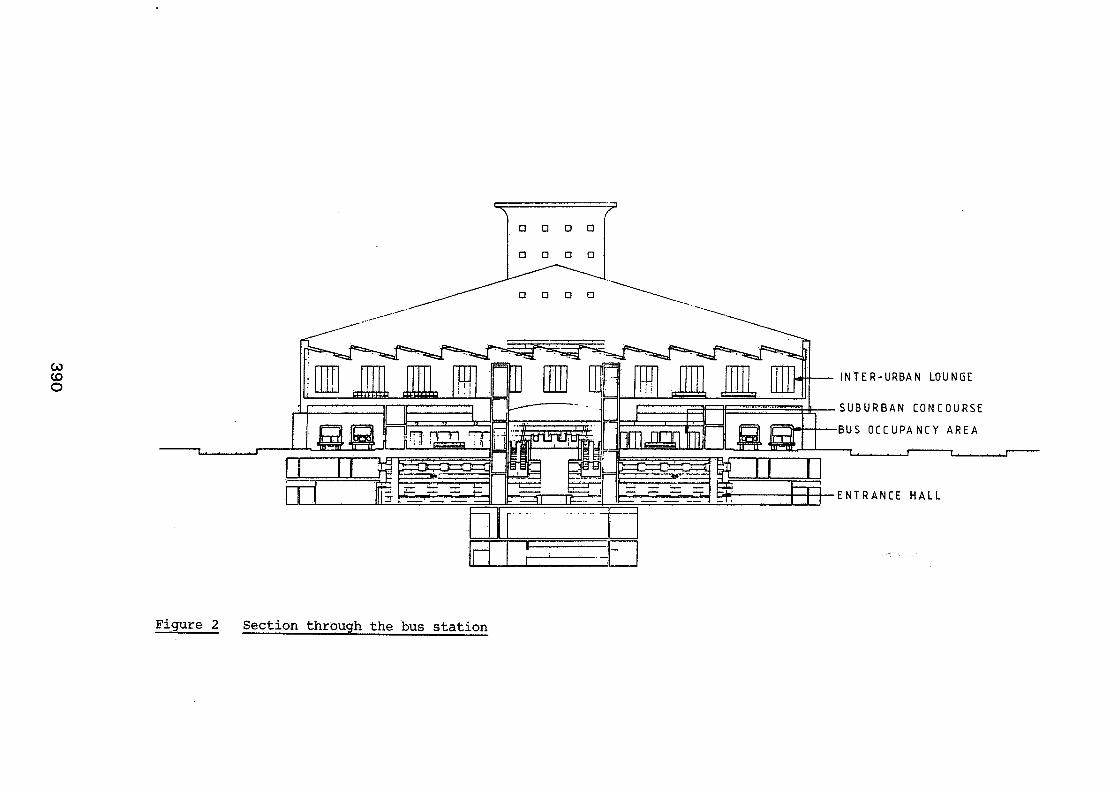
I N T E R - U R B A N LOUNGE
S U B U R B A N CON C O U R S E
B U S O C C U P A N C Y A R E A
E N T R A N C E H A L L t
Figure 2 Section through the bus station
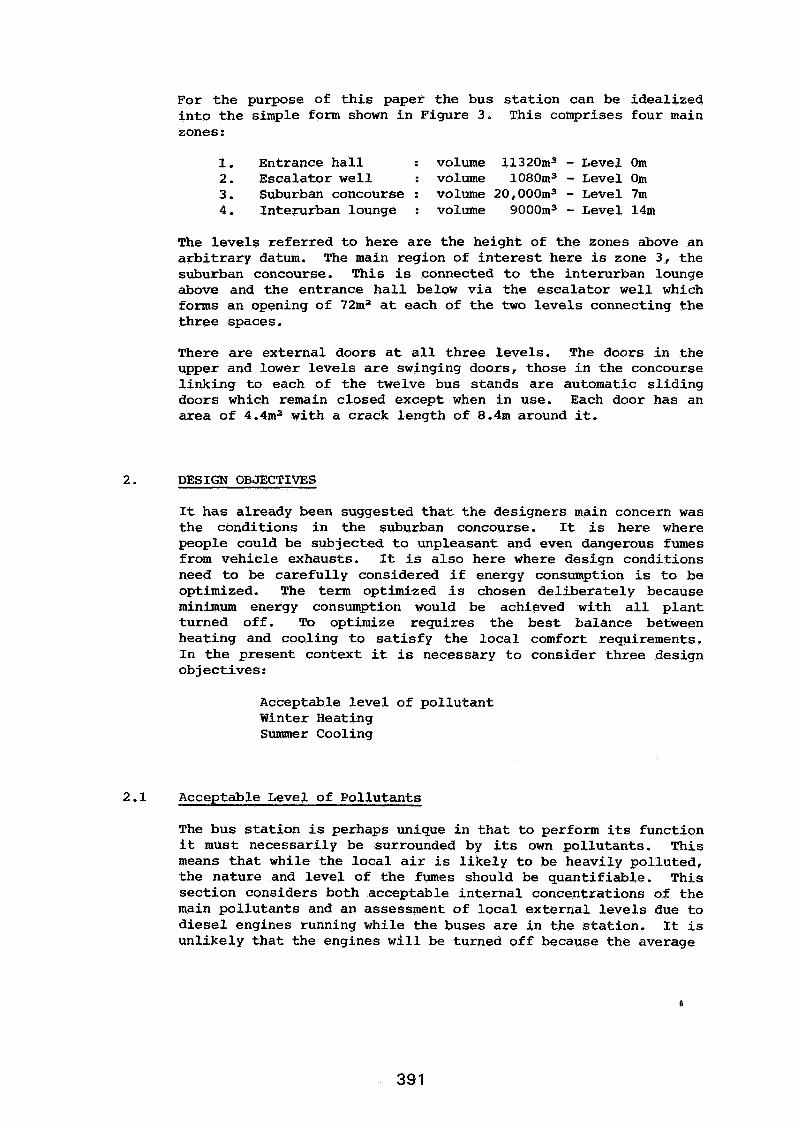
For t h e purpose of t h i s paper t he bus s t a t i o n can be ideal ized i n t o t h e simple form shown i n Figure 3. This comprises four main zones:
1. Entrance h a l l : volume 11320m3 - Level Om 2. Escalator w e l l : volume 1080m3 - Level Om 3. Suburban concourse : volume 20,000m3 - Level 7m 4. Interurban lounge : volume 9000m3 - Level 14m
The l eve l s re fe r red t o here a r e t he height of t he zones above an a r b i t r a r y datum. The main region of i n t e r e s t here is zone 3, t he suburban concourse. This is connected t o t h e interurban lounge above and t h e entrance h a l l below v i a the esca la tor w e l l which forms an opening of 72ma a t each of t h e two l eve l s connecting t h e t h r ee spaces.
There a r e external doors a t a l l th ree levels . The doors i n the upper and lower l eve l s a r e swinging doors, those i n t he concourse l ink ing t o each of t h e twelve bus stands a r e automatic s l i d ing doors which remain closed except when i n use. Each door has an area of 4.4m2 with a crack length of 8.4m around it.
2. DESIGN OBJECTIVES
It has already been suggested t h a t t h e designers main concern was t he conditions i n t he suburban concourse. It i s here where people could be subjected t o unpleasant and even dangerous fumes from vehicle exhausts. I t is a l s o here where design conditions need t o be care fu l ly considered i f energy consumption is t o be optimized. The term optimized is chosen de l ibera te ly because minimum energy consumption would be achieved with a l l p l a n t turned of f . To optimize requires the bes t balance between heat ing and cooling t o s a t i s f y t he l oca l comfort requirements. In t h e present context it is necessary t o consider th ree design objectives:
Acceptable l eve l of po l lu tan t Winter Heating Summer Cooling
2.1 Acceptable Level of Pol lutants
The bus s t a t i o n is perhaps unique i n t h a t t o perform i ts function it must necessari ly be surrounded by i t s own pol lutants . This means t h a t while the l o c a l a i r is l i k e l y t o be heavily polluted, the nature and l eve l of t h e fumes should be quant i f iable . This sec t ion considers both acceptable i n t e rna l concentrations of the main po l lu tan ts and an assessment of l oca l external l eve l s due t o d i e se l engines running while the buses a r e i n the s ta t ion . It i s unl ikely t h a t the engines w i l l be turned of f because the average
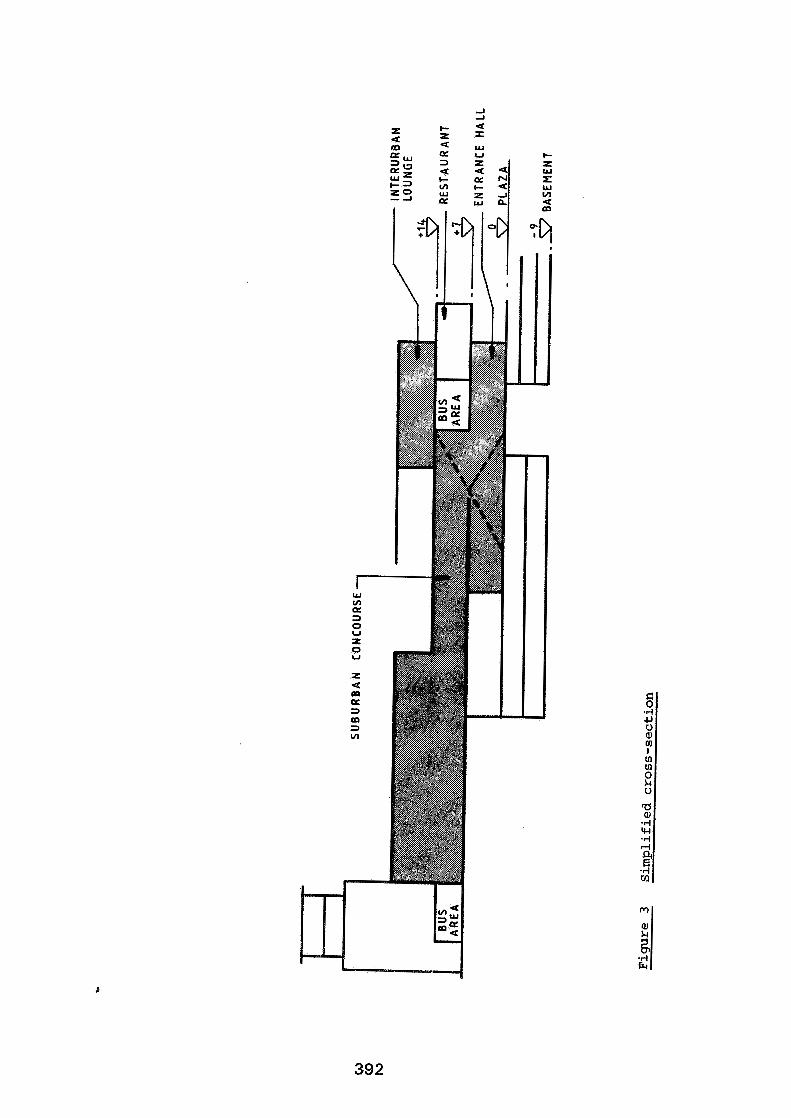
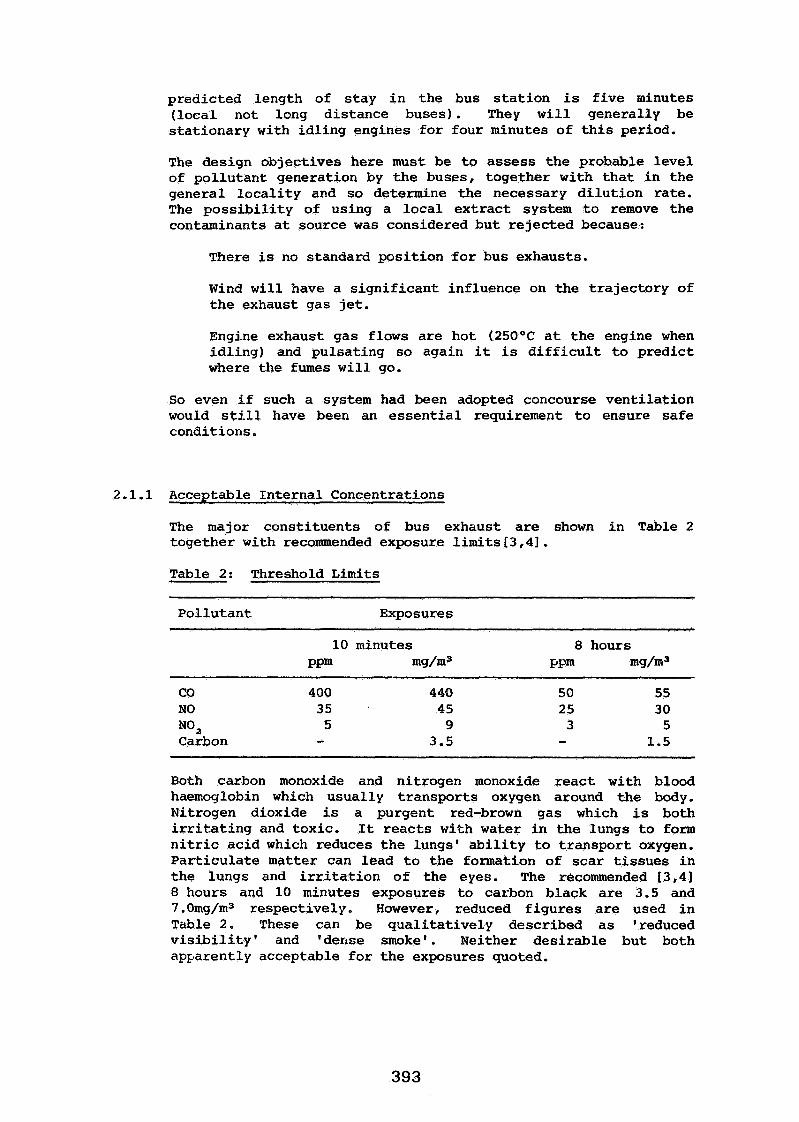
predicted length of s t ay i n the bus s t a t i o n i s f i v e minutes ( l oca l not long dis tance buses). They w i l l generally be s ta t ionary with i d l i ng engines f o r four minutes of t h i s period.
The design object ives here must be t o assess t h e probable l eve l of po l lu tan t generation by t h e buses, together with t h a t i n t h e general l o c a l i t y and so determine the necessary d i l u t i on ra te . The p o s s i b i l i t y of using a l oca l ex t r ac t system t o remove the contaminants a t source was considered bu t re jec ted because:
There is no standard posi t ion f o r bus exhausts.
Wind w i l l have a s ign i f i can t influence on the t ra jec tory of t h e exhaust gas j e t .
Engine exhaust gas flows a r e hot (250°C a t t h e engine when id l i ng ) and pulsat ing s o again it is d i f f i c u l t t o predict where the fumes w i l l go.
So even i f such a system had been adopted concourse ven t i l a t ion would still have been an e s s e n t i a l requirement t o ensure sa fe conditions.
2.1.1 Acceptable In te rna l Concentrations
The major const i tuents of bus exhaust a r e shown i n Table 2 together with recommended exposure limits[3,41.
Table 2: Threshold L i m i t s
Po l lu tan t Exposures
10 minutes P P ~ mg/m3
8 hours 3?pm m9/m3
NO, Carbon
Both carbon monoxide and nitrogen monoxide r eac t with blood haemoglobin which usually t ranspor t s oxygen around the body. Nitrogen dioxide is a purgent red-brown gas which is both i r r i t a t i n g and toxic. It r eac t s with water i n t he lungs t o form n i t r i c acid which reduces t h e lungs' a b i l i t y t o t ranspor t oxygen. Par t icu la te matter can lead t o the formation of scar t i s sues i n the lungs and i r r i t a t i o n of the eyes. The recommended [3,41 8 hours and 10 minutes exposures t o carbon black a r e 3.5 and 7.0mg/m3 respectively. However, reduced f i gu re s a r e used i n Table 2. These can be qua l i t a t i ve ly described a s 'reduced v i s i b i l i t y ' and 'dense smoke'. Neither des i rab le but both apparently acceptable f o r t he exposures quoted.
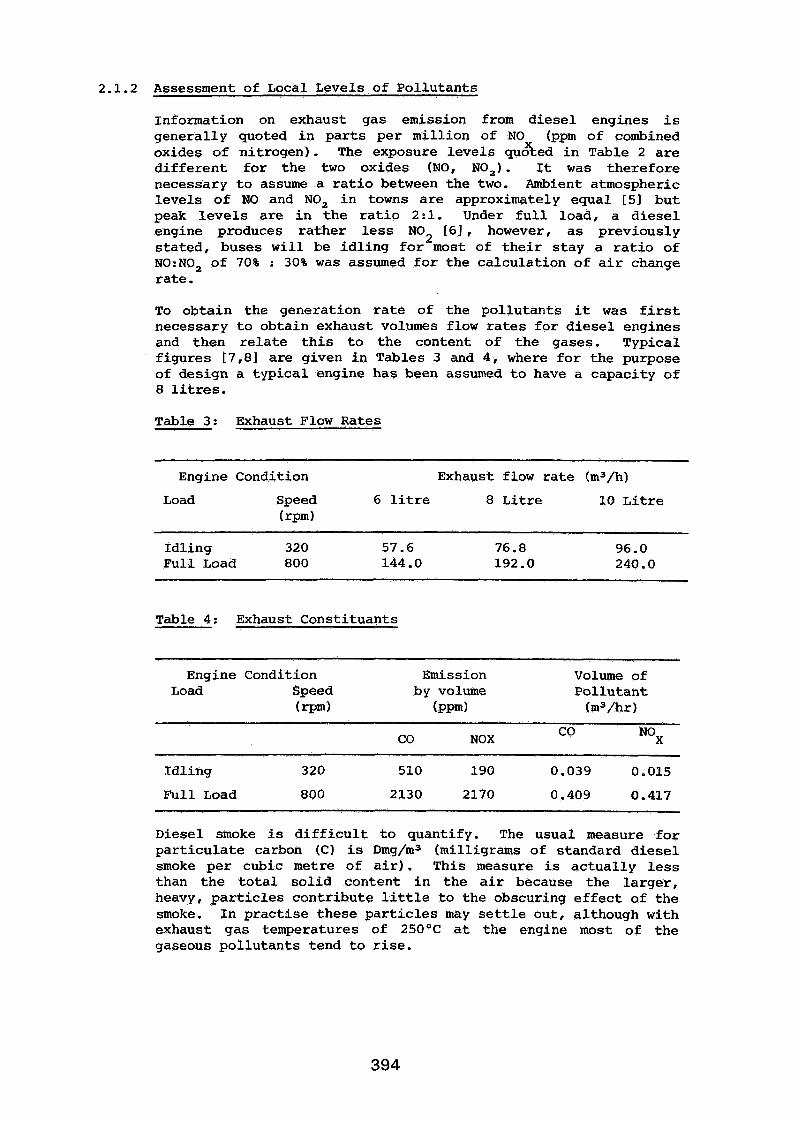
2.1.2 Assessment of Local Levels of Pol lutants
Information on exhaust gas emission from d i e se l engines i s generally quoted i n p a r t s pe r mil l ion of NO (ppm of combined oxides of nitrogen). The exposure leve ls cp&ed i n Table 2 a r e d i f f e r e n t f o r t h e two oxides (NO, NO,). It was there fore necessary t o assume a r a t i o between the two. Ambient atmospheric l eve l s o f NO and NO, i n towns a r e approximately equal [5] but peak l e v e l s a re i n t h e r a t i o 2:l. Under f u l l load, a d i e s e l engine produces ra ther l e s s NO [61 , however, a s previously
2 s ta ted , buses w i l l be i d l i ng f o r most of t h e i r s t ay a r a t i o of NO:NO, of 70% : 30% was assumed f o r the calculat ion of a i r change ra te .
To obtain the generation r a t e of the po l lu tan ts it was f i r s t necessary t o obtain exhaust volumes flow r a t e s f o r d i e s e l engines and then r e l a t e t h i s t o t h e content of t h e gases. Typical f igures [7,81 a re given i n Tables 3 and 4, where f o r the purpose of design a t yp i ca l engine has been assumed t o have a capacity of 8 litres.
Table 3: Exhaust Flow Rates
Engine Condition - -
Exhaust flow r a t e (m3/h)
Load Speed 6 l i t r e 8 L i t r e 10 L i t r e (rpm)
Idl ing 320 57.6 76.8 96.0 Full Load 800 144 .O 192.0 240.0
Table 4 : Exhaust Consti tuants
--
Engine Condition Emission Volume of Load Speed by volume Pol lu tan t
( rpm ( P P ~ ) (m3/hr)
CO NOX co NOx
Idl ing 320 510 190 0.039 0.015
Ful l Load 800 2130 2170 0.409 0.417
Diesel smoke is d i f f i c u l t t o quantify. The usual measure f o r pa r t i cu l a t e carbon (C) is Dmg/m3 (milligrams of standard d i e s e l smoke pe r cubic metre of a i r ) . This measure i s ac tua l ly l e s s than t h e t o t a l s o l i d content i n t he a i r because the la rger , heavy, p a r t i c l e s contr ibute l i t t l e t o the obscuring e f f e c t of the smoke. In p rac t i s e these p a r t i c l e s may s e t t l e out, although with exhaust gas temperatures of 250°C a t the engine most of the gaseous po l lu tan ts tend t o rise.
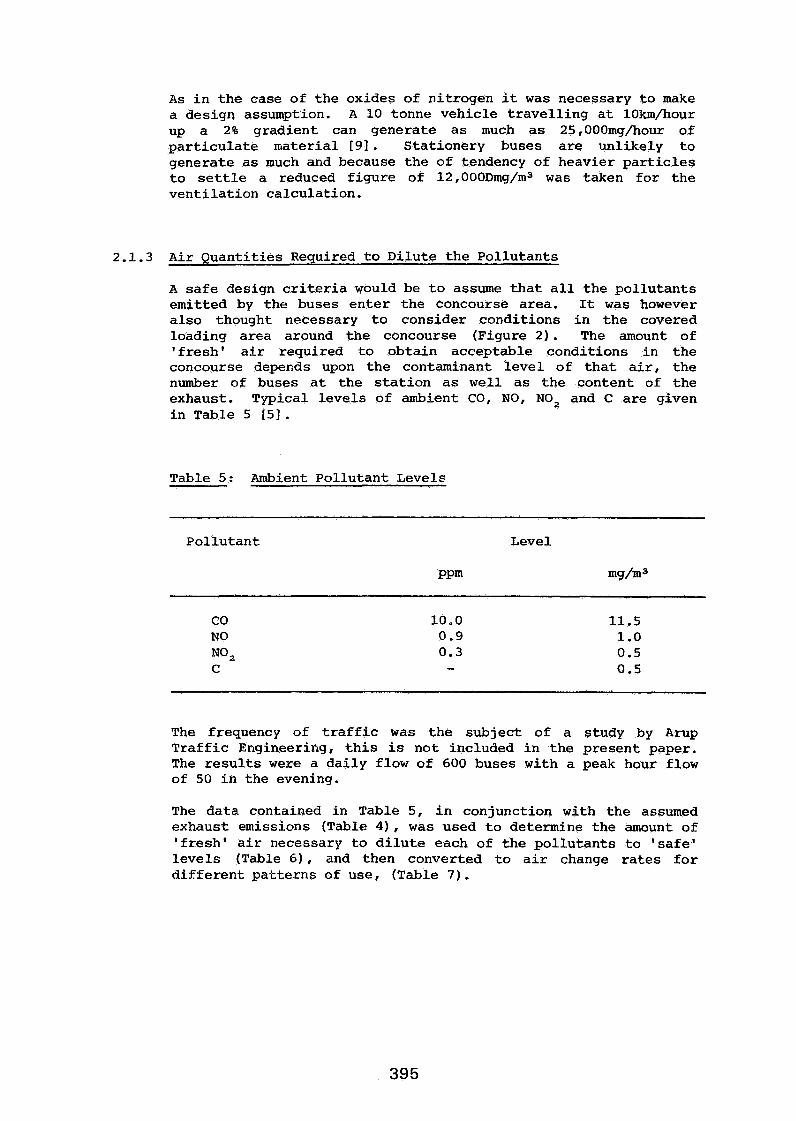
A s i n t h e case of t h e oxides of n i t rogen it w a s necessary t o make a des ign assumption. A 10 tonne veh ic le t r a v e l l i n g a t lOkm/hour up a 2% grad ien t can genera te a s much as 25,00Omg/hour of p a r t i c u l a t e mate r i a l [91. Sta t ionery buses are unl ikely t o genera te a s much and because t h e of tendency of heavier p a r t i c l e s t o set t le a reduced f i g u r e of 12,000Dmg/m3 was taken f o r t h e v e n t i l a t i o n ca lcula t ion.
2.1.3 A i r Quan t i t i e s Required t o D i l u t e t h e Po l lu tan t s
A s a f e design c r i t e r i a would be t o assume t h a t a l l t h e p o l l u t a n t s emit ted by t h e buses e n t e r t h e concourse area . It w a s however a l s o thought necessary t o consider condi t ions i n t h e covered loading a rea around t h e concourse (Figure 2 ) . The amount of ' f r e s h ' a i r required t o ob ta in acceptable condi t ions i n t h e concourse depends upon t h e contaminant l e v e l of t h a t a i r , t h e number of buses a t t h e s t a t i o n a s w e l l as t h e content of t h e exhaust. Typical l e v e l s of ambient CO, NO, NO2 and C are given i n Table 5 151.
Table 5: Ambient P o l l u t a n t Levels
P o l l u t a n t Level
P P ~ mg/m3
The frequency of t r a f f i c w a s t h e sub jec t o f a s tudy by Arup T r a f f i c Engineering, t h i s is n o t included i n t h e p resen t paper. The r e s u l t s were a d a i l y f low o f 600 buses wi th a peak hour flow of 50 i n t h e evening.
The d a t a contained i n Table 5, i n conjunction with t h e assumed exhaust emissions (Table 41, w a s used t o determine t h e amount of ' f r e s h ' a i r necessary t o d i l u t e each of t h e p o l l u t a n t s t o ' s a f e ' l e v e l s (Table 61, and then converted t o a i r change r a t e s f o r d i f f e r e n t p a t t e r n s of use, (Table 7 ) .
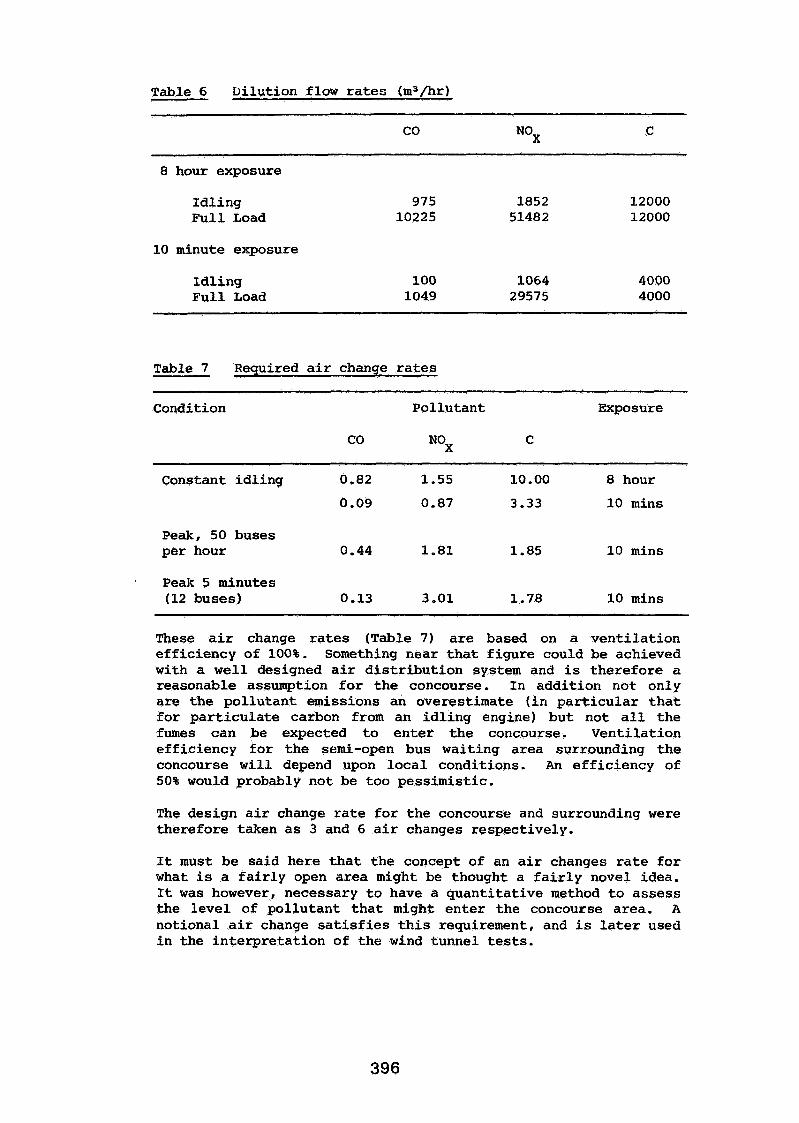
Table 6 Di lu t ion flow rates (mJ/hr)
8 hour exposure
I d l i n g F u l l Load
10 minute exposure
I d l i n g 100 1064 4000 F u l l Load 1049 29575 4000
Table 7 Required a i r change r a t e s
Condition P o l l u t a n t Exposure
CO NOx C
Constant i d l i n g 0.82 1.55 10.00 8 hour
0.09 0.87 3.33 10 mins
Peak, 50 buses p e r hour 0.44 1.81 1.85 10 mins
Peak 5 minutes (12 buses) 0.13 3 -01 1.78 10 mins
These air change r a t e s (Table 7) are based on a v e n t i l a t i o n e f f i c iency of 100%. Something near t h a t f i g u r e could be achieved with a w e l l designed air d i s t r i b u t i o n system and is t h e r e f o r e a reasonable assumption f o r t h e concourse. I n add i t ion not only a r e t h e p o l l u t a n t emissions an overest imate ( i n p a r t i c u l a r t h a t f o r p a r t i c u l a t e carbon from an i d l i n g engine) b u t not a l l t h e fumes can be expected t o e n t e r t h e concourse. Ven t i l a t ion e f f i c iency f o r t h e semi-open bus wai t ing a r e a surrounding t h e concourse w i l l depend upon l o c a l condit ions. An e f f i c i e n c y of 50% would probably not be too pess imis t i c .
The design a i r change r a t e f o r t h e concourse and surrounding were the re fo re taken a s 3 and 6 a i r changes respect ively .
It must be sa id here t h a t t h e concept of an air changes rate f o r what is a f a i r l y open a r e a might be thought a f a i r l y novel idea. It was however, necessary t o have a q u a n t i t a t i v e method t o a s s e s s t h e l e v e l of p o l l u t a n t t h a t might enter t h e concourse area . A notional air change s a t i s f i e s t h i s requirement, and i s l a t e r used i n t h e i n t e r p r e t a t i o n of t h e wind tunnel tests.
2.2 Winter Heating
In t h i s case only problem is t o assess the probable a c t i v i t y and clothing leve ls of the occupants. It was thought reasonable t o assume t h a t they would have walked several hundred metres before a r r iv ing a t the waiting area and t h a t they would be dressed f o r outs ide conditions. In addit ion, f a i r l y s t i l l a i r conditions would be expected. A comfort analysis according t o Fanger's 111 theory f o r ac t ive people (123w/ma) with a clothing l eve l corresponding t o 1.5 c lo , suggestea t h a t 12OC would be a su i tab le design temperature would appear t o be 12OC.
Because of the need t o use r e l a t i ve ly large amounts of a i r (2Om3/s), t o minimise the en t ry of contaminants, a warm a i r system was considered t o be appropriate (otherwise a radiant system would have been appropriate). It i s worth mentioning here t h a t with a peak occupancy of 275 people the application of current regulations [I01 would r e s u l t i n a f resh a i r requirement of 3. 3m3/s (0.6 air-changes) . The l a rge amounts of a i r required suggest t h a t some of exhaust a i r hea t recovery system should be considered. The low in t e rna l winter design temperature means t h a t such a scheme is unlikely t o be c o s t effect ive. It could be argued t h a t higher design temperatures could then be used without any increase i n energy consumption. I f t h i s were done then the occupants leve l of c lothing would not be compatible with l oca l environment. Alternatively some recirculat ion could be used (and t h i s is included i n t h e proposed design) provided the leve l of contaminants does not become c~acceptab le .
2.3 Summer Conditions
The main source of heat gain a r e people and l i gh t s , with a s o l a r contribution from a skyl ight i n the centre of the concourse. The space has high thermal i n e r t i a and a well insulated roof. It was therefore f e l t t h a t mechanical ven t i la t ion would be adequate perhaps with night time pre-cooling. This f i t s i n w e l l with the vent i la t ion demands f o r the d i lu t ion of pol lutants .
3. DESIGN OPTIONS
Section 2 went s l i gh t ly beyond the general design objectives b y including an assessment of the amount of a i r required t o d i l u t e exhaust emissions t o acceptable levels . This sect ion presents the options open t o t he designer t o achieve those objectives. Analysis of the proposed design i s covered i n Section 4.
The range of options t h a t were considered a re given below i n order of increasing cos t , complexity and environmental comfort:
1) Trea t t h e suburban bus s t a t i o n a s an ex te rna l covered na tura l ly ven t i l a ted space with columns supporting t h e deck of t h e interurban bus s t a t i o n above. There would need t o be doors t o t he esca la tors serving t h e interurban lounge above and t h e entrance h a l l below. This i s t h e only solut ion which would enable na tura l ven t i l a t i on throughout.
2 ) Introduce a small c en t r a l a rea f o r the ca fe f a c i l i t i e s and t o i l e t s with people wait ing 'outside ' i n the same space a s t he buses. This c e n t r a l core, however, reduces the effect iveness of na tura l c ross flow vent i l a t ion ,
~ o t h (1) and (2) above were i n c o n f l i c t with t h e a r ch i t ec tu ra l concept and were therefore not considered t o be v iab le technical solutions.
3) Accept t he a r ch i t ec t s proposed scheme with an i n t e r n a l occupied, environmentally controlled space, with buses outside. The bus occupied a rea could be p a r t i a l l y screened of f a t low l e v e l also.
4) The most sophis t icated solut ion would be t o u t i l i s e a separate ven t i l a t i on system f o r t he concourse area and the bus area. The external ven t i l a t i on system would cons i s t of a l o c a l ex t r ac t system a t each bus parking bay. This would l i m i t fu ture f l e x i b i l i t y a s t h e ex t r ac t would need t o be c lo se t o the exhaust pipe t o be e f fec t ive . The d i f f i c u l t i e s associated with t he implementation of a l o c a l ex t r ac t system (see 2 . 1 , i n conjunction with an an t ic ipa ted high l i f e cycle cos t of t he proposal resul ted i n t h e recommendation not t o adopt t h i s method.
It was f e l t t h a t t h e proposed a r ch i t ec tu ra l solut ion is analogous t o an a i r p o r t arr ivals /depar ture lounge ra ther than an external covered garage and hence option 3 above was studied i n more d e t a i l (Section 4) i n order t o quantify the major design parameters, I n pa r t i cu l a r , t he pos s ib i l i t y of pressur iz ing t he suburban concourse was examined using the mechanical ven t i l a t i on system t o minimise the en t ry of bus fumes. This was considered t o be of pa r t i cu l a r importance a s t he concourse is completely surrounded by bus stands.
4. ANALYSIS OF THE DESIGN
For t h e purpose of t h i s paper t h i s means t he ven t i l a t i on s t ra tegy. The so l e objective of t he analysis was t o prove t h a t the qua l i t y of a i r within t h e concourse would be both acceptable t o those waiting f o r buses and, of course, o f f e r no danger t o t h e i r heal th . To do t h i s it was necessary t o ensure an adequate supply of f resh a i r t o the concourse.
This can be done by carrying o u t an a n a l y s i s of a i r movements wi th in and i n t o t h e a reas of i n t e r e s t . Such an a n a l y s i s can done by means of a mul t i -ce l l v e n t i l a t i o n model. The main problem with us ing such a model (excluding its v a l i d i t y ) i s i n t h e s p e c i f i c a t i o n of t h e l o c a l wind cl imate. This can be done by a wind tunne l test. I n t h i s case such tests w e r e considered e s s e n t i a l t o determine t h e p r o b a b i l i t y of obtaining s a t i s f a c t o r y condit ions. A by-product of such tests would be t h e most s a t i s f a c t o r y p o s i t i o n f o r t h e f r e s h a i r i n l e t s .
Wind tunne l tests a r e expensive and it takes some t i m e t o cons t ruc t a model and do t h e test. It was t h e r e f o r e thought necessary t o make a prel iminary a n a l y s i s of a i r f low p a t t e r n s wi th in t h e bu i ld ing using a mul t i -ce l l v e n t i l a t i o n model. This a n a l y s i s would g ive a good idea of what t o look f o r i n t h e wind tunnel test programme. This s e c t i o n f i r s t desc r ibes t h a t a n a l y s i s and then t h e wind tunne l tests.
4-1 Vent i l a t ion Analysis
The bulk of t h e work described here w a s done using t h e Arup Environmental p red ic t ion Units ' computer program VENT. This program, which w a s a l s o used f o r t h e a n a l y s i s of t h e Gateway 2 bu i ld ing [21, i s described i n Sect ion 5 of t h i s paper. It is s u f f i c i e n t t o state here t h a t i n add i t ion t o t h e usua l considera t ion of flow through o r i f i c e s and cracks VENT conta ins a n a l y t i c a l rou t ines t o allow t h e simultaneous c a l c u l a t i o n of inflow and outflow a t l a r g e openings such a s t h e bus s t a t i o n doors.
4.1.1 Scope of t h e Analysis
With t h e exclusion of a l o c a l exhaust e x t r a c t system t h e r e a r e only two ways t o ensure adequate v e n t i l a t i o n :
a) Mechanical v e n t i l a t i o n by p r e s s u r i s a t i o n of t h e concourse. b) Natural v e n t i l a t i o n .
Mechanical v e n t i l a t i o n involves p ressur i s ing t h e concourse by supplying air e i t h e r t o t h e concourse i t s e l f o r t o t h e two main l inked spaces. This has t h e advantages of f l e x i b i l i t y , r e l i a b i l i t y and ease of control .
Natural v e n t i l a t i o n can t ake p lace a s a r e s u l t of both wind and thermal e f f e c t s . The thermal o r "stack" e f f e c t is usual ly n e g l i g i b l e compared with t h a t of t h e wind a s t h e p ressure d i f f e r e n c e s induced by thermal changes i n a i r dens i ty a r e much smaller than those due t o t h e wind. The s i z e of t h e concourse a rea makes it unl ikely t h a t an e f f e c t i v e c ross flow could be achieved. I n add i t ion , simple ca lcu la t ion demonstrated t h a t an
adequate l eve l of ven t i l a t ion would achieved a t t he most 50% of the t i m e . This was done by assuming an e f f e c t i v e pressure coef f ic ien t over t h e building of 0.5, two doors (6.6m2, each) open on each s ide , and the exhaust from two buses. The wind speed exceeded f o r 50% of t h e t i m e was taken a s 4.5m/s, s o following the CIBSE Guide [91 :
9 is t h e volume flow rate .
A is the a rea of two doors
Ap i s the pressure drop across t he building (= 6Pa).
Thus t h e ven t i l a t ion a i r flow t h a t w i l l be exceeded 50% of t h e time is approximately 19 m3/s. The exhaust from two buses would require about 16m3/s t o d i l u t e it t o a sa fe l eve l . Natural ven t i l a t ion was therefore not thought t o be acceptable.
The study was therefore confined t o an inves t iga t ion of mechanical vent i la t ion. The amount of a i r required t o d i l u t e the exhaust to an acceptable l eve l has already been shown t o be about 30m3/s. Supplying a l l t h i s a i r with t he doors closed could generate large pressure within t h e concourse. The simplest way t o prevent t h i s happening is t o add leakage, The s i z e of a su i t ab l e r e l i e f duct - which remains open a l l t he time - formed p a r t of t h e s tudies .
Building Geometry
The s impl i f ied version of t h e building i n Figure 3, was used f o r a l l the ana ly t i ca l work.
There are external openings from t h e concourse i n t h e form of doors and small na tura l leakage paths such a s cracks around doors. Each bus stand has th ree doors which open t o enable boarding from and a l igh t ing t o t he concourse.
There a r e a l so doors and cracks i n t he urban lounge and t i c k e t areas. Although the bulk of t h e study was concerned with leakage through l a rge open doorways, t h e leakage through closed doors can be s ign i f i can t when pressurized t o 50pa. One manucacturer of s l id ing doors gives a f igure t h a t r e s u l t i n a leakage from a l l 12 doors of 1.5m3/s, whereas a 3mm crack would r e s u l t i n between 7 and 8m3/s. The ANSI/ASHRAE/IES 90A-1980 a i r leakage standard f o r non-residential dwellings, swing, revolving o r s l i d ing doors gives 4 .5m3/s. This has been taken here t o be t yp i ca l of what might occur.
The following assumptions were made regarding the geometry of t he building:
a ) Both the urban lounge and t h e entrance h a l l a r e l inked t o t h e concourse through openings of 72m2 area.
b) The doors i n the urban lounge and t i c k e t h a l l a r e swinging doors. Those i n t he concourse a r e automatic, s l i d ing doors which remain closed except when i n use. The d e t a i l s of t he doors and the way i n which they a r e used a r e important t o determine t he leakage pa ths out of t he building and a l so the r a t e a t which pressure bui lds up a f t e r they a r e closed.
4.1.1.2 Input parameters
The major f ac to r s influencing air-flow i n t h e concourse w e r e each invest igated and t h e i r r e l a t i v e importance examined. This was done by taking the following simple 'control ' case:
a ) N o wind
b) Summer temperatures 2g°C outside, 20°C i n s ide (these a r e assumed design conditions t h a t exaggerate t h e e f f e c t a t the la rge doors)
C ) Mechanical ven t i l a t ion r a t e of 25m3/s, supplied v i a systems i n t he urban lounge and entrance h a l l
d) Four open doors i n t h e concourse.
Any s tudy of t h i s nature w i l l have the po t en t i a l f o r a very large number of computer runs, Figure 4 shows t h e t o t a l number of combinations of a l l var iab les t h a t might have been considered with a i r supplied t o l inked spaces only. The f igure a l s o shows which combinations were considered s ign i f i can t f o r the purpose of analysis .
After an assessment of these preliminary runs fur ther cases were considered invest igat ing t h e e f f e c t s of rec i rcu la t ing some a i r i n l inked spaces, supplying some a i r t o t he concourse and t o determine the s i z e of t he r e l i e f duct. The supply a i r volumes chosen i n these fur ther cases were based on t h e normal ven t i l a t i on requirements for a l l th ree spaces. The r e l i e f duct area was chosen t o maintain a pos i t i ve pressure i n the concourse.
4.1.1.3 Output Evaluation
A summary of a l l the computer runs ( t e s t s ) i s given i n Table 8, with some selected r e s u l t s given diagrammatically i n Figure 5 Obviously the amount of a i r which en t e r s t h e concourse depends on the i n t e rna l pressure and the a i r temperature, a s these determine the l e v e l of the neutra l plane, i.e. t h e l e v e l a t which in te rna l and ex te rna l pressures a r e t he same f o r any opening.
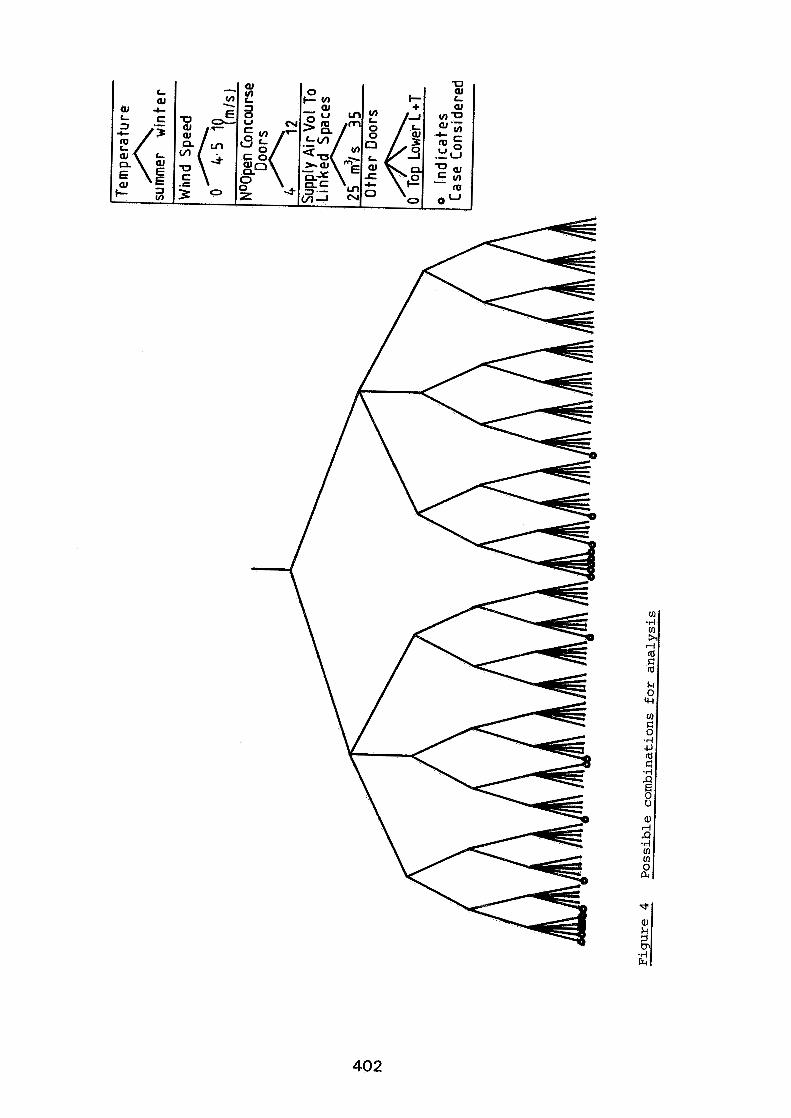
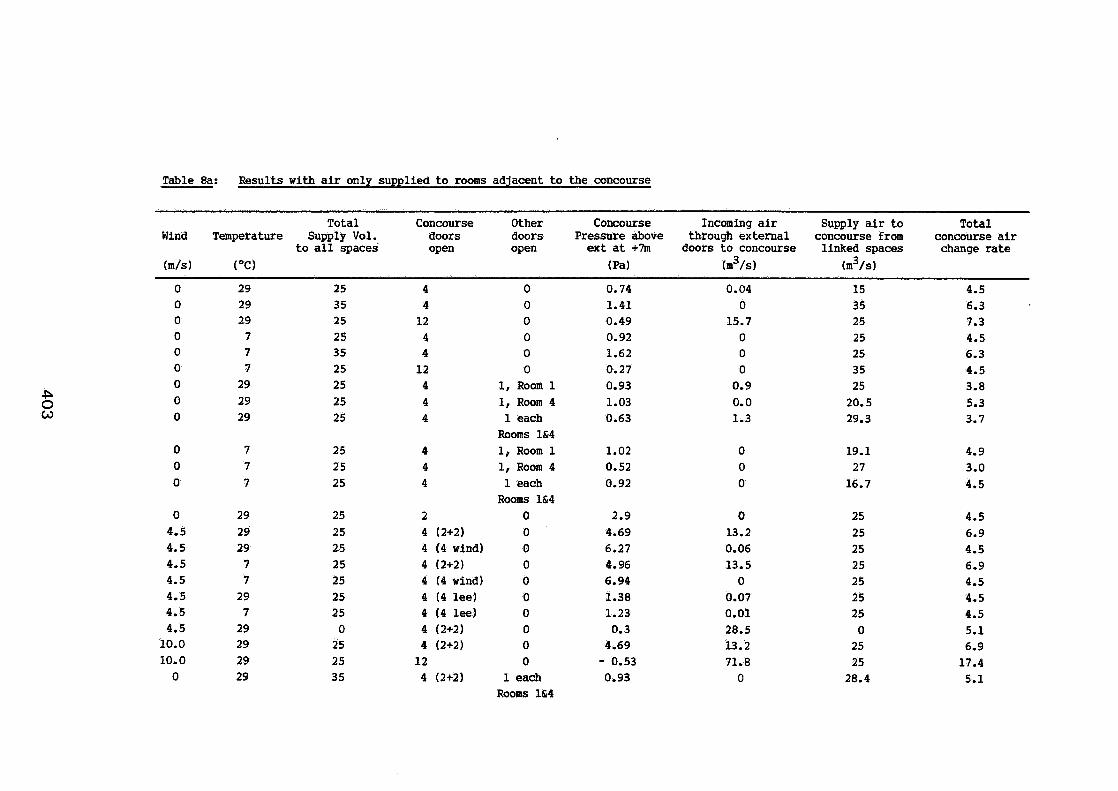
Table 8a: Results with a i r only supplied t o rooms adjacent t o the concourse
Total Concourse Other Concourse Incoming a i r Supply a i r t o Total Wind Temperature Supply Vol. doors doors h-essure above through external concourse from concourse a i r
t o a l l spaces open open ex t a t +7m doors t o concourse linked spaces change ra te
( m / s ) (OC) (pa) (m3/s) (m3/s)
2 4 (2+2) 4 (4 wind) 4 (2+2) 4 (4 wind) 4 (4 lee) 4 (4 lee) 4 (2+2) 4 (2+2)
12 4 (2+2)
0 0 0 0 0 0
1, Room 1 1, Room 4 1 each
Rooms 1&4 1, Room 1 1, Room 4 1 each
Rooms 1&4 0 0 0 0 0 0 0 0 0 0
1 each Rooms 1&4
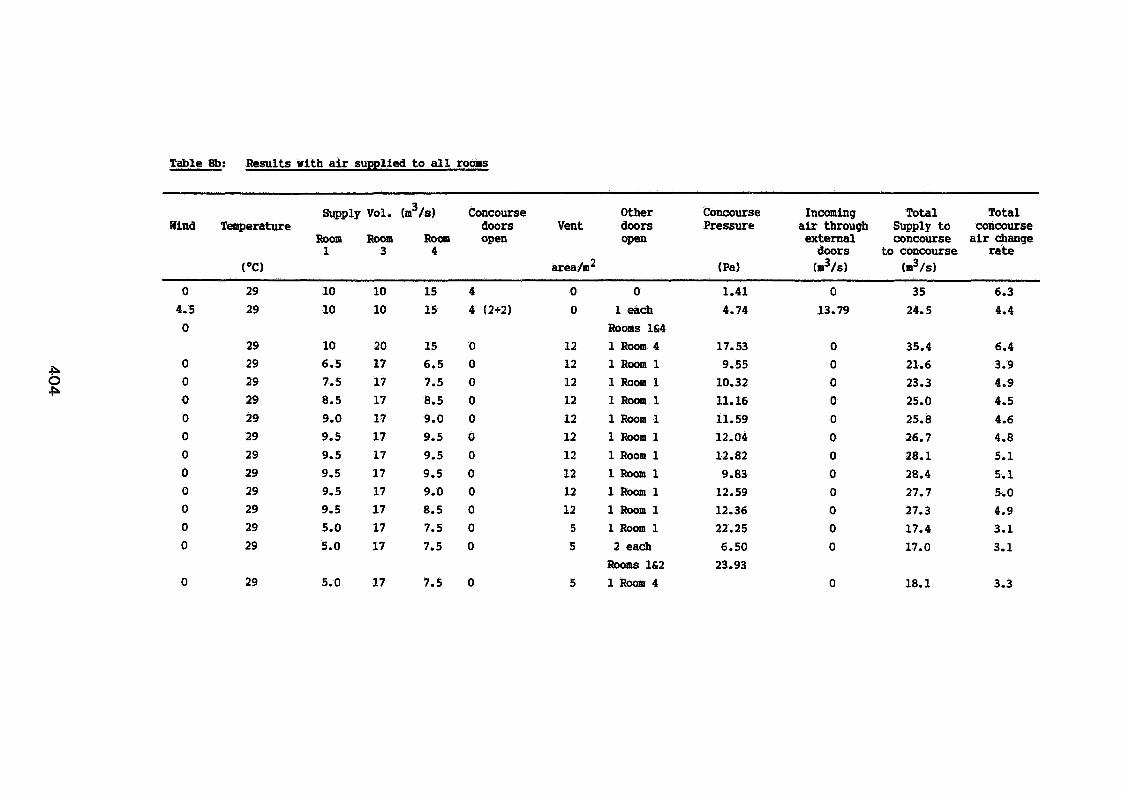
Table 8b: Results with a i r supplied to a l l roors
Supply Vol. (m3/s) Concourse Other Concourse Incoming Total Total Wind Tenrperature doors Vent doors Pressure a i r through Supply to concourse
Room Room Roapr open Open external concourse a i r change 1 3 4 doors to concourse ra te
( O C ) area/a2 (Pa) (m3/s) (m3/s)
0 1 each
Rooms 1&4 1 Room 4 1 Room 1 1 R o o m 1
1 Room 1 1 Room 1
1 Room 1
1 Room 1
1 R o o p p 1
1 Room 1
1 Room 1
1 Room 1
2 each Roams 1&2
1Room4
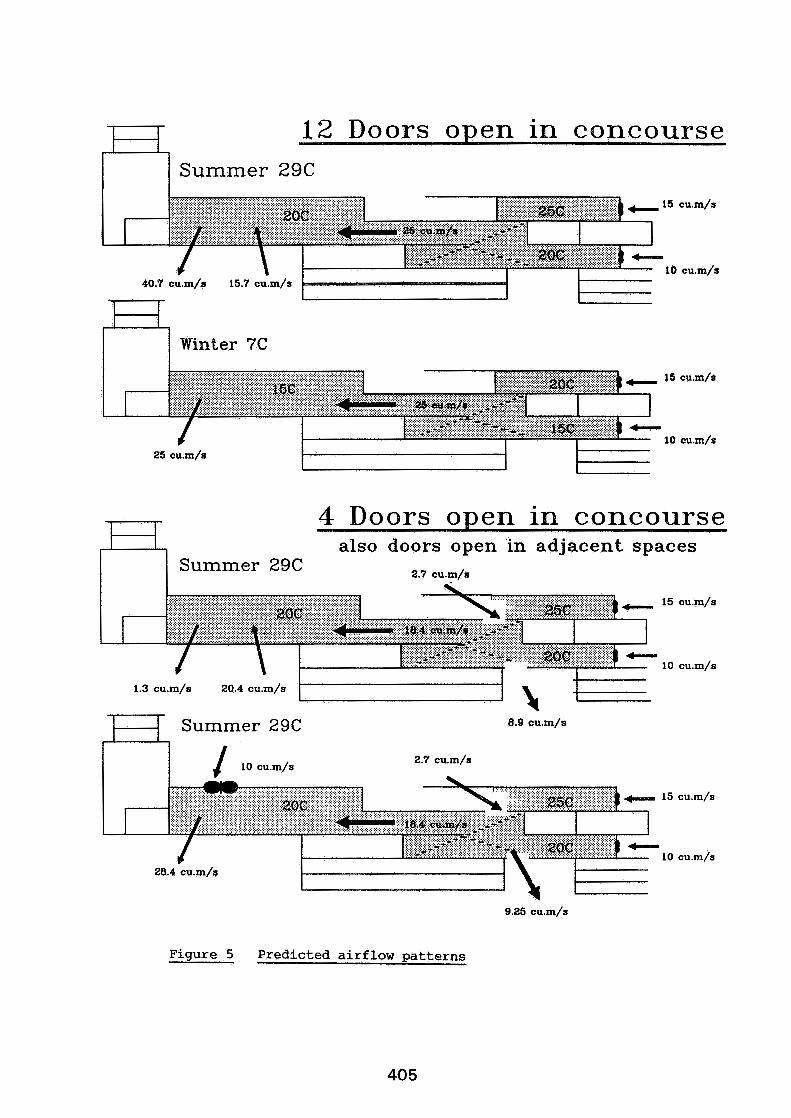
I 1 Summer 2 9 C
a I I
Winter 7C
4 Doors open in concourse also doors open in adjacent spaces
Summer 29C 2.7 cu.m/s
1.3 cu.m/s 20.4 cu.m/s
Summer 29C 0.9 C U . ~ / S
Figure 5 Predicted airflow patterns
The i n t e r n a l pressure depends on the e f f ec t i ve area through which a i r can escape, and t h e supply volume. Increasing the number of concourse doors which a r e open increases the e f f ec t i ve o u t l e t area and therefore reduces t h e pressure. Even i n still a i r t h i s increases the volume of a i r enter ing from outside. For instance, when two doors a r e open the re is no incoming a i r , when four doors a r e open 0.04m3/s of a i r en t e r s t h e concourse. If a l l twelve doors a r e open the ingress of a i r is 15.7m3/s.
The e f f e c t of wind overrides a l l o ther e f f e c t s by inducing la rge pressure differences across t he doorways. Under these circumstances it is not possible t o prevent a i r coming i n t o t he concourse, by pressur is ing the concourse a s t he volume of supply a i r required would be too great . However, it i s possible t o d i l u t e any po l lu tan ts t h a t en t e r t o an acceptable l eve l . The degree of pressur izat ion obviously depends upon the amount of a i r supplied t o the concourse. This can be increased d i rec t ly by a l t e r i ng t h e supply a i r flow i n t h a t area , o r i nd i r ec t l y by a i r from adjacent spaces. Inward a i r flow occurs only a s a r e s u l t of stack e f f e c t and i s usually ins ign i f ican t , outward a i r flow occurs because open door provides a low res i s tance t o flow. This means t h a t a f a i r l y large proportion of a i r supplied t o t he linked spaces w i l l not be usefu l i n ven t i l a t ing t he concourse. The r e s u l t s given (Table 8) a r e f o r one open door only i n l inked spaces, doubling t he open area w i l l make the outward a i r f low from linked spaces more s ign i f ican t .
The open area required f o r a r e l i e f duct was 5m2, given a supply volume of 29.5m3/s and a maximum allowable pressure across it of 50Pa.
Altering t he volumes of ex t r ac t , and hence t he degree of p ressur i sa t ion of t he urban lounge and entrance h a l l has very l i t t l e e f f e c t on flow ins ide t h e concourse. A s t h e degree of pressur isat ion is reduced, some a i r flows from the esca la tor well t o t h e entrance h a l l and urban lounge, bu t there i s no flow from the concourse t o t he esca la tor well. This means t h a t pol luted a i r should not spread ou t of t h e concourse area.
4.1.2 Conclusion and recommendations
The computer s tud ies resul ted i n the recommendation t h e following ven t i l a t i on ra tes :
a ) 17m3/s supply a i r t o concourse,
b) 15m3/s supply a i r t o urban lounge,
C ) 10m3/s supply a i r t o t i c k e t h a l l ,
d ) Half of the a i r supplied t o t h e entrance h a l l and urban lounge can be extracted and some of it can be recirculated.
These ven t i l a t i on r a t e s would maintain an a i r supply t o t he concourse of 20m3/s. The ex t r a a i r must be supplied because a i r supplied t o t he linked spaces can escape through any open doors i n these spaces and cannot therefore be used t o v e n t i l a t e the concourse.
The vent i la t ion r a t e s a r e based on t h e requirement t o d i l u t e exhaust po l lu tan ts i n a l l t h r ee spaces a t both peak and average t i m e s . In addit ion these supply a i r quan t i t i e s should s a t i s f y f r e sh a i r requirements, a i r movement c r i t e r i a and l i m i t t h e concourse temperature t o 5OC above t h e ambient ex te rna l temperature.
The i n i t i a l s tud ies a l s o suggested t h a t it would a l so be possible t o p ressur i se t h e concourse by supplying a i r a t 20m3/s t o t h e entrance h a l l and a t 15m3/s t o t he urban lounge only. It i s however, necessary t o v e n t i l a t e and supply f resh a i r t o a l l t h e spaces,
On windy days some fumes w i l l en t e r t he concourse but t h e supply r a t e i s su f f i c i en t t o d i l u t e any fumes which do e n t e r t o an acceptable level . In addit ion, under these condit ions t h e concentration of fumes present i n t he bus-occupied areas w i l l be lower.
Pressure within t he concourse must not be allowed t o rise above 50Pa above atmospheric as t h i s makes it d i f f i c u l t t o open and close doors. The pressure w i l l only rise t o t h i s l e v e l i f a l l t he doors a r e closed, and can be l imited b y a r e l i e f duct with an open a r ea 5m2 a t roof level . This could be achieved by opening a window i n the roof l i g h t during t he summer. It might a l s o be possible t o rec i rcu la te some ' a i r o r recover some heat from t h e outgoing a i r during t he i f a separate duct is provided.
The design of the proposed mechanical ven t i l a t ion system cannot be ca r r i ed out i n d e t a i l without an analysis of the unsteady s t a t e . The var ia t ion of pressure with t i m e and the time taken t o e s t ab l i sh a steady s t a t e should be invest igated a t t he next stage. To carry ou t t h i s study more de ta i led information would be required concerning the way i n which the bus s t a t i o n w i l l be used.
During t h e de ta i led design s tage it may be necessary t o ca r ry ou t an addi t iona l study of t h e wind e f f e c t s i n the two following cases: f i r s t l y i n t he bus occupied areas where t he wind w i l l determine the ambient po l lu tan t l eve l s , and secondly on the external doors where the l oca l wind pressures developed w i l l influence the ingress of bus exhaust fumes.
4.2 The Wind Tunnel Tests
These tests were car r ied out on a 1:400 sca le model (Figure 6) of the passenger interchange and i ts surrounding passenger interchange by T. W. Everett and T. V. Lawson using the environmental wind tunnel i n the Department of Aeronatural Engineering a t t he University of Br i s to l . This tunnel can be used t o model:
a ) Variation of mean windspeed with height b) Variation of turbulence with height C) Spectrum of turbulence a t a l l heights.
This paper is not intended t o be a discussion of t h e way wind tunnels can be used t o model atmospheric winds, s o i f more information should be required references [12-141 contain the t heo re t i ca l bas i s f o r t h e wind tunnel studies.
4.2.1 The Invest igat ion
The object ive of t h e study was t o provide da ta on t h e a i r change r a t e s i n t he concourse and bus stand area as a function of wind speed and direct ion. To do t h i s it was f i r s t necessary t o obtain surface pressure coef f ic ien ts on both t he open s ides of t he bus stand a r ea and a l l surfaces of t he urban concourse, The measurement of pressures on open areas is d i f f i c u l t so a r t i f i c i a l walls w e r e introduced, a t t he s ides of t he bus stands. These were removed f o r t he concourse ven t i l a t ion prediction. The measured pressure coef f ic ien ts were then used a s input t o a computer program (not the one described here) along with leakage areas t o p red ic t ven t i l a t ion flow ra tes .
Such tests only provide da ta f o r par t i cu la r combination of wind speed and direct ions . To be of value i n determining the probabi l i ty of obtaining sa t i s fac tory ven t i l a t ion r a t e s f o r t he purpose o f po l lu tan t removal, it is necessary t o r e l a t e t he r e s u l t s t o l oca l weather data. I t is then possible t o determine the frequency of occurrence of specif ied a i r charge ra tes .
In t he present case the only meteorological da ta ava i lab le was f o r Santander, and t h i s was r e s t r i c t e d t o 0700 and 1800 hours. A l l ana lys i s was therefore based on these data , which comprised both wind speeds and direct ion. Should data f o r Bilbao town centre ever become avai lable then it would be simple t o repeat the ana lys i s with t h a t data.
4.2.2 Results
The r e s u l t s of t he analysis were used t o ca lcu la te t he percentage of t i m e f o r which a s t a t ed volume flow r a t e would be exceeded i n
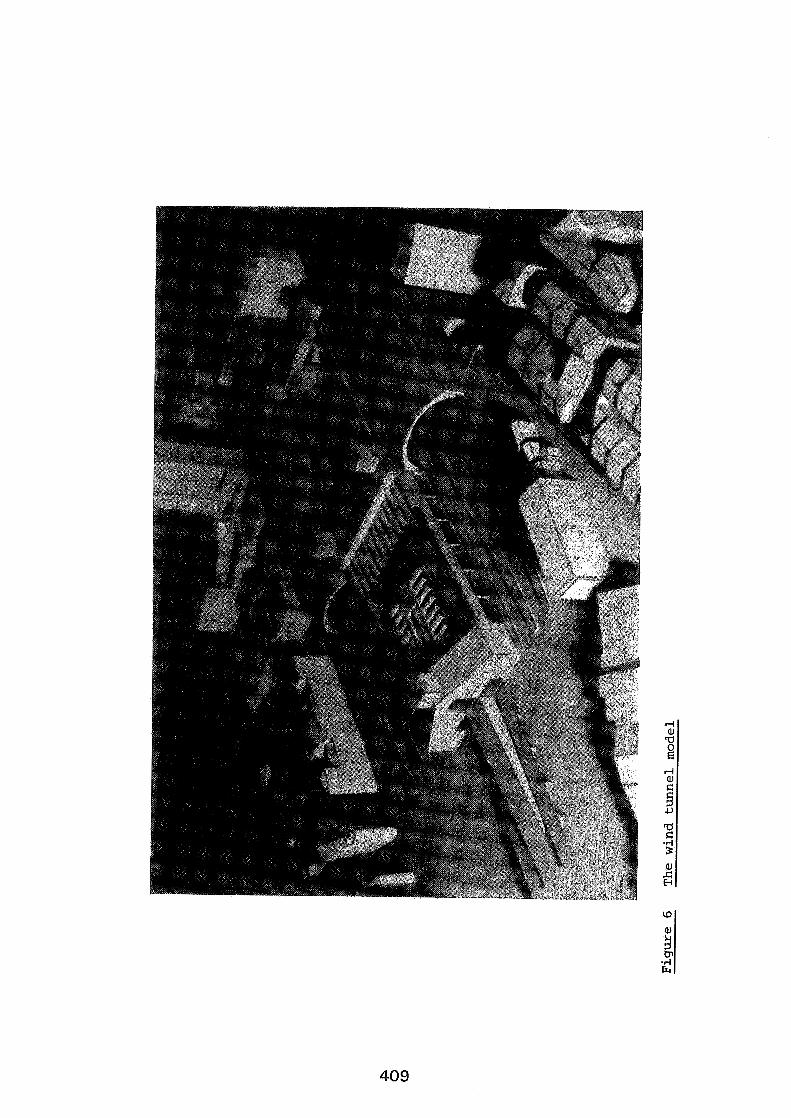
both t h e bus stand and concourse a reas a t 0700 and 1800 hrs , I n the case of t he former, two example were considered:
A l l external doors open (12 bays each of three 4mZ doors).
A ' r e s t r i c t e d opening' with a s ing le 4m2 door open on the e x i s t i n g s t a t i o n s ide and 4 bays of three 4m2 doors on t he other .
Detailed r e s u l t s cannot be of any general i n t e r e s t so it is only per t inen t t o quote t he general conclusions which were:
a ) Bus Areas
A ven t i l a t i on r a t e of t h r ee a i r changes per hour i n t h e bus a r e a s would be exceeded 96.3% of the time a t 07:OO hours and 96.7% of t h e t i m e a t 1 8 : O O hours. There is very l i t t l e va r i a t i on of these average f igures through t h e year. 6 a i r changes would be exceeded 92% of t he time and 1 air change 99% of t h e time.
These f igures ind ica te t h a t na tura l ven t i l a t ion is an adequate method of ven t i l a t i ng t h e bus areas of t he suburban bus s t a t i on . On calm days when the required a i r change r a t e s w i l l not be achieved, there w i l l be s ign i f i can t ly l e s s d i s t r i b u t i o n and mixing of bus exhaust fumes; these w i l l tend t o r i s e up ou t of the occupied space and so should not pose a t h r ea t t o safety . In addi t ion, a t these times, fumes a t low l eve l w i l l be more concentrated and so w i l l be avoided na tura l ly due t o t h e i r unpleasantness.
The f a c t t h a t pol luted a i r may re-enter t he bus area a t some po in t s has been taken i n t o account i n assuming a ven t i l a t i on e f f ic iency of 50% i n ca lcu la t ing the required a i r change r a t e s .
b) Concourse Areas
With a l l doors open a l l of t he time and no pressur isat ion, a ven t i l a t i on r a t e of th ree a i r changes pe r hour i n the concourse a rea i s exceeded 61% of the t i m e and a rate of one a i r change pe r hour is exceeded 87% of t he t i m e . With r e s t r i c t e d openings these f igures reduce t o about 9% and 49% respectively.
The f igures a r e t heo re t i ca l and t h e following po in t s need t o be considered before drawing any conclusions:
It is assumed t h a t i n each case doors w i l l be open a l l t he t i m e . A s already discussed a l l 12 stands w i l l only be f u l l f o r 5 minutes i n the peak hour and even then t h e s ing le en t ry and two e x i t doors w i l l not be open together. The case with a l l doors open simply serves t o prove therefore t h a t natural ven t i l a t ion of t he concourse a rea is not possible.
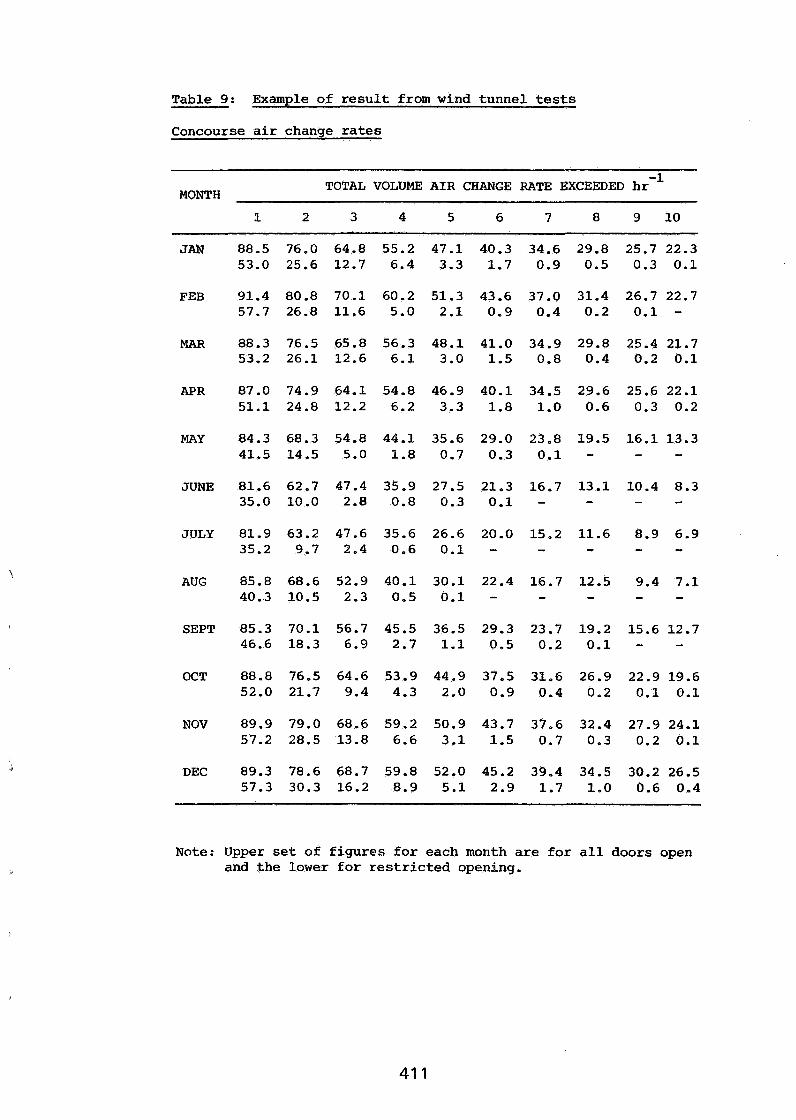
Table 9: Example of result from wind tunnel tests
Concourse a ir change rates
TOTAL VOLUME AIR CHANGE RATE EXCEEDED hr-I MONTH
1 2 3 4 5 6 7 8 9 10
JAN
FEB
MAR
APR
MAY
JUNE
JULY
AUG
SEPT
OCT
NOV
DEC
Note: Upper s e t of figures for each month are for a l l doors open and the lower for restricted opening.
The 'restricted openings' case is however, a l i t t l e more realistic b u t even t h i s assumes t h a t doors a r e open continuously i n any one hour. I n p r a c t i c e doors w i l l be opening and c los ing on t h e windward and leeward s i d e s and t h e r e w i l l be s i g n i f i c a n t per iods i n any one hour when a l l t h e doors a r e closed,
N o allowance has been made f o r t h e sh ie ld ing e f f e c t of t h e buses.
No account has been taken of t h e modificat ion t o a i r f low rates caused by p ressur i s ing t h e concourse. This w i l l only have an e f f e c t a t low e x t e r n a l windspeeds (although a v e l o c i t y p ressure o f 50Pa corresponds t o a wind v e l o c i t y of 9.12m/s).
Taking a l l these f a c t o r s i n t o account, it would be safe t o assume t h a t t h r e e a i r changes w i l l very seldom be exceeded and one a i r change w i l l only be exceeded f o r about 10% of t h e t i m e .
Thus mechanical v e n t i l a t i o n again is predic ted a s e s s e n t i a l i f a s a t i s f a c t o r y environment is t o be generated wi th in t h e wai t ing area. It is a l s o of i n t e r e s t t h a t t h e very simple c a l c u l a t i o n shown i n Sect ion 4.1.1 d i d n o t lead t o a conclusion d i f f e r e n t from t h a t of t h e wind tunnel tests. The advantage of these tests w a s t h e d e t a i l e d information provided, such a s t h e frequency of occurrence of d i f f e r e n t airchange rates, an example of which is given i n Table 9.
5 . PROGRAM VENT
This program is intended t o p r e d i c t a i r movement through both purpose b u i l t openings and f a b r i c imperfect ions between spaces o r rooms. The d r iv ing fo rce f o r t h i s can be a combination of :
a) Wind pressure. b) In te rna l / ex te rna l temperature d i f fe rence (s tack e f f e c t ) . c) Temperature d i f fe rence between rooms. d) Mechanical p lan t .
The ou tpu t from t h e program comprises:
a ) Summary of t h e inpu t data .
b) A sumnary o f a l l air-f lows from outs ide t o each room, t h e corresponding airchange rate, and hea t gain. I n addi t ion t h e con t inu i ty e r r o r i s given. The program works by s a t i s f y i n g t h e con t inu i ty equation f o r each room (mass flow i n = mass flow o u t ) . An i t e r a t i v e so lu t ion technique is used, s o t h e r e w i l l be an e r r o r i n t h e flow balance. This is displayed s o t h a t t h e o v e r a l l accuracy of t h e p red ic t ion can be assessed.
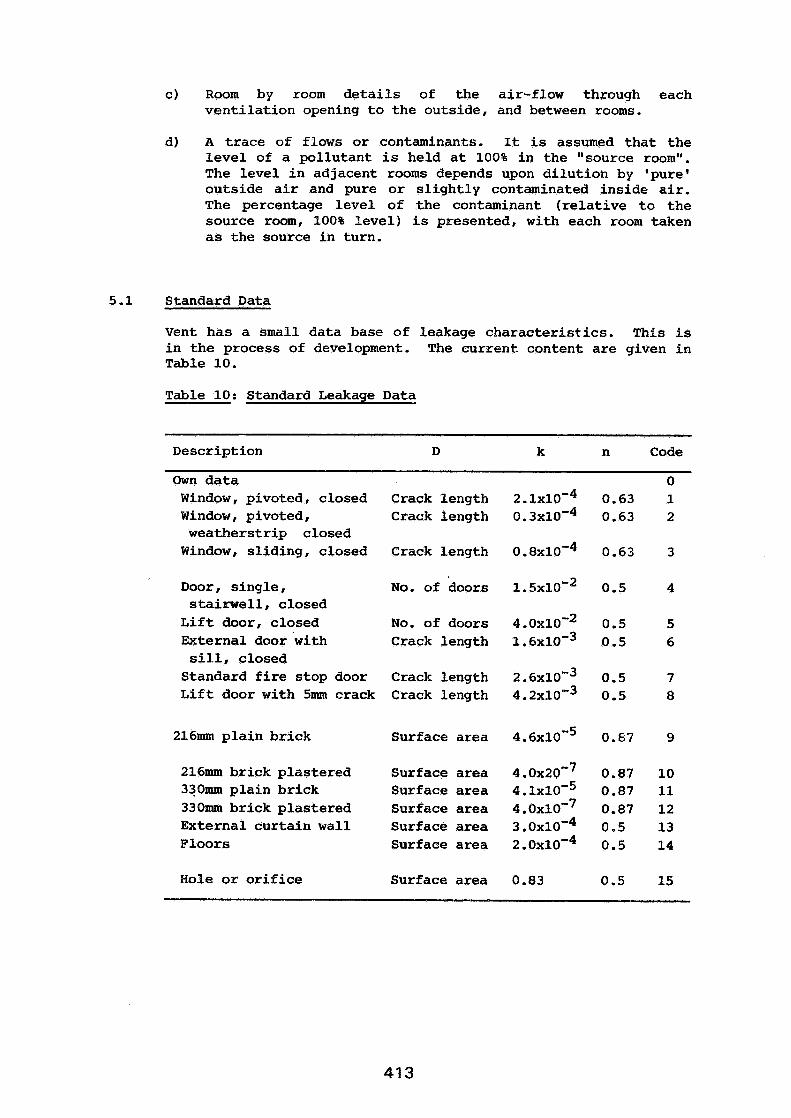
C) Room by room d e t a i l s of t he air-flow through each ven t i l a t i on opening t o t h e outside, and between rooms.
d) A t r ace of flows o r contaminants. It i s assumed t h a t t he l e v e l of a po l lu tan t i s held a t 100% i n t he "source room". The leve l i n adjacent rooms depends upon d i lu t i on by 'pure' outs ide a i r and pure o r s l i g h t l y contaminated ins ide a i r . The percentage l e v e l of t h e contaminant ( r e l a t i v e t o t h e source room, 100% l eve l ) is presented, with each room taken a s t he source i n turn.
5.1 Standard Data
Vent has a small da ta base of leakage charac te r i s t i cs . This is i n t h e process of development. The current content a r e yiven i n Table 10.
Table 10: Standard Leakage Data
Description D k n Code
Own d a t a 0 Window, pivoted, closed Crack length 2 . 1 ~ 1 0 ' ~ 0.63 1 Window, pivoted, Crack length 0 . 3 ~ 1 0 ' ~ 0.63 2
weathers t r ip closed Window, s l id ing , closed Crack length 0 . 8 x l 0 - ~ 0.63 3
Door, s ingle , No. of doors 1 . 5 ~ 1 0 ' ~ 0 .5 4 s t a i rwe l l , closed
L i f t door, closed No. of doors 4 .0x10-~ 0.5 5 External door with Crack length 1 . 6 ~ 1 0 ' ~ 0.5 6 sill, closed
Standard f i r e s top door Crack length 2 .6x10-~ 0.5 7 L i f t door with 5mm crack Crack length 4 . 2 ~ 1 0 " ~ 0.5 8
216nun p l a i n br ick Surface area 4 . 6 ~ 1 0 ~ ~ 0.87 9
216m brick p las te red Surface area 4 . 0 ~ 2 0 ~ ~ 0.87 10 330m p la in br ick Surface a rea 4 . 1 ~ 1 0 ' ~ 0.87 11 330mm brick p las te red Surface area 4 . 0 ~ 1 0 ~ ~ 0.87 12 External cur ta in wall Surf ace area 3.0x10-~ 0.5 13 Floors Surface area 2 . O X ~ O ' ~ 0.5 14
Hole o r o r i f i c e Surface area 0.83 0.5 15
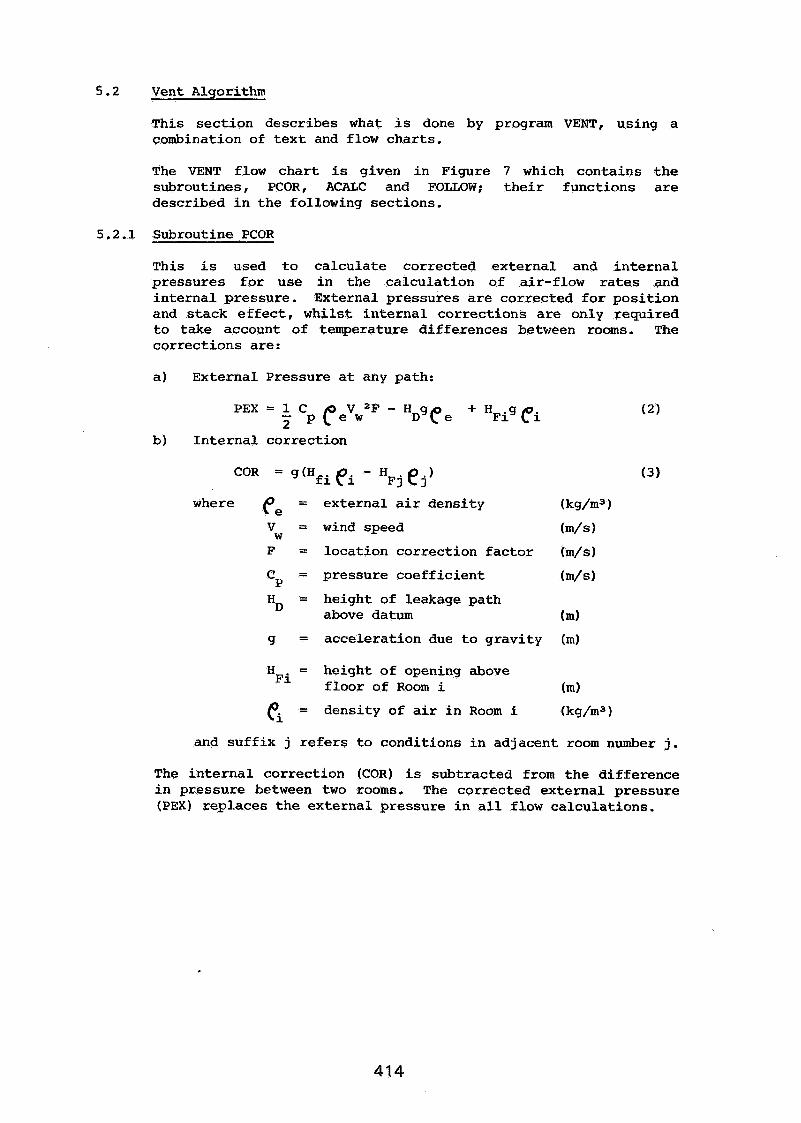
5-2 Vent Algorithm
This s e c t i o n descr ibes what i s done by program VENT, using a combination of t e x t and flow char t s .
The VENT flow c h a r t is given i n Figure 7 which con ta ins t h e subroutines, PCOR, ACALC and FOLLOW; t h e i r func t ions a r e described i n t h e following sec t ions .
5.2.1 Subroutine PCOR
This i s used t o c a l c u l a t e cor rec ted e x t e r n a l and i n t e r n a l p ressures f o r use i n t h e c a l c u l a t i o n of air-f low r a t e s and i n t e r n a l pressure . External p ressures are cor rec ted f o r p o s i t i o n and s t a c k e f f e c t , w h i l s t i n t e r n a l co r rec t ions are only required t o take account of temperature d i f fe rences between rooms. The cor rec t ions are:
a) External Pressure a t any path:
b) I n t e r n a l co r rec t ion
where ee = e x t e r n a l a i r dens i ty (kg/m3 I
V = wind speed W
(m/s )
F = loca t ion cor rec t ion f a c t o r (m/s I
Cy = pressure c o e f f i c i e n t (m/s)
HD = height of leakage pa th above datum (m)
g = acce le ra t ion due t o g r a v i t y (m)
= he igh t of opening above H ~ i f l o o r of Room i (m)
Ci = dens i ty of air i n Room i (kg/m3
and s u f f i x j refers t o condi t ions i n adjacent room number j,
The i n t e r n a l co r rec t ion (COR) is subtrac ted from t h e d i f fe rence i n pressure between two rooms. The cor rec ted e x t e r n a l p ressure (PEX) rep laces t h e e x t e r n a l p ressure i n a l l flow ca lcu la t ions .
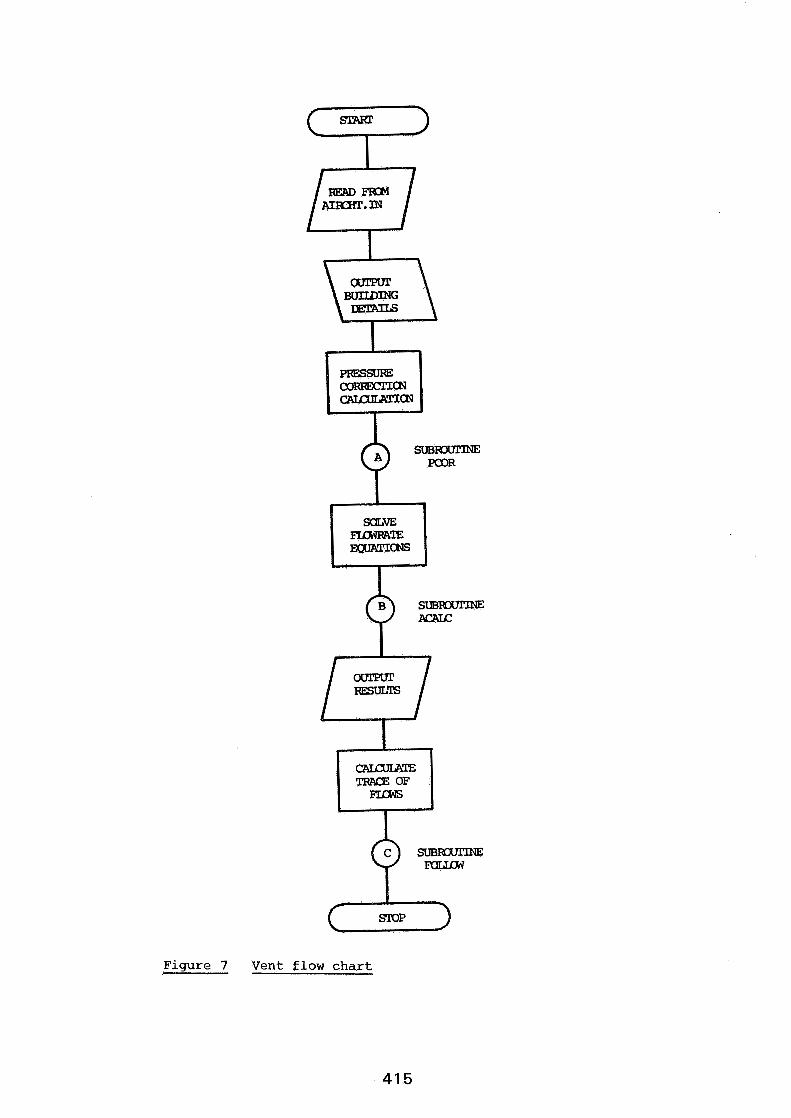
Figure 7 Vent flow chart
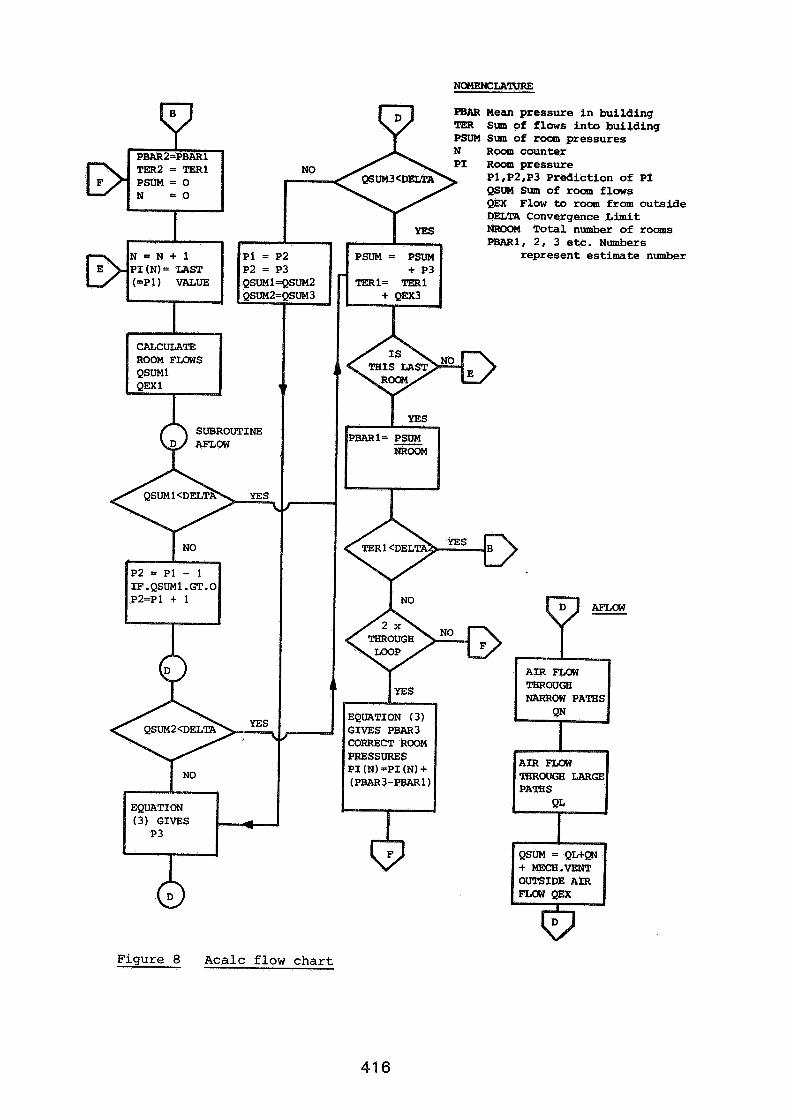
NOMENCLATURE
PBAR Mean pressure in building
SUM Slrm of room pressures Room counter
I Room pressure Pl,PZ,P3 Prediction of PI QSUM Sum of room flows Q M Flow to room from outside DELTA Convergence Lfmit NROOM Total number of rooms PBAR1, 2, 3 etc. Numbers
represent estimate number
SUBROUTINE
Figure 8 Acalc flow c h a r t
5.2-2 Subroutine ACALC
This is the main calculation routine. The object is to satisfy the continuity equation for each room, and the whole building. In general the air flow equations are non-linear, so it is necessary to employ an iterative technique. The method employed is a numerical form of the well known Newton-Raphson technique. This approach is used so that almost any flow equation can be incorporated into VENT, An example of what might be included is given in Section 5.2.4.
Taking the room flow balance as an example:
a) An estimate is made of the internal pressure (PI), and the sum of all flows from outside and adjacent rooms calculated, this should be zero, but unless the estimate is good, will have some value QSUMl (calculated by Subroutine AFLOW which determines air flow from pressure drop).
b) Using a second estimate, P2, calculate QSUM2.
c) A better estimate of the room pressure is then obtained from:
P3 = P2 + QSUMZ x (~2-pl) / (QSUM~-QSUM~) (4 )
Calculate :
QSUM3 = flow sum at room pressure P3; check if near to zero and if not:
d) P1 = P2 P2 = P3 QSUMl = QSUM2 QSUM2 = QSUM3 Return to (c) - and continue,
The process is applied to the whole building as well as each room, with the mean building pressure replacing room pressure in Equation (3). Figure 8 presents the flow chart for ACALC. Room convergence limits are based on the maximum flow from any single room opening and building convergence is related to the maximum flow through any single external opening.
Additional checks are made to ensure that QSUM1 is not equal to QSUMZ, if this occurs then convergence is assumed - although a warning message is written to the terminal or log file. Experience has shown that such an event only occurs when close to a converged solution.
5.2.3 Subroutine FOLLOW
This subroutine i s used t o trace t h e passage of a contaminant from a source room, through each room i n t h e building. It i s assumed t h a t t h e l e v e l i n t h e source room i s constant a t loo%, t h e d i l u t i o n i n o t h e r rooms can then be ca lcu la ted by so lv ing t h e set of equations:
where Li i s t h e l e v e l of t h e contaminant i n Room (%)
Qi i s t h e a i r flow rate leaving Room i (m3/s) L i s t h e l e v e l of t h e contaminant i n Room j (%) j
Q g i i s t h e flow o f a i r from Room j to Room i (m3/s ) - Nr i s t h e number of rooms minus 1 (no
so lu t ion is required f o r t h e source room).
Each room i s t r e a t e d as a source room i n tu rn (unless t h e r e i s no flow t o adjacent rooms), s o Equations (5) a r e solved N t i m e s .
r Gaussian e l iminat ion, with p a r t i a l p ivot ing i s used. Matrix inversion - based methods a r e not s u i t a b l e because t h e equation set changes as t h e source room i s changed.
5.2.4 Example o f an a n a l y t i c a l flow so lu t ion
The example is t h e c a l c u l a t i o n of flow through a l a r g e opening. Consider an opening of height H I with e x t e r n a l condi t ions given the s u f f i x 0 and i n t e r n a l i. then:
The pressure a t any height (y) is:
Outside
Where P i s t h e p resure a t y = o g is t h e g r a v i t a t i o n a l constant cis t h e dens i ty of air, assumed here t o be
independent of height .
The po in t where these a r e equal , t h e neu t ra l p lane (y = z ) defines a boundary above which ( i f t h e ins ide is h o t t e r than t h e outside) a i r flows o u t from t h e bui ld ing, and below which t h e r e is a cold inflow.
The flow i n t o the building pe r u n i t width of opening is (Q.): z
1
where :
W i s the width of t he opening
C i s the discharge coe f f i c i en t D
The outflow (is obtained by in tegra t ing between t h e neu t ra l plane and t h e top of t he opening H I giving:
6. CONCLUSIONS
This paper has attempted t o describe t h e bas i s of t he design f o r the ven t i l a t i on of t he bus s t a t i o n i n f a i r l y general terms, i n p a r t i c u l a r t o demonstrate how t h e work of t he A i r I n f i l t r a t i o n and Vent i la t ion Centre is used i n industry. The paper does not contain a lengthy discussion of computer predict ions because t h e inclusion of l a rge numbers of calculat ions a r e of l i t t l e value t o those not d i r ec t l y involved with t he design. More de ta i led information is avai lable and can be supplied on request, by t h e authors.
The design of t h e ven t i l a t ion s y s t e m does, of course, not s top with t h e calculat ion of the required flow rates . It is necessary t o s i z e p lan t , loca te t he f r e sh a i r i n l e t s i n pos i t ions where there is the bes t chance of taking i n t h e l e a s t pol luted a i r , and i n t h i s example, assessing t h e time required t o achieve f u l l pressur izat ion a f t e r the doors a r e closed. A t present t he p ro j ec t i s s t i l l i n t he form of a proposal so no de ta i led design has been done. It i s possible t h a t t he s i t ua t i on may have changed by the time of t he conference.
ACKNOWLEDGEMENTS
The design of a building i s a team e f f o r t , and the authors wish t o acknowledge the contributions of t h e i r colleagues i n the Ove Arup Partnership and i n pa r t i cu l a r Fiona Cousins.
REFERENCES
[ l ] Fanger P.O. Thermal Comfort. Danish Technical Press, Copenhagen 1970.
[2] Holmes M.J. Design for Ventilation. Proceedings 6th AIC Conference. Ventilation strategies and measurement techniques. 16-19 September 1985.
[3] Health and Safety Executive, Occupational Exposure limits. 1986.
I41 Bendelius A, Design criteria for Vehicular road tunnels. Ashrae Journal. June 1985.
[5] Messresultate des Nationalen Beobachtungsnetzes fur Luf tfremdstof f e (NABEL) . Schritenreibe Umweltschutz. Nr 42. Herausgegeben vom Bundesamt fur Umweltschutz, Bern. September 1985.
[61 Private communications. Warren Springs Laboratory (UK). Transport and Roads Research Laboratory (UK). Health and Safety Executive (UK).
[7] London Transport. Exhaust Gas Analysis of Leyland 0600 Engine.
181 Private communication from Motor Industries Research Association. Analysis of BOSCH engine exhaust gases.
[91 Haerter AA. Fresh Air rates for road tunnels. AVVT. 1973.
[ lo] CIBSE Guide Book B, Section B2, Chartered Instituion of Building Services Engineers. 1986.
[I11 ClBSE Guide Book A, Section 14, Chartered Institution of Building Services Engineers. 1986.
[12] E. S .I). U, "Strong Winds in the Atmospheric Boundary Layer, Part 1 Mean Hourly Speeds" ESDU Data Item 82026 Amend. A Dec. 1982. (Obtainable from ESDU International Ltd., 251-259 Regent Street, London W1R 7AD).
1131 COOK N,J. "Wind Tunnel Simulation of the Adiabatic Atmospheric Boundary Layer of Roughness, Barrier and Mixing Device Methods" Journal of Indust Aerodynamics Vol 3 Nos 2/3 July 1978.
[I41 E.S.D.U. Characteristics of Atmospheric Turbulence near the Ground Part 11 : Single Point Data for Strong Winds (Neutral Atmosphere)" EDU Data Item 74031 Amend A March 1975.
EFFECTIVE VENTILATION
9th AIVC Conference, Gent, Belgium 12-15 September, 1988
Paper 2 3
VENTILATION AND AIR QUALITY IN BELGIAN BUILDINGS: A STATE OF THE ART.
P. WOUTERS, D. L'HEUREUX, P. VOORDECKER AND R. BOSSICARD
W.T.C.B./C.S.T.C. Lombardstraat, 41 1000 Brussels BELGIUM

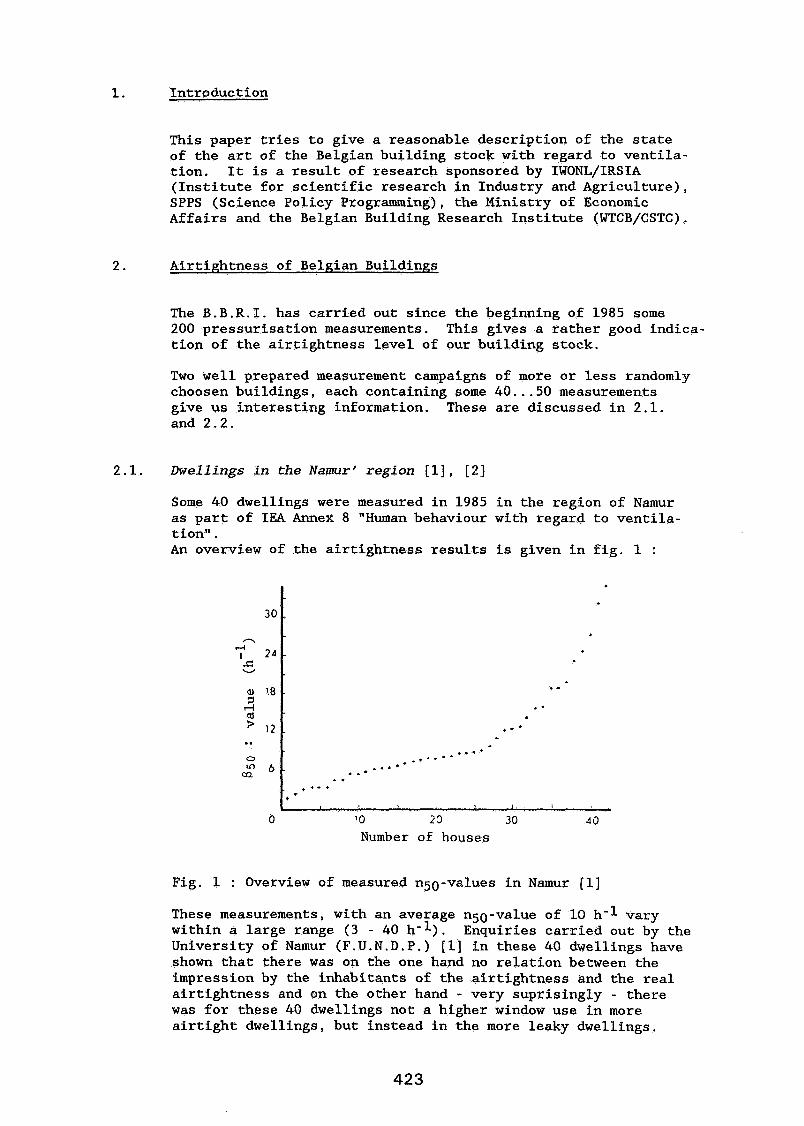
1. Introduction
This paper tries to give a reasonable description of the state of the art of the Belgian building stock with regard to ventila- tion. It is a result of research sponsored by IWONL/IRSIA (Institute for scientific research in Industry and Agriculture), SPPS (Science Policy Programming), the Ministry of Economic Affairs and the Belgian Building Research Institute (WTCB/CSTC).
Airtightness of Behian Buildings
The B.B.R.I. has carried out since the beginning of 1985 some 200 pressurisation measurements. This gives a rather good indica- tion of the airtightness level of our building stock.
Two well prepared measurement campaigns of more or less randomly choosen buildings, each containing some 40 ... 50 measurements give us interesting information. These are discussed in 2.1. and 2.2.
2.1. Dwellings in the Namur' region [I], [2]
Some 40 dwellings were measured in 1985 in the region of Namur as part of IEA Annex 8 "Human behaviour with regard to ventila- t ion" . An overview of the airtightness results is given in fig. 1 :
Number of houses
Fig. 1 : Overview of measured n50-values in Namur [I]
These measurements, with an average ng0-value of 10 h'l vary within a large range (3 - 40 h-l). Enquiries carried out by the University of Namur (F.U.N.D.P.) [I] in these 40 dwellings have shown that there was on the one hand no relation between the impression by the inhabitants of the airtightness and the real airtightness and on the other hand - very suprisingly - there was for these 40 dwellings not a higher window use in more airtight dwellings, but instead in the more leaky dwellings.
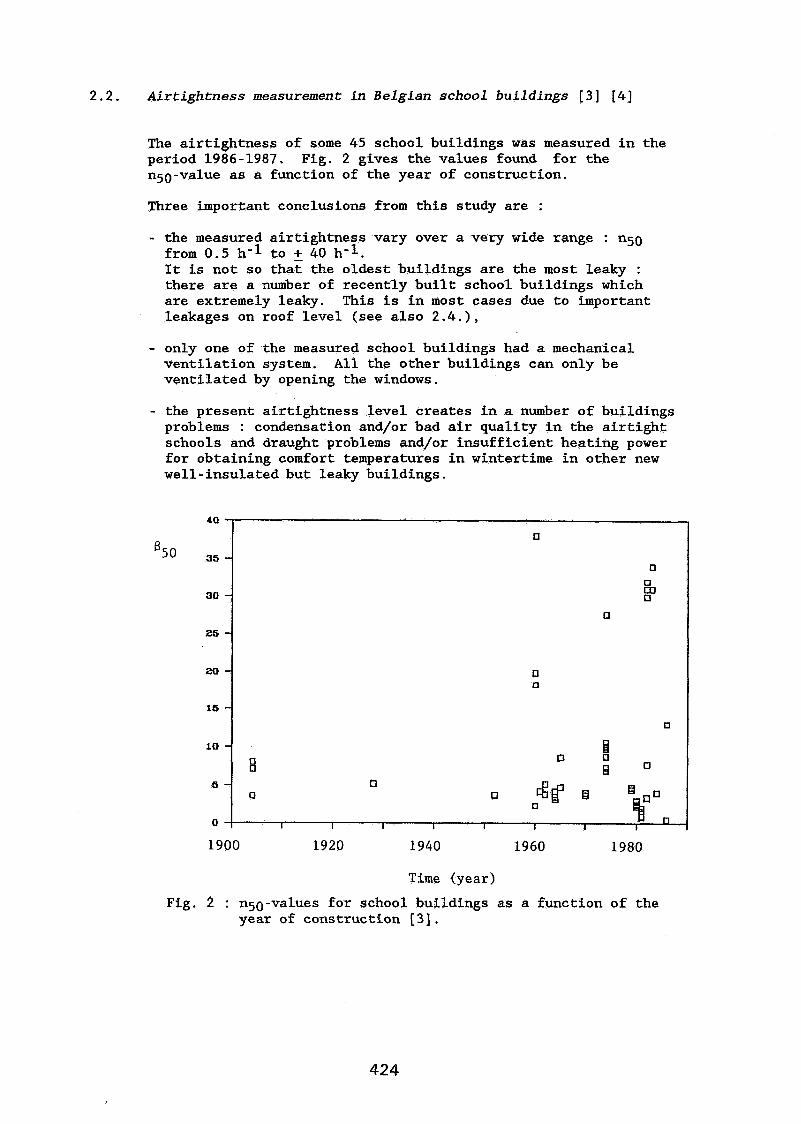
2.2. Airtightness measurement i n Belgian school buildings [ 3 ] [4]
The airtightness of some 45 school buildings was measured in the period 1986-1987. Fig. 2 gives the values found for the n50-value as a function of the year of construction.
Three important conclusions from this study are :
- the measured airtightness vary over a very wide range : 1150 from 0.5 h'l to + 40 h-l. It is not so that the oldest buildings are the most leaky : there are a number of recently built school buildings which are extremely leaky. This is in most cases due to important leakages on roof level (see also 2.4.),
- only one of the measured school buildings had a mechanical ventilation system. All the other buildings can only be ventilated by opening the windows.
- the present airtightness level creates in a number of buildings problems : condensation and/or bad air quality in the airtight schools and draught problems and/or insufficient heating power for obtaining comfort temperatures in wintertime in other new well-insulated but leaky buildings.
Time (year )
Fig. 2 : n50-values for school buildings as a function of the year of construction [ 3 ] .
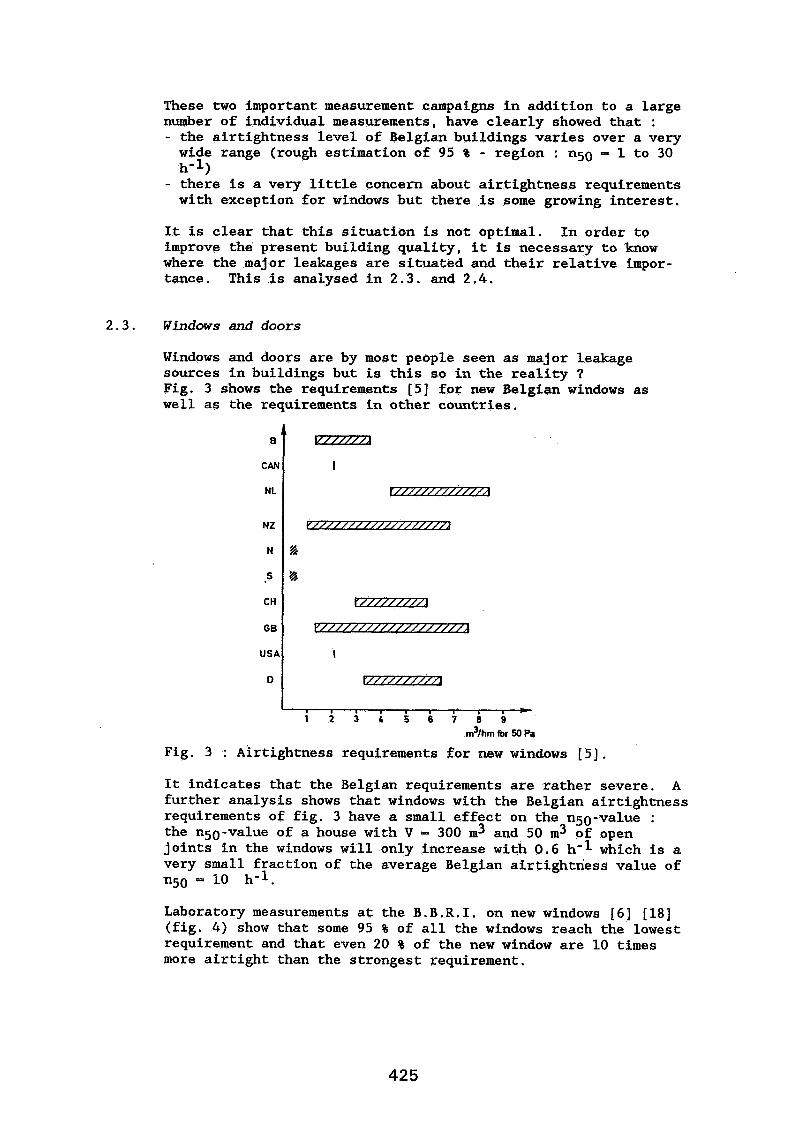
These two important measurement campaigns in addition to a large number of individual measurements, have clearly showed that : - the airtightness level of Belgian buildings varies over a very wide range (rough estimation of 95 % - region : n50 - 1 to 30- h-1)
- there is a very little concern about airtightness requirements with exception for windows but there is some growing interest.
It is clear that this situation is not optimal. In order to improve the present building quality, it is necessary to know where the major leakages are situated and their relative impor- tance. This is analysed in 2.3, and 2.4.
2.3. Windows and d o o r s
Windows and doors are by most people seen as major leakage sources in buildings but is this so in the reality ? Fig. 3 shows the requirements [5] for new Belgian windows as well as the requirements in other countries.
I . . . . , . * 1 2 3 4 5 6 7 8 9
m3/hm for 50 Pa
Fig. 3 : Airtightness requirements for new windows 151.
It indicates that the Belgian requirements are rather severe. A further analysis shows that windows with the Belgian airtightness requirements of fig. 3 have a small effect on the 1150-value : the n50-value of a house with V = 300 m3 and 50 m3 of open joints in the windows will only increase with 0.6 h"l which is a very small fraction of the average Belgian airtightness value of 1150 = 10 h-1.
Laboratory measurements at the B.B.R.I. on new windows [6] [18] (fig. 4) show that some 95 % of all the windows reach the lowest requirement and that even 20 % of the new window are 10 times more airtight than the strongest requirement.
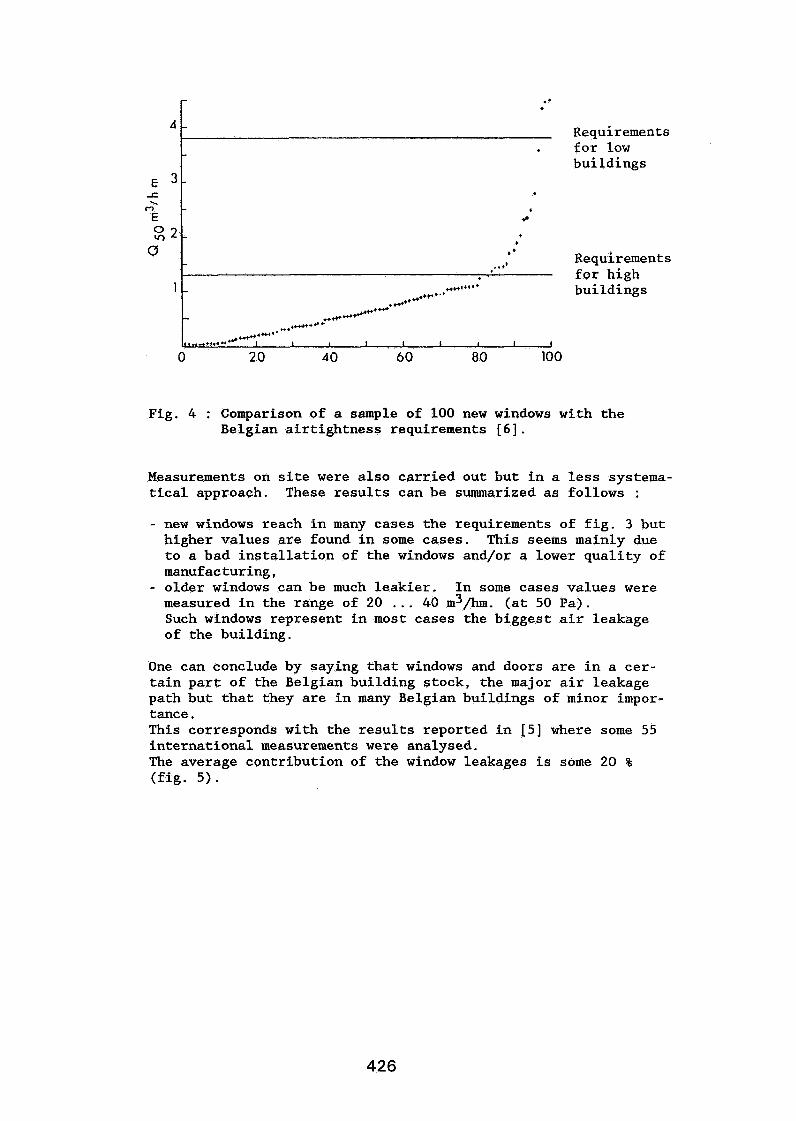
4
E 3 -
Fig. 4 : Comparison of a sample of 100 new windows with the Belgian airtightness requirements [ 6 ] .
- Requirements . for low - buildings
z2- (II
1
Measurements on site were also carried out but in a less systema- tical approach. These results can be summarized as follows :
+ * +
- .I.'
Requirements . for high - CW,..t+
,,+c+.' buildings + -* 4' +
- *trt-* _*uu+-**
&+,"+,**'. -,++. C - I I I I I I 1 I 1
- new windows reach in many cases the requirements of fig. 3 but higher values are found in some cases. This seems mainly due to a bad installation of the windows and/or a lower quality of manufacturing ,
- older windows can be much leakier. In some cases values were measured in the range of 20 . . . 40 m3/hm. (at 50 Pa). Such windows represent in most cases the biggest air leakage of the building.
One can conclude by saying that windows and doors are in a cer- tain part of the Belgian building stock, the major air leakage path but that they are in many Belgian buildings of minor impor- tance. This corresponds with the results reported in [5] where some 55 international measurements were analysed. The average contribution of the window leakages is some 20 % (fig. 5).

+ WINDOWS AND
+
+
Fig. 5 : Leakages in windows an/or doors expressed as percen- tages of the total building leakage : results for some 55 measurement campaigns [5].
WINDOWS DOORS
+ +
+ ++ + + + + +
T
v , , , 1 1 1 1 ' * 1 1 1 ~
2 . 4 . Other leakages
In many Belgian buildings there are important leakages besides the window leakages.
- inclined roofs can be very leaky if the interior finishing is made of wooden or aluminium panels with open joints and if there is no air-barrier in the roof. In 2 recently built school buildings, 1 office building and 1 individual dwelling, air flow rates of 5 100 m3/h,m2 were measured at 50 Pa difference. Fig. 6 gives a typical cross section of such a roof [ 7 ] .
In both schools and in the individual dwelling, 1 room has been renovated by installing a PVC-foil in the roof construc- tion.
Table 1 summarises the results. The results indicate the importance of good workmanship.
PVC-foils (0.2 mm) between layers 1 and 2, joints not
PVC-foils (0.2 mm) between
Table 1 : Measured values in a classroom (with 3 different situations for the roof construction [7]
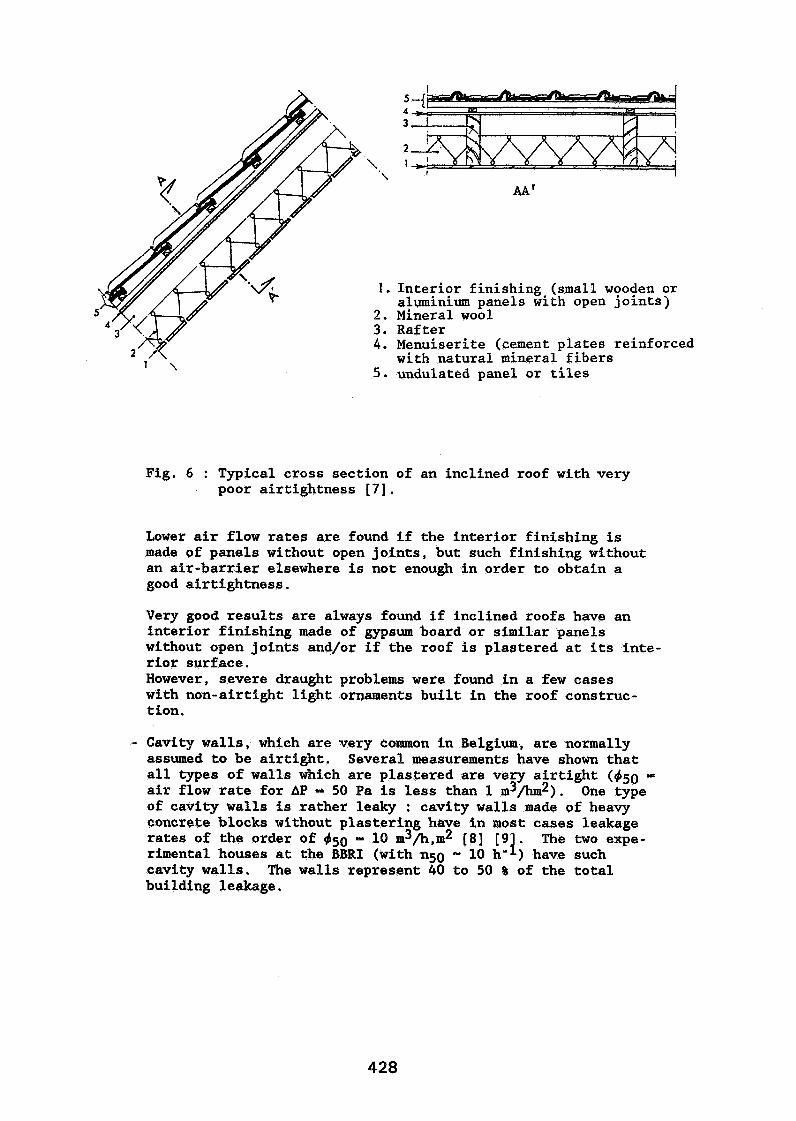
1. Inte~i?r finishing.(small woo$en or aluminium panels with open jolnts)
2. Mineral wool 3. Rafter 4. ~enuiserite (cement plates reinforced
with natural mineral fibers 5. undulated panel or tiles
Fig. 6 : Typical cross section of an inclined roof with very poor airtightness [7].
Lower air flow rates are found if the interior finishing is made of panels without open joints, but such finishing without an air-barrier elsewhere is not enough in order to obtain a good airtightness.
Very good results are always found if inclined roofs have an interior finishing made of gypsum board or similar panels without open joints and/or if the roof is plastered at its inte- rior surface. However, severe draught problems were found in a few cases with non-airtight light ornaments built in the roof construc- tion.
- Cavity walls, which are very common in Belgium, are normally assumed to be airtight. Several measurements have shown that all types of walls which are plastered are very airtight (450 = air flow rate for AP - 50 Pa is less than 1 m3/hm2). One type of cavity walls is rather leaky : cavity walls made of heavy concrete blocks without plastering have in most cases leakage rates of the order of 450 - 10 m3/h,m2 [ a ] [ 9 . The two expe- 1 rimental houses at the BBRI (with n50 - 10 h' ) have such cavity walls. The walls represent 40 to 50 % of the total building leakage.
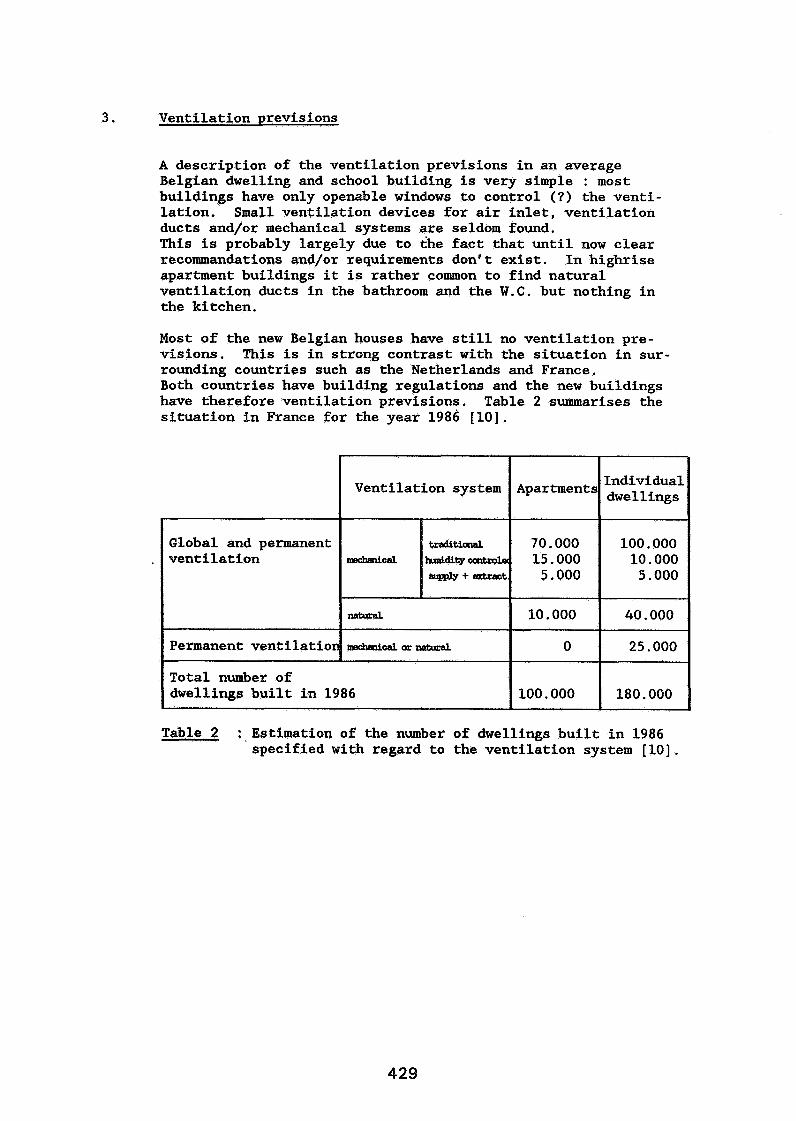
3. Ventilation previsions
A description of the ventilation previsions in an average Belgian dwelling and school building is very simple : most buildings have only openable windows to control (?) the venti- lation. Small ventilation devices for air inlet, ventilation ducts and/or mechanical systems are seldom found. This is probably largely due to the fact that until now clear recommandations and/or requirements don't exist. In highrise apartment buildings it is rather common to find natural ventilation ducts in the bathroom and the W.C. but nothing in the kitchen.
Most of the new Belgian houses have still no ventilation pre- visions. This is in strong contrast with the situation in sur- rounding countries such as the Netherlands and France. Both countries have building regulations and the new buildings have therefore ventilation previsions. Table 2 summarises the situation in France for the year 1986 [lo].
Global and permanent ventilation
Total number of dwellings built in 1986 100.000 180.000
Table 2 : Estimation of the number of dwellings built in 1986 specified with regard to the ventilation system [lo].

4 . Ventilation related problems in Belpian buildin~s
4.1. Introduction - - - - - - - - - - - - The combination of a large non-intended range of airtightness levels and the non-existence of appropriate ventilation previ- sions signifies in practice a very large variation in air change rates. This is qualitatively shown in fig. 7.
- Hous jng g tock with 'good ventllatlon
- - Belgian housing stock
-----
Fig. 7 : Seasonal air change rate for the whole building stock as a function of the ventilation system (qualitative approach).
Fig. 7 shows the average seasonal air change rate for the whole housing stock. In the situation with no ventilation previsions, there is a very wide range due to the wide range in airtightness and the non-existence of ventilation previsions. It seems not possible-to give clear statements about the average of both populations (A > B or B > A) but it is very clear that the standard deviation of A is much smaller than the standard deviation of B.
One conclusion is that it is very difficult to predict the air change rate for dwellings with uncontrolled airtightness and no ventilation previsions (Belgian situation).
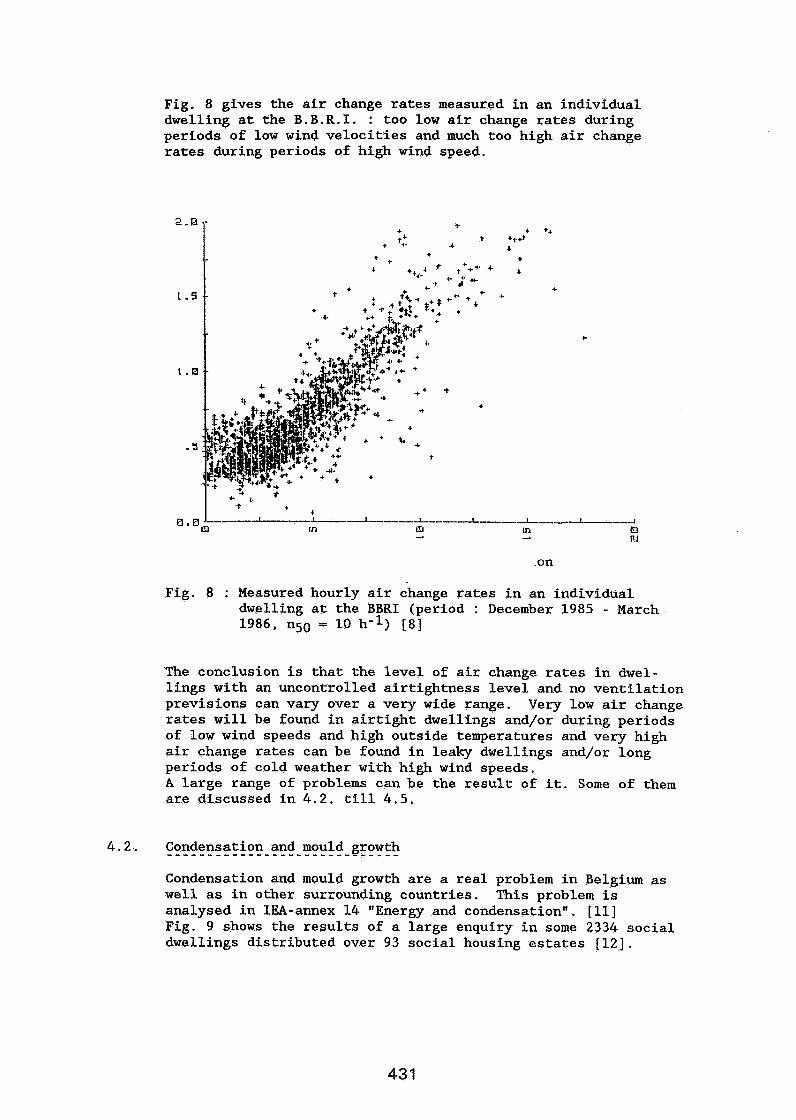
Fig. 8 gives the air change rates measured in an individual dwelling at the B.B.R.I. : too low air change rates during periods of low wind velocities and much too high air change rates during periods of high wind speed.
Fig. 8 : Measured hourly air change rates in an individual dwelling at the BBRI (period : December 1985 - March 1986, 1150 = 10 h-l) [8]
The conclusion is that the level of air change rates in dwel- lings with an uncontrolled airtightness level and no ventilation previsions can vary over a very wide range. Very low air change rates will be found in airtight dwellings and/or during periods of low wind speeds and high outside temperatures and very high air change rates can be found in leaky dwellings and/or long periods of cold weather with high wind speeds. A large range of problems can be the result of it. Some of them are discussed in 4.2. till 4.5.
2. Condensation and mould growth . . . . . . . . . . . . . . . . . . . . . . . . . . . . . Condensation and mould growth are a real problem in Belgium as well as in other surrounding countries. This problem is analysed in IEA-annex 14 "Energy and condensation". [ll] Fig. 9 shows the results of a large enquiry in some 2334 social dwellings distributed over 93 social housing estates [12].
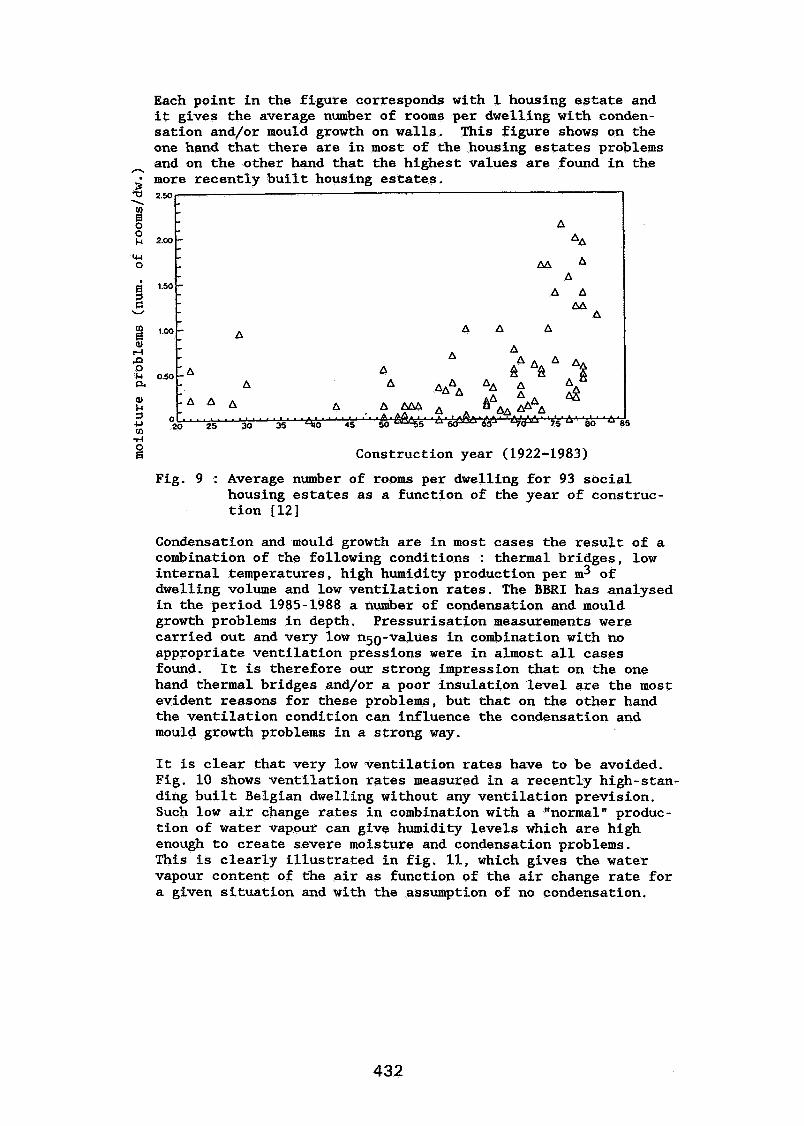
Each point in the figure corresponds with 1 housing estate and it gives the average number of rooms per dwelling with conden- sation and/or mould growth on walls. This figure shows on the one hand that there are in most of the housing estates problems
h and on the other hand that the highest values are found in the ; more recently built housing estates. a 2.501 I
Construction year (1922-1983)
Fig. 9 : Average number of rooms per dwelling for 93 social housing estates as a function of the year of construc- tion [12]
Condensation and mould growth are in most cases the result of a combination of the following conditions : thermal bridges, low internal temperatures, high humidity production per m3 of dwelling volume and low ventilation rates. The BBRI has analysed in the period 1985-1988 a number of condensation and mould growth problems in depth. Pressurisation measurements were carried out and very low n50-values in combination with no appropriate ventilation pressions were in almost all cases found. It is therefore our strong impression that on the one hand thermal bridges and/or a poor insulation level are the most evident reasons for these problems, but that on the other hand the ventilation condition can influence the condensation and mould growth problems in a strong way.
It is clear that very low ventilation rates have to be avoided. Fig. 10 shows ventilation rates measured in a recently high-stan- ding built Belgian dwelling without any ventilation prevision. Such low air change rates in combination with a "normal" produc- tion of water vapour can give humidity levels which are high enough to create severe moisture and condensation problems. This is clearly illustrated in fig. 11, which gives the water vapour content of the air as function of the air change rate for a given situation and with the assumption of no condensation.

f; Air change rate (h-l) + temperature(Oc/100) -I
I I l t l l l l l l t l l . O l l S 1 I , , ,
0 4 T ime (h
Fig. 10 :
Measured air change rate in a new indivi- dual dwelling [13]
Fig. 11 : Exemple of the water vapour content as a function of the air change rate [14]
The fact that low air change rates have to be avoided does of course not mean that very high air change rates are the best solution. Very high air change rates in buildings with a high thermal intertia are in certain situations even the cause for humidity problems.
This is shown in a research project sponsored by IWONL/IRSIA. The following situation was simulated in a hot box - cold box : a room which was ventilated during a long period with open windows, so that the room becomes very cold, is from a certain moment on heated with the windows closed. Fig. 12 gives the cross section of the non-insulated cavity wall with balcony where fig. 13 gives the evolution of 3 representative tempera- tures. The rise of the temperature in the corner A is var slow.
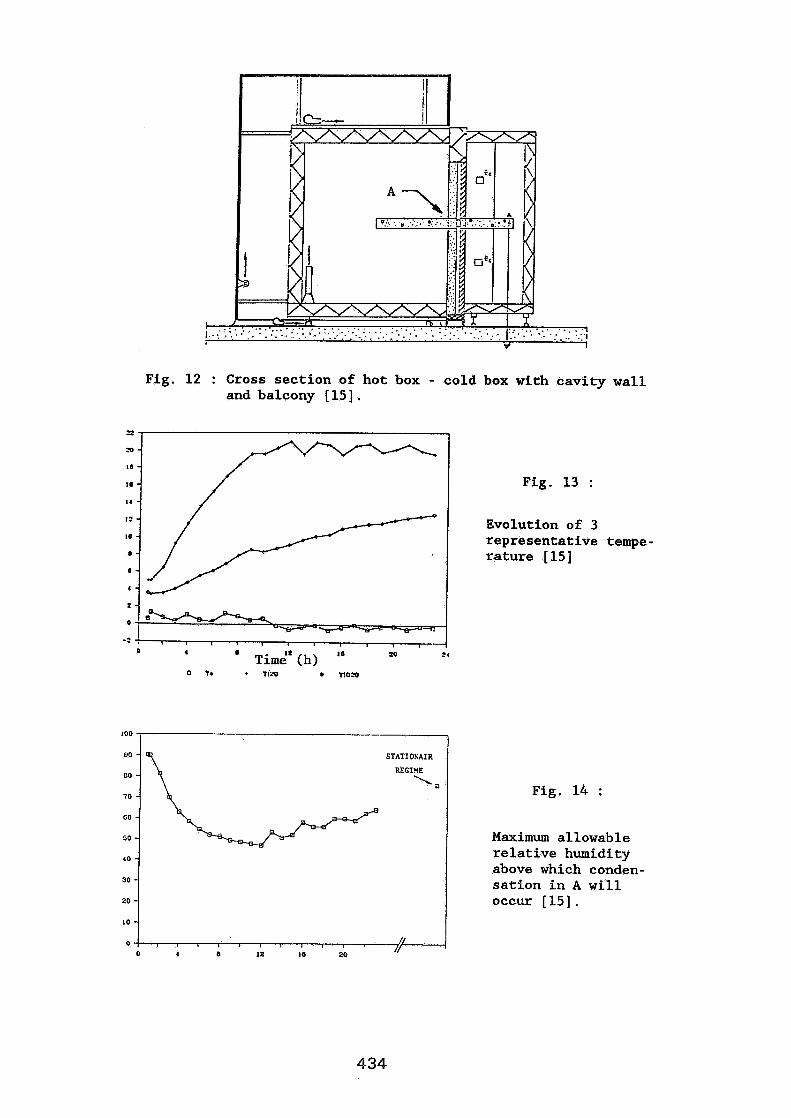
Fig. 12 : Cross section of hot box - cold box with cavity wall and balcony [ 15 ] .
Fig. 13 :
Evolution of 3 representative tempe- rature [IS]
-2 ' 0 4 I 0 20
r -I (h) 2 4
Fig. 14 :
Maximum allowable relative humidity above which conden- sation in A will occur [15].
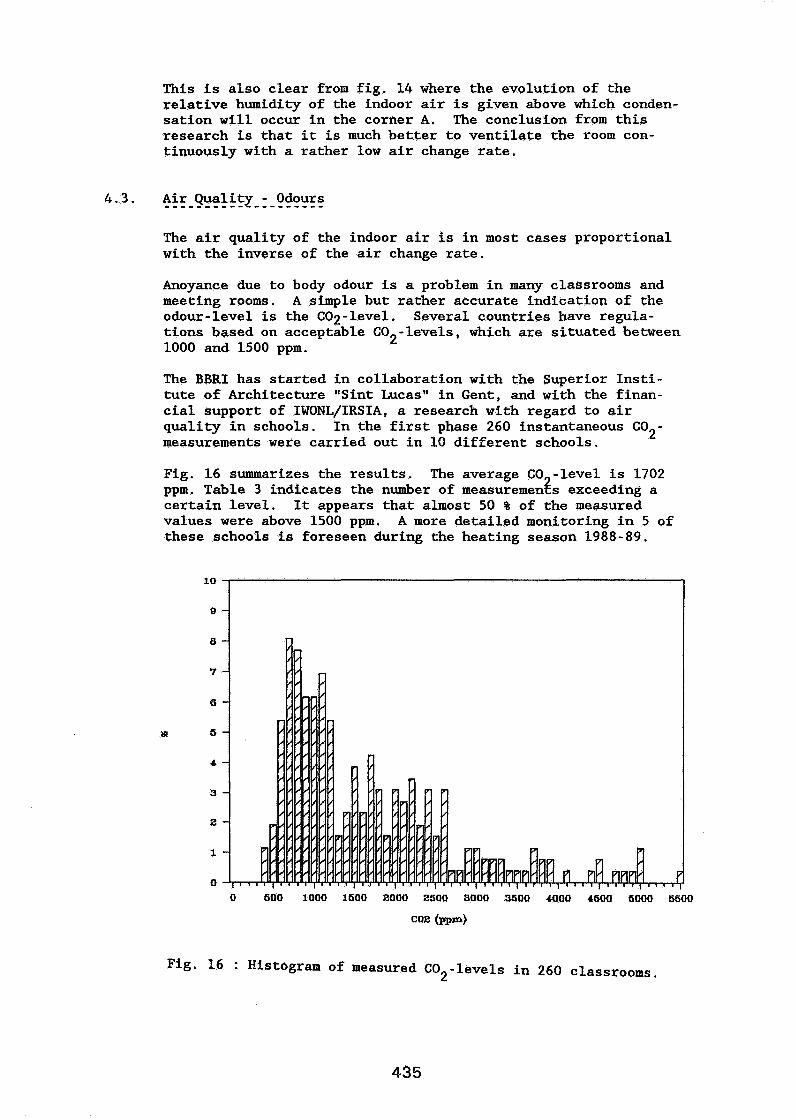
This is also clear from fig. 14 where the evolution of the relative humidity of the indoor air is given above which conden- sation will occur in the corner A. The conclusion from this research is that it is much better to ventilate the room con- tinuously with a rather low air change rate.
4.3. Air Quality - Odours . . . . . . . . . . . . . . . . . . . .
The air quality of the indoor air is in most cases proportional with the inverse of the air change rate.
Anoyance due to body odour is a problem in many classrooms and meeting rooms. A simple but rather accurate indication of the odour-level is the C02-level. Several countries have regula- tions based on acceptable GO2-levels, which are situated between 1000 and 1500 ppm.
The BBRI has started in collaboration with the Superior Insti- tute of Architecture "Sint Lucas" in Gent, and wich the finan- cial support of IWONL/IRSIA, a research with regard to air quality in schools. In the first phase 260 instantaneous CO measurements were carried out in 10 different schools.
2 -
Fig. 16 summarizes the results. The average 60 -level is 1702 ppm. Table 3 indicates the number of measuremenzs exceeding a certain level. It appears that almost 50 % of the measured values were above 1500 ppm. A more detailed monitoring in 5 of these schools is foreseen during the heating season 1988-89.
Fig. 16 : Histogram of measured CO -levels in 260 classrooms. 2
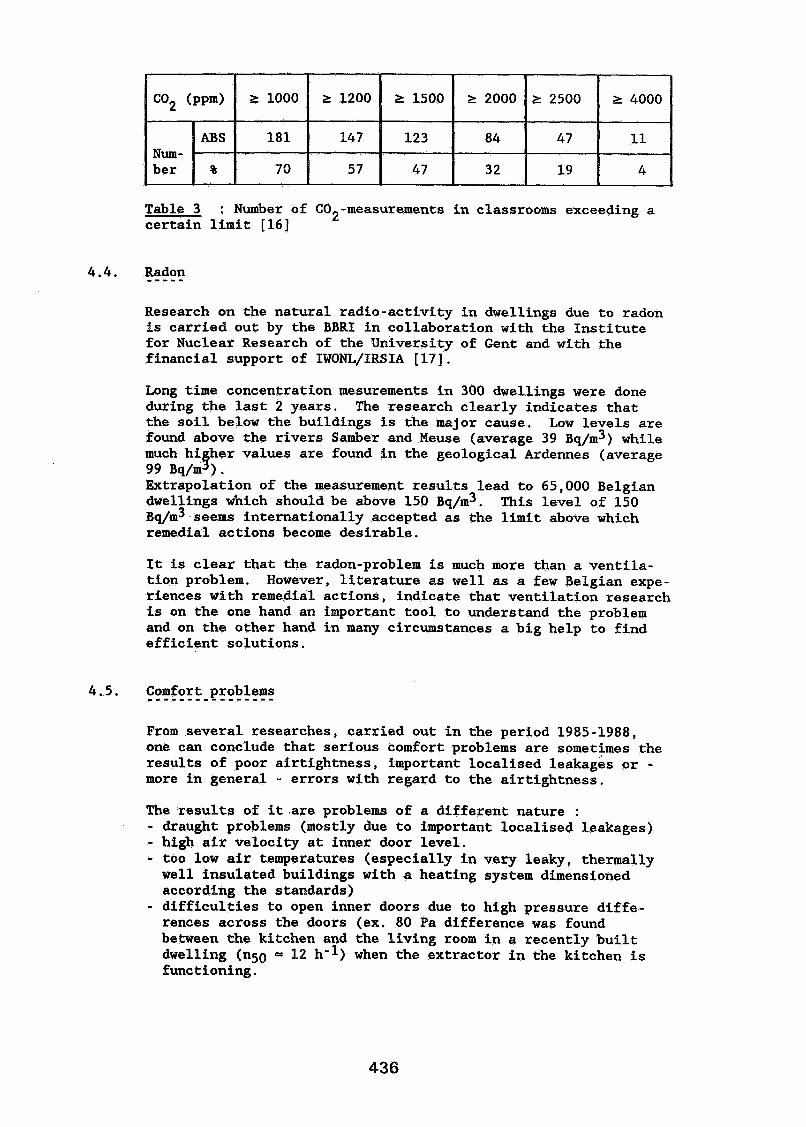
Table 3 : Number of CO -measurements in classrooms exceeding a certain limit [16]
2
4.4. Radon - - - - - Research on the natural radio-activity in dwellings due to radon is carried out by the BBRI in collaboration with the Institute for Nuclear Research of the University of Gent and with the financial support of IWONL/IRSIA [17].
Long time concentration mesurements in 300 dwellings were done during the last 2 years. The research clearly indicates that the soil below the buildings is the major cause. Low levels are found above the rivers Samber and Meuse (average 39 Bq/m3) while much hi her values are found in the geological Ardennes (average f 99 Bq/m ). Extrapolation of the measurement results lead to 65,000 Belgian dwellings which should be above 150 Bq/m3. This level of 150 ~q/rn~ seems internationally accepted as the limit above which remedial actions become desirable.
It is clear that the radon-problem is much more than a ventila- tion problem. However, literature as well as a few Belgian expe- riences with remedial actions, indicate that ventilation research is on the one hand an important tool to understand the problem and on the other hand in many circumstances a big help to find efficient solutions.
4.5. Comfort problems - - - - - - - - - - - - - - - - From several researches, carried out in the period 1985-1988, one can conclude that serious comfort problems are sometimes the results of poor airtightness, important localised leakages or - more in general - errors with regard to the airtightness. The results of it are problems of a different nature : - draught problems (mostly due to important localised leakages) - high air velocity at inner door level. - too low air temperatures (especially in very leaky, thermally well insulated buildings with a heating system dimensioned according the standards)
- difficulties to open inner doors due to high pressure diffe- rences across the doors (ex. 80 Pa difference was found between the kitchen and the living room in a recently built dwelling (n50 = 12 h-l) when the extractor in the kitchen is functioning.
5. CONCLUSIONS
The Belgian research projects on ventilation in buildings, which were carried out during the last years, allow to give a rather precise overview of the quality of the Belgian building stock on this matter.
It shows that the airtightness vary very much from one building to another. Very leaky as well as very airtight buildings are frequently found. The almost non-existence of controlable ventilation previsions in individual Belgian dwellings is remarkable.
Some problems in Belgian Buildings (condensation, odours, radon, comfort) were discussed as well as their relation to ventila- tion. It is clear that a better ventilation will lead to a significant reduction of these problems.
An important conclusion with regard to the future concerns the urgent need of improved concepts for the ventilation control in Belgian buildings.
Finally, but not at least, it is our believe that the present situation of the Belgian building stock is not worser or better than 5 years ago. The difference is that we have now a reasonable idea where the problems are situated and that we have also already some answers how to solve them.
The Belgian membership of the Air Infiltration and ventilation Center has contributed in a significant way to this increase of knowlegde.
7. References
[I] Dubrul, C., Annex 8 : Inhabitants behaviour with regard to ventila- tion, D.P.W.B., Brussels, 1988
[2] Dubrul, C., Annex 8 : Inhabitants behaviour with regard to ventila- tion, A.1.C.-TI?-23-88, A.I.V.C., Bracknell, Great Britain, March 1988
[3] Wouters, P., L'Heureux, D., Voordecker, P., De ventilatieproble- matiek in gebouwen, D.P.W.B., National R & D programma Energie, Brussels, 1988 (in Dutch)
[3] Wouters, P., L'Heureux, D., Voordecker, P., De ventilatieproblema- tiek : Bespreking van de pressurisatiemetingen in een aantal Belgische scholen : algemene situering, B.B.R.I., Brussels, 1986 (in Dutch)
141 Wouters, P., L'Heureux, D., Voordecker, P., Analyse dBtaill8e des mesures de pressurisation effectuBes dans 15 Bcoles belges, B.B.R.I., Brussels, 1986 (in French)
[S] Wouters, P., Ventilatie en infiltratie in gebouwen : de stand van zaken in Belgie, B.B.R.1.-revue nr 3/4, Brussels, 1986 (in Dutch and French)
[6] van Dijk, H.A.L. (ed.), I.E.A. annex 12 : Thermal and Solar proper- ties of windows - Expert Guide, Delft, 1988
[7] Wouters, P., Luchtdichtheidsproblemen bij daken met een plafondaf- werking van schroten met open voegen, B.B.R.1.-review 3/4, Brussels, 1986 (in Dutch and French)
[8] Wouters, P., L'Heureux, D., Voordecker, P., De IDEE-woningen : een gedetailleerde hygrothermische studie - Deelrapport 1 - Ventilatie en luchtdichtheid, W.T.C.B., Brussels, 1986 (in Dutch)
[9] Le Compte, J., Invloed van natuurlijke konvektie op het hygrother- misch gedrag van bouwelementen, K.U.Leuven, 1985 (in Dutch).
[lo] Becirspahic, S., Synthbse du sBminaire "Ventilation et renouvel- lement de l'air dans l'habitat", Sofia Antipolis, 17-18 novembre 1987 (in French).
[ll] Senaeve, E., I.E.A. Annex XIV Energy and Condensation, Proceedings 9th AIVC conference, Gent, 1988.
[12] B.B.R.1.-D.P.W.B.-N.M.H., Eerste analyse van de databank N.M.H. 5000, W.T.C.B., Brussel, 1987 (in Dutch)
[13] Internal B.B.R.I. Report
[14] B.B.R.I. Vochthuishouding in gebouwen, TV 153, B.B.R.I., Brussels, May-June 1984 (in Dutch and French)
[15] Wouters, P., Bossicard, R., L'Heurew, D., Voordecker, P., Betonnen balkonuitkragingen met termische onderbrekingen. Bespreking van de hygrotermische meet- en rekenstudie, 1.W.O.N.L.-research, B.B.R.I., Brussels, juni 1988 (in Dutch)
[16] Report in preparation.
[17] Report in preparation.
1181 Verougstraete, P., Commentaire de plusieurs essais de laboratoire relatifs B lf6tanch6it6 des fenetres au vent et h la pluie, BBRI review, March, 1983 (in Dutch and French).


Related Documents