1 Venture Capital Fund Performance and the IPO Market Abstract In this paper, the investment performance of a large database of venture funds is considered over a 28 year period. The results suggest that a portfolio of venture capital partnerships can provide an average return that is superior to the public equity market, although the individual fund returns are highly positively skewed. Absent these outliers, the level of fund performance is more inline with public equity market returns. This paper also establishes a link between public equity market conditions and venture capital returns. Finally, some preliminary evidence is provided of venture fund performance during and immediately following the dot.com bubble.

Welcome message from author
This document is posted to help you gain knowledge. Please leave a comment to let me know what you think about it! Share it to your friends and learn new things together.
Transcript

1
Venture Capital Fund Performance and the IPO Market
Abstract In this paper, the investment performance of a large database of venture funds is considered over a 28 year period. The results suggest that a portfolio of venture capital partnerships can provide an average return that is superior to the public equity market, although the individual fund returns are highly positively skewed. Absent these outliers, the level of fund performance is more inline with public equity market returns. This paper also establishes a link between public equity market conditions and venture capital returns. Finally, some preliminary evidence is provided of venture fund performance during and immediately following the dot.com bubble.

2
Introduction
The U.S. National Venture Capital Association (NVCA) was founded in 1974 by 78
firms with aggregate capital of barely half a billion US dollars.1 Since that time, the
industry has experienced remarkable growth and by December, 2006, there were 798
venture capital firms managing a total of $236 billion2 making it one of the key asset
categories in the alternative investments industry. Despite its importance however,
relatively little is known about the experience of those who invest in venture capital
funds. This is an important issue as the liquidity risk of venture funds is significantly
greater than for any other class of asset insomuch as most venture funds have a
contractual lifespan of ten years and there is a very limited secondary market to
facilitate an early exit.
The most significant impediment to any research on the venture capital industry is a
lack of suitable data, as partners are typically not subject to public disclosure
requirements (see Denis, 2004, p. 320, for a discussion).3 Despite this obstacle, a
small literature has emerged that has attempted to provide insights into the venture
industry, including characterising fund performance (see Phalippou, 2007, for a
survey). For example, Cochrane, 2000, Quigley and Woodward, 2003 and Hwang,
Quigley and Woodward, 2005, infer aggregate information about the performance of
private equity investing using data on the returns to individual venture capital
projects. Peng, 2001, Chen, Baeirl and Kaplan, 2002, Woodward and Hall, 2004, and
Hwang, Quigley and Woodward, 2005 use a repeat valuation model to construct an
index of venture capital from which overall industry performance may be inferred. A
problem with these studies is that they do not take into account the timing of the cash
flows or the risk profile of the investing companies. Gompers and Lerner (1997),
Schmidt (2003) and, in particular, Ljungqvist and Richardson (2003) and Kaplan and
Schoar (2005) attempt to overcome these problems by undertaking a more detailed
level of analysis in which the individual investments of a fund are considered (see
Section I for a detailed survey of the literature).
1 American Research and Development Corp. is generally regarded as the first venture capital firm. It was launched in 1946 with the aim of commercialising technology developed during the war. 2 Source: US National Venture Capital Association, 2006 Yearbook. 3 Recently some fund-level data has been revealed by public sector pension funds subject to state-level “Sunshine Law” or “Freedom of Information Act” requirements.

3
The purpose of this paper is to characterise and explore the sources of investment
performance in the venture industry. To this end, we draw on a unique proprietary
database of the venture capital investments made by two major limited partners (LPs),
which is provided on an anonymised basis. The dataset for one LP begins in 1980,
while the other begins in 1985. Since their inception, these LPs have invested in a
combined total of 387 venture funds, providing a rich database of information for
analysis. Dated cash flow information is provided on all takedowns and
disbursements throughout the life of each fund. The ability to examine dated
disbursements to, and realizations from, individual venture funds distinguishes this
paper from most of the previous literature that has attempted to analyse the returns to
venture capital.
The sample of fund data is benchmarked using the Venture Expert database, and the
investment activity of the LPs generally reflects the overall trends in the industry.
Where the LPs do distinguish themselves however, is in their ability to generate a
level of return that is superior to both that of the public equity market and the venture
industry itself. These returns however, are highly positively skewed such that only a
small number of extremely high performing funds are responsible for generating the
excess returns. In the absence of these outliers, the level of fund performance is far
less impressive and more inline with public equity market returns. Thus, although our
LPs are not representative of the industry as a whole, we consider this to be a virtue of
our study. By focusing on two high performing LPs, we are able to explore the source
of excess returns in the industry. Further, the results help to explain the high degree
of variation in venture returns reported in the literature. To put it simply, our LPs are
above average performers and this status is a function of their ability to access a small
number of funds that generate extreme returns. The majority of LPs however, are not
be able to invest in these funds, as established general partners (GPs) typically only
solicit investments from LPs with which they have long standing relationships. As a
result, the average industry returns are similar to listed equity and only an elite group
are able to outperform the public market.4
4 Discussions with industry participants provide anecdotal support for this finding.

4
These findings raise a number of interesting questions about the supposed benefits of
investing in the venture industry. In terms of the returns to venture investing, the
majority of investors are unlikely to be able to access the select group of extremely
high performing funds that are the key to out-performance. Thus, venture investing
may not necessarily result in an enhanced expected portfolio return.
A second important contribution of this paper is to establish a link between public
equity market conditions and venture capital returns. The early empirical and
theoretical work on venture capital frequently assumed that the performance of private
equity was independent of the public equity sector. A more recent literature has
emerged that broadly identifies the state of the IPO market as a factor affecting
venture capital returns. In this paper, we provide a detailed characterization of the
evolving state of the venture IPO market through time and link this to venture fund
performance. The results of this analysis suggest that the public equity market
substantially influences venture returns. Specifically, the median IRR achieved when
the IPO market is unfavourable at time of exit is 9%, whereas the median IRR for
funds exiting in a favourable IPO environment was 76%. The observed correlation of
venture returns with the public equity market may reduce the diversification benefits
of a venture capital investment portfolio for institutional investors.
A third contribution of this study is to furnish some preliminary evidence of venture
fund performance during and immediately following the dot.com bubble. The
available data suggests that venture investing during the build up to the peak of the
bubble was unprecedented in terms of the number of funds, the size of the investments
made and the extraordinary levels of fund performance. Further, the number of
venture-backed IPOs approached an all-time peak during this period. The most
distinctive characteristic of the bubble was the unprecedented number of listings of
unprofitable companies. The performance of the funds following the bursting of the
bubble was dramatically lower compared to any time in the preceding 20 year sample
period. This reversal coincided with a radical decline in the number of venture-
backed IPOs and the almost complete inability to take unprofitable companies public.
The remainder of this paper is set out as follows. Section I surveys the relevant
literature. Section II characterizes our set of venture funds in some detail. Section III

5
characterises the performance of the sample and compares it to the return on both
public equity and the venture industry in general. Section IV considers the issue of
the persistence in the returns of the funds. In Section V, the combined database of
terminated and effectively terminated funds is used to explore the relationship
between conditions in the public equity market and venture fund performance.
Section VI considers the impact of the dot.com bubble on the venture industry.
Finally, Section VII provides some concluding comments.
I. Literature Survey
The principal source of venture investment data is a commercial database maintained
by the Venture Economics5 (VE hereafter) unit of Thompson Financial group. This
database contains aggregate information on voluntarily reported quarterly fund-level
cash flows, self-estimated residual values and calculated rates of return, for a large
number of venture funds. The VE database is useful when characterising the
investment behaviour of private equity funds (its intended purpose). When estimating
the returns to these funds however, the nature of the data presents a number of
problems (see Ljungqvist and Richardson, 2003). Lerner, Schoar and Wongsunwai
(2007) attempt to overcome this problem by combining the VE database with returns
data sourced from Private Equity Intelligence as well as other databases that provide
information on institutional characteristics. While this does create coverage issues
(their IRR data is only available for 40% of the funds in the sample and the database
from which they collect fund information changes is less complete in the early part of
the sample period) and the data is focused on the lead up to the 2000 bubble period
(only funds raised between 1991 and 1998 are included), they report a net average
return to venture investment of 23.7%. Further, the authors document systematic
differences in the returns across LPs, which they conclude is a function of different
investment objectives and levels of sophistication across investors.
As an alternative to using aggregate data to estimate the performance of venture
funds, a number of different approaches have been taken. Cochrane (2000), Quigley
and Woodward (2003) and Hwang, Quigley and Woodward (2005) infer aggregate
5 Formerly known as the Venture eXpert database. The authors would like to thank Thompson Reuters for providing access to this database.

6
information about the performance of private equity investing using data on the
returns to individual venture capital projects. Cochrane (2000) argues that this
approach overcomes the problem of selection bias, which is shown to distort
estimated venture returns greatly: an uncorrected estimate of 698% is reduced to 59%
after correction. Peng (2001) uses the same data as Cochrane (2000) to generate a
venture capital index based on a repeat sampling method and finds an average
geometric return of 55%. Chen, Baeirl and Kaplan (2002), Woodward and Hall
(2004) and Hwang, Quigley and Woodward (2005) also use a repeat valuation model
to construct an index of venture capital. Chen, Baeirl and Kaplan (2002) examined
completed venture funds and reported a 45% annual average arithmetic return
(13.38% annual compounded log average return) to their index.
Kaplan and Schoar (2005) take a much more direct route and access the underlying
fund level data which VE use to derive their published aggregate performance data.
This approach overcomes the problem of aggregation, but not the issues related to
self-reporting. Their analysis of private equity fund performance over the period 1980
to 2001 documents a high degree of skew and persistence in venture capital returns.
They also find that returns on average are not dissimilar to public equity as proxied by
the S&P500 index. Jones and Rhodes-Kropf (2003) argue that, as VCs are forced to
hold undiversified portfolios of illiquid assets, they should be compensated for their
total risk and not just the idiosyncratic component. They analyse virtually the same
database as Kaplan and Schoar (2005) and find that concentrated portfolios have
higher returns, which is taken as evidence in support of their hypothesis. Hochberg,
Ljungqvist and Lu (2007) also consider firm level VE data and find that better
networked venture capital firms offer superior performance and greater survival rates.
On a similar theme, Gomper, Kovner, Lerner and Scharfstein (2006) find that venture
capital partners with more industry-specific experience tend to outperform their peers.
With the exception of Kaplan and Schoar, an important criticism of these studies is
that they do not take into account the timing of the cash flows (see Ljungqvist and
Richardson, 2003) or the risk profile of the investing companies. To overcome these
problems requires a more detailed level of analysis, in which the individual
investments of a fund are considered. Lerner, Schoar and Wongsunwai (2007, p. 737)

7
argue in favour of using cash flow data to estimate fund returns, even though they
themselves did not have access to such detailed fund information.
Schmidt (2003) explores a unique dataset of precisely dated cash flows at the
company level over the period 1970 to 2002. This data is supplied by the Centre of
Private Equity Research, which collects detailed private equity data on a completely
anonymous basis. The results show that the mean return to private equity only
outperforms the Russell based US equity benchmark since the late 90’s. Gompers and
Lerner (1997) examine the investments of a single venture capital firm (both failures
as well as successes), and report average annual returns of 30.5% gross of fees over
the period 1972 – 1997. Problems related to selection bias (the firm still exists) and
the authors’ use of marking to market each investment in order to obtain the fund’s
market value, however, suggest some caution is required when interpreting the results.
Ljungqvist and Richardson (2003) provide an analysis of private equity returns based
on actual cash flows using the investment record of a single large institutional
investor. This data consists of complete cash flow records for all private equity
investments made in 73 funds over the period 1981 to 2001. Ljungqvist and
Richardson (2003) document an IRR of 19.8% and a positive risk adjusted premium
of 5–6%, which they attribute to the illiquidity of this type of investment. One
limitation of the data used in this study is that the investment objective of their
institution was not solely limited to maximising returns. It also had a strategic aspect
of building relationships with clients who would purchase services from the
institution. A further problem is that their “sample represents a reasonable cross
section of large buyout funds and a much smaller cross-section of venture funds” (p.
17). Specifically, only a quarter of the funds in the investment portfolio of the limited
partner are venture funds. By way of comparison, 75% of all private equity funds in
the VE database are venture focussed. Similarly, 15% of the limited partners capital
was invested in venture funds, compared to 41.5% for all funds in the VE database.
Thus, the bias of this sample toward buy-out funds limits the extent to which it is able
to provide insights into the venture investment experience.
8
II. Venture Capital Fund Characteristics
The dataset in this paper is derived from the records of two large LPs, each of whom
has been actively investing in venture capital funds for over 20 years. The investment
objective of these LPs is limited solely to maximising their risk-adjusted returns, and
both have a policy of not holding stock distributed from the General Partner (GP).
This data was provided under the conditions of anonymity, which precludes us from
revealing their names or details of the funds in which they invested. The LPs provide
a complete record of the takedowns and disbursements for every fund on a cash-out
(to the venture capital firm) and cash/stock-in (to the LP) basis up to the end of June
30, 2007.6 As a result, these data are not subject to survivorship bias as all
investments made by the LPs are included.7 The data includes both terminated funds
and residual value funds (i.e., those funds that have investments that are yet to be fully
realised) giving a total of 387 funds.8
A summary of the number of funds in the database across each year is presented in
Table I. Note that the data from 1980 through 1984 represents the activity of only one
of the LPs, who invested in an average of six funds each year. Data on the second
LPs venture investments begins in 1985. The first funds in the database have a
vintage year of 1979 and made their first investment in 1980. The most recent fund in
the sample commenced in 2002 and was terminated in early 2006 after only 3.2 years.
This fund does not mark the end of the sample however, as the last fund to be
terminated was fully redeemed in June 2007.9
6 The information does not include descriptions of the funds, which means that we do not know how representative our database is of the universe of venture capital funds in terms of the types of investments made (size, specific or general, industry focus) nor whether the fund is a first time or subsequent fund raised by the GP. Where possible, this data will be benchmarked against the wider industry to provide some insights as to how representative the sample is. 7 Although it could be argued that since both of these LPs still exist, a second order survivorship bias is present. 8 There is some overlap in the database where both LPs invested in the same fund, but this only occurred on a small number of occasions and does not serve to alter the results. 9 The average terminated fund in the database commenced investing in 1989. While the takedown of most funds is 100% of committed capital, there is a small number of funds (7%) whose aggregate takedown is different from the amount committed. The biggest discrepancy is a fund from early in the sample period that only drew down 44% of the committed capital. This shortfall of takedown to commitment did not indicate a lack of performance however, as the fund did generate a return of almost seven times the initial investment. On one occasion an LP invested greater than the capital committed (115%) and this fund was also profitable.

9
The investment activity of the LPs is reasonably constant throughout the 1980s.
There is a large drop in the combined venture investing activity of the LPs in the early
1990’s, when the number of terminated funds fell back to typically 7 or fewer funds
each year. Most of the funds raised over the last decade are still active, i.e. the GP has
not yet fully drawn down the committed capital and/or a component of the investment
returns is yet to be realised. The second column in Table I presents the number of
active funds by vintage year. The bracketed terms are the number of active funds that
may be classified as “effectively terminated”; that is, the residual fund value is less
than 10% of the total distributions to date. From the total set of 251 active funds, we
deem 69 to be effectively terminated, the residual value of which is unlikely
materially to change the fund’s performance metrics. As a guide to the net activity of
the LPs over the entire sample period, the third column shows the total number of
funds by vintage year.
To provide some sense of the activity of the LPs relative to the industry as a whole,
Figure I presents a plot of the total number of funds in the database by vintage year
and a plot of the number of new venture funds by vintage year as reported by VE.
The overall correlation between these two series is 0.859 and the rate of investment by
the LPs in new funds closely mirrors the overall trends in the number of new funds
established in the industry. One notable exception was during the late 1980’s, where
the LPs were investing in an increasing number of funds whereas the number of new
funds in the industry was relatively stable.
It is possible that the increased number of investments made during the period leading
up to the dot.com boom may reflect a higher number of smaller investments designed
to spread risk or take advantage of the myriad of opportunities that presented
themselves during that period. To test this possibility, the latter part of Table I
presents information on the average commitments of the LPs for terminated, active
and all funds. It is clear from these figures that not only were the LPs investing in
more funds, but that their average investment in the industry has also increased (the
total investment figures mirrored this result). This is true for both terminated and
active funds. In fact, around the time of the dot.com boom, the LPs invested in more
funds and commited higher levels of capital than at any other time. These trends are
reflected in the aggregate data: the amount of money committed to venture investing

10
rose from $10 billion in 1995 to $106 billion in 2000 before dropping back to less
than $10 billion in 2002.10 To benchmark this data against the overall industry trend,
Figure II presents a plot of the average commitment for the LPs relative to the average
size of a fund in the VE database. The correlation between these two series is 0.729
and both the LPs and the average size of the fund in the industry are closely linked. It
is interesting to note that, during the bubble period when the average fund size
increased markedly, the average commitment of the LPs was reasonably stable
(although as previously discussed, they were investing in more funds).
Panel A and B of Table II presents a summary of the investment life-cycle of the 136
terminated and effectively terminated funds respectively.11 The highly heterogeneous
nature of the funds is reflected in these statistics, with each takedown percentage
exhibiting a relatively large standard deviation and the range of takedowns covering a
spectrum of 1 day (a sole initial investment is made with no further takedowns) to
11.76 years to be fully invested. These fund life metrics serve to highlight the
typically long term nature of this type of investment. Gompers and Lerner (2004)
report that the contractual life of most funds is typically around 10 years with the
option to extend subject to mutual agreement. The 25th percentile fund in our
terminated fund data has a life of 10.46 years, which suggests that a large proportion
of funds will seek to extend their life beyond the initial agreed term.
Panel A and B of Table III presents a summary of the takedowns and distributions of
the terminated and effectively terminated funds respectively. Focussing on the
terminated funds, the average total takedown by a fund is $4.8 million, with most
investments in the range of $1.7 to $6.0 million. With respect to the total distributions
made by the GP to the LP, the average total distribution of $14.3 million is around 3
times greater than the average fund takedown and the median distribution of $7.4
million is around twice the median takedown. The distributions are highly variable
however, as evidenced by the standard deviation of $22.6 million. While we do not
10 NVCA 2007 Yearbook, Figure 2.02, p. 23. 11 The average number of years till 25% of the committed capital is drawn down is 0.37, and the average fund was 50% drawn down after 1.30 years, 75% invested after an average of 2.24 years and fully invested after 4.61 years. The average fund is fully redeemed after 12.90 years and the standard deviation is 4.04 years, which highlights the highly variable nature of a venture fund’s life. The longest fund in the sample had a life of almost 25 years before all investments were redeemed, while the fund with the shortest life was active for only 2.48 years.

11
know the absolute size of the funds, the ratio of total distributions to total takedowns
to and from our LPs (the ‘fund multiple’) is a useful measure of fund performance, as
discussed in Section III below.
The average terminated fund has 11 takedowns: most funds make between 4 and 15
calls against committed capital and the average takedown at each call is $0.524
million. To put these takedowns in context, it is possible to express the average size
of a funds takedown relative to the total takedowns. The average takedown is 18% of
the committed capital and most takedowns are between 7% and 25%. In some cases
though, the takedown can be very small (the lowest is 2%) and the six funds with a
sole takedown provide the upper limit of 100%.
The distributions from a venture fund can be in the form of either cash or stock. By
definition, stock distributions follow on a company going public, and they are
typically subject to a 180-day holding period covenant. Cash distributions on the
other hand, can be generated by the sale of a company to an acquirer or by the sale of
post-IPO stock on the market. Discussions with industry participants suggest that
cash distributions are more likely to come from an acquisition, as GPs will typically
distribute stock and leave it to the LP to decide whether to hold the stock or sell.
The distributions to the LPs by venture funds are typically well spread out across time
(Table II). Panel A of Table III shows that the average number of distributions per
fund is 30, with one fund making 108 distributions over a 9 year period. There are 11
cash distributions per fund on average, while for stock distributions, the average is 20.
The average size of a distribution is $0.541 million, almost identical to the average
takedown. The average size of a cash distribution is $0.396 million and the average
size of a stock distribution is almost double ($0.582 million).
III. Venture Capital Fund Performance
The two most commonly used performance metrics are fund multiple, which
measures the total distributions relative to the total takedown, and the internal rate of
return (IRR), which takes into account the time value of money. Tables IV and V
summarise venture fund performance using these two measures for the sample of

12
terminated and effectively terminated funds as well as a combined sample of funds.
The following discussion shall focus solely on the IRR results, as a discussion of the
estimated fund multiples does not furnish any additional insights and they are
presented for the sake of completeness.
Table IV presents a summary of the IRR for the 136 terminated (Panel A) and
effectively terminated (Panel B) funds. Panel B of Table IV also summarises the size
(absolute and relative to the total distributions of the fund) of the residual for these
effectively terminated funds. The median return for the terminated funds is 17%, the
average return is 27%, with a maximum of 256% and a minimum of -94%. The
standard deviation of the distribution is 44%. Most funds generated a positive return
of between 7% and 33% while 19 funds had a negative IRR. The IRR of the
effectively terminated funds (Panel B of Table IV) is extraordinary, with an average
of 85% and a median of 61%. The lower degree of skew in this sub-sample suggests
that the extreme market conditions of the Bubble years outweighed the idiosyncratic
talents of the individual GPs. We return to consider the impact of the dotcom bubble
more fully later in the paper.
The combined sample performance metrics (Table V) again illustrates the dispersion
of returns, as the average IRR of 47% is almost twice the median IRR of 24%. The
range of IRRs across these venture capital funds is substantial and serves to highlight
the dispersion of the returns to this type of investing. By way of comparison, Kaplan
and Schoar (2005) report a median (mean) venture fund IRR of 11% (17%), and a
standard deviation of 34%, which is lower than the sample of funds that form the
focus of this paper. Ljungqvist and Richardson (2003) report an average IRR of
19.8%, which is also substantially below the estimated mean IRR of the sample
analysed in this paper. As will be discussed at greater length below, the performance
of our sample is superior to that of the VC industry as a whole.
A notable feature of the venture fund performance metrics is the small number of
extremely high performing funds, which result in high positive skewness coefficients.
To characterise these outliers, each of Tables IV and V contains a summary of the top
decile of the sample. The top decile of terminated funds ranked by IRR has an
average value of 127% and the median is 93%, while the top decile of the effectively

13
terminated funds has an average IRR of 301% and a median IRR of 292%. The
impact of these top performing funds on overall portfolio performance is
considerable. To highlight the significance of this skewness of venture fund returns,
the performance measures are re-estimated excluding the top decile of funds ranked
by IRR or multiple. In this case, the median IRR for the terminated funds falls to 15%
with a standard deviation of 22%, and, if the top quintile is excluded, the median IRR
is 12% with a standard deviation of 19%. In both cases, the mean and median metric
are very close. Again, excluding the top deciles and quintiles from the set of
effectively terminated funds substantially reduces the IRRs: without the top decile the
median IRR is 45% and the standard deviation is 56% and without the top quintile the
median IRR is 39% and the top quintile is 45%.
A final observation on venture fund performance relates to the average fund
performance through time. As stated in the introduction, the venture fund industry
has grown considerably since the start of the data sample period. It is interesting to
examine the average fund performance over time given this increasing competition in
the industry. To this end, Table V presents a breakdown of these performance metric
summaries by vintage year, where vintage year is arbitrarily split into the periods
1980 – 1984, 1985 – 1989, 1990 – 1994 and 1995 – 2006. It must be remembered
that these funds are grouped by vintage year and the IRR relates to cash flows well
into the future. Keeping this point in mind, both the average IRR and fund multiple
have increased over time. For example, the average IRR for all funds with a vintage
year of 1980 – 1984 is 17%. The funds raised in the second half of the 1980s had an
average IRR of 23%, while for the first half of the 1990s, it is 42%. Finally, the most
recent vintage group of funds has an average IRR of 86%. The skewness of these
results however, biases these figures as the median IRR is below the mean in each
period. The standard deviation of fund returns is also reported in Table V. Over each
of the four periods distinguished, the standard deviation of the IRRs and fund multiple
has increased. Thus, although the median returns vary across time, the average
returns and the variability of the data have generally increased. This evidence clearly
highlights the extreme skewness of the fund returns as an important characteristic of
the data.

14
A. Public Equity Performance Compared to Venture Fund Performance
One of the most contentious issues in the venture capital literature is whether private
equity outperforms public market equity and whether any alpha earned is sufficient to
compensate the investor for the illiquidity of this type of investment and the risk that
it carries. Our database of precisely dated venture fund cash flows provides an ideal
opportunity to cast light on this issue, and in this paper the following process is
adopted. For each terminated fund, the schedule of cash takedowns is retained. At
each point in time a takedown occurs, however, it is assumed that an equivalent
amount of money is invested in public equity. Redemptions from this hypothetical
investment are matched to the date of the distribution from the venture fund.
Specifically, a portion of the invested amount is redeemed that is equal to the
percentage of total distribution received from the fund on that date. This money is
assumed to be held at face value for the remaining life of the fund. In this way, a
series of dated investments and redemptions is created that represents the return to the
investor if he had invested his money in the public equity market rather than the
venture fund. The public equity market in this case is proxied in the first instance by
the S&P500. Due to the speculative nature of the type of firms a venture fund invests
in, it is possible to argue that the NASDAQ market index is a more suitable proxy.
Thus, both are considered.
Table VI presents a summary of these results for the terminated funds. The average
fund multiple when the fund outflows are invested in the S&P500 is 2.00 and for the
NASDAQ is 2.42, which are both below the 3.65 multiple generated for the actual
funds themselves. Thus, the average return on investment in the S&P500 generated a
doubling of the capital, whereas the venture funds generated a return that is well over
triple the invested amount. The most noticeable difference between these
hypothetical multiples and their actual values is the standard deviation of multiples
across the set of hypothetical funds, which are 0.53 and 0.83 for the S&P500 and
NASDAQ respectively. These are around fifteen times smaller than the distribution
of the actual fund multiples. The range of observations provides further insights into
this result, as the highest observed multiple for these proxy investments in the
S&P500 is 3.85 (or 5.05 in the case of the NASDAQ), whereas the actual highest
multiple generated is 96.10.

15
As an alternative method of assessing the relative performance of venture funds, it is
possible to estimate the IRR of the cash flows from the hypothetical S&P500 and
NASDAQ based investments: a summary of the estimates is presented in Table VI.
The average IRR of the hypothetical S&P investment is 12%, which approximates the
long term rate of return on the US stock market. The average IRR for the NASDAQ
funds is 16%. The range of investment returns generally falls within a narrow band of
between 11% and 14% for the S&P500 with a higher upper bound for the NASDAQ
(21%). Some S&P500 based investments that had distributions that were focussed
around the 2000 – 2002 dot.com build-up period did particularly well (the maximum
is 27%) and those that were exposed to the downside of the bubble bursting did badly
(the minimum is -17%), but these were certainly the exception, given that the majority
of the funds were terminated prior to 1998. When the top decile and quintile of funds
are excluded from these S&P500 and NASDAQ hypothetical investments, the average
and median metrics only change by a relatively small amount. Thus, the skewness of
these hypothetical funds is not nearly as influential as for the actual sample of venture
funds.
To aid in the interpretation of these results, Figure III presents a plot of the IRR of
each terminated fund against their respective S&P 500 based IRR. Any fund that falls
on the solid line in the figure performs in line with the public equity market over the
same period. Where a fund falls above the solid line, it outperforms the S&P500 and
where it falls below the line, it underperforms relative to the return the same
investment would have made in the S&P500 over the same period. The majority of
funds are clustered around the 10% to 15% IRR nexus. A small but distinct group of
high performing funds is clearly evident however, and it does not appear that their
performance is contingent on the public equity market conditions. Thus, these results
highlight the importance of a select group of funds that generate the skewness in the
returns data and cause the mean and the median performance metric to deviate
substantially.
A more direct comparison of the returns from a fund’s distributions with those of the
public market benchmarks is provided by Kaplan and Schoar’s (2005) Public Market
Equivalent (PME) metric. The PME is the total disbursements to a fund expressed
16
relative to the total distributions to a hypothetical investment in either the S&P500 or
the NASDAQ index. A PME of greater than one signifies that the fund has
outperformed its benchmark. A summary of this PME performance metric for the
terminated funds is provided in Table VI. When the S&P500 is the public market
benchmark, the average PME is 1.98, whereas for the NASDAQ it is 1.59. This
means that the venture funds generated distributions that are on average 98% (59%)
higher than the distributions generated by the S&P500 (NASDAQ) based
investments. In some instances, the differences are quite marked as the maximum
PME for the S&P benchmark is 58.44, while the minimum is 0.20. Not surprisingly,
the standard deviation and skewness of the PME metric is quite high for the entire
sample and excluding the top decile causes a marked fall in these estimates. Thus,
these observations with respect to the PME reinforce the earlier discussion of the
variance of venture fund returns relative to forms of public equity market investment.
Comparing these S&P500 and NASDAQ based IRR estimates to the actual average
IRR of the venture investments (27%), it is clear that the sample of funds performed
substantially better than the public equity market. Thus, in contrast to Moskowitz and
Vissing-Jorgensen (2002), Gottschlag, Phalippou and Zollo (2004), Phalippou and
Zollo (2005), Kaplan and Schoar (2005) and Phalippou and Gottschlag (2007), the
evidence provided by the sample of funds in this paper finds that a portfolio of
venture funds can offer a higher rate of return compared to public market equity.
Another way of comparing these hypothetical public market investments to the
sample of venture funds, however, is to use a simple measure of reward relative to the
dispersion of returns. The average IRR of the venture funds expressed relative to the
standard deviation of those returns is equal to 0.61. When the median fund return is
used, the ratio falls to 0.38. By way of comparison, for the sample of hypothetical
S&P investments the equivalent ratio is 2.0. When the Nasdaq is considered, the
measure is equal to 1.6. Thus, while the high degree of skewness of the venture funds
provides an average return that is well above that of public equity; once the variability
of those returns is taken into consideration, public equity provides a superior
variability-adjusted level of reward.

17
B. Venture Fund Performance Relative to the Industry
The analysis of the previous section provides clear evidence that the venture funds
sampled in this paper outperform public market equity as proxied by either a general
market index (S&P500) or a more speculative public equity market index
(NASDAQ). This raises the question as to whether the investment track record of
these LPs is representative of the industry as a whole. That is to say, do most LPs
outperform the public equity market or do our LPs outperform their peers?
One possible approach to answering this question would be to replicate the
hypothetical fund analysis of the previous section using a venture industry index in
place of the S&P500 or NASDAQ indexes. While a number of attempts have been
made to construct venture capital investment indices (see Peng, 2001, Chen, Baeirl
and Kaplan, 2002, Woodward and Hall, 2003, and Hwang, Quigley and Woodward,
2003), our analysis will focus on the Woodward and Hall (2004) ‘Sandhill’ index,
which is available over the period December, 1988 to the end of the sample period.
This Sandhill data is based on firm level valuations and so provides gross return
estimates. This creates a problem as the LP cash flow data used in this paper is net of
fees. Thus, to provide a fair basis for comparison, some adjustment must be made to
account for the likely fees a GP would receive. Metrick and Yasuda (2007) provide
some guidance on this issue. In their study, they report that the average expected
revenue for the general partners of venture funds per $100 of committed capital is
$24.18 over the life of the fund. That is to say, a GP is likely to charge management
fees and receive a share of profits (‘carried interest’) totalling 24.18% of committed
capital, with the surplus distributed to the LPs.
For the sample of terminated venture funds, a matched hypothetical fund is created
assuming that each fund takedown is invested in the market index. A redemption is
made from each hypothetical fund at the time of the actual redemptions, assuming the
money is invested in the venture capital market as proxied by the Sandhill venture
index. This money is then held at face value for the remaining life of the fund. Thus,
an equivalent set of cash flows is generated that mimic an equivalent investment in
the general venture industry. Table VII presents a summary of this information and
the average (median) IRR of the synthetic venture market investment is 33% (35%)

18
with a standard deviation of 20%.12 Recall that Metrick and Yasuda (2007) suggest
that the average income to the general partners is 24.18% of the gross return. This
means that after fees, the venture industry provides an average net return of
approximately 25% to the limited partners.
To provide a fair basis for comparison, the IRR of the sample of venture funds
included in this paper must be calculated over the same period. To this end, Table VII
presents the summary metrics for this restricted sample: the average net IRR for this
subset of the data is 34%, with a standard deviation of 60%. Thus, the funds in the
sample have outperformed relative to the Sandhill market benchmark adjusted for fees
by 9%. The equivalent analysis based on the multiple performance metric for the
synthetic industry funds provided an average investment multiple of 4.26 with a
standard deviation of 2.56. The average multiple for the restricted sample of LP funds
is 4.82 with a standard deviation of 12.37. Finally, in terms of the PME, the average
is 1.24. Recall a PME of greater than one indicates out-performance relative to the
specified benchmark and so this metric reinforces the IRR and multiple metrics that
show the sample of venture funds have outperformed relative to the industry as
measured by the Sandhill index.
An alternative approach to benchmarking the performance of our LPs may focus on
the quarterly cash flow information provided by the VE database. Unfortunately, the
aggregate nature of this data means that it is not possible to identify which cash flows
belong to which fund. This means that the timing of the cash flows cannot be
identified and so, a rate of return type analysis is not possible. It is possible however,
to establish the aggregate multiple by vintage year by dividing the sum of the total
distributions divided by the total takedowns for all funds raised in a particular vintage
year. This measure therefore, provides a proxy for the average multiple earned across
a sample of all funds raised in each vintage year.
Table VIII presents the aggregate multiple across all funds in the VE database for
each vintage year in the sample period. For the first vintage year in the sample, $1.75
billion was taken down and $4.21 billion was distributed, giving a fund multiple of
12 It should be noted that the volatility of the Sandhill Index is substantially lower than for other time series of venture performance.

19
2.40 for the 1980 vintage. The aggregate fund multiple drops to below 2 in the
following year and remains at that level for the first half of the 1980’s. The venture
fund industry performance improved after 1985 and the fund multiples are
consistently above 2 for the rest of this decade. The mid-90s is characterised by
increasing multiples for funds raised during this period, peaking at 4.15 for funds with
a vintage year of 1996. The more recent data must be interpreted with some caution as
the declining multiples are not necessarily indicative of the dot.com boom and inferior
performance. Recall that as the vintage year moves closer to 2007, a higher
proportion of funds will have residual values. Thus, the multiple estimate is biased
downwards, most obviously in the last year of the sample where no fund has made
any distributions and the estimated multiple is zero.
To compare the LPs in this paper to this VE data, it is necessary to estimate the
average multiple by vintage year for all funds in the database. Table VIII presents
this information, and the trends observed for the VE database are mirrored in the
investment experience of the LPs that form our sample (the correlation is 0.84).
Specifically, after a period of declining performance in the early 1980’s, fund
performance progressively improved till the mid-1990’s until the funds that are still
active begin to dominate, causing the multiples to decline.
Comparing the industry to our LPs, it is interesting to note that the average LP
multiple is greater than the industry average in every year except 1981, 1983, 1991
and 2004. That is, the total distributions from the venture funds in which the LPs
have invested have exceeded the investment amount by more than the industry
average in almost every year. Specifically, the fund multiple has been higher than the
industry average by 181% across all the years in the sample and in some cases the
difference has been very substantial. For example, the industry multiple for funds of
vintage year 1996 is 4.15, where as for the LPs in this study the average multiple is
12.73, i.e., a difference of 307%.
In general, the results of Section III reveal that the average return for the sample of
funds is above that of both the public equity market and also the industry itself.
These excess returns are the result of a small number of extremely high performing

20
funds. In the absence of these outliers however, the level of fund performance is more
in keeping with public equity market returns.
IV. Venture Fund Performance Persistence
The results of the previous section suggest a high degree of persistence in the out-
performance of our LPs relative to the industry over a period covering more than a
quarter of a century. By way of contrast, virtually no evidence of return persistence
has been found in the context of the general equity funds management industry, even
over much shorter periods of time (for a survey see Kazemi, Schneeweis and
Pancholi, 2003 and more recently Bollen and Buse, 2005, and Wang, 2006). The
persistence observed in this sample of data may well reflect the significant experience
and contacts the LPs have accumulated after almost 30 years of investing, factors
which Gomper, Kovner, Lerner and Scharfstein (2006), and Hochberg, Ljungqvist
and Lu (2007) suggest are important elements to successful venture investing. For
example, Lerner, Schoar and Wongsunwai (2007, p. 734) report that “anecdotes in the
private equity industry suggest that established LPs often have prefential access to
funds”.
The combined sample of 205 terminated and effectively terminated funds captures the
investment track record of the industry over a long period of time. This database may
be used to provide some insights into the persistence of venture fund performance,
which in this industry may be high as a successful GP is more likely to be able to raise
a follow on fund. In this case, the performance of a fund may be related to its
sequence number. To test this hypothesis, Kaplan and Schoar (2005) specify the
following regression equation:
IRRi = β0 + β1 IRRi-1 [+ β 2 IRRi-2] + εt (2)
that is, the IRR of fund i is regressed against the IRR of the GPs previous fund. The
results of applying this regression equation to the sub-sample of funds for which we
have sequence numbers are presented in Table IX, where all standard errors are
corrected for serial correlation and heteroscedasticity. In the first column of results,

21
the regression equation only includes the IRR of the most recent fund and a positive
and significant result is generated. The second column of Table IX presents the
regression results where the two most recent funds are included as regressor terms and
the first lagged fund retains its sign and significance; however, the second lagged fund
is insignificant. A lack of data prevents higher lags of funds being tested. Table IX
also includes the same set of regression output where the fund multiple is specified as
the measure of performance. The results are qualitatively consistent to the IRR results
as the one period lagged multiple is positive and significant and the second period lag
is insignificant. These results are similar to those of Kaplan and Schoar (2005),
except that their second lag fund IRR coefficient was also positive and significant.
The outlier high performing funds in the sample provide an interesting example of
fund performance persistence as eight of the top 10 funds ranked by IRR, produced a
follow on fund that generated an IRR in excess of 100%. This is consistent with the
evidence of Gompers Kovner Lerner and Scharfstein (2006a), who find that VCs with
a track record of success are likely to be successful in the future. Thus, the data
provides clear evidence of fund performance persistence and suggests that the past
fund return is indicative of current fund performance.
V. Venture Fund Performance and the Public Equity Market
The early empirical and theoretical work on venture capital frequently assumed that
the performance of private equity is independent of the public equity sector (see inter
alia Cochrane, 2000) and many investment professionals also shared this belief. For
example, Gompers and Lerner (2004, p. 354) state:
“… many institutions … have increased their allocation to venture
capital … in the belief that the returns of these funds are largely
uncorrelated with the public markets.”
More recently, this assumption has been called into question and a literature has
evolved that considers venture capital investment performance in the context of
22
broader capital market conditions.13 This includes the theoretical work of Inderst and
Muller (2004) and, most relevant in the current context, the empirical research of
Gompers, Kovner, Lerner and Scharfstein (2005) and Kaplan and Schoar (2005). The
former explore the relationship between shifting valuations and activity in public and
private equity markets and find “that an important component of volatility in venture
capital investment activity is driven by volatility of fundamentals” (p. 3): further they
observe that “…an increase in IPO activity from the bottom to the top quartile
increases the number of [venture] investments by 22%” (p. 10). Kaplan and Schoar
(2005, p. 1792) found evidence of substantial persistence of investment returns in
both the venture and the LBO sectors. They link this persistence to market conditions
and conclude that “…funds raised when market returns are higher are less likely to
raise a follow-on fund …. This suggests that funds raised in boom times are more
likely to perform poorly and, therefore, are unable to raise a follow-on fund”.
A number of authors have gone a step further and specifically identified the state of
the market for initial public offerings (IPOs) as a key driver of venture performance.
For example, Metrick (2006, p. 100) argues:
“Without a doubt, the most important driver of VC investment is the
existence of a lucrative market to exit these investments. … The most
profitable exits are achieved through initial public offerings.”
Jeng and Wells (2000), Das, Jagannathan and Sarin (2003) and Gompers and Lerner
(2004) link the state of the IPO market to the amount and profitability of venture
capital investing. While these studies have broadly identified the state of the IPO
market as a factor affecting venture capital returns, they stop short of actually
undertaking a detailed characterization of the evolving state of the IPO market
through time.
13 A related literature has found links between the public and private equity sectors. For example, Lerner (1994) finds that biotechnology firms go public when equity market valuations are high. Barry (1998) finds that VC returns follow cycles of performance. Black and Gilson (1998) highlight the importance of an active stock market for growth of a VC industry. Phalippou and Zollo (2006) find that the performance of private equity funds is related to the state of the business cycle and the stock market.

23
A. Public Equity Market Classification
The goal of this section of the paper is to provide a formal analysis of the link
between the public equity market and the performance of the venture investment
industry. This necessitates the classification of the state of the IPO market. A number
of different approaches to identifying a hot issue market have been used such as
periods of high IPO returns (Ritter, 1984), NBER business cycle peaks (Choe,
Masulis and Nanda, 1993) and scaled issue volume (Bayless and Chaplinsky, 1996).
While useful, we argue that it is possible to specify a measure that is more appropriate
in the current context.
Recall that venture capitalists will typically prefer to exit via an IPO.14 Thus, a
favourable market from a venture capitalists point of view is one which conditions are
conducive to listing. In this case, IPO activity, or more specifically venture-backed
IPO activity, is relevant. Further, the sooner the venture capitalist is able to exit the
investment by bringing the firm to market, all other things being equal, the greater
will be the IRR. Thus, the ideal state of the IPO market from the perspective of a
venture capitalist is when it is possible to list a firm before it has become profitable.
In this situation, venture capitalists are able to exit the investment and realise a return
earlier than if they have to wait for the company to become profitable. Thus, the
market classification measure needs to be based on the listing activity of venture-
backed companies, including information on the profitability of these companies.
The VE database15 has information on all US IPOs and includes a flag that denotes a
firm as having received venture funding. This flag is used to distinguish VC from non
VC-backed IPOs and uniquely identifies 3,032 VC-backed IPOs. For each of these
companies, company financial information is acquired from a variety of sources. In
the first instance, companies are identified in Compustat using SEDOL, CUSIP and
ISIN identifiers and company profit information for the last financial year prior to
14 Das, Jagannathan and Sarin (2003) report higher exit valuation for IPOs in comparison to exits by merger or acquisition. Ross and Isenstein (1988) report that a $1 investment in a firm that goes public provides an average cash return of $1.95 beyond the initial investment, while an acquisition yields a cash return of only 40 cents. Further, the option to exit via IPO improves bargaining power with any potential acquirer. 15 The VE provides a database of 12,066 U.S. IPOs over the period 1980 to 2006, which compares reasonably with the Ritter IPO database of 11,209 companies over the same period.

24
listing is extracted as well as the year of listing. Thus, if a company listed on June 5,
1996 and its reporting date is December 31, the company financials to the year ended
December, 1995 are recorded as the year prior to IPO. These financials represent the
last complete set of corporate information for that company that investors would have
had access to at the time the company was listing. The financials submitted for the
year ended December 1996, are classified as belonging to the year of the IPO. Where
a company could not be found in the Compustat database, the Osiris and Datastream
databases are accessed. These alternative databases are used to verify the Compustat
information as well as to fill in gaps where possible. Using this process, financial
information for a total of 2375 companies is gathered, which represents 78% of our
sample. Most of the missing data relates to companies that listed in the early part of
the sample when company coverage across these three databases is the least complete.
Nonetheless, we argue that this list of companies is sufficient to provide a
representative cross section of the companies that were listing at the point in time and
so allow us to characterise the market conditions with reasonable accuracy.
Figure IV presents a summary of the total number of IPOs, the total number of VC-
backed IPOs and the total number of VC-backed IPOs that were unprofitable at the
time of listing per quarter over the sample period (the Appendix presents the data in
full). The number of VC-backed IPOs closely tracks the total IPO data: the
correlation between the two series is 0.8436. On average, 24% of all IPOs coming to
market in the sample period were VC-backed, although this varies from a high of 53%
in 1999Q4 to a low of only 6% in 2002Q3. This data highlights how vulnerable GPs
are to changing market fortunes in terms of their ability to exit an investment.
Examining the total number of IPOs, there are five distinct hot IPO markets that are
identifiable: the peak of each occurs during the 1983Q4, 1986Q3, 1993Q4, 1996Q2
and 2000Q1 periods. It is interesting to note that the maximum number of IPOs
during the dot.com bubble was actually the lowest of any of these hot-issue periods.
This raises the issue as to what does distinguish the 2000 bubble market from other
hot IPO markets, as these volume figures clearly demonstrate that it was not the
number of IPOs.

25
To aid in the interpretation of this data, the lower panel in Figure IV presents the
percentage of unprofitable VC-backed IPOs. The average across the sample is 41%.
However, this ranges from only 3% in 1984Q4 to 83% in 2000Q4. The ability of VCs
to bring firms that were unprofitable to market increased through the 1990s (the spike
in 1990Q4 is a reflection of the small number of IPOs during this period) and peaked
during the dot.com boom, when virtually all of the VC-backed listings were
unprofitable. In the aftermath of the 2000 crash, the number of VC-backed IPOs fell
to historically low levels (the 25 VC-backed IPOs in 2002 is the lowest for any year in
the sample period) and the high percentage of unprofitable IPOs per quarter is a
reflection of the small number of listings during this period. Thus, the 2000 bubble
period is not distinguished by the number of companies that listed during this period,
but the fact that an unprecedented number of unprofitable companies were coming to
market during this time.16
To capture the state of the market, a classification system is used that distinguishes a
poor issue market (=1, when less than 20 VC-backed IPOs occurs17), a normal issue
market (=2, when at least 20 but less than 40 VC-backed IPOs occur), a hot issue
market (=3, when more than 40 VC-backed IPOs occur) and an ultra-hot issue market
(=4, when more than 40 VC-backed IPOs occur, more than 50% of which are
unprofitable).18 This last criteria identifies 1996Q2 and the period 1999Q2 to 2000Q3
as ‘ultra-hot’. This VC IPO market indicator may be used to consider whether a link
exists between the state of the public equity market and venture capital returns.
When venture capitalists invest in a firm, their return is a function of two factors. On
the one hand, the return is a function of the amount of the company they are able to
secure for their initial investment. This ownership percentage will reflect the
competitive environment that prevails. If there is a lot of VC money chasing few
deals, then the firm has the upper hand. Alternatively, where venture investing is out
of favour and there are many deals chasing a limited supply of funds, the VCs have
the upper hand and will be able to secure a better deal for their investment. The
16 Ritter and Welch (2002) have also identified the size of the first day returns as a distinguishing feature of this period 17 These categorisations are based on the standard deviation of the number of VC backed IPOs for which we have financial data, which is arbitrarily rounded down from 21.9 to 20 for ease of exposition. 18 This classification system identifies hot and cold IPO markets that are generally consistent with those identified by Ritter (1984) and Bayless and Chaplinsky (1996).

26
evidence suggests that the volume of funds made available to the venture industry is
directly linked to its performance, i.e., when the industry is doing well, people are
more inclined to invest and so a greater supply of funds is available. Where venture
funds are performing poorly, investors typically seek alternative investments and
funding is limited. Thus, there is a direct link between the performance of VC funds
and the amount of capital available for investment (see Gompers and Lerner, 2004,
pp. 134-145). VCs will rationally wish to invest in a firm when the market is
performing poorly and they are able to negotiate the best deals.
Once a VC has taken a stake in a company in return for an initial investment, the
actual return on their investment is a direct function of how much is received for that
stake on exit. If the firm is able to list at a time when the public equity market has an
appetite for VC-backed IPOs, this equity stake is likely to be worth more compared to
when the firm lists in a normal market. Ideally, the GP would want to list the
company in an ultra-hot issue market and exit as soon as possible thereafter.
We have used the data on VC-backed IPOs to generate an indicator of market
conditions at the time when investments are made and when distributions are
received. As the investments and distributions are spaced irregularly through time
however, it is necessary to weight the market conditions at the time of each cash flow
by the proportion of total investment or distribution that it represents. This gives a
weighted market conditions indicator on entry and exit for each fund. The lowest
possible market condition score is a 1, which indicates that the all of the cash flows
occurred in poor listing conditions. The highest possible score is a 4, which indicates
that the cash flows occurred in a hot issue market when more than 50% of all VC-
backed IPOs were unprofitable.
To provide an overall market conditions score for each fund, the exit indicator less the
entry indicator is used. The optimal scenario is one in which the VC invests in the
firm when there is a limited supply of money chasing deals and exits when there is a
high demand for venture IPOs. In terms of the market classification system, the
optimal scenario occurs when the market conditions on entry are equal to 1 and on
exit are equal to 4. Thus, where the overall market conditions indicator is +3, there is
little money chasing deals on entry and a ultra-hot issue market on exit. The worst

27
possible scenario for a VC fund is when the general market conditions indicator is -3,
i.e. the fund has invested in an ultra-hot market and exited in a poor market.
Table X presents a summary of the entry, exit and overall market conditions indicator
across all terminated and effectively terminated funds. The average entry (exit)
conditions indicator across all funds is 2.19 (2.52) and most funds generated an
indicator of between 1.60 (2.14) to 2.70 (2.98). The average market conditions metric
across all funds is 0.33. That is, the difference between the capital weighted entry and
exit conditions is small. The range of observations however, shows that for some
funds, the entry and exit conditions were markedly different. The maximum value for
the market conditions indicator is 2.36 and the minimum is -2.59.
B. Fund Performance and Market Conditions
If public equity market conditions affect venture returns, the best performing funds
should be associated with a high positive market indicator and the worst performing
funds should be associated with a high negative market indicator. Figure V presents a
plot of the IRR and market conditions indicator for all terminated and effectively
terminated funds, where the vintage year of each fund is highlighted with the use of
different symbols. Most funds in the sample exited in market conditions more
favourable than they entered, i.e. the average market conditions estimate is positive.
For the funds that did get it wrong and exited in conditions that were less favourable
compared to when they invested, most are from the more recent period that includes
the bubble. Further, while a number of these funds did lose money, a few notable
exceptions did well despite the market being against them. Finally, where a fund is
associated with a positive market conditions parameter, while most generated a
positive IRR, it is not true that more favourable market conditions guarantee a higher
IRR. In fact, the funds that timed the market the best were very ordinary performing
funds with positive, but relatively low IRRs. The correlation between the market
conditions and the fund IRR across all of the data presented in Figure V is 0.102.
Panel A of Table XI presents a summary of the fund IRR and market conditions
parameter. The median IRR when the fund market conditions are less than minus one
28
is 4%.19 When the market conditions are neutral however, the median IRR is 27%. It
is interesting to note that when the fund has entered and exited the market in
favourable conditions (an indicator of greater than plus one), the median IRR is 20%,
which is less than the median for the neutral indicator. One reason for this result may
be the skewness of the data. The standard deviation of the neutral conditions data is
77%, which is higher than the standard deviation for the favourable and unfavourable
market conditions data (60% and 52% respectively). Further, the range of
observations for the neutral market data is large. To test the robustness of these
results to the presence of these outliers, the top decile of funds in each category is
excluded and a summary of this abbreviated dataset is presented in Panel B of Table
XI. Focusing on the median IRR, the poor market conditions indicator has a median
IRR of -2%. For the neutral and favourable market conditions indicator however, the
same result is again evident in that both have a median IRR that is greater than where
the market conditions are poor (24% and 18% respectively), but the favourable
conditions median IRR is less than the neutral value. Thus, some evidence of poor
market conditions impacting on venture fund returns can be found, although the
evidence does not support the contention that favourable market conditions lead to
higher returns.
Metrick (2006) suggests that exit conditions are an important influence on venture
investment returns. This suggests that it may be more appropriate to focus on exit
conditions rather than an overall measure of market conditions. To this end, Figure VI
presents a plot of the market exit conditions and IRR for each fund, with the vintage
year of each fund highlighted with the use of different symbols. The funds from the
early 1980s and early 1990s are relatively clustered by exit conditions parameter. The
late 1980s funds are very widely dispersed, however, and only a few high performing
funds are present. The more recent period is characterised by funds that span the
range of exit conditions and have some funds that have done exceptionally well, some
that have performed poorly and still others that are more typical of the rest of the
sample. The correlation between the exit conditions and the fund IRR across all of
the data presented in Figure VI is 0.417. These results suggest that the exit conditions
at the time of distributions are quite relevant in determining overall fund performance.
19 The equivalent information based on the fund multiple is qualitatively consistent to that presented here and is not presented to conserve space.

29
To clarify this result, Panel A of Table XI also presents a summary of the fund IRR
grouped by fund exit conditions. When the exit conditions are poor, the median IRR
is 9%. Neutral exit conditions however, are associated with a median IRR of 24%.
On the other hand, when the exit conditions are favourable, the median IRR is 76%.
The standard deviation of these IRR estimates is similar for the poor and neutral exit
conditions indicator (42%), however, it is much higher when the exit conditions are
favourable (110%). This suggests that a small number of extremely high performing
funds may be driving these results.
To test the robustness of these results to the skewness of the data, Panel B of Table XI
presents a summary of the performance data, grouped by market conditions and exit
conditions, with the top decile of funds excluded. The median IRR when the market
conditions are unfavourable is -2%. When neutral market conditions prevail, the
median IRR is 24%, which is greater than the median IRR when favourable market
conditions prevail (18%). Where the data is categorised based on exit conditions, the
results show that poor exit conditions are associated with an average IRR of 7%,
neutral exit conditions produce a median IRR of 20% and favourable exit conditions
generated an IRR of 69% (the skewness of the data is lowest of the three categories in
this case).
Thus, the exclusion of the top decile of funds, in order to account for any bias caused
by the skewness of the data, only serves to reinforce the full sample results discussed
earlier. The results of this analysis suggest that while poor market conditions lessen
the probability of a venture fund performing well, it is the exit conditions of a fund
that are more likely to result in high rates of return to investment. In general, the data
establishes a link between the conditions of the most relevant sector of the public
equity market and venture fund performance.
VI. Venture Capital Funds and the Dot.Com Bubble
The dot.com boom represents a period of unprecedented activity in the venture capital
industry. Specifically, the VE database reveals that more than double the number of
funds were started during the 1999Q2 to 2000Q3 period in comparison to the first half
30
of that decade. Further, these peak years greatly exceeded the previous peaks reached
in 1984 and 1987. NVCA industry data reveals that the number of fund and the
dollars committed to the venture industry almost doubled in 1999 and doubled again
in 2000. The LPs in this paper were also unusually active during this period both in
terms of the number of funds they invested in and the average commitment to each
fund (Table I).
It is an interesting empirical issue as to what impact this bubble period had on venture
fund performance. Unfortunately, the long-term horizon of the investment cycle
means that only in the fullness of time, will the impact of these events come to be
fully understood. It is possible however to provide some preliminary insights using
the sample of terminated funds and the subset of active funds that have a small
residual value and may be considered effectively terminated. This combined sample
of funds may be sorted based on the proportion of their redemptions that are made
during the bubble period. Those that made a minimum of 50% of their distributions
during the bubble period are selected for analysis. Using this criterion, we identified a
total of 56 funds, and an examination of their characteristics reveals that they are
similar to the larger sample of residual funds discussed in the previous section in
terms of takedowns, distributions and life cycle. Consequently, the remainder of the
analysis focuses solely on their performance metrics.
A summary of the performance metrics for all funds that had a minimum of 50% of
their distributions during the bubble period is presented in Table XII. The average
IRR (multiple) across these funds is 111% (7.94). This is the highest set of
performance metrics for any subset of the data considered in this paper and is a
reflection of the premium that this class of investment was generating during this
period. Furthermore, the performance of venture funds during this period is not as
skewed as the terminated fund sample. The median fund IRR is 91% and when the
top decile of funds is excluded, the average IRR is 85% and the skewness coefficient
falls to 0.51. An analysis of the fund multiple provides the same conclusions. This
suggests that the fund performance during this dot.com period is not characterised by
just a small number of outlier funds, but that funds were doing well virtually across
the board (although two funds in this sample did lose money, both of which were
relatively small).

31
The sample of terminated and effectively terminated funds may also be used to
characterise the performance of the venture capital industry after the collapse of the
bubble in 2001Q1. To this end, the sample of funds is sorted by the proportion of
their distributions that occurred following the bubble period, and the funds with a
proportion of greater than 50% are selected for analysis. Table XII presents a
summary of the performance metrics for these 28 funds. The median IRR is -3%.
When the top decile of funds are excluded from the sample, this falls further to -7%.
These returns not only represent a dramatic reversal relative to performance during
the bubble. They are also far below the returns generated by our terminated funds in
all prior periods. The average multiple is 2.37, which is similar to the terminated fund
average where the top decile is excluded (2.41). Excluding only three funds however,
causes this average to fall by nearly 50% to 1.21. It should not come as a surprise that
a number of post-bubble funds managed to generate profits (12 of the 28 funds are
profitable) or that positive skewness still characterises the data. The end of the boom
does not necessarily impose losses on venture capitalists. The drop in listing activity
meant that it was more difficult to exit an investment through an IPO, but not
impossible if a firm had sound financials. However, the number of VC-backed
companies qualifying for listing was limited to those that were mature financially and
the valuations achieved at offering were substantially below those of the bubble
period. Returns for the set of post-bubble funds reflect these realities.
Our data permits one further exercise to explore the behaviour of venture capitalists
during the bubble years: an investigation into the speed with which they invested the
funds available to them or the intensity of investment. To construct a measure of
investment intensity, the following process is specified. For each year in the sample,
the available pool of capital is estimated as the sum of the amount of committed
capital from previous years that has not yet been taken down by the GP and the capital
committed for that year. The total takedown for that year is estimated as a composite
of the sum of takedowns for funds of the current vintage year as well as takedowns
from funds of previous vintage years that are still actively investing. The intensity of
the fund takedown in a given year is the total takedown relative to the total amount of
capital available for investment in that year. Table XIII presents the data and it is
plotted in Figure VII. To provide an industry benchmark, the same information is

32
constructed using the VE database (note that the aggregate nature of the VE database
means that it is not known which fund was drawing down in any given period, only
the total value of the drawdowns).
The correlation between the investment intensity measure for the sample of funds and
the VE data is 0.32. As the fund database only commences in 1980 whereas the VE
database has data from 1969, the early part of the sample period may be biased for our
sample of funds. The correlation between the two series from 1985 onwards is 0.660.
A number of spikes in the intensity of the investment process may be observed in the
data, which correspond to the data for 1983, 1994 and 1999 – 2000. It is interesting to
note that each of these periods corresponds to the hot issue markets identified earlier.
In particular, the bubble period is associated with an unprecedented level of
investment activity which rose from 29% in 1996 (the sample low is only slightly less
at 26% during the poor issue market of the late-1980s) to 64% in 1999 and the sample
high of 71% in 2000. Thus, we find evidence to suggest that GPs increase the
intensity of the rate at which they invest in response to market conditions.
In general, this evidence tends to suggest that not only is the listing activity of venture
backed companies is high in a hot market (and by inference, the intensity of the
distributions to LPs, should also be high), GPs must also pay higher prices to invest in
new opportunities, which necessitates a larger drawdown of capital, i.e. a higher
intensity of the investment process. The implication is that venture capitalists
accelerate their investment activity in the hope of capturing the extraordinary returns
being generated by a hot IPO market (a goal that is only transiently achieved).
It is unclear how representative these results are of the hundreds of venture funds that
were raised and active during the dot.com bubble and the usual small sample caveats
apply. In due course, once the funds active during this period have been terminated, a
complete analysis of the impact of the dot.com bubble on venture returns can be
undertaken and its impact understood. The preliminary results of this paper however,
suggest that the level of venture investing during the bubble period was
unprecedented and the returns to investors were extremely high. Following the
bursting of the buddle however, the average return to venture funds has been the
lowest observed during the sample period. In extreme form, the bubble period and

33
its aftermath illustrate the correlation between venture capital returns and the state of
the IPO market.
VII. Conclusions
Venture capital is a significant part of the alternative investments industry. The lack
of public reporting and readily available data, however, means that relatively little is
known about venture funds and their track record of investment performance. In this
paper, a database consisting of 136 terminated and 69 effectively terminated venture
funds active over a 28 year sample period are considered. For each fund, the
takedown and distributions are recorded on a cash-in and cash-out basis. As such, this
sample overcomes many of the problems suffered by the previous literature in terms
of using aggregated data or self-reported fund values.
This sample of fund data is used to characterise investments in the venture industry.
In terms of the performance of venture funds, both an IRR and a fund multiple based
performance metric are considered. The median IRR across all funds is 24%, while
the median fund multiple is 2.66. The investment performance of venture funds
relative to both public market equity (proxied by the S&P500 and NASDAQ) as well
as the industry itself is considered and a number of conclusions can be drawn. First,
our sample of venture funds outperforms both the S&P500 and NASDAQ over the
sample period, albeit with very substantial dispersion of returns across the funds.
Second, significant evidence of persistence in out-performance is observed, as the
average fund multiple by vintage year is greater than that of the industry as measured
using aggregate data sampled from the Thompson VE database and the Sandhill
venture index. Third, a high degree of skewness is evident in the data, such that a
small number of high performing funds are responsible for the bulk of the excess
returns to the portfolio as a whole. Thus, our LPs enjoyed the benefit of having
access to some of the top performers in the industry, and the consequent skewness of
their venture portfolio returns is the decisive component of their alpha. This may help
to explain why past studies may have not been able to find any evidence of venture
funds outperforming the public equity market. If LPs are unable to secure an
investment in the select grouping of high performing funds, they are unlikely to
outperform any benchmark.

34
This paper also considers the relationship between the public equity market and the
returns to venture investing. Historically, public equity market conditions have been
proxied by the total number of IPOs. Given the focus of this paper however, the exit
conditions are proxied by the total number of venture-backed IPOs with special
attention given to the number of unprofitable venture IPOs to characterise the exit
conditions for the industry. The number of venture-backed IPOs is found to correlate
with the IPO market as a whole. The profitability of these IPOs, however, varies
substantially, and the dot.com era in particular represented a unique environment,
insofar as the number of unprofitable venture backed IPOs was noticeably higher than
in any other period since 1980 and, in some quarters, was close to 100%. Using a
measure of exit conditions based on the number of venture backed IPOs and their
profitability, the evidence presented in this paper suggests that the public equity
market substantially influences venture returns. Specifically, the median IRR realised
when investments have been made in a competitive market and redeemed in an
unfavourable market is 4%. On the other hand, the median IRR is 20% when the
investments are made at a time when there is a shortage of such funds and the
distributions are made at a time of favourable valuations. However, the most
important element of the investment conditions are those prevailing at the time of exit,
which cause IRRs to vary substantially: from a median return of 9% in a poor IPO
market environment to a median return of 76% in an ultra-hot IPO market
The results reported in this paper on the relationship between VC returns and the state
of the IPO market suggest certain directions for future research. Specifically, the
criteria for gaining access to the IPO market have varied greatly over time. Analysis
of those criteria and their determinants may provide insight into the context in which
the venture capital industry continues to evolve. An extended period of time in which
the availability of the IPO market is strictly limited to more mature, profitable
companies has negative implications both for prospective VC returns and eventually
for the flow of funds to the VC industry.
Finally, some preliminary evidence of venture fund performance during and
immediately following the dot.com bubble is presented. Given the life cycle of
venture funds, only a relatively small number of terminated funds exist that cover this
35
period. Using a sample of active funds and self-reported residual values, it is possible
to make some observations about this period. First, venture investing during this
period was unprecedented both in terms of the number of funds and the size of the
investments made. Second, fund performance during the bubble was extraordinary,
and the average performance of the funds is less driven by outliers as a large
proportion of funds did well during this period. Third, the rational desire to take
advantage of Bubble conditions in the IPO market is reflected in the increased
investment intensity during that period.
Such performance reflected unprecedented access to the IPO market for unprofitable
venture-backed companies. The performance of the funds following the bursting of
the bubble was dramatically lower not only relative to the bubble period but also to all
periods prior to the bubble. This reversal coincided with a radical constriction of the
IPO market and its near absolute closure to unprofitable venture-backed companies.
36
References
Anson, M. (2007), “Performance measurement in private equity: another look”, Journal of Private Equity, 10(3): pp.7-21 Barry, C.B. (1998) “Venture Capital” AIMR Proceeding on Alternative Investing, August. Bayless, M. and Chaplinsky, S. (1996) “Is There a Window of Opportunity for Seasoned Equity Issuance?” Journal of Finance, 51, 253-278. Black, B.S. and Gilson, R.J. (1998) “Venture Capital and the Structure of Capital Markets: Bank versus stock markets” Journal of Financial Economics, 47, 243 – 77. Bollen, N.P.B. and Buse, J.A. (2005) “Short-Term Persistence in Mutual Fund Performance” Review of Financial Studies, 18, 569-97. Chen, P., Baierl, G.T. and Kaplan, P.D. (2002) “Venture Capital and its Role in Strategic Asset Allocation” Journal of Portfolio Management, 28, 83 – 9. Choe, H., Masulis, R.W. and Nanda, V.K. (1993) “Common Stock Offerings Across the Business Cycle: Theory and Evidence” Journal of Empirical Finance, 1, 3 – 33. Cochrane, J.H. (2000) “The risk and return of venture capital” Journal of Financial
Economics, 75, 3 – 52. Das, S.R., Jagannathan, M. and Sarin, A. (2003) “The Private Equity Discount: An empirical examination of the exit of venture backed companies” Journal of Investment
Management, 1, 1–26. Denis, D.J. (2004) “Entrepreneurial finance: An overview of the issues and evidence” Journal of Corporate Finance, 10, 301– 326 Gompers, P., Kovner, A., Lerner, J. and Scharfstein, D. (2005) “Venture Capital Investment Cycles: The Impact of Public Markets” NBER Working Paper Series No. 11385. Gompers, P., Kovner, A., Lerner, J. and Scharfstein, D. (2006) “Skill vs. Luck in Entrepreneurship and Venture Capital: Evidence from Serial Entrepreneurs” NBER Working Paper Series No. 12592 Gompers, P., Kovner, A., Lerner, J. and Scharfstein, D. (2006a) “Specialization and Success: Evidence from Venture Capital” Harvard University working paper. Gompers, P. and Lerner, J. (1997) “Risk and Reward in Private Equity Investments: The Challenge of Performance Assessment” Journal of Private Equity, 1, 5-12. Gompers, P. and Lerner, J. (2004) “The Venture Capital Cycle”, 2nd Ed., MIT Press.

37
Gottschalg, O., Phalippou, L. and Zollo, M. (2004) “Performance of Private Equity Funds: Another Puzzle?” INSEAD-Wharton Alliance Center for Global Research and Development, Working Paper Series, 2004/82/SM/ACGRD 3. Hochberg, Y.V., Ljungqvist, A. and Lu, Y. (2007), “Whom You Know Matters: Venture Capital Networks and Investment Performance,” Journal of Finance, Vol. LXII, No. 1, 251-301. Hwang, M., Quigley, J.M. and Woodward, S.E. (2005) “An Index For Venture Capital, 1987-2003” Contributions to Economic Analysis & Policy, 4, Article 13, 1 – 45. Inderst, R. and Muller, H.M. (2004) “The Effect of Capital Market Characteristics on the Value of Start-Up Firms” Journal of Financial Economics, 72, 319–356 Jeng, L.A. and Wells, P.C. (2000) “The determinants of venture capital funding: evidence across countries” Journal of Corporate Finance, 6, 241–289 Jones, C.M. and Rhodes-Kropf, M. (2003) “The Price of Diversifiable Risk in Venture Capital and Private Equity” AFA 2003 Washington, DC Meetings. Kaplan, S. and Schoar, A. (2005) “Private Equity Performance: Returns, Persistence and Capital Flows” MIT Sloan School of Management, Working Paper 4446-03. Kazemi, H., Schneeweis, T. and Pancholi, D. (2003) “Performance Persistence for Mutual Funds: Academic Evidence” Centre for International Securities and Derivatives Markets, May, Isenberg School of Management, University of Massachusetts. Kaplan, S.N. and Schoar, A. (2005) “Private Equity Performance: Returns, Persistence and Capital Flows” Journal of Finance, 60, 1791 – 1823. Lerner, J. (1994) “Venture capitalists and the decision to go public” Journal of
Financial Economics, 35, 293-316. Lerner, J., Schoar, A. and Wongsunwai, W. (2007) “Smart Institutions, Foolish Choices: The limited partner performance puzzle” Journal of Finance, 62, 731 – 764. Ljungqvist, A. and Richardson, M. (2003) “The cash flow, return and risk characteristics of private equity” NBER Working Paper No. W9454. Metrick, A. (2006) “Venture Capital and the Finance of Innovation”, Wiley Publishing Company. Metrick, A. and Yasuda, A. (2007) “The Economics of Private Equity Funds” Working Paper. Moskowitz, T.J. and Vissing-Jorgensen, A. (2002) “The Returns to Entrepreneurial Investment: A Private Equity Premium Puzzle?” American Economic Review, 92, 745 – 78.

38
Peng, L. (2001) “Building a Venture Capital Index” Yale ICF Working Paper No. 00-51. Phalippou, L. (2007) “Investing in Private Equity Funds: A survey” CFA Research Institute, Research Foundation Literature Reviews, April, 1-22. Phalippou, L. and Gottschlag, O. (2007) “The Performance of Private Equity Funds” AFA, 2008, New Orleans Meetings, available at SSRN. Phalippou, L. and Zollo, M. (2005) “Performance of Private Equity Funds” Wharton Financial Working Paper No. 05-42, Wharton Financial Institutions Center. Phalippou, L. and Zollo, M. (2006) “What Drives Private Equity Fund Performance?” Wharton Financial Working Paper No. 05-41, Wharton Financial Institutions Center. Quigley, J.M. and Woodward, S.E. (2003) “An Index for Venture Capital” University of California at Berkeley, Working Paper No. E03-333. Ritter, J.R. (1984) “The Hot Issue Market of 1980” Journal of Business, 57, 215 - 40. Ritter, J.R. and Welch, I. (2002) “A Review of IPO Activity, Pricing, and Allocations” Journal of Finance, 57, 1795-1828. Ross, P.W. and Isenstein, S. (1988) “Exiting venture capital investments” Venture Economics, Needham, MA. Schmidt, D. (2003) “Private equity-, stock- and mixed asset-portfolios: A bootstrap approach to determine performance characteristics, diversification benefits and optimal portfolio allocations” Center for Financial Studies CFS Working Paper No. 2004/12 Wang, Y. (2006) “Mutual Fund Flows, Performance Persistence and Manager Skill” paper presented at the FMA Annual Meeting, Salt Lake City, October. Woodward, S.E. and Hall, R.E. (2004) “Benchmarking the Returns to Venture” NBER Working Paper No. 10202

Table I
Summary of Fund Database by Year This table presents a summary of the number of terminated, active and effectively terminated funds in the database by vintage year. Further, the average commitment of the LP to a fund is summarised by fund status and vintage year.
Number of Funds Average Commitment (000’s)
Year
Terminated
Funds
Active Funds
(Effectively
Terminated)
All
Funds
Terminated
Funds
Active
Funds
All
Funds
1980* 6 6 877 877
1981* 5 5 1,620 1,620
1982* 5 5 2,400 2,400
1983* 6 6 1,416 1,416
1984* 6 1 (1) 7 2,100 3,000 2,228
1985 9 9 3,158 3,158
1986 15 15 3,331 3,331
1987 13 3 (3) 16 3,196 3,000 3,170
1988 11 3 (2) 14 4,777 3,333 4,468
1989 12 2 (2) 14 6,041 4,000 5,749
1990 4 4 7,033 7,033
1991 4 1 (1) 5 7,720 4,000 6,976
1992 7 4 (4) 11 4,823 5,000 4,862
1993 5 2 (2) 7 5,171 11,750 7,051
1994 4 8 (8) 12 4,205 8,511 6,789
1995 6 9 (9) 15 6,928 5,730 6,243
1996 3 8 (7) 12 14,728 13,708 14,048
1997 3 11 (9) 14 6,422 11,471 9,956
1998 4 17 (11) 21 10,916 10,409 10,544
1999 5 29 (4) 34 12,941 15,357 14,721
2000 1 39 (6) 40 18,422 10,176 10,568
2001 22 22 11,825 11,825
2002 2 9 11 814 10,542 7,299
2003 9 9 19,837 19,837
2004 12 12 21,497 21,497
2005 20 20 17,907 17,907
2006 31 31 16,159 16,159
2007 11 10 16,034 16,034
Total 136 251 (69) 387 - - -
Note: * - only 1 Limited Partner was active during this period : Effectively Terminated Funds are those funds that have a residual value of less than 10% of the total distributions.
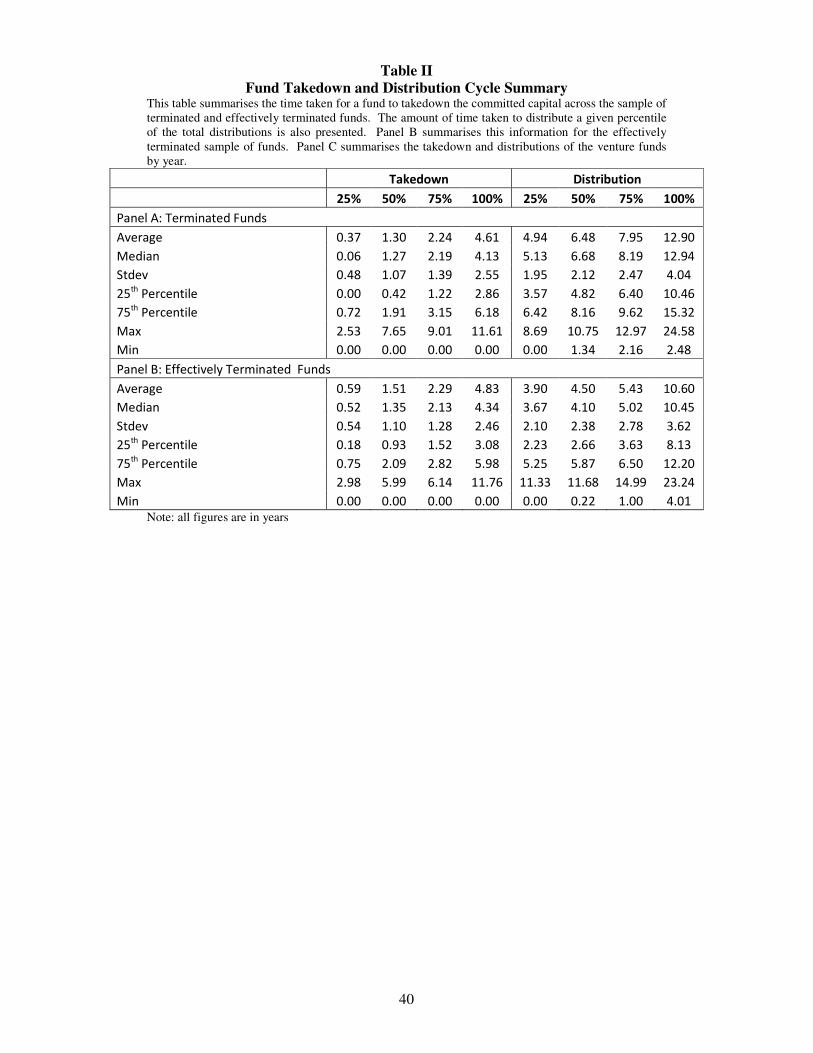
40
Table II
Fund Takedown and Distribution Cycle Summary This table summarises the time taken for a fund to takedown the committed capital across the sample of terminated and effectively terminated funds. The amount of time taken to distribute a given percentile of the total distributions is also presented. Panel B summarises this information for the effectively terminated sample of funds. Panel C summarises the takedown and distributions of the venture funds by year.
Takedown Distribution
25% 50% 75% 100% 25% 50% 75% 100%
Panel A: Terminated Funds
Average 0.37 1.30 2.24 4.61 4.94 6.48 7.95 12.90
Median 0.06 1.27 2.19 4.13 5.13 6.68 8.19 12.94
Stdev 0.48 1.07 1.39 2.55 1.95 2.12 2.47 4.04
25th
Percentile 0.00 0.42 1.22 2.86 3.57 4.82 6.40 10.46
75th
Percentile 0.72 1.91 3.15 6.18 6.42 8.16 9.62 15.32
Max 2.53 7.65 9.01 11.61 8.69 10.75 12.97 24.58
Min 0.00 0.00 0.00 0.00 0.00 1.34 2.16 2.48
Panel B: Effectively Terminated Funds
Average 0.59 1.51 2.29 4.83 3.90 4.50 5.43 10.60
Median 0.52 1.35 2.13 4.34 3.67 4.10 5.02 10.45
Stdev 0.54 1.10 1.28 2.46 2.10 2.38 2.78 3.62
25th
Percentile 0.18 0.93 1.52 3.08 2.23 2.66 3.63 8.13
75th
Percentile 0.75 2.09 2.82 5.98 5.25 5.87 6.50 12.20
Max 2.98 5.99 6.14 11.76 11.33 11.68 14.99 23.24
Min 0.00 0.00 0.00 0.00 0.00 0.22 1.00 4.01
Note: all figures are in years

41
Table III
Summary of Fund Takedown and Distributions This table summarises the takedowns and distributions of the sample of terminated and effectively terminated funds in the sample.
TakeDown Distributions
Total
Takedown
Total
Distributions Number Size
Size/Total
Takedown
Number Number
(Cash)
Number
(Stock)
Size
Size (Cash)
Size
(Stock)
Panel A: Terminated Funds
Average 4,855,667 14,383,297 11 524,010 18% 30 11 20 541,392 396,210 582,467
Median 3,775,000 7,499,962 9 428,571 11% 28 8 13 301,614 218,353 325,018
Stdev 4,704,654 22,611,150 8 437,000 20% 20 8 18 709,660 578,288 775,432
25th
Percentile 1,754,344 3,186,464 4 276,810 7% 15 5 7 156,905 81,343 157,123
75th
Percentile 6,003,221 16,037,387 15 585,558 25% 41 14 28 582,847 521,350 601,962
Max 29,179,400 206,164,273 45 3,000,000 100% 108 34 76 4,624,042 4,624,042 4,708,884
Min 400,000 284,006 1 699 2% 1 1 0 31,043 8,565 0
Panel B: Effectively Terminated Funds
Average 9,903,562 66,451,561 15 856,079 9% 42 13 28 1,822,875 524,944 2,404,010
Median 6,999,999 22,950,101 17 526,316 6% 32 7 22 997,830 313,418 1,079,337
Stdev 8,420,531 93,107,917 7 1,279,736 10% 37 19 26 2,312,773 547,529 3,013,469
25th
Percentile 5,000,000 8,963,051 11 307,692 5% 18 4 11 287,378 164,133 415,357
75th
Percentile 13,125,000 82,425,988 19 839,588 9% 50 13 38 2,525,460 834,378 3,542,579
Max 52,011,904 443,267,157 40 9,250,000 50% 244 114 130 11,011,571 3,217,244 14,880,744
Min 806,100 655,204 2 38,386 3% 7 0 0 19,271 4,900 3,384

42
Table IV
Summary of Venture Fund Performance Panel A and B of this table summarises the performance of the terminated and effectively terminated funds in the database, respectively. The residual value of the terminated funds in the database is also summarised at the end of the table, both in nominal terms and also as a percentage of the total distributions of the fund as at the end of the sample period.
Average Median St. Dev.
Skewness
25th
Percentile
75th
Percentile Max. Min.
Panel A: Terminated Funds
Fund Multiple 3.65 2.34 8.33 10.31 1.50 3.93 96.10 0.18
- Top decile only 14.42 7.24 23.72 3.63 6.69 8.13 96.10 6.29
- Excluding top decile 2.41 2.01 1.43 0.75 1.42 3.15 5.97 0.18
- Excluding top quintile 2.04 1.89 1.03 0.30 1.22 2.77 4.25 0.18
IRR 27% 17% 44% 2.49 7% 33% 256% -94%
- Top decile only 127% 93% 63% 1.12 82% 160% 256% 71%
- Excluding top decile 15% 15% 22% -1.06 6% 28% 70% -94%
- Excluding top quintile 11% 12% 19% -2.11 4% 24% 39% -94%
Panel B: Effectively Terminated Funds
Fund Multiple
- Effectively Terminated Funds 5.82 3.76 6.13 2.08 1.82 6.50 32.45 0.58
- Top decile 20.26 17.26 5.88 1.87 16.86 21.31 32.45 15.76
- Excluding top decile 4.19 3.33 3.45 1.56 1.74 5.69 14.85 0.58
- Excluding top quintile 3.19 2.90 1.94 0.57 1.65 4.23 7.55 0.58
IRR
- Effectively Terminated Funds 85% 61% 96% 1.98 15% 125% 515% -22%
- Top decile 301% 292% 108% 1.42 228% 323% 515% 200%
- Excluding top decile 61% 45% 56% 0.54 15% 108% 193% -22%
- Excluding top quintile 48% 39% 45% 0.42 12% 85% 133% -22%
Residual 1,355,340 485,883 2,133,199 - 108,155 1,271,694 9,735,209 1,565
Residual / Total Distributions 3% 2% 3% - 1% 5% 10% 0%

43
Table V
Performance Summary of Combined Sample of Terminated and Effectively Terminated Venture Funds This table summarises the combined performance of the terminated and effectively terminated funds in the database. These metrics are also estimated for the top decile of funds and the database excluding the top decile and quintile of funds. A summary of the funds by vintage year is also provided to allow insights into the performance of the funds over time.
Average Median St. Dev.
Skewness
25th
Percentile
75th
Percentile Max. Min.
Fund Multiple
- Terminated and Effectively Terminated Funds 4.38 2.66 7.72 8.79 1.62 4.99 96.1 0.18
- Top decile 18.17 14.82 18.86 3.86 9.27 17.26 96.1 7.55
- Excluding top decile 2.8 2.34 1.78 0.79 1.5 3.84 7.28 0.18
- Excluding top quintile 2.34 2.01 1.3 0.55 1.34 3.23 5.49 0.18
- 1980 – 1984 2.33 1.83 1.56 2.04 1.43 2.57 7.28 0.59
- 1985 – 1989 3.07 2.66 1.68 0.69 1.89 3.98 7.6 0.57
- 1990 – 1994 5.07 2.99 6.13 3.07 1.86 5.81 32.45 0.53
- 1995 – 2006 6.18 3.12 12.25 6.22 1.1 6.49 96.1 0.18
IRR
- Terminated and Effectively Terminated Funds 47% 24% 72% 2.74 9% 61% 515% -94%
- Top decile 215% 193% 92% 1.97 155% 254% 515% 133%
- Excluding top decile 27% 20% 35% 0.69 7% 41% 125% -94%
- Excluding top quintile 18% 16% 24% -0.46 6% 31% 76% -94%
- 1980 – 1984 17% 9% 23% 2.1 4% 20% 92% -5%
- 1985 – 1989 23% 19% 26% 2.06 11% 32% 155% -57%
- 1990 – 1994 42% 37% 40% -0.37 17% 64% 125% -94%
- 1995 - 2006 86% 55% 107% 1.48 4% 136% 515% -34%

44
Table VI
Venture Fund Performance Relative to the Public Equity Market Fund Multiple and IRR measures of performance are estimated for a hypothetical set of funds that are created assuming that each terminated fund in the database made an equivalent investment in either the S&P500 or the NASDAQ. The Public Market Equivalent (PME) is a measure of the total disbursements to a fund expressed relative to the total distributions to the hypothetical fund. This data is also summarised excluding the top decile and quintile of funds.
Average Median St. Dev.
Skewness
25th
Percentile
75th
Percentile Max. Min.
S&P500 Multiple 2.00 2.06 0.53 -0.05 1.75 2.29 3.85 0.73
- Excluding top decile 1.90 1.98 0.44 -0.87 1.71 2.21 2.52 0.73
- Excluding top quintile 1.82 1.91 0.41 -0.96 1.65 2.14 2.33 0.73
S&P500 IRR 12% 12% 6% -1.28 11% 14% 27% -17%
- Excluding top decile 11% 12% 5% -2.50 11% 13% 19% -17%
- Excluding top quintile 10% 12% 5% -3.00 10% 13% 15% -17%
S&P500 PME 1.98 1.21 5.07 10.43 0.68 1.88 58.44 0.20
- Excluding top decile 1.23 1.02 0.74 0.89 0.64 1.64 3.11 0.20
- Excluding top quintile 1.03 0.92 0.52 0.43 0.57 1.41 2.25 0.20
Nasdaq Multiple 2.42 2.38 0.83 0.39 1.96 2.82 5.05 0.63
- Excluding top decile 2.23 2.27 0.63 -0.69 1.92 2.71 3.27 0.63
- Excluding top quintile 2.12 2.21 0.58 -0.90 1.86 2.58 2.92 0.63
Nasdaq IRR 16% 15% 10% -0.24 11% 21% 45% -24%
- Excluding top decile 14% 14% 8% -1.50 11% 19% 28% -24%
- Excluding top quintile 13% 13% 7% -2.02 11% 17% 23% -24%
Nasdaq PME 1.59 1.00 3.67 10.33 0.57 1.68 42.36 0.14
- Excluding top decile 1.02 0.93 0.57 0.66 0.57 1.33 2.48 0.14
- Excluding top quintile 0.88 0.83 0.43 0.44 0.54 1.19 1.85 0.14

45
Table VII
Venture Fund Performance Relative to the Industry (1989 – 2006) Fund Multiple and IRR measures of performance are estimated for a hypothetical set of funds that are created assuming that each fund in the database with a vintage year of 1989 or later, made an equivalent investment in the Sandhill venture industry benchmark index. A summary of the multiple and IRR measures of performance for venture funds in the database is also presented over the restricted sample period. The Public Market Equivalent (PME) is a measure of the total disbursements to a fund expressed relative to the total distributions to the hypothetical fund.
Average Median St. Dev.
Skewness
25th
Percentile
75th
Percentile Max. Min.
Fund Multiple 4.82 2.68 12.37 8.34 1.12 5.11 96.10 0.18
Fund Multiple (Sandhill) 4.26 4.26 2.56 0.46 2.27 6.29 11.51 0.62
IRR 34% 25% 60% 1.97 6% 46% 256% -94%
IRR (Sandhill) 33% 35% 20% -0.72 27% 49% 70% -25%
PME (Sandhill) 1.24 0.67 2.85 6.99 0.38 1.17 22.23 0.11

46
Table VIII
Average Fund Multiple by Vintage Year Compared to the Industry The following table summarises the average multiple by vintage year across all terminated and active funds in the database. This may be compared to an industry benchmark that is proxied by the average fund multiple for all funds in the Venture Economics database grouped by vintage year.
Year
Average Fund
Multiple
Average VE
Multiple
No. of Funds in
VE Database
1980 4.53 2.40 18
1981 1.40 1.88 22
1982 1.61 1.39 28
1983 1.68 1.75 59
1984 2.12 1.43 66
1985 2.26 1.95 46
1986 3.25 2.53 43
1987 3.24 2.34 63
1988 2.68 2.52 44
1989 3.59 2.32 54
1990 4.95 2.79 22
1991 2.63 2.74 18
1992 2.86 2.71 26
1993 4.84 3.65 40
1994 8.91 3.37 40
1995 11.21 3.68 49
1996 12.73 4.15 35
1997 4.50 2.15 60
1998 3.65 1.26 77
1999 0.77 0.36 110
2000 0.45 0.29 119
2001 0.29 0.26 54
2002 0.25 0.15 18
2003 0.43 0.06 14
2004 0.05 0.09 20
2005 0.04 0.03 9
2006 0.01 0.00 9

47
Table IX
Fund Performance Persistence The following table summarises the output from a regression equation that measures fund performance persistence. The current fund performance is regressed against the performance of the previous GPs fund(s).
Dependent Variable IRRi IRRi Multiplei Multiplei
IRRi-1 0.6313 0.4088 Multiplei-1 0.5269 0.4771
(6.01) (2.17) (6.77) (5.61)
IRRi-2 -0.1330 Multiplei-2 -0.0923
(0.34) (1.04)
Adjusted R2 0.2438 0.1065 Adjusted R
2 0.2464 0.1568
No. of Obs. 110 61 No. of Obs. 110 61
Note: absolute values of t-statistics are reported in parentheses. : all standard errors are corrected for serial correlation and heteroscedasticity

48
Table X
Venture Fund Performance (IRR) Relative to the State of the Market This table summarises the fund market conditions indicator which measures the state of the IPO market at the time the fund invested and redeemed those investments. The fund exit conditions indicator focuses solely on measuring the IPO market conditions at the time the fund distributions are made. The performance of the funds, as measured by the IRR, is summarised by market and exit conditions indicators in Panel B. The same set of summary metrics are presented in Panel C, where the top decile of funds of funds are excluded.
Average Median St. Dev.
25th
Percentile
75th
Percentile Max Min
Investment Conditions Summary
Entry Conditions 2.19 2.20 0.70 1.60 2.70 3.94 1.00
Exit Conditions 2.52 2.60 0.67 2.14 2.98 3.94 1.00
Market Conditions 0.33 0.42 0.90 -0.00 0.91 2.36 -2.59

49
Table XI
Venture Fund Performance (IRR) Relative to the IPO Market The performance of the sample of venture funds, as measured by the IRR, is summarised by market and exit conditions indicators in Panel A. The same set of summary metrics are presented in Panel B, where the top decile of funds of funds are excluded.
Average Median St. Dev.
Skewness
25th
Percentile
75th
Percentile Max Min
Panel A: IRR Summary by Market and Exit Conditions
- Market Conditions < -1 22% 4% 52% 1.28 -15% 39% 141% -30%
- Market Conditions = -1 to 1 51% 27% 77% 2.75 9% 65% 515% -94%
- Market Conditions > 1 41% 20% 60% 2.52 10% 32% 256% -10%
- Exit Conditions <2 19% 9% 42% 1.60 -7% 29% 155% -34%
- Exit Conditions = 2 to 3 33% 24% 42% 1.93 11% 40% 237% -94%
- Exit Conditions >3 106% 76% 110% 1.56 22% 167% 515% -6%
Panel B: IRR Summary by Market and Exit Conditions (excluding top decile)
- Market Conditions < -1 9% -2% 37% 1.69 -16% 29% 116% -30%
- Market Conditions = -1 to 1 31% 24% 36% 0.60 8% 44% 133% -94%
- Market Conditions > 1 23% 18% 25% 1.62 9% 27% 94% -10%
- Exit Conditions <2 6% 7% 23% 0.86 -9% 15% 83% -34%
- Exit Conditions = 2 to 3 22% 20% 23% -1.20 10% 33% 71% -94%
- Exit Conditions >3 78% 69% 70% 0.64 18% 130% 254% -6%

50
Table XII
The Bubble and Venture Fund Performance: 1998 – 2002 The following table summarises the performance of funds that were active during the bubble and post bubble periods. To be considered active during the bubble period, a fund had to have made more than 50% of its distributions during the 1999Q2 – 2000Q3 period. To be considered active during the post-bubble period, a fund had to have made more than 50% of its distributions after 2000Q4.
Bubble Funds Post-Bubble Funds
Full Sample Excluding Top Decile Full Sample Excluding Top Decile
IRR Multiple IRR Multiple IRR Multiple IRR Multiple
Average 111% 7.94 85% 5.05 8% 2.37 -3% 1.21
Median 91% 4.66 78% 4.14 -3% 0.89 -7% 0.85
Stdev 100% 13.15 61% 3.73 38% 3.83 20% 1.18
Skewness 1.68 5.71 0.51 1.41 1.82 2.78 0.79 1.15
25th
Percentile 39% 2.73 33% 2.12 -15% 0.64 -16% 0.58
75th
Percentile 146% 7.73 131% 6.47 11% 1.70 7% 1.33
Max 515% 96.10 237% 16.69 116% 14.85 42% 6.13
Min -2% 0.97 -2% 0.97 -34% 0.18 -34% 0.18
No. Obs. 56 56 50 50 28 28 25 25

51
Table XIII
Investment Intensity by Vintage Year of Fund Table XIII presents a measure of the investment intensity of the fund database as well as the equivalent metric for all the funds in the VE database.
Year
Number
of
Funds
Fund
Investment
Intensity
VE Fund
Investment
Intensity
1980 6 56% 16%
1981 5 40% 21%
1982 5 52% 27%
1983 6 58% 28%
1984 7 40% 29%
1985 9 36% 28%
1986 15 39% 32%
1987 16 42% 34%
1988 13 30% 30%
1989 14 26% 24%
1990 4 27% 25%
1991 5 36% 26%
1992 11 36% 33%
1993 7 45% 31%
1994 12 29% 22%
1995 15 35% 27%
1996 10 29% 32%
1997 12 30% 30%
1998 15 39% 28%
1999 9 64% 38%
2000 7 71% 42%
2001 0 58% 26%
2002 2 42% 27%
Note: n/a – insufficient data

52
Figure I
LP Investment Activity Compared to the Industry – Number of Funds The figure presents a plot of the total number of funds in the database by year compared to the total number of new VC funds being raised by year as reported in the Venture Economics database.
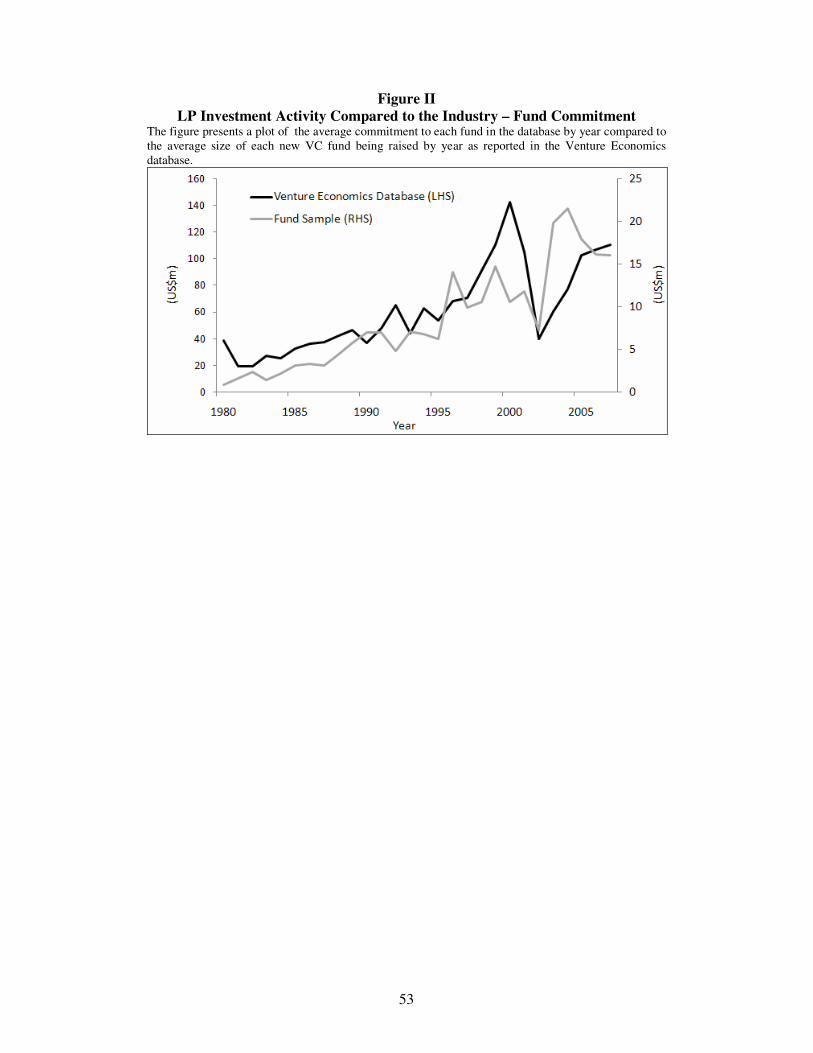
53
Figure II
LP Investment Activity Compared to the Industry – Fund Commitment The figure presents a plot of the average commitment to each fund in the database by year compared to the average size of each new VC fund being raised by year as reported in the Venture Economics database.

54
Figure III
Venture Fund IRR and Equivalent S&P500 Based IRR The estimated IRR of each terminated venture fund is plotted against the estimated IRR where an equivalent investment is made in the S&P500. The solid line shows the equivalence between the two IRRs, such that where a fund generates an IRR that is superior (inferior) to an equivalent investment in the public equity market, its plot will fall above (below) the solid line.

55
Figure IV
Quarterly IPO Market Data The total number of IPOs, total number of venture backed IPOs and total number of venture backed IPOs that were unprofitable at the time of investment are plotted in the upper panel. The lower panel presents a plot of the percentage of venture backed IPOs that were unprofitable.

56
Figure V
Venture Fund IRR and Market Conditions The following table presents a plot of the fund IRR relative to the market conditions parameter for each fund. The symbols are used to denote different vintage periods.

57
Figure VI
Venture Fund IRR and Investment Exit Conditions The following table presents a plot of the venture fund IRR relative to the fund exit conditions. The symbols are used to denote different vintage periods.

58
Figure VII
Intensity of Fund Takedown This figure presents a plot of the intensity of the takedown process for each year in the sample period for the funds captured in the database. To provide a comparison to the industry, a similar metric is constructed for all funds captured in the Venture Economics database.
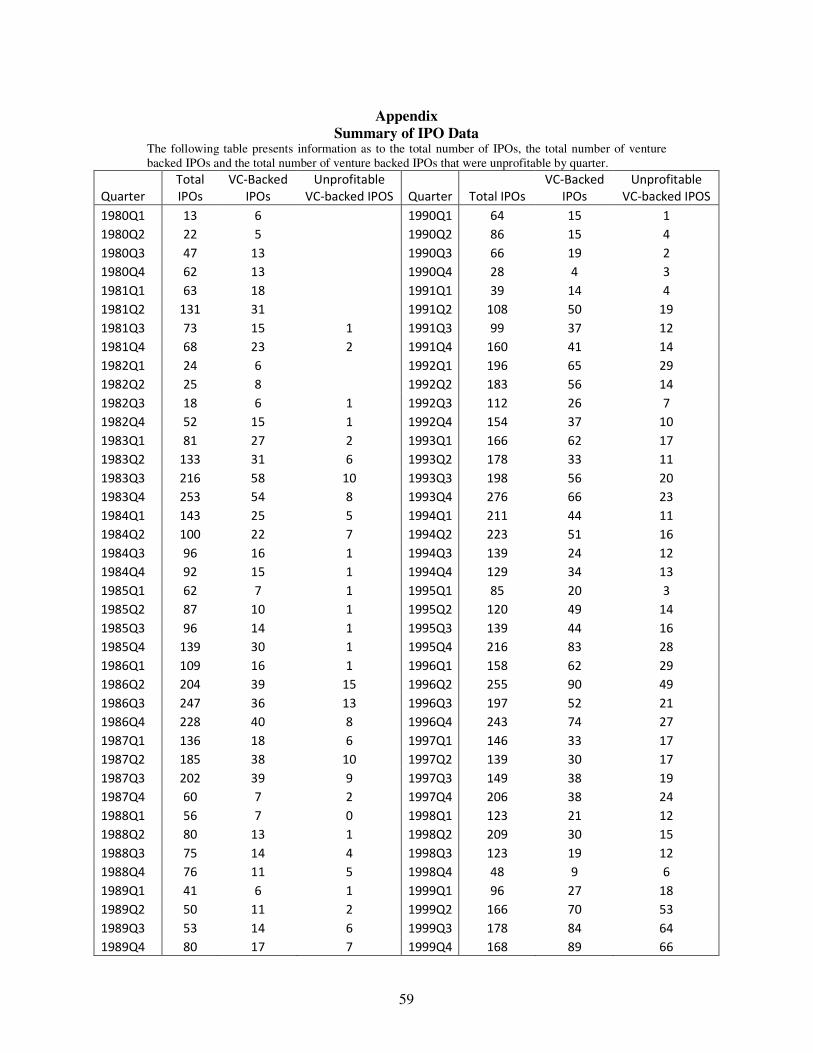
59
Appendix
Summary of IPO Data The following table presents information as to the total number of IPOs, the total number of venture backed IPOs and the total number of venture backed IPOs that were unprofitable by quarter.
Quarter
Total
IPOs
VC-Backed
IPOs
Unprofitable
VC-backed IPOS Quarter Total IPOs
VC-Backed
IPOs
Unprofitable
VC-backed IPOS
1980Q1 13 6 1990Q1 64 15 1
1980Q2 22 5 1990Q2 86 15 4
1980Q3 47 13 1990Q3 66 19 2
1980Q4 62 13 1990Q4 28 4 3
1981Q1 63 18 1991Q1 39 14 4
1981Q2 131 31 1991Q2 108 50 19
1981Q3 73 15 1 1991Q3 99 37 12
1981Q4 68 23 2 1991Q4 160 41 14
1982Q1 24 6 1992Q1 196 65 29
1982Q2 25 8 1992Q2 183 56 14
1982Q3 18 6 1 1992Q3 112 26 7
1982Q4 52 15 1 1992Q4 154 37 10
1983Q1 81 27 2 1993Q1 166 62 17
1983Q2 133 31 6 1993Q2 178 33 11
1983Q3 216 58 10 1993Q3 198 56 20
1983Q4 253 54 8 1993Q4 276 66 23
1984Q1 143 25 5 1994Q1 211 44 11
1984Q2 100 22 7 1994Q2 223 51 16
1984Q3 96 16 1 1994Q3 139 24 12
1984Q4 92 15 1 1994Q4 129 34 13
1985Q1 62 7 1 1995Q1 85 20 3
1985Q2 87 10 1 1995Q2 120 49 14
1985Q3 96 14 1 1995Q3 139 44 16
1985Q4 139 30 1 1995Q4 216 83 28
1986Q1 109 16 1 1996Q1 158 62 29
1986Q2 204 39 15 1996Q2 255 90 49
1986Q3 247 36 13 1996Q3 197 52 21
1986Q4 228 40 8 1996Q4 243 74 27
1987Q1 136 18 6 1997Q1 146 33 17
1987Q2 185 38 10 1997Q2 139 30 17
1987Q3 202 39 9 1997Q3 149 38 19
1987Q4 60 7 2 1997Q4 206 38 24
1988Q1 56 7 0 1998Q1 123 21 12
1988Q2 80 13 1 1998Q2 209 30 15
1988Q3 75 14 4 1998Q3 123 19 12
1988Q4 76 11 5 1998Q4 48 9 6
1989Q1 41 6 1 1999Q1 96 27 18
1989Q2 50 11 2 1999Q2 166 70 53
1989Q3 53 14 6 1999Q3 178 84 64
1989Q4 80 17 7 1999Q4 168 89 66

60
Appendix (Continued)
Quarter Total IPOs
VC-Backed
IPOs
Unprofitable
VC-backed IPOS
2000Q1 243 81 62
2000Q2 162 53 38
2000Q3 174 79 63
2000Q4 84 24 20
2001Q1 46 9 7
2001Q2 40 9 7
2001Q3 31 5 4
2001Q4 45 14 7
2002Q1 37 4 2
2002Q2 66 15 9
2002Q3 33 2 1
2002Q4 52 4 2
2003Q1 10 1 -
2003Q2 24 2 1
2003Q3 44 8 2
2003Q4 57 16 12
2004Q1 75 26 12
2004Q2 107 26 18
2004Q3 78 23 15
2004Q4 79 25 16
2005Q1 57 8 6
2005Q2 78 7 5
2005Q3 100 16 10
2005Q4 61 12 6
2006Q1 69 12 9
2006Q2 88 19 8
2006Q3 87 7 1
2006Q4 82 20 4
Related Documents