Technology Sector Scorecard Q4 2013 www.pwc.com

Welcome message from author
This document is posted to help you gain knowledge. Please leave a comment to let me know what you think about it! Share it to your friends and learn new things together.
Transcript

Technology Sector Scorecard Q4 2013
www.pwc.com
PwC Technology Sector Scorecard
2
Contents
Executive summary
Snapshot by subsector
• Communications
• Consumer Electronics
• EMS/Distributors
• Internet
• Semiconductors
• Software
• Software Services
• Systems and PC Hardware
PwC Technology Industry Territory Leaders
3

PwC Technology Sector Scorecard
3
Q4 2013 Executive summary

PwC Technology Sector Scorecard
4
Q4 2013 Executive summary
• The technology market was positively impacted by the slowly reviving global economy, posting strong or moderate revenue growth in the fourth quarter.
• Three of the subsectors, Consumer Electronics, Software and Internet, reported revenue growth of 25% or more quarter over quarter. EMS posted 17% growth, and Systems & PC Hardware, challenged by disruption from mobile and cloud, recorded 7% growth. Flat to negative revenue growth occurred in the Software Services, Semiconductor and Communications subsectors.
• Cloud computing adoption is having a profound effect on server, storage and network products. Revenue in the worldwide server market decreased -4.4% year over year to US$14.2bn in the fourth quarter. This was the fourth consecutive quarter of year-over-year revenue decline, as the server market demand remained weak ahead of a forthcoming refresh cycle, which is expected to emerge in early 2014.1
• Momentum in the capital markets led to the best technology IPO performance of the year in Q4 and set the stage for a strong 2014. Internet Software & Services and Software remained the most active subsectors in 2013.2
• US venture capital funding in the technology sector increased by 47% in dollars and 4% in deal volume from Q4’12, reaching US$5.3bn in 687 deals during the fourth quarter.3
Improving economic conditions and rising investor confidence Mobile and cloud continue to lead disruption
1. IDC Worldwide Quarterly Server Tracker, February 2014 2. PwC Global Technology IPO Review: Full year and Q4 2013 3. PricewaterhouseCoopers/National Venture Capital Association MoneyTreeTM Report: Technology Q4 2013

PwC Technology Sector Scorecard
5
Q4 2013 Executive summary (continued)
• Strength in the US technology market continues to lead the global tech market, with approximately 40% share of global technology purchases. While the US economy has been exhibiting steady, though slow growth, Western and Central Europe is just starting to recover from its debt crisis and related economic slump; Japan is experiencing a modest expansion after years of deflation, while Brazil, India, and Russia are going through a period of sluggish and uneven growth.4
• China’s pace of growth slowed in 2013 and is expected to remain modest in 2014. However, with Chinese authorities lifting the freeze on IPOs we expect significant growth in Chinese IPOs in 2014.
• Looking forward, worldwide IT spending is projected to increase 3.1% and reach US$3.8 trillion in 2014 in contrast to flat growth of 0.4% in 2013.5
• Business and government purchases of software are expected to post the fastest 2014 growth of 7.8%, followed by IT consulting and systems integration services at 7.3%.4
• Improvement is expected in the Communications Equipment sector, driven by business and government spending on smartphones and wireless equipment, which will offset weakness in traditional routers, switches and other wireline equipment.4
4. Forrester, Global Tech Market Forecast 2014-2015, January 2014 5. Gartner, IT Spending Forecast Summary, Q4 2013 Update, December 2013
PwC Technology Sector Scorecard
6
Source: ISM
47
.3
32.5
36
.4 45.3
50
.0
50
.0
56
.6
55
.3
53
.1
54
.3
56
.0
55
.1
53
.9
52
.6
51
.0
50
.8
52
.9
51
.0
51
.4
54
.6 58
.2
56
.2
54
.4
57
.0
61
.0
56
.4
51
.0
52
.4
53
.3
52
.7
50
.3
50
.6
52
.9
50
.2
55
.8
56
.5
30
35
40
45
50
55
60
65
4Q
04
1Q
05
2Q
05
3Q
05
4Q
05
1Q
06
2Q
06
3Q
06
4Q
06
1Q
07
2Q
07
3Q
07
4Q
07
1Q
08
2Q
08
3Q
08
4Q
08
1Q
09
2Q
09
3Q
09
4Q
09
1Q
10
2Q
10
3Q
10
4Q
10
1Q
11
2Q
11
3Q
11
4Q
11
1Q
12
2Q
12
3Q
12
4Q
12
1Q
13
2Q
13
3Q
13
4Q
13
Quarter
Recession Threshold (42.7)
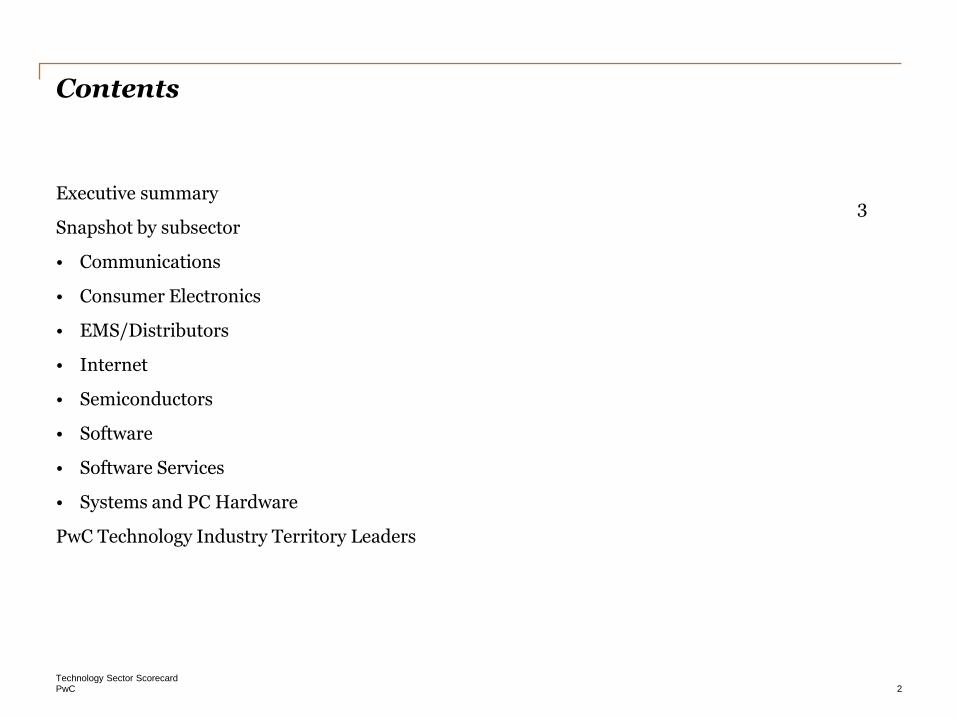
The Purchasing Manager’s Index (PMI) rose to 56.5 in Q4’13 and reached the highest point since Q2’11, indicating an improved macro economic picture in the US. With increase in GDP, the PMI is expected to sustain if not rise in 2014. Unfortunately, January (51.3) and February (53.2) values dropped back down, continuing the uneven pattern that began in 2011.
US Purchasing Manager’s Index trends (2004-2013)
PwC Technology Sector Scorecard
7
Snapshot by subsector
Communications
PwC Technology Sector Scorecard
8
Market analysis Communications
• Worldwide sales of smartphones to end users totaled 968mn units in 2013, an increase of 42.3% from 2012. Sales of smartphones accounted for 53.6% of overall mobile phone sales in 2013, and exceeded annual sales of feature phones for the first time.1
• Smartphone sales grew 36% in Q4'13 and accounted for 57.6 % of overall mobile phone sales in Q4'13, up from 44% in Q4'12. This increasing ratio of smartphones to mobile phones was led by growth in Latin America, the Middle East and Africa, Asia-Pacific and Eastern Europe, where Q4’13 smartphone sales grew by more than 50%. With a 166.8% increase in Q4'13 , India recorded the highest smartphone sales growth at a country level and Latin America saw the strongest growth among all regions (96.1%) in Q4'13. China also contributed significantly to worldwide smartphone sales as sales grew 86.3% in 2013.1
• Retailers believe that mobile must be the number-one priority for their digital business in 2014. According to 2014 Shop.org/Forrester Research Inc: State Of Retailing Online survey, which surveyed 70 retailers in October and November 2013, more than half (53%) of the survey respondents marked mobile efforts as a top priority and identified responsive design, mobile site optimisation and tablet redesign among key focus areas.2
• As cloud computing adoption accelerates, core hardware components such as servers, storage and networks need to rapidly evolve to support emerging cloud-use models that are challenging existing performance, security, availability and agility capabilities.
1. Gartner Press Release, February 2014 2. Forrester, January 2014
PwC Technology Sector Scorecard
9
Market analysis (continued) Communications
• On 27 January 2014, Ericsson and Samsung reached an agreement on global patent licenses. The cross-license agreement covers patents relating to GSM, UMTS and LTE standards for both networks and handsets. Ericsson’s sales for comparable units, adjusted for foreign exchange rates, increased 4% YoY. Ericsson’s successful close of an Intellectual Property Rights cross-license agreement with Samsung on FRAND (fair, reasonable and non-discriminatory) terms positively impacted net income by SEK 3.3bn in Q4'13, as the initial payment from the agreement contributed to net sales. Ericsson’s sales increased in China and Russia, while Network sales in North America and overall sales in Japan declined. CDMA sales in North America, as well as GSM sales in China, continued to decline.
• Cisco’s net income decreased by more than 50% YoY to US$1.4bn led by downside volatility in emerging markets and product transitions, which (broadly defined) include transition away from low-price set-top boxes to software, as well as new core routers; and near-term competitive weakness in edge and metro Ethernet routers. Net income for Q2’14 (calendar quarter Q4’13) was also adversely impacted by a pre-tax charge of US$655mn related to the expected cost of remediation of issues with memory components in certain products sold in prior fiscal years.
PwC Technology Sector Scorecard
10
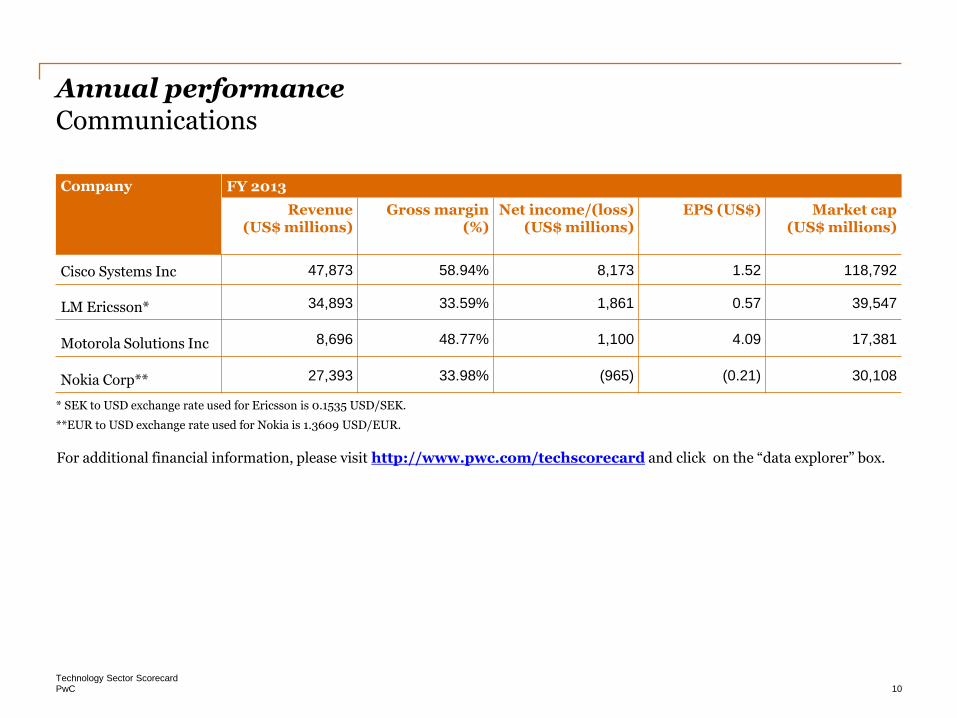
Annual performance Communications
Company FY 2013
Revenue (US$ millions)
Gross margin (%)
Net income/(loss) (US$ millions)
EPS (US$) Market cap (US$ millions)
Cisco Systems Inc 47,873 58.94% 8,173 1.52 118,792
LM Ericsson* 34,893 33.59% 1,861 0.57 39,547
Motorola Solutions Inc 8,696 48.77% 1,100 4.09 17,381
Nokia Corp** 27,393 33.98% (965) (0.21) 30,108
* SEK to USD exchange rate used for Ericsson is 0.1535 USD/SEK.
**EUR to USD exchange rate used for Nokia is 1.3609 USD/EUR.
For additional financial information, please visit http://www.pwc.com/techscorecard and click on the “data explorer” box.

PwC Technology Sector Scorecard
11
Q4 performance Communications
Company Q4 2013
Revenue (US$ millions)
Gross margin (%)
Net income/(loss) (US$ millions)
EPS (US$) Market cap (US$ millions)
Cisco Systems Inc 11,155 53.35% 1,429 0.27 118,792
LM Ericsson* 10,289 37.09% 984 0.30 39,547
Motorola Solutions Inc 2,504 48.48% 343 1.31 17,381
Nokia Corp** 4,730 42.52% (34) (0.01) 30,108
* SEK to USD exchange rate used for Ericsson is 0.1535 USD/SEK.
**EUR to USD exchange rate used for Nokia is 1.3609 USD/EUR.
For additional financial information, please visit http://www.pwc.com/techscorecard and click on the “data explorer” box.

PwC Technology Sector Scorecard
12
Q3 performance Communications
Company Q3 2013
Revenue (US$ millions)
Gross margin (%)
Net income/(loss) (US$ millions)
EPS (US$) Market cap (US$ millions)
Cisco Systems Inc 12,417 59.17% 2,270 0.42 135,078
LM Ericsson* 8,438 32.39% 231 0.07 36,381
Motorola Solutions Inc 2,107 48.84% 258 0.94 15,350
Nokia Corp** 7,437 33.49% (363) (0.08) 13,884
* SEK to USD exchange rate used for Ericsson is 0.1525 USD/SEK.
**EUR to USD exchange rate used for Nokia is 1.3058 USD/EUR.
For additional financial information, please visit http://www.pwc.com/techscorecard and click on the “data explorer” box.

PwC Technology Sector Scorecard
13
Q2 performance Communications
Company Q2 2013
Revenue (US$ millions)
Gross margin (%)
Net income/(loss) (US$ millions)
EPS (US$) Market cap (US$ millions)
Cisco Systems Inc 12,417 59.17% 2,270 0.42 135,078
LM Ericsson* 8,438 32.39% 231 0.07 36,381
Motorola Solutions Inc 2,107 48.84% 258 0.94 15,350
Nokia Corp** 7,437 33.49% (363) (0.08) 13,884
* SEK to USD exchange rate used for Ericsson is 0.1525 USD/SEK.
**EUR to USD exchange rate used for Nokia is 1.3058 USD/EUR.
For additional financial information, please visit http://www.pwc.com/techscorecard and click on the “data explorer” box.
PwC Technology Sector Scorecard
14
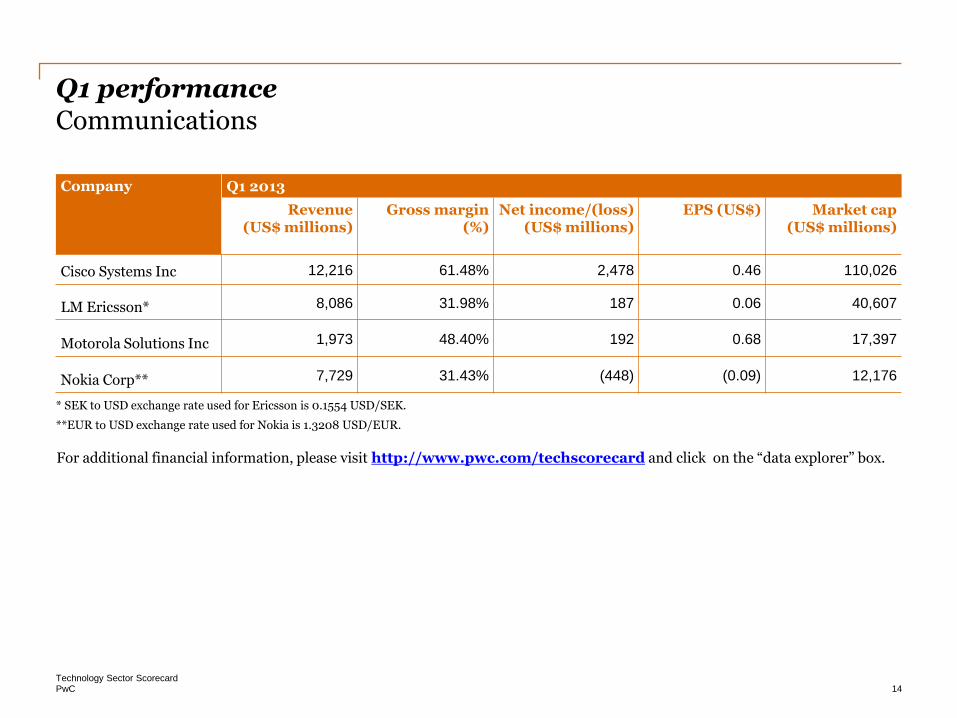
Q1 performance Communications
Company Q1 2013
Revenue (US$ millions)
Gross margin (%)
Net income/(loss) (US$ millions)
EPS (US$) Market cap (US$ millions)
Cisco Systems Inc 12,216 61.48% 2,478 0.46 110,026
LM Ericsson* 8,086 31.98% 187 0.06 40,607
Motorola Solutions Inc 1,973 48.40% 192 0.68 17,397
Nokia Corp** 7,729 31.43% (448) (0.09) 12,176
* SEK to USD exchange rate used for Ericsson is 0.1554 USD/SEK.
**EUR to USD exchange rate used for Nokia is 1.3208 USD/EUR.
For additional financial information, please visit http://www.pwc.com/techscorecard and click on the “data explorer” box.
PwC Technology Sector Scorecard
15
Snapshot by subsector
Consumer Electronics

PwC Technology Sector Scorecard
16
Market analysis Consumer Electronics
• Revenues for the Consumer Electronics (CE) industry are projected to grow 2.4% in 2014, reaching a new record high of US$208bn. The new, emerging product categories (3D printers, Bluetooth wireless speakers, convertible PCs, health and fitness devices, wearables and Ultra HD television displays) will grow by 107% YoY in 2014. These new technology categories are cumulatively expected to contribute more than US$6bn to the overall CE industry in 2014. While these emerging product categories represent less than 3% of the entire CE industry today, they drive 65% of total industry revenue growth in absolute terms.1, 2
• In terms of the Q4'13 results, average revenue grew by 20% QoQ (for companies in this analysis) led by higher holiday orders in the last quarter. Apple led the way with QoQ revenue growth of 53.7%, followed by Sony Corp (27%) and Philips (25.5%). On a sequential basis, margins improved for Apple and Philips while Toshiba experienced a 115bp drop in margin.
• Worldwide combined shipments of devices (PCs, tablets, ultra-mobiles and mobile phones) are projected to reach 2.5 billion units in 2014, a 7.6% increase from 2013. The device market continues to evolve, with buyers deciding which combination of devices is required to meet their wants and needs. Mobile phones are a must have but the new demand is focused on mid- to lower range smartphones. Users continued to move away from traditional PCs (laptops and desk-based), preferring the greater flexibility of tablets, hybrids and lighter notebooks that address users' increasingly different needs.3
1. Consumer Electronics Association, January 2014 2. There is widespread anticipation that potential launch of key products by major players will finally inject life in wearable products. 3. Gartner January 2014
PwC Technology Sector Scorecard
17
Market analysis (continued) Consumer Electronics
• Apple’s financial results for its Q1’14 ending December 2013 were quite positive with revenue of US$57.6bn and quarterly net profit of US$13.1bn. These results compare to revenue of US$54.5bn and net profit of US$13.1bn in the year-ago quarter. Gross margin declined to 37.9% compared to 38.6% YoY. International sales accounted for 63% of the quarter’s revenue. This shift towards international sales was led by stronger demand in Europe and China. Sales in China and other emerging markets are adversely impacting Apple’s margins and they are expected to continue to do so in the near term. The company sold 51 million iPhones, an all-time quarterly record, compared to 47.8 million in the year-ago quarter. Apple also sold 26 million iPads during the quarter, also an all-time quarterly record, compared to 22.9 million in the year-ago quarter. The company sold 4.8 million Macs, compared to 4.1 million in the year-ago quarter.
• Toshiba Group’s net sales increased by ¥192.5bn to ¥1549.6bn in Q4’13, with all five major segments recording higher sales. The Electronic Devices & Components segment, which benefited from demand for memory products, posted the highest sales. Consolidated operating income increased by ¥18.1bn to ¥47.7bn. But net income decreased by ¥12.2bn to ¥17.2bn due to higher income tax.

PwC Technology Sector Scorecard
18
Annual performance Consumer Electronics
Company FY 2013
Revenue (US$ millions)
Gross margin (%)
Net income/(loss) (US$ millions)
EPS
(US$)
Market cap (US$ millions)
Apple Inc 173,992 37.41% 37,031 40.32 503,640
Canon Inc 37,626 48.20% 2,319 1.91 36,384
Philips* 31,098 41.54% 1,588 1.74 33,766
Sony Corp 76,832 34.61% 1,253 0.92 17,941
Toshiba Corporation 64,322 24.68% 627 0.16 18,661
*EUR to USD exchange rate used for Philips is 1.37249USD/EUR.
For additional financial information, please visit http://www.pwc.com/techscorecard and click on the “data explorer” box.

PwC Technology Sector Scorecard
19
Q4 performance Consumer Electronics
Company Q4 2013
Revenue (US$ millions)
Gross margin (%)
Net income/(loss) (US$ millions)
EPS
(US$)
Market cap (US$ millions)
Apple Inc 57,594.00 37.93% 13,072.00 14.50 503,640.21
Canon Inc 9,854.27 47.17% 611.92 0.43 36,383.97
Philips* 9,331.56 42.40% 561.35 0.60 33,766.11
Sony Corp 22,979.00 34.27% 416.00 0.22 17,941.00
Toshiba Corporation 14,757.99 24.07% 163.27 0.04 18,660.64
*EUR to USD exchange rate used for Philips is 1.37249USD/EUR.
For additional financial information, please visit http://www.pwc.com/techscorecard and click on the “data explorer” box.
PwC Technology Sector Scorecard
20
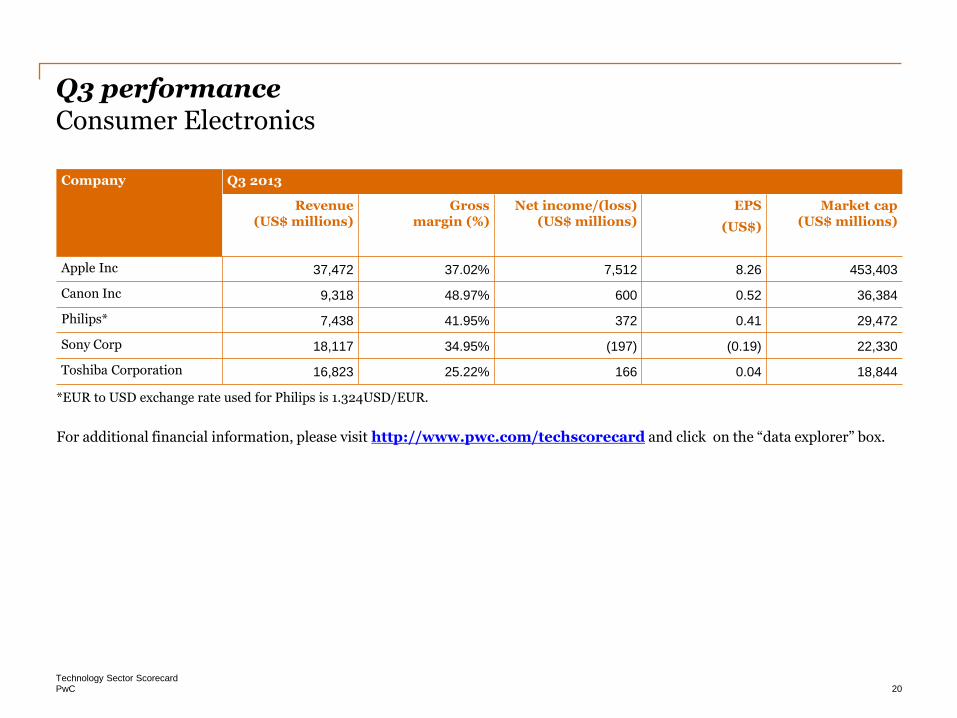
Q3 performance Consumer Electronics
Company Q3 2013
Revenue (US$ millions)
Gross margin (%)
Net income/(loss) (US$ millions)
EPS
(US$)
Market cap (US$ millions)
Apple Inc 37,472 37.02% 7,512 8.26 453,403
Canon Inc 9,318 48.97% 600 0.52 36,384
Philips* 7,438 41.95% 372 0.41 29,472
Sony Corp 18,117 34.95% (197) (0.19) 22,330
Toshiba Corporation 16,823 25.22% 166 0.04 18,844
*EUR to USD exchange rate used for Philips is 1.324USD/EUR.
For additional financial information, please visit http://www.pwc.com/techscorecard and click on the “data explorer” box.

PwC Technology Sector Scorecard
21
Q2 performance Consumer Electronics
Company Q2 2013
Revenue (US$ millions)
Gross margin (%)
Net income/(loss) (US$ millions)
EPS
(US$)
Market cap (US$ millions)
Apple Inc 35,323 36.87% 6,900 7.47 360,225
Canon Inc 9,766 49.37% 672 0.58 37,892
Philips* 7,383 41.51% 414 0.46 24,848
Sony Corp 17,300 35.84% 35 0.03 21,421
Toshiba Corporation 14,046 24.71% 54 0.01 20,581
*EUR to USD exchange rate used for Philips is 1.30575 USD/EUR.
For additional financial information, please visit http://www.pwc.com/techscorecard and click on the “data explorer” box.

PwC Technology Sector Scorecard
22
Q1 performance Consumer Electronics
Company Q1 2013
Revenue (US$ millions)
Gross margin (%)
Net income/(loss) (US$ millions)
EPS
(US$)
Market cap (US$ millions)
Apple Inc 43,603 37.50% 9,547 10.09 415,750
Canon Inc 8,688 47.26% 435 0.38 42,307
Philips* 6,945 39.96% 240 0.26 26,754
Sony Corp 18,436 33.57% 999 0.86 17,590
Toshiba Corporation 18,695 24.66% 245 0.07 21,386
*EUR to USD exchange rate used for Philips is 1.3209 USD/EUR.
For additional financial information, please visit http://www.pwc.com/techscorecard and click on the “data explorer” box.

PwC Technology Sector Scorecard
23
Snapshot by subsector
EMS/Distributors

PwC Technology Sector Scorecard
24
Market analysis EMS/Distributors
• The EMS sector performed well in Q4'13 compared to Q3'13 with average revenue growth of 17% (for companies in this analysis). Days inventory also decreased an average of six days QoQ, clearly indicating an uptick in demand. While revenue improved, margins declined for most of the companies on a sequential basis due to higher cost-of-goods-sold and operating expenses. Year-over-year, gross margins improved by 1.5%.
• Arrow Electronics reported Q4'13 net income of US$134.8mn, or US$1.32 per share, compared with net income of US$174.7mn, or US$1.62 per share on a diluted basis in Q4’12. Q4'13 sales of US$6.15bn increased 14% from prior year sales of US$5.40bn. Sales in the Asia-Pacific region increased 9% YoY, with significant contribution from China. Global Enterprise Computing Solutions (“ECS”) led the strong growth in overall revenue with Q4'13 sales of US$2.72bn, an increase of 23% YoY. Improved profitability was also realised due to significant margin improvement. Arrow’s net income for 2013 was US$399.4mn, or US$3.85 per share on a diluted basis, compared with net income of US$506.3mn, or US$4.56 per share in 2012.
• Flextronics’ net sales were US$7.2bn in Q4’13, higher than the company’s previous revenue guidance of US$6.5bn to US$6.9bn. The company’s adjusted earnings per diluted share of US$0.26 in Q4'13 was also higher than the company’s prior guidance of US$0.21-$0.25. The increase in revenue was propelled by a 57% increase in the High Velocity Solutions segment.
• Flextronics adjusted operating income increased US$28mn or 18% sequentially to US$187mn. GAAP operating income of US$174mn increased US$24mn from US$150mn in the prior quarter.

PwC Technology Sector Scorecard
25
Annual & Q4 performance EMS/Distributors
Company FY 2013
Revenue (US$ millions)
Gross margin (%)
Net income/(loss) (US$ millions)
EPS(US$) Market cap (US$ millions)
Arrow Electronics Inc 21,357 13.07% 399 3.85 6,804
Avnet Inc 26,657 11.67% 458 3.28 5,955
Flextronics International Ltd 24,680 5.78% 296 0.47 4,681
For additional financial information, please visit http://www.pwc.com/techscorecard and click on the “data explorer” box.
Company Q4 2013
Revenue (US$ millions)
Gross margin (%)
Net income/(loss) (US$ millions)
EPS(US$) Market cap (US$ millions)
Arrow Electronics Inc 6,153 12.80% 135 1.32 6,804
Avnet Inc 7,422 11.43% 125 0.89 5,955
Flextronics International Ltd 7,183 5.55% 145 0.23 4,681

PwC Technology Sector Scorecard
26
Q2 & Q3 performance EMS/Distributors
Company Q3 2013
Revenue (US$ millions)
Gross margin (%)
Net income/(loss) (US$ millions)
EPS(US$) Market cap (US$ millions)
Arrow Electronics Inc 5,048 13.30% 97 0.95 6,039
Avnet Inc 6,346 11.59% 121 0.86 5,740
Flextronics International Ltd 6,410 5.75% 118 0.19 4,822
For additional financial information, please visit http://www.pwc.com/techscorecard and click on the “data explorer” box.
Company Q2 2013
Revenue (US$ millions)
Gross margin (%)
Net income/(loss) (US$ millions)
EPS(US$) Market cap (US$ millions)
Arrow Electronics Inc 5,306 13.00% 90 0.86 4,998
Avnet Inc 6,591 11.70% 126 0.91 4,605
Flextronics International Ltd 5,791 5.98% 59 0.09 4,778
PwC Technology Sector Scorecard
27
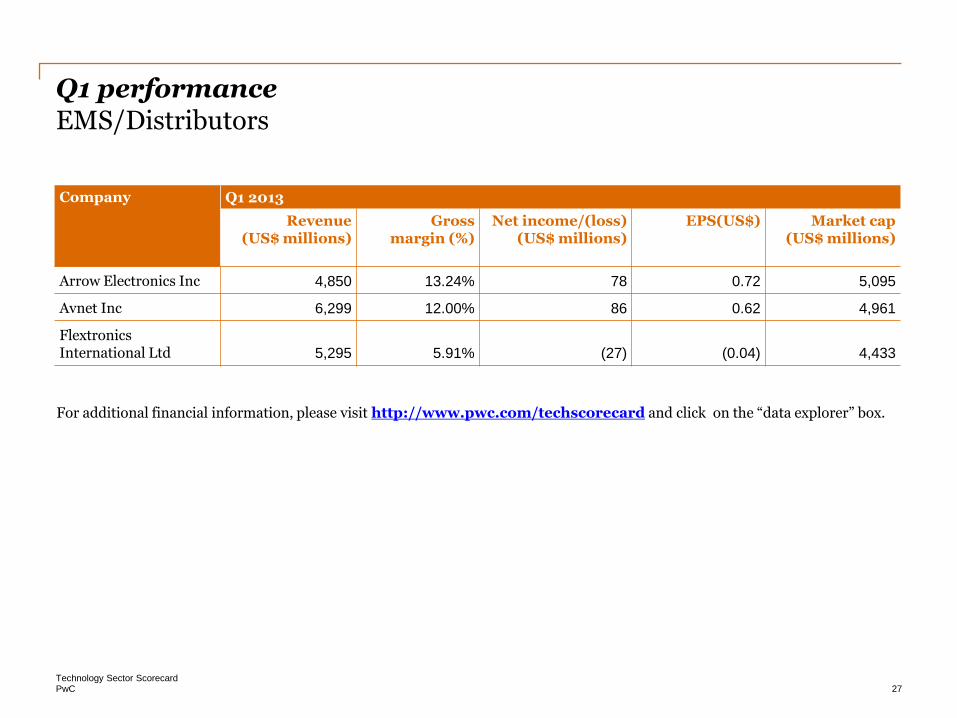
Q1 performance EMS/Distributors
Company Q1 2013
Revenue (US$ millions)
Gross margin (%)
Net income/(loss) (US$ millions)
EPS(US$) Market cap (US$ millions)
Arrow Electronics Inc 4,850 13.24% 78 0.72 5,095
Avnet Inc 6,299 12.00% 86 0.62 4,961
Flextronics International Ltd 5,295 5.91% (27) (0.04) 4,433
For additional financial information, please visit http://www.pwc.com/techscorecard and click on the “data explorer” box.
PwC Technology Sector Scorecard
28
Snapshot by subsector
Internet
PwC Technology Sector Scorecard
29
Market analysis Internet
• The Internet of Things is expected to evolve from a niche area into a mainstream activity in the next three years. According to Gartner, organisations should seriously start investigations and initiate pilot projects to exploit upcoming opportunities.
• In 2009, there were about 2.5 billion devices with unique IP addresses connected to the Internet. Most of these were devices people carry such as cell phones and PCs. By 2020, it is expected that there will be up to 30 billion devices connected with unique IP addresses, most of which will be products. According to Gartner, the total economic value add for the Internet of Things by 2020, will be around US$1.9tn dollars. This is expected to create a new economy, benefiting a wide range of industries, such as healthcare, retail, utilities and transportation.1
• US adults spend an average of 34 hours per month using the mobile Internet on smartphones, while time spent on the PC Internet by them is 27 hours according to Nielsen. Of the smartphone Internet time, applications capture approximately 86% of usage, while around 14% of the smartphone Internet access time is used via the mobile Web. According to the release, social media are used daily by around 64% of US adults (on the PC); and around 47% of smartphone owners use social media daily on their smartphones.2
• Worldwide business-to-consumer eCommerce sales is expected to increase by 20% in 2014, reaching US$1.5tn according to eMarketer’s forecasts. Growth is expected primarily from the rapidly expanding online and mobile user bases in emerging markets, increases in mCommerce sales, advancing shipping and payment options and the push into new international markets by major brands.3
1. InformationWeek, Gartner , February 2014 2. Marketing Land, Nielsen , February 2014 3. eMarketer , February 2014
PwC Technology Sector Scorecard
30
Market analysis (continued) Internet
• Amazon’s net sales increased 20% to US$25.59bn in Q4'13, compared with US$21.27 bn in Q4’12. Excluding US$258mn unfavourable impact from YoY changes in foreign exchange rates, net sales grew 22% compared with Q4’12. Seasonal effect continued in Q4'13, with net sales increasing by 50% (QoQ) against an increase of 54% in Q4’12 and 60% in Q4’11. YoY net sales increases in FY 2013 and FY 2012 were 22% and 27% respectively. The North American region was the main contributor, with both net sales and operating expense increasing by 26% as compared to Q4’12. In Q4'13 the Electronics and Other General Merchandise segment (representing 67% of total revenue in Q4'13) increased by 23% as compared to Q4’12.
• LinkedIn’s revenue in Q4'13 was US$447.2mn, an increase of 47% compared to US$303.6mn in Q4'12. Revenue from Talent Solutions products totaled US$245.6mn, an increase of 53% compared to Q4'12. Talent Solutions represented 55% of total revenue in Q4'13, compared to 53% in Q4'12. Revenue from Marketing Solutions products (representing 25% of total revenue in Q4'13) increased 36% and revenue from Premium Subscriptions products (representing 20% of total revenue in Q4'13) increased 48% compared to Q4'12. Driven by strong sales, LinkedIn’s YoY revenue increased by 57% and 86% in FY 2013 and FY 2012 respectively.
• Yelp’s net revenue was US$70.7mn in Q4'13, reflecting 72% growth from Q4'12. Its net revenue for FY 2013 was US$233.0mn, an increase of 69% compared to US$137.6mn in FY 2012. Net loss for FY 2013 was US$10.1mn, or US$0.15 per share, compared to a net loss of US$19.1mn, or US$0.35 per share for FY 2012. In FY 2013, Yelp’s cumulative reviews grew 47% YoY to approximately 53 million, while its average monthly unique visitors and active local business accounts grew by 39% and 69% YoY respectively.

PwC Technology Sector Scorecard
31
Annual performance Internet
Company FY 2013
Revenue (US$ millions)
Gross margin (%)
Net income/(loss)
(US$ millions)
EPS (US$) Market cap (US$ millions)
Amazon 74,453 27.23% 273 0.58 183,045
eBay 16,047 68.62% 2,856 2.18 71,057
Google 59,825 56.78% 12,920 38.13 376,370
LinkedIn 1,529 86.73% 27 0.23 25,890
Netflix 4,375 29.52% 112 1.85 21,946
Yahoo! 4,680 71.17% 1,369 1.26 41,422
Yelp 233 92.89% (10) (0.16) 4,518
For additional financial information, please visit http://www.pwc.com/techscorecard and click on the “data explorer” box.
PwC Technology Sector Scorecard
32
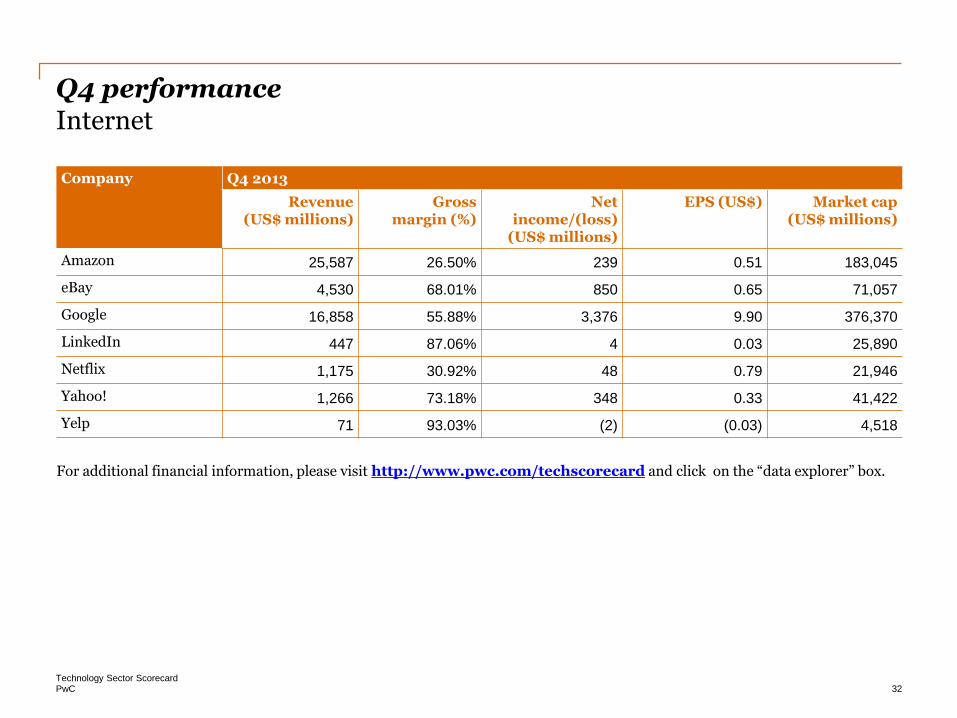
Q4 performance Internet
Company Q4 2013
Revenue (US$ millions)
Gross margin (%)
Net income/(loss)
(US$ millions)
EPS (US$) Market cap (US$ millions)
Amazon 25,587 26.50% 239 0.51 183,045
eBay 4,530 68.01% 850 0.65 71,057
Google 16,858 55.88% 3,376 9.90 376,370
LinkedIn 447 87.06% 4 0.03 25,890
Netflix 1,175 30.92% 48 0.79 21,946
Yahoo! 1,266 73.18% 348 0.33 41,422
Yelp 71 93.03% (2) (0.03) 4,518
For additional financial information, please visit http://www.pwc.com/techscorecard and click on the “data explorer” box.

PwC Technology Sector Scorecard
33
Q3 performance Internet
Company Q3 2013
Revenue (US$ millions)
Gross margin (%)
Net income/(loss)
(US$ millions)
EPS (US$) Market cap (US$ millions)
Amazon 17,092 27.65% (41) (0.09) 143,189
eBay 3,892 68.55% 689 0.53 72,199
Google 14,893 56.94% 2,970 8.75 289,032
LinkedIn 393 86.41% (3) (0.03) 28,026
Netflix 1,106 28.48% 32 0.52 18,324
Yahoo! 1,139 71.01% 299 0.28 33,976
Yelp 61 93.01% (2) (0.04) 4,335
For additional financial information, please visit http://www.pwc.com/techscorecard and click on the “data explorer” box.

PwC Technology Sector Scorecard
34
Q2 performance Internet
Company Q2 2013
Revenue (US$ millions)
Gross margin (%)
Net income/(loss)
(US$ millions)
EPS (US$) Market cap (US$ millions)
Amazon 15,704 28.62% (7) (0.02) 126,904
eBay 3,877 68.76% 640 0.49 66,926
Google 14,105 57.02% 3,228 9.54 290,233
LinkedIn 364 86.45% 4 0.03 19,950
Netflix 1,069 29.54% 29 0.49 12,454
Yahoo! 1,135 70.44% 331 0.30 27,260
Yelp 55 92.70% (1) (0.01) 2,208
For additional financial information, please visit http://www.pwc.com/techscorecard and click on the “data explorer” box.
PwC Technology Sector Scorecard
35
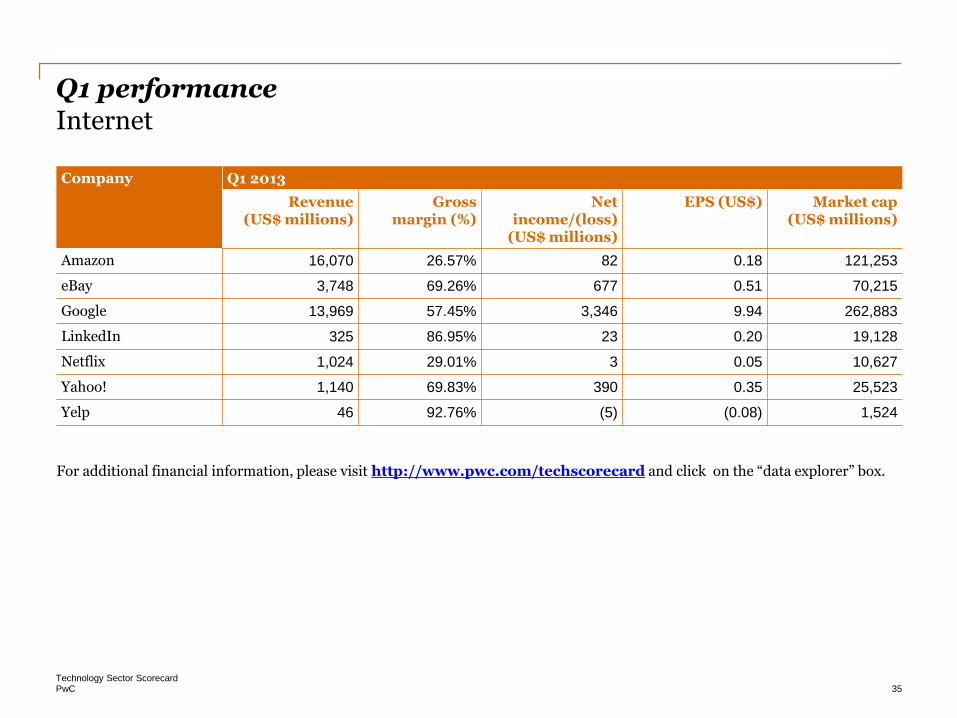
Q1 performance Internet
Company Q1 2013
Revenue (US$ millions)
Gross margin (%)
Net income/(loss)
(US$ millions)
EPS (US$) Market cap (US$ millions)
Amazon 16,070 26.57% 82 0.18 121,253
eBay 3,748 69.26% 677 0.51 70,215
Google 13,969 57.45% 3,346 9.94 262,883
LinkedIn 325 86.95% 23 0.20 19,128
Netflix 1,024 29.01% 3 0.05 10,627
Yahoo! 1,140 69.83% 390 0.35 25,523
Yelp 46 92.76% (5) (0.08) 1,524
For additional financial information, please visit http://www.pwc.com/techscorecard and click on the “data explorer” box.

PwC Technology Sector Scorecard
36
Snapshot by subsector
Semiconductors
PwC Technology Sector Scorecard
37
Market analysis Semiconductors
• The Semiconductor Industry Association announced that worldwide semiconductor sales for 2013 reached US$305.6bn, the industry’s highest-ever annual total and an increase of 4.8% from the 2012 total of US$291.6bn. Global sales for the month of December 2013 reached US$26.6bn, and December sales in the Americas increased 17.3% YoY. Q4'13 global sales of US$79.9bn were 7.7% higher than the total of US$74.2bn from Q4’12. This was due to improved consumer sentiments in the developed markets and an upturn led by Christmas holiday sales which is seasonally a peak for electronics demand globally.
• The industry saw strong demand in several product segments during 2013. Logic was the largest semiconductor category by sales, reaching US$85.9bn in 2013, a 5.2% increase compared to 2012. Memory at US$67.0bn and Metal-oxide-semiconductor micro-ICs at US$58.7bn rounded out the top three segments in terms of sales revenue. Memory was the fastest growing segment, increasing 17.6% in 2013. Within memory, DRAM performed well, increasing by 33.3% YoY, while NAND flash experienced strong growth of 8.1%. Other positively performing product segments included Optoelectronic products, which reached US$27.6bn in sales, and Analog, which reached US$40.1bn in sales.1
• Samsung Electronics and Apple remained the top semiconductor buyers in 2013, increasing their combined semiconductor demand by 17%, according to Gartner. Samsung and Apple together consumed US$53.7bn of semiconductors in 2013, an increase of US$7.7bn from 2012. The top 10 companies bought US$114bn of semiconductors, accounting for 36% of semiconductor vendors' worldwide revenue in 2013. This was up from US$105.1bn and 35% in 2012. 2
1. SIA, February 2014 2. Gartner, January 2014

PwC Technology Sector Scorecard
38
Market analysis (continued) Semiconductors
• Applied Materials generated orders of US$2.29bn, up 9% from the prior quarter led by demand for Silicon Systems group products. Net sales were US$2.19bn, up 10% sequentially. Silicon Systems group (SSG) orders were US$1.57bn, up 13%, with growth in foundry and flash partially offset by decreases in logic and DRAM. Net sales increased 19% to US$1.48bn. Operating income increased to US$314mn or 21.2% of net sales. New order composition was: foundry 60%; flash 27%; logic/other 8%; and DRAM 5%. Display orders of US$79mn were down 31%, while net sales declined slightly to US$159mn. Backlog grew 3% to US$2.44bn including negative adjustments of US$32mn, primarily related to currency adjustments. Backlog composition by segment was: SSG 56%; AGS 27%; Display 12%; and EES 5%.
• Qualcomm’s revenue of US$6.62bn, was up 10% YoY and 2% sequentially. Operating income was down 28% YoY to US$1.49bn. Net income of US$1.88bn was down 2% YoY but up 25% sequentially. It was driven by growth in sales of MSMTM chips---213 million units, up 17% YoY and 12% sequentially. Net income was also positively impacted by a US$665mn gain from discontinued operations associated with the sale of all of the operations of Omnitracs division.
PwC Technology Sector Scorecard
39
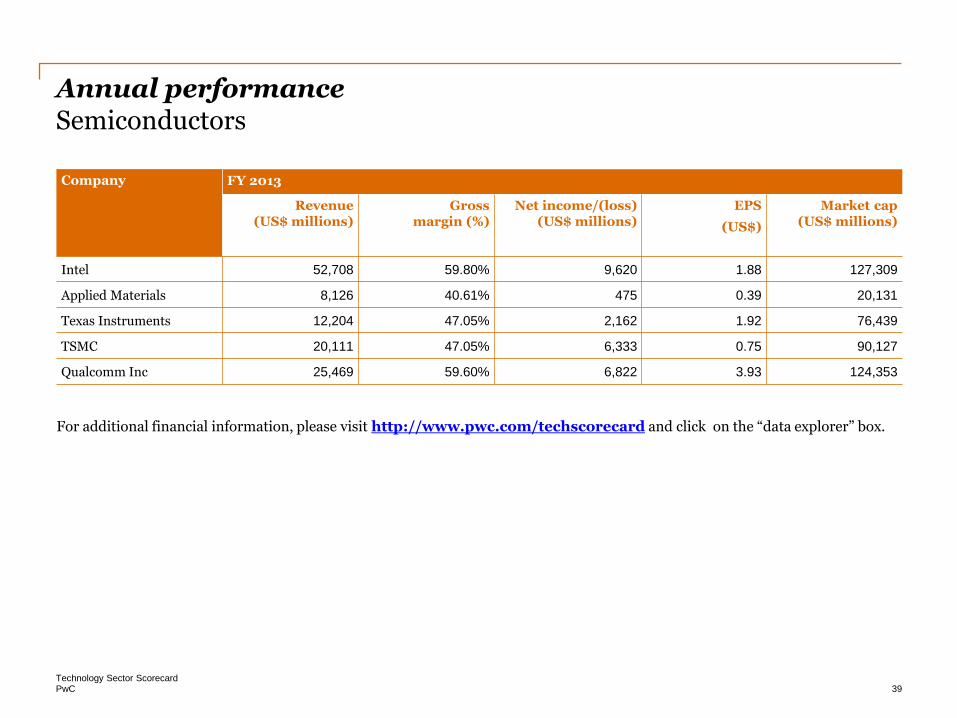
Annual performance Semiconductors
For additional financial information, please visit http://www.pwc.com/techscorecard and click on the “data explorer” box.
Company FY 2013
Revenue (US$ millions)
Gross margin (%)
Net income/(loss) (US$ millions)
EPS
(US$)
Market cap (US$ millions)
Intel 52,708 59.80% 9,620 1.88 127,309
Applied Materials 8,126 40.61% 475 0.39 20,131
Texas Instruments 12,204 47.05% 2,162 1.92 76,439
TSMC 20,111 47.05% 6,333 0.75 90,127
Qualcomm Inc 25,469 59.60% 6,822 3.93 124,353
PwC Technology Sector Scorecard
40
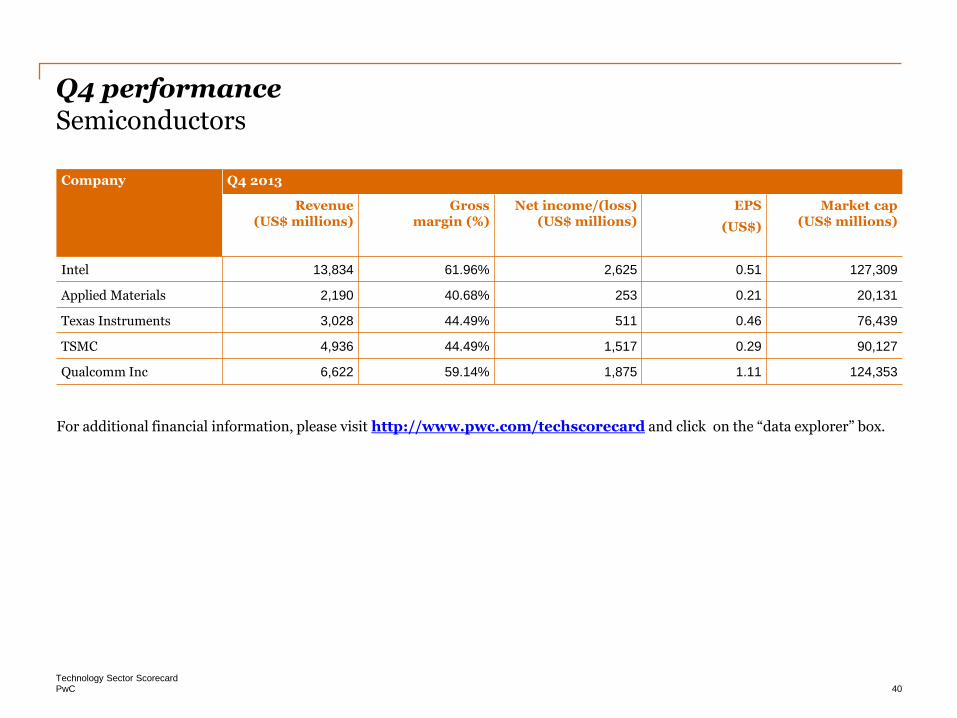
Q4 performance Semiconductors
For additional financial information, please visit http://www.pwc.com/techscorecard and click on the “data explorer” box.
Company Q4 2013
Revenue (US$ millions)
Gross margin (%)
Net income/(loss) (US$ millions)
EPS
(US$)
Market cap (US$ millions)
Intel 13,834 61.96% 2,625 0.51 127,309
Applied Materials 2,190 40.68% 253 0.21 20,131
Texas Instruments 3,028 44.49% 511 0.46 76,439
TSMC 4,936 44.49% 1,517 0.29 90,127
Qualcomm Inc 6,622 59.14% 1,875 1.11 124,353

PwC Technology Sector Scorecard
41
Q3 performance Semiconductors
For additional financial information, please visit http://www.pwc.com/techscorecard and click on the “data explorer” box.
Company Q3 2013
Revenue (US$ millions)
Gross margin (%)
Net income/(loss) (US$ millions)
EPS
(US$)
Market cap (US$ millions)
Intel 13,483 62.40% 2,950 0.58 114,280
Applied Materials 1,988 39.99% 183 0.15 21,227
Texas Instruments 3,244 54.84% 629 0.56 70,137
TSMC 5,441 48.52% 1,738 0.34 87,951
Qualcomm Inc 6,480 58.12% 1,501 0.86 114,950

PwC Technology Sector Scorecard
42
Q2 performance Semiconductors
For additional financial information, please visit http://www.pwc.com/techscorecard and click on the “data explorer” box.
Company Q2 2013
Revenue (US$ millions)
Gross margin (%)
Net income/(loss) (US$ millions)
EPS
(US$)
Market cap (US$ millions)
Intel 12,811 58.31% 2,000 0.39 120,690
Applied Materials 1,975 40.81% 168 0.14 19,605
Texas Instruments 3,047 51.53% 660 0.58 60,667
TSMC 5,225 49.03% 1,735 0.07 95,004
Qualcomm Inc 6,243 60.00% 1,580 0.90 104,220
PwC Technology Sector Scorecard
43
Q1 performance Semiconductors
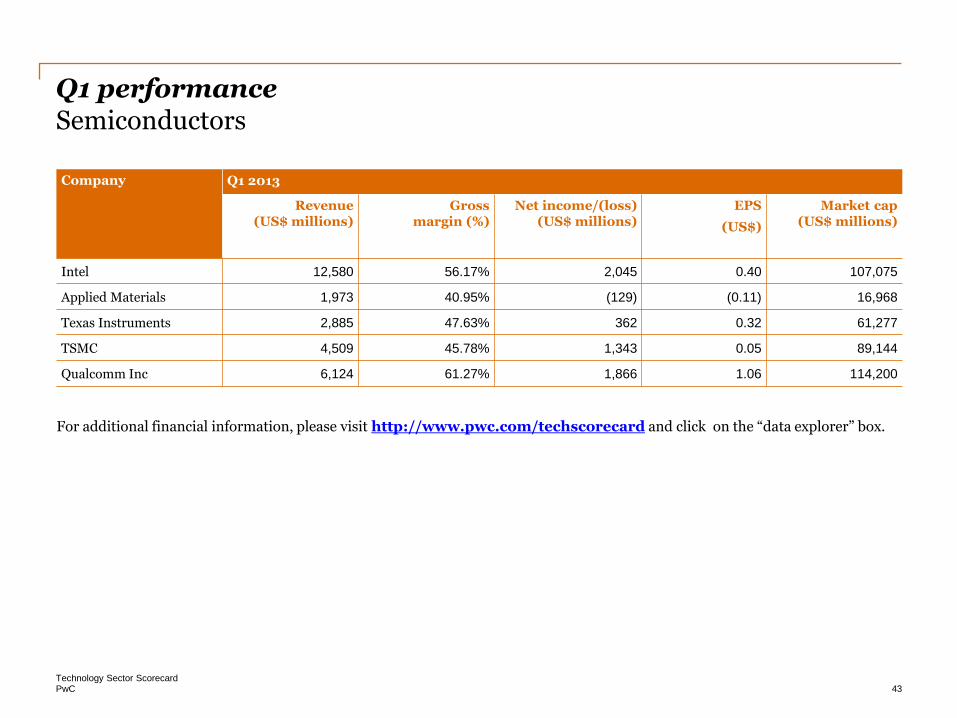
For additional financial information, please visit http://www.pwc.com/techscorecard and click on the “data explorer” box.
Company Q1 2013
Revenue (US$ millions)
Gross margin (%)
Net income/(loss) (US$ millions)
EPS
(US$)
Market cap (US$ millions)
Intel 12,580 56.17% 2,045 0.40 107,075
Applied Materials 1,973 40.95% (129) (0.11) 16,968
Texas Instruments 2,885 47.63% 362 0.32 61,277
TSMC 4,509 45.78% 1,343 0.05 89,144
Qualcomm Inc 6,124 61.27% 1,866 1.06 114,200

PwC Technology Sector Scorecard
44
Snapshot by subsector
Software

PwC Technology Sector Scorecard
45
Market analysis Software
• By the end of 2013 there was clear evidence that enterprise software buying is increasingly shaped by the nexus of the disruptive forces of cloud, mobile, social and analytics which will reach mainstream status in 2014 and create new software technology requirements, drive new purchasing and establish new competitive realities. Cloud and SaaS popularity and adoption have continued to increase. Emphasis over the next few years will be on providing enterprise-class support for mobile data and applications that sit on top of existing enterprise mobile architectures. This will be driven by key technologies, such as enterprise mobile management systems (EMMSs), mobile containers, enterprise application stores and mobile collaboration.
• Tablet and mobile users are demanding mobile device applications that exploit the capabilities of these devices and that can integrate into existing corporate systems. This trend is pushing the application software market in a new direction, and a mobile application product strategy has become a strategic imperative for all application vendors.
• Further, the converging forces of social, mobile, cloud and analytics are helping to push forward successful collaboration and social software initiatives.1
• Big data and analytics (BDA) has become a top agenda item and investment priority for a growing number of retail companies. No stranger to massive, time-sensitive data volumes, retail is at the epicenter of emerging BDA opportunities in enterprise data, social media, digital and mobile advertising, mobile metadata and instrumented store operations.2
1 .Gartner Press Release, December 2013 2 IDC Press Release, February 2014

PwC Technology Sector Scorecard
46
Market analysis (continued) Software
• SAP delivered strong revenue growth in 2013 due in large part to their fast-growing cloud business. Cloud subscription and support revenue was €787mn at constant currencies, which exceeded the company’s full-year 2013 guidance of €750mn (2012: €343mn). Full-year non-IFRS software and cloud subscription revenue increased 11% at constant currencies (6% at actual currencies to €5.28bn). Non-IFRS software and software-related service revenue grew 11% at constant currencies (6% at actual currencies to €14.03bn). Non-IFRS total revenue grew 8% at constant currencies (4% at actual currencies to €16.90bn).
• Microsoft reported revenue of US$24.52bn for the quarter ended December 31, 2013. Gross margin, operating income, net income and diluted earnings per share for the quarter were US$16.24bn, US$7.97bn, US$6.56bn and US$0.78 per share, respectively. Windows OEM revenue declined 3%. Though Windows OEM Pro revenue posted strong 12% growth, it was more than offset by continued softness in the consumer PC market, leading to a net decline for Windows OEM. Surface revenue more than doubled sequentially, from US$400mn in the first quarter to US$893mn in the second quarter. The company sold 7.4 million Xbox console units into the retail channel, including 3.9 million Xbox One consoles and 3.5 million Xbox 360 consoles. Bing US search share grew to 18.2%, compared to 16% in December 2012, and search advertising revenue grew by 34% compared to 15% in December 2012.

PwC Technology Sector Scorecard
47
Annual performance Software
Company FY 2013
Revenue (US$ millions)
Gross margin (%)
Net income/(loss)
(US$ millions)
EPS
(US$)
Market cap (US$ millions)
Adobe 4,055 85.54% 290 0.57 28,178
Intuit 4,216 85.48% 758 2.49 20,854
Microsoft 83,433 71.49% 22,822 2.71 310,503
Oracle 37,552 81.64% 11,055 2.35 159,017
SAP 22,430 70.33% 4,460 3.75 105,045
Symantec 6,799 82.72% 869 1.22 16,135
VMware 5,207 85.98% 1,014 2.34 38,458
*Euro to USD exchange rate used for SAP is 1.37249 USD/Euro.
For additional financial information, please visit http://www.pwc.com/techscorecard and click on the “data explorer” box.
PwC Technology Sector Scorecard
48
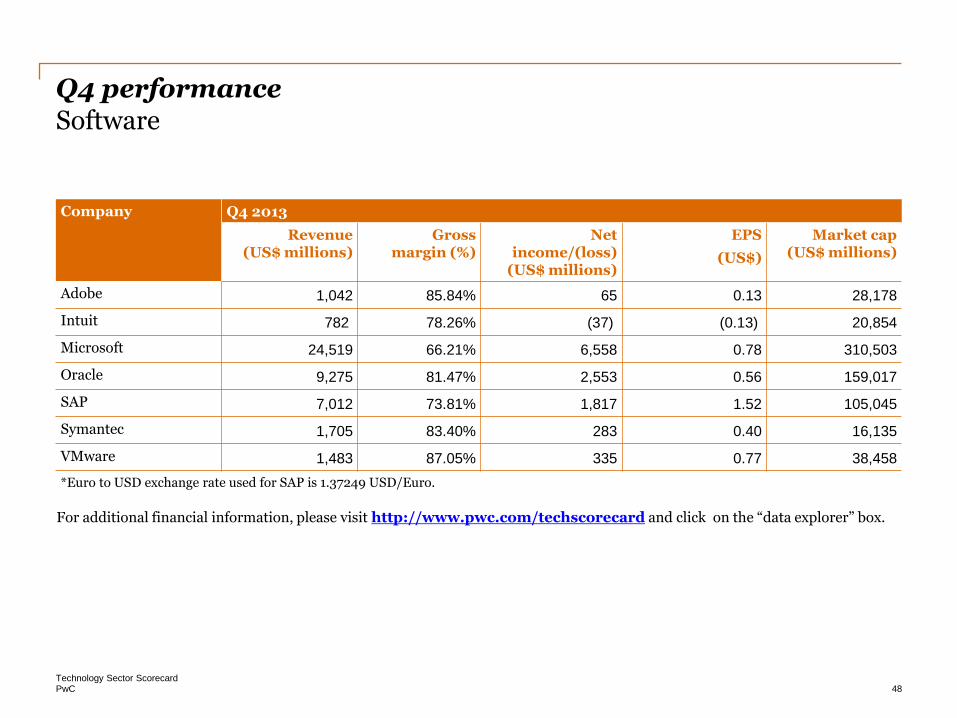
Q4 performance Software
Company Q4 2013
Revenue (US$ millions)
Gross margin (%)
Net income/(loss)
(US$ millions)
EPS
(US$)
Market cap (US$ millions)
Adobe 1,042 85.84% 65 0.13 28,178
Intuit 782 78.26% (37) (0.13) 20,854
Microsoft 24,519 66.21% 6,558 0.78 310,503
Oracle 9,275 81.47% 2,553 0.56 159,017
SAP 7,012 73.81% 1,817 1.52 105,045
Symantec 1,705 83.40% 283 0.40 16,135
VMware 1,483 87.05% 335 0.77 38,458
*Euro to USD exchange rate used for SAP is 1.37249 USD/Euro.
For additional financial information, please visit http://www.pwc.com/techscorecard and click on the “data explorer” box.

PwC Technology Sector Scorecard
49
Q3 performance Software
Company Q3 2013
Revenue (US$ millions)
Gross margin (%)
Net income/(loss)
(US$ millions)
EPS
(US$)
Market cap (US$ millions)
Adobe 995 85.22% 83 0.16 22,958
Intuit 622 77.97% (11) (0.04) 21,388
Microsoft 18,529 72.40% 5,244 0.62 277,755
Oracle 8,372 80.49% 2,191 0.47 145,568
SAP 5,357 69.32% 1,009 0.85 88,224
Symantec 1,637 82.65% 241 0.34 17,311
VMware 1,289 85.80% 261 0.60 34,868
*Euro to USD exchange rate used for SAP is 1.3244 USD/Euro.
For additional financial information, please visit http://www.pwc.com/techscorecard and click on the “data explorer” box.
PwC Technology Sector Scorecard
50
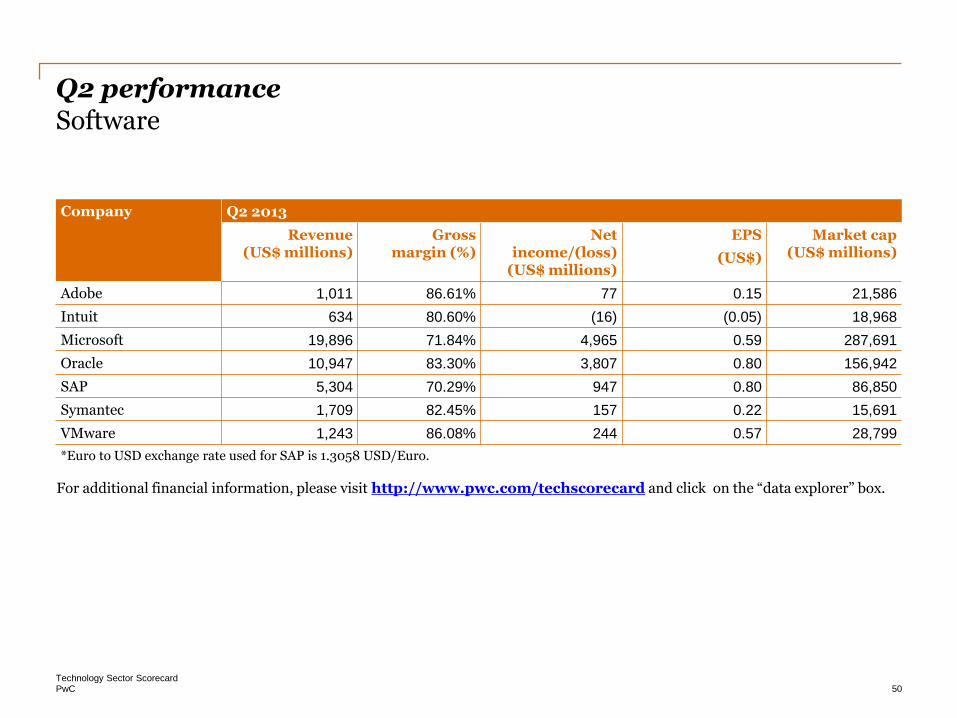
Q2 performance Software
Company Q2 2013
Revenue (US$ millions)
Gross margin (%)
Net income/(loss)
(US$ millions)
EPS
(US$)
Market cap (US$ millions)
Adobe 1,011 86.61% 77 0.15 21,586
Intuit 634 80.60% (16) (0.05) 18,968
Microsoft 19,896 71.84% 4,965 0.59 287,691
Oracle 10,947 83.30% 3,807 0.80 156,942
SAP 5,304 70.29% 947 0.80 86,850
Symantec 1,709 82.45% 157 0.22 15,691
VMware 1,243 86.08% 244 0.57 28,799
*Euro to USD exchange rate used for SAP is 1.3058 USD/Euro.
For additional financial information, please visit http://www.pwc.com/techscorecard and click on the “data explorer” box.

PwC Technology Sector Scorecard
51
Q1 performance Software
Company Q1 2013
Revenue (US$ millions)
Gross margin (%)
Net income/(loss)
(US$ millions)
EPS
(US$)
Market cap (US$ millions)
Adobe 1,008 84.45% 65 0.13 19,696
Intuit 2,178 91.64% 822 2.71 17,698
Microsoft 20,489 76.64% 6,055 0.72 238,823
Oracle 8,958 80.84% 2,504 0.52 161,579
SAP 4,756 66.40% 687 0.58 96,044
Symantec 1,748 82.38% 188 0.26 17,227
VMware 1,191 84.73% 174 0.40 33,790
*Euro to USD exchange rate used for SAP is 1.3058 USD/Euro.
For additional financial information, please visit http://www.pwc.com/techscorecard and click on the “data explorer” box.
PwC Technology Sector Scorecard
52
Snapshot by subsector
Software Services
PwC Technology Sector Scorecard
53
• ISG (Information Services Group), a technology insights company, said that global outsourcing activity rose sharply in Q4'13, even as contract values fell as part of a trend toward smaller deals. Data from the ISG Outsourcing Index, which measures commercial outsourcing contracts with annual contract value (ACV) of US$5mn or more, showed the number of contracts awarded during Q4'13 climbed by 13%, while ACV dropped 12%, to US$4.6bn. For the full year, the number of awards edged up 2%, but values fell 18%, to US$18.7bn. In all, 309 contracts were awarded in the fourth quarter, while 1,155 contracts were awarded for all of 2013, both in line with the totals of the previous two years. ISG attributed the drop in value to a number of factors, among them a fall-off in the number of “mega relationships” (those with ACV of US$100mn or more); a sharp decline in activity within the Manufacturing sector and, to a lesser extent, Financial Services; and weakness in business process outsourcing (BPO).
• For the year, areas of particularly strong deal activity were contract restructurings, up 22%, as more enterprises converted long-term deals with a single supplier into shorter-term contracts with multiple providers. Information technology outsourcing (ITO) increased significantly (up 8%), especially in the applications development and maintenance (ADM) space; and the EMEA region, which saw contract counts jump 18%.
• Across industries, the Manufacturing sector saw the steepest drop in value, with ACV of more than US$2bn from the prior five-year average and 47% for the year. Financial Services was down 15%, but was flat with its five-year average ACV. Travel, Transport and Leisure, on the other hand, saw its ACV climb 56% in 2013, while the Energy and Healthcare and Pharmaceutical sectors recorded slight gains.1
Market analysis Software Services
1. The Global ISG (Information Services Group) Outsourcing Index, January 2014
PwC Technology Sector Scorecard
54
• According to the ISG Outsourcing Index for Asia Pacific, ACV totaled US$1bn for the second half, same as the US$1bn recorded in the first half. Full-year ACV of US$2bn was down 80% from the standout year of 2012, but consistent with prior years. Similarly, the total number of contracts for the year, 126, was down from 2012 but broadly in line with the volume of contracts in the 2009-2011 period. The volume of activity did, however, pick up in the second half of 2013, as the number of deals rose 7% compared with the first six months of the year. Last year, only three contracts valued between US$40mn and US$99mn were awarded, compared with 12 in 2012. Most Asia Pacific contracts fell into the US$5mn to US$39mn range, but the number of those contracts, like that of the large-scale deals, were down for the year.
• Although 2013 pales in comparison to 2012, it was more truly representative of the long-term trend in the region. Indeed, the value of both mega deals and sub-US$40mn contracts in 2013 were in line with their five-year averages.
• Clearly, deal value is getting smaller, as clients take advantage of lower service costs and increased competition, while moving toward multi-sourcing environments. The work that was awarded to a single vendor in the past is now being split up among multiple service providers offering specialised capabilities.1
Market analysis (continued) Software Services
1. The Global ISG (Information Services Group) Outsourcing Index, January 2014

PwC Technology Sector Scorecard
55
• Cognizant’s revenue for the fourth quarter of 2013 rose to US$2.36bn, up 20.9% from US$1.95bn in the fourth quarter of 2012. GAAP net income was US$324.3mn, or US$1.06 per diluted share, compared to US$278.8mn, or US$0.92 per diluted share, in the fourth quarter of 2012. Diluted EPS on a non-GAAP basis was US$1.15, compared to US$0.99 in the fourth quarter of 2012. This was led by higher demand growth from rest of Europe (ex. UK) segment and also improvement in operating margins.
• TCS reported revenue of US$3.44bn, an increase of 17% YoY. International revenues grew 3.8% in dollar terms sequentially. Net income was US$858mn up 31.7% YoY. This was due to strong international demand for the company’s services. In terms of market segments, TCS witnessed a surge in demand from its MEA (Middle East Europe) market. In terms of business segment, Media & Entertainment showed the highest growth in demand of 43.6%.
Market analysis (continued) Software Services

PwC Technology Sector Scorecard
56
Annual & Q4 performance Software Services Company FY 2013
Revenue (US$ millions)
Gross margin (%)
Net income/(loss) (US$ millions)
EPS (US$) Market cap (US$ millions)
Cognizant 8,843 40.46% 1,229 4.03 30,686
CSC 13,372 25.20% 781 5.11 8,116
Infosys 8,095 35.33% 1,708 2.99 32,341
HCL 5,010 37.57% 874 1.37 14,248
TCS 12,980 47.32% 2,948 1.50 65,990
For additional financial information, please visit http://www.pwc.com/techscorecard and click on the “data explorer” box.
Company Q4 2013
Revenue (US$ millions)
Gross margin (%)
Net income/(loss) (US$ millions)
EPS (US$) Market cap (US$ millions)
Cognizant 2,355 40.09% 324 1.06 30,686
CSC 3,228 26.83% 141 0.94 8,116
Infosys 2,100 36.14% 463 0.81 32,341
HCL 1,321 38.43% 242 0.48 14,248
TCS 3,438 48.22% 858 0.44 65,990
PwC Technology Sector Scorecard
57
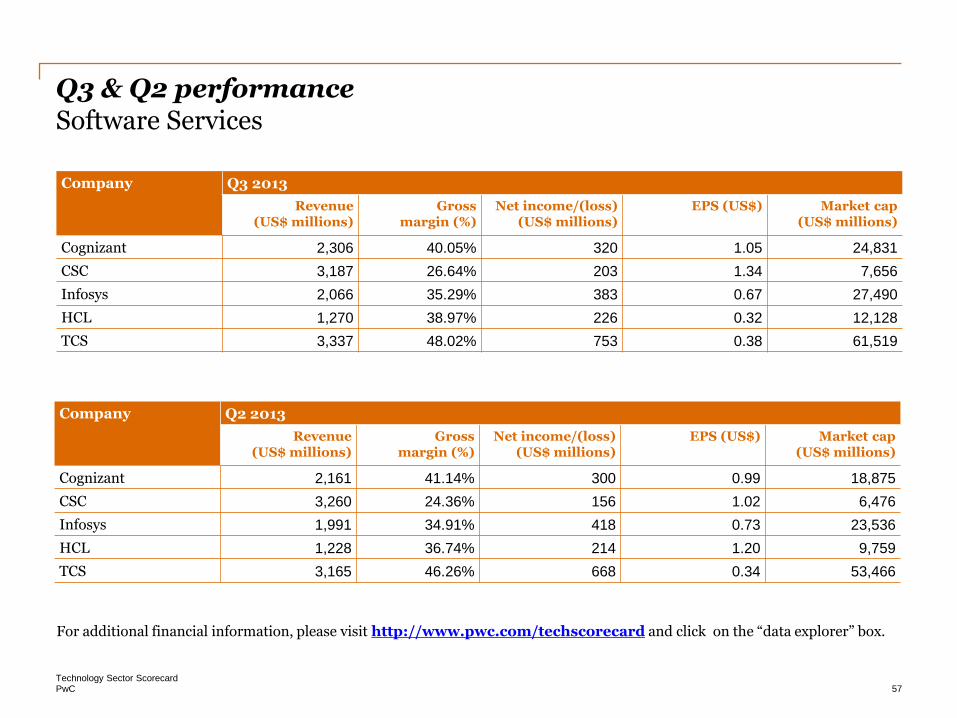
Q3 & Q2 performance Software Services Company Q3 2013
Revenue (US$ millions)
Gross margin (%)
Net income/(loss) (US$ millions)
EPS (US$) Market cap (US$ millions)
Cognizant 2,306 40.05% 320 1.05 24,831
CSC 3,187 26.64% 203 1.34 7,656
Infosys 2,066 35.29% 383 0.67 27,490
HCL 1,270 38.97% 226 0.32 12,128
TCS 3,337 48.02% 753 0.38 61,519
For additional financial information, please visit http://www.pwc.com/techscorecard and click on the “data explorer” box.
Company Q2 2013
Revenue (US$ millions)
Gross margin (%)
Net income/(loss) (US$ millions)
EPS (US$) Market cap (US$ millions)
Cognizant 2,161 41.14% 300 0.99 18,875
CSC 3,260 24.36% 156 1.02 6,476
Infosys 1,991 34.91% 418 0.73 23,536
HCL 1,228 36.74% 214 1.20 9,759
TCS 3,165 46.26% 668 0.34 53,466

PwC Technology Sector Scorecard
58
Q1 performance Software Services
Company Q1 2013
Revenue (US$ millions)
Gross margin (%)
Net Income (US$ millions)
EPS (US$) Market cap (US$ millions)
Cognizant 2,021 40.62% 284 0.93 23,177
CSC 3,697 23.29% 281 1.81 7,559
Infosys 1,938 34.93% 444 0.78 30,804
HCL 1,191 35.98% 193 1.09 10,347
TCS 3,040 46.66% 669 0.34 56,605
For additional financial information, please visit http://www.pwc.com/techscorecard and click on the “data explorer” box

PwC Technology Sector Scorecard
59
Snapshot by subsector
Systems and PC Hardware
PwC Technology Sector Scorecard
60
Market analysis Systems and PC Hardware
• Worldwide PC shipments totaled 82.6 million units in Q4'13, a 6.9% decline from Q4'12 and the seventh consecutive quarterly decline.
• Although PC shipments continued to decline in the worldwide market in Q4'13, industry analysts believe major markets, such as the US, have bottomed out as the adjustment to the installed base slows. Strong growth in tablets continued to negatively impact PC growth in emerging markets. Further, in emerging markets, the first connected device for consumers is often a smartphone, and their first computing device is a tablet. As a result, the adoption of PCs in emerging markets will be slower as consumers pass over PCs for tablets.
• HP and Lenovo were virtually neck and neck for the top global position in the PC market throughout 2013. Lenovo maintained their Q3’13 lead in the fourth quarter, accounting for 18.1% of global PC shipments.
• PC shipments in Western Europe totaled 14.7 million units in Q4'13, a decline of 4.4% compared with the same period in 2012. All PC segments in Western Europe decreased in the fourth quarter. Mobile and desktop PC shipments declined 6.5% and 0.3%, respectively. PC shipments in the professional PC market declined 1.7%, while the consumer PC market fell 7% in Q4'13. For all of 2013, shipments for traditional PCs (desktops and mobile PCs) decreased 14%, but the rate of unit decline was moderate across geographies. This may indicate that the impact of tablets cannibalising PC sales in mature markets is fading. In Q4'13 HP remained the No. 1 PC vendor in Western Europe. HP, Lenovo and ASUS strengthened their positions in the PC market at the expense of Samsung and Toshiba. 1
1. Gartner Press Release, January 2014
PwC Technology Sector Scorecard
61
Market analysis (continued) Systems and PC Hardware
• Worldwide tablet shipments grew to 76.9 million units in Q4'13, representing 62.4% growth QoQ and 28.2% growth YoY. While the growth rate remains impressive, it is down dramatically compared to YoY rates of the same quarter one year ago (87.1%) and indicates a significant slowing of the overall tablet market. For the full calendar year 2013, worldwide tablet shipments totaled 217.1 million units, which is up from 144.2 million units for the full-year 2012 and represents a YoY growth rate of 50.6%. Analysts expect commercial purchases of tablets to continue to accelerate, but experience softness in the consumer segment in mature markets. Apple once again led the worldwide market for tablets, shipping 26 million units during the quarter, up from 14.1 million the previous quarter and 22.9 million in Q4'12.
• Apple saw its worldwide tablet market share for the quarter grow to 33.8%, up from 29.7% in the third quarter but down from its 38.2% share in the fourth quarter of 2012. Samsung retained its second-place spot on the strength of a wide portfolio of products and increased carrier support in markets like the US, and achieving an 18.8% share worldwide. That's down slightly from the 18.9% of the previous quarter, but up significantly from its 13% share a year ago. Filling out the top five were Amazon (7.6%), ASUS (5.1%), and Lenovo (4.4%).
• Lenovo’s access to the Chinese whitebox manufacturing infrastructure has helped it drive more low-priced tablet products into the market, growing its share to 4.4% from just 1.3% in the same quarter last year. The company's strength in emerging markets, and its increased market share in adjoining markets such as PCs and smartphones, makes it well positioned to see additional tablet gains in 2014.2
2. IDC, January 2014
PwC Technology Sector Scorecard
62
Market analysis (continued) Systems and PC Hardware
• EMC revenue in Q4’13 was US$6.7bn, an increase of 11% YoY. Q4'13 net income increased 17% YoY to US$1.0bn. Full-year 2013 revenue was US$23.2bn, an increase of 7% YoY. This result was highlighted by 5% YoY revenue growth for EMC's Information Infrastructure business, and 15% YoY revenue growth each for VMware and Pivotal. Net income attributable to EMC for 2013 increased 6% YoY to US$2.9bn. EMC's Information Storage business accelerated revenue growth to 10% YoY in Q4, and its Emerging Storage business accelerated revenue 73% YoY, propelled by the very successful launch of EMC XtremIO and the continued strong growth of EMC Isilon, EMC Atmos and EMC VPLEX products. The company's Unified and Backup Recovery business increased revenue 11% YoY, benefitting from the recent product launches of the next-generation EMC VNX and EMC Data Domain product lines.
• IBM announced Q4'13 diluted earnings of US$5.73 per share, compared with diluted earnings of US$5.13 per share in Q4'12, an increase of 12%. Q4'13 net income, which includes benefits from tax audit settlements, was US$6.2bn compared with US$5.8bn in Q4'12, an increase of 6%. Total revenues for Q4'13 of US$27.7bn decreased 5% (down 3% adjusting for currency) YoY. This increase in revenue and net profits was adversely impacted by the Systems and Technology segment, which totaled US$4.3bn for the quarter, down 26% YoY. Systems and Technology pre-tax income was US$0.2bn, a decrease of US$768mn. Total Systems revenues decreased 25%. Revenues from System z mainframe server products decreased 37% compared with the year-ago period.
PwC Technology Sector Scorecard
63
Annual performance Systems and PC Hardware
For additional financial information, please visit http://www.pwc.com/techscorecard and click on the “data explorer” box.
Company FY 2013
Revenue (US$ millions)
Gross margin (%)
Net income/(loss) (US$ millions)
EPS (US$) Market cap (US$ millions)
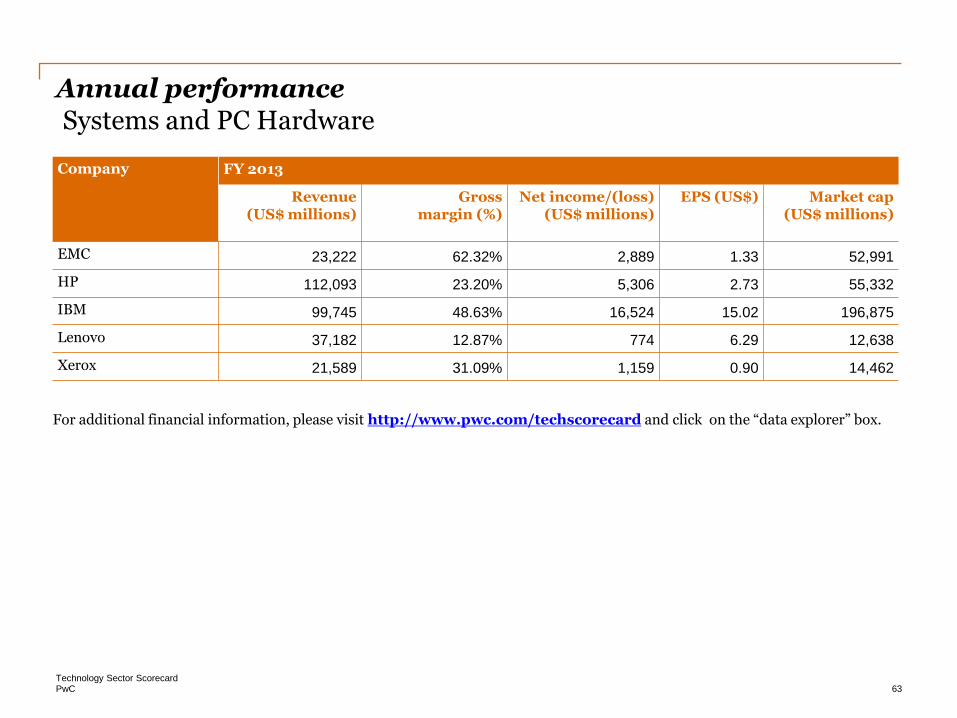
EMC 23,222 62.32% 2,889 1.33 52,991
HP 112,093 23.20% 5,306 2.73 55,332
IBM 99,745 48.63% 16,524 15.02 196,875
Lenovo 37,182 12.87% 774 6.29 12,638
Xerox 21,589 31.09% 1,159 0.90 14,462

PwC Technology Sector Scorecard
64
Q4 performance Systems and PC Hardware
Company Q4 2013
Revenue (US$ millions)
Gross margin (%)
Net income/(loss) (US$ millions)
EPS (US$) Market cap (US$ millions)
EMC 6,682 63.21% 1,022 0.48 52,991
HP 28,154 23.20% 1,425 0.74 55,332
IBM 27,699 51.68% 6,185 5.73 196,875
Lenovo 10,789 12.64% 265 2.52 12,638
Xerox 5,569 30.69% 306 0.24 14,462
For additional financial information, please visit http://www.pwc.com/techscorecard and click on the “data explorer” box.
PwC Technology Sector Scorecard
65
Q3 performance Systems and PC Hardware
Company Q3 2013
Revenue (US$ millions)
Gross margin (%)
Net income/(loss) (US$ millions)
EPS (US$) Market cap (US$ millions)
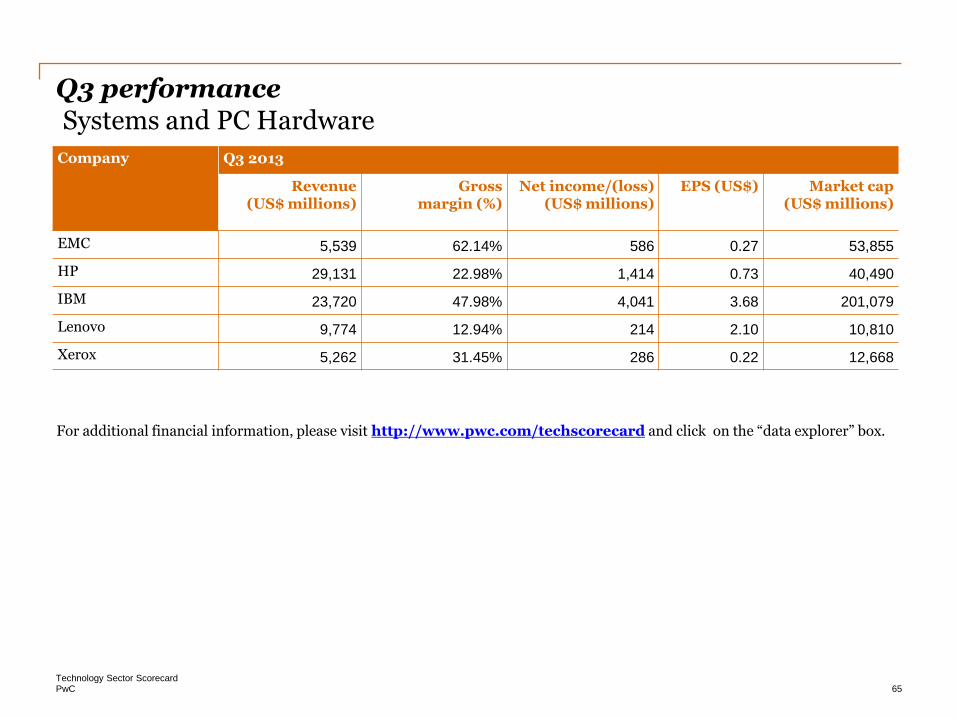
EMC 5,539 62.14% 586 0.27 53,855
HP 29,131 22.98% 1,414 0.73 40,490
IBM 23,720 47.98% 4,041 3.68 201,079
Lenovo 9,774 12.94% 214 2.10 10,810
Xerox 5,262 31.45% 286 0.22 12,668
For additional financial information, please visit http://www.pwc.com/techscorecard and click on the “data explorer” box.

PwC Technology Sector Scorecard
66
Q2 performance Systems and PC Hardware
Company Q2 2013
Revenue (US$ millions)
Gross margin (%)
Net income/(loss) (US$ millions)
EPS (US$) Market cap (US$ millions)
Dell 14,514 18.53% 204 0.12 24,008
EMC 5,614 62.50% 701 0.32 49,767
HP 27,226 23.39% 1,390 0.71 49,627
IBM 24,924 48.68% 3,266 2.91 421,206
Lenovo 8,787 13.56% 170 1.65 10,011
Xerox 5,402 31.43% 271 0.21 12,412
For additional financial information, please visit http://www.pwc.com/techscorecard and click on the “data explorer” box.
PwC Technology Sector Scorecard
67
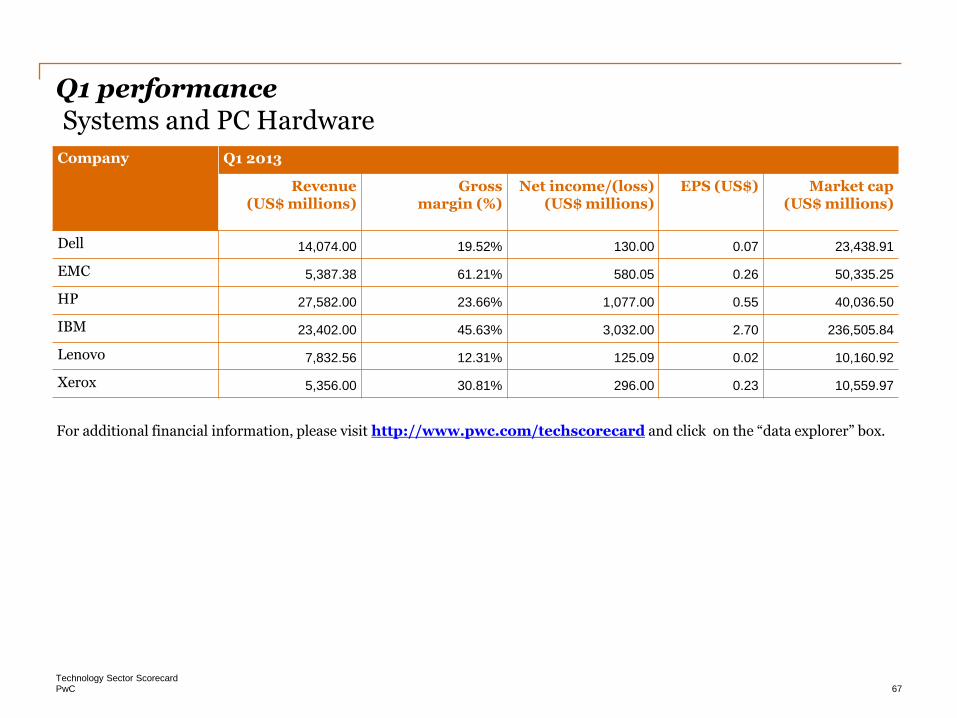
Q1 performance Systems and PC Hardware
Company Q1 2013
Revenue (US$ millions)
Gross margin (%)
Net income/(loss) (US$ millions)
EPS (US$) Market cap (US$ millions)
Dell 14,074.00 19.52% 130.00 0.07 23,438.91
EMC 5,387.38 61.21% 580.05 0.26 50,335.25
HP 27,582.00 23.66% 1,077.00 0.55 40,036.50
IBM 23,402.00 45.63% 3,032.00 2.70 236,505.84
Lenovo 7,832.56 12.31% 125.09 0.02 10,160.92
Xerox 5,356.00 30.81% 296.00 0.23 10,559.97
For additional financial information, please visit http://www.pwc.com/techscorecard and click on the “data explorer” box.
PwC Technology Sector Scorecard
68
Technology industry leaders
Raman Chitkara Global Technology Leader Phone: 1 408 817 3746 Email: [email protected]
Rod Dring – Australia Werner Ballhaus – Germany Yury Pukha – Russia Phone: 61 2 8266 7865 Email: [email protected]
Phone: 49 211 981 5848 Email: [email protected]
Phone: 7 495 223 5177 Email: [email protected]
Estela Vieira – Brazil Sandeep Ladda– India Greg Unsworth – Singapore Phone: 55 1 3674 3802 Email: [email protected]
Phone: 91 22 6689 1444 Email: [email protected]
Phone: 65 6236 3738 Email: [email protected]
Christopher Dulny– Canada Masahiro Ozaki– Japan Philip Shepherd – UAE Phone: 1 416 869 2355 Email: [email protected]
Phone: 81 3 5326 9090 Email: [email protected]
Phone: 97 1 43043501 Email: [email protected]
Jianbin Gao – China & Hong Kong Hoonsoo Yoon – Korea Jass Sarai – UK
Phone: 86 21 2323 3362 Email: [email protected]
Phone: 82 2 709 0201 Email: [email protected]
Phone: 44 0 1895 52 2206 Email: [email protected]
Pierre Marty – France Ilja Linnemeijer– The Netherlands Tom Archer– US Phone: 33 1 5657 5815 Email: [email protected]
Phone: 31 88 792 4956 Email: [email protected]
Phone: 1 408 817 3836 Email: [email protected]

We exercised reasonable professional care and diligence in the collection, processing and reporting of this information. However, the data used is from third-party sources and PricewaterhouseCoopers has not independently verified, validated or audited the data. PricewaterhouseCoopers makes no representations or warranties with respect to the accuracy of the information, nor whether it is suitable for the purposes to which it is put by users.
PricewaterhouseCoopers shall not be liable to any user of this report or to any other person or entity for any inaccuracy of this information or any errors or omissions in its content, regardless of the cause of such inaccuracy, error or omission. Furthermore, in no event shall PricewaterhouseCoopers be liable for consequential, incidental or punitive damages to any person or entity for any matter relating to this information. © 2014 PricewaterhouseCoopers LLP. All rights reserved. In this document, “PwC” refers to PricewaterhouseCoopers LLP, which is a member firm of PricewaterhouseCoopers International Limited, each member firm of which is a separate legal entity.
pwc.com/techscorecard
Related Documents