NBER WORKING PAPER SERIES USING GENETIC LOTTERIES WITHIN FAMILIES TO EXAMINE THE CAUSAL IMPACT OF POOR HEALTH ON ACADEMIC ACHIEVEMENT Jason M. Fletcher Steven F. Lehrer Working Paper 15148 http://www.nber.org/papers/w15148 NATIONAL BUREAU OF ECONOMIC RESEARCH 1050 Massachusetts Avenue Cambridge, MA 02138 July 2009 We are grateful to Ken Chay, Dalton Conley, Weili Ding, Ted Joyce, Robert McMillan, John Mullahy, Matthew Neidell, Jody Sindelar and participants at the 2007 NBER Summer Institute, Northwestern University, Brown University, CUNY, McGill University, University of Calgary, Tinbergen Institute, Institute for Fiscal Studies, Warwick University, University of Calgary, 2008 AHEC Conference at the University of Chicago, 2008 SOLE meetings, Yale Health Policy Colloquium, University of British Columbia, University of Connecticut, University of Saskatchewan, University of Tennessee, University of Toronto and Simon Fraser University for comments and suggestions that have improved this paper. We are both grateful to the CLSRN for research support. Lehrer also wishes to thank SSHRC for additional research support. We are responsible for all errors. This research uses data from Add Health, a program project designed by J. Richard Udry, Peter S. Bearman, and Kathleen Mullan Harris, and funded by a grant P01-HD31921 from the National Institute of Child Health and Human Development, with cooperative funding from 17 other agencies. Special acknowledgment is due Ronald R. Rindfuss and Barbara Entwisle for assistance in the original design. Persons interested in obtaining data files from Add Health should contact Add Health, Carolina Population Center, 123 W. Franklin Street, Chapel Hill, NC 27516-2524 ([email protected]). The views expressed herein are those of the author(s) and do not necessarily reflect the views of the National Bureau of Economic Research. NBER working papers are circulated for discussion and comment purposes. They have not been peer- reviewed or been subject to the review by the NBER Board of Directors that accompanies official NBER publications. © 2009 by Jason M. Fletcher and Steven F. Lehrer. All rights reserved. Short sections of text, not to exceed two paragraphs, may be quoted without explicit permission provided that full credit, including © notice, is given to the source.

Welcome message from author
This document is posted to help you gain knowledge. Please leave a comment to let me know what you think about it! Share it to your friends and learn new things together.
Transcript

NBER WORKING PAPER SERIES
USING GENETIC LOTTERIES WITHIN FAMILIES TO EXAMINE THE CAUSALIMPACT OF POOR HEALTH ON ACADEMIC ACHIEVEMENT
Jason M. FletcherSteven F. Lehrer
Working Paper 15148http://www.nber.org/papers/w15148
NATIONAL BUREAU OF ECONOMIC RESEARCH1050 Massachusetts Avenue
Cambridge, MA 02138July 2009
We are grateful to Ken Chay, Dalton Conley, Weili Ding, Ted Joyce, Robert McMillan, John Mullahy,Matthew Neidell, Jody Sindelar and participants at the 2007 NBER Summer Institute, NorthwesternUniversity, Brown University, CUNY, McGill University, University of Calgary, Tinbergen Institute,Institute for Fiscal Studies, Warwick University, University of Calgary, 2008 AHEC Conference atthe University of Chicago, 2008 SOLE meetings, Yale Health Policy Colloquium, University of BritishColumbia, University of Connecticut, University of Saskatchewan, University of Tennessee, Universityof Toronto and Simon Fraser University for comments and suggestions that have improved this paper.We are both grateful to the CLSRN for research support. Lehrer also wishes to thank SSHRC for additionalresearch support. We are responsible for all errors. This research uses data from Add Health, a programproject designed by J. Richard Udry, Peter S. Bearman, and Kathleen Mullan Harris, and funded bya grant P01-HD31921 from the National Institute of Child Health and Human Development, with cooperativefunding from 17 other agencies. Special acknowledgment is due Ronald R. Rindfuss and BarbaraEntwisle for assistance in the original design. Persons interested in obtaining data files from Add Healthshould contact Add Health, Carolina Population Center, 123 W. Franklin Street, Chapel Hill, NC 27516-2524([email protected]). The views expressed herein are those of the author(s) and do not necessarilyreflect the views of the National Bureau of Economic Research.
NBER working papers are circulated for discussion and comment purposes. They have not been peer-reviewed or been subject to the review by the NBER Board of Directors that accompanies officialNBER publications.
© 2009 by Jason M. Fletcher and Steven F. Lehrer. All rights reserved. Short sections of text, not toexceed two paragraphs, may be quoted without explicit permission provided that full credit, including© notice, is given to the source.

Using Genetic Lotteries within Families to Examine the Causal Impact of Poor Health onAcademic AchievementJason M. Fletcher and Steven F. LehrerNBER Working Paper No. 15148July 2009JEL No. C33,I12,I21
ABSTRACT
While there is a well-established, large positive correlation between mental and physical health andeducation outcomes, establishing a causal link remains a substantial challenge. Building on findingsfrom the biomedical literature, we exploit specific differences in the genetic code between siblingswithin the same family to estimate the causal impact of several poor health conditions on academicoutcomes. We present evidence of large impacts of poor mental health on academic achievement.Further, our estimates suggest that family fixed effects estimators by themselves cannot fully accountfor the endogeneity of poor health. Finally, our sensitivity analysis suggests that these differencesin specific portions of the genetic code have good statistical properties and that our results are robustto reasonable violations of the exclusion restriction assumption.
Jason M. FletcherYale UniversitySchool of Public Health60 College Street, #303New Haven, CT [email protected]
Steven F. LehrerSchool of Policy Studiesand Department of EconomicsQueen's UniversityKingston, OntarioK7L, 3N6 CANADAand [email protected]
1 Introduction
One of the most controversial debates in academic circles concerns the relative importance of an
individual’s innate qualities ("nature") versus environmental factors ("nurture") in determining
individual differences in physical and behavioral traits.1 For many years, researchers in the social
sciences could only examine the relative importance of a multitude of environmental factors on
various individual outcomes, as data on genetic variation between individuals was unavailable.
Yet, with the decoding of the human genome, this limitation no longer exists, and recent years
have been characterized by substantial amounts of research in the biomedical literature examining
whether specific point mutations in genetic code (aka single nucleotide polymorphisms (SNPs))
between dizygotic twins (among other family-based samples) are associated with specific diseases
and outcomes. Findings from these studies have not only led to new drug discoveries but also
improved diagnostic tools, therapies, and preventive strategies for a number of complex medical
conditions.2 As clinical researchers identify unique genetic bases for many complex health behaviors,
1This debate has been traced back to 13th-century France and the field of quantitative behavioural genetics basi-
cally compares trait similarities across individuals that systemically differ in the genetic or environmental influences
they have in common (e.g. identical vs. fraternal twins, adoptive vs. biological children), to decompose the variation
of quantitative traits, and their covariances with other traits, into genetic and environmental (co)variance compo-
nents. Within economics, Cesarini et al. [2008, 2009] utilize these methodologies to demonstrate that preferences
for cooperative behavior, risk and giving have a significant genetic component. The relative importance of nature
and nurture is of particular relevance for public policy. For example, consider education policy. If nurture factors
drive the success of children in school, inequality in educational opportunity may well come from sources such as
failing capital markets suggesting that specific policies could reduce future inequalities in schooling. However, if
inequality in educational opportunity reflects the distribution of innate ability among the population, there is fewer
opportunities to design policies that can reduce future inequality. That being said, the notion that nurture inputs
are more easily susceptible to policy remediation relative to nature, is a non sequitur.2For example, see Johnson [2003], Kelada et al. [2003], Goldstein et al. [2003], Zerhouni [2003] and Merikangas
and Risch [2003].
2
diseases and other outcomes,3 opportunities arise for social scientists to exploit this knowledge and
use differences in specific sets of genetic information to gain new insights into a variety of questions.
In this paper, we exploit differences in genetic inheritance among children within the same
family to estimate the impact of several poor health conditions on academic outcomes via a family
fixed effects instrumental variables strategy. Understanding the consequences of growing up in poor
health for adolescent development has presented serious challenges to empirical researchers due to
endogeneity that arises from both omitted variables and measurement error problems pertaining to
health.4 Empirical research that has attempted to estimate a causal link have either used a within-
family strategy (i.e. Currie and Stabile [2006], Fletcher and Wolfe [2008a,2008b], and Fletcher
[2008]) or instrumental variables approach (i.e. Ding et al. [2006,2009], Behrman and Lavy [1998],
Norton and Han [2008] as well as Glewwe and Jacoby [1995]) and in general researchers find large
negative impacts of poor health on academic outcomes.5 Our empirical strategy combines both
elements and identifies the causal impact of health on education by exploiting exogenous variation
in genetic inheritance among both siblings and dizygotic twins.
Differences in genetic inheritance occur at conception and remain fixed between family mem-
bers at every point in the lifecycle, irrespective of all nurture investments an individual faces (even
3Using similar methodologies, economists have begun to explore whether specific genetic loci are associated with
financial risk preferences (e.g. Dreber et al [2009], Benjamin et al. [2009]).4Grossman and Kaestner [1997] and Strauss and Thomas [1998] present surveys of the literature of the impact
of health on, respectively, education and income. The majority of empirical studies discussed in the surveys report
correlational relationships.5Several other studies that use alternative empirical approaches are worth noting. Kremer and Miquel [2004]
randomly assign health treatments to primary schools in Kenya and find that health improvements from the clinical
treatment significantly reduced school absenteeism but did not yield any gains in academic performance. Bleakley
(2007) uses a quasi-experimental strategy that exploits different timing at which cohorts were exposed to a large-
scale public health intervention against hookworm in childhood. He finds that the treatment boosted health, and
was associated with larger gains in income and higher rates of return to schooling later in life.
3
those that occur in utero).6 Since a great deal of variation in characteristics and outcomes is found
within families, exploiting the genetic processes that affect development (but are not self-selected
by the individuals themselves) presents a potential strategy to identify differences within families.7
However, it is worth stating explicitly that this identification strategy relies on assumptions re-
garding how specific genetic markers affect health and academic outcomes in adolescence. As the
biomedical literature has not reached a consensus on how specific genetic markers operate, concerns
could exist that, despite no detectable evidence in the biomedical literature,8 the specific genetic
markers we use in our analysis are not only related to poor health in adolescence but also to genetic
factors that directly impact education outcomes. In our analysis, we examine the sensitivity of our
empirical results to the degree in which the exclusion restriction assumption is potentially violated,
6Genes consist of two alleles, and a child randomly inherits one of the two alleles from each parent at the time
of conception. The child’s genome consists of approximately 3.2 billion base pairs, along which there are 9.2 million
candidate SNPs (International HapMap Consortium, 2005), which are specific locations where a mutation in the
genetic code is known to occur in the population. This variaility in the genetic code may influence an indiviudual’s
susceptibility to various developmental outcomes such as developing an illness. In other words, our empirical strategy
exploits these differences in the coding of a specific marker between full siblings and can intuitively be viewed as an
experiment in “nature”.7Ding et al. [2006, 2009] was the first empirical study within economics to explicitly use differences in genetic
information across individuals as an instrumental variable in estimating the effects of poor health on high school
grade point average (GPA). More recently, Norton and Han [2008] use genetic information to attempt to estimate
the impact of obesity on employment. Neither study exploited variation in genetic inhertitance within families
(the “genetic lottery”), which we show to be important empirically and improves the plausibility of the exclusion
restriction.8Plomin et al. [2006] and de Quervain and Papassotriopoulos [2006] present recent surveys on which genes are
believed to be directly associated with intelligence and memory ability respectively. Using maps of the location
between these genes and the specific genetic markers in our study, we find no evidence that they are located closely
on the genome, suggesting that linkage in inheritance is unlikely. Researchers have found no direct links between
several of the genes in this study and intelligence (i.e. Moises et al. [2001]) or cognitive ability (e.g. Petrill et al.
[1997]), and we hypothesize that if a link exists, that it operates through specific health measures.
4
finding that our main results are not sensitive to the plausibility of the instruments at reasonable
levels. Since nearly every social, behavioral and health outcome has a unique genetic basis, this
identification strategy can potentially shed light on a large number of questions.9
Our empirical analysis reaches three major conclusions. First, we find that the impact of poor
mental health outcomes on academic achievement is substantial. Our preferred estimates examine
the relationship with a sample consisting only of same sex dizygotic twins, and they indicate that
inattention leads on average to a one standard deviation decrease in academic performance.10 The
significant negative impacts of inattention on academic performance remain large and significant if
we examine the relationship using other family-based samples.
Second, we conduct a variety of specification tests which indicate that family fixed effects esti-
mators by themselves cannot fully account for the endogeneity of poor health. This indicates that
the commonly observed differences in health and education outcomes between full biological siblings
should not be treated as random in empirical analyses.
Third, we find that differences in specific portions of the genetic code have desirable properties to
identify the impact of poor health on education within families, as there are, statistically significant
correlations with each endogenous health variables that are consistent with the biomedical literature.
In addition, sensitivity analyses indicate that our results are robust to reasonable violations of the
exclusion restriction assumption.11
9These ideas are not new, having been discussed in Harrison (1970) and Allen (1970).10Similarly large negative impacts of poor health on measures of later cognitive achievement have been found in
studies that exploit shocks to an individual’s prenatal conditions such as in utero exposure to the flu (Almond, 2006)
and low levels of radiation (Almond, Edlund and Palme, 2008).11The importance of the sensitivity analysis should not be understated, since poor health conditions often occur
simultaneously and it is hard to identify a unique source of genetic or environmental variation to identify the impact
of specific disorders due to the potential presence of unmeasured comorbid conditions. As we discuss in the results
section in our context, the main threats are schizophrenia and Tourette’s syndrome, health measures which were
not collected in the data set. We argue that this concern is unlikely to be a serious threat to our main results as
5
The rest of the paper is organized as follows. In Section II, we provide an overview of the data
we employ in the study. We also review the scientific literature linking the genes in our dataset
to health behaviors and health outcomes. The empirical framework that guides our investigation
and our identification strategy is described in Section III. The empirical results are presented and
discussed in Section IV. A concluding section summarizes our findings and discusses directions for
future research.
2 Data
This project makes use of the National Longitudinal Study of Adolescent Health (Add Health),
a nationally representative longitudinal dataset.12 The dataset was initially designed as a school-
based study of the health-related behaviors of 12 to 18 year old adolescents who were in grades 7 to
12 in 1994/5. A large number of these adolescents have subsequently been followed and interviewed
two additional times in both 1995/6, and 2001/2. To develop our identification strategy, we use a
specific subsample of the respondents for which DNA measures were collected during the 2001/2
interview and for which there were multiple family members in the survey. This specific subsample is
composed of monozygotic twins, dizygotic twins and full biological siblings, and includes information
on 2,101, 2,147, and 2,275 individuals who completed the survey at each interview point. Excluding
those individuals for whom there is incomplete education, health and DNA measures for multiple
family members reduces the sample to 1684 individuals.
schizophrenia does not manifest itself among adolescents and Tourette’s syndrome is extremely uncommon, with
current estimates indicating that it affects approximately 0.5 to 3 people in 1000.12Add Health selected schools in 80 communities that were stratified by region, urbanicity, school type (public,
private, or parochial), ethnic mix and size. In each community, a high school was initially selected but since not all
high schools span grades 7-12, a feeder school (typically a middle school) was subsequently identified and recruited.
In total, there are 132 schools in the sample. Additional details on the construction of the sample are provided in
Harris et al. [2003].
6
The dataset contains information on a number of health conditions, including depression, ADHD
and obesity. Depression is assessed using 19 responses to the Center for Epidemiologic Studies-
Depression Scale (CES-D), a 20-item self-report measure of depressive symptoms. Items on the
CES-D are rated along a four-point Likert scale to indicate how frequently in the past week each
symptom occurred (0 = never or rarely; 3 = very often). The sum of these items is calculated
to provide a total score, where higher scores indicate a greater degree of depressive symptoms.
To determine whether an individual may be depressed, we followed findings from earlier research
with adolescent samples (Roberts, Lewinsohn, and Seeley [1991]) and use specific age and gender
cutoffs. We also use adult-based cutoffs to capture a broader measure of depressive symptoms in
our analyses. The primary indicator of childhood ADHD symptoms is taken from an 18-question
retrospective rating collected during the third data wave. Since there is evidence that the effects of
ADHD may vary by whether the symptoms are of the inattentive or hyperactive type,13 we examine
the effects of these different domains as well as the clinical measure of ADHD of any type. Finally,
overweight and obesity are calculated from each individual’s self-reported height and weight applied
to age and gender specific definitions obtained from the Center for Disease Control.
While concerns may exist regarding the use of self-reports to construct indicators for health
measures such as ADHD or obesity, we believe this is a limited concern for our study. Not only
are we using an instrumental variables approach, but past research with this data (Goodman et al.
[2000]) indicates that there is a strong correlation between measured and self-reported height (0.94),
and between measured and self-reported weight (0.95). There is no evidence that reporting errors are
correlated with observed variables such as race, parental education, and household income. Further,
several reviews have concluded that childhood experiences are recalled with sufficient accuracy to
provide useful information in retrospective studies (e.g. Kessler et al. 2005).
13For example, Babinski et al. [1999], Ding et al. [2009], and Fletcher and Wolfe [2008a] present empirical evidence
of different impacts from these two diagnoses.
7
Regarding academic outcomes, the data contains information on GPA and an age standardized
score on a common verbal test.14 The data also provides a rich set of information on environmental
and demographic variables (i.e. family income, gender, parental education, family structure, etc.)
that are used as control variables in our analysis. Finally, the restricted Add Health data allows
community-level variables from the Census Bureau and school input variables from the NCES
common core of data to be matched to the individuals in the dataset to serve as additional controls.
Summary statistics on our sample are provided in Table 1. Household income for the full
sample (column 1) is slightly higher than US averages and the majority of mothers have attended
college. Both the sibling and twins subsamples respectively presented in columns 2 and 3 appear
gender balanced. With the sole exception of race variables, there are few differences in any of
the summary statistics between the subsample of siblings and twins. While the mean verbal test
score for each sample approximates the national average, the standard deviation of test scores is
slightly smaller than those obtained with nationally representative samples.15 Unlike the education
and demographic variables that are similar to those obtained from nationally represented surveys,
the incidence of poor mental health outcomes differ. On the one hand, roughly 8% of the sample
is coded with ADHD, which exceeds the 6% national average. On the other hand, adolescents
classified as being depressed in our sample is lower than the 1999 estimate of the fraction of the
adolescent population being clinically depressed (12.5%) from the U.S. Department of Health and
Human Services. Similarly, both obesity rates and rates of being overweight rates fall slightly below
the national average for this period. Only the separate diagnoses of AD and HD fall within standard
ranges observed with adolescent samples.
14The test is an abridged version of the Peabody Picture Vocabulary Test-Revised and consists of 78 items. The test
was administered at the beginning of the in-home interview and first involves the interviewer reading a word aloud.
The respondent then selects the illustration that is the closest match to the word from four simple black-and-white
illustrations. The test is arranged in a multiple-choice format.15See http://www.agsnet.com/assessments/technical/ppvt.asp for details.
8
Table 2 documents the well-known positive association between good health and educational
outcomes. Individuals classified as depressed and obese have significantly lower (one sided t-tests)
verbal test scores. Surprisingly, individuals classified to have HD score higher on average than those
who are not coded with this disorder.
2.1 Genetic Data
The DNA samples were drawn in the third collection and were genotyped for six candidate poly-
morphisms.16 The specific markers that have been collected in this study were selected based upon
a large and growing body of research showing a strong correlation between their variation and
health outcomes such as obesity, ADHD and depression, controlling for other relevant factors. It is
important to state that these health outcomes are polygenic–they are affected by many mutations
at many genetic loci (including many that are not collected in the study) as well as the environment
an individual encounters throughout her life (as well as possible gene-environment interactions).17
However, only an individual’s genetic make-up is both assigned at conception prior to any inter-
action with the environment and remains invariant to all nurture investments over the life-cycle,
16Complete details of the sampling and laboratory procedures for DNA extraction, genetic typing and
analysis are provided in an online document prepared by Add Health Biomarker Team available at
http://www.cpc.unc.edu/addhealth/files/biomark.pdf/. Note that the method to genotype varies across markers
and different assays were conducted. In addition to reduce coding errors, genotypes were scored independently by
two individuals. To control for potential genotyping errors, any analysis that is questionable for routine problems
(i.e. poor amplification, gel quality, software problems, etc.) is repeated.17More recently, evidence indicates that differences within families, even among identical twins, can exist because
of epigenetic factors. Epigenetics refer to natural chemical modifications that occur in a person’s genome shortly after
conception and that act on a gene like a gas pedal or a brake, marking it for higher or lower activity. For instance,
identical twins have different fingerprints. The general pattern of their fingerprints is determined by genetic factors
and is initially identical; however the exact pattern changes in utero based on when and how each twin touched the
amniotic sac (Jain et al. 2002).
9
eliminating concerns related to reverse causality.
The set of genetic markers we use in our analysis includes the dopamine transporter (DAT),
dopamine D4 receptor (DRD4), serotonin transporter (5HTT), monoamine oxidase A (MAOA),
dopamine D2 receptor (DRD2) and cytochrome P4502A6 (CYP2A6) gene. Mutations in the coding
of these genes, not the genes themselves, are believed to impact multiple health outcomes and
behaviors. Scientists hypothesize that these point mutations distort cell functions and/or processes,
leading to the higher propensities for specific disorders. It is important to state explicitly that
individual point mutations can have phenotypic effects of any strength, including quite mild effects,
and it is likely that each genetic marker has pleiotropic effects.18
The genetic markers collected in the Add Health study are primarily linked to the transmis-
sion of two specific neurotransmitters in the primitive limbic system of the brain: dopamine and
serotonin.19 The scientific hypothesis of how these genetic markers predispose individuals to poor
health is that these genetic markers each impact the synaptic level of dopamine and serotonin,
which provides larger signals of pleasure from the limbic system and leads individuals to forego
other basic activities.20 The specific markers are believed to achieve these impacts as follows: Indi-
18Pleiotropy refers to the heterogeneous impacts that a difference in specific genetic marker occurs. Intuitively the
operation is similar to a "power grid", as a single-gene mutation may also affect the expression of other genes, which
together leads to changes in behaviors and outcomes.19The effect of a neurotransmitter comes about by its binding with receptor proteins on the membrane of the
postsynaptic neuron. As long as the neurotransmitter remains in the synapse, it continues to bind its receptors
and stimulate the postsynaptic neuron. In the brain, dopamine and serotonin function as a neurotransmitter as
they are commonly believed to provide individuals with feelings of enjoyment. Caplin and Dean [2008] and Caplin
et al. [2009] have recently developed formal neuroeconomic models that are consistent with specific neuroscientific
hypotheses that respectively explain how dopamine affects individual decision making and belief formation.20The limbic system is highly interconnected with the region of the brain associated with reward and pleasure.
This region was initially discovered in Olds and Milner [1954], who reported that if given the choice of food versus
stimulation by electrodes of the neurons within this region of the brain, rodents ended up dying from starvation and
exhaustion, rather than lessening the stimulation of their pleasure center. Recent studies using mice whose genes have
10
viduals with the A1 allele variants of the DRD2 gene have fewer dopamine D2 receptors than those
with the A2 allele, thereby requiring larger consumption of substances to achieve the same level of
pleasure. The DAT and 5HTT genes code for proteins that lead to the reuptake of dopamine and
serotonin respectively. For each of these genes, longer lengths are believed to affect the speed at
which production of these proteins occur. The MAOA gene product is primarily responsible for the
degradation of dopamine, serotonin and norepinephrine in several regions of the brain. A SNP of
this gene is believed to have decreased productivity of this protein, thereby increasing the risk for
a number of poor outcomes. Individuals with a longer version of the DRD4 gene are more inclined
to partake in additional novelty or sensation-seeking activities to achieve similar levels of reward
as those with shorter variants. The CYP2A6 gene is primarily located in the liver and affects the
rate of metabolism for tobacco, drugs and other toxins. Once these compounds are broken down,
they travel in the bloodstream to the brain where they generally lead to neurotransmitters being
released. Finally, in our analysis we will not only consider the SNPs by themselves but also allow for
gene-gene interactions, which may also have potentially powerful effects.21 We present and discuss
the genetic characteristics of our sample and unconditional relationships with poor health outcomes
in the results section of the paper.
been mutated to affect dopamine and serotonin production have confirmed that these markers affect basic activities.21For example, Dremencov et al. [2004] present evidence that the SNPs of the 5HTT gene interacts with genes
that release dopamine and suggest this channel could impact the speed at which certain pharmaceutical treatments
become effective. Similarly, since many addictors stimulate dopamine release in the nucleus accumbens, it is likely
that the rate of metabolism of these drugs (which is in part determined by the CYP2A6 gene) interacts with the
DRD2 genes.
11
3 Empirical Framework
The empirical framework that underlies our analysis involves the estimation of a system of equations
generated from a simple extension to the model developed in Ding et al. [2009]. We assume that in
each period, altruistic parents select inputs to maximize the household indirect utility function after
receiving noisy signals of their children’s health status, health behaviors and ability endowment.
Subsets of these inputs enter both an education production function and health production function,
generating stocks of human capital for each child. The parents provide children who have different
abilities and health outcomes with different inputs where in equilibrium the marginal returns to
investments in schooling of one child is equated to the marginal returns to investments in health in
their sibling.
First, consider a linear representation of the child’s education production function, which trans-
lates a set of inputs into human capital as measured by a score on an achievement test as
AifjT = β0 + β1XiT + β2HiT + β3QjT + β4NiT + vf + εifjT (1)
where AifjT is a measure of achievement for child i in family f, in school j in year t, the vector
X contains individual and family characteristics (child gender, race, parental education, birth or-
der, family income and family structure),22 the vector H consists of variables that capture health
measures, the vector Q contains school quality variables, the vector N contains information on
community and neighborhood inputs, vf is an unobserved family effect and εifjT is an idiosyncratic
error term. Notice that HiT is directly included as an input to the education production function.
22Ex ante, one could hypothesize that parental education and family income are positively associated with mea-
sures of academic performance. In genetic studies, controlling for ethnicity and race are important as it has been
hypothesized that there are differences in allele frequencies across race and ethnic groups (e.g. Cooper et al. [2003)).
Within families, birth order effects could exist as higher rank children are more likely to have older parents at birth,
which could affect the amount of time invested by parents. Similarly, across families, higher rank children are more
likely to be born into larger families, which can also capture family size effects.
12
We hypothesize that there are several possible channels under which health status potentially affects
academic performance. First, it may affect the physical energy level of a child which determines the
time (including classroom attendance) that can be used for learning. Second, it affects the child’s
mental status that may have a direct impact on academic performance. Lastly, a child’s health
status may affect the way a child is treated by teachers, parents and peers; which can in part shape
the learning environment that is encountered.
The major empirical challenge in estimating equation (1) is that the health vector (HiT ) is
likely to be endogenous.23 That is, individuals with a higher health "endowment" could obtain
improved academic performance because of genetic characteristics or parental investments that
are also unobserved to the analyst. The inclusion of family fixed effects (vf) in equation (1) di-
rectly accounts for unobserved to the researcher family factors that are common across siblings and
may be related to both individual health and education outcomes. This allows the researcher to
simultaneously control (assuming constant impacts between family members) for many parental
characteristics/behaviors and some genetic factors. However, it does not provide any guidance as to
why, within a twin or sibling pair, the subjects differ in explanatory characteristics such as health
status. Thus, estimating equation (1) using a family fixed effects approach may overcome biases
from correlations between the health vector and the family effect vf , but it may not completely
solve the endogeneity problem, as correlations may remain the health variables and the error term
(i.e. Cov(HiT −Hf , εifjT − εf) 6= 0).
Supplementing the family fixed effects strategy with instrumental variables can potentially over-
come the endogeneity bias arising from Cov(HiT −Hf , εifjT − εf). We propose to use exogenous
variation from the "genetic lottery" between family members to identify the impact of poor health
23An equally important challenge occurs in measuring the health vector from omitted variables. If the researcher
omits comorbid conditions, biased estimates of the impacts of poor health on academic outcomes will be recovered.
This empirical challenge is discussed in detail in Section 4.4 of the text.
13
on measures of achievement. In the first stage equation, we explain differences in health outcomes
between family members using differences in the coding of specific genetic markers between family
members as an instrumental variable, while controlling for other individual and family characteristics
that affect health and education outcomes. Formally the first stage presents a linear representation
of the child’s health production function
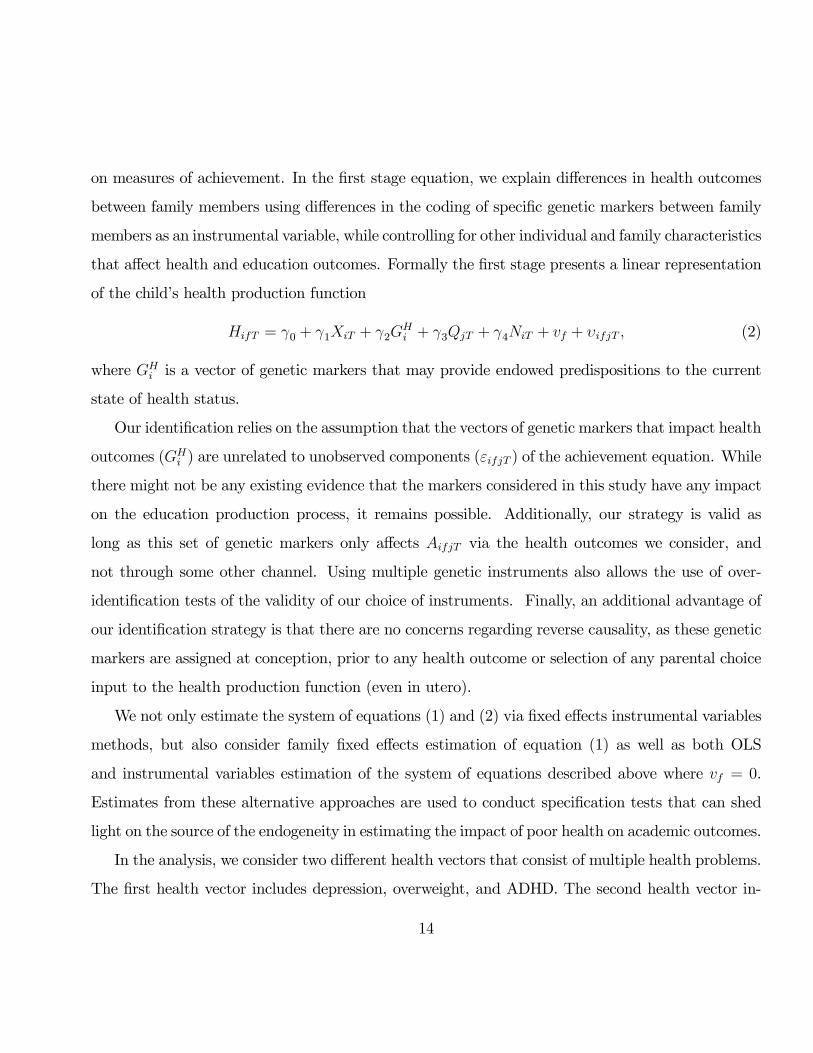
HifT = γ0 + γ1XiT + γ2GHi + γ3QjT + γ4NiT + vf + υifjT , (2)
where GHi is a vector of genetic markers that may provide endowed predispositions to the current
state of health status.
Our identification relies on the assumption that the vectors of genetic markers that impact health
outcomes (GHi ) are unrelated to unobserved components (εifjT ) of the achievement equation. While
there might not be any existing evidence that the markers considered in this study have any impact
on the education production process, it remains possible. Additionally, our strategy is valid as
long as this set of genetic markers only affects AifjT via the health outcomes we consider, and
not through some other channel. Using multiple genetic instruments also allows the use of over-
identification tests of the validity of our choice of instruments. Finally, an additional advantage of
our identification strategy is that there are no concerns regarding reverse causality, as these genetic
markers are assigned at conception, prior to any health outcome or selection of any parental choice
input to the health production function (even in utero).
We not only estimate the system of equations (1) and (2) via fixed effects instrumental variables
methods, but also consider family fixed effects estimation of equation (1) as well as both OLS
and instrumental variables estimation of the system of equations described above where vf = 0.
Estimates from these alternative approaches are used to conduct specification tests that can shed
light on the source of the endogeneity in estimating the impact of poor health on academic outcomes.
In the analysis, we consider two different health vectors that consist of multiple health problems.
The first health vector includes depression, overweight, and ADHD. The second health vector in-
14
cludes depression and overweight but decomposes ADHD into being inattentive (AD) or hyperactive
/ impulsive (HD). We make this distinction as ADHD is often denoted by AD/HD since, as defined
in the American Psychiatric Association’s Diagnostic and Statistical Manual, it encompasses the
“Inattentive Type” marked by distractibility and difficulty following through on tasks as well as the
“Hyperactive Type,” which includes excessive talking, impulsivity and restlessness. It is not un-
common for people to be diagnosed with the “Combined Type,” showing a history of both features,
but ex-ante we would imagine that inattention and hyperactivity could have different impacts on
academic performance as well as other human capital outcomes.
Finally, to examine the robustness of our results, we consider including an individual’s birth
weight (both linearly and up to a quartic) as an additional control variable(s) in equations (1) and
(2).24 An individual’s birth weight can be viewed as an imperfect proxy for an individual’s initial
stock of health capital. While birth weight is known to have a large genetic component (e.g. Lunde
et al. [2007] it is well established to differ even among monozygotic twins. Royer [2009] presents
evidence that these birth weight differences between twins have impacts on educational attainment
and Christensen et al. [2001] demonstrates differences in birth weight also affects health later in
life between twins. Accounting for differences in birth weight can capture additional differences in
both genetic factors and pre-natal environments between full biological siblings.
24It is well documented by many authors that better health early in life is associated with higher educational
attainment (e.g. (Grossman [1975], Perri [1984]) and that more educated individuals in turn have better health later
in life (e.g. Grossman and Kaestner [1997], and Cutler and Lleras-Muney [2007]).
15
4 Results
4.1 Genetic Associations
Our empirical identification relies on the validity of the “genetic lottery” to serve as a source
to identify the impact of adolescent health on education outcomes. Statistically, for the genetic
markers to serve as instruments, they must possess two properties. First, they must be correlated
with the potentially endogenous health variables. Second, they must be unrelated to unobserved
determinants of the achievement equation.
Prior to describing our instrument set and conducting formal tests, we present some summary
information in our data that motivates the notion that these markers and their two-by-two polygenic
interactions are good candidates to serve as instruments for adolescent health outcomes. Table
3 contains the conditional mean, standard deviation and odds ratio of alternative poor health
outcomes for individuals that possess a particular marker. For each genetic marker, we use at most
three discrete indicators that are defined by specific allelic combinations.25
For each poor health outcome and behavior, there is at least one gene in which a specific SNP
exhibits a higher propensity. Statistically different odds ratios in Table 3 are denoted with an
asterisk. For depression, individuals with the A2A2 allele of the DRD2 gene and two 7-repeats of
the DRD4 gene have significantly lower odds. For ADHD, individuals with two 4-repeats of the
25The DAT genotypes are classified with indicator variables for the number of 10-repeat alleles (zero, one, or two).
The MAOA genotypes is classified with indicator variables for the number of 4-repeat alleles (zero, one, or two).
Similarly, the DRD4 genotype is classified with indicator variables for the number of 7-repeat alleles (zero, one, or
two). The DRD2 gene is classified as A1/A1, A1/A2 or A2/A2 where the A1 allele is believed to code for reduced
density of D2 receptors. The SLC6A4 gene is classified as SS, SL or LL where S denotes short and L denotes long.
A2/A2. Finally, we include indicator variables for the two possible variants of the CYP gene. We organize the genetic
data reported in the empirical table in order of the raw number of individuals who possess each particular marker
within that gene from lowest frequency to most common.
16
MAOA gene have greater odds and individuals with one 4-repeat of the MAOA gene have lower
odds. These relationships also show up for inattention (AD) and hyperactivity (HD). For obesity,
those with no repeats of the DAT1 gene have substantially lower odds.
The significant correlations between the SNPs and the heath outcomes are also consistent with
the scientific hypotheses outlined in Section 2. Each of the health disorders we consider in this
paper is believed to have a large genetic component and be polygenic.26 To date, the scientific
literature has not identified a unique depression, ADHD or obesity gene. Concerns could exist that
the genetic markers we use in our analysis are not only related to poor health in adolescence but
also to genetic factors that directly impact education outcomes. To examine this concern, we first
present evidence that there are no direct links between the inheritance of the specific genetic markers
in our study with other portions of the genetic codes. Second, we present over-identification tests
of our instrument sets. Last, we use a procedure developed in Conley, Hansen and Rossi [2007] to
examine the sensitivity of our estimates to the degree in which the exclusion restriction assumption
is violated.
Regarding whether the inheritance of different portions of the genetic code are correlated, we
examine the extent to which genetic linkages occurs in our sample.27 Appendix Table 1 presents
26Polygenic refers to a phenotype that is determined by multiple genes. For example, the ninth annual Human
Obesity Gene Map released in 2006 identified more than 300 genes and regions of human chromosomes linked to
obesity in humans. Several of the genetic markers contained in Add Health are listed but one should reasonably
expect that they only account for a limited amount of variation in the health outcomes.27Examining whether genetic linkages occur is an active area of study as it presents a test of whether Mendel’s
law of independent assortment is supported. This law suggests that different genes are inherited independently
of each other, and scientists have essentially concluded that there is an independent assortment of chromosomes
during meiosis. however, alleles that are in close proximity on the same chromosome may be inherited as a group.
Studies finding small links in genetic assortment have been obtained from samples consisting only of family members.
However, there appears to be evidence that different groups of alleles are transmitted together across families when
many of these studies and samples are examined jointly. Thus, violations are not systematic.
17

cross-tabulations of different genetic combinations for both the full sample as well as by the first
and second family member in the data. We constructed the sample of single family members
based on their relative age, since one could expect linkages within families. Whether Mendel’s law
of independent assortment is violated can only be tested across families. Each cell in Appendix
Table 1 provides the raw count of people and conditional probability (based on possessing the gene
given by the row variable) of possessing that specific genetic combination. We conducted tests
for homogeneity of odds ratios to see whether possessing a polymorphism in one genetic marker
increases the odds of possessing a specific polymorphism in a different genetic marker. We did not
find any evidence indicating a systematic relationship between markers of any two of the genes for
either sample that contains only one family member, lessening concerns regarding linkage.28. This
was not a surprise as linkage was highly unlikely due to the location of these markers on the genome.
Additionally, using maps of the location between the specific genetic markers in our study and those
which have been hypothesized to be linked to education outcomes (Plomin et al. [2007], see footnote
8 for more details), we find no evidence that they are located closely on the genome, suggesting that
linkage in inheritance is unlikely. Nearly all of the cells in Appendix Table 1 are populated with
multiple individuals, which indicates that the polygenic interactions can be identified both within
and across families.
To construct the instrument set, we only included genetic markers or their interactions that had
statistically significant (at the 2% level) differences in the odds ratio of suffering from one of the four
conditions.29 It is unlikely that the majority of these unconditional relationships are due to chance
28As dissussed in the preceding footnote, this result is consistent with a large amount of evidence presented in the
scientific literature.29Recall that Table 3 demonstrated that significant correlations do indeed exist between health outcomes and the
genetic markers in our data. To construct the instrument set, we considered two alternative strategies. First, we
followed Klepinger, Lundberg and Plotnick [1999], who used forward stepwise estimation to select a subset of these
markers and their interactions. This implementation is identical to Ding et al. [2006, 2009] and this approach has
18
and we also considered whether the direction of the odds ratio was biologically plausible. We do
not vary our instrument set across samples so that any observed difference in terms of health effects
is not the result of the selection of different instrument sets that vary based on genetic similarity
between family members. It is worth repeating that these genes are pleiotropic and cannot credibly
account for the majority of the variation in these health disorders. Thus, even if two siblings had
the same markers for many of these six genes, this would neither guarantee that they suffer from
the same disorders nor that these particular genes would affect the siblings in a similar fashion.
4.2 Estimates of the Empirical Model
We now examine whether poor health is related to academic outcomes in adolescence. Table 4
presents estimates of equation (1) for the full sample. In the odd columns, results are presented
for the first health vector, which includes depression, overweight and ADHD. The even columns
decompose the classification of ADHD into being inattentive (AD) or hyperactive / impulsive (HD)
in the health vector. The first four columns of Table 4 presents OLS and family fixed effects, which
either assume that health is exogenous or that health is only correlated with the family-specific
component of the residual.
the advantage of making it easier to replicate the study. The scientific literature provides some (arguably weak)
guidance for selecting particular markers, as the evidence tends to be inconsistent across studies, which tend to use
very small unrepresentative clinical samples. We examined the robustness of our results by using the complete set
of the markers in our study. The general pattern of IV and fixed effects IV results are robust to the instrument set
for the full sample. The first-stage properties are particularly weak for the full set of markers and their two by two
interactions, yet the partial R-squared for that instrument set is substantially larger than studies using dates of birth
in the labor economics literature. Finally, at the request of a seminar participant, we considered five other strategies
based on either stepwise regression using different criteria or retaining those markers with significant relationships
at the 5% level. Again the pattern of results was fairly consistent. These results are available from the authors upon
request.
19
We find that depression is strongly negatively correlated with academic performance. However,
the estimated magnitude diminishes by over 50% when family fixed effects are included in the
specification. While the impacts of depression in the OLS specifications are fairly large relative to
the other health variables, they remain approximately half of the estimated magnitude of the race
variables. In addition to depression, the two other mental health conditions enter the equation in
a significant manner. AD is strongly negatively correlated and HD is positively correlated with
academic performance when family fixed effects are not included. Despite the evidence in Table
2 that overweight and obese students score significantly lower than non-overweight and non-obese
students, this state of health does not significantly affect verbal test scores in any of the specifi-
cations in Table 4, which is consistent with Kaestner and Grossman [2008]. The OLS results also
indicate that both African Americans and Hispanics score substantially lower on the verbal test
than Caucasian and Asian students, the children who are older in their families perform slightly
better than their siblings and that parental education and family income are positively correlated
with test scores. There does not appear to be any evidence indicating that gender differences exist
once family fixed effects are controlled.
Instrumental variable and family fixed effects IV estimates of the impacts of poor health on
education are presented in the last four columns of Table 4. The IV estimated impacts of depression,
AD and HD are very large relative to the OLS results, and the latter two are marginally significant.
As to the size of the impact, the results indicate that both depression and inattention lead to
substantial decreases in test scores whereas HD leads to a marked increase. The inclusion of family
fixed effects leads the IV point estimate of HD and depression to become statistically insignificant
in both health vectors. Notice in the last column that the magnitude of the coefficient on depression
and HD diminishes substantially as we add the family fixed effects into the IV analysis. Only the
IV fixed effects estimate of AD remains statistically significant once we account for family fixed
effects. It also increases by over 40% in magnitude. Focusing on the fixed effects IV specification in
20
column 8 as a benchmark, the point estimate indicates that suffering from inattention would lead
to roughly a 26 point decline in academic performance. We note that the parameters in Table 4 are
reduced-form estimates. Since we have instrumented for poor health outcomes, we make the causal
assertion that AD significantly decreases verbal tests scores, while a range of other demographic
variables excluding race, birth order and maternal education have at best a tenuous impact on test
score performance.30
Attenuation bias due to measurement error in the AD and HD variables could account for some
of the difference between the OLS and instrumental variable estimates in Table 4. Recall that these
classifications are based on answers to retrospective questions, which are thought to be recorded with
error. By including statistical controls for common family influences, the fixed effects strategy only
uses information within families, attenuating the variance in the regressors. Thus, measurement
error imposes a degradation in the signal to noise ratio and a variable measured with error will be
severely biased toward zero. Interestingly, only the estimates on two health conditions, HD and
depression, become smaller when family fixed effects are accounted for when estimating equation
(1), suggesting this is not the explanation for the large difference in the impact of AD.
The estimates from Table 4 can also be used to examine the source of the endogeneity in the
health variables. Tests of joint significance of the family effects are statistically significantly for all
specifications. This indicates that one should account for family-specific heterogeneity. Random
effect estimates (not reported) were used to conduct Hausman tests of the endogeneity of the health
variables and the results suggest fixed effects indeed removes some of the endogeneity. We next
30While the estimated effect for AD is quite large (approximately two standard deviations in the test score) in
comparison to the estimated effects of depression and obesity, the effect size differences are consistent with differences
in the typical age of onset of the health outcomes. For AD and HD, symptoms occur at a young age, typically
during elementary school or earlier. In contrast, the age of onset for symptoms of depression is typically during
middle adolescence. There is also emerging evidence that children seem to outgrow HD symptoms to some extent
but not AD symptoms.
21
examined whether accounting for family fixed effects eliminates the need to treat the health vector
as endogenous by testing the Null hypothesis that the IV estimates and the fixed effects IV estimates
are similar using a Hausman-Wu test. If the Null is accepted, this would suggest there are efficiency
gains from conducting family fixed effects estimates. For both health vectors, we can reject the Null
of IV and IV/FE coefficient equality, suggesting that the family fixed effects do not fully remove
the sources of endogeneity that bias estimates of the impacts of poor health.
Similarly, we conducted Hausman tests between the simple OLS and IV estimates. In the event
of weak instruments (as well as overfitting), the fixed effects IV estimates would be biased towards
the OLS estimates. We can reject the Null of exogeneity of health outcomes for each health vector
with each sample at the 5% level.
Testing the Validity of the Instruments
We considered several specification tests that examine the statistical performance of the instru-
ments for each health equation and sample. Since our IV estimates are over-identified, we use a
J-test to formally test the overidentifying restrictions. This test is the principal method to test
whether a subset of instruments satisfy the orthogonality conditions. The smallest of the p-values
for these tests is 0.29, providing little evidence against the overidentifying restrictions.31
In order to further examine whether these genetic markers are valid instruments, we considered
several specification tests to be used with multiple endogenous regressors. First, we used the Cragg—
Donald [1993] statistic to examine whether the set of instruments is parsimonious (i.e. the matrix
is of full rank) and has explanatory power. Second, in order to examine whether weak instruments
are a concern, we calculated the test statistic proposed by Stock and Yogo [2005].32 To demonstrate
31Many of the p-values are large and exceed 0.5. P-values are computed from Sargan tests of the joint Null
hypothesis that the excluded instruments are valid instruments for the health variables in the achievement equation.
Similarly with other instrument sets that we explored, we found evidence of large p-values above 0.2.32This is an F-statistic form of the Cragg and Donald (1993) statistic and requires an assumption of i.i.d. errors,
which is more likely to be met in the specifications with family fixed effects. We are not aware of any studies on
22
the strength of the instruments, we considered the most difficult test with our data is using the full
set of genetic instruments. That is, since using a large number of instruments or moment conditions
can cause the estimator to have poor finite sample performance, we will demonstrate results using
the full set of genetic instruments and their polygenic interactions. Our preferred instrument sets
are a subset, and one could argue that we achieved strong results in those contexts since we dropped
redundant instruments, thereby leading to more reliable estimates.33 The critical value for the Stock
and Yogo [2005] test is determined by the number of instruments, endogenous regressors and the
amount of bias (or size distortion) one is willing to tolerate with their IV estimator. With the
full set of instruments, the critical value increases substantially and we find that the Cragg-Donald
statistic is 45.73 and 46.11 in health vector 2 with and without family fixed effects respectively,
which exceeds the critical value.34 This suggests that even with this large set of instruments, the
estimator will not perform poorly in finite samples and that, with or without family fixed effects,
we can reject the Null hypothesis, suggesting an absence of a weak instruments problem. We also
considered more traditional F-statistics with our preferred set to test for the joint significance of the
full set of instruments in each first stage equation. The first stage F-statistics indicate that in each
equation the full set of instruments is jointly significant in both the specifications that include and
exclude family fixed effects.35 We also examined the partial R-squared for each outcome and they
ranged between 2.3% - 5.1%, which fit our prior, that since these disorders are polygenic, it would
be unlikely that these genes would account for more than 5% of the variation in the disorders.
To examine the sensitivity of both our IV and family fixed effect IV estimates to the degree
testing for weak instruments in the presence of non-i.i.d. errors.33We did conduct Kleinbergen and Paap (2006) tests for the preferred instrument set reported in table 5 and can
reject the Null hypothesis at the 10% level. This suggests the matrix is of full rank and while overidentified the set
does provide identification of the health variables.34For health vector 1, the results are 48.03 and 51.62.35The F-statistics also suggest that our empirical results in Table 5 are not driven by the instruments performing
well in certain health equations and not in others.
23
in which the exclusion restriction assumption is potentially violated, we considered the local to
zero approximation sensitivity analysis proposed in Conley, Hansen and Rossi [2007]. This analysis
involves making an adjustment to the asymptotic variance matrix, thereby directly affecting the
standard errors. While the variance matrix continues to account for the usual sampling behavior,
Conley, Hansen and Rossi [2007] suggest including a term that measures the extent to which the
exogeneity assumption is erroneous.36 The amount of uncertainty about the exogeneity assumption
is constructed from prior information regarding plausible values of the impact of genetic factors on
academic performance that are obtained from the reduced form. We successively increased by 5%
increments the amount of exogeneity error from 0% to 90% of the reduced form impacts. At levels
below 40% of the reduced form impacts, our results are robust as inattention continues to have a
statistically significant negative impact on verbal test scores. Our full set of results become statisti-
cally insignificant only if the extent of deviations from the exact exclusion restrictions are assumed
to be above 60% of the reduced form impacts. Since there does not exist any scientific evidence
that these specific markers directly affect academic achievement, the sensitivity analysis indicates
the levels at which our results are sensitive to the exclusion restriction assumption appear highly
implausible. The sensitivity analysis suggests that our quantitative results are robust to potentially
mild and moderate violations of the exogeneity assumption, further increasing our confidence in
Table 4.36Essentially, the procedure involves estimates of the second stage equation with the instrumented health vector
where the instruments are additionally included in the specification. If the exclusion restriction assumption is satisfied,
the coefficients on the instrument are not identified. To conduct the analysis, we assume a prior distribution for
the estimated impact of these coefficients. In our analysis, the impacts are distributed N(0,δ2), where δ is the q%
percentage of the reduced form impact obtained from an OLS regression of academic achievement on the instruments
and exogenous factors. We vary q to conduct our sensitivity analysis.
24
4.3 Robustness
In order to demonstrate the robustness of our empirical findings, we replicated the analysis on
various subsets of the data based on family relationships, zygosity and gender as well as additional
controls for health endowments. We considered these family relationship breakdowns as the inclusion
of family fixed effects ensures that only the dizygotic twins and siblings identify the fixed effect IV
estimates of β2. The measure of genetic relatedness does not differ in theory between dizygotic twins
and full siblings since dizygotic twins come from different eggs, they are as genetically similar as
any other non-twin sibling and have a genetic correlation of approximately half that of monozygotic
twins. However, the inclusion of family fixed effects also imposes an equal environment assumption
on the family members. That is 1) family inputs that are unobserved to the analyst do not differ
between family members, and 2) these factors have the same impact on achievement between
relations. This assumption of equal impacts from family factors is more likely to be satisfied with
data on twins than siblings as one could imagine that 1) parents make differential time-varying
investments across siblings, and 2) the impacts of particular family factors may differ for children of
different ages. In addition, sibling models do not effectively deal with endogeneity bias that could
result from parents adjusting their fertility patterns in response to the (genetic) quality of their
earlier children.37
While one could imagine that data on the subsample of twins would provide the strongest
robustness check, we imposed an additional sample restriction that the pairs (or trios) of children
are of the same gender. It is more likely that parents will make the same investments in the children
who are most similar.38 We replicate the above analysis only on the subsample of twins of the same
37A large empirical literature has documented that subsequent fertility decisions are influenced by prior birth
outcomes. For example, Angrist and Evans [1998] and Preston [1985], among others, have established that fertility
decisions are influenced by sex composition of exisiting children as well as past neo-natal or infant mortality.38For example birth order, birth spacing and sex composition have been shown to affect differential levels of
investment by parents into children (e. g. Hanushek [1992], Black, Devereux, and Salvanes [2005] and Conley and
25

gender and the results from all four estimation approaches are presented in Table 5.
Notice the OLS estimates (column 2) suggest a substantially larger role for ADHD (column 1)
and AD (column 2), whose magnitude is nearly twice as large as that for the full sample presented
in Table 4. On average, inattention leads to a six-point decline in verbal test scores. Depression no
longer enters the equation in a significant manner, though the magnitude is similar, and the impact
of being overweight on academic performance leads to a small decrease in academic performance
that is statistically significant at the 10% level. None of the health variables enter the equation
in a significant manner once we either include family fixed effects or use traditional IV analysis.
However, once we account for family fixed effects and also instrument the health conditions, AD
continues to enter the equation in a significant manner. On average, a child with AD scores almost
14 points lower. ADHD also now enters significantly in these specification and HD now enters in a
marginally significant manner but the sign of the coefficient has changed. The large impact of both
AD and HD are identified from dizygotic twin pairs, which differ in these classifications, but this
is the only specification in which the impacts of AD and HD enter in a significant manner and are
not significantly different. While neither depression or obesity enter the equation in a statistically
significant manner, it is important to stress that we have a very small sample size in which we are
able to identify effects and approximately 60% of the twin pairs are monozygotic, leading to larger
standard errors.39 However, the coefficient estimates for depression and overweight are practically
identical in magnitude and sign to those presented in Table 4. Additionally, tests of the validity of
the instrument continue to suggest that this set of genetic markers has good statistical properties
and Hausman tests between columns 2 and 6 of Table 5 reject the exogeneity of the health vector.
We believe that the estimates in Table 5 present the strongest possible robustness check for
Glauber [2005]).39For example birth order, birth spacing and sex composition have been shown to affect differential levels of
parental investment into their children (e. g. Hanushek [1992], Black, Devereux and Salvanes [2005] and Conley and
Glauber [2005]).
26
our empirical evidence of causal impacts of poor mental health on academic achievement as the
family members are of the same age, race and gender. With the exception of health and education
outcomes, the only other measures contained in our data for which there are different values within
kids in these families are genetic markers. As noted above, these results are also robust to including
birth weight controls. The fixed effect-IV estimates presented in the last column continue to suggest
that poor mental health impacts academic performance, whereas our physical health measure has
no significant impact.
Since one must always be cautious in attributing external validity to an analysis with twins
data, we replicate the analysis that corresponds to Table 4 where we only utilize the subsamples
of siblings in Appendix Table 2. As discussed above, the equal family environment assumption
is inconsistent with many models of family behavior40 and the likelihood that the assumption is
valid is higher with the subsample of twins (of the same gender) versus siblings.41 However, results
with the siblings sample are likely of increased external validity (presented in Appendix Table 2),
so there is a clear trade-off. In the sibling sample, it is interesting to note that the AD condition
continues to lead to a significant decrease in test scores (column 8). The large penalty on academic
performance to a sibling with AD is striking, particularly if the assumption that parents are making
equal investments in their children holds. None of the other health variables enter the equation in a
significant manner in the family fixed effects and IV analyses. Ignoring family fixed effects, the IV
estimates indicate that both hyperactivity (HD) has a positive impact on test score performance and
depression has a negative impact that is marginally significant when we exclude family fixed effects
from the IV analysis. The change in sign in the estimated impact of HD on test scores between
Table 5 and Appendix Table 2 may suggest that other inputs in the production process are being
40See Rosenzweig and Wolpin [2000] for a discussion.41Results for the full subsample of twins (n=617) are available upon request. There are few differences in the
significance and magnitude of the impacts from health variables.
27
increased in response to the disorder.42 Finally, in this subsample, the instrument set continues to
have good first stage properties, the p-values of the overidentification tests are above 0.35, Hausman
tests suggest that the health vector should be treated as endogenous, and that family fixed effects
by themselves do not remove all of the potential biases.
As a final robustness check of our main results, we consider including an individual’s birth weight
(both linearly and up to a quartic) as an additional control variable(s) in equation (1). By directly
accounting for differences in birth weight we could potentially control for additional differences in
both genetic factors and prenatal environments between full biological siblings. We find that our
full set of results (available upon request) from Tables 4 through 7 are robust to both of these
specifications. In particular, inattention continues to negatively impact academic performance and
specification tests reject family fixed effects estimators in favor of family fixed effect IV estimators.
4.4 Comorbidity and Measurement Error
In our study, we used a rich vector of health outcomes in part to ensure that the exclusion restriction
property of the instrument holds. Using only a single health outcome to proxy for health could
lead to different results, since health disorders and risky health behaviors are known in the medical
literature to be more common among individuals with one particular disorder than among the
remaining population. Table 6 demonstrates the substantial presence of comorbidities in our sample.
Column 1 of Table 6 displays the number of individuals (and marginal distribution) in each wave
who smoke or have been classified with either AD, HD, ADHD, obesity or depression. Across each
row, we present the number of individuals (and conditional frequency) who also engage in smoking
or suffer other poor health outcomes. Not only are adolescents with ADHD more likely to smoke
but they also have a higher rate of being classified as either depressed or obese than their cohorts
(one sided t-tests). This result is not unique to ADHD, as we find that individuals with any of these
42We are grateful to Richard Blundell for identifying this difference.
28
health disorders are significantly more likely to have a second disorder. In addition, those with any
health disorder are more likely to smoke cigarettes.
The majority of the empirical literature that estimates the impact or association of health
with socioeconomic outcomes generally include only a single explanatory measure such as obesity,
smoking or birth weight in their analysis. We considered what would happen to the sign, significance
and magnitude of the estimated impact of each specific disorder if we followed the usual practice
and did not control for comorbidities in the achievement equation. It is reasonable to hypothesize
that in OLS and family fixed effects strategies, omitted variable bias would arise, since many of the
neglected health conditions would be correlated with both the included health condition as well as
verbal test scores. Further, in these specifications, IV or family fixed effects IV estimates may not
overcome these biases, unless a subset of the genetic instruments are known to be scientifically unique
to that included health condition to ensure the plausibility of the exclusion restriction assumption.
Excluding significant comorbid conditions potentially leads to problems not only with sets of genetic
markers as instruments, but makes it equally difficult to imagine that any nurture or environmental
factor could break the statistical association between those included and excluded to the estimating
equation measures of poor health.43 In our application, there may be a concern that the genetic
markers used in the above analysis may also be associated with health measures not available in
the data. An exhaustive survey of PubMed indicates two potential disorders: schizophrenia and
Tourette’s syndrome. However, each of these disorders has low prevalence rates and low discordance
rates within families. Thus, we do not believe that this is a major issue with either the IV or fixed
effects IV specification reported earlier, but it remains an empirical question.
Table 7 presents OLS, family fixed effect, IV and fixed effects IV estimation of equation (1) where
43For example, Chou et al. [2004] and Gruber and Frakes [2006] examine whether higher cigarette prices affected
relative prices, thereby reducing smoking but increasing obesity. The former study finds evidence and the latter
examines the robustness and suggests that much of the results are implausible.
29

the health vector includes only a single specific disorder at a time.44 Thus, each entry in Table 7
refers to the point estimate of that specific health outcome on verbal achievement, controlling for
the same set of observed controls as in Table 4. The empirical estimates of several disorders differ
from that obtained using the full health vector reported in Table 4. In the OLS regressions reported
in Table 7, HD no longer enters significantly and the magnitude of the impact of AD is substantially
smaller. The fixed effects results in Table 7 are very similar to those obtained in Table 4, which
could suggest that there are limited sets of twins/siblings that are discordant for multiple health
problems. Interestingly, the impact of depression does not vary substantially between Table 7 and
Table 4 in the OLS and fixed effects analysis.
The IV estimates in Table 7 differ greatly and it could be concluded that each health variable
(with the exception of AD) has a significant impact on academic performance. Depression is neg-
atively and significantly related to verbal test scores, but the estimated impact of hyperactivity
changes signs from that reported in Table 4. ADHD is highly negatively related to test scores and
enters in a significant manner at the 15% level. The estimated impact of being overweight now be-
comes significant at the 15% level and leads to a seven point increase in test scores on average when
estimating equation (1) using IV analysis. Regarding the preferred fixed effects IV specifications
from Table 7, we would conclude that AD and ADHD each has a negative and significant impact on
academic performance. The sign of the estimated impact on HD changes from negative to positive.
Interestingly, the addition of family fixed effects leads the estimated signs of the impacts of ADHD,
HD and obesity to change signs when instruments are also employed. Similar to Table 4, the es-
timated impact of depression decreases substantially when family fixed effects and instrumental
variables are used to estimate equation (1). Finally, sensitivity analysis for all IV and family fixed
effects IV estimates in Table 7 indicate that they are extremely sensitive to the degree in which the
exclusion restriction assumption is potentially violated. None of the results remain significant at
44The results reported in this subsection are robust to examining only the same-sex twin subsample.
30

very low levels of exogeneity error (5-10% of the reduced form impacts), confirming that ignoring
comorbid conditions leads to the exclusion restriction assumption becoming implausible.
Overall, this investigation clearly demonstrates that controlling for comorbid conditions is an im-
portant issue to credibly estimate the impact of specific health conditions on educational outcomes.
We find that there are numerous differences in the estimated impacts of mental health disorders
when estimating equation (1) by OLS, IV and family fixed effects with IV, depending on whether
one comorbid conditions are accounted for in the specifications. To summarize, constructing an
appropriate health vector presents an additional challenge for empirical researchers, as the omission
of comorbid conditions could lead to either biases in coefficient estimates or invalidate exclusion
restriction assumptions.
5 Conclusions
Numerous studies have reported that within families, siblings and twins are often radically different
in personality traits, health, education and labor market outcomes. Researchers have traditionally
examined whether different environmental factors account for the development of these differences
within families but have concluded that these factors can only account for a limited amount of the
variation in outcomes within families. Each time a new sibling is conceived, a "genetic lottery"
occurs and roughly half of the genes from each parent are passed on to the child in a random
process. With recent scientific discoveries (most notably the decoding of the human genome), it is
now possible to collect data that provides a precise measure of specific genetic markers, permitting
researchers to directly explore a variable that empirical researchers traditionally viewed as unob-
served heterogeneity. In this paper, we exploit variation within siblings and twins from the "genetic
lottery" to identify the causal effect of several poor health conditions on academic outcomes via a
family fixed effect / instrumental variables strategy.
31
We find evidence of large impacts from poor mental health to lower academic performance.
Inattention leads on average to a one standard deviation decrease in performance on a verbal tests
within families. Our results indicate that, while researchers should treat health as an endogenous
input when estimating education production functions, family fixed effects estimators by themselves
cannot fully remove the endogeneity bias. We present evidence that differences in genetic inheri-
tance have desirable properties to identify the impact of poor health on education within families as
there are, consistent with the biomedical literature, statistically significant correlations with each
endogenous health variables and sensitivity analyses indicate that our results are robust to reason-
able violations of the exclusion restriction assumption. Lastly, our results underscore the challenge
facing empirical researchers interested in identifying the impact of specific health conditions that
arises due to comorbidities.
The quantitative and qualitative patterns of our empirical results are robust to not only multiple
sample definitions, including the restriction to using only dizygotic twins of the same gender, but also
the inclusion of an individual’s birth weight. A potential limitation of this study deals with external
validity. It is important to consider whether our analysis of family members can be generalized to
larger populations of interest.
We believe that there is substantial potential from explicitly using data on genetic markers in
social science research. As the scientific literature is developing an ever-increasing understanding of
how genetic inheritance relates to individual (health) outcomes, this knowledge can be used to refine
searches for potential genetic markers to serve as instrumental variables. Genetic markers have a
great deal of conceptual validity as instruments for many (health) outcomes since i) the markers are
inherited at conception prior to any interaction with the environment, eliminating concerns related
to reverse causality, ii) a large body of literature exists that documents robust correlations between
specific markers and individual (health) outcomes, iii) studies of genetic inheritance and measures of
genetic distance frommaps of the human genome are available to investigate whether genetic linkage
32

is a valid concern, and iv) most genes are pleiotropic so that a predisposition can be viewed as a
form of inherited encouragement. In addition, researchers could investigate the sources of pleiotropy
by examining how different environmental disturbances affect gene expression and how that relates
to a variety of economic outcomes. In summary, we believe that integrating biological findings
into the social sciences has the potential to not only address open research questions but also help
develop policies that can promote human capital development. However, unlike biological measures
such as height, weight, blood pressure, blood alcohol content, cholesterol levels or hormones whose
measures are influenced by behavioral inputs, genetic markers are time-invariant and cannot be
modified by environmental influences. However, within families, any differences in the inheritance
of specific markers present the opportunity for additional experiments in “nature”.
33
References
[1] Allen, G. (1970). "Within Group and Between Group Variation Expected in Human BehavioralCharacters.” Behavior Genetics, 1(3-4), 175-194.
[2] Almond, D., Edlund. L. and M. Palme (2008). "Chernobyl’s Subclinical Legacy: Prenatal Ex-posure to Radioactive Fallout and School Outcomes in SwedenT forthcoming in the QuarterlyJournal of Economics.
[3] Almond D. (2006). "Is the 1918 Influenza Pandemic Over? Long-term Effects of In UteroInfluenza Exposure in the Post-1940 U.S. PopulationT Journal of Political Economy, 114(4),672-712.
[4] Angrist, J. D. and W. Evans. (1998). "Children and Their Parents’ Labor Supply: Evidencefrom Exogenous Variation in Family Size.” American Economic Review, 88, 450-477.
[5] Babinski, L. M., C. S. Hartsough and N. M. Lasbert. (1999). "Childhood Conduct Problems,Hyperactivity-Impulsivity, and Inattention as Predictors of Adult Criminal Activity,” Journalof Child Psychology and Psychiatry and Allied Disciplines, 40(3), 347-355.
[6] Behrman, J. R. and P. Taubman. (1976). "Intergenerational Transmission of Income andWealth." American Economic Review, 66(2), 436-440.
[7] Behrman, Jere R., P. Taubman, T. Wales, and Z. Hrubec. (1977). "Inter- and IntragenerationalDetermination of Socioeconomic Success with Special Reference to Genetic Endowment andFamily and Other Environment." mimeo, University of Pennsylvania.
[8] Behrman, J. R. and V. Lavy. (1998). “Child Health and Schooling Achievement: Associa-tion, Causality and Household Allocations.” CARESS Working Papres 97-23, University ofPennsylvania.
[9] Behrman, J. R., M. R. Rosenzweig and P. Taubman. (1994). “Endowments and the Allocationof Schooling in the Family and in the Marriage Market: The Twins Experiment.” Journal ofPolitical Economy, 102, 1131-1174.
[10] Benjamin, D., C. Chabris, E. l. Glaeser and D. Laibson. (2009). “Genetic Influences on Eco-nomic Outcomes.” paper presented at 2009 AEA Annual meeting, San Fransisco.
[11] Black, S., P. Devereux, and K. Salvanes. (2005). “The More the Merrier? The Effect of FamilySize and Birth Order on Children’s Education.” Quarterly Journal of Economics, 120, 669-700.
34

[12] Bleakley, H. C. (2007). "Disease and Development: Evidence from Hookworm Eradication inthe American South.” Quarterly Journal of Economics, 122(1), 73-117.
[13] Caplin, M., M. Dean, P. Glimcher and R. Rutledge. (2009). “Measuring Beliefs and Rewards:A Neuroeconomic Approach.” mimeo, New York University.
[14] Caplin, M. and M. Dean. (2008). “Dopamine, Reward Prediction Error, and Economics.”Quarterly Journal of Economics, 123(2), 663-701.
[15] Cesarini D, Dawes C. T., Johannesson M, Lichtenstein P, Wallace B. 2009. Genetic Variationin Preferences for Giving and Risk-Taking, Quarterly Journal of Economics, in press.
[16] Cesarini D, C. T. Dawes, J. H. Fowler, M. Johannesson, P. Lichtenstein, B. Wallace. (2008).”Heritability of Cooperative Behavior in the Trust Game.” unrecognized105, pp. 3721-3726.
[17] Christensen, K., A. Wienke, A. Skytthe, N. V. Holm, J. W. Vaupel, and A. I. Yashin (2001),“Cardiovascular mortality in twins and the fetal origins hypothesis.” Twin Research 4, 344—349.
[18] Conley, T., C. Hansen and P. E. Rossi. (2007). "Plausibly Exogenous." mimeo, University ofChicago.
[19] Cooper R. S., J. S. Kaufman and R. Ward. (2003). "Race and Genomics." The New EnglandJournal of Medicine, 348(12), 1166—1170.
[20] Cragg, J. G., and S. G. Donald. (1993). "Testing Identifiability and Specification in Instru-mental Variables Models." Econometric Theory 9, 222—240.
[21] Chou, S.-Y., M. Grossman and H. Saffer. (2004). "An Economic Analysis of Adult Obesity:Results from the Behavioral Risk Factor Surveillance System." Journal of Health Economics,23, 565—587.
[22] Conley, D. and R. Glauber. (2005). “Parental Education Investment and Children’s AcademicRisk: Estimates of the Impact of Sibship Size and Birth Order from Exogenous Variation inFertility.” NBER Working Paper w11302.
[23] Currie, J. and M. Stabile. (2006). “Child Mental Health and Human Capital Accumulation:The Case of ADHD.” Journal of Health Economics, 25(6), 1094-1118.
[24] Cutler, D. and A. Lleras-Muney. (2007). “Education and Health: Evaluating Theories andEvidence.” NBER Working Paper w12352.
35
[25] de Quervain, D. J.-F. and A. Papassotiropoulos. (2006). “Identification of a Genetic ClusterInfluencing Memory Performance and Hippocampal Activity in Humans.” Proceedings of theNational Academy of Sciences USA, 103, 4270-4274.
[26] Ding, W., S. F. Lehrer, J. N. Rosenquist and J. Audrain-McGovern. (2009). “The Impact ofPoor Health on Academic Performance: New Evidence Using Genetic Markers.” Journal ofHealth Economics, 28(3), 578—597.
[27] Ding, W., S. F. Lehrer, J. N. Rosenquist and J. Audrain-McGovern. (2006). “The Impact ofPoor Health on Education: New Evidence Using Genetic Markers.” NBER Working Paperw12304.
[28] Dreber, A., C. L. Apicella, D. T. A. Eisenberg, J. R. Garcia, R. Zamore, J. K. Lum and B.C. Campbell. (2009). ”The 7R Polymorphism in the Dopamine Receptor D4 Gene (DRD4) isAssociated with Financial Risk-Taking in Men.” Evolution and Human Behavior, 30(2), 85—92.
[29] Dremencov, E., I. Gispan-Herman, M. Rosenstein, A. Mendelman, D.H. Overstreet, J. Zoharand G. Yadid. (2004). ”The Serotonin—Dopamine Interaction is Critical for Fast-Onset Actionof Antidepressant Treatment: In Vivo Studies in an Animal Model of Depression.” Progress inNeuro-Psychopharmacology and Biological Psychiatry, 28, 141—147.
[30] Fletcher, J.M. (2008). “Adolescent Depression and Educational Attainment: Evidence fromSibling Fixed Effects.” Health Economics, 17: 1215-1235
[31] Fletcher, J.M. and B.L. Wolfe. (2008a). "Long-term Consequences of Childhood ADHD onCriminal Activities." mimeo, Yale University.
[32] Fletcher, J.M. and B.L. Wolfe. (2008b). “Child Mental Health and Human Capital Accumula-tion: The Case of ADHD Revisited.” Journal of Health Economics, 27(3): 794-800
[33] Glewwe, P. and H. Jacoby. (1995). “An Economic Analysis of Delayed Primary School Enroll-ment in a Low-Income Country-the Role of Early Childhood Nutrition.” Review of Economicsand Statistics, 77, 156-169.
[34] Goldstein D. B., S. K. Tate and S. M. Sisodiya. (2003). ”Pharmacogenetics Goes Genomic.”Nature Reviews Genetics, 4, 937-947.
[35] Goodman E., B. R. Hinden and S. Khandelwal. (2000). “Accuracy of Teen and Parental Reportsof Obesity and Body Mass Index.” Pediatrics, 106(1), 52—58.
[36] Gorseline, D.W. (1932). The Effect of Schooling Upon Income. (Bloomington: Indiana Univer-sity Press).
36

[37] Grossman, M. and R. Kaestner. (1997). “Effects of Education on Health,” in J. R. Behrmanand N. Stacey eds. The Social Benefits of Education, University of Michigan Press, Ann Arbor.
[38] Grossman, M. (1975). “The Correlation between Health and Schooling,” in Household Produc-tion and Consumption, Ed N. E. Terleckyj, Studies in Income and Wealth, Vol. 40, Conferenceon Research in Income and Wealth. New York: Columbia University Press for the NationalBureau of Economic Research.
[39] Gruber, J. and M. Frakes. (2006). "Does Falling Smoking Lead to Rising Obesity?" Journal ofHealth Economics, 25, 183—197.
[40] Hanushek, E. (1992). “The Trade-off between Child Quantity and Quality.” Journal of PoliticalEconomy, 100 84-117.
[41] Harris, K. M., F. Florey, J. Tabor, P. S. Bearman, J. Jones and J. R. Udry. (2003). "The Na-tional Longitudinal Study of Adolescent Health: Research Design," www document availableat http://www.cpc.unc.edu/projects/addhealth/design, Carolina Population Center, Univer-sity of North Carolina, Chapel Hill, NC.
[42] Harrison, A.G. (1970). "Human Variation and Its Social Causes and Consequences." Proceed-ings of the Royal Anthropological Institute of Great Britain and Ireland, 1970, 5-13.
[43] The International HapMap Consortium. (2005). "A Haplotype Map of the Human Genome."Nature, 437 1299-1320.
[44] Jain, A.K., S. Prabhakar, and S. Pankanti. (2002). ”On the Similarity of Identical Twin Fin-gerprints.” Pattern Recognition, 35:2 653-2663.
[45] Johnson J. A. (2003). ”Pharmacogenetics: Potential for Individualized Drug Therapy ThroughGenetics.” Trends Genetics, 19:6 60—66.
[46] Kelada S. N., D. L. Eaton, S. S. Wang, N. R. Rothman and M. J. Khoury. (2003). "The Roleof Genetic Polymorphisms in Environmental Health." Environmental Health Perspectives, 111,1055—1064.
[47] Kaester, R., M. Grossman. (2008). "Effects of Weight on Children’s Educational Achievement."NBER Working Paper 13764.
[48] Kessler, R. at al. (2005). “Patterns and Predictors of Attention-Deficit / Hyperactivity DisorderPersistence into Adulthood: Results from the National Co-morbidity Survey Replication.”Biological Psychiatry, 57, 1442-1451.
37

[49] Kleibergen, F., and R. Paap. (2006). ”Generalized Reduced Rank Tests Using the SingularValue Decomposition.” Journal of Econometrics 127(1), 97—126.
[50] Klepinger, D. S. Lundberg and R. Plotnick. (1999). "How Does Adolescent Fertility Affectthe Human Capital and Wages of Young Women?" The Journal of Human Resources, 34(3),421-448.
[51] Kremer M. and E. Miguel. (2004). “Worms: Identifying Impacts on Education and Health inthe Presence of Treatment Externalities.” Econometrica, 72, 159-217.
[52] Lunde, A., K. K. Melve, H. K. Gjessing, R. Skjaerven, and L. M. Irgens (2007). “Genetic andEnvironmental Influences on BirthWeight, Birth Length, Head Circumference, and GestationalAge by Use of Population-based Parent-Offspring Data.” American Journal of Epidemiology165(7): 734—741.
[53] Merikangas K. R. and N. Risch. (2003). ”Genomic Priorities and Public Health.” Science 302,599—601.
[54] Moises H. W., R. M. Frieboes, P. Spelzhaus, L. Yang, M. Kohnke, O. Herden-Kirchhoff,P.Vetter, J. Neppert, and I. Gottesman. (2001). “No Association between Dopamine D2 Re-ceptor Gene (DRD2) and Human Intelligence.” Journal of Neural Transmission, 108, 115-121.
[55] Neumark, D. (1999). “Biases in Twin Estimates of the Return to Schooling.” Economics ofEducation Review, 18, 143-148.
[56] Norton, E.C. and E. Han. (2008). ”Genetic Information, Obesity, and Labor Market Out-comes.” Health Economics, 17(9), 1089—1104.
[57] Olds, J., Milner, P. (1954). ”Positive Reinforcement Produced by Electrical Stimulation ofSeptal Area and Other Regions of Rat Brain.” Journal of Comparative and Physiological Psy-chology, 47, 419—427.
[58] Perri, T. J. (1984). “Health Status and Schooling Decisions of Young Men.” Economics ofEducation Review, 3, 207-213.
[59] Petrill, S. A., R. Plomin, G. E. McClearn, D. L. Smith, S. Vignetti, M. J. Chorney, K. Chorney,L. A. Thompson, D. K. Detterman, C. Benbow, D. Lubinski, J. Daniels, M. Owen and P.McGuffin. (1997). “No Association between General Cognitive Ability and the A1 Allele of theD2 Dopamine Receptor Gene.” Behavior Genetics, 27(1), 29-31.
[60] Plomin, R., J. K. J. Kennedy and I. W. Craig. (2006). “The Quest for Quantitative Trait LociAssociated with Intelligence.” Intelligence, 34(6), 513-526.
38

[61] Preston, S. H. (1985). ”Mortality in Childhood: Lessons from WFS,” in J. G. Cleland andJ. Hobcraft (eds.), Reproductive Change in Developing Countries, Oxford: Oxford UniversityPress, pp. 46-59.
[62] Roberts, R.E., Lewinsohn, P.M., and J.R. Seeley. (1991). ”Screening for Adolescent Depression:A Comparison of Depression Scales.” Journal of the American Academy of Child & AdolescentPsychiatry. 30(1): 58-66
[63] Rosenzweig, M. R. and K. I. Wolpin. (2000). “Natural ”Natural Experiments” in Economics.”Journal of Economic Literature, 38, 827-874.
[64] Royer, H. (2009). “Separated at Girth: US Twin Estimates of the Effects of Birth Weight.”American Economic Journal: Applied Economics, 1(1), 49U
[65] Stock, J. H., and M. Yogo. (2005). "Testing for Weak Instruments in Linear IV Regression,"in D.W. Andrews and J. H. Stock (eds.), Identification and Inference for Econometric Models:Essays in Honor of Thomas Rothenberg, Cambridge University Press.
[66] Strauss, J. and D. Thomas. (1998). “Health, Nutrition, and Economic Development.” Journalof Economic Literature, 36(2), 766-817.
[67] Taubman, P. (1976a). ”The Determinates of Earnings: Genetics, Family and Other Environ-ments, a Study of White Male Twins.” American Economic Review, 66(5), 858-870.
[68] Taubman, P. (1976b). ”Earnings, Education, Genetics, and Environment.” Journal of HumanResources, 11(4), 447-461.
[69] Zerhouni E. (2003). ”Medicine. The NIH Roadmap.” Science, 302, 63—72.
39
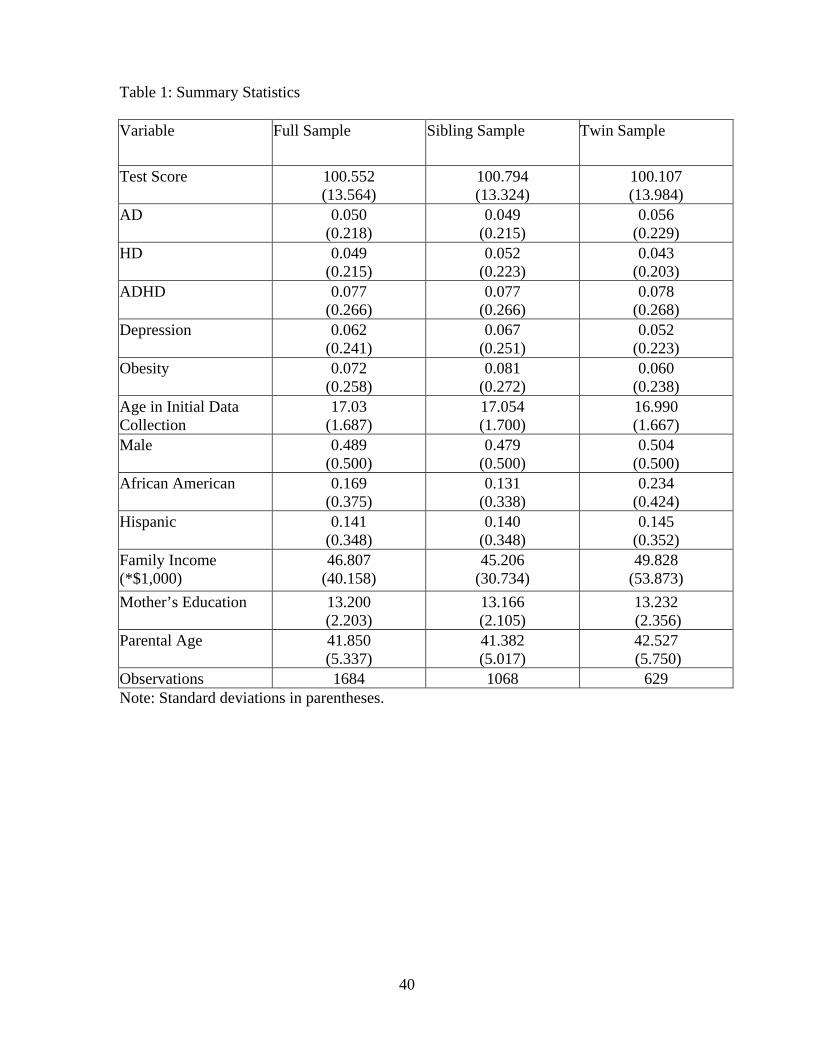
40
Table 1: Summary Statistics Variable Full Sample Sibling Sample Twin Sample
Test Score 100.552 (13.564)
100.794 (13.324)
100.107 (13.984)
AD 0.050 (0.218)
0.049 (0.215)
0.056 (0.229)
HD 0.049 (0.215)
0.052 (0.223)
0.043 (0.203)
ADHD 0.077 (0.266)
0.077 (0.266)
0.078 (0.268)
Depression 0.062 (0.241)
0.067 (0.251)
0.052 (0.223)
Obesity 0.072 (0.258)
0.081 (0.272)
0.060 (0.238)
Age in Initial Data Collection
17.03 (1.687)
17.054 (1.700)
16.990 (1.667)
Male 0.489 (0.500)
0.479 (0.500)
0.504 (0.500)
African American 0.169 (0.375)
0.131 (0.338)
0.234 (0.424)
Hispanic 0.141 (0.348)
0.140 (0.348)
0.145 (0.352)
Family Income (*$1,000)
46.807 (40.158)
45.206 (30.734)
49.828 (53.873)
Mother’s Education 13.200 (2.203)
13.166 (2.105)
13.232 (2.356)
Parental Age 41.850 (5.337)
41.382 (5.017)
42.527 (5.750)
Observations 1684 1068 629 Note: Standard deviations in parentheses.

41
Table 2: Summary Statistics on Peabody Verbal Test Score Performance by Health Disorder and Health Behavior
Full sampling Sibling Twin Depression 92.00
(14.19) 94.03
(13.53) 91.63
(15.87) No depression 101.03
(13.38) 101.23 (13.16)
100.70 (13.73)
T-statistic 5.705 4.44 3.66 ADHD 100.19
(12.336) 101.5
(12.167) 98.06
(12.44) No ADHD 100.58
(13.664) 100.68 (13.40)
100.40 (14.09)
T-statistic 0.312 -0.527 1.13 HD 102.18
(11.550) 103.11 (11.77)
100.39 (11.09)
No HD 100.49 (13.657)
100.62 (13.38)
100.22 (14.10)
T-statistic -1.112 -1.34 -0.06 AD 98.45
(12.41) 99.56
(11.92) 96.84
(13.11) No AD 100.66
(13.62) 100.81 (13.38)
100.42 (14.01)
T-statistic 1.456 0.646 1.46 Obese 98.00
(12.755) 98.84
(13.22) 96.02
(11.50) Not obese 100.74
(13.68) 100.91 (13.31)
100.48 (14.08)
T-statistic 2.14 1.37 1.86 Overweight
100.798 (13.44)
99.70 (14.42)
97.32 (13.76)
Not overweight 98.92 (14.22)
100.92 (13.12)
100.61 (13.97)
T-statistic 1.92 1.02 1.89 Smoke Cigarettes 100.12
(12.22) 100.65 (11.93)
99.27 (12.69)
Does not smoke cigarettes
100.71 (13.97)
100.79 (13.73)
100.57 (14.38)
T-statistic 0.757 0.14 1.01 Note: Most cells present the mean verbal test score and standard deviations in parentheses for individuals by health category.
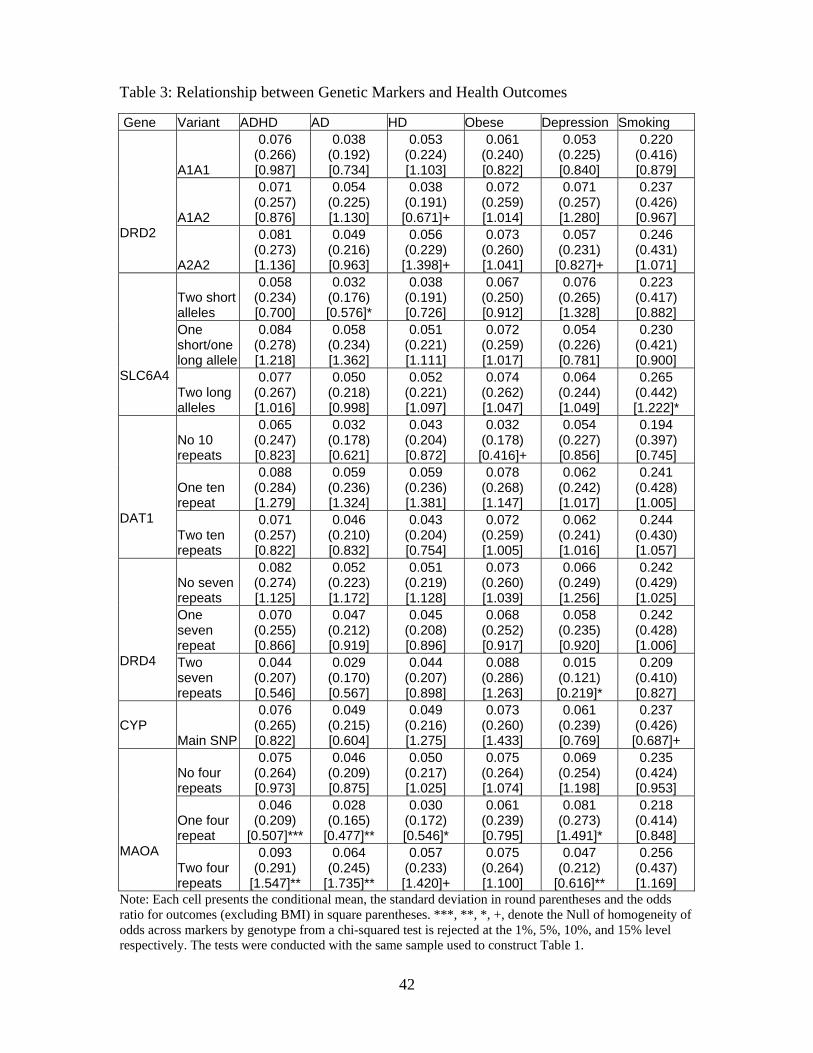
42
Table 3: Relationship between Genetic Markers and Health Outcomes
Note: Each cell presents the conditional mean, the standard deviation in round parentheses and the odds ratio for outcomes (excluding BMI) in square parentheses. ***, **, *, +, denote the Null of homogeneity of odds across markers by genotype from a chi-squared test is rejected at the 1%, 5%, 10%, and 15% level respectively. The tests were conducted with the same sample used to construct Table 1.
Gene Variant ADHD AD HD Obese Depression Smoking
A1A1
0.076 (0.266) [0.987]
0.038 (0.192) [0.734]
0.053 (0.224) [1.103]
0.061 (0.240) [0.822]
0.053 (0.225) [0.840]
0.220 (0.416) [0.879]
A1A2
0.071 (0.257) [0.876]
0.054 (0.225) [1.130]
0.038 (0.191) [0.671]+
0.072 (0.259) [1.014]
0.071 (0.257) [1.280]
0.237 (0.426) [0.967]
DRD2 A2A2
0.081 (0.273) [1.136]
0.049 (0.216) [0.963]
0.056 (0.229) [1.398]+
0.073 (0.260) [1.041]
0.057 (0.231) [0.827]+
0.246 (0.431) [1.071]
Two short alleles
0.058 (0.234) [0.700]
0.032 (0.176) [0.576]*
0.038 (0.191) [0.726]
0.067 (0.250) [0.912]
0.076 (0.265) [1.328]
0.223 (0.417) [0.882]
One short/one long allele
0.084 (0.278) [1.218]
0.058 (0.234) [1.362]
0.051 (0.221) [1.111]
0.072 (0.259) [1.017]
0.054 (0.226) [0.781]
0.230 (0.421) [0.900]
SLC6A4
Two long alleles
0.077 (0.267) [1.016]
0.050 (0.218) [0.998]
0.052 (0.221) [1.097]
0.074 (0.262) [1.047]
0.064 (0.244) [1.049]
0.265 (0.442) [1.222]*
No 10 repeats
0.065 (0.247) [0.823]
0.032 (0.178) [0.621]
0.043 (0.204) [0.872]
0.032 (0.178) [0.416]+
0.054 (0.227) [0.856]
0.194 (0.397) [0.745]
One ten repeat
0.088 (0.284) [1.279]
0.059 (0.236) [1.324]
0.059 (0.236) [1.381]
0.078 (0.268) [1.147]
0.062 (0.242) [1.017]
0.241 (0.428) [1.005]
DAT1
Two ten repeats
0.071 (0.257) [0.822]
0.046 (0.210) [0.832]
0.043 (0.204) [0.754]
0.072 (0.259) [1.005]
0.062 (0.241) [1.016]
0.244 (0.430) [1.057]
No seven repeats
0.082 (0.274) [1.125]
0.052 (0.223) [1.172]
0.051 (0.219) [1.128]
0.073 (0.260) [1.039]
0.066 (0.249) [1.256]
0.242 (0.429) [1.025]
One seven repeat
0.070 (0.255) [0.866]
0.047 (0.212) [0.919]
0.045 (0.208) [0.896]
0.068 (0.252) [0.917]
0.058 (0.235) [0.920]
0.242 (0.428) [1.006]
DRD4
Two seven repeats
0.044 (0.207) [0.546]
0.029 (0.170) [0.567]
0.044 (0.207) [0.898]
0.088 (0.286) [1.263]
0.015 (0.121) [0.219]*
0.209 (0.410) [0.827]
CYP Main SNP
0.076 (0.265) [0.822]
0.049 (0.215) [0.604]
0.049 (0.216) [1.275]
0.073 (0.260) [1.433]
0.061 (0.239) [0.769]
0.237 (0.426) [0.687]+
No four repeats
0.075 (0.264) [0.973]
0.046 (0.209) [0.875]
0.050 (0.217) [1.025]
0.075 (0.264) [1.074]
0.069 (0.254) [1.198]
0.235 (0.424) [0.953]
One four repeat
0.046 (0.209)
[0.507]***
0.028 (0.165)
[0.477]**
0.030 (0.172) [0.546]*
0.061 (0.239) [0.795]
0.081 (0.273) [1.491]*
0.218 (0.414) [0.848]
MAOA
Two four repeats
0.093 (0.291)
[1.547]**
0.064 (0.245)
[1.735]**
0.057 (0.233) [1.420]+
0.075 (0.264) [1.100]
0.047 (0.212)
[0.616]**
0.256 (0.437) [1.169]
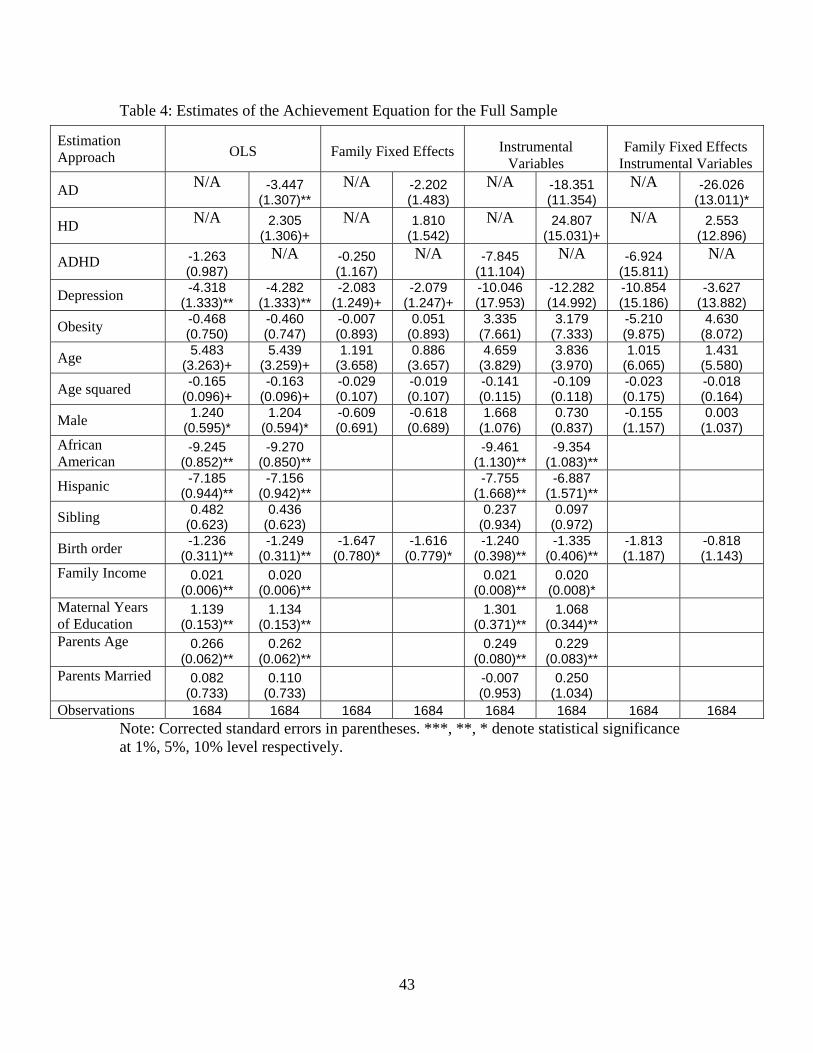
43
Table 4: Estimates of the Achievement Equation for the Full Sample
Note: Corrected standard errors in parentheses. ***, **, * denote statistical significance at 1%, 5%, 10% level respectively.
Estimation Approach
OLS
Family Fixed Effects
Instrumental
Variables
Family Fixed Effects
Instrumental Variables
AD N/A
-3.447 (1.307)**
N/A
-2.202 (1.483)
N/A
-18.351 (11.354)
N/A
-26.026 (13.011)*
HD N/A
2.305 (1.306)+
N/A
1.810 (1.542)
N/A
24.807 (15.031)+
N/A
2.553 (12.896)
ADHD -1.263 (0.987)
N/A
-0.250 (1.167)
N/A
-7.845 (11.104)
N/A
-6.924 (15.811)
N/A
Depression -4.318 (1.333)**
-4.282 (1.333)**
-2.083 (1.249)+
-2.079 (1.247)+
-10.046 (17.953)
-12.282 (14.992)
-10.854 (15.186)
-3.627 (13.882)
Obesity -0.468 (0.750)
-0.460 (0.747)
-0.007 (0.893)
0.051 (0.893)
3.335 (7.661)
3.179 (7.333)
-5.210 (9.875)
4.630 (8.072)
Age 5.483 (3.263)+
5.439 (3.259)+
1.191 (3.658)
0.886 (3.657)
4.659 (3.829)
3.836 (3.970)
1.015 (6.065)
1.431 (5.580)
Age squared -0.165 (0.096)+
-0.163 (0.096)+
-0.029 (0.107)
-0.019 (0.107)
-0.141 (0.115)
-0.109 (0.118)
-0.023 (0.175)
-0.018 (0.164)
Male 1.240 (0.595)*
1.204 (0.594)*
-0.609 (0.691)
-0.618 (0.689)
1.668 (1.076)
0.730 (0.837)
-0.155 (1.157)
0.003 (1.037)
African American
-9.245 (0.852)**
-9.270 (0.850)**
-9.461 (1.130)**
-9.354 (1.083)**
Hispanic -7.185 (0.944)**
-7.156 (0.942)**
-7.755 (1.668)**
-6.887 (1.571)**
Sibling 0.482 (0.623)
0.436 (0.623)
0.237 (0.934)
0.097 (0.972)
Birth order -1.236 (0.311)**
-1.249 (0.311)**
-1.647 (0.780)*
-1.616 (0.779)*
-1.240 (0.398)**
-1.335 (0.406)**
-1.813 (1.187)
-0.818 (1.143)
Family Income
0.021 (0.006)**
0.020 (0.006)**
0.021 (0.008)**
0.020 (0.008)*
Maternal Years of Education
1.139 (0.153)**
1.134 (0.153)**
1.301 (0.371)**
1.068 (0.344)**
Parents Age
0.266 (0.062)**
0.262 (0.062)**
0.249 (0.080)**
0.229 (0.083)**
Parents Married
0.082 (0.733)
0.110 (0.733)
-0.007 (0.953)
0.250 (1.034)
Observations 1684 1684 1684 1684 1684 1684 1684 1684
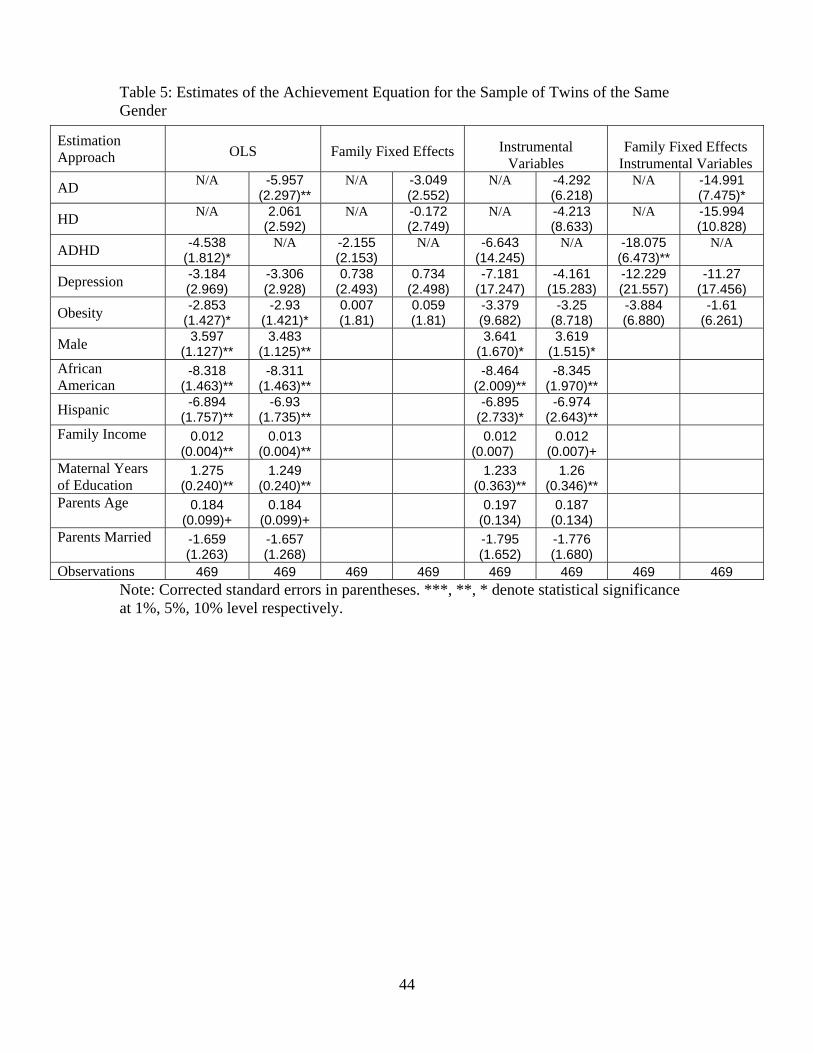
44
Table 5: Estimates of the Achievement Equation for the Sample of Twins of the Same Gender
Note: Corrected standard errors in parentheses. ***, **, * denote statistical significance at 1%, 5%, 10% level respectively.
Estimation Approach
OLS
Family Fixed Effects
Instrumental
Variables
Family Fixed Effects
Instrumental Variables
AD N/A
-5.957 (2.297)**
N/A
-3.049 (2.552)
N/A
-4.292 (6.218)
N/A
-14.991 (7.475)*
HD N/A
2.061 (2.592)
N/A
-0.172 (2.749)
N/A
-4.213 (8.633)
N/A
-15.994 (10.828)
ADHD -4.538 (1.812)*
N/A
-2.155 (2.153)
N/A
-6.643 (14.245)
N/A
-18.075 (6.473)**
N/A
Depression -3.184 (2.969)
-3.306 (2.928)
0.738 (2.493)
0.734 (2.498)
-7.181 (17.247)
-4.161 (15.283)
-12.229 (21.557)
-11.27 (17.456)
Obesity -2.853 (1.427)*
-2.93 (1.421)*
0.007 (1.81)
0.059 (1.81)
-3.379 (9.682)
-3.25 (8.718)
-3.884 (6.880)
-1.61 (6.261)
Male 3.597 (1.127)**
3.483 (1.125)** 3.641
(1.670)* 3.619
(1.515)*
African American
-8.318 (1.463)**
-8.311 (1.463)**
-8.464 (2.009)**
-8.345 (1.970)**
Hispanic -6.894 (1.757)**
-6.93 (1.735)**
-6.895 (2.733)*
-6.974 (2.643)**
Family Income
0.012 (0.004)**
0.013 (0.004)**
0.012 (0.007)
0.012 (0.007)+
Maternal Years of Education
1.275 (0.240)**
1.249 (0.240)**
1.233 (0.363)**
1.26 (0.346)**
Parents Age
0.184 (0.099)+
0.184 (0.099)+
0.197 (0.134)
0.187 (0.134)
Parents Married
-1.659 (1.263)
-1.657 (1.268)
-1.795 (1.652)
-1.776 (1.680)
Observations 469 469 469 469 469 469 469 469
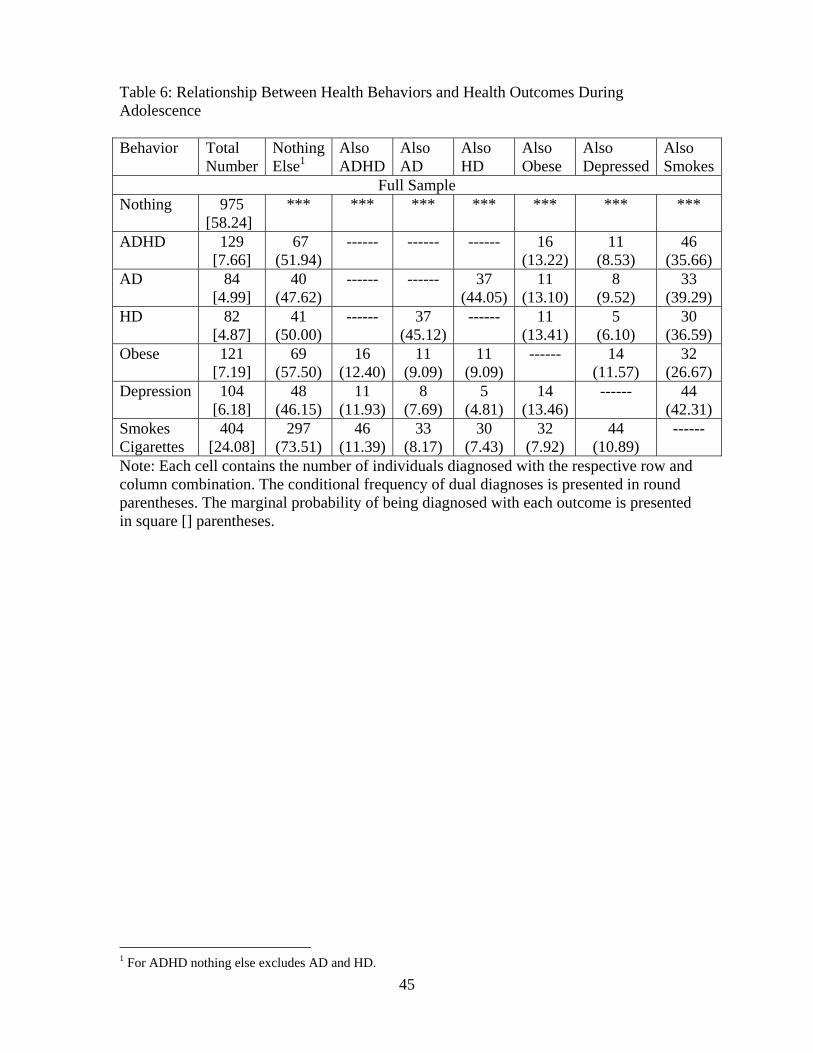
45
Table 6: Relationship Between Health Behaviors and Health Outcomes During Adolescence Behavior Total
Number Nothing Else1
Also ADHD
Also AD
Also HD
Also Obese
Also Depressed
Also Smokes
Full Sample Nothing 975
[58.24] *** *** *** *** *** *** ***
ADHD
129 [7.66]
67 (51.94)
------ ------ ------ 16 (13.22)
11 (8.53)
46 (35.66)
AD 84 [4.99]
40 (47.62)
------ ------ 37 (44.05)
11 (13.10)
8 (9.52)
33 (39.29)
HD 82 [4.87]
41 (50.00)
------ 37 (45.12)
------ 11 (13.41)
5 (6.10)
30 (36.59)
Obese 121 [7.19]
69 (57.50)
16 (12.40)
11 (9.09)
11 (9.09)
------ 14 (11.57)
32 (26.67)
Depression 104 [6.18]
48 (46.15)
11 (11.93)
8 (7.69)
5 (4.81)
14 (13.46)
------ 44 (42.31)
Smokes Cigarettes
404 [24.08]
297 (73.51)
46 (11.39)
33 (8.17)
30 (7.43)
32 (7.92)
44 (10.89)
------
Note: Each cell contains the number of individuals diagnosed with the respective row and column combination. The conditional frequency of dual diagnoses is presented in round parentheses. The marginal probability of being diagnosed with each outcome is presented in square [] parentheses.
1 For ADHD nothing else excludes AD and HD.
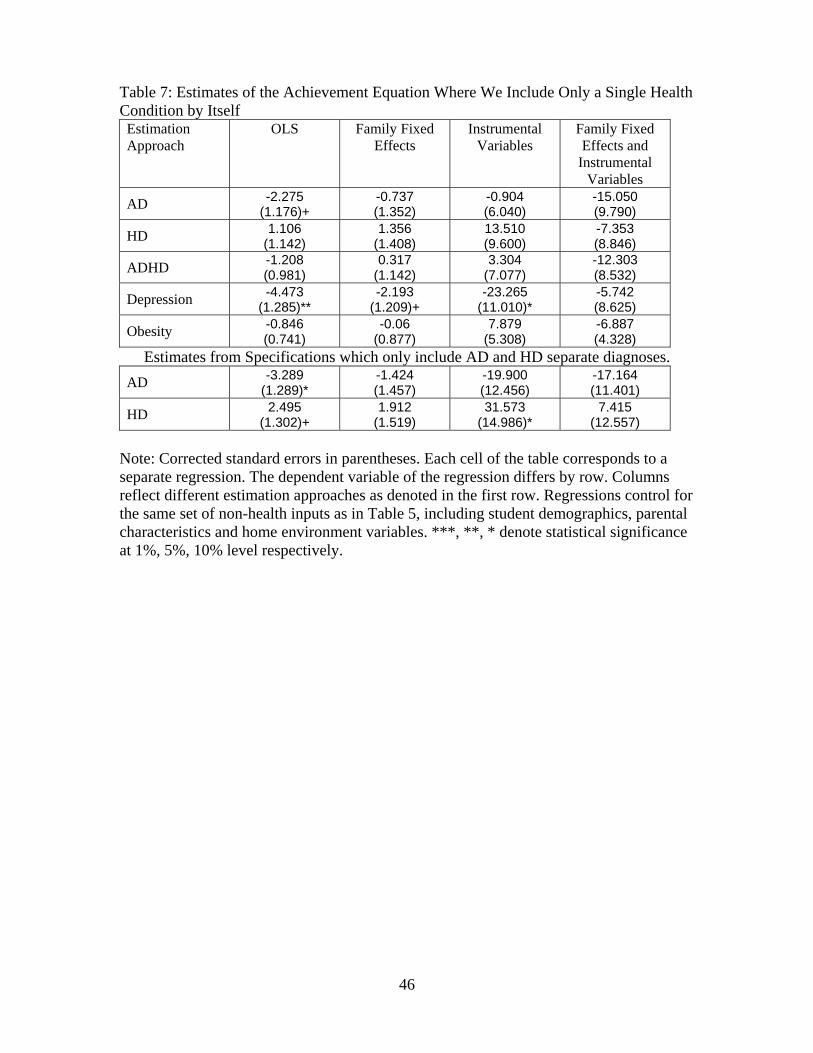
46
Table 7: Estimates of the Achievement Equation Where We Include Only a Single Health Condition by Itself Estimation Approach
OLS Family Fixed Effects
Instrumental Variables
Family Fixed Effects and
Instrumental Variables
AD -2.275 (1.176)+
-0.737 (1.352)
-0.904 (6.040)
-15.050 (9.790)
HD 1.106 (1.142)
1.356 (1.408)
13.510 (9.600)
-7.353 (8.846)
ADHD -1.208 (0.981)
0.317 (1.142)
3.304 (7.077)
-12.303 (8.532)
Depression -4.473 (1.285)**
-2.193 (1.209)+
-23.265 (11.010)*
-5.742 (8.625)
Obesity -0.846 (0.741)
-0.06 (0.877)
7.879 (5.308)
-6.887 (4.328)
Estimates from Specifications which only include AD and HD separate diagnoses. AD -3.289
(1.289)* -1.424 (1.457)
-19.900 (12.456)
-17.164 (11.401)
HD 2.495 (1.302)+
1.912 (1.519)
31.573 (14.986)*
7.415 (12.557)
Note: Corrected standard errors in parentheses. Each cell of the table corresponds to a separate regression. The dependent variable of the regression differs by row. Columns reflect different estimation approaches as denoted in the first row. Regressions control for the same set of non-health inputs as in Table 5, including student demographics, parental characteristics and home environment variables. ***, **, * denote statistical significance at 1%, 5%, 10% level respectively.
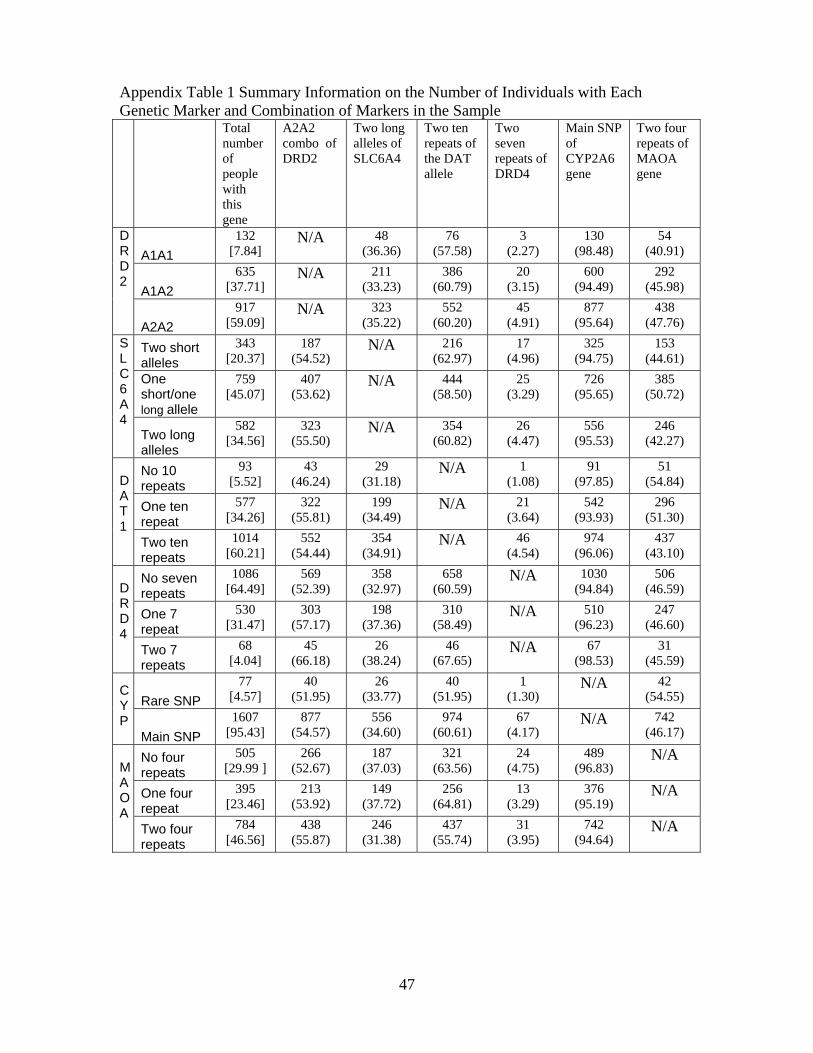
47
Appendix Table 1 Summary Information on the Number of Individuals with Each Genetic Marker and Combination of Markers in the Sample Total
number of people with this gene
A2A2 combo of DRD2
Two long alleles of SLC6A4
Two ten repeats of the DAT allele
Two seven repeats of DRD4
Main SNP of CYP2A6 gene
Two four repeats of MAOA gene
A1A1 132
[7.84] N/A
48
(36.36) 76
(57.58) 3
(2.27) 130
(98.48) 54
(40.91)
A1A2 635
[37.71] N/A
211
(33.23) 386
(60.79) 20
(3.15) 600
(94.49) 292
(45.98)
DRD2
A2A2 917
[59.09] N/A
323
(35.22) 552
(60.20) 45
(4.91) 877
(95.64) 438
(47.76)
Two short alleles
343 [20.37]
187 (54.52)
N/A
216 (62.97)
17 (4.96)
325 (94.75)
153 (44.61)
One short/one long allele
759 [45.07]
407 (53.62)
N/A
444 (58.50)
25 (3.29)
726 (95.65)
385 (50.72)
SLC6A4
Two long alleles
582 [34.56]
323 (55.50)
N/A
354 (60.82)
26 (4.47)
556 (95.53)
246 (42.27)
No 10 repeats
93 [5.52]
43 (46.24)
29 (31.18)
N/A
1 (1.08)
91 (97.85)
51 (54.84)
One ten repeat
577 [34.26]
322 (55.81)
199 (34.49)
N/A
21 (3.64)
542 (93.93)
296 (51.30)
DAT1
Two ten repeats
1014 [60.21]
552 (54.44)
354 (34.91)
N/A
46 (4.54)
974 (96.06)
437 (43.10)
No seven repeats
1086 [64.49]
569 (52.39)
358 (32.97)
658 (60.59)
N/A
1030 (94.84)
506 (46.59)
One 7 repeat
530 [31.47]
303 (57.17)
198 (37.36)
310 (58.49)
N/A
510 (96.23)
247 (46.60)
DRD4
Two 7 repeats
68 [4.04]
45 (66.18)
26 (38.24)
46 (67.65)
N/A
67 (98.53)
31 (45.59)
Rare SNP 77
[4.57] 40
(51.95) 26
(33.77) 40
(51.95) 1
(1.30) N/A
42
(54.55) CYP Main SNP
1607 [95.43]
877 (54.57)
556 (34.60)
974 (60.61)
67 (4.17)
N/A
742 (46.17)
No four repeats
505 [29.99 ]
266 (52.67)
187 (37.03)
321 (63.56)
24 (4.75)
489 (96.83)
N/A
One four repeat
395 [23.46]
213 (53.92)
149 (37.72)
256 (64.81)
13 (3.29)
376 (95.19)
N/A
MAOA
Two four repeats
784 [46.56]
438 (55.87)
246 (31.38)
437 (55.74)
31 (3.95)
742 (94.64)
N/A
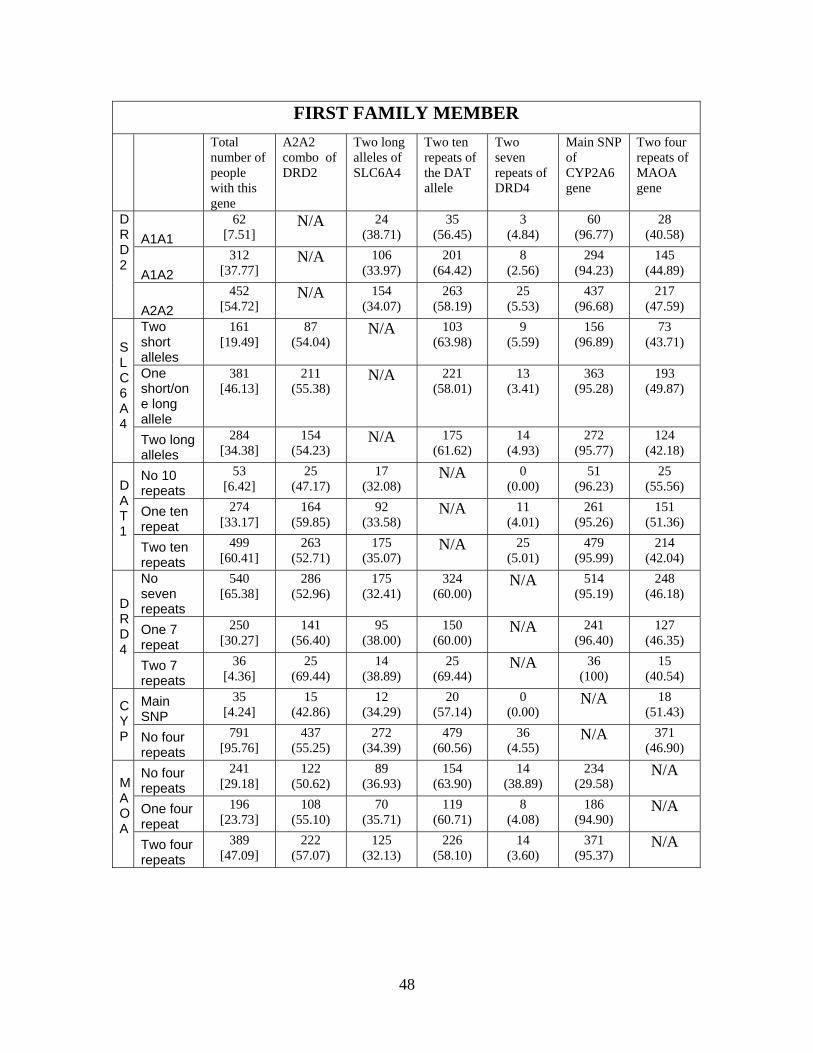
48
FIRST FAMILY MEMBER
Total number of people with this gene
A2A2 combo of DRD2
Two long alleles of SLC6A4
Two ten repeats of the DAT allele
Two seven repeats of DRD4
Main SNP of CYP2A6 gene
Two four repeats of MAOA gene
A1A1 62
[7.51] N/A
24
(38.71) 35
(56.45) 3
(4.84) 60
(96.77) 28
(40.58)
A1A2 312
[37.77] N/A
106
(33.97) 201
(64.42) 8
(2.56) 294
(94.23) 145
(44.89)
DRD2
A2A2 452
[54.72] N/A
154
(34.07) 263
(58.19) 25
(5.53) 437
(96.68) 217
(47.59) Two short alleles
161 [19.49]
87 (54.04)
N/A
103 (63.98)
9 (5.59)
156 (96.89)
73 (43.71)
One short/one long allele
381 [46.13]
211 (55.38)
N/A
221 (58.01)
13 (3.41)
363 (95.28)
193 (49.87)
SLC6A4
Two long alleles
284 [34.38]
154 (54.23)
N/A
175 (61.62)
14 (4.93)
272 (95.77)
124 (42.18)
No 10 repeats
53 [6.42]
25 (47.17)
17 (32.08)
N/A
0 (0.00)
51 (96.23)
25 (55.56)
One ten repeat
274 [33.17]
164 (59.85)
92 (33.58)
N/A
11 (4.01)
261 (95.26)
151 (51.36)
DAT1
Two ten repeats
499 [60.41]
263 (52.71)
175 (35.07)
N/A
25 (5.01)
479 (95.99)
214 (42.04)
No seven repeats
540 [65.38]
286 (52.96)
175 (32.41)
324 (60.00)
N/A
514 (95.19)
248 (46.18)
One 7 repeat
250 [30.27]
141 (56.40)
95 (38.00)
150 (60.00)
N/A
241 (96.40)
127 (46.35)
DRD4
Two 7 repeats
36 [4.36]
25 (69.44)
14 (38.89)
25 (69.44)
N/A
36 (100)
15 (40.54)
Main SNP
35 [4.24]
15 (42.86)
12 (34.29)
20 (57.14)
0 (0.00)
N/A
18 (51.43) C
YP
No four repeats
791 [95.76]
437 (55.25)
272 (34.39)
479 (60.56)
36 (4.55)
N/A
371 (46.90)
No four repeats
241 [29.18]
122 (50.62)
89 (36.93)
154 (63.90)
14 (38.89)
234 (29.58)
N/A
One four repeat
196 [23.73]
108 (55.10)
70 (35.71)
119 (60.71)
8 (4.08)
186 (94.90)
N/A
MAOA
Two four repeats
389 [47.09]
222 (57.07)
125 (32.13)
226 (58.10)
14 (3.60)
371 (95.37)
N/A
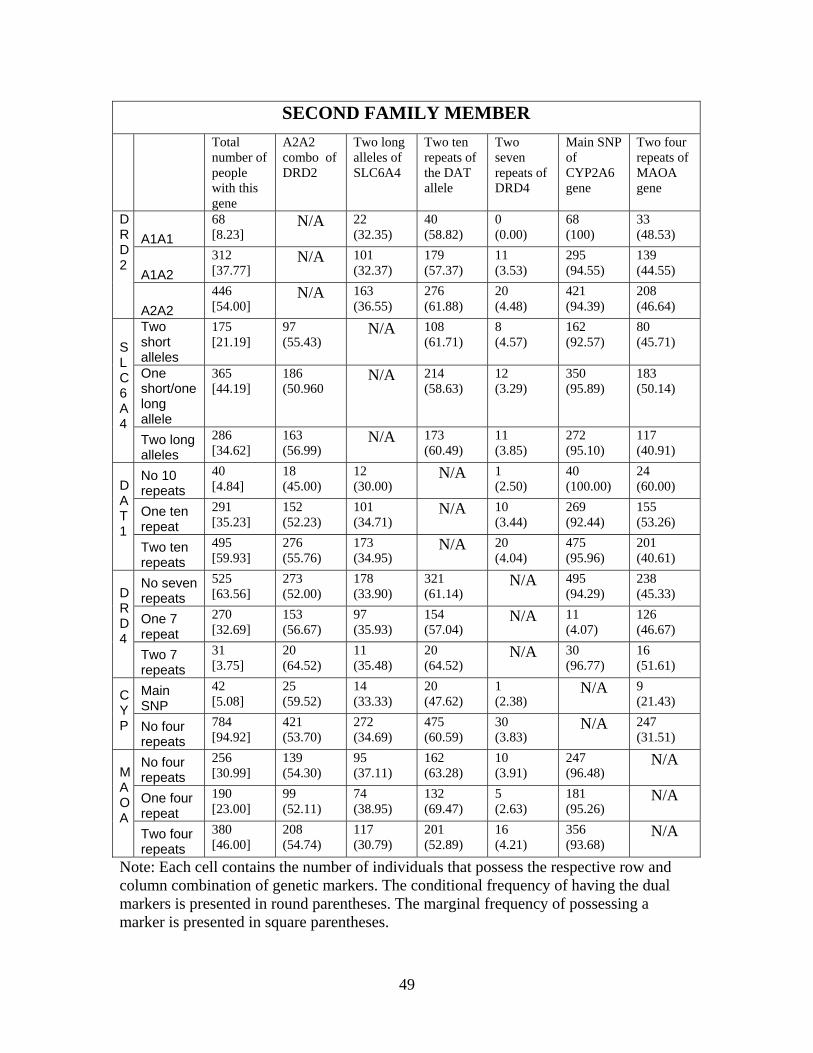
49
SECOND FAMILY MEMBER
Total number of people with this gene
A2A2 combo of DRD2
Two long alleles of SLC6A4
Two ten repeats of the DAT allele
Two seven repeats of DRD4
Main SNP of CYP2A6 gene
Two four repeats of MAOA gene
A1A1 68 [8.23]
N/A
22 (32.35)
40 (58.82)
0 (0.00)
68 (100)
33 (48.53)
A1A2 312 [37.77]
N/A
101 (32.37)
179 (57.37)
11 (3.53)
295 (94.55)
139 (44.55)
DRD2
A2A2 446 [54.00]
N/A
163 (36.55)
276 (61.88)
20 (4.48)
421 (94.39)
208 (46.64)
Two short alleles
175 [21.19]
97 (55.43)
N/A
108 (61.71)
8 (4.57)
162 (92.57)
80 (45.71)
One short/one long allele
365 [44.19]
186 (50.960
N/A
214 (58.63)
12 (3.29)
350 (95.89)
183 (50.14)
SLC6A4
Two long alleles
286 [34.62]
163 (56.99)
N/A
173 (60.49)
11 (3.85)
272 (95.10)
117 (40.91)
No 10 repeats
40 [4.84]
18 (45.00)
12 (30.00)
N/A
1 (2.50)
40 (100.00)
24 (60.00)
One ten repeat
291 [35.23]
152 (52.23)
101 (34.71)
N/A
10 (3.44)
269 (92.44)
155 (53.26)
DAT1
Two ten repeats
495 [59.93]
276 (55.76)
173 (34.95)
N/A
20 (4.04)
475 (95.96)
201 (40.61)
No seven repeats
525 [63.56]
273 (52.00)
178 (33.90)
321 (61.14)
N/A
495 (94.29)
238 (45.33)
One 7 repeat
270 [32.69]
153 (56.67)
97 (35.93)
154 (57.04)
N/A
11 (4.07)
126 (46.67)
DRD4
Two 7 repeats
31 [3.75]
20 (64.52)
11 (35.48)
20 (64.52)
N/A
30 (96.77)
16 (51.61)
Main SNP
42 [5.08]
25 (59.52)
14 (33.33)
20 (47.62)
1 (2.38)
N/A
9 (21.43) C
YP
No four repeats
784 [94.92]
421 (53.70)
272 (34.69)
475 (60.59)
30 (3.83)
N/A
247 (31.51)
No four repeats
256 [30.99]
139 (54.30)
95 (37.11)
162 (63.28)
10 (3.91)
247 (96.48)
N/A
One four repeat
190 [23.00]
99 (52.11)
74 (38.95)
132 (69.47)
5 (2.63)
181 (95.26)
N/A
MAOA
Two four repeats
380 [46.00]
208 (54.74)
117 (30.79)
201 (52.89)
16 (4.21)
356 (93.68)
N/A
Note: Each cell contains the number of individuals that possess the respective row and column combination of genetic markers. The conditional frequency of having the dual markers is presented in round parentheses. The marginal frequency of possessing a marker is presented in square parentheses.
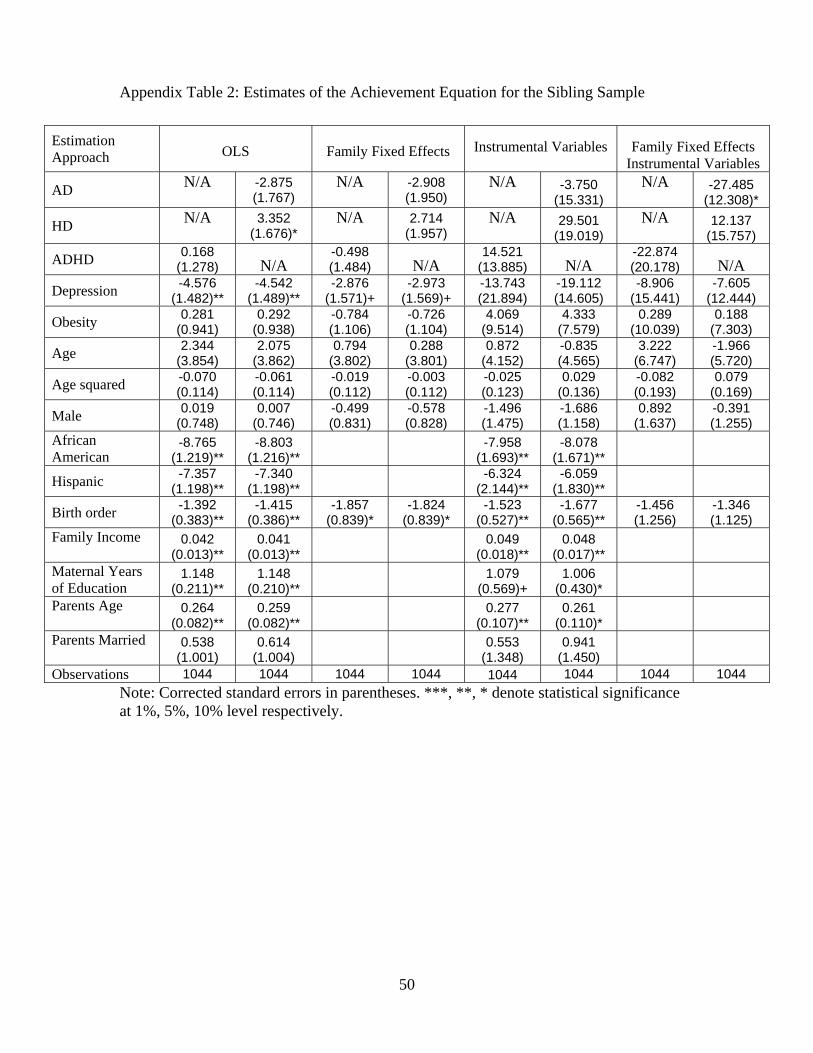
50
Appendix Table 2: Estimates of the Achievement Equation for the Sibling Sample
Note: Corrected standard errors in parentheses. ***, **, * denote statistical significance at 1%, 5%, 10% level respectively.
Estimation Approach
OLS
Family Fixed Effects
Instrumental Variables
Family Fixed Effects
Instrumental Variables
AD N/A
-2.875 (1.767)
N/A
-2.908 (1.950)
N/A
-3.750 (15.331)
N/A
-27.485 (12.308)*
HD N/A
3.352 (1.676)*
N/A
2.714 (1.957)
N/A
29.501 (19.019)
N/A
12.137 (15.757)
ADHD 0.168 (1.278) N/A
-0.498 (1.484) N/A
14.521 (13.885) N/A
-22.874 (20.178) N/A
Depression -4.576 (1.482)**
-4.542 (1.489)**
-2.876 (1.571)+
-2.973 (1.569)+
-13.743 (21.894)
-19.112 (14.605)
-8.906 (15.441)
-7.605 (12.444)
Obesity 0.281 (0.941)
0.292 (0.938)
-0.784 (1.106)
-0.726 (1.104)
4.069 (9.514)
4.333 (7.579)
0.289 (10.039)
0.188 (7.303)
Age 2.344 (3.854)
2.075 (3.862)
0.794 (3.802)
0.288 (3.801)
0.872 (4.152)
-0.835 (4.565)
3.222 (6.747)
-1.966 (5.720)
Age squared -0.070 (0.114)
-0.061 (0.114)
-0.019 (0.112)
-0.003 (0.112)
-0.025 (0.123)
0.029 (0.136)
-0.082 (0.193)
0.079 (0.169)
Male 0.019 (0.748)
0.007 (0.746)
-0.499 (0.831)
-0.578 (0.828)
-1.496 (1.475)
-1.686 (1.158)
0.892 (1.637)
-0.391 (1.255)
African American
-8.765 (1.219)**
-8.803 (1.216)**
-7.958 (1.693)**
-8.078 (1.671)**
Hispanic -7.357 (1.198)**
-7.340 (1.198)**
-6.324 (2.144)**
-6.059 (1.830)**
Birth order -1.392 (0.383)**
-1.415 (0.386)**
-1.857 (0.839)*
-1.824 (0.839)*
-1.523 (0.527)**
-1.677 (0.565)**
-1.456 (1.256)
-1.346 (1.125)
Family Income
0.042 (0.013)**
0.041 (0.013)**
0.049 (0.018)**
0.048 (0.017)**
Maternal Years of Education
1.148 (0.211)**
1.148 (0.210)**
1.079 (0.569)+
1.006 (0.430)*
Parents Age
0.264 (0.082)**
0.259 (0.082)**
0.277 (0.107)**
0.261 (0.110)*
Parents Married
0.538 (1.001)
0.614 (1.004)
0.553 (1.348)
0.941 (1.450)
Observations 1044 1044 1044 1044 1044 1044 1044 1044
Related Documents