441 Comprehensive Analytical Chemistry, Vol. 68. http://dx.doi.org/10.1016/B978-0-444-63340-8.00009-1 Copyright © 2015 Elsevier B.V. All rights reserved. Chapter 9 Food Forensics Maurizio Aceto Dipartimento di Scienze e Innovazione Tecnologica, Università degli Studi del Piemonte Orientale “Amedeo Avogadro”, Alessandria, Italy E-mail: [email protected] Chapter Outline 1. Introduction 442 1.1 Definitions 445 1.2 The Role of Chemometrics in Food Forensics 448 1.3 The Principal Foods Subjected to Fraud 449 1.3.1 Wine, Fermented Drinks, and Other Beverages 449 1.3.2 Milk and Dairy Products 451 1.3.3 Vegetable Oils 452 1.3.4 Meats 453 1.3.5 Fish 454 1.3.6 Fruits and Vegetables 455 1.3.7 Animal Products 457 1.3.8 Products from Cereals 458 1.3.9 Organic Food 459 2. Mass Spectrometric Analysis for Food Forensics 460 2.1 Analytical Methods in Food Forensics 460 2.2 Isotope Ratios as Chemical Markers 461 2.2.1 Wine, Fermented Drinks, and Other Beverages 465 2.2.2 Milk and Dairy Products 468 2.2.3 Vegetable Oils 468 2.2.4 Meats 469 2.2.5 Fish 470 2.2.6 Fruits and Vegetables 471 2.2.7 Animal Products 473 2.2.8 Products from Cereals 474 2.2.9 Organic Food 474 2.3 Trace Elements as Chemical Markers 476 2.3.1 Wine, Fermented Drinks, and other Beverages 479 2.3.2 Milk and Dairy Products 480 2.3.3 Vegetable Oils 480 2.3.4 Meats 481 2.3.5 Fish 482 2.3.6 Fruits and Vegetables 482 2.3.7 Animal Products 485 2.3.8 Products from Cereals 486 2.3.9 Organic Food 486 2.4 Molecular Ions as Chemical Markers 486 2.4.1 Strategies of Molecular Analysis 486

Welcome message from author
This document is posted to help you gain knowledge. Please leave a comment to let me know what you think about it! Share it to your friends and learn new things together.
Transcript
441Comprehensive Analytical Chemistry, Vol. 68. http://dx.doi.org/10.1016/B978-0-444-63340-8.00009-1Copyright © 2015 Elsevier B.V. All rights reserved.
Chapter 9
Food Forensics
Maurizio AcetoDipartimento di Scienze e Innovazione Tecnologica, Università degli Studi del Piemonte Orientale “Amedeo Avogadro”, Alessandria, Italy E-mail: [email protected]
Chapter Outline 1. Introduction 442 1.1 Definitions 445 1.2 The Role of Chemometrics
in Food Forensics 448 1.3 The Principal Foods
Subjected to Fraud 449 1.3.1 Wine, Fermented
Drinks, and Other Beverages 449
1.3.2 Milk and Dairy Products 451
1.3.3 Vegetable Oils 452 1.3.4 Meats 453 1.3.5 Fish 454 1.3.6 Fruits and Vegetables 455 1.3.7 Animal Products 457 1.3.8 Products from
Cereals 458 1.3.9 Organic Food 459 2. Mass Spectrometric Analysis
for Food Forensics 460 2.1 Analytical Methods in
Food Forensics 460 2.2 Isotope Ratios as
Chemical Markers 461 2.2.1 Wine, Fermented
Drinks, and Other Beverages 465
2.2.2 Milk and Dairy Products 468
2.2.3 Vegetable Oils 468 2.2.4 Meats 469 2.2.5 Fish 470 2.2.6 Fruits and Vegetables 471 2.2.7 Animal Products 473 2.2.8 Products from Cereals 474 2.2.9 Organic Food 474 2.3 Trace Elements as Chemical
Markers 476 2.3.1 Wine, Fermented
Drinks, and other Beverages 479
2.3.2 Milk and Dairy Products 480
2.3.3 Vegetable Oils 480 2.3.4 Meats 481 2.3.5 Fish 482 2.3.6 Fruits and Vegetables 482 2.3.7 Animal Products 485 2.3.8 Products from
Cereals 486 2.3.9 Organic Food 486 2.4 Molecular Ions as Chemical
Markers 486 2.4.1 Strategies of
Molecular Analysis 486
442 PART | II Mass Spectrometry Applications within Food Safety and Quality
1. INTRODUCTION
The term “food forensics” involves the possibility of using powerful scientific methods for the authentication and traceability of foodstuffs, in a way similar to popular TV series such as CSI in which scientific methods are used to solve foren-sic problems. Food forensics must be considered a discipline of primary impor-tance. The global food import bills have been estimated at USD 1,29 trillion by Food and Agriculture Organization of the United Nations [1]; it is the fifth year in succession that the world bill has surpassed USD 1 trillion. Considering the high numbers expressed, it must not be surprising how high the fraud rate is. In 2007, John Spink, Director of the Packaging for Food and Product Protection Initia-tive at Michigan State University (USA) estimated the total value of food fraud $49 billion, while according to the UK Food Standards Agency, the level of fraud accounted for 10% of food market, i.e., around $7 billion. Examples are innumer-able; to name a few among the most recent cases, the 2013 meat adulteration scandal, also known as Horsegate, with concern to foods advertised as beef that actually contained undeclared horse meat [2]; the latest case of wine fraud in Italy [3] in which 30,000 bottles were sold labeled as Brunello di Montalcino, Chianti, and other valuable wines, but indeed they contained false or low quality wines; finally, the so-called Honey Laundering Conspiracy [4] that has been dubbed as the “largest food fraud in the USA history,” where honey produced in China has been introduced in the USA market using a network of Asian countries to “wash” Chinese origin product with new packaging and false documents.
Italy is with no doubt among the countries most damaged by food frauds. The list of frauds perpetrated to the detriment of Italian food brands is endless:
l cow buffalo mozzarella made with freeze-dried cow milk, with milk from Southern America or with curd from Eastern Europe;
l wine made synthetically with water, sugar, and tartaric acid; l rapeseed oil or olive pomace oil from Mediterranean countries colored with
chlorophylls and artificially flavored, sold as olive oil; l Chinese eels and moribund mussels from Turkey revived with local seawater; l pummarola, i.e., tomato sauce, produced in China then diluted and reworked
in Italy;
2.4.2 Hyphenated Systems 489 2.4.3 Stand-Alone Systems 489 2.4.4 Wine, Fermented
Drinks, and Other Beverages 490
2.4.5 Milk and Dairy Products 493
2.4.6 Vegetable Oils 494 2.4.7 Meats 494
2.4.8 Fish 495 2.4.9 Fruits and Vegetables 496 2.4.10 Animal Products 497 2.4.11 Products from
Cereals 497 2.4.12 Organic Food 497 3. Conclusions and Future Trends 498Acknowledgments 499References 499

Food Forensics Chapter | 9 443
l capers from Northern Africa sold as Pantelleria capers; l Aceto balsamico tradizionale di Modena produced in Germany.
According to a 2007 report by Coldiretti [5], the Italian organization of agricultural entrepreneurs, in foreign food export one product in four is fake; the global amount of food fraud to the detriment of Italian export can be esti-mated in 60 billions of Euros [6]. In some countries, i.e., USA, only 2% of cheese labeled as Italian is based on original products. It must be noted that if a made in Italy product can be sometimes recognized (e.g., wines, cheeses, salami, etc.), much more complex is recognizing the culinary product, once that foodstuffs have been worked and transformed into recipes (cannoli sicil-iani, pasta e fagioli, etc.).
These are with no doubt impressive figures and high costs to both produc-ers and consumers. In addition, a lot of technical resources must be spent in the inspection; at present, in fact, only a small percentage of food supply can be controlled. US Food and Drug Administration reported in its 2013 annual report on food facilities and food imports [7] that a mere 14% of domestic food facilities were inspected and an even lower percentage of foreign food facilities.
Indeed, fraud accompanied commercial transactions since ancient times possibly due to a reflection of human nature. Crooked traders always were all the rage, maximizing incomes by diluting their products with cheaper raw mate-rials. In biblical times, rules and suitability standards were issued for inspec-tion of meat, which can be found in the Book of Leviticus, possibly the most ancient health codex ever written. Galen, considered among the fathers of mod-ern medicine, warned against adulteration of herbs and spices. In ancient Rome and Athens, there were laws concerning the adulteration of wines with flavors and colors [8]. In the first century AD, Pliny the Elder, in his Naturalis Historia [9], Book XII, Chapter XIV, tells that “…piper lungum facillime adulteratur Alexandrino sinapi…” (long pepper is very easily adulterated with Alexandrian mustard) and also that “…adulteratur iunipiri bacis…” (pepper is adulterated with juniper berries). In the nineteenth-century text, A treatise on adulterations of food and culinary poisons by German chemist Frederick Accum [10], pos-sibly the first written account of food fraud, the author exposed culinary sharp practice in London, detailing how bakers cut their flour with alum and chalk to make loaves whiter, tipped in plaster and sawdust to make them heavier; how brewers added substances like strychnine to beer to make it taste bitter and save money on hops; and, perhaps worst of all, how lead, copper, or mercury salts were used to make brightly colored sweets and jellies that would be attractive to children.
In those times only simple, empirical methods were available to inspectors in order to recognize adulterations, so that the most clamorous frauds could be committed. Nowadays, both sides have increased their talents: impostors have developed more subtle ways to bypass regulations and inspectors have at their disposal more powerful analytical methods to investigate.
444 PART | II Mass Spectrometry Applications within Food Safety and Quality
A great difference among ancient and modern times is also the huge amount of information available at present. Moore et al. [11] reviewed the informa-tion concerning food frauds issued on scholarly journals and general media and developed a database published in the US Pharmacopeial Convention’s Food Chemicals Codex [12], labeled USP Food Fraud Database; this resource is also freely accessible at the Web site http://www.foodfraud.org.
Food fraud can be resumed in a simple concept: the will of selling a cheaper product at the price of a more valuable one. Three main strategies can be singled out: adulteration, i.e., the illicit variation in composition of a food product by means of addition or, most commonly, subtraction of some of its components; sophistication, i.e., the illicit variation in the natu-ral or legal composition of a food product adding an external, unauthorized compound; counterfeiting, i.e., substitution of a food product with a similar but cheaper one. Inside these strategies, different types of frauds can be described:
l partial or complete substitution of a product with similar but cheaper alterna-tives: this kind of fraud is relatively easy to be identified because adulterants or sophisticants may contain substances acting as natural markers;
l sea trout sold as salmon; l orange juice sophisticated with apple juice; l olive oil blended with other vegetable oils; l pork salami blended with donkey or horse meat; l false geographic provenance of the product: it is well known that foodstuffs
coming from certain regions may result more attractive to consumers with respect to equivalent products coming from less renowned regions: this kind of counterfeit can be discovered only if markers of the respective regions are identified;
l truffles coming from Piedmont (Italy) versus truffles coming from other countries;
l saffron coming from Tuscany or Abruzzi (Italy) versus saffron coming from other countries;
l false declaration of process: several foodstuffs have an added quality value when produced with specific processes that are usually time and resources consuming; fraud is carried out when a quality brand is used for a food obtained with cheaper production methods;
l extra virgin olive oil is a valuable brand that can be applied only to a prod-uct obtained by means of physical or mechanical methods, while chemical extraction with solvents is not allowed;
l food labeled as organic but produced with conventional methods; l processes not allowed: several kinds of fraud concern with illicit practices car-
ried out in the view of improving the quality features of foodstuffs; l addition of undeclared sugars to fruit juices in order to increase their taste; l addition of glycerine to wine to improve its body;
Food Forensics Chapter | 9 445
l addition of natural but not allowed dyes (e.g., flavonoids from berries other than grapes) to wine to improve its hue;
l sale of spoiled products: this fraud can easily be identified.
Authentication of foodstuffs is strictly bound to labeling. For example, a product labeled “vegetable oil” will be any edible oil of vegetal origin, whereas a product labeled “olive oil” must be only the one obtained from olives. Labels imply rules imposing specific features from the technical point of view.
Problems arise frequently whereas rules are different from country to country. Some countries pursue more strict rules in the commercialization of foodstuffs, other are less strict; this may request observing more or less restric-tive analytical parameters. One example is the addition of sugar to must in winemaking: in most jurisdictions (e.g., Italy) this practice is forbidden, while in others (i.e., Germany) its use in chaptalization is regulated but permissible in lower quality wines only and in France it is permitted, though under strict regulation.
1.1 Definitions
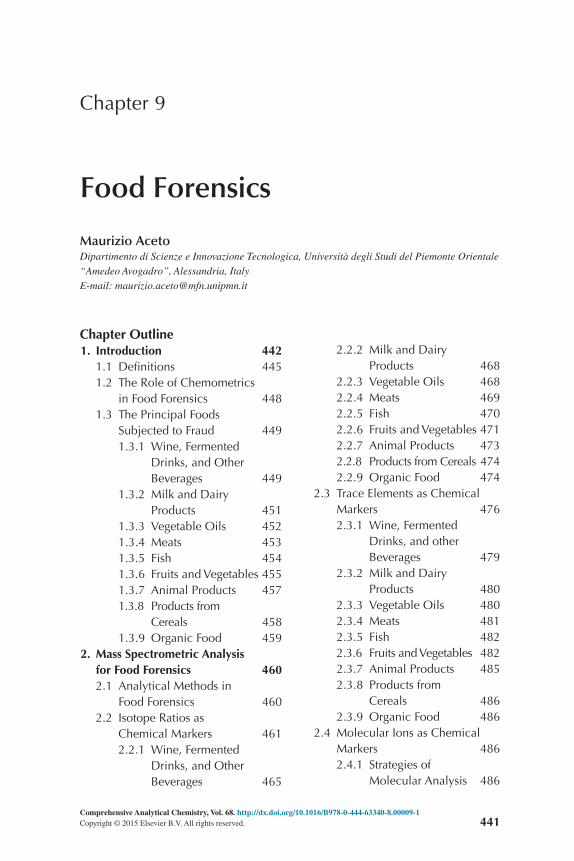
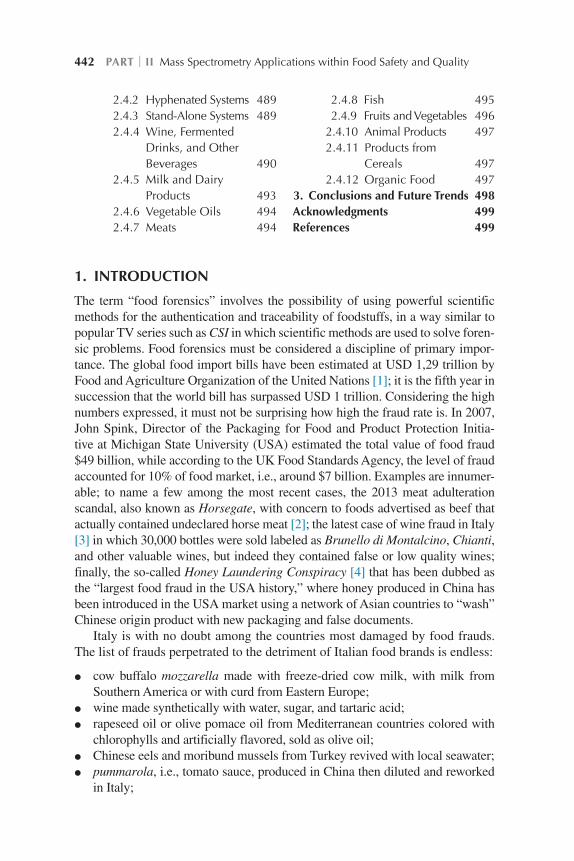
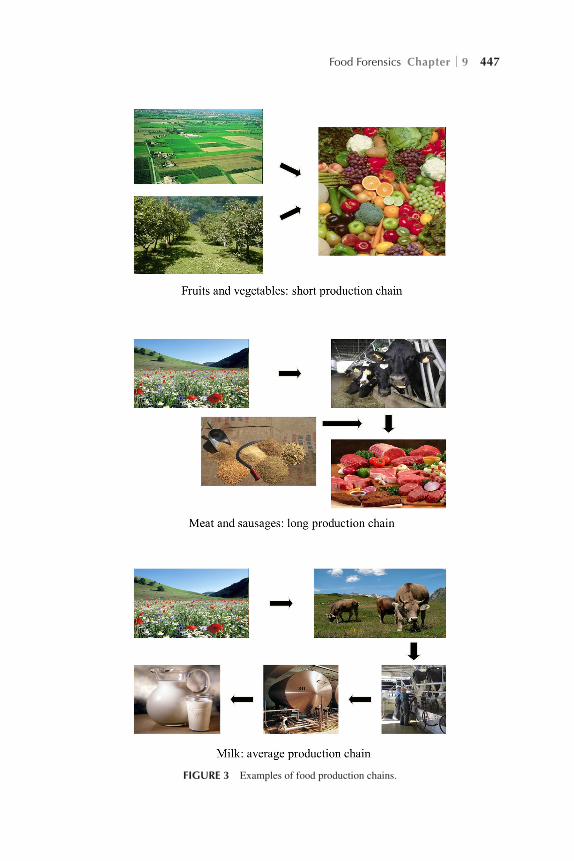
Food forensics implies the possibility to verify whether a foodstuff be authentic or not. It is useful at this stage to define some terms which will be used in the following. In particular, the difference among authentication and traceability must be pointed out [13]. Authentication is a procedure useful to verify the features declared by a product label and to reveal if a product has been adulter-ated or counterfeit (Figure 1). Traceability is a procedure useful to verify the link among a foodstuff and the raw materials with which it has been produced (Figure 2). Authentication studies look for chemical parameters useful to dis-criminate authentic products from nonauthentic products, using one or more groups of variables whose distribution must be evaluated with reference to geographic provenance, botanic or animal variety, and production technology of samples of a particular food. Instead, traceability studies look for chemi-cal parameters useful to find tracks of the different stages inside a production chain. If a food product can be traced—linked to its raw materials—it can be certainly authenticated, but if a food product can be authenticated (i.e., has all the features declared in its label) not necessarily can be traced. Authentication and traceability are not, therefore, synonyms, but are concepts pointing in the same direction, i.e., working at the consumers’ advantage by guaranteeing the quality of foodstuffs. For the sake of simplicity, in the following text we will use the term classification referring to the whole of authentication and trace-ability, while we will use either authentication or traceability when the specific meaning will be implied.
Considering the scientific literature in the field of food forensics, most classification studies are focused on food authentication. This is due to the fact that by selecting the proper variables, almost every food can be authenticated,
446 PART | II Mass Spectrometry Applications within Food Safety and Quality
i.e., discriminated by its substitutes. Traceability has more strict rules and only a selection of foods can be actually traced. The following cases can be singled out:
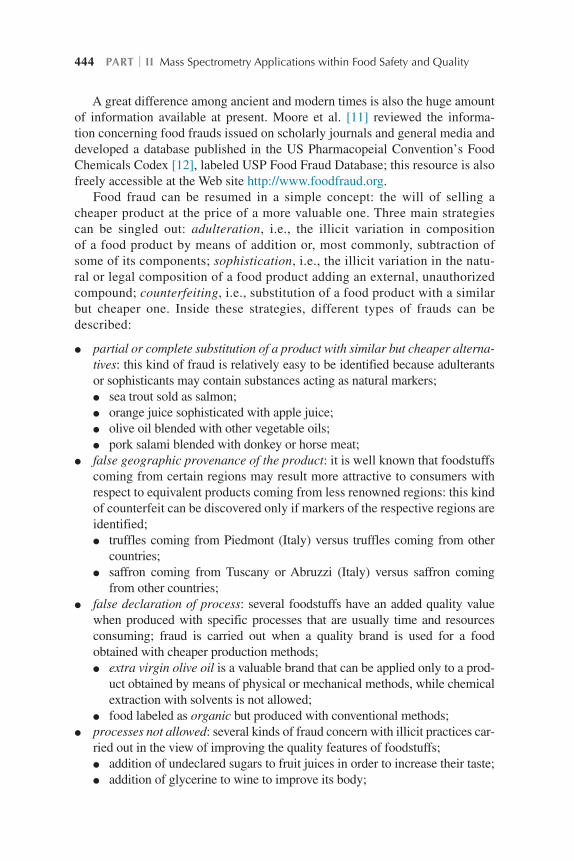
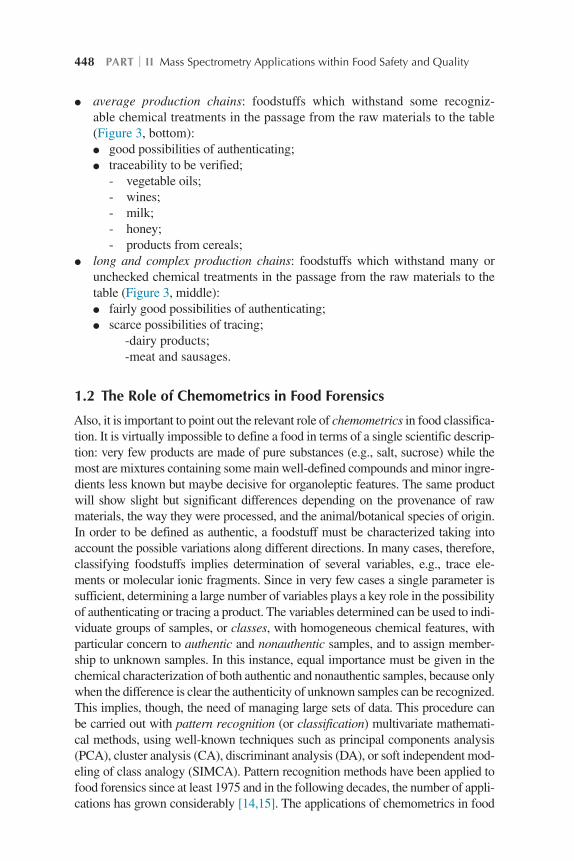
l short and very short production chains: foodstuffs which withstand very few or no chemical treatments in the passage from the raw materials to the table (Figure 3, top):
l very good possibilities of authenticating; l good possibilities of tracing; - fruit and vegetables;
FIGURE 1 Food authentication.
FIGURE 2 The concept of food traceability.
Food Forensics Chapter | 9 447
FIGURE 3 Examples of food production chains.
448 PART | II Mass Spectrometry Applications within Food Safety and Quality
l average production chains: foodstuffs which withstand some recogniz-able chemical treatments in the passage from the raw materials to the table (Figure 3, bottom):
l good possibilities of authenticating; l traceability to be verified; - vegetable oils; - wines; - milk; - honey; - products from cereals; l long and complex production chains: foodstuffs which withstand many or
unchecked chemical treatments in the passage from the raw materials to the table (Figure 3, middle):
l fairly good possibilities of authenticating; l scarce possibilities of tracing;
-dairy products;-meat and sausages.
1.2 The Role of Chemometrics in Food Forensics
Also, it is important to point out the relevant role of chemometrics in food classifica-tion. It is virtually impossible to define a food in terms of a single scientific descrip-tion: very few products are made of pure substances (e.g., salt, sucrose) while the most are mixtures containing some main well-defined compounds and minor ingre-dients less known but maybe decisive for organoleptic features. The same product will show slight but significant differences depending on the provenance of raw materials, the way they were processed, and the animal/botanical species of origin. In order to be defined as authentic, a foodstuff must be characterized taking into account the possible variations along different directions. In many cases, therefore, classifying foodstuffs implies determination of several variables, e.g., trace ele-ments or molecular ionic fragments. Since in very few cases a single parameter is sufficient, determining a large number of variables plays a key role in the possibility of authenticating or tracing a product. The variables determined can be used to indi-viduate groups of samples, or classes, with homogeneous chemical features, with particular concern to authentic and nonauthentic samples, and to assign member-ship to unknown samples. In this instance, equal importance must be given in the chemical characterization of both authentic and nonauthentic samples, because only when the difference is clear the authenticity of unknown samples can be recognized. This implies, though, the need of managing large sets of data. This procedure can be carried out with pattern recognition (or classification) multivariate mathemati-cal methods, using well-known techniques such as principal components analysis (PCA), cluster analysis (CA), discriminant analysis (DA), or soft independent mod-eling of class analogy (SIMCA). Pattern recognition methods have been applied to food forensics since at least 1975 and in the following decades, the number of appli-cations has grown considerably [14,15]. The applications of chemometrics in food
Food Forensics Chapter | 9 449
forensics have been reviewed in several instances [16–18], putting particular focus on unsupervised [19] or supervised [20] methods of pattern recognition.
1.3 The Principal Foods Subjected to Fraud
In the development of methods for food classification, there is a strong differ-ence among authentication and traceability. In order to trace a food product, a perfect knowledge of the whole production chain, from raw materials to the final product, is mandatory because every single passage can influence the pos-sibility to follow the chain by means of analytical measurements. This feature is less essential in authentication, where it can be sufficient distinguishing the authentic finished product from the nonauthentic one, irrespective of the pro-duction chain. In this case also, however, the knowledge of the various passages inside the production chain allows individuating the suitable analytical tests in a more efficient way. For this reason, it is well timed to illustrate shortly the production chains of the most important foodstuffs and to understand, for each category, what the more common frauds are.
1.3.1 Wine, Fermented Drinks, and Other BeveragesWine is with no doubt one among the foodstuffs mostly subjected to frauds. High-quality wines or particular vintages may reach high prices, becoming ideal objectives for illicit commerce. Although regulations on wines are among the most complete, the extent of frauds is so high that could hardly be quantified.
The role of analytical chemistry in wine classification is definitely strategic. In the past, the only way to verify the authenticity of a wine was the tasting by experts, but today powerful instrumental methods are available. Not all frauds, though, can be revealed.
The production chain of wine is complex and many passages occur among grapes and bottled wine. Trace elements and stable isotope ratios have been suggested as traceability markers, as it will be detailed further on. In the case of authentication, several classes of organic compounds, typical of specific passages in the production chain, can be used as markers.
Saurina [21] and Versari et al. [22] recently reviewed classification methods of wine with different analytical techniques.
The most common frauds in the wine and spirits market are the following:
l adulteration: l addition of water; l sophistication: l use of sugars or alcohols from other plants different from grapes; l use of additives, flavors, and dyes not allowed; l use of vinous products made with table grapes; l counterfeiting: l wines obtained totally with musts and/or with table grapes marketed as
products derived from wine grapes;
450 PART | II Mass Spectrometry Applications within Food Safety and Quality
l wines marketed under registered names, i.e. Italian Denominazione di Origine Controllata (DOC) and/or Denominazione di Origine Controllata e Garantita (DOCG), without having the prescribed chemical, physical, organoleptic, and documental requisites;
l Single malt whisky replaced by blended one.
The previous considerations have valid for all other fermented drinks, among which:
l spirits from grapes (e.g., cognac); l spirits from other vegetable species (e.g., rhum, grappas, whisky, tequila); l beer (from barley); l cider (from apples); l sakè (from rice).
In all these cases, raw materials undergo at least one chemical conversion due to alcoholic fermentation. Moreover, production and conservation can include other specific treatments. In addition, in some cases more than a single raw material is used: beer, as an example, is made from both barley and hop, which makes it more difficult to go back to their origin.
A particular fermented drink is Aceto balsamico di Modena, which stands out for quality and commercial value. It is a product obtained from cooked grapes must, fined in barrels for at least 12 years; along this period it is sub-jected to progressive concentration in a series of casks of different woods and sizes, called acetaia, until it becomes a dense juice, rich in flavors. The chem-istry underlying the aging of Aceto balsamico is still partially unknown, but it is certain that all passages involved in the production (alcoholic and acetic fermentations, conservation in six different types of barrels) heavily modify the raw matters. A traceability study can hardly be figured, while authentication could be based on the development of typical flavoring compounds.
Besides alcoholic drinks, another drink of high consumption is of course mineral water. The production chain of mineral water is for sure the simplest. To be marketed as mineral, water must not withdraw any treatment from source to bottle, which is a striking difference among mineral and tap water (i.e., deliv-ered by domestic water systems). Water would then seem to be the ideal food for classification studies, being the chemical features untouched all along the production chain. Indeed, the commercial value of mineral water does not jus-tify application of powerful but expensive analytical techniques such as mass spectrometry or nuclear magnetic resonance (NMR).
The most common frauds in the mineral water market are the following:
l adulteration: l dilution with tap water; l sophistication: l use of purification agents; l counterfeiting: l bottles labeled as mineral water but containing tap water.
Food Forensics Chapter | 9 451
1.3.2 Milk and Dairy ProductsInside dairy products, two groups are present:
l products obtained from mechanical and physical transformations (milk); l products with more elaborate production chains, including chemical transfor-
mation passages (yoghurt, cheeses, butter).
It is obvious that the first group is more suitable to be studied for traceability. Milk traceability is relatively simple as its composition reflects instantaneously the conditions at which, the producing animal is exposed to. Transfer of nutri-ents and/or contaminants from grass to milk, passing through the animal stom-ach, is fast and it is then possible to use different vegetal biomarkers such as carotenoids, terpenes, and polyphenolic compounds to yield information on the animal’s diet, while determination of stable isotopes ratio can yield information of the provenance of milk. As for water, though, the market value of the product can hardly justify traceability studies.
For what concerns authentication, it is possible to identify organic markers allowing discrimination of different productions. The chemical composition of dairy products reflects that of the milk they come from, but it also depends on other factors such as processing, aging, and quality of microbial flora. More-over, most of them are alive products, hosting microbial species which breed on a substrate rich in nutrients and whose metabolism generates chemical com-pounds continuously evolving. It is apparent that traceability studies can be dif-ficult while authentication schemes can be easily developed based on typical organic compounds.
Zachar et al. [23] recently reviewed classification methods of milk and dairy products with different analytical techniques.
The most common frauds in the dairy products market are the following:
l adulteration: l addition of water to milk; l sophistication: l preparation of cheeses with fraudulent use of milk powder, casein or
caseinates instead of natural liquid milk; l use of milk different from the one declared in the label (e.g., the
cheaper cow’s milk in place of buffalo, sheep, or goat’s milk, all more expensive);
l use of expired cheeses in the preparation of pasta filata fresh cheeses; l use of casein and butter in the production of pasta filata fresh cheeses; l counterfeiting: l use of milk of animal origin and/or geographic source different from those
prescribed in product specifications; l production of butter from buttermilk of buffalo, sheep, and goat’s milk
and its marketing as butter obtained from cream or from buttermilk of cow’s milk;
l use of not allowed additives and colorants;

452 PART | II Mass Spectrometry Applications within Food Safety and Quality
l use of animal and/or vegetal fats and/or butter produced in EU in the pro-duction of fresh butter:
l false declaration of cheese made from heat-treated milk instead of raw milk.
1.3.3 Vegetable OilsExtra virgin olive oils are among the highest quality products in Europe, which attract counterfeit. Adulterated olive oil is possibly the biggest agricultural fraud in the EU. In the production of vegetable oils, and in particular of olive oil, there is difference among authentication and traceability. In fact, it is rela-tively easy, on the basis of several organic compounds, distinguishing oils from different botanical sources (e.g., olive, hazelnut, sunflower, etc.) and therefore identifying fraudulent additions to higher quality oils; on the other hand, it is more difficult in tracing the production chain as the passages from olives to the final product can be many, with both physical and chemical transformations, even if the higher quality products (i.e., extra virgin olive oils) must be pro-duced with physical methods only. It must be considered, moreover, that olive oil in particular is a complex system bound to several variables such as olive cultivars, climatic features, modality of handling the raw matter and the final product, etc.
Ben-Ayed et al. [24] recently reviewed classification methods of oils with different analytical techniques.
The most common frauds in the vegetable oils market are the following:
l adulteration: l olive oil illicitly subjected to deodorization to obtain products deprived of
organoleptic defects, passed off as extra virgin oil; l olive oil illicitly subjected to disacidification to obtain products with low
acidity, passed off as extra virgin oil; l sophistication: l blending of olive oil with seed oil unaltered or previously subjected to
specific treatments (e.g., desterolization) in order of hiding specific com-pounds that could reveal its addition under an analytical check;
l oil declared as extra virgin olive oil illicitly obtained by mixing refined oil with virgin oil;
l counterfeiting: l seed oil colored with chlorophyll, marketed as virgin olive oil; l virgin and extra virgin oil made in foreign countries sold as local
product; l virgin oil introduced in one country with merceological denomination of
seed oil or foreign olive oil, temporarily imported to be refined or packaged and then given back to the original country, which instead, by means of tri-angulation transactions, is input on the national market at low price thanks to fiscal advantages.
Food Forensics Chapter | 9 453
1.3.4 MeatsMeat has obviously a central role in the diet of most regions, with particular concern to Western countries. At the same time, in recent years, there have been several issues of security concern in the meat market, e.g., bovine spongiform encephalopathy (BSE), human variant Creutzfeldt–Jakob disease (CJD), and more recently the use of equine meat in products labeled as beef meat. Therefore, classi-fication of meat products has potentially a strategic importance, even considering that most consumers address their choice of purchase according to the geographic provenance of animals. Yet, the whole traceability system, which should guaran-tee origin and so quality of meat, is actually based on brands, tattoos, and animal passports, that is ultimately on paper documentation, not on chemical analysis.
On the other hand, in order to develop a classification scheme, the complex-ity of the livestock system is from the traceability point of view must be consid-ered. Several variables, such as environment, race, diet, drinking water features, conjugal conditions, etc., can influence. Moreover, analytical strategies are necessarily different for global or microregional scales. The feed used to feed livestock can come from different sources, the chemical features (e.g., isotopic ratios, trace metals, etc.) of which will be mixed while fixing into beasts’ muscle fibers, a process that in addition occurs for long periods, so that the original fin-gerprints of diet foods are lost. It is also possible that animals had been bred in different farms along their lives, maybe with different feeding methods. Finally, the biological and physical factors influencing the isotopic composition of ani-mal tissues are not entirely clarified, unlike the case of wine in which stable isotope analysis is by now a powerful, straightforward method of authentication.
Information that can be easily yielded from chemical analysis is the type of livestock feeding, which is reflected on the isotope fingerprint of slaughtered meat. Extensive systems of production, such as organic farming, are strongly related to the local environment. This livestock is let to spend free outdoors, sometimes even during winter. Feeding needs few supplements from sources external to farms as prescribed by EEC Regulation 2092/91 (and further amend-ing acts) for organic farming [25]. As a consequence, animals could incorpo-rate mineral substances and isotope profiles typical of a local, restricted area. For livestock subjected to intensive systems, the situation is more complicate: feeding systems can change from free grazing and assumption of local feeds to whole indoors housing with assumption of feeds produced externally, pos-sibly from different sources. In particular, soy-based protein supplements are marketed all over the world. In meats slaughtered from animals fed with these systems, the assumed mineral substances reflect a mixture of provenances, which is not an ideal situation for classification and specifically for traceability. Particularly complex is the case of poultry, where animals are hardly bred with extensive systems so that their meats have weak links with the territory.
In the case of sausages, the possibility of traceability is even worst, due to the fact that their preparation, by definition, calls for addition of different sub-stances to favor conservation: salt, spices, additives, and sometimes selected

454 PART | II Mass Spectrometry Applications within Food Safety and Quality
microorganisms, all instances heavily influencing the original chemical features in terms of trace elements or isotope ratios. Authentication could nevertheless be possible thanks to identification of specific organic compounds; this is particu-larly important when high-quality handcrafted productions are involved, i.e., Pata Negra raw ham, culatello di Zibello, etc., which have relevant commercial values.
The analytical methods for meat classification have been recently reviewed by Vlachos et al. [26] and by Sentandreu and Sentandreu [27].
The most common frauds in the meat market are the following:
l adulteration: l addition of water in order to increase meat weight; l addition of disproportionately high amounts of extenders and fillers of non-
meat origin; l sophistication: l undeclared addition of offal; l undeclared addition of mechanically separated meat (MSM); l counterfeiting: l meat produced in foreign countries sold as local meat; l meat of lower quality animals passed off as meat of higher quality animals
(i.e., horse meat passed off as beef meat); l meat from animals stolen and/or illegally slaughtered; l meat from poached wild animals; l previously frozen meat labeled as fresh.
1.3.5 FishThe term fish is collective term encompassing all water-dwelling animals of inter-est for human consumption; in the market sense, it comprises any fish, mollusc, or crustacean species, which is harvested, either from sea or from internal water sources. Fish is the most traded food commodity in the world; this means it is an ideal subject for falsification. Frauds in the fish market are very common: a recent survey [28] carried out in 21 states in the USA estimated that one-third of the ana-lyzed fish samples were mislabeled, according to USA Food and Drug Adminis-tration (FDA) guidelines, with rates hitting as high as 52% in Southern California. This is not surprising if we consider that, once a fish is filleted and skinned, can be difficult to determine what species it actually is. From the analytical point of view, fish is not so different from meat: classification studies must start from diet of individuals destined to consumption, and this is valid only for what concerns bred individuals, while it is meaningless for what concerns caught individuals, whose diets cannot be controlled. Indeed, analytical controls on fishes are limited to sanitary check or to the possibility of distinguishing fresh items from preserved items. Processed fish products (i.e., canned products, pastes, etc.) pose additional difficulties as some chemical markers can be easily degraded.
The analytical methods for fish classification have been recently reviewed by Lavilla et al. [29]; a comprehensive list of methods is also reported in food and agriculture organization (FAO) Fisheries Technical Paper n.455 [30].
Food Forensics Chapter | 9 455
The most common frauds in the fish market are the following:
l adulteration: l addition of water in order to increase weight; l overglazing, i.e., use of excess ice in preservation; l soaking, i.e., use of excess additives in preservation; l counterfeiting: l fish caught or farmed in foreign countries sold as local product; l fish of lower quality passed off as of higher quality (i.e., wild salmon
passed off as farmed salmon); l meat from fish stolen and/or illegally caught; l transshipping, i.e., fish exported through different countries to avoid duties
and tariffs; l previously frozen fish labeled as fresh.
1.3.6 Fruits and VegetablesFruits and vegetables are the ideal subjects for classification studies. The link between soil and the marketed product is almost free of intermediate pas-sages that could alter chemical and physical features, in particular for what concerns inorganic parameters. Treatments with agrochemicals can introduce some organic and/or inorganic compounds; nevertheless it is not difficult to find chemical markers behaving as tracers. In most raw products, it could be possible to find the elemental of isotopic profile of the soil on which the plants grew. Basically, however, the geographical origin of most fruit and vegetable products does not appear as a real commercial argument and few labels men-tion their origin. As a result, classification studies on these matrices are scarce and limited to items of notable value. Particular productions, located in small areas and strictly regulated, could be easily subjected to counterfeit. In Italy, this can be the case of typical productions such as the cardo gobbo of Nizza Monferrato (near Asti, Piedmont), the cherry tomato of Pachino (near Siracusa, Sicily), or the pistachio nut of Bronte (near Catania, Sicily). A relevant product is the hazelnut, mostly employed in the confectionary industry; the most prized variety, the renowned Tonda Gentile delle Langhe, is easily counterfeit by sub-stituting it with cheaper varieties.
The considerations made above are valid for the most common products. Some specific categories of fruit and vegetable products can draw particular attention for their commercial value. Truffle is the natural foodstuff par excel-lence, so that it is hard to obtain high-quality products by cultivation. It is pos-sibly the foodstuff most suitable for classification studies: (1) its price is quite high (the variety Tuber Magnatum pico, the highly renowned white truffle from Alba costs 1500–2500 €/Kg), with prices strongly varying according to geographic provenance and variety; (2) in the passage from soil to table there is no transformation, so that its composition is only bound to soil and plant metabolism; (3) it has a complex composition, which is an advantage in order to develop classification schemes; (4) it has a fairly high content in metals,
456 PART | II Mass Spectrometry Applications within Food Safety and Quality
which is an advantage for traceability studies based on the distribution of trace elements. Despite all these features, for market reasons very few classification studies have been carried out since now with concern to truffles. Similar consid-erations can be drawn on mushrooms: even these natural products are suitable subjects for classification studies, with a considerably lower commercial value.
Another class of relevant vegetable items include spices and herbs. Tra-ditionally used worldwide, these items cover a large part of the food market. Saffron is unquestionably the world’s most expensive spice [31] and definitely the foodstuff most suitable for classification studies. The real product, prepared with traditional, manual methods from stigmas of Crocus sativus can be sold at 15.000–20.000 €/Kg (gold costs 30.000 €/Kg!). This outstanding quotation is justified by the fact that for 1 g of saffron it takes 150 fresh blossoms, each giv-ing three stigmas. Second in price comes vanilla, which is commonly counter-feit by introducing synthetic vanillin into less quality products, while authentic vanilla contains mostly 4-hydroxybelzaldehyde.
From the perspective of classification studies, tea and coffee also can be considered fruit and vegetable foodstuffs, ranking very high for what concerns the impact on the market. Their production is however more complex, as the final products intended for use withstand some manipulations (e.g., toasting of coffee) that can alter the original composition of raw matter.
Arvanitoyannis and Vaitsi [32] have reviewed the application of analytical and chemometrics methods for the classification of vegetables, with particular concern to tomato.
The most common frauds in the market of fresh fruits and vegetables are the following:
l adulteration: l addition of water or low value materials to increase weight of products; l sophistication: l addition of substitutes such as maltodextrins in coffee; l counterfeiting: l products marketed under registered names (i.e. (PDO) or protected
designation of origin) without having the prescribed chemical, physical, organoleptic, and documental requisites;
l incorrect botanical declaration.
Far more complex, from the classification point of view, is the matter of fruit and vegetable juices and conserves. Inside the food market these products have a highly relevant importance, due to the fact that transformation of fresh products into conserved products is particularly interesting to food industry: in this way less perishable products (juices or conserves) are generated instead of others (fresh fruits or vegetables) whose organoleptic features are more difficult to preserve. Of course, the physicochemical operations (pressing, clarification, addition of preservatives, etc.) involved render hard traceability, leaving some possibilities for authentication based on identification of chemical markers of the original fruit or vegetable raw matters.
Food Forensics Chapter | 9 457
The most common frauds in the juices and conserves market are the following:
l sophistication: l addition of glucose and complex sugars for lowering acidity index; l addition of thickening agents (e.g., gelatin, agar–agar, fecula, etc.) for
improving stability and consistency of products and for hiding the effect of the use of defective raw matters or of undesired or noncompliant production techniques;
l addition of natural and synthetic dyes to not-fully ripe raw matter; l addition of antiseptic substances in order to guarantee conservation of
products of unsuitable matter; l extreme squeezing of fruits; l preparation of synthetic juices; l addition of fruit and vegetable products different from those declared; l counterfeiting: l declaration in labeling unequal to what is inspected inside confections, in
terms of net weight, drained weight, residues, nutritional values, ingredi-ents, etc.;
l reuse of expired products, changing expiry date.
1.3.7 Animal ProductsSeveral foodstuffs are produced by animals but consumed by man. Among these, particularly relevant are eggs and honey.
The composition of eggs should strongly reflect chicken’s diet, since there is no chemical transformation in the passage from collection to marketing (at least for correctly preserved eggs). It is therefore a case similar to meat, for what concerns classification studies. A different matter is, on the contrary, for egg-based foodstuffs, whose production can involve addition of several compounds. The commercial value of eggs and egg-based products cannot justify the need of traceability.
The most common frauds in the market of eggs and egg-based products are the following:
l counterfeiting: l sale of broken eggs delivered to food industry; l marketing of broken eggs; l marketing of loose eggs lacking the prescribed labeling systems; l apposition of wrappers on packages in the days following the day of clas-
sification and selection of egg or the day of recommended sale, which cor-responds to 21 days after picking up;
l marketing of eggs belonging to weight categories different to the one declared;
l marketing of eggs reporting a deposition date successive to the real one; l labeling indicating a chicken breeding system different from the one
adopted in the farm from which eggs come (e.g., battery farming in place of free range).
458 PART | II Mass Spectrometry Applications within Food Safety and Quality
Honey is a highly concentrated solution of carbohydrates in water. It is with no doubt a product strongly linked to the territory, being its composition and organo-leptic features deriving mostly from the type of flora gathered by bees; EU regula-tions, moreover, specify that no additive can be added to the product. In addition to botanic variations, other relevant parameters linked to territory are the type of soil and the human activities that can have consequences on the quality.
Considering honey, the geographical parameter does not allow establish-ing absolute rankings, but it is well known the fact that some origins are more recognizable in terms of composition and quality. For example, honeys from Ethiopia and Italy are renowned for being among the best in the world.
At present, the most suitable method for obtaining the botanical and geo-graphical origin of honey is melissopalynology, which is the identification of honey pollens. Also promising are techniques that allow determining the distri-bution of sugars and other organic compounds. For what concerns traceability, the production chain is simple, as from the collection of bees’ secretion to the packaging, no chemical process are included. Therefore, the composition of packed honey reflects the inorganic parameters of the area of origin, but it must be considered that it is frequently hard to establish the territory on which bees stand on. The matter is even more complicate for thousand flower-type honeys, i.e., honey produced from a variety of flowers.
Arvanitoyannis et al. [33] and Camina et al. [34] have recently reviewed the application of analytical and chemometrics methods for the classification of honey.
The most common frauds in the honey market are the following:
l adulteration: l honey produced with illicit addition of water; l sophistication: l honey produced with illicit addition of sugars (mostly glucose) or molasses; l counterfeiting: l honey labeled as unifloral (e.g., Acacia honey) which is actually thousand
flower honey, i.e., with botanical origin different from the one declared; l honey made in foreign countries sold as local product.
1.3.8 Products from CerealsCereals have been used since antiquity for both human and animal nutrition. The most common cereals are corn, wheat, rice, barley, rye, and oats. From milling of some cereals, flours are obtained which are the bases for production of several com-mon derivatives, such as bread, pasta, and bakery products. The industrial process-ing of cereals comes through milling and other mechanical procedures, which make flours and other intermediate products easily traceable. The same holds for cereals, which are consumed after collection and refining, as in the case of rice. In the case of bread and bakery products, instead, additional substances are involved such as yeasts, fats, salt, eggs, etc., which complicate the possibility of tracing.
It must be considered that the commercial value of cereals and bakery products can hardly justify classification studies; nevertheless, valuable niche productions,
Food Forensics Chapter | 9 459
such as the pane nero di Castelvetrano (Sicily) or some rice varieties (Indian–Pakistani basmati rice), could take advantage from authentication studies.
Vlachos and Arvanitoyannis recently reviewed the methods for classifica-tion of rice [35] and maize [36].
The most common frauds in the cereals market are the following:
l sophistication: l production of pasta labeled durum wheat semolina, made from durum
wheat semolato; l production of pasta labeled durum wheat semolina, made from soft wheat
flour; l counterfeiting: l partial or total substitution of higher quality products, i.e., basmati rice
with lesser value rice cultivars; l products of similar cultivars sold as original productions, i.e., basmati rice
brand assigned to rice produced from countries other than Himalayan foot-hill regions of India and Pakistan.
1.3.9 Organic FoodThe term organic food is limited to foodstuffs and agricultural productions obtained in the respect of biological equilibria, of human and animal health, and in the safe-guard of environmental resources. This statement includes use of natural tech-nical means, exclusion of chemical products and excessive exploitation of natural resources. Organic farming systems involve using organic fertilizers, such as animal manure and extensive cultivation of nitrogen-fixing plants. Conventional farming systems, on the contrary, allow to use agrochemicals and synthetic fertilizers.
From the classification point of view, the sector of organic foodstuffs is deli-cated. In this case, more than individuating the link between soil and product, it is important to verify analytically whether an organic product can be distin-guished from a conventional or industrially made one. Differences in farming systems should be reflected in the chemical composition of plants growing on different crops, but it is difficult to evidence chemical markers able to trace or even authenticate really organic products. Several analytical tests exist based on the presence/absence of prohibited compounds (e.g., agrochemicals, pesticides, heavy metals, etc.). The content of pesticide residues is systematically lower in organic plant products than in conventional products; the same holds with concern to drugs in organic meat versus conventional meat. However, the num-ber of undesired compounds is too large to be wholly checked. At present, the discrimination among organic and conventional products is troublesome on an analytical base. Better chemical markers are needed.
The analytical methods for classification of organic foodstuffs have been recently reviewed by Capuano et al. [37].
The most common frauds in the organic food market are the following:
l sophistication: l foodstuffs produced with illicit addition of various compounds;

460 PART | II Mass Spectrometry Applications within Food Safety and Quality
l counterfeiting: l production of foodstuffs using technical means not allowed (fertilizers,
pesticides, etc.); l marketing of agricultural products declared as obtained from organic farm-
ing, with a label quoting certification, while they come from conventional farming;
l importing, packaging, or marketing of products labeled as organic, lacking the mandatory certificate;
l production and manipulation of products labeled as organic without the producer had submitted to the requested control system;
l improper use of captions such as natural, bio-, eco-, incorrectly recalling an organic method for conventional products;
l undeclared use of genetically modified food.
2. MASS SPECTROMETRIC ANALYSIS FOR FOOD FORENSICS
2.1 Analytical Methods in Food Forensics
In the last 15–20 years, a large number of highly sophisticated techniques, not spe-cifically developed for food classification, have been found to be suitable in food forensics. Spectroscopic techniques such as nuclear magnetic resonance (NMR) and infrared spectrophotometry (FT-IR) have been used in several applications on all kinds of foodstuffs [38,39]. Other techniques, usually developed for determi-nation of compounds of biological interest, resulted to be useful; this is the case of chromatographic, electrophoretic, and enzymatic analysis. More recently, DNA analysis has proven to be one of the most powerful techniques in food forensics [40] as it is in all sectors of forensic analysis. It is no doubt, however, that the lion’s share in food forensic is played by mass spectrometric (MS) techniques. The key role of MS in individuating elemental and molecular parameters that can be used as markers in the classification of foodstuffs cannot definitely be under-estimated. Due to the great diagnostic potential in classification of foodstuffs, the application of MS techniques in food forensics has received much attention in the scientific literature; the subject has been recently reviewed by Aiello et al. [41] and by Drivelos and Georgiou [42] with concern to the geographical origin of foods in the European Union. Further references to applications of MS can be found in more general discussions on the subject of food forensics [40,43–48].
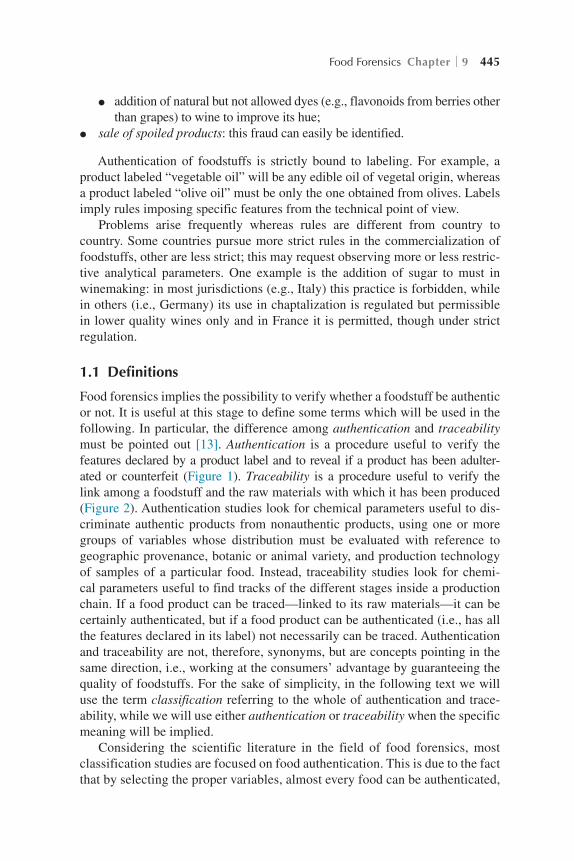
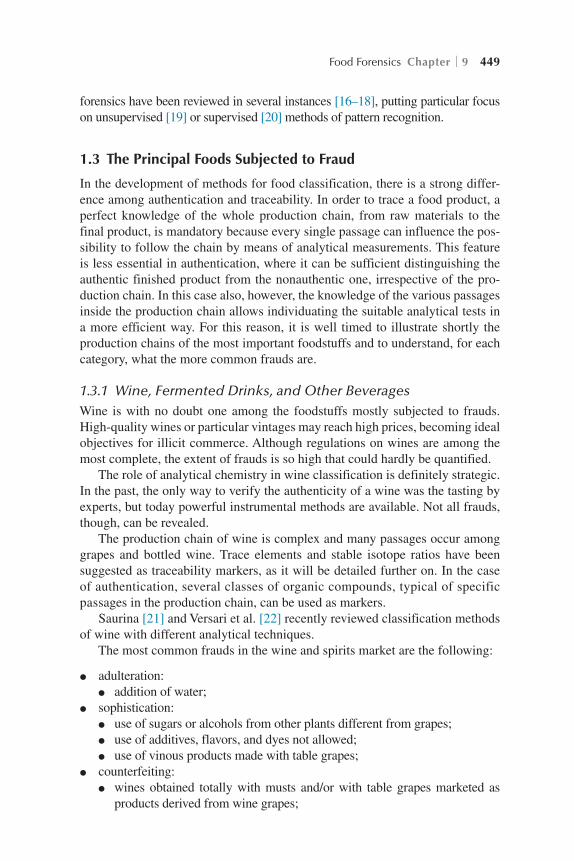
MS techniques can be used in food forensics with concern to three main classes of chemical markers (Figure 4):
l isotope ratios: the most powerful markers for food classification, a fact certi-fied by several hundred of scientific publications;
l trace elements: mass spectrometry coupled with plasma techniques can deter-mine elements at trace and ultratrace level, which are known to act as geo-chemical markers;
l molecular ions of ionic fragments: whole molecular ions or low molecular weight ions can be used to identify typical patterns.

Food Forensics Chapter | 9 461
2.2 Isotope Ratios as Chemical Markers
The role of isotope ratio analysis is well known and consolidated in scientific field, in particular with concern to stable isotopes analysis (SIA). Its poten-tial has been soon recognized in the field of food forensics, thanks to the comprehension of the mechanisms ruling isotopic fractionation of light ele-ments, i.e., the elements constituting living matter. On the basis of ultraslight variations in isotope ratios, SIA allows identifying molecules in foodstuffs with similar chemical structure but coming from different raw materials or
FIGURE 4 Chemical markers useful in food classification.
462 PART | II Mass Spectrometry Applications within Food Safety and Quality
produced with different processes, e.g., for biological versus industrial syn-thesis. With concern to determination of hydrogen isotope ratio, the most powerful SIA method is site-specific natural isotope fractionation–nuclear magnetic resonance (SNIF-NMR), developed by Martin and Martin [49] at the beginning of 1980s; further on, Caer et al. showed the potential of SNIF-NMR for determination of 13C/12C ratio also [50]. The use of mass spec-trometry to perform isotope ratio measurements is much older, as it has been initiated in the field of geosciences in the 1940s and 1950s. This soon has led to the development of the powerful technique known as isotope ratio mass spectrometry (IRMS). Technical details on SIA and IRMS can be found in several publications [51–53].
The high diagnostic power of IRMS has been recognized at legislative level by indication of its use, together with SNIF-NMR, inside national and interna-tional laws ruling food analysis. In the European Union legislation, EC Regula-tion No 2676/90 [54] and successive amendment in EC Regulation No 822/97 [55], ruling Community methods for the analysis of wines, indicated IRMS for determination of 18O/16O isotopic ratio of water content in wines, useful for identifying fraudulent addition of water. A further amendment in EC Regulation No 440/2003 [56] indicated IRMS also for determination of 13C/12C isotopic ratio in wine alcohol in order to identify fraudulent addition of sugar from cane or beet. Similar solutions have been adopted by organisation international de la vigne et du vin (OIV) in Resolution OENO 17/2001 [57] concerning IRMS determination of 13C/12C ratio on wine ethanol, Resolution OENO 7/2005 [58] concerning IRMS determination of 13C/12C ratio on CO2 in sparkling wines, and Resolution OENO 353/2009 [59] concerning IRMS determination of 18O/16O ratio on water in wine and must. In the UK, the application of SIA techniques for food forensics has been strongly supported by the British Food Standards Agency (FSA) since the mid-1990s. In a similar way, the European Office for Wine, Alcohol and Spirit Drinks (BEVABS), established by EU in 1993, recom-mended the use of SIA to combat major fraud in the beverage sector since 1997. In the USA, the Association of Official Analytical Chemists indicated IRMS as method of choice for determination of 13C/12C isotopic ratio in honey [60] and fruit juices and maple syrups [61].
IRMS applied to whole samples is usually known as bulk SIA. Since the middle of 1980s, a new type of instrument, resulting from the interface of IRMS to a gas chromatographic system, became available. This hyphenated system allowed performing what is commonly known as compound-specific isotope analysis (CSIA), i.e., determination of isotope signatures at the molecular level. Despite the main applications of CSIA are in environmental studies, this tech-nique has also proved to be a powerful method for food forensics. CSIA can be also carried out by extraction of single compounds from the sample.
IRMS has been used for classification of several different types of food-stuffs. Once again, it is necessary to distinguish between authentication and traceability. Isotope ratios of light elements, such as hydrogen, boron, carbon,
Food Forensics Chapter | 9 463
nitrogen, oxygen, and sulfur, are strongly influenced by chemical, physical, and biological phenomena. Instead of using the simple ratio, it is more common to compare δ value that is the ratio of isotopes in the sample to the ratio in a standard. δD values in plant products originate from the water taken up by the roots and are higher in regions with relatively low humidity. δ13C values are more bound to the metabolism of plants, with particular concern to the pathway followed in fixation of CO2: the main discrimination is between C3 (the first product of photosynthesis is 3-phosphoglycerate) and C4 (the first product of photosynthesis is a C4 unit) plants [62]. C3 plants account for 95% of edible species, among which sugar beet, potato, rice, barley, wheat, soy, sunflower, olive, rye, apricot, orange, grapes, and peanut. C4 plants are 1%, examples are sugarcane, sorghum, maize, and millet. A minor category, to which pineapple, vanilla, agave, and cactus belong, is the one associated with Crassulacean acid metabolism (CAM). δ18O values originate from CO2, H2O, and O2 and cor-relate with water, reflecting the isotopic composition of groundwater and the average precipitations in the region (related to latitude, distance from the sea and altitude) and the extent of evapotranspiration, mainly influenced by humid-ity and temperature [63]. The geographical signature from water is transferred into plant and animal products [64]. δ15N values have relatively shorter ranges but vary according to different factors: the nitrogen cycle (fixation, uptake, mineralization, nitrification, and denitrification), trophic ecology (an increase in trophic level correlates with an increase in δ15N value), and anthropogenic activity [65]. Finally, δ34S values are bound to sulfur sources such as bedrock weathering, atmospheric deposition, and microbiological activity. When plants are converted into food for man or animals, geographic provenance, animal/botanic species, or way of processing are all factors that can cause strong frac-tionation in the ratios of light elements in products, providing therefore the basis of authentication schemes. At the same time, high rates of fractionation are a negative feature if traceability, where constant parameters are sought for, is the objective; therefore, light elements isotope ratios usually are not efficient trac-ers. On the contrary, isotope ratios of heavy elements, such as strontium or lead, are not influenced by biological phenomena, since the corresponding ele-ments are usually kept off from biological cycles; therefore, once established into rocks, they are potentially maintained unaltered in the passage from soil to food. Isotope ratios of Sr and Pb change strongly from rock to rock. In the case of strontium, 87Sr is a radiogenic nuclide generated by the radioactive decay of 87Rb, so its content in rocks (and consequently in soils derived from them) increases with age; 87Sr/86Sr values are therefore lower in younger rocks such as carbonaceous, volcanic, and basaltic rocks and higher in older rocks such as magmatic and metamorphic rocks. The case of lead is more variegated: this ele-ment has three radiogenic nuclides, 206Pb, 207Pb, and 208Pb, plus one nonradio-genic, 204Pb. Different ratios are possible with a strong link to the age of rocks. The role of the isotopic signatures of strontium and lead as suitable markers for geologic and therefore geographic provenance of foodstuffs has been generally
464 PART | II Mass Spectrometry Applications within Food Safety and Quality
discussed in many studies [42,66–68]. Of particular interest is a recent, funda-mental study by Voerkelius et al. [69] in which authors showed that an 87Sr/86Sr database of surface waters could be used to predict the geographic origin of some types of food, such as honey and wheat.
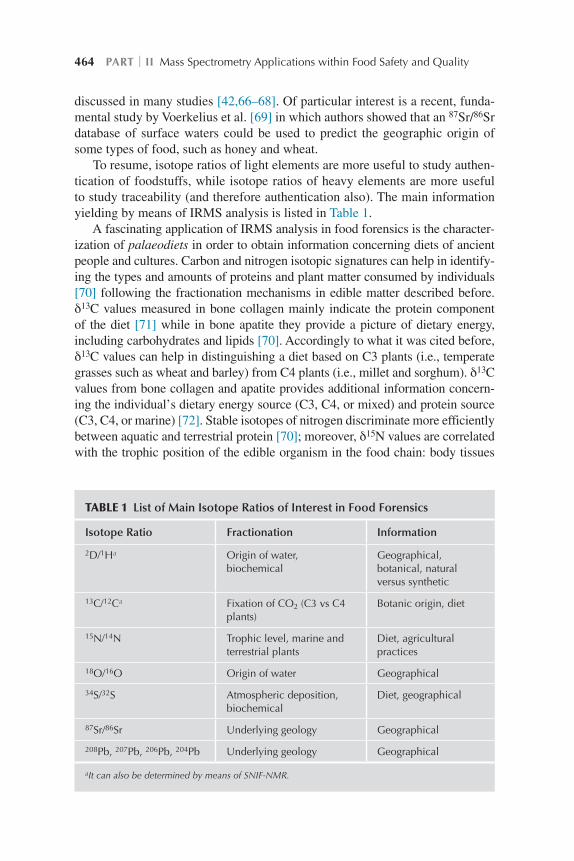
To resume, isotope ratios of light elements are more useful to study authen-tication of foodstuffs, while isotope ratios of heavy elements are more useful to study traceability (and therefore authentication also). The main information yielding by means of IRMS analysis is listed in Table 1.
A fascinating application of IRMS analysis in food forensics is the character-ization of palaeodiets in order to obtain information concerning diets of ancient people and cultures. Carbon and nitrogen isotopic signatures can help in identify-ing the types and amounts of proteins and plant matter consumed by individuals [70] following the fractionation mechanisms in edible matter described before. δ13C values measured in bone collagen mainly indicate the protein component of the diet [71] while in bone apatite they provide a picture of dietary energy, including carbohydrates and lipids [70]. Accordingly to what it was cited before, δ13C values can help in distinguishing a diet based on C3 plants (i.e., temperate grasses such as wheat and barley) from C4 plants (i.e., millet and sorghum). δ13C values from bone collagen and apatite provides additional information concern-ing the individual’s dietary energy source (C3, C4, or mixed) and protein source (C3, C4, or marine) [72]. Stable isotopes of nitrogen discriminate more efficiently between aquatic and terrestrial protein [70]; moreover, δ15N values are correlated with the trophic position of the edible organism in the food chain: body tissues
TABLE 1 List of Main Isotope Ratios of Interest in Food Forensics
Isotope Ratio Fractionation Information
2D/1Ha Origin of water, biochemical
Geographical, botanical, natural versus synthetic
13C/12Ca Fixation of CO2 (C3 vs C4 plants)
Botanic origin, diet
15N/14N Trophic level, marine and terrestrial plants
Diet, agricultural practices
18O/16O Origin of water Geographical
34S/32S Atmospheric deposition, biochemical
Diet, geographical
87Sr/86Sr Underlying geology Geographical
208Pb, 207Pb, 206Pb, 204Pb Underlying geology Geographical
aIt can also be determined by means of SNIF-NMR.

Food Forensics Chapter | 9 465
are generally 3–4‰ higher than the δ15N of the diet [73]. Examples of recent palaeodietary studies were those by Killgrove and Tycot [74] who investigated human skeletons found in two cemeteries in Rome dating to the Imperial period (first–third centuries AD) and by Gregoricka and Sheridan [75] who analyze skel-etons from an early medieval Byzantine monastery in Jerusalem.
In the following paragraphs, examples of applications of IRMS analysis to food forensics are cited with concern to different food categories. This matter has been reviewed by Rossmann [66].
2.2.1 Wine, Fermented Drinks, and Other BeveragesA major part of IRMS applications in food forensics is devoted to wine. Three main objectives are sought for: (1) identification of addition of water; (2) identi-fication of addition of sugars coming from plants other than grapes; (3) recogni-tion of the geographic provenance.
The first objective can be obtained from the determination of 18O/16O iso-topic ratio of water [76]. A close correlation between the oxygen isotope sig-nature of must and the related wine water must be found in genuine wines. Actually, there is a very low chance that water illicitly added to wine had the same isotopic signature of the original water, which confirms the potentiality of the method in recognizing this kind of fraud.
Addition of sugars obtained from plants other than grapes needs a two-step approach. The discriminating factor is the metabolic pathway followed by plants to fix CO2: C3 plants have 13C/12C isotopic ratio values more negative in terms of δ13C [77]. Sugars from cane or maize can be easily detected, being them C4 plants while grape is a C3 plant. Addition of sugar from beet needs a further step, being beet a C3 plant as well; in this case determination of D/H ratio by means of SNIF-NMR helps in further discrimination between grapes and beet, being δD values higher in sugars from grapes.
Also of interest in enological field is the identification of addition of syn-thetic ingredients in winemaking. Moreno Rojas et al. [78] investigated the pos-sibility of frauds committed using natural external l-tartaric acid in wines by means of IRMS. Particular focus was given to l-tartaric acid extracted from tamarind in place of the natural compound present in grapes, which is the only source allowed for acidification treatments according to both EU and OIV regu-lations. Samples of l-tartaric extracted from musts in Romania were compared with samples extracted from commercial tamarind pulp of four different ori-gins (India, Mexico, Colombia, and Thailand). The different botanical sources (grapes vs tamarind) were discriminated on the basis of δD, δ13C, and δ18O val-ues. Combining hydrogen, carbon, and oxygen isotopic signatures, it was also possible to distinguish between natural l-tartaric acid and synthetic l-tartaric acid (petroleum by-products).
For what concerns the determination of the geographic provenance, the situ-ation is more complicate. EU regulation 2676/90 [54], apart from establishing rules for identification of fraudulent water addition to wine, set the rules for

466 PART | II Mass Spectrometry Applications within Food Safety and Quality
creation of a database of isotopic ratio values in wines in order to allow the possibility of recognizing the geographic provenance of a wine. Wines from the main European wine-producing countries and also from some foreign countries have been analyzed since then, collecting every year hundreds of samples and determining D/H values of ethanol by 2H-NMR, δ13C values of ethanol, and δ18O values of wine water. Conventional wine analysis data are included. Due to the different possibilities of adulteration and to the relevant seasonal and regional variability, though, it is hard to obtain a reliable assessment of geo-graphic provenance [66]. This is a consequence of the intrinsic variability of light elements isotopic signature.
On the contrary, the isotopic signatures of heavy elements are more constant, because they are not subject to relevant seasonal variability and to biological cycles. Several studies showed that strontium and lead isotope ratios are pow-erful markers of geographic provenance. Horn et al. [79] were among the first suggesting that the isotopic signature of strontium could be a tracer for the geo-graphic provenance of wine. Almeida and Vasconcelos [80] demonstrated that, while total Sr concentration changes dramatically along the passage from soil to bottled wine, 87Sr/86Sr ratio keeps identical, providing a tool for the identifica-tion of the geographic provenance of a wine. This result is justified by the fact that the isotopic signature of strontium, once set into rocks, has not influenced biological or chemical phenomena so that it can be considered a powerful geo-graphic marker. Several studies thereafter have confirmed these results [81–83]. Similar but not identical considerations can be drawn on the use of lead isotope ratios. Contrarily to strontium, which is almost totally an element of natural ori-gin, lead in wine has two major sources [84]: the primary source is linked to soil, as for strontium, while the secondary source is anthropogenic and it involves fertilizers, pesticides, road traffic (the introduction of leaded gasoline in 1939 by Ford has caused an increasing lead pollution in the environment, reversed in the 1970s due to the introduction of unleaded fuel), and the equipment used during vinification. Therefore, the isotopic signature of anthropogenic lead can overlap to the geochemical one. Despite this, several studies have investigated the pos-sibility of determining the geographical origin of wine samples on the basis of lead isotopic signature [85,86]. An additional feature is that in the case of lead, more than one isotope ratio can be exploited. The key factor in the determination of lead isotope ratio is the precision of the instruments used. Conventional quad-rupole inductively coupled plasma–mass spectrometry (ICP-MS) has a limited potential for distinguishing very small differences between isotope ratios, while higher precision of measurement is yielded by ICP-Time of Flight-MS, thermal ionization mass spectrometry, and multicollector sector-field-ICP-MS.
Recently, the use of boron as 11B/10B isotope ratio has been suggested as additional means for wine traceability; the results obtained by Vorster et al. [87] in discrimination of wines from South Africa seems promising, but at present this element has not found many applications in food forensics, though its natu-ral isotopic variation could go as wide as 90‰ [88].
Food Forensics Chapter | 9 467
In food forensics, a relatively lower amount of research has been devoted to spirits. In this field also, however, do exist authenticity issues such as delib-erate and illegal substitution of a prised brand with a cheaper one. Simpkins and Rigby [89] were among the first to apply IRMS for identification of coun-terfeit spirits. Among hard liquors, whisky is a traditional drink with a strong commercial value, which production is defined by both EU and local regu-lations. Prices for whisky bottles can vary dramatically according to purity (single malt vs blended), vintage, geographic provenance (Scotland vs Ireland vs Northern American countries), and raw matters (barley vs corn/wheat). For this reason, several studies have tried to develop methods for whisky clas-sification according to the variables cited. Using compound-specific isotope analysis of hydrogen in ethanol, Hilkert et al. [90] discriminated single malt whiskies made from barley (a C3 plant) from blended whiskies made from barley and corn (a C4 plant) and from whiskies made from corn alone. This classification was made possible due to the high rate of variation of δD among C3 and C4 plants. Parker et al. [91] used compound-specific isotope analysis of carbon in volatile congeners, classifying whiskies of different brands. More recently, Meier-Augenstein et al. [92] found a good correlation among δD and δ18O values for waters used in the production of Scottish whiskies and the corresponding bottled whiskies, allowing to develop a method for geographic classification and for identification of counterfeit products. Again, with appli-cation of compound-specific isotope analysis of carbon, Rhodes et al. [93] developed a method for identification of illicit addition of neutral alcohol to whisky, based on internal isotopic correlations for ethanol and the congeners from the same sample.
Bottled water accounts for a relevant segment of the food market, with par-ticular concern to the Italian market. Frauds are always possible in terms of product misrepresentation. As an example, carbonated water can contain natu-ral CO2 coming from sources or industrial CO2 artificially added. IRMS can be applied to the classification of mineral waters, investigating the correlation among the isotopic signature of hydrogen and oxygen in bottled water with estimated mean annual precipitation isotope ratios for source or bottling loca-tions. Carbon isotopic signature in the dissolved inorganic carbon of carbonated bottled water can yield information on the origin of CO2; extreme negative val-ues of δ13C in bottled waters can be due to exogenous (industrial) CO2 sources. Raco et al. [94] investigated samples of bottled water from Italy, among which some sparkling waters (i.e., naturally carbonated). δ2D and δ18O values of sam-ples were found to vary within the reported natural variations for Italian waters as samples lied along the global and Italian meteoric water line. According to the authors’ opinion, these values might reflect relatively unaltered source water signatures. Voerkelius et al. [69] carried out a large-scale investigation of stron-tium isotope ratios on 650 different European natural mineral waters as part of the food traceability project ‘‘TRACE” funded by the EU. Isotopic data were combined with a GIS-based geological map of Europe in order to elaborate a
468 PART | II Mass Spectrometry Applications within Food Safety and Quality
novel spatial prediction for strontium isotopic composition of groundwater and thus the composition of bioavailable strontium, which is available for uptake by plants and subsequently transferred into the food chain.
2.2.2 Milk and Dairy ProductsThe classification of milk and some dairy products can be obtained by IRMS anal-ysis. Scampicchio et al. [95] analyzed raw, pasteurized (HTST), and ultrapasteur-ized (UHT) milk from different Italian origins by determining δ13C and δ15N for milk and milk fractions (fat, casein, and whey). Significant changes in δ13C and δ15N were observed as a function of heat processing, which allowed identifying markers useful for pattern recognition methods. It was possible to discriminate simultaneously the geographical origin and type of processing of milk samples.
Of particular concern is the possibility of verifying the provenance of cheeses, which in several cases are high-quality products. Intermediate pro-cesses in the production chain play, of course, a relevant role in fixing the isoto-pic signatures of light elements. 13C/12C ratio in milk fat and in cheese protein reflects the type of forage fed to the cows mainly constituted of C3 plants. Also 15N/14N ratio results from forage, but the use of organic fertilizers and intensive farming methods can increase this value; other influent factors are climate and soil conditions. Finally, nitrogen-fixing plants, such as leguminosae, have lower δ15N than nonnitrogen-fixing plants and can be administered in the cows’ fod-der. 18O/16O ratio of milk depends on the water ingested and the proportion of fresh versus dry fodder; ultimately, climatic features play a primary role.
Mozzarella cheese is a highly renowned Italian product made from buffalo milk, characterized by a protected designation of origin (PDO). Brescia et al. [96] analyzed buffalo milk and mozzarella cheese from two sites in Southern Italy; authors found that milk could be distinguished on the basis of 13C/12C versus 15N/14N ratios, probably due to a difference in the diets of buffalos in the two locations, while in order to distinguish mozzarella samples, D/H data determined by means of SNIF-NMR must be included. Pillonel et al. [97] distin-guished Emmental cheeses produced in six European regions: Allgau (Germany), Bretagne and Savoie (France), Finland, Switzerland and Vorarlberg (Austria). Different variables were used in the study: stable isotope ratios of light elements (13C/12C, 15N/14N, 18O/16O, and D/H) and of 87Sr/86Sr and concentrations of major (Ca, Mg, Na, K), trace (Cu, Mn, Mo, I), and radioactive elements (90Sr, 234U, 238U) elements. A complete discrimination was obtained only by using all the variables determined, since isotope ratios yielded a partial classification.
2.2.3 Vegetable OilsOlive oil is a noble product with a very long tradition, with particular concern to the Mediterranean area (olive tree was already cultivated in Syria at least 6000 years ago). It is commonly recognized that the highest quality oils are produced in Italy and Spain. Frauds in the olive oil market are frequent since

Food Forensics Chapter | 9 469
it is not easy to identify products with features different from those declared in labels, at least for what concern the geographic provenance of the raw mat-ter. For this reason, several studies have investigated the possibility to classify samples. Most of the studies concern extra virgin olive oils, the products with highest quality. Camin et al. [98] carried out a thorough analytical study within the framework of the food traceability project “TRACE” funded by EU, in which authors analyzed 267 olive oils coming from eight European sites. Both isotopic (H, C, and O stable isotope ratios) and elemental concentrations were determined. In addition, the same parameters were measured in 314 fresh sur-face waters from the same sites. The main scope of the project was verifying whether olive oils could be discriminated according to the climatic and geo-logical characteristics of the sites on which they were produced, and finding a possible relation with the corresponding surface waters. δD and δ18O values in oils resulted to be correlated to each other and to corresponding waters. δ13C and δ18O showed significant correlation with geographical parameters, such as latitude and distance from the coast, and climatic parameters, such as tempera-ture, relative humidity, and amount of precipitation; δD correlated with latitude, distance from the coast, altitude, and temperature. Pattern recognition carried out with canonical discriminant analysis (CDA) allowed a good classification on a geographic scale; this result was improved adding elemental data as vari-ables in the classification.
Also, it is possible to verify the addition of lesser quality oils to olive oil with compound-specific IRMS (even if this issue can be addressed much more easily by GC-MS). Blending of olive oil with edible oils with slightly different fatty acid composition (olive pomace, sunflower, hazelnut) might be detected by using δ13C16:0 versus δ13C18:1 covariations combined with molecular infor-mation and carbon isotopic composition of the bulk oil [99].
2.2.4 MeatsIt is not surprising, due to the importance of meat in the diet of Western coun-tries, that stable isotopes, together with trace element distribution, had been frequently used for meat classification. As discussed before, the production chain of meat is complex due to several confounding factors such as the var-iegated diet of livestock, the movement of animals among different farms (or even farming systems) before slaughtering, and the metabolic turnover times of animal tissues [100]. Studies have been carried out on beef [101–105], lamb [106,107], and pork meat [108]. More recently, Heaton et al. [109] carried out an extensive study in which they analyzed beef samples from the major cat-tle producing regions of the world (Europe, USA, South America, Australia, and New Zealand) with both IRMS and ICP-MS. The results were promising for what concerns the geographic classification. Measurements carried out on defatted dry mass (DDM) showed that δ13C values were clearly lower in beef samples from England, Ireland, and Scotland than in American samples (Brazil and USA); similar results have been reported by Schmidt et al. [105]. It is well
470 PART | II Mass Spectrometry Applications within Food Safety and Quality
known that differences in δ13C values are bound to the proportion of C3 and C4 plant materials in the diet of livestock. Extensive C3 pasture feeding is the prevailing system in Northern Europe, while feeding with maize or grain (C4) is more common in American countries, which accounts for the less negative values. Beef samples from Central and Southern Europe show an intermediate behavior, indicating possibly prolonged periods of maize feeding. δ15N values have smaller variations, but higher values may indicate the use of marine prod-ucts (fishmeal, seaweed) in the cattle feed [110] or feeding with other animal products: it is known that increases in the trophic level can raise δ15N values of around 3%; this practice, however, is forbidden in Europe because of the risks of BSE infection [111]. Low values of δ15N may be due to the use of synthetic nitrogen-based fertilizers, whose isotopic signature can pass through crops, cereals, and eventually cattle diet, or to foraging of leguminous clover or con-centrates. Of particular interest is the isotopic signature described by 18O/16O. This parameter was measured on beef lipid in place of beef DDM due to instru-mental problems. It was found that a significant correlation existed among δ18O values and latitude of the production region. Data from 2D/1H analysis gave similar responses and a plot of δ2D versus δ18O mean values in beef lipid showed even better this feature, with samples from higher latitudes (Scotland, New Zealand, Shetland, England, etc.) ranging at lower values and samples from warmer climates and lower latitudes (Southern Africa, Australia, Brazil, and Uruguay) ranging at the opposite side. A supervised pattern recognition analysis with CDA, applied to isotopic and elemental data, allowed classifying samples into three broad groups, i.e., European, South American, and Austral-asian. Finally, Guo et al. [112] showed that information on the dietary intake of livestock and geographical origin could be obtained with isotopic analysis of C and N from defatted beef as well as from crude fat and tail hair.
The classification of meat and meat products with isotopic analysis has been reviewed by Montowska and Pospiech [113] and by Zhao et al. [114].
2.2.5 FishIn the classification of fish using isotopic (as well as elemental) parameters, it is usual analyzing otoliths and/or scales, while soft tissues and bones are less useful. Otoliths have metabolic inertness and their composition can reflect the environmental history of organisms. Determination of isotopic signature can help establishing fish origin. 18O/16O and 2D/1H ratios are strongly latitude dependent, while 13C/12C ratio is bound to metabolism and diet [115]. 87Sr/86Sr has great potential in determining the geographic origin [116].
Salmon is a fish typically subjected to frauds, with particular concern to the actual geographical provenance and whether the fish is caught or farmed. Wild or line-caught salmon can cost three times farmed salmon. A comprehensive study on salmon classification was carried out by Thomas et al. [117], who analyzed a large number of samples of wild and farmed Atlantic salmon from 32 origins within Europe, North America, and Tasmania. Hydrogen, carbon,
Food Forensics Chapter | 9 471
oxygen, and nitrogen isotope ratios were determined in different parts of ani-mals (muscle, oil, and body water) and in different molecular fractions extracted (glycerol, fatty acids, lipids). It can be assumed that the isotopic signatures in salmon reflected both the environment in which it is grown and the composi-tion of the diet consumed. Results of IRMS analysis evidenced that δ15N val-ues measured on choline and δ18O values measured on total oil were the best variable for discrimination between wild and farmed fish, while it was more difficult to discriminate between different geographical origins. These results were confirmed by Anderson et al. [118] who analyzed for its elemental and isotopical composition of a large number of salmon muscle tissues from the Pacific Ocean.
Isotopic methods of classification of fish have been recently reviewed by Lavilla et al. [29].
2.2.6 Fruits and VegetablesThis category comprised fruits, vegetables, spices, flavors, herbs, tea, and cof-fee. A large part of food forensics studies involving IRMS are devoted to clas-sification of these products, due to low complexity of their production chains. Zhao et al. [114] recently reviewed the applications of IRMS in classifica-tion of agroproducts from plant sources. Bontempo et al. [63] carried out a vast research on characterization of tomato and its derivatives, using isotopic (δ13C, δ15N, δ18O, δ34S, δD), elemental (trace elements), and anionic param-eters (major anions), verifying how these variables change along the production chain and evaluating their usefulness as geographical origin markers. Tomato samples were from three Italian regions: Piedmont, Emilia-Romagna, and Apu-lia. Juice, passata, and paste were analyzed in all cases. Analysis of variance evidenced the statistically significant variables in the discrimination: for what concerns the differently processed tomato products δD, δ18Obulk, δ18Owater, B, Cr, Sr, Ba, phosphate, sulfate, and chloride were highlighted, while for the dif-ferent geographical origin δ13C, δ15N, δ18Obulk, δ34S, δ18Owater, Li, Mg, P, K, Cr, Fe, Co, Ni, Ga, As, Se, Mo, Cd, Sn, Sb, Ba, La, Eu, Gd, Tm, Tl, Pb, and U were found. Classification with linear discriminant analysis (LDA) allowed a good discrimination on the basis of geographic provenance, with selection of 10 variables: Gd, La, Tl, Eu, Cs, Ni, Cr, Co, δ34S, and δ15N.
Spices can be considered quality foods in cases in which they express tra-ditional values and are obtained with highly selected raw matters and difficult processes. Among spices, the most valuable is saffron, obtained from stigmas of C. sativus. Saffron of the highest quality can be sold at 15.000–20.000 €/Kg, which renders a good idea of the importance of classification. Martin et al. [119] used the carbon isotopic signature to distinguish between safranal extracted from authentic saffron versus that produced by chemical synthesis, but δ13C val-ues were not so different; application of SNIF-NMR for determination of 2D/1H ratio was more successful. More recently, Maggi et al. [120] analyzed 28 saffron samples from leading producers (Greece, Iran, Italy, and Spain) and from the
472 PART | II Mass Spectrometry Applications within Food Safety and Quality
same harvesting year (2006). Analyses were carried out on defatted dry matter. Using data from hydrogen, carbon, and nitrogen isotopic analysis treated with CDA, authors succeeded in discriminating samples with concern to geographi-cal origin, with better results than using conventional chemical parameters. A further valuable example of this category is paprika (dried and powdered red pepper), a traditional spice in the Hungarian diet but a well-known and widely used product all over the world. In Hungary, the so-called Szegedi Füszerpa-prika was acknowledged of PDO. Brunner et al. [121] investigated the pro-duction chain of Szegedi Füszerpaprika in order to verify whether processing could alter the isotopic signatures provided by soil. Results of both isotopic and elemental analysis (ICP-MS) showed that the production process has no signifi-cant influence on the Sr isotopic signature and on most of the investigated ele-ments, with the exception of Al, Ti, Cr, and Fe, which were mainly introduced through the cutting process of the dried pods. A unique fingerprint for PDO Szegedi Füszerpaprika could be created in order to discriminate it from foreign paprika products.
With concern to flavors, vanilla is one of the most important and widely used products in the food industry. Natural vanilla flavor, extracted from the pods of the tropic orchid vanilla, is much more expensive than synthetic vanillin: the difference is $1200–$4000/kg for the natural versus $15/kg for its synthetic equivalent. A particular feature of the vanilla orchid is that it is a CAM-type plant, which is advantageous from the diagnostic point of view since its δ13C values are in a characteristic range (around −21.0‰), so they are distinguishable from C3 and C4 plants. However, measurement of δ13C values of bulk vanillin is no longer sufficient for classification purposes because it is possible to enrich synthetic vanillin in 13C on both the methoxyl and aldehydic groups and thereby produce synthetic material with the same δ13C value as that of natural vanillin. Greule et al. [122] determined carbon and hydrogen ratios of vanillin molecule and vanillin methoxyl groups of samples of different origins, including authen-tic, synthetic, and semisynthetic samples, the last ones obtained biosyntheti-cally by wood lignin and eugenol. Results showed that the combined isotopic approach with 13C and δ2H values of both vanillin bulk and vanillin methoxyl groups allowed to fully differentiate between natural vanillin extracted from orchid, synthetic ex guaiacol, and semisynthetic ex lignin, providing a rapid and reliable authenticity assessment of vanillin.
Fruits juices were among the first foodstuffs to be subjected to SIA for iden-tification of frauds. As for wine, measurement of 13C/12C ratio by means of IRMS soon proved to be useful to identify sugars produced from C4 plants, such as corn or cane, in C3 plant products, such as citrus, apple, or grape juices [123]. This measurement is also useful in order to identify fraudulent addition of l-ascorbic acid to juices [124]; most commercially available l-ascorbic acid is produced starting from C4 plant carbohydrates (e.g., maize starch) whereas authentic l-ascorbic acid comes, of course, from C3 fruits so that after isolation from sample juice exhibits δ13C values of 10–14%, range from 19% to 23%.

Food Forensics Chapter | 9 473
Measurement of 18O/16O ratio is used in order to distinguish among directly pressed and rediluted single strength juices. Values of δ18O are higher in authen-tic juices since tap water, used as diluent, is relatively depleted in heavy iso-topes [125]. Guyon et al. [126] used an hyphenated system composed by HPLC linked to IRMS via an interface allowing the chemical oxidation of organic matter (HPLC-co-IRMS); in this way they were able to determine δ13C values of organic acids, glucose, and fructose in lime and lemon juices from various geographical origins. These samples constituted a basis to define a confidence domain to which comparing commercial samples of uncertain origin. Among these samples, several of them presented δ13C values outside the defined range revealing the unlabeled addition of C4-type organic acids or sugars (lemons are C3-type plants), in disagreement with EU regulation.
Tea and coffee are two products of vegetable origin consumed all over the world. For these items, the price is strongly determined by quality, flavor, and the reputation of the producing area; classification is therefore strategic for the market value. Pilgrim et al. [127] classified tea samples from different Asian and African countries by isotopic (δD, δ13C, and δ15N) and elemental (trace elements) data. Geographical classification with pattern recognition methods yielded good results, unaffected by tea type (black, green, or oolong), quality, or harvest year. For what concerns coffee, the isotopic composition of oxygen and strontium [128] and of boron and strontium [129] in samples from different countries were found to be useful in the geographic classification.
Rummel et al. [130] discriminated orange juice samples from different regions in North and SouthAmerica, Africa, and Europe. Isotopic signature of δD, δ13C, δ15N, and δ87Sr allowed a good classification of samples. In addition, authors showed the possibility of recognizing fraudulent addition of orange juice concentrate by comparing 87Sr/86Sr of soluble and insoluble components of the juices.
2.2.7 Animal ProductsStudies on animal products are mainly focused on eggs and honey. Rogers [131] determined carbon and nitrogen isotope values in whole and delipidized yolk, albumen and egg membrane in eggs samples from 18 different brands of chicken eggs laid under caged, barn, free range, and organic farming regimes. It was possible to distinguish free range and organic egg from caged and barn laid eggs on the basis of higher δ15N values, possibly due to a higher animal protein (trophic) contribution to the chicken’s diet in contrast to pure plant-based foods, as suggested by De Niro and Epstein [132]. δ13C values, instead, did not elu-cidate laying regimen. Rock [133] recently reviewed the applications of IRMS techniques for eggs classification.
An important study by Schellenberg et al. [134], within the framework of the food traceability project “TRACE” funded by EU, was focused on the possibility to classify honey samples produced in different European regions by the isotopic signatures of light elements. 516 authentic honeys from 20 European regions were

474 PART | II Mass Spectrometry Applications within Food Safety and Quality
analyzed. Floral types of samples were acacia, brambles, buckthorn, chestnut, citrus, clover, dandelion, eucalyptus, heather lavender, rape, rosemary, sunflower, thyme, forest, and honeydew, plus mixed floral honeys and samples of unknown floral origin. On all samples the stable isotope ratios of hydrogen, carbon, nitro-gen, and sulfur were determined. Analyses were made upon precipitation of honey proteins in order to increase the concentrations of nitrogen and sulfur. Results showed the high potential of SIA in honey geographic classification. A significant correlation was found between δD values in honey protein and climatic condi-tions in the production regions. δ13C values also were found to be influenced by climate, with higher values in samples from warmer and drier regions; regional differences were more significant than botanical origin. Nitrogen isotopic com-position was not clearly correlated with geographical or botanical features of the samples. Finally, δ34S values were correlated with soil sulfur isotopic ratio and eventually with geographical locations of the plant’s growing areas, with strong influence of sea spray for regions close to the sea. Chemometric analysis with LDA identified 13C/12C and 34S/32S as the most discriminant variables.
A further field of forensic investigation on honey is the identification of illicit use of sugar syrups either by addition to honey or by feeding the bee colonies. δ13C values from honey protein, as indicated by the official White method [135], can reveal honey manipulation with C4 plant sugars such as high-fructose corn syrup (HFCS), which derives mainly from maize, while the main nectar-providing sources of the honeybees are C3 plants; the difference between δ13C value of protein and whole honey should be lower than 1‰ [136]. The addition of sugars from C3 plants (beet, wheat), however, cannot be proved by this method. To overcome this drawback, Daniele et al. [137] proposed honey organic acids as internal standards in order to detect honey adulteration.
2.2.8 Products from CerealsCereals are a major part in the diet of most cultures all over the world. Among cereals, rice has attracted most of the attention in classification studies, due to the fact that in many countries the geographic provenance of this product is an important issue to consumers. Several studies indicated that SIA can help in dis-tinguishing the provenance of rice samples [138,139]. Ariyama et al. [140] used isotope signatures of heavy elements, i.e., strontium and lead, to distinguish rice samples from Japan, China, Thailand, and USA. δ87Sr was found to be more effective in the discrimination, also coupled to total Sr and Rb concentration, while lead isotope ratios were found to be more influenced by anthropogenic sources of pollution and therefore less useful in the classification.
2.2.9 Organic FoodThe possibility of discriminating organic foodstuffs from the equivalent items obtained by means of conventional systems has been frequently discussed in the last two decades. Particular interest has been given to the application of δ15N values, due to the fact that the isotopic signature of nitrogen is strongly
Food Forensics Chapter | 9 475
influenced by the type of fertilizers. Synthetic nitrogen fertilizers, commonly used in conventional agriculture, generate low δ15N values (from −6‰ to 6‰) in crops while manures and fertilizers permitted in organic agriculture have much higher values (from 1‰ to 37‰). Camin et al. [141] in their recent study involving a large set of fruits grown in Italy, verified that δ15N is the only isotopic parameter suitable for discrimination of organic fruits from conven-tional fruits, being less influenced by variables such as cultivar, year, and site of production. However, this isotopic parameter becomes unreliable in cases in which organic production is managed with crop rotation or derived from green manure based on leguminous (N-fixing) plants. Laursen et al. [142] investi-gated the possibility of distinguishing vegetables grown with organic agricul-ture from conventionally grown products, using the isotopic signatures of H, C, N, O, Mg, and S to analyzed winter wheat, spring barley, faba bean, and potato. Vegetables were obtained with organic (two different systems, using respectively animal and green manure) and conventional farming systems under similar controlled conditions in two different harvests, 2007 and 2008. Results from SIA analysis showed that none of the isotope ratios measured could allow discrimination of organic versus conventional samples for all the products studied. δD values discriminate organic versus conventional cereals, while δ15N was useful to identify the use of animal manure in organic wheat, barley, and potato. On the contrary, compound-specific isotope analysis of nitrogen and oxygen isotopes in isolated nitrate allowed a good discrimination of organic and conventional plants [143]. These studies suggest that discrimi-nation with δ15N is not valid in all instances and nitrogen isotopic analysis should be combined with other analytical approaches (e.g., other stable isotope ratios or secondary metabolic profiling).
Schmidt et al. [105] investigated the isotopic signatures of carbon, nitrogen, and sulfur in samples of Irish beef coming from organic and conventional farm-ing. Conventional beef samples showed slightly less negative and more variable δ13C values, higher δ15N and lower δ34S values, as a result of different diet regimes of cattle. In the case of poultry meat, Rhodes et al. [144] developed a method based on determination of δ13C to verify whether animals had been corn-fed, a label assigned by EU legislation to chicken fed with a diet contain-ing at least 50% corn for the greater part of the fattening period. δ13C value in protein resulted to be a reliable marker of the dietary status of the chicken, depending on the difference in the ratio of C3 versus C4 plants assumed.
Chung et al. [145] investigated the isotopic signatures of carbon and nitro-gen in organic and conventional milk. Organic milk samples presented on aver-age δ13C values higher and δ15N values lower than those of conventional milk samples, as expected considering dairy cow’s diet and the use of natural ver-sus synthetic fertilizers, but significant variations were found as a function of the collection date and the milk brand. Much better results were obtained by a combination of δ13C and δ15N values which was effective in the discrimination among organic and conventional milk.
476 PART | II Mass Spectrometry Applications within Food Safety and Quality
2.3 Trace Elements as Chemical Markers
Geochemists used trace and ultratrace elements (called for simplicity trace ele-ments further on) since long time ago for their role as markers of rock origin [146]. This is due to several reasons:
l variations of concentration in trace elements are wider than in major and minor elements;
l every system has many more trace elements than major and minor elements, which means a larger set of variables and therefore a potentially higher dis-crimination power;
l trace elements are collectively sensitive to processes to which major and minor elements are not.
These reasons are still valid when trace elements are used for food classifi-cation. In fact, these analytes are considered as suitable variables for geographic classification because they act as territory markers, providing information linked to the geochemical origin of the raw matters with which a food is pro-duced. They can be called primary geographic indicators, differently from organic parameters (e.g., volatile compounds, polyphenols, etc.), which can be considered as secondary geographic indicators when they reflect technologies typical of regional or national traditions.
Of course, not all elements can play this role: chemical transformation of raw matters and addition of external substances all along the production chain can change the original distribution of some elements. From food to food, ade-quate elemental markers must be individuated.
Determination of trace elements can be performed with different elemental techniques, such as graphite furnace atomic absorption spectrometry (GFAAS), inductively coupled plasma–atomic emission spectrometry (ICP-AES), or anodic stripping voltammetry (ASV), but the performance features of the plasma–MS system cannot be matched. ICP-MS is at present the most suitable elemental technique in food forensics. This is due to its features of sensitivity, accuracy and precision, speed of analysis, and ability of determining a large amount of variables in short time. The last feature implies that large set of data can be produced and further on treated with pattern recognition methods for classification studies. Table 2 lists the main analytical features of elemental techniques.
The application of ICP-MS analysis to food forensics is relatively straight-forward since at least 25 years. At the beginning of 1990s, the work by McCurdy et al. [147] on wine analysis was one of the first suggesting that trace element distribution could be utilized for traceability studies of foodstuffs. Since then, several publications have deepened this point.
As for isotope ratios determination, in the case of trace elements determina-tion, the difference between authentication and traceability must be taken into account. In order to set up an authentication scheme for a particular food, a number of elements are determined, from major to trace and ultratrace. The
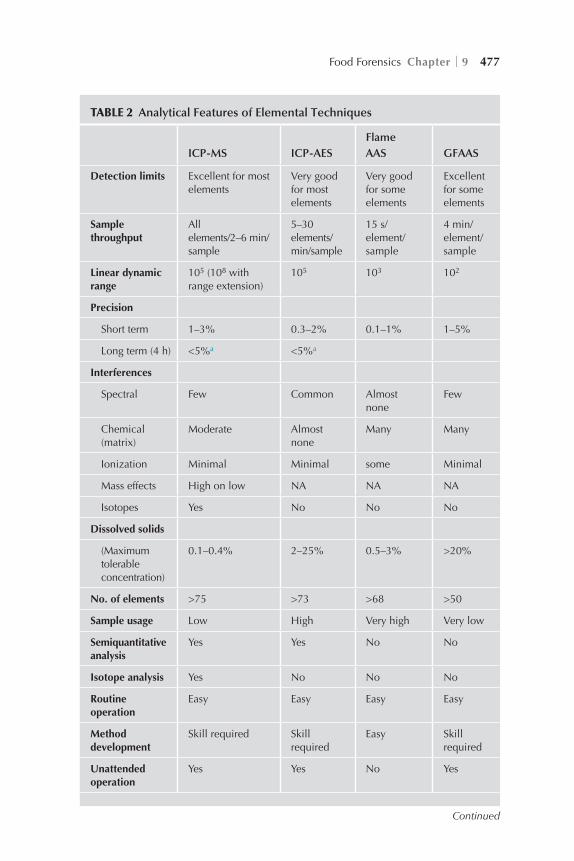
Food Forensics Chapter | 9 477
TABLE 2 Analytical Features of Elemental Techniques
ICP-MS ICP-AESFlame AAS GFAAS
Detection limits Excellent for most elements
Very good for most elements
Very good for some elements
Excellent for some elements
Sample throughput
All elements/2–6 min/sample
5–30 elements/min/sample
15 s/element/sample
4 min/element/sample
Linear dynamic range
105 (108 with range extension)
105 103 102
Precision
Short term 1–3% 0.3–2% 0.1–1% 1–5%
Long term (4 h) <5%a <5%a
Interferences
Spectral Few Common Almost none
Few
Chemical (matrix)
Moderate Almost none
Many Many
Ionization Minimal Minimal some Minimal
Mass effects High on low NA NA NA
Isotopes Yes No No No
Dissolved solids
(Maximum tolerable concentration)
0.1–0.4% 2–25% 0.5–3% >20%
No. of elements >75 >73 >68 >50
Sample usage Low High Very high Very low
Semiquantitative analysis
Yes Yes No No
Isotope analysis Yes No No No
Routine operation
Easy Easy Easy Easy
Method development
Skill required Skill required
Easy Skill required
Unattended operation
Yes Yes No Yes
Continued
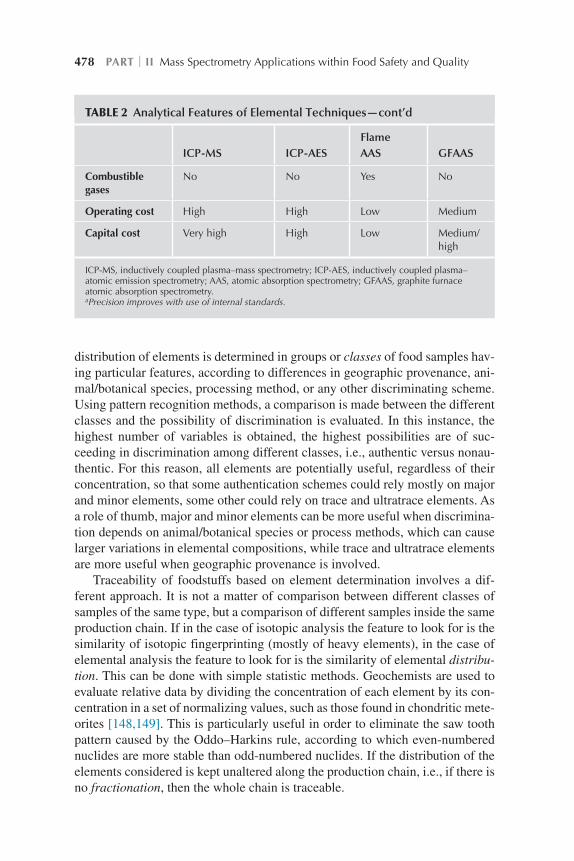
478 PART | II Mass Spectrometry Applications within Food Safety and Quality
distribution of elements is determined in groups or classes of food samples hav-ing particular features, according to differences in geographic provenance, ani-mal/botanical species, processing method, or any other discriminating scheme. Using pattern recognition methods, a comparison is made between the different classes and the possibility of discrimination is evaluated. In this instance, the highest number of variables is obtained, the highest possibilities are of suc-ceeding in discrimination among different classes, i.e., authentic versus nonau-thentic. For this reason, all elements are potentially useful, regardless of their concentration, so that some authentication schemes could rely mostly on major and minor elements, some other could rely on trace and ultratrace elements. As a role of thumb, major and minor elements can be more useful when discrimina-tion depends on animal/botanical species or process methods, which can cause larger variations in elemental compositions, while trace and ultratrace elements are more useful when geographic provenance is involved.
Traceability of foodstuffs based on element determination involves a dif-ferent approach. It is not a matter of comparison between different classes of samples of the same type, but a comparison of different samples inside the same production chain. If in the case of isotopic analysis the feature to look for is the similarity of isotopic fingerprinting (mostly of heavy elements), in the case of elemental analysis the feature to look for is the similarity of elemental distribu-tion. This can be done with simple statistic methods. Geochemists are used to evaluate relative data by dividing the concentration of each element by its con-centration in a set of normalizing values, such as those found in chondritic mete-orites [148,149]. This is particularly useful in order to eliminate the saw tooth pattern caused by the Oddo–Harkins rule, according to which even-numbered nuclides are more stable than odd-numbered nuclides. If the distribution of the elements considered is kept unaltered along the production chain, i.e., if there is no fractionation, then the whole chain is traceable.
ICP-MS ICP-AESFlame AAS GFAAS
Combustible gases
No No Yes No
Operating cost High High Low Medium
Capital cost Very high High Low Medium/high
ICP-MS, inductively coupled plasma–mass spectrometry; ICP-AES, inductively coupled plasma–atomic emission spectrometry; AAS, atomic absorption spectrometry; GFAAS, graphite furnace atomic absorption spectrometry.aPrecision improves with use of internal standards.
TABLE 2 Analytical Features of Elemental Techniques—cont’d
Food Forensics Chapter | 9 479
Of particular interest in traceability of foods are considered the rare earth elements (REE). These elements are popular among geochemists as geological markers, because they can help identifying the origin of rocks. The potential of REE as markers is due to their similar chemical behavior. In biological systems, they do not seem to participate actively to plant metabolism: it is suggested that REE 3+ ions can compete with calcium in some instances but with no discrimi-nation among different REE. Plants tend to assume REE ions from soil with little or no fractionation of the original distribution [150–152]. It has been pro-posed, therefore, that REE distribution in soil could be reflected on plants [13]. It can be hypothesized that only slight or no variations of the original distribu-tion of REE occur when passing from soil to products, in foods with favorable production chains (see Section 1.1).
In the following paragraphs, examples of applications of ICP-MS analysis to food forensics are cited with concern to different food categories.
2.3.1 Wine, Fermented Drinks, and other BeveragesAuthentication studies on wine using trace elements distribution are possibly among the first classification works on foodstuffs. Several works evidenced that elemental patterns can be used to classify wines because these patterns may reveal their geographic provenance [153–156]. Factors such as soil chemistry and regional geology influence the elemental composition of crops and can be exploited positively in the classification. On the contrary, anthropogenic factors such as viticultural practices and processing methods, which can have a strong effect, are more difficult to elucidate.
In 1994, Latorre et al. [157] differentiated the prised Rias Baixas Spanish wine from Galicia—Certified Brand of Origin—from its imitations. Pattern rec-ognition analysis, performed on ICP-MS data, revealed that Li and Rb were the most discriminating variables. Similar studies were carried out by Baxter et al. [158] on wines from different regions of Spain and England. Marengo and Aceto [159] analyzed with ICP-MS samples of five different DOC and DOCG wines obtained from Nebbiolo variety: Barolo, Barbaresco, Nebbiolo d’Alba, Roero, and Langhe Nebbiolo. These wines are different with concern to aging (respectively 3 years, 2 years, 1 year, 6 months, and no aging) and partially to geographic provenance (different areas inside the province of Cuneo, Pied-mont). It was possible to discriminate the five brands by means of pattern rec-ognition methods. The variables with the most discriminating power resulted to be Si, Mg, Ti, Mn, and Mo, which could be related to the aging method more than to the geological features of soil, considering that samples come from a narrow area.
Relatively, fewer studies have been carried on the traceability of wines through determination of elements. Taylor et al. [160] studied soils and wines from the Okanagan Valley and the Niagara Peninsula, the Canada’s two major wine-producing regions. They found that, among trace elements, strontium was able to differentiate both soils and wines from the two regions. Oddone et al.
480 PART | II Mass Spectrometry Applications within Food Safety and Quality
[161] analyzed the samples of soil, grapes, must and wine in four enological production chains from Piedmont (Italy): Gavi, Barbera, Brachetto d’Acqui, and Freisa. Particular concern was given to the role of REE. Data obtained by ICP-MS showed that REE distribution was clearly maintained unaltered in the pas-sage from soil to must; from must to wine some fractionation occurred on heavier analytes (Gd-Lu), possibly as a consequence of winemaking processes, while lighter analytes (La-Eu) seem to remain unaltered. Similar results were obtained by Aceto et al. [162] in a study on Moscato d’Asti white wine in which samples were analyzed at every step of the production chain. The fingerprint of REE was kept unaltered in the passage soil–grapes–must, while fractionation occurred in wine after the clarification with bentonites. In addition, analysis of Moscato musts from 102 samples showed that is possible to classify their geographic ori-gin, building a basis for identification of possible addition of foreign musts.
Classification of wines by means of elements distribution has been recently reviewed by Gonzálvez and de la Guardia [163].
2.3.2 Milk and Dairy ProductsThe classification of milk samples by means of trace elements distribution must take into account two different sources: the metabolism of the animal species producing milk and the geographic location of farms, a factor bound to local geology and hydrology features. Benincasa et al. [164] studied the effect of ani-mal species on milk composition. Milk samples were obtained from cows and water buffaloes fed in an Italian farm with identical forage and water, herded in the same field and managed with similar regimes of veterinary medicinal care. Sixteen elements were determined by ICP-MS. Treatment of data with PCA evi-denced that cow and water buffalo milk samples could be clearly discriminated; in particular, Ca, P, Ga, Zn, Mn, Ba, and S were higher in the water buffalo milk samples while K and Rb were higher in cow milk samples. The final purpose was to identify “biomarker” elements that could be used to check fraudulent labeling of milk and associated by-products, e.g., mozzarella cheese.
In authentication of dairy products based on trace metals, it can be hypoth-esized that most of them, with few exceptions (e.g., Cu), are not influenced by milk transformation processes and therefore, they can reflect the geochemical features of soil-cows’ milk chain. Pillonel et al. [97] in the already cited clas-sification study on Emmental cheeses, determined trace elements with ICP-MS together with and radioactive elements activity. Interesting elements for dis-crimination were molybdenum and sodium.
2.3.3 Vegetable OilsClassification studies on edible oils based on elemental analysis require the superior sensitivity of ICP-MS, since the lipophilic environment of oils keeps the metal con-tent obviously at a minimum. In addition, the high carbon content is a drawback for most spectroscopic techniques and requires to be addressed with particular devices,
Food Forensics Chapter | 9 481
such as addition of oxygen to the plasma and low temperature inside the nebu-lization chamber. Nevertheless, using ICP-MS, several studies have been issued that allowed to classify oil samples coming from different countries. Trace metals in oil can originate from soil, environment, genotype of the plant, fertilizers and/or metal-containing pesticides, manipulation of olives during the manufacturing, or contamination from the metal-processing equipment. If suitable variables (i.e., elements of natural origin only) are selected, the trace elements distribution in oil samples should reflect the geographic provenance. Benincasa et al. [165] devel-oped an ICP-MS method to determine 18 trace elements in organic extra virgin olive oils coming from the Italian regions Apulia, Calabria, Umbria, and Abruzzo. Oil samples were obtained from two different cultivars, Carolea and Coratina. A model with LDA was built that allowed optimal discrimination of geographic prov-enances. The most discriminating variables resulted to be Fe, Mg, Sr, Ca, and As. Llorent-Martínez et al. [166] focused their study on the possibility of distinguishing different types of oils produced in Spain. They determined 18 elements by ICP-MS in samples of virgin olive, olive, pomace olive, corn, sunflower, and soybean oils. Application of PCA allowed a good discrimination among the different categories, in particular olive oils from other lesser quality oils. Cr, Cu, Fe, and Mn resulted to be the most discriminating variables, with Cr and Fe mostly abundant in vegetable oils while Cu and Mn were higher in olive oils. In the already cited study by Camin et al. [98] in which authors analyzed several samples of European olive oils obtain-ing both isotopic and elemental data, the contribution of trace elements variables in the geographic classification was a relevant one. First at all, authors classified samples on a geological basis, i.e., dividing the whole samples set into three groups according to soil type: shale/clay, limestone, or acid magmatic. Analysis of variance (ANOVA) procedure highlighted statistically significant differences in the content of 16 elements (Mg, Al, K, Ca, V, Mn, Ni, Zn, Rb, Sr, Ce, Sm, Cs, La, Eu, U) among the olive oils produced in the three different geological zones; this classification was confirmed by means of CDA. Similar results were obtained by combining elemental and isotopic data in order to perform geographic classification.
2.3.4 MeatsTrace elements in meat and meat products may derive from different sources. The occurrence of minerals in soils is obviously a primary source, with par-ticular concern to livestock herded on pasture lands; other relevant sources are feed supplements and environmental pollution. Franke et al. [104] reviewed the information concerning the sources of trace elements in meat. They con-cluded that selenium and rubidium could be interesting geochemical markers. According to some studies these elements, more than to mineral supplementa-tion, i.e., feeding practices, could be related to geographic origin, reflecting the differences of these elements in soils [167]. Other studies [168], instead, suggest a more relevant role to feeding supplements. Pollution from industry, mining or occasional events such as disasters (i.e., Chernobyl) can contribute to soil composition and ultimately to meat. In some cases, it is possible to use
482 PART | II Mass Spectrometry Applications within Food Safety and Quality
polluting elements as markers of geographic origin of meat. A study on tissues of livestock grazing nearby Kidston Gold Mine (North Queensland, Australia) showed that liver, muscle, and blood of animals were enriched in As and Zn [169]. In contrast, Chessa et al. [170] did not find statistically significant differ-ences in Pb, Zn, and Cd between muscle tissues of sheep from a polluted area in Southwest Sardinia and sheep herded on unpolluted areas.
The already cited study by Heaton et al. [109] used trace element distribu-tion in addition to isotopic data to classify beef samples from different coun-tries. The most important elements in the classification were strontium, iron, rubidium, and selenium. The classification into three broad groups, i.e., Euro-pean, South American, and Australasian was obtained with CDA.
2.3.5 FishIn the classification of fish, several factors can influence the elemental distri-bution: metabolism of organisms, geomorphology, lithology, food availability, contamination from external sources, etc. An example of high-quality fish is the Galician mussel (Mytilus galloprovincialis), the first fish acknowledged by European PDO. Costas-Rodriguez et al. [171] established the geographical ori-gin of mussels from different areas of Galician Rías (Vigo, Pontevedra, Arousa, Muros-Noia, Ares-Betanzos). For this, the distribution of 40 elements was determined by ICP-MS in 158 samples of Galician origin and in samples from two Mediterranean regions representative as non-Galician samples. Different supervised pattern recognition techniques (LDA, SIMCA, and ANN) were used that allowed to classify correctly PDO Galician mussels versus non-Galician samples and Galician mussels according to the ría of origin. Cubadda et al. [172] developed an ICP-MS method for the determination of trace elements distribution in marine organisms. The aim of the study was, apart from identify-ing pollution hot spots, verifying whether it was possible to have an elemental fingerprinting of seafood destined to the fishing market. In the case of mus-sels, results evidenced that a good separation was achieved between samples collected in three different farming sites. A recent study by Guo et al. [173] evidenced that the trace element distribution in fish muscles can be used as a fingerprint to discriminate among fishes captured in different sea regions. The geographic variability, in fact, was larger than the species variability. Element data were treated with partial least squares discriminant analysis (PLS-DA) and probabilistic neural network (PNN) supervised pattern recognition methods.
Classification of fish by means of elements distribution has been recently reviewed by Lavilla et al. [29].
2.3.6 Fruits and VegetablesThe soil elemental composition can serve as a fingerprint for different crops, providing a useful marker for geographical classification. Fruits and vegetables, which are the foodstuffs more directly linked to soil, reflect well this utility.
Food Forensics Chapter | 9 483
Several studies have already shown that the trace element distribution is a pow-erful marker for classification of fruit and vegetable foodstuffs. The elemental fingerprint given by soil can be affected by various factors such as botanic vari-eties, fertilization, climatic conditions, and agricultural practices, but several studies [174,175] suggest that the variations of element composition induced by these factors are smaller than the differences between production places when proper elemental markers are selected. As a consequence, in every classification study the proper variables must be selected.
In the category of fruits and vegetables, spices rank among the first places in terms of cost. It has already been cited the fact that saffron from C. sativus is perhaps the most expensive food in the world and therefore the ideal candidate for a classification study. D’Archivio et al. [176] analyzed saffron samples com-ing from three Italian regions, Abruzzo (one among the most important regions in the world producing saffron), Umbria, and Sardinia. Analysis with ICP-MS and LDA allowed discriminating the three geographical provenances; the most significant variables were Li, B, Na, Ga, Rb, Sr, Zr, Nb, Cs, Ba, Sm, and Hf with particular concern to B, Na, Sr, and Rb. These elements can be considered mostly of geochemical origin and therefore characteristic of soil, so that their distribution is not fractionated in the passage from soil to plant. In the already cited study by Brunner et al. [121] on Szegedi Hungarian paprika, authors dis-tinguished authentic samples labeled with PDO from foreign paprika products on the basis of both isotopic signature of strontium and trace elements distribu-tion, with main concern to REE.
Bettinelli et al. [177] investigated the link among soil and the different parts of tomato plant for what concerns the distribution of REE. Bontempo et al. [63], in the already cited study on tomato and its derivatives, highlighted the importance of trace elements and in particular of REE in tracing the geographic provenance of these products. Tomato samples from three Italian regions could be discriminated and several trace elements, namely Gd, La, Tl, Eu, Cs, Ni, Cr, and Co, were found to be highly relevant in the classification. Lo Feudo et al. [178] analyzed with ICP-MS tomato samples cultivated in four Italian regions (Apulia, Calabria, Basilicata, and Emilia-Romagna) along two growing seasons; also, a tomato paste sample made in Italy was compared with similar products coming from California, China, and Greece. In both instances, a good discrimination result was obtained on a geographical base, using 32 trace ele-ments as variables and classification with supervised pattern recognition meth-ods (LDA, KNN, and SIMCA).
Classification of hazelnuts from Piedmont was achieved with ICP-MS by Oddone et al. [179] with ICP-MS, using REE as chemical tracers. Authors dem-onstrated that no fractionation occurred to the original distribution of REE in the passage from soil to fruits (Figure 5), and it was possible to evaluate the differences among hazelnuts from Piedmont, other Italian regions, and Turkey.
Several classification studies on fruits and vegetables based on trace ele-ments determination have been recently issued by a research group working at

484 PART | II Mass Spectrometry Applications within Food Safety and Quality
Dipartimento di Chimica, Universita della Calabria (Southern Italy). They stud-ied the distribution of trace elements in Clementine (Citrus clementina Hort. ex Tan.) mandarins, one of the most important cultivated varieties in the Mediterra-nean basin [180]. This variety is cultivated in many countries on different conti-nents, but a world renowned production is the one located in Calabria (Southern Italy), awarded with protected geographical indications (PGI) certification by the European Union as “Clementine di Calabria.” Authors were able to dis-criminate PGI samples of four different Calabrian zones, from non-PGI samples coming from Spain, Tunisia, and Algeria, using supervised pattern recognition methods, such as SIMCA, PLS-DA, and LDA. In another study, they classified samples of Tropea red onion (Allium cepa L. var. Tropea), one among the most highly appreciated Italian products, awarded with PGI certification as “Cipolla Rossa di Tropea Calabria,” from non-PGI onion samples, i.e., samples coming from cultivation areas located outside the distribution area specified in the pro-duction regulations [181]. Authors evidenced the importance of the contribution of REE in the classification.
Tea and coffee are both foodstuffs of vegetable origin with a relevant com-mercial value. The classification of tea and coffee samples has been attempted by means of trace elements distribution using ICP-MS (in some cases also using ICP-AES). Moreda-Piñeiro et al. [182] were able to discriminate tea samples from Asian and African countries on the basis of element distribution as deter-mined with ICP-AES and ICP-MS. Data treated with supervised pattern recog-nition techniques (LDA and SIMCA) allowed to distinguish also among teas from China, India, and Sri Lanka. More recently, Pilgrim et al. in the already cited study [127] combined data from ICP-MS and SIA to classify tea sam-ples from different Asian and African countries. Twenty trace elements, among which four REE, were used for application of LDA method.
FIGURE 5 Distribution of rare earth elements (REEs) in soil and hazelnuts.

Food Forensics Chapter | 9 485
2.3.7 Animal ProductsA very particular animal product is caviar, i.e., roe descending from certain fish species. Caviar is an extremely exclusive and greatly demanded delicacy and therefore one of the most expensive—and most counterfeit—foodstuffs in the world. The most prised caviar is recognized to be that produced from stur-geons of the Caspian Sea, the renowned caviar Volga. Perhaps due to the high incomes involved, few analytical studies have been devoted to the classification of caviar; Ebert and Islam [183] used a histological method to identify caviar imitations of Russian sturgeon roe. Rodushkin et al. [184] used the elemental distributions determined by ICP-MS to classify vendace and whitefish caviar samples according to the geographic origin (Sweden, Finland, and USA) and to the type of water in which fish grow (brackish vs freshwater, with brackish caviar being more expensive). Seventy-two elements, from μg/g to pg/g con-centrations, were determined. The element distribution in caviar is influenced by its main constituents, i.e., roe and salt, but impurities originating from the caviar preparation and packaging processes can also contribute. Furthermore, contamination during the various analytical stages is possible. To check for this possibility, authors analyzed also samples of unprocessed vendace roe and salt used in caviar production. Elements potentially allowing to establish the sample provenance were As, Ba, Br, I, Li, Mo, Se and Sr while Fe, Al, Ti, and V, even though useful in the discrimination, were reputed to arise during processing and packaging. Particularly useful were element ratios, i.e., Sr/Mg, Sr/Ca, and Sr/Ba that achieved a good discrimination of geographical provenance. In fact, Sr/Ca ratio in otoliths reflects their relative proportion in the ambient water, as showed Bath et al. [185]. Differentiation between caviar from brackish and freshwater sources was accomplished using Sr isotope ratio measurements.
The classification of honey based on geographical or botanical origin has been studied using trace elements distribution in several studies. Minerals could be useful for a classification system, since they can be associated with the soil where Mellifer-ous flora grows. In the passage from soil to honey, however, different sources can contribute to the final elemental composition. Environmental pollution can cause increase of heavy and transition metals concentration. The use of particular fer-tilizers, rich in REE, in crops can result in anomalous values of these elements’ amounts [186]. Chudzinska and Baralkiewicz [187] analyzed with ICP-MS samples of honey of three types (honeydew, buckwheat, and rape) produced in 16 areas of Poland. Data obtained from determination of 15 elements were treated with super-vised pattern recognition methods and allowed a good classification according to the regional provenance and to the honey type. Al, Mg, and Zn were the best markers of geographical origin while K and Mn were the markers of honey type. Similar results were obtained by Batista et al. [186] in a study on Brazilian honey samples. In that case Pb, Tl, Pt, Ho, and Er were the most significant variables in the geographi-cal classification. Chen et al. [188] determined 12 elements in 163 Chinese honey samples in order to classify samples according to the botanical origin obtaining a good discrimination between samples of linden, vitex, rape, and acacia honeys.
486 PART | II Mass Spectrometry Applications within Food Safety and Quality
2.3.8 Products from CerealsRaw cereals, as fruits and vegetables, are ideal subjects for classification studies using trace elements distribution. Ariyama et al. [140] determined trace ele-ments in rice samples from Japan, China, Thailand, and USA together with isotope ratios of heavy elements. A good classification was obtained, where the most discriminating variables were Rb, Sr, Ba, and Co. Shen et al. [189] studied the correlation between the distributions of trace elements in rice and soil, based on determination of the available fraction of metals. Samples were from four provinces of China. Analysis by means of ICP-MS revealed that most of the ele-ments determined (Mg, K, Ca, Na, Be, Mn, Ni, Cu, and Cd) were significantly different in both soil and rice samples of the four regions. These results were confirmed by LDA chemometric analysis.
Zhao et al. [190] investigated the classification of wheat samples collected from four major wheat-producing regions in China in two subsequent harvests, on the basis of trace elements distribution. Application of LDA to elemental data allowed a good geographical classification.
2.3.9 Organic FoodLaursen et al. [191] investigated the possibility of distinguishing organic and conventional productions of selected vegetables by means of element distribu-tion as determined with ICP-OES and ICP-MS. Wheat, barley, faba bean, and potato were the products studied, cultivated in 2 years at three different loca-tions using both organic and conventional cropping systems. The study was car-ried out under controlled and comparable conditions for what concerns soil type and climate, so that differences could be due only to the cropping system. Using trace elements as variables, a good discrimination was obtained among organic and conventional products; Cd and Cl were the elements giving higher contribu-tion to the classification, possibly due to trace impurities from inorganic fertil-izers used in conventional cropping system. Kelly and Bateman [192] used δ15N values and trace elements distributions to distinguish between organic and con-ventional grown tomato and lettuce samples; results were better for tomatoes and poor for lettuces. Systematic differences were found in the concentrations of certain elements, such as manganese, calcium, copper, and zinc, possibly due to the presence of elevated levels of arbuscular mycorrhizal fungi in soils run with organic systems.
2.4 Molecular Ions as Chemical Markers
2.4.1 Strategies of Molecular AnalysisThe previous two paragraphs accounted for techniques relying on elemental parameters. A classical use of mass spectrometry, however, is the separation and identification of molecules. This can be done either using hyphenated sys-tems, i.e., interfacing a mass spectrometer with a separative system, or with

Food Forensics Chapter | 9 487
stand-alone or MS-only systems. Hyphenated systems will be the subject of the following paragraph, while stand-alone systems will be dealt within Section 2.4.3. Both systems are now more than consolidated techniques to identify molecular markers to be used in food classification. General discussions on the application of hyphenated and stand-alone systems in food forensics have been recently issued by Herrero et al. [193] and by Wang et al. [194].
An improvement in the diagnostic power of molecular analysis with MS systems applied to food forensics is the development of advanced fingerprint-ing and profiling methods. The concepts of fingerprinting and profiling are not specifically referred to MS since they encompass all the analytical methods that can provide multiple responses from samples; in this sense, techniques such as NMR, vibrational spectroscopies (FT-IR and Raman), electronic spectroscopies (UV–Visible–NIR spectrophotometry) are included together with MS tech-niques. While traditional methods are focused on identification and quantifica-tion of specific compounds in a particular food sample, which is the approach typical of targeted strategies, fingerprinting and profiling methods (i.e., nontar-geted strategies) provide specific information about groups of samples based on their component distribution without need of accurate identification of all molecules. The difference between fingerprinting and profiling is that the lat-ter requires previous knowledge of the samples because it focuses on a spe-cific group of related compounds. Fingerprint/profiling methods call for highly reliable and powerful detection systems such as MS. Moreover, the amount of information given by mass spectral data sets asks for a mandatory chemomet-ric treatment of data with pattern recognition methods [195]. Food forensics studies using fingerprinting/profiling methods based on hyphenated systems are strongly greatly increasing in the last years. The application of these methods has been extensively reviewed by Esslinger et al. [196].
A further improvement occurring in the very last years in the knowledge and potentiality of food forensics resulting from the development of foodomics. The new frontier of the application of mass spectrometry to food analysis has an English name but a Spanish father, Alejandro Cifuentes [197]. This discipline results from a powerful interaction among food and nutrition science, advanced analytical techniques (i.e., biomolecular and bioinformatics), with particular emphasis in chemometrics (Figure 6, based on Herrero et al. [193]). Further in-depth analyses on this subject can be found in recent publications [198,199]. Even if the concept of foodomics goes beyond the field of food forensics, one of its main features is the analytical study of foods for compound profiling with the aim of identifying biomarkers useful for food classification. It is clear that mass spectrometry is definitely the core technology for such a task: the depth of information achieved by MS techniques cannot be reached by other techniques. In addition, interfacing of MS with protein and peptide databases has allowed new possibilities of the characterization of biomolecules.
The definition of foodomics encompasses, among others, three main analyti-cal sectors, which have been developed in the last 20 years and have found large

488 PART | II Mass Spectrometry Applications within Food Safety and Quality
application, among several other fields, in food forensics: proteomics, peptidomics, and metabolomics. Proteomics is the analytical field devoted to the characteriza-tion of the proteins expressed in a particular biological system; from the analytical point of view, a major problem is due to the different physicochemical properties of proteins and their large concentration range in real samples. Peptidomics is the analysis of all peptide content within an organism, tissue, or cell, including tran-sient products of protein degradation; in this case, also difficulties arise from the concentration range and the high number of peptidic sequences available in real samples. The applications of proteomics and peptidomics in food forensics have been recently reviewed [200,201]. Metabolomics is focused on the analysis of a metabolome, i.e., the full set of endogenous or exogenous low molecular weight compounds (<1500 Da), which means a large number of different molecules with different chemical and physical properties in a wide concentration range [202]. The term metabolomics has been established in the late 1990s. Oliver et al. used the expression metabolome for the first time in 1998 [203]. Recalling the concepts of fingerprinting and profiling expressed before, there are three different ways for ana-lyzing metabolites in a biological system: namely, target analysis, metabolic profil-ing, and metabolic fingerprinting. Target analysis is the quantitative determination of selected, well-individuated analytes. Metabolic profiling is a nontargeted strat-egy requiring previous knowledge of the sample, which focuses on the study of a group of related metabolites (e.g., amino acids, alcohols, etc.) or metabolites from a specific metabolic pathway. Metabolic fingerprinting is focused on comparing pat-terns or fingerprints of metabolites among different samples, aiming not to identify
FIGURE 6 The concept of foodomics.

Food Forensics Chapter | 9 489
all the involved metabolites but to detect those that can be considered biomarkers. The differences among these approaches have been clarified by Fiehn [204] and reviewed by Dettmer et al. [205]. Due to the great potentialities of metabolomics-based approaches, it is not surprising that several reviews on their applications in the field of food science and nutrition had been recently issued [206–209], with a large number of citations to works of interest in the field of food forensics. Oms-Oliu et al. [210] reviewed the use of metabolomics for classification of plant-derived food. A major part of the cited studies describes the application of MS techniques either in hyphenated or in stand-alone systems. Cubero-Leon et al. [211], in their review work on food classification with metabolomics, showed that the percentage of studies involving mass spectrometry was nearly 50% in the last 10 years, with NMR and vibrational spectroscopy accounting for most of the remaining part.
2.4.2 Hyphenated SystemsIn the field of food forensics, a large number of applications have been developed using MS as a powerful detection system coupled with separative techniques. The composition of most foodstuffs results from a complex mixture of dozens or even hundreds of compounds. The application of separative techniques (chro-matographic and/or electrophoretic) hyphenated to detection system giving full structural information makes it possible to elucidate the chemical nature of food-stuffs and to develop reliable classification schemes. The hyphenated systems GC-MS and LC-MS have, therefore, a long tradition in the field of food forensics. Interfacing of MS with gas chromatographic systems is historically older and more consolidated, even though limited to the separation of volatile or volatiliz-able compounds. Nowadays the development of atmospheric pressure ionization (API) sources, such as electrospray ionization (ESI) and atmospheric pressure chemical ionization (APCI), which have solved the issues of pressure difference between a liquid phase at high-pressure and low-pressure vacuum regions, has favored the spread of LC-MS-based methods. Applications have been recently reviewed [212–214]. Relatively more recent is the interfacing of MS with elec-trophoretic systems [215,216] with particular concern to capillary electrophore-sis (CE). CE-MS systems have been applied mainly for identification of organic compounds that can play as biological markers in food classification.
2.4.3 Stand-Alone SystemsBesides hyphenated systems, only stand-alone or MS methods have been devel-oped. A list, not necessarily extensive, of the most important stand-alone MS tech-niques nowadays available must include Pyrolysis (Py-MS), direct infusion of samples by means of ESI-MS or atmospheric pressure photoionization mass spec-trometry (APPI-MS), matrix-assisted laser desorption/ionisation–time of flight mass spectrometry (MALDI-ToF-MS), proton transfer reaction–time of flight (PTR-ToF-MS), desorption electrospray ionization (DESI-MS), direct analysis in real time (DART-MS), and secondary electrospray ionization (SESI-MS).

490 PART | II Mass Spectrometry Applications within Food Safety and Quality
Stand-alone techniques allowed the building of molecular profiling proce-dures and yielded new insight in the identification of molecular markers in food matrices that can be exploited for classification purposes, without need of prior separation. Sample profiling, therefore, can be achieved with similar perfor-mances compared to hyphenated systems but in a faster and easier way. These methods have a high potential in food forensics, in particular when coupled with chemometric data treatment. In fact, the spectra obtained can be considered as quantitative fingerprints of the organic components of food samples and, even if simple visual inspection of the spectra usually does not allow identifying promi-nent peaks that could be used for classification, the use of multivariate pat-tern recognition methods can yield optimal results. In addition, stand-alone MS methods can request minimal time consumption and low costs (a few minutes are necessary for sample preparation and mass spectrum acquisition) in contrast with traditional methods of molecular biology. The construction of molecular profile databases can integrate methods and provide high-tech tools in large-scale screening for control and authentication of foodstuffs.
A particular system, specifically devoted to the profiling of volatile com-pounds, is the headspace mass spectrometer (HS-MS). It is a variant of the so-called electronic nose or e-nose systems [21,217] in which a mass spectrometer is used as a chemical sensor in order to yield a fingerprint pattern of volatile compounds, which coupled with pattern recognition methods, allows classifica-tion of samples according to variety and to other technological features. With respect to classical e-nose systems, based on solid state sensors, the advantage of MS-based e-nose systems lies in the signal reproducibility, higher specificity, and interpretation of the results. In fact, it is possible to obtain information about complex mixtures of volatile compounds even if it is not possible to identify and/or quantify each chemical species. The synergic use of HS-MS with mul-tivariate statistical techniques allows the relevant information for classification and discrimination of the investigated samples to be extracted. Śliwińska et al. [218] have reviewed the applications of artificial senses, including e-noses, in food analysis and classification.
In the following sections, the application of hyphenated and stand-alone MS techniques to food forensics is illustrated according to the different food cat-egories. In each section, examples involving hyphenated systems are described firstly and then come examples involving stand-alone MS systems. As the application of classical targeted methods using hyphenated systems is relatively straightforward in food forensics, particular focus will be given to fingerprint-ing/profiling applications and to methods involving stand-alone MS.
2.4.4 Wine, Fermented Drinks, and Other BeveragesThe application of hyphenated systems to wine analysis and classification has a long tradition. Profiling of volatile compounds, polyphenols, and other chemi-cal classes have been used for the classification of wine samples according to geographical origin, grape variety, and aging. Marengo et al. [219] analyzed
Food Forensics Chapter | 9 491
with solid phase microextraction (SPME)-GC-MS samples of five different DOC and DOCG wines obtained in Piedmont from Nebbiolo variety: Barolo, Barbaresco, Nebbiolo d’Alba, Roero, and Langhe Nebbiolo. These wines have different aging periods (respectively 3 years, 2 years, 1 year, 6 months, and no aging). This feature is remarkably reflected in the respective values: Barolo and Barbaresco, in fact, are among the most prised wines in the world. Using a target approach, it was possible to discriminate the five brands by means of pat-tern recognition methods (PCA, HCA, Kohonen self-organizing map, stepwise LDA, and SIMCA) according to the aging characteristics. Vaclavik et al. [220] used HPLC coupled to ToF-MS to differentiate red wines of three varieties (Cabernet Sauvignon, Merlot, and Pinot Noir) of various geographical origins (European and the US retail market). A nontargeted metabolomic approach was applied to data: the molecular identification of the compounds separated was not necessary, while ions with identical elution profiles and related m/z values were extracted as molecular features. Data were treated by means of multivari-ate statistical analysis and yielded a good classification according to varieties. A higher level of confidence for the identification process was achieved by using tandem mass spectrometry. Jaitz et al. [221] developed a rapid LC-MS/MS method for phenols and polyphenols profiling, including three isomeric pairs, in wine samples from 11 Austrian regions, including 6 grape varieties and 5 vintages. A good classification was achieved according to geographical, variety, and vintage features using CDA. Serrano et al. [222] developed an LC method with UV-Vis and fluorescence detection for the differentiation of Spanish PDO wines based on their chromatographic profiles; the most discriminating com-pounds were then identified by means of MS.
With concern to beer classification, Mattarucchi et al. [223] used a finger-printing approach with LC-MS to authenticate Trappist beer samples of differ-ent brands. In this case, a total of 232 beers were fingerprinted and classified through multivariate data analysis. The selected beer samples were clearly dis-tinguished from beers of different brands; only three samples were wrongly classified when compared with other types of beer of the same Trappist brewery.
In recent years, stand-alone MS techniques have been intensively applied to wine. Fingerprinting with protein or peptides profiles have been proposed. Among the first applications of MALDI-ToF-MS to wine protein characteriza-tion, it must be cited in the work by Szilágyi et al. [224], which dates back to 1996. The paper suggested the feasibility of MALDI as an alternative to IRMS or Py-MS for distinction of wines and musts. Chambery et al. [225] applied MALDI-ToF-MS in the analysis of peptide profiles obtained from whole wine protein tryptic digests to the classification of high-quality white wines produced in Campania (Southern Italy). MALDI spectra provided fingerprints of samples that attained their discrimination according to different grape varieties or differ-ent winemakers. The qualitative presence or absence of peptide m/z values were used as variables for both types of classification. However, Nunes-Miranda et al. [226] reviewed the methods of protein and peptide profiling, highlighting
492 PART | II Mass Spectrometry Applications within Food Safety and Quality
some critical points in the possibility of wine authentication. Fulcrand et al. [227] proposed a method involving direct MS with ESI-ToF and MALDI-ToF-MS to determine the profile of polyphenolic compounds and use it as a tool for wines discrimination.
An interesting application of MS in wine analysis is the use of MS-based e-nose systems for profiling/fingerprinting of volatile compounds. In the case of alcoholic drinks, e-nose can be useful in the classification of products accord-ing to the varieties or enological features (i.e., aged vs young wines) [21]. With respect to classical e-nose systems based on solid state sensors, MS-based e-nose systems have the advantage of withstanding the high concentrations of ethanol that often interfere with solid state sensors. An example of application to wine classification was issued by Cynkar et al. [228], which used an MS-based e-nose system combined with chemometrics to ascertain the geographical origin of Tem-pranillo wines produced in Australia and Spain. Capone et al. [229] used solid phase extraction (SPE) to extract volatile compounds from different typical wines from Apulia (Southern Italy). The analysis of the extracts by GC-MS in conju-gation with e-nose identified 18 compounds over odor threshold, which were used for further pattern recognition analysis with PCA. By means of PLS-DA analysis, data from e-nose and GC-MS analysis were correlated, establishing the relationships between e-nose response and wine aroma compounds. Vera et al. [230] used MS-based e-nose to discriminate between beer samples produced in different factories. Jelen et al. [231] analyzed raw spirits made from rye, potato, and corn in order to verify the possibility of a classification based on the botanical origin. They used an SPME-MS method in which volatile compounds profiles were determined; PCA and LDA pattern recognition methods allowed a good separation between the three botanical sources. A detailed review on the applica-tion of e-noses for the analysis of alcoholic beverages has been published [232].
Other stand-alone MS systems were used on alcoholic drinks. With concern to beers, Cajka et al. [233] developed a method based on direct interfacing of SPME to DART-ToF-MS for classification of beer samples from Belgium, the Netherlands, and Czech Republic. This system, together with a more classical SPME-GC-MS system, allowed the characterization of the profile of volatile compounds, which reflect the chemical features typical of different brewing processes. Šedo et al. [234] showed how the application of MALDI-ToF-MS could be used in the classification of beers, allowing to distinguish samples of the same brand but from different breweries. The protein profiles resulted to be highly discriminating, having a strong relation to the brewing materials, tech-nology processes, and sensory characteristics of beer samples. Protein composi-tion of beer depends on the raw materials and the enzymatic reactions that take place in the course of the beer production process.
Among spirits, a major interest has been devoted to characterization and clas-sification of whisky, according to its commercial and traditional value. Aylott et al. [235] applied Py-MS followed by multivariate analysis of the resulting mass spectra to distinguish authentic samples from nonauthentic, in addition

Food Forensics Chapter | 9 493
to higher-alcohol congener analysis by GC-MS; Py-MS proved to be reliable as a stand-alone method for whisky classification. An improvement of stand-alone MS methods was later proposed by Møller et al. [236] who used direct infusion of samples with ESI-MS to classify whisky samples from different countries. Authors verified that analysis in negative ion mode yielded the most characteristic whisky fingerprinting mass spectra. Three groups were clearly discriminated: Scotch whiskies, American whiskies, and presumably counter-feit whiskies commercialized in Brazil. Discrimination among single malt and blended Scotch whiskies was also achieved. The proposed method resulted to be a simple and rapid way to check quality and proof of authenticity of whisky samples, with further improvement by means of data treatment with pattern rec-ognition chemometric methods. In addition, application of ESI-MS/MS analy-sis allowed identifying the most diagnostic anions, which resulted to be simple sugars, disaccharides (indicating the possible use of caramel to adjust color and flavor) and phenolic compounds. Garcia et al. [237], using ESI coupled to ultra-high resolution and accuracy Fourier transform ion cyclotron resonance mass spectrometry (FT-ICR MS), extended the range of diagnostic molecules and further improved the possibility of identifying counterfeit samples. In this case, both positive and negative ion modes yielded useful information.
The Aceto Balsamico Tradizionale di Modena, a high-quality vinegar pro-duced in Emilia-Romagna (Central Italy), is a typical case in which the com-position of a foodstuff is so complex that it is hard to find chemical markers for its classification. Its characteristic flavor is the effect of different variables. In such cases, molecular fingerprinting is the best approach for classification. Cocchi et al. [238] used HS-MS, the already cited e-nose system, to distin-guish correctly aged (and therefore marketable) Aceto Balsamico Tradizionale di Modena products from the ones, which are still undergoing maturation. Clas-sification with supervised pattern recognition methods (SIMCA, LDA) was suc-cessful and allowed recognizing the different stages of maturation.
2.4.5 Milk and Dairy ProductsProtein profiling is particularly useful in the classification of milk and dairy products. Factors such as genetic and nongenetic polymorphisms and milk pro-cessing (i.e., thermal denaturation and proteolysis) can induce variations in the structure of individual proteins, so that milk samples from different species or from different animal breeds of the same species, or resulting from different processes, can be distinguished. Nicolaou et al. [239] analyzed with MALDI-ToF-MS binary and tertiary mixtures of cow’s, goat’s, and sheep’s milks; using supervised pattern recognition methods (linear PLS and nonlinear Kernel PLS) on the protein and peptidic profiles of the samples, they were able to identify the addition of an adulterant milk regardless of milk processing. Yang et al. [240] used two-dimensional gel electrophoresis (2-DE) coupled with MS to acquire protein profiles of milk samples from different animals (cow, goat, camel, yak, and buffalo). The different protein spots acted as specific molecular markers for
494 PART | II Mass Spectrometry Applications within Food Safety and Quality
identification of milk samples, with particular concern to adulteration; in fact, the animal species could be singled out even in binary mixtures. Cunsolo et al. [241] used MALDI-ToF-MS to identify the fraudulent addition of bovine and caprine milk in raw donkey’s milk, a product considered as precious pharma-food thanks to its use in anallergic diets. Extraneous milks were detected by using the protein profiles of some whey proteins as molecular markers. Cunsolo et al. [242] reviewed the applications of MS-based techniques for characteriza-tion of milk protein profiles and their use in milk classification.
2.4.6 Vegetable OilsGiven the complexity of the composition of vegetable oils and the high-quality and commercial value of extra virgin olive oils, hyphenated and stand-alone MS techniques can have great potential in their classification. Di Donna et al. [243] developed a method for classification of Italian olives based on the polyphenolic profile as determined with HPLC-MS. Salter et al. [244] used pyrolysis-MS to classify extra virgin olive oils from different regions of Italy and obtained from different olive cultivars. The molecular fingerprints of samples were analyzed with artificial neural network pattern recognition method and allowed a good discrimination of olive oils on the basis of their geographical origin. Vaclavik et al. [245] used high-resolution ToF-MS coupled with DART to determine the comprehensive profiling of triacylglycerols in oils products. Authors were able to discriminate between extra virgin olive oil, olive pomace oil, and olive oil; also, adulteration of extra virgin olive oil with hazelnut oil was achieved.
With concern to e-nose MS-based systems, Oliveros et al. [246] used HS-MS for classification of olive oils of different geographical origin with a fast method of analysis. Samples were from five different Mediterranean areas. Both unsu-pervised and supervised pattern recognition methods, applied to the profiles of volatile compounds, yielded good results in the classification. Similar results were obtained by Cosio et al. [247] using an e-nose system in combination with artificial neural networks.
2.4.7 MeatsThe classification of meat and meat products can be achieved by means of different strategies. Profiling of volatile compounds and lipids is one typical approach. Narvaez-Rivas et al. [248] determined with GC-MS the profile of vol-atile compounds in samples of Iberian dry-cured hams. Classification according to different pork fattening systems was achieved.
Zaima et al. [249] used a metabolomic approach with MALDI-imaging mass spectrometry in the assessment of beef authenticity. The analysis was carried out on extracted lipids and in few minutes enabled the visualization of the distribution of individual biomolecules. Peaks in the mass range 700–1500 m/z were used for a pattern recognition treatment with PCA; the results allowed obtaining a good discrimination among beef samples from three different areas of Japan.

Food Forensics Chapter | 9 495
Among cured meat products, it is highly renowned the quality of Iberian and Italian dry-cured hams. Del Pulgar et al. [250] used the recently developed proton transfer reaction time of flight mass spectrometry (PTR-ToF-MS) technique for the characterization of dry-cured hams produced in Italy (Prosciutto di San Daniele, Prosciutto di Parma and Prosciutto Toscano) and Spain (Dehesa de Extremadura) according to PDOs. Samples were analyzed by direct injection without any pre-treatment. Analysis by means of PTR-ToF-MS yielded information concerning the volatile organic profile, which reflects the different manufacturing practices (i.e., rearing system of livestock, salting, and curing process, etc.); data from molecular profiling were treated with PCA that allowed a good classification according to the production processes of the different PDOs. González-Dominguez et al. [251] studied the classification of different types of Iberian ham with other stand-alone MS techniques. Authors analyzed intramuscular fat extracts using two techniques, direct infusion electrospray mass spectrometry (ESI(+)-MS) and flow injection atmospheric pressure photoionization ionization mass spectrometry (APPI(+)-MS). Total lipid profiles (triacylglycerides, diacylglycerides, monoacylglycerides, and free fatty acids) were obtained with simple sample preparation. Data were treated with PLS-DA method that allowed classifying Iberian ham samples according to their feeding systems (traditional feeding based on natural resources vs feeding based on commercial foodstuffs) and provenance.
From a completely different point of view, molecular analysis by means of MS techniques can be used to check for absence of meat in particular foodstuffs. Kosher is the term for food that may be consumed by Jews according to halakha (Jewish law); in a similar way, halal stands for food considered permissible to Muslims according to Islamic law. Compliance of food to kosherness and halal-ness is very important for Jew and Muslim people and its control is therefore a rele-vant commercial matter considering the extension of the global Halal food market. Indrasti et al. [252] characterized with two-dimensional comprehensive GC-ToF-MS the fatty acid profile in samples containing animal fat, in order to discriminate among cattle fat, chicken fat, goat fat, and the prohibited lard. Rohman and Man [253] reviewed the analytical methods used in the detection and quantification of pig derivatives in food products to verify compliance to kosherness and halalness of food destined for consumption by Jew and Muslim people. Among the different methods listed, applications were reported using LC-MS and GC-MS.
2.4.8 FishFish authentication demands for more innovative methodologies since the identifi-cation of morphological characteristics, such as the head, fins, skin, or bones, can be lost during processing so that the original fish species cannot be recognized. In addition, globalization and freer markets determined the fact that a growing number of species are used for transformed products. Sophisticated MS techniques using molecular profiling can address these needs. Recently, it has been proposed the use of MALDI-ToF-MS for the unequivocal identification of seafood species [254]. This method is based on the evaluation of the mass signals generated from proteins

496 PART | II Mass Spectrometry Applications within Food Safety and Quality
with molecular weights of about 11 kDa, which can play as specific biomarkers for species discrimination. The applicability of the method was checked by analyzing protein extracts from 25 different seafood species, selected among largely consumed products either of high commercial value or commonly involved in frauds. Authors underlined the fact that this method does not require either preliminary information on the investigated sample or preliminary identification of the proteins generating biomarkers. It was nevertheless evidenced the role of parvalbumins, calcium-bind-ing proteins with molecular weights in the 10,000–12,000 Da range, as progeni-tors of several of the biomarkers individuated. With concern to processed seafood products, Barik et al. [255] developed a proteomic method for identification of the species of origin based on detection of species-specific sarcoplasmic peptides. The technique used was a combination of 2-DE gel electrophoresis and MALDI-ToF-MS; in addition, LC-MS analysis was performed on the protein spots cut from gel.
2.4.9 Fruits and VegetablesThe classification of fruit and vegetable products can be favored in cases in which foodstuffs are characterized by a wide aromatic or polyphenolic profile. Examples are the characterization of tomato, hazelnuts, coffee, and other items with a marked flavor. Lo Feudo et al. [256] classified samples of fresh tomatoes and triple concentrate tomato pastes of different geographical origin according to volatile fraction profiling as determined with HS-SPME-GC-MS. With a simi-lar metabolomic approach, Jandric et al. [257] classified fruit juices using ultra performance liquid chromatography (UPLC)-QToF MS analysis. Of particular interest are some recently issued studies that illustrated the potentialities of an analytical platform involving sample preparation by headspace SPME, separation by two-dimensional comprehensive GC-MS (GC × GC-MS) and data processing using advanced fingerprinting–profiling approaches. This platform was applied in the classification of coffee samples [258], hazelnuts [259], flavored fruit foods [260], and hazelnuts with comparison to hazelnut-containing sweet pastes [261].
Guo et al. [262] analyzed Chinese apple juices of different varieties and geo-graphical origin with HS-SPME-GC-MS. A fingerprinting approach was fol-lowed, using the chromatographic profiles as nonspecific signals and avoiding an a priori identification of the volatile compounds separated. The application of stepwise LDA yielded satisfactory discrimination of the samples according to variety and geographical origin.
Sabatino et al. [263] developed a hyphenated method using HPLC with both diode array and MS detectors for authentication of saffron. The high specificity of MS allowed the unequivocal identification of characteristic markers of adul-terants (e.g., safflower, marigold, turmeric, etc.).
With concern to coffee, Arruda et al. [264] analyzed with HS-SPME-GC-MS coffee samples harvested in different maturation stages and treated by different processes. Profiling of volatile compounds, with more than 110 mole-cules, allowed to discriminate both the maturity stage and processing type used. Garrett et al. [265] analyzed green beans of arabica coffee of different cultivars

Food Forensics Chapter | 9 497
and geographic provenance by means of direct infusion electrospray ionization Fourier transform ion cyclotron resonance mass spectrometry (ESI FT-ICR MS) and a metabolomic approach. The application of PCA and PLS-DA pattern rec-ognition methods to data from the identified metabolites allowed discriminating samples according to both genetic and geographical features.
2.4.10 Animal ProductsRadovic et al. [266] applied the potential of Py-MS for the authentication of honey samples according to the botanical origin. Ten unifloral types were tested: acacia, chestnut, eucalyptus, heather, lime, rapeseed, sunflower, citrus, lavender, and rosemary. Using discriminant function analysis (DFA) as supervised pattern recognition method, the data obtained allowed a good discrimination among the different botanical sources but not among the geographical provenances. More recently, Wang et al. [267] used MALDI-ToF-MS to determine the geographic origin of honey samples according to the protein pattern, in order to overcome the limitations of other parameters such as volatile trace compounds, saccha-rides, or trace elements in the classification. Protein profiling has already shown its potential in the botanical classification of honey [268]. In this work, honey samples from Hawaii and other regions in the world were analyzed and their MALDI-ToF-MS protein ion mass spectra were transformed into protein ion mass spectral barcodes, which allowed a robust and accurate comparison with the mass spectral database library generated by authors with dedicated software. Classification with PCA of protein fingerprints, expressed as barcodes, allowed separating honeys of different geographical and floral origins.
2.4.11 Products from CerealsStudies on cereals and bakery foods are not very common. Bianchi et al. [269] characterized the profile of volatile compounds in samples of PDO Altamura bread, a renowned bakery food produced in Apulia (Southern Italy). The influence of different baking modes was also evaluated. Beleggia et al. [270] determined with HS-SPMR-GC-MS the profiles of the volatile components in semolina and pasta samples obtained from four durum wheat cultivars, evi-dencing differences among the different cv employed. Dinelli et al. [271] used HPLC interfaced with ESI-TOF-MS to highlight differences in the profiles of phenolic compounds in modern and old common wheat varieties. Pattemore et al. [272] used MALDI-ToF-MS for identification of cereal varieties. Authors identified single nucleotide polymorphism (SNP)-based markers.
2.4.12 Organic FoodLevandi et al. [273] analyzed different varieties of conventionally grown spring and winter wheat and of organic wheat with an untargeted metabolomic strat-egy using HPLC-ESI-MS/MS. The results of pattern recognition treatment with PCA allowed discriminating between conventional and organic wheat varieties.
498 PART | II Mass Spectrometry Applications within Food Safety and Quality
Zörb et al. suggested an analytical approach based on 2D gel electrophoresis coupled with MALDI-ToF-MS to determine the protein profile in wheat grains and to distinguish organic and conventional wheat products [274]. A selected number of proteins were isolated that could be useful as markers.
A field of particular concern is the one of transgenic foods, a term which is referred to food products containing or derived from genetically modi-fied organisms (GMO). GMOs are the well-known organisms derived from recombinant DNA technology which have found wide applications in many fields, among which agriculture. The use of GMOs is of course prohibited in the production of organic foodstuffs in legislations all over the world, therefore proper analytical strategies are needed in order to recognize their fraudulent (or in many cases involuntary) application. These strategies rely mostly on gene expression profiling, protein profiling, or metabolic profil-ing, recalling the use of MS techniques. Examples of applications are on maize [275,276] and soybeans [277]. This matter has been recently reviewed by Valdés et al. [278].
A slightly different concept is one of the healthy products: this includes foods, dietary supplements, and nutraceutics that can positively affect human health and wellness. Phytochemicals have been proposed as health promot-ers. Several commercial products containing phytochemicals are submitted for evaluation of health claim. Evaluation must be sustained by an increase in the knowledge on phytochemicals’ bioactivity and their impact in health, which can be obtained by means of analytical platforms based on MS techniques [279].
3. CONCLUSIONS AND FUTURE TRENDS
The contribution of mass spectrometry in the field of food forensics has been well demonstrated by the huge number of applications developed in the last years. Several approaches have been issued, concerning hyphenated systems versus stand-alone MS systems, different strategies (targeted vs nontargeted methods) and different ways of sample introduction. The advantages of MS techniques against traditional techniques are apparent in terms of robustness, completeness of information, and fastness of application, which means reduced costs of analysis also.
The prospects of the application of MS techniques to the classification of foodstuffs are almost limitless. There is no doubt that mass spectrometry had features well-suited to become the ideal tool for food certification. In particular, a huge improvement of knowledge in this field will be given by the close inter-action of MS analysis, bioinformatics, availability of large databases, and all the advanced “omics” technologies. These potentialities could now be applied to build robust and reliable procedures for insertion in national and international regulations. Unfortunately in many countries, with particular concern to those with large-scale industry, the matter of food forensics has to face the interest of great producers. It would be hard to explain why, at present, only in few cases

Food Forensics Chapter | 9 499
MS techniques were indicated as methods of choice in official national regula-tions. At the end, therefore, limitations in the possible developments will be rather a politic-economic matter than a technical or scientific one.
ACKNOWLEDGMENTS
Author is indebted with Dr Massimo Baldizzone and Dr. Matteo Oddone for their invaluable help in carrying out research on food classification and for being such great friends.
REFERENCES
[1] Food and Agriculture Organization of the United Nations, Food Outlook - Biannual Report on Global Food Markets, http://www.fao.org/docrep/019/i3751e/i3751e.pdf.
[2] http://www.bbc.com/news/uk-21375594. [3] http://www.repubblica.it/cronaca/2014/05/29/news/vini_falso_brunello_di_montalcino_
sequestrate_30_mila_bottiglie-87525005/. [4] http://www.theglobeandmail.com/technology/science/honey-laundering-the-sour-side-of-
natures-golden-sweetener/article562759/. [5] http://www.coldiretti.it/docindex/cncd/informazioni/753_07.shtm. [6] http://www.coldiretti.it/News/Pagine/94–-7-Febbraio-2014.aspx. [7] h t t p : / / w w w. f d a . g o v / F o o d / G u i d a n c e R e g u l a t i o n / F S M A / u c m 3 7 6 4 7 8 .
htm?source=govdelivery&utm_medium=email&utm_source=govdelivery. [8] S. Sumar, H. Ismail, Adulteration of foods – past and present, Nutr. Food Sci. 95 (1995)
11–15. [9] Pliny the Elder, Natural History, the Loeb Classical Library, Harvard University Press,
Cambridge, MA, USA, 1952. [10] F. Accum, A Treatise on Adulterations of Food and Culinary Poisons: Exhibiting the Fraudulent
Sophistications of Bread, Beer, Wine, Spirituous Liquors, Tea, Coffee, Cream, Confection-ery, Vinegar, Mustard, Pepper, Cheese, Olive Oil, Pickles, and Other Articles Employed in Domestic Economy, and Methods of Detecting Them, Longman, Hurst, Rees, Orme, and Brown, London, 1820.
[11] J.C. Moore, J. Spink, M. Lipp, Development and application of a database of food ingrediente fraud and economically motivated adulteration from 1980 to 2010, J. Food Sci. 77 (2012) 118–126.
[12] USP, Food Chemical Codex, 2014–2016, ninth ed., US Pharmacopeial Convention, Rockville, MD (USA), 2014.
[13] M. Aceto, M. Baldizzone, M. Oddone, Keeping the track of quality: authentication and traceability studies on wine, in: P. O’Byrne (Ed.), Red Wine and Health, Nova Science Publishers, Hauppauge, NY, 2009, pp. 429–466.
[14] M. Forina, G. Drava, Chemometrics for wine. Applications, Analusis Mag. 25 (1997) M38–M42.
[15] M. Forina, S. Lanteri, C. Armanino, Chemometrics in food chemistry, in: Chemometrics and Species Identification, Topics in current chemistry series, vol. 141, Springer-Verlag, Berlin, 1987, pp. 91–143.
[16] N.E. Tzouros, I.S. Arvanitoyannis, Agricultural produces: synopsis of employed quality control methods for the authentication of foods and application of chemometrics for the classifica-tion of foods according to their variety or geographical origin, Crit. Rev. Food Sci. Nutr. 41 (2001) 287–319.
500 PART | II Mass Spectrometry Applications within Food Safety and Quality
[17] Y. Chen, Y. Ni, Application of chemical pattern recognition techniques in food quality control, Chem. Res. Appl. 21 (2009) 1–7.
[18] S. Lingxia, C. Jinping, Z. Gaiming, L. Miaoyun, Research progress in application of chemo-metrics in food analysis, Sci. Technol. Food Ind. 33 (2012) 444–448.
[19] L.A. Berrueta, R.M. Alonso-Salces, K. Heberger, Supervised pattern recognition in food analysis, J. Chromatogr. A 1158 (2007) 196–214.
[20] M. Kozak, C.H. Scaman, Unsupervised classification methods in food sciences: discussion and outlook, J. Sci. Food Agric. 88 (2008) 1115–1127.
[21] J. Saurina, Characterization of wines using compositional profiles and chemometrics, Trends Anal. Chem. 29 (2010) 234–245.
[22] A. Versari, V.F. Laurie, A. Ricci, L. Laghi, G.P. Parpinello, Progress in authentication, typification and traceability of grapes and wines by chemometric approaches, Food Res. Int. 60 (2014) 2–18.
[23] P. Zachar, M. Soltes, R. Kasarda, J. Novotny, M. Novikmecova, D. Marcincakova, Analyti-cal methods for the species identification of milk and milk products, Mljekarsvo 61 (2011) 199–207.
[24] R. Ben-Ayed, N. Kamoun-Grati, A. Rebai, An overview of the authentication of olive tree and oil, Compr. Rev. Food Sci. F. 12 (2013) 218–227.
[25] Council regulation (EEC) No 2092/91 of 24 June 1991 on organic production of agricultural products and indications referring thereto on agricultural products and foodstuffs, Off. J. Eur. Communities, L198 (July 22,1991) 1–15.
[26] A. Vlachos, I.S. Arvanitoyannis, P. Tserkezou, An updated review of meat authenticity methods and applications, Crit. Rev. Food Sci. Nutr. (2013). http://dx.doi.org/10.1080/10408398.2012.691573.
[27] M.Á. Sentandreu, E. Sentandreu, Authenticity of meat products: tools against fraud, Food Res. Int. 60 (2014) 19–29.
[28] http://oceana.org/sites/default/files/National_Seafood_Fraud_Testing_Results_FINAL.pdf. [29] I. Lavilla, M. Costas-Rodriguez, C. Bendicho, Authentication of fishery products, in: M. de
la Guardia, A. Gonzalvez (Eds.), Food Protected Designation of Origin: Methodologies and Applications, Comprehensive Analytical Chemistry, vol. 60, Elsevier, Amsterdam, 2013, pp. 657–717.
[30] I. Martinez, D. James, H. Loréal, Application of Modern Analytical Techniques to Ensure Seafood Safety and Authenticity, FAO Fisheries technical paper n.455, FAO, Rome, 2005.
[31] J.P. Melnyk, S. Wang, M.F. Marcone, Chemical and biological properties of the world’s most expensive spice: Saffron, Food Res. Int. 43 (2010) 1981–1989.
[32] I.S. Arvanitoyannis, O.B. Vaitsi, A review on tomato authenticity: quality control methods in conjunction with multivariate analysis (chemometrics), Crit. Rev. Food Sci. Nutr. 47 (2007) 675–699.
[33] I.S. Arvanitoyannis, C. Chalhoub, P. Gotsiou, N. Lydakis-Simantiris, P. Kefalas, Novel quality control methods in conjunction with chemometrics (multivariate analysis) for detecting honey authenticity, Crit. Rev. Food Sci. Nutr. 45 (2005) 193–203.
[34] J.M. Camina, R.G. Pellerano, E.J. Marchevsky, Geographical and botanical classification of honeys and apicultural products by chemometric methods. A review, Curr. Anal. Chem. 8 (2012) 408–425.
[35] A. Vlachos, I.S. Arvanitoyannis, A review of rice authenticity/adulteration methods and results, Crit. Rev. Food Sci. Nutr. 48 (2008) 553–598.
[36] I.S. Arvanitoyannis, A. Vlachos, Maize authentication: quality control methods and multi-variate analysis (chemometrics), Crit. Rev. Food Sci. Nutr. 49 (2009) 501–537.

Food Forensics Chapter | 9 501
[37] E. Capuano, R. Boerrigter-Eenling, G. van der Veer, S.M. van Ruth, Analytical authentica-tion of organic products: an overview of markers, J. Sci. Food Agric. 93 (2013) 12–28.
[38] I.J. Colquhoun, M. Lees, Nuclear magnetic resonance spectroscopy, in: P.R. Ashurst, M.J. Dennis (Eds.), Analytical Methods of Food Authentication, Blackie Academic & Professional, London, 1998, pp. 36–75.
[39] C.N.G. Scotter, R. Wilson, Infrared spectroscopy, in: P.R. Ashurst, M.J. Dennis (Eds.), Analytical Methods of Food Authentication, Blackie Academic & Professional, London, 1998, pp. 76–96.
[40] S. Primrose, M. Woolfe, S. Rollinson, Food forensics: methods for determining the authen-ticity of foodstuffs, Trends Food Sci. Tech. 21 (2010) 582–590.
[41] D. Aiello, D. De Luca, E. Gionfriddo, A. Naccarato, A. Napoli, E. Romano, A. Russo, G. Sindona, A. Tagarelli, Multistage mass spectrometry in quality, safety and origin of foods, Eur. J. Mass Spectrom. 17 (2011) 1–31.
[42] S.A. Drivelos, C.A. Georgiou, Multi-element and multi-isotope-ratio analysis to determine the geographical origin of foods in the European Union, Trend Anal. Chem. 40 (2012) 38–51.
[43] S. Kelly, K. Heaton, J. Hoogewerff, Tracing the geographical origin of food: the application of multi-element and multi-isotope analysis, Trends Food Sci. Tech. 16 (2005) 555–567.
[44] D.M.A.M. Luykx, S.M. van Ruth, An overview of analytical methods for determining the geographical origin of food products, Food Chem. 107 (2008) 897–911.
[45] D. Sun (Ed.), Modern Techniques for Food Authentication, Elsevier, Amsterdam, 2008. [46] A. Gonzalvez, S. Armenta, M. de la Guardia, Trace-element composition and stable-isotope
ratio for discrimination of foods with protected designation of origin, Trends Anal. Chem. 28 (2009) 1295–1311.
[47] S.E. Ebeler, G.R. Takeoka, P. Winterhalter (Eds.), Progress in Authentication of Food and Wine, ACS Symposium Series, American Chemical Society, Washington, DC, 2011.
[48] Food protected designation of origin, in: M. de la Guardia, A. Gonzálvez (Eds.), Meth-odologies and Applications, Comprehensive Analytical Chemistry, vol. 60, Elsevier, Amsterdam, 2013.
[49] G.J. Martin, M.L. Martin, Deuterium labelling at the natural abundance level as studied by high field quantitative 2H NMR, Tetrahedron Lett. 22 (1981) 3525–3528.
[50] V. Caer, M. Trierweiler, G.J. Martin, M.L. Martin, Determination of site-specific carbon isotope ratios at natural abundance by carbon-13 nuclear magnetic resonance spectroscopy, Anal. Chem. 63 (1991) 2306–2313.
[51] P.A. de Groot (Ed.), Handbook of Stable Isotope Analytical Techniques, Elsevier, Amster-dam, 2004.
[52] G. Gremaud, A. Hilkert, Isotopic-spectroscopic technique: stable isotope ratio mass spec-trometry (IRMS), in: D. Sun (Ed.), Modern Techniques for Food Authentication, Elsevier, Amsterdam, 2008, pp. 269–320.
[53] W. Meier-Augenstein, Stable Isotope Forensics: An Introduction to the Forensic Application of Stable Isotope Analysis, John Wiley & Sons, Chichester, UK, 2010.
[54] Commission regulation (EC) No 2676/90 determining community methods for the analysis of wines, Off. J. Eur. Communities, L272 (October 3, 1990) 1–192.
[55] Commission Regulation (EC) No 822/97 of 6 May 1997 amending Regulation (EEC) No 2676/90 determining Community methods for the analysis of wines, Off. J. Eur. Communi-ties L117 (07/05/1997) 10–12.
[56] Commission Regulation (EC) No 440/2003 of 10 March 2003 amending Regulation (EEC) No 2676/90 determining Community methods for the analysis of wines, Off. J. Eur. Com-munities L66 (11/03/2003) 15–23.

502 PART | II Mass Spectrometry Applications within Food Safety and Quality
[57] OIV (Organisation International de la Vigne et du Vin), Determination by Isotope Ratio Mass Spectrometry of 13C/12C of Wine Ethanol or that Obtained through the Fermentation of Musts, Concentrated Musts or Grape Sugar, Resolution OENO 17/2001, Paris, 2001.
[58] OIV (Organisation International de la Vigne et du Vin), Determination of the Carbon Isotope Ratio 13C/12C of CO2 in Sparkling Wines Method Using Isotope Ratio Mass Spectrometry (IRMS), Resolution OENO 7/2005, Paris, 2005.
[59] OIV (Organisation International de la Vigne et du Vin), Method for 18O/16O Isotope Ratio Determination of Water in Wine and Must, Resolution OENO 353/2009, Paris, 2009.
[60] Association of Analytical Communities (AOAC), Official Methods of Analysis Method 998.12: C-4 Plant Sugars in Honey, Internal Standard Stable Carbon Isotope Ratio Method, vol. 44, AOAC International, Gaithersburg, MD, USA, 2012, pp. 25–36.
[61] Association of Analytical Communities (AOAC), Official Methods of Analysis Method 2004.01: Carbon Stable Isotope Ratio of Ethanol Derived from Fruit Juices and Maple Syr-ups, vol. 44, AOAC International, Gaithersburg, MD, USA, 2012, p. 1.
[62] B.N. Smith, S. Epstein, Two categories of 13C/12C ratios for higher plants, Plant Physiol. 47 (1971) 380–384.
[63] L. Bontempo, F. Camin, L. Manzocco, G. Nicolini, R. Wehrens, L. Ziller, R. Larcher, Trace-ability along the production chain of Italian tomato products on the basis of stable isotopes and mineral composition, Rapid Commun. Mass Spectrom. 25 (2011) 899–909.
[64] K.A. Hobson, Tracing origins and migration of wildlife using stable isotopes: a review, Oecologia 120 (1999) 314–326.
[65] W. Meier-Augenstein, Stable Isotope Forensics: An Introduction to the Forensic Application of Stable Isotope Analysis, John Wiley & Sons, New York, 2010.
[66] A. Rossmann, Determination of stable isotope rations in food analysis, Food Rev. Int. 17 (2001) 347–381.
[67] G. Fortunato, K. Mumic, S. Wunderli, L. Pillonel, J.O. Bosset, G. Gremaud, Application of strontium isotope abundance ratios measured by MC-ICP-MS for food authentication, J. Anal. At. Spectrom. 19 (2004) 227–234.
[68] H. Förstel, The natural fingerprint of stable isotopes - use of IRMS to test food authenticity, Anal. Bioanal. Chem. 388 (2007) 541–544.
[69] S. Voerkelius, G.D. Lorenz, S. Rummel, C.R. Quétel, G. Heiss, M. Baxter, C. Brach-Papa, P. Deters-Itzelsberger, S. Hoelzl, J. Hoogewerff, E. Ponzevera, M. Van Bocxstaele, H. Uneck-ermann, Strontium isotopic signatures of natural mineral waters, the reference to a simple geological map and its potential for authentication of food, Food Chem. 118 (2010) 933–940.
[70] M. Katzenberg, Stable isotope analysis: a tool for studying past diet, demography, and life history, in: M. Katzenberg, S. Saunders (Eds.), Biological Anthropology of the Human Skel-eton, Wiley-Liss, New York, 2008, pp. 413–442.
[71] H. Krueger, C. Sullivan, Models for carbon isotope fractionation between diet and bone, in: J.R. Turnlund, P.E. Johnson (Eds.), Stable Isotopes in Nutrition, ACS Symposium Series 258, American Chemical Society, Washington, DC, 1984, pp. 205–220.
[72] C. Kellner, M. Schoeninger, A simple carbon isotope model for reconstructing prehistoric human diet, Am. J. Phys. Anthropol. 133 (2007) 1112–1127.
[73] M. Schoeninger, M. DeNiro, Nitrogen and carbon isotopic composition of bone collagen from marine and terrestrial animals, Geochim. Cosmochim. Acta 48 (1984) 625–639.
[74] K. Killgrove, R.H. Tykot, Food for Rome: a stable isotope investigation of diet in the Impe-rial period (1st-3rd centuries AD), J. Anthropol. Archaeol. 32 (2012) 28–38.
[75] L.A. Gregoricka, S.G. Sheridan, Ascetic or affluent? Byzantine diet at the monastic com-munity of St. Stephen’s, Jerusalem from stable carbon and nitrogen isotopes, J. Anthropol. Archaeol. 32 (2013) 63–73.

Food Forensics Chapter | 9 503
[76] A. Rossmann, F. Reniero, I. Moussa, H.L. Schmidt, G. Versini, M.H. Merle, Stable oxygen isotope content of water of EU data-bank wines from Italy, France and Germany, Z. Lebensm. Unters. Forsch. A 208 (1999) 400–407.
[77] G.D. Farquhar, J.R. Ehleringer, K.T. Hubick, Carbon isotope discrimination and photosyn-thesis, Annu. Rev. Plant Physiol. Mol. Biol. 40 (1989) 503–537.
[78] J.M. Moreno Rojas, S. Cosofret, F. Reniero, C. Guillou, F. Serra, Control of oenological products: discrimination between different botanical sources of L-tartaric acid by isotope ratio mass spectrometry, Rapid Commun. Mass Spectrom. 21 (2007) 2447–2450.
[79] P. Horn, P. Schaaf, B. Holbach, S. Holzl, H. Eschnauer, 87Sr/86Sr from rock and soil in vine and wine, Z. Lebensm. Unters. Forsch. 196 (1993) 407–409.
[80] C.M.R. Almeida, M.T.S.D. Vasconcelos, Does the winemaking process influence the wine 87Sr/86Sr? A case study, Food Chem. 85 (2004) 7–12.
[81] C. Durante, C. Baschieri, L. Bertacchini, M. Cocchi, S. Sighinolfi, M. Silvestri, A. Marchetti, Geographical traceability based on Sr-87/Sr-86 indicator: a first approach for PDO Lambr-usco wines from Modena, Food Chem. 141 (2013) 2779–2787.
[82] S. Marchionni, E. Braschi, S. Tommasini, A. Bollati, F. Cifelli, N. Mulinacci, M. Mattei, S. Conticelli, High-precision Sr-87/Sr-86 analyses in wines and their use as a geological fingerprint for tracing geographic provenance, J. Agric. Food Chem. 61 (2013) 6822–6831.
[83] P. Martins, M. Madeira, F. Monteiro, R.B. De Sousa, A.S. Curvelo-Garcia, S. Catarino, Sr-87/Sr-86 ratio in vineyard soils from Portuguese denominations of origin and its potential for origin authentication, J. Int. Sci. Vigne Vin 48 (2014) 21–29.
[84] M. Barbaste, L. Halicz, A. Galy, B. Medina, H. Emteborg, F.C. Adams, R. Lobinski, Evaluation of the accuracy of the determination of lead isotope ratios in wine by ICP MS using quadrupole, multicollector magnetic sector and time-of-flight analyzers, Talanta 54 (2001) 307–317.
[85] C.M.R. Almeida, M.T.S.D. Vasconcelos, Determination of lead isotope ratios in port wine by inductively coupled plasma mass spectrometry after pre-treatment by UV-irradiation, Anal. Chim. Acta 396 (1999) 45–53.
[86] R. Larcher, G. Nicolini, P. Pangrazzi, Isotope ratios of lead in italian wines by inductively coupled plasma mass spectrometry, J. Agric. Food Chem. 51 (2003) 5956–5961.
[87] C. Vorster, L. Greeff, P.P. Coetzee, The determination of B-11/B-10 and Sr-87/Sr-86 isotope ratios by Quadrupole-based ICP-MS for the fingerprinting of South African wine, S. Afr. J. Chem. 63 (2010) 207–214.
[88] J. Hoefs, Stable Isotope Geochemistry, Springer-Verlag, Berlin, 2009. [89] W.A. Simpkins, D. Rigby, Detection of illicit extension of potable spiritous liquors using
13C:12C ratios, J. Sci. Food Agr. 33 (1982) 898–903. [90] A.W. Hilkert, C.B. Douthitt, H.J. Schlüter, W.A. Brand, Isotope ratio monitoring gas chro-
matography/mass spectrometry of D/H by high temperature conversion isotope ratio mass spectrometry, Rapid Commun. Mass Spectrom. 13 (1999) 1226–1230.
[91] I.G. Parker, S.D. Kelly, M. Sharman, M.J. Dennis, D. Howie, Investigation into the use of carbon isotope ratios (13C/12C) of Scotch whisky congeners to establish brand authentic-ity using gas chromatography-combustion-isotope ratio mass spectrometry, Food Chem. 63 (1998) 423–428.
[92] W. Meier-Augenstein, H.F. Kemp, S.M.L. Hardie, Detection of counterfeit Scotch whisky by 2H and 18O stable isotope analysis, Food Chem. 133 (2012) 1070–1074.
[93] C.N. Rhodes, K. Heaton, I. Goodall, P.A. Brereton, Gas chromatography carbon isotope ratio mass spectrometry applied to the detection of neutral alcohol in Scotch whisky: an internal reference approach, Food Chem. 114 (2009) 697–701.
[94] B. Raco, E. Dotsika, A. Cerrina Feroni, R. Battaglini, D. Poutoukis, Stable isotope composi-tion of Italian bottled waters, J. Geochem. Explor. 124 (2013) 203–211.
504 PART | II Mass Spectrometry Applications within Food Safety and Quality
[95] M. Scampicchio, T. Mimmo, C. Capici, C. Huck, N. Innocente, S. Drusch, S. Cesco, Identification of milk origin and process-induced changes in milk by stable isotope ratio mass spectrometry, J. Agric. Food Chem. 60 (2012) 11268–11273.
[96] M.A. Brescia, M. Monfreda, A. Buccolieri, C. Carrino, Characterisation of the geographical origin of buffalo milk and mozzarella cheese by means of analytical and spectroscopic deter-minations, Food Chem. 89 (2005) 139–147.
[97] L. Pillonel, R. Badertscher, P. Froidevaux, G. Haberhauer, S. Hölzl, P. Horn, A. Jakob, E. Pfammatter, U. Piantini, A. Rossmann, R. Tabacchi, J.O. Bosset, Stable isotope ratios, major, trace and radioactive elements in emmental cheeses of different origins, Lebensm.-Wiss. Technol. 36 (2003) 615–623.
[98] F. Camin, R. Larcher, G. Nicolini, L. Bontempo, D. Bertoldi, M. Perini, C. Schlicht, A. Schellenberg, F. Thomas, K. Heinrich, S. Voerkelius, M. Horacek, H. Ueckermann, H. Froeschl, B. Wimmer, G. Heiss, M. Baxter, A. Rossmann, J. Hoogewerff, Isotopic and elemental data for tracing the origin of European olive oils, J. Agric. Food Chem. 58 (2010) 570–577.
[99] J.E. Spangenberg, N. Ogrinc, Authentication of vegetable oils by bulk and molecular carbon isotope analyses with emphasis on olive oil and pumpkin seed oil, J. Agric. Food Chem. 49 (2001) 1534–1540.
[100] F. Schwagele, Traceability from a European perspective, Meat Sci. 71 (2005) 164–173. [101] L. Hegerding, D. Seidler, H.J. Danneel, A. Gessler, B. Nowak, Oxygen isotope-ratio-analysis
for the determination of the origin of beef, Fleischwirtschaft 82 (2002) 95–100. [102] J.P. Renou, G. Bielicki, C. Deponge, P. Gachon, D. Micol, P. Ritz, Characterization of animal
products according to geographic origin and feeding diet using nuclear magnetic resonance and isotope ratio mass spectrometry. Part II: beef meat, Food Chem. 86 (2004) 251–256.
[103] M. Boner, H. Förstel, Stable isotope variation as a tool to trace the authenticity of beef, Anal. Bioanal. Chem. 378 (2004) 301–310.
[104] B.M. Franke, G. Gremaud, R. Hadorn, M. Kreuzer, Geographic origin of meat-elements of an analytical approach to its authentication, Eur. Food Res. Technol. 221 (2005) 493–503.
[105] O. Schmidt, J.M. Quilter, B. Bahar, A.P. Maloney, C.M. Scrimgeour, I.S. Begley, F.J. Mona-han, Inferring the origin and dietary history of beef from C, N and S stable isotope ratio analysis, Food Chem. 91 (2005) 545–549.
[106] E. Piasentier, R. Valusso, F. Camin, G. Versini, Stable isotope ratio analysis for authentica-tion of lamb meat, Meat Sci. 64 (2003) 239–247.
[107] D. Sacco, M.A. Brescia, A. Buccolieri, A.C. Jambrenghi, Geographical origin and breed dis-crimination of Apulian lamb meat samples by means of analytical and spectroscopic deter-minations, Meat Sci. 71 (2005) 542–548.
[108] I. González-Martin, C. González-Pérez, J. Hernández Méndez, E. Marqués-Macias, F.S. Sanz-Poveda, Use of isotope analysis to characterize meat from Iberian-breed swine, Meat Sci. 52 (1999) 437–441.
[109] K. Heaton, S.D. Kelly, J. Hoogewerff, M. Woolfe, Verifying the geographical origin of beef: the application of multi-element isotope and trace element analysis, Food Chem. 107 (2008) 506–515.
[110] F.J. Winkler, Application of natural abundance stable isotope mass spectrometry in food con-trol, in: A. Frigerio, H. Milon (Eds.), Chromatography and Mass Spectrometry in Nutrition Science and Food Safety, Elsevier, Amsterdam, Netherlands, 1984, pp. 173–190.
[111] A. Delgado, N. Garcia, δ15N and δ13C analysis to identify cattle fed on feed containing animal proteins: a safety/quality index in meat, milk and cheese, in: Proceedings of the 6th International Symposium on Food Authenticity and Safety, Nantes, France, 2001, pp. 1–11.
Food Forensics Chapter | 9 505
[112] B.L. Guo, Y.M. Wei, J.R. Pan, Y. Li, Stable C and N isotope ratio analysis for regional geographical traceability of cattle in China, Food Chem. 118 (2010) 915–920.
[113] M. Montowska, E. Pospiech, Is authentication of regional and traditional food made of meat possible? Crit. Rev. Food Sci. Nutr. 52 (2012) 475–487.
[114] Y. Zhao, B. Zhang, G. Chen, A. Chen, S. Yang, Z. Ye, Recent developments in application of stable isotope analysis on agro-product authenticity and traceability, Food Chem. 145 (2014) 300–305.
[115] A.T. Correia, F. Barrosa, A.N. Sial, Stock discrimination of European conger eel (Conger conger L.) using otolith stable isotope ratios, Fish Res. 108 (2011) 88–94.
[116] R. Barnett-Johnson, T.E. Pearson, F.C. Ramos, C.B. Grimes, R.B. MacFarlane, Tracking natal origins of salmon using isotopes, otoliths, and landscape geology, Limnol. Oceanogr. 53 (2008) 1633–1642.
[117] F. Thomas, E. Jamin, K. Wietzerbin, R. Guérin, M. Lees, E. Morvan, I. Billault, S. Derrien, J.M. Moreno Rojas, F. Serra, C. Guillou, M. Aursand, L. McEvoy, A. Prael, R.J. Robins, Determination of origin of Atlantic salmon (Salmo salar): the use of multiprobe and mul-tielement isotopic analyses in combination with fatty acid composition to assess wild or farmed origin, J. Agric. Food Chem. 56 (2008) 989–997.
[118] K.A. Anderson, K.A. Hobbie, B.W. Smith, Chemical profiling with modeling differentiates wild and farm-raised salmon, J. Agric. Food Chem. 58 (2010) 11768–11774.
[119] G. Martin, G. Remaud, G.J. Martin, Food flavours - Generation, analysis, and process influ-ence, in: C. Charalambous (Ed.), Proceedings of the 8th International Flavour Conference, Elsevier, Amsterdam, 1995, pp. 355–378.
[120] L. Maggi, M. Carmona, S.D. Kelly, N. Marigheto, G.L. Alonso, Geographical origin differentiation of saffron spice (Crocus sativus L. stigmas) - preliminary investigation using chemical and multi-element (H, C, N) stable isotope analysis, Food Chem. 128 (2011) 543–548.
[121] M. Brunner, R. Katona, Z. Stefanka, T. Prohanska, Determination of the geographical origin of processed spice using multielement and isotopic pattern on the example of Szegedi paprika, Eur. Food Res. Technol. 231 (2010) 623–634.
[122] M. Greule, L.D. Tumino, T. Kronewald, U. Hener, J. Schleucher, A. Mosandl, F. Keppler, Improved rapid authentication of vanillin using δ13C and δ2H values, Eur. Food Res. Technol. 231 (2010) 933–941.
[123] J. Bricout, J.C. Fontes, Analytical distinction between cane and beet sugar, Ann. Fals. Exp. Chim. 67 (1974) 211–215.
[124] M. Gensler, A. Rossmann, H.L. Schmidt, Detection of added L-ascorbic acid in fruit juices by isotope ratio mass spectrometry, J. Agric. Food Chem. 308 (1995) 299–307.
[125] J. Koziet, A. Rossmann, G.J. Martin, P. Johnson, Determination of the oxygen-18 and deu-terium content of fruit and vegetable juice water. A European inter-laboratory comparison study, Anal. Chim. Acta 302 (1995) 29–37.
[126] F. Guyon, P. Auberger, L. Gaillard, C. Loublanches, M. Viateau, N. Sabathié, M.H. Salagoïty, B. Médina, 13C/12C isotope ratios of organic acids, glucose and fructose determined by HPLC-co-IRMS for lemon juices authenticity, Food Chem. 146 (2014) 36–40.
[127] T.S. Pilgrim, R.J. Watlinga, K. Grice, Application of trace element and stable isotope sig-natures to determine the provenance of tea (Camellia sinensis) samples, Food Chem. 118 (2010) 921–926.
[128] C. Rodrigues, C. Máguas, T. Prohaska, Strontium and oxygen isotope fingerprinting of green coffee beans and its potential to proof authenticity of coffee, Eur. Food Res. Technol. 232 (2011) 361–373.
506 PART | II Mass Spectrometry Applications within Food Safety and Quality
[129] H. Liu, C. You, C. Chen, Y. Liu, M. Chung, Geographic determination of coffee beans using multi-element analysis and isotope ratios of boron and strontium, Food Chem. 142 (2014) 439–445.
[130] S. Rummel, S. Hoelzl, P. Horn, A. Rossmann, C. Schlicht, The combination of stable isotope abundance ratios of H, C, N and S with (87)Sr/(86)Sr for geographical origin assignment of orange juices, Food Chem. 118 (2010) 890–900.
[131] K.M. Rogers, Stable isotopes as a tool to differentiate eggs laid by caged, barn, free range, and organic hens, J. Agric. Food Chem. 57 (2009) 4236–4242.
[132] M.J. De Niro, S. Epstein, Influence of diet on the distribution of nitrogen isotopes in animals, Geochim. Cosmochim. Acta 45 (1981) 341–351.
[133] L. Rock, The use of stable isotope techniques in egg authentication schemes: a review, Trends Food Sci. Tech. 28 (2012) 62–68.
[134] A. Schellenberg, S. Chmielus, C. Schlicht, F. Camin, M. Perini, L. Bontempo, K. Heinrich, S.D. Kelly, A. Rossmann, F. Thomas, E. Jamin, M. Horacek, Multielement stable isotope ratios (H, C, N, S) of honey from different European regions, Food Chem. 121 (2010) 770–777.
[135] J.W. White, K. Winters, P. Martin, A. Rossman, Stable carbon isotope ratio analysis of honey: validation of internal standard procedure for worldwide application, J. Assoc. Off. Anal. Chem. Int. 81 (1998) 610–619.
[136] A. Guler, H. Kocaokutgen, A.V. Garipoglu, H. Onder, D. Ekinci, S. Biyik, Detection of adul-terated honey produced by honeybee (Apis mellifera L.) colonies fed with different levels of commercial industrial sugar (C3 and C4 plants) syrups by the carbon isotope ratio analysis, Food Chem. 155 (2014) 155–160.
[137] G. Daniele, D. Maitre, H. Casabianca, Identification, quantification and carbon stable isotopes determinations of organic acids in monofloral honeys. A powerful tool for botanical and authenticity control, Rapid Commun. Mass Spectrom. 26 (2012) 1993–1998.
[138] H. Oda, A. Kawasaki, T. Hirata, Determination of the geographic origin of brown-rice with isotope ratios of 11B/10B and 87Sr/86Sr, Anal. Sci. 17 (2001) i1627–i1630.
[139] T. Korenaga, M. Musashi, R. Nakashita, Y. Suzuki, Statistical analysis of rice samples for compositions of multiple light elements (H, C, N, and O) and their stable isotopes, Anal. Sci. 26 (2010) 873–878.
[140] K. Ariyama, M. Shinozaki, A. Kawasaki, Determination of the geographic origin of rice by chemometrics with strontium and lead isotope ratios and multielement concentrations, J. Agric. Food Chem. 60 (2012) 1628–1634.
[141] F. Camin, M. Perini, L. Bontempo, S. Fabroni, W. Faedi, S. Magnani, G. Baruzzi, M. Bonoli, M.R. Tabilio, S. Musmeci, A. Rossmann, S.D. Kelly, P. Rapisarda, Potential isotopic and chemical markers for characterising organic fruits, Food Chem. 125 (2011) 1072–1082.
[142] K.H. Laursen, A. Mihailova, S.D. Kelly, V.N. Epov, S. Bérail, J.K. Schjoerring, O.F.X. Donard, E.H. Larsen, N. Pedentchouk, A.D. Marca-Bell, U. Halekoh, J.E. Olesen, S. Husted, Is it really organic? - multi-isotopic analysis as a tool to discriminate between organic and conventional plants, Food Chem. 141 (2013) 2812–2820.
[143] A. Mihailova, N. Pedentchouk, S.D. Kelly, Stable isotope analysis of plant-derived nitrate - novel method for discrimination between organically and conventionally grown vegetables, Food Chem. 154 (2014) 238–245
[144] C.N. Rhodes, J.H. Lofthouse, S. Hird, P. Rose, P. Reece, J. Christy, R. Macarthur, P.A. Brere-ton, The use of stable carbon isotopes to authenticate claims that poultry have been corn-fed, Food Chem. 118 (2010) 927–932.
[145] I. Chung, I. Park, J. Yoon, Y. Yang, S. Kim, Determination of organic milk authenticity using carbon and nitrogen natural isotopes, Food Chem. 160 (2014) 214–218.
Food Forensics Chapter | 9 507
[146] W.M. White, Geochemistry, Wiley-Blackwell, New York, 2013. [147] E. McCurdy, D. Potter, M. Medina, Trace elements in wine, Lab. News 9 (1992) 10–11. [148] A. Masuda, Regularities in variation of relative abundances of lanthanide elements and
an attempt to analyze separation index patterns of some minerals, J. Earth Sci. 10 (1962) 173–187.
[149] C.D. Coryell, J.W. Chase, J.W. Winchester, A procedure for geochemical interpretation of terrestrial rare-earth abundance patterns, J. Geophys. Res. 68 (1963) 559–566.
[150] T. Liang, S. Ding, W. Song, Z. Chong, C. Zhang, H. Li, A review of fractionations of rare earth elements in plants, J. Rare Earths 26 (2008) 7–15.
[151] P.H. Brown, A.H. Rathjen, R.D. Graham, D.E. Tribe, Rare earth elements in biological sys-tems, in: in: K.A. Gschneider, L. Eyring (Eds.), Handbook on the Physics and Chemistry of Rare Earths, vol. 13, Elsevier, Amsterdam, 1990, pp. 423–452.
[152] G. Tyler, Rare earth elements in soil and plant systems: a review, Plant Soil 267 (2004) 191–206.
[153] J.D. Greenough, H.P. Longerich, S.E. Jackson, Trace element concentrations in wines by ICP-MS: evidence for the role of solubility in determining uptake by plants, Can. J. Appl. Spectrosc. 41 (1996) 76–80.
[154] V.F. Taylor, H.P. Longerich, J.D. Greenough, Geology and wine 5. – provenance of Okana-gan Valley wines, British Columbia, using trace elements: Promise and limitations, Geosci. Can. 29 (2002) 110–120.
[155] G. Thiel, G. Geisler, I. Blechschmidt, Determination of trace elements in wines and classifi-cation according to their provenance, Anal. Bioanal. Chem. 378 (2004) 1630–1636.
[156] P. Pohl, What do metals tell us about wine? Trends Anal. Chem. 26 (2007) 941–949. [157] M.J. Latorre, C. Garcia-Jares, B. Medina, C. Herrero, Pattern recognition analysis applied to
classification of wines from Galicia (Northwestern Spain) with Certified Brand of Origin, J. Agric. Food Chem. 43 (1994) 1451–1455.
[158] M.J. Baxter, H.M. Crews, M.J. Dennis, I. Goodall, D. Anderson, The determination of the authenticity of wine from its trace element composition, Food Chem. 60 (1997) 443–450.
[159] E. Marengo, M. Aceto, Statistical investigation of the differences in the distribution of metals in Nebbiolo-based wines, Food Chem. 81 (2003) 621–630.
[160] V.F. Taylor, H.P. Longerich, J.D. Greenough, Multielement analysis of Canadian wines by Inductively Coupled Plasma Mass Spectrometry (ICP-MS) and multivariate statistics, J. Agric. Food Chem. 51 (2003) 856–860.
[161] M. Oddone, E. Robotti, M. Marengo, M. Baldizzone, M. Aceto, Studio della tracciabilita sulla filiera del vino mediante determinazione dei lantanidi con ICP-MS, in: J.D. Coisson, M. Arlorio, A. Martelli (Eds.), Proceedings of VI Italian Congress “Chimica degli Alimenti”, Taro, Alessandria, 2007, pp. 573–577.
[162] M. Aceto, E. Robotti, M. Oddone, M. Baldizzone, G. Bonifacino, G. Bezzo, R. Di Stefano, F. Gosetti, E. Mazzucco, M. Manfredi, E. Marengo, A traceability study on the Moscato wine chain, Food Chem. 138 (2013) 1914–1922.
[163] A. Gonzálvez, M. de la Guardia, Mineral profile, in: M. de la Guardia, A. Gonzalvez (Eds.), Food Protected Designation of Origin: Methodologies and Applications, Comprehensive Analytical Chemistry, vol. 60, Elsevier, Amsterdam, 2013, pp. 51–76.
[164] C. Benincasa, J. Lewis, G. Sindona, A. Tagarelli, The use of multi element profiling to differentiate between cow and buffalo milk, Food Chem. 110 (2008) 257–262.
[165] C. Benincasa, J. Lewis, E. Perri, G. Sindona, A. Tagarelli, Determination of trace element in Italian virgin olive oils and their characterization according to geographical origin by statistical analysis, Anal. Chim. Acta 585 (2007) 366–370.
508 PART | II Mass Spectrometry Applications within Food Safety and Quality
[166] E.J. Llorent-Martínez, P. Ortega-Barrales, M.L. Fernández-de Córdova, A. Domínguez-Vidal, A. Ruiz-Medina, Investigation by ICP-MS of trace element levels in vegetable edible oils produced in Spain, Food Chem. 127 (2011) 1257–1262.
[167] K.J. Hintze, G.P. Lardy, M.J. Marchello, J.W. Finley, J. Agric. Food Chem. 49 (2001) 1062–1067.
[168] K.J. Hintze, G.P. Lardy, M.J. Marchello, J.W. Finley, J. Agric. Food Chem. 50 (2002) 3938–3942.
[169] S.L. Bruce, B.N. Noller, A.H. Grigg, B.F. Mullen, D.R. Mulligan, P.J. Ritchie, N. Currey, J.C. Ng, A field study conducted at Kidston Gold Mine to evaluate the impact of arsenic and zinc from mine tailing to grazing cattle, Toxicol. Lett. 137 (2003) 23–34.
[170] G. Chessa, G. Calaresu, G. Ledda, M.C. Testa, A. Orrù, Lead, zinc and cadmium in biologi-cal tissues of sheep bred in a polluted area, in: B. Markert, K. Friese (Eds.), Trace Elements-Their Distribution and Effect in the Environment, Elsevier, Amsterdam, 2000, pp. 479–483.
[171] M. Costas-Rodríguez, I. Lavilla, C. Bendicho, Classification of cultivated mussels from Gali-cia (Northwest Spain) with European Protected Designation of Origin using trace element fingerprint and chemometric analysis, Anal. Chim. Acta 664 (2010) 121–128.
[172] F. Cubadda, A. Raggi, E. Coni, Element fingerprinting of marine organisms by dynamic reac-tion cell inductively coupled plasma mass spectrometry, Anal. Bioanal. Chem. 384 (2006) 887–896.
[173] L. Guo, L. Gong, Y. Yu, H. Zhang, Multi-element fingerprinting as a tool in origin authentica-tion of four East China Marine species, J. Food Sci. 78 (2013) C1852–C1857.
[174] K. Ariyama, T. Nishida, T. Noda, M. Kadokura, A. Yasui, Effects of fertilization, crop year, variety, and provenance factors on mineral concentrations in onions, J. Agric. Food Chem. 54 (2006) 3341–3350.
[175] K. Ariyama, Y. Aoyama, A. Mochizuki, Y. Homura, M. Kadokura, A. Yasui, Determination of the geographic origin of onions between three main production areas in japan and other countries by mineral composition, J. Agric. Food Chem. 55 (2007) 347–354.
[176] A.A. D’Archivio, A. Giannitto, A. Incani, S. Nisi, Analysis of the mineral composition of Italian saffron by ICP-MS and classification of geographical origin, Food Chem. 157 (2014) 485–489.
[177] M. Bettinelli, S. Spezia, C. Baffi, G.M. Beone, R. Rocchetta, A. Nassisi, ICP-MS determina-tion of REEs in tomato plants and related products: a new analytical tool to verify traceabil-ity, At. Spectrosc. 26 (2005) 41–50.
[178] G. Lo Feudo, A. Naccarato, G. Sindona, A. Tagarelli, Investigating the origin of tomatoes and triple concentrated tomato pastes through multielement determination by inductively coupled plasma mass spectrometry and statistical analysis, J. Agric. Food Chem. 58 (2010) 3801–3807.
[179] M. Oddone, M. Aceto, M. Baldizzone, D. Musso, D. Osella, Authentication and traceability study of hazelnuts from Piedmont, Italy, J. Agric. Food Chem. 57 (2009) 3404–3408.
[180] H. Benabdelkamel, L. Di Donna, F. Mazzotti, A. Naccarato, G. Sindona, A. Tagarelli, D. Taverna, Authenticity of PGI “Clementine of Calabria” by multielement fingerprint, J. Agric. Food Chem. 60 (2012) 3717–3726.
[181] E. Furia, A. Naccarato, G. Sindona, G. Stabile, A. Tagarelli, Multielement fingerprinting as a tool in origin authentication of PGI food products: Tropea Red Onion, J. Agric. Food Chem. 59 (2011) 8450–8457.
[182] A. Moreda-Piñeiro, A. Fisher, S.J. Hill, The classification of tea according to region of origin using pattern recognition techniques and trace metal data, J. Food Compos. Anal. 16 (2003) 195–211.
Food Forensics Chapter | 9 509
[183] M. Ebert, R. Islam, Caviar and caviar imitations - adulterations of sturgeon roe provable by histological method, Fleischwirtschaft 87 (2007) 124–126.
[184] I. Rodushkin, T. Bergman, G. Douglas, E. Engström, D. Sörlin, D.C. Baxter, Authenti-cation of Kalix (N.E. Sweden) vendace caviar using inductively coupled plasma-based analytical techniques: evaluation of different approaches, Anal. Chim. Acta 583 (2007) 310–318.
[185] G.E. Bath, S.R. Thorrold, C.M. Jones, S.E. Campana, J.W. McLaren, J.W. Lam, Strontium and barium uptake in aragonitic otoliths of marine fish, Geochim. Cosmochim. Acta 64 (2000) 1705–1714.
[186] B.L. Batista, L.R.S. da Silva, B.A. Rocha, J.L. Rodrigues, A.A. Berretta-Silva, T.O. Bonates, V.S.D. Gomes, R.M. Barbosa, F. Barbosa, Multi-element determination in Brazilian honey samples by inductively coupled plasma mass spectrometry and estimation of geographic origin with data mining techniques, Food Res. Int. 49 (2012) 209–215.
[187] M. Chudzinska, D. Baralkiewicz, Application of ICP-MS method of determination of 15 elements in honey with chemometric approach for the verification of their authenticity, Food Chem. Toxicol. 49 (2011) 2741–2749.
[188] H. Chen, C. Fan, Q. Chang, G. Pang, X. Hu, M. Lu, W. Wang, Chemometric determination of the botanical origin for Chinese honeys on the basis of mineral elements determined by ICP-MS, J. Agric. Food Chem. 62 (2014) 2443–2448.
[189] S. Shen, L. Xia, N. Xiong, Z. Liu, H. Sun, Determination of the geographic origin of rice by element fingerprints and correlation analyses with the soil of origin, Anal. Methods 5 (2013) 6177–6185.
[190] H. Zhao, B. Guo, Y. Wei, B. Zhang, Effects of wheat origin, genotype, and their interaction on multielement fingerprints for geographical traceability, J. Agric. Food Chem. 60 (2012) 10957–10962.
[191] K.H. Laursen, J.K. Schjoerring, J.E. Olesen, M. Askegaard, U. Halekoh, S. Husted, Multi-elemental fingerprinting as a tool for authentication of organic wheat, barley, faba bean, and potato, J. Agric. Food Chem. 59 (2011) 4385–4396.
[192] S.D. Kelly, A.S. Bateman, Comparison of mineral concentrations in commercially grown organic and conventional crops - tomatoes (Lycopersicon esculentum) and lettuces (Lactuca sativa), Food Chem. 119 (2010) 738–745.
[193] M. Herrero, C. Simó, V. García-Cañas, E. Ibáñez, A. Cifuentes, Foodomics: MS-based strate-gies in modern food science and nutrition, Mass Spectrom. Rev. 31 (2012) 49–69.
[194] X. Wang, S. Wang, Z. Cai, The latest developments and applications of mass spectrometry in food-safety and quality analysis, Trends Anal. Chem. 52 (2013) 170–185.
[195] M.M.W.B. Hendriks, F.A. Eeuwijk, R.H. Jellema, J.A. Westerhuis, T.H. Reijmers, H.C.J. Hoefsloot, A.K. Smilde, Data-processing strategies for metabolomics studies, Trends Anal. Chem. 30 (2011) 1685–1698.
[196] S. Esslinger, J. Riedl, C. Fauhl-Hassek, Potential and limitations of non-targeted fingerprint-ing for authentication of food in official control, Food Res. Int. 60 (2014) 189–204.
[197] A. Cifuentes, Foodomics. Advanced Mass Spectrometry in Modern Food Science and Nutri-tion, John Wiley & Sons, New York, 2013.
[198] F. Toldrá, L.M.L. Nollet (Eds.), Proteomics in Foods. Principles and Applications, Springer, Berlin, 2013.
[199] S. Sforza (Ed.), Food Authentication Using Bioorganic Molecules, DEStech Publications, Lancaster, PA (USA), 2013.
[200] G. Mammone, G. Picariello, S. Caira, F. Addeo, P. Ferranti, Analysis of food proteins and peptides by mass spectrometry-based techniques, J. Chromatogr. A 1216 (2009) 7130–7142.

510 PART | II Mass Spectrometry Applications within Food Safety and Quality
[201] J.M. Gallardo, I. Ortea, M. Carrera, Proteomics and its applications for food authentication and food-technology research, Trends Anal. Chem. 52 (2013) 135–141.
[202] E. Trujillo, C. Davis, J. Millner, Nutrigenomics, proteomics, metabolomics, and the practice of dietetics, J. Am. Diet. Assoc. 106 (2006) 403–413.
[203] S.G. Oliver, M.K. Winson, D.B. Kell, F. Baganz, Systematic functional analysis of the yeast genome, Trends Biotechnol. 16 (1998) 373–378.
[204] O. Fiehn, Metabolomics–the link between genotypes and phenotypes, Plant Mol. Biol. 48 (2002) 155–171.
[205] K. Dettmer, P.A. Aronov, B.D. Hammock, Mass spectrometry-based metabolomics, Mass Spectrom. Rev. 26 (2007) 51–78.
[206] J.P. Antignac, F. Courant, G. Pinel, E. Bichon, F. Monteau, C. Elliott, B. Le Bizec, Mass spectrometry-based metabolomics applied to the chemical safety of food, Trends Anal. Chem. 30 (2011) 292–301.
[207] C. Hu, G. Xu, Mass-spectrometry-based metabolomics analysis for foodomics, Trends Anal. Chem. 52 (2013) 36–46.
[208] M. Castro-Puyana, M. Herrero, Metabolomics approaches based on mass spectrometry for food safety, quality and traceability, Trends Anal. Chem. 52 (2013) 74–87.
[209] C. Ibáñez, V. García-Cañas, A. Valdés, C. Simó, Novel MS-based approaches and applica-tions in food metabolomics, Trends Anal. Chem. 52 (2013) 100–111.
[210] G. Oms-Oliu, I. Odriozola-Serrano, O. Martín-Belloso, Metabolomics for assessing safety and quality of plant-derived food, Food Res. Int. 54 (2013) 1172–1183.
[211] E. Cubero-Leon, R. Peñalver, A. Maquet, Review on metabolomics for food authentication, Food Res. Int. 60 (2014) 95–107.
[212] A. Soria, A. Ruiz-Matute, M. Sanz, I. Martínez-Castro, Chromatographic technique: Gas chromatography (GC), in: D. Sun (Ed.), Modern Techniques for Food Authentication, Else-vier, Amsterdam, 2008, pp. 321–359.
[213] A.K. Malik, C. Blasco, Y. Pico, Liquid chromatography-mass spectrometry in food safety, J. Chromatogr. A 1217 (2010) 4018–4040.
[214] V. Di Stefano, G. Avellone, D. Bongiorno, V. Cunsolo, V. Muccilli, S. Sforza, A. Dossena, L. Drahos, K. Vekey, Applications of liquid chromatography-mass spectrometry for food analysis, J. Chromatogr. A 1259 (2012) 74–85.
[215] C. Ibáñez, C. Simó, V. García-Cañas, A. Cifuentes, M. Castro-Puyana, Metabolomics, pep-tidomics and proteomics applications of capillary electrophoresis-mass spectrometry in Foodomics: a review, Anal. Chim. Acta 802 (2013) 1–13.
[216] V. García-Cañas, C. Simó, M. Castro-Puyana, A. Cifuentes, Recent advances in the applica-tion of capillary electromigration methods for food analysis and Foodomics, Electrophoresis 35 (2014) 147–169.
[217] B. Plutowska, W. Wardencki, Aromagrams - aromatic profiles in the appreciation of food quality, Food Chem. 101 (2007) 845–872.
[218] M. Śliwińska, P. Wiśniewska, T. Dymerski, J. Namieśnik, W. Wardencki, Food analysis using artificial senses, J. Agric. Food Chem. 62 (2014) 1423–1448.
[219] E. Marengo, M. Aceto, V. Maurino, Classification of Nebbiolo-based wines from Piedmont (Italy) by means of solid-phase microextraction-gas chromatography-mass spectrometry of volatile compounds, J. Chromatogr. A 943 (2002) 123–137.
[220] L. Vaclavik, O. Lacina, J. Hajslova, J. Zweigenbaum, The use of high performance liquid chromatography–quadrupole time-of-flight mass spectrometry coupled to advanced data mining and chemometric tools for discrimination and classification of red wines according to their variety, Anal. Chim. Acta 685 (2011) 45–51.
Food Forensics Chapter | 9 511
[221] L. Jaitz, K. Siegl, R. Eder, G. Rak, L. Abranko, G. Koellensperger, S. Hann, LC–MS/MS analysis of phenols for classification of red wine according to geographic origin, grape vari-ety and vintage, Food Chem. 122 (2010) 366–372.
[222] D. Serrano-Lourido, J. Saurina, S. Hernández-Cassou, A. Checa, Classification and charac-terisation of Spanish red wines according to their appellation of origin based on chromato-graphic profiles and chemometric data analysis, Food Chem. 135 (2012) 1425.
[223] E. Mattarucchi, M. Stocchero, J.M. Moreno-Rojas, G. Giordano, F. Reniero, C. Guillou, Authentication of trappist beers by LC-MS fingerprints and multivariate data analysis, J. Agric. Food Chem. 58 (2010) 12089–12095.
[224] Z. Szilágyi, G. Vas, G. Mády, K. Vékey, Investigation of macromolecules in wines by matrix-assisted laser desorption/ionization time-of-flight mass spectrometry., Rapid Commun. Mass Spectrom. 10 (1996) 1141–1143.
[225] A. Chambery, G. del Monaco, A. Di Maro, A. Parente, Peptide fingerprint of high quality Cam-pania white wines by MALDI-TOF mass spectrometry, Food Chem. 113 (2009) 1283–1289.
[226] J.D. Nunes-Miranda, G. Igrejas, E. Araujo, M. Reboiro-Jato, J.L. Capelo, Mass Spectrom-etry-based fingerprinting of proteins & peptides in wine quality control: a critical overview, Crit. Rev. Food Sci. Nutr. 53 (2013) 751–759.
[227] H. Fulcrand, C. Mané, S. Preys, G. Mazerolles, C. Bouchut, J.P. Mazauric, J.M. Souquet, E. Meudec, Y. Li, R.B. Cole, V. Cheynier, Direct mass spectrometry approaches to characterize polyphenol composition of complex samples, Phytochemistry 69 (2008) 3131–3138.
[228] W. Cynkar, R. Dambergs, P. Smith, D. Cozzolino, Classification of Tempranillo wines according to geographic origin, Anal. Chim. Acta 660 (2010) 227–231.
[229] S. Capone, M. Tufariello, L. Francioso, G. Montagna, F. Casino, A. Leone, P. Siciliano, Aroma analysis by GC/MS and electronic nose dedicated to Negroamaro and Primitivo typi-cal Italian Apulian wines, Sensor Actuat. B-Chem. 179 (2013) 259–269.
[230] L. Vera, L. Acena, J. Guasch, R. Boque, M. Mestres, O. Busto, Characterization and clas-sification of the aroma of beer samples by means of an MS e-nose and chemometric tools, Anal. Bioanal. Chem. 399 (2011) 2073–2081.
[231] H.H. Jelen, A. Ziolkowska, A. Kaczmarek, Identification of the botanical origin of raw spirits produced from rye, potato, and corn based on volatile compounds analysis using a SPME-MS method, J. Agric. Food Chem. 58 (2010) 12585–12591.
[232] M. Pilar Marti, R. Boque, O. Busto, J. Guasch, Electronic noses in the quality control of alcoholic beverages, Trends Anal. Chem. 24 (2005) 57–66.
[233] T. Cajka, K. Riddellova, M. Tomaniova, J. Hajslova, Recognition of beer brand based on multivariate analysis of volatile fingerprint, J. Chromatogr. A 1217 (2010) 4195–4203.
[234] O. Šedo, I. Márová, Z. Zdráhal, Beer fingerprinting by matrix-assisted laser desorption-Ion-isation-time of flight mass spectrometry, Food Chem. 135 (2012) 473–478.
[235] R.I. Aylott, A.H. Clyne, A.P. Fox, D.A. Walker, Analytical strategies to confirm Scotch Whisky authenticity, Analyst 119 (1994) 1741–1746.
[236] J.K.S. Møller, R.R. Catharino, M.N. Eberlin, Electrospray ionization mass spectrometry fingerprinting of whisky: immediate proof of origin and authenticity, Analyst 130 (2005) 890–897.
[237] J.S. Garcia, B.G. Vaz, Y.E. Corilo, C.F. Ramires, S.A. Saraiva, G.B. Sanvido, E.M. Schmidt, D.R.J. Maia, R.G. Cosso, J.J. Zacca, M. Nogueira Eberlin, Whisky analysis by electrospray ionization-Fourier transform mass spectrometry, Food Res. Int. 51 (2013) 98–106.
[238] M. Cocchi, C. Durante, A. Marchetti, C. Armanino, M. Casale, Characterization and dis-crimination of different aged ‘Aceto Balsamico Tradizionale di Modena’ products by head space mass spectrometry and chemometrics, Anal. Chim. Acta 589 (2007) 96–104.
512 PART | II Mass Spectrometry Applications within Food Safety and Quality
[239] N. Nicolaou, Y. Xu, R. Goodacre, MALDI-MS and multivariate analysis for the detection and quantification of different milk species, Anal. Bioanal. Chem. 399 (2011) 3491–3502.
[240] Y. Yang, N. Zheng, J. Yang, D. Bu, J. Wang, L. Ma, P. Sun, Animal species milk identifica-tion by comparison of two-dimensional gel map profile and mass spectrometry approach, Int. Dairy J. 35 (2014) 15–20.
[241] V. Cunsolo, V. Muccilli, R. Saletti, S. Foti, MALDI-TOF mass spectrometry for the monitoring of she-donkey’s milk contamination or adulteration, J. Mass Spectrom. 48 (2013) 148–153.
[242] V. Cunsolo, V. Muccilli, R. Saletti, S. Foti, Review: applications of mass spectrometry tech-niques in the investigation of milk proteome, Eur. J. Mass. Spectrom. 17 (2011) 305–320.
[243] L. Di Donna, F. Mazzotti, A. Naccarato, R. Salerno, A. Tagarelli, D. Taverna, G. Sindona, Secondary metabolites of Olea europaea leaves as markers for the discrimination of cultivars and cultivation zones by multivariate analysis, Food Chem. 121 (2010) 492–496.
[244] G.J. Salter, M. Lazzari, L. Giansante, R. Goodacre, A. Jones, G. Surricchio, D.B. Kell, G. Bianchi, Determination of the geographical origin of Italian extra virgin olive oil using pyrol-ysis mass spectrometry, J. Anal. Appl. Pyrol. 40/41 (1997) 159–170.
[245] L. Vaclavik, T. Cajka, V. Hrbek, J. Hajslova, Ambient mass spectrometry employing direct analysis in real time (DART) ion source for olive oil quality and authenticity assessment, Anal. Chim. Acta 645 (2009) 56–63.
[246] C. Oliveros, R. Boggia, R. Casale, C. Armanino, M. Forina, Optimisation of a new headspace mass spectrometry instrument discrimination of different geographical origin olive oils, J. Chromatogr. A 1076 (2005) 7–15.
[247] M.S. Cosio, D. Ballabio, S. Benedetti, C. Gigliotti, Geographical origin and authentication of extra virgin olive oils by an electronic nose in combination with artificial neural networks, Anal. Chim. Acta 567 (2006) 202–210.
[248] M. Narvaez-Rivas, I.M. Vicario, M.J. Alcalde, M. Leon-Camacho, Volatile hydrocarbon pro-file of Iberian dry-cured hams. A possible tool for authentication of hams according to the fattening diet, Talanta 81 (2010) 1224–1228.
[249] N. Zaima, N. Goto-Inoue, T. Hayasaka, H. Enomoto, M. Setou, Authenticity assessment of beef origin by principal component analysis of matrix-assisted laser desorption/ionization mass spectrometric data, Anal. Bioanal. Chem. 400 (2001) 1865–1871.
[250] J.S. del Pulgar, C. Soukoulis, F. Biasioli, L. Cappellin, C. García, F. Gasperi, P. Granitto, T.D. Märk, E. Piasentier, E. Schuhfried, Rapid characterization of dry cured ham produced following different PDOs by proton transfer reaction time of flight mass spectrometry (PTR-ToF-MS), Talanta 85 (2011) 386–393.
[251] R. González-Dominguez, T. García-Barrera, J.L. Gómez-Ariza, Iberian ham typification by direct infusion electrospray and photospray ionization mass spectrometry fingerprinting, Rapid Commun. Mass Spectrom. 26 (2012) 835–844.
[252] D. Indrasti, Y.B.C. Man, S. Mustafa, D.M. Hashim, Lard detection based on fatty acids profile using comprehensive gas chromatography hyphenated with time-of-flight mass spectrometry, Food Chem. 122 (2010) 1273–1277.
[253] A. Rohman, Y.B. Che Man, Analysis of pig derivatives for Halal authentication studies, Food Rev. Int. 28 (2012) 97–112.
[254] M.F. Mazzeo, B. De Giulio, G. Guerriero, G. Ciarcia, A. Malorni, G.L. Russo, R.A. Siciliano, Fish authentication by MALDI-TOF mass spectrometry, J. Agric. Food Chem. 56 (2008) 11071–11076.
[255] S.K. Barik, S. Banerjee, S. Bhattacharjee, S.K. Das Gupta, S. Mohanty, B.P. Mohanty, Proteomic analysis of sarcoplasmic peptides of two related fish species for food authentica-tion, Appl. Biochem. Biotechnol. 171 (2013) 1011–1021.
Food Forensics Chapter | 9 513
[256] G. Lo Feudo, B. Macchione, A. Naccarato, G. Sindona, A. Tagarelli, The volatile fraction profiling of fresh tomatoes and triple concentrate tomato pastes as parameter for the determi-nation of geographical origin, Food Res. Int. 44 (2011) 781–788.
[257] Z. Jandric, D. Roberts, M.N. Rathor, A. Abrahim, M. Islam, A. Cannavan, Assessment of fruit juice authenticity using UPLC-QToF MS: a metabolomics approach, Food Chem. 148 (2014) 7–17.
[258] C. Cordero, E. Liberto, C. Bicchi, P. Rubiolo, S.E. Reichenbach, X. Tian, Q. Tao, Tar-geted and non-targeted approaches for complex natural sample profiling by GC×GC-qMS, J. Chrom. Sci. 48 (2010) 251–261.
[259] C. Cordero, E. Liberto, C. Bicchi, P. Rubiolo, P. Shieberle, S.E. Reichenbach, Q. Tao, Pro-filing food volatiles by comprehensive two-dimensional gas chromatography coupled with mass spectrometry: advanced fingerprinting approaches for comparative analysis of the vola-tile fraction of roasted hazelnuts (Corylus avellana L.) from different origins, J. Chromatogr. A 1217 (2010) 5848–5858.
[260] C. Cagliero, C. Bicchi, C. Cordero, P. Rubiolo, B. Sgorbini, E. Liberto, Fast headspace-enan-tioselective GC-mass spectrometric-multivariate statistical method for routine authentication of flavoured fruit foods, Food Chem. 132 (2012) 1071–1079.
[261] L. Nicolotti, C. Cordero, C. Cagliero, E. Liberto, B. Sgorbini, P. Rubiolo, C. Bicchi, Quan-titative fingerprinting by headspace-two-dimensional comprehensive gas chromatography-mass spectrometry of solid matrices: some challenging aspects of the exhaustive assessment of food volatiles, Anal. Chim. Acta 798 (2013) 115–125.
[262] J. Guo, T. Yue, Y. Yuan, Feature selection and recognition from nonspecific volatile profiles for discrimination of apple juices according to variety and geographical origin, J. Food Sci. 77 (2012) C1090–C1096.
[263] L. Sabatino, M. Scordino, M. Gargano, A. Belligno, P. Traulo, G. Gagliano, HPLC/PDA/ESI-MS evaluation of saffron (Crocus sativus L.) adulteration, Nat. Prod. Commun. 6 (2011) 1873–1876.
[264] N.P. Arruda, A.M.C. Hovell, C.M. Rezende, S.P. Freitas, S. Couri, H.R. Bizzo, Arabica cof-fee discrimination between maturation stages and post-harvesting processing types, using solid phase microextraction coupled to gas chromatography and principal components analy-sis, Quim. Nova 34 (2011) 819–824.
[265] R. Garrett, E.M. Schmidt, L.F.P. Pereira, C.S.G. Kitzberger, M.B.S. Scholz, M.N. Eberlin, C.M. Rezende, Discrimination of arabica coffee cultivars by electrospray ionization Fourier transform ion cyclotron resonance mass spectrometry and chemometrics, LWT-Food Sci. Technol. 50 (2013) 496–502.
[266] B.S. Radovic, R. Goodacre, E. Anklam, Contribution of pyrolysis-mass spectrometry (Py-MS) to authenticity testing of honey, J. Anal. Appl. Pyrol. 60 (2001) 79–87.
[267] J. Wang, M.K. Kliks, W. Qu, S. Jun, G. Shi, Q. Li, Rapid determination of the geographical origin of honey based on protein fingerprinting and barcoding using MALDI TOF MS, J. Agric. Food Chem. 57 (2009) 10081–10088.
[268] S.R. Won, D.C. Lee, S.H. Ko, J.W. Kim, H.I. Rhee, Honey major protein characterization and its application to adulteration detection, Food Res. Int. 41 (2008) 952–956.
[269] F. Bianchi, M. Careri, E. Chiavaro, M. Musci, E. Vittadini, Gas chromatographic–mass spec-trometric characterisation of the Italian Protected Designation of Origin ‘Altamura’ bread volatile profile, Food Chem. 110 (2008) 787.
[270] R. Beleggia, C. Platani, G. Spano, M. Monteleone, L. Cattivelli, Metabolic profiling and analysis of volatile composition of durum wheat semolina and pasta, J. Cereal Sci. 49 (2009) 301–309.

514 PART | II Mass Spectrometry Applications within Food Safety and Quality
[271] G. Dinelli, A. Segura-Carretero, R. Di Silvestro, I. Marotti, D. Arraez-Roman, S. Bene-dettelli, L. Ghiselli, A. Fernadez-Gutierrez, Profiles of phenolic compounds in modern and old common wheat varieties determined by liquid chromatography coupled with time-of-flight mass spectrometry, J. Chromatogr. A 1218 (2011) 7670–7681.
[272] J.A. Pattemore, N. Rice, D.F. Marshall, R. Waugh, R.J. Henry, Cereal variety identification using MALDI-TOF mass spectrometry SNP genotyping, J. Cereal Sci. 52 (2010) 356–361.
[273] T. Levandi, T. Pussa, M. Vaher, A. Ingver, R. Koppel, M. Kaljurand, Principal component analysis of HPLC-MS/MS patterns of wheat (Triticum aestivum) varieties, Proc. Est. Acad. Sci. 63 (2014) 86–92.
[274] C. Zorb, T. Betsche, G. Langenkamper, Search for diagnostic proteins to prove authenticity of organix wheat grains (Triticum aestivum L), J. Agric. Food Chem. 57 (2009) 2932–2937.
[275] M.C. García-López, V. Garcia-Cañas, M.L. Marina, Reversed-phase high performance liquid chromatography-electrospray mass spectrometry profiling of transgenic and non-transgenic maize for cultivar characterization, J. Chromatogr. A 1216 (2009) 7222–7228.
[276] T. Levandi, C. Leon, M. Kaljurand, V. Garcia-Cañas, A. Cifuentes, Capillary electrophoresis-time of flight-mass spectrometry for comparative metabolomics of transgenic vs. conven-tional maize, Anal. Chem. 80 (2008) 6329–6335.
[277] C. Simó, E. Domínguez-Vega, M.L. Marina, M.C. García, G. Dinelli, A. Cifuentes, CE-TOF MS analysis of complex protein hydrolyzates from genetically modified soybeans — A tool for foodomics, Electrophoresis 31 (2010) 1175–1183.
[278] A. Valdés, C. Simó, C. Ibáñez, V. García-Cañas, Foodomics strategies for the analysis of transgenic foods, Trends Anal. Chem. 52 (2013) 2–15.
[279] M.D. del Castillo, N. Martinez-Saez, M. Amigo-Benavent, J.M. Silvan, Phytochemomics and other omics for permitting health claims made on foods, Food Res. Int. 54 (2013) 1237–1249.
Related Documents