PCB Monitoring at Walla Walla and College Place Wastewater Treatment Plants, 2006-07 October 2007 Publication No. 07-03-046

Welcome message from author
This document is posted to help you gain knowledge. Please leave a comment to let me know what you think about it! Share it to your friends and learn new things together.
Transcript

PCB Monitoring at Walla Walla and College Place
Wastewater Treatment Plants, 2006-07
October 2007
Publication No. 07-03-046

Publication Information This report is available on the Department of Ecology’s website at www.ecy.wa.gov/biblio/0703046.html Data for this project are available on Ecology’s Environmental Information Management (EIM) website at www.ecy.wa.gov/eim/index.htm Search User Study ID, BRWA0002. Ecology’s Study Tracker Code for this study is 07-065 For more information contact: Communications Consultant Environmental Assessment Program P.O. Box 47600 Olympia, WA 98504-7600 E-mail: [email protected] Phone: 360-407-6677
Washington State Department of Ecology - www.ecy.wa.gov/ o Headquarters, Olympia 360-407-6000 o Northwest Regional Office, Bellevue 425-649-7000 o Southwest Regional Office, Olympia 360-407-6300 o Central Regional Office, Yakima 509-575-2490 o Eastern Regional Office, Spokane 509-329-3400
Any use of product or firm names in this publication is for descriptive purposes only and does not imply endorsement by the author or the Department of Ecology. If you need this publication in an alternate format, call Cindy Cook at 360-407-6677. Persons with hearing loss can call 711 for Washington Relay Service. Persons with a speech disability can call 877-833-6341.

PCB Monitoring at Walla Walla and College Place
Wastewater Treatment Plants, 2006-07
by Brandi Lubliner
Environmental Assessment Program Washington State Department of Ecology
Olympia, Washington 98504-7710
303(d) Listings Addressed in this Study:
Mill Creek (WA-32-1060) – PCBs Garrison Creek (WA-32-2000) – PCBs

This page is purposely left blank

Table of Contents
Page
List of Figures and Tables....................................................................................................2
Abstract ................................................................................................................................3
Acknowledgements..............................................................................................................4
Introduction..........................................................................................................................5
Methods................................................................................................................................7
Data Quality .........................................................................................................................9 Data Verification Review ..............................................................................................9
Laboratory Quality Control (QC)..........................................................................9 Field Blanks.........................................................................................................10 Precision of Duplicate Samples...........................................................................10
Results and Discussion ......................................................................................................13 Influent and Effluent Concentrations...........................................................................13 Source Tracking PCBs in the Sewer Service Network................................................15
Conclusions........................................................................................................................17
Recommendation ...............................................................................................................17
References..........................................................................................................................18 Appendices
Appendix A. Case Summaries of All Data Reports Appendix B. Location Descriptions
Page 1

List of Figures and Tables
Page Figures
Figure 1. Map of WWTPs and Sewer Service Network Sampling Locations............................... 6
Figure 2. WWTP Effluents and the Human Health Criteria for PCBs ....................................... 14
Tables
Table 1. 2002-2003 PCB Concentrations in Effluent from Walla Walla and College Place WWTPs. .......................................................................................................................... 5
Table 2. TMDL Assigned Total PCB Wasteload and Load Allocations for Mill Creek and Garrison Creek. ............................................................................................................... 6
Table 3. Laboratory Methods and Reporting Limits for Monitored Parameters. .......................... 7
Table 4. Laboratory and Field Quality Control Data for Total PCBs.......................................... 11
Table 5. Influent and Effluent Results from Walla Walla and College Place WWTPs............... 13
Table 6. Comparison of Mean Total PCBs Effluent Concentrations for WWTP Effluents ........ 14
Table 7. Total PCB Concentrations for Sewage Samples Taken During the Study. ................... 15
Page 2

Abstract This 2006-07 Department of Ecology study presents monitoring results for polychlorinated biphenyls (PCBs) in the influent, effluent, and sewer service networks of the Walla Walla and College Place Wastewater Treatment Plants (WWTPs). The purpose of the study was to (1) establish whether effluent discharges currently exceed U.S. Environmental Protection Agency (EPA) human health water quality criteria, and (2) assess the extent to which the contamination is internal or external to each facility. The study was done as a result of PCB wasteload allocations established through a 2005 Total Maximum Daily Load (water cleanup plan) for the Walla Walla River watershed. The findings of this 2006-07 study indicate that the effluent concentrations are almost meeting the EPA human health criterion for PCBs. The study assists the Cities of Walla Walla and College Place in identifying PCB sources within their service areas. The cities should continue to identify and clean up likely nonpoint (diffuse) sources of PCBs. This will reduce the influent concentrations of PCBS to the WWTPs as recommended in the Total Maximum Daily Load implementation schedule.
Page 3

Acknowledgements
The author of this report would like to thank the following people for their contributions to this study:
• Waste Water Treatment Plant Operators: Bill Slovensky, William Breshears, and Bill Putnam.
• City of Walla Walla: Frank Nicholson.
• Washington State Department of Ecology Staff: Dan Dugger and Kristin Kinney for field sampling assistance.
• Karin Feddersen for detailed laboratory work and many consultations.
• Art Johnson for report contributions.
• Joan LeTourneau and Cindy Cook for formatting and editing the final report.
Page 4

Introduction In 1996, the Walla Walla River was listed by Washington State under Section 303(d) of the federal Clean Water Act for non-attainment of the Environmental Protection Agency human health criteria for 4,4’-DDE, 4,4’-DDD, dieldrin, chlordane, hexachlorobenzene, heptachlor epoxide, and PCB-1260 in edible fish tissue. The listings are based on sampling done by the Washington State Department of Ecology (Ecology) in 1993 (Davis et al., 1995). Chlorinated pesticides, their breakdown products, and polychlorinated biphenyls (PCBs) are no longer used in the United States, having been banned in the 1970s and 1980s for ecological concerns. These chemicals are now classed as probable human carcinogens by EPA. In 2002-2003, Ecology initiated a Total Maximum Daily Load (TMDL) evaluation of chlorinated pesticides and PCBs in the Walla Walla River and its tributaries (Johnson et al., 2004). Wasteload and load allocations were assigned for PCBs in Garrison Creek and Mill Creek because of the PCB levels detected in the College Place and Walla Walla Wastewater Treatment Plant (WWTP) effluents (Table 1). Table 1. 2002-2003 PCB Concentrations in Effluents from Walla Walla and College Place WWTPs (ng/L; parts per trillion).
WWTP Date Total PCBs (ng/L)
5/28-30/02 0.88 9/10-11/02 0.65
12/2-3/02 0.75 Walla Walla
2/24-25/03 0.87 5/28-29/02 2.5 9/10-11/02 0.92
12/2-3/02 1.3 College Place
2/24-25/03 0.53 From Johnson et al., 2004. The TMDL submittal report suggested that nonpoint (diffuse) sources coming into the WWTPs may be contributing to elevated PCB levels found in the WWTP effluent. Future remedial actions directed at nonpoint sources may help to alleviate the PCB problem in the discharges from the WWTPs (Gray et al., 2005). The WWTP wasteload allocations were calculated as the product of the human health water quality criterion (0.17 ng/L) and the National Pollutant Discharge Elimination System permit limit for the average monthly effluent flow (Johnson et al., 2004) (Table 2). The remaining loading capacities of Mill Creek and Garrison Creek were allocated to nonpoint sources. The Walla Walla WWTP effluent discharges to Mill Creek, and the College Place WWTP discharges seasonally to Garrison Creek (Figure 1).
Page 5

Table 2. TMDL Assigned Total PCB Wasteload and Load Allocations for Mill Creek and Garrison Creek (gm/day) (Johnson et al., 2004).
Mill Creek Garrison Creek Wasteload Allocation for WWTP (gm/day) 0.0062 0.0011 Load Allocation for Nonpoint Sources (gm/day) 0.023 0.0017 Loading Capacity (gm/day) 0.029 0.0028
Figure 1. Map of WWTPs and Sewer Service Network Sampling Locations.
The cities of Walla Walla and College Place requested additional PCB monitoring be done to verify the levels observed during the TMDL study and to assess the source of contamination. In response, Ecology’s Environmental Assessment Program monitored PCBs in influent and effluent from the Walla Walla and College Place WWTPs during 2006 - 2007. The goal of the study was to better characterize PCB loading and to assist the cities in identifying PCB sources within their service areas. Flow data were obtained from WWTP records. The latitude and longitude of the sampling sites was recorded from a portable GPS unit.
Page 6
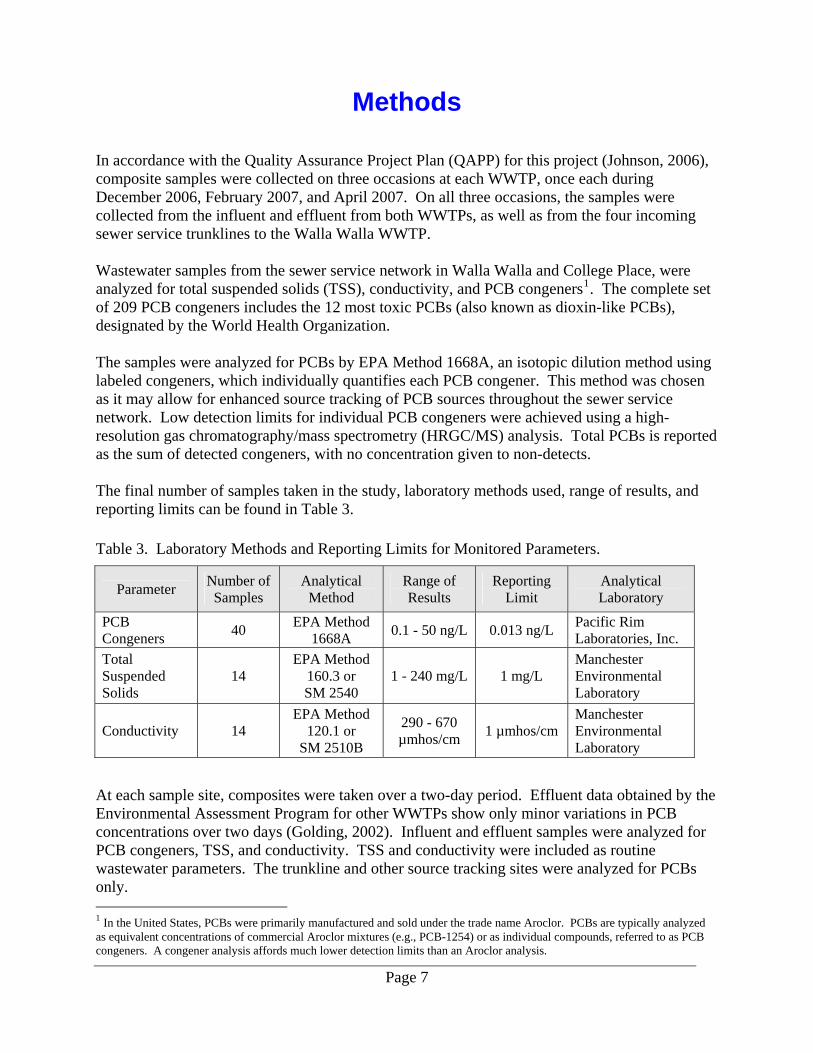
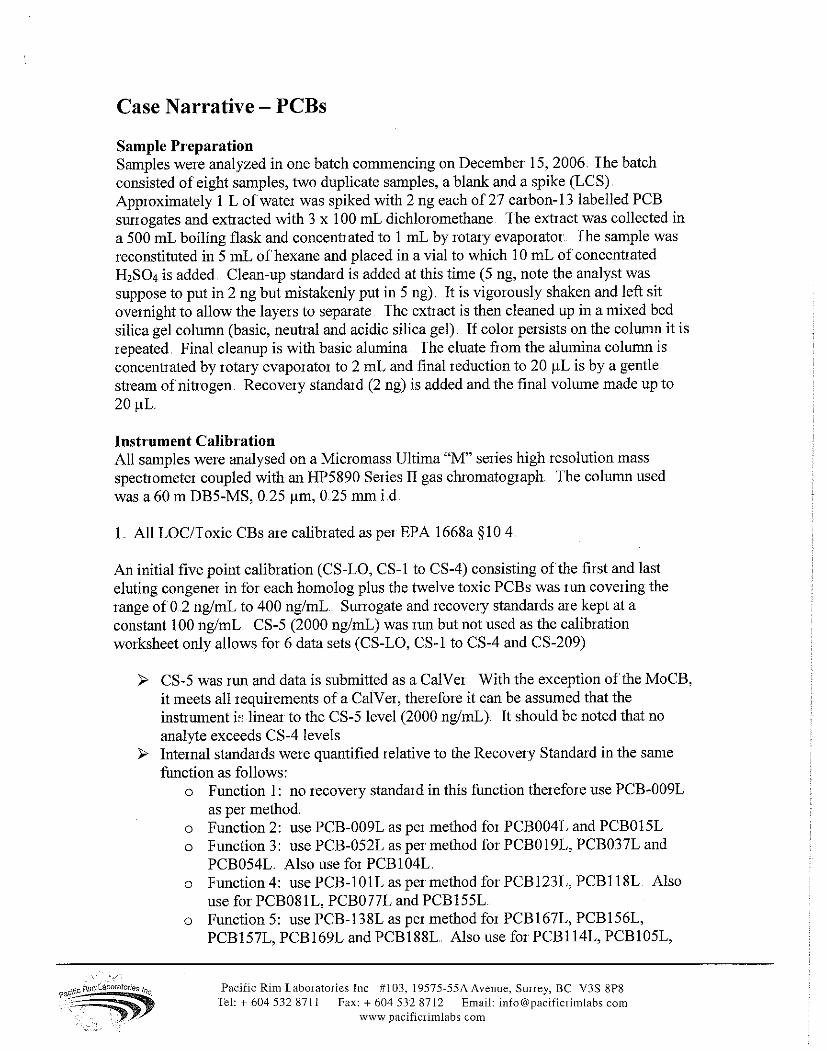
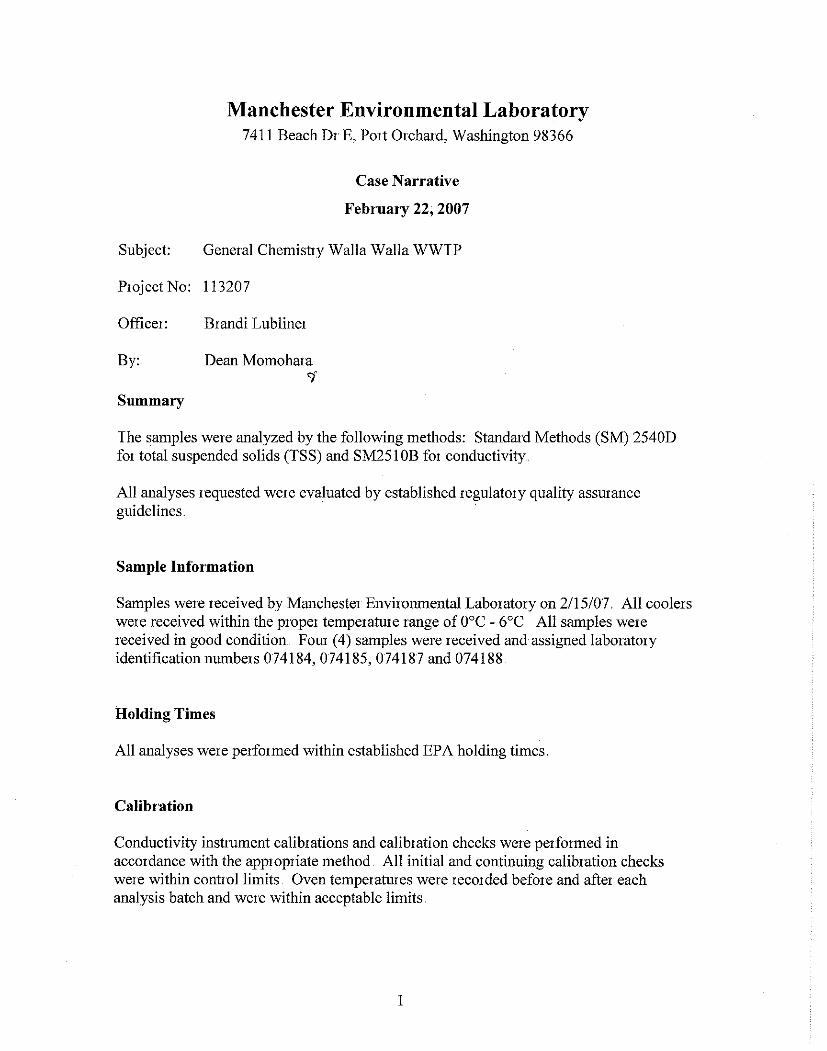
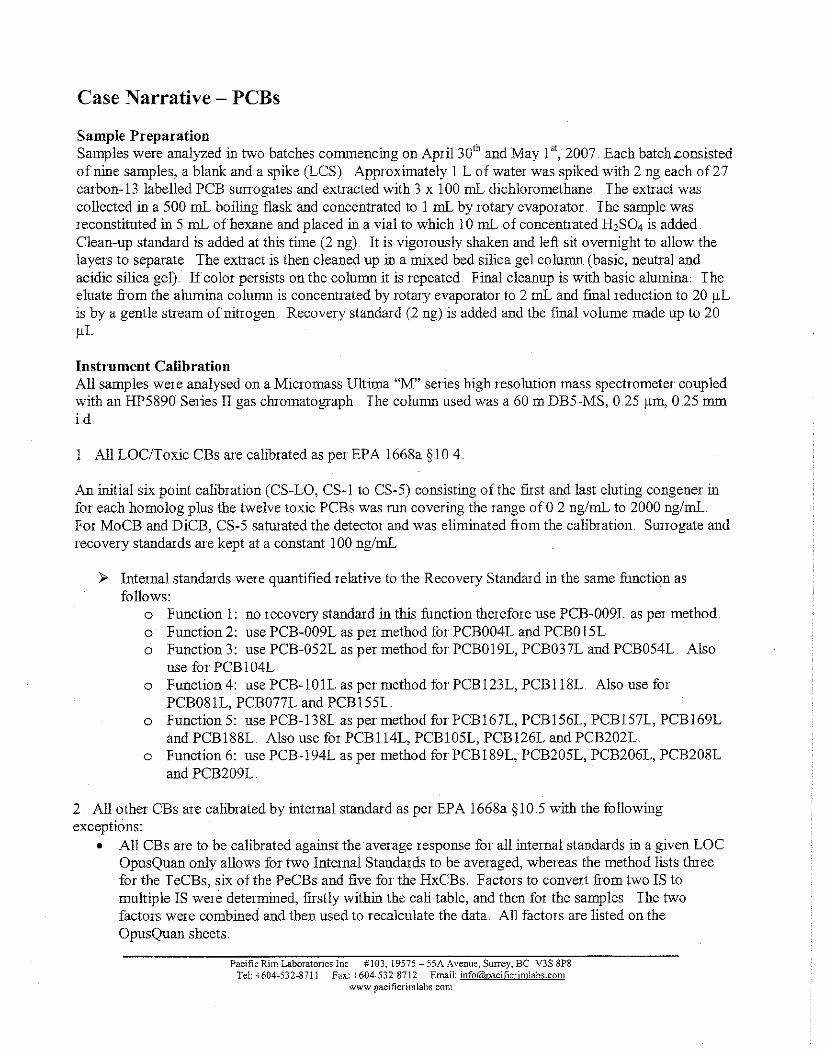
Methods In accordance with the Quality Assurance Project Plan (QAPP) for this project (Johnson, 2006), composite samples were collected on three occasions at each WWTP, once each during December 2006, February 2007, and April 2007. On all three occasions, the samples were collected from the influent and effluent from both WWTPs, as well as from the four incoming sewer service trunklines to the Walla Walla WWTP. Wastewater samples from the sewer service network in Walla Walla and College Place, were analyzed for total suspended solids (TSS), conductivity, and PCB congeners1. The complete set of 209 PCB congeners includes the 12 most toxic PCBs (also known as dioxin-like PCBs), designated by the World Health Organization. The samples were analyzed for PCBs by EPA Method 1668A, an isotopic dilution method using labeled congeners, which individually quantifies each PCB congener. This method was chosen as it may allow for enhanced source tracking of PCB sources throughout the sewer service network. Low detection limits for individual PCB congeners were achieved using a high-resolution gas chromatography/mass spectrometry (HRGC/MS) analysis. Total PCBs is reported as the sum of detected congeners, with no concentration given to non-detects. The final number of samples taken in the study, laboratory methods used, range of results, and reporting limits can be found in Table 3. Table 3. Laboratory Methods and Reporting Limits for Monitored Parameters.
Parameter Number of Samples
Analytical Method
Range of Results
Reporting Limit
Analytical Laboratory
PCB Congeners 40 EPA Method
1668A 0.1 - 50 ng/L 0.013 ng/L Pacific Rim Laboratories, Inc.
Total Suspended Solids
14 EPA Method
160.3 or SM 2540
1 - 240 mg/L 1 mg/L Manchester Environmental Laboratory
Conductivity 14 EPA Method
120.1 or SM 2510B
290 - 670 µmhos/cm 1 µmhos/cm
Manchester Environmental Laboratory
At each sample site, composites were taken over a two-day period. Effluent data obtained by the Environmental Assessment Program for other WWTPs show only minor variations in PCB concentrations over two days (Golding, 2002). Influent and effluent samples were analyzed for PCB congeners, TSS, and conductivity. TSS and conductivity were included as routine wastewater parameters. The trunkline and other source tracking sites were analyzed for PCBs only. 1 In the United States, PCBs were primarily manufactured and sold under the trade name Aroclor. PCBs are typically analyzed as equivalent concentrations of commercial Aroclor mixtures (e.g., PCB-1254) or as individual compounds, referred to as PCB congeners. A congener analysis affords much lower detection limits than an Aroclor analysis.
Page 7

Each composite sample consisted of four grabs: two in the morning and two in the afternoon. The grabs were taken by hand using either clean2 glass jars or clean2 teflon-lined pole samplers. Each grab filled the sample container in 1/4 increments. Field personnel wore powder-free nitrile gloves at all times during sample collection, and field personnel followed standard health and safety procedures. The composites were maintained on ice and in the dark during collection and transport to Manchester Environmental Laboratory. The PCB congener samples were sent by Fed-Ex to Pacific Rim Laboratories, Inc., a contractor selected by Manchester Environmental Laboratory (MEL). Chain of custody was maintained. Mid-study, Ecology’s Water Quality Program provided additional funding for more samples to be collected in the source-tracking effort. Therefore, seven additional sites throughout the sewer service network were added to the final sampling run in April 2007. Figure 1 shows the location of the study sites. All field sites were selected in consultation with the WWTP operators, city engineers, and Ecology.
2 Priority pollutant cleaning according to EPA Quality Assurance/Quality Control specifications (EPA, 1990) outlined in the Quality Assurance Project Plan for this project, (Johnson, 2006).
Page 8

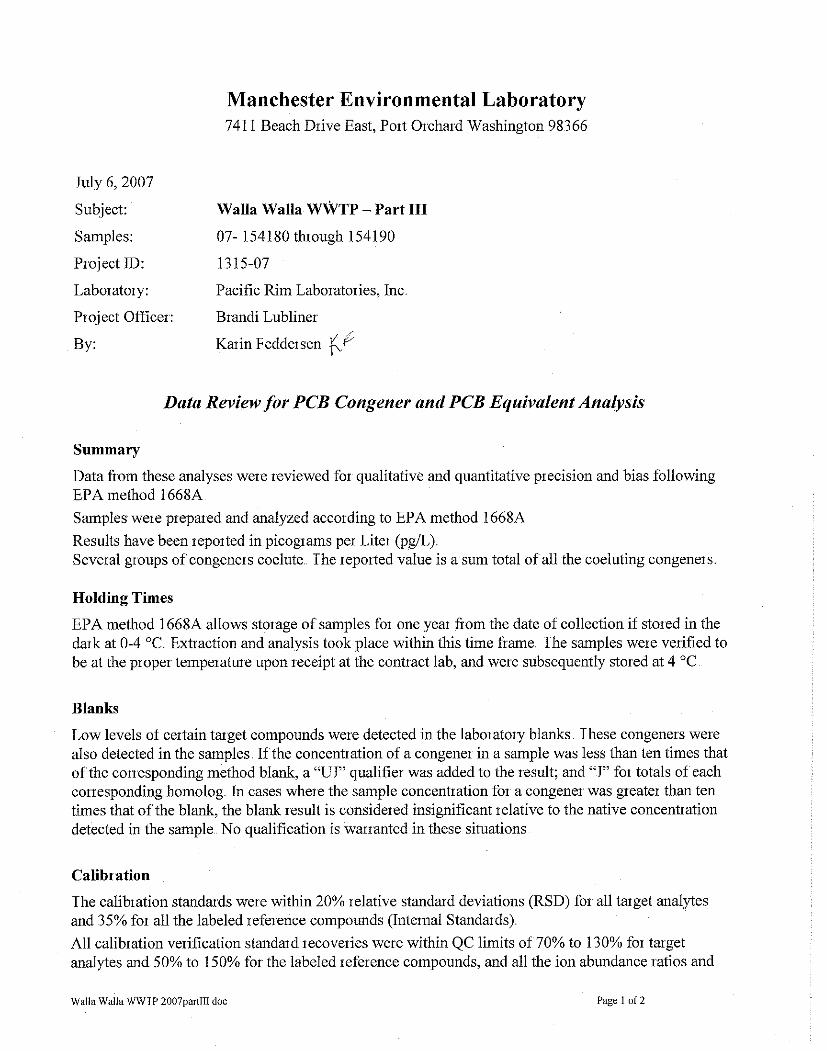
Data Quality Manchester Environmental Laboratory (MEL) and Pacific Rim Laboratories, Inc. met all quality control (QC) requirements of the analytical methods outlined in the quality assurance project plan for this project (Johnson, 2006). All quality objectives were met, and data are considered usable for making calculations, determinations, and decisions for which the project was conducted. Case summaries of all data reports are provided in Appendix A. Complete data are available from the author on request.
Data Verification Review MEL and the project lead extensively reviewed the contract laboratory methods, protocols, and results. This verification process includes checking that:
1. Holding times, instrument calibration, procedural blanks, laboratory control sample analyses, and appropriateness of data qualifiers assigned were acceptable and appropriate.
2. All calibrations, checks on quality control, and intermediate calculations were performed for all samples.
3. Data are consistent, correct, and complete, with no errors or omissions. 4. Targets for reporting limits have been met, and non-detects were not counted in the total PCB
values. Laboratory Quality Control (QC) Data from this study were reviewed for qualitative and quantitative precision and bias following EPA method 1668A for PCBs, standard methods (SM) 2510B for conductivity, and SM2540D for TSS. Calibration All samples arrived at MEL within the appropriate timeframe for analysis and at the proper temperature, and were subsequently stored at 4°C. Conductivity and TSS calibrations and checks were performed in accordance with the appropriate method and were within acceptable limits. The PCB calibration standards were within 20% relative standard deviations for target analytes and 35% for all the labeled internal standard compounds. Calibration recovery standards were within QC limits of 70 – 130% for target analytes, and 50-150% for the labeled reference compounds. Internal Standard Recoveries Internal standard compounds (referred to as ‘surrogates’), used to indicate bias due to sample preparation and calibration, were found to be within the method specified QC limits of 25-150% for all labeled compounds, with several exceptions. Congener results in the samples have been
Page 9

qualified with “J” for detected analytes and “UJ” for non-detects showing a possible low bias. A high bias in detected congeners has been qualified with a “J”. Congener values qualified with “UJ” are not included in the corresponding homolog. On-going Precision and Recovery One liter of laboratory water was spiked with 1 ng each of 72 PCB congeners and carried through the extraction and clean-up procedure. Recoveries of all PCBs were within the acceptable range of 50-150%. These samples for conductivity and TSS were recovered within adequate ranges, indicating there were no interferences from the field samples to bias the results. Method Blanks Laboratory water known as the method blank is carried through the extraction and clean-up procedure. No analytically significant levels of analyte were detected in the blanks for conductivity and TSS. Low levels of certain target compounds for PCBs were detected in method blanks and also in the samples. If the concentrations of a congener in a sample were less than ten times that of the corresponding method blank, a “UJ” qualifier was assigned to describe the result as not detected. A “J” is used to qualify the results of the totals for the corresponding homolog, indicating it is an estimated value. The values for these congeners are not included in the totals reported for either the corresponding homologue or the total PCBs. In cases where the sample concentration for a congener was greater than ten times that of the blank, the blank result is considered insignificant relative to the native concentrations detected in the sample. Field Blanks Two field blanks for PCBs only were analyzed to detect contamination arising from sample containers or sample handling. Field blanks were prepared by transferring a portion of organic-free water supplied by MEL from one bottle to another in the field, which mimicked the grab sampling procedure. One field blank was poured at each of the WWTPs. The field blank values were lower than the laboratory method blank values which indicate there was no container or sample handling contamination. Table 4 shows the values of the laboratory method blanks and the field transfer blanks. Precision of Duplicate Samples Two field duplicate samples were taken for PCBs, and one field duplicate was taken for TSS and conductivity. Field duplicates are samples taken side-by-side in the field. Duplicates provide estimates of field and laboratory variability. Variability can be expressed as the relative percent difference (RPD) between a sample and its duplicate, Equation 1.
RPD = 100mean
results 2 of difference×⎟⎠⎞
⎜⎝⎛
Equation 1
Page 10

Table 4 shows total PCB values for the blanks and field duplicate samples. Table 4. Laboratory and Field Quality Control Data for Total PCBs (ng/L).
Date Sampled
Method Blanks
Field Blanks
WW_Trunkline_4 and
Duplicate
CP_Effluent and
Duplicate
WW_TL3-1 and
Duplicate Statistics
0.096 - 42.00 0.243 - Sample - - 49.50 0.266 - Sample dup - - 45.75 0.250 - Mean - - 16% 9% - RPD
Dec 12-13, 2006
- - 5.30 0.02 - Standard deviation
0.048 0.03 - - - Sample 1
- 0.05 - - - Sample 2 - 0.04 - - - Mean - NA - - - RPD
Feb 13-14, 2007
- 0.01 - - - Standard Deviation
0.147 - 11.63 - 9.68 Sample 0.111 - 11.08 - 9.18 Sample dup 0.10* - 11.36 - 9.43 Mean
- - 5% - 5% RPD
Apr 10-11, 2007
0.040* - 0.39 - 0.35 Standard deviation
Trunkline = Main feeder pipeline. *Mean and standard deviation for all four method blank measurements. Dup = duplicate. RPD = relative percent difference.
Two sample bottles collected virtually at the same time are expected to be within 20% RPD for PCBs. A larger RPD would indicate a problem with the field collection, transportation, or potentially laboratory bias. The RPD for the two duplicated samples ranges from 5-16%, which is acceptable. The RPD for TSS and conductivity on the single College Place WWTP effluent sample was below 1% for both parameters. The RPD between field blank samples was not calculated because these samples were collected at two different WWTPs and are not intended to be duplicates.
Page 11
This page is purposely left blank
Page 12

Results and Discussion
Influent and Effluent Concentrations Influent and effluent samples taken during three time periods from the Walla Walla and College Place WWTPs were analyzed for PCBs, TSS, and conductivity. The results are summarized in Table 5. Table 5. Influent and Effluent Results from Walla Walla and College Place WWTPs.
Total PCBs (ng/L)
TSS (mg/L)
Conductivity (µmhos/cm) WWTP
Influent Effluent Influent Effluent Influent Effluent Walla Walla Dec 12-13, 2006 44.10 0.40 180 1 363 292 Feb 13-14, 2007 11.10 0.48 158 1 417 336 Apr 10-11, 2007 8.86 0.25 129 1 370 293
Mean 21.35 0.38 156 1 383 307 College Place Dec 12-13, 2006 12.90 0.254* 240 1* 640 486* Feb 13-14, 2007 22.60 0.336 218 1 628 482 Apr 10-11, 2007 10.74 0.35 181 1 673 462
Mean 15.41 0.30 213 1 647 472 * December effluent results are the mean of the sample and duplicate.
The mean effluent concentrations from Walla Walla and College Place WWTPs for total PCBs were 0.38 and 0.30 ng/L, respectively. The mean effluent TSS (1 mg/L) and conductivity (307-472 µmhos/cm) are within reasonable ranges for typical WWTP effluents. TSS adheres to the NPDES permit limits for both WWTPs. All PCB influent concentrations are considerably higher than the effluent concentrations at the time these samples were collected. The WWTPs were reducing PCB concentrations by two orders of magnitude, most likely through the sediment removal processes, although this has not been verified. Table 1 shows the 2002-03 PCBs effluent concentrations from the TMDL technical study (Johnson et al., 2004). In Table 6, the mean effluent concentrations of the two studies are compared to each other and to the mean values.
Page 13

Table 6. Comparison of Mean Total PCB Concentrations (ng/L) for WWTP Effluents.
Sample TMDL Study May 2002 to Feb 2003
This Study Dec 2006 to April 2007
One Standard Deviation
Walla Walla 0.79 ng/L 0.38 ng/L 0.12
College Place 1.31 ng/L 0.30 ng/L 0.05
The WWTPs effluents are now lower by a factor of 2 and 4.4 for Walla Walla and College Place, respectively. The 2005 TMDL report did explain that the College Place WWTP was experiencing a TSS upset when the TMDL samples were being collected. This may have led to the higher concentrations of PCBs detected as part of that study (Johnson et al., 2004). Comparison to Human Health Criteria A comparison between the effluent concentrations and the human health criteria is presented in Figure 2, data shown in Table 6.
0.38
0.30
0.00
0.05
0.10
0.15
0.20
0.25
0.30
0.35
0.40
0.45
0.50
Wal
la W
alla
WW
TPEf
fluen
t
Col
lege
Pla
ceW
WTP
Efflu
ent
Mea
n To
tal P
CB
s ng
/L
Hum an Hea lth Crite ria 0.17 ng/L
Figure 2. WWTP Effluents and the EPA Human Health Criteria for PCBs.
Page 14

The error bars in Figure 2 represent one standard deviation from the mean. The PCB concentrations found in the WWTP effluents are relatively small and appear to have decreased since the TMDL study. The mean effluent concentrations for total PCBs at Walla Walla and College Place WWTPs exceeded the human health criterion of 0.17 ng/L total PCBs by factors of 2.2 and 1.8, respectively. A rigorous statistical analysis of these data was not performed because it is evident that there are small differences in these small numbers. For example, just one standard deviation in the effluent data yields an exceedance of the criterion by only 0.08 ng/L. This number, although technically above the criterion, is not meaningfully significant. Given that there has already been an improvement in effluent concentrations between the TMDL and this study, it seems reasonable to conclude that the WWTPs are capable of meeting the human health criterion.
Source Tracking PCBs in the Sewer Service Network In addition to sampling the influent and effluent at the WWTPs, this study assessed the relative importance of influent lines that enter the Walla Walla plant. One influent line to the College Place WWTP was also sampled. The results for total PCBs in the influent trunklines and other sewer service area sites sampled are provided in Table 7. Table 7. Total PCB Concentrations for Sewage Samples Taken During the 2006-07 Study.
Location_ID Dec 12-13, 2006
Feb 13-14, 2007
Apr 10-11, 2007
Overall Average
Walla Walla WWTP WW Headworks 44.10 11.10 8.86 21.35 WW Effluent 0.40 0.48 0.25 0.38 WW Trunkline 1 6.39 8.17 7.05 7.20 WW Trunkline 2 5.96 9.04 8.80 7.93 WW Trunkline 3 14.80 16.10 4.88 11.93 WW Trunkline 4 45.75* 9.92 11.35* 22.34 WW TL4-1 - 7.57 11.29 9.43 WW TL4-2 - - 3.75 - WW TL4-3 - - 7.55 - WW TL4-4 - - 19.19 - WW TL4-5 - - 19.42 - WW TL3-1 - - 9.43* - WW TL3-2 - - 16.69 - College Place WWTP CP Headworks 12.90 22.60 10.74 15.41 CP Effluent 0.25* 0.34 0.35 0.31 CP TL1-1 - - 15.47 -
*Mean of duplicate samples.
Page 15

PCB concentrations measured in the Walla Walla trunklines are ranked in descending order of importance as sources of PCBs to the Walla Walla WWTP:
• Trunkline 4 – Tracking samples TL4-4 and TL4-5 • Trunkline 3 – Tracking sample TL3-2 • Trunkline 2 • Trunkline 1
Page 16

Conclusions The following conclusions are made as a result of this study: • Both Walla Walla and College Place WWTPs were found to be reducing PCB concentrations
by two orders of magnitude from influent to effluent samples.
• Effluent concentrations have improved since the 2005 TMDL study and are on track in meeting the EPA human health criterion. The observed exceedances of the criterion do not appear to be meaningfully significant.
• Improvements could be made in future studies of this nature. The detection limit (0.13 ng/L), the method blank “noise” level (0.14 ng/L, see Table 4), and the human health criterion are relatively close to one another.
Recommendation The following recommendation is made as a result of this study: • Two of the four Walla Walla influent trunklines (numbers 3 and 4) appear to have higher
PCB concentrations than the other two trunklines. As a first priority, the city should work to identify PCB sources within the service area of trunklines 3 and 4.
Page 17
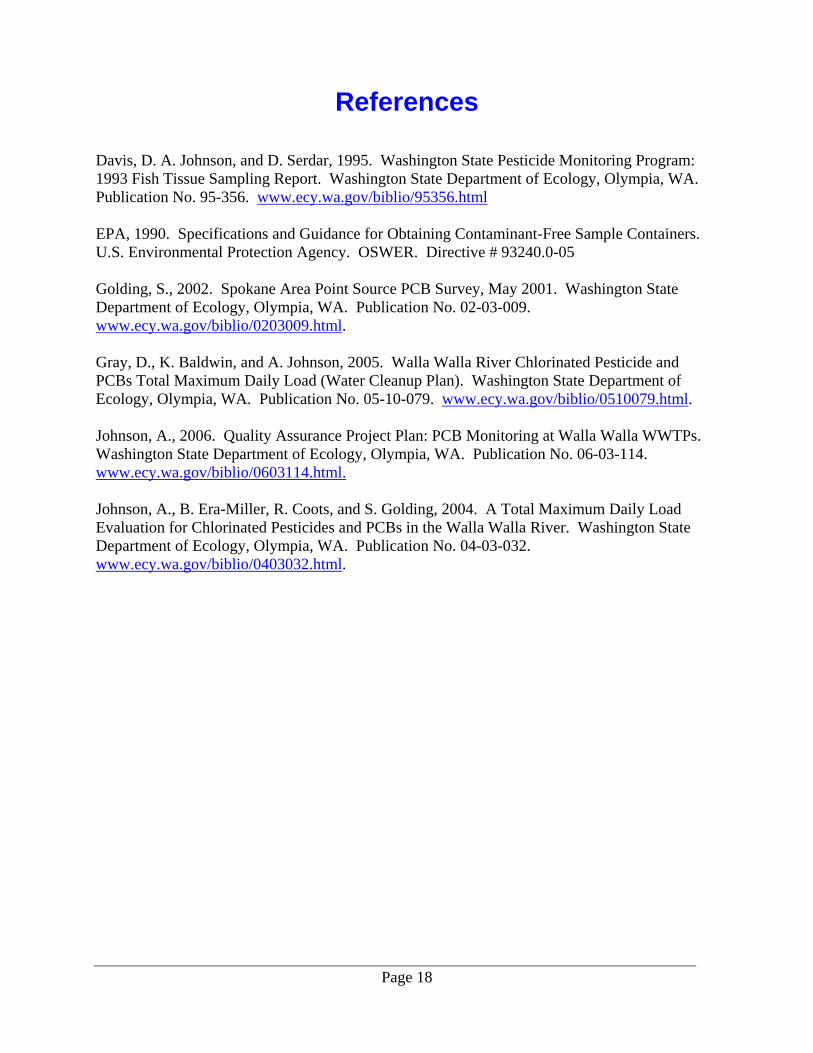
References Davis, D. A. Johnson, and D. Serdar, 1995. Washington State Pesticide Monitoring Program: 1993 Fish Tissue Sampling Report. Washington State Department of Ecology, Olympia, WA. Publication No. 95-356. www.ecy.wa.gov/biblio/95356.html EPA, 1990. Specifications and Guidance for Obtaining Contaminant-Free Sample Containers. U.S. Environmental Protection Agency. OSWER. Directive # 93240.0-05 Golding, S., 2002. Spokane Area Point Source PCB Survey, May 2001. Washington State Department of Ecology, Olympia, WA. Publication No. 02-03-009. www.ecy.wa.gov/biblio/0203009.html. Gray, D., K. Baldwin, and A. Johnson, 2005. Walla Walla River Chlorinated Pesticide and PCBs Total Maximum Daily Load (Water Cleanup Plan). Washington State Department of Ecology, Olympia, WA. Publication No. 05-10-079. www.ecy.wa.gov/biblio/0510079.html. Johnson, A., 2006. Quality Assurance Project Plan: PCB Monitoring at Walla Walla WWTPs. Washington State Department of Ecology, Olympia, WA. Publication No. 06-03-114. www.ecy.wa.gov/biblio/0603114.html. Johnson, A., B. Era-Miller, R. Coots, and S. Golding, 2004. A Total Maximum Daily Load Evaluation for Chlorinated Pesticides and PCBs in the Walla Walla River. Washington State Department of Ecology, Olympia, WA. Publication No. 04-03-032. www.ecy.wa.gov/biblio/0403032.html.
Page 18

Appendix A. Case Summaries of All Data Reports

This page is purposely left blank


This page is purposely left blank
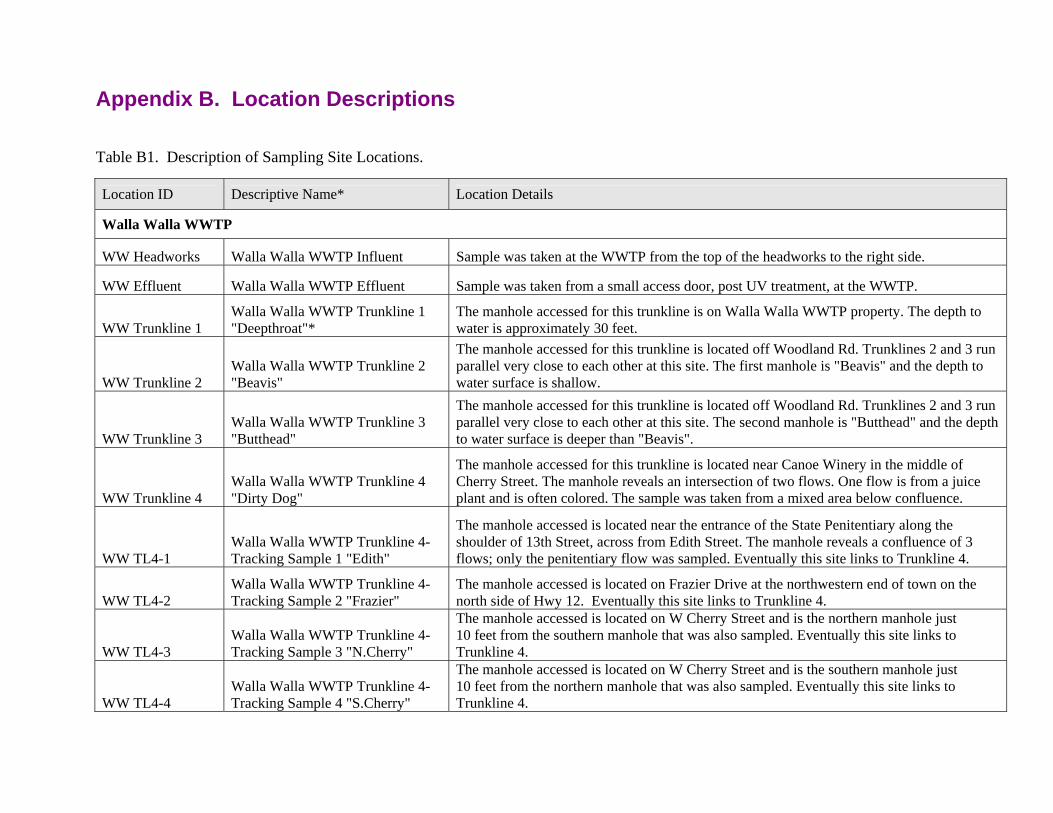
Appendix B. Location Descriptions Table B1. Description of Sampling Site Locations.
Location ID Descriptive Name* Location Details
Walla Walla WWTP
WW Headworks Walla Walla WWTP Influent Sample was taken at the WWTP from the top of the headworks to the right side.
WW Effluent Walla Walla WWTP Effluent Sample was taken from a small access door, post UV treatment, at the WWTP.
WW Trunkline 1 Walla Walla WWTP Trunkline 1 "Deepthroat"*
The manhole accessed for this trunkline is on Walla Walla WWTP property. The depth to water is approximately 30 feet.
WW Trunkline 2 Walla Walla WWTP Trunkline 2 "Beavis"
The manhole accessed for this trunkline is located off Woodland Rd. Trunklines 2 and 3 run parallel very close to each other at this site. The first manhole is "Beavis" and the depth to water surface is shallow.
WW Trunkline 3 Walla Walla WWTP Trunkline 3 "Butthead"
The manhole accessed for this trunkline is located off Woodland Rd. Trunklines 2 and 3 run parallel very close to each other at this site. The second manhole is "Butthead" and the depth to water surface is deeper than "Beavis".
WW Trunkline 4 Walla Walla WWTP Trunkline 4 "Dirty Dog"
The manhole accessed for this trunkline is located near Canoe Winery in the middle of Cherry Street. The manhole reveals an intersection of two flows. One flow is from a juice plant and is often colored. The sample was taken from a mixed area below confluence.
WW TL4-1 Walla Walla WWTP Trunkline 4-Tracking Sample 1 "Edith"
The manhole accessed is located near the entrance of the State Penitentiary along the shoulder of 13th Street, across from Edith Street. The manhole reveals a confluence of 3 flows; only the penitentiary flow was sampled. Eventually this site links to Trunkline 4.
WW TL4-2 Walla Walla WWTP Trunkline 4-Tracking Sample 2 "Frazier"
The manhole accessed is located on Frazier Drive at the northwestern end of town on the north side of Hwy 12. Eventually this site links to Trunkline 4.
WW TL4-3 Walla Walla WWTP Trunkline 4-Tracking Sample 3 "N.Cherry"
The manhole accessed is located on W Cherry Street and is the northern manhole just 10 feet from the southern manhole that was also sampled. Eventually this site links to Trunkline 4.
WW TL4-4 Walla Walla WWTP Trunkline 4-Tracking Sample 4 "S.Cherry"
The manhole accessed is located on W Cherry Street and is the southern manhole just 10 feet from the northern manhole that was also sampled. Eventually this site links to Trunkline 4.
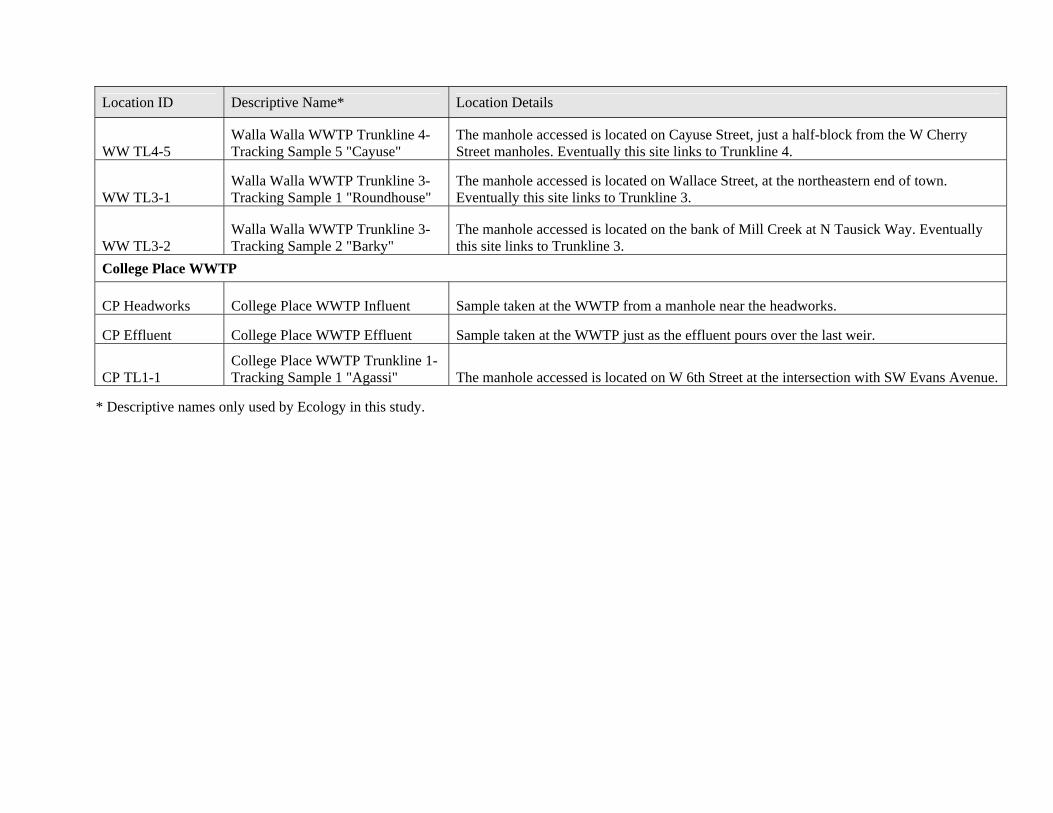
Location ID Descriptive Name* Location Details
WW TL4-5 Walla Walla WWTP Trunkline 4-Tracking Sample 5 "Cayuse"
The manhole accessed is located on Cayuse Street, just a half-block from the W Cherry Street manholes. Eventually this site links to Trunkline 4.
WW TL3-1 Walla Walla WWTP Trunkline 3-Tracking Sample 1 "Roundhouse"
The manhole accessed is located on Wallace Street, at the northeastern end of town. Eventually this site links to Trunkline 3.
WW TL3-2 Walla Walla WWTP Trunkline 3-Tracking Sample 2 "Barky"
The manhole accessed is located on the bank of Mill Creek at N Tausick Way. Eventually this site links to Trunkline 3.
College Place WWTP
CP Headworks College Place WWTP Influent Sample taken at the WWTP from a manhole near the headworks.
CP Effluent College Place WWTP Effluent Sample taken at the WWTP just as the effluent pours over the last weir.
CP TL1-1 College Place WWTP Trunkline 1- Tracking Sample 1 "Agassi" The manhole accessed is located on W 6th Street at the intersection with SW Evans Avenue.
* Descriptive names only used by Ecology in this study.
Related Documents