Strasbourg, 22 March 2011 pc‐cp\space\documents\ pc‐cp (2011) 3e PC‐CP (2011) 3 SURVEY 2009 MARCELO F. AEBI NATALIA DELGRANDE UNIVERSITY OF LAUSANNE,SWITZERLAND SPACE I COUNCIL OF EUROPE ANNUAL PENAL STATISTICS

Welcome message from author
This document is posted to help you gain knowledge. Please leave a comment to let me know what you think about it! Share it to your friends and learn new things together.
Transcript

Strasbourg, 22 March 2011 pc‐cp\space\documents\ pc‐cp (2011) 3e PC‐CP (2011) 3
SURVEY 2009
MARCELO F. AEBI NATALIA DELGRANDE
UNIVERSITY OF LAUSANNE, SWITZERLAND
SPACE I
COUNCIL OF EUROPE ANNUAL PENAL STATISTICS
Council of Europe Annual Penal Statistics – SPACE I – 2009
Strasbourg, 22 March 2011, pc-cp\space\documents\pc-cp (2011) 3e PC-CP (2011) 3
2
Contents
SURVEY BACKGROUND .................................................................................................................................. 4
A. PRISON POPULATIONS ................................................................................................................................. 6 A.1. GLOBAL INDICATORS OF PRISON POPULATIONS ON 1ST
SEPTEMBER 2009 ......................................................................... 6 A.2. FLOW OF ENTRIES, LENGTH OF IMPRISONMENT, ESCAPES AND DEATHS IN 2008 .............................................................. 11 B. PRISON STAFF .......................................................................................................................................... 14 C. CONVENTIONS AND STATISTICAL MEASURES .................................................................................................... 16 C.1. CONVENTIONS USED: ........................................................................................................................................... 16 C.2. MEASURES OF CENTRAL TENDENCY: ........................................................................................................................ 16 D. DEMOGRAPHIC DATA ................................................................................................................................ 17 E. DATA VALIDATION PROCEDURE .................................................................................................................... 18
STATISTICAL TABLES .................................................................................................................................... 19
1. PRISON POPULATIONS: STATE OF PRISON POPULATIONS ON SEPTEMBER 1ST, 2009 ...................................................... 20 I.1. GENERAL NOTES (INCLUDING LEGISLATIVE OR OTHER MEASURES WHICH DIRECTLY INFLUENCE TRENDS IN THE NUMBER OF
PRISONERS) ............................................................................................................................................................... 20 Table 1: Situation of penal institutions on 1st September 2009 ............................................................................ 26 Table 1.2: Categories included in the total number of prisoners ......................................................................... 27 Table 1.3: Capacity of penal institutions on 1st September 2009 (by categories) ................................................. 29 NOTES –TABLES 1, 1.2 AND 1.3 ................................................................................................................................... 30 Figure 1.a: Countries with the highest Prison Population Rates per 100 000 inhabitants (more than 100 prisoners per 100 000 inhabitants) ....................................................................................................................... 38 Figure 1.b: Countries with prison population overcrowding (more than 100 prisoners per 100 places) ............. 38 Table 1.4: Evolution of prison populations between 2000 and 2009 ................................................................... 39 Table 1.5: Year‐to‐year rates of increase and decrease of prison population rates per 100,000 inhabitants between 2008 and 2009 ....................................................................................................................................... 41 NOTES – TABLES 1.4 AND 1.5 ...................................................................................................................................... 41 Map 1: Prison population rates per 100,000 inhabitants ..................................................................................... 42 Table 2: Age structure of prison population on 1st September 2009: general breakdown by categories of age . 43 NOTES – TABLE 2 ....................................................................................................................................................... 45 Table 2.1: Age structure of prison populations on 1st September 2009: minors and persons between 18 and 21 of age .................................................................................................................................................................... 49 NOTES – TABLE 2.1 .................................................................................................................................................... 50 Map 2: Breakdown of the age of criminal responsibility and percentages of prisoners less than 18 years of age in European countries ........................................................................................................................................... 51 Table 2.2: Median and Average ages of the prison population (including pre‐trial detainees) on 1st September 2009 ...................................................................................................................................................................... 52 Figure 2.a: Countries with the youngest (less than 35 years) prison population classified by decreasing median age ......................................................................................................................................................................... 52 Table 3.1: Structure of prison populations on 1st September 2009: female prisoners ......................................... 53 NOTES – TABLE 3.1 .................................................................................................................................................... 54 Table 3.2: Structure of prison populations on 1st September 2009: foreign prisoners ........................................ 55 NOTES – TABLE 3.2 .................................................................................................................................................... 56 Table 4: Legal status of prison populations on 1st September 2009 (numbers) ................................................... 57 NOTES – TABLE 4 ....................................................................................................................................................... 58 Table 5: Legal status of detainees not serving a final sentence on 1st September 2009 (percentages and rates) 62 NOTES – TABLE 5 ....................................................................................................................................................... 63 Table 6: Breakdown of sentenced prisoners (final sentence) on 1st September 2009, by main offence (numbers) .............................................................................................................................................................................. 64 NOTES – TABLE 6 ....................................................................................................................................................... 66 Table 7: Breakdown of sentenced prisoners (final sentence) on 1st September 2009, by main offence (percentages) ........................................................................................................................................................ 70 Table 8: Breakdown of sentenced prisoners (final sentence) on 1st September 2009, by length of sentence (numbers) .............................................................................................................................................................. 71

Council of Europe Annual Penal Statistics – SPACE I – 2009
Strasbourg, 22 March 2011, pc-cp\space\documents\pc-cp (2011) 3e PC-CP (2011) 3
3
NOTES – TABLE 8 ....................................................................................................................................................... 73 Table 9: Breakdown of sentenced prisoners (final sentence) on 1st September 2009, by length of sentence (percentages) ........................................................................................................................................................ 75 Table 10: Breakdown of sentenced prisoners (final sentence) on 1st September 2009, by length of sentence (cumulative percentages) ..................................................................................................................................... 76 Table 11: Breakdown of prisoners sentenced to less than one year (final sentence) on 1st September 2009, by length of sentence (percentages) ......................................................................................................................... 77 NOTES – TABLES 9, 10, AND 11 ................................................................................................................................... 78 Figure 2.b: Countries with the highest percentages of prisoners sentenced to less than one year ..................... 78 2. PRISON POPULATIONS: FLOW OF ENTRIES, LENGTH OF IMPRISONMENT, ESCAPES AND DEATHS IN 2008 ............................ 79 Table 12.1: Flow of Entries to Penal Institutions in 2008 ...................................................................................... 79 Table 12.2: Additional categories of the Flow of Entries to Penal Institutions in 2008 ........................................ 80 NOTES – TABLES 12.1 AND 12.2 .................................................................................................................................. 81 Table 13.1: Indicator of Average Length of Imprisonment in 2008, based on the total number of days spent in penal institutions .................................................................................................................................................. 83 NOTES – TABLES 13.1 ................................................................................................................................................ 84 Table 13.2: Indicator of Average Length of Imprisonment in 2008, based on the total number of prisoners in penal institutions on 1st September 2008 ............................................................................................................. 85 Table 14: Escapes of prisoners in 2008 ................................................................................................................. 86 NOTES – TABLE 14 ..................................................................................................................................................... 87 Table 15.1: Deaths in Penal Institutions in 2008 (including suicides) ................................................................... 89 Table 15.2: Types of deaths and suicides in Penal Institutions in 2008 making reference to the categories included/excluded in the figures of the Table 15.1 .............................................................................................. 90 NOTES – TABLES 15.1 AND 15.2 .................................................................................................................................. 91 Table 16: Average amount spent per day of detention of one person in penal institutions in 2008 (in €) .......... 92 NOTES – TABLE 16 ..................................................................................................................................................... 94 3. PRISON STAFF.............................................................................................................................................. 96 Table 17: Full‐time and Part‐time Staff working in Penal Institutions on 1st September 2009 –on the basis of Full‐time equivalents (numbers) ........................................................................................................................... 96 NOTES – TABLE 17 ..................................................................................................................................................... 98 Table 18.1: Full‐time and Part‐time Staff working in Penal Institutions on 1st September 2009 –on the basis of Full‐time equivalents (percentages) ................................................................................................................... 101 Table 18.2: Full‐time and Part‐time Staff working INSIDE Penal Institutions on 1st September 2009 –on the basis of Full‐time equivalents (percentages) ............................................................................................................... 102 NOTES – TABLES 18.1 AND 18.2 ................................................................................................................................ 103 Figure 3: Percentages of staff working INSIDE penal institutions (1st September 2009) classified on the basis of the “custodial staff” ............................................................................................................................................ 103 Table 19: Staff working in Penal Institutions but not employed by the Prison Administration on 1st September 2009 (numbers and percentages) ....................................................................................................................... 104 NOTES – TABLE 19 ................................................................................................................................................... 106 Table 20: Rate of Supervision of Prisoners by Custodial Staff, Treatment and Educational Staff, and Staff responsible for workshops on 1st September 2009 ............................................................................................ 108 NOTES – TABLE 20 ................................................................................................................................................... 109
LIST OF TABLES AND FIGURES: ................................................................................................................... 110

Council of Europe Annual Penal Statistics – SPACE I – 2009
Strasbourg, 22 March 2011, pc-cp\space\documents\pc-cp (2011) 3e PC-CP (2011) 3
4
COUNCIL OF EUROPE ANNUAL PENAL STATISTICS – SPACE I
2009 SURVEY ON PRISON POPULATIONS by Marcelo F. AEBI and Natalia DELGRANDE1
Survey Background
For the first time since the creation of the SPACE series in 1982, the 2009 SPACE I survey has been conducted using an electronic questionnaire for the data collection. The questionnaire was available on a restricted Website, and each national correspondent received a personal password in order to get access to it. The questionnaire could be filled in as many sessions as necessary. Once the questionnaire completed, data were exported automatically to a database, reducing thus the risk of human mistakes while introducing manually the data into the database. The questionnaire used for the 2009 survey is an updated version of the one introduced in the 2004 survey. The main goal of the modifications included since 2004 is to clarify precisely what is being counted in the statistics of each country. This implies collecting metadata on the national rules applied to collect data for prison statistics. In order to reach that goal, new questions were added in the questionnaire. The answers to these questions –presented mainly in Table 1.2 – suggest that cross‐national comparisons of prison population rates must be conducted cautiously as the categories included in the total number of prisoners vary from country to country. The same is true for cross‐national comparisons of deaths and suicides in penal institutions as well as for staff working in penal institutions. The modifications introduced to the questionnaire increase the reliability of the survey and should allow more accurate comparisons between the Member States of the Council of Europe.
The main modifications introduced in the SPACE I 2008 and 2009 surveys are the following:
In former SPACE questionnaires there was a slight difference between the French and the English definitions of assault and battery. While the English version referred to assault, the French version referred to assault and battery (coups et blessures volontaires). This problem has been solved and both versions refer now to assault and battery.
Former SPACE questionnaires referred to rape, but an analysis of the answers received suggested that some countries were also including other sexual offences under that heading. As a consequence, sexual offences have now been divided in two categories: rape and other types of sexual offences.
The following categories of offences have been added: economic and financial offences, terrorism and organised crime.
1 Marcelo F. Aebi, Professor of Criminology and Natalia Delgrande, Researcher: Institut de Criminologie et de Droit Pénal, École des Sciences Criminelles, University of Lausanne

Council of Europe Annual Penal Statistics – SPACE I – 2009
Strasbourg, 22 March 2011, pc-cp\space\documents\pc-cp (2011) 3e PC-CP (2011) 3
5
Some clarifications were introduced in the definitions of other items such as counting units and dates of reference.
The former category of mentally ill offenders has been divided in three subcategories: non‐criminally liable prisoners, mentally ill offenders held in psychiatric institutions, and mentally ill offenders who are held in special sections of penitentiary institutions.
Under the category of juvenile offenders held in special institutions, an additional question allows to get information on the number of the persons aged 18 and over.
The item on the capacity of penal institution was completed with subcategories on sections/institutions designed for mentally ill offenders as well as on institutions for persons held in administrative detention.
A new item on foreign prisoners who are citizens of Member States of the European Union has been added.
Regarding the legal status of prisoners, two additional subcategories have been included: persons detained because of the revocation, suspension or annulment of the conditional release or probation and persons detained as a consequence of the conversion of a fine (fine defaulters).
The category of entries to penal institutions has been completed with several detailed questions in order to separate transfers from the rest of the entries.
The 2008 and the 2009 questionnaires have also been translated into Russian. The goals of the translation were to facilitate the completion of the questionnaire and the inclusion of comments on the particularities of the national data, and to increase the number of responses received and the reliability of the information included.
Figures on prison population (stock) as well as on penitentiary staff relate to 1st September 2009; while number of entries into penal institutions (flow), total number of days spent in them, and incidents (escapes, deaths and suicides) relate to the whole year 2008. The forty‐seven Member States of the Council of Europe in 2009 counted fifty‐two Prison Administrations under their control. Forty‐six of these Prison Administrations answered the 2009 SPACE I Questionnaire. The following Prison Administrations did not answer the survey: Austria, Bosnia and Herzegovina (State level of pre‐trial detention), Georgia, Greece, Montenegro, and Russian Federation.
Austria: due to a technical problem the national correspondent received the questionnaire after the deadline. For this reason, Austria provided only three general figures of the stock.
Bosnia and Herzegovina (State level) and Greece were unable to answer the questionnaire due to the lack of human resources to achieve the task.
Montenegro (that became the 47th Member State of the Council of Europe on May, 11, 2007) has not yet appointed a national correspondent responsible for answering the SPACE I questionnaire.
Georgia and Russian Federation did not provide any explanation for not having answered the questionnaire.
Data were not available for the following geopolitical entities: Northern Cyprus, Kosovo, Transdniestria, Abkhazia, South Ossetia and Nagorno‐Karabakh. The majority of countries answered the questionnaire on time, but in some cases the responses arrived only in January and February 2011. At the same time, for some of the countries that answered the questionnaire on time, the data validation procedure (see below, point E) took more than 8 months. Finally, for a few countries (and in particular for some specific figures) the data validation procedure could not be achieved. For this reason the non‐validated figures are presented between brackets.

Council of Europe Annual Penal Statistics – SPACE I – 2009
Strasbourg, 22 March 2011, pc-cp\space\documents\pc-cp (2011) 3e PC-CP (2011) 3
6
A. Prison Populations
Part A of the Survey includes global indicators of prison populations on 1st September 2009 (Section A.1) as well as data on flow of entries, length of imprisonment, escapes and deaths for the whole year 2008 (Section A.2). In order to ensure –as much as possible– comparability across countries, some figures are included only in the raw data tables. This means that figures that did not seem to fit the definitions used in this questionnaire were not integrated in the tables that include calculations of rates and percentages.
A.1. Global indicators of prison populations on 1st September 2009
The situation of prison populations on a given date ("STOCK STATISTICS") is set in Tables from 1 to 11. This indicator varies in time under the influence of the number of entries and releases in/from penal institutions and the length of stays in these institutions. Table 1: Situation of penal institutions on 1st September 2009
(a) Total number of prisoners (including pre‐trial detainees) (b) Number of detainees held in remand institutions/sections (“pre‐trials”) (c) Number of prisoners held in institutions serving a sentence (d) Prison population rate per 100,000 inhabitants: number of prisoners (including pre‐trial
detainees) as of 1st September 2009 in relation to the number of inhabitants at the same date (in view of the information available, the figures actually used are on 1st January 2009)2.
(e) Capacity of penal institutions: number of places available in penal institutions (f) Surface area per prisoner (calculated in square meters), when provided (g) Prison density per 100 places: number of prisoners (including pre‐trial detainees) in
relation to the number of places available in penal institutions. As a complement to Table 1, we include five supplementary tables and one map. Table 1.2: Categories included in the total number of prisoners The goal of this Table is to clarify the categories of persons held in different types of penal institutions that are being counted in the total number of prisoners. The Table includes the answers (Yes, No or NAP [not applicable]) to the question Does the total number of prisoners include the following categories?
(1) Persons held in facilities that do not depend on the Prison Administration (police stations, non‐Ministry of Justice facilities or similar facilities)
(2) Persons held in institutions/units for juvenile offenders (2.1) If the persons under point (2) are counted, how many of them are 18 years and over
(3) Persons held in institutions/special sections for drug‐addicted offenders
(4) Offenders with psychological and/or psychotic disorders who were considered as non‐criminally liable
2 This indicator is sometimes referred to as “detention rate”, or “prisoner rate”, or “imprisonment rate”, but these terms are ambiguous. Therefore the Council of Europe has adopted the term “prison population rate”.
Table 1.2 shows that the categories included in the total number of prisoners vary from country to country. As a consequence, international comparisons of prison population rates, as in Tables 1, cannot be regarded as unproblematic, and this must be borne in mind when using these Tables.
Council of Europe Annual Penal Statistics – SPACE I – 2009
Strasbourg, 22 March 2011, pc-cp\space\documents\pc-cp (2011) 3e PC-CP (2011) 3
7
by the court, held in psychiatric institutions, hospitals or special sections inside penitentiary institutions
(5) Offenders with psychological and/or psychotic disorders held in psychiatric institutions or hospitals in order to execute the main or the supplementary sanction (including sexual offenders)
(6) Offenders with psychological and/or psychotic disorders held in especially designed sections insight penal institutions in order to execute the main or the supplementary sanction (including sexual offenders)
(7) Asylum seekers or illegal aliens held for administrative reasons (7.1) If the persons under point (7) are counted, how many of them are held in centres/sections especially designated for this type of detention
(8) Persons serving their sentence under electronic surveillance/ Electronic Monitoring (9) Persons detained in other types of institutions
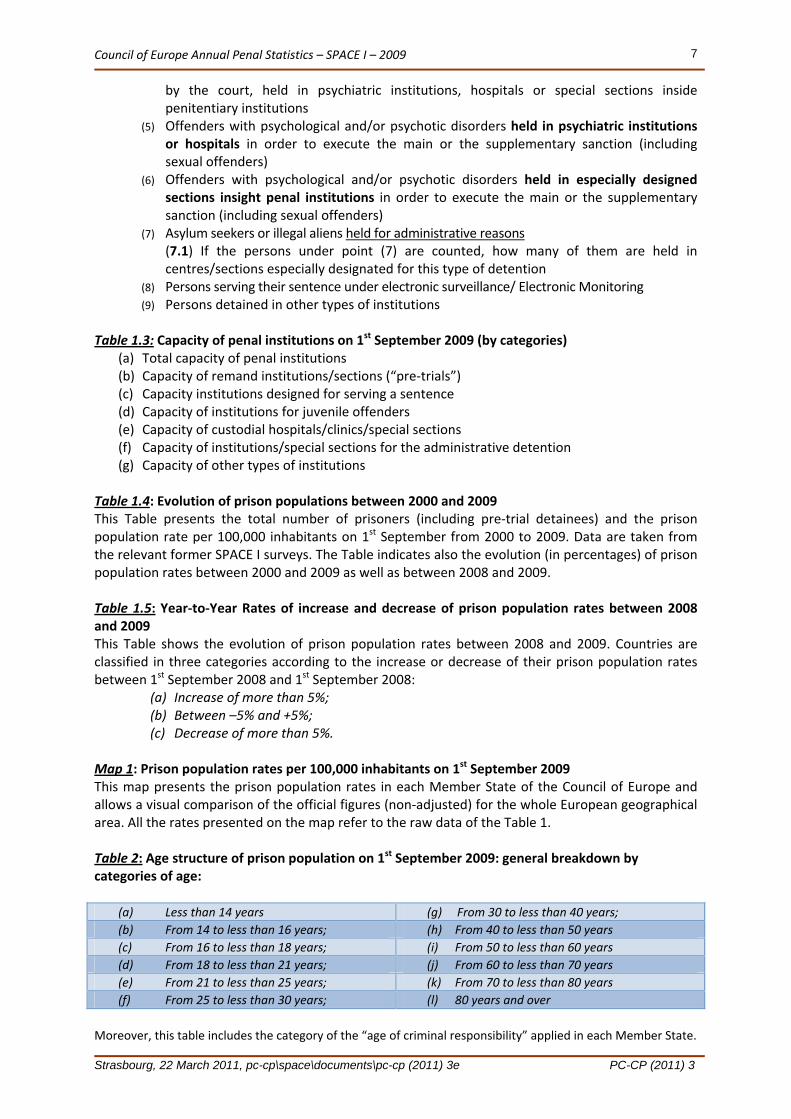
Table 1.3: Capacity of penal institutions on 1st September 2009 (by categories)
(a) Total capacity of penal institutions (b) Capacity of remand institutions/sections (“pre‐trials”) (c) Capacity institutions designed for serving a sentence (d) Capacity of institutions for juvenile offenders (e) Capacity of custodial hospitals/clinics/special sections (f) Capacity of institutions/special sections for the administrative detention (g) Capacity of other types of institutions
Table 1.4: Evolution of prison populations between 2000 and 2009 This Table presents the total number of prisoners (including pre‐trial detainees) and the prison population rate per 100,000 inhabitants on 1st September from 2000 to 2009. Data are taken from the relevant former SPACE I surveys. The Table indicates also the evolution (in percentages) of prison population rates between 2000 and 2009 as well as between 2008 and 2009. Table 1.5: Year‐to‐Year Rates of increase and decrease of prison population rates between 2008 and 2009 This Table shows the evolution of prison population rates between 2008 and 2009. Countries are classified in three categories according to the increase or decrease of their prison population rates between 1st September 2008 and 1st September 2008:
(a) Increase of more than 5%; (b) Between –5% and +5%; (c) Decrease of more than 5%.
Map 1: Prison population rates per 100,000 inhabitants on 1st September 2009 This map presents the prison population rates in each Member State of the Council of Europe and allows a visual comparison of the official figures (non‐adjusted) for the whole European geographical area. All the rates presented on the map refer to the raw data of the Table 1. Table 2: Age structure of prison population on 1st September 2009: general breakdown by categories of age:
(a) Less than 14 years (g) From 30 to less than 40 years;
(b) From 14 to less than 16 years; (h) From 40 to less than 50 years
(c) From 16 to less than 18 years; (i) From 50 to less than 60 years
(d) From 18 to less than 21 years; (j) From 60 to less than 70 years
(e) From 21 to less than 25 years; (k) From 70 to less than 80 years
(f) From 25 to less than 30 years; (l) 80 years and over
Moreover, this table includes the category of the “age of criminal responsibility” applied in each Member State.

Council of Europe Annual Penal Statistics – SPACE I – 2009
Strasbourg, 22 March 2011, pc-cp\space\documents\pc-cp (2011) 3e PC-CP (2011) 3
8
Table 2.1: Age structure of prison populations on 1st September 2009: minors and persons between 18 and 21 of age:
(a) Prisoners under 18 years of age (including pre‐trial detainees): number and percentage; (b) Prisoners between 18 and 21 years of age (including pre‐trial detainees): number and
percentage. Map 2: Breakdown of the age of criminal responsibility and percentages of prisoners less than 18 years of age in European countries This map shows the minimum age of criminal responsibility across Europe and shows the percentage of juveniles held in penal institutions in each country. Table 2.2: Median and Average ages of the prison population (including pre‐trial detainees) on 1st September 2009: This table includes the median and average values calculated by national Prison Administrations. An additional graph completes the raw data of the table with the distribution of the countries with youngest prison populations (distribution based on median values). Table 3.1: Female prisoners on 1st September 2009
(a) Female prisoners (including pre‐trial detainees): number and percentage; (b) Of which:
a. Female pre‐trial detainees; b. Female foreign prisoners.
Table 3.2: Foreign prisoners on 1st September 2009
(a) Foreign prisoners (including pre‐trial detainees): number and percentage; (b) Of which:
a. Foreign pre‐trial detainees: number and percentage of foreign prisoners who are pre‐trial detainees.
b. Foreign prisoners citizens of Member States of the European Union: number and percentage;
c. Foreign juvenile (aged under 18) detainees: number and percentage. Table 4: Legal status of prison populations on 1st September 2009 (numbers)
(a) Untried prisoners (no court decision yet reached); (b) Prisoners convicted but not yet sentenced; (c) Sentenced prisoners who have appealed or who
are within the statutory limits for doing so; (d) Sentenced prisoners (final sentence) – Including:
a. Persons detained for fine conversion reasons (fine defaulters)
b. Persons detained against the revocation, suspension or annulment of the conditional release or probation
(e) Other cases; (f) Total.
Table 5: Legal status of prison populations on 1st September 2009 (percentages and rates) Four indicators have been selected as a basis for comparing the situation of the prison populations across Europe:
When there is no data available under heading (c) "sentenced prisoners who have appealed or who are within the statutory time limit for doing so" of Table 4, without any further information being provided, it is assumed that prisoners in that situation are included among those under heading (d) "sentenced prisoners, final sentence". In that case, both indicators are presented between brackets and must be interpreted

Council of Europe Annual Penal Statistics – SPACE I – 2009
Strasbourg, 22 March 2011, pc-cp\space\documents\pc-cp (2011) 3e PC-CP (2011) 3
9
(a) Percentage of prisoners not serving a final sentence on 1st September 2009 (often inaccurately referred to as percentage of unconvicted prisoners): the number of prisoners whose sentence is not final, present at that date, expressed as a percentage of the total number of prisoners at the same date;
(b) Rate of prisoners not serving a final sentence per 100,000 inhabitants on 1st September 2009: the number of prisoners whose sentence is not final, present at that date, in relation to the
number of inhabitants at the same date expressed per 100,000 inhabitants.
In order to calculate indicators (a) and (b), the number of prisoners not serving a final sentence is obtained by adding headings (a), (b), (c) and (g) of Table 4. (c) Percentage of untried prisoners (no court
decision yet reached) on 1st September 2009: the number of untried prisoners (not yet convicted), present at that date, expressed as a percentage of the total number of prisoners at the same date;
(d) Rate of untried prisoners (no court decision yet reached) per 100,000 inhabitants on 1st September 2009: the number of untried prisoners (not yet convicted), present at that date, in relation to the number of inhabitants
at the same date expressed per 100,000 inhabitants.
In order to calculate indicators (c) and (d), only prisoners under heading (a) "untried prisoners (not yet convicted)" of Table 4 are taken into account.
Table 6: Breakdown of sentenced prisoners (final sentence) on 1st September 2009, by main offence (numbers) Table 7: Breakdown of sentenced prisoners (final sentence) on 1st September 2009, by main offence (percentages)
Tables 6 and 7 present the breakdown of prisoners with final sentence those under heading (d) of Table 4 according to the main offence for which they were convicted. The following breakdown is used:
(a) Prisoners sentenced for homicide (including attempts); (b) Prisoners sentenced for assault and battery; (c) Prisoners sentenced for rape; (d) Prisoners sentenced for other types of sexual offences; (e) Prisoners sentenced for robbery; (f) Prisoners sentenced for other types of theft; (g) Prisoners sentenced for economic and financial offences; (h) Prisoners sentenced for drug offences; (i) Prisoners sentenced for terrorism (j) Prisoners sentenced for organised crime (k) Prisoners sentenced for other offences; (l) Total.
Table 8: Breakdown of sentenced prisoners (final sentence) on 1st September 2009, by length of the sentence (numbers)
When there is no data available under heading (b) "prisoners convicted but not yet sentenced" of Table 4, without any further information being provided, it cannot be excluded that prisoners in that situation are included among those under heading (a) "untried prisoners (no court decision yet reached)". In that case, both indicators are presented between brackets and must be interpreted cautiously.

Council of Europe Annual Penal Statistics – SPACE I – 2009
Strasbourg, 22 March 2011, pc-cp\space\documents\pc-cp (2011) 3e PC-CP (2011) 3
10
Table 9: Breakdown of sentenced prisoners (final sentence) on 1st September 2009, by length of the sentence (percentages)
Tables 8 and 9 present the breakdown of prisoners with final sentence those under heading (d) of Table 4 according to the length of the sentence imposed on them. The following breakdown is used:
(a) Prisoners sentenced to less than one month; (b) Prisoners sentenced to one month to less than three months; (c) Prisoners sentenced to three months to less than six months; (d) Prisoners sentenced to six months to less than one year; (e) Prisoners sentenced to one year to less than three years; (f) Prisoners sentenced to three years to less than five years; (g) Prisoners sentenced to five years to less than ten years; (h) Prisoners sentenced to ten years to less than twenty years; (i) Prisoners sentenced to twenty years and over; (j) Prisoners sentenced to life imprisonment; (k) Prisoners sentenced to death.
Table 10: Breakdown of sentenced prisoners (final sentence) on 1st September 2009, by length of the sentence (cumulative percentages) This Table presents the breakdown, expressed in cumulative percentages, of prisoners with final
sentence those under heading (d) of Table 4 according to the length of the sentence imposed on them. The following breakdown is used:
(a) Percentage of prisoners sentenced to less than one year; (b) Percentage of prisoners sentenced to one year and over (fixed‐term sentence); (c) Percentage of prisoners sentenced to three years and over (fixed‐term sentence); (d) Percentage of prisoners sentenced to five years and over (fixed‐term sentence); (e) Percentage of prisoners sentenced to ten years and over (fixed‐term sentence); (f) Percentage of prisoners sentenced to fixed‐term sentences; (g) Percentage of prisoners sentenced to life imprisonment; (h) Percentage of prisoners sentenced to death.
Table 11: Breakdown of prisoners sentenced to less than one year (final sentence), on 1st September 2009, by length of the sentence (percentages) This Table presents the breakdown, expressed in percentages, of prisoners sentenced to less than one year according to the length of the sentence imposed on them. The following breakdown is used:
(a) Prisoners sentenced to less than one month; (b) Prisoners sentenced to one month to less than three months; (c) Prisoners sentenced to three months to less than six months; (d) Prisoners sentenced to six months to less than one year.
Figure 2.b is to be used for a comparative view of the highest percentages of prisoners sentenced to less than one year. This figure is available as additional part to the Tables 10 and 11.

Council of Europe Annual Penal Statistics – SPACE I – 2009
Strasbourg, 22 March 2011, pc-cp\space\documents\pc-cp (2011) 3e PC-CP (2011) 3
11
A.2. Flow of entries, length of imprisonment, escapes and deaths in 2008
Tables 12.1 to 15.2 show the number of entries into prison (“FLOW STATISTICS”), the length of imprisonment, and the number of escapes and deaths in penal institutions during the year 2008. Table 12.1: Flow of entries to penal institutions in 2008
(a) Total number of entries to penal institutions in 2008. This indicator is usually known as “flow of entries”;
(b) Rate of entries to penal institutions per 100,000 inhabitants: the number of entries in 2008, in relation to the average number of inhabitants during the same period;
(c) Entries before final sentence: number and percentage; (d) Entries after the revocation, suspension or annulment of the conditional release or
probation: number and percentage. Figures relate to the number of events (entries) and not to the number of individuals. The same individual may enter prison several times in the same year for the same case. This applies, for instance, to an individual who is placed in pre‐trial detention during year n (first entry), released by the prosecution authorities at the pre‐trial investigation stage, tried without being re‐detained, convicted and sentenced to a term of imprisonment exceeding the period of pre‐trial detention, and re‐imprisoned during the same year n to serve the remainder of the sentence (second entry). A fortiori, the same individual may enter prison several times in the same year for different cases. In the questionnaire, countries were asked to meet the following definition of entry: THE TERM "ENTRY" REFERS TO ALL ENTRIES INTO PENAL INSTITUTIONS, EXCEPT IN THE FOLLOWING SITUATIONS:
ENTRY FOLLOWING TRANSFER FROM ONE PENAL
INSTITUTION TO ANOTHER; ENTRY FOLLOWING THE PRISONER’S REMOVAL FROM THE
INSTITUTION IN ORDER TO APPEAR BEFORE A JUDICIAL
AUTHORITY (INVESTIGATING JUDGE, TRIAL COURT, ETC); ENTRY FOLLOWING PRISON LEAVE OR A PERIOD OF
AUTHORIZED ABSENCE; ENTRY FOLLOWING AN ESCAPE, AFTER RE‐ARREST BY THE
POLICE.
Table 12.2: Additional categories of the Flow of entries to penal institutions in 2008 This Table includes three additional categories of entries that were not included Table 12.1:
(a) Entries following transfer from one penal institution to another; (b) Entries following an escape, after the re‐arrest by the police; (c) Entries following transfer from a foreign country to the country responding the
questionnaire. Of which: Entries following transfer from a Member State of the European Union to
your country in 2008 (even if your country is a member of the EU) Table 13.1: Indicator of average length of imprisonment in 2008, based on the total number of days spent in penal institutions
(a) Total number of days spent in penal institutions in 2008; (b) Average number of prisoners in 2008: b = a / 366 (because 2008 was a leap year); (c) Total number of entries to penal institutions in 2008 (flow of entries) = heading (a) of
Table 12;
Only entries of untried prisoners (not yet convicted), prisoners convicted but not yet sentenced, or sentenced prisoners who have appealed or who are within the statutory time limit to do so are recorded under (c). This figure therefore corresponds to a subset of the entries recorded under (a). Entries for pre‐trial detention are included.

Council of Europe Annual Penal Statistics – SPACE I – 2009
Strasbourg, 22 March 2011, pc-cp\space\documents\pc-cp (2011) 3e PC-CP (2011) 3
12
(d) Indicator of average length of imprisonment expressed in months (D): quotient of the average number of prisoners in 2008 (P) by the flow of entries during that period (E), multiplied by 12 (months): D = 12 (P / E).
The figure under heading (a) corresponds to the total number of days spent in penal institutions by all persons placed in detention for at least one day during the reference year (2008). This may be time spent in pre‐trial detention or time spent serving a prison sentence, or may even correspond to other circumstances (detention for failure to pay a fine, for instance). No distinction is made here between those categories. By dividing the number of days of imprisonment by 365 (366 in leap years) we obtained the "average number of prisoners in the year" or the number of "prisoner‐years" (b), which constitutes probably the best possible indicator of the average number of prisoners present in the year. Table 13.2: Indicator of average length of imprisonment in 2008, based on the total number of days spent in penal institutions As some countries did not provide data regarding the total number of days spent in penal institutions
in 2008 heading (a) of Table 13.1 and others provided figures that did not seem reliable (see Notes to Table 13.1), we have added Table 13.2 (Indicator of average length of imprisonment in 2008, based on the total number of prisoners on 1st September 2008). In this Table, the indicator of the average length of imprisonment has been computed by using the total number of prisoners on 1st September 2008 (source: SPACE 2008) instead of the total number of days spent in penal institutions. We have also used this indicator to work out other figures presented in Tables 14 and 15 (escape rate, mortality rate and suicide rate). Table 14: Escapes of prisoners in 2008 The Table includes two types of escapes:
(a) Escapes by prisoners (convicted prisoners or pre‐trial detainees under the supervision of the prison administration) from a closed penal institution or during an administrative transfer (for example, to or from a court, another penal institution, or a hospital).
In the SPACE questionnaire used for this survey it is clearly indicated that the counting unit is the person. In the event of a group breakout, the number of escapes is equal to the number of inmates involved. Relating the number of escapes to the total number of prisoners on 1st September 2008 (used here as an estimate of the average number of prisoners) provided in SPACE I 2008 we obtain the rate of escapes per 10,000 prisoners: 10,000 X (a / total number of prisoners on 1st September 2008).
(b) Other forms of escape (absconding or running off): Examples are escapes from open institutions (such as work farms) or from semi‐detention, and escapes during an authorised short‐term absence (or leave) from all kinds of institutions (including closed institutions).
We have not worked out the rate here, as that would lead to calculate the ratio of escapes (other forms) to the average number of prisoners without taking account of the proportion of inmates placed in "open institutions". Table 15.1: Deaths in penal institutions in 2008 (including suicides)
(a) Total number of deaths in penal institutions; (b) Number of suicides; (c) Suicides as a percentage of total deaths: 100 (b / a)
This kind of data is usually prepared by the departments responsible for prison budgets and is used to calculate the average daily cost of imprisonment.

Council of Europe Annual Penal Statistics – SPACE I – 2009
Strasbourg, 22 March 2011, pc-cp\space\documents\pc-cp (2011) 3e PC-CP (2011) 3
13
Relating the total number of deaths in prison (a) and the number of suicides in prison (b) to the total number of prisoners on 1st September 2008 (used here as an estimate of the average number of prisoners) provided in SPACE I 2008 we obtain respectively:
(d) Mortality rate per 10,000 prisoners: 10,000 X (a / total number of prisoners on 1st September 2008);
(e) Suicide rate per 10,000 prisoners: 10,000 X (b / total number of prisoners on 1st September 2008).
Table 15.2: Types of deaths and suicides included in Table 15.1 The goal of this Table is to clarify which types of suicides are being counted. The Table includes the answers (Yes or No) to the following questions:
(a) Does data include prisoners who died or committed suicide in prison hospitals? (b) Does data include prisoners who died or committed suicide in community hospitals? (c) Does data include prisoners who died or committed suicide outside prison (during a prison
leave or a period of absence by permission)? Table 16: Average amount spent per day for detention of one person (pre‐trial and serving a sentence) in penal institutions –2008 year (in Euros) Figures included in this Table should allow comparisons of the costs of detention across Europe. No rigorous definition has been used in the questionnaire; therefore national particularities (e.g. the way in which costs are calculated) are indicated in the notes to the Table. Figures in national currencies other than Euro have been converted into Euro.
Deaths of convicted prisoners and pre‐trial detainees while in hospital are included in this Table.

Council of Europe Annual Penal Statistics – SPACE I – 2009
Strasbourg, 22 March 2011, pc-cp\space\documents\pc-cp (2011) 3e PC-CP (2011) 3
14
B. Prison Staff
Part B of the Survey includes figures related to persons working in prisons or, more generally, in the penitentiary system. The Survey makes a distinction between staff working under the control of the National Prison Administrations and staff working under the control of any other authority. Data on the staff employed by the Prison administrations are presented without distinction between full‐time and part‐time staff. Full‐time equivalents (FTE) have been used as the counting unit for these tables. Table 17: Full‐time and part‐time staff working in penal institutions on the basis of full‐time equivalents on 1st September 2009 (numbers) Table 18.1: Full‐time and part‐time staff working in penal institutions on 1st September 2009: on the basis of full‐time equivalents (percentage) Table 18.2: Full‐time and part‐time staff working INSIDE penal institutions on 1st September 2009: on the basis of full‐time equivalents (percentage) Tables 17 to 18.2 describe the situation of staff working in penal institutions on 1st September 2009. The goal of these Tables is to count all staff engaged by the prison authorities. Respondents were asked to exclude persons working in penal institutions but not employed by the prison authorities (in some countries this applies to doctors, teachers or perimeter guards). Such employees are included in Table 19. Tables 17 and 18.1, 18.2 are structured with respect to the following categories:
(a) Total (b) Staff at the national prison administration
(Head Office) (c) Staff in regional prison administration offices (d) Other staff employed by the prison
administration, but who work OUTSIDE penal institutions
(e) Total number of staff working INSIDE penal institutions
(f) Executives (managers) of penal institutions (g) Custodial staff, excluding staff already included
in (f); (h) Medical and paramedical staff, excluding staff already included in (f) or (g); (i) Staff responsible for assessment and the psychologists excluding staff already included in (f)
to (h) (j) Staff responsible for education activities (including social workers, teachers / educators,
etc.) excluding staff already included in (g) to (i) (k) Staff responsible for workshops or vocational training excluding staff already included in (f)
to (j) (l) Other staff working INSIDE penal institutions
Respondents were asked to calculate the number of staff working part time on the basis of "full‐time equivalents". This means that when two people work half the standard number of hours, they count for one "full‐time equivalent". One half‐time worker should count for 0.5 of a full‐time equivalent.

Council of Europe Annual Penal Statistics – SPACE I – 2009
Strasbourg, 22 March 2011, pc-cp\space\documents\pc-cp (2011) 3e PC-CP (2011) 3
15
Table 19: Staff working in penal institutions but not employed by the Prison Administration –on 1st September 2009 This Table presents the staff employed by institutions that are not under the control of the Prison Administration (i.e. staff not employed by the Prison Administration), but that is involved in the security, treatment, training or other activities developed in penal institutions placed under the prison administration authority. In some countries these categories do not exist. In others, doctors, teachers and perimeter guards may sometimes be employed by institutions that are not under the control of the prison authorities (for instance health authorities, departments of the Ministries of Education, Interior or Justice, or private security). Table 20: Supervision of prisoners
(a) Total number of prisoners at 1st September 2009: see Table 1. (b) Total number of custodial staff at 1st September 2009: see Table 17. (c) Rate of supervision of prisoners (number of prisoners per custodian): c = a / b (d) Total number of treatment, education staff, and staff responsible for workshops. (e) Rate of supervision of prisoners (number of prisoners per other employee): e = a / d.

Council of Europe Annual Penal Statistics – SPACE I – 2009
Strasbourg, 22 March 2011, pc-cp\space\documents\pc-cp (2011) 3e PC-CP (2011) 3
16
C. Conventions and Statistical Measures
C.1. Conventions used:
NAP ***
The question is irrelevant; the item refers to a concept not found in the penal system of the country concerned.
0 The number is 0 but the concept exists in the penal system of the country concerned.
NA …
No figures available, but the concept exists in the penal system of the country concerned.
(number)
When the data are shown in brackets this means that they are not strictly comparable with the data requested by SPACE I questionnaire. For example, this applies to items whose definition is not the same as the one used in the SPACE questionnaire. Or when the total number of analysed figure is less or equal to 10 individuals.
When the questionnaire box is left blank or a symbol is used, whose meaning is not explicit (for example "/" or "‐"), we leave the box blank.
All cases of divergence and additional comments provided by national correspondents have been grouped and explained in the notes to the Tables.
C.2. Measures of central tendency:
In Tables containing rates or percentages, we have used the following measures to describe the distribution of the data:
Mean: the arithmetic mean is the outcome of dividing the sum of the data supplied by the total number of countries. The mean is sensitive to extreme values (very high or very low).
Median: the median is the value that divides the data supplied by the countries concerned into two equal groups so that 50% of the countries are above the median and 50% are below it. The median is not influenced by very high or very low values.
Minimum: the lowest recorded value in the given column of the Table.
Maximum: the highest recorded value in the given column of the Table.
For reasons of accuracy we have calculated the mean and median values from the original database, which contains all the decimals not presented in the tables. Readers who rework the calculations from the data in the tables ‐ which only contain one or two decimals ‐ will therefore obtain slightly different results than ours.

Council of Europe Annual Penal Statistics – SPACE I – 2009
Strasbourg, 22 March 2011, pc-cp\space\documents\pc-cp (2011) 3e PC-CP (2011) 3
17
D. Demographic Data
The rates presented in this report have been calculated using demographic data (total population of each European country on January 1st, 2009), taken from the EUROSTAT Data Base (“Population on 1st January by age and gender”): http://epp.eurostat.ec.europa.eu/portal/page/portal/statistics/search_database All these figures have been retrieved on December 13th, 2010. Exceptions: When data provided for the questionnaire by national correspondents referred to a different territorial division than demographic data, we have used other sources (which are described below) for the latter. These exceptions concern the following countries and administrative areas:
Bosnia and Herzegovina (Federation of Bosnia and Herzegovina): Demographic data are mid‐2009 estimates. Data were retrieved from the Website of the Federal Office of Statistics (provisional data, nowadays not included in the annual report), available at: http://www.fzs.ba/Dem/Vital/VitalnaEngl.htm (retrieved on December 13th, 2010).
Bosnia and Herzegovina (Republika Srpska): Demographic data are estimates. We made our estimation on the basis of official data for 2009 (“Demographic statistics. Statistical Bulletin” no. 13, Republika Srpska Institute of Statistics, Banja Luka, 2010, p. 15), available at: http://www.rzs.rs.ba/PublikDemENG.htm (December 13th, 2010).
France: Demographic data are estimates by the National Institute for Statistics and Economic Studies, INSEE (http://www.insee.fr/fr/ffc/figure/NATTEF02133.XLS). They relate to the 1st January 2009 and include the European territory of France (known as the Metropolitan France) as well as the French overseas departments (Guadeloupe, Martinique, Guiana and Reunion, known as DOM or Départements d’Outre‐mer).
Serbia: Demographic data exclude Kosovo and Metohija territories.
Monaco: Demographic data are mid‐2009 estimates. Data were retrieved from the Website of the U.S. Census Bureau: http://www.census.gov/ipc/www/idb/country.php.
Spain (State Administration and Catalonia): Demographic data refer to 1st January 2009. Data were retrieved on December 13th, 2010, available for Spain at the Website of the National Statistics Institute of Spain: http://www.ine.es/jaxi/tabla.do, and for Catalonia, at the Official Statistics Website of Catalonia (IDESCAT), at: http://www.idescat.cat/en/poblacio/poblrecomptes.html
United Kingdom (England and Wales, Northern Ireland, and Scotland): Demographic data are mid‐2009 estimates by National Statistics Online. Data were retrieved on December 13th, 2010, available (separately for the each administrative level) at: http://www.statistics.gov.uk/statbase/Product.asp?vlnk=15106

Council of Europe Annual Penal Statistics – SPACE I – 2009
Strasbourg, 22 March 2011, pc-cp\space\documents\pc-cp (2011) 3e PC-CP (2011) 3
18
E. Data Validation Procedure
One of the goals of SPACE is to ensure data comparability on two levels: cross‐sectional and longitudinal. In order to reach this goal, special attention is given every year to the improvement of data validation techniques. According to the authors of the European Sourcebook of Crime and Criminal Justice Statistics (Strasbourg, Council of Europe, 1999), "validation is often the most important –and in many cases the most forgotten– stage of the data collection process". Thus, since the 2002 SPACE I survey, we have introduced a validation procedure for the data received. Such procedure substantially increases the workload of all the individuals and countries involved in the elaboration of SPACE. It also delays the publication of the data. However, we believe that the results
obtained in other words, the improvements to the quality of the data justify its use. As part of the validation procedure, we produced a preliminary version of SPACE and a series of control Tables that revealed a number of inconsistencies in the data received from some countries.
Those countries were contacted again by means of a telephone call or a personal letter sent by e‐mail or fax setting out the specific problems encountered in their data. In some cases, it was imperative to translate some information in order to avoid mistakes. Most of the countries corrected their figures, sent new ones for certain parts of the questionnaire, or indicated the reasons for the divergences identified. Such divergences are mainly due to differences in the national prison statistics systems as well as in criminal justice systems across Europe and are explained in the notes to the relevant Tables. Nevertheless, despite our efforts to identify errors and inconsistencies, some of them may still remain and others may have been introduced involuntarily during the data processing. Moreover, it has not always been possible to correct the inconsistencies discovered in a totally satisfactory way. In that context, any readers' comments, notes or criticisms are welcomed.
Finally, the authors would like to thank all those who brought their support, advice, suggestions or knowledge of specific national features have contributed to the achievement of this report, in particular the national correspondents of each country included in it. A particular gratitude goes to Mr Roy Walmsley for providing us with missing figures and for his critical reading of our reports.

Council of Europe Annual Penal Statistics – SPACE I – 2009
Strasbourg, 22 March 2011, pc-cp\space\documents\pc-cp (2011) 3e PC-CP (2011) 3
19
Statistical Tables

Council of Europe Annual Penal Statistics – SPACE I – 2009
Strasbourg, 22 March 2011, pc-cp\space\documents\pc-cp (2011) 3e PC-CP (2011) 3
20
1. Prison Populations: State of Prison Populations on September 1st, 2009
This part of the report presents statistical Tables, explanatory notes and maps concerning the general situation in European penal institutions. It also includes data on detention in different types of penal institutions as well as an analysis of the evolution of several indicators of the penitentiary systems across Europe.
I.1. General Notes (including legislative or other measures which directly influence trends in the number of prisoners)
ALBANIA:
New legislations (the reference period is between 1st September 2009 and 31st August 2010): Inner Prison Regulations, for 21 penal institutions General Regulation of Prisons
Individual pardons: 367 persons ANDORRA:
New legislations: The Criminal Code and the Code of Criminal Procedure have been modified (they entered into force on October 3, 2008).
ARMENIA:
Amnesties: The act of amnesty entered into force on 19th June 2009 Individual pardons: 8 persons. In Armenia the pardon is always an individual measure.
AUSTRIA:
New legislations: Strafrechtsänderungsgesetz entered into force in 2008, BGBl. I Nr. 109/2007, concerning release on parole.
No other special information has been provided due to the fact that Austrian figures are not available for this year’s report.
AZERBAIJAN:
New legislations: Act of 24th June 2008 significantly improved the conditions of detention of persons serving life sentences. The number of visits increased. This category of prisoners have additional right of receiving packages throughout the year, telephone calls, the amount of money allowed for spending on a monthly basis. Have been cancelled restrictions on receiving vocational training. Access to television broadcasts has been allowed.
Amnesties: The act of amnesty has been applied to 9,564 people, of which 8,604 were men and 960 women, including 23 juveniles. As a result of amnesty, were released 2,030 persons sentenced to prison, 137 persons sentenced to disciplinary measures and for 516 persons the remaining length of serving prison sentence was reduced by half. Were released 1,600 persons with sentences of restriction of freedom, 2,853 ‐ correctional works, 198 ‐ administrative work, and 1,860 persons who were unable to pay the fine due to their financial situation.
Collective pardons: 99 sentenced persons were subjected to a collective pardon in 2009. BELGIUM: No measures (legislative or other) influencing directly the trends in the number of prisoners have been taken in the course of the last 12 months.

Council of Europe Annual Penal Statistics – SPACE I – 2009
Strasbourg, 22 March 2011, pc-cp\space\documents\pc-cp (2011) 3e PC-CP (2011) 3
21
BOSNIA & HERZEGOVINA (BOSNIA AND HERZEGOVINA – FEDERATION LEVEL): Changes in criminal law: Changes to the Law on execution of criminal sanctions in the Federation of Bosnia and Herzegovina published in the Official Gazette of FBiH no 12/09.
Conditional release: 393 persons BOSNIA & HERZEGOVINA (BOSNIA AND HERZEGOVINA – STATE LEVEL): Data are not available for this year’s report. BOSNIA & HERZEGOVINA (REPUBLIKA SRPSKA – ENTITY LEVEL):
Individual pardons: 35 persons Conditional release: Conditional release approved by the RS Government's Commission was applied to 183 persons. Conditional release approved by the prison establishments’ governor (up to 3 months) was applied to 236 sentenced persons.
BULGARIA:
Changes in criminal law: In 2008 there were three changes in the Criminal Code (on 22nd February 2008, 29th July 2008, as well as in November 2008), and two changes in the Code of Criminal Procedure (5th August 2008 and 23rd December 2008).
New legislations: New Law on Execution of Sentences entered into force on 1st June 2008. Amnesties: 350 persons Individual pardons: 9 persons
CROATIA:
Data relate to 31st December 2009 instead of 1st September 2009 No measures (legislative or other) influencing directly the trends in the number of prisoners have been taken in the course of the last 12 months.
CYPRUS:
Prison population figures do not include the areas that not under the effective control of the Government of the Republic of Cyprus;
New legislations: Law 116(I)/2008 was enacted in 2008, which modifies the Law on Prisons (Laws 62(I)/1996, 12(I)/1997 and 96(I)/2005). The 2008 law provides that a prisoner who has been convicted to a prison sentence longer than three months and shorter than four years and who has served at least half the length of his sentence, may request permission to serve part of his sentence on house arrest with the use of an electronic bracelet, for a period ranging from 15 days to 4 months. This law is enacted but not implemented yet.
Collective pardons: 466 persons (given by the President of the Republic of Cyprus –a Constitutional Right).
Other: 3 transfers abroad and 6 transfers decided by the Supreme Court. CZECH REPUBLIC:
New legislations: Waste of financial interests of the European Communities and participation transferred to him‐/herself or to another person or uses thing acquired by an act, which is punishable in the Czech Republic or in another country (the Act No. 140/1961, the Criminal Act, as amended by the Act No. 122/2008 Coll.) ‐ effective since July 1st, 2008.
Individual pardons: There is no data available on the pardons for prisoners (persons who did really spend a time imprisoned). In some cases there is no special mention if the person got the President’s pardon after of before being imprisoned. Estimated number of individual pardons is 10 (on the basis of information available on www.hrad.cz).

Council of Europe Annual Penal Statistics – SPACE I – 2009
Strasbourg, 22 March 2011, pc-cp\space\documents\pc-cp (2011) 3e PC-CP (2011) 3
22
DENMARK: New legislations and changes in criminal law:
Amendment of the Danish Act on Enforcement of Sentences (Act no. 496 of 17th June 2008 and Act. No. 500 of 17th June 2008). The change allows serving the sentence at home under intensive surveillance and control (the electronic monitoring program). This concerns persons sentenced to prison for 3 months or less. The electronic monitoring program does not apply on persons sentenced to prison for two weeks or less for violation of the law on weapons and explosives unless the punishment is also given due to violation of other law(s) and the violation of the law on weapons and explosives has not had a significant impact on the length of the sentence.
Act no. 319 of April 28th, 2009: Implementation of The Council of Europe Convention on the Protection of Children against Sexual Exploitation and Sexual Abuse. Necessary changes in the Danish Criminal Act in order to ratify the convention.
Act no. 501 of June 12th, 2009: Improved efforts to prevent gang crime etc. Increase of the maximum sentences for certain crimes related to illegal possession of weapons. Introduction of minimum sentences for certain crimes related to illegal possession of weapons. Increase of the sentences applied to persons convicted for certain severe crimes committed as part of gang encounters.
ESTONIA: No measures (legislative or other) influencing directly the trends in the number of prisoners have been taken in the course of the last 12 months. FINLAND:
Data relate to 1st May 2009 instead of 1st September 2009. Changes in criminal law: From 1st June 2008, the law was changed concerning fine defaulters. Unpaid fines less than 120 Euros or 12 day‐fines are no longer converted into imprisonment. It is estimated that this change produced a decrease between 170 and 210 inmates on the daily prison population.
FRANCE:
General notes:
Data relate to 1st October 2009 instead of 1st September 2009.
Under the category of “prisoners” are also included persons serving their sentences under the electronic monitoring and those, who are in external placements (not hosted by the Prison Administration).
Data relate to the European territory of France (known as Métropole) as well as to the French overseas territories (Guadeloupe, Martinique, French Guiana and Reunion, known as DOM or Départements d’Outre‐mer).
Changes in criminal law: several changes have been made on the Penitentiary Law New legislations: Law on criminal reoffending and Law on domestic violence
GEORGIA: Data are not available for this year’s report. GERMANY:
Data relate to 31st March 2009 instead of 1st September 2009. No measures (legislative or other) influencing directly the trends in the number of prisoners have been taken in the course of the last 12 months.
GREECE: Data are not available for this year’s report.

Council of Europe Annual Penal Statistics – SPACE I – 2009
Strasbourg, 22 March 2011, pc-cp\space\documents\pc-cp (2011) 3e PC-CP (2011) 3
23
HUNGARY: No measures (legislative or other) influencing directly the trends in the number of prisoners have been taken in the course of the last 12 months. ICELAND: No measures (legislative or other) influencing directly the trends in the number of prisoners have been taken in the course of the last 12 months. IRELAND: No measures (legislative or other) influencing directly the trends in the number of prisoners have been taken in the course of the last 12 months. ITALY:
Data do not include juveniles. New legislations: Law nr.94 of 15th July 2009, affecting the special prison regime of maximum security, so‐called "41‐b".
LATVIA:
Changes in criminal law: Criminal Code was amended on 30th October 2008, on 21st May 2009 and on 16th June 2009.
New legislations:
2nd September 2008, Cabinet of Ministers No.700 “Amendments to Cabinet Regulations of 12th October 1999 No.351 Regulations on the material assistance to persons who are released from the detention center”. Prison administration do not provide a single benefit at the amount of State social security benefit to a person on its release date;
8th September 2008, Cabinet of Ministers No.725 “Procedures for establishing and closing of the convicted person's release fund and paying the accumulated money from the release funds”;
12th May 2009, Cabinet of Ministers No.413 “Amendment to the Cabinet of Ministers Regulations No. 423 30 May 2006 Custodial institution's internal rules of procedure”: § 88: “After a sentence or a request of the sentenced person placed in a disciplinary cell, based on the regulatory legislation of criminal enforcement, prison administration gives this person an opportunity to write letters, except letters to individuals.”
Individual pardons: 33 persons. LIECHTENSTEIN: No measures (legislative or other) influencing directly the trends in the number of prisoners have been taken in the course of the last 12 months. LITHUANIA:
Data relate to 1st July 2009 instead of 1st September 2009. Individual pardons: During the period from 1st September 2008 to 31st August 2009, there were 2 Presidential Decrees proclaimed granting pardon. As a result, 3 prisoners were pardoned from the service of the rest of the sentence and 4 prisoners had the term of their service reduced.
LUXEMBOURG:
Individual pardons: 328 persons, of which 8 were commutations of the sentence (for the year 2009).

Council of Europe Annual Penal Statistics – SPACE I – 2009
Strasbourg, 22 March 2011, pc-cp\space\documents\pc-cp (2011) 3e PC-CP (2011) 3
24
MALTA: Individual pardons: 3 persons
MOLDOVA:
Data relate to the Republic of Moldova, without taking into account Transdniestria. Changes in criminal law: The law No 277 ‐ XVI of Moldova, from 18th December 2008 on “Introducing changes and completions in the criminal law of the Republic of Moldova”.
Amnesties: The law No 188 ‐ XVI of Moldova, from 10th July 2008, on “Amnesty in relation with the proclamation of 2008 year the Year of Youth”.
Collective pardons: 18 persons MONACO: No measures (legislative or other) influencing directly the trends in the number of prisoners have been taken in the course of the last 12 months. NETHERLANDS:
In Table 1, figures refer to the total number of prisoners: 16,284 (see the breakdown of the general category in the notes to Tables 1, 1.2 and 1.3). In the rest of the Tables, figures refer only to prisoners held in penal institutions for adults (11,629).
No measures (legislative or other) influencing directly the trends in the number of prisoners have been taken in the course of the last 12 months.
NORWAY:
Electronic monitoring (EM) introduced. The system has gradually been taken in use with a capacity of 150 (September 2010). EM is used only on convicted persons and may be employed as both "front‐door" and "back‐door".
POLAND:
Data relate to 31st December 2009 instead of 1st September 2009. Changes in criminal law: Article of 9th October 2009 concerning the change in the Executive Penal Code
New legislations: Article of 18th June 2009 concerning the monitoring of convicts with status "dangerous".
PORTUGAL:
Data relate to 31st December 2009 instead of 1st September 2009. Changes in criminal law: Law no 115/2009 of 12th October approving the “Code of the Execution of Custodial Sanctions and Measures”
ROMANIA:
Individual pardons: 5 persons RUSSIAN FEDERATION: Data are not available for this year’s report. SAN MARINO: No measures (legislative or other) influencing directly the trends in the number of prisoners have been taken in the course of the last 12 months. REPUBLIC OF SERBIA:
Individual pardons: 29 persons

Council of Europe Annual Penal Statistics – SPACE I – 2009
Strasbourg, 22 March 2011, pc-cp\space\documents\pc-cp (2011) 3e PC-CP (2011) 3
25
SLOVAKIA: One change made in criminal law (no special details provided).
SLOVENIA: No measures (legislative or other) influencing directly the trends in the number of prisoners have been taken in the course of the last 12 months. SPAIN (NATIONAL ADMINISTRATION):
Data do not include juveniles. Collective pardons are forbidden by Spanish Constitution. No relevant data are available on the number of Individual pardons.
SPAIN (CATALONIA):
Individual pardons: 1 person SWEDEN:
Data relate to 1st October 2009 instead of 1st September 2009. No measures (legislative or other) influencing directly the trends in the number of prisoners have been taken in the course of the last 12 months.
SWITZERLAND:
Data relate to 2nd September 2009 instead of 1st September 2009. THE FORMER YUGOSLAV REPUBLIC OF MACEDONIA:
Individual pardons: 31 persons Collective pardons: 82 pronounced Conditional releases: 787 persons and 56 persons released by a court decision.
TURKEY:
No measures (legislative or other) influencing directly the trends in the number of prisoners have been taken in the course of the last 12 months.
UKRAINE:
Data relate to 1st July 2009 instead of 1st September 2009. Changes in criminal law: Law of Ukraine N 270‐VI from 15th April 2008 “On Introducing Amendments to the Criminal Code and the Criminal Procedure Code of Ukraine as to Humanization of Criminal Liability”
UK – ENGLAND AND WALES:
Data relate to 30th June 2009 instead of 1st September 2009. Individual pardons: 1 person. Abolition of End of Custody licence (saved 1,200 prison places), and compassionate release granted in about 20 cases.
UK – NORTHERN IRELAND:
Data relate to 27th August 2009 instead of 1st September 2009. The Prisons Young offenders Centre (Amendment) Rules (Northern Ireland) 2009 (SR2009 No 429) – 1st February 2010.
UK – SCOTLAND: No measures (legislative or other) influencing directly the trends in the number of prisoners have been taken in the course of the last 12 months.

Council of Europe Annual Penal Statistics – SPACE I – 2009
Strasbourg, 22 March 2011, pc-cp\space\documents\pc-cp (2011) 3e PC-CP (2011) 3
26
Table 1: Situation of penal institutions on 1st September 2009 Reference: Council of Europe, SPACE I 2009.1
Country
Population on 1st January 2009
(thousands)
Total number of prisoners (including pre‐trial detainees)
Total number of detainees held in remand
institutions/sections (“pre‐trials”)
Total number of prisoners held in
institutions serving a sentence
Prison population rate per 100,000
inhabitants
Total capacity of
penal institutions
Surface area per prisoner (m
2)
Prison density per 100 places
Albania 3 184.7 4 482 1 507 2 975 140.7 4 340 103.3
Andorra 84.5 68 29 39 80.5 125 54.4
Armenia 3 238.0 3 989 1 088 2 901 123.2 4 396 90.7
Austria 8 355.3 8 423 1 983 5 542 100.8
Azerbaijan 8 896.9 20 470 2 765 17 708 230.1 26 351 77.7
Belgium 10 753.1 10 901 3 167 5 639 101.4 8 490 128.4
BH: Fed. BiH 2 852.0 1 619 247 1 372 56.8 1 680 4 96.4
BH: Rep. Srpska 1 435.2 961 187 774 67.0 1 121 85.7
Bulgaria 7 606.6 10 028 1 665 8 363 131.8 10 564 4 94.9
Croatia 4 435.1 4 891 1 212 3 679 110.3 3 501 4 139.7
Cyprus 796.9 883 373 510 110.8 597 147.9
Czech Republic 10 467.5 22 021 2 373 19 648 210.4 19 384 113.6
Denmark 5 511.5 3 721 1 426 2 295 67.5 4 085 91.1
Estonia 1 340.4 3 555 836 2 719 265.2 3 656 97.2
Finland 5 326.3 3 589 NAP 67.4 3 545 101.2
France 64 321.4 66307 15602 50705 103.1 53 764 123.3
Georgia 4 385.4 19 825 452.1
Germany 82 002.4 73 263 11 385 61 387 89.3 79 436 92.2
Greece 11 260.4 11 080 98.4
Hungary 10 031.0 16 459 5 034 11 117 164.1 12 335 133.4
Iceland 319.4 118 37 81 36.9 91 129.7
Ireland 4 450.0 3 919 569 3 339 88.1 4 008 97.8
Italy 60 045.1 63 981 52 293 10 056 106.6 43 159 148.2
Latvia 2 261.3 6 999 1 992 5 007 309.5 7 970 3 87.8
Liechtenstein 35.6 7 2 2 19.7 20 35.0
Lithuania 3 349.9 8 295 1 679 6 616 247.6 9 062 91.5
Luxembourg 493.5 679 263 385 137.6 701 96.9
Malta 413.6 494 316 178 119.4 480 102.9
Moldova 3 567.5 6 769 2 274 4 495 189.7 9 250 73.2
Monaco 31.0 23 NAP NAP 74.2 81 28.4
Montenegro 630.1 986 156.5
Netherlands 16 485.8 16 284 5 467 6 162 98.8 13 822 79.2
Norway 4 799.3 3 285 782 2 503 68.4 3 582 91.7
Poland 38 135.9 84 003 9 460 74 543 220.3 84 490 99.4
Portugal 10 627.3 11 099 NAP NAP 104.4 11 921 93.1
Romania 21 498.6 27 028 3 946 23 082 125.7 34 199 79.0
Russian Federation 141 904.0 880 671 620.6
San Marino 31.3 2 1 1 6.4 12 6 16.7
Serbia 7 334.9 10 262 2 505 7 757 139.9 6 500 157.9
Slovak Republic 5 412.3 9 170 1 759 7 411 169.4 10 348 88.6
Slovenia 2 032.4 1 365 340 990 67.2 1 098 124.3
Spain (State Adm.) 39 270.4 67 986 14 132 53 854 173.1 44 434 153.0
Spain (Catalonia) 7 475.4 10 356 2 185 8 171 138.5 10 987 94.3
Sweden 9 256.3 7 147 1 420 241 77.2 6 913 103.4
Switzerland 7 701.9 6 084 1 888 3 603 79.0 6 683 91.0
The FYRO Macedonia 2 048.6 2 461 254 2 207 120.1 2 395 102.8
Turkey 71 517.1 116 340 40 111 75 429 161.6 104 650 110.4
Ukraine 45 963.4 146 394 36 474 109 920 318.5 157 984 92.7
UK: England & Wales 54 809.1 83 454 13 456 68 488 152.3 84 962 98.2
UK: Northern Ireland 1 788.9 1 456 541 915 81.4 1 775 82.0
UK: Scotland 5 194.0 8 113 1 589 6 524 156.2 7 600 106.8
Mean 143.8 98.4
Median 119.4 96.6
Minimum 6.4 16.7
Maximum 620.6 157.9
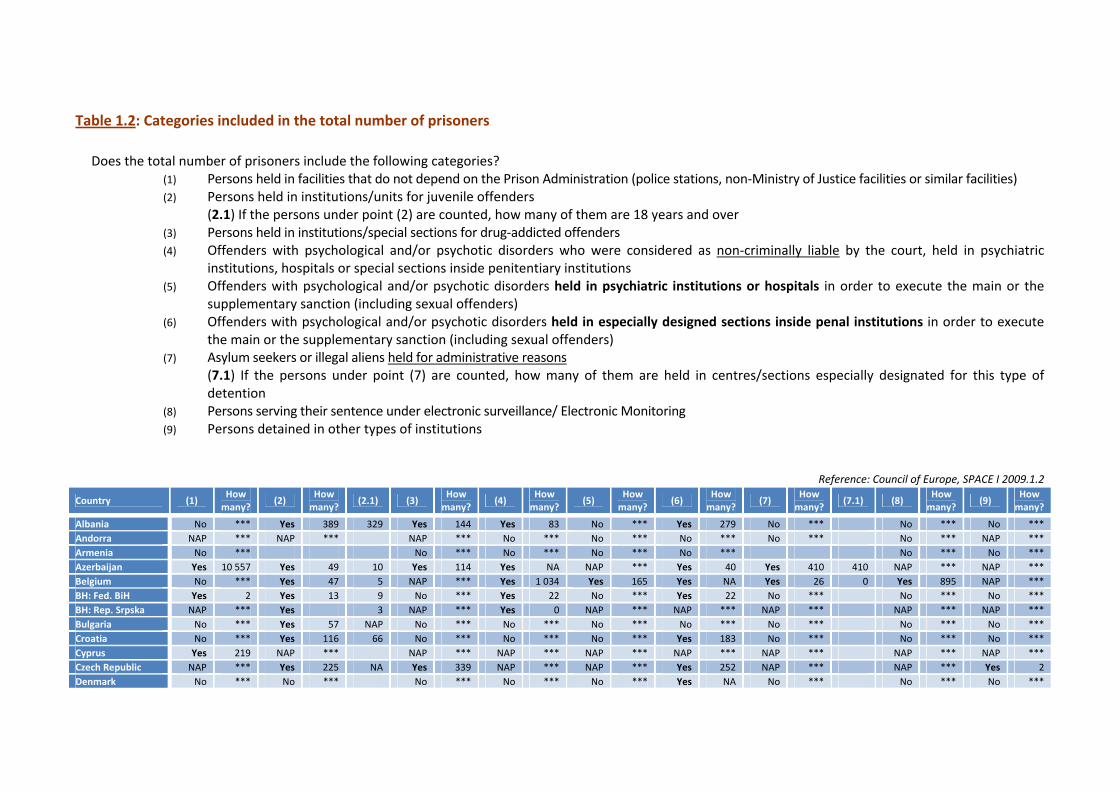
Table 1.2: Categories included in the total number of prisoners
Does the total number of prisoners include the following categories?
(1) Persons held in facilities that do not depend on the Prison Administration (police stations, non‐Ministry of Justice facilities or similar facilities) (2) Persons held in institutions/units for juvenile offenders (2.1) If the persons under point (2) are counted, how many of them are 18 years and over (3) Persons held in institutions/special sections for drug‐addicted offenders (4) Offenders with psychological and/or psychotic disorders who were considered as non‐criminally liable by the court, held in psychiatric
institutions, hospitals or special sections inside penitentiary institutions (5) Offenders with psychological and/or psychotic disorders held in psychiatric institutions or hospitals in order to execute the main or the
supplementary sanction (including sexual offenders) (6) Offenders with psychological and/or psychotic disorders held in especially designed sections inside penal institutions in order to execute
the main or the supplementary sanction (including sexual offenders) (7) Asylum seekers or illegal aliens held for administrative reasons (7.1) If the persons under point (7) are counted, how many of them are held in centres/sections especially designated for this type of
detention (8) Persons serving their sentence under electronic surveillance/ Electronic Monitoring (9) Persons detained in other types of institutions
Reference: Council of Europe, SPACE I 2009.1.2
Country (1) How many?
(2) How many?
(2.1) (3) How many?
(4) How many?
(5) How many?
(6) How many?
(7) How many?
(7.1) (8) How many?
(9) How many?
Albania No *** Yes 389 329 Yes 144 Yes 83 No *** Yes 279 No *** No *** No ***
Andorra NAP *** NAP *** NAP *** No *** No *** No *** No *** No *** NAP ***
Armenia No *** No *** No *** No *** No *** No *** No ***
Azerbaijan Yes 10 557 Yes 49 10 Yes 114 Yes NA NAP *** Yes 40 Yes 410 410 NAP *** NAP ***
Belgium No *** Yes 47 5 NAP *** Yes 1 034 Yes 165 Yes NA Yes 26 0 Yes 895 NAP ***
BH: Fed. BiH Yes 2 Yes 13 9 No *** Yes 22 No *** Yes 22 No *** No *** No ***
BH: Rep. Srpska NAP *** Yes 3 NAP *** Yes 0 NAP *** NAP *** NAP *** NAP *** NAP ***
Bulgaria No *** Yes 57 NAP No *** No *** No *** No *** No *** No *** No ***
Croatia No *** Yes 116 66 No *** No *** No *** Yes 183 No *** No *** No ***
Cyprus Yes 219 NAP *** NAP *** NAP *** NAP *** NAP *** NAP *** NAP *** NAP ***
Czech Republic NAP *** Yes 225 NA Yes 339 NAP *** NAP *** Yes 252 NAP *** NAP *** Yes 2
Denmark No *** No *** No *** No *** No *** Yes NA No *** No *** No ***

Council of Europe Annual Penal Statistics – SPACE I – 2009
Strasbourg, 22 March 2011, pc-cp\space\documents\pc-cp (2011) 3e PC-CP (2011) 3
28
Country (1) How many?
(2) How many?
(2.1) (3) How many?
(4) How many?
(5) How many?
(6) How many?
(7) How many?
(7.1) (8) How many?
(9) How many?
Estonia Yes 304 Yes 150 136 NAP *** NAP *** NAP *** NAP *** NAP *** Yes 182 NAP ***
Finland No *** NAP *** Yes NA No *** Yes NA Yes NA No *** Yes 89 No ***
France No *** Yes 198 1 No *** No *** No *** No *** No *** Yes 3 984 No ***
Germany No *** Yes 7 909 6 837 No *** No *** No *** Yes 1 814 No *** No *** No ***
Hungary No *** Yes 927 216 No *** Yes 181 No *** Yes 317 No *** NAP *** Yes 28
Iceland Yes 596 Yes 36 Yes No *** NAP *** No ***
Ireland No *** Yes 95 0 NAP *** NAP *** NAP *** NAP *** Yes 11 0 No *** No ***
Italy No *** No *** Yes 15 346 Yes 1 881 NAP *** No *** No *** NAP ***
Latvia No *** Yes 157 24 No *** No *** No *** Yes 30 Yes 99 NAP NAP *** NAP ***
Liechtenstein No *** No *** No *** No *** No *** No *** Yes 1 NAP No *** No ***
Lithuania No *** Yes 200 36 No *** No *** No *** No *** No *** NAP *** No ***
Luxembourg No *** No *** No *** No *** No *** No *** Yes 20 0 Yes 20 No ***
Malta NAP *** Yes 29 3 Yes 39 Yes 37 Yes 37 NAP *** NAP *** NAP *** NAP ***
Moldova No *** Yes 50 15 NAP *** NAP *** NAP *** NAP *** NAP *** NAP *** NAP ***
Monaco NAP *** NAP *** NAP *** NAP *** NAP *** NAP *** NAP *** NAP ***
Netherlands No *** No *** Yes 741 No *** Yes 226 Yes 390 No *** Yes 385 No ***
Norway No *** NAP *** No *** No *** No *** No *** No *** No *** No ***
Poland No *** No *** No *** No *** No *** Yes 1 642 No *** Yes NA No ***
Portugal NAP *** Yes 213 211 NAP *** Yes 250 No *** No *** No *** NAP *** NAP ***
Romania No *** Yes 567 441 No *** NAP *** Yes 2 921 No *** No *** NAP *** Yes 154
San Marino NAP *** No *** No *** NAP *** NAP *** NAP *** No *** NAP *** NAP ***
Serbia No *** Yes 255 81 Yes 114 Yes 257 No *** No *** No *** No *** No ***
Slovak Republic Yes 29 Yes 96 0 Yes 895 No *** NAP *** Yes 640 Yes 108 108 NAP *** NAP ***
Slovenia No *** Yes 28 28 No *** No *** No *** Yes NA No *** No *** No ***
Spain (State Adm.) No *** No *** Yes 12 847 Yes 567 Yes NA Yes NA No *** Yes 1 834 NAP ***
Spain (Catalonia) No *** No *** Yes 80 Yes 63 No *** Yes 91 NAP *** Yes 56 Yes 142
Sweden No *** No *** No *** No *** No *** No *** No *** Yes No ***
Switzerland No *** Yes 77 23 No *** No *** No *** Yes NA Yes 411 200 No *** No ***
FYRO Macedonia No *** Yes 66 50 No *** No *** No *** No *** No *** No *** No ***
Turkey Yes NA Yes 1 035 233 Yes NA Yes NA Yes NA Yes NA Yes NA NAP *** Yes NA
Ukraine NAP *** Yes 1 523 579 No *** Yes NAP *** No *** NAP ***
UK: Engl. & Wales NAP *** Yes 2 333 235 No *** No *** No *** No *** Yes 1 950 NA No *** No ***
UK: North. Ireland No *** No *** No *** No *** No *** No *** Yes 4 0 No *** No ***
UK: Scotland No *** Yes 1 042 873 NAP *** No *** No *** No *** No *** No *** No ***

Council of Europe Annual Penal Statistics – SPACE I – 2009
Strasbourg, 22 March 2011, pc-cp\space\documents\pc-cp (2011) 3e PC-CP (2011) 3
29
Table 1.3: Capacity of penal institutions on 1st September 2009 (by categories)
Reference: Council of Europe, SPACE I 2009.1.3
Country
Total capacity of
penal institutions
Capacity of remand
institutions/sections
(“pre‐trials”)
Capacity of institutions designed for serving a sentence
Capacity of institutions for juvenile offenders
Capacity of custodial hospitals/ clinics/ special sections
Capacity of institutions/
special sections for
the administr. detention
Capacity of other types
of institutions
Albania 4 340 1 177 2 829 NAP 334 NAP NAP
Andorra 125 52 67 6 0 0 0
Armenia 4 396 900 3 072 424
Azerbaijan 26 351 4 342 15 850 232 1 750 127 4050
Belgium 8 490 NA NA 50 NA NAP NAP
BH: Fed. BiH 1 680 312 1 311 35 22 NA NA
BH: Rep. Srpska 1 121 285 800 36 NA NA 0
Bulgaria 10 564 1 824 8 382 358 240 NAP NAP
Croatia 3 501 1 647 1 597 150 107 NAP NAP
Cyprus 597 314 265 18 NAP NAP NAP
Czech Republic 19 384 2 564 16 338 210 224 NAP 48
Denmark 4 085 1 706 2 379 NAP NAP NAP NAP
Estonia 3 656 1 257 2 203 196 105 NAP NAP
Finland 3 545 NAP 3 455 NAP 90 NAP NAP
France 53 764 32 643 24 825 296 NAP NAP NAP
Germany 79 436 70 733 7 700 1 003
Hungary 12 335 2 736 9 599 512 NA NAP
Iceland 91 NA NA NA
Ireland 4 008 454 3 554 101 0 0 0
Italy 43 159 33 648 8 319 NAP 1 101 NAP 91
Latvia 7 970 1 963 5 487 320 200 NA NA
Liechtenstein 20
Lithuania 9 062 1 334 7 442 167 119 NAP NAP
Luxembourg 701 306 395 NA 0 27 NAP
Malta 480 NAP NAP 36 NAP NAP NAP
Moldova 9 250 2 780 6 470 109 342 30 NA
Monaco 81 81 NAP NAP NAP
Netherlands 20 571 7 093 6 019 1 839 1 362 2 808 NAP
Norway 3 582 NAP NAP NAP NAP NAP NAP
Poland 84 490 76 452 NAP 1 103 NAP 6935
Portugal 11 921 NAP NAP 347 195 NAP NAP
Romania 34 199 4 039 27 394 723 1 570 NAP 473
San Marino 12 12 NAP NAP NAP
Serbia 6 500 1 700 3 900 300 300 200 100
Slovak Republic 10 348 2 389 7 959 122 166 NAP NAP
Slovenia 1 098 246 774 78 NAP NAP NAP
Spain (State Adm.) 44 434 NA NA NA 411 NA NAP
Spain (Catalonia) 10 987 2 000 8 987 1 702 144
Sweden 6 913 NA NA NA NA NA NA
Switzerland 6 683 NA NA NA NA NA NA
the FYRO Macedonia 2 395 440 1 766 40 149 NAP NAP
Turkey 104 650 NA 102 956 1 694 NA NA NA
Ukraine 157 984 37 673 109 885 2 784 7 642 NAP NAP
UK: England & Wales 84 962 NA NA 3 527 NA NA NA
UK: Northern Ireland 1 775
UK: Scotland 7 600 NAP NAP NAP NAP

Council of Europe Annual Penal Statistics – SPACE I – 2009
Strasbourg, 22 March 2011, pc-cp\space\documents\pc-cp (2011) 3e PC-CP (2011) 3
30
Notes –Tables 1, 1.2 and 1.3
Table 1 must be read taking into account that some countries were unable to provide data on September 1st. In such cases, the relevant reference’ day is indicated in the following notes. The reader should also be aware that statistical counting rules vary across Europe and such diversity influence the way in which the total number of prisoners and the capacity of penal institutions are calculated in each country. Table 1.2 bring a more accurate distribution of the different categories of persons held in penal institutions (or institutions designed for detention of the persons managed by criminal justice system). Table 1.3 presents information collected for the first time this year. The main goal of these data is to allow a more accurate calculation of the prison density and of the prison overcrowding. ALBANIA:
Table 1.3 (Capacity of institutions for juvenile offenders): The institution for juvenile offenders was opened in October 2009. Until September 2009, juvenile offenders were held in separate sections within penal institutions.
AZERBAIJAN:
Table 1: The surface area is 4m2/prisoner in penal institutions and 5m2/prisoner in medical treatment institutions.
Table 1.2:
Point (3): 114 persons held in the special unit for drug treatment managed by the Prison Administration;
Point (4): Are included persons with psychological of psychiatric disorders, recognised by the court as non‐criminally liable, who are held in psychiatric institutions under the authority of the Ministry of Health;
Point (6): Separate statistics on sex offenders are not available. BELGIUM:
Table 1: Under the points “Total number of detainees in remand institutions/sections (pre‐trials)” and “Total number of prisoners held in institutions serving a sentence” are counted persons who are de facto held in these institutions and not the theoretical distribution intended for these types of institutions, pre‐trial detention and places for serving a sentence respectively.
Table 1.2:
Points (2) to (9): Are included persons held in institutions which are under direct control of the Prison Administration.
BOSNIA & HERZEGOVINA (BOSNIA AND HERZEGOVINA – STATE LEVEL):
BiH State level only includes pre‐trail detainees who are held in the State level pre‐trail detention unit. There is no State level prison for sentenced persons, they are held in the Federation and Republika Srpska prisons as an interim solution until the State prison is built in 2012. State pre‐trial detention unit has the capacity of 21 cells. If the state court (whose purposes this detention unit serves) has more detainees, then they must be referred to entity establishments (BiH: Fed. and BiH: RS). Besides these ''state'' pre‐trial detainees, entity establishments also hold ''entity'' pre‐trial detainees, referred to serve detention by entity courts.
BOSNIA & HERZEGOVINA (REPUBLIKA SRPSKA – ENTITY LEVEL):

Council of Europe Annual Penal Statistics – SPACE I – 2009
Strasbourg, 22 March 2011, pc-cp\space\documents\pc-cp (2011) 3e PC-CP (2011) 3
31
Table 1:
Total number of prisoners includes also information on persons sentenced by both, the State level courts and Entity level courts.
Total capacity of penal institutions has been calculated by using the surface area, which is 4m2/prisoner. Same surface area is used on the BiH: Fed. level.
Table 1.3: Capacity of the institutions for juvenile offenders is included in the total capacity of institutions intended for the enforcement of prison sentence. Capacity of the juvenile prison is 20, and the capacity of the correctional‐educational facility for juveniles is 16 places.
BULGARIA:
Table 1: The average surface area is 4m2 per prisoner. The surface area is between 4 and 6m2 per prisoner in open type of penitentiary institutions, in the female prison and the Reformatory in Bojchinovtsi.
Table 1.3: The capacity of 240 places in custodial hospitals/clinics/special sections is not included in the total capacity of penal institutions.
CROATIA:
Data relate to 31st December 2009 instead of 1st September 2009 Table 1: Surface area foreseen per prisoner is 4m2. Table 1.3: Total capacity of remand institutions (14 prisons/jails) is 1,647 places which are designed for "pre‐trials" (primary) and for a serving sentence.
CYPRUS:
Table 1: In the total number of prisoners (883) are included the following categories: o Total number of prisoners (including pre‐trial detainees):
670 in the prison institution and 213 in police stations o Total number of detainees held in remand institutions/sections (“pre‐trials”):
160 in the prison institution and 213 in police stations Table 1.2:
o Point (1): 6 prisoners under the protection witness program held in a separate facility from the prison institution and 213 persons held in police stations
Table 1.3: o Places in police stations are included in the total capacity of penal institutions. The
number of places available is 597, of which: 340 in the prison institution and 257 in police stations
o Capacity of remand institutions/sections (“pre‐trials”): 57 in the prison institution and 257 in police stations
Total capacity of penal institutions has been calculated by using the surface area, which is 7m2/prisoner.
CZECH REPUBLIC:
Table 1: Total capacity of penal institutions has been calculated by using the surface area, which is 4m2/prisoner.
Table 1.2:
Points (3) and (6): Data relate to 25th August 2009 instead of 1st September 2009
Point (9): The preventive detention institution for very dangerous offenders. Table 1.3:
Under the category “Capacity of custodial hospitals/clinics/special sections” are counted places in prison hospitals;
Under the category of “Capacity of other types of institutions” are counted places in the preventive detention institution.

Council of Europe Annual Penal Statistics – SPACE I – 2009
Strasbourg, 22 March 2011, pc-cp\space\documents\pc-cp (2011) 3e PC-CP (2011) 3
32
DENMARK:
Table 1.3: Places included under “Capacity of remand institutions/sections (pre‐trials)” are primarily used for remand detainees.
ESTONIA:
Table 1.3:
Places foreseen under the category “Capacity of remand institutions/sections (pre‐trials)” may also be used for sentenced prisoners.
The number of places under the category “Capacity of custodial hospitals/clinics/special sections” in not included in the total capacity of penal institutions.
FINLAND:
Figures are on 1st May 2009 instead of 1st September 2009. Table 1.2:
Point (8): Backdoor monitoring FRANCE:
Figures are on 1st October 2009 instead of 1st September 2009. Table 1: On 1st October 2009, 61,781 persons had status “écrouées détenues” (those, who were held de facto in penal institutions). This figure should be used when calculating the occupancy rate per number of places in penal institutions. 66,307 persons had status “écrouées”, but 4,526 of them were placed under Electronic Surveillance or external placement (outside penal institutions), so non‐hosted by Prison Administration. All figures presented in this report are on the persons held inside penal institutions (managed by Prison Administration).
Table 1.3: The capacity of penal institutions is calculated for the detention institutions (hosting persons inside penal institution, without considering external placements). The capacity includes places for persons in pre‐trial detention as well as for those who serve a prison sentence.
GEORGIA:
Table 1: The total number of prisoners has been provided by Mr Roy Walmsley from The International Centre for Prison Studies (World Prison Brief): www.prisonstudies.org, and relate to 31st August 2009 instead of 1st September 2009.
GERMANY:
Figures are on 31st March 2009 instead of 1st September 2009. Table 1: Total number of prisoners includes 491 persons under preventive measures. Table 1.3: The number of places foreseen for pre‐trial detention and the number of places in institutions designed for serving sentences are presented together. The main reason is that some of 16 Bundesländer were unable to provide separate statistics. Nevertheless, persons serving a sentence and those who are in pre‐trial detention are held in separately.
GREECE:
Table 1: The total number of prisoners has been provided by Mr Roy Walmsley from The International Centre for Prison Studies (World Prison Brief): www.prisonstudies.org.
HUNGARY:
Table 1.2:
Point (9): Büntetés‐végrehajtás Központi Kórháza ‐ Central Hospital of the Prison Service
Table 1.3:

Council of Europe Annual Penal Statistics – SPACE I – 2009
Strasbourg, 22 March 2011, pc-cp\space\documents\pc-cp (2011) 3e PC-CP (2011) 3
33
The number of places under “Capacity of custodial hospitals/clinics/special sections” is not presented in the table, and not included in the total capacity of penal institutions. Nevertheless, the number of places designed for the in hospitals, medical facilities is known: Central Hospital (Tököl) 297 beds Psychiatric Clinic 311 beds Nagyfa Rehabilitation Unit 80 beds
The number of places under “Capacity of institutions for juvenile offenders” (512 places) is not included in the total capacity of penal institutions.
ICELAND:
Table 1.3: The surface area varies between 6 and 13m2/prisoner. There is no distribution presented for different categories as the detention is organised within the same institution.
IRELAND:
Table 1.3:
The places under “Capacity of institutions for juvenile offenders” are not included in the total capacity of penal institutions, because this figure (101 places) represents only detention schools.
Persons in remand detention can be held in any “closed” prison. ITALY:
Table 1.2:
Point (2): Figures are on 30th June 2009 instead of 1st September 2009.
Points (4) and (5): These figures are presented together as it’s impossible to keep them separately. The common name used for the both categories is “internees”.
LATVIA:
Table 1: The norm for living space in prisons for one convicted person in hostel‐type premises shall not be smaller than 2.5m2 for men and 3m2 for women and juveniles.
Table 1.2:
Point (7): Data does not concern detainees in the framework of the criminal procedure.
LIECHTENSTEIN:
Table 1.3: Under the total capacity of penal institutions are included only places designed in Liechtenstein. Nevertheless, there exist places which are part of the contract between Liechtenstein and Austria. This additional capacity allows adjustments of the detention to the suitable institution.
LITHUANIA: Figures are on 1st July 2009 instead of 1st September 2009. LUXEMBOURG:
Table 1: Total number of prisoners concerns persons held in penitentiary centres (closed) in Luxembourg and Givenich (semi‐detention).
Table 1.2:
Point (7): The Grand‐ducal Regulation of 20th September 2002 provides that the “Centre for aliens in irregular situation” is to be designed within a special section of the Luxembourg’ Penitentiary Centre, awaiting the construction of a separate detention facility, which will be undertaken in early 2011.

Council of Europe Annual Penal Statistics – SPACE I – 2009
Strasbourg, 22 March 2011, pc-cp\space\documents\pc-cp (2011) 3e PC-CP (2011) 3
34
Table 1.3: The number of places under “Capacity of institutions/special sections for the administrative detention” (27 places) is already included among places under “Capacity institutions designed for serving a sentence”.
MALTA:
Table 1.3: Total capacity figure is an approximation, which takes into account the actual number of single cells as well as the ad hoc dormitories used due to the overcrowding problem. In Malta, a single cell policy is applied (one inmate per cell). New beds were added in order to accommodate the additional number of incoming inmates in the facility.
MOLDOVA:
Table 1.3: Capacity of institutions for juvenile offenders (109 places), capacity of custodial hospitals/clinics/special sections (342 places) and capacity of institutions/special sections for the administrative detention (30 places) are not included in the total capacity of penal institutions.
MONACO:
Table 1: Total capacity of the only penal institution has been calculated by using the surface area, which is 5.6m2/prisoner.
Table 1.2:
Point (2): Special places exist for juveniles in the “Juveniles’ section”.
Points (4) to (6): No special places are provided for mentally‐ill persons, who are transferred to the “Princess Grace” Hospital in Monaco.
MONTENEGRO:
Table 1: The total number of prisoners was retrieved on 12th March 2011 from The International Centre for Prison Studies Website (World Prison Brief): http://www.prisonstudies.org/info/worldbrief/wpb_country.php?country=173. It relates to September 2008 instead of 1st September 2009.
NETHERLANDS:
Table 1:
Total number of prisoners is 16,284, of which: 11,629 are in penal institutions, 1,185 are in juvenile institutions 1,982 are in custodial clinics and 1,488 are in institutions for illegal aliens.
In this Table has been used the total number of prisoners held in all types of penal institutions. In further tables has been used the number of prisoners held in penal institutions (11,629).
Table 1.3:
The total capacity is 20,571, of which: 13,822 places in penal institutions. 7,093 places are in remand and 6,019 for
serving a sentence. Moreover, there are 710 places which may be used for both remand and sentenced prisoners, of which 274 places are reserve capacity.
1,839 places in institutions for juveniles, 2,102 places in custodial clinics, and 2,808 places in institutions for illegal aliens.

Council of Europe Annual Penal Statistics – SPACE I – 2009
Strasbourg, 22 March 2011, pc-cp\space\documents\pc-cp (2011) 3e PC-CP (2011) 3
35
NORWAY: Table 1:
“Total number of detainees held in remand institutions/sections (pre‐trials)”: Norway has no remand institutions and although most remand prisoners will be placed in special wings or units, many will be housed with convicted prisoners. All remand prisoners are included under this category.
“Total number of prisoners held in institutions serving a sentence”: are included 93 fine defaulters.
Table 1.2:
Point (7): Most asylum seekers are placed in units not connected with the Correctional Service. However, a few illegal aliens may be placed in a prison establishment. There were 5 persons on 1st September 2009. These 5 persons are included in the total number of prisoners.
Table 1.3: Some prisons are almost exclusively for the use of convicted prisoners. There are no special institutions for remand or juvenile prisoners. Only exceptionally remand prisoners are placed in open prisons. Some prisons have wings allocated to remand prisoners but remand prisoners can also be found among convicted prisoners. Juveniles will normally be placed such that attention can be made to their special needs.
POLAND:
Data relate to 31st December 2009 instead of 1st September 2009. Table 1: Total capacity of penal institutions has been calculated by using the surface area, which is 3m2/prisoner.
Table 1.3: The number of places foreseen for pre‐trial detention and the number of places in institutions designed for serving sentences are presented together. Remand prisoners may be placed in prisons and sentenced prisoners can still be held in pre‐trial detention units. 76,452 places is the capacity of remand institutions and institutions designed for serving a sentence together.
PORTUGAL:
Data relate to 31st December 2009 instead of 1st September 2009. Table 1: Total number of prisoners includes 250 persons with psychological disorders, of which 96 persons are placed in psychiatric institutions or prison hospitals and 154 persons are held in non‐custodial psychiatric institutions or hospitals.
Table 1.2:
Point (2): Leiria’s Penitentiary Institution – institution for persons aged 16 to 21 years. Under this point are counted 213 persons, including remand detainees.
Point (4): Under this point are included 250 prisoners, of which 96 prisoners held in custodial psychiatric institutions or hospitals, and 154 prisoners held in non‐custodial psychiatric institutions or hospitals. 250 is the total number of persons considered non‐criminally liable by the court, who are not stricto sensu sentenced prisoners, but persons under a security measure (which is rather therapeutic). These persons are under the authority of the Prison Administration and their files are managed by the Court of Execution of Sentences. Nevertheless, all decisions concerning this category of persons are taken on the advice of medical authorities.
Point (8): Persons placed under electronic surveillance are managed by the General Service of the Community Reintegration (Direcção General de Reinserção Social).

Council of Europe Annual Penal Statistics – SPACE I – 2009
Strasbourg, 22 March 2011, pc-cp\space\documents\pc-cp (2011) 3e PC-CP (2011) 3
36
ROMANIA: Table 1: The number of places in cells in the penal institutions is calculated by using the volume – the volume foreseen per prisoner is 6m3 (cubic meters).
Table 1.2:
Point (9): Education centres for juvenile offenders (which are different from penitentiary institutions for juveniles and young adults).
Table 1.3:
“Capacity of institutions for juvenile offenders”: are included places in penitentiary institutions for juveniles and young adults
“Capacity of other types of institutions”: are included places in education centres for juvenile offenders
RUSSIA:
Table 1: The total number of prisoners has been provided by Mr Roy Walmsley from The International Centre for Prison Studies (World Prison Brief): www.prisonstudies.org.
SAN‐MARINO:
Table 1: Total capacity of the only penal institution has been calculated by using the surface area, which is 6m2/prisoner.
SLOVAK REPUBLIC:
Table 1: Total capacity of penal institutions has been calculated by using the surface area, which is 4m2/prisoner.
Table 1.3: Figures under “Capacity of institutions for juvenile offenders” and “Capacity of custodial hospitals/clinics/special sections” have not been included in the total capacity of penal institutions.
SLOVENIA:
Prescribed standards are: 9m2 for single rooms and 7m2 per prisoner for double and multiple‐bed rooms.
SPAIN (STATE ADMINISTRATION):
Table 1: Total capacity of penal institutions has been calculated by using the surface area, which is 9m2/cell.
Table 1.3:
Points (1) and (2): the majority of penitentiary institutions are designed to host remand detainees and sentenced prisoners.
Point (4): are included places in custodial psychiatric centres of Alicante and Seville. SPAIN (CATALONIA):
Table 1.2:
Point (9): are included dependent units, re‐education centres and therapeutic communities.
Table 1.3: The total capacity includes two categories (Capacity of remand institutions/sections (“pre‐trials”) and Capacity institutions designed for serving a sentence). The totality of penal institutions is designed for remand detainees and sentenced prisoners. Inside each institution there is an infirmary unit and some have other special units as well (Mental Health‐Addictions‐unit, Geriatric Medicine, etc.), which can host remand detainees or sentenced prisoners without distinction.

Council of Europe Annual Penal Statistics – SPACE I – 2009
Strasbourg, 22 March 2011, pc-cp\space\documents\pc-cp (2011) 3e PC-CP (2011) 3
37
SWEDEN: Data relate to 1st October 2009 instead of 1st September 2009. Table 1.2:
Point (8): are included prisoners under pre‐release measures still serving a sentence (“back‐door” electronic monitoring).
SWITZERLAND:
Data relate to 2nd September 2009 instead of 1st September 2009. “THE FORMER YUGOSLAV REPUBLIC OF MACEDONIA”:
Table 1: Total capacity of penal institutions has been calculated by using the surface area, which is 4m2/prisoner.
TURKEY:
Table 1.2:
Point (2): Total number of persons held in Juvenile Reformatories is 173. Total number of persons held in Juvenile and Youth Closed Prisons is 862.
Point (3): Persons aged 18 and more in Juvenile Reformatories is 19. Persons aged 18 and more in Juvenile and Youth Closed Prisons is 214.
UKRAINE:
Table 1: The standard residential area in penal settlements is 3m2/prisoner, in penal colonies and penal settlements intended to detain women is 4m2/prisoner, in medical institutions at penal settlements, in penal settlements intended to detain and treat patients suffering from tuberculosis, at inpatient department is 5m2/prisoner (article 115 of the Criminal Executive Code of Ukraine).
UK: ENGLAND AND WALES:
Data relate to 30th June 2009 instead of 1st September 2009. Table 1: The total prison population includes remand and non‐criminal prisoners (total population of prison establishments in England and Wales). In the total are not included secure training centres and local authority secure children's homes.
UK: NORTHERN IRELAND:
Data relate to 27th August 2009 instead of 1st September 2009. UK: SCOTLAND: This figure is the design capacity of the penal institutions.

Council of Europe Annual Penal Statistics – SPACE I – 2009
Strasbourg, 22 March 2011, pc-cp\space\documents\pc-cp (2011) 3e PC-CP (2011) 3
38
Figure 1.a: Countries with the highest Prison Population Rates per 100 000 inhabitants (more than 100 prisoners per 100 000 inhabitants)
European median (119.4) in 2009 for the prison population slightly increased compared to 2008 (109.2). Almost all countries which experienced highest prisons population rates remained at the same level or continued to increase. Very few countries experienced a decrease of this rate, the general European trend being in grow.
Figure 1.b: Countries with prison population overcrowding (more than 100 prisoners per 100 places)
Comparisons of prison overcrowding should be conducted cautiously as the rules for establishing the capacity of penal institutions vary from country to country (e.g. some countries use the design capacity of their penal institutions and other used their operational capacity). When comparing the median values of 2009 and 2008, a slight increase in prison density could be seen (it passed from 95.9 in 2008 to 96.6 in 2009). The number of countries with more than 130 prisoners per 100 places continues to grow (in 2007: 3 countries; in 2008: 6 countries and 7 countries in 2009).
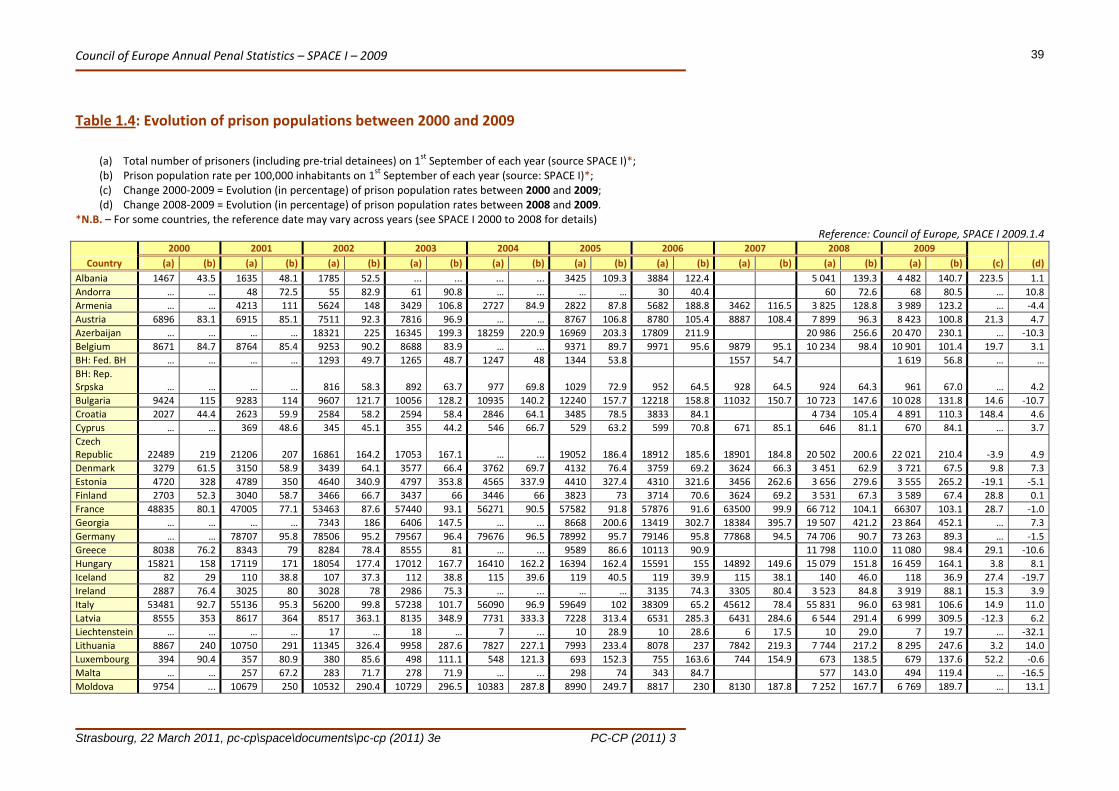
Council of Europe Annual Penal Statistics – SPACE I – 2009
Strasbourg, 22 March 2011, pc-cp\space\documents\pc-cp (2011) 3e PC-CP (2011) 3
39
Table 1.4: Evolution of prison populations between 2000 and 2009
(a) Total number of prisoners (including pre‐trial detainees) on 1st September of each year (source SPACE I)*; (b) Prison population rate per 100,000 inhabitants on 1st September of each year (source: SPACE I)*; (c) Change 2000‐2009 = Evolution (in percentage) of prison population rates between 2000 and 2009; (d) Change 2008‐2009 = Evolution (in percentage) of prison population rates between 2008 and 2009.
*N.B. – For some countries, the reference date may vary across years (see SPACE I 2000 to 2008 for details) Reference: Council of Europe, SPACE I 2009.1.4
Country
2000 2001 2002 2003 2004 2005 2006 2007 2008 2009
(c) (d) (a) (b) (a) (b) (a) (b) (a) (b) (a) (b) (a) (b) (a) (b) (a) (b) (a) (b) (a) (b)
Albania 1467 43.5 1635 48.1 1785 52.5 ... ... ... ... 3425 109.3 3884 122.4 5 041 139.3 4 482 140.7 223.5 1.1
Andorra … … 48 72.5 55 82.9 61 90.8 … ... … … 30 40.4 60 72.6 68 80.5 … 10.8
Armenia … … 4213 111 5624 148 3429 106.8 2727 84.9 2822 87.8 5682 188.8 3462 116.5 3 825 128.8 3 989 123.2 … ‐4.4
Austria 6896 83.1 6915 85.1 7511 92.3 7816 96.9 … … 8767 106.8 8780 105.4 8887 108.4 7 899 96.3 8 423 100.8 21.3 4.7
Azerbaijan … … … … 18321 225 16345 199.3 18259 220.9 16969 203.3 17809 211.9 20 986 256.6 20 470 230.1 … ‐10.3
Belgium 8671 84.7 8764 85.4 9253 90.2 8688 83.9 … ... 9371 89.7 9971 95.6 9879 95.1 10 234 98.4 10 901 101.4 19.7 3.1
BH: Fed. BH … … … … 1293 49.7 1265 48.7 1247 48 1344 53.8 1557 54.7 1 619 56.8 … …
BH: Rep. Srpska … … … … 816 58.3 892 63.7 977 69.8 1029 72.9 952 64.5 928 64.5 924 64.3 961 67.0 … 4.2
Bulgaria 9424 115 9283 114 9607 121.7 10056 128.2 10935 140.2 12240 157.7 12218 158.8 11032 150.7 10 723 147.6 10 028 131.8 14.6 ‐10.7
Croatia 2027 44.4 2623 59.9 2584 58.2 2594 58.4 2846 64.1 3485 78.5 3833 84.1 4 734 105.4 4 891 110.3 148.4 4.6
Cyprus … … 369 48.6 345 45.1 355 44.2 546 66.7 529 63.2 599 70.8 671 85.1 646 81.1 670 84.1 … 3.7
Czech Republic 22489 219 21206 207 16861 164.2 17053 167.1 … ... 19052 186.4 18912 185.6 18901 184.8 20 502 200.6 22 021 210.4 ‐3.9 4.9
Denmark 3279 61.5 3150 58.9 3439 64.1 3577 66.4 3762 69.7 4132 76.4 3759 69.2 3624 66.3 3 451 62.9 3 721 67.5 9.8 7.3
Estonia 4720 328 4789 350 4640 340.9 4797 353.8 4565 337.9 4410 327.4 4310 321.6 3456 262.6 3 656 279.6 3 555 265.2 ‐19.1 ‐5.1
Finland 2703 52.3 3040 58.7 3466 66.7 3437 66 3446 66 3823 73 3714 70.6 3624 69.2 3 531 67.3 3 589 67.4 28.8 0.1
France 48835 80.1 47005 77.1 53463 87.6 57440 93.1 56271 90.5 57582 91.8 57876 91.6 63500 99.9 66 712 104.1 66307 103.1 28.7 ‐1.0
Georgia … … … … 7343 186 6406 147.5 … ... 8668 200.6 13419 302.7 18384 395.7 19 507 421.2 23 864 452.1 … 7.3
Germany … … 78707 95.8 78506 95.2 79567 96.4 79676 96.5 78992 95.7 79146 95.8 77868 94.5 74 706 90.7 73 263 89.3 … ‐1.5
Greece 8038 76.2 8343 79 8284 78.4 8555 81 … ... 9589 86.6 10113 90.9 11 798 110.0 11 080 98.4 29.1 ‐10.6
Hungary 15821 158 17119 171 18054 177.4 17012 167.7 16410 162.2 16394 162.4 15591 155 14892 149.6 15 079 151.8 16 459 164.1 3.8 8.1
Iceland 82 29 110 38.8 107 37.3 112 38.8 115 39.6 119 40.5 119 39.9 115 38.1 140 46.0 118 36.9 27.4 ‐19.7
Ireland 2887 76.4 3025 80 3028 78 2986 75.3 … ... … … 3135 74.3 3305 80.4 3 523 84.8 3 919 88.1 15.3 3.9
Italy 53481 92.7 55136 95.3 56200 99.8 57238 101.7 56090 96.9 59649 102 38309 65.2 45612 78.4 55 831 96.0 63 981 106.6 14.9 11.0
Latvia 8555 353 8617 364 8517 363.1 8135 348.9 7731 333.3 7228 313.4 6531 285.3 6431 284.6 6 544 291.4 6 999 309.5 ‐12.3 6.2
Liechtenstein … … … … 17 … 18 … 7 ... 10 28.9 10 28.6 6 17.5 10 29.0 7 19.7 … ‐32.1
Lithuania 8867 240 10750 291 11345 326.4 9958 287.6 7827 227.1 7993 233.4 8078 237 7842 219.3 7 744 217.2 8 295 247.6 3.2 14.0
Luxembourg 394 90.4 357 80.9 380 85.6 498 111.1 548 121.3 693 152.3 755 163.6 744 154.9 673 138.5 679 137.6 52.2 ‐0.6
Malta … … 257 67.2 283 71.7 278 71.9 … ... 298 74 343 84.7 577 143.0 494 119.4 … ‐16.5
Moldova 9754 ... 10679 250 10532 290.4 10729 296.5 10383 287.8 8990 249.7 8817 230 8130 187.8 7 252 167.7 6 769 189.7 … 13.1
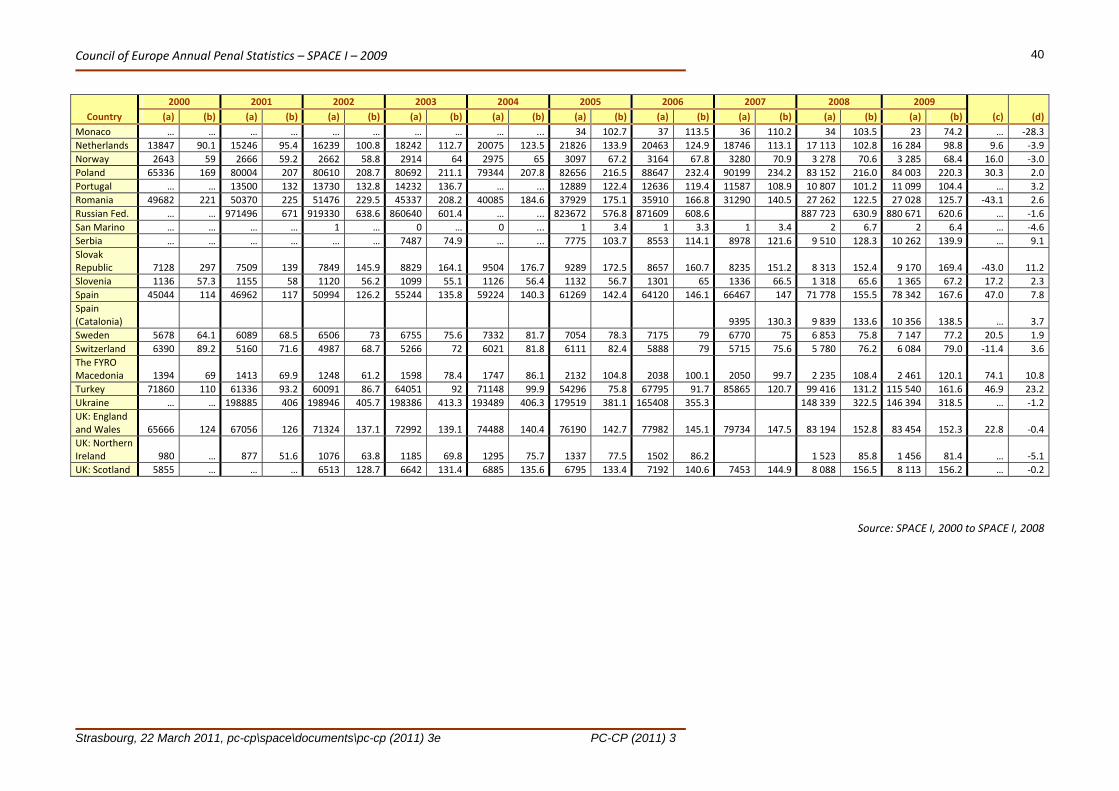
Council of Europe Annual Penal Statistics – SPACE I – 2009
Strasbourg, 22 March 2011, pc-cp\space\documents\pc-cp (2011) 3e PC-CP (2011) 3
40
Country
2000 2001 2002 2003 2004 2005 2006 2007 2008 2009
(c) (d) (a) (b) (a) (b) (a) (b) (a) (b) (a) (b) (a) (b) (a) (b) (a) (b) (a) (b) (a) (b)
Monaco … … … … … … … … … ... 34 102.7 37 113.5 36 110.2 34 103.5 23 74.2 … ‐28.3
Netherlands 13847 90.1 15246 95.4 16239 100.8 18242 112.7 20075 123.5 21826 133.9 20463 124.9 18746 113.1 17 113 102.8 16 284 98.8 9.6 ‐3.9
Norway 2643 59 2666 59.2 2662 58.8 2914 64 2975 65 3097 67.2 3164 67.8 3280 70.9 3 278 70.6 3 285 68.4 16.0 ‐3.0
Poland 65336 169 80004 207 80610 208.7 80692 211.1 79344 207.8 82656 216.5 88647 232.4 90199 234.2 83 152 216.0 84 003 220.3 30.3 2.0
Portugal … … 13500 132 13730 132.8 14232 136.7 … ... 12889 122.4 12636 119.4 11587 108.9 10 807 101.2 11 099 104.4 … 3.2
Romania 49682 221 50370 225 51476 229.5 45337 208.2 40085 184.6 37929 175.1 35910 166.8 31290 140.5 27 262 122.5 27 028 125.7 ‐43.1 2.6
Russian Fed. … … 971496 671 919330 638.6 860640 601.4 … ... 823672 576.8 871609 608.6 887 723 630.9 880 671 620.6 … ‐1.6
San Marino … … … … 1 … 0 … 0 ... 1 3.4 1 3.3 1 3.4 2 6.7 2 6.4 … ‐4.6
Serbia … … … … … … 7487 74.9 … ... 7775 103.7 8553 114.1 8978 121.6 9 510 128.3 10 262 139.9 … 9.1
Slovak Republic 7128 297 7509 139 7849 145.9 8829 164.1 9504 176.7 9289 172.5 8657 160.7 8235 151.2 8 313 152.4 9 170 169.4 ‐43.0 11.2
Slovenia 1136 57.3 1155 58 1120 56.2 1099 55.1 1126 56.4 1132 56.7 1301 65 1336 66.5 1 318 65.6 1 365 67.2 17.2 2.3
Spain 45044 114 46962 117 50994 126.2 55244 135.8 59224 140.3 61269 142.4 64120 146.1 66467 147 71 778 155.5 78 342 167.6 47.0 7.8
Spain (Catalonia) 9395 130.3 9 839 133.6 10 356 138.5 … 3.7
Sweden 5678 64.1 6089 68.5 6506 73 6755 75.6 7332 81.7 7054 78.3 7175 79 6770 75 6 853 75.8 7 147 77.2 20.5 1.9
Switzerland 6390 89.2 5160 71.6 4987 68.7 5266 72 6021 81.8 6111 82.4 5888 79 5715 75.6 5 780 76.2 6 084 79.0 ‐11.4 3.6
The FYRO Macedonia 1394 69 1413 69.9 1248 61.2 1598 78.4 1747 86.1 2132 104.8 2038 100.1 2050 99.7 2 235 108.4 2 461 120.1 74.1 10.8
Turkey 71860 110 61336 93.2 60091 86.7 64051 92 71148 99.9 54296 75.8 67795 91.7 85865 120.7 99 416 131.2 115 540 161.6 46.9 23.2
Ukraine … … 198885 406 198946 405.7 198386 413.3 193489 406.3 179519 381.1 165408 355.3 148 339 322.5 146 394 318.5 … ‐1.2
UK: England and Wales 65666 124 67056 126 71324 137.1 72992 139.1 74488 140.4 76190 142.7 77982 145.1 79734 147.5 83 194 152.8 83 454 152.3 22.8 ‐0.4
UK: Northern Ireland 980 … 877 51.6 1076 63.8 1185 69.8 1295 75.7 1337 77.5 1502 86.2 1 523 85.8 1 456 81.4 … ‐5.1
UK: Scotland 5855 … … … 6513 128.7 6642 131.4 6885 135.6 6795 133.4 7192 140.6 7453 144.9 8 088 156.5 8 113 156.2 … ‐0.2
Source: SPACE I, 2000 to SPACE I, 2008

Council of Europe Annual Penal Statistics – SPACE I – 2009
Strasbourg, 22 March 2011, pc-cp\space\documents\pc-cp (2011) 3e PC-CP (2011) 3
41
Table 1.5: Year‐to‐year rates of increase and decrease of prison population rates per 100,000 inhabitants between 2008 and 2009
Reference: Council of Europe, SPACE I 2009.1.5
San Marino ‐4.6 Armenia ‐4.4 Netherlands ‐3.9 Norway ‐3.0 Russian Fed. ‐1.6 Germany ‐1.5 Ukraine ‐1.2 France ‐1.0 Luxembourg ‐0.6 UK: England & Wales ‐0.4 UK: Scotland ‐0.2 Finland 0.1 Albania 1.1 Sweden 1.9
Latvia 6.2 Poland 2.0 Denmark 7.3 Slovenia 2.3 Georgia 7.3 Romania 2.6 Spain (incl. Catalonia) 7.8 Belgium 3.1
Hungary 8.1 Portugal 3.2 Liechtenstein ‐32.1Serbia 9.1 Switzerland 3.6 Monaco ‐28.3The FYRO Macedonia 10.8 Spain (Catalonia) 3.7 Iceland ‐19.7Andorra 10.8 Cyprus 3.7 Malta ‐16.5Italy 11.0 Ireland 3.9 Bulgaria ‐10.7Slovak Republic 11.2 BH: Rep. Srpska 4.2 Greece ‐10.6Moldova 13.1 Croatia 4.6 Azerbaijan ‐10.3Lithuania 14.0 Austria 4.7 Estonia ‐5.1Turkey 23.2 Czech Republic 4.9 UK: Northern Ireland ‐5.1
Increase of more than 5% Between ‐5% and +5% Decrease of more than 5%
Notes – Tables 1.4 and 1.5
Tables 1.4 and 1.5 are based on non‐adjusted figures in order to ensure comparability with data from previous years. CYPRUS: For the calculations in the Tables 1.4 and 1.5 we have used data excluding detainees held in police stations. This information has not always been provided for the previous years. Therefore, in order to ensure the comparability with the data from previous years, we kept this year only the category of prisoners in penal institutions (670) without detainees held in police stations (213). ITALY: Data for 2004 are not comparable with data for 2003, because in 2003 the prison population included juveniles, and in 2004 they are not more counted. In 2009, figures do not include juveniles either; therefore these data are comparable with figures from 2004, 2005, 2006, 2007, and 2008. SPAIN (INCLUDING CATALONIA): In order to ensure the accuracy of the comparisons with the previous years’ data, we added Catalonian data in the total number of prisoners (Spain‐ State Administration and Catalonia), and we recalculated the prison population rate for the whole country. Among ten countries which experienced a decrease of more than 5%, three already showed decreasing trend between 2007 and 2008 (Monaco, Bulgaria, and Azerbaijan). Among the thirteen countries with an increase of more than 5%, six were in an important increase already between 2007 and 2008 (Spain, Serbia, the Former Yugoslav Republic of Macedonia, Italy, Turkey, and Georgia). For more detailed information on the 2009 data, see explanatory notes for previous tables of this report.

Council of Europe Annual Penal Statistics – SPACE I – 2009
Strasbourg, 22 March 2011, pc-cp\space\documents\pc-cp (2011) 3e PC-CP (2011) 3
42
Map 1: Prison population rates per 100,000 inhabitants Reference: Council of Europe, SPACE I 2009.m.1
* ISO 3166‐1 alpha‐3 codes: The three‐letter country codes are the ones published by ISO (International Organisation of Standardization). These country codes were used to identify Member States of the Council of Europe on the map presented above (excluding Bosnia and Herzegovina). For constituent countries of the United Kingdom we have used the three‐letter codes from FIFA (International Federation of Association Football): ENG, WAL, NIR, and SCO.
ALB Albania CZE Czech Republic
IRL Ireland NLD Netherlands ESP Spain
AND Andorra DNK Denmark ITA Italy NOR Norway SWE Sweden
ARM Armenia EST Estonia LVA Latvia POL Poland CHE Switzerland
AUT Austria FIN Finland LIE Liechtenstein PRT Portugal MKD The FYRO Macedonia
AZE Azerbaijan FRA France LTU Lithuania ROU Romania TUR Turkey
BEL Belgium GEO Georgia LUX Luxembourg RUS Russian Federation
UKR Ukraine
BIH Bosnia and Herzegovina
DEU Germany MLT Malta SMR San Marino UK:
ENG&WAL UK: England and Wales
BGR Bulgaria GRC Greece MDA Moldova SRB Serbia UK: NIR UK: Northern Ireland
HRV Croatia HUN Hungary MCO Monaco SVK Slovakia UK: SCO UK: Scotland
CYP Cyprus ISL Iceland MNE Montenegro SVN Slovenia BLR Belarus (Not CoE member)
RUS
TUR
ESP
UKR
FRA
FIN
SWE
DEU
ITA
POL
NOR
BLR
ROU
ISL
BGR
GRC
PRT
IRL
AZE
CZE
SRB
AUT HUN
LVA
LTU
GEO
BIH
SVK
HRV
EST
UK:ENG&WAL
CHE
BEL
NLD
ALB
ARM
MKD
SVN
UK:SCO
MDA
DNK
MNE
UK:NIR
CYP
LUX
AND
MLT
LIE
SMRMCO
PRISON POPULATIONPER 100,000 INHABITANTS
1ST SEPTEMBER 2009
Less than 50
From 51 to less than 100
From 100 to less than 200
from 200 to less than 300
300 and over
Data not supplied
Not a CoE Member State

Council of Europe Annual Penal Statistics – SPACE I – 2009
Strasbourg, 22 March 2011, pc-cp\space\documents\pc-cp (2011) 3e PC-CP (2011) 3
43
Table 2: Age structure of prison population on 1st September 2009: general breakdown by categories of age
Reference: Council of Europe, SPACE I 2009.2
Country
Total number of prisoners (including pre‐trial detainees)
Less than 14 years
From 14 to less than 16 years
From 16 to less than 18 years
From 18 to less than 21 years
From 21 to less than 25 years
From 25 to less than 30 years
From 30 to less than 40 years
From 40 to less than 50 years
From 50 to less than 60 years
From 60 to less than 70 years
From 70 to less than 80 years
80 years and over
Age of criminal responsibi
lity (a) (b) (c) (d) (e) (f) (g) (h) (i) (j) (k) (l)
Albania 4 482 NAP 60 329 1 397 1 346 667 329 125 14 years
Andorra 68 0 0 2 2 34 10 14 4 2 0 0 0 18 years
Armenia 3 989 NAP 105 850 1 199 955 795 85 14 years
Austria 8 423 14 years
Azerbaijan 20 470 NAP NA 39 16 130 1 340 196 NA 16 years
Belgium 10 901 3 17 62 500 1 315 2 077 3 620 2 136 861 237 62 9 18 years
BH: BiH (state level) 14 years
BH: Fed. BiH 1 619 0 1 14 71 256 386 452 258 121 47 13 0 14 years
BH: Republika Srpska 961 NAP 1 5 8 125 236 257 214 83 22 9 1 14 years
Bulgaria 10 028 NAP 0 21 160 626 1 583 3 270 1 746 714 196 41 6 14 years
Croatia 4 891 0 7 57 123 406 907 1 535 1 066 577 166 42 5 14 years
Cyprus 883 0 0 3 27 137 147 207 102 35 12 0 0 14 years
Czech Republic 22 021 NAP 1 65 621 2 425 3 501 6 880 3 938 1 629 297 17 NA 15 years
Denmark 3 721 NAP 1 19 426 671 660 1 053 672 167 46 4 2 15 years
Estonia 3 555 0 5 29 249 530 741 1 121 565 249 60 5 1 14 years
Finland 3 589 NAP 1 7 107 408 663 1 152 776 376 89 10 0 15 years
France 66307 50 583 4 827 11 548 13 360 17 159 11 029 5 384 2 367 13 years
Georgia 23 864 14 years
Germany 73 263 NAP 43 594 3 359 7 811 12 153 17 819 12 381 5 184 1 758 285 NA 14 years
Greece 11 547 13 years
Hungary 16 459 NAP 187 1 368 1 535 2 670 5 687 3 364 1 382 266 14 years
Iceland 118 NA NA NA NA NA NA NA NA NA NA NA NA 15 years
Ireland 3 919 2 20 73 344 787 889 1 049 489 166 79 18 3 12 years
Italy 63 981 NAP NA NA 1 636 5 381 10 378 21 711 14 916 6 812 2 131 456 14 years
Latvia 6 999 NAP 20 72 416 850 1 112 1 450 778 262 67 14 years
Liechtenstein 7 0 0 0 0 0 1 2 1 1 2 0 0 14 years
Lithuania 8 295 NAP 11 115 655 2 826 2 143 1 079 426 109 16 years
Luxembourg 679 4 27 106 129 188 158 56 8 2 1 18 years
Malta 494 NAP 3 14 31 108 122 171 30 7 7 1 NAP 16 years
Moldova 6 769 NAP 3 32 426 2 147 1 711 675 358 67 14 years
Monaco 23 0 0 1 1 1 2 8 5 2 3 0 0 13 years

Council of Europe Annual Penal Statistics – SPACE I – 2009
Strasbourg, 22 March 2011, pc-cp\space\documents\pc-cp (2011) 3e PC-CP (2011) 3
44
Country
Total number of prisoners (including pre‐trial detainees)
Less than 14 years
From 14 to less than 16 years
From 16 to less than 18 years
From 18 to less than 21 years
From 21 to less than 25 years
From 25 to less than 30 years
From 30 to less than 40 years
From 40 to less than 50 years
From 50 to less than 60 years
From 60 to less than 70 years
From 70 to less than 80 years
80 years and over
Age of criminal responsibi
lity (a) (b) (c) (d) (e) (f) (g) (h) (i) (j) (k) (l)
Montenegro 986 14 years
Netherlands 11 629 0 0 0 906 1 739 1 961 3 470 2 490 842 202 15 4 12 years
Norway 3 285 0 2 11 207 457 613 993 662 246 79 14 1 15 years
Poland 84 003 0 17 682 4 998 10 374 19 767 20 355 14 010 11 726 1 219 428 NA 15 years
Portugal 11 099 NAP NAP 30 303 1 130 2 000 3 691 2 497 1 072 376 16 years
Romania 27 028 0 52 411 1 789 9 937 8 559 5 899 381 14 years
Russian Federation 819 200 14 years
San Marino 2 0 0 0 0 0 0 0 0 0 2 0 0 12 years
Serbia 10 262 0 18 63 452 2 119 2 465 2 586 1 439 816 208 81 15 14 years
Slovak Republic 9 170 NAP 14 103 495 1 229 1 664 2 663 1 829 871 148 17 0 14 years
Slovenia 1 365 NAP NAP 4 44 158 290 425 264 138 39 3 0 14 years
Spain (State Administration) 67 986 NAP NA NA 1 445 8 785 14 305 22 184 17 124 1 464 14 years
Spain (Catalonia) 10 356 NAP 0 0 474 1 062 1 914 3 755 2 161 726 212 45 7 14 years
Sweden 7 147 NA NA NA 171 739 962 1 515 1 259 660 187 15 years
Switzerland 6 084 54 NA NA NA NA NA NA NA NA NA 10 years
the FYRO Macedonia 2 461 0 5 16 82 340 600 819 381 170 42 6 0 14 years
Turkey 115 540 52 536 2 033 8 085 16 236 23 140 35 683 19 096 7 982 2 041 601 55 12 years
Ukraine 146 394 NAP 809 3 847 47 492 35 432 19 056 2 244 1 040 14 years
UK: England and Wales 83 454 0 201 1 900 8 949 13 875 15 475 21 723 13 798 4 994 1 999 492 48 10 years
UK: Northern Ireland 1 456 0 0 17 130 266 269 370 269 90 38 7 0 10 years
UK: Scotland 8 113 0 0 169 873 1 329 1 535 2 247 1 333 465 126 35 1 8 years
General remark: As the question on the age of criminal responsibility was interpreted by some national correspondents as corresponding to the age of majority, a few adjustments to this Table were introduced by the authors of this report. The latter also introduced the age of criminal responsibility for Austria, Georgia, Greece, Russian Federation, and Switzerland, on the basis of personal communications and literature research.
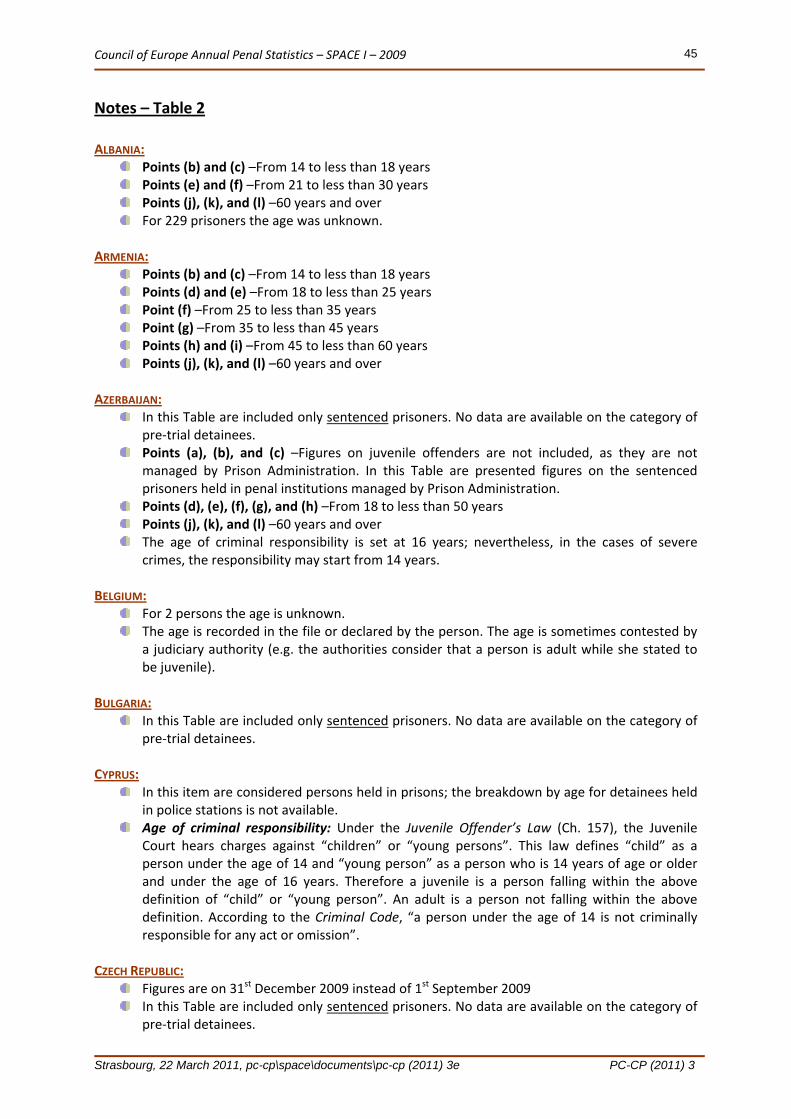
Council of Europe Annual Penal Statistics – SPACE I – 2009
Strasbourg, 22 March 2011, pc-cp\space\documents\pc-cp (2011) 3e PC-CP (2011) 3
45
Notes – Table 2
ALBANIA:
Points (b) and (c) –From 14 to less than 18 years Points (e) and (f) –From 21 to less than 30 years Points (j), (k), and (l) –60 years and over For 229 prisoners the age was unknown.
ARMENIA:
Points (b) and (c) –From 14 to less than 18 years Points (d) and (e) –From 18 to less than 25 years Point (f) –From 25 to less than 35 years Point (g) –From 35 to less than 45 years Points (h) and (i) –From 45 to less than 60 years Points (j), (k), and (l) –60 years and over
AZERBAIJAN:
In this Table are included only sentenced prisoners. No data are available on the category of pre‐trial detainees.
Points (a), (b), and (c) –Figures on juvenile offenders are not included, as they are not managed by Prison Administration. In this Table are presented figures on the sentenced prisoners held in penal institutions managed by Prison Administration.
Points (d), (e), (f), (g), and (h) –From 18 to less than 50 years Points (j), (k), and (l) –60 years and over The age of criminal responsibility is set at 16 years; nevertheless, in the cases of severe crimes, the responsibility may start from 14 years.
BELGIUM:
For 2 persons the age is unknown. The age is recorded in the file or declared by the person. The age is sometimes contested by a judiciary authority (e.g. the authorities consider that a person is adult while she stated to be juvenile).
BULGARIA:
In this Table are included only sentenced prisoners. No data are available on the category of pre‐trial detainees.
CYPRUS:
In this item are considered persons held in prisons; the breakdown by age for detainees held in police stations is not available.
Age of criminal responsibility: Under the Juvenile Offender’s Law (Ch. 157), the Juvenile Court hears charges against “children” or “young persons”. This law defines “child” as a person under the age of 14 and “young person” as a person who is 14 years of age or older and under the age of 16 years. Therefore a juvenile is a person falling within the above definition of “child” or “young person”. An adult is a person not falling within the above definition. According to the Criminal Code, “a person under the age of 14 is not criminally responsible for any act or omission”.
CZECH REPUBLIC:
Figures are on 31st December 2009 instead of 1st September 2009 In this Table are included only sentenced prisoners. No data are available on the category of pre‐trial detainees.

Council of Europe Annual Penal Statistics – SPACE I – 2009
Strasbourg, 22 March 2011, pc-cp\space\documents\pc-cp (2011) 3e PC-CP (2011) 3
46
Point (b) – As the age of criminal responsibility is 15, juveniles included in this category are 15 years old. Persons held in institutions for juvenile offenders are not included in the distribution presented in this Table.
FINLAND: Figures are on 1st May 2009 instead of 1st September 2009. FRANCE:
Figures are on 1st October 2009 instead of 1st September 2009. Points (a) and (b) –From 13 to less than 16 years Points (j), (k), and (l) –60 years and over
GERMANY:
Figures are on 31st March 2009 instead of 1st September 2009. In this Table are included sentenced prisoners and prisoners under preventive measures. Point (k) –The oldest prisoner in this age group is 72. Point (l) –No special data collection is undertaken under the category of 80 years and over. Pre‐trial detainees – the distribution available for this group of detainees is as follow:
From 14 to less than 18 years – 435
From 18 to less than 21 years – 1,130
From 21 years and over – 9,820 HUNGARY:
Point (a) –On the basis of the change in the Criminal Code the age of the criminal responsibility is 14 years.
Points (b) and (c) –From 14 to less than 18 years Point (d) –From 18 to less than 22 years Point (e) –From 22 to less than 25 Points (j), (k), and (l) –60 years and over
IRELAND:
The age of criminal responsibility is 12 years. There is an exception for children aged 10 or 11 who can be charged with murder, manslaughter, rape or aggravated sexual assault.
ITALY:
Points (a), (b), and (c) –Data on persons less than 18 years of age are not available in these statistics. These categories are held in specially designed institutions for juvenile offenders, which are not managed by the Italian Penitentiary Administration.
Point (g) –The number of persons aged 30 to less than 35 is 11,299, and the number of those aged 35 to less than 40 is 10,412.
Point (h) –The number of persons aged 40 to less than 45 is 8,736, and the number of those aged 45 to less than 50 is 6,180.
Points (k) and (l) –70 years and over Unknown –560 persons for who the age has not been recorded.
LATVIA:
Figures are on 1st October 2009 instead of 1st September 2009. In this Table are included only sentenced prisoners. No data are available on the category of pre‐trial detainees.
Points (j), (k), and (l) –60 years and over

Council of Europe Annual Penal Statistics – SPACE I – 2009
Strasbourg, 22 March 2011, pc-cp\space\documents\pc-cp (2011) 3e PC-CP (2011) 3
47
LITHUANIA:
Figures are on 1st July 2009 instead of 1st September 2009. In this Table are included only sentenced prisoners. Pre‐trial detainees and prisoners under preventive measures are not counted; insofar no special data are available.
Points (e) and (f) –from 21 to less than 30 years Points (j), (k), and (l) –60 years and over Age of criminal responsibility: Criminal responsibility may be applied to a person, who at the moment of the commitment of the offence was aged 16. Nevertheless, a person who prior to committing a crime or a criminal offence has reached the age of 14 shall be responsible for murder (art. 129), causing heavy health disturbances (“grievous bodily harm”, art. 135), rape (art. 149 and art. 150 – “hetero and homo”), theft (art. 178), robbery (art. 180), property extortion (art. 181), aggravated destruction or damage to property (art. 187, Part 2), seizure of firearms, ammunition, explosives or explosive substances (art. 254), theft, extortion or other illegal seizure of drugs or psycho‐tropic substances (art. 263), aggravated damage of means of transport, roads or equipment therein (art. 280, Part 2).
MOLDOVA:
In this Table are included only sentenced prisoners. No data are available on the category of pre‐trial detainees.
Points (e) and (f) –From 21 to less than 30 years Point (h) and (i) –From 40 to less than 60 years Points (k), and (l) –70 years and over
NETHERLANDS:
The distribution in this Table concerns only the population in the penal institutions and institutions for aliens, without taking into account juvenile offenders, and people in custodial clinics.
The age of criminal responsibility is 12 years. People younger than 18 years can be detained from the age of 12 in special institutions for juveniles. The age in which people can be detained under adult criminal law is 18 years (with a few exceptions in which youngsters can be trialled according to adult law).
POLAND:
Figures are on 31st December 2009 instead of 1st September 2009.
Unknown –427 persons under a special measure (“punished”). For these persons the age distribution is unknown.
PORTUGAL:
Figures are on 31st December 2009 instead of 1st September 2009. Points (j), (k), and (l) –60 years and over
ROMANIA:
Points (e) and (f) –From 21 to less than 30 years Point (h) and (i) –From 40 to less than 60 years Points (j), (k), and (l) –60 years and over
SLOVAK REPUBLIC:
The distribution in this Table concerns only the population in the penal institutions. Data on persons held for administrative reasons (108 persons) and on persons held in facilities which do not depend on the Prison Administration (29 persons) are missing.

Council of Europe Annual Penal Statistics – SPACE I – 2009
Strasbourg, 22 March 2011, pc-cp\space\documents\pc-cp (2011) 3e PC-CP (2011) 3
48
SPAIN (STATE ADMINISTRATION): Point (e) –From 21 to less than 26 years Point (f) –From 26 to less than 31 years Point (g) –From 31 to less than 41 years Points (h) and (i) –from 41 to less than 60 years old Points (j), (k), and (l) –60 years and over Unknown –For 2,679 persons the age is unknown. Age of criminal responsibility: The age of “sanctioning responsibility” is 14. Only at 18 years a prison sentence can be imposed.
SPAIN (CATALONIA):
Point (d) –From 18 to less than 22 Point (e) –From 22 to less than 26 years Point (f) –From 26 to less than 31 years Point (g) –From 31 to less than 41 years Point (h) – From 41 to less than 51 years Point (i) –From 51 to less than 61 years Points (j) –From 61 to less than 71 years Point (k) – From 71 to less than 80 years Point (l) –80 years and over Age of criminal responsibility: The Criminal Code applies to persons aged 18 and over. Between 14 and 17 years the Law on the Juveniles’ responsibility is applied. Persons under 14 years are not trialed under the criminal law system.
SWEDEN:
Figures are on 1st October 2009 instead of 1st September 2009. In this Table are included only sentenced prisoners. Pre‐trial detainees and prisoners under preventive measures are not counted; insofar no special data are available.
Points (j), (k) and (l) –60 years and over SWITZERLAND:
Figures are on 2nd September instead of 1st September 2009. Points (a), (b), and (c) –Are included detainees less than 18 years. For no any other category data are not available.
UKRAINE:
In this Table are included only sentenced prisoners. Pre‐trial detainees and prisoners under preventive measures are not counted; insofar no special data are available.
Points (b) and (c) –From 14 to less than 18 years Points (e) and (f) –From 21 to less than 30 years Point (h) –From 40 to 55 years Point (i) –From 56 to less than 60 years Points (j), (k), and (l) –60 years and over Age of criminal responsibility: Criminal liability arises from 16 years, in special cases from 14 years (art. 22 of the Criminal Code of Ukraine).
UK: ENGLAND AND WALES: Figures are on 30th June 2009 instead of 1st September 2009.
UK: NORTHERN IRELAND:
Figures are on 27th June 2009 instead of 1st September 2009.

Council of Europe Annual Penal Statistics – SPACE I – 2009
Strasbourg, 22 March 2011, pc-cp\space\documents\pc-cp (2011) 3e PC-CP (2011) 3
49
Table 2.1: Age structure of prison populations on 1st September 2009: minors and persons between 18 and 21 of age
Reference: Council of Europe, SPACE I 2009.2.1
Country
Total number
of prisoners
Persons held in institutions for juvenile offenders (Table 1.2) Number of
prisoners under 18 years old
Number of prisoners from 18 to less than 21 years
old
% of Prisoners under 18 years old
% of Prisoners from 18 to less than 21 years
old
Incl. (yes)/Excl.
(no)
If yes, how many?
Of which aged 18 years and
over
Albania 4 482 Yes 389 329 60 329 1.3 7.3
Andorra 68 NAP *** 2 2 2.9 2.9
Armenia 3 989 105 850 2.6 21.3
Austria 8 423
Azerbaijan 17 705* Yes 49 10 39 NA 0.2 NA
Belgium 10 901 Yes 47 5 82 500 0.8 4.6
BH: BiH (state level)
BH: Fed. BiH 1 619 Yes 13 9 15 71 0.9 4.4
BH: Republika Srpska 961 Yes 3 6 8 0.6 0.8
Bulgaria 8 363* Yes 57 0 21 160 0.3 1.9
Croatia 4 891 Yes 116 66 64 123 1.3 2.5
Cyprus 670 NAP *** 3 27 0.4 4.0
Czech Republic 19 648* Yes 225 NA 66 621 0.3 3.2
Denmark 3 721 No *** 20 426 0.5 11.4
Estonia 3 555 Yes 150 136 34 249 1.0 7.0
Finland 3 589 NAP *** 8 107 0.2 3.0
France 66307 Yes 198 1 633 4 827 1.0 7.3
Georgia 23 864
Germany 73 263 Yes 7 909 6 837 1 072 4 489 1.5 6.1
Greece 11 547
Hungary 16 459 Yes 927 216 187 1 368 1.1 8.3
Iceland 118 Yes 596 NA NA NA NA
Ireland 3 919 Yes 95 0 95 344 2.4 8.8
Italy 63 981 No *** 0 1 636 0.0 2.6
Latvia 5 007* Yes 157 24 92 416 1.8 8.3
Liechtenstein 7 No *** 0 0 0.0 0.0
Lithuania 6 911* Yes 200 36 126 655 1.8 9.5
Luxembourg 679 No *** 4 27 0.6 4.0
Malta 494 Yes 29 3 17 31 3.4 6.3
Moldova 5 466* Yes 50 15 35 426 0.6 7.8
Monaco 23 NAP *** 1 1 4.3 4.3
Montenegro 986
Netherlands 11 629 No *** 0 906 0.0 7.8
Norway 3 285 NAP *** 13 207 0.4 6.3
Poland 84 003 No *** 699 4 998 0.8 5.9
Portugal 11 099 Yes 213 211 30 303 0.3 2.7
Romania 27 028 Yes 567 441 463 1 789 1.7 6.6
Russian Federation 819 200
San Marino 2 No *** 0 0 0.0 0.0
Serbia 10 262 Yes 255 81 81 452 0.8 4.4
Slovak Republic 9 170 Yes 96 0 117 495 1.3 5.4
Slovenia 1 365 Yes 28 28 4 44 0.3 3.2
Spain (State Adm.) 67 986 No *** NA 1 445 NA 2.1
Spain (Catalonia) 10 356 No *** 0 474 0.0 4.6
Sweden 5 486* No *** NA 171 NA 3.1
Switzerland 6 084 Yes 77 23 54 NA 0.9 NA
the FYRO Macedonia 2 461 Yes 66 50 21 82 0.9 3.3
Turkey 115 540 Yes 1 035 233 2 621 8 085 2.3 7.0
Ukraine 109 920* Yes 1 523 579 809 3 847 0.7 3.5
UK: England & Wales 83 454 Yes 2 333 235 2 101 8 949 2.5 10.7
UK: Northern Ireland 1 456 No *** 17 130 1.2 8.9
UK: Scotland 8 113 Yes 1 042 873 169 873 2.1 10.8
Mean 1.1 5.7
Median 0.9 4.6
Minimum 0.0 0.0
Maximum 4.3 21.3

Council of Europe Annual Penal Statistics – SPACE I – 2009
Strasbourg, 22 March 2011, pc-cp\space\documents\pc-cp (2011) 3e PC-CP (2011) 3
50
Notes – Table 2.1
For more detailed information on the 2009 data, see the notes to previous tables. Data provided in Table 2.1 should be considered cautiously as the percentages could not always be calculated on the basis of the total number of prisoners. The following countries provided the age breakdown for sentenced prisoners only: Azerbaijan, Bulgaria, Czech Republic, Latvia, Lithuania, Moldova, Sweden, and Ukraine. For these countries, the figure included in the first column of Table 2.1 (“Total number of prisoners”) corresponds to the number of sentenced prisoners only and the percentages included in the Table are calculated on the basis of that figure. The calculation of the percentage of prisoners aged less than 18 was impossible for Iceland, Spain (State Administration), and Sweden because the raw data on this category of prisoners are missing (see notes to Table 2). The calculation of the percentage of prisoners aged 18 to less than 21 was impossible for Azerbaijan, Iceland and Switzerland as no distribution was available for this group of age (see notes to Table 2). ARMENIA: Under the heading “Number of prisoners from 18 to less than 21 years old” prisoners aged less than 25are included. This figure is the only available (see notes to Table 2). CYPRUS: Percentages for this Table were calculated on the basis of the total prison population in prisons (670), excluding persons held in police stations (213). GERMANY:
The total number of prisoners under 18 years is 1,072, of which 435 are pre‐trial detainees, and 637 are sentenced prisoners. Consequentially, the percentage in this Table was calculated on the basis of the whole population in penal institutions.
The total number of prisoners between 18 and less than 21 years is 4,489, of which 1,130 are pre‐trial detainees, and 3,359 are sentenced prisoners. Consequentially, the percentage in this table was calculated on the basis of the whole population in penal institutions.
NETHERLANDS:
Figures presented in this Table concerns only the population held in penal institutions, without taking into account juvenile offenders, people in custodial clinics, and institutions for aliens.
As the number of persons aged less than 18 years and between 18 and less than 21 years is known for the institutions for juvenile offenders, the percentage was recalculated at the level of the whole population held in penal institutions and institutions for juvenile offenders (12,814). The recalculated percentages are as follow:
Percentage of prisoners under 18 years old = 5.7%
Percentage of prisoners from 18 to less than 21 years old = 10.6%

Council of Europe Annual Penal Statistics – SPACE I – 2009
Strasbourg, 22 March 2011, pc-cp\space\documents\pc-cp (2011) 3e PC-CP (2011) 3
51
Map 2: Breakdown of the age of criminal responsibility and percentages of prisoners less than 18 years of age in European countries
Reference: Council of Europe, SPACE I 2009.m.2
This map must be interpreted cautiously as the categories included in it are not always strictly comparable across countries. Thus, for the countries that did not provide the age breakdown for the whole prison population, calculations are based on the available data (e.g. only on sentenced prisoners). Moreover, some of the countries (e.g. Italy) included in the Map do not count persons held in institutions for juvenile offenders in their prison population. As a consequence, their percentage of prisoners aged less than 18 years is nil or close to zero. In most cases, the main reason for excluding juveniles from the calculation is that the special institutions for juvenile offenders are not managed by Prison Administrations. For more details, please see the notes to Tables 2 and 2.1. The percentage of persons aged less than 18 (5.7%) for the Netherlands is based on an adjusted calculation, which includes the institutions for juvenile offenders. If persons held in institutions for juvenile offenders are excluded, the percentage is equal to 0 (see Table 2.1). In France, the total number of prisoners corresponds to the number of “écroués”. However, 4,526 persons (6.8%) of the total 66,307 “écroués” are not de facto held inside penal institutions.
0
0
1
1
2.5
1.2
2.1
0.7
2.3
0.3
1.3
0.8
1.7
0.3
0.8
0.4
5.7
3.4
0.9
0.6
4.3
1.8
0.6
1.8
2.4
1.1
1.3
0.2
0.5
1.5
0.3
0.4
0.9
0.9
0.3
0.8
0.2
2.6
2.9
1.3
AGE OF CRIMINAL RESPONSIBILITY AND THE % OF PRISONERS AGED LESS THAN 18 YEARS
Percentage
0.0 to less than 0.5
0.5 to less than 1.0
1.0 to less than 1.5
1.5 to less than 3.0
3.0 to less than 4.0
4.0 and over
Age
8 years
10 years
12 years
13 years
14 years
15 years
16 years
18 years
Data not supplied
Not a CoE Member State

Council of Europe Annual Penal Statistics – SPACE I – 2009
Strasbourg, 22 March 2011, pc-cp\space\documents\pc-cp (2011) 3e PC-CP (2011) 3
52
Table 2.2: Median and Average ages of the prison population (including pre‐trial detainees) on 1st September 2009 Reference: Council of Europe, SPACE I 2009.2.2
Among countries presented in the Table 2.2, 16 do not include persons held in institutions for juveniles in the calculations of the mean and median ages: Andorra, Cyprus, Denmark, Finland, Italy, Liechtenstein, Luxembourg, Monaco, Netherlands, Norway, Poland, San Marino, Spain (St. level), Spain (Catalonia), Sweden, and UK: Northern Ireland. Moreover, Azerbaijan, Bulgaria, Czech Republic, Germany, Latvia, Lithuania, Moldova, and Ukraine calculated the median age only for the sentenced prisoners. Median and average values for Cyprus are based on prison population (without police stations). Norway: the median value refers to 1st September 2010 instead of 1st September 2009.
Figure 2.a: Countries with the youngest (less than 35 years) prison population classified by decreasing median age
Country Median Average
Albania NA 30
Andorra 25 25
Armenia NA NA
Austria
Azerbaijan 37 NA
Belgium 35 33
BH: BiH (state level)
BH: Fed. BiH 34.29 38.87
BH: Republika Srpska 36 NA
Bulgaria 36.33 34.94
Croatia 37.54 36
Cyprus 34 32
Czech Republic 36 NA
Denmark 32 30
Estonia 33.6 31.5
Finland 36 34
France NA 31.6
Georgia
Germany 35.4 33.4
Greece
Hungary 35.25 NA
Iceland NA NA
Ireland 31 29
Italy 37 35
Latvia 44.5 34
Liechtenstein 45.4 41
Lithuania 33.5 NA
Luxembourg 37 33 (CPL) 39 (CPG)
Malta NA NA
Moldova 32.6 31
Monaco 39 24
Montenegro
Netherlands 34.2 33
Norway 34.5 33
Poland 35.2 32.5
Portugal 36.8 NA
Romania 34 31
Russian Federation
San Marino NA NA
Serbia 35 49
Slovak Republic NA NA
Slovenia NA NA
Spain (State Adm.) 36.4 36
Spain (Catalonia) 36.05 NA
Sweden 36 34
Switzerland NA NA
the FYRO Macedonia 32 34.5
Turkey 34 32
Ukraine NA NA
UK: England and Wales 33 30
UK: Northern Ireland 33.6 30.9
UK: Scotland 32 30
Mean 35.2 33.0
Median 35.1 32.8
Minimum 25.0 24
Maximum 45.4 49.0

Council of Europe Annual Penal Statistics – SPACE I – 2009
Strasbourg, 22 March 2011, pc-cp\space\documents\pc-cp (2011) 3e PC-CP (2011) 3
53
Table 3.1: Structure of prison populations on 1st September 2009: female prisoners
Reference: Council of Europe, SPACE I 2009.3.1
Country
Total number of prisoners (including pre‐trial detainees)
Number of female prisoners (including pre‐trial detainees)
% of female prisoners in the total number of prisoners (including pre‐trial detainees)
Number of foreign female prisoners (including pre‐trial detainees)
% of foreign females in the total number of female prisoners (including pre‐trial detainees)
Number of pre‐trial female
detainees
% of pre‐trial female
detainees in the total number of female prisoners
Albania 4 482 123 2.7 2 1.6 31 25.2
Andorra 68 13 19.1 11 84.6 6 46.2
Armenia 3 989 159 4.0 NA NA 54 34.0
Azerbaijan 20 470 433 2.1 16 3.7 112 25.9
Belgium 10 901 440 4.0 129 29.3 163 37.0
BH: Fed. BiH 1 619 39 2.4 3 7.7 8 20.5
BH: Republika Srpska 961 20 2.1 2 10.0 3 15.0
Bulgaria 10 028 298 3.0 3 1.0 29 9.7
Croatia 4 891 225 4.6 16 7.1 60 26.7
Cyprus 670 39 5.8 28 71.8 13 33.3
Czech Republic 22 021 1 189 5.4 68 5.7 162 13.6
Denmark 3 721 178 4.8 52 29.2 82 46.1
Estonia 3 555 195 5.5 85 43.6 45 23.1
Finland 3 589 241 6.7 11 4.6 39 16.2
France 66307 2 321 3.5 521 22.4 723 31.2
Germany 73 263 3 918 5.3 761 19.4 606 15.5
Hungary 16 459 1 065 6.5 36 3.4 92 8.6
Iceland 11 833 598 5.1 267 44.6 237 39.6
Ireland 3 919 129 3.3 30 23.3 24 18.6
Italy 63 981 2 740 4.3 1 196 43.6 1 372 50.1
Latvia 6 999 415 5.9 8 1.9 135 32.5
Liechtenstein 7 0 0.0 0 0.0 0 0.0
Lithuania 8 295 353 4.3 2 0.6 35 9.9
Luxembourg 679 32 4.7 23 71.9 14 43.8
Malta 494 28 5.7 NA NA 23 82.1
Moldova 6 769 418 6.2 5 1.2 129 30.9
Monaco 23 2 8.7 2 100.0 2 100.0
Netherlands 11 629 725 6.2 195 26.9 333 45.9
Norway 3 285 208 6.3 48 23.1 54 26.0
Poland 84 003 2 697 3.2 NA NA NA NA
Portugal 11 099 613 5.5 196 32.0 177 28.9
Romania 27 028 1 268 4.7 11 0.9 139 11.0
San Marino 2 0 0.0 0 0.0 0 0.0
Serbia 10 262 324 3.2 14 4.3 105 32.4
Slovak Republic 9 170 474 5.2 5 1.1 74 15.6
Slovenia 1 365 64 4.7 7 10.9 15 23.4
Spain (State Adm.) 67 986 5 391 7.9 2 156 40.0 1 328 24.6
Spain (Catalonia) 10 356 722 7.0 275 38.1 170 23.5
Sweden 7 147 374 5.2 NA NA 92 24.6
Switzerland 6 084 374 6.1 NA NA 138 36.9
the FYRO Macedonia 2 461 63 2.6 4 6.3 9 14.3
Turkey 115 540 4 150 3.6 244 5.9 1 803 43.4
Ukraine 146 394 7 742 5.3 NA NA 1 463 18.9
UK: England & Wales 83 454 4 296 5.1 838 19.5 554 12.9
UK: North. Ireland 1 456 52 3.6 10 19.2 24 46.2
UK: Scotland 8 113 438 5.4 22 5.0 110 25.1
Mean 4.9 21.6 28.6
Median 4.9 10.5 25.2
Minimum 0.0 0.0 0.0
Maximum 19.1 100.0 100.0

Council of Europe Annual Penal Statistics – SPACE I – 2009
Strasbourg, 22 March 2011, pc-cp\space\documents\pc-cp (2011) 3e PC-CP (2011) 3
54
Notes – Table 3.1
CYPRUS:
In this table, the categorisation is based on the number of persons held in prisons. Persons held in police stations are excluded.
CZECH REPUBLIC:
Figures are on 31st December 2009 instead of 1st September 2009. FINLAND:
Figures are on 1st May 2009 instead of 1st September 2009. GERMANY:
Figures are on 31st March 2009 instead of 1st September 2009. Among the foreign female prisoners are included 274 foreign female pre‐trial detainees.
LATVIA:
Figures are on 1st October 2009 instead of 1st September 2009. LITHUANIA:
Figures are on 1st July 2009 instead of 1st September 2009. LUXEMBOURG:
The total number of female prisoners includes 3 juveniles as well. These persons are held in a special disciplinary section on the basis of a decision of a juvenile court judge. Female prisoners are held in a special section of the Penitentiary Centre of Luxembourg.
POLAND:
Figures are on 31st December 2009 instead of 1st September 2009. PORTUGAL:
Figures are on 31st December 2009 instead of 1st September 2009. SWEDEN:
Figures are on 1st October 2009 instead of 1st September 2009. SWITZERLAND:
Figures are on 2nd September 2009 instead of 1st September 2009. UK: ENGLAND AND WALES:
Figures are on 30th June 2009 instead of 1st September 2009. Under the heading of the females in pre‐trial detention are included foreign females as well.

Council of Europe Annual Penal Statistics – SPACE I – 2009
Strasbourg, 22 March 2011, pc-cp\space\documents\pc-cp (2011) 3e PC-CP (2011) 3
55
Table 3.2: Structure of prison populations on 1st September 2009: foreign prisoners
Reference: Council of Europe, SPACE I 2009.3.2
Country To
tal number of prisoners
(including pre‐trial
detainees)
Number of foreign
prisoners (including pre‐
trial detainees)
% of foreign prisoners in
the total number of
prisoners (including pre‐
trial detainees)
Number of foreign pre‐
trial detainees
% of foreign pre‐trial
detainees in the total
number of foreign
prisoners
Number of prisoners
citizens of Member States
of the European Union
% of the EU citizens in the
total number of foreign
prisoners
Number of foreign ju
venile
(aged under 18) detainees
% of foreign ju
veniles in
the total number of
foreign prisoners
Albania 4 482 45 1.0 32 71.1 15 33.3 1 2.2
Andorra 68 60 88.2 28 46.7 55 91.7 1 1.7
Armenia 3 989 103 2.6 NA NA NA NA NA NA
Azerbaijan 20 470 650 3.2 131 20.2 2 0.3 NA NA
Belgium 10 901 4 450 40.8 1 707 38.4 3 255 73.1 47 1.1
BH: Fed. BiH 1 619 62 3.8 32 51.6 3 4.8 0 0.0
BH: Rep. Srpska 961 31 3.2 16 51.6 2 6.5 0 0.0
Bulgaria 10 028 223 2.2 45 20.2 NA NA 0 0.0
Croatia 4 891 280 5.7 114 40.7 56 20.0 0 0.0
Cyprus 670 415 61.9 109 26.3 117 28.2 2 0.5
Czech Republic 22 021 1 559 7.1 537 34.4 741 47.5 5 0.3
Denmark 3 721 811 21.8 469 57.8 266 32.8 8 1.0
Estonia 3 555 1 385 39.0 369 26.6 33 2.4 5 0.4
Finland 3 589 356 9.9 137 38.5 174 48.9 0 0.0
France 66307 12 007 18.1 NA NA 2 775 23.1 NA NA
Germany 73 263 19 347 26.4 5 046 26.1 5 691 29.4 NA NA
Hungary 16 459 612 3.7 422 69.0 320 52.3 2 0.3
Iceland 118 69 58.5 25 36.2 NA NA 6 8.7
Ireland 3 919 511 13.0 176 34.4 102 20.0 2 0.4
Italy 63 981 23 696 37.0 13 446 56.7 4 261 18.0 NAP NAP
Latvia 6 999 80 1.1 29 36.3 NA NA 1 1.3
Liechtenstein 7 5 71.4 2 40.0 4 80.0 0 0.0
Lithuania 8 295 89 1.1 24 27.0 29 32.6 0 0.0
Luxembourg 679 465 68.5 223 48.0 450 96.8 9 1.9
Malta 494 NA NA NA NA NA NA NA NA
Moldova 6 769 NA NA NA NA NA NA NA NA
Monaco 23 21 91.3 12 57.1 13 61.9 1 4.8
Netherlands 11 629 2 525 21.7 1 310 51.9 800 31.7 0 0.0
Norway 3 285 913 27.8 414 45.3 315 34.5 NA NA
Poland 84 003 595 0.7 322 54.1 250 42.0 NA NA
Portugal 11 099 2 263 20.4 771 34.1 420 18.6 11 0.5
Romania 27 028 198 0.7 26 13.1 60 30.3 0 0.0
San Marino 2 1 50.0 1 100.0 1 100.0 0 0.0
Serbia 10 262 176 1.7 83 47.2 NA NA 0 0.0
Slovak Republic 9 170 148 1.6 84 56.8 52 35.1 NA NA
Slovenia 1 365 137 10.0 59 43.1 28 20.4 1 0.7
Spain (State Adm.) 67 986 22 760 33.5 7 126 31.3 4 183 18.4 NA NA
Spain (Catalonia) 10 356 4 424 42.7 1 350 30.5 638 14.4 NA NA
Sweden 7 147 1 572 22.0 NA NA NA NA NA NA
Switzerland 6 084 4 274 70.2 1 500 35.1 NA NA 33 0.8
FYRO Macedonia 2 461 79 3.2 20 25.3 9 11.4 1 1.3
Turkey 115 540 1 856 1.6 1 118 60.2 NA NA 18 1.0
Ukraine 146 394 2 463 1.7 177 7.2 NA NA NA NA
UK: Engl. & Wales 83 454 11 350 13.6 1 711 15.1 2 987 26.3 180 1.6
UK: North. Ireland 1 456 106 7.3 4 3.8 67 63.2 0 0.0
UK: Scotland 8 113 314 3.9 147 46.8 NA NA NA NA
Mean 23.1 40.4 36.8 1.0
Median 11.5 38.5 31.0 0.4
Minimum 0.7 3.8 0.3 0.0
Maximum 91.3 100.0 100.0 8.7
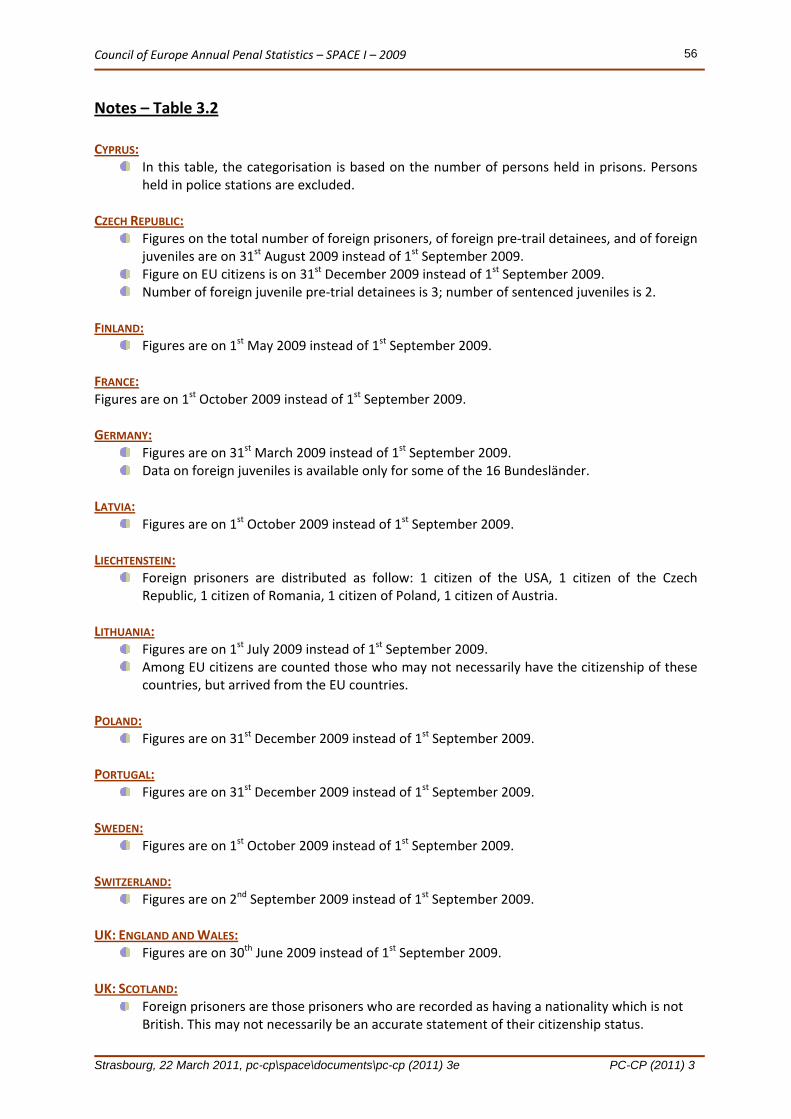
Council of Europe Annual Penal Statistics – SPACE I – 2009
Strasbourg, 22 March 2011, pc-cp\space\documents\pc-cp (2011) 3e PC-CP (2011) 3
56
Notes – Table 3.2
CYPRUS:
In this table, the categorisation is based on the number of persons held in prisons. Persons held in police stations are excluded.
CZECH REPUBLIC:
Figures on the total number of foreign prisoners, of foreign pre‐trail detainees, and of foreign juveniles are on 31st August 2009 instead of 1st September 2009.
Figure on EU citizens is on 31st December 2009 instead of 1st September 2009. Number of foreign juvenile pre‐trial detainees is 3; number of sentenced juveniles is 2.
FINLAND:
Figures are on 1st May 2009 instead of 1st September 2009. FRANCE: Figures are on 1st October 2009 instead of 1st September 2009. GERMANY:
Figures are on 31st March 2009 instead of 1st September 2009. Data on foreign juveniles is available only for some of the 16 Bundesländer.
LATVIA:
Figures are on 1st October 2009 instead of 1st September 2009. LIECHTENSTEIN:
Foreign prisoners are distributed as follow: 1 citizen of the USA, 1 citizen of the Czech Republic, 1 citizen of Romania, 1 citizen of Poland, 1 citizen of Austria.
LITHUANIA:
Figures are on 1st July 2009 instead of 1st September 2009. Among EU citizens are counted those who may not necessarily have the citizenship of these countries, but arrived from the EU countries.
POLAND:
Figures are on 31st December 2009 instead of 1st September 2009. PORTUGAL:
Figures are on 31st December 2009 instead of 1st September 2009. SWEDEN:
Figures are on 1st October 2009 instead of 1st September 2009. SWITZERLAND:
Figures are on 2nd September 2009 instead of 1st September 2009. UK: ENGLAND AND WALES:
Figures are on 30th June 2009 instead of 1st September 2009. UK: SCOTLAND:
Foreign prisoners are those prisoners who are recorded as having a nationality which is not British. This may not necessarily be an accurate statement of their citizenship status.

Council of Europe Annual Penal Statistics – SPACE I – 2009
Strasbourg, 22 March 2011, pc-cp\space\documents\pc-cp (2011) 3e PC-CP (2011) 3
57
Table 4: Legal status of prison populations on 1st September 2009 (numbers)
Reference: Council of Europe, SPACE I 2009.4
Country
Untried prisoners (no court
decision yet reached)
Convicted prisoners, b
ut
not yet sentenced
Sentenced prisoners who
have appealed or who are
within the statutory limit
for doing so
Sentenced prisoners (final
sentence)
Persons detained for fine
conversion reasons (fine
defaulters)
Persons detained because
of the revo
cation,
suspension or an
nulm
ent
of the conditional release
or probation
Other cases
Total number of prisoners
(including pre‐trial
detainees)
(a) (b) (c) (d) (e) (f) (g) (h)
Albania 1 507 NA NA 2 975 NA NA NA 4 482
Andorra 29 0 1 39 0 0 0 68
Armenia 734 330 2 901 24 3 989
Austria 5 542 8 423
Azerbaijan 2 418 347 NA 17 705 NA NA NA 20 470
Belgium 2 517 NAP 651 6 534 1 NA 1 199 10 901
BH: Fed. BiH 209 5 33 1 372 30 0 0 1 619
BH: Rep. Srpska 183 4 0 749 10 0 15 961
Bulgaria 1 665 NA NA 8 363 NAP NA 0 10 028
Croatia 1 212 3 592 32 0 87 4 891
Cyprus 373 NAP NA 510 NAP NA NAP 883
Czech Republic NA NA NA 19 648 NA NA NAP 22 021
Denmark 1 181 245 2 295 0 NA NAP 3 721
Estonia 836 2 719 NA NA NAP 3 555
Finland 575 3 014 90 NA 0 3 589
France 11 775 NAP 3 827 50 705 6 NA 66307
Georgia
Germany 11 385 61 387 4 197 NA 491 73 263
Greece
Hungary 4 254 NAP 765 11 117 403 NA 323 16 459
Iceland 35 NA NA 81 NA NA NA 118
Ireland 569 NA NA 3 339 36 NA 11 3 919
Italy 14 887 NAP 15 651 31 562 NAP NA 1 881 63 981
Latvia 419 249 682 5 007 28 NA 642 6 999
Liechtenstein 0 2 2 3 1 1 NAP 7
Lithuania 931 123 330 6 911 NA NA NAP 8 295
Luxembourg 220 NAP 43 385 2 7 1 679
Malta 316 NAP NAP 178 9 4 165 494
Moldova 163 382 283 5 466 NA NA 475 6 769
Monaco 12 0 2 9 0 0 0 23
Montenegro
Netherlands 4 235 1 232 5 942 561 NAP 220 11 629
Norway 782 NA NA 2 503 93 NA 0 3 285
Poland 9 460 434 NA 74 116 3 302 NA NA 84 003
Portugal 1 556 NAP 585 8 708 NAP NAP 250 11 099
Romania 2 481 1 465 NA 23 082 NA NA 0 27 028
Russian Federation
San Marino 1 0 0 1 0 0 0 2
Serbia 319 1 845 381 7 757 NAP 0 0 10 262
Slovak Republic 1 622 NA NA 7 411 NAP NA NA 9 170
Slovenia 285 55 42 948 NA NA 35 1 365
Spain (State Adm.) 14 132 53 854 124 NA NA 67 986
Spain (Catalonia) 2 185 8 171 108 42 10 356
Sweden 1 548 5 486 NA NA NA 7 147
Switzerland 2 404 596 3 084 NA NA NA 6 084
FYRO Macedonia 49 137 25 2 250 13 2 461
Turkey 40 111 NAP 19 641 55 684 NA NA NA 115 540
Ukraine 22 629 2 385 8 170 109 920 NAP 3 290 NAP 146 394
UK: Engl. & Wales 8 933 4 523 NA 68 375 113 NA 1 510 83 454
UK: North. Ireland 541 9 906 24 NA 0 1 456
UK: Scotland 1 101 488 NA 6 524 4 615 5 905 8 113

Council of Europe Annual Penal Statistics – SPACE I – 2009
Strasbourg, 22 March 2011, pc-cp\space\documents\pc-cp (2011) 3e PC-CP (2011) 3
58
Notes – Table 4
BELGIUM:
Point (g) –The category “Other cases” includes: o Mentally ill prisoners kept detained for security reasons; o Inmate sentenced prisoners in enforcement of the Law on social protection; o Aliens handed over to the Office of the Aliens (illegal aliens held for administrative
reasons); o Wanderers/beggars handed over to the Government; o Recidivists/habitual offenders handed over to the Government; o Persons temporarily detained against the revocation of the release on parole; o Suspension of the release on parole; o Persons temporarily detained against the revocation of the probation.
BH: REPUBLIKA SRPSKA:
Point (f) – Persons detained for fine conversion reasons (fine defaulters) are counted separately and not as part of the sentenced prisoners.
CROATIA:
Figures are on 31st December 2009 instead of 1st September 2009; Points (a), (b), and (c) –It is not possible to keep these groups separate in the statistics; Point (g) – In this category are included juveniles with educational measures in correctional institutions and prisoners sentenced on the basis of Misdemeanours Act.
CYPRUS:
Point (a) –Total number of untried detainees is 373, of which 160 detainees are held in prisons and 213 are held in police stations.
CZECH REPUBLIC:
Figures on sentenced prisoners are on 31st August 2009 instead of 1st September 2009. DENMARK:
Point (a) –Under this heading, 55 detainees held according to the Aliens Act are included as well;
Points (b), and (c) –It is not possible to keep these groups separate in the statistics. ESTONIA:
Points (a), (b), and (c) –It is not possible to keep these groups separate in the statistics. FINLAND:
Figures are on 1st May 2009 instead of 1st September 2009; Points (a), (b), and (c) –It is not possible to keep these groups separate in the statistics.
FRANCE:
Figures are on 1st October 2009 instead of 1st September 2009; In this table are presented data on all categories of prisoners (“écrouées détenues”) (those, who are de facto held in penal institutions and those who have a status of “detainees”). It is impossible to provide more accurate figures for the separate category of persons de facto held in penal institutions.
Point (e) –Legal measures of constraint.

Council of Europe Annual Penal Statistics – SPACE I – 2009
Strasbourg, 22 March 2011, pc-cp\space\documents\pc-cp (2011) 3e PC-CP (2011) 3
59
GERMANY:
Figures are on 31st March 2009 instead of 1st September 2009; Points (a), (b), and (c) –It is not possible to keep these groups separate in the statistics; Point (g) –“Preventive detention”. In this category are counted detainees which have already served their sentence, but who are kept in penitentiary facilities for security reasons (Sicherungsverwahrung).
HUNGARY:
Point (g) –The category “Other cases” includes: o Detention arising from misdemeanor acts (127); o Imprisonment for administrative offences (15); o Forced medical treatment and temporary forced medical treatment (181).
IRELAND:
Point (g) –11 Immigration warrants. ITALY:
Point (g) –Internees (Internati) and temporary internees, that are persons held in Judicial Psychiatric Hospitals (Ospedali Psichiatrici Giudiziari), which are special penal institutions under the authority of the Penitentiary Administration, managed by a psychiatrist of the Penitentiary Administration. These prisoners may also be held in prison hospitals, as they are executing a security detention measure.
LATVIA:
Figures are on 1st October 2009 instead of 1st September 2009; Point (e) – Are included information on the number of persons to whom fine and forced labour are replaced by the arrest.
LITHUANIA:
Figures are on 1st July 2009 instead of 1st September 2009; Point (b) – Following the provisions of the Code of Criminal Procedure, sentenced prisoners after having submitted their written consent are able to start the service of their term of imprisonment before the hearing of their case in order of appeal.
LUXEMBOURG:
Point (g) – Voluntary detained. MALTA:
Point (g) – 165 persons included under this heading are not counted among the total number of prisoners.
MOLDOVA:
Point (g) – In this category are included prisoners; who are at the disposal of the prosecuting agencies and those who lodged a cassation appeal to the Supreme Court.
MONACO:
Point (d) –The only detention facility in the Principality of Monaco is a remand centre. Only nationals are intended to serve their entire sentence. Aliens who received their final sentence to over six months of imprisonment are usually transferred to the prison of Nice. These transfers are regulated by an agreement between Monaco and France (Article 14 of the Treaty of Cooperation “Convention de voisinage” from 1963).

Council of Europe Annual Penal Statistics – SPACE I – 2009
Strasbourg, 22 March 2011, pc-cp\space\documents\pc-cp (2011) 3e PC-CP (2011) 3
60
NETHERLANDS:
Data are available for the population held in penal institutions (see general notes). The total number of prisoners does not refer to persons held in institutions for juvenile offenders, custodial clinics and institutions for aliens.
Points (a) and (b) – It is not possible to keep these groups separate in the statistics. Point (c) – Are included persons who appealed. Prisoners sentenced but who have not appealed being still within the statutory limit to do so are counted under point (a).
Point (g) –The category “Other cases” includes other and unknown cases. NORWAY:
Point (a) – Under this heading are counted untried detainees as well as those who have been sentenced by a lower court but who appealed to a higher court. A person who is sentenced to imprisonment while remanded in custody and appeals against the sentence may remain classified as "remanded in custody" until the appeal is decided by a higher court. An exception this is where only the length of sentence is appealed against. In such cases the offender may elect to start serving the sentence pending the outcome of the appeal;
Point (f) – Those returned to prison for breach of conditions will, in many cases (all in 2009), be convicted for a new offence. Breach of conditions will be taken into account when passing sentence, but it is the new offence that will be registered.
POLAND:
Data relate to 31st December 2009 instead of 1st September 2009. PORTUGAL:
Figures are on 31st December 2009 instead of 1st September 2009; Point (g) – 250 detainees are under “security measures” (mentally ill persons), of which 96 are placed in special psychiatric institutions or in penitentiary hospitals, and 154 in non‐penitentiary hospitals.
SPAIN (STATE ADMINISTRATION):
Points (a), (b), and (c) –It is not possible to keep these groups separate in the statistics. SPAIN (CATALONIA):
Points (a), (b), and (c) –It is not possible to keep these groups separate in the statistics. SWEDEN:
Points (a), (b), and (c) –It is not possible to keep these groups separate in the statistics; SWITZERLAND:
Figures are on 2nd September 2009 instead of 1st September 2009; Points (b) and (c) –It is not possible to keep these groups separate in the statistics; Point (g) –The category “Other cases” includes:
o Confinement for purposes of assistance within the meaning of Articles 314a and 397 of the Civil Code;
o Detention in order to proceed to the expulsion or extradition of a person; o Persons waiting transfer from one penal institution to another; o Juveniles serving sentences of the Juvenile Criminal Law.
TURKEY:
Point (b) – In the Turkish criminal justice system, a suspect or a detainee cannot be found guilty until final verdict. The jury system does not exist in the Turkish criminal justice system.

Council of Europe Annual Penal Statistics – SPACE I – 2009
Strasbourg, 22 March 2011, pc-cp\space\documents\pc-cp (2011) 3e PC-CP (2011) 3
61
UKRAINE:
Point (a) –Additional categories are included under this heading: therapeutic‐prophylactic center alcoholics, sentenced prisoners in arrest houses, lifers, sentenced prisoners who are continued to be held at the remand prisons and are engaged in providing different services to the pre‐trial detainees (cooking, cleaning, laundry etc.), sentenced transit prisoners, sentenced prisoners who wait to be transferred.
Point (f) – Persons detained for fine conversion reasons (fine defaulters) are counted separately and not as part of the sentenced prisoners.
UK: ENGLAND AND WALES:
Figures are on 30th June 2009 instead of 1st September 2009; Point (e) – Persons under this heading (113 persons) are not included in the total number of prisoners.
Point (g) –Non‐criminal population, held for civil offences. UK: NORTHERN IRELAND:
Points (a) and (b) –It is not possible to keep these groups separate in the statistics;

Council of Europe Annual Penal Statistics – SPACE I – 2009
Strasbourg, 22 March 2011, pc-cp\space\documents\pc-cp (2011) 3e PC-CP (2011) 3
62
Table 5: Legal status of detainees not serving a final sentence on 1st September 2009 (percentages and rates)
Reference: Council of Europe, SPACE I 2009.5
Country
Percentage of prisoners not serving a final sentence (1)
Rate of prisoners not serving a final sentence per
100,000 inhabitants (1)
Percentage of prisoners not serving a final sentence (2)
Rate of prisoners not serving a final sentence per
100,000 inhabitants (2)
Percentage of untried
detainees (no court decision yet reached)
Rate of untried detainees (no court decision yet reached) per 100,000 inhabitants
a.1 b.1 a.2 b.2 c d
Albania (33.6) (47.3) (33.6) (47.3) [33.6] [47.3]
Andorra 44.1 35.5 44.1 35.5 42.6 34.3
Armenia 27.3 33.6 26.7 32.9 18.4 22.7
Austria
Azerbaijan (13.5) (31.1) (13.5) (31.1) 11.8 27.2
Belgium 40.1 40.6 29.1 29.5 23.1 23.4
BH: Fed. BiH 15.3 8.7 15.3 8.7 12.9 7.3
BH: Republika Srpska 21.0 14.1 19.5 13.0 19.0 12.8
Bulgaria (16.6) (21.9) (16.6) (21.9) [16.6] [21.9]
Croatia 24.8 27.3 24.8 27.3 24.8 27.3
Cyprus (42.2) (46.8) (42.2) (46.8) 42.2 46.8
Czech Republic NA NA NA NA NA NA
Denmark 38.3 25.9 38.3 25.9 31.7 21.4
Estonia 23.5 62.4 23.5 62.4 23.5 62.4
Finland 16.0 10.8 16.0 10.8 16.0 10.8
France 23.5 24.3 23.5 24.3 17.8 18.3
Georgia
Germany (16.2) (14.5) (15.5) (13.9) [15.5] [13.9]
Greece
Hungary 32.5 53.3 30.5 50.0 25.8 42.4
Iceland (29.7) (11.0) (29.7) (11.0) [29.7] [11.0]
Ireland (14.8) (13.0) (14.5) (12.8) [14.5] [12.8]
Italy 50.7 54.0 47.7 50.9 23.3 24.8
Latvia 28.5 88.1 19.3 59.7 6.0 18.5
Liechtenstein 57.1 11.2 57.1 11.2 0.0 0.0
Lithuania 16.7 41.3 16.7 41.3 11.2 27.8
Luxembourg 38.9 53.5 38.7 53.3 32.4 44.6
Malta 97.4 116.3 64.0 76.4 64.0 76.4
Moldova 12.2 23.2 12.2 23.2 2.4 4.6
Monaco 60.9 45.2 60.9 45.2 52.2 38.7
Montenegro
Netherlands 48.9 34.5 47.0 33.2 36.4 25.7
Norway (23.8) (16.3) (23.8) (16.3) [23.8] [16.3]
Poland (11.8) (25.9) (11.8) (25.9) 11.3 24.8
Portugal 21.5 22.5 19.3 20.1 14.0 14.6
Romania (14.6) (18.4) (14.6) (18.4) 9.2 11.5
Russian Federation
San Marino 50.0 3.2 50.0 3.2 50.0 3.2
Serbia (Republic of) 24.8 34.7 24.8 34.7 3.1 4.3
Slovak Republic (17.7) (30.0) (17.7) (30.0) [17.7] [30.0]
Slovenia 30.5 20.5 28.0 18.8 20.9 14.0
Spain (State Adm.) 20.8 36.0 20.8 36.0 20.8 36.0
Spain (Catalonia) 21.1 29.2 21.1 29.2 21.1 29.2
Sweden 21.7 16.7 21.7 16.7 21.7 16.7
Switzerland (49.3) (39.0) (49.3) (39.0) 39.5 31.2
the FYRO Macedonia 8.6 10.3 8.6 10.3 2.0 2.4
Turkey 51.7 83.5 51.7 83.5 34.7 56.1
Ukraine 22.7 72.2 22.7 72.2 15.5 49.2
UK: England and Wales (17.9) (27.3) (16.1) (24.6) 10.7 16.3
UK: Northern Ireland 37.8 30.7 37.8 30.7 37.2 30.2
UK: Scotland (92.4) (144.3) (19.6) (30.6) 13.6 21.2
Mean 31.6 36.7 28.4 32.0 22.5 25.2
Median 24.8 30.0 23.5 29.5 20.8 22.7
Minimum 8.6 3.2 8.6 3.2 0.0 0.0
Maximum 97.4 144.3 64.0 83.5 64.0 76.4

Council of Europe Annual Penal Statistics – SPACE I – 2009
Strasbourg, 22 March 2011, pc-cp\space\documents\pc-cp (2011) 3e PC-CP (2011) 3
63
Notes – Table 5
See notes to Table 4.
TABLE 5 includes two different types of calculation for the category of “prisoners not serving a final sentence”:
in the first case (a.1 and b.1), the category (g) “Other cases” from Table 4 is included, while
in the second one (a.2 and b.2), that category is excluded. The second type of calculation has been introduced on the basis of additional information provided by the national correspondents, which can be found in the notes to Table 4. Indeed, it seems that a significant part of the persons included under the heading “Other cases” cannot be assimilated to persons waiting for a final sentence to be imposed (i.e. this category includes persons held for security reasons, persons held for civil reasons, etc.). Nevertheless, in order to ensure the comparability of the data with previous years’ reports, we have kept the first type of calculation (a.1 and b.1).
In TABLE 4, when no data were available under heading (c) “SENTENCED PRISONERS WHO HAVE
APPEALED OR WHO ARE WITHIN THE STATUTORY TIME LIMIT FOR DOING SO" and no further information was provided, it is assumed that prisoners in that situation are included among those under heading (d) "SENTENCED PRISONERS (FINAL SENTENCE)".
In that case, the results under headings “Percentage of prisoners not serving a final sentence” (a.1 and a.2) and those under headings “Rate of prisoners not serving a final sentence per 100,000 inhabitants” (b.1 and b.2) of TABLE 5 ARE PRESENTED BETWEEN BRACKETS AND MUST BE USED WITH CAUTION.
In TABLE 4, when no data were available under heading (b) "PRISONERS CONVICTED BUT NOT YET SENTENCED" and no further information was provided, it cannot be excluded that prisoners in that situation are included among those under heading (a) "UNTRIED DETAINEES (NO COURT DECISION YET REACHED)".
In that case, the results under heading (c) “Percentage of untried detainees (not court decision yet reached)” and those under heading (d) “Rate of untried detainees (no court decision yet reached) per 100,000 inhabitants” of TABLE 5 ARE PRESENTED BETWEEN SQUARE BRACKETS AND MUST BE USED WITH CAUTION.

Council of Europe Annual Penal Statistics – SPACE I – 2009
Strasbourg, 22 March 2011, pc-cp\space\documents\pc-cp (2011) 3e PC-CP (2011) 3
64
Table 6: Breakdown of sentenced prisoners (final sentence) on 1st September 2009, by main offence (numbers)
Reference: Council of Europe, SPACE I 2009.6
Country Homicide (including attempts)
Assault and Battery
Rape Other types of sexual offences
Robbery Other types of theft
Economic and
financial offences
Drug offences
Terrorism Organised crime
Other Total
Albania 1 139 NA 86 NA 594 NA NA NA NA NA 1 156 2 975
Andorra 0 0 2 0 3 16 6 12 0 0 0 39
Armenia 840 42 1 279 46 347 131 216 2 901
Austria 5 542
Azerbaijan 2 426 849 271 NA 1 057 2 447 261 4 837 NA NA 5 557 17 705
Belgium 756 1 910 796 832 2 656 2 932 NA 2 371 NA NA 4 648 6 534
BH: BiH (state level)
BH: Fed. BiH 309 76 50 42 338 177 43 177 15 23 122 1 372
BH: Republika Srpska 192 18 25 13 239 26 8 75 0 19 25 749
Bulgaria 1 123 206 458 179 1 648 4 387 513 605 79 86 NA 8 363
Croatia 454 108 245 48 383 586 51 765 0 NAP 952 3 592
Cyprus 49 14 22 5 20 122 0 95 0 0 183 510
Czech Republic 238 1 285 219 9 1 743 8 783 2 032 1 434 0 7 11 019 19 648
Denmark 180 540 53 68 289 318 NA 534 NA NA 313 2 295
Estonia 578 199 106 NAP 432 524 9 483 0 0 388 2 719
Finland 591 597 99 195 338 109 413 0 NA 582 3 014
France 3 470 12 437 7 839 5 158 3 951 4 050 7 342 NA NA 6 458 50 705
Georgia
Germany 4 441 7 479 4 322 121 7 596 12 706 8 618 9 281 NA NA 6 823 61 387
Greece
Hungary 1 181 796 243 NA 2 286 3 034 NA 291 4 NA 3 282 11 117
Iceland 18 14 7 6 45 81
Ireland 339 481 147 151 91 913 0 727 32 0 458 3 339
Italy 5 559 72 1 834 663 4 238 1 834 122 11 632 68 182 5 358 31 562
Latvia 610 413 245 89 1 572 1 138 58 704 0 7 171 5 007
Liechtenstein 0 0 0 1 0 1 0 0 0 0 1 3
Lithuania 1 804 396 400 NA 1 265 1 791 55 578 0 14 1 061 6 911
Luxembourg 52 19 27 4 52 50 12 149 20 385
Malta 24 2 11 NAP 81 2 NAP 95 NAP NAP 75 178
Moldova 1 267 512 384 461 1 792 36 255 0 46 713 5 466
Monaco 1 0 1 0 0 2 3 1 0 0 2 9
Montenegro

Council of Europe Annual Penal Statistics – SPACE I – 2009
Strasbourg, 22 March 2011, pc-cp\space\documents\pc-cp (2011) 3e PC-CP (2011) 3
65
Country Homicide (including attempts)
Assault and Battery
Rape Other types of sexual offences
Robbery Other types of theft
Economic and
financial offences
Drug offences
Terrorism Organised crime
Other Total
Netherlands 778 217 171 769 698 234 1 058 0 28 1 989 5 942
Norway 163 247 140 135 135 216 142 750 1 NAP 481 2 503
Poland 4 931 NA 2 030 999 11 858 16 963 644 NA NA 450 36 241 74 116
Portugal 1 219 136 234 250 1 350 1 231 NA 2 026 2 512 8 708
Romania 5 703 464 1 502 81 4 588 6 796 718 967 3 34 2 226 23 082
Russian Federation
San Marino 0 0 0 0 0 0 1 0 0 0 1
Serbia 891 572 259 175 1 124 2 012 264 1 247 26 64 1 123 7 757
Slovak Republic 497 78 138 128 1 132 1 494 NA 464 0 1 NA 7 411
Slovenia 108 37 42 93 181 137 43 85 0 57 165 948
Spain (State Adm.) 2 620 2 505 2 051 841 16 675 1 441 1 516 14 171 441 982 10 611 53 854
Spain (Catalonia) 536 381 370 150 1 558 1 516 216 2 111 0 0 1 333 8 171
Sweden 557 709 274 183 530 372 230 1 640 NA NA 991 5 486
Switzerland NA NA NA NA NA NA NA NA NA NA NA 3 084
the FYRO Macedonia 214 55 37 111 92 926 46 304 55 74 336 2 250
Turkey 9 221 1 258 222 1 516 6 986 8 098 7 220 2 784 528 17 851 55 684
Ukraine 18 992 10 742 2 615 NA 13 883 25 000 NA 19 117 NAP NAP NA 109 920
UK: England and Wales 7 299 12 647 4 535 3 437 9 049 11 266 1 875 10 696 NA NA 7 571 68 375
UK: Northern Ireland 166 191 36 99 107 72 28 82 NA NA 125 906
UK: Scotland 1 011 866 176 194 421 670 NA 896 1 NA 2 288 6 524

Council of Europe Annual Penal Statistics – SPACE I – 2009
Strasbourg, 22 March 2011, pc-cp\space\documents\pc-cp (2011) 3e PC-CP (2011) 3
66
Notes – Table 6
ALBANIA:
The only categories for which statistics are available are: “Homicides”, “Rape” and “Robbery”. All other offences have been included under the heading “Other cases”, as the distribution is not available in national reports.
ARMENIA:
Categories of Homicide and Assault and battery cannot be separated in these statistics; Categories of Rape and Other types of sexual offences cannot be separated in these statistics; Categories of Robbery and Other types of theft cannot be separated in these statistics.
AUSTRIA:
Only the total number of sentenced prisoners (final sentence) has been provided for this year’s report.
BELGIUM:
The main offence rule is not well‐defined. Therefore, prisoners sentenced for more than one offence can be counted several times. Indeed, the information in this Table relates to the number of prisoners with a final relative sentence concerning at least one offence of the corresponding category. Therefore the total number exceeds the number of sentenced prisoners.
“Other cases”: For 6 detainees (not included in this category) the record on the type of offence was missing.
BOSNIA AND HERZEGOVINA (STATE LEVEL PRISON ADMINISTRATION):
Just one pre‐trial detention unit, consequently figures on sentenced prisoners are not
available for this administrative area. BOSNIA AND HERZEGOVINA (REPUBLIKA SRPSKA):
The main offence rule is not well‐defined. Therefore, prisoners sentenced for more than one offence can be counted several times.
BULGARIA:
The main offence rule is not well‐defined. Therefore, prisoners sentenced for more than one offence can be counted several times.
CROATIA:
Organized criminal acts are aggravating circumstances in determining the sentence and not a special type of crime.
CZECH REPUBLIC:
Figures are on 31st August 2009 instead of 1st September 2009; The main offence rule is not well‐defined. Therefore, prisoners sentenced for more than one offence can be counted several times. The distribution by main offence rule may be found at the Ministry of Justice, but is not available at Prison Administration.
DENMARK:
The category of Homicide may include the particularly grievous assault.

Council of Europe Annual Penal Statistics – SPACE I – 2009
Strasbourg, 22 March 2011, pc-cp\space\documents\pc-cp (2011) 3e PC-CP (2011) 3
67
FINLAND:
Figures are on 1st May 2009 instead of 1st September 2009; Categories of Rape and Other types of sexual offences cannot be separated in these statistics: are included all types of sexual offences;
Main offence of fine defaulters (90 persons) is not available. FRANCE:
Figures are on 1st October 2009 instead of 1st September 2009; Categories of Rape and Other types of sexual offences cannot be separated in these statistics: are included all types of sexual offences;
Under the heading Economic and financial offences are included: fraud, breach of faith, handling stolen goods, forgery and use of forged documents.
GERMANY:
Figures are on 31st March 2009 instead of 1st September 2009. IRELAND:
Under the heading Other cases are included criminal damage, public order, road traffic offences, firearms/offensive weapons, damage to property, attempted burglary and miscellaneous.
ITALY:
In the category of Terrorism are included all types of crimes supplied in the Criminal Code under the denomination of “crimes against the personality of the State”.
LATVIA:
Figures are on 1st October 2009 instead of 1st September 2009. LIECHTENSTEIN:
Under the heading Other cases is included the fine defaulter. LITHUANIA:
Figures are on 1st July 2009 instead of 1st September 2009; Following legal provisions of the Code of Criminal Proceedings, sentenced prisoners may start serving their term of imprisonment prior to the appeal hearing of the case in court provided they declared their request in written form. This is the reason why sentenced prisoners who have appealed or who are within the statutory limit for doing so, also convicted prisoners, but not yet sentenced included in the present survey are accounted for together with the sentenced prisoners with final sentence and serving their term of imprisonment.
MALTA:
The main offence rule is not applied in Malta. Many residents are sentenced on a number of charges. Figures include all the charges that the residents were sentenced upon;
Assault and Battery –Grievous Bodily Harm cases also included. MOLDOVA:
Categories of Rape and Other types of sexual offences cannot be separated in these statistics: are included all types of sexual offences.
MONACO:
One person was sentenced for theft and drug offence.

Council of Europe Annual Penal Statistics – SPACE I – 2009
Strasbourg, 22 March 2011, pc-cp\space\documents\pc-cp (2011) 3e PC-CP (2011) 3
68
NETHERLANDS:
Data are available for the population held in penal institutions (see general notes). The total number of prisoners does not refer to persons held in institutions for juvenile offenders custodial clinics, and in institution for administrative aliens.
Categories of Rape and Other types of sexual offences cannot be separated in these statistics: are included all types of sexual offences.
NORWAY:
Organized Crime‐ is not itself classified as offence, but is aggravating element that may result in longer sentences. It is not possible to quantify these categories of offences.
POLAND:
Figures are on 31st December 2009 instead of 1st September 2009. PORTUGAL:
Figures are on 31st December 2009 instead of 1st September 2009; Under the distribution of the sentenced prisoners are not included 250 mentally‐ill offenders, which are counted separately.
SPAIN (STATE ADMINISTRATION):
Under the heading Other types of sexual offences are included abuse, harassment, exhibition; Under the heading Other types of theft are included, among others, thefts for own use of the vehicles;
Under the heading Economic and financial crimes are included other socioeconomic crimes and crimes against public finance;
Under the heading Drug offences are included crimes against public health; Under the heading Organised crime are included offences related to the prostitution, offences related to the right of workers and the weapons trafficking;
Under the heading Other cases, among others, are included 842 persons sentenced for the crimes against traffic safety.
SWEDEN:
Figures are on 1st October 2009 instead of 1st September 2009. SWITZERLAND:
Figures are on 2nd September 2009 instead of 1st September 2009; The total number of sentenced prisoners (final sentence) has been taken from point (d) of Table 4.
UKRAINE:
The main offence rule is not well‐defined. Therefore, prisoners sentenced for more than one offence can be counted several times.
Sentenced juveniles (less than 18 years) are not included in the total number of prisoners in this Table.

Council of Europe Annual Penal Statistics – SPACE I – 2009
Strasbourg, 22 March 2011, pc-cp\space\documents\pc-cp (2011) 3e PC-CP (2011) 3
69
UK: ENGLAND AND WALES:
Figures are on 30th June 2009 instead of 1st September 2009; Under the headings Terrorism and Organised Crime offences there is no information provided. These prisoners are recorded in other cells of the table depending on the type of offence;
The numbers recorded under Economic and financial offences are taken from the "Fraud and Forgery" category as used in England and Wales. As this category did not feature in 2008 there is a substantial fall in the number in the other cases category where it was previously recorded.
UK: SCOTLAND:
In the category of Rape are also included prisoners sentenced for attempted rape; The type of offence is not always known for the prisoners recalled from custody.

Council of Europe Annual Penal Statistics – SPACE I – 2009
Strasbourg, 22 March 2011, pc-cp\space\documents\pc-cp (2011) 3e PC-CP (2011) 3
70
Table 7: Breakdown of sentenced prisoners (final sentence) on 1st September 2009, by main offence (percentages)
Reference: Council of Europe, SPACE I 2009.7
Country
Homicide
(including
attempts)
Assau
lt and
Battery
Rap
e
Other types
of sexual
offences
Robbery
Other types
of theft
Economic
and finan
cial
offences
Drug
offences
Terrorism
Organ
ised
crim
e
Other
Albania 38.3 NA 2.9 NA 20.0 NA NA NA NA NA 38.9
Andorra 0.0 0.0 5.1 0.0 7.7 41.0 15.4 30.8 0.0 0.0 0.0
Armenia 29.0 1.4 44.1 1.6 12.0 4.5 7.4
Austria
Azerbaijan 13.7 4.8 1.5 NA 6.0 13.8 1.5 27.3 NA NA 31.4
Belgium (11.6) (29.2) (12.2) (12.7) (40.6) (44.9) NA (36.3) NA NA (71.1)
BH: BiH (st. level)
BH: Fed. BiH 22.5 5.5 3.6 3.1 24.6 12.9 3.1 12.9 1.1 1.7 8.9
BH: Rep. Srpska (25.6) (2.4) (3.3) (1.7) (31.9) (3.5) (1.1) (10.0) (0.0) (2.5) (3.3)
Bulgaria (13.4) (2.5) (5.5) (2.1) (19.7) (52.5) (6.1) (7.2) (0.9) (1.0) NA
Croatia 12.6 3.0 6.8 1.3 10.7 16.3 1.4 21.3 0.0 NAP 26.5
Cyprus 9.6 2.7 4.3 1.0 3.9 23.9 0.0 18.6 0.0 0.0 35.9
Czech Republic (1.2) (6.5) (1.1) (0.0) (8.9) (44.7) (10.3) (7.3) (0.0) (0.0) (56.1)
Denmark 7.8 23.5 2.3 3.0 12.6 13.9 NA 23.3 NA NA 13.6
Estonia 21.3 7.3 3.9 NAP 15.9 19.3 0.3 17.8 0.0 0.0 14.3
Finland 19.6 19.8 3.3 6.5 11.2 3.6 13.7 0.0 NA 19.3
France 6.8 24.5 15.5 10.2 7.8 8.0 14.5 NA NA 12.7
Georgia
Germany 7.2 12.2 7.0 0.2 12.4 20.7 14.0 15.1 NA NA 11.1
Greece
Hungary 10.6 7.2 2.2 NA 20.6 27.3 NA 2.6 0.0 NA 29.5
Iceland (22.2) (17.3) (8.6) (7.4) (55.6)
Ireland 10.2 14.4 4.4 4.5 2.7 27.3 0.0 21.8 1.0 0.0 13.7
Italy 17.6 0.2 5.8 2.1 13.4 5.8 0.4 36.9 0.2 0.6 17.0
Latvia 12.2 8.2 4.9 1.8 31.4 22.7 1.2 14.1 0.0 0.1 3.4
Liechtenstein 0.0 0.0 0.0 33.3 0.0 33.3 0.0 0.0 0.0 0.0 33.3
Lithuania (26.1) (5.7) (5.8) NA (18.3) (25.9) (0.8) (8.4) (0.0) (0.2) (15.4)
Luxembourg 13.5 4.9 7.0 1.0 13.5 13.0 3.1 38.7 5.2
Malta (13.5) (1.1) (6.2) NAP (45.5) (1.1) NAP (53.4) NAP NAP (42.1)
Moldova 23.2 9.4 7.0 8.4 32.8 0.7 4.7 0.0 0.8 13.0
Monaco (11.1) (0.0) (11.1) (0.0) (0.0) (22.2) (33.3) (11.1) (0.0) (0.0) (22.2)
Montenegro
Netherlands 13.1 3.7 2.9 12.9 11.7 3.9 17.8 0.0 0.5 33.5
Norway 6.5 9.9 5.6 5.4 5.4 8.6 5.7 30.0 0.0 NAP 19.2
Poland 6.7 NA 2.7 1.3 16.0 22.9 0.9 NA NA 0.6 48.9
Portugal 14.0 1.6 2.7 2.9 15.5 14.1 NA 23.3 28.8
Romania 24.7 2.0 6.5 0.4 19.9 29.4 3.1 4.2 0.0 0.1 9.6
Russian Fed.
San Marino 0.0 0.0 0.0 0.0 0.0 0.0 100.0 0.0 0.0 0.0
Serbia 11.5 7.4 3.3 2.3 14.5 25.9 3.4 16.1 0.3 0.8 14.5
Slovak Republic (6.7) (1.1) (1.9) (1.7) (15.3) (20.2) NA (6.3) (0.0) (0.0) NA
Slovenia 11.4 3.9 4.4 9.8 19.1 14.5 4.5 9.0 0.0 6.0 17.4
Spain (State Adm.) 4.9 4.7 3.8 1.6 31.0 2.7 2.8 26.3 0.8 1.8 19.7
Spain (Catalonia) 6.6 4.7 4.5 1.8 19.1 18.6 2.6 25.8 0.0 0.0 16.3
Sweden 10.2 12.9 5.0 3.3 9.7 6.8 4.2 29.9 NA NA 18.1
Switzerland NA NA NA NA NA NA NA NA NA NA NA
FYRO Macedonia 9.5 2.4 1.6 4.9 4.1 41.2 2.0 13.5 2.4 3.3 14.9
Turkey 16.6 2.3 0.4 2.7 12.5 14.5 13.0 5.0 0.9 32.1
Ukraine (17.3) (9.8) (2.4) NA (12.6) (22.7) NA (17.4) NAP NAP NA
UK: Engl. & Wales 10.7 18.5 6.6 5.0 13.2 16.5 2.7 15.6 NA NA 11.1
UK: North. Ireland 18.3 21.1 4.0 10.9 11.8 7.9 3.1 9.1 NA NA 13.8
UK: Scotland 15.5 13.3 2.7 3.0 6.5 10.3 NA 13.7 0.0 NA 35.1
Mean 13.1 7.7 4.6 3.9 14.4 19.7 4.5 18.7 0.5 0.8 21.4
Median 11.9 4.9 4.1 2.1 12.8 17.5 3.0 15.4 0.0 0.2 17.0
Minimum 0.0 0.0 0.0 0.0 0.0 0.0 0.0 0.0 0.0 0.0 0.0
Maximum 38.3 29.2 17.3 33.3 45.5 52.5 33.3 55.6 5.0 6.0 71.1

Council of Europe Annual Penal Statistics – SPACE I – 2009
Strasbourg, 22 March 2011, pc-cp\space\documents\pc-cp (2011) 3e PC-CP (2011) 3
71
Table 8: Breakdown of sentenced prisoners (final sentence) on 1st September 2009, by length of sentence (numbers)
(A) – LESS THAN 1 MONTH (G) – FROM 5 YEARS TO LESS THAN 10 YEARS (B) – FROM 1 MONTH TO LESS THAN 3 MONTHS (H) – FROM 10 YEARS TO LESS THAN 20 YEARS (C) – FROM 3 MONTHS TO LESS THAN 6 MONTHS (I) – 20 YEARS AND OVER (D) – FROM 6 MONTHS TO LESS THAN ONE YEAR (J) – LIFE IMPRISONMENT (E) – FROM 1 YEAR TO LESS THAN 3 YEARS (K) – PRISONERS SENTENCED TO DEATH (F) – FROM 3 YEARS TO LESS THAN 5 YEARS
Reference: Council of Europe, SPACE I 2009.8
Country (A) (B) (C) (D) (E) (F) (G) (H) (I) (J) (K)
Albania NAP 287 255 655 (1 061) (343) 248 126 NAP
Andorra 5 8 5 2 7 5 6 1 0 0 NAP
Armenia NAP 62 359 818 1 181 387 94 NAP
Austria
Azerbaijan (2 356) (8 510) (4 798) (1 802) NAP 239 NAP
Belgium 0 3 15 244 1 085 1 721 2 058 698 474 236 NAP
BH: Fed. BiH 14 53 125 169 370 197 223 187 34 NA NAP
BH: Republika Srpska 5 20 45 59 177 143 155 153 17 0 NAP
Bulgaria 3 286 752 1 401 2 646 1 131 984 979 32 149 NAP
Croatia 117 83 130 393 1 073 729 638 345 84 NAP NAP
Cyprus 10 29 45 54 123 72 75 74 11 17 NAP
Czech Republic 64 373 2 155 4 782 6 475 1 895 2 328 (1 034) (218) 38 NAP
Denmark 35 162 223 335 721 268 295 185 3 20 NAP
Estonia 0 43 141 153 701 694 628 296 29 36 NAP
Finland 85 296 295 443 1 090 337 267 19 0 152 NAP
France 8 925 8 659 14 341 5 402 4 796 6 391 1 666 519 NAP
Georgia
Germany 980 5 314 7 733 (12 042) (12 007) (15 402) (5 012) (888) NAP 2 009 NAP
Greece
Hungary 31 59 256 1 504 4 080 2 019 2 112 803 20 233 NAP
Iceland 26 24 NAP
Ireland 18 28 84 318 835 741 772 247 20 276 NAP
Italy 82 139 548 2 348 8 134 7 460 6 174 3 560 1 679 1 438 NAP
Latvia 3 21 28 228 1 217 1 048 1 796 614 6 46 NAP
Liechtenstein 0 1 1 0 1 0 0 0 0 0 NAP
Lithuania 22 99 134 384 2 237 1 585 1 634 1 142 21 106 NAP
Luxembourg 1 0 5 19 107 64 81 63 32 13 NAP

Council of Europe Annual Penal Statistics – SPACE I – 2009
Strasbourg, 22 March 2011, pc-cp\space\documents\pc-cp (2011) 3e PC-CP (2011) 3
72
Country (A) (B) (C) (D) (E) (F) (G) (H) (I) (J) (K)
Malta 73 46 88 75 160 46 36 57 26 8 NAP
Moldova NAP NAP NAP 72 475 1 148 1 686 1 615 384 86 NAP
Monaco 0 3 1 1 1 1 0 2 0 0 NAP
Montenegro
Netherlands 764 638 481 843 1 402 516 631 375 25 24 NAP
Norway 98 378 231 330 613 303 250 187 20 NAP NAP
Poland NAP 681 5 002 14 923 30 997 8 652 5 826 2 973 1 515 245 NAP
Portugal 4 80 185 397 1 243 1 496 3 241 1 423 284 NAP NAP
Romania 181 18 110 487 4 159 5 763 6 623 4 756 847 138 NAP
Russian Federation
San Marino 0 0 0 0 1 0 0 0 0 0 NAP
Serbia 247 1 385 1 558 1 372 1 385 769 613 364 64 0 NAP
Slovak Republic 50 154 619 1 345 2 312 849 1 465 507 78 32 NAP
Slovenia 0 4 39 79 317 206 186 100 17 0 NAP
Spain (State Adm.) NAP NAP NA NA NA NA NA NA 991 NAP NAP
Spain (Catalonia) 55 41 138 235 1 296 2 002 2 601 1 475 328 NAP NAP
Sweden 12 358 296 626 1 914 911 429 156 NAP
Switzerland NA NA NA NA NA NA NA NA NA NA NAP
FYRO Macedonia 3 12 96 324 710 456 412 210 NA 27 NAP
Turkey NA NA NA NA NA NA NA NA NA NA NAP
Ukraine NAP NAP NAP 867 18 201 35 901 40 836 12 263 288 1 564 NAP
UK: England and Wales 319 1 466 3 330 2 465 19 963 13 178 11 439 3 399 296 12 521 NAP
UK: Northern Ireland 30 8 53 62 150 124 177 121 6 175 NAP
UK: Scotland 9 112 371 857 1 646 986 954 209 2 762 NAP
General remarks: Some countries could have included persons sentenced to security measures (mentally ill offenders and persons considered as dangerous) under the category “life imprisonment” because in such cases the length of detention/imprisonment is not fixed. However, as a rule, such persons have been excluded from the distribution, and counted separately (see notes to Table 8). Several figures are presented between brackets because they do not correspond to the categorization of the length of sentences used in the SPACE questionnaire.

Council of Europe Annual Penal Statistics – SPACE I – 2009
Strasbourg, 22 March 2011, pc-cp\space\documents\pc-cp (2011) 3e PC-CP (2011) 3
73
Notes – Table 8
ALBANIA:
Point (G) – From 5 to less than 15 years (instead of 5 years to less than 10 years); Point (H) – From 15 to less than 20 years (instead of 10 years to less than 20 years).
AZERBAIJAN:
Points (A), (B), (C), (D), and (E) –Less than 2 years. These categories cannot be separated in these statistics;
Point (F) –2 years to less than 7 years (instead of 3 years to less than 5 years); Point (G) –7 years to less than 12 years (instead of 5 years to less than 10 years); Points (H) – 12 years to less than 15 years (instead of 10 years to less than 20 years).
CZECH REPUBLIC:
Figures are on 31st December 2009 instead of 1st September 2009; Point (H) – 10 years to less than 15 years (instead of 10 years to less than 20 years); Point (I) – 15 years to 25 years (instead of 20 years and over).
DENMARK:
Other (not presented in the Table) – “Preventive detention”: sentence not limited in time and given to persons who are mentally disturbed – 32 prisoners. Prisoners convicted according to Criminal Law of Greenland (special measures against mentally ill people and particularly dangerous people) – 16 prisoners. These measures have no time limits; though, annually an evaluation is made in order to establish if these prisoners could be released on a trial basis.
FINLAND:
Data relate to 1st May 2009 instead of 1st September 2009; Other (not presented in the Table) – 30 prisoners whose sentences were not yet counted (the administrative process is in process) or prisoners who run away.
FRANCE:
Data relate to 1st October 2009 instead of 1st September 2009; Points (A), (B), and (C) – It is not possible to keep these groups separate in the statistics; Data relate to the whole of the penal population, and not only on thus who are held in penal institutions. Nevertheless, 6 judicial restraints are not included in the distribution.
GERMANY:
Data relate to 31st March 2009 instead of 1st September 2009; Point (D) – 6 moths to 1 year (instead of 6 months to less than 1 year); Point (E) – more than 1 year to 2 years (instead of 1 year to less than 3 years); Point (F) – more than 2 years to 5 years (instead of 3 year to less than 5 years); Point (G) – more than 5 years to 10 years (instead of 5 years to less than 10 years); Point (H) – more than 10 years to 15 years (instead of 10 years to less than 20 years).
LATVIA:
Figures are on 1st October 2009 instead of 1st September 2009; Point (K) – In Latvia the death penalty is not applicable for the crimes committed in a peace time. The Criminal Law of Latvia provides the possibility of application of the death sentence for the crimes perpetrated in wartime.

Council of Europe Annual Penal Statistics – SPACE I – 2009
Strasbourg, 22 March 2011, pc-cp\space\documents\pc-cp (2011) 3e PC-CP (2011) 3
74
LITHUANIA: Figures are on 1st July 2009 instead of 1st September 2009; Following legal provisions of the Code of Criminal Proceedings, sentenced prisoners may start serving their term of imprisonment prior to the appeal hearing of the case in court provided they declared their request in written form. This is the reason why sentenced prisoners who have appealed or who are within the statutory limit for doing so, also convicted prisoners, but not yet sentenced included in the present survey are accounted for together with the sentenced prisoners with final sentence and serving their term of imprisonment.
MALTA:
The main offence rule is not applied in Malta. Many residents are sentenced on a number of charges. Figures include all the charges that the residents were sentenced upon. Therefore, the distribution by length is as well influenced by this particularity.
MOLDOVA:
In the Moldavian Criminal Code (art. 70 CPRM) sentences with deprivation of freedom cannot be stated for less than 6 months. However, there exist arrests (art. 68 CPRM) which cannot be included under the same heading.
NETHERLANDS:
Other (not presented in the Table) – 243 prisoners held in different penitentiary institutions. The information about the length of the sentence is not available.
POLAND:
Figures are on 31st December 2009 instead of 1st September 2009; Other (not presented in the Table) –In this category are included 3,302 persons serving “substitutive” imprisonment lengths of less than 12 months.
PORTUGAL:
Figures are on 31st December 2009 instead of 1st September 2009; Other (not presented in the Table) – 560 prisoners held in different penitentiary institutions. 46 prisoners sentenced to the indeterminate length, 309 with non‐consecutive days of imprisonment, and 250 detainees are under “security measures” (mentally ill persons), of which 96 are placed in special psychiatric institutions or in penitentiary hospitals, and 154 in non‐penitentiary hospitals.
SLOVENIA:
Point (J) –Life imprisonment has been introduced by the Parliament as sentence in the Criminal Code in 2008.
SWEDEN: Figures are on 1st October 2009 instead of 1st September 2009 UKRAINE:
Point (H) –10 years to less than 15 years (instead of 10 years to less than 20 years). Point (I) – 15 years and over (instead of 20 years and over).
UK: ENGLAND AND WALES:
Figures are on 30th June 2009 instead of 1st September 2009; Fine defaulters are not included in the distribution.
UK: SCOTLAND:
Other (not presented in the Table) – 615 prisoners recalled from supervision/conditional release.

Council of Europe Annual Penal Statistics – SPACE I – 2009
Strasbourg, 22 March 2011, pc-cp\space\documents\pc-cp (2011) 3e PC-CP (2011) 3
75
Table 9: Breakdown of sentenced prisoners (final sentence) on 1st September 2009, by length of sentence (percentages)
(A) – LESS THAN 1 MONTH (G) – FROM 5 YEARS TO LESS THAN 10 YEARS (B) – FROM 1 MONTH TO LESS THAN 3 MONTHS (H) – FROM 10 YEARS TO LESS THAN 20 YEARS (C) – FROM 3 MONTHS TO LESS THAN 6 MONTHS (I) – 20 YEARS AND OVER (D) – FROM 6 MONTHS TO LESS THAN ONE YEAR (J) – LIFE IMPRISONMENT (E) – FROM 1 YEAR TO LESS THAN 3 YEARS (K) – PRISONERS SENTENCED TO DEATH (F) – FROM 3 YEARS TO LESS THAN 5 YEARS
Reference: Council of Europe, SPACE I 2009.9
Country (a) (b) (c) (d) (e) (f) (g) (h) (i) (j) (k)
Albania NAP 9.6 8.6 22.0 35.7 11.5 8.3 4.2 NAP
Andorra 12.8 20.5 12.8 5.1 17.9 12.8 15.4 2.6 0.0 0.0 NAP
Armenia NAP 2.1 12.4 28.2 40.7 13.3 NAP 3.2 NAP
Azerbaijan 13.3 48.1 27.1 10.2 NAP 1.3 NAP
Belgium 0.0 0.0 0.2 3.7 16.6 26.3 31.5 10.7 7.3 3.6 NAP
BH: Fed. BiH 1.0 3.9 9.1 12.3 27.0 14.4 16.3 13.6 2.5 NA NAP
BH: Republika Srpska 0.7 2.7 6.0 7.9 23.6 19.1 20.7 20.4 2.3 0.0 NAP
Bulgaria 0.0 3.4 9.0 16.8 31.6 13.5 11.8 11.7 0.4 1.8 NAP
Croatia 3.3 2.3 3.6 10.9 29.9 20.3 17.8 9.6 2.3 NAP NAP
Cyprus 2.0 5.7 8.8 10.6 24.1 14.1 14.7 14.5 2.2 3.3 NAP
Czech Republic 0.3 1.9 11.0 24.3 33.0 9.6 11.8 5.3 1.1 0.2 NAP
Denmark 1.5 7.1 9.7 14.6 31.4 11.7 12.9 8.1 0.1 0.9 NAP
Estonia 0.0 1.6 5.2 5.6 25.8 25.5 23.1 10.9 1.1 1.3 NAP
Finland 2.8 9.8 9.8 14.7 36.2 11.2 8.9 0.6 0.0 5.0 NAP
France 17.6 17.1 28.3 10.7 9.5 12.6 3.3 1.0 NAP
Germany 1.6 8.7 12.6 19.6 19.6 25.1 8.2 1.4 NAP 3.3 NAP
Hungary 0.3 0.5 2.3 13.5 36.7 18.2 19.0 7.2 0.2 2.1 NAP
Iceland NA NA NA NA NA NA NA NA NA NA NAP
Ireland 0.5 0.8 2.5 9.5 25.0 22.2 23.1 7.4 0.6 8.3 NAP
Italy 0.3 0.4 1.7 7.4 25.8 23.6 19.6 11.3 5.3 4.6 NAP
Latvia 0.1 0.4 0.6 4.6 24.3 20.9 35.9 12.3 0.1 0.9 NAP
Liechtenstein 0.0 33.3 33.3 0.0 33.3 0.0 0.0 0.0 0.0 0.0 NAP
Lithuania 0.3 1.4 1.9 5.6 32.4 22.9 23.6 16.5 0.3 1.5 NAP
Luxembourg 0.3 0.0 1.3 4.9 27.8 16.6 21.0 16.4 8.3 3.4 NAP
Malta 41.0 25.8 49.4 42.1 89.9 25.8 20.2 32.0 14.6 4.5 NAP
Moldova NAP NAP NAP 1.3 8.7 21.0 30.8 29.5 7.0 1.6 NAP
Monaco 0.0 33.3 11.1 11.1 11.1 11.1 0.0 22.2 0.0 0.0 NAP
Netherlands 12.9 10.7 8.1 14.2 23.6 8.7 10.6 6.3 0.4 0.4 NAP
Norway 3.9 15.1 9.2 13.2 24.5 12.1 10.0 7.5 0.8 NAP NAP
Poland NAP 0.9 6.7 20.1 41.8 11.7 7.9 4.0 2.0 0.3 NAP
Portugal 0.0 0.9 2.1 4.6 14.3 17.2 37.2 16.3 3.3 NAP NAP
Romania 0.8 0.1 0.5 2.1 18.0 25.0 28.7 20.6 3.7 0.6 NAP
San Marino 0.0 0.0 0.0 0.0 100.0 0.0 0.0 0.0 0.0 0.0 NAP
Serbia (Republic of) 3.2 17.9 20.1 17.7 17.9 9.9 7.9 4.7 0.8 0.0 NAP
Slovak Republic 0.7 2.1 8.4 18.1 31.2 11.5 19.8 6.8 1.1 0.4 NAP
Slovenia 0.0 0.4 4.1 8.3 33.4 21.7 19.6 10.5 1.8 0.0 NAP
Spain (State Adm.) NA NA NA NA NA NA NA NA 1.8 NAP NAP
Spain (Catalonia) 0.7 0.5 1.7 2.9 15.9 24.5 31.8 18.1 4.0 NAP NAP
Sweden 0.2 6.5 5.4 11.4 34.9 16.6 7.8 2.8 NAP
Switzerland NA NA NA NA NA NA NA NA NA NA NAP
the FYRO Macedonia 0.1 0.5 4.3 14.4 31.6 20.3 18.3 9.3 NA 1.2 NAP
Turkey NA NA NA NA NA NA NA NA NA NA NAP
Ukraine NAP NAP NAP 0.8 16.6 32.7 37.2 11.2 0.3 1.4 NAP
UK: England and Wales 0.5 2.1 4.9 3.6 29.2 19.3 16.7 5.0 0.4 18.3 NAP
UK: Northern Ireland 3.3 0.9 5.8 6.8 16.6 13.7 19.5 13.4 0.7 19.3 NAP
UK: Scotland 0.1 1.7 5.7 13.1 25.2 15.1 14.6 3.2 0.0 11.7 NAP
Mean 3.4 6.2 8.0 10.6 28.2 18.0 18.7 10.9 2.3 3.0
Median 0.5 2.1 5.8 10.6 25.8 17.7 18.7 10.7 1.1 1.4
Minimum 0.0 0.0 0.0 0.0 8.6 0.0 0.0 0.0 0.0 0.0
Maximum 41.0 33.3 49.4 42.1 100.0 48.1 40.7 32.0 14.6 19.3

Council of Europe Annual Penal Statistics – SPACE I – 2009
Strasbourg, 22 March 2011, pc-cp\space\documents\pc-cp (2011) 3e PC-CP (2011) 3
76
Table 10: Breakdown of sentenced prisoners (final sentence) on 1st September 2009, by length of sentence (cumulative percentages)
Reference: Council of Europe, SPACE I 2009.10
Country Less than 1
year
1 year and over (fixed‐
term sentence)
3 years and over (fixed‐
term sentence)
5 years and over (fixed‐
term sentence)
10 years and over (fixed‐
term sentence)
Total fixed‐term
sentences
life imprisonment [Table 9]
Albania 9.6 86.1 77.5 55.5 19.9 95.8 4.2
Andorra 51.3 48.7 30.8 17.9 2.6 100.0 0.0
Armenia 2.1 94.6 82.2 54.1 13.3 96.8 3.2
Austria
Azerbaijan 13.3 85.3 85.3 37.3 10.2 98.7 1.3
Belgium 4.0 92.4 75.8 49.4 17.9 96.4 3.6
BH: BiH (state level)
BH: Fed. BiH 26.3 73.7 46.7 32.4 16.1 100.0 NA
BH: Republika Srpska 17.2 86.1 62.5 43.4 22.7 103.3 0.0
Bulgaria 29.2 69.0 37.4 23.9 12.1 98.2 1.8
Croatia 20.1 79.9 50.0 29.7 11.9 100.0 NAP
Cyprus 27.1 69.6 45.5 31.4 16.7 96.7 3.3
Czech Republic 37.5 60.8 27.9 18.2 6.4 98.4 0.2
Denmark 32.9 64.1 32.7 21.0 8.2 97.0 0.9
Estonia 12.4 86.4 60.6 35.0 12.0 98.7 1.3
Finland 37.1 56.8 20.7 9.5 0.6 94.0 5.0
France 34.7 64.3 36.0 25.3 15.9 99.0 1.0
Georgia
Germany 42.5 54.3 34.7 9.6 1.4 96.7 3.3
Greece
Hungary 16.6 81.3 44.6 26.4 7.4 97.9 2.1
Iceland NA NA NA NA NA NA NA
Ireland 13.4 78.3 53.3 31.1 8.0 91.7 8.3
Italy 9.9 85.6 59.8 36.2 16.6 95.4 4.6
Latvia 5.6 93.5 69.2 48.3 12.4 99.1 0.9
Liechtenstein 66.7 33.3 0.0 0.0 0.0 100.0 0.0
Lithuania 9.2 95.8 63.4 40.5 16.8 105.0 1.5
Luxembourg 6.5 90.1 62.3 45.7 24.7 96.6 3.4
Malta NA NA NA NA NA NA 4.5
Moldova 1.3 97.1 88.4 67.4 36.6 98.4 1.6
Monaco 55.6 44.4 33.3 22.2 22.2 100.0 0.0
Montenegro
Netherlands 45.9 49.6 26.0 17.4 6.7 95.5 0.4
Norway 41.4 54.9 30.4 18.3 8.3 96.3 NAP
Poland 27.8 67.4 25.6 13.9 6.1 95.2 0.3
Portugal 7.6 88.3 74.0 56.8 19.6 95.9 NAP
Romania 3.4 96.0 77.9 53.0 24.3 99.4 0.6
Russian Federation
San Marino 0.0 100.0 0.0 0.0 0.0 100.0 0.0
Serbia 58.8 41.2 23.3 13.4 5.5 100.0 0.0
Slovak Republic 29.3 70.3 39.1 27.7 7.9 99.6 0.4
Slovenia 12.9 87.1 53.7 32.0 12.3 100.0 0.0
Spain (State Adm.) 0.0 1.8 1.8 1.8 1.8 1.8 NAP
Spain (Catalonia) 5.7 94.3 78.4 53.9 22.1 100.0 NAP
Sweden 23.6 59.3 24.4 7.8 0.0 82.9 2.8
Switzerland NA NA NA NA NA NA NA
the FYRO Macedonia 19.3 79.5 47.9 27.6 9.3 98.8 1.2
Turkey NA NA NA NA NA NA NA
Ukraine 0.8 97.8 81.2 48.6 11.4 98.6 1.4
UK: England and Wales
11.1 70.6 41.4 22.1 5.4 81.7 18.3
UK: Northern Ireland 16.9 63.8 47.2 33.6 14.0 80.7 19.3
UK: Scotland 20.7 58.2 33.0 17.9 3.2 78.9 11.7
Mean 21.6 72.7 47.3 29.9 11.7 93.8 3.0
Median 17.1 76.0 46.1 28.7 11.7 98.1 1.4
Minimum 0.0 1.8 0.0 0.0 0.0 1.8 0.0
Maximum 66.7 100.0 88.4 67.4 36.6 100.0 19.3

Council of Europe Annual Penal Statistics – SPACE I – 2009
Strasbourg, 22 March 2011, pc-cp\space\documents\pc-cp (2011) 3e PC-CP (2011) 3
77
Table 11: Breakdown of prisoners sentenced to less than one year (final sentence) on 1st September 2009, by length of sentence (percentages)
Reference: Council of Europe, SPACE I 2009.11
Country Less than 1 month 1 month to less than 3 months
3 months to less than 6 months
6 months to less than 1 year
Total less than 1 year
Albania NAP 100.0 100.0
Andorra 25.0 40.0 25.0 10.0 100.0
Armenia NAP 100.0 100.0
Austria
Azerbaijan NA NA NA NA NA
Belgium 0.0 1.1 5.7 93.1 100.0
BH: BiH (state level)
BH: Fed. BiH 3.9 14.7 34.6 46.8 100.0
BH: Republika Srpska 3.9 15.5 34.9 45.7 100.0
Bulgaria 0.1 11.7 30.8 57.4 100.0
Croatia 16.2 11.5 18.0 54.4 100.0
Cyprus 7.2 21.0 32.6 39.1 100.0
Czech Republic 0.9 5.1 29.2 64.8 100.0
Denmark 4.6 21.5 29.5 44.4 100.0
Estonia 0.0 12.8 41.8 45.4 100.0
Finland 7.6 26.5 26.4 39.6 100.0
France 50.8 49.2 100.0
Georgia
Germany 3.8 20.4 29.7 46.2 100.0
Greece
Hungary 1.7 3.2 13.8 81.3 100.0
Iceland 57.7 42.3 100.0
Ireland 4.0 6.3 18.8 71.0 100.0
Italy 2.6 4.5 17.6 75.3 100.0
Latvia 1.1 7.5 10.0 81.4 100.0
Liechtenstein 0.0 50.0 50.0 0.0 100.0
Lithuania 3.4 15.5 21.0 60.1 100.0
Luxembourg 4.0 0.0 20.0 76.0 100.0
Malta 25.9 16.3 31.2 26.6 100.0
Moldova NAP NAP NAP 100.0 100.0
Monaco 0.0 60.0 20.0 20.0 100.0
Montenegro
Netherlands 28.0 23.4 17.6 30.9 100.0
Norway 9.5 36.5 22.3 31.8 100.0
Poland NAP 3.3 24.3 72.4 100.0
Portugal 0.6 12.0 27.8 59.6 100.0
Romania 22.7 2.3 13.8 61.2 100.0
Russian Federation
San Marino
Serbia (Republic of) 5.4 30.4 34.2 30.1 100.0
Slovak Republic 2.3 7.1 28.6 62.0 100.0
Slovenia 0.0 3.3 32.0 64.8 100.0
Spain (State Adm.) NAP NAP NA NA NA
Spain (Catalonia) 11.7 8.7 29.4 50.1 100.0
Sweden 0.9 27.7 22.9 48.5 100.0
Switzerland NA NA NA NA NA
the FYRO Macedonia 0.7 2.8 22.1 74.5 100.0
Turkey NA NA NA NA NA
Ukraine NAP NAP NAP 100.0 100.0
UK: England and Wales 4.2 19.3 43.9 32.5 100.0
UK: Northern Ireland 19.6 5.2 34.6 40.5 100.0
UK: Scotland 0.7 8.3 27.5 63.5 100.0
Mean 7.8 20.4 27.2 53.7
Median 3.9 12.8 27.6 50.1
Minimum 0.0 0.0 5.7 0.0
Maximum 50.8 100.0 57.7 100.0

Council of Europe Annual Penal Statistics – SPACE I – 2009
Strasbourg, 22 March 2011, pc-cp\space\documents\pc-cp (2011) 3e PC-CP (2011) 3
78
Notes – Tables 9, 10, and 11
See notes to Table 8. In TABLE 11, when figures did not correspond to the categorization of the length of sentences used in the SPACE questionnaire, they were omitted in the calculations of the mean, median, as well as the minimum and maximum figures.
Figure 2.b: Countries with the highest percentages of prisoners sentenced to less than one year
Figure 2.b provides a classification of the countries with the highest percentages of prisoners serving short prison sentences (less than one year). This Figure includes the 21 countries whose percentages of prisoners sentenced to less than 1 year were above the European median value (17.1%). For more accurate comparisons, notes to Table 8 should be taken into account.

Council of Europe Annual Penal Statistics – SPACE I – 2009
Strasbourg, 22 March 2011, pc-cp\space\documents\pc-cp (2011) 3e PC-CP (2011) 3
79
2. Prison Populations: Flow of Entries, Length of Imprisonment, Escapes and Deaths in 2008
Table 12.1: Flow of Entries to Penal Institutions in 2008 Reference: Council of Europe, SPACE I 2009.12.1
Country Entries to Penal
Institutions
Rate of Entries to Penal
Institutions per 100,000
inhabitants
Entries before Final Sentence Entries after the revocation,
suspension or annulment of the conditional release or probation
Number Percentage (%) Number Percentage (%)
Albania 3 293 103.4 NA NA NA NA
Andorra 71 84.0 30 42.3 6 8.5
Armenia NA NA NA
Azerbaijan 8 447 94.9 1 705 20.2 NA NA
Belgium 17 867 166.2 12 042 67.4 NA NA
BH: Fed. BiH 2 942 103.2 627 21.3 0 0.0
BH: Republika Srpska 1 290 89.9 424 32.9 0 0.0
Bulgaria 27 136 356.7 23 596 87.0 NA NA
Croatia 13 259 299.0 NA NA NA NA
Cyprus 11 719 1 470.6 10 464 89.3 1 255 11
Czech Republic NA NA NA NA NA NA
Denmark 14 197 257.6 9 891 69.7 4 306 30.3
Estonia NA NA NA NA NA NA
Finland 7 321 137.4 1 930 26.4 NA NA
France 89 055 138.5 51 115 57.4 NA NA
Germany 103 325 126.0 43 489 42.1 NA NA
Hungary 22 454 223.8 5 703 25.4 NA NA
Iceland NA NA NA NA NA NA
Ireland 13 806 310.2 5 218 37.8 NA NA
Italy 92 800 154.6 87 073 93.8 NA NA
Latvia 19 898 879.9 11 497 57.8 NA NA
Liechtenstein 78 (219.2) 44 56.4 1 1.3
Lithuania 9 747 291.0 6 020 61.8 NA NA
Luxembourg 1 133 229.6 562 49.6 7 0.6
Malta 573 138.5 399 69.6 NA NA
Moldova 12 980 363.8 2 268 17.5 NAP NAP
Monaco 160 516.1 118 73.8 0 0.0
Netherlands 41 905 254.2 18 713 44.7 NAP NAP
Norway 12 401 258.4 3 181 25.7 NA NA
Poland 89 987 236.0 23 934 26.6 NA NA
Portugal 5 065 47.7 2 114 41.7 NA NA
Romania 10 852 50.5 NA NA NA NA
San Marino 13 (41.6) 10 (76.9) 0 (0.0)
Serbia 23 263 317.2 9 907 42.6 0 0.0
Slovak Republic 5 123 94.7 1 666 32.5 NA NA
Slovenia 3 251 160.0 914 28.1 NA NA
Spain (State Adm.) 43 043 109.6 NA NA NA NA
Spain (Catalonia) 6 809 91.1 5 423 79.6 41 0.6
Sweden 21 502 232.3 NA NA NA NA
Switzerland 47 479 616.5 NA NA NA NA
the FYRO Macedonia 4 433 216.4 657 14.8 NA NA
Turkey NA NA NA NA 13 NA
Ukraine NA NA NA NA 4 925 NA
UK: England and Wales 134 148 244.8 81 728 60.9 NA NA
UK: Northern Ireland 6 185 345.7 2 905 47.0 NA NA
UK: Scotland 40 035 770.8 23 206 58.0 406 1.0
Mean 24 226 271.0 13 193 49.4 783 4.4
Median 12 060 221.5 4 200 45.8 7 0.6
Minimum 13 41.6 10 14.8 0 0.0
Maximum 134 148 1 470.6 87 073 93.8 4 925 30.3

Council of Europe Annual Penal Statistics – SPACE I – 2009
Strasbourg, 22 March 2011, pc-cp\space\documents\pc-cp (2011) 3e PC-CP (2011) 3
80
Table 12.2: Additional categories of the Flow of Entries to Penal Institutions in 2008
Reference: Council of Europe, SPACE I 2009.12.2
Country
Entries following transfer from one penal institution / prison to
another in 2008 (inside the same country: including
departments, cantons, regions, administrative entities)
Entries following an escape, after re‐arrest by the police in 2008
Entries following transfer from a
foreign country in 2008 (Total)
Entries following transfer from a Member State of the
European Union to the country in 2008 (even if the country is a member of the
EU)
Albania 271 2 106 76
Andorra 0 0 0 0
Armenia 3 236 7 19
Austria
Azerbaijan 192 205 33 0
Belgium 12 809 181 NA NA
BH: BiH (state level)
BH: Fed. BiH 237 67 4 0
BH: Republika Srpska 118 25 8 5
Bulgaria 16 971 46 NA NA
Croatia 2 987 9 4 2
Cyprus NAP 0 0 0
Czech Republic NA NA 16 14
Denmark NA NA NA NA
Estonia NA NA NA NA
Finland 6 212 195 21 20
France NA NA NA NA
Georgia
Germany 126 549 NA 98 68
Greece
Hungary 11 849 0 NA NA
Iceland
Ireland 7 826 0 5 5
Italy 38 728 68 NA NA
Latvia NA 18 7 4
Liechtenstein 0 0 1 EWR
Lithuania 107 10 42 37
Luxembourg 147 26 1 1
Malta NAP NA 0 0
Moldova 9 327 NA NA NA
Monaco NAP 0 4 3
Montenegro
Netherlands 18 123 0 98 NA
Norway 3 483 128 5 NA
Poland 102 007 NA NA NA
Portugal NA NA NA NA
Romania 61 111 0 NA NA
Russian Federation
San Marino NAP 0 1 0
Serbia 1 013 178 55 NA
Slovak Republic 16 933 1 9 NA
Slovenia 577 33 13 NA
Spain (State Adm.) 42 694 NA NA NA
Spain (Catalonia) 8 839 4 8 2
Sweden NA NA NA NA
Switzerland NA NA NA NA
the FYRO Macedonia 308 135 11 5
Turkey NA NA NA NA
Ukraine NA NA NA NA
UK: England and Wales NA NA NA NA
UK: Northern Ireland NA NA NA NA
UK: Scotland 7 073 NA NA NA
Mean 17 232 48 22 13
Median 6 212 10 8 3
Minimum 0 0 0 0
Maximum 126 549 205 106 76

Council of Europe Annual Penal Statistics – SPACE I – 2009
Strasbourg, 22 March 2011, pc-cp\space\documents\pc-cp (2011) 3e PC-CP (2011) 3
81
Notes – Tables 12.1 and 12.2
BELGIUM:
Table 12.2: Entries following an escape, after re‐arrest by the police – Since the definitions of the prison population and the one of the entries include electronic monitoring, the entries following an escape from detention under electronic monitoring are included under this heading.
BULGARIA:
Figures for these tables are comparable with three previous years’ data, but not with years before 2006. The reason is that before 2006 entries in detention facilities/pre‐trial detention have not been counted, only those in prisons.
CYPRUS:
Total number of entries in penal institutions in 2008 was 11,719, of which 2,372 were entries in prisons and 9,347 were entries in police stations. In the Table 12.1 the calculation is based on the totality of entries (prisons and police stations);
Entries before final sentence were 10,464, of which 1,117 were entries in prison and 9,347 were entries in police stations. In the Table 12.1 are presented the result based on the totality of entries (to prisons and police stations).
LIECHTENSTEIN:
According to a treaty between Liechtenstein and Austria, long‐term prisoners usually serve their sentences in Austrian penal institutions. For this reason, rates are presented between brackets.
NETHERLANDS:
In the total number of entries were included only entries to penal institutions. Entries to the custodial clinics, institutions for juveniles and institutions for aliens were excluded from these figures. In this category are considered entries from free society and those from police stations into penal institutions;
Entries before final sentence –were included only entries to penal institutions. Entries to the custodial clinics, institutions for juveniles and institutions for aliens were excluded from these figures.
In the number of entries transfer from one penal institution to another are included all transfers between all types of institutions.
NORWAY:
Entries following an escape, after re‐arrest by the police –In this category are also included entries following absconds and failure to return.
SAN MARINO:
Under the Criminal Code (Art. 99), a person serving a sentence of at least six months imprisonment in San Marino may be transferred to a “foreign penal institution”, if the competent judge decides so, and if there is a relevant international agreement. These prisoners are not included in the San Marino statistics. For this reason, rate and percentage in Table 12.1 are presented between brackets.
SPAIN (STATE LEVEL AND CATALONIA):
Under the total number of entries are included only entries from free society. Any entry from another detention institution is not included in these figures.

Council of Europe Annual Penal Statistics – SPACE I – 2009
Strasbourg, 22 March 2011, pc-cp\space\documents\pc-cp (2011) 3e PC-CP (2011) 3
82
SWITZERLAND:
In the total number of entries are also included the transfers and entries after escapes with a length of more than 7 days;
In the category of entries before final sentence are also included entries in anticipated serving of the sentence of imprisonment or measures.
UK: ENGLAND AND WALES:
In the total number of entries are included exclusively first receptions. UK: SCOTLAND:
These figures count receptions not entries. “Receptions” are not equivalent to “persons received”. Where a person has several sentences imposed on him by one court in one day this is counted as one reception. However, where custodial sentences are imposed on the same person by 2 or more courts in one day, 2 or more receptions are counted. Where a person is reconvicted while serving, and a further custodial sentence is imposed on him, this too is regarded as a further reception.
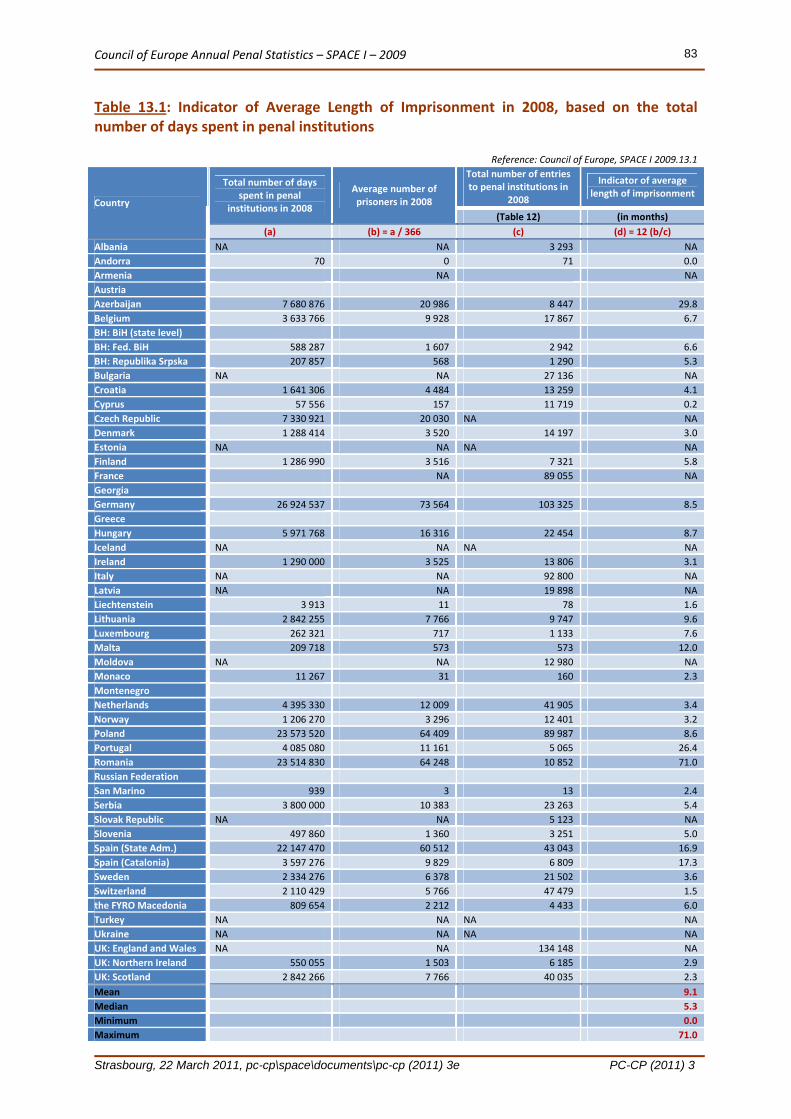
Council of Europe Annual Penal Statistics – SPACE I – 2009
Strasbourg, 22 March 2011, pc-cp\space\documents\pc-cp (2011) 3e PC-CP (2011) 3
83
Table 13.1: Indicator of Average Length of Imprisonment in 2008, based on the total number of days spent in penal institutions
Reference: Council of Europe, SPACE I 2009.13.1
Country
Total number of days spent in penal
institutions in 2008
Average number of prisoners in 2008
Total number of entries to penal institutions in
2008
Indicator of average length of imprisonment
(Table 12) (in months)
(a) (b) = a / 366 (c) (d) = 12 (b/c)
Albania NA NA 3 293 NA
Andorra 70 0 71 0.0
Armenia NA NA
Austria
Azerbaijan 7 680 876 20 986 8 447 29.8
Belgium 3 633 766 9 928 17 867 6.7
BH: BiH (state level)
BH: Fed. BiH 588 287 1 607 2 942 6.6
BH: Republika Srpska 207 857 568 1 290 5.3
Bulgaria NA NA 27 136 NA
Croatia 1 641 306 4 484 13 259 4.1
Cyprus 57 556 157 11 719 0.2
Czech Republic 7 330 921 20 030 NA NA
Denmark 1 288 414 3 520 14 197 3.0
Estonia NA NA NA NA
Finland 1 286 990 3 516 7 321 5.8
France NA 89 055 NA
Georgia
Germany 26 924 537 73 564 103 325 8.5
Greece
Hungary 5 971 768 16 316 22 454 8.7
Iceland NA NA NA NA
Ireland 1 290 000 3 525 13 806 3.1
Italy NA NA 92 800 NA
Latvia NA NA 19 898 NA
Liechtenstein 3 913 11 78 1.6
Lithuania 2 842 255 7 766 9 747 9.6
Luxembourg 262 321 717 1 133 7.6
Malta 209 718 573 573 12.0
Moldova NA NA 12 980 NA
Monaco 11 267 31 160 2.3
Montenegro
Netherlands 4 395 330 12 009 41 905 3.4
Norway 1 206 270 3 296 12 401 3.2
Poland 23 573 520 64 409 89 987 8.6
Portugal 4 085 080 11 161 5 065 26.4
Romania 23 514 830 64 248 10 852 71.0
Russian Federation
San Marino 939 3 13 2.4
Serbia 3 800 000 10 383 23 263 5.4
Slovak Republic NA NA 5 123 NA
Slovenia 497 860 1 360 3 251 5.0
Spain (State Adm.) 22 147 470 60 512 43 043 16.9
Spain (Catalonia) 3 597 276 9 829 6 809 17.3
Sweden 2 334 276 6 378 21 502 3.6
Switzerland 2 110 429 5 766 47 479 1.5
the FYRO Macedonia 809 654 2 212 4 433 6.0
Turkey NA NA NA NA
Ukraine NA NA NA NA
UK: England and Wales NA NA 134 148 NA
UK: Northern Ireland 550 055 1 503 6 185 2.9
UK: Scotland 2 842 266 7 766 40 035 2.3
Mean 9.1
Median 5.3
Minimum 0.0
Maximum 71.0

Council of Europe Annual Penal Statistics – SPACE I – 2009
Strasbourg, 22 March 2011, pc-cp\space\documents\pc-cp (2011) 3e PC-CP (2011) 3
84
Notes – Tables 13.1
As some countries did not provide data regarding the total number of days spent in penal institutions
in 2008 heading (a) of Table 13.1 and other countries provided figures that did not seem reliable (see notes below), in Table 13.2 we have calculated an alternative indicator of the average length of imprisonment (in months) based on the total number of prisoners on 1st September 2008, which is used as an estimate of the average number of prisoners during that year (source: SPACE I 2008). BELGIUM:
Prisoners (without taking into account those under electronic surveillance): 3,633,766 days; Persons who served their sentence in 2008 under electronic surveillance: 218,999 days.
BULGARIA:
Total number of days is known only for pre‐trial detention facilities: 335,856 days. For prisons such figures are not available.
CYPRUS:
The total number of days spent in penal institutions is 57,556.03 days, of which 616.03 days spent in prisons, and 56,940 days spent in police stations.
LIECHTENSTEIN:
The indicator of average length of imprisonment should be used very cautiously, as other prisoners from Liechtenstein serve their sentences in Austrian prisons (see general notes).
NETHERLANDS:
Figures in this table refer only to the population in penal institutions. Institutions for juveniles, custodial clinics and institutions for aliens are excluded. The number of days spent in penal institutions only was 4,395,330.
ROMANIA: The indicator of average length of imprisonment is quite high. This might be due to a calculation of the number of days spent in penal institutions which includes additional categories of penal populations which were excluded from the main raw data. A more reliable indicator for Romania is presented in Table 13.2. SAN MARINO:
The average number of prisoners in 2008 year was 3 persons, but the number of entries is 939. Therefore it is better to refer to the indicator of average length of imprisonment used in the Table 13.2 for this country. See general notes.

Council of Europe Annual Penal Statistics – SPACE I – 2009
Strasbourg, 22 March 2011, pc-cp\space\documents\pc-cp (2011) 3e PC-CP (2011) 3
85
Table 13.2: Indicator of Average Length of Imprisonment in 2008, based on the total number of prisoners in penal institutions on 1st September 2008
Reference: Council of Europe, SPACE I 2009.13.2
Country
Total number of prisoners on 1st
September 2008 (SPACE I 2008) Total number of entries to penal institutions in 2008 (Table 12)
Indicator of average length of imprisonment (in moths)
(a) (b) (c)=12(a/b)
Albania 5041 3 293 18.4
Andorra 60 71 10.1
Armenia 3825 NA NA
Austria 7899
Azerbaijan 20986 8 447 29.8
Belgium 10234 17 867 6.9
BH: BiH (state level) 19
BH: Fed. BiH 1568 2 942 6.4
BH: Republika Srpska 924 1 290 8.6
Bulgaria 10723 27 136 4.7
Croatia 4734 13 259 4.3
Cyprus 831 11 719 0.9
Czech Republic 20502 NA NA
Denmark 3451 14 197 2.9
Estonia 3656 NA NA
Finland 3531 7 321 5.8
France 66712 89 055 9.0
Georgia 19507
Germany 74706 103 325 8.7
Greece 11798
Hungary 15079 22 454 8.1
Iceland 140 NA NA
Ireland 3523 13 806 3.1
Italy 55831 92 800 7.2
Latvia 6544 19 898 3.9
Liechtenstein 10 78 1.5
Lithuania 7744 9 747 9.5
Luxembourg 673 1 133 7.1
Malta 577 573 12.1
Moldova 7252 12 980 6.7
Monaco 34 160 2.6
Montenegro
Netherlands 17113 41 905 4.9
Norway 3278 12 401 3.2
Poland 83152 89 987 11.1
Portugal 10807 5 065 25.6
Romania 27262 10 852 30.1
Russian Federation 887723
San Marino 2 13 1.8
Serbia 9510 23 263 4.9
Slovak Republic 8313 5 123 19.5
Slovenia 1318 3 251 4.9
Spain (State Adm.) 61939 43 043 17.3
Spain (Catalonia) 9839 6 809 17.3
Sweden 6853 21 502 3.8
Switzerland 5780 47 479 1.5
the FYRO Macedonia 2235 4 433 6.1
Turkey 99416 NA NA
Ukraine 148339 NA NA
UK: England and Wales 83194 134 148 7.4
UK: Northern Ireland 1523 6 185 3.0
UK: Scotland 8088 40 035 2.4
Mean 8.6
Median 6.6
Minimum 0.9
Maximum 30.1
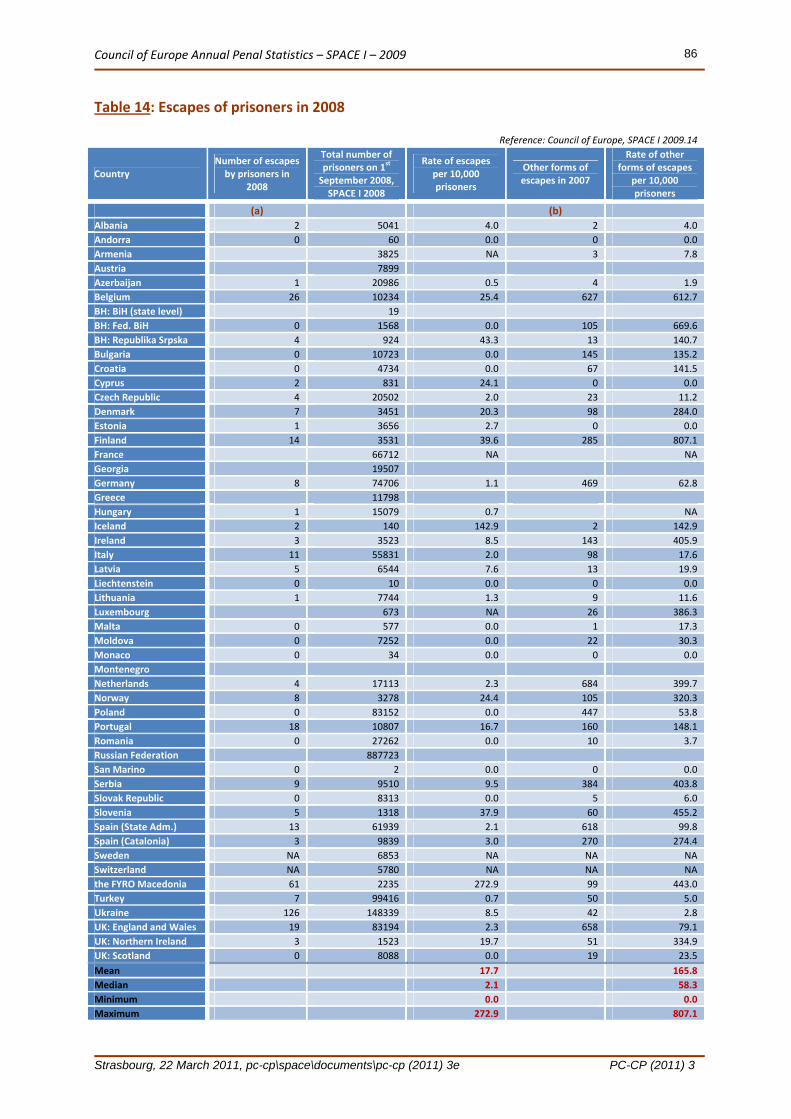
Council of Europe Annual Penal Statistics – SPACE I – 2009
Strasbourg, 22 March 2011, pc-cp\space\documents\pc-cp (2011) 3e PC-CP (2011) 3
86
Table 14: Escapes of prisoners in 2008
Reference: Council of Europe, SPACE I 2009.14
Country Number of escapes by prisoners in
2008
Total number of prisoners on 1
st
September 2008, SPACE I 2008
Rate of escapes per 10,000 prisoners
Other forms of escapes in 2007
Rate of other forms of escapes
per 10,000 prisoners
(a) (b)
Albania 2 5041 4.0 2 4.0
Andorra 0 60 0.0 0 0.0
Armenia 3825 NA 3 7.8
Austria 7899
Azerbaijan 1 20986 0.5 4 1.9
Belgium 26 10234 25.4 627 612.7
BH: BiH (state level) 19
BH: Fed. BiH 0 1568 0.0 105 669.6
BH: Republika Srpska 4 924 43.3 13 140.7
Bulgaria 0 10723 0.0 145 135.2
Croatia 0 4734 0.0 67 141.5
Cyprus 2 831 24.1 0 0.0
Czech Republic 4 20502 2.0 23 11.2
Denmark 7 3451 20.3 98 284.0
Estonia 1 3656 2.7 0 0.0
Finland 14 3531 39.6 285 807.1
France 66712 NA NA
Georgia 19507
Germany 8 74706 1.1 469 62.8
Greece 11798
Hungary 1 15079 0.7 NA
Iceland 2 140 142.9 2 142.9
Ireland 3 3523 8.5 143 405.9
Italy 11 55831 2.0 98 17.6
Latvia 5 6544 7.6 13 19.9
Liechtenstein 0 10 0.0 0 0.0
Lithuania 1 7744 1.3 9 11.6
Luxembourg 673 NA 26 386.3
Malta 0 577 0.0 1 17.3
Moldova 0 7252 0.0 22 30.3
Monaco 0 34 0.0 0 0.0
Montenegro
Netherlands 4 17113 2.3 684 399.7
Norway 8 3278 24.4 105 320.3
Poland 0 83152 0.0 447 53.8
Portugal 18 10807 16.7 160 148.1
Romania 0 27262 0.0 10 3.7
Russian Federation 887723
San Marino 0 2 0.0 0 0.0
Serbia 9 9510 9.5 384 403.8
Slovak Republic 0 8313 0.0 5 6.0
Slovenia 5 1318 37.9 60 455.2
Spain (State Adm.) 13 61939 2.1 618 99.8
Spain (Catalonia) 3 9839 3.0 270 274.4
Sweden NA 6853 NA NA NA
Switzerland NA 5780 NA NA NA
the FYRO Macedonia 61 2235 272.9 99 443.0
Turkey 7 99416 0.7 50 5.0
Ukraine 126 148339 8.5 42 2.8
UK: England and Wales 19 83194 2.3 658 79.1
UK: Northern Ireland 3 1523 19.7 51 334.9
UK: Scotland 0 8088 0.0 19 23.5
Mean 17.7 165.8
Median 2.1 58.3
Minimum 0.0 0.0
Maximum 272.9 807.1

Council of Europe Annual Penal Statistics – SPACE I – 2009
Strasbourg, 22 March 2011, pc-cp\space\documents\pc-cp (2011) 3e PC-CP (2011) 3
87
Notes – Table 14
(a) Escapes by prisoners (pre‐trial detainees or convicted prisoners) from a closed penal
institution or during administrative transfer (2008);
(b) Other forms of escape (from an open penal institution –agricultural colony or other– from semi‐detention, or during an authorised short‐term absence or leave, etc.) in 2008.
The SPACE questionnaire specifies that the counting unit for this Table should be the escaped persons. Therefore, when no explicit notes were provided by the national correspondents, we assumed that this counting unit has been respected (i.e. the Table refers to persons and not cases of escape with several prisoners). ALBANIA:
Point (A) – Two convicted prisoners escaped from Burrel, a closed penal institution in 2008. ARMENIA:
Point (B) – Three convicted prisoners escaped together. AZERBAIJAN:
Point (A) – One escape had been done from a pre‐trial facility. Point (B) – Four escapes had been perpetrated from institutions designed for serving prison sentences. The institutions concerned are open type settlements.
DENMARK:
Point (B) – Fail to appear from leave are not included under this heading. FINLAND:
Counting unit is case. One person may have escaped more often than once and all the cases are counted.
IRELAND:
Point (A) – the 3 escapes referred to, are all minors and includes an incident where one minor escaped from his room onto the roof of his place of detention but he did not breach the perimeter.
LITHUANIA:
Point (B) –Absence from any type of penal institution (including closed prisons) during authorized short‐term absence is not considered as an escape. Therefore, these data are not included in figures presented in this Table.
LUXEMBOURG:
Four fails to return after an authorised leave have not been included in this Table. NETHERLANDS:
Figures refer to the population in the penal institutions. Other categories of institutions (for juveniles, for aliens and custodial clinics) are not considered in the figures of this Table.
PORTUGAL:
Point (B) –Among 160 escapes 13 were from open institutions, 2 from semi‐detention, and 145 during the authorized leave. During 2008, 13,677 authorized leaves without supervision have been allowed.

Council of Europe Annual Penal Statistics – SPACE I – 2009
Strasbourg, 22 March 2011, pc-cp\space\documents\pc-cp (2011) 3e PC-CP (2011) 3
88
SLOVENIA:
Counting unit is case instead of person as asked in the questionnaire; Point (B) – 15 of 60 escapes were recorded in Correctional Home for juveniles.
SPAIN (CATALONIA):
Point (B) – From semi‐detention institutions – 2, during an authorized leave – 180, during programmed leaves – 7, and breach of trust – 81.
UK: ENGLAND AND WALES:
Point (B) – The number of other forms of escape consists of absconds and temporary release failures.
UK: NORTHERN IRELAND:
Points (A) and (B) – All escaped and absconded prisoners above were recaptured and returned to custody.
UK: SCOTLAND:
These figures are for financial rather calendar years (i.e. from 1 April 2008 to 31 March 2009);
Counting unit is case instead of person as asked in the questionnaire.
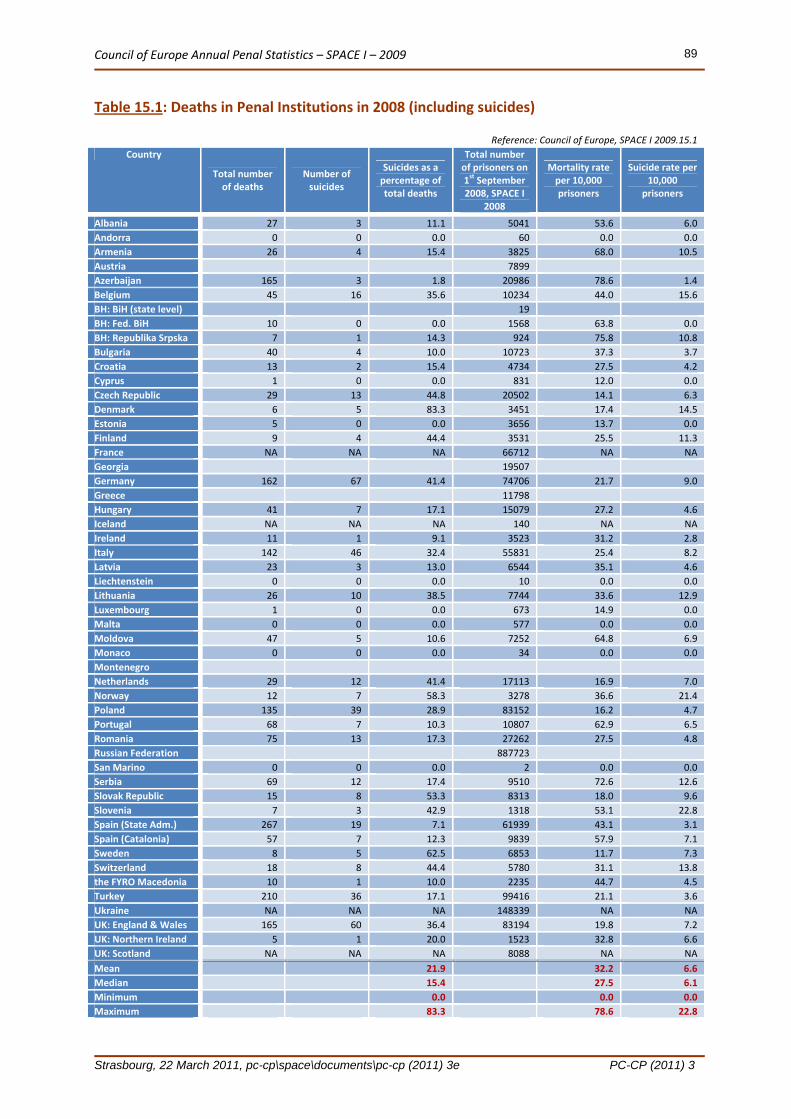
Council of Europe Annual Penal Statistics – SPACE I – 2009
Strasbourg, 22 March 2011, pc-cp\space\documents\pc-cp (2011) 3e PC-CP (2011) 3
89
Table 15.1: Deaths in Penal Institutions in 2008 (including suicides)
Reference: Council of Europe, SPACE I 2009.15.1
Country
Total number of deaths
Number of suicides
Suicides as a percentage of total deaths
Total number of prisoners on 1st September
2008, SPACE I 2008
Mortality rate per 10,000 prisoners
Suicide rate per 10,000
prisoners
Albania 27 3 11.1 5041 53.6 6.0
Andorra 0 0 0.0 60 0.0 0.0
Armenia 26 4 15.4 3825 68.0 10.5
Austria 7899
Azerbaijan 165 3 1.8 20986 78.6 1.4
Belgium 45 16 35.6 10234 44.0 15.6
BH: BiH (state level) 19
BH: Fed. BiH 10 0 0.0 1568 63.8 0.0
BH: Republika Srpska 7 1 14.3 924 75.8 10.8
Bulgaria 40 4 10.0 10723 37.3 3.7
Croatia 13 2 15.4 4734 27.5 4.2
Cyprus 1 0 0.0 831 12.0 0.0
Czech Republic 29 13 44.8 20502 14.1 6.3
Denmark 6 5 83.3 3451 17.4 14.5
Estonia 5 0 0.0 3656 13.7 0.0
Finland 9 4 44.4 3531 25.5 11.3
France NA NA NA 66712 NA NA
Georgia 19507
Germany 162 67 41.4 74706 21.7 9.0
Greece 11798
Hungary 41 7 17.1 15079 27.2 4.6
Iceland NA NA NA 140 NA NA
Ireland 11 1 9.1 3523 31.2 2.8
Italy 142 46 32.4 55831 25.4 8.2
Latvia 23 3 13.0 6544 35.1 4.6
Liechtenstein 0 0 0.0 10 0.0 0.0
Lithuania 26 10 38.5 7744 33.6 12.9
Luxembourg 1 0 0.0 673 14.9 0.0
Malta 0 0 0.0 577 0.0 0.0
Moldova 47 5 10.6 7252 64.8 6.9
Monaco 0 0 0.0 34 0.0 0.0
Montenegro
Netherlands 29 12 41.4 17113 16.9 7.0
Norway 12 7 58.3 3278 36.6 21.4
Poland 135 39 28.9 83152 16.2 4.7
Portugal 68 7 10.3 10807 62.9 6.5
Romania 75 13 17.3 27262 27.5 4.8
Russian Federation 887723
San Marino 0 0 0.0 2 0.0 0.0
Serbia 69 12 17.4 9510 72.6 12.6
Slovak Republic 15 8 53.3 8313 18.0 9.6
Slovenia 7 3 42.9 1318 53.1 22.8
Spain (State Adm.) 267 19 7.1 61939 43.1 3.1
Spain (Catalonia) 57 7 12.3 9839 57.9 7.1
Sweden 8 5 62.5 6853 11.7 7.3
Switzerland 18 8 44.4 5780 31.1 13.8
the FYRO Macedonia 10 1 10.0 2235 44.7 4.5
Turkey 210 36 17.1 99416 21.1 3.6
Ukraine NA NA NA 148339 NA NA
UK: England & Wales 165 60 36.4 83194 19.8 7.2
UK: Northern Ireland 5 1 20.0 1523 32.8 6.6
UK: Scotland NA NA NA 8088 NA NA
Mean 21.9 32.2 6.6
Median 15.4 27.5 6.1
Minimum 0.0 0.0 0.0
Maximum 83.3 78.6 22.8

Council of Europe Annual Penal Statistics – SPACE I – 2009
Strasbourg, 22 March 2011, pc-cp\space\documents\pc-cp (2011) 3e PC-CP (2011) 3
90
Table 15.2: Types of deaths and suicides in Penal Institutions in 2008 making reference to the categories included/excluded in the figures of the Table 15.1
Reference: Council of Europe, SPACE I 2009.15.2
Country
Does data include detainees who died
or committed suicide in hospital INSIDE prisons
If yes, how many?
Does data include
detainees who died or
committed suicide in
COMMUNITY hospitals
If yes, how many?
Does data include deaths or suicides outside prison (e.g. during a prison
leave or permission)
If yes, how many?
Albania No *** No *** No ***
Andorra No *** No *** No ***
Armenia Yes NA Yes NA No ***
Austria
Azerbaijan Yes 107 No *** Yes 35
Belgium Yes NA No *** No ***
BH: BiH (state level)
BH: Fed. BiH Yes 1 Yes 0 Yes 0
BH: Republika Srpska NAP NAP Yes 6
Bulgaria Yes 5 Yes 6 Yes 15
Croatia Yes 6 No *** No ***
Cyprus No *** No *** No ***
Czech Republic Yes 2 Yes 0 Yes 0
Denmark Yes NA No *** No ***
Estonia Yes 2 No *** No ***
Finland Yes NA Yes NA Yes NA
France NA NA NA
Georgia
Germany Yes NA Yes NA Yes NA
Greece
Hungary Yes 17 Yes 2 No ***
Iceland Yes NA NA No ***
Ireland No *** Yes NA No ***
Italy Yes NA Yes NA No ***
Latvia Yes 16 Yes 3 No ***
Liechtenstein No *** No *** No ***
Lithuania Yes 12 Yes 4 Yes 0
Luxembourg No *** No *** No ***
Malta Yes 0 Yes 0 No ***
Moldova Yes 45 Yes 1 Yes 1
Monaco No *** No *** No ***
Montenegro
Netherlands Yes NA Yes NA Yes NA
Norway Yes NA Yes NA Yes NA
Poland Yes 43 Yes 21 No ***
Portugal Yes NA Yes NA No ***
Romania Yes 36 Yes 12 Yes 0
Russian Federation
San Marino Yes 0 Yes 0 Yes 0
Serbia Yes 9 No *** Yes 3
Slovak Republic Yes 0 Yes 0 Yes 0
Slovenia No *** Yes 1 No ***
Spain (State Adm.) Yes 2 Yes 0 Yes 42
Spain (Catalonia) Yes 19 Yes 22 Yes 16
Sweden Yes NA Yes NA Yes NA
Switzerland Yes NA Yes NA Yes NA
the FYRO Macedonia Yes 1 Yes 3 Yes 5
Turkey Yes 50 Yes 114 Yes 3
Ukraine
UK: England and Wales Yes NA Yes NA No ***
UK: Northern Ireland Yes 1 Yes 1 No ***
UK: Scotland NA NA NA

Council of Europe Annual Penal Statistics – SPACE I – 2009
Strasbourg, 22 March 2011, pc-cp\space\documents\pc-cp (2011) 3e PC-CP (2011) 3
91
Notes – Tables 15.1 and 15.2
AZERBAIJAN:
107 persons died in penitentiary clinics (inside penal institutions). BH: REPUBLIKA SRPSKA:
All the deaths in 2008 occurred outside penal institutions. CZECH REPUBLIC:
The total amount of suicides (this number also includes such cases of death that occurred not immediately after a suicide attempt but after some time ‐ the death was a consequence of a suicide attempt) was 13 in 2008. Of which, 5 were committed in the cell, 3 in an Emergency (crisis) Department, 2 in prison hospitals, 1 in a Specialized Unit, 1 at the toilet of the admission department, and 1 in a room used for sport activities.
NETHERLANDS:
Figures refer to the population in the penal institutions. Other categories of institutions (for juveniles, for aliens and custodial clinics) are not considered in the figures of these Tables.
NORWAY:
Suicide is defined in accordance with the Nordisk Statistisk registration rules. If an inmate injures himself in prison and later dies of these injuries outside of the prison (i.e. in or on the way to hospital) then the incident is registered as “in prison”. Cases of overdose are not included unless there are clear indications that the act was intentional;

Council of Europe Annual Penal Statistics – SPACE I – 2009
Strasbourg, 22 March 2011, pc-cp\space\documents\pc-cp (2011) 3e PC-CP (2011) 3
92
Table 16: Average amount spent per day of detention of one person in penal institutions in 2008 (in €)
Reference: Council of Europe, SPACE I 2009.16
Country
Average amount spent per day for the detention of one person in
pre‐trial detention
Average amount spent per day for the detention of one person in correctional
facility
Average amount spent per day for the detention of one person in the
special facility/section for
persons with psychotic or psychological disorders
Total number of days spent in
penal institutions in 2008
Number of days in pre‐trial detention in
2008
Total average number of prisoners in
2008
Average number of pre‐trial
detainees in 2008
Average amount per prisoner (pre‐trial, sentenced and
mentally‐ill offenders)
Average amount per prisoner (pre‐
trial & sentenced)
Average amount spent
for all prisoners in
2008 (thousands)
(a) (b) (c) (d) (e) (f) =(d)/366 (g) =(e)/366 (h) = Mean (a, b, c) (i) =Mean (a, b) (j) =(f)*(h)
Albania 9 € 9 € 17 € NA NA NA NA 12 € 9 € NA
Andorra 10.95 € 10.95 € 70 30 0.2 0.1 11 € 11 € 2.1 €
Armenia 6 € 7 € NA NA 7 € 7 € NA
Austria
Azerbaijan 8.79 € 8.79 € 8.79 € 7 680 876 882 792 20 986.0 2 412.0 9 € 9 € 184 466.9 €
Belgium NA NA NA 3 633 766 1 273 798 9 928.3 3 480.3 NA NA NA
BH: BiH (state level)
BH: Fed. BiH 36 € 36 € 36 € 588 287 108 507 1 607.3 296.5 36 € 36 € 57 864.3 €
BH: Republika Srpska 20 € 20 € NA 207 857 50 252 567.9 137.3 20 € 20 € 11 358.3 €
Bulgaria 2.40 € 2.41 € 102.61 € NA 335 856 NA 917.6 36 € 2 € NA
Croatia 41.8 € 41.8 € 41.8 € 1 641 306 NA 4 484.4 NA 42 € 42 € 187 449.7 €
Cyprus 64 € 64 € NA 57 556 57 057 157.3 155.9 64 € 64 € 10 064.4 €
Czech Republic 33 € 33 € 33 € 7 330 921 864 703 20 029.8 2 362.6 33 € 33 € 660 984.7 €
Denmark 135.88 € 209.89 € 367.14 € 1 288 414 437 672 3 520.3 1 195.8 238 € 173 € 836 542.1 €
Estonia NA NA NA NA NA NA NA NA NA NA
Finland NA 148 € 226 € 1 286 990 NA 3 516.4 NA 187 € 148 € 657 560.5 €
France NA NA NA NA NA
Georgia
Germany 94.41 € 94.41 € 94.41 € 26 924 537 NA 73 564.3 NA 94 € 94 € 6 945 206.4 €
Greece
Hungary NA NA NA 5 971 768 NA 16 316.3 NA NA NA NA
Iceland 30.14 € 30.14 € 34.14 € NA NA NA NA 31 € 30 € NA
Ireland 253 € 253 € 253 € 1 290 000 NA 3 524.6 NA 253 € 253 € 891 721.3 €
Italy 121.25 € NA NA NA NA NA 121 € 121 € NA
Latvia 20.93 € 20.93 € 20.93 € NA 6 516 NA 17.8 21 € 21 € NA
Liechtenstein 215 € 215 € NAP 3 913 394 10.7 1.1 215 € 215 € 2 298.6 €

Council of Europe Annual Penal Statistics – SPACE I – 2009
Strasbourg, 22 March 2011, pc-cp\space\documents\pc-cp (2011) 3e PC-CP (2011) 3
93
Country
Average amount spent per day for the detention of one person in
pre‐trial detention
Average amount spent per day for the detention of one person in correctional
facility
Average amount spent per day for the detention of one person in the
special facility/section for
persons with psychotic or psychological disorders
Total number of days spent in
penal institutions in 2008
Number of days in pre‐trial detention in
2008
Total average number of prisoners in
2008
Average number of pre‐trial
detainees in 2008
Average amount per prisoner (pre‐trial, sentenced and
mentally‐ill offenders)
Average amount per prisoner (pre‐
trial & sentenced)
Average amount spent
for all prisoners in
2008 (thousands)
(a) (b) (c) (d) (e) (f) =(d)/366 (g) =(e)/366 (h) = Mean (a, b, c) (i) =Mean (a, b) (j) =(f)*(h)
Lithuania 18.35 € 19.14 € NAP 2 842 255 634 370 7 765.7 1 733.3 19 € 19 € 145 568.5 €
Luxembourg 157.13 € 157.13 € NAP 262 321 716.7 0.0 157 € 157 € 112 618.8 €
Malta NA NA NA 209 718 146 034 573.0 399.0 NA NA NA
Moldova 3.84 € 4.33 € NAP NA NA NA NA 4 € 4 € NA
Monaco NAP 38.73 € NAP 11 267 4 805 30.8 13.1 39 € 39 € 1 192.3 €
Montenegro
Netherlands 202.32 € 203.93 € 266.78 € 4 395 330 2 016 260 12 009.1 5 508.9 224 € 203 € 2 694 161.2 €
Norway 168 € 168 € NAP 1 206 270 267 011 3 295.8 729.5 168 € 168 € 553 697.7 €
Poland 21.65 € NA NA 23 573 520 NA 64 408.5 NA 22 € 22 € 1 394 444.6 €
Portugal 44.43 € 44.43 € NA 4 085 080 796 065 11 161.4 2 175.0 44 € 44 € 495 901.9 €
Romania NA 22 € NAP 23 514 830 2 403 572 64 248.2 6 567.1 22 € 22 € 1 413 459.7 €
Russian Federation
San Marino 700 € 700 € NAP 939 552 2.6 1.5 700 € 700 € 1 795.9 €
Serbia 15 € 10 € 35 € 3 800 000 800 000 10 382.5 2 185.8 20 € 13 € 207 650.3 €
Slovak Republic 41.49 € 41.49 € 41.49 € NA NA NA NA 41 € 41 € NA
Slovenia 64 € 64 € 64 € 497 860 112 785 1 360.3 308.2 64 € 64 € 87 057.5 €
Spain (State Adm.) 51.85 € 51.85 € NA 22 147 470 5 548 846 60 512.2 15 160.8 52 € 52 € 3 137 558.3 €
Spain (Catalonia) 78 € 78 € 78 € 3 597 276 859 886 9 828.6 2 349.4 78 € 78 € 766 632.6 €
Sweden 200 € 200 € NA 2 334 276 623 464 6 377.8 1 703.5 200 € 200 € 1 275 560.7 €
Switzerland NA NA NA 2 110 429 649 229 5 766.2 1 773.8 NA NA NA
the FYRO Macedonia 6.05 € 6.38 € 809 654 82 289 2 212.2 224.8 6 € 6 € 13 748.6 €
Turkey 8.58 € 8.58 € 8.58 € NA NA NA NA 9 € 9 € NA
Ukraine NA NA NA NA NA NA NA NA NA NA
UK: England & Wales NA 129.4 € NA NA NA NA NA 129 € 129 € NA
UK: Northern Ireland 255.2 € 255.2 € NAP 550 055 NA 1 502.9 NA 255 € 255 € 383 535.6 €
UK: Scotland 99 € 99 € NAP 2 842 266 616 115 7 765.8 1 683.4 99 € 99 € 768 809.7 €
Mean 92 € 95 € 96 € 12 973.8 1 910.5 97.0 92.6 824 100.5
Median 42 € 42 € 42 € 4 484.4 1 056.7 41.8 41.8 383 535.6
Minimum 2 € 2 € 9 € 0.2 0.0 4.1 2.4 2.1
Maximum 700 € 700 € 367 € 73 564.3 15 160.8 700.0 700.0 6 945 206.4

Council of Europe Annual Penal Statistics – SPACE I – 2009
Strasbourg, 22 March 2011, pc-cp\space\documents\pc-cp (2011) 3e PC-CP (2011) 3
94
Notes – Table 16
Data presented in this Table are not necessarily comparable across countries. Indeed, no indications were provided on the items (meals, services, cleaning etc.) included in the total amounts shown in the Table. Moreover, the purchasing power varies widely across Europe. Thus, these data should be used very carefully. AZERBAIJAN:
The amounts have been converted by the authors of the report. In national currency (manat) is 9.96.
CROATIA:
In prisons, no separate determination of the amounts is made for costs of pre‐trial detainees and sentenced prisoners. Therefore, the amounts presented in this Table are the same for three categories of prison populations (41.8 €).
DENMARK:
The average amount spent per day for the detention of one person in correctional facility is 209.89 €. This amount varies as follow: in open prisons is of 155.33€/day per prisoner and in closed prison is 264.44€/day per prisoner.
GERMANY:
The amounts included in this Table represent the average amount altogether spent per day of one person in a penal institution.
IRELAND:
Point (a) –253€ for adults, and 1,343€ for juveniles; Point (b) –253€ for adults, and 1,343€ for juveniles. The figures included in this Table represent the overall cost of an available staffed prison space during the calendar year 2008. It is not possible to provide separate figures in respect of the detention of pre‐trial detainees, or persons with psychotic or psychological disorders.
ITALY:
The average daily cost of one prisoner in 2009 was of 121.25 €, but the breakdown by specific categories of prison populations is not available.
LATVIA:
The amount spent per day (20.93 €) for the detention of one person in the special facility/section for persons with psychotic or psychological disorders does not include medicine costs.
LUXEMBOURG:
As the pre‐trial detainees and sentenced prisoners are held in the same place, the coasts applied to ensure their detention are the same.
MONACO:
The Monaco’s Arrest House, the only detention facility in the Principality of Monaco, is designed for pre‐trial detention and for detention of persons serving short prison sentences. Exceptionally, it may be the place of detention of prisoners sentenced to long prison terms. This is an important element to be considered in comparisons.

Council of Europe Annual Penal Statistics – SPACE I – 2009
Strasbourg, 22 March 2011, pc-cp\space\documents\pc-cp (2011) 3e PC-CP (2011) 3
95
NORWAY: Convicted persons and remand prisoners are held in the same institutions. Therefore there is no differentiation of the coasts applied.
PORTUGAL:
The average amount presented in this Table had been applied in 2007, and refers to the coast of the detention for pre‐trial detainees as well as for sentenced prisoners.
TURKEY:
The amount presented in this Table is calculated on the basis of national currency (19 Turkish Liras/day per prisoner).
UK: ENGLAND AND WALES:
The amount presented in this Table is calculated on the basis of national currency (£113/day per prisoner).
UK: NORTHERN IRELAND:
The amount presented in this Table is calculated on the basis of national currency. Amounts given are based on an average cost per prisoner place, per day, for the period between 1st April 2008 and 31st March 2009 and are for all prisoner types ‐ sentenced and remand (£222.85/day, which corresponds to 255.2€).
UK: SCOTLAND:
It is not directly possible to calculate the cost of pre‐trail detention. Figures have been produced using the annual cost of holding one prisoner in custody in 2008.

Council of Europe Annual Penal Statistics – SPACE I – 2009
Strasbourg, 22 March 2011, pc-cp\space\documents\pc-cp (2011) 3e PC-CP (2011) 3
96
3. Prison Staff
Table 17: Full‐time and Part‐time Staff working in Penal Institutions on 1st September 2009 –on the basis of Full‐time equivalents (numbers)
Reference: Council of Europe, SPACE I 2009.17
Country Total
National prison
administration (Head
Office)
Regional prison
administration offices
Other staff employed by
PA, w
orking outside penal
institutions
Total number of staff
working INSIDE penal
institutions
Executives (m
anagers) of
penal institutions
Custodial staff
Medical and paramedical
staff
Staff responsible for
assessment and the
psychologists
Staff responsible for
education activities
(including social workers,
teachers / educators, etc.)
Staff responsible for
workshops or vo
cational
training
Other staff
(a) (b) (c) (d) (e) (f) (g) (h) (i) (j) (k) (l)
Albania 3 822 181 272 18 3 351 21 2 835 213 22 104 4 152
Andorra 64 3 0 0 75 3 61 5 2 3 1 0
Armenia 2 182 224 310 0 1 648 55 1 241 161 33 63 0 95
Austria
Azerbaijan 3 681 169 352 918 2 242 296 775 222 7 201 106 635
Belgium 8 645.13 76.75 3 480.1 8 085.28 793.35 6 316.77 174.1 346.11 51.3 344.2 59.45
BH: BiH (state level)
BH: Fed. BiH 920 NA NA NA 920 11 620 30 30 7 34 188
BH: Republika Srpska 764 6 0 0 758 6 423 15 40 35 140 99
Bulgaria 4 382 96 122 0 4 164 141 2 919 161 631 0 0 312
Croatia 2 597 43 NAP NAP 2 554 111 1 496 114 7 144 266 416
Cyprus 439 NAP NAP NAP 439 14 388 12 NAP NAP 25 NAP
Czech Republic 10 901.7 182.5 NAP 6 120.5 4 598.7 103.0 2 478.5 467.0 1 208.2 33.0 309.0
Denmark 4782 226 336 717 3503 49 2615 138 NA 73 430 197
Estonia 1 960 30 0 4 1 926 19 879 134 20 38 4 832
Finland 2 998 89 48 NAP 2 861 76 1 661 189 263 232 440
France 33 306.2 449.1 2 950.0 270.9 29 636.2 314.4 23 088.4 NA NA 2 849.9 183.1 3 200.4
Georgia
Germany 37 174 NAP 490 0 36 684 445 27 016 257 576 1 647 2 250 4 493
Greece
Hungary 7 843 176 0 160 7 507 64 3 237 565 30 347 253 3 008

Council of Europe Annual Penal Statistics – SPACE I – 2009
Strasbourg, 22 March 2011, pc-cp\space\documents\pc-cp (2011) 3e PC-CP (2011) 3
97
Country Total
National prison
administration (Head
Office)
Regional prison
administration offices
Other staff employed by
PA, w
orking outside penal
institutions
Total number of staff
working INSIDE penal
institutions
Executives (m
anagers) of
penal institutions
Custodial staff
Medical and paramedical
staff
Staff responsible for
assessment and the
psychologists
Staff responsible for
education activities
(including social workers,
teachers / educators, etc.)
Staff responsible for
workshops or vo
cational
training
Other staff
(a) (b) (c) (d) (e) (f) (g) (h) (i) (j) (k) (l)
Iceland
Ireland 4 400 130 460 20 3 790 93 2 960 155 21 254 256 88
Italy 48 054 1 278 1 170 1 789 43 817 291 41 512 987 2 1 922 42 1 723
Latvia 3004.5 104 0 0 2900.5 42 1416 139.5 14 27 4 1258
Liechtenstein 16 0 0 0 16 1 15 2 0 3 0 0
Lithuania 3 742 89 NAP 283 3 370 57 2 018 320 35 212 12 716
Luxembourg 406.5 4 0 0 402.5 5 292 8.5 5 24 33.5 34.5
Malta 210 NA NA 2 208 4 199 21 3 21 NA 4
Moldova 3418.5 125 3293.5 NAP 3418.5 46 2105 296 38 123 NAP 810.5
Monaco 48 0 0 0 48 2 32 3 1 0 1 10
Montenegro
Netherlands 12 595.27 299.09 814.82 893.31 10 588.05 148.14 6 776.52 345.31 59.94 309.95 767.79 2 180.42
Norway 3 200 30 105 0 3 065 83 2 199 463 320
Poland 29 116 376 400 NAP 28 340 1 697 15 645 1 845 NA 643 NA 8 510
Portugal 5 899 26 NAP 525 5 348 NAP 4 148 NA NA 474 NA 726
Romania 12 046 246 NAP 465 11 335 740 3 166 714 94 406 33 6 182
Russian Federation
San Marino 7 NAP NAP NAP 7 1 6 1 0 0 0 0
Serbia 3 993 37 0 0 3 956 29 2 186 239 36 251 584 631
Slovak Republic 5 165 129 5 036 NAP 5 165 63 4 603 225 39 224 11 0
Slovenia 836 31 NAP NAP 805 24 497 12 8 63 97 104
Spain (State Adm.) 24 452 361 8 3 304 20 787 357 15 652 961 1 376 NA 448 1 993
Spain (Catalonia) 5 162 214 NAP NAP 4 948 59 3 192 265 122 732 128 450
Sweden 6 911 259 222 373 6 057 264 4 351 114 24 254 336 714
Switzerland NA NA NA NA NA NA NA NA NA NA NA NA
the FYRO Macedonia 766 10 NAP NAP 756 36 481 26 17 51 46 99
Turkey 27299 305 NA NA 26170 824 NA 281 NA NAP
Ukraine 46659 295 1404 NAP 44960 651 22731 3725 2289 4091 11473
UK: England and Wales 52 582 3 869 471 346 47 896 2 208 33 848 629 906 358 4 155 6 138
UK: Northern Ireland 2 317 187 132 44 1 954 216 1 478 71 31 27 56 68
UK: Scotland

Council of Europe Annual Penal Statistics – SPACE I – 2009
Strasbourg, 22 March 2011, pc-cp\space\documents\pc-cp (2011) 3e PC-CP (2011) 3
98
Notes – Table 17
ANDORRA:
Point (a) – In the total number of staff 14 persons are included, who are part‐time employees. In full‐time equivalents (FTE) the total number is lesser than the sum of the distribution under different categories included in this Table.
AZERBAIJAN:
Point (h) – Under this heading are included staff employed by the General Medical Directorate of the Ministry of Justice.
Point (j) – Among the 201 persons included under this heading, 43 of them are external teachers (not employed by the Prison Administration).
Point (k) – All the staff included under this heading is external staff (not employed by the Prison Administration).
BULGARIA:
Figures presented in this Table are real working employees (4,382 persons). The total number of staff positions is 4,708, but 326 places of them are vacant.
CYPRUS:
Point (h) –are counted medical staff and prison warders; Psychologists, social workers and educators are not employed by the Prison Administration.
CZECH REPUBLIC:
Point (f) – Under this heading have been counted prison directors and their deputies; Point (g) – Are included head of department, prison guards; Point (i) and (j) – These categories of staff are counted together: staff responsible for assessment and education; teachers, educators, therapists, pedagogues, psychologist, social workers;
Point (e) – Under this heading are counted priests and chaplains, guards responsible for service dogs, prevention (internal prison inspection).
DENMARK:
Point (c) – Staff in regional Penal Institutions Administration offices. FINLAND:
Point (i) and (j) – These categories of staff are counted together. It’s impossible to keep these categories separated in the statistics.
FRANCE:
Point (c) –National School of Penitentiary Administration and the Penitentiary Employment Service are included as well;
Point (e) –In this category are also included probation staff. GERMANY:
Point (h) – Under this heading only medical staff in counted. No special data of paramedical staff is available; insofar staff is included under the point (g) of the Table.
HUNGARY:
Point (d) –160 (including the number of staff of the Prison Service Training Centre, Prison Service Training and Recreation Centre, Prison Service Department at the Police College.

Council of Europe Annual Penal Statistics – SPACE I – 2009
Strasbourg, 22 March 2011, pc-cp\space\documents\pc-cp (2011) 3e PC-CP (2011) 3
99
ITALY:
Point (h) – Are included 883 healthcare staff employed under special contracts, paid by the Penitentiary Administration. These staff performs their duties in the Regions with Special Statute, namely in Friuli Venezia Giulia, Valle d'Aosta, Trentino Alto Adige, Sicilia and Sardegna.
LIECHTENSTEIN:
Under points (b), (c) and (d) there are no staff presented. This is due to the fact that staff employed is shared between custodial and police duties. The detention units are located in the same building with the police station.
LITHUANIA:
In this table the distribution presents the figures on full and part‐time employees of the Prison Administration. Staff working in penal institutions but not directly employed by the Prison Administration have not been accounted.
All the figures of the Table are on 1st July 2009. LUXEMBOURG:
Point (b) – In this category is also included Public Prosecutor delegate; Pont (e) – Under this heading are counted 7 engineers in charge with the maintenance of the buildings, 12 officials, 5 employees in charge with administrative works. Total authorized staff in both penitentiary centres (Givenich and Luxembourg).
MALTA:
Staff included under points (h) and (i) work on a part‐time basis. MONACO:
Point (i) – The person included under this point is actually employed as a custodian (already included under point (g)), but who performs vocational training tasks as well.
NORWAY:
Point (f) – Under this heading are counted prison governors, assistant governors and deputy governors.
Points (h) to (k) – Most of the treatment and educational tasks are performed by imported services (not included in these points). The 87 persons however are directly employed by The Correctional Service to execute specified tasks. For administrative reasons (e.g. salary scales) some of these have the same formal title as custodial staff.
POLAND:
Figures for this Table are on 30th September 2009 instead of 1st September 2009 PORTUGAL:
Figures for this Table are on 31st December 2009 instead of 1st September 2009 ROMANIA:
Figures presented in this Table include as well staff working in three Reeducation Centres for Juveniles.
SLOVENIA:
Figures for this Table are on 31st December 2009 instead of 1st September 2009

Council of Europe Annual Penal Statistics – SPACE I – 2009
Strasbourg, 22 March 2011, pc-cp\space\documents\pc-cp (2011) 3e PC-CP (2011) 3
100
SPAIN (STATE ADMINISTRATION): Point (c) –In SPACE I 2007, data in this point referred to civil servants working as administrative staff inside prisons. Nevertheless, it is more accurate to exclude this category, as regional Head Offices do not exist within Spanish Penitentiary Administration. This year only regional directors are included.
Point (d) – Staff employed for administrative tasks. Point (f) –in this category are included only executives. Point (i) – Under this heading are counted staff evolved in treatment programs: lawyers, psychologists, educators, social workers etc.
Point (j) – Teachers are managed directly by autonomous communities. Point (k) – Staff evolved in penitentiary training programs and training for preparing further employment.
UK: ENGLAND AND WALES:
Figures for this Table are on 30th June 2009 instead of 1st September 2009 UK: NORTHERN IRELAND:
Point (e) – There is a difference of 7 persons between the figure provided under Point (e) and the sum of points from (f) to (l). This could be due to late notification of leavers/ new entrants which did not appear on the monthly statistics for September 2009 but appear on the grade lists produced to complete this section.

Council of Europe Annual Penal Statistics – SPACE I – 2009
Strasbourg, 22 March 2011, pc-cp\space\documents\pc-cp (2011) 3e PC-CP (2011) 3
101
Table 18.1: Full‐time and Part‐time Staff working in Penal Institutions on 1st September 2009 –on the basis of Full‐time equivalents (percentages)
Reference: Council of Europe, SPACE I 2009.18.1
Country Total number Total
percentage
National prison
administration (Head Office)
Regional prison
administration offices
Other staff employed by PA, working outside penal institutions
Total number of staff working
INSIDE penal institutions
Albania 3 822 100.0 4.7 7.1 0.5 87.7
Andorra 64 (121.9) 4.7 0.0 0.0 117.2
Armenia 2 182 100.0 10.3 14.2 0.0 75.5
Austria
Azerbaijan 3 681 100.0 4.6 9.6 24.9 60.9
Belgium 8 645.13 100.0 0.9 0.0 5.6 93.5
BH: BiH (State level)
BH: Fed. BiH 920 100.0
BH: Republika Srpska 764 100.0 0.8 0.0 0.0 99.2
Bulgaria 4 382 100.0 2.2 2.8 0.0 95.0
Croatia 2 597 100.0 1.7 0.0 0.0 98.3
Cyprus 439 100.0 0.0 0.0 0.0 100.0
Czech Republic 10 901.7 100.0 1.7 0.0 56.1 42.2
Denmark 4782 100.0 4.7 7.0 15.0 73.3
Estonia 1 960 100.0 1.5 0.0 0.2 98.3
Finland 2 998 100.0 3.0 1.6 0.0 95.4
France 33 306.2 100.0 1.3 8.9 0.8 89.0
Georgia
Germany 37 174 100.0 0.0 1.3 0.0 98.7
Greece
Hungary 7 843 100.0 2.2 0.0 2.0 95.7
Iceland
Ireland 4 400 100.0 3.0 10.5 0.4 86.1
Italy 48 054 100.0 2.7 2.4 3.7 91.2
Latvia 3004.5 100.0 3.5 0.0 0.0 96.5
Liechtenstein 16 100.0 0.0 0.0 0.0 100.0
Lithuania 3 742 100.0 2.4 0.0 7.6 90.1
Luxembourg 406.5 100.0 1.0 0.0 0.0 99.0
Malta 210 100.0 1.0 99.0
Moldova 3418.5 (103.7) 3.7 0.0 100.0
Monaco 48 100.0 0.0 0.0 0.0 100.0
Montenegro
Netherlands 12 595.27 100.0 2.4 6.5 7.1 84.1
Norway 3 200 100.0 0.9 3.3 0.0 95.8
Poland 29 116 100.0 1.3 1.4 0.0 97.3
Portugal 5 899 100.0 0.4 0.0 8.9 90.7
Romania 12 046 100.0 2.0 0.0 3.9 94.1
Russian Federation
San Marino 7 100.0 0.0 0.0 0.0 100.0
Serbia 3 993 100.0 0.9 0.0 0.0 99.1
Slovak Republic 5 165 (102.5) 2.5 0.0 100.0
Slovenia 836 100.0 3.7 0.0 0.0 96.3
Spain (State Adm.) 24 452 100.0 1.5 0.0 13.5 85.0
Spain (Catalonia) 5 162 100.0 4.1 0.0 0.0 95.9
Sweden 6 911 100.0 3.7 3.2 5.4 87.6
Switzerland NA
the FYRO Macedonia 766 100.0 1.3 0.0 0.0 98.7
Turkey 27299 (97.0) 1.1 95.9
Ukraine 46659 100.0 0.6 3.0 0.0 96.4
UK: England and Wales 52 582 100.0 7.4 0.9 0.7 91.1
UK: Northern Ireland 2 317 100.0 8.1 5.7 1.9 84.3
UK: Scotland
Mean 2.5 2.4 3.9 91.8
Median 2.0 0.0 0.0 95.8
Minimum 0.0 0.0 0.0 42.2
Maximum 10.3 14.2 56.1 100.0

Council of Europe Annual Penal Statistics – SPACE I – 2009
Strasbourg, 22 March 2011, pc-cp\space\documents\pc-cp (2011) 3e PC-CP (2011) 3
102
Table 18.2: Full‐time and Part‐time Staff working INSIDE Penal Institutions on 1st September 2009 –on the basis of Full‐time equivalents (percentages)
Reference: Council of Europe, SPACE I 2009.18.2
Country
Total number of
staff working
INSIDE penal
institutions
sum %
% Executives
(man
agers) of
penal institutions
% Custodial staff
% M
edical and
param
edical staff
% Staff responsible
for assessment
and the
psychologists
% Staff responsible
for education
activities
% Staff responsible
for workshops or
vocational training
% Other staff
Albania 3 351 100.0 0.6 84.6 6.4 0.7 3.1 0.1 4.5
Andorra 75 100.0 4.0 81.3 6.7 2.7 4.0 1.3 0.0
Armenia 1 648 100.0 3.3 75.3 9.8 2.0 3.8 0.0 5.8
Azerbaijan 2 242 100.0 13.2 34.6 9.9 0.3 9.0 4.7 28.3
Belgium 8 085.28 100.0 9.8 78.1 2.2 4.3 0.6 4.3 0.7
BH: Fed. BiH 920 100.0 1.2 67.4 3.3 3.3 0.8 3.7 20.4
BH: Rep. Srpska 758 100.0 0.8 55.8 2.0 5.3 4.6 18.5 13.1
Bulgaria 4 164 100.0 3.4 70.1 3.9 15.2 0.0 0.0 7.5
Croatia 2 554 100.0 4.3 58.6 4.5 0.3 5.6 10.4 16.3
Cyprus 439 100.0 3.2 88.4 2.7 0.0 0.0 5.7 0.0
Czech Republic 4 598.7 100.0 2.2 53.9 10.2 26.3 0.7 6.7
Denmark 3503 100.0 1.4 74.7 3.9 NA 2.1 12.3 5.6
Estonia 1 926 100.0 1.0 45.6 7.0 1.0 2.0 0.2 43.2
Finland 2 861 100.0 2.7 58.1 6.6 0.0 9.2 8.1 15.4
France 29 636.2 100.0 1.1 77.9 NA NA 9.6 0.6 10.8
Germany 36 684 100.0 1.2 73.6 0.7 1.6 4.5 6.1 12.2
Hungary 7 507 100.0 0.9 43.1 7.5 0.4 4.6 3.4 40.1
Iceland NA NA NA NA NA NA NA NA NA
Ireland 3 790 (101.0) 2.5 78.1 4.1 0.5 6.7 6.8 2.3
Italy 43 817 (106.1) 0.7 94.7 2.3 0.0 4.4 0.1 3.9
Latvia 2900.5 100.0 1.4 48.8 4.8 0.5 0.9 0.1 43.4
Liechtenstein 16 (131.3) 6.3 93.8 12.5 0.0 18.8 0.0 0.0
Lithuania 3 370 100.0 1.7 59.9 9.5 1.0 6.3 0.4 21.2
Luxembourg 402.5 100.0 1.2 72.5 2.1 1.2 6.0 8.3 8.6
Malta 208 (121.2) 1.9 95.7 10.1 1.4 10.1 NA 1.9
Moldova 3418.5 100.0 1.3 61.6 8.7 1.1 3.6 0.0 23.7
Monaco 48 102.1 4.2 66.7 6.3 2.1 0.0 2.1 20.8
Netherlands 10 588.05 100.0 1.4 64.0 3.3 0.6 2.9 7.3 20.6
Norway 3 065 100.0 2.7 71.7 0.0 0.0 0.0 15.1 10.4
Poland 28 340 100.0 6.0 55.2 6.5 NA 2.3 NA 30.0
Portugal 5 348 100.0 0.0 77.6 NA NA 8.9 NA 13.6
Romania 11 335 100.0 6.5 27.9 6.3 0.8 3.6 0.3 54.5
San Marino 7 (114.3) 14.3 85.7 14.3 0.0 0.0 0.0 0.0
Serbia 3 956 100.0 0.7 55.3 6.0 0.9 6.3 14.8 16.0
Slovak Republic 5 165 100.0 1.2 89.1 4.4 0.8 4.3 0.2 0.0
Slovenia 805 100.0 3.0 61.7 1.5 1.0 7.8 12.0 12.9
Spain (State Adm.) 20 787 100.0 1.7 75.3 4.6 6.6 NA 2.2 9.6
Spain (Catalonia) 4 948 100.0 1.2 64.5 5.4 2.5 14.8 2.6 9.1
Sweden 6 057 100.0 4.4 71.8 1.9 0.4 4.2 5.5 11.8
Switzerland NA NA NA NA NA NA NA NA NA
the FYROM 756 100.0 4.8 63.6 3.4 2.2 6.7 6.1 13.1
Turkey 26170 3.1 NA 1.1 NA 0.0
Ukraine 44960 100.0 1.4 50.6 8.3 5.1 9.1 25.5
UK: Engl. & Wales 47 896 (100.7) 4.6 70.7 1.3 1.9 0.7 8.7 12.8
UK: North. Ireland 1 954 (99.6) 11.1 75.6 3.6 1.6 1.4 2.9 3.5
UK: Scotland
Mean 3.3 67.9 5.3 2.5 4.7 4.7 14.0
Median 2.2 70.4 4.6 1.0 4.2 3.4 11.8
Minimum 0.0 27.9 0.0 0.0 0.0 0.0 0.0
Maximum 14.3 95.7 14.3 26.3 18.8 18.5 54.5

Council of Europe Annual Penal Statistics – SPACE I – 2009
Strasbourg, 22 March 2011, pc-cp\space\documents\pc-cp (2011) 3e PC-CP (2011) 3
103
Notes – Tables 18.1 and 18.2
In Table 18.1, there are three cases (ANDORRA, MOLDOVA and SLOVAK REPUBLIC) in which the total percentage of the staff is higher than 100 and one country where the total does not reach 100% (TURKEY). These data are presented between brackets. In Table 18.2 the total percentage of staff working inside penal institutions is higher than 100% in five countries: IRELAND, ITALY, LIECHTENSTEIN, MALTA and SAN MARINO. These data are presented between brackets. In both cases, some of these inconsistencies have been explained by the national correspondents (see notes to Table 17).
Figure 3: Percentages of staff working INSIDE penal institutions (1st September 2009) classified on the basis of the “custodial staff”
Countries with more than 50% of custodial staff

Council of Europe Annual Penal Statistics – SPACE I – 2009
Strasbourg, 22 March 2011, pc-cp\space\documents\pc-cp (2011) 3e PC-CP (2011) 3
104
Table 19: Staff working in Penal Institutions but not employed by the Prison Administration on 1st September 2009 (numbers and percentages)
Reference: Council of Europe, SPACE I 2009.19
Country
Total number of
staff
Total % of staff
Teachers and
educators
% Teachers and
educators
Doctors and healthcare
staff
% Doctors and
healthcare staff
Security staff and perimeter guards
% Security staff and perimeter guards
Probation staff and social
workers
% Probation staff and social
workers
Other staff % Other staff
(a) (a.1) (b) (b.1) (c) (c.1) (d) (d.1) (e) (e.1) (f) (f.1)
Albania NAP NAP NAP NAP NAP NAP NAP NAP NAP NAP NAP NAP
Andorra 6 (116.7) 2 33.3 4 66.7 0 0.0 1 16.7 0 0.0
Armenia 10 100.0 10 100.0 0 0.0 0 0.0 0 0.0 0 0.0
Austria
Azerbaijan 371 100.0 43 11.6 222 59.8 NA NA NA NA 106 28.6
Belgium NA NA NA NA NA NA NA NA NA NA NA NA
BH: BiH (state level)
BH: Fed. BiH 123 (83.7) 44 35.8 22 17.9 35 28.5 1 0.8 1 0.8
BH: Republika Srpska 4 100.0 0 0.0 4 100.0 0 0.0 0 0.0 0 0.0
Bulgaria 92 100.0 0 0.0 0 0.0 21 22.8 0 0.0 71 77.2
Croatia 18 100.0 3 16.7 15 83.3 0 0.0 0 0.0 0 0.0
Cyprus 17 100.0 1 5.9 15 88.2 NAP NAP 1 5.9 NAP NAP
Czech Republic NAP NAP NAP NAP NAP NAP NAP NAP NAP NAP NAP NAP
Denmark NAP NAP NAP NAP NAP NAP NAP NAP NAP NAP NAP NAP
Estonia NA NA NA NA NA NA NA NA NA NA NA NA
Finland NA NA NA NA NA NA NAP NAP NAP NAP
France
Georgia
Germany 1 541 100.0 375 24.3 177 11.5 125 8.1 166 10.8 698 45.3
Greece
Hungary NA NA NA NA NA NA NA NA NA NA NA NA
Iceland
Ireland 32.5 100.0 25.5 78.5 1 3.1 5 15.4 1 3.1 0 0.0
Italy 1 443 100.0 12 0.8 1424 98.7 NAP NAP NAP NAP 7 0.5
Latvia 39 100.0 36 92.3 0 0.0 0 0.0 3 7.7 0 0.0
Liechtenstein 5 100.0 1 20.0 2 40.0 0 0.0 2 40.0 0 0.0
Lithuania 406 100.0 156 38.4 4 1.0 NAP NAP 0 0.0 246 60.6
Luxembourg 98.525 100.0 13 13.2 40.025 40.6 0 0.0 0 0.0 45.5 46.2
Malta 41 100.0 20 48.8 21 51.2 NA NA NA NA NA NA
Moldova 3 418.5 (99.0) 161 4.7 296 8.7 2 105 61.6 11 0.3 810.5 23.7
Monaco 14 100.0 7 50.0 2 14.3 NAP NAP 1 7.1 4 28.6
Montenegro

Council of Europe Annual Penal Statistics – SPACE I – 2009
Strasbourg, 22 March 2011, pc-cp\space\documents\pc-cp (2011) 3e PC-CP (2011) 3
105
Country
Total number of
staff
Total % of staff
Teachers and
educators
% Teachers and
educators
Doctors and healthcare
staff
% Doctors and
healthcare staff
Security staff and perimeter guards
% Security staff and perimeter guards
Probation staff and social
workers
% Probation staff and social
workers
Other staff % Other staff
(a) (a.1) (b) (b.1) (c) (c.1) (d) (d.1) (e) (e.1) (f) (f.1)
Netherlands NAP NAP NAP NAP NAP NAP NAP NAP NAP NAP NAP NAP
Norway 310 (107.7) 190 61.3 107 34.5 NAP NAP NA NA 37 11.9
Poland NAP NAP NAP NAP NAP NAP NAP NAP NAP NAP NAP NAP
Portugal NA NA NA NA NA NA NA NA NA NA NA NA
Romania 376 100.0 259 68.9 NAP NAP NAP NAP 61 16.2 56 14.9
Russian Federation
San Marino 2 100.0 1 50.0 1 50.0 NAP NAP NAP NAP NAP NAP
Serbia NAP NAP NAP NAP NAP NAP NAP NAP NAP NAP NAP NAP
Slovak Republic NAP NAP NAP NAP NAP NAP NAP NAP NAP NAP NAP NAP
Slovenia NA NA NA NA NA NA NA NA NA NA NA NA
Spain (State Adm.) NA NA NA NA NA NA NA NA NA NA NA NA
Spain (Catalonia) 1 145 100.0 140 12.2 NAP NAP 703 61.4 158 13.8 144 12.6
Sweden
Switzerland NA NA NA NA NA NA NA NA NA NA NA NA
the FYRO Macedonia
Turkey 27 299 100.0 433 1.6 281 1.0 22 823 83.6 175 0.6 3 587 13.1
Ukraine 46 659 NA NA NAP NAP NAP NAP 2 534 5.4 NA NA
UK: England and Wales NAP NAP NAP NAP NAP NAP NAP NAP NAP NAP NAP NAP
UK: Northern Ireland
UK: Scotland
Mean 33.4 36.7 20.1 6.8 18.2
Median 24.3 34.5 4.1 3.1 12.3
Minimum 0.0 0.0 0.0 0.0 0.0
Maximum 100.0 100.0 83.6 40.0 77.2

Council of Europe Annual Penal Statistics – SPACE I – 2009
Strasbourg, 22 March 2011, pc-cp\space\documents\pc-cp (2011) 3e PC-CP (2011) 3
106
Notes – Table 19
AZERBAIJAN:
Point (b) –43 teachers are counted Point (c) – Under this heading are included perimeter guards of the penitentiary institutions. Point (e) – Staff of the probation agencies and social workers do not exist. Nevertheless, there is an enforcement service employing 220 persons in charge with the probation matters.
CYPRUS:
Point (e) – There are no independent specialist probation services. Probation services are provided by Welfare Officers who act as Probation Officers (staff employed by Social Welfare Services, Ministry of Justice and Social Insurance) for a specified period (minimum one year and maximum three years) providing the convicted person with necessary support and social network which will prevent recurrent deviant behaviour. One person was employed by the Welfare Service to perform probation tasks in penal institutions.
GERMANY:
Figures presented in this Table are collected since 2009. Point (f) – In this category is included staff with administrative tasks, catering service, pastors, temporary workers, cleaning service.
IRELAND:
Figures presented in this Table are on 31st October 2009 instead of 1st September 2009. Point (b) – All teachers for adult prison population are supplied by the IVEC (Irish Vocational Education Association).
Point (c) – Dentists are supplied by the Dental Hospital in Dublin. LIECHTENSTEIN:
Point (d) – Staff included under this heading is shared between penitentiary institution and local police service.
LITHUANIA:
Figures presented in this Table are on 1st July 2009 instead of 1st September 2009. LUXEMBOURG:
Point (f) – Private companies’ staff on hire, temporary workers, and unemployed persons under the reintegration programs, etc.
NORWAY:
Tasks supplied by the staff not employed by Prison Administration are managed by many departments and local authorities. Resource allocation is not always calculated in FTEs. No recent figures are available. The figures presented in the Table are estimates based on the 2008 figures adjusted by the increase in the number of places in penal institutions.
ROMANIA:
Designated judges’ services exist in each penal institution. Staff employed by these services manages the appeals against administrative decisions which may be made by any person held in penal institutions.

Council of Europe Annual Penal Statistics – SPACE I – 2009
Strasbourg, 22 March 2011, pc-cp\space\documents\pc-cp (2011) 3e PC-CP (2011) 3
107
SPAIN (STATE ADMINISTRATION):
Point (b) – Teachers are not employed by National Prison administration. They are managed by autonomous communities.
Point (c): o Doctors are contracted by Spanish Penitentiary Administration, as civil servants. o Healthcare staff: includes Nurseries, porters, technicians for radio diagnosis and for
laboratory, pharmacist in charge. All of them are contracted directly by this administration through a Labor contract instead of being civil servants. They are not managed by National Prison administration.
Point (d) – Security staff is employed by the General Police Directorate and Guardia Civil. SPAIN (CATALONIA):
Point (b) –Teachers Point (d) –Catalonian police is in charge of the transfers from one penal institution to another. Moreover, they also manage the perimeter security of the penal institutions. These staffs are cumulating prison charges with other police activities.
Point (e) – Staff from the Institute of Social Rehabilitation, who manage the non‐custodial and community service measures.
Point (f) – Staff in charge with working groups/ professional workshops. UK: SCOTLAND:
Staff employed through contractors is not directly under the supervision of the Scottish Prison Service. Therefore, numbers in this Table are not available.

Council of Europe Annual Penal Statistics – SPACE I – 2009
Strasbourg, 22 March 2011, pc-cp\space\documents\pc-cp (2011) 3e PC-CP (2011) 3
108
Table 20: Rate of Supervision of Prisoners by Custodial Staff, Treatment and Educational Staff, and Staff responsible for workshops on 1st September 2009
Reference: Council of Europe, SPACE I 2009.20
Country Total number of
prisoners (including pre‐
trials)
Total number of custodial staff
Rate of supervision of prisoners (number of prisoners per custodian)
Total number of treatment,
education staff, and staff
responsible for workshops
Rate of supervision of prisoners (number of prisoners per
other employee)
a b c=a/b d e=a/d
Albania 4 482 2 835 1.6 343 13.1
Andorra 68 61 1.1 11 6.2
Armenia 3 989 1 241 3.2 257 15.5
Austria 8 423
Azerbaijan 20 470 775 26.4 536 38.2
Belgium 10 901 6 316.77 1.7 915.71 11.9
BH: Fed. BiH 1 619 620 2.6 101 16.0
BH: Republika Srpska 961 423 2.3 230 4.2
Bulgaria 10 028 2 919 3.4 792 12.7
Croatia 4 891 1 496 3.3 531 9.2
Cyprus 883 388 2.3 37 23.9
Czech Republic 22 021 2 478.5 8.9 1708.2 12.9
Denmark 3 721 2 615 1.4 641 5.8
Estonia 3 555 879 4.0 196 18.1
Finland 3 589 1 661 2.2 684 5.2
France 66307 23 088.4 2.9 3033 21.9
Georgia 19 825
Germany 73 263 27 016 2.7 4730 15.5
Greece 11 080
Hungary 16 459 3 237 5.1 1195 13.8
Iceland 118
Ireland 3 919 2 960 1.3 685.6 5.7
Italy 63 981 41 512 1.5 2953 21.7
Latvia 6 999 1 416 4.9 184.5 37.9
Liechtenstein 7 15 0.5 5 1.4
Lithuania 8 295 2 018 4.1 579 14.3
Luxembourg 679 292 2.3 71 9.6
Malta 494 199 2.5 45 11.0
Moldova 6 769 2 105 3.2 457 14.8
Monaco 23 32 0.7 5 4.6
Montenegro 986
Netherlands 16 284 6 776.52 2.4 1482.99 11.0
Norway 3 285 2 199 1.5 463 7.1
Poland 84 003 15 645 5.4 2488 33.8
Portugal 11 099 4 148 2.7 474 23.4
Romania 27 028 3 166 8.5 1247 21.7
Russian Federation 880 671
San Marino 2 6 0.3 1 2.0
Serbia 10 262 2 186 4.7 1110 9.2
Slovak Republic 9 170 4 603 2.0 499 18.4
Slovenia 1 365 497 2.7 180 7.6
Spain (State Adm.) 67 986 15 652 4.3 2785 24.4
Spain (Catalonia) 10 356 3 192 3.2 1247 8.3
Sweden 7 147 4 351 1.6 728 9.8
Switzerland 6 084 NA
the FYRO Macedonia 2 461 481 5.1 140 17.6
Turkey 115 540 NA 281 411.2
Ukraine 146 394 22 731 6.4 10105 14.5
UK: England and Wales 83 454 33 848 2.5 6048 13.8
UK: Northern Ireland 1 456 1 478 1.0 185 7.9
UK: Scotland 8 113
Mean 3.6 23.4
Median 2.6 13.1
Minimum 0.3 1.4
Maximum 26.4 411.2
Council of Europe Annual Penal Statistics – SPACE I – 2009
Strasbourg, 22 March 2011, pc-cp\space\documents\pc-cp (2011) 3e PC-CP (2011) 3
109
Notes – Table 20
See notes to the previous tables. Many figures calculated in this Table are estimates, and therefore the Table must be used with caution. The total number of prisoners used in this Table is based on the non‐adjusted figures provided in Table 1.

Council of Europe Annual Penal Statistics – SPACE I – 2009
Strasbourg, 22 March 2011, pc-cp\space\documents\pc-cp (2011) 3e PC-CP (2011) 3
110
List of Tables and Figures: TABLE 1: SITUATION OF PENAL INSTITUTIONS ON 1ST
SEPTEMBER 2009 .............................................................. 26 TABLE 1.2: CATEGORIES INCLUDED IN THE TOTAL NUMBER OF PRISONERS ........................................................... 27 TABLE 1.3: CAPACITY OF PENAL INSTITUTIONS ON 1ST
SEPTEMBER 2009 (BY CATEGORIES) ..................................... 29 FIGURE 1.A: COUNTRIES WITH THE HIGHEST PRISON POPULATION RATES PER 100 000 INHABITANTS (MORE THAN 100
PRISONERS PER 100 000 INHABITANTS) ................................................................................................ 38 FIGURE 1.B: COUNTRIES WITH PRISON POPULATION OVERCROWDING (MORE THAN 100 PRISONERS PER 100 PLACES) 38 TABLE 1.4: EVOLUTION OF PRISON POPULATIONS BETWEEN 2000 AND 2009 ..................................................... 39 TABLE 1.5: YEAR‐TO‐YEAR RATES OF INCREASE AND DECREASE OF PRISON POPULATION RATES PER 100,000
INHABITANTS BETWEEN 2008 AND 2009 .............................................................................................. 41 MAP 1: PRISON POPULATION RATES PER 100,000 INHABITANTS ....................................................................... 42 TABLE 2: AGE STRUCTURE OF PRISON POPULATION ON 1ST
SEPTEMBER 2009: GENERAL BREAKDOWN BY CATEGORIES OF
AGE ................................................................................................................................................. 43 TABLE 2.1: AGE STRUCTURE OF PRISON POPULATIONS ON 1ST
SEPTEMBER 2009: MINORS AND PERSONS BETWEEN 18 AND 21 OF AGE ................................................................................................................................. 49
MAP 2: BREAKDOWN OF THE AGE OF CRIMINAL RESPONSIBILITY AND PERCENTAGES OF PRISONERS LESS THAN 18 YEARS OF AGE IN EUROPEAN COUNTRIES ........................................................................................................ 51
TABLE 2.2: MEDIAN AND AVERAGE AGES OF THE PRISON POPULATION (INCLUDING PRE‐TRIAL DETAINEES) ON 1ST
SEPTEMBER 2009 ............................................................................................................................. 52 FIGURE 2.A: COUNTRIES WITH THE YOUNGEST (LESS THAN 35 YEARS) PRISON POPULATION CLASSIFIED BY DECREASING
MEDIAN AGE ..................................................................................................................................... 52 TABLE 3.1: STRUCTURE OF PRISON POPULATIONS ON 1ST
SEPTEMBER 2009: FEMALE PRISONERS ............................ 53 TABLE 3.2: STRUCTURE OF PRISON POPULATIONS ON 1ST
SEPTEMBER 2009: FOREIGN PRISONERS ........................... 55 TABLE 4: LEGAL STATUS OF PRISON POPULATIONS ON 1ST
SEPTEMBER 2009 (NUMBERS) ....................................... 57 TABLE 5: LEGAL STATUS OF DETAINEES NOT SERVING A FINAL SENTENCE ON 1ST
SEPTEMBER 2009 (PERCENTAGES AND RATES) ............................................................................................................................................. 62
TABLE 6: BREAKDOWN OF SENTENCED PRISONERS (FINAL SENTENCE) ON 1ST SEPTEMBER 2009, BY MAIN OFFENCE
(NUMBERS) ...................................................................................................................................... 64 TABLE 7: BREAKDOWN OF SENTENCED PRISONERS (FINAL SENTENCE) ON 1ST
SEPTEMBER 2009, BY MAIN OFFENCE
(PERCENTAGES) ................................................................................................................................. 70 TABLE 8: BREAKDOWN OF SENTENCED PRISONERS (FINAL SENTENCE) ON 1ST
SEPTEMBER 2009, BY LENGTH OF SENTENCE (NUMBERS) ........................................................................................................................ 71
TABLE 9: BREAKDOWN OF SENTENCED PRISONERS (FINAL SENTENCE) ON 1ST SEPTEMBER 2009, BY LENGTH OF
SENTENCE (PERCENTAGES) .................................................................................................................. 75 TABLE 10: BREAKDOWN OF SENTENCED PRISONERS (FINAL SENTENCE) ON 1ST
SEPTEMBER 2009, BY LENGTH OF SENTENCE (CUMULATIVE PERCENTAGES) ............................................................................................... 76
TABLE 11: BREAKDOWN OF PRISONERS SENTENCED TO LESS THAN ONE YEAR (FINAL SENTENCE) ON 1ST SEPTEMBER
2009, BY LENGTH OF SENTENCE (PERCENTAGES) .................................................................................... 77 FIGURE 2.B: COUNTRIES WITH THE HIGHEST PERCENTAGES OF PRISONERS SENTENCED TO LESS THAN ONE YEAR ......... 78 TABLE 12.1: FLOW OF ENTRIES TO PENAL INSTITUTIONS IN 2008 ...................................................................... 79 TABLE 12.2: ADDITIONAL CATEGORIES OF THE FLOW OF ENTRIES TO PENAL INSTITUTIONS IN 2008 ........................ 80 TABLE 13.1: INDICATOR OF AVERAGE LENGTH OF IMPRISONMENT IN 2008, BASED ON THE TOTAL NUMBER OF DAYS
SPENT IN PENAL INSTITUTIONS ............................................................................................................. 83 TABLE 13.2: INDICATOR OF AVERAGE LENGTH OF IMPRISONMENT IN 2008, BASED ON THE TOTAL NUMBER OF
PRISONERS IN PENAL INSTITUTIONS ON 1ST SEPTEMBER 2008 ................................................................... 85
TABLE 14: ESCAPES OF PRISONERS IN 2008 ................................................................................................... 86 TABLE 15.1: DEATHS IN PENAL INSTITUTIONS IN 2008 (INCLUDING SUICIDES) ..................................................... 89 TABLE 15.2: TYPES OF DEATHS AND SUICIDES IN PENAL INSTITUTIONS IN 2008 MAKING REFERENCE TO THE CATEGORIES
INCLUDED/EXCLUDED IN THE FIGURES OF THE TABLE 15.1 ........................................................................ 90

Council of Europe Annual Penal Statistics – SPACE I – 2009
Strasbourg, 22 March 2011, pc-cp\space\documents\pc-cp (2011) 3e PC-CP (2011) 3
111
TABLE 16: AVERAGE AMOUNT SPENT PER DAY OF DETENTION OF ONE PERSON IN PENAL INSTITUTIONS IN 2008 (IN €) 92 TABLE 17: FULL‐TIME AND PART‐TIME STAFF WORKING IN PENAL INSTITUTIONS ON 1ST
SEPTEMBER 2009 –ON THE BASIS OF FULL‐TIME EQUIVALENTS (NUMBERS) ....................................................................................... 96
TABLE 18.1: FULL‐TIME AND PART‐TIME STAFF WORKING IN PENAL INSTITUTIONS ON 1ST SEPTEMBER 2009 –ON THE
BASIS OF FULL‐TIME EQUIVALENTS (PERCENTAGES) ............................................................................... 101 TABLE 18.2: FULL‐TIME AND PART‐TIME STAFF WORKING INSIDE PENAL INSTITUTIONS ON 1ST
SEPTEMBER 2009 –ON THE BASIS OF FULL‐TIME EQUIVALENTS (PERCENTAGES) ......................................................................... 102
FIGURE 3: PERCENTAGES OF STAFF WORKING INSIDE PENAL INSTITUTIONS (1ST SEPTEMBER 2009) CLASSIFIED ON THE
BASIS OF THE “CUSTODIAL STAFF” ...................................................................................................... 103 TABLE 19: STAFF WORKING IN PENAL INSTITUTIONS BUT NOT EMPLOYED BY THE PRISON ADMINISTRATION ON 1ST
SEPTEMBER 2009 (NUMBERS AND PERCENTAGES) ................................................................................ 104 TABLE 20: RATE OF SUPERVISION OF PRISONERS BY CUSTODIAL STAFF, TREATMENT AND EDUCATIONAL STAFF, AND
STAFF RESPONSIBLE FOR WORKSHOPS ON 1ST SEPTEMBER 2009.............................................................. 108
Related Documents


