PC 235: Mass Spectrometry and Proteomics Lecture 1 May 11 th , 2009 Shenheng Guan NIH NCRR Mass Spectrometry Facility, UCSF [email protected]

PC 235: Mass Spectrometry and Proteomics Lecture 1 May 11 th, 2009 Shenheng Guan NIH NCRR Mass Spectrometry Facility, UCSF [email protected].
Dec 20, 2015
Welcome message from author
This document is posted to help you gain knowledge. Please leave a comment to let me know what you think about it! Share it to your friends and learn new things together.
Transcript

PC 235: Mass Spectrometry and Proteomics
Lecture 1
May 11th, 2009
Shenheng Guan
NIH NCRR Mass Spectrometry Facility, UCSF

2
Course OutlineLectures: 10hrs:
10am-12 in Genentech Hall Room S271, Mission Bay Campus
Date Lecturer Topic
Lecture1 Monday, May 11 S. Guan Mass Spectrometry Fundamentals: Instrumentation; ion optics, resolution and mass accuracy; why these are important at protein vs peptide vs PTM level.
Lecture2 Wednesday, May 13
R. Chalkley Sample preparation: Gels and Chromatography; IP/Tags. What shouldn’t be in the sample. Contaminants. Digestion. Basics of peptide fragmentation.
Lecture3 Monday, May 18 R. Chalkley Protein Identification: Database searching. How to measure the reliability of assignments.
Lecture4 Wednesday, May 20
K. Medzihradszky PTMs: Protein vs peptide analysis. PTM enrichment, modification specific scans/ions.
Lecture5 Friday, May 22 R. Chalkley Quantitation strategies. Cross-linking for identifying complexes/binding partners and interfaces.

3
Course Outline – cont.Laboratory: Approximately 30hrs total
Will include a half-day tutorial on instrumentation and how data is acquired. There will also be training on data interpretation and bioinformatic analysis.

4
What is Mass Spectrometry?
IUPAC Definition: The branch of science dealing with all aspects of mass spectrometers and the results obtained with these instruments.
My Definition: An analytical instrument that measures the mass-to-charge ratio of charged particles.
Applications:
1. identification
2. Quantification
3. Molecular structure
4. higher-order structure (H/D exchange, cross-link)
5. gas-phase ion chemistry
6. tissue imaging

5
What do we use Mass Spectrometry for in this course?
1. Protein identification, either by direct protein analysis, or by digesting the protein into smaller pieces (peptides), then identifying the peptides.
• Complex mixture; e.g. cell organelle
• Immunoprecipitation of protein of interest
• ID binding partners
2. Identification of post-translational modifications:e.g. phosphorylation, acetylation.
3. Quantifying relative differences in protein/peptide levels between related samples.
4. Quantifying changes in post-translational modifications.
6
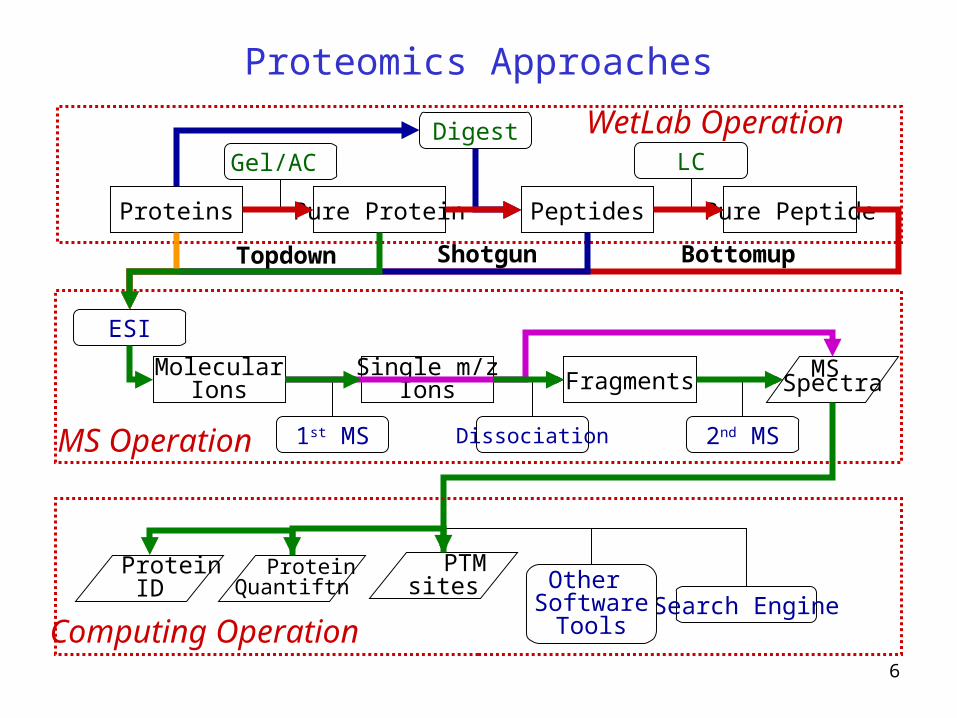
Proteins Pure Protein Peptides Pure Peptide
MolecularIons
Single m/zIons Fragments
Gel/AC Digest
LC
ESI
1st MS Dissociation 2nd MS
MS Spectra
MS Operation
WetLab Operation
ShotgunTopdown Bottomup
Proteomics Approaches
Computing Operation
ProteinID
ProteinQuantiftn
PTMsites
Search EngineOther
SoftwareTools

7
Outline: Lecture 1
• Mass Measurement
– Mass definitions
– Isotopes
– Characteristics of a mass spectrum
• Instrumentation
– Ion sources
– Fragmentation methods
– Mass analyzers
– Ion detection methods

8
Isotopes and Mass Measurement
9
.
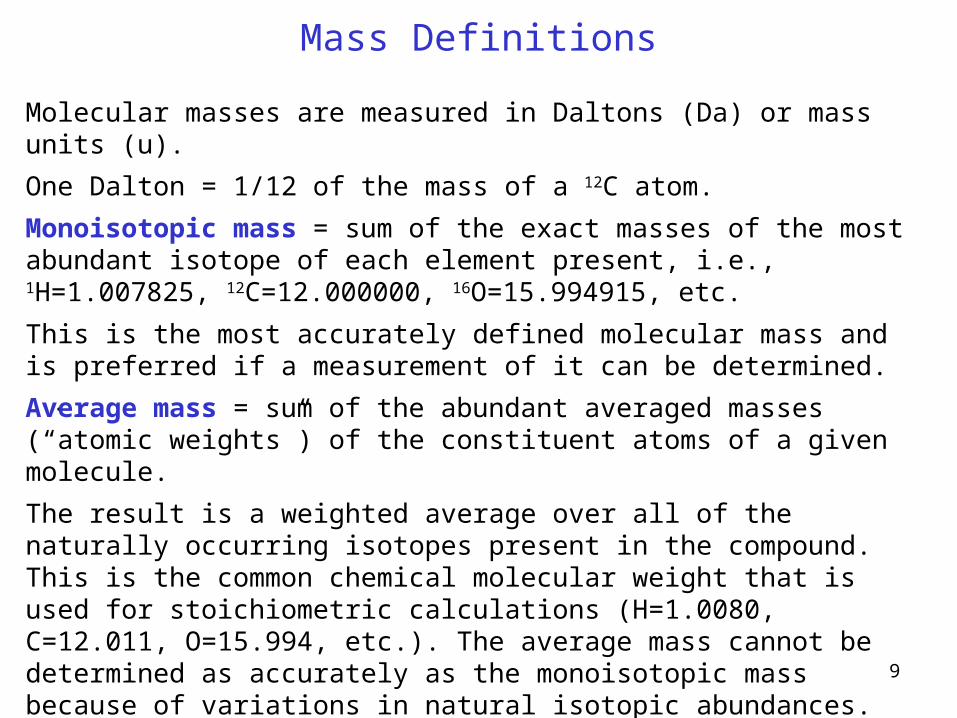
Mass Definitions
Molecular masses are measured in Daltons (Da) or mass units (u).
One Dalton = 1/12 of the mass of a 12C atom.
Monoisotopic mass = sum of the exact masses of the most abundant isotope of each element present, i.e., 1H=1.007825, 12C=12.000000, 16O=15.994915, etc.
This is the most accurately defined molecular mass and is preferred if a measurement of it can be determined.
Average mass = sum of the abundant averaged masses (“atomic weights”) of the constituent atoms of a given molecule.
The result is a weighted average over all of the naturally occurring isotopes present in the compound. This is the common chemical molecular weight that is used for stoichiometric calculations (H=1.0080, C=12.011, O=15.994, etc.). The average mass cannot be determined as accurately as the monoisotopic mass because of variations in natural isotopic abundances.
The mass to charge ratio (m/z). A quantity formed by dividing the mass (in u) of an ion by its charge number; unit: Thomson or Th.
10
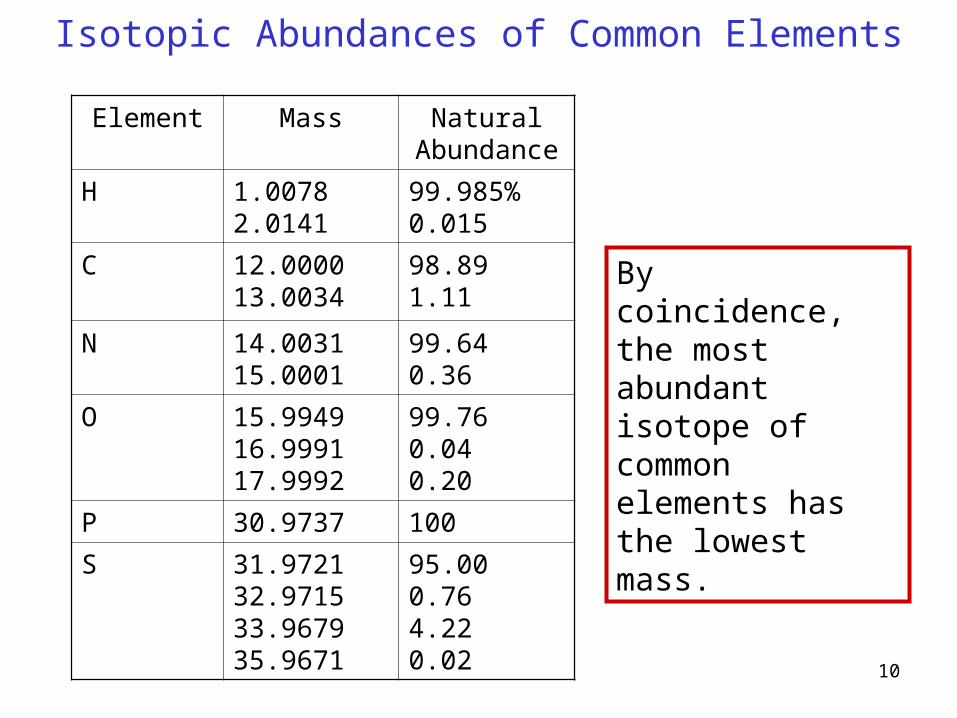
Isotopic Abundances of Common Elements
Element Mass NaturalAbundance
H 1.00782.0141
99.985%0.015
C 12.000013.0034
98.891.11
N 14.003115.0001
99.640.36
O 15.994916.999117.9992
99.760.040.20
P 30.9737 100
S 31.972132.971533.967935.9671
95.000.764.220.02
By coincidence, the most abundant isotope of common elements has the lowest mass.
11Mass (Da)
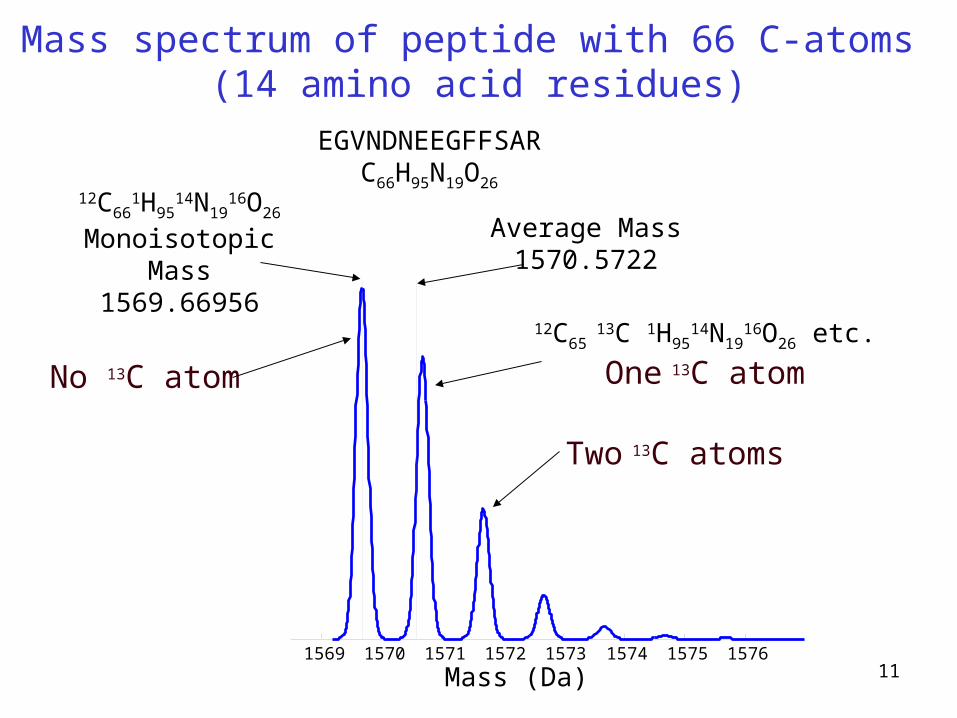
12C661H95
14N1916O26
Monoisotopic Mass
1569.66956
Average Mass1570.5722
1569 1570 1571 1572 1573 1574 1575 1576
EGVNDNEEGFFSARC66H95N19O26
No 13C atom
12C65 13C 1H95
14N1916O26 etc.
One 13C atom
Two 13C atoms
Mass spectrum of peptide with 66 C-atoms (14 amino acid residues)

1000 2000 3000 4000 5000 6000
5730 3655 3660 2465 2095 1295
As the number of C-atoms in the molecule increases, the peaks due to higher mass isotopes increase in relative abundance. Data are for a series of peptides.
Isotope Pattern Changes with Mass
m/z
13
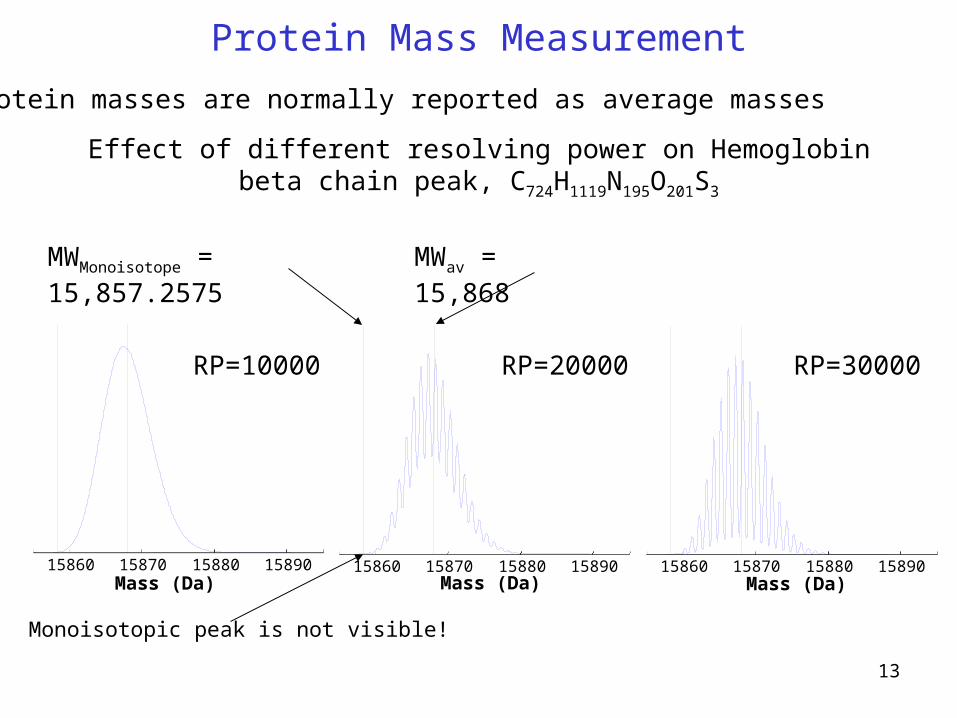
Protein Mass Measurement
Effect of different resolving power on Hemoglobin beta chain peak, C724H1119N195O201S3
•Protein masses are normally reported as average masses
15860 15870 15880 15890 15860 15870 15880 1589015860 15870 15880 15890
RP=10000 RP=20000 RP=30000
Monoisotopic peak is not visible!
MWMonoisotope = 15,857.2575 MWav = 15,868
Mass (Da) Mass (Da) Mass (Da)
14
Three Important Properties to Assess Performance of a Mass Spectrometer
1. Sensitivity•Minimum quantity of sample needed (always estimate how much sample you have, in femtomoles!)
2. Mass Accuracy•Needed for identifying samples by database searching or to determine elemental composition
3. Resolving Power•Determine charge state. Resolve mixtures. High resolving can also improve mass accuracy.
15
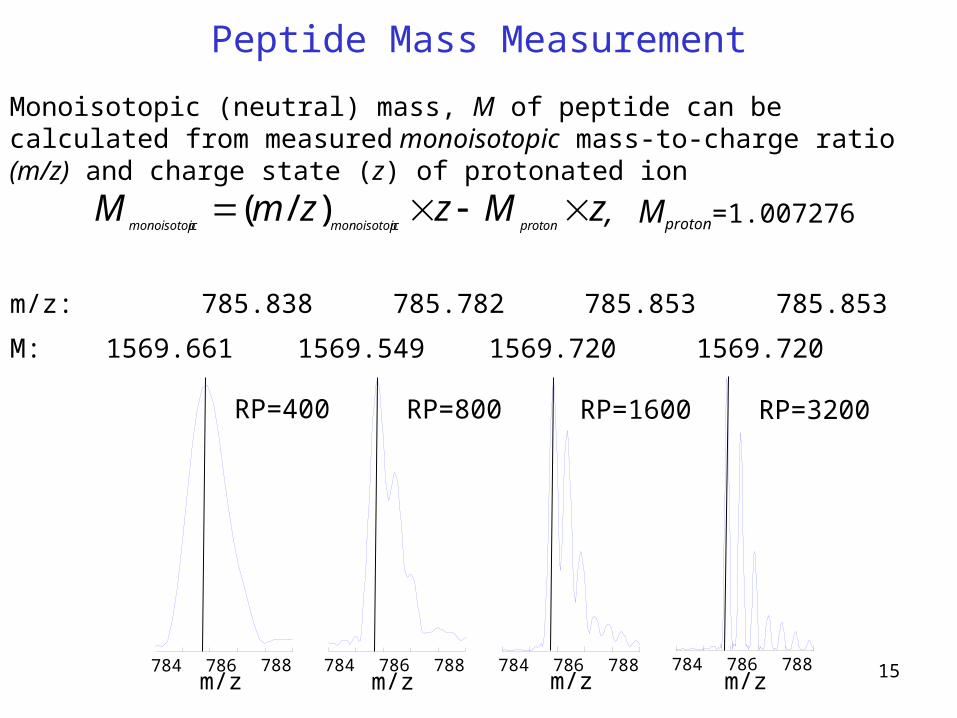
Peptide Mass Measurement
Monoisotopic (neutral) mass, M of peptide can be calculated from measured monoisotopic mass-to-charge ratio (m/z) and charge state (z) of protonated ion
784 786 788784 786 788 784 786 788784 786 788
RP=3200
m/zm/zm/zm/z
RP=1600RP=800RP=400
m/z: 785.838 785.782 785.853 785.853
M: 1569.661 1569.549 1569.720 1569.720
zMzzmMprotonicmonoisotopicmonoisotop
)/( , Mproton=1.007276
16
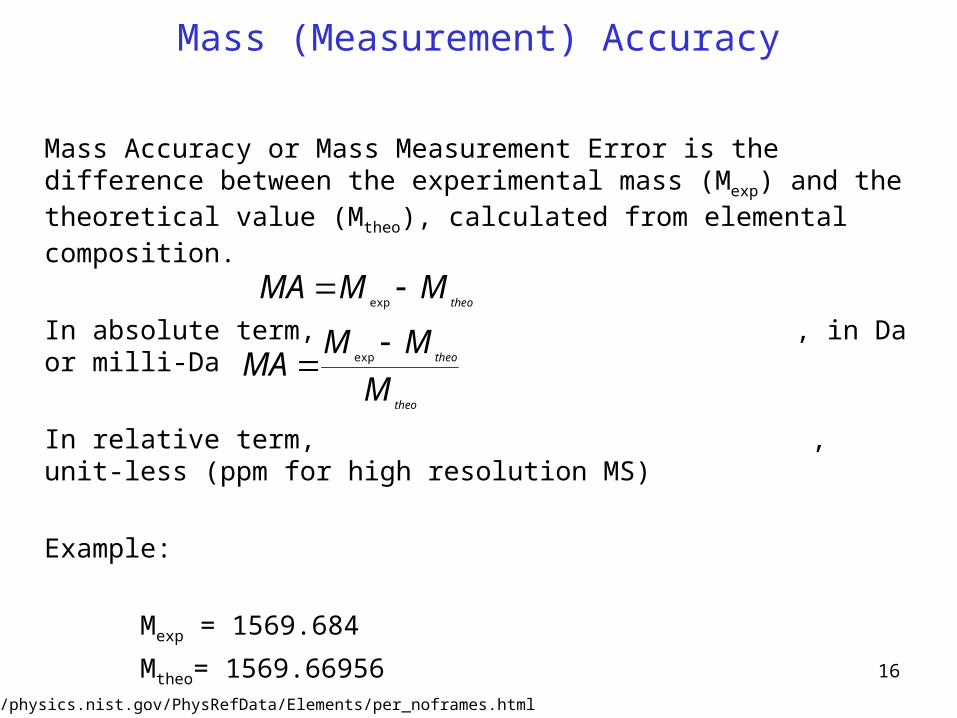
Mass (Measurement) Accuracy
Mass Accuracy or Mass Measurement Error is the difference between the experimental mass (Mexp) and the theoretical value (Mtheo), calculated from elemental composition.
In absolute term, , in Da or milli-Da
In relative term, , unit-less (ppm for high resolution MS)
Example:
Mexp = 1569.684
Mtheo= 1569.66956
Mass Measurement Error = 0.014Da or 9.2ppm
theo
theo
M
MMMA
exp
theoMMMA
exp
http://physics.nist.gov/PhysRefData/Elements/per_noframes.html
17
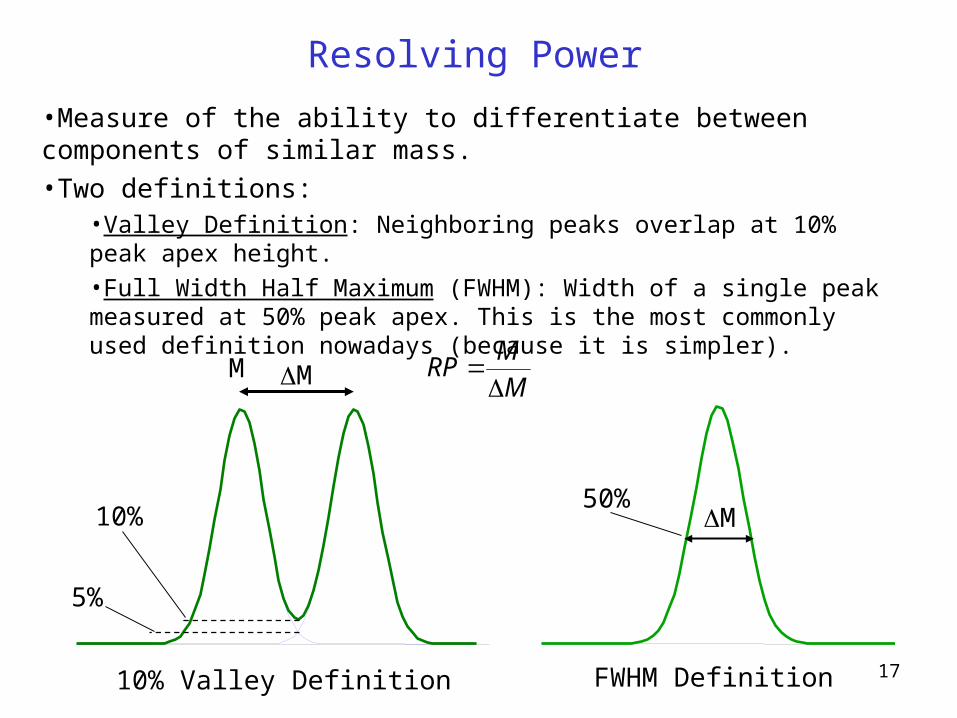
Resolving Power
•Measure of the ability to differentiate between components of similar mass.•Two definitions:
•Valley Definition: Neighboring peaks overlap at 10% peak apex height.
•Full Width Half Maximum (FWHM): Width of a single peak measured at 50% peak apex. This is the most commonly used definition nowadays (because it is simpler).
M
MRP
MM
5%
10%50%
M
10% Valley Definition FWHM Definition
18
Resolution vs Resolving Power
Resolution (Mass) – The smallest mass difference (ΔM) between two equal magnitude peaks such that the valley between them is a specified fraction of the peak height.
-IUPAC definition
For most people in the field, mass resolution and mass resolving power are used interchangeably.
19
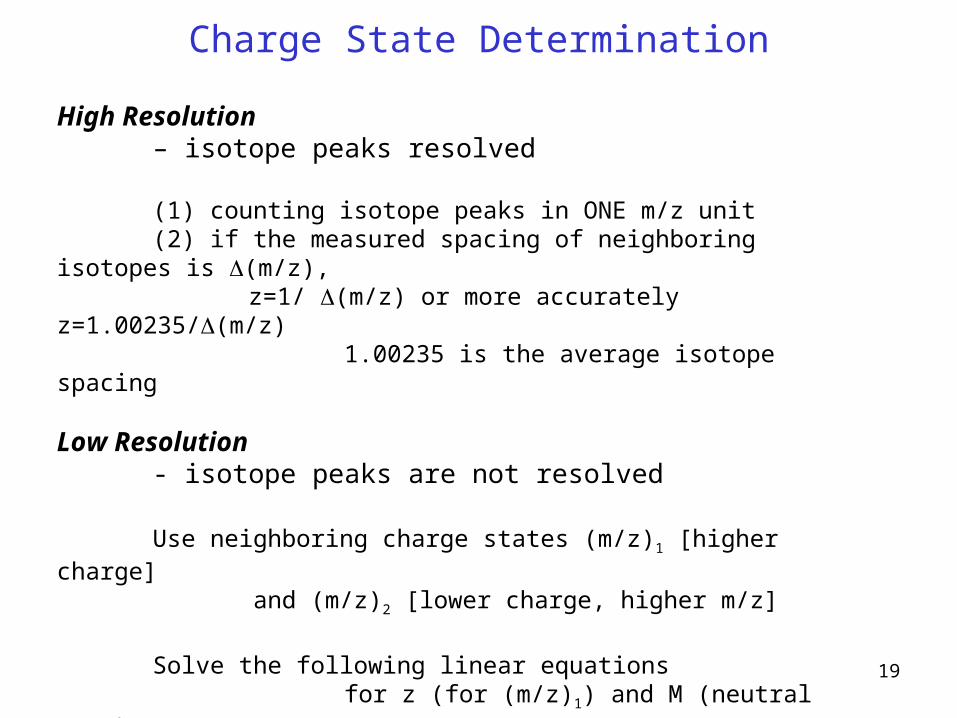
Charge State Determination
High Resolution – isotope peaks resolved
(1) counting isotope peaks in ONE m/z unit(2) if the measured spacing of neighboring isotopes is (m/z),
z=1/ (m/z) or more accurately z=1.00235/(m/z) 1.00235 is the average isotope spacing
Low Resolution- isotope peaks are not resolved
Use neighboring charge states (m/z)1 [higher charge] and (m/z)2 [lower charge, higher m/z]
Solve the following linear equations for z (for (m/z)1) and M (neutral mass)
(m/z)1Xz – z =M(m/z)2X(z-1) – (z-1) =M

20
Electrospray Mass Spectrum of Bovine Ubiquitin
700 800 900 1000 1100m/z
779.44+11
856.9681
857.47+10
952.63+9
714.72+12
659.75+13
857 858
+0.1
+0.2
+0.3
+0.4+0.5
+0.6
+0.7
+0.9+0.8
+1.0
Mtheo=8559.6112Mexp =8559.603
Z=+10
858.5857.5

21
Instrumentation
22
Data System
Mass spectrum
out
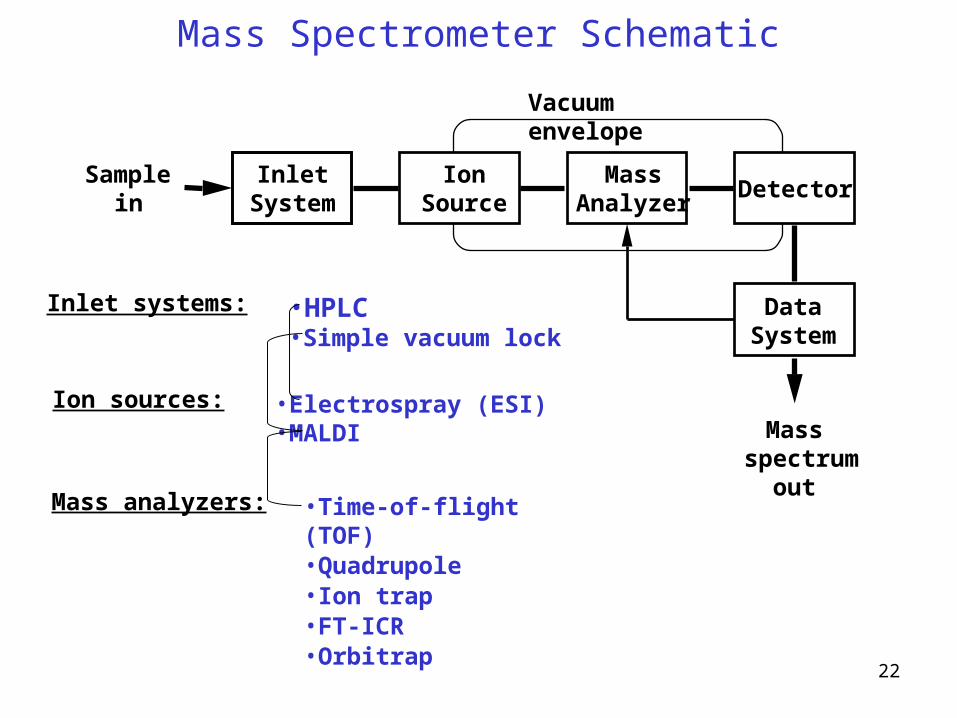
Inlet System
Mass Analyzer
Ion Source
Detector
Vacuum envelope
Sample in
Inlet systems: •HPLC •Simple vacuum lock
Ion sources:
Mass analyzers:
•Electrospray (ESI)•MALDI
•Time-of-flight (TOF)•Quadrupole•Ion trap•FT-ICR•Orbitrap
Mass Spectrometer Schematic

23
Ion sources
MALDI & ESI

24
Sinapinic acid -cyano-4-hydroxycinnamic acid (CHCA) 2,5-dihydroxybenzoic acid (DHB)HO
COOH
OHCH3O
CH3O
HO CH=CH-COOH HO CH=C-COOH
CN
•Analyte is dissolved in solution with excess matrix (>104).
•Sample/matrix mixture is dried on a target and placed in the MS vacuum.
Requirements for a satisfactory matrix:
•It must co-crystallize with typical analyte molecules
•It must absorb radiation at the wavelength of the laser (usually 337 nm)
•To transfer protons to the analyte it should be acidic
Typical successful matrices for UV MALDI are aromatic carboxylic acids.
Matrix-Assisted Laser Desorption/Ionization (MALDI)
25
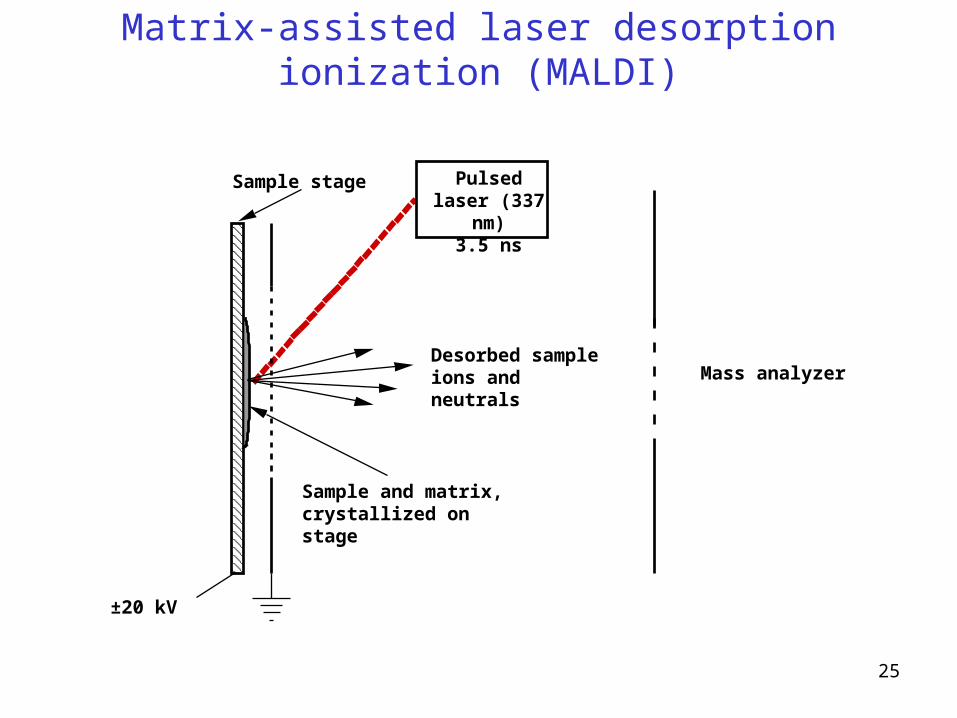
±20 kV
Sample and matrix, crystallized on stage
Desorbed sample ions and neutrals
Pulsed laser (337 nm)
3.5 ns
Sample stage
Mass analyzer
Matrix-assisted laser desorption ionization (MALDI)
26
-
+-
++
++
--
--
--
-
--
--
-
-
- ++ +
+ +
+
++
+
++
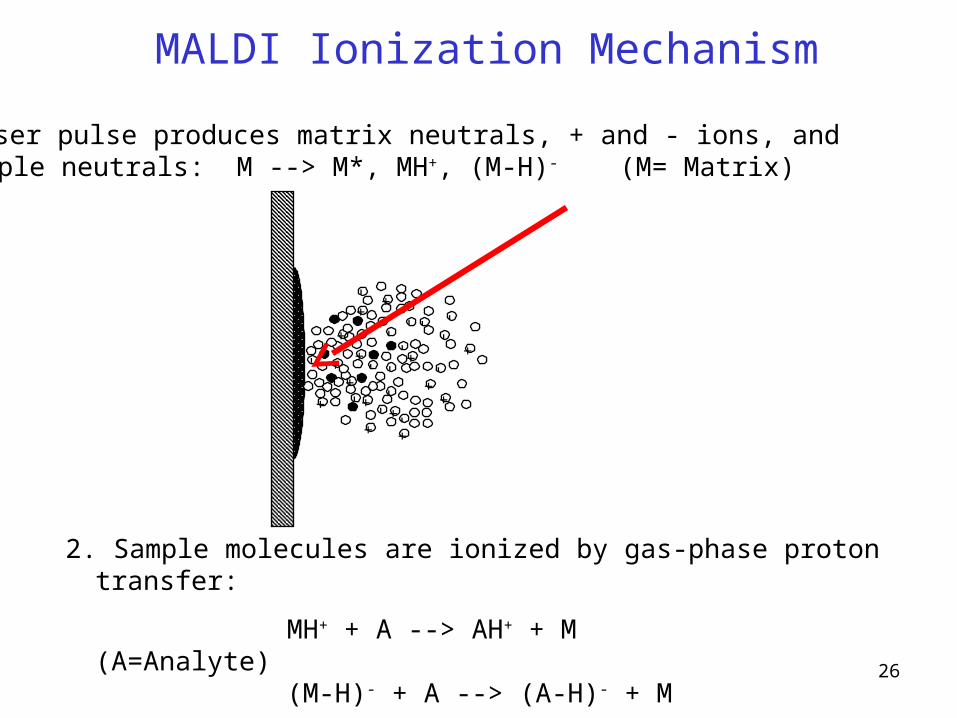
1. Laser pulse produces matrix neutrals, + and - ions, and sample neutrals: M --> M*, MH+, (M-H)- (M= Matrix)
2. Sample molecules are ionized by gas-phase proton transfer:
MH+ + A --> AH+ + M (A=Analyte)(M-H)- + A --> (A-H)- + M
MALDI Ionization Mechanism

27
MALDI Mass Spectrum of Protein Tryptic Digest
m/z
28
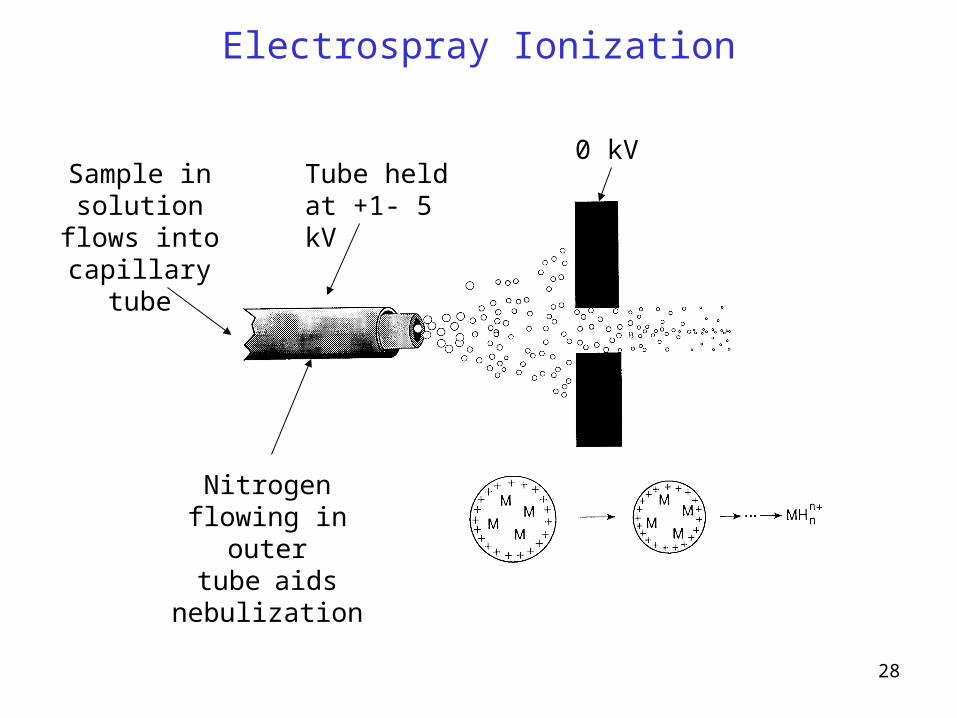
Electrospray Ionization
Sample in solution flows into capillary
tube
Nitrogen flowing in outer tubeaids
nebulization
Tube held at +1- 5 kV
0 kV

29
Electrospray ionization
30
++
++
+
+
++
+ +++
++
+ +++ +
++
+++
+++
++
+
+
++
++
+
+++
+++
+++
MH+
[M+2H]2+
[M+3H]3+
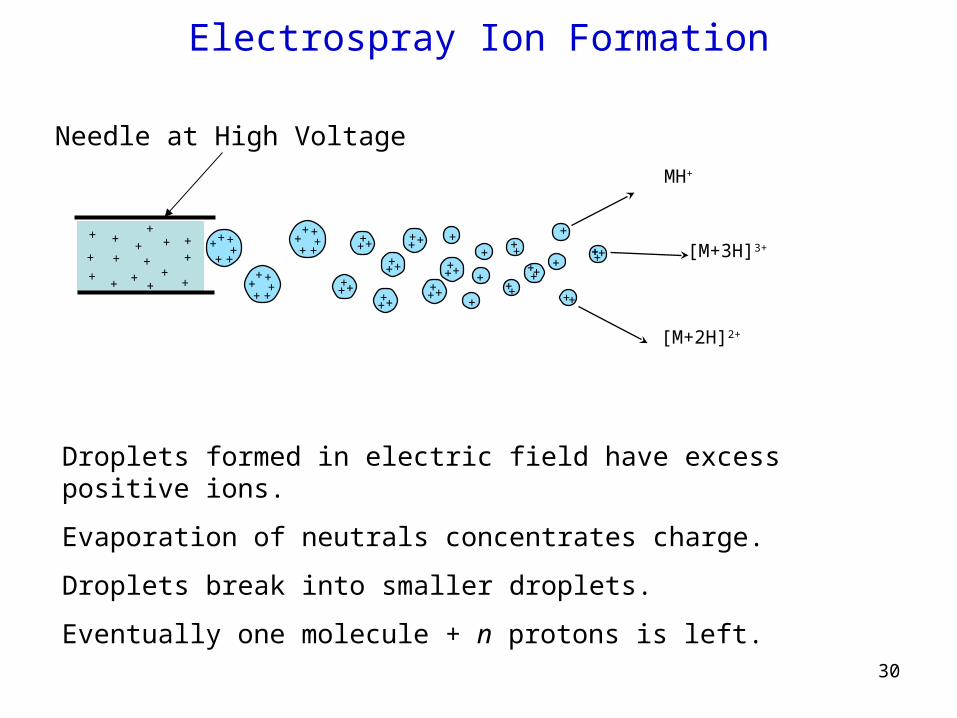
Electrospray Ion Formation
Droplets formed in electric field have excess positive ions.
Evaporation of neutrals concentrates charge.
Droplets break into smaller droplets.
Eventually one molecule + n protons is left.
+
+
+
++++++
++++
Needle at High Voltage
+
+
+++
+++ +
++
+ +++
+

31
Nanospray
Online analysis
~ 20 µm tip ID
Interface with nanoLC
Flow rate: ~300nL/min
Offline analysis (static infusion)
~ 2 µm tip ID
Flow rate: ~40nL/min
Requires pure sample free from salt
New Objective, Inc.
32
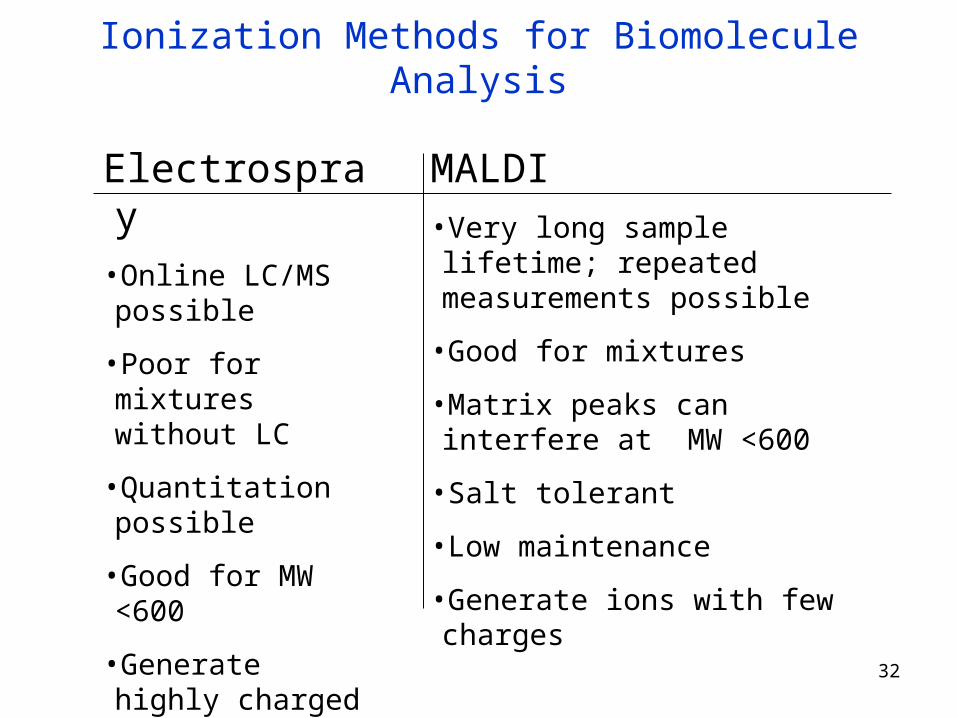
Ionization Methods for Biomolecule Analysis
MALDI•Very long sample lifetime; repeated measurements possible
•Good for mixtures
•Matrix peaks can interfere at MW <600
•Salt tolerant
•Low maintenance
•Generate ions with few charges
Electrospray•Online LC/MS possible
•Poor for mixtures without LC
•Quantitation possible
•Good for MW <600
•Generate highly charged ions
33
Mass analyzers
TOFQuadruploe
Ion TrapFTICR
Orbitrap

34
Ion Optics
Einzel lens modeled with SIMION ion optics simulation program (computing electric and magnetic fields and ion trajectories)
http://simion.com/
A device for manipulating ion beams. A mass spectrometer consists of many ion optical components
35
+
+
+
+
Source Drift region (flight tube)
dete
ctor
V
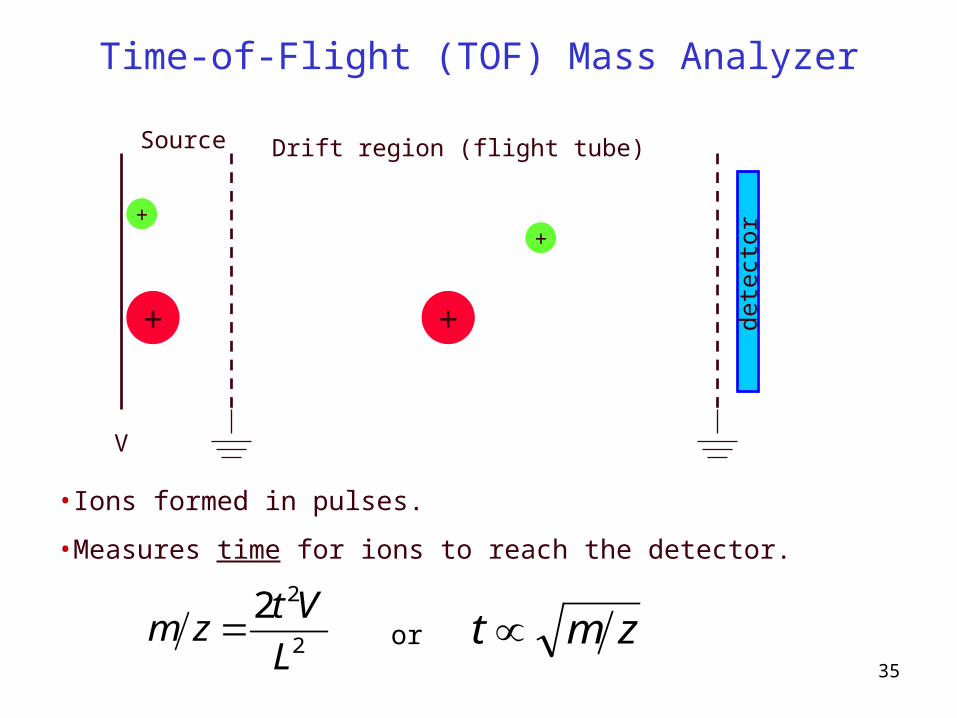
•Ions formed in pulses.
•Measures time for ions to reach the detector.
Time-of-Flight (TOF) Mass Analyzer
2
22
L
Vtzm or zmt
36
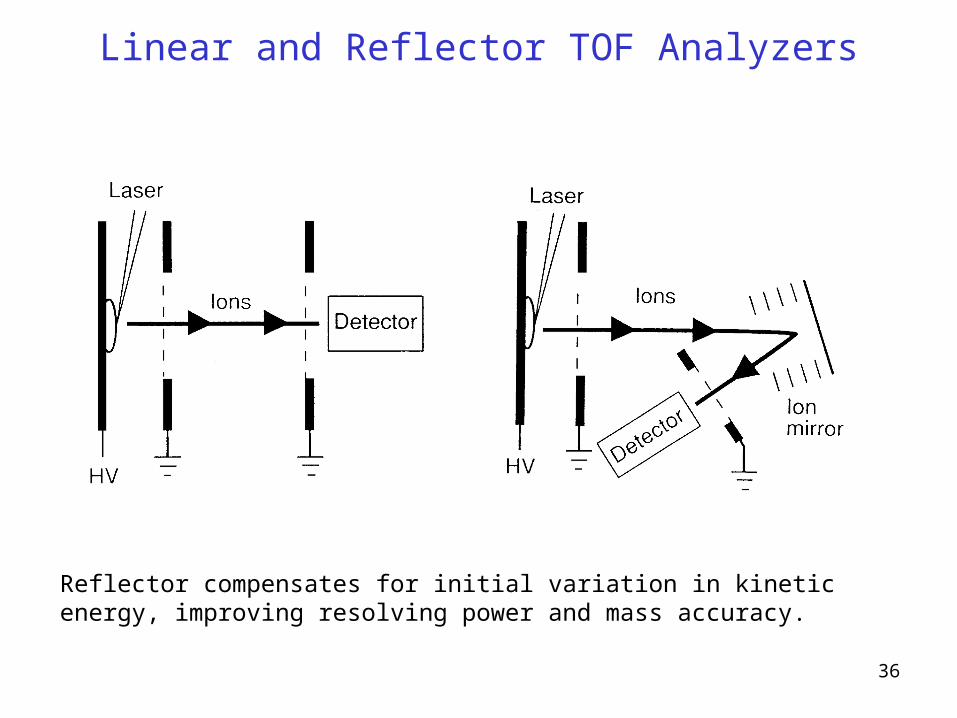
Linear and Reflector TOF Analyzers
Reflector compensates for initial variation in kinetic energy, improving resolving power and mass accuracy.
37
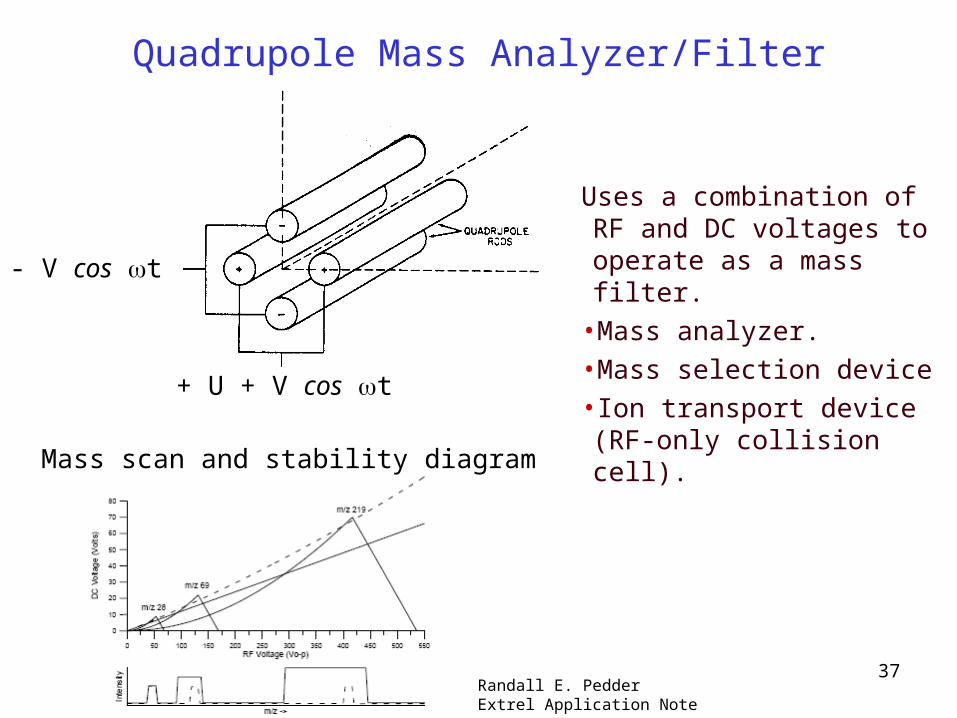
Uses a combination of RF and DC voltages to operate as a mass filter.
•Mass analyzer.•Mass selection device•Ion transport device (RF-only collision cell).
Quadrupole Mass Analyzer/Filter
+ U + V cos t
-U - V cos t
Randall E. Pedder Extrel Application Note
Mass scan and stability diagram

38
Quadrupole Ion Trap
•Uses a combination of DC and RF fields to trap ions
•Ions are sequentially ejected by scanning the RF voltage
Linear Trap
•Essentially a quadrupole with end-caps•Advantage: Larger ion storage capacity, leading to better dynamic range
Ions in(from ESI)
3D TrapEnd caps
Ions outto detector
Ring electrode (~V)
Insulated spacer
He gas1x10-3 Torr
Raymond E. March, JOURNAL OF MASS SPECTROMETRY, VOL. 32, 351È369 (1997)
39
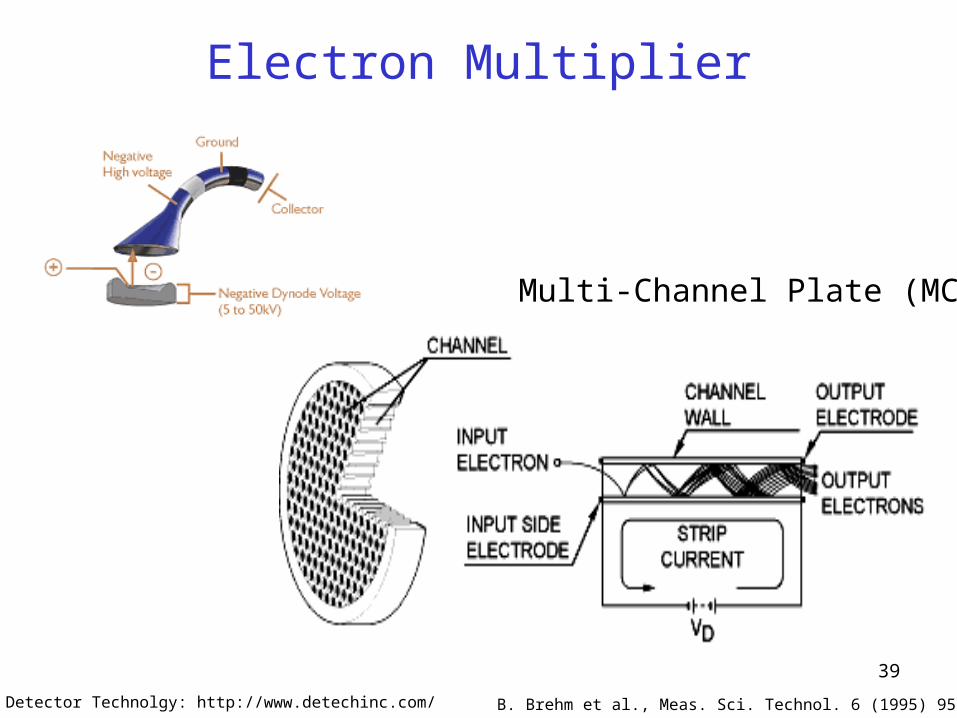
Electron Multiplier
From Detector Technolgy: http://www.detechinc.com/ B. Brehm et al., Meas. Sci. Technol. 6 (1995) 953-958.
Multi-Channel Plate (MCP)

40
B0
Detect++
+++
+++
+
R C
Excite
+++ + ++
+++
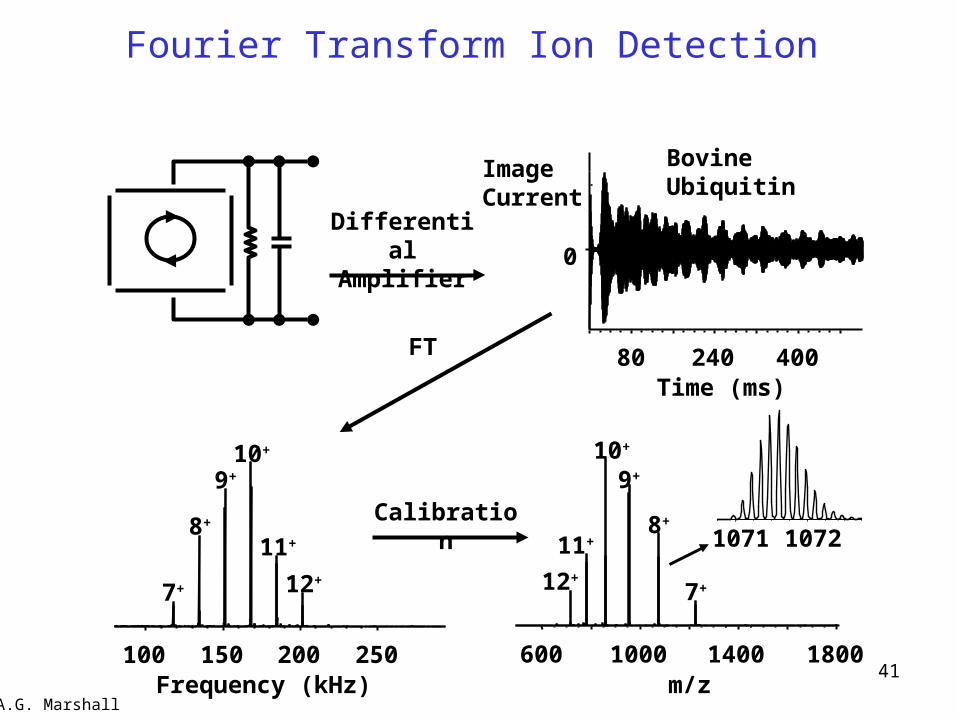
Fourier Transform Ion Cyclotron Resonance (FT-ICR)
•Ions trapped and measured in ultrahigh vacuum inside a superconducting magnet.
A.G. Marshall
zm
1
41
Differential Amplifier
FT
100 150 200 250Frequency (kHz)
7+
8+
10+
11+
12+
9+
600 1000 1400 1800
12+
11+
10+
9+
8+
7+
m/z
Calibration
0
80 240 400Time (ms)
ImageCurrent
BovineUbiquitin
10721071
Fourier Transform Ion Detection
A.G. Marshall

42Alexander Makarov, Anal. Chem. 2000, 72, 1156-1162
Orbitrap
TOF•Simultaneous excitation
FTICR•Confined ion trajectory•Image current detection•Fourier transform data conversion
Unique to Orbitrap•3D electric field trapping•No need for magnet•Easy access•Final detection device
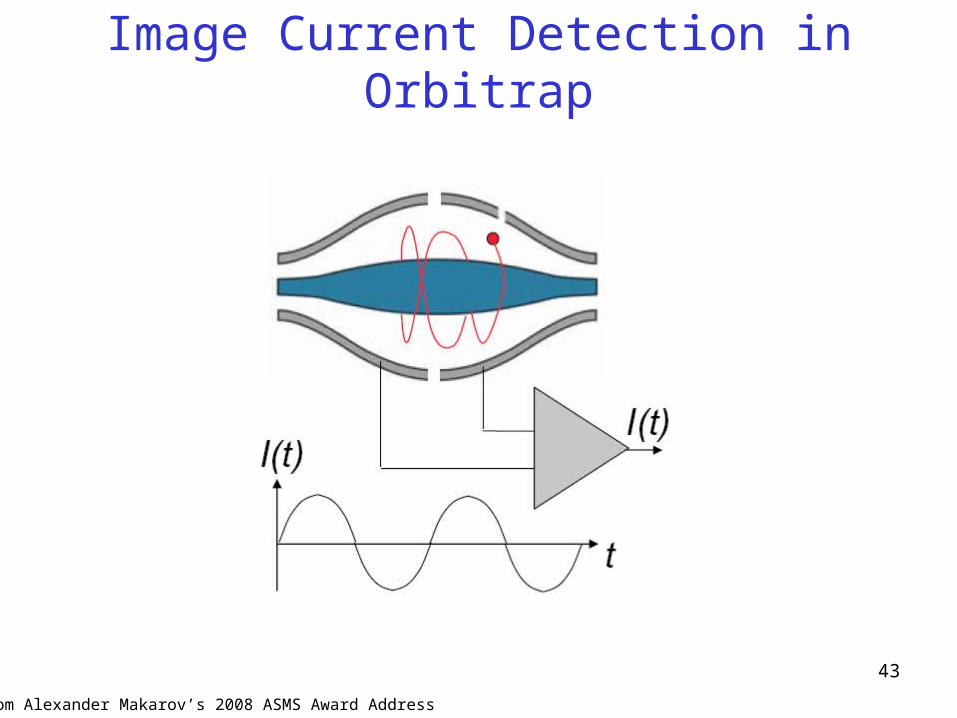
43
Image Current Detection in Orbitrap
From Alexander Makarov’s 2008 ASMS Award Address
44
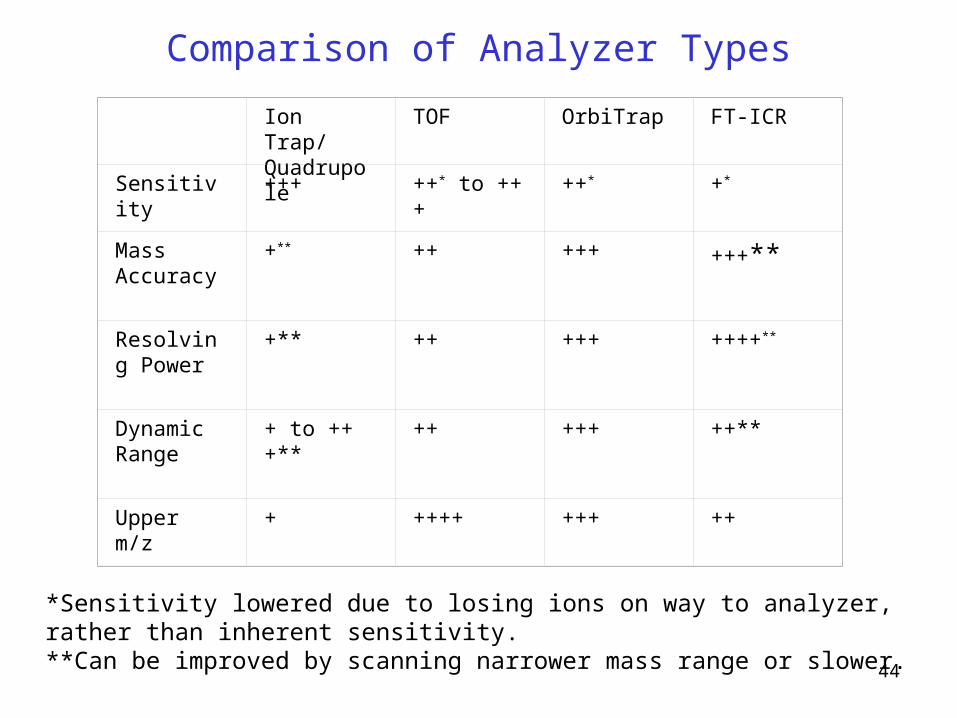
Comparison of Analyzer Types
Ion Trap/Quadrupole
TOF OrbiTrap FT-ICR
Sensitivity +++ ++* to +++ ++* +*
Mass Accuracy
+** ++ +++ +++**
Resolving Power
+** ++ +++ ++++**
Dynamic Range
+ to +++** ++ +++ ++**
Upper m/z + ++++ +++ ++
*Sensitivity lowered due to losing ions on way to analyzer, rather than inherent sensitivity.**Can be improved by scanning narrower mass range or slower.

45
Hybrid/Tandem Instruments
•Combine (1) ion selection, (2) ion dissociation, and (3) mass analyzer devices
•Quadrupoles and ion traps good for selective isolation of precursor ions and for fragmentation (required for MSMS - Topic of Lecture 2)
•Reflectron TOF, FT-ICR, and OrbiTrap have higher mass accuracy and resolving power (high mass accuracy is good for identification – Lecture 3)
46
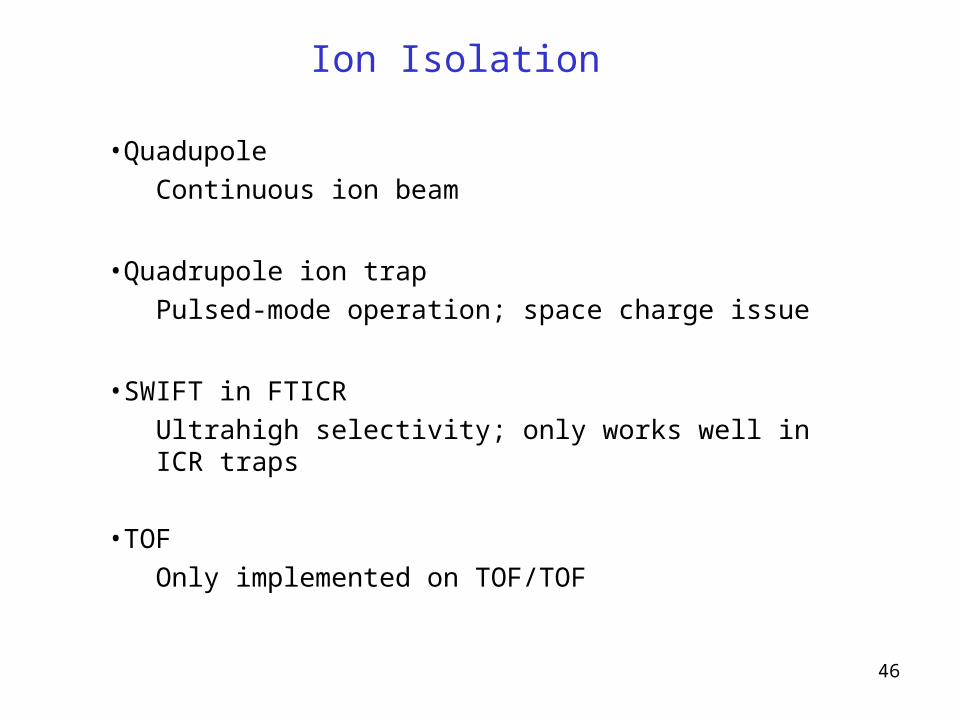
Ion Isolation
•Quadupole
Continuous ion beam
•Quadrupole ion trap
Pulsed-mode operation; space charge issue
•SWIFT in FTICR
Ultrahigh selectivity; only works well in ICR traps
•TOF
Only implemented on TOF/TOF

47
Ion Dissociation
•Collision Induced Dissociation (CID or Collision Activated Dissociation (CAD)
ion traps: off-resonance excitation
rf-only multi-poles: higher kinetic energy (HCD) and cascaded CID
TOF/TOF: single collision
•Electron capture dissociation (ECD) and Electron transfer dissociation (ETD)
ECD: FTICR, reagent: electron
ETD: ion traps, reagent: free radical anion
Other important factors to consider: how product ions are collected and detected

48
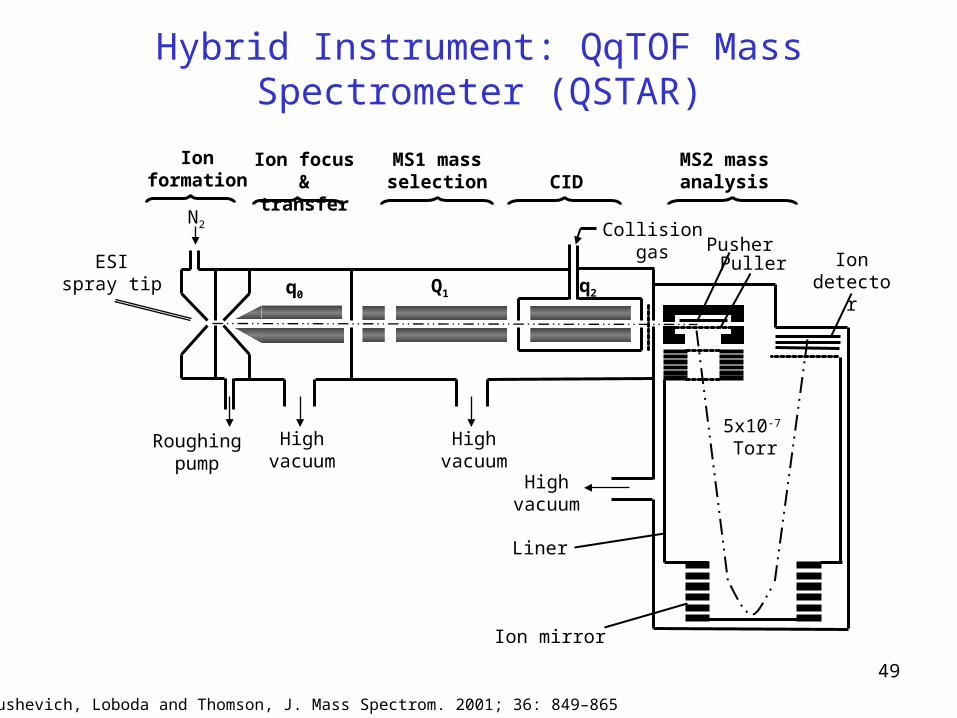
250 l/s turbopump
250 l/s turbopump
250 l/s turbopump
Collision gas
2nd source (accelerates
fragment ions)
Ion gate
Multiplier detectors
Reflectron
Floating collision cellN2 laser
Retarding lens
Beam 1 lens & x/y deflectors
Beam 2 lens, metastable
suppressor & x/y deflectors
MALDI-TOF/TOF (4700 Proteomics Analyzer)
• High performance TOF analysis for MS1 and MS2 give high resolving power and good mass accuracy.
• High accelerating voltage allows high energy CID, giving a wider range of fragment ions and facilitating side-chain cleavages that distinguish isomeric amino acids Ile and Leu.
Marvin L. Vestal and Jennifer M. Campbell, Methods Enzymol. 2005 ;402 :79-108
49
5x10⁻⁷
Torr
Liner
Ion mirror
Ion detector
PusherPuller
Q1 q2
MS1 mass selection CID
Ion focus & transfer
q0
N2
ESIspray tip
Roughing pump
Turbopump
Highvacuum
Highvacuum
Highvacuum
Collision gas
MS2 mass analysis
Ion formation
Hybrid Instrument: QqTOF Mass Spectrometer (QSTAR)
Chernushevich, Loboda and Thomson, J. Mass Spectrom. 2001; 36: 849–865
50
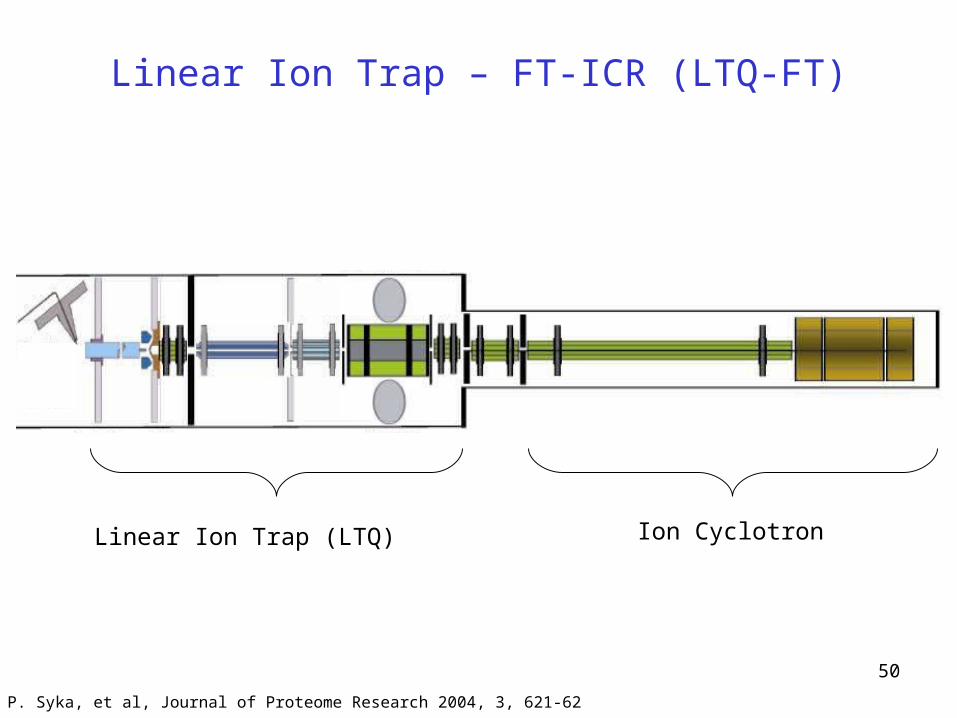
Linear Ion Trap (LTQ) Ion Cyclotron
Linear Ion Trap – FT-ICR (LTQ-FT)
John E. P. Syka, et al, Journal of Proteome Research 2004, 3, 621-62

51
Data Dependent Acquisition
•Data Dependent Scans
MSMS based on intensity ranking of precursor ions
•Dynamic Exclusion
Precursor m/z of previous MSMS are memorized and no MSMS
done on them during a defined time period
•Automatic Gain Control (AGC, unique to ion trap)
Control how many ions are scanned – to achieve signal/noise ratio and to minimize space charge effect

52
Scan Sequence of LTQFT
Thermo Application Note: 30046

53
Linear Ion Trap - Orbitrap - ETD
Alexander Makarov, Stevan Horning, et al, Anal. Chem. 2006, 78, 2113-2120
G. C. McAlister, et al, J Proteome Res. 2008, 7, 3127-36
54
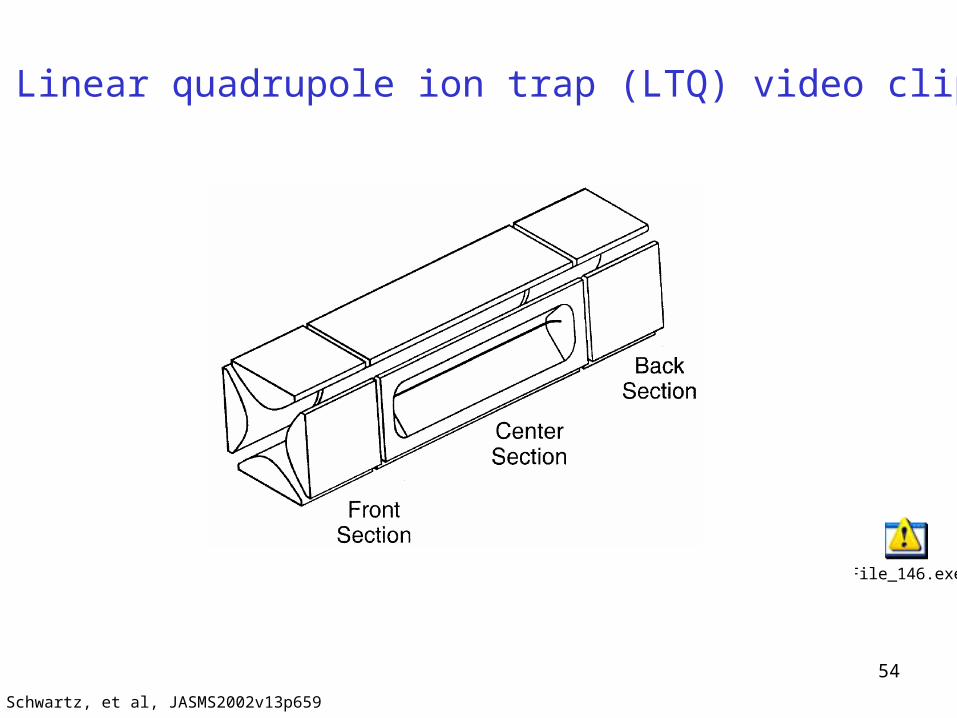
J. Schwartz, et al, JASMS2002v13p659
Linear quadrupole ion trap (LTQ) video clip
File_146.exe

55
Have you filled out the attendance sheet?
I will e-mail a pdf covering the topics of this introduction to all addresses on this list.
56
Mass Spectrometry Online Resources
NIH NCRR Mass Spectrometry Facility, UCSF
http://ms-facility.ucsf.edu/
American Society for Mass Spectrometry (ASMS)
http://www.asms.org
Molecular & Cellular Proteomics
http://www.mcponline.org
Ninth International Symposium on Mass Spectrometry in the Health and Life Sciences: Molecular and Cellular Proteomics
http://ms-facility.ucsf.edu/symposium/
August 23-27, 2009
Hotel Nikko, San Francisco
Abstract submission deadline is June 12, 2009
Early registration now open until June 12, 2009
Related Documents