COVER PAGE Title of Design: PAWS- Design of a Low Level, Affordable Wind Shear Detection System for GA Airports Design Challenge addressed: Runway Safety/Runway Incursions/Runway Excursions University name: Roger Williams University Team Member(s) names: Samantha Gildersleeve, Stephanie Norris, Benny Tortorici, Andrew Wilson Number of Undergraduates: 4 Number of Graduates: 0 Advisor(s) name: Dr. Linda Ann Riley

Welcome message from author
This document is posted to help you gain knowledge. Please leave a comment to let me know what you think about it! Share it to your friends and learn new things together.
Transcript
COVER PAGE
Title of Design: PAWS- Design of a Low Level, Affordable Wind Shear Detection System for
GA Airports
Design Challenge addressed: Runway Safety/Runway Incursions/Runway Excursions
University name: Roger Williams University
Team Member(s) names: Samantha Gildersleeve, Stephanie Norris, Benny Tortorici,
Andrew Wilson
Number of Undergraduates: 4
Number of Graduates: 0
Advisor(s) name: Dr. Linda Ann Riley

PAWS: ROGER WILLIAMS UNIVERSITY | PAGE 1
Executive Summary This report presents a solution to Technical Design Challenge 2, Runway Safety/Runway
Incursions/Runway Excursions, for the 2013-2014 FAA Design Competition for Universities. As
stated in Challenge 2, the proposed system should demonstrate an innovative process to identify
hazards that present the greatest risk to air carrier operations within the runway environment.
Furthermore, proposed strategies and solutions should mitigate those hazards and improve safety
of airport surface operations.
To address the Challenge 2 directive, the FAA Consulting Team (FAACT) has
conceptualized, designed and fabricated the Protection Against Wind Shear (PAWS) system. The
system is affordable compared to existing systems with an approximate cost of $10,000. The
motivation for designing this system results from a number of aircraft incidents, some resulting
in fatalities that have occurred due to wind shear. These deaths potentially could have been
prevented if there was a broad spectrum wind shear detection system in place. Four primary
design goals were considered in developing this system; 1. to create or modify a system that
detects rapid change in wind patterns (i.e., speed and direction) at different heights and in
different planes; 2. to utilize the system to generate its own power as it takes measurements in
real time; 3. to communicate those readings via wireless transmitter to local ground control for
broadcasting over the local Automated Terminal Information System (ATIS) during periods of
dangerous weather activity; and last 4. to integrate this system and process into existing systems
for accurate detection and communication at an airport. Ultimately, this system has been
designed for implementation into smaller general aviation (GA) airports to enhance the safety
environment for aircraft.
The PAWS system has been successfully implemented and tested in realistic conditions
at our partner on the project, Tweed New Haven Airport.
PAWS: ROGER WILLIAMS UNIVERSITY | PAGE 2
Table of Contents Executive Summary ........................................................................................................................ 1
List of Figures ................................................................................................................................. 3
List of Tables .................................................................................................................................. 3
1- Problem Statement ................................................................................................................... 4
2- Background .............................................................................................................................. 6
2.1- What is Wind Shear? ....................................................................................................................... 6
2.2- History of Wind Shear Events .......................................................................................................... 8
2.3- Technical Discussion of Wind Shear................................................................................................ 9
3- Literature Review Supporting Design of PAWS ................................................................... 13
3.1- Overview of Research Process ....................................................................................................... 13
3.2- Wind Shear Detection Systems Currently in Use ........................................................................... 13
4- Problem Solving Approach for Design Process .................................................................... 14
4.1- Team Composition ......................................................................................................................... 14
4.2- Research Process ........................................................................................................................... 15
4.3- Development Methods ................................................................................................................... 16
4.3- Safety and Risk Management ......................................................................................................... 17
5- Description of Technical Aspects of PAWS ......................................................................... 19
5.1- Development of PAWS ................................................................................................................... 19
5.2- PAWS System Technical Analysis .................................................................................................. 20
5.3- PAWS System Electrical Components ............................................................................................ 24
5.4- PAWS System Programming .......................................................................................................... 26
6- Interactions with Airport Operators and Industry Experts .................................................... 28
6.1- Tweed New Haven Airport ............................................................................................................. 28
6.2- Survey Results ................................................................................................................................ 29
6.3- Stakeholder Considerations ........................................................................................................... 30
7- Commercial Potential & Projected Impacts of the PAWS System ....................................... 31
7.1- Manufacturability .......................................................................................................................... 31
7.2- Testing ........................................................................................................................................... 32
7.3- Operation....................................................................................................................................... 33
7.4- Maintenance .................................................................................................................................. 34
7.5- Financial Analysis ......................................................................................................................... 35
8- Conclusions ........................................................................................................................... 38
Appendix A- Contact Information ................................................................................................ 39
Appendix B- Roger Williams University ..................................................................................... 40
Appendix C- Non-University Partners.......................................................................................... 42
Appendix D- Sign-off Form.......................................................................................................... 44
Appendix E- Educational Experience ........................................................................................... 44
Appendix F- References ............................................................................................................... 50
PAWS: ROGER WILLIAMS UNIVERSITY | PAGE 3
List of Figures Figure 1: Process flow chart........................................................................................................................ 4
Figure 2: Commercialized design ............................................................................................................... 5
Figure 3: Wind shear effects on flight path on approach. Microburst reduces airspeed and lift at normal
altitude which results in pitch down tendency to regain airspeed................................................................ 6
Figure 4: Graphic of different types of wind shear ..................................................................................... 7
Figure 5: Microburst graphic of plane unable to land properly due to a wind shear event .......................... 8
Figure 6: Wind shear encounter during approach. (1) Approach initially appeared normal. (2) Increasing
downdraft and tailwind encountered at transaction. (3) Airspeed decrease combined with reduced visual
cues resulted in pitch altitude reduction. (4) Airplane crashed short of approach end of runway.............. 10
Figure 7: Conceptual design development, from Savonius wind turbine tree, to anemometer tree, to final
anemometer tree........................................................................................................................................ 16
Figure 8: Initial testing of PAWS at HVN ................................................................................................ 19
Figure 9: Free body diagram of system pole structure .............................................................................. 20
Figure 10: REM Enterprises "Seabird" VAWT ........................................................................................ 23
Figure 11: Vertical anemometers .............................................................................................................. 24
Figure 12: Horizontal anemometers .......................................................................................................... 24
Figure 13: Full circuit schematic for scaled PAWS system ...................................................................... 25
Figure 14: Scaled PAWS System Electrical Board ................................................................................... 25
Figure 15: Coding snapshot for "slave" Arduinos ..................................................................................... 26
Figure 16: Coding snapshot for "master" Arduino .................................................................................... 27
Figure 17: Warning light rendering in SolidWorks ................................................................................... 28
Figure 18: 1/5 scaled prototype being tested at HVN................................................................................ 32
List of Tables Table 1: Incidents of wind shear accidents reported by the FAA Advisory Circular from 1990-2000 ........ 9
Table 2: Wind shear exponents for different terrains (The Engineering Toolbox, 2013) .......................... 11
Table 3: Four essential components of safety management system .......................................................... 18
Table 4: Benefits of using the "Seabird" VAWT ...................................................................................... 24
Table 5: Itemized budget of the PAWS System ........................................................................................ 36
Table 6: Excel spreadsheet used to calculate net present value and annualized equivalent cost ................ 37
PAWS: ROGER WILLIAMS UNIVERSITY | PAGE 4
1- Problem Statement This report responds to the FAA design challenge within the Runway Safety/Runway
Incursion/Runway Excursion category. The Roger Williams University FAA Consulting Team,
FAACT, has been tasked to expand situational awareness of pilots and ground operators on the
airfield and to create an innovative design that identifies hazards presenting the greatest risk to
aircraft operations on the runway. The team has employed risk analysis of runway incidents and
developed a new approach to measure, record, analyze, and display spatial data for improved
situational awareness, thus improving the overall safety of airport surface operations. The
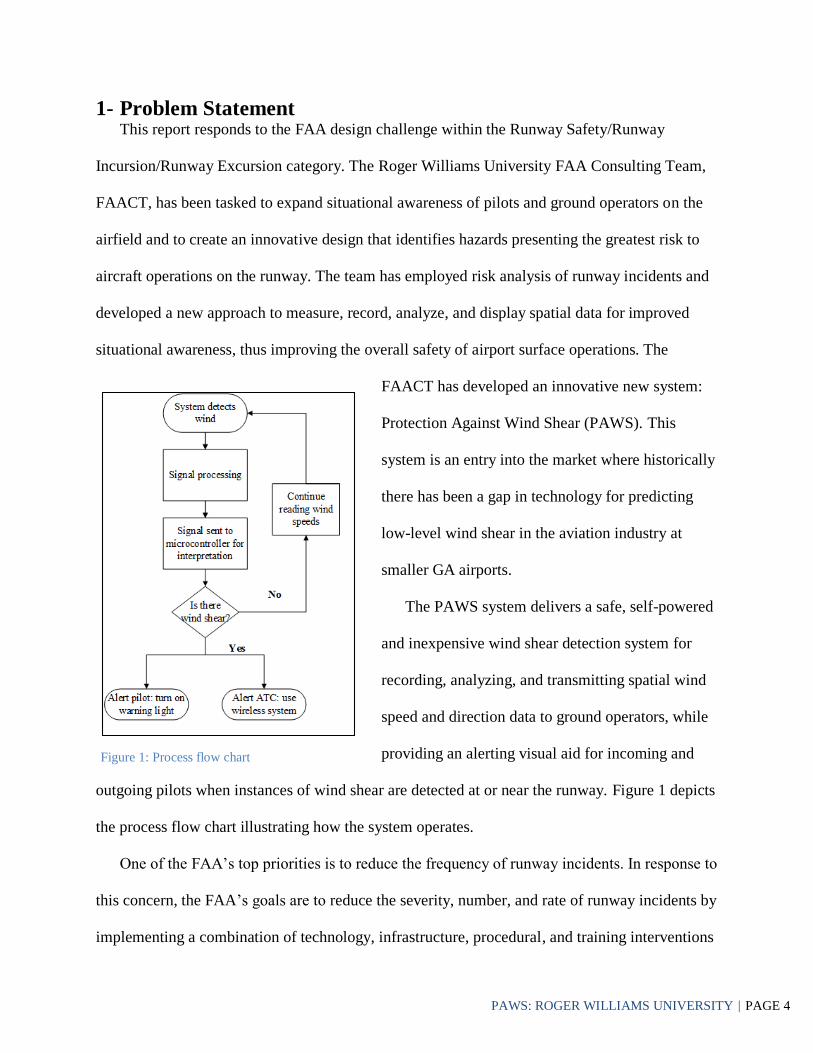
FAACT has developed an innovative new system:
Protection Against Wind Shear (PAWS). This
system is an entry into the market where historically
there has been a gap in technology for predicting
low-level wind shear in the aviation industry at
smaller GA airports.
The PAWS system delivers a safe, self-powered
and inexpensive wind shear detection system for
recording, analyzing, and transmitting spatial wind
speed and direction data to ground operators, while
providing an alerting visual aid for incoming and
outgoing pilots when instances of wind shear are detected at or near the runway. Figure 1 depicts
the process flow chart illustrating how the system operates.
One of the FAA’s top priorities is to reduce the frequency of runway incidents. In response to
this concern, the FAA’s goals are to reduce the severity, number, and rate of runway incidents by
implementing a combination of technology, infrastructure, procedural, and training interventions
Figure 1: Process flow chart

PAWS: ROGER WILLIAMS UNIVERSITY | PAGE 5
to decrease prevalence of these accidents and increase the error tolerance of airport surface
movement operations. The FAA is developing airport design concepts and surface movement
procedures to address such initiatives. In response to the need for an affordable, efficient, and
effective wind shear detection system, FAACT presents the PAWS system. This system records
all wind acting in both the horizontal and vertical directions within a 50 foot height range from
the ground in a designated zone. PAWS will be located within 200 feet of the runway, easily
visible to ground operations and pilots. The system is comprised of 16 calibrated anemometers
positioned in clusters of 4 units located at 3 different
heights on the pole. In each cluster of 4 anemometer
units, the orientation of each individual anemometer is
either vertically or horizontally placed as shown in
Figure 2. Each anemometer is linked to an on-board
microcontroller that communicates to a master data
acquisition system (DAQ). The master DAQ implements a Boolean state program that initiates a
visual warning and sends a wireless transmission output to ground operations for alert responses
to threatening wind shear conditions. In addition, the system is powered by two vertical axis
wind turbines that provide the necessary power input for the DAQ system and warning light.
FAACT suggests that PAWS is an essential technology for smaller airports due to the
prevalence of preventable incidents at the runway-level caused by wind shear episodes. Though
there are systems in place to address low-level wind shear conditions, they require multi-million
dollar investments and are beyond the budget of smaller GA airports. As consequently, there is a
need for a reliable, self-powered and affordable wind shear alert system to optimize pilot and
Figure 2: Commercialized design

PAWS: ROGER WILLIAMS UNIVERSITY | PAGE 6
ground operations awareness at the runway level, The PAWS system embodies these design
specifications.
2- Background 2.1- What is Wind Shear?
Low-level wind shear during takeoff and approach can be highly hazardous to aircraft
operations. Wind shear generates eddies between two wind currents of differing velocities
(National Aeronautics and Space Administration, 1992). This difference can be in wind speed,
direction, or both. The associated vertical motion known as updrafts and downdrafts can produce
an increase or decrease in altitude for an aircraft. Thus, information on wind speed, magnitude,
and directional shear with respect to varying altitudes is essential for a safe takeoff or landing.
Wind shear can be associated with any wind speed gradient or direction in the atmosphere.
However, the behavior of the wind in the final 100 ft. of descent, specifically between 100 and
50 ft., is the most important to an aircraft on its final approach. Wind speed shears greater than
0.1s-1 (6kts/100ft) are categorized as dangerous, while greater changes in wind direction (greater
than 40 degrees) are considered hazardous (National Research Council, 1983). Industry experts
have emphasized that horizontal magnitude of wind shear of 0.02s-1 (1kt/100ft) is of major
significance. As shown in Figure 3, the
final approach landing procedure is critical
to the safety of passengers and the aircraft.
When wind shear is encountered, the
aircraft loses altitude and begins to pitch
downward with too little time to recover its
position and lift before contact with the
ground.
Figure 3: Wind shear effects on flight path on approach.
Microburst reduces airspeed and lift at normal altitude
which results in pitch down tendency to regain airspeed
(U.S. Department of Transportation, 1988)

PAWS: ROGER WILLIAMS UNIVERSITY | PAGE 7
Figure 4 illustrates the types of wind shear from directional and speed perspectives.
Directional wind shear acts in the vertical and horizontal planes, while speed shear acts at
varying magnitudes (National Weather
Service Forecast Office, 2010). Horizontal
wind shear affects aircraft velocity, and is
classified as headwind or tailwind shear.
Low-level wind shear is categorized at
altitudes below 2,000ft (National Weather
Association, 2003). Currently, the Doppler
radar found on most aircrafts has a hazard F-
factor and wind shear intensity scale acting to guide the pilot, however when wind shear is
considered clear-air turbulence, the Doppler radar is not capable of measuring this condition in
advance.
Many changes to how low-level wind shear is detected and reacted upon have been
introduced over the years due to major plane crashes and other accidents. Large airports now
have systems in place, such as the Terminal Doppler Weather Radar (TDWR) to help detect
dangerous changes in wind speed and direction. The FAA has also implemented and tested the
Low Level Windshear Alert Systems (LLWAS). Though that system has proved capable for low-
level wind shear detection in some incidents, it has also failed in other circumstances such as the
Dallas/Fort Worth crash in 1985. Because of these recurring incidents, the aviation community
has lacked a completely reliable solution. Since the 1985 incident, the FAA has implemented the
National Integrated Wind Shear Plan which involved better training for pilots’ abilities to detect
and handle wind shear situations which led to the TDWRs at larger airports today. (Jones, 2004)
Figure 4: Graphic of different types of wind shear
(Weather Questions, 2010)

PAWS: ROGER WILLIAMS UNIVERSITY | PAGE 8
2.2- History of Wind Shear Events According to several NASA and International Civil Aviation Organization (ICAO) reports,
unsteady weather hazards caused by low-level wind shear have been linked to a number of
severe aviation accidents within the past thirty years. The ICAO provides statistical reports for
weather related aviation accidents; 30 percent of the fatal accidents are due to severe weather
patterns (International Civil Aviation Organization, 2005). Though aviation technology
continues to advance and provide convenient means of transportation, turbulence caused by wind
shear still poses a major threat to aircrafts with no updating alert system during their
descent/final approach. Experienced pilots will follow recommended procedures for turbulence
caused by storms, however, when it occurs in
clear-air, the pilot experiences the invisible
enemy with little-to-no warning. Figure 5
demonstrates how a microburst downdraft can
cause a plane to reduce its lift and crash.
One of the first aircraft accidents attributed
to wind shear was a Boeing 727 passenger
airplane in 1975. As the prevalence of this
clear-air turbulence became universally recognized, the ICAO formally established the Low-
Level Wind Shear and Turbulence Group. The group’s initiatives are to circulate studies from
various countries, and prepare low-level wind shear related documentation. This led to
cooperative efforts on many aviation-related assets, such as the FAA and NASA. “In 1981, both
national organizations jointly promoted the project of Joint Airports Weather Study (JAWS),
which focused on flying skills, flight training, and the evaluation of the low-level wind shear
alert system” (Guan and Yong, 2009). Catastrophic events have prompted FAA initiatives to
Figure 5: Microburst graphic of plane unable to land
properly due to a wind shear event (Ackerman, 2000)

PAWS: ROGER WILLIAMS UNIVERSITY | PAGE 9
publish advisory circulars addressing pilot awareness of wind shear. The advisory circulars focus
on enhancing pilots’ skills to identify, avoid, and handle wind shear situations. Severe wind
shear conditions are beyond the control and handling ability of aircrafts and even highly skilled
pilots. According to the Aviation Safety Network (ASN) of the United States, from 1950-2000,
there were over 40 aviation accidents caused by wind shear events. Some major accidents caused
by wind shear resulted in over 200 fatalities as presented in Table 1:
Date Incident Description Casualties
12/21/1992 DC-10 crashed during landing at Faro Airport in Portugal 56 fatalities;
284 injured
6/17/1993 Antonov-26 crashed when it encountered severe turbulence while
cruising over Tblilis in Georgia
41 fatalities
7/2/1994 DC-9 crashed when it encountered wind shear during go around at
Charlotte-Douglas Municipal Airport in North Carolina
37 fatalities;
20 injured
6/1/1999 MD-82 encountered thunderstorm and wind shear during landing at
Little Rock Airport in Arkansas. Due to strong crosswind after
landing, the aircraft failed to stop and crashed
11 fatalities;
134 injured
8/22/1999 MD-11 encountered severe tropical storm during landing at Chek-
Lap-Kok Airport in Hong Kong. After hard landing on its right
main-gear the aircraft burst into flames, and continued to roll on the
runway, resulting in severe structural damage
3 fatalities; 50
injured
Table 1: Incidents of wind shear accidents reported by the FAA Advisory Circular from 1990-2000
As the ASN reports have indicated, major accidents have been caused by wind shear and
related occurrences. Though not identified as severe accidents causing fatalities, there have been
many more incidents due to wind shear that have caused pilots to alter their final approaches,
divert their aircrafts to safer landing zones, and combat the conditions with strategies that are
also safety risks. It is because of these tragedies that FAACT decided to focus its efforts on
solving the problem of low-level wind shear detection at GA airports.
2.3- Technical Discussion of Wind Shear According to Wind Speed and Direction Shears With Associated Vertical Motion During
Strong Surface Winds, as wind shear is encountered during the descending approach, the effects
are considered twofold and opposite in direction. One effect is dependent upon the rate of the

PAWS: ROGER WILLIAMS UNIVERSITY | PAGE 10
wind shear, while the other is dependent only upon the magnitude of the wind shear. The effect
due to wind shear rate is associated with the pilot’s attempt to maintain appropriate airspeed. As
a standard example, if an aircraft is on an approach at ~60 m/s with ~ 10 m/s headwind, the
ground speed will be approximately 50 m/s. If that headwind were to cease, the aircraft would
need to compensate by accelerating to a ground speed of 60 m/s to maintain their airspeed. In
order to accomplish this, the pilot would adjust the nose of the fuselage and decrease altitude or
apply thrust to accelerate the aircraft at a rate equivalent to the rate of the acting wind shear. The
effect due to wind shear magnitude is associated with the pilot’s attempt to fly at the
recommended glide slope. If an aircraft encounters instantaneous wind shear, the airspeed will
drop, the nose will pitch down, and the aircraft will drop below the glide slope. The loss in
altitude will be directly proportional to the new wind condition, assuming the thrust is
maintained constant. Once that energy has been exchanged from potential to kinetic energy, the
aircraft will have an excess amount of thrust, forcing the aircraft to gradually gain on the glide
slope and overfly it, as seen in Figure 6. This then leads to runway incursion and excursion
accidents. Also important to note, is the resulting accidents that would occur if the aircraft were
within 100 ft. from the ground because the aircraft would have no time to recover from a
downward pitch in that instance.
Figure 6: Wind shear encounter during approach. (1) Approach initially appeared normal. (2) Increasing
downdraft and tailwind encountered. (3) Airspeed decrease combined with reduced visual cues resulted in pitch
altitude reduction. (4) Airplane crashed short of end of runway (U.S. Department of Transportation, 1988)

PAWS: ROGER WILLIAMS UNIVERSITY | PAGE 11
The effect of wind shear varies depending upon the location the wind shear occurs relative to
the ground, the rate of shear, and the magnitude. When wind shear occurs very close to the
ground, the aircraft will hit short of the runway, whereas, if it occurs a reasonable distance above
the ground, the aircraft will tend to overfly the touchdown zone. To better understand the
dangers of wind shear, and how to properly respond, mathematical analyses can be performed.
Wind shear speed is calculated using the following equation:
𝑣
𝑣0= (
ℎ
ℎ0)
∝
; 𝑒𝑞𝑢𝑎𝑡𝑖𝑜𝑛 1
𝑊ℎ𝑒𝑟𝑒;
𝑣 = 𝑡ℎ𝑒 𝑣𝑒𝑙𝑜𝑐𝑖𝑡𝑦 𝑎𝑡 ℎ𝑒𝑖𝑔ℎ𝑡 ℎ (𝑚
𝑠)
𝑣0 = 𝑡ℎ𝑒 𝑣𝑒𝑙𝑜𝑐𝑖𝑡𝑦 𝑎𝑡 ℎ𝑒𝑖𝑔ℎ𝑡 ℎ0 (𝑚
𝑠)
𝛼 = 𝑡ℎ𝑒 𝑤𝑖𝑛𝑑 𝑠ℎ𝑒𝑎𝑟 𝑒𝑥𝑝𝑜𝑛𝑒𝑛𝑡
Equation 1 determines the speed of wind shear using the wind shear exponent, which changes
with respect to the surrounding terrain. Higher wind shear exponents imply an increased density
of obstructive elements leading to lower wind shear velocity. The higher the altitude, the greater
the wind shear velocity due to its reference point at ground level. Table 2 evaluates wind shear
exponent values according to their respective terrain characteristics.
Terrain Wind Shear Exponent
- α -
Open water 0.1
Smooth, level, grass-covered 0.15
Row crops 0.2
Low bushes with a few trees 0.2
Heavy trees 0.25
Several buildings 0.25
Hilly, mountainous terrain 0.25
Table 2: Wind shear exponents for different terrains (The Engineering Toolbox, 2013)

PAWS: ROGER WILLIAMS UNIVERSITY | PAGE 12
Vertical shear magnitudes are derived by subtracting the wind speed at a lower level from the
speed at an upper level, and dividing by the distance between those levels. This relationship is
shown using Equation 2:
𝑉𝑢𝑝𝑝𝑒𝑟 − 𝑉𝑙𝑜𝑤𝑒𝑟
𝑑𝑢−𝑙=
∆𝑉
∆𝑑; 𝑒𝑞𝑢𝑎𝑡𝑖𝑜𝑛 2
𝑊ℎ𝑒𝑟𝑒; 𝑣 = 𝑤𝑖𝑛𝑑 𝑣𝑒𝑙𝑜𝑐𝑖𝑡𝑦
𝑑 = 𝑑𝑖𝑠𝑡𝑎𝑛𝑐𝑒 𝑏𝑒𝑡𝑤𝑒𝑒𝑛 𝑎𝑛𝑒𝑚𝑜𝑚𝑒𝑡𝑒𝑟 ℎ𝑒𝑖𝑔ℎ𝑡
The horizontal wind shear is the change of wind speed with respect to horizontal distance. The
horizontal wind shear magnitudes can then be derived algebraically by subtracting the wind
speeds at each device and dividing by distance between devices. This mathematical process can
be seen in Equation 3:
𝑣1 − 𝑣2
𝑑1−2=
∆𝑣
∆𝑑
′
; 𝑒𝑞𝑢𝑎𝑡𝑖𝑜𝑛 3
The vertical and horizontal wind shear directions are calculated in similar fashion, using
direction instead of wind speed, as shown in Equation 4:
𝑊𝐷1−𝑊𝐷2
𝑑1−2=
∆𝑊𝐷
∆𝑑; 𝑒𝑞𝑢𝑎𝑡𝑖𝑜𝑛 4
𝑊ℎ𝑒𝑟𝑒; 𝑊𝐷 = 𝑤𝑖𝑛𝑑 𝑑𝑖𝑟𝑒𝑐𝑡𝑖𝑜𝑛
𝑑 = 𝑑𝑖𝑠𝑡𝑎𝑛𝑐𝑒 𝑏𝑒𝑡𝑤𝑒𝑒𝑛 𝑑𝑒𝑣𝑖𝑐𝑒𝑠
The equations presented in this section illustrate how wind speed is calculated at various
heights to determine whether wind shear is present (Alexander & Camp, 1984). This analysis is
the foundation of the PAWS design and will be further discussed in the Technical Aspects
section.

PAWS: ROGER WILLIAMS UNIVERSITY | PAGE 13
3- Literature Review Supporting Design of PAWS 3.1- Overview of Research Process
The design team used a number of resources to gather as much information as possible to
design a system that would effectively increase situational awareness of pilots during wind shear
episodes. In the earlier conceptual stages, most research was focused on existing technology
literature. As the design evolved, the team consulted publicly available conference proceedings
and patents to determine the types of wind shear detection systems already in existence.
Information on the TDWR, and other related systems, helped to provide the team with design
goals and objectives. The design team also used academic courses and textbooks to investigate
appropriate mathematical models for analyzing wind shear using the designed system.
3.2- Wind Shear Detection Systems Currently in Use As specified earlier, there are a number of ground-based wind shear detection/warning
systems in place today. Notably among these is the LLWAS, the acoustic Doppler system, laser
system, and pulsed microwave Doppler radar system. Upon further investigation, there are
advantages to these systems, but also disadvantages that the PAWS system addresses.
The LLWAS detects the presence of wind shear in the vicinity of the airport at the surface
using anemometers and microcontroller for data transmission, however, this system cannot
guarantee protection in all cases. It was designed to detect horizontal wind shears that move
across the airport, thus is better suited for cold frontal passage and thunderstorm gust fronts than
for outflow portions of microburst events. Moreover, it proved unable to detect the downdraft
associated with microbursts and other forms of vertical winds (Airbus, 2013).
The acoustic Doppler system determines wind speed and direction by measuring frequency
shift in signals reflected by the atmosphere. However, the system is expensive and unable to
operate under heavy precipitation, in zones of aircraft noise, or detect clear-air turbulence. The
PAWS: ROGER WILLIAMS UNIVERSITY | PAGE 14
laser systems lacked the ability to scan within the range of the glide slope and takeoff flight path
for wind shear detection.
The pulsed microwave Doppler radar and TDWR systems are perhaps the most efficient and
effective systems in place today, however, these systems cannot properly measure the vertical
component or downdraft. To utilize such a system the airport must be equipped with a Doppler
radar which is considered a substantial expense to airport operations managers. These systems
are also out of the price range for GA Airports, at $6 million (National Research Council, 1983).
Although all the previously cited wind shear detection and warning systems have value, no
one system has proven to be fully adequate for fail-safe detection of low-level wind shear.
Consequently, there is a need for an inexpensive, simplified system that can detect vertical and
horizontal low-level wind shear and communicate the real-time data to ground control towers or
ATIS communication channels for continuous updates to incoming and outgoing pilots in range.
4- Problem Solving Approach for Design Process Upon initial assessment of the technical design challenge and problem statement, several
theoretical designs were brainstormed. At first, the defined problem focused on wind shear and
clear air turbulence at the runway level. This idea emerged from a discussion of airport
operations and technology that require improvement and have not yet been thoroughly
investigated. The first few weeks of the fall semester were spent on wind shear research, factors
that affect it, specifications, and potential solutions for the issue it imposes on aircrafts at takeoff
and landing. After extensive research on this topic, the design team began focusing on GA
Airports that lacked the wind shear detection technology due to airport and fleet sizes.
4.1- Team Composition With various backgrounds in engineering, FAACT was motivated to undertake individual
research as well as group brainstorming to introduce new design concepts to weekly meetings

PAWS: ROGER WILLIAMS UNIVERSITY | PAGE 15
and utilize constructive feedback from each member and faculty advisor as a means of overall
design improvement. Major areas of focus for the team included: consumer needs, safety and risk
assessment, cost analysis, and communication with industry experts. With a broad range of
categories set forth by the FAA Design Competition, FAACT explored creative, unique, and
feasible solutions to relevant aircraft/airport issues. The team decided to focus on smaller airports
and fleet sizes that lack the capabilities or budget to install expensive, complex systems for
tracking wind shear. The reason for this focus is because smaller aircrafts have a higher risk of
accidents due to drastic wind pattern changes and pilots with less experience than commercial
pilots. Therefore, the PAWS design is an inexpensive and simplified alternative to current
systems such as the multi-million dollar TDWR’s in place at large, commercial airports
throughout the U.S. Collectively, the team’s design tasks for PAWS included research, risk
management, risk and safety assessment, engineering analysis, prototyping, conceptualized
SolidWorks modeling, scaled fabrication, and experimentation.
4.2- Research Process Due to the significant impact that the FAA has had on safety advancements in the aviation
industry, the literature review and research was an important on-going process throughout the
entire project. The review ensured full team comprehension of existing solutions, present
problematic areas, and background history. The fall semester was focused on studying runway
safety risks due to wind shear and developing potential formal solutions through extensive
research, various system designs, engineering analysis and communication with local airports.
As the concept became more refined, the research and conceptual design process evolved in
several simultaneous paths.
FAACT partnered with Tweed New Haven Regional Airport located in New Haven,
Connecticut. While on site, the team met with airport safety operations manager Kurt Rodman

PAWS: ROGER WILLIAMS UNIVERSITY | PAGE 16
and pilots at the Airport, toured the control tower, viewed their ATIS communication system,
and explored runway equipment to gain a better general knowledge of runway safety at smaller
airports. Kurt Rodman became the main point of contact at HVN for the team. FAACT
introduced the concept for an affordable system that would detect low-level wind shear events
during takeoff and landing with various GA pilots and airport operations managers. In response,
the team received constructive feedback from pilot, ATC, and FAA perspectives. In addition, a
survey introducing the design group objectives, the conceptual design, and wind shear inquiries
was sent to national airport managers, FAA expert advisors, and AAAE members to solicit a
broader range of advice. As the concept moved to design, various techniques such as functional
flow diagrams, planning Gantt charts and system modeling tools were integral elements
employed throughout the design process to aid in the full-scale, commercialized design and
scaled prototype version.
4.3- Development Methods The evolutionary progression of conceptual designs is presented in Figure 7. Due to regular
contact with faculty and technical mentors within the aviation industry, FAACT developed a
final, functioning prototype
after several design and
development iterations. After
much research, contact with
FAA affiliates, and airport site
visits to HVN, an initial design
concept was conceived. This
concept grew into a formal
Figure 7: Conceptual design development, from Savonius wind turbine
tree, to anemometer tree, to PAWS system
PAWS: ROGER WILLIAMS UNIVERSITY | PAGE 17
design and was modeled using a photorealistic simulation in SolidWorks and constructed at a
one fifth scale for testing at HVN.
The fully functioning prototype was evaluated based on safety, cost, effectiveness,
efficiency, and ergonomics which resulted in modifications that better addressed the team’s
objectives. The final anemometer tree design shown in Figure 7, suggested further analysis of the
structural integrity of the 50 ft tower pole. Following in accordance with FAA airport equipment
regulations, lighting system, color codes, and safety precaution advisory circulars, the team
finalized a design. FAACT was able to complete the development of the scaled PAWS system
through continuous modification and refinement until it met all acceptable criterion for
implementation at HVN. Using feedback from pilots, FAA expert advisors and airport operators,
the prototype models evolved to represent a reliable system.
4.3- Safety and Risk Management FAACT employed a thorough risk assessment to comply with the FAA Safety Management
System Manual (SMS). Each PAWS system will be integrated into cooperating airports based on
number of runways, runway length, layout of taxiways, and prevailing wind patterns. Due to
wide variations in location and environment, FAACT focused on a general framework for
operational procedures that measures wind speed and direction, interpret data in real-time, and
report potential risks to ground control operations. The PAWS system acts in accordance with
safety considerations detailed in various advisory circulars, FAR AIM, and the FAA SMS.
FAACT has identified certain safety considerations that apply universally. The modern
aviation system is characterized by increasingly diverse and complex networks of
business/governmental organizations as well as increasingly advanced aircraft and equipment.
According to AC No: 120-92A: Safety Management Systems for Aviation Service Providers, the
important characteristics of systems and their underlying process are their safety attributes when

PAWS: ROGER WILLIAMS UNIVERSITY | PAGE 18
related to operational and support processes. These attributes have safety requirements built into
their design to provide improved safety outcomes. These attributes include: responsibility and
authority, procedures and controls, process measures, and interfaces (ATOS). FAACT followed
AC protocols when analyzing the safety and risk of the system. As a result, the team has
assumed responsibility for accomplishing required precautions, providing clear instructions for
members to follow, providing organizational and supervisory controls on the involved activities,
measuring processes and products, and recognizing the important interrelationships between
processes and activities within the airport as well as with consumers and other stakeholders. As
directly stated by SMS principles, the four essential components of a safety management system
provided in Table 3:
Principle Description
Policy All management systems must define policies, procedures, and organizational
structures to accomplish their goals.
Safety Risk
Management (SRM)
A formal system of hazard identification and SRM is essential in controlling
risk to acceptable levels
Safety Assurance
(SA)
Once SRM controls are identified and operation, the operator must ensure the
controls continue to be effective in a changing environment
Safety Promotion Finally, the operator must promote safety as a core value with practices that
support a sound safety culture Table 3: Four essential components of safety management system
PAWS complies with all SMS, FAA, and specific airport operations safety protocol and was
commercially designed with a factor of safety of 4.4.

PAWS: ROGER WILLIAMS UNIVERSITY | PAGE 19
5- Description of Technical Aspects of PAWS 5.1- Development of PAWS
The PAWS system fully functioning prototype was designed at one-fifth scale and
constructed using PVC pipe, as seen in Figure 8.
PVC is designed to be a strong, waterproof, and
weather resistant material. Safety was a major
concern when developing plans for the system
model. The FAA has a multitude of rules and
regulations regarding runway equipment,
installation, lighting, system location, height
restrictions, and color codes all identified and
outlined in the FAR AIM Manual and FAA advisory
circulars.
Following regulation standards, the full-scale commercialized design will be made of
galvanized steel to avoid weathering and to maintain structural integrity. The pole will be 50 ft.
tall, meeting the height requirements set forth by HVN Airport Operations. An L-810 red
obstruction light at the top of the pole will act as a warning alert to incoming and outgoing pilots
when wind shear occurrences have been detected by the system. The entire system will be a
bright orange color, following FAA code. To demonstrate proof of concept, the prototype model
has been tested within the pre-approved area of the segmented circle where the wind socket
resides at HVN. This avoided interference with airport operations and maintained a safe distance
from the.
The overall objective of the PAWS system is to aid in safety precaution procedures taken by
airport operations and pilots which lack specific equipment dedicated to episodes of low-level
Figure 8: Initial testing of PAWS at HVN
PAWS: ROGER WILLIAMS UNIVERSITY | PAGE 20
wind shear. Though this system was designed for smaller airports, fleet sizes, runways, and
annual traffic, PAWS can be theoretically implemented in any type of airport. It is inexpensive,
ergonomic, easily-maintained, and uses simple data acquisition and alert system output to
provide a marketable device for airports and pilots on a global scale.
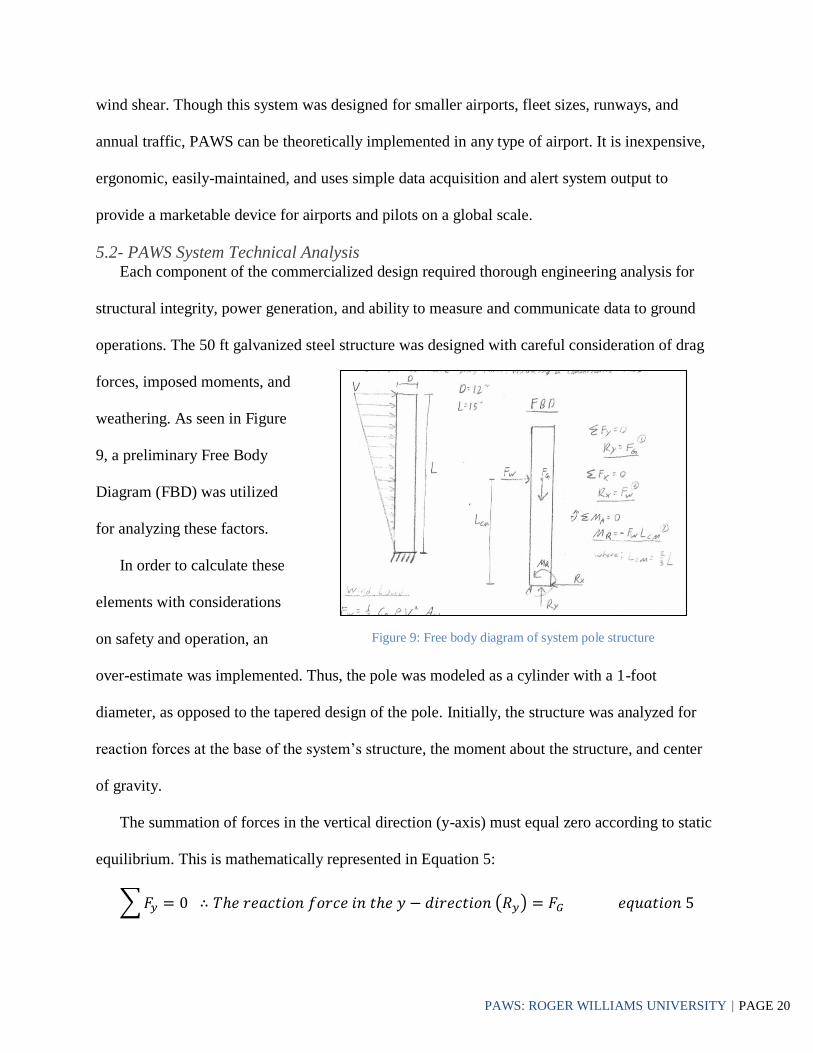
5.2- PAWS System Technical Analysis Each component of the commercialized design required thorough engineering analysis for
structural integrity, power generation, and ability to measure and communicate data to ground
operations. The 50 ft galvanized steel structure was designed with careful consideration of drag
forces, imposed moments, and
weathering. As seen in Figure
9, a preliminary Free Body
Diagram (FBD) was utilized
for analyzing these factors.
In order to calculate these
elements with considerations
on safety and operation, an
over-estimate was implemented. Thus, the pole was modeled as a cylinder with a 1-foot
diameter, as opposed to the tapered design of the pole. Initially, the structure was analyzed for
reaction forces at the base of the system’s structure, the moment about the structure, and center
of gravity.
The summation of forces in the vertical direction (y-axis) must equal zero according to static
equilibrium. This is mathematically represented in Equation 5:
∑ 𝐹𝑦 = 0 ∴ 𝑇ℎ𝑒 𝑟𝑒𝑎𝑐𝑡𝑖𝑜𝑛 𝑓𝑜𝑟𝑐𝑒 𝑖𝑛 𝑡ℎ𝑒 𝑦 − 𝑑𝑖𝑟𝑒𝑐𝑡𝑖𝑜𝑛 (𝑅𝑦) = 𝐹𝐺 𝑒𝑞𝑢𝑎𝑡𝑖𝑜𝑛 5
Figure 9: Free body diagram of system pole structure

PAWS: ROGER WILLIAMS UNIVERSITY | PAGE 21
The summation of forces acting in the horizontal direction (x-axis) must equal zero also to
prove the structure will remain stable during applied loads. This relationship can be seen in
Equation 6:
∑ 𝐹𝑥 = 0 ∴ 𝑇ℎ𝑒 𝑟𝑒𝑎𝑐𝑡𝑖𝑜𝑛 𝑓𝑜𝑟𝑐𝑒 𝑖𝑛 𝑡ℎ𝑒 𝑦 − 𝑑𝑖𝑟𝑒𝑐𝑡𝑖𝑜𝑛 (𝑅𝑥) = 𝐹𝑤 𝑒𝑞𝑢𝑎𝑡𝑖𝑜𝑛 6
Once reaction forces were calculated, the structure required allowable wind load analysis.
Equation 7 depicts the wind load analysis:
𝐹𝑤 =1
2𝐶𝐷𝜌𝑉𝑎𝑣𝑔
2𝐴𝑝𝑟𝑜𝑗 𝑒𝑞𝑢𝑎𝑡𝑖𝑜𝑛 7
𝑊ℎ𝑒𝑟𝑒; 𝐹𝑊 = 𝑤𝑖𝑛𝑑 𝑙𝑜𝑎𝑑 (𝑙𝑏𝑓)
𝐶𝐷 = 𝐶𝑜𝑒𝑓𝑓𝑖𝑐𝑖𝑒𝑛𝑡 𝑜𝑓 𝑑𝑟𝑎𝑔
𝜌 = 𝑑𝑒𝑛𝑠𝑖𝑡𝑦 𝑜𝑓 𝑎𝑖𝑟; 2.42 ∗ 10−3𝑠𝑙𝑢𝑔/𝑓𝑡3
𝑉𝑎𝑣𝑔 = 110𝑚𝑝ℎ (161 𝑓𝑡/𝑠)
𝐴𝑝𝑟𝑜𝑗 = 𝐿 ∗ 𝐷 = 50𝑓𝑡2
The Vavg term refers to a three-second gust wind speed that has been determined as extremely
dangerous wind shear conditions (ASCE ISEI 7.05). The reason for applying a significant wind
gust velocity was to ensure the structure could handle the load applied in such a scenario. The
coefficient of drag is dependent upon the Reynolds Number, thus the Reynolds Number was
required for evaluating the system’s structure, and was calculated as follows:
𝑅𝑒 =𝑈∞𝜌𝐷
𝜇=
(161𝑚𝑝ℎ) ∗ (2.42 ∗ 10−3 𝑠𝑙𝑢𝑔𝑓𝑡3 ) ∗ (1𝑓𝑡)
(3.82 ∗ 10−3 𝑙𝑏𝑓 ∗ 𝑆𝑓𝑡2 )
𝑅𝑒 = 1.06 ∗ 106
𝑊ℎ𝑒𝑟𝑒;
𝑈∞ = 𝑉𝑎𝑣𝑔 = 161 𝑓𝑡
𝑠
𝜇 = 3.82 ∗ 10−3 𝑙𝑏𝑓∗𝑠
𝑓𝑡2
𝐷 = 1 𝑓𝑡
PAWS: ROGER WILLIAMS UNIVERSITY | PAGE 22
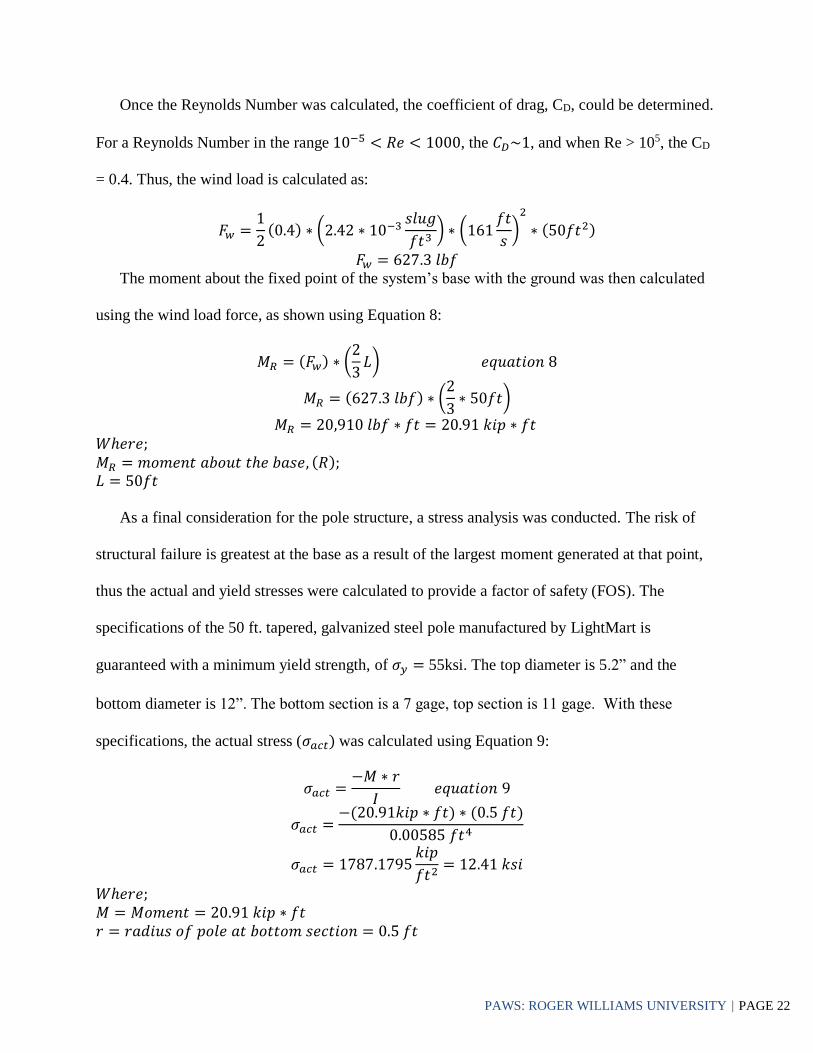
Once the Reynolds Number was calculated, the coefficient of drag, CD, could be determined.
For a Reynolds Number in the range 10−5 < 𝑅𝑒 < 1000, the 𝐶𝐷~1, and when Re > 105, the CD
= 0.4. Thus, the wind load is calculated as:
𝐹𝑤 =1
2(0.4) ∗ (2.42 ∗ 10−3
𝑠𝑙𝑢𝑔
𝑓𝑡3) ∗ (161
𝑓𝑡
𝑠)
2
∗ (50𝑓𝑡2)
𝐹𝑤 = 627.3 𝑙𝑏𝑓
The moment about the fixed point of the system’s base with the ground was then calculated
using the wind load force, as shown using Equation 8:
𝑀𝑅 = (𝐹𝑤) ∗ (2
3𝐿) 𝑒𝑞𝑢𝑎𝑡𝑖𝑜𝑛 8
𝑀𝑅 = (627.3 𝑙𝑏𝑓) ∗ (2
3∗ 50𝑓𝑡)
𝑀𝑅 = 20,910 𝑙𝑏𝑓 ∗ 𝑓𝑡 = 20.91 𝑘𝑖𝑝 ∗ 𝑓𝑡 𝑊ℎ𝑒𝑟𝑒; 𝑀𝑅 = 𝑚𝑜𝑚𝑒𝑛𝑡 𝑎𝑏𝑜𝑢𝑡 𝑡ℎ𝑒 𝑏𝑎𝑠𝑒, (𝑅); 𝐿 = 50𝑓𝑡
As a final consideration for the pole structure, a stress analysis was conducted. The risk of
structural failure is greatest at the base as a result of the largest moment generated at that point,
thus the actual and yield stresses were calculated to provide a factor of safety (FOS). The
specifications of the 50 ft. tapered, galvanized steel pole manufactured by LightMart is
guaranteed with a minimum yield strength, of 𝜎𝑦 = 55ksi. The top diameter is 5.2” and the
bottom diameter is 12”. The bottom section is a 7 gage, top section is 11 gage. With these
specifications, the actual stress (𝜎𝑎𝑐𝑡) was calculated using Equation 9:
𝜎𝑎𝑐𝑡 =−𝑀 ∗ 𝑟
𝐼 𝑒𝑞𝑢𝑎𝑡𝑖𝑜𝑛 9
𝜎𝑎𝑐𝑡 =−(20.91𝑘𝑖𝑝 ∗ 𝑓𝑡) ∗ (0.5 𝑓𝑡)
0.00585 𝑓𝑡4
𝜎𝑎𝑐𝑡 = 1787.1795𝑘𝑖𝑝
𝑓𝑡2= 12.41 𝑘𝑠𝑖
𝑊ℎ𝑒𝑟𝑒; 𝑀 = 𝑀𝑜𝑚𝑒𝑛𝑡 = 20.91 𝑘𝑖𝑝 ∗ 𝑓𝑡
𝑟 = 𝑟𝑎𝑑𝑖𝑢𝑠 𝑜𝑓 𝑝𝑜𝑙𝑒 𝑎𝑡 𝑏𝑜𝑡𝑡𝑜𝑚 𝑠𝑒𝑐𝑡𝑖𝑜𝑛 = 0.5 𝑓𝑡
PAWS: ROGER WILLIAMS UNIVERSITY | PAGE 23
𝐼 = 𝑀𝑜𝑚𝑒𝑛𝑡 𝑜𝑓 𝐼𝑛𝑒𝑟𝑡𝑖𝑎 =𝜋
64(𝐷0
4 − 𝐷𝑖4); 𝐷0 = 1𝑓𝑡, 𝐷𝑖 = 0.96875 𝑓𝑡
𝐼 =𝜋
64(14 − 0.9687544) = 0.00585 𝑓𝑡4
With the actual stress and yield stress, the factor of safety was determined:
𝐹𝑂𝑆 =𝜎𝑦
𝜎𝑎𝑐𝑡=
55 𝑘𝑠𝑖
12.41 𝑘𝑠𝑖= 4.4
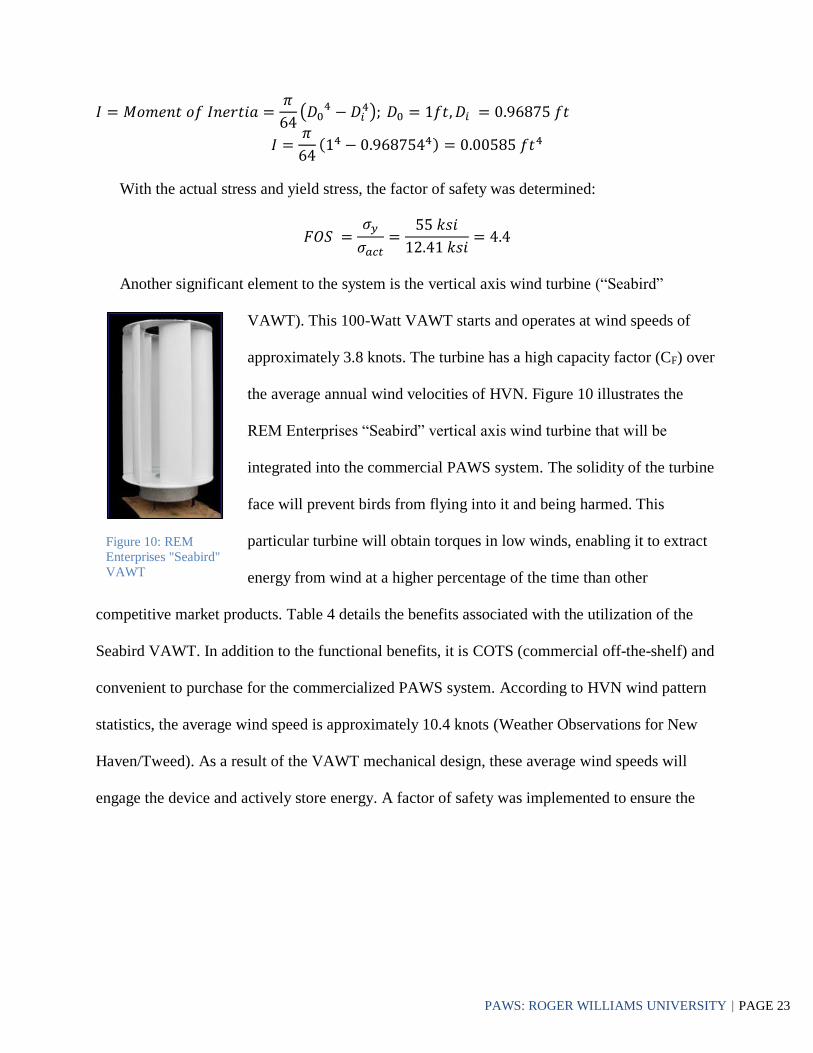
Another significant element to the system is the vertical axis wind turbine (“Seabird”
VAWT). This 100-Watt VAWT starts and operates at wind speeds of
approximately 3.8 knots. The turbine has a high capacity factor (CF) over
the average annual wind velocities of HVN. Figure 10 illustrates the
REM Enterprises “Seabird” vertical axis wind turbine that will be
integrated into the commercial PAWS system. The solidity of the turbine
face will prevent birds from flying into it and being harmed. This
particular turbine will obtain torques in low winds, enabling it to extract
energy from wind at a higher percentage of the time than other
competitive market products. Table 4 details the benefits associated with the utilization of the
Seabird VAWT. In addition to the functional benefits, it is COTS (commercial off-the-shelf) and
convenient to purchase for the commercialized PAWS system. According to HVN wind pattern
statistics, the average wind speed is approximately 10.4 knots (Weather Observations for New
Haven/Tweed). As a result of the VAWT mechanical design, these average wind speeds will
engage the device and actively store energy. A factor of safety was implemented to ensure the
Figure 10: REM
Enterprises "Seabird"
VAWT
PAWS: ROGER WILLIAMS UNIVERSITY | PAGE 24
system is always powered, continuously transferring data collected by the DAQ with sufficient
energy stored in the battery to power the obstruction light when necessary.
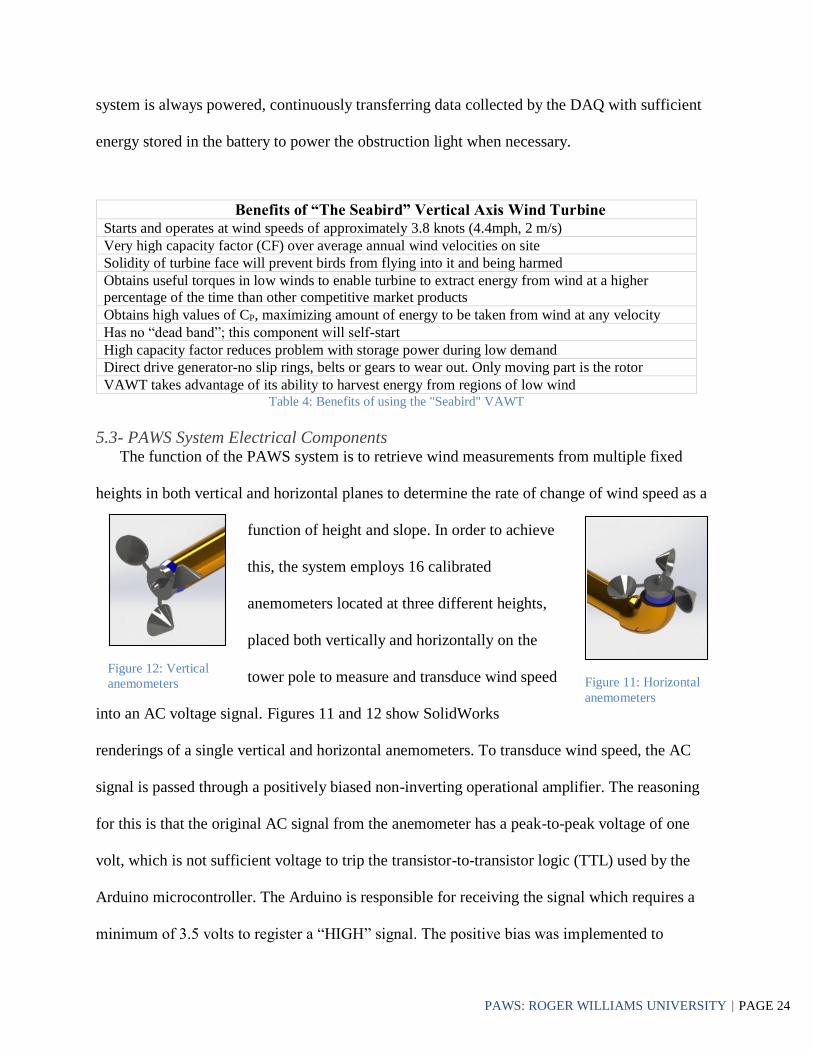
5.3- PAWS System Electrical Components The function of the PAWS system is to retrieve wind measurements from multiple fixed
heights in both vertical and horizontal planes to determine the rate of change of wind speed as a
function of height and slope. In order to achieve
this, the system employs 16 calibrated
anemometers located at three different heights,
placed both vertically and horizontally on the
tower pole to measure and transduce wind speed
into an AC voltage signal. Figures 11 and 12 show SolidWorks
renderings of a single vertical and horizontal anemometers. To transduce wind speed, the AC
signal is passed through a positively biased non-inverting operational amplifier. The reasoning
for this is that the original AC signal from the anemometer has a peak-to-peak voltage of one
volt, which is not sufficient voltage to trip the transistor-to-transistor logic (TTL) used by the
Arduino microcontroller. The Arduino is responsible for receiving the signal which requires a
minimum of 3.5 volts to register a “HIGH” signal. The positive bias was implemented to
Figure 12: Vertical
anemometers
Figure 11: Horizontal
anemometers
Benefits of “The Seabird” Vertical Axis Wind Turbine
Starts and operates at wind speeds of approximately 3.8 knots (4.4mph, 2 m/s)
Very high capacity factor (CF) over average annual wind velocities on site
Solidity of turbine face will prevent birds from flying into it and being harmed
Obtains useful torques in low winds to enable turbine to extract energy from wind at a higher
percentage of the time than other competitive market products
Obtains high values of CP, maximizing amount of energy to be taken from wind at any velocity
Has no “dead band”; this component will self-start
High capacity factor reduces problem with storage power during low demand
Direct drive generator-no slip rings, belts or gears to wear out. Only moving part is the rotor
VAWT takes advantage of its ability to harvest energy from regions of low wind Table 4: Benefits of using the "Seabird" VAWT
PAWS: ROGER WILLIAMS UNIVERSITY | PAGE 25
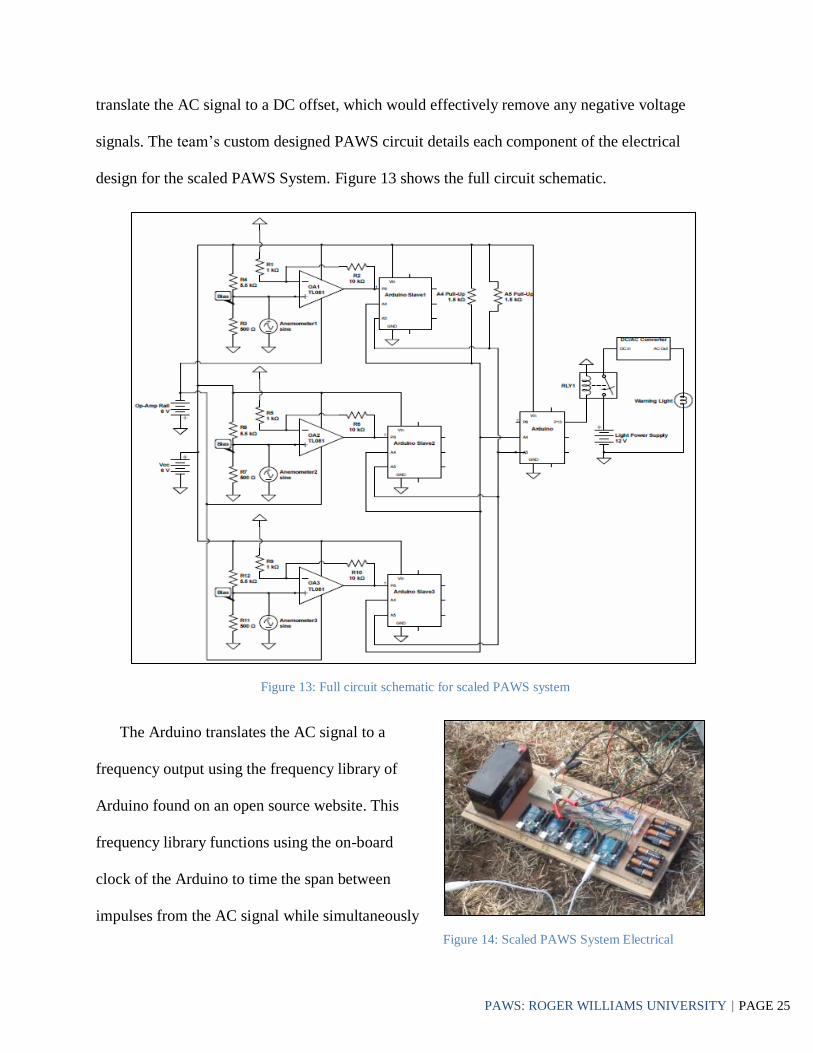
translate the AC signal to a DC offset, which would effectively remove any negative voltage
signals. The team’s custom designed PAWS circuit details each component of the electrical
design for the scaled PAWS System. Figure 13 shows the full circuit schematic.
The Arduino translates the AC signal to a
frequency output using the frequency library of
Arduino found on an open source website. This
frequency library functions using the on-board
clock of the Arduino to time the span between
impulses from the AC signal while simultaneously
Figure 13: Full circuit schematic for scaled PAWS system
Figure 14: Scaled PAWS System Electrical
Board
PAWS: ROGER WILLIAMS UNIVERSITY | PAGE 26
counting the number of impulses. This information is then used to determine frequency. The
frequency is then fed into a transfer function taken from the data sheet of the anemometers to
yield the correlating wind speed in MPH.
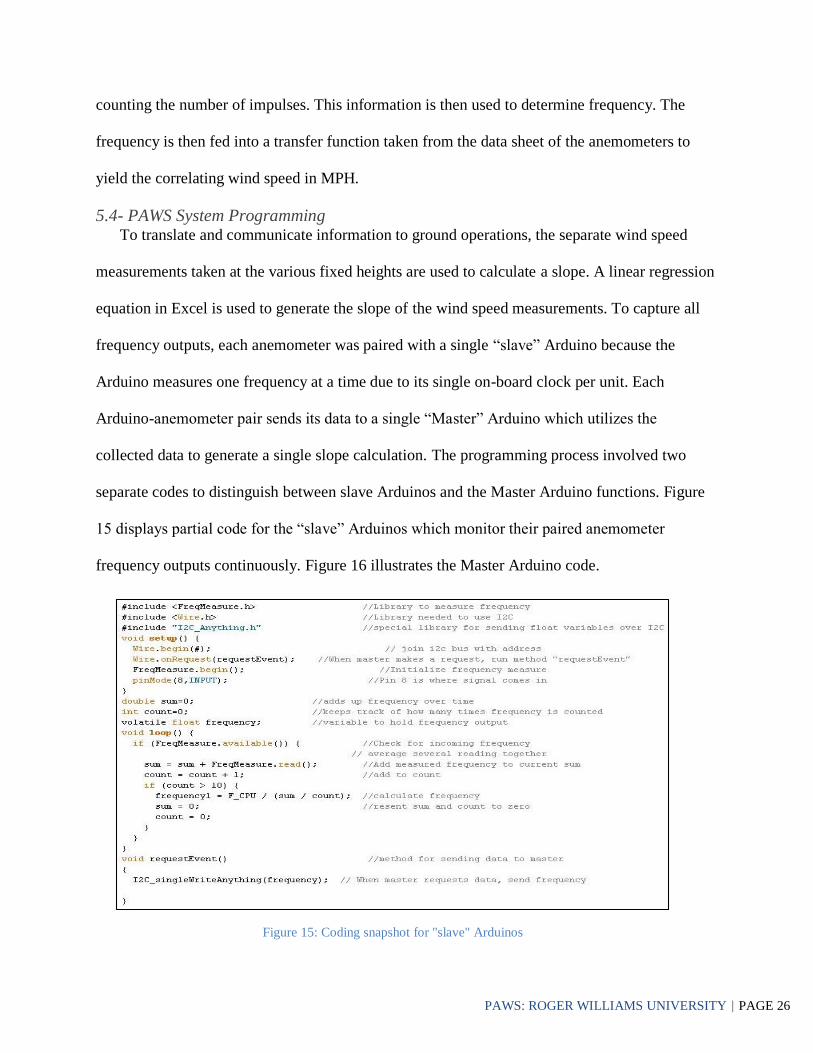
5.4- PAWS System Programming To translate and communicate information to ground operations, the separate wind speed
measurements taken at the various fixed heights are used to calculate a slope. A linear regression
equation in Excel is used to generate the slope of the wind speed measurements. To capture all
frequency outputs, each anemometer was paired with a single “slave” Arduino because the
Arduino measures one frequency at a time due to its single on-board clock per unit. Each
Arduino-anemometer pair sends its data to a single “Master” Arduino which utilizes the
collected data to generate a single slope calculation. The programming process involved two
separate codes to distinguish between slave Arduinos and the Master Arduino functions. Figure
15 displays partial code for the “slave” Arduinos which monitor their paired anemometer
frequency outputs continuously. Figure 16 illustrates the Master Arduino code.
Figure 15: Coding snapshot for "slave" Arduinos
PAWS: ROGER WILLIAMS UNIVERSITY | PAGE 27
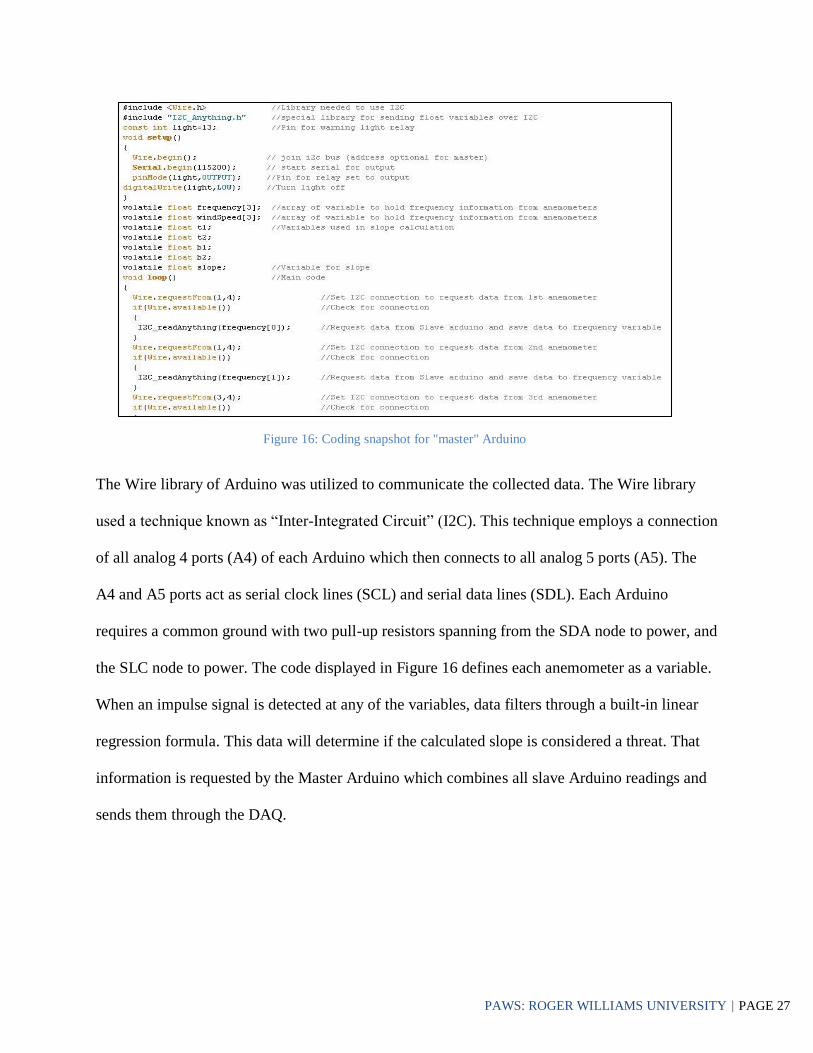
The Wire library of Arduino was utilized to communicate the collected data. The Wire library
used a technique known as “Inter-Integrated Circuit” (I2C). This technique employs a connection
of all analog 4 ports (A4) of each Arduino which then connects to all analog 5 ports (A5). The
A4 and A5 ports act as serial clock lines (SCL) and serial data lines (SDL). Each Arduino
requires a common ground with two pull-up resistors spanning from the SDA node to power, and
the SLC node to power. The code displayed in Figure 16 defines each anemometer as a variable.
When an impulse signal is detected at any of the variables, data filters through a built-in linear
regression formula. This data will determine if the calculated slope is considered a threat. That
information is requested by the Master Arduino which combines all slave Arduino readings and
sends them through the DAQ.
Figure 16: Coding snapshot for "master" Arduino
PAWS: ROGER WILLIAMS UNIVERSITY | PAGE 28
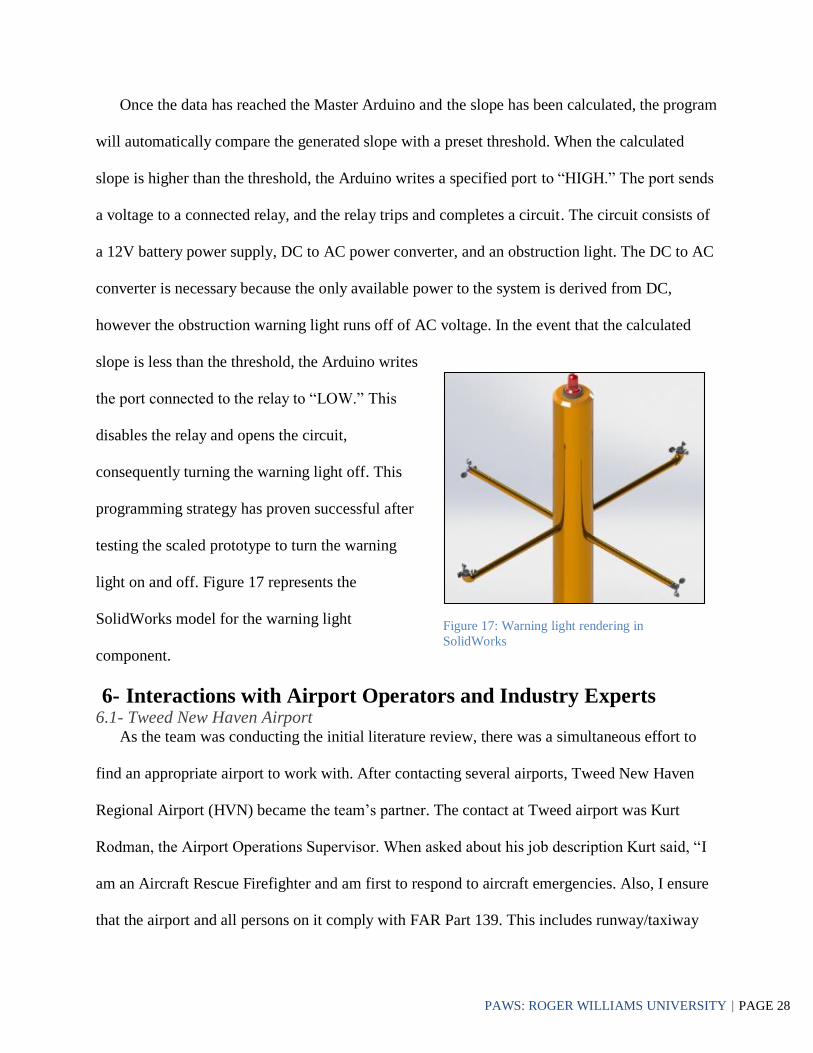
Once the data has reached the Master Arduino and the slope has been calculated, the program
will automatically compare the generated slope with a preset threshold. When the calculated
slope is higher than the threshold, the Arduino writes a specified port to “HIGH.” The port sends
a voltage to a connected relay, and the relay trips and completes a circuit. The circuit consists of
a 12V battery power supply, DC to AC power converter, and an obstruction light. The DC to AC
converter is necessary because the only available power to the system is derived from DC,
however the obstruction warning light runs off of AC voltage. In the event that the calculated
slope is less than the threshold, the Arduino writes
the port connected to the relay to “LOW.” This
disables the relay and opens the circuit,
consequently turning the warning light off. This
programming strategy has proven successful after
testing the scaled prototype to turn the warning
light on and off. Figure 17 represents the
SolidWorks model for the warning light
component.
6- Interactions with Airport Operators and Industry Experts 6.1- Tweed New Haven Airport
As the team was conducting the initial literature review, there was a simultaneous effort to
find an appropriate airport to work with. After contacting several airports, Tweed New Haven
Regional Airport (HVN) became the team’s partner. The contact at Tweed airport was Kurt
Rodman, the Airport Operations Supervisor. When asked about his job description Kurt said, “I
am an Aircraft Rescue Firefighter and am first to respond to aircraft emergencies. Also, I ensure
that the airport and all persons on it comply with FAR Part 139. This includes runway/taxiway
Figure 17: Warning light rendering in
SolidWorks
PAWS: ROGER WILLIAMS UNIVERSITY | PAGE 29
inspections, lighting inspections, FOD removal, wildlife control, security, general coordination
and enforcement, work orders, emergency management, escorting, airport/airline/FBO personnel
training, etc.” Kurt has worked with the team to develop PAWS and has provided contact
information for other individuals relevant to the project. Kurt has helped the team present the
design to pilots and other airport operations employees to maximize feedback. Kurt also
facilitated the prototype testing of the PAWS system at HVN.
6.2- Survey Results In an effort to collect information and feedback from industry experts, the team also
conducted an electronic survey using Survey Monkey to introduce the design. The survey was
sent to over 1,000 U.S. airport operations managers and industry experts listed on the World
Airport Database. Although the response rate was low, valuable information was provided by
many airport operations managers, industry experts and technical mentors.
The first wave of the survey was sent to the list of technical mentors provided to the team by
the design competition. This survey consisted of questions about challenges related to the design,
suggestions for improvement, projected costs, and information about the respondents’ area of
expertise. This first wave of the survey received a number of responses that suggested some
areas of the design would need improvement. When asked if there were any challenges related to
the current design that the advisors could identify, a respondent replied, “One unit is insufficient.
As in the LLWAS you need a ring of these around an area because it is very important to
monitor the variance between wind intensity between locations, not just in one area so as to be
able to predict wind shear migration.” FAACT took this into consideration when deciding how
many units to use at an airport. The team decided that one unit per runway would be sufficient.
This was concluded after identifying the average length of runways for GA airports and knowing
that wind speed can change horizontally between 2 and 4 km (1.2 to 2.5 miles). Since the
PAWS: ROGER WILLIAMS UNIVERSITY | PAGE 30
runways are less than one mile long the horizontal changes in wind shear would not be sufficient
to warrant multiple systems. Another comment to the question of challenges related to the design
stated, “Unless your team has someone with some expertise in meteorology, or an industry
expert on meteorology, this project would appear to be beyond the level of a college team to
interpret the impacts of wind shear and protocols for offering guidance.” To address this concern,
the team has undertaken an extensive amount of research into the topic of wind shear. The team
has reviewed publically available course material, textbooks, and scholarly articles in order to
understand a wind shear episode. FAACT is confident that the team’s technical background,
research, and testing has allowed for an accurate interpretation of the impact of wind shear.
The second survey was sent to airport operations managers throughout the U.S. This survey
also yielded a number of helpful responses that the team took into consideration throughout the
design process. This survey focused on determining how many airports, of the ones surveyed,
had incidents related to wind shear and the types of systems the airports may, or may not, have in
place to detect wind shear. The survey concluded that approximately 25% of the airports
surveyed had at least one accident that was caused by low level wind shear, and only 15% of the
surveyed airports had a system in place to detect low level wind shear. When the respondents’
airports were considered, none of those that had some type of system in place to detect low level
wind shear had any accidents to report that were related to wind shear. This indicated that when
the proper measures are taken to detect wind shear, pilots can react accordingly to avoid a
potentially fatal accident.
6.3- Stakeholder Considerations There were many stakeholders involved in the implementation of PAWS. Understanding the
potential users and other participating constituencies of the PAWS system was carefully
considered to deliver a product design that proves beneficial, safe, and adheres to FAA

PAWS: ROGER WILLIAMS UNIVERSITY | PAGE 31
regulations. These stakeholders include; the FAA, pilots, private aircraft owners, non-towered
airports, airports which operate tower-closed during overnight hours, installation personnel (i.e.,
airport lighting technicians, facilities management), airport maintenance personnel, airport
lighting system manufacturers, airport anemometer device manufacturers, and the public in
general. Each stakeholder involved in the implementation of the PAWS system has varying
interests and levels of authority on each matter throughout the development of the system. Their
influence has been accounted for in creating a successful low-level wind shear detection system.
The close collaboration with HVN allowed for operating within the scope of non-towered
airports or airports that function without control operators during overnight hours. With
consideration for GA Airports, the lifespan and reliability of the PAWS design is vital in terms
of associated cost and maintenance. One unique benefit to the system is its energy conservation.
PAWS can be considered an environmentally-sound product as it will operate using self-stored
energy conserved in a battery that is charged by the vertical axis wind turbine components.
Therefore, the system will have no need to tap into the electrical grid of the runway. This self-
sufficient device will power the microcontroller, wireless transmitter, and warning light when
necessary.
7- Commercial Potential & Projected Impacts of the PAWS System 7.1- Manufacturability
The PAWS system is designed using off-the-shelf components. The motivation for this was
to increase convenience for obtaining materials and optimizing production and manufacturability
while maintaining low-costs. The PAWS system is designed in accordance with FAA regulations
for weather detection equipment. In order to meet these regulations, the PAWS system uses a 50
ft. galvanized steel pole as the support structure of the design. This type of pole is rigid enough
to withstand extreme weather conditions and is currently used for other airport runway systems.

PAWS: ROGER WILLIAMS UNIVERSITY | PAGE 32
The cross-sections that house the SecondWind C3 Anemometers are 3 ft. long, 2 in wide pieces
of galvanized steel pipe. The pipes can be ordered pre-cut to reduce manufacturing time. The
SecondWind C3 anemometers have been chosen for this system because they have been tested to
be accurate and are calibrated. Furthermore, they were used during the testing phases of the
scaled prototype and the code to control them has already been developed. The obstruction light
employed at top of the PAWS system is the Honeywell L810 Red Obstruction Light developed
for airport use and is compliant with FAA regulations. In addition, the micro-controller and
onboard DAQ system come pre-assembled and ready to be placed into a weatherproof box
enclosure. The VAWT also comes pre-manufactured and ready for attachment to the system.
To manufacture the system, FAACT tested the ease of assembly by building a 1/5 scale
model out of PVC and other pre-manufactured parts. The scaled PAWS system was constructed
in a matter of days with basic hand tools. If the PAWS system were to move to full scale
commercialization, assembly time would decrease.
7.2- Testing To validate the PAWS system operation, testing was
required on the prototype and code. To test the system,
FAACT brought the prototype to HVN. Figure 18 shows the
prototype, in operation, next to the HVN wind sock. The
prototype is made of PVC and stands ten feet high. Three of
the calibrated SecondWind C3 anemometers were used to take
measurements at different fixed heights.
At the time of testing, the prototype showed different wind
speeds at the varying heights where anemometers were placed.
To validate the results gathered from PAWS, wind speeds that
Figure 18: 1/5 scaled prototype
being tested at HVN
PAWS: ROGER WILLIAMS UNIVERSITY | PAGE 33
were recorded by ground traffic control at the time of the testing were compared to the results
gathered by the PAWS system. When these results were compared, PAWS reported identical
wind speeds of 18 mph to ground traffic control. This successful proof of concept was necessary
to showed that this system can be used to accurately detect wind speeds. However, the primary
objective of the system is to identify and measure wind shear conditions that ground traffic
control could not measure.
The next step in testing then was to ensure that if wind shear was present, the warning light at
the top of the system would turn on. To test this, FAACT created a wind shear like event using
fans at various speeds and heights in addition to the wind already present. The team used a
Boolean statement to tell the light when to turn on and off. When the system observed wind
shear, the light at the top of the pole turned on. The light remained on until 10 minutes after the
wind shear simulation ended. This 10 minutes was used as a “safe-zone” in the event that wind
shear was observed again during that time. This would give pilots enough time to react to wind
shear. The testing validated that the design worked as intended.
7.3- Operation The detection system is distinctive based on the self-powered nature and automated
transmission of real-time data measurements to the automated computers in the control tower. In
the control tower there are separate instruments for measurements such as dew point,
temperature, wind, etc. Each piece of information is then broadcasted and consolidated onto a
shared screen. It is the duty of the controller to read these measurements via recorder microphone
onto the ATIS. The ATIS is then recorded and broadcast repetitively on a discrete frequency that
pilots tune into before contacting ground control for initial descent. This procedure is followed
universally so the pilot can prepare for any oncoming weather behavior before reducing altitude
and becoming vulnerable to a dangerous and unrecoverable situation.

PAWS: ROGER WILLIAMS UNIVERSITY | PAGE 34
For the system to be integrated into ground control operations, the micro-controller, which
acquires and transmits wireless data, needs to be compatible with the airport’s ground control
software. Once communication with the micro-controller is established, information will be
continuously transmitted to ATC. Ground control will then place this information onto the ATIS
which will communicate updated conditions directly to incoming pilots. The ATIS is an integral
component to the safety and precautionary actions taken by all aircrafts and pilots. The system is
designed to be independent and allow airports to obtain information easily without the struggle
of complex integration into the large network of runway equipment and instrumentation.
7.4- Maintenance The maintenance required for PAWS is minimal. The components requiring the most
attention will be the anemometers and wind turbines. The turbine blades and gear train need to
be well maintained to guarantee an extended life cycle for the system. The Seabird VAWT used
for this system has a 5 year warranty. The SecondWind C3 Anemometers come with a 10 year
manufacturer’s warranty and are fully weather resistant. These anemometers have been tested in
all types of weather and have proven to last well beyond the warranty period. The electronic
components of the system will likely outlast the mechanical components as they are not exposed
to external factors such as solar radiation, wind, rain, sleet, snow, etc., and are therefore not a
lifecycle concern. Since the system will stand 50 ft. tall, servicing could be complicated. The
system is designed to mitigate any need for servicing the higher components. The PAWS system
will require servicing about once a year to ensure working quality. The major servicing will test
all of the attached batteries to ensure that they are in proper working condition and will continue
to hold a charge.

PAWS: ROGER WILLIAMS UNIVERSITY | PAGE 35
7.5- Financial Analysis As previously noted, cost is a significant factor in any potential upgrade at a small airport.
The economic rationale of public investment decisions concerning project implementation
requires the identification and measuring of benefits and costs during the life of the project and
calculating the net present value of this flow. Due to the downturn in the recent economy, airport
development projects have been the first to experience budget cuts by local governments.
FAACT has conducted a cost-benefit analysis using an annual equivalent cost methodology to
provide a detailed economic analysis for implementing the PAWS system.
As previously mentioned, a unique feature to the PAWS system is the self-powered element
provided by two VAWTs. The system does not use electrical power from the airport runway grid
which will eliminate electric bill costs. Thus, the cost of PAWS is comprised of initial cost,
installation, maintenance, testing and evaluation, and training.
The cost of PAWS’ installation is the sum of the initial cost of the structure, associated
wiring costs, and the installation of the system and obstruction light. The team estimated an
average of $5,000 for annual maintenance and training costs. To further develop the costs
associated with the system, the team chose to outfit a single PAWS system for small airports
which typically have only one or two runways.
The service life of PAWS will be measured in terms of a decade. The majority of the
galvanized steel structure is warranted for 10 years with associated components (anemometers,
VAWTs) having 5 to 10 year life spans. Aside from annual safety checks, the system would only
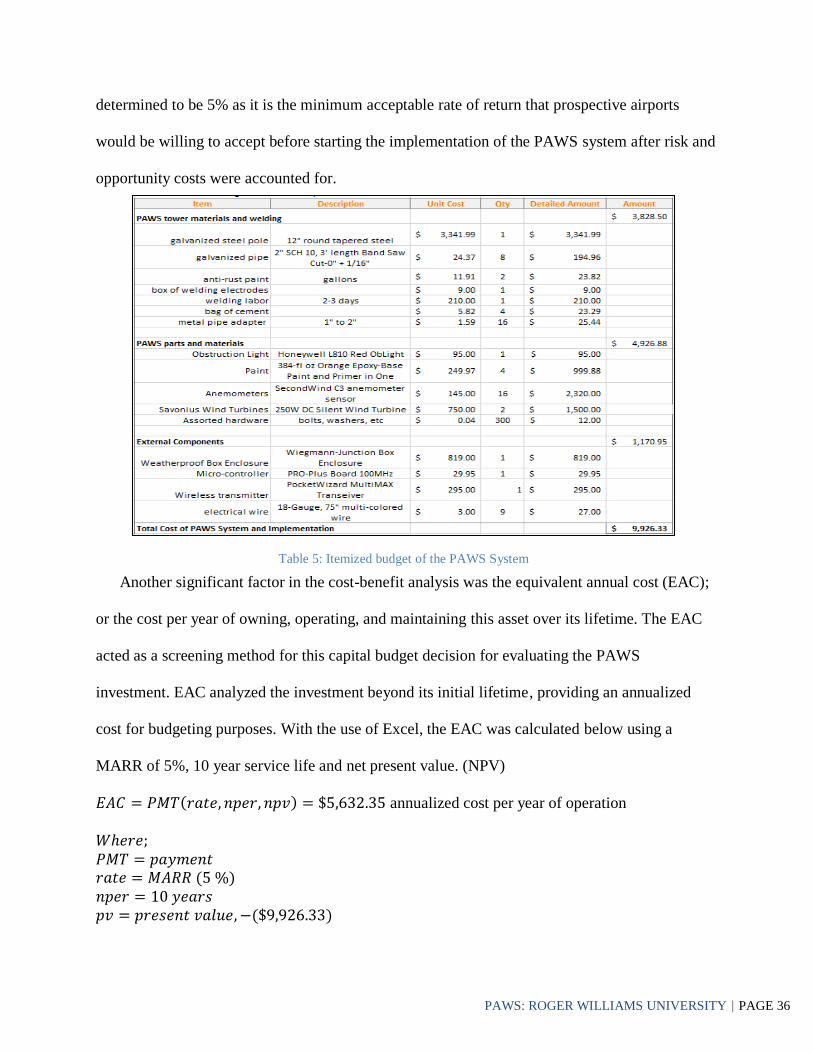
require major maintenance every 10 years. The itemized budget of the PAWS system
construction and implementation is introduced in Table 5. As shown, the initial investment costs
are less than $10,000. All necessary components and tools were included in this cost estimation.
Further considerations include the minimum acceptable rate of return (MARR). The MARR was
PAWS: ROGER WILLIAMS UNIVERSITY | PAGE 36
determined to be 5% as it is the minimum acceptable rate of return that prospective airports
would be willing to accept before starting the implementation of the PAWS system after risk and
opportunity costs were accounted for.
Another significant factor in the cost-benefit analysis was the equivalent annual cost (EAC);
or the cost per year of owning, operating, and maintaining this asset over its lifetime. The EAC
acted as a screening method for this capital budget decision for evaluating the PAWS
investment. EAC analyzed the investment beyond its initial lifetime, providing an annualized
cost for budgeting purposes. With the use of Excel, the EAC was calculated below using a
MARR of 5%, 10 year service life and net present value. (NPV)
𝐸𝐴𝐶 = 𝑃𝑀𝑇(𝑟𝑎𝑡𝑒, 𝑛𝑝𝑒𝑟, 𝑛𝑝𝑣) = $5,632.35 annualized cost per year of operation
𝑊ℎ𝑒𝑟𝑒; 𝑃𝑀𝑇 = 𝑝𝑎𝑦𝑚𝑒𝑛𝑡
𝑟𝑎𝑡𝑒 = 𝑀𝐴𝑅𝑅 (5 %)
𝑛𝑝𝑒𝑟 = 10 𝑦𝑒𝑎𝑟𝑠
𝑝𝑣 = 𝑝𝑟𝑒𝑠𝑒𝑛𝑡 𝑣𝑎𝑙𝑢𝑒, −($9,926.33)
Table 5: Itemized budget of the PAWS System
PAWS: ROGER WILLIAMS UNIVERSITY | PAGE 37
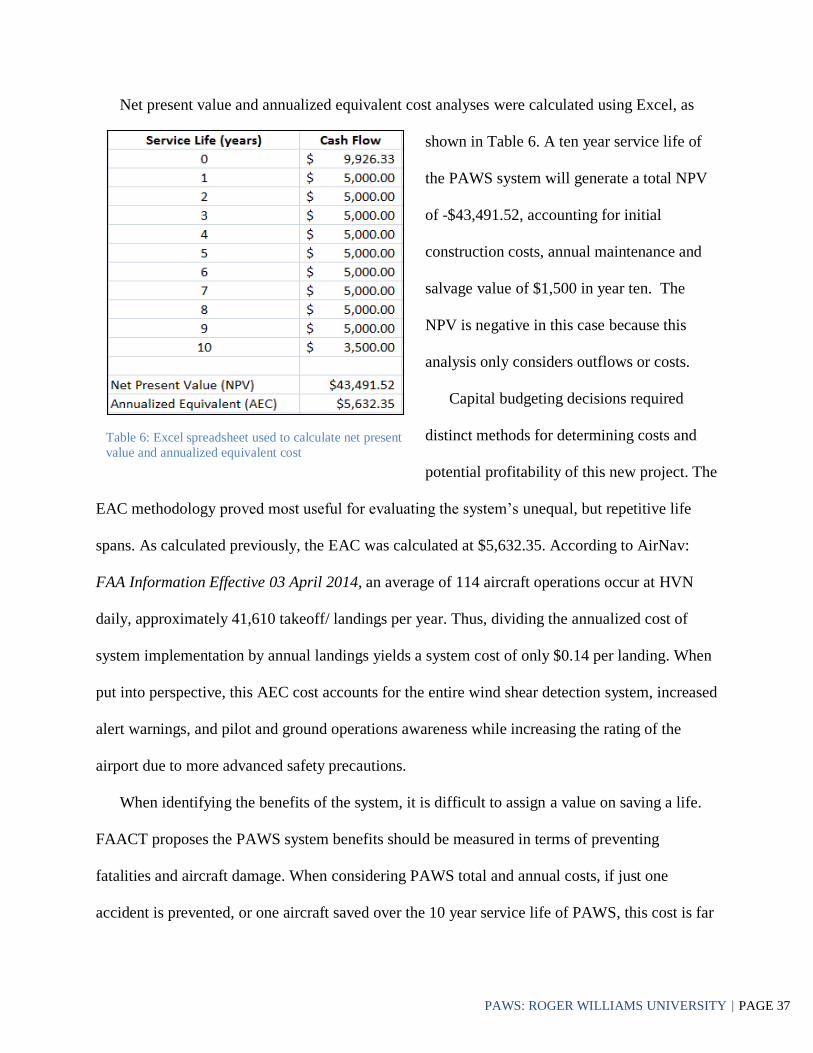
Net present value and annualized equivalent cost analyses were calculated using Excel, as
shown in Table 6. A ten year service life of
the PAWS system will generate a total NPV
of -$43,491.52, accounting for initial
construction costs, annual maintenance and
salvage value of $1,500 in year ten. The
NPV is negative in this case because this
analysis only considers outflows or costs.
Capital budgeting decisions required
distinct methods for determining costs and
potential profitability of this new project. The
EAC methodology proved most useful for evaluating the system’s unequal, but repetitive life
spans. As calculated previously, the EAC was calculated at $5,632.35. According to AirNav:
FAA Information Effective 03 April 2014, an average of 114 aircraft operations occur at HVN
daily, approximately 41,610 takeoff/ landings per year. Thus, dividing the annualized cost of
system implementation by annual landings yields a system cost of only $0.14 per landing. When
put into perspective, this AEC cost accounts for the entire wind shear detection system, increased
alert warnings, and pilot and ground operations awareness while increasing the rating of the
airport due to more advanced safety precautions.
When identifying the benefits of the system, it is difficult to assign a value on saving a life.
FAACT proposes the PAWS system benefits should be measured in terms of preventing
fatalities and aircraft damage. When considering PAWS total and annual costs, if just one
accident is prevented, or one aircraft saved over the 10 year service life of PAWS, this cost is far
Table 6: Excel spreadsheet used to calculate net present
value and annualized equivalent cost
PAWS: ROGER WILLIAMS UNIVERSITY | PAGE 38
less than a damaged or totaled GA aircraft, ($35,000 - $172,000). This significant expense does
not even consider the potential loss of life.
During the process of construction and implementation, FAACT will institute a system to
evaluate the frequency of times the system is engaged. At the end of the ten year period, the team
will have sufficient evidence and data to evaluate the viability of the investment.
8- Conclusions The PAWS system is intended to actively prevent the threat of wind shear for aircrafts at the
runway level. The implementation of this system will mitigate runway incidents at smaller airports,
especially those that lack ground control towers. The continuous updates of wind speed and
directional patterns will prove beneficial for overall operational awareness of pilots and airport
operators. For smaller airports which lack these types of alert systems or ground control towers,
this system will prove essential for pilot awareness of low-level runway conditions by adhering to
ATIS procedures and reacting to the PAWS visual aid.
PAWS is an affordable and sustainable concept addressing society’s need for “green,” next
generation technology. The design was created considering a variety of technical discussions with
airport operations managers and pilots. It is based on a simple and easy to assemble design to
deliver efficient and effective data to ground control which will then update to the ATIS in real-
time. As pilots approach their final descent, they will be able to call into the specific ATIS
frequency of the airport for weather condition updates and alerts.
The team expects that the simplicity, affordability and sustainability of the PAWS system will
provide optimal awareness of ground operations to pilots, prevent incidents due to low-level wind
shear and increase overall safety of smaller airports. The benefits of PAWS and its ability to
conform to current airport operations and FAA regulation procedures will provide a feasible and
marketable product for commercial development.

PAWS: ROGER WILLIAMS UNIVERSITY | PAGE 39
Appendix A- Contact Information
Faculty Advisors
Linda Ann Riley Ph.D.
Engineering Program Coordinator and
Full-Time Professor of Engineering
School of Engineering, Computing and
Construction Management
Roger Williams University
1 Old Ferry Road
Bristol, RI 02809-2921
(401) 254-3896
Anthony Ruocco, Ph.D.
Computer Science Program Coordinator and
Full-Time Professor of Engineering
School of Engineering, Computing and
Construction Management
Roger Williams University
1 Old Ferry Road
Bristol, RI 02809-2921
(401) 254-3334
Technical Mentor
Kurt Rodman, MAS, C.M., ACE
Airport Operations Supervisor at
Students
Samantha Gildersleeve
118 Commons Road
Germantown, NY 12526
(518) 610-1729
Stephanie Norris
116 Geraldine Drive
Naugatuck, CT 06770
(203) 206-1028
Benny Tortorici
22 Greenway
New Hyde Park, NY 11040
(516) 375-6763
Andrew Wilson
138 Summer Street
Easton, MA 02356
(508) 269-5186
Tweed-New Haven Airport (AvPorts)
155 Burr Street
New Haven, CT 06512
(203) 466-1199
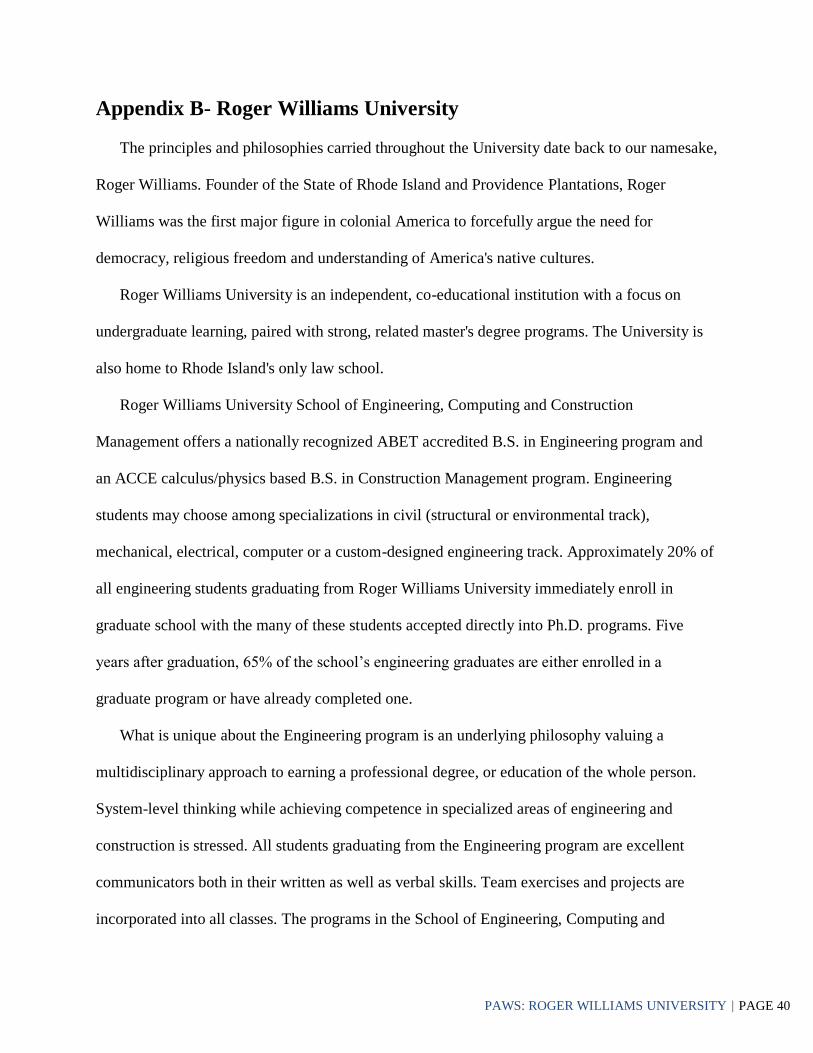
PAWS: ROGER WILLIAMS UNIVERSITY | PAGE 40
Appendix B- Roger Williams University
The principles and philosophies carried throughout the University date back to our namesake,
Roger Williams. Founder of the State of Rhode Island and Providence Plantations, Roger
Williams was the first major figure in colonial America to forcefully argue the need for
democracy, religious freedom and understanding of America's native cultures.
Roger Williams University is an independent, co-educational institution with a focus on
undergraduate learning, paired with strong, related master's degree programs. The University is
also home to Rhode Island's only law school.
Roger Williams University School of Engineering, Computing and Construction
Management offers a nationally recognized ABET accredited B.S. in Engineering program and
an ACCE calculus/physics based B.S. in Construction Management program. Engineering
students may choose among specializations in civil (structural or environmental track),
mechanical, electrical, computer or a custom-designed engineering track. Approximately 20% of
all engineering students graduating from Roger Williams University immediately enroll in
graduate school with the many of these students accepted directly into Ph.D. programs. Five
years after graduation, 65% of the school’s engineering graduates are either enrolled in a
graduate program or have already completed one.
What is unique about the Engineering program is an underlying philosophy valuing a
multidisciplinary approach to earning a professional degree, or education of the whole person.
System-level thinking while achieving competence in specialized areas of engineering and
construction is stressed. All students graduating from the Engineering program are excellent
communicators both in their written as well as verbal skills. Team exercises and projects are
incorporated into all classes. The programs in the School of Engineering, Computing and

PAWS: ROGER WILLIAMS UNIVERSITY | PAGE 41
Construction Management at Roger Williams University exist in an educational infrastructure
that is flexible in its ability to address industry needs with regard to characteristics required in
new graduates.
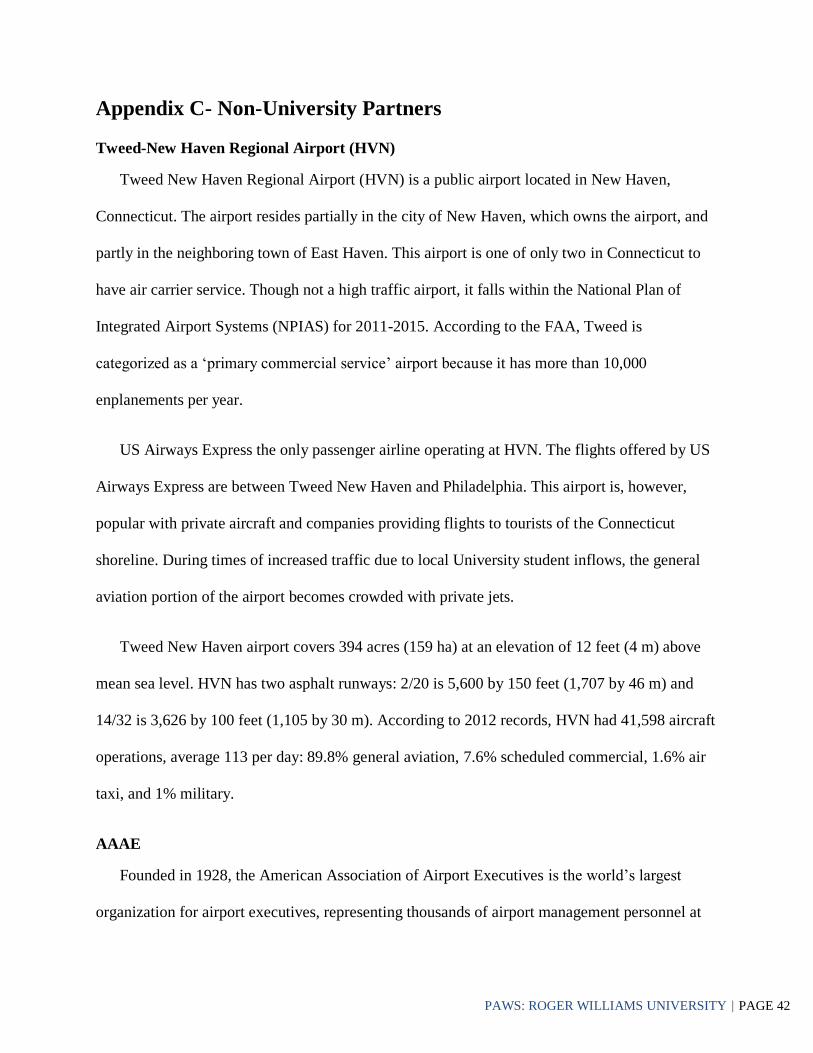
PAWS: ROGER WILLIAMS UNIVERSITY | PAGE 42
Appendix C- Non-University Partners
Tweed-New Haven Regional Airport (HVN)
Tweed New Haven Regional Airport (HVN) is a public airport located in New Haven,
Connecticut. The airport resides partially in the city of New Haven, which owns the airport, and
partly in the neighboring town of East Haven. This airport is one of only two in Connecticut to
have air carrier service. Though not a high traffic airport, it falls within the National Plan of
Integrated Airport Systems (NPIAS) for 2011-2015. According to the FAA, Tweed is
categorized as a ‘primary commercial service’ airport because it has more than 10,000
enplanements per year.
US Airways Express the only passenger airline operating at HVN. The flights offered by US
Airways Express are between Tweed New Haven and Philadelphia. This airport is, however,
popular with private aircraft and companies providing flights to tourists of the Connecticut
shoreline. During times of increased traffic due to local University student inflows, the general
aviation portion of the airport becomes crowded with private jets.
Tweed New Haven airport covers 394 acres (159 ha) at an elevation of 12 feet (4 m) above
mean sea level. HVN has two asphalt runways: 2/20 is 5,600 by 150 feet (1,707 by 46 m) and
14/32 is 3,626 by 100 feet (1,105 by 30 m). According to 2012 records, HVN had 41,598 aircraft
operations, average 113 per day: 89.8% general aviation, 7.6% scheduled commercial, 1.6% air
taxi, and 1% military.
AAAE
Founded in 1928, the American Association of Airport Executives is the world’s largest
organization for airport executives, representing thousands of airport management personnel at
PAWS: ROGER WILLIAMS UNIVERSITY | PAGE 43
public-use commercial and general aviation airports. AAAE’s members represent roughly 850
airports and hundreds of companies and organizations that support airports. AAAE serves its
members through results-oriented representation in Washington, D.C. and delivers a wide range
of industry services and professional development opportunities including training, meetings,
conference, and a highly respected accreditation program (American Association of Airport
Executives, 2013).
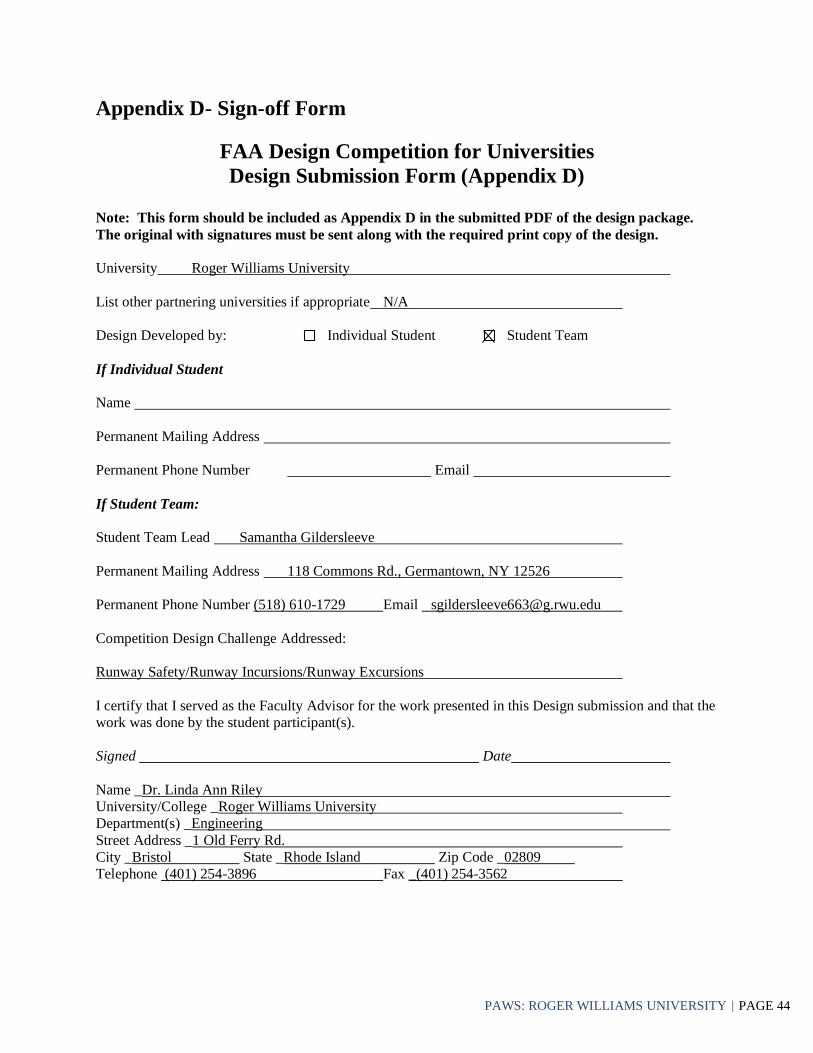
PAWS: ROGER WILLIAMS UNIVERSITY | PAGE 44
Appendix D- Sign-off Form
FAA Design Competition for Universities
Design Submission Form (Appendix D)
Note: This form should be included as Appendix D in the submitted PDF of the design package.
The original with signatures must be sent along with the required print copy of the design.
University Roger Williams University
List other partnering universities if appropriate N/A
Design Developed by: Individual Student Student Team
If Individual Student
Name
Permanent Mailing Address
Permanent Phone Number Email
If Student Team:
Student Team Lead Samantha Gildersleeve
Permanent Mailing Address 118 Commons Rd., Germantown, NY 12526
Permanent Phone Number (518) 610-1729 Email [email protected]
Competition Design Challenge Addressed:
Runway Safety/Runway Incursions/Runway Excursions
I certify that I served as the Faculty Advisor for the work presented in this Design submission and that the
work was done by the student participant(s).
Signed Date
Name _Dr. Linda Ann Riley
University/College _Roger Williams University
Department(s) _Engineering
Street Address _1 Old Ferry Rd.
City _Bristol State _Rhode Island Zip Code _02809
Telephone (401) 254-3896 Fax _(401) 254-3562
PAWS: ROGER WILLIAMS UNIVERSITY | PAGE 45
Appendix E- Educational Experience
Faculty Advisor- Dr. Linda Riley
As a faculty member and mentor to the team, I view the educational experience that the
students gained over the past two semesters as extremely valuable to their development as
practicing engineers and in their preparation for graduate school. The competition provides an
excellent platform for the senior engineering capstone design project in that the open-ended
nature of the challenge fits perfectly with the learning objectives of the class. What makes the
FAA competition especially effective is that student teams have the ability to stretch their
intellectual boundaries. This is especially important for a team such as this one since all four of
the students are high-achievers and two will continue with their graduate studies in aerospace
engineering. The open-ended nature of the challenge allowed the team to truly delve deeply into
subject matter and bring fresh new perspectives to solving and addressing an FAA challenge.
This particular team of students, in contrast to past teams of mine entering the competition, were
very comfortable and in fact embraced the challenges associated with facing the unknown. With
every challenge, they identified paths to solutions or actively pursued experts in the field to assist
them in filling knowledge gaps. At this point, they truly are experts on the topic of low level
wind shear. Furthermore, they used their expertise to conceptualize and fabricate a very
innovative solution that not only is functional, but has been successfully tested at Tweed New
Haven Airport.
As expected, at the beginning of the process the students spent a great deal of time
researching and meeting with industry experts to ultimately decide on a direction for their
problem statement. However having participated in the competition in the past, I had seen this
PAWS: ROGER WILLIAMS UNIVERSITY | PAGE 46
phase before and did not force them into making a hasty decision by adopting a problem
statement that may not have been entirely appropriate.
In the future, I see continued participation by RWU in the competition. I feel that this
competition is one of the best defined from the perspective of expectations, deliverables and
evaluation metrics. In addition, the expert resources made available for students and overall
administration of the competition is outstanding.
Undergraduate- Samantha Gildersleeve
The FAA Design Competition has played a very significant role in my academic experience
as a mechanical engineer. Not only has it given me the opportunity to exhibit professional and
technical skills, but has provided a gateway to the aviation industry. Throughout this competition
process, the team has been able to work together and explore solutions that would meet standards
for the FAA, various stakeholders as well as our technical and academic mentors. One of the
larger challenges faced by the team was the broadness of competition categories and constraints
on time to determine a current issue within the industry and propose solutions that would fill a
gap between current technology. Extensive research and team communication on our strengths,
weaknesses and major interests were methods for overcoming this challenge. After several
discussions, the team decided to focus on the issue of wind shear and its lack of detection
technology at the runway level because we felt we could integrate our technical and academic
backgrounds in mechanical and electrical engineering. Participation by industry was a key factor
in our success as it was helpful to receive feedback from industry experts working in the field.
Overall, the project has helped with our ability to communicate our ideas to various audiences,
develop technical solutions to complex issues and provide insight into the aviation industry.
More specifically, it has given me experience with the entry into this field and encouraged me to
move forward in pursuing graduate study for aerospace engineering.

PAWS: ROGER WILLIAMS UNIVERSITY | PAGE 47
Undergraduate- Stephanie Norris
The FAA Design Competition provided a meaningful learning experience for me. This
competition gave me, and the rest of the team, our first real chance at using all of the engineering
we have been learning for four years. The competition also offered us the ability to work on our
professional communication skills. The largest challenge that the team faced was gaining the
technical knowledge of wind shear to be able to undertake this system design. This challenge
was overcome by doing an extensive amount of research on the subject of wind shear. This
resulted in the team knowing wind shear almost as well as professionals. In order to develop our
hypothesis, we first had to know what wind shear was and why it was a problem. After figuring
that out, the team then looked into technologies that are already in existence for wind shear
detection. We discovered that a few different technologies had been developed but there was a
niche missing, an affordable detection system. We then started contacting local, GA airports.
After contacting Tweed, we began the modeling process of the design. Talking to, and working
with, industry professionals was crucial to the project. The industry professionals gave us critical
insight into the project and how we could improve our design. Through this project I learned
about airport operations. This will be useful in my future career if I choose to go into aerospace
engineering.
Undergraduate- Benny Tortorici
The FAA Design Competition provided a meaningful learning experience for me. It was a
very unique competition that allowed me to sharpen and utilize my skills. In addition it was a
project that offered a lot of freedom where we could identify and solve a problem of our
choosing. Over the course of this competition our group faced a number of challenges. These
challenges ranged from technical challenges to bureaucratic challenges. As far as technical

PAWS: ROGER WILLIAMS UNIVERSITY | PAGE 48
challenges go, our group needed to understand the properties of various electronic components
and combine these with mechanical components. The bridging of these two areas took a
significant time and effort. Fortunately, our group was able to overcome these challenges by
taking the time to understand the characteristics of each component and utilizing each group
member’s strengths. The team was able to develop our hypothesis by attempting to find a gap in
some area of runway incursions. After many hours of research, the group noticed a significant
gap in detecting low level wind shear. The current technology to detect low level wind shear is
available but costs an enormous amount of money. Smaller airports cannot afford these types of
technologies and so we decided to develop a cost effective and reliable wind shear detection
system. Participation by industry was very important in the development of this project. Working
in collaboration with Tweed New Haven Airport and Kurt Rodman proved to be imperative and
essential to the success of this project. I learned a significant amount for this project. Such as
working as a team, improving my technical skills and improving my communication skills. This
project will help me in my future endeavors because this project offered an insight into the real
world applications and how a problem is actually solved.
Undergraduate- Andrew Wilson
The FAA Design Competition provided a meaningful experience for me in several ways. It
provided a valuable experience in communicating with industry professionals, it provided a
platform to experience the engineering design process, and it was an excellent opportunity to
experience group dynamics. The greatest challenge faced by my group was to come up with a
design problem in the first place. This was overcome by research and many group brainstorming
sessions. The process used to develop our hypothesis was to propose ideas and then research
current solutions. We chose our hypothesis based on what our research yielded. The

PAWS: ROGER WILLIAMS UNIVERSITY | PAGE 49
participation between our group and industry was a very important part of the project. Our
industry connection provided critical insight into our project that we had never been exposed to.
What I mainly learned from this project was an ability to work with others and communicate
with industry professionals.
PAWS: ROGER WILLIAMS UNIVERSITY | PAGE 50
Appendix F- References
Ackerman, S. (2000). Wather for Pilots. Retrieved from University of Wisconsin- Madison:
http://profhorn.meteor.wisc.edu/wxwise/wxpilot/lesson9/lesson9lift.html
Airbus. (2013). Flight Operations Briefing Notes; Windshear Awareness. Retrieved from Airbus:
http://www.airbus.com/fileadmin/media_gallery/files/safety_library_items/AirbusSafetyLib_-
FLT_OPS-ADV_WX-SEQ02.pdf
Alexander, M. B., & Camp, D. W. (1984). Wind Speed and Direction Shears With Associated Vertical
Motion During Strong Surface Winds. Huntsville: NASA.
Chan, P. W., & Lee, Y. F. (2012). Application of Short-Range Lidar in Wind Shear Alerting. Journal of
Atmospheric & Oceanic Technology, 29(2), 207-220.
Charvat, G. L. (2011, Janurary 14). Doppler Experiment Using the MIT IAP 2011 Laptop Based Radar.
Cambridge, Massachusetts, United States of America: MIT Lincoln Laboratory.
Charvat, G. L. (2011, October 28). MIT IAP 2011 Laptop Based Radar: Block Diagram, Schematics, Bill
of Material, and Fabrication Instructions. Cambridge, Massachusetts, United States of America:
MIT Lincoln Laboratory.
Charvat, G. L. (2011). Synthetic Aperture Radar (SAR) Imaging Using the MIT IAP 2011 Laptop Based
Radar. MIT Independent Activities Period (IAP). Cambridge.
Charvat, G., Williams, J., Fenn, A., Kogon, S., & Herd, J. (2011, January). Building a Small Radar
System Capable of Sensing Range, Doppler, and Synthetic Aperture Radar Imaging. Retrieved
October 1, 2013, from MIT Open Courseware: http://ocw.mit.edu/resources/res-ll-003-build-a-
small-radar-system-capable-of-sensing-range-doppler-and-synthetic-aperture-radar-imaging-
january-iap-2011
Department of Atmospheric Science at the University of Illinois. (2010). Interpreting Doppler Radar
Velocities. Retrieved October 1, 2013, from
http://ww2010.atmos.uiuc.edu/(Gh)/guides/rs/rad/ptrn/ptrn1.rxml
Fenn, A. J. (2011, January 14). Antenna Design for the Laptop Radar Project. Cambridge, Massachusetts,
United States of America: MIT Lincoln Laboratory.
Frehlich, R. (2001). Estimation of Velocity Error for Doppler Lidar Measurements. Journal of
Atmospheric & Oceanic Technology, 18(10), 1628-1640.
Guan, W.-L., & Yong, K. (2014, March 27). Review of Aviation Accidents Caused by Wind Shear and
Identification Methods. Retrieved from Aviation Safety Council of Republic of China:
http://www.asc.gov.tw/author_files/WINSHEAR.pdf
How Stuff Works, Inc. (2013). How Radar Works. (How Stuff Works, Inc.) Retrieved October 1, 2013,
from http://www.howstuffworks.com/radar.htm
International Civil Aviation Organization. (2005). Manual on Low-Level Wind Shear. International Civil
Aviation Organization.

PAWS: ROGER WILLIAMS UNIVERSITY | PAGE 51
Jones, J. E. (2004). Successfule Acquisition of FAA Terminal Doppler Weather Radar. Third Annual
Conference on the Acquisition of Software-Intensive Systems. Arlington.
Komarov, V. S., Lavrinenko, A. V., Kreminskii, A. V., Lomakina, N. Y., Popov, Y. B., & Popova, A. I.
(2006, March 15). New Method of Spatial Extrapolation of Meteorological Fields on the
Mesoscale Level Using a Kalman Filter Algorithm for a Four-Dimensional Dynamic-Stochastic
Model. Journal of Atmospheric and Oceanic Technology, 24, 12.
Massachusetts Institute of Technology. (n.d.). How to Bias an Op-Amp. Retrieved from Massachusetts
Institute of Technology: http://resenv.media.mit.edu/classes/MAS836/bias.pdf
Merritt, M. W., Klingle-Wilson, D., & Campbell, S. D. (1989). Wind Shear Detection with Pencil-Beam
Radars. The Lincoln Laboratory Journal, 2(3), 483-510.
National Aeronautics and Space Administration. (1992, June). Making the Skies Safe from Windshear.
Retrieved October 1, 2013, from
http://www.nasa.gov/centers/langley/news/factsheets/Windshear.html
National Research Council. (1983). Low-Altitude Wind Shear and Its Hazard to Aviation. Washington,
D.C.: National Academy Press.
National Weather Association. (2003, November 23). Microbursts. Retrieved from National Weather
Association: http://www.nwas.org/committees/avnwxcourse/lesson5.htm
National Weather Service Forecast Office. (2010, May 5). Downbursts. Retrieved February 8, 2014, from
National Weather Service: http://www.erh.noaa.gov/cae/svrwx/downburst.htm
Orth, A., Schonbrun, E., & Crozier, K. B. (2011, September 8). Multiplexed Pressure Sensing with
Elastomer Membranes. Dynamic Article Links, p. 3.
Polvinen, J. (2009). Are you prepared for safety hazards caused by wind shear? Retrieved October 1,
2013, from
http://www.vaisala.com/Vaisala%20Documents/Vaisala%20News%20Articles/VN180/vn180_Ar
e_you_prepared_for_safety_hazards_caused_by_wind_shear.pdf
Ray, M. L., Rogers, A. L., & McGowan, J. G. (2006). Analysis of Wind Shear Models and Trends in
Different Terrains. Retrieved October 1, 2013, from
http://www.ceere.org/rerl/publications/published/2006/AWEA%202006%20Wind%20Shear.pdf
Shun, C. M., & Chan, P. W. (2008). Applications of an Infrared Doppler Lidar in Detection of Wind
Shear. Journal of Atmospheric & Oceanic Technology, 25(5), 637-655.
The Engineering Toolbox. (2013). Wind Shear. Retrieved from The Engineering Toolbox:
http://www.engineeringtoolbox.com/wind-shear-d_1215.html
The MathWorks, Inc. (2013). Wind Shear Model. (The MathWorks, Inc.) Retrieved October 1, 2013,
from http://www.mathworks.com/help/aeroblks/windshearmodel.html
U.S. Department of Transportation. (1988, November 11). Pilot Windshear Guide. Retrieved from
Federal Aviation Administration Advisory Circular:
http://www.airweb.faa.gov/Regulatory_and_Guidance_Library/rgAdvisoryCircular.nsf/0/B3FB7
DD636FB870B862569BA0068920B?OpenDocument

PAWS: ROGER WILLIAMS UNIVERSITY | PAGE 52
U.S. Department of Transportation. (2007, August 28). Hazardous Wildlife Attractants On Or Near
Airports. Retrieved from Federal Aviation Administration Advisory Circular.
U.S. Department of Transportation. (2011, September 30). Standards For Specifying Construction Of
Airports. Retrieved from Federal Aviation Administration Advisory Circular.
U.S. Department of Transportation. (2013, September 28). Airport Design. Retrieved from Federal
Aviation Administration Advisory Circular.
U.S. Department of Transportation. (2013, September 26). FAA Specification for Wind Cone Assemblies.
Retrieved from Federal Aviation Administration Advisory Circular.
U.S. Department of Transportation. (2013, September 25). Segmented Circle Airport Marker System.
Retrieved from Federal Aviation Administration Advisory Circular.
U.S. Department of Transportation. (2013, January 23). Specification for Airport Light Bases,
Transformer Housings, Junction Boxes, and Accessories. Retrieved from Federal Aviation
Administration Advisory Circular.
Weather Questions. (2010, November 28). What is wind shear? Retrieved from WeatherQuestions:
http://www.weatherquestions.com/What_is_wind_shear.htm
Williams, J. H. (2011, January). Modular System RF Design. Cambridge, Massachusetts, United States of
America: MIT Lincoln Laboratory.
Zhang, G., & Doviak, R. J. (2007). Spaced-Antenna Interferometry to Measure Crossbeam Wind, Shear,
and Turbulence: Theory and Formulation. American Meteorological Society, 791-805.
Related Documents