Pavement Life-Cycle Cost Studies Using Actual Cost Data A SYNTHESIS

Welcome message from author
This document is posted to help you gain knowledge. Please leave a comment to let me know what you think about it! Share it to your friends and learn new things together.
Transcript

Pavement Life-Cycle Cost StudiesUsing Actual Cost Data
A S Y N T H E S I S

Pavement Life-Cycle Cost StudiesUsing Actual Cost Data
A S Y N T H E S I S
BYJorge N. VillacresCONSULTING ENGINEER
FEBRUARY 2005
i
ACKNOWLEDGEMENTS
This synthesis was written by Jorge N. Villacres, consulting engineer, and formerly with theAsphalt Institute and Ohio Department of Transportation.
Thanks are expressed to the following reviewers of the synthesis who furnished comment andideas for the improvement of the document:
Mark BuncherDave NewcombRay HogrefeCliff UrsichMike Kvach
ii
PAVEMENT LIFE-CYCLE COST STUDIESUSING ACTUAL COST DATA
A Synthesis
Table of Contents Page
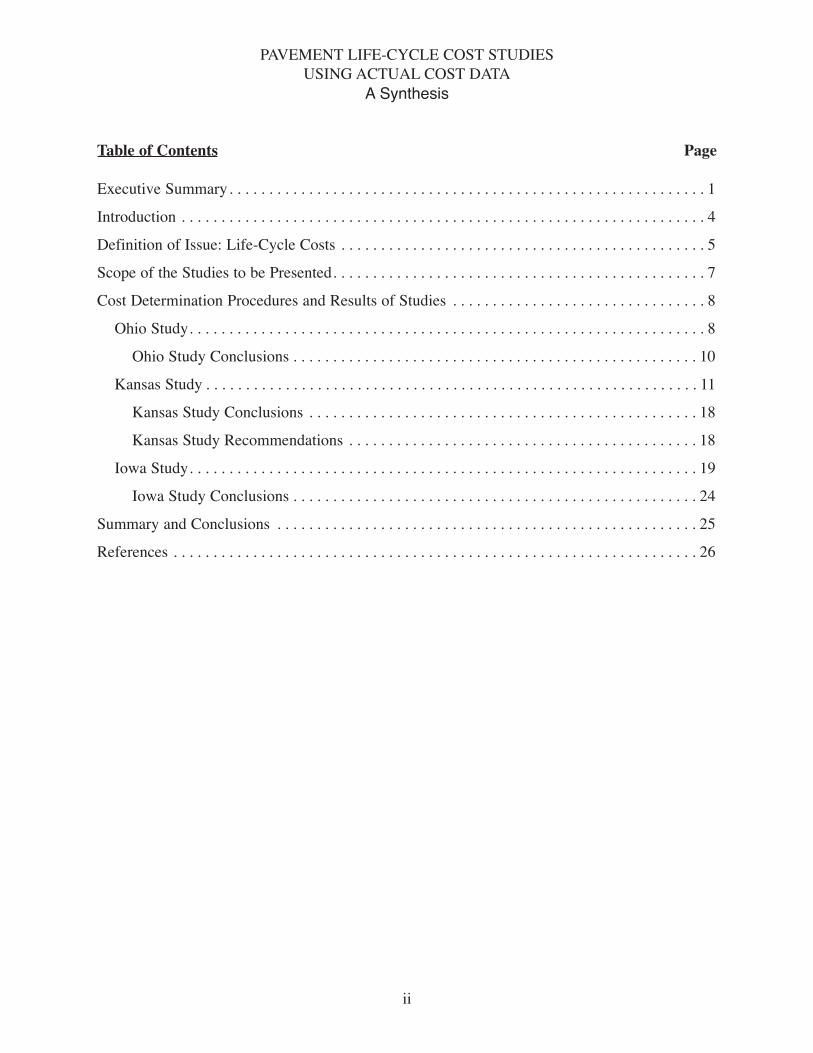
Executive Summary. . . . . . . . . . . . . . . . . . . . . . . . . . . . . . . . . . . . . . . . . . . . . . . . . . . . . . . . . . . . 1
Introduction . . . . . . . . . . . . . . . . . . . . . . . . . . . . . . . . . . . . . . . . . . . . . . . . . . . . . . . . . . . . . . . . . . 4
Definition of Issue: Life-Cycle Costs . . . . . . . . . . . . . . . . . . . . . . . . . . . . . . . . . . . . . . . . . . . . . . 5
Scope of the Studies to be Presented. . . . . . . . . . . . . . . . . . . . . . . . . . . . . . . . . . . . . . . . . . . . . . . 7
Cost Determination Procedures and Results of Studies . . . . . . . . . . . . . . . . . . . . . . . . . . . . . . . . 8
Ohio Study. . . . . . . . . . . . . . . . . . . . . . . . . . . . . . . . . . . . . . . . . . . . . . . . . . . . . . . . . . . . . . . . . 8
Ohio Study Conclusions . . . . . . . . . . . . . . . . . . . . . . . . . . . . . . . . . . . . . . . . . . . . . . . . . . . 10
Kansas Study . . . . . . . . . . . . . . . . . . . . . . . . . . . . . . . . . . . . . . . . . . . . . . . . . . . . . . . . . . . . . . 11
Kansas Study Conclusions . . . . . . . . . . . . . . . . . . . . . . . . . . . . . . . . . . . . . . . . . . . . . . . . . 18
Kansas Study Recommendations . . . . . . . . . . . . . . . . . . . . . . . . . . . . . . . . . . . . . . . . . . . . 18
Iowa Study. . . . . . . . . . . . . . . . . . . . . . . . . . . . . . . . . . . . . . . . . . . . . . . . . . . . . . . . . . . . . . . . 19
Iowa Study Conclusions . . . . . . . . . . . . . . . . . . . . . . . . . . . . . . . . . . . . . . . . . . . . . . . . . . . 24
Summary and Conclusions . . . . . . . . . . . . . . . . . . . . . . . . . . . . . . . . . . . . . . . . . . . . . . . . . . . . . 25
References . . . . . . . . . . . . . . . . . . . . . . . . . . . . . . . . . . . . . . . . . . . . . . . . . . . . . . . . . . . . . . . . . . 26

PAVEMENT LIFE-CYCLE COST STUDIESUSING ACTUAL COST DATA
A Synthesis
EXECUTIVE SUMMARY
This synthesis presents the results of studies of interstate highways in three states which showthe comparison of costs between hot mix asphalt (HMA) pavements and portland cementconcrete (PCC) pavements.
The process used to determine the economical performance of pavements over time is called"Life-cycle Cost Analysis" (LCCA). There are two ways of using LCCA: (1) For the prediction offuture costs of proposed pavements over a given period of time, using the best availableinformation as to total costs and predicted performance; and (2) For the determination of actualcosts of existing pavements over a given period of time based on historical data from agencyrecords.
The three studies in this synthesis use the second way, which takes actual costs of all workperformed to construct and maintain a pavement from agency records and the times at which thecosts were incurred to determine the total cost of the pavements over time. In all cases,comparisons were made to the greatest extent possible of HMA and PCC pavements with similartraffic and comparable age.
There are many variables in the LCCA process, both in predicting future costs and indetermining actual costs. These variables greatly influence the results of the analysis. Thedetermination of actual pavement costs is highly dependent on the adequacy, or inadequacy, ofrecords showing what was done to the pavement, when it was done, and how much it cost. Thisinformation is typically difficult to assemble, requiring diligent searching of agency constructionand rehabilitation records. Inaccuracies or omissions in the records for these items will affect theaccuracy of the results. In that light, the information provided in the three studies is unique andvaluable due to the diligence of the authors in obtaining complete and accurate information.
The three studies were diverse in their approach to the question of which pavement type is moreeconomical. The Ohio study examined five locations on four interstate highways where HMAand PCC pavements were constructed in close proximity and at approximately the same time.The costs were calculated per square yard of mainline pavement. The Kansas study looked atapproximately 218 miles of PCC pavement and 262 miles of HMA pavement on rural interstatehighways across the state. Comparative costs were calculated using the "four-lane mile ofmainline pavement" as the unit of measure. The Iowa study examined three locations on oneinterstate route where HMA and PCC pavements were constructed adjacent to each other atnearly the same time. The comparison of costs was made using the "two-lane mile" as the unitof measure.
The Ohio study used the present worth method of costs wherein all of the costs during theanalysis period of each project were discounted to the year of the original construction project.The adjacent HMA and PCC pavements were located on I-71 from central to northern Ohio, onI-75 and I-475 in the northwestern part of the state, and in two locations on I-275 in southwestern
1
2
Ohio. Calculations were made using both a 5.0% discount rate, which the Ohio DOT was usingat that time, and a 2.5% discount rate to show the effect of a lower rate.
The Ohio results showed that in all cases the initial construction costs of HMA pavements wereabout 10 to 25 percent less than those of compared PCC pavements on the same route. The costsavings for the present worth values (or total discounted costs) of HMA compared to PCCpavements were even more dramatic, ranging from 13 percent to 107 percent, with most of thesavings in the 25 percent to 70 percent range. The results are detailed in Table 1.
In the Kansas study, all of the compared pavements were not the same age, therefore equitablecomparisons could not be made using the net present value (or worth) method. The comparisonswere made using inflation adjusted dollars. An annual inflation rate of 3.5% was used, and allcosts were carried forward to 2001 and referred to as "2001 dollars." A total of 218 miles ofPCC pavement and 262 miles of HMA pavement on three interstate highways were evaluated.The HMA pavement on I-70 extends about 250 miles from the western border of the state to I-135 in central Kansas. The PCC pavement is in 3 locations: 95 miles on I-70 east of I-135; 68miles on I-135 south of I-70; and 55 miles on I-35 in the eastern part of the state. Using aninflation rate of 3.5%, all costs were carried forward to 2001 and referred to as "2001 dollars."
The nine sections of HMA on I-70, one in each of nine counties and 249.7 miles in length, hadan average life-cycle cost of $1.89 million per 4-lane mile in 2001 dollars. The five sections ofPCC on I-70, one in each of five counties and 95.1 miles in length, had an average life-cycle costof $3.22 million per 4-lane mile in 2001 dollars. On I-35, the 12.1 miles of HMA pavement inCoffey County had a life-cycle cost of $1.39 million per 4-lane mile in 2001 dollars. The threesections of PCC pavement on I-35, in three counties and 35.5 miles in length, had an averagelife-cycle cost of $3.43 million per 4-lane mile in 2001 dollars. There was no HMA pavementon I-135, but the 68.4 miles of PCC pavement in three counties had a life-cycle cost of $2.89million per 4-lane mile in 2001 dollars. Costs for each county are shown in Table 2.
The Iowa study determined the total life-cycle costs by calculating the present worth of costs ofselected pavements discounted back to 1957 dollars using a discount rate of four percent. Threesections each of PCC and HMA pavement on I-80 in three counties between Des Moines andIowa City were analyzed in the study.
In Iowa County—the one farthest east—the 4.58-mile PCC section had present worth costs of$272, 000 per 2-lane mile. The adjacent HMA section, 3.00 miles long, had present worth costs of$157,528 by comparison. The 4.64-mile section of PCC pavement in Jasper County, the western-most, showed total costs discounted to 1957 dollars of $290,151 per 2-lane mile, while theadjacent 6.43 mile section of HMA pavement had total costs of $179,136 per 2-lane mile. InPoweshiek County, the 9.15-mile PCC pavement section had present worth costs of $186,471 per2-lane mile for the eastbound lanes and $189,253 per 2-lane mile for the westbound lanes. Theadjacent 3.14-mile HMA pavement section, in comparison, had higher present worth costsamounting to $199,473 per 2-lane mile. The costs are shown in Table 4.
The results of the studies show that HMA pavement was overall more economical in both initialconstruction cost and life-cycle costs than comparable PCC pavement. In Ohio, all five of theareas compared showed lower initial construction costs and life-cycle costs for HMA pavement.In Kansas, the 10 HMA and 11 PCC pavement sections evaluated on three interstate routes

3
showed that HMA was substantially more economical over the life of the pavement. Initialconstruction costs of nine HMA pavement sections in Kansas averaged less than those of fivePCC pavement sections on I-70, but one HMA pavement section on I-35 had a higher initialconstruction cost than the average of three PCC pavement sections on the same route. In Iowa,two HMA pavement sections were substantially more economical over the life of the pavementsthan the comparable PCC sections, and one PCC section was slightly more economical in lifecycle costs than the comparable HMA section.

4
PAVEMENT LIFE-CYCLE COST STUDIESUSING ACTUAL COST DATA
A Synthesis
INTRODUCTION
The performance and economy of highway pavements is a matter of critical importance togovernmental agencies, highway engineers, paving contractors and others involved in thehighway industry. The subject is also important to the citizen taxpayers, who want the best valuefor their tax dollars.
In that light, it is beneficial to know the economic value over time of pavements, generally calledthe "life-cycle costs" of pavements. In this synthesis, the results of studies of interstate highwaysin three states will be presented to show the comparison of life-cycle costs between hot mixasphalt (HMA) pavements and portland cement concrete (PCC) pavements.
There has historically been a difference of opinion as to whether hot mix asphalt (or flexible)pavements are more economical or less economical over time than portland cement concrete (orrigid) pavements. Each industry claims that its product is more economical or longer lasting, orboth. Even experienced state highway agencies and highway engineers disagree on the subject.While the information presented here is not expected to settle the argument, it will show thatcareful, detailed studies in three states indicate that HMA pavements are more economical overtime – that is, they have lower life-cycle costs.
The three studies examined here use actual costs from agency records and the times at which thecosts were incurred to determine the total cost of the pavements over a period of time. Thisinformation is typically difficult to assemble, requiring diligent searching of agency constructionand rehabilitation records. This makes these three studies unique and valuable. In all cases,comparisons were made to the greatest extent possible of HMA and PCC pavements with similartraffic and age.

5
DEFINITION OF ISSUE: LIFE-CYCLE COSTS
The process used to determine the economical performance of pavements is called "Life-cycleCost Analysis" (LCCA). The subject is of such importance that the Federal HighwayAdministration has published an Interim Technical Bulletin (3) furnishing technical guidanceand recommendations on best practices in conducting LCCA. There are two ways of usingLCCA: (1) For the prediction of future costs of proposed pavements over a given period of time,using the best available information as to total costs and predicted performance; and (2) For thedetermination of actual costs of existing pavements over a given period of time based onhistorical data from agency records.
The prediction of future costs using LCCA can be used to make a comparison of costs betweencompeting pavement designs, such as HMA versus PCC, or even two or more different HMA orPCC designs. Normally the procedure is used to compare HMA and PCC pavements designed tocarry the predicted traffic load for an equal period of time. The results of an impartial LCCA willshow which pavement type is most economical. This information can then be used to makea decision as to which pavement type is best for the agency or owner.
The predicted costs of a LCCA must be based on accurate unit costs of materials andconstruction, and on realistic cost estimates and timing of maintenance and rehabilitationprocedures used during the pavement's life. The analysis takes the following costs intoconsideration: initial construction, routine and preventive maintenance, resurfacing,rehabilitation, reconstruction, and user costs; and it considers the salvage value of the pavement.Sometimes routine maintenance costs, user costs, and salvage value are not included, dependingon agency procedures.
The LCCA procedure calls for the costs at the different times in the life of the pavement to bediscounted to equate to dollar values at the beginning of the pavement's life. The resulting totalcost over time is called the "net present value," also known as the "present worth of costs." Thediscounting of costs is based on a formula using a "discount rate," which converts costs duringthe life of a pavement to dollar values at the beginning of the pavement's life. The discount rateis generally defined as the difference between the interest rate on borrowed money forgovernment bonds and the inflation rate. The Federal Highway Administration (FHWA) statesthat good practice suggests using a discount rate of 3 to 5 percent based on that definition and ona study of interest and inflation rates in the early and mid-1990's.
The period of time over which all of these costs are determined is called the "analysis period,"and it usually ranges from 30 to 50 years. The period of time for which the initial pavement isdesigned is called the "performance period," or the "design period," and it usually varies between20 and 30 years. The performance period is the time from completion of pavement constructionto the time when the pavement is expected to reach its terminal serviceability and requirerehabilitation or resurfacing. The timing for further rehabilitation activities is determined andapplied to the project through the remainder of the analysis period.

6
The other use of LCCA, the determination of actual costs of existing pavements and thesubsequent comparison of pavements of similar age and similar traffic loading, is accomplishedthrough diligent search and compilation of agency information. Actual costs of the workperformed on the pavements under study can then be discounted, normally to the beginning ofthe analysis periods if they are close in time. The total of these costs yields the net present value,i.e. the cost of each project in dollars at the beginning of its life. An alternate method is to adjustdollars forward to a common year using an appropriate inflation rate. This method can be usefulparticularly when the ages of compared pavements are not similar. Both of these procedures canbe thought of as a "life-cycle cost study," because they are based on the determination of actualcosts and information indicating when work on the pavement actually took place.
There are many variables in the LCCA process, both in predicting future costs and indetermining actual costs. These variables greatly influence the results of the analysis. In theprediction of future costs, the use of realistic unit costs for materials and labor is critical,particularly in determining initial costs. The predicted frequency and extent of the variousmaintenance, rehabilitation, and reconstruction procedures and their resultant costs also willaffect the outcome substantially. Routine maintenance costs, due to work usually performed bythe agency, will normally have minimal effect on the total life-cycle costs.
The determination of actual pavement costs is highly dependent on the adequacy or inadequacyof records showing what was done to the pavement, when it was done, and how much it cost.Any inaccuracies or omissions in the records for these items will certainly skew the results. Inaddition, the construction of overlays or rehabilitation within boundaries other than the originalsections of pavement makes it difficult to accurately determine the total cost of some pavementsections.
Different units of measure can be used to compare the costs of competing pavements. Probablythe most basic unit is the square yard of mainline pavement. A lane-mile of pavement is aconvenient method also of determining unit costs. For interstate and other four-lane pavements,the two-lane mile or four-lane mile of pavement can also be used as a unit of measure.

7
SCOPE OF THE STUDIES TO BE PRESENTED
The three studies presented in this synthesis examine the actual costs of HMA pavement sectionsversus PCC pavement sections over time. They were conducted on interstate pavements in Ohio,Kansas, and Iowa.
The Ohio study examined five locations on four interstate highways where HMA and PCCpavements were constructed in close proximity and at approximately the same time. The costswere calculated per square yard of mainline pavement. Initial construction, maintenance,resurfacing, rehabilitation, and reconstruction costs were considered, but user costs and salvagevalue were not considered. The net present value (NPV), or present worth (PW), of eachpavement section was calculated using discount rates of 5.0% and 2.5% for comparison.
The Kansas study looked at rural interstate pavements across the state, approximately 218 milesof PCC pavement and 262 miles of HMA pavement. Comparative costs were calculated usingthe "four-lane mile of mainline pavement" as the unit of measure. Mainline pavement in thisstudy is defined as the 24-foot wide travel lanes, shoulders, and ramps. It does not includebridges, bridge approach slabs, cross roads, drainage structures, rest areas, or other ancillarystructures. Costs considered were those for initial construction, maintenance work,rehabilitation, and reconstruction. An annual inflation rate of 3.5% was used, and all costs werecarried forward to 2001 and referred to as “2001 dollars”.
The Iowa study examined three locations on Interstate Route 80 where HMA and PCCpavements were constructed adjacent to each other at nearly the same time. The comparison ofcosts was made using the "two-lane mile" as the unit of measure. The costs included were initialconstruction, contract maintenance, rehabilitation, and reconstruction costs. User delay costs andsalvage, or residual, values were not taken into account. Cumulative costs of the pavementswere calculated to obtain the present worth (or net present value) in 1957 dollars using a discountrate of four percent.
8
COST DETERMINATION PROCEDURES AND RESULTS OF STUDIES
Ohio Study
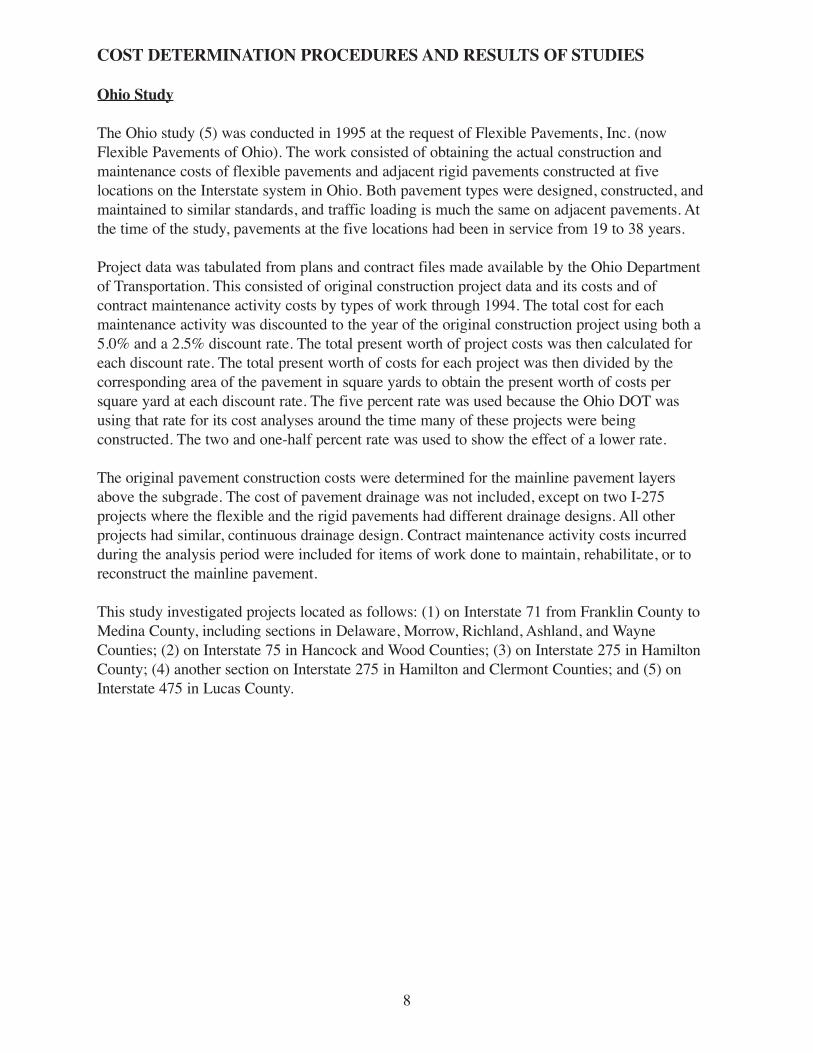
The Ohio study (5) was conducted in 1995 at the request of Flexible Pavements, Inc. (nowFlexible Pavements of Ohio). The work consisted of obtaining the actual construction andmaintenance costs of flexible pavements and adjacent rigid pavements constructed at fivelocations on the Interstate system in Ohio. Both pavement types were designed, constructed, andmaintained to similar standards, and traffic loading is much the same on adjacent pavements. Atthe time of the study, pavements at the five locations had been in service from 19 to 38 years.
Project data was tabulated from plans and contract files made available by the Ohio Departmentof Transportation. This consisted of original construction project data and its costs and ofcontract maintenance activity costs by types of work through 1994. The total cost for eachmaintenance activity was discounted to the year of the original construction project using both a5.0% and a 2.5% discount rate. The total present worth of project costs was then calculated foreach discount rate. The total present worth of costs for each project was then divided by thecorresponding area of the pavement in square yards to obtain the present worth of costs persquare yard at each discount rate. The five percent rate was used because the Ohio DOT wasusing that rate for its cost analyses around the time many of these projects were beingconstructed. The two and one-half percent rate was used to show the effect of a lower rate.
The original pavement construction costs were determined for the mainline pavement layersabove the subgrade. The cost of pavement drainage was not included, except on two I-275projects where the flexible and the rigid pavements had different drainage designs. All otherprojects had similar, continuous drainage design. Contract maintenance activity costs incurredduring the analysis period were included for items of work done to maintain, rehabilitate, or toreconstruct the mainline pavement.
This study investigated projects located as follows: (1) on Interstate 71 from Franklin County toMedina County, including sections in Delaware, Morrow, Richland, Ashland, and WayneCounties; (2) on Interstate 75 in Hancock and Wood Counties; (3) on Interstate 275 in HamiltonCounty; (4) another section on Interstate 275 in Hamilton and Clermont Counties; and (5) onInterstate 475 in Lucas County.

9
Figure 1. Ohio Interstate Highways
The original construction costs and the maintenance costs over the lives of the pavementscompiled in the report indicated that the HMA (flexible) pavements produced a significanteconomic advantage over the PCC (rigid) pavements. The cost advantage of HMA pavementwould have been even greater if maintenance of traffic and user delay costs had been included.This is because the construction time required for maintenance, rehabilitation, and reconstructionof rigid pavements proved to be substantially longer than for flexible pavements.
Table 1 contains a summary of the comparison of project costs on interstate pavements in thefive aforementioned areas of the state. The values are shown in dollars per square yard andinclude costs of maintenance, rehabilitation, and reconstruction at discount rates (DR) of 5.0%and 2.5%. The total present worth of costs, which includes the initial construction cost, is alsoshown for both discount rates. The costs are discounted to the year of the original constructionproject.
The section of I-75 in Wood County from milepost 14.91 to 19.92 received concreterehabilitation with tied concrete shoulders added. Table 1 shows rehabilitation costs calculatedboth with and without tied shoulder costs. The flexible section, I-275 Hamilton 13.91 – 16.22,and the composite section, I-275 Hamilton 10.66 – 13.91, had higher initial construction costsbecause the cost of drainage was included. This was done because drainage on the two projects

10
was substantially different, while the other compared projects had essentially the same drainagetreatment.
Costs are shown in $ / sq. yd. "DR" stands for discount rate. The composite pavement consists of 3" ofasphalt concrete over 9" of portland cement concrete.
Table 1. Comparison of Costs for Ohio Interstate Pavements
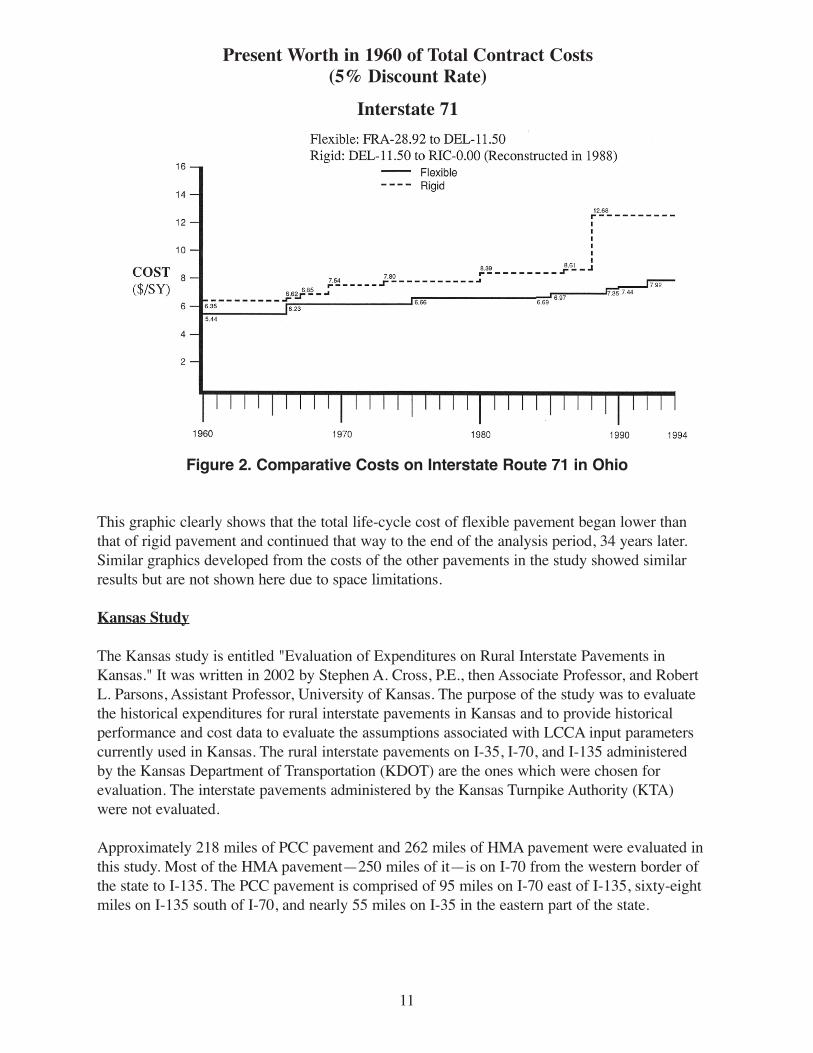
Ohio Study ConclusionsIt can be seen from the values in Table 1 that the costs of initial construction for HMApavements were consistently less than the initial construction costs of PCC pavements, rangingfrom approximately 10 percent to 25 percent less. The cost savings for the present worth values,both at 5 and 2.5 percent discount rates, were even more dramatic, ranging from 13 percent to107 percent, with most of the savings in the 25 percent to 70 percent range. When the PCCrehabilitation with tied shoulders was considered, the cost savings for HMA were even greater.A graphical representation of the comparative project costs over time on Interstate Route 71 inOhio is shown in Figure 2. The flexible pavement section from mileage 28.92 in FranklinCounty to mileage 11.50 in Delaware County (5.44 miles) is compared against the rigidpavement section from mileage 11.50 in Delaware County to mileage 0.00 in Richland County(6.35 miles).
11
Figure 2. Comparative Costs on Interstate Route 71 in Ohio
This graphic clearly shows that the total life-cycle cost of flexible pavement began lower thanthat of rigid pavement and continued that way to the end of the analysis period, 34 years later.Similar graphics developed from the costs of the other pavements in the study showed similarresults but are not shown here due to space limitations.
Kansas Study
The Kansas study is entitled "Evaluation of Expenditures on Rural Interstate Pavements inKansas." It was written in 2002 by Stephen A. Cross, P.E., then Associate Professor, and RobertL. Parsons, Assistant Professor, University of Kansas. The purpose of the study was to evaluatethe historical expenditures for rural interstate pavements in Kansas and to provide historicalperformance and cost data to evaluate the assumptions associated with LCCA input parameterscurrently used in Kansas. The rural interstate pavements on I-35, I-70, and I-135 administeredby the Kansas Department of Transportation (KDOT) are the ones which were chosen forevaluation. The interstate pavements administered by the Kansas Turnpike Authority (KTA)were not evaluated.
Approximately 218 miles of PCC pavement and 262 miles of HMA pavement were evaluated inthis study. Most of the HMA pavement—250 miles of it—is on I-70 from the western border ofthe state to I-135. The PCC pavement is comprised of 95 miles on I-70 east of I-135, sixty-eightmiles on I-135 south of I-70, and nearly 55 miles on I-35 in the eastern part of the state.
Present Worth in 1960 of Total Contract Costs(5% Discount Rate)
Interstate 71
12
The cost comparisons were made for mainline paving only, which consisted of the 24-foot widetravel lanes, shoulders, and ramps. Not included were costs for bridges, bridge approach slabs,cross roads, drainage structures, rest areas, and other ancillary work. Costs included in theanalysis were for original construction, maintenance work (minor and structural overlays),rehabilitation, and reconstruction. The expenditures for these work items were determined fromcontract bid sheets obtained from records of the Kansas DOT Bureau of Construction. Theconstruction contracts usually do not cross county lines and the records are kept in each county.Two or more contracts were often required for original construction because of the large size ofthe counties.
Typical PCC pavement sections for original construction on all three interstate routes consistedof a 9-inch thick reinforced slab over a 4-inch aggregate base course. Lime stabilized subgradeswere typically used and shoulders were either aggregate or HMA.
Typical HMA sections for I-70 were built using 15-inch Full-Depth Asphalt with HMAshoulders. The last three inches of the pavement were not placed at initial construction due tobudgetary constraints but were planned for a later date. This procedure was characterized asplanned stage construction (PSC). The HMA pavement on I-35 was constructed using 19.5-inchFull-Depth Asphalt. None of the I-135 pavement sections used HMA for mainline paving.
Maintenance work performed on the pavement was let either as a construction contract or as amaintenance contract. The costs of all construction and maintenance contracts related tomainline paving were included in the study. However, the cost of maintenance work performedby KDOT forces was not included because the records were not readily available and the costwas generally minimal compared to other costs.
Many of the PCC pavement sections had been reconstructed or were being reconstructedat the time of the study due to joint deterioration, faulting, or spalling. Expenditures for mainlinepaving reconstruction included the following costs: traffic control, pavement removal, subgradecompaction, subgrade stabilization, installing drainable base and edge drains, and paving thedriving lanes, shoulders, and ramps. The reconstructed sections consisted of 11 to 12-inch thickPCC slabs—the earlier ones reinforced and the later ones plain—with tied concrete shoulders.
Four original HMA sections were reconstructed. One of these was a section that had beenwhitetopped and was later reconstructed with full-depth PCC. The other three sections werereconstructed using Full-Depth Asphalt. Mainline paving items used for determining the cost ofHMA reconstruction were selected in the same manner as those used for calculating PCCpavement reconstruction.
13
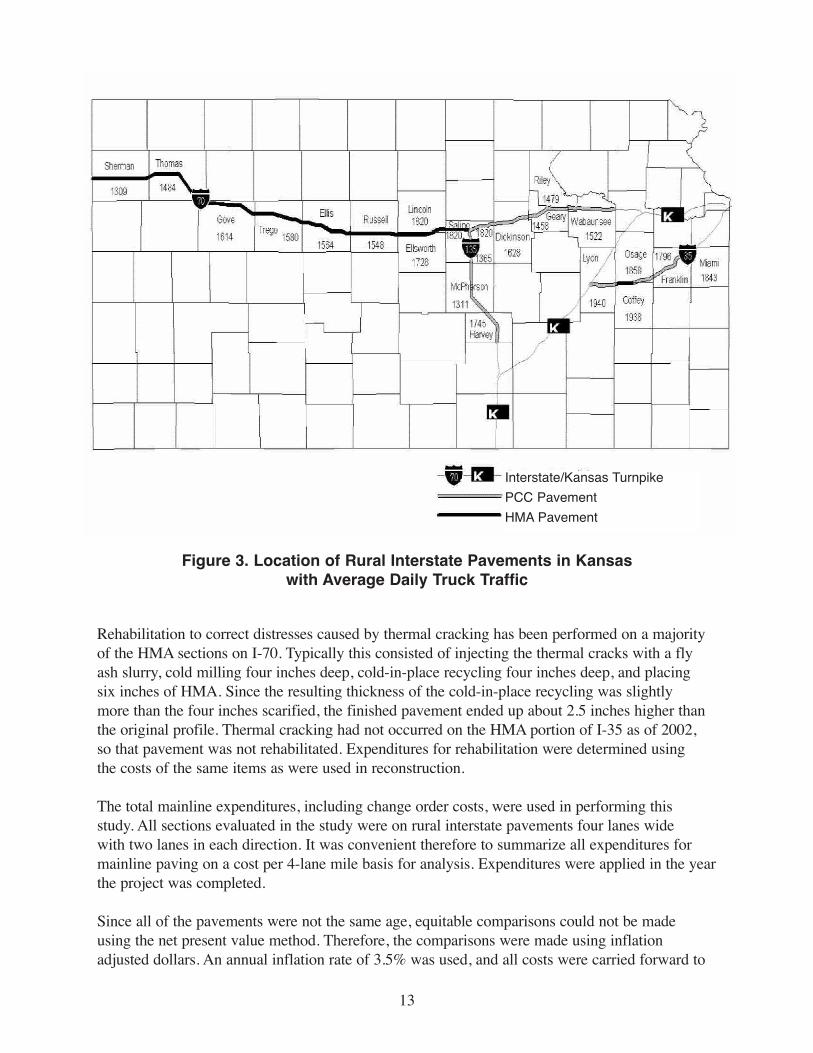
Figure 3. Location of Rural Interstate Pavements in Kansas with Average Daily Truck Traffic
Interstate/Kansas TurnpikePCC PavementHMA Pavement
Rehabilitation to correct distresses caused by thermal cracking has been performed on a majorityof the HMA sections on I-70. Typically this consisted of injecting the thermal cracks with a flyash slurry, cold milling four inches deep, cold-in-place recycling four inches deep, and placing six inches of HMA. Since the resulting thickness of the cold-in-place recycling was slightly more than the four inches scarified, the finished pavement ended up about 2.5 inches higher thanthe original profile. Thermal cracking had not occurred on the HMA portion of I-35 as of 2002,so that pavement was not rehabilitated. Expenditures for rehabilitation were determined usingthe costs of the same items as were used in reconstruction.
The total mainline expenditures, including change order costs, were used in performing this study. All sections evaluated in the study were on rural interstate pavements four lanes widewith two lanes in each direction. It was convenient therefore to summarize all expenditures formainline paving on a cost per 4-lane mile basis for analysis. Expenditures were applied in the yearthe project was completed.
Since all of the pavements were not the same age, equitable comparisons could not be made using the net present value method. Therefore, the comparisons were made using inflation adjusted dollars. An annual inflation rate of 3.5% was used, and all costs were carried forward to

14
2001 and referred to as "2001 dollars." This inflation rate was obtained using guidance from theFHWA's Publication No.FHWA-SA-98-079, Life-Cycle Cost Analysis in Pavement Design. TheFHWA recommends a discount rate of 3% to 5% based on rates of return on 10-year Treasurynotes from 1991 to 1996. This same data indicates an inflation rate of 3% to 4% annually.
Table 2 shows the total costs per 4-lane mile in actual dollars and in 2001 dollars using a 3.5%inflation rate for I-35, I-135, and I-70. The 4-lane mile costs per county were determined bysumming the total costs of the sections in each county and dividing by the length in miles.
Table 2. Total Costs per 4-Lane MileKansas Rural Interstate Highways

15
I-35The pavement sections evaluated and compared on I-35 consist of 12.1 miles of HMA pavementin Coffey County and 35.5 miles of PCC pavement in the eastern half of Lyon County, theeastern part of Osage County, and the western half of Franklin County. The HMA pavement inCoffey County and the PCC pavement in Osage County and Franklin County were opened totraffic in 1973. The PCC pavement in Lyon County was opened to traffic in 1977. These are theonly sections of pavement on I-35 where a direct comparison of costs was believed to befeasible. Two other sections, 19.2 miles of PCC pavement in the eastern half of Franklin Countyand in Miami County, were opened to traffic in 1959 and it was felt that the 14-year difference inages was too great for direct comparison.
On I-35, the total costs in actual dollars for the HMA section (Coffey County) were $677,000per 4-lane mile. For the PCC sections the 4-lane mile total costs were $3,696,000 for the easternhalf of Lyon County, $1,604,000 for Osage County, and $2,490,000 for the western half ofFranklin County. When converted to 2001 dollars, the total cost per 4-lane mile for the HMAsection was $1,393,000. For the PCC sections, the 2001-dollar costs were $4,662,000 for theeastern half of Lyon County, $2,419,000 for Osage County, and $3,347,000 for the western halfof Franklin County.
I-135The PCC pavement sections evaluated on I-135 consisted of 15.6 miles in Harvey County (notincluding the 4.5-mile section in the town of Newton), 33.6 miles in McPherson County, and19.2 miles in Saline County. There were no HMA sections on I-135. Table 2 shows the totalcosts per 4-lane mile in actual dollars to be $1.53 million, $1.79 million, and $3.02 million forHarvey, McPherson, and Saline Counties, respectively. The costs in 2001 dollars for the samecounties are $2.20 million, $2.62 million, and $3.93 million.
Of the 68.4 miles of that original PCC pavement, 40.8 miles (60%) have been reconstructedusing PCC at a cost of $2.15 million per 4-lane mile ($2.26 million in 2001 dollars). Incomparison, another 19.4 miles of the original pavement was rehabilitated using rubblization andan asphalt overlay and had an average cost of $1.08 million per 4-lane mile ($1.32 million in2001 dollars). Only 8.2 miles of the original PCC pavement on these sections of I-135 have notbeen rehabilitated or reconstructed.
I-70The rural Interstate sections evaluated and compared on I-70 consisted of 249.7 miles of HMApavement and 95.1 miles of PCC pavement. The HMA sections were constructed between 1960and 1970, and the PCC sections were constructed between 1959 and 1965. Table 2 shows thetotal costs per 4-lane mile in actual dollars and in 2001 dollars using a 3.5% inflation rate.
All of the HMA sections on I-70, except Sherman County and Saline County, had total life-cyclecosts in 2001 dollars between $1.55 million and $1.98 million per 4-lane mile. The cost inSherman County was driven up partly because the western 27.4 miles (77.6%) of the pavementwere whitetopped and had a total cost in 2001 dollars of $2.52 million per 4-lane mile. Incontrast, the eastern-most 7.9 miles in Sherman County were rehabilitated using HMA and had atotal cost in 2001 dollars of $1.65 million per 4-lane mile. This resulted in an overall county costof $2.32 million per 4-lane mile in 2001 dollars. In Saline County, the two sections of HMA
16
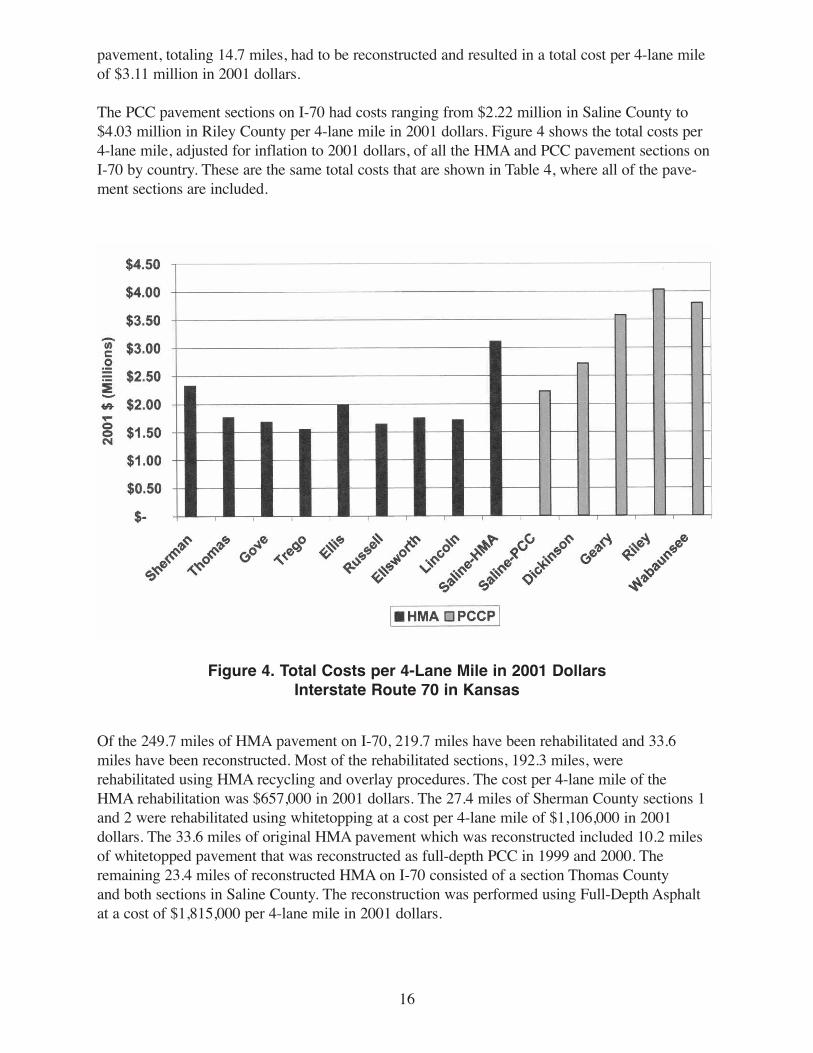
Of the 249.7 miles of HMA pavement on I-70, 219.7 miles have been rehabilitated and 33.6miles have been reconstructed. Most of the rehabilitated sections, 192.3 miles, were rehabilitated using HMA recycling and overlay procedures. The cost per 4-lane mile of the HMA rehabilitation was $657,000 in 2001 dollars. The 27.4 miles of Sherman County sections 1and 2 were rehabilitated using whitetopping at a cost per 4-lane mile of $1,106,000 in 2001 dollars. The 33.6 miles of original HMA pavement which was reconstructed included 10.2 milesof whitetopped pavement that was reconstructed as full-depth PCC in 1999 and 2000. Theremaining 23.4 miles of reconstructed HMA on I-70 consisted of a section Thomas County and both sections in Saline County. The reconstruction was performed using Full-Depth Asphaltat a cost of $1,815,000 per 4-lane mile in 2001 dollars.
pavement, totaling 14.7 miles, had to be reconstructed and resulted in a total cost per 4-lane mileof $3.11 million in 2001 dollars.
The PCC pavement sections on I-70 had costs ranging from $2.22 million in Saline County to$4.03 million in Riley County per 4-lane mile in 2001 dollars. Figure 4 shows the total costs per4-lane mile, adjusted for inflation to 2001 dollars, of all the HMA and PCC pavement sections onI-70 by country. These are the same total costs that are shown in Table 4, where all of the pave-ment sections are included.
Figure 4. Total Costs per 4-Lane Mile in 2001 DollarsInterstate Route 70 in Kansas

17
The average original construction cost for PCC pavement was $742,000 per 4-lane mile as compared to $576,000 per 4-lane mile for HMA pavement. From the 6th to the 15th year, averageannual expenditures were higher for HMA payment than for PCC pavement, due mainly to theplanned stage construction overlays placed between years 7 and 13 on I-70. The average annual
Of the 95.1 miles of PCC pavement on I-70, 52.3 miles (55%) have been reconstructed and noneof the remaining pavement has been rehabilitated. The average cost per 4-lane mile of the reconstruction was $2,103,000 in 2001 dollars, thus accounting for the higher life-cycle costs ofPCC pavement shown in Table 2 and Figure 4.
All SectionsThe average yearly cost per 4-lane mile for all the HMA and PCC pavement sections, by their age in years, was calculated using weighted averages of cost per mile for each of the analysissections. There were 24 HMA pavement analysis sections totaling 261.8 miles, and 32 PCC sections totaling 218.2 miles. Figure 5 shows the average life-cycle cost at any given age of HMA and PCC rural interstate pavements in Kansas. At approximately 15 years the costs areequal, but then they diverge, with PCC becoming more expensive with time. This shows theimportance of using an analysis period long enough to include at least one major rehabilitation orreconstruction for each type of pavement.
Figure 5. Average Life-Cycle Costs By Pavement Age,Adjusted for Inflation, of Rural Interstate Pavements in Kansas

18
expenditures during the next 27 years were $63,000 per 4-lane mile for PCC pavement ascompared to $26,000 per 4-lane mile for HMA pavement.
The performance lives of the two pavement types were very similar. The average service life inyears—or the time until 50% of the miles had undergone rehabilitation or reconstruction—were33 years for the HMA pavement sections and 34 years for the PCC sections. However, the costswere considerably different. Sixty-eight percent of the PCC pavement mileage studied wasreconstructed at an average cost of $2,037,000 per 4-lane mile, and 9% was rehabilitated at anaverage cost of $1,321,000 per 4-lane mile. Nine percent of the HMA pavement mileage studiedwas reconstructed at an average cost of $1,815,000, and 71% was rehabilitated using the HMArecycling and overlay procedure at an average cost of $657,000 per 4-lane mile. The 10% ofHMA pavement mileage rehabilitated using whitetopping cost an average of $1,106,000 per 4-lane mile.
The performance of a realistic life-cycle cost analysis requires the input of data based onanticipated pavement service life. This information has not always been available. The FHWArecommends using reasonable assumptions of pavement life based on past performance and costhistories. This study determined pavement lives and cost data on rural interstate pavements inKansas that provide recommendations for input parameters for future life-cycle cost analyses.
Kansas Study ConclusionsBased on the results of this study, the following conclusions are warranted.1. For the rural interstate pavements evaluated, total life-cycle costs in actual dollars and 2001
dollars were less for HMA pavements than for PCC pavements.2. Original construction costs per 4-lane mile in 2001 dollars were less for HMA pavements
than for PCC pavements: $576,000 as compared to $742,000.3. From the 6th to the 15th year of the pavement's life, annual maintenance costs were slightly
higher for HMA pavements, resulting in practically equal life-cycle costs at the end of thattime. Annual expenditures over the next 25 years, however, were 2.4 times higher for PCCpavements than for HMA pavements: $63,000 per 4-lane mile for PCC as compared to$26,000 for HMA.
4. HMA and PCC pavements had similar average service lives until rehabilitation orreconstruction, 33 and 34 years for HMA and PCC, respectively. Reconstruction costs forPCC pavements averaged $2.04 million per 4-lane mile compared to rehabilitation costs of$0.66 million per 4-lane mile for HMA pavements.
Kansas Study RecommendationsBased on the results and limitations of this study, the following recommendations are warrantedfor pavement performance and treatment timing in life-cycle cost analysis for locations withsimilar materials and environment to Kansas. These recommendations are shown in Table 3.

19
*Thermal cracked HMA pavements only.Table 3. Recommended Pavement Performance Input Parameters
Used for Life-Cycle Cost Analysis in Kansas
Both pavement types were originally constructed using the best available materials, methods, andprocedures available at the time of construction. The major reported modes of pavement distresswere thermal cracking for HMA pavements and joint deterioration due to D-cracking, faulting,and spalling for PCC pavements. These distress mechanisms have been addressed by changes inmaterial specifications, design procedures, and construction methods. The recommendationsshown in Table 3 are based on past performance and should be considered conservative valuesfor use in life-cycle cost analysis.
Iowa Study
The Iowa research study (1) was conducted in 1998 by the Asphalt Paving Association of Iowawith the assistance of the Center for Transportation Research and Education. The objective ofthe study was to compare the performance of adjacent portland cement concrete (PCC) and hotmix asphalt (HMA) interstate pavement sections in Iowa using life-cycle cost analysisprocedures. The decision to study pavements on the Interstate System was based on theknowledge that they are all typically designed, constructed, and maintained to similar standards,and that good original construction, maintenance, and rehabilitation records are kept.
Sections of PCC and HMA pavement on Interstate Route 80 in three counties between DesMoines and Iowa City were selected for analysis in this study. These sections, in Jasper,Poweshiek, and Iowa Counties, were selected because original construction of the PCC andHMA projects was completed during the same time period and the projects were adjacent to eachother, thus assuring similar traffic loads. Care was taken not to select sections for study thatwould favor one pavement type over another.
20
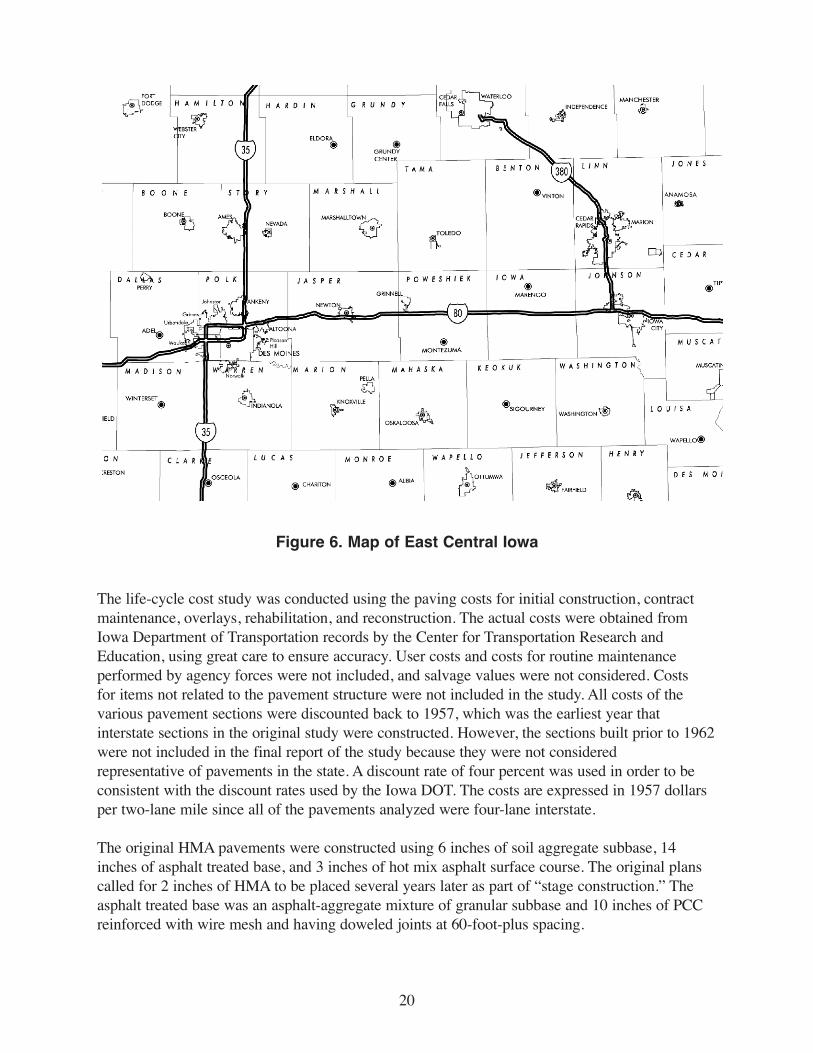
The life-cycle cost study was conducted using the paving costs for initial construction, contractmaintenance, overlays, rehabilitation, and reconstruction. The actual costs were obtained fromIowa Department of Transportation records by the Center for Transportation Research andEducation, using great care to ensure accuracy. User costs and costs for routine maintenance performed by agency forces were not included, and salvage values were not considered. Costsfor items not related to the pavement structure were not included in the study. All costs of the various pavement sections were discounted back to 1957, which was the earliest year thatinterstate sections in the original study were constructed. However, the sections built prior to 1962were not included in the final report of the study because they were not consideredrepresentative of pavements in the state. A discount rate of four percent was used in order to beconsistent with the discount rates used by the Iowa DOT. The costs are expressed in 1957 dollarsper two-lane mile since all of the pavements analyzed were four-lane interstate.
The original HMA pavements were constructed using 6 inches of soil aggregate subbase, 14 inches of asphalt treated base, and 3 inches of hot mix asphalt surface course. The original planscalled for 2 inches of HMA to be placed several years later as part of “stage construction.” Theasphalt treated base was an asphalt-aggregate mixture of granular subbase and 10 inches of PCCreinforced with wire mesh and having doweled joints at 60-foot-plus spacing.
Figure 6. Map of East Central Iowa
21
Traffic volumes were approximately the same in all sections of this study. The traffic at the timeof the study was about 26,000 vehicles per day with 36 percent trucks. That equates to about 1.7million equivalent single axle loads (ESALs) per year.
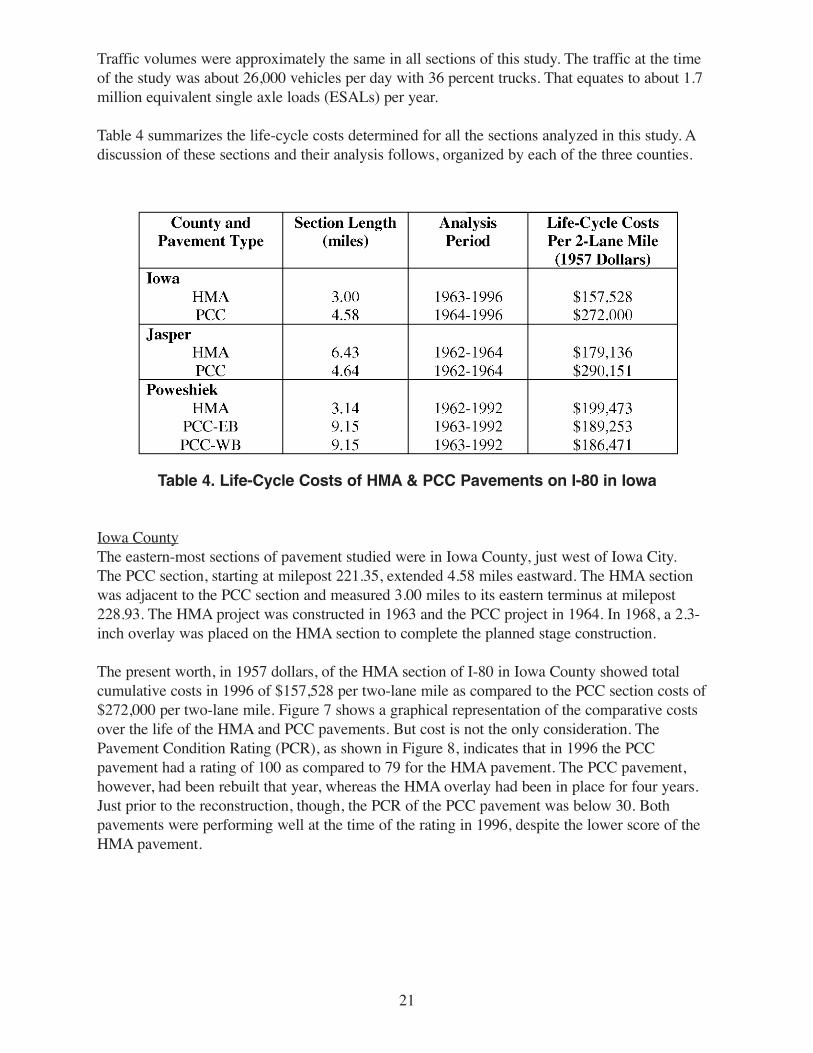
Table 4 summarizes the life-cycle costs determined for all the sections analyzed in this study. Adiscussion of these sections and their analysis follows, organized by each of the three counties.
Table 4. Life-Cycle Costs of HMA & PCC Pavements on I-80 in Iowa
Iowa CountyThe eastern-most sections of pavement studied were in Iowa County, just west of Iowa City.The PCC section, starting at milepost 221.35, extended 4.58 miles eastward. The HMA sectionwas adjacent to the PCC section and measured 3.00 miles to its eastern terminus at milepost228.93. The HMA project was constructed in 1963 and the PCC project in 1964. In 1968, a 2.3-inch overlay was placed on the HMA section to complete the planned stage construction.
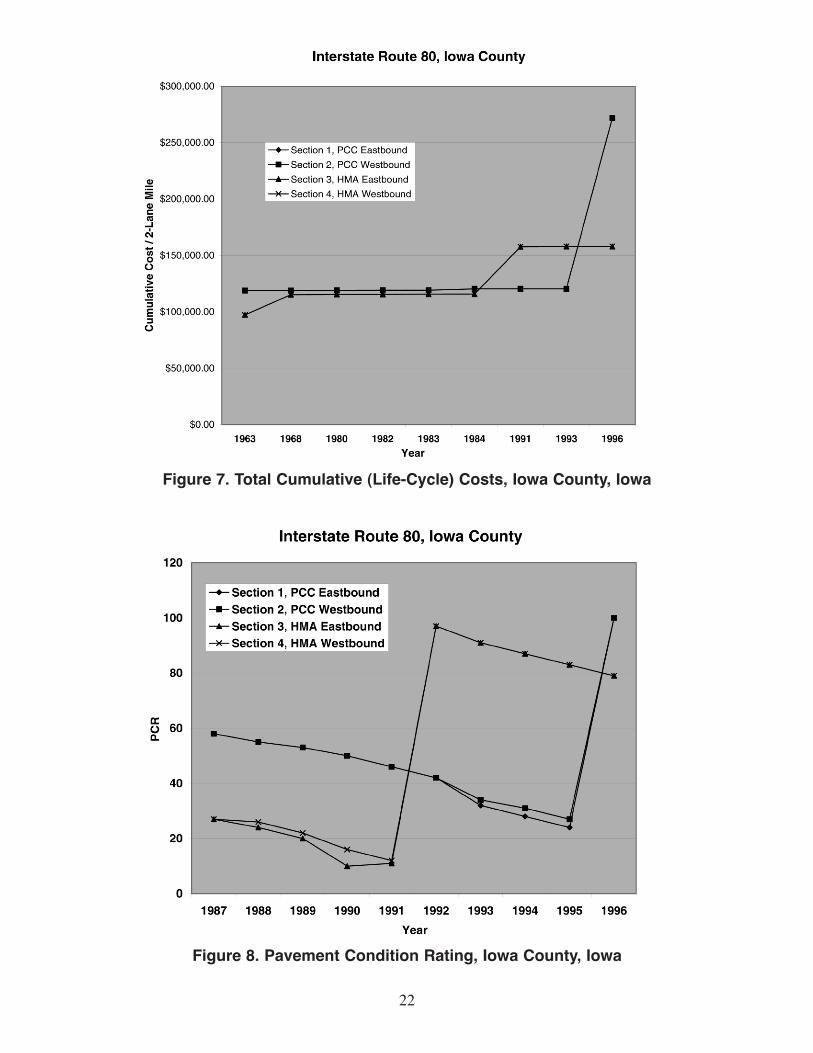
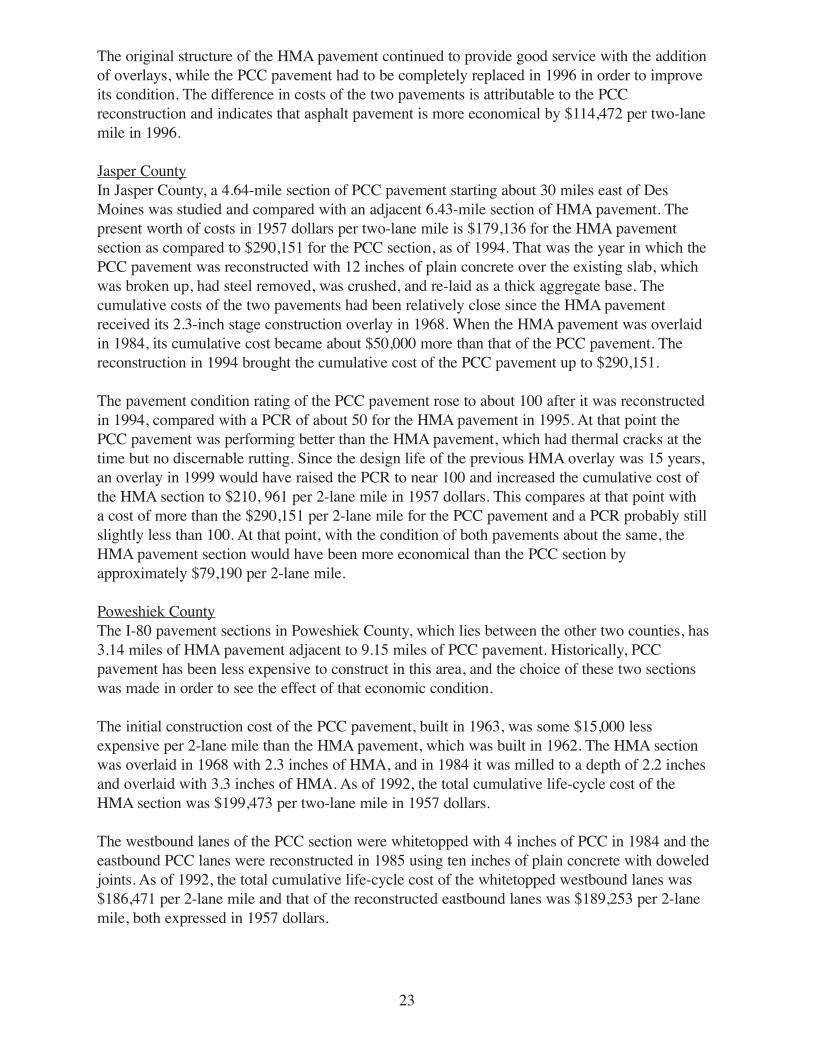
The present worth, in 1957 dollars, of the HMA section of I-80 in Iowa County showed totalcumulative costs in 1996 of $157,528 per two-lane mile as compared to the PCC section costs of$272,000 per two-lane mile. Figure 7 shows a graphical representation of the comparative costsover the life of the HMA and PCC pavements. But cost is not the only consideration. ThePavement Condition Rating (PCR), as shown in Figure 8, indicates that in 1996 the PCCpavement had a rating of 100 as compared to 79 for the HMA pavement. The PCC pavement,however, had been rebuilt that year, whereas the HMA overlay had been in place for four years.Just prior to the reconstruction, though, the PCR of the PCC pavement was below 30. Bothpavements were performing well at the time of the rating in 1996, despite the lower score of theHMA pavement.
22
Figure 7. Total Cumulative (Life-Cycle) Costs, Iowa County, Iowa
Figure 8. Pavement Condition Rating, Iowa County, Iowa
23
The original structure of the HMA pavement continued to provide good service with the additionof overlays, while the PCC pavement had to be completely replaced in 1996 in order to improveits condition. The difference in costs of the two pavements is attributable to the PCCreconstruction and indicates that asphalt pavement is more economical by $114,472 per two-lanemile in 1996.
Jasper CountyIn Jasper County, a 4.64-mile section of PCC pavement starting about 30 miles east of DesMoines was studied and compared with an adjacent 6.43-mile section of HMA pavement. Thepresent worth of costs in 1957 dollars per two-lane mile is $179,136 for the HMA pavementsection as compared to $290,151 for the PCC section, as of 1994. That was the year in which thePCC pavement was reconstructed with 12 inches of plain concrete over the existing slab, whichwas broken up, had steel removed, was crushed, and re-laid as a thick aggregate base. Thecumulative costs of the two pavements had been relatively close since the HMA pavementreceived its 2.3-inch stage construction overlay in 1968. When the HMA pavement was overlaidin 1984, its cumulative cost became about $50,000 more than that of the PCC pavement. Thereconstruction in 1994 brought the cumulative cost of the PCC pavement up to $290,151.
The pavement condition rating of the PCC pavement rose to about 100 after it was reconstructedin 1994, compared with a PCR of about 50 for the HMA pavement in 1995. At that point thePCC pavement was performing better than the HMA pavement, which had thermal cracks at thetime but no discernable rutting. Since the design life of the previous HMA overlay was 15 years,an overlay in 1999 would have raised the PCR to near 100 and increased the cumulative cost ofthe HMA section to $210, 961 per 2-lane mile in 1957 dollars. This compares at that point witha cost of more than the $290,151 per 2-lane mile for the PCC pavement and a PCR probably stillslightly less than 100. At that point, with the condition of both pavements about the same, theHMA pavement section would have been more economical than the PCC section byapproximately $79,190 per 2-lane mile.
Poweshiek CountyThe I-80 pavement sections in Poweshiek County, which lies between the other two counties, has3.14 miles of HMA pavement adjacent to 9.15 miles of PCC pavement. Historically, PCCpavement has been less expensive to construct in this area, and the choice of these two sectionswas made in order to see the effect of that economic condition.
The initial construction cost of the PCC pavement, built in 1963, was some $15,000 lessexpensive per 2-lane mile than the HMA pavement, which was built in 1962. The HMA sectionwas overlaid in 1968 with 2.3 inches of HMA, and in 1984 it was milled to a depth of 2.2 inchesand overlaid with 3.3 inches of HMA. As of 1992, the total cumulative life-cycle cost of theHMA section was $199,473 per two-lane mile in 1957 dollars.
The westbound lanes of the PCC section were whitetopped with 4 inches of PCC in 1984 and theeastbound PCC lanes were reconstructed in 1985 using ten inches of plain concrete with doweledjoints. As of 1992, the total cumulative life-cycle cost of the whitetopped westbound lanes was$186,471 per 2-lane mile and that of the reconstructed eastbound lanes was $189,253 per 2-lanemile, both expressed in 1957 dollars.

24
The pavement condition of both PCC and HMA shows a gradual decline from 1987 to 1996.The westbound PCC lanes, which had been whitetopped, had a PCR of 76 in 1987, whereas thereconstructed eastbound lanes were rated at 96, for an average of 86. By 1996 the average PCRof the PCC section was 58, but the whitetopped section was showing signs of failure, with aconsiderable number of areas having to be patched due to severe cracking. The HMA sectionhad an average PCR of 89 in 1987 and decreased to an average of 47 by 1996.
The PCC showed a slightly lesser life-cycle cost as of 1992 and a slightly higher pavementcondition rating as of 1996. However, if the analysis period is extended to the next overlay ofthe HMA section and to the reconstruction of the whitetopped section, both of which shouldoccur near the same time, the cumulative life-cycle costs of the PCC pavement would certainlyexceed those of the HMA pavement and the PCR of the two pavements would be close to equal.
Iowa Study ConclusionsThe results of the study conducted on the PCC and HMA sections of I-80 indicate that: (1) theHMA sections provided more than 22 years of service without the need for reconstruction orrehabilitation; and (2) the HMA sections had a lesser rate of increase in cost for maintenancethan the adjoining PCC pavements.
In the cases studied, two of the HMA sections – in Iowa and Jasper Counties – were significantlymore economical in cumulative life-cycle costs than the adjacent PCC sections, and theyperformed as well or better than the PCC pavement. In Poweshiek County, the PCC pavementwas slightly more economical in life-cycle costs and the pavement performed slightly betterduring the time of the study. However, a longer analysis period to include the next overlay of theHMA pavement and the reconstruction of the PCC pavement would probably change the resultsin Poweshiek County to favor HMA pavement.
25
SUMMARY AND CONCLUSIONS
By comparing the HMA and PCC sections of pavement in the three life-cycle cost studiespresented here, a consistent and definitive result is obtained. The HMA pavement was overallmore economical than PCC pavement in both initial construction cost and life-cycle cost.
In Ohio, all five areas of Interstate pavement studied showed HMA pavement to be moreeconomical than PCC pavement. All of the compared pavements showed lower initialconstruction costs for HMA pavement than for PCC pavement by 10 to 25 percent. The netpresent value (NPV), or present worth (PW), of the pavement sections, calculated over analysisperiods ranging from 20 to 39 years, showed that the HMA pavement in each area was moreeconomical than its corresponding PCC pavement using both 2.5% and 5.0% discount rates. TheNPV of HMA pavement was generally 25 percent to 70 percent more economical than PCCpavement.
The Kansas study of 21 pavement sections on three Interstate routes, I-70, I-35, and I-135,showed that HMA was substantially more economical than PCC over the life of thesepavements. Direct comparisons between HMA and PCC pavements were made only on I-70 andI-35, since the three I-135 pavement sections were all PCC. While no direct comparisons weremade between HMA and PCC initial construction costs, the average initial construction cost ofnine HMA pavements on I-70 was approximately 25% lower than the average of the five PCCpavements on the same route. Even though the initial construction cost of the one HMA sectionon I-35 was about 10% higher than the average initial construction cost of the three PCCsections, the HMA pavement cost less over its life than the PCC pavement average. Life-cyclecosts were evaluated from total expenditures carried forward to the year 2001 using an inflationrate of 3.5%, and referred to as "2001 dollars per 4-lane mile" of pavement. On I-35, the totalexpenditures per 4-lane mile in 2001 dollars for the three PCC sections varied from $2.42 millionto $4.66 million, while the HMA section had a total cost of $1.39 million. On I-70, the totalexpenditures per 4-lane mile in 2001 dollars for the five PCC sections ranged from $2.22 millionto $4.03 million and averaged $3.27 million, as compared to the nine HMA sections, whichranged from $1.55 million to $3.11 million and averaged $1.94 million.
The Iowa study evaluated an area in each of three counties along I-80, each with one HMA andone PCC section. Two of the HMA sections were substantially more economical in life-cyclecosts than the corresponding PCC section, and in the other county the PCC section was slightlymore economical than the HMA section. The life-cycle costs were calculated from total costsover the analysis period and discounted at a rate of 4% back to 1957. The costs are expressed as"1957 dollars per 2-lane mile" of pavement. In Iowa County, the HMA pavement section wasmore economical than the PCC section by 42% as of 1996. In Jasper County, the HMA sectioncost 62% less than the PCC section as of 1994, the year the PCC section was reconstructed. InPoweshiek County, the life-cycle cost of the HMA section was 6% more than that of the PCCsection as of 1992.
From the information and results shown in these three studies based on actual costs ofconstructing, maintaining, rehabilitating, and reconstructing interstate pavements in three states,it can be seen that hot mix asphalt pavement provides more cost-effective pavement withcomparable performance when compared to portland cement concrete pavement.

26
REFERENCES
1. Asphalt Paving Association of Iowa (1998) Iowa Interstates: A Look at Performance andCosts, Ames, Iowa
2. Cross, Stephen A. and Robert L. Parsons (2002) Evaluation of Expenditures on RuralInterstate Pavements in Kansas, Executive Summary, Kansas University Transportation Center, University of Kansas, Lawrence
3. Federal Highway Administration (1998) Life-Cycle Cost Analysis in Pavement Design—Interim Technical Bulletin, Publication No. FHWA-SA-98-079, Washington, DC
4. Flexible Pavements of Ohio (2001) Ohio Asphalt Interstates are Long-Lasting and Economical (Prepared for the Asphalt Pavement Alliance), Columbus, Ohio
5. Gibboney, Willis B. (1995) Flexible and Rigid Pavement Costs on the Ohio InterstateHighway System, Westerville, Ohio
6. Hogrefe, Raymond H. (2000) A Look at Actual Life Cycle Costs on Iowa's Interstates, SiouxCity, Iowa

Pavement Life Cycle Cost StudiesUsing Actual Cost Data, A SynthesisFinal ReportFEBRUARY 2005
1 (877) APA-0077www.asphaltalliance.com
Report No. 5672-2/1 IM023
Related Documents