Expanding an accelerating access to tuberculosis diagnostics and laboratory services 2 nd meeting of the Global Laboratory Initiative, Veyrier-du-Lac Scaling up management and control of multidrug resistant TB – what will it take? Paul Nunn, WHO, Geneva

Welcome message from author
This document is posted to help you gain knowledge. Please leave a comment to let me know what you think about it! Share it to your friends and learn new things together.
Transcript
Expanding an accelerating access to tuberculosis diagnostics andlaboratory services
2nd meeting of the Global Laboratory Initiative, Veyrier-du-Lac
Scaling up management and control of multidrug resistant TB – what will it take?
Paul Nunn, WHO, Geneva
� Scaling up projections of the Global Plan to Stop TB, 2006-2015
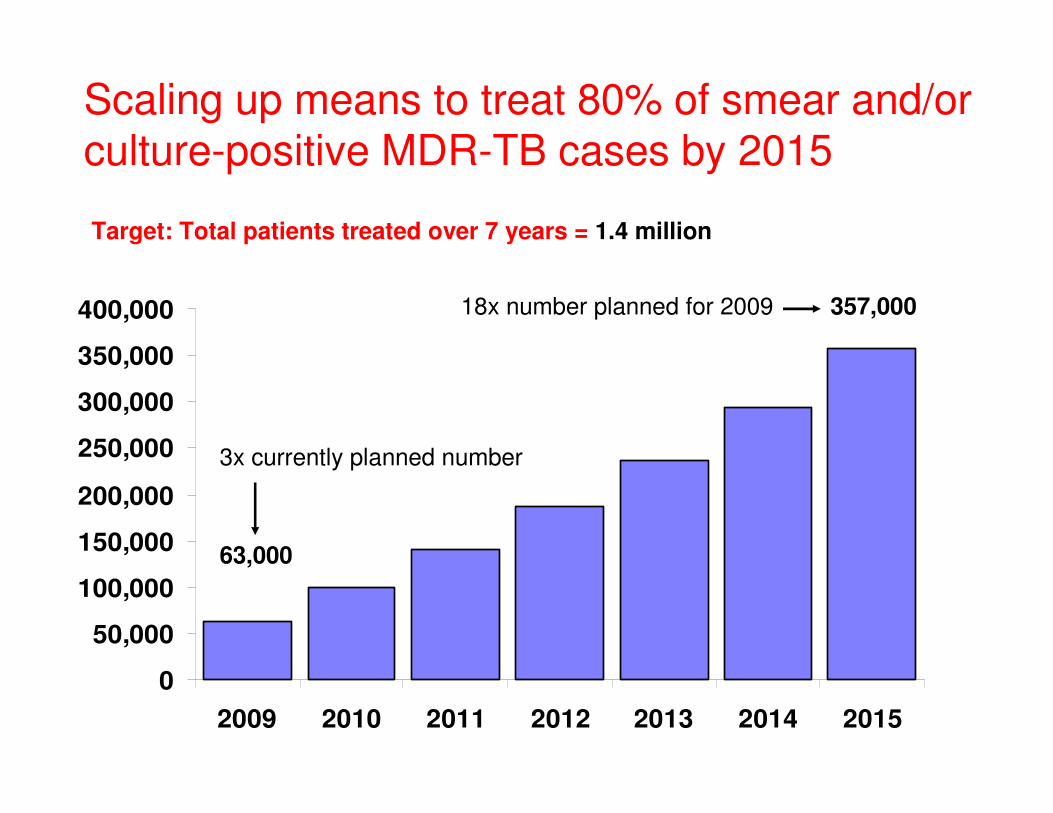
Scaling up means to treat 80% of smear and/or culture-positive MDR-TB cases by 2015
0
50,000
100,000
150,000
200,000
250,000
300,000
350,000
400,000
2009 2010 2011 2012 2013 2014 2015
357,000
63,000
Target: Total patients treated over 7 years = 1.4 million
3x currently planned number
18x number planned for 2009
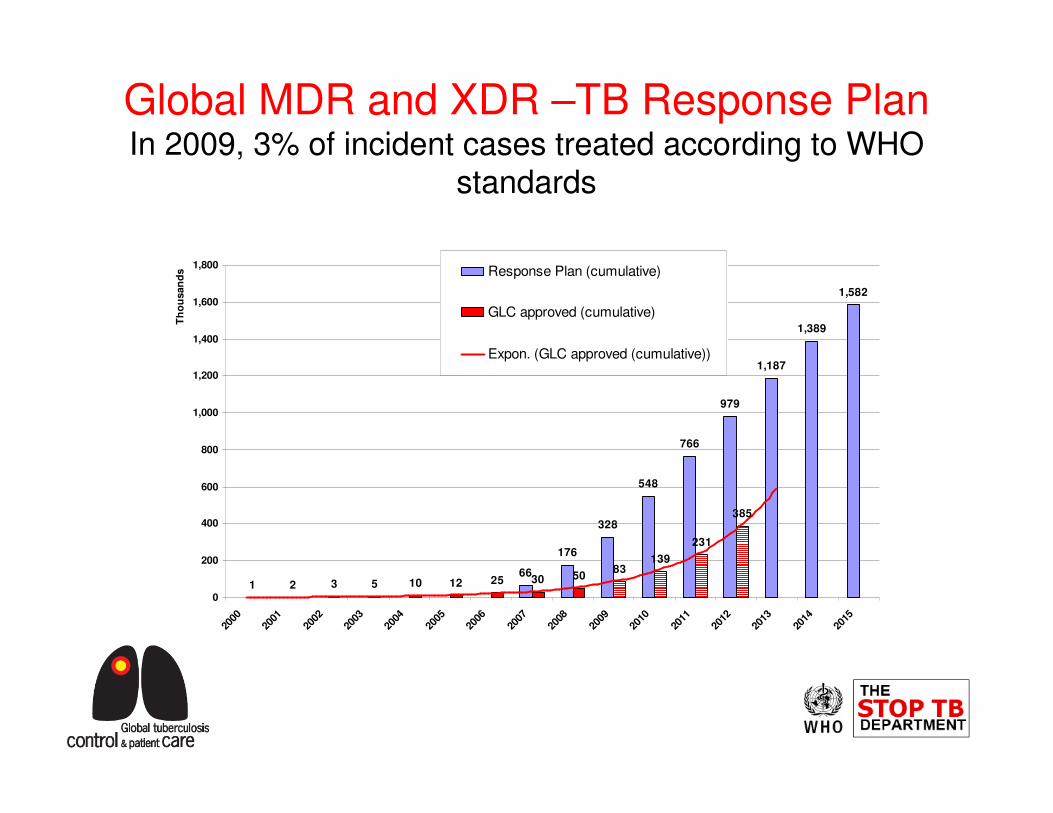
Global MDR and XDR –TB Response PlanIn 2009, 3% of incident cases treated according to WHO
standards
66
176
328
548
766
979
1,187
1,389
1,582
1 2 3 5 10 12 25 30 5083
139
231
385
0
200
400
600
800
1,000
1,200
1,400
1,600
1,800
2000
2001
2002
2003
2004
2005
2006
2007
2008
2009
2010
2011
2012
2013
2014
2015
Th
ou
san
ds Response Plan (cumulative)
GLC approved (cumulative)
Expon. (GLC approved (cumulative))
What will it take?
� Money
� Greatly strengthened laboratories with new tools
� Infection control
� Coordination
� Global Plan projections of funding required for
MDR-TB, 2009–2015
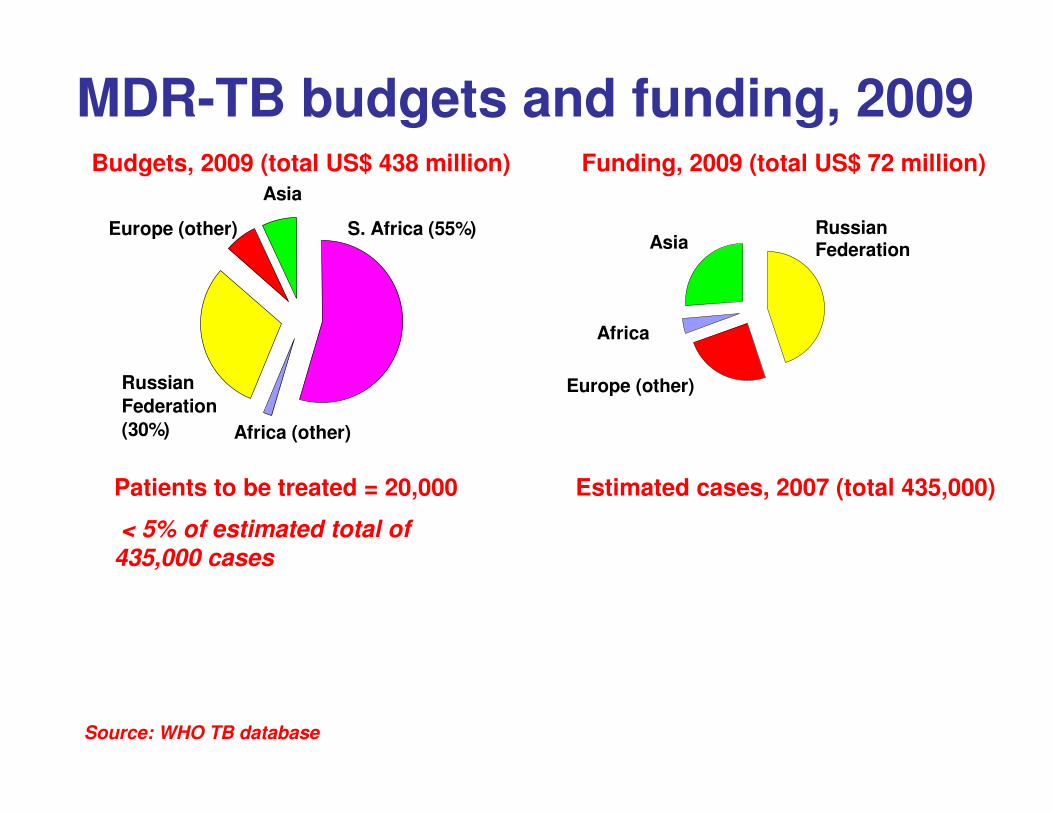
S. Africa (55%)
Africa (other)
Russian
Federation
(30%)
Europe (other)
Asia
Budgets, 2009 (total US$ 438 million) Funding, 2009 (total US$ 72 million)
MDR-TB budgets and funding, 2009
Patients to be treated = 20,000
< 5% of estimated total of
435,000 cases
Estimated cases, 2007 (total 435,000)
Russian FederationAsia
Africa
Europe (other)
Source: WHO TB database
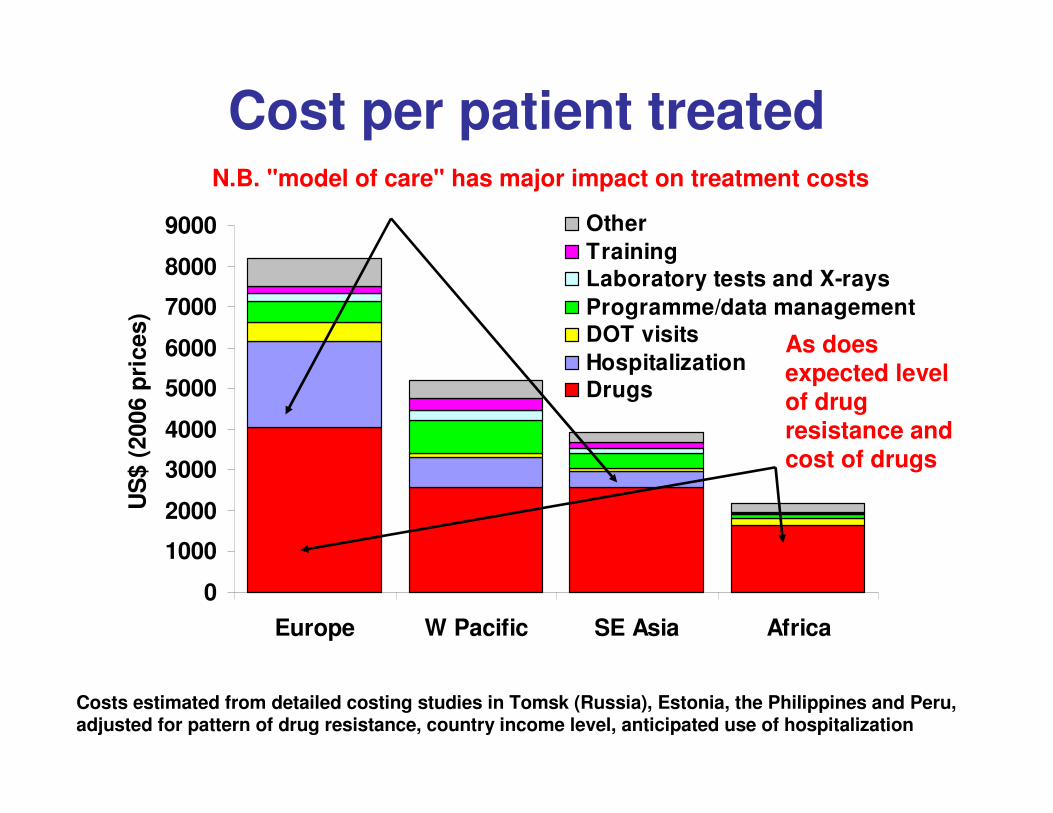
Cost per patient treatedN.B. "model of care" has major impact on treatment costs
Costs estimated from detailed costing studies in Tomsk (Russia), Estonia, the Philippines and Peru, adjusted for pattern of drug resistance, country income level, anticipated use of hospitalization
0
1000
2000
3000
4000
5000
6000
7000
8000
9000
Europe W Pacific SE Asia Africa
US
$ (
200
6 p
ric
es)
Other
TrainingLaboratory tests and X-rays
Programme/data managementDOT visits
HospitalizationDrugs
As does expected level of drug resistance and cost of drugs
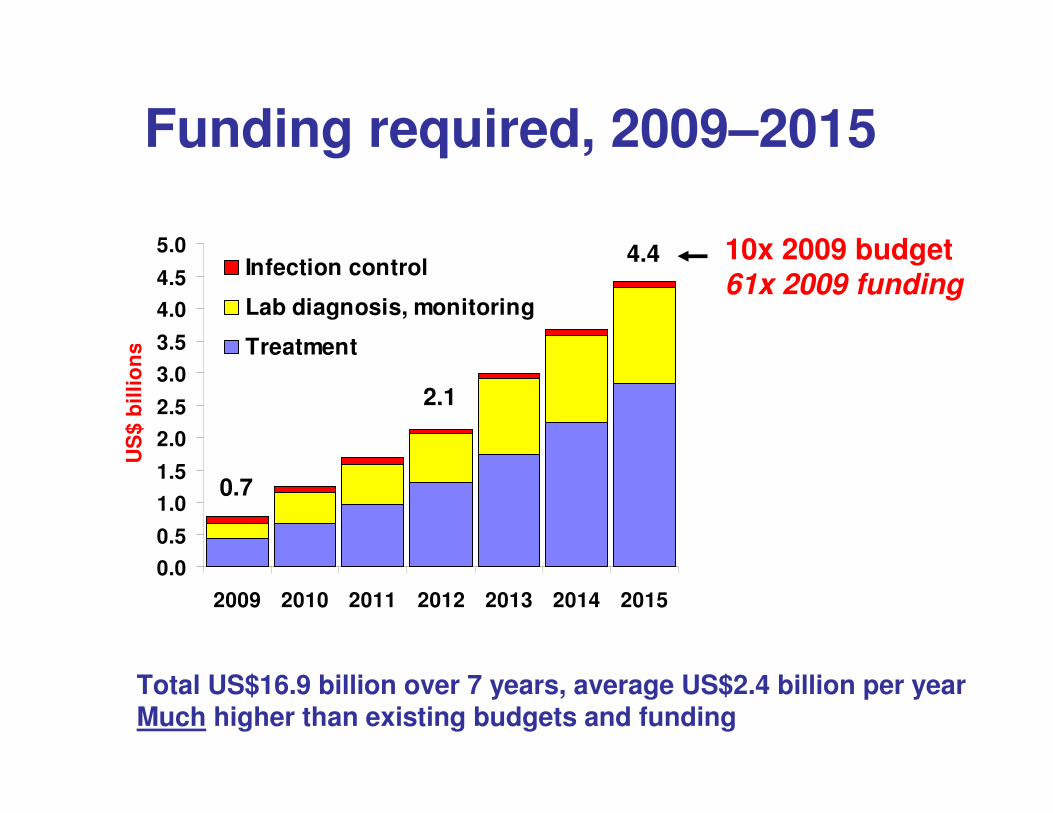
Funding required, 2009–2015
Total US$16.9 billion over 7 years, average US$2.4 billion per yearMuch higher than existing budgets and funding
10x 2009 budget61x 2009 funding
0.0
0.5
1.0
1.5
2.0
2.5
3.0
3.5
4.0
4.5
5.0
2009 2010 2011 2012 2013 2014 2015
US
$ b
illi
on
s
Infection control
Lab diagnosis, monitoring
Treatment
4.4
2.1
0.7
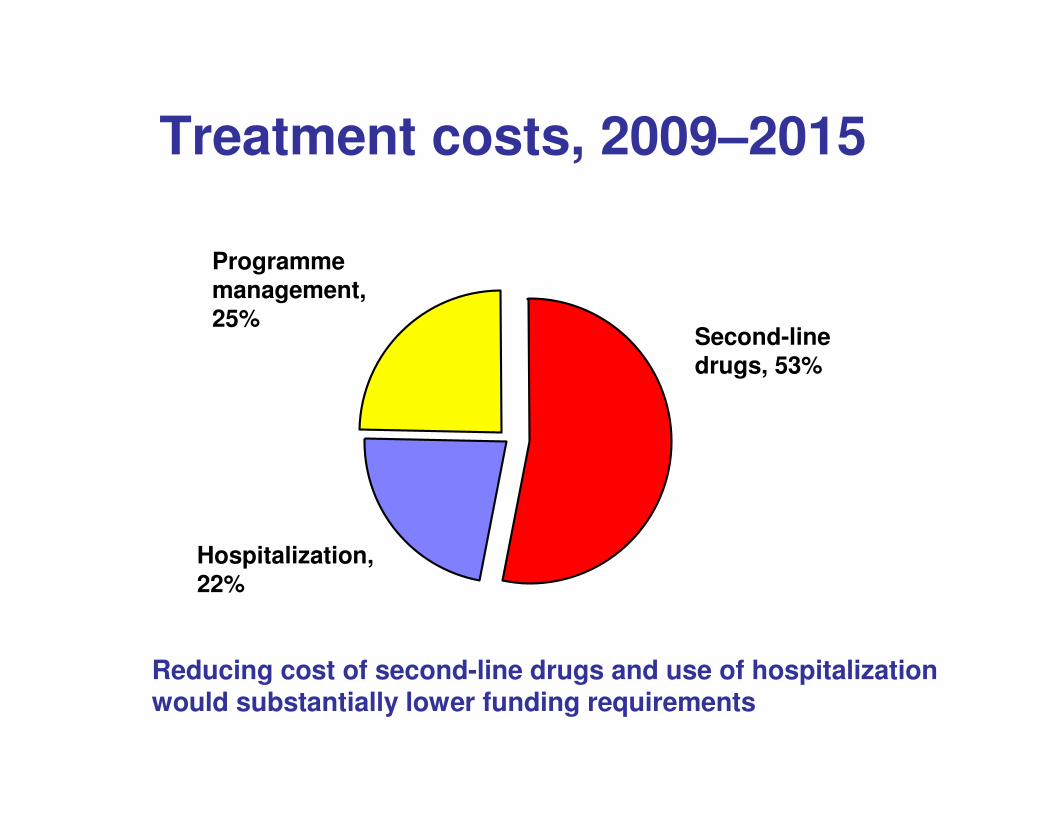
Treatment costs, 2009–2015
Programme management, 25%
Second-line drugs, 53%
Hospitalization, 22%
Reducing cost of second-line drugs and use of hospitalization would substantially lower funding requirements
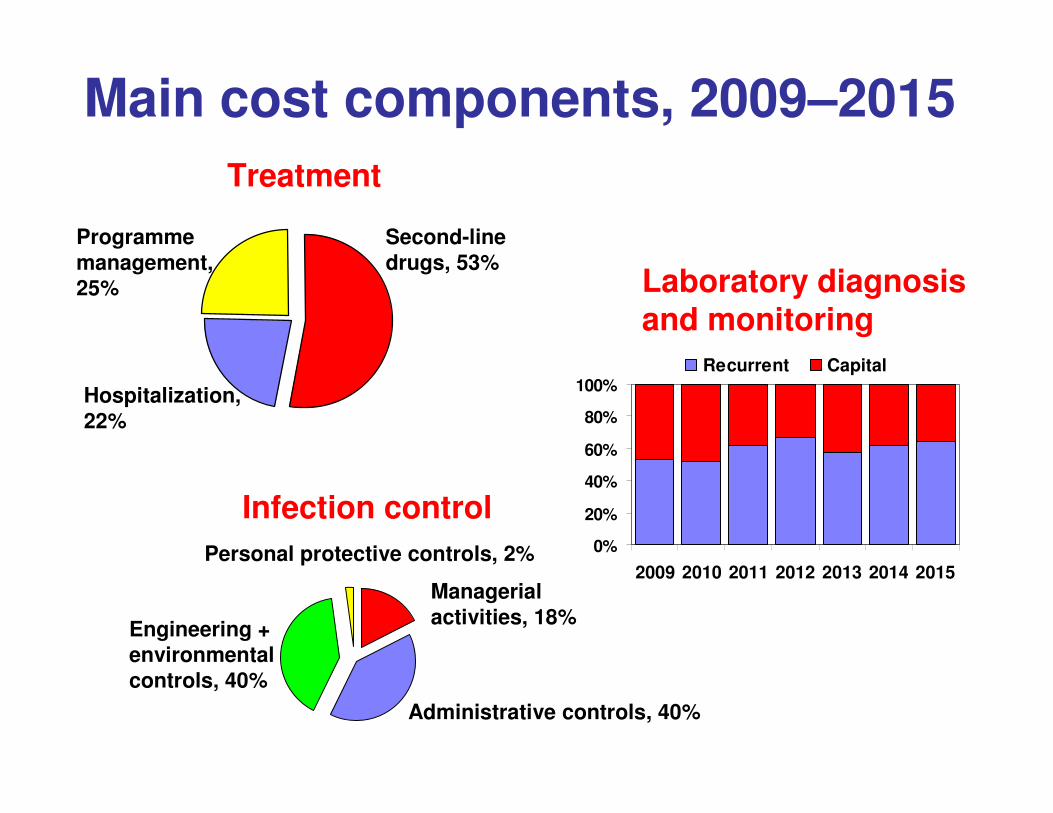
Main cost components, 2009–2015
Personal protective controls, 2%
Treatment
Laboratory diagnosis and monitoring
Infection control0%
20%
40%
60%
80%
100%
2009 2010 2011 2012 2013 2014 2015
Recurrent Capital
Managerial activities, 18%
Administrative controls, 40%
Engineering + environmental controls, 40%
Programme management, 25%
Second-line drugs, 53%
Hospitalization, 22%
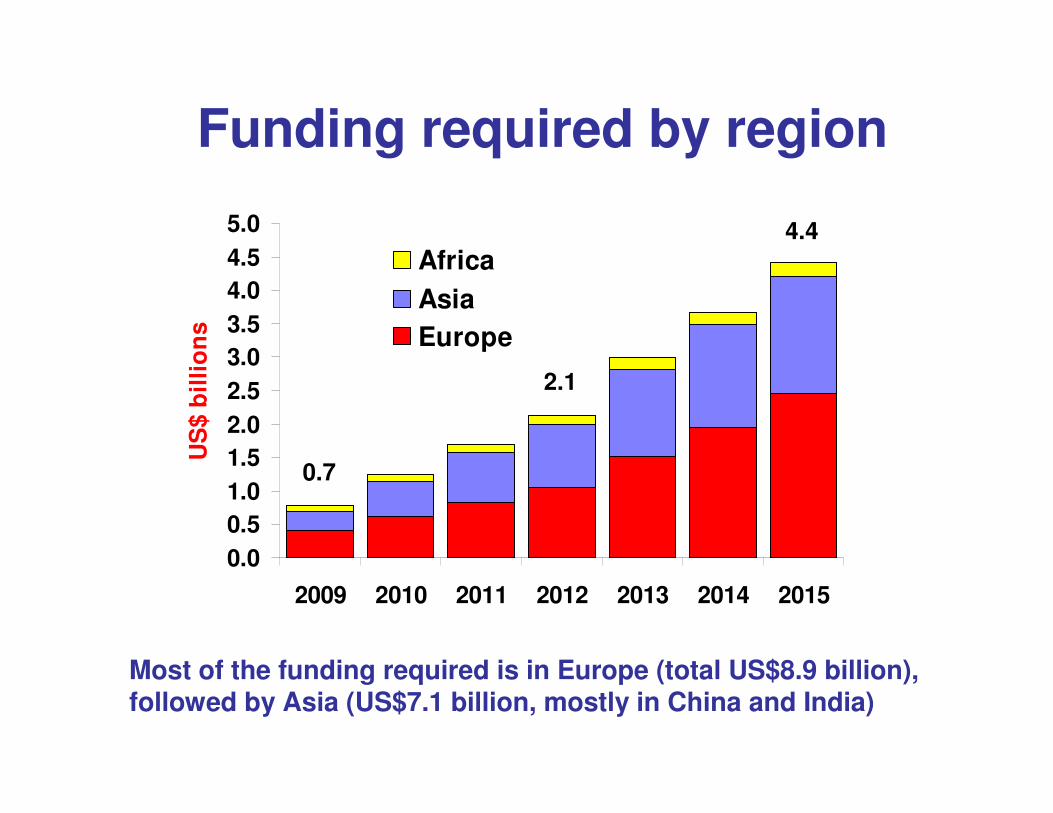
Funding required by region
Most of the funding required is in Europe (total US$8.9 billion), followed by Asia (US$7.1 billion, mostly in China and India)
0.0
0.5
1.0
1.5
2.0
2.5
3.0
3.5
4.0
4.5
5.0
2009 2010 2011 2012 2013 2014 2015
US
$ b
illi
on
s
Africa
Asia
Europe
4.4
2.1
0.7
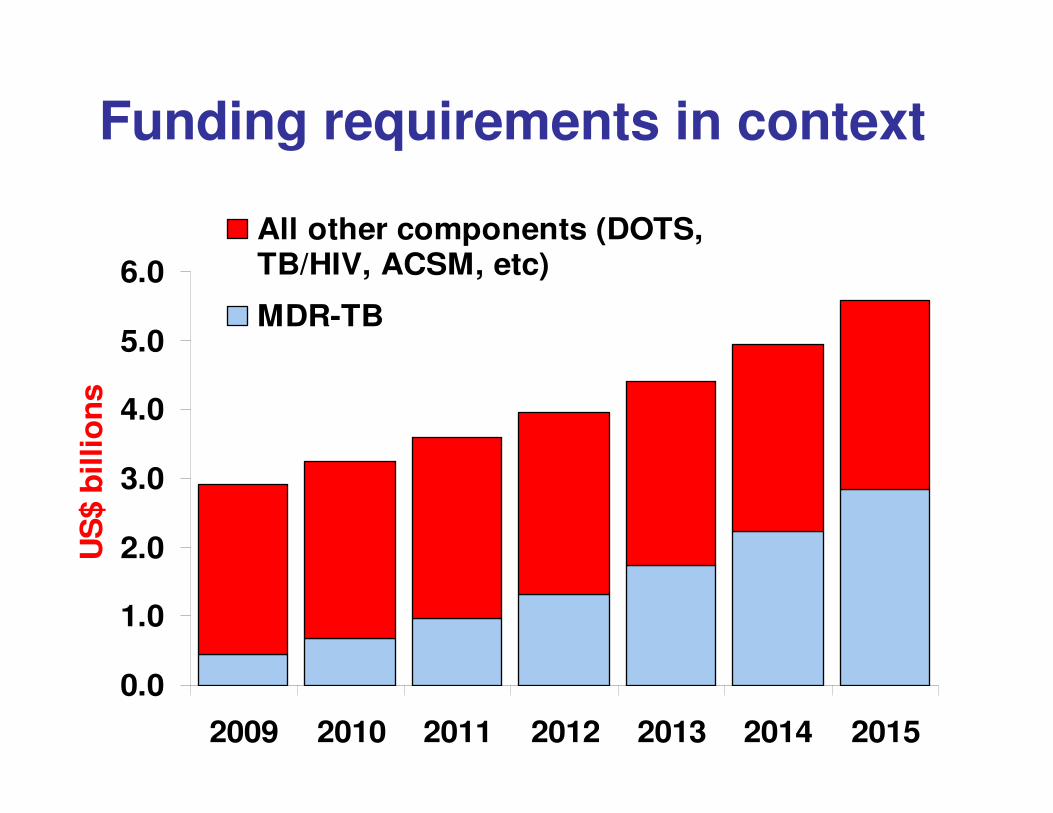
Funding requirements in context
0.0
1.0
2.0
3.0
4.0
5.0
6.0
2009 2010 2011 2012 2013 2014 2015
US
$ b
illio
ns
All other components (DOTS,TB/HIV, ACSM, etc)
MDR-TB
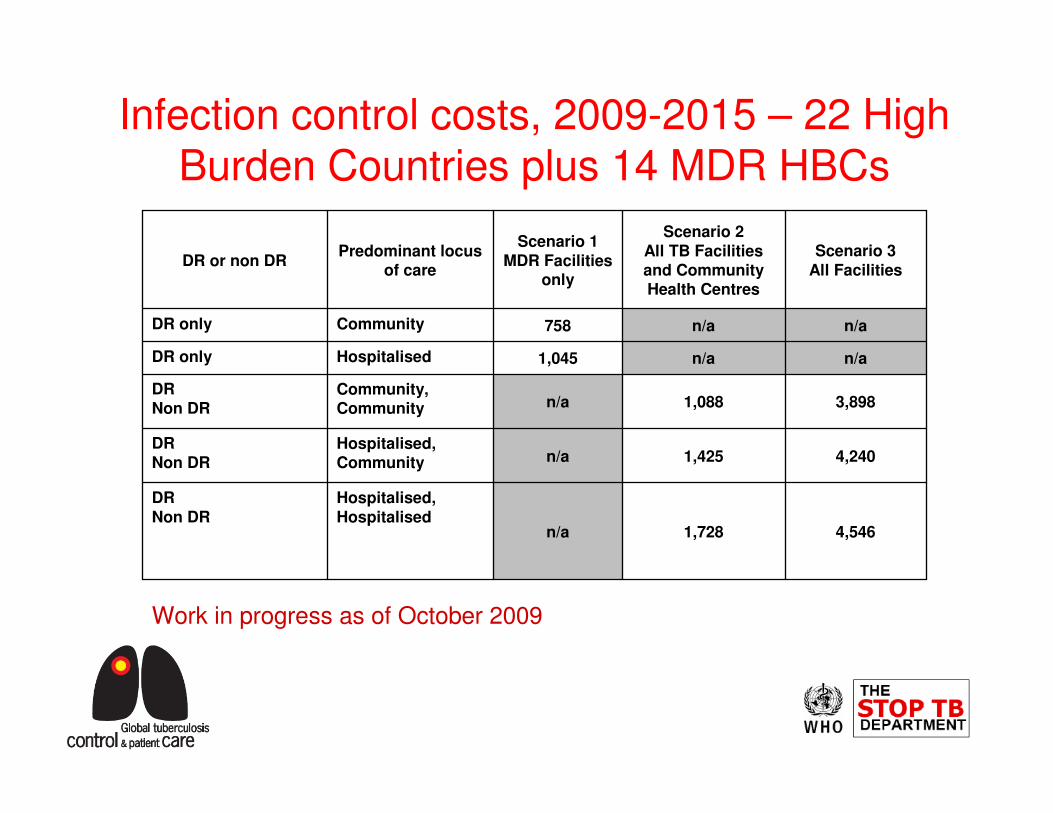
4,5461,728n/a
Hospitalised,Hospitalised
DRNon DR
4,2401,425n/aHospitalised, Community
DRNon DR
3,8981,088n/aCommunity, Community
DRNon DR
n/an/a1,045HospitalisedDR only
n/an/a758CommunityDR only
Scenario 3All Facilities
Scenario 2All TB Facilities and Community Health Centres
Scenario 1MDR Facilities
only
Predominant locus of care
DR or non DR
Infection control costs, 2009-2015 – 22 High Burden Countries plus 14 MDR HBCs
Work in progress as of October 2009
� How can the required funding be mobilized?
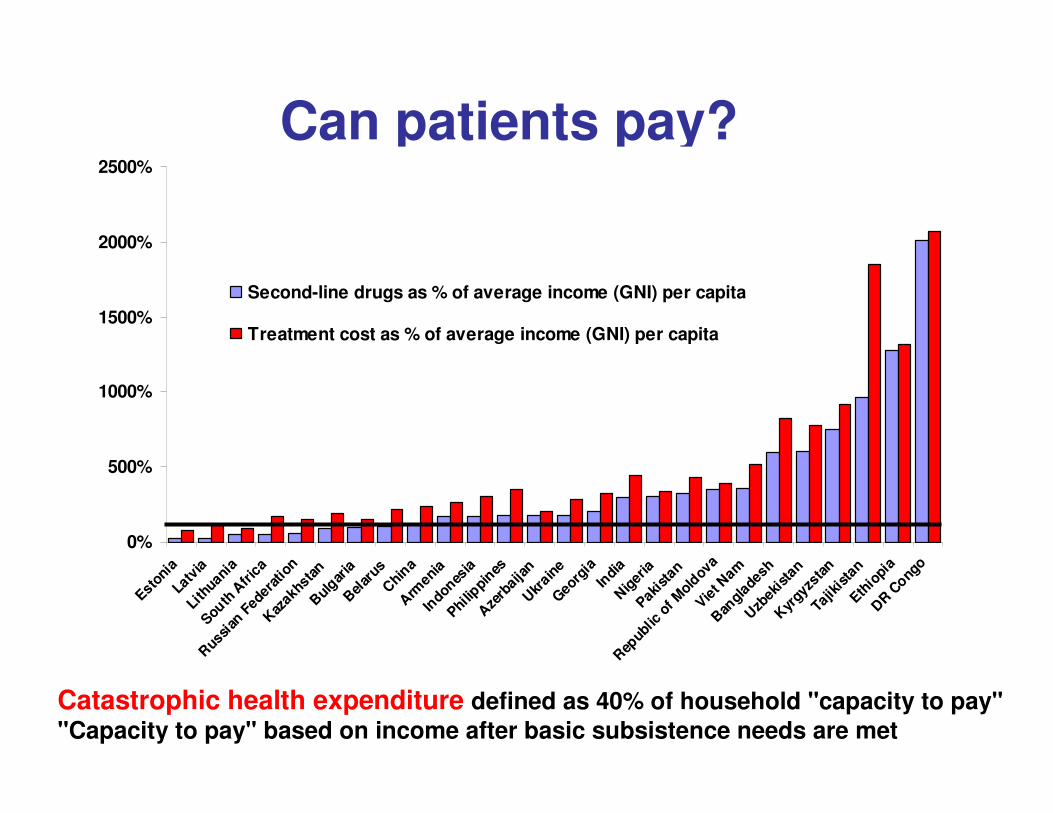
Can patients pay?
Catastrophic health expenditure defined as 40% of household "capacity to pay""Capacity to pay" based on income after basic subsistence needs are met
0%
500%
1000%
1500%
2000%
2500%
Estoni
aLa
tvia
Lith
uania
South
Afr
ica
Rus
sian
Fed
erat
ion
Kaz
akhs
tan
Bul
garia
Bel
arus
Chi
naA
rmen
iaIn
dones
iaPhi
lippi
nesA
zerb
aija
nU
krain
eG
eorg
iaIn
dia
Nig
eria
Pakis
tan
Rep
ublic
of M
oldov
aVie
t Nam
Ban
glad
esh
Uzb
ekis
tan
Kyr
gyzs
tan
Tajik
ista
nEth
iopi
aD
R Cong
o
Second-line drugs as % of average income (GNI) per capita
Treatment cost as % of average income (GNI) per capita
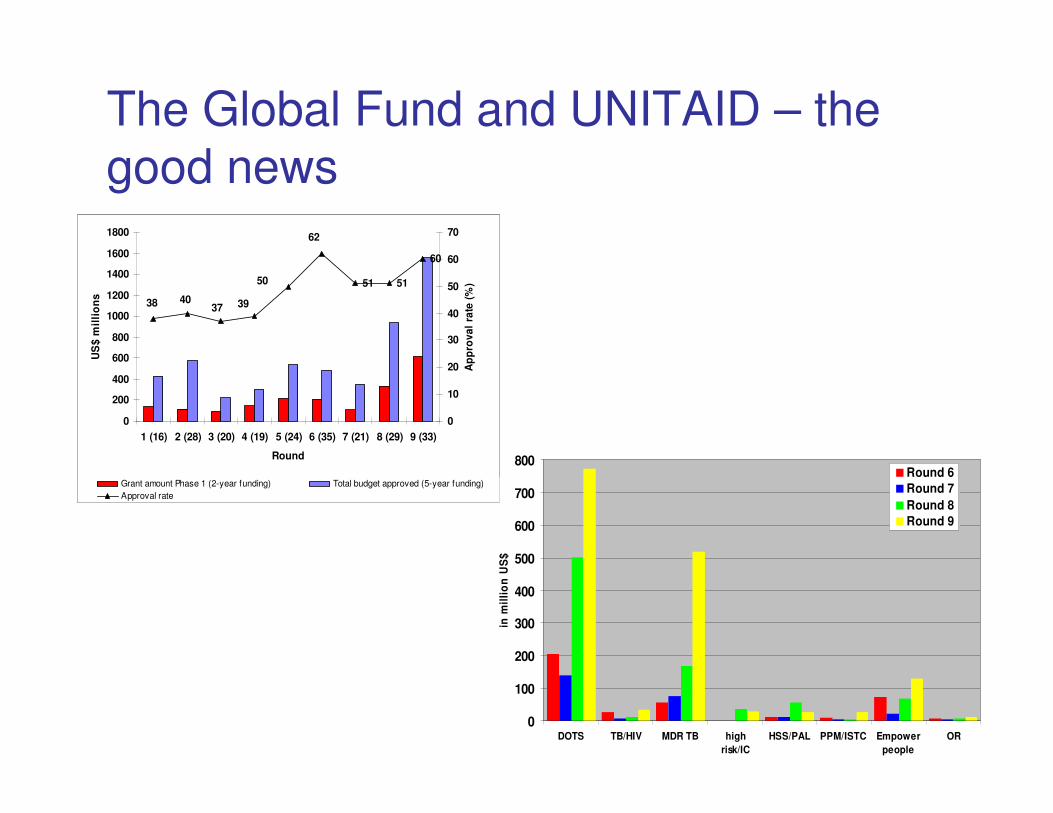
The Global Fund and UNITAID – the
good news
51 51
60
38 4037 39
50
62
0
200
400
600
800
1000
1200
1400
1600
1800
1 (16) 2 (28) 3 (20) 4 (19) 5 (24) 6 (35) 7 (21) 8 (29) 9 (33)
Round
US
$ m
illi
on
s
0
10
20
30
40
50
60
70
Ap
pro
va
l ra
te (
%)
Grant amount Phase 1 (2-year funding) Total budget approved (5-year funding)
Approval rate
0
100
200
300
400
500
600
700
800
DOTS TB/HIV MDR TB high
risk/IC
HSS/PAL PPM/ISTC Empower
people
OR
in m
illi
on
US
$
Round 6
Round 7
Round 8
Round 9
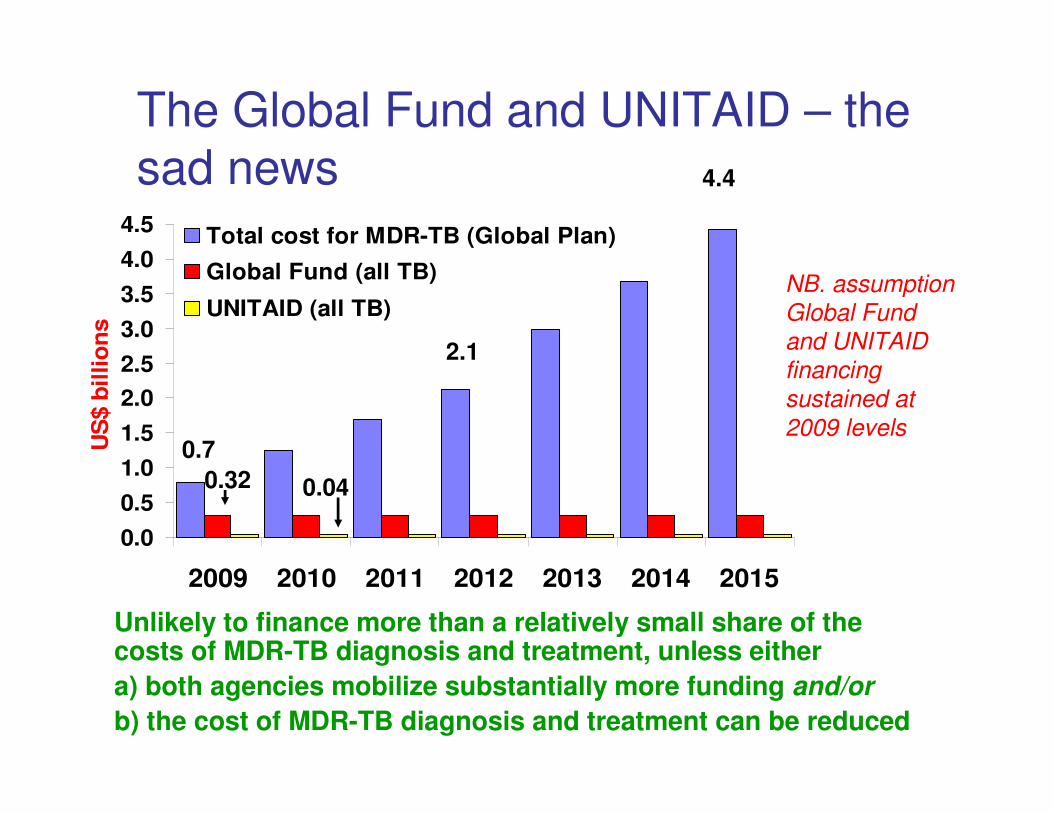
The Global Fund and UNITAID – the
sad news
0.0
0.5
1.0
1.5
2.0
2.5
3.0
3.5
4.0
4.5
2009 2010 2011 2012 2013 2014 2015
US
$ b
illio
ns
Total cost for MDR-TB (Global Plan)
Global Fund (all TB)
UNITAID (all TB)
0.7
2.1
4.4
0.32 0.04
NB. assumption
Global Fund
and UNITAID
financing
sustained at
2009 levels
Unlikely to finance more than a relatively small share of the costs of MDR-TB diagnosis and treatment, unless either
a) both agencies mobilize substantially more funding and/or
b) the cost of MDR-TB diagnosis and treatment can be reduced
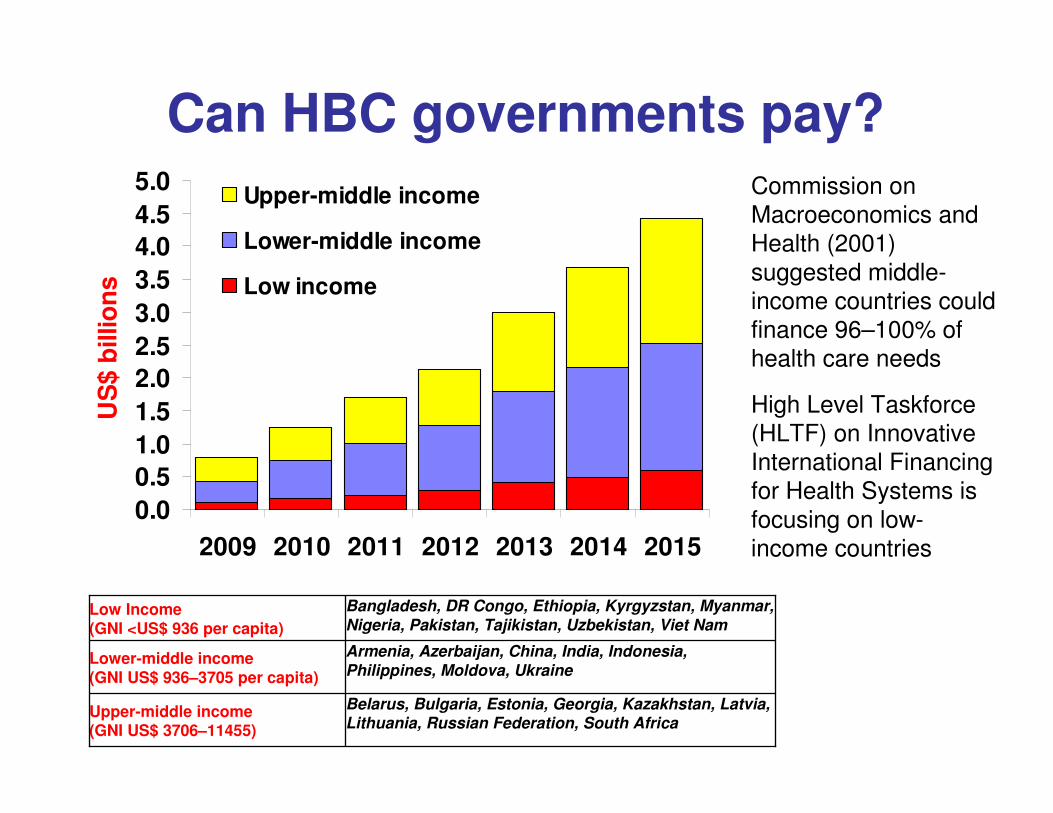
Can HBC governments pay?
0.0
0.5
1.0
1.5
2.0
2.5
3.0
3.5
4.0
4.5
5.0
2009 2010 2011 2012 2013 2014 2015
US
$ b
illio
ns
Upper-middle income
Lower-middle income
Low income
Belarus, Bulgaria, Estonia, Georgia, Kazakhstan, Latvia, Lithuania, Russian Federation, South Africa
Upper-middle income (GNI US$ 3706–11455)
Armenia, Azerbaijan, China, India, Indonesia, Philippines, Moldova, Ukraine
Lower-middle income (GNI US$ 936–3705 per capita)
Bangladesh, DR Congo, Ethiopia, Kyrgyzstan, Myanmar, Nigeria, Pakistan, Tajikistan, Uzbekistan, Viet Nam
Low Income (GNI <US$ 936 per capita)
Commission on
Macroeconomics and
Health (2001)
suggested middle-
income countries could
finance 96–100% of
health care needs
High Level Taskforce
(HLTF) on Innovative
International Financing
for Health Systems is
focusing on low-
income countries
� Some aspects of Coordination
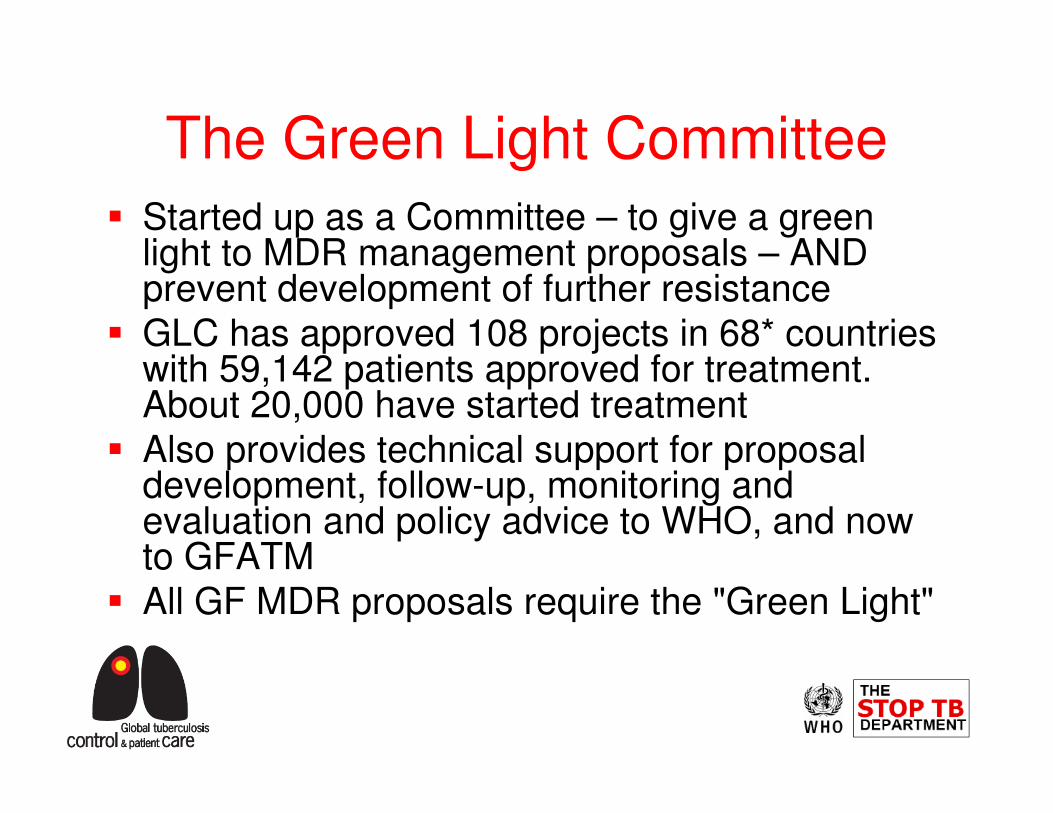
The Green Light Committee
� Started up as a Committee – to give a green light to MDR management proposals – AND prevent development of further resistance
� GLC has approved 108 projects in 68* countries with 59,142 patients approved for treatment. About 20,000 have started treatment
� Also provides technical support for proposal development, follow-up, monitoring and evaluation and policy advice to WHO, and now to GFATM
� All GF MDR proposals require the "Green Light"
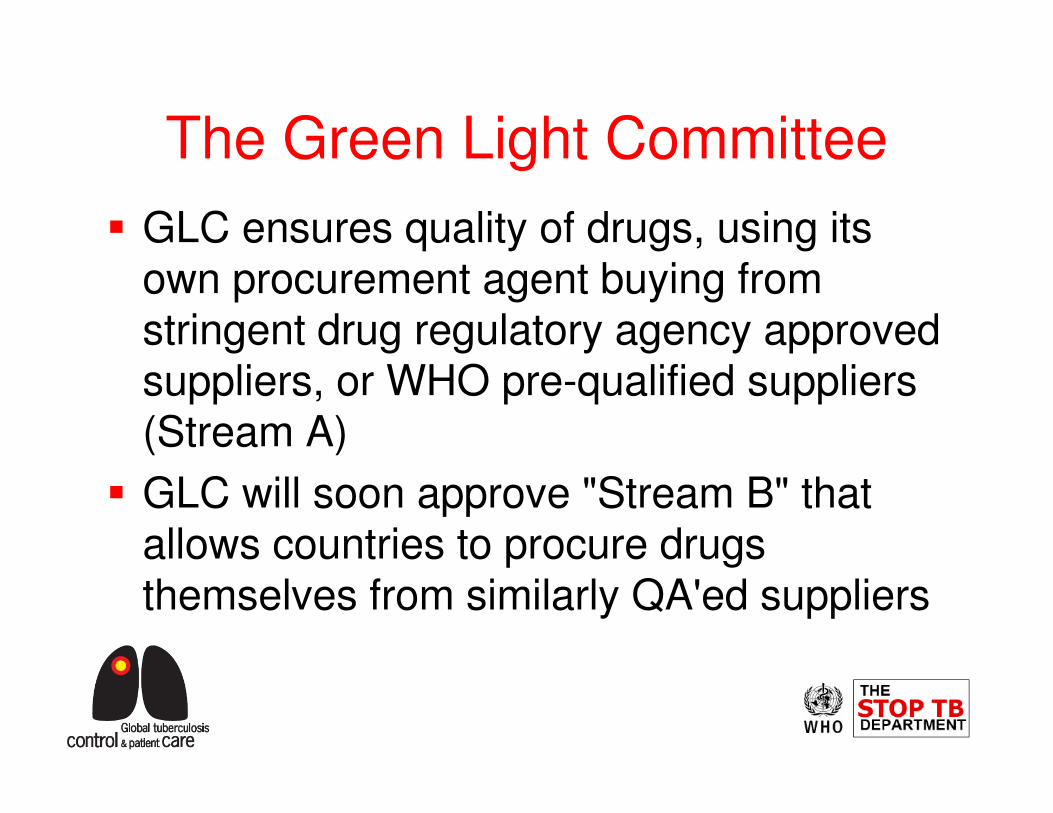
The Green Light Committee
� GLC ensures quality of drugs, using its own procurement agent buying from stringent drug regulatory agency approved suppliers, or WHO pre-qualified suppliers (Stream A)
� GLC will soon approve "Stream B" that allows countries to procure drugs themselves from similarly QA'ed suppliers
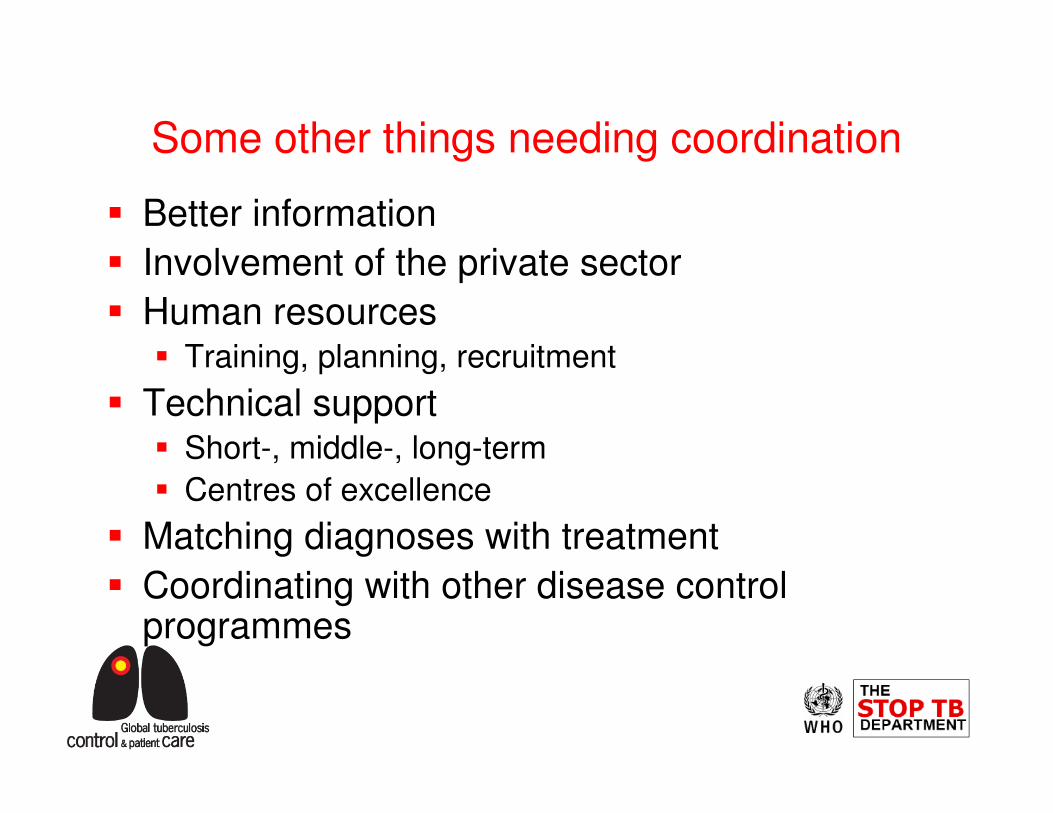
Some other things needing coordination
� Better information
� Involvement of the private sector
� Human resources� Training, planning, recruitment
� Technical support� Short-, middle-, long-term
� Centres of excellence
� Matching diagnoses with treatment
� Coordinating with other disease control programmes
Conclusions
� Substantial increases in funding are required for TB control going forward
� Fund-raising strategies need much more focus on national domestic expenditure needs
� More attention needed on reducing costs of commodities and models of care
� Countries may effectively postpone targets
Related Documents