Patuxent River Watershed Assessment COMMUNITY MEETING NO. 2 January 23, 2017

Welcome message from author
This document is posted to help you gain knowledge. Please leave a comment to let me know what you think about it! Share it to your friends and learn new things together.
Transcript

Patuxent River Watershed Assessment
COMMUNITY MEETING NO. 2
January 23, 2017

Meeting Outline
• Welcome and Introductions• Watersheds 101• Reasons for Study• Countywide Implementation
Strategy (CIS) – Part 1• Watershed Study (Assessment
Results, Concept Development, Pollutant Load Reductions)
• Restoration Toolbox • Countywide Implementation
Strategy (CIS) – Part 2• Office of Community Sustainability• Q&A

Watersheds101


Where does storm water go?
A. To a wastewater treatment
plant so pollutants and trash
can be removed before the
water goes to a nearby
stream. False
B. To a nearby stream without
any treatment. Possibly
C. To a stormwater management
facility for pollutant removal
and then to a nearby stream.
Possibly

The Problem

8-10%
20%
30%> 65%
< 5%
County = 12.7% Columbia ~ 15%-20%

County Watersheds

Impervious Area by Watershed
Watershed Impervious
Acres PercentSouth Br. Patapsco 744 4.6
Triadelphia Reservoir 1,830 5.0
(Brighton Dam)
Rocky Gorge Reservoir 585 7.3
Middle Patuxent 3,411 9.2
Patapsco - Lower North Br. 4,425 18.3
Little Patuxent 9,140 24.0
Patuxent – Upper 440 25.5

Water quickly runs off a shoreline cleared of natural
vegetation, washing nutrients and pesticides into the water. A
natural shoreline holds rainfall, which soaks into the soil; less
water, soil and chemicals run into the lake or river. Shoreline
and aquatic plants anchor shoreline areas, helping to protect
them from erosion due to runoff and waves (Source:MN DNR)
Source: Minnesota Department of Natural Resources
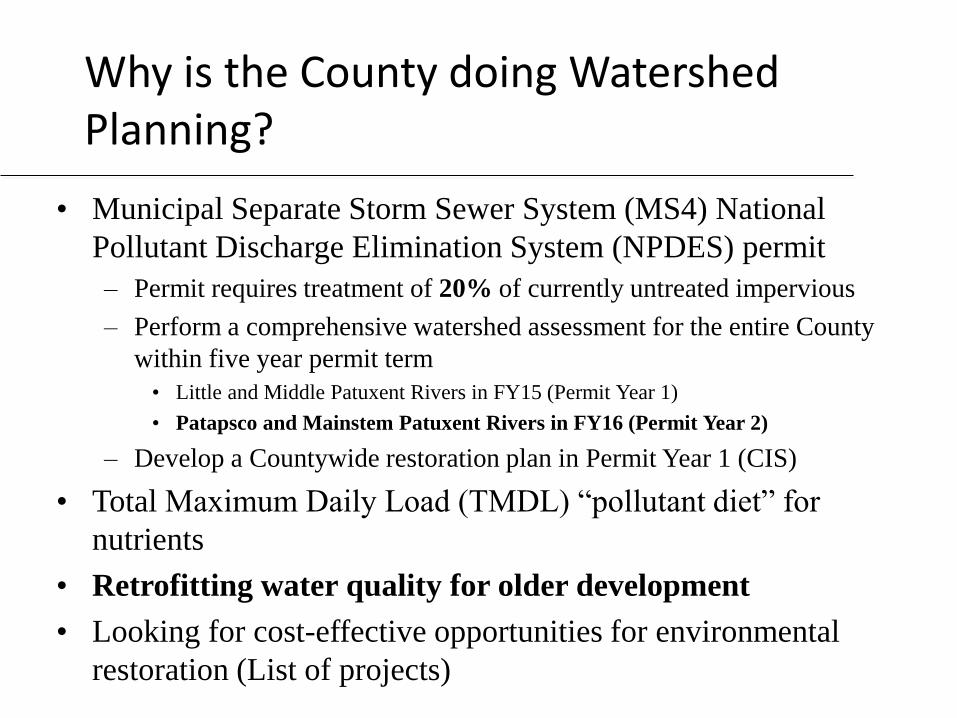
Why is the County doing Watershed Planning?
• Municipal Separate Storm Sewer System (MS4) National
Pollutant Discharge Elimination System (NPDES) permit
– Permit requires treatment of 20% of currently untreated impervious
– Perform a comprehensive watershed assessment for the entire County
within five year permit term
• Little and Middle Patuxent Rivers in FY15 (Permit Year 1)
• Patapsco and Mainstem Patuxent Rivers in FY16 (Permit Year 2)
– Develop a Countywide restoration plan in Permit Year 1 (CIS)
• Total Maximum Daily Load (TMDL) “pollutant diet” for
nutrients
• Retrofitting water quality for older development
• Looking for cost-effective opportunities for environmental
restoration (List of projects)

Total Maximum Daily Load (TMDL)
• Chesapeake Bay TMDL Sectors:
• Agriculture
• Forest
• Septic
• Urban Stormwater
• Wastewater
• NPDES Permit Year 1 - Restoration Plan for All Existing
TMDL Waste Load Allocations (Bay and Local)
• All Sectors – Reduce Phosphorus (P) by ~30% and
Nitrogen (N) by ~40% (approx. half of total reduction is
urban stormwater)
• Bay TMDL - Meet 60% by 2017 and 100% by 2025
• Local TMDLs – County/MDE agree upon completion date

Countywide Implementation
Strategy (CIS)
• County Restoration Plan
• Blue print for NPDES permit compliance, meeting TMDLs, and environmental improvements/protection
• Submitted to MDE December 17, 2015
• Review annually – currently finishing update for Patapsco/Patuxent study
• Consists of nine chapters
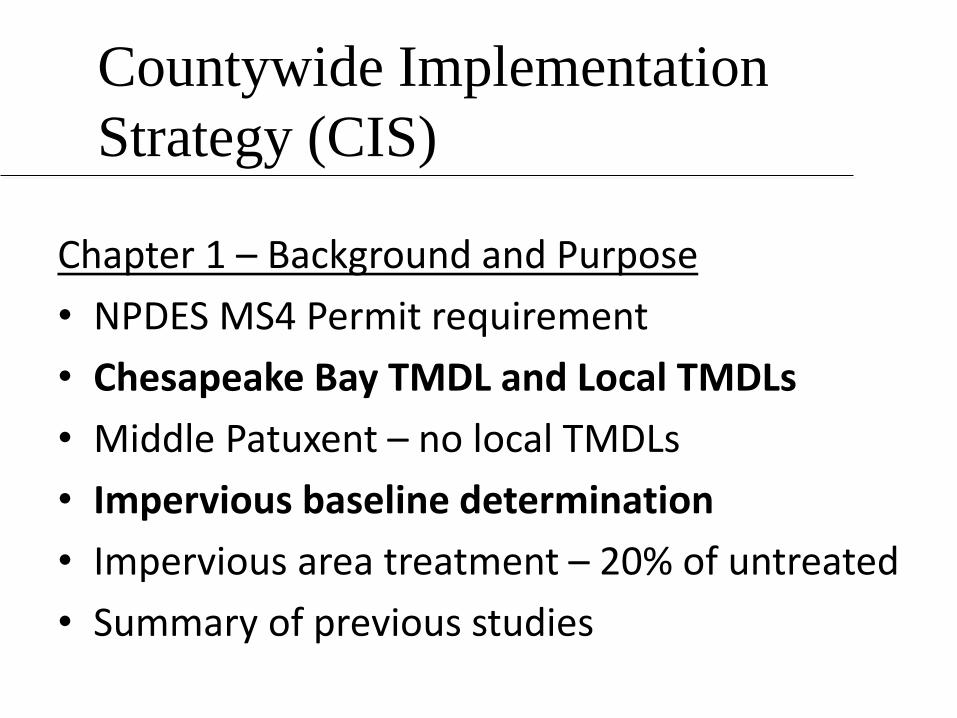
Countywide Implementation
Strategy (CIS)
Chapter 1 – Background and Purpose
• NPDES MS4 Permit requirement
• Chesapeake Bay TMDL and Local TMDLs
• Middle Patuxent – no local TMDLs
• Impervious baseline determination
• Impervious area treatment – 20% of untreated
• Summary of previous studies

Howard County TMDL Watersheds
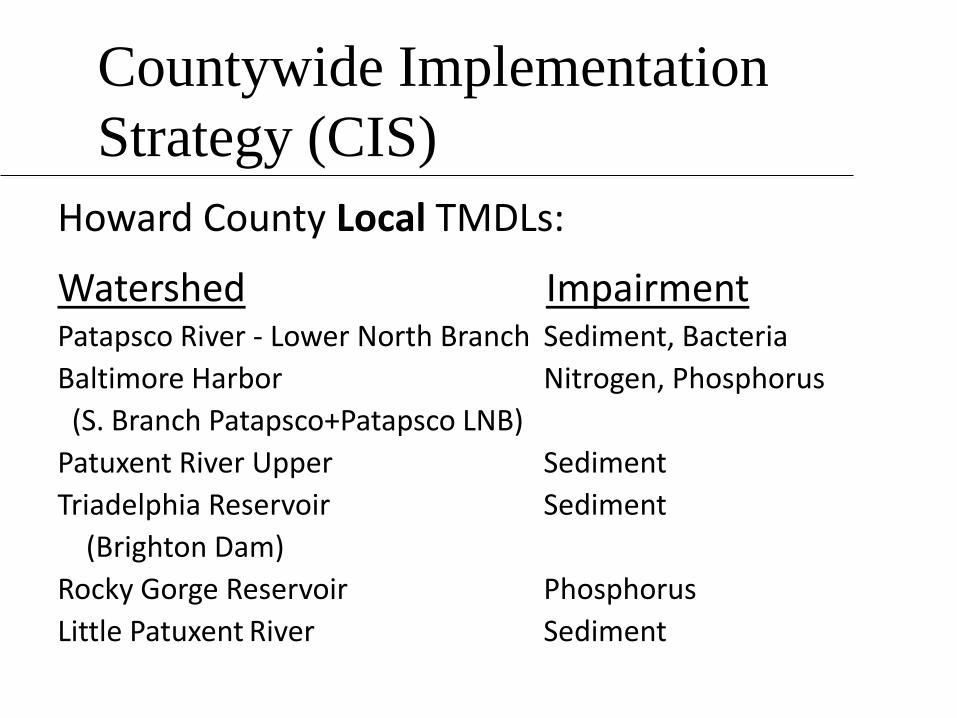
Countywide Implementation
Strategy (CIS)
Howard County Local TMDLs:
Watershed ImpairmentPatapsco River - Lower North Branch Sediment, Bacteria
Baltimore Harbor Nitrogen, Phosphorus
(S. Branch Patapsco+Patapsco LNB)
Patuxent River Upper Sediment
Triadelphia Reservoir Sediment
(Brighton Dam)
Rocky Gorge Reservoir Phosphorus
Little Patuxent River Sediment

Impervious Area Baseline• Countywide 10,161.7 untreated County impervious acres
• 20% Restoration Goal = 2,032.3 acres
1,090.2
3,935.1
1,932.9
2,223.7
232.0
340.2
407.6
10,161.7
0.0 2,000.0 4,000.0 6,000.0 8,000.0 10,000.0 12,000.0 14,000.0 16,000.0 18,000.0 20,000.0
BrightonDam
Little Patuxent
Middle Patuxent
Patapsco LNB
Patuxent Upper
Rocky Gorge Dam
S Branch Patapsco
Countywide
Watershed Treated and Untreated Impervious Area
Other Jurisdiction County Treated County Untreated

Countywide Implementation
Strategy (CIS)
Chapter 2 – Causes and Sources of Impairment
• Biological impairments
• Nutrients, sediment, bacteria
• Land use/Land cover
• Impervious areas
• Anticipated growth

Countywide Implementation
Strategy (CIS)
Chapter 3 – Management Measures
• Watershed assessments
• Summarizes Little/Middle Patuxent; updated now for Patapsco/Patuxent
• Modeling approach (MAST – Maryland Assessment Scenario Tool & BayFAST)
• BMPs – types and efficiencies for pollutant removal

Patuxent/Patapsco Watershed Assessment

Watershed Characteristics
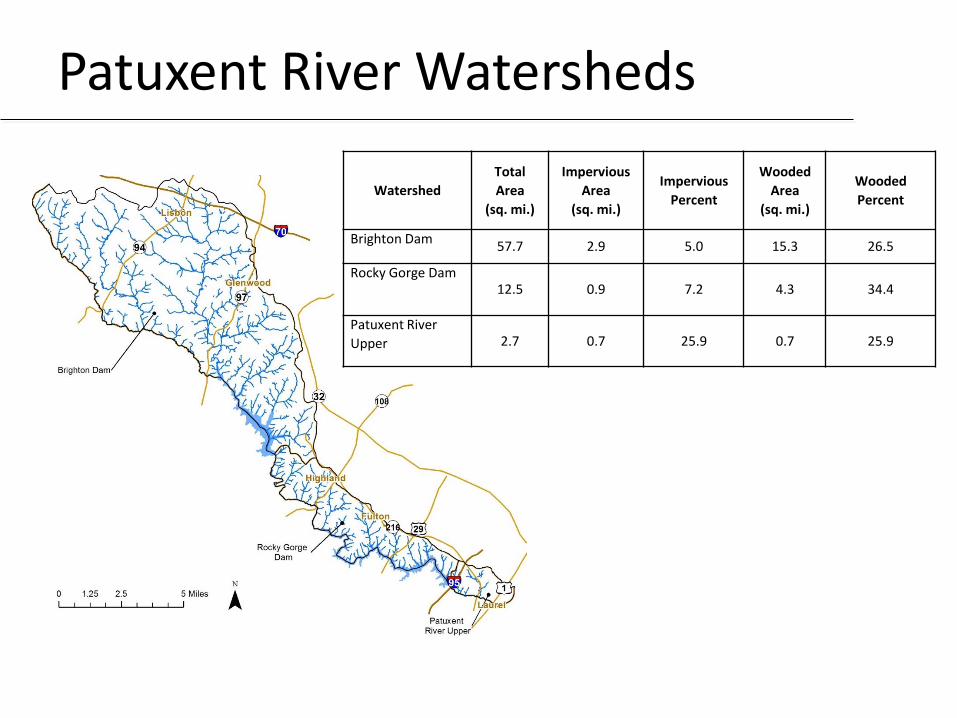
Patuxent River Watersheds
Watershed
Total
Area
(sq. mi.)
Impervious
Area
(sq. mi.)
Impervious
Percent
Wooded
Area
(sq. mi.)
Wooded
Percent
Brighton Dam57.7 2.9 5.0 15.3 26.5
Rocky Gorge Dam12.5 0.9 7.2 4.3 34.4
Patuxent River
Upper 2.7 0.7 25.9 0.7 25.9

Stormwater BMPs
WatershedStormwater
BMPs
Treated Area
(acres)
Treated Area
(sq. mi.)
Brighton Dam 800 390.0 0.6
Rocky Gorge Dam 303 108.5 0.2
Patuxent River Upper 134 86.1 0.1
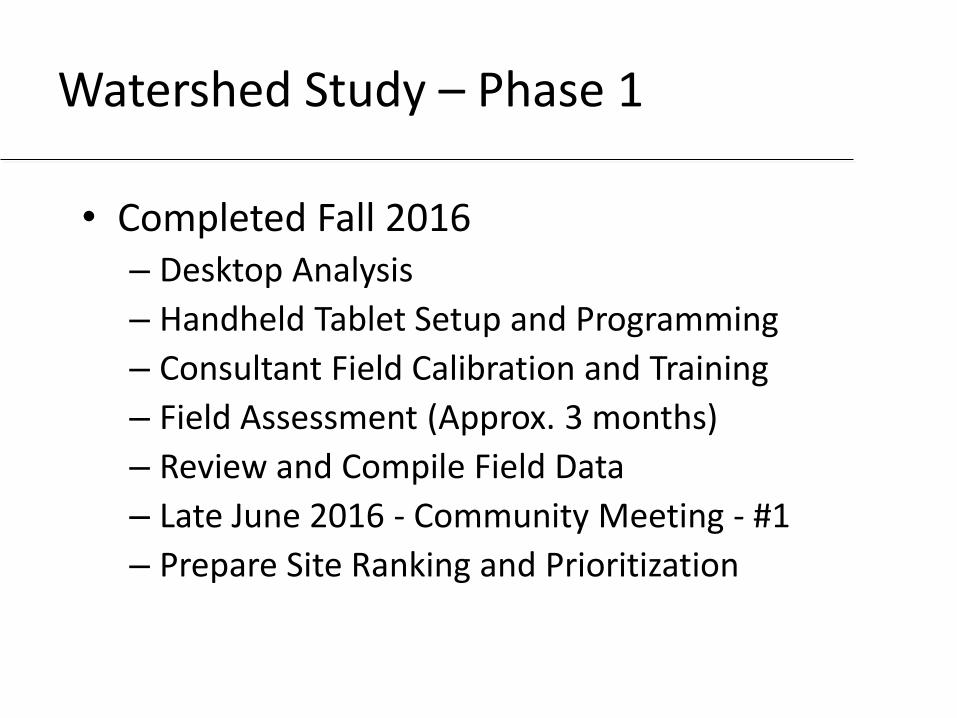
Watershed Study – Phase 1
• Completed Fall 2016– Desktop Analysis
– Handheld Tablet Setup and Programming
– Consultant Field Calibration and Training
– Field Assessment (Approx. 3 months)
– Review and Compile Field Data
– Late June 2016 - Community Meeting - #1
– Prepare Site Ranking and Prioritization

Field Assessments and Results

Project Types Investigated
• Retrofit of Existing BMPs• New BMPs• Outfall Stabilization• Stream Restoration• Reforestation/Riparian Buffers
• Source Reduction?

Field Assessment

Assessment Results – Total
0 20 40 60 80 100 120 140
BMP Conversion
New BMPs
Stream Miles
Tree Planting
Outfall Stabilization
2016 Assessment Totals
Patuxent River Upper Rocky Gorge
Brighton Dam Patapsco River South Branch
Patapsco River Lower North Branch
Sites Assessed:
- 130 Outfall stabilizations
- 86 Tree planting sites
- 65.0 Stream miles
- 56 New BMP sites
- 65 BMP conversions

Assessment Sites – Patuxent Watersheds
Type Unit Brighton Dam Rocky Gorge Patuxent River Upper
BMP Conversion Number of sites 9 3 4
New BMP Number of sites 11 1 1
Stream Restoration Stream miles 2.9 1.4 3.2
Tree Planting Number of sites 22 8 2
Outfall Stabilization Number of sites 4 0 9
Total Assessments 44 sites
2.9 stream miles
12 sites
1.4 stream miles
16 sites
3.2 stream miles
Numbers of Sites Assessed
Note: includes Field and Desktop Assessments
0 5 10 15 20 25 30 35
BMP Conversion
New BMP
Stream Restoration
Tree Planting
Outfall Stabilization
Sites Assessed
Brighton Dam Rocky Gorge Patuxent River Upper

Assessment Sites

Assessment Sites

Assessment Recommendations
Type Brighton Dam Rocky Gorge Patuxent River Upper
BMP Conversion 9 3 4
New BMP 27 2 4
Stream Restoration 17 8 5
Tree Planting 26 8 1
Outfall Stabilization 3 0 6
Total
Recommendations82 21 20
Number of Sites Recommended by Field Crews
0 5 10 15 20 25 30 35 40
BMP Conversion
New BMP
Stream Restoration
Tree Planting
Outfall Stabilization
Sites Recommended
Brighton Dam Brighton Dam Rocky Gorge

Recommended Sites

Recommended Sites

Watershed Study – Phase II
• Scheduled completion early 2017
– Perform Concept Level Designs (Including Cost Estimates)
– Rank sites ($/acre of impervious treated)
– Input to restoration plan (CIS) update
– Generate Draft Watershed Report
– Community Meeting - #2
– Review and Comment Period
– Report to MDE - Early 2017
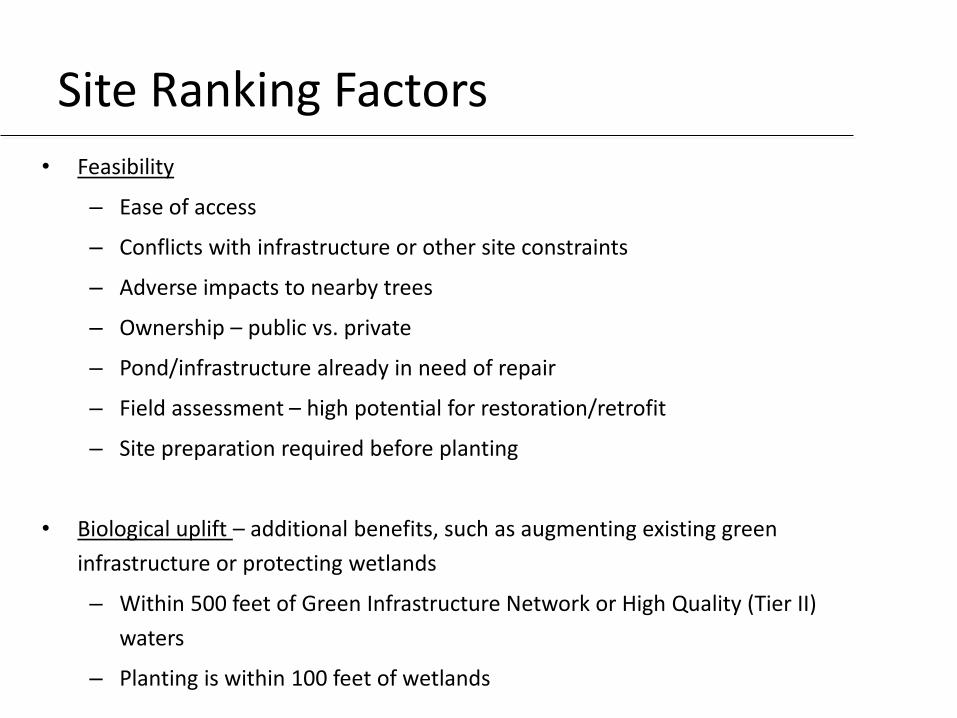
Site Ranking Factors
• Feasibility
– Ease of access
– Conflicts with infrastructure or other site constraints
– Adverse impacts to nearby trees
– Ownership – public vs. private
– Pond/infrastructure already in need of repair
– Field assessment – high potential for restoration/retrofit
– Site preparation required before planting
• Biological uplift – additional benefits, such as augmenting existing green
infrastructure or protecting wetlands
– Within 500 feet of Green Infrastructure Network or High Quality (Tier II)
waters
– Planting is within 100 feet of wetlands

Site Ranking Factors
• Permit contribution – how project will help meet MS4 impervious
treatment requirements and TMDL pollutant reduction goals
– Acres of impervious treatment
– Pollutant load reduction factor (Sum of % load reductions for TN, TP,
and sediment)
– Cost per acre of impervious treatment
• Programmatic benefit – value beyond primary functional purpose
– Site has educational value and/or is visible for public demonstration
– Site is near 2 or more other potential projects allowing for easier
monitoring and demonstration of benefit

Site Ranking Factors
• Erosion factor (stream and outfall stabilization projects)
– Length and severity of erosion
• Stream condition factors (stream projects)
– Average Bank Erosion Hazard Index score
– Habitat Assessment score
– Number of other problems along reach (exposed pipes,
pipe outfalls, unusual conditions, etc.)
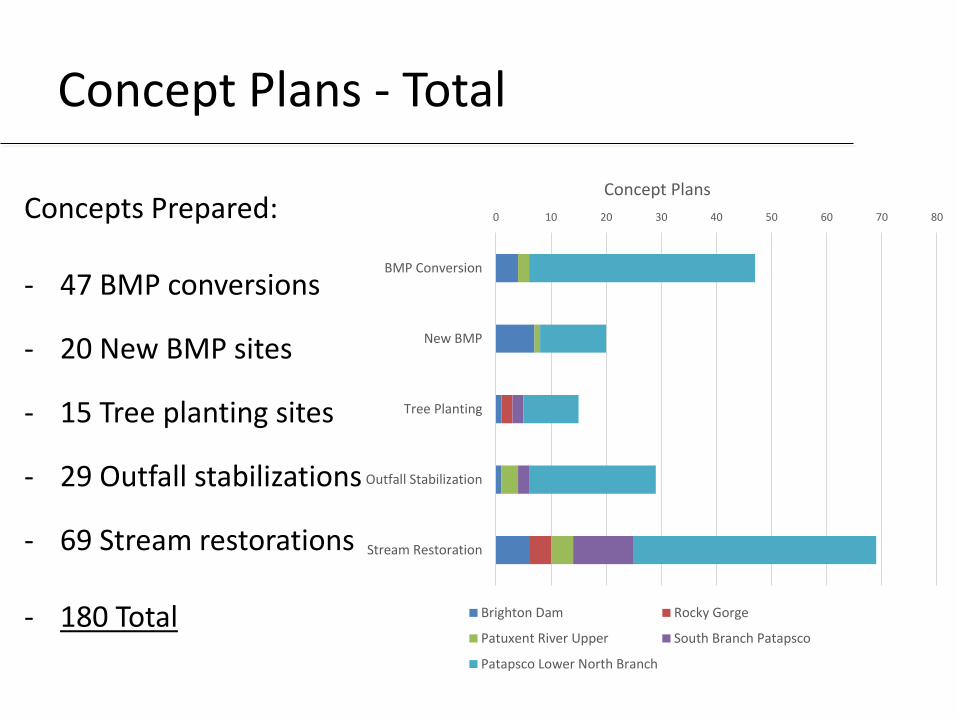
Concept Plans - Total
Concepts Prepared:
- 47 BMP conversions
- 20 New BMP sites
- 15 Tree planting sites
- 29 Outfall stabilizations
- 69 Stream restorations
- 180 Total
0 10 20 30 40 50 60 70 80
BMP Conversion
New BMP
Tree Planting
Outfall Stabilization
Stream Restoration
Concept Plans
Brighton Dam Rocky Gorge
Patuxent River Upper South Branch Patapsco
Patapsco Lower North Branch

Concept Plans – Patuxent Watersheds
Project Type
Number of Concept Plans Developed
Brighton Dam Rocky Gorge Dam Patuxent River Upper
BMP Conversion 4 2
New BMP 7 1
Tree Planting 1 2
Outfall Stabilization 1 3
Stream Restoration 6 4 4
Total 19 6 10
0 2 4 6 8 10 12 14 16
BMP Conversion
New BMP
Tree Planting
Outfall Stabilization
Stream Restoration
Concept Plans
Brighton Dam Rocky Gorge Patuxent River Upper

Concept Plan Sites

Concept Plan Sites


Project Results – Patuxent Summary
Number of
Projects/
Concepts
Impervious
Credit
TMDL Estimated Load Reductions
TN-EOS lbs TP-EOS lbs TSS-EOS lbs
Brighton Dam 19 84 1,055 425 290,387
BMP Conversion 4 20 491 36 31,228
New BMP 7 3 39 4 2,992
Stream Restoration 6 56 417 378 250,425
Tree Planting 1 1 24 1 379
Outfall Stabilization - SPSC 1 3 84 6 5,363
Patuxent River Upper 10 70 572 354 231,215
BMP Conversion 2 14 140 16 8,630
New BMP 1 2 25 3 1,337
Stream Restoration 4 49 364 330 218,250
Outfall Stabilization - SPSC 3 6 43 5 2,998
Rocky Gorge Dam 6 46 411 274 182,811
Stream Restoration 4 40 298 270 178,830
Tree Planting 2 7 113 4 3,981
Total 35 200 2,038 1,053 704,413

Project Results – Patuxent Summary
Based on doing ALL 35 concept projects in the Patuxent Watershed:
Impervious Restoration
• 200 restored acres possible with implementation of all identified projects
• Represents 10% of the projects needed to meet the impervious restoration goal
(2,032 acres) or 1% of the 20% restoration target
Pollutant Load Reductions
• Patuxent River Upper – Potential sediment reduction of 231,215 lbs of represents
50 times the remaining reduction required (4,708 lbs)
• Rocky Gorge – Potential phosphorus reduction of 274 lbs represents 6 times the
remaining reduction required (45 lbs)
• Brighton Dam – Potential phosphorus reduction of 425 lbs represents 1.8 times
the remaining reduction required (232 lbs)

Estimated Costs – Patuxent Concepts
Brighton Dam Rocky Gorge Dam
Patuxent River
Upper TotalNumber
of
Projects Cost
Number
of
Projects Cost
Number
of
Projects Cost
Number of
Projects Cost
BMP Conversion 4 $2,444,662 0 $0 2 $1,414,563 6 $ 3,859,225
New BMP 7 $1,870,083 0 $0 1 $413,543 8 $ 2,283,626 Stream
Restoration 6 $5,400,005 4 $4,408,677 4 $4,137,250 14 $ 13,945,932
Tree Planting 1 $162,760 2 $741,520 0 $0 3 $ 904,280 Outfall
Stabilization - SPSC 1 $413,400 0 $0 3 $1,671,800 4 $ 2,085,200
Total 19 $10,290,909 6 $5,150,197 10 $7,637,156 35 $23,078,263

Watershed Assessment Summary:
• Identified restoration opportunities• More need/potential projects in Patapsco
than Patuxent• Streams – scored higher, more cost efficient,
and plentiful• Approx. 60% of projects on private property• 180 projects will make a dent in our permit
requirements . . . and our checkbook

Watershed Study - Next Steps
• Master list for developing annual Capital Budget requests (included with Little Patuxent, Middle Patuxent, and new citizen generated projects)
• Help define total budget and manpower needs to meet permit conditions
• Valuable input to CIS restoration plan• Factor in private property projects• Public review and submittal to MDE

Can’t wait for restoration projects . . .

Restoration Toolbox
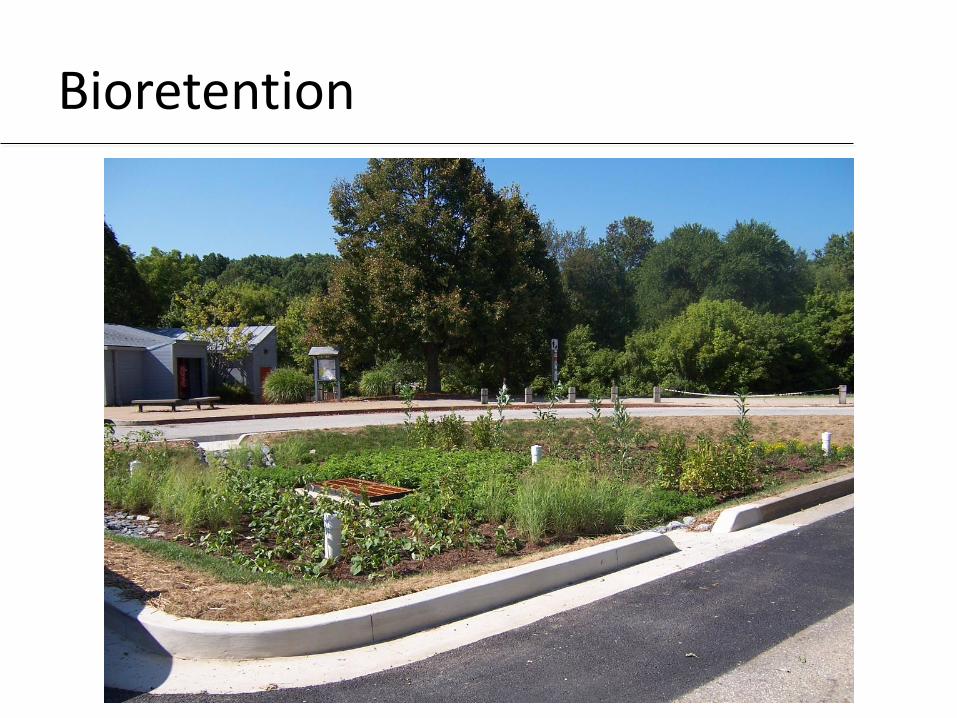
Bioretention

Pond Retrofit Project

Pond Retrofit Project

Outfall Stabilization

Stream Restoration

Riparian Buffer Enhancement
Alternative BMPs
Can we get credit from MDE?

Countywide Implementation
Strategy (CIS) - Continued

Countywide Implementation
Strategy (CIS)
Chapter 4 – Load Reductions/Impervious Treated
• Summaries based on Actual Implementation and Planned Implementation
• Bay TMDL and Local TMDLs
• By BMP types and subwatershed
• Compare results to goals

20% Impervious Acre Goal
Number of BMPs (FY2017-2019)
Brighton Dam Little Patuxent
Middle Patuxent
Patapsco LNB
Patuxent Upper
Rocky Gorge Dam
S Branch Patapsco Countywide
Number of Restoration BMPs 1 34 10 26 1 0 0 72
FY17 Credit Year 8 4 7 19
FY18 Credit Year 1 7 5 9 22
FY19 Credit Year 19 1 10 1 31
Planned Projects - Countywide• A selected suite of projects to meet the goal of 2,032 acres in 2019 (FY2017 to end of 2019)• Total Cost of $50 million• Per NPDES Permit - Meeting 20% impervious acre goal => Bay TMDL requirements are met
Cost (FY2017-2019)
Total Cost $1,850,000 $27,168,234 $4,893,016 $15,149,167 $611,000 $0 $0 $49,671,417
FY17 Credit Year$6,503,600 $1,046,202 $2,817,959 $10,367,761
FY18 Credit Year$1,850,000 $5,555,112 $2,075,806 $6,389,764 $15,870,682
FY19 Credit Year$15,109,522 $1,771,008 $5,941,444 $611,000 $23,432,974

20% Impervious Acre GoalBrighton
Dam
Little
Patuxent
River
Middle
Patuxent
River
Patapsco
River L N Br
Patuxent
River
upper
Rocky
Gorge Dam
S Branch
PatapscoCountywide
Impervious Baseline and Target (Impervious Credit Acres)
County MS4 Impervious Area 1,378.5 7,080.1 2,506.9 2,971.4 311.0 426.2 552.2 15,226.4
Impervious Baseline Treated 288.3 3,145.0 574.0 747.8 79.0 86.0 144.6 5,064.7
Impervious Baseline Untreated 1,090.2 3,935.1 1,932.9 2,223.7 232.0 340.2 407.6 10,161.7
20% Restoration Target 218.0 787.0 386.6 444.7 46.4 68.0 81.5 2,032.3
FY2016 Progress Impervious Restoration (Impervious Credit Acres)
FY2016 Total Progress Restoration 101.7 508.3 235.6 133.0 7.1 22.5 19.5 1,027.7
% Impervious Treated 9.3% 12.9% 12.2% 6.0% 3.1% 6.6% 4.8% 10.1%
Planned Impervious Restoration (FY2017 – End of 2019) (Impervious Credit Acres)
Total Restoration BMPs 64.0 379.0 73.7 194.7 6.0 0.0 0.0 717.5
FY17 Credit Year 58.0 20.5 43.3 121.8
FY18 Credit Year 64.0 44.6 33.2 96.0 237.8
FY19 Credit Year 276.4 20.0 55.4 6.0 357.8
Rain Barrels 0.04 0.30 0.09 0.13 0.01 0.02 0.61 1.2
Septic Pump-outs 38.6 38.6 38.6 38.6 38.6 38.6 38.6 270.0
Septic Upgrades 4.5 4.5 4.5 4.5 4.5 4.5 4.5 31.2
Total Planned Impervious Restoration 107.1 422.3 116.8 237.9 49.0 43.0 43.6 1,019.9
% Impervious Treated 9.8% 10.7% 6.0% 10.7% 21.1% 12.7% 10.7% 10.0%
Total Impervious Restoration to 2019 (Impervious Credit Acres)
FY2016 Progress 101.7 508.3 235.6 133.0 7.1 22.5 19.5 1,027.7
FY2017-2019 Planned 107.1 422.3 116.8 237.9 49.0 43.0 43.6 1,019.9
Total Impervious Restoration 208.8 930.6 352.5 370.8 56.2 65.6 63.1 2,047.6
% Impervious Treated 19.2% 23.6% 18.2% 16.7% 24.2% 19.3% 15.5% 20.2%

Local TMDL Goals
Baltimore HarborLittle
PatuxentPatapsco R LN Branch
Patuxent
R Upper
Rocky
Gorge
Reservoir
Triadelphia
Reservoir
(Brighton
Dam)
TN-EOS
lbs/yr
TP-EOS
lbs/yr
TSS-EOS
lbs/yr
TSS-EOS
lbs/yr
Bacteria
MPN/100
mL/yr
TSS-EOS
lbs/yr
TP-EOS
lbs/yr
TP-EOS
lbs/yr
Baseline Loads and Target Reductions
TMDL Baseline Year 1995 1995 2005 2005 2003 2005 2000 2000
Calibrated Baseline Load 107,059 6,546 10,346,821 6,123,442 21,826 145,902 861 2,654
Target Percent Reduction 15.0% 15.0% 48.1% 10.0% 75.0% 11.4% 15.0% 15.0%
Calibrated Target Reduction 16,059 982 4,976,821 612,344 16,370 16,633 129 398
Calibrated TMDL WLA 91,000 5,564 5,370,000 5,511,098 5,457 129,269 732 2,256

*Patapsco R LNB is located within Baltimore Harbor watershed; therefore, projects/costs in Patapsco R LNB are part of the Baltimore Harbor numbers
Local TMDL Goals
Planned Projects• Additional projects build on the impervious restoration progress to meet local TMDL goals• FY2017 to end of 2019
Number of Planned BMPsBaltimore
HarborLittle
PatuxentMiddle
PatuxentPatapsco R LN Branch
Patuxent R Upper
Rocky Gorge Reservoir
Triadelphia Reservoir Total*
Planned Projects 181 58 10 159 1 2 1 253
FY17 Credit Year 7 8 4 7 19
FY18 Credit Year 9 7 5 9 1 22
FY19 Credit Year 10 19 1 10 1 31
2015 Concepts - Inventory 24 24
2016 Concepts - Inventory 139 124 2 141
Additional Required Projects 16 9 16
Planned Costs $137,533,214 $44,330,000 $4,893,016 $114,832,701 $611,000 $1,287,549 $1,850,000 $190,504,778FY17 Credit Year $2,817,959 $6,503,600 $1,046,202 $2,817,959 $10,367,761FY18 Credit Year $6,389,764 $5,555,112 $2,075,806 $6,389,764 $1,850,000 $15,870,682FY19 Credit Year $5,941,444 $15,109,522 $1,771,008 $5,941,444 $611,000 $23,432,974
2015 Concepts - Inventory $17,161,766 $17,161,7662016 Concepts - Inventory $105,911,931 $90,466,826 $1,287,549 $107,199,480
Additional Required Projects $16,472,116 $9,216,708 $16,472,116

Local TMDL Goals Met
Baltimore HarborLittle
PatuxentPatapsco R LN Branch
Patuxent R
Upper
Rocky
Gorge
Reservoir
Triadelphia
Reservoir
(Brighton
Dam)
TN-EOS
lbs/yr
TP-EOS
lbs/yr
TSS-EOS
lbs/yr
TSS-EOS
lbs/yr
Bacteria
MPN/100
mL/yr
TSS-EOS
lbs/yr
TP-EOS
lbs/yr
TP-EOS
lbs/yr
Baseline Loads and Target Reductions
Target Percent Reduction 15.0% 15.0% 48.1% 10.0% 75.0% 11.4% 15.0% 15.0%
FY2016 Progress Reductions
Restoration Reductions 3,112 517 3,235,928 223,739 22 11,924 84 166
Restoration BMPs 2,335 206 3,055,184 139,920 22 4,526 28 103
Street Sweeping 778 311 180,744 83,818 0 7,398 56 63
Restoration Reduction Percent 2.9% 7.9% 31.3% 3.7% 0.1% 8.2% 9.8% 6.2%
Planned Reductions
Planned Reductions 13,015 8,135 2,211,506 4,784,877 19,638 27,000 69 435
FY17 Credit Year 307 187 133,952 138,778 - - - -
FY18 Credit Year 718 584 140,076 397,253 - - - 435
FY19 Credit Year 585 290 1,149,331 230,023 31 27,000 - -
2015 Concepts - Inventory - - 788,147 - - - - -
2016 Concepts - Inventory 9,805 6,027 - 3,606,051 2,864 69
Additional Placeholder Projects 1,601 1,047 - 412,772 373 - - -
Pet Waste 16,370
Restoration Reduction % 12.2% 124.3% 21.4% 78.1% 90.0% 18.5% 8.0% 16.4%
Totals
Reduction
(Progress+Planned) 16,128 8,652 5,447,434 5,008,616 19,660 38,924 152 601
Reduction Percent
(Progress + Planned) 15.1% 132.2% 52.6% 81.8% 90.1% 26.7% 17.7% 22.6%

Countywide Implementation
Strategy (CIS)
Chapter 5 – Technical/Financial Assistance Needs
• Technical assistance
• Implementation cost summary
• Funding sources

Cost Summary Estimate
Cost - Design and Construction Combined Baltimore Harbor
Watershed Little PatuxentMiddle
PatuxentPatuxent River
UpperRocky Gorge
ReservoirTriadelphia Reservoir
South Branch Patapsco
Patapsco LNB*
TotalLocal TMDL Target Year
2025 NA 2019 2019 2020 2029
FY2017 to FY2019 Near Term Planning Shown as Fiscal Year Budget Costs
FY2017 $3,690,663 $2,221,004 $850,000 $4,225,629 $10,987,296
FY2018 $8,295,336 $1,800,000 $260,000 $376,200 $1,000,000 $5,974,230 $17,705,766
FY2019 $10,934,027 $351,000 $931,158 $3,690,948 $15,907,132
FY2020 to FY2027 Out Years Planning Shown as Credit Year Costs**
FY2020 $4,298,529 $2,369,220 $11,056,360 $17,724,109
FY2021 $4,298,529 $2,369,220 $11,056,360 $17,724,109
FY2022 $4,298,529 $2,369,220 $12,635,840 $19,303,589
FY2023 $4,298,529 $2,369,220 $12,635,840 $19,303,589
FY2024 $2,369,220 $14,215,320 $16,584,539
FY2025 $2,369,220 $14,215,320 $16,584,539
FY2026 $1,579,480 $15,005,059 $16,584,539
FY2027 $1,579,480 $14,215,320 $15,794,799
FY2028
FY2029
Total $40,114,143 $4,021,004 $611,000 $1,307,358 $1,850,000 $17,374,279 $118,926,223 $184,204,007
*Patapsco Lower North Branch sediment local TMDL target year also 2029** Out Years include the full cost of the completed project, actual FY budget allocations will be adjusted as needed

Countywide Implementation
Strategy (CIS)
Chapter 6 – Public Participation/Education
• Lists current environmental outreach
• This meeting is part of Public Outreach
• 30-day public review/comment period
Chapter 7 – Implementation Schedule
• Lists various milestones
• Provides possible schedule for attaining goals

Project Schedule Summary
Number of Projects - by Credit Year* Baltimore Harbor
Watershed Little PatuxentMiddle
PatuxentPatuxent River
UpperRocky Gorge
ReservoirTriadelphia Reservoir
South Branch
Patapsco
Patapsco LNB**
Total
Local TMDL Target Year
2025 NA 2019 2019 2020 2029
FY2017 8 4 7 19
FY2018 7 5 1 9 22
FY2019 19 1 1 2 10 33
FY2020 6 3 14 23
FY2021 6 3 14 23
FY2022 6 3 16 25
FY2023 6 3 16 25
FY2024 3 18 21
FY2025 3 18 21
FY2026 2 19 21
FY2027 2 18 20
FY2028
FY2029
Total 58 10 1 2 1 22 159 253
* All projects listed by credit year, i.e. the year the project is complete** Patapsco Lower North Branch sediment local TMDL target year also 2029

Goals met?
Based on all projections and assumptions in CIS:
• 20% impervious acres – MS4 permit condition met by end of 2019
• Local TMDLs – known TMDLs met by 2027 (some earlier)
• Bay TMDL (Urban Stormwater Sector)– By the numbers: TP, TSS met; TN partially met by 2025
– By MS4 permit – all met if achieve 20% impervious treatment goal

Countywide Implementation
Strategy (CIS)
Chapter 8 – Load Reduction Evaluation Criteria
• 2-year interim milestone reporting (State)
• Annual NPDES reporting
• Triennial BMP inspections
• Regular evaluation and adaptive management
Chapter 9 – Monitoring
• Current monitoring – biological, chemical, physical
• Stormwater Design Manual

In Summary:
• CIS is a comprehensive summary of County’s current and proposed efforts for environmental restoration and permit compliance
• Planning document including possible schedule and anticipated costs
• Detailed watershed assessments complete for entire County

Want to learn more about stormwater?
Office of Community Sustainabilitywww.cleanwaterhoward.com
SWM Division Website
www.howardcountymd.gov/SWM.htm• Meeting #1 and #2 Powerpoints• Watershed Assessment Reports• CIS Report
Related Documents