MOLECULAR TOXICOLOGY Patterns of dioxin-altered mRNA expression in livers of dioxin-sensitive versus dioxin-resistant rats Monique A. Franc Ivy D. Moffat Paul C. Boutros Jouni T. Tuomisto Jouko Tuomisto Raimo Pohjanvirta Allan B. Okey Received: 25 January 2008 / Accepted: 2 April 2008 / Published online: 9 May 2008 Ó Springer-Verlag 2008 Abstract Dioxins exert their major toxicologic effects by binding to the aryl hydrocarbon receptor (AHR) and altering gene transcription. Numerous dioxin-responsive genes previously were identified both by conventional biochemical and molecular techniques and by recent mRNA expression microarray studies. However, of the large set of dioxin-responsive genes the specific genes whose dysregulation leads to death remain unknown. To identify specific genes that may be involved in dioxin lethality we compared changes in liver mRNA levels fol- lowing exposure to 2,3,7,8-tetrachlorodibenzo-p-dioxin (TCDD) in three strains/lines of dioxin-sensitive rats with changes in three dioxin-resistant rat strains/lines. The three dioxin-resistant strains/lines all harbor a large deletion in the transactivation domain of the aryl hydrocarbon receptor (AHR). Despite this deletion, many genes exhibited a ‘‘Type-I’’ response—that is, their responses were similar in dioxin-sensitive and dioxin-resistant rats. Several genes that previously were well established as being dioxin- responsive or under AHR regulation emerged as Type-I responses (e.g. CYP1A1, CYP1A2, CYP1B1 and Gsta3). In contrast, a relatively small number of genes exhibited a Type-II response—defined as a difference in responsive- ness between dioxin-sensitive and dioxin-resistant rat strains. Type-II genes include: malic enzyme 1, ubiquitin C, cathepsin L, S-adenosylhomocysteine hydrolase and ferritin light chain 1. In silico searches revealed that AH response elements are conserved in the 5 0 -flanking regions of several genes that respond to TCDD in both the Type-I and Type-II categories. The vast majority of changes in mRNA levels in response to 100 lg/kg TCDD were strain- specific; over 75% of the dioxin-responsive clones were affected in only one of the six strains/lines. Selected genes were assessed by quantitative RT-PCR in dose-response and time-course experiments and responses of some genes were assessed in Ahr-null mice to determine if their response was AHR-dependent. Type-II genes may lie in pathways that are central to the difference in susceptibility to TCDD lethality in this animal model. Keywords 2,3,7,8-Tetrachlorodibenzo-p-dioxin TCDD Aryl hydrocarbon receptor mRNA expression microarray Resistant rat model M.A. Franc and I.D. Moffat contributed equally to this project. Electronic supplementary material The online version of this article (doi:10.1007/s00204-008-0303-0) contains supplementary material, which is available to authorized users. M. A. Franc I. D. Moffat P. C. Boutros A. B. Okey (&) Department of Pharmacology and Toxicology, Medical Sciences Building, University of Toronto, Toronto, ON, Canada M5S 1A8 e-mail: [email protected] Present Address: M. A. Franc Department of Pharmacogenomics, Johnson & Johnson Pharmaceutical Research and Development, 1000 Route 202 South, P.O. Box 300, Raritan, NJ 08869, USA J. T. Tuomisto J. Tuomisto Department of Environmental Health, Centre for Environmental Health Risk Analysis, National Public Health Institute, 70701 Kuopio, Finland R. Pohjanvirta Department of Food and Environmental Hygiene, Faculty of Veterinary Medicine, University of Helsinki, 00014 Helsinki, Finland 123 Arch Toxicol (2008) 82:809–830 DOI 10.1007/s00204-008-0303-0

Welcome message from author
This document is posted to help you gain knowledge. Please leave a comment to let me know what you think about it! Share it to your friends and learn new things together.
Transcript
MOLECULAR TOXICOLOGY
Patterns of dioxin-altered mRNA expression in liversof dioxin-sensitive versus dioxin-resistant rats
Monique A. Franc Æ Ivy D. Moffat Æ Paul C. Boutros ÆJouni T. Tuomisto Æ Jouko Tuomisto Æ Raimo Pohjanvirta ÆAllan B. Okey
Received: 25 January 2008 / Accepted: 2 April 2008 / Published online: 9 May 2008
� Springer-Verlag 2008
Abstract Dioxins exert their major toxicologic effects by
binding to the aryl hydrocarbon receptor (AHR) and
altering gene transcription. Numerous dioxin-responsive
genes previously were identified both by conventional
biochemical and molecular techniques and by recent
mRNA expression microarray studies. However, of the
large set of dioxin-responsive genes the specific genes
whose dysregulation leads to death remain unknown. To
identify specific genes that may be involved in dioxin
lethality we compared changes in liver mRNA levels fol-
lowing exposure to 2,3,7,8-tetrachlorodibenzo-p-dioxin
(TCDD) in three strains/lines of dioxin-sensitive rats with
changes in three dioxin-resistant rat strains/lines. The three
dioxin-resistant strains/lines all harbor a large deletion in
the transactivation domain of the aryl hydrocarbon receptor
(AHR). Despite this deletion, many genes exhibited a
‘‘Type-I’’ response—that is, their responses were similar in
dioxin-sensitive and dioxin-resistant rats. Several genes
that previously were well established as being dioxin-
responsive or under AHR regulation emerged as Type-I
responses (e.g. CYP1A1, CYP1A2, CYP1B1 and Gsta3).
In contrast, a relatively small number of genes exhibited a
Type-II response—defined as a difference in responsive-
ness between dioxin-sensitive and dioxin-resistant rat
strains. Type-II genes include: malic enzyme 1, ubiquitin
C, cathepsin L, S-adenosylhomocysteine hydrolase and
ferritin light chain 1. In silico searches revealed that AH
response elements are conserved in the 50-flanking regions
of several genes that respond to TCDD in both the Type-I
and Type-II categories. The vast majority of changes in
mRNA levels in response to 100 lg/kg TCDD were strain-
specific; over 75% of the dioxin-responsive clones were
affected in only one of the six strains/lines. Selected genes
were assessed by quantitative RT-PCR in dose-response
and time-course experiments and responses of some genes
were assessed in Ahr-null mice to determine if their
response was AHR-dependent. Type-II genes may lie in
pathways that are central to the difference in susceptibility
to TCDD lethality in this animal model.
Keywords 2,3,7,8-Tetrachlorodibenzo-p-dioxin �TCDD � Aryl hydrocarbon receptor �mRNA expression microarray � Resistant rat model
M.A. Franc and I.D. Moffat contributed equally to this project.
Electronic supplementary material The online version of thisarticle (doi:10.1007/s00204-008-0303-0) contains supplementarymaterial, which is available to authorized users.
M. A. Franc � I. D. Moffat � P. C. Boutros � A. B. Okey (&)
Department of Pharmacology and Toxicology,
Medical Sciences Building, University of Toronto,
Toronto, ON, Canada M5S 1A8
e-mail: [email protected]
Present Address:
M. A. Franc
Department of Pharmacogenomics, Johnson & Johnson
Pharmaceutical Research and Development,
1000 Route 202 South, P.O. Box 300,
Raritan, NJ 08869, USA
J. T. Tuomisto � J. Tuomisto
Department of Environmental Health,
Centre for Environmental Health Risk Analysis,
National Public Health Institute, 70701 Kuopio, Finland
R. Pohjanvirta
Department of Food and Environmental Hygiene,
Faculty of Veterinary Medicine, University of Helsinki,
00014 Helsinki, Finland
123
Arch Toxicol (2008) 82:809–830
DOI 10.1007/s00204-008-0303-0

Introduction
Dioxins, especially the most potent congener 2,3,7,8-tet-
rachlorodibenzo-p-dioxin (TCDD), produce a broad
spectrum of toxic outcomes in laboratory and feral animals.
These include hepatotoxicity, immunotoxicity, teratoge-
nicity, cancer, wasting and death (Pohjanvirta and
Tuomisto 1994). It is firmly established that the essential
first step in dioxin toxicity is the binding of TCDD and
related dioxins to the aryl hydrocarbon receptor (AHR)
(reviewed in Okey 2007) although not all compounds that
bind the AHR with high affinity cause dioxin-like toxicity
(Fried et al. 2007). The most conclusive evidence that the
AHR mediates dioxin toxicity arises from experiments in
mice whose AHR has been genetically knocked out; these
Ahr-null mice are extraordinarily resistant to TCDD tox-
icities (Fernandez-Salguero et al. 1995, 1996; Lin et al.
2001; Mimura et al. 1997; Thurmond et al. 1999). Dioxin
toxicity also is dramatically reduced in mice whose AHR
has been genetically altered to create an AHR that has an
impaired nuclear translocation/gene-transactivation
domain (Bunger et al. 2003) and in mice that are hypo-
morphic for the AHR’s dimerization partner, ARNT
(Walisser et al. 2004).
Dioxin toxicity appears to be fundamentally a conse-
quence of dysregulation of gene expression mediated by
the AHR (Okey et al. 2005). Previous studies using con-
ventional biochemical and molecular methods along with
more recent mRNA expression array methods have
revealed numerous genes that are regulated by the AHR or
that exhibit altered expression following TCDD exposure
in cell culture (Frericks et al. 2006; Frueh et al. 2001;
Karyala et al. 2004; Lee et al. 2006; Martinez et al. 2002;
Puga et al. 2000; Schwanekamp et al. 2006; Zeytun et al.
2002) or in vivo (Boverhof et al. 2005, 2006; Fletcher et al.
2005; Hayes et al. 2005, 2007; Ovando et al. 2006; Slatter
et al. 2006; Tijet et al. 2006; Vezina et al. 2004). A few
dioxin-responsive genes have been identified that may be
central to thymic toxicity (Boverhof et al. 2004; Frericks
et al. 2006; Kolluri et al. 1999) or to hepatotoxicity
(Fletcher et al. 2005; Pande et al. 2005). However, the key
genes whose dysregulation by dioxins underlie the lethal
effects of dioxin remain elusive despite rapid progress in
recent studies in this field.
To identify the genes relevant to susceptibility to TCDD
lethality, we coupled mRNA expression microarray anal-
ysis with an in vivo genetic model of dioxin resistance.
Specifically, we contrasted mRNA expression profiles in
rats that are highly resistant to lethality from TCDD with
expression profiles in rats that are sensitive to TCDD. Our
rationale was that since the AHR is a transcription factor
and also is the primary mediator of dioxin toxicity, those
genes that are mechanistically responsible for major dioxin
toxicities should respond differently to TCDD in dioxin-
resistant rats than in dioxin-sensitive rats.
The Han/Wistar (Kuopio) (H/W) strain is the prototype
resistant rat strain. H/W rats are remarkably resistant to
lethal effects of TCDD with an LD50 of [9,600 lg/kg
compared with LD50 values of 10–50 lg/kg in most
standard laboratory rat strains (Pohjanvirta and Tuomisto
1994). However, for other endpoints (e.g., thymic atrophy,
fetotoxicity, hypercholesterolemia) H/W rats exhibit sus-
ceptibility similar to that of most standard laboratory rat
strains. This prototype rat model is useful for examining
the key mechanisms of specific TCDD toxicities. Important
leads towards understanding the cause of death from
TCDD have emerged from this model including: a poten-
tial role for the CNS in TCDD susceptibility (Pohjanvirta
et al. 1989), identification of a mutant form of the AHR
which is a major determinant of the lethality response
(Pohjanvirta et al. 1999) and evidence of a modifier gene,
gene ‘‘B’’ (of unknown identity), as a subsidiary contrib-
utor to lethality (Tuomisto et al. 1999). Nevertheless, the
events that are key to lethality and associated toxicities
have evaded discovery. We contrasted mRNA expression
between dioxin-resistant rat strains and lines that express
the H/W form of AHR with that in dioxin-sensitive strains
and lines that express wildtype AHR. The resistant rat
constitutes a powerful model system for several reasons:
(1) it is a within-species model; (2) the magnitude of dif-
ference in TCDD response phenotypes between H/W rats
and a substrain of Long–Evans (Turku/AB) (L-E) rats is
very large; (3) only some TCDD response phenotypes
differ between strains while others are conserved. Where
similarities exist between the two strains, these may help to
identify mechanisms of toxicity or adaptive responses that
are common to both sensitive and resistant animals.
Resistance to TCDD lethality in H/W rats is associated
with a genetic variation in the AHR that results in deletion
of either 38 or 43 amino acids from the transactivation
domain of the receptor (Moffat et al. 2007; Okey et al.
2005; Pohjanvirta et al. 1998; Tuomisto et al. 1999).
Because the AHR transactivation domain is crucial to
dioxin toxicity in mice (Bunger et al. 2003), we hypothe-
sized (Okey et al. 2005) that the deletion in the AHR
transactivation domain of H/W rats alters a region of the
AHR protein that is required for dysregulation of the par-
ticular dioxin-responsive genes that are important
determinants of susceptibility to TCDD lethality.
Numerous phenotypic responses to TCDD are similar
between L–E and H/W rats; these are termed ‘‘Type-I’’
responses. In contrast, there are many responses, including
lethality, that differ markedly between rats with wildtype
AHR and rats that carry variant H/W forms of AHR; these
are termed ‘‘Type-II’’ responses (Simanainen et al. 2002,
2003). Our main goal was to identify sets of genes that
810 Arch Toxicol (2008) 82:809–830
123

exhibit Type-I responses and sets of genes that exhibit
Type-II responses to TCDD using mRNA expression
arrays. Type-I response genes may be relevant to toxicity
endpoints that are widespread among rat strains or that
represent common adaptive mechanisms and may lead to
insight into new aspects of AHR function. Type-II response
genes are potentially central components in the mecha-
nism(s) that determine susceptibility to dioxin lethality.
Knowledge of the mechanisms by which dioxins cause
toxicity in animal models may facilitate assessment of
dioxin risk to humans (Tuomisto 2005).
Materials and methods
Overview of experiments
Table 1 provides a summary of animal treatments and
mRNA expression analyses.
Chemicals
TCDD was purchased from the UFA-Oil Institute (Ufa,
Russia) and was [99% pure as determined by gas chro-
matography–mass spectrometry (Vartiainen et al. 1995).
TCDD was dissolved in ether and added to corn oil; the
ether was subsequently evaporated off.
Resistant rat model
Responses of mRNA levels to TCDD were compared
among three dioxin-sensitive rat strains and lines versus
three dioxin-resistant rat strains and lines. TCDD-sensi-
tive rats (‘‘sensitive collective’’) comprised L–E, Line-C
(LnC) and Sprague Dawley (SD) rats; TCDD-resistant
rats (‘‘resistant collective’’) comprised H/W, Line-A
(LnA) and F1 offspring of a L–E 9 H/W cross. LnA and
LnC rats originally were developed by multiple crosses
between H/W and L–E rat strains combined with phe-
notyping for susceptibility to TCDD lethality (Tuomisto
et al. 1999). LnA rats are similar to H/W rats in their
resistance to TCDD lethality (LD50 for males
[10,000 lg/kg) and LnC rats are similar to L–E rats in
their sensitivity (LD50 for males *40 lg/kg) (Tuomisto
et al. 1999). The main determinant of sensitivity or
resistance in these lines is the AHR isoform (Tuomisto
et al. 1999). LnA differs from LnC at the AH locus but
these lines have fewer differences at other genetic loci
than do the prototype L–E and H/W strains. Therefore,
LnA, LnC and F1 rats were included in the study to
reduce the impact of confounding loci to help to distin-
guish those genes that are toxicologically relevant from
those that are strain-specific. Sprague Dawley rats were
included as an independent sensitive strain
(LD50 *50 lg/kg). L–E, LnC and SD are homozygous
for the wildtype form of the AHR. H/W and LnA are
homozygous for the variant AHR that has a deletion in
the transactivation domain. F1 rats are heterozygous.
Initially, 50 lg/kg TCDD was used in the Clontech 1.2 k
experiments. Subsequently, the dose was increased to
100 lg/kg TCDD to ensure that the LD50 for all three
sensitive strains was exceeded. The duration of treatment
in all experiments was selected to allow detection of both
up-regulation and down-regulation of mRNA levels. The
duration of TCDD exposure was shortened slightly from
the initial 24 h (Clontech 1.2 k experiments) to 19 h (all
other experiments) for operational convenience. The liver
was selected for study since the liver is a major target for
TCDD toxicity and is differentially susceptible to TCDD
toxicity in the rat model (mild hepatotoxicity in H/W;
Table 1 Overview of the experimental design
Experiment
Clontech 1.2 k Clontech and
OCI 15 k
RT-PCR dose–response RT-PCR
time-course
Ahr-null mice
Strain/line L–E and H/W L–E and H/W L–E and H/W, LnC and
LnA (100 lg/kg
TCDD only)
L–E and H/W C57BL/6 versus Ahr-null
Treatment TCDD 50 lg/kg TCDD 100 lg/kg TCDD 0.001, 0.01, 0.1,
1, 10, 100, 1,000 and
3,000 (H/W only)
lg/kg
TCDD 100 lg/kg TCDD 1,000 lg/kg
Age of males (weeks) 10–12 10–12 10–12 10–12 10–15
Time of liver harvest (h) 24 19 h 19 h 3, 6, 10 or 19 h 19 h
Method of RNA
isolation
Absolutely RNA
(Stratagene)
Absolutely RNA
(Stratagene)
RNeasy (Qiagen) RNeasy (Qiagen) RNeasy (Qiagen)
Arch Toxicol (2008) 82:809–830 811
123

severe hepatotoxicity in L–E). The tissue responsible for
animal death following TCDD exposure is unknown.
Male rats, 10–12 weeks of age, were obtained from
breeding colonies at the National Public Health Institute,
Division of Environmental Health, Kuopio, Finland. The
rats were housed in stainless steel wire-mesh cages with
unlimited access to standard animal feed (R36, Ewos,
Sodertalje, Sweden) and tap water. Lights were on between
7:00 and 19:00. The ambient room temperature and
humidity were maintained at 21.5 ± 1�C and 55 ± 10%,
respectively.
mRNA expression array studies
Three independent expression array platforms were used as
hypothesis-generating screening tools and did not consti-
tute a comprehensive investigation of the entire known rat
transcriptome. Subsequently, mRNA levels for selected
genes were measured by real-time quantitative RT-PCR.
Clontech 1.2 Rat Arrays
Initially, the effect of TCDD on mRNA expression was
examined in L–E and H/W rats only, using Clontech
Atlas� Rat 1.2 nylon membrane array. This array contained
1,185 cDNA fragments (200–600 bp in length) represent-
ing rat genes of known identity. The rats were given a
single dose of 50 lg/kg TCDD or the corn oil vehicle by
gavage, and then euthanized by decapitation after 24 h. To
minimize the impact of biological variability, the livers
from three rats were pooled within each treatment group
and total RNA was isolated from this pool using the
Stratagene (La Jolla, CA, USA) Absolutely RNA� Mini-
prep Kit with on-column DNase treatment according to the
manufacturer’s instructions. The RNA yield was quantified
by UV spectrophotometry (A260/280 in TE buffer[1.9) and
RNA integrity was verified using an Agilent 2100 Bioan-
alyzer with an electropherogram peak integration ratio
C1.7 for the 18S and 28S ribosomal RNA constituents. The
mRNA enriched from 50 lg of total RNA was reverse-
transcribed to incorporate [a-32P]dATP with a cocktail of
primers specific to only those genes spotted on the array
using the Atlas� Pure Total RNA Labeling System
(Clontech, Laboratories Inc., Palo Alto, CA, USA). Radi-
olabeled cDNAs from each strain (L–E or H/W) and
treatment group (control or TCDD-treated) were hybrid-
ized to separate membranes. Hybridization and washing
were performed according to the manufacturer’s instruc-
tions. Radioactive emissions were captured with a single
phosphor screen (48 h) and digitized using a Storm Phos-
phorimager (Molecular Dynamics, Sunnyvale, CA, USA).
Image intensities were quantitated with Atlas Image 2.0
software. Quantitation parameters were: signal
threshold = 200% of background; global normalization
(sum method); ratio threshold = 1.5 9 background; dif-
ference threshold = 2 9 average background; background =
mean signal intensity of non-spotted area of the array. Fold
changes between TCDD-treated and control animals of a
given strain were calculated, except when the signal for the
control animal was below the detection limit specified by
Clontech software. In these cases the relative differences
were calculated. Since there was only one measurement for
each strain with Clontech 1.2 k arrays, no tests of statistical
significance could be performed.
Clontech 4 k Rat Arrays
In a second experiment we examined mRNA expression
using Clontech Atlas� 4 k Rat Plastic Arrays which con-
tained 80 bp oligonucleotides from 4,000 rat genes. The
L–E and H/W rats were given a single dose of 100 lg/kg
TCDD or corn oil vehicle by gavage; after 19 h, RNA was
isolated from approximately 150 mg frozen liver from
individual rats using Stratagene’s Absolutely RNA� Mini-
prep Kit (with on-column DNase treatment), according to
the manufacturer’s instructions. The RNA quality was
measured as described above. Ten micrograms of total RNA
from one TCDD-treated rat or from a pool of six control rats
from each rat strain (L–E or H/W), was reverse-transcribed
to incorporate [a-33P]dATP with a cocktail of random
primers using the Atlas� Pure Total RNA Labeling System
(Clontech, Laboratories Inc.). Radiolabeled cDNAs from
each strain (L–E or H/W) and treatment group (control or
TCDD-treated) were hybridized to separate membranes.
Hybridization, washing, imaging and data analysis were as
described above for the Clontech 1.2 k arrays.
OCI 15 k mouse cDNA arrays
In a third experiment, we examined mRNA expression
using cDNA-spotted glass arrays manufactured by the
Ontario Cancer Institute (OCI, Toronto, Canada) that con-
tain *15,000 cDNA sequences, each spotted in adjacent
duplicates. Source clones for the OCI cDNA arrays were
from the National Institute on Aging (NIH, USA) (Tanaka
et al. 2000). Spotted products represent clones derived from
mouse mRNAs that are expressed in pre- and peri-implan-
tation embryos, E12.5. Clones had an average insert size of
*200 bp. A mouse array was used since a comparable rat
array was not available at the time of the investigation. The
RNA samples from L–E and H/W rats used in the Clontech
4 k experiments and RNA samples from the additional four
rat strains/lines (RNA extracted by the same method) were
analyzed using the OCI cDNA arrays.
There were six rats per treatment group (control or
TCDD-treated). For each sample, 15 lg total RNA was
812 Arch Toxicol (2008) 82:809–830
123
reverse-transcribed with SuperScript� II RT enzyme
(Invitrogen Life Technologies, Burlington, ON, Canada) to
incorporate either Cyanine3-dCTP (Cy3) or Cyanine5-
dCTP (Cy5). Reverse transcription, sample purification,
hybridization and washing were according to the UHN
Microarray Centre’s direct labeling protocol as described at
http://www.microarrays.ca/support/PDFs/Directlabeling%
20protocol_GFX_Oct2004.pdf.
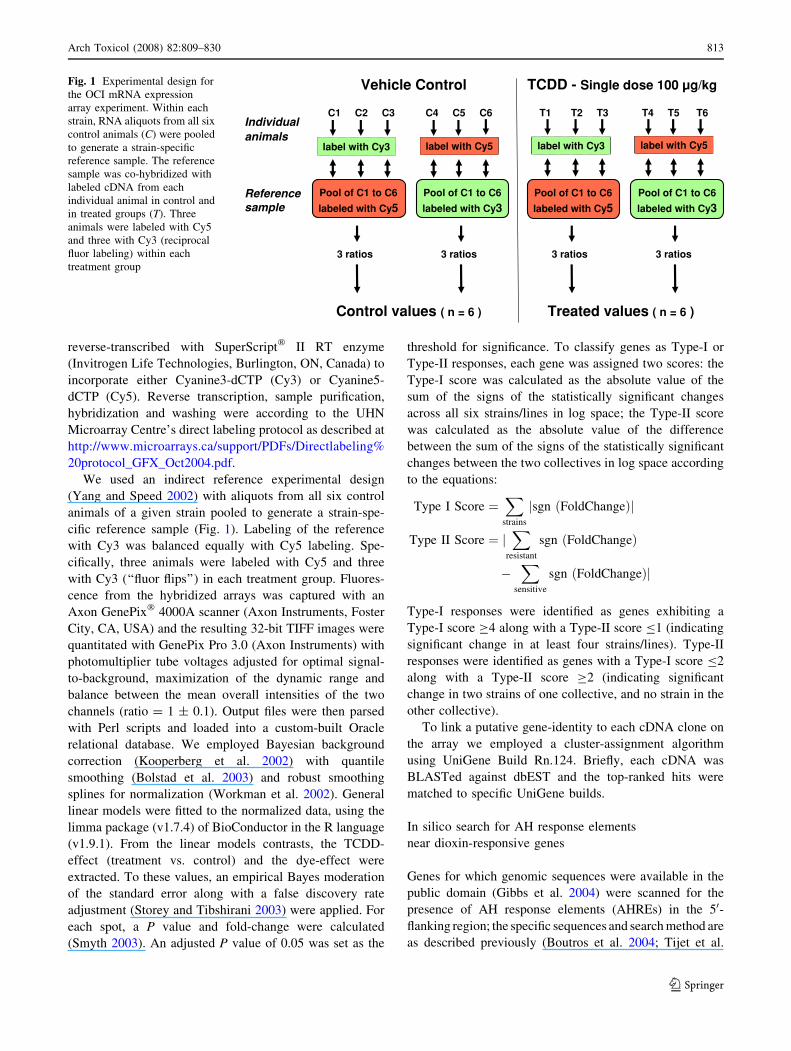
We used an indirect reference experimental design
(Yang and Speed 2002) with aliquots from all six control
animals of a given strain pooled to generate a strain-spe-
cific reference sample (Fig. 1). Labeling of the reference
with Cy3 was balanced equally with Cy5 labeling. Spe-
cifically, three animals were labeled with Cy5 and three
with Cy3 (‘‘fluor flips’’) in each treatment group. Fluores-
cence from the hybridized arrays was captured with an
Axon GenePix� 4000A scanner (Axon Instruments, Foster
City, CA, USA) and the resulting 32-bit TIFF images were
quantitated with GenePix Pro 3.0 (Axon Instruments) with
photomultiplier tube voltages adjusted for optimal signal-
to-background, maximization of the dynamic range and
balance between the mean overall intensities of the two
channels (ratio = 1 ± 0.1). Output files were then parsed
with Perl scripts and loaded into a custom-built Oracle
relational database. We employed Bayesian background
correction (Kooperberg et al. 2002) with quantile
smoothing (Bolstad et al. 2003) and robust smoothing
splines for normalization (Workman et al. 2002). General
linear models were fitted to the normalized data, using the
limma package (v1.7.4) of BioConductor in the R language
(v1.9.1). From the linear models contrasts, the TCDD-
effect (treatment vs. control) and the dye-effect were
extracted. To these values, an empirical Bayes moderation
of the standard error along with a false discovery rate
adjustment (Storey and Tibshirani 2003) were applied. For
each spot, a P value and fold-change were calculated
(Smyth 2003). An adjusted P value of 0.05 was set as the
threshold for significance. To classify genes as Type-I or
Type-II responses, each gene was assigned two scores: the
Type-I score was calculated as the absolute value of the
sum of the signs of the statistically significant changes
across all six strains/lines in log space; the Type-II score
was calculated as the absolute value of the difference
between the sum of the signs of the statistically significant
changes between the two collectives in log space according
to the equations:
Type I Score ¼X
strains
sgn ðFoldChangeÞjj
Type II Score ¼ jX
resistant
sgn ðFoldChangeÞ
�X
sensitive
sgn ðFoldChangeÞj
Type-I responses were identified as genes exhibiting a
Type-I score C4 along with a Type-II score B1 (indicating
significant change in at least four strains/lines). Type-II
responses were identified as genes with a Type-I score B2
along with a Type-II score C2 (indicating significant
change in two strains of one collective, and no strain in the
other collective).
To link a putative gene-identity to each cDNA clone on
the array we employed a cluster-assignment algorithm
using UniGene Build Rn.124. Briefly, each cDNA was
BLASTed against dbEST and the top-ranked hits were
matched to specific UniGene builds.
In silico search for AH response elements
near dioxin-responsive genes
Genes for which genomic sequences were available in the
public domain (Gibbs et al. 2004) were scanned for the
presence of AH response elements (AHREs) in the 50-flanking region; the specific sequences and search method are
as described previously (Boutros et al. 2004; Tijet et al.
Individualanimals
Referencesample
Vehicle Control TCDD - Single dose 100 µg/kg
C1 C2 C3 C4 C5 C6
3 ratios 3 ratios
Control values ( n = 6 )
Pool of C1 to C6
labeled with Cy3Pool of C1 to C6
labeled with Cy5
label with Cy5label with Cy3
T1 T2 T3 T4 T5 T6
3 ratios 3 ratios
Treated values ( n = 6 )
Pool of C1 to C6
labeled with Cy3Pool of C1 to C6
labeled with Cy5
label with Cy5label with Cy3
Fig. 1 Experimental design for
the OCI mRNA expression
array experiment. Within each
strain, RNA aliquots from all six
control animals (C) were pooled
to generate a strain-specific
reference sample. The reference
sample was co-hybridized with
labeled cDNA from each
individual animal in control and
in treated groups (T). Three
animals were labeled with Cy5
and three with Cy3 (reciprocal
fluor labeling) within each
treatment group
Arch Toxicol (2008) 82:809–830 813
123
2006). Subsequently, a PhyloHMM conservation score was
associated with each nucleotide base within each identified
AHRE-motif; then the average PhyloHMM score for each
motif was calculated (Siepel and Haussler 2004). Phyl-
oHMM scores provide a measure of conservation that
accounts for phylogenetic relationships across different
species. Scores can range from 0 (minimal conservation) to 1
(strong conservation). A high degree of phylogenetic con-
servation across multiple mammalian species signifies motifs
that are most likely to constitute functional regulatory sites.
Real-time RT-PCR
We used two real-time RT-PCR methods to quantitate the
levels of selected mRNAs. We selected both Type-I and
Type-II candidate responses for further study. Please see
Supplementary material for primer sequences (Table S1)
and details of the RT-PCR procedure.
Dose–response and time-course analysis of mRNA
expression
To determine the relationship of TCDD dose to the
response of selected genes, four rats per group were ga-
vaged with corn oil (vehicle control) or with doses of
0.001, 0.01, 0.1, 1, 10, 100 and 1,000 lg/kg TCDD for the
dioxin-sensitive L–E rats. For the dioxin-resistant H/W rats
the range was expanded to 3,000 lg/kg TCDD, the maxi-
mal dose that could be given by the method used. Rats
were euthanized by decapitation 19 h after dosing.
For the time-course analysis, rats were treated by gavage
with corn oil or with 100 lg/kg TCDD. Four animals were
treated per time-point and dose-group. Rats were euthanized
by decapitation at 3, 6, 10 or 19 h after dosing. Total RNA
was isolated from approximately 150 mg frozen rat liver
using RNeasy kits (Qiagen, with on-column DNase treat-
ment) according to manufacturer’s instructions. Total RNA
yield was quantified by UV spectrophotometry and RNA
integrity was verified using an Agilent 2100 Bioanalyzer.
RT-PCR was performed as described in Supplementary
material using the 50fluorogenic probe method. Dose–
response curves and ED50 values for alteration of mRNA
levels were generated with Graph Pad 4.0 software using a
sigmoidal four-parameter logistic regression. The R2 values
were, CYP1A1: 0.95 for L–E and H/W; Nfe2l2: 0.58 for L–E
and 0.51 for H/W; Tgfb1i4: 0.76 for L–E and 0.82 for H/W.
Ahr-null mice
To determine if the AH receptor was essential for candidate
genes (identified by expression array studies) to respond to
TCDD, we tested the ability of TCDD to alter expression of
some genes (Cyp1a1, Nfe2l2, Tgfbp1i4 and Polr2c) in
livers of Ahr-null (Ahr-/-) mice. Details of the treatment
and RNA isolation were as reported previously (Tijet et al.
2006). Briefly, male Ahr-/- mice in a C57BL/6J back-
ground as well as wild-type (Ahr+/+) C57BL/6J mice were
given a single dose of 1,000 lg/kg TCDD or corn oil
vehicle by gavage. Liver was harvested 19 h after treat-
ment. There were three TCDD-treated and three control
mice in the Ahr-/- groups and six TCDD-treated and five
control mice in the Ahr+/+ groups. RT-PCR using the
50fluorogenic probe method was performed as described in
Supplementary material.
Results
Response of classic AHR-responsive genes detected
by Clontech arrays
Initial experiments with Clontech Atlas� Rat 1.2 Arrays
demonstrated that four classic AHR-regulated/TCDD-
responsive genes—CYP1A1, CYP1A2, CYP1B1 and
Gsta3—continue to be significantly upregulated by TCDD in
H/W rats despite loss of a large segment from the AHR
transactivation domain in this dioxin-resistant strain
(Fig. 2). The magnitudes of induction (ratio of TCDD-
treated to control) for these four well-known AH-regulated
genes were similar between the prototype dioxin-sensitive
L–E strain and the prototype dioxin-resistant H/W strain:
approximately 16-fold for CYP1A2 and threefold for Gsta3.
Fold-induction could not be computed for CYP1A1 or
CYP1B1 because the constitutive mRNA levels in control
L–E and control H/W animals were indistinguishable from
background for each of these genes. However, the spot
intensity for CYP1A1 in TCDD-treated L–E rats as well as in
H/W rats was approximately 1,000-times higher than back-
ground levels. For CYP1B1, TCDD-treated L–E and H/W
rats both exhibited signals approximately 30-times higher
than background. Only one experiment was performed on
Clontech 1.2 k arrays. A second experiment on Clontech
Atlas� 4 k Rat Arrays confirmed that CYP1A1, CYP1A2,
CYP1B1 and Gsta3 were similarly induced by TCDD
treatment in H/W rats as well as in L–E rats (data not shown).
Overall patterns of mRNA expression detected by OCI
cDNA arrays
Of the 15,297 total unique clones on the mouse-derived
OCI cDNA array (Table 2), 10,533 (69%) could be
assigned to a rat UniGene Cluster ID based on nucleotide
sequence. Since some clusters were represented by multi-
ple clones, the actual number of unique clusters examined
was 7,538; this represents the estimated number of unique
genes screened for responsiveness to TCDD in our OCI
814 Arch Toxicol (2008) 82:809–830
123

cDNA experiments. Of the 7,538 unique UniGene clusters,
398 (5.3%) responded significantly (Padjusted \ 0.05) to
TCDD treatment in at least one rat strain or line (Fig. 3;
Table 2) of which no more than 20 would be expected to be
false-positives based on the adjusted statistical threshold
employed. However, only 13 of the 7,538 total clusters on
the array responded significantly to TCDD treatment in all
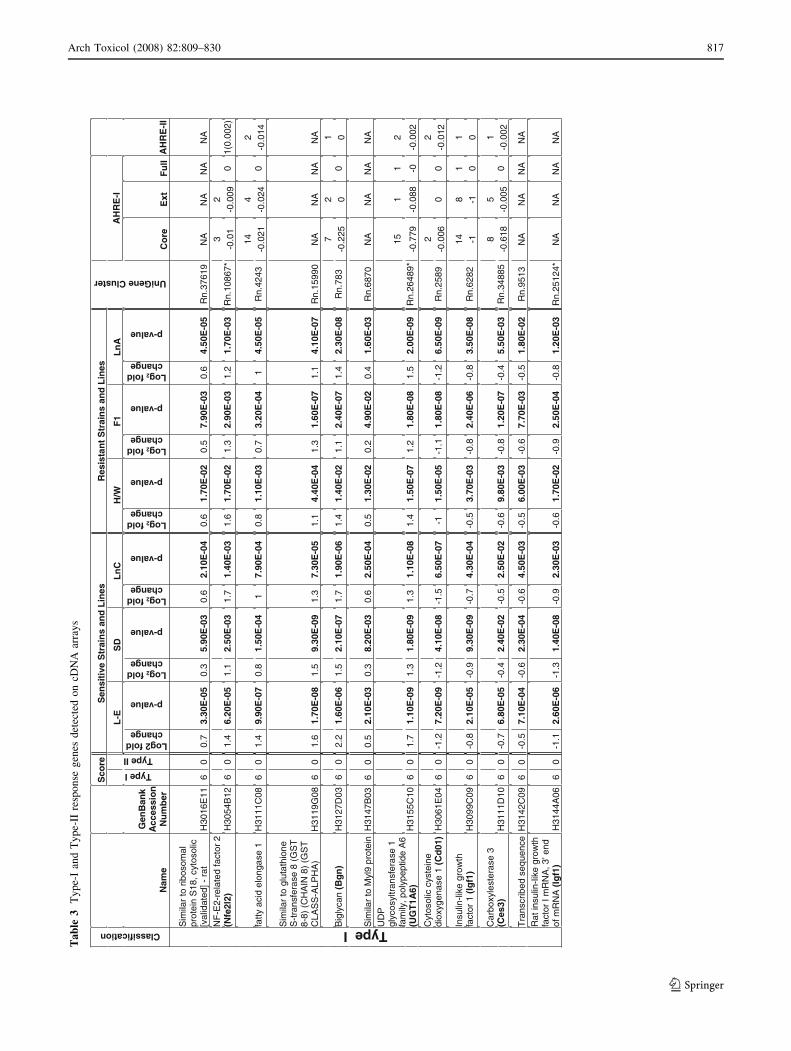
six strains/lines (Table 3).
We classified TCDD-responsive genes detected on
cDNA arrays into two categories, using the scheme pre-
viously developed for toxic endpoints by Simanainen et al.
(2002): Type-I responses are defined as responses to TCDD
that are similar between dioxin-sensitive and dioxin-resis-
tant rat strains/lines. Type-II responses are defined as
responses to TCDD that show reduced efficacy (magnitude
of effect) in dioxin-resistant rat strains/lines.
As shown in Table 2, the majority of genes that
responded to TCDD could not be assigned to a specific
Type-I or Type-II category and were classified as
‘‘Ambiguous’’ (i.e., Type-I Score = 4; Type-II Score = 2).
Of those genes that could be classified, there were more
Type-I responders than Type-II responders (Table 3).
For some genes, multiple clones representing different
regions of the transcript were present on the array; the
similarity of response for multiple independent clones
gives added confidence in the validity of the TCDD effect
for these genes. In particular, three clones representing
ferritin light chain 1 (Ftl1), three clones representing S-
adenosylhomocysteine hydrolase (Ahcy) and two clones
representing a cluster similar to ribosomal protein S18,
cytosolic-rat showed induction by TCDD. Two clones
representing glutamate dehydrogenase 1 (Glud1) and two
clones representing transforming growth factor beta 1
induced transcript 4 (Tgfb1i4) showed repression
(Table 3).
Type-I response genes
In total, 38 clones responded significantly to TCDD in
dioxin-sensitive as well as in dioxin-resistant collectives on
OCI cDNA arrays (upper portion of Table 3); i.e., repre-
sent Type-I responses. These clones represent 32 unique
UniGene clusters and 18 RGD (Rat Genome Database)
genes (Table 2). As was seen with Clontech arrays, the
OCI cDNA arrays revealed that several genes that are well
known to be upregulated by AHR agonists were induced
independently of the dioxin-sensitivity phenotype. These
include (Table 3) CYP1B1 (Zhang et al. 2003), Nfe2l2
(Miao et al. 2005; Tijet et al. 2006) and UGT1A6 (Bock
and Kohle 2005b). Clearly the AHR transactivation-
domain deletion in H/W and LnA rats does not prevent
induction by TCDD of these standard AHR-regulated
genes.
Fig. 2 Response in dioxin-sensitive L–E rats and dioxin-resistant H/
W rats of genes that are well known to be AHR-regulated and TCDD-
responsive. Rats were treated with a single TCDD dose of 50 lg/kg or
the corn oil vehicle as a control. Liver was harvested 24 h after
TCDD and RNA was pooled from three animals within each
treatment and strain. mRNA levels were determined with Clontech
1.2 k arrays as described in ‘‘Materials and methods’’. The figures
show only a sub-section from each array that contains four classic
AHR-regulated/dioxin-responsive genes: CYP1A1, CYP1A2, CYP1B1and Gsta3. The mRNA level for each of these genes is represented by
the intensity of the spots encircled by dotted lines
Table 2 Summary of the gene
clusters on OCI cDNA arrays
and their responsiveness to
TCDD
Number of
clones/clusters
Percent of all
assignable clones
Percent of
unique clusters
Total unique clones per array 15,297 100 N/A
Total clones assignable to UniGene clusters 10,533 68.9 N/A
Total unique UniGene clusters (i.e., number
of genes screened)
7,538 71.6 100
UniGene clusters that significantly respond to
TCDD in at least one strain (P \ 0.05)
398 3.8 5.3
Type-I responsive named genes 18 0.17 0.24
Type-II responsive named genes 10 0.10 0.13
Arch Toxicol (2008) 82:809–830 815
123

In addition to detecting upregulation of classic AHR-
mediated genes, the OCI cDNA arrays also identified
multiple novel genes, not previously known to be affected
by TCDD, whose expression was altered by TCDD in at
least four of the six rat lines/strains tested. For genes that
exhibited this Type-I response, approximately half were
upregulated by TCDD and half were downregulated
(Table 3).
Type-II response genes
Genes that responded differently between dioxin-sensitive
and dioxin-resistant collectives on OCI cDNA arrays are
listed in the lower portion of Table 3. These 22 clones
represent 15 unique UniGene clusters and 10 RGD genes
(Table 2). The magnitude of the TCDD effect on mRNA
levels generally was much lower for Type-II response genes
than for Type-I response genes. No gene showed a striking
difference in magnitude of response between sensitive and
resistant collectives. Consequently, no Type-II genes from
the OCI cDNA arrays were selected for further follow-up by
RT-PCR. However, it cannot be excluded that some genes
in the Type-II group may be involved in susceptibility to the
lethal effects of TCDD since the magnitude of change in
mRNA expression does not necessarily reflect the biologi-
cal impact of that change on a given phenotype.
Ambiguous response genes
Six unique clones could not be unambiguously classified as
either Type-I or Type-II responses. These are shown in the
middle portion of Table 3, classified as ‘‘Ambiguous’’. For
glutamate dehydrogenase 1 (Glud1) and transforming
growth factor beta 1 induced transcript 4 (Tgfb1i4), a
second clone on the array for each of these genes emerged
under Type-I, potentially resolving the ambiguous classi-
fication (Table 3).
Measurement of mRNA levels by real-time quantitative
RT-PCR
To evaluate the validity of the microarray results, 20 genes
were selected for assessment of TCDD responsiveness by
an independent method, real-time RT-PCR (Fig. 4). These
genes were selected primarily based on their plausible
involvement in biological pathways related to toxic
responses to dioxins. Ten candidate genes that appeared as
TCDD-responsive on Clontech 4 k arrays (CYP1A1, Sdc1,
Mt1, Mt2l, Srd5a1, Lcat, Pc, Slc2a2, Tat, Igfbp) and ten on
the OCI cDNA arrays (All Type-I: Nfe2l2, Tgfb1i4, Bgn,
Glud1, Aldh3a2, Polr2c, H3144A09, Ces3, H3119G08,
Ftl1) were selected for validation by RT-PCR. In most
instances mRNA levels were quantitated by RT-PCR only
in the prototype sensitive (L–E) and resistant (H/W)
strains. However, for some genes, mRNA levels also were
quantitated in additional sensitive or resistant lines/strains
(Fig. 4).
CYP1A1 served as a benchmark for the effectiveness of
TCDD treatment since CYP1A1 is a well-established
Type-I response gene that is highly inducible via the AHR
pathway (Denison and Whitlock 1995; Nebert et al. 2004;
Okey et al. 2005). CYP1A1 mRNA was below detection
limits in livers from control dioxin-sensitive rats (L–E and
LnC) as well as in livers from control dioxin-resistant rats
(H/W and LnA). CYP1A1 mRNA was highly induced by
TCDD treatment in all four of these rat strains/lines as
quantitated by RT-PCR (Fig. 4a); hence CYP1A1 was
confirmed to be a Type-I gene.
In general, the RT-PCR measurements corroborated the
responses that were detected by microarray analyses.
However, for certain genes the RT-PCR analyses showed
some degree of discordance with the cDNA array results.
For biglycan (Bgn), the OCI cDNA array analyses indi-
cated significant upregulation by TCDD in all six rat
strains/lines (Table 3) but RT-PCR analyses performed in
L–E and H/W did not detect a significant change in Bgn
mRNA level in either strain (Fig. 4a); for Polr2c (classified
as Type-I by arrays and as Type-II by RT-PCR) results
were discordant for three of four strains tested (L–E, LnC,
H/W) (Table 3; Fig. 4b); for Ces3 (classified as Type-I by
arrays and Type-II by RT-PCR) results were discordant for
H/W, although only L–E and H/W were tested by RT-PCR
(Table 3; Fig. 4b). For some genes, RT-PCR resolved the
ambiguous genes: for Glud1, one clone was classified as
Type-I and the other as ambiguous by the array while
Fig. 3 Summary of the number of TCDD-responsive UniGene
clusters within the collective of dioxin-sensitive rats and the
collective of dioxin-resistant rats as detected on OCI cDNA arrays
The numbers in each sector of the Venn diagrams represent the
numbers of UniGene clusters whose expression was significantly
affected (P \ 0.05) by TCDD treatment in each rat strain or line. Data
were obtained from experiments with OCI cDNA arrays as described
in Materials and methods
816 Arch Toxicol (2008) 82:809–830
123
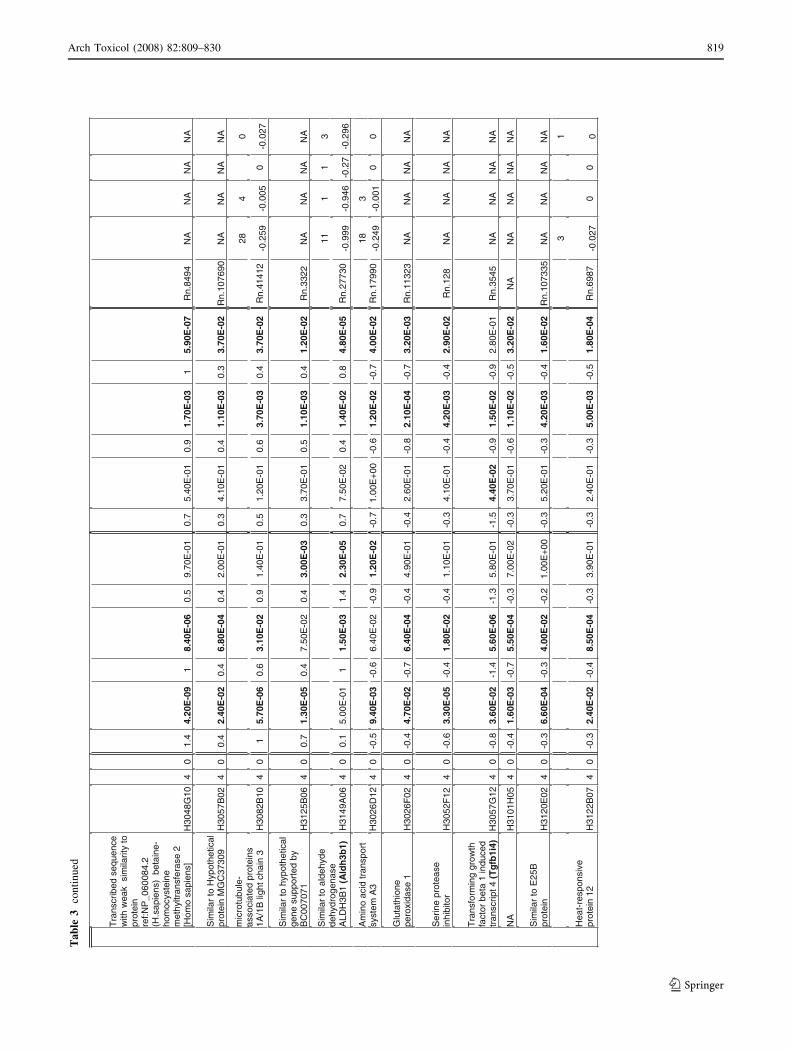
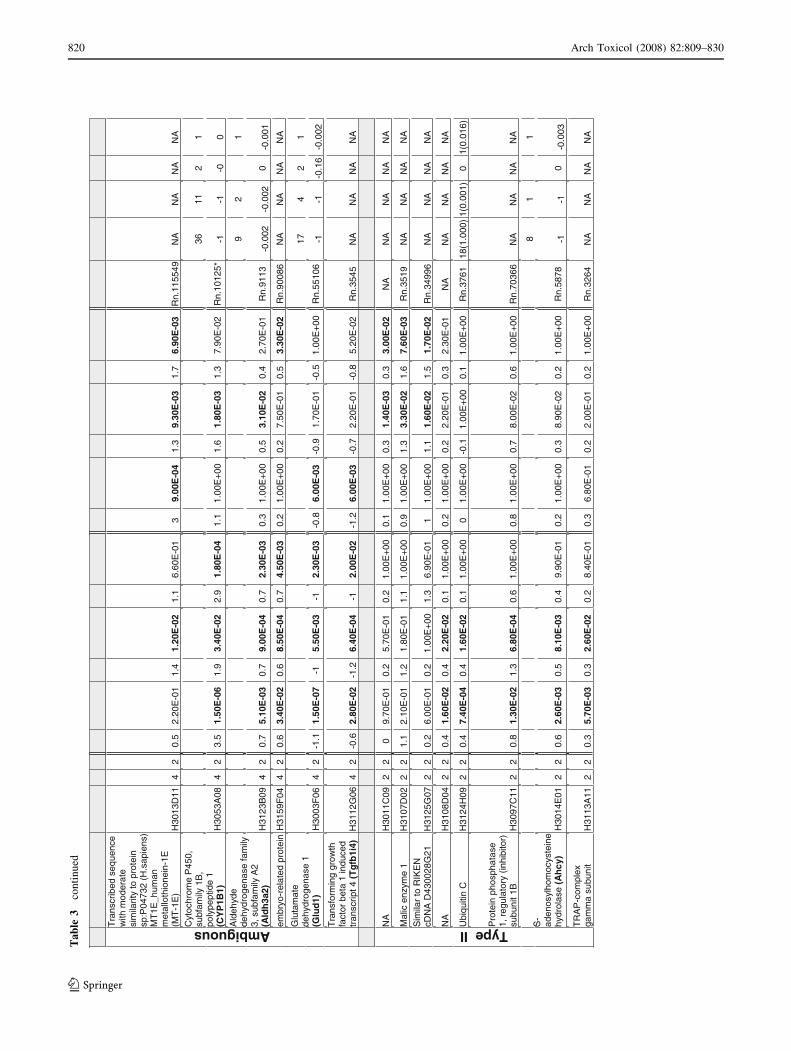
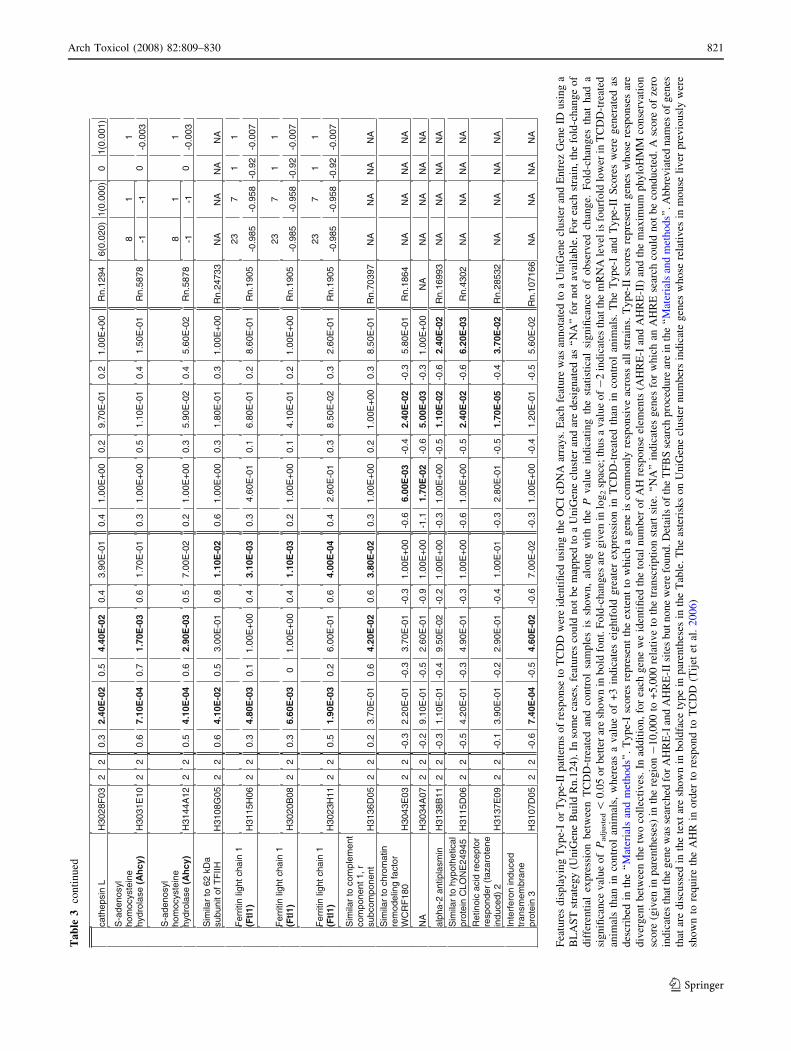
Ta
ble
3T
yp
e-I
and
Ty
pe-
IIre
spo
nse
gen
esd
etec
ted
on
cDN
Aar
ray
s
seni
Ld
nas
niartS
tnatsise
Rse
niL
dna
sniart
Sevitis
neS
e roc
S
L-E
S
D
Ln
C
H/W
F
1 L
nA
A
HR
E-I
Classification
Nam
e
Gen
Ban
k A
cces
sio
n
Nu
mb
er
Type I
Type II
Log2 fold change
p-value
Log2 fold change
p-value
Log2 fold change
p-value
Log2 fold change
p-value
Log2 fold change
p-value
Log2 fold change
p-value
UniGene Cluster
Co
re
Ext
F
ull
AH
RE
-II
Sim
ilar
to r
ibos
omal
pr
otei
n S
18, c
ytos
olic
[v
alid
ated
] - r
at
H30
16E
11
6 0
0.7
3.30
E-0
50.
35.
90E
-03
0.6
2.10
E-0
40.
61.
70E
-02
0.5
7.90
E-0
30.
64.
50E
-05
Rn.
3761
9N
A
NA
N
A
NA
3
2 N
F-E
2-re
late
d fa
ctor
2
(Nfe
2l2)
H
3054
B12
6
0 1.
4 6.
20E
-05
1.1
2.50
E-0
31.
71.
40E
-03
1.6
1.70
E-0
21.
32.
90E
-03
1.2
1.70
E-0
3R
n.10
867*
-0.0
1 -0
.009
0 1(
0.00
2)
14
4 2
fatty
aci
d el
onga
se 1
H
3111
C08
6
0 1.
4 9.
90E
-07
0.8
1.50
E-0
41
7.90
E-0
40.
81.
10E
-03
0.7
3.20
E-0
41
4.50
E-0
5R
n.42
43-0
.021
-0
.024
0-0
.014
Sim
ilar
to g
luta
thio
ne
S-t
rans
fera
se 8
(G
ST
8-
8) (
CH
AIN
8)
(GS
T
CLA
SS
-ALP
HA
) H
3119
G08
6
0 1.
6 1.
70E
-08
1.5
9.30
E-0
91.
37.
30E
-05
1.1
4.40
E-0
41.
31.
60E
-07
1.1
4.10
E-0
7R
n.15
990
NA
N
A
NA
N
A
7 2
1 B
igly
can
(Bg
n)
H31
27D
03
6 0
2.2
1.60
E-0
61.
52.
10E
-07
1.7
1.90
E-0
61.
41.
40E
-02
1.1
2.40
E-0
71.
42.
30E
-08
Rn.
783
-0.2
25
0 0
0
Sim
ilar
to M
yl9
prot
ein
H31
47B
03
6 0
0.5
2.10
E-0
30.
38.
20E
-03
0.6
2.50
E-0
40.
51.
30E
-02
0.2
4.90
E-0
20.
41.
60E
-03
Rn.
6870
N
A
NA
N
A
NA
15
1 1
2
UD
Pgl
ycos
yltr
ansf
eras
e 1
fam
ily, p
olyp
eptid
e A
6 (U
GT
1A6)
H31
55C
10
6 0
1.7
1.10
E-0
91.
31.
80E
-09
1.3
1.10
E-0
81.
41.
50E
-07
1.2
1.80
E-0
81.
52.
00E
-09
Rn.
2648
9*-0
.779
-0
.088
-0
-0.0
02
22
Cyt
osol
ic c
yste
ine
diox
ygen
ase
1 (C
d01
)H
3061
E04
6
0 -1
.2
7.20
E-0
9-1
.24.
10E
-08
-1.5
6.50
E-0
7-1
1.50
E-0
5-1
.11.
80E
-08
-1.2
6.50
E-0
9R
n.25
89-0
.006
0 0
-0.0
12
14
8 1
1 In
sulin
-like
gro
wth
fa
ctor
1 (
Igf1
) H
3099
C09
6
0 -0
.8
2.10
E-0
5-0
.99.
30E
-09
-0.7
4.30
E-0
4-0
.53.
70E
-03
-0.8
2.40
E-0
6-0
.83.
50E
-08
Rn.
6282
-1
-1
0 0
8 5
1 C
arbo
xyle
ster
ase
3 (C
es3)
H31
11D
10
6 0
-0.7
6.
80E
-05
-0.4
2.40
E-0
2-0
.52.
50E
-02
-0.6
9.80
E-0
3-0
.81.
20E
-07
-0.4
5.50
E-0
3R
n.34
885
-0.6
18
-0.0
050
-0.0
02
Tra
nscr
ibed
seq
uenc
e H
3142
C09
6
0 -0
.5
7.10
E-0
4-0
.62.
30E
-04
-0.6
4.50
E-0
3-0
.56.
00E
-03
-0.6
7.70
E-0
3-0
.51.
80E
-02
Rn.
9513
N
A
NA
N
A
NA
Type I Rat
insu
lin-li
ke g
row
th
fact
or I
mR
NA
, 3' e
nd
of m
RN
A (
Igf1
)H
3144
A06
6
0 -1
.1
2.60
E-0
6-1
.31.
40E
-08
-0.9
2.30
E-0
3-0
.61.
70E
-02
-0.9
2.50
E-0
4-0
.81.
20E
-03
Rn.
2512
4*N
A
NA
N
A
NA
Arch Toxicol (2008) 82:809–830 817
123

Ta
ble
3co
nti
nu
ed
Sim
ilar
to m
icro
som
al
glut
athi
one
S-
tran
sfer
ase
3 H
3157
D12
6
0 -0
.5
2.60
E-0
3-0
.54.
00E
-03
-0.9
1.70
E-0
4-0
.71.
60E
-03
-0.6
3.20
E-0
4-0
.44.
00E
-02
Rn.
1916
N
A
NA
N
A
NA
S
imila
r to
rib
osom
al
prot
ein
S18
, cyt
osol
ic
[val
idat
ed] -
rat
H
3006
C11
5
1 0.
6 1.
00E
-05
0.3
3.80
E-0
1 0.
62.
30E
-03
0.5
4.30
E-0
20.
56.
20E
-03
0.5
3.70
E-0
2R
n.37
619
NA
N
A
NA
N
A
7 1
1 C
ytoc
hrom
e b-
5 (C
yb5)
H30
29A
08
5 1
-0.5
6.
50E
-01
0.9
2.10
E-0
90.
63.
50E
-05
0.6
9.00
E-0
40.
53.
20E
-04
0.3
4.50
E-0
3R
n.10
55*
-0.0
01
-0.0
010
-0.0
0415
6
Bet
aine
-hom
ocys
tein
e m
ethy
ltran
sfer
ase
H30
33G
02
5 1
2.2
7.30
E-0
91.
32.
50E
-06
0.5
1.00
E+
00
0.8
2.50
E-0
21.
22.
60E
-03
1.2
1.50
E-0
4R
n.11
406
-1
-0.9
930
0
Sim
ilar
to 2
4-de
hydr
ocho
lest
erol
re
duct
ase
H31
35D
07
5 1
0.7
4.30
E-0
50.
61.
60E
-03
0.7
3.60
E-0
30
1.00
E+
00
0.5
3.20
E-0
40.
41.
60E
-02
Rn.
9470
N
A
NA
N
A
NA
24
4 4
Sim
ilar
to P
olym
eras
e (R
NA
) II
(DN
A
dire
cted
) po
lype
ptid
e C
(Po
lr2c
)H
3137
C07
5
1 1.
6 1.
50E
-07
1.5
1.60
E-0
71.
44.
50E
-03
1.2
2.80
E-0
1 1.
5 3.
80E
-08
1.5
2.30
E-0
8R
n.22
044
-1
-1
0-0
.999
Tra
nscr
ibed
seq
uenc
e w
ith s
tron
g si
mila
rity
to
prot
ein
ref:N
P_0
5733
9.1
(H.s
apie
ns)
Aut
osom
al H
ighl
y C
onse
rved
Pro
tein
[H
omo
sapi
ens]
H
3144
A09
5
1 3.
3 2.
40E
-08
1.9
7.10
E-0
32.
14.
50E
-03
1.2
7.40
E-0
1 1.
6 7.
10E
-06
1.2
1.30
E-0
3R
n.80
25
NA
N
A
NA
N
A
21
Com
plem
ent
com
pone
nt fa
ctor
H
H31
46G
02
5 1
-0.6
1.
30E
-05
-0.6
1.10
E-0
4-0
.53.
50E
-02
-0.2
8.00
E-0
1 -0
.4
4.60
E-0
3-0
.51.
40E
-03
Rn.
1017
770
0 0
-0.0
02
NA
H
3036
B02
5
1 -1
.1
3.50
E-0
4-0
.67.
10E
-03
-0.9
4.90
E-0
1 -0
.82.
10E
-04
-0.7
5.70
E-0
4-0
.53.
20E
-02
NA
N
A
NA
N
A
NA
17
4 2
1 G
luta
mat
ede
hydr
ogen
ase
1 (G
lud
1)H
3140
E08
5
1 -0
.7
2.10
E-0
6-0
.37.
80E
-02
-0.5
9.10
E-0
3-0
.66.
70E
-04
-0.5
8.10
E-0
3-0
.31.
90E
-02
Rn.
5510
6-1
-1
-0
.16
-0.0
02
NA
H
3012
B07
4
0 0.
5 2.
10E
-04
0.2
7.20
E-0
1 0.
63.
90E
-04
0.4
1.10
E-0
20.
34.
40E
-02
0.4
5.80
E-0
2 N
A
NA
N
A
NA
N
A
NA
H
3020
C02
4
0 0.
4 1.
20E
-02
0.3
3.90
E-0
30.
53.
40E
-01
0.6
3.70
E-0
30.
32.
50E
-02
0.3
2.60
E-0
1 N
A
NA
N
A
NA
N
A
Tra
nscr
ibed
seq
uenc
e w
ith m
oder
ate
sim
ilarit
y to
pro
tein
pi
r:S
1220
7(M
.mus
culu
s) S
1220
7 hy
poth
etic
al p
rote
in
(B2
elem
ent)
- m
ouse
H
3044
A09
4
0 0.
4 2.
50E
-05
0.3
1.50
E-0
20.
21.
00E
+00
0.
21.
00E
+00
0.
4 3.
20E
-03
0.3
3.20
E-0
2R
n.10
5274
NA
N
A
NA
N
A
NA
H
3045
E08
4
0 0.
8 3.
30E
-05
0.7
3.60
E-0
60.
52.
00E
-01
0.4
1.00
E+
00
0.5
7.60
E-0
40.
62.
40E
-03
NA
N
A
NA
N
A
NA
818 Arch Toxicol (2008) 82:809–830
123
Ta
ble
3co
nti
nu
ed
Tra
nscr
ibed
seq
uenc
e w
ith w
eak
sim
ilarit
y to
pr
otei
nre
f:NP
_060
084.
2 (H
.sap
iens
) b
etai
ne-
hom
ocys
tein
e m
ethy
ltran
sfer
ase
2 [H
omo
sapi
ens]
H
3048
G10
4
0 1.
4 4.
20E
-09
18.
40E
-06
0.5
9.70
E-0
1 0.
75.
40E
-01
0.9
1.70
E-0
31
5.90
E-0
7R
n.84
94
NA
N
A
NA
N
A
Sim
ilar
to H
ypot
hetic
al
prot
ein
MG
C37
309
H30
57B
02
4 0
0.4
2.40
E-0
20.
46.
80E
-04
0.4
2.00
E-0
1 0.
34.
10E
-01
0.4
1.10
E-0
30.
33.
70E
-02
Rn.
1076
90N
A
NA
N
A
NA
28
4 0
mic
rotu
bule
-as
soci
ated
pro
tein
s 1A
/1B
ligh
t cha
in 3
H
3082
B10
4
0 1
5.70
E-0
60.
63.
10E
-02
0.9
1.40
E-0
1 0.
51.
20E
-01
0.6
3.70
E-0
30.
43.
70E
-02
Rn.
4141
2-0
.259
-0
.005
0-0
.027
Sim
ilar
to h
ypot
hetic
al
gene
sup
port
ed b
y B
C00
7071
H
3125
B06
4
0 0.
7 1.
30E
-05
0.4
7.50
E-0
2 0.
43.
00E
-03
0.3
3.70
E-0
1 0.
5 1.
10E
-03
0.4
1.20
E-0
2R
n.33
22
NA
N
A
NA
N
A
11
1 1
3 S
imila
r to
ald
ehyd
e de
hydr
ogen
ase
ALD
H3B
1(A
ldh
3b1)
H31
49A
06
4 0
0.1
5.00
E-0
11
1.50
E-0
31.
42.
30E
-05
0.7
7.50
E-0
2 0.
4 1.
40E
-02
0.8
4.80
E-0
5R
n.27
730
-0.9
99
-0.9
46-0
.27
-0.2
96
18
3 A
min
o ac
id tr
ansp
ort
syst
em A
3 H
3026
D12
4
0 -0
.5
9.40
E-0
3-0
.66.
40E
-02
-0.9
1.20
E-0
2-0
.71.
00E
+00
-0
.6
1.20
E-0
2-0
.74.
00E
-02
Rn.
1799
0-0
.249
-0
.001
0 0
Glu
tath
ione
pero
xida
se 1
H
3026
F02
4
0 -0
.4
4.70
E-0
2-0
.76.
40E
-04
-0.4
4.90
E-0
1 -0
.42.
60E
-01
-0.8
2.
10E
-04
-0.7
3.20
E-0
3R
n.11
323
NA
N
A
NA
N
A
Ser
ine
prot
ease
in
hibi
tor
H30
52F
12
4 0
-0.6
3.
30E
-05
-0.4
1.80
E-0
2-0
.41.
10E
-01
-0.3
4.10
E-0
1 -0
.4
4.20
E-0
3-0
.42.
90E
-02
Rn.
128
NA
N
A
NA
N
A
Tra
nsfo
rmin
g gr
owth
fa
ctor
bet
a 1
indu
ced
tran
scrip
t 4 (
Tg
fb1i
4)H
3057
G12
4
0 -0
.8
3.60
E-0
2-1
.45.
60E
-06
-1.3
5.80
E-0
1 -1
.54.
40E
-02
-0.9
1.50
E-0
2-0
.92.
80E
-01
Rn.
3545
N
A
NA
N
A
NA
NA
H
3101
H05
4
0 -0
.4
1.60
E-0
3-0
.75.
50E
-04
-0.3
7.00
E-0
2 -0
.33.
70E
-01
-0.6
1.
10E
-02
-0.5
3.20
E-0
2N
A
NA
N
A
NA
N
A
Sim
ilar
to E
25B
pr
otei
nH
3120
E02
4
0 -0
.3
6.60
E-0
4-0
.34.
00E
-02
-0.2
1.00
E+
00
-0.3
5.20
E-0
1 -0
.3
4.20
E-0
3-0
.41.
60E
-02
Rn.
1073
35N
A
NA
N
A
NA
13
Hea
t-re
spon
sive
pr
otei
n 12
H
3122
B07
4
0 -0
.3
2.40
E-0
2-0
.48.
50E
-04
-0.3
3.90
E-0
1 -0
.32.
40E
-01
-0.3
5.
00E
-03
-0.5
1.80
E-0
4R
n.69
87-0
.027
0 0
0
Arch Toxicol (2008) 82:809–830 819
123
Ta
ble
3co
nti
nu
ed
Tra
nscr
ibed
seq
uenc
e w
ith m
oder
ate
sim
ilarit
y to
pro
tein
sp
:P04
732
(H.s
apie
ns)
MT
1E_h
uman
met
allo
thio
nein
-1E
(MT
-1E
) H
3013
D11
4
2 0.
5 2.
20E
-01
1.4
1.20
E-0
21.
16.
60E
-01
3 9.
00E
-04
1.3
9.30
E-0
31.
76.
90E
-03
Rn.
1155
49N
A
NA
N
A
NA
36
11
2 1
Cyt
ochr
ome
P45
0,
subf
amily
1B
, po
lype
ptid
e 1
(CY
P1B
1)H
3053
A08
4
2 3.
5 1.
50E
-06
1.9
3.40
E-0
22.
91.
80E
-04
1.1
1.00
E+
00
1.6
1.80
E-0
31.
37.
90E
-02
Rn.
1012
5*-1
-1
-0
0
9 2
1 A
ldeh
yde
dehy
drog
enas
e fa
mily
3,
sub
fam
ily A
2 (A
ldh
3a2)
H31
23B
09
4 2
0.7
5.10
E-0
30.
79.
00E
-04
0.7
2.30
E-0
30.
31.
00E
+00
0.
5 3.
10E
-02
0.4
2.70
E-0
1 R
n.91
13
-0.0
02
-0.0
020
-0.0
01
embr
yo-r
elat
ed p
rote
in H
3159
F04
4
2 0.
6 3.
40E
-02
0.6
8.50
E-0
40.
74.
50E
-03
0.2
1.00
E+
00
0.2
7.50
E-0
1 0.
53.
30E
-02
Rn.
9008
6N
A
NA
N
A
NA
17
4 2
1 G
luta
mat
ede
hydr
ogen
ase
1 (G
lud
1)
H30
03F
06
4 2
-1.1
1.
50E
-07
-15.
50E
-03
-12.
30E
-03
-0.8
6.00
E-0
3-0
.9
1.70
E-0
1 -0
.51.
00E
+00
R
n.55
106
-1
-1
-0.1
6-0
.002
Ambiguous Tra
nsfo
rmin
g gr
owth
fa
ctor
bet
a 1
indu
ced
tran
scrip
t 4 (
Tg
fb1i
4)
H31
12G
06
4 2
-0.6
2.
80E
-02
-1.2
6.40
E-0
4-1
2.00
E-0
2-1
.26.
00E
-03
-0.7
2.
20E
-01
-0.8
5.20
E-0
2 R
n.35
45
NA
N
A
NA
N
A
NA
H
3011
C09
2
2 0
9.70
E-0
10.
25.
70E
-01
0.2
1.00
E+
00
0.1
1.00
E+
00
0.3
1.40
E-0
30.
33.
00E
-02
NA
N
A
NA
N
A
NA
Mal
ic e
nzym
e 1
H31
07D
02
2 2
1.1
2.10
E-0
11.
21.
80E
-01
1.1
1.00
E+
00
0.9
1.00
E+
00
1.3
3.30
E-0
21.
67.
60E
-03
Rn.
3519
N
A
NA
N
A
NA
S
imila
r to
RIK
EN
cD
NA
D43
0028
G21
H
3125
G07
2
2 0.
2 6.
00E
-01
0.2
1.00
E+
00
1.3
6.90
E-0
1 1
1.00
E+
00
1.1
1.60
E-0
21.
51.
70E
-02
Rn.
3499
6N
A
NA
N
A
NA
NA
H
3108
D04
2
2 0.
4 1.
60E
-02
0.4
2.20
E-0
20.
11.
00E
+00
0.
21.
00E
+00
0.
2 2.
20E
-01
0.3
2.30
E-0
1 N
A
NA
N
A
NA
N
A
Ubi
quiti
n C
H
3124
H09
2
2 0.
4 7.
40E
-04
0.4
1.60
E-0
20.
11.
00E
+00
0
1.00
E+
00
-0.1
1.
00E
+00
0.
11.
00E
+00
R
n.37
61
18(1
.000
)1(
0.00
1)0
1(0.
016)
Pro
tein
pho
spha
tase
1,
reg
ulat
ory
(inhi
bito
r)
subu
nit 1
B
H30
97C
11
2 2
0.8
1.30
E-0
21.
36.
80E
-04
0.6
1.00
E+
00
0.8
1.00
E+
00
0.7
8.00
E-0
2 0.
61.
00E
+00
R
n.70
366
NA
N
A
NA
N
A
8 1
1 S
-ad
enos
ylho
moc
yste
ine
hydr
olas
e (A
hcy
)H
3014
E01
2
2 0.
6 2.
60E
-03
0.5
8.10
E-0
30.
49.
90E
-01
0.2
1.00
E+
00
0.3
8.90
E-0
2 0.
21.
00E
+00
R
n.58
78
-1
-1
0-0
.003
Type II TR
AP
-com
plex
ga
mm
a su
buni
t H
3113
A11
2
2 0.
3 5.
70E
-03
0.3
2.60
E-0
20.
28.
40E
-01
0.3
6.80
E-0
1 0.
2 2.
00E
-01
0.2
1.00
E+
00
Rn.
3264
N
A
NA
N
A
NA
820 Arch Toxicol (2008) 82:809–830
123
Ta
ble
3co
nti
nu
ed
cath
epsi
n L
H30
28F
03
2 2
0.3
2.40
E-0
20.
54.
40E
-02
0.4
3.90
E-0
1 0.
41.
00E
+00
0.
2 9.
70E
-01
0.2
1.00
E+
00
Rn.
1294
6(
0.02
0)1(
0.00
0)0
1(0.
001)
8 1
1 S
-ade
nosy
l ho
moc
yste
ine
hydr
olas
e (A
hcy
) H
3031
E10
2
2 0.
6 7.
10E
-04
0.7
1.70
E-0
30.
61.
70E
-01
0.3
1.00
E+
00
0.5
1.10
E-0
1 0.
41.
50E
-01
Rn.
5878
-1
-1
0
-0.0
03
8 1
1 S
-ade
nosy
l ho
moc
yste
ine
hydr
olas
e (A
hcy
)H
3144
A12
2
2 0.
5 4.
10E
-04
0.6
2.90
E-0
30.
57.
00E
-02
0.2
1.00
E+
00
0.3
5.90
E-0
2 0.
45.
60E
-02
Rn.
5878
-1
-1
0
-0.0
03
Sim
ilar
to 6
2 kD
a su
buni
t of T
FIIH
H
3108
G05
2
2 0.
6 4.
10E
-02
0.5
3.00
E-0
1 0.
81.
10E
-02
0.6
1.00
E+
00
0.3
1.80
E-0
1 0.
31.
00E
+00
R
n.24
733
NA
N
A
NA
N
A
23
7 1
1 F
errit
in li
ght c
hain
1
(Ftl
1)
H31
15H
06
2 2
0.3
4.80
E-0
30.
11.
00E
+00
0.
43.
10E
-03
0.3
4.60
E-0
1 0.
1 6.
80E
-01
0.2
8.60
E-0
1 R
n.19
05
-0.9
85
-0.9
58-0
.92
-0.0
07
23
7 1
1 F
errit
in li
ght c
hain
1
(Ftl
1)H
3020
B08
2
2 0.
3 6.
60E
-03
0 1.
00E
+00
0.
41.
10E
-03
0.2
1.00
E+
00
0.1
4.10
E-0
1 0.
21.
00E
+00
R
n.19
05
-0.9
85
-0.9
58-0
.92
-0.0
07
23
7 1
1 F
errit
in li
ght c
hain
1
(Ftl
1)H
3023
H11
2
2 0.
5 1.
90E
-03
0.2
6.00
E-0
1 0.
64.
00E
-04
0.4
2.60
E-0
1 0.
3 8.
50E
-02
0.3
2.60
E-0
1 R
n.19
05
-0.9
85
-0.9
58-0
.92
-0.0
07
Sim
ilar
to c
ompl
emen
t co
mpo
nent
1, r
su
bcom
pone
ntH
3136
D05
2
2 0.
2 3.
70E
-01
0.6
4.20
E-0
20.
63.
80E
-02
0.3
1.00
E+
00
0.2
1.00
E+
00
0.3
8.50
E-0
1 R
n.70
397
NA
N
A
NA
N
A
Sim
ilar
to c
hrom
atin
re
mod
elin
g fa
ctor
W
CR
F18
0H
3043
E03
2
2 -0
.3
2.20
E-0
1-0
.33.
70E
-01
-0.3
1.00
E+
00
-0.6
6.00
E-0
3-0
.42.
40E
-02
-0.3
5.80
E-0
1 R
n.18
64
NA
N
A
NA
N
A
NA
H
3034
A07
2
2 -0
.2
9.10
E-0
1-0
.52.
60E
-01
-0.9
1.00
E+
00
-1.1
1.70
E-0
2-0
.65.
00E
-03
-0.3
1.00
E+
00
NA
N
A
NA
N
A
NA
alph
a-2
antip
lasm
in
H31
38B
11
2 2
-0.3
1.
10E
-01
-0.4
9.50
E-0
2 -0
.21.
00E
+00
-0
.31.
00E
+00
-0
.5
1.10
E-0
2-0
.62.
40E
-02
Rn.
1699
3N
A
NA
N
A
NA
S
imila
r to
hyp
othe
tical
pr
otei
n C
LON
E24
945
H31
15D
06
2 2
-0.5
4.
20E
-01
-0.3
4.90
E-0
1 -0
.31.
00E
+00
-0
.61.
00E
+00
-0
.5
2.40
E-0
2-0
.66.
20E
-03
Rn.
4302
N
A
NA
N
A
NA
R
etin
oic
acid
rec
epto
r re
spon
der
(taz
arot
ene
indu
ced)
2
H31
37E
09
2 2
-0.1
3.
90E
-01
-0.2
2.90
E-0
1 -0
.41.
00E
-01
-0.3
2.80
E-0
1 -0
.5
1.70
E-0
5-0
.43.
70E
-02
Rn.
2853
2N
A
NA
N
A
NA
In
terf
eron
indu
ced
tran
smem
bran
e pr
otei
n 3
H
3107
D05
2
2 -0
.6
7.40
E-0
4-0
.54.
60E
-02
-0.6
7.00
E-0
2 -0
.31.
00E
+00
-0
.4
1.20
E-0
1 -0
.55.
60E
-02
Rn.
1071
66N
A
NA
N
A
NA
Fea
ture
sd
isp
lay
ing
Ty
pe-
Io
rT
yp
e-II
pat
tern
so
fre
spo
nse
toT
CD
Dw
ere
iden
tifi
edu
sin
gth
eO
CI
cDN
Aar
ray
s.E
ach
feat
ure
was
ann
ota
ted
toa
Un
iGen
ecl
ust
eran
dE
ntr
ezG
ene
IDu
sin
ga
BL
AS
Tst
rate
gy
(Un
iGen
eB
uil
dR
n.1
24
).In
som
eca
ses,
feat
ure
sco
uld
no
tb
em
app
edto
aU
niG
ene
clu
ster
and
are
des
ign
ated
as‘‘
NA
’’fo
rn
ot
avai
lab
le.
Fo
rea
chst
rain
,th
efo
ld-c
han
ge
of
dif
fere
nti
alex
pre
ssio
nb
etw
een
TC
DD
-tre
ated
and
con
tro
lsa
mp
les
issh
ow
n,
alo
ng
wit
hth
eP
val
ue
ind
icat
ing
the
stat
isti
cal
sig
nifi
can
ceo
fo
bse
rved
chan
ge.
Fo
ld-c
han
ges
that
had
a
sig
nifi
can
cev
alu
eo
fP
adju
sted\
0.0
5o
rb
ette
rar
esh
ow
nin
bo
ldfo
nt.
Fo
ld-c
han
ges
are
giv
enin
log
2sp
ace;
thu
sa
val
ue
of
-2
ind
icat
esth
atth
em
RN
Ale
vel
isfo
urf
old
low
erin
TC
DD
-tre
ated
anim
als
than
inco
ntr
ol
anim
als,
wh
erea
sa
val
ue
of
+3
ind
icat
esei
gh
tfo
ldg
reat
erex
pre
ssio
nin
TC
DD
-tre
ated
than
inco
ntr
ol
anim
als.
Th
eT
yp
e-I
and
Ty
pe-
IIS
core
sw
ere
gen
erat
edas
des
crib
edin
the
‘‘M
ater
ials
and
met
ho
ds’
’.T
yp
e-I
sco
res
rep
rese
nt
the
exte
nt
tow
hic
ha
gen
eis
com
mo
nly
resp
on
siv
eac
ross
all
stra
ins.
Ty
pe-
IIsc
ore
sre
pre
sen
tg
enes
wh
ose
resp
on
ses
are
div
erg
ent
bet
wee
nth
etw
oco
llec
tiv
es.
Inad
dit
ion
,fo
rea
chg
ene
we
iden
tifi
edth
eto
tal
nu
mb
ero
fA
Hre
spo
nse
elem
ents
(AH
RE
-Ian
dA
HR
E-I
I)an
dth
em
axim
um
ph
ylo
HM
Mco
nse
rvat
ion
sco
re(g
iven
inp
aren
thes
es)
inth
ere
gio
n-
10
,00
0to
+5
,00
0re
lati
ve
toth
etr
ansc
rip
tio
nst
art
site
.‘‘
NA
’’in
dic
ates
gen
esfo
rw
hic
han
AH
RE
sear
chco
uld
no
tb
eco
nd
uct
ed.
Asc
ore
of
zero
ind
icat
esth
atth
eg
ene
was
sear
ched
for
AH
RE
-Ian
dA
HR
E-I
Isi
tes
bu
tn
on
ew
ere
fou
nd
.D
etai
lso
fth
eT
FB
Sse
arch
pro
ced
ure
are
inth
e‘‘
Mat
eria
lsan
dm
eth
od
s’’.
Ab
bre
via
ted
nam
eso
fg
enes
that
are
dis
cuss
edin
the
tex
tar
esh
ow
nin
bo
ldfa
cety
pe
inp
aren
thes
esin
the
Tab
le.
Th
eas
teri
sks
on
Un
iGen
ecl
ust
ern
um
ber
sin
dic
ate
gen
esw
ho
sere
lati
ves
inm
ou
seli
ver
pre
vio
usl
yw
ere
sho
wn
tore
qu
ire
the
AH
Rin
ord
erto
resp
on
dto
TC
DD
(Tij
etet
al.
20
06
)
Arch Toxicol (2008) 82:809–830 821
123

RT-PCR corroborated the Type-I classification (Table 3;
Fig. 4a); for Aldh3a2 (classified as ambiguous by array and
as Type-II by RT-PCR) results were discordant for only one
of the four strains tested (LnC) (Table 3; Fig. 4b); for
Tgfb1i4 (classified as ambiguous by arrays and as Type-I by
RT-PCR) results were discordant for two of the four strains
tested (LnA and LnC) (Table 3; Fig. 4a). Some of the dis-
cordance between the analytical approaches may be
explained, in part, by non-specific or poor hybridization of rat
samples to mouse arrays. Of the ten genes selected from the
Clontech 4 k array, five were found to be Type-I (CYP1A1,
Sdc1, Mt1, Mt2l, Slc2a2) and five to be Type-II (Srd5a1,
Lcat, Pc, Tat, Igfbp) by RT-PCR. Of the ten genes selected
from the OCI cDNA array, seven were classified as Type-I
(Nfe2l2, Tgfb1i4, Bgn, Glud1, H3144A09, H3119G08, Ftl)
and three to be Type-II (Aldh3a2, Polr2c, Ces3).
Dose–response and time course of response for selected
genes
The 100 lg/kg TCDD dose given to rats in the cDNA array
experiments exceeds the LD50 for the three dioxin-sensi-
tive strains/lines (L–E, SD and LnC) but is far below the
LD50 for the resistant strains/lines (H/W, F1, LnA). In
order to gain some understanding of potential quantitative
differences in response to TCDD between sensitive and
resistant rats we conducted dose–response experiments
over a wide range of TCDD exposure and measured mRNA
levels by real-time RT-PCR for the benchmark gene
CYP1A1, as well as one up-regulated gene (Nfe2l2) and
one down-regulated gene (Tgfb1i4). As shown in Fig. 5
No
rmal
ized
mR
NA
exp
ress
ion
( p
erce
nt
of
max
imal
res
po
nse
)
Type-I responses
TCDDControl
Glud1
L-E H/W0
60
100
******
Slc2a2
L-E H/W
******
Nfe2l2(Nrf2)
L-E LnC H/W LnA
***
******
Ftl
L-E H/W0
60
100 ** ***Sdc1
L-E H/W
******
Tgfb1i4
L-E LnC H/W LnA0
60
100
* *** **
*
Bgn
L-E H/W
H3144A09
L-E H/W0
60
100 ******
H3119G08
L-E H/W
CYP1A1
L-E LnC H/W LnA0
60
100***
*** *** ***
Mt1a
L-E SD H/W0
60
100 ***
*****
Mt2l
L-E SD H/W
*
***
Srd5a1
L-E H/W0
60
100
*
Ces3
L-E H/W0
60
100
***
Polr2c
L-E LnC H/W LnA0
60
100 ***
Lcat
L-E H/W0
60
100 *
No
rmal
ized
mR
NA
exp
ress
ion
( p
erce
nt
of
max
imal
res
po
nse
) Igfbp
L-E H/W
*
Pc
L-E H/W
**
Tat
L-E H/W
*
Aldh3a2
L-E LnC H/W LnA
***
Type-II responses
Control TCDD
a
b
Fig. 4 Measurement of mRNA levels by real-time RT-PCR. Real-
time QRT-PCR was used to measure mRNA levels for several genes
that had been identified as TCDD-responsive in array experiments.
Genes are classified as Type-I responders (a) or Type-II responders
(b). Animals, treatments and sample preparation are the same as for
the OCI cDNA arrays described in ‘‘Materials and methods’’. For
each gene, the mRNA level that was highest for any strain or
treatment was set at 100% and all other mRNA levels for that gene
are shown as a percentage of the maximal level. All results plotted
represent the mean of four rats ±SD. Asterisks indicate groups where
the mRNA level in TCDD-treated animals differs significantly from
that of the control: *P \ 0.05; **P \ 0.01; ***P \ 0.001. Note that
for Cyp1a1 (a) the mRNA level in control animals is below the
detection limit of the assay; therefore no bars are presented for control
animals in this plot. Abbreviations for gene names: CYP1A1,
cytochrome P4501A1; Nfe2l2, nuclear factor erythroid derived 2;
Mt1a and Mt2l, methallothionein 1a and 2l; Glud1, glutamate
dehydrogenase; Slc2a2, solute carrier family 2, member 2; Ftl1,
ferritin light chain 1; Sdc1, syndecan 1; Tgfb1i4, transforming growth
factor beta 1-induced transcript 4; Bgn, biglycan; H3144A09,
unidentified clone; H3119G08, clone similar to glutathione S-
transferase 8 alpha. (b) Srd5a1, steroid 5a reductase 1; Igfbp,
insulin-like growth factor binding protein; Ces3, carboyxylesterase-3;
Pc, pyruvate carboxylase; Lcat, lecithin cholesterol acyltransferase;
Tat, tyrosine aminotransferase; Polr2c, Polymerase RNA II (DNA-
directed) polypeptide C; Aldh3a2, aldehyde dehydrogenase 3a2
b
822 Arch Toxicol (2008) 82:809–830
123
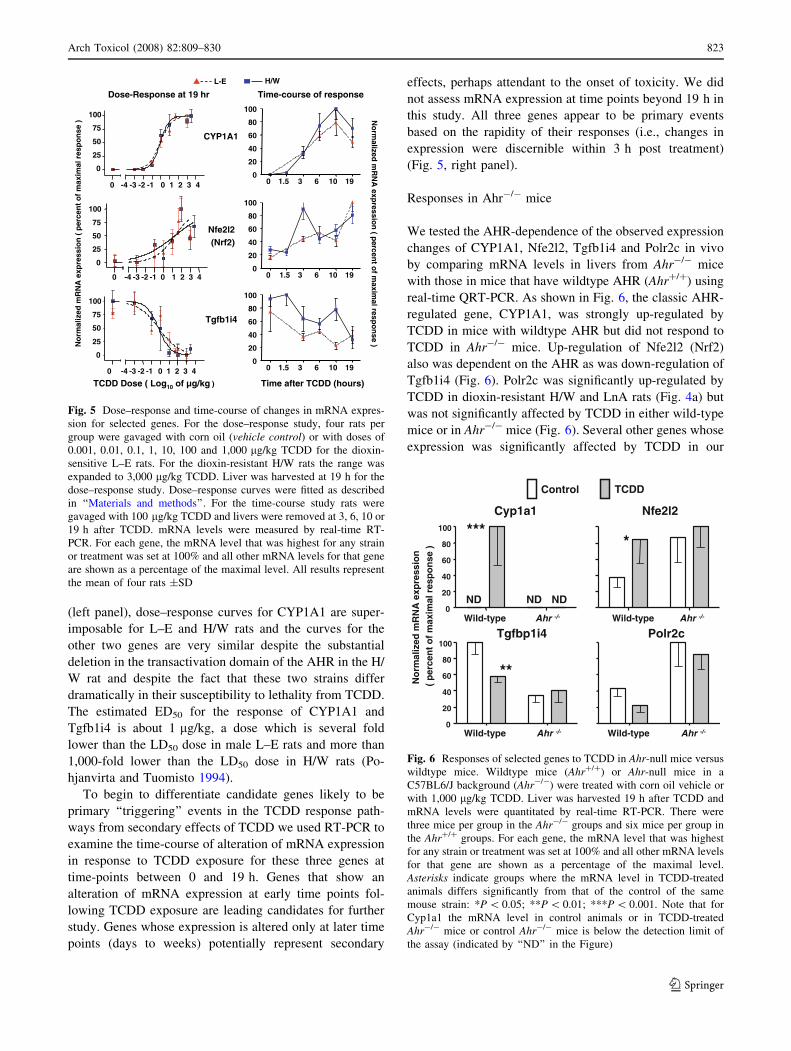
(left panel), dose–response curves for CYP1A1 are super-
imposable for L–E and H/W rats and the curves for the
other two genes are very similar despite the substantial
deletion in the transactivation domain of the AHR in the H/
W rat and despite the fact that these two strains differ
dramatically in their susceptibility to lethality from TCDD.
The estimated ED50 for the response of CYP1A1 and
Tgfb1i4 is about 1 lg/kg, a dose which is several fold
lower than the LD50 dose in male L–E rats and more than
1,000-fold lower than the LD50 dose in H/W rats (Po-
hjanvirta and Tuomisto 1994).
To begin to differentiate candidate genes likely to be
primary ‘‘triggering’’ events in the TCDD response path-
ways from secondary effects of TCDD we used RT-PCR to
examine the time-course of alteration of mRNA expression
in response to TCDD exposure for these three genes at
time-points between 0 and 19 h. Genes that show an
alteration of mRNA expression at early time points fol-
lowing TCDD exposure are leading candidates for further
study. Genes whose expression is altered only at later time
points (days to weeks) potentially represent secondary
effects, perhaps attendant to the onset of toxicity. We did
not assess mRNA expression at time points beyond 19 h in
this study. All three genes appear to be primary events
based on the rapidity of their responses (i.e., changes in
expression were discernible within 3 h post treatment)
(Fig. 5, right panel).
Responses in Ahr-/- mice
We tested the AHR-dependence of the observed expression
changes of CYP1A1, Nfe2l2, Tgfb1i4 and Polr2c in vivo
by comparing mRNA levels in livers from Ahr-/- mice
with those in mice that have wildtype AHR (Ahr+/+) using
real-time QRT-PCR. As shown in Fig. 6, the classic AHR-
regulated gene, CYP1A1, was strongly up-regulated by
TCDD in mice with wildtype AHR but did not respond to
TCDD in Ahr-/- mice. Up-regulation of Nfe2l2 (Nrf2)
also was dependent on the AHR as was down-regulation of
Tgfb1i4 (Fig. 6). Polr2c was significantly up-regulated by
TCDD in dioxin-resistant H/W and LnA rats (Fig. 4a) but
was not significantly affected by TCDD in either wild-type
mice or in Ahr-/- mice (Fig. 6). Several other genes whose
expression was significantly affected by TCDD in our
Cyp1a1
Wild-type Ahr -/-0
20
40
60
80
100 ***Nfe2l2
Wild-type
*
Tgfbp1i4
Wild-type0
20
40
60
80
100
**
Polr2c
Wild-type
No
rmal
ized
mR
NA
exp
ress
ion
( p
erce
nt
of
max
imal
res
po
nse
)
Ahr -/-Ahr -/-
Ahr -/-
Control TCDD
ND ND ND
Fig. 6 Responses of selected genes to TCDD in Ahr-null mice versus
wildtype mice. Wildtype mice (Ahr+/+) or Ahr-null mice in a
C57BL6/J background (Ahr-/-) were treated with corn oil vehicle or
with 1,000 lg/kg TCDD. Liver was harvested 19 h after TCDD and
mRNA levels were quantitated by real-time RT-PCR. There were
three mice per group in the Ahr-/- groups and six mice per group in
the Ahr+/+ groups. For each gene, the mRNA level that was highest
for any strain or treatment was set at 100% and all other mRNA levels
for that gene are shown as a percentage of the maximal level.
Asterisks indicate groups where the mRNA level in TCDD-treated
animals differs significantly from that of the control of the same
mouse strain: *P \ 0.05; **P \ 0.01; ***P \ 0.001. Note that for
Cyp1a1 the mRNA level in control animals or in TCDD-treated
Ahr-/- mice or control Ahr-/- mice is below the detection limit of
the assay (indicated by ‘‘ND’’ in the Figure)
CYP1A1
Nfe2l2(Nrf2)
Tgfb1i4
0 1.5 3 6 10 190
20
40
60
80
100
Time-course of response
0 1.5 3 6 10 190
20
40
60
80
100
0 1.5 3 6 10 190
20
40
60
80
100
No
rmalized
mR
NA
expressio
n ( p
ercent o
f maxim
al respo
nse )
Time after TCDD (hours)
L-E H/W
Dose-Response at 19 hr
TCDD Dose ( Log10 of µg/kg )
0
0
25
50
75
100
-4 -3 -2 -1 0 1 2 3 4
0
25
50
75
100
0 -4 -3 -2 -1 0 1 2 3 4
0
25
50
75
100
0 -4 -3 -2 -1 0 1 2 3 4
No
rmal
ized
mR
NA
exp
ress
ion
( p
erce
nt
of
max
imal
res
po
nse
)
Fig. 5 Dose–response and time-course of changes in mRNA expres-
sion for selected genes. For the dose–response study, four rats per
group were gavaged with corn oil (vehicle control) or with doses of
0.001, 0.01, 0.1, 1, 10, 100 and 1,000 lg/kg TCDD for the dioxin-
sensitive L–E rats. For the dioxin-resistant H/W rats the range was
expanded to 3,000 lg/kg TCDD. Liver was harvested at 19 h for the
dose–response study. Dose–response curves were fitted as described
in ‘‘Materials and methods’’. For the time-course study rats were
gavaged with 100 lg/kg TCDD and livers were removed at 3, 6, 10 or
19 h after TCDD. mRNA levels were measured by real-time RT-
PCR. For each gene, the mRNA level that was highest for any strain
or treatment was set at 100% and all other mRNA levels for that gene
are shown as a percentage of the maximal level. All results represent
the mean of four rats ±SD
Arch Toxicol (2008) 82:809–830 823
123
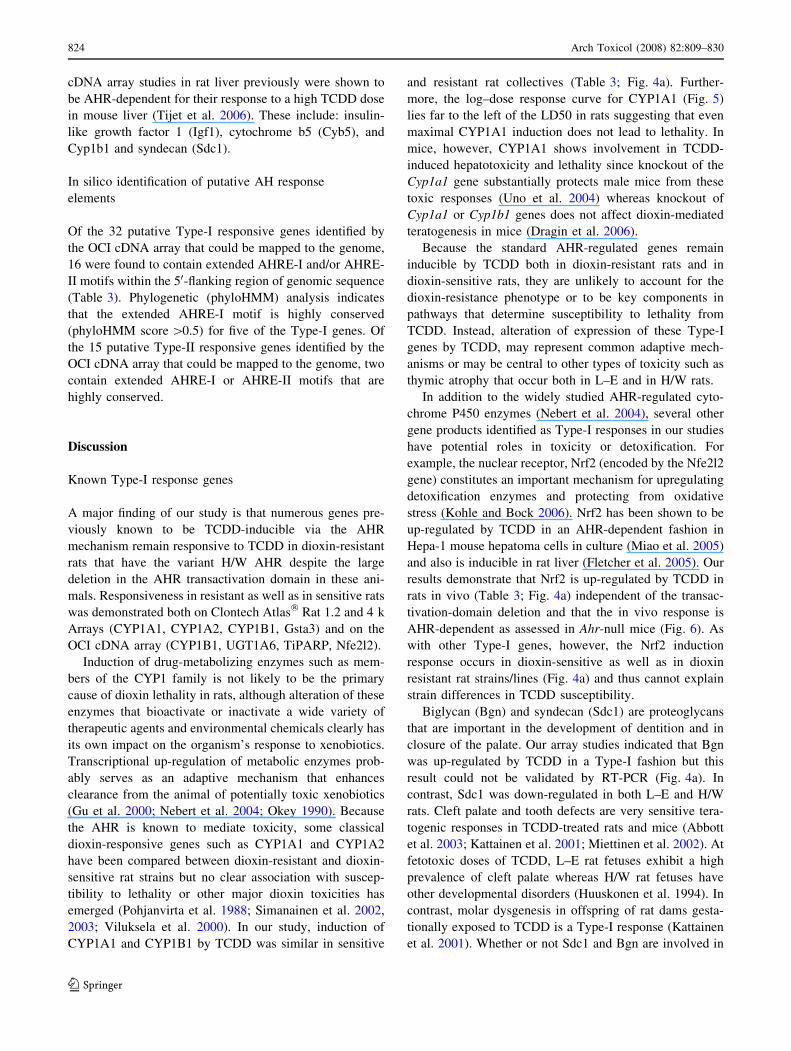
cDNA array studies in rat liver previously were shown to
be AHR-dependent for their response to a high TCDD dose
in mouse liver (Tijet et al. 2006). These include: insulin-
like growth factor 1 (Igf1), cytochrome b5 (Cyb5), and
Cyp1b1 and syndecan (Sdc1).
In silico identification of putative AH response
elements
Of the 32 putative Type-I responsive genes identified by
the OCI cDNA array that could be mapped to the genome,
16 were found to contain extended AHRE-I and/or AHRE-
II motifs within the 50-flanking region of genomic sequence
(Table 3). Phylogenetic (phyloHMM) analysis indicates
that the extended AHRE-I motif is highly conserved
(phyloHMM score [0.5) for five of the Type-I genes. Of
the 15 putative Type-II responsive genes identified by the
OCI cDNA array that could be mapped to the genome, two
contain extended AHRE-I or AHRE-II motifs that are
highly conserved.
Discussion
Known Type-I response genes
A major finding of our study is that numerous genes pre-
viously known to be TCDD-inducible via the AHR
mechanism remain responsive to TCDD in dioxin-resistant
rats that have the variant H/W AHR despite the large
deletion in the AHR transactivation domain in these ani-
mals. Responsiveness in resistant as well as in sensitive rats
was demonstrated both on Clontech Atlas� Rat 1.2 and 4 k
Arrays (CYP1A1, CYP1A2, CYP1B1, Gsta3) and on the
OCI cDNA array (CYP1B1, UGT1A6, TiPARP, Nfe2l2).
Induction of drug-metabolizing enzymes such as mem-
bers of the CYP1 family is not likely to be the primary
cause of dioxin lethality in rats, although alteration of these
enzymes that bioactivate or inactivate a wide variety of
therapeutic agents and environmental chemicals clearly has
its own impact on the organism’s response to xenobiotics.
Transcriptional up-regulation of metabolic enzymes prob-
ably serves as an adaptive mechanism that enhances
clearance from the animal of potentially toxic xenobiotics
(Gu et al. 2000; Nebert et al. 2004; Okey 1990). Because
the AHR is known to mediate toxicity, some classical
dioxin-responsive genes such as CYP1A1 and CYP1A2
have been compared between dioxin-resistant and dioxin-
sensitive rat strains but no clear association with suscep-
tibility to lethality or other major dioxin toxicities has
emerged (Pohjanvirta et al. 1988; Simanainen et al. 2002,
2003; Viluksela et al. 2000). In our study, induction of
CYP1A1 and CYP1B1 by TCDD was similar in sensitive
and resistant rat collectives (Table 3; Fig. 4a). Further-
more, the log–dose response curve for CYP1A1 (Fig. 5)
lies far to the left of the LD50 in rats suggesting that even
maximal CYP1A1 induction does not lead to lethality. In
mice, however, CYP1A1 shows involvement in TCDD-
induced hepatotoxicity and lethality since knockout of the
Cyp1a1 gene substantially protects male mice from these
toxic responses (Uno et al. 2004) whereas knockout of
Cyp1a1 or Cyp1b1 genes does not affect dioxin-mediated
teratogenesis in mice (Dragin et al. 2006).
Because the standard AHR-regulated genes remain
inducible by TCDD both in dioxin-resistant rats and in
dioxin-sensitive rats, they are unlikely to account for the
dioxin-resistance phenotype or to be key components in
pathways that determine susceptibility to lethality from
TCDD. Instead, alteration of expression of these Type-I
genes by TCDD, may represent common adaptive mech-
anisms or may be central to other types of toxicity such as
thymic atrophy that occur both in L–E and in H/W rats.
In addition to the widely studied AHR-regulated cyto-
chrome P450 enzymes (Nebert et al. 2004), several other
gene products identified as Type-I responses in our studies
have potential roles in toxicity or detoxification. For
example, the nuclear receptor, Nrf2 (encoded by the Nfe2l2
gene) constitutes an important mechanism for upregulating
detoxification enzymes and protecting from oxidative
stress (Kohle and Bock 2006). Nrf2 has been shown to be
up-regulated by TCDD in an AHR-dependent fashion in
Hepa-1 mouse hepatoma cells in culture (Miao et al. 2005)
and also is inducible in rat liver (Fletcher et al. 2005). Our
results demonstrate that Nrf2 is up-regulated by TCDD in
rats in vivo (Table 3; Fig. 4a) independent of the transac-
tivation-domain deletion and that the in vivo response is
AHR-dependent as assessed in Ahr-null mice (Fig. 6). As
with other Type-I genes, however, the Nrf2 induction
response occurs in dioxin-sensitive as well as in dioxin
resistant rat strains/lines (Fig. 4a) and thus cannot explain
strain differences in TCDD susceptibility.
Biglycan (Bgn) and syndecan (Sdc1) are proteoglycans
that are important in the development of dentition and in
closure of the palate. Our array studies indicated that Bgn
was up-regulated by TCDD in a Type-I fashion but this
result could not be validated by RT-PCR (Fig. 4a). In
contrast, Sdc1 was down-regulated in both L–E and H/W
rats. Cleft palate and tooth defects are very sensitive tera-
togenic responses in TCDD-treated rats and mice (Abbott
et al. 2003; Kattainen et al. 2001; Miettinen et al. 2002). At
fetotoxic doses of TCDD, L–E rat fetuses exhibit a high
prevalence of cleft palate whereas H/W rat fetuses have
other developmental disorders (Huuskonen et al. 1994). In
contrast, molar dysgenesis in offspring of rat dams gesta-
tionally exposed to TCDD is a Type-I response (Kattainen
et al. 2001). Whether or not Sdc1 and Bgn are involved in
824 Arch Toxicol (2008) 82:809–830
123
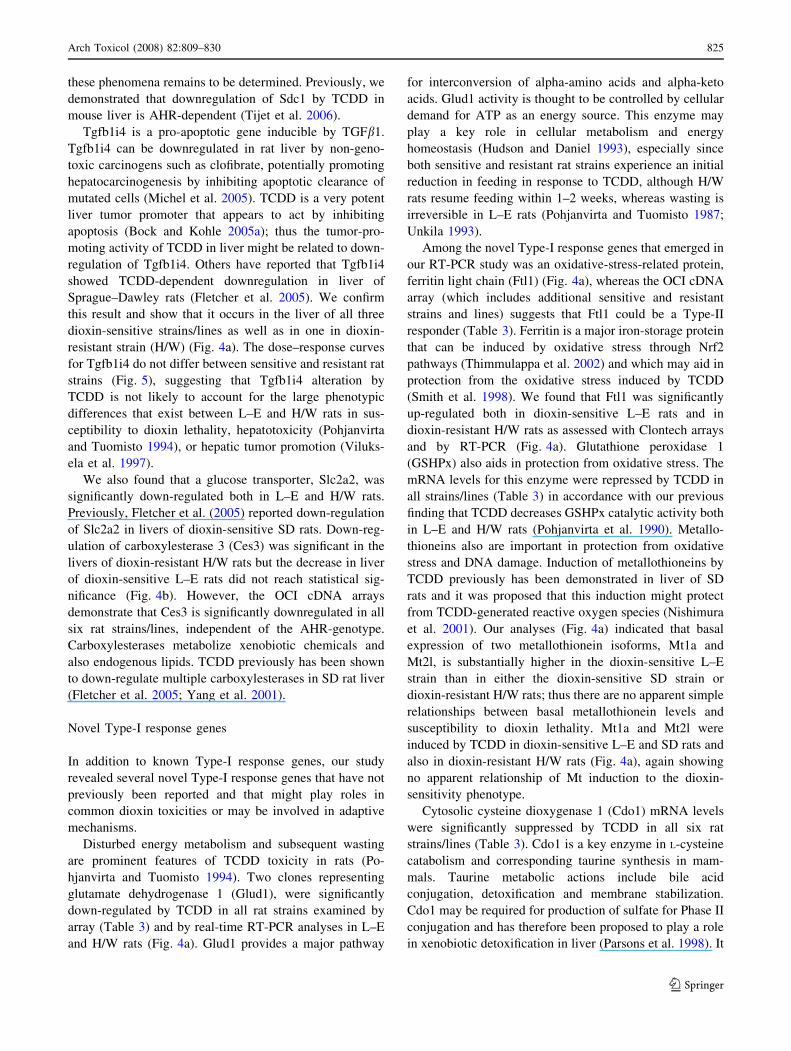
these phenomena remains to be determined. Previously, we
demonstrated that downregulation of Sdc1 by TCDD in
mouse liver is AHR-dependent (Tijet et al. 2006).
Tgfb1i4 is a pro-apoptotic gene inducible by TGFb1.
Tgfb1i4 can be downregulated in rat liver by non-geno-
toxic carcinogens such as clofibrate, potentially promoting
hepatocarcinogenesis by inhibiting apoptotic clearance of
mutated cells (Michel et al. 2005). TCDD is a very potent
liver tumor promoter that appears to act by inhibiting
apoptosis (Bock and Kohle 2005a); thus the tumor-pro-
moting activity of TCDD in liver might be related to down-
regulation of Tgfb1i4. Others have reported that Tgfb1i4
showed TCDD-dependent downregulation in liver of
Sprague–Dawley rats (Fletcher et al. 2005). We confirm
this result and show that it occurs in the liver of all three
dioxin-sensitive strains/lines as well as in one in dioxin-
resistant strain (H/W) (Fig. 4a). The dose–response curves
for Tgfb1i4 do not differ between sensitive and resistant rat
strains (Fig. 5), suggesting that Tgfb1i4 alteration by
TCDD is not likely to account for the large phenotypic
differences that exist between L–E and H/W rats in sus-
ceptibility to dioxin lethality, hepatotoxicity (Pohjanvirta
and Tuomisto 1994), or hepatic tumor promotion (Viluks-
ela et al. 1997).
We also found that a glucose transporter, Slc2a2, was
significantly down-regulated both in L–E and H/W rats.
Previously, Fletcher et al. (2005) reported down-regulation
of Slc2a2 in livers of dioxin-sensitive SD rats. Down-reg-
ulation of carboxylesterase 3 (Ces3) was significant in the
livers of dioxin-resistant H/W rats but the decrease in liver
of dioxin-sensitive L–E rats did not reach statistical sig-
nificance (Fig. 4b). However, the OCI cDNA arrays
demonstrate that Ces3 is significantly downregulated in all
six rat strains/lines, independent of the AHR-genotype.
Carboxylesterases metabolize xenobiotic chemicals and
also endogenous lipids. TCDD previously has been shown
to down-regulate multiple carboxylesterases in SD rat liver
(Fletcher et al. 2005; Yang et al. 2001).
Novel Type-I response genes
In addition to known Type-I response genes, our study
revealed several novel Type-I response genes that have not
previously been reported and that might play roles in
common dioxin toxicities or may be involved in adaptive
mechanisms.
Disturbed energy metabolism and subsequent wasting
are prominent features of TCDD toxicity in rats (Po-
hjanvirta and Tuomisto 1994). Two clones representing
glutamate dehydrogenase 1 (Glud1), were significantly
down-regulated by TCDD in all rat strains examined by
array (Table 3) and by real-time RT-PCR analyses in L–E
and H/W rats (Fig. 4a). Glud1 provides a major pathway
for interconversion of alpha-amino acids and alpha-keto
acids. Glud1 activity is thought to be controlled by cellular
demand for ATP as an energy source. This enzyme may
play a key role in cellular metabolism and energy
homeostasis (Hudson and Daniel 1993), especially since
both sensitive and resistant rat strains experience an initial
reduction in feeding in response to TCDD, although H/W
rats resume feeding within 1–2 weeks, whereas wasting is
irreversible in L–E rats (Pohjanvirta and Tuomisto 1987;
Unkila 1993).
Among the novel Type-I response genes that emerged in
our RT-PCR study was an oxidative-stress-related protein,
ferritin light chain (Ftl1) (Fig. 4a), whereas the OCI cDNA
array (which includes additional sensitive and resistant
strains and lines) suggests that Ftl1 could be a Type-II
responder (Table 3). Ferritin is a major iron-storage protein
that can be induced by oxidative stress through Nrf2
pathways (Thimmulappa et al. 2002) and which may aid in
protection from the oxidative stress induced by TCDD
(Smith et al. 1998). We found that Ftl1 was significantly
up-regulated both in dioxin-sensitive L–E rats and in
dioxin-resistant H/W rats as assessed with Clontech arrays
and by RT-PCR (Fig. 4a). Glutathione peroxidase 1
(GSHPx) also aids in protection from oxidative stress. The
mRNA levels for this enzyme were repressed by TCDD in
all strains/lines (Table 3) in accordance with our previous
finding that TCDD decreases GSHPx catalytic activity both
in L–E and H/W rats (Pohjanvirta et al. 1990). Metallo-
thioneins also are important in protection from oxidative
stress and DNA damage. Induction of metallothioneins by
TCDD previously has been demonstrated in liver of SD
rats and it was proposed that this induction might protect
from TCDD-generated reactive oxygen species (Nishimura
et al. 2001). Our analyses (Fig. 4a) indicated that basal
expression of two metallothionein isoforms, Mt1a and
Mt2l, is substantially higher in the dioxin-sensitive L–E
strain than in either the dioxin-sensitive SD strain or
dioxin-resistant H/W rats; thus there are no apparent simple
relationships between basal metallothionein levels and
susceptibility to dioxin lethality. Mt1a and Mt2l were
induced by TCDD in dioxin-sensitive L–E and SD rats and
also in dioxin-resistant H/W rats (Fig. 4a), again showing
no apparent relationship of Mt induction to the dioxin-
sensitivity phenotype.
Cytosolic cysteine dioxygenase 1 (Cdo1) mRNA levels
were significantly suppressed by TCDD in all six rat
strains/lines (Table 3). Cdo1 is a key enzyme in L-cysteine
catabolism and corresponding taurine synthesis in mam-
mals. Taurine metabolic actions include bile acid
conjugation, detoxification and membrane stabilization.
Cdo1 may be required for production of sulfate for Phase II
conjugation and has therefore been proposed to play a role
in xenobiotic detoxification in liver (Parsons et al. 1998). It
Arch Toxicol (2008) 82:809–830 825
123
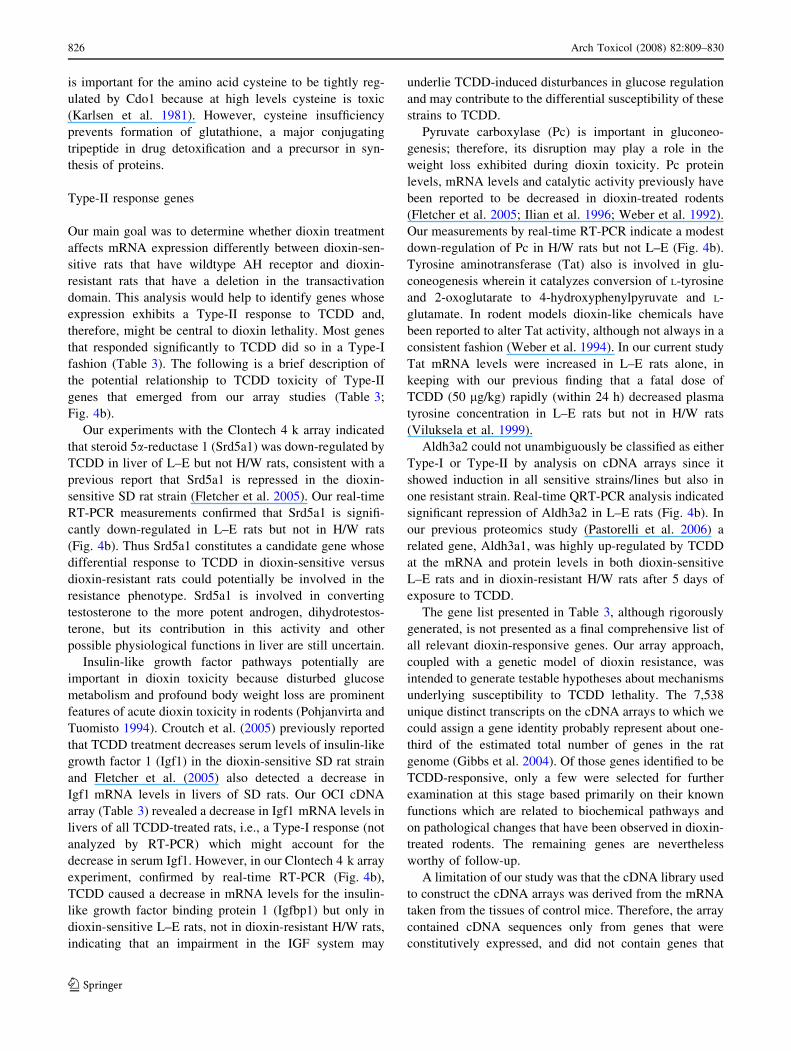
is important for the amino acid cysteine to be tightly reg-
ulated by Cdo1 because at high levels cysteine is toxic
(Karlsen et al. 1981). However, cysteine insufficiency
prevents formation of glutathione, a major conjugating
tripeptide in drug detoxification and a precursor in syn-
thesis of proteins.
Type-II response genes
Our main goal was to determine whether dioxin treatment
affects mRNA expression differently between dioxin-sen-
sitive rats that have wildtype AH receptor and dioxin-
resistant rats that have a deletion in the transactivation
domain. This analysis would help to identify genes whose
expression exhibits a Type-II response to TCDD and,
therefore, might be central to dioxin lethality. Most genes
that responded significantly to TCDD did so in a Type-I
fashion (Table 3). The following is a brief description of
the potential relationship to TCDD toxicity of Type-II
genes that emerged from our array studies (Table 3;
Fig. 4b).
Our experiments with the Clontech 4 k array indicated
that steroid 5a-reductase 1 (Srd5a1) was down-regulated by
TCDD in liver of L–E but not H/W rats, consistent with a
previous report that Srd5a1 is repressed in the dioxin-
sensitive SD rat strain (Fletcher et al. 2005). Our real-time
RT-PCR measurements confirmed that Srd5a1 is signifi-
cantly down-regulated in L–E rats but not in H/W rats
(Fig. 4b). Thus Srd5a1 constitutes a candidate gene whose
differential response to TCDD in dioxin-sensitive versus
dioxin-resistant rats could potentially be involved in the
resistance phenotype. Srd5a1 is involved in converting
testosterone to the more potent androgen, dihydrotestos-
terone, but its contribution in this activity and other
possible physiological functions in liver are still uncertain.
Insulin-like growth factor pathways potentially are
important in dioxin toxicity because disturbed glucose
metabolism and profound body weight loss are prominent
features of acute dioxin toxicity in rodents (Pohjanvirta and
Tuomisto 1994). Croutch et al. (2005) previously reported
that TCDD treatment decreases serum levels of insulin-like
growth factor 1 (Igf1) in the dioxin-sensitive SD rat strain
and Fletcher et al. (2005) also detected a decrease in
Igf1 mRNA levels in livers of SD rats. Our OCI cDNA
array (Table 3) revealed a decrease in Igf1 mRNA levels in
livers of all TCDD-treated rats, i.e., a Type-I response (not
analyzed by RT-PCR) which might account for the
decrease in serum Igf1. However, in our Clontech 4 k array
experiment, confirmed by real-time RT-PCR (Fig. 4b),
TCDD caused a decrease in mRNA levels for the insulin-
like growth factor binding protein 1 (Igfbp1) but only in
dioxin-sensitive L–E rats, not in dioxin-resistant H/W rats,
indicating that an impairment in the IGF system may
underlie TCDD-induced disturbances in glucose regulation
and may contribute to the differential susceptibility of these
strains to TCDD.
Pyruvate carboxylase (Pc) is important in gluconeo-
genesis; therefore, its disruption may play a role in the
weight loss exhibited during dioxin toxicity. Pc protein
levels, mRNA levels and catalytic activity previously have
been reported to be decreased in dioxin-treated rodents
(Fletcher et al. 2005; Ilian et al. 1996; Weber et al. 1992).
Our measurements by real-time RT-PCR indicate a modest
down-regulation of Pc in H/W rats but not L–E (Fig. 4b).
Tyrosine aminotransferase (Tat) also is involved in glu-
coneogenesis wherein it catalyzes conversion of L-tyrosine
and 2-oxoglutarate to 4-hydroxyphenylpyruvate and L-
glutamate. In rodent models dioxin-like chemicals have
been reported to alter Tat activity, although not always in a
consistent fashion (Weber et al. 1994). In our current study
Tat mRNA levels were increased in L–E rats alone, in
keeping with our previous finding that a fatal dose of
TCDD (50 lg/kg) rapidly (within 24 h) decreased plasma
tyrosine concentration in L–E rats but not in H/W rats
(Viluksela et al. 1999).
Aldh3a2 could not unambiguously be classified as either
Type-I or Type-II by analysis on cDNA arrays since it
showed induction in all sensitive strains/lines but also in
one resistant strain. Real-time QRT-PCR analysis indicated
significant repression of Aldh3a2 in L–E rats (Fig. 4b). In
our previous proteomics study (Pastorelli et al. 2006) a
related gene, Aldh3a1, was highly up-regulated by TCDD
at the mRNA and protein levels in both dioxin-sensitive
L–E rats and in dioxin-resistant H/W rats after 5 days of
exposure to TCDD.
The gene list presented in Table 3, although rigorously
generated, is not presented as a final comprehensive list of
all relevant dioxin-responsive genes. Our array approach,
coupled with a genetic model of dioxin resistance, was
intended to generate testable hypotheses about mechanisms
underlying susceptibility to TCDD lethality. The 7,538
unique distinct transcripts on the cDNA arrays to which we
could assign a gene identity probably represent about one-
third of the estimated total number of genes in the rat
genome (Gibbs et al. 2004). Of those genes identified to be
TCDD-responsive, only a few were selected for further
examination at this stage based primarily on their known
functions which are related to biochemical pathways and
on pathological changes that have been observed in dioxin-
treated rodents. The remaining genes are nevertheless
worthy of follow-up.
A limitation of our study was that the cDNA library used
to construct the cDNA arrays was derived from the mRNA
taken from the tissues of control mice. Therefore, the array
contained cDNA sequences only from genes that were
constitutively expressed, and did not contain genes that
826 Arch Toxicol (2008) 82:809–830
123
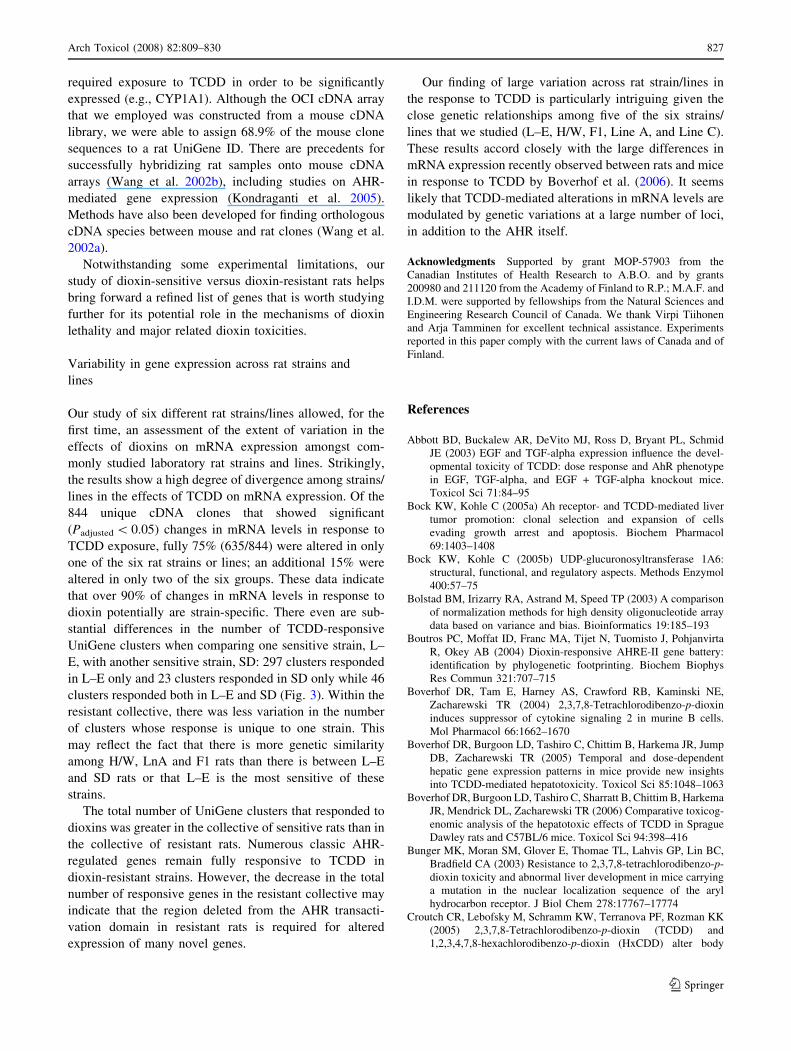
required exposure to TCDD in order to be significantly
expressed (e.g., CYP1A1). Although the OCI cDNA array
that we employed was constructed from a mouse cDNA
library, we were able to assign 68.9% of the mouse clone
sequences to a rat UniGene ID. There are precedents for
successfully hybridizing rat samples onto mouse cDNA
arrays (Wang et al. 2002b), including studies on AHR-
mediated gene expression (Kondraganti et al. 2005).
Methods have also been developed for finding orthologous
cDNA species between mouse and rat clones (Wang et al.
2002a).
Notwithstanding some experimental limitations, our
study of dioxin-sensitive versus dioxin-resistant rats helps
bring forward a refined list of genes that is worth studying
further for its potential role in the mechanisms of dioxin
lethality and major related dioxin toxicities.
Variability in gene expression across rat strains and
lines
Our study of six different rat strains/lines allowed, for the
first time, an assessment of the extent of variation in the
effects of dioxins on mRNA expression amongst com-
monly studied laboratory rat strains and lines. Strikingly,
the results show a high degree of divergence among strains/
lines in the effects of TCDD on mRNA expression. Of the
844 unique cDNA clones that showed significant
(Padjusted \ 0.05) changes in mRNA levels in response to
TCDD exposure, fully 75% (635/844) were altered in only
one of the six rat strains or lines; an additional 15% were
altered in only two of the six groups. These data indicate
that over 90% of changes in mRNA levels in response to
dioxin potentially are strain-specific. There even are sub-
stantial differences in the number of TCDD-responsive
UniGene clusters when comparing one sensitive strain, L–
E, with another sensitive strain, SD: 297 clusters responded
in L–E only and 23 clusters responded in SD only while 46
clusters responded both in L–E and SD (Fig. 3). Within the
resistant collective, there was less variation in the number
of clusters whose response is unique to one strain. This
may reflect the fact that there is more genetic similarity
among H/W, LnA and F1 rats than there is between L–E
and SD rats or that L–E is the most sensitive of these
strains.
The total number of UniGene clusters that responded to
dioxins was greater in the collective of sensitive rats than in
the collective of resistant rats. Numerous classic AHR-
regulated genes remain fully responsive to TCDD in
dioxin-resistant strains. However, the decrease in the total
number of responsive genes in the resistant collective may
indicate that the region deleted from the AHR transacti-
vation domain in resistant rats is required for altered
expression of many novel genes.
Our finding of large variation across rat strain/lines in
the response to TCDD is particularly intriguing given the
close genetic relationships among five of the six strains/
lines that we studied (L–E, H/W, F1, Line A, and Line C).
These results accord closely with the large differences in
mRNA expression recently observed between rats and mice
in response to TCDD by Boverhof et al. (2006). It seems
likely that TCDD-mediated alterations in mRNA levels are
modulated by genetic variations at a large number of loci,
in addition to the AHR itself.
Acknowledgments Supported by grant MOP-57903 from the
Canadian Institutes of Health Research to A.B.O. and by grants
200980 and 211120 from the Academy of Finland to R.P.; M.A.F. and
I.D.M. were supported by fellowships from the Natural Sciences and
Engineering Research Council of Canada. We thank Virpi Tiihonen
and Arja Tamminen for excellent technical assistance. Experiments
reported in this paper comply with the current laws of Canada and of
Finland.
References
Abbott BD, Buckalew AR, DeVito MJ, Ross D, Bryant PL, Schmid
JE (2003) EGF and TGF-alpha expression influence the devel-
opmental toxicity of TCDD: dose response and AhR phenotype
in EGF, TGF-alpha, and EGF + TGF-alpha knockout mice.
Toxicol Sci 71:84–95
Bock KW, Kohle C (2005a) Ah receptor- and TCDD-mediated liver
tumor promotion: clonal selection and expansion of cells
evading growth arrest and apoptosis. Biochem Pharmacol
69:1403–1408
Bock KW, Kohle C (2005b) UDP-glucuronosyltransferase 1A6:
structural, functional, and regulatory aspects. Methods Enzymol
400:57–75
Bolstad BM, Irizarry RA, Astrand M, Speed TP (2003) A comparison
of normalization methods for high density oligonucleotide array
data based on variance and bias. Bioinformatics 19:185–193
Boutros PC, Moffat ID, Franc MA, Tijet N, Tuomisto J, Pohjanvirta
R, Okey AB (2004) Dioxin-responsive AHRE-II gene battery:
identification by phylogenetic footprinting. Biochem Biophys
Res Commun 321:707–715
Boverhof DR, Tam E, Harney AS, Crawford RB, Kaminski NE,
Zacharewski TR (2004) 2,3,7,8-Tetrachlorodibenzo-p-dioxin
induces suppressor of cytokine signaling 2 in murine B cells.
Mol Pharmacol 66:1662–1670
Boverhof DR, Burgoon LD, Tashiro C, Chittim B, Harkema JR, Jump
DB, Zacharewski TR (2005) Temporal and dose-dependent
hepatic gene expression patterns in mice provide new insights
into TCDD-mediated hepatotoxicity. Toxicol Sci 85:1048–1063
Boverhof DR, Burgoon LD, Tashiro C, Sharratt B, Chittim B, Harkema
JR, Mendrick DL, Zacharewski TR (2006) Comparative toxicog-
enomic analysis of the hepatotoxic effects of TCDD in Sprague
Dawley rats and C57BL/6 mice. Toxicol Sci 94:398–416
Bunger MK, Moran SM, Glover E, Thomae TL, Lahvis GP, Lin BC,
Bradfield CA (2003) Resistance to 2,3,7,8-tetrachlorodibenzo-p-
dioxin toxicity and abnormal liver development in mice carrying
a mutation in the nuclear localization sequence of the aryl
hydrocarbon receptor. J Biol Chem 278:17767–17774
Croutch CR, Lebofsky M, Schramm KW, Terranova PF, Rozman KK
(2005) 2,3,7,8-Tetrachlorodibenzo-p-dioxin (TCDD) and
1,2,3,4,7,8-hexachlorodibenzo-p-dioxin (HxCDD) alter body
Arch Toxicol (2008) 82:809–830 827
123
weight by decreasing insulin-like growth factor I (IGF-I)
signaling. Toxicol Sci 85:560–571
Denison MS, Whitlock JP Jr (1995) Xenobiotic-inducible transcrip-
tion of cytochrome P450 genes. J Biol Chem 270:18175–18178
Dragin N, Dalton TP, Miller ML, Shertzer HG, Nebert DW (2006)
For dioxin-induced birth defects, mouse or human CYP1A2 in
maternal liver protects whereas mouse CYP1A1 and CYP1B1
are inconsequential. J Biol Chem 281:18591–18600
Fernandez-Salguero P, Pineau T, Hilbert DM, McPhail T, Lee SS,
Kimura S, Nebert DW, Rudikoff S, Ward JM, Gonzalez FJ
(1995) Immune system impairment and hepatic fibrosis in mice
lacking the dioxin-binding Ah receptor (see comments). Science
268:722–726
Fernandez-Salguero PM, Hilbert DM, Rudikoff S, Ward JM, Gonz-
alez FJ (1996) Aryl-hydrocarbon receptor-deficient mice are
resistant to 2,3,7,8-tetrachlorodibenzo-p-dioxin-induced toxicity.
Toxicol Appl Pharmacol 140:173–179
Fletcher N, Wahlstrom D, Lundberg R, Nilsson CB, Nilsson KC,
Stockling K, Hellmold H, Hakansson H (2005) 2,3,7,8-Tetra-
chlorodibenzo-p-dioxin (TCDD) alters the mRNA expression of
critical genes associated with cholesterol metabolism, bile acid
biosynthesis, and bile transport in rat liver: a microarray study.
Toxicol Appl Pharmacol 207:1–24
Frericks M, Temchura VV, Majora M, Stutte S, Esser C (2006)
Transcriptional signatures of immune cells in aryl hydrocarbon
receptor (AHR)-proficient and AHR-deficient mice. Biol Chem
387:1219–1226
Fried KW, Bazzi R, Levy Lopez W, Corsten C, Schramm KW, Bell
DR, Rozman KK (2007) Relationship between aryl hydrocarbon
receptor-affinity and the induction of EROD activity by 2,3,7,8-
tetrachlorinated phenothiazine and derivatives. Toxicol Appl
Pharmacol 224:147–155
Frueh FW, Hayashibara KC, Brown PO, Whitlock JP (2001) Use of
cDNA microarrays to analyze dioxin-induced changes in human
liver gene expression. Toxicol Lett 122:189–203
Gibbs RA, Weinstock GM, Metzker ML, Muzny DM, Sodergren EJ,
Scherer S, Scott G, Steffen D, Worley KC, Burch PE, Okwuonu
G, Hines S, Lewis L, DeRamo C, Delgado O, Dugan-Rocha S,
Miner G, Morgan M, Hawes A, Gill R, Celera, Holt RA, Adams
MD, Amanatides PG, Baden-Tillson H, Barnstead M, Chin S,
Evans CA, Ferriera S, Fosler C, Glodek A, Gu Z, Jennings D,
Kraft CL, Nguyen T, Pfannkoch CM, Sitter C, Sutton GG, Venter
JC, Woodage T, Smith D, Lee HM, Gustafson E, Cahill P, Kana
A, Doucette-Stamm L, Weinstock K, Fechtel K, Weiss RB, Dunn
DM, Green ED, Blakesley RW, Bouffard GG, De Jong PJ,
Osoegawa K, Zhu B, Marra M, Schein J, Bosdet I, Fjell C, Jones
S, Krzywinski M, Mathewson C, Siddiqui A, Wye N, McPherson
J, Zhao S, Fraser CM, Shetty J, Shatsman S, Geer K, Chen Y,
Abramzon S, Nierman WC, Havlak PH, Chen R, Durbin KJ, Egan
A, Ren Y, Song XZ, Li B, Liu Y, Qin X, Cawley S, Cooney AJ,
D’Souza LM, Martin K, Wu JQ, Gonzalez-Garay ML, Jackson
AR, Kalafus KJ, McLeod MP, Milosavljevic A, Virk D, Volkov
A, Wheeler DA, Zhang Z, Bailey JA, Eichler EE, Tuzun E,
Birney E, Mongin E, Ureta-Vidal A, Woodwark C, Zdobnov E,
Bork P, Suyama M, Torrents D, Alexandersson M, Trask BJ,
Young JM, Huang H, Wang H, Xing H, Daniels S, Gietzen D,
Schmidt J, Stevens K, Vitt U, Wingrove J, Camara F, Mar Alba
M, Abril JF, Guigo R, Smit A, Dubchak I, Rubin EM, Couronne
O, Poliakov A, Hubner N, Ganten D, Goesele C, Hummel O,
Kreitler T, Lee YA, Monti J, Schulz H, Zimdahl H, Himmelbauer
H, Lehrach H, Jacob HJ, Bromberg S, Gullings-Handley J,
Jensen-Seaman MI, Kwitek AE, Lazar J, Pasko D, Tonellato PJ,
Twigger S, Ponting CP, Duarte JM, Rice S, Goodstadt L, Beatson
SA, Emes RD, Winter EE, Webber C, Brandt P, Nyakatura G,
Adetobi M, Chiaromonte F, Elnitski L, Eswara P, Hardison RC,
Hou M, Kolbe D, Makova K, Miller W, Nekrutenko A, Riemer C,
Schwartz S, Taylor J, Yang S, Zhang Y, Lindpaintner K, Andrews
TD, Caccamo M, Clamp M, Clarke L, Curwen V, Durbin R,
Eyras E, Searle SM, Cooper GM, Batzoglou S, Brudno M, Sidow
A, Stone EA, Payseur BA, Bourque G, Lopez-Otin C, Puente XS,
Chakrabarti K, Chatterji S, Dewey C, Pachter L, Bray N, Yap VB,
Caspi A, Tesler G, Pevzner PA, Haussler D, Roskin KM,
Baertsch R, Clawson H, Furey TS, Hinrichs AS, Karolchik D,
Kent WJ, Rosenbloom KR, Trumbower H, Weirauch M, Cooper
DN, Stenson PD, Ma B, Brent M, Arumugam M, Shteynberg D,
Copley RR, Taylor MS, Riethman H, Mudunuri U, Peterson J,
Guyer M, Felsenfeld A, Old S, Mockrin S, Collins F (2004)
Genome sequence of the Brown Norway rat yields insights into
mammalian evolution. Nature 428:493–521
Gu YZ, Hogenesch JB, Bradfield CA (2000) The PAS superfamily:
sensors of environmental and developmental signals. Annu Rev
Pharmacol Toxicol 40:519–561
Hayes KR, Vollrath AL, Zastrow GM, McMillan BJ, Craven MW,
Jovanovich SB, Walisser JA, Rank DR, Penn SG, Reddy JK,
Thomas RS, Bradfield CA (2005) EDGE: a centralized resource
for the comparison, analysis and distribution of toxicogenomic
information. Mol Pharmacol 67:1360–1368
Hayes KR, Zastrow GM, Nukaya M, Pande K, Glover E, Maufort JP,
Liss AL, Liu Y, Moran SM, Vollrath AL, Bradfield CA (2007)
Hepatic transcriptional networks induced by exposure to 2,3,7,8-
tetrachlorodibenzo-p-dioxin. Chem Res Toxicol
Hudson RC, Daniel RM (1993) L-glutamate dehydrogenases: distri-
bution, properties and mechanism. Comp Biochem Physiol B
106:767–792
Ilian MA, Sparrow BR, Ryu BW, Selivonchick DP, Schaup HW
(1996) Expression of hepatic pyruvate carboxylase mRNA in
C57BL/6J Ah(b/b) and congenic Ah((d/d)) mice exposed to
2,3,7,8-tetrachlorodibenzo-p-dioxin. J Biochem Toxicol 11:51–
56
Karlsen RL, Grofova I, Malthe-Sorenssen D, Fonnum F (1981)
Morphological changes in rat brain induced by L-cysteine
injection in newborn animals. Brain Res 208:167–180
Karyala S, Guo J, Sartor M, Medvedovic M, Kann S, Puga A, Ryan P,
Tomlinson CR (2004) Different global gene expression profiles
in benzo[a]pyrene- and dioxin-treated vascular smooth muscle
cells of AHR-knockout and wild-type mice. Cardiovasc Toxicol
4:47–74
Kattainen H, Tuukkanen J, Simanainen U, Tuomisto JT, Kovero O,
Lukinmaa PL, Alaluusua S, Tuomisto J, Viluksela M (2001) In
utero/lactational 2,3,7,8-tetrachlorodibenzo-p-dioxin exposure
impairs molar tooth development in rats. Toxicol Appl Pharma-
col 174:216–224
Kohle C, Bock KW (2006) Activation of coupled Ah receptor and
Nrf2 gene batteries by dietary phytochemicals in relation to
chemoprevention. Biochem Pharmacol 72:795–805
Kolluri SK, Weiss C, Koff A, Gottlicher M (1999) p27(Kip1)
induction and inhibition of proliferation by the intracellular Ah
receptor in developing thymus and hepatoma cells. Genes Dev
13:1742–1753
Kondraganti SR, Muthiah K, Jiang W, Barrios R, Moorthy B (2005)
Effects of 3-methylcholanthrene on gene expression profiling in
the rat using cDNA microarray analyses. Chem Res Toxicol
18:1634–1641
Kooperberg C, Fazzio TG, Delrow JJ, Tsukiyama T (2002) Improved
background correction for spotted DNA microarrays. J Comput
Biol 9:55–66
Lee K, Burgoon LD, Lamb L, Dere E, Zacharewski TR, Hogenesch
JB, Lapres JJ (2006) Identification and characterization of genes
susceptible to transcriptional cross-talk between the hypoxia and
dioxin signaling cascades. Chem Res Toxicol 19:1284–1293
Lin TM, Ko K, Moore RW, Buchanan DL, Cooke PS, Peterson RE
(2001) Role of the aryl hydrocarbon receptor in the development
828 Arch Toxicol (2008) 82:809–830
123

of control and 2,3,7,8-tetrachlorodibenzo-p-dioxin-exposed male
mice. J Toxicol Environ Health A 64:327–342
Martinez JM, Afshari CA, Bushel PR, Masuda A, Takahashi T,
Walker NJ (2002) Differential toxicogenomic responses to
2,3,7,8-tetrachlorodibenzo-p-dioxin in malignant and nonmalig-
nant human airway epithelial cells. Toxicol Sci 69:409–423
Miao W, Hu L, Scrivens PJ, Batist G (2005) Transcriptional
regulation of NF-E2 p45-related factor (NRF2) expression by
the aryl hydrocarbon receptor–xenobiotic response element
signaling pathway: direct cross-talk between phase I and II
drug-metabolizing enzymes. J Biol Chem 280:20340–20348
Michel C, Roberts RA, Desdouets C, Isaacs KR, Boitier E (2005)
Characterization of an acute molecular marker of nongenotoxic
rodent hepatocarcinogenesis by gene expression profiling in a
long term clofibric acid study. Chem Res Toxicol 18:611–618
Miettinen HM, Alaluusua S, Tuomisto J, Viluksela M (2002) Effect
of in utero and lactational 2,3,7,8-tetrachlorodibenzo-p-dioxin
exposure on rat molar development: the role of exposure time.
Toxicol Appl Pharmacol 184:57–66
Mimura J, Yamashita K, Nakamura K, Morita M, Takagi TN, Nakao
K, Ema M, Sogawa K, Yasuda M, Katsuki M, Fujii-Kuriyama Y
(1997) Loss of teratogenic response to 2,3,7,8-tetrachlo-
rodibenzo-p-dioxin (TCDD) in mice lacking the Ah (dioxin)
receptor. Genes Cells 2:645–654
Moffat ID, Roblin S, Harper PA, Okey AB, Pohjanvirta R (2007) Aryl
hydrocarbon receptor splice variants in the dioxin-resistant rat:
tissue expression and transactivational activity. Mol Pharmacol
72:956–966
Nebert DW, Dalton TP, Okey AB, Gonzalez FJ (2004) Role of aryl
hydrocarbon receptor-mediated induction of the CYP1 enzymes
in environmental toxicity and cancer. J Biol Chem 279:23847–
23850
Nishimura N, Miyabara Y, Suzuki JS, Sato M, Aoki Y, Satoh M,
Yonemoto J, Tohyama C (2001) Induction of metallothionein in
the livers of female Sprague–Dawley rats treated with 2,3,7,8-
tetrachlorodibenzo-p-dioxin. Life Sci 69:1291–1303
Okey AB (1990) Enzyme induction in the cytochrome P-450 system.
Pharmacol Ther 45:241–98
Okey AB (2007) An aryl hydrocarbon receptor Odyssey to the Shores
of Toxicology: the Deichmann lecture, International Congress of
Toxicology-XI. Toxicol Sci 98:5–38
Okey AB, Franc MA, Moffat ID, Tijet N, Boutros PC, Korkalainen
M, Tuomisto J, Pohjanvirta R (2005) Toxicological implications
of polymorphisms in receptors for xenobiotic chemicals: the case
of the aryl hydrocarbon receptor. Toxicol Appl Pharmacol
207:S43–S51
Ovando BJ, Vezina CM, McGarrigle BP, Olson JR (2006) Hepatic
gene downregulation following acute and subchronic exposure to
2,3,7,8-tetrachlorodibenzo-p-dioxin. Toxicol Sci 94:428–438
Pande K, Moran SM, Bradfield CA (2005) Aspects of dioxin toxicity
are mediated by interleukin 1-like cytokines. Mol Pharmacol
67:1393–1398
Parsons RB, Ramsden DB, Waring RH, Barber PC, Williams AC
(1998) Hepatic localisation of rat cysteine dioxygenase. J
Hepatol 29:595–602
Pastorelli R, Carpi D, Campagna R, Airoldi L, Pohjanvirta R,
Viluksela M, Hakansson H, Boutros PC, Moffat ID, Okey AB,
Fanelli R (2006) Differential expression profiling of the hepatic
proteome in a rat model of dioxin resistance: correlation with
genomic and transcriptomic analyses. Mol Cell Proteomics
5:882–894
Pohjanvirta R, Tuomisto J (1987) Han/Wistar rats are exceptionally
resistant to TCDD. II. Arch Toxicol Suppl 11:344–347
Pohjanvirta R, Tuomisto J (1994) Short-term toxicity of 2,3,7,8-
tetrachlorodibenzo-p-dioxin in laboratory animals: effects,
mechanisms, and animal models. Pharmacol Rev 46:483–549
Pohjanvirta R, Juvonen R, Karenlampi S, Raunio H, Tuomisto J
(1988) Hepatic Ah-receptor levels and the effect of 2,3,7,8-
tetrachlorodibenzo-p-dioxin (TCDD) on hepatic microsomal
monooxygenase activities in a TCDD-susceptible and -resistant
rat strain. Toxicol Appl Pharmacol 92:131–140
Pohjanvirta R, Tuomisto L, Tuomisto J (1989) The central nervous
system may be involved in TCDD toxicity. Toxicology 58:167–
174
Pohjanvirta R, Sankari S, Kulju T, Naukkarinen A, Ylinen M,
Tuomisto J (1990) Studies on the role of lipid peroxidation in the
acute toxicity of TCDD in rats. Pharmacol Toxicol 66:399–408
Pohjanvirta R, Wong JMY, Li W, Harper PA, Tuomisto J, Okey AB
(1998) Point mutation in intron sequence causes altered
carboxyl-terminal structure in the aryl hydrocarbon receptor of
the most 2,3,7,8-tetrachlorodibenzo-p-dioxin-resistant rat strain.
Mol Pharmacol 54:86–93
Pohjanvirta R, Viluksela M, Tuomisto JT, Unkila M, Karasinska J,
Franc M-A, Holowenko M, Giannone JV, Harper PA, Tuomisto
J, Okey AB (1999) Physicochemical differences in the AH
receptors of the most TCDD-susceptible and the most TCDD-
resistant rat strains. Toxicol Appl Pharmacol 155:82–95
Puga A, Maier A, Medvedovic M (2000) The transcriptional signature
of dioxin in human hepatoma HepG2 cells. Biochem Pharmacol
60:1129–1142
Schwanekamp JA, Sartor MA, Karyala S, Halbleib D, Medvedovic
M, Tomlinson CR (2006) Genome-wide analyses show that
nuclear and cytoplasmic RNA levels are differentially affected
by dioxin. Biochim Biophys Acta 1759:388–402
Siepel A, Haussler D (2004) Combining phylogenetic and hidden
Markov models in biosequence analysis. J Comput Biol 11:413–
428
Simanainen U, Tuomisto JT, Tuomisto J, Viluksela M (2002)
Structure–activity relationships and dose responses of polychlo-
rinated dibenzo-p-dioxins for short-term effects in 2,3,7,8-
tetrachlorodibenzo-p-dioxin-resistant and -sensitive rat strains.
Toxicol Appl Pharmacol 181:38–47
Simanainen U, Tuomisto JT, Tuomisto J, Viluksela M (2003) Dose–
response analysis of short-term effects of 2,3,7,8-tetrachlo-
rodibenzo-p-dioxin in three differentially susceptible rat lines.
Toxicol Appl Pharmacol 187:128–136
Slatter JG, Cheng O, Cornwell PD, de Souza A, Rockett J, Rushmore
T, Hartley D, Evers R, He Y, Dai X, Hu R, Caguyong M,
Roberts CJ, Castle J, Ulrich RG (2006) Microarray-based
compendium of hepatic gene expression profiles for prototypical
ADME gene-inducing compounds in rats and mice in vivo.
Xenobiotica 36:902–937
Smith AG, Clothier B, Robinson S, Scullion MJ, Carthew P, Edwards
R, Luo J, Lim CK, Toledano M (1998) Interaction between iron
metabolism and 2,3,7,8-tetrachlorodibenzo-p-dioxin in mice
with variants of the Ahr gene: a hepatic oxidative mechanism.
Mol Pharmacol 53:52–61
Smyth GK (2003) Linear models and empirical Bayes methods for
assessing differential expression in microarray experiments. Stat
Appl Genetics Mol Biol 3:1–26
Storey JD, Tibshirani R (2003) Statistical significance for genome-
wide studies. Proc Natl Acad Sci USA 100:9440–9445
Tanaka TS, Jaradat SA, Lim MK, Kargul GJ, Wang X, Grahovac MJ,
Pantano S, Sano Y, Piao Y, Nagaraja R, Doi H, Wood WH III,
Becker KG, Ko MS (2000) Genome-wide expression profiling of
mid-gestation placenta and embryo using a 15,000 mouse
developmental cDNA microarray. Proc Natl Acad Sci USA
97:9127–9132
Thimmulappa RK, Mai KH, Srisuma S, Kensler TW, Yamamoto M,
Biswal S (2002) Identification of Nrf2-regulated genes induced
by the chemopreventive agent sulforaphane by oligonucleotide
microarray. Cancer Res 62:5196–5203
Arch Toxicol (2008) 82:809–830 829
123
Thurmond TS, Silverstone AE, Baggs RB, Quimby FW, Staples JE,
Gasiewicz TA (1999) A chimeric aryl hydrocarbon receptor
knockout mouse model indicates that aryl hydrocarbon receptor
activation in hematopoietic cells contributes to the hepatic
lesions induced by 2,3,7, 8- tetrachlorodibenzo-p-dioxin. Toxicol
Appl Pharmacol 158:33–40
Tijet N, Boutros PC, Moffat ID, Okey AB, Tuomisto J, Pohjanvirta R
(2006) The aryl hydrocarbon receptor regulates distinct dioxin-
dependent and dioxin-independent gene batteries. Mol Pharma-
col 69:140–153
Tuomisto J (2005) Does mechanistic understanding help in risk
assessment-the example of dioxins. Toxicol Appl Pharmacol
207:2–10
Tuomisto JT, Viluksela M, Pohjanvirta R, Tuomisto J (1999) The AH
receptor and a novel gene determine acute toxic responses to
TCDD: segregation of the resistant alleles to different rat lines.
Toxicol Appl Pharmacol 155:71–81
Unkila M (1993) Differential effect of TCDD on brain serotonin
metabolism in a TCDD-susceptible and a TCDD-resistant rat
strain. Chemosphere 27:401–406
Uno S, Dalton TP, Sinclair PR, Gorman N, Wang B, Smith AG,
Miller ML, Shertzer HG, Nebert DW (2004) Cyp1a1(-/-) male
mice: protection against high-dose TCDD-induced lethality and
wasting syndrome, and resistance to intrahepatocyte lipid
accumulation and uroporphyria. Toxicol Appl Pharmacol
196:410–421
Vartiainen T, Lampi P, Tuomisto JT, Tuomisto J (1995) Poly-
chlorodibenzo-p-dioxin and polychlorodibenzofuran con-
centrations in human fat samples in a village after pollution of
drinking water with chlorophenols. Chemosphere 30:1429–1438
Vezina CM, Walker NJ, Olson JR (2004) Subchronic exposure to
TCDD, PeCDF, PCB126, and PCB153: effect on hepatic gene
expression. Environ Health Perspect 112:1636–1644
Viluksela M, Bager Y, Tuomisto JT, Scheu G, Unkila M, Pohjanvirta
R, Flodstrom S, Warngard L, Tuomisto J (1997) Comparison of
liver tumor promoting activity of TCDD in a TCDD-sensitive
and a TCDD-resistant rat strain. Pharmacol Toxicol 80:152–156
Viluksela M, Unkila M, Pohjanvirta R, Tuomisto JT, Stahl BU,
Rozman KK, Tuomisto J (1999) Effects of 2,3,7,8-tetrachlo-
rodibenzo-p-dioxin (TCDD) on liver phosphoenolpyruvate
carboxykinase (PEPCK) activity, glucose homeostasis and
plasma amino acid concentrations in the most TCDD-susceptible
and the most TCDD-resistant rat strains. Arch Toxicol 73:323–
336
Viluksela M, Bager Y, Tuomisto JT, Scheu G, Unkila M, Pohjanvirta
R, Flodstrom S, Kosma VM, Maki-Paakkanen J, Vartiainen T,
Klimm C, Schramm KW, Warngard L, Tuomisto J (2000) Liver
tumor-promoting activity of 2,3,7,8-tetrachlorodibenzo-p-dioxin
(TCDD) in TCDD-sensitive and TCDD-resistant rat strains.
Cancer Res 60:6911–6920
Walisser JA, Bunger MK, Glover E, Bradfield CA (2004) Gestational
exposure of Ahr and Arnt hypomorphs to dioxin rescues vascular
development. Proc Natl Acad Sci USA 101:16677–16682
Wang P, Ding F, Chiang H, Thompson RC, Watson SJ, Meng F
(2002a) ProbeMatchDB—a web database for finding equivalent
probes across microarray platforms and species. Bioinformatics
18:488–489
Wang W, Wyckoff JB, Frohlich VC, Oleynikov Y, Huttelmaier S,
Zavadil J, Cermak L, Bottinger EP, Singer RH, White JG, Segall
JE, Condeelis JS (2002b) Single cell behavior in metastatic
primary mammary tumors correlated with gene expression
patterns revealed by molecular profiling. Cancer Res 62:6278–
6288
Weber LW, Lebofsky M, Stahl BU, Kettrup A, Rozman K (1992)
Comparative toxicity of four chlorinated dibenzo-p-dioxins
(CDDs) and their mixture. Part II: structure–activity relation-
ships with inhibition of hepatic phosphoenolpyruvate
carboxykinase, pyruvate carboxylase, and gamma-glutamyl
transpeptidase activities. Arch Toxicol 66:478–483
Weber LW, Palmer CD, Rozman K (1994) Reduced activity of
tryptophan 2,3-dioxygenase in the liver of rats treated with
chlorinated dibenzo-p-dioxins (CDDs): dose–responses and
structure–activity relationship. Toxicology 86:63–69
Workman C, Jensen LJ, Jarmer H, Berka R, Gautier L, Nielser HB,
Saxild HH, Nielsen C, Brunak S, Knudsen S (2002) A new non-
linear normalization method for reducing variability in DNA
microarray experiments. Genome Biol 3:research0048
Yang YH, Speed T (2002) Design issues for cDNA microarray
experiments. Nat Rev Genet 3:579–588
Yang D, Li Y, Yuan X, Matoney L, Yan B (2001) Regulation of rat
carboxylesterase expression by 2,3,7,8-tetrachlorodibenzo-p-
dioxin (TCDD): a dose-dependent decrease in mRNA levels
but a biphasic change in protein levels and activity. Toxicol Sci
64:20–27
Zeytun A, McKallip R, Fisher M, Camacho I, Nagarkatti M,
Nagarkatti P (2002) Analysis of 2,3,7,8-tetrachlorodibenzo-p-
dioxin-induced gene expression profile in vivo using pathway-
specific cDNA arrays. Toxicology 178:241
Zhang L, Zheng W, Jefcoate CR (2003) Ah receptor regulation of
mouse Cyp1B1 is additionally modulated by a second novel
complex that forms at two AhR response elements. Toxicol Appl
Pharmacol 192:174–190
830 Arch Toxicol (2008) 82:809–830
123
Related Documents