Patterns of Clonal Growth Modes Along a Chronosequence of Post-Coppice Forest Regeneration in Beech Forests of Central Italy Roberto Canullo & Giandiego Campetella & Ladislav Mucina & Stefano Chelli & Camilla Wellstein & Sándor Bartha # Institute of Botany, Academy of Sciences of the Czech Republic 2010 Abstract Forest coppicing leads to changes in composition of the herbaceous understory through soil disturbance and alteration of the light regime. While the role of seed dispersal traits at the start of succession after coppicing has been extensively studied, the role of persistence traits such as clonal growth and bud banks is not yet sufficiently understood. To gain better understanding of this role, we studied the patterns of clonal growth organs and related clonal traits of species in a series of coppiced beech forests of the Central Apennines (Marches region, Italy) in various stages of recovery after the last coppicing event. We conducted stratified random sampling and established a chronosequence of recovery stages based on stand age (reflecting the number of years since the last coppicing). The beech stands Folia Geobot DOI 10.1007/s12224-010-9087-0 Electronic supplementary material The online version of this article (doi:10.1007/s12224-010-9087-0) contains supplementary material, which is available to authorized users. R. Canullo (*) : G. Campetella : S. Chelli Department of Environmental Science, Section of Botany & Ecology, University of Camerino, Via Pontoni, 5, Camerino, MC 62032, Italy e-mail: [email protected] G. Campetella e-mail: [email protected] S. Chelli e-mail: [email protected] L. Mucina School of Science, Curtin University of Technology, GPO Box U1987, Perth, WA 6845, Australia e-mail: [email protected] C. Wellstein Department of Biogeography, University of Bayreuth, Universitätsstr. 30, Bayreuth 95440, Germany e-mail: [email protected] S. Bartha Hungarian Academy of Sciences, Institute of Ecology & Botany, Vácrátót 2163, Hungary e-mail: [email protected]

Welcome message from author
This document is posted to help you gain knowledge. Please leave a comment to let me know what you think about it! Share it to your friends and learn new things together.
Transcript
Patterns of Clonal Growth Modes Alonga Chronosequence of Post-Coppice Forest Regenerationin Beech Forests of Central Italy
Roberto Canullo & Giandiego Campetella & Ladislav Mucina &
Stefano Chelli & Camilla Wellstein & Sándor Bartha
# Institute of Botany, Academy of Sciences of the Czech Republic 2010
Abstract Forest coppicing leads to changes in composition of the herbaceousunderstory through soil disturbance and alteration of the light regime. While the roleof seed dispersal traits at the start of succession after coppicing has been extensivelystudied, the role of persistence traits such as clonal growth and bud banks is not yetsufficiently understood. To gain better understanding of this role, we studied thepatterns of clonal growth organs and related clonal traits of species in a series ofcoppiced beech forests of the Central Apennines (Marches region, Italy) in variousstages of recovery after the last coppicing event. We conducted stratified randomsampling and established a chronosequence of recovery stages based on standage (reflecting the number of years since the last coppicing). The beech stands
Folia GeobotDOI 10.1007/s12224-010-9087-0
Electronic supplementary material The online version of this article (doi:10.1007/s12224-010-9087-0)contains supplementary material, which is available to authorized users.
R. Canullo (*) : G. Campetella : S. ChelliDepartment of Environmental Science, Section of Botany & Ecology, University of Camerino,Via Pontoni, 5, Camerino, MC 62032, Italye-mail: [email protected]
G. Campetellae-mail: [email protected]
S. Chellie-mail: [email protected]
L. MucinaSchool of Science, Curtin University of Technology, GPO Box U1987, Perth, WA 6845, Australiae-mail: [email protected]
C. WellsteinDepartment of Biogeography, University of Bayreuth, Universitätsstr. 30, Bayreuth 95440, Germanye-mail: [email protected]
S. BarthaHungarian Academy of Sciences, Institute of Ecology & Botany, Vácrátót 2163, Hungarye-mail: [email protected]

were classified into three age groups (Post-logged, Recovering, and Old-coppicestands) according to the characteristic stages of beech coppice dynamics. Clonalgrowth organs and the corresponding clonal traits of plants in the forestunderstory vegetation were assessed with the help of a CLO-PLA1 database.We found no significant change in the proportion of clonal species along thestudied chronosequence. In contrast, most of the traits and about the half of theclonal growth organs showed correlation with stand age or preference for acertain habitat (i.e., stage of regeneration). Clonal and bud bank traits proved toplay an important role in the persistence of species subjected to forest coppicingcycles in the studied area.
Keywords Adaptation . Clonality . Coppice rotation cycle . Forest succession .
Persistence . Plant functional traits . Stand age . Understory vegetation . Vegetativemobility
AbbreviationsCGO – Clonal growth organ . PCO – Principal coordinate analysis .
DCA – Detrended correspondence analysis . RDA – Redundancy analysis
Plant nomenclature Pignatti (1982) except for Cardamine bulbifera, Cyanustriumfettii, Drymochloa sylvatica, Koeleria lobata and Lactuca muralis, thenomenclature of which follows the latest taxonomic findings
Introduction
Silvicultural management interventions cause disturbance in forest ecosystems andalter such ecological parameters as light, temperature, air humidity and soilproperties (Federer and Tanner 1966; Anderson et al. 1969; Gondard and Deconchat2003; Rubio and Escudero 2003). Considering that the response of species toenvironmental conditions is determined by their biological traits (Reich et al. 2003;McIntyre and Lavorel 2007), study of life-history traits offers new possibilities forimproving our understanding of ecological processes such as community assemblyin space and time (Lavorel et al. 2007). Consequently the detection and prediction ofspecies responses to environmental changes on a range of scales (Garnier et al. 2004;Aubin et al. 2009) is facilitated.
Recently, plant traits have been used in studies of the effects of disturbance inforests (Graae and Sunde 2000; Verheyen et al. 2003; Sammul et al. 2004; Aubin etal. 2009). It has been demonstrated that the diverse environmental conditions incoppiced forests act as filters on plant functional traits, especially those pertinent todispersal and demands for light, i.e., seed and leaf traits (Mason and MacDonald2002; Decocq et al. 2004; Bartha et al. 2008). Specifically, light demanding specieswith low SLA are replaced by low light tolerating species with high SLA,while species with persistent seed bank are replaced by species without seedbank during forest succession (Brown and Warr 1992; Dahlgren et al. 2006). Therole of persistence traits such as clonality and bud bank, however, remain to beexplored in depth.
R. Canullo et al.
There is evidence that clonal growth is generally less abundant in disturbedhabitats (Silvertown 2008) and more abundant in shaded ones (van Groenendael etal. 1996). The guerilla strategy (sensu Lovett Doust and Lovett Doust 1982) wasshown to be of importance in nutrient-rich, well-watered and/or shaded habitats(Lovett-Doust 1981), presumably due to foraging for light (Sammul et al. 2004). Thetrait syndromes related to phalanx-strategy (i.e., shorter spacers, large bud bank),however, are more important in heterogeneous, disturbed habitats characterized bynutrient-poor and water-stressed habitat conditions (Oborny 1994; Jònsdòttir andWatson 1997; Vesk and Westoby 2004; Halassy et al. 2005; Klimešová and Klimeš2008). Song et al. (2002) showed that in different kinds of forests the speciesdiversity was positively correlated with the relative importance of clonal plants, andwith phalanx strategy in particular. Demographic investigations (Vandepitte et al.2009) on the clonal species Mercurialis perennis in a forest succession contextsuggested that sexual reproduction is reduced under closed canopies of oldersuccession stages where species persistence would mainly rely on clonal growth.This has further implications for the clonal diversity and spatial genetic structure ofclonal species with respect to the degree of canopy closure (Vandepitte et al. 2009).
To cope with the complexity of clonal plant traits, Klimeš et al. (1997) introducedthe concept of groups sharing the same Clonal Growth Organs (CGOs), pertinent tothe patterns and dynamics of clonal growth. These groups are based on acombination of plant traits related to the origin of CGOs, such as stem, root, initialand final position of CGOs (above-ground or below-ground), presence of specialstorage organs (tubers and bulbs), length and longevity of spacers between ramets,presence of bud bank (small, large), and finally, patterns of bud protection andthickening (Klimeš et al. 1997). Recent developments in construction of databases ofplant traits related to vegetative reproduction (van Groenendael et al. 1996; Klimešet al. 1997; Klimeš and Klimešová 1999; Kull et al. 2000; Mucina et al. 2003;Klimešová and Klimeš 2008) offer new perspectives on comparative field studies,allowing to tackle multi-species systems at multiple spatiotemporal scales (Prach andPyšek 1994; van Groenendael et al. 1996; Klimeš et al. 1997; Klimeš and Klimešová1999; Liira et al. 2002; Song et al. 2002; Klimeš 2003; Sammul et al. 2003; Halassyet al. 2005; Canullo et al. 2006; Klimešová and Klimeš 2007; Wellstein and Kuss2011 – this issue).
However, few papers have dealt with coppice woods, particularly in theMediterranean (Decocq et al. 2004; Gondard and Romane 2005; Gondard et al.2006), and there are no investigations focusing on community-level patterns ofclonal traits along the regeneration chronosequences initiated after cessation ofcoppicing.
In this study we compared the composition of CGOs of plant species in aseries of coppice beech forests in stages of recovery after the last coppicingevent. Coppicing opens the tree canopy and perturbs the forest understoryvegetation, bringing about changes in light, moisture and nutrient conditions anddamaging the soil surface and forest-ground plant cover (Buckley 1992; Ciancioet al. 2006; Coppini and Hermanin 2007). Based on the assumption that thesechanges accompanying regeneration processes in forests act like filters that areselective for species with appropriate clonal traits, we wished to address thefollowing hypotheses:
Patterns of Clonal Growth Modes Along a Chronosequence

(H1) The proportion of clonal species increases during the recovery of a forestafter the abandonment of coppicing because clonal growth in general is lessprominent in disturbed conditions and more prominent in shady habitats.(H2) Older stages of forest regeneration are characterized by a higher number ofclonal species with longer spacers, short-lived connections (splitting clones),and small below-ground bud-banks because such species prefer shaded andmoist habitat conditions.
Material and Methods
Study Area
The study area is located in the Central Apennines in the southern part of the Marcheregion, Italy (Fig. 1), a region with a temperate climate, annual precipitation rangingfrom 1,100 mm to 1,500 mm and mean annual temperatures of 8°C to 12°C (Amiciand Spina 2002). The local bedrocks are mainly Mesozoic and Tertiary limestones,supporting soils classified Skeleti-Calcaric Phaeozems and Calcari-Humic Leptosols,
Fig. 1 The location of the study area in the Central Apennines, Italy (southern Marches mountain range,outlined in the box). The beech stands are shown as shaded patches; full dots indicate the positions ofsampled plots (modified from IPLA 2001)
R. Canullo et al.
having low water capacity, medium-high (10%–40%) content of carbonates, loamytexture, and pH ranging from neutral to sub-alkaline (ASSAM 2006).
The studied beech forests belong to the Cardamino kitaibelii-Fagetum sylvaticaeand the Lathyro veneti-Fagetum sylvaticae (the Geranio striati-Fagion), accordingto the Zürich-Montpellier system (cfr. Di Pietro et al. 2004). The tree layer isdominated by Fagus sylvatica, with mixtures of Acer obtusatum, Laburnumanagyroides, Fraxinus excelsior, Sorbus aria, Acer platanoides, A. pseudoplatanus,Corylus avellana, Taxus baccata and Ilex aquifolium. The geomorphology is themajor complex factor controlling the landscape-level distribution of the beech forestsin the study area. Compact and larger patches of forests are present on the valleyslopes, in contact with secondary grasslands at the upper elevation limit; they bordermixed deciduous forests at their low elevation limit. Recent decreases of the humanpopulation density in the region due to urban-bound emigration and the resultingdrop in firewood and charcoal demand brought about changes in traditional intensivecoppice management (Ciancio et al. 2006). The beech forests in the study area todaycover around 10,000 hectares, of which 90% are managed or abandoned coppices(IPLA 2001). In this silvicultural system, clear felling of stems is carried out incoppicing rotation cycles of 25–30 years. Some mature trees (so called “standards”)are retained through two or three normal coppicing rotation cycles, usually in adensity of 80 to 150 trees per hectare (Coppini and Hermanin 2007). For furtherdetails on vegetation dynamics of the studied area see Bartha et al. (2008).
Sampling Design
From a large pool of beech coppice forest stands identified by Bartha et al. (2008), 20sites (0.5 to 35 ha large) were selected through a stratified procedure involvingelevation (200 m classes, between 1,000 m and 1,600 m a.s.l.) and stand age (10 yearsclasses, since the last coppicing) as the major stratifying criteria (Bartha et al. 2008).Elevation was used as a “proxy” variable accounting for the main beech forest typesreported in the regional forest inventory (IPLA 2001). In the selected forest sites, 33plots (20 m × 20 m each) were sampled (Fig. 1); two plots were placed in larger andheterogeneous sites. Relatively precise age estimation of each forest site was used toconstruct a chronosequence (space-for-time substitution system; Pickett 1989) startingat the time of the last coppicing. Hence, the chronosequence included 20 sites aged 4,5, 6, 8, 8, 14, 15, 17, 22, 22, 24, 28, 29, 35, 45, 48, 48, 55, 64, 65 years, respectively.The pool of sites was classified into three age groups, including:
1. Post-logged stands coppiced within the last 14 years (n=9), and encompassingall the stands where the canopy closure provided by sucker growth is still notcomplete; (In a coppiced beech stand canopy closure occurs 8–10 years afterharvesting (Ash and Barkham 1976), but it can take longer in habitats with poorsoils and low stem density (Barkham 1992), as noted for some of the study areasites. For this reason, the 14-year-old sites were also included.)
2. Recovering stands 15 to 30 years old (n=13), where the main features ofcoppice forest structure are under recovery; these stands include the maximumextent of coppicing time rotation in the study area;
3. Old coppice stands, including sites left unexploited for at least 31 years (n=11).
Patterns of Clonal Growth Modes Along a Chronosequence
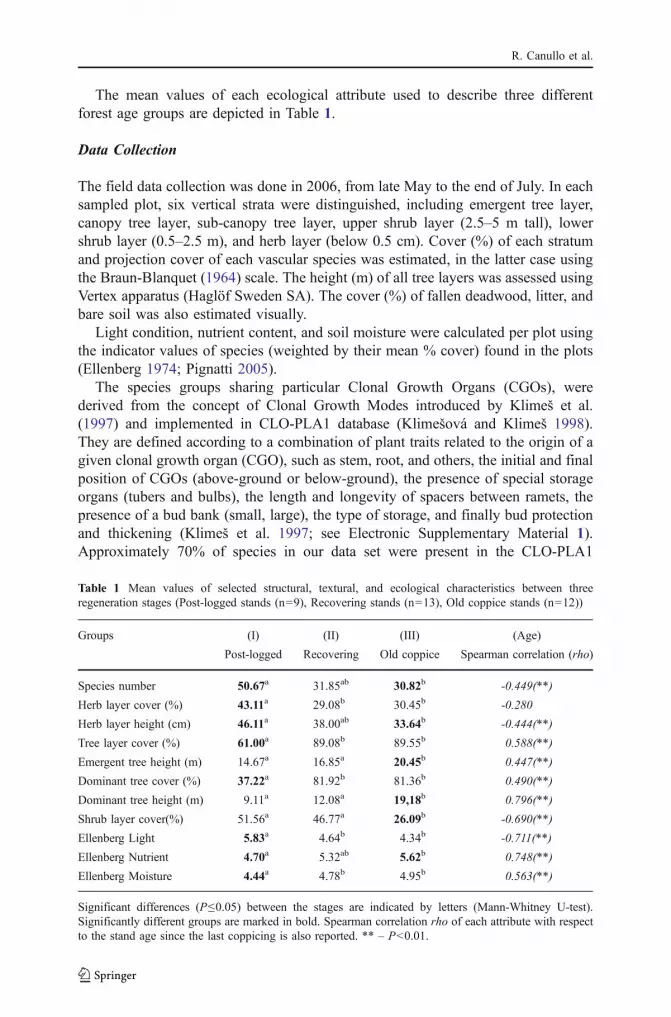
The mean values of each ecological attribute used to describe three differentforest age groups are depicted in Table 1.
Data Collection
The field data collection was done in 2006, from late May to the end of July. In eachsampled plot, six vertical strata were distinguished, including emergent tree layer,canopy tree layer, sub-canopy tree layer, upper shrub layer (2.5–5 m tall), lowershrub layer (0.5–2.5 m), and herb layer (below 0.5 cm). Cover (%) of each stratumand projection cover of each vascular species was estimated, in the latter case usingthe Braun-Blanquet (1964) scale. The height (m) of all tree layers was assessed usingVertex apparatus (Haglöf Sweden SA). The cover (%) of fallen deadwood, litter, andbare soil was also estimated visually.
Light condition, nutrient content, and soil moisture were calculated per plot usingthe indicator values of species (weighted by their mean % cover) found in the plots(Ellenberg 1974; Pignatti 2005).
The species groups sharing particular Clonal Growth Organs (CGOs), werederived from the concept of Clonal Growth Modes introduced by Klimeš et al.(1997) and implemented in CLO-PLA1 database (Klimešová and Klimeš 1998).They are defined according to a combination of plant traits related to the origin of agiven clonal growth organ (CGO), such as stem, root, and others, the initial and finalposition of CGOs (above-ground or below-ground), the presence of special storageorgans (tubers and bulbs), the length and longevity of spacers between ramets, thepresence of a bud bank (small, large), the type of storage, and finally bud protectionand thickening (Klimeš et al. 1997; see Electronic Supplementary Material 1).Approximately 70% of species in our data set were present in the CLO-PLA1
Table 1 Mean values of selected structural, textural, and ecological characteristics between threeregeneration stages (Post-logged stands (n=9), Recovering stands (n=13), Old coppice stands (n=12))
Groups (I) (II) (III) (Age)
Post-logged Recovering Old coppice Spearman correlation (rho)
Species number 50.67a 31.85ab 30.82b -0.449(**)
Herb layer cover (%) 43.11a 29.08b 30.45b -0.280
Herb layer height (cm) 46.11a 38.00ab 33.64b -0.444(**)
Tree layer cover (%) 61.00a 89.08b 89.55b 0.588(**)
Emergent tree height (m) 14.67a 16.85a 20.45b 0.447(**)
Dominant tree cover (%) 37.22a 81.92b 81.36b 0.490(**)
Dominant tree height (m) 9.11a 12.08a 19,18b 0.796(**)
Shrub layer cover(%) 51.56a 46.77a 26.09b -0.690(**)
Ellenberg Light 5.83a 4.64b 4.34b -0.711(**)
Ellenberg Nutrient 4.70a 5.32ab 5.62b 0.748(**)
Ellenberg Moisture 4.44a 4.78b 4.95b 0.563(**)
Significant differences (P≤0.05) between the stages are indicated by letters (Mann-Whitney U-test).Significantly different groups are marked in bold. Spearman correlation rho of each attribute with respectto the stand age since the last coppicing is also reported. ** – P<0.01.
R. Canullo et al.
database. We revised the classification of these species into CGO groups using ourfield observations (unpublished data) and on the basis of the relevant clonal traits(Klimeš et al. 1997; Halassy et al. 2005). For species found in the CLO-PLA1, allthe assigned clonal traits were extracted from Klimeš et al. (1997: Table 2). Weclassified those species not found in the CLO-PLA1 database with CGOs usingdetailed field observations of the clonal traits according to Klimeš et al. (1997) (seeElectronic Supplementary Material 1). Some species can be characterized by morethan one type of CGO in the classification system of Klimeš et al. (1997). Only thedominating CGO (as established by our field observations) was considered in theanalyses in the latter cases.
Data Analyses
For every trait and for every CGO, the number of species and the percentage numberof species representing that trait or that CGO were calculated to express theimportance of the traits or the importance of CGOs at plot scale, only consideringthe herb layer. Because the total number of species varied considerably betweenplots (cf. Bartha et al. 2008) and because we were interested in the relativeimportance of traits and CGOs along the chronosequence of the forest regeneration,the percentage number of species (proportion of species) with a certain trait or with acertain CGO was used in the comparative analyses.
Prior to analyses, the CGOs of low importance (fewer than five species in thesample) were omitted from the dataset. Some traits were complementary ordependent (e.g., CGO of above-ground origin or CGO of below-ground origin). Inthis case, only one of the traits was chosen (at random) and included in the dataset.This selection procedure resulted in two matrices (a matrix based on 13 CGOs, andthe other based on 13 traits).
The correlations (Spearman’s rho) between the stand age and selected structuraland ecological characteristics of stands were calculated (Table 1). Differences inthese characteristics between the three regeneration stages were tested as well(Mann-Whitney U-test). Differences in the importance of CGOs and related clonaltraits between post-coppice regeneration stages were analyzed using a Kruskal-Wallis test, followed by Mann-Whitney U-test.
We ran a detrended correspondence analysis (DCA) first to decide (on the basis ofthe species turnover gradients depicted by axis 1 of DCA) whether the linear orunimodal model was more appropriate in the subsequent ordination analyses. Bothgradients were short (1.225 S.D. and 0.442 S.D. for the CGO data and clonal-traitdata, respectively), suggesting that an ordination technique based on the linear modelcould be used in the subsequent multivariate analyses.
Principal coordinate analysis (PCO) was used to analyze the patterns of changesin both the CGO and trait compositions. The original age of the stands and theoriginal importance values (relative frequency of trait or of CGO for each speciespresent in a plot) were then correlated (using Spearman’s rho) with sample scoresalong the PCO axes. As the first axes of both trait-based and CGO-based ordinationsshowed significant correlations with the stand age (cf. the Results section fordetails), we report the related correlations only (i.e., correlations with the first PCOaxis). To test whether the stand age alone is sufficient to explain the compositional
Patterns of Clonal Growth Modes Along a Chronosequence

Tab
le2
Meannu
mberandpercentage
ofclon
alspeciessharingthesameclon
altraitin
threeregeneratio
nstages
(Post-logg
edstands
(n=9),Recov
eringstands
(n=13
),Old
coppicestands
(n=12
))
TRAITS
MeanSPECIESNUMBER
MeanSPECIES%
Post-Logged
Recov
ering
Old
copp
ice
Post-Log
ged
Recov
ering
Old
copp
ice
CGO
root
8.55
a(3.84)
2.92
b(2.01)
2.00
b(0.89)
24.17a
(4.87)
11.53b
(7.47)
9.22
b(4.13)
CGO
stem
28.00a
(14.07
)20
.00a
(6.36)
20.09a
(3.85)
75.82a
(4.87)
88.46b
(7.47)
90.77b
(4.13)
CGO
abov
egrou
nd2.77
a(2.22)
0.92
b(0.86)
0.90
b(0.83)
7.03
a (3.34
)3.93
b(4.38)
3.79
ab(3.21)
CGO
below
grou
nd33
.77a
(15.73
)22
.00a
b(7.58)
21.18b
(3.18)
92.96a
(3.34)
96.06b
(4.38)
96.20a
b(3.21)
SpacerLon
g10
.77a
(4.73)
7.61
a(2.18)
8.18
a(2.04)
30.06a
(4.73)
35.03a
b(9.18)
37.17b
(7.56)
SpacerSho
rt22
.11a
(11.40
)13
.38b
(5.69)
12.81b
(3.06)
60.06a
(5.42)
56.12a
(12.63
)57
.86a
(8.69)
NoSpacer
3.66
a(2.34)
1.92
a(1.18)
1.09
b(0.53)
9.86
a(5.11)
8.83
a(5.61)
4.95
b(2.63)
ConnectionLon
g31
.33a
(15.97
)16
.85b
(5.02)
16.27b
(15.97
)84
.73a
(5.39)
72.24b
(11.54
)73
.78b
(6.13)
ConnectionSho
rt5.33
a(2.39)
6.07
a(2.72)
5.81
a(1.94)
15.26a
(5.39)
27.75b
(11.53
)26
.21b
(6.13)
FastSpread
15.44a
(6.40)
9.23
b(3.32)
8.54
b(1.91)
43.32a
(8.36)
41.69a
(14.37
)38
.97a
(8.34)
Insign
ificantSpread
21.11a
(11.77
)13
.69a
(6.66)
13.45a
(3.26)
56.67a
(8.36)
58.30a
(14.37
)60
.54a
(8.02)
RareSpread
0.00
(0.00)
0.00
(0.00)
0.09
(0.30)
0.00
(0.00)
0.00
(0.00)
0.47
(1.58)
Storage
34.55a
(15.89
)22
.61a
b(7.73)
21.90b
(3.61)
95.08a
(1.84)
98.65b
(2.15)
99.28b
(1.59)
CGO
Storage
0.77
a(0.83)
0.38
a(0.65)
0.45
a(0.52)
2.54
a(2.79)
1.24
a(2.09)
2.00
a(2.35)
No-CGO
Storage
0.22
a(0.44)
1.00
b(0.57)
0.81
ab(0.87)
0.52
a(1.12)
5.63
b(6.07)
3.94
ab(4.27)
Bud
Protection
2.44
a(1.58)
1.46
a(0.87)
1.63
a(0.80)
7.04
a(4.84)
7.39
a(6.05)
7.24
a(3.38)
Large
Bud
Bank
29.33a
(14.19
)16
.92b
(5.96)
17.09b
(3.01)
80.06a
(4.78)
72.88a
(12.85
)77
.37a
(4.70)
SmallBud
Bank
4.00
a(1.73)
5.46
a(2.78)
4.90
a(1.44)
11.30a
(3.46)
25.16b
(13.11)
22.28b
(5.14)
Extensive
Perennial
Roo
t31
.44a
(15.88
)17
.15b
(6.53)
16.45b
(3.04)
85.43a
(4.73)
73.16b
(11.76
)74
.46b
(5.13)
Multip
licationFrequ
ent
32.11a
(14.22
)21
.53a
b(7.05)
20.90b
(3.85)
88.88a
(5.94)
94.08a
b(3.87)
94.53b
(3.91)
Multip
licationInfrequent
4.33
a(3.39)
1.15
b(1.21)
0.72
b(0.46)
10.95a
(5.75)
4.17
b(3.83)
3.19
b(2.13)
NoMultip
lication
0.11
(0.33)
0.23
(0.43)
0.45
(0.52)
0.16
a(0.49)
1.73
a(3.58)
2.26
a(2.60)
Thickening
29.00a
(15.12
)16
.38b
(5.85)
15.45b
(2.42)
78.21a
(6.39)
70.48a
b(11.94)
70.48b
(7.63)
LongLongevity
spacer
23.77a
(13.61
)14
.53a
(5.02)
14.90a
(2.91)
62.88a
(5.55)
62.93a
(7.82)
67.42a
(6.20)
ShortLongevity
spacer
9.11
a(2.47)
6.46
b(2.63)
6.09
b(1.81)
27.25a
(8.13)
28.22a
(6.14)
27.61a
(7.15)
NoLon
gevity
3.66
a(2.34)
1.92
a(1.18)
1.09
b(0.53)
9.86
a(5.11)
8.83
a(5.61)
4.95
b(2.63)
The
standard
deviationvalues
aregivenin
parentheses.Meanvalues
sharingthesameletters
with
inarow
meanthat
grou
psof
stands
areno
tsign
ificantly
differentat
P=0.05
basedon
Mann-Whitney
U-test.Significantly
differenttraitsvalues
arehighlig
hted
inbold.
R. Canullo et al.

variation in clonal traits and in CGOs, a partial redundancy analysis (partial RDA)was used. The stand age was set as covariable, while selected forest structuralcharacteristics (tree layer cover, emergent tree height, dominant tree cover, dominanttree height, shrub layer cover, herb layer cover, herb layer height; Table 1) served asvariables of interest. The potential effects of light, soil nutrients and soil moisture(expressed as cover-weighted Ellenberg indicator values of species per plots) wereevaluated using a similar partial RDA design. Significance of the axes was assessedusing Monte Carlo permutation tests (n=1,000).
The SYN-TAX 5.0 software package (Podani 1993) was used to execute the PCOordinations. Product moment correlation was used as the resemblance measure in thePCO analyses. CANOCO 4.5 (ter Braak and Šmilauer 2002) was used to performthe DCA and RDA analyses. The non-parametric tests were performed usingStatistica 7.0 (StatSoft 2005).
Results
We found 261 vascular plant species, of which approximately 74% were clonal, inthe pool of our sampling plots. The number of species decreased along thechronosequence (Fig. 2). The number of clonal species showed a logarithmic negativeregression with age (S=-7.9307 * ln(Age) + 51.162, R2=0.291, P<0.01). Non-clonalspecies followed a similar non-linear function (S=-2.803 * ln(Age) + 18.435, R2=0.266, P<0.01). In contrast with the considerable variation in the species richness, wefound no significant change in the proportion of clonal species (Fig. 2).
0
10
20
30
40
50
60
70
80
90
100
0 10 20 30 40 50 60 70
AGE OF STANDS (years since last coppicing)
SP
EC
IES
NU
MB
ER
Fig. 2 Trends in species richness along the studied chronosequence. Black triangles represent totalspecies number, with the relevant regression curve (Species = -7.9307 * ln(Age) + 51.162, R2=0.291;P<0.01 – solid line); empty squares represent clonal species, with the related regression curve(Species = -10.734 * ln(Age) + 69.596, R2=0.337; P<0.01 – dashed line)
Patterns of Clonal Growth Modes Along a Chronosequence
The Mann-Whitney U-test revealed significant differences in the relativeimportance of clonal growth traits along the chronosequence (Table 2). Theproportion of species with CGOs of root origin, and the proportion of species withabove-ground CGOs, long connection between ramets, and extensive perennialprimary roots was the highest in the post-logged stage (the early stage of theregenerative post-coppice succession). The relative number of clonal species withoutspacers was higher in the post-logged and in the recovering stages than in the oldcoppice stage. The proportion of species with CGOs of stem origin, and theproportion of species with below-ground CGOs, short connection between ramets,small bud bank and with specialized storage capacity were higher in older post-coppice developmental stages. However, the relative importance of these clonal traitsdid not differ between the recovering and old stages of the post-coppice succession.The relative contribution of species with long spacers, frequent multiplications, andstorage capacity not located in specialized clonal organs increased gradually alongthe chronosequence. The proportion of species endowed with the ability ofsecondary growth or thickening, however, showed the opposite trend. There werethree traits (bud protection, spacer longevity, and the speed of spatial spread) that didnot show any significant trends during the post-coppice regeneration.
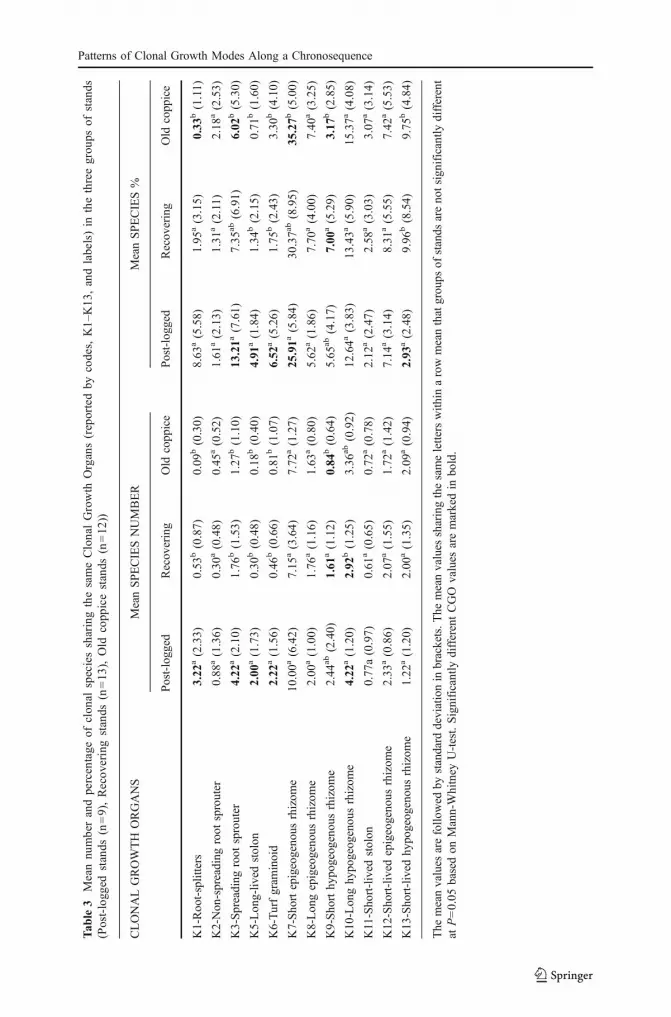
Seven CGOs showed significant changes among the stages of the regenerativepost-coppice succession (Table 3). The relative participation (expressed as % ofpresent species assigned to a given CGO) of Root-splitters (K1), Spreading rootsprouters (K3), Long-lived stolons (K5) and Turf graminoids (K6) was the highest inthe post-logged stage, whereas Short epigeogenous rhizome (K7) and Short-livedhypogeogenous rhizome (K13) showed the opposite trend. The CGOs with trends ofpreference for the stages of post-coppice regeneration is approximately 40%–50% ofthe present species (Fig. 2). Approximately 30% of clonal species belonged to CGOgroups (K2, K8, K10, K11, K12) the relative success of which did not change alongthe studied regeneration chronosequence.
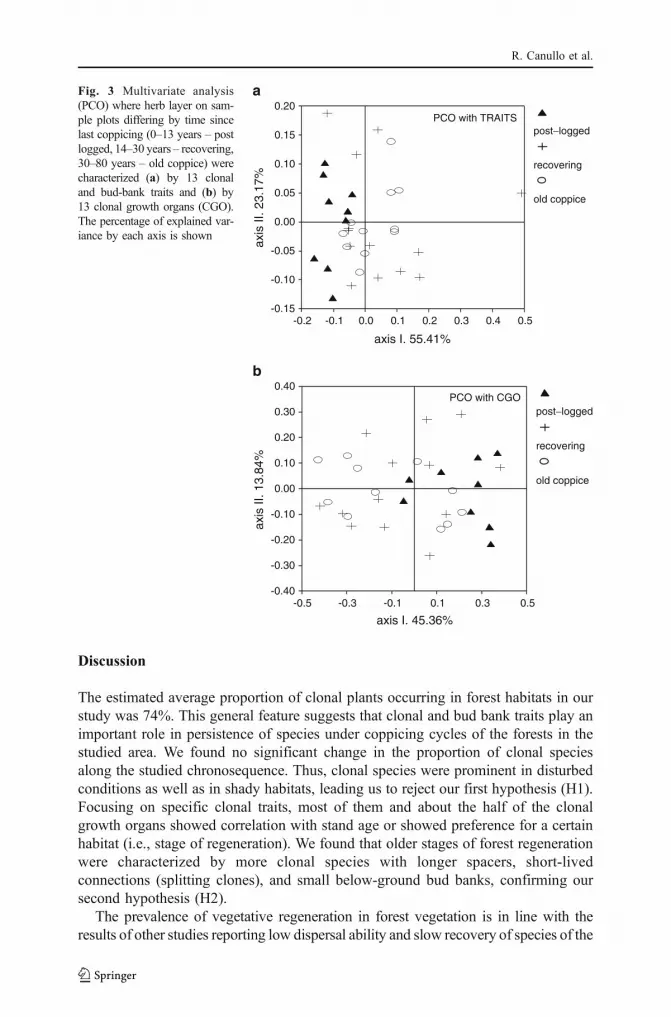
Multivariate analyses of plots, using 13 CGOs or 13 individual clonal plant traitsas attributes, respectively, showed similar results. Both ordinations revealed a slighttendency to differentiation between the post-logged and the other two stages of thepost-coppice regeneration (Fig. 3a,b). Both ordinations revealed significantcorrelations between the ordination scores of the first axes and the age of plots(-0.547, P<0.01 in case of ordination based on CGOs; 0.558, P<0.05 for ordinationbased on clonal traits). There were significant correlations found between theordination scores and the individual CGOs or between the ordination scores and theindividual clonal traits (Tables 4 and 5). These correlations were consistent with theresults suggested by the Mann-Whitney U-tests (see Tables 2 and 3). After removingthe effect of plot age (by partial RDA analysis), no significant effects of the variablesrepresenting forest stand structure were detected on the compositional variability ofCGO (P=0.116) or on the compositional variability of clonal traits (P=0.413).However, the analyses involving Ellenberg indicator values as variables and plot ageas a covariate, revealed that the additional information provided by local light, soilmoisture and soil nutrient conditions (represented by the cumulative % variance ofthe first three partial RDA axes) explained 15.7% of the compositional variability ofCGOs (P=0.044) and 28.3% of the compositional variability of clonal traits(P=0.004).
R. Canullo et al.
Tab
le3
Meannu
mberandpercentage
ofclon
alspeciessharingthesameClonalGrowth
Organs(reportedby
codes,
K1–
K13
,andlabels)in
thethreegrou
psof
stands
(Post-logg
edstands
(n=9),Recov
eringstands
(n=13
),Old
copp
icestands
(n=12
))
CLONALGROWTH
ORGANS
MeanSPECIESNUMBER
MeanSPECIES%
Post-logged
Recovering
Old
copp
ice
Post-logg
edRecov
ering
Old
coppice
K1-Root-splitters
3.22
a(2.33)
0.53
b(0.87)
0.09
b(0.30)
8.63
a(5.58)
1.95
a(3.15)
0.33
b(1.11)
K2-Non-spreading
root
sprouter
0.88
a(1.36)
0.30
a(0.48)
0.45
a(0.52)
1.61
a(2.13)
1.31
a(2.11)
2.18
a(2.53)
K3-Spreading
root
sprouter
4.22
a(2.10)
1.76
b(1.53)
1.27
b(1.10)
13.21a
(7.61)
7.35
ab(6.91)
6.02
b(5.30)
K5-Long-liv
edstolon
2.00
a(1.73)
0.30
b(0.48)
0.18
b(0.40)
4.91
a(1.84)
1.34
b(2.15)
0.71
b(1.60)
K6-Turfgram
inoid
2.22
a(1.56)
0.46
b(0.66)
0.81
b(1.07)
6.52
a(5.26)
1.75
b(2.43)
3.30
b(4.10)
K7-Sho
rtepigeogenous
rhizom
e10
.00a
(6.42)
7.15
a(3.64)
7.72
a(1.27)
25.91a
(5.84)
30.37a
b(8.95)
35.27b
(5.00)
K8-Longepigeogenous
rhizom
e2.00
a(1.00)
1.76
a(1.16)
1.63
a(0.80)
5.62
a(1.86)
7.70
a(4.00)
7.40
a(3.25)
K9-Sho
rthy
pogeogenou
srhizom
e2.44
ab(2.40)
1.61
a(1.12)
0.84
b(0.64)
5.65
ab(4.17)
7.00
a(5.29)
3.17
b(2.85)
K10
-Longhy
pogeog
enou
srhizom
e4.22
a(1.20)
2.92
b(1.25)
3.36
ab(0.92)
12.64a
(3.83)
13.43a
(5.90)
15.37a
(4.08)
K11-Sho
rt-lived
stolon
0.77
a(0.97)
0.61
a(0.65)
0.72
a(0.78)
2.12
a(2.47)
2.58
a(3.03)
3.07
a(3.14)
K12-Short-lived
epigeogenous
rhizom
e2.33
a(0.86)
2.07
a(1.55)
1.72
a(1.42)
7.14
a(3.14)
8.31
a(5.55)
7.42
a(5.53)
K13-Short-lived
hypogeogenousrhizom
e1.22
a(1.20)
2.00
a(1.35)
2.09
a(0.94)
2.93
a(2.48)
9.96
b(8.54)
9.75
b(4.84)
The
meanvalues
arefollo
wed
bystandard
deviationin
brackets.T
hemeanvalues
sharingthesameletterswith
inarowmeanthatgroups
ofstands
areno
tsign
ificantly
different
atP=0.05
basedon
Mann-Whitney
U-test.Significantly
differentCGO
values
aremarkedin
bold.
Patterns of Clonal Growth Modes Along a Chronosequence
Discussion
The estimated average proportion of clonal plants occurring in forest habitats in ourstudy was 74%. This general feature suggests that clonal and bud bank traits play animportant role in persistence of species under coppicing cycles of the forests in thestudied area. We found no significant change in the proportion of clonal speciesalong the studied chronosequence. Thus, clonal species were prominent in disturbedconditions as well as in shady habitats, leading us to reject our first hypothesis (H1).Focusing on specific clonal traits, most of them and about the half of the clonalgrowth organs showed correlation with stand age or showed preference for a certainhabitat (i.e., stage of regeneration). We found that older stages of forest regenerationwere characterized by more clonal species with longer spacers, short-livedconnections (splitting clones), and small below-ground bud banks, confirming oursecond hypothesis (H2).
The prevalence of vegetative regeneration in forest vegetation is in line with theresults of other studies reporting low dispersal ability and slow recovery of species of the
a
-0.15
-0.10
-0.05
0.00
0.05
0.10
0.15
0.20
axis
II. 2
3.17
%
-0.2 -0.1 0.0 0.1 0.2 0.3 0.4 0.5
axis I. 55.41%
post−logged
recovering
old coppice
PCO with TRAITS
b
-0.40
-0.30
-0.20
-0.10
0.00
0.10
0.20
0.30
0.40
axis
II. 1
3.84
%
-0.5 -0.3 -0.1 0.1 0.3 0.5
axis I. 45.36%
post−logged
recovering
old coppice
PCO with CGO
Fig. 3 Multivariate analysis(PCO) where herb layer on sam-ple plots differing by time sincelast coppicing (0–13 years – postlogged, 14–30 years – recovering,30–80 years – old coppice) werecharacterized (a) by 13 clonaland bud-bank traits and (b) by13 clonal growth organs (CGO).The percentage of explained var-iance by each axis is shown
R. Canullo et al.

forest herb layer (Moola and Vasseur 2004; Godefroid et al. 2005; Moora et al. 2009).Furthermore, the contribution of weedy and invasive species is negligible in themountainous landscape of the Apennines (Bartha et al. 2008).
The detected relative constancy of clonality along the studied chronosequencemight also suggest a high level of resilience of the forest vegetation by using the
Table 4 Correlation (Spearman rho) between the PCO axis 1 (age gradient, where the scores of the firstPCO axis correlate positively with the forest stand age) and 13 selected clonal traits
Clonal traits Axis (I)
Clonal organs are stems 0.808 (**)
Clonal organ below-ground 0.497 (**)
Spacer length long 0.651 (**)
Connection long time -0.915 (**)
Vegetative spreading fast 0.261
Storage 0.665 (**)
Specialized clonal storage organs 0.016
Bud protection specialized leaves 0.019
Bud bank large -0.723 (**)
Extensive perennial roots -0.923 (**)
Multiplication frequent 0.092
Secondary thickening -0.757 (**)
Spacer longevity long -0.195
** – P<0.01.
Table 5 Correlation (Spearman rho) between the PCO axis 1 (age gradient, where the decreasing scoresof the first PCO axis represent the increasing time from the last coppicing) and 13 CGOs (reported bycodes, K1–K13, and labels)
Clonal growth organ Axis I
K1 Root-splitters 0.483 (**)
K2 Non-spreading root sprouter -0.379 (*)
K3 Spreading root sprouter 0.682 (**)
K5 Long-lived stolon 0.396 (*)
K6 Turf graminoid 0.175
K7 Short epigeogenous rhizome -0.528 (**)
K8 Long epigeogenous rhizome -0.347 (*)
K9 Short hypogeogenous rhizome 0.019
K10 Long hypogeogenous rhizome 0.169
K11 Short-lived stolon 0.255
K12 Short-lived epigeogenous rhizome -0.072
K13 Short-lived hypogeogenous rhizome -0.645 (**)
NC Non-clonal species 0.864 (**)
* – P<0.05; ** – P<0.01.
Patterns of Clonal Growth Modes Along a Chronosequence

clonal mode as the major tool for speedy recovery after cessation of disturbance. It islikely that rather than employing risky seedling recruitment, the post-disturbanceforest recovery processes exploit functional redundancy of CGOs (especially theirability to acquire space and resources, and ability to persist) by using variousrearrangements of CGOs, but still showing in summary rather balanced (constant)patterns of clonality along the time recovery axis.
The significant differences between the habitat conditions and the preference ofcertain clonal traits and clonal growth organs for a certain habitat support earlierfindings by Vesk and Westoby (2004), Halassy et al. (2005), Canullo et al. (2006)and Klimešová and Klimeš (2008). Clonal plants with a large bud bank were mostfrequent in the initial stage. Disturbance, such as erosion and animal browsing, istypical in the early stages of post-coppice regeneration. The large bud banks helpplants effectively regenerate after a disturbance event. Similar studies (Moola andVasseur 2009) showed that forest clonal species tolerate clear-cut logging throughtheir “release growth” strategy of new vegetative stems originating from persistentbud banks. In habitats where the above-ground parts of plants can be completelyremoved, resprouting relates to below-ground buds (Klimešová and Klimeš 2003,2008; Vesk and Westoby 2004).
During the subsequent post-coppice forest regeneration, the available lightdecreased, while soil fertility and soil moisture increased. Parallel with thesechanges in the environment, the relative importance of species with long spacersand short longevity of connections increased. However, it appears that this trendcan be attributed to a single CGO – Short-lived hypogeogenous rhizome (K13) therelative abundance of which increased during the chronosequence. In the oldcoppices this CGO accounted for approximately 25% of the cover of the herb layerand made up 10% of the present species. The other CGO with increasingcontribution was Short epigeogenous rhizome (K7). This group was the mostabundant in all stages of the post-coppice regeneration and accounted for 25%–35%of the present species. This CGO is characterized by short spacers, long connectionbetween ramets, and slow spread – a trait syndrome contrasting the one of Short-lived hypogeogenous rhizome (K13). The trait-level analyses revealed that therelative frequency of species with short-connection permanency and long spacersincreased during the post-coppice succession. Therefore we believe that theincreasing contribution of species with high mobility (Short-lived hypogeogenousrhizome) is an indication of the habitat filtering for this CGO. In contrast, therelative increase of Short epigeogenous rhizome (K7) is only a statisticalconsequence of the decrease of other CGOs (K1, K3, K5 and K6). This argumentis also supported by the fact that the absolute cover and the absolute number ofspecies in Short epigeogenous rhizome (K7) did not change, while there was asignificant increase in the absolute cover of Short-lived hypogeogenous rhizome(K13) (from 1.83 to 24.71, P<0.05) along the chronosequence. This CGO groupcomprises Galium odoratum, Cardamine bulbifera, C. enneaphyllos, C. kitaibeliiand Epilobium montanum (characterized by high mobility and low integration),known to be closed-canopy beech forest specialists in the region (Bartha et al. 2008).
There were four CGOs (K1, K3, K5 and K6) with decreasing importance alongthe chronosequence. Traits common to Root-splitters (K1), Spreading root sprouter(K3, e.g. Rubus idaeus, Hypericum perforatum), Long-lived stolon (K5), and Turf
R. Canullo et al.
graminoid (K6) underpin highly integrated genets with high persistence and lowmobility. The three latter CGOs are also related to a large bud bank. These featuresmight explain the success of these CGOs in the post-logged open (dry and nutrient-poor) habitats. This is supported by Callaghan (1988) and van Groenendael et al.(1996), who report tightly packed modules (short spacers, potential for frequentmultiplication, prolonged period of physical connection among ramets) to beadvantageous in open, nutrient-poor habitats.
Using clonal traits and clonal trait syndromes (CGOs) instead of speciesprovided the opportunity to address functional aspects of the compositionalvariation of vegetation along a regeneration chronosequence. Principal coordinateanalyses revealed strong patterns in both clonal trait and CGO matrices. The firstordination axes in two different PCO analyses accounted for 55% and 45% ofvariance, respectively, and in both ordinations the first axes appeared to becorrelated with the age of the plots since the last coppicing. Forest standstructure changed considerably along the coppice regeneration chronosequence,implying significant changes in light conditions, soil moisture, and soil nutrients.Our results present evidence that all these characteristics are correlated with theplot age. Yet, the partial RDA analyses revealed that after removing the effect ofplot age, the pattern of clonal traits and CGOs remained correlated with theEllenberg indicator values for light, moisture and nutrient conditions. Thissuggests that the environmental conditions related to light, moisture and nutrientconditions vary across the landscape and might be determined by factors otherthan plot age, e.g., topography, land-use history and elevation. This aspect meritsfurther attention in a separate study.
The variable proportion of clonal species (importance of clonality) in plantcommunities can be expressed at the level of plant traits or at the level of clonalgrowth organs. Trait level patterns are easier to link to theory. Therefore it is easierto formulate hypotheses about the individual traits and the related interpretationsmight become more convincing. However, traits may appear and evolve in aconcerted manner (as trait combinations or trait syndromes, such as CGOs), andtherefore we believe that CGOs are more natural units and more suited to explaincommunity-level patterns.
In our particular research context, the trait spectrums appeared to be morepredictable and more characteristic of a habitat than the related CGO (as frequencydistributions of specially organized combinations of traits). On the contrary, thefunctional group approach demonstrated suitability in other studies at the communitylevel (e.g., Lavorel and Garnier 2002) and the landscape (e.g., Steinmann et al.2009). However, in a comparative study of the trait-based and the group-basedapproaches conceived on a wider array of traits related to dispersal, establishmentand persistence, a combination of the two approaches was found to be most usefulfor exploring species responses to a gradient of old-field forest succession (Aubin etal. 2009).
Acknowledgements This research was partially supported by funds of the Montagna di TorricchioNature Reserve and the Hungarian National Science Foundation (OTKA K 72561). The authors thank theMinistero delle Politiche Agricole Alimentari e Forestali, S.I.A. Office, the Corpo Forestale dello Stato ofthe Marche region, and the authorities of the Monti Sibillini National Park for information support.
Patterns of Clonal Growth Modes Along a Chronosequence
References
Amici M, Spina R (2002) Campo medio della precipitazione annuale e stagionale sulle Marche per ilperiodo 1950–2000. Centro di Ecologia e Climatologia Osservatorio Geofisico Sperimentale,Macerata
Anderson RC, Loucks OL, Swain AM (1969) Herbaceous response to canopy cover, light intensity, andthroughfall precipitation in coniferous forests. Ecology 50:255–263
Ash JE, Barkham JP (1976) Changes and variability in the field layer of a coppiced woodland in Norfolk,England. J Ecol 64:697–712
Aubin I, Ouellette MH, Legendre P, Messier C, Bouchard A (2009) Comparison of two plant functionalapproaches to evaluate natural restoration along an old-field – deciduous forest chronosequence. J VegSci 20:185–198
Barkham JP (1992) The effect of coppicing and neglect on the performance of the perennial ground flora.In Buckley GP (ed) Ecology and management of coppice woodlands. Chapman & Hall, London, pp115–146
Bartha S, Merolli A, Canullo R, Campetella G, Canullo R (2008) Changes of vascular plant diversity along achronosequence of beech coppice stands, central Apennines, Italy. Pl Biosystems 142:572–583
Braun-Blanquet J (1964) Pflanzensoziologie. Grundzüge der Vegetationskunde. Ed. 3., Springer Verlag,Wien
Brown AHF, Warr SJ (1992) The effects of changing management on seed banks in ancient coppice. InBuckley GP (ed) Ecology and management of coppice woodlands. Chapman & Hall, London, pp147–166
Buckley GP (ed) (1992) Ecology and management of coppice woodlands. Chapman & Hall, LondonCallaghan TV (1988) Physiological and demographic implications of modular construction in cold
environment. In Davy AJ, Hutchings MJ, Watkinson AR (eds) Plant population ecology. Blackwell,Oxford, pp 111–135
Canullo R, Campetella G, Halassy M, Mucina L (2006) Clonal growth modes in plant communities alonga stress gradient in the Central Apennines, Italy. In Gafta D, Akeroyd J (eds) Conceptions andmethods of nature conservation in Europe. Springer Verlag, Berlin, pp 289–308
Ciancio O, Corona P, Lamonaca A, Portoghesi L, Travaglino D (2006) Conversion of clearcut beechcoppices into high forests with continuous cover: A case study in central Italy. Forest Ecol Managem224:235–240
Coppini M, Hermanin L (2007) Restoration of selective beech coppices: A case study in the Apennines(Italy). Forest Ecol Managem 249:18–27
Dahlgren J P, Eriksson O, Bolmgren K, Strindell M, Ehrlen J (2006) Specific leaf area as a superiorpredictor of changes in field layer abundance during forest succession. J Veg Sci 17:577–582
Decocq G, Aubert M, Dupont F, Alard D, Saguez R, Wattez-Franger A, de Foucault B, Delelis-DusollierA, Bardat J (2004) Plant diversity in a managed temperate deciduous forest: understory response totwo silvicultural systems. J Appl Ecol 41:1065–1079
Di Pietro R, Izco J, Blasi C (2004) Contribution to the nomenclatural knowledge of Fagus sylvaticawoodlands of southern Italy. Pl Biosystems 138:27–36
Ellenberg H (1974) Zeigerwerte der Gefäßpflanzen Mitteleuropas. Scripta Geobot 9:1–97Federer CA, Tanner CB (1966) Spectral distribution of light in the forest. Ecology 47:555–560Garnier E, Cortez J, Billè GS, Navas ML, Roumet C, Debussche M, Laurent G, Blanchard A, Aubry D,
Bellmann A, Neill C, Toussaint JP (2004) Plant functional markers capture ecosystem propertiesduring secondary succession. Ecology 85:2630–2637
Godefroid S, Rucquoij S, Koedam N (2005) To what extent do forest herb recover after clearcutting inbeech forest? Forest Ecol Managem 210:39–53
Gondard H, Deconchat M (2003) Effects of soil surface disturbances after logging on plant functionaltypes. Ann Forest Sci 60:725–732
Gondard H, Romane F (2005) Long-term evolution of understory plant species composition after loggingin chestnut coppice stands (Cevennes Mountains, southern France). Ann Forest Sci 62:333–342
Gondard H, Romane F, Santa Regina I, Leonardi S (2006) Forest management and plant species diversityin chestnut stands of three Mediterranean areas. Biodivers & Conservation 15:1129–1142
Graae BJ, Sunde PB (2000) The impact of forest continuity and management on forest floor vegetationevaluated by species traits. Ecography 23:720–731
Halassy M, Campetella G, Canullo R, Mucina L (2005) Patterns of functional clonal traits and clonalgrowth modes in contrasting grasslands in the central Apennines, Italy. J Veg Sci 16:29–36
R. Canullo et al.
IPLA (2001) I tipi forestali delle Marche. Inventario e Carta Forestale della Regione Marche. DiffusioniGrafiche, Torino
Jonsdóttir IS, Watson MA (1997) Extensive physiological integration: an adaptive trait in resource-poorenvironments? In de Kroon H, van Groenendael J (eds) The ecology and evolution of clonal plants.Backhuys Publishing, Leiden, pp 109–136
Klimeš L (2003) Life-forms and clonality of vascular plants along an altitudinal gradient in E Ladakh(NW Himalayas). Basic Appl Ecol 4:317–328
Klimeš L, Klimešová J (1999) CLO-PLA2 – A database of clonal plants in central Europe. Pl Ecol 141:9–19
Klimeš L, Klimešová J, Hendriks R, van Groenendael J (1997) Clonal plant architectures: a comparativeanalysis of form and function. In de Kroon H, van Groenendael J (eds) The ecology and evolution ofclonal plants. Backhuys Publishing, Leiden, pp 1–29
Klimešová J, Klimeš L (1998) CLOPLA1 (CLOnal PLAnts, version 1) – A Database of Clonal Growth inPlants of Central Europe. Available at: http://www.butbn.cas.cz/klimes/ (last accessed on January2009)
Klimešová J, Klimeš L (2003) Resprouting of herbs in disturbed habitats: is it adequately described byBellingham-Sparrow’s model? Oikos 103:225–229
Klimešová J, Klimeš L (2007) Bud banks and their role in vegetative regeneration – A literature reviewand proposal for simple classification and assessment. Perspect Pl Ecol Evol Syst 8:115–129
Klimešová J, Klimeš L (2008) Clonal growth diversity and bud banks of plants in the Czech flora: anevaluation using the CLO-PLA3 database. Preslia 80:255–275
Kull K, Sammul M, Tamm A (2000) Comparative ecomorphology of clonal growth: a little atlas.Manuscript, Institute of Zoology and Botany, Tartu
Lavorel S, Garnier E (2002) Predicting changes in community composition and ecosystem functioningfrom plant traits: revisiting the Holy Grail. Funct Ecol 16:545–556
Lavorel S, Díaz S, Cornelissen JHC, Garnier E, Harrison SP, McIntyre S, Pausas JG, Peréz-HarguindeguyN, Roumet C, Urcelay C (2007) Plant functional types: are we getting any closer to the Holy Grail? InCanadell J, Pitelka LF, Pataki D (eds) Terrestrial ecosystems in a changing world. Springer Verlag,Berlin, pp 149–160
Liira J, Zobel K, Magi R, Molenberghs G (2002) Vertical structure of herbaceous canopies: the importanceof plant growth-form and species-specific traits. Pl Ecol 163:123–134
Lovett Doust L (1981) Population-dynamics and local specialization in a clonal perennial (Ranunculusrepens). 1. The dynamics of ramets in contrasting habitats. J Ecol 69:743–755.
Lovett Doust L, Lovett Doust J (1982) The battle strategies of plants. New Sci 8:81–84ASSAM – Agenzia Servizi Settore Agroalimentare delle Marche (2006) Suoli e paesaggi delle Marche.
Errebi Grafiche Ripesi, AnconaMason CF, MacDonald SM (2002) Responses of ground flora to coppice management in an English
woodland – a study using permanent quadrats. Biodivers & Conservation 11:1773–1789McIntyre S, Lavorel S (2007) A conceptual model of land use effects on the structure and function of
herbaceous vegetation. Agric Ecosyst Environm 119:11–21Moola FM, Vasseur L (2004) Recovery of late-seral vascular plants in a chronosequence of post-clearcut
forest stands in coastal Nova Scotia, Canada. Pl Ecol 172:183–197Moola FM, Vasseur L (2009) The importance of clonal growth to the recovery of Gaultheria procumbens
L. (Ericaceae) after forest disturbance. Pl Ecol 201:319–337Moora M, Öpik M, Zobel K, Zobel M (2009) Understory plant diversity is related to higher variability of
vegetative mobility of coexisting species. Oecologia 159:355–361Mucina L, Campetella G, Canullo R (2003) Un database per la biodiversità della flora nella Riserva
naturale “Montagna di Torricchio”. Riserva Naturale Montagna di Torricchio 11:371–386Oborny B (1994) Spacer length in clonal plants and the efficiency of resource capture in heterogeneous
environments: a Monte Carlo simulation. Folia Geobot Phytotax 29:139–158Pickett STA (1989) Space-for-time substitution as an alternative to long-term studies. In Likens GE (ed)
Long-term studies in ecology. Springer Verlag, New York, pp 110–135Pignatti S (1982) Flora d’Italia. 1–3. Edagricole, BolognaPignatti S (2005) Valori indicatori delle piante vascolari della Flora d’Italia. Braun-Blanquetia 39:1–100Podani J (1993) SYN-TAXpc. Version 5.0. User’s Guide. Scientia Publishing, BudapestPrach K, Pyšek P (1994) Clonal plants – what is their role in succession? Folia Geobot Phytotax 29:307–320Reich PB, Wright IJ, Cavender-Bares J, Craine JM, Oleksyn J, Westoby M, Walters MB (2003)
The evolution of plant functional variation: traits, spectra and strategies. Int J Pl Sci 164:S143–S164
Patterns of Clonal Growth Modes Along a Chronosequence
Rubio A, Escudero A, (2003) Clear-cut effects on chestnut forest soils under stressful conditions:lengthening of time-rotation. Forest Ecol Managem 183:195–204
Sammul M, Kull K, Tamm A (2003) Clonal growth in species-rich grassland: the results of a 20-yearfertilization experiment. Folia Geobot 38:1–20
Sammul M, Kull K, Niitla T, Möls T (2004) A comparison of plant communities on the basis of theirclonal patterns. Evol Ecol 18:443–467
Silvertown J (2008) The evolutionary maintenance of sexual reproduction: evidence from the ecologicaldistribution of asexual reproduction in clonal plants. Int J Pl Sci 169:157–168
Song M, Dong M, Jiang G (2002) Importance of clonal plants and plant species diversity in the NortheastChina Transect. Ecol Res 17:705–716
StatSoft Italia (2005) Statistica 7.1. per Windows. Statsoft, Tulsa, OKSteinmann K, Linder HP, Zimmermann NE (2009) Modelling plant species richness using functional
groups. Ecol Modelling 220:962–967ter Braak CJF, Šmilauer P (2002) CANOCO Reference Manual and CanoDraw for Windows User’s
Guide: Software for Canonical Community Ordination (Version 4.5). Microcomputer Power, Ithaca,NY
van Groenendael JM, Klimeš L, Klimešová J, Hendriks RJJ (1996) Comparative ecology of clonal plants.Philos Trans, Ser B 351:1331–1339
Vandepitte K, Roldan-Ruiz I, Leus L, Jacquemyn H, Honnay O (2009) Canopy closure shapes clonaldiversity and fine-scale genetic structure in the dioecious understorey perennial Mercurialis perennis.J Ecol 97:404–414
Verheyen K, Honnay O, Motzkin G, Hermy M, Foster DR (2003) Response of forest plant species to land-used change: a life-history trait-based approach. J Ecol 91:563–577
Vesk PA, Westoby M (2004) Funding the bud bank: a review of the costs of buds. Oikos 106:200–208Wellstein C, Kuss P (2011) Diversity and frequency of clonal traits along natural and land-use gradients in
grasslands of the Swiss Alps. Folia Geobot 46 (this issue) doi:10.1007/s12224-010-9075-4
Received: 30 April 2009 /Revised: 8 June 2010 /Accepted: 12 July 2010
R. Canullo et al.
Related Documents


