Working Paper MARCH 2017 169 www.younglives.org.uk Patterns and Drivers of Internal Migration Among Youth in Ethiopia, India, Peru and Vietnam Maria Franco Gavonel

Welcome message from author
This document is posted to help you gain knowledge. Please leave a comment to let me know what you think about it! Share it to your friends and learn new things together.
Transcript

Wo
rkin
g P
aper
MARCH 2017
169
www.younglives.org.uk
Patterns and Drivers of Internal Migration Among
Youth in Ethiopia, India, Peru and Vietnam
Maria Franco Gavonel

Patterns and Drivers of Internal Migration Among Youth in Ethiopia, India, Peru and Vietnam
Maria Franco Gavonel
© Young Lives 2017 ISBN 978-1-909403-90-1
A catalogue record for this publication is available from the British Library. All rights reserved. Reproduction, copy, transmission, or translation of any part of this publication may be made only under the following conditions:
• with the prior permission of the publisher; or
• with a licence from the Copyright Licensing Agency Ltd., 90 Tottenham Court Road, London W1P 9HE, UK, or from another national licensing agency; or
• under the terms set out below.
This publication is copyright, but may be reproduced by any method without fee for teaching or non-profit purposes, but not for resale. Formal permission is required for all such uses, but normally will be granted immediately. For copying in any other circumstances, or for re-use in other publications, or for translation or adaptation, prior written permission must be obtained from the publisher and a fee may be payable.
Young Lives, Oxford Department of International Development (ODID), University of Oxford,
Queen Elizabeth House, 3 Mansfield Road, Oxford OX1 3TB, UK
Tel: +44 (0)1865 281751 • Email: [email protected]
Core funded by
PATTERNS AND DRIVERS OF INTERNAL MIGRATION AMONG YOUTH IN ETHIOPIA, INDIA, PERU AND VIETNAM
3
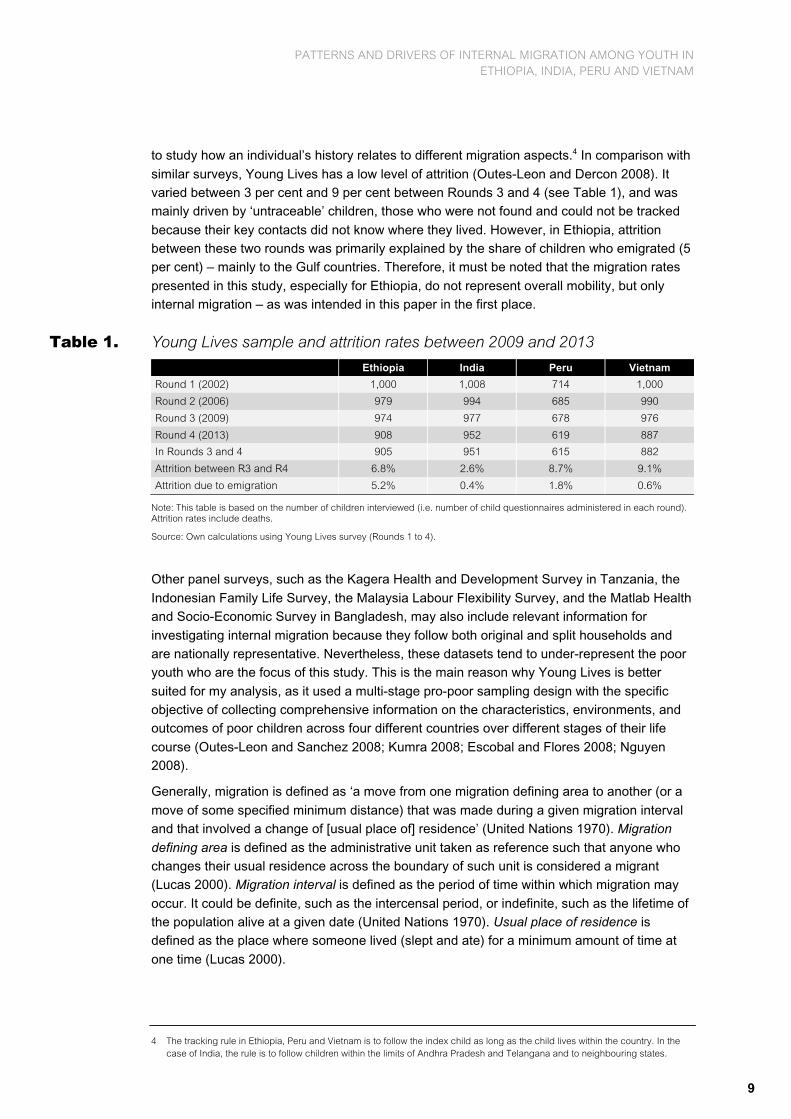
Contents The author 4
Acknowledgements 4
Summary 5
1. Introduction 6
2. Data and descriptive statistics 8
3. Patterns of internal mobility 11
3.1 Prevalence 11
3.2 Frequency 12
3.3 Timing 13
3.4 Reasons 14
3.5 Streams 15
3.6 Type of household 16
3.7 Employment at destination 18
3.8 Subjective well-being 20
3.9 Migration aspirations 21
4. Drivers of migration 24
4.1 Predictors of migration by gender 28
4.2 Predictors of the reasons to migrate 34
5. Conclusions 39
References 42

PATTERNS AND DRIVERS OF INTERNAL MIGRATION AMONG YOUTH IN ETHIOPIA, INDIA, PERU AND VIETNAM
4
The author Maria Franco Gavonel is a doctoral candidate in international development at the University
of Oxford. Her thesis investigates youth migration and human development in four low- and middle-income countries, drawing on longitudinal data collected as part of the Young Lives study. Maria holds an MSc in Development Economics and Policy from the University of
Manchester and a Bachelor’s degree in Economics from the Universidad del Pacifico (Lima). Before starting her doctoral studies, Maria has worked for more than eight years in research and policy at Young Lives at the University of Oxford, Save the Children, the World Bank,
and the Research Centre of the Universidad del Pacifico.
Acknowledgements I am grateful to my thesis supervisors, Doug Gollin and Stefan Dercon, for their valuable
feedback during the development of this paper.
About Young Lives
Young Lives is an international study of childhood poverty, following the lives of 12,000 children in four countries (Ethiopia, India, Peru and Vietnam) over 15 years. www.younglives.org.uk
The views expressed are those of the author. They are not necessarily those of, or endorsed by, the University of Oxford, Young Lives, DFID or other funders.

PATTERNS AND DRIVERS OF INTERNAL MIGRATION AMONG YOUTH IN ETHIOPIA, INDIA, PERU AND VIETNAM
5
Summary There is general consensus in literature on migration that migrants are primarily young
people. During the transition to adulthood, young people make important choices regarding education, labour force participation, and family formation. Using a unique panel dataset on
youth born in 1994-95 in Ethiopia, India, Peru, and Vietnam, this working paper investigates how life-course transitions to adulthood relate to patterns and predictors of internal migration in low- and middle-income countries. It documents patterns on prevalence, frequency, timing,
reasons and streams of migration, employment at destination, subjective well-being, and migration aspirations. The paper then describes the factors associated with young men and women’s decision to migrate, and the reasons for migrating.
The results suggest that there is a significant share of migrants between 15 and 19 years old
across all four countries, and they are very likely to move more than once. In all countries, migrants are more likely to move after the school-age years, between ages 17 and 18. These patterns on frequency and timing of moves provide new evidence that young individuals
migrate very often even before having finished school, which is key to understanding educational performance. The patterns on the reasons for moving provide evidence that young people move for a variety of reasons that go beyond the economic-related: family
formation and family reunion are also important motives for migrating, especially in the studied age range. The migration streams presented show that these youth do not necessarily follow rural-urban migration as it is generalised in the literature (Taylor and Martin
2001), and they shed light on the dynamics of the less studied rural-rural migration. The results suggest that at this age, migration is a household strategy: although migrants do not necessarily contribute remittances to their previous household, they are often receiving them
from their caregiver.
Choices made during the transition to adulthood shape young people’s migration patterns,
and migrants are therefore a very heterogeneous group as there are systematic differences in their characteristics depending on their reasons for moving. This is important because
understanding this puts us in a better position to propose more effective policies that target young migrants’ well-being in developing countries.

PATTERNS AND DRIVERS OF INTERNAL MIGRATION AMONG YOUTH IN ETHIOPIA, INDIA, PERU AND VIETNAM
6
1. Introduction There is general consensus in the literature on migration that migrants are primarily young
people (Lee 1966; Lloyd 2005). Based on migration patterns during the 1970s, Todaro (1980) suggested that migrants are ‘disproportionately young, better educated, less risk-
averse, and more achievement-oriented and have better personal contacts in destination areas’. More recently, using demographic household surveys from 65 developing countries, Young (2013) provided sound evidence that most migrants between 25 to 49 years old
moved in their early to mid-twenties.
Different theories provide distinct explanations for this stylised fact. According to the human
capital model of migration led by Sjaastad (1962), migration is seen as an individual investment and, thus, the sooner the migrant moves, the greater the benefits of migrating.
Nevertheless, Stark (1985) argued that migration decisions are often made jointly by the migrant and by a group of non-migrants, generally the family, in order to mitigate income risks. Rosenzweig (1989) provided an example of this strategy by analysing marriage and
migration patterns in India. He claimed that movement for marriage is the result of an implicit inter-household arrangement aimed at smoothing consumption in the presence of spatially covariant risks.
However, during late adolescence the decision to migrate becomes more complex as young
people are also experiencing biological, cognitive, psychosocial and interpersonal changes that will shape their future as adults (Rice and Dolgin 2005). Furthermore, transitions into adulthood1 are characterised by decision-making about education, labour force participation,
and family formation, and these are closely linked to the decision to move. Kley (2011) explains that the intention to migrate relies on the perception that accomplishing important life goals may be more achievable in a different place than the current one. Therefore,
migration decision-making would be highly influenced by life-course events, especially during life-course transitions. Thus, understanding the patterns, determinants and effects of youth migration is important not only because this phenomenon is prevalent, but also because they
are very different from those of other age groups as youth migration greatly overlaps with other transitions to adulthood (Zenteno et al. 2013).
Despite this, little is known about the migration of youths2 in the context of transition to
adulthood, since existing research on the causes and consequences of migration mainly focuses on adult males (Curran et al. 2006). An exception is the work by Juarez (2013), who
put together a series of studies on the transitions to adulthood and youth migration in developing countries. Using both quantitative and qualitative methods, these studies document patterns on international and internal mobility among young people. Similarly,
Herrera and Sahn (2013) described the determinants of youth migration in Senegal. They found that the socio-economic factors associated with the decision to migrate are heterogeneous by gender, and that childhood characteristics predict migration later in life.
1 Throughout this paper, I use the term ‘transitions to adulthood’ as a heuristic device to capture the fuzzy shift from childhood to
adulthood, during which young people take on new roles and responsibilities and make important choices. For a discussion on the suitability of this term applied to the context of developing countries, see Morrow (2013).
2 I use the United Nation’s definition of ‘youth’ as individuals between the ages of 15 and 24 (United Nations Department of Economic and Social Affairs).

PATTERNS AND DRIVERS OF INTERNAL MIGRATION AMONG YOUTH IN ETHIOPIA, INDIA, PERU AND VIETNAM
7
This working paper builds on this literature by investigating how life-course transitions to
adulthood relate to patterns and predictors of internal migration in low- and middle-income countries. To do this, I draw on data from Young Lives, a unique longitudinal study on young people in Ethiopia, India (Andhra Pradesh and Telangana), Peru and Vietnam, specifically
utilising the data on the Older Cohort of young people, born in 1994-95. Young Lives’ quantitative survey contains extensive information at the individual, household and community level of both migrants and non-migrants from ages 8 to 19, which allows me to
study how an individual’s history relates to different migration aspects.
Given the remarkable richness of the data, this paper’s goal is not to identify causality, but to
describe the major empirical regularities in a systematic way. In particular, the aim is twofold. First, I document detailed patterns of internal mobility (before and after the move) among young people and how they differ across contexts. Specifically, I report patterns on
prevalence, frequency, timing, reasons and streams of migration, employment at destination, subjective well-being, and migration aspirations. Second, using a Linear Probability Model I describe the factors associated with young men and women’s decision to migrate, and using
a Multinomial Logit Model I estimate the correlates associated with the reasons for migrating. In doing so, I account for demographic and socio-economic characteristics, including young people’s and their caregivers’ educational aspirations as key predictors of later migration.
The results reveal that a significant portion of young people migrated between 15 and 19
years old across all countries, and in many cases, they moved more than once during this period. The main reason for moving is for studying, although in India, marriage is the most prevalent reason among girls. In all countries, migrants moved at an age that was just above
school-completion age. The migration streams differ according to country: rural-rural moves prevail in Ethiopia and India, urban-urban in Peru, and rural-urban in Vietnam. In all countries, except Ethiopia, migrants reported having better opportunities for work than non-
migrants, although they also reported having worse quality of environment than those who stayed. Finally, the results suggest that the main reason for not being willing to move is family attachment, whereas job search is the main reason for being willing to move.
Regarding the predictors of migration, I find that overall the region where young people live has gender-specific effects on the decision to migrate in all countries, except in Peru where it
has a similar effect for the two groups. Except for India, poorer youths are more likely to migrate. Household size is a predictor of girls’ migration in all countries, except for Peru. In fact, differences in characteristics between migrants and non-migrants by gender are very
weak in Peru. Finally, ethnicity only predicts migration in Vietnam.
Regarding the factors associated with the reasons for moving, I find that there is great
heterogeneity among young migrants: the average migrant that moves to study is systematically different from those that move for work and for family formation. The average
characteristics of migrants that move for studies are very similar across countries: being more educated is associated with a higher probability of moving for studies. Except for Peru,
gender is also a predictor of this category: girls in Ethiopia and Vietnam, and boys in India
are more likely to move to study. The profile of the average migrant who moved for work is very different. The young person’s education is only correlated with the probability of moving for work in Vietnam. In India, the caregiver’s educational aspirations are negatively
associated with the probability of migrating for work. In both India and Vietnam, young people living in relatively poorer households are more likely to move for this reason. In Ethiopia,

PATTERNS AND DRIVERS OF INTERNAL MIGRATION AMONG YOUTH IN ETHIOPIA, INDIA, PERU AND VIETNAM
8
youth that do not own land and that received transfers from other households are more likely
to move for work.3 In Peru, young people that live in households that received transfers from the government or NGOs are less likely to move for work-related reasons. Lastly, girls that are less educated and whose caregivers have lower educational aspirations are more likely
to move for family formation in India.
In sum, choices made during the transition to adulthood shape the migration patterns of
young people. They are closely intertwined and their influence goes beyond the motivations behind the decision to migrate. They are present in the decision of when to move, how often, where to, and with whom. However, it is also true that migration itself affects these
transitions. By living in a new place, young migrants are exposed to different opportunities that may drive them into other trajectories. For example, although most young migrants reported moving for studies, there is a non-negligible share of migrants that both study and
work. This is important because it means that gauging the effects of migration on young people’s welfare should take into account these choices in order to understand the heterogeneity of young migrants. In this way, we will be in a better position to propose more
effective policies that target young migrants’ well-being in developing countries.
This paper is organised as follows: Section 2 presents the data and descriptive statistics;
Section 3 shows the patterns of internal mobility; Section 4 describes the factors associated with the decision to migrate and with the reasons for moving; and Section 5 summarises the
conclusions of the study.
2. Data and descriptive statistics The data used here are drawn from Young Lives, including information on a sample of
individuals in Ethiopia, India (the states of Andhra Pradesh and Telangana only), Peru and
Vietnam from childhood through early adulthood. Young Lives includes extensive information at the individual, household, and community level on two cohorts through four rounds of surveys between 2002 and 2013. The analysis here is restricted to data on individuals from
the Older Cohort (born between 1994 and 1995), who were followed from approximately ages 8 to 19 years old.
Unlike working with census data, using survey data on migrants allows identification of
migration trends in more depth and more accurately, as the data are collected at more frequent and regular intervals. This is especially important among youth since they are highly
mobile (Beegle and Poulin 2012). In the case of Young Lives, the time elapsed between Rounds 3 and 4 is sufficiently short to allow collection of accurate information about the history of individual movements between surveys. Furthermore, the variety of information
collected in Young Lives enables the probing of specific migration questions with other sections in order to minimise measurement error; for example, the type of locality of the last move in the mobility history part of the questionnaire can be compared to the type of locality
where the individual was interviewed.
Moreover, one of the major advantages of the Young Lives data is its longitudinal nature, as
it tracks the index children from an early age over a long period of time, and thus allows one
3 In the Young Lives questionnaire, transfers are defined as any support in money or goods sent to the household and/or that
the household has sent to someone else.
PATTERNS AND DRIVERS OF INTERNAL MIGRATION AMONG YOUTH IN ETHIOPIA, INDIA, PERU AND VIETNAM
9
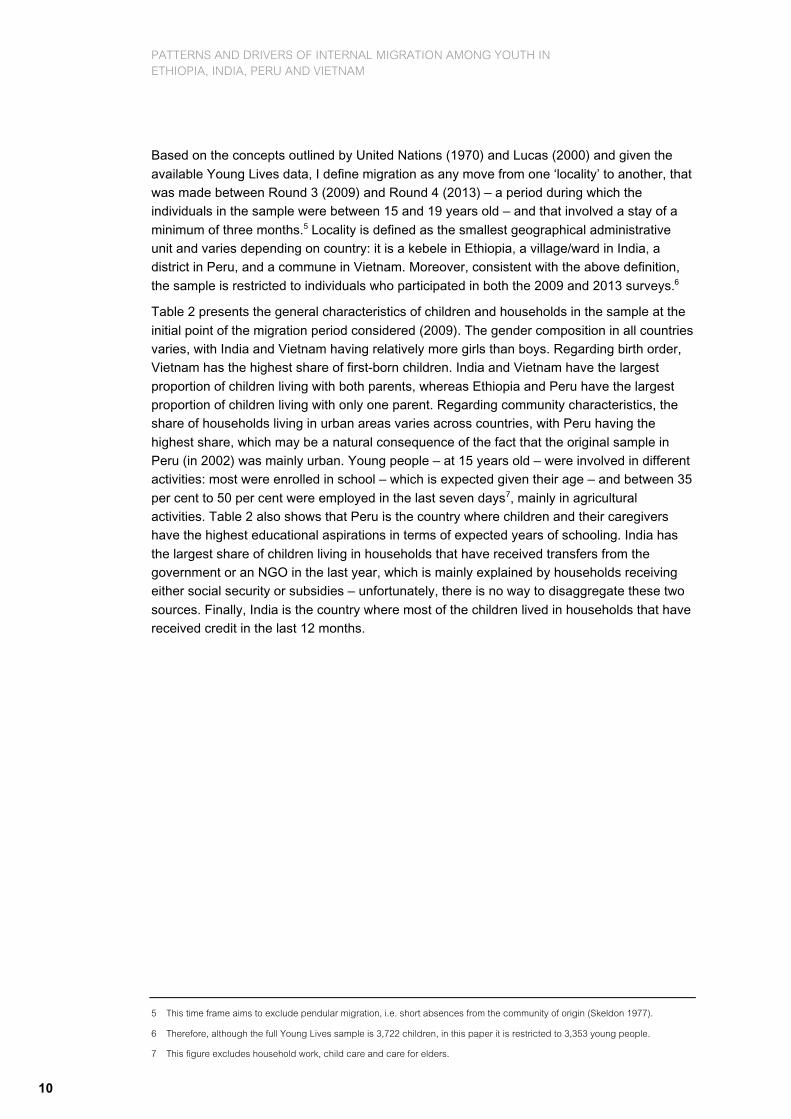
to study how an individual’s history relates to different migration aspects.4 In comparison with
similar surveys, Young Lives has a low level of attrition (Outes-Leon and Dercon 2008). It varied between 3 per cent and 9 per cent between Rounds 3 and 4 (see Table 1), and was mainly driven by ‘untraceable’ children, those who were not found and could not be tracked
because their key contacts did not know where they lived. However, in Ethiopia, attrition between these two rounds was primarily explained by the share of children who emigrated (5 per cent) – mainly to the Gulf countries. Therefore, it must be noted that the migration rates
presented in this study, especially for Ethiopia, do not represent overall mobility, but only internal migration – as was intended in this paper in the first place.
Table 1. Young Lives sample and attrition rates between 2009 and 2013
Ethiopia India Peru Vietnam
Round 1 (2002) 1,000 1,008 714 1,000
Round 2 (2006) 979 994 685 990
Round 3 (2009) 974 977 678 976
Round 4 (2013) 908 952 619 887
In Rounds 3 and 4 905 951 615 882
Attrition between R3 and R4 6.8% 2.6% 8.7% 9.1%
Attrition due to emigration 5.2% 0.4% 1.8% 0.6%
Note: This table is based on the number of children interviewed (i.e. number of child questionnaires administered in each round). Attrition rates include deaths.
Source: Own calculations using Young Lives survey (Rounds 1 to 4).
Other panel surveys, such as the Kagera Health and Development Survey in Tanzania, the
Indonesian Family Life Survey, the Malaysia Labour Flexibility Survey, and the Matlab Health and Socio-Economic Survey in Bangladesh, may also include relevant information for
investigating internal migration because they follow both original and split households and are nationally representative. Nevertheless, these datasets tend to under-represent the poor youth who are the focus of this study. This is the main reason why Young Lives is better
suited for my analysis, as it used a multi-stage pro-poor sampling design with the specific objective of collecting comprehensive information on the characteristics, environments, and outcomes of poor children across four different countries over different stages of their life
course (Outes-Leon and Sanchez 2008; Kumra 2008; Escobal and Flores 2008; Nguyen 2008).
Generally, migration is defined as ‘a move from one migration defining area to another (or a
move of some specified minimum distance) that was made during a given migration interval and that involved a change of [usual place of] residence’ (United Nations 1970). Migration
defining area is defined as the administrative unit taken as reference such that anyone who changes their usual residence across the boundary of such unit is considered a migrant (Lucas 2000). Migration interval is defined as the period of time within which migration may
occur. It could be definite, such as the intercensal period, or indefinite, such as the lifetime of the population alive at a given date (United Nations 1970). Usual place of residence is defined as the place where someone lived (slept and ate) for a minimum amount of time at
one time (Lucas 2000).
4 The tracking rule in Ethiopia, Peru and Vietnam is to follow the index child as long as the child lives within the country. In the
case of India, the rule is to follow children within the limits of Andhra Pradesh and Telangana and to neighbouring states.
PATTERNS AND DRIVERS OF INTERNAL MIGRATION AMONG YOUTH IN ETHIOPIA, INDIA, PERU AND VIETNAM
10
Based on the concepts outlined by United Nations (1970) and Lucas (2000) and given the
available Young Lives data, I define migration as any move from one ‘locality’ to another, that was made between Round 3 (2009) and Round 4 (2013) – a period during which the individuals in the sample were between 15 and 19 years old – and that involved a stay of a
minimum of three months.5 Locality is defined as the smallest geographical administrative unit and varies depending on country: it is a kebele in Ethiopia, a village/ward in India, a district in Peru, and a commune in Vietnam. Moreover, consistent with the above definition,
the sample is restricted to individuals who participated in both the 2009 and 2013 surveys.6
Table 2 presents the general characteristics of children and households in the sample at the
initial point of the migration period considered (2009). The gender composition in all countries varies, with India and Vietnam having relatively more girls than boys. Regarding birth order, Vietnam has the highest share of first-born children. India and Vietnam have the largest
proportion of children living with both parents, whereas Ethiopia and Peru have the largest proportion of children living with only one parent. Regarding community characteristics, the share of households living in urban areas varies across countries, with Peru having the
highest share, which may be a natural consequence of the fact that the original sample in Peru (in 2002) was mainly urban. Young people – at 15 years old – were involved in different activities: most were enrolled in school – which is expected given their age – and between 35
per cent to 50 per cent were employed in the last seven days7, mainly in agricultural activities. Table 2 also shows that Peru is the country where children and their caregivers have the highest educational aspirations in terms of expected years of schooling. India has
the largest share of children living in households that have received transfers from the government or an NGO in the last year, which is mainly explained by households receiving either social security or subsidies – unfortunately, there is no way to disaggregate these two
sources. Finally, India is the country where most of the children lived in households that have received credit in the last 12 months.
5 This time frame aims to exclude pendular migration, i.e. short absences from the community of origin (Skeldon 1977).
6 Therefore, although the full Young Lives sample is 3,722 children, in this paper it is restricted to 3,353 young people.
7 This figure excludes household work, child care and care for elders.

PATTERNS AND DRIVERS OF INTERNAL MIGRATION AMONG YOUTH IN ETHIOPIA, INDIA, PERU AND VIETNAM
11
Table 2. Child and household characteristics of Young Lives sample (2009) Ethiopia India Peru Vietnam
Mean SD N Mean SD N Mean SD N Mean SD N
Male 0.54 0.50 905 0.49 0.50 951 0.53 0.50 615 0.48 0.50 882
Age of Young Lives child (in months) 179.81 3.64 905 179.18 4.13 951 178.72 4.63 615 180.45 3.84 882
First born 0.19 0.39 905 0.28 0.45 951 0.32 0.47 615 0.37 0.48 882
Living with both parents 0.60 0.49 905 0.85 0.36 951 0.67 0.47 615 0.88 0.32 882
Living with one of the parents 0.28 0.45 905 0.12 0.33 951 0.27 0.44 615 0.09 0.29 882
Father's years of schooling 4.33 3.85 905 4.73 5.05 951 9.24 4.65 615 8.01 5.04 882
Caregiver's years of schooling 2.91 3.53 905 2.93 4.29 951 7.44 4.27 615 6.84 4.21 882
Wealth index 0.35 0.17 905 0.52 0.17 951 0.59 0.18 615 0.62 0.19 882
Owns land (in hectares) 1.13 8.90 905 1.67 21.25 951 2.57 26.05 615 0.64 3.36 882
Owns livestock 0.71 0.45 905 0.43 0.50 951 0.63 0.48 615 0.40 0.49 882
Household size 6.35 2.12 905 5.06 1.92 951 5.36 1.87 615 4.54 1.34 882
Urban 0.42 0.49 905 0.25 0.43 951 0.77 0.42 615 0.19 0.39 882
Currently enrolled 0.90 0.31 905 0.77 0.42 951 0.93 0.25 615 0.78 0.42 882
Highest grade attained 5.50 2.10 905 8.09 1.86 951 7.71 1.38 615 8.24 1.45 882
Employed in the last 12 months 0.43 0.50 905 0.38 0.48 951 0.50 0.50 615 0.35 0.48 882
Work in agricultural act. 0.57 0.50 390 0.65 0.48 357 0.44 0.50 308 0.75 0.44 307
Self-employed in non-agri. act. 0.14 0.35 390 0.07 0.26 357 0.32 0.47 308 0.21 0.40 307
Wage-employed in non-agri. act. 0.12 0.33 390 0.27 0.45 357 0.22 0.42 308 0.17 0.38 307
Young Lives child's educational aspirations 14.60 2.94 905 14.59 2.32 951 15.41 1.85 615 14.48 2.96 882
Caregiver's educational aspirations 14.97 2.27 905 13.32 3.54 951 15.26 1.79 615 13.99 1.23 882
Received transfers from Gov/NGO 0.28 0.45 905 0.92 0.28 951 0.41 0.49 615 0.39 0.49 882
Received transfers from other households 0.26 0.44 905 0.09 0.29 951 0.40 0.49 615 0.36 0.48 882
Received earnings from assets and savings 0.12 0.32 905 0.25 0.43 951 0.09 0.29 615 0.07 0.25 882
Received credit in the last 12 months 0.35 0.48 905 0.81 0.39 951 0.33 0.47 615 0.60 0.49 882
Source: Own calculations using Young Lives survey (Round 3).
3. Patterns of internal mobility This section focuses on the descriptive evidence of youth migration in the four countries. This
is important because it sheds light on different aspects of migration that are not usually observed among young people. The compilation of these stylised facts should contribute to the development of a theoretical framework for youth migration in the context of transition to
adulthood.
3.1 Prevalence
Figure 1 shows the prevalence of migration in the Young Lives sample. Between one third and one half of the sample has migrated at least once between 2009 and 2013, India and
Vietnam being the countries with the highest share of migrants. These migration rates are relatively high in comparison to the available national figures, partly due to different definitions of migration defining area, usual place of residence, and migration interval.
According to the Ethiopian National Labour Force Survey (NLFS), the migration rate among youth aged 15 to 19 in 2013 was 13 per cent. However, it must be noted that the NLFS defines the usual place of residence as a stay of a minimum of six months. The migration
rate in India is also higher than the rate of 34 per cent reported by Rajan (2013) based on

PATTERNS AND DRIVERS OF INTERNAL MIGRATION AMONG YOUTH IN ETHIOPIA, INDIA, PERU AND VIETNAM
12
individuals aged 15 to 29 using the 2001 census.8 This census also defines the usual place
of residence as a stay of a minimum of six months, and the migration interval considered for this figure is defined by the place of last residence. The migration rate in Peru is also higher than the 4.5 per cent reported by Yamada (2012), despite the latter figure including a
migration interval of five years; nonetheless, it includes all the population. Similarly, the migration rate in Vietnam is considerably higher than the 3.6 per cent and 2.9 per cent intra-provincial and inter-provincial rates, respectively, reported by Nguyen Anh (2005) for the
population aged 5 years old and above.
Figure 1. Migration rates between Rounds 3 and 4 (2009 and 2013)
Source: Own calculations using Young Lives survey (Rounds 3 and 4).
3.2 Frequency
Figure 2 presents the distribution of the number of moves per migrant. Around half of the
migrants in three of the four countries moved more than once. On one hand, this may be indicative of return or seasonal migration, especially considering that India is the country with the highest frequency of migration. This could be related to the common practice that
children in India, especially in rural areas, move to hostels in order to attend school (Crivello et al. 2012) and/or that poor families in rural areas often move during the lean season to work for six to eight months and then return to their villages (Smita 2008). On the other hand, this
fact may suggest that there is sequential migration. According to Pessino (1991), a migrant observes the outcome of having moved and sequentially decides to stay, return, or move onwards. She found that individuals in Peru move first from poorer areas and then they move
again to relatively richer areas. It may also be the case that each country follows a different
8 For limitations of official data on migration in India, see Deshingkar (2010).
N=905
N=951
N=615
N=882
0.1
.2.3
.4.5
.6.7
Mig
ratio
n ra
tes
Ethiopia India Peru Vietnam

PATTERNS AND DRIVERS OF INTERNAL MIGRATION AMONG YOUTH IN ETHIOPIA, INDIA, PERU AND VIETNAM
13
pattern; however, based on these migration histories only, it is not possible to disentangle
whether these moves are circular or sequential.
Figure 2. Distribution of number of moves per migrant
Source: Own calculations using Young Lives survey (Round 4).
3.3 Timing
It is expected that migration depends on the stages of the life course of the individual and will
greatly vary by gender (Herrera and Sahn 2013). In order to document patterns related to the
timing of the moves, I calculated the age of migrants at the time when each movement occurred – for all moves reported.9 Figure 3 summarises the timing of the moves by gender. Except for Vietnam, boys seem to be more mobile than girls, India being the country where
this pattern is most marked. In India, Peru and Vietnam, both boys and girls moved frequently during school-age years, and the number of moves peaked at the age of 17, which
9 A caveat related to the calculation of the age at the time of the move is that the Young Lives survey only collected information
on the year of the move, and therefore I imputed the day and month. Thus, I estimated the average age in the year of the move as follows: for moves that took place between the years of the survey, I calculated the age at the beginning of the year reported and the age at the end, and then the average of the two. If the year reported is the same as the year of administration of Round 3 (2009) survey, I took the average of the age one day after the interview (minimum age) and the age at the end of 2009 (maximum age). If the year reported is the same as the year of administration of Round 4 (2013) survey, then I took the average of the age at the beginning of 2013 (minimum age) and the age one day before the date of interview (maximum age). Thus, I ensure that the date used to estimate the average age of the migrants is consistent with the dates of administration of the survey.
0.2
.4.6
Den
sity
1 2 3 4 5 6 7 8Number of moves
Ethiopia
0.2
.4.6
Den
sity
1 2 3 4 5 6 7 8 9 10 11 12 13Number of moves
India
0.2
.4.6
Den
sity
1 2 3 4 5 6 7Number of moves
Peru
0.2
.4.6
.81
Den
sity
1 2 3 4 5 6 7Number of moves
Vietnam

PATTERNS AND DRIVERS OF INTERNAL MIGRATION AMONG YOUTH IN ETHIOPIA, INDIA, PERU AND VIETNAM
14
is the age at which they generally finish school.10 This finding provides evidence that young
people migrate very often even before having finished school, which is key to understanding educational performance. In line with this, McKenzie (2011) argues that 16- to 18-year-old males who live in a migrant household in rural Mexico are more likely to move later on, which
in turn is associated with a lower likelihood of school participation.
Figure 3. Number of moves and age at the time of the move, by gender
Source: Own calculations using Young Lives survey (Round 4).
3.4 Reasons
We have seen that a non-negligible share of the sample has moved more than once (Figure
2). In order to present the characteristics of the movement, I defined ‘relevant move’ as the
last move (most recent one) reported in the migration history section of the questionnaire. The reasons for moving have been grouped as follows: (i) to study; (ii) to work – includes those who found a job, were looking for work, had lost their job, and were transferred from
one job to another; (iii) for family formation – includes marriage, cohabiting, following a spouse/partner and for pregnancy/birth; (iv) to follow/join family – includes following relatives (excluding spouse/partner), and visiting/staying with friends/family; (v) other.
10 It is worth noting that all countries present sharp declines at age 19, which may not necessarily mean that mobility decreased,
but may just be a result of the time at which Round 4 data was collected.
020
4060
80
Num
ber
of m
oves
14 15 16 17 18 19Age at the time of the move
Ethiopia
050
100
150
Num
ber
of m
oves
14 15 16 17 18 19Age at the time of the move
India
020
4060
Num
ber
of m
oves
14 15 16 17 18 19 20Age at the time of the move
Peru
050
100
Num
ber
of m
oves
14 15 16 17 18 19 20Age at the time of the move
Vietnam
Males Females Males Females
Males Females Males Females

PATTERNS AND DRIVERS OF INTERNAL MIGRATION AMONG YOUTH IN ETHIOPIA, INDIA, PERU AND VIETNAM
15
Table 3 summarises the reasons of the last move.11 Overall, the main reason for moving in all
countries is study-related, although the shares vary across countries: in India and Vietnam, around half of the moves are education-related, whereas in Ethiopia and Peru, these represent around one third. In the case of Peru, 17 per cent of the moves correspond to
various reasons grouped under other, ‘looking for better housing’ being the most prevalent reason among these.
Table 3. Reasons for moving, by gender
Ethiopia India Peru Vietnam
Female Male Overall Female Male Overall Female Male Overall Female Male Overall
To study 0.42 0.32 0.37 0.33 0.57 0.45 0.38 0.37 0.38 0.56 0.52 0.54
To work 0.12 0.26 0.19 0.09 0.32 0.20 0.22 0.27 0.25 0.20 0.40 0.28
For marriage/birth 0.12 0.00 0.06 0.50 0.00 0.26 0.13 0.00 0.07 0.18 0.01 0.11
To follow/join family 0.26 0.31 0.29 0.03 0.04 0.04 0.11 0.17 0.14 0.02 0.00 0.01
Other 0.07 0.10 0.09 0.05 0.05 0.05 0.15 0.19 0.17 0.04 0.07 0.05
N 153 156 309 245 228 473 98 102 200 255 179 434
Source: Own calculations using Young Lives survey (Round 4).
However, several differences emerge by gender. Females in Ethiopia moved mainly to study,
while males moved both to study and to follow/join family. Regarding this last category, it is worth noting that 28 per cent of the children in Ethiopia were living with only one of their parents in 2009 (as shown in Table 1). These facts are consistent with the NLFS, which reports that the
most prevalent reason (33 per cent) for moving between 15 and 19 years old is to move along with family (Central Statistical Agency 2014). Although early marriage is very prevalent in Ethiopia (Boyden et al. 2012), only a few moves were marriage-related.12 In India, most males
moved to study, while females moved mainly for marriage. This is consistent with Rajan (2013), who found that the most prevalent reason for moving among youth aged 15 to 19 in India is marriage (28 per cent). In particular, Rosenzweig and Stark (1989) point out that migration in
India is mainly ‘a marital phenomenon’, particularly for women as they practice patrilocal patterns of social organisation. However, it is worth noting that 33 per cent of female migrants in India moved to study. In Peru and Vietnam, the main reason for migration for both boys and
girls is education-related, followed by work-related moves.
3.5 Streams
Within the internal migration literature, rural-urban migration has been a major source of
interest for researchers and concern for policymakers. Urban population pressures on infrastructure, efficiency of labour use, and effects of migration on poverty are just some examples of why rural-urban migration rates are important and, hence, have attracted most
of the attention of theoretical and empirical literature on internal migration. However, this is not the most frequent type of movement in developing countries, rather, rural-rural migration is. Nonetheless, due mainly to data limitations, empirical evidence on intra-rural movement is
relatively scarce (Lucas 1997).
11 These shares do not change dramatically when the reasons for migrating are analysed for all moves reported – instead of the
last move. In fact, they are very similar across all groups, except for males in Ethiopia and Peru, for whom the most prevalent reason among all moves is work-related, while the most important reason of the last move is education-related.
12 In the Young Lives sample, only 6 per cent of the young people in Ethiopia at age 19 reported being married or cohabiting.

PATTERNS AND DRIVERS OF INTERNAL MIGRATION AMONG YOUTH IN ETHIOPIA, INDIA, PERU AND VIETNAM
16
The definitions of urban and rural vary across the four countries and were assigned as follows:
the place of destination was categorised as urban or rural according to the type of locality reported in the mobility history section of the questionnaire. In Ethiopia, rural includes small towns, whereas urban includes Addis Ababa and zonal and regional centres. In India, rural
includes villages, while urban includes towns, district and state capitals, and cities. If the child reported having moved to a woreda (in Ethiopia) or mandal (in India) headquarter, then the classification of urban or rural was assigned according to the type of woreda or mandal where
the child lived in Round 4.13 In Peru, urban and rural were defined on a case-by-case basis according to the type of locality reported. For example, rural includes anexo and caserío, while urban includes urbanización and barrio. In Vietnam, rural includes rural communes, while
urban includes urban communes and towns. Similarly, the place of origin was categorised in the same way only for those individuals that reported more than one move; in the case of individuals that moved only once, I assigned the type of locality reported in Round 3.
Table 4 shows that in terms of spatial mobility, there are less gender disparities in all countries, except India, where girls moved mainly from rural to rural areas – again consistent
with (Rosenzweig and Stark 1989) – whereas males followed a more disperse pattern. In Ethiopia, rural-rural migration is the most prevalent type of migration for both boys and girls. In Peru, both males and females moved mainly from urban to urban areas, which is generally
consistent with the fact that the sample was primarily concentrated in cities in 2009 (see Table 1). In Vietnam, both females and males moved mainly from rural to urban areas, which resembles the pattern presented in Deshingkar (2005).
Table 4. Type of migration, by place of origin and destination
Ethiopia India Peru Vietnam
Female Male Overall Female Male Overall Female Male Overall Female Male Overall
Rural-Rural 0.40 0.34 0.37 0.54 0.29 0.42 0.02 0.04 0.03 0.21 0.16 0.19
Rural-Urban 0.24 0.23 0.23 0.20 0.29 0.24 0.22 0.23 0.23 0.67 0.69 0.68
Urban-Rural 0.11 0.13 0.12 0.05 0.05 0.05 0.11 0.12 0.11 0.02 0.02 0.02
Urban-Urban 0.26 0.31 0.28 0.21 0.37 0.29 0.65 0.61 0.63 0.10 0.13 0.12
N 148 150 298 235 227 462 94 99 193 253 179 432
Source: Own calculations using Young Lives survey (Round 4).
3.6 Type of household
Much of the literature on the determinants of migration has debated whether it is an individual
or a household strategy. This question is especially relevant during the transition to
adulthood as not all young migrants are already economically independent individuals moving in search of a better future (McKenzie 2007). They may move on their own or with the household, and if they move alone, they may or may not send remittances to their
previous household – in some cases, they may instead receive support from them. All these factors affect the impact that migration will have on the migrant’s well-being (UNESCO and UNICEF 2012).
13 This classification was taken from internal documentation of the Young Lives clusters (woredas or mandals) where the children
were interviewed.

PATTERNS AND DRIVERS OF INTERNAL MIGRATION AMONG YOUTH IN ETHIOPIA, INDIA, PERU AND VIETNAM
17
Given that the Young Lives study did not collect this information as part of the mobility
history, I defined individual migration as the situation where the migrant lived in 2013 in a different household than that of 2009.14 In order to calculate the share of individual migrants, I
classify them into three groups in 2009 and 2013: (i) living with at least one of the parents; (ii) living with the primary caregiver (if different from biological parents); or (iii) living with someone other than the biological parents or the primary caregiver. If the migrant’s status
changes between 2009 and 2013, I categorise this as an independent move; otherwise, it is a household move.15
Table 5 shows that in all countries, except for Peru, most migrants moved with the
household, although there are gender disparities, especially in India, where the share of
females that moved individually is considerably higher than the proportion of males that did so. This is consistent with the fact that most Indian girls moved for marriage. Furthermore, Table 6 suggests that migrants are not fully detached from their previous households.16 In all
countries, except for Ethiopia, more than half of migrants received remittances from their previous caregivers.17 In Ethiopia, although this proportion is slightly smaller (46 per cent), it is still larger than the share of migrants that sent any remittances to their previous caregivers
(17 per cent). I also investigated the receipt and sending of remittances by reason for migrating and found no systematic pattern, except in India, where most of the migrants that received remittances from their previous households are girls that moved for marriage.
Table 5. Share of migrants living in different households, by gender
Ethiopia India Peru Vietnam
Mean N Mean N Mean N Mean N
Female 0.41 152 0.54 245 0.50 98 0.21 254
Male 0.25 155 0.01 228 0.37 106 0.04 178
Overall 0.33 307 0.29 473 0.43 204 0.14 432
Source: Own calculations using Young Lives survey (Round 4).
14 Young Lives uses the United Nations definition of household, namely ‘a group of individuals who live under the same roof or
within the same compound/homestead/stand, share food from a common source at least once a day, and contribute to or share in a common resource pool’ (United Nations 1989).
15 This procedure has an important caveat: it overlooks circular migration, and therefore, may overestimate the share of household migration. For example, if the migrant lived with her parents in 2009 and then moved back and forth so that in 2013 they live again with their parents, this would not be counted as individual migration, but rather as household migration.
16 The sample sizes in Tables 5 and 6 are different because the latter includes only those migrants that did not live with their previous caregiver in 2013 (provided that the caregiver was alive).
17 Remittances are defined as any support, help or gift in cash or in kind given to the migrant by their previous primary caregiver or any of their household members during the last 12 months. They also include any support, help or gift in cash or in kind sent by the migrant to their previous primary caregiver or any of their household members during the last 12 months.

PATTERNS AND DRIVERS OF INTERNAL MIGRATION AMONG YOUTH IN ETHIOPIA, INDIA, PERU AND VIETNAM
18
Table 6. Share of migrants that sent or received remittances, by gender
Ethiopia India Peru Vietnam
Mean N Mean N Mean N Mean N
Female
Sent 0.12 90 0.10 134 0.35 52 0.32 151
Received 0.50 90 0.50 134 0.62 52 0.69 154
Male
Sent 0.25 59 0.30 27 0.41 54 0.33 95
Received 0.41 59 0.48 27 0.59 54 0.56 96
Overall
Sent 0.17 149 0.14 161 0.38 106 0.33 246
Received 0.46 149 0.50 161 0.60 106 0.64 250
Note: Sample size in this table only includes migrants who were not living with their primary caregiver in 2013, provided that they were alive.
Source: Own calculations using Young Lives survey (Round 4).
3.7 Employment at destination
We have seen that transitions to adulthood are greatly reflected in the migrants’ motivations
to move. However, migration also affects these transitions in the sense that it places young migrants into a new environment where either more or less choices are available, exposing
them to new ideas and living standards that affect their expectations and shape their behaviour. This may lead them into new trajectories that may not have been undertaken had they stayed in their place of origin.
In order to account for this, Table 7 shows the descriptive statistics of what migrants are
doing after they migrated, by reasons for moving. Except for Vietnam, most migrants are only working, which may be explained by the fact that, in this sample, young people that moved for other reasons than studying are more likely to be working. This should not be surprising,
considering that at age 15, between one third and one half of the young people were already working, mainly in agricultural activities (see Table 2).
Table 7. Employment status and reasons for moving
To study To work For marriage / birth
To follow / join family
Other Total
Ethiopia
Neither studying nor working 0.01 0.10 0.56 0.22 0.19 0.14
Only studying 0.73 0.02 0.11 0.10 0.33 0.34
Only working 0.08 0.82 0.28 0.58 0.33 0.40
Both studying and working 0.18 0.07 0.06 0.09 0.15 0.12
N 115 60 18 89 27 309
India
Neither studying nor working 0.04 0.06 0.47 0.11 0.17 0.17
Only studying 0.65 0.03 0.04 0.22 0.08 0.32
Only working 0.05 0.89 0.49 0.50 0.63 0.38
Both studying and working 0.25 0.01 0.00 0.17 0.13 0.13
N 213 95 123 18 24 473
PATTERNS AND DRIVERS OF INTERNAL MIGRATION AMONG YOUTH IN ETHIOPIA, INDIA, PERU AND VIETNAM
19
To study To work For marriage / birth
To follow / join family
Other Total
Peru
Neither studying nor working 0.04 0.12 0.23 0.14 0.21 0.12
Only studying 0.44 0.00 0.00 0.11 0.06 0.19
Only working 0.15 0.72 0.77 0.61 0.50 0.46
Both studying and working 0.37 0.16 0.00 0.14 0.24 0.24
N 75 50 13 28 34 200
Vietnam
Neither studying nor working 0.02 0.14 0.33 0.00 0.05 0.09
Only studying 0.72 0.00 0.00 0.17 0.41 0.41
Only working 0.03 0.86 0.67 0.83 0.41 0.37
Both studying and working 0.23 0.00 0.00 0.00 0.14 0.13
N 236 121 49 6 22 434
Source: Own calculations using Young Lives survey (Round 4).
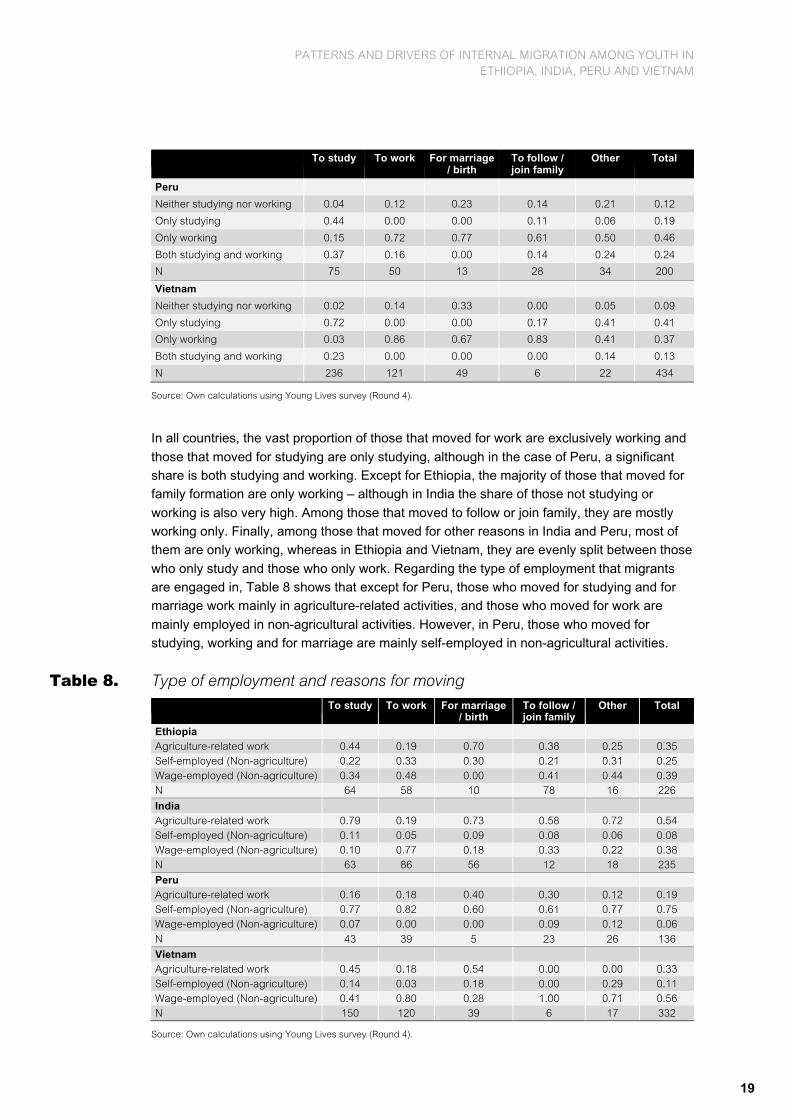
In all countries, the vast proportion of those that moved for work are exclusively working and
those that moved for studying are only studying, although in the case of Peru, a significant share is both studying and working. Except for Ethiopia, the majority of those that moved for family formation are only working – although in India the share of those not studying or
working is also very high. Among those that moved to follow or join family, they are mostly working only. Finally, among those that moved for other reasons in India and Peru, most of them are only working, whereas in Ethiopia and Vietnam, they are evenly split between those
who only study and those who only work. Regarding the type of employment that migrants are engaged in, Table 8 shows that except for Peru, those who moved for studying and for marriage work mainly in agriculture-related activities, and those who moved for work are
mainly employed in non-agricultural activities. However, in Peru, those who moved for studying, working and for marriage are mainly self-employed in non-agricultural activities.
Table 8. Type of employment and reasons for moving
To study To work For marriage / birth
To follow / join family
Other Total
Ethiopia Agriculture-related work 0.44 0.19 0.70 0.38 0.25 0.35 Self-employed (Non-agriculture) 0.22 0.33 0.30 0.21 0.31 0.25 Wage-employed (Non-agriculture) 0.34 0.48 0.00 0.41 0.44 0.39 N 64 58 10 78 16 226
India Agriculture-related work 0.79 0.19 0.73 0.58 0.72 0.54 Self-employed (Non-agriculture) 0.11 0.05 0.09 0.08 0.06 0.08 Wage-employed (Non-agriculture) 0.10 0.77 0.18 0.33 0.22 0.38 N 63 86 56 12 18 235
Peru Agriculture-related work 0.16 0.18 0.40 0.30 0.12 0.19 Self-employed (Non-agriculture) 0.77 0.82 0.60 0.61 0.77 0.75 Wage-employed (Non-agriculture) 0.07 0.00 0.00 0.09 0.12 0.06
N 43 39 5 23 26 136
Vietnam Agriculture-related work 0.45 0.18 0.54 0.00 0.00 0.33 Self-employed (Non-agriculture) 0.14 0.03 0.18 0.00 0.29 0.11 Wage-employed (Non-agriculture) 0.41 0.80 0.28 1.00 0.71 0.56 N 150 120 39 6 17 332
Source: Own calculations using Young Lives survey (Round 4).

PATTERNS AND DRIVERS OF INTERNAL MIGRATION AMONG YOUTH IN ETHIOPIA, INDIA, PERU AND VIETNAM
20
These results show that young people’s trajectories are intertwined with each other. This is in
line with qualitative studies that argue that transitions to adulthood in poor households are not linear since the sequencing of traditional markers of adulthood are diverse and disordered (Chuta and Morrow 2015).
3.8 Subjective well-being
It is difficult to define what a successful transition to adulthood is, especially in developing
countries. With the aim of encouraging governments to promote policies that facilitate smooth transitions to adulthood, Lloyd (2005) proposes a broad definition, in which she includes ‘a
sense of well-being’. This may be understood as general life satisfaction (life as a whole) or in domain terms (in specific areas such as work, health, and so on) (Diener and Lucas 1999). This is particularly relevant for migrants as they have to face trade-offs between the push and
pull factors of their places of origin and destination. Although they have changed their environments in search of better opportunities with a primary focus on one aspect (such as work, education or family formation, as seen in Table 3), it may well be the case that they
also have to assume certain costs (such as less access to social networks).
In order to explore this in more detail, I compared the change in subjective well-being
between 2009 and 2013 among migrants and non-migrants across a range of dimensions that characterise their current and previous location. This measure was captured through the
use of a nine-step ladder that characterises a given dimension of subjective well-being for a given place and time.18 The change in subjective well-being is calculated as the difference between the final and initial value of the position in the ladder reported.
Table 9 presents the results separately for migrants and non-migrants, together with tests for statistical significance of the difference between the two groups. Migrants in all countries
reported having a smaller increase in support from neighbours and friends than non-migrants between their locations in Rounds 3 and 4. In fact, in Peru and Vietnam, migrants were actually worse in 2013 than in 2009 in this respect. Except in India, migrants also had a lower
increase in support from the government, not-for-profit organisations and local associations – in Vietnam, this actually decreased between the two points in time. In all countries, except Ethiopia, migrants reported having a larger increase in opportunities for work and access to
health services than non-migrants, whereas only migrants in Peru and Vietnam reported having an increased access to education than non-migrants. In all countries, except Ethiopia, migrants reported having a smaller increase in quality of environment than non-migrants.
Moreover, in Peru and Vietnam, the latter aspect of subjective well-being did not improve, but actually worsened between 2009 and 2013.
18 The protocol for asking this question is as follows. The enumerator asked the child: “There are nine steps in this ladder.
Suppose the ninth step at the very top, represents the best possible life for you, and the bottom represents the worst possible life for you. Where on the ladder do you feel you personally stand at the present time?” This question was asked for the locality where the child was living in Round 4 (2013) and the locality in Round 3 (2009), regardless of whether they had moved or not.

PATTERNS AND DRIVERS OF INTERNAL MIGRATION AMONG YOUTH IN ETHIOPIA, INDIA, PERU AND VIETNAM
21
Table 9. Subjective well-being of migrants and non-migrants
Non-migrants Migrants P-value of equality Mean N Mean N
Ethiopia
Opportunities for education 1.61 596 1.48 307 0.3283
Opportunities for work 1.39 591 1.35 305 0.7801
Access to health services 1.82 595 1.77 307 0.6886
Quality of housing 1.56 596 1.79 309 0.0731
Quality of living environment 1.25 596 1.12 308 0.3560
Support from neighbours/friends 0.90 596 0.26 306 0.0000
Support from government/NGOs/local associations 0.92 591 0.39 299 0.0003
Food availability 1.15 596 0.92 308 0.0792
India
Opportunities for education 0.98 478 1.10 473 0.3159
Opportunities for work 1.04 478 1.26 473 0.0479
Wealth/income 1.09 478 1.13 473 0.7490
Access to health services 0.92 478 1.35 473 0.0001
Quality of housing 1.04 478 1.10 473 0.6184
Quality of environment 0.43 478 0.20 473 0.0374
Support from neighbours 0.45 478 0.22 473 0.0152
Support from friends 0.74 478 0.44 473 0.0054
Support from government 0.74 478 0.71 473 0.7337
Support from NGOs/local associations 0.49 478 0.53 473 0.6507
Peru
Opportunities for education 0.99 408 1.33 204 0.0430
Opportunities for work 0.92 406 1.99 204 0.0000
Living costs 0.49 408 0.47 204 0.9197
Access to health services 0.90 408 1.28 203 0.0370
Quality of housing 1.47 409 1.20 204 0.1192
Quality of environment 0.18 409 -0.73 204 0.0000
Support from friends/neighbours 0.40 408 -0.55 202 0.0000
Support from government/NGOs/local associations 0.67 401 0.20 198 0.0030
Vietnam
Opportunities for education 0.18 439 0.65 432 0.0001
Opportunities for work 0.89 441 1.55 430 0.0000
Income/assets 0.87 441 1.08 426 0.0408
Access to health services 0.73 445 1.24 434 0.0000
Quality of housing 0.61 445 0.43 434 0.0828
Quality of environment 0.15 442 -0.19 433 0.0013
Support from neighbours 0.16 445 -0.93 429 0.0000
Support from friends 0.41 445 0.04 433 0.0001
Support from government 0.28 433 0.11 409 0.0458
Support from NGOs/local associations 0.19 428 -0.01 407 0.0028
Food availability 0.51 446 0.25 432 0.0109
Source: Own calculations using Young Lives survey (Round 4).
3.9 Migration aspirations
Whether seen as an individual or a household strategy, migration is expected to bring
benefits to the migrant. However, as seen in the previous subsection, it is a process that
comes with costs. These costs may be high enough for some individuals that they represent barriers for migrating.

PATTERNS AND DRIVERS OF INTERNAL MIGRATION AMONG YOUTH IN ETHIOPIA, INDIA, PERU AND VIETNAM
22
This subsection explores the preferences and constraints for future migration among migrants
and non-migrants, and tests for the statistical significance of the difference between these two groups. Table 10 shows the results for all countries. The difference between the shares of migrants and non-migrants that would be willing to move in the next 10 years is only
statistically significant in Vietnam: 51 per cent of migrants are willing to move while only 29 per cent of non-migrants are willing to do so. In all countries, the most prevalent reasons reported for their decision (either willing or not willing to move) are the same: both migrants and non-
migrants that prefer not to move do so because their family is in their place of residence, while those that prefer to move do so because they are willing to work somewhere else.
Table 10. Migration aspirations
Non-migrants Migrants P-value of equality Mean N Mean N
Ethiopia
Would like to move in next 10 years 0.68 596 0.67 308 0.6718
Reasons for not willing to move
Studying here 0.17 189 0.14 103 0.3918
Working here 0.08 189 0.21 103 0.0009
Family here 0.47 189 0.42 103 0.3825
Property here 0.06 189 0.00 103 0.0125
Happy here 0.07 189 0.14 103 0.0869
Other 0.14 189 0.10 103 0.2628
Reasons for willing to move
To study 0.34 405 0.17 205 0.0000
To work 0.54 405 0.72 205 0.0000
To follow/join family 0.03 405 0.03 205 0.8815
To broaden horizons 0.00 405 0.00 205 0.4773
Other 0.09 405 0.08 205 0.8842
Preferred destination place
Within the country - rural 0.05 404 0.08 201 0.1200
Within the country - urban 0.34 404 0.38 201 0.3462
Outside the country 0.12 404 0.25 201 0.0001
Do not know 0.48 404 0.28 201 0.0000
India
Would like to move in next 10 years 0.66 457 0.62 460 0.2440
Reasons for not willing to move
Studying here 0.01 155 0.01 173 0.5002
Working here 0.10 155 0.20 173 0.0133
Family here 0.47 155 0.51 173 0.4332
Property here 0.23 155 0.16 173 0.1088
Happy here 0.09 155 0.08 173 0.7619
Other 0.09 155 0.03 173 0.0356
Reasons for willing to move
To study 0.29 296 0.30 285 0.8389
To work 0.42 296 0.53 285 0.0074
For marriage/birth 0.09 296 0.06 285 0.1612
To follow/join family 0.02 296 0.04 285 0.2994
To broaden horizons 0.02 296 0.02 285 0.6057
Other 0.15 296 0.06 285 0.0002
Preferred destination place
Within the country - rural 0.08 300 0.09 284 0.5176
Within the country - urban 0.41 300 0.51 284 0.0147
Outside the country 0.05 300 0.04 284 0.3784
Do not know 0.46 300 0.36 284 0.0135

PATTERNS AND DRIVERS OF INTERNAL MIGRATION AMONG YOUTH IN ETHIOPIA, INDIA, PERU AND VIETNAM
23
Non-migrants Migrants P-value of equality Mean N Mean N
Peru
Would like to move in next 10 years 0.75 411 0.75 204 0.8819
Reasons for not willing to move
Studying here 0.07 101 0.22 49 0.0059
Working here 0.03 101 0.12 49 0.0249
Family here 0.58 101 0.39 49 0.0239
Property here 0.03 101 0.08 49 0.1594
Happy here 0.15 101 0.10 49 0.4357
Other 0.14 101 0.08 49 0.3171
Reasons for willing to move
To study 0.18 307 0.17 153 0.7425
To work 0.27 307 0.39 153 0.0097
To follow/join family 0.03 307 0.09 153 0.0073
To broaden horizons 0.23 307 0.18 153 0.2025
Other 0.28 307 0.17 153 0.0077
Preferred destination place
Within the country 0.58 308 0.58 154 0.9470
Outside the country 0.21 308 0.25 154 0.3857
Do not know 0.21 308 0.18 154 0.4092
Vietnam
Would like to move in next 10 years 0.29 429 0.51 401 0.0000
Reasons for not willing to move
Studying here 0.02 305 0.04 196 0.1617
Working here 0.06 305 0.12 196 0.0078
Family here 0.73 305 0.63 196 0.0197
Property here 0.05 305 0.03 196 0.3124
Happy here 0.08 305 0.12 196 0.0783
Other 0.07 305 0.05 196 0.4198
Reasons for willing to move
To study 0.10 122 0.03 204 0.0168
To work 0.56 122 0.60 204 0.4205
To follow/join family 0.02 122 0.20 204 0.0000
To broaden horizons 0.07 122 0.00 204 0.0012
Other 0.25 122 0.16 204 0.0315
Preferred destination place
Within the country - rural 0.11 122 0.26 201 0.0006
Within the country - urban 0.43 122 0.47 201 0.5055
Outside the country 0.07 122 0.02 201 0.0354
Do not know 0.39 122 0.24 201 0.0043
Source: Own calculations using Young Lives survey (Round 4).
Although migrants and non-migrants may seem to have similar aspirations regarding future
migration, the distribution of these preferences does differ between them. In all countries, the share of migrants that are not willing to move because they are working at their place of
residence is at least twice as the share of non-migrants. In Ethiopia, the share of stayers that would not like to move because they have property in their place of residence is statistically significantly higher than that of migrants. In Peru and Vietnam, the share of non-migrants
who are not willing to move because they have family there is higher than that of migrants.

PATTERNS AND DRIVERS OF INTERNAL MIGRATION AMONG YOUTH IN ETHIOPIA, INDIA, PERU AND VIETNAM
24
There are also differences among migrants and stayers that are willing to move. In Ethiopia
and Vietnam, the share of non-migrants that would be willing to move to study is at least twice that of migrants that reported being willing to. In all countries, except for Vietnam, the share of migrants that are willing to move to work is statistically significantly higher than that
of stayers – in Vietnam, these shares are almost the same.
Among those that are willing to move, there are differences regarding the preferred place of
destination. On one hand, most non-migrants in Ethiopia and India do not know where they would go, whereas in Peru they would go somewhere within the country,19 and in Vietnam they would go to an urban locality. On the other hand, most migrants in Ethiopia, India and
Vietnam would go to urban areas, and in Peru they would move within the country. Finally, in Ethiopia, the share of migrants that are willing to emigrate outside the country is twice as high as that of non-migrants, whereas in Vietnam, this figure is inverted.
This section has covered the patterns of different aspects of migration and their relation with
some key transitions to adulthood. The next section will make use of the richness of the data to describe who these migrants are in terms of their average characteristics at the individual, household and community levels.
4. Drivers of migration It is well established that migrants do not constitute a random sample of the general
population (Lucas 1997). Movers differ systematically from stayers for reasons other than their migration status. Understanding the self-selection of migrants is vital to assess the
effects of migration on the young person’s welfare. This section analyses a set of predetermined characteristics at the individual, household and locality levels in order to estimate a migration decision regression.
The first set of predictors relates to individual characteristics of the young person: gender, ethnicity, age (in months), and birth order. The second set of predictors consists of
household characteristics, which include caregiver’s education, household’s wealth, land and livestock ownership, and household size. The third set of predictors relates to community characteristics, such as the type of locality and the region where the young person lived in
2009. It is likely that the incidence of migration varies across these groups (McKenzie and Sasin 2007).
The fourth set of predictors relates to the child’s education (highest grade attained) and to the
educational aspirations of both the child and the caregiver, that is, the ideal number of years of
schooling that the child and the caregiver, respectively, would like the child to attain.20 There is a growing literature around the role of aspirations as predictors of later outcomes (Serneels and Dercon 2014; Favara 2016; Singh and Espinoza Revollo 2016). In the case of young
people, the transition to adulthood is very much shaped by previous experiences and events during childhood and earlier adolescence, as well as by ‘what lies ahead’ (Lloyd 2005). Czaika (2014) found that migrants in Indonesia reported strikingly higher levels of aspirations for the
19 Unlike in the other countries, in Peru it was only possible to disaggregate the categories of preferred destination place into
‘Within the country’, ‘Outside the country’, and ‘Do not know’ due to data limitations.
20 These were collected when the child was 15 years old, except in India, where it was collected when the child was 12 years old.

PATTERNS AND DRIVERS OF INTERNAL MIGRATION AMONG YOUTH IN ETHIOPIA, INDIA, PERU AND VIETNAM
25
future than non-migrants, while (Crivello 2011) argued that bundled aspirations about
migration and education among youth might shape their willingness to migrate.
Finally, the fifth set of predictors consists of indicator variables that capture access to credit
and transfers from the government and NGOs, from other households, and from assets and savings. The rationale for including these variables relies on the literature of the ‘new economics of migration’ theory, according to which migration is seen as a household strategy
aimed at diversifying income and coping with risks in absence of insurance markets (Stark and Bloom 1985). Therefore, these characteristics may be relevant in determining the probability of migrating.
Table 11 shows the mean characteristics of migrants and non-migrants, together with tests
for statistical significance of the difference between the two groups. Characteristics vary in each country, although a common feature for all of them is that migrants come mainly from relatively poorer, rural households.21 Except in Vietnam, migrants have less educated
caregivers than non-migrants; nonetheless, migrants in Ethiopia and Vietnam are more educated than stayers, and they come from smaller households. In Ethiopia and Peru, migrants were more likely to work in agricultural activities than stayers (before migration). In
Vietnam, migrants are predominantly females, and have caregivers not only with higher levels of education, but also with higher educational aspirations compared to non-migrants, whereas the opposite holds for India. Migrants are less likely to come from households
receiving credit in Ethiopia and Peru, whereas the opposite is the case for India.
21 By poorer I mean households with lower wealth index. The wealth index ranges from 0 to 1 and is calculated as the average of
three sub-indices: (i) Housing Quality Index, which assesses the number of rooms in the house and the material of the walls, roof and floor; (ii) Consumer Durable Index, which assesses whether the household owns a TV, radio, fridge, bike, motorbike, car, telephone, mobile phone, and a fan; (iii) Services Index, which assesses if the household has access to electricity, drinking water, a toilet, and cooking fuel.

PATTERNS AND DRIVERS OF INTERNAL MIGRATION AMONG YOUTH IN ETHIOPIA, INDIA, PERU AND VIETNAM
26
Table 11. Characteristics of migrants
Non-migrants Migrants P-value of Equality Mean N Mean N
Ethiopia
Male 0.55 596 0.50 309 0.1777
Age of Young Lives child in months 179.79 596 179.84 309 0.8510
First born 0.20 596 0.18 309 0.4333
Living with both parents 0.60 596 0.60 309 0.9905
Living with one of the parents 0.29 596 0.26 309 0.2946
Father's years of schooling 4.63 596 3.76 309 0.0012
Caregiver's years of schooling 3.09 596 2.56 309 0.0334
Wealth index 0.36 596 0.33 309 0.0033
Owns land (in hectares) 1.31 596 0.79 309 0.4046
Owns livestock 0.68 596 0.77 309 0.0043
Household size 6.46 596 6.15 309 0.0346
Urban 0.47 596 0.32 309 0.0000
Enrolled at educational institution 0.89 596 0.90 309 0.5779
Highest grade attained 5.27 596 5.96 309 0.0000
Employed in the last 12 months 0.43 596 0.43 309 0.9819
Work in agricultural act. 0.54 257 0.63 133 0.0865
Self-employed in non-agri. act. 0.16 257 0.12 133 0.3467
Wage-employed in non-agri. act. 0.15 257 0.07 133 0.0165
YL child's educational aspirations 14.57 596 14.65 309 0.6856
Caregiver's educational aspirations 15 596 14.91 309 0.5482
Received transfers from government/NGO 0.28 596 0.29 309 0.7268
Received transfers from other households 0.26 596 0.28 309 0.5896
Received earnings from assets and savings 0.12 596 0.10 309 0.2888
Received credit in the last 12 months 0.39 596 0.28 309 0.0018
India
Male 0.50 478 0.48 473 0.6711
Age of Young Lives child in months 179.28 478 179.08 473 0.4648
First born 0.27 478 0.28 473 0.7510
Living with both parents 0.84 478 0.85 473 0.5741
Living with one of the parents 0.14 478 0.11 473 0.1559
Father's years of schooling 5.04 478 4.41 473 0.0546
Caregiver's years of schooling 3.16 478 2.69 473 0.0883
Wealth index 0.55 478 0.50 473 0.0000
Owns land (in hectares) 1.19 478 2.15 473 0.4872
Owns livestock 0.36 478 0.51 473 0.0000
Household size 4.93 478 5.20 473 0.0340
Urban 0.37 478 0.12 473 0.0000
Enrolled at educational institution 0.79 478 0.75 473 0.1378
Highest grade attained 8.11 478 8.07 473 0.7467
Employed in the last 12 months 0.34 478 0.41 473 0.0195
Work in agricultural act. 0.62 162 0.68 195 0.2408
Self-employed in non-agri. act. 0.09 162 0.06 195 0.1913
Wage-employed in non-agri. act. 0.27 162 0.27 195 0.9968
YL child's educational aspirations 14.64 478 14.53 473 0.4670
Caregiver's educational aspirations 13.58 478 13.07 473 0.0271
Received transfers from government/NGO 0.91 478 0.92 473 0.7617
Received transfers from other households 0.08 478 0.10 473 0.2923
Received earnings from assets and savings 0.26 478 0.23 473 0.1806
Received credit in the last 12 months 0.78 478 0.84 473 0.0199

PATTERNS AND DRIVERS OF INTERNAL MIGRATION AMONG YOUTH IN ETHIOPIA, INDIA, PERU AND VIETNAM
27
Non-migrants Migrants P-value of Equality Mean N Mean N
Peru
Male 0.53 411 0.52 204 0.7573
Age of Young Lives child in months 178.59 411 178.97 204 0.3396
First born 0.35 411 0.27 204 0.0577
Living with both parents 0.67 411 0.68 204 0.8066
Living with one of the parents 0.29 411 0.22 204 0.0787
Father's years of schooling 9.62 411 8.48 204 0.0040
Caregiver's years of schooling 7.93 411 6.46 204 0.0001
Wealth index 0.62 411 0.51 204 0.0000
Owns land (in hectares) 2.61 411 2.47 204 0.9500
Owns livestock 0.55 411 0.77 204 0.0000
Household size 5.30 411 5.48 204 0.2727
Urban 0.84 411 0.64 204 0.0000
Enrolled at educational institution 0.94 411 0.91 204 0.1677
Highest grade attained 7.81 411 7.51 204 0.0109
Employed in the last 12 months 0.46 411 0.57 204 0.011
Work in agricultural act. 0.31 191 0.67 117 0.0000
Self-employed in non-agri. act. 0.39 191 0.21 117 0.0011
Wage-employed in non-agri. act. 0.26 191 0.16 117 0.0534
YL child's educational aspirations 15.46 411 15.30 204 0.3103
Caregiver's educational aspirations 15.31 411 15.14 204 0.2698
Received transfers from government/NGO 0.41 411 0.4 204 0.8268
Received transfers from other households 0.40 411 0.39 204 0.7801
Received earnings from assets and savings 0.09 411 0.09 204 0.8208
Received credit in the last 12 months 0.37 411 0.25 204 0.0030
Vietnam
Male 0.54 448 0.41 434 0.0002
Age of Young Lives child in months 180.32 448 180.58 434 0.3257
First born 0.35 448 0.38 434 0.5245
Living with both parents 0.89 448 0.87 434 0.4249
Living with one of the parents 0.10 448 0.09 434 0.7547
Father's years of schooling 7.88 448 8.15 434 0.4338
Caregiver's years of schooling 6.59 448 7.11 434 0.0687
Wealth index 0.64 448 0.60 434 0.0010
Owns land (in hectares) 0.66 448 0.62 434 0.8618
Owns livestock 0.33 448 0.48 434 0.0000
Household size 4.67 448 4.40 434 0.0024
Urban 0.30 448 0.08 434 0.0000
Enrolled at educational institution 0.77 448 0.78 434 0.6353
Highest grade attained 8.07 448 8.42 434 0.0003
Employed in the last 12 months 0.35 448 0.35 434 0.8806
Work in agricultural act. 0.75 157 0.74 150 0.8163
Self-employed in non-agri. act. 0.20 157 0.21 150 0.9510
Wage-employed in non-agri. act. 0.13 157 0.22 150 0.0319
YL child's educational aspirations 14.15 448 14.82 434 0.0008
Caregiver's educational aspirations 13.92 448 14.07 434 0.0759
Received transfers from government/NGO 0.41 448 0.36 434 0.1190
Received transfers from other households 0.39 448 0.33 434 0.1077
Received earnings from assets and savings 0.08 448 0.06 434 0.4240
Received credit in the last 12 months 0.58 448 0.62 434 0.1608
Source: Own calculations using Young Lives survey (Rounds 1 to 4).

PATTERNS AND DRIVERS OF INTERNAL MIGRATION AMONG YOUTH IN ETHIOPIA, INDIA, PERU AND VIETNAM
28
4.1 Predictors of migration by gender
Migration is a gendered process in that the motivations behind it vary between men and
women (Richter and Taylor 2008). In the case of young people, the decision to migrate may vary greatly between boys and girls not only because transitions to adulthood differ by
gender (Morrow 2013), but also because parents may have different incentives for encouraging migration between them (World Bank 2007). In order to test if the drivers of migration are gender-specific, I estimated a Linear Probability Model on the decision to
migrate separately for young men and women using the following specification:
(1)
Where is a binary variable that takes the value of 1 if the individual migrated between
time and (between the ages of 15 and 19 years old, respectively); is a vector of individual characteristics at time ; is a vector of parental and household characteristics at time ; is a vector of location characteristics at time ; is
a vector including child’s education and educational aspirations, and caregiver’s aspirations at time ; is a vector of indicator variables on whether the household received transfers from different sources at time ; is the error term, and where j = 1, …, 5
are vectors of parameters.
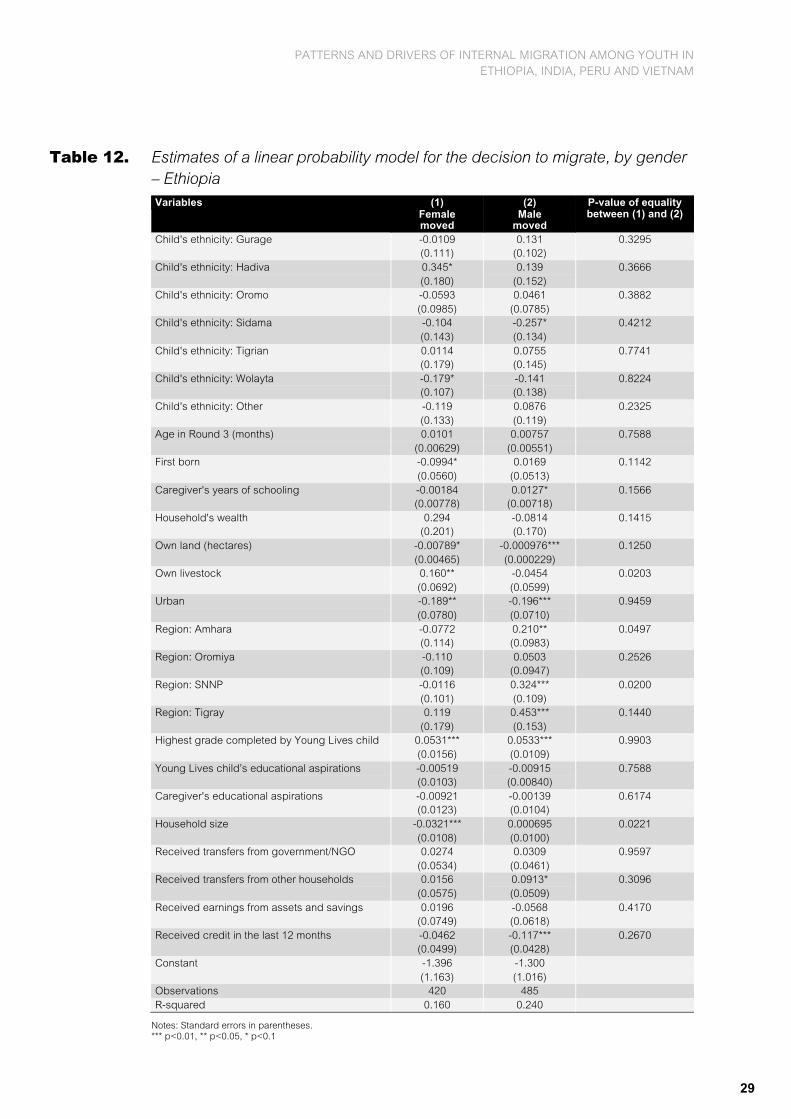
Tables 12-15 present the results together with tests of statistical significance of the difference
in the coefficients of regressors between females in column 1 and males in column 2. In Ethiopia (Table 12), having less land, living in a rural area and having more years of education predicts the decision to migrate among both boys and girls. However, livestock
ownership has a differentiated effect on the probability of migration: assuming everything else is constant, girls that live in households that own livestock are more likely to move than those who do not. This may be related to the fact that girls move mainly for education and,
therefore, their households need to own assets to afford the time they will be studying. This is consistent with Ezra (2000), who points out that leaving home for education purposes is considered prestigious as not everyone can afford it. In addition, Ezra (2001) suggests that it
is not access to land but access to livestock that determines household wealth in Ethiopia, since the relative importance of land has diminished due to the current land tenure system. Similarly, household size has different predictive power for each group: girls living in a
smaller household are more likely to migrate than those that live in a larger one. This suggests that these girls may actually be moving with the household – according to Table 5, more than half of the female migrants were living in the same household in 2009 and 2013.
Having received a credit in the last year has significant predictive power for boys’ decisions to migrate, decreasing it by 12 percentage points. This finding is in line with the ‘new economics of migration’ as it suggests that those who are better able to self-insure are less
likely to migrate. Finally, boys living in the Amhara and SNNP regions are more likely to migrate than those living in the capital, Addis Ababa.
PATTERNS AND DRIVERS OF INTERNAL MIGRATION AMONG YOUTH IN ETHIOPIA, INDIA, PERU AND VIETNAM
29
Table 12. Estimates of a linear probability model for the decision to migrate, by gender – Ethiopia Variables (1)
Female moved
(2) Male
moved
P-value of equality between (1) and (2)
Child's ethnicity: Gurage -0.0109 0.131 0.3295 (0.111) (0.102) Child's ethnicity: Hadiva 0.345* 0.139 0.3666 (0.180) (0.152) Child's ethnicity: Oromo -0.0593 0.0461 0.3882 (0.0985) (0.0785) Child's ethnicity: Sidama -0.104 -0.257* 0.4212 (0.143) (0.134) Child's ethnicity: Tigrian 0.0114 0.0755 0.7741 (0.179) (0.145) Child's ethnicity: Wolayta -0.179* -0.141 0.8224 (0.107) (0.138) Child's ethnicity: Other -0.119 0.0876 0.2325 (0.133) (0.119) Age in Round 3 (months) 0.0101 0.00757 0.7588 (0.00629) (0.00551) First born -0.0994* 0.0169 0.1142 (0.0560) (0.0513) Caregiver's years of schooling -0.00184 0.0127* 0.1566 (0.00778) (0.00718) Household's wealth 0.294 -0.0814 0.1415 (0.201) (0.170) Own land (hectares) -0.00789* -0.000976*** 0.1250 (0.00465) (0.000229) Own livestock 0.160** -0.0454 0.0203 (0.0692) (0.0599) Urban -0.189** -0.196*** 0.9459 (0.0780) (0.0710) Region: Amhara -0.0772 0.210** 0.0497 (0.114) (0.0983) Region: Oromiya -0.110 0.0503 0.2526 (0.109) (0.0947) Region: SNNP -0.0116 0.324*** 0.0200 (0.101) (0.109) Region: Tigray 0.119 0.453*** 0.1440 (0.179) (0.153) Highest grade completed by Young Lives child 0.0531*** 0.0533*** 0.9903 (0.0156) (0.0109) Young Lives child’s educational aspirations -0.00519 -0.00915 0.7588 (0.0103) (0.00840) Caregiver's educational aspirations -0.00921 -0.00139 0.6174 (0.0123) (0.0104) Household size -0.0321*** 0.000695 0.0221 (0.0108) (0.0100) Received transfers from government/NGO 0.0274 0.0309 0.9597 (0.0534) (0.0461) Received transfers from other households 0.0156 0.0913* 0.3096 (0.0575) (0.0509) Received earnings from assets and savings 0.0196 -0.0568 0.4170 (0.0749) (0.0618) Received credit in the last 12 months -0.0462 -0.117*** 0.2670 (0.0499) (0.0428) Constant -1.396 -1.300 (1.163) (1.016) Observations 420 485 R-squared 0.160 0.240
Notes: Standard errors in parentheses. *** p<0.01, ** p<0.05, * p<0.1

PATTERNS AND DRIVERS OF INTERNAL MIGRATION AMONG YOUTH IN ETHIOPIA, INDIA, PERU AND VIETNAM
30
In India (Table 13), the only common predictor of the decision to migrate between boys and
girls is whether they live in an urban area. For both groups, it has a negative effect: for boys, it decreases the probability of migrating by 39 percentage points, whereas for girls it decreases it by 35 percentage points. Other predictors in India have gender-specific effects:
age has a positive effect in the girls’ probability of migrating, whereas it has a negative effect for boys. This may be partly explained by the fact that girls tend to move for marriage, and age and marriage are positively correlated in the sample (Singh and Espinoza Revollo 2016).
Similarly, the child’s and caregiver’s education have a significant positive effect on the boys’ likelihood of moving, whereas they have no effect on the girls’. This is consistent with the fact that boys in India move mainly for studies. Girls from larger households are more likely to
move. Living in Rayalaseema, in comparison to living in Telangana, decreases the boys’ probability of migrating by 12 percentage points, whereas it increases the girls’ likelihood of migrating by 12 percentage points. Finally, transfers-related controls are only significant for
girls: having received transfers from other households increases their likelihood of moving by 14 percentage points. This is suggestive evidence of a transfer being received by the girl’s family before migrating for family formation, possibly to be able to afford the dowry or a
wedding-related expense.
Table 13. Estimates of a linear probability model for the decision to migrate, by gender – India
Variables (1) Female moved
(2) Male
moved
P-value of equality between
(1) and (2)
Child's ethnicity: Scheduled Castes 0.00125 0.0398 0.6958
(0.0720) (0.0704)
Child's ethnicity: Scheduled Tribes -0.00683 0.0127 0.8782
(0.0876) (0.0964)
Child's ethnicity: Backward Classes -0.0140 0.0106 0.7651
(0.0600) (0.0589)
Age in Round 3 (months) 0.00936* -0.0141*** 0.0021
(0.00559) (0.00545)
First born 0.0129 0.0135 0.9926
(0.0488) (0.0519)
Caregiver's years of schooling -0.000723 0.0168*** 0.0463
(0.00651) (0.00620)
Household's wealth -0.0262 0.0900 0.6434
(0.172) (0.191)
Own land (hectares) 0.000171 0.0211 0.2501
(0.000584) (0.0186)
Own livestock -0.0148 0.0378 0.4794
(0.0509) (0.0566)
Urban -0.346*** -0.387*** 0.6571
(0.0655) (0.0671)
Region: Coastal Andhra -0.0539 -0.0900 0.6739
(0.0609) (0.0631)
Region: Rayalaseema 0.115** -0.116** 0.0034
(0.0558) (0.0582)
Highest grade completed by Young Lives child -0.00763 0.0363** 0.0245
(0.0131) (0.0151)
Young Lives child's educational aspirations 0.00394 0.00212 0.8987
(0.00944) (0.0112)
Caregiver's educational aspirations -0.00770 -0.0137 0.5865
(0.00704) (0.00890)
Household size 0.0271** -0.000487 0.0774

PATTERNS AND DRIVERS OF INTERNAL MIGRATION AMONG YOUTH IN ETHIOPIA, INDIA, PERU AND VIETNAM
31
Variables (1) Female moved
(2) Male
moved
P-value of equality between
(1) and (2)
(0.0116) (0.0110)
Received transfers from government/NGO -0.124 -0.0334 0.4559
(0.0909) (0.0856)
Received transfers from other households 0.142** -0.0185 0.1288
(0.0720) (0.0804)
Received earnings from assets and savings -0.00399 -0.0283 0.7431
(0.0522) (0.0549)
Received credit in the last 12 months 0.0307 -0.0632 0.2471
(0.0575) (0.0598)
Constant -1.039 2.995***
(1.027) (1.015)
Observations 486 465
R-squared 0.145 0.125
Notes: Standard errors in parentheses.
*** p<0.01, ** p<0.05, * p<0.1
In Peru (Table 14), boys and girls living in relatively poorer households and those that live in
the Andean region are more likely to move. However, differences in characteristics between migrants and non-migrants by gender are very weak. Girls that have less land and that own livestock are more likely to move. Unlike girls, boys living in the Jungle region and those
receiving earnings from assets and savings are more likely to move than those who did not receive these transfers. Given that both males and females move both for studies and work, these results may be indicative of the different sources used to fund migration in Peru.
Table 14. Estimates of a linear probability model for the decision to migrate, by gender – Peru
Variables (1) Female moved
(2) Male
moved
P-value of equality between (1) and (2)
Child's ethnicity: White -0.139 0.0795 0.2281
(0.151) (0.112)
Child's ethnicity: Amazon native -0.174 0.128 0.3660
(0.166) (0.303)
Child's ethnicity: Black 0.349 -0.0407 0.3392
(0.412) (0.0980)
Age in Round 3 (months) 0.00307 0.00714 0.6810
(0.00760) (0.00689)
First born -0.0573 -0.0217 0.6550
(0.0629) (0.0535)
Caregiver's years of schooling 0.0104 -0.00721 0.0977
(0.00839) (0.00714)
Household's wealth -0.430** -0.350* 0.7802
(0.217) (0.203)
Own land (hectares) -0.000739*** 0.00165 0.4537
(0.000231) (0.00329)
Own livestock 0.142** -0.00222 0.0741
(0.0636) (0.0547)
Urban 0.00700 -0.107 0.3739
(0.0961) (0.0911)
Region: Andean 0.169** 0.236*** 0.4344
(0.0666) (0.0588)

PATTERNS AND DRIVERS OF INTERNAL MIGRATION AMONG YOUTH IN ETHIOPIA, INDIA, PERU AND VIETNAM
32
Variables (1) Female moved
(2) Male
moved
P-value of equality between (1) and (2)
Region: Jungle 0.0861 0.215** 0.3378
(0.102) (0.0948)
Highest grade completed by Young Lives child -0.00181 0.00163 0.9223
(0.0298) (0.0212)
Young Lives child's educational aspirations -0.00478 -0.0172 0.5711
(0.0154) (0.0167)
Caregiver's educational aspirations 0.00845 0.0141 0.8238
(0.0182) (0.0188)
Household size 0.00436 -0.00629 0.6027
(0.0147) (0.0153)
Received transfers from government/NGO -0.0347 -0.0375 0.9692
(0.0575) (0.0522)
Received transfers from other households 0.0246 0.0179 0.9295
(0.0573) (0.0532)
Received earnings from assets and savings -0.0155 0.205* 0.0908
(0.0800) (0.108)
Received credit in the last 12 months -0.0295 -0.0531 0.7682
(0.0614) (0.0562)
Constant -0.228 -0.658
(1.365) (1.276)
Observations 290 325
R-squared 0.120 0.189
Notes: Standard errors in parentheses. *** p<0.01, ** p<0.05, * p<0.1
In Vietnam (Table 15), both boys and girls that live in relatively poorer households and that
belong to the Kinh ethnicity, relative to the H’mong, are more likely to migrate. However,
strong gender disparities emerge when it comes to age, location and education: older, better educated girls and those whose caregivers are better educated are more likely to move. Most girls in Vietnam moved for education, which may explain why these are important predictors of
mobility (see Table 3). Similarly, girls living in the Northern Uplands, Red River Delta, Phu Yen, and Mekong River Delta regions are more prone to migrate than those living in Da Nang. This is in line with the fact that most girls moved from a rural to an urban area (see Table 4). In
the case of boys, those with higher educational aspirations are more likely to move.
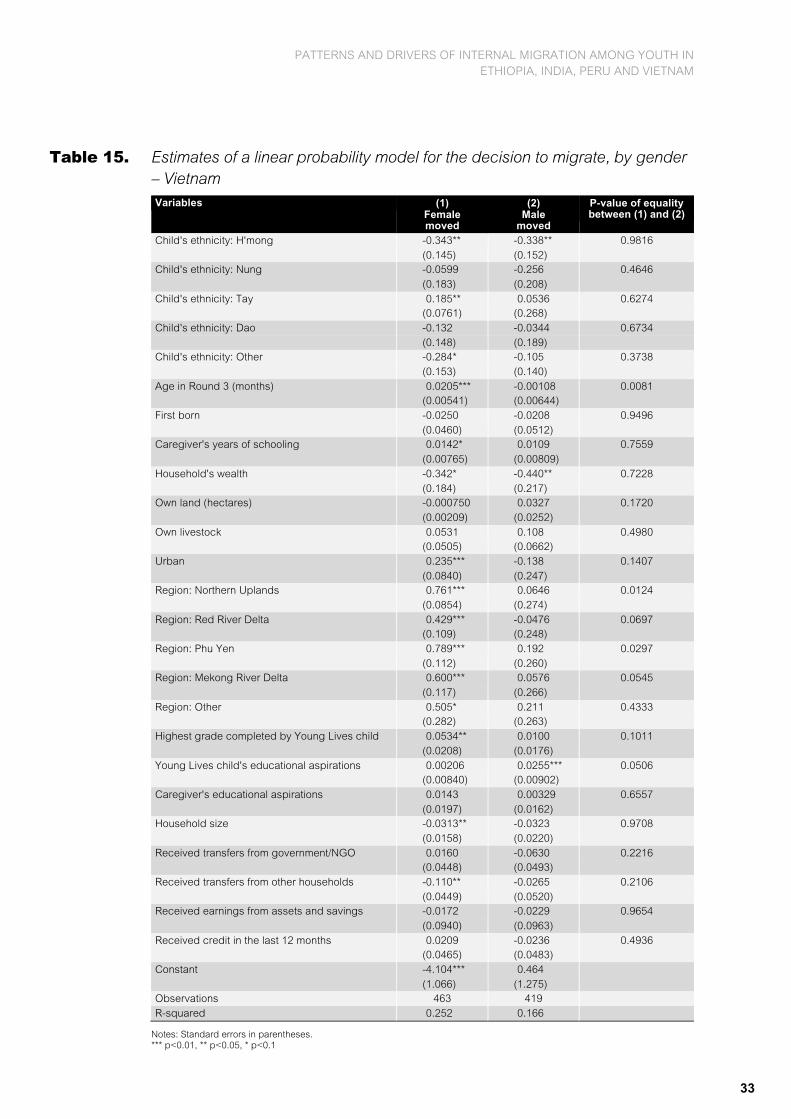
PATTERNS AND DRIVERS OF INTERNAL MIGRATION AMONG YOUTH IN ETHIOPIA, INDIA, PERU AND VIETNAM
33
Table 15. Estimates of a linear probability model for the decision to migrate, by gender – Vietnam Variables (1)
Female moved
(2) Male
moved
P-value of equality between (1) and (2)
Child's ethnicity: H'mong -0.343** -0.338** 0.9816 (0.145) (0.152) Child's ethnicity: Nung -0.0599 -0.256 0.4646 (0.183) (0.208) Child's ethnicity: Tay 0.185** 0.0536 0.6274 (0.0761) (0.268) Child's ethnicity: Dao -0.132 -0.0344 0.6734 (0.148) (0.189) Child's ethnicity: Other -0.284* -0.105 0.3738 (0.153) (0.140) Age in Round 3 (months) 0.0205*** -0.00108 0.0081 (0.00541) (0.00644) First born -0.0250 -0.0208 0.9496 (0.0460) (0.0512) Caregiver's years of schooling 0.0142* 0.0109 0.7559 (0.00765) (0.00809) Household's wealth -0.342* -0.440** 0.7228 (0.184) (0.217) Own land (hectares) -0.000750 0.0327 0.1720 (0.00209) (0.0252) Own livestock 0.0531 0.108 0.4980 (0.0505) (0.0662) Urban 0.235*** -0.138 0.1407 (0.0840) (0.247) Region: Northern Uplands 0.761*** 0.0646 0.0124 (0.0854) (0.274) Region: Red River Delta 0.429*** -0.0476 0.0697 (0.109) (0.248) Region: Phu Yen 0.789*** 0.192 0.0297 (0.112) (0.260) Region: Mekong River Delta 0.600*** 0.0576 0.0545 (0.117) (0.266) Region: Other 0.505* 0.211 0.4333 (0.282) (0.263) Highest grade completed by Young Lives child 0.0534** 0.0100 0.1011 (0.0208) (0.0176) Young Lives child's educational aspirations 0.00206 0.0255*** 0.0506 (0.00840) (0.00902) Caregiver's educational aspirations 0.0143 0.00329 0.6557 (0.0197) (0.0162) Household size -0.0313** -0.0323 0.9708 (0.0158) (0.0220) Received transfers from government/NGO 0.0160 -0.0630 0.2216 (0.0448) (0.0493) Received transfers from other households -0.110** -0.0265 0.2106 (0.0449) (0.0520) Received earnings from assets and savings -0.0172 -0.0229 0.9654 (0.0940) (0.0963) Received credit in the last 12 months 0.0209 -0.0236 0.4936 (0.0465) (0.0483) Constant -4.104*** 0.464 (1.066) (1.275) Observations 463 419 R-squared 0.252 0.166
Notes: Standard errors in parentheses. *** p<0.01, ** p<0.05, * p<0.1

PATTERNS AND DRIVERS OF INTERNAL MIGRATION AMONG YOUTH IN ETHIOPIA, INDIA, PERU AND VIETNAM
34
4.2 Predictors of the reasons to migrate
The literature on migration selectivity has often overlooked the motivations for migration (De
Jong and Fawcett 1981). However, given the heterogeneity in the reasons for migrating shown in Table 3, it is also useful to understand the differences in characteristics between
movers and stayers depending on their reason to migrate. In order to account for this, I estimate jointly the decision to migrate and the reason for migrating using a Multinomial Logit model using the following specification:
(2)
Where is a categorical variable that takes the value of 0 if the child did not migrate (the
base category), 1 if the child migrated to study between time and (between age 15 and 19 years, respectively), 2 if the child migrated to work, 3 if the child migrated to follow/join family22, and 4 if the child migrated for other reason. is the error term, and
where j = 1, …, 5 are vectors of parameters.
In Multinomial Logit models, the estimated coefficients do not reflect the partial effects of each
regressor on the dependent variable. Instead, marginal effects averaged over individuals are a better indicator of this (Cameron and Trivedi 2005). Tables 16 to 19 show the average marginal effects of the model for each country. In all countries, being more educated is
associated with a higher probability of moving for studies. This is an expected result as it suggests that as the child completes secondary school, they are more likely to continue studying in higher education. However, it is very likely that due to a lack of higher education
institutions in their place of residence, especially in rural areas, they would have to move. Except for Peru, gender is also a predictor of this category: girls in Ethiopia and Vietnam, and boys in India are more likely to move to study, which is consistent with the results in Table 3.
In Ethiopia and Peru, being first born is associated with a lower probability of migrating for studies. Similarly, using data from the Philippines, Ejrnaes and Portner (2004) estimated a model of intra-household allocation with endogenous fertility and found that last-born children
received more education than their earlier-born siblings. In India and Vietnam, the caregiver plays an important role. In the former, the caregiver’s years of schooling and her educational aspirations for the child are associated with a greater likelihood of moving to study. In the
latter, the caregiver’s education and the child’s educational aspirations are positively correlated with the probability of migrating for studies. Overall, the average characteristics of migrants that move to study are very similar across countries.
22 In the case of India, I used the category ‘Moved for marriage’ instead due to a higher prevalence of this reason for migration.
In the case of Vietnam, none of these were used due to little variation across the four streams.

PATTERNS AND DRIVERS OF INTERNAL MIGRATION AMONG YOUTH IN ETHIOPIA, INDIA, PERU AND VIETNAM
35
Table 16. Marginal effects of multinomial logit model for the decision to migrate, by reasons for moving – Ethiopia (1) (2) (3) (4) Variables Study Work Follow family Other Male -0.0434* 0.0420* 0.00234 -0.0293 (0.0207) (0.0164) (0.0190) (0.0151) Child's ethnicity: Gurage -0.0778* 0.176 0.0787 -0.0277 (0.0345) (0.114) (0.0757) (0.0367) Child's ethnicity: Hadiva -0.0953** 0.0971 0.335** -0.0729** (0.0302) (0.132) (0.120) (0.0247) Child's ethnicity: Oromo 0.0130 -0.0114 0.0298 -0.0264 (0.0432) (0.0424) (0.0702) (0.0285) Child's ethnicity: Sidama 0.0179 0.0388 -0.0876 -0.0576* (0.0768) (0.0872) (0.0713) (0.0284) Child's ethnicity: Tigrian 0.123 -0.0164 -0.0892 0.00214 (0.0846) (0.0409) (0.168) (0.0742) Child's ethnicity: Wolayta -0.0123 0.0138 -0.0378 -0.0729** (0.0593) (0.0783) (0.0637) (0.0247) Child's ethnicity: Other -0.0953** 0.109 0.00245 -0.0402 (0.0302) (0.113) (0.105) (0.0386) Age in Round 3 (months) 0.00336 -0.000985 0.00342 0.00454* (0.00285) (0.00223) (0.00278) (0.00202) First born -0.0494* 0.0303 0.0123 -0.0323* (0.0224) (0.0243) (0.0251) (0.0149) Caregiver's years of schooling 0.000647 -0.000844 0.00425 0.00328 (0.00350) (0.00384) (0.00354) (0.00274) Household's wealth 0.0574 0.00468 0.0334 -0.0369 (0.0873) (0.0816) (0.0791) (0.0632) Own land (hectares) 0.00875 -0.0355* -0.00752 -0.00703 (0.00479) (0.0160) (0.0183) (0.0137) Own livestock 0.0150 0.0401 0.0111 -0.00616 (0.0304) (0.0214) (0.0280) (0.0214) Urban -0.0834* -0.0304 -0.0390 -0.0423 (0.0360) (0.0297) (0.0317) (0.0297) Region: Amhara -0.0249 0.0548 0.0548 -0.0103 (0.0486) (0.0378) (0.0462) (0.0334) Region: Oromiya -0.0410 0.0863 -0.0376 0.00664 (0.0463) (0.0446) (0.0214) (0.0355) Region: SNNP 0.00416 0.0197 0.0489 0.0513 (0.0756) (0.0185) (0.0370) (0.0519) Region: Tigray -0.0232 0.135 0.316 -0.0177 (0.0823) (0.138) (0.479) (0.0405) Highest grade completed by Young Lives child 0.0487*** 0.00331 0.00223 0.000897 (0.00731) (0.00506) (0.00570) (0.00415) Young Lives child's educational aspirations 0.0115 -0.00315 -0.00568 -0.00362* (0.00615) (0.00301) (0.00387) (0.00179) Caregiver's educational aspirations -0.00217 -0.00248 0.00428 -0.00489* (0.00505) (0.00389) (0.00485) (0.00237) Household size -0.00315 0.00361 -0.00930 -0.00359 (0.00528) (0.00446) (0.00502) (0.00403) Received transfers from government/NGO -0.0279 -0.0114 0.0492 0.0184 (0.0227) (0.0191) (0.0256) (0.0185) Received transfers from other households -0.00943 0.0554* -0.0175 0.00825 (0.0256) (0.0251) (0.0226) (0.0193) Received earnings from assets and savings -0.0209 -0.0329 -0.00801 0.0406 (0.0313) (0.0223) (0.0316) (0.0310) Received credit in the last 12 months -0.0146 -0.0191 -0.0397 -0.0186 (0.0230) (0.0189) (0.0219) (0.0131) Observations 905 905 905 905
Notes: Standard errors in parentheses. *** p<0.01, ** p<0.05, * p<0.1 The excluded child’s ethnicity is Amhara and the excluded region is Addis Ababa.

PATTERNS AND DRIVERS OF INTERNAL MIGRATION AMONG YOUTH IN ETHIOPIA, INDIA, PERU AND VIETNAM
36
Table 17. Marginal effects of multinomial logit model for the decision to migrate, by reasons for moving – India
(1) (2) (3) (4)
Variables Study Work Marriage Other
Male 0.0839** 0.130*** -0.230*** 0.0105
(0.0258) (0.0196) (0.0174) (0.0134)
Child's ethnicity: Scheduled Castes 0.0345 0.0299 -0.0151 -0.0226
(0.0427) (0.0267) (0.0297) (0.0203)
Child's ethnicity: Scheduled Tribes 0.0190 -0.0104 -0.00290 0.0266
(0.0531) (0.0288) (0.0384) (0.0353)
Child's ethnicity: Backward Classes -0.0761* 0.0622* 0.0321 -0.0127
(0.0338) (0.0253) (0.0265) (0.0191)
Age in Round 3 (months) -0.00462 0.00129 0.00323 -0.00237
(0.00304) (0.00239) (0.00234) (0.00161)
First born 0.0294 -0.0361* 0.0113 0.00935
(0.0277) (0.0182) (0.0207) (0.0158)
Caregiver's years of schooling 0.0120*** -0.00381 -0.00552 0.00117
(0.00359) (0.00417) (0.00323) (0.00215)
Household's wealth 0.181 -0.143* -0.0184 -0.00643
(0.0991) (0.0643) (0.0717) (0.0435)
Own land (hectares) 0.00376 -0.00501 -0.00194 -0.00506
(0.00293) (0.00900) (0.00384) (0.00647)
Own livestock 0.0646* -0.0356 0.00632 -0.0136
(0.0290) (0.0210) (0.0209) (0.0156)
Urban -0.200*** -0.0760*** -0.0441 -0.0250
(0.0273) (0.0198) (0.0301) (0.0164)
Region: Coastal Andhra -0.0883* 0.0455 -0.00650 -0.0352
(0.0358) (0.0244) (0.0242) (0.0187)
Region: Rayalaseema -0.0790* 0.0405 0.0546* -0.0150
(0.0316) (0.0233) (0.0252) (0.0213)
Highest grade completed by Young Lives child 0.0266** -0.000413 -0.0119* 0.0137
(0.00883) (0.00512) (0.00522) (0.00726)
Young Lives child's educational aspirations 0.00826 -0.00439 -0.00288 -0.000990
(0.00691) (0.00359) (0.00359) (0.00261)
Caregiver's educational aspirations 0.0268*** -0.0110*** -0.00985*** -0.00387*
(0.00617) (0.00272) (0.00268) (0.00188)
Household size 0.00540 -0.00441 0.0117* 0.000472
(0.00575) (0.00563) (0.00472) (0.00335)
Received transfers from government/NGO -0.0357 -0.0177 0.0347 -0.0213
(0.0464) (0.0520) (0.0446) (0.0319)
Received transfers from other households 0.00274 0.0608 -0.0247 0.0223
(0.0428) (0.0454) (0.0334) (0.0272)
Received earnings from assets and savings 0.0510 -0.0470* -0.00715 -0.0293*
(0.0304) (0.0200) (0.0223) (0.0128)
Received credit in the last 12 months -0.00882 -0.00793 0.0111 0.000761
(0.0347) (0.0301) (0.0252) (0.0176)
Observations 951 951 951 951
Notes: Standard errors in parentheses. *** p<0.01, ** p<0.05, * p<0.1 The excluded child’s ethnicity is Other Castes and the excluded region is Telangana.

PATTERNS AND DRIVERS OF INTERNAL MIGRATION AMONG YOUTH IN ETHIOPIA, INDIA, PERU AND VIETNAM
37
Table 18. Marginal effects of multinomial logit model for the decision to migrate, by reasons for moving – Peru
(1) (2) (3) (4)
Variables Study Work Follow family Other
Male -0.00658 0.00528 0.00258 -0.0356
(0.0252) (0.0216) (0.0162) (0.0223)
Child's ethnicity: White -0.0722 -0.0212 0.156 -0.0395
(0.0510) (0.0477) (0.0858) (0.0402)
Child's ethnicity: Amazon native -0.0812 0.0150 -0.0453*** -0.00543
(0.0464) (0.0654) (0.00838) (0.0672)
Child's ethnicity: Black 0.444 -0.0816*** -0.0453*** -0.0784***
(0.290) (0.0108) (0.00838) (0.0113)
Age in Round 3 (months) -0.00222 0.00174 0.000207 0.00335
(0.00266) (0.00214) (0.00162) (0.00240)
First born -0.0828*** 0.0159 0.0233 0.00720
(0.0243) (0.0266) (0.0220) (0.0251)
Caregiver's years of schooling -0.00149 -0.00141 0.00303 -0.000436
(0.00369) (0.00367) (0.00251) (0.00329)
Household's wealth -0.0398 -0.0927 -0.151* -0.0747
(0.0959) (0.0919) (0.0619) (0.0816)
Own land (hectares) -0.000408 -0.000262 -0.000420 0.000128
(0.000766) (0.000364) (0.000711) (0.000244)
Own livestock 0.0769** 0.0491 0.00597 -0.0470
(0.0259) (0.0262) (0.0184) (0.0310)
Urban -0.0118 -0.0277 0.0203 -0.0246
(0.0391) (0.0356) (0.0227) (0.0386)
Region: Andean 0.0993*** 0.0609* 0.00111 0.0267
(0.0283) (0.0259) (0.0182) (0.0271)
Region: Jungle 0.143** 0.0235 0.00340 0.00549
(0.0466) (0.0309) (0.0328) (0.0359)
Highest grade completed by Young Lives child 0.0419** -0.00566 -0.0122 -0.00922
(0.0150) (0.00968) (0.00655) (0.0121)
Young Lives child's educational aspirations 0.0130 -0.0125 -0.00260 0.00616
(0.0192) (0.00705) (0.00503) (0.00934)
Caregiver's educational aspirations 0.00735 0.0154 -0.00412 -0.00303
(0.00950) (0.00793) (0.00482) (0.00839)
Household size -0.00310 0.000379 0.00274 0.0000349
(0.00811) (0.00598) (0.00488) (0.00743)
Received transfers from government/NGO 0.0172 -0.0532* 0.0317 -0.0165
(0.0274) (0.0210) (0.0171) (0.0227)
Received transfers from other households 0.0122 -0.0103 -0.0172 0.0281
(0.0285) (0.0222) (0.0170) (0.0240)
Received earnings from assets and savings 0.0959 -0.0248 0.00287 0.00877
(0.0583) (0.0385) (0.0345) (0.0443)
Received credit in the last 12 months -0.0140 -0.0314 -0.0175 0.00233
(0.0283) (0.0241) (0.0157) (0.0246)
Observations 611 611 611 611
Notes: Standard errors in parentheses. *** p<0.01, ** p<0.05, * p<0.1 The excluded child’s ethnicity is Mestizo and the excluded region is Coast.

PATTERNS AND DRIVERS OF INTERNAL MIGRATION AMONG YOUTH IN ETHIOPIA, INDIA, PERU AND VIETNAM
38
Table 19. Marginal effects of multinomial logit model for the decision to migrate, by reasons for moving – Vietnam (1) (2) (3) Variables Study Work Other Male -0.0615* 0.0502* -0.0981*** (0.0257) (0.0217) (0.0177) Child's ethnicity: H'mong -0.0807 -0.175*** -0.0342 (0.110) (0.0240) (0.0306) Child's ethnicity: Nung -0.0908 0.000363 -0.0772*** (0.0762) (0.0924) (0.00896) Child's ethnicity: Tay 0.258* -0.120* 0.126 (0.117) (0.0605) (0.0971) Child's ethnicity: Dao 0.0218 -0.149*** 0.0688 (0.0898) (0.0318) (0.0664) Child's ethnicity: Other 0.0260 -0.169*** 0.110 (0.113) (0.0233) (0.0820) Age in Round 3 (months) 0.00304 0.00265 0.00221 (0.00384) (0.00283) (0.00214) First born -0.0378 -0.00945 0.0243 (0.0271) (0.0221) (0.0214) Caregiver's years of schooling 0.0134** -0.00428 -0.00108 (0.00472) (0.00389) (0.00308) Household's wealth 0.172 -0.492*** -0.113 (0.110) (0.0935) (0.0744) Own land (hectares) 0.00926** -0.00188 -0.00341 (0.00305) (0.00254) (0.00207) Own livestock 0.0563 0.0565* -0.0435 (0.0309) (0.0257) (0.0230) Urban 0.109 0.0312 -0.233*** (0.190) (0.0977) (0.00828) Region: Northern Uplands 0.386*** 0.135*** -0.722*** (0.0603) (0.0335) (0.0239) Region: Red River Delta 0.228*** 0.108*** -0.753*** (0.0592) (0.0267) (0.0176) Region: Phu Yen 0.394*** 0.257*** -0.777*** (0.0579) (0.0383) (0.0149) Region: Mekong River Delta 0.414*** 0.0691*** -0.762*** (0.0614) (0.0173) (0.0166) Region: Other 0.113 0.271* -0.742*** (0.105) (0.116) (0.0821) Highest grade completed by Young Lives child 0.124*** -0.0253** -0.0121 (0.0278) (0.00929) (0.00775) Young Lives child's educational aspirations 0.0415*** -0.0107** -0.00555 (0.00849) (0.00407) (0.00360) Caregiver's educational aspirations 0.0268 0.00164 0.000498 (0.0195) (0.00858) (0.00661) Household size -0.0235* -0.0169 0.0126 (0.0118) (0.00942) (0.00669) Received transfers from government/NGO 0.00468 -0.0219 -0.0121 (0.0269) (0.0221) (0.0180) Received transfers from other households -0.0641* 0.0162 -0.0141 (0.0278) (0.0232) (0.0199) Received earnings from assets and savings -0.0324 0.0496 -0.0160 (0.0492) (0.0594) (0.0351) Received credit in the last 12 months -0.00576 0.0312 -0.0110 (0.0273) (0.0228) (0.0192) Observations 882 882 882
Notes: Standard errors in parentheses. *** p<0.01, ** p<0.05, * p<0.1 The excluded child’s ethnicity is Kinh and the excluded region is Da Nang.

PATTERNS AND DRIVERS OF INTERNAL MIGRATION AMONG YOUTH IN ETHIOPIA, INDIA, PERU AND VIETNAM
39
The profile of the average migrant that moved for work is different. In all countries, except for
Peru, boys are more prone to move for work. The child’s education is only correlated with the probability of moving for work in Vietnam: a year’s increase in schooling is associated with 3 percentage points lower probability of moving for work-related reasons. Similarly, the child’s
educational aspirations are negatively correlated with the likelihood of moving for this reason. In India, the caregiver’s aspirations are also negatively associated with the probability of migrating for work. In both India and Vietnam, young people living in relatively poorer
households are more likely to move for this category. In all countries, except for Vietnam, access to transfers predicts migration for this category, although not all of them in the same direction. In Ethiopia, children that own less land and that received transfers from other
households are more likely to move for work. In Peru, young people that live in households that received transfers from the government or NGOs are less likely to move for work-related reasons. Similarly, in India, youth that live in households that received earnings from assets
or savings were less likely to migrate for this reason.
Finally, column 3 in Table 19 shows the characteristics of migrants that moved for family
formation in India. Gender is the strongest predictor: girls are 23 percentage points more likely to move for marriage than non-migrants. This is consistent with Rosenzweig (1989), who points out that the main reason for migrating in India is marriage, especially among girls,
as this is a means to provide income insurance benefits in the presence of spatially covariate risks. Education-related controls are also significant: child’s education and caregiver’s aspirations are negatively associated with the probability of migrating for family formation.
This is consistent with Singh (2016), who found that child’s education and teenage marriage in India are strongly negatively correlated as parents often see higher education and marriage as substitutes. Lastly, it is also observed that young people living in larger
households are more likely to move for marriage in this sample. This may be related to the fact that many empirical studies find that child’s schooling attainment is negatively associated with the family size (Jensen 2003; Lloyd 1994).
5. Conclusions This working paper used Young Lives data to document patterns of internal migration among
youth in Ethiopia, India, Peru and Vietnam. The results indicate that there is a significant share of migrants between 15 and 19 years old across all four countries, and they are very
likely to move more than once. In all countries, migrants are more likely to move after the school-age years, that is between ages 17 and 18. These patterns on frequency and timing of moves provide new evidence that young individuals migrate very often even before having
finished school, which is key to understanding educational performance. The patterns on the reasons for moving provide evidence that young people move for a variety of reasons that go beyond the economic-related: family formation and family reunion are also important motives
for migrating, especially in the studied age range. The migration streams presented show that these youth do not necessarily follow rural-urban migration as it is generalised in the literature (Taylor and Martin 2001), and they shed light on the dynamics of the less studied
rural-rural migration. The results suggest that at this age, migration is a household strategy: although migrants do not necessarily contribute remittances to their previous household, they are often receiving them from their caregiver.

PATTERNS AND DRIVERS OF INTERNAL MIGRATION AMONG YOUTH IN ETHIOPIA, INDIA, PERU AND VIETNAM
40
The employment status at the place of destination gives an overview of the situation of the
migrants after having moved. In all four countries, migrants are either only working or only studying – although in the case of Peru, there is an important share that do both. Regarding the type of employment, in all countries except for Peru, those who moved for studying and
for marriage work mainly in agriculture-related activities and those who moved for work are mainly wage-employed in non-agricultural activities. However, in Peru, those who moved for studying, working and for family formation are mainly self-employed in non-agricultural
activities. These results show that youth’s trajectories are interrelated and it is very difficult to dissociate one from the other.
The changes in subjective well-being provide a more balanced view of migration as they
reflect the trade-offs that migrants face when they decide to move. In Ethiopia, migrants seem to be better off than non-migrants in terms of quality of housing, but worse off in terms
of support from networks and food availability. In India, migrants are better off than stayers regarding opportunities for work and access to health services, but they are worse off in terms of quality of environment and support from networks. In Peru and Vietnam, movers
have better opportunities for both education and work and access to health services than stayers, but they are worse off regarding support from networks and quality of environment.
The analysis on migration aspirations sheds some light on the preferences and constraints
that migrants face before they take the decision to move. In all countries, the most prevalent
reasons reported by both migrants and non-migrants about their willingness to move in the next 10 years are the same: both migrants and stayers that prefer not to move do so because their family is in their place of residence, while those that prefer to move do so
because they are willing to work somewhere else. However, the distribution of these preferences differs between migrants and non-migrants. In all countries, the share of migrants that are not willing to move because they are working at their place of residence is
at least twice the share of non-migrants that are. In all countries, except for Vietnam, the share of migrants that are willing to move for work is statistically significantly higher than that of stayers – in Vietnam, these shares are almost the same.
Overall, it is important to document these patterns among youth because they provide a better insight on the migration process in different contexts between late adolescence and
early adulthood. Migrants in the Young Lives sample are highly mobile and the data show that between 2009 and 2013, they were permanently on the move following primarily life course patterns rather than one-goal permanent moves.
In addition, the paper has documented the characteristics of migrants by gender and reasons
for moving, which provides valuable evidence on migrants’ self-selection across four developing countries. Regarding the drivers of migration, the average characteristics of migrants differ by country. Boys and girls living in poorer households are more likely to move
in Peru and Vietnam, whereas those that live in households that own less land are more likely to move in Ethiopia. In India and Ethiopia, youth living in rural areas are more prone to migrate. However, there are differences in characteristics between movers and stayers by
gender. Overall, the region where young people lived in 2009 has gender-specific effects on the decision to migrate in all countries. Household size is a driver of girls’ migration in all countries, except for Peru, where land and livestock ownership predict girls’ mobility. Finally,
the child’s education and aspirations are drivers of boys’ migration in India and Vietnam, respectively, whereas access to credit and earnings from assets and savings predict boys’ migration in Ethiopia and Peru, respectively.

PATTERNS AND DRIVERS OF INTERNAL MIGRATION AMONG YOUTH IN ETHIOPIA, INDIA, PERU AND VIETNAM
41
Finally, during the transition to adulthood, young people make important choices regarding
education, labour force participation, and family formation, which are closely linked to the decision to migrate. In all countries, except for Peru, gender predicts the probability of moving for studies and for work. As expected, better educated youth are more likely to move
for studies, whereas relatively poorer ones are more likely to move for work. Lastly, in India, girls that live in larger households, that are less educated and whose caregivers have lower educational aspirations, are more likely to move for family formation.
Choices made during the transition to adulthood shape young people’s migration patterns, and migrants are therefore a very heterogeneous group as there are systematic differences
in their characteristics depending on their reasons for moving. This is important because understanding this puts us in a better position to propose more effective policies that target young migrants’ well-being in developing countries.

PATTERNS AND DRIVERS OF INTERNAL MIGRATION AMONG YOUTH IN ETHIOPIA, INDIA, PERU AND VIETNAM
42
References Beegle, K. and M. Poulin (2012) Migration and the Transition to Adulthood in Contemporary
Malawi, World Bank Policy Research Working Paper, Washington, DC: The World Bank.
Boyden, J., A. Pankhurst, and Y. Tafere (2012) 'Child protection and harmful traditional
practices: female early marriage and genital modification in Ethiopia', Development in
Practice 22.4: 510-522.
Cameron, A.C., and P.K. Trivedi (2005) Microeconometrics: Methods and Applications, New
York: Cambridge University Press.
Central Statistical Agency (2014) 'Statistical Report on the 2013 National Labour Force
Survey', Statistical Bulletin. Addis Ababa: Central Statistical Agency.
Chuta, N. and V. Morrow (2015) Youth Trajectories through Work and Marriage in Rural
Ethiopia, Young Lives Working Paper 135, Oxford: Young Lives.
Crivello, G. (2011) '"Becoming somebody": Youth transitions through education and
migration in Peru', Journal of Youth Studies, 14: 395-411.
Crivello, G., U.Vennam, and A. Komanduri (2012) ''Ridiculed for Not Having Anything':
Children's Views on Poverty and Inequality in Rural India', in J. Boyden and M. Bourdillon (eds.) Childhood Poverty. London: Palgrave Macmillan.
Curran, S., S. Shafer, K. Donato, and F. Garip (2006) 'Mapping Gender and Migration in
Sociological Scholarship: Is It Segregation or Integration?' International Migration Review 40:
199-223.
Czaika, M. and M. Vothknecht (2014) 'Migration and aspirations - are migrants trapped on a
hedonic treadmill?' IZA Journal of Migration 3.1.
De Jong, G.F. and J.T. Fawcett (1981) 'Motivations for Migration: An Assessment and a
Value-Expectancy Research Model', in G.F. De Jong and R.W. Gardner (eds.) Migration Decision Making: Multidisciplinary Approaches to Microlevel Studies in Developed and
Developing Countries, New York: Pergamon Policy Studies.
Deshingkar, P. (2010) 'Migration, remote rural areas and chronic poverty in India', London:
Overseas Development Institute, Chronic Poverty Research Centre.
Deshingkar, P. and S. Grimm (2005) Internal Migration and Development: A Global
Perspective, IOM Migration Research Series, Geneva: International Organization for Migration.
Diener, E. and R.E. Lucas (1999) 'Personality and Subjective Well-Being', in D. Kahneman,
E. Diener, and N. Schwarz (eds.) Well-Being: Foundations of Hedonic Psychology New York: Russell Sage Foundation.
Ejrnaes, M. and C. Portner (2004) 'Birth order and the intrahousehold allocation of time and
education', The Review of Economics and Statistics 86: 1008-1019.
Escobal, J. and E. Flores (2008) An Assessment of the Young Lives Sampling Approach in Peru, Young Lives Technical Note 3, Oxford: Young Lives.
Ezra, M. (2000) 'Leaving-home of young adults under conditions of ecological stress in the
drought prone communities of Northern Ethiopia', Genus 56: 121-144.

PATTERNS AND DRIVERS OF INTERNAL MIGRATION AMONG YOUTH IN ETHIOPIA, INDIA, PERU AND VIETNAM
43
Ezra, M. and G-E. Kiros (2001) 'Rural-Out Migration in the Drought Prone Areas of Ethiopia:
A Multilevel Analysis', The International Migration Review 35: 749-771.
Favara, M. (2016) Do dreams come true? Aspirations and educational attainments of
Ethiopian boys and girls, Young Lives Working Paper 146, Oxford: Young Lives.
Herrera, C. and D. Sahn (2013) Determinants of Internal Migration among Senegalese
Youth, Serie Etudes Documents du CERDI. Centre d'etudes et de Recherches Sur le Developpement International.
Jensen, R. (2003) Equal treatment, unequal outcomes? Generating sex inequality through fertility behavior, Cambridge, MA: John F. Kennedy School of Government.
Juarze, F., T. Legrand, C. Lloyd, S. Singh, and V. Hertrich (2013) 'Youth Migration and
Transitions to Adulthood in Developing Countries', Annals of The American Academy of Political and Social Science 648.1: 6-15.
Kley, S. (2011) 'Explaining the Stages of Migration within a Life-course Framework',
European Sociological Review 27: 469-486.
Kumra, N. (2008) An Assessment of the Young Lives Sampling Approach in Andhra Pradesh, India, Young Lives Technical Note 2, Oxford: Young Lives.
Lee, E. (1966) 'A theory of migration', Demography 3: 47-57.
Lloyd, C. (1994) 'Investing in the next generation: The implications of high fertility at the level of the family', in R. Cassen (ed.) Population and Development: Old debates, new
conclusions, Washington, DC: Overseas Development Council.
Lloyd, C. (2005) Growing Up Global: The Changing Transitions to Adulthood in Developing
Countries, Washington, DC: The National Academies Press.
Lucas, R.E.B. (1997) 'Internal Migration in Developing Countries', in M.R. Rosenzweig and
O. Stark (eds.) Handbook of Population and Family Economics, Oxford: Elsevier Science.
Lucas, R.E.B. (2000) 'Migration', in M. Grosh and P. Glewwe (eds.) Designing Household Survey Questionnaires for Developing Countries, Washington, DC: The World Bank.
McKenzie, D. (2007) 'A Profile of the World's Young Developing Country Migrants', In: BANK,
W. (ed.) World Bank Policy Research Working Paper.
McKenzie, D. and H. Rapoport (2011) 'Can migration reduce educational attainment?
Evidence from Mexico', Journal of Population Economics 24: 1331-1358.
McKenzie, D. and M. Sasin (2007) Migration, Remittances, Poverty, and Human Capital:
Conceptual and empirical challenges, World Bank Policy Research Working Paper, New York: The World Bank.
Morrow, V. (2013) 'Troubling transitions? Young people's experiences of growing up in
poverty in rural Andhra Pradesh, India', Journal of Youth Studies 16: 86-100.
Nguyen Anh, D. (2005) 'Vietnam Internal Migration: Opportunities and Challenges for
Development', paper presented at the Regional Conference on Migration and Development in Asia, Lanzhou, China.
Nguyen, N.P. (2008) An Assessment of the Young Lives Sampling Approach in Vietnam,
Young Lives Technical Note 4, Oxford: Young Lives.

PATTERNS AND DRIVERS OF INTERNAL MIGRATION AMONG YOUTH IN ETHIOPIA, INDIA, PERU AND VIETNAM
44
Outes-Leon, I. and S. Dercon (2008) Survey Attrition and Attrition Bias in Young Lives,
Young Lives Technical Note 5, Oxford: Young Lives.
Outes-Leon, I. and A. Sanchez (2008) An Assessment of the Young Lives Sampling
Approach in Ethiopia, Young Lives Technical Note 1, Oxford: Young Lives.
Pessino, C. (1991) 'Sequential migration theory and evidence from Peru', Journal of
Development Economics 36.
Rajan, I. (2013) Internal Migration and Youth in India: Main Features, Trends and Emerging
Challenges, Discussion Paper, New Delhi: UNESCO.
Rice, P. and K.G. Dolgin (2005) The Adolescent: Development, Relationships, and Culture,
Boston, MA: Pearson/Allyn and Bacon.
Richter, S. and J.E. Taylor (2008) 'Gender and the Determinants of International Migration
from Rural Mexico over Time', in A.R. Morrison, M. Schiff and M. Sjoblom (eds.) The International Migration of Women, Washington, DC: The World Bank.
Rosenzweig, M.R. and O. Stark (1989) 'Consumption Smoothing, Migration and Marriage:
Evidence from Rural India', Journal of Political Economy 97.22.
Serneels, P. and S. Dercon (2014) Aspirations, Poverty and Education: Evidence from India,
Young Lives Working Paper 125, Oxford: Young Lives.
Singh, A. and P. Espinoza Revollo (2016) Teenage Marriage, Fertility, and Well-being: Panel Evidence from India, Young Lives Working Paper 151, Oxford: Young Lives.
Sjaastad, L. (1962) 'The Costs and Returns of Human Migration', Journal of Political
Economy 70.14.
Skeldon, R. (1977) 'The Evolution of Migration Patterns during Urbanization in Peru',
Geographical Review, 67.18.
Smita, S. (2008) 'Distress Seasonal Migration and its Impact on Children's Education',
CREATE Pathways to Access Series, Research Monograph Number 28, Brighton: CREATE.
Stark, O. and D. Bloom (1985) 'The New Economics of Labour Migration', The American
Economics Review 75: 173-178.
Taylor, J. E. and P.L. Martin (2001) 'Human Capital: Migration and Rural Population Change',
in B. Gardner and G. Rausser (eds.) Handbook of Agricultural Economics, Amsterdam,: North Holland Press.
Todaro, M.P. (1980) 'Internal Migration in Developing Countries: A Survey', in R. Easterlin.
(ed.) Population and Economic Change in Developing Countries, Chicago: University of Chicago Press.
UNESCO and UNICEF (2012) 'National Workshop on Internal Migration and Human
Development in India: Workshop Papers', New Delhi: UNESCO and UNICEF.
United Nations (1970) Methods of Measuring Internal Migration. Manuals on methods of
estimating population, New York: United Nations.
United Nations (1989) Household Income and Expenditure Surveys: A technical study,
National Household Survey Capability Programme, New York: United Nations.
United Nations 'Fact Sheet: Definition of Youth', New York: United Nations Department of
Economic and Social Affairs (UNDESA).

PATTERNS AND DRIVERS OF INTERNAL MIGRATION AMONG YOUTH IN ETHIOPIA, INDIA, PERU AND VIETNAM
45
World Bank (2007) World Development Report 2007: Development and the Next Generation,
Washington, DC: The World Bank.
YAMADA, G. (2012) 'Patrones de migracion interna en el Peru reciente', in C. Garavito and I.
Munoz (eds.) Empleo y Proteccion Social, Lima: Pontificia Universidad Catolica del Peru.
Young, A. (2013) 'Inequality, the Urban-Rural Gap, and Migration', The Quarterly Journal of
Economics 128: 1727-1785.
Zenteno, R., S. Giorguli and E. Gutierrez (2013) 'Mexican Adolescent Migration to the United
States and Transitions to Adulthood', in F. Juarez, T. Legrand, C. Lloyd, S. Singh and V. Hertrich (eds.) Youth Migration and Transitions to Adulthood in Developing Countries,
Philadelphia: The American Academy of Political and Social Science.
Patterns and Drivers of Internal Migration Among Youth in Ethiopia, India, Peru and Vietnam
There is general consensus in literature on migration that migrants are primarily young people. During the transition to adulthood, young people make important choices regarding education, labour force participation, and family formation. Using a unique panel dataset on youth born in 1994‑95 in Ethiopia, India, Peru, and Vietnam, this working paper investigates how life‑course transitions to adulthood relate to patterns and predictors of internal migration in low‑ and middle‑income countries. It documents patterns on prevalence, frequency, timing, reasons and streams of migration, employment at destination, subjective well‑being, and migration aspirations. The paper then describes the factors associated with young men and women’s decision to migrate, and the reasons for migrating.
The results suggest that there is a significant share of migrants between 15 and 19 years old across all four countries, and they are very likely to move more than once. In all countries, migrants are more likely to move after the school‑age years, between ages 17 and 18. These patterns on frequency and timing of moves provide new evidence that young individuals migrate very often even before having finished school, which is key to understanding educational performance. The patterns on the reasons for moving provide evidence that young people move for a variety of reasons that go beyond the economic‑related: family formation and family reunion are also important motives for migrating, especially in the studied age range. The migration streams presented show that these youth do not necessarily follow rural‑urban migration as it is generalised in the literature, and they shed light on the dynamics of the less studied rural‑rural migration. The results suggest that at this age, migration is a household strategy: although migrants do not necessarily contribute remittances to their previous household, they are often receiving them from their caregiver.
Choices made during the transition to adulthood shape young people’s migration patterns, and migrants are therefore a very heterogeneous group as there are systematic differences in their characteristics depending on their reasons for moving. This is important because understanding this puts us in a better position to propose more effective policies that target young migrants’ well‑being in developing countries.
www.younglives.org.uk
About Young Lives
Young Lives is an international study of childhood poverty, involving 12,000 children in 4 countries over 15 years. It is led by a team in the Department of International Development at the University of Oxford in association with research and policy partners in the 4 study countries: Ethiopia, India, Peru and Vietnam.
Through researching different aspects of children’s lives, we seek to improve policies and programmes for children.
Young Lives Partners
Young Lives is coordinated by a small team based at the University of Oxford, led by Professor Jo Boyden.
• Ethiopian Development Research Institute, Ethiopia
• Pankhurst Development Research and Consulting plc, Ethiopia
• Centre for Economic and Social Studies, Hyderabad, India
• Save the Children India
• Sri Padmavathi Mahila Visvavidyalayam (Women’s University), Andhra Pradesh, India
• Grupo de Análisis para el Desarollo (GRADE), Peru
• Instituto de Investigación Nutricional, Peru
• Centre for Analysis and Forecasting, Vietnamese Academy of Social Sciences, Vietnam
• General Statistics Office, Vietnam
• Oxford Department of International Development, University of Oxford, UK
Contact:Young LivesOxford Department of International Development,University of Oxford,3 Mansfield Road,Oxford OX1 3TB, UKTel: +44 (0)1865 281751Email: [email protected]: www.younglives.org.uk
Related Documents