Ecological Modelling 222 (2011) 3305–3319 Contents lists available at ScienceDirect Ecological Modelling jo ur n al homep ag e: www.elsevier.com/locate/ecolmodel Pattern-oriented modeling of bird foraging and pest control in coffee farms Steven F. Railsback a,∗ , Matthew D. Johnson b a Department of Mathematics, Humboldt State University, Arcata, CA 95521, USA b Department of Wildlife, Humboldt State University, Arcata, CA 95521, USA a r t i c l e i n f o Article history: Received 6 April 2011 Received in revised form 7 July 2011 Accepted 9 July 2011 Keywords: Bird foraging Coffee Foraging theory Individual-based ecology Jamaica Pattern-oriented modeling a b s t r a c t We develop a model of how land use and habitat diversity affect migratory bird populations and their ability to suppress an insect pest on Jamaican coffee farms. Bird foraging—choosing which habitat patch and prey to use as prey abundance changes over space and time—is the key process driving this system. Following the “pattern-oriented” modeling strategy, we identified nine observed patterns that character- ize the real system’s dynamics. The model was designed so that these patterns could potentially emerge from it. The resulting model is individual-based, has fine spatial and temporal resolutions, represents very simply the supply of the pest insect and other arthropod food in six habitat types, and includes foraging habitat selection as the only adaptive behavior of birds. Although there is an extensive heritage of bird foraging theory in ecology, most of it addresses only the individual level and is too simple for our context. We used pattern-oriented modeling to develop and test foraging theory for this across-scale problem: rules for individual bird foraging that cause the model to reproduce a variety of patterns observed at the system level. Four alternative foraging theories were contrasted by how well they caused the model to reproduce the nine characteristic patterns. Four of these patterns were clearly reproduced with the “null” theory that birds select habitat randomly. A version of classical theory in which birds stay in a patch until food is depleted to some threshold caused the model to reproduce five patterns; this theory caused lower, not higher, use of habitat experiencing an outbreak of prey insects. Assuming that birds select the nearby patch providing highest intake rate caused the model to reproduce all but one pattern, whereas assuming birds select the highest-intake patch over a large radius produced an unrealistic distribution of movement distances. The pattern reproduced under none of the theories, a negative relation between bird density and distance to trees, appears to result from a process not in the model: birds return to trees at night to roost. We conclude that a foraging model for small insectivorous birds in diverse habitat should assume birds can sense higher food supply but over short, not long, distances. © 2011 Elsevier B.V. All rights reserved. 1. Introduction This study is about modeling how land use and habitat diver- sity determine the extent to which birds suppress pest insects on Jamaican coffee farms. The birds, mainly migratory warblers from North America, forage on a variety of arthropod prey in forest, large trees, and shaded coffee, so these habitat types and their food sup- plies control bird abundance. However, the birds are capable of switching to consumption of insect pests of coffee shrubs when those pests are abundant. Our model is designed to address such questions as how the relative area of forest and coffee habitat affect bird abundance and the economic value of pest suppression by birds. Bird foraging, therefore, is key to understanding and mod- eling this problem. ∗ Corresponding author. Tel.: +1 707 822 0453. E-mail addresses: [email protected], [email protected] (S.F. Railsback). Bird foraging has long been a subject of ecological theory and modeling, and empirical evaluation of models. This heritage is often described as starting with the pioneering optimal foraging models of Emlen (1966) and MacArthur and Pianka (1966), which addressed the question of how an individual should select between alternative prey types. Charnov (1976) proposed the “marginal value theorem” model for how long an individual should deplete the food in a patch before moving to another, and this model was supported in empirical experiments with chickadees by Krebs et al. (1974). The same question was modeled in more complex ways by Oaten (1977) and Green (1980), and more recently by measur- ing giving-up densities (Shochat et al., 2004). Even by 1977, Pyke et al. (1977) were able to review a number of models (and tests of the models) of individual foraging decisions such as: (1) selection among food types, (2) selection among habitat types, (3) allocation of time among patches, and (4) how to move through habitat in search of food. The great majority of this work has been in the tradition of behavioral ecology, with both models and empirical experiments 0304-3800/$ – see front matter © 2011 Elsevier B.V. All rights reserved. doi:10.1016/j.ecolmodel.2011.07.009

Welcome message from author
This document is posted to help you gain knowledge. Please leave a comment to let me know what you think about it! Share it to your friends and learn new things together.
Transcript

P
Sa
b
a
ARRA
KBCFIJP
1
sJNtpstqbbe
(
0d
Ecological Modelling 222 (2011) 3305– 3319
Contents lists available at ScienceDirect
Ecological Modelling
jo ur n al homep ag e: www.elsev ier .com/ locate /eco lmodel
attern-oriented modeling of bird foraging and pest control in coffee farms
teven F. Railsbacka,∗, Matthew D. Johnsonb
Department of Mathematics, Humboldt State University, Arcata, CA 95521, USADepartment of Wildlife, Humboldt State University, Arcata, CA 95521, USA
r t i c l e i n f o
rticle history:eceived 6 April 2011eceived in revised form 7 July 2011ccepted 9 July 2011
eywords:ird foragingoffeeoraging theoryndividual-based ecologyamaicaattern-oriented modeling
a b s t r a c t
We develop a model of how land use and habitat diversity affect migratory bird populations and theirability to suppress an insect pest on Jamaican coffee farms. Bird foraging—choosing which habitat patchand prey to use as prey abundance changes over space and time—is the key process driving this system.Following the “pattern-oriented” modeling strategy, we identified nine observed patterns that character-ize the real system’s dynamics. The model was designed so that these patterns could potentially emergefrom it. The resulting model is individual-based, has fine spatial and temporal resolutions, represents verysimply the supply of the pest insect and other arthropod food in six habitat types, and includes foraginghabitat selection as the only adaptive behavior of birds. Although there is an extensive heritage of birdforaging theory in ecology, most of it addresses only the individual level and is too simple for our context.We used pattern-oriented modeling to develop and test foraging theory for this across-scale problem:rules for individual bird foraging that cause the model to reproduce a variety of patterns observed atthe system level. Four alternative foraging theories were contrasted by how well they caused the modelto reproduce the nine characteristic patterns. Four of these patterns were clearly reproduced with the“null” theory that birds select habitat randomly. A version of classical theory in which birds stay in a patchuntil food is depleted to some threshold caused the model to reproduce five patterns; this theory causedlower, not higher, use of habitat experiencing an outbreak of prey insects. Assuming that birds select the
nearby patch providing highest intake rate caused the model to reproduce all but one pattern, whereasassuming birds select the highest-intake patch over a large radius produced an unrealistic distributionof movement distances. The pattern reproduced under none of the theories, a negative relation betweenbird density and distance to trees, appears to result from a process not in the model: birds return totrees at night to roost. We conclude that a foraging model for small insectivorous birds in diverse habitatshould assume birds can sense higher food supply but over short, not long, distances.. Introduction
This study is about modeling how land use and habitat diver-ity determine the extent to which birds suppress pest insects onamaican coffee farms. The birds, mainly migratory warblers fromorth America, forage on a variety of arthropod prey in forest, large
rees, and shaded coffee, so these habitat types and their food sup-lies control bird abundance. However, the birds are capable ofwitching to consumption of insect pests of coffee shrubs whenhose pests are abundant. Our model is designed to address suchuestions as how the relative area of forest and coffee habitat affect
ird abundance and the economic value of pest suppression byirds. Bird foraging, therefore, is key to understanding and mod-ling this problem.∗ Corresponding author. Tel.: +1 707 822 0453.E-mail addresses: [email protected], [email protected]
S.F. Railsback).
304-3800/$ – see front matter © 2011 Elsevier B.V. All rights reserved.oi:10.1016/j.ecolmodel.2011.07.009
© 2011 Elsevier B.V. All rights reserved.
Bird foraging has long been a subject of ecological theory andmodeling, and empirical evaluation of models. This heritage isoften described as starting with the pioneering optimal foragingmodels of Emlen (1966) and MacArthur and Pianka (1966), whichaddressed the question of how an individual should select betweenalternative prey types. Charnov (1976) proposed the “marginalvalue theorem” model for how long an individual should depletethe food in a patch before moving to another, and this model wassupported in empirical experiments with chickadees by Krebs et al.(1974). The same question was modeled in more complex waysby Oaten (1977) and Green (1980), and more recently by measur-ing giving-up densities (Shochat et al., 2004). Even by 1977, Pykeet al. (1977) were able to review a number of models (and tests ofthe models) of individual foraging decisions such as: (1) selectionamong food types, (2) selection among habitat types, (3) allocation
of time among patches, and (4) how to move through habitat insearch of food.The great majority of this work has been in the tradition ofbehavioral ecology, with both models and empirical experiments
3 logica
asfaucbbbitiatGmn
fstt2cmOte
ossote
meetufs
2
2
tibiowbitetCbus
306 S.F. Railsback, M.D. Johnson / Eco
ddressing the decisions of a single bird in a somewhat (or highly)implified setting. For our coffee farm problem, though, we need aoraging model in the tradition of individual-based ecology (Grimmnd Railsback, 2005): a model of individual decisions in a pop-lation context, with individuals competing for resources in aomplex, dynamic, and unpredictable environment. The traditionalehavioral ecology literature provides an important foundation,ut much of it is not directly useful in a population-level modelecause its fundamental assumptions are not met. A prime example
s the assumption of the “marginal value theorem” (Charnov, 1976)hat there is a constant “average” resource availability, whereasn a model with birds depleting resources throughout the habitat,
spatial average of resource availability changes constantly overime. Stillman et al. (2000), Amano et al. (2006), and Stillman andoss-Custard (2010) provide important examples of bird foragingodels that do work in this individual-based ecology context, but
one of them apply to the kinds of birds and habitats we address.Our objectives were to design a model of the Jamaican coffee
arm system, and then to use it to develop theory for foraging bymall insectivorous birds that is useful in this population-level con-ext. Both the model design and theory development phases usehe “pattern-oriented modeling” strategy (Grimm and Railsback,005; Grimm et al., 2005). Pattern-oriented modeling uses a set ofharacteristic patterns observed in the real system—along with theodel’s purpose—as the basis for designing and testing a model.bserved patterns are almost always important in designing and
esting models, but in pattern-oriented modeling their use is madexplicit.
The first modeling phase we describe is the use of pattern-riented modeling to design a model. In Section 2.2 we select aet of characteristic patterns observed in the Jamaican coffee farmystem, and identify what the patterns tell us about the structuref a model of the system: its scales, entities, and processes. Wehen (Section 2.3) develop the full model, incorporating additionalmpirical information from our study site.
The second phase of our study (Section 3) uses pattern-orientedodeling to develop theory for bird foraging decisions. We hypoth-
size several alternative foraging theories, then conduct simulationxperiments to test how well the model, using each alternativeheory, reproduces the observed patterns. These experiments lets draw conclusions about which theory best represents the birds’oraging behavior and how useful the entire model is for under-tanding and managing the coffee farm system.
. Methods
.1. Study site: the Jamaican coffee farm system
Coffee is the highest value agricultural commodity produced inhe tropics (O’Brien and Kinnaird, 2003; Vandermeer, 2003), andts most important pest is a very small beetle, the coffee berryorer (CBB, Hypothenemus hampei, LePelley, 1973). Female CBB bore
nto coffee berries, where they deposit eggs; the next generationf females can emerge ready to infest additional berries in 4–5eeks (Damon, 2000). Coffee farmers must sort out and discard
erries infested with CBB, a significant loss of income. CBB occursn almost all coffee-growing regions and it is notoriously difficulto control (Barrera et al., 1990; Batchelor et al., 2005; Jaramillot al., 2005). However, we and colleagues discovered that migra-ory insectivorous warblers sometimes consume large numbers of
BB on Jamaican coffee farms and provide a substantial economicenefit (Johnson et al., 2010; Kellermann et al., 2008; Sherry et al.,npubl. manuscript: “Diet comparisons and the potential for inter-pecific competition in five Neotropical migrant warbler speciesl Modelling 222 (2011) 3305– 3319
wintering in Jamaican shade coffee farms”, T. W. Sherry, Depart-ment of Ecology and Evolutionary Biology, Tulane University).
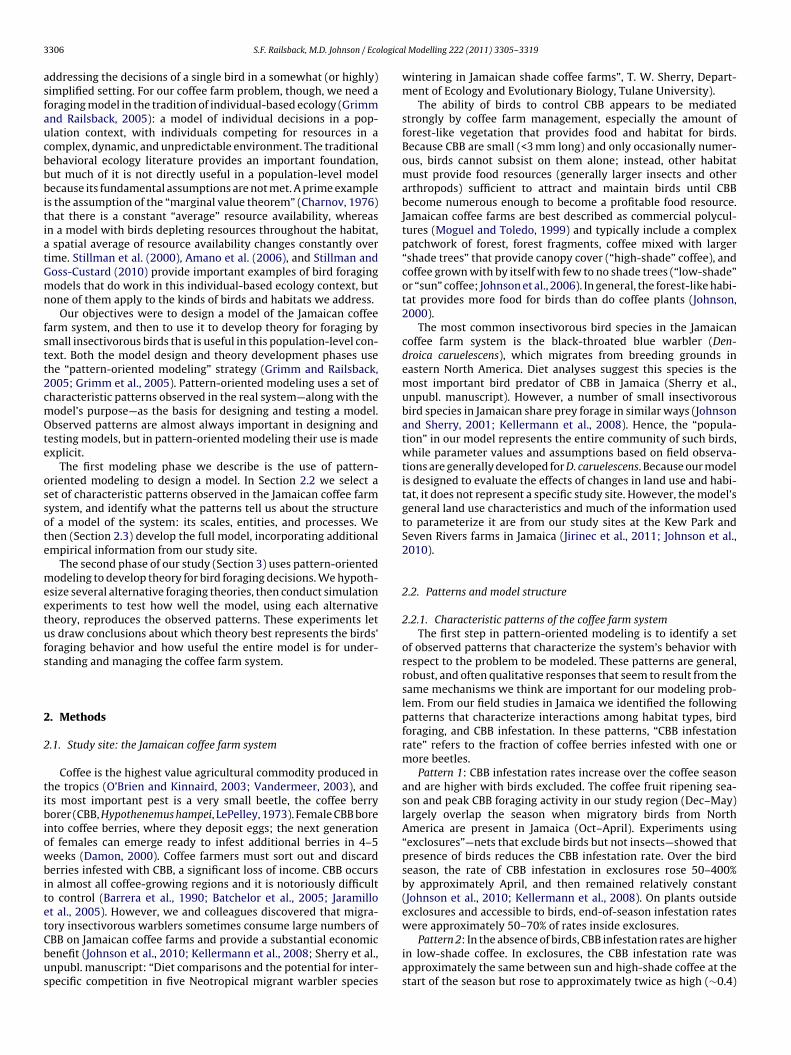
The ability of birds to control CBB appears to be mediatedstrongly by coffee farm management, especially the amount offorest-like vegetation that provides food and habitat for birds.Because CBB are small (<3 mm long) and only occasionally numer-ous, birds cannot subsist on them alone; instead, other habitatmust provide food resources (generally larger insects and otherarthropods) sufficient to attract and maintain birds until CBBbecome numerous enough to become a profitable food resource.Jamaican coffee farms are best described as commercial polycul-tures (Moguel and Toledo, 1999) and typically include a complexpatchwork of forest, forest fragments, coffee mixed with larger“shade trees” that provide canopy cover (“high-shade” coffee), andcoffee grown with by itself with few to no shade trees (“low-shade”or “sun” coffee; Johnson et al., 2006). In general, the forest-like habi-tat provides more food for birds than do coffee plants (Johnson,2000).
The most common insectivorous bird species in the Jamaicancoffee farm system is the black-throated blue warbler (Den-droica caruelescens), which migrates from breeding grounds ineastern North America. Diet analyses suggest this species is themost important bird predator of CBB in Jamaica (Sherry et al.,unpubl. manuscript). However, a number of small insectivorousbird species in Jamaican share prey forage in similar ways (Johnsonand Sherry, 2001; Kellermann et al., 2008). Hence, the “popula-tion” in our model represents the entire community of such birds,while parameter values and assumptions based on field observa-tions are generally developed for D. caruelescens. Because our modelis designed to evaluate the effects of changes in land use and habi-tat, it does not represent a specific study site. However, the model’sgeneral land use characteristics and much of the information usedto parameterize it are from our study sites at the Kew Park andSeven Rivers farms in Jamaica (Jirinec et al., 2011; Johnson et al.,2010).
2.2. Patterns and model structure
2.2.1. Characteristic patterns of the coffee farm systemThe first step in pattern-oriented modeling is to identify a set
of observed patterns that characterize the system’s behavior withrespect to the problem to be modeled. These patterns are general,robust, and often qualitative responses that seem to result from thesame mechanisms we think are important for our modeling prob-lem. From our field studies in Jamaica we identified the followingpatterns that characterize interactions among habitat types, birdforaging, and CBB infestation. In these patterns, “CBB infestationrate” refers to the fraction of coffee berries infested with one ormore beetles.
Pattern 1: CBB infestation rates increase over the coffee seasonand are higher with birds excluded. The coffee fruit ripening sea-son and peak CBB foraging activity in our study region (Dec–May)largely overlap the season when migratory birds from NorthAmerica are present in Jamaica (Oct–April). Experiments using“exclosures”—nets that exclude birds but not insects—showed thatpresence of birds reduces the CBB infestation rate. Over the birdseason, the rate of CBB infestation in exclosures rose 50–400%by approximately April, and then remained relatively constant(Johnson et al., 2010; Kellermann et al., 2008). On plants outsideexclosures and accessible to birds, end-of-season infestation rateswere approximately 50–70% of rates inside exclosures.
Pattern 2: In the absence of birds, CBB infestation rates are higherin low-shade coffee. In exclosures, the CBB infestation rate wasapproximately the same between sun and high-shade coffee at thestart of the season but rose to approximately twice as high (∼0.4)

S.F. Railsback, M.D. Johnson / Ecological Modelling 222 (2011) 3305– 3319 3307
Fig. 1. Observed relation between bird reduction in CBB infestation and exclosureid
i2
st
trlBi
msaa
si(tan
tptotd
foDtwo
ovad
Reproducing population decreases requires including mortality
nfestation rate. April, May, June mean results from Kew Park (M. Johnson, unpubl.ata).
n sun coffee compared to high-shade coffee (∼0.2; Johnson et al.,010).
Pattern 3: Bird densities (number per area) are higher in high-hade than in low-shade coffee; Johnson et al. (2010) observed 2–3imes more birds in high-shade coffee at the Kew Park site.
Pattern 4: There is a positive relationship between (a) CBB infes-ation rate in exclosures and (b) the percentage by which birdseduce the infestation rate. This pattern is supported by unpub-ished data from exclosure experiments at our study site (Fig. 1).irds appear more effective at suppressing CBB when CBB density
s high.Pattern 5: Birds respond quickly to local irruptions in their nor-
al arthropod food supply. Short-term, sharp increases in foodupply (approximately fivefold increases within 2 weeks) producedn immediate local increase in the density of feeding birds (Johnsonnd Sherry, 2001).
Pattern 6: Changes in bird densities over time within a sea-on are related to changes in food supply. Over sites comparablen size to the entire spatial extent we model, Johnson and Sherry2001; their Figure 5) observed that the rate at which bird densi-ies changed between censuses was positively related to the ratet which arthropod food density changed, for both positive andegative changes.
Pattern 7: There is a weak relation between vegetation charac-eristics and bird density at intermediate scales. At 400 m2 surveylots, there was a weak negative relationship between the distanceo a patch of forest or tree habitat and the density of birds that preyn CBB (Kellermann et al., 2008). There was no relation at distanceso forest or tree habitat less than 60 m, but low bird densities atistances of 70–120 m (Figure 2 of Kellermann et al., 2008).
Pattern 8: Bird movement distances measured at an hourly scaleollow a log-normal distribution. Field observations in the wintersf 2008–2009 and 2009–2010 identified locations of radio-tagged. caruelescens at approximately hourly intervals (Fig. 2). The dis-
ribution of distances between hourly locations was highly skewed,ith a peak (around 30 m) well below the mean (around 50 m) and
ccasional movements of between 200 and 500 m.Pattern 9: Bird consumption of CBB is episodic. Our observations
f bird feeding and stomach content samples indicate that CBB is a
ery small and highly variable part of the overall bird diet. On aver-ge, CBB composed 8 ± 1.7% SE of the identifiable prey in warbleriet samples, but these values ranged from 0 to 96% (Sherry et al.,Fig. 2. Distribution of distances between hourly observations of individual birds atthe Kew Park site (B. Campos, unpubl. data, Department of Wildlife, Humboldt StateUniversity).
unpubl. manuscript). Our energetic assumptions in Section 2.3.7.1indicate that a bird would have to consume over 10,000 of thesevery small beetles to meet their daily food requirement. However,individual birds occasionally and briefly feed heavily on CBB.
2.2.2. What the patterns tell us about model structureThe second step of pattern-oriented modeling is to identify what
the characteristic patterns indicate about the structure of a modelof the system (Grimm et al., 2005). The model should use the samespatial and temporal scales as the empirical data that revealed theobserved patterns, include the entities—kinds of things—that arein the patterns, and represent the processes believed to drive thepatterns. Also, the model must produce outputs that let us test it byexamining how well it reproduces the patterns. The following con-clusions from the patterns strongly influenced the model structuredescribed in Section 2.3.2.
• Many of the patterns concern changes over time, so the modelneeds to be dynamic.
• Many patterns concern differences among habitat types, so themodel must be spatial with resolution fine enough to representthe small, irregular patches of low- and high-shade coffee, forest,and forest fragments that characterize Jamaican coffee farms.
• Foraging habitat selection by birds is a key process driving thepatterns, so it needs to be included in the model explicitly.Because this individual behavior is important, individual-basedmodeling is a natural approach. Birds move among the smallhabitat patches rapidly, so the model needs a very short timestep.
• Many patterns involve CBB infestation rate, so the model mustrepresent this rate and how it is affected by bird feeding. Infes-tation rate is not a direct measure of CBB population but is themeasure used to quantify CBB in the field and calculate its eco-nomic impact.
• Patterns 1, 2, and 4 are results of exclosure experiments, so themodel needs to represent exclosures.
• Reproducing pattern 5 requires the ability to simulate irruptionsof arthropod prey.
• Pattern 6 includes increases and decreases in bird populations.The model does not include the reproductive season, so reproduc-ing population increases would require including immigration.
or emigration.• Pattern 9 indicates that CBB are profitable as food only when
infestation rates are higher than the average rate over time or

3308 S.F. Railsback, M.D. Johnson / Ecological Modelling 222 (2011) 3305– 3319
Fig. 3. Conceptual diagram of the coffee farm model. The model’s outcomes (coffee berry infestation rate; bird survival) emerge from the spatial arrangement of habitat typesa monoa ciallya
2
c(La
2
fiact
2
2sTrtrc
sdsnmaf
of six different habitat types described here. (The more conven-tional term “patch” has a different meaning in NetLogo.) Each cellis assigned a habitat type, using methods that produce distinct butirregular clumps of each type (Fig. 4). All cells have the same equa-
nd how birds decide which type to forage in. Key habitat types, left to right, are
nd trees. Birds also decide whether to feed on general arthropods, which are espebundant and easy to catch on coffee plants.
space. Therefore, CBB infestation must be spatially and tempo-rally variable.
.3. Model description
This model description follows the ODD (Overview, Design con-epts, Details) protocol for describing individual-based modelsGrimm et al., 2006, 2010). The model was implemented in Net-ogo (Wilensky, 1999) so we use some NetLogo conventions suchs for variable names.
.3.1. PurposeThe model’s purpose is to explore the effects of changes in coffee
arm management on suppression of CBB by birds. In particular its designed to help us understand and predict how the relative areand spatial arrangement of several common habitat types, espe-ially high- and low-shade coffee, affect local bird densities andhe reduction of CBB infestation rates by birds (Fig. 3).
.3.2. Entities, state variables, and scalesThis section describes the model’s structure.
.3.2.1. Scales. The model’s spatial extent is a square of 200 × 200quare cells, each 5 m × 5 m in size; hence, the total area is 100 ha.his relatively fine resolution was chosen so the model can rep-esent the effects of the small patches of trees and other habitatypes that typify Jamaican coffee farms. The model’s space is rep-esented as bounded, not toroidal: birds at one edge of the spaceannot jump to cells on the opposite edge.
The model runs at a 1-day time step, except that bird habitatelection and foraging is modeled at much shorter time step duringaytime hours. This “foraging time step” is a parameter forage-time-tep with value of 0.0167 h (1 min). The model does not represent
ight; it assumes all events occur during the day. The parameterax-forage-hrs-per-day specifies how many foraging hours therere per day, assumed constant at 12. Hence, birds can move andeed up to 720 times per day.
culture (low-shade) coffee, coffee mixed with overstory trees (high-shade coffee), abundant in trees, or on CBB (represented as dots), which are occasionally highly
The time period modeled represents the period when CBB infestberries and when North American birds winter in Jamaica. Themodel runs for 151 days representing December 1 to April 30.
2.3.2.2. Habitat cells. The model landscape is made up of “clumps”
Fig. 4. Example model landscape with six habitat types. Dark green border on right:forest; grey: high-shade coffee; yellow: low-shade coffee; brown: unusable; orange:other; small green clumps: trees. (For interpretation of the references to color in thisfigure legend, the reader is referred to the web version of the article.)
logica
tfaTS
o(ir
eacttlh
stcfvasac
iou
dttc
u
ksptoci
2sttsto
2talaCso
S.F. Railsback, M.D. Johnson / Eco
ions for habitat processes but each habitat type has its own valuesor habitat parameters. The amount of area in each habitat type,nd the number of clumps of each, are set by model parameters.he rules for assigning cells to the habitat types are explained inection 2.3.5.1.
Forest habitat represents a single, large tract of forest. The sizef the forest is controlled by the parameter frac-forest, the fraction0–1) of all cells that are assigned the forest habitat type. The forests arranged as a single clump that forms a ragged boundary on theight side of the space.
High-shade habitat represents coffee habitat with diverse veg-tation and a relatively high canopy cover provided by shade treesbove the coffee bushes. The fraction of cells that are high-shadeoffee is determined by the parameter frac-high-shade (the frac-ion of all cells—except those of type trees, explained below—set tohis type). High-shade habitat is arranged as a number of irregu-ar clumps spread throughout the non-forest space. The number ofigh-shade clumps is set by the parameter num-high-shade-clumps.
Low-shade represents coffee habitat that is has little to nohade-tree canopy cover, low vegetation diversity, and is effec-ively a monoculture. In Jamaica, coffee landscapes are diverse, withlumps of high-shade and low-shade coffee often within a singlearm under one ownership. In other coffee growing regions, indi-idual farms are often characterized along a shade gradient, suchs that described by Moguel and Toledo (1999). The area of low-hade coffee is set by the parameter frac-low-shade (the fraction ofll cells except those of type trees set to this type). The number oflumps is set by the parameter num-low-shade-clumps.
Unusable habitat represents land uses unusable for bird forag-ng, especially pasture. The parameter frac-unusable is the fractionf all non-trees cells set to this type, and the parameter num-nusable-clumps sets how many clumps there are.
Trees habitat represents non-coffee trees or forest fragments,ispersed among the other non-forest habitat types. The area ofhis habitat type is set by the parameter frac-trees, the fraction ofhe total area that is of this habitat type. The parameter num-trees-lumps sets how many clumps there are.
Other habitat represents non-forest and non-agricultural landse such as roads and housing.
Each cell has state variables for the supply (as biomass, g) of twoinds of invertebrate prey for birds. These variables do not repre-ent the total biomass density of invertebrates but the amount ofrey exposed and available for consumption by birds. The first preyype is CBB, the pest beetles that infest coffee berries. “Bugs” are allther prey for birds. The supply of these prey are contained in theell variables CBB-availability and bug-availability. CBB-availabilitys calculated from cell variable CBB-I, the CBB infestation rate.
.3.2.3. Birds. Birds are represented as mobile individuals withtate variables for their location and energetic status. Location isracked only as which cell the bird is in, and birds have a variable forheir “home cell”, which does not change over time. The energetictate variable daily-intake is simply the grams of food consumed onhe current day. (Several other variables are used only to generateutput on how much time birds foraged in what kinds of habitat.)
.3.2.4. Exclosures. The model represents exclosures—coffee habi-at from which birds but not CBB are excluded. These are not treateds discrete objects located in space. Instead, the model simply calcu-ates daily CBB infestation without bird consumption, in both low-
nd high-shade coffee. These calculations use the mean of the oneBB parameter that varies among cells (Section 2.3.5.2), and werehown experimentally to produce results very close to the meanver all coffee habitat when the model was run without birds.l Modelling 222 (2011) 3305– 3319 3309
2.3.3. Process overview and schedulingOn each daily time step, the following actions happen in this
order. The order in which the individual cells and birds processeach action is randomized each time the action is executed.
Bug production: Each cell re-sets its bug prey availability (Sec-tion 2.3.7.2).
CBB production: Each cell and exclosure updates its CBB infes-tation rate and biomass density of CBB prey (Section 2.3.7.3).
Bird updates: Birds re-set their daily-intake state variable (andother variables that track habitat use and food use for output) tozero.
Bird habitat selection and foraging: Each bird conducts its for-aging action, selecting which cell to feed in and determining whatkind (bugs or CBB) and how much food it consumes. The consumedfood is subtracted from the cell’s food availability. This action isrepeated once for each foraging time step, up to the total numberof foraging hours per day (details are in Section 2.3.7.1). The birdorder is shuffled each foraging time step to represent the lack ofany hierarchy or dominance in competition for habitat.
Birds return to home cell: At the end of the day’s foraging, eachbird returns to its home cell. This behavior imposes a kind of homerange on the birds.
Bird mortality: At the end of each day, birds that have notobtained a minimum daily food intake of 5.0 g (Section 2.3.7.1)experience a daily risk of dying or leaving. Such birds have a randomchance with probability 0.2 of being removed from the model. Theprocess is necessary to allow changes in the bird population (pat-tern 6, Section 2.2.1). Mortality is also included because it, alongwith a high initial density of birds, is how we let local bird distribu-tion patterns emerge at the start of a simulation (Section 2.3.5.2).This simple approach to starvation is not completely unrealisticfor birds, which have high metabolic rates and little ability to storeenergy, and avoids the need to model energy reserves and balances.Emigration and immigration were not represented because (a) theperiod we simulate is after the end of migration so no more birdsarrive from North America and (b) we assume that the area wemodel is large enough that emigration and immigration due to birdhabitat selection balance each other and hence are negligible.
Observer updates: The last action executed each time step is anupdate of model outputs. The interface graphics are re-drawn, andcurrent statistics on the birds and cells are written to an output file.The model also produces “virtual surveys” at a frequency selectedvia a model parameter; these produce observations comparable tosome of our field surveys (Section 2.3.7.4).
2.3.4. Design conceptsThis section describes the model at a conceptual level, using the
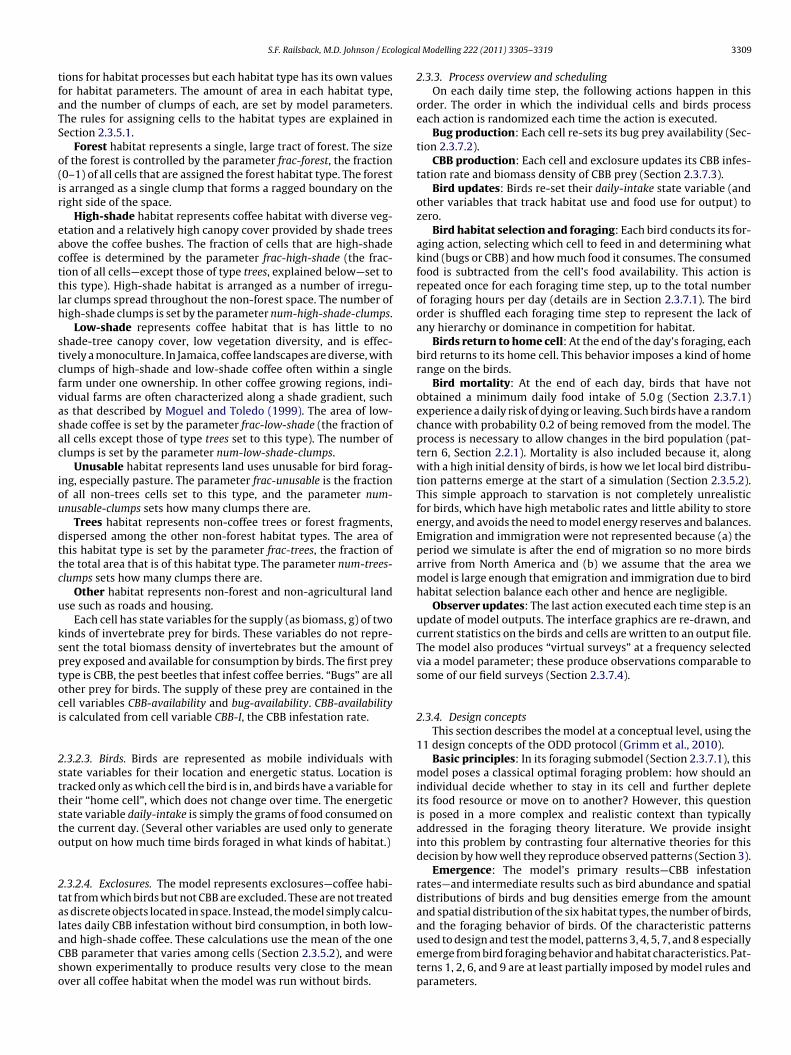
11 design concepts of the ODD protocol (Grimm et al., 2010).Basic principles: In its foraging submodel (Section 2.3.7.1), this
model poses a classical optimal foraging problem: how should anindividual decide whether to stay in its cell and further depleteits food resource or move on to another? However, this questionis posed in a more complex and realistic context than typicallyaddressed in the foraging theory literature. We provide insightinto this problem by contrasting four alternative theories for thisdecision by how well they reproduce observed patterns (Section 3).
Emergence: The model’s primary results—CBB infestationrates—and intermediate results such as bird abundance and spatialdistributions of birds and bug densities emerge from the amountand spatial distribution of the six habitat types, the number of birds,and the foraging behavior of birds. Of the characteristic patterns
used to design and test the model, patterns 3, 4, 5, 7, and 8 especiallyemerge from bird foraging behavior and habitat characteristics. Pat-terns 1, 2, 6, and 9 are at least partially imposed by model rules andparameters.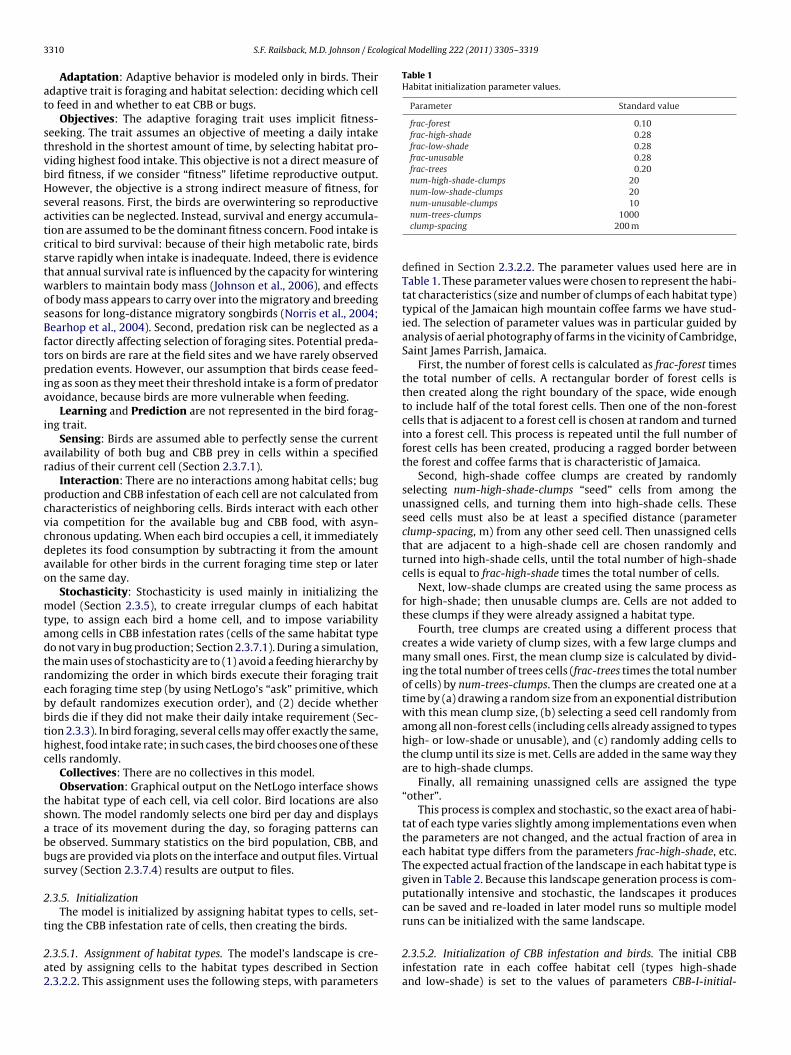
3 logical Modelling 222 (2011) 3305– 3319
at
stvbHsatcstwosBftpia
i
ar
pcvcdao
mtadtrebbthc
tsabbs
2
t
2a2
Table 1Habitat initialization parameter values.
Parameter Standard value
frac-forest 0.10frac-high-shade 0.28frac-low-shade 0.28frac-unusable 0.28frac-trees 0.20num-high-shade-clumps 20num-low-shade-clumps 20num-unusable-clumps 10
310 S.F. Railsback, M.D. Johnson / Eco
Adaptation: Adaptive behavior is modeled only in birds. Theirdaptive trait is foraging and habitat selection: deciding which cello feed in and whether to eat CBB or bugs.
Objectives: The adaptive foraging trait uses implicit fitness-eeking. The trait assumes an objective of meeting a daily intakehreshold in the shortest amount of time, by selecting habitat pro-iding highest food intake. This objective is not a direct measure ofird fitness, if we consider “fitness” lifetime reproductive output.owever, the objective is a strong indirect measure of fitness, for
everal reasons. First, the birds are overwintering so reproductivectivities can be neglected. Instead, survival and energy accumula-ion are assumed to be the dominant fitness concern. Food intake isritical to bird survival: because of their high metabolic rate, birdstarve rapidly when intake is inadequate. Indeed, there is evidencehat annual survival rate is influenced by the capacity for winteringarblers to maintain body mass (Johnson et al., 2006), and effects
f body mass appears to carry over into the migratory and breedingeasons for long-distance migratory songbirds (Norris et al., 2004;earhop et al., 2004). Second, predation risk can be neglected as a
actor directly affecting selection of foraging sites. Potential preda-ors on birds are rare at the field sites and we have rarely observedredation events. However, our assumption that birds cease feed-
ng as soon as they meet their threshold intake is a form of predatorvoidance, because birds are more vulnerable when feeding.
Learning and Prediction are not represented in the bird forag-ng trait.
Sensing: Birds are assumed able to perfectly sense the currentvailability of both bug and CBB prey in cells within a specifiedadius of their current cell (Section 2.3.7.1).
Interaction: There are no interactions among habitat cells; bugroduction and CBB infestation of each cell are not calculated fromharacteristics of neighboring cells. Birds interact with each otheria competition for the available bug and CBB food, with asyn-hronous updating. When each bird occupies a cell, it immediatelyepletes its food consumption by subtracting it from the amountvailable for other birds in the current foraging time step or latern the same day.
Stochasticity: Stochasticity is used mainly in initializing theodel (Section 2.3.5), to create irregular clumps of each habitat
ype, to assign each bird a home cell, and to impose variabilitymong cells in CBB infestation rates (cells of the same habitat typeo not vary in bug production; Section 2.3.7.1). During a simulation,he main uses of stochasticity are to (1) avoid a feeding hierarchy byandomizing the order in which birds execute their foraging traitach foraging time step (by using NetLogo’s “ask” primitive, whichy default randomizes execution order), and (2) decide whetherirds die if they did not make their daily intake requirement (Sec-ion 2.3.3). In bird foraging, several cells may offer exactly the same,ighest, food intake rate; in such cases, the bird chooses one of theseells randomly.
Collectives: There are no collectives in this model.Observation: Graphical output on the NetLogo interface shows
he habitat type of each cell, via cell color. Bird locations are alsohown. The model randomly selects one bird per day and displays
trace of its movement during the day, so foraging patterns cane observed. Summary statistics on the bird population, CBB, andugs are provided via plots on the interface and output files. Virtualurvey (Section 2.3.7.4) results are output to files.
.3.5. InitializationThe model is initialized by assigning habitat types to cells, set-
ing the CBB infestation rate of cells, then creating the birds.
.3.5.1. Assignment of habitat types. The model’s landscape is cre-ted by assigning cells to the habitat types described in Section.3.2.2. This assignment uses the following steps, with parameters
num-trees-clumps 1000clump-spacing 200 m
defined in Section 2.3.2.2. The parameter values used here are inTable 1. These parameter values were chosen to represent the habi-tat characteristics (size and number of clumps of each habitat type)typical of the Jamaican high mountain coffee farms we have stud-ied. The selection of parameter values was in particular guided byanalysis of aerial photography of farms in the vicinity of Cambridge,Saint James Parrish, Jamaica.
First, the number of forest cells is calculated as frac-forest timesthe total number of cells. A rectangular border of forest cells isthen created along the right boundary of the space, wide enoughto include half of the total forest cells. Then one of the non-forestcells that is adjacent to a forest cell is chosen at random and turnedinto a forest cell. This process is repeated until the full number offorest cells has been created, producing a ragged border betweenthe forest and coffee farms that is characteristic of Jamaica.
Second, high-shade coffee clumps are created by randomlyselecting num-high-shade-clumps “seed” cells from among theunassigned cells, and turning them into high-shade cells. Theseseed cells must also be at least a specified distance (parameterclump-spacing, m) from any other seed cell. Then unassigned cellsthat are adjacent to a high-shade cell are chosen randomly andturned into high-shade cells, until the total number of high-shadecells is equal to frac-high-shade times the total number of cells.
Next, low-shade clumps are created using the same process asfor high-shade; then unusable clumps are. Cells are not added tothese clumps if they were already assigned a habitat type.
Fourth, tree clumps are created using a different process thatcreates a wide variety of clump sizes, with a few large clumps andmany small ones. First, the mean clump size is calculated by divid-ing the total number of trees cells (frac-trees times the total numberof cells) by num-trees-clumps. Then the clumps are created one at atime by (a) drawing a random size from an exponential distributionwith this mean clump size, (b) selecting a seed cell randomly fromamong all non-forest cells (including cells already assigned to typeshigh- or low-shade or unusable), and (c) randomly adding cells tothe clump until its size is met. Cells are added in the same way theyare to high-shade clumps.
Finally, all remaining unassigned cells are assigned the type“other”.
This process is complex and stochastic, so the exact area of habi-tat of each type varies slightly among implementations even whenthe parameters are not changed, and the actual fraction of area ineach habitat type differs from the parameters frac-high-shade, etc.The expected actual fraction of the landscape in each habitat type isgiven in Table 2. Because this landscape generation process is com-putationally intensive and stochastic, the landscapes it producescan be saved and re-loaded in later model runs so multiple modelruns can be initialized with the same landscape.
2.3.5.2. Initialization of CBB infestation and birds. The initial CBBinfestation rate in each coffee habitat cell (types high-shadeand low-shade) is set to the values of parameters CBB-I-initial-
S.F. Railsback, M.D. Johnson / Ecological Modelling 222 (2011) 3305– 3319 3311
Table 2Equations for expected actual fractions of landscape in each habitat type, and expected number of cells in the 200 × 200 cell landscape.
Habitat type Expected fraction of total landscape Expected number of cells
Forest frac-forest 4000High-shade frac-high-shade − {frac-trees × [frac-high-shade/(1 − frac-forest)]} 8711Low-shade frac-low-shade − {frac-trees × [frac-low-shade/(1 − frac-forest)]} 8711
le/(1 −
habita
hrsabCrtcttc
(ccttToseheum
2
d
2
c
2r1hsb(
of
wtsbtc
wCi
as wet weight) is estimated for black-throated blue warblers to be5 g. These birds typically weigh about 10 g (Holmes et al., 1979;Nagy et al., 2007). Holmes et al. (1979) estimated a daily energy
Y
Y
N
N
Unusable frac-unusable − {frac-trees × [frac-unusabTrees frac-trees
Other One minus expected fraction of all other
igh-shade and CBB-I-initial-low-shade. The maximum infestationate CBB-I-K described in Section 2.3.7.3 varies among cells andet during initialization by drawing its value randomly from
normal distribution with mean and standard deviation sety parameters CBB-I-K-high-shade-mean, CBB-I-K-high-shade-SD,BB-I-K-low-shade-mean, CBB-I-K-low-shade-SD (Table 4). If theesulting value of CBB-I-K is greater than 1.0, it is set to 1.0 (infes-ation rates cannot be greater than 1.0). Likewise, infestation ratesannot decrease, so if the randomly drawn value of CBB-I-K is lesshan the initial infestation rate, it is re-set to that initial rate. Thenhe CBB dynamics methods in Section 2.3.7.3 are executed to cal-ulate initial CBB availability values for each cell of coffee habitat.
The initial number of birds is the parameter initial-bird-densitybirds/ha) multiplied by the total area of the space (ha). The homeell of each bird is chosen randomly, with equal probability for eachell (whether or not another bird has chosen the same cell), andhe bird moves to its home cell. Birds are therefore spread rela-ively evenly, regardless of habitat type, at the start of a simulation.he model depends on a high initial bird density for the densityf birds in various habitat types to emerge. The initial bird densityhould be a value that only the most productive habitat types (for-st and trees) can support, so many initial birds in less-productiveabitat types die of starvation in the first few time steps. However,xtremely high initial densities can bias model results by causingnrealistically high CBB consumption and excess mortality early inodel runs. The standard value of initial-bird-density is 20 birds/ha.
.3.6. Input dataThis model has no time-series inputs or external environmental
rivers.
.3.7. SubmodelsThe following subsections provide full detail on how model pro-
esses are simulated.
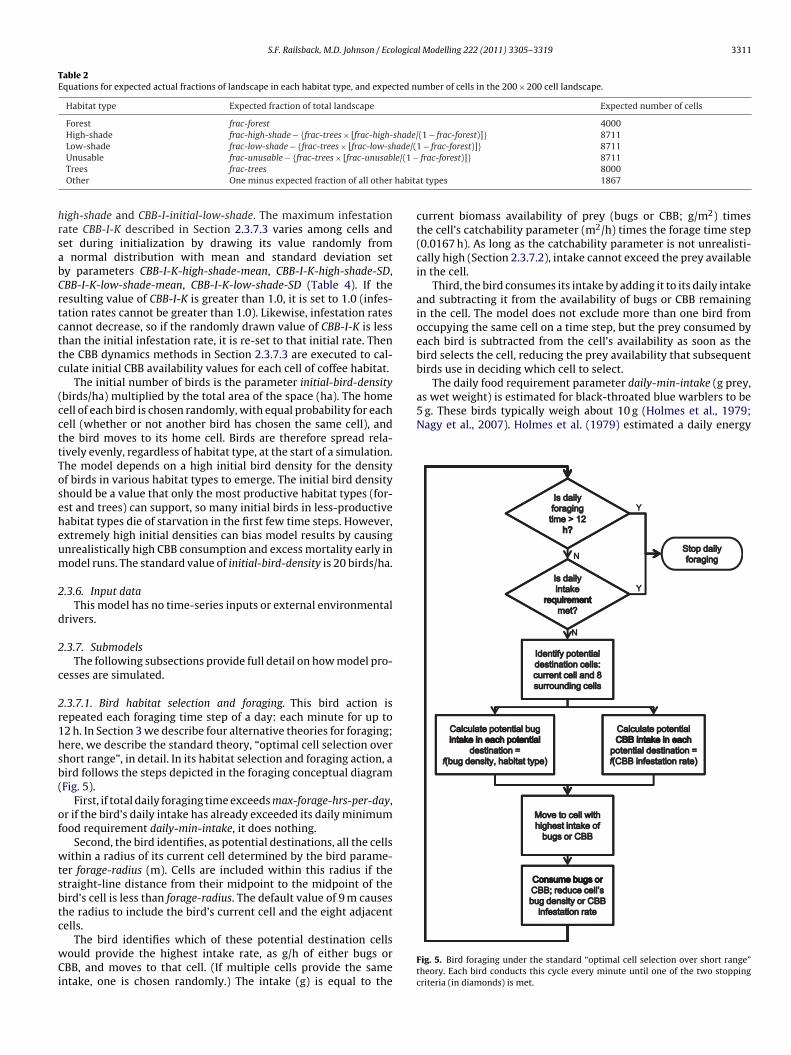
.3.7.1. Bird habitat selection and foraging. This bird action isepeated each foraging time step of a day: each minute for up to2 h. In Section 3 we describe four alternative theories for foraging;ere, we describe the standard theory, “optimal cell selection overhort range”, in detail. In its habitat selection and foraging action, aird follows the steps depicted in the foraging conceptual diagramFig. 5).
First, if total daily foraging time exceeds max-forage-hrs-per-day,r if the bird’s daily intake has already exceeded its daily minimumood requirement daily-min-intake, it does nothing.
Second, the bird identifies, as potential destinations, all the cellsithin a radius of its current cell determined by the bird parame-
er forage-radius (m). Cells are included within this radius if thetraight-line distance from their midpoint to the midpoint of theird’s cell is less than forage-radius. The default value of 9 m causeshe radius to include the bird’s current cell and the eight adjacentells.
The bird identifies which of these potential destination cellsould provide the highest intake rate, as g/h of either bugs orBB, and moves to that cell. (If multiple cells provide the same
ntake, one is chosen randomly.) The intake (g) is equal to the
frac-forest)]} 87118000
t types 1867
current biomass availability of prey (bugs or CBB; g/m2) timesthe cell’s catchability parameter (m2/h) times the forage time step(0.0167 h). As long as the catchability parameter is not unrealisti-cally high (Section 2.3.7.2), intake cannot exceed the prey availablein the cell.
Third, the bird consumes its intake by adding it to its daily intakeand subtracting it from the availability of bugs or CBB remainingin the cell. The model does not exclude more than one bird fromoccupying the same cell on a time step, but the prey consumed byeach bird is subtracted from the cell’s availability as soon as thebird selects the cell, reducing the prey availability that subsequentbirds use in deciding which cell to select.
The daily food requirement parameter daily-min-intake (g prey,
Fig. 5. Bird foraging under the standard “optimal cell selection over short range”theory. Each bird conducts this cycle every minute until one of the two stoppingcriteria (in diamonds) is met.
3312 S.F. Railsback, M.D. Johnson / Ecological Modelling 222 (2011) 3305– 3319
Table 3Bug production and catchability parameter values.
Habitat type Parameter name Value
Forest forest-bug-prod (g/m2) 0.018forest-bug-catchability (m2/h) 35
High-shade high-shade-bug-prod 0.016high-shade-bug-catchability 90
Low-shade low-shade-bug-prod 0.0054low-shade-bug-catchability 170
Unusable unusable-bug-prod 0.00054unusable-bug-catchability 35
Trees trees-bug-prod 0.018trees-bug-catchability 70
dtpuwofido21btt
WpaipetaiS
2bbtcfad
iawwaptdJUJhi3ii
Table 4Parameters for CBB dynamics. The parameters for CBB-I-K are explained in Section2.3.5.2.
Parameter Value
CBB-I-initial-high-shade 0.05*
CBB-I-initial-low-shade 0.05*
CBB-I-r-high-shade 0.05*
CBB-I-r-low-shade 0.05*
CBB-I-K-high-shade-mean 0.2*
CBB-I-K-high-shade-SD 0.05CBB-I-K-low-shade-mean 0.4*
CBB-I-K-low-shade-SD 0.1CBB-berry-density-high-shade (coffee berry density Dc) 220**
CBB-berry-density-low-shade (coffee berry density Dc) 270**
CBB-borer-wt (female borer weight Wb) 0.00049***
* Estimated from Figure 2 of Johnson et al. (2010).** Estimated from harvest data for the Kew Park site and the assumption that
2.3.7.3. CBB dynamics. Our formulation for the dynamics of CBBpopulations and availability as bird prey is based on several obser-
Other other-bug-prod 0.0014other-bug-catchability 35
emand of 0.965 kcal/g/d for the pre-nesting period, equivalento 40 kJ/d for a 10-g bird. To convert this demand to g insectrey, we assumed 25 kJ per g dry insect weight (similar to val-es for crickets reported by Levey and Karasov, 1989), a typicalater content of 60%, and a typical energy assimilation efficiency
f 75% (Levey and Karasov reported a metabolizable energy coef-cient of 71–73% for robins and starlings consuming crickets andescribe it as an underestimate). Therefore, each g (wet weight)f prey is assumed equivalent to 0.4 g dry weight and to provide5 kJ × 0.4 g × 0.75 = 7.5 kJ. Therefore, 5 g/d of prey is needed by a0-g bird, matching the general rule-of-thumb that insectivorousirds eat half their body weight per day. The other common migra-ory warblers in Jamaican coffee farms range in body mass from 6.5o 12 g, so are reasonably represented by daily-min-intake of 5 g.
The intake rate is modeled with a simple, conventional, method.e assume a linear “functional response”: the intake rate is pro-
ortional to food availability, so birds must feed longer whenvailability is lower. The slope of intake rate vs. food availabil-ty differs among habitat types and is considered a “catchability”arameter (Section 2.3.7.2) that represents how much time andnergy it takes to find and catch food in a particular kind of habi-at. This simple approach has been supported as adequate (if notlways the best compared to more complex alternatives) by empir-cal studies of birds including Whittingham and Markland (2002),tillman and Simmons (2006), and Baker et al. (2009).
.3.7.2. Bug production and catchability. Bugs are treated as aiomass density of available prey (g bugs/m2). Bugs are assumed toecome available daily at a constant rate: at the start of each day,he initial bug density of each cell is reset to a “production rate” spe-ific to the habitat type. This very simple representation assumesood production is equal to consumption by birds at a daily scale:t the start of each day, the bug biomass consumed on the previousay is replaced.
The daily bug production rates in each habitat type are spec-fied by parameters provided in Table 3. Direct measurements ofrthropod biomass per unit area or the rate of prey intake by birdsere not available. Instead, parameter values for each habitat typeere developed using these steps. The relative biomass density
mong habitat types was estimated from measurements of arthro-od prey biomass per mass of vegetation, made at the study site inhe 2009–2010 winter (Smith, C., et al., unpubl. manuscript “Pre-ictors of aggression in Black-throated Blue Warblers wintering in
amaican coffee farms,” Department of Wildlife, Humboldt Stateniversity), combined with vegetation volume estimates made by
ohnson (1999). These observations indicate that bug availability isighest in forest and trees habitat types, is 90% of the forest value
n high-shade coffee, 30% of the forest value in low-shade coffee,% in unusable habitat, and 8% in other habitat. The bug production
n forest habitat was estimated inversely by assuming a bird forag-ng in unlimited forest, without competition, could obtain its daily
low-shade coffee is 25% more dense than high-shade.*** Mean weight of 100 gravid female CBB (pers. comm., J. Jaramillo, International
Center for Insect Ecology and Physiology, ICIPE, Nairobi, Kenya, 2010).
energy requirement in 8 h. Bug production rates for other habitattypes were then calculated from the forest rate using the abovepercentages.
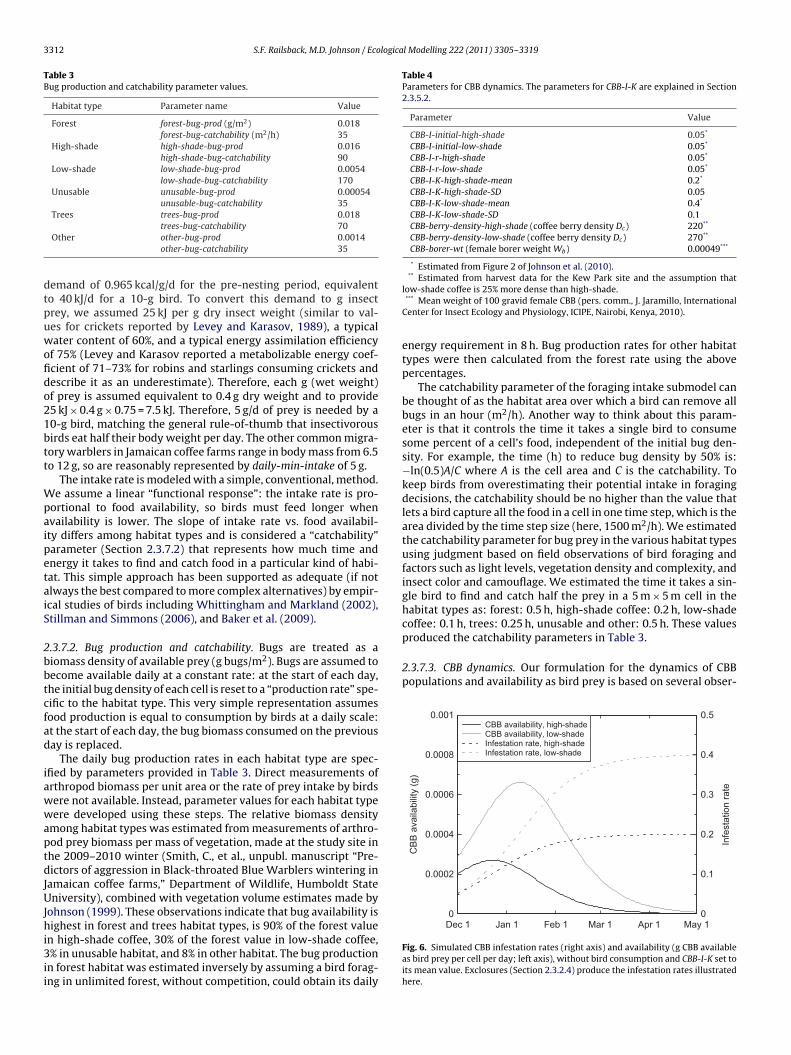
The catchability parameter of the foraging intake submodel canbe thought of as the habitat area over which a bird can remove allbugs in an hour (m2/h). Another way to think about this param-eter is that it controls the time it takes a single bird to consumesome percent of a cell’s food, independent of the initial bug den-sity. For example, the time (h) to reduce bug density by 50% is:−ln(0.5)A/C where A is the cell area and C is the catchability. Tokeep birds from overestimating their potential intake in foragingdecisions, the catchability should be no higher than the value thatlets a bird capture all the food in a cell in one time step, which is thearea divided by the time step size (here, 1500 m2/h). We estimatedthe catchability parameter for bug prey in the various habitat typesusing judgment based on field observations of bird foraging andfactors such as light levels, vegetation density and complexity, andinsect color and camouflage. We estimated the time it takes a sin-gle bird to find and catch half the prey in a 5 m × 5 m cell in thehabitat types as: forest: 0.5 h, high-shade coffee: 0.2 h, low-shadecoffee: 0.1 h, trees: 0.25 h, unusable and other: 0.5 h. These valuesproduced the catchability parameters in Table 3.
Fig. 6. Simulated CBB infestation rates (right axis) and availability (g CBB availableas bird prey per cell per day; left axis), without bird consumption and CBB-I-K set toits mean value. Exclosures (Section 2.3.2.4) produce the infestation rates illustratedhere.

S.F. Railsback, M.D. Johnson / Ecological Modelling 222 (2011) 3305– 3319 3313
Fig. 7. Simulated CBB infestation rates over time, for (a) random, (b) optimal departure, (c) optimal cell-short distance, and (d) optimal cell-long distance foraging theories.N nt lowr
vtaaocatkaitilaiibianas
tabtt
cCadw
arrow black lines represent high-shade coffee habitat and wide grey lines represeepresent results for the five replicate landscapes.
ations and assumptions. First, the model of CBB must representhe infestation rate (Section 2.2.2). Second, the only CBB avail-ble to birds as prey are gravid female beetles when drilling inton uninfested coffee berry. This assumption is supported by ourbservations of bird foraging, and the presumed difficulty of birdsatching CBB while the beetles are flying or inside a berry. Thisssumption also links infestation rate to bird predation: each bee-le captured by a bird while drilling can be equated with one berryept from being infested. Third, we assume infestation rates in thebsence of bird predation follow a logistic curve. This assumptions simple and convenient, but is also supported by field observa-ions (Johnson et al., 2010; Kellermann et al., 2008), which shownfestation rates in the absence of birds rising from an early lowevel until they reach a relatively constant high level. The logisticpproach also makes conceptual sense: at low infestation levels thenfestation rate should increase at an increasing rate because eachnfested berry can produce several gravid females to infest newerries; but at high infestation levels the rate of increase is lim-
ted by the supply of uninfested berries and should asymptoticallypproach 1.0 (when all berries are infested). Finally, this approacheglects the dynamics of coffee itself: production, development,nd harvest of beans. Therefore, it may not be useful outside theeason we simulate.
CBB dynamics are executed at the start of each day by cells ofhe high- and low-shade coffee habitat types. The following stepsre used, with the variable CBB-availability (g) representing theiomass of CBB currently boring into berries, and hence availableo birds, in the cell. Parameter values are in Table 4, and results ofhe submodel are illustrated in Fig. 6.
First, the cell’s infestation rate CBB-I is updated by adding thehange in infestation rate during the previous day (�IP) to it:
BB-I = CBB-I + �IP with �IP = CBB-availability/(Dc × Wb × A). CBB-vailability is the biomass of available CBB at the end of the previousay, Dc is the density of coffee berries (berries/m2), Wb is theeight of a female borer (g), and A is the cell area (m2). On the-shade coffee. Solid lines represent exclosures while the dashed and dotted lines
first day simulated, the value of CBB-availability used in this step iszero.
Second, the current day’s potential change in infestation rate (ifno bird predation; �IC) is calculated from the new value of CBB-I using the logistic assumption: �IC = rI(1 − I/K). Here I representsCBB-I, r represents the infestation increase rate parameter CBB-I-r,and K represents the maximum infestation rate parameter CBB-I-K.
Third, CBB-availability is updated from the fraction of berriesnow being infested: CBB-availability = �IC × Dc × Wb × A.
The bird foraging submodel requires a catchability parameterfor CBB. Because female CBB boring into coffee berries are highexposed, obvious (black beetle on green or bright-red berry), andstationary, we assume their catchability is high. The parameter CBB-catchability is set to 1000 for both high- and low-shade coffee, so abird can consume half of a cell’s available CBB in 1 min.
2.3.7.4. Virtual bird surveys. “Virtual ecologists” are a technique forcomparing simulation results to field data collected in specific ways(Zurell et al., 2010). We model virtual bird surveys to produce out-put comparable to the coffee farm bird surveys of Kellermann et al.(2008). The actual surveys are the basis of characteristic pattern7 (Section 2.2.1). Kellermann et al. counted the birds in 30 plotswithin coffee plantations; the plots were circles with area 400 m2
(radius = 11.3 m). Plots were placed randomly but with centers atleast 10 m apart and 10 m from the plantation boundary. The dis-tance from each plot’s center to the nearest forest or group of treeswas recorded.
The model’s virtual bird surveys reproduce the actual surveyprotocol as closely as possible, with the most important differencebeing the survey plot area. The model tracks bird locations only bywhich cell they are in, so modeled birds can only be counted over
a discrete number of cells. Therefore, the survey plot area was setto the 21 cells (total area of 525 m2) with centers within a distanceof 11.3 m from center of the plot’s central cell. The survey plotsare created at the start of a model run. Thirty plot center cells are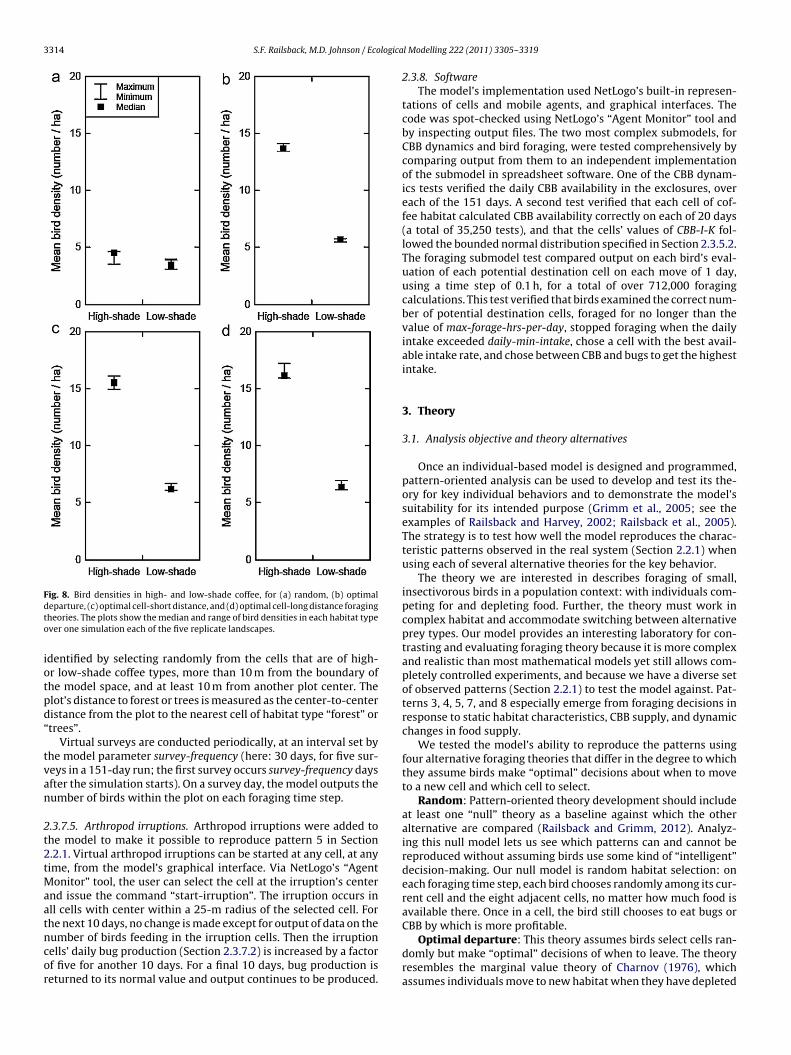
3314 S.F. Railsback, M.D. Johnson / Ecologica
Fig. 8. Bird densities in high- and low-shade coffee, for (a) random, (b) optimaldto
iotpd“
tvan
2t2tMaatncor
eparture, (c) optimal cell-short distance, and (d) optimal cell-long distance foragingheories. The plots show the median and range of bird densities in each habitat typever one simulation each of the five replicate landscapes.
dentified by selecting randomly from the cells that are of high-r low-shade coffee types, more than 10 m from the boundary ofhe model space, and at least 10 m from another plot center. Thelot’s distance to forest or trees is measured as the center-to-centeristance from the plot to the nearest cell of habitat type “forest” ortrees”.
Virtual surveys are conducted periodically, at an interval set byhe model parameter survey-frequency (here: 30 days, for five sur-eys in a 151-day run; the first survey occurs survey-frequency daysfter the simulation starts). On a survey day, the model outputs theumber of birds within the plot on each foraging time step.
.3.7.5. Arthropod irruptions. Arthropod irruptions were added tohe model to make it possible to reproduce pattern 5 in Section.2.1. Virtual arthropod irruptions can be started at any cell, at anyime, from the model’s graphical interface. Via NetLogo’s “Agent
onitor” tool, the user can select the cell at the irruption’s centernd issue the command “start-irruption”. The irruption occurs inll cells with center within a 25-m radius of the selected cell. Forhe next 10 days, no change is made except for output of data on the
umber of birds feeding in the irruption cells. Then the irruptionells’ daily bug production (Section 2.3.7.2) is increased by a factorf five for another 10 days. For a final 10 days, bug production iseturned to its normal value and output continues to be produced.l Modelling 222 (2011) 3305– 3319
2.3.8. SoftwareThe model’s implementation used NetLogo’s built-in represen-
tations of cells and mobile agents, and graphical interfaces. Thecode was spot-checked using NetLogo’s “Agent Monitor” tool andby inspecting output files. The two most complex submodels, forCBB dynamics and bird foraging, were tested comprehensively bycomparing output from them to an independent implementationof the submodel in spreadsheet software. One of the CBB dynam-ics tests verified the daily CBB availability in the exclosures, overeach of the 151 days. A second test verified that each cell of cof-fee habitat calculated CBB availability correctly on each of 20 days(a total of 35,250 tests), and that the cells’ values of CBB-I-K fol-lowed the bounded normal distribution specified in Section 2.3.5.2.The foraging submodel test compared output on each bird’s eval-uation of each potential destination cell on each move of 1 day,using a time step of 0.1 h, for a total of over 712,000 foragingcalculations. This test verified that birds examined the correct num-ber of potential destination cells, foraged for no longer than thevalue of max-forage-hrs-per-day, stopped foraging when the dailyintake exceeded daily-min-intake, chose a cell with the best avail-able intake rate, and chose between CBB and bugs to get the highestintake.
3. Theory
3.1. Analysis objective and theory alternatives
Once an individual-based model is designed and programmed,pattern-oriented analysis can be used to develop and test its the-ory for key individual behaviors and to demonstrate the model’ssuitability for its intended purpose (Grimm et al., 2005; see theexamples of Railsback and Harvey, 2002; Railsback et al., 2005).The strategy is to test how well the model reproduces the charac-teristic patterns observed in the real system (Section 2.2.1) whenusing each of several alternative theories for the key behavior.
The theory we are interested in describes foraging of small,insectivorous birds in a population context: with individuals com-peting for and depleting food. Further, the theory must work incomplex habitat and accommodate switching between alternativeprey types. Our model provides an interesting laboratory for con-trasting and evaluating foraging theory because it is more complexand realistic than most mathematical models yet still allows com-pletely controlled experiments, and because we have a diverse setof observed patterns (Section 2.2.1) to test the model against. Pat-terns 3, 4, 5, 7, and 8 especially emerge from foraging decisions inresponse to static habitat characteristics, CBB supply, and dynamicchanges in food supply.
We tested the model’s ability to reproduce the patterns usingfour alternative foraging theories that differ in the degree to whichthey assume birds make “optimal” decisions about when to moveto a new cell and which cell to select.
Random: Pattern-oriented theory development should includeat least one “null” theory as a baseline against which the otheralternative are compared (Railsback and Grimm, 2012). Analyz-ing this null model lets us see which patterns can and cannot bereproduced without assuming birds use some kind of “intelligent”decision-making. Our null model is random habitat selection: oneach foraging time step, each bird chooses randomly among its cur-rent cell and the eight adjacent cells, no matter how much food isavailable there. Once in a cell, the bird still chooses to eat bugs orCBB by which is more profitable.
Optimal departure: This theory assumes birds select cells ran-domly but make “optimal” decisions of when to leave. The theoryresembles the marginal value theory of Charnov (1976), whichassumes individuals move to new habitat when they have depleted
S.F. Railsback, M.D. Johnson / Ecological Modelling 222 (2011) 3305– 3319 3315
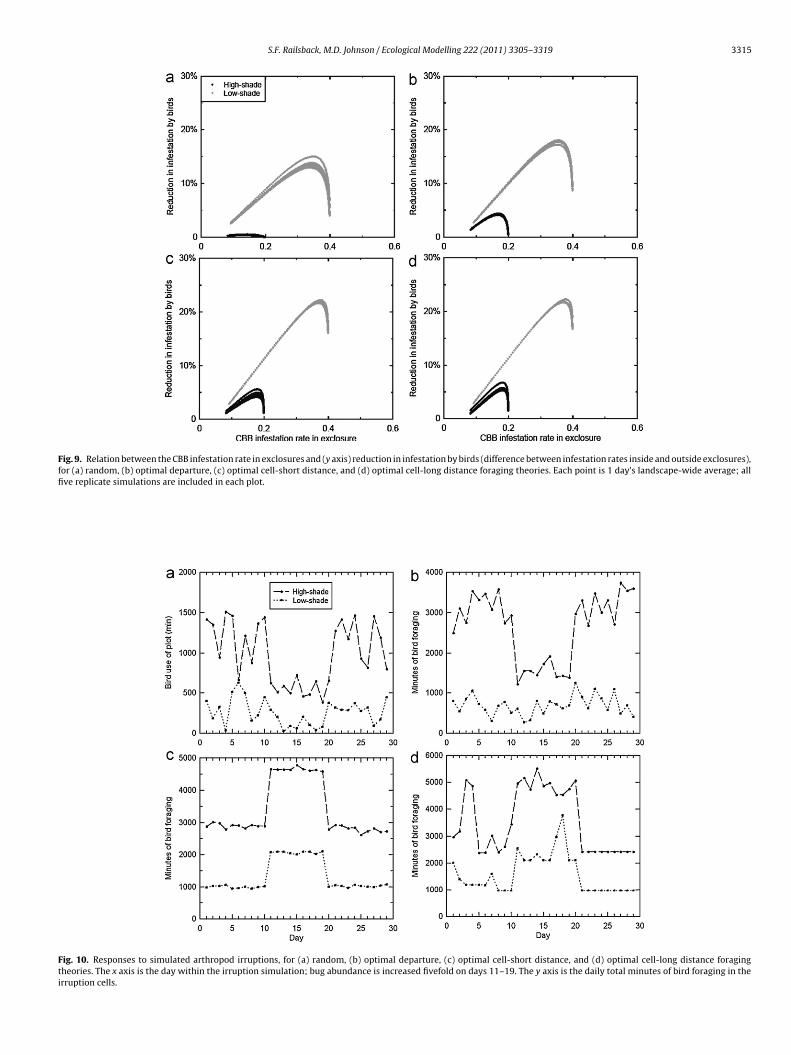
Fig. 9. Relation between the CBB infestation rate in exclosures and (y axis) reduction in infestation by birds (difference between infestation rates inside and outside exclosures),for (a) random, (b) optimal departure, (c) optimal cell-short distance, and (d) optimal cell-long distance foraging theories. Each point is 1 day’s landscape-wide average; allfive replicate simulations are included in each plot.
Fig. 10. Responses to simulated arthropod irruptions, for (a) random, (b) optimal departure, (c) optimal cell-short distance, and (d) optimal cell-long distance foragingtheories. The x axis is the day within the irruption simulation; bug abundance is increased fivefold on days 11–19. The y axis is the daily total minutes of bird foraging in theirruption cells.

3316 S.F. Railsback, M.D. Johnson / Ecologica
Fig. 11. Effects of reduced bug production on simulated bird abundance. (a) Birdabundance over simulated time under the random foraging theory, for five valuesof food-step. Under all foraging theories, abundance decreased stepwise when bugproduction was reduced each 30 days. (b) Final bird abundance vs. food-step for allf
taahuiirtrcir(mdTir
ttBh
tss
our theories, with five landscapes simulated for each value of food-step.
he food at their current location down to the average avail-ble throughout their habitat. Marginal value theory is not clearlypplicable to this model’s context because it assumes that theabitat-wide average food availability is constant over time andnaffected by individual behavior; these assumptions are not true
n our model. We retain the primary assumption of this theory, thatndividuals base habitat selection decisions on the state of their cur-ent cell, not nearby cells. However, we assume individuals baseheir departure decision on their own energetic state, which seemseasonable to assume birds can sense. We assume a bird leaves itsell when the food intake rate it would obtain in the next forag-ng time step falls below the rate needed to meet its daily intakeequirement in the day’s remaining foraging time. At any time th) during daily foraging, the intake rate (g/h) needed for a bird to
eet its daily intake requirement is: (ID − IC)/(TF − t) where ID isaily-min-intake (g), IC is the intake so far on the current day, andF is max-forage-hrs-per-day. When a bird determines that this rates greater than the intake in its current cell, it selects a new cellandomly from among the adjacent cells.
Optimal cell selection over short range: This is our standardheory (Section 2.3.7.1), which assumes birds can sense and selecthe cell offering highest intake rate, but only over a short distance.irds depart their current cell whenever an adjacent one offersigher intake.
Optimal cell selection over long range: The fourth alternative
heory is identical to the third except that birds are assumed toense and select among cells over a much longer distance. Birdselect among cells within a radius of 100 m of their current cell.l Modelling 222 (2011) 3305– 3319
This alternative is designed to test the assumption that birds cansense widespread and detailed information about their habitat.
3.2. Theory testing methods
Each of the foraging theories was implemented in its own ver-sion of the model. To avoid bias due to calibration, the modelwas not calibrated to reproduce any of the patterns in Section2.2.1 quantitatively or qualitatively. Instead, our independent, pre-calibration estimates of parameter values described in Section 2.3were used in all analyses. We ran each version of the model fivetimes, using five replicate landscapes produced by using the meth-ods and parameters of Section 2.3.5.1 with five different randomnumber seeds. We then analyzed the output to determine whetherthe patterns were reproduced. These analyses were generally qual-itative and graphical because the patterns are generally qualitativeand because the model was uncalibrated. Results from the first 14days were excluded from most analyses because bird populationswere still decreasing from their initial high density.
4. Results
4.1. Pattern 1: CBB infestation reduced by birds
Pattern 1 was reproduced to some extent with all four forag-ing theories (Fig. 7): the CBB infestation rate increased over time,and was reduced (compared to rates in exclosures) by bird forag-ing. However, the random foraging model resulted in very littlereduction of CBB infestation in high-shade coffee (Fig. 7a). Birdsreduced CBB infestation the most under the two optimal cell selec-tion theories, with little difference between short- and long-rangecell selection (Fig. 7c and d).
4.2. Pattern 2: CBB infestation higher in low-shade coffee
This pattern was met with all four theories (Fig. 7); it is stronglyimposed by the model’s parameters for CBB dynamics.
4.3. Pattern 3: Bird densities higher in high-shade coffee
This pattern was met with all foraging theories except randomhabitat selection (Fig. 8). With random selection, the difference inbird density between high- and low-shade coffee was very smallor nonexistent; under the other theories bird densities were 2–3times higher in high-shade than in low-shade, matching empiricalobservations.
4.4. Pattern 4: Bird reduction in CBB increases with infestationrate
The model generally reproduced the pattern that birds reduceCBB more at higher infestation rates (Fig. 9). The pattern is notclearly reproduced for high-shade coffee under the random selec-tion and optimal departure foraging theories (Fig. 9a and b).However, these results also depict the model’s assumption thatthe availability of CBB to birds decreases as the infestation rateapproaches its maximum, because fewer females are boring intonew berries (Fig. 6). If this assumption is realistic, then the modelleads us to expect birds to be less effective at reducing CBB infes-tation rates as those rates reach their peak.
4.5. Pattern 5: Birds respond to local irruptions
To test this pattern, we started one arthropod irruption (Section2.3.7.5) each in high- and low-shade coffee. The irruptions werestarted in cells chosen arbitrarily from a region relatively far from
S.F. Railsback, M.D. Johnson / Ecological Modelling 222 (2011) 3305– 3319 3317
F lated
a n num
tttofwbhtw
4
sbefb
sdhmlivt
4a
v
cell selection are distinctly different from the observations in Fig. 2.
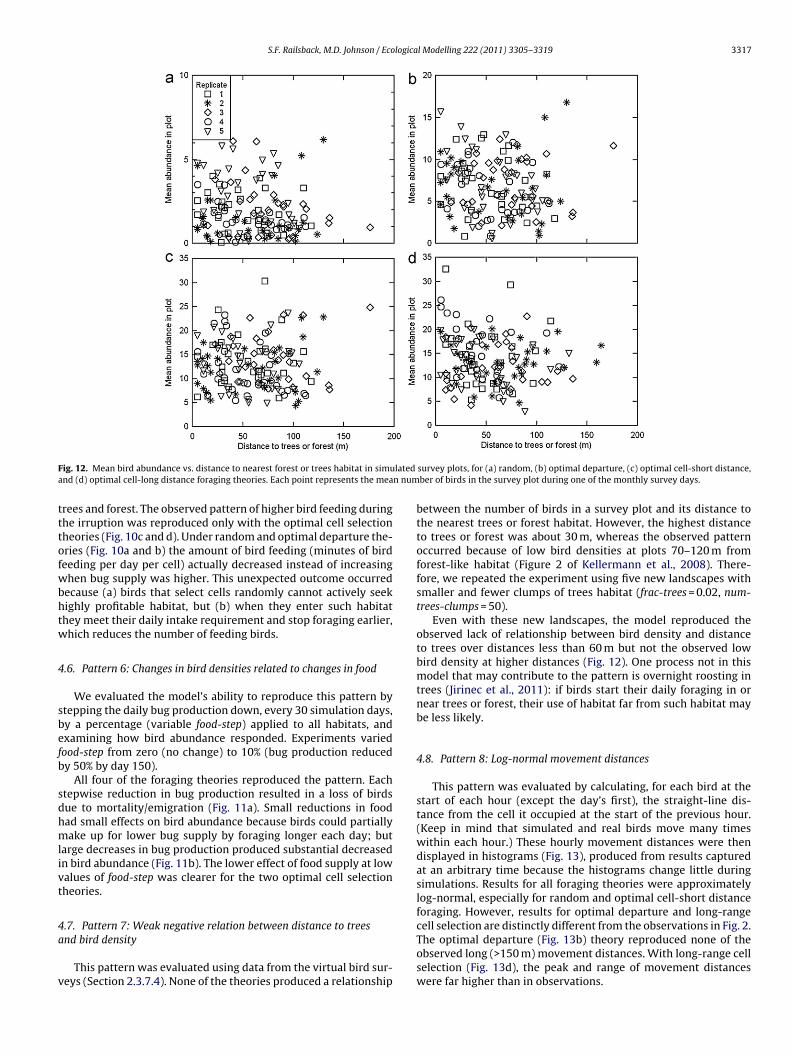
ig. 12. Mean bird abundance vs. distance to nearest forest or trees habitat in simund (d) optimal cell-long distance foraging theories. Each point represents the mea
rees and forest. The observed pattern of higher bird feeding duringhe irruption was reproduced only with the optimal cell selectionheories (Fig. 10c and d). Under random and optimal departure the-ries (Fig. 10a and b) the amount of bird feeding (minutes of birdeeding per day per cell) actually decreased instead of increasinghen bug supply was higher. This unexpected outcome occurred
ecause (a) birds that select cells randomly cannot actively seekighly profitable habitat, but (b) when they enter such habitathey meet their daily intake requirement and stop foraging earlier,hich reduces the number of feeding birds.
.6. Pattern 6: Changes in bird densities related to changes in food
We evaluated the model’s ability to reproduce this pattern bytepping the daily bug production down, every 30 simulation days,y a percentage (variable food-step) applied to all habitats, andxamining how bird abundance responded. Experiments variedood-step from zero (no change) to 10% (bug production reducedy 50% by day 150).
All four of the foraging theories reproduced the pattern. Eachtepwise reduction in bug production resulted in a loss of birdsue to mortality/emigration (Fig. 11a). Small reductions in foodad small effects on bird abundance because birds could partiallyake up for lower bug supply by foraging longer each day; but
arge decreases in bug production produced substantial decreasedn bird abundance (Fig. 11b). The lower effect of food supply at lowalues of food-step was clearer for the two optimal cell selectionheories.
.7. Pattern 7: Weak negative relation between distance to trees
nd bird densityThis pattern was evaluated using data from the virtual bird sur-eys (Section 2.3.7.4). None of the theories produced a relationship
survey plots, for (a) random, (b) optimal departure, (c) optimal cell-short distance,ber of birds in the survey plot during one of the monthly survey days.
between the number of birds in a survey plot and its distance tothe nearest trees or forest habitat. However, the highest distanceto trees or forest was about 30 m, whereas the observed patternoccurred because of low bird densities at plots 70–120 m fromforest-like habitat (Figure 2 of Kellermann et al., 2008). There-fore, we repeated the experiment using five new landscapes withsmaller and fewer clumps of trees habitat (frac-trees = 0.02, num-trees-clumps = 50).
Even with these new landscapes, the model reproduced theobserved lack of relationship between bird density and distanceto trees over distances less than 60 m but not the observed lowbird density at higher distances (Fig. 12). One process not in thismodel that may contribute to the pattern is overnight roosting intrees (Jirinec et al., 2011): if birds start their daily foraging in ornear trees or forest, their use of habitat far from such habitat maybe less likely.
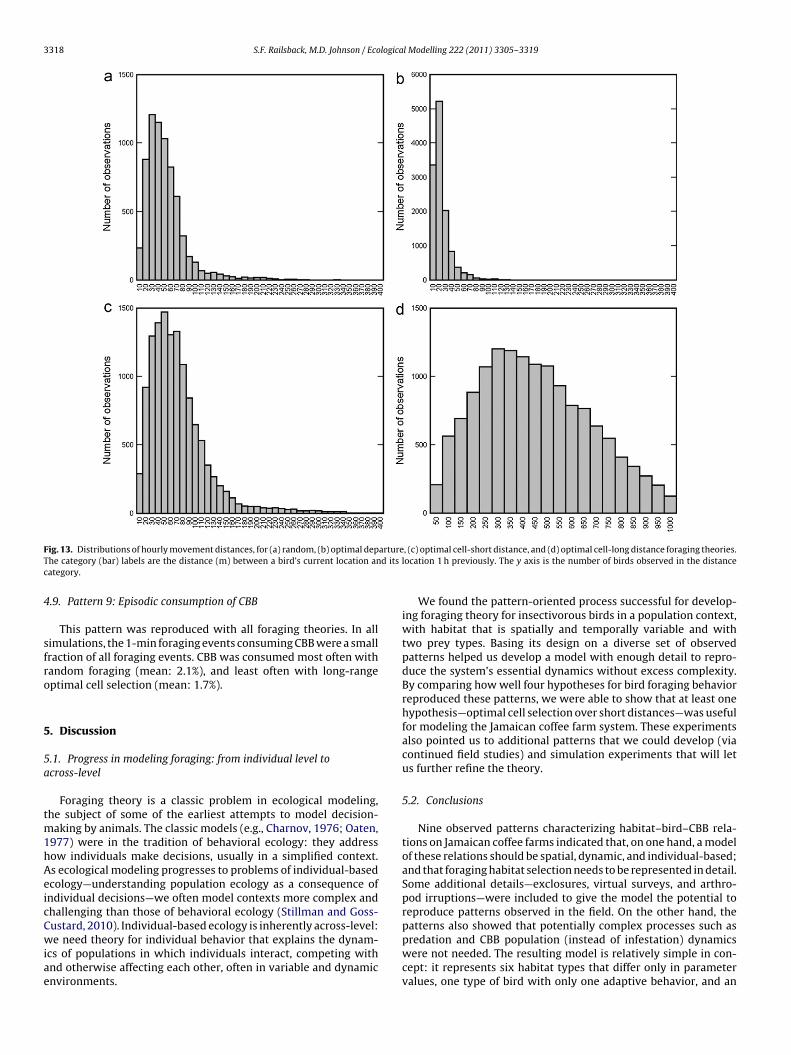
4.8. Pattern 8: Log-normal movement distances
This pattern was evaluated by calculating, for each bird at thestart of each hour (except the day’s first), the straight-line dis-tance from the cell it occupied at the start of the previous hour.(Keep in mind that simulated and real birds move many timeswithin each hour.) These hourly movement distances were thendisplayed in histograms (Fig. 13), produced from results capturedat an arbitrary time because the histograms change little duringsimulations. Results for all foraging theories were approximatelylog-normal, especially for random and optimal cell-short distanceforaging. However, results for optimal departure and long-range
The optimal departure (Fig. 13b) theory reproduced none of theobserved long (>150 m) movement distances. With long-range cellselection (Fig. 13d), the peak and range of movement distanceswere far higher than in observations.
3318 S.F. Railsback, M.D. Johnson / Ecological Modelling 222 (2011) 3305– 3319
F artureT d its
c
4
sfro
5
5a
tm1hAeicCwiae
ig. 13. Distributions of hourly movement distances, for (a) random, (b) optimal dephe category (bar) labels are the distance (m) between a bird’s current location anategory.
.9. Pattern 9: Episodic consumption of CBB
This pattern was reproduced with all foraging theories. In allimulations, the 1-min foraging events consuming CBB were a smallraction of all foraging events. CBB was consumed most often withandom foraging (mean: 2.1%), and least often with long-rangeptimal cell selection (mean: 1.7%).
. Discussion
.1. Progress in modeling foraging: from individual level tocross-level
Foraging theory is a classic problem in ecological modeling,he subject of some of the earliest attempts to model decision-
aking by animals. The classic models (e.g., Charnov, 1976; Oaten,977) were in the tradition of behavioral ecology: they addressow individuals make decisions, usually in a simplified context.s ecological modeling progresses to problems of individual-basedcology—understanding population ecology as a consequence ofndividual decisions—we often model contexts more complex andhallenging than those of behavioral ecology (Stillman and Goss-ustard, 2010). Individual-based ecology is inherently across-level:
e need theory for individual behavior that explains the dynam-cs of populations in which individuals interact, competing withnd otherwise affecting each other, often in variable and dynamicnvironments.
, (c) optimal cell-short distance, and (d) optimal cell-long distance foraging theories.location 1 h previously. The y axis is the number of birds observed in the distance
We found the pattern-oriented process successful for develop-ing foraging theory for insectivorous birds in a population context,with habitat that is spatially and temporally variable and withtwo prey types. Basing its design on a diverse set of observedpatterns helped us develop a model with enough detail to repro-duce the system’s essential dynamics without excess complexity.By comparing how well four hypotheses for bird foraging behaviorreproduced these patterns, we were able to show that at least onehypothesis—optimal cell selection over short distances—was usefulfor modeling the Jamaican coffee farm system. These experimentsalso pointed us to additional patterns that we could develop (viacontinued field studies) and simulation experiments that will letus further refine the theory.
5.2. Conclusions
Nine observed patterns characterizing habitat–bird–CBB rela-tions on Jamaican coffee farms indicated that, on one hand, a modelof these relations should be spatial, dynamic, and individual-based;and that foraging habitat selection needs to be represented in detail.Some additional details—exclosures, virtual surveys, and arthro-pod irruptions—were included to give the model the potential toreproduce patterns observed in the field. On the other hand, thepatterns also showed that potentially complex processes such as
predation and CBB population (instead of infestation) dynamicswere not needed. The resulting model is relatively simple in con-cept: it represents six habitat types that differ only in parametervalues, one type of bird with only one adaptive behavior, and an
logica
imr
ssrcfltn
ddtsnoo
pahOsirsbba
A
tJSgWaa
R
A
B
B
B
B
C
D
E
G
S.F. Railsback, M.D. Johnson / Eco
nsect pest represented only via a simple logistic equation. Yet theodel could, with our standard foraging theory and no calibration,
obustly reproduce almost all the observed patterns.The pattern-oriented analysis of alternative foraging habitat
election theories illustrated that some of the nine patterns weretrongly imposed or “hardwired”—especially, that CBB infestationates increase over time and are higher in low-shade vs. high-shadeoffee. Other patterns emerged robustly under several differentoraging theories: that bird densities are higher in high-shade vs.ow-shade coffee, that birds reduce infestation rates more whenhose rates are high, that hourly movement distances follow a log-ormal distribution, and that CBB consumption is rare and episodic.
Some patterns, though, proved very useful for falsifying candi-ate foraging theories. The observed increase in local bird densitiesuring arthropod food irruptions was reproduced only by theorieshat assume individuals actively seek good habitat cells instead ofelecting cells randomly. Quantitative characteristics of the log-ormal movement distribution were reproduced poorly by theptimal departure theory and, especially, by optimal cell selectionver long distances.
These results indicate that a useful bird foraging theory, in thisopulation-level context, needs to assume that birds have somebility to detect and select habitat where food intake is relativelyigh, but that this selection ability operates over short distances.ur optimal departure theory, which resembles classical models
uch as the marginal value theory, generally produced results sim-lar to those of the optimal cell selection theory, but failed toeproduce patterns that illustrate the ability of birds to activelyelect better habitat when it is available nearby. Classical theory ofehavioral ecology has also been shown inadequate for individual-ased population models of fish (Railsback et al., 1999; Railsbacknd Harvey, 2002).
cknowledgements
The field data necessary for this work was provided by theireless work of: Caitlyn Bishop, Brent Campos, Jay Iwasaki, Vitekirinec, Jherime Kellermann, Michael Mesler, Brian Robinson, Amycarpignato, Chris Smith, and Shannon Wadham. Special thankso to farmers offering hospitality and access to their land: Peterilliams, Gina Green, Calvin James, the Seven Rivers coffee farm,
nd the Coffee Industry Board of Jamaica. Funding was provided byn NSF IRES grant to Matt Johnson and Michael Mesler.
eferences
mano, T., Ushiyama, K., Moriguchi, S., Fujita, G., Higuchi, H., 2006. Decision-makingin group foragers with incomplete information: test of individual-based modelin geese. Ecol. Monogr. 76, 601–616.
aker, D.J., Stillman, R.A., Bullock, J.M., 2009. The effect of habitat complexity on thefunctional response of a seed-eating passerine. Ibis 151, 547–558.
arrera, J.F., Moore, D., Abraham, Y.J., Murphy, S.T., Prior, C.,1990. Biological controlof the coffee berry borer, Hypothenemus hampei, in Mexico and possibilities forfurther action. In: Brighton Crop Protection Conference, Pests and Diseases –1990, vol. 1. British Crop Protection Council, Thornton Heath, UK, pp. 391–396.
atchelor, T.P., Hardy, I.C.W., Berrera, J.F., Pérez-Lachaud, G., 2005. Insect gladia-tors. II. Competitive interactions within and between bethylid parasitoid speciesof the coffee berry borer, Hypothenemus hampei (Coleoptera: Scolytidae). Biol.Control 33, 194–202.
earhop, S., Hilton, G.M., Votier, S.C., Waldron, S., 2004. Stable isotope ratios indicatethat body condition in migrating passerines is influenced by winter habitat. Biol.Lett. 27, 215–218.
harnov, E.L., 1976. Optimal foraging, the marginal value theorem. Theor. Popul.Biol. 9, 129–136.
amon, A., 2000. A review of the biology and control of the coffee berry borer,
Hypothenemus hampei (Coleoptera: Scolytidae). Bull. Entomol. Res. 90, 453–465.mlen, J.M., 1966. The role of time and energy in food preference. Am. Nat. 100,611–617.
reen, R.F., 1980. Bayesian birds: a simple example of Oaten’s stochastic model ofoptimal foraging. Theor. Popul. Biol. 18, 244–256.
l Modelling 222 (2011) 3305– 3319 3319
Grimm, V., Railsback, S.F., 2005. Individual-based Modeling and Ecology. PrincetonUniversity Press, Princeton, New Jersey.
Grimm, V., Revilla, E., Berger, B., Jeltsch, F., Mooij, W.M., Railsback, S.F., et al., 2005.Pattern-oriented modeling of agent-based complex systems: lessons from ecol-ogy. Science 310, 987–991.
Grimm, V., Berger, U., Bastiansen, F., Eliassen, S., Ginot, V., Giske, J., et al., 2006.A standard protocol for describing individual-based and agent-based models.Ecol. Model. 198, 115–296.
Grimm, V., Berger, U., DeAngelis, D.L., Polhill, G., Giske, J., Railsback, S.F., 2010. TheODD protocol: a review and first update. Ecol. Model. 221, 2760–2768.
Holmes, R.T., Black, C.P., Sherry, T.W., 1979. Comparative population bioenergeticsof three insectivorous passerines in a deciduous forest. Condor 81, 9–20.
Jaramillo, J., Bustillo, A.E., Montoya, E.C., Borgemeister, C., 2005. Biological controlof coffee berry borer Hypothenemus hampei (Coleoptera: Curculionidae) by Phy-mastichus coffea (Hymenoptera: Eulophidae) in Colombia. Bull. Entomol. Res. 95,467–472.
Jirinec, V., Campos, B.R., Johnson, M.D., 2011. Roosting behaviour of a migratorysongbird on Jamaican coffee farms: landscape composition may affect deliveryof an ecosystem service. Bird Conserv. Int. 21, 1–9.
Johnson, M.D., 1999. Habitat relationships of migratory birds wintering in Jamaica,West Indies. PhD Dissertation, Tulane University, New Orleans, Louisiana.
Johnson, M.D., 2000. Effects of shade-tree species and crop structure on the winterarthropod and bird communities in a Jamaican shade coffee plantation. Biotrop-ica 32, 133–145.
Johnson, M.D., Sherry, T.W., 2001. Effects of food availability on the distribution ofmigratory warblers among habitats in Jamaica. J. Anim. Ecol. 70, 546–560.
Johnson, M.D., Sherry, T.W., Holmes, R.T., Marra, P.P., 2006. Assessing habitat qualityfor a migratory songbird wintering in natural and agricultural habitats. Conserv.Biol. 20, 1433–1444.
Johnson, M.D., Kellermann, J.L., Stercho, A.M., 2010. Pest reduction services by birdsin shade and sun coffee in Jamaica. Anim. Conserv. 13, 140–147.
Kellermann, J.L., Johnson, M.D., Stercho, A.M., Hackett, S.C., 2008. Ecological andeconomic services provided by birds on Jamaican Blue Mountain coffee farms.Conserv. Biol. 22, 1177–1185.
Krebs, J.R., Ryan, J.C., Charnov, E.L., 1974. Hunting by expectation or optimal forag-ing? A study of patch use by chickadees. Anim. Behav. 22, 953–964.
LePelley, R.H., 1973. Coffee insects. Ann. Rev. Entomol. 18, 121–142.Levey, D.J., Karasov, W.H., 1989. Digestive responses of temperate birds switched to
fruit or insect diets. Auk 106, 675–689.MacArthur, R.H., Pianka, E.R., 1966. On optimal use of a patchy environment. Am.
Nat. 100, 603–609.Moguel, P., Toledo, V.M., 1999. Biodiversity conservation in traditional coffee sys-
tems of Mexico. Conserv. Biol. 13, 11–21.Nagy, L.R., Stanculescu, D., Holmes, R.T., 2007. Mass loss by breeding female
songbirds: food supplementation supports energetic stress hypothesis in black-throated blue warblers. Condor 109, 304–311.
Norris, D.R., Marra, P.P., Kyser, T.K., Sherry, T.W., Ratcliffe, L.M., 2004. Tropical win-ter habitat limits reproductive success on the temperate breeding grounds in amigratory bird. Proc. R. Soc. B 271, 59–64.
Oaten, A., 1977. Optimal foraging in patches: a case for stochasticity. Theor. Popul.Biol. 12, 263–285.
O’Brien, T.G., Kinnaird, M.F., 2003. Caffeine and conservation. Science 300, 587.Pyke, G.H., Pulliam, H.R., Charnov, E.L., 1977. Optimal foraging: a selective review of
theory and tests. Q. Rev. Biol. 52, 137–154.Railsback, S.F., Lamberson, R.H., Harvey, B.C., Duffy, W.E., 1999. Movement rules
for spatially explicit individual-based models of stream fish. Ecol. Model. 123,73–89.
Railsback, S.F., Harvey, B.C., 2002. Analysis of habitat selection rules using anindividual-based model. Ecology 83, 1817–1830.
Railsback, S.F., Harvey, B.C., Hayse, J.W., LaGory, K.E., 2005. Tests of theory for dielvariation in salmonid feeding activity and habitat use. Ecology 86, 947–959.
Railsback, S.F., Grimm, V., 2012. Agent-based and Individual-based Modeling: APractical Introduction. Princeton University Press, Princeton, New Jersey.
Shochat, E., Lerman, S.B., Katti, M., Lewis, D.B., 2004. Linking optimal foraging behav-ior to bird community structure in an urban-desert landscape: field experimentswith artificial food patches. Am. Nat. 164, 232–243.
Stillman, R.A., Goss-Custard, J.D., West, A.D., Durell SEAVld, Caldow, R.W.G.,McGrorty, S., Clarke, R.T., 2000. Predicting mortality in novel environments: testsand sensitivity of a behaviour-based model. J. Appl. Ecol. 37, 564–588.
Stillman, R.A., Simmons, V.L., 2006. Predicting the functional response of a farmlandbird. Funct. Ecol. 20, 723–730.
Stillman, R.A., Goss-Custard, J.D., 2010. Individual-based ecology of coastal birds.Biol. Rev. 85, 265–276.
Vandermeer, J.H. (Ed.), 2003. Tropical Agroecosystems. CRC Press, Boca Raton,Florida.
Whittingham, M.J., Markland, H.M., 2002. The influence of substrate on the func-tional response of an avian granivore and its implications for farmland birdconservation. Oecologia 130, 637–644.
Wilensky, U., 1999. NetLogo. http://ccl.northwestern.edu/netlogo/. Center for Con-
nected Learning and Computer-Based Modeling, Northwestern University,Evanston, IL.Zurell, D., Berger, U., Cabral, J.S., Jeltsch, F., Meynard, C.N., Münkemüller, T., Nehrbass,N., Pagel, J., Reineking, B., Schröder, B., Grimm, V., 2010. The virtual ecologistapproach: simulating data and observers. Oikos 221, 98–105.
Related Documents