Working Paper Series No. E/302/2009 Pattern of Agricultural Diversification in India Brajesh Jha Nitesh Kumar Biswajit Mohanty Institute of Economic Growth University of Delhi Enclave North Campus Delhi – 110 007, India Fax: 91-11-27667410 Gram: GROWTH – Delhi – 110 007 Phones: +91-11-27667101, 27667288, 27667365 WEBSITE: iegindia.org

Welcome message from author
This document is posted to help you gain knowledge. Please leave a comment to let me know what you think about it! Share it to your friends and learn new things together.
Transcript
Working Paper Series No. E/302/2009
Pattern of Agricultural Diversification in India
Brajesh Jha Nitesh Kumar
Biswajit Mohanty
Institute of Economic Growth University of Delhi Enclave
North Campus Delhi – 110 007, India Fax: 91-11-27667410
Gram: GROWTH – Delhi – 110 007 Phones: +91-11-27667101, 27667288, 27667365
WEBSITE: iegindia.org
1
Pattern of Agricultural Diversification in India
Brajesh Jha, Nitesh Kumar and Biswajit Mohanty•
Abstract
Agricultural diversification as measured by increase in the percent of non-food crops has
grown; whereas diversification as measured by the concentration indices has remained
unchanged in the recent decade. There have been significant changes in the pattern of
agricultural diversification at the regional level. Within a region, smaller sub-regions or
pockets of specialization in certain crops and crop-groups have emerged. Farms do not
remain diversified and the usual notion of crop diversification as a risk management
practice is also belied in the present study. The study also found certain kind of structural
changes in all sub-sectors of agriculture: crop, livestock, and fisheries. Concerns over
extreme effects of such changes are however, not valid.
I. Introduction
In relation to agricultural development, “diversification” is probably one of the most
frequently used terms in the recent decade. Traditionally, diversification was used more
in the context of a subsistence kind of farming, wherein farmers grew many crops on
their farm. The household level food security as also risk was an important consideration
in diversification. In the recent decade, diversification is increasingly being used to
describe increase in area under high value crops1. In this perspective one would like to
know what exactly diversification is? Diversification originated from the word
“diverge”, which means to move or extend in a different direction from a common point.
In this sense diversification is the opposite of concentration, therefore, most of the
• Associate Professor in the Institute of Economic Growth, coauthors have worked in the institute as Research Analyst. 1 In agriculture the concept of high value crops emerged with trade liberalization in the 1990s; during the initial years of trade liberalization gap between per unit cost of production and export prices was significantly higher in certain commodities. These commodities have been frequently referred as high value crops.
2
techniques of measuring diversification actually measures concentration in the system. In
economics, diversification refers to a situation in which decrease in the dominance of an
activity, alternately increase in the share of many activities in a system is depicted.
Extending the same notion to agriculture means increase in the share of many
commodities in agricultural income may be termed as income diversification in
agriculture; whereas increase in the share of withdrawal of a resource by many crops
may be termed as resource diversification in agriculture. Diversification is therefore
measured with concentration ratios.
The concentration indices however do not explain the alternate definition of agricultural
diversification that is, increase in the share of high value crops in agriculture. The notion
of ‘high value’ has emerged after liberalization of trade in agriculture. This largely refers
to those commodities for which exports were liberalized during the mid-1990s and
differences between domestic and international prices were high at least during the initial
period of trade liberalization2. The high value range of crops is definitely wider than
fruits and vegetables. The present study therefore measures diversification with the
changes in the percent of non-food crops at the aggregate level. This will also contribute
to the recent debate on food versus non-food crops in the country.
The present paper while examining the pattern of diversification in Indian agriculture
also assesses the potential of the so-called high value commodities in augmenting
agricultural diversification in the country. The study takes into account alternate
definitions of agricultural diversification; first definition is based on a concentration
index, whereas second is based on the percent of gross cropped area under non-food
crops. Also it takes note of different bases of measuring diversification more
importantly, income-, output-, and resource-based agricultural diversification. While
income or output diversification has been studied at the country level as well as state;
resource diversification is examined at the level of country, state and district. After
studying resource diversification at the country level as also involving states; one of the
relatively progressive states, Haryana has been chosen purposively to study
diversification at the levels of state involving districts of the state. An average farm is
finally, chosen to study diversification at the micro- level. The reference period of the
2 The literature on the high value categorizes basmati rice besides fruits and vegetables as high value commodities (Haque 1995). The present study therefore considers all those commodities as high value crops, exports of which were liberalized in the mid-nineties and difference in the domestic cost of production and export price for which was high
3
study largely deals with the post 1980s but varies across the analysis depending on the
availability of data. The present paper proceeds as follows: Sections II and III study
diversification in agricultural income and agricultural production at the aggregate level;
subsequently, Sections IV, V and VI study resource diversification at the country, state
and farm-level; finally, Section VII concludes the discussion of the study.
II. Agriculture Income Diversification
The Aggregate Agricultural income (agriculture gross domestic product at factor cost,
GDP at factor cost) as per the CSO annual series consists of income from crop outputs
(field and plantation crops), livestock, fisheries and forestry. Again at the individual
sub-sector level, income or GDP at factor cost is available separately for fisheries and the
forestry sector; GDP at factor cost is not available separately for the crop and livestock
sector. Agricultural GDP at factor cost is available from the combined outputs of crop
and livestock. The contribution of agriculture in total GDP as is known widely is
decreasing, and the share of industry and the service sector in the economy is increasing.
The decline in the share of agricultural GDP has been rapid during the post-liberalization
period; in spite of the fact that growth of agricultural income during the 1990s has been
marginally higher than the corresponding rate of growth in the 1980s. Growth in
agriculture has stagnated towards the end of the 1990s and decelerated thereafter. In this
context, the composition of income from agriculture and allied sector of economy has
been studied.
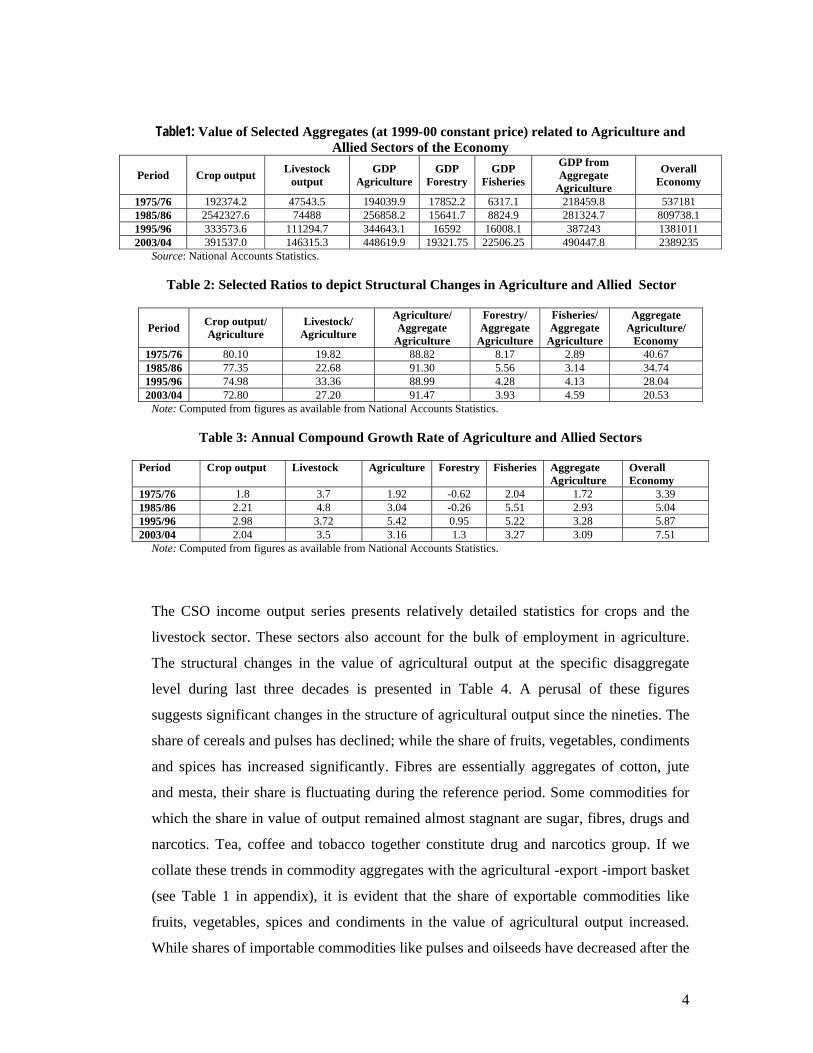
The agricultural commodity basket has changed significantly during the reference period.
A temporal comparison of the various constituents of agricultural income at 1999-2000
prices is presented in Tables1, 2 and 3. These tables show that after the 1980s livestock
has been growing at a rate of around 4 per cent. As a result of high growth, livestock
now accounts for around 27 percent of agricultural (crop and plantation) output. The
corresponding figure in the initial year of reference was less than 20 percent. GDP from
fisheries has been increasing at an exponential rate of around 2 percent after the 1980s;
its share in aggregate agriculture GDP has improved from 2.9 to 4.6 per cent during the
reference period. The growth rate of fisheries has however decelerated during the 1990s.
Forestry, another sub-sector of agriculture presents a different picture. The rate of growth
of GDP forestry was abysmally low during the eighties; the corresponding figure
however, improved in the subsequent decades.
4
Table1: Value of Selected Aggregates (at 1999-00 constant price) related to Agriculture and Allied Sectors of the Economy
Source: National Accounts Statistics.
Table 2: Selected Ratios to depict Structural Changes in Agriculture and Allied Sector
Note: Computed from figures as available from National Accounts Statistics.
Table 3: Annual Compound Growth Rate of Agriculture and Allied Sectors
Period Crop output Livestock Agriculture Forestry Fisheries Aggregate Agriculture
Overall Economy
1975/76 1.8 3.7 1.92 -0.62 2.04 1.72 3.39 1985/86 2.21 4.8 3.04 -0.26 5.51 2.93 5.04 1995/96 2.98 3.72 5.42 0.95 5.22 3.28 5.87 2003/04 2.04 3.5 3.16 1.3 3.27 3.09 7.51
Note: Computed from figures as available from National Accounts Statistics.
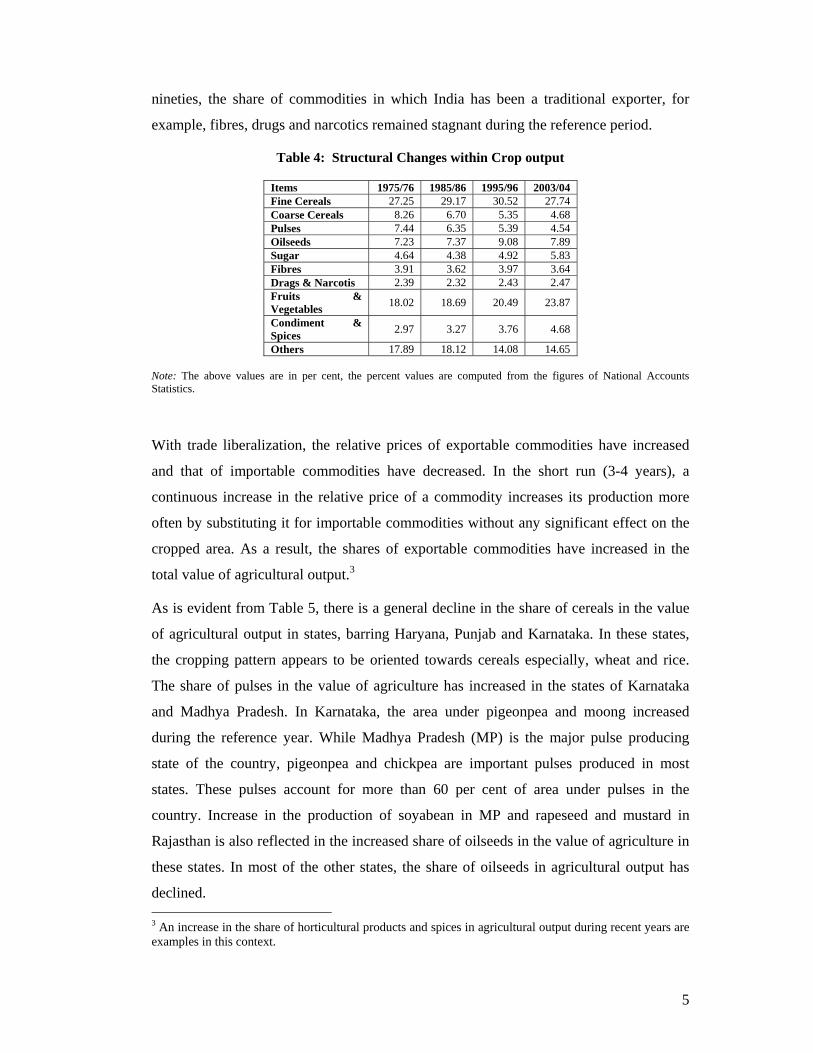
The CSO income output series presents relatively detailed statistics for crops and the
livestock sector. These sectors also account for the bulk of employment in agriculture.
The structural changes in the value of agricultural output at the specific disaggregate
level during last three decades is presented in Table 4. A perusal of these figures
suggests significant changes in the structure of agricultural output since the nineties. The
share of cereals and pulses has declined; while the share of fruits, vegetables, condiments
and spices has increased significantly. Fibres are essentially aggregates of cotton, jute
and mesta, their share is fluctuating during the reference period. Some commodities for
which the share in value of output remained almost stagnant are sugar, fibres, drugs and
narcotics. Tea, coffee and tobacco together constitute drug and narcotics group. If we
collate these trends in commodity aggregates with the agricultural -export -import basket
(see Table 1 in appendix), it is evident that the share of exportable commodities like
fruits, vegetables, spices and condiments in the value of agricultural output increased.
While shares of importable commodities like pulses and oilseeds have decreased after the
Period Crop output Livestock output
GDP Agriculture
GDP Forestry
GDP Fisheries
GDP from Aggregate
Agriculture
Overall Economy
1975/76 192374.2 47543.5 194039.9 17852.2 6317.1 218459.8 537181 1985/86 2542327.6 74488 256858.2 15641.7 8824.9 281324.7 809738.1 1995/96 333573.6 111294.7 344643.1 16592 16008.1 387243 1381011 2003/04 391537.0 146315.3 448619.9 19321.75 22506.25 490447.8 2389235
Period Crop output/ Agriculture
Livestock/ Agriculture
Agriculture/ Aggregate
Agriculture
Forestry/ Aggregate
Agriculture
Fisheries/ Aggregate
Agriculture
Aggregate Agriculture/
Economy 1975/76 80.10 19.82 88.82 8.17 2.89 40.67 1985/86 77.35 22.68 91.30 5.56 3.14 34.74 1995/96 74.98 33.36 88.99 4.28 4.13 28.04 2003/04 72.80 27.20 91.47 3.93 4.59 20.53
5
nineties, the share of commodities in which India has been a traditional exporter, for
example, fibres, drugs and narcotics remained stagnant during the reference period.
Table 4: Structural Changes within Crop output
Items 1975/76 1985/86 1995/96 2003/04 Fine Cereals 27.25 29.17 30.52 27.74 Coarse Cereals 8.26 6.70 5.35 4.68 Pulses 7.44 6.35 5.39 4.54 Oilseeds 7.23 7.37 9.08 7.89 Sugar 4.64 4.38 4.92 5.83 Fibres 3.91 3.62 3.97 3.64 Drags & Narcotis 2.39 2.32 2.43 2.47 Fruits & Vegetables 18.02 18.69 20.49 23.87
Condiment & Spices 2.97 3.27 3.76 4.68
Others 17.89 18.12 14.08 14.65 Note: The above values are in per cent, the percent values are computed from the figures of National Accounts Statistics.
With trade liberalization, the relative prices of exportable commodities have increased
and that of importable commodities have decreased. In the short run (3-4 years), a
continuous increase in the relative price of a commodity increases its production more
often by substituting it for importable commodities without any significant effect on the
cropped area. As a result, the shares of exportable commodities have increased in the
total value of agricultural output.3
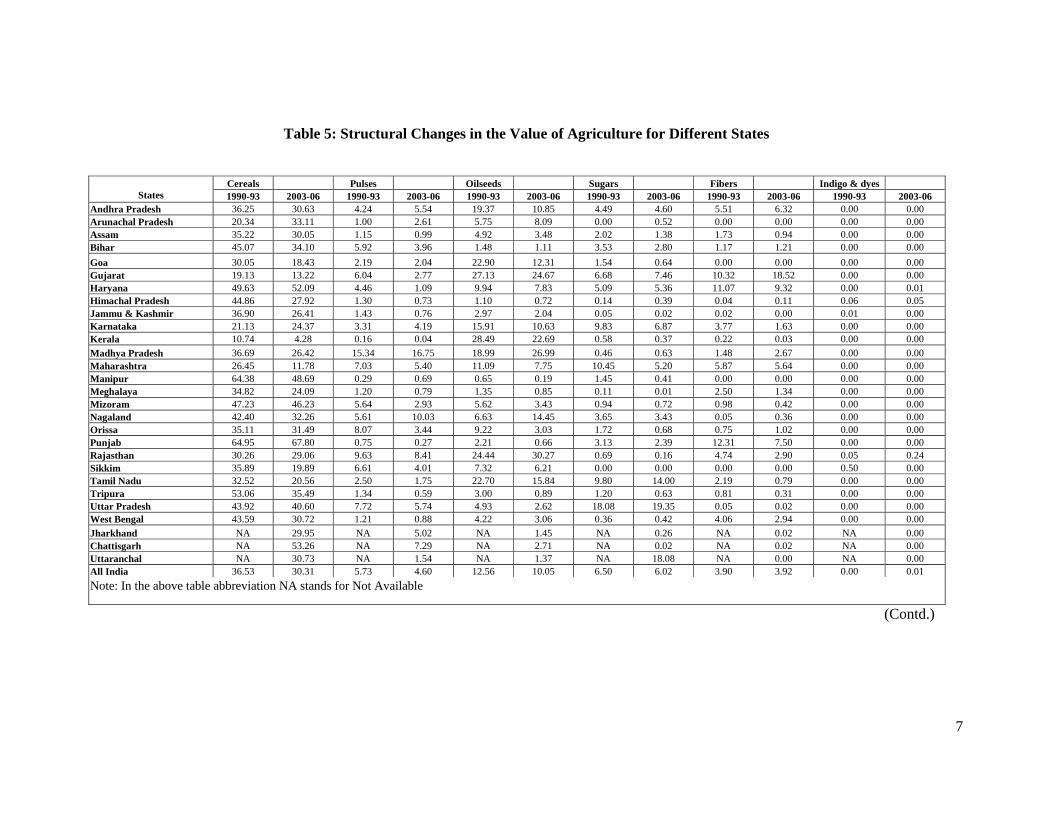
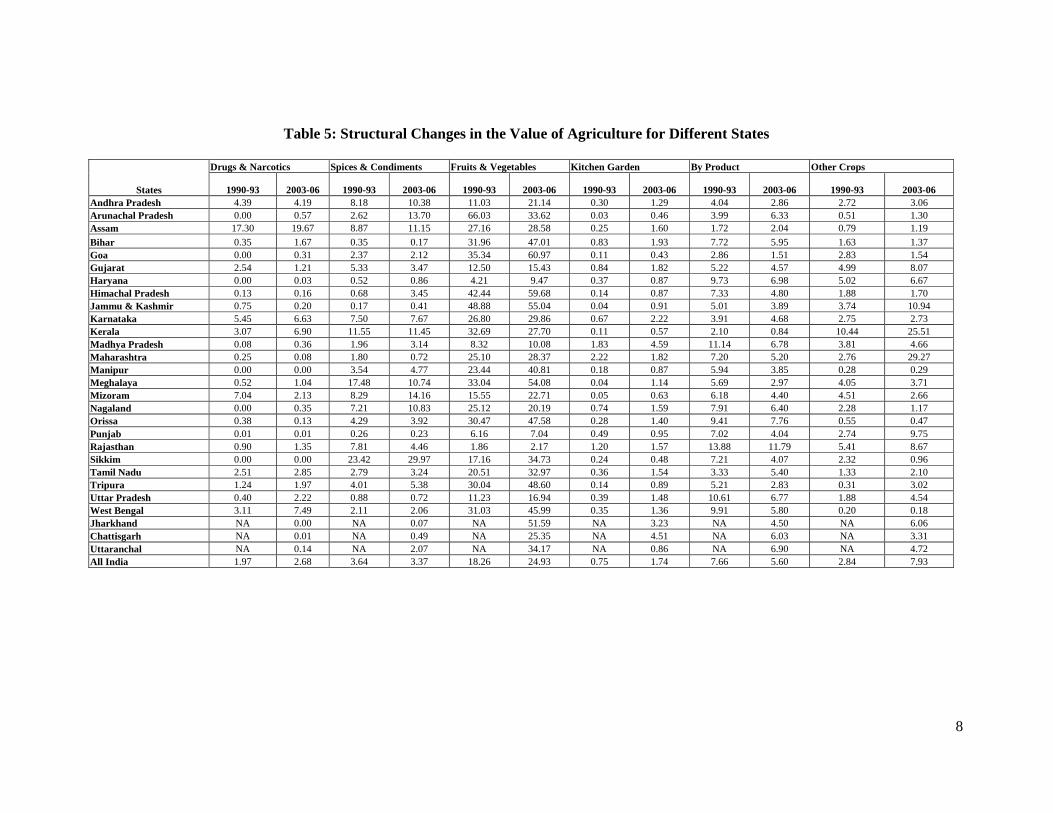
As is evident from Table 5, there is a general decline in the share of cereals in the value
of agricultural output in states, barring Haryana, Punjab and Karnataka. In these states,
the cropping pattern appears to be oriented towards cereals especially, wheat and rice.
The share of pulses in the value of agriculture has increased in the states of Karnataka
and Madhya Pradesh. In Karnataka, the area under pigeonpea and moong increased
during the reference year. While Madhya Pradesh (MP) is the major pulse producing
state of the country, pigeonpea and chickpea are important pulses produced in most
states. These pulses account for more than 60 per cent of area under pulses in the
country. Increase in the production of soyabean in MP and rapeseed and mustard in
Rajasthan is also reflected in the increased share of oilseeds in the value of agriculture in
these states. In most of the other states, the share of oilseeds in agricultural output has
declined. 3 An increase in the share of horticultural products and spices in agricultural output during recent years are examples in this context.
6
The share of sugar did not change significantly during the reference periods; though a
significant reorientation in the structure of production of sugar is evident from states. In
Maharashtra, the share of sugar in the recent decade is only one-half the share of the
previous decade. Tamilnadu and UP improved their shares in the sugarcane production
of the country. The share of fibres in total value of agricultural output has increased
considerably in Andhra Pradesh and Gujarat, primarily due to increase in the area under
cotton in these states. One of the important commodity groups, which have registered an
increase of its share in the agricultural commodity basket in most of the states, is fruits
and vegetables. The share of fruits and vegetables has increased considerably in
Himachal Pradesh, Bihar, and West Bengal, Tamilnadu, Andhra Pradesh and most of the
North Eastern states. Fruits and vegetables are increasingly being considered as engine of
agricultural growth in the country. There are also doubts about this potential and this
concern is examined here.
7
Table 5: Structural Changes in the Value of Agriculture for Different States
(Contd.)
Cereals Pulses Oilseeds Sugars Fibers Indigo & dyes States 1990-93 2003-06 1990-93 2003-06 1990-93 2003-06 1990-93 2003-06 1990-93 2003-06 1990-93 2003-06
Andhra Pradesh 36.25 30.63 4.24 5.54 19.37 10.85 4.49 4.60 5.51 6.32 0.00 0.00 Arunachal Pradesh 20.34 33.11 1.00 2.61 5.75 8.09 0.00 0.52 0.00 0.00 0.00 0.00 Assam 35.22 30.05 1.15 0.99 4.92 3.48 2.02 1.38 1.73 0.94 0.00 0.00 Bihar 45.07 34.10 5.92 3.96 1.48 1.11 3.53 2.80 1.17 1.21 0.00 0.00 Goa 30.05 18.43 2.19 2.04 22.90 12.31 1.54 0.64 0.00 0.00 0.00 0.00 Gujarat 19.13 13.22 6.04 2.77 27.13 24.67 6.68 7.46 10.32 18.52 0.00 0.00 Haryana 49.63 52.09 4.46 1.09 9.94 7.83 5.09 5.36 11.07 9.32 0.00 0.01 Himachal Pradesh 44.86 27.92 1.30 0.73 1.10 0.72 0.14 0.39 0.04 0.11 0.06 0.05 Jammu & Kashmir 36.90 26.41 1.43 0.76 2.97 2.04 0.05 0.02 0.02 0.00 0.01 0.00 Karnataka 21.13 24.37 3.31 4.19 15.91 10.63 9.83 6.87 3.77 1.63 0.00 0.00 Kerala 10.74 4.28 0.16 0.04 28.49 22.69 0.58 0.37 0.22 0.03 0.00 0.00 Madhya Pradesh 36.69 26.42 15.34 16.75 18.99 26.99 0.46 0.63 1.48 2.67 0.00 0.00 Maharashtra 26.45 11.78 7.03 5.40 11.09 7.75 10.45 5.20 5.87 5.64 0.00 0.00 Manipur 64.38 48.69 0.29 0.69 0.65 0.19 1.45 0.41 0.00 0.00 0.00 0.00 Meghalaya 34.82 24.09 1.20 0.79 1.35 0.85 0.11 0.01 2.50 1.34 0.00 0.00 Mizoram 47.23 46.23 5.64 2.93 5.62 3.43 0.94 0.72 0.98 0.42 0.00 0.00 Nagaland 42.40 32.26 5.61 10.03 6.63 14.45 3.65 3.43 0.05 0.36 0.00 0.00 Orissa 35.11 31.49 8.07 3.44 9.22 3.03 1.72 0.68 0.75 1.02 0.00 0.00 Punjab 64.95 67.80 0.75 0.27 2.21 0.66 3.13 2.39 12.31 7.50 0.00 0.00 Rajasthan 30.26 29.06 9.63 8.41 24.44 30.27 0.69 0.16 4.74 2.90 0.05 0.24 Sikkim 35.89 19.89 6.61 4.01 7.32 6.21 0.00 0.00 0.00 0.00 0.50 0.00 Tamil Nadu 32.52 20.56 2.50 1.75 22.70 15.84 9.80 14.00 2.19 0.79 0.00 0.00 Tripura 53.06 35.49 1.34 0.59 3.00 0.89 1.20 0.63 0.81 0.31 0.00 0.00 Uttar Pradesh 43.92 40.60 7.72 5.74 4.93 2.62 18.08 19.35 0.05 0.02 0.00 0.00 West Bengal 43.59 30.72 1.21 0.88 4.22 3.06 0.36 0.42 4.06 2.94 0.00 0.00 Jharkhand NA 29.95 NA 5.02 NA 1.45 NA 0.26 NA 0.02 NA 0.00 Chattisgarh NA 53.26 NA 7.29 NA 2.71 NA 0.02 NA 0.02 NA 0.00 Uttaranchal NA 30.73 NA 1.54 NA 1.37 NA 18.08 NA 0.00 NA 0.00 All India 36.53 30.31 5.73 4.60 12.56 10.05 6.50 6.02 3.90 3.92 0.00 0.01 Note: In the above table abbreviation NA stands for Not Available
8
Table 5: Structural Changes in the Value of Agriculture for Different States
Drugs & Narcotics Spices & Condiments Fruits & Vegetables Kitchen Garden By Product Other Crops
States 1990-93 2003-06 1990-93 2003-06 1990-93 2003-06 1990-93 2003-06 1990-93 2003-06 1990-93 2003-06 Andhra Pradesh 4.39 4.19 8.18 10.38 11.03 21.14 0.30 1.29 4.04 2.86 2.72 3.06 Arunachal Pradesh 0.00 0.57 2.62 13.70 66.03 33.62 0.03 0.46 3.99 6.33 0.51 1.30 Assam 17.30 19.67 8.87 11.15 27.16 28.58 0.25 1.60 1.72 2.04 0.79 1.19 Bihar 0.35 1.67 0.35 0.17 31.96 47.01 0.83 1.93 7.72 5.95 1.63 1.37 Goa 0.00 0.31 2.37 2.12 35.34 60.97 0.11 0.43 2.86 1.51 2.83 1.54 Gujarat 2.54 1.21 5.33 3.47 12.50 15.43 0.84 1.82 5.22 4.57 4.99 8.07 Haryana 0.00 0.03 0.52 0.86 4.21 9.47 0.37 0.87 9.73 6.98 5.02 6.67 Himachal Pradesh 0.13 0.16 0.68 3.45 42.44 59.68 0.14 0.87 7.33 4.80 1.88 1.70 Jammu & Kashmir 0.75 0.20 0.17 0.41 48.88 55.04 0.04 0.91 5.01 3.89 3.74 10.94 Karnataka 5.45 6.63 7.50 7.67 26.80 29.86 0.67 2.22 3.91 4.68 2.75 2.73 Kerala 3.07 6.90 11.55 11.45 32.69 27.70 0.11 0.57 2.10 0.84 10.44 25.51 Madhya Pradesh 0.08 0.36 1.96 3.14 8.32 10.08 1.83 4.59 11.14 6.78 3.81 4.66 Maharashtra 0.25 0.08 1.80 0.72 25.10 28.37 2.22 1.82 7.20 5.20 2.76 29.27 Manipur 0.00 0.00 3.54 4.77 23.44 40.81 0.18 0.87 5.94 3.85 0.28 0.29 Meghalaya 0.52 1.04 17.48 10.74 33.04 54.08 0.04 1.14 5.69 2.97 4.05 3.71 Mizoram 7.04 2.13 8.29 14.16 15.55 22.71 0.05 0.63 6.18 4.40 4.51 2.66 Nagaland 0.00 0.35 7.21 10.83 25.12 20.19 0.74 1.59 7.91 6.40 2.28 1.17 Orissa 0.38 0.13 4.29 3.92 30.47 47.58 0.28 1.40 9.41 7.76 0.55 0.47 Punjab 0.01 0.01 0.26 0.23 6.16 7.04 0.49 0.95 7.02 4.04 2.74 9.75 Rajasthan 0.90 1.35 7.81 4.46 1.86 2.17 1.20 1.57 13.88 11.79 5.41 8.67 Sikkim 0.00 0.00 23.42 29.97 17.16 34.73 0.24 0.48 7.21 4.07 2.32 0.96 Tamil Nadu 2.51 2.85 2.79 3.24 20.51 32.97 0.36 1.54 3.33 5.40 1.33 2.10 Tripura 1.24 1.97 4.01 5.38 30.04 48.60 0.14 0.89 5.21 2.83 0.31 3.02 Uttar Pradesh 0.40 2.22 0.88 0.72 11.23 16.94 0.39 1.48 10.61 6.77 1.88 4.54 West Bengal 3.11 7.49 2.11 2.06 31.03 45.99 0.35 1.36 9.91 5.80 0.20 0.18 Jharkhand NA 0.00 NA 0.07 NA 51.59 NA 3.23 NA 4.50 NA 6.06 Chattisgarh NA 0.01 NA 0.49 NA 25.35 NA 4.51 NA 6.03 NA 3.31 Uttaranchal NA 0.14 NA 2.07 NA 34.17 NA 0.86 NA 6.90 NA 4.72 All India 1.97 2.68 3.64 3.37 18.26 24.93 0.75 1.74 7.66 5.60 2.84 7.93
9
Potential of Horticulture- based Agricultural Diversification
There have been studies (Joshi et al. 2007) eulogizing the role of fruits, vegetables and
similar exportable crops often termed as ‘high value’ crops in the ongoing
diversification-led growth of Indian agriculture. The potential of fruits and vegetables as
the new source of growth can be examined in terms of supply and demand side factors.
The demand-side pull for fruits and vegetables was further strengthened with the opening
up of the economy and increase in per capita income. The prices of fruits and vegetables
have increased consistently. The wholesale prices of fruits and vegetables during 1994-
2008 have grown at an annual compound growth rate of 3.8 and 6.7 percent. This growth
in price was even sharper during certain sub-periods4. Considering the high income
elasticity for fruits and vegetables demand for these commodities would remain firm and
this will be reflected in the relatively higher prices for fruits and vegetables.
The higher price has led to an increase in the area under fruits and vegetables,
subsequently, production and value of output from horticulture has also increased. This
is evident from Tables 4 and 5. The future potential for increasing the growth of fruits
and vegetables in the states would depend on their existing levels in the respective states
and therefore a distribution of states on the basis of share of fruits and vegetables is
important. The distribution of states on the basis of the share of horticulture (fruits and
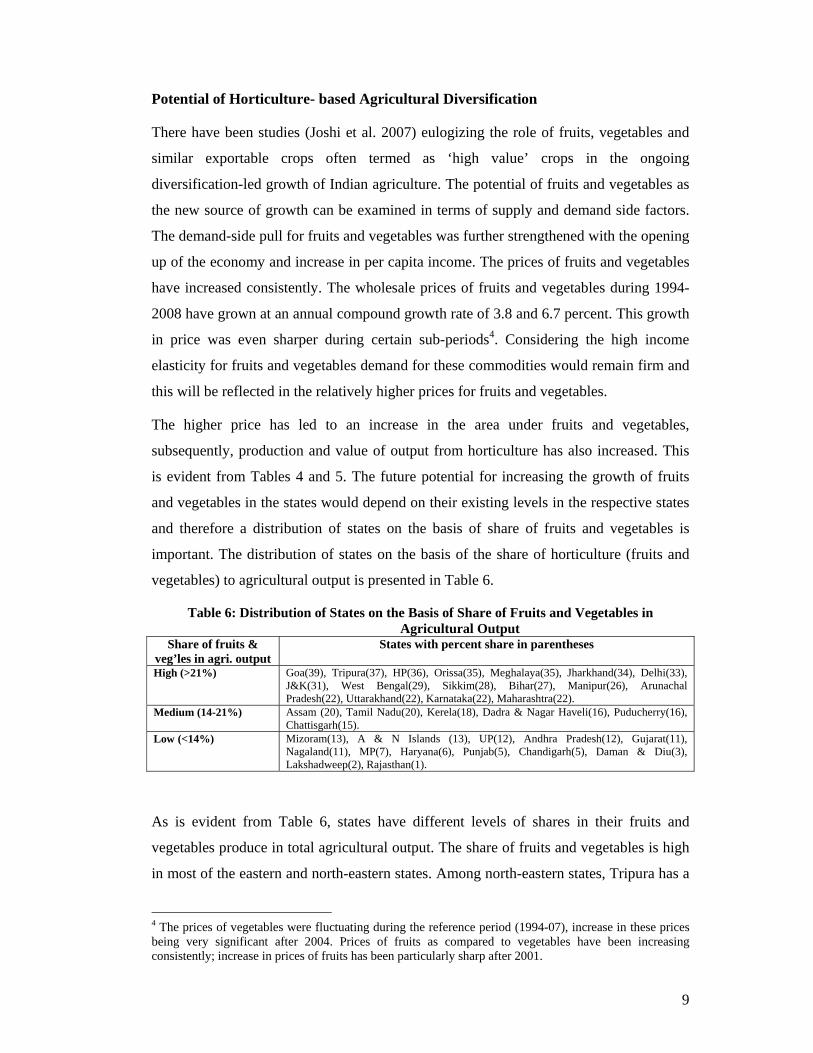
vegetables) to agricultural output is presented in Table 6.
Table 6: Distribution of States on the Basis of Share of Fruits and Vegetables in Agricultural Output
Share of fruits & veg’les in agri. output
States with percent share in parentheses
High (>21%) Goa(39), Tripura(37), HP(36), Orissa(35), Meghalaya(35), Jharkhand(34), Delhi(33), J&K(31), West Bengal(29), Sikkim(28), Bihar(27), Manipur(26), Arunachal Pradesh(22), Uttarakhand(22), Karnataka(22), Maharashtra(22).
Medium (14-21%) Assam (20), Tamil Nadu(20), Kerela(18), Dadra & Nagar Haveli(16), Puducherry(16), Chattisgarh(15).
Low (<14%) Mizoram(13), A & N Islands (13), UP(12), Andhra Pradesh(12), Gujarat(11), Nagaland(11), MP(7), Haryana(6), Punjab(5), Chandigarh(5), Daman & Diu(3), Lakshadweep(2), Rajasthan(1).
As is evident from Table 6, states have different levels of shares in their fruits and
vegetables produce in total agricultural output. The share of fruits and vegetables is high
in most of the eastern and north-eastern states. Among north-eastern states, Tripura has a
4 The prices of vegetables were fluctuating during the reference period (1994-07), increase in these prices being very significant after 2004. Prices of fruits as compared to vegetables have been increasing consistently; increase in prices of fruits has been particularly sharp after 2001.
10
share of 37 percent followed by Meghalaya with 35 percent. Most of the northern and
western states have a very low share in the produce of fruits and vegetables with
Rajasthan registering a share as low as 1 percent. In the northern region, Himachal
Pradesh is an exception; fruits and vegetables account for as high as 36 percent of
agricultural output. In the southern states, the share of fruits and vegetables are around
the national average of 17 percent. The corresponding figures for Kerala and Tamilnadu
are 18 and 20 percent, respectively.
These figures clearly show that in many states of India, the share of fruits and vegetables
in total agricultural output has been less than the national average. The area under fruits
and vegetables may increase in these states. These states however, present a different
kind of resource endowment which is often not suitable for horticulture. Again
institutional arrangements that encourage production of horticulture, wherein gain to
producers is high are negligible for many commodities in these states. In certain states
like Himachal Pradesh (HP), the share of fruits and vegetables in agricultural output is
very high which suggests exhaustion of the potential area under fruits and vegetables in
HP under the existing circumstances.
Land utilization statistics are also used to assess the potential of horticulture-led
diversification. The percent of gross cropped area under fruits and vegetables is
presented in Table 14 which shows that in most of the states of India barring Haryana,
and Punjab the percent of GCA under fruits and vegetables has increased. Though the
percent increase has differed across states; at the aggregate level increase in the percent
of gross cropped area has been around one only. Such small increase has however raised
several questions related to its implications for food security and also the long-term fruits
and vegetable-led growth in agriculture.
Increase the production potential depends on the sources of growth in the production of
fruits and vegetables. The area, production and productivity-related figures for fruits
suggest that in fruits most of the increase in production during 1987-2007 is accounted
for by the increase in area under fruits since productivity increase during the period has
been negative. At the commodity level, positive growth in the productivity of fruits is
registered in fruits such as apple, banana, grapes, guava, pineapple, coconut, and litchi.
Traditional fruits like mango, citrus have registered a negative growth during the
reference period.
11
The land utilization statistics as available from National Horticulture Board shows that
production of vegetables at the all-India level during the period, 1987-2007 has increased
by around 4.6 per cent; increase in productivity has been very significant at 1.7 percent.
Growth in the productivity of vegetables has been positive for cabbage, cauliflower,
brinjal, lady finger, tomato; while traditional vegetables like potato, and onion registered
a negative growth during the above period. Vegetables also hold a greater promise for
agricultural development on account of its labour-intensive nature. The requirement of
labour in vegetable cultivation is less skewed; in such cases family labour, specifically
female labour is utilized efficiently.
The above discussion highlights an increase in the share of fruits and vegetables in the
gross cropped area and the values of agriculture in states. Horticulture especially fruits
require a new set of investments in infrastructure. Favourable institutions that increase
the share of the producer in the consumer’s rupee are extremely important for both fruits
and vegetables. Vegetables as compared to fruits show greater promise as productivity
increase has been very significant. The labour requirement in vegetables also suits small
farms dominated by family labour.
Potential of Livestock-led Diversification
Livestock output in India, is growing faster than any other agricultural sub-sector.
Livestock accounted for less than one-fifth of agricultural output in the early seventies;
the corresponding figure has increased to 40 percent in the recent years (after 2000s).
This is often considered as a new source of agricultural growth in the country. CSO also
presents information related to livestock output separately for milk, meat, egg and wool.
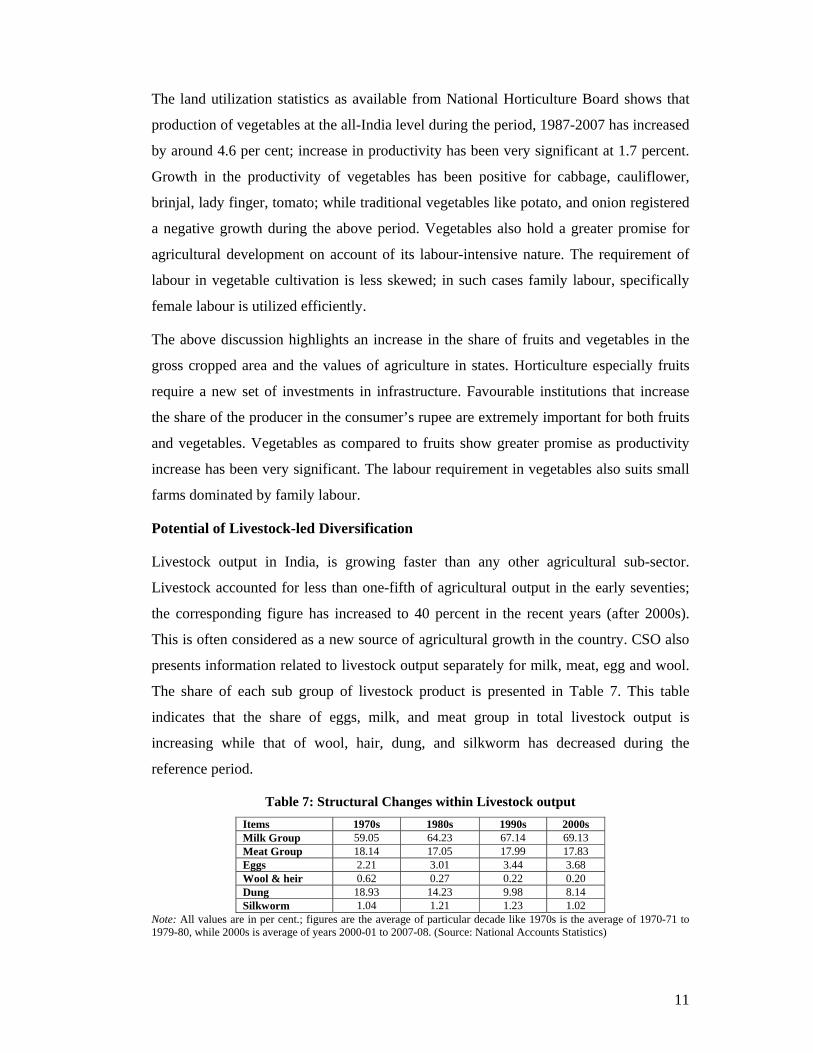
The share of each sub group of livestock product is presented in Table 7. This table
indicates that the share of eggs, milk, and meat group in total livestock output is
increasing while that of wool, hair, dung, and silkworm has decreased during the
reference period.
Table 7: Structural Changes within Livestock output Items 1970s 1980s 1990s 2000s Milk Group 59.05 64.23 67.14 69.13 Meat Group 18.14 17.05 17.99 17.83 Eggs 2.21 3.01 3.44 3.68 Wool & heir 0.62 0.27 0.22 0.20 Dung 18.93 14.23 9.98 8.14 Silkworm 1.04 1.21 1.23 1.02
Note: All values are in per cent.; figures are the average of particular decade like 1970s is the average of 1970-71 to 1979-80, while 2000s is average of years 2000-01 to 2007-08. (Source: National Accounts Statistics)
12
There has been supply as well as demand side impetus for growth of dairy in the
livestock sector in India. Livestock products have become increasingly significant in the
food basket of consumers. Income elasticity of demand for livestock products is more
than one suggesting an increase in demand for livestock products (milk and milk
products) as per capita income increases5. India has also been exporting a considerable
amount of milk products to neighbouring and Middle-East Asian countries. Demand for
milk and milk products would therefore remain robust. Constraints would probably be on
account of supply of milk products.
Livestock-based rural livelihoods have emerged as important in India with the increased
fragmentation of land and increased number of small and marginal farmers. The
expectation from livestock often appears high on the following accounts. In India, mixed
farming has been a way of life and in such a system, agriculture and livestock have a
complementary relationship. This suggests that livestock alone cannot continue to grow
for long. This complementary relationship that thrives with the use of inputs from one
sub-system to another is weakening with the onslaught of commercialization. There are
evidences from northwest India to show that a complementary relationship is giving way
to competitive relations. The competitive relationship is on account of labour on a large
farm. Field visits to Kurukshetra district of Haryana show that large farmers frequently
depend on attached labour as family labour is not sufficient for animal husbandry-related
operations on their farm. Milk production with hired labour is not very profitable in
India6. Constraints on account of family labour therefore limit the intensity of livestock
on the large farms of the region.
The competitive relationship is apparent on account of land on a small farm. Though
secondary information on the area under fodder is not available, in a state like Haryana
where dairy is highly developed, around 10 percent of the cropped area appears to be
allocated to fodder crops at the state level. The corresponding figure varies across
districts and also across size of farms. The author’s own estimate based on farms in the
Kurukshetra district shows that around 15 percent of cropped area is under fodder. The
5 Income elasticity of demand for milk is 1.15 and 0.99, respectively in rural and urban part of the country, the corresponding estimate for most of the agricultural commodities is substantially lower than one (Radhakrishna and Ravi 1980). 6Though India is an efficient producer of milk; productivity of cattle in a large part of the country has been so low that milk production is profitable in these regions only with the efficient utilization of family labour. There are several studies in the library of the National Dairy Research Institute, Karnal that report a negative return from milk production in the above regions once imputed value of family labour is incorporated.
13
corresponding figure is even higher on small farms. The possibility of competition for
scarce land has increased with the deterioration of common resources in the country. The
pressure on availability of fodder is also on account of deterioration in the quality of crop
residue with the increased application of pesticides for crops.
Some of the livestock–related development has however, reduced competition between
food and fodder. The livestock population has been decreasing in the recent period.
There have been structural changes in the bovine population as well. The structural
changes are in the form of increased population of buffalo and replacement of desi cow
with cross-bred cow (Jha 2004).
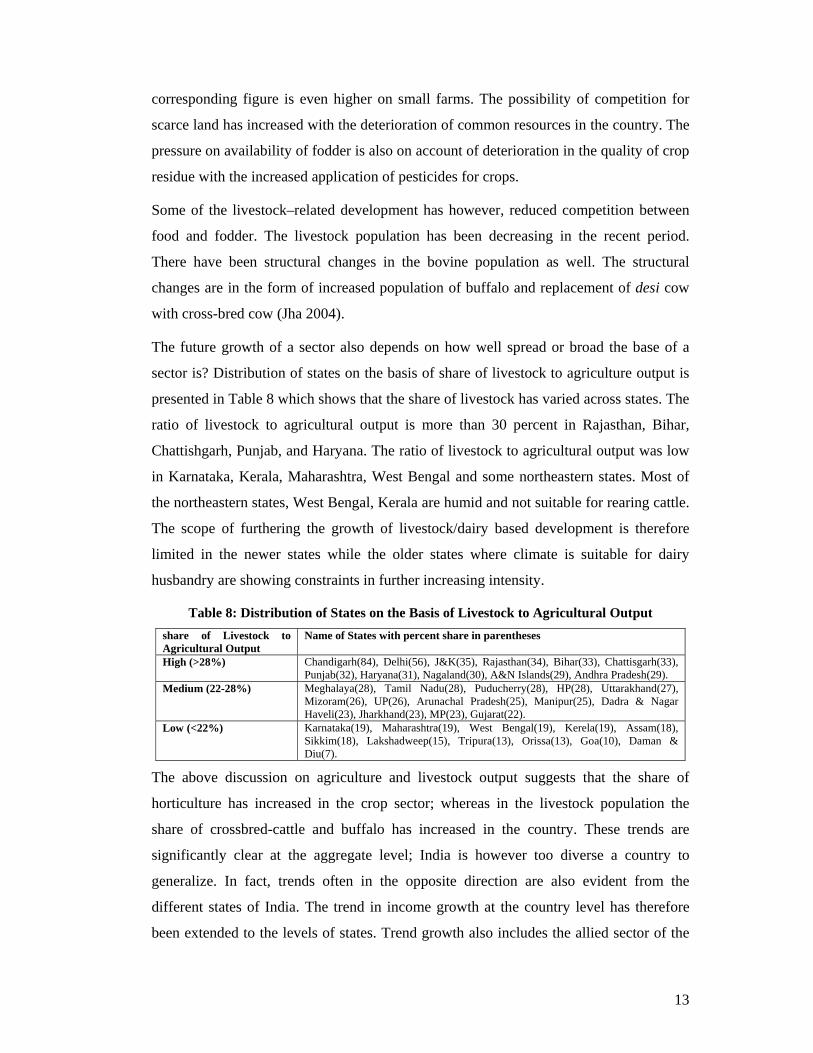
The future growth of a sector also depends on how well spread or broad the base of a
sector is? Distribution of states on the basis of share of livestock to agriculture output is
presented in Table 8 which shows that the share of livestock has varied across states. The
ratio of livestock to agricultural output is more than 30 percent in Rajasthan, Bihar,
Chattishgarh, Punjab, and Haryana. The ratio of livestock to agricultural output was low
in Karnataka, Kerala, Maharashtra, West Bengal and some northeastern states. Most of
the northeastern states, West Bengal, Kerala are humid and not suitable for rearing cattle.
The scope of furthering the growth of livestock/dairy based development is therefore
limited in the newer states while the older states where climate is suitable for dairy
husbandry are showing constraints in further increasing intensity.
Table 8: Distribution of States on the Basis of Livestock to Agricultural Output share of Livestock to Agricultural Output
Name of States with percent share in parentheses
High (>28%) Chandigarh(84), Delhi(56), J&K(35), Rajasthan(34), Bihar(33), Chattisgarh(33), Punjab(32), Haryana(31), Nagaland(30), A&N Islands(29), Andhra Pradesh(29).
Medium (22-28%) Meghalaya(28), Tamil Nadu(28), Puducherry(28), HP(28), Uttarakhand(27), Mizoram(26), UP(26), Arunachal Pradesh(25), Manipur(25), Dadra & Nagar Haveli(23), Jharkhand(23), MP(23), Gujarat(22).
Low (<22%) Karnataka(19), Maharashtra(19), West Bengal(19), Kerela(19), Assam(18), Sikkim(18), Lakshadweep(15), Tripura(13), Orissa(13), Goa(10), Daman & Diu(7).
The above discussion on agriculture and livestock output suggests that the share of
horticulture has increased in the crop sector; whereas in the livestock population the
share of crossbred-cattle and buffalo has increased in the country. These trends are
significantly clear at the aggregate level; India is however too diverse a country to
generalize. In fact, trends often in the opposite direction are also evident from the
different states of India. The trend in income growth at the country level has therefore
been extended to the levels of states. Trend growth also includes the allied sector of the
14
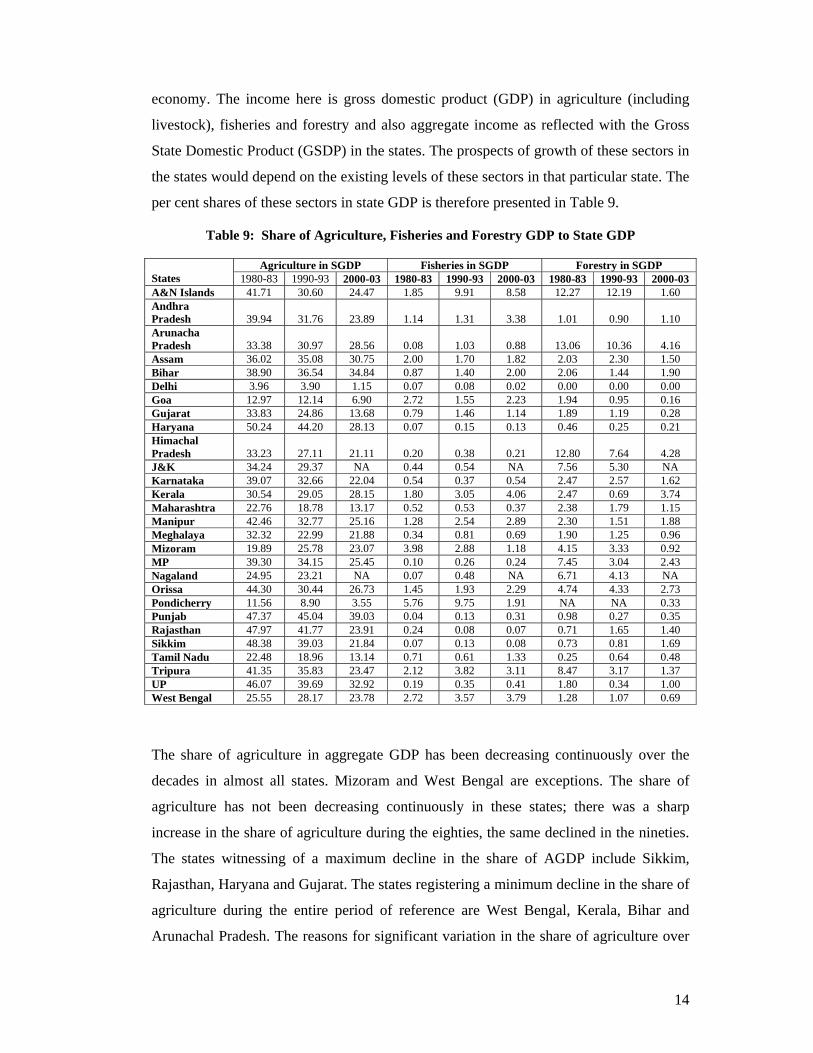
economy. The income here is gross domestic product (GDP) in agriculture (including
livestock), fisheries and forestry and also aggregate income as reflected with the Gross
State Domestic Product (GSDP) in the states. The prospects of growth of these sectors in
the states would depend on the existing levels of these sectors in that particular state. The
per cent shares of these sectors in state GDP is therefore presented in Table 9.
Table 9: Share of Agriculture, Fisheries and Forestry GDP to State GDP
Agriculture in SGDP Fisheries in SGDP Forestry in SGDP States 1980-83 1990-93 2000-03 1980-83 1990-93 2000-03 1980-83 1990-93 2000-03 A&N Islands 41.71 30.60 24.47 1.85 9.91 8.58 12.27 12.19 1.60 Andhra Pradesh 39.94 31.76 23.89 1.14 1.31 3.38 1.01 0.90 1.10 Arunacha Pradesh 33.38 30.97 28.56 0.08 1.03 0.88 13.06 10.36 4.16 Assam 36.02 35.08 30.75 2.00 1.70 1.82 2.03 2.30 1.50 Bihar 38.90 36.54 34.84 0.87 1.40 2.00 2.06 1.44 1.90 Delhi 3.96 3.90 1.15 0.07 0.08 0.02 0.00 0.00 0.00 Goa 12.97 12.14 6.90 2.72 1.55 2.23 1.94 0.95 0.16 Gujarat 33.83 24.86 13.68 0.79 1.46 1.14 1.89 1.19 0.28 Haryana 50.24 44.20 28.13 0.07 0.15 0.13 0.46 0.25 0.21 Himachal Pradesh 33.23 27.11 21.11 0.20 0.38 0.21 12.80 7.64 4.28 J&K 34.24 29.37 NA 0.44 0.54 NA 7.56 5.30 NA Karnataka 39.07 32.66 22.04 0.54 0.37 0.54 2.47 2.57 1.62 Kerala 30.54 29.05 28.15 1.80 3.05 4.06 2.47 0.69 3.74 Maharashtra 22.76 18.78 13.17 0.52 0.53 0.37 2.38 1.79 1.15 Manipur 42.46 32.77 25.16 1.28 2.54 2.89 2.30 1.51 1.88 Meghalaya 32.32 22.99 21.88 0.34 0.81 0.69 1.90 1.25 0.96 Mizoram 19.89 25.78 23.07 3.98 2.88 1.18 4.15 3.33 0.92 MP 39.30 34.15 25.45 0.10 0.26 0.24 7.45 3.04 2.43 Nagaland 24.95 23.21 NA 0.07 0.48 NA 6.71 4.13 NA Orissa 44.30 30.44 26.73 1.45 1.93 2.29 4.74 4.33 2.73 Pondicherry 11.56 8.90 3.55 5.76 9.75 1.91 NA NA 0.33 Punjab 47.37 45.04 39.03 0.04 0.13 0.31 0.98 0.27 0.35 Rajasthan 47.97 41.77 23.91 0.24 0.08 0.07 0.71 1.65 1.40 Sikkim 48.38 39.03 21.84 0.07 0.13 0.08 0.73 0.81 1.69 Tamil Nadu 22.48 18.96 13.14 0.71 0.61 1.33 0.25 0.64 0.48 Tripura 41.35 35.83 23.47 2.12 3.82 3.11 8.47 3.17 1.37 UP 46.07 39.69 32.92 0.19 0.35 0.41 1.80 0.34 1.00 West Bengal 25.55 28.17 23.78 2.72 3.57 3.79 1.28 1.07 0.69
The share of agriculture in aggregate GDP has been decreasing continuously over the
decades in almost all states. Mizoram and West Bengal are exceptions. The share of
agriculture has not been decreasing continuously in these states; there was a sharp
increase in the share of agriculture during the eighties, the same declined in the nineties.
The states witnessing of a maximum decline in the share of AGDP include Sikkim,
Rajasthan, Haryana and Gujarat. The states registering a minimum decline in the share of
agriculture during the entire period of reference are West Bengal, Kerala, Bihar and
Arunachal Pradesh. The reasons for significant variation in the share of agriculture over
15
the reference period appear to be different for different states. In states like West Bengal,
the particular trend has implications for performance of agriculture; while, the above
trend in states like Gujarat and Rajasthan indicates a relatively better performance of
sectors other than the agriculture. Although a declining share of agricultural GDP in
overall GDP is a sign of development, a similar structural transformation has not
happened in employment and in this context any land-saving activity like dairy and
fisheries has become important for rural livelihood. The GDP in fisheries and forestry
has been studied to assess the performance of these sectors.
Figures reveal that the share of GDP from forestry in the total SGDP has also declined in
most of the states over the decades. Changes in forestry-related regulations have
important implications in this context. The decline has been particularly sharp in states
like Arunachal Pradesh wherein the share declined from 13 to 4 percent and in Himachal
Pradesh wherein the share declined from 14 to 4 percent. India is one of major fish
producing countries of the world occupying a third position in fisheries and a second in
aquaculture. A comparison of fish GDP to GSDP over states shows that the share of
fishery in GSDP has increased in most of the states; the increase was however more
pronounced in the eighties. Particular trends in agriculture and different sub-sectors of
agriculture would be clear, once we collate the percent changes in these sectors with the
trend growth in the sector.
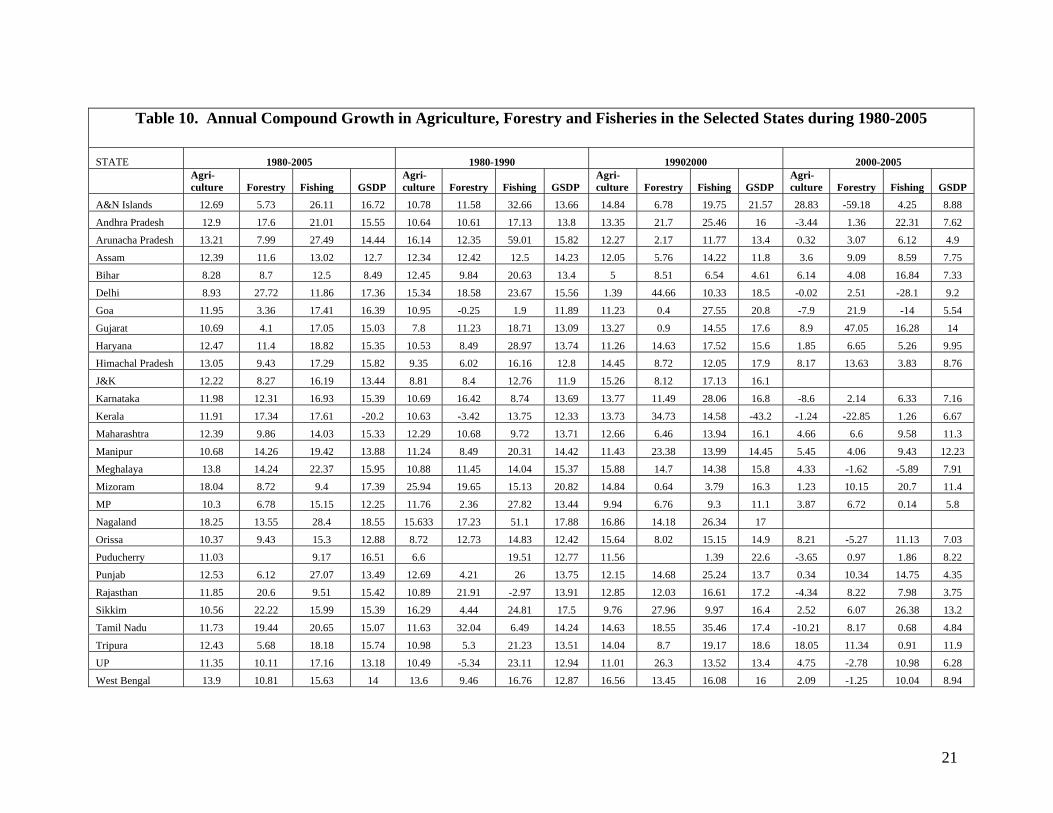
A comparative account of growth in agriculture, forestry, fisheries and state GDP during
the eighties (between 1980-81 and 1989-90), nineties (between 1990-91 and 1999-00)
and 2000s (between 2000-01 and 22005-06) is presented in Table 10. As is apparent
from the table, growth in agriculture has decelerated in many states. This deceleration
was particularly sharp in Maharashtra, Madhya Pradesh (MP), Tamilnadu, Rajasthan,
Haryana and Bihar. In some of these states, growth during the eighties was higher and
growth at the same rate could not be maintained thereafter. There are also exceptions to
the above trend; the growth in agriculture accelerated in Himachal Pradesh (HP), Jammu
and Kashmir (J&K), Meghalaya and Nagaland. Interestingly, these are states with a high
proportion of fruits and vegetable cultivation; these crops were favoured during the years
of trade liberalization; therefore the share of agriculture has also increased in these states.
Growth in forestry was considerably high in Uttar Pradesh (UP), Punjab, Kerala, Delhi,
Haryana and some northeastern states like Sikkim, Tripura and Manipur. Many of these
states have experienced poor growth of forestry in the eighties; in few of the above states
16
the share of forestry in state GDP has been extremely low suggesting lower levels of
forestry in these states. In fisheries, Andhra Pradesh, Goa, Karnataka, Jammu and
Kashmir (J&K), Rajasthan and Tamil Nadu improved their rate of growth during the
reference period. Tamil Nadu, AP and Goa have long coastlines highlighting the
importance of marine fisheries in the state GDP; whereas, Rajasthan, J&K have more of
inland fisheries. The pattern of fish production in India indicates a surge in inland fish
production in the recent past; this can be attributed to increased performance of inland
aquaculture in the country7 (Jha 2006). The scope of expanding marine fisheries beyond
the shallow sea zone remains important for the country.
The above discussion highlights the decreasing role of agriculture in the aggregate
economy. Though the above structural changes in the economy are common for
developing economies; some Indian states like WB, Kerala, and Bihar lag behind other
states in the above change. The share of horticulture in crop, cross-bred in bovine, bovine
in livestock, inland in total fisheries and fisheries in allied sectors has increased thereby
suggesting significant changes in the structure of agriculture and allied economies. The
role of trade in the above structural changes in agriculture and allied activities is also
evident.
III. Agriculture Output Diversification The previous section discusses agricultural diversification with the help of the CSO
Income Series. The findings illustrate the kind of diversification in the country’s
agricultural economy with income data. Income data has however, several limitations.
The present section therefore discusses diversification with agricultural production data.
Earlier the extent of agricultural diversification across sub-sectors and again in the crop
sector across crops was examined. The present section discusses the extent of
diversification of the production basket for an individual crop. Diversification here is
across states.
Diversification is an analogy for concentration; if production of a commodity is
concentrated in a few states, the present study presumes that the production of that
commodity is less diversified across states. The percent share of a commodity during the
reference period is based on the share of states in the aggregate production of a
7 The CSO National Accounts Statistics income series at the 1993-94 prices shows that the inland fisheries has registered a growth of around 6 percent while marine fisheries grew by around 2 percent during 1994-2002.
17
commodity. Since there have been fluctuations in production of a commodity, the states
share is obtained from production data of two consecutive years; for instance, the year
1982-84 is an average of production in the year 1982-83 and 1983-84.
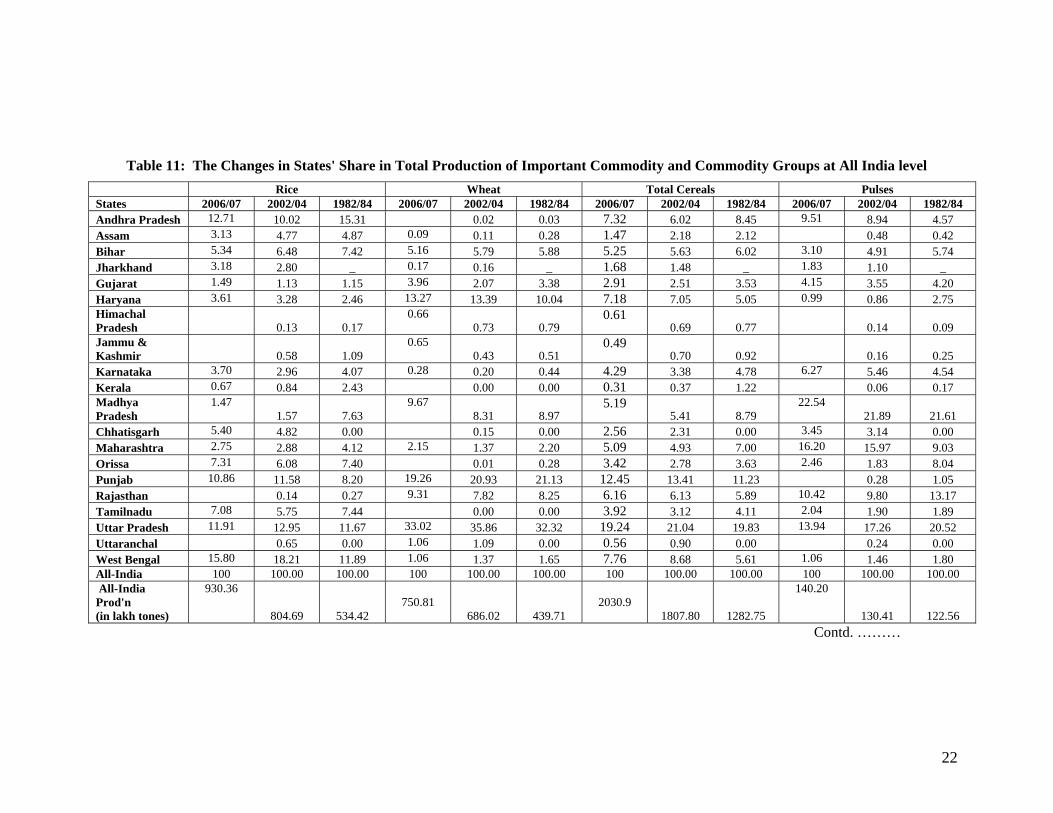
The share of states in the production of selected commodities is presented in Tables11
and 12. Table 11 shows an average share of states in the production of commodities like
paddy, wheat, cotton, sugarcane. These commodities are cultivated in a large number of
states, therefore changes in the share of states during the reference period is presented in
Table 11. There are some other agricultural commodities that are cultivated in selected
states only; and production of such commodities is further concentrated in certain states.
Examples of such commodities are jowar, bajra, maize, barley, gram, tur, groundnut,
rape-mustard, sunflower and soyabean. For these commodities, the five important states
which have been growing the respective commodity are presented in Table 12.
As is evident from Table 11, the production of paddy is relatively better distributed
across states. In the recent year 2002-04, West Bengal accounted for the highest
proportion (18.2 percent) of paddy production in the country, the corresponding share
was only 11.9 percent in the earlier period of the reference in which span Andhra
Pradesh was the highest paddy producer of the country. As regards the implications of
the production of paddy on natural resources especially water; the above changes in the
share of states in the production basket of paddy appear desirable since paddy is a water
intensive crop and West Bengal receives more rainfall than Andhra Pradesh (AP). In this
perspective, decline in the share of Orissa in the aggregate production of paddy is
important. There could be state-specific constraints for decline in the share of states in
paddy8. Examples of other paddy-producing states, which account for more than the 5
percent of the area under paddy, are Uttar Pradesh, Punjab, Haryana, and Tamilnadu. In
the production of paddy, the percent share of Tamilnadu (TN) has decreased over the
years. It may be noted that a large part of TN falls under the semi-arid region of the
country and decline of area under paddy is encouraging; in this context increase in the
share of states located in the northwest part of the country is baffling. This highlights the
effect of policy-distortions on the production of paddy in the semi-arid region of the
country.
8 For example in Orissa, it is reported that a large tract of paddy-cultivating area has became uncultivable (saline) due to rearing of shrimp in the coastal belt of AP. (Source: Das 2009)
18
As compared to paddy, production of wheat is relatively concentrated in Uttar Pradesh,
Punjab and Haryana. These states together account for around 70 percent of wheat
production in the country. The pattern of wheat production has not changed significantly
during the reference period (Table 11).
Jowar (sorghum), bajra, maize and barley are major coarse cereals produced in the
country. At the aggregate level, the production of jowar and barley has decreased during
the reference period whereas the production of bajra and maize has increased during the
same period (Table 12). Increase in the production of maize has been very significant.
The production structure of maize has also changed significantly for example; Andhra
Pradesh, Rajasthan and Karnataka have emerged as important maize producing states in
the recent period. The share of these states in the earlier year of reference (1982-84) was
very low. Maize is increasingly being used as poultry feed in the country and a high
growth of the poultry sector is creating a demand for these commodities.9 This has given
an impetus to the production of other coarse cereals as well since many of the coarse
grains are used alongwith maize in the preparation of poultry feeds. On the supply side,
popularization of rabi maize has also contributed to an increase in the production of
maize in the country. The production structure of coarse cereals other than maize has not
changed significantly. In jowar, Maharashtra accounts for more than 50 percent of the
aggregate production of the country. In barley, another relatively neglected coarse cereal,
Uttar Pradesh and Rajasthan together account for more than 70 percent of production at
the all-India level. Production of bajra is relatively distributed among the leading states;
five major bajra-producing states such as Rajasthan, Gujarat, Maharashtra, Uttar Pradesh
and Haryana together account for around 90 percent of the production of bajra at the all-
India level.
Though the production of pulses has increased at the all-India level; production of gram
and pigeonpea has stagnated during the reference period suggesting an increase in the
production of pulses other than the above (Table 11). Gram and pigeonpea together
account for around 60 percent of the total production of pulses in the country. A total
gram production of 6.33 lakh tonnes is distributed among the states of Madhya Pradesh,
Uttar Pradesh, Rajasthan, Maharashtra, and Andhra Pradesh. A temporal comparison of
9 Eggs exclusively obtained from poultry have increased their share in livestock output from 2.2 percent in the 1970s to 3.8 percent in 2000s. This growth in percent is in addition to the growth of poultry meat, one of the important constituents of meat (a commodity group) in livestock output as provided by the CSO Income series.
19
the state-wise production structure of gram during the reference period shows that
Andhra Pradesh has emerged as an important pulse-growing state replacing Haryana.
The important pigeonpea producing states are Maharashtra, Uttar Pradesh, Gujarat,
Karnataka and MP. Table 11 shows that five major gram and pigeonpea producing states
together account for 87.4 and 77.7 percent of total gram and pigeonpea production in the
country.
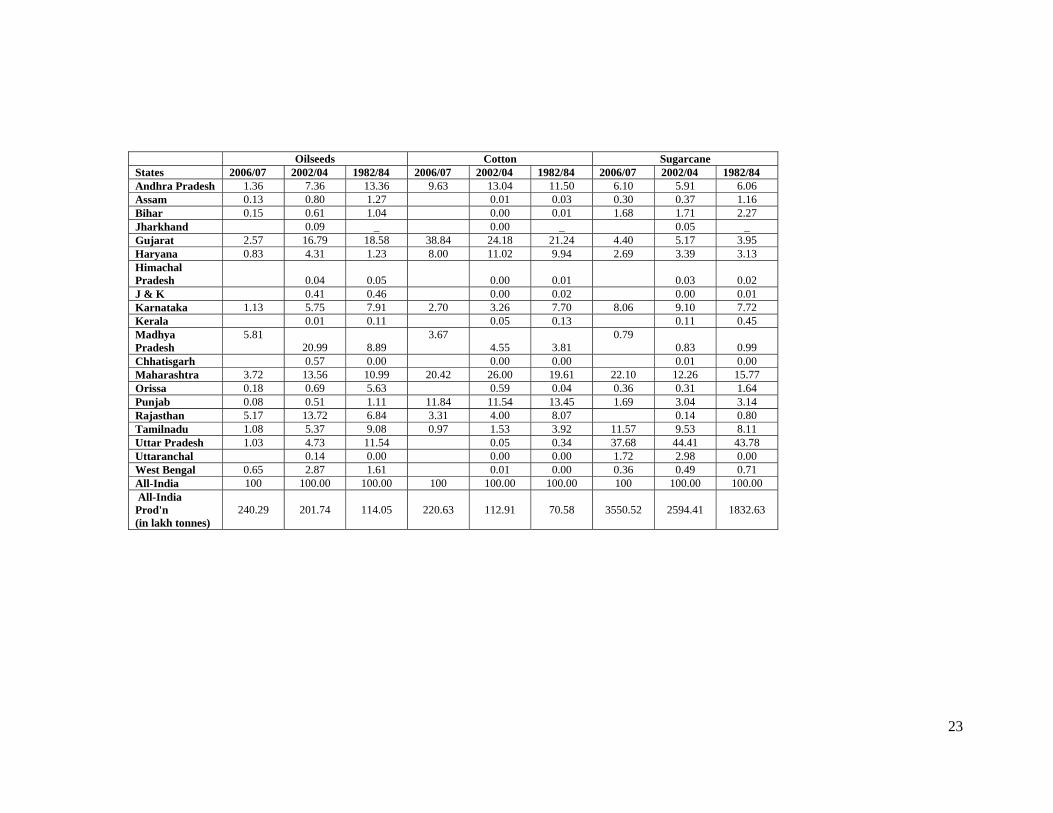
The major oilseeds-growing states of the country are MP, Gujarat, Maharashtra,
Rajasthan and AP. Four major oilseeds namely, groundnut, rape-mustard, soyabean and
sunflower, together account for more than 90 percent of aggregate oilseeds production of
the country. Interestingly, Gujarat, Rajasthan and Karnataka account for around 40 per
cent of aggregate production of groundnut, rape-mustard and sunflower, respectively
whereas Madhya Pradesh accounts for as high as 58 percent of the domestic production
of soyabean. Among oilseeds, the production of rape-mustard has increased significantly
during the reference period; production of rape-mustard has further concentrated during
the reference period. As is evident from Table 5, major edible oil producing states have
accounted for around 80 percent of the aggregate production in the year 1982-84; while
in the year 2002-04, these states together account for around 87 percent of the aggregate
production in the country. This clearly suggests an increase in the concentration of
production of oilseeds in the country. Soyabean and sunflower are relatively new crops;
the production structure of these commodities is therefore not available for the earlier
reference period (1982-84).
In India, cotton and sugarcane are important commercial crops. The state of Maharashtra,
Gujarat, Andhra Pradesh, Haryana, Punjab, Karnataka, Madhya Pradesh and Rajasthan
are important cotton producers. Amongst these states, Maharashtra and Gujarat together
account for more than 50 per cent of the domestic production of cotton in the year 2002-
04; while during the earlier period of reference (1982-84) the share of these states was 40
per cent. This shows an increase in the concentration of production of cotton in the
country. In cotton production, the share of Andhra Pradesh, Madhya Pradesh and
Haryana has increased; while the share of Punjab, Karnataka, and Rajasthan has declined
during the reference period. In sugarcane, Uttar Pradesh accounts for around 44 percent
of the aggregate production in the country. Other important sugarcane producing states
are Maharashtra, Tamilnadu, Karnataka, Gujarat, and Andhra Pradesh. The percent share
20
of these states in the aggregate production of sugarcane has changed marginally during
the reference period.
Sugarcane is water intensive crop. Eastern states like Bihar now accounts for a very
small proportion of sugarcane production in the country though historically this has been
important producers of sugarcane in the country and world. The regional skewness in the
production of sugarcane without any regard for natural resource endowment is rooted in
the differential incentives for sugar manufacture in different states of the country. The
sugar mills are concentrated in certain states on account of favorable industrial
environment. The existence of these mills has affected the allocation of land and
production of sugarcane in its surroundings irrespective of the natural resource status of
the region. A high concentration of sugar mills in West UP, Maharashtra, Tamilnadu and
Gujarat are a few examples of such distorted policies.
The above discussion shows that for most of the crops, the percent share of the leading
producing states has increased during the reference period (1983, 2003, 2006-07). This
suggests an increasing trend towards specialization of agricultural production in the
country. This specialization is not necessarily in accordance with the natural resource
endowment of the region; favourable institutions and incentive structures have induced
the above specialization.
21
Table 10. Annual Compound Growth in Agriculture, Forestry and Fisheries in the Selected States during 1980-2005
STATE 1980-2005 1980-1990 19902000 2000-2005
Agri-culture Forestry Fishing GSDP
Agri-culture Forestry Fishing GSDP
Agri-culture Forestry Fishing GSDP
Agri-culture Forestry Fishing GSDP
A&N Islands 12.69 5.73 26.11 16.72 10.78 11.58 32.66 13.66 14.84 6.78 19.75 21.57 28.83 -59.18 4.25 8.88
Andhra Pradesh 12.9 17.6 21.01 15.55 10.64 10.61 17.13 13.8 13.35 21.7 25.46 16 -3.44 1.36 22.31 7.62
Arunacha Pradesh 13.21 7.99 27.49 14.44 16.14 12.35 59.01 15.82 12.27 2.17 11.77 13.4 0.32 3.07 6.12 4.9
Assam 12.39 11.6 13.02 12.7 12.34 12.42 12.5 14.23 12.05 5.76 14.22 11.8 3.6 9.09 8.59 7.75
Bihar 8.28 8.7 12.5 8.49 12.45 9.84 20.63 13.4 5 8.51 6.54 4.61 6.14 4.08 16.84 7.33
Delhi 8.93 27.72 11.86 17.36 15.34 18.58 23.67 15.56 1.39 44.66 10.33 18.5 -0.02 2.51 -28.1 9.2
Goa 11.95 3.36 17.41 16.39 10.95 -0.25 1.9 11.89 11.23 0.4 27.55 20.8 -7.9 21.9 -14 5.54
Gujarat 10.69 4.1 17.05 15.03 7.8 11.23 18.71 13.09 13.27 0.9 14.55 17.6 8.9 47.05 16.28 14
Haryana 12.47 11.4 18.82 15.35 10.53 8.49 28.97 13.74 11.26 14.63 17.52 15.6 1.85 6.65 5.26 9.95
Himachal Pradesh 13.05 9.43 17.29 15.82 9.35 6.02 16.16 12.8 14.45 8.72 12.05 17.9 8.17 13.63 3.83 8.76
J&K 12.22 8.27 16.19 13.44 8.81 8.4 12.76 11.9 15.26 8.12 17.13 16.1
Karnataka 11.98 12.31 16.93 15.39 10.69 16.42 8.74 13.69 13.77 11.49 28.06 16.8 -8.6 2.14 6.33 7.16
Kerala 11.91 17.34 17.61 -20.2 10.63 -3.42 13.75 12.33 13.73 34.73 14.58 -43.2 -1.24 -22.85 1.26 6.67
Maharashtra 12.39 9.86 14.03 15.33 12.29 10.68 9.72 13.71 12.66 6.46 13.94 16.1 4.66 6.6 9.58 11.3
Manipur 10.68 14.26 19.42 13.88 11.24 8.49 20.31 14.42 11.43 23.38 13.99 14.45 5.45 4.06 9.43 12.23
Meghalaya 13.8 14.24 22.37 15.95 10.88 11.45 14.04 15.37 15.88 14.7 14.38 15.8 4.33 -1.62 -5.89 7.91
Mizoram 18.04 8.72 9.4 17.39 25.94 19.65 15.13 20.82 14.84 0.64 3.79 16.3 1.23 10.15 20.7 11.4
MP 10.3 6.78 15.15 12.25 11.76 2.36 27.82 13.44 9.94 6.76 9.3 11.1 3.87 6.72 0.14 5.8
Nagaland 18.25 13.55 28.4 18.55 15.633 17.23 51.1 17.88 16.86 14.18 26.34 17
Orissa 10.37 9.43 15.3 12.88 8.72 12.73 14.83 12.42 15.64 8.02 15.15 14.9 8.21 -5.27 11.13 7.03
Puducherry 11.03 9.17 16.51 6.6 19.51 12.77 11.56 1.39 22.6 -3.65 0.97 1.86 8.22
Punjab 12.53 6.12 27.07 13.49 12.69 4.21 26 13.75 12.15 14.68 25.24 13.7 0.34 10.34 14.75 4.35
Rajasthan 11.85 20.6 9.51 15.42 10.89 21.91 -2.97 13.91 12.85 12.03 16.61 17.2 -4.34 8.22 7.98 3.75
Sikkim 10.56 22.22 15.99 15.39 16.29 4.44 24.81 17.5 9.76 27.96 9.97 16.4 2.52 6.07 26.38 13.2
Tamil Nadu 11.73 19.44 20.65 15.07 11.63 32.04 6.49 14.24 14.63 18.55 35.46 17.4 -10.21 8.17 0.68 4.84
Tripura 12.43 5.68 18.18 15.74 10.98 5.3 21.23 13.51 14.04 8.7 19.17 18.6 18.05 11.34 0.91 11.9
UP 11.35 10.11 17.16 13.18 10.49 -5.34 23.11 12.94 11.01 26.3 13.52 13.4 4.75 -2.78 10.98 6.28
West Bengal 13.9 10.81 15.63 14 13.6 9.46 16.76 12.87 16.56 13.45 16.08 16 2.09 -1.25 10.04 8.94
22
Table 11: The Changes in States' Share in Total Production of Important Commodity and Commodity Groups at All India level Rice Wheat Total Cereals Pulses States 2006/07 2002/04 1982/84 2006/07 2002/04 1982/84 2006/07 2002/04 1982/84 2006/07 2002/04 1982/84 Andhra Pradesh 12.71 10.02 15.31 0.02 0.03 7.32 6.02 8.45 9.51 8.94 4.57 Assam 3.13 4.77 4.87 0.09 0.11 0.28 1.47 2.18 2.12 0.48 0.42 Bihar 5.34 6.48 7.42 5.16 5.79 5.88 5.25 5.63 6.02 3.10 4.91 5.74 Jharkhand 3.18 2.80 _ 0.17 0.16 _ 1.68 1.48 _ 1.83 1.10 _ Gujarat 1.49 1.13 1.15 3.96 2.07 3.38 2.91 2.51 3.53 4.15 3.55 4.20 Haryana 3.61 3.28 2.46 13.27 13.39 10.04 7.18 7.05 5.05 0.99 0.86 2.75 Himachal Pradesh
0.13 0.17
0.66 0.73 0.79
0.61 0.69 0.77
0.14 0.09
Jammu & Kashmir
0.58 1.09
0.65 0.43 0.51
0.49 0.70 0.92
0.16 0.25
Karnataka 3.70 2.96 4.07 0.28 0.20 0.44 4.29 3.38 4.78 6.27 5.46 4.54 Kerala 0.67 0.84 2.43 0.00 0.00 0.31 0.37 1.22 0.06 0.17 Madhya Pradesh
1.47 1.57 7.63
9.67 8.31 8.97
5.19 5.41 8.79
22.54 21.89 21.61
Chhatisgarh 5.40 4.82 0.00 0.15 0.00 2.56 2.31 0.00 3.45 3.14 0.00 Maharashtra 2.75 2.88 4.12 2.15 1.37 2.20 5.09 4.93 7.00 16.20 15.97 9.03 Orissa 7.31 6.08 7.40 0.01 0.28 3.42 2.78 3.63 2.46 1.83 8.04 Punjab 10.86 11.58 8.20 19.26 20.93 21.13 12.45 13.41 11.23 0.28 1.05 Rajasthan 0.14 0.27 9.31 7.82 8.25 6.16 6.13 5.89 10.42 9.80 13.17 Tamilnadu 7.08 5.75 7.44 0.00 0.00 3.92 3.12 4.11 2.04 1.90 1.89 Uttar Pradesh 11.91 12.95 11.67 33.02 35.86 32.32 19.24 21.04 19.83 13.94 17.26 20.52 Uttaranchal 0.65 0.00 1.06 1.09 0.00 0.56 0.90 0.00 0.24 0.00 West Bengal 15.80 18.21 11.89 1.06 1.37 1.65 7.76 8.68 5.61 1.06 1.46 1.80 All-India 100 100.00 100.00 100 100.00 100.00 100 100.00 100.00 100 100.00 100.00 All-India Prod'n (in lakh tones)
930.36
804.69 534.42
750.81
686.02 439.71
2030.9
1807.80 1282.75
140.20
130.41 122.56 Contd. ………
23
Oilseeds Cotton Sugarcane States 2006/07 2002/04 1982/84 2006/07 2002/04 1982/84 2006/07 2002/04 1982/84 Andhra Pradesh 1.36 7.36 13.36 9.63 13.04 11.50 6.10 5.91 6.06 Assam 0.13 0.80 1.27 0.01 0.03 0.30 0.37 1.16 Bihar 0.15 0.61 1.04 0.00 0.01 1.68 1.71 2.27 Jharkhand 0.09 _ 0.00 _ 0.05 _ Gujarat 2.57 16.79 18.58 38.84 24.18 21.24 4.40 5.17 3.95 Haryana 0.83 4.31 1.23 8.00 11.02 9.94 2.69 3.39 3.13 Himachal Pradesh
0.04 0.05
0.00 0.01
0.03 0.02
J & K 0.41 0.46 0.00 0.02 0.00 0.01 Karnataka 1.13 5.75 7.91 2.70 3.26 7.70 8.06 9.10 7.72 Kerala 0.01 0.11 0.05 0.13 0.11 0.45 Madhya Pradesh
5.81 20.99 8.89
3.67 4.55 3.81
0.79 0.83 0.99
Chhatisgarh 0.57 0.00 0.00 0.00 0.01 0.00 Maharashtra 3.72 13.56 10.99 20.42 26.00 19.61 22.10 12.26 15.77 Orissa 0.18 0.69 5.63 0.59 0.04 0.36 0.31 1.64 Punjab 0.08 0.51 1.11 11.84 11.54 13.45 1.69 3.04 3.14 Rajasthan 5.17 13.72 6.84 3.31 4.00 8.07 0.14 0.80 Tamilnadu 1.08 5.37 9.08 0.97 1.53 3.92 11.57 9.53 8.11 Uttar Pradesh 1.03 4.73 11.54 0.05 0.34 37.68 44.41 43.78 Uttaranchal 0.14 0.00 0.00 0.00 1.72 2.98 0.00 West Bengal 0.65 2.87 1.61 0.01 0.00 0.36 0.49 0.71 All-India 100 100.00 100.00 100 100.00 100.00 100 100.00 100.00 All-India Prod'n (in lakh tonnes)
240.29 201.74
114.05
220.63 112.91
70.58
3550.52 2594.41
1832.63
24
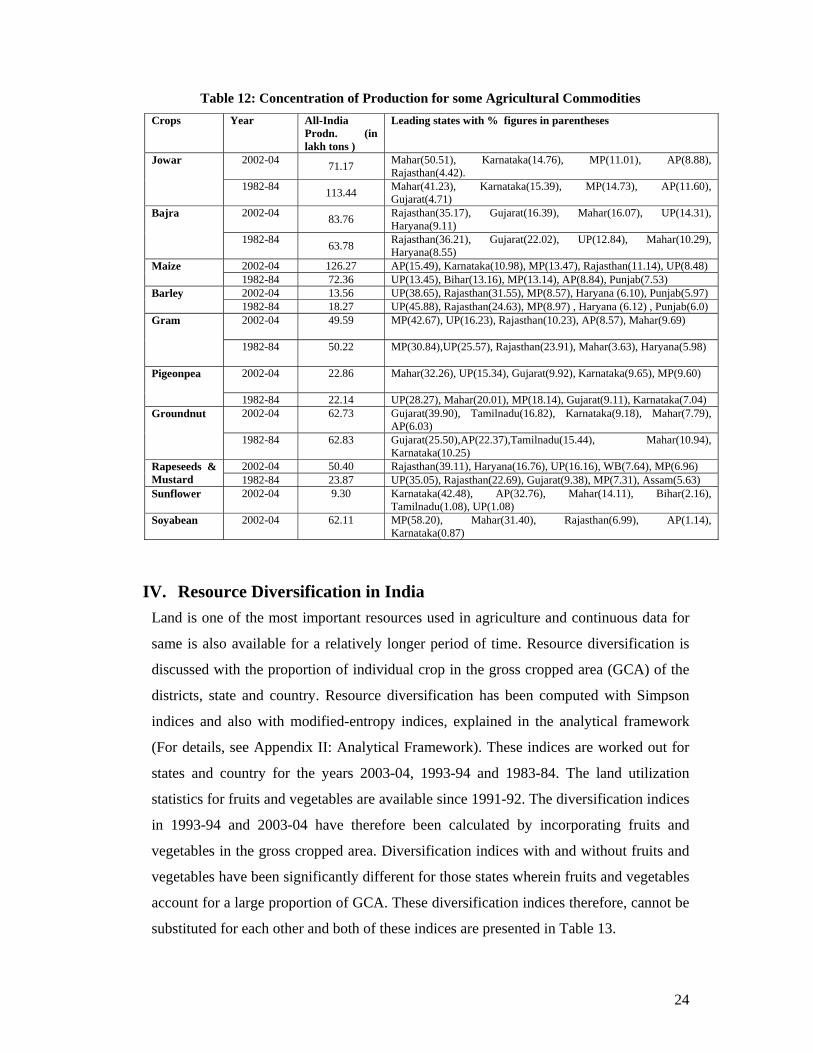
Table 12: Concentration of Production for some Agricultural Commodities Crops Year All-India
Prodn. (in lakh tons )
Leading states with % figures in parentheses
2002-04 71.17 Mahar(50.51), Karnataka(14.76), MP(11.01), AP(8.88), Rajasthan(4.42).
Jowar
1982-84 113.44 Mahar(41.23), Karnataka(15.39), MP(14.73), AP(11.60), Gujarat(4.71)
2002-04 83.76 Rajasthan(35.17), Gujarat(16.39), Mahar(16.07), UP(14.31), Haryana(9.11)
Bajra
1982-84 63.78 Rajasthan(36.21), Gujarat(22.02), UP(12.84), Mahar(10.29), Haryana(8.55)
2002-04 126.27 AP(15.49), Karnataka(10.98), MP(13.47), Rajasthan(11.14), UP(8.48) Maize 1982-84 72.36 UP(13.45), Bihar(13.16), MP(13.14), AP(8.84), Punjab(7.53) 2002-04 13.56 UP(38.65), Rajasthan(31.55), MP(8.57), Haryana (6.10), Punjab(5.97) Barley 1982-84 18.27 UP(45.88), Rajasthan(24.63), MP(8.97) , Haryana (6.12) , Punjab(6.0) 2002-04 49.59
MP(42.67), UP(16.23), Rajasthan(10.23), AP(8.57), Mahar(9.69) Gram
1982-84 50.22
MP(30.84),UP(25.57), Rajasthan(23.91), Mahar(3.63), Haryana(5.98)
2002-04 22.86
Mahar(32.26), UP(15.34), Gujarat(9.92), Karnataka(9.65), MP(9.60) Pigeonpea
1982-84 22.14 UP(28.27), Mahar(20.01), MP(18.14), Gujarat(9.11), Karnataka(7.04) 2002-04 62.73 Gujarat(39.90), Tamilnadu(16.82), Karnataka(9.18), Mahar(7.79),
AP(6.03) Groundnut
1982-84 62.83 Gujarat(25.50),AP(22.37),Tamilnadu(15.44), Mahar(10.94), Karnataka(10.25)
2002-04 50.40 Rajasthan(39.11), Haryana(16.76), UP(16.16), WB(7.64), MP(6.96) Rapeseeds & Mustard 1982-84 23.87 UP(35.05), Rajasthan(22.69), Gujarat(9.38), MP(7.31), Assam(5.63) Sunflower 2002-04 9.30 Karnataka(42.48), AP(32.76), Mahar(14.11), Bihar(2.16),
Tamilnadu(1.08), UP(1.08) Soyabean 2002-04 62.11 MP(58.20), Mahar(31.40), Rajasthan(6.99), AP(1.14),
Karnataka(0.87)
IV. Resource Diversification in India Land is one of the most important resources used in agriculture and continuous data for
same is also available for a relatively longer period of time. Resource diversification is
discussed with the proportion of individual crop in the gross cropped area (GCA) of the
districts, state and country. Resource diversification has been computed with Simpson
indices and also with modified-entropy indices, explained in the analytical framework
(For details, see Appendix II: Analytical Framework). These indices are worked out for
states and country for the years 2003-04, 1993-94 and 1983-84. The land utilization
statistics for fruits and vegetables are available since 1991-92. The diversification indices
in 1993-94 and 2003-04 have therefore been calculated by incorporating fruits and
vegetables in the gross cropped area. Diversification indices with and without fruits and
vegetables have been significantly different for those states wherein fruits and vegetables
account for a large proportion of GCA. These diversification indices therefore, cannot be
substituted for each other and both of these indices are presented in Table 13.
25
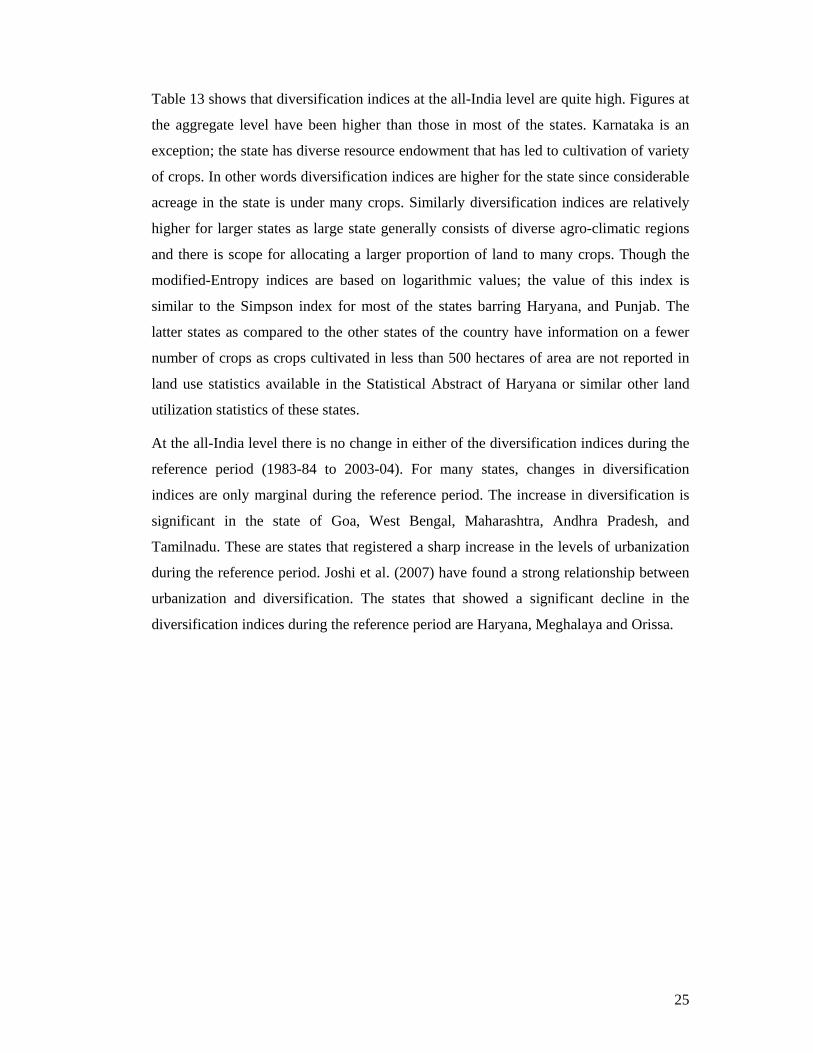
Table 13 shows that diversification indices at the all-India level are quite high. Figures at
the aggregate level have been higher than those in most of the states. Karnataka is an
exception; the state has diverse resource endowment that has led to cultivation of variety
of crops. In other words diversification indices are higher for the state since considerable
acreage in the state is under many crops. Similarly diversification indices are relatively
higher for larger states as large state generally consists of diverse agro-climatic regions
and there is scope for allocating a larger proportion of land to many crops. Though the
modified-Entropy indices are based on logarithmic values; the value of this index is
similar to the Simpson index for most of the states barring Haryana, and Punjab. The
latter states as compared to the other states of the country have information on a fewer
number of crops as crops cultivated in less than 500 hectares of area are not reported in
land use statistics available in the Statistical Abstract of Haryana or similar other land
utilization statistics of these states.
At the all-India level there is no change in either of the diversification indices during the
reference period (1983-84 to 2003-04). For many states, changes in diversification
indices are only marginal during the reference period. The increase in diversification is
significant in the state of Goa, West Bengal, Maharashtra, Andhra Pradesh, and
Tamilnadu. These are states that registered a sharp increase in the levels of urbanization
during the reference period. Joshi et al. (2007) have found a strong relationship between
urbanization and diversification. The states that showed a significant decline in the
diversification indices during the reference period are Haryana, Meghalaya and Orissa.
26
Table 13: A Temporal and Spatial Comparison of Diversification Indices in India
Div. Indices without Fruits and Vegetables Div. Indices with Fruits and Vegetables Simpson Index Modified Entropy Index Simpson Index Mod-Entropy Index States 2003-04 1993-94 1983-84 2003-04 1993-94 1983-84 2003-04 1993-94 2003-04 1993-94 Andhra Pradesh 0.87 0.83 0.83 0.79 0.71 0.72 0.88 0.85 0.81 0.73 Assam 0.42 0.42 0.45 0.43 0.42 0.47 0.5 0.48 0.49 0.48 Arunachal Pradesh 0.1 0.08 0.07 0.17 0.14 0.14 0.44 0.38 0.4 0.35 Bihar & Jharkhand 0.67 0.68 0.7 0.54 0.58 0.62 0.7 0.7 0.58 0.61 Goa 0.46 0 0 0.59 0 0.63 0.41 0.74 0.08 Haryana 0.77 0.79 0.8 0.65 0.71 0.72 0.77 0.8 0.66 0.73 Jammu & Kashmir 0.69 0.69 0.7 0.69 0.69 0.8 0.73 0.72 0.74 0.74 Himachal Pradesh 0.64 0.65 0.67 0.62 0.62 0.69 0.7 0.7 0.68 0.68 Gujarat 0.88 0.88 0.87 0.81 0.82 0.82 0.88 0.88 0.83 0.84 Karnataka 0.92 0.9 0.89 0.85 0.81 0.81 0.92 0.91 0.87 0.83 Kerala 0.68 0.71 0.71 0.7 0.73 0.79 0.76 0.78 0.75 0.78 Maharashtra 0.88 0.86 0.84 0.8 0.77 0.75 0.89 0.86 0.83 0.79 MP & Ch'sgarh 0.86 0.87 0.87 0.76 0.79 0.81 0.86 0.87 0.77 0.8 Meghalaya 0.5 0.58 0.56 0.51 0.69 0.85 0.45 0.53 0.45 0.61 Orissa 0.41 0.5 0.66 0.36 0.41 0.54 0.54 0.6 0.44 0.49 Punjab 0.61 0.63 0.64 0.51 0.55 0.61 0.63 0.64 0.54 0.56 Rajasthan 0.82 0.85 0.83 0.76 0.78 0.78 0.83 0.85 0.77 0.79 Sikkim 0.1 0.04 0.05 0.18 0.09 0.16 0.46 0.51 0.48 0.47 Tamil Nadu 0.85 0.81 0.81 0.76 0.7 0.71 0.87 0.83 0.79 0.73 Tripura 0.1 0.08 0.08 0.16 0.08 0.15 0.45 0.42 0.38 0.33 UP & Utt'chal 0.77 0.79 0.82 0.64 0.68 0.73 0.79 0.81 0.67 0.7 West Bengal 0.5 0.44 0.45 0.45 0.41 0.45 0.6 0.53 0.53 0.48 All- India 0.88 0.88 0.88 0.76 0.79 0.78 0.89 0.89 0.81 0.81
27
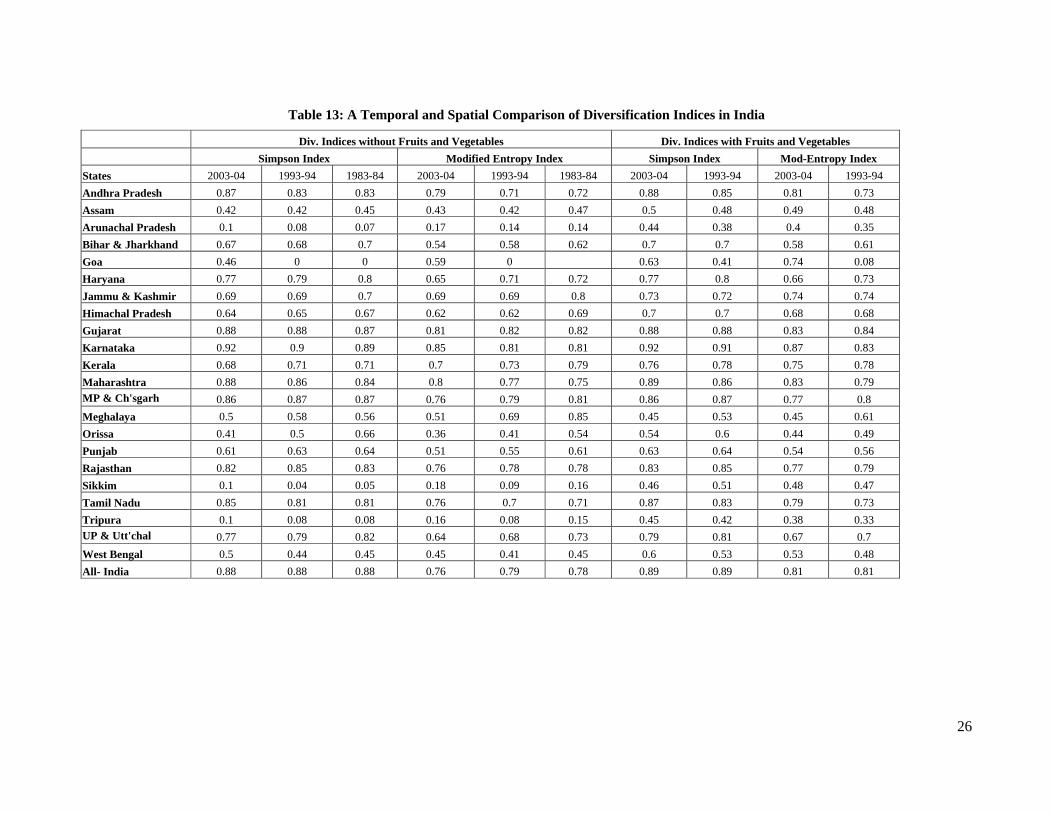
Table 14: Percentage of Different Crop-groups to Gross Cropped Area
Fine Cereals Coarse Cereals Pulses Oilseeds
States 2003-
04 1993-
94 1983-
84 2003-04 1993-
94 1983-
84 2003-
04 1993-
94 1983-
84 2003-
04 1993-
94 1983-
84 Andhra Pradesh 23.46 28.05 31.23 12.86 13.79 26.42 17.17 12.30 11.19 19.91 25.61 16.87 Assam 65.70 68.24 67.42 0.00 0.00 0.00 0.00 0.00 0.00 7.58 8.12 8.64 Arunachal Pradesh 46.04 49.11 61.02 0.00 0.00 0.00 0.00 0.00 0.00 0.00 0.00 0.00 Bihar & Jharkhand 71.31 69.66 66.20 9.01 9.54 11.36 9.51 9.13 11.87 1.50 2.46 2.41 Haryana 52.55 47.29 40.77 12.19 11.52 19.87 3.17 8.25 12.54 10.13 10.66 3.63 Jammu & Kashmir 47.00 48.44 48.30 31.65 30.56 32.11 0.00 0.00 0.00 0.00 0.00 0.00 Himachal Pradesh 46.16 46.39 46.33 35.56 36.92 36.77 0.00 0.00 0.00 0.00 0.00 0.00 Gujarat 13.42 10.21 12.29 16.49 18.93 27.54 7.73 8.34 7.70 27.76 28.30 25.55 Karnataka 11.83 12.93 13.19 31.36 30.97 39.28 15.94 12.23 13.71 19.37 25.18 14.60 Kerala 9.69 16.77 25.87 0.00 0.00 0.00 0.00 0.00 0.00 0.00 0.00 0.00 Maharashtra 9.87 10.77 12.80 29.00 39.56 42.07 15.59 16.06 14.01 12.56 13.30 10.63 MP & Ch'sgarh 38.31 37.74 38.56 11.00 14.02 21.03 22.32 19.61 21.97 21.39 21.43 10.16 Madhya Pradesh 30.04 37.74 38.56 12.29 14.02 21.03 24.26 19.61 21.97 27.67 21.43 10.16 Orissa 51.20 46.82 46.21 1.93 2.46 7.46 8.07 10.26 17.97 3.41 5.64 9.83 Punjab 75.77 72.41 66.02 2.38 3.28 5.72 0.00 0.00 0.00 1.13 2.36 2.23 Pondicherry 0.00 0.00 0.00 0.00 0.00 0.00 0.00 0.00 0.00 0.00 0.00 0.00 Rajasthan 10.58 11.17 12.28 37.98 31.94 38.25 18.56 17.30 19.61 15.53 18.75 7.98 Sikkim 4.32 6.30 8.56 0.00 0.00 0.00 0.00 0.00 0.00 0.00 0.00 0.00 Tamil Nadu 22.49 32.27 33.88 15.26 14.39 23.87 8.67 9.64 10.19 11.89 19.00 16.14 Tripura 56.48 53.54 77.01 0.00 0.00 0.00 0.00 0.00 0.00 0.00 0.00 0.00 UP & Utt'chal 57.32 56.37 55.37 9.95 11.74 15.40 10.02 11.24 11.16 4.22 6.73 10.16 Uttar Pradesh 58.49 56.37 55.37 9.26 11.74 15.40 10.50 11.24 11.16 4.42 6.73 10.16 West Bengal 64.32 71.31 72.71 0.61 0.92 1.37 2.56 3.11 5.06 6.95 6.11 4.58 All- India 36.30 36.31 36.55 16.19 17.61 23.12 12.32 11.94 13.05 12.46 14.43 10.36
Contd………
28
Plantation Crops Commercial Crops Potatoes & Onions Fruits &
Vegetables States 2003-
04 1993-
94 1983-
84 2003-
04 1993-
94 1983-
84 2003-
04 1993-
94 1983-
84 2003-
04 1993-
94 Andhra Pradesh 1.85 1.28 0.87 9.74 8.91 6.60 0.23 0.16 0.14 6.55 4.15 Assam 7.33 6.57 6.21 2.53 3.14 4.55 1.97 1.57 1.23 7.30 5.48 Arunachal Pradesh 0.84 0.27 0.00 0.00 0.00 0.00 0.00 0.00 0.00 16.42 12.79 Bihar & Jharkhand 0.01 0.00 0.00 2.85 2.77 2.87 1.59 1.64 1.33 4.99 4.53 Haryana 0.00 0.00 0.00 10.92 11.52 9.57 0.60 0.17 0.16 0.95 1.07 Jammu & Kashmir 0.00 0.00 0.00 0.00 0.00 0.00 0.00 0.00 0.00 6.69 5.56 Himachal Pradesh 0.24 0.21 0.33 0.00 0.00 0.00 1.57 2.05 1.43 10.36 7.49 Gujarat 0.00 0.00 0.00 17.59 12.74 15.45 0.75 0.37 0.24 2.81 1.87 Karnataka 5.98 3.91 3.31 5.55 7.48 9.82 1.33 0.72 0.50 4.37 2.19 Kerala 53.85 52.27 39.17 0.00 0.00 0.00 0.00 0.00 0.00 20.29 18.87 Maharashtra 0.75 0.28 0.16 14.86 13.39 14.43 0.49 0.47 0.27 4.03 2.38 MP & Ch'sgarh 0.00 0.00 0.00 2.60 2.17 2.60 0.29 0.24 0.19 1.20 0.87 Madhya Pradesh 0.00 0.00 0.00 3.37 2.17 2.60 0.37 0.24 0.19 0.98 0.87 Orissa 1.98 1.03 0.83 0.51 0.65 1.47 0.13 0.51 0.54 10.66 10.22 Punjab 0.00 0.00 0.00 7.14 8.66 10.52 0.83 0.39 0.38 1.95 1.09 Pondicherry 0.00 0.00 0.00 0.00 0.00 0.00 0.00 0.00 0.00 2.56 2.22 Rajasthan 0.00 0.00 0.00 1.63 2.80 2.20 0.16 0.08 0.06 0.51 0.39 Sikkim 0.23 0.13 0.21 0.00 0.00 0.00 0.00 0.00 0.00 9.09 5.51 Tamil Nadu 9.16 6.33 3.21 4.75 6.85 4.92 0.46 0.42 0.47 8.67 5.00 Tripura 1.58 1.33 1.66 0.00 0.00 0.00 1.30 0.00 0.67 22.22 18.26 UP & Utt'chal 0.00 0.00 0.01 8.07 6.97 6.79 1.64 1.61 1.23 3.67 3.39 Uttar Pradesh 0.00 0.00 0.01 7.95 6.97 6.79 1.72 1.61 1.23 3.68 3.39 West Bengal 1.42 1.47 1.43 6.62 5.65 6.47 3.15 2.65 1.86 13.09 10.03 All- India 2.18 1.83 1.45 6.84 6.44 6.83 0.92 0.76 0.59 4.62 3.59
29
Table 15: Categorization of States on the basis of Average Annual Growth Rate in Area for important Crops during the period 1994-2004
Crops Significant Increase (More than 1%)
Marginal Increase (Between 0.99 to 0.11%)
Stagnant (0.09 to -0.09%)
Marginal Decrease (-0.11 to -0.99%)
Significant Decrease (More than -1%)
Paddy Haryana, Gujarat, Punjab, UP MP, BR Assam, MHT, WB AP, J & K ,HP, Orissa, Tripura AP, Karnataka,Rajasthan, Kerala, TN Wheat AP, Haryana, Gujarat, Orissa, WB BR, J & K, Punjab,Rajasthan, UP HP, Karnataka, MP Assam, AP, MHT, Sikkim, Tripura Jowar Rajasthan BR & Jharkhand Orissa AP, Gujarat,Karnataka, MHT, MP, TN, UP Bajra Haryana, J & K ,MP, Rajasthan Karnataka, UP & UT, AP Gujarat, MHT, TN Maize AP,BR,Gujarat,Karnataka,MHT,Rajasthan, TN J& K MP & CHT HP, Orissa Punjab, UP & UT,WB Gram AP, Gujarat, Karnataka, MHT,MP & CHT, WB Rajasthan BR , Haryana, Orissa,UP Pigeonpea AP, BR , Karnataka MHT Haryana, Gujarat, MP, Orissa,TN, UP Pulses AP,Karnataka,MP, Rajasthan BR, MHT Gujarat, UP & UT, WB Haryana, Orissa, TN Oilseeds WB Haryana MP & CHT Assam, Gujarat,,MHT, AP,BR ,Karnataka, Orissa,Punjab,Rajasthan,TNRapeseed & Mustard WB Haryana Assam BR, Gujarat, MP, Punjab, Rajasthan, UP Groundnut Gujarat AP, Karnataka,MHT,MP,Orissa,RajasthanTN,USoyabean AP, Karnataka, MHT, MP ,Rajasthan UP Sunflower AP Haryana, Karnataka, MHT,TN,UP Sugarcane AP,Haryana, Gujarat, MHT,Punjab,UP, WB MP & CHT, Orissa Assam,BR KarnatakaRajasthan,TN Cotton AP, Gujarat, MHT, MP Haryana Karnataka, Punjab, Rajasthan, TN Jute & Mesta BR, WB AP, Assam, MHT, Orissa Tobacco BR, Karnataka, UP AP, Gujarat, MHT, TN Coconut AP,Assam,Goa,MHT,Karnataka,Orissa,TN Kerala Cashew nut AP, Karnataka, MHT, Orissa, WB TN Kerala Tea Assam, , AP., BR, HP,Manipur,TN,UP,Sikkim,Nag Karnataka, Kerala, WB,Tripura, Coffee Karnataka Kerala, TN AP Rubber Karnataka Kerala, TN Potato Assam,Haryana,Gujarat, Karnataka,Punjab,UP, WB MP & CHT, Meghalaya BR & Jharkhand HP, Orissa, TN Onion AP, Gujarat,Karnataka,Mahar,MP,TN,Rajasthan Orissa, UP & UT, Fruits & Vegetables AP,Assam,AnP,BR, Delhi, Goa, J & K,HP,Gujarat,
MHT, MP, Meghalaya ,Mizoram,Manipur, Nagaland,Punjab,Rajasthan,Sikkim, TN, Tripura, UP, WB
Kerala Orissa, Haryana
Note: Abbreviations for states in the above Table are BR-Bihar, MHT-Maharashtra, CHT-Chattisgargh,AP-Andhra Pradesh,,UP-Uttar Pradesh,MP-Madhya Pradesh, J&K –Jammu & Kashmir,TN-Tamil nadu,,UTS-
Uttaranchal, WB-West Bengal, HP-Himachal Pradesh,
30
Table 16: Categorization of States on the basis of Average Annual Growth Rate in Area for Important Crops during the period 1984-1994
Table 17: Categorization of States on the basis of Average Annual Growth Rate in Area for Important Crops during the period 1984-2004
Crops Significant Increase (More than 1%)
Marginal Increase (Between 0.99 to 0.11%)
Stagnant (0.09 to -0.09%)
Marginal Decrease (-0.11 to -0.99%)
Significant Decrease (More than -1%)
Paddy AP, Haryana, Gujarat, Karnataka, Punjab Assam,MHT, MP, Orissa, WB J & K, UP BR, TN AP, HP, Kerala, Rajasthan Tripura Wheat A.P., Haryana, J & K, Tripura BR& Jharkhand, HP, MP, Punjab, UP Rajasthan, WB AP,Assam, Gujarat, Karnataka, MHT, Orissa,
Sikkim Jowar Karnataka, MHT AP, Haryana,Gujarat, MP, Orissa, Rajasthan ,TN, UP Bajra MHT, AP, Haryana, J & K,Gujarat, Karnataka, MP, Rajasthan, Maize Gujarat, Karnataka, MHT, MP, TN J & K, HP, Rajasthan AP, UP BR, Punjab, WB Gram AP,Karnataka, MHT, MP BR, Haryana, Gujarat,Orissa, Rajasthan, UP, WB Pigeonpea AP, Haryana, Gujarat, MHT, Orissa Karnataka, UP BR, MP, TN Pulses Gujarat, MHT, AP, UP Karnataka, MP, TN BR, Haryana, Orissa, Rajasthan, WB Oilseeds AP,Haryana,Gujarat,MP, Karnataka, MHT ,
TN,Punjab, Rajasthan, WB Assam BR, Orissa, UP & UT,
Rapeseed & Mustard BR, Haryana, Gujarat, MP, Rajasthan, WB Assam Punjab, UP & UT, Groundnut AP, Karnataka, Rajasthan, TN Gujarat MHT,MP,Orissa, UP Soyabean MP & C, Rajasthan UP & UT, Sunflower AP, Karnataka, MHT , TN, UP Sugarcane AP, Karnataka,Gujarat, MHT, TN UP, MP BR, Punjab Assam, Haryana, Orissa, WB Cotton AP, Haryana, Rajasthan, TN MHT Gujarat,Karnataka, MP, Punjab,TN Jute & Mesta BR, Meghalaya, WB AP, Assam, MHT, Orissa Tobacco Karnataka, UP Gujarat, MHT AP, BR & Jharkhand, TN Coconut AP,Assam,Karnataka, Kerala,Orissa,TN,WB Goa MHT Cashew nut AP, Karnataka, MHT, Orissa Kerala Tea AP,Manipur,Nagaland, Orissa TN Kerala Tripura BR, HP, Sikkim, UP Coffee AP, Karnataka, Kerala Assam, Karnataka, TN, WB TN Rubber Karnataka, Kerala Potato Assam, ,BR, HP,Haryana, Gujarat, MP, Punjab Orissa, TN Meghalaya Tripura Onion Gujarat,Karnataka,MP, MHT,Rajasthan,UP & Orissa Haryana, TN Fruits & Vegetables
AP, Assam,AP, BR, Delhi, Goa,J&K,HP, PunjaKarnataka, Meghalaya,Mizoram, Manipur,NagaMP,Rajasthan, Sikkim, TN, Tripura, UP, WB
Kerala Haryana, Orissa
Years Significant Increase (More than 1%)
Marginal Increase (Between 0.99 to 0.11%)
Stagnant (0.09 to -0.09%)
Marginal Decrease (-0.11 to -0.99%)
Significant Decr(More than -1%
1994-04 WB UP, Sikkim, Rajasthan, Punjab, MHT,J & K,Haryana, Bi, AnP, Assam
AP, Gujarat, MP & HP, Karnataka,Kerala, Orissa, Tripu Pondicherry, TN
1984-94 AP, Sikkim, Tripura, WB Assam, Haryana, J&K, Gujarat, Karnataka, Kerala, TMahar, MP, Orissa, Punjab, Pondiccherry Rajasthan,
HP AP, BR,
1984-04 Assam,A.P., Haryana, Punjab, Rajasthan, Sikkim, Tripura, WB J & K, Gujarat, Karnataka, Kerala, Mahar, MP, UP AP, BR,HP,Orissa, Pondicherry, TN
31
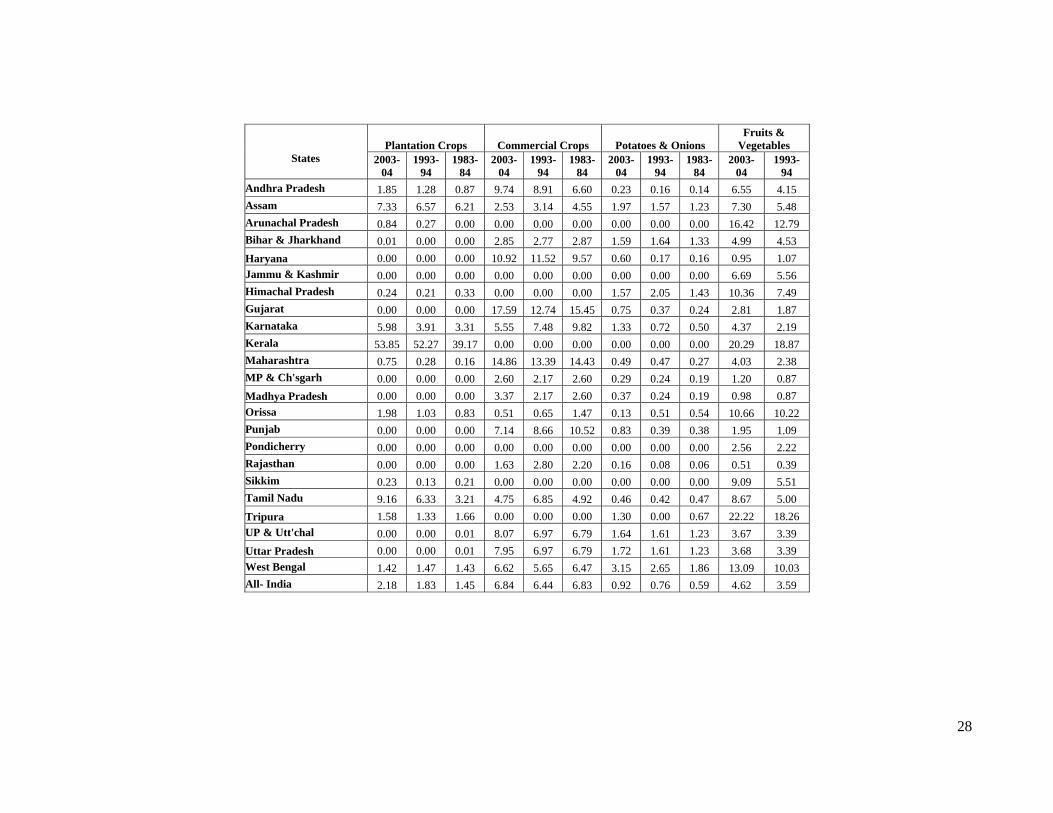
The above indices do not explain changes in the pattern of diversification during the
reference period. Such aggregate indices often conceal rather than reveal the detailed
pattern of agricultural diversification in the country. The diversification indices are
obtained from the percent of gross cropped area under different crops and a discussion on
the changes in the percent area during the reference period would explain the pattern of
crop diversification in agriculture. There are around 40 crops for which the Ministry of
Agriculture (MOA) maintains crop-acreage related information. Percent area under these
crops has been worked out; in order to make it presentable several commodities are
grouped together as commodity groups and percent changes in these commodities group
are presented in Table 14. The table shows changes in the percent of area under crops /
crop groups for the year 2003-04, 1993-94 and 1983-84. These crops are grouped
together under following commodity groups namely, fine cereals, coarse cereals, pulses,
oilseeds, plantations and commercial crops. The percent of gross cropped area under
potato and onion has been grouped together.
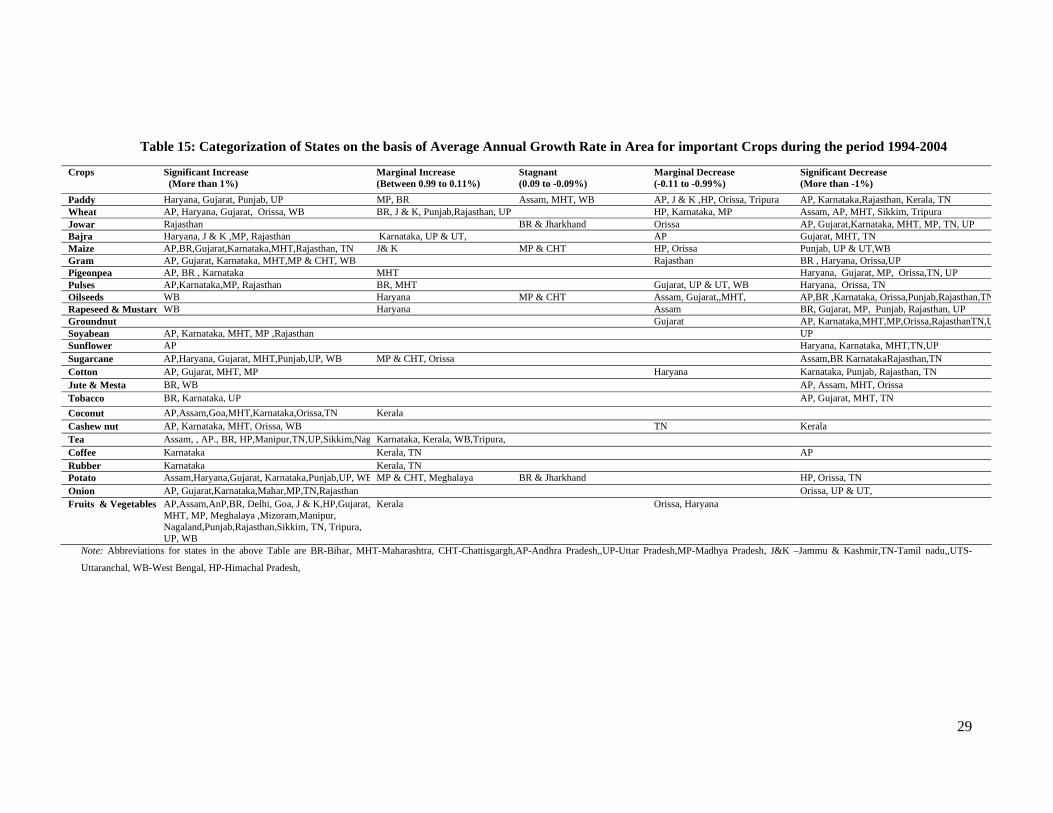
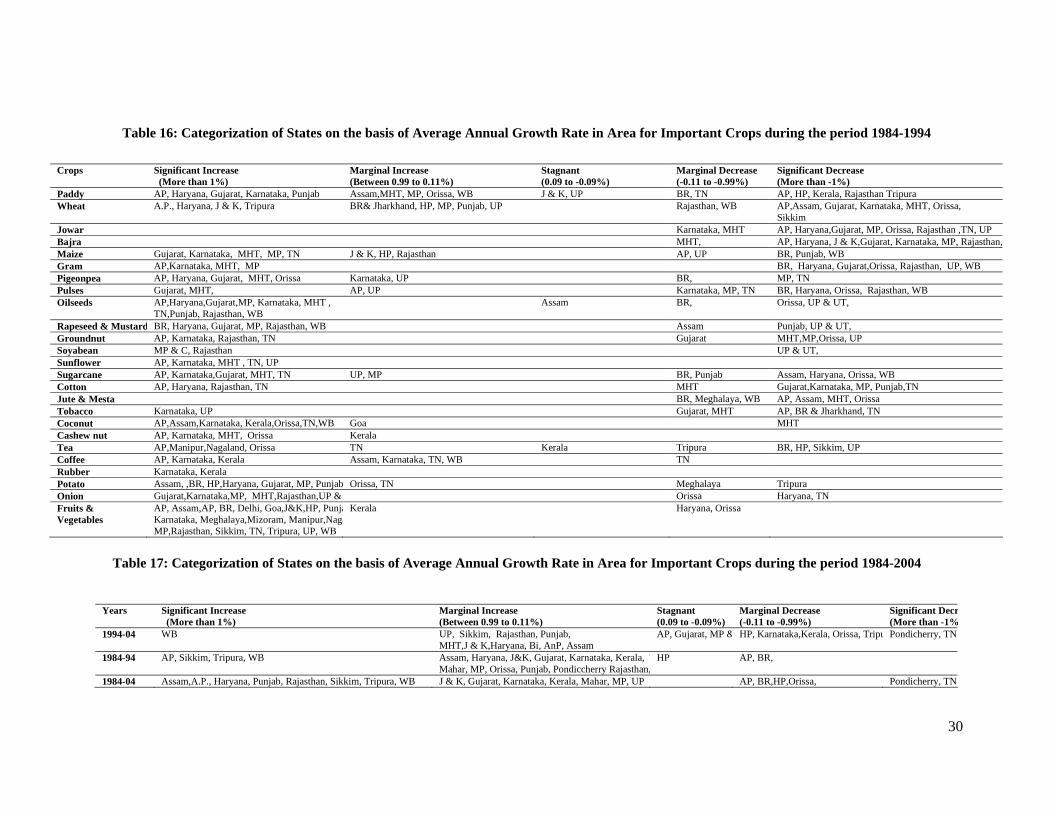
In addition to the percent changes in area, the average annual growth rate in area during
the reference period is presented comprehensively in Tables 15, 16 and 17. Table 15
presents the growth in area between 1994 and 2004, whereas Table 16 presents growth in
area between 1984 and 1994. The above tables on the basis of the average annual rate of
growth in area under important crops categorize states into five groups. The first and
second group consists of states that registered significant (more than one percent) and
marginal (0.99 to 0.11percent) increase in area under a crop; the third group constitutes
states that show stagnation and registered an average annual growth in acreage between
0.09 to –0.09 percent; whereas the fourth and fifth group consists of states registering
marginal (-0.11 to –0.99 percent) and significant (more than one percent) decline in area
under the selected crops. Again an increase or decrease in area under certain crops in a
state has to be viewed in simultaneity with the increase in the gross cropped area.
Therefore on the basis of average annual growth rate in gross cropped area, states are
presented into five groups. Table 17 presents the growth rate in area during the above
two periods. The growth in acreage has to be seen in the backdrop of the percentage of
gross cropped area under a crop and the changes in the above percent during the
reference period (Table 14). Though these tables are self-explanatory the particular trend
across states for crops / crop groups is discussed with figures from Table 14.
32
Fine cereals include paddy and wheat; the percent area under fine cereals at the all-India
level has not changed significantly during the1994-2004, while the percent area under
fine cereals has decreased marginally (0.20%) during the pre-liberalization period (1984-
94). This decline is on the account of decrease in area under paddy; in fact the percent
area under wheat has increased (Appendix Table 2). The states that registered a decline
in the percent area under fine cereals are Andhra Pradesh, Kerala, Tamilnadu, Assam,
Arunachal Pradesh, Sikkim, West Bengal, and Madhya Pradesh. The decreasing trend
was similar for most of the states during the 1980, though the decrease in percent area
was sharper for a few states. The states that registered an increase in area under fine
cereals are Bihar inclusive of Jharkhand, Orissa, Haryana and Punjab. Though there have
been significant efforts towards the reduction of area under fine cereals in the latter
group of states, Gujarat and Tripura show a different trend as the percent area under fine
cereals has decreased during the first period and increased during the second period.
It is almost a known fact that the area under coarse cereals has been decreasing at the all
-India level (Table 11). The rate of decline has however slowed down during the 1990s.
In most of the states barring Bihar, HP, Rajasthan, J&K, the percent area under coarse
cereals has declined significantly during 1984-2004. There can be many reasons for
preferring coarse cereals in these states. The marginal land hypothesis for coarse cereals
still prevails. Coarse cereals are good fodder crop and are well suited to the traditional
mixed farming system. In difficult areas like J&K, Himachal Pradesh, Bihar people are
probably still dependent on coarse cereals as the reach of the Public Distribution System
(PDS) in the region is insufficient. For people of some states like Rajasthan, coarse
cereals are an integral part of their food consumption basket. It may be noted that coarse
cereals as compared to many other cereals provide more nutrients per unit of cereals
consumed.
Among coarse cereals only maize registered a significant increase in area under some
states in the eighties whereas, in the nineties all coarse cereals (jowar, bajra and maize)
registered significant increase in the growth of area in many states of the country. The
coarse-cereals based dietary pattern of people in a large part of the country was being
changed with the subsidized rice and wheat through the PDS. In the nineties coarse
cereals gained in importance with their alternate uses like feed in the poultry industry,
raw material for industry. There are sufficient reasons for incorporating coarse cereals in
the consumption basket as well.
33
At the all-India level the percent area under pulses has increased marginally in the 1990s,
though this has declined during the entire period of reference (1984-2004). Increase in
area under pulses in the 1990s occurred in Andhra Pradesh, Karnataka, Madhya Pradesh
and Rajasthan whereas Gujarat, Maharashtra and Uttar Pradesh have registered a decline
in the area during this period. The share of pulses in the gross cropped area (GCA) has
declined considerably in the states of Orissa and Haryana. The oilseeds contain
information for a group of nine oilseeds. A favourable price policy for a group of nine
oilseeds during the 1980s has led to an increase in the proportionate area under oilseeds.
But with the moderation of price policy in the 1990s, the area under oilseeds has in fact
declined at the all-India level during the reference period (1994-04). In states like Orissa
and Uttar Pradesh, the area under oilseeds has decreased continuously since the 1980s.
Haryana, Gujarat, Madhya Pradesh and Maharashtra were able to hold their share during
the 1990s as well. In states like West Bengal and Madhya Pradesh, the area under
oilseeds has increased during the 1990s.
Plantation crops include tea, coffee, coconut and rubber. At the all-India level the area
under plantation crops has increased during the reference period (1984-04). Plantation
crops are concentrated in selected states of the country. The area under plantation crops
has increased in Kerala, Karnataka, AP and Maharashtra. The percent area under
plantation crops has either stagnated or declined in West Bengal, Himachal Pradesh,
Sikkim and Tripura. One can infer that the area under plantation crops has increased in
the coastal states with tropical climate; while the same decreased in the hilly states with a
temperate kind of climate. This trend has implications for differential performances of
plantation crops in the country since the different kinds of plantation crops are cultivated
in the hilly and coastal region of the country.
The commercial crops in Table 14 consist of sugarcane and cotton. The percent area
under commercial crops has stagnated at the all-India level; however from states there
are mixed trends. The percent area under commercial crops has increased in Andhra
Pradesh but decreased in Assam, Karnataka, Orissa, Rajasthan and Punjab. In potatoes
and onions, increase in the area is observed in the most of the states barring Karnataka,
Orissa and Tamilnadu.
Since the nineties, the percent area under fruits and vegetables has increased in the
country; this increase in the percent of GCA is only one percent at the aggregate level. A
substantial increase in the share of area under fruits and vegetables is observed in the
34
northeastern states of Sikkim, Tripura and Arunachal Pradesh; while West Bengal,
Tamilnadu and Andhra Pradesh registered more than a three percent increase in the area
under fruits and vegetables.
The above discussion suggests that there is no significant improvement in diversification
indices during the reference period. There are in fact evidences of specialization from
certain states. The production basket of a commodity is now less diversified across
states; in other words the production of a commodity is getting specialized in states as
per the resource endowment and institutional arrangement for that commodity in the
individual state. Interestingly, within the commodity groups, the percent area under
specific crops has increased while that of other commodities in the same commodity
group has decreased. In coarse cereals for instance, the percent area under sorghum and
barley has decreased while that of maize and bajra has increased during the reference
period. There are also evidences from states of specialization in certain crops. The
changes in percent area under crops in the recent decade broadly show that the area
under fruits and vegetables has increased significantly, while the area under fine cereals
and oilseeds has stagnated. The percent area under coarse cereals and pulses are
decreasing since 1970s; decline in the percent of GCA has however ceased in the
nineties. Area under commercial crops has not changed significantly in the recent period.
The percent change in the GCA for crops clearly shows a periodic shift in the acreage of
certain crops in the specific regions of the country following favourable institutions and
an incentive structure for these crops in the region.
V. Resource Diversification in Haryana Following the discussion of crop diversification at the aggregate level in this section,
crop diversification at meso-level has been studied for Haryana and all its districts.
Diversification indices which include Simpson and Modified-Entropy are worked out
with percent of individual crop in gross cropped area for all the 19 districts of Haryana.
The reference years, as for the previous analysis, are 1983-84, 1993-94, and 2003-04.
These indices are presented in Table 18. As is apparent from the table both the indices
have declined for Haryana and for most of the districts of the state during the reference
period. Though there are a few exceptions. The differences in diversification indices
have implications for the estimation techniques. The Entropy index is not sensitive to
changes in the number of crops. Off late in many districts of Haryana, acreage under
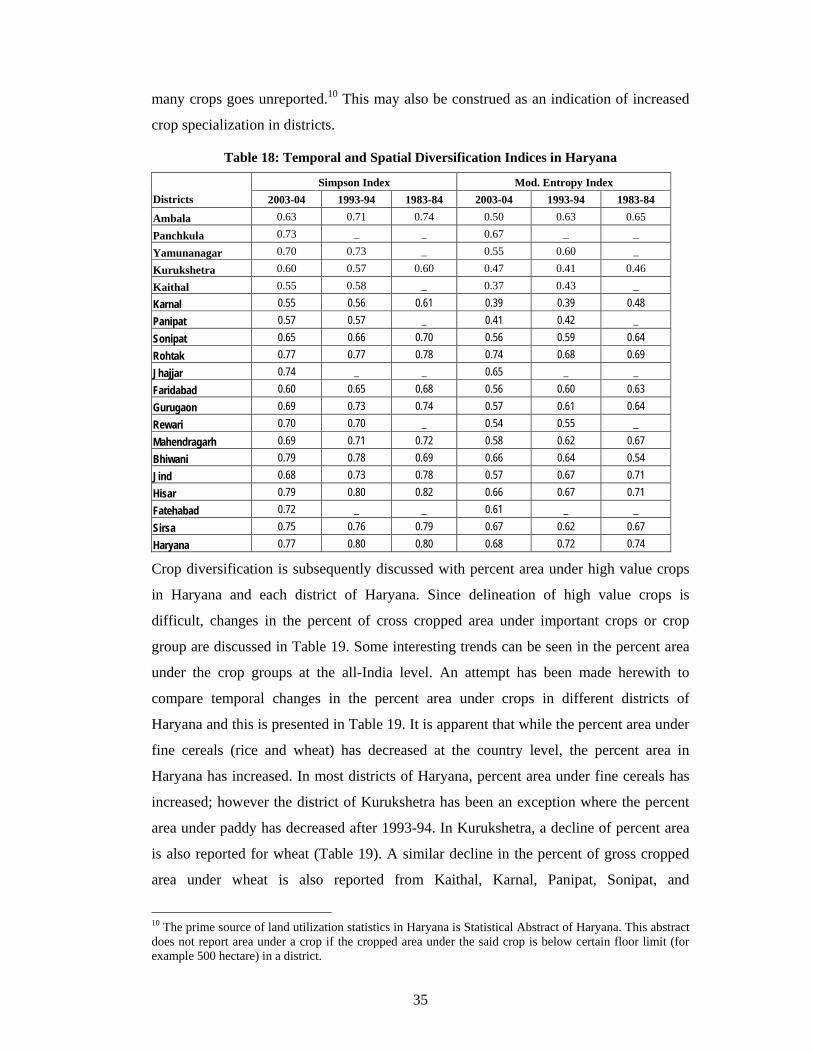
35
many crops goes unreported.10 This may also be construed as an indication of increased
crop specialization in districts.
Table 18: Temporal and Spatial Diversification Indices in Haryana
Simpson Index Mod. Entropy Index Districts 2003-04 1993-94 1983-84 2003-04 1993-94 1983-84
Ambala 0.63 0.71 0.74 0.50 0.63 0.65
Panchkula 0.73 _ _ 0.67 _ _
Yamunanagar 0.70 0.73 _ 0.55 0.60 _
Kurukshetra 0.60 0.57 0.60 0.47 0.41 0.46
Kaithal 0.55 0.58 _ 0.37 0.43 _
Karnal 0.55 0.56 0.61 0.39 0.39 0.48 Panipat 0.57 0.57 _ 0.41 0.42 _ Sonipat 0.65 0.66 0.70 0.56 0.59 0.64 Rohtak 0.77 0.77 0.78 0.74 0.68 0.69 Jhajjar 0.74 _ _ 0.65 _ _ Faridabad 0.60 0.65 0.68 0.56 0.60 0.63 Gurugaon 0.69 0.73 0.74 0.57 0.61 0.64 Rewari 0.70 0.70 _ 0.54 0.55 _ Mahendragarh 0.69 0.71 0.72 0.58 0.62 0.67 Bhiwani 0.79 0.78 0.69 0.66 0.64 0.54 Jind 0.68 0.73 0.78 0.57 0.67 0.71 Hisar 0.79 0.80 0.82 0.66 0.67 0.71 Fatehabad 0.72 _ _ 0.61 _ _ Sirsa 0.75 0.76 0.79 0.67 0.62 0.67 Haryana 0.77 0.80 0.80 0.68 0.72 0.74
Crop diversification is subsequently discussed with percent area under high value crops
in Haryana and each district of Haryana. Since delineation of high value crops is
difficult, changes in the percent of cross cropped area under important crops or crop
group are discussed in Table 19. Some interesting trends can be seen in the percent area
under the crop groups at the all-India level. An attempt has been made herewith to
compare temporal changes in the percent area under crops in different districts of
Haryana and this is presented in Table 19. It is apparent that while the percent area under
fine cereals (rice and wheat) has decreased at the country level, the percent area in
Haryana has increased. In most districts of Haryana, percent area under fine cereals has
increased; however the district of Kurukshetra has been an exception where the percent
area under paddy has decreased after 1993-94. In Kurukshetra, a decline of percent area
is also reported for wheat (Table 19). A similar decline in the percent of gross cropped
area under wheat is also reported from Kaithal, Karnal, Panipat, Sonipat, and
10 The prime source of land utilization statistics in Haryana is Statistical Abstract of Haryana. This abstract does not report area under a crop if the cropped area under the said crop is below certain floor limit (for example 500 hectare) in a district.
36
Mahendragarh. As a matter of fact the area under wheat in these districts has realized to
its full potential. With the depletion of ground water table, the availability of assured
irrigation has been a major problem for many farmers. This has constrained acreage
under water -intensive and sensitive crops like wheat (Jha 2000). Consequently, increase
of area under less water-intensive crops like rape-mustard, sunflower and fodder has
taken place.
In coarse cereals maize has emerged as an important crop, information for which is
therefore presented in Table 19 along with other coarse cereals. As is evident from table,
the percent area under these crops has decreased, though the rate of decrease has
decelerated during the 1990s. The trend is similar for the most of the districts other than
Mohindergarh, Jind, Rohtak and Hissar. In the 1990s the percent area under maize has
increased marginally in Jind and Bhiwani. Interestingly, the percent area under coarse
cereals has increased in Haryana during the 1990s, though during the 1980s this had
declined significantly.
Following the above mode of presentation, the percent area under pulse, oilseeds,
commercial crops are presented with the percent area under the most important pulse
(gram), oilseed (rape-mustard) and commercial crops (cotton) produced in Haryana
(Table 19). The percent area under pulses has been decreasing since 1983-84. The
percent area under oilseeds has increased during the reference period; though the area
has declined marginally during the 1990s. The sharp increase in the area under oilseeds
during 1984-94 is largely due to the Technical Mission on Oilseeds (TMO) initiated
during the mid-80s which ushered in the much acclaimed yellow revolution in the
country. A bulk of the area under oilseeds in Haryana is under rapeseed and mustard and
acreage under these crops did not change significantly during the 1990s, inspite of the
fact that the price policy for oilseeds in the nineties was not as favourable as in the late
1980s (Jha 2009). In contrast the percent area under pulses has not increased in the
region despite a favourable price policy for pulses in the country. This clearly suggests
that there are many factors other than price that affects allocation of land under a crop.
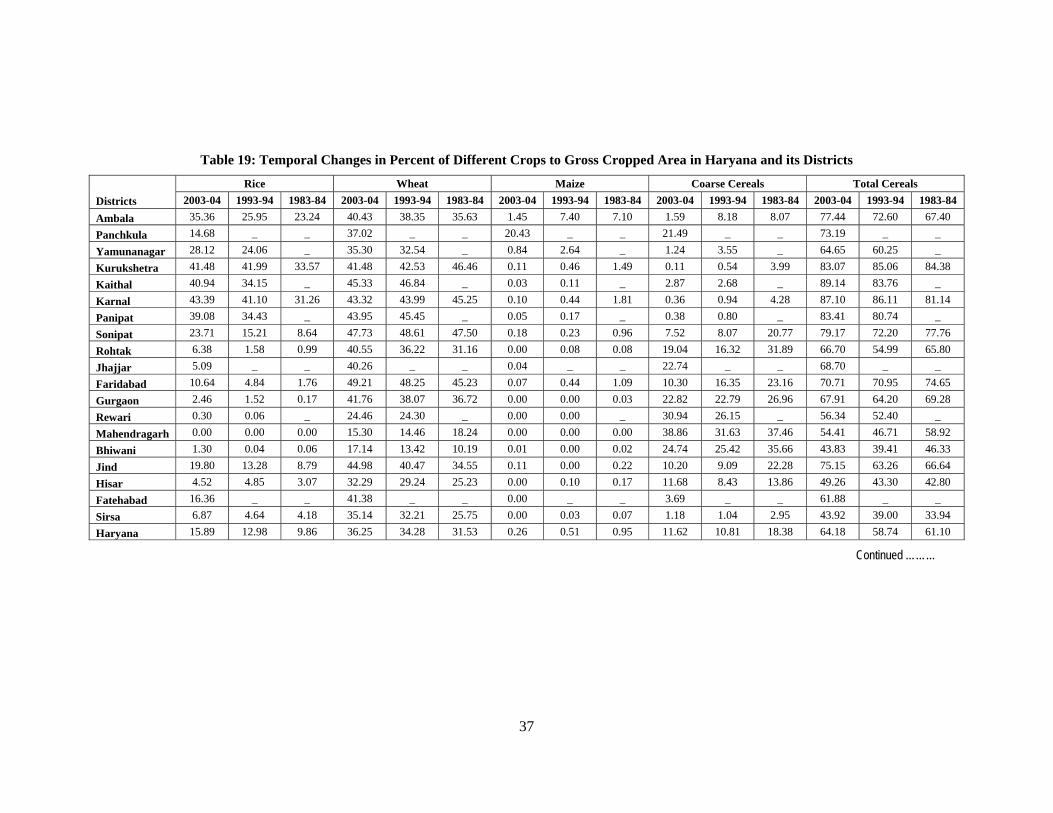
37
Table 19: Temporal Changes in Percent of Different Crops to Gross Cropped Area in Haryana and its Districts
Rice Wheat Maize Coarse Cereals Total Cereals Districts 2003-04 1993-94 1983-84 2003-04 1993-94 1983-84 2003-04 1993-94 1983-84 2003-04 1993-94 1983-84 2003-04 1993-94 1983-84 Ambala 35.36 25.95 23.24 40.43 38.35 35.63 1.45 7.40 7.10 1.59 8.18 8.07 77.44 72.60 67.40 Panchkula 14.68 _ _ 37.02 _ _ 20.43 _ _ 21.49 _ _ 73.19 _ _ Yamunanagar 28.12 24.06 _ 35.30 32.54 _ 0.84 2.64 _ 1.24 3.55 _ 64.65 60.25 _ Kurukshetra 41.48 41.99 33.57 41.48 42.53 46.46 0.11 0.46 1.49 0.11 0.54 3.99 83.07 85.06 84.38 Kaithal 40.94 34.15 _ 45.33 46.84 _ 0.03 0.11 _ 2.87 2.68 _ 89.14 83.76 _ Karnal 43.39 41.10 31.26 43.32 43.99 45.25 0.10 0.44 1.81 0.36 0.94 4.28 87.10 86.11 81.14 Panipat 39.08 34.43 _ 43.95 45.45 _ 0.05 0.17 _ 0.38 0.80 _ 83.41 80.74 _ Sonipat 23.71 15.21 8.64 47.73 48.61 47.50 0.18 0.23 0.96 7.52 8.07 20.77 79.17 72.20 77.76 Rohtak 6.38 1.58 0.99 40.55 36.22 31.16 0.00 0.08 0.08 19.04 16.32 31.89 66.70 54.99 65.80 Jhajjar 5.09 _ _ 40.26 _ _ 0.04 _ _ 22.74 _ _ 68.70 _ _ Faridabad 10.64 4.84 1.76 49.21 48.25 45.23 0.07 0.44 1.09 10.30 16.35 23.16 70.71 70.95 74.65 Gurgaon 2.46 1.52 0.17 41.76 38.07 36.72 0.00 0.00 0.03 22.82 22.79 26.96 67.91 64.20 69.28 Rewari 0.30 0.06 _ 24.46 24.30 _ 0.00 0.00 _ 30.94 26.15 _ 56.34 52.40 _ Mahendragarh 0.00 0.00 0.00 15.30 14.46 18.24 0.00 0.00 0.00 38.86 31.63 37.46 54.41 46.71 58.92 Bhiwani 1.30 0.04 0.06 17.14 13.42 10.19 0.01 0.00 0.02 24.74 25.42 35.66 43.83 39.41 46.33 Jind 19.80 13.28 8.79 44.98 40.47 34.55 0.11 0.00 0.22 10.20 9.09 22.28 75.15 63.26 66.64 Hisar 4.52 4.85 3.07 32.29 29.24 25.23 0.00 0.10 0.17 11.68 8.43 13.86 49.26 43.30 42.80 Fatehabad 16.36 _ _ 41.38 _ _ 0.00 _ _ 3.69 _ _ 61.88 _ _ Sirsa 6.87 4.64 4.18 35.14 32.21 25.75 0.00 0.03 0.07 1.18 1.04 2.95 43.92 39.00 33.94 Haryana 15.89 12.98 9.86 36.25 34.28 31.53 0.26 0.51 0.95 11.62 10.81 18.38 64.18 58.74 61.10
Continued ………
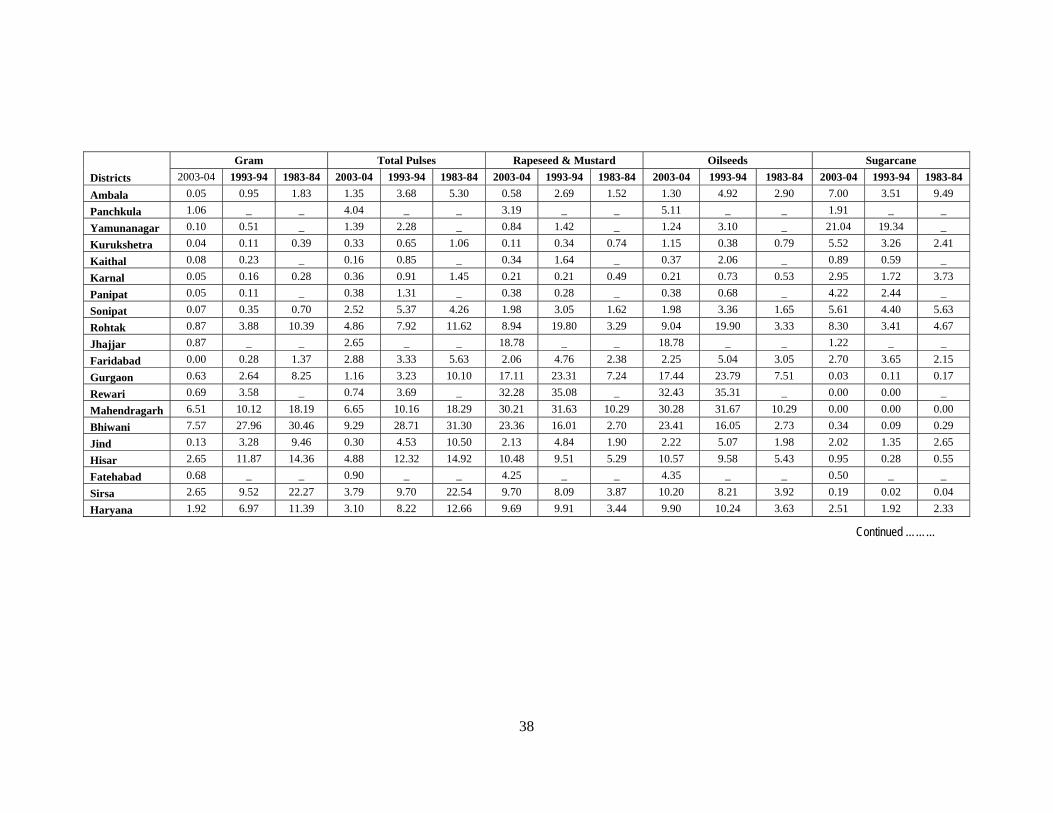
38
Gram Total Pulses Rapeseed & Mustard Oilseeds Sugarcane Districts 2003-04 1993-94 1983-84 2003-04 1993-94 1983-84 2003-04 1993-94 1983-84 2003-04 1993-94 1983-84 2003-04 1993-94 1983-84 Ambala 0.05 0.95 1.83 1.35 3.68 5.30 0.58 2.69 1.52 1.30 4.92 2.90 7.00 3.51 9.49 Panchkula 1.06 _ _ 4.04 _ _ 3.19 _ _ 5.11 _ _ 1.91 _ _ Yamunanagar 0.10 0.51 _ 1.39 2.28 _ 0.84 1.42 _ 1.24 3.10 _ 21.04 19.34 _ Kurukshetra 0.04 0.11 0.39 0.33 0.65 1.06 0.11 0.34 0.74 1.15 0.38 0.79 5.52 3.26 2.41 Kaithal 0.08 0.23 _ 0.16 0.85 _ 0.34 1.64 _ 0.37 2.06 _ 0.89 0.59 _ Karnal 0.05 0.16 0.28 0.36 0.91 1.45 0.21 0.21 0.49 0.21 0.73 0.53 2.95 1.72 3.73 Panipat 0.05 0.11 _ 0.38 1.31 _ 0.38 0.28 _ 0.38 0.68 _ 4.22 2.44 _ Sonipat 0.07 0.35 0.70 2.52 5.37 4.26 1.98 3.05 1.62 1.98 3.36 1.65 5.61 4.40 5.63 Rohtak 0.87 3.88 10.39 4.86 7.92 11.62 8.94 19.80 3.29 9.04 19.90 3.33 8.30 3.41 4.67 Jhajjar 0.87 _ _ 2.65 _ _ 18.78 _ _ 18.78 _ _ 1.22 _ _ Faridabad 0.00 0.28 1.37 2.88 3.33 5.63 2.06 4.76 2.38 2.25 5.04 3.05 2.70 3.65 2.15 Gurgaon 0.63 2.64 8.25 1.16 3.23 10.10 17.11 23.31 7.24 17.44 23.79 7.51 0.03 0.11 0.17 Rewari 0.69 3.58 _ 0.74 3.69 _ 32.28 35.08 _ 32.43 35.31 _ 0.00 0.00 _ Mahendragarh 6.51 10.12 18.19 6.65 10.16 18.29 30.21 31.63 10.29 30.28 31.67 10.29 0.00 0.00 0.00 Bhiwani 7.57 27.96 30.46 9.29 28.71 31.30 23.36 16.01 2.70 23.41 16.05 2.73 0.34 0.09 0.29 Jind 0.13 3.28 9.46 0.30 4.53 10.50 2.13 4.84 1.90 2.22 5.07 1.98 2.02 1.35 2.65 Hisar 2.65 11.87 14.36 4.88 12.32 14.92 10.48 9.51 5.29 10.57 9.58 5.43 0.95 0.28 0.55 Fatehabad 0.68 _ _ 0.90 _ _ 4.25 _ _ 4.35 _ _ 0.50 _ _ Sirsa 2.65 9.52 22.27 3.79 9.70 22.54 9.70 8.09 3.87 10.20 8.21 3.92 0.19 0.02 0.04 Haryana 1.92 6.97 11.39 3.10 8.22 12.66 9.69 9.91 3.44 9.90 10.24 3.63 2.51 1.92 2.33
Continued ………
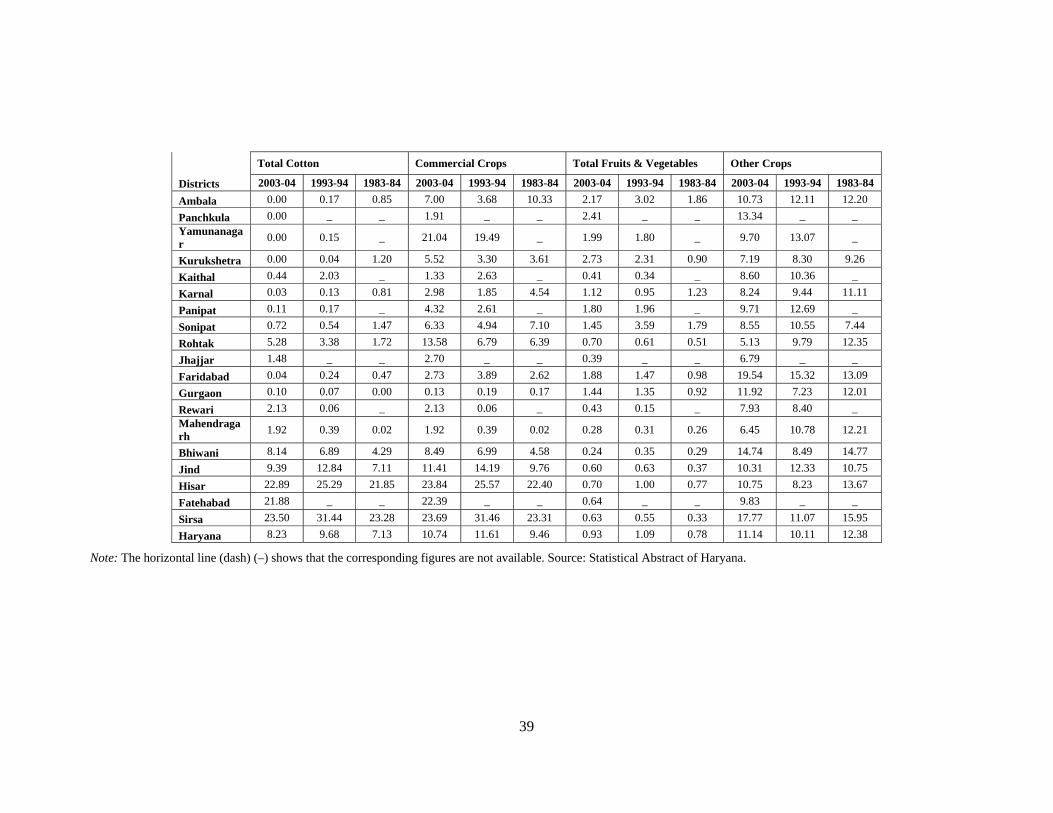
39
Total Cotton Commercial Crops Total Fruits & Vegetables Other Crops Districts 2003-04 1993-94 1983-84 2003-04 1993-94 1983-84 2003-04 1993-94 1983-84 2003-04 1993-94 1983-84 Ambala 0.00 0.17 0.85 7.00 3.68 10.33 2.17 3.02 1.86 10.73 12.11 12.20 Panchkula 0.00 _ _ 1.91 _ _ 2.41 _ _ 13.34 _ _ Yamunanagar 0.00 0.15 _ 21.04 19.49 _ 1.99 1.80 _ 9.70 13.07 _
Kurukshetra 0.00 0.04 1.20 5.52 3.30 3.61 2.73 2.31 0.90 7.19 8.30 9.26 Kaithal 0.44 2.03 _ 1.33 2.63 _ 0.41 0.34 _ 8.60 10.36 _ Karnal 0.03 0.13 0.81 2.98 1.85 4.54 1.12 0.95 1.23 8.24 9.44 11.11 Panipat 0.11 0.17 _ 4.32 2.61 _ 1.80 1.96 _ 9.71 12.69 _ Sonipat 0.72 0.54 1.47 6.33 4.94 7.10 1.45 3.59 1.79 8.55 10.55 7.44 Rohtak 5.28 3.38 1.72 13.58 6.79 6.39 0.70 0.61 0.51 5.13 9.79 12.35 Jhajjar 1.48 _ _ 2.70 _ _ 0.39 _ _ 6.79 _ _ Faridabad 0.04 0.24 0.47 2.73 3.89 2.62 1.88 1.47 0.98 19.54 15.32 13.09 Gurgaon 0.10 0.07 0.00 0.13 0.19 0.17 1.44 1.35 0.92 11.92 7.23 12.01 Rewari 2.13 0.06 _ 2.13 0.06 _ 0.43 0.15 _ 7.93 8.40 _ Mahendragarh 1.92 0.39 0.02 1.92 0.39 0.02 0.28 0.31 0.26 6.45 10.78 12.21
Bhiwani 8.14 6.89 4.29 8.49 6.99 4.58 0.24 0.35 0.29 14.74 8.49 14.77 Jind 9.39 12.84 7.11 11.41 14.19 9.76 0.60 0.63 0.37 10.31 12.33 10.75 Hisar 22.89 25.29 21.85 23.84 25.57 22.40 0.70 1.00 0.77 10.75 8.23 13.67 Fatehabad 21.88 _ _ 22.39 _ _ 0.64 _ _ 9.83 _ _ Sirsa 23.50 31.44 23.28 23.69 31.46 23.31 0.63 0.55 0.33 17.77 11.07 15.95 Haryana 8.23 9.68 7.13 10.74 11.61 9.46 0.93 1.09 0.78 11.14 10.11 12.38
Note: The horizontal line (dash) (–) shows that the corresponding figures are not available. Source: Statistical Abstract of Haryana.
40 | P a g e
In Haryana, sugarcane and cotton constitute the commercial crops together. Sugarcane
accounts for only 2.5 percent of the gross cropped area of the state. Acreage under
sugarcane has increased marginally in Haryana; an increase in the percent area has been
very significant in certain districts. It may be noted that the profitability of sugarcane in
the vicinity of a sugar factory is very high and farmers prefer it over other crops inspite of
the fact that it is a highly water-intensive crop. In the 1990s, the area under cotton
declined in the most of the districts of Haryana, barring Rohtak, Rewari, Mahendragarh
and Bhiwani. In these districts, the ground water table being low and the water quality
saline, the farmers therefore have limited options in the cultivation of crops other than
cotton in the kharif season. The above example argues for a specialization of cotton
cultivation in certain districts. Interestingly, the area under cotton in the districts
discussed above has increased, though the crop area has declined at the level of state and
country.
In Haryana, unlike for India, the percent area under fruits and vegetables has declined
during the 1990s; though the corresponding area has increased during the 1980s. Districts
show a different pattern for example the percent area under fruits and vegetables has
increased marginally in Kurukshetra, Karnal, Kaithal, Faridabad, Gurgaon, Rewari,
Rohtak, Yamunanagar and Sirsa districts. Many of these districts are relatively better
connected with the city / town; and this has played an important role in the diversification
of area under fruits and vegetables. Urbanization-led agricultural diversification in favour
of fruits and vegetables has been explained by Joshi et al. 2007. Again if we compare
temporal changes in the percent area under crops in different districts of Haryana, it
would be evident that Kurukshetra and Karnal have been leading other districts of
Haryana on the basis of certain parameters of intensive agriculture (Jha 2000).
Kurukshetra for example was ahead of other districts in the adoption of intensive
agriculture in the 1980s; whereas in the year 2003-04, Kurukshetra again led other
districts as far as adjustment to the consequences of intensive agriculture is concerned.
One may note that the percent area under paddy and wheat started decreasing in the
41 | P a g e
above districts in the recent decade on account of the stress on natural resources. An
increase of percent area under fruits and vegetables in the district may also be construed
as another step towards the adjustment against resource stress.
If the percent area under the above crops is discounted from the gross cropped area, in
most districts of Haryana around 10 percent of GCA remained unaccounted for during all
the reference years. This figure is not too small to be ignored. Field visits to the villages
in Haryana suggest that most of the farmers allocate a significant proportion of their area
to fodder crops. This is however, not reported in the existing system of land utilization
statistics published from states and country. If we consider this residual as fodder then the
area under fodder crops has increased in the 1990s. This increase is more in the districts
of Faridabad, Gurgaon, Hissar, Bhiwani, Sirsa. The earlier two districts are highly
urbanized and the demand for milk is generally high in such districts. This is also on
account of increased emphasis on dairy in the state.
In summing up, some of the salient points that emerged after comparing crop
diversification in the districts of Haryana with the diversification trend at the all-India
level are as under:
• The percent area under fine cereals decreases at the all-India level; the
corresponding figure has however increased in Haryana. In some of the
progressive districts of Haryana, the percent of gross cropped area has started
declining under resource stress.
• The percent area under coarse cereals increases in certain districts of Haryana,
though the corresponding figure has declined at the all-India level.
• The area under oilseeds increases in many districts of Haryana though the percent
area has declined for the commodity-group at the state level.
• Despite some encouraging trends in certain districts of Haryana, the percent area
under pulses has not increased in any of the districts of Haryana. This highlights
the limitations of price-induced incentives for growing certain crops.
42 | P a g e
The above discussion shows that small crop-specific pockets such as for fine cereals,
oilseeds, sugarcane, cotton, coarse cereals are being created in Haryana. Though many of
the above changes in per cent area under crops are influenced with the state of natural
resources in the region, institutions and the incentive structure provide the necessary
impetus for the above specialization.
VI. Farm level Diversification in Kurukshetra district of Haryana The previous section shows that on many accounts, diversification at the state and district
levels has been different. As these disparate trends are often not understandable, therefore
the pattern of agricultural diversification at the level of farm is studied here. Farm-level
diversification has been examined for the Kurukshetra district of Haryana, as this has
been one of the most progressive districts as far as the adoption of agricultural practices
is concerned. Again most of the districts in Haryana are moving towards the pattern
followed by Kurukshetra district (Jha 2008). Agriculture in many other states is also
developing in a manner similar to Haryana. In this backdrop, the study of farm-level
diversification in Kurukshetra district may guide us in understanding the pattern of
agricultural diversification in the country. The sample farmers are selected by adopting a
multistage stratified random sampling technique (Jha 2009a).
Table 20 presents a profile of small, medium and large farms with an average operational
holding of 2.8, 12.3, and 22.5 acres, respectively an equivalent to 1.13, 4.97, 9.12
hectares, respectively in the study area. Table 20 presents crop-enterprise mixes for
average farms of small, medium and large categories of sample farmers. Table 20 shows
that paddy and wheat account for more than two-thirds of the gross cropped area. On the
basis of intensity of enterprises, the difference between medium and large farms is not
very significant. On the large farm, the percent area under basmati paddy, sugarcane,
pulses, oilseeds, fruits and vegetables are higher than the medium farm whereas the area
under wheat, potato and fodders is lower than in the medium farm. Small farmers are
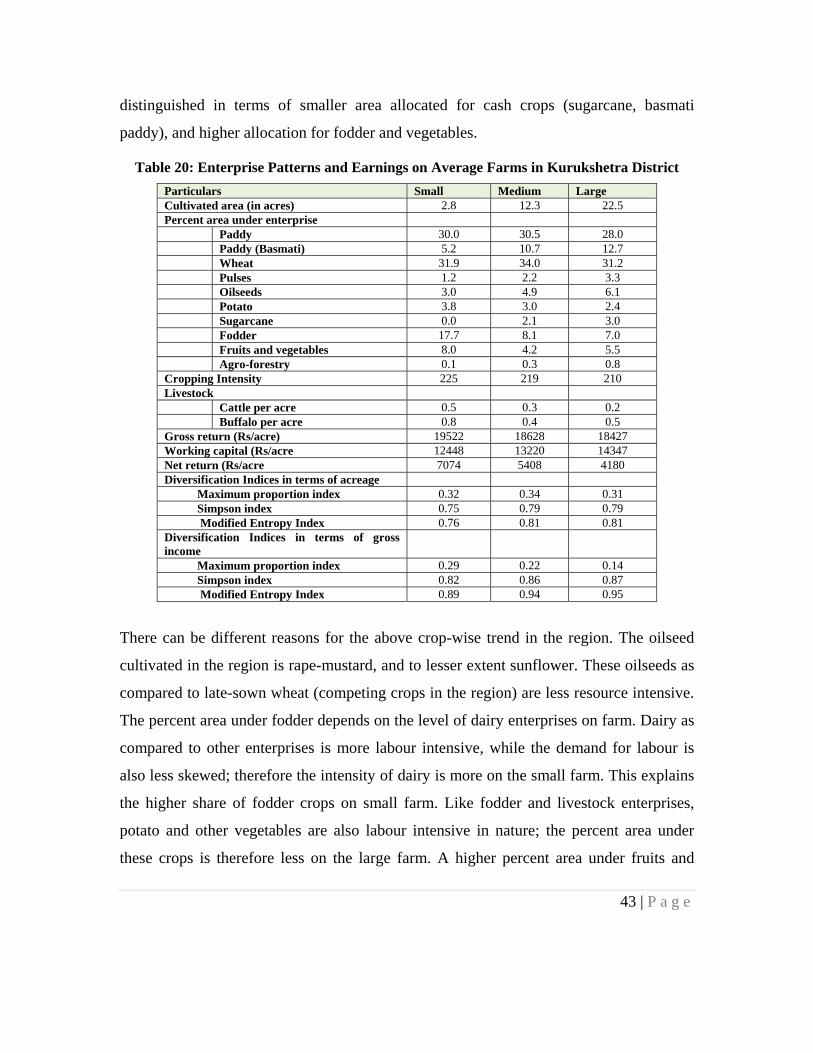
43 | P a g e
distinguished in terms of smaller area allocated for cash crops (sugarcane, basmati
paddy), and higher allocation for fodder and vegetables.
Table 20: Enterprise Patterns and Earnings on Average Farms in Kurukshetra District Particulars Small Medium Large Cultivated area (in acres) 2.8 12.3 22.5 Percent area under enterprise Paddy 30.0 30.5 28.0 Paddy (Basmati) 5.2 10.7 12.7 Wheat 31.9 34.0 31.2 Pulses 1.2 2.2 3.3 Oilseeds 3.0 4.9 6.1 Potato 3.8 3.0 2.4 Sugarcane 0.0 2.1 3.0 Fodder 17.7 8.1 7.0 Fruits and vegetables 8.0 4.2 5.5 Agro-forestry 0.1 0.3 0.8 Cropping Intensity 225 219 210 Livestock Cattle per acre 0.5 0.3 0.2 Buffalo per acre 0.8 0.4 0.5 Gross return (Rs/acre) 19522 18628 18427 Working capital (Rs/acre 12448 13220 14347 Net return (Rs/acre 7074 5408 4180 Diversification Indices in terms of acreage Maximum proportion index 0.32 0.34 0.31 Simpson index 0.75 0.79 0.79 Modified Entropy Index 0.76 0.81 0.81 Diversification Indices in terms of gross income
Maximum proportion index 0.29 0.22 0.14 Simpson index 0.82 0.86 0.87 Modified Entropy Index 0.89 0.94 0.95
There can be different reasons for the above crop-wise trend in the region. The oilseed
cultivated in the region is rape-mustard, and to lesser extent sunflower. These oilseeds as
compared to late-sown wheat (competing crops in the region) are less resource intensive.
The percent area under fodder depends on the level of dairy enterprises on farm. Dairy as
compared to other enterprises is more labour intensive, while the demand for labour is
also less skewed; therefore the intensity of dairy is more on the small farm. This explains
the higher share of fodder crops on small farm. Like fodder and livestock enterprises,
potato and other vegetables are also labour intensive in nature; the percent area under
these crops is therefore less on the large farm. A higher percent area under fruits and
44 | P a g e
vegetables on the large farm is more on account of fruits rather than vegetables. In the
sample households, kinnow orchard is reported from two large farmers. Though the size
of the orchard is of around five acres, the percent area on the average large farm has been
significant on account of the small numbers of large farmers in the sample. In the study
area eucalyptus, papular plants are planted around a farm near or on the boundary of the
holding; some large farmers have also allocated a small piece of land exclusively for
agro-forestry.
The extent of diversification involving alternate indices is presented in Table 21. The
simplest way to measure diversification at the farm level is by means of the number of
enterprises undertaken on a farm. The number of enterprises on a small farm is 11;
whereas, it is 12 on medium and large farms. These figures indicate that small farms are
less diversified than medium and large farms. The difference in number is on account of
cultivation of sugarcane; the small farmers in the sample households did not cultivate
sugarcane during the survey year (2000-01). While sugarcane is one of the most
profitable crops in the region, its cultivation depends on the proximity of a sugar
processing plant in the region.
Though the number of enterprises within an individual production unit is one of the
simplest ways of measuring diversification, this does not explain the levels of activities in
a farm portfolio. In this context, the index of maximum proportion (MPI), another
measure of diversification compares the share of individual enterprise in the aggregate
farm portfolio, and reports the share of the enterprise that commands the maximum share
in farm portfolio. The MPI suggests that if the share of individual enterprise in a farm is
high, say more than 50 percent of the total cropped area or farm income then the above
farm is specialized in favour of that enterprise. The index of maximum proportion can be
worked out on the basis of acreage, resources diversification and farm income, and
income diversification. The MPI estimates, based on acreage, show that the large farms
are more diversified than medium and small farms. Amongst different crops, the share of
wheat has been the maximum in a farm portfolio which is true across farm sizes. Paddy
45 | P a g e
would record the maximum proportion in area, if the areas under basmati and non-
basmati paddy are combined. The share of wheat on a medium farm is higher than on the
small farm.
In terms of gross income (G1), the index of maximum proportion is 29 percent on the
small farm; the corresponding figures for medium and large farms are 22 and 14 percent,
respectively. The index of maximum proportion indicates that the small farms are less
diversified than the other farms of the region. On small farms, buffalo accounts for the
maximum proportion in the gross income of farms; whereas, on medium and large farms
it is wheat. In terms of gross income, rice would command the maximum proportion if
we combine the contribution of basmati and non-basmati rice on an average farm. The
above trend is similar to the agricultural economy at the aggregate level. Towards the end
of the 1990s, milk has taken over rice as the maximum contributor to the agricultural
income in the country. A comparison of livestock statistics with operational holding at
the aggregate level shows that the small and marginal farms in the country are more
livestock-centric.
The index of maximum proportion does not give due importance to enterprises other than
the most dominant one. In order to improve this limitation, Simpson and Modified-
Entropy indices are calculated both for acreage and farm income. These indices are based
on the share of all individual enterprises on an average farm. The above indices like
earlier indices have also been worked out with respect to the area (resources) and farm
income. The Simpson index for area and gross income is at the minimum for small farms
indicating a lower diversification on small farms. However, differences in indices for
crop area are small suggesting less variation in crop diversification across farms. The
difference in either of the above indices worked out in terms of income or acreage is less
for medium and large farms. This manifests a similar level of area and income
diversification on these farms. The differences across farms are more conspicuous with
the Entropy Index. The index for small farms is significantly lower than for the medium
and large farms which confirms the earlier findings that the small farm is the least
46 | P a g e
diversified in north-west India. The difference in crop diversification between medium
and large farms is less; though the enterprise diversification on large farms is slightly
more than for the medium farms suggesting a positive relationship between farm size and
diversification.
The above relationship is perplexing in the light of the fact that risk aversion is negatively
associated with the size of holding and diversification is a risk management practice.
Diversification with crops is not a risk management practice in the study area since crop
incomes are not negatively associated amongst themselves. (Jha et.al. 2009) In northwest
India, wheat and paddy as compared to other crops involve less risk. In these crops, price-
induced risk is low owing to an assured market;11 and the production-induced risk is also
less on account of assured irrigation (Jha, 1995). The above discussion therefore suggests
that as the percent area under crops other than paddy and wheat increases, the risk on
farm also increases. It is also evident from Table 20 that the proportionate area under
basmati paddy increases with the increase of operational holding. An increase of crop
diversification with the operational landholding is therefore, not unfounded in the study
area. Wheat and paddy being remunerative and less risky in irrigated conditions have
substituted other crops and led to specialization in the region.
In brief, farm-level diversification has been studied with the sample households from
Kurukshetra district of Haryana. The study categorizes farmers into small, medium and
large. The study found that the large farms are the most diversified while small farms are
the least diversified in northwest India. The positive relationship between farm size and
risk management is difficult to accept in the light of the established literature on
diversification, risk management and the risk attitude of farmers. Diversification with
crops is not a risk management practice in the study area. The study further argues that
with commercialization, the subsistence type of crop production has been replaced by
specialized farms. There may be several reasons for the increasing trend towards
11 Government largely depends on the northwest India to procure wheat and paddy for the public distribution system; the market for wheat and paddy is therefore, assured in the region.
47 | P a g e
specialization in agriculture for example; agro-climatic conditions, suitability of
technology for specific regions, concentration of irrigation facilities, assured market,
remunerative prices, supportive institutions, increased communication and transportation
facilities among others.
VII. Conclusions
This present study discusses the pattern of agricultural diversification considering
different definitions of agricultural diversification. Though the share of agriculture in the
overall economy has been decreasing, the share of livestock and fisheries in agriculture
has increased. There have been significant structural changes in the livestock and
fisheries sectors of the economy. For many commodities, the production basket has
concentrated over the years. For most of the crops, the percent share of leading producing
states has increased during the reference period (1983, 2003 and 2006-07). This suggests
an increasing trend towards specialization in agricultural production. Changes in the
percent of gross cropped area also suggest a move towards specialization. There has been
a significant increase in the percent of gross cropped area under fruits and vegetables. On
this account, a threat to the availability of fine cereals is however a long drawn one since
the crop diversification trends from states like Haryana are not necessarily supportive to
the diversification trend as available at the aggregate level. The micro-level evidences
suggest that the certain crops are more remunerative in the given resource endowments
and institutional framework. Farms in the region are getting specialized under these crops
and such specialization has not increased risk on the farm.
__

48 | P a g e
49 | P a g e
References
Das, Saudamini (2009). “Addressing Coastal Vulnerability at the Village Level: The Role of Socio-economic and Physical Factors”. IEG Working Paper Series No.E/295/2009, Institute of Economic Growth, New Delhi. Fertiliser Association in India (2008). Fertilizer Statistics, Several Issues, Fertiliser Association in
India, New Delhi. Fraser, R.W. (1991). "Production risk, product complementarity and product diversification,"
Journal of Agricultural Economics, 43(1): 103-107. Government of India (2008). Agricultural Statistic at a Glance, Directorate of Economics and
Statistics, Ministry of Agriculture, New Delhi. Government of India (2008). National Accounts Statistics, Central Statistical Organization,
Ministry of Statistics and Programme Implementation, New Delhi, India. Government of India (2008). National Accounts Statistics: Back Series 1950/51 to 1999/2000,
Central Statistical Organization, Ministry of Statistics and Programme Implementation, New Delhi, India.
Government of India (2008). State Domestic Products, Central Statistical Organization, Ministry
of Statistics and Programme Implementation, New Delhi, India. Haque T. (1995) (ed) Small Farm Diversification - Problems & Prospect, NCAP, New Delhi. Jha, Brajesh. (1995) “Growth and Instability in Agriculture Associated with New Technology:
District Level Evidences” Agricultural Situation in India, 49(7): 517-524 ------------- (1996). "Farm-level Diversification: Some Disconcerting Evidences from the Green
belt of India.” Agricultural Economics Research Review, 9(1): 49-56. ------------- (2000). "Implications of Intensive Agriculture on Soil and Groundwater Resources."
Indian Journal of Agricultural Economics, 55(2): 182-193. ------------- (2004). “Towards Measuring Sustainability of Indian Greenbelt” IEG Discussion
Paper Series No. 88/2004, Institute of Economic Growth, New Delhi. ------------- (2006). “Employment Wages and Productivity in Indian Agriculture”, IEG Working
Paper Series No.E/266/2006, Institute of Economic Growth, New Delhi.
50 | P a g e
------------- (2009). “Evaluating Agricultural Policy in a Farming System Framework: A Case Study from North West India”, IEG Working Paper Series No.E/299/2009, Institute of Economic Growth, New Delhi.
Jha, B. and D. Jha (1995). "Farmers attitude towards risk in the Greenbelt of India". Journal of
Rural Development, 14(3): 231-240. Jha B., A. Tripathy and B. Mohanty (2009). “Drivers of Agricultural Diversification in India”,
IEG Working Paper Series No.E/-/2009, Institute of Economic Growth, New Delhi. Joshi P. K., A. Gulati and Ralph Cummings Jr. (2007) (ed). Agricultural Diversification and
Smallholders in South Asia, New Delhi: Academic Foundation. Shiyani R.L. and H.R. Pandya (1998). Diversification of Agriculture in Gujarat: A Spatio-
temporal Analysis” Indian Journal of Agricultural Economics, 53, (4): 627-639. Walker T.S., R. P. Singh and N. S. Jodha (1983). “Dimensions of Farm Level Diversification in
the Semi-arid Tropics of Rural South India.” Economic Programme Progress Report 51, ICRISAT, Hyderabad.
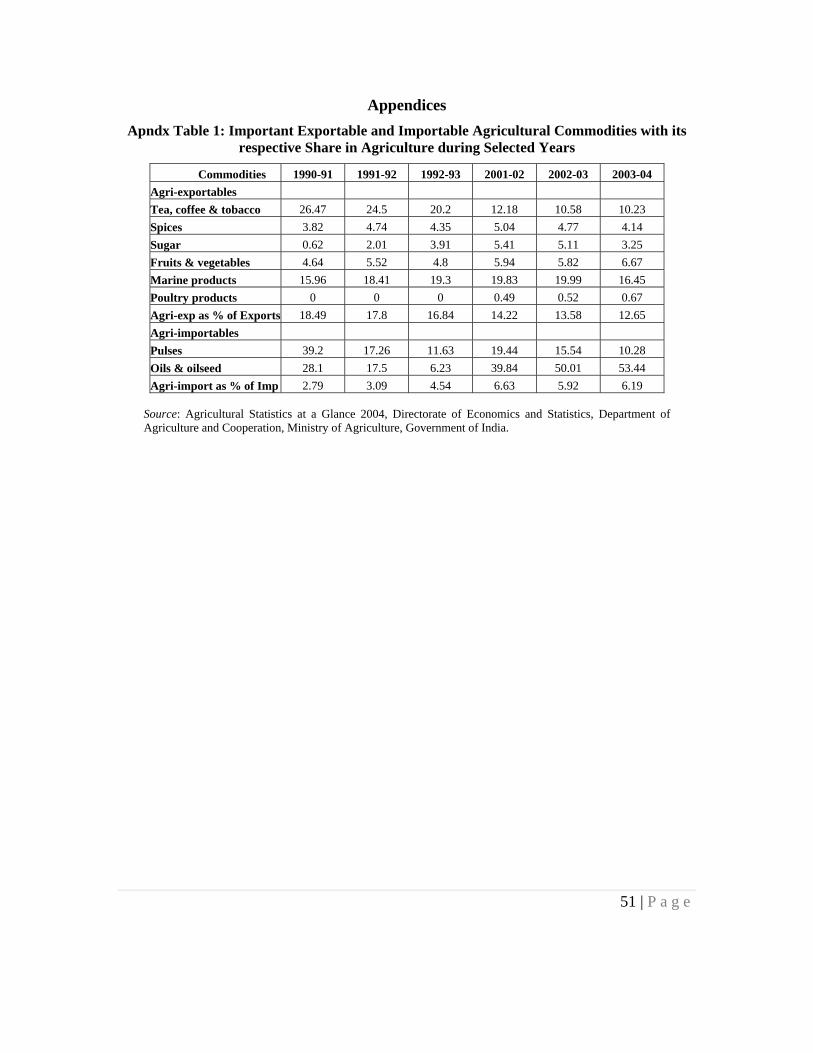
51 | P a g e
Appendices Apndx Table 1: Important Exportable and Importable Agricultural Commodities with its
respective Share in Agriculture during Selected Years
Commodities 1990-91 1991-92 1992-93 2001-02 2002-03 2003-04 Agri-exportables Tea, coffee & tobacco 26.47 24.5 20.2 12.18 10.58 10.23 Spices 3.82 4.74 4.35 5.04 4.77 4.14 Sugar 0.62 2.01 3.91 5.41 5.11 3.25 Fruits & vegetables 4.64 5.52 4.8 5.94 5.82 6.67 Marine products 15.96 18.41 19.3 19.83 19.99 16.45 Poultry products 0 0 0 0.49 0.52 0.67 Agri-exp as % of Exports 18.49 17.8 16.84 14.22 13.58 12.65 Agri-importables Pulses 39.2 17.26 11.63 19.44 15.54 10.28 Oils & oilseed 28.1 17.5 6.23 39.84 50.01 53.44 Agri-import as % of Imp 2.79 3.09 4.54 6.63 5.92 6.19
Source: Agricultural Statistics at a Glance 2004, Directorate of Economics and Statistics, Department of Agriculture and Cooperation, Ministry of Agriculture, Government of India.
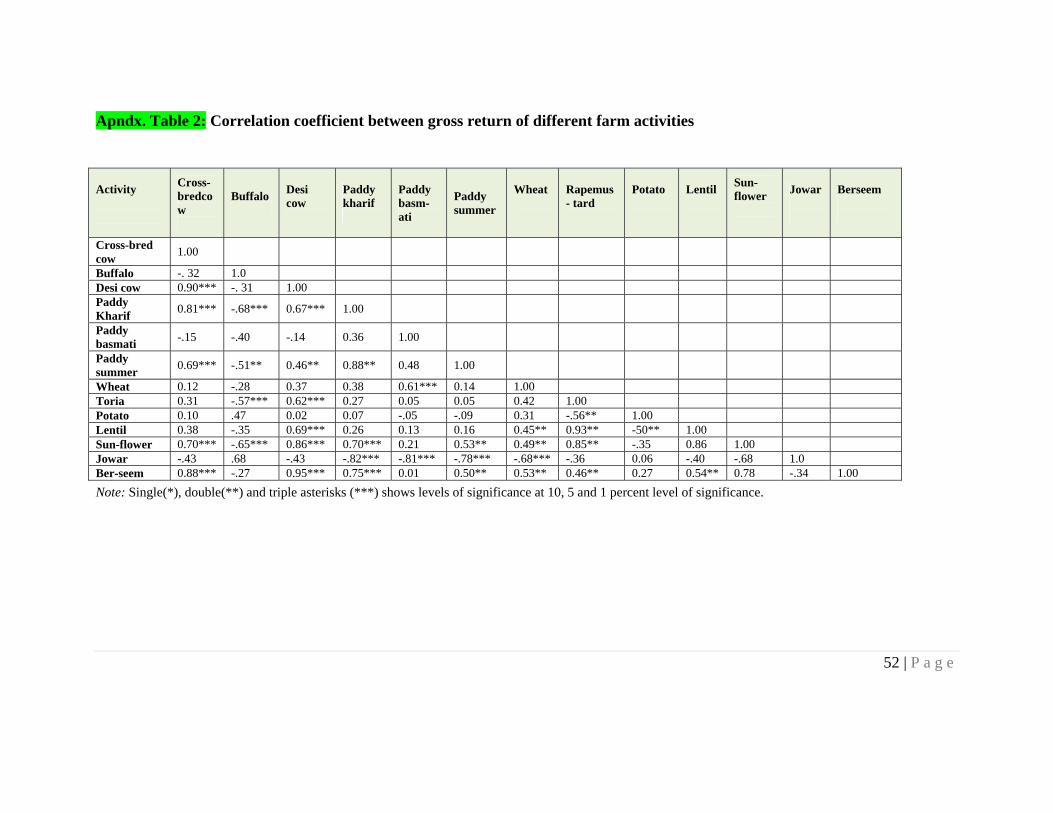
52 | P a g e
Apndx. Table 2: Correlation coefficient between gross return of different farm activities
Note: Single(*), double(**) and triple asterisks (***) shows levels of significance at 10, 5 and 1 percent level of significance.
Activity
Cross-bredcow
Buffalo
Desi cow
Paddy kharif
Paddy basm-ati
Paddy summer
Wheat
Rapemus- tard
Potato
Lentil
Sun-flower
Jowar
Berseem
Cross-bred cow 1.00
Buffalo -. 32 1.0 Desi cow 0.90*** -. 31 1.00 Paddy Kharif 0.81*** -.68*** 0.67*** 1.00
Paddy basmati -.15 -.40 -.14 0.36 1.00
Paddy summer 0.69*** -.51** 0.46** 0.88** 0.48 1.00
Wheat 0.12 -.28 0.37 0.38 0.61*** 0.14 1.00 Toria 0.31 -.57*** 0.62*** 0.27 0.05 0.05 0.42 1.00 Potato 0.10 .47 0.02 0.07 -.05 -.09 0.31 -.56** 1.00 Lentil 0.38 -.35 0.69*** 0.26 0.13 0.16 0.45** 0.93** -50** 1.00 Sun-flower 0.70*** -.65*** 0.86*** 0.70*** 0.21 0.53** 0.49** 0.85** -.35 0.86 1.00 Jowar -.43 .68 -.43 -.82*** -.81*** -.78*** -.68*** -.36 0.06 -.40 -.68 1.0 Ber-seem 0.88*** -.27 0.95*** 0.75*** 0.01 0.50** 0.53** 0.46** 0.27 0.54** 0.78 -.34 1.00
53 | P a g e
Appendix II. Analytical Framework Towards Measuring Diversification
The present study has used various concentration indices: Harfindhal and Entropy to work out
agricultural diversification. The Harfindhal index (DHI) is a sum of the square of the proportion
of individual activities in a portfolio. With an increase in diversification a sum of the square of
the proportion of activities decreases and so also the DHI. This is a measure of concentration,
alternately, an inverse measure of diversification since the Harfindhal index decreases with an
increase in diversification. The Harfindhal index is bound by zero (complete diversification) to
one (complete specialization).
Harfindhal index (Dh) = ∑ Pi2,
Where, Pi = Ai / ∑1Ai is the proportion of the i th activity in acreage / income.
The above Harfindhal index is a measure of concentration and the index decreases with
diversification, while Entropy indices discussed below is a positive measure of diversification. In
order to make the DHI comparable with the Entropy index, the Simpson index that is (1-
Harfindhal Index) has been worked out.
The Entropy index is a direct measure of diversification having a logarithmic character. This
index increases with an increase of diversification. It approaches zero when the farm is
specialized and takes a maximum value when there is perfect diversification. The upper limit of
the Entropy Index is determined by the base chosen for taking logarithms and the number of
crops. The upper value of the index can exceed one, when the number of total crops is higher
than the value of logarithm’s base, and it is less than one when the number of crops is lower than
the base of logarithm. Thus the major limitation of the Entropy Index is that it does not give a
standard scale for assessing the degree of diversification.
Entropy index (EI) = ∑i Pi * log (1/Pi)
The modified Entropy index is used to overcome the limitations of the Entropy index by using a
variable base of logarithm instead of a fixed base of logarithm. The EI lies between zero
54 | P a g e
(complete specialization) to one (perfect diversification). The Entropy index is bound by zero
and one. It can be computed as:
MEI = -∑i (Pi * logNPi)
The MEI is equal to EI/logN, it is worth mentioning that the base of the logarithm is shifted to
‘N’ number of crops. This index has a lower limit equal to zero when there is complete
specialization or concentration and it assumes an upper limit of one in the case of perfect
diversification, i.e. it is bounded by zero and one.
Maximum M.E.I. (when Pi approaches 1/N) = ∑ 1/N * logNN = ∑ 1/N = 1 (4)
Since the modified entropy index imparts uniformity and fixity to the scale used as a norm to
examine the extent of diversification; the index is quite useful. The MEI however, measures
deviations from equal distribution among existing activities i.e. the number of crops only, and
does not incorporate the number of activities in it. This index measures diversification given the
number of crops and the index is not sensitive to the change in the number of crops (Shiyani and
Pandya 1998).
Agricultural diversification at the level of farm is also studied in terms of enterprise income and
acreage under crops, and alternately resources at farmer’s disposal. Resource diversification
based on acreage explains the diversification of crops only, whereas enterprise diversification
involves all enterprises both crops and livestock. Diversification was measured by enumerating
the number of enterprises on the farm. The expressions for these indices are as follows:
Index of maximum proportion (Dm) = Max Pi.
For increasing diversification Dm should decrease; and the maximum share held by any activity
in total income/cropped area decreases and that of other activities increase with an increase in
diversification. This index is however silent about the share of other enterprises on total farm
income/cropped area.
__
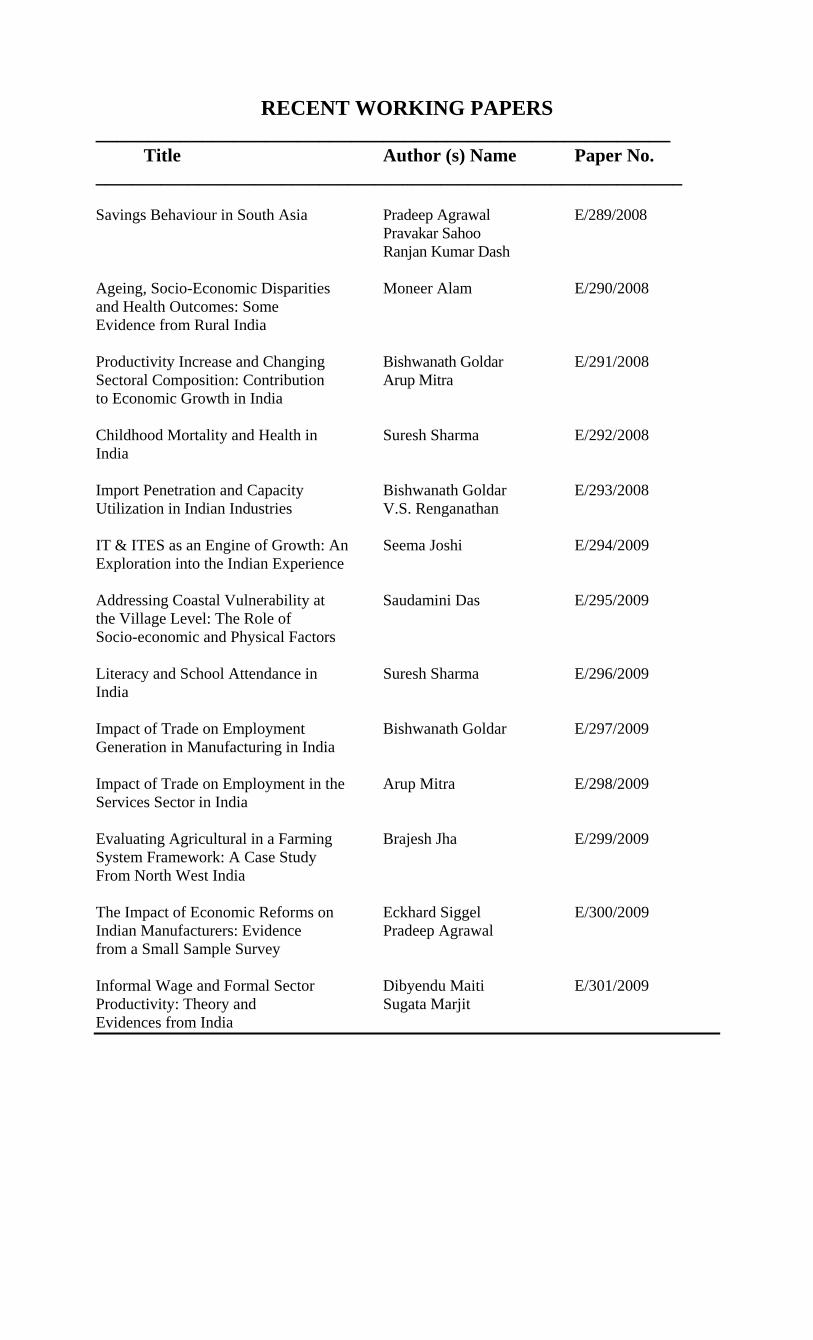
RECENT WORKING PAPERS ______________________________________________________
Title Author (s) Name Paper No. _______________________________________________________________ Savings Behaviour in South Asia Pradeep Agrawal E/289/2008
Pravakar Sahoo Ranjan Kumar Dash Ageing, Socio-Economic Disparities Moneer Alam E/290/2008 and Health Outcomes: Some Evidence from Rural India Productivity Increase and Changing Bishwanath Goldar E/291/2008 Sectoral Composition: Contribution Arup Mitra to Economic Growth in India Childhood Mortality and Health in Suresh Sharma E/292/2008 India Import Penetration and Capacity Bishwanath Goldar E/293/2008 Utilization in Indian Industries V.S. Renganathan IT & ITES as an Engine of Growth: An Seema Joshi E/294/2009 Exploration into the Indian Experience Addressing Coastal Vulnerability at Saudamini Das E/295/2009 the Village Level: The Role of Socio-economic and Physical Factors Literacy and School Attendance in Suresh Sharma E/296/2009 India Impact of Trade on Employment Bishwanath Goldar E/297/2009 Generation in Manufacturing in India Impact of Trade on Employment in the Arup Mitra E/298/2009 Services Sector in India Evaluating Agricultural in a Farming Brajesh Jha E/299/2009 System Framework: A Case Study From North West India The Impact of Economic Reforms on Eckhard Siggel E/300/2009 Indian Manufacturers: Evidence Pradeep Agrawal from a Small Sample Survey Informal Wage and Formal Sector Dibyendu Maiti E/301/2009 Productivity: Theory and Sugata Marjit Evidences from India
Related Documents