Patients’ preferences for preventive osteoporosis drug treatment EW de Bekker-Grob ML Essink-Bot WJ Meerding HAP Pols BW Koes EW Steyerberg Dept. Public Health, Dept. Internal Medicine, and Dept. General Practice, Erasmus MC Rotterdam, the Netherlands [email protected]

Patients’ preferences for preventive osteoporosis drug treatment EW de Bekker-Grob ML Essink-Bot WJ Meerding HAP Pols BW Koes EW Steyerberg Dept. Public.
Dec 30, 2015
Welcome message from author
This document is posted to help you gain knowledge. Please leave a comment to let me know what you think about it! Share it to your friends and learn new things together.
Transcript

Patients’ preferences for preventive osteoporosis drug treatment
EW de Bekker-Grob
ML Essink-Bot
WJ Meerding
HAP Pols
BW Koes
EW Steyerberg
Dept. Public Health, Dept. Internal Medicine, and Dept. General Practice,
Erasmus MC Rotterdam, the Netherlands
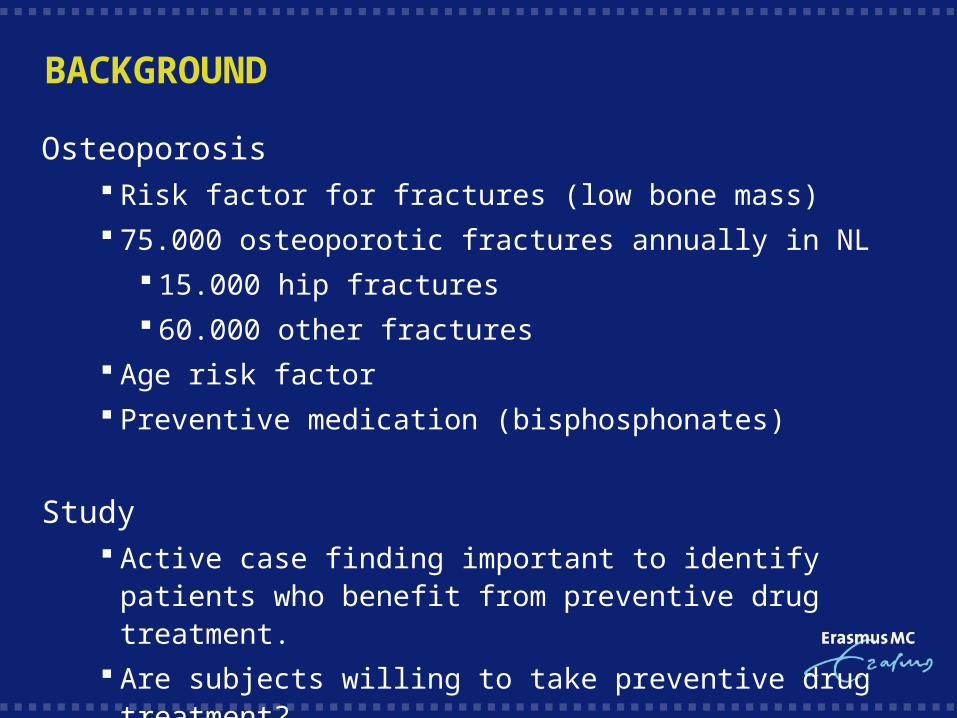
BACKGROUND
Osteoporosis Risk factor for fractures (low bone mass)
75.000 osteoporotic fractures annually in NL
15.000 hip fractures
60.000 other fractures
Age risk factor
Preventive medication (bisphosphonates)
Study Active case finding important to identify patients who benefit from
preventive drug treatment.
Are subjects willing to take preventive drug treatment?
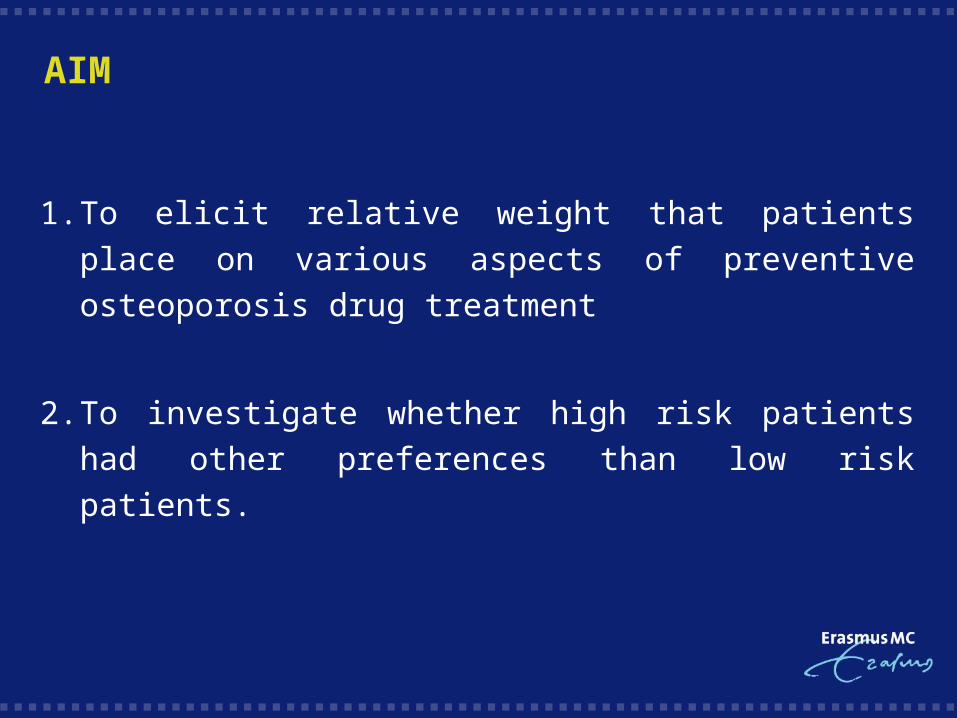
AIM
1. To elicit relative weight that patients place on various aspects of
preventive osteoporosis drug treatment
2. To investigate whether high risk patients had other preferences
than low risk patients.
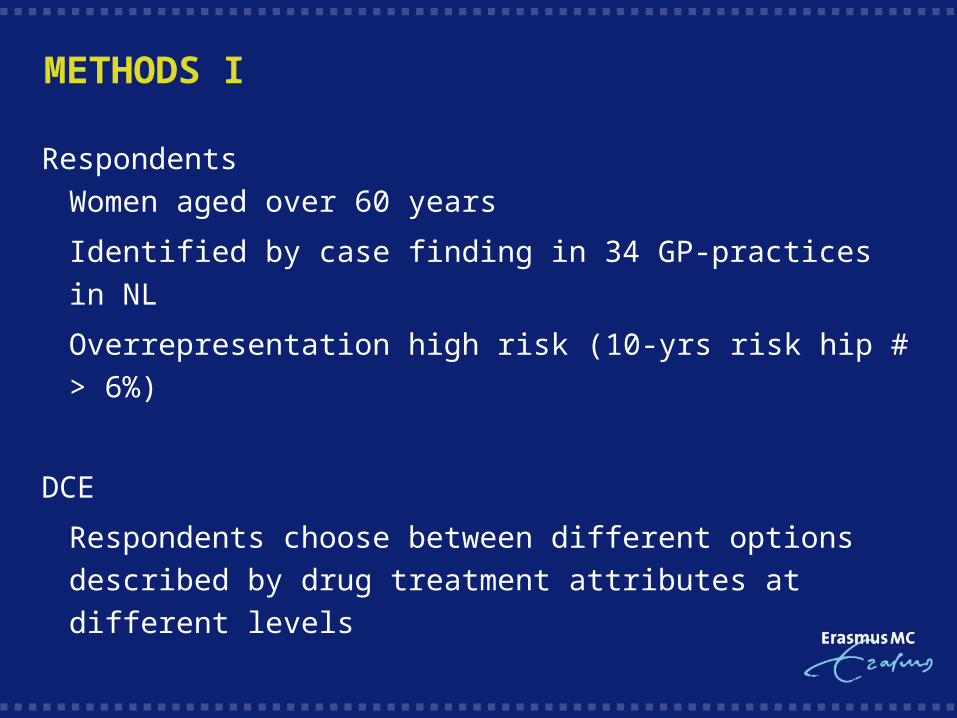
METHODS I
Respondents
Women aged over 60 years
Identified by case finding in 34 GP-practices in NL
Overrepresentation high risk (10-yrs risk hip # > 6%)
DCE
Respondents choose between different options described by drug
treatment attributes at different levels

METHODS II
Background information DCE
Survey method
Good and services can be described by their characteristics
(attributes)
Used to estimate:
Whether attribute is important
Relative importance of attributes
Trade-off between attributes
Willingness to pay (monetary measure of benefit)
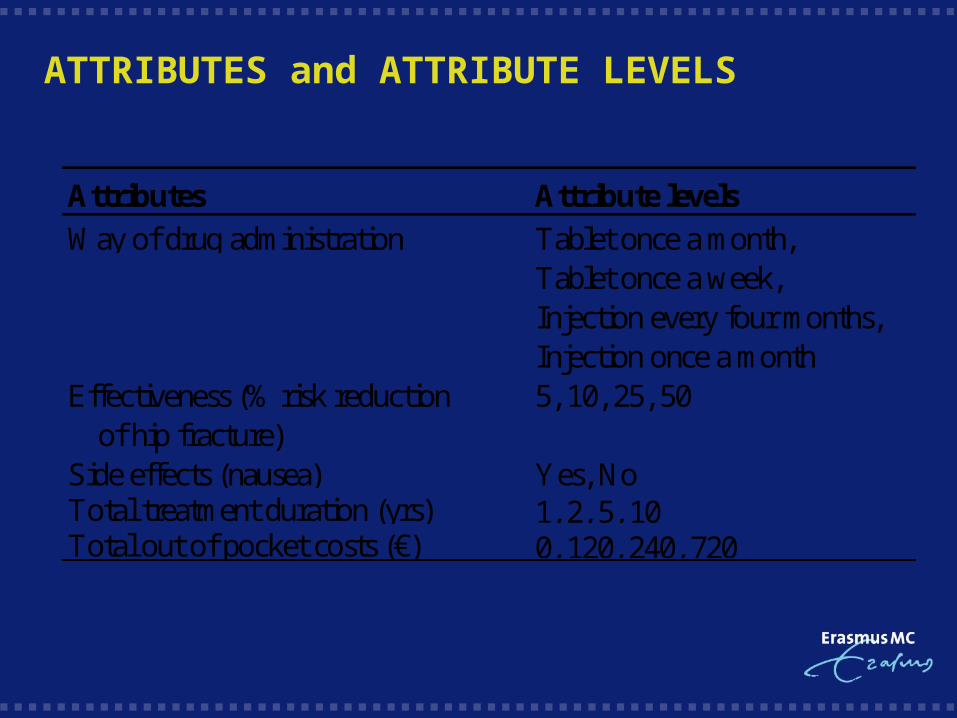
ATTRIBUTES and ATTRIBUTE LEVELS
Attributes Attribute levels
Tablet once a month,Tablet once a week,Injection every four months,Injection once a month5, 10, 25, 50
of hip fracture)Yes, No1, 2, 5, 100, 120, 240, 720Total out of pocket costs (€)
Way of drug administration
Effectiveness (% risk reduction
Side effects (nausea)Total treatment duration (yrs)

CHOICE SETS
Fractional factorial design (main effects only design)
16 drug profiles
Folder-over technique (01, 12, etc) for minimal overlap
Treatment A Treatment B No treatment
Way of drug administration
Tablet once a week
Injection by GP every 4 months
Not applicable
10-years risk reduction of a hip fracture
10% 25% 0%
Nausea (during two hours after use)
Yes No No
Total treatment duration 2 years 5 years 0 years Total cost to you € 0 € 120 € 0
Which treatment 0 Treatment A 0 Treatment B 0 No treatment do you prefer?
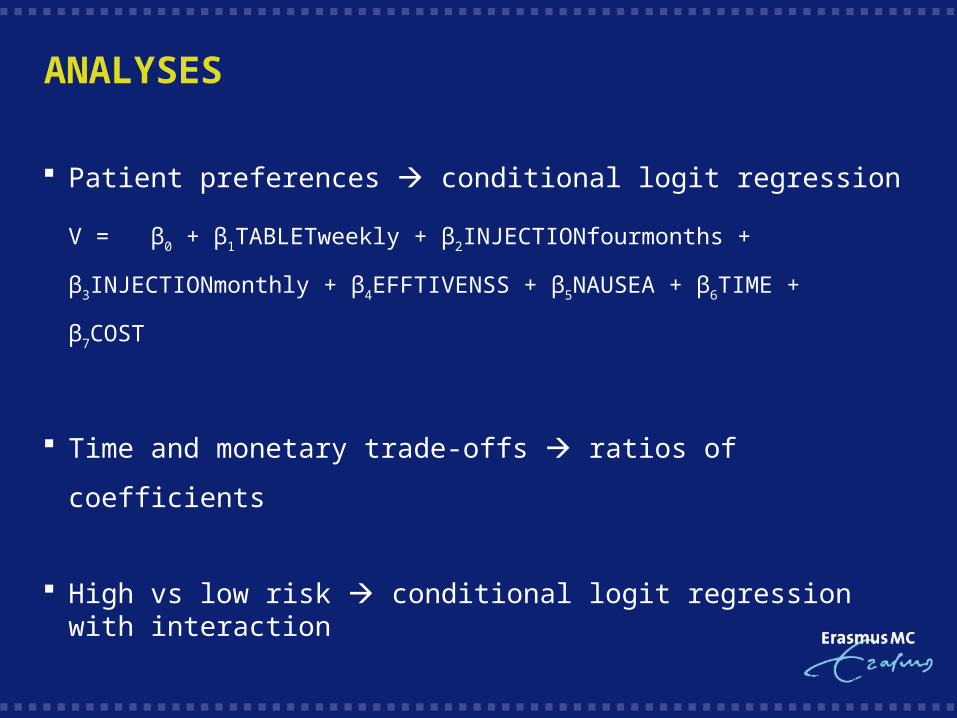
ANALYSES
Patient preferences conditional logit regression
V = β0 + β1TABLETweekly + β2INJECTIONfourmonths +
β3INJECTIONmonthly + β4EFFTIVENSS + β5NAUSEA + β6TIME +
β7COST
Time and monetary trade-offs ratios of coefficients
High vs low risk conditional logit regression with interaction
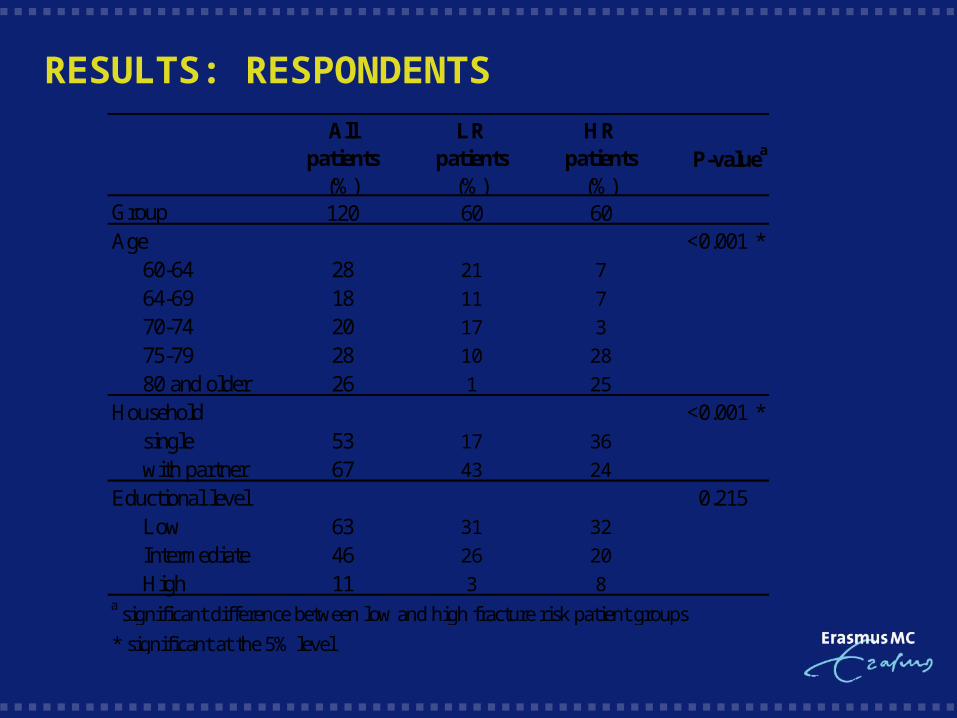
RESULTS: RESPONDENTSAll
patients (%)
LR patients
(%)
HR patients
(%)120 60 60
Age <0.001 *60-64 28 21 7
64-69 18 11 7
70-74 20 17 3
75-79 28 10 28
80 and older 26 1 25
Household <0.001 *single 53 17 36
with partner 67 43 24
Eductional level 0.215Low 63 31 32
Intermediate 46 26 20
High 11 3 8a significant difference between low and high fracture risk patient groups
* significant at the 5% level
P-valuea
Group

RESULTS: CONDITIONAL LOGIT REGRESSION
Beta coefficient
p Value
Constant (drug treatment) 1.23 <0.001* 0.81 1.66Drug administration (base level
tablet once a month):tablet once a week -0.31 <0.001* -0.45 -0.17injection every four months -0.21 0.027* -0.41 -0.02injection once a month -0.44 <0.001* -0.64 -0.25
Effectiveness (10% risk reduction) 0.28 <0.001* 0.23 0.34Side effect nausea -1.10 <0.001* -1.30 -0.89Treatment duration (1 year) -0.04 <0.001* -0.06 -0.02Cost (€100) -0.15 <0.001* -0.18 -0.11* significant at the 5% level
Attribute 95% CI
Number of observations 5,589 (117 respondents x 16 choices x 3 options per choice, minus 27
missing values), Pseudo R2 = 0.1847, log pseudolikelihood = -1668.7

RESULTS: TRADE-OFFS
WTP for total
treatment (€)
Constant (no drug treatment) 32.7 847Drug administration (base level
tablet once a month):tablet once a week 8.2 212injection every four months 5.7 147injection once a month 11.7 304
Effectiveness 7.5 195Side effect nausea 29.0 752Treatment duration 26Cost 3.9
Attribute
Willingness to adhere to the
drug treatment longer (years)

RESULTS: EXAMPLE
Bisphosphonate
Weekly tablet
Nausea
Duration 5 years
Women prefer this drug treatment above no drug treatment,
if WTP is positive, thus
0 < €constant + €weekly tablet + €nausea + €time + €effectiveness
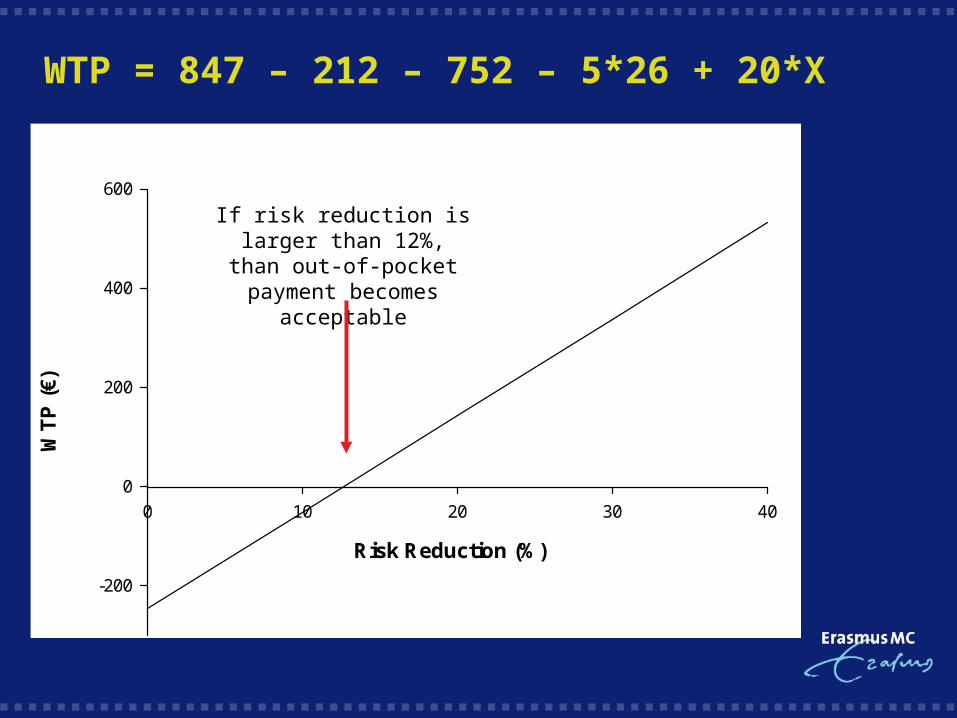
WTP = 847 – 212 – 752 – 5*26 + 20*X
Risk Reduction (%)
0 10 20 30 40
WT
P (
€)
-200
0
200
400
600
If risk reduction is larger than 12%, than out-of-pocket
payment becomes acceptable
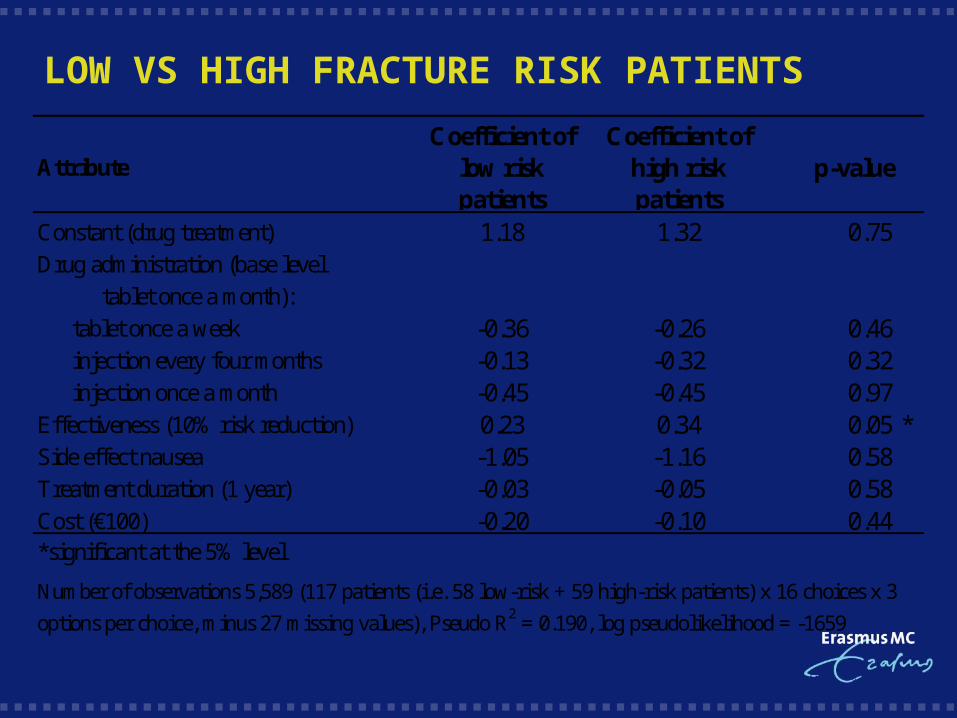
LOW VS HIGH FRACTURE RISK PATIENTS
AttributeCoefficient of
low risk patients
Coefficient of high risk patients
p-value
Constant (drug treatment) 1.18 1.32 0.75Drug administration (base level
tablet once a month):
tablet once a week -0.36 -0.26 0.46injection every four months -0.13 -0.32 0.32injection once a month -0.45 -0.45 0.97
Effectiveness (10% risk reduction) 0.23 0.34 0.05 *Side effect nausea -1.05 -1.16 0.58Treatment duration (1 year) -0.03 -0.05 0.58Cost (€100) -0.20 -0.10 0.44*significant at the 5% level
Number of observations 5,589 (117 patients (i.e. 58 low-risk + 59 high-risk patients) x 16 choices x 3
options per choice, minus 27 missing values), Pseudo R2 = 0.190, log pseudolikelihood = -1659
CONCLUSIONS
1. Women exhibited a very positive attitude towards preventive
osteoporosis drug treatment
2. Important message for policy decision-making on introduction
of active osteoporosis case finding at large scale (in addition to
cost-effectiveness considerations)
3. This study demonstrates feasibility of DCE in older patients
We would like to thank the Netherlands Organization for Health Research and Development (ZonMw) for funding the research.
Related Documents