Pathways to Success in Engineering Degrees and Careers A project for the Royal Academy of Engineering Tim Bullough School of Engineering, University of Liverpool and Diane Taktak EMERG, School of Engineering, University of Liverpool Engineering Professors’ Council Congress 2015, 14 April 2015

Welcome message from author
This document is posted to help you gain knowledge. Please leave a comment to let me know what you think about it! Share it to your friends and learn new things together.
Transcript
Pathways to Success in Engineering Degrees and Careers
A project for the Royal Academy of Engineering
Tim Bullough School of Engineering, University of Liverpool
and Diane Taktak
EMERG, School of Engineering, University of Liverpool
Engineering Professors’ Council Congress 2015, 14 April 2015
Pathways to Success in Engineering Degrees and Careers
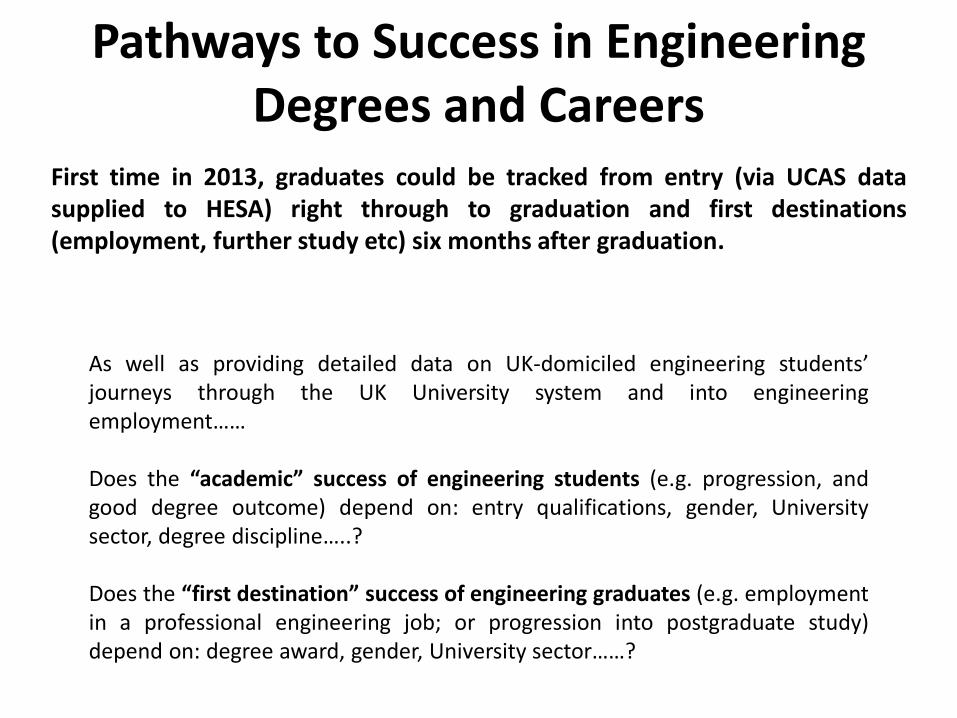
First time in 2013, graduates could be tracked from entry (via UCAS data supplied to HESA) right through to graduation and first destinations (employment, further study etc) six months after graduation.
As well as providing detailed data on UK-domiciled engineering students’ journeys through the UK University system and into engineering employment…… Does the “academic” success of engineering students (e.g. progression, and good degree outcome) depend on: entry qualifications, gender, University sector, degree discipline…..? Does the “first destination” success of engineering graduates (e.g. employment in a professional engineering job; or progression into postgraduate study) depend on: degree award, gender, University sector……?
Pathways to Success in Engineering Degrees and Careers
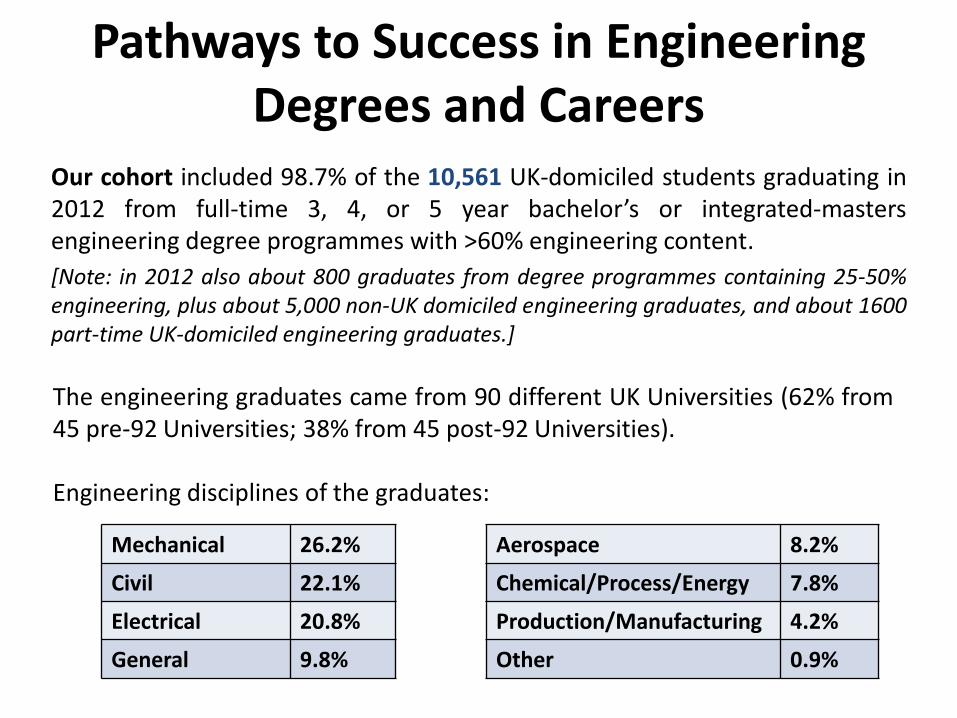
Our cohort included 98.7% of the 10,561 UK-domiciled students graduating in 2012 from full-time 3, 4, or 5 year bachelor’s or integrated-masters engineering degree programmes with >60% engineering content.
[Note: in 2012 also about 800 graduates from degree programmes containing 25-50% engineering, plus about 5,000 non-UK domiciled engineering graduates, and about 1600 part-time UK-domiciled engineering graduates.]
Mechanical 26.2% Aerospace 8.2%
Civil 22.1% Chemical/Process/Energy 7.8%
Electrical 20.8% Production/Manufacturing 4.2%
General 9.8% Other 0.9%
The engineering graduates came from 90 different UK Universities (62% from 45 pre-92 Universities; 38% from 45 post-92 Universities). Engineering disciplines of the graduates:

Integrated-master’s graduates
Bachelor’s graduates
“Degree awards” of UK Engineering graduates
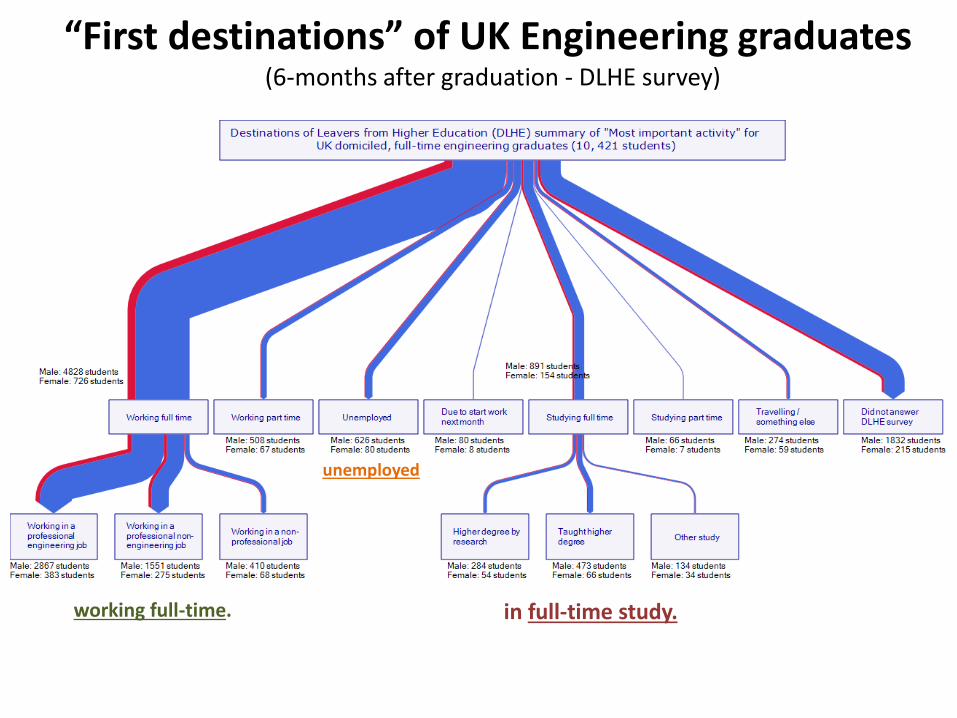
“First destinations” of UK Engineering graduates (6-months after graduation - DLHE survey)
working full-time. in full-time study.
unemployed
• Entry Qualifications
• Progression: how important is Maths and Physics
• Degree success at graduation
• 1st destination success
Pathways to Success in Engineering Degrees and Careers
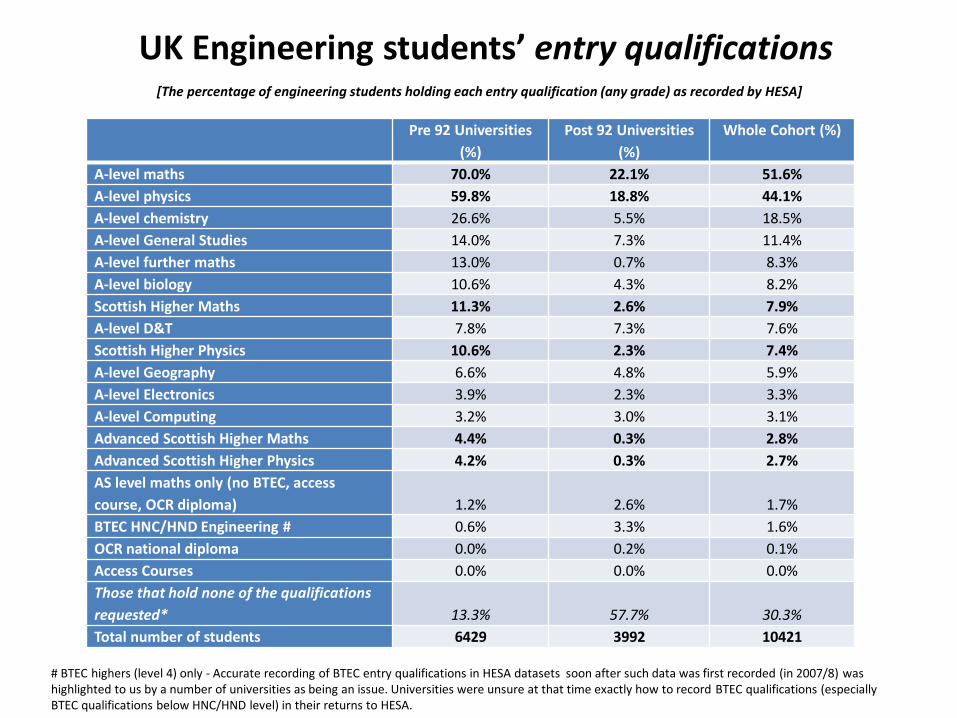
UK Engineering students’ entry qualifications
Pre 92 Universities
(%)
Post 92 Universities
(%)
Whole Cohort (%)
A-level maths 70.0% 22.1% 51.6%
A-level physics 59.8% 18.8% 44.1%
A-level chemistry 26.6% 5.5% 18.5%
A-level General Studies 14.0% 7.3% 11.4%
A-level further maths 13.0% 0.7% 8.3%
A-level biology 10.6% 4.3% 8.2%
Scottish Higher Maths 11.3% 2.6% 7.9%
A-level D&T 7.8% 7.3% 7.6%
Scottish Higher Physics 10.6% 2.3% 7.4%
A-level Geography 6.6% 4.8% 5.9%
A-level Electronics 3.9% 2.3% 3.3%
A-level Computing 3.2% 3.0% 3.1%
Advanced Scottish Higher Maths 4.4% 0.3% 2.8%
Advanced Scottish Higher Physics 4.2% 0.3% 2.7%
AS level maths only (no BTEC, access
course, OCR diploma) 1.2% 2.6% 1.7%
BTEC HNC/HND Engineering # 0.6% 3.3% 1.6%
OCR national diploma 0.0% 0.2% 0.1%
Access Courses 0.0% 0.0% 0.0%
Those that hold none of the qualifications
requested* 13.3% 57.7% 30.3%
Total number of students 6429 3992 10421
[The percentage of engineering students holding each entry qualification (any grade) as recorded by HESA]
# BTEC highers (level 4) only - Accurate recording of BTEC entry qualifications in HESA datasets soon after such data was first recorded (in 2007/8) was highlighted to us by a number of universities as being an issue. Universities were unsure at that time exactly how to record BTEC qualifications (especially BTEC qualifications below HNC/HND level) in their returns to HESA.
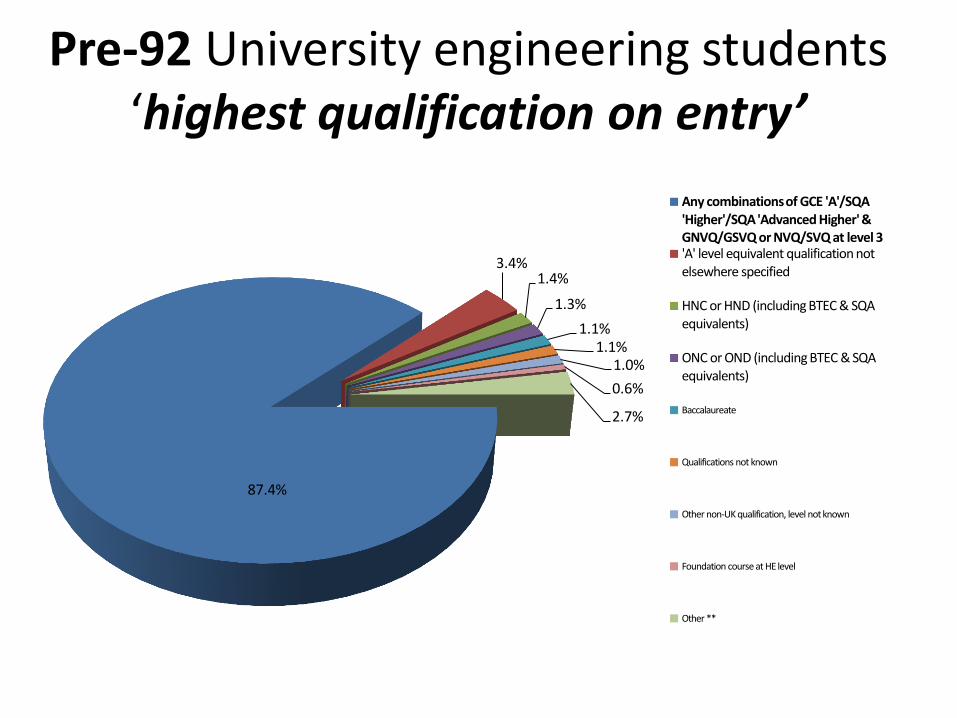
Pre-92 University engineering students ‘highest qualification on entry’
87.4%
3.4% 1.4%
1.3%
1.1% 1.1%
1.0%
0.6%
2.7%
Any combinations of GCE 'A'/SQA 'Higher'/SQA 'Advanced Higher' & GNVQ/GSVQ or NVQ/SVQ at level 3 'A' level equivalent qualification not elsewhere specified
HNC or HND (including BTEC & SQA equivalents)
ONC or OND (including BTEC & SQA equivalents)
Baccalaureate
Qualifications not known
Other non-UK qualification, level not known
Foundation course at HE level
Other **
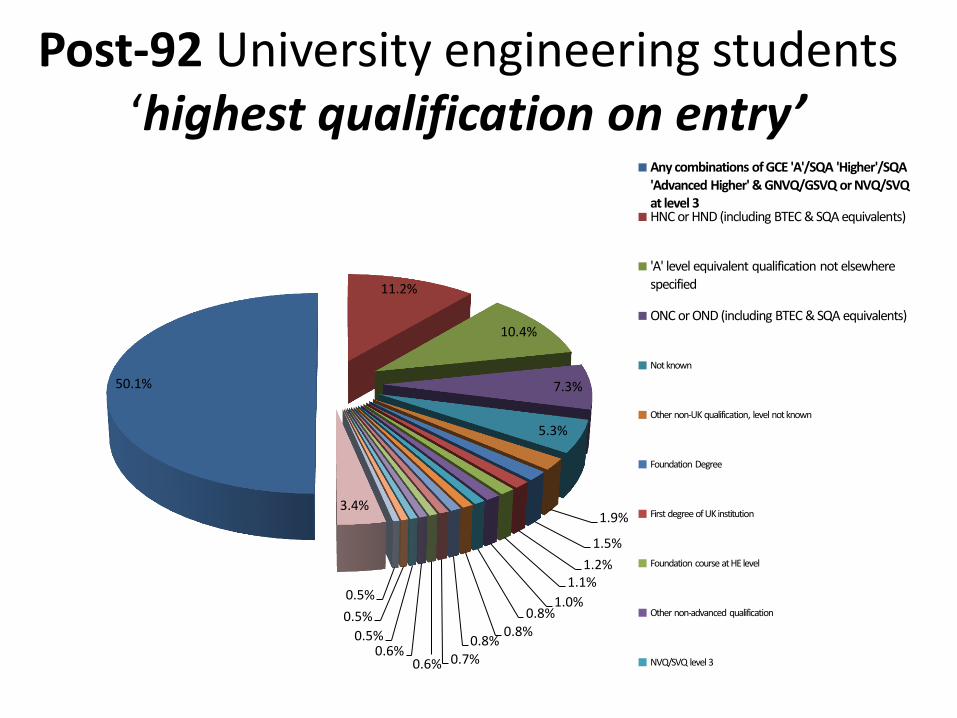
Post-92 University engineering students ‘highest qualification on entry’
50.1%
11.2%
10.4%
7.3%
5.3%
1.9%
1.5%
1.2% 1.1%
1.0% 0.8%
0.8% 0.8%
0.7% 0.6% 0.6%
0.5%
0.5%
0.5%
3.4%
Any combinations of GCE 'A'/SQA 'Higher'/SQA 'Advanced Higher' & GNVQ/GSVQ or NVQ/SVQ at level 3 HNC or HND (including BTEC & SQA equivalents)
'A' level equivalent qualification not elsewhere specified
ONC or OND (including BTEC & SQA equivalents)
Not known
Other non-UK qualification, level not known
Foundation Degree
First degree of UK institution
Foundation course at HE level
Other non-advanced qualification
NVQ/SVQ level 3
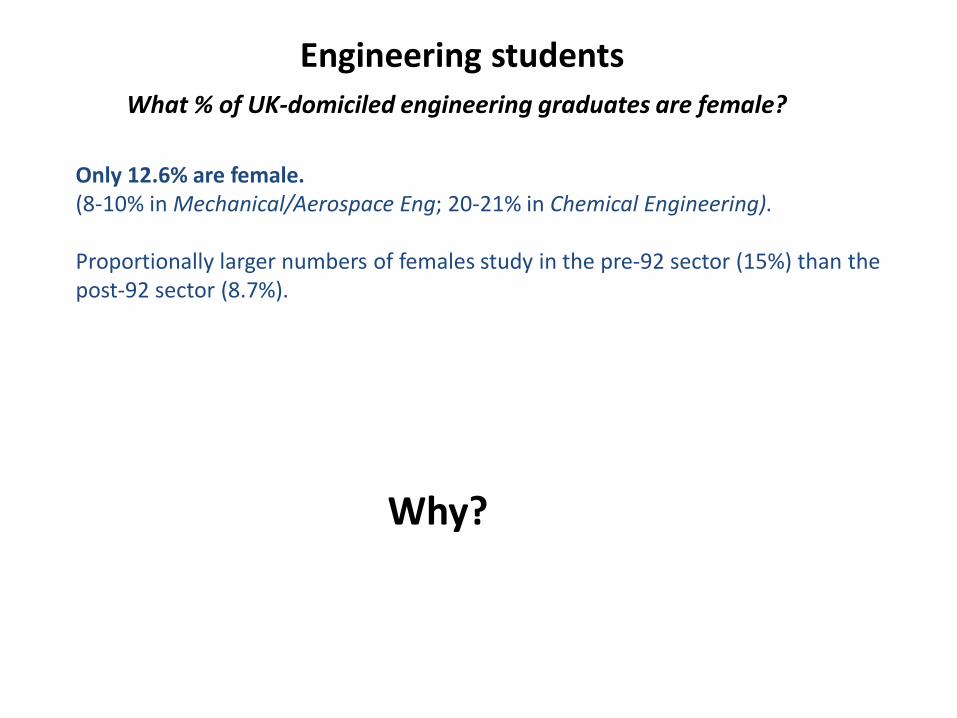
Only 12.6% are female. (8-10% in Mechanical/Aerospace Eng; 20-21% in Chemical Engineering). Proportionally larger numbers of females study in the pre-92 sector (15%) than the post-92 sector (8.7%).
What % of UK-domiciled engineering graduates are female?
Engineering students
Why?

Maths A level:
2007 2011 Awarded a Maths A-level in 2007 (nationally)
% with Maths A-level who subsequently study engineering
% of those who achieved an A grade in Maths that went on to study engineering
Awarded a Maths A-level in 2011 (nationally)
% with Maths A-level who subsequently study engineering
% of those who achieved A or A* grade in Maths that went on to study engineering
Male 36036 (60%)
15% 15% 49828 (60%)
17% 18.6%
Female 24057 (40%)
3.7% 3.9% 33167 (40%)
3.9% 5.1%
0
10000
20000
30000
40000
50000
60000
70000
80000
90000
100000
2003 2004 2005 2006 2007 2008 2009 2010 2011 2012 2013 2014
Boys
Girls
National picture:
Nu
mb
ers
awar
ded
Mat
hs
A-l
evel
In 2014: 61% male: 39% female
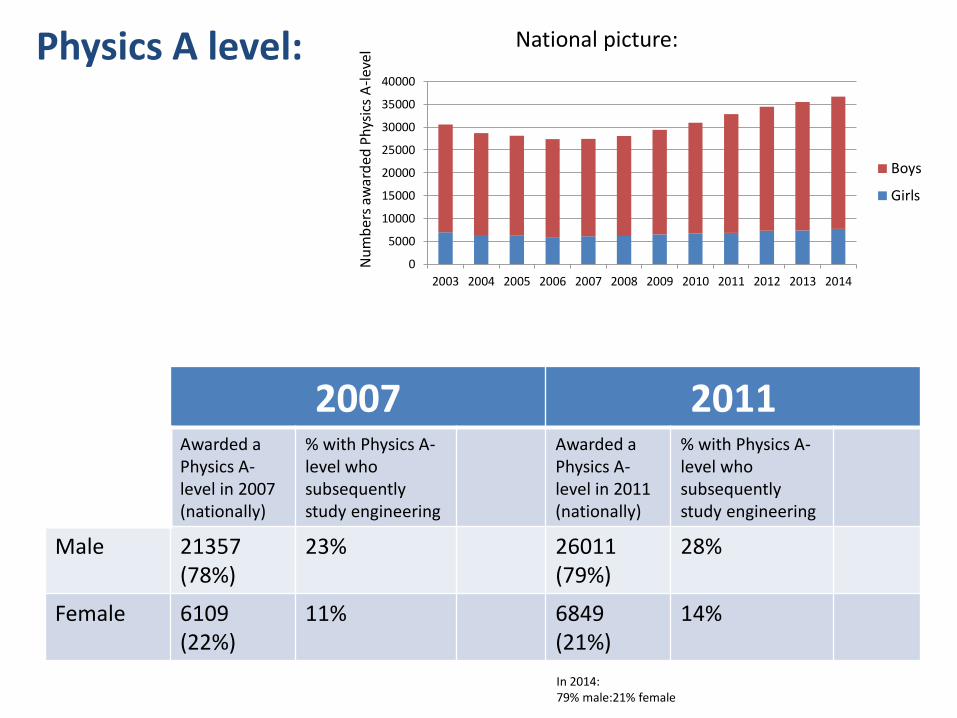
Physics A level:
0
5000
10000
15000
20000
25000
30000
35000
40000
2003 2004 2005 2006 2007 2008 2009 2010 2011 2012 2013 2014
Boys
Girls
National picture:
Nu
mb
ers
awar
ded
Ph
ysic
s A
-lev
el
2007 2011 Awarded a Physics A-level in 2007 (nationally)
% with Physics A-level who subsequently study engineering
Awarded a Physics A-level in 2011 (nationally)
% with Physics A-level who subsequently study engineering
Male 21357 (78%)
23% 26011 (79%)
28%
Female 6109 (22%)
11% 6849 (21%)
14%
In 2014: 79% male:21% female
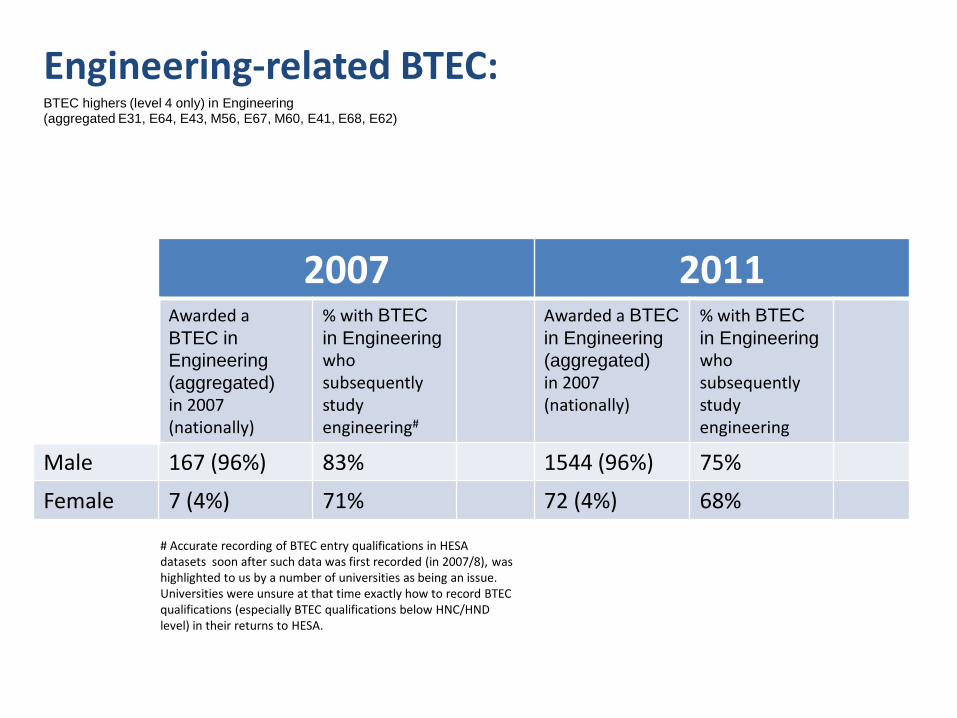
Engineering-related BTEC:
2007 2011 Awarded a BTEC in
Engineering
(aggregated) in 2007 (nationally)
% with BTEC
in Engineering who subsequently study engineering#
Awarded a BTEC
in Engineering
(aggregated)
in 2007 (nationally)
% with BTEC
in Engineering who subsequently study engineering
Male 167 (96%) 83% 1544 (96%) 75%
Female 7 (4%) 71% 72 (4%) 68%
BTEC highers (level 4 only) in Engineering (aggregated E31, E64, E43, M56, E67, M60, E41, E68, E62)
# Accurate recording of BTEC entry qualifications in HESA datasets soon after such data was first recorded (in 2007/8), was highlighted to us by a number of universities as being an issue. Universities were unsure at that time exactly how to record BTEC qualifications (especially BTEC qualifications below HNC/HND level) in their returns to HESA.

Progression: how important is Maths and Physics?
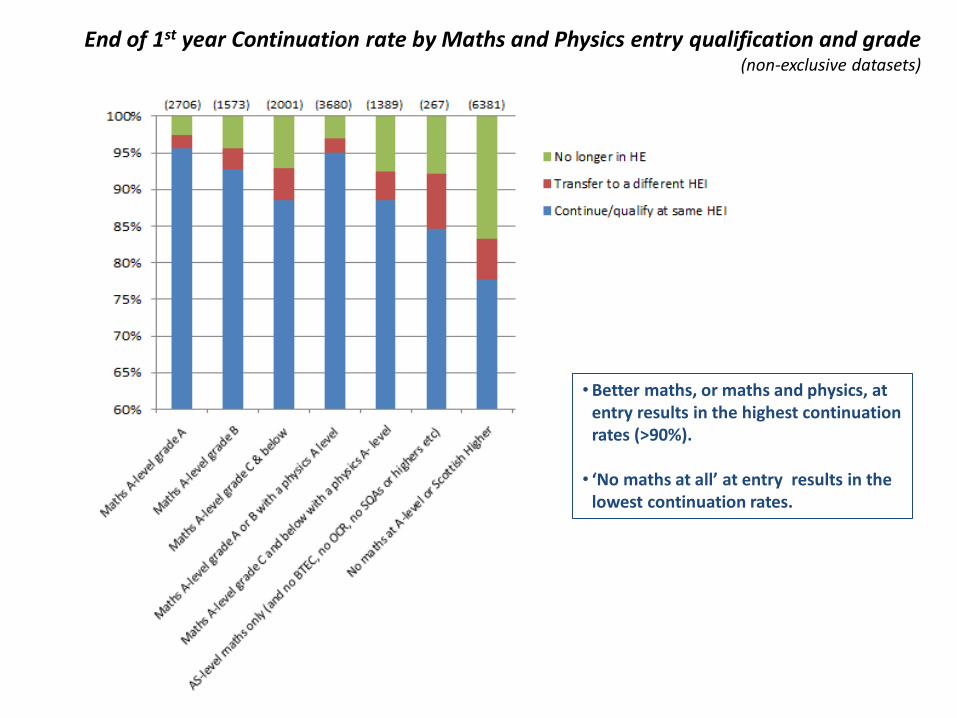
End of 1st year Continuation rate by Maths and Physics entry qualification and grade (non-exclusive datasets)
•Better maths, or maths and physics, at entry results in the highest continuation rates (>90%).
• ‘No maths at all’ at entry results in the
lowest continuation rates.

Degree success at graduation: degree awards
Graduation: degree awards
What % of UK-domiciled engineering graduates leave with integrated-masters (MEng etc) compared with bachelor (BEng etc) degrees? How many engineering graduates receive 1st, 2.1, 2.2 etc classifications?
• 32.5% of the full-time UK-domiciled engineering students graduate with an integrated master’s degree,
• 65% of graduates leave with a bachelor degree, and
• 2.5% leave with an ordinary degree.

Integrated-master’s graduates:
38% receive a 1st class degree 46% receive a 2:1 6.4% receive a 2:2 or lower, and 10% receive a degree without a classification*.
Bachelor’s graduates:
23% receive a 1st class degree 40% receive a 2:1 29% receiving a 2:2, and 8% a 3rd class degree or lower.

N.B. The final degree classifications of female graduates from integrated master’s degrees are almost the same as for male graduates, but female graduates obtain proportionally more 1st and 2:1 classification bachelor’s degrees.

Are there differences between Pre-92 and post-92 University sectors?
0%
10%
20%
30%
40%
50%
60%
70%
80%
90%
100% Unclassified degree (Bachelors - inclordinary degrees)3rd/pass (Bachelors - incl ordinarydegrees)2:2 (Bachelors)
2:1 (Bachelors)
1st (Bachelors)
3rd/pass (MEng)
2:2 (MEng)
2:1 (MEng)
1st (MEng)
Unclassified degree (MEng)
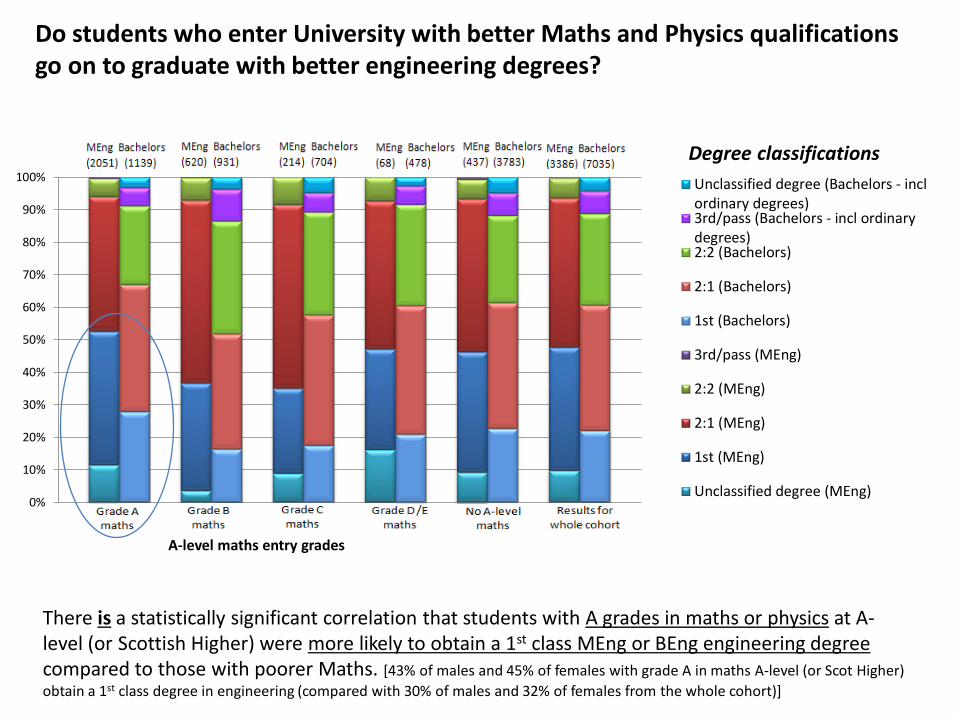
Do students who enter University with better Maths and Physics qualifications go on to graduate with better engineering degrees?
A-level maths entry grades
There is a statistically significant correlation that students with A grades in maths or physics at A-level (or Scottish Higher) were more likely to obtain a 1st class MEng or BEng engineering degree compared to those with poorer Maths. [43% of males and 45% of females with grade A in maths A-level (or Scot Higher)
obtain a 1st class degree in engineering (compared with 30% of males and 32% of females from the whole cohort)]
Degree classifications
First destinations (i.e. employment or further study 6 months after graduation)
First destinations (6-months after graduation - DLHE survey)
How many engineering graduates are working, in further study, or unemployed? Of those working, how many are in “professional” jobs, and how many in “engineering professional” jobs? Are there any gender differences in types of first destination employment? Is a working integrated-masters graduate more likely to be in an engineering professional job, compared with a working bachelor graduate?
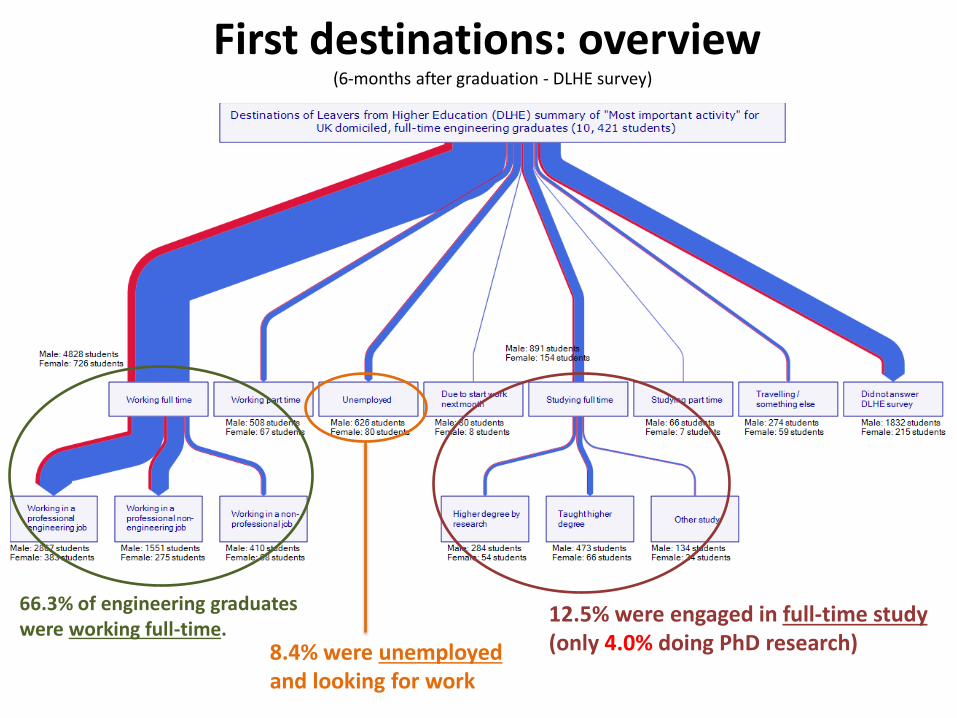
First destinations: overview (6-months after graduation - DLHE survey)
66.3% of engineering graduates were working full-time.
12.5% were engaged in full-time study (only 4.0% doing PhD research) 8.4% were unemployed
and looking for work

First destinations: full-time workers (6-months after graduation - DLHE survey)
Of those working full-time: • 58.5% were in engineering professional jobs (79% of MEng;
50% of BEng), • 32.9% in non-engineering professional jobs, • 8.6% in non-professional jobs.
66.3% of engineering graduates were working full-time.
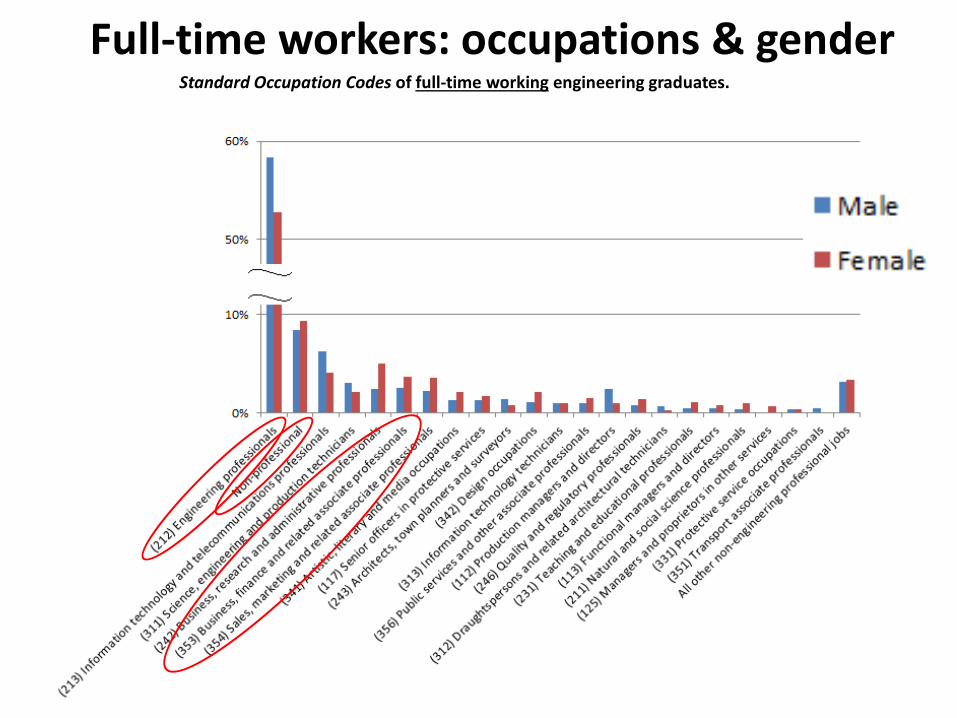
Standard Occupation Codes of full-time working engineering graduates.
Full-time workers: occupations & gender
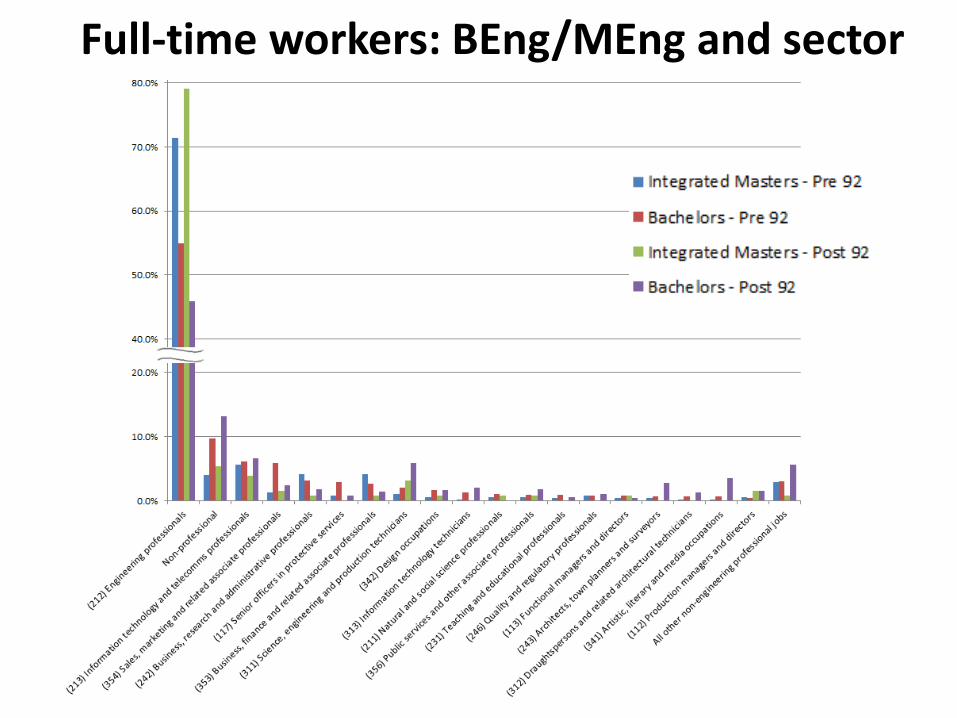
Full-time workers: BEng/MEng and sector
Maths as an entry qualification Better mathematics qualifications upon entry correspond with lower drop-out and higher attainment in engineering degrees. Girls taking Maths and Physics A-levels are much less likely than boys to study Engineering. Continued work should be undertaken to investigate why, and consider alternative approaches to school and university qualification routes to identify those which would maximise the talent pool for the engineering profession. Curriculum differences across UK higher education Post-92 universities are admitting mainly bachelor’s students with a wide range of non-A-level and A-level entry qualifications, but are graduating similar proportions of 1st, 2.1s as in the pre-92 sector (which admit primarily A-level entrants, with A-levels in the sciences and maths). More work should be done to identify the suitability of non-A-level qualifications, and understand the differences in curriculum and graduate attributes between pre- and post-92 engineering programmes. MEng provision in Post-92 Universities Although there are relatively few MEng graduates from post-92 institutions, they appear to be very employable with greater proportions entering professional engineering jobs than from any other sector. The engineering profession should look into ways of encouraging more students with good entry qualifications to study MEng at post-92 universities, and review capability limitations in such Universities to deliver such provision.
Conclusions/recommendations I
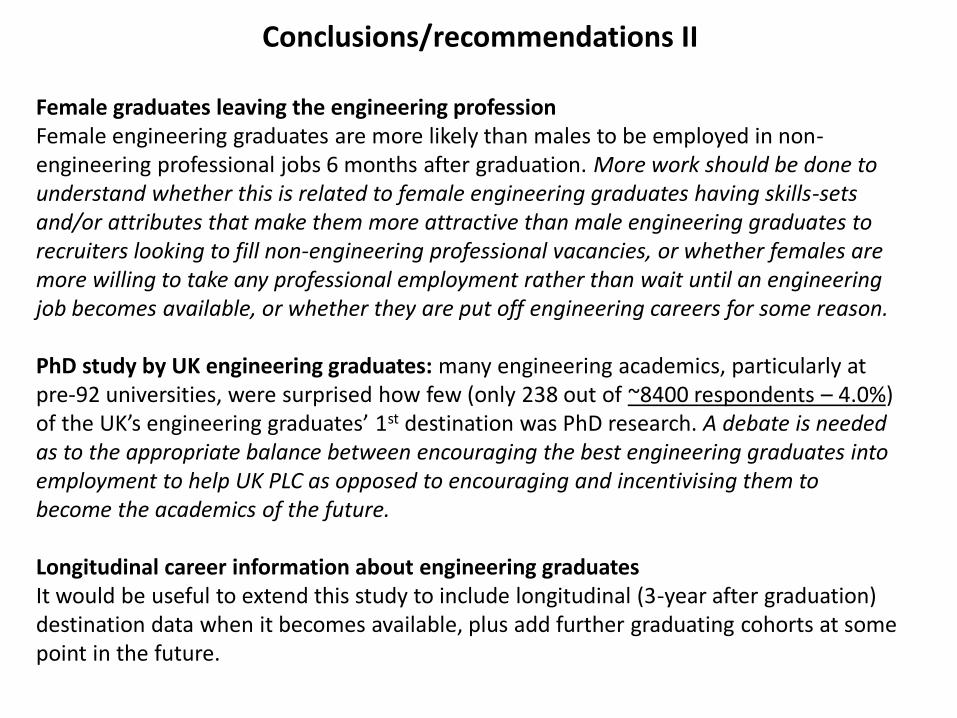
Female graduates leaving the engineering profession Female engineering graduates are more likely than males to be employed in non-engineering professional jobs 6 months after graduation. More work should be done to understand whether this is related to female engineering graduates having skills-sets and/or attributes that make them more attractive than male engineering graduates to recruiters looking to fill non-engineering professional vacancies, or whether females are more willing to take any professional employment rather than wait until an engineering job becomes available, or whether they are put off engineering careers for some reason. PhD study by UK engineering graduates: many engineering academics, particularly at pre-92 universities, were surprised how few (only 238 out of ~8400 respondents – 4.0%) of the UK’s engineering graduates’ 1st destination was PhD research. A debate is needed as to the appropriate balance between encouraging the best engineering graduates into employment to help UK PLC as opposed to encouraging and incentivising them to become the academics of the future. Longitudinal career information about engineering graduates It would be useful to extend this study to include longitudinal (3-year after graduation) destination data when it becomes available, plus add further graduating cohorts at some point in the future.
Conclusions/recommendations II
Related Documents


