Pathways analysis Iowa State Workshop 11 June 2009

Pathways analysis Iowa State Workshop 11 June 2009.
Dec 16, 2015
Welcome message from author
This document is posted to help you gain knowledge. Please leave a comment to let me know what you think about it! Share it to your friends and learn new things together.
Transcript

Pathways analysis
Iowa State Workshop
11 June 2009

All tools and materials from this workshop are available online at the AgBase database Educational Resources link.
For continuing support and assistance please contact:
This workshop is supported by USDA CSREES grant number MISV-329140.

Pathways analysis enables Analysis of data in the context of molecular mechanisms to move
beyond statistical analysis of expression to novel biological insights
Applying biological filters to focus in on the changes most relevant to experimental model
Comparison of affected pathways and phenotypes across platform, time, dose etc
(www.ingenuity.com)

What regulatory relationships exist between the genes, proteins in my dataset?
Which biological and disease processes are most relevant to my genes of interest?
Which well-characterized cell signaling and metabolic pathways are most relevant to my experimental data?
Networks
Functionalanalysis
MetabolicAnd Signaling pathways
http://www.ingenuity.com
Cytoscape
Cytoscape is a freely-available (open-source, java-based) bioinformatics software platform forvisualizing biological networks (e.g. molecular interaction networks) andanalyzing networks with gene expression profiles and other data

Core Features
Customize network data display using visual styles
• Powerful graph layout tools
• Easily organize multiple networks
• Easily navigate large networks
• Filter the network
• Plugin API

• Cytoscape includes a flexible plugin architecture that enables developers to add extra functionality beyond that provided in the core
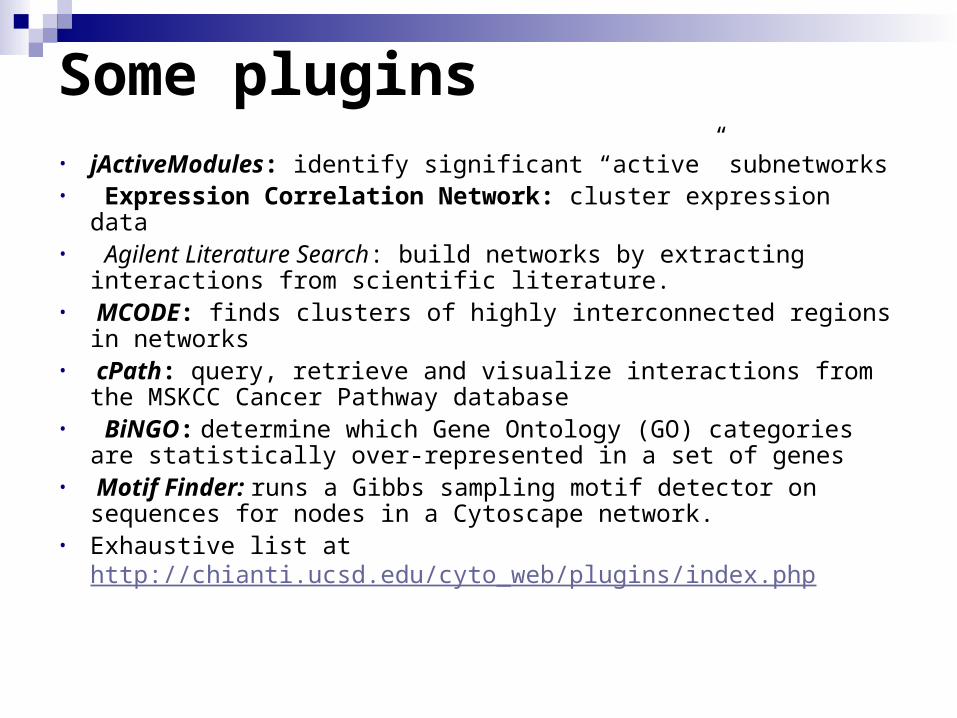
Some plugins• jActiveModules: identify significant “active” subnetworks• Expression Correlation Network: cluster expression data • Agilent Literature Search: build networks by extracting interactions from
scientific literature.• MCODE: finds clusters of highly interconnected regions in networks• cPath: query, retrieve and visualize interactions from the MSKCC Cancer
Pathway database• BiNGO: determine which Gene Ontology (GO) categories are statistically
over-represented in a set of genes • Motif Finder: runs a Gibbs sampling motif detector on sequences for
nodes in a Cytoscape network. • Exhaustive list at http://chianti.ucsd.edu/cyto_web/plugins/index.php

Gene Ontology enrichment analysis
BiNGO plugin
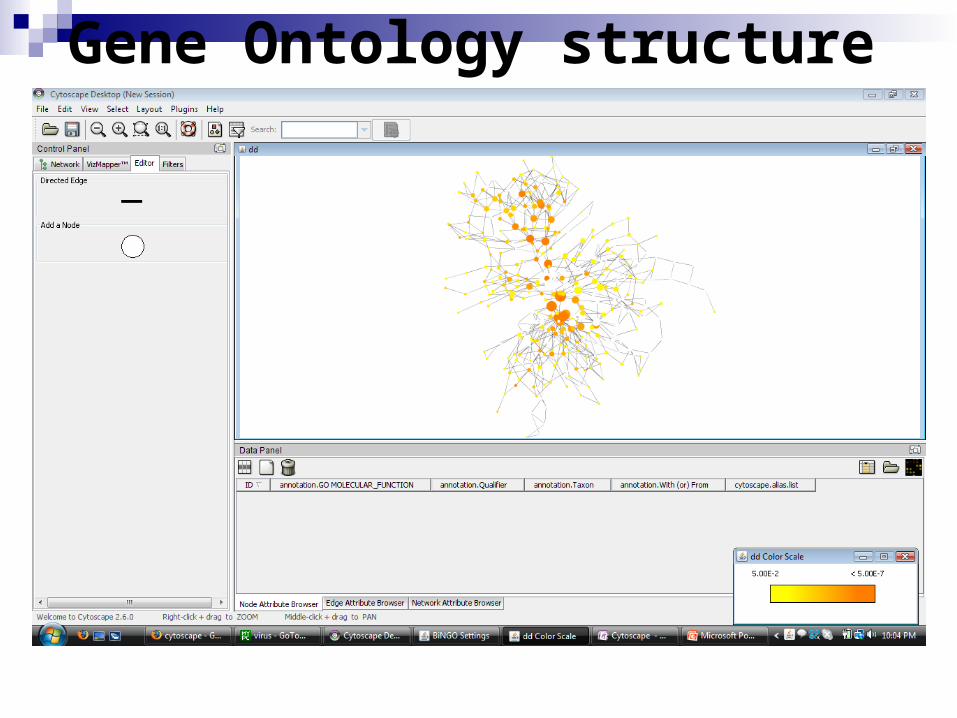
Gene Ontology structure
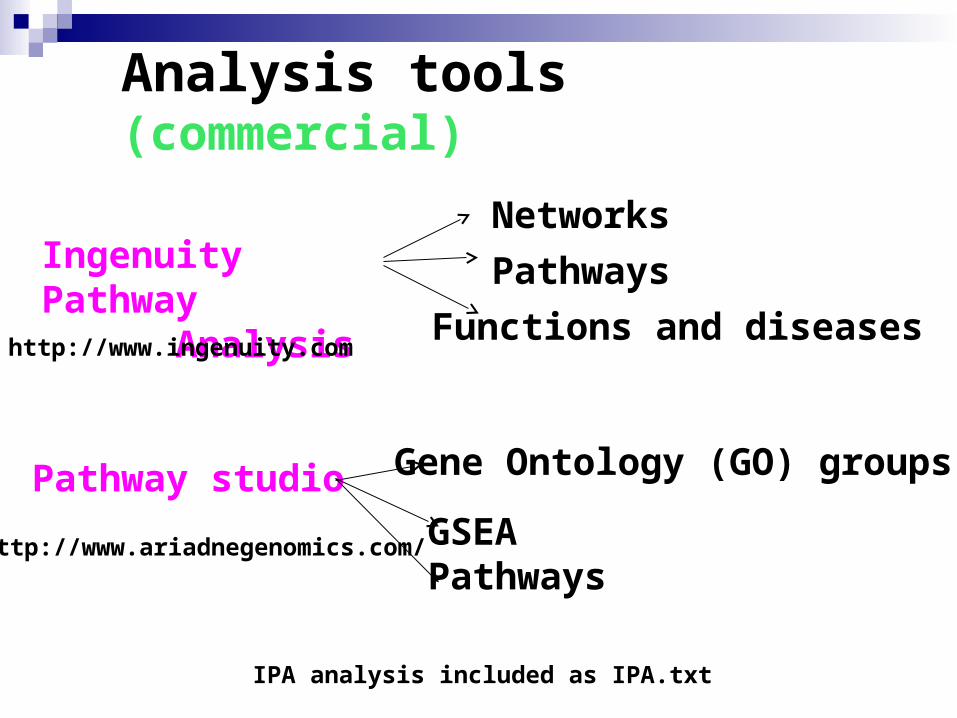
Analysis tools (commercial)
Ingenuity Pathway Analysis
Networks
Pathways
Functions and diseases
Gene Ontology (GO) groupsPathway studio
GSEAPathways
http://www.ingenuity.com
http://www.ariadnegenomics.com/
IPA analysis included as IPA.txt
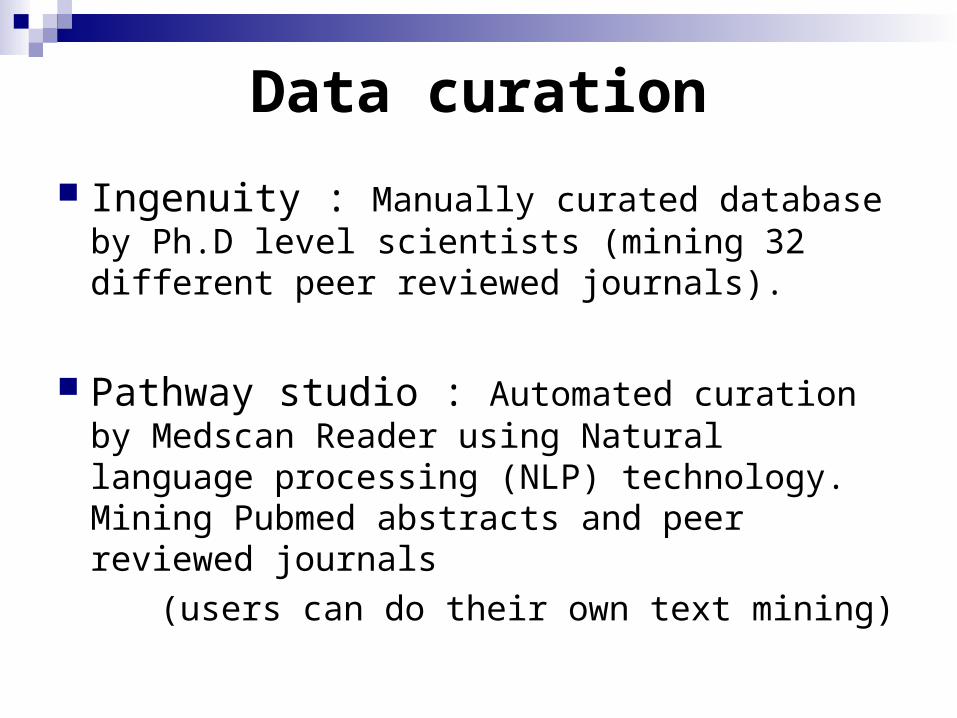
Data curation
Ingenuity : Manually curated database by Ph.D level scientists (mining 32 different peer reviewed journals).
Pathway studio : Automated curation by Medscan Reader using Natural language processing (NLP) technology. Mining Pubmed abstracts and peer reviewed journals
(users can do their own text mining)

Comparison Criteria
Features Proportion of proteins involved in modeling Data generation Display Test Dataset: 3,600 bovine spermatozoa
proteins
(Comparison by Divya Swetha Peddinti)
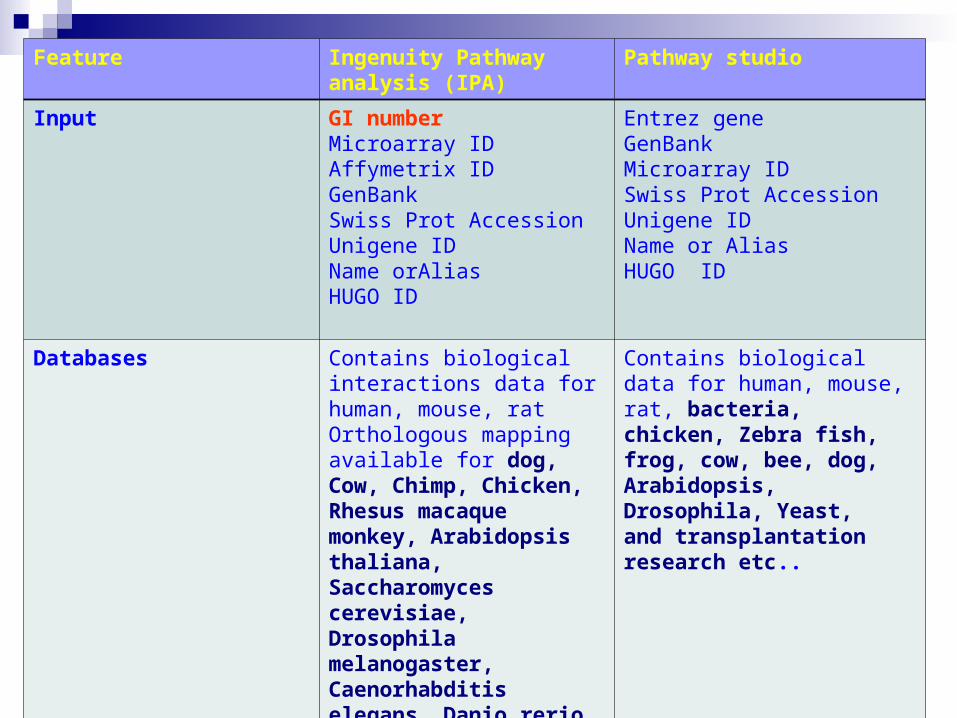
Feature Ingenuity Pathway analysis (IPA)
Pathway studio
Input GI numberMicroarray IDAffymetrix IDGenBankSwiss Prot AccessionUnigene IDName orAliasHUGO ID
Entrez geneGenBankMicroarray IDSwiss Prot AccessionUnigene IDName or AliasHUGO ID
Databases Contains biological interactions data for human, mouse, rat Orthologous mapping available for dog, Cow, Chimp, Chicken, Rhesus macaque monkey, Arabidopsis thaliana, Saccharomyces cerevisiae, Drosophila melanogaster, Caenorhabditis elegans, Danio rerio
Contains biological data for human, mouse, rat, bacteria, chicken, Zebra fish, frog, cow, bee, dog, Arabidopsis, Drosophila, Yeast, and transplantation research etc..

Ingenuity Pathway analysis (IPA)
Pathway studio
Statistical test The significance value( p value) assigned to the function / pathways using Fischer’s exact test
The statistical significance of the overlap between the protein list and a GO group or pathway using the Fischer’s exact test.
Updates Quarterly Quarterly
Networks Builds networks with a maximum of 35 genes/ proteins
-

Proteins involved in modeling
57.5
99.85
42.5
0.15
0
20
40
60
80
100
120
Ingenuity
Pathwaystudio
Proteins not involved in modeling
Proteins involved in modeling

Data generation
44
33
0
10
20
30
40
50
Pathways
Ingenuity pathway anlaysis
Pathway studio
37 7 26
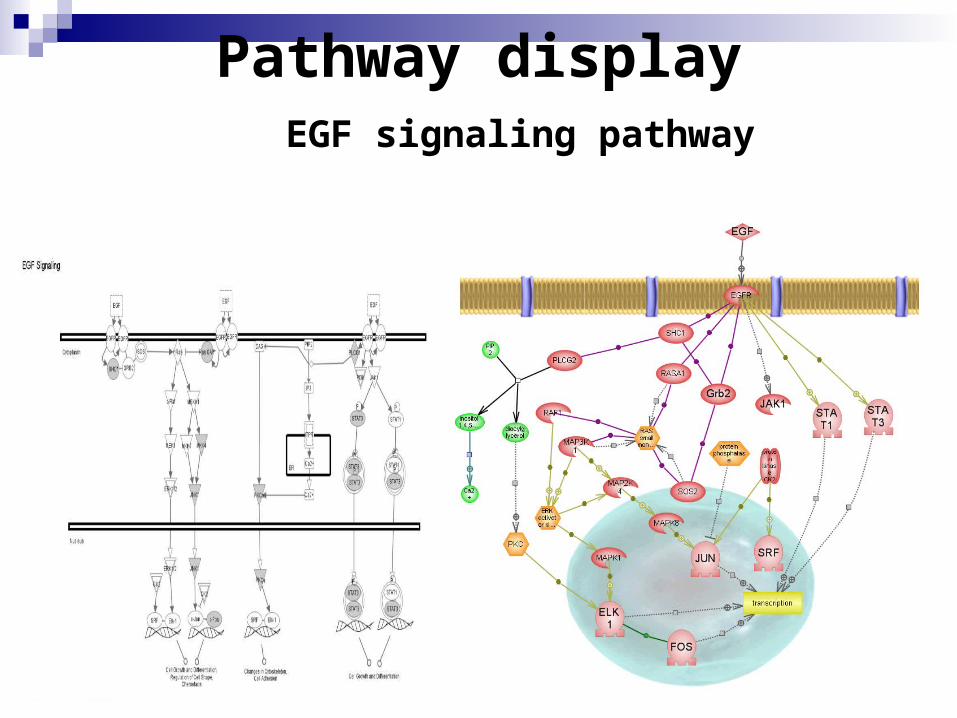
Pathway display EGF signaling pathway

Equally efficient at drawing networks of relationships.
IPA : simplifies the pathway display and creates more manageable user friendly network for users to analyze.
Pathway Studio: Shows the relations in a table format.

Ariadne supported database statistics
Mamamlian ResNet 1.5 Million molecular interactions and
functional relationships from the entire PubMed (17,000,000 abstracts) and 61 full text journals for
110,435 proteins 13,533 small molecules 2814 cellular processes 2,410 diseasesPathways: 227 Receptor signaling pathways 21 new cellular process regulation pathways Atlas of Signaling - all cellular signaling on one
map
Plant ResNet Relations to Arabidopsis proteins, (and rice genes that are
mapped to Arabidopsis), Protein annotation for eight other plant species;
Over 90,000 functional relationships and molecular interactions from 117,000 plant-specific abstracts and 8 plant-specific full-text journals for
71,501 proteins 3,831 small molecules 915 cellular processes 97 plant diseasesPathways: 17 Plant Signaling Pathways 315 AraCyc pathways
Journals: Annals of BotanyCrop ScienceJournal of Experimental BotanyNew PhytologistPlant CellPlant, Cell and EnvironmentPlant JournalPlant Physiology
Related Documents