Cover page Paths of Justification in Israeli 7th grade mathematics textbooks Silverman, Boaz; Even, Ruhama https://weizmann.esploro.exlibrisgroup.com/discovery/delivery/972WIS_INST:ResearchRepository/1279091300003596?l#1395557440003596 Silverman, & Even, R. (2016). Paths of Justification in Israeli 7th grade mathematics textbooks. Proceedings of the 40th Conference of the International Group for the Psychology of Mathematics Education, 4, 203–210. https://weizmann.esploro.exlibrisgroup.com/discovery/fulldisplay/alma993265059903596/972WIS_INST:R esearchRepository Document Version: Published (Version of record) downloaded on 2022/10/03 15:16:59 +0300 Research:Open Free to read and download [email protected] https://weizmann.alma.exlibrisgroup.com/discovery/search?vid=972WIS_INST:ResearchRepository Please do not remove this page

Welcome message from author
This document is posted to help you gain knowledge. Please leave a comment to let me know what you think about it! Share it to your friends and learn new things together.
Transcript

Cover page
Paths of Justification in Israeli 7th grademathematics textbooksSilverman, Boaz; Even, Ruhamahttps://weizmann.esploro.exlibrisgroup.com/discovery/delivery/972WIS_INST:ResearchRepository/1279091300003596?l#1395557440003596
Silverman, & Even, R. (2016). Paths of Justification in Israeli 7th grade mathematics textbooks.Proceedings of the 40th Conference of the International Group for the Psychology of MathematicsEducation, 4, 203–210.https://weizmann.esploro.exlibrisgroup.com/discovery/fulldisplay/alma993265059903596/972WIS_INST:ResearchRepositoryDocument Version: Published (Version of record)
downloaded on 2022/10/03 15:16:59 +0300Research:OpenFree to read and [email protected]://weizmann.alma.exlibrisgroup.com/discovery/search?vid=972WIS_INST:ResearchRepository
Please do not remove this page


Proceedings of the 40th Conference of the
International Group for the Psychology of Mathematics Education
PME40, Szeged, Hungary, 3–7 August, 2016

Proceedings of the
40th Conference of the International
Group for the Psychology of Mathematics Education
Editors
Csaba Csíkos
Attila Rausch
Judit Szitányi
PME40, Szeged, Hungary, 3–7 August, 2016
Volume 4
RESEARCH REPORTS

Cite as:
Csíkos, C., Rausch, A., & Szitányi, J. (Eds.). Proceedings of the 40th Conference of the
International Group for the Psychology of Mathematics Education, Vol. 4. Szeged,
Hungary: PME.
Website: http://pme40.hu
The proceedings are also available via http://www.igpme.org
Publisher:
International Group for the Psychology of Mathematics Education
Copyrights © 2016 left to the authors
All rights reserved
ISSN 0771-100X
ISBN 978-1-365-46345-7
Logo: Lóránt Ragó
Composition of Proceedings: Edit Börcsökné Soós
Printed in Hungary
Innovariant Nyomdaipari Kft., Algyő
www.innovariant.hu
PME40 – 2016 2–i
TABLE OF CONTENTS
VOLUME 4 — RESEARCH REPORTS (OST – Z)
Osta, Iman; Thabet, Najwa .............................................................................. 3–10
ALTERNATIVE CONCEPTIONS OF LIMIT OF FUNCTION HELD
BY LEBANESE SECONDARY SCHOOL STUDENTS
Otaki, Koji; Miyakawa, Takeshi; Hamanaka, Hiroaki ................................. 11–18
PROVING ACTIVITIES IN INQUIRIES USING THE INTERNET
Ottinger, Sarah; Kollar, Ingo; Ufer, Stefan .................................................... 19–26
CONTENT AND FORM – ALL THE SAME OR DIFFERENT
QUALITIES OF MATHEMATICAL ARGUMENTS?
Palmér, Hanna ................................................................................................... 27–34
WHAT HAPPENS WHEN ENTREPRENEURSHIP ENTERS
MATHEMATICS LESSONS?
Papadopoulos, Ioannis; Diamantidis, Dimitris; Kynigos, Chronis .............. 35–42
MEANINGS AROUND ANGLE WITH DIGITAL MEDIA DESIGNED
TO SUPPORT CREATIVE MATHEMATICAL THINKING
Papadopoulos, Ioannis; Kindini, Theonitsa; Tsakalaki, Xanthippi ............. 43–50
USING MOBILE PUZZLES TO DEVELOPE ALGEBRAIC
THINKING
Pelen, Mustafa Serkan; Dinç Artut, Perihan .................................................. 51–58
AN INVESTIGATION OF MIDDLE SCHOOL STUDENTS’
PROBLEM SOLVING STRATEGIES ON INVERSE
PROPORTIONAL PROBLEMS
Pettersen, Andreas; Nortvedt, Guri A. ............................................................ 59–66
RECOGNISING WHAT MATTERS: IDENTIFYING COMPETENCY
DEMANDS IN MATHEMATICAL TASKS
Pinkernell, Guido ............................................................................................... 67–74
MAKING SENSE OF DYNAMICALLY LINKED MULTIPLE
REPRESENTATIONS OF FUNCTIONS

2–ii PME40 – 2016
Pongsakdi, Nonmanut; Brezovszky, Boglarka; Veermans, Koen;
Hannula-Sormunen, Minna; Lehtinen, Erno ................................................. 75–82
A COMPARATIVE ANALYSIS OF WORD PROBLEMS IN
SELECTED THAI AND FINNISH TEXTBOOKS
Portnov-Neeman, Yelena; Amit, Miriam ........................................................ 83–90
THE EFFECT OF THE EXPLICIT TEACHING METHOD ON
LEARNING THE WORKING BACKWARDS STRATEGY
Potari, Despina; Psycharis, Giorgos; Spiliotopoulou, Vassiliki;
Triantafillou, Chrissavgi; Zachariades, Theodossios; Zoupa, Aggeliki ....... 91–98
MATHEMATICS AND SCIENCE TEACHERS’ COLLABORATION:
SEARCHING FOR COMMON GROUNDS
Proulx, Jérôme; Simmt, Elaine ...................................................................... 99–106
DISTINGUISHING ENACTIVISM FROM CONSTRUCTIVISM:
ENGAGING WITH NEW POSSIBILITIES
Pustelnik, Kolja; Halverscheid, Stefan ........................................................ 107–114
ON THE CONSOLIDATION OF DECLARATIVE MATHEMATICAL
KNOWLEDGE AT THE TRANSITION TO TERTIARY EDUCATION
Rangel, Letícia; Giraldo, Victor; Maculan, Nelson ................................... 115–122
CONCEPT STUDY AND TEACHERS’ META-KNOWLEDGE: AN
EXPERIENCE WITH RATIONAL NUMBERS
Reinhold, Simone; Wöller, Susanne ............................................................ 123–130
THIRD-GRADERS' BLOCK-BUILDING: HOW DO THEY EXPRESS
THEIR KNOWLEDGE OF CUBOIDS AND CUBES?
Rellensmann, Johanna; Schukajlow, Stanislaw ......................................... 131–138
ARE MATHEMATICAL PROBLEMS BORING? BOREDOM WHILE
SOLVING PROBLEMS WITH AND WITHOUT A CONNECTION
TO REALITY FROM STUDENTS' AND PRE-SERVICE TEACHERS'
PERSPECTIVES
Rott, Benjamin; Leuders, Timo ................................................................... 139–146
MATHEMATICAL CRITICAL THINKING: THE CONSTRUCTION
AND VALIDATION OF A TEST
Salle, Alexander; Schumacher, Stefanie; Hattermann, Mathias .............. 147–154
THE PING-PONG-PATTERN – USAGE OF NOTES BY DYADS
DURING LEARNING WITH ANNOTATED SCRIPTS

PME40 – 2016 2–iii
Scheiner, Thorsten; Pinto, Márcia M. F. .................................................... 155–162
IMAGES OF ABSTRACTION IN MATHEMATICS EDUCATION:
CONTRADICTIONS, CONTROVERSIES, AND CONVERGENCES
Schindler, Maike; Lilienthal, Achim; Chadalavada, Ravi;
Ögren, Magnus .............................................................................................. 163–170
CREATIVITY IN THE EYE OF THE STUDENT. REFINING
INVESTIGATIONS OF MATHEMATICAL CREATIVITY USING
EYE-TRACKING GOGGLES.
Segal, Ruti; Shriki, Atara; Movshovitz-Hadar, Nitsa ................................ 171–178
FACILITATING MATHEMATICS TEACHERS’ SHARING OF
LESSON PLANS
Shahbari, Juhaina Awawdeh; Tabach, Michal .......................................... 179–186
DIFFERENT GENERALITY LEVELS IN THE PRODUCT OF A
MODELLING ACTIVITY
Shimada, Isao; Baba, Takuya ...................................................................... 187–194
TRANSFORMATION OF STUDENTS' VALUES IN THE PROCESS
OF SOLVING SOCIALLY OPEN-ENDED ROBLEMS(2):FOCUSING
ON LONG-TERM TRANSFORMATION
Shinno, Yusuke; Fujita, Taro ....................................................................... 195–202
PROSPECTIVE MATHEMATICS TEACHERS’ PROOF
COMPREHENSION OF MATHEMATICAL INDUCTION: LEVELS
AND DIFFICULTIES
Silverman, Boaz; Even, Ruhama ................................................................. 203–210
PATHS OF JUSTIFICATION IN ISRAELI 7TH GRADE
MATHEMATICS TEXTBOOKS
Skott, Charlotte Krog; Østergaard, Camilla Hellsten ............................... 211–218
HOW DOES AN ICT-COMPETENT MATHEMATICS TEACHER
BENEFIT FROM AN ICT-INTEGRATIVE PROJECT?
Sommerhoff, Daniel; Ufer, Stefan; Kollar, Ingo ........................................ 219–226
PROOF VALIDATION ASPECTS AND COGNITIVE STUDENT
PREREQUISITES IN UNDERGRADUATE MATHEMATICS
Staats, Susan .................................................................................................. 227–234
POETIC STRUCTURES AS RESOURCES FOR PROBLEM-
SOLVING

2–iv PME40 – 2016
Stouraitis, Konstantinos ................................................................................ 235–242
DECISION MAKING IN THE CONTEXT OF ENACTING A NEW
CURRICULUM: AN ACTIVITY THEORETICAL PERSPECTIVE
Strachota, Susanne M.; Fonger, Nicole L.; Stephens, Ana C.;
Blanton, Maria L.; Knuth, Eric J.; Murphy Gardiner, Angela ............... 243–250
UNDERSTANDING VARIATION IN ELEMENTARY STUDENTS’
FUNCTIONAL THINKING
Sumpter, Lovisa; Sumpter, David ............................................................... 251–258
HOW LONG WILL IT TAKE TO HAVE A 60/40 BALANCE IN
MATHEMATICS PHD EDUCATION IN SWEDEN?
Tabach, Michal; Hershkowitz, Rina; Azmon, Shirly; Rasmussen, Chris;
Dreyfus, Tommy ............................................................................................ 259–266
TRACES OF CLASSROOM DISCOURSE IN A POSTTEST
Takeuchi, Miwa; Towers, Jo; Martin, Lyndon .......................................... 267–274
IMAGES OF MATHEMATICS LEARNING REVEALED THROUGH
STUDENTS' EXPERIENCES OF COLLABORATION
Tjoe, Hartono ................................................................................................. 275–282
WHEN IS A PROBLEM REALLY SOLVED? DIFFERENCES IN THE
PURSUIT OF MATHEMATICAL AESTHETICS
Triantafillou, Chrissavgi; Bakogianni, Dionysia; Kosyvas, Georgios ...... 283–290
TENSIONS IN STUDENTS’ GROUP WORK ON MODELLING
ACTIVITIES
Uegatani, Yusuke; Koyama, Masataka ....................................................... 291–298
A NEW FRAMEWORK BASED ON THE METHODOLOGY OF
SCIENTIFIC RESEARCH PROGRAMS FOR DESCRIBING THE
QUALITY OF MATHEMATICAL ACTIVITIES
Ulusoy, Fadime .............................................................................................. 299–306
THE ROLE OF LEARNERS’ EXAMPLE SPACES IN EXAMPLE
GENERATION AND DETERMINATION OF TWO PARALLEL AND
PERPENDICULAR LINE SEGMENTS
Uziel, Odelya; Amit, Miriam ........................................................................ 307–314
COGNITIVE AND AFFECTIVE CHARACTERISTICS OF YOUNG
SOLVERS PARTICIPATING IN 'KIDUMATICA FOR YOUTH'

PME40 – 2016 2–v
Van Hoof, Jo; Verschaffel, Lieven; Ghesquière, Pol;
Van Dooren, Wim .......................................................................................... 315–322
THE NATURAL NUMBER BIAS AND ITS ROLE IN RATIONAL
NUMBER UNDERSTANDING IN CHILDREN WITH
DYSCALCULIA: DELAY OR DEFICIT?
Van Zoest, Laura R.; Stockero, Shari L.; Leatham, Keith R.;
Peterson, Blake E. .......................................................................................... 323–330
THEORIZING THE MATHEMATICAL POINT OF BUILDING ON
STUDENT MATHEMATICAL THINKING
Vázquez Monter, Nathalie ............................................................................ 331–338
INCORPORATING MOBILE TECHNOLOGIES INTO THE PRE-
CALCULUS CLASSROOM: A SHIFT FROM TI GRAPHIC
CALCULATORS TO PERSONAL MOBILE DEVICES
Vermeulen, Cornelis ...................................................................................... 339–346
DEVELOPING ALGEBRAIC THINKING: THE CASE OF SOUTH
AFRICAN GRADE 4 TEXTBOOKS.
Vlassis, Jöelle; Poncelet, Débora .................................................................. 347–354
PRE-SERVICE TEACHERS’ BELIEFS ABOUT MATHEMATICS
EDUCATION FOR 3-6-YEAR-OLD CHILDREN
Waisman, Ilana .............................................................................................. 355–362
ENLISTING PHYSICS IN THE SERVICE OF MATHEMATICS:
FOCUSSING ON HIGH SCHOOL TEACHERS
Walshaw, Margaret ....................................................................................... 363–370
REFLECTIVE PRACTICE AND TEACHER IDENTITY:
A PSYCHOANALYTIC VIEW
Wang, Ting-Ying; Hsieh, Feng-Jui .............................................................. 371–378
WHAT TEACHERS SHOULD DO TO PROMOTE AFFECTIVE
ENGAGEMENT WITH MATHEMATICS—FROM THE
PERSPECTIVE OF ELEMENTARY STUDENTS
Wasserman, Nicholas H. ............................................................................... 379–386
NONLOCAL MATHEMATICAL KNOWLEDGE FOR TEACHING
Wilkie, Karina J. ............................................................................................ 387–394
EXPLORING MIDDLE SCHOOL GIRLS’ AND BOYS’
ASPIRATIONS FOR THEIR MATHEMATICS LEARNING

2–vi PME40 – 2016
Xenofontos, Constantinos; Kyriakou, Artemis .......................................... 395–402
PROSPECTIVE ELEMENTARY TEACHERS’ TALK DURING
COLLABORATIVE PROBLEM SOLVING
Zeljić, Marijana; Đokić, Olivera; Dabić, Milana ....................................... 403–410
TEACHERS' BELIEFS TOWARDS THE VARIOUS
REPRESENTATIONS IN MATHEMATICS INSTRUCTION
Index of Authors .............................................................................................. 413–414

Volume 4
RESEARCH REPORTS
OST - Z

2016. In Csíkos, C., Rausch, A., & Szitányi, J. (Eds.). Proceedings of the 40th Conference of the International
Group for the Psychology of Mathematics Education, Vol. 4, pp. 3–10. Szeged, Hungary: PME. 4–3
ALTERNATIVE CONCEPTIONS OF LIMIT OF FUNCTION HELD
BY LEBANESE SECONDARY SCHOOL STUDENTS
Iman Osta
Lebanese American University
Najwa Thabet
Lebanese American University
A good conceptual understanding of “limits of functions” is essential for students to
successfully proceed further with other calculus concepts. However, students usually
hold wrong or alternative conceptions of limit. This paper aims to investigate the
conceptions of limit held by Lebanese secondary school students (17-18 years old) and
their perceptions of difficulties faced while learning it. A questionnaire was
administered to 35 students. An “Index of Adoption” was created to identify and rank
students’ alternative conceptions. Results showed that different models are held by
students, the dominant one being a dynamic symmetrical duality model. Most
difficulties expressed by students relate to procedural processing of limits.
The concept of “limit of a function” plays a fundamental key role in the study of
calculus. A good conceptual understanding of this concept and its applications is
essential in order for students to successfully proceed further with other calculus
concepts such as continuity, derivative and integral. Students’ erroneous
understandings of limits will affect their whole subsequent learning process in
mathematics as well as in other subjects.
Literature is rich with studies that investigated the teaching and learning of limits,
whether from a psycho-cognitive perspective (Cottrill et al., 1996), or from
epistemological perspectives (Cornu, 1991; Moru, 2008; Sierpinska, 1987). Many
studies were also concerned with didactical aspects of teaching and learning of limits.
Barbé, Bosch, Espinoza and Cascon (2005) consider that the processes of learning and
teaching go hand in hand and that the problems that arise in learning the concept of
limit require an understanding of the choices that teachers make and the related content
of the curriculum. Huillet (2005) investigated five Mozambican teachers’ professional
knowledge of limits of functions and showed that they had weak knowledge. Research
clearly showed that the concept of limit creates major difficulties for students and that
students face many obstacles while learning it (Cornu, 1991; Sierpinska, 1987; Tall &
Vinner, 1981). Some obstacles emerge from students’ intuitive understanding of other
foundational concepts such as: infinitesimals, the notion of infinity, and continuity.
Pehkonen, Hannula, Maijala, and Soro (2006) conducted a study on students’
understanding of the notion of infinity. They consider infinity as an inspiring but rather
difficult concept for both mathematicians and students. Being foundational building
blocks to the concept of limits, the notions of infinity and infinitesimals are expected
to cause difficulties in students’ learning of limits. Students will probably be prone to
build erroneous conceptions of limits of functions. It is therefore important to
investigate the possible alternative conceptions that students may develop, as a step

Osta, Thabet
2–4 PME40 – 2016
toward elaborating teaching strategies to challenge them. Williams (1991) studied the
informal models of limit of function held by 10 college students. He then designed
problems aiming to create a change in students’ conceptions. He came up with the
conclusion that the dynamic aspects – based on graphic models – were extremely
resistant to change. Students’ previous experiences with graphs of simple functions
create obstacles to students’ developing of a formal view of limit.
This paper reports preliminary results obtained in the context of a large study targeting
the teaching and learning of limits of functions in the Lebanese context. Due to the size
limitations of the paper, only a part of the study is considered. The purpose is to
investigate the different conceptions of limit of function held by Lebanese secondary
school students, one year after its introduction in grade 11. Grade 11 (16-17 year-old
students) is the second secondary year in the Lebanese educational ladder. The reported
study targeted grade-12 students, in their last year of secondary school.
METHOD
The study adopts a qualitative analytical approach, based on text analysis of students’
answers to a questionnaire. Participants are 35 students, 17-18 years old, in two grade-
12 classes of a Lebanese private, mixed-gender school. These students were introduced
to the concept of limits in the previous school year, after which they also worked on
continuity and differentiability. To investigate their conceptions of limit a year later to
its introduction, students were asked to answer a questionnaire consisting of three
questions, designed to make explicit those conceptions, as well as their views of the
difficulties they associate to the concept of limit.
FINDINGS
Question 1 of the questionnaire (named Selecting) asks students to choose, among six
statements, the three statements that best describe their understanding of limits and to
rank them in the order of preference. This is a slight adaptation of a question used by
Williams (1991, p. 221) who asked students to decide, for each statement, whether it
is true or false, and then select only the one that most describes their idea of limit.
Question 2 (Formulating), also adapted from Williams (1991), asks students to express,
in their own words, what they understand by limit. Question 3 (Expressing difficulties)
focuses on getting students’ views on the difficulties that they faced and/or are still
facing while learning, and working with, limits.
Question 1: Selecting
“From the following list of statements, choose the three statements that best describe
your understanding of limit, and rate them from 1 to 3 in the order of preference.”
A limit describes how a function moves as x moves toward a certain point (S1).
A limit is a number or point past which a function cannot go (S2).
A limit is a number that the y-values of a function can be made arbitrarily close to by
assigning specific numbers to the x-values (S3).
A limit is a number or point the function gets close to but never reaches (S4).
Osta, Thabet
PME40 – 2016 4–5
A limit is an approximation that can be made as accurate as you wish (S5).
A limit is determined by plugging in numbers closer and closer to a given number
until the limit is reached (S6).
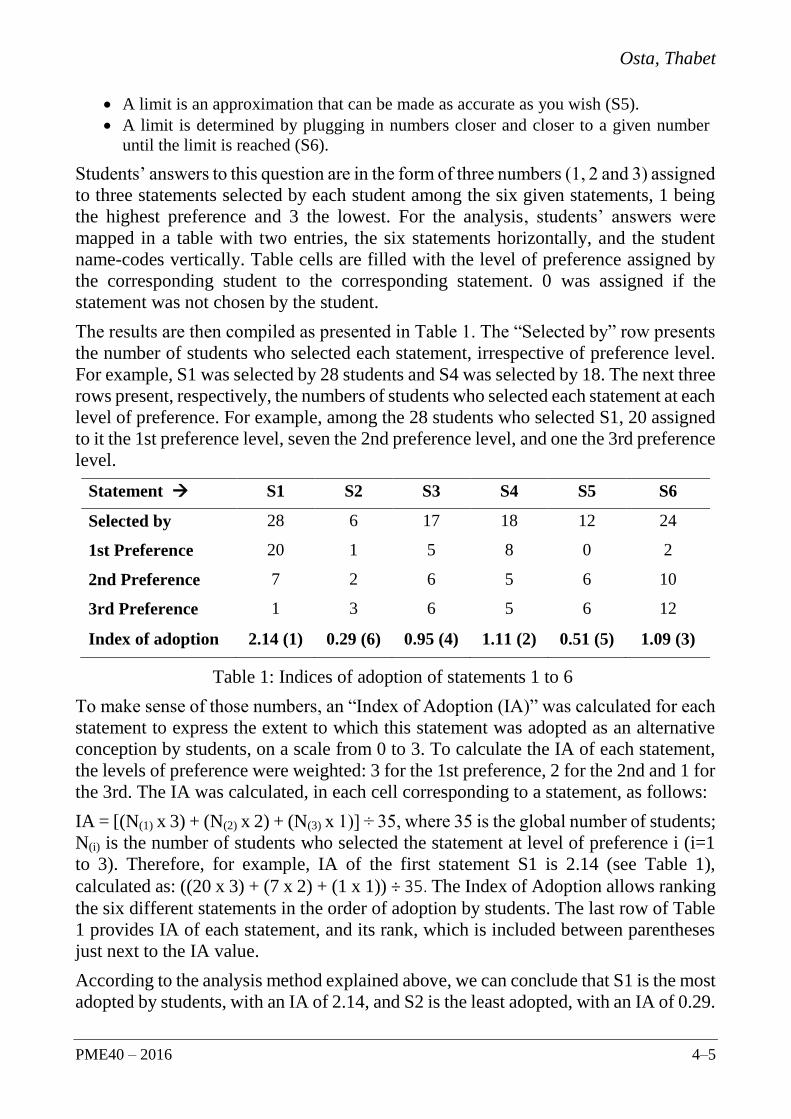
Students’ answers to this question are in the form of three numbers (1, 2 and 3) assigned
to three statements selected by each student among the six given statements, 1 being
the highest preference and 3 the lowest. For the analysis, students’ answers were
mapped in a table with two entries, the six statements horizontally, and the student
name-codes vertically. Table cells are filled with the level of preference assigned by
the corresponding student to the corresponding statement. 0 was assigned if the
statement was not chosen by the student.
The results are then compiled as presented in Table 1. The “Selected by” row presents
the number of students who selected each statement, irrespective of preference level.
For example, S1 was selected by 28 students and S4 was selected by 18. The next three
rows present, respectively, the numbers of students who selected each statement at each
level of preference. For example, among the 28 students who selected S1, 20 assigned
to it the 1st preference level, seven the 2nd preference level, and one the 3rd preference
level.
Statement S1 S2 S3 S4 S5 S6
Selected by 28 6 17 18 12 24
1st Preference 20 1 5 8 0 2
2nd Preference 7 2 6 5 6 10
3rd Preference 1 3 6 5 6 12
Index of adoption 2.14 (1) 0.29 (6) 0.95 (4) 1.11 (2) 0.51 (5) 1.09 (3)
Table 1: Indices of adoption of statements 1 to 6
To make sense of those numbers, an “Index of Adoption (IA)” was calculated for each
statement to express the extent to which this statement was adopted as an alternative
conception by students, on a scale from 0 to 3. To calculate the IA of each statement,
the levels of preference were weighted: 3 for the 1st preference, 2 for the 2nd and 1 for
the 3rd. The IA was calculated, in each cell corresponding to a statement, as follows:
IA = [(N(1) x 3) + (N(2) x 2) + (N(3) x 1)] ÷ 35, where 35 is the global number of students;
N(i) is the number of students who selected the statement at level of preference i (i=1
to 3). Therefore, for example, IA of the first statement S1 is 2.14 (see Table 1),
calculated as: ((20 x 3) + (7 x 2) + (1 x 1)) ÷ 35. The Index of Adoption allows ranking
the six different statements in the order of adoption by students. The last row of Table
1 provides IA of each statement, and its rank, which is included between parentheses
just next to the IA value.
According to the analysis method explained above, we can conclude that S1 is the most
adopted by students, with an IA of 2.14, and S2 is the least adopted, with an IA of 0.29.

Osta, Thabet
2–6 PME40 – 2016
The difference between these two extremes (the range) is 1.85 on a 0-to-3 scale.
Therefore, a dominating conception of limit of function among the participants is that
“A limit describes how a function moves as x moves toward a certain point”. Students
thus strongly hold a dynamic conception of both, the variable and the function, being
in motion, each on its track and toward a certain value. This conception is distinctively
higher than the others. It exceeds the next one (IA = 1.11) by 1.03 on a 0-to-3 scale.
The second- and third-adopted conceptions, i.e. S4 and S6, have close IA values,
respectively 1.11 and 1.09 on a 0-to-3 scale. So, students moderately think that “A limit
is a number or point the function gets close to but never reaches” (S4), yet they also
think, at almost the same level, that “A limit is determined by plugging in numbers
closer and closer to a given number until the limit is reached” (S6).
The two least adopted conceptions are S5 (IA=0.5) and S2 (IA=0.28), corresponding
respectively to: “A limit is an approximation that can be made as accurate as you wish”,
and “A limit is a number or point past which a function cannot go”.
Question 2: Formulating
“Please describe in a few sentences what you understand a limit to be. That is, describe
what it means to say that limit of a function f as ax is some number L.”
While question 1 provides students with a limited choice of pre-determined statements
to select from, question 2 leaves it open for them to freely formulate their
understanding of the notion. A text analysis was conducted on students’ answers, with
focus on the sentence structure and vocabulary used, in as much as they reflect their
conceptions. The following categories of alternative conceptions were identified. They
are briefly explained, within the size limits of this paper:
Dual parallelism between variable and function behaviors
Most of the students’ answers express a kind of “parallelism”, reflecting what can be
named a “symmetrical duality” in the behaviors of the variable and the function. As
one “moves”, the other “moves”, and as one “gets close” to a value, the other “gets
close” to a value. Twenty-four out of the 35 students used such a type of duality.
Different verbs were used, such as “moves” (M), “tends to” (T), “approaches” (A),
“reaches” (R), “gets closer” (Cl), “comes” (Co) , “becomes” (B), “is” (I). Following
are examples of students’ answers showing duality:
As x tends to a number a, y tends to a number L (TT)
As x moves towards a, f moves towards L (MM)
As the x reaches the number a, the function reaches the number L (RR)
x tends to a nb “a”, thus, y approaches the number L, but might never reach it (T-A)
When x tends to a number a the function f(x) tends to reach L (T-TtoR)
The value that the f(x) approaches as x gets infinitesmaly [sic] close to a is L (Cl-A)
As x tends to a f(x) will move as L moves (T-M)
As x becomes closer to a, f (x) becomes closer to L regardless if L is reached or not,
if f(a) = L or not. f(a) could not be defined (Cl-Cl)

Osta, Thabet
PME40 – 2016 4–7
The different verbs used by students reflect different conceptions of functions and
limits. For example, the verbs “moves toward”, “approaches”, “gets closer to”, “tends
to” provide a dynamic nature to the variable and the function. They also reflect the idea
that x and/or f(x) may not get equal to the values they are approaching. Such a
conception is different from the one reflected by verbs such as “reaches”, “becomes”,
“is”, which reflect a static conception, while at the same time expressing the fact that
the limit may be attained. It is worth noting that one of the answers included a sentence,
explicitly highlighting the fact that the function does not reach the value L and using
the idea of the infinitely small:
F(x) tends to L as x is a, but isn’t L, like 0.000001 but not 0 (I-T)
Graph based conceptions
Some of the students’ statements included instances of graphical connections that are
distinctively different from the above “duality based”, formal and symbolic notions.
However, these graphic based answers included erroneous use of the mathematical
language that reflects serious confusions and misconceptions, mostly related to their
knowledge of functions, the relationships between functions and their graphs, and
confusion of the concepts of variable and function. Following are examples, where
some of the parts reflecting confusions are underlined:
The graph tends to be close to x = a, it can be x ⇾ a- or x ⇾ a+, giving same limit=L
As x tends to a, f(x) will move as L moves
As the function f approaches x = a, the ordinate approaches L; i.e the function curve
approaches y = L
The y or ordinate of the number (a) will be obtained by calc. the limit of it as a tends
towards it. It might be a number or ∞
As the curve of a function moves across a plane closer and closer to x = a, it also
moves closer to the number L, (it may or may not pass through the point (a,L)
depending on the domain of f itself)
A Limit helps us determine where a function moves to or ends at a differentiable pt
Alternative conceptions related to whether the limit can be reached or not
The dilemma about whether a limit is reached or not, or even about whether a limit
may be reached or not, is clear in students’ answers. Some students consider that the
limit of a function is the value of the function at the point, as in “f(x) = L”, or “the
function reaches its limit”. Others use terms that reflect a notion that interferes with the
common language use of the word “limit”, that is the function cannot go beyond the
limit; e.g. “the function ends at the point”, or “the function reaches its limit”. Other
students’ statements, on the other hand, explicitly emphasize the fact that the limit
either cannot be reached, or might not be reached. The following are some examples:
As the function gets close to x = a it reaches its limit and y is approximately equal to
L and very close to it
x tends to a nb “a”, thus, y approaches the number L, but might never reach it
Closest value of y at a certain value x
Osta, Thabet
2–8 PME40 – 2016
When x tends to a number (which is a here) the function f(x) tends to reach L
A thorough text analysis reveals also other various alternative meanings attributed to
the concept of limit, related to whether the function would be defined, or undefined at
the point, or would be continuous / differentiable at a point:
As f reaches x=0 the function reaches the point y=L; fct may not be defined on f(a)
Limit is the number that the function cannot reach, due to the function being
undefined at this point. L represents the number that the function would have reached
if it is defined at a
Procedural understanding of limit
Some of the students’ answers reflect their permanent concern about solving exercises
involving limits of functions, rather than a more conceptual meaning. Their statements
either recite rules to use in solving limits as they memorized them, or they present the
limit as a way for calculating other values, or for finding some characteristics of the
function in certain conditions:
The y or ordinate of the number (a) will be obtained by calculating the limit of it as
a tends towards it. It might be a number or ∞
Finally, the following example presents the limit as a solution for finding an
approximate value of the function when it is not possible to calculate the exact value.
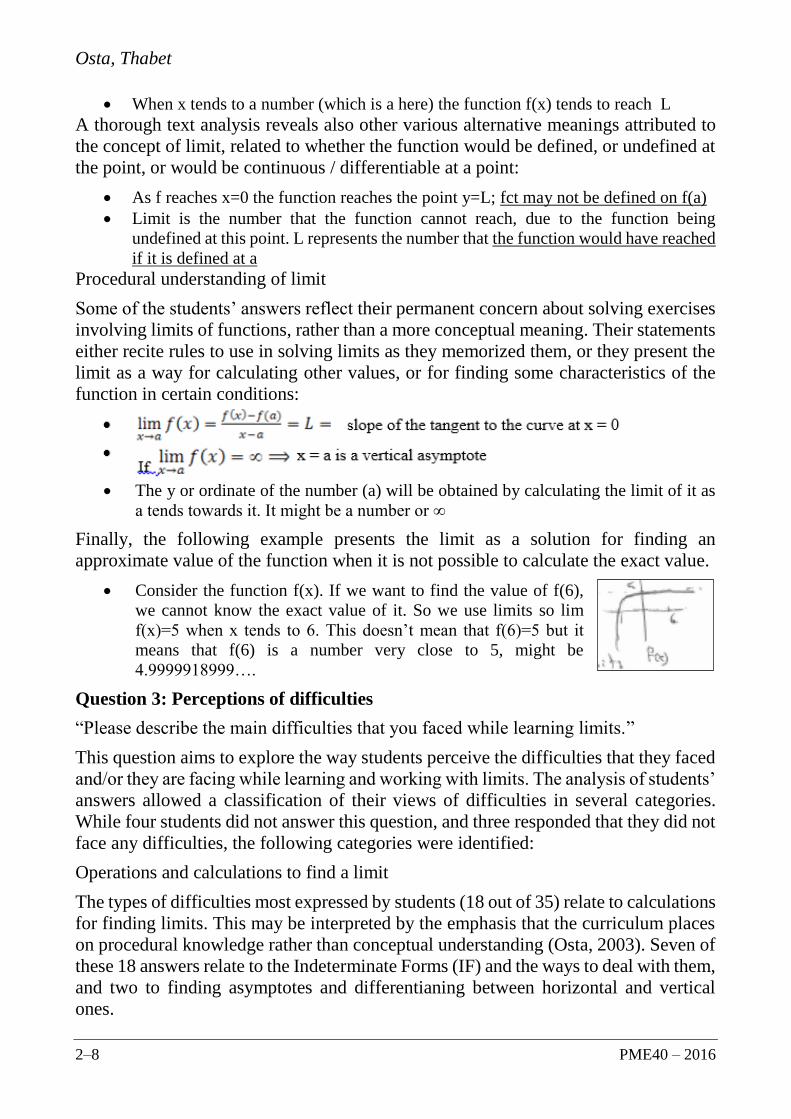
Consider the function f(x). If we want to find the value of f(6),
we cannot know the exact value of it. So we use limits so lim
f(x)=5 when x tends to 6. This doesn’t mean that f(6)=5 but it
means that f(6) is a number very close to 5, might be
4.9999918999….
Question 3: Perceptions of difficulties
“Please describe the main difficulties that you faced while learning limits.”
This question aims to explore the way students perceive the difficulties that they faced
and/or they are facing while learning and working with limits. The analysis of students’
answers allowed a classification of their views of difficulties in several categories.
While four students did not answer this question, and three responded that they did not
face any difficulties, the following categories were identified:
Operations and calculations to find a limit
The types of difficulties most expressed by students (18 out of 35) relate to calculations
for finding limits. This may be interpreted by the emphasis that the curriculum places
on procedural knowledge rather than conceptual understanding (Osta, 2003). Seven of
these 18 answers relate to the Indeterminate Forms (IF) and the ways to deal with them,
and two to finding asymptotes and differentianing between horizontal and vertical
ones.

Osta, Thabet
PME40 – 2016 4–9
Making an undetermined [sic] limit determined [sic]
If it is an IF and I can’t find the proper method to make the limit work
Dealing with the indeterminant [sic] and the function where the limit doesn’t exist
Multiplying by the conjugate in the denominator
How we can work out some limits
The problem was finding limits to relatively hard functions
The properties of limits (adding, dividing, multiplying)
The idea of calculating a limit whether to factorize, divide, or plug in numbers
I never fully understood l’Hopital’s rule. I know how to utilize it while solving limits
but I don’t know why it’s there…..or I just don’t remember
Continuity and differentiability as related to limits
The confusion between limits, continuity and differentiability comes next in the list of
difficulties, expressed by 7 students out of 35.
To know the difference between continuous, differentiable
The idea of differentiable, has limit, continuous
Trying to understand the concept of a function being differentiable at a point and
studying it’s [sic] limit was tough
Meaning and purpose of limits
Six students expressed their confusion about the definition and meaning of limit and
the purpose of its use, “the main concept”, “what is limit and why it is used?”,
“difficulties about the definition”, etc.
Metaphysical aspect of limit
Many students expressed difficulties related to aspects of limits that can be related to
its “metaphysical” nature, and to the fact that they “had not seen anything similar
before”. They considered the concept of limit to be a “new idea” and that it is “hard to
understand its usage and importance”, that “we can’t directly understand what we are
working with”. One student wrote that he could not relate the concept with examples,
another student could not visualize the concept in his/her head, a third could not deal
with non-existing limit, and another one calculated the limits “without thinking of what
are we [sic] finding, whether graphically or logically”.
CONCLUSION
The analysis of data from questions 1 and 2 concurred to show that the participating
students hold different conceptions of limit of function, some of which are not in line
with the formal definition. It also showed that the dominating conception is that of a
dynamic, symmetrical-duality model, whereby both, the variable and the function
move, each on its track, toward certain values. This result concurs with Williams’
findings (1991). Graphical models, expressed with conceptual and language
confusions, are moderately held by students. As to the students’ perceptions of their
difficulties, they are mostly of a procedural nature, related to the calculation of limits
or other related entities, together with difficulties about their “metaphysical” nature.

Osta, Thabet
2–10 PME40 – 2016
References
Barbé, J., Bosch, M., Espinoza, L., & Gascón, J. (2005). Didactic restrictions on the teacher’s
practice: The case of limits of functions in Spanish high schools. Educational Studies in
Mathematics, 59, 235–268.
Cornu, B. (1981). Apprentissage de la notion de limite: Modèles spontanés et modèles
propres. Proceedings of the Fifth Conference of the International Group for the
Psychology of Mathematics Education (pp. 322-326). Grenoble, France.
Cornu, B. (1991). Limits. In D. Tall (Ed.), Advanced mathematical thinking (pp. 153-166).
Dordrecht, the Netherlands: Kluwer Academic.
Cottrill, J., Dubinsky, E., Nichols, D., Schwingendorf, K., Thomas, K., &Vidakovic, D.
(1996). Understanding the limit concept: Beginning with a coordinated process schema.
Journal of Mathematical Behavior, 15, 167-192.
Huillet, D. (2005). Mozambican teachers’ professional knowledge about limits. In Chick,
H.L. & Vincent, J.L. (Eds.). Proceedings of the 29th Conference of the International Group
for the Psychology of Mathematics Education, vol.3 (pp. 169-176). Melbourne.
Moru, E. K. (2008). Epistemological obstacles in coming to understand the limit of a function
at undergraduate level: A case from the National University of Lesotho. International
Journal of Science and Mathematics Education, 7, 431 – 454.
Osta, I. (2003). Etude de la Conséquence d’un curriculum de Mathématiques: Cas du Liban.
Proceedings of the Espace Mathématique Francophone Conference EMF 2003. Tozeur: France.
Pehkonen, E., Hannula, M. S., Maijala, H., & Soro, R. (2006). Infinity of numbers: How students
understand it. Proceedings 30thConference of the International Group for the Psychology of
Mathematics Education: Vol. 4, (pp. 4-345). Prague: PME.
Sierpinska, A. (1987). Humanities students and epistemological obstacles related to limits,
Educational Studies in Mathematics,18, 371-397.
Tall, D., & Vinner, S. (1981). Concept image and concept definition in mathematics with
particular reference to limits and continuity. Educational Studies in Mathematics, 12, 151-
169.
Williams, S. R. (1991). Models of limit held by college calculus students. Journal for
Research in Mathematics Education, 22, 219-236.

2016. In Csíkos, C., Rausch, A., & Szitányi, J. (Eds.). Proceedings of the 40th Conference of the International
Group for the Psychology of Mathematics Education, Vol. 4, pp. 11–18. Szeged, Hungary: PME. 4–11
PROVING ACTIVITIES IN INQUIRIES USING THE INTERNET
Koji Otaki1, Takeshi Miyakawa2, Hiroaki Hamanaka3
1Hokkaido University of Education, 2Joetsu University of Education, 3Hyogo
University of Teacher Education
This paper elucidates the nature of proving activities required in the inquiry-based
learning of mathematics using the Internet, wherein the didactic contract is different
from that in the ordinary mathematics classroom. Based on the anthropological theory
of didactics, proving activities conducted in the study and research paths are explored
in the context of Japanese pre-service mathematics teacher education. We design and
implement situations for finding the cube root of a given number by using a simple
pocket calculator. The analysis of the realised situations shows that inquiries using the
Internet generate, in a way adidactic, students’ different activities related to the proof,
such as reading proofs, posing new why-questions, proving by themselves to
understand the information obtained on the Internet and the method of calculation.
INTRODUCTION
The difficulties of learning proof and proving are well known, and this has been the
subject of a significant body of research (cf. Mariotti, 2006). One difficulty which is
often discussed, especially in the authors’ country, is the necessity of proofs (MEXT,
2009). Students do not feel the necessity of proving a statement, particularly statements
already known as true since elementary school (e.g. properties of a parallelogram).
However, teachers also face difficulties in creating learning situations in which proofs
are required to solve a problem, that is, situations wherein students feel the necessity
of proving. We consider that this difficulty is, to some extent, due to the didactic
contract (Brousseau, 1997) which is created in ordinary teaching and learning
situations in mathematics classrooms, and due to the paramathematical nature of a
proof (Chevallard, 1985/1991): proof is a tool for studying mathematics rather than a
mathematical object to be studied (except in mathematical logic). Since a proof is a
paramathematical object, its teaching cannot be dissociated from other mathematical
knowledge to be taught. In the classroom, what is justified by the proof is the statement
related to this knowledge, and this statement to be proven is always true because what
is taught in school is the set of organized objects which are known to be true. There is
a contract, that the teacher teaches or education generally provides ‘true’ knowledge to
students. Students know that the statement to be proven is true before proving it, since
it is given by the teacher and it is a piece of knowledge which students have to know.
What if the didactic contract differs from that found in the ordinary mathematics
classroom? What kinds of proving activities would be conducted? Further, is it possible
to radically change such a didactic contract? In a recent study, a ‘new’ way to conceive
mathematics teaching is proposed, and the didactic contract created in such teaching
seems very different from the ordinary didactic contract. It is a sequence of activities

Otaki, Miyakawa, Hamanaka
4–12 PME40 – 2016
called Study and Research Paths (SRP hereafter: Chevallard, 2006; 2015) within the
Anthropological Theory of the Didactic (ATD) developed by Chevallard. SRP is based
on the didactic paradigm called questioning the world (Chevallard, 2015), in which the
learning is aimed at nurturing scientists’ attitudes in the process of elaborating an
answer to a question. Students investigate a question by means of any tool available
(e.g. calculator, computer, Internet, any books), and mathematical knowledge is learnt
through a process when necessary. Unlike teaching based on the ‘old’ paradigm
wherein raison d’être or rationale as to why students should learn it is often implicit,
mathematical knowledge to be taught is not organized in a sequence to be learnt one-
by-one, and it is accompanied by a raison d’être. Additionally, it might be the teacher
who proposes the initial question, but there is no specific expected answer and no
specific mathematical knowledge to be taught. The teacher’s role is that of a supervisor
of scientific research. The didactic contract is thus very different from the ordinary
mathematics classroom.
In such inquiries, what kinds of proving activities would be required and conducted
especially in the case of inquiries using the Internet? We investigate this question by
designing and implementing situations based on the idea of SRP in the context of
Japanese pre-service mathematics teacher education. Through an analysis of the
realised situations, we try to identify the nature of proving activities in such situations.
We expect that different activities related to the proof, difficult to conduct in ordinary
teaching, will be identified while the students elaborate an answer to the question.
THEORETICAL FRAMEWORK
In what follows, we briefly introduce the notion of SRP, which plays a crucial role in
this study. It is used as a conceptual tool to develop the learning situations to be realised
and as an analytical tool to clarify the nature of students’ activities conducted in the
situations realised in the teaching experiment. In ATD, inquiries in mathematics and
other fields are characterised by the notion of SRP (cf. Barquero & Bosch, 2015). SRP
expresses dialectic processes between questions and answers, where an inquirer starts
from an initial question Q0 and arrives at a final answer A♥. The simplest SRP is
modelled as ‘Q0 → A♥’. However, the process of finding an answer includes other
steps. The inquirer usually encounters another various questions Qk derived from the
initial question or others, and finds answers Ak to them. Some answers could have
already been produced by the predecessors: those are labelled as Ai. This process is
modelled, for example, as Q0 → Q1 → A1 → Q2 → A2 → Q3 → A♥. However, most
study processes cannot be formulated by a linear diagram but by a tree diagram,
because a question often leads to multiple questions.
Further, the process of the elaboration of an answer is characterised in ATD by the
media-milieu dialectic. Similar to its use in the Theory of Didactic Situations (TDS), a
milieu refers to a system without didactic intention, acting as a fragment of ‘nature’,
with which the inquirer interacts during the study process (cf. Chevallard, 2004;
Artigue et al., 2010; Kidron et al., 2014). In contrast, the media refers to any system

Otaki, Miyakawa, Hamanaka
PME40 – 2016 4–13
with the intention of supplying information about the world or a part of it to a certain
type of audience (cf. Chevallard, 2004; Artigue et al., 2010; Kidron et al., 2014). In
order to get an answer to a question, the inquirer looks for and obtains information
from media, and elaborates an answer by interacting with the milieu including such
information. SRP based on the questioning the world presupposes the use of media as
in scientists’ activities, restricted in ordinary teaching based on the ‘old’ paradigm.
METHODOLOGY
In this study, we design and implement learning situations based on the idea of SRP
and analyse the data collected in the experiment in order to clarify the nature of proving
activities in inquiries. We adopt as a methodology didactic engineering within ATD,
which includes four phases of the analysis and design of didactic phenomena:
preliminary analysis; conception and a priori analysis; experimentation and in vivo
analysis; and a posteriori analysis (cf. Barquero & Bosch, 2015). In this paper, we
report some parts of these analyses.
As we mentioned above, the notion of SRP is used as a conceptual tool to design
learning situations. It allows us not only to design tools for students to use in class (e.g.,
Internet), but also to consider the nature of the initial question Q0 proposed to them: Q0
should be an alive question, so that it is connected with various mathematical or other
activities; Q0 should have generative power, so that many other questions Qk are
derived. We looked for such an initial question and designed a sequence of situations
in the context of pre-service mathematics teacher education. The details of the design
are revealed in the next section.
In the experiment, we collected students’ worksheets, PC screen views which show the
history of pages visited on the Internet, and the video and audio data for the entire
lessons and the activities of each group which were translated later. In the analysis, the
SRP is now used as an analytical tool. The tree structure of questions and answers in
SRP allows us to model the dynamics and process of inquiry, and the media-milieu
dialectic allows us to model the dynamics of mathematical activities. Specifically, in
the in vivo analysis, we first identify various questions Qk posed by students, answers
obtained from the media Ai, and temporary or final answers elaborated Ak or A♥, from
which are constructed a diagram representing a tree structure of SRP. Further, we
describe, by means of the media-milieu dialectic, students’ activities related to these
questions and answers, in particular those concerning proving. Then we discuss, as an
a posteriori analysis, the nature of the proving activities required in SRP, based on the
results of the in vivo analysis.
MATHEMATICAL AND DIDACTIC DESIGN: A PRIORI ANALYSIS
We design situations in the context of pre-service mathematics teacher education in a
university dedicated to elementary-school teacher training. Target students are third-
year undergraduate students enrolled in a program to obtain a secondary-school
mathematics teacher certificate, in addition to the elementary-school teacher certificate.
In general, students in this university are not very competent in mathematics.

Otaki, Miyakawa, Hamanaka
4–14 PME40 – 2016
The initial question Q0 we chose is: how to calculate the cube root of a given number
by using a simple pocket calculator? The calculator has the function of calculating a
square root, in addition to the four basic operations (+, –, and ), but nothing other
than these functions. This question is generally well known in Japan, and one may find
different websites related to it on the Internet. The question is closed and its answer
could be easily found in the media. However, starting from this question, students
might ask other different questions that lead to the various mathematical concepts. In
this sense, we consider that Q0 is an alive question which has generative power.
In search for the answer to Q0, one may find two methods of calculation A0-1 and A0-2
given in Fig. l. The naïve question derived from these answers, for the students of the
university, is the question Q1: why does such a method allow the calculation of the
cube root? The answer to this question A1 could be found in the media (websites) or
through interacting with a milieu. For example, the operations on the calculator could
be translated into an infinite series on the exponent part which converges to 1/3 (the
operations of A0-1 to the first line of Fig. 2 and the operations of A0-2 to the second line).
At this point, students are exposed to mathematical works on infinite series, such as
the limit of series and the recurrence relation, and are required to read and understand
the proof obtained from the media, which is A, or to prove by themselves. Further, the
question of calculating the cube root of a given number would also derive questions
related to the calculation of the nth root, such as the 5th root and 7th root. Developing
an answer to such a question allows students to encounter other mathematical works
such as those related to the Mersenne numbers 2k – 1 (appearing when solving a
recurrence relation such as xn+1 = (xn ap)^(1/2)q), binary numbers (converting 1/n to a
binary representation provides an infinite series like the second line of Fig. 2), etc.
In the class, students will be asked to conduct the inquiry based on their own interests.
While some questions will be provided by the teacher, the derived questions might or
might not be the ones we anticipated above. Students deal with the questions they pose
on their own. There is no
specific mathematical
knowledge expected for the
students to acquire (open SRP).
The objective of the class is to
nurture scientists’ attitude and
to develop students’ views on
mathematical activities (SRP
Fig. 2. The series on the exponents converges to 1/3
Fig. 1. Two answers to the initial question Q0. (a is a given number)

Otaki, Miyakawa, Hamanaka
PME40 – 2016 4–15
for teacher training). In such situations, the didactic contract should be different from
that in ordinary situations.
EXPERIMENTATION: IN VIVO ANALYSIS
The third author of this paper taught a class based on the situations designed in the a
priori phase. This class includes three teaching periods of 90 minutes (one period per
week), allocated to the inquiries using the Internet, and one period for the presentation
of the results of the inquiries. Nine students assisted in this class. The inquiry was
conducted in a group of three students. Thus, three groups were created. A pocket
calculator was provided to each student, and a laptop PC connected to Wi-Fi was
provided to each group. At the beginning of the first period, in addition to providing
the initial question Q0, the teacher explained the objective of the class and the modality
of the inquiry. The objective is for students to experience and know the ‘authentic’
mathematical activities that mathematicians conduct in their research. The students
may use any tools (media) to advance their inquiries; there is no final goal expected by
the teacher and the inquiries may follow any direction, depending on the students’
interests and their new questions. The teacher’s role is to support their inquiries. In the
last period, they should present the products of their inquiries. At this stage, the teacher
tried to devolve the situations so that the students and the teacher could create a didactic
contract which is specific to the inquiries.
Overall, each group worked sincerely during the three teaching periods and also during
the time-out period of the class, for preparing a presentation. In the first period, the
inquiry is conducted especially for identifying the method to calculate the cube root of
a given number and to understand why such a method works. From the second to third
periods, each group inquires into its own question and proceeds towards different
directions: the first group proceeded to the calculation of the nth root, the second group
to another justification of the calculation method by using a graphic representation of
the convergence, and the third group to the speed of convergence.
We describe here the process of inquiry through an analysis of students’ activities from
the theoretical perspective of ATD, particularly SRP and the media-milieu dialectic. In
the in vivo and a posteriori phases, we focus on SRP of the first period in the second
group (Group 2 hereafter). In the beginning of the inquiry for an answer to Q0, Group
2 immediately reached a first webpage, ‘calculation of cube roots using a calculator’
(http://www004.upp.so-net.ne.jp/s_honma/urawaza/root.htm). This page introduces a
method of calculation by a simple calculator. The explanation starts with the recurrence
relation of exponents ‘a1 = a, 4an+1 = an + 1’, and then introduces the method ‘[a] [×]
[N] [=] [√] [√]; [×] [N] [=] [√] [√]; [×] [N] [=] [√] [√] ...’ in the case of ‘a = 2, N = 2’.
The explanation justifying the method is given in a way ‘mathematical’. The recurrent
relation is given at first without raison d’être, and then the formula corresponding to
the method (Xn+1 = √√Xn × N) is deduced. Group 2 firstly regarded the given solution
as A0-1. This answer generated a new question Q1: why should we consider ‘4an+1 = an
+ 1’? The students was trying to determine the general term an by themselves in

Otaki, Miyakawa, Hamanaka
4–16 PME40 – 2016
interacting with the milieu. However, at that moment, the teacher intervened and asked
again Q0 about the method of calculation. Indeed, the students read and follow the
proof for a method, although they did not know the method itself. This teacher’s
intervention lead the students to focus on the method given in the first website A0-1.
Further, this information from the media prompted the use of calculators as a part of
their milieu. The students worked back and forth between reading the proof on the
webpage and calculating using a calculator and found that this method works after
checking it with different numbers. The method they verified became their own answer
A0. However, two new questions were produced successively: ‘why does such method
works?’ (Q2) and ‘why could the first number a be arbitrary?’ (Q3). Related to these
questions, the small questions and answers could be identified. For example, they asked
about the operations of calculator like ‘why are there so many repetitions?’ In fact, they
did not even realised at the first moment that the repetitive operations and its
convergent value correspond respectively to the recurrent relation and the limits of a
series. After a short moment, they found an answer related to the limit of a series. For
Q3, they asked by themselves the meaning of ‘arbitrary’ and were searching an answer
on the Internet. They found some explanation on the websites, but they understood
rather in the second website (A0-2) about the method of calculating cube roots, wherein
the page explains the same method as that of the first website and writes the first
number can be any number such as 1, 2, 3 (http://www.nishnet.ne.jp/~math/mr_
boo/DENTAKU1.HTM).
In searching for the answers to Q2, the students found the third webpage (A0-3:
http://blog.livedoor.jp/ddrerizayoi/archives/26225078.html). This page provides the
same method as before in the case of ‘a = 1, N = 7’, and also a justification with the
recurrence relation of exponents. In contrast to the first and second webpages, the third
one explicitly describes the process of exponential changes in each operation: 0 → 1
→ 1/4 → (1/4) + 1 → (1/4)((1/4) + 1) .... The students interacted with this information
as a part of milieu and advanced their inquiry. They first realized the relationship
between the operation on the calculator and the number of exponent and also how the
recurrent relation given in A0-3 (a1 = a, an+1 = 1/4(an + 1)) relates to the operations. In
Fig. 3. A2: the proof written by a member of Group 2
Otaki, Miyakawa, Hamanaka
PME40 – 2016 4–17
this website, while the limit of the series
‘1/3’ is given, its proof was not given.
Reading this page, the students found
the general term an by themselves give
a proof like Fig. 3. This is thus their
devised answer A2 to Q2.
After getting A2, the question Q3
became one of main questions the
students of Group 2 tackled in the last
part of the first teaching period. We
could not provide details here.
However, they carried out different activities such as observing the behavior of
convergence when changing the initial number a in the spreadsheet. These processes
of inquiry are summarised as Fig. 4.
DISCUSSION: A POSTERIORI ANALYSIS
In SRP of Fig. 4, three questions Q1, Q2 and Q3 emerged not from the teacher but from
the students through the media-milieu dialectics. For example, Q2 and Q3 were
generated, while they were reading the proof given in the first webpage (A0-1), that is
to say, Q2 and Q3 were produced as a result of the interaction with the milieu including
A0-1 obtained from the media. What is interesting here is that these questions require
a kind of proving activities, while Q0 asked by the teacher requires just providing a
method which could be easily found on the Internet. Further, Q3 was not expected by
the teacher while Q2 was. In ordinary teaching situations, the question asked by
students would not be dealt with as a main issue, because they are based on a didactic
contract that the teacher has exclusively legitimacy about questioning (e.g. Chevallard,
2015). In addition, the teacher has a difficulty of creating a situation wherein students
ask by themselves why-questions and elaborate their justification to them, as we have
discussed earlier. However, in the situations of SRP, such activities could be easily
observed.
On the other hand, a written mathematical proof was given only for Q2, and Q3 was
investigated empirically at least in this teaching period. Nevertheless, the students
validated the method A0 on their own by interacting with their milieu, and made their
own answer A2 to the question Q2 by proving a statement. In this step, the students
constructed a proof in order to understand the method of calculation and the answer A0-
3 obtained from the media. The proving for understanding is unfortunately infrequent
in ordinary class, although Hanna pointed out that ‘proof can make its greatest
contribution in the classroom only when the teacher is able to use proofs that convey
understanding’ (2000, p. 7). The mathematical understanding should be a principal role
of proof. However, to what extent does the proving activities carried out by secondary
students in mathematics classroom really lead the mathematical understanding? We
Fig. 4. Tree structure of SRP of Group 2
Q0
A 0 -1♢ A 0 -2♢
Q1 Q2
Q3
A 0
A 0 -3♢
A 2

Otaki, Miyakawa, Hamanaka
4–18 PME40 – 2016
consider that the inquiries using the Internet like the SRP have a possibility for
overcoming this problem.
Acknowledgements
This work is supported by JSPS KAKENHI (15H03501) and Hirabayashi Research Fund.
References
Artigue, M., Bosch, M., Gascon, J. & Lenfant, A. (2010). Research problems emerging from
a teaching episode: a dialogue between TDS and ATD. In Proceedings of CERME 6 (pp.
1535–1544), Lyon: INRP.
Barquero, B. & Bosch, M. (2015). Didactic engineering as a research methodology: From
fundamental situations to study and research paths. In A. Watson & M. Ohtani (eds), Task
design in mathematics education (pp. 249–272). Springer.
Brousseau, G. (1997). Theory of didactical situations in mathematics: Didactique des
mathématiques, 1970–1990. Kluwer Academic Publishers.
Chevallard, Y. (1985/1991). La transposition didactique: Du savoir savant au savoir
enseigné. La Pensée Sauvage.
Chevallard, Y. (2004). Vers une didactique de la codisciplinarité. Notes sur une nouvelle
épistémologie scolaire. Journées de didactique comparée (Lyon, mai 2004).
(http://yves.chevallard.free.fr)
Chevallard, Y. (2006). Steps towards a new epistemology in mathematics education. In
Bosch, M. (ed.) Proceedings of the IV Congress of the European Society for Research in
Mathematics Education (pp. 21–30). Barcelona, Spain: FUNDEMI-IQS.
Chevallard, Y. (2015). Teaching mathematics in tomorrow’s society: A case for an oncoming
counter paradigm. In S. J. Cho (ed.), The proceedings of the 12th international congress
on mathematical education: Intellectual and attitudinal challenges (pp. 173–187).
Springer.
Hanna, G. (2000). Proof, explanation and exploration: An overview. Educational Studies in
Mathematics, 44(1), 5–23.
Kidron, I., Artigue, M., Bosch, M., Dreyfus, T. & Haspekian, M. (2014). Context, milieu, and
media-milieus dialectic: A case study on networking of AiC, TDS, and ATD. In A. Bikner-
Ahsbahs & S. Prediger (eds.), Networking of theories as a research practice in
mathematics education: Authored by networking theories group (pp. 153–177). Springer.
Mariotti, M. A. (2006). Proof and proving in mathematics education. In A. Gutiérrez & P.
Boero (Eds.), Handbook of research on the psychology of mathematics education (pp. 173–
204). Sense Publishers.
MEXT (2009). Zenkoku gakuryoku gakusyu jokyo chosa chugakko hokokusyo [Report on
results of the national achievement test: Junior secondary school]. National Institute for
Educational Policy Research.
2016. In Csíkos, C., Rausch, A., & Szitányi, J. (Eds.). Proceedings of the 40th Conference of the International
Group for the Psychology of Mathematics Education, Vol. 4, pp. 19–26. Szeged, Hungary: PME. 4–19
CONTENT AND FORM – ALL THE SAME OR DIFFERENT
QUALITIES OF MATHEMATICAL ARGUMENTS?
Sarah Ottinger1, Ingo Kollar2, Stefan Ufer1
1University of Munich (LMU), 2University of Augsburg
Students entering academic mathematics programmes struggle with various
challenges in their transition from secondary school to tertiary education. One
challenge is the strong focus on formal-deductive argumentation and proof in
university mathematics. Producing acceptable mathematical arguments requires both,
the ability to find deductive lines of arguments as well as skills to communicate these
arguments with precision. We present a study with N=159 students at the transition
from secondary to tertiary education that examines how the quality of mathematical
arguments and of different formal aspects of their presentation are interrelated. We
discuss implications for research as well as for support of students at the beginning of
their mathematics study.
INTRODUCTION
A substantial amount of students give up studying mathematics during their first year
at university (Heublein, 2014). Possible reasons for the high drop-out rate might be
that the character of mathematics as a scientific discipline changes dramatically in the
transition from school to university. This is not primarily a change of topics, but there
is a shift toward an increased depth in the subject, with respect to the understanding
and use of formal mathematics (Clark & Lovric, 2008). In tertiary mathematics
courses, abstract concepts, formally presented arguments and proofs play a central role.
Students are exposed to the emphasis on multiple representations of mathematical
objects and on the precision of mathematical language (Clark & Lovric, 2008). Our
study is situated in the transition phase from secondary to tertiary education with a
specific focus on mathematical argumentation and proving, and the use of formal
representations to communicate mathematical arguments.
Mathematical argumentation, i.e. to generate arguments for or against a mathematical
conjecture and to convince oneself as well as the mathematical community about their
validity, comprises empirical exploration (e.g., Koedinger, 1998), logical deductions
and the ability to deal consciously with formal-symbolic representations and
mathematical language (Epp, 2003). Several studies indicated that students at all levels
have great difficulty with the task of proof construction (e.g., Healy & Hoyles, 1998;
Ufer, Reiss, & Heinze, 2008). Even students who want to pursue undergraduate courses
in mathematics at university often show poor proof-writing attempts, which may
consist of little more than a few disconnected calculations or are characterised by an
imprecise or incorrect use of mathematical words or phrases (Epp, 2003). There has
been much research pointing to reasons for these deficiencies (e.g., Selden & Selden,
2011). Models of the proving process suggest to differentiate two idealized sub-
Ottinger, Kollar, Ufer
4–20 PME40 – 2016
processes of proving when searching for explanations (Selden & Selden, 2009): Firstly,
students have to find adequate arguments and organize them into a deductive chain
mentally. Secondly, they have to communicate their arguments and proofs in a
formally correct way according to mathematical standards.
The content of mathematical arguments
Identifying a conclusive chain of mathematical arguments is a complex problem
solving process that relies on several individual prerequisites, like knowledge of
heuristic strategies (Schoenfeld, 1985) and conceptual mathematical knowledge (Ufer
et al., 2008). Moreover, methodological knowledge on the nature of proofs (e.g., Healy
& Hoyles, 1998) is necessary to direct this search process. For example, evaluating the
truth or falsity of mathematical statements requires knowledge about the role of
examples and counterexamples (Koedinger, 1998). During the proof construction
process, students have to identify relations between mathematical concepts, and select
those for which they see a chance to support them by acceptable mathematical
arguments and organize them in a conclusive deductive chain.
When analysing students’ proof skills, research has often focused on the content of
students’ arguments that become visible in students’ work, deliberately disregarding
the formal quality of the presentation of these arguments (e.g., Healy & Hoyles, 1998;
Reichersdorfer, Vogel, Fischer, Kollar, Reiss, & Ufer, 2012). Even though this is a
reasonable choice when viewing proof from a problem solving perspective, the
adequate presentation of arguments is also a relevant goal of most university
mathematics programmes (Epp, 2003).
The form of mathematical arguments
Engelbrecht (2010) points out that students have to be able to communicate their
arguments in a “subject-specific, scientific language”. When thinking about the quality
of a specific mathematical argument, however, the use of a specific formal notation or
corresponding mathematical language constructs (like “Let x be…”, “For all y…”) is
certainly not a necessary feature for the validity and acceptability of a proof, even if
this feature occurs in many mathematical texts. On the other hand and more generally,
the precise communication of mathematical ideas is a decisive criterion. This means
that, if a specific formal notation or specific mathematical language is used, it must be
used in a precise and correct way.
However, there is a wide basis of research documenting that students have problems
to use formal notations and specific mathematical language in a correct way: (1)
Students’ difficulties in using logical symbols correctly are well documented (Epp,
2003). One reason for this might be that logical statements can be interpreted
differently in formal and informal settings. For instance, in informal settings, the
statement “Some A are B.” is taken to imply that “Some A are not B.”, but in
mathematics, this implication is not valid (Epp, 2003). (2) Clement (1982) reported
that a large proportion of university engineering students have problems translating
relationships expressed in spoken language into corresponding mathematical

Ottinger, Kollar, Ufer
PME40 – 2016 4–21
expressions, and vice versa. A famous example is the statement “There are 8 times as
many people in China as there are in England”. Some students seem to treat variables
as symbols for objects or persons, writing 8C=E in this case. Comparable problems
might be identified in symbolizing relationships like the divisibility of two integers.
(3) Connected to this, students often have trouble with using variable symbols
correctly. For example, they fail to understand that the value of a variable can be
arbitrary, but fixed and does not change its value within one algebraic expression.
Some also fail to introduce the meaning of the variable symbols they use. Epp (2011)
noted that, alongside the emphasis on mechanical procedures at school, the meaning of
variables as unknown quantities with specific properties, such as in functions or as
expression for universal statements may be obscured. (4) Students’ problems with
quantifiers are also well-documented (e.g., Dubinsky & Yiparaki, 2000; Epp, 2003;
Selden & Selden 2011). It seems to be a challenge for students to understand that the
meaning of a statement is influenced by the order of the quantifiers, or to know the
scope of a quantifier. Selden and Selden (1995) see students’ difficulties in interpreting
implicit quantifiers (i.e. expressed in words, not symbols) as a significant barrier for
proof construction.
Even though newer studies take into account the content of students’ arguments as well
as their formal quality (e.g., Selden & Selden, 2009, 2011), the relation between the
two has rarely been studied. In some works, the two quality aspects seem to be treated
as fairly separated, as if skills in the formal presentation of arguments are something
that is necessary primarily after a conclusive chain of arguments is found (e.g.,
Engelbrecht, 2010). While the skill to use some formal aspects might – in this sense –
be fairly independent of students’ skills to find conclusive chains of arguments, this
needs not to be held for all formal aspects. Some works emphasize a stronger
connection between, for example, understanding the language of logic (as different
from everyday language) and logical notation, and the understanding of logical
structures themselves (e.g., Epp, 2003). This is in line with theories that emphasize an
epistemic function of language use (Sfard, 2008), which assumes that (mathematical)
thinking is at least partly structured by the mental use of language. Following this line
of argument, not being able to use formal language, notations or representations
correctly might reflect and also cause a deficient understanding of the arguments that
are constructed and presented in a proving or argumentation process. Thus, it remains
an open question, which aspects of formal quality of students’ arguments are connected
to the content quality of these arguments, and which are less related to it.
GOALS OF THE STUDY AND RESEARCH QUESTIONS
Although undergraduate students’ problems in constructing mathematical proofs and
generating rigorous mathematical argumentations have been reported in many studies
(e.g., Selden & Selden, 2011), there have been little attempts to study how the content
quality of mathematical arguments and their formal quality are interrelated. To fill this
gap, the present study addresses the following questions: (1) Which difficulties of
mathematical argumentation regarding content and formal quality can be identified?
Ottinger, Kollar, Ufer
4–22 PME40 – 2016
(2) Do content quality and different dimensions of formal quality of students’
arguments form a one-dimensional construct, or is it necessary to differentiate multiple
quality dimensions of students’ mathematical arguments?
DESIGN AND METHODS
N=159 incoming students (72 female) from a regular mathematics programme,
financial mathematics programme and a mathematics teacher education programme
with an average age of 19.67 years (SD = 3.18) from two German universities took part
in our study, which was embedded in a voluntary two-week preparatory course for
university mathematics. Daily lectures and tutorials about elementary number theory
as well as about other basic topics such as sets, functions and relations were included
in this course. On day four, students worked for 45 minutes on mathematical
argumentation problems from elementary number theory on their own adapted from
Reichersdorfer et al. (2012). These comprised technical proof skills (e.g., “Show that
for all natural numbers, a and b the following statement is true: If 15 divides (10a-5b)
then 3 divides (2a-b).”, 5 items), flexible proof skills (e.g. “Prove the following
statement: The product of three consecutive even numbers is divisible by three.”, 4
items) and conjecturing skills (e.g. “Prove or refute the following statement: If the sum
of two natural numbers is even, then the product of these two numbers is always even.”,
4 items with correct and false statements, each).
To score the content quality of students’ argumentations a four-level coding was
applied. For this, we analysed the mathematical ideas visible in the students’ solution,
disregarding their formal presentation as much as possible. We scored no or irrelevant
trials with score zero, partially correct solutions including less than half of all central
arguments required with score one, solutions including more than half of all central
arguments but with small methodological errors (like an incorrect proof structure) with
score two and completely correct solutions with score three.
Coding schemes for different aspects of formal quality were developed based on data
from prior studies: Symbolizing divisibility (e.g., use of the symbol |) was coded on two
levels (0: incorrect, 1: correct). A three-level coding was applied to score the use of
logical symbols (e.g., ⟺ or ⇒; 0: using logical notations, although no logical statement
is made, 1: use of incorrect logical symbols for logical statements, 2: correct),
symbolizing definitions (“Let x be 3…”, =:, := , :⇔) (0: not symbolizing of definitions,
although necessary, 1: incorrect, 2: correct), and the use of variables (0: inconsistent
or incorrect, 1: correct and consistent, but without systematic introduction, 2:
completely correct). The use of quantifiers (universal quantifiers and existential
quantifiers) was coded on four levels (0: no use of quantifier, although necessary, 1:
incorrect use of a single quantifier, 2: correct use of single quantifiers, but problems
with the use of consecutive quantifiers, 3: correct). If a certain formal notation or
corresponding language constructs were not used in a student solution, the respective
value was coded as missing value. The only exception was if the corresponding aspect
would have been required to communicate the argument according to the mathematical
Ottinger, Kollar, Ufer
PME40 – 2016 4–23
standards of the course. If this was the case and the corresponding aspect did not occur,
this was coded with the lowest score (0). All arguments were coded by two independent
raters and interrater reliability for each part of the test was found to be good (Mean of
ICC=.86, SD =.08).
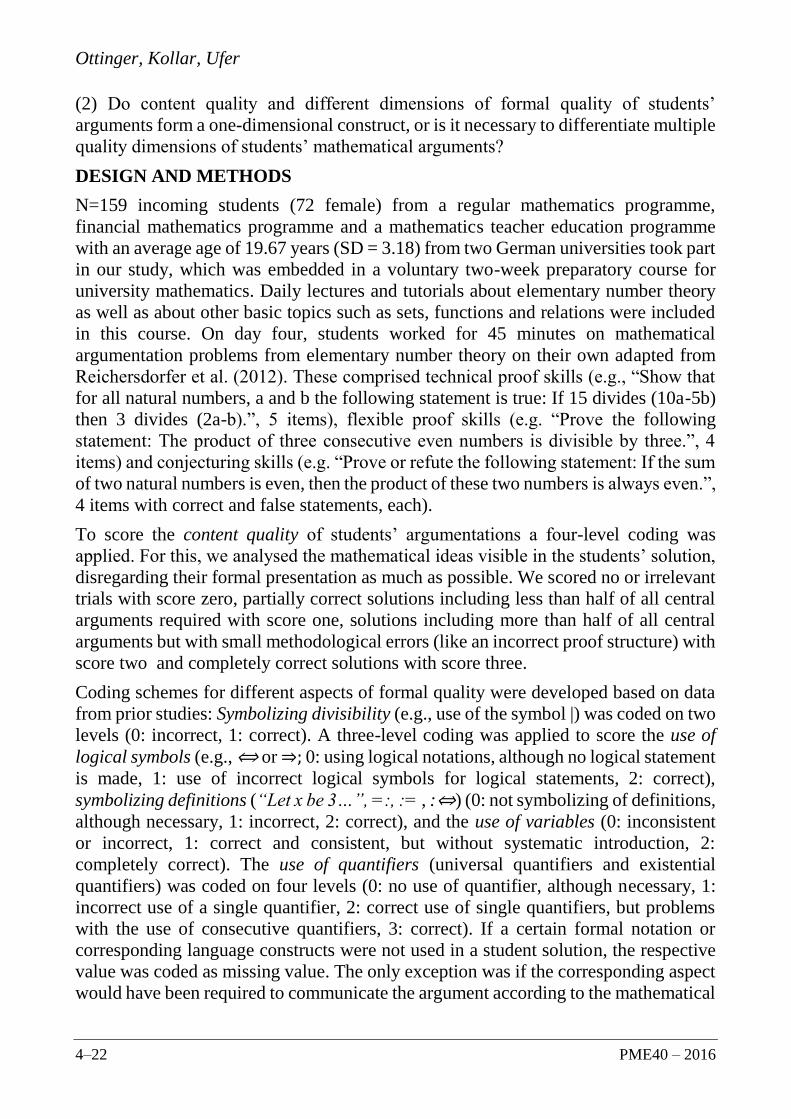
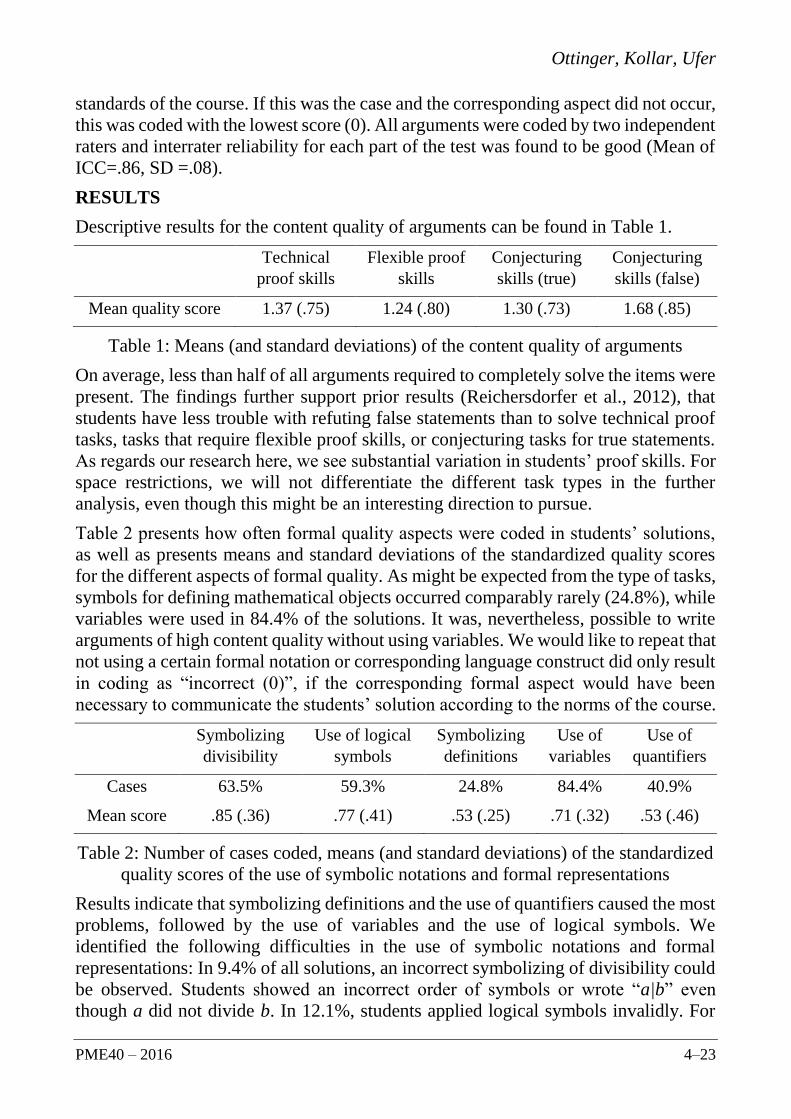
RESULTS
Descriptive results for the content quality of arguments can be found in Table 1.
Technical
proof skills
Flexible proof
skills
Conjecturing
skills (true)
Conjecturing
skills (false)
Mean quality score 1.37 (.75) 1.24 (.80) 1.30 (.73) 1.68 (.85)
Table 1: Means (and standard deviations) of the content quality of arguments
On average, less than half of all arguments required to completely solve the items were
present. The findings further support prior results (Reichersdorfer et al., 2012), that
students have less trouble with refuting false statements than to solve technical proof
tasks, tasks that require flexible proof skills, or conjecturing tasks for true statements.
As regards our research here, we see substantial variation in students’ proof skills. For
space restrictions, we will not differentiate the different task types in the further
analysis, even though this might be an interesting direction to pursue.
Table 2 presents how often formal quality aspects were coded in students’ solutions,
as well as presents means and standard deviations of the standardized quality scores
for the different aspects of formal quality. As might be expected from the type of tasks,
symbols for defining mathematical objects occurred comparably rarely (24.8%), while
variables were used in 84.4% of the solutions. It was, nevertheless, possible to write
arguments of high content quality without using variables. We would like to repeat that
not using a certain formal notation or corresponding language construct did only result
in coding as “incorrect (0)”, if the corresponding formal aspect would have been
necessary to communicate the students’ solution according to the norms of the course.
Symbolizing
divisibility
Use of logical
symbols
Symbolizing
definitions
Use of
variables
Use of
quantifiers
Cases 63.5% 59.3% 24.8% 84.4% 40.9%
Mean score .85 (.36) .77 (.41) .53 (.25) .71 (.32) .53 (.46)
Table 2: Number of cases coded, means (and standard deviations) of the standardized
quality scores of the use of symbolic notations and formal representations
Results indicate that symbolizing definitions and the use of quantifiers caused the most
problems, followed by the use of variables and the use of logical symbols. We
identified the following difficulties in the use of symbolic notations and formal
representations: In 9.4% of all solutions, an incorrect symbolizing of divisibility could
be observed. Students showed an incorrect order of symbols or wrote “a|b” even
though a did not divide b. In 12.1%, students applied logical symbols invalidly. For

Ottinger, Kollar, Ufer
4–24 PME40 – 2016
example, they used the implication symbol to delineate different statements, even
though no valid implication could be established between the two statements. They
marked valid logical relations by the use of an incorrect symbol in 3.4% of all solutions.
In 2.6 % of all solutions, definitions were not made explicit at all, although the meaning
of a symbol had been changed. In 18.4%, definitions were made explicit, but using a
wrong symbol. For instance, some students marked a definition only by using the usual
equal sign. In 6.4% of all solutions, variables were used inconsistently, for instance,
representing the sum of consecutive even numbers by (2k) + (2m). In 36.1%, variables
were used without a systematic introduction that explained what they stood for. We
found that in 14.5% of all solutions, students did not use quantifiers or verbal
quantifications, even it would have been necessary. In 6.7%, single quantifiers or
verbal quantifications were used incorrectly, for example introducing a variable x, with
a statement like “Ǝ x...” instead of “∀x…”. In less than 1% of all solutions, students
used single quantifiers correctly, but still showed problems with the order of
consecutive quantifiers.
Table 3: Geomin rotated factor loadings
To analyse how the quality of arguments and the quality of different formal aspects of
their representations are interrelated, we used exploratory factor analysis. Missing
values in codings of formal quality were accounted for using the Full Information
Maximum Likelihood (FIML) method. Each single task solution represented one case.
The resulting hierarchical structure of the data (solutions nested in students) was also
accounted for statistically analysis. Principal components analysis was used because
the primary purpose of this study was to identify and later compute composite scores
for the factors. Initial eigenvalues indicated that the first two factors explained 32.67%
and 18.5% of the variance in all quality codings. The two factor solution was preferred
because of our previous theoretical considerations and because it showed a
significantly better model fit than the one factor solution (χ2 (9) = 40.946, p<.001).
Table 3 contains the Geomin rotated factor loadings for all quality criteria. The two
factors were correlated significantly (r=.40, p<.01).
DISCUSSION
The goal of this study was to identify students’ difficulties of mathematical
argumentation and proving, and to analyse how the quality of the content of students’
Factor 1 Factor 2
Quality of arguments .445* .142
Symbolizing divisibility .706* -.037
Use of logical symbols .676* .010
Symbolizing definitions .091 .178*
Use of variables .004 .582*
Use of quantifiers -.037 .352*

Ottinger, Kollar, Ufer
PME40 – 2016 4–25
arguments and the formal quality of their presentation are interrelated. Firstly, our
study replicates results that finding adequate arguments and communicating arguments
with formal precision is a great challenge for students at the secondary-tertiary
transition in mathematics (e.g., Clark & Lovric, 2008; Selden & Selden, 2009). In
particular, when longer arguments have to be produced, students at the transition show
similar problems as were reported for secondary students (Ufer et al., 2008) to find and
describe conclusive chains of multiple deductive arguments. Regarding the formal
quality of students’ arguments, our sample shows evidence of all those problems that
are documented in the literature, e.g., use of mathematical symbols, use of variables
and quantifiers, and explicating definitions (e.g., Epp, 2003; Selden & Selden, 2011).
Apart from this, our study is to our knowledge the first that systematically studies
relations between the content of students’ arguments and their formal presentation.
There are good theoretical arguments to assume that some of the formal aspects are
quite unrelated to the content quality of an argument (Engelbrecht, 2010).
Nevertheless, there are also theoretical reasons to assume that some formal aspects
might be connected to the content quality of an argument (Epp, 2003; Sfard, 2008). We
took an explorative approach to study these relations, and our analyses indicate that
two dimensions of argument quality can be distinguished in our sample. One of these
dimensions is substantially related to the content quality of students’ arguments, but
also to higher scores on symbolizing divisibility and using logical symbols for the
respective arguments. Both of these formal aspects address relations between
mathematical ideas (numbers and statements). The other dimension, largely unrelated
to content quality, described the use of variables and quantifiers and – less pronounced
– symbolizing definitions. These formal aspects seem to be more relevant to clarify the
meaning of the mathematical objects used in an argument.
Of course our study was restricted to a specific educational setting and mathematical
content. Nevertheless, our results indicate that not all, but some aspects of formal
argument quality go along with the quality of the argument to be presented itself. If
these results can be sustained, they might offer fruitful information to conceptualize
student support in the learning of mathematical argumentation and proof. In particular,
it might be possible to address some aspects (e.g., variables, quantifiers) separately in
form of general behavioural schemata (Selden & Selden, 2009), while for others (e.g.,
logical symbols) a deeper connection to the underlying argument content will be
necessary.
References
Clark, M., & Lovric, M. (2008). Suggestion for a theoretical model for secondary-tertiary
transition in mathematics. Mathematics Education Research Journal, 20(2), 25–37.
Clement, J. (1982). Algebra Word Problem Solutions: Thought Processes Underlying a
Common Misconception. Journal for Research in Mathematics Education, 13(1), 16–30.

Ottinger, Kollar, Ufer
4–26 PME40 – 2016
Dubinsky, E., & Yiparaki, O. (2000). On student understanding of AE and EA quantification.
In E. Dubinsky, A.H. Schoenfeld, & J. Kaput (Eds.), Research in collegiate mathematics
education IV. (pp. 239-286). Providence, RI: AMS.
Engelbrecht, J. (2010). Adding structure to the transition process to advanced mathematical
activity. International Journal of Mathematical Education in Science and Technology,
41(2), 143-154.
Epp, S. S. (2003). The role of logic in teaching proof. American Mathematical Monthly, 110
(10), 886-899.
Epp, S. (2011). Variables in mathematics education. In P. Blackburn, H. van Ditmasch, M.
Manzano & F. Soler-Toscano (Eds.), Tools for Teaching Logic (pp. 54-61). Berlin/
Heidelberg: Springer.
Heublein, U. (2014). Student Drop-out from German Higher Education Institutions.
European Journal of Education 4, 497-513.
Healy, L. & Hoyles, C. (1998). Justifying and Proving in School Mathematics: Technical
Report on the Nationwide Survey. London: Institute of Education.
Koedinger, K. R. (1998). Conjecturing and argumentation in high school geometry
students. In Lehrer, R. and Chazan, D. (Eds.), New Directions in the Teaching and
Learning of Geometry. Hillsdale, NJ: Lawrence Erlbaum Associates.
Reichersdorfer, E., Vogel, F., Fischer, F., Kollar, I., Reiss, K., & Ufer, S. (2012). Different
collaborative learning settings to foster mathematical argumentation skills. In T. Tso (Ed.):
Proceedings of the 36th Conference of the International Group for the Psychology of
Mathematics Education, Vol. 3, 345-352.
Schoenfeld, A. H. (1985). Mathematical problem solving. New York: Academic press.
Selden, J. & Selden A. (1995). Unpacking the logic of mathematical statements. Educational
Studies in Mathematics, 29, 123-151.
Selden, J., & Selden, A. (2009). Teaching proving by coordinating aspects of proofs with
students’ abilities. In M. Blanton, D. Stylianou, & E. Knuth (Eds.), The learning and
teaching of proof across the grades (pp. 339-354). London: Routledge/ Taylor & Francis.
Selden, A., & Selden, J. (2011). Mathematical and non-mathematical university students’
proving difficulties. In L. R. Wiest & T. D. Lamberg (Eds.), Proceedings of the 33rd
annual conference of the North American chapter of the International Group for the
Psychology of Mathematics Education (pp. 675–683). Reno, NV.
Sfard, A. (2008). Thinking as communicating: Human development, the growth of discourses,
and mathematizing. Cambridge, UK: Cambridge University Press.
Ufer, S., Heinze, A., & Reiss, K. (2008). Individual predictors of geometrical proof
competence. In O. Figueras, J. L. Cortina, S. Alatorre, T. Rojano, & A. Sepúlveda (Eds.),
Proceedings of the Joint Meeting of PME 32 and PME-NA XXX, Vol. 4 (pp. 361-368).
Morelia, Mexico: Cinvestav-UMSNH.

2016. In Csíkos, C., Rausch, A., & Szitányi, J. (Eds.). Proceedings of the 40th Conference of the International
Group for the Psychology of Mathematics Education, Vol. 4, pp. 27–34. Szeged, Hungary: PME. 4–27
WHAT HAPPENS WHEN ENTREPRENEURSHIP ENTERS
MATHEMATICS LESSONS?
Hanna Palmér
Linnaeus University, Sweden
According to the Swedish curriculum, entrepreneurship is to permeate all teaching in
primary school. However, little is known about how entrepreneurship influences the
teaching of different subjects. This paper reports on an educational design research
study investigating the potential in combining entrepreneurship and mathematics in
primary school. Two examples are given of how mathematics teaching changes when
entrepreneurship enters mathematics lessons. The results indicate that there may be a
win-win situation between mathematical and entrepreneurial competences, at least
when it comes to creativity and tolerance for ambiguity.
INTRODUCTION
Entrepreneurial and mathematical competences are two of the key competences the
European Community stresses as important in a society of lifelong learning (EU,
2007). On the basis of this, entrepreneurship is getting increased interest in educational
settings around the world, not necessarily in the sense of starting companies but rather
as an approach to education that gives children opportunities to develop abilities that
characterize entrepreneurs. It is believed that entrepreneurial competences, like
mathematical competences, will contribute to individuals’ future success in society, no
matter what kind of work they do.
This paper reports on an educational design research study exploring the potential in
combining entrepreneurship and mathematics in Swedish primary schools. It seems to
be generally assumed that entrepreneurship is necessarily something positive, but there
are very few studies on entrepreneurial competences in subjects in general and in
primary school in particular. In the study presented here, instead of taking an
unconsidered stance, we try to investigate both possibilities and reservations regarding
this combination. The research question we ask is: What happens when
entrepreneurship enters mathematics lessons?
ENTREPRENEURIAL COMPETENCES
When stressing entrepreneurship as important in a society of lifelong learning, the
European Community refers to the ability to turn ideas into action, which involves such
competences as creativity, risk taking, innovation, and managing projects (EU, 2007).
As mentioned, the European Community’s emphasis on the importance of
entrepreneurial competence has increased the attention directed towards
entrepreneurship in educational settings and, according to the Swedish curriculum,
entrepreneurship is to permeate all teaching in primary school (National Agency for
Education, 2011).

Palmér
4–28 PME40 – 2016
The school should stimulate pupils’ creativity, curiosity and self-confidence, as well as
their desire to explore their own ideas and solve problems. Pupils should have the
opportunity to take initiatives and responsibility, and develop their ability to work both
independently and together with others. The school in doing this should contribute to pupils
developing attitudes that promote entrepreneurship. (National Agency for Education, 2011,
p. 11)
Based on the European Community, the national curriculum, and research literature on
entrepreneurship (Leffler & Svedberg, 2010; Sarasvathy & Venkataraman, 2011), this
study focused on the following six entrepreneurial competences: creativity, tolerance
for ambiguity, courage, ability to take initiative, ability to collaborate, and ability to
take responsibility. Creativity is about finding new, for the individual, solutions to new
and old problems. Tolerance for ambiguity is about solving a task even when a situation
is ambiguous and not fully understood, and courage is about stepping out of the comfort
zone into situations the individual is not fully comfortable with. Ability to take
initiative is about being proactive. The ability to collaborate involves both sharing and
absorbing thoughts and knowledge, and the ability to take responsibility involves
responsibility for both oneself and others.
MATHEMATICAL COMPETENCES
When stressing mathematical competences as important in a society of lifelong
learning, the European Community emphasizes the ability to solve problems in
everyday situations (EU, 2007). In the Swedish national curriculum mathematics is
described as a “creative, reflective, problem-solving activity” (National Agency for
Education, 2011, p. 62). On the basis of these documents, problem solving in
mathematics was especially emphasized in the study. In line with research (Cai, 2010;
Lesh & Zawojewski, 2007), problem solving is described in the national curriculum
both as a purpose (an ability to formulate and solve problems) and a strategy (a way to
acquire mathematical knowledge). The study focused on both of these; students
worked with problem-solving tasks they did not know in advance how to solve, and
they therefore had to develop new (for them) strategies, methods, and/or models to
solve the tasks.
EDUCATIONAL DESIGN RESEARCH
The study was conducted through educational design research, which is not a fixed
method but a genre of inquiry. Common in educational design research is the iterative
development of solutions to practical and complex educational “problems” where the
context for the empirical investigation is the educational arena (McKenney & Reeves,
2012). The intention of the methodology is to enable impact and transfer of research
into school practice by building theories that “guide, inform, and improve both practice
and research” (Anderson & Shattuck, 2012, p. 16). Since collaboration with
practitioners improves understanding of the “problems,” educational design research
is conducted in collaboration with, not solely for or on, practice (McKenney & Reeves,
2012).

Palmér
PME40 – 2016 4–29
The complex educational “problem” to be explored in the study presented in this paper
was “what happens when entrepreneurship enters mathematics lessons”? Each iterative
design cycle included (a) preparations for a mathematics lesson into which
entrepreneurial competences were merged, (b) implementation of this lesson, and (c)
retrospective analysis of the lesson. The goal in educational design research is to –
through the iterative design cycles – develop design propositions, which refer to further
specifications of what the design should look like to reach a desired situation. However,
this study was more explorative since the desired situation was not known in advance.
When the study was initiated it was not known whether bringing entrepreneurship into
mathematics lessons was something desirable or not; that is what was to be
investigated. Problem solving and the six entrepreneurial competences presented in the
previous section framed the design of the lessons; that is, creativity, tolerance for
ambiguity, courage, ability to take initiative, ability to collaborate, and ability to take
responsibility. Each iterative design cycle was conducted in collaboration between
teachers and researchers.
THE STUDY
The study was conducted following the above-described educational design research.
Nine researchers from mathematics education and entrepreneurship as well as
approximately 30 teachers from eight primary schools were involved. These eight
primary schools were selected based on the teachers’ interest in being involved in the
research project. In Sweden, as in other countries around the world (Tatto, Lerman &
Novotná, 2009), most primary school teachers are educated as generalists, teaching
several subjects, one of which is mathematics.
This paper will focus on one of the involved schools where the author was the
researcher in charge. Ten teachers from preschool class (six-year-olds) up to grade five
(eleven-year-olds) chose to be part of the study. In the previous school year the teachers
from this school had been involved in a national professional development program
named Boost for Mathematics. This program was initiated by the government in 2012
with the aim of improving mathematics teaching and thereby students’ learning. The
program is organized around teacher collaboration, where teachers work in groups with
external tutors. Within this program these teachers had focused especially on problem
solving in mathematics. Thus, based on Boost for Mathematics, they were experienced
with problem solving in mathematics, both theoretically and practically. They were
also used to collaborating with external participants, so what was “new” for them with
this study was mainly the entrepreneurial competences.
Before initiating the iterative design cycle the teachers and their students were
interviewed about their experiences with mathematics and entrepreneurial
competences. In addition, the researcher visited each class to get an idea of the ongoing
teaching and to get to know the teachers and students better. All requirements for
information, approval, confidentiality, and appliance advocated by the Swedish
Research Council (2008) were followed. After the interviews and the visits, the
Palmér
4–30 PME40 – 2016
researcher and the teachers met to plan the first mathematics lesson into which
entrepreneurial competences were to be merged.
In line with educational design research, the planning of the lessons was conducted in
collaboration between the researcher and the teachers. The teachers were told that they
could either modify tasks they had used before or choose tasks that were new to them.
The teachers decided to work with tasks where the mathematical idea would be the
same from preschool class up to grade five but with adapted levels of difficulty. The
teachers also decided to focus on one of the entrepreneurial competences at a time. The
researcher was present during the lessons, taking notes. After each lesson was
conducted in all classes, the researcher and the teachers met for an evaluation. This
was made on an evaluation form that focused on both entrepreneurial and mathematical
competences as well as on possible connections between them. After the evaluation,
the next lesson was planned, and the iterative process continued in this manner
throughout one school year. As space is limited, this paper will present only the first
two design cycles, which introduced creativity and tolerance for ambiguity.
RESULTS
As mentioned, the teachers chose to introduce one of the entrepreneurial competences
at the time, and below is a description of how they included creativity and tolerance
for ambiguity in their mathematics lessons. As also mentioned, each iterative design
cycle included (a) preparations for a mathematics lesson into which entrepreneurial
competences were merged, (b) implementation of this lesson, and (c) retrospective
analysis of the lesson.
Creativity – The tower task
(a) The teachers chose to start with creativity. In relation to mathematics, the teachers
translated creativity as being able to solve tasks without being told which strategy to
use beforehand. The teachers chose to modify a task they were familiar with from the
Boost for Mathematics program. In the task, the students are shown a picture of a tower
and asked how many blocks were used to build it. The teachers considered the task
creative since it can be solved by using different strategies; for example, students can
build with blocks, draw, make patterns, and/or count. The level of difficulty could be
adapted by selecting different towers for students of different ages. No students were
to work with towers they had worked with beforehand.
(b) When the teachers worked with “tower tasks” during the Boost for Mathematics
program, they introduced strategies for solutions at the start of the lesson. They did not
do so during this study, however, in order to promote creativity; instead, they let the
students present strategies for solutions at the end of the lesson. The teachers were
surprised by the solutions the students came up with, which were more numerous and
sometimes more innovative than they had expected. The students thought up more
strategies than the teachers normally would have introduced at the start of a similar
lesson.

Palmér
PME40 – 2016 4–31
(c) When planning the “tower task” the teachers treated creativity as something “new”
to be added into the mathematics lesson. They chose a task they were already familiar
with, but to promote creativity they carried it out differently than before. The difference
was mainly in the instructions – or rather in the lack of instructions – given in the
introduction of the lesson. One could argue that creativity is not something new in
mathematics and/or problem solving, and as noted earlier, mathematics is described as
a “creative, reflective, problem-solving activity” in the national curriculum (National
Agency for Education, 2011, p. 62). However, in this lesson creativity became a goal
in itself, not just one notion among others in the curriculum. Studies have shown that
there are often big differences in the potentials of a problem-solving task and the
opportunities for learning when the task is used in the classroom. This is because many
teachers tend to give too many instructions for solutions when introducing lessons,
leaving no space for the students to understand the task or figure out its solution by
themselves (Mason & Johnston-Wilder, 2006). This seems to have been the case for
the teachers in this study also, but this changed when creativity was introduced as a
goal in itself. In the evaluation it became apparent that creativity could be a valuable
competence for students when working with mathematics, but also that mathematics
tasks could be used to promote students’ creativity. Thus, there seems to be a win-win
situation between entrepreneurship and mathematics when it comes to creativity, as
illustrated in figure 1. The design proposition derived from this design cycle became
“say less beforehand.”
Figure 1: A win-win situation between entrepreneurship and mathematics when it
comes to creativity.
Tolerance for ambiguity – The Fermi problems
(a) In the next design cycle the teachers chose to work with tolerance for ambiguity.
To promote tolerance for ambiguity they decided to work with Fermi problems which
were new for them. These are open problems where exact answers are difficult or
impossible to arrive at, so estimates must be made instead, based mainly on known
facts or facts that can be easily found (Flognman, 2011). Requiring students to make
and justify their estimates without having a fixed answer to check against presents them
with a situation of ambiguity. Fermi problems can be solved by using different
strategies. As with the “tower task,” the level of difficulty was adapted for students of
different ages. Both the context and the content of the tasks chosen for this design cycle

Palmér
4–32 PME40 – 2016
were unfamiliar to the students, and based on the positive results from the first design
cycle focused on creativity, “say less beforehand” was used as a starting point for these
lessons.
(b) The original plan was to have each class work with one Fermi problem, but because
the experiences were so positive, the teachers continued to work with these tasks in
one or several of their mathematics lessons for several weeks. Examples of tasks used
were “How much popcorn would be needed to fill our classroom?” and “Will I manage
to bike to the ice-skating day if I start at half past seven?” The popcorn problem was
given to students who had not learned the formula for calculating volume, and the bike
problem was given to students who were going on an ice-skating day who not had
previous experience calculating speed. Several students became quite troubled when
the teachers introduced the Fermi problems. They said things like “That is not possible
to find out” or “Do you really know the answer?” However, most of the students
became very involved in solving the tasks. To the teachers’ great surprise, it was the
students who they considered to be the more talented and interested in mathematics
who most strenuously resisted working with the Fermi problems. These students
continued to argue that the tasks were impossible to solve since there were no “real
answers” and thus these were not proper mathematics tasks. Further, the teachers were
surprised by the mathematics that the students used, which involved more advanced
calculations than the students had normally worked with, and during the presentations
at the end of the lessons, the formulas for calculating volume and speed were presented
by the students.
(c) This time the teachers had chosen to work with tasks of a kind that neither they nor
their students were already familiar with. Fermi problems are not new in mathematics
education, but it was not until tolerance for ambiguity was introduced as an
entrepreneurial competence that the teachers at this school became interested in these
kinds of tasks. The context of the tasks was new and the students who had been
considered particularly talented and interested in mathematics had the hardest time
coping with this change in approach. Maybe dealing with tolerance for ambiguity was
harder for these students as they were normally quite sure of what to do in the
mathematics lessons. Even though the teachers had not specifically worked with
tolerance for ambiguity previously, several students might experience tolerance for
ambiguity during “everyday” mathematics lessons. In the evaluation it became visible
how tolerance for ambiguity can be a valuable competence for students when working
with mathematics, and that mathematics can also be used to promote tolerance for
ambiguity. Thus, also regarding tolerance for ambiguity, there seems to be a win-win
situation between entrepreneurship and mathematics, as illustrated in figure 2.
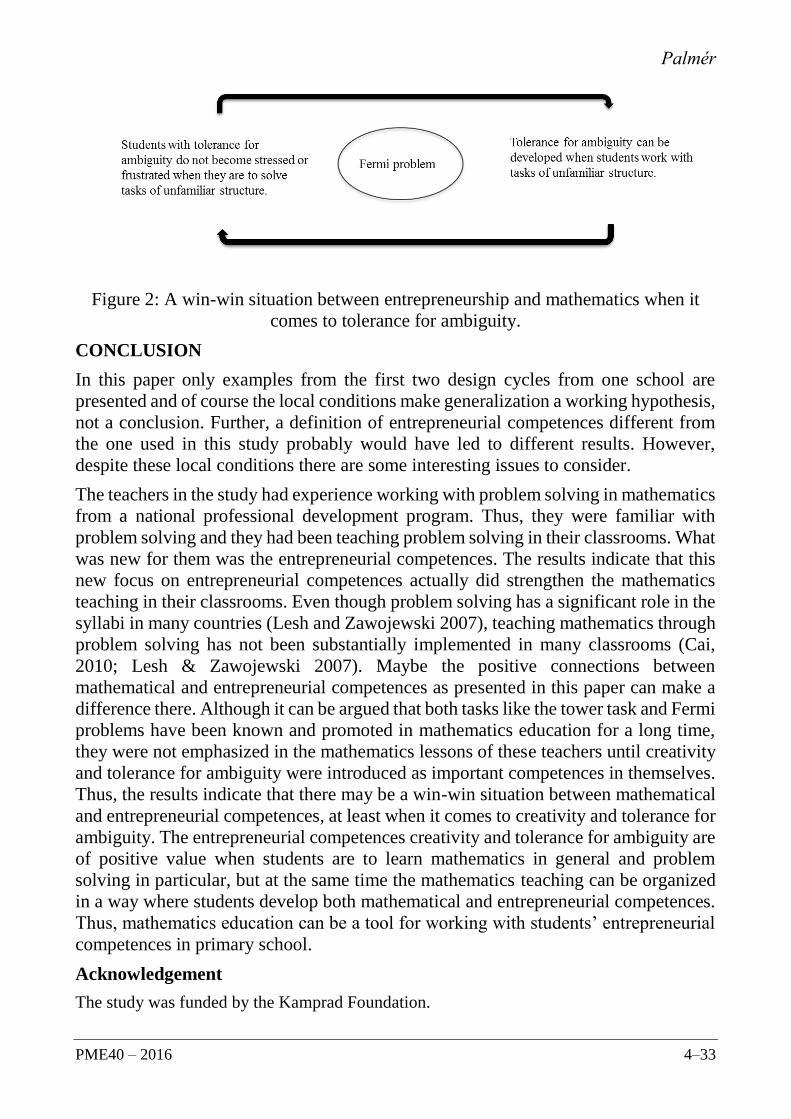
Palmér
PME40 – 2016 4–33
Figure 2: A win-win situation between entrepreneurship and mathematics when it
comes to tolerance for ambiguity.
CONCLUSION
In this paper only examples from the first two design cycles from one school are
presented and of course the local conditions make generalization a working hypothesis,
not a conclusion. Further, a definition of entrepreneurial competences different from
the one used in this study probably would have led to different results. However,
despite these local conditions there are some interesting issues to consider.
The teachers in the study had experience working with problem solving in mathematics
from a national professional development program. Thus, they were familiar with
problem solving and they had been teaching problem solving in their classrooms. What
was new for them was the entrepreneurial competences. The results indicate that this
new focus on entrepreneurial competences actually did strengthen the mathematics
teaching in their classrooms. Even though problem solving has a significant role in the
syllabi in many countries (Lesh and Zawojewski 2007), teaching mathematics through
problem solving has not been substantially implemented in many classrooms (Cai,
2010; Lesh & Zawojewski 2007). Maybe the positive connections between
mathematical and entrepreneurial competences as presented in this paper can make a
difference there. Although it can be argued that both tasks like the tower task and Fermi
problems have been known and promoted in mathematics education for a long time,
they were not emphasized in the mathematics lessons of these teachers until creativity
and tolerance for ambiguity were introduced as important competences in themselves.
Thus, the results indicate that there may be a win-win situation between mathematical
and entrepreneurial competences, at least when it comes to creativity and tolerance for
ambiguity. The entrepreneurial competences creativity and tolerance for ambiguity are
of positive value when students are to learn mathematics in general and problem
solving in particular, but at the same time the mathematics teaching can be organized
in a way where students develop both mathematical and entrepreneurial competences.
Thus, mathematics education can be a tool for working with students’ entrepreneurial
competences in primary school.
Acknowledgement
The study was funded by the Kamprad Foundation.

Palmér
4–34 PME40 – 2016
References
Andersson, T. & Shattuck, J. (2012). Design-based research: A decade of progress in
education research? Educational Researcher, 41(1), 16-25.
Cai, J. (2010). Commentary on problem solving heuristics, affect, and discrete mathematics:
A representational discussion. In B. Sriraman & L. English (Eds.), Theories of
mathematics education: Seeking new frontiers (pp. 251–258). London: Springer.
EU. (2007). Nyckelkompetenser för livslångt lärande. En europeisk Referensram. Europeiska
gemenskaperna: Luxemburg.
Flognman, C. (2011). Fermiproblem och klassrumskultur. Nämnaren Nr3. Göteborg: NCM.
Leffler, E. & Svedberg, G. (2010). Skapa och våga. Om entreprenörskap i skolan. Skolverket:
Stockholm.
Lesh, R. & Zawojewski, J. (2007). Problem solving and modeling. In F. K. Lester (Eds.),
Second handbook of research on mathematics teaching and learning (pp.763-799).
Charlotte: National Council of Teachers of Mathematics & Information Age Publishing.
Mason, J. & Johnston-Wilder, S. (2006). Designing and using mathematical tasks. Tarquin:
The Open University
McKenney, S. & Reeves, T. (2012). Conducting educational design research. London:
Routledge.
National Agency for Education (2011). Curriculum for the primary school, preschool class
and leisure time center 2011. Stockholm: National Agency for Education
Sarasvathy, S. D. & Venkataraman S. (2011). Entrepreneurship as method: Open questions
for an entrepreneurial future. Entrepreneurship: Theory & Practice, 34, 113–135.
Swedish Research Council (2008). Forskningsetiska Principer inom Humanistisk-
Samhällsvetenskaplig Forskning. Stockholm: Vetenskapsrådet.
Tatto, M.T., Lerman, S. & Novotná, J. (2009). Overview of teacher education systems across
the world. In R. Even & D.L. Ball (Eds.), The professional education and development of
teachers of mathematics. The 15th ICMI Study (pp.15-23). New York: Springer.

2016. In Csíkos, C., Rausch, A., & Szitányi, J. (Eds.). Proceedings of the 40th Conference of the International
Group for the Psychology of Mathematics Education, Vol. 4, pp. 35–42. Szeged, Hungary: PME. 4–35
MEANINGS AROUND ANGLE WITH DIGITAL MEDIA
DESIGNED TO SUPPORT CREATIVE MATHEMATICAL
THINKING
Ioannis Papadopoulos1, Dimitris Diamantidis2, Chronis Kynigos2
1 Aristotle University of Thessaloniki and CTI & Press Diophantus, 2 University of Athens, Educational Technology Lab and CTI & Press Diophantus
In this study two groups of Grade-8 students interact with a new expressive digital
medium, experimenting with the concept of angles through a “tool-shaping” process.
The medium, designed to foster students’ Creative Mathematical Thinking (CMT),
provides a novel set of affordances that are studied under the focus of a meaning-
generation process. The study indicates that the students can arrive to mathematical
meaning that enriches the more abstract understanding of angles, while at the same
time improving upon certain aspects of CMT.
INTRODUCTION
Creative Mathematical Thinking (CMT) possesses a central role in the research in
mathematics education. However, there is no consensus between the researchers as far
as its definition is concerned. It can be seen as a product or process, general or domain-
specific ability, situated within the ‘genius’ approach, or the problem solving and
posing approach, or lately, in the so-called approach of ‘techno-mathematical
literacies’ (Noss & Hoyles, 2013). Only the last one addresses the use and role of digital
media for CMT. But, as Healy and Kynigos (2010) noticed, the development of CMT
with the use of exploratory and expressive digital media has rarely been centrally
addressed in providing users with an access to and a potential for creative engagements
in meaning-generation activities. According to Ruthven (2008) the uses of these media
is mainly instrumented towards contexts of traditional lecturing and demonstration of
exercise solutions, which may not be characterized as learning environments that
provoke exploration and dense construction of mathematical meanings by students
Consequently students are not supported to develop CMT. Our paper studies the impact
of such media in the development of students’ CMT in conjunction with the generation
of mathematical meaning by the students. We call this new kind of mediation ‘c-book’,
(‘c’ for creativity) which is designed to afford CMT to the end users. The paper
therefore focuses on the question: To what extend does this medium foster the
meaning-making process? Are there indicators that aspects of CMT emerge during the
meaning-making process?
THEORETICAL FRAMEWORK
Given the diverse approaches to CMT outlined above, and the relative lack of
connection to math activity with expressive digital media, the concept remains fuzzy
in the literature. In this study, which is part of a broader one (Papadopoulos et al, 2015),

Papadopoulos, Diamantidis, Kynigos
4–36 PME40 – 2016
CMT is matched with: (i)‘construction’ of math ideas or objects which is in accordance
to the constructionism that sees CMT being expressed through exploration,
modification and creation of digital artefacts (Daskolia & Kynigos, 2012), (ii) Fluency
(as many answers as possible) and Flexibility (different solutions/strategies for the
same problem) (both seen as characteristics of a creative mathematical process in the
literature, see for example Leikin & Lev, 2007), (iii) novelty/originality (Liljedahl &
Sriraman, 2006) which is related with new/unusual/unexpected ways of applying
mathematical knowledge in posing and solving problems, not easily met in students’
solutions (Vale et al., 2012), and (iv) usability/applicability (Stenberg & Lubart, 2000)
through associations between different mathematical areas or between mathematics
and other scientific fields and through elaboration which extends the (personal) body
of knowledge via formulating new questions, making and checking conjectures,
generalizing mathematical content, and reflecting on the mathematical work that takes
place.
On the other hand, students’ engagement with expressive media provides rich
opportunity for making appropriate mathematical meaning (Kynigos & Psycharis,
2003). Microworlds are such environments, allowing at the same time creativity –in
our case CMT, customization and personal construction of tools (Healy & Kynigos,
2010). C-books exploit half-baked microworlds (Kynigos, 2007) which are incomplete
by design, challenging students to explore the reason for the buggy behavior they show,
and foster learning through tinkering. To understand the process of making meaning in
this context, the instrumental approach (Verillon & Rabardel, 1995) as a ‘tool shaping’
procedure seems a useful theoretical tool which refers to how the affordances of an
artefact, are adjusted by the student in order to be used as a tool for specific reasons.
THE DIGITAL MEDIUM
The C-book technology
C-book is a new expressive medium that affords the design and use of modules named
c-book units. Each c-book-unit includes diverse “widgets” into the text and between
the lines of the narrative, which a student can browse through, explore, experiment
with, reconstruct and be actively involved in tasks and problems designed to promote
CMT (Kynigos, 2015). The term ‘widget’ refers to objects, other than text, such as
hyperlinks, videos and most importantly instances, or activities, from a broad range of
digital tools in mathematics education such as Geogebra and MaLT2, a web-based
Turtle Geometry environment which integrates Logo-mathematics symbolic notation
with dynamic manipulation of 3D geometrical objects using sliders as variation tools.
C-book also includes the “Workspace”, an asynchronous tool providing the interface
for discussions organized in ‘trees’ (Fig.1).

Papadopoulos, Diamantidis, Kynigos
PME40 – 2016 4–37
The Don Quixote c-book unit
Figure 1: The C-book environment
The c-book unit used in this study presents a different twist of Don Quixote’s story,
agglomerated with a series of half-baked microworlds and other challenging tasks
mostly in MaLT2 and Geogebra, in relation to the storyline. Its design aimed to
provoke students to tinker and reconstruct windmills buggy by design, with many
functionality issues. Even though the c-book technology affords a non-linear browsing
of the c-book unit and engagement in any activity that the students find interesting it
makes more sense to read and interact with the c-book unit starting from the beginning
because of its narrative.
THE DESIGN OF THE STUDY
In the present study the methodological tool of “design experiments” (Collins et al.,
2004) was used, designing and implementing an educational intervention in classroom
and searching for relationships between the learning process and the use of digital
media used by the students during the implementation phase.
Eighteen Grade-8 and six Grade-9 students of a public Experimental School in Athens,
as well as two mathematics teachers and two researchers participated. The study took
place in the school’s pc lab during after-class Math Club activities (four sessions of
two teaching hours each in approximately one month period). The students were
divided into eleven groups of two and most of them were familiar with the usage of 2D
E-slate Turtleworlds. Researchers took the role of ‘participant observers’ searching
for students’ interactions with the digital medium. The teachers’ main role was to offer
assistance in technical issues when required. Conversations between students or groups
of students and their constructions on the screen constituted our data. This is why we
used voice recorders and a screen-capture software (HyperCam2) to record students’
interactions with the c-book unit tools. The data corpus was completed by the
researchers’ field notes.

Papadopoulos, Diamantidis, Kynigos
4–38 PME40 – 2016
The process of meaning-generation around angle of a group of students while engaged
in the tinkering of two diverse widget instances of the c-book unit is presented. For the
first one (Fig. 2) Logo code was developed in MaLT2 producing a quite abstract
representation of an unfinished squared paper. Through the narrative, students were
prompted to use it as a guide, in order to make a fan of a windmill like an origami made
construction. The second one (Fig. 3) was about another half-baked logo code in
MaLT2, were the stake was to shape up a windmill’s fan by finding and fixing the bug.
Our hypothesis is that in a creative process (in terms of CMT) the students move from
a static conceptualization to a more dynamic one, linking different angle aspects,
through consecutively tinkering three diverse challenges of the same c-book unit.
RESULTS
A step towards conceptualization of angle, through elaboration of an artefact
Following the narrative linearly, the students initially had to address the first challenge,
creating the fan of a windmill. It was easy for them to create the horizontal and vertical
parts of the fan but they needed effort and systematic approach to overcome the
difficulty of creating the oblique parts (in terms of angle and length) (Fig. 2).
Figure 2: The ‘squared paper’ and the fan students constructed
To achieve their goal they constructed several angles in a more static context, where
both arms of each angle were visible. Then they proceeded to the second task trying to
shape up a windmill’s fan by fixing the bug (Fig 3, left). This fan is much different not
only as a geometrical figure, but as an abstract representation of a windmill as well. A
line segment stands for the windmill’s tower and the turn is represented by a variable
in the code. By dragging a slider the user can make the fan rotating around a point. As
students were observing the rotating figure, an original and unexpected idea came up.
Instead of trying to fix the Logo code -as it was implicitly suggested in this task- they
preferred to use the origami-made fan of the previous task.
Student1: What we want our fan to look like? How many blades should they be?
Student2: Let me go back… here look at the Origami code.
Student1: Let’s use this figure as a fan.
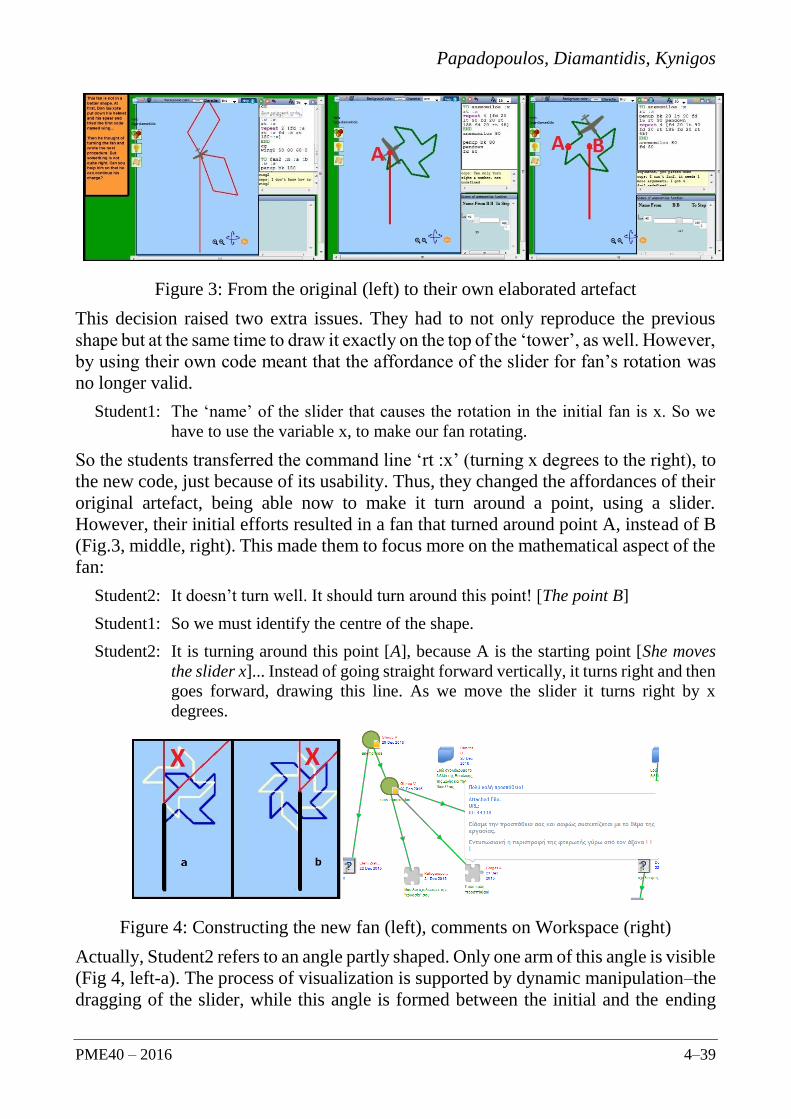
Papadopoulos, Diamantidis, Kynigos
PME40 – 2016 4–39
Figure 3: From the original (left) to their own elaborated artefact
This decision raised two extra issues. They had to not only reproduce the previous
shape but at the same time to draw it exactly on the top of the ‘tower’, as well. However,
by using their own code meant that the affordance of the slider for fan’s rotation was
no longer valid.
Student1: The ‘name’ of the slider that causes the rotation in the initial fan is x. So we
have to use the variable x, to make our fan rotating.
So the students transferred the command line ‘rt :x’ (turning x degrees to the right), to
the new code, just because of its usability. Thus, they changed the affordances of their
original artefact, being able now to make it turn around a point, using a slider.
However, their initial efforts resulted in a fan that turned around point A, instead of B
(Fig.3, middle, right). This made them to focus more on the mathematical aspect of the
fan:
Student2: It doesn’t turn well. It should turn around this point! [The point B]
Student1: So we must identify the centre of the shape.
Student2: It is turning around this point [A], because A is the starting point [She moves
the slider x]... Instead of going straight forward vertically, it turns right and then
goes forward, drawing this line. As we move the slider it turns right by x
degrees.
Figure 4: Constructing the new fan (left), comments on Workspace (right)
Actually, Student2 refers to an angle partly shaped. Only one arm of this angle is visible
(Fig 4, left-a). The process of visualization is supported by dynamic manipulation–the
dragging of the slider, while this angle is formed between the initial and the ending
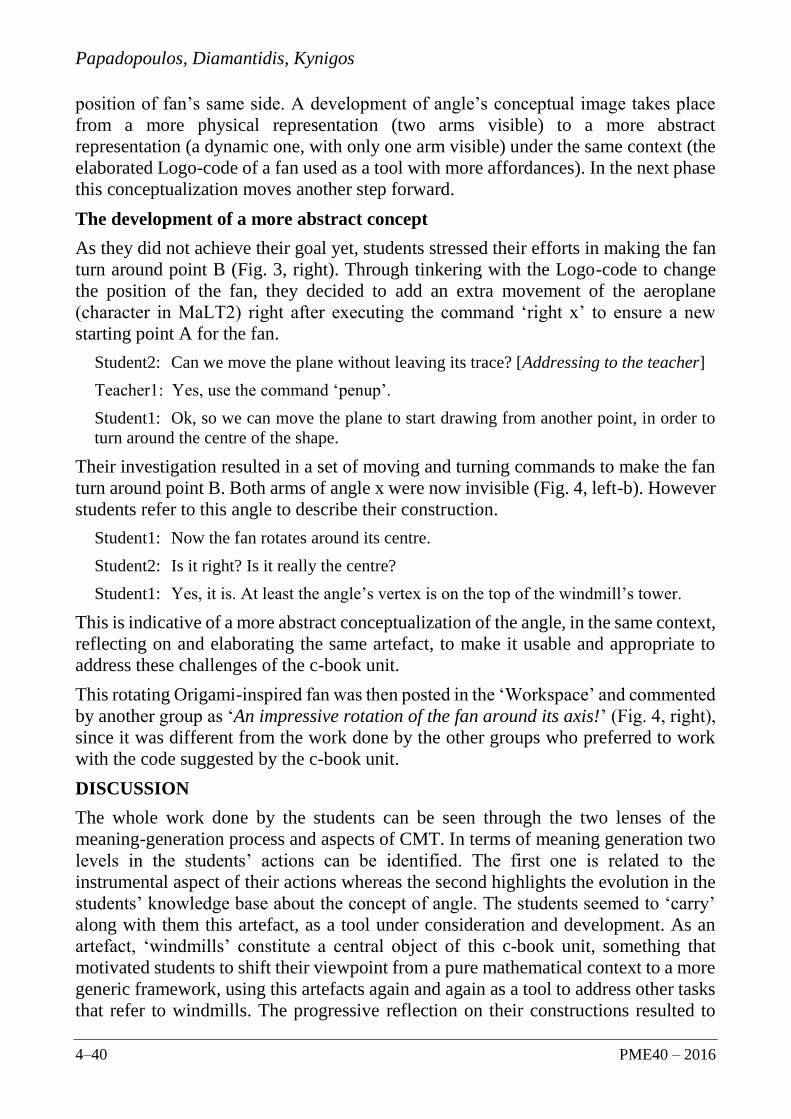
Papadopoulos, Diamantidis, Kynigos
4–40 PME40 – 2016
position of fan’s same side. A development of angle’s conceptual image takes place
from a more physical representation (two arms visible) to a more abstract
representation (a dynamic one, with only one arm visible) under the same context (the
elaborated Logo-code of a fan used as a tool with more affordances). In the next phase
this conceptualization moves another step forward.
The development of a more abstract concept
As they did not achieve their goal yet, students stressed their efforts in making the fan
turn around point B (Fig. 3, right). Through tinkering with the Logo-code to change
the position of the fan, they decided to add an extra movement of the aeroplane
(character in MaLT2) right after executing the command ‘right x’ to ensure a new
starting point A for the fan.
Student2: Can we move the plane without leaving its trace? [Addressing to the teacher]
Teacher1: Yes, use the command ‘penup’.
Student1: Ok, so we can move the plane to start drawing from another point, in order to
turn around the centre of the shape.
Their investigation resulted in a set of moving and turning commands to make the fan
turn around point B. Both arms of angle x were now invisible (Fig. 4, left-b). However
students refer to this angle to describe their construction.
Student1: Now the fan rotates around its centre.
Student2: Is it right? Is it really the centre?
Student1: Yes, it is. At least the angle’s vertex is on the top of the windmill’s tower.
This is indicative of a more abstract conceptualization of the angle, in the same context,
reflecting on and elaborating the same artefact, to make it usable and appropriate to
address these challenges of the c-book unit.
This rotating Origami-inspired fan was then posted in the ‘Workspace’ and commented
by another group as ‘An impressive rotation of the fan around its axis!’ (Fig. 4, right),
since it was different from the work done by the other groups who preferred to work
with the code suggested by the c-book unit.
DISCUSSION
The whole work done by the students can be seen through the two lenses of the
meaning-generation process and aspects of CMT. In terms of meaning generation two
levels in the students’ actions can be identified. The first one is related to the
instrumental aspect of their actions whereas the second highlights the evolution in the
students’ knowledge base about the concept of angle. The students seemed to ‘carry’
along with them this artefact, as a tool under consideration and development. As an
artefact, ‘windmills’ constitute a central object of this c-book unit, something that
motivated students to shift their viewpoint from a pure mathematical context to a more
generic framework, using this artefacts again and again as a tool to address other tasks
that refer to windmills. The progressive reflection on their constructions resulted to
Papadopoulos, Diamantidis, Kynigos
PME40 – 2016 4–41
usable and appropriate tools that not only addressed the tasks in an effective way but
also had a crucial impact on the process of meaning making. The students moved from
a concrete static image about angle to a more abstract and dynamic one since they
started talking about a specific angle given that they were not able to see its sides. In
parallel with the meaning generation process, aspects of CMT were also apparent in
the students’ engagement with the c-book technology. The students’ decision to abort
the suggested fan and make their own is a construction inspired by the affordances
offered by the c-book environment. Within this environment they also were supported
by the available technology to exhibit an alternative solution (flexibility) to the
problem of the design of the specific fan in a way that indicates originality. Originality
can be judged on the basis of the low frequency since this was the less preferred
approach (actually the only one) and the same time it was acknowledged as such by
the class community (see the peer’s comment in the Workspace).
So, on the one hand there is a new medium that provides a context and within this
context the students work with activities that contain half-baked microworlds, change
and/or fix them, connect the narrative with mathematics, make connections between
the tasks. On the other hand, the combination of Constructionism, Flexibility and
Originality, despite they come from different theoretical frameworks, constitutes a
conceptual tool enabling researchers to better understand the students’ CMT.
CONCLUSIONS
Given the lack of consensus about CMT in the Mathematics Education community it
is important to look for conceptual tools that would enable us to understand CMT. In
this paper it was evident that the affordances of the specific medium enabled processes
of meaning generation and the presence of some aspects of CMT. In order to identify
and understand the students’ CMT a combination of three different theoretical
constructs (constructionism, flexibility, and originality) was used. The decision to
combine different theoretical frameworks seems to be a conceptual tool that contributes
to our understanding of CMT and lessens the fuzziness around it. However, we need
further research to develop more precise tools that will enable us to obtain a deeper
understanding of CMT.
Acknowledgement
The research leading to these results was co-funded by the European Union, under FP7
(2007-2013), GA 610467 project “M C Squared”. This publication reflects only the authors'
views and the Union is not liable for any use of the information contained therein
References
Collins, A., Joseph, D., & Bielaczyz, K. (2004). Design Research: Theoretical And
Methodological Issues. The Journal of Learning Sciences, 13(1), 15-42.
Daskolia, M., & Kynigos, C. (2012). Applying a Constructionist Frame to Learning about
Sustainability. Creative Education, 3, 818-823.

Papadopoulos, Diamantidis, Kynigos
4–42 PME40 – 2016
Healy, L., & Kynigos, C. (2010). Charting the microworld territory over time: design and
construction in mathematics education. ZDM - The International Journal on Mathematics
Education, 42(1), 63-76.
Kynigos, C. (2007). Half-baked Microworlds as Boundary Objects in Integrated Design.
Informatics in Education, 6(2), 1-24.
Kynigos, C. (2015). Designing Constructionist E-Books: New Mediations for Creative
Mathematical Thinking? Constructivist Foundations, 10(3), 305-313.
Kynigos, C., & Psycharis, G. (2003). 13 Year-Olds' Meanings around Intrinsic Curves with a
Medium for Symbolic Expression and Dynamic Manipulation. In S. Dawson (Ed.), Proc.
27th Conf. of the Int. Group for the Psychology of Mathematics Education (Vol. 3, pp. 165-
172), Hawai.
Leikin, R., & Lev, M. (2007). Multiple solution tasks as a magnifying glass for observation
of mathematical creativity. In J.-H. Woo, H.-C. Lew, K.-S. Park, & D.-Y. Seo (Eds.), Proc.
31st Conf. of the Int. Group for the Psychology of Mathematics Education (Vol. 3, pp. 161–
168), Korea: The Korea Society of Educational Studies in Mathematics.
Liljedahl, P., & Sriraman, B. (2006). Musing on mathematical creativity. For the learning of
mathematics, 26(1), pp. 20-23.
Noss, R., & Hoyles, C. (2013). Modeling to address techno-mathematical literacies in work.
In R. Lesh, P. Galbraith, C.R., Haines, and A. Hurford (Eds), Modeling Students'
Mathematical Modeling Competencies, pp. 75-86, Dordrecht: Springer.
Papadopoulos, I., Barquero, B., Richter, A., Daskolia, M., Barajas, M., & Kynigos, C. (2015).
Representations of Creative Mathematical Thinking in Collaborative Designs of C-book
units. CERME 9. Prague.
Ruthven, K. (2008). The interpretative flexibility, instrumental evolution and institutional
adoption of mathematical software in educational practice: The examples of computer
algebra and dynamic geometry. Journal of Educational Computing Research, 39(4), pp.
379-394.
Sternberg, R., & Lubart, T. (2000). The concept of creativity: Prospects and paradigms. In R.
Sternberg (Ed.), Handbook of creativity (pp. 93-115). Cambridge, UK: Cambridge
University Press.
Vale, I., Pimentel, T., Cabrita, I., & Barbosa, A. (n.d.). Pattern Problem Solving Tasks as a
Mean to Foster Creativty in Mathematics. In T. Tso (Ed.), Proc.36th Conf. of the Int. Group
for the Psychology of Mathematics Education, (Vol. 4, pp. 171-178). Taipei, Taiwan:
PME.
Verillon, P., & Rabardel, P. (1995). Cognition and Artifacts: A Contribution to the Study of
Thought in Relation to Instrument Activity. European Journal of Psychology in Education,
9(3), 77-101.
2016. In Csíkos, C., Rausch, A., & Szitányi, J. (Eds.). Proceedings of the 40th Conference of the International
Group for the Psychology of Mathematics Education, Vol. 4, pp. 43–50. Szeged, Hungary: PME. 4–43
USING MOBILE PUZZLES TO DEVELOPE ALGEBRAIC
THINKING
Ioannis Papadopoulos, Theonitsa Kindini, Xanthippi Tsakalaki
Aristotle University of Thessaloniki, Dep. of Primary Education
In this paper the potential contribution of mobile puzzles in the development of
algebraic thinking in 6th graders is examined. The findings give evidence that the
students started developing certain types of thinking supporting thus certain algebraic
habits of mind. They did not follow arbitrary rules imposed by an authority but they
induced them trying to maintain the balance of the mobiles. This was accompanied by
an intuitive sense of certain properties of the operations that will later be introduced
formally to them.
INTRODUCTION
Young students have natural algebraic ideas that can be used in order to develop certain
mathematical habits of mind. These habits must take precedence over rules, formulas,
procedures that do not derive from the students’ logic (Goldenberg, Mark & Cuoco,
2010). If the foundations for their learning are based on their logic then they will have
the tools not only to memorize but to understand. Goldenberg and his colleagues (2015)
gave emphasis on developing algebraic habits of mind to the students initially through
a series of mathematical textbook and recently by publishing a book entitled ‘Making
sense of algebra’. In this book a series of logico-mathematical puzzles are suggested
in order to foster certain habits of mind. In this paper we focus on the usage of mobiles,
one of the suggested puzzles, that can be connected with certain habits of mind such as
“Puzzling and Persevering”, “Seeking and Using Structure”, and “Communicating
with Precision”. The aim is to look for evidence on whether the specific puzzle
environment can foster the development of algebraic thinking and this actually
constitutes our research question.
EARLY ALGEBRAIC THINKING AND MOBILE PUZZLES
Early algebraic thinking can occur in several forms in the classroom. Despite some
differences it seems that the researchers (see for example Blanton & Kaput, 2005;
Usiskin, 1988) agree that these forms can be met through arithmetic generalization, the
study of functions and patterns, problem solving and the study of structures. The study
of structures mainly refers to recognizing the structure of a simple pattern (Papic et al,
2011). Moss and McNab (2011) found that with appropriate instruction studying
patterns support students to improve their algebraic thinking. Additionally, the study
of structures very often concerns among others generalizing arithmetic structures
(Blandon & Kaput, 2005), and the structure of equivalent number sentences (Mulligan,
Cavanagh & Keanan-Brown, 2012). In this study it was decided to use mobile puzzles
in accordance to Waren’s (2003) (p. 123) claim that mathematical structure is
concerned with the (i) relationships between quantities; (ii) group properties of

Papadopoulos, Kindini, Tsakalaki
4–44 PME40 – 2016
operations (associative and/or commutative operation); (iii) relationships between the
operations (does one operation distribute over the other?); and (iv) relationships across
the quantities (transitivity of equality and inequality). This decision raises two
questions: Why puzzles? Why mobile puzzles? For the first question Goldenberg and
colleagues (2015) claim that puzzles are a safe environment since you do not have to
worry in case you are not able to know where to start. Moreover, puzzles allow students
to take their time to think. They counterbalance the students’ belief that doing
mathematics is to learn a collection of facts and rules. They can support differentiate
learning since they can be adapted to meet the needs and skills of the students through
the control of the level of cognitive demand and the required mathematical knowledge.
They can help students to develop mathematical habits useful in making sense of
algebraic topics such as modeling with equations, solving equations and systems of
equations, seeking and using algebraic structure. In order now to answer the second
question it is necessary to present this kind of puzzle.
Figure 1. Mobiles A, B, C (first row) D, E (second row)
A mobile puzzle presents multiple balanced collections of objects (Fig. 1). The
horizontal beams are always suspended at the middle by strings and for that reason the
two ends of each beam have the same amount of weight on them. Beams and strings
weight nothing and identical shapes represent the same weight whereas different
shapes may have the same or different weights. The puzzler is asked to determine the
unknown weight. Actually, the mobile puzzle presents a system of equations in the
form of a picture which highlights the underlying structure. These puzzles are focused
on the equality of expressions and students use their imagery to build the logic of
balancing equations while at the same time they do not need rules to solve them. For
one who is fluent with algebra it is an easy task to solve the system of equations. But
for one who is neither novice nor expert this becomes a “fun” challenge. While solving
the puzzle, the students gradually grasp the concept and role of variable as well as the
logic of algebraic manipulation. They start intuitively to use substitution and develop
personal strategies that will be later connected with standard algebraic “moves”
involved in solving equations (Goldenberg et al., 2015). One step towards all these
aspects of algebraic thinking is the translation of the information presented in a mobile
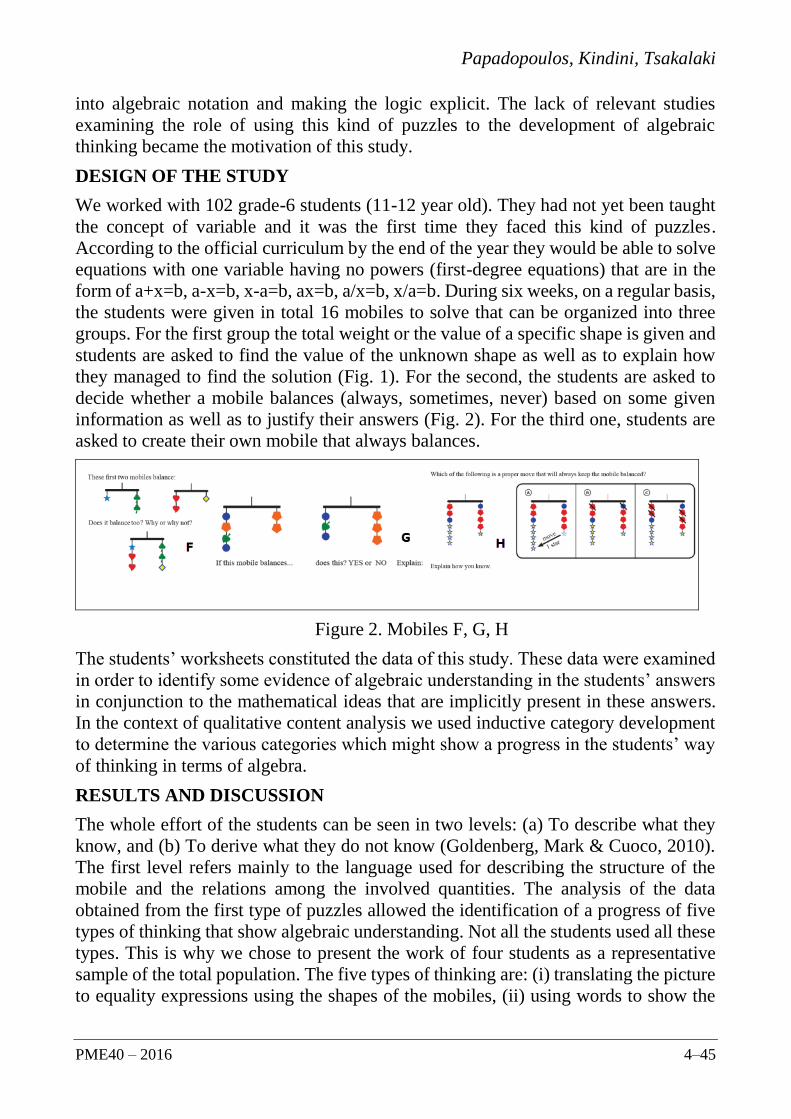
Papadopoulos, Kindini, Tsakalaki
PME40 – 2016 4–45
into algebraic notation and making the logic explicit. The lack of relevant studies
examining the role of using this kind of puzzles to the development of algebraic
thinking became the motivation of this study.
DESIGN OF THE STUDY
We worked with 102 grade-6 students (11-12 year old). They had not yet been taught
the concept of variable and it was the first time they faced this kind of puzzles.
According to the official curriculum by the end of the year they would be able to solve
equations with one variable having no powers (first-degree equations) that are in the
form of a+x=b, a-x=b, x-a=b, ax=b, a/x=b, x/a=b. During six weeks, on a regular basis,
the students were given in total 16 mobiles to solve that can be organized into three
groups. For the first group the total weight or the value of a specific shape is given and
students are asked to find the value of the unknown shape as well as to explain how
they managed to find the solution (Fig. 1). For the second, the students are asked to
decide whether a mobile balances (always, sometimes, never) based on some given
information as well as to justify their answers (Fig. 2). For the third one, students are
asked to create their own mobile that always balances.
Figure 2. Mobiles F, G, H
The students’ worksheets constituted the data of this study. These data were examined
in order to identify some evidence of algebraic understanding in the students’ answers
in conjunction to the mathematical ideas that are implicitly present in these answers.
In the context of qualitative content analysis we used inductive category development
to determine the various categories which might show a progress in the students’ way
of thinking in terms of algebra.
RESULTS AND DISCUSSION
The whole effort of the students can be seen in two levels: (a) To describe what they
know, and (b) To derive what they do not know (Goldenberg, Mark & Cuoco, 2010).
The first level refers mainly to the language used for describing the structure of the
mobile and the relations among the involved quantities. The analysis of the data
obtained from the first type of puzzles allowed the identification of a progress of five
types of thinking that show algebraic understanding. Not all the students used all these
types. This is why we chose to present the work of four students as a representative
sample of the total population. The five types of thinking are: (i) translating the picture
to equality expressions using the shapes of the mobiles, (ii) using words to show the

Papadopoulos, Kindini, Tsakalaki
4–46 PME40 – 2016
relationship between shapes in a mobile, (iii) using symbolic language (instead of
words) to show the relationship between shapes, (iv) combination of more than one of
the previous types indicative of more advanced understanding, and (v) using question
mark or an empty box to denote the unknown number. The last type was not used by
the specific four students.
Type-1. Translating the picture to equality expressions
It is worth mentioning here that this type incorporates sometimes a thinking that goes
beyond the mere translation since it includes properties of the operations or extra
components of the mobile structure as it will be shown immediately. Student-1 (S1)
working on mobile-A (Fig.1) wrote and . Both
expressions describe the situation presented in the mobile-A. However, for mobile-B,
instead of the exact translation of the three stars as addition (i.e., + + =1) he used
the equivalent expression of multiplication . It seems also that he was able to
transfer this knowledge (type-1) to more complex mobiles like the mobile-C. This time
a third string had been added to the mobile. Students S1 translated the structure of the
mobile using the expression for the right part of the
mobile. It can be seen that the students do not have to talk about variables or use letters
instead of numbers. They merely describe what they know about the mobile and write
it simply as they can.
Type-2. Using words to show relationships
In this type students made a step further. They did not merely translate the picture to
equality expressions but they noticed certain relationships between the (known and/or
unknown) quantities of the mobile. This goes further than the previous type.
For mobile-D (Fig.1), student S2 wrote in his worksheet:
S2: ….For the left part of the mobile… there are four pentagons on the left and one circle
plus two pentagons on the right…which means that one circle equals two pentagons…!
It is obvious here that the student intuitively followed the formal rules in an algebraic
context. If we denote by p the pentagon and by c the circle then the left part of the
mobile can be written as 4p=c+2p. Subtracting 2p from both sides we obtain 2p=c.
This indicates that the student managed to see a relationship between these two objects
which is not obvious when one initially sees the mobile. Moreover, the identification
of this relation leads faster to the solution. In a similar manner, student S4 working
with mobile-B (Fig.1) wrote that:
S4: ….three stars equal one pentagon…!
Type-3: Using ‘symbolic’ language
Students used this type to express again the relationships between the objects. But, this
time they used a kind of symbolic language instead of using only words. Since the
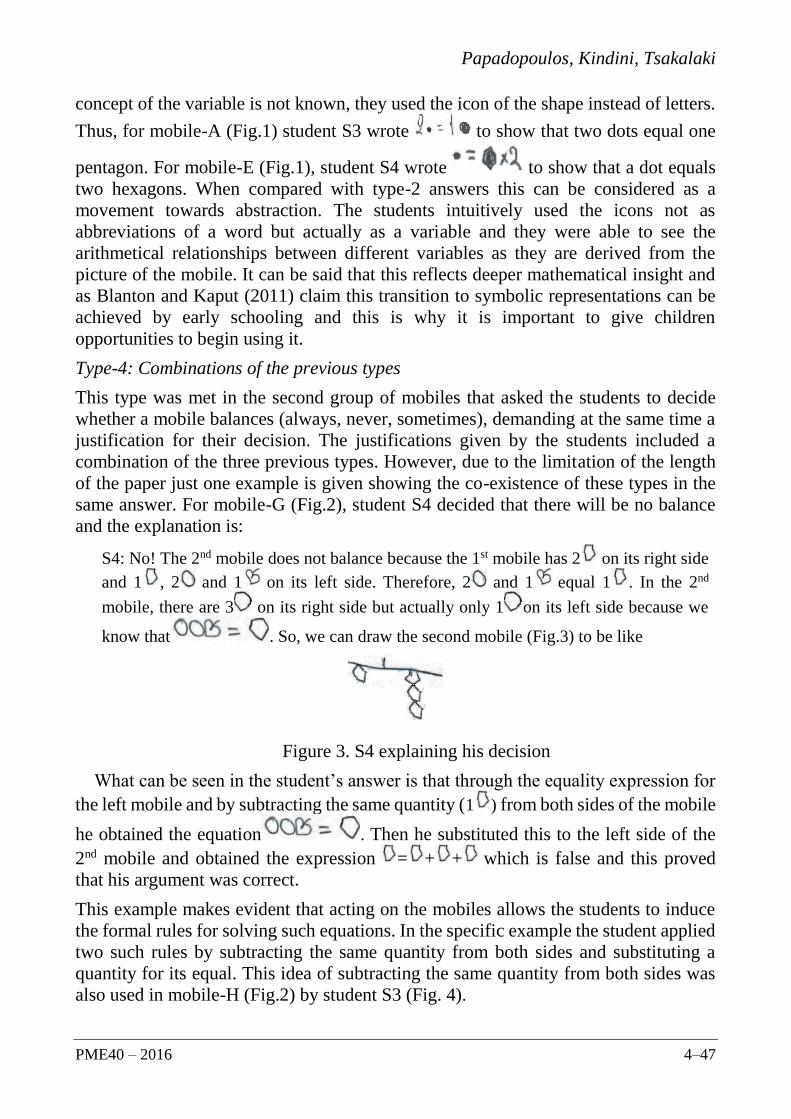
Papadopoulos, Kindini, Tsakalaki
PME40 – 2016 4–47
concept of the variable is not known, they used the icon of the shape instead of letters.
Thus, for mobile-A (Fig.1) student S3 wrote to show that two dots equal one
pentagon. For mobile-E (Fig.1), student S4 wrote to show that a dot equals
two hexagons. When compared with type-2 answers this can be considered as a
movement towards abstraction. The students intuitively used the icons not as
abbreviations of a word but actually as a variable and they were able to see the
arithmetical relationships between different variables as they are derived from the
picture of the mobile. It can be said that this reflects deeper mathematical insight and
as Blanton and Kaput (2011) claim this transition to symbolic representations can be
achieved by early schooling and this is why it is important to give children
opportunities to begin using it.
Type-4: Combinations of the previous types
This type was met in the second group of mobiles that asked the students to decide
whether a mobile balances (always, never, sometimes), demanding at the same time a
justification for their decision. The justifications given by the students included a
combination of the three previous types. However, due to the limitation of the length
of the paper just one example is given showing the co-existence of these types in the
same answer. For mobile-G (Fig.2), student S4 decided that there will be no balance
and the explanation is:
S4: No! The 2nd mobile does not balance because the 1st mobile has 2 on its right side
and 1 , 2 and 1 on its left side. Therefore, 2 and 1 equal 1 . In the 2nd
mobile, there are 3 on its right side but actually only 1 on its left side because we
know that . So, we can draw the second mobile (Fig.3) to be like
Figure 3. S4 explaining his decision
What can be seen in the student’s answer is that through the equality expression for
the left mobile and by subtracting the same quantity (1 ) from both sides of the mobile
he obtained the equation . Then he substituted this to the left side of the
2nd mobile and obtained the expression = + + which is false and this proved
that his argument was correct.
This example makes evident that acting on the mobiles allows the students to induce
the formal rules for solving such equations. In the specific example the student applied
two such rules by subtracting the same quantity from both sides and substituting a
quantity for its equal. This idea of subtracting the same quantity from both sides was
also used in mobile-H (Fig.2) by student S3 (Fig. 4).

Papadopoulos, Kindini, Tsakalaki
4–48 PME40 – 2016
S3: The correct answer is (c) because we can remove two
polygons from each side and this does not influence the
balance of the mobile
Figure 4. Intuitive idea of formal rules
Moreover, student S3 went one step further. After subtracting the two pentagons she
noticed that she can apply again the same rule and this is why she put the equal sign
between the two circles (above) and the two stars (below). So, by subtracting one circle
and one star from both sides she resulted to the relationship between the pentagon and
the star (Fig.4).
The next intuitive rule is connected with the solution of a system of equations. Student
S2 working on mobile-F (Fig.2) initially translated both balanced mobiles into two
equations (Fig.5, left). Then he actually proposed to add both equations (Fig.5, right)
in order to show that the new mobile is also in balance.
Figure 5. Adding equations
The last task for the students was to create their own mobile that will always balance.
It is interesting that all the above presented aspects of algebraic thinking were present
in their creations. Three of the mobiles created by the students S3, S4 and S1 are
presented in Figure 6. Student S3 explained that given that a pentagon (p) equals 2
triangles (t) , his mobile will always balance. The substitution of the
pentagon on the right side by its equal results to the reflexive property ensuring thus
the balance: c+t+t = c+p = c+t+t (c for the cycle). Having the same objects on both
sides the total weight for each side is the same. Student S4 chose the star as the basic
unit and then used arrows to express the weight of each object in terms of the basic
unit: , , . Then the strategy was to use on the
left any combination of the objects and on the right the substitution of these objects by
their equivalent number of units. So, given that a circle (c) equals 2 stars (s) and a
pentagon (p) with 3 stars then the mobile will always balance because 4c+s+p =
(2s+2s+2s+2s)+s+3s=12s. Finally, student S1 designed his mobile on the basis of the
following ideas: If each string on the right part of the mobile weighs as one bucket and
if (i.e., 2 drops(d) must be equal 1 cookie(c)) then the mobile will
always balance since as he explained he can “ignore” the stars (s) given that there is
one of them on each string. This means that he starts with a relationship between the
objects (2d=1c), then he applies the knowledge that the same quantity (one star) can be
added in both sides of the equality (2d+s=c+s). This is the right part of the mobile.

Papadopoulos, Kindini, Tsakalaki
PME40 – 2016 4–49
Given that each bucket(b) has the same weight with each one of the strings then he
creates a more complex equation 2b=(2d+s)+(c+s).
S3 S4 S1
Figure 6. Creating their own mobiles
CONCLUSIONS
The findings of this research study give evidence that the usage of mobiles can smooth
the transition from arithmetic to algebra. The types of thinking they used show a
progressive movement towards algebraic thinking. The students began with a mere
translation of the picture to equation expressions. Then they started using words to
express relationships between objects which later was substituted by a kind of symbolic
language. The next step was to combine more than one of these types of thinking. The
students did not have to think in terms of following certain rules imposed by their
teacher. However, they actually induced these rules (isolate variables, add or remove
the same amount from both sides, substitute weights that are known to be equal) trying
to maintain the balance and make sense of the mobiles. This process included an
intuitive sense of certain properties of the operations that will later be introduced
formally as commutative, associative or reflexive properties. This does not mean that
mobiles are suggested as a substitute for algebra but rather as a tool for thinking about
solving equations and grasping the logic that is behind the solution. Moreover,
prompting the students to create their own mobiles opens a window to their
understanding on what it means for a mobile to balance. Finally, working with mobile
puzzles students focused on the following algebraic habits of mind: (i) Puzzling and
persevering: It is very important for the solver to figure out where to start and what to
do next while solving a problem. Mobile puzzles put emphasis on this particular skill
since the students must consider the most effective place to start and the most useful
next steps. So, instead of seeing mathematics as a collection of rules to know and
follow, mobiles support mathematical ways of essential thinking in algebra, (ii)
Seeking and using structure: The students paid attention to the structure of the mobiles,
identifying relationships between shapes and thinking on how the mobiles can be
translated into equations. For doing this they represented quantities with shapes, words
and an early algebraic language, and (iii) Communicating with precision: The issue of
language for reasoning about mathematical ideas is crucial in Algebra. As students
learn to use symbolic language while dealing with mobiles, in essence they learn to
Papadopoulos, Kindini, Tsakalaki
4–50 PME40 – 2016
develop their ability to use language for mathematical discussion, to justify their
answers and explain their steps for solving mobiles.
References
Blanton, M. L., & Kaput, J. J. (2005). Characterizing a classroom practice that promotes
algebraic reasoning. Journal for Research in Mathematics Education, 36, 412–446.
Blanton, M. L., & Kaput, J. J. (2011). Functional thinking as a route into algebra in the
elementary grades. In G. Kaiser and B. Sriraman (Eds.), Early algebraization (pp. 5-23).
Springer Berlin Heidelberg.
Goldenberg, E.P., Mark, J., & Cuoco, P. (2010). An algebraic-habits-of-mind perspective on
elementary school. Teaching Children Mathematics, 6(9), 548-556. all, D. L. (1990).
Prospective elementary and secondary teachers’ understanding of division. Journal for
Research in Mathematics Education, 21(2), 132-144.
Goldenberg, E.P., Mark, J., Kang, J., Fries, M., Carter, C., & Cordner, T. (2015). Making
sense of algebra. Portsmouth, NH: Heinemann
Moss, J., & McNab, S. L. (2011). An approach to geometric and numeric patterning that
fosters second grade students’ reasoning and generalizing about functions and co-variation.
In Early Algebraization (pp. 277-301). Springer Berlin Heidelberg.
Mulligan, J., Cavanagh, M., & Keanan-Brown, D. (2012). The Role of algebra and early
algebraic reasoning in the Australian curriculum: mathematics. In B. Atweh, M. Goos, R.
Jorgensen & D. Siemon, (Eds.). (2012). Engaging the Australian National Curriculum:
Mathematics – Perspectives from the Field. Online Publication: Mathematics Education
Research Group of Australasia pp. 47‐70
Papic, M. M., Mulligan, J. T., & Mitchelmore, M. C. (2011). Assessing the development of
preschoolers’ mathematical patterning. Journal for Research in Mathematics Education,
42(3), 237–268.
Usiskin, Z. (1988). Conceptions of school algebra and uses of variable. In A. F. Coxford &
A. P. Shulte (Eds.), The Ideas of Algebra, K-12, 1988 Yearbook of the National Council of
Teachers of Mathematics(pp. 8–12). Reston, VA: NCTM.
Warren, E. (2003). The role of arithmetic structure in the transition from arithmetic to algebra.
Mathematics Education Research Journal, 15(2), 122-137.

2016. In Csíkos, C., Rausch, A., & Szitányi, J. (Eds.). Proceedings of the 40th Conference of the International
Group for the Psychology of Mathematics Education, Vol. 4, pp. 51–58. Szeged, Hungary: PME. 4–51
AN INVESTIGATION OF MIDDLE SCHOOL STUDENTS’
PROBLEM SOLVING STRATEGIES ON INVERSE
PROPORTIONAL PROBLEMS Mustafa Serkan Pelen, Perihan Dinç Artut
Çukurova University
This research was conducted to investigate middle school students’ problem solving
strategies on inverse proportional problems and whether these strategies change with
different number structures. 23 eighth grade students participated in this study. A
problem test which contains four inverse proportional missing value word problems
with four different number structures was used as a data collecting tool for the
research. Data were analyzed by descriptive analysis. Analysis has shown that eighth
grade students used six different strategies on solving inverse proportional problems.
The findings of the study also indicate that number structure affects the strategies used
and the difficulty level of the problems.
THEORITICAL BACKGROUND
Studies on proportional reasoning have shown that additive strategy is the most
frequently used erroneous strategy while students solve proportional problems
(Karplus, Pulos, Stage, 1983; Tourniaire, 1986; Misailidou & Williams, 2003).
Similarly, students give proportional responses to non-proportional problems (De
Bock, Van Dooren, Janssens, Verschaffel, 2002; De Bock, De Bolle, Van Dooren,
Janssens, Verschaffel, 2003; Van Dooren, De Bock, Evers, Verschaffel, 2006; Van
Dooren, De Bock, Vleugels, Verschaffel, 2010; Van Dooren, De Bock, Verschaffel,
2010). Numerous studies have focused on direct proportional and additive problems as
measuring and evaluating proportional reasoning. However, the middle school
mathematics education programme includes inverse proportional relations along with
direct proportional and additive relations in Turkey (MEB, 2013). In related literature,
inverse proportional relations investigated to a certain extend (Singh, 2000; Hilton,
Hilton, Dole, Goos, O’Brien, 2012; Tjoe & Torre, 2014). The available literature on
the factors that have effects on inverse proportional problems is limited and not
highlighted as much as direct proportional and additive problems. In this sense, inverse
proportional problems placed in the central focus of this study. It was considered to be
beneficial to study inverse proportional problems to gain broader aspect about this type
of problems in specific and proportional reasoning in general. It was intended to
elaborate what kind of strategies students can apply on this kind of problems with
different number structures. The present study investigates eighth grade students’
problem solving strategies on inverse proportional word problems with different
number structures.

Pelen, Dinç Artut
4–52 PME40 – 2016
Number structure refers to the multiplicative relationships within and between ratios.
A ‘within’ relationship is the multiplicative relationship between elements in the same
ratio, whereas a ‘between’ relationship is the multiplicative relationship between the
corresponding parts of different ratios (Steinthorsdottir & Sriraman, 2009).
Researchers have identified that the number structures of the problems have various
effects on proportional reasoning ability. Van Dooren et al., (2010) stated that the
strategies used by students during solving the problems are affected with the number
structure of the problems. Steinthorsdottir (2006) stated that number structure
influence problem difficulty level. Several studies have shown that students have
tendency to use multiplicative strategies when the presence of integer ratios and use
additive strategies when the absence of integer ratios no matter of proportional or non-
proportional situations (Degrande, Verschaffel, Van Dooren, 2014; Tourniaire &
Pulos, 1985; Cramer & Post, 1993; Karplus et al., 1983; Steinthorsdottir, 2006; Van
Dooren et al., 2010;). In the current study, besides the effects of the number structures
on direct proportional and additive problems, it was also intended to investigate the
effects of number structures on inverse proportional problems and whether the
difficulty level or strategies used change with different numbers structures.
RESEARCH QUESTIONS
1. What kind of strategies does eight grade students use while solving inverse
proportional word problems?
2. Do the difficulty level and strategies used affect by the number structures of the
inverse proportional word problems?
METHODOLOGY
The subjects of this study are the 23 (13 girls, 10 boys) eighth-grade students from a
public school in a southern province of Turkey. A problem test which contains direct
proportional, inverse proportional and additive word problems was designed as a data
collecting tool for the research. In this study, merely the findings and results of the
inverse proportional problems are presented since this study is a part of an ongoing
research. Number structures which involve within integer (WI), between integer (BI),
both within and between integer (WBI) and non-integer (NI) relations considered in
the problem test. Problems used in this study consisted of four open ended items and
these items were developed in parallel with the objectives of renewed elementary
mathematics curriculum (MEB, 2013). All students solved four experimental word
problems. The number structures and the statements of these word problems are
illustrated in Table 1.

Pelen, Dinç Artut
PME40 – 2016 4–53
Number Structure Title Statement
Between Integer
Relation
Pool Problem 4 pipes which all of them pour same
amount of water fill an empty pool in 12
hours. In how many hours 6 pipes which
all of them pour same amount of water fill
the same empty pool?
Within Integer
Relation
Detergent Problem A package of detergent finishes in 3 weeks
when laundry takes places 4 times a week.
When the laundry takes places 2 times a
week, in how many weeks the same
package of detergent finishes?
Both Between and
Within Integer
Relation
Sweater Problem Emel finishes a sweater in 24 days by
hand-knitting 2 hours in a day. If Emel
hand-knits 4 hours in a day, in how many
days can she finish the same sweater?
Non-Integer Relation Ice-Cream Problem Irem can take 9 ice-creams which is 2 euro
apiece with the money in her pocket. How
many ice-creams can Irem take with the
money in her pocket which 3 euro apiece?
Table 1. Experimental Items
Data were analysed by descriptive analysis. The strategies used in solving problems
with different number structures were identified by evaluating the students’ answers
on problems and comparisons among the different categories were made. Strategy
examples from the students’ solutions are presented below.
Figure 1. Example of unit – total strategy in ice-cream problem
In figure 1, student reached 18 by multiplying 2 and 9. Student obtained the total money
with this multiplication (total). Then student divided the total 18 to 3 and gained 6 as a
result (unit).

Pelen, Dinç Artut
4–54 PME40 – 2016
Figure 2. Example of factor – multiple strategy in detergent problem
In figure 2, student realized the inverse proportional relations of the problem then by
using the within integer relation 4:2=2 (factor) student used this factor as a multiple for
the unknown in the other ratio 3x2=6 (multiple).
After the students’ solution for each problem examined, clinical interviews were used
to elaborate students’ judgments and make inferences about their cognitive processes.
One student was selected (selection criteria explained in results section) for the clinical
interview in order to comprehend whether number structures affect problem difficulty
and strategy choices.
RESULTS
Table 2 shows the strategies used by students to inverse proportional problems with
different number structures. Analysis of the responses showed that students used six
distinct solution strategies in inverse proportional problems. The findings of the study
indicate that number structure of problems affect strategies used by students. Students
did not use any unit – total strategy in both between and within integer relation (BWI)
problem whereas they did not use any factor – multiple strategy in between integer
relation (BI) and non-integer relation (NI) problems. Analysis of the students’ solutions
also showed that students have tendency to use multiplicative strategies when the
presence of integer ratios. In these terms, the results are in accord with previous studies
(Steinthorsdottir, 2006; Tourniaire & Pulos, 1985; Van Dooren et al., 2010; Cramer &
Post, 1993).
Strategies Number Structure
BI WI BWI NI
Unit – Total 3 2 - 19
Factor – Multiple - 4 8 -
Inverse Proportion Algorithm - - - 1
Evidence of Inverse Proportion 4 2 - -
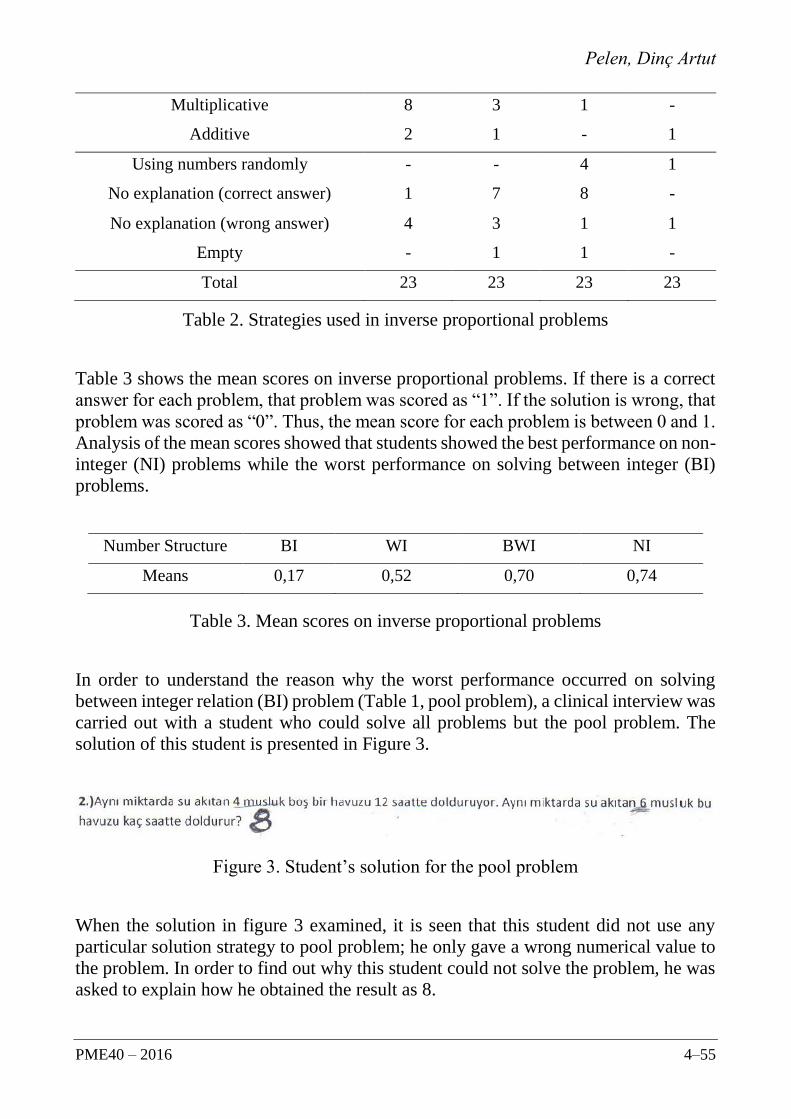
Pelen, Dinç Artut
PME40 – 2016 4–55
Multiplicative 8 3 1 -
Additive 2 1 - 1
Using numbers randomly
No explanation (correct answer)
-
1
-
7
4
8
1
-
No explanation (wrong answer) 4 3 1 1
Empty - 1 1 -
Total 23 23 23 23
Table 2. Strategies used in inverse proportional problems
Table 3 shows the mean scores on inverse proportional problems. If there is a correct
answer for each problem, that problem was scored as “1”. If the solution is wrong, that
problem was scored as “0”. Thus, the mean score for each problem is between 0 and 1.
Analysis of the mean scores showed that students showed the best performance on non-
integer (NI) problems while the worst performance on solving between integer (BI)
problems.
Number Structure BI WI BWI NI
Means 0,17 0,52 0,70 0,74
Table 3. Mean scores on inverse proportional problems
In order to understand the reason why the worst performance occurred on solving
between integer relation (BI) problem (Table 1, pool problem), a clinical interview was
carried out with a student who could solve all problems but the pool problem. The
solution of this student is presented in Figure 3.
Figure 3. Student’s solution for the pool problem
When the solution in figure 3 examined, it is seen that this student did not use any
particular solution strategy to pool problem; he only gave a wrong numerical value to
the problem. In order to find out why this student could not solve the problem, he was
asked to explain how he obtained the result as 8.

Pelen, Dinç Artut
4–56 PME40 – 2016
Interviewer: So how did you obtain the result as 8?
Student: Since 4 pipes fill in 12 hours, 6 pipes should fill in less amount of time.
Interviewer: Why 6 pipes should fill in less amount of time?
Student: 6 t pipes is 2 more than 4 pipes. When there are more pipes, they will pour
more water thus the pool will fill in less time.
This dialogue can be interpreted as that the student is aware of the mathematical
structure (inverse proportional) of the pool problem. In this sense, in order to
understand whether the number structure of the problem affect the difficulty of the pool
problem, problem is asked again by changing number structure while maintaining the
content as follows: “4 pipes which all of them pour same amount of water fill an empty
pool in 12 hours. In how many hours 6 pipes which all of them pour same amount of
water fill the same empty pool?” In this case, student could solve the problem and
obtain a correct answer. This finding can be interpreted as number structure of the
problem affects the difficulty level of the problem.
CONCLUSION AND DISCUSSION
This study focused on the strategies used while solving inverse proportional problems
and whether difficulty levels and strategy choices of inverse proportional problems
change with different number structures. In the current study, the findings have shown
that students used six different strategies on inverse proportional problems’ solutions.
Furthermore, students’ strategy choices were flexible with respect to different number
structures. Students could adjust their problem solving strategies to alternating
different number structures situations.
Among the four inverse proportional problems, between integer relation (BI) problem
(pool problem) had the lowest mean score. In order to understand the reason of this
situation, a clinical interview with a student (who could solve all but the pool problem)
carried out. Analysis of clinical interview has shown that number structure affects the
difficulty level and strategy choice of inverse proportional problems. Similarly the
literature (Degrande et al., 2014; Steinthorsdottir, 2006; Tourniaire & Pulos, 1985; Van
Dooren et al., 2010) has shown that number structure affects difficulty level and
strategy choice of direct proportional and additive problems.
The results of this have some implications for instruction. Educators should consider
the number structures when students engage with inverse proportional problem
situations. For further studies, it can be suggested to investigate the strategies used
while solving inverse proportional problems and the effects of different number
structures on inverse proportional problems with larger participants from different
grade levels.

Pelen, Dinç Artut
PME40 – 2016 4–57
References
Cramer, K., Post T. (1993), “Connecting Research To Teaching Proportional Reasoning”,
Mathematics Teacher, (86), S. 5, ss. 404 – 407.
De Bock, D., Van Dooren, W., Janssens, D., Verschaffel, L. (2002), “Improper Use Of Linear
Reasoning: An In-Depth Study Of The Nature And The Irresistibility of Secondary School
Students’ Errors”, Educational Studies In Mathematics, 50: 311-334.
De Bock, D., De Bolle, E., Janssens, D., Van Dooren, W., Verschaffel, L. (2003), Secondary
School Students' Improper Proportional Reasoning: The Role of Direct Versus Indirect
Measures, PME Conference, 2, no. Conf 27, (2003): 293-300
Degrande, T., Verschaffel, L., Van Dooren, W. (2014), “That sounds Greek to me!” Primary
children’s additive and proportional responses to unreadable word problems, Proceedings
of the Joint Meeting 2 - 361 of PME 38 and PME-NA 36,Vol. 2, pp. 361-368. Vancouver,
Canada: PME.
Hilton, A., Hilton, G., Dole, S., Goos, M., O’Brien, M. (2012). Evaluating middle school years
students’ proportional reasoning. In. J. Dindyal, L. P. Chen, & S. F. Ng. (Eds),
Mathematics Education: Expanding Horizons, (Proceedings of the 35th Annual
Conference of the Mathematics Education Research Group of Australia MERGA) (pp. 330-
37). Singapore: MERGA, Inc.
Karplus, R., Pulos, S., Stage, E. K. (1983), Early adolescents’ proportional reasoning on rate
problems. Educational Studies in Mathematics, 14, 219-234
MEB (2013), Ortaokul Matematik Dersi (5, 6, 7 ve 8.Sınıflar) Öğretim Programı, Ankara:
MEB Yayınları
Misailidou, C., Williams, J. (2003), Diagnostic assessment of children’s proportional
reasoning, Journal of Mathematical Behavior, v22 n3 (2003): 335-368
Singh, P. (2000), “Understanding the concepts of proportion and ratio among grade nine
students in Malaysia”, International Journal of MathematicsEducation in Science and
Technology, v31 n4 p579-99.
Steinthorsdottir, O. B. (2006), Proportional reasoning variable influencing the problems
difficulty level and one’s use of problem solving strategies, Proceedings of the Conference
of the International Group for the Psychology of Mathematics Education (30th, Prague,
Czech Republic, July 16-21, 2006). Volume 5
Steinthorsdottir, O. B., Sriraman, B. (2009), Icelandic 5th-Grade Girls' Developmental
Trajectories in Proportional Reasoning, Mathematics Education Research Journal, v21 n1
p6-30 2009
Tjoe, H., Torre, J., (2014), On recognizing proportionality: Does the ability to solve missing
value proportional problems presuppose the conception of proportional reasoning?, Journal
of Mathematical Behavior 33 (2014) 1– 7
Tourniaire, F., Pulos, S. (1985), Proportional Reasoning: A Review of the Literature,
Educational Studies in Mathematics, v16 n2 (May, 1985): 181-204

Pelen, Dinç Artut
4–58 PME40 – 2016
Tourniaire, F. (1986), Proportions in Elementary School, Educational Studies in Mathematics,
v17 n4 (Nov., 1986): 401-412
Van Dooren, W., De Bock, D., Evers, M. & Verschaffel, L. (2006), Pupils’ over-use of
proportionality on missing-value problems: How numbers may change solutions.
Proceedings of the 30th PME International Conference, 5, 305-312.
Van Dooren, W., De Bock, D., Verschaffel, L. (2010), From Addition to Multiplication …
and Back: The Development of Students' Additive and Multiplicative Reasoning Skills,
Cognition and Instruction, 28, no. 3 (2010): 360-381
Van Dooren, W. De Bock, D. Vleugels, K. Verschaffel, L. (2010), Just Answering … or
Thinking? Contrasting Pupils' Solutions and Classifications of Missing-Value Word
Problems, Mathematical Thinking and Learning, 12:1, 20-35

2016. In Csíkos, C., Rausch, A., & Szitányi, J. (Eds.). Proceedings of the 40th Conference of the International
Group for the Psychology of Mathematics Education, Vol. 4, pp. 59–66. Szeged, Hungary: PME. 4–59
RECOGNISING WHAT MATTERS: IDENTIFYING
COMPETENCY DEMANDS IN MATHEMATICAL TASKS
Andreas Pettersen and Guri A. Nortvedt
University of Oslo
The aim of this study was to investigate how an item analysis scheme could be utilised
by a group of five teachers and prospective teachers to identify the level of competency
demands in mathematical tasks. The fairly high overall agreement on such competency
demands indicates that the scheme might be used to promote discussions and
reflections about the demands of mathematical tasks and, as such, support mathematics
teaching. While the assessment output demonstrates that many of the tasks were
challenging to the students, the teachers viewed most of the tasks as having a low
competency demand. These two findings might stem from different interpretations of
the competency descriptors, such as the words ‘simple’ versus ‘complex’ or the term
‘model’.
INTRODUCTION
For decades, the term ‘competence’ has been widely used in mathematics education
research, and this has influenced what is conceived as the goal of mathematics
education (Kilpatrick, 2014). Currently, curricula often focus on competencies and
include aspects of mathematical literacy (Burkhardt, 2014). Although several different
competency frameworks exist (Kilpatrick, 2014), a common factor is that
mathematical competence extends conceptual and procedural knowledge.
Traditionally, with a strong focus on procedural knowledge, tasks have played an
important role in instruction, offering opportunities for practising skills. Even with the
recent development toward mathematical competence, mathematical tasks are still an
important tool for teachers. Consequently, it is vital that teachers can judge the tasks
that they consider to use in their classrooms, to be confident that these tasks can
stimulate learning of mathematical competencies. However, recent research has
demonstrated that both textbooks and teacher-made tests to a large extent utilise
algorithmic tasks (Palm, Boesen, & Lithner, 2011). A plausible interpretation might be
that it is easier for teachers to recognise students’ factual knowledge and calculation
skills than other aspects of mathematical competence, such as communication or
problem solving abilities. In our study, we aimed to investigate to what extent teachers
could utilise an item analysis scheme developed by the PISA Mathematics Expert
Group (MEG) to identify the competency demands of mathematical tasks.
MATHEMATICAL COMPETENCE AND TASKS
Hiebert (1986) argued that for students to be fully competent in mathematics, they need
both conceptual and procedural knowledge and to understand the link and relationship
between the two. Hiebert (1986) was commenting on the long-standing tradition in
mathematics education of viewing conceptual and procedural knowledge as separate

Pettersen, Nortvedt
4–60 PME40 – 2016
entities. More recently, a rich view on mathematics and mathematics education has
evolved. By the early 2000s, several frameworks had emerged emphasising not only
the interaction between conceptual and procedural knowledge but also the importance
of abilities such as communication, modeling and mathematical thinking (Kilpatrick,
2014; Niss & Højgaard, 2011). Some (e.g. Kilpatrick, Swafford, & Findell, 2001) have
even emphasised the importance of positive beliefs and attitudes toward mathematics.
Coinciding with this changing view on mathematics teaching and learning has been an
increased focus on the acquisition of competencies in education, which has been
embraced as ‘a new standard for curriculum design’ (Westera, 2001, p. 75).
Competence can be related to a variety of cognitive abilities, and a lack of a common
definition and understanding of the term ‘competence’ poses challenges when
developing competence-based curricula (Westera, 2001).
A framework for mathematical competence that has influenced curricula and
assessment reforms in several European countries (see Turner, Dossey, Blum, & Niss,
2013) is found in a report from the Danish KOM project (Niss & Højgaard, 2011). This
framework comprises eight mathematical competencies that, as a whole, ‘encapsulate
the essence of mathematical competence’ (Niss & Højgaard, 2011, p. 50). According
to Niss and Højgaard (2011), activities must be orchestrated ‘with the explicit aim of
developing the mathematical competencies of the individual’ (p. 31) to offer
opportunities for students to develop these mathematical competencies.
Mathematical tasks 1 are regarded as key to mathematics education as a learning
resource (Wiliam, 2007), and much of the teaching and learning in mathematics
classrooms is situated around solving mathematical tasks. For instance, several studies
have indicated that cognitively demanding problems promote higher learning
outcomes (Boaler & Staples, 2008; Stein & Lane, 1996). If the students are to develop
the mathematical competence described in the curriculum, they need to engage in tasks
that stimulate and activate these competencies. To develop or select appropriate tasks,
teachers must be able to recognise the competency demands of the tasks. Prior research
has shown that this can be challenging for teachers (Wiliam, 2007). Yet some studies
have shown how training teachers in analysing task demands might be fruitful. For
instance, Arbaugh and Brown (2005) observed that engaging teachers in critically
examining mathematical tasks made them consider more deeply the opportunities
embedded in the tasks, and also changed the types of tasks they chose for their classes.
Building on the mathematical competence framework developed in the KOM project
(Turner et al., 2013), since 2003, the PISA MEG (Mathematics Expert Group) has been
continuously developing and refining an item analysis scheme for identifying the
mathematical competencies needed to solve mathematical problems (Turner, Blum, &
Niss, 2015). Applying the scheme to analyse 48 mathematics items used in both the
1 In this paper, the term ‘task’ comprises various types of mathematical problems and questions
including routine and non-routine, complex and simple problems and assessment tasks. ‘Tasks’ is
used interchangeably with the term ‘item’.

Pettersen, Nortvedt
PME40 – 2016 4–61
PISA 2003 and PISA 2006 surveys, Turner et al. (2013) found that it could be used by
experts to effectively identify the competency requirements of items. Further, Turner
et al. (2015) proposed that the scheme could be used by teachers to devise assessment
items, and that mathematics teaching and learning should focus on developing these
mathematical competencies among students.
METHODOLOGY
The aim of this study was to investigate how the item analysis scheme would be utilised
by a group of teachers for identifying the competency demands of mathematical tasks.
After initial training in applying the scheme, the teachers individually analysed items
from the PISA 2012 paper-based assessment (Np = 85) and the 2014 Norwegian grade
10 national exam (Ne = 56). For each item, the teachers rated the cognitive demand of
six mathematical competencies. The consistency and distribution of the teachers’
ratings were analysed to identify possibilities, challenges and limitations connected to
the implementation of the scheme.
Participants
Mathematics teachers, prospective teachers and university employees were approached
for recruitment. The inclusion criteria were (1) experience teaching mathematics in
secondary school and (2) having a degree in or being enrolled in a master’s programme
in secondary school mathematics teacher education. Two trained teachers and three
prospective teachers in their final year of the teacher education programme were
recruited, in the following referred to as teachers.
Material
The item analysis scheme (Turner et al., 2015) consisted of operational definitions of
six mathematical competencies: Communication (C), Devising Strategies (DS),
Mathematising (M), Representation (R), Using Symbols, Operations and Formal
Language (SF—referred to as Symbols and Formalism) and Reasoning and Argument
(RA). In addition, four levels of demand (0–3) were described for each competency.
When analysing an item, the level that best fit the demand of the item was identified
for each of the six competencies, with a higher level indicating higher cognitive
demand. A competency rated at level 0 implied that the item did not demand the
activation of this competency (or at a minimal use), while level 3 implied an advanced
or complex level of demand for this competency.
All teachers were provided with an English version of the MEG item analysis scheme
in addition to a user guide presenting and explaining the scheme. They were also given
examples and an explanation of item analysis performed by the MEG members. The
teachers analysed two sets of mathematics assessment items: (1) 85 items from the
paper-based PISA 2012 survey and (2) 56 items from the 2014 Norwegian grade 10
national exam, consisting of part one (33 items) mainly comprising traditional tasks
focused on procedures and part two (23 items) emphasising problem solving. Both
assessments were targeted at 15-year-old students.
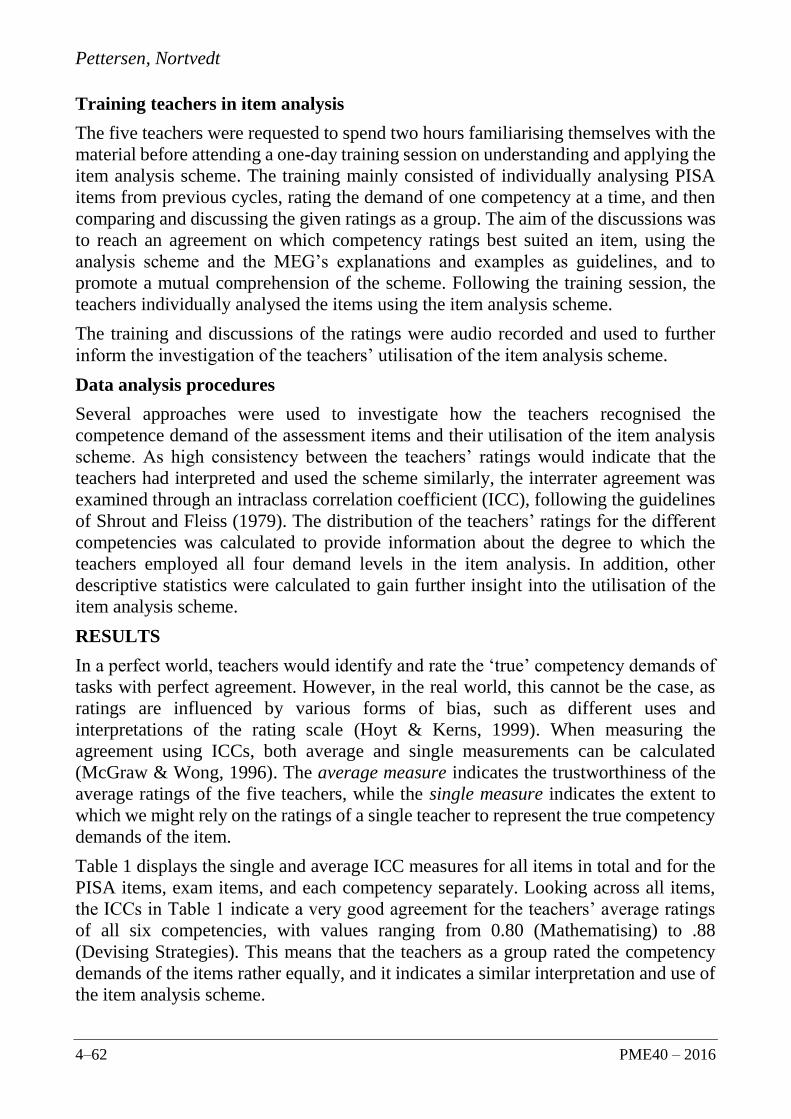
Pettersen, Nortvedt
4–62 PME40 – 2016
Training teachers in item analysis
The five teachers were requested to spend two hours familiarising themselves with the
material before attending a one-day training session on understanding and applying the
item analysis scheme. The training mainly consisted of individually analysing PISA
items from previous cycles, rating the demand of one competency at a time, and then
comparing and discussing the given ratings as a group. The aim of the discussions was
to reach an agreement on which competency ratings best suited an item, using the
analysis scheme and the MEG’s explanations and examples as guidelines, and to
promote a mutual comprehension of the scheme. Following the training session, the
teachers individually analysed the items using the item analysis scheme.
The training and discussions of the ratings were audio recorded and used to further
inform the investigation of the teachers’ utilisation of the item analysis scheme.
Data analysis procedures
Several approaches were used to investigate how the teachers recognised the
competence demand of the assessment items and their utilisation of the item analysis
scheme. As high consistency between the teachers’ ratings would indicate that the
teachers had interpreted and used the scheme similarly, the interrater agreement was
examined through an intraclass correlation coefficient (ICC), following the guidelines
of Shrout and Fleiss (1979). The distribution of the teachers’ ratings for the different
competencies was calculated to provide information about the degree to which the
teachers employed all four demand levels in the item analysis. In addition, other
descriptive statistics were calculated to gain further insight into the utilisation of the
item analysis scheme.
RESULTS
In a perfect world, teachers would identify and rate the ‘true’ competency demands of
tasks with perfect agreement. However, in the real world, this cannot be the case, as
ratings are influenced by various forms of bias, such as different uses and
interpretations of the rating scale (Hoyt & Kerns, 1999). When measuring the
agreement using ICCs, both average and single measurements can be calculated
(McGraw & Wong, 1996). The average measure indicates the trustworthiness of the
average ratings of the five teachers, while the single measure indicates the extent to
which we might rely on the ratings of a single teacher to represent the true competency
demands of the item.
Table 1 displays the single and average ICC measures for all items in total and for the
PISA items, exam items, and each competency separately. Looking across all items,
the ICCs in Table 1 indicate a very good agreement for the teachers’ average ratings
of all six competencies, with values ranging from 0.80 (Mathematising) to .88
(Devising Strategies). This means that the teachers as a group rated the competency
demands of the items rather equally, and it indicates a similar interpretation and use of
the item analysis scheme.

Pettersen, Nortvedt
PME40 – 2016 4–63
Table 1. Agreement measures (ICCs) of the teachers’ average ratings of the items for
each competency individually. The ‘single teacher’ measure is given in parentheses.
C DS M R SF RA
All items .86 (.55) .88 (.61) .80 (.44) .84 (.51) .85 (.52) .84 (.51)
PISA items .77 (.40) .86 (.54) .77 (.39) .84 (.50) .83 (.49) .74 (.36)
Exam items .89 (.61) .92 (.69) .84 (.50) .79 (.43) .82 (.47) .89 (.61)
Exam part 1 .86 (.54) .92 (.69) .89 (.62) .86 (.54) .85 (.52) .78 (.42)
Exam part 2 .79 (.43) .88 (.60) .71 (.34) .67 (.29) .79 (.42) .84 (.52)
Note: C = Communication; DS = Devising Strategies; M = Mathematising; R = Representation;
SF = Symbols and Formalism; RA = Reasoning and Argument.
When looking at the agreement for the PISA and exam items separately, we observe
lower values for the PISA items for some of the competencies, with Reasoning and
Argument having the lowest agreement, with an ICC of .74. Yet this value also
indicates a good agreement. Table 1 also shows that the ICCs for single measures are
much lower than for the average measures. Looking at all items, the values range from
.44 (Mathematising) to .61 (Devising strategies), which can be regarded as moderate
agreement. Thus, if we want to have ‘reliable’ information about the competency
demand of the items, the ratings from one teacher would be insufficient, as they would
vary significantly depending on the choice of teacher.
When looking at the ICCs of the PISA and exam items separately, we observe higher
agreement for the exam items than for the PISA items for all but two of the
competencies (Representation and Symbols and Formalism). For the exam items the
average agreement across all competencies is .86, while the corresponding agreement
for the PISA items is .80. One hypothesis to explain this difference in agreement is that
the more complex items (i.e. items that demand a higher number of competencies) are
more difficult to analyse. By calculating the average number of competencies
demanded (i.e. rated above level 0) per item for the different assessments, we find that
the PISA items have a higher average number of competencies demanded per item
(3.97) than the exam items (2.96) do and can thus be regarded as more complex. This
pattern is even more distinct if we look at the items in exam parts 1 and 2 separately.
The agreement measures in Table 1 show a higher agreement in part 1 for five of the
six competencies, and also a considerably higher average agreement across all
competencies (.86 for part 1, compared to .78 for part 2). At the same time, the average
number of competencies demanded per item is almost twice as large for part 2 (4.13)
relative to part 1 (2.15), which would explain this pattern.
Figure 1 displays the distribution of ratings across the four levels for all 141 items
given by the 5 teachers for each of the competencies.

Pettersen, Nortvedt
4–64 PME40 – 2016
Figure 1. Distribution of the total number of ratings across the four
levels for all items.
As can be observed from Figure 1, the majority of the ratings are at levels 0 and 1.
Level 3 is rarely used. For the Mathematising and Representation competency a similar
pattern is observed for level 2, with less than 5% ratings at this level. There are several
plausible reasons for the somewhat surprising pattern, with most ratings at levels 0 and
1. One reason could simply be that the items mostly demand a low level of cognitive
demand. However, the students’ scores on the two assessments show that both assess-
ments comprise several items that are very challenging to the students (in total, 21%
of the items were solved correctly by less than 20% of the students). In addition, when
comparing the teachers’ ratings to those of the PISA MEG on 48 PISA items (Turner
et al., 2013), partly overlapping with the items used in this study, the results indicate a
higher portion of ratings at levels 2 and 3. Another plausible explanation might be that
the level descriptions are inadequate operationalisations of the actual competency
demands, and when asked to analyse the items, the teachers struggled to understand
and differentiate between the higher levels. To be able to understand if the scheme or
the teachers contributed to the observed pattern in Figure 1, we propose that the two
be seen in relation to each other. The teachers’ discussions during the training session
indicated a somewhat ambiguous understanding of some of the competency definitions
and level descriptions. For instance, during the training, some teachers expressed that
the Mathematising competency was hard to understand. One reason for this could be
the use of the term ‘model’ in the level descriptions without a proper explanation, as it
seemed to be interpreted differently by the teachers. Table 1 shows that Mathematising
is the competency where the teachers have the lowest agreement, and at the same time
Figure 1 shows that this competency has less than 10% of the ratings at levels 2 and 3.
Another issue is the use of relative words in the level descriptions, for instance,
‘simple’ and ‘complex’—words that tend to have different meanings for different
people (Turner et al., 2015). During the revisions of this analysis scheme, Turner et al.
Pettersen, Nortvedt
PME40 – 2016 4–65
(2015) attempted to minimise the use of such terms. Still, when examining the wording
of levels 2 and 3, we find that the term ‘complex’ (e.g. representation competency) is
frequently used in the descriptions.
CONCLUSION
This study sought to explore whether an item analysis scheme could be applied by
teachers to identify the competency demands of mathematics items, and thus be used
to support mathematics teaching. The scheme was previously used by Turner et al.
(2013) to analyse assessment items and predict the item difficulty, indicating that the
scheme potentially is a valuable tool for test developers and item writers.
The rather high agreement measures for the teachers’ ratings indicate that the teachers
as a group are fairly consistent when identifying the competency demands of the items.
To meet the demands of a competence-based curriculum, teachers should be able to
understand and recognise the competencies embedded in mathematical tasks and
activities (Niss & Højgaard, 2011). However, the moderate single measures indicate
that the identified competency demands of a single teacher are not similarly
trustworthy. This implies that for teachers as a group, the item analysis scheme can be
a valuable tool for promoting discussions and reflections about mathematical tasks and
the competencies students need to activate when solving them. According to Arbaugh
and Brown (2005), this type of critical examination of mathematical tasks can support
growth in pedagogical content knowledge and change teachers’ practice.
In addition, the agreement observed for the different assessments could indicate that
the more complex items were more challenging for the teachers to analyse. One reason
for this might be that teachers mainly are exposed to tasks from textbooks that focus
on applying algorithms (Palm et al., 2011), and they are not used to examining the
demands of complex tasks requiring multiple competencies. This might be an issue, as
cognitively demanding tasks seem to promote higher learning outcomes (Boaler &
Staples, 2008; Stein & Lane, 1996), and thus should play a considerable role in
mathematics education. Even though the teachers seemed to have a similar
understanding of the competencies and were able to recognise when an item demanded
the activation of a competency, the distribution of the teachers’ ratings shows that they
judged only a small proportion of the competency demand to be at the higher levels 2
and 3. This uneven distribution of ratings is most likely not due to low competency
demand in the items. Rather, the observed patterns stem from the level descriptions in
the item analysis scheme and the teachers’ interpretations of these. Thus, further
revisions of the scheme may be needed for teachers to be able to use it to distinguish
between the different levels of demand for each competency.
References
Arbaugh, F., & Brown, C. A. (2005). Analyzing mathematical tasks: A catalyst for change?
Journal of Mathematics Teacher Education, 8(6), 499–536.
Boaler, J., & Staples, M. (2008). Creating mathematical futures through an equitable teaching
approach: The case of Railside School. The Teachers College Record, 110(3), 608–645.

Pettersen, Nortvedt
4–66 PME40 – 2016
Burkhardt, H. (2014). Curriculum design and curriculum change. In Y. Li & G. Lappan
(Eds.), Mathematics curriculum in school education (pp. 13–33). Dordrecht, Netherlands:
Springer.
Hiebert, J. (1986). Conceptual and procedural knowledge: The case of mathematics.
Hillsdale, NJ: Erlbaum.
Hoyt, W. T., & Kerns, M.-D. (1999). Magnitude and moderators of bias in observer ratings:
A meta-analysis. Psychological Methods, 4(4), 403–424.
Kilpatrick, J. (2014). Competency Frameworks in Mathematics Education. In S. Lerman
(Ed.), Encyclopedia of mathematics education (pp. 85–87). Dordrecht, Netherlands:
Springer.
Kilpatrick, J., Swafford, J., & Findell, B. (Eds.) (2001). Adding It Up: Helping Children Learn
Mathematics. Washington, DC: National Academy Press.
McGraw, K. O., & Wong, S. P. (1996). Forming inferences about some intraclass correlation
coefficients. Psychological Methods, 1(1), 30–46.
Niss, M., & Højgaard, T. (2011). Competencies and mathematical learning. Ideas and
Inspiration for the development of mathematics teaching and learning in Denmark.
Roskilde, Denmark: Roskilde University.
Palm, T., Boesen, J., & Lithner, J. (2011). Mathematical reasoning requirements in Swedish
upper secondary level assessments. Mathematical Thinking and Learning, 13(3), 221–246.
Shrout, P. E., & Fleiss, J. L. (1979). Intraclass correlations: Uses in assessing rater reliability.
Psychological Bulletin, 86(2), 420–428.
Stein, M. K., & Lane, S. (1996). Instructional tasks and the development of student capacity
to think and reason: An analysis of the relationship between teaching and learning in a
reform mathematics project. Educational Research and Evaluation, 2(1), 50–80. doi:
10.1080/1380361960020103
Turner, R., Blum, W., & Niss, M. (2015). Using competencies to explain mathematical item
demand: A work in progress. In K. Stacey & R. Turner (Eds.), Assessing mathematical
literacy: The PISA Experience. (pp. 85–115). Switzerland: Springer International
Publishing.
Turner, R., Dossey, J., Blum, W., & Niss, M. (2013). Using mathematical competencies to
predict item difficulty in PISA: A MEG study. In M. Prenzel, M. Kobarg, K. Schöps, & S.
Rönnebeck (Eds.), Research on PISA (pp. 23–37). New York: Springer.
Westera, W. (2001). Competences in education: A confusion of tongues. Journal of
Curriculum Studies, 33(1), 75–88.
Wiliam, D. (2007). Keeping learning on track. In F. K. J. Lester (Ed.), Second handbook of
research on mathematics teaching and learning (pp. 1053–1098). Charlotte, NC:
Information Age.

2016. In Csíkos, C., Rausch, A., & Szitányi, J. (Eds.). Proceedings of the 40th Conference of the International
Group for the Psychology of Mathematics Education, Vol. 4, pp. 67–74. Szeged, Hungary: PME. 4–67
MAKING SENSE OF DYNAMICALLY LINKED
MULTIPLE REPRESENTATIONS OF FUNCTIONS
Guido Pinkernell
Pädagogische Hochschule Heidelberg
The dynamisation of multiple representations of parametrized functions add to the
variety of how the effects of a parameter on graph and table are perceived, sometimes
in a way that seems specific to a dynamic environment. While these perceptualizations
seem perfectly valid within the geometric or numeric representational system alone,
they contradict to how the multiple representation environment should be read as a
whole. For building a coherent mental model of a dynamic multiple representation of
a parametrized function, this paper proposes to identify the parameter as an invariant
within and between representational systems. This mainly normative position is further
examined in the light of two theories of knowledge construction by perception, and by
abstraction.
INTRODUCTION
Perceptual bias with dynamic representations of function
Open a dynamic multi-representational software, add a glider that controls a parameter
a, then plot the graph of the function f(x) = x² + a. Increase the value of the parameter
and watch closely how the graph of f changes. It does appear to move upwards, yes,
but doesn't it give the impression of becoming narrower, too? This was what a teacher
student at the University of Education in Heidelberg pointed out when she was asked
to describe the effects of the parameter on the representations of f, using a dynamic
multi-representation environment (fig. 1, cf. Pinkernell 2015). She even knew that her
perceptualization of how the graph changed contradicted to what she knew from
school: The “width” of a parabola is controlled by a parameter in front of the quadratic
term, she recalled. But there wasn't one.
Fig. 1: Moving upwards, and getting narrower, too?

Pinkernell
4–68 PME40 – 2016
Following the movement of graphs across a dynamic coordinate plane which is
restricted by window boundaries seems to invite other perceptualizations than those
associated with static material. For another example, plot the graph of the function f
with f(x) = x + a, then increase the parameter value. Do you actually see the graph
moving upwards? Or wouldn't you agree that it rather moves to the upper left corner
of the graph window? It is obvious that our instantaneous perception of the movements
on the screen is biased by irrelevant or ambiguous properties of the medium. By which
they interfere with building an adequate concept of the mathematical notion
represented in the dynamic learning material.
The parameter as an invariant in the dynamic multirepresentation of functions
To understand the effects of the parameter on the three representations of f(x) + a, it
helps to recall that the parameter value a must be present in all three representations,
in some form or another. In the algebraic representation the parameter can be identified
as the operator +a that increases the function value f(x) by a, in the numeric
representation the actual parameter value can be identified as the constant difference
between neighbouring cells of f(x) and f(x)+a in each line of the table, and in the
geometric representation, the actual parameter value can be identified as the constant
vertical distance between the corresponding points (x,f(x)) and (x,f(x)+a) of the two
graphs. Thus, the parameter is characterised as an invariant within each and between
all three standard representations of a function. One could visualize it as an arrow of
the same direction and of the same length, placed into appropriate places in table,
graph, and equation (fig. 2). Hence, the effect of the parameter change on the graph of
x² + a, in particular, must be described as a vertical translation.
Fig. 2: The parameter, visualized as an invariant operator in all
three representational systems

Pinkernell
PME40 – 2016 4–69
However, one could argue that simple mnemonic phrases should be sufficient to know,
eventually, to be able to translate between function representations, e. g. “the parameter
a in f(x) = x² + a results in a vertical translation of the parabola by a units,” as they are
is generally found in textbooks (cf. Hußmann & Laakman 2011). Yet the student knew
these rules from school. She simply could not apply them when the familiar static
representations of functions suddenly became “alive” on the computer screen.
To ask for identifying the parameter as an invariant within and between the dynamic
function representations is a normative heuristic. It derives from considering the
mathematics behind function representation. In the following we will examine how this
position integrates into other theoretical perspectives on the learning with
representations. First with a psychological focus on the processes of knowledge
construction by perception, then with a domain specific focus on construction of
mathematical concepts by abstraction.
MAKING SENSE BY PERCEPTION AND ABSTRACTION
Knowledge Construction by Perception
In his analysis of information processing of pictures, Palmer (1975) differs between
parametric (colour, size, etc.) and structural information (figure-ground, relations
between elements, etc.). When an individual perceives a change of colours, then these
must have changed in the stimulus. When he or she perceives a change of relations of
picture elements, the picture itself must not have changed at all. The Necker cube is a
well-known example (fig. 3).
Fig. 3: A transparent cube – as seen from above or from below?
To tell whether the graph of x² + a follows a vertical translation only or whether it is
getting narrower, too, means to decide on a specific interpretation of the visuo-spatial
relations of the movements on the screen. Since depictive information about visuo-
spatial relations is ambivalent, both perceptualizations are perfectly valid within the
geometric representation of the effects of a on x²+a. So further information is needed
to decide on how the movement of the graph should be seen within the whole of the
multiple representation environment.
In their theory of knowledge construction from multiple representations, Schnotz &
Bannert (2003) describe the mental model of the given external information as the one
cognitive instance that first “makes sense” during information processing (cf. Vogel

Pinkernell
4–70 PME40 – 2016
2007). While the mental model is based on the perceived properties of the external
information, it is also based on cognitive schemata that contain propositional
instructions relevant for processing information from the given types of depichtive
material. For understanding realistic pictures the individual can use cognitive schemata
of everyday perception, for understanding logical pictures, e. g. technical graphs or
diagrams, so-called graphic schemata are needed for constructing adequate mental
models. From a perceptual-cognitive perspective, the heuristic of identifying the
parameter as an invariant throughout the dynamic material seems an adequate base for
developing cognitive schemata which are suitable for building an appropriate mental
model of the dynamic multiple representation of a parametrized function. However,
there is evidence that only experts or individuals with higher learning abilities are able
to develop graphic schemata for reading information from elaborated graphs or
diagrams (Lowe 1999, Tversky, Morrison & Betrancourt 2002).
Knowledge Construction by Theoretical Abstraction
A mathematical concept is, essentially, abstract. There are no real objects called
“functions” from which to learn what a function is. To access the mathematical concept
of a function means to analyse its representations. Following Duval (1999, 2006),
understanding the concept of function by its representations is the ability of modifying
representations within the same representational system according to its specific rules,
and of translating coherently between representational systems.
All three representational systems are fundamentally different semiotic systems, each
with a specific syntax and set of symbols. To identify the parameter within each
representational system means to find a form that is specific to each system: In algebra
it is the operator +a, in the numeric representation it is the constant difference between
neighbouring table cells, and in the geometric representation the constant vertical
distance between corresponding points of the graphs of x² and x²+a. To identify all
these different forms of appearance as refering to the same quantity means to identify
structural analogies between the different forms of appearance. What in one
representation is a numeric difference between neighbouring values in the table is, in
another representation, a geometric difference between corresponding points in the
coordinate system. To condense system specific information about relations between
cell values or coordinates down to pure structural information about a constant
difference between parametrized function values can be characterized as abstraction.
The nature of constructing mathematical knowledge by abstraction has been discussed
controversially (cf. Mitchelmore & White 2007), ranging from developing context
dependent yet transferable knowledge (Noss, Hoyles & Pozzi 2005) to forming
decontextualized mental entities of knowledge (Sfard 1994). In this paper, the term
abstraction follows what Mitchelmore & White (2007) call theoretical abstraction.
Generally speaking, theoretical abstraction means to create “concepts to fit into some
theory” (Mitchelmore & White, p. 4), i. e. theoretical thought is providing a base for

Pinkernell
PME40 – 2016 4–71
deciding which properties need to be considered and which aspects are irrelevant for
constructing a new concept. Moreover, theoretical thought allows identifying objects
as relevant which, superficially, seem to have nothing in common: “A theoretical idea
or concept should bring together things that are dissimilar, different, multifaceted, and
not coincident, and should indicate their proportion in the whole. ... Such a concept, in
contrast to an empirical one, does not find something identical in every particular
object in a class, but traces the interconnection of particular objects within the whole,
within the system in its formation” (Davydov 1990, p. 255). A model of learning by
abstraction that describes, to put it simply, how to compare the incomparable seems a
suitable framework for describing knowledge construction in a learning environment
that consists of different representational systems.
So within the framework of theoretical abstraction, theoretical thought is a base for the
construction of abstract knowledge. An initial theoretical base could derive from
activating a priori abstract knowledge, it also could derive from a close analysis of the
material at hand (Ohlsson & Lehtinen 1997). Material that allows change and variation
facilitates forming initial abstractions (Giest 2011). Both activating a priori abstract
knowledge about function representations and forming initial abstractions by analysing
changes in a multirepresentational environment underlines the pertinency of the
heuristic proposed in this paper, i. e. to identify the parameter as an invariant in the
dynamic multirepresentational material as proposed above.
SUMMARY AND DISCUSSION
The dynamisation of multiple representations of parametrized functions allows for
unusual, if not mathematically incorrect perceptions of changes on the screen. With
visuo-spatial information being ambiguous in depictive material, a viewer can form
contradicting perceptions of the movements of a function graph across the computer
screen, even when he or she knows better.
To form a coherent mental model of dynamic multirepresentational information, it
helps to identify the parameter as an invariant within and between all three standard
representations. This is mainly a normative view that derives from theoretical
considerations of the mathematics involved in constructing representations of
functions. It is also a view that finds justification in psychological theories of
knowledge construction by perception, where the mental processing of depictive
information is guided by cognitive schemata, which helps to form an adequate mental
model of the multirepresentational information. It also finds justification in
mathematical theories of knowledge construction by abstraction which emphasize the
need for a theoretical base for analysing multirepresentational learning material that
allows identifying the connecting beyond surface properties of each representational
system.

Pinkernell
4–72 PME40 – 2016
Several questions arise:
1 Processing information from logical pictures like graphs or diagrams are highly
demanding (Tversky, Morrison & Betrancourt 2002, Lowe 1996). So are pupils
or students actually able to give a coherent explanation of dynamically linked
multirepresentation of a parametrized function? What kinds of explanations
appear at all, which of those refer to invariants? What are the learning
preconditions on which this ability relies?
2 The potential of dynamic material for the learning of mathematical concepts has
been described as allowing search of invariants that helps to identify the
irrelevant properties (Ainsworth 2006). A search of invariants yield those initial
abstractions that provide the first theoretical base for forming a new concept
(Ohlsson & Lehtinen 1997, Giest 2007). For analysing theory-based processes
of mathematical knowledge construction, the AiC model of abstract knowledge
construction by epistemic actions seems appropriate (Hershkowitz, Schwarz &
Dreyfus 2001, Dreyfus 2012). So how does this model apply to the analysis of
learning processes that are initiated by dynamic material? Esp., is it possibly to
identify instances of initial abstraction with learners?
3 A search for invariants starts with a close analysis of the structure of the
algebraic expression. The parameters in b·f(x) and f(x+c) obviously result in a
vertical dilation or a horizontal translation of the graph of f, resp. Yet with f(x)
= ex, the graph's movement across the coordinate plane appears virtually
identical in both cases. To be able to decide which interpretation is coherent
with the whole multiple representation environment, basic abilities in algebra
structure sense (Hoch & Dreyfus 2006) seem indispensable. So is it possible to
confirm a correlation between structure sense and the ability to give a coherent
explanation of dynamically linked multirepresentation of a parametrized
function?
4 Knowledge based on static material needs to prove itself in a dynamic
environment too. The validity of mathematical knowledge does not depend on
how it is represented. So what is the potential of dynamic material for building
decontextualized and resilient knowledge? Addressing awareness of
perceptional bias adds to its potential. What kind of misperceptions are possible,
which do appear? How to develop appropriate dynamic learning material that
can unfold its “semiotic potential” (Mariotti 2009)?
Questions 1 and 3 are presently subject of research within the DiaLeCo project at the
Pädagogische Hochschule in Heidelberg. A first qualitative content analysis from
standardized interviews shows that, regarding questions 1, students were in fact able
to refer to structural analogies. One particular neat response involved a ruler that moves
vertically across the coordinate plane while measuring a constant distance of the graphs
Pinkernell
PME40 – 2016 4–73
of f(x) and f(x) + a (Pinkernell 2015). Concerning the third set of questions, a test on
algebra is presently being developed with a particular focus on structure sense and
representational flexibility.
References
Ainsworth, S. (2006). DeFT: A conceptual framework for considering learning with multiple
representations. Learning and Instruction, 16, 183–198.
Davydov, V. V. (1990). Types of Generalization in Instruction: Logical and Psychological
Problems in the Structuring of School Curricula. (Vol. 2). Reston, Virginia: National
Council of Teachers of Mathematics.
Dreyfus, T. (2012). Constructing Abstract Mathematical Knowledge in Context. In Sung Je
Cho (Hrsg.), The Proceedings of the 12th International Congress on Mathematical
Education. Seoul, South Korea.
Giest, H. (2011). Wissensaneignung, Conceptual Change und die Lehrstrategie des
Aufsteigens vom Abstrakten zum Konkreten. Tätigkeitstheorie (4). http://www.ich-
sciences.de/index.php?id=135
Hershkowitz, R., Schwarz, B. B., & Dreyfus, T. (2001). Abstraction in context: Epistemic
actions. Journal for Research in Mathematics Education, (32), 195–222.
Hoch, M., & Dreyfus, T. (2006). Structure sense versus manipulation skills: An unexpected
result. In J. Novotná, M. Moraová, M. Krátká, & N. Stehlíková (Hrsg.), Proceedings of the
30th Conference of the International Group for the Psychology of Mathematics Education
(Bd. 3, S. 305–312). Prague.
Hußmann, S., & Laakmann, B. (2011). Eine Funktion - viele Gesichter. PM, 53(38), 2–11.
Lowe, R. K. (1996). Background knowledge and the construction of a situational
representation from a diagram. European journal of Psychology of Education, 11(4), 377–
397.
Mitchelmore, M., & White, P. (2007). Abstraction in Mathematics Learning. Mathematics
Education Research Journal, 19(2), 1–9.
Noss, R., Hoyles, C., & Pozzi, S. (2002). Abstraction in expertise: A study of
nurses’ conceptions of concentration. Journal for Research in Mathematics Education,
33(3), 204–229.
Ohlsson, S., & Lehtinen, E. (1997). Abstraction and the Acquisition of Complex Ideas.
International Journal of Educational Research, 27, 37–48.
Pinkernell, G. (2015). Reasoning with dynamically linked multiple representations of
functions. Proceedings of the 9th Congress of European Research in Mathematics
Education, Prag.
Schnotz, W., & Bannert, M. (2003). Construction and interference in learning from multiple
representation. Learning and Instruction, 13, 141–156.

Pinkernell
4–74 PME40 – 2016
Sfard, A. (1994). Reification As The Birth Of Metaphor. For the Learning of Mathematics,
14(1), 44–55.
Tversky, B., Morrison, J. B., & Betrancourt, M. (2002). Animation: can it facilitate?
International Journal of Human-Computer Studies, 57(4), 247–262.
Vogel, M. (2007). Multimediale Unterstützung zum Lesen von Funktionsgraphen.
Grundlagen, Anwendungen und empirische Untersuchung eines theoriegeleiteten
Ansatzes zur Arbeit mit multiplen Repräsentationen. Mathematica didactica, 30(1), 3–28.
2016. In Csíkos, C., Rausch, A., & Szitányi, J. (Eds.). Proceedings of the 40th Conference of the International
Group for the Psychology of Mathematics Education, Vol. 4, pp. 75–82. Szeged, Hungary: PME. 4–75
A COMPARATIVE ANALYSIS OF WORD PROBLEMS
IN SELECTED THAI AND FINNISH TEXTBOOKS
Nonmanut Pongsakdi, Boglarka Brezovszky, Koen Veermans,
Minna Hannula-Sormunen , & Erno Lehtinen
Centre for Learning Research & Dept. of Teacher Education, University of Turku
The purpose of this study is to compare the characteristics of word problems used in a
selection of Thai and Finnish mathematics textbooks. A total of 1,565 word problems
from a series of 2nd grade to 4th grade Thai and Finnish mathematics textbooks were
analysed. The results show that the characteristics of word problems used in Thai
textbooks differ from Finnish textbooks in many aspects. A majority of word problems
in Finnish textbooks are multi-step word problems, while in Thai textbooks, one-step
word problems are more prominent. Finnish textbooks have a higher percentage of
repetitive sections (ones that include only the same type of problems) than Thai
textbooks. In both countries, word problems requiring the use of realistic
considerations are infrequent, making up less than 5 percent of the total.
INTRODUCTION
A word problem is defined as a text which describes a situation with question(s) to be
answered by applying mathematical operation(s) based on a provided set of
descriptions (Verschaffel, Greer, & De Corte, 2000). However, in early-grade
textbooks, instead of using only text, word problems often include graphical
representation (e.g., pictures, graphs, tables) to describe situations and provide
meaningful numerical data (Pongsakdi, Brezovszky, Hannula-Sormunen, Lehtinen,
2013). Therefore, in this study, a word problem is not only a text, but can also be a
combination of text and picture(s) that describes a situation, provides meaningful data
and requires applying mathematical operation(s) for the question(s) to be answered.
Word problems are intended to provide a connection between classroom mathematics
and mathematics in the real world. It is believed that through practicing with word
problems, students could learn not only mathematical skills, but also how to apply these
skills effectively, which in turn would allow them to solve math problems that they
encounter in everyday life (Verschaffel et al., 2000).
For this to be realized, the word problems presented to students need to resemble math
problem situations that occur in everyday life. Students also need to understand the
situations described in word problem texts and use realistic considerations when
solving the problems. Unfortunately these two requirements are rarely met. For
instance, several studies indicated that many students do not develop an adequate
understanding of the situations described in word problem texts and only apply
superficial strategies, such as a keyword approach (looking for the individual word that
indicates which calculation to perform, e.g. “altogether” = addition) (Van Dooren, De
Bock, Vleugels, & Verschaffel, 2010). Even those students who do use more

Pongsakdi, Brezovszky, Veermans, Hannula-Sormunen, Lehtinen
4–76 PME40 – 2016
comprehensive strategies often do not use realistic considerations when solving the
word problems (for an overview, see Verschaffel et al., 2000).
The reason that students apply superficial strategies and exclude the use of realistic
considerations in the modelling process may originate from the nature of the word
problems and the way they are presented in mathematics textbooks. First, if none of
the word problems presented to students resemble math problem situations that occur
in everyday life, one can hardly expect students to use realistic considerations. Second,
if word problems are sequenced in a way that allows students to determine the solution
method and the operation needed without reading the text (e.g., providing students with
whole pages of the same type of word problems) (Jonsson, Norqvist, Liljekvist, &
Lithner, 2014), this can be expected to trigger einstellung (Luchins, 1942) rather than
comprehensive strategies that would lead to a proper understanding of the situation
presented in the problems. Jonsson and colleagues (2014) explained that when
problems are presented in such a way, students do not use conceptual understanding
and proper reasoning skills. They only practice computation skills by recalling facts
and imitating a solution procedure illustrated in the textbooks. Lastly, some word
problems include graphical representations to describe the situation of that word
problem, for instance, using pictures to illustrate how 15 candies can be divided equally
into 3 boxes. By using graphical representations in this manner, it is already clear to
students what they should do, since a solution procedure is explained within the
pictures.
Traditional word problems have been described as too simple or straightforward, and
solved easily by using superficial strategies (Wyndhamn & Säljö, 1997). They mostly
ask for a precise numerical answer, which leaves little room for realistic considerations
to be integrated into the solution process (Freudenthal, 1991). Gkoris and colleagues
(2013) presented evidence to support this claim. Their studies revealed that around 90
percent of word problems in old and new 5th grade Greek mathematics textbooks can
be solved by a direct translation of the problem texts into mathematical operations
without the need for any realistic considerations. Joutsenlahti and Vainionpää (2008)
obtained similar results, finding that around 94 percent of word problems in 5th grade
Finnish mathematics textbooks are word problems that include a simple objective and
always have only one correct answer, suggesting a lack of word problems requiring the
use of realistic considerations.
Most of the studies concerning the nature of word problems used in textbooks and
mathematics education have been made in Western cultures and there have been very
few studies in other cultural and educational contexts (e.g., Chan & Mousley, 2005).
The purpose of the present study is to explore whether these issues also exist in highly
regarded mathematical textbooks (2nd grade to 4th grade), and to compare Thai and
Finnish mathematics textbooks from that perspective. Specifically, the present study
attempted to answer these four research questions: 1) How do the types of word
problems differ between Thai and Finnish math textbooks? 2) How do Thai and Finnish
textbooks differ in the number of repetitive sections that contain only the same type of

Pongsakdi, Brezovszky, Veermans, Hannula-Sormunen, Lehtinen
PME40 – 2016 4–77
word problems? 3) How do Thai and Finnish textbooks differ in the graphical
representations included with word problems? and 4) How do Thai and Finnish
textbooks differ in the number of word problems requiring the use of realistic
considerations?
METHODS
Selection of Textbooks
Most studies point out that regular mathematics textbooks mainly include word
problems that have a simple goal and do not require students to use realistic
considerations in the modelling process. However, it is not clear whether the same
problems exist in the textbooks that are considered to be one of the most high quality
mathematics textbooks in that country. Therefore, unlike typical textbook studies, this
study selected only textbooks that are highly regarded, drawing on the opinions of
experienced teachers. A series of 2nd grade to 4th grade mathematics textbooks, used in
spring term, were selected for the purpose of this study. A total of 1,565 word problems
were analysed.
Grade Thai textbook Finnish textbook
No. of word
problems No. of sections
No. of word
problems No. of sections
2 81 13 323 64
3 164 28 314 74
4 324 45 359 75
Total 569 86 996 226
Table1: Number of word problems and sections in Thai and Finnish textbooks
expressed by grade level.
Analytical Framework
The framework for analysis of word problems consists of four main coding schemes:
1) classification of word problem types, 2) repetitiveness of word problem sequences,
3) graphical representations, and 4) the use of realistic considerations.
Classification of word problem types
The coding scheme for word problem types was constructed based on the classification
schemes from Greer (1987). Each word problem in the textbooks was classified as
belonging to either one-step addition and subtraction word problem types (21 different
types of Change, Combine, Compare, and Equalize word problems), one-step
multiplication and division word problem types (18 different types of Multiple group,
Iteration of measure, Rate, Measure conversion, Rectangular array, Combinations, and
Area), one-step word problems that do not belong to any category (e.g., Metinee
finished her homework at 11.25. She spent 1 hour 20 minutes doing it. When did she

Pongsakdi, Brezovszky, Veermans, Hannula-Sormunen, Lehtinen
4–78 PME40 – 2016
start to do the homework?), or multi-step word problem. The inter-rater agreement for
word problem types between two independent coders was high (κ= .81).
Repetitiveness of word problem sequences
Repetitiveness of word problems was investigated by determining the type of word
problems used in a section of word problems. A section was considered repetitive if it
contained only one type of word problem. For sections that included only multi-step
word problems, it was investigated whether those multi-step word problems could be
solved in the same way (even if the given numbers were different). Sections in which
all multi-step word problems could be solved in the same way were also considered to
be repetitive.
Graphical representations
Graphical representations used in word problems were classified according to the
coding scheme presented in Table 2. The inter-rater reliability between two
independent coders was excellent (κ= .93).
Types Description Code
No graphical
representation
There is no graphical representation used in the word
problem.
0
Picture containing
numerical data
The main purpose of using the picture is to provide
numerical data.
1
Picture describing the
situation
The main purpose of using the picture is to illustrate the
situation of the word problem. Although the picture
may contain the numerical data, students do not need to
use them since all data already are provided in word
problem.
2
Picture representing
the object
The main purpose of using the picture is to represent
the objects mentioned in that word problem. For
example, there are 20 in the basket.
3
Picture for decorative
purposes
The picture is related to the word problem but it is used
only for decorative purposes.
4
Chart, graph, table The data were represented in the chart, graph and table
format.
5
Table 2: Classification of graphical representations used in the textbooks.
The use of realistic considerations
This coding scheme for the use of realistic considerations was adopted from Gkoris et
al. (2003). If word problems are constructed in a way that requires the use of non-direct
translation of the word problem texts on the basis of real-world knowledge and
assumptions into the mathematical model, then they are coded as 1; those word

Pongsakdi, Brezovszky, Veermans, Hannula-Sormunen, Lehtinen
PME40 – 2016 4–79
problems that can be answered by direct translation of the word problem texts are coded
as 0. For example, the bus problem “304 students must be bused to their camping area.
Each bus can hold 32 students. How many buses are needed?” Instead of the answer
“9.5 buses”, which derives from a mathematical model translated directly from the
problem’s statement (304 ÷ 32), students need to consider whether their answer is
appropriate for the situation being modeled, and provide an alternate more suitable
answer (10 buses). Therefore, this word problem was coded as 1. The inter-rater
agreement between two independent coders was excellent (κ= .91).
RESULTS
Type of word problems included in Thai and Finnish textbooks
Figure 1 displays the number (and percentage) of word problems by problem types in
the Thai and Finnish mathematics textbooks. Overall results showed that a majority of
word problems included in the 2nd grade to 4th grade Finnish textbooks were multi-step
word problems, while most word problems used in the 2nd grade Thai textbook were
one-step multiplication and division word problems. In the 3rd grade Thai textbook, a
majority of word problems were one-step addition and subtraction and multi-step word
problems, while in the 4th grade Thai textbook, multi-step word problems were more
prominent.
Figure 1: Number (and percentage) of word problems by problem types in Thai and
Finnish textbooks.
Repetitiveness of word problem sequences
The repetitiveness of word problem sequence was investigated. Surprisingly, more
than half (60.9%) of sections in the 2nd grade Finnish textbook were repetitive. These
sections included either the same type of one-step word problems or multi-step word
problems that could be solved in the same way. However, the number of sections with
the same word problem types was lower in the 3rd (54.1%) and 4th grade textbooks
(45.3%). In Thai textbooks, the percentage of sections with the same word problem
types was around 38.5% in the 2nd grade, but it decreased in the 3rd (14.3%) and 4th
grade textbooks (17.8%).
0 %
41
.5%
23
.8%
9%
6.1
%
6.1
%
93
.8%
12
.2% 2
3.5
% 40
.9%
38
.2%
20
.1%
6.2
%
8.5
% 16
.7%
5.3
%
8.9
% 15
.9%
0%
37
.8% 3
6.1
%
44
.9%
46
.8%
57
.9%
0
50
100
150
200
250
Second Grade Third Grade Fourth Grade Second Grade Third Grade Fourth Grade
Thai textbooks Finnish textbooks
One-step addition and subtraction One-step multiplication and division
Undefined one-step Multi-steps

Pongsakdi, Brezovszky, Veermans, Hannula-Sormunen, Lehtinen
4–80 PME40 – 2016
Graphical representations
The use of graphical representations in all word problems was investigated. A majority
of word problems in the 2nd grade Thai textbook used pictures to represent objects and
describe the situation, while a plurality of word problems in the 3rd and 4th grade Thai
textbooks did not include any graphical representations. In the 2nd grade to 4th grade
Finnish mathematics textbooks, a majority of word problems used pictures that
contained numerical data.
Figure 2: Number (and percentage) of word problems by types of graphical
representation used in Thai and Finnish textbooks.
The use of realistic considerations
All word problems were examined for including realistic considerations. The results
revealed that there were no word problems in the 2nd and 3rd grade Thai textbooks
requiring the use of realistic considerations, while in the 4th grade Thai textbook, the
percentage of word problems requiring the use of realistic considerations was just
1.9%. Similar to Thai textbooks, the 2nd grade Finnish textbook contained no word
problems requiring students to use realistic considerations. The percentage of word
problems requiring the use of realistic considerations in the 3rd and 4th grade Finnish
textbooks was 3.2% and 4.5%, respectively.
DISCUSSION
The present study investigated characteristics of word problems from a series of 2nd
grade to 4th grade Thai and Finnish mathematics textbooks used in spring term.
Although the textbooks used in this study had a good reputation in Thailand and
Finland, the results are in agreement with previous studies that most word problems
used in textbooks usually include a simple goal without the need for any realistic
28.4%
52.4%
43.5%
1.9%
1.6%
6.7%
0%
7.9%
23.1%
78.6%
79.3%
55.7%
33.3%
7.3%
1.9%
6.2%
6.1%
7.5%
38.3%
0%
0%
0%
0%
0%
0%
17.7%
9.3%
13.3%
13.1%
25.9%
0%
14.6%
22.2%
0%
0%
4.2%
0 50 100 150 200 250 300
Second Grade
Third Grade
Fourth Grade
Second Grade
Third Grade
Fourth Grade
Thai
te
xtb
oo
ksFi
nn
ish
te
xtb
oo
ks
None Numerical data Describing situation
Representing object Decorative purposes Chart, Graph, Table
Pongsakdi, Brezovszky, Veermans, Hannula-Sormunen, Lehtinen
PME40 – 2016 4–81
considerations (Gkoris et al., 2013; Joutsenlahti & Vainionpää, 2008). The results
indicate that the main findings concerning the realistic considerations made in Western
educational systems also characterized the use of word problems in Thailand.
However, the characteristics of word problems used in Thai textbooks differed from
Finnish textbooks in many other aspects. Thai textbooks had a traditional way of
introducing word problems to the students. For instance, in the 2nd grade Thai textbook,
a majority of word problems were simple one-step multiplication and division
problems. This might be due to the Thai curriculum, in which students must learn
multiplication and division in the spring term, and results might have differed if the
sampled textbooks covered the whole year. Further, multi-step word problems were
not yet included in the 2nd grade Thai textbook, although they began to be used in the
3rd and 4th grade Thai textbooks. In contrast, multi-step word problems were already
emphasized in the 2nd grade in Finnish textbook, and this trend continued across grade
levels. Notably, Finnish textbooks had much more word problems, particularly in the
2nd and 3rd grade, than the Thai textbooks.
Many multi-step word problems, particularly in the 2nd and 3rd grade Finnish textbooks,
did not use long sentences to describe the situation of the problems. This might be due
to concerns with the reading comprehension skills of young students. Instead of using
long texts, graphical representations were utilised to provide meaningful information
such as numerical data. For example, a word problem included a picture of several
banknotes, and it asked how much money a boy would have left after he bought a ticket
which cost 22 Euros. Originally, this word problem was a simple one-step subtraction
problem (change problem), but because of the use of graphical representations,
students first needed to calculate the total amount of money that the boy had and then
subtract 22 Euros from this total. With this additional function of graphical
representation, the word problem would be considered a multi-step word problem. In
contrast, in the 2nd grade Thai textbooks, a majority of graphical representations were
used only to represent objects and to describe the situation. In the 3rd and 4th grade Thai
textbooks, word problems hardly included any graphical representations. One possible
reason why many word problems in the 2nd grade Thai textbooks included graphical
representations to describe the situation is that these pictures might assist students to
understand difficult mathematical concepts, such as multiplication and division.
However, this type of graphical representations also trivialises the purpose of using
word problems. Students already knew the answer to the problem in advance, since a
solution procedure is presented within the pictures. Furthermore, the repetitiveness of
word problems was investigated. The results revealed that Thai textbooks had a smaller
percentage of repetitive sections than Finnish textbooks. Although Thai textbooks used
more one-step word problems than the Finnish textbooks, they included a greater
variety of types of word problems in each section. Presenting word problems in this
manner requires students to read the problems more carefully. It may also prevent
students from using the same solution procedure repeatedly without thinking, which
can easily occur when the section of problems is repetitive.

Pongsakdi, Brezovszky, Veermans, Hannula-Sormunen, Lehtinen
4–82 PME40 – 2016
References
Chan, K. Y. & Mousley, J. (2005). Using word problems in Malaysian mathematics
education: Looking beneath the surface. In H. L. Chick & J. L. Vincent (Eds.), Proc. 29th
Conf. of the Int. Group for the Psychology of Mathematics Education, (Vol. 2, pp. 217-
224). Melbourne, Australia: PME.
Freudenthal, H. (1991). Revisiting Mathematics Education: China Lectures. Dordrecht:
Kluwer.
Gkoris, E., Depaepe, F., & Verschaffel, L. (2013). Investigating the gap between real world
and school word problems: A comparative analysis of the authenticity of word problems
in the old and the current mathematics textbooks for the 5th grade of elementary school in
Greece. Mediterranean Journal for Research in Mathematics Education, 12 (1-2), 1-22.
Greer, B. (1987). Understanding of arithmetical operations as models of situations. In J.A.
Sloboda & D. Rogers (Eds.), Cognitive Processes in Mathematics (pp. 60-80). Oxford:
Clarendon Press.
Jonsson, B., Norqvist, M., Liljekvist, Y., & Lithner, J. (2014). Learning mathematics through
algorithmic and creative reasoning. The Journal of Mathematical Behavior, 36(1), 20-32.
Joutsenlahti, J. & Vainionpää, J. (2008). Oppikirja vai harjoituskirja. Perusopetuksen
luokkien 1-6 matematiikan oppimateriaalin tarkastelua MOT-projektissa. In A.
Kallioniemi (ed.), Uudistuva ja kehittyvä ainedidaktiikka. Ainedidaktinen symposiumi,
Tutkimuksia 299. Helsinki: Helsingin yliopiston Kasvatustieteen laitos, 547–558.
Luchins, A. S. (1942). Mechanization in problem solving: The effect of Einstellung.
Psychological Monograph, 54, 248.
Pongsakdi, N., Brezovszky, B., Hannula-Sormunen, M.M., & Lehtinen, E. (2013). An
Analysis of Word Problem Solving Tasks: A Development of Framework. Poster presented
at the15th conference of the Junior Researchers of EARLI, 26-27 August, Munich,
Germany.
Van Dooren, W., De Bock, D., Vleugels, K., & Verschaffel, L. (2010). Just Answering... or
Thinking? Contrasting Pupils' Solutions and Classifications of Missing-Value Word
Problems. Mathematical Thinking and Learning: An International Journal, 12(1), 20-35.
Verschaffel, L., Greer, B., & De Corte, E. (2000). Making sense of word problems. Lisse:
Swets and Zeitlinger.
Wyndhamn, J., & Säljö, R. (1997). Word Problems and Mathematical Reasoning - A Study
of Children's Mastery of Reference and Meaning in Textual Realities. Learning and
Instruction, 7, 361- 382.

2016. In Csíkos, C., Rausch, A., & Szitányi, J. (Eds.). Proceedings of the 40th Conference of the International
Group for the Psychology of Mathematics Education, Vol. 4, pp. 83–90. Szeged, Hungary: PME. 4–83
THE EFFECT OF THE EXPLICIT TEACHING METHOD ON
LEARNING THE WORKING BACKWARDS STRATEGY
Yelena Portnov-Neeman & Miriam Amit
Department of Science and Technology Education, Ben-Gurion University of the
Negev, Beer-Sheva, Israel
It has been shown that children who control strategies are able to direct their own
learning and knowledge. Seeking for an effective teaching method to achieve this goal,
we experimented with the Explicit Teaching method vs. a traditional school one, using
both to teach the working backwards strategy. A mixed method analysis showed that
explicit teaching showed better results on students' ability to use the strategy. In
addition, we found that the teaching method did not affect the students' ability to
recognize the strategy. This indicates that young students can understand when to use
this powerful tool and, with further guidance, can master their ability to use
mathematical strategies.
Theoretical Framework
Children that behave strategically are able to direct their own learning and acquire
knowledge of a specific domain. Often, the use of strategies in problem solving will
help the child to understand how the strategy works, why it works, and why it is the
most efficient way to solve the problem (English, 1993; Portnov-Neeman & Amit,
2015). Students who control many strategies will become faster, more effective and
more intelligent problem solvers (Polya, 1957). Tishmen, Perkins & Jay (1996)
claimed that most students and adults will not tend to think and behave strategically
without proper instruction, guidance and encouragement. Researchers and teachers are
constantly learning how best to teach strategies so as to increase students' ability to
control them. However, there is a concern among teachers and instructors that teaching
mathematical strategies will be difficult to implement and understand (Zbiek & Larson,
2015). The current study will address those concerns by demonstrating the effect of a
specific teaching method called Explicit Teaching on the learning process of the
Working Backward Strategy.
Explicit Teaching - Definition and model
Explicit teaching is a systematic methodology of teaching used mainly in areas of
reading and mathematics (Anhalt & Cortez, 2015; Archer & Hughes, 2011; Edwards-
Groves, 2002). This method is “highly organized and structured, teacher-directed, and
task-oriented” (Ellis, 2005). There is a mediation process between the teacher and the
learner during all stages of learning (Tetzlaff, 2009), and the teacher is responsible for
transmitting an external understanding of information to the learner, who is then
Portnov-Neeman, Amit
4–84 PME40 – 2016
responsible for processing that pre-determined understanding (Olson, 2003). Using
explicit teaching does not necessarily predetermine or confine the learners’ way
thinking; on the contrary, it can help to become more active solvers and foster
independent thinking (Portnov-Neeman & Amit, 2015). Tetzlaff (2009) summarized
this method into a five step model:
Orientation
Each lesson begins with a clear instruction about the purpose of the lesson. Learners
need to understand what they going to learn and how it connects to previous lessons.
Presentation
The lesson material divides into small units that fit the learners’ cognitive abilities. The
teacher uses a model or schema to guide them through their problem solving process.
Structured Practice
The instructor gives a direct and detailed explanation of the problem solving using a
model or schema that was presented in the previous step. During this phase, it is critical
that the instructor asks learners questions to check and assess their understanding of
the material and clarify any confusion.
Guided Practice
In this practice the instructor addresses individuals’ questions and misconceptions one-
on-one, and tailors responses to meet the individual needs of each leaner.
Independent Practice
In this step, learners are asked to complete an assignment on their own and without
assistance. They are not expected to have a flawless understanding of the lesson, but
they must understand the steps involved in the process. This step should continue till
learners gain full independent proficiency with the materials.
Working Backwards Strategy
The working backwards strategy is a useful and efficient strategy in many aspects of
our lives (Newell & Simons, 1972; Portnov-Neeman & Amit, 2015). Sometimes, the
achievable outcome is known, but we have not yet determined the path towards
achieving it. When dealing with word problems, the information given in a problem
can appear like a complex list of facts. In problems such as these, it is sometimes
helpful to begin with the last detail given (Wrigh, 2010). To apply this strategy, the
following steps must be followed:
1) Read the problem from beginning to end and identify all components and steps
that involved in the problem.
2) Check the final outcome of the problem.

Portnov-Neeman, Amit
PME40 – 2016 4–85
3) From the final outcome, start reversing each mathematical operation in each step
until reaching the beginning of the problem.
4) Resolve the initial state.
5) Check the answer by starting from the initial state and working through the steps
to see if the final outcome is achieved (Amit, Heifets & Samovol, 2007).
Methodology
The current study examined the effect of using the explicit teaching method to learn a
new strategy, specifically the working backwards strategy for mathematical problem
solving. The research questions examined to what extent explicit teaching affects:
a) The ability to solve working backwards problems.
b) The ability to recognize the working backwards strategy.
Research Setting
Subject
The study was conducted in the framework of the "Kidumatica" program. Kidumatica
is targeted at talented students from the 5th to the 11th grades who are interested in
mathematics, but require further tools to reach their full potential (Amit, 2009). Fifty-
seven (N= 57) 6th grade students were divided in two groups: an experimental group
(EG = 30 students) and a control group (CG = 27 students). Over six months, the
students studied different mathematical strategies, including the working backwards
strategy. The EG studied via the explicit teaching method while the CG studied via the
traditional school one. None of them had served as research subjects in previous studies
involving the working backward strategy and they had not learned it before. Both
groups were taught by the same teacher, who was trained in the delivery of the
intervention and was mindful of the possibility of contamination between the different
methods employed by the experiment and control group. The fidelity of the teacher to
the delivery of the intervention was checked through classroom observations by the
program supervisor.
Experimental Group – Explicit Teaching
Students in this group studied the working backwards strategy using the explicit
teaching method. The strategy was taught for four weeks and the learning process was
based on the explicit teaching model. Each lesson started with an explanation about
strategy, including its importance as well as where and how it should be implemented.
The teacher demonstrated the model of the strategy and explained the role of each step
in the solution process. Afterwards, the teacher demonstrated the strategy on one
problem and started a discussion based on students' questions. The following lessons

Portnov-Neeman, Amit
4–86 PME40 – 2016
were dedicated to structural, guided and independent practice, with many complex
problems being presented during the lessons.
Control Group- Traditional Teaching
Students in this group studied using a more traditional school approach. The working
backwards strategy was taught for the same period of time as the EG. The first lesson
started with brief explanation about strategies and their use. Then the teacher
demonstrated how to solve several problems based on the working backwards strategy.
The teacher did not name the strategy and did not show the model of the strategy. The
students then had to solve similar problems by themselves. In the following lessons the
teacher presented how to solve more complex problems (similar to the EG) and gave
the students some more practice time. The nature of the practice was mainly
independent and the teacher gave guidance or explanations only when needed.
Data collection and analysis
Data was collected from pre-post questionnaire tests based on working backwards
problems. The tests were conducted at the beginning and the end of the learning
process. In the pre-test, students received a worksheet that included 3-5 problems based
on one strategy. This paper will address two of these (figure 1). The post-test included
six problems, two of which were based on the working backward strategy (figure 2).
At the end of each test, the students were asked to write what method helped them to
solve the problems. The purpose of the pre-test was to examine students’ ability to
solve different working backwards problems, and to determine the homogeneity
between the two groups. The post-test examined the effect of the teaching methods at
the end of the learning process. We used a mixed method to analyze students’ answers
in both tests.
Card Problem: “Yael Danny and Michael played cards. In the beginning of the game each one
had a different amount of cards. Yael gave Danny 12 cards. Danny gave Michael 10 cards and
Michael passed Yael 4 cards. At the end each one of them had 20 cards. How many cards did
Yael, Danny and Michael have in the beginning?”
The Mangoes Problem: “One night the King couldn't sleep, so he went down into the royal
kitchen, where he found a bowl full of mangoes. Being hungry, he took 1/6 of the mangoes. Later
that same night, the Queen was hungry and couldn't sleep. She, too, found the mangoes and took
1/5 of what the King had left. Still later, the first Prince awoke, went to the kitchen, and ate 1/4
of the remaining mangoes. Even later, his brother, the second Prince, ate 1/3 of what was then
left. Finally, the third Prince ate 1/2 of what was left, leaving only three mangoes for the servants.
How many mangoes were originally in the bowl?”

Portnov-Neeman, Amit
PME40 – 2016 4–87
Figure 2: Problems from the pre-test
We used a 5 point scale to rank the answers (5 points - full and correct answer, 0 points
- no answer). For example in the “Weight problem” (figure 2) there were three steps:
(1) Jenya was seven kilograms heavier than Gaby; (2) Gaby was twice as heavy as
Cobi; (3) Cobi was 15 kilograms lighter than Adi. If students identified all the steps,
calculated each one by doing the opposite mathematical calculation and wrote the final
answer correctly, they received 5 points. They got 4 points if they had one calculation
mistake but used the strategy correctly. 3 points were given if they failed to reverse
one step, 2 points if they did not reverse two steps, 1 point if they did not reverse any
step at all, and 0 points they did not solve the problem. Figure 3 shows a five point
solution to this problem. The student wrote all the steps and calculated each step
correctly. He found the initial weight and wrote the answer. Figure 4 shows an example
of a 2 point solution, where the student calculated the first step correctly but did not
reverse the next two steps.
Figure 3: Example of a five point answer to the weight problem
Figure 4: Example to a two point answer to the weight problem
Weight Problem: “Four students in the class weighed themselves. Cobi was 15 kilograms
lighter than Adi. Gaby was twice as heavy as Cobi and Jenya was seven kilograms heavier
than Gaby. If Jenya weighed 71 kilograms what was Adi’s weight?”
Basketball Problem: “The Wolverines baseball team opened a new box of baseballs for
today’s game. They sent 1/3 of their baseballs to be rubbed with special mud to take the gloss
off. They gave 15 baseballs to their star outfielder to autograph. The batboy took 20 baseballs
for batting practice. They had only 15 baseballs left. How many baseballs were in the box at
the start?”

Portnov-Neeman, Amit
4–88 PME40 – 2016
Findings
The findings from the pre-post tests are summarized in table 1 and figure 5. We can
see that both problems in the pre-test showed no significant difference between the
groups, which indicates that both groups had the same level of homogeneity. After six
months of learning strategies, the average scores in the post-test in both problems was
higher among the EG than the CG. We can see a significant difference in the post-test
between the two groups in both problems. Figure 5 shows us that students’ ability to
recognize the strategy improved after the learning process. Both groups had similar
results in the pre and post-test.
Table 1: Results from pre- and post-test in the EG and the CG.
Figure 5: Amount of students from the EG and CG that recognized the working
backwards strategy in pre- and post-tests.
Discussion and limitations
There is no doubt that strategies are an important tool for goal-directed procedures in
problem solving. Introducing them at a younger age can improve learners’ math ability
(Polya, 1957) and promote their understanding and thinking (English, 1993). To
achieve this goal, it is important to use a specific teaching approach (Tishmen, Perkins
37% 41%
13% 11%
90% 88%83% 81%
0%
20%
40%
60%
80%
100%
EG-pre test CG-pre test EG-post test CG-post test
Students' ability to recognize the strategy
Card problem Mango Problem Weight Problem Basketball Problem
Portnov-Neeman, Amit
PME40 – 2016 4–89
& Jay, 1996). In this study, that approach is the explicit teaching method, which we
employed in order to introduce the working backwards strategy. The study examined
the effect of this method on students' ability to solve and recognize a working
backwards problem. Fifty seven six graders were divided into two groups, an
experiment group (EG) that studied with the explicit teaching method and a control
group (CG) that studied with a traditional school one. The strategy was unfamiliar to
both groups and the findings from the pre-test showed that both groups had a similar
starting point.
At the end of the learning process, both groups showed significant improvement, which
indicates that young students are capable of using mathematical strategies for problem
solving (Tishman, Perkins& Jay, 1996). The group that studied explicitly showed
higher results than students that studied with the traditional way, which indicates that
the structural and systematic method of explicit teaching proved to be a suitable
framework for teaching complex concepts (Anhalt & Cortez, 2015). Previous research
has shown that teaching explicitly can help students become active learners and foster
their independent thinking (Portnov- Neeman & Amit, 2015). Our results showed that
learning explicitly does not necessarily fix students' way of solving a problem and
thinking. On the contrary, students understood the principle of the working backwards
strategy and applied it in a way that they deemed fit. Though the CG had lower scores
in the post test, both groups had similar levels of higher percentage in their ability to
recognize a working backwards problem. This finding is very encouraging, since it
may indicate that the teaching method did not affect students' ability to recognize
strategies. With additional practice, students could master strategies and develop their
understanding and their strategic approach towards problem solving. Alongside with
those findings, we should take into account that the study had certain limitations. In
further research, there is a need to examine regular students and not only talented ones.
In addition, there is a need to investigate other mathematical strategies and examine
the effect of explicit teaching on larger population.
Conclusion
As educators, our goal is to find the best way to teach specific math concepts. Our
concern, however, is that mathematical strategies are difficult to teach and to
understand. In order to deal with this concern, we used the explicit teaching method.
We found that students who studied with this approach had higher scores than students
who studied with a traditional school approach. The use of explicit teaching improved
the students' understanding and ability to use the working backwards strategy. As
teachers we do not have to be afraid of introducing this subject to young children. The
process of introducing mathematical strategies will benefit them and help them evolve
into better thinkers and solvers. We can see that students' ability to recognize the time
and place where a certain strategy should be used, was not much affected by the method
of teaching. This can show teachers that young students are capable of understanding
when to use this powerful tool, and that with further guidance and instruction students
can master their ability to use mathematical strategies.

Portnov-Neeman, Amit
4–90 PME40 – 2016
References
Amit, M. (2009). The "Kidumatica" project - for the promotion of talented students from
underprivileged backgrounds. In L. Paditz, & A. Rogerson (Eds.), Proceedings of the 10th
International Conference "Models in Developing Mathematics Education", (pp. 23-28).
Dresden, Germany: University of Applied Science.
Amit, M., Heifets, J., Samovol, P. (2007). Kidumatica- mathematical excellence. Culture,
thinking and creativity methods and applications. Beer- Sheva: Ben-Gurion University.
Anhalt, C. O., & Cortez, R. (2015). Mathematical Modeling: A Structured Process.
Mathematics Teacher, 108(6), 446-452.
Archer, A. L., & Hughes, C. A. (2011). Explicit instruction: Effective and efficient teaching.
New York: Guilford Press.
Edwards-Groves, C.J. (2002). Building an inclusive classroom through explicit pedagogy:
A focus on the language of teaching. Literacy Lexicon Sydney: Prentice Hall, Australia Pty
Ltd.
English, L. D. (1993). Development of children's strategic and metastrategic knowledge in
novel mathematical domain. Queenslande, Australia.
Ellis, A. (2005). Research on educational innovations. Larchmont, NY: Eye On Education,
Inc.
Olson, D. (2003). Psychological theory and educational reform: how school remakes mind
and society. New York, NY: Cambridge University Press.
Polya, G. (1957). How to solve it (2nd ed.). Princeton: Princeton University Press.
Portnov- Neeman, Y. & Amit, M. (2015). Mathematics Education in a Connected World,
Proceedings of the 13th International Conference, Sicily, Italy, September 16-21.
Tetzlaff, T. (2009). Constructivist learning verses explicit teaching: A personal discovery of
balance (Master's thesis). Retrieved from: http://www.cct.umb.edu/tetzlaff.pdf
Tishman, S., Perkins, D., & Jay, E. (1996). The thinking classrom: Learning and teaching in
a culture of thinking. Jerusalem, Isreal: The Branco Weiss Institute for Development of
Thinking.
Wright, C. (2010). Wright's kitchen table math: A step-by-step guide for teaching your child
math. Encinitas, CA: CSBD Pub. Group.
Zbiek, R. M., & Larson, M. R. (2015). Teaching Strategies to Improve Algebra
Learning. Mathematics Teacher, 108(9), 696-699.

2016. In Csíkos, C., Rausch, A., & Szitányi, J. (Eds.). Proceedings of the 40th Conference of the International
Group for the Psychology of Mathematics Education, Vol. 4, pp. 91–98. Szeged, Hungary: PME. 4–91
MATHEMATICS AND SCIENCE TEACHERS’
COLLABORATION: SEARCHING FOR COMMON GROUNDS
Despina Potari1,2, Giorgos Psycharis1, Vassiliki Spiliotopoulou3, Chrissavgi
Triantafillou1, Theodossios Zachariades1, Aggeliki Zoupa1
1 National and Kapodistrian University of Athens, 2Linnaeus University, 3ASPETE
This paper focuses on the collaboration between one mathematics teacher and three
science teachers during a school year in a professional development context
supporting inquiry-oriented approaches and connections with the world of work.
Through an Activity Theory perspective it addresses contradictions and convergences
that emerged in this collaboration as well as interactions between the activity systems
of mathematics and science teaching when the mediating tool is the notion of function
and its graphical representations. The results indicate the development of shared
understandings for the different perspectives that function and graphs are viewed in
mathematics and science teaching and shifts in the teaching activity of the teachers in
the direction of connecting meaningfully mathematics and science.
INTRODUCTION
The issue of communication between science and mathematics in school classrooms
has been acknowledged as crucial for a deeper understanding of common or related
conceptual domains. Consequences of the lack of this communication are spread in
different directions as on the textbooks’ rationale (Triantafillou, Spiliotopoulou &
Potari, 2015); students’ understanding (Planinic, Susac & Ivanjek, 2012); teachers’
classroom discourse and activities (Shirley et al., 2011). The need to provide teachers
opportunities to build connections between mathematics and science teaching into their
classrooms is more than evident. For example, Berlin and White (1995) argue that this
collaboration provides opportunities for students to have less fragmented, and more
learning stimulating experiences. However, the undertaken research needs to be
strengthened, while more evidence on the actual context of mathematics and science
teachers’ collaboration could be emerged. Frykholm and Glasson (2005) suggest that
authentic contexts could provide fertile ground for this collaboration, while King,
Newmann and Carmichael (2009) introduce the idea of 'rich tasks' that involve inquiry-
oriented activities in the context of real world scenarios.
This paper refers to a study that took place in the context of a European project, Mascil
(see: www.Mascil-project.eu), that aims to promote the integration of inquiry-based
learning (IBL) and the world of work (WoW) in the teaching and learning of
mathematics and science. To achieve these goals, teacher education and professional
development activities have been designed where science and mathematics teachers
collaborate in groups to design, implement and analyse lessons in the spirit of lesson
study approaches (Hart, Alston & Murata, 2011). A critical issue to consider is in what
ways these collaborative activities challenge teachers from different disciplines to

Potari, Psycharis, Spiliotopoulou, Triantafillou, Zachariades, Zoupa
4–92 PME40 – 2016
explore the integration of mathematics and science into their teaching and recognize
epistemological and didactical issues related to these different practices. To address
this issue, we adopt an Activity Theory (AT) perspective to focus on the teaching
activity of mathematics and science teachers and on its development in the context of
collaboration. We focus on the notion of function and its graphical representation that
appeared to be central in the teachers’ collaborative activities and we address the
following research question: How do mathematics and science teachers’ collaborative
efforts enrich their teaching activity and enhance connections between the different
epistemological and didactical issues on functions and graphs?
THEORETICAL FRAMEWORK
We adopt Engeström’s (2001) approach to investigate the process of mathematics and
science teachers’ professional learning when they are challenged to integrate IBL and
the WoW into their teaching. We consider two activity systems, the activity of teaching
mathematics and the activity of teaching science, to study the contradictions and
convergences that emerged between the two systems, when teachers attribute meaning
to the notion of function and its graphical representation. Functions and their graphs
are approached from different perspectives in the two disciplines. The teaching of
function in school mathematics is mainly formal and the focus is on its definition and
its properties. Function is a multifaceted object playing a central role in the
development of other mathematical ideas. In science teaching, functions are formulated
on the basis of experimental data and are tools for describing, explaining, and
predicting real world phenomena (Michelsen, 2006). As regards graphs, making sense
of a graph in mathematics means “gaining meaning about the relationship between the
two variables and, in particular, of their pattern of co-variation” (Leinhardt, Zaslavsky
& Stein, 1990, p.11). In physics, the role of the context in which a graph is used takes
a significant role in its meaning (Roth & McGinn, 1997). Below, we provide some
main theoretical concepts related to our AT perspective.
The “activity system” is a basic concept of AT in the way that is approached by
Engeström (2001). It is collective,
tool-mediated and it needs a motive
and an object. Individual and group
actions are studied and interpreted
against the background of entire
activity systems. Activity systems are
transformed over lengthy periods of
time when the object and the motive
of the activity are reconceptualized to
embrace a radically wider horizon of
possibilities than in the previous mode of the activity. Central to the process of
transformation are contradictions within and between activity systems emerging when
a new element comes from the outside. The idea of movement across borders appear
in what Engeström (2001) describes as third generation of AT. Figure 1 shows a
Fig. 1. Interacting activity systems
(Engeström 2001, p. 136)

Potari, Psycharis, Spiliotopoulou, Triantafillou, Zachariades, Zoupa
PME40 – 2016 4–93
representation of a third generation activity in the form of two interacting activity
systems represented by an extended mediational triangle. The two triangles indicate
the basic dimensions of the second generation AT with elements the subject and the
object of the activity that is constructed through the mediation of tools, but it is also
framed by the community in which the subject participates, its rules and the division
of labor. Object 1 moves from an un-reflected and situationally given goal to a
collectively meaningful object constructed by the activity system (object 2) and to a
potentially shared or jointly constructed object (object 3). By studying contradictions
and convergences between the two activity systems, we examine how the notion of
function and its graph (mediating artifacts) mediate the teaching actions of mathematics
and science teachers (subjects) to form shared meanings and goals (object 3).
METHODOLOGY
In mascil implementation, 12 groups of in-service secondary teachers from
mathematics, science and technology have been established. Each group, supported by
a teacher educator, participated in two or three cycles of designing, implementing and
reflecting during a period of a school year. Before and after each implementation of
the designed lessons professional development (PD) meetings took place. During PD
meetings teachers collaborated in designing together inquiry-based tasks, shared their
experiences from the implementations and discussed emerging issues. Besides,
interviews were arranged with a number of participants from each group in order to
further address the impact of the PD experience on their professional learning.
In this study, we focus on three science teachers (sctA, sctB, sctC) and one mathematics
teacher (mtA) who worked in the same upper secondary school and were members of
the same mascil group (7 teachers). These teachers collaborated in the design and
implementation of three tasks (Elasticity of Ropes, Biodiesel and Drug Concentration)
integrating mathematics and science in the context of three cycles of designing-
implementing-reflecting. Here, we analyze data from the first four out of six PD
meetings, the classroom implementation of the first task and the teachers’ interviews.
In these PD meetings, the teachers started to exchange ideas about co- designing,
discussed about the design of the first task and reflected on its implementation. The
classroom implementation of this task lasted 3 teaching sessions (45 minutes each) and
it involved: introduction to the task through short videos of situations where ropes
broke; discussion about the importance of exploring these phenomena;
experimentation with weights and springs to conjecture Hook’s law; experimentation
with weights and wires in non-linear situations where the elasticity is destroyed and
the material breaks; construction of graphs of the Hook’s law by the students based on
their measurements; comparison of weight-elongation graphs for different materials
(e.g., glass, rubber); classroom discussion on emerging issues about the elasticity of
materials and the functional relations used to model the relevant phenomena. The
science teachers orchestrated mainly the experimentation phases while the
mathematics teacher had the responsibility to manage the classroom activity related to
functions and graphs.

Potari, Psycharis, Spiliotopoulou, Triantafillou, Zachariades, Zoupa
4–94 PME40 – 2016
The data were audio-recorded and transcribed. Under a grounded theory approach
(Charmaz, 2006) we analysed the different sources of data related to the three phases
of the first cycle and to the teachers’ interviews. Initially, we identified parts of the
data concerning the activity of mathematics teaching and the activity of science
teaching. Then we focused on common themes that cross the two practices (e.g.,
inquiry in mathematics and science teaching, the role of context in mathematics and
science teaching, the nature of concepts and processes in mathematics and science).
Episodes indicating contradictions and convergences were selected within and across
the common themes. Finally, we indentified interactions between the two activity
systems (mathematics and science teaching). In this paper, the steps of the analysis
described above concern the notion of function and its graphical representations that
appeared to be central in mathematics and science teachers’ interactions.
RESULTS
The meaning of contradictions is related to the elements of the AT triangles across the
two activity systems. Convergences appear as common actions and goals that indicate
an integration of the objects of these systems. Below, we address epistemological and
didactical issues around the design and implementation of tasks integrating
mathematics and science that emerged in different phases of teacher activity. A central
theme of discussion throughout the PD meetings was the notion of function and the
different ways by which it is approached in science and mathematics teaching.
Searching for tasks and concepts to integrate science and mathematics
In the first PD meeting, the teachers were introduced to the mascil philosophy through
the analysis of existing mascil tasks and they were encouraged to collaborate in co-
designing lessons based on these tasks or new ones developed by them. In the second
PD meeting, the teachers brought their own ideas for tasks and started to discuss
possible links between mathematics, physics and chemistry. The mathematics teacher
(mtA) made explicit his willingness to work together with the science teachers by
recognising that science teachers could provide ideas for contextual tasks where
mathematics is embedded: “I see that you have the knowledge of the contexts that we
can use to design lessons together”. He also provided specific suggestions promoting
their collaboration: “We can co-teach for four hours in the an 11th grade class”. The
science teachers provided different contexts for potential tasks (e.g., heat engines,
biodiesel, elasticity of ropes) and with the encouragement of the teacher educator they
suggested possible mathematical ideas related to these contexts. The physics teacher
(sctA) suggested as a mathematical idea the concept of function appearing in the
transformation of thermal energy in heat engines. He mentioned that graphs of
functions such as straight lines, hyperbolas and exponentials used in this context can
provide a bridge to mathematics. However, he recognized divergences between how
mathematics and science approach functions:
“In science, you first take measurements in an experiment and then you want to see what
function is behind. Are you interested in this in mathematics? The function may be a
Potari, Psycharis, Spiliotopoulou, Triantafillou, Zachariades, Zoupa
PME40 – 2016 4–95
familiar one, a polynomial. What we actually do as physicists is to do the measurements
and insert them in a software that gives us the corresponding function that can be a known
one or not”. (sctA, 2nd PD meeting)
In the realm of the discussion, mtA indicated that functions and graphs constitute
objects of study in mathematics, but usually in context-free situations. The
contradiction that appears here concerns epistemological issues on how function is
considered in science and in pure mathematics. The view that sctA expresses is closer
to how function is used in modelling, which is not emphasised in school mathematics.
In the third PD meeting, the notion of function and its graph emerged when the two
physics teachers proposed the Elasticity of Ropes. The discussion that followed was
around didactical issues such as: students’ tendency to consider all relations as linear;
students’ difficulty to connect graphs with physical phenomena; the meaning of inquiry
in the task; the connection of the tasks to mathematics curriculum. Initially, mtA found
the mathematics involved in the task rather trivial for high school students: “I cannot
see how to contribute here. The law is too simple from a mathematical point of view
… It is too experimental”. Later on, the discussion moved in graphs for non-linear
relations when the elasticity is destroyed and the students were asked to interpret the
graph in relation to the behavior of materials. mtA at this point seemed to overcome
his initial doubts and recognized the potential of the task to indicate the distance
between real world phenomena and mathematical models: “A law models a situation
under certain conditions. And this is important in mathematics as well”.
Implementing the designed tasks
The students have already made the experiment with the springs and have collected
their measurements. The two physics teachers had also performed the experiment for
testing the elasticity of wires by using weights. At this phase, the mathematics teacher
took over the management of the lesson by asking the students to draw a graph of the
relation weight–displacement based on their measurements. The notion of function and
its main properties again is the common tool pertaining mathematics and science
teaching. In the classroom discussion, the teachers took the opportunity to make
explicit to the students the different conventions and rules followed in mathematics and
science as it appears in the following extract:
sctA: Let’s see how we use graphs in science. In science, we are not allowed to put
numbers in the two axes as well as on the graphs. Is this common in
mathematics?
mtA: This is not a problem for us.
sctA: The criterion for selecting scale is to find the extreme measurements and their
difference. I do not know what mathematics teachers do in the classroom.
mtA: We try to have the same scale in the two axes as we usually draw graph functions
with a known formula.
sctA: This is very interesting. We never do this. And we do not have any problem with
the origin of the axes.

Potari, Psycharis, Spiliotopoulou, Triantafillou, Zachariades, Zoupa
4–96 PME40 – 2016
mtA: And the way we treat the slope is different.
sctA: We discuss it because we realise that we say to our students different things. In
science, the slope has always units of measurement, but not in mathematics.
The teachers also started to make connections between the function as a mathematical
tool and the physical phenomenon. For instance, mtA working in the context of the
physical phenomenon (the specific measurements of the spring displacements for
different weights) used the notion of function as a tool for interpreting this
phenomenon, an approach that is not common in mathematics teaching. In particular,
he challenged students to make connections between the properties of function as a
mathematical object with the experiment. Below, we list questions he posed to the
students to illustrate his attempts: “I would like you to explain why two successive
measurements as points in the graph can be connected only with a straight line”; “If
the graph is a straight line what does it mean as regards the relation between the weight
and the displacement?”; “Can you make predictions for different values of
displacements and weights?; “What is the meaning of slope in this experiment?”; “How
do you interpret the tangent of the angle in the Hook’s law?”. sctA extended the
discussion by pointing out that in physics the function that describes a phenomenon is
a dynamic object depending on the variability of the measurements: “Why some of
your measurements are not on the straight line? It is not needed to connect all the points
in one straight line; we draw the best line fit”.
Reflecting on the experience
Reflecting on the implementation in the fourth PD meeting, the teachers discussed
about what the students gained from this lesson and what they themselves learned.
They made explicit the epistemological divergences underlying the notion of function
and they became aware of the fragmented way that this notion is approached in the
teaching of mathematics and science in school. In the following two extracts we
illustrate mtA’s and sctA’s development of awareness of these epistemological and
didactical divergences:
Through observing and interpreting weight-elongation graphs for different materials, the
students recognized that the elasticity and the stiffness of the materials are related to the
slope of the graph. (mtA’s reflection, 4th PD meeting)
The students managed to connect a mathematical tool, the slope of a line, to the elasticity
of materials. They had the opportunity to interpret the slope as we conceive it in physics,
as a required force that can cause a unit of change in the length of a spring. They also
realised that a graph in physics is beyond the formal way is taught in mathematics. It is a
tool that helps them to interpret a physical phenomenon and also make predictions…
Teaching mathematics and science together made us realise that we teach the same thing
with completely different ways… (sctA’s reflection, 4th PD meeting)
In the interviews, teachers appreciated the collaboration and seemed to become aware
of the different epistemological and didactical perspectives that mathematics and
science teachers adopt in teaching. They also recognised that students’ learning was

Potari, Psycharis, Spiliotopoulou, Triantafillou, Zachariades, Zoupa
PME40 – 2016 4–97
rather fragmented and their own difficulty to bridge the distance between mathematics
and science in the actual classroom:
In a school day, I teach my part and the mathematics teacher his own. However, the
students can listen to many different things. It is a problem not to have an idea of other
teachers’ work. Through mascil we realised the diversity of our teaching approaches and
the emerging problems. Before, we were not aware of it. (sctA’s reflection, interview)
Maybe more time was needed to integrate the actual teaching of the two subjects. In the
reality, we distributed our responsibilities, I do this, you do that. Each of us remained in
his own space. (mtA’s reflection, interview)
The transformation of teaching
By analysing the mathematics and science teachers’ collaborative activities we could
trace developments and changes in teachers’ perspectives as regards epistemological
and didactical issues on functions and graphs. Particularly, mtA overcame his initial
doubts and recognized the potential challenges of the Elasticity of Ropes task for his
students. During their collaborative activity, they utilized common tools (e.g., the same
worksheet) and transformed their initial goals (individual teaching goals) into shared
goals and teaching practices. Their joint activity made them realize divergences in the
meaning they attribute to the function concept and the representational conventions
and rules they follow in their communities. They also developed awareness on the
fragmental way of teaching the notion of function which could have an effect on
students’ understanding. Besides, we could identify mtA’s shifts in his teaching
practice of function when he posed context-specific questions to his students (e.g., what
is the meaning of slope for this experiment?), or he used the notion of function as a
prediction tool for the physical phenomenon under consideration. Finally, in their
reflections all teachers appreciated the existed difficulties in achieving the fusion of
mathematics and science teaching practices.
CONCLUNDING REMARKS
The short analysis supported also by other evidence emerged during the project reveals
the strength of collaborative work between science and mathematics teachers and the
value of sharing practices in actual science and mathematics teaching. The process of
developing a shared understanding of common concepts and the meaning of their
teaching for students appears to be rather demanding. However, it evolved through
teachers’ engagement in discussing connections, discerning epistemological aspects,
finding complementary elements and sharing classroom experiences. As King et al.
(2009) also argue, inquiry-oriented activities in the context of real world scenarios
offered opportunities for science and mathematics teachers to integrate mathematical
and scientific ideas and processes into their teaching.
Acknowledgements
Mascil has received funding from the European Union seventh Framework Programme
(FP7/2007-2013) under grant agreement n° 320693. This paper reflects only the authors’

Potari, Psycharis, Spiliotopoulou, Triantafillou, Zachariades, Zoupa
4–98 PME40 – 2016
views and the European Union is not liable for any use that may be made of the information
contained herein.
References
Berlin, D. F., & White, A. L. (1995). Connecting school science and mathematics. In P.A.
House & A.F. Coxford (Eds.), Connecting mathematics across the curriculum. Reston,
VA: National Council of Teachers of Mathematics.
Charmaz, K. (2006). Constructing grounded theory. A practical guide through qualitative
analysis. London: Sage.
Engeström, Y. (2001). Expansive learning at work: Toward an activity theoretical
reconceptualization. Journal of Education and Work, 14, 133–156.
Frykholm, J., & Glasson, G. (2005). Connecting science and mathematics instruction:
Pedagogical content knowledge for teachers. School Science and Mathematics, 105(3),
127-141.
Hart, L.C., Alston, A. S., & Murata, A. (2011). Lesson study research and practice in
mathematics education. Dordrecht: Springer.
King, M. B., Newmann, F. M., & Carmichael, D. L. (2009). Authentic intellectual work:
Common standards for teaching social studies. Social Education, 73(1), pp.43-49.
Leinhardt, G, Zaslavsky, O., & Stein M. (1990). Functions, graphs and graphing: Tasks,
learning and teaching. Review of Educational Research, 60(1), 37-42.
Michelsen, C. (2006). Commentary to Lesh and Sriraman: Mathematics education as a design
science. ZDM, 38, 73-76.
Planinic, M., Susac, A., & Ivanjek, L. (2012). Comparison of student understanding oflLine
graph slope in physics and mathematics. International Journal of Science and Mathematics
Education, 10, 1393-1414.
Roth, W., & McGinn, M. K. (1997). Graphing: Cognitive ability or practice? Science
Education, 81, 91–106.
Shirley, M. L., Irving, K. E., Sanalan, V. A., Pape, S. J., & Owens, D. T. (2011). The
practicality of implementing connected classroom technology in secondary mathematics
and science classrooms. International Journal of Science and Mathematics Education, 9,
459-481.
Triantafillou, C., Spiliotopoulou, V., & Potari, D. (2015). The nature of argumentation in
school mathematics and physics texts: The case of periodicity. International Journal in
Mathematics and Science Education, DOI 10.1007/s10763-014-9609-y.(online first).

2016. In Csíkos, C., Rausch, A., & Szitányi, J. (Eds.). Proceedings of the 40th Conference of the International
Group for the Psychology of Mathematics Education, Vol. 4, pp. 99–106. Szeged, Hungary: PME. 4–99
DISTINGUISHING ENACTIVISM FROM CONSTRUCTIVISM:
ENGAGING WITH NEW POSSIBILITIES
Jérôme Proulx* & Elaine Simmt**
*Université du Québec à Montréal, Canada, **University of Alberta, Canada
In this paper, we continue the conversation on distinctions between an enactivist theory
of cognition and constructivism. These distinctions are not raised to create oppositions
or argue against constructivism in favour of enactivism, but to engage in explorations
of what these distinctions can allow as possibilities for mathematics education
research. We engage with an example to weave together our claims.
CONTEXT OF THE PAPER
Consider this episode taken from a research session in which a group of 12
undergraduates had 20 seconds to mentally solve x2–4=5 for x. Among the many
strategies presented, one person’s strategy was to depict the equation as the comparison
of two equations in a system of equations (y=x2–4 and y=5) in order to find the
intersection point of those two equations by imagining the graphs. In other words, he
thought of the equation as a comparison between two (other) equations in order to find
the common value of x, and used the positive and negative values of x to find a second
quadratic with a common y. To do so, the student pictured the line y=5 in the graph and
also superimposed on the same axes, y=x2–4. The latter was referenced to the quadratic
function y=x2, which crosses y=5 at
x = 5 . In the case of y=x2–4, the function is
translated of 4 units lower in on the axes, and the 5 of the line y=5 became a 9 in terms
of distances. Hence, how to obtain an image of 9 with the function y=x2? With an x=3
or x=–3. For these, the function y=x2–4 cuts the line y=5. Figure 1 illustrates what the
student explained having solved mentally.
Figure 1. Image of a person’s explanation

Proulx, Simmt
4–100 PME40 – 2016
Our research is about trying to make sense of what we observe people do when they
are given a prompt we anticipate will trigger mathematical behaviour. That is, what
sense do we make of solver’s engagement, as is done in the above example? Our work
is not much different than colleagues who for decades have been researching
mathematical understanding (e.g. Tom Kieren) and children’s mathematics (e.g. Les
Steffe). However, we claim differences. To begin, we are mathematics educations
researchers inspired by an enactivist theory of cognition (e.g. Maturana & Varela,
1992; Varela, Thompson & Rosch, 1991). Further, we have observed over the last
decade recurrent assertions that suggest enactivism is a form of constructivism (see
e.g., at PME-33, Ernest, 2009). In spite of sharing some similarities, we claim it is
distinct from constructivism, something we have written about in e.g., Research
Forum05, PME-33; Proulx and Simmt (2012) and we expand upon here. In this paper,
we contribute to the ongoing PME (informal and formal) discussions on the matter, as
we raise and discuss a number of distinctions around issues of knowledge, problem
solving, strategies, and interpretations. By using the above episode to discuss
differences that make a difference (as Bateson might note), we illustrate the
possibilities that emerge from these distinctions and the potential they offer.
SOME ASPECTS OF ENACTIVISM
Enactivism is a term given to a theory of cognition that views human knowledge and
meaning-making as processes understood from a biological standpoint. Such
biological perspectives have often been adopted as metaphors for thinking about
knowledge and learning, as is the case within constructivism (see e.g., Piaget in
Piatelli-Palmarini, 1979, or Glasersfeld, 1995, for notion of adaptation and evolution).
However, for Maturana and Varela (1992), cognition is a biological phenomenon,
implying that knowing is literally biological. Enactivism considers all living organisms
as cognitive: a spider knitting its web, a plant orienting itself toward the sun, a student
answering mathematical questions, etc., all act in ways that enable them to continue to
evolve, to live, to express knowledge; to maintain their structural coupling with/in the
environment (see below). By adopting a biological perspective on knowing, enactivism
considers the organism both part of and in an environment. They explain that organism
and environment adapt to each other, impacting the other in their courses of evolution.
For those of us interested in mathematics knowing, the knower and the problem co-
evolve through the process of and with the product of solving. This co-evolution is
what Maturana and Varela call structural coupling, where environment and organism
interact/experience mutual histories of evolutionary transformation, resulting in their
adaptability and compatibility to each other.
Every ontogeny occurs within an environment […] the interactions (as long as they are
recurrent) between [organism] and environment will consists of reciprocal perturbations.
[…] The results will be a history of mutual congruent structural changes as long as the
[organism] and its containing environment do not disintegrate: there will be a structural
coupling. (Maturana and Varela, 1992, p. 75)

Proulx, Simmt
PME40 – 2016 4–101
It follows that environment and organism are mutual “triggers” for the evolution of
each other; changes are occasioned by the environment, but determined by the
organism’s structure and vice-versa, what they call structural determinism:
the changes that result from the interaction between the living being and its environment
are brought about by the disturbing agent but determined by the structure of the disturbed
system. The same holds true for the environment: the living being is a source of
perturbations and not of instructions. (Maturana and Varela, 1992, p. 96)
The structure of an organism is understood as its biological constitution, hence not
static and in a constant flux of interaction with the environment, in continual structural
coupling with it. This (recursively-dynamically-evolving) structure is more than
physical, as it is realized with/in experience, and through its histories of interactions.
Enactivism thus deals more with experiential subjects that (en)acts, in the recursive
flux of action; and less so with cognitive subjects that build or take things in.
Experiences shape one’s structure. In the course of living, an organism integrates
experiences in its structure which in turn recursively enables the enactment of
(re)actions in specific conditions. It is the structure of the organism that allows for
changes to occur, triggered by the interaction of the organism with/in its environment.
Maturana and Varela (1992) give the example of a car being destroyed by colliding
with a tree and contrast it with an unaffected army tank that collides with the same tree;
note that the environment, the tree, is also affected by this interaction. Hence, the
interaction is relative to the structures of car, tank and tree. These notions are key to
enactivism, to which we raise distinctions with constructivism.
FROM A FOCUS ON KNOWLEDGE TO A FOCUS ON DOING
Several mathematics education scholars have drawn on enactivist ideas to rethink what
it means to know mathematically and to reflect on mathematics knowledge (see ZDM,
2015). Focusing on emergence, adaptation and co-specification of knowers and their
environments, mathematical cognition has been defined as a dynamic process that
emerges in people’s interaction with the environment (Pirie & Kieren, 1994) rather
than as mental representations of phenomena from the environment that individuals
construct in their minds, as Glasersfeld (1995) expresses:
[Radical Constructivism] starts from the assumption that knowledge, no matter how it be
defined, is in the heads of persons, and that the thinking subject has no alternative but to
construct what he or she knows on the basis of his or her own experience. (p. 1).
Radford and Sabena (2015) explain that there are two primary traditions that have
inspired Western philosophies on knowledge. A first one is the rationalist tradition,
where “knowledge is considered to be the result of the doings and meditations of a
subject whose mind obeys logical drives” (p. 162). A second tradition is the dialectic-
materialist one, where knowledge is “the result of individuals’ sensuous reflections and
material deeds in cultural, historical, and political contexts” and is seen as dynamical
and cannot be represented because it is conceived as “pure possibility,” as source for
action (p. 163). Enactivism aligns itself with the latter, but breaks from it on a specific

Proulx, Simmt
4–102 PME40 – 2016
matter: knowledge is not the “result of” or a “source of” action, it is the emergent
action. Mathematical knowing becomes inseparable from mathematical doing (Davis,
1996), emerging in the interaction with the task. Mathematical strategies brought forth
by knowers to solve problems (their emergent adapted responses) are not illustrations
of their knowing, but are their knowing: the process of knowing and its product are
one and the same thing (Pirie & Kieren, 1994). The adaptation process required to
engage in a problem is not a representation of one’s capacity for knowing, but is one’s
knowing: adaptation and action are knowledge. There is no separation between
knowledge and action, where “all doing is knowing, and all knowing is doing”
(Maturana & Varela, 1992, p. 17). In the episode we read above, a constructivist might
explain that the person’s knowledge was the source for the strategy, or that the strategy
represented the person’s knowledge, but an enactivist would claim that the strategy is
the person’s knowledge.
For enactivists, knowledge is not in the subject nor in the environment, but emerges in
the dynamics of interaction between each. In short, no interaction no cognition! Hence,
knowledge is not conceived as a possession or a thing one has, but rather an enactment,
an emergence in moment-to-moment living. This enactment forms the basis of
Maturana’s view of knowledge as adequate action:
I am saying that knowledge is never about something. I am saying that knowledge is
adequate action in a domain of existence, that knowledge is a manner of being, that
knowledge has no content because knowledge is being. (Maturana, in Simon, 1985, p.37)
Thus, if someone claims to know algebra – that is, to be an algebraist – we demand of him
or her to perform in the domain of what we consider algebra to be, and if according to us
she or he performs adequately in that domain, we accept the claim. (1988, pp. 4-5)
Conceiving of knowledge as “adequate action in a domain specified by a questioner”
(Maturana, in Simon, 1985, p. 37) insists that this adequacy is not judged on the basis
of some allegedly external objective criteria, but in relation the observer who assesses
and judges the knowledge on the basis of his/her own reference criteria of what he/she
conceived to be adequate in his/her understanding of this domain. In short, the observer
matters. In the case of the person’s response to being asked to solve x2–4=5, an observer
can claim that this person knows how to solve the algebraic equation, since that
observer assesses as adequate this system of equations solution to the task.
FROM INTERPRETATIONS OF THE WORLD TO BRINGING IT FORTH
Issues related to “interpretation” of reality differ between enactivism and
constructivism. Constructivists substituted realists’ notions of truth and existence with
that of viability, a concept closely aligned with the Darwinian notion of “fit”.
Constructivism goes back to Vico, who considered human knowledge a human
construction that was to be evaluated according to its coherence and its fit with the world
of human experience, and not as a representation of God’s world as it might be beyond the
interface of human experience. (Glasersfeld, 1992, p. 3)
This suggests that there exist a number of viable interpretations of the world, each

Proulx, Simmt
PME40 – 2016 4–103
knower developing one that fits within his/her functioning of the world. In
constructivist thought, interpretations are not said to be made in an arbitrary fashion,
but on the basis of invariants or constants one finds in the world and attempts to make
sense of. In the case of enactivism, coming to know in a situation is not about the
invariants within the environment, but about the coordination of the knower and the
environment. The focus on invariants and what the knower can construe from the
environment sets these discourses apart. In enactivism, both knower and known, and
organism and environment, co-evolve in a constant process of becoming. There is no
fixed state for the interpreter to interpret, no invariants or constants that are a priori,
since both interpreter and environment are in flux, influencing each other in the
ongoing process of living: knower and known co-emerge with and in the interaction.
The actions of an animal and the world in which it performs these actions are inseparably
connected. […] What is perceived appears inseparably connected with the actions and the
way of life of an organism: cognition is, as I would claim, the bringing forth of a world, it
is embodied action. (Varela & Poerksen, 2004, p. 87)
In enactivism, the notion of viability of interpretations gives way to a notion of the
knower being brought forth as he/she brings forth a world. Rather than learners
interpreting the world in multiple ways, enactivists understand them as bringing forth
distinct worlds of significance through their knowing. Maturana explains:
Systems theory first enabled us to recognize that all the different views presented by the
different members of a family has some validity, but systems theory implied that there
were different views of the same system. What I am saying is different. I am not saying
that the different descriptions that the members of a family make are different views of the
same system. I am saying that there is no one way which the system is; that there is no
absolute, objective family. I am saying that for each member there is a different family,
and that each of these is absolutely valid. (Maturana, in Simon, 1985, p. 36)
In the example of x2–4=5, a variety of strategies emerged and were discussed among
solvers in the session (for details, see Proulx, 2013). A constructivist could see these
as various interpretations or ways of solving the equation x2–4=5. For enactivists, the
notion is less about how the problem is interpreted and solved, than about what problem
was being brought into being and solved. The nuance resides in seeing knowers acting
in a multi-verse, bringing forth worlds, rather than interpreting the uni-verse in multiple
ways. Hence, an enactivist would say that for each person there were different
mathematics being (adequately) solved; and simultaneously knowers (as structurally
determined organisms) continue to be brought into being, evolving with their knowing.
Solvers brought forth distinct worlds of significance, what Varela addresses through
the issue of problem-posing, which we turn to in the next section.
This said, note that this issue is not to be misinterpreted as a relativism nouveau genre,
since enactivism decries both positivist’s top-down view of objective/external
knowledge and post-positivist assertions of subjective knowledge emerging from the
bottom-up. The enactivist position (e.g. Thompson & Varela, 2001; Varela &
Poerksen, 2004) cuts across both views, being on the razor edge, conceiving of
Proulx, Simmt
4–104 PME40 – 2016
knowledge as a continuously emergent bottom-up phenomena that subsequently
imposes itself in a top-down fashion, through a never-ending recursive loop. In
enactivism, knowledge is part of the multi-verse, thus is viewed as an ontological
question, as well as an epistemological one. In Varela’s (1996, p. 99) words, “knower
and known, subject and object, are reciprocal and simultaneous specifications of each
other. In philosophical terms: knowledge is ontological.”
FROM PROBLEM-SOLVING TO PROBLEM-POSING
For Varela (1996; Varela et al., 1991), the notion of problem solving implies that
problems are already in the world, lying “out there” somewhere, independent of us as
knowers, waiting to be solved. Varela explains that because of what we are
biologically, historically, socially, culturally, etc., because we are coupled with the
environment, and because we and our world co-dependently arise, we do not find
problems readymade in our environment but rather we specify the problems in our day
to day living through the meanings we make of the world.
The most important ability of all living cognition is precisely, to a large extent, to pose the
relevant questions that emerge at each moment of our life. They are not predefined but
enacted, we bring them forth against a background, and the relevance criteria are oriented
by our common sense, always in a contextualized fashion. (Varela, 1996, p. 91)
The problems that we encounter, and the questions we ask, are thus as much a part of
us as they are a part of our environment since they emerge from our interaction with it.
We do not act on pre-existing situations because the pre-existing situation does not
arise until we bring it forth. The problems that we solve are relevant for us, they emerge
for us as our structure couples with the environment. The effects of the environment
are not in the environment, but made possible through structural coupling. The example
shows this process unfolding in the solving of x2–4=5. The person described how he
posed the problem as a system of equations problem (it became a task about this
context) and how he solved it (about this specific context).
As we claimed at last year’s PME (Proulx, 2015), reactions to a prompt do not reside
inside either the knower or the prompt (as they do in constructivism): they emerge from
the knower’s interaction with the prompt, through posing what is relevant in the
moment. If one adheres to this perspective for mathematics education, one cannot
assume, as René de Cotret (1999) notes, that instructional properties are present in the
(mathematics) prompts offered and that these properties will determine learners’
reactions. Strategies are thus not predetermined either by the task setter (teacher) or the
task solver (student), but are continuously generated in the solving of problems (which
are also emerging with the solvers’ actions/acting). Enactivists, contrary to
constructivists, do not conceive the solver as encountering a perturbation which causes
a disequilibrium in his/her mental structures requiring either accommodation or
assimilation of the new stimuli resulting in the solution to the problem. Nor do they
conceive, in cognitivist terms, that a solver reads, interprets and plans his/her problem
solving, then selects from his/her toolbox or prior knowledge a strategy to solve the

Proulx, Simmt
PME40 – 2016 4–105
problem and solves it. In that sense, enactivists are letting go of the concept of (building
on) prior knowledge. Further, structure is not to be conflated with (prior) knowledge
or cognition, because it is the organism’s structure that enables cognition/knowledge
to emerge in the interaction with the environment (or with a mathematical task), in a
constant recursively-dynamical process of mutual influence.
Thus, for enactivists, strategies for solving emerge in the moment-to-moment
interaction and co-evolution of knowers and problems. In that sense, problems given
are not problems but prompts for solvers to create problems with: prompts are offered,
not problems (Simmt, 2000). Problems become problems when knowers engage with
them, when they pose them as problems to solve. Thus knowers transform prompts
into mathematical problems for themselves, making the problems theirs, which can be
different from the designer’s intentions. In this case, x2–4=5 is not a task, but a prompt,
with its own designed (emergently observed) structure, with which the solver engages.
The prompt was posed by the solver as a system of equations task, and this posed task
brought out the consideration of the graph for solving it (and not, e.g., its algebra). The
posed task became a graph/system of equation one (even if no graph was provided),
which oriented the kind of solution obtained (e.g., in terms of distances, translations,
and so forth). There is thus a mutually influential relation between the solving, which
generates a context for solving the task, and the generated context itself, which
modifies the solving in return, in a continual loop of mutual influence. It is thus not a
static “posing of problem” that would give a fixed task to solve; it is one that
continually evolves as the task is solved: the posing and the solving are mutually
influential and co-evolving. It is also an illustration of how solver and environment
both evolve during the solving: the “task” is not static, it evolves as it gets solved for
that solver, and as it gets solved, it transforms the solver as well, who is neither static
and reacts differently to the prompt as it is transformed. Both are coupled, both evolve
in a fitting fashion through shaping each other in this continuous process.
CONCLUDING REMARKS
Raising these distinctions is not to suggest enactivism is “better” than constructivism,
since we have discussed, what are for us, useful distinctions between enactivism and
constructivism. As researchers inspired by enactivism, we aim for a dynamical view,
where knowledge is not a thing, there is no fixed world to interpret, and problems are
not waiting to be solved but are dependant on solvers in a constantly recursive
dynamical fashion. Although these theories of cognition are related, their distinctions
lead the observer, the mathematics education researcher, to bring forth different worlds
of significance. Acknowledging that our enactivist way of knowing collapses the
epistemological with the ontological, our concerns turn to being, where we find
ourselves complicit in the mathematics knowledge we bring forth as observers.

Proulx, Simmt
4–106 PME40 – 2016
References
Davis, B. (1996). Teaching mathematics: Toward a sound alternative. New York: Garland.
Ernest, P. (2009). What is first philosophy in mathematics education? Proceedings of PME-
33 (vol.1, pp. 25-42). PME.
Glasersfeld, E. von (1992). Aspects of radical constructivism and its educational
recommandations. Paper presented at ICME-7 (Working Group #4), Quebec, Canada.
Glasersfeld, E. von. (1995). Radical Constructivism. Falmer: London and Washington.
Maturana, H. (1988). Ontology of observing. Texts in cybernetic theory. ASC: Felton, CA.
Maturana, H., & Varela, F. (1992). The tree of knowledge. Boston, MA: Shambhala.
Piatelli-Palmarini, M. (1979). Théories du langage, theories de l’apprentissage. Le débat
entre Jean Piaget et Noam Chomsky. Paris: Seuil.
Pirie, S., & Kieren, T. (1994). Growth in mathematical understanding. Educational Studies
in Mathematics, 26(2-3), 165-190.
Proulx, J. (2013). Le calcul mental au-delà des nombres. Annales de didactique et de sciences
cognitives, 18, 61-90.
Proulx, J. (2015). Solving problems and mathematical activity through Gibson’s concept of
affordances. Proceedings of PME-39. PME.
Proulx, J., & Simmt, E. (2013). Enactivism in mathematics education: moving toward a re-
conceptualization of learning and knowledge. Education Sciences & Society, 4, 59-79.
Proulx, J., Simmt, E., & Towers, J. (2009). RF05: The enactivist theory of cognition and
mathematics education research. Proceedings of PME-33 (vol.1, pp.249-278). PME.
Radford, L., & Sabena, C. (2015). The question of method in a Vygotskian semiotic approach.
In A.Bikner-Ahsbahs, C.Knipping & N.Presmeg (Eds.), Approaches to qualitative
research in mathematics education (pp. 157-182). Dordrecht: Springer.
René de Cotret, S. (1999). Perspective bio-cognitive pour l’étude des relations didactiques.
In Le cognitif en didactique des mathématiques (pp. 103-120). Montreal, Qc: PUM.
Simmt, E. (2000). Mathematics knowing in action: A fully embodied interpretation. PhD
dissertation. University of Alberta, Edmonton, Canada.
Simon, R. (1985). A frog’s eye view of the world. Structure is destiny: An interview with
Humberto Maturana. The Family Therapy Networker, 9 (3), 32-37; 41-43.
Thompson, E., & Varela, F. (2001). Radical embodiment: neural dynamics and
consciousness. TRENDS in Cognitive Science, 5(10), 418-425.
Varela, F. (1996). Invitation aux sciences cognitives. Paris: Éditions du Seuil.
Varela F. & Poerksen B. (2004) Truth is what works. In B. Poerksen (Ed.), The certainty of
uncertainty (pp. 85-107). Imprint Academic, UK.
Varela, F., Thompson, E., & Rosch, E. (1991). The embodied mind. MIT Press: Cambridge.
ZDM (2015). SI – Enactivist methodology in mathematics education research, 47(2).
2016. In Csíkos, C., Rausch, A., & Szitányi, J. (Eds.). Proceedings of the 40th Conference of the International
Group for the Psychology of Mathematics Education, Vol. 4, pp. 107–114. Szeged, Hungary: PME. 4–107
ON THE CONSOLIDATION OF DECLARATIVE
MATHEMATICAL KNOWLEDGE AT THE TRANSITION TO
TERTIARY EDUCATION
Kolja Pustelnik Stefan Halverscheid
Georg-August-University Goettingen, Germany
The areas of differential and integral calculus, trigonometry, exponential and
polynomial functions, equations and inequalities, analytic geometry, and foundations
of algebra are both important in high school mathematics and in entry courses at
universities. With a questionnaire on declarative knowledge in these areas, new
university students of mathematics, physics, computer science and the high school
teacher education programme have been tested in three consecutive years. The results
are considered to be a function of the time lag between the high school degree and the
start at the university. In a longitudinal comparison with exam results of the first
courses, time lag turns out to make a significant difference, and more recently
acquainted knowledge was less consolidated.
INTRODUCTION
Dropout rate for science and maths students is still a problem of great importance for
study programmes at universities. The challenges involved in the transition from high
school to university have not been solved over the last decades despite considerable
efforts. One reason why the transition has been an issue for a long time is the plain
difference in competencies of students who attend universities for mathematics.
In this study the competencies of students beginning their studies in mathematics,
physics, computer science, and pre-service teachers who want to teach mathematics at
high school, are investigated. Therefore, a test is described that focuses on the
declarative knowledge of the students. For a better understanding of the reasons for the
measured differences the influences of three individual variables on the students test
performance are studied. The three variables are: the study subject, the time of school
duration, and possible gap between leaving school and entering the university.
THEORETICAL BACKGROUND
Consolidation of knowledge
There are different approaches to describe the construction of mathematical
knowledge. Wilder (1981) regards mathematics as a socio-historical culture with a
certain development. A sociological approach considers mathematics as part of a
universal knowledge that appears when mathematicians interact (Heintz, 2000, pp.
177-207). The interrelationship between knowledge and social context has been
theoretically shaped by Steinbring (2005) for analysing the role of classroom
interaction for the establishment of mathematical knowledge. In all these approaches,
it is widely regarded as a human activity.

Pustelnik, Halverscheid
4–108 PME40 – 2016
According to the theory of abstraction in context (Hershkovitz, Schwarz, & Dreyfus,
2001), the construction of mathematical knowledge is followed by its consolidation.
This process of consolidation has been described in an empirically based theory
(Dreyfus & Tsamir, 2004). In-depth qualitative studies have been carried out, for
instance, in the cases of algebra (Tabach, Hershkowitz, & Schwarz, 2006) and analysis
(Kidron, 2006). The detailed empirical description of the process of forgetting, for
instance according to Wixted (1990), is still far from being understood.
Duration of school attendance
The time students attend school in Germany was reduced by one year, down to 12, in
most federal states in Germany, excluding two states, which have had a 12-year school
duration for a long time. Nevertheless there exists little empirical research on the
effects of this change. But there is some evidence that even a small increase in overall
course time in mathematics has an influence in the mathematic competence of students
(Trautwein et al., 2010). However, teaching time does not have to be reduced when
overall duration of school attendance is reduced.
For the federal state of Saxony-Anhalt, a comparison of the scores achieved on final
school examinations for mathematics, German literature, and English language was
performed (Büttner & Thompsen, 2010). Students of both groups took the same
standardized written exam. This made it possible to compare the two groups directly.
Results show that there was a better performance of students attending school for
thirteen years compared to students attending school for only twelve years in
mathematics. For the other two subjects the change in performance was not that strong:
in German literature there was no change to be measured, while for the English
language test there were only differences for female students, who performed better
when being in school for thirteen years.
In Switzerland, different cantons have been compared from the perspective of their
human capital (Skirbekk, Lutz, & Leader, 2006). In this case, different cantons have
different duration of school attendance. So not a single canton with a change in school
duration was investigated, but different cantons had differences in school duration. The
data of Third International Mathematics and Science Survey were compared. In this
case no differences in performance regarding mathematics and science literacy being
dependent on school duration could be found.
Overall, there is some evidence of lower competencies from students who attend school
for one less year. This might be especially true for math competencies as the study of
Saxony-Anhalt suggests.
Time lag
Some students start their studies with one or more years of lag after leaving school, e.
g., due to civil or military service. These students could be considered as having weaker
declarative knowledge than students starting their studies without this time lag.
However, not much research exists on this phenomenon. A previous analysis of the test

Pustelnik, Halverscheid
PME40 – 2016 4–109
(Halverscheid & Pustelnik, 2013) based on previous data from 2012 showed that a lag
can have a big influence on the results in the test and be a risk for dropping out from
university. The data from 2013 through 2015 used here confirms this result.
So there is a strong hint that students without a time gap will perform better than
students with this time gap.
TEST CONCEPT
The test is based on a comparison between school curricula and the content of the
university courses of the first semester, calculus and linear algebra. As a first step, the
school curriculum conceptions and fields of knowledge that students should have after
leaving school were identified. So, the following eight fields were found: foundations
of algebra, systems of equations and inequalities, polynomial functions, exponential
functions, trigonometry, differential and integral calculus and analytic geometry.
Then, the given competencies of the school curriculum were compared to the university
courses’ content and the important competencies were identified. Items on the chosen
competencies were formulated.
The formulated items are given in three different formats, namely single choice items,
multiple choice items, and numeric items. To analyse the test, the one person Rasch
Model (Bond & Fox, 2013) was used. So a person parameter was assigned to every
student describing his or her test performance.
Example of an item on equivalence equations:
- Choose the equivalent equations to 𝑦 = 𝑥 + 5 with x and y being real numbers.
𝑦2 = 𝑥2 + 10𝑥 + 25 𝑦 + 2 = 𝑥 + 7
√𝑦 = √𝑥 + 5 13𝑥 = 13𝑦 − 65
Example of an item on the product rule for derivatives:
- Choose the derivative function of 𝑓̇ = 𝑥2 ∗ 𝑒𝑥.
𝑓̇ = 𝑥2 ∗ 𝑒𝑥 𝑓̇ = 2𝑥 + 𝑒𝑥
𝑓̇ = (𝑥2 + 2) ∗ 𝑒𝑥 𝑓̇ = 2𝑥 ∗ 𝑒𝑥
𝑓̇ = (𝑥2 + 2𝑥) ∗ 𝑒𝑥 𝑓̇ =1
3𝑥3 ∗ 𝑒𝑥
RESEARCH QUESTIONS
The research questions correspond to the three variables described:
Are there differences between the students of different degree courses? If so,
how big are they?
Which influence do one or more years of delay before tertiary education have
on the test results of the first year students? Is a possible influence dependent
on the study subject?

Pustelnik, Halverscheid
4–110 PME40 – 2016
Does one less year of school attendance have a measurable impact on the test
results?
SAMPLE
The sample of students consists of university students of mathematics, physics,
computer science, and pre-service teachers who want to teach mathematics at high
school. Although they do not take the same courses in the first semester, these students
take the same prep course one month before their actual studies. Participation in the
prep course is not compulsory but students are highly advised to take the course. The
test was taken on the first day of the prep course before anything else happened.
Data was taken over the last three years. Overall, N=584 students are part of the
analysis. The distribution on the years and the subjects can be seen in the table below.
Mathematics Physics Computer
science
Pre-service
teachers in
Maths
Sum
2013 26 93 28 26 173
2014 30 97 32 29 188
2015 36 92 54 41 223
Sum 92 282 114 96 584
Table 1: Participants distribution by year and degree course
The length of a time gap between leaving school and the start of university studies
varies from 0 years to 27 years: 408 students start without a time gap, 112 students start
with a gap of one year, and 64 students have a gap of at least two years, without big
changes in the distribution over the three years.
Regarding the time of school attendance there are 408 students visiting school for
twelve years and 176 students visiting school for 13 years. The percentage of students
with 13 years of school attendance was much higher in 2013, with 39%, than it was in
the other years, with 26%.
METHODOLOGY
To investigate the influence of the different variables an analysis of variance was
performed. The test results of the students were the independent variables and there
were three independent variables: degree course, time gap, and duration of school
attendance. The time gap is split into three groups: No time gap, one year, and at least
two years between school leave and entering university. As a fourth factor the year in
which the test was taken was included in the analysis.
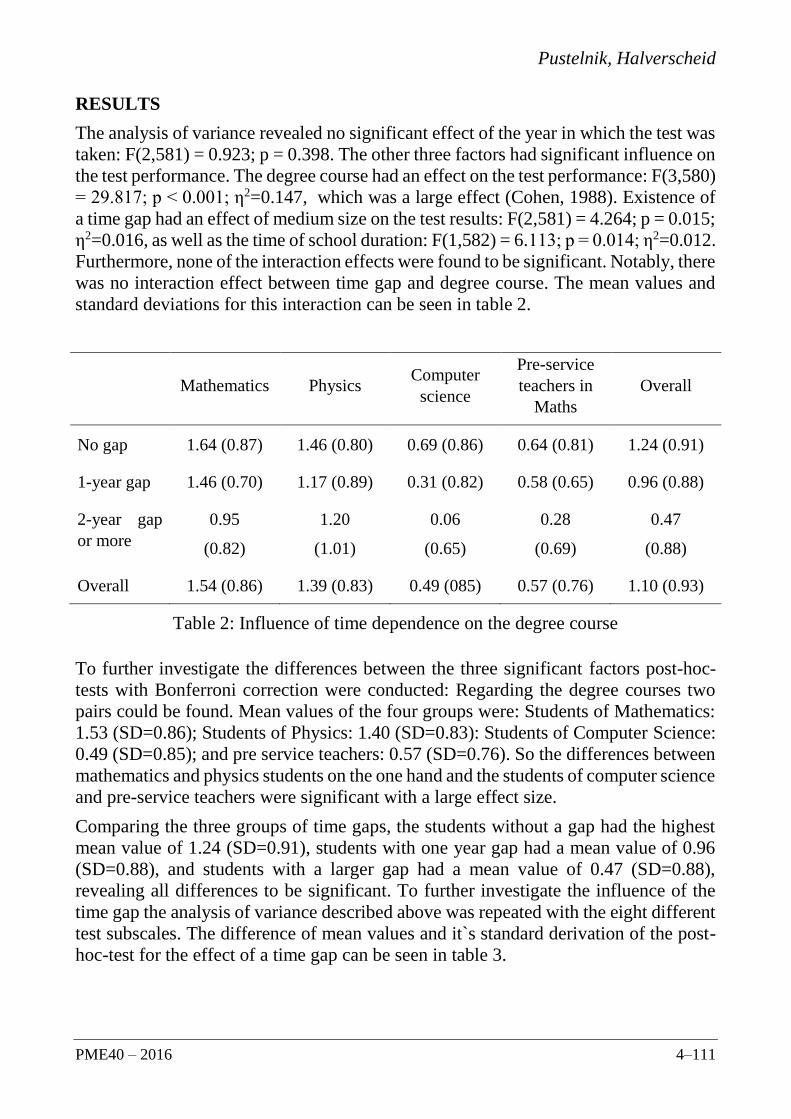
Pustelnik, Halverscheid
PME40 – 2016 4–111
RESULTS
The analysis of variance revealed no significant effect of the year in which the test was
taken: F(2,581) = 0.923; p = 0.398. The other three factors had significant influence on
the test performance. The degree course had an effect on the test performance: F(3,580)
= 29.817; p < 0.001; η2=0.147, which was a large effect (Cohen, 1988). Existence of
a time gap had an effect of medium size on the test results: F(2,581) = 4.264; p = 0.015;
η2=0.016, as well as the time of school duration: F(1,582) = 6.113; p = 0.014; η2=0.012.
Furthermore, none of the interaction effects were found to be significant. Notably, there
was no interaction effect between time gap and degree course. The mean values and
standard deviations for this interaction can be seen in table 2.
Mathematics Physics Computer
science
Pre-service
teachers in
Maths
Overall
No gap 1.64 (0.87) 1.46 (0.80) 0.69 (0.86) 0.64 (0.81) 1.24 (0.91)
1-year gap 1.46 (0.70) 1.17 (0.89) 0.31 (0.82) 0.58 (0.65) 0.96 (0.88)
2-year gap
or more
0.95
(0.82)
1.20
(1.01)
0.06
(0.65)
0.28
(0.69)
0.47
(0.88)
Overall 1.54 (0.86) 1.39 (0.83) 0.49 (085) 0.57 (0.76) 1.10 (0.93)
Table 2: Influence of time dependence on the degree course
To further investigate the differences between the three significant factors post-hoc-
tests with Bonferroni correction were conducted: Regarding the degree courses two
pairs could be found. Mean values of the four groups were: Students of Mathematics:
1.53 (SD=0.86); Students of Physics: 1.40 (SD=0.83): Students of Computer Science:
0.49 (SD=0.85); and pre service teachers: 0.57 (SD=0.76). So the differences between
mathematics and physics students on the one hand and the students of computer science
and pre-service teachers were significant with a large effect size.
Comparing the three groups of time gaps, the students without a gap had the highest
mean value of 1.24 (SD=0.91), students with one year gap had a mean value of 0.96
(SD=0.88), and students with a larger gap had a mean value of 0.47 (SD=0.88),
revealing all differences to be significant. To further investigate the influence of the
time gap the analysis of variance described above was repeated with the eight different
test subscales. The difference of mean values and it`s standard derivation of the post-
hoc-test for the effect of a time gap can be seen in table 3.

Pustelnik, Halverscheid
4–112 PME40 – 2016
No gap –
1-year gap
No gap –
2-year gap or more
1-year gap –
2-year gap or more
foundations of algebra 0.13 (0.10) 0.34 (0.12) * 0.21 (0.14)
systems of equations and
inequalities 0.12 (0.10) 0.39 (0.12) * 0.27 (0.14)
polynomial functions 0.23 (0.15) 0.95 (0.19) * 0.72 (0.22) *
exponential functions 0.24 (0.12) 0.46 (0.15) * 0.22 (0.17)
trigonometry 0.48 (0.13) * 1.07 (0.16) * 0.69 (0.19) *
analytic geometry 0.58 (0.14) * 1.37 (0.18) * 0.78 (0.21) *
differential calculus 0.30 (0.11) * 1.02 (0.13) * 0.72 (0.16) *
integral calculus 0.33 (0.11) * 0.87 (0.14) * 0.54 (0.16) *
Table 2: Influence of time dependence on the subscales (* significant on 5% level)
Concerning the duration of school attendance the group with twelve years had a mean
value of 1.24 (SD=0.89), which was bigger than the mean value of students with one
more year of school attendance 0.79 (SD=0.97).
DISCUSSION
The first important result is the missing influence of the year in which the test was
taken. This lack of significant influence shows that the test can be used in the context
of the prep course and measure the competencies of the first year students despite
changes in the school system over recent years. So it is possible to compare the results
of the different years of first-year students.
The main effect found was the importance of the study subject on the test performance.
Thereby, the similar test performance of math and physics students made sense based
on the importance of mathematics for physics and corresponding demands for the
studies. On the other hand, students of computer science and pre-service teachers
would need less mathematics for their studies and later jobs. So, the overall order of
mean values made sense based on the expected demands of the different degree
courses.
On the other hand, mathematics students and pre-service teachers in mathematics had
to attend the same lectures in the first year of their studies, while students of physics
and computer science had their own mathematics lectures. This was especially
problematic since we knew that the used test could predict success in first semester
exams. So the big gap caused tremendous problems for the pre-service teachers that
could not be overcome in their first year of studies.

Pustelnik, Halverscheid
PME40 – 2016 4–113
But the rather weak results of pre-service teachers did not only influence their studies
but also their later work as teachers since teachers also need knowledge of mathematics
and not only the content they teach. It is especially known that knowledge in
mathematics is necessary for knowledge in mathematics education. So the results
suggest that many pre-service teachers were not aware of the amount of mathematics
they would need, leading to high dropout rates.
The second important main effect on the test results was the time gap before entering
the university. Results showed that not only did one year of time gap have an influence
on initial knowledge but also that one year or more of waiting led to worse test results.
Also, this second difference might be increased due to grouping all students with more
than one year of time gap, especially because this gaps might be caused by worse
performances in school. However, the offer of prep courses seemed to be especially
helpful for students having a time gap in refreshing their mathematics knowledge since
the disadvantages at the beginning could be made up in the first semester. Furthermore,
an interaction effect between time gap and degree course could not be found, showing
that forgetting affected different groups in the same way.
It was also interesting to look for the fields of knowledge where differences could be
found. While having two years of time gap had a significant effect on each field, there
was no significant effect in the fields located at the earlier grades between students
only having one year of time gap: foundations of algebra, systems of equations and
inequalities, polynomial functions, and exponential functions. So it could be assumed
that knowledge on these fields is more consolidated and thus not influenced by a time
gap of only one year.
The last significant effect was caused by the time of school duration, showing that
students with a shorter time of school attendance have better test results, which is a
somewhat unexpected direction. However, prior findings on this variable have shown
differences. Also, the time spent taking math lessons was more important than the time
of school duration, which did not decrease in all cases. So there seemed to be another
effect on students with less time of school attendance that lead to better test results.
References
Bond, T.G., & Fox, C. M. (2013). Applying the Rasch model: Fundamental measurement in
the human sciences. New York, USA: Psychology Press.
Büttner, B., & Thompsen, S. L. (2010). Are we spending too many years in school? Causal
evidence of the impact of shortening secondary school duration. ZEW Discussion
paper No 10-011.
Cohen, J. (1988). Statistical Power Analysis for the Behavioral Sciences (2nd Ed.). Hillsdale:
Earlbaum.
Dreyfus, T., & Tsamir, P. (2004). Ben's consolidation of knowledge structures about infinite
sets. The Journal of Mathematical Behavior, 23(3), 271-300.

Pustelnik, Halverscheid
4–114 PME40 – 2016
Halverscheid, S., & Pustelnik, K. (2013). Studying math at the university: Is dropout
predictable. In Lindmeier, A. M., & Heinze, A. (Eds.). Proceedings of the 37th
Conference of the International Group for the Psychology of Mathematics Education,
Vol.2. Kiel, Germany: PME.
Heintz, B. (2000). Beweisen und Überprüfen. Die Rolle der Mathematischen Gemeinschaft.
In: Die Innenwelt der Mathematik. Springer Vienna.
Hershkowitz, R., Schwarz, B. B., & Dreyfus, T. (2001). Abstraction in context: Epistemic
actions. Journal for Research in Mathematics Education, 32(2), 195-222.
Kidron, I. (2008). Abstraction and consolidation of the limit procept by means of
instrumented schemes: The complementary role of three different frameworks.
Educational Studies in Mathematics, 69(3), 197-216.
Skirbekk, V., Lutz, W., & Leader, P. O. P. (2006). Does school duration affect student
performance? Findings from canton-based variation in Swiss educational length.
Schweizerische Zeitschrift für Volkswirtschaft und Statistik, 142(4), 115.
Steinbring, H. (2005). The construction of new mathematical knowledge in classroom
interaction: An epistemological perspective. Berlin, Germany: Springer.
Tabach, M., Hershkowitz, R., & Schwarz, B. (2006). Constructing and consolidating of
algebraic knowledge within dyadic processes: A case study. Educational studies in
mathematics, 63(3), 235-258.
Trautwein, U., Neumann, M., Nagy, G., Lüdtke, O., & Maaz, K. (Eds.). (2010).
Schulleistungen von Abiturienten: Die neu geordnete gymnasiale Oberstufe auf dem
Prüfstand. Wiesbaden, Germany: VS Verlag für Sozialwissenschaften.
Wilder, R. L. (1981). Mathematics as a Cultural System. Pergamon Press: Oxford.
Wixted, J. T. (1990). Analyzing the empirical course of forgetting. Journal of Experimental
Psychology: Learning, Memory, and Cognition, 16(5), 927-935.

2016. In Csíkos, C., Rausch, A., & Szitányi, J. (Eds.). Proceedings of the 40th Conference of the International
Group for the Psychology of Mathematics Education, Vol. 4, pp. 115–122. Szeged, Hungary: PME. 4–115
CONCEPT STUDY AND TEACHERS’ META-KNOWLEDGE:
AN EXPERIENCE WITH RATIONAL NUMBERS
Letícia Rangel, Victor Giraldo & Nelson Maculan
Universidade Federal do Rio de Janeiro, Brasil
This paper aims to contribute with the reflection on the mathematical knowledge
needed for teaching (Ball, Thames and Phelps, 2008). The study’s theoretical
framework the notion of Concept Study (Davis, 2010; Davis & Renert, 2014), a
collective study model in which groups of teachers share their experiences emergent
from practice in order to question and (re)construct their own mathematical knowledge
for teaching. More specifically, we address the potentialities of Concept Studies to
develop participants’ knowledge on elementary mathematics and meta-knowledge.
INTRODUCTION
Concerns about the gaps between pre-service teachers’ education and their classroom
future practice are not new. More than one century ago, on the compendium
Elementary Mathematics from an Advanced Standpoint (Klein, 1908, 2010), the
German mathematician Felix Klein denounces a rupture between school and university
mathematics – which he identifies as a double discontinuity: little relation is established
between the mathematics future teachers get in touch with as university students, the
mathematics they have previously learnt at school, and the mathematics they will deal
with in their future classroom practice.
Such concerns have echoes on more recent research literature that addresses the content
knowledge needed for teaching, its construction and its relations with practice (e.g.
Ball et al. 2009). A main reference is Shulman’s work, which presents pedagogical
content knowledge (PCK) as a kind of knowledge which “goes beyond knowledge of
subject matter per se to the dimension of subject matter knowledge for teaching […]
the particular form of content knowledge that embodies the aspects of content most
germane to its teachability” (Shulman, 1986, p.9). An important feature of PCK is that
it rests upon its own epistemic groundings, and cannot be reduced to a subset of general
content knowledge per se. In the words of Davis & Simmt (2006, p.295): “The subject
matter knowledge needed for teaching is not a watered down version of formal
mathematics.” Similarly, Noddings remarks:
“Knowledge of mathematics cannot be sufficient to describe the professional knowledge
of teachers. What does a mathematics teacher know that similar mathematical preparation
does not? What specialized knowledge does teacher have? […] Research on teacher
knowledge is crucial not only for the conduct of teaching itself but also for teacher
preparation.” (Noddings, 1992, p.202)
This paper addresses the discussion on how to design activities for in-service teacher
preparation that takes into account the specificity of the subject matter knowledge
needed for teaching. More specifically, we report results from a collective study with

Rangel, Giraldo, Maculan
4–116 PME40 – 2016
a group of teachers, with focus on the teaching of rational numbers, designed according
to the model of concept study, proposed by Davis (Davis, 2010). Our aim is to
investigate how and to which extend this model of collective study can contribute with
the (re)construction of the participants’ mathematical knowledge for teaching and
development of meta-knowledge. These research goals are also inspired by Klein’s
ideas about teachers’ knowledge.
KLEIN AND ELEMENTARY MATHEMATICS
A key assumption for Felix Klein’s program for teacher’s education (Klein, 1908,
2010) is the role the author assigns to the School in the scientific development of
Mathematics. For Klein, the School plays a role as important as the University in the
production of mathematical knowledge: to establish a cultural terrain upon which new
knowledge will be constructed. Thus, school mathematical practices interfere in the
ways mathematics as a science will follow. Klein’s perspective is opposite to the views
that attribute to the School a role of spreading knowledge, which would be produced
singly in the University, with no interference in this knowledge.
This perspective is related with Klein’s notion of elementary mathematics, as the
nuclear parts that can support and structure mathematical knowledge within a historical
context. The author calls elementarization the process of historical shifting through
which mathematical ideas are progressively more clearly understood and constitute the
groundwork for the production of new knowledge. Thus, for the author, there is no
hierarchy or difference of value between elementary and advanced parts of
mathematics: he regards such hierarchy as an obstacle to overcome.
Under this perspective, for Klein, mathematical knowledge needed for teaching
includes the development of a broader view of concepts and theories, their multiple
relations, and their historical evolution – a view of elementary mathematics from a
higher standpoint. According to Schubring (2014), Klein’s perspective stresses the
importance of a meta-knowledge, that is, teachers’ knowledge on their own content
knowledge. The notion of meta-knowledge, firstly proposed by Smith (1969), is
essentially epistemological: mathematics teacher must not only known concept, but
mostly be aware of the scientific nature of such knowledge, and its relevance for
teaching.
THEORETICAL FRAMEWORK: CONCEPT STUDY
Davis (2010) describes concept study as collective study, focused on the mathematical
content, in which groups of teacher share their experiences emergent from practice as
a means to question and elaborate their content knowledge towards teaching. This
model is grounded on a dynamical perspective of the mathematical knowledge for
teaching. For Davis and his colleagues (e.g. Davis 2010; Davis & Renert, 2014), a
concept study allows a conceptual (re)construction established upon already existent
knowledge. Such process is referred to by the author as “substruct”:
“Substructing is derived from the Latin sub-, “under, from below” and struere, “pile,
assemble” (and the root of strew and construe, in addition to structure and construct). To

Rangel, Giraldo, Maculan
PME40 – 2016 4–117
substruct is to build beneath something. In industry, substruct refers to reconstructing a
building without demolishing it – and, ideally, without interrupting its use. Likewise, in
concept studies, teachers rework mathematical concepts, sometimes radically, while using
them almost without interruption in their teaching.” (Davis, 2014, p.43, emphasis on the
original)
For Davis and his colleagues a concept study highlights and gives assess to the depth
and scope of teachers’ knowledge on mathematical concepts. A concept study uses a
topic of the school curriculum, as a starting point. This topic determines the range of
questions and themes that emerge during the discussion, through the contribution of
the participants, as they share their impressions. The data analysis from a concept study
is essentially interpretative and structured as identification of emphasis, regarding the
group’s reflections (Figure 1).
Figure 1: A visual metaphor to the relationships among concept study emphasis
(Davis & Renert, 2014, p. 57).
Davis & Renert (2014) stress that only the first emphasis could be described as
intentional in any structural sense. The others were emergent – unanticipated,
unplanned, arising from shared interests, divergent knowing, and accidental
encounters. The first emphasis – meanings – is characterized by putting together a list
of images, metaphors, impressions that emerge from the collective reflection. The
following emphasis are built upon the account of connections between the meanings
ranked in the first emphasis. Thus, the first emphasis is the only intentional one, from
which all the others emerge. Davis (2010, Davis & Renert, 2014) highlights shifts on
the perception of Mathematics of the participants as a frequent outcome of Concept
Studies. According to the author, this framework allows to identify of developing
collective abilities of the teachers, to explore and to reshape their knowledge.
THE STUDY
Aims and Research Questions
The focus of this research is the potential for collaborative studies involving math
teacher groups for the construction of mathematical knowledge for teaching. More
specifically the central research question that guides this work is: How and to which
extend can a collective study, structured in accordance with the model of Concept
Study (Davis, 2010; Davis & Renert, 2014), contribute with: (a) the recognition by the
participants of elementary aspects of school mathematics, and its potential influence

Rangel, Giraldo, Maculan
4–118 PME40 – 2016
on (re)construction of mathematical knowledge for teaching; and (b) the development
of participants’ meta-knowledge.
To investigate these questions, the central topic of the concept study was rational
numbers. This topic was chosen because it incorporates different aspects (such as
representations and operations) commonly recognized by teachers as they involve
learning obstacles and difficulties. This research does not intend to map out what
teachers know, or do not know, about rational numbers. The focus is on the
investigation of connections and links between various topics of mathematics in a
collaborative study aimed at the professional development of mathematics teachers and
the (re)construction of their mathematical knowledge for teaching.
Setting and Method
The participants of the collective study were a group of 15 teachers, all working in the
public school system, with experience varying from 1 to 20 years, who were taking an
in-service training course at the Federal University of Rio de Janeiro. Each session was
4 hour long each, and there were 19 weekly sessions in total. Data collection included
audio and video recording (that were fully transcribed), field notes by the researcher,
and written registers by the participants during the discussions.
The construction of the list (Figure 2) that characterizes emphasis 1 – meanings – were
triggered by the question: What is fundamental when we teach rational numbers at
elementary school? The formulation of this question aims to identification of
elementary aspects by the participants.
Figure 2: Meanings.
The subsequent emphases were determined from the dimensions and complexity of the
relationships established by the participants between different aspects of the central
Rangel, Giraldo, Maculan
PME40 – 2016 4–119
topic (rational numbers) and between this and other topics and fields of mathematics.
In particular, as these emphases are characterized by the dimensions of the collective
discussion, they do not correspond to consecutive and well defined periods of time.
Although there is a chronological order between the beginning of each emphasis,
thereafter they may overlap and joint nonlinear or stepwise. The dynamic relationship
between the emphasis identified in the study can be better perceived from the visual
metaphor shown in Figure 1. Therefore, taking into account the complexity of the
articulations around the central topic, 3 other emphasis were distinguished: landscapes,
entailments e inference.
RESULTS: CONCEPT STUDY EMPHASIS
Emphasis 1 – Meanings
The composition of this emphasis took a long discussion. In general, participants’ main
reference was their classroom experience, rather than the mathematical relevance of
each item. For example, the discussion that led to the inclusion of “understanding the
idea of unit” came from the recognition by the group of difficulties students face in
solving problems involving units corresponding to sets with more than one element.
The only item for which mathematical relevance was explicit (and determinant for the
inclusion on the list) was the “density of rational numbers set”. All the participants
agreed that the understand of property that “given two distinct rational numbers, it is
always possible to find another one between them” was essential for learning, despite
some of them did not associate this property with the definition of a dense set.
Emphasis 2 – Landscapes
This emphasis was marked by the recognition by teachers of elementary aspects that
form the groundwork for the understanding of rational numbers. A highlight was the
notions of equivalence and equality in the context of fractions. From the discussion
about the question “What is right: ½ is equal to or equivalent to 2/4?” (brought about
by one of the participants), the group reflected upon definitions of equivalence classes
and rational number. This question unveiled uncertainties underlying their practices.
This point of the study marked a significant inflexion on the participants’ criteria to
seek for answers. Until then, they had been using school textbooks as references for
their theoretical questions. The uncertainties on equivalence of fractions drove them to
seek for answers on academic books. It was clear for them that, despite the
formalization of rational numbers is not to be taught at school, its knowledge may
provide answers of questions such as the one the group involved with.
Another discussion concerning division with fractions was also prominent. This
discussion was triggered by a problem brought by one the participants: “In a library,
all of the books were placed on 6 full shelves. These shelves will be replaced by new
ones. Each new shelf fits ¾ of the capacity of each of old ones. How many new shelves
will be necessary to keep all the books of the library?” It is not rare that the solution
for this problem is based on a strategy that bypasses the division with fractions:

Rangel, Giraldo, Maculan
4–120 PME40 – 2016
Suppose that the capacity of each of the original shelves is, say, 100 books. Then, each
of the new shelves would fit 75 books, and the solution is the result of the division 600
÷ 75. This strategy is certainly correct, however, it avoids the experience with division
of fractions. A visual approach for this problem, proposed by one of the teachers, led
the participants to associate it with the idea of division as measurement within the
context of rational numbers. The discussion raised led them to articulate different
elementary aspects of the concept of rational number: the role of the unit; the
interpretation of division as measurement; and graphic representations for division.
Emphasis 3 – Entailments
In our analysis, the third emphasis is marked by mathematical connections established,
that increased in range and complexity and extended beyond the context of rational
numbers. For instance, the discussion reached incommensurability, the notion of
infinity e the construction of real numbers. They started to explicitly relate approaches
for the elementary school with more advanced mathematical topics.
Emphasis 4 – Inferences
The last emphasis is characterized by a shift on teachers’ attitude. A key aspect was
that they started to put their warrants of truth at stake. For instance, they were sure
about the fact that every rational number has to representations: as a fraction, and as
decimal expansion. They realized that this was a certainty built throughout their years
as school students, and not on undergraduate courses. Our analysis suggests that their
finding is associated with the double discontinuity point out by Klein (2010).
Moreover, the participants go further and inquire: What are the warrants for this fact?
How should be treated in the classroom? This suggests that they developed a new
perception for the content: It is not enough to know, it is also necessary to understand
how this knowledge is constituted, what is its nature and its origin, as well as in which
sense and to which extend it is relevant to the classroom. We identified this perspective
as a process of meta-knowledge construction. In order to seek for answers for questions
that emerged from their practice, it was necessary to recall more advanced knowledge
(such as abstract algebra and analysis) and refer to the consistency of formal
mathematics. Yet, this perspective did not lead participants to neglect the importance
of an approach suitable to elementary school.
Another highlight of this emphasis is the development of a critical attitude by teachers.
One of the participants brought forward a problem (Figure 4), because he found out a
“flaw” on its formulation. The group noticed that, from a purely mathematical stand
point, the choice of interval’s borders is irrelevant, and a generic algorithm for the
procedure could be established. However, they also noticed that, with data given on
the problem formulation, the right answer could be reached through a wrong strategy,
which they believed to be likely to be done by students: the point B corresponds to the
second out of 5 parts in which the segment is dived.
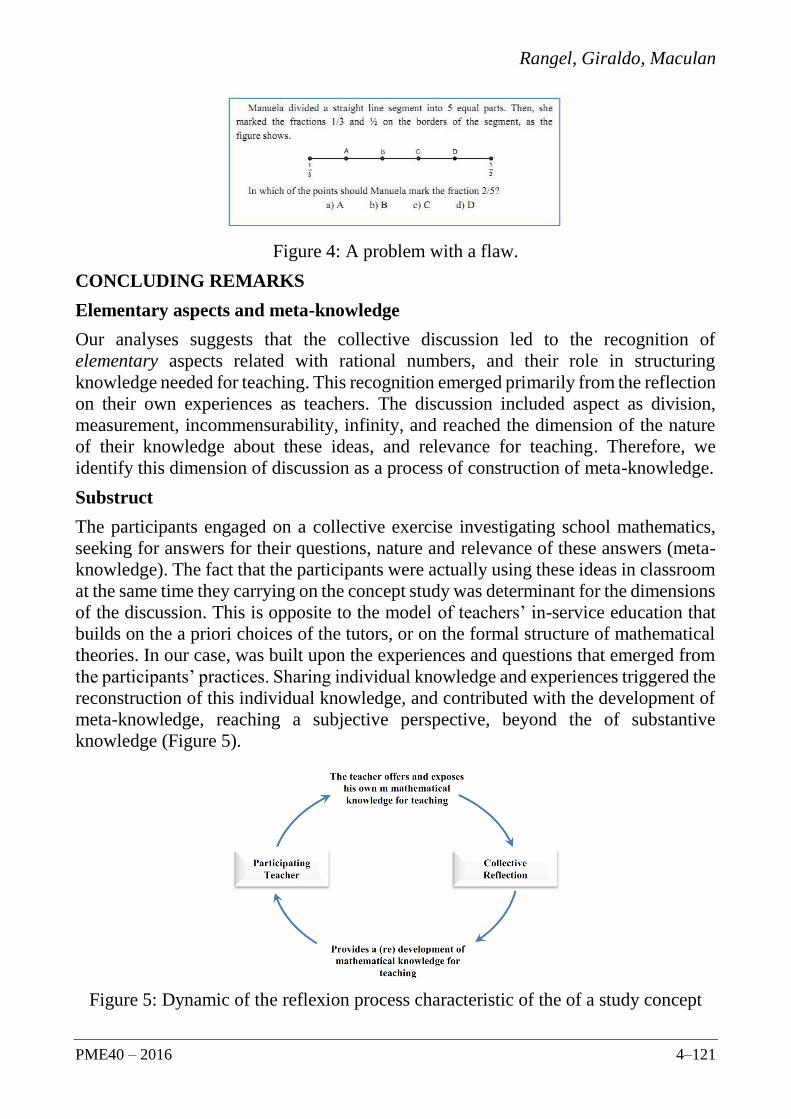
Rangel, Giraldo, Maculan
PME40 – 2016 4–121
Figure 4: A problem with a flaw.
CONCLUDING REMARKS
Elementary aspects and meta-knowledge
Our analyses suggests that the collective discussion led to the recognition of
elementary aspects related with rational numbers, and their role in structuring
knowledge needed for teaching. This recognition emerged primarily from the reflection
on their own experiences as teachers. The discussion included aspect as division,
measurement, incommensurability, infinity, and reached the dimension of the nature
of their knowledge about these ideas, and relevance for teaching. Therefore, we
identify this dimension of discussion as a process of construction of meta-knowledge.
Substruct
The participants engaged on a collective exercise investigating school mathematics,
seeking for answers for their questions, nature and relevance of these answers (meta-
knowledge). The fact that the participants were actually using these ideas in classroom
at the same time they carrying on the concept study was determinant for the dimensions
of the discussion. This is opposite to the model of teachers’ in-service education that
builds on the a priori choices of the tutors, or on the formal structure of mathematical
theories. In our case, was built upon the experiences and questions that emerged from
the participants’ practices. Sharing individual knowledge and experiences triggered the
reconstruction of this individual knowledge, and contributed with the development of
meta-knowledge, reaching a subjective perspective, beyond the of substantive
knowledge (Figure 5).
Figure 5: Dynamic of the reflexion process characteristic of the of a study concept

Rangel, Giraldo, Maculan
4–122 PME40 – 2016
Changes in attitude
Our results indicate a shift to a more inquiring attitude by teachers. The participants
engaged on discussion and reflection on ideas that were already familiar to them, and
regarded as elementary, without refraining from exposing doubts and uncertainties
about these ideas. They exposed their knowledge and beliefs, and expressed the
intention to extend the experience with an inquiring attitude to their classrooms. They
showed to me effectively more watchful to their students’ discourses, reasoning and
difficulties. This attitude was clear as the teachers declared to be more confident on
dealing with her students’ difficulties.
We highlight the potential of the concept study model to raise teachers’ awareness of
the nature of their knowledge and it relevance to teaching (meta-knowledge), and,
mostly, and to equip them with a protagonist role, as role of their own knowledge
construction.
REFERENCES
Ball, D. et al. (2009). Mathematical Knowledge for teaching: Focusing on the work teaching
and its demands. In M. Tzekaki, M. Kaldrimidou, & H. Sakonidis (Eds), Proceedings of
33rd Conference of International Group for the Psychology of Mathematics Education
(vol. 1, pp. 133–139). Thessaloniki, GR: PME.
Ball, D; Thames, M. & Phelps, G. (2008). Content knowledge for teaching: What makes it
special? Journal of Teacher Education, 59 (5), 389-407
Davis, B. (2010). Concept Studies: Designing settings for teacher’s disciplinary knowledge.
Proceedings of the 34th Annual Conference of the International Group for the Psychology
of Mathematics Education, Minas Gerais, Brasil, 1, pp.63-78.
Davis, B; Renert, M. (2014). The Math Teachers Know – Profound Understanding of
Emergent Mathematics. Routledge, London.
Davis, B. & Simmt, E. (2006). Mathematics-for-teaching: An ongoing investigation of the
mathematics that teachers (need to) know. Educational Studies in Mathematics. Vol. 61,
No. 3 (Mar., 2006), pp. 293-319. Springer.
Klein, Felix. (1908, 2010). Elementary Mathematics from an Advanced Standpoint:
Arithmetics, Algebra, Analysis. USA: Breinigsville.
Noddings, N. (1992). Professionalization and Mathematics Teaching In: GROUWS, D. (Ed).
(1992) Handbook of Research on Mathematics Teaching and Learning. (pp. 197-208).
New York, NY: Macmillan.
Shulman, L. (1986). Those who understand: Knowledge growth in teaching. Educational
Researcher, Vol.15, pp.4-14.
Schubring, G. (2014). A Matemática Elementar de um Ponto de Vista Superior: Felix Klein
e a sua Atualidade. In Roque, T, & Giraldo, V. (eds.), O Saber do Professor de
Matemática: Ultrapassando a Dicotomia entre Didática e Conteúdo. Rio de Janeiro:
Ciência Moderna.
Smith, B.O., in colaboration with, Cohen, S.B. & Pearl, A. (1969). Teachers for the Real
World. Washington DC: The American Association of Colleges for Teacher Education.
2016. In Csíkos, C., Rausch, A., & Szitányi, J. (Eds.). Proceedings of the 40th Conference of the International
Group for the Psychology of Mathematics Education, Vol. 4, pp. 123–130. Szeged, Hungary: PME. 4–123
THIRD-GRADERS’ BLOCK-BUILDING: HOW DO THEY
EXPRESS THEIR KNOWLEDGE OF CUBOIDS AND CUBES?
Simone Reinhold & Susanne Wöller
Leipzig University, Germany
The study we report on here intends to detect third-graders’ conceptual knowledge on
cuboids and cubes, respectively. Avoiding methods which are restricted to commenting
verbally or drawing to investigate young children’s knowledge on geometrical solids,
we used wooden blocks in construction tasks: German and Malaysian children aged
8 to 9 were asked to take wooden cubes, cuboids, prisms or blocks from Froebel’s Gifts
and to construct cuboids (cubes) by assembling the blocks according to their
knowledge and visualization. First observations are interpreted according to the Van
Hiele framework. In addition, we have a closer look on the variety of constructions
some children produced and raise concluding hypotheses concerning the development
of children’s conceptual knowledge on geometrical solids.
INTRODUCTION
Geometry education in primary school plays a fundamental role for the development
of basic knowledge on geometrical shapes and solids. Thus, classroom activities often
focus on naming and sorting shapes. Besides, the primary curriculum has also been
extended to activities with hands-on-materials and tasks which have to be solved
mentally (Franke & Reinhold, 2016). This includes “working on the composing/
decomposing, classifying, comparing and mentally manipulating both two- and three-
dimensional figures” (Sinclair & Bruce, 2015, p. 319). Obviously, both sides of the
coin – namely visualizing and mentally manipulating and multi-sensory or haptic
experiences – facilitate young children’s ability of recognizing shapes and foster their
acquisition of geometrical knowledge (e. g. Kalenine et al., 2011). As younger children
often face difficulties in articulating this knowledge, we consider block building
activities to be a meaningful way for them to express their geometrical concepts on
solids. Yet, we do not investigate how constructions with tangible blocks foster the
development of conceptual knowledge on geometrical solids, in this study.
THEORETICAL FRAMEWORK
Conceptualizing Conceptual Knowledge on Geometrical Solids
The customary conception of a concept comprises the “(…) ideal representation of a
class of objects, based on their common features” (Fischbein, 1993, p. 139). In this
sense, geometrical concepts refer to common features of a class of geometrical shapes
or solids which can be visualized or perceived (visually and haptic) when encountering
concrete representatives. For example, specific figural properties like the shape of a
solid’s surfaces or the angles which determine the way the surfaces are interrelated
may indicate that a representative is part of a certain class of solids. Based on this

Reinhold, Wöller
4–124 PME40 – 2016
notion, students’ conceptual knowledge on geometrical solids reaches beyond the
capability of correctly naming concrete representatives or giving a verbal definition,
later on at secondary level. It rather comprehends the perception, visualization and
identification of distinctive properties which refers to individual mental images
students have while thinking of a specific solid (cf. Tall & Vinner, 1981). In addition,
Vollrath (1984, p. 9-10) suggests that geometrical concept knowledge can be
operationalized by illustrating examples of a certain category of shapes or solids, by
assigning the term to a superordinate term, or by solving problems which correspond
to the used term and its associated properties.
Development of Conceptual Knowledge on Geometrical Solids
The development of geometrical concept knowledge from primary to secondary has
been described by the well-known Van Hiele Model which defines five levels of
development which are based on previous level(s) and include specific characteristics:
School starters and younger children most often classify shapes according to their
holistic appearance which is limited to recognition of resemblance. At this level of
VISUALIZATION “There is no why, one just sees it.” (Van Hiele, 1986, p. 83) Thus,
identification of prototypes at this level is fairly easy and enables children to identify
other shapes or to visually distinguish different types of four-side figures (e. g.
rectangles, parallelograms). Yet, shape recognition is limited to recognition of
resemblance and does not pay attention to reasoning on properties or (sub-ordinate)
relations between different shapes. In addition, Clements et al. (1999) and others
discuss a pre-recognitive level which characterizes young children’s abilities before
reaching the level of VISUALIZATION. Based on this and at the ensuing level of
ANALYSIS, children are capable of taking a shape’s properties into account when they
decide upon categorization. Activities of (de)composing, discussing and reflecting
upon those activities facilitate children’s noticing of properties, but still, they do not
realize relationships between properties and are unable to give a concise definition
(with necessary and sufficient conditions). Thus, they are usually not able to tell that a
cube is a very special cuboid. Only when children are able to cope with questions
concerning relationships of shapes and when they start arguing about the impact of
various properties on relations among shapes in their definitions, children have reached
the level of ABSTRACTION (Van Hiele, 1999, p. 311).
Expressing Geometrical Knowledge in Drawings and Constructions
In numerous previous studies, scholars have analyzed children’s drawing processes
and products to get access to children’s understanding and their developmental stages
of conceptual knowledge on geometrical shapes. For example, knowledge on the
variety of triangles and quadrilaterals in terms of identifying, sorting and comparing
representatives was detected by Burger & Shaughnessy (1986). Maier & Benz (2014)
stated an immense variety in understanding the concept of triangles according to their
analysis of German and English primary children’s drawings, too. A significant
relationship between children´s drawings and their geometric understanding was also

Reinhold, Wöller
PME40 – 2016 4–125
stated by Thom & McGarvey (2015), and Hasegawa (1997) tried to identify stages on
the development of an n-gon-concept by using drawing activities and rotations. These
and other studies regard student´s drawings as a representation of student´s geometric
concepts (cf. Hasegawa, 1997, p. 177). In line with this research, children’s drawing
processes and products are widely accepted as individual expressions of spatial abilities
(Milbrath & Trautner, 2008) or spatial structuring of two-dimensional shapes
(Mulligan et al., 2004; Mulligan & Mitchelmore, 2009). Based on the work of Lewis
(1963) who was among the first to investigate how children draw a cube, Mitchelmore
(1978) examined how children aged 7 to 15 draw cubes, cuboids, cylinders and four-
sided pyramids. Yet, these and following studies have to cope with children’s limited
drawing skills concerning three-dimensional shapes in primary age. Hence, we derive
only very specific information on children’s geometrical knowledge on solids when
we ask them to draw a solid.
A promising alternative can be found in concrete constructions with blocks: When
playing with blocks, even young children deal with geometrical congruence or they
distinguish solids according to their properties which is an important aspect of
geometrical concept knowledge (see above). Besides, they reflect on spatial relations,
orientations or the structure of a three-dimensional array. In Reinhold et al. (2013), we
reported on (young) children’s difficulties in the (re)construction of cube arrays for
purposes of enumeration, but we also found evidence in many ensuing studies1 that
children’s fine motor function and their general haptic competence to assemble single
blocks or components to three-dimensional arrays is usually entirely developed at the
age of 9.
RESEARCH QUESTIONS, DATA COLLECTION AND ANALYSIS
Based on this theoretical framework, we assume that analyses of differences in
individual construction processes and products (which may, additionally, be
commented verbally) provide deeper insight into children’s visualization of solids.
This is expected to contribute to a deeper understanding of children’s concept
knowledge on geometrical solids, while we were interested in exploring to what extent
third-graders can articulate their conceptual knowledge on geometrical solids via
constructing activities with wooden blocks:
What kind (and sizes) of cubes and cuboids do third-graders construct and which
variations occur?
Are these constructions in line with their verbal explanations?
How can we interrelate these results with Van Hiele framework and is there a
necessity and supportive data to enrich the framework?
1 Data was gained in various unpublished Master Theses research studies which reported on part-
studies of the project (Y)CUBES at the Universities of Braunschweig and Leipzig, Germany (cf.
Reinhold et al, 2013).

Reinhold, Wöller
4–126 PME40 – 2016
Data collection focused on one-on-one-interviews with ten children aged eight to nine
in a primary school in one of the larger East-German cities and with twelve nine year-
olds in a primary school in a Northern Malaysian city in 2015 (“Grundschule” in
Germany and “Malay-medium National School” in Malaysia) 2 . In the beginning,
children were asked to explain their ideas and knowledge concerning cubes and
cuboids in a short dialogue with the interviewer. Afterwards, a variety of tasks (e. g.
“Please, build a cuboid using these blocks.”) invited them to express their knowledge
on cubes and cuboids via construction activities with wooden cubes, cuboids, prisms
and a collection of different blocks (Froebel´s Gift 6). During their constructions, they
were encouraged to describe their proceeding. A manual for all interviews referred to
previous research related to the development of geometrical thought (e. g. Crowley,
1987). All interviews were transcribed verbatim and coded with software support by
Atlas.ti. A coding guideline was developed mainly according to Grounded Theory
Methods (Corbin & Strauss, 2015), trying to detect new facets of articulating
conceptual knowledge on geometrical solids and to generate new hypotheses
concerning the development of third-graders’ geometrical concepts.
EXCERPTS FROM THE RESULTS
Qualitative analyses of the data reveal a wide variety among either the German or the
Malaysian children’s construction activities, and thereby indicate a wide variety in
third-graders geometrical concept knowledge on the selected solids.
The range of PRODUCTS FOR CUBOIDS (using cubic blocks) included regular cubes
(e. g. 2 x 2 x 2 or 3 x 3 x 3), convex constructions with various identical layers (e. g.
3 x 4 x 2), and flat constructions made of only one layer of attached cubes (put as a
“lying layer” or as “walls”, e. g. made of 2 x 5 x 1 or 3 x 1 x 1 cubes). Additionally,
we observed children who (correctly) identified rows of entirely connected cubes (e. g.
3 x 1 x 1) as cuboids (see first row in figure 1).
Figure 1: Variety of cuboids constructed by third-graders
2 Data collection in Malaysia was supported by the DAAD (Higher Education Dialogue with the
Muslime World; Faculty of Education, Leipzig University, Germany and Universiti Sains
Malaysia, Penang; “Pupil’s Diversity and Success in Education in Germany and Malaysia”).
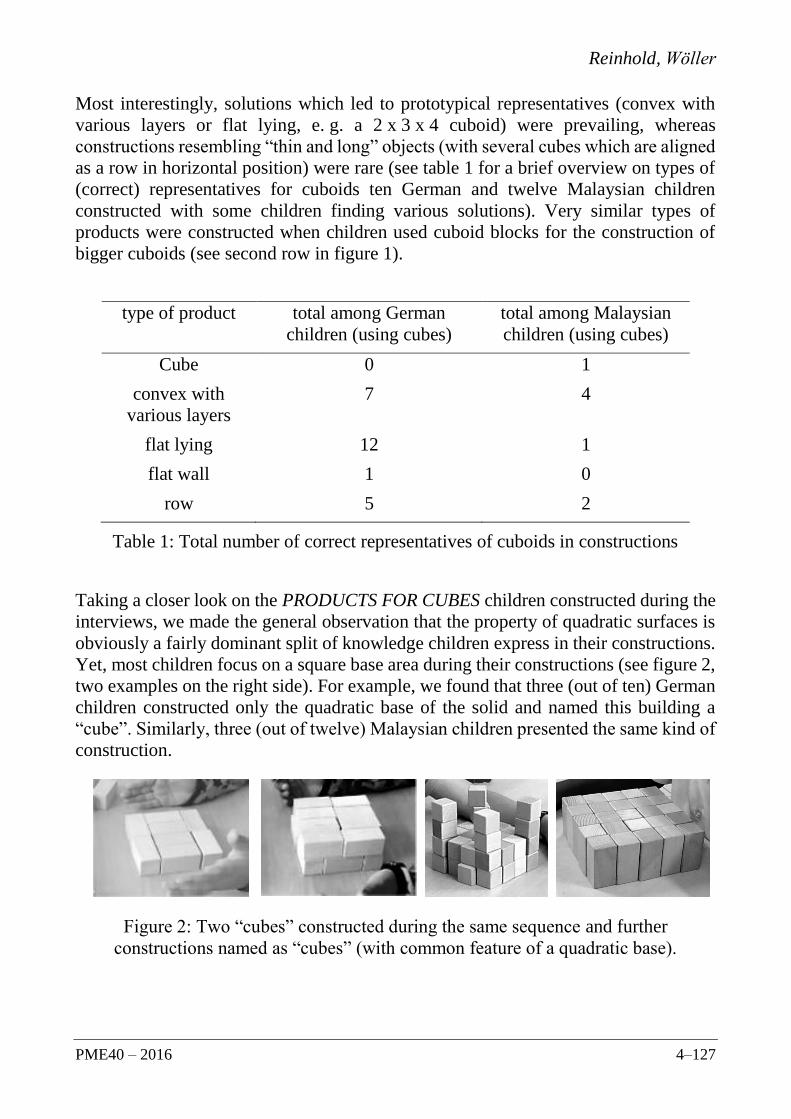
Reinhold, Wöller
PME40 – 2016 4–127
Most interestingly, solutions which led to prototypical representatives (convex with
various layers or flat lying, e. g. a 2 x 3 x 4 cuboid) were prevailing, whereas
constructions resembling “thin and long” objects (with several cubes which are aligned
as a row in horizontal position) were rare (see table 1 for a brief overview on types of
(correct) representatives for cuboids ten German and twelve Malaysian children
constructed with some children finding various solutions). Very similar types of
products were constructed when children used cuboid blocks for the construction of
bigger cuboids (see second row in figure 1).
type of product total among German
children (using cubes)
total among Malaysian
children (using cubes)
Cube 0 1
convex with
various layers
7 4
flat lying
flat wall
row
12
1
5
1
0
2
Table 1: Total number of correct representatives of cuboids in constructions
Taking a closer look on the PRODUCTS FOR CUBES children constructed during the
interviews, we made the general observation that the property of quadratic surfaces is
obviously a fairly dominant split of knowledge children express in their constructions.
Yet, most children focus on a square base area during their constructions (see figure 2,
two examples on the right side). For example, we found that three (out of ten) German
children constructed only the quadratic base of the solid and named this building a
“cube”. Similarly, three (out of twelve) Malaysian children presented the same kind of
construction.
Figure 2: Two “cubes” constructed during the same sequence and further
constructions named as “cubes” (with common feature of a quadratic base).

Reinhold, Wöller
4–128 PME40 – 2016
The German third-grader Anna struggles with the demands she has to cope with when
constructing a cube, too: Within a longer sequence of the interview she initially
constructs a flat lying cuboid with all blocks arranged in a quadratic array. Next, she
constructs a second quadratic layer on the lower quadratic layer – naming both
constructions a “cube” (see figure 2, first and second picture). Additionally, her focus
lies on quadratic arrays as a starting point when building cuboids, as well. She does not
identify the thin and long cuboid (from Froebel´s Gift) as a cuboid (“No, this one is not
a cuboid, because it is too long.”), but identifies another cuboid (from Froebel´s Gift)
with the feature of two quadratic surfaces correctly. These comments and constructions
are in line with Anna’s verbal explanation in the beginning of the interview “A cube is
quadratic.” and “A cuboid has equal long sides, except for this side (showing the lateral
quadratic surfaces of a block lying on the table.).” In summary, we can state that Anna
is on her way to the level of ANALYSIS as she tries to use descriptive mathematical
knowledge when giving comments on her construction (e. g. using mathematical terms
like “side” or “edge”).
On one hand, these observations obviously reveal problems in developing a sound
geometrical concept of “cuboid” and the sub-ordinate concept of “cube”. On the other
hand, most German children tried to name properties and offered answers like “because
it has equally long edges” when they were asked to explain why they considered their
own building to be a cube. Some Malaysian children were capable of arguing in a
similar way and offered arguments like “It looks the same from all sides.” or “All
surfaces are the same and it’s three-dimensional.”
Another interesting aspect was to observe cognitive conflicts some German children
faced when using the material: For example, they said “With cuboid-bricks I can´t
build a cube.”, “With this strange bricks (referring to prisms) I can´t build a cube or
cuboid.” or “With triangles I can´t build a cube.” This reveals that the participating
third-graders often DO identify at least a limited set of common features of cuboids
(and of the sub-ordinate class of cubes) in the sense of Fischbein (1993). Yet, they
obviously often have difficulties in considering all relevant features at the same time.
Compared to German children, children’s block constructions in Malaysia revealed a
wider distribution on different developmental stages of geometrical concept
knowledge (e. g. several children stating “I just know this is a cube.” at the level of
VISUALIZATION, but only a few children listing properties of the constructed object
in detail at the level of ANALYSIS). These differences could be due to language
peculiarities: In German, the term “Wuerfel” is used in children’s every-day-life. It
serves both for dice and cubes and is particularly different from “Quader” (cuboid),
whereas there is a significant similarity of the words “cubes” and “cuboids” (which is
also obvious in Bahasa Malay some children speak at home: “Bentuk Kiub” or “Bentuk
Kubus” for “cube” and “Dadu” for “dice”).

Reinhold, Wöller
PME40 – 2016 4–129
CONCLUSIONS AND OUTLOOK
Aiming at more detailed information on the question how third-graders articulate their
geometrical knowledge via constructions with wooden blocks, we found an impressive
variety of different types of products and of individual approaches which provided the
opportunity to interrelate the constructive activities with the Van Hiele framework.
According to our analyses of third-graders’ conceptual knowledge on cubes and
cuboids, none of the participating German and Malaysian children was in the phase of
transition from ANALYSIS to ABSTRACTION – a result which is basically in line with
similar studies (e. g. Szinger, 2008, p. 173). All children faced difficulties in realizing
relationships between the geometrical solids cube and cuboid. The more surprising
results were the difficulties some children had in constructing ANY correct
representative of adjacent blocks for either cubes or cuboids or both.
Additionally, the results from our work with children of different cultural backgrounds
may serve as an empirically grounded enrichment of the Van Hiele framework –
keeping in mind that all data only derived from a fairly small sample (N = 22). The
results also raise new hypotheses concerning the development of children’s conceptual
knowledge on geometrical solids: As the variety we detected among third-graders is
likely to enlarge in ensuing years of children’s development, the individual variety and
flexibility in constructing cuboids and cubes and the ability to give comments might
extent and change during a longer phase of children’s individual development
(especially from grade three until grade five). In this sense, the results of our initial
study in this field provides the starting point for a longitudinal study we have set up
recently. This is encouraged by a particular interest in children’s development on
geometrical concept knowledge on cuboids and cubes which has not been tracked
intensely, so far.
References
Burger, W. F., & Shaughnessy, J. M. (1986). Characterizing the Van Hiele Levels of
Development in Geometry. Journal for Research in Mathematics Education, 17(1), 31-48.
Crowley, M. (1987). The Van Hiele Model of the Development of Geometric Thought. In M.
Montgomery Lindquist (Ed.), Learning and Teaching Geometry, K-12 (Yearbook of the
National Council of Teachers of Mathematics, pp. 1-16). Reston, VA: NCTM.
Clements, D. H., Swaminathan, S., Zeitler Hannibal, M. A., & Sarama, J. (1999). Young
Children´s Concept of Shape. Journal for Research in Mathematics Education, 30(2), 192-
212.
Corbin, J., & Strauss, A. (2015). Basics of Qualitative Research: Techniques and
Procedures for Developing Grounded Theory. Thousand Oaks: Sage.
Fischbein, E. (1993). The Theory of Figural Concepts. Educational Studies in Mathematics,
24(2), 139-162.
Franke, M., & Reinhold, S. (2016). Didaktik der Geometrie in der Grundschule. Wiesbaden:
Springer.

Reinhold, Wöller
4–130 PME40 – 2016
Hasegawa, J. (1997). Concept Formation of Triangles and Quadrilaterals in the Second Grade.
Educational Studies in Mathematics, 32(2), 157-179.
Kalenine, S., Pinet, L., & Genta, E. (2011). The Visual and Visio-haptic Exploration of
Geometrical Shapes Increases their Recognition in Preschoolers. Int. Journal of Behavioral
Development, 35(1), 18-26.
Lewis, H. P. (1963). Spatial Representation in Drawing as a Correlate of Development and a
Basis for Picture Preference. Journal of Genetic Psychology, 102, 95-107.
Maier, A. S., & Benz, C. (2014). Children’s Conceptual Knowledge on Triangles Manifested
in their Drawings. In P. Liljedahl, S. Oesterle, C. Nicol, & D. Alann (Eds.), Proceedings
of the Joint Meeting of PME 38 and PME-NA36 (Vol. 4, pp. 153-160). Vancouver,
Canada: PME.
Milbrath, C., & Trautner, H. M. (Eds.) (2008). Children’s Understanding and Production of
Pictures, Drawings and Art. Göttingen: Hogrefe.
Mitchelmore, M. C. (1978). Developmental Stages in Children’s Representation of Regular
Solid Figures. The Journal of Genetic Psychology, 133(2), 229-239.
Mulligan, J., Prescott, A., & Mitchelmore, M. (2004). Children’s Development of Structure
in Early Mathematics. In M. J. Høines & A. B. Fuglestad (Eds.), Proceedings of the 28th
Conference of the IGPME (Vol. 2, pp. 465-472). Bergen, Norway: PME.
Mulligan, J., & Mitchelmore, M. (2009). Awareness of Pattern and Structure in Early
Mathematical Development. Mathematics Education Research Journal, 21(2), 33-49.
Reinhold, S., Beutler, B., & Merschmeyer-Brüwer, C. (2013). Preschoolers Count and
Construct: Spatial Structuring and its Relation to Building Strategies in Enumeration-
Construction Tasks. In A. Lindmeier & A. Heinze (Eds.), Proceedings of the 37th
Conference of the IGPME (Vol. 4, pp. 81-88). Kiel: PME.
Sinclair, N., & Bruce, C. D. (2015). New Opportunities in Geometry Education at the Primary
School. ZDM Mathematics Education, 47(3), 319-329.
Szinger, I. S. (2008). The Evolvement of Geometrical Concepts in Lower Primary
Mathematics. Annales Mathematicae et Informaticae, 35, 173-188.
Tall, D., & Vinner, S. (1981). Concept Image and Concept Definition in Mathematics with
Particular Reference to Limits and Continuity. Educational Studies in Mathematics, 12,
151–169.
Thom, J. S., & McGarvey, L. M. (2015). The Act and Artifact of Drawing(s): Observing
Geometric Thinking with, in, and through children´s drawings. ZDM Mathematics
Education, 47(3), 465-481.
Van Hiele, P. M. (1986). Structure and Insight: A Theory of Mathematics Education. Orlando:
Academic Press.
Van Hiele, P. M. (1999). Developing Geometric Thinking through Activities That Begin with
Play. Teaching Children Mathematics, 5, 310-316.
Vollrath, H.-J. (1984). Methodik des Begriffslehrens im Mathematikunterricht. Stuttgart:
Klett.
2016. In Csíkos, C., Rausch, A., & Szitányi, J. (Eds.). Proceedings of the 40th Conference of the International
Group for the Psychology of Mathematics Education, Vol. 4, pp. 131–138. Szeged, Hungary: PME. 4–131
ARE MATHEMATICAL PROBLEMS BORING?
BOREDOM WHILE SOLVING PROBLEMS WITH AND
WITHOUT A CONNECTION TO REALITY FROM STUDENTS’
AND PRE-SERVICE TEACHERS’ PERSPECTIVES
Johanna Rellensmann, Stanislaw Schukajlow
University of Münster, Germany
In this study, we asked 100 ninth graders about their boredom while solving problems
with and without a connection to reality. We additionally asked 163 pre-service
teachers to judge students’ task-specific boredom with respect to the same problems.
Our results show that whereas students experienced the same level of boredom for
problems with and without a connection to reality, pre-service teachers judged
students’ boredom as higher for problems without a connection to reality. Moreover,
pre-service teachers’ judgment accuracy of students’ boredom was low for both
problem types with huge variability among pre-service teachers.
INTRODUCTION
Emotions are important for mathematics learning and achievement (Hannula, Evans,
Philippou, & Zan, 2004). In the mathematics classroom, mathematical tasks can induce
emotions in students (McLeod, 1992), and it can be assumed that varying the types of
tasks might induce different emotional reactions. For example, a student might enjoy
working on a real-world problem but might be bored when solving a purely
mathematical problem or vice versa. In order to enhance lesson quality, teachers should
be aware of students’ task-specific emotions as teachers select problems for their
classes. Thus, teachers need to accurately judge students’ task-specific emotions. The
aim of this study was to investigate students’ experiences of boredom as they solved
problems with and without a connection to reality and the ability of pre-service teachers
to judge students’ task-specific boredom.
THEORETICAL BACKGROUND
Problems with and without a connection to reality
Mathematical problems can be divided into problems without a connection to reality
and problems with a connection to reality, and the latter can be subdivided into
modelling problems and “dressed up” word problems. Examples of all problem types
are illustrated in Figure 1. The differences between the problem types arise from the
cognitive processes that are necessary to solve the problems (Niss, Blum, & Galbraith,
2007). To solve a modelling problem, the student first has to construct a mental model
of the realistic problem situation, which then has to be simplified, structured, and
mathematized to construct a mathematical model of the problem. All cognitive
processes in modelling are challenging for students, as structuring, for example, can
include making assumptions about missing data. After the mathematical model is

Rellensmann, Schukajlow
4–132 PME40 – 2016
constructed, mathematical methods can be applied to compute a mathematical result,
which finally has to be interpreted and validated with regard to the real situation. In a
“dressed up” word problem, the reality-related cognitive processes are less complex.
A simplified situation model is already given and only has to be “undressed” to find
the mathematical model. Validation of the real result is limited to checking the
mathematics and does not include checking the hypothesized models. Modelling and
“dressed up” word problems have in common that they require processes of
transferring between reality and mathematics and vice versa. By contrast, in a problem
without a connection to reality, the mathematical model is already given. Mathematical
methods can be applied directly, and the mathematical result does not have to be
interpreted in reality. All problem types are important for students’ learning
(Schukajlow et al., 2012). For example, by solving problems without a connection to
reality, students can practice mathematical procedures. Solving “dressed up” word
problems can introduce students to modelling activities. And finally, by solving
modelling problems, students can learn to apply their mathematical knowledge in
reality.
Students’ experiences of boredom while solving mathematical problems
Mathematical problems can elicit emotional reactions in students (e.g. boredom;
Hannula et al., 2004). Boredom is one of the most frequently experienced emotions in
the mathematics classroom (Frenzel, Pekrun, & Goetz, 2007) and can negatively
influence students’ thoughts, motivations, and achievements (Schukajlow, accepted;
van Tilburg & Igou, 2012). The control-value-theory posits that students’ perceived
competence and students’ value appraisals are important sources of students’ boredom
(Pekrun, 2006). Students’ perceived competence is related to students’ ability to
perform a task and depends on the difficulty of the task. As task difficulty can vary
within problem types, the impact of task difficulty on students’ boredom should be
taken into account in research on students’ task-specific boredom. Students’ value
appraisal refers to the perceived valences and personal relevance of task activities and
outcomes. Accordingly, boredom is elicited by a mathematical problem if the student
perceives the activities of solving the problem to be meaningless (van Tilburg & Igou,
2012).
Value appraisals for problems with and without a connection to reality can have
different sources. A student might attribute a high value to solving an intra-
mathematical problem because he or she perceives that solving the mathematical
problem is valuable in its own right (e.g. because the problems helps the student to
understand a mathematical idea or to practice mathematical procedures). A student
who attributes a high value to a problem with a connection to reality may perceive
either solving the real problem or solving the inherent mathematical problem as a
meaningful activity. Consequently, the experience of task-specific boredom can differ
for problems with and without a connection to reality according to students’ task-
specific value appraisal. In mathematics education, it seems to be a common belief that
problems with a connection to reality can improve students’ affect in relation to
Rellensmann, Schukajlow
PME40 – 2016 4–133
mathematics (Beswick, 2011). The underlying assumption is that real-world problems
make students experience and value the usefulness of mathematics in real life.
However, Beswick (2011) argues that there is a lack of evidence for the positive impact
of real-world connections on students’ affect. For example, previous research did not
find a difference in students’ enjoyment while solving problems with and without a
connection to reality (Schukajlow et al., 2012). However, in other studies on this issue,
the impact of task difficulty was not controlled for (Schukajlow & Krug, 2014).
Pre-service teachers’ judgments of students’ boredom
As solving problems is a central activity in mathematics classrooms (Hiebert et al.,
2003), knowledge about students’ boredom while solving mathematical problems is
important for teaching quality. Teachers have to judge students’ task-specific emotions
in order to be aware of task-specific effects on students’ boredom. The accuracy of
judgments of students’ cognitive and affective characteristics is regarded as a key
aspect of teacher expertise. Previous studies have indicated a deficit in teachers’ ability
to judge students’ affective characteristics (Givvin, Stipek, Salmon, & MacGyvers,
2001; Karing, Dörfler, & Artelt, 2013). As one example, Karing et al. (2013) reported
low-to-medium correlations between teachers’ judgments and lower secondary
students’ anxiety in mathematics. Pre-service teachers’ ability to judge students’
boredom is a concern in teacher education, but it has not been investigated yet.
Research questions
In this study, we examined three research questions:
1. Does students’ task-specific boredom differ between problems with and without
a connection to reality?
2. Do pre-service teachers’ judgments of students’ task-specific boredom differ
between problems with and without a connection to reality?
3. Do pre-service teachers accurately judge students’ task-specific boredom when
students solve problems with and without a connection to reality?
METHOD
Procedure and participants
In this study, we asked 100 ninth-grade students (56% female) from two German
comprehensive schools to indicate their task-specific enjoyment and boredom on a
questionnaire administered after task processing. Students’ mean age was M = 15.97
years (SD = 0.93). We additionally administered an adjusted questionnaire to ask 163
pre-service teachers (86% female) in their first university year to judge ninth graders’
task-specific enjoyment and boredom when solving the problems. The pre-service
teachers’ mean age was M = 21.01 years (SD = 2.51).
Sample problems
We used eight problems with a connection to reality and four problems without a
connection to reality. All problems could be solved by using the Pythagorean theorem.

Rellensmann, Schukajlow
4–134 PME40 – 2016
Figure 1 shows sample problems for both problem types. The problems with a
connection to reality could be subdivided into dressed up word problems (e.g. Table
tennis) and modelling problems (e.g. Maypole).
Angle
Where does the right angle
have to be in the triangle (not
drawn true to scale) so that the
equation
n2 - o2 = m2
is satisfied?
Draw the right angle into the
triangle.
Table tennis
How long is the diagonal (dashed line)
of a table tennis table?
Maypole
Every year on Mayday
in Bad Dinkelsdorf,
there is a traditional
dance around the maypole (a tree trunk
approx. 8 m high). During the dance, the
participants hold ribbons in their hands, and
each ribbon is fixed to the top of the
maypole. With these 15-m long ribbons, the
participants dance around the maypole, and
as the dance progresses, a beautiful pattern is
produced on the stem (in the picture, such a
pattern can already be seen at the top of the
maypole stem).
At what distance from the maypole do the
dancers stand at the beginning of the dance
(the ribbons are tightly stretched)?
Figure 1: Problem without a connection to reality (Angle) and problems with a
connection to reality (Table tennis and Maypole)
Affect scales
To measure task-specific boredom, we adapted well-evaluated scales from previous
studies (Schukajlow et al., 2012). In the questionnaires, each problem was followed by
statements about students’ affect.
In the students’ questionnaire, the statement about boredom was “I was bored when
working on this problem.” Students rated the degree to which they agreed with the
statements on a 5-point Likert scale (1=not true at all, 5=completely true).
In the pre-service teachers’ questionnaire, the statement about students’ enjoyment was
“Students enjoy working on this problem,” and the statement about students’ boredom
was “Students are bored when working on this problem.” Pre-service teachers applied
a 5-point Likert scale (1=not true at all, 5=completely true) to rate the degree to which
the statements were true for ninth graders from a German comprehensive school.
Task difficulty
In order to exclude the confounding effect from task difficulty on task-specific
boredom, we adjusted students’ boredom values and pre-service teachers’ judgments
by the impact of task difficulty.
To adjust students’ boredom values, we used students’ task performance as an indicator
of task difficulty. A code of 0 was given for an incorrect problem solution, and a code

Rellensmann, Schukajlow
PME40 – 2016 4–135
of 1 was given for a correct problem solution. Inter-coder reliabilities for task
performance were good (κ > .86).
To adjust pre-service teachers’ judgments of students’ boredom, we used pre-service
teachers’ perceptions of task difficulty, which were assessed in the questionnaire. Pre-
service teachers used a 5-point Likert scale to rate the degree to which the statement
“This task is too difficult for students” was true for ninth graders.
RESULTS
Preliminary results
In order to control for the impact of task difficulty on boredom, we computed adjusted
boredom values. The adjusted values were only slightly different from the unadjusted
values (Table 1). However, we used the adjusted values for our further analyses to
control for the theoretically justified impact of task difficulty on boredom.
Table 1: Adjusted values for students’ boredom and pre-service teachers’ judgments
Problem type Students Pre-service teachers
M (SD) Madj (SDadj) M (SD) Madj (SDadj)
With a connection to reality 2.46 (1.09) 2.49 (1.08) 2.59 (0.45) 2.61 (0.44)
Without a connection to reality 2.48 (1.12) 2.46 (1.12) 3.14 (0.73) 3.11 (0.73)
Students’ boredom while solving problems with and without a connection to
reality
Students' adjusted mean values on boredom were M = 2.49 (SD = 1.08) for problems
with a connection to reality and M = 2.46 (SD = 1.12) for problems without a
connection to reality (Table 1). Means and standard errors are graphically displayed in
Figure 2. A t-test for dependent samples showed that the difference in students'
adjusted task-specific boredom was statistically nonsignificant (t(99) = 0.49, p > .05).
This means that students experienced the same level of boredom while solving
problems with and without a connection to reality when the impact of task difficulty
was controlled for.
Teachers’ judgments of students’ task-specific boredom
We also asked the pre-service teachers to judge the level of boredom that the students
experienced while solving the same problems. When task difficulty was controlled for,
pre-service teachers predicted a mean value of M = 2.61 (SD = 0.44) for problems with
a connection to reality and a mean value of M = 3.11 (SD = 0.73) for problems without
a connection to reality. A t-test for dependent samples revealed that the difference in
pre-service teachers' judgments was statistically significant (t(162) = -9.29, p < .05)
and that the effect size was large (d = 0.73). This means that pre-service teachers
believe that students experience more boredom while solving intra-mathematical
problems than while solving real-world problems.

Rellensmann, Schukajlow
4–136 PME40 – 2016
Figure 2: Means for students’ boredom and pre-service teachers’ judgments for
problems with and without a connection to reality (Error bars represent standard
errors)
Pre-service teachers’ judgment accuracy
To assess pre-service teachers’ accuracy in judging students’ task-specific boredom,
we estimated the level component and the rank component of judgment accuracy
(Helmke & Schrader, 1987).
The level component of judgment accuracy relies on difference scores computed
between students’ boredom values and pre-service teachers’ judgments and indicates
whether pre-service teachers are able to accurately judge students’ absolute levels of
boredom. The mean difference scores indicated that pre-service teachers overrated
students’ boredom for problems with a connection to reality (M = 0.09, SD = 0.40) and
problems without a connection to reality (M = 0.64, SD = 0.74). Single-sample t-tests
showed that difference scores for problems with and without a connection to reality
differed significantly from a value of 0, which stands for accurate judgments (t(162) =
2.88, p < .01, d = 0.23 and t(162) = 11.12, p < .01, d = 0.86, respectively).
The rank component of judgment accuracy indicates whether pre-service teachers are
able to rank problems according to the level of boredom that the problems induce in
students. For students’ boredom, the mean correlation was r = .02 (SD = .37) for
problems with a connection to reality and r = .02 (SD = .70) for problems without a
connection to reality. Near-zero correlations and a huge range of correlations indicated
that pre-service teachers have trouble judging students’ task-specific boredom and that
the ability to make accurate judgments differs greatly among pre-service teachers.
DISCUSSION
In this study, we found that students experience the same level of boredom while
solving problems with and without a connection to reality when the difficulty of the
assessed problems was taken into account. According to the hypothesized relation
between feelings of boredom and the subjective values of activities in the control-
value-theory (Pekrun, 2006), it can be assumed that students perceive intra-
mathematical problems and real-world problems as equally meaningful. This means

Rellensmann, Schukajlow
PME40 – 2016 4–137
that students perceive that solving an intra-mathematical problem (e.g. to understand a
mathematical idea) is a valuable activity in its own right and that its value is not
necessarily extended by a real-world connection. This result is in line with previous
findings on students’ task-specific enjoyment (Schukajlow et al., 2012).
In our study, pre-service teachers predicted that students would experience more
boredom while solving problems without a connection to reality. This finding might
indicate that pre-service teachers believe that students place more value on the use of
mathematics to solve problems in the real world than they do on intra-mathematical
problem solving—a commonly articulated argument in favor of real-world problems
(Beswick, 2011). However, our study shows that students do not perceive intra-
mathematical problem solving as particularly boring.
In line with previous research (Karing et al., 2013), our findings on pre-service
teachers’ judgment accuracy indicate that pre-service teachers have trouble judging
students’ boredom. Pre-service teachers overrated students’ boredom for both problem
types and were not able to rank problems according to the level of boredom that
students experience while solving the problems. Moreover, our results showed huge
variability in judgment accuracy among pre-service teachers. The deficit in pre-service
teachers’ ability to judge students’ emotions should be addressed in teacher education
and classroom practice. One method that can be used to improve teachers’ knowledge
about students is student feedback (Hattie, 2013). Regularly asking students to give
feedback on their emotions can help teachers improve their judgment accuracy and
enable them to match their teaching to students’ learning conditions, which can
improve learning.
Limitations and future directions
In this study, we distinguished between problems with and without a connection to
reality. However, problems with a connection to reality can be subdivided into
modelling problems and dressed up word problems. Although Schukajlow et al. (2012)
did not find differences in students’ boredom for modelling and dressed up word
problems, it remains an open question whether students’ experiences of boredom vary
for different types of real-world problems when the impact of task difficulty is
controlled for.
Conclusion
Are mathematical problems boring? Our results show that students and pre-service
teachers answer this question differently. Whereas students report the same level of
boredom while solving problems with and without a connection to reality, pre-service
teachers judge students’ boredom as higher for problems without a connection to
reality. This result indicates a deficit in pre-service teachers’ ability to judge students’
task-specific boredom, which could also be seen in pre-service teachers’ trouble in
ranking problems according to students’ task-specific boredom.
Rellensmann, Schukajlow
4–138 PME40 – 2016
References
Beswick, K. (2011). Putting context in context: An examination of the evidence for the
benefits of ‘contextualised’ tasks. International Journal of Science and Mathematics
Education, 9(2), 367-390.
Frenzel, A. C., Pekrun, R., & Goetz, T. (2007). Perceived learning environment and students’
emotional experiences: A multilevel analysis of mathematics classrooms. Learning and
Instruction, 17, 478-493.
Givvin, K. B., Stipek, D. J., Salmon, J. M., & MacGyvers, V. L. (2001). In the eyes of the
beholder: Students’ and teachers’ judgments of students’ motivation. Teaching and
Teacher Education, 17(3), 321-331.
Hannula, M., Evans, J., Philippou, G., & Zan, R. (2004). Affect in mathematics education -
Exploring theoretical frameworks. International Group for the Psychology of Mathematics
Education.
Hattie, J. (2013). Visible learning: A synthesis of over 800 meta-analyses relating to
achievement: Routledge.
Helmke, A., & Schrader, F.-W. (1987). Interactional effects of instructional quality and
teacher judgement accuracy on achievement. Teaching and Teacher Education, 3(2), 91-
98.
Hiebert, J., Gallimore, R., Garnier, H., Givvin, K. B., Hollingsworth, H., Jacobs, J., . . . Stigler,
J. (2003). Teaching mathematics in seven countries. Results from the TIMSS 1999 video
study. Washington, DC: NCES.
Karing, C., Dörfler, T., & Artelt, C. (2013). How accurate are teacher and parent judgements
of lower secondary school children’s test anxiety? Educational Psychology, 1-17.
McLeod, D. B. (1992). Research on affect in mathematics education: A reconceptualization.
In D. A. Grouws (Ed.), Handbook of Research on Mathematics, Teaching and Learning
(pp. 575-596). New York: Macmillan.
Niss, M., Blum, W., & Galbraith, P. L. (2007). Introduction. In W. Blum, P. L. Galbraith, H.-
W. Henn & M. Niss (Eds.), Modelling and Applications in Mathematics Education: the
14th ICMI Study (pp. 1-32). New York: Springer.
Pekrun, R. (2006). The control-value theory of achievement emotions: Assumptions,
corollaries, and implications for educational research and practice. Educational
Psychology Review, 18, 315-341.
Schukajlow, S. (accepted). Is boredom important for students' performance? In N. Vondrova
& J. Novotna (Eds.), Proceedings of the Ninth Congress of the European Society for
Research in Mathematics Education. Prag, Szech Republic: Charles University of Prag.
Schukajlow, S., & Krug, A. (2014). Are interest and enjoyment important for students'
performance? Paper presented at the Proceedings of the Joint Meeting of PME 38 and
PME-NA 36, Vancouver, Canada.
Schukajlow, S., Leiss, D., Pekrun, R., Blum, W., Müller, M., & Messner, R. (2012). Teaching
methods for modelling problems and students’ task-specific enjoyment, value, interest and
self-efficacy expectations. Educational Studies in Mathematics, 79(2), 215-237.
van Tilburg, W. A. P., & Igou, E. R. (2012). On boredom: Lack of challenge and meaning as
distinct boredom experiences. Motivation and Emotion, 36, 181–194.

2016. In Csíkos, C., Rausch, A., & Szitányi, J. (Eds.). Proceedings of the 40th Conference of the International
Group for the Psychology of Mathematics Education, Vol. 4, pp. 139–146. Szeged, Hungary: PME. 4–139
MATHEMATICAL CRITICAL THINKING:
THE CONSTRUCTION AND VALIDATION OF A TEST
Benjamin Rott Timo Leuders
University of Duisburg-Essen University of Education, Freiburg
Critical thinking is an important component of general competencies, even though it is
rarely mentioned explicitly in curricula. In the psychological literature, critical
thinking is generally discussed as domain-general. However, domain-specific
conceptualizations of critical thinking have recently gained interest. In this article, the
development and validation of a test of mathematics-specific critical thinking is
described and reflected upon. For this purpose, the results of three quantitative and
one qualitative pilot studies are presented.
MOTIVATION AND RATIONALE
In educational psychology, critical thinking (CT) is framed “as a set of generic thinking
and reasoning skills, including a disposition for using them, as well as a commitment
to using the outcomes of CT as a basis for decision-making and problem solving.”
(Jablonka, 2014, p. 121). In his Delphi Report, Facione (1990, p. 3) understands CT
“to be purposeful, self-regulatory judgment which results in interpretation, analysis,
evaluation, and inference, as well as explanation of the evidential, conceptual,
methodological, criteriological, or contextual considerations upon which that judgment
is based. […]”. Though there are many different conceptualizations of CT (in
philosophy, psychology, and education) the following abilities are commonly agreed
upon (Lai, 2011, p. 9 f.): analyzing arguments, claims, or evidence; making inferences
using inductive or deductive reasoning; judging or evaluation and making decisions;
or solving problems.
CT skills are widely accepted as a very important part of student learning in schools as
well as in universities (Lai, 2011; Jablonka, 2014). CT has long been supported by
educators – and especially mathematics educators –, even though explicit reference to
CT is rare in curricula around the world (Jablonka, 2014, p. 122).
CT skills cannot be located within mathematics alone, as Facione (1990, p. 14)
emphasizes: Narrowing the range of CT to a single domain would misapprehend its
nature and diminish its value. Learning CT can clearly be distinguished from learning
domain-specific content. However, there can be domain-specific manifestations of CT
and subject contexts play an important role in learning CT (ibid.).
Jablonka (2014, p. 121) stresses the importance of mathematics education for the
development of CT skills: “The role assigned to CT in mathematics education includes
CT as a by-product of mathematics learning, as an explicit goal of mathematics
education, as a condition for mathematical problem solving, as well as critical
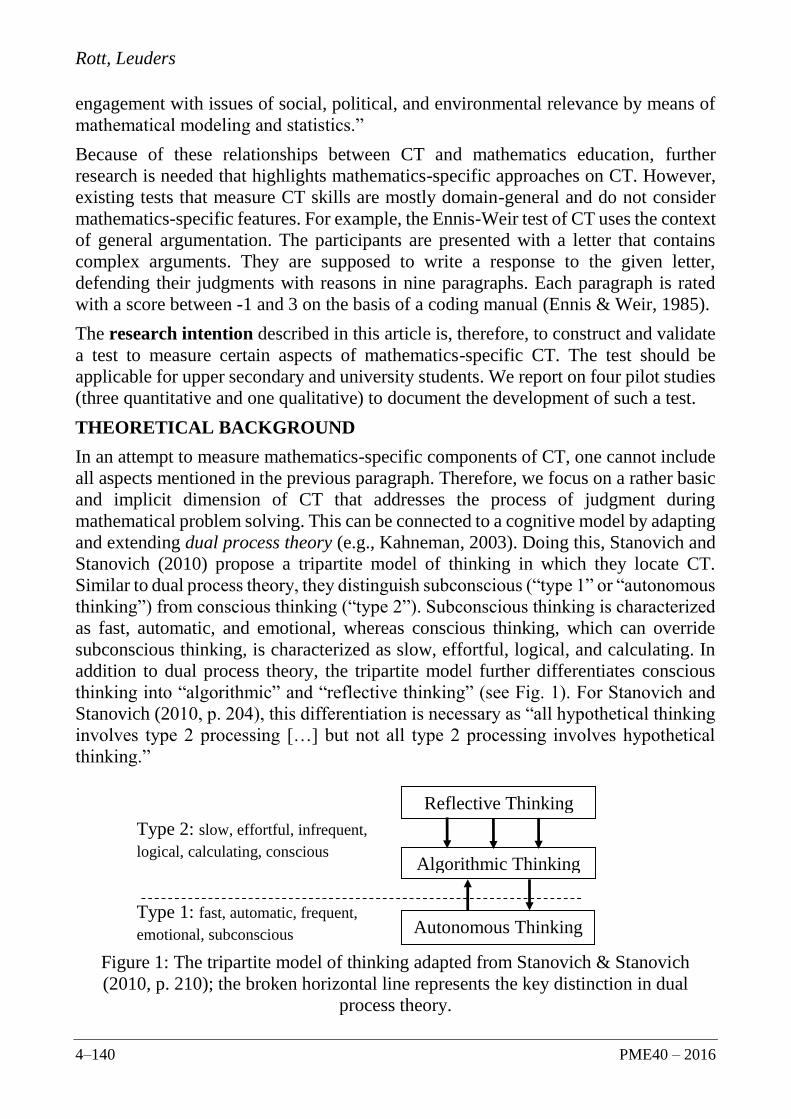
Rott, Leuders
4–140 PME40 – 2016
engagement with issues of social, political, and environmental relevance by means of
mathematical modeling and statistics.”
Because of these relationships between CT and mathematics education, further
research is needed that highlights mathematics-specific approaches on CT. However,
existing tests that measure CT skills are mostly domain-general and do not consider
mathematics-specific features. For example, the Ennis-Weir test of CT uses the context
of general argumentation. The participants are presented with a letter that contains
complex arguments. They are supposed to write a response to the given letter,
defending their judgments with reasons in nine paragraphs. Each paragraph is rated
with a score between -1 and 3 on the basis of a coding manual (Ennis & Weir, 1985).
The research intention described in this article is, therefore, to construct and validate
a test to measure certain aspects of mathematics-specific CT. The test should be
applicable for upper secondary and university students. We report on four pilot studies
(three quantitative and one qualitative) to document the development of such a test.
THEORETICAL BACKGROUND
In an attempt to measure mathematics-specific components of CT, one cannot include
all aspects mentioned in the previous paragraph. Therefore, we focus on a rather basic
and implicit dimension of CT that addresses the process of judgment during
mathematical problem solving. This can be connected to a cognitive model by adapting
and extending dual process theory (e.g., Kahneman, 2003). Doing this, Stanovich and
Stanovich (2010) propose a tripartite model of thinking in which they locate CT.
Similar to dual process theory, they distinguish subconscious (“type 1” or “autonomous
thinking”) from conscious thinking (“type 2”). Subconscious thinking is characterized
as fast, automatic, and emotional, whereas conscious thinking, which can override
subconscious thinking, is characterized as slow, effortful, logical, and calculating. In
addition to dual process theory, the tripartite model further differentiates conscious
thinking into “algorithmic” and “reflective thinking” (see Fig. 1). For Stanovich and
Stanovich (2010, p. 204), this differentiation is necessary as “all hypothetical thinking
involves type 2 processing […] but not all type 2 processing involves hypothetical
thinking.”
Figure 1: The tripartite model of thinking adapted from Stanovich & Stanovich
(2010, p. 210); the broken horizontal line represents the key distinction in dual
process theory.
Type 1: fast, automatic, frequent,
emotional, subconscious
Type 2: slow, effortful, infrequent,
logical, calculating, conscious
Reflective Thinking
Algorithmic Thinking
Autonomous Thinking
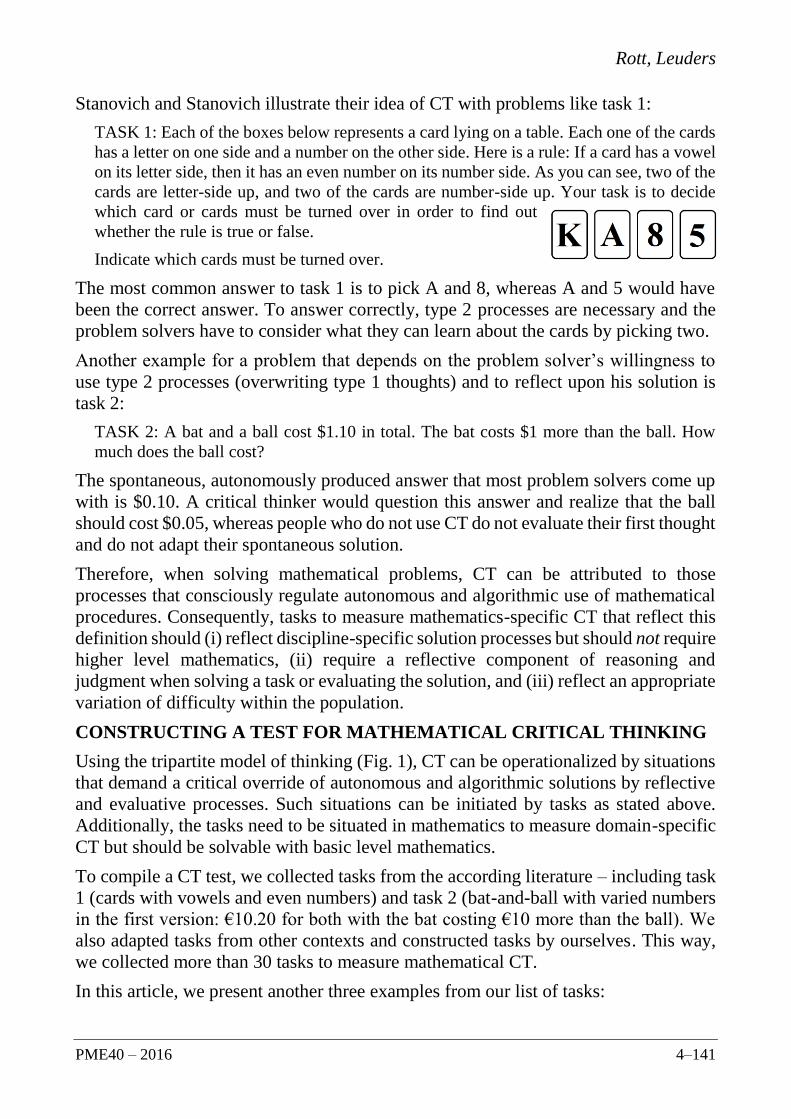
Rott, Leuders
PME40 – 2016 4–141
Stanovich and Stanovich illustrate their idea of CT with problems like task 1:
TASK 1: Each of the boxes below represents a card lying on a table. Each one of the cards
has a letter on one side and a number on the other side. Here is a rule: If a card has a vowel
on its letter side, then it has an even number on its number side. As you can see, two of the
cards are letter-side up, and two of the cards are number-side up. Your task is to decide
which card or cards must be turned over in order to find out
whether the rule is true or false.
Indicate which cards must be turned over.
The most common answer to task 1 is to pick A and 8, whereas A and 5 would have
been the correct answer. To answer correctly, type 2 processes are necessary and the
problem solvers have to consider what they can learn about the cards by picking two.
Another example for a problem that depends on the problem solver’s willingness to
use type 2 processes (overwriting type 1 thoughts) and to reflect upon his solution is
task 2:
TASK 2: A bat and a ball cost $1.10 in total. The bat costs $1 more than the ball. How
much does the ball cost?
The spontaneous, autonomously produced answer that most problem solvers come up
with is $0.10. A critical thinker would question this answer and realize that the ball
should cost $0.05, whereas people who do not use CT do not evaluate their first thought
and do not adapt their spontaneous solution.
Therefore, when solving mathematical problems, CT can be attributed to those
processes that consciously regulate autonomous and algorithmic use of mathematical
procedures. Consequently, tasks to measure mathematics-specific CT that reflect this
definition should (i) reflect discipline-specific solution processes but should not require
higher level mathematics, (ii) require a reflective component of reasoning and
judgment when solving a task or evaluating the solution, and (iii) reflect an appropriate
variation of difficulty within the population.
CONSTRUCTING A TEST FOR MATHEMATICAL CRITICAL THINKING
Using the tripartite model of thinking (Fig. 1), CT can be operationalized by situations
that demand a critical override of autonomous and algorithmic solutions by reflective
and evaluative processes. Such situations can be initiated by tasks as stated above.
Additionally, the tasks need to be situated in mathematics to measure domain-specific
CT but should be solvable with basic level mathematics.
To compile a CT test, we collected tasks from the according literature – including task
1 (cards with vowels and even numbers) and task 2 (bat-and-ball with varied numbers
in the first version: €10.20 for both with the bat costing €10 more than the ball). We
also adapted tasks from other contexts and constructed tasks by ourselves. This way,
we collected more than 30 tasks to measure mathematical CT.
In this article, we present another three examples from our list of tasks:

Rott, Leuders
4–142 PME40 – 2016
TASK 3: A sequence of 6 squares made of matches consists of 19 matches (see the figure).
How many matches does a sequence of 30 squares consist of?
Uncritical thinkers might infer from 6 squares to 30, resulting in 19 ∙ 5 = 95 matches.
This solution uses algorithmic thinking without the realization that the correct solution
is only 91 matches because of twice counted matches after six squares each.
TASK 4: If the sum of the digits of an integer is divisible by three, then it cannot be a prime
number. This statement is
correct incorrect
Uncritical thinkers might answer “correct” because of the “divisible by three”-rule
without realizing that the prime number 3 also has a sum of digits divisible by three.
TASK 5: Write an equation using the variables S and P to represent the following
statement: “There are six times as many students as professors at this university.” Use S
for the number of students and P for the number of professors.
This task by Kaput and Clement (1979) is famous for its difficulty with most persons
wrongly answering “P = 6S”, revealing missing reflection.
The list of CT tasks was then used to construct a test of mathematical CT. The first
version of this test did not include all tasks from our list but only 22 CT tasks. This
was done to keep the time required to carry out the test below 30 minutes.
VALIDATING THE TEST FOR MATHEMATICAL CRITICAL THINKING
To control whether our test is suited to measure CT, we designed and carried out three
quantitative and one qualitative pilot studies. In all studies, the tasks were rated
dichotomously, 1 point for a correct answer and 0 points for a wrong answer.
Pilot Study 1: CT vs. non-CT items; task formulations
The first pilot study was designed to test the tasks and their formulations. It was also
used to explore whether our test actually addresses CT. To investigate on the latter
question, we constructed non-CT tasks that can be solved using algorithmic thinking
without the need for reflection. We matched those tasks to the CT tasks with a similar
context and similar computational difficulty. For example, we used the following task
as a non-CT version of the bat-and-ball and matches tasks, respectively:
TASK 2b: You buy eight items for €14.32 altogether. You pay with a 20 Euro note. How
much change do you get?
TASK 3b: How many matches does the figure consist of? [The according picture shows
30 squares of matches similar to task 3, arranged in a 5x6 pattern.]
In total, the test of study 1 consisted of 22 CT tasks and 10 non-CT tasks. It was carried
out with n=15 upper secondary students (grade 11) within 40 minutes in October 2013.

Rott, Leuders
PME40 – 2016 4–143
The students correctly solved 80 % of the non-CT tasks but only 58 % of the CT tasks.
Therefore, we concluded that our collection of tasks was suited to measure CT. As a
result of this study, we removed 8 tasks from our collection due to floor or ceiling
effects. Additionally, we improved the wordings of some tasks on which the students
orally reported difficulties in understanding the formulations after completing the test.
Pilot Study 2: fatigue and learning effects within the CT test
The second pilot study was designed to test for decreasing concentration and possible
learning effects within the 30 min of testing. We used the improved test with 14 CT
tasks in two versions. Version A had the tasks 1 – 14 whereas version B had a different
order of tasks with tasks 8 – 14 in the first and tasks 1 – 7 in the second half of the test.
In April 2014, this study was carried out with n=121 pre-service teachers – students at
the University of Education, Freiburg – that attended a lecture on arithmetic. The
students were split into four practice groups, with two groups getting version A and the
other two groups version B of the test. The results are summarized in table 1. There
were no statistical differences between the two groups (multiple t-tests with Bonferroni
correction), indicating no fatigue or learning effects within working on the CT test.
task 1 – 7 task 8 – 14 total
M (SD) min / max M (SD) min / max M (SD) min / max
A (n=66) 3.50 (1.26) 1 / 6 2.73 (1.32) 1 / 6 6.23 (2.02) 2 / 12
B (n=55) 3.53 (1.32) 0 / 7 2.60 (1.34) 0 / 6 6.13 (2.19) 2 / 11
total (n=121) 3.51 (1.28) 0 / 7 2.67 (1.33) 0 / 6 6.18 (2.09) 2 / 12
Table 1: Results of study 2, mean values (standard deviations), minimum / maximum
Pilot Study 3: differentiation between groups
The third pilot study was conducted to examine whether the CT test is able to
discriminate between different groups of students, which were either enrolled to
become mathematics teachers for upper secondary schools or to become computer
scientists. Some of the students were in the so-called “basic study” (semesters 1 – 4)
whereas others were in their main study period (semesters 5 or higher). We used a
shortened version (15 min) of the test from study 2 with 11 CT-items. This study was
carried out with n=94 students at the University of Duisburg-Essen in August 2014.
Our hypothesis was that students with more university experience (i.e. a higher number
of semesters) would score better than students with less university experience. Table 2
(left side) shows the results of the students in their basic study and main study period,
respectively. A t-test (after testing for normal distribution) confirmed the expected
differences in favour of the more experienced students (p1-sided = 0.008 < 0.01).
For the comparison of the students of both study programs, we did not have an
assumption which program would prepare its students better for mathematical CT. The

Rott, Leuders
4–144 PME40 – 2016
results, however, show a clear advantage for the pre-service mathematics teachers (see
table 2, right side, p2-sided = 0.038 < 0.05).
university experience task 1 – 11 study program task 1 – 11
semester ≤ 4 (n=28) 4.29 (2.19) mathematics (n=46) 5.63 (2.50)
semester ≥ 5 (n=66) 5.50 (2.34) informatics (n=48) 4.67 (2.14)
total (n=94) 5.14 (2.31) total (n=94) 5.14 (2.31)
Table 2: Results of pilot study 3, mean values (and standard deviations)
Overview of pilot studies 1 – 3
Interestingly, the tasks showed very similar solution rates within all pilot studies
despite the considerably different study participants. Table 3 presents these rates for
the five tasks selected for this paper for all (sub-) populations (see above).
study S1 S2 S3
task / n= 15 66 55 121 28 66 46 48 94
1: Cards (K, A, 8, 5) 0.20 0.20 0.13 0.17 0.14 0.20 0.28 0.08 0.18
2: Bat-and-ball* 0.67 0.45 0.49 0.47 0.50 0.62 0.59 0.58 0.59
3: Matches 0.53 0.59 0.58 0.59 0.61 0.61 0.74 0.48 0.61
4: Digits divisible by 3 0.40 0.41 0.36 0.39 0.54 0.65 0.67 0.56 0.62
5: Students & professors 0.20 0.06 0.09 0.07 0.14 0.24 0.28 0.15 0.21
*Using other numbers (€10.20 for both bat and ball) leads to more computational solutions and, thus,
higher solution rates in study 1. We therefore used the original version (with €1.10) in later studies.
Table 3: Solution rates of the five selected tasks in all three pilot studies
Pilot Study 4: task-based interviews
The fourth pilot study was designed to better understand the way students worked on
the CT tasks. Therefore, task-based interviews with n=5 pre-service mathematics
teachers were conducted: three interviews at the University of Education Freiburg and
two at the University of Duisburg-Essen in the period from January 2014 to September
2014. These interviews covered all 14 tasks that were used in pilot study 2. Due to
space reasons, we can only present a small excerpt of these interviews.
The interviews regarding task 1 (vowels and numbers on cards) revealed that this task
rather tested for knowledge (rules of mathematical reasoning) instead of CT. However,
one interviewee (that previously did not have the required knowledge) solved this task
correctly by reflecting on his choice of cards, showing the importance of CT for task 1.
Working on task 2 (bat-and-ball), four interviewees spontaneously said 10 Cent.
However, two of them corrected their solution to 5 Cent shortly afterwards. Both told
the interviewer that they found the correct solution because of checking their result.

Rott, Leuders
PME40 – 2016 4–145
Therefore, this task is suited to reveal CT. The fifth interviewee did not express a
spontaneous solution but used an equation from the beginning. It should be added that
both students who checked their solution admitted that this checking was mostly due
to the interview situation. This information could lead to further studies revealing
situations that trigger the use of CT within students (see future prospects, below).
For task 3 (matches), the interviews showed that the wrong approach (multiplying by
5) seems to be an obvious idea. Three interviewees expressed this idea with two of
them correcting their approach after a check. The other two solved this task correctly
from the start. Thus, this task is also suited to test for reflective thinking.
Task 4 was solved correctly by all five interviewees with all of them showing signs of
CT by expressing thoughts like: “The statement is correct. Wait, does this rule include
the number 3 itself? Then it is not correct.”
Task 5 was solved correctly by only one interviewee who knew the task beforehand.
In total, the task-based interviews helped us to reveal tasks that did not require CT and
to confirm the use of critical or reflective thinking (in contrast to automatic or
algorithmic thinking) with other tasks.
CONCLUSION AND DISCUSSION
Based on the results from the quantitative pilot studies (floor and ceiling effects) and
the insight provided by the interviews, we eliminated tasks (e.g., task 5). The final test
consists of 14 CT tasks (including tasks 1 – 4) with an average time requirement of 20
minutes in total.
With our approach, we do not intend to include the broad range of aspects and
dimensions that are currently discussed under the umbrella term “critical thinking”.
We also cannot contribute to the societal, curricular, and philosophical aspects of the
topic. However, when one realizes the few efforts to measure CT with respect to
mathematics, one could take the studies presented as an approach to pinpoint
interindividual differences within CT quantitatively. Furthermore, the connection to
dual process theory allows for a theoretical interpretation of cognitive processes that
contribute to CT. In this context, our instrument can be useful in further studies to
elucidate the relations of CT with other aspects such as knowledge, dispositions, and
epistemological beliefs (see Rott, Leuders, & Stahl, 2015). Some further theoretical
connections to other relevant theories of mathematical thinking, especially to problem
solving and the role of metacognition, which could not be addressed in this article,
should be explored more deeply on a theoretical and empirical basis.
ADDITIONAL REMARKS AND FUTURE PROSPECTS
In two studies with n=215 and n=463 mathematics pre-service teachers, a short version
of the CT test (11 tasks) was used to measure the students’ CT as a part of their mathe-
matical knowledge base. With the test, we were able to differentiate between students
of different study programs (students for upper secondary schools scored better than
for primary and lower secondary schools) and different university experience (students

Rott, Leuders
4–146 PME40 – 2016
with a higher number of semesters scored better). There were also highly significant
correlations between good test scores in the CT test and the ability to justify
epistemological beliefs sophisticatedly (for details, see Rott et al., 2015).
Even though this test has been validated and used, it still needs to be further explored.
The next step will be a study with two groups. One group will be working on the test
without further information, while the other group will receive prompts that encourage
them to “think critically” and “check [their] results”. We expect the second group to
score significantly better, confirming the sensitivity of the test for reflective thinking.
Additionally, the correlation of our mathematics-specific CT test with general CT tests
(e.g., by Enis & Weir, 1985) should be explored as well as its correlation to students’
performance in mathematical problem solving and/or argumentation. Besides
improving the test, such studies could also help us to better understand the general
conception of CT and its connections to problem solving, argumentation, and meta-
cognition as “such association[s] remain under-theorized” (Jablonka, 2014, p. 121).
References
Ennis, R. H., & Weir, E. (1985). The Ennis-Weir critical thinking essay test. Pacific Grove,
CA: Midwest Publications.
Facione, P. A. (1990). Critical thinking: A statement of expert consensus for purposes of
educational assessment and instruction. Executive Summary “The Delphi Report”.
Millbrae, Ca: The California Academic Press.
Jablonka, E. (2014). Critical thinking in mathematics education. In S. Lerman (Ed.),
Encyclopedia of Mathematics Education (pp. 121 - 125). Dordrecht: Springer.
Kahneman, D. (2003). A perspective on judgment and choice. American Psychologist, 58,
697-720.
Kahneman, D., & Frederick, S. (2002). Representativeness revisited: Attribute substitution in
intuitive judgment. In T. Gilovich, D. Griffin, & D. Kahneman (Eds.), Heuristics and
biases: The psychology of intuitive judgment (S. 49-81). New York, NY: Cambridge
University Press.
Kaput, J. J., & Clement, J. (1979). Letter to the editor. The Journal of Children’s
Mathematical Behavior 2(2), 208.
Lai, E. R. (2011). Critical Thinking: A Literature Review. www.pearsonassessments.com/hai/
images/tmrs/criticalthinkingreviewfinal.pdf
Rott, B., Leuders, T., & Stahl, E. (2015). Assessment of Mathematical Competencies and
Epistemic Cognition of Preservice Teachers. Zeitschrift für Psychologie, 223(1), 39-46.
Stanovich, K. E. & Stanovich, P. J. (2010). A framework for critical thinking, rational
thinking, and intelligence. In D. Preiss & R. J. Sternberg (Eds.), Innovations in educational
psychology: Perspectives on learning, teaching and human development (pp. 195-237).
New York: Springer.

2016. In Csíkos, C., Rausch, A., & Szitányi, J. (Eds.). Proceedings of the 40th Conference of the International
Group for the Psychology of Mathematics Education, Vol. 4, pp. 147–154. Szeged, Hungary: PME. 4–147
THE PING-PONG-PATTERN – USAGE OF NOTES BY DYADS
DURING LEARNING WITH ANNOTATED SCRIPTS
Alexander Salle*, Stefanie Schumacher*, Mathias Hattermann**
*Osnabrück University, **Paderborn University
23 pairs of novice students from two German universities learned with video tutorials
or verbally annotated scripts in different study settings, either with or without
accompanying prompts. This paper focuses on phases in which students sum up and
review the notes they have taken while watching the videos or presentations. The
reported case study shows in what ways notes influence and structure the
communication and interaction processes of dyads that are learning with annotated
scripts on descriptive statistics.
NOTE-TAKING
During the last years, mathematical learning with new instructional media like video
tutorials, podcasts, or animated worked-out examples has become gradually more
influential from primary school to further education. Especially universities make more
and more use of such formats to provide first semester students with chances to acquire
basic mathematical knowledge for studying successfully (Biehler et al., 2014).
Ongoing research analyzes in how far e.g. the social form (learning alone, learning in
dyads, learning in groups, etc.) or supporting impulses (prompts, trainings, quizzes,
etc.) influence learning outcomes in settings with instructional media (e.g. Lou, Abrami
& d’Apollonia, 2001).
In all of these different settings, taking notes can be a helpful strategy. Note-taking is
a frequently used and well reported activity consisting of filtering, comprehending,
writing down, organizing, restructuring and integrating newly presented information
in already existing knowledge (Makany, Kemp, & Dror, 2009, p. 620; Anderson &
Armbruster, 1986). There are several strands of research detectable either focusing on
the notes themselves (i.e. methods, media, and functions of note-taking) (Lawson,
Bodle, and McDonough, 2007; Staub, 2006; Bui, Myerson, and Hale, 2013; Mueller
& Oppenheimer, 2014), or analyzing the usefulness of note-taking for different groups
of individuals, different learning styles or different aims to be pursued such as solving
problems or passing an exam (Kiewra, 1989; Staub, 2006; Makany et al., 2009).
From a cognitive point of view, there are two main functions of note-taking (Kiewra,
1989; Anderson & Armbruster, 1986): (1) The encoding function regards the process
of taking notes itself as facilitative for learning (Staub, 2006, p. 61). (2) The storage
function emphasizes the preservation of notes for later use, e.g. reviewing information
before an exam. To make sure the storing works, Anderson and Armbruster (1986,
p. 20) point out the importance of deep instead of shallow processing regarding the
review of the notes.

Salle, Schumacher, Hattermann
4–148 PME40 – 2016
The large majority of studies analyzing notes and note-taking focuses on single
learners. Investigating the process of note-taking and working with notes in dyads has
been neglected so far. However, analyses of communication processes in different
domains have shown the importance of inscriptions and materialities, and their impact
on face to face interaction (e.g. Streeck, Goodwin & LeBaron, 2014).
In mathematical contexts in primary school mathematics, Fetzer (2007) and Fetzer,
Schreiber & Krummheuer (2004) analyze writing processes and products, and their
effect on the accompanying communication processes, and vice versa. The researchers
could show that writing processes affect the interacting participators and can lead to
‘condensed argumentation processes’, that means that learners actively address
inconsistencies in argumentations instead of passively acknowledging them (Fetzer
2007). In how far such results can be transferred to learners of other ages remains
unclear.
Based on these findings and open questions, our study concentrates on note-taking and
its interplay with the corresponding communication between learners in dyads in
mathematical contexts at universities. While cognitive functions of notes are identified
in various studies, their possible roles in communication processes are investigated
sparsely, especially in university context. The main research question is as follows:
How do taken notes influence and structure the communication and
interaction processes of dyads that are learning with educational
videos or annotated scripts on a mathematical topic in university context?
METHODS
Procedure
Students worked in dyads with annotated presentations or video tutorials. Half of the
dyads received prompts (fig. 1). Those who did not receive prompts were asked to learn
the mathematics shown in the instructional material in order to pass a post-test on the
topic. The learning phases with the instructional material lasted about 75 minutes on
average. The computer screen was captured, the sound and the image of the two
learners were videotaped. All notes taken by the learners were scanned afterwards.
Sample & Learning Material
The 46 students who worked in dyads during the media-intervention-period are in their
first semester at two German universities: 22 students (3 female, 19 male) from the
University of Applied Sciences in Offenburg were enrolled in a statistics course in
business studies, 24 students (21 female, 3 male) from Bielefeld University were
enrolled in a statistics course in psychology.
Students in Offenburg learned with two educational videos, both about 15 minutes
long. The first one focuses on measures of center (i.e. arithmetic mean, median,
harmonic mean), the second one on measures of spread (i.e. variance, standard
deviation). The video tutorials explain statistical terms and concepts with the help of
short stories that deal with realistic contexts relevant for students of business studies.

Salle, Schumacher, Hattermann
PME40 – 2016 4–149
Figure 2: The different conditions with dyads in the pilot study.
Students in Bielefeld learned with two annotated scripts addressing the same topics.
The scripts encompassed 8-10 slides which the students could rewind, forward or play
again. The slides resemble a usual lecture script with formulas, definitions and
examples with a psychological context (fig. 2), accompanied by verbal annotation. The
oral comments stay close to the written words.
Figure 2: Screenshot of an annotated script on measures of center and spread.
Analysis
The learner interaction and the computer screen were captured and analyzed
qualitatively using video recordings as well as the students’ individual notes generated
in this phase.
The analysis follows the triangulation method by Fetzer (2007): First, the video data is
interpreted, second, the notes are analyzed, and third, both documents are synchronized
and interpreted together. In the analysis we focus on phases in which students sum up
and review the notes they have taken while watching the videos (review phases,
Anderson & Armbruster, 1986). These review phases can be identified in nearly all
videos; some pairs make extensive use of these phases, others have repeatedly short
phases between the videos or in short pauses during video learning.

Salle, Schumacher, Hattermann
4–150 PME40 – 2016
In this paper, due to the limited space, an excerpt of one case of the condition
“annotated presentations without prompts” is depicted. This case was chosen for its
passages that illustrate central findings and patterns during review phases.
RESULTS – THE CASE OF LISA AND RANA
Lisa (L) and Rana (R) watched the presentations thoroughly, paused them several times
and copied many statements from the slides into their notes. Both students wrote down
a lot of similar facts and aspects from the annotated script. Their notes show typical
attributes compared to the notes of the other pairs that worked without prompts, such
as many verbatim statements, mainly technical terms accompanied by explaining
statements, and a contentual structure similar to the presentations. Furthermore, the
notes of Lisa and Rana embody the highlighting and underlining of terms.
Having finished the second presentation, Lisa and Rana agree to review their notes
before dealing with the post-test: “Let’s go through it again.” The scene starts at
approximately 1:30 of this review phase, when they reach the paragraph ”measures of
dispersion“ in their notes (fig. 4).
01 L: (looks at her notes) And, uhm, the measures of dispersion, uhm, gives the spread
02 R: (looks at her notes) Exactly, how do the characteristic attributes differ…
03 L: Yes (circles the words “spread” and “measures of dispersion”, then
04 circles “measures of centre” and “measures of dispersion” various times, [fig. 4])
05 R: (looks at Lisa’s circling, laughs)
06 L: (laughs) Let’s see what this does. Ok, uhm, yes .. how they differ…
07 (underlines “differ”)
08 R: (takes her pencil) Then we had the difference between nominal scaled
09 and ordinal scaled variables (circles “nominal scaled variables”)
The scene starts with Lisa’s statement addressing the term “measures of dispersion”
that “gives the spread”, while she is looking at her notes (01). Rana looks at her notes,
too, agrees and adds, that the spread describes “how the characteristic attributes differ”
(02). Lisa agrees and draws circles around the terms “spread” and “measures of
dispersion” (03), then she intensifies the circle around “measures of dispersion” and a
former drawn circle around “measures of centre” (04).
Rana recognizes Lisa’s drawing and laughs (05, fig.4). Lisa returns this laughter and
utters the hope that her strategy may be helpful (06). Then she repeats the words “how
they differ” Lisa already said and underlines “differ” in her notes (06-07). Rana looks
back at her notes, grabs her pencil and begins to address the difference between two
variables, which is the next paragraph on her notepad (08-09). She now circles the
words “nominal scaled variables” in her notes.

Salle, Schumacher, Hattermann
PME40 – 2016 4–151
Building blocks of Lisa’s and Rana’s review phase: The ping-pong-pattern
In this short scene, an interaction pattern can be observed. An interaction pattern is
defined as a structure of interaction of two or more subjects, if a) with that structure a
specific social and contentual regularity is reconstructed, b) the structure is formed by
the actions of at least two interacting subjects, c) the structure can not be explained
with the compliance with given rules and d) the interacting subjects neither reflect the
regularity nor create it consciously but routine (Voigt, 1984). We called the observed
pattern the ping-pong-pattern:
i. Opening: One of the two students begins with paraphrasing or reading out a
statement based on his or her notes. This statement is the beginning of a
subtopic in the annotated video presentation, marked on the notepad with a
headline or emphasized with a keyword /technical term in the presentation
itself (see fig. 4 for examples of subtopic paragraphs in notes).
ii. Approval and additional statement #1: The second student agrees on the
opening by uttering “Yes” or “Ok”. The same student continues
paraphrasing or reading out a statement based on his or her notes.
iii. Approval and additional statement #2 – #n: The first student confirms the
previous statement with an approval, because it seems to be in line with his
or her notes (identification of a similar aspect/statement in his or her own
notes). The first student now continues by paraphrasing or reading out a
statement based on his or her notes. Then, the speaker switches again.
iv. Finish/Closure: This alternating procedure regularly ends, when the
corresponding paragraph in the notes has been worked through completely.
The majority of Lisa’s and Rana’s review phase consists of such “switch-overs”
between the speakers (fig. 3). The number of switch-overs depends on the length of the
noted paragraph, the resemblance of the notes and the occurrence of irritation by the
learners. Especially the similarity of the noted aspects plays an important role for the
emergence of the ping-pong-pattern. In the presented case, three alternative
progressions of the pattern could be observed:
a) The switch-overs cover all noted aspects of a subtopic paragraph in a linear
way and come to an end without irritation.
b) The switch-overs are interrupted or paused by a question, some comments,
a phase of memorization without notes, comparison and alteration of notes
or metacognitive statements, etc. Afterwards, further additional statements
addressing this subtopic paragraph are thematized and the switch-overs
continue.
c) The switch-overs based on a subtopic are cancelled and the rest of the notes
concerning this paragraph is skipped. Cancellations occur when the content
is perceived as too difficult or not important with regard to the post-test.
Oftentimes, the next jotted down subtopic is chosen.

Salle, Schumacher, Hattermann
4–152 PME40 – 2016
Figure 3 shows that Lisa’s and Rana’s review phase is structured in large parts by ping-
pong-patterns. Only between 8:30 and 9:10 a dialogue detached from verbatim notes
and without the characteristic switch-overs could be observed.
Figure 3: Occurrence of the ping-pong-pattern during the review phase that lasts
approximately 10:30 minutes. (The boxes above and below the time line
stand for dialogues that follow the described pattern about a subtopic
paragraph depicted in the notes. The position of the boxes above and
below the time line indicates which student “opens“ the sequence.
The number in a box gives the total number of additional statements.
The color of a box and the letter below the number indicate, whether
a) (black) the sequence of switch-overs ends without irritation,
b) (grey) the switch-overs are interrupted, or c) (white) the switch-overs
are cancelled before all aspects from a paragraph in the notes have
been mentioned. The hatched box located directly on the time line
at 9:30 stands for a dialogue that does not follow the described pattern).
Highlighting during interaction
Lisa starts highlighting (circling and underlining) various words during the review
phase with a different color. Shortly after her first circling (03-04), she intensifies the
circles around the terms “measures of dispersion” and “measures of centre”. By this
text markup, she adds a typical layout characteristic of mathematic textbooks to her
notes: She highlights the term that is specified by a definition. With further lines she
emphasizes words in the defining text (“differ”).
Lisa’s first act of highlighting takes place after Rana’s approval, the second one takes
up Rana’s additional statement “how do the characteristics differ”. This can be
interpreted in two ways. On one hand, Lisa’s choice could be influenced by Rana’s
approval and her additional statement. Lisa agrees with Rana, that “differ” is an
important term in this context. On the other hand, Lisa’s circles and lines could be a
kind of check off. Topics and terms that were addressed during the review phase are
marked to document that they have already been discussed. Both interpretations show
how the interaction between the learners can influence note-taking processes. In later
scenes, Lisa and Rana supplement their notes with further comments based on their
interaction.
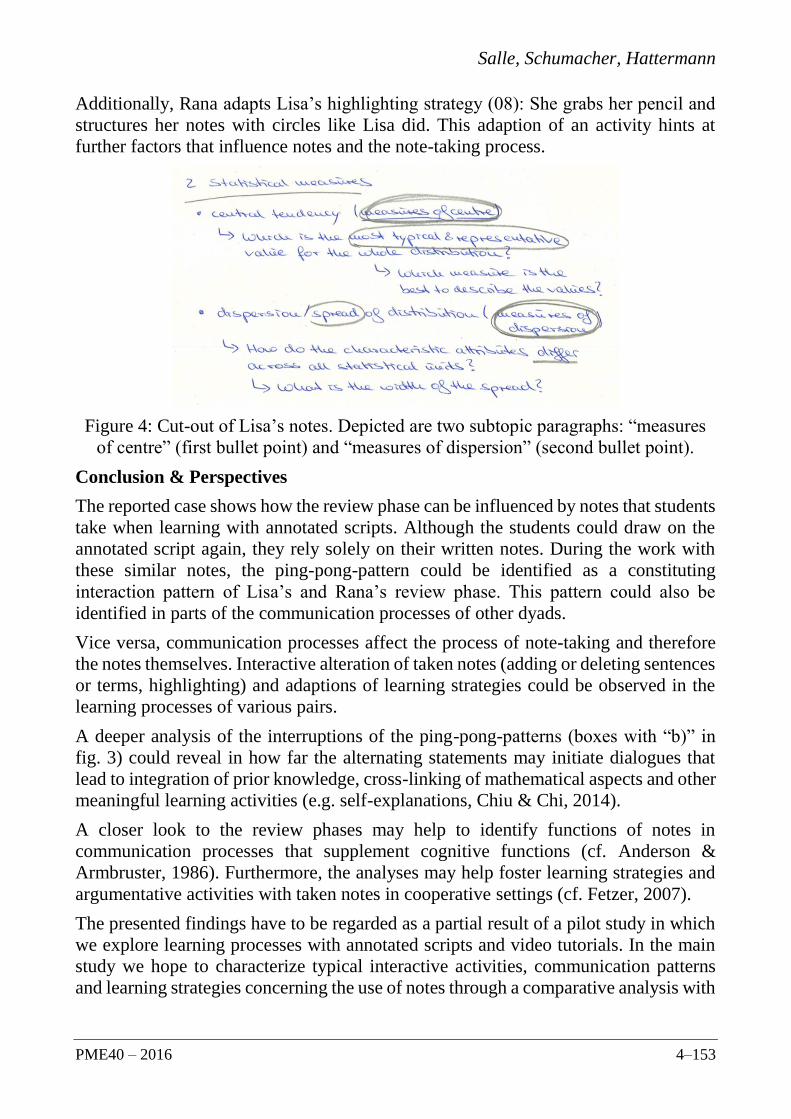
Salle, Schumacher, Hattermann
PME40 – 2016 4–153
Additionally, Rana adapts Lisa’s highlighting strategy (08): She grabs her pencil and
structures her notes with circles like Lisa did. This adaption of an activity hints at
further factors that influence notes and the note-taking process.
Figure 4: Cut-out of Lisa’s notes. Depicted are two subtopic paragraphs: “measures
of centre” (first bullet point) and “measures of dispersion” (second bullet point).
Conclusion & Perspectives
The reported case shows how the review phase can be influenced by notes that students
take when learning with annotated scripts. Although the students could draw on the
annotated script again, they rely solely on their written notes. During the work with
these similar notes, the ping-pong-pattern could be identified as a constituting
interaction pattern of Lisa’s and Rana’s review phase. This pattern could also be
identified in parts of the communication processes of other dyads.
Vice versa, communication processes affect the process of note-taking and therefore
the notes themselves. Interactive alteration of taken notes (adding or deleting sentences
or terms, highlighting) and adaptions of learning strategies could be observed in the
learning processes of various pairs.
A deeper analysis of the interruptions of the ping-pong-patterns (boxes with “b)” in
fig. 3) could reveal in how far the alternating statements may initiate dialogues that
lead to integration of prior knowledge, cross-linking of mathematical aspects and other
meaningful learning activities (e.g. self-explanations, Chiu & Chi, 2014).
A closer look to the review phases may help to identify functions of notes in
communication processes that supplement cognitive functions (cf. Anderson &
Armbruster, 1986). Furthermore, the analyses may help foster learning strategies and
argumentative activities with taken notes in cooperative settings (cf. Fetzer, 2007).
The presented findings have to be regarded as a partial result of a pilot study in which
we explore learning processes with annotated scripts and video tutorials. In the main
study we hope to characterize typical interactive activities, communication patterns
and learning strategies concerning the use of notes through a comparative analysis with

Salle, Schumacher, Hattermann
4–154 PME40 – 2016
more cases and further types of instructional material (scripts without comments,
animated screencasts).
Acknowledgement: The research project mamdim – learning mathematics with digital media
– is funded by the German Federal Ministry of Education and Research BMBF (grant
01PB14011). Participating researchers: Alexander Salle, Mathias Hattermann, Stefanie
Schumacher, Viktor Fast, Marcel Krause.
References
Anderson, T. H., & Armbruster, B. B. (1986). The Value of Taking Notes during Lectures.
Technical Report No. 374.
Biehler, R., Bruder, R., Hochmuth, R., Koepf, W., Bausch, I., Fischer, P., & Wassong, T.
(2014). VEMINT- Interaktives Lernmaterial für mathematische Vor- und Brückenkurse.
In Bausch, I., Biehler, R., Bruder, R., Fischer, P. R., Hochmuth, R., Koepf, W., & Wassong,
T. (Eds.). Mathematische Vor- und Brückenkurse (pp. 231-242). Wiesbaden: Imprint:
Springer Spektrum.
Bui, D. C., Myerson, J., & Hale, S. (2013). Note-taking with computers: Exploring alternative
strategies for improved recall. Journal of Educational Psychology, 105(2), 299–309.
Chiu, J. L., & Chi, M. T. H. (2014). Supporting Self-Explanation in the Classroom. In V. A.
Benassi, C. E. Overson, & C. M. Hakala (Hrsg.), Applying Science of Learning in
Education – Infusing Psychological Science into the Curriculum (S. 91–103). Society for
the Teaching of Psychology.
Fetzer, M. (2007): Interaktion am Werk. Bad Heilbrunn: Verlag Julius Klinkhardt.
Fetzer, M., Schreiber, C., & Krummheuer, G. (2004): An Interactionistic Perspective on
Externalization in Mathematics Classes Based on Writing and Grafic Representation.
ICME Copenhagen, TSG 25: Language and Education In Mathematics Education.
Kiewra, K. A. (1989). A Review of Note-Taking: The Encoding-Storage Paradigm and
Beyond. Educational Psychology Review, 1(2).
Lawson, T. J., Bodle, J. H., & McDonough, T. A. (2007). Techniques for Increasing Student
LearningTechniques for Increasing Student Learning From Educational Videos: Notes
Versus Guiding Questions. Teaching of Psychology, 34(2).
Lou, Y.; Abrami, P. C.; d'Apollonia, S. (2001): Small Group and Individual Learning with
Technology. A Meta-Analysis. In: Review of Educational Research 71 (3), S. 449–521.
Makany, T., Kemp, J., & Dror, I. E. (2009). Optimising the use of note-taking as an external
cognitive aid for increasing learning. British Journal of Educational Technology, 40(4),
619–635.
Mueller, P. A., & Oppenheimer, D. M. (2014). The pen is mightier than the keyboard:
advantages of longhand over laptop note taking. Psychological science, 25(6), 1159–1168.
Staub, F. C. (2006). Notizenmachen: Funktionen, Formen und Werkzeugcharakter von
Notizen. In H. Mandl (Ed.), Handbuch Lernstrategien (pp. 59–71). Göttingen: Hogrefe.
Streeck, J., Goodwin, C., & LeBaron (2014). Embodied Interaction. Language and Body in
the Material World. New York: Cambridge University Press.
Voigt, J. (1984). Interaktionsmuster und Routinen im Mathematikunterricht. Weinheim:
Beltz.

2016. In Csíkos, C., Rausch, A., & Szitányi, J. (Eds.). Proceedings of the 40th Conference of the International
Group for the Psychology of Mathematics Education, Vol. 4, pp. 155–162. Szeged, Hungary: PME. 4–155
IMAGES OF ABSTRACTION IN MATHEMATICS EDUCATION:
CONTRADICTIONS, CONTROVERSIES, AND CONVERGENCES
Thorsten Scheiner1 & Márcia M. F. Pinto2
1University of Hamburg, Germany; 2Federal University of Rio de Janeiro, Brazil
In this paper we offer a critical reflection of the mathematics education literature on
abstraction. We explore several explicit or implicit basic orientations, or what we call
images, about abstraction in knowing and learning mathematics. Our reflection is
intended to provide readers with an organized way to discern the contradictions,
controversies, and convergences concerning the many images of abstraction. Given
the complexity and multidimensionality of the notion of abstraction, we argue that
seemingly conflicting views become alternatives to be explored rather than competitors
to be eliminated. We suggest considering abstraction as a constructive process that
characterizes the development of mathematical thinking and learning and accounts for
the contextuality of students’ ideas by acknowledging knowledge as a complex system.
INTRODUCTION
Several scholars in the psychology of mathematics education have recognized
abstraction to be one of the key traits in mathematics learning and thinking (e.g., Boero
et al., 2002). The literature acknowledges a variety of forms of abstraction (Dreyfus,
2014) that take place at different levels of mathematical learning (Mitchelmore &
White, 2012) or in different worlds of mathematics (Tall, 2013), and underlie different
ways of constructing mathematical concepts compatible with various sense-making
strategies (Scheiner, 2016). While the complexity and multi-dimensionality of
abstraction is widely documented (e.g., Boero et al., 2002; Dreyfus, 1991), the
literature lacks a discourse on – conflicting, controversial, and converging – images of
abstraction in mathematics education.
In this article, we offer a reflection on the literature on abstraction in mathematics
learning that is somewhat at variance with other reflections and overviews. We
explicitly focus on what key writings in this realm assert, assume, and imply about the
nature of abstraction in mathematics education. Much of the literature is concerned
with a discussion about the multiplicity and diversity of approaches and with
frameworks of abstraction; however, what is missing is an articulation of basic
orientations or images of abstraction. Our reflection is intended to provide readers with
an organized way to discern the controversies, contradictions, and convergences of the
many images of abstraction that are explicit or implicit in the literature.
The three following sections consider each of the above facets (contradictions,
controversies, and convergences), and relate our reflections on the literature regarding
abstraction in mathematics education. We approach each of them by presenting issues
that in our view are central to the debate. We conclude with some remarks on viewing

Scheiner, Pinto
4–156 PME40 – 2016
knowledge as a complex dynamic system that acknowledges abstraction in terms of
levels of complexity and increases in context-sensitivity.
SOME CONTRADICTING IMAGES OF ABSTRACTION
We take the following description of abstraction by Fuchs et al. (2003) as a starting
point for discussing the main contradicting images of abstraction still present in the
literature:
“To abstract a principle is to identify a generic quality or pattern across instances of the
principle. In formulating an abstraction, an individual deletes details across exemplars,
which are irrelevant to the abstract category […]. These abstractions […] avoid contextual
specificity so they can be applied to other instances or across situations.” (Fuchs et al.,
2003, p. 294)
The contradicting image of abstraction as generalization
The description of abstraction given by Fuchs et al. (2003) focuses on the generality,
or, rather, on the generic quality of a concept. Here abstraction is identified with
generalization. Generalization of a concept implies taking away a certain number of
attributes from a specific concept. For example, taking away the attribute ‘to have
orthogonal sides’ from the concept of rectangle leads to the concept of parallelogram.
This operation implies an extension of the scope of the concept and forms a more
general concept.
Abstraction, in contrast, does not mean taking away but extracting and attributing
certain meaningful components. In considering forms of abstraction on the background
of students’ sense-making, Scheiner (2016) argued that ‘abstractions from actions’
approaches (e.g., reflective abstraction) are compatible with students’ sense-making
strategy of ‘extracting meaning’ and ‘abstractions from objects’ approaches (e.g.,
structural abstraction) are compatible with students’ sense-making strategy of ‘giving
meaning’ – two prototypical sense-making strategies identified by Pinto (1998). From
this perspective, in attributing meaningful components, one’s concept image becomes
richer in content.
Thus, the image of abstraction as generalization seems inadequate when knowledge is
considered as construction. The image of abstraction as generalization is elusive about
abstraction as a constructive process and overlooks abstraction that takes account of an
individual’s cognitive development.
The contradicting image of abstraction as decontextualization
The above quoted description of abstraction by Fuchs et al. (2003) implies that
abstraction is concerned with a certain degree of decontextualization. This is not
surprising, given the confusion of abstraction with generalization as “generalization
and decontextualization [often] act as two sides of the same coin” (Ferrari, 2003, p.
1226). Fuchs et al. (2003) suggested getting away from contextual specificities so that
“abstractions […] can be applied to other instances or across situations” (p. 294).
Furthermore, the meaning abstract-general of the term ‘abstract’ (Mitchelmore &
Scheiner, Pinto
PME40 – 2016 4–157
White, 1995), refers to ideas which are general to a wide variety of contexts, and this
may cause such confusions.
The consideration of abstraction as decontextualization contradicts the recent advances
in understanding knowledge as situated and context sensitive (e.g., Brown, Collins, &
Duguid, 1989; Cobb & Bowers, 1999). Several scholars in mathematics education have
argued against the decontextualization view of abstraction. For example, Noss and
Hoyles’ (1996) situated abstraction approach and Hershkowitz, Schwarz, and
Dreyfus’ (2001) abstraction in context framework have foregrounded the significance
of context for abstraction processes in mathematics learning and thinking. These
contributions go beyond purely cognitive approaches and frameworks of abstraction in
mathematics education and take account of the situated nature and context-sensitivity
of knowledge, as articulated by the situated cognition (or situated learning) paradigm.
van Oers (1998) focussed on this aspect in arguing that abstraction is a kind of
recontextualization rather than a decontextualization. From his perspective, removing
context will impoverish a concept rather than enrich it. Scheiner and Pinto (2014)
presented a case study in which a student integrated diverse elements of representing
the limit concept of a sequence into a single representation that the student used
generically to construct and reconstruct the limit concept in multiple contexts. Their
analysis indicated that the representation (that the student constructed) supported his
actions through its complex sensitivity to the contextual differences he encountered.
Thus, from our point of view, we acknowledge abstraction as a process of increasing
context-sensitivity rather than considering abstraction as simply decontextualization.
SOME CONTROVERSIAL IMAGES OF ABSTRACTION
The controversial image of abstraction on structures: similarity or diversity?
Theoretical research in learning mathematics has long moved beyond categorization or
classification, that is, beyond collecting together objects on the basis of similarities of
their superficial characteristics. As diSessa and Sherin (1998) reminded us, though
abstraction as derived from the recognition of commonalities of properties works well
for ‘category-like concepts’, empirical approaches limited to the perceptual
characteristics of objects do not provide fertile insights into cognitive processes
underlying concept construction in mathematics. Skemp’s (1986) idea of abstraction,
that is, of studying the underlying structure rather than superficial characteristics
moved the field in new directions. Further, Mitchelmore and White (2000), in drawing
on Skemp’s conception of abstraction, developed an empirical abstraction approach
for learning elementary mathematics.
Though the literature portrays a mutual understanding that abstraction in mathematics
is concerned with the underlying (rather than the superficial) structures of a concept,
there is a controversy as to whether abstraction means the consideration of similarities
of structures or of their diversity. While Skemp (1986) focused on similarities in
structures, Vygotsky (1934/1987) considered the formation of scientific concepts along
differences.
Scheiner, Pinto
4–158 PME40 – 2016
A theoretical idea or concept should bring together things that are dissimilar, different,
multifaceted, and not coincident, and should indicate their proportion in the whole. [...]
Such a concept [...] traces the interconnection of particular objects within the whole, within
the system in its formation. (Vygotsky, 1934/1987, p. 255)
Scheiner (2016) proposed a framework for structural abstraction, a kind of abstraction,
already introduced by Tall (2013), that takes account of abstraction as a process of
complementarizing meaningful components. From this perspective, the meaning of
mathematical concepts is constructed by complementarizing diverse meaningful
components of a variety of specific objects that have been contextualized and
recontextualized in multiple situations.
Thus, it is still debated whether the meaning of a mathematical concept relies on the
commonality of elements or on the interrelatedness of diverse elements – or, to put it
in other words, whether the core of abstraction is similarity or complementarity.
The controversial image of abstraction as the ascending of abstractness or
complexity
Scholars seem to agree in distinguishing between concrete and abstract objects, yet not
between concrete and abstract concepts since every concept is an abstraction. In fact,
scholars differ with regard to their understanding of the notions of ‘concrete’ and
‘abstract’. According to Skemp (1986), the initial forms of cognition are perceptions
of concrete objects; the abstractions from concrete objects are called percepts. These
percepts are considered primary concepts and serve as building blocks for secondary
concepts; the latter are concepts that do not have to correspond to any concrete object.
Taking this perspective, it is not surprising that concreteness and abstractness are often
considered as properties of an object. In contrast, Wilensky (1991) considered
concreteness and abstractness rather as properties of an individual’s relatedness to an
object in the sense of the richness of an individual’s re-presentations, interactions, and
connections with the object. This view leads to allowing objects not mediated by the
senses, objects which are usually considered abstract (such as mathematical objects) to
be concrete; as long as that the individual has multiple modes of interaction and
connection with them and a sufficiently rich collection of representations to denote
them.
Skemp viewed abstraction as a movement from the concrete to the abstract, while,
according to Wilensky, individuals begin their understanding of scientific
mathematical concepts with the abstract. This ascending from the abstract to the
concrete is the main principle in Davydov’s (1972/1990) theory and has been taken as
a reference point for the development of other frameworks of abstraction (e.g.,
Hershkowitz, Dreyfus, & Schwarz, 2001; Scheiner, 2016).
On the other hand, Noss and Hoyles (1996) adopted a situated cognition perspective to
investigate mathematical activities within computational environments. These
environments are specially built to provide learners an opportunity for new intellectual
connections. The authors’ concern is “to develop a conscious appreciation of

Scheiner, Pinto
PME40 – 2016 4–159
mathematical abstraction as a process which builds build upon layers of intuitions and
meanings” (Noss & Hoyles, 1996, p. 105).
Thus, in taking the understanding of the concrete and the abstract as properties of
objects, scholars could consider abstraction as levels of abstractness; while, in taking
the understanding of concreteness and abstractness as properties of an individual’s
view of objects, scholars could view abstraction as levels of complexity, as Scheiner
and Pinto’s (2014) recent contribution indicated.
SOME CONVERGING IMAGES OF ABSTRACTION
Piaget (1977/2001) made a distinction between cognitive approaches to abstraction:
dichotomizing ‘abstraction from actions’ and ‘abstraction from objects’. Research in
mathematics education has mostly considered the first of these approaches to
abstraction. In referring to the latter, Piaget (1977/2001) limited his attention to
empirical abstraction, that is, to drawing out common features of objects, “recording
the most obvious information from objects” (p. 319). Supported by Skemp’s view on
abstraction, Mitchelmore and White (2000), and later Scheiner and Pinto (2014),
considered objects as starting points for abstraction processes, and, in doing so, took
account of ‘abstraction from objects’. Scheiner (2016) blended the abstraction from
actions and the abstraction from objects frameworks to provide an account for a
dialectic between reflective and structural abstraction. In the following, we provide
convergent images of these various notions of abstraction, as we see them.
The converging image of abstraction as a process of knowledge compression
Here we understand compression of knowledge as “taking complicated phenomena,
focusing on essential aspects of interest to conceive of them as whole to make them
available as an entity to think about” (Gray & Tall, 2007, p. 24). Or, to put it in
Thurston’s (1990) words, knowledge is compressed if “you can file it away, recall it
quickly and completely when you need it, and use it as just one step in some other
mental process” (p. 847).
Dubinsky and his colleagues’ (Dubinsky, 1991; Cottrill et al., 1996) APOS framework,
which seems to refer mostly to ‘abstraction from actions’, proposed the notion of
encapsulation of processes into an object through what Piaget called reflective
abstraction. The single encapsulated object may be understood as a compression in a
sense that encapsulation results in an entity to think about. The same holds for Sfard
and Linchevski’s (1994) framework of reification, a process that results in a structural
conception of an object. In the same strand, Gray and Tall (1994) considered some
mathematical symbols as an amalgam of processes and related objects; thus,
compressing knowledge into a symbol which is conveniently understood as a process
to compute or manipulate, or as a concept to think about. They proposed that “the
natural process of abstraction through compression of knowledge into more
sophisticated thinkable concepts is the key to developing increasingly powerful
thinking” (Gray & Tall, 2007, p. 14).

Scheiner, Pinto
4–160 PME40 – 2016
Researchers working within the ‘abstraction from objects’ strand (Mitchelmore &
White, 2000; Scheiner & Pinto, 2014) are guided by the assumption that learners
acquire mathematical concepts initially based on their backgrounds of existing domain-
specific conceptual knowledge – considering abstraction as the progressive integration
of previous concept images and/or the insertion of a new discourse alongside existing
mathematical experiences. For instance, the cognitive function of structural abstraction
is to provide an assembly of such various experiences into more complex and
compressed knowledge structures (Scheiner & Pinto, 2014).
Thus, both ‘abstraction from actions’ and ‘abstraction from objects’ approaches seem
to share the image of abstraction as a process of knowledge compression.
The converging image of abstraction as a complex dynamic constructive process
One may argue that researchers who see abstraction as decontextualization propose the
result of an abstraction process as a stable stage. Once decontextualized, the product
of an abstraction – the concept – appears as standing still. An understanding of the
entire process as a recontextualization considers abstraction to be a dynamic
constructive process, which could evolve in a movement through levels of complexity.
In fact, concepts can be continuously revised and enriched while placed in new
contexts. This seems to agree with the understanding of Noss and Hoyles (1996) and
of Hershkowitz, Schwarz and Dreyfus (2001). In the case of Scheiner and Pinto (2014),
the underlying cognitive processes support a specific use of the concept image while
building mathematical knowledge. Models of partial constructions are gradually built
through these processes and are used as generic representations. In other words, a
model of an evolving concept is built and used for generating meaningful components
as needed, while inducing a restructuring of one’s knowledge system. From this
perspective, an individual’s restructuring of the knowledge system aims for stability of
the knowledge pieces and structures. Such dynamic constructive processes emphasize
a gradually developing process of knowledge construction.
Thus, rather than considering knowledge as an abstract, stable system, we consider
knowledge as a complex dynamic system of various types of knowledge elements and
structures.
FINAL REMARKS
This brief discussion underlines the many images of abstraction in mathematics
learning and thinking. If abstraction is regarded from the viewpoint of knowledge as a
static system, then abstraction refers to meanings that are ‘abstracted’ from situations
or events. By taking this view, abstraction is considered as a highly hierarchized
process, whereby abstractions of higher order are built upon abstractions of lower
order. However, if we consider knowledge as a complex system, it is possible to
acknowledge abstraction in terms of levels of complexity and increases in context-
sensitivity. In viewing knowledge as a complex dynamic system rather than a static
system, seemingly conflicting views become alternatives to be explored rather than
competitors to be eliminated. The central assertion of all approaches and frameworks

Scheiner, Pinto
PME40 – 2016 4–161
should be to consider abstraction as a constructive process that characterizes the
development of mathematical thinking and learning and accounts for the contextuality
of students’ ideas.
Acknowledgments
We want to thank Annie Selden for her thoughtful comments and suggestions given
throughout the development of this paper.
References
Boero, P., Dreyfus, T., Gravemeijer, K., Gray, E., Hershkowitz, R., Schwarz, B., Sierpinska,
A., & Tall, D. O. (2002). Abstraction: Theories about the emergence of knowledge
structures. In A. D. Cockburn & E. Nardi (Eds.), Proceedings of the 26th Annual
Conference of the International Group for the Psychology of Mathematics Education (Vol.
1, pp. 113-138). Norwich: PME.
Brown, J. S., Collins, A., & Duguid, P. (1989). Situated cognition and the culture of learning.
Educational Researcher, 18(1), 32-42.
Cobb, P., & Bowers, J. (1999). Cognitive and situated learning perspectives in theory and
practice. Educational Researcher, 28(2), 4-15.
Cottrill, J., Dubinsky, E., Nichols, D., Schwingendorf, K., Thornas, K., & Vidakovic, D.
(1996). Understanding the limit concept: Beginning with a coordinated process scheme.
Journal of Mathematical Behavior, 15, 167-192.
Davydov, V. V. (1972/1990). Types of generalization in instruction: Logical and
psychological problems in the structuring of school curricula (Soviet studies in
mathematics education, Vol. 2) (translated by J. Teller). Reston, VA: NCTM.
diSessa, A. A., & Sherin, B. L. (1998). What changes in conceptual change? International
Journal of Science Education, 20(10), 1155-1191.
Dreyfus, T. (1991). Advanced mathematical thinking processes. In D. O. Tall (Ed.), Advanced
mathematical thinking (pp. 25-41). Dordrecht, The Netherlands: Kluwer.
Dreyfus, T. (2014). Abstraction in mathematics education. In S. Lerman (Ed.), Encyclopedia
of mathematics education (pp. 5-8). New York: Springer.
Dubinsky, E. (1991). Reflective abstraction in advanced mathematical thinking. In D. O. Tall
(Ed.), Advanced mathematical thinking (pp. 95-123). Dordrecht, The Netherlands: Kluwer.
Ferrari, P. L. (2003). Abstraction in mathematics. Philosophical Transactions of the Royal
Society B: Biological Sciences, 358, 1225-1230.
Fuchs, L. S., Fuchs, D., Prentice, K., Burch, M., Hamlett, C. L., Owen, R., et al. (2003).
Explicitly teaching transfer: Effects on third-grade students’ mathematical problem
solving. Journal of Educational Psychology, 95(2), 293-305.
Gray, E. M., & Tall, D. O. (1994). Duality, ambiguity and flexibility: A proceptual view of
simple arithmetic. Journal for Research in Mathematics Education, 26(2), 115–141.
Gray, E. M., & Tall, D. O. (2007). Abstraction as a natural process of mental compression.
Mathematics Education Research Journal, 19(2), 23-40
Scheiner, Pinto
4–162 PME40 – 2016
Hershkowitz, R., Schwarz, B., & Dreyfus, T. (2001). Abstraction in context: Epistemic
actions. Journal for Research in Mathematics Education, 32, 195-222.
Mitchelmore, M. C., & White, P. (1995). Abstraction in mathematics: Conflict, resolution
and application. Mathematics Education Research Journal, 7(1), 50-68.
Mitchelmore, M. C., & White, P. (2000). Development of angle concepts by progressive
abstraction and generalisation. Educational Studies in Mathematics, 41(3), 209-238.
Noss, R., & Hoyles, C. (1996). Windows on mathematical meanings: Learning cultures and
computers. Dordrecht, The Netherlands: Kluwer.
Piaget, J. [and collaborators] (1977/2001). Studies in reflecting abstraction (Recherches sur
l’ abstraction réfléchissante) (translated by R. Campbell). Philadelphia: Psychology Press.
Pinto, M. M. F. (1998). Students’ understanding of real analysis. Coventry, UK: University
of Warwick.
Scheiner, T. (2016). New light on old horizon: Constructing mathematical concepts,
underlying abstraction processes, and sense making strategies. Educational Studies in
Mathematics, 91(2), 165-183.
Scheiner, T., & Pinto, M. M. F. (2014). Cognitive processes underlying mathematical concept
construction: The missing process of structural abstraction. In C. Nicol, S. Oesterle, P.
Liljedahl, & D. Allan (Eds.). Proceedings of the 38th Conference of the International
Group for the Psychology of Mathematics Education and the 36th Conference of the North
American Chapter of the Psychology of Mathematics Education (Vol. 5, pp. 105-112).
Vancouver, Canada: PME.
Sfard, A., & Lichevski, L. (1994). The gains and the pitfalls of reification: the case of algebra.
Educational Studies in Mathematics, 26, 191-228.
Skemp, R. R. (1986). The psychology of learning mathematics. (Second edition, first
published 1971). London: Penguin Group.
Tall, D. O. (2013). How humans learn to think mathematically. Exploring the three worlds of
mathematics. Cambridge, UK: Cambridge University Press.
van Oers, B. (1998). From context to contextualizing. Learning and Instruction, 8(6), 473-
488.
Wilensky, U. (1991). Abstract meditations on the concrete and concrete implications for
mathematics education. In I. Harel & S. Papert (Eds.), Constructionism (pp. 193-204).
Norwood, NJ: Ablex Publishing Corporation.

2016. In Csíkos, C., Rausch, A., & Szitányi, J. (Eds.). Proceedings of the 40th Conference of the International
Group for the Psychology of Mathematics Education, Vol. 4, pp. 163–170. Szeged, Hungary: PME. 4–163
CREATIVITY IN THE EYE OF THE STUDENT.
REFINING INVESTIGATIONS OF MATHEMATICAL
CREATIVITY USING EYE-TRACKING GOGGLES
Maike Schindler, Achim J. Lilienthal, Ravi Chadalavada, & Magnus Ögren
Örebro University
Mathematical creativity is increasingly important for improved innovation and
problem-solving. In this paper, we address the question of how to best investigate
mathematical creativity and critically discuss dichotomous creativity scoring schemes.
In order to gain deeper insights into creative problem-solving processes, we suggest
the use of mobile, unobtrusive eye-trackers for evaluating students’ creativity in the
context of Multiple Solution Tasks (MSTs). We present first results with inexpensive
eye-tracking goggles that reveal the added value of evaluating students’ eye
movements when investigating mathematical creativity—compared to an analysis of
written/drawn solutions as well as compared to an analysis of simple videos.
INTRODUCTION
Creativity as an ability is crucial whenever novelties are generated—this concerns
problem solving situations in educational learning contexts as well as everyday life
problems. In particular, mathematical creativity is significant for improved innovation
and problem-solving processes within all STEM areas (science, technology,
engineering, and mathematics) in our increasingly interconnected high-technology
based society and economy. All students have the potential to be mathematically
creative (Mann, 2005). However, research findings indicate that their creativity differs
and that—as a trend over time—students tend to be less creative than they were in the
past (Kim, 2011). Therefore, it is adequate that research increasingly focuses on
mathematical creativity (e.g., Leikin & Pitta-Pantazi, 2013; Sheffield, 2013).
For investigating how mathematical creativity can be best fostered, it is important to
address the question of how creativity can be best investigated. The methods of
investigation have gained special interest within research (Sriraman, Haavold, & Lee,
2014, Joklitschke, Rott & Schindler, 2016). Different approaches for assessing or
rather measuring mathematical creativity have been developed and established (e.g.,
Kattou et al., 2013; Leikin & Lev, 2013). However, these approaches have certain
restrictions: The aim to find measurement tools has led to a product-view on students’
solutions, in which creative problem-solving processes are neglected. However,
research is needed that investigates how creative solutions emerge in students.
Additionally, dichotomous scoring schemes have led to an analysis which excludes
approaches that are not complete or not completely correct. All in all, the question
arose whether this assessment of creativity is valid and how mathematical creativity
can be investigated more adequately (Joklitschke et al., 2016).

Schindler, Lilienthal, Chadalavada, Ögren
4–164 PME40 – 2016
This paper contributes to research on mathematical creativity. It relates to the question
which additional value a process-oriented analysis of students’ mathematical creativity
offers—compared to an analysis of only products. In an empirical investigation, we
analyzed to what extent eye-tracking can contribute to studying students’ mathematical
creativity in a process-view. We compared the findings from three analyses of the same
data: First, the “common” analysis of the written solutions (product-view), (b) a video
analysis of students’ creative problem-solving (process-view), and (c) an analysis of
eye-tracking videos (process-view). Our results show benefits for addressing
mathematical creativity arising from the eye-tracking data, which, for example, allow
to disambiguate alternative interpretations of the product-view and to discover creative
processes that are not even observable in a video analysis.
THEORETICAL BACKGROUND
Mathematical Creativity and its investigation
The concept of creativity is derived from research in psychology. Here, creativity was
originally seen as one dimension of intelligence (Guilford, 1967). Creativity is
furthermore characterized as a key component of the ability to find unique and
manifold ideas, called divergent thinking (Guilford, 1967). Four aspects are
differentiated with respect to divergent thinking; these are fluency, addressing the
number of solutions; flexibility, addressing the diversity of produced solutions;
originality, addressing the uniqueness of produced solutions; and elaboration,
addressing the level of detail.
Within mathematics education research, the psychology approach to creativity has
been taken up and adapted. Here, tests have been developed for quantifying
mathematical creativity (e.g., Kattou et al., 2013; Leikin & Lev, 2013). These tests
draw on mathematical problems that can be solved in diverse ways—so called Multiple
Solution Tasks (MSTs). In these tests, students are supposed to solve the MSTs in as
many ways as possible—based on the theoretical assumption that “solving
mathematical problems in multiple ways is closely related to personal mathematical
creativity” (Leikin & Lev, 2013, p. 185). This way of testing mathematical creativity
is accepted and appreciated within educational research (e.g., Muldner & Burleston,
2015). For measuring students’ mathematical creativity, the tests draw on Guilford’s
categories of fluency, flexibility, and originality which are counted in a dichotomous
scoring: only mathematically entirely correct and complete solutions are considered.
However, research indicates validity concerns of this approach investigating students’
mathematical creativity: The analysis of students’ written solutions revealed that
students provided solutions that were partially not completed or not entirely correct
(Joklitschke et al., 2016). Even though these incomplete approaches of the students
were not counted in the scoring schemes, they indicate creative processes; which are
then, however, not appreciated in the existing methods. Joklitschke et al. accordingly
suggest to improve the methods for investigating mathematical creativity—particularly
to focus on the processes in which students solve problems.
Schindler, Lilienthal, Chadalavada, Ögren
PME40 – 2016 4–165
Eye-Tracking
Eye-tracking technologies with which students’ eye-movements are investigated are
increasingly used in educational research (e.g., Scheiter & van Gog, 2009), particularly
in mathematics education research (e.g., Andrá et al., 2015; Epelboim & Suppes, 2001)
and in research on mathematical creativity (Muldner & Burleston, 2015). Even though
the use of eye-tracking in educational research is still in the early stages of its
development, existing findings show its remarkable potential: Following Andrá et al.
(2015, p. 241), we assume that “the merit from a didactic perspective is that we can
examine how and which information students are attending to”. Based on findings in
neurosciences, research on eye-tracking has shown that what students look at correlates
with what we they pay attention to (e.g., Andrá et al., 2015; Rayner, 1998). Eye-
tracking helps us to understand what students focus on when working on a problem. It
is used and perceived as especially beneficial in geometrical settings (e.g., Muldner &
Burleston, 2015; Schimpf & Spannagel, 2011; Epelboim & Suppes, 2001).
Our research connects to Muldner and Burleston (2015) who investigated eye
movements on subjects who dealt with mathematical MSTs that addressed proof in
geometry (see also Levav-Waynberg & Leikin, 2012). This study showed that and why
eye-tracking is feasible for investigations with these kinds of problems: As MSTs are
rich, allow different ways to solve them and do not require extensive background
knowledge, the analysis of eye-movements holds an enormous potential. Muldner and
Burleston’s (2015) purpose was to find “reliable differences in sensor features
characterizing low vs. high creativity students” (p. 127). By comparing for instance
students’ saccade lengths and saccade speed with EEG data, they characterized groups
of students with their data. However, eye-tracking research is needed that rather
investigates mathematical creativity and can contribute to rethinking the investigations
of mathematical creativity in order to appreciate students’ creative approaches more
adequately from a process-oriented view (Joklitschke et al., 2016). Based on findings
that show that cognitive processing correlates with fixations (see Andrá et al., 2015),
we assume that the analysis of students’ eye-movements can contribute to
understanding what students focus on when creatively solving MSTs. Thus, eye-
tracking technology can be used to better understand how students “think” in terms of
what they pay attention to when figuring out ways to solve a MST. Accordingly, we
ask the research question: To what extent does the analysis of students’ eye-movements
contribute to understanding their creative problem-solving processes, and hence,
mathematical creativity?
METHOD
Setting the scene
In order to answer the research question, we used data of four upper secondary school
students in the Swedish research project KMT (“kreativa matteträffar”). In the project,
which takes place at Örebro University, the students meet every second week for
working on multifaceted mathematical problems. The idea of the project is to foster

Schindler, Lilienthal, Chadalavada, Ögren
4–166 PME40 – 2016
the abilities of interested students and especially their mathematical creativity.
Therefore, they are, for example, often involved in collaborative, inquiry-based group
work. Furthermore, they work on MSTs; first, they work on the problems individually;
afterwards, they work in groups, discussing their solutions. The MSTs are mostly
derived from scientific publications (e.g., Novotná, 2015; Joklitschke et al., 2016). The
MSTs undergo an a priori analysis, in which the potential for finding both unique and
manyfold solutions is assessed. The investigation presented in this paper took place
when the students were already used to dealing with MSTs.
The Multiple Solution Task (MST)
The investigation presented in this paper focuses on students’ creative problem-solving
when dealing with the MST shown in Figure 1. It was chosen because it addresses
proof in geometry, which research had shown to be a suitable context for applying eye-
tracking (Muldner & Burleston, 2015). We used this particular problem because it had
revealed itself rich and suitable for addressing mathematical creativity in prior work
(Joklitschke et al., 2016), motivating students to find manifold approaches. Second, the
problem does not require extensive subject-matter knowledge of the students; which is
desirable as we wanted to address creativity rather than assessing prior mathematical
knowledge and achievement. For this purpose, we added the information that all angles
in an equilateral hexagon are 120°.
Task: Solve the following problem. Can you find different ways to solve the
problem? Show as many ways as you can find.
Problem: This figure is an equilateral hexagon: How big is the angle ε?
Remember: In an equilateral hexagon, all sides have the same length and all
angles have the same size, which is 120°.
Figure 1: The hexagon-problem (Multiple Solution Task)
Eye-Tracking
The four participating students worked on the hexagon-MST in turns wearing eye-
tracking goggles (see Figure 2(1)), which allow to record gaze point sequences, pro-
jected on the scene view from the perspective of the student (see Figure 2(3,4)). The
time to work on the MST was 15 minutes and we asked the students to change pen
colors for every new approach. Apart from the calibration routine at the beginning of
each session and the placement of the MST on a reading stand for improved eye-
tracking (see Figure 2(2)), no further adjustments were necessary. In this work, we
recorded gaze point sequences and analyzed them manually.
Even though stand-alone eye-trackers measuring eye-movements on a computer screen
can be advantageous in terms of accuracy (see Muldner & Burleston, 2015; Epelboim
& Suppes, 2001), we propose to use eye-tracking goggles for purposes as ours. In this
study, we used the headset Pupil Pro (Kassner, Patera & Bulling, 2014; see Figure
2(1)), which has a number of advantages for our purpose: First, goggles allow for
mobile eye-tracking and are easy to set-up. Thus, they can be used straightforwardly
in a room students are familiar with, avoiding biases through an artificial surrounding.

Schindler, Lilienthal, Chadalavada, Ögren
PME40 – 2016 4–167
The students in our project usually solved MSTs with paper and pen and we wanted to
provide the same possibility to draw with pens, to use a ruler, etc., and keep the setting
as familiar as possible. Second, eye-tracking with goggles is unobtrusive. We observed
that the students soon “forget” they are wearing the eye-tracking device and thus act
naturally when working on their tasks. Third, this type of eye-tracker is more affordable
than traditional eye-tracking devices (we purchased the Pupil Pro for approx. 2,000$).
It is thus possible to acquire and use several of them for research studies and it is also
conceivable that similar, less expensive eye-tracking headsets could be routinely used
in educational contexts in the future.
Data analysis
In a first step, we evaluated—similar to previous researchers (Kattou et al., 2013;
Leikin & Lev, 2013; Joklitschke et al., 2016)—students’ mathematical creativity using
their solutions drawn/written on paper. Two different researchers independently
analyzed the documents and then compared their analyses. In a second step, we
evaluated simple videos. These videos from the eye-tracking goggles show the view of
the students. We used them without the eye-tracking overlay in order to be able to
investigate the additional value of gaze point sequences later on. Using the simple
videos, we investigated how students proceeded. Therefore, we focused on their
drawings, writings, and gestures. In a third step, we evaluated the eye-tracking videos.
These were derived from overlaying the simple videos with gaze point sequences
(Figure 2(4)) indicated by green dots connected by magenta lines. Following Andrá et
al. (2015), we conceptualize students’ focuses and eye-movements as indicating their
area of interest. In a micro-level analysis, we evaluated students’ particular focuses of
attention in order to investigate creative approaches in detail (Andrá et al., 2015).
(1)
(2)
(3)
(4)
Figure 2: (1) Pupil Pro eye tracking headset used in this study
(https://pupil-labs.com/); (2) Student working on the hexagon MST; (3) screenshot of
simple video and (4) screenshot of video with eye-tracking overlay
FIRST RESULTS
In the following, we present first results and illustrate those using data from David, an
18 year old student.
In the analysis of students’ drawings/writings, we were able to get a first account on
students’ approaches. In David’s case (see Figure 3), both researchers independently
found four approaches, and named them after the colors used (red, green, blue 1 (upper
left corner), blue 2 (lower right corner)). The interpretation of three of the approaches
Schindler, Lilienthal, Chadalavada, Ögren
4–168 PME40 – 2016
was very similar or identical; one approach was interpreted differently (blue 1). Here,
the writing/drawing did not allow to clearly reconstruct how the approach emerged.
One approach (red) was evaluated as correct and complete by both researchers; another
one (green) by only one. In a dichotomous scoring, as used in the creativity-test offered
by Leikin and Lev (2013), one or respectively two solutions would accordingly count
for evaluating fluency, flexibility, and originality. In sum, we found that this analysis
did not suffice for reconstructing how students came up with their creative ideas, how
these developed, and how they built on one another (incl. their order).
Figure 3: David’s written/drawn solution
The evaluation of simple videos (without eye-tracking overlay) revealed in which order
the approaches emerged. In David’s case, this analysis showed that he started with the
red approach, went on with the green one, interrupted for correcting the red one, and
then continued with the green one. Later on, he went on with “blue 1”, then
intermediately worked on “blue 2”, and finally finished approach “blue 1”. However,
using the analysis of simple videos does rarely reveal what student focus on when, for
instance, switching approaches, and therefore sheds little light on what reasons they
have for rethinking or for interrupting. Here, we expected the analysis of eye-tracking
videos to be advantageous for evaluating students’ focuses of attention. Also, it
appeared that students, such as David, interrupt their proceeding for over 20s in which
they did not write, draw or point at something. We assumed that eye-tracking videos
offer information on what the students are paying attention to in these episodes.
The evaluation of eye-tracking videos offered, indeed, a more fine-grained access to
what students were paying attention to and focusing on. Regarding the evaluation of
mathematical creativity, it especially contributed to reconstructing how new, creative
ideas evolved, to reconstructing approaches that were complex and whose
written/drawn descriptions did not allow to clearly reconstruct them, and to evaluating
the degree of elaboration of students’ approaches. In David’s case, it shed light on how
he proceeded in detail and what he focused on for instance in the approach “blue 1”.
Here, he started with paying attention to the symmetry of the upper triangle: He focused
on the equal-sized angles in the two lower corners (ε and the symmetrical angle, see

Schindler, Lilienthal, Chadalavada, Ögren
PME40 – 2016 4–169
Figure 4): He first focused on the right-handed angle, second, looked towards the left-
handed angle ε and back, then marked the right-handed angle as ε, and finally looked
back and forth between the two angles, probably checking his idea. Following his eye-
movement, we found that his approach was much more elaborated than we had
expected. In fact, it revealed that his two blue approaches complement each other and
that he—contrary to our prior analysis—inferred them correctly in an approach that
was complete. The eye-tracking was crucial for revealing his entire creative effort and
for finding that his approach was correct.
(1)
(2)
(3)
(4)
Figure 4: David’s eye-movement marking ε in the upper triangle
CONCLUSION AND OUTLOOK
Our results support the findings of Joklitschke et al. (2016) that a more sophisticated
evaluation is valuable for understanding students’ mathematical creativity. Drawing on
the idea to study mathematical creativity using MSTs (Leikin & Lev, 2013), we
investigated to what extent the required deeper insight into creative problem-solving
processes can be achieved using mobile, unobtrusive eye-trackers that do not require
substantial adjustments of standard problem-solving settings. We presented first results
obtained with eye-tracking goggles, which are representative of a new generation of
mobile, inexpensive eye-tracking devices, and observed the remarkable potential of
these novel devices for creativity research: Using the data we were able to shed light
on how new, creative ideas evolved and how students inferred them. In particular,
analyzing eye movements enables us to evaluate the degree of elaboration, which is
not yet sufficiently addressed in research on mathematical creativity (Joklitschke et al.,
2016). We were able to reconstruct approaches that the analysis of written/drawn
solutions and simple videos of the scene as looked at by students had not clarified.
Through the improved capability to reconstruct students’ approaches, we are able to
better evaluate their mathematical creativity. As the value of the analysis of eye
movements was persuasive in our study, it is inevitable to use data from eye-tracking
googles in future work on mathematical creativity. We will investigate more
extensively how creativity maps to gaze sequences and investigate how to partially
automate the analysis of gaze sequences in research on mathematical creativity.
References
Andrá, C., Lindström, P., Arzarello, F., Holmqvist, K., Robutti, O., & Sabena, C. (2015).
Reading mathematics representations: an eye-tracking study. International Journal of
Science and Mathematics Education, 13(2), 237–259.

Schindler, Lilienthal, Chadalavada, Ögren
4–170 PME40 – 2016
Epelboim, J., & Suppes, P. (2001). A model of eye movements and visual working memory
during problem solving in geometry. Vision Research, 41, 1561–1574
Guilford, J. P. (1967). The nature of human intelligence. New York: McGraw-Hill.
Joklitsche, J., Rott, B., & Schindler, M. (2016). Revisiting the identification of mathematical
creativity: Validity concerns regarding the correctness of solutions. ICME 2016 pre-
proceedings.
Kassner, M., Patera, W., & Bulling, A. (2014). Pupil: an open source platform for pervasive
eye tracking and mobile gaze-based interaction. arXiv:1405.0006 [cs.CV]
Kattou, M., Kontoyianni, K., Pitta-Pantazi, D., & Christou, C. (2013). Connecting
mathematical creativity to mathematical ability. ZDM, 45(2), 167–181.
Kim, H., Cho, S., & Ahn, D. (2004). Development of mathematical creative problem solving
ability test for identification of the gifted in math. Gifted Education International, 18(2),
164–174.
Leikin, R., & Lev, M. (2013). Mathematical creativity in generally gifted and mathematically
excelling adolescents: what makes the difference? ZDM, 45(2), 183–197.
Leikin, R., & Pitta-Pantazi, D. (2013). Creativity and mathematics education: The state of the
art. ZDM, 45(2), 159–166.
Levav-Waynberg, A., & Leikin, R. (2012). The role of multiple solution tasks in developing
knowledge and creativity in geometry. Journal of Mathematical Behavior, 31, 73–90.
Mann, E. L. (2005). Mathematical Creativity and School Mathematics. Indicators of
Mathematical Creativity in Middle School Students (Dissertation). University of
Connecticut, USA.
Muldner, K., & Burleston, W. (2015). Utilizing sensor data to model students’ creativity in a
digital environment. Computers in Human Behavior, 42, 127–137.
Novotná, J. (2015, February). Research in teacher education and innovation at schools:
Cooperation, competition or two separate worlds? CERME9, Prague, Czech Republic.
Scheiter, K., & van Gog, T. (2009). Using eye tracking in applied research to study and
stimulate the process of information from multi-representational sources. Applied
Cognitive Psychology, 23, 1209–1214.
Schimpf, F., & Spannagel, C. (2011). Reducing the graphical user interface of a dynamic
geometry system. ZDM, 43(3), 389–397.
Sheffield, L. J. (2013). Creativity and school mathematics: Some modest observations. ZDM,
45(2), 325–332.
Sriraman, B., Haavold, P., & Lee, K. (2014). Creativity in Mathematics Education. In S.
Lerman (Ed.), Encyclopedia of Mathematics Education (pp. 109–115). Dordrecht:
Springer.

2016. In Csíkos, C., Rausch, A., & Szitányi, J. (Eds.). Proceedings of the 40th Conference of the International
Group for the Psychology of Mathematics Education, Vol. 4, pp. 171–178. Szeged, Hungary: PME. 4–171
FACILITATING MATHEMATICS TEACHERS’
SHARING OF LESSON PLANS
Ruti Segal Atara Shriki Nitsa Movshovitz-Hadar
Shaanan Academic
College of Education
Oranim Academic
College of Education
Neamann Institute,
Technion – Israel Institute
of Technology
This paper presents results of 3 preliminary research and development studies, each
aimed at examining some deliberation about shaping up our initiative towards
facilitating mathematics teachers’ collaboration in lesson planning and in sharing
lesson plans with one another. These studies involve, among others, the development
of software that supports the accumulation, preservation and on-going modification of
teachers’ lesson plans. Additionally, some of the open questions we are still struggling
with are described.
INTRODUCTION
Almost every country in the world has assumed some form of educational reform
during the past two decades, but “very few have succeeded in improving their systems
from poor to fair to good to great to excellent” (McKinsey report , Mourshed, Chijioke
& Barber, 2010, p. 10). This report examined school systems’ improvement by
analysing the experiences of 20 education systems around the world that achieved
significant and sustained student outcome gains, as measured by national and
international standards of assessment in recent years. Although there is no conclusive
answer to why a certain reform fails while another one succeeds, clearly, as stated in
their previous McKinsey report (2007), “The quality of an education system cannot
exceed the quality of its teachers” and “The only way to improve outcome is to improve
instruction” (ibid p. 43). One of the eight factors identified as contributing to success
of a reform was nurturing teacher cooperation, and cultivating the next generation of
system leaders to ensure a long-term continuity in achieving the reform goals.
Inspired by these reports our deliberation focused on appropriate manageable ways for
nurturing teacher cooperation and cultivating system leaders. Stimulated by wiki-based
software such as Wikipedia, which enable sharing common knowledge, its
accumulation and preservation, we considered ways to support such processes by
adapting existing powerful technology to this initiative.
In this paper we describe an educational R&D project, i.e. it can be characterised as
“applied research that seeks solutions to practical questions in education, with less
emphasis on developing, testing and advancing theory” (OECD, 2004, p.8). We present
our dilemmas, and results of three preliminary studies that assisted us in shaping up
our initiative.

Segal, Shriki, Movshovitz-Hadar
4–172 PME40 – 2016
THEORETICAL BACKGROUND
In this section, we briefly present some of the theoretical background related to
teachers’ community of practice (TCoP) and lesson plans (LPs) as the community’s
central resource.
Teacher professional development. Mourshed et al.’s (2010) report points at the
central role of investing in teachers’ professionalization in the success of a reform.
Frameworks aimed at supporting teachers’ professional development can take various
forms, have diverse goals, different duration, etc. Nevertheless, teachers' participation
in such programs, per se, does not guarantee their development (Guskey, 2002).
Moreover, the effect of teachers’ professional development program, and as a result its
effect on students’ outcomes, often fade out quite quickly soon after the program ends.
One of the reasons for this phenomenon is that, generally speaking, teachers’
professional development programs are led by off-school factors (e.g. academic
institutions, Ministry of Education) and do not support the formation of an autonomous
professional TCoP (Movshovitz-Hadar, Shriki & Zohar, 2014).
Teacher community of practice. The last two decades have brought educators to
acknowledge the need for teachers to “abandon” their typical isolation for the benefit
of joining forces and sharing knowledge. Managing shared knowledge might be best
achieved by nurturing professional CoPs (Levine, 2010). The origin of the concept
“community of practice” is rooted in learning theory, and was coined by Lave &
Wenger (1991) while studying apprenticeship as a model for learning a profession.
CoPs are formed by people who engage in a process of collective learning in a common
domain, share a concern or a passion for something they do, and learn how to do it
better as they interact with one another on a regular basis. In this view, becoming a
professional is not seen as the individual's acquisition of knowledge, but rather as a
social process of participation in a learning community. In order for a community to
be recognized as a CoP, a combination of three characteristics should be fostered
simultaneously (Wenger, 1998): (1) The domain: A CoP must have an identity defined
by a shared domain of interest; (2) The community: Members engage in joint activities
and discussions, help each other, share information, and build relationships that enable
them to learn from each other. They do not, however, necessarily work together on a
daily basis; (3) The practice: Members of a CoP are practitioners. They develop a
shared repertoire of resources, such as experiences, stories, tools, and ways of
addressing recurring problems, thus learn with and from each other. Such communities
develop their practice through a variety of activities, among them: documenting
projects and ideas, assisting each other in finding information, sharing resources,
discussing developments, solving professional problems collectively, mapping
knowledge, and more. In general, national mathematics TCoP conform to Wenger's
first two characteristics: they share an interest in mathematics, its teaching and
learning, they meet in professional conferences, read professional journals, and share
a professional terminology. However, the third characteristic, to a large extent, is still
absent in many national mathematics TCoP (Shriki & Movshovitz-Hadar, 2011).

Segal, Shriki, Movshovitz-Hadar
PME40 – 2016 4–173
This raises questions related to steps needed for enabling the development of an
autonomous TCoP. In this context, we were mainly concerned about the meaning of
“resources” and the technology through which they can be preserved, shared,
accumulated, discussed, and continuously improved through a collaborative effort,
keeping in mind the aim of improving students' outcomes and attainments. This led us
to deepen our understanding in sharing LPs and the role of joint lesson planning.
Joint lesson planning. Teaching is an extremely complex profession. Teachers need
to possess a wide range of skills and various types of knowledge, e.g. pedagogical
knowledge that relates to teaching materials and methods, knowledge about students’
learning, capability of analyzing reflectively their actions and impact, and more (Shriki
& Lavy, 2012). But above all, they should be able to integrate these skills and
knowledge and translate them into LPs. In fact, designing LPs are at the heart of
teachers’ professional work. However, in most cases teachers prepare their LPs “in
mind”, and the preparation of a detailed LP is considered to be an “unnecessary
burden” required only in pre-service teacher education. Even after teaching a certain
lesson, LP is not recorded and, at best, notes are written in the textbook for future
reference. As a result, at the individual level, drawing conclusions is limited, and at the
community level there is a lack of sharing practical knowledge with colleagues
(Movshovitz-Hadar et al., 2014). This stands in a stark contrast to the recognized
benefits of sharing knowledge through joint lesson planning: “we discovered the magic
of effective joint lesson planning… Joint lesson planning has become a cornerstone
of…collaborative practice…The expectation of teachers is not only that they should
develop and employ effective practices in the classroom, but that they should share
them throughout the whole system. Best practice therefore quickly becomes standard
practice, adding to the pedagogy” (Mourshed et al., 2010, p. 77).
FROM THEORY TO PRACTICE
With respect to writing and sharing LPs, and to the role of sharing LPs and
providing/receiving feedback in the process of becoming TCoP we looked for answers
to the four questions: (1) Are there ongoing voluntary processes of sharing knowledge
among teachers? If so, what motivates these processes? If not, why? (2) What are the
processes involved in designing LPs for sharing with colleagues, as compared with
processes of designing LPs for one’s own use? (3) What kind of interaction occurs in
the process of joint preparation of LP? (4) In providing and receiving feedback to peers’
LPs: To what extent are teachers ready to provide feedback to peers’ LPs, to receive
feedback from peers to their LPs, to reflect on peers’ feedback and to accept it?
In order to receive initial answers, we conducted three preliminary R&D studies.
R&D study 1 - My favorite math LP. In this study, we examined teachers’ willing to
respond to an e-mail call for sharing their LPs voluntarily. We approached about 400
high school mathematics teachers, asking them to send their favorite LP, written
according to specific guidelines provided. They were asked to approve uploading their
LPs into a designated open web site. To encourage the teachers to share their LPs, we

Segal, Shriki, Movshovitz-Hadar
4–174 PME40 – 2016
announced three “raffle prizes” of $250 (in local currency) to be held at the annual
National Conference of High School Mathematics Teachers. It should be emphasized
that there was no judgmental process as to the quality of the LPs, since we believe that
relevant standards should be determined and take shape by the TCoP itself. Four rounds
of raffles took place in 6 months intervals. Only 10-15 LPs were sent to each round.
This first step left us not only disappointed but with many open questions related to
teachers’ responsiveness and motivation to share their LPs with their colleagues.
However, a large number of teachers were curious to see other teachers’ LPs as
indicated by the number of entries to the website where these LPs appeared
(http://ramzor.technion.ac.il).
R&D study 2 - Joint lesson planning on MediaWiki system. Eleven graduate
students, experienced mathematics high school teachers, participated in a semester
long activity in which they collaboratively designed LPs on a MediaWiki system. At
the time this experiment was carried out, MediaWiki seemed to us as the best available
platform for facilitating collaborative group work aimed at developing a dynamic
repository of LPs and discussing educational ideas. Results of a study that followed the
teachers’ experience (Shriki & Movshovitz-Hadar, 2011) indicated that the process of
joint lesson planning supported the development of the participants as a small TCoP
that interact on a daily basis, discuss ideas, and share LPs and other professional
resources. The results also pointed at many concerns of the participants, categorised as
social and technical ones. The social concerns were associated with participants’
contemplating about ways to provide and receive feedback, and fears of losing
ownership over their creative work as authors of LPs. The technical concerns were
linked to difficulties the teachers faced while writing in Wiki syntax.
These results led us to recognize the need for teachers to arrive at agreed upon social
norms for managing a shared repository of learning and teaching resources as a
preliminary necessary condition for nurturing TCoP. It should be remembered that
unlike Wikipedia, which is mainly an encyclopedic or consensus-based reference
repository, teachers' LPs repository is a creative design work, experience-based, that
expresses personal endeavors. Thus, as part of becoming TCoP, teachers should decide
how to carry out a productive discourse and successful collaboration, what is the
meaning of “constructive feedback”, how to consider provided feedback, how to keep
ownership, and more. There are also questions related to the proper ways for reaching
agreement on each issue. Subsequent to this experience we also realized that the
technical concerns related to WikiMedia make it an inappropriate platform for
accumulating, preserving, and improving mathematical LPs. To develop more
appropriate software we approached Omnisol Information Systems Company, and
started the development of RAMZOR software. The term “RAMZOR” means “traffic
light” in Hebrew. This term was chosen to metaphorically signal: Red light - Stop to
search and ponder about your next lesson; Yellow light - Get Ready by looking for
various LPs in your desired topic and/or prepare your own LP; Green light – Go well
prepared to your class and possibly afterwards upload your experience results.

Segal, Shriki, Movshovitz-Hadar
PME40 – 2016 4–175
R&D study 3 - A 3-day summer school for joint lesson planning. With the insight
gained from R&D study 2, we organized a 3-day summer school for two consecutive
years in which two groups of selected teachers designed LPs (individually or in
pairs/small groups), provided feedback to peers’ LPs (orally or in writing), improved
their own LPs subsequent to receiving feedback, and reflected upon the entire process.
The teachers participated in the summer school (18 in the first one and 20 in the second
one) on a voluntary basis subsequent to an invitation that was e-mailed to them
following recommendations received from the superintendent of school mathematics
and the school principals. Data was gained through questionnaires, interviews,
transcripts of small groups discussion and whole group ones, and content analysis of
the LPs and feedbacks (Movshovitz-Hadar et al., 2014). Our findings indicated that
ongoing processes of collaboration and sharing are rare at schools. According to the
teachers, this situation is a result of several causes, among them: (1) Heavy workload
that leaves no time for interaction (“We work very intensively, and fail to find a suitable
time to sit and think together beyond planning exams”); (2) Mathematics teachers'
tendency not to consult their colleagues for fear of being perceived as having
insufficient mathematical knowledge (“Math teachers do not ask each other questions
about how to solve a specific problem, or how to teach a certain topic. I know it is
something typical for math teachers. Perhaps we are afraid to be seen as someone who
does not know enough math”); (3) In small schools there is often only one mathematics
teacher or one mathematics teacher for certain grades/levels of teaching, and therefore
has no colleague to consult with (“In my school I am the only one who teaches high
level math, so I have no one to learn from or exchange ideas with”); (4) A lack of
awareness to the benefits of cooperating and sharing knowledge (“I have been teaching
math for 13 years now. I don’t believe other teachers can tell me something I don’t
know yet”).
In the framework of the summer schools we mainly focused on bringing teachers to
acknowledge the benefits of collaborating in planning detailed LPs in writing and of
sharing knowledge, as well as the limitations and the affective aspects that are involved
in such processes. The LPs were written using the initial version of RAMZOR
software. This enabled participants to relate to the LPs, and enabled us to witness
shortcomings of the software, thus to extend our R&D efforts towards improving the
suitability of RAMZOR as a tool for managing professional knowledge.
The teachers’ reflections (verbally and in writing) indicated that they had developed
awareness of their personal gains from writing LPs, and from receiving peers’
feedback. The teachers also pointed out that writing LPs and sharing knowledge
strengthened their self-efficacy and contributed to empowering them as members of
the TCoP. As for the personal gains, teachers realized that a detailed design of LPs
“enables to verify what you intend to achieve in the lesson, and make sure that what
you are going to teach corresponds to your goals”; “A detailed plan of the 45 minutes
class lesson by units of 5-10 minutes increases the likelihood that the time will be used
optimally”. Teachers also realized that writing LPs helped them focus on learning
Segal, Shriki, Movshovitz-Hadar
4–176 PME40 – 2016
processes: “It compels you to think about how your teaching will affect students’
learning”; “In writing the LPs, I had to think about students’ difficulties, how to
prepare for it, what examples to present, what questions to ask, and how to phrase
them”; “A detailed pre-planning assures an interesting and challenging lesson that the
students will always remember”. Furthermore, teachers had discovered that writing
LPs has implications for deepening their mathematics knowledge: “I found myself
probing in specific aspect of derivations which I had never thought about before. No
doubt that writing LPs contributes to our understanding of math”. The majority of the
teachers concluded by saying something similar to: “I'm leaving this summer school
feeling that I had become more professional…I understand now that we have to be
more accountable to our teaching in each lesson”. Nonetheless, 4 teachers (about 10%)
said that “writing LPs is exhausting. I believe in most cases it is enough to write only
the numbers of the exercises one is going to give, while a detailed LP should be written
only in special cases”; ”I’m not sure I’ll actually teach exactly the way I planned it,
so it makes me think about ‘cost-effectiveness’ issues of the investment in detailed
writing of LPs”. Receiving peers’ feedback had a meaningful effect on teachers. All
the teachers admitted that “it was the first time I had the opportunity to share my
thoughts about lesson ideas”. In fact, “Just the knowing that the other teachers are
going to give feedback to my LPs, motivated me to think more deeply about all possible
aspects of the lesson and improve it”. This stemmed from two main motives: “I have
to write the best LP I can in order to leave a good impression, and also, I definitely
want my colleagues to try out my LP in their classes”.
The mutual feedback was provided in various phases of writing the LPs (from a
consultation regarding not-detailed LP outlines, to comments on a complete detailed
LP), and in three main modes (small group talk, a whole class discussion, and written
feedback through the software). Most teachers believed that receiving feedback from
their colleagues is beneficial at every phase of designing the LP, since “At any point
you are in a different state of ‘maturity’, so at every phase you have different gains”.
Teachers felt their main benefits from receiving feedback were related to gaining “new
ideas and fresh viewpoints” and “insights regarding the weak points of the LP”. But
above all, “I figured out that there is no substitute for consultation with colleagues”,
and “the feedback I received changed my entire thinking about teaching students’
learning”. As for the mode of receiving feedback, while at the beginning all the
teachers thought that “feedback given face-to-face is more effective, because one may
ask clarifying questions”, soon after they experienced the process of receiving
feedback through the software many of them admitted that “such feedback is no less
efficient. I could learn a lot from the written comments”. In particular, most teachers
realized that “in ‘real life’ it makes more sense to expect a written feedback, because
one can write it in his or her available time, and there is no need for scheduling face-
to-face meetings”.
Whereas the teachers’ responses that relate to the benefit of writing LPs and receiving
feedback did not surprise us, we could not anticipate the effect of this process on
Segal, Shriki, Movshovitz-Hadar
PME40 – 2016 4–177
strengthening their self-efficacy and on sensing that the process contributed to their
empowerment as members of TCoP: “I realized that our work as teachers is somewhat
‘amateurish’. No one inspect our work (except for maybe the grades of our students in
the matriculation exams). Each teacher works at his or her discretion, no supervision,
no setting goals. In contrast, working together, ‘regulating’ each other, and
collaboratively setting the standards that would be expressed in our LPs, no doubt
would lead us to do our job much more professionally”; “The unique thing was that we
had a chance to learn about lesson planning from each other, and not from some
academic figure. I learnt the strength of learning from peers, learning from equals. It
is much more meaningful than any other kind of learning”; “What we did here was the
start of a social revolution. I felt that everything is in our hands, the teachers’ hands.
This is the first time that I feel trusted as a teacher. It really made me proud!”. In this
regard, most teachers specifically related to the central role of repository of LPs and a
media through which they can interact and share knowledge: “Our community needs
to change the traditional approach of adhering exclusively to textbooks. Only a joint
effort of all members of our community to generate a database of LPs will make a
change in our profession”; “This repository of LPs on RAMZOR is the only way to
preserve the community knowledge for the benefit of all, new as well as veteran”; “This
software is an amazing tool. It allows teachers to see they are not alone, they are part
of a community. They can see how others teach and learn from it. Networking with
colleagues allows to maintain fruitful discussions and improve the teaching”.
CONCLUDING REMARKS, MOVING TO R&D STUDY 4
To summarize our three preliminary studies, one important observation is that although
teachers recognize the major role of planning their lessons in details, they do not rush
into the opportunity to share LPs, and they refrain from sharing their LPs with others
unless they are put in a framework that makes them do it. Another observation is that
once provided with software that enables lesson planning they become aware of the
impact of writing detailed LPs on the quality of their lessons. In addition receiving and
giving feedback on LPs are processes which are highly demanding, and teachers
gradually become appreciative of their potential to improve their work.
Towards the next step we also considered the short duration of each preliminary R&D
study which did not allow us to examine a long-term effect of writing detailed LPs
through RAMZOR software and sharing them on teachers’ professional development,
or long-term processes of the evolvement of an independent TCoP. Furthermore, the
small samples and the fact that the studies were carried out under “laboratory
conditions”, do not allow us to draw conclusions about the impact of lesson planning
via RAMZOR on the professional development of various mathematics teachers.
As typical to an R&D project, we put less emphasis on developing, testing and
advancing theory (OECD, 2004, p. 8). Our emphasis is rather the design of a long-term
study, situated in the real-life school settings, which involves a larger sample of
mathematics teachers using RAMZOR for planning their work and sharing their

Segal, Shriki, Movshovitz-Hadar
4–178 PME40 – 2016
experiences. Following the three R&D preliminary studies and 2 years of RAMZOR
software development, R&D study 4 started in the school year 2014/15 in 19 high
schools spread about Israel Northern District. This is a three-year project which enables
data collection aimed at finding answers to the yet open questions.
References
Guskey, T. R. (2002). Professional development and teacher change. Teachers and Teaching:
Theory and Practice, 8(3/4), 381-390.
Lave, J., & Wenger, E. (1991). Situated learning: Legitimate peripheral participation.
Cambridge: Cambridge University Press.
Levine, T. H. (2010). Tools for the study and design of collaborative teacher learning: The
affordances of different conceptions of teacher community and activity theory. Teacher
Education Quarterly, 37(1), 109-130.
McKinsey & Company (2007). How the world's best-performing school systems come out on
top. https://mckinseyonsociety.com/downloads/reports/Education/Worlds_School_Systems_
Final.pdf
Mourshed, M., Chijioke, C., & Barber, M. (2010). How the world's most improved school
systems keep getting better. http://mckinseyonsociety.com/how-the-worlds-most-improved-
school-systems-keep-getting-better
Movshovitz-Hadar, N., Shriki, A., & Zohar, O. (2014). Collaborative structuring of the
pedagogical content knowledge accumulating within mathematics teachers’ community of
practice. Paper presented at a symposium in The second Jerusalem Conference on Research
in Mathematics Education (JCRME2), Jerusalem College of Technology, Israel.
OECD (2004). National review on educational R&D- Examiners’ report on Denmark.
Available at: http://www.oecd.org/edu/ceri/33888206.pdf
Shriki, A., & Lavy, I. (2012). Perceptions of Israeli mathematics teachers regarding their
professional development needs. Professional Development in Education, 38(3), 411-433.
Shriki, A., & Movshovitz-Hadar, N. (2011). Nurturing a community of practice through a
collaborative design of lesson plans on Wiki system. Interdisciplinary Journal of E-Learning
and Learning Objects, 7, 339-357. http://www.ijello.org/Volume7/IJELLOv7p339-357
Shriki768.pdf
Wenger, E. (1998). Communities of practice: Learning, meaning, and identity. Cambridge,
UK: Cambridge University Press.

2016. In Csíkos, C., Rausch, A., & Szitányi, J. (Eds.). Proceedings of the 40th Conference of the International
Group for the Psychology of Mathematics Education, Vol. 4, pp. 179–186. Szeged, Hungary: PME. 4–179
DIFFERENT GENERALITY LEVELS IN THE PRODUCT OF A
MODELLING ACTIVITY
Juhaina Awawdeh Shahbari Michal Tabach
Tel-Aviv University & Al-Qasemi Academy Tel-Aviv University
The current study examines features of modelling processes and the competence of
groups that elicit models with different generality levels while working on modelling
activity. To this end, 34 practicing teachers and 72 prospective teachers engaged in a
modelling activity in 23 groups. Data were collected from reports, worksheets and
video recordings. The findings indicate that the models elicited by the 23 groups can
be divided into two main generality levels: 74% of the models were symbolic-general
while 26% were numerical. Analyses of the modelling processes of six groups indicate
that the general and numerical groups went through the entire modelling cycle,
including all the phases and actions. However, the modelling routs was different, and
some of the modelling competence was lacking in the numerical groups.
INTRODUCTION
While the product of a modelling process is a model (Sriraman, 2005), modelling
perspectives tend to emphasize the process over the product (Ang, 2001). The
importance of modelling processes led researchers (Stillman, Galbraith, Brown &
Edwards, 2007; Borromeo Ferri, 2006) to focus only on the process itself, with little
attention devoted to the relations between the modelling process and the final models.
We believe that monitoring and comparing the modelling processes of groups whose
final product models differ in level of generality may shed light on the competencies
needed for eliciting models that are more general. In this study, we focus on practicing
and prospective teachers because they play a pivotal role in guiding student learning in
mathematical modelling activities (Borromeo Ferri & Blum, 2010) and they consider
modelling to be difficult (Blum & Borromeo Ferri, 2009). The current study attempts
to shed light on the competencies of the participating teachers, which may result in
differences in the generality levels of their models.
THEORETICAL BACKGROUND
Modelling
Mathematical modelling is considered to be the two-way process of translating
between the real world and mathematics (Blum & Borromeo Ferri, 2009). The
modelling approach emphasizes the effectiveness of mathematics in real life
(Vorhölter, Kaiser, & Borromeo Ferri, 2014). Modelling activities begin with
incomplete, ambiguous or undefined information about a situation, and learners are
required to mathematize this information in meaningful ways while working in small
groups (Doerr & English, 2003).

Shahbari, Tabach
4–180 PME40 – 2016
Modelling processes of authentic/real world problems are described as cycles that
translate between the real world and mathematics in both directions through a series of
steps or phases (Blum & Borromeo Ferri, 2009). We have adapted the modelling cycle
of Blum and Leib (2005), who organized the modelling process into six actions and
four phases. The actions consist of (1) understanding the problem and simplifying a
situation model; (2) presenting a real model; (3) mathematizing, which leads to
constructing a mathematical model; (4) applying the mathematical model that elicits
mathematical results; (5) interpreting these mathematical results while considering the
real-world situation; and (6) validating these results according to the original situation.
These actions lead to the modelling phases, which include (a) a real model; (b) a
mathematical model; (c) mathematical results; and (d) realistic results. If the results
are unacceptable, the cycle starts again.
These actions describe the transitions between the modelling phases and include
several modelling competencies. Modelling competencies include “skills and abilities
to perform modelling processes appropriately and goal-oriented as well as the
willingness to put these into action" (Maaß, 2006. P. 117). Modelling competencies are
needed in order to complete modelling activities successfully (Stillman et al, 2007).
Researchers (Maaß, 2006; Stillman et al, 2007) defined lists of modelling competencies
in each transition between the modelling phases. These include: (i) to make
assumptions about the problem and simplify the situation; (ii) to recognize relevant
variables and to mathematize them; (iii) to mathematize relevant quantities and their
relations; (iv) to use mathematical knowledge to solve the problem; (v) to select and
apply appropriate formulae; (vi) to generalize or extend the solution; (vii) to critically
check results with the real situation; and (viii) to consider implications of decisions and
results.
Models are the product of the modelling process (Sriraman, 2005). They represent the
phase in which the learner makes external representations on a mathematical level
(Borromeo Ferri, 2006) or abstractions of a complex real situation into a mathematical
form (Ang, 2001).
RESEARCH QUESTIONS
1. What are the differences in the modelling cycles of groups that elicit models
with different levels of generality?
2. What are the differences between the modelling competencies of groups that
elicited models with different levels of generality?
METHOD
The current study included 106 participants, 34 of them practicing teachers (primary
and middle schools) that took a problem-solving course as part of their master’s degree
studies at a college of education. The other participants included 72 prospective
teachers taking a problem-solving course at a different college.

Shahbari, Tabach
PME40 – 2016 4–181
As an introduction to the activity (Figure 1), the first author presented some historical
facts on the development of toothpaste production. Then, the participants received the
activity. They worked in groups and were asked to submit reports that included an
explanation about the change in toothpaste consumption.
Data were collected from the reports of 23 groups in the form of worksheets and notes.
In addition, the work of six groups was video-recorded and transcribed verbatim.
To analyze the modelling products, we categorized each model in the reports according
to mathematical operations, relations and processes emerging in the mathematical
models. The worksheets and notes served as a source for triangulating our
interpretation of the mathematical models.
We used an iterative process of reading the transcripts and watching the video to
analyze the modelling of the six recorded groups. We analyzed the participants'
discussions in each group according to the modelling cycle of Blum and Leib (2005).
The researchers identified and distinguished the modelling process (phases and
actions) of each group and presented their analyses visually (see next section). The
modelling competencies were analyzed according to definitions of modelling
competencies by Stillman et al. (2007) and Maaß (2006).
A student went to the general manager of the Colgate corporation and suggested an idea that
would increase company profits without any effort. The student said, "I would be happy to
share my idea with you, but you must pay a million dollars in case you decide to use the idea."
The general manager accepted the condition, and the young student suggested enlarging the
opening of the toothpaste tube.
The opening of your toothpaste tube has been enlarged. Write a letter that includes a
description of the change in your consumption compared to the original toothpaste tube.
Figure 1: The toothpaste activity
FINDINGS
Categorization of the elicited models
The 23 models were categorized according to mathematical operations and processes
into two categories: (1) general algebraic models - 74% of the groups; and
(2) numerical models - 26% of the groups. The features of the general model used
general algebraic expressions, making the model appropriate to various situations. The
algebraic expressions differed. Some expressed the variables of the situation as
additive relations or multiplicative relations and some used ratios. The features of the
numerical model referred to specified numbers, making the model relevant to a single
situation. Examples of one model from each category follow.
General model: “The radius of the opening of the old toothpaste was x: R=x. We
enlarged the radius by y, so that R* is the new radius: R*= x·y. The volume of the
amount of toothpaste that comes out of the original tube is x²h, where h= the height
of the cylinder. The volume of the toothpaste that comes out of the new tube is R*²h=
(xy)²h. The rate of flow is (xy)²h/ x²h = y², so that consumption is increased by y².”
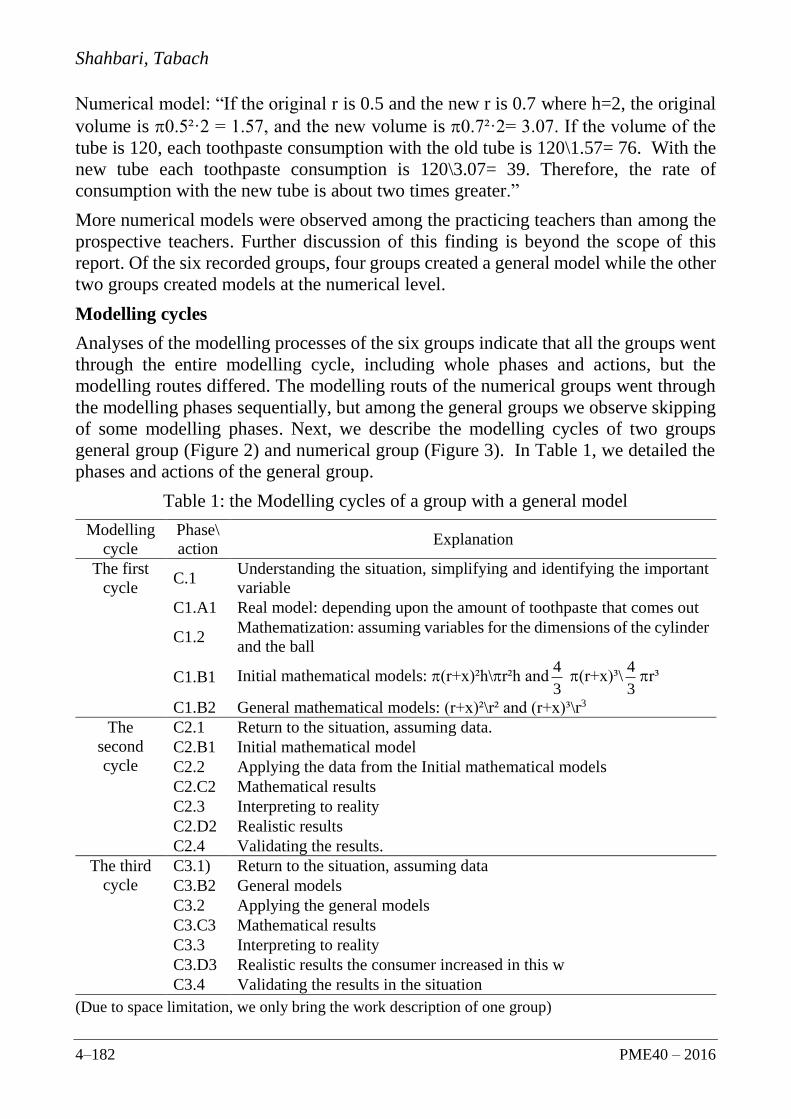
Shahbari, Tabach
4–182 PME40 – 2016
Numerical model: “If the original r is 0.5 and the new r is 0.7 where h=2, the original
volume is 0.5²·2 = 1.57, and the new volume is 0.7²·2= 3.07. If the volume of the
tube is 120, each toothpaste consumption with the old tube is 120\1.57= 76. With the
new tube each toothpaste consumption is 120\3.07= 39. Therefore, the rate of
consumption with the new tube is about two times greater.”
More numerical models were observed among the practicing teachers than among the
prospective teachers. Further discussion of this finding is beyond the scope of this
report. Of the six recorded groups, four groups created a general model while the other
two groups created models at the numerical level.
Modelling cycles
Analyses of the modelling processes of the six groups indicate that all the groups went
through the entire modelling cycle, including whole phases and actions, but the
modelling routes differed. The modelling routs of the numerical groups went through
the modelling phases sequentially, but among the general groups we observe skipping
of some modelling phases. Next, we describe the modelling cycles of two groups
general group (Figure 2) and numerical group (Figure 3). In Table 1, we detailed the
phases and actions of the general group.
Table 1: the Modelling cycles of a group with a general model
Modelling
cycle
Phase\
action Explanation
The first
cycle C.1
Understanding the situation, simplifying and identifying the important
variable
C1.A1 Real model: depending upon the amount of toothpaste that comes out
C1.2 Mathematization: assuming variables for the dimensions of the cylinder
and the ball
C1.B1 Initial mathematical models: (r+x)²h\r²h and3
4 (r+x)³\
3
4r³
C1.B2 General mathematical models: (r+x)²\r² and (r+x)³\r3
The
second
cycle
C2.1 Return to the situation, assuming data.
C2.B1 Initial mathematical model
C2.2 Applying the data from the Initial mathematical models
C2.C2 Mathematical results
C2.3 Interpreting to reality
C2.D2 Realistic results
C2.4 Validating the results.
The third
cycle
C3.1) Return to the situation, assuming data
C3.B2 General models
C3.2 Applying the general models
C3.C3 Mathematical results
C3.3 Interpreting to reality
C3.D3 Realistic results the consumer increased in this w
C3.4 Validating the results in the situation
(Due to space limitation, we only bring the work description of one group)

Shahbari, Tabach
PME40 – 2016 4–183
Figure 2: The modelling cycle of general group
Figure3: the modelling cycle of numerical group

Shahbari, Tabach
4–184 PME40 – 2016
Modelling competences
Closer analyses of the discussions of the six groups allowed us to identify differences
in modelling competencies through the transition from the situation to the real model
and through the transition from the real model to the mathematical model. Table 2
shows the main differences in modelling competencies. However, the modelling
competencies in the transitions between the mathematical model and the mathematical
results and between the mathematical results and the realistic results, and the validating
process of the realistic results were similar between the numerical groups and the
general groups.
Table 2: Different modelling competencies identified in the discussions of six groups
and examples of student discourse. (The numbers in the examples indicate numbered
line in the transcript).
Modelling
competencies in
the transitions
Numerical groups General groups
From situation to
real model:
- To simplify the
situation.
They use specific examples in
order to simplify the situations.
Ex.
[2]Amani: What will happen
to the consumption?
[3]Manal: It will change.
[6]Manal: For example, we
have a tube with volume of
150ml.
[7]Rana: 100 or 150.
[14]Manal: Ok, let's take 100.
We have to organize a table
that shows the new and old
consumption.
They use general terms through
simplifying the situation.
Ex.
[2]Muhammed: It was like this
and now it changes (drawing
two cycles).
[12]Areej: It means how much
toothpaste comes out now and
how much came out with the
old opening.
[14]Muhammed: We must look
at the ratio by which the use
increased.
- To identify
dependent and
independent
variables
They did not identify dependent
and independent variables.
Ex.
[28] Manal: How many times
does a person brush his teeth?
[31] Rana: Let's say twice.
They identified the relevant
variables.
Ex.
[9]Fatmeh: It is related to the
opening.
[43]Fatmeh: How long a
person brushes his teeth does
not matter.

Shahbari, Tabach
PME40 – 2016 4–185
From real model
to mathematical
model:
-To choose
appropriate
mathematical
notations
-To mathematize
relevant
quantities and
their relations.
-To select and
apply appropriate
formulae
They assume numbers through
the mathematization process.
They did not use algebraic
notions and did not suggest
formulas.
Ex.
[6]Manal: The opening is 2
mm, the length is 1.5 cm.
[23]Rana: The new opening is
4.
[24]Manal: Maybe 3, we can
use different numbers each
time.
[60]Manal: The radius is 0.5,
the old one is 0.25, the length
is 1.5.
[61] Rana: We first compute
the area of the base and then
multiply.
They assume variables through
the mathematization process.
They use variables to present the
mathematical model. They use
appropriate formulae.
Ex.
[56] Areej: We assume the old
radius is r. The length of the
brush is h. The amount is
r²h.
[62]Areej: If this is like pea,
we need to compute the
volume of the ball.
[75]Areej: If we expand the
opening by x.
[91]Fatmeh: the ratio will be
3
4(r+x)³\
3
4r³.
[92]Areej : The ratio is
(r+x)³\r³
DISCUSSION
The main finding of the current study is that there is no relation between going through
the entire modelling cycle and the generality level of the models. Working through the
entire modelling cycle as was defined in different studies (Blum and Leib, 2005;
Stillman et al., 2007) does not necessarily lead to sophisticated models. The numerical-
model groups went through all the phases and actions in the modelling cycle in a
manner similar to that of the general-model groups. Yet, the elicited models of the two
groups differed in their generality level. The differences between the groups are similar
to the differences between beginners and expert modellers according to Kaiser (2007).
She explained that beginners tend to produce assumptions for modelling without any
plan and without regard for the involved complexity of the models. Experts, on the
other hand, control their solving strategies and therefore achieve their aim faster.
Finer analyses of the modelling processes indicate that the differences between the
numerical and general groups were found in some of the modelling competencies. The
numerical groups lacked competencies, such as recognizing relevant and irrelevant
variables, choosing appropriate mathematical notations, generalizing or extending
solutions. Lacking modelling competencies is considered a barrier to successful
completion of modelling activities (Stillman et al, 2007). However, the findings
obtained from the analyses of the modelling processes of the numerical and general
groups indicate that the validating process did not play a role in distinguishing the

Shahbari, Tabach
4–186 PME40 – 2016
generality level of the elicited models. As a result, specified mathematical models were
accepted yet did not meet the demands of the situation.
We recommend expanding the current study with several modelling activities and
examining the differentiation between specified mathematical models and general
models. This may also lead to expanding the mathematical model phase in the
modelling cycle to provide a tool for distinguishing the modelling route of models with
different generality levels.
References
Ang, K. C. (2001). Teaching mathematical modelling in Singapore schools. The Mathematics
Educator, 6(1), 63-75.
Blum, W., & Borromeo Ferri, R. (2009). Mathematical modelling: Can it be taught and
learnt?. Journal of mathematical modelling and application, 1(1), 45-58.
Borromeo Ferri, R., & Blum, W. (2010). Insights into teachers’ unconscious behaviour in
modeling contexts. In R. Lesh, P. Galbraith, C. Haines, & A. Hurford (Eds.), Modelling
students’ mathematical modeling competencies (pp. 423–432). New York: Springer.
Blum, W., & Leib, D. (2005). "Filling Up"-the problem of independence-preserving teacher
interventions in lessons with demanding modelling tasks. In M. Bosch, (Ed). Proceedings
of the Fourth Conference of the European Society for Research in Mathematics Education
(pp. 1623-1633). Sant Feliu de Guixols.
Borromeo Ferri, R. (2006). Theoretical and empirical differentiations of phases in the
modelling process. ZDM, 38(2), 86-95.
Doerr, H., & English, L. (2003). A modelling perspective on students’ mathematical
reasoning about data. Journal for Research in Mathematics Education, 34(2), 110–136.
Kaiser, G. (2007). Mathematical modelling at schools how to promote modelling
competencies. In C. P. Haines, P. Galbraith, W. Blum, & S. Khan (Eds.), Mathematical
modelling): education, engineering and economics (pp. 110–119). Chichester: Horwood.
Maaß, K. (2006). What are modelling competencies?. ZDM, 38(2), 113-142.
Sriraman, B. (2005). Conceptualizing the model-eliciting perspective of mathematical
problem solving. In M. Bosch (Ed.), Proceedings of the Fourth Congress of the European
Society for Research in Mathematics Education (pp. 1686-1695). Sant Feliu de Guíxols.
Stillman, G., Galbraith, P., Brown, J., & Edwards, I. (2007). A framework for success in
implementing mathematical modelling in the secondary classroom. J. Watson & K.
Beswick (Eds), Proceedings of the 30th annual conference of the Mathematics Education
Research Group of Australasia Mathematics: Essential research, essential practice (Vol.
2, pp.688-697). Hobart, Tasmania: MERGA.
Vorhölter, K., Kaiser, G., & Borromeo Ferri, R. (2014). Modelling in Mathematics Classroom
Instruction: An Innovative Approach for Transforming Mathematics Education. In Y. Li,
E. A. Silver & S. Li (Eds.), Transforming Mathematics Instruction (pp. 21-36). Cham,
Switzerland: Springer.

2016. In Csíkos, C., Rausch, A., & Szitányi, J. (Eds.). Proceedings of the 40th Conference of the International
Group for the Psychology of Mathematics Education, Vol. 4, pp. 187–194. Szeged, Hungary: PME. 4–187
TRANSFORMATION OF STUDENTS’ VALUES IN THE PROCESS OF
SOLVING SOCIALLY OPEN-ENDED PROBLEMS (2): FOCUSING ON
LONG-TERM TRANSFORMATION
Isao Shimada Takuya Baba
Nippon Sport Science University, Japan Hiroshima University, Japan
Bishop (1991) pointed out the importance of research on values in mathematics education. Based
on this idea, Shimada and Baba (2012) developed three “socially open-ended” problems. They
gave each of them to fourth graders, and identified four characteristics. In our subsequent
research (Shimada & Baba, 2015), we researched the transformation of students’ social values
and mathematical models emerging within a lesson. However, the issue of the long-term
transformation of their values and models remained. The aim of this paper is to study this issue.
To attain this aim, the current study employs a comparison of students in the sixth grade with
those in the fourth grade. As a result of our analysis, we identified three characteristics such as
transformation of values, re-existence of implicit values, and change of models.
RESEARCH BACKGROUND
In certain “socially open-ended” problems1 (Baba 2010), it has been pointed out that values
are expressed with mathematical solutions in the process of problem solving (Iida et al.,
1995). We believe that the values described in this paper exist within the reasoning provided
for the mathematical solutions. For example, in the problem of division of a cake, when we
divide it equally for reasons of fairness, we judge the equal division as the mathematical
solution and the fairness as the value. It is important for students to associate mathematical
solutions and values, in order to develop problem-solving abilities related to issues such as
environmental problems, which may produce the different value judgments that are seen in
modern society. According to the current Japanese course of study, teachers make much of
cultivating judgment using mathematics. Therefore, there is a demand for teachers to think
about different mathematical solutions together with the reasons in the background. Shimada
and Baba (2012, 2015) conducted teaching experiments to discuss these mathematical
solutions and values at the same time in the classroom. Through such discussions, the students
actively expressed their ideas regarding their mathematical solutions and the reasons for them,
and refined their mathematical solutions by listening to the mathematical solutions and
reasons that other students expressed, and thus transformed their values (Shimada & Baba,
2012, 2015). In these papers, we mainly examined a transformation of values and
mathematical models between the beginning and end of a class. We also pointed out that next
our research would be to confirm the influence such teaching has on students in the long term.
Therefore, in this study, we hope to work on this issue.
RESEARCH OBJECTIVE AND METHODOLOGY
Research Objective
The objective of this paper is to study the long-term transformation of students’ social values
and mathematical models, which occur through problem-solving.
1 A socially open-ended problem is a particular type of problem (Baba, 2010) which has been developed to
elicit students’ values by extending the traditional open-ended approach (Shimada, 1977).
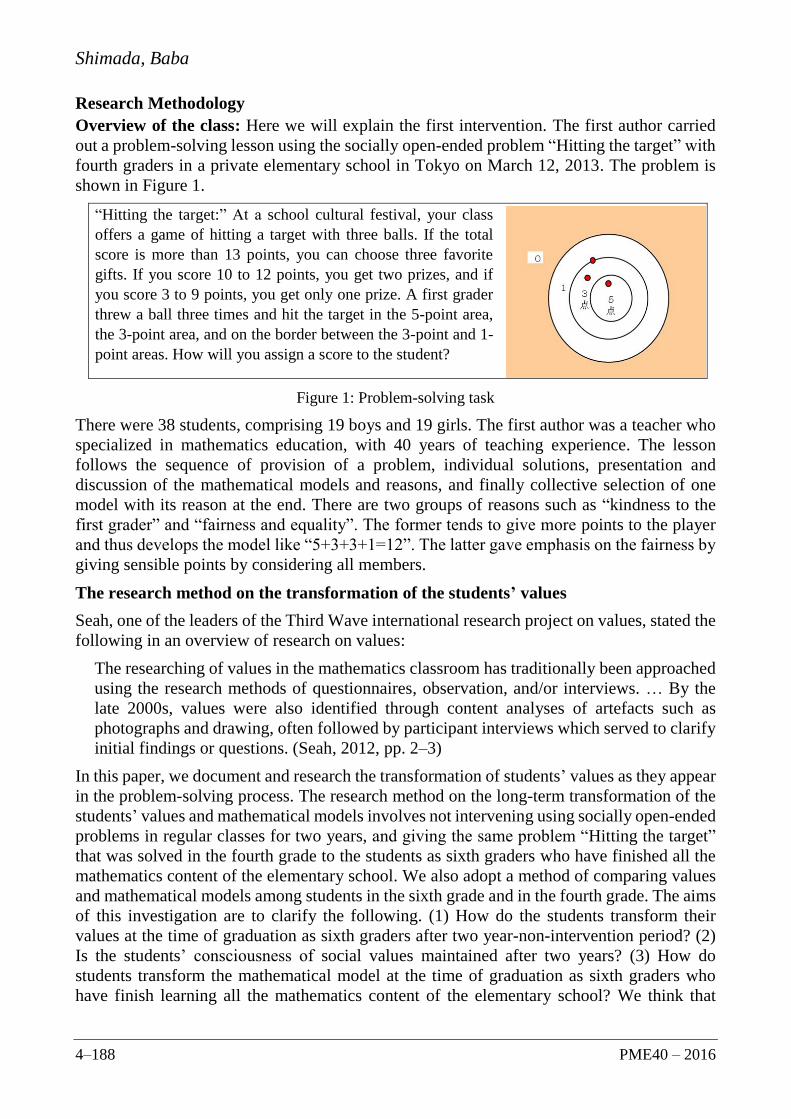
Shimada, Baba
4–188 PME40 – 2016
Research Methodology
Overview of the class: Here we will explain the first intervention. The first author carried
out a problem-solving lesson using the socially open-ended problem “Hitting the target” with
fourth graders in a private elementary school in Tokyo on March 12, 2013. The problem is
shown in Figure 1.
“Hitting the target:” At a school cultural festival, your class
offers a game of hitting a target with three balls. If the total
score is more than 13 points, you can choose three favorite
gifts. If you score 10 to 12 points, you get two prizes, and if
you score 3 to 9 points, you get only one prize. A first grader
threw a ball three times and hit the target in the 5-point area,
the 3-point area, and on the border between the 3-point and 1-
point areas. How will you assign a score to the student?
Figure 1: Problem-solving task
There were 38 students, comprising 19 boys and 19 girls. The first author was a teacher who
specialized in mathematics education, with 40 years of teaching experience. The lesson
follows the sequence of provision of a problem, individual solutions, presentation and
discussion of the mathematical models and reasons, and finally collective selection of one
model with its reason at the end. There are two groups of reasons such as “kindness to the
first grader” and “fairness and equality”. The former tends to give more points to the player
and thus develops the model like “5+3+3+1=12”. The latter gave emphasis on the fairness by
giving sensible points by considering all members.
The research method on the transformation of the students’ values
Seah, one of the leaders of the Third Wave international research project on values, stated the
following in an overview of research on values:
The researching of values in the mathematics classroom has traditionally been approached
using the research methods of questionnaires, observation, and/or interviews. … By the
late 2000s, values were also identified through content analyses of artefacts such as
photographs and drawing, often followed by participant interviews which served to clarify
initial findings or questions. (Seah, 2012, pp. 2–3)
In this paper, we document and research the transformation of students’ values as they appear
in the problem-solving process. The research method on the long-term transformation of the
students’ values and mathematical models involves not intervening using socially open-ended
problems in regular classes for two years, and giving the same problem “Hitting the target”
that was solved in the fourth grade to the students as sixth graders who have finished all the
mathematics content of the elementary school. We also adopt a method of comparing values
and mathematical models among students in the sixth grade and in the fourth grade. The aims
of this investigation are to clarify the following. (1) How do the students transform their
values at the time of graduation as sixth graders after two year-non-intervention period? (2)
Is the students’ consciousness of social values maintained after two years? (3) How do
students transform the mathematical model at the time of graduation as sixth graders who
have finish learning all the mathematics content of the elementary school? We think that

Shimada, Baba
PME40 – 2016 4–189
clarifying these three issues will lead to the creation of basic documents when we perform
active intervention for mathematics teaching in the future. Therefore, we clarify some
characteristics of the long-term transformation using the same method for analysis we
previously reported (Shimada & Baba 2015), in which we used quantitative analysis and
qualitative analysis.
ANALYSIS OF STUDENTS’ DATA
The comparative analysis of students’ values and mathematical models on a worksheet both
in the sixth grade and at the final selection time in the fourth grade reveals three characteristics
of students’ long-term transformation of values and mathematical models, which are noted
below.
Some students transform their values from the fourth grade to the sixth grade
The first characteristic regards the existence of both students who transform their values from
the fourth grade to sixth grade, and those who do not. Table 1 is a cross-tabulation table
showing the relationship between values in the fourth grade and in the sixth grade. All
numbers are percentages except those in parenthesis. The fractions in parenthesis show the
number of students who expressed the values in both the fourth grade and in the sixth grade
over the number of all students in the class. Table 1 below shows the values by types, both
for the fourth grade and the sixth grade. For example, the percentage of students who selected
the values “fairness and equality” in the fourth grade and selected the value “kindness to the
first grader” in the sixth grade is 21.1%. Overall, the percentage of students who selected
different values in both grades is 50.0% (21.1 + 28.9 = 50.0). We identified that half of the
students transformed their values after 2 years.
Values in the sixth grade
Values Fairness and
equality
Kindness to the first
grader Total
Values in the
fourth grade
Fairness and
equality 31.5 (12/38) 21.1 (8/38) 52.6 (20/38)
Kindness to the first
grader 28.9 (11/38) 18.4 (7/38) 47.4 (18/38)
Total 60.5 (23/38) 39.5 (15/38) 100.0 (38/38)
Table 1: The Values in the Fourth Grade and in the Sixth Grade (n = 38)
Furthermore, we understood the following from Table 1. In the fourth grade, the percentage
of fourth graders who select the values “fairness and equality” and “kindness to the first
grader” is about 50% each; in contrast, the ratio of the values “fairness and equality” to
“kindness to the first grader” in the sixth grade is approximately 3:2. From these data (Table
1), we hypothesized that some students might have transformed from the value of “kindness
to the first grader” to the values of “fairness and equality” as they became older. Why did half
of the students transform their values? We think that the transformation of students’ values
was affected by social and cultural experiences accompanying growth.
Some students transform from explicit values to the re-existence of implicit values in the
sixth grade
The second characteristic is that there are some students who transformed from explicit values
to the re-existence of implicit values in the sixth grade. Table 2 below shows the

Shimada, Baba
4–190 PME40 – 2016
transformation of the values “fairness and equality” in the fourth grade and in the sixth grade.
The 10 students noted in Table 2 are those who selected the same values “fairness and
equality” in both grades, and they were able to express their mathematical models and reasons
using words indicating the values “fairness and equality,” such as “fairness,” “fair,”
“equality,” “equally,” “equal,” “all people,” and “for the upper graders,” in the fourth grade.
However, 8 students, I.K., T.R., H.K., Y.S., K.H., T.H., T.A., and T.J., could not express their
reasons using the above value words in the sixth grade, and only 2 students, A.T. and M.H.,
could express their reasons using these words in the sixth grade. However, almost all of them
mentioned that the ball is on the boundary in their reasons. The consciousness of this
boundary condition may be polished by their daily and mathematical experience. Table 3
below shows the transformation of the values “kindness to the first grader” in both grades.
The 6 students noted in Table 3 were those who selected the same value “kindness to the first
grader” in both grades, and were able to express their reasons using words indicating the value
“kindness to the first grader,” such as “for the first grader” and “to the first grader,” in the
fourth grade. All these students could express their reasons using these value words in the
sixth grade. From the above results, in the transformation of the values “fairness and
equality,” we were able to understand that some students transformed their values from
explicit values to the re-existence of implicit values in the sixth grade. In other words, they
could express themselves regarding the values “fairness and equality” in the fourth grade, but
they could not express these values in the sixth grade. In contrast, the value “kindness to the
first grader” could be expressed in both grades. From these facts, we can learn that some
values may become implicit unless we have a continuous intervention using the expression
of values and mathematical models.
In the fourth grade In the sixth grade
Name Mathematical
models
Explanation Mathematical
models
Explanation
I.K. 5+3+1=9 I selected K’s opinion.
Because I thought that it is
good for everybody to be
equal.
5+3+2=10 I gave two points
because the ball is on the
boundary of 3 points and
1 point.
T.R. 5+3=8,
(1+3)÷2=2,
8+2=10
I selected my idea. Because
I felt my idea is like
sportsmanship and equality.
So, my idea was good.
(3+1)÷2+5+3=10 The ball is on the
boundary of 3 and 1. It
becomes 4 by adding 1
and 3, then it becomes 2
by dividing 4 by 2. It
becomes 10 when I add
8 and 2.
H.K. 5+3+1=9 I selected K’s opinion.
Because nobody complains
if I treat all people equally.
5+3+2=10 Because the ball was on
a line between 1 and 3, I
gave two points for the
middle.
Y.S. 5+3+1=9 I selected K’s opinion.
Because K’s opinion is
equal for all people.
5+3+1=9 Because the ball was
very close to one point.
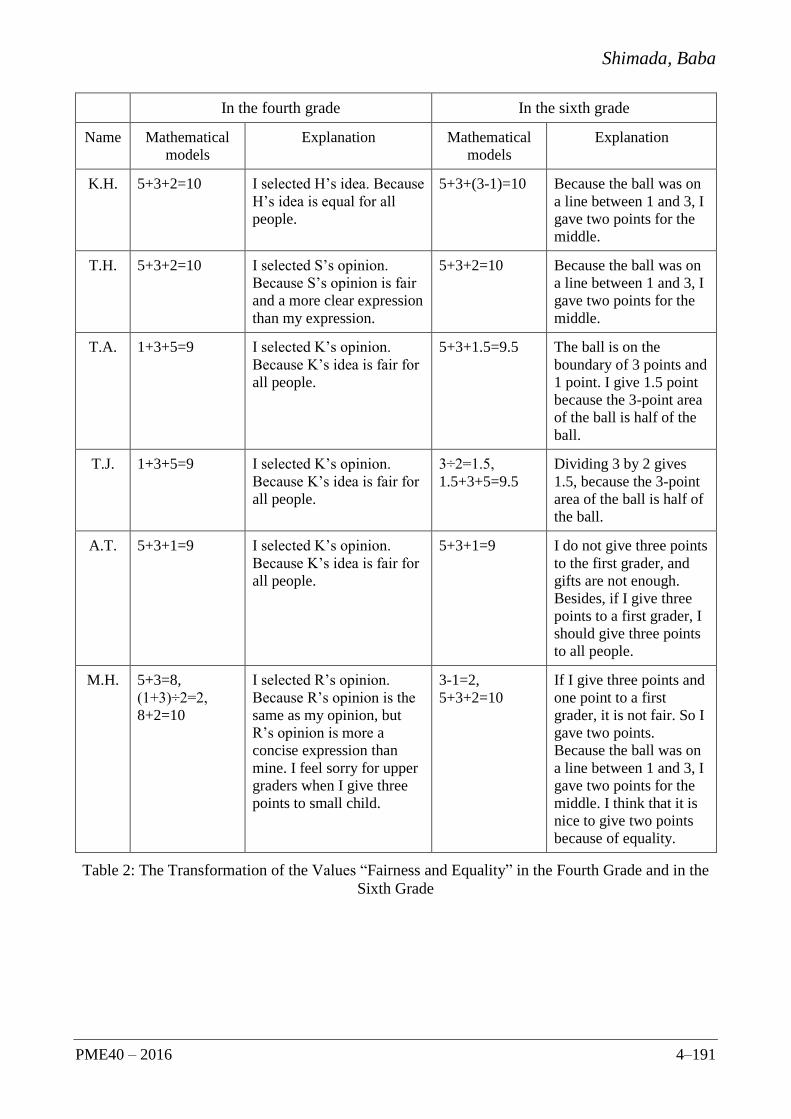
Shimada, Baba
PME40 – 2016 4–191
In the fourth grade In the sixth grade
Name Mathematical
models
Explanation Mathematical
models
Explanation
K.H. 5+3+2=10 I selected H’s idea. Because
H’s idea is equal for all
people.
5+3+(3-1)=10 Because the ball was on
a line between 1 and 3, I
gave two points for the
middle.
T.H. 5+3+2=10 I selected S’s opinion.
Because S’s opinion is fair
and a more clear expression
than my expression.
5+3+2=10 Because the ball was on
a line between 1 and 3, I
gave two points for the
middle.
T.A. 1+3+5=9 I selected K’s opinion.
Because K’s idea is fair for
all people.
5+3+1.5=9.5 The ball is on the
boundary of 3 points and
1 point. I give 1.5 point
because the 3-point area
of the ball is half of the
ball.
T.J. 1+3+5=9 I selected K’s opinion.
Because K’s idea is fair for
all people.
3÷2=1.5,
1.5+3+5=9.5
Dividing 3 by 2 gives
1.5, because the 3-point
area of the ball is half of
the ball.
A.T. 5+3+1=9 I selected K’s opinion.
Because K’s idea is fair for
all people.
5+3+1=9 I do not give three points
to the first grader, and
gifts are not enough.
Besides, if I give three
points to a first grader, I
should give three points
to all people.
M.H. 5+3=8,
(1+3)÷2=2,
8+2=10
I selected R’s opinion.
Because R’s opinion is the
same as my opinion, but
R’s opinion is more a
concise expression than
mine. I feel sorry for upper
graders when I give three
points to small child.
3-1=2,
5+3+2=10
If I give three points and
one point to a first
grader, it is not fair. So I
gave two points.
Because the ball was on
a line between 1 and 3, I
gave two points for the
middle. I think that it is
nice to give two points
because of equality.
Table 2: The Transformation of the Values “Fairness and Equality” in the Fourth Grade and in the
Sixth Grade

Shimada, Baba
4–192 PME40 – 2016
In the fourth grade In the sixth grade
Name Mathematical
models Explanation
Mathematical
models Explanation
K.R. 5+3=8,
1+3=4,
5+3=8,
1+3=4,
8+4=12
12+1=13
I selected K’s idea.
Because K’s idea is good
for the first grader. I more
strongly affected by the
value of "kindness to the
first grader."
5+3+3=11 I give three points to the
first grader, but the ball is
close to the one-point area.
The first grader is happy.
S.J. 5+3+3+1=12 I selected Ko’s idea. My
idea is a small service for
the first grader. But Ko’s
idea is just good for the
first grader.
5+3+3=11 I gave three points to the
first grader. It is good for
us to give a bonus to the
first grader.
T.K. 3+3+5=11 I selected my idea. Doing
something for the first
grader is kind and
agreeable. The first grader
will be happy and come
here again.
5+3+3=11 I gave three points to the
first grader, because a first
grader threw a ball.
I.A. 5+3=8,
1+3=4,
8+4=12,
12+1=13
I selected K’s idea. K’s
idea is good for the first
grader.
5+3+3=11 I gave three points to the
first grader. It is good for
us to be kind to the first
grader.
O.N. 5+3+3=11 I selected S’s idea. Because
I think it is good for us to
give a bonus to the first
grader.
3+3+5=11 I gave three points to the
first grader. The first
grader feels happy.
T.A. 5+3=8,
1+3=4,
8+4=12,
12+1=13
I selected K’s idea.
Because it is good for us to
give a bonus to the first
grader.
3+3+5=11 I give three points to the
first grader, but the ball is
close to the one-point area.
The first grader is happy.
Table 3: The Transformation of the Value “Kindness to the first grader” in the Fourth Grade and in
the Sixth Grade
Many students change mathematical models in the sixth grade
The third characteristic is that there are many students who changed mathematical models in
the sixth grade. Table 4 is a cross-tabulation table for viewing the relationship between
mathematical models in the fourth grade and in the sixth grade. All numbers are percentages
except those in parenthesis. The fractions in parenthesis show, for example, in the case of
3/38, the number of students who expressed the same mathematical models in both grades
with respect to the values “fairness and equality” over the number of all students and 9/38,
the number of students, who expressed different mathematical models to the same values.
Thus, the percentage of students who selected the values “fairness and equality” in the fourth
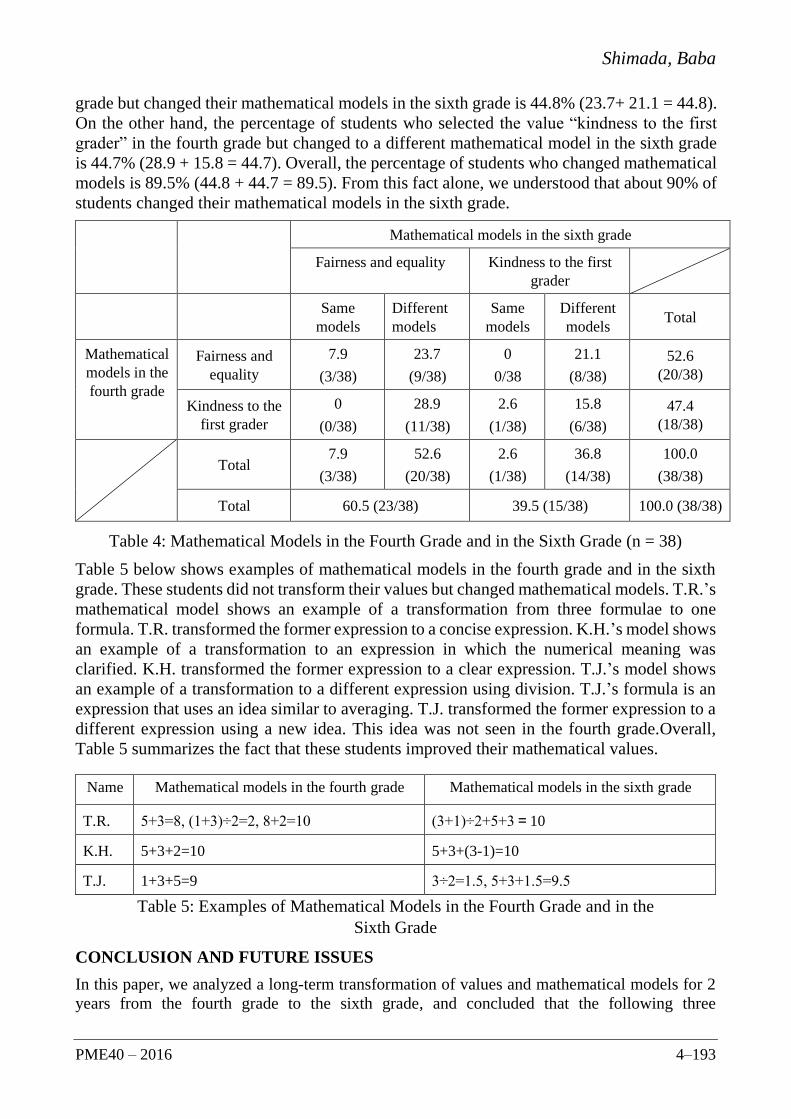
Shimada, Baba
PME40 – 2016 4–193
grade but changed their mathematical models in the sixth grade is 44.8% (23.7+ 21.1 = 44.8).
On the other hand, the percentage of students who selected the value “kindness to the first
grader” in the fourth grade but changed to a different mathematical model in the sixth grade
is 44.7% (28.9 + 15.8 = 44.7). Overall, the percentage of students who changed mathematical
models is 89.5% (44.8 + 44.7 = 89.5). From this fact alone, we understood that about 90% of
students changed their mathematical models in the sixth grade.
Mathematical models in the sixth grade
Fairness and equality Kindness to the first
grader
Same
models
Different
models
Same
models
Different
models Total
Mathematical
models in the
fourth grade
Fairness and
equality
7.9
(3/38)
23.7
(9/38)
0
0/38
21.1
(8/38)
52.6
(20/38)
Kindness to the
first grader
0
(0/38)
28.9
(11/38)
2.6
(1/38)
15.8
(6/38)
47.4
(18/38)
Total
7.9
(3/38)
52.6
(20/38)
2.6
(1/38)
36.8
(14/38)
100.0
(38/38)
Total 60.5 (23/38) 39.5 (15/38) 100.0 (38/38)
Table 4: Mathematical Models in the Fourth Grade and in the Sixth Grade (n = 38)
Table 5 below shows examples of mathematical models in the fourth grade and in the sixth
grade. These students did not transform their values but changed mathematical models. T.R.’s
mathematical model shows an example of a transformation from three formulae to one
formula. T.R. transformed the former expression to a concise expression. K.H.’s model shows
an example of a transformation to an expression in which the numerical meaning was
clarified. K.H. transformed the former expression to a clear expression. T.J.’s model shows
an example of a transformation to a different expression using division. T.J.’s formula is an
expression that uses an idea similar to averaging. T.J. transformed the former expression to a
different expression using a new idea. This idea was not seen in the fourth grade.Overall,
Table 5 summarizes the fact that these students improved their mathematical values.
Name Mathematical models in the fourth grade Mathematical models in the sixth grade
T.R. 5+3=8, (1+3)÷2=2, 8+2=10 (3+1)÷2+5+3=10
K.H. 5+3+2=10 5+3+(3-1)=10
T.J. 1+3+5=9 3÷2=1.5, 5+3+1.5=9.5
Table 5: Examples of Mathematical Models in the Fourth Grade and in the
Sixth Grade
CONCLUSION AND FUTURE ISSUES
In this paper, we analyzed a long-term transformation of values and mathematical models for 2
years from the fourth grade to the sixth grade, and concluded that the following three
Shimada, Baba
4–194 PME40 – 2016
characteristics apply: half of the students transformed their values in the sixth grade; some
students transformed from explicit values to the re-existence of implicit values in the sixth
grade; and 90% of students changed their mathematical models in the sixth grade. Looking at
the second one more closely, we realize that kindness to the first grader has been sustained
well. So becoming implicit does not apply equally to all kinds of values. Besides,
consciousness of the critical condition in the value “fairness and equality” is also developed,
and the reason behind it may be both experience-based and mathematical learning-based.
From these results, we hope to suggest the following for performing active intervention in
mathematics teaching. (1) Because the students’ consciousness of at least the value “fairness
and equality” does not continue, it is necessary to repeat the class using the socially open-
ended problems. Generally in the social setting, the judgment can be done by based on not
only mathematical models but also the reasons behind the models. (2) An idea that resembled
averaging, which is to be learned by fifth graders and sixth graders in Japan, was newly seen
when the students became sixth graders, so we understood that various mathematical models
were expressed as they learned many kinds of mathematical content. The same values can be
represented by more mathematically sophisticated models. (3) As its example, concise
expressions and expressions of numerical meanings were seen in the mathematical models of
the sixth graders. These are forms representing mathematical values. In this sense, both social
and mathematical values are relating to each other. From these three points, we conjectured
that this long-term transformation of students’ mathematical models and values was affected
by both mathematical learning and social and cultural experiences in daily life. So in order to
grasp this transformation, we will follow the process of transformation of students’
mathematical models and values, when the students learn continuously socially open-ended
problems for two years, as distinct from the present study. Furthermore, in this process, we
are to analyze how implicit values change and what kind of experiences make an impact on
this process.
References
Baba, T. (2010). Socially Open-Ended Approach and Critical Mathematics Education. Paper
presented at EARCOME 5, Tokyo.
Becker, J. P. & Shimada, S. (Eds.) (1997). The Open-Ended Approach in Mathematics Education:
A New Proposal for Teaching Mathematics. Reston: National Council of Teachers of
Mathematics. [Translation of Shimada, Ed. (1977).]
Bishop, A. (1991). Mathematical Enculturation: A Cultural Perspective on Mathematics
Education. Dordrecht: Kluwer Academic Publishers.
Iida, I., et al. (1995). Study on Perceptions of Values with Open-Ended Problems in Mathematics
Learning. Journal of Mathematical Education in Kyushu No. 1, pp. 32–43.
Seah, W.T. (2012). Identifying Values in Mathematics Learning and Teaching. Document in the
study group of values in Hiroshima University.
Shimada, S. (Ed.) (1977). Open-Ended Approach in Mathematics Education: A Proposal for
Lesson Improvement. Tokyo: Mizuumi Press. [In Japanese.]
Shimada, I. & Baba, T. (2012). Emergence of Students’ Values in the Process of Solving Socially
Open-Ended Problems. Proceedings of the 36th Conference of the International Group for the
Psychology of Mathematics Education. Vol. 4., pp. 75–82.
Shimada, I. & Baba, T. (2015). Transformation of Students’ Values in the Process of Solving
Socially Open-Ended Problems. Proceedings of the 39th Conference of the International
Group for the Psychology of Mathematics Education, Vol. 4., pp. 161–168.

2016. In Csíkos, C., Rausch, A., & Szitányi, J. (Eds.). Proceedings of the 40th Conference of the International
Group for the Psychology of Mathematics Education, Vol. 4, pp. 195–202. Szeged, Hungary: PME. 4–195
PROSPECTIVE MATHEMATICS TEACHERS’ PROOF
COMPREHENSION OF MATHEMATICAL INDUCTION: LEVELS
AND DIFFICULTIES
Yusuke Shinnoa and Taro Fujitab
aOsaka Kyoiku University; bUniversity of Exeter
The purpose of this paper is to characterize the levels of proof reading comprehension
specific to proof by mathematical induction in order to provide a broader framework
for analysing various difficulties. Especially, we focus on the prospective mathematics
teachers’ difficulties in understanding of the necessity of the base step and the logical
validity of the inductive step. In this study, we pay particular attention to the local level
of comprehension rather than the holistic level. Data are collected through the
subjects’ writing responses to a set of scripted statements and proofs. The results
suggest that the essential difficulties of MI are characterized in terms of the gaps
between the levels of proof comprehension. Based on the findings, the necessity of
“encapsulation” is also discussed.
DIFFICULTIES OF MATHEMATICAL INDUCATION
In general, a proposition “∀n∈N, P(n)” can be proven by two steps in MI: the base step,
which establishes the base case such as P(1), and inductive step, which proves the
implication P(k)→P(k+1) for an arbitrary k∈N. Since both the base and inductive steps
have been performed, by appealing to the Principle of Mathematical Induction
(Peano’s fifth axiom for the foundation of natural numbers), the original proposition
P(n) holds for all natural numbers. From the logical point of view, by appealing to
logical inferences such as conjunctive inference (p, q →p∧q) and modus ponens ([p,
p→q]→q), the structure of proof by MI can be represented as follows (see also, Ernest,
1984; Movshovitz-Hadar, 1993; Shinno & Fujita, 2015):
Figure 1: Logical inference form of MI
In many countries, mathematical induction (MI) has been introduced at upper
secondary school level, although in some countries it may be intended to be taught at
college or university level. A number of previous studies on MI in the field of
mathematics education have investigated various difficulties or weak understanding
targeting high school students, university students, or prospective teachers. For
P(1) "k[P(k)® P(k+1)]
P(1) Ù"k[P(k)® P(k+1)] [P(1) Ù"k[P(k)® P(k+1)]]®"nP(n)
"nP(n)
PrincipleofMathematicalInduction
Basestep Inductivestep
(∵ conjunction)
(∵ modus ponens)

Shinno, Fujita
4–196 PME40 – 2016
example, Stylianides et al. (2007) have reported a weak understanding of the base step
as well as a misunderstanding of the implication statement P(k)→P(k+1) in the
inductive step (see also, Ernest, 1984; Dubinsky & Lewin, 1986). Recently, Palla et al.
(2012) mentions that there is a gap between the operational and structural level in
understanding MI, as follows:
Operational level is the initial approach to MI, which is also emphasized in most school
textbooks. At this level, the structure of the natural numbers is implicit and appears in an
intuitive form. The “structural level” is mainly encountered in advanced mathematical
studies and refers explicitly to Peano’s fifth axiom of the structure of natural number. (Palla
et al., 2012, p. 1025)
When writing or reading proof by MI, one may often pay attention to the operational
aspects of MI but rarely recognize the substance of the structural and logical aspects
because of its implicit nature. Shinno and Fujita (2015) have provided a more explicit
distinction between these aspects in terms of Mathematical Theorem (Mariotti et al.,
1997) that is constituted by a system of relations between a statement, its proof, and
the theory within which the proof makes sense. Since different difficulties in MI have
been reported in different studies, a broader framework may be necessary to synthesise
different studies and propose a way to characterize different kinds or levels of
difficulties of MI. In this paper we will consider the levels of proof comprehension
(Yang & Lin, 2008; Mejia-Ramos et al., 2012) as a theoretical framework for
characterising different difficulties of MI. When taking proof comprehension into
account, there are few links between previous studies on proof comprehension and on
MI. Thus, a research question appears as follows: How can we apply the theoretical
model of proof reading comprehension to proof by mathematical induction?
THEORETICAL FRAMEWORK
Let us briefly explain the basic tenets of the frameworks. Yang and Lin (2008)
proposed a model for proof comprehension, which is called “reading comprehension
of geometrical proof (RCGP)”. A model for RCGP consists of four hierarchical levels:
surface, recognizing the elements, chaining the elements, and encapsulation. The first
level involves epistemic understanding of the meaning of mathematical terms, symbols
or figures. At the second level, the comprehension involves recognizing the premises,
conclusions or properties that may be implicit in the proof. The third level focuses on
logical connections between the premises, conclusions and properties that are
recognized at the second level respectively. Finally, at the fourth level, the proof may
be viewed as a whole, where one reflects on how to apply the proof to other contexts.
Recently, Mejia-Ramos et al. (2012) reconstructed the model for RCGP, by taking the
proofs in advanced mathematics into account. In this work, they distinguished the local
and holistic proof comprehension in order to consider or assess the more complex
proofs that undergraduate students would encounter. The local comprehension consists
of three levels, which corresponds to the first three levels of the RCGP model, although
Mejia-Ramos et al. (2012) termed 1) meaning of terms and statements, 2) logical status

Shinno, Fujita
PME40 – 2016 4–197
of statements and proof framework, and 3) justification of claims. Additionally, they
introduced the notions of holistic comprehension of the proof, which “must be
ascertained by inferring the ideas or methods that motivate a major part of the proof,
or the proof in its entirety” (p. 6). Mejia-Ramos et al. (2012) elaborated the notion of
encapsulation by Yang and Lin (2008) in terms of four different levels: 4) summarizing
via high-level ideas, 5) identifying modular structure, 6) transferring the general idea
or methods to another context, and 7) illustrating with examples. By using these seven
levels, they described ways to assess students’ comprehension of the theorem related
to number theory. It implies that these local and holistic levels of proof comprehension
can apply to proofs in different mathematical domains other than geometrical proof. In
the present study, we attempt to apply mostly the local levels of comprehension made
by Mejia-Ramos et al.’s (2012) model, with special attention to the notion of
encapsulation by Yang and Lin’s (2008) model, to proof by MI, in order to consider
what is specific to the comprehension of MI and its difficulties.
METHOD
Data are collected by a set of questions based on Stylianides et al.’s (2007) item with
additional input from the idea of “proof script” (Zazkis & Zazkis, 2015), which
involves a scripted proof and a scripted dialogue. We use this method as a tool for
engaging prospective teachers in considering particular students’ difficulties as well as
for identifying the prospective teachers’ comprehension of the proof.
The figure 2 shows a scripted proof (and a given statement) used in the present study.
In this script, the proposed proof is invalid, but there are three points that have to be
examined. Firstly, the given statement does not hold for any natural numbers.
Secondly, the base step is missing in the given proof. Thirdly, the inductive step is still
correctly applied. We, like Sylianides et al. (2007), aimed to see whether the
prospective teachers who could realize the absence of the base step would be able to
explain why the base step is necessary. We also intended to investigate the prospective
teachers’ understanding of the logical validity of the inductive step by reading the
proof.
Statement: For every n ∈ N the following is true: 1+3+5+…+(2n-1)=n2 +3 (*)
Proof: I assume that (*) is true for n=k: 1+3+5+…+(2k-1)=k2+3
I check whether (*) is true for n=k+1:
1+3+5+…+(2k-1)+(2k+1)=(k2+3)+(2k+1)=( k2+2k +1)+3=(k+1)2+3
True.
Therefore (*) is true for every n ∈ N.
Figure 2: A scripted proof (Stylianides et al., 2007, p. 151)
In order to utilize this item, unlike Stylianides et al. (2007), we introduced the questions
with the following dialogue (Figure 3). The first dialogue by Alan and Barbara is
concerned with the reason way the base step is essential. The second dialogue by
Christine and David is related to the logical validity of the inductive step, although
David’s suspicion might suggest additional misunderstanding about circular reasoning

Shinno, Fujita
4–198 PME40 – 2016
(Ernest, 1984). Participants were asked to first read the scripted proof above and then
write their thought or rationale regarding four each scripted dialogue.
Alan and Barbara, high school students, are having a conversation about the above
proof. Read through and answer the following questions.
Alan says: This proof is not valid. Because its first step is missing.
Barbara says, followed by Alan: Why is it necessary to check for n=1?
Christine and David, high school students, are having a conversation about the above
proof. Read through and answer the following questions.
Christine says: This proof shows the inductive step, that is, “if it is true for
n=k, then it is true for n=k+1”. So, the proof of inductive step is valid.
David says, followed by Christine: Mathematical induction is the method in
which you assume what you have to prove, and then prove it. So, I have a
suspicious likeness to assuming what you have to prove!
Figure 3: A scripted dialogue
In what follows we present findings from our selected cases of 38 prospective
secondary school mathematics teachers both in England (N=19) and Japan (N=19).
They were asked to write their thoughts by reading the above scripted proofs and
dialogues. The 19 participants from England were trainees on a Post Graduate
Certificate of Education in secondary mathematics course. Most of them have majored
in mathematics at undergraduate level, although a few majored in physics or
engineering. The 19 participants in Japan were third year undergraduate students of
mathematics in the faculty of education.
The results will be considered for exemplifying the first three levels of proof
comprehension, that is, the local comprehension of MI. Based on these findings, the
necessity of encapsulation will be also discussed in the final place of the paper.
RESULTS AND DISCUSSION
The first level: Meaning of terms and statements
At the first level of reading comprehension, although it may be not specific to proof by
MI, it is important to understand the meaning of mathematical terms included in a given
statement. In the case of the scripted proof, it may involve understanding the meaning
of the symbol “n∈N” or the given equation, and understanding the fact that the
equation does not hold for any natural numbers. Most of participants (89.5%; 34/38)
agreed with Alan’s remark by stating, for example, “this proof is not valid. Because its
first step is missing”, or “Because the presented statement is not true”. On the other
hand, the following responses exemplify weak understanding of the base step. (Note:
“J5” represents “participant #5 in Japan, and A (B) represents the response to Alan’s
(Barbara’s) remark”) (underline is added):
J5-A: True. Since we show that it holds for all natural number, we need to show that it holds for 1, the minimum value in natural numbers.
J5-B: When it says “for n=k”, it doesn’t say that k is an arbitrary natural number. But if k is a natural number, I don’t think that it needs to prove the case for n=1.

Shinno, Fujita
PME40 – 2016 4–199
J5-A might be seen as an acceptable explanation, but the same participant went on to
remark, in J5-B, that the base step is not necessary.
J6-A: When prove for n=1, we see that the statement is not true.
Some participants who were considered as demonstrating the first level of
comprehension had difficulties in explaining the validity of the presented proof without
the base step. For example, E8 wrote as follows (Note: “E8” represents “participant #8
in England):
E8-B: It is necessary to check for n=1 since without this, the statement may only hold for some n, beginning it a number higher than 1.
E8 also recognized that in the presented proof the inductive step is valid as follows:
E8-C (response to Christine’s remark): The proof shows that if true for n=k, true for n=k+1 and hence this shows it is true for each consecutive number onward. (But n=1 would still have needed proof)
This finding is consistent with the fact, found by Stylianides et al. (2007), that some
prospective teachers claimed that the statement is true “in some cases”. In the presented
statement and proof, even if the proof of the implication statement “P(k)→P(k+1)” is
valid, the original statement does not hold for any natural numbers. Although it is
unclear if s/he actually checked the statement for n=1, it suggests the participant’s
focus was on the surface or appearance of the presented proof.
The second level: Logical status of statements and proof framework
At the second level of reading comprehension, “understanding the status of the
different assertions in the proof is necessary to understanding the logic of the proof”
(Mejia-Ramos et al., 2012, p. 9). In the case of MI, it is reasonable to say that a reader
needs not only to identify the statement to be proven and the proof of the base and
inductive step, but also to recognize “previous statements and mathematical principle”
used in the two proof steps. When the statement is about the domain of all natural
numbers, an initial number should be n=1. So, for example, E15-B can be considered
as demonstrating the second level of comprehension, in which the essence of the base
step P(1) can be explained as follows:
E15-B: Because n=1 is the first natural number, so to prove for all n∈N, you need to
prove the first step and then use induction to prove for all.
Moreover, concerning the inductive step, in this level, a reader needs to identify a
procedure used in the proof of the inductive step. For example, when showing
“1+3+5+7+…+(2k-1)+(2k+1)=(k2+2k+1)+3=(k+1)2+3”, a multiplication formula
“a2+2ab+b2=(a+b)2” is correctly applied. However, J11-C who viewed Christine’s
remark as false could read incorrectly the computational aspect of the presented proof
the inductive step as follows:
J11-C: Incorrect. For n=k+1, the right side k2+3 should be (k+1)2+3 by substituting k+1
for k.

Shinno, Fujita
4–200 PME40 – 2016
Most participants (92.1%; 35/38) agreed with Christine’s remark such that the proof of
inductive step is valid, but they had difficulty in explaining the truth of the implication
statement. Such participants can be considered to be at the second level, i.e. their
reading comprehension is heavily influenced by the existence of the two steps. In other
words, since the proof by MI always requires a rigid 2-step format, when the reader
sees two steps are stated, they may think this is adequate and not challenge the content
of those steps, so the proof of the implication statement may be hidden or out of focus
for a reader at this level.
The third level: Justification of claims
At the third level of reading comprehension, “the reader needs to infer what previous
statements and mathematical principle are used to deduce a new assertion with a proof”
(Mejia-Ramos et al., 2012, p. 9). This level, termed chaining elements in the RCGP
model (Yang & Lin, 2008), deals with relating premises, properties and conclusions in
the proof in order to establish logically chaining arguments. In the case of MI, chaining
elements in this level are considered as the logical necessity of the base step, and the
logical validity of the proof of the implication P(k)→P(k+1). Since the base step is
associated to the inductive step, the logical necessity of the base step can be explicit as
a logical form: i.e., (P(1)∧[P(k)→P(k+1)]) or informally, “P(1), and P(k) implies
P(k+1)”. Superficially most participants (92.1%; 35/38) agreed with Christine’s
remark. But this alone does not suggest that they have solid knowledge of the inductive
step. For example, eight participants (21.1%), like J8-D, claimed intuitively an
incorrect implication rule such that “If P(1) and P(k), and if P(k) implies P(k+1), then
for P(n)” in responding Christine and David’s dialogue.
J8-D (response to David’s remark): So, we need to prove the first number like n=1, and
show the equation holds. If it is not true for the first number, we should not assume
the truth [for n=k] in the inductive step. If it is true for the first number, we can
assume it because at least it holds for n=k=1. By this, if it holds for n=k=1, then it
holds for the next natural number.
Only one participant gave a good answer and responded explicitly with the logical
validity of the proof of the implication statement:
J10-D (response to David’s remark): Even if it is true for one number, it doesn’t mean
that it is true for the next number. The truth of “A” or “B” is different from the truth
of “A→B”.
As far as Christine and David’s dialogue are concerned, like some previous studies
(Dubinsky & Lewin, 1986; Stylianides et al., 2007), we also found that some
participants (15.8%; 6/38) tend to think that the inductive step proves P(k+1) rather
than the implication P(k)→P(k+1) (e.g., E12-C), as well as the inductive step proves
“P(k) and P(k+1)” rather than “P(k) implies P(k+1)” (e.g., J1-C; J15-C).
E12-C: No: you have to check if it is true for n=k+1, otherwise you haven't proved it.
J1-C: We have to assume that antecedent is true, if not, the statement will always be false.

Shinno, Fujita
PME40 – 2016 4–201
J15-C: [The presented proof is] True. It applies the equation that holds for the assumption
n=k, then it deduces n=k+1.
At the third level, moreover, when concluding that a given statement holds for all
natural numbers, the Principle of Mathematical Induction (PMI) is implicitly applied.
Therefore, at the third level, it is also important to make the implicit status of PMI
explicit. In our study, however, none of the participants clearly referred to PMI.
Necessity of encapsulation: A discussion
The above findings suggest that it is necessary to explore the status of PMI as well as
the necessity of encapsulation for the holistic comprehension further. In the study, a
considerable number of participants (18.4%; 7/38) stayed at local levels of
comprehensions, relying on the procedural or sequential chaining of modus ponens in
responding Christine and David’s dialogue as follows:
E11-D: You assume it is true for k. Then prove that if it is true for k, then it is true for
k+1. We check it is true for n=1, if it is, then it is also true for 2, so it is also true for
3, etc. ∴true for all n∈N
J19-D: Mathematical induction requires that at first we show that it holds for n=1, then
we assume that it holds for n=k, then we show that it holds for n=k+1. Since we
have already shown that it holds for n=1, it holds for n=2, and if it holds for n=2,
then it holds for n=3, likewise, this proof method proceeds successively by using
the truth of the predecessor.
It seems that their comprehension of MI has not yet encapsulated as a fully-fledged
structural object. Figures 4 and 5 represent two different forms of modus ponens that
are carried out in MI (cf., Dubinsky & Lewin, 1986; Movshovitz-Hadar, 1993); Figure
4 suggests a local or sequential view, and Figure 5 suggests a holistic or static view.
Figure 4: Local form of modus pones Figure 5: Holistic form of modus ponens
We think that Figure 4 can represent a specific character of the local comprehension of
MI. As far as the proof by MI concerned, we use the term encapsulation to refer to the

Shinno, Fujita
4–202 PME40 – 2016
progression or transition into holistic comprehension. The holistic level of
comprehension of MI relies on viewing the proof method by MI as a whole, like Figure
5, where the status of PMI can be conceptualized as a more explicit object. We think
that the transition from local to the holistic comprehension of MI requires
encapsulation of an infinite chain of modus ponens as a whole, because “in studying
the specific logical details of the proof, one can lose track of the big picture” (Mejia-
Ramos et al., 2012, p. 11). In this study, we briefly mentioned the necessity of the
encapsulation of MI, as a next step, it should be worthwhile examining in detail the
status and process of the encapsulation to proceed to the holistic comprehension level
regarding this proof method.
References
Ernest, P. (1984). Mathematical induction: a pedagogical discussion. Educational Studies in
Mathematics, 15, 173-189.
Dubinsky, E. & Lewin, P. (1986). Reflective abduction and mathematics education: the
generic decomposition of induction and compactness. Journal of Mathematical Behavior,
5, 55-92.
Mejia-Ramos, J. P., Fuller, E., Weber K., Rhoads, K., & Samkoff, A. (2012). An assessment
model for proof comprehension. Educational Studies in Mathematics, 79, 3-18.
Movshovitz-Hadar, N. (1993). The false coin problem, mathematical induction, and
knowledge fragility. Journal of Mathematical Behavior, 12, 253-268.
Mariotti, M. A., Bartolini, M, Boero, P., Ferri, F. & Garuti, R. (1997) Approaching geometry
theorems in contexts: from history and epistemology to cognition. In E. Pehkonen (Ed.),
Proceedings of the 21st Conference of the International Group for the Psychology of
Mathematics Education, (Vol. 1, pp.180-195). Lahti, Finland.
Palla, M., Potari, D., & Spyrou P. (2012). Secondary school students’ understanding of
mathematical induction: structural characteristics and the process of proof construction.
International Journal of Science and Mathematics Education, 10, 1023-1045.
Shinno, Y. & Fujita, T. (2015). An analysis of the essential difficulties with mathematical
induction: in the case of prospective teachers. In Adams, G. (Ed.), Proceedings of the
British Society for Research into Learning Mathematics, 35(3).
Stylianides, G. J., Stylianides, A. J., & Philippou, G. N. (2007). Preservice teachers’
knowledge of proof by mathematical induction. Journal of Mathematics Teacher
Education, 10, 145-166.
Yang, K-L. & Lin, F-L. (2008). A model of reading comprehension of geometry proof.
Educational Studies in Mathematics, 67, 59-76.
Zazkis, D & Zazkis, R. (2015). Prospective teachers’ conceptions of proof comprehension:
revisiting a proof of the Pythagorean theorem. International Journal of Science and
Mathematics Education. Advance online publication.

2016. In Csíkos, C., Rausch, A., & Szitányi, J. (Eds.). Proceedings of the 40th Conference of the International
Group for the Psychology of Mathematics Education, Vol. 4, pp. 203–210. Szeged, Hungary: PME. 4–203
PATHS OF JUSTIFICATION IN ISRAELI 7TH GRADE
MATHEMATICS TEXTBOOKS
Boaz Silverman and Ruhama Even
Weizmann Institute of Science
This study examines the paths of justification offered in 7th grade Israeli textbooks.
Analysis included the paths formed by instances of justification for 10 mathematical
statements, in eight 7th grade Israeli textbooks. The findings suggest that the lengths of
the paths of justification varied, for different statements in the same textbook, and for
the same statement across textbooks. Many paths included both empirical and
deductive types of justification. Three types of justification were prevalent –
Experimental demonstration (in most paths), Deduction using a specific case (in paths
of algebra statements) and Deduction using a general case (in paths of geometry
statements). Experimental demonstration commonly preceded deductive type(s), and
Deduction using a specific case usually preceded Deduction using a general case.
INTRODUCTION
Justifying is an important component of doing and learning mathematics. However, the
extensive research on students’ conceptions of proof and ways of justifying
mathematical claims reveals students' difficulties in understanding the need for
justification and in distinguishing between deductive and other types of justification
(e.g., Harel & Sowder, 2007). Research suggests that the textbooks used in class
considerably influence students’ opportunities to learn mathematics in general
(Haggarty & Pepin, 2002), and to justify in particular (Ayalon & Even, in press).
Accordingly, the study of the opportunities to learn to justify offered in mathematics
textbooks is increasing in recent years. This research focuses on (1) the justifications
for mathematical statements presented in textbooks (e.g., Dolev, 2011; Stacey &
Vincent, 2009), and (2) the opportunities for students to justify and explain their own
mathematical work (e.g., Dolev & Even, 2013; Stylianides, 2009). This paper belongs
to the first mentioned line of research. It examines the justifications to mathematical
statements that are offered in Israeli 7th grade mathematics textbooks. The study is part
of a larger research program that examines the opportunities to learn to justify
mathematical statements offered in mathematics textbooks.
THEORETICAL BACKGROUND
Research shows that the justifications to mathematical statements presented in
textbooks are of different kinds (e.g., Stacey & Vincent, 2009; Stylianides, 2009).
Grounded in an analysis of Australian 8th grade textbook explanations, Stacey and
Vincent (2009) identified seven types of textbook justifications. These types of
justification are a refinement of Harel and Sowder's (2007) categories of proof schemes
used by students: external, empirical, and deductive, documented in numerous studies
of justification in school mathematics. Table 1 presents Stacey and Vincent’s seven
Silverman, Even
4–204 PME40 – 2016
types of textbook justifications of mathematical statements, grouped into Harel and
Sowder's three categories.
Table 1. Types of justification (adapted from Stacey and Vincent, (2009)).
Type of justification Description
External
Appeal to authority Reliance on external sources of authority.
Qualitative analogy A surface similarity to non-mathematical
situations.
Empirical
Experimental demonstration A pattern formed after checking specific
examples.
Concordance of a rule with a model Matching specific results of a rule and a model.
Deductive
Deduction using a model A model illustrating a mathematical structure.
Deduction using a specific case An inference process by using a special case.
Deduction using a general case An inference process by using a general case.
Using this framework, Stacey and Vincent (2009) analysed the justifications offered
for seven mathematical statements in nine 8th grade Australian textbooks. They found
that the textbooks employed several types of justification when justifying mathematical
statements, and in some cases, textbooks justified a statement using more than one type
of justification or one type more than once. Dolev (2011) used this framework to
analyse the justifications offered for three mathematical statements in six 7th grade
Israeli textbooks (experimental version), and obtained similar results.
This use of several justifications for one mathematical statement could serve a didactic
goal of reinforcing and extending students’ understanding – as the use of several
justifications for one statement is likely to have an additive effect (Sierpinska, 1994).
The finding that textbooks present more than one justification for one statement
indicates that in addition to examining the types of justification used to justify
mathematical statements, it is important to attend also to the “paths of justification”,
i.e., to the ways justifications of one statement are arranged and structured – an aspect
that receives little attention in the literature. This is the focus of our study. It examines
the types and the paths of justification to key mathematical statements in Israeli 7th
grade textbooks.
METHODOLOGY
Analysis included all eight approved Israeli 7th grade textbooks (and teacher guides)
for Hebrew speakers. Six textbooks (labelled A-F) are of regular/extended scope, and
two (labelled G-H) are of limited scope, written for students with low achievements.
Ten key mathematical statements were selected for analysis from the Israeli 7th grade
mathematics national curriculum, five in algebra and five in geometry:
• The distributive property: a(b + c) = ab + ac for any three numbers a, b, c.

Silverman, Even
PME40 – 2016 4–205
• Division by zero is undefined.
• Manipulating algebraic expressions using properties of real numbers transforms
expressions into equivalent expressions.
• The product of two negative numbers is a positive number.
• Applying operations to both sides of an equation yields an equivalent equation.
• The area of a trapezium with bases a, b and altitude h is (a + b)h/2.
• The area of a disc with radius r is πr2.
• Vertical angles are equal.
• Corresponding angles between parallel lines are equal.
• The angle sum of a triangle is 180o.
For each statement, data sources included the textbook chapters introducing it, in each
textbook (3-49 pages per statement per textbook) – a total of 816 textbook pages. We
analysed both the explanatory texts and the related task pools. We also analysed the
related teacher guides to help interpret the justifications offered in the textbooks. In
addition to the first author, about 70% of the data were analysed and discussed by
several members of our research group (1-4), including the second author, until a
consensus was achieved; the remaining 30% were analysed by the first author alone.
Analysis comprised four stages:
1. Identifying instances of justification for each statement, in each textbook. Figure
1 illustrates two instances of justification for the area formula for a trapezium,
both in textbook B.
2. Coding the type of justification for each instance of justification (following
Stacey & Vincent, 2009). For example, the instance of justification in Figure
1(a) was coded as deduction using a specific case, and the one in Figure 1(b) as
deduction using a general case.
3. Constructing paths of justification for each statement, in each textbook (80 paths
in total). Figure illustrates paths of justification for the area of a trapezium in
two textbooks (B and F). Each step represents either a single instance of
justification or the location of the mathematical statement in the path, in order
of appearance in the textbook. Each instance of justification is labelled for its
type of justification.
4. Comparative analysis of types and paths of justification, by textbook and by
mathematical statement.

Silverman, Even
4–206 PME40 – 2016
(a) (b)
Figure 1. Area of a trapezium – two instances of justification in textbook B
Textbook B Statement
Textbook F Statement
e s g g g
e e e g g
e= experimental demonstration; s/g= deduction using a specific/general case.
Figure 2. Area of a trapezium – two paths of justification (textbooks B and F)
FINDINGS
Analysis reveals that Israeli 7th grade mathematics textbooks provided justifications
for all analysed statements (but one statement in one textbook). A total of 225 instances
of justification were found for the ten analysed mathematical statements. They were
typically included in the explanatory texts, yet several instances of justification were
found in tasks intended for student individual or small-group work.
Six of the seven types of justification in Stacey and Vincent’s framework (2009) were
identified in the Israeli textbook justifications; all but concordance of a rule with a
model. In the following we describe the types of justification found, first across
textbooks and then across mathematical statements. Then we present initial findings
regarding paths of justification.
Types of justification across textbooks
Table 2 presents the frequencies for the types of justification in instances of
justification, by textbook. As can be seen, the total number of instances of justification
was between 23-35 instances per textbook. The frequencies of most types of
justification were similar across the textbooks, except for Deduction using a specific
case, and Deduction using a general case, where there was a noticeable variation.
Nevertheless, most of the instances of justification in each textbook were of three
types: one empirical – Experimental demonstration, and two deductive – Deduction
using a specific case, and Deduction using a general case. The latter two types
accounted for about one-half of the instances of justification in seven of the textbooks
and almost one-third in one (G). The two external types of justification – Appeal to
authority and Qualitative analogy – were rare, accounting for less than 3% of all
instances of justification.

Silverman, Even
PME40 – 2016 4–207
Table 2. Frequencies of types of justification by textbook.
Type of justification Textbook Total (%)
A B C D E F G H
External
Appeal to authority 0 0 0 0 1 0 1 0 2 (1%)
Qualitative analogy 1 1 0 0 2 0 0 0 4 (2%)
Empirical
Experimental demonstration 9 10 11 11 9 12 12 12 86 (38%)
Deductive
Deduction using a model 8 3 3 2 3 3 3 3 28 (13%)
Deduction using a specific case 9 8 9 4 10 5 5 9 59 (26%)
Deduction using a general case 8 7 5 7 3 10 2 4 46 (20%)
Total 35 29 28 24 28 30 23 28 225 (100%)
Types of justification across mathematical statements
Table 3 presents the frequencies for the types of justification in instances of
justification, by mathematical statement. As can be seen, there was a great variation in
the number of instances of justification across the statements, between 9-38 instances
per statement. There was also a great variation in the frequencies of all types of
justification (but the rarely used ones) across the statements.
Table 3. Frequencies of types of justification by mathematical statement.
Type of Justification Mathematical statement Total
Distrib
utiv
e law
Div
ision b
y zero
Equiv
alent ex
pressio
ns
Pro
duct o
f neg
atives
Balan
cing eq
uatio
ns
Area o
f trapeziu
m
Area o
f disc
Vertical an
gles
Corresp
ondin
g an
gles
Angle su
m o
f triangle
External
Appeal to authority 0 0 0 1 0 0 1 0 0 0 2 (1%)
Qualitative analogy 0 0 1 2 1 0 0 0 0 0 4 (2%)
Empirical
Experiment. demonstration 2 3 9 0 24 14 0 4 15 15 86 (38%)
Deductive
Deduction using a model 13 1 6 2 6 0 0 0 0 0 28 (13%)
Deduction/specific case 0 8 17 12 1 13 0 5 1 2 59 (26%)
Deduction/general case 0 5 0 0 0 11 8 7 2 13 46 (20%)
Total 15 17 33 17 32 38 9 16 18 30 225 (100%)

Silverman, Even
4–208 PME40 – 2016
Furthermore, the two deductive types of justification that were commonly used in all
textbooks: Deduction using a specific case, and Deduction using a general case (see
Table 2), were used to different extents in algebra and in geometry statements (see
Table 3). Deduction using a general case was prevalent almost exclusively in geometry
statements whereas Deduction using a specific case was common mostly in algebra
statements (and in a geometry statement involving the use of algebra: the area formula
of a trapezium), and so was Deduction using a model. In contrast, Experimental
demonstration, which was used to a large extent in all textbooks (see Table 2), was
used in both algebra and geometry statements.
Paths of justifications
Table 4 presents the paths of justification for each mathematical statement, by
textbook. As can be seen, the lengths of the paths varied considerably, between one
and seven instances of justification per path. Likewise, the lengths varied for different
statements in the same textbook. For instance, in textbook A, the path of justification
for the statement The product of two negative numbers is a positive number included
five instances of justification, but only one for the statement The area of a disc with
radius r is πr2. Moreover, the lengths varied for the same statement across textbooks.
For example, the paths of justification for the above mentioned statements in textbook
F included one and two instances of justification (respectively).
Table 4: Paths of justification by textbook and statement.
Statement Textbook
A B C D E F G H
Distributive law m,m m,m m m,m m,e m,m e,m m
Division by zero s,m s e,s,g e,s,g s,g s,g s e,s,g
Equivalent expressions s,s,m,
s,e m,e, s,s
m,e, s,s
e,e,s q,e,m,s,s
e,s,s,s m,e, s,s
m,e, s,s
Product of negatives m,s,s, q,m
s,s,q s,s s,s s,s s a s
Balancing equations e,m,e,m e,e,s,e e,e,e,e
,m e,e e,m,e,
e,q,e e,m,e e,e,e e,e,e,
m,e
Area of a trapezium e,g,s,
s,s e,s,g, g,g
e,s,s, s,g
e,e,e, g,g
s,s,s,e e,e,e, g,g
e,e,g,e e,s,s, s,g
Area of a disc g g g g a g,g g g
Opposite angles e,e,g s,g s,g g s,g e,g e,s s,g
Corresponding angles e,g,e,g e,e e,e e,e e e e,e,e s,e,e
Angle sum of a triangle e,g,g,g e,e,e,
g,g e,e,g e,g,g e,s,g e,g,g,e
e,g,g e,s e,e,e
a= appeal to authority; q= qualitative analogy; e= experimental demonstration; m= deduction using
a model; s= deduction using a specific case; g= deduction using a general case.

Silverman, Even
PME40 – 2016 4–209
As can be seen in Table 4, most paths of justification included more than one type of
justification (64 out of 80 paths); often both empirical and deductive (39 paths). Focus
on the most commonly used types of justification suggests that in almost all paths that
included both Experimental demonstration and Deduction using a specific case or
Deduction using a general case, Experimental demonstration preceded the deductive
one(s) – 29 out of 32 paths. Similarly, in most paths that included both Deduction using
a specific case and Deduction using a general case, the specific case preceded the
general more formal mathematical justification – 13 out of 14 paths.
DISCUSSION
This study examined types and paths of justification offered to 10 key mathematical
statements in eight Israeli 7th grade textbooks. Our findings show that almost all
instances of justification in the textbooks (97%) were either deductive or empirical;
types of justification that are considered desirable in school mathematics (Harel &
Sowder, 2007; Stylianides, 2009). This finding is different from the results in Stacey
and Vincent (2009), where 17% of the justifications for similar topics in Australian
textbooks were neither deductive nor empirical.
Our findings also suggest that the most employed types of justification in all textbooks
were three (out of the six types identified): Experimental demonstration, Deduction
using a specific case, and Deduction using a general case. Together these types
accounted for 84% of the instances of justification. Still, whereas Experimental
demonstration was used in both algebra and geometry statements, this was not the case
with the deductive types. Deduction using a specific case was mostly used in algebra
statements, and Deduction using a general case was prevalent almost solely in
geometry statements. Hence, the type of justification closest to a formal proof was used
mainly in geometry statements. This might convey to students that proof is part of
doing mathematics in the case of geometry but not in algebra, where one could use
“softer” ways of justification. Still, Deduction using a specific case may allow students
who are newcomers to algebra to experience an inference process with a lower risk of
‘getting lost’ in algebraic manipulations.
The similarities among the textbooks in using the aforementioned three types of
justification did not imply identical paths of justification in different textbooks for the
same mathematical statements. As shown in Table 4, there were cases where some
textbooks offered long paths that included an assortment of types of justification –
offering students a variety of opportunities that may have an additive effect
(Sierpinska, 1994) – whereas other textbooks used rather short paths with limited types
of justification for the same statement. This difference implies a great variety in
students’ opportunities to learn to justify that were offered in different textbooks.
In spite of these differences, it appears that textbooks that used both empirical and
deductive types of justification tended to offer the empirical before the deductive.
Similarly, textbooks that used both deduction using specific and general cases, tended
to offer the specific case before the more general deductive justification type. This
Silverman, Even
4–210 PME40 – 2016
order appears to reflect a shared view among textbook authors about ways of learning
to justify mathematical statements that indeed might be useful for helping students
learn to justify. Yet, there is a need to examine whether deductive ways of justifying
have unique status in mathematics.
Finally, we would like to emphasize that our study focused on 7th grade textbooks. As
Thompson (2014) noted, the similarities and differences identified in this particular
grade level among textbooks might change over a textbook series. Additional research
is needed to characterize the paths of justification in textbooks intended for higher
grades.
Acknowledgement: This research was supported by the Israel Science Foundation (grant
No. 221/12).
References
Ayalon, M., & Even, R. (in press). Factors shaping students’ opportunities to engage in
argumentative activity. International Journal of Science and Mathematics Education.
Dolev, S. (2011). Justifications and proofs of mathematical statements in 7th grade textbooks.
Rehovot: MSc thesis - Weizmann Institute of Science.
Dolev, S., & Even, R. (2013). Justifications and explanations in Israeli 7th grade math
textbooks. International Journal of Science and Mathematics Education, 13(2), 309–327.
Haggarty, L., & Pepin, B. (2002). An investigation of mathematics textbooks and their use in
English, French and German classrooms: who gets an opportunity to learn what? British
Educational Research Journal, 28(4), 567–590.
Harel, G., & Sowder, L. (2007). Toward Comprehensive Perspectives on the Learning and
Teaching of Proof. In F. K. Lester (Ed.), Second handbook of research on mathematics
teaching and learning: A project of the National Council of Teachers of Mathematics (pp.
805–842). Charlotte, NC: Information Age Publishing.
Sierpinska, A. (1994). Understanding in Mathematics. London: Falmer.
Stacey, K., & Vincent, J. (2009). Modes of reasoning in explanations in Australian eighth-
grade mathematics textbooks. Educational Studies in Mathematics, 72, 271–288.
Stylianides, G. J. (2009). Reasoning-and-proving in school mathematics textbooks.
Mathematical Thinking and Learning, 11, 258–288.
Thompson, D. R. (2014). Reasoning-and-proving in the written curriculum: Lessons and
implications for teachers, curriculum designers, and researchers. International Journal of
Educational Research, 64, 141–148.

2016. In Csíkos, C., Rausch, A., & Szitányi, J. (Eds.). Proceedings of the 40th Conference of the International
Group for the Psychology of Mathematics Education, Vol. 4, pp. 211–218. Szeged, Hungary: PME. 4–211
HOW DOES AN ICT-COMPETENT MATHEMATICS TEACHER
BENEFIT FROM AN ICT-INTEGRATIVE PROJECT?
Charlotte Krog Skott, Camilla Hellsten Østergaard
University College Capital, University College Metropol
We investigate an ICT-competent mathematics teacher’s potentials for professional
development as she participates in a sixth-grade statistics project aimed at developing
practices that integrate ICTs. This is a critical case study, partly because the teacher
is not challenged by the proposed ICTs. We use a theoretical framework for classroom
mathematical practices to conceptualise teachers´ learning from a participatory
perspective. On the one hand, the teacher realises a potential for a more dialogical
approach to teaching. On the other hand, she appears to maintain her habits in relation
to ICT-use. These contrary tendencies negatively influence the students’ learning
opportunities. We offer explanations for why the teacher seems to sticks with her ICT-
habits as well as suggestions for future research- and development projects.
It is generally acknowledged that the teacher plays a critical role in the integration of
ICT in teaching. However, only a limited number of research studies have
systematically examined teachers´ appropriation of ICT into their classroom practices
(Healy & Lagrage, 2010). We aim to contribute more insights by focusing on how an
ICT-competent teacher develops through her participation in a large Teacher
Professional Development (TPD) project in Denmark intended to enhance the
integration of ICT in the major school subjects. The teacher, Ea, is not technologically
challenged by the ICTs suggested in a sub-project on sixth-grade statistics “Youngsters
and ICTs”; rather she perceives the proposals as insufficiently innovative. In this light
we aim to explore her developments in relation to how she contributes to the
implementations of the sub-project´s intended classroom mathematical practices. Our
hypothesis is that if in this critical case the teacher does not to some extent implement
these practices, then the chances that less ICT-competent teachers will are poor. More
precisely, we ask: What potentials for professional development does an ICT-
competent teacher realise when participating in “Youngsters and ICTs”?
TEACHER LEARNING AS REGARDS ICT
Generally, research in mathematics education agrees that ICT offers potentials for
students to develop fundamental mathematical understandings. After an initial period
in the 80s of high optimism that ICT would transform teaching, researchers now regard
the integration of ICT as a more complicated and prolonged process (Drijvers,
Doorman, Boon, Reed, & Gravemeijer, 2010). This view is underpinned by a new
OECD-report (2015) concluding that “PISA results show no appreciable
improvements in student achievement in reading, mathematics or science in the
countries that had invested heavily in ICT for education” (p.17). The report interprets
the slight or non-existing correlation between students´ learning and accessibility
Skott, Østergaard
4–212 PME40 – 2016
to/use of computers at school as “we have not yet become good enough at the kind of
pedagogies that make the most of technology” (p.3).
Research studies support the assertion that we need to know more about teachers´
appropriation of ICTs and about appropriate ways to bolster it (Grugeon, Lagrange, &
Jarvis, 2010; Healy & Lagrange, 2010). Pierce and Stacey (2013) took a two-year
Lesson Study TPD approach with early majority teachers (teachers with no specific
interest in ICT but who accept the necessity of changing). They conclude that the
teachers tended to absorb the new technology (mathematics analysis software) “into
current practices, more than changing practice” (p.323). They further conclude that the
didactical contract (the mutual obligations and expectations between teacher and
students) was unchanged with respect to mathematics. Similarly, studies report how
teachers use ICTs to absorb or accentuate certain pedagogical priorities in their
practices. For example, Ruthven, Hennessy & Deaney (2008) use the concept of
“interpretative flexibility” to emphasise that teachers align and adopt the use of ICTs
according to their own concerns and settings. They argue that interpretative flexibility
can explain disparities in the ways teachers use ICT, as well as disparities between
designers´ intentions with dynamic geometry and its use in pioneering studies, on the
one hand, and its more mainstream use, on the other hand. They characterise this
mainstream use as “a marginal amplifier of established practices” (p.315). Drijvers et
al. (2010) investigate three teachers´ instrumental orchestrations in a project based on
a digital algebraic learning environment with prescribed research-based activities and
a teacher guide. They conclude that the teachers´ choice of orchestration is related to
their views of mathematics education and the role of ICT herein, especially their
conceptions of technological and time constraints as well as issues of control.
Some of the challenges that teachers face include the (too) rapid development of ICT
and the complexities involved in learning the appropriate technological skills. On the
other hand, ICTs seem to enhance the complexity of teachers’ practice as “practices
used in ‘traditional’ settings can no longer be applied in a routine-like manner when
technology is available” (Drijvers et al., 2010, p. 214). In keeping with this, Ruthven,
Deaney & Hennessy (2009) emphasise that using ICT in the classroom requires that
key structuring features of classroom practices be adapted. These features include the
working environment (room location, physical layout, class organisation), resource
system (a coherent combination of a teacher´s range of tools, ICTs, textbooks, etc.),
activity format (the framing of the activities and of interactions in the classroom),
curriculum script (a teacher´s broad mental sketch for teaching a particular topic and a
flexible enactment of the sketch) and time economy (the time cost of using ICT versus
the students´ expected outcome). These two sets of challenges might seem
insurmountable for a teacher. Thus, the elaboration of teaching practices that integrate
ICT ought to be a shared responsibility among teachers, curriculum developers, teacher
educators and researchers, and not a task more or less solely entrusted to teachers.
We use a different theoretical framework than normal in research on ICT. We adopt a
participatory perspective on teachers’ learning by using Cobb’s concept of classroom

Skott, Østergaard
PME40 – 2016 4–213
mathematical practice (2002). This concept is part of a larger theoretical framework
that makes an overall division into a social and a psychological perspective. A
classroom mathematical practice is established when a procedure or way of doing
mathematics is generally accepted in the classroom and is treated as a self-evident
mathematical fact. By participating in a practice, students develop idiosyncratic
mathematics interpretations while also contributing to the development of the practice
at the classroom level. In this way the relationship between practices (the social
perspective) and the participating students´ interpretations (the psychological
perspective) is reflexive (Cobb, 2001). Cobb focuses on how students contribute to
practice formation, while we are interested in how teachers initiate, negotiate and guide
the establishment of practices. This seems possible within the framework, as the
teacher has a special authority to initiate, guide and re-negotiate the establishment of
practices regardless of how students contribute to shaping them. We consider changes
in a teacher´s way of participating in classroom mathematical interactions as a sign of
learning. A classroom mathematical practice is characterised by three normative
aspects: a normative purpose, normative standards of argumentation and normative
ways of reasoning (Cobb, 2002). This research report focuses on the first aspect. By
teaching practices we mean actions the teacher takes to support the development of
classroom mathematical practices.
“YOUNGSTERS AND ITCS”
The overarching project determines to a great extent the design and assumptions of
“Youngsters and ICTs”. To characterise the sub-project, we use a framework
developed by Grugeon, Lagrange and Jarvis (2010). The framework consists of three
different views: 1) views of the implementation of technology in the classroom, 2)
views of changes in the teacher’s role, activity and practices, and 3) views of teacher
preparation. The first view subdivides into views regarding the contribution of ICT on
one axis and modes of supported use on the other axis. To some extent “Youngsters
and ICTs” inherits the one extreme of the contribution axis from the overarching
project, namely the view that ICTs will necessarily improve learning if teachers
implement “Youngsters and ICTs” as prescribed. However, the other extreme view is
also present as the researchers are concerned more about the complexity of the
suggested teaching practices that integrate ICT and less about the complexity of the
ICT itself. The suggested practices are designed in keeping with the reform orientation
of mathematics teaching as conveyed by the NCTM (2000), while an inherited design
principle was to use well-known or easily accessible ICTs rather than new. These two
design principles also constitute our reasons for not adding an artefact perspective to
Cobb´s framework. Regarding the second axis (mode of use), “Youngsters and ICTs”
prepares teachers for classroom use of ICT (and not for communication use) by
offering a comprehensive, research-based course consisting of 15 lessons with detailed
descriptions of the working environment, resource systems, activity format and part of
the curriculum script. The course also includes elaborated classroom cases from
teaching in test classes and provides outside support from teacher educators. In relation

Skott, Østergaard
4–214 PME40 – 2016
to the second view (changes in the role of the teacher, etc.), we place “Youngsters and
ICTs” in a “new role for the teacher”, as it focuses on developing new teaching
practices, not on integrating new ICT-based activities. As regards the third view,
“Youngsters and ICTs” is placed in the short-term end of the time duration axis and in
the middle of the professional proficiency axis, as it has suggestions for both statistical
content and teacher practices.
When designing “Youngsters and ICTs”, we were inspired by Cobb and McClain´s
design-based research, especially the five design principles shown to be critical to
students´ development of statistical reasoning (2004). These principles urge a focus on
central statistical ideas, the instructional activities, the classroom activity structure, the
computer-based tools used by the students and the classroom discourse.
“Youngsters and ITCs” aims to get teachers to use ICTs to initiate, negotiate and
establish two overall classroom mathematical practices: to be critical towards the use
of statistics and to investigate tendencies and patterns in data sets. To realise these
aims, the course frames and prescribes the way that teachers engage students in
statistical investigations: Formulate statistical problems; generate, analyse and reason
about data; interpret results and disseminate them in/out of the school. The proposed
teaching practices integrate, for instance, the use of spreadsheets and MiniTools (ibid)
to support students´ data analysis and reasoning processes, electronic surveys to aid
data generation processes and Explain Everything (app) to support students´ reasoning
and interpretation. One central and general teaching practice is to include and capitalise
on student´s mathematical contributions in classroom discussions.
METHODOLOGICAL APPROACH
Ea’s participation in “Youngsters and ICTs” is a critical case study (Flyvbjerg, 2006).
Such a case can be identified as either “most likely” or “least likely” cases (p. 231).
Our case is “most likely” in the sense that if Ea does not establish the intended
classroom mathematical practices, the chances seem poor that less ICT-competent
teachers might establish them. The case is identified on the basis of Ea's eager
participation in “Youngsters and ICTs”, her engaged ICT narratives and preoccupation
with its potentials.
Over a two-year period we observed 31 classroom lessons (16 from the sub-project and
15 from before or after it (video recorded)) and conducted four semi-structured
interviews (audio recorded). We transcribed the interviews and selected excerpts from
the observations, corresponding to 15 lessons. Inspired by grounded theory (Charmaz,
2014), we coded the transcriptions (in Nvivo) word-by-word and line-by-line. Out of
28 developed coding categories, we selected 10, such as “Learning mathematics with
ICT”, “Communication” and “Classroom organisation”, as a basis for our analysis.
The analysis produced a teacher profile and a case in which Ea teaches the first lesson
of “Youngsters and ICTs” during her second implementation of the course. The main
aim of the profile is to make Ea´s daily teaching practices and priorities visible, thus
enabling us to consider the case as having development potential. The case is

Skott, Østergaard
PME40 – 2016 4–215
representative of Ea´s general approach to teaching with ICT within the sub-project
and illustrates a potential for professional development, which Ea seems to realise.
EA´S PROFILE AS AN ICT-COMPETENT MATHEMATICS TEACHER
Ea is an experienced mathematics teacher at a large school with a strong ICT profile.
Ea says of the school: “They like that we´re ahead of it … it´s a prestige project.” Ea
is an early adaptor (Sahin, 2006), as she integrates ICT in her classroom, is selected
by the school management to support her colleagues in integrating ITC and participates
in ICT-development and research projects. She recounts her experiences from such
projects: “I have a naive belief that someone can inspire me and tell me what they do
and how… but no-one does.” Ea considers “Youngsters and ICTs” as insufficiently
innovative: “I do not think there has been enough ICT ... but mathematically it's another
way of teaching than I have taught in the past.”
Ea´s classroom has an interactive whiteboard, and all students obtained iPads last year.
Ea´s incorporation of ICT into her daily teaching has only superficially changed the
working environment, the activity format and her curriculum script. Generally, she
only gives short classroom directions followed by individual or small group work with
the textbook or iPad, partly because “I fail to tell them anything in twenty minutes ... I
think I often supervise more than I teach … because I do not think they listen, when I
stand at the blackboard”. Thus, she rarely assembles the whole class and seldom for
joint mathematical activities. She primarily uses an e-exercise base for skill practice
and a digital platform as a framework for student homework. She describes her
teaching with ICTs as: “So that part [the homework] is different ... it is not my teaching
that has changed ... still one-man work … it has really not changed.”
Ea conceives teaching mathematical skills as a prerequisite to working with problem
solving: “I am a bit old-fashioned. I think it is most important they have skills… I can
pose open problems, but if they do not have the skills, then they cannot solve them.”
Ea’s curriculum script is dominated by skills practice and individual or small group
work framed by the textbook or iPad exercises. Interpretative flexibility can explain
her daily use of ICTs primarily to support skills practice, to structure student work and
to control/check it.
CASE OF EA´S TEACHING IN “YOUNGSTERS AND ICTS”
By and large, Ea follows the proposals in the plan as regards the working environment
and the activity format. Thus, she has produced a flipped-classroom video introducing
the course by using the suggested text. She initiates the lesson by showing the video
even though this was homework. She then introduces the course in her own words,
emphasising the end product (a newscast about young people’s use of ICTs) and what
the students are going to do. This is mainly to answer a range of questions, for instance
one of the course´s principal ones: “Is your own use of ICTs too high?” She says
nothing about the statistical content nor establishes an inquiry-based frame. The object
appears to be answering questions more or less mechanically. Ea cancels her planned
small group work, as only one student has done the homework; instead, she initiates
Skott, Østergaard
4–216 PME40 – 2016
and maintains a long classroom discussion (20 min) about the students´ experience
with everyday use of statistics. She structures the discussion by dividing the blackboard
into two columns headed “How” and “Where”, under which she writes the students´
contributions. Generally, Ea accepts the contributions unconditionally without
inquiring into associated societal issues, questioning the data generation process or
unfolding the emergent statistical potentials. Thus, the classroom discussion
degenerates into one of enumerating arbitrary examples. Ea then initiates a classroom
dialogue (2 min) about related statistical concepts and methods, in which the students´
contributions stand unquestioned and unrelated to the long list of newly produced
examples. The emergent purpose of the dialogue also becomes one of enumeration,
this time of statistical concepts. Subsequently, the students are to write the examples
and the few mentioned concepts into their own digital concept map. Ea states “you
have to write it all down” as the purpose of the activity. For nearly half of the activity
time (25 min), Ea solves technical problems. As the students finish up, they are told to
work with an e-exercise base individually (10 min). There is no common closing. There
is a friendly, pleasant atmosphere with good relations between the teacher and the
students. Most of the students are active during the lesson and participate eagerly in
the discussions.
REALISATION OF POTENTIALS FOR DEVELOPMENT
In the case Ea challenges her normal priorities as regards the communicative aspects
of the working environment and activity format, as she initiates and maintains two
classroom discussions related to the statistical content. Thus, she prioritises classroom
discussion over individual and small group activities and the subject matter over
directional information. In interviews, Ea discloses that she does not feel competent in
her verbal communication about mathematics, but she emphasises this very aspect as
having been valuable to her professional development as well as her students´ learning.
Especially in this light, Ea´s changed participation in classroom interactions as regards
her initiative to discuss content-related themes in the class is noteworthy.
An analysis of the classroom discussions confirms that it is not simple to change one’s
teaching practices. Regardless of Ea´s presumed intentions, the emergent purposes of
the discussions become superficial enumerations that do not contribute to the students´
development of statistical reasoning or understanding. These emergent purposes are in
keeping with the norms, routines and conception of mathematical activities generally
established in the classroom. As indicated in the case, there are no norms requiring the
teacher or the students to explain or argue for the proposed examples or concepts. It
also appears that the overall purpose of mathematical activity is to answer closed
questions. That is questions with one answer and one way to find this answer.
Like the teachers in Drijvers et al´s study (2010), Ea ignores to a large extent the ICT
related proposals in “Youngsters and ICTs”. The intention of the case lesson is for the
teacher to use a digital concept map to initiate, negotiate and guide the establishment
of a mathematical practice: to meaningfully relate everyday statistical examples to
Skott, Østergaard
PME40 – 2016 4–217
statistical concepts and methods. By jointly constructing a digital concept map the
teacher and students were supposed to investigate and negotiate connections and
relations between examples and statistical concepts/methods. Ea refrains from this
opportunity of classroom investigation by deciding that each student makes a concept
map on their own iPad. Ea further reduces the students´ learning opportunities by
requiring a digital re-writing of the examples from the black broad, and not requesting
the construction of a genuine map. On the one hand, Ea seems to initiate the intended
classroom mathematical practice, but then her decisions, regarding ICT-use in
particular, prevent her from maintaining the practice, and the activity degenerates into
a mechanical re-writing of insignificant examples.
We thus conclude that Ea realises opportunities for professional development with
regard to dialogical aspects of the working environment and the activity format. In
relation to the resource systems, curriculum script and the ICT-part of the activity
format, it appears that Ea retains her habits, thus confirming the tendency to absorb
ICT into existing teaching practices (Pierce & Stacey, 2013). This is notably, as she is
participating in a TPD-project focusing on changing such practices.
CONCLUSION AND DISCUSSION
Our study´s overall results are that the teacher to some extent realises a developmental
potential for a more dialogical teaching approach, while she does not realise potentials
regarding ICT-use. On the contrary, she maintains her usual ICT-habits. Together these
two tendencies negatively influence the students´ learning opportunities.
The teacher´s maintenance of her habitual ICT-use can partly be traced to her
conception of mathematics education and the role of ICT herein (Drijvers et al., 2010).
Her skill-based conceptions can be seen as orienting her contributions to classroom
interactions in a product-oriented way, focusing on readymade procedures and facts.
However, our study suggests a further explanation concerning the conception of her as
a highly ICT-competent mathematics teacher, a conception shared by the school
management, her colleagues and herself. This constructed image apparently legitimises
and promotes her maintenance of ICT-habits, thus preventing the intended
developments. As such our initial hypothesis is too limited. The complexities involved
in developing teachers´ ICT-use seem far more exhaustive. Firstly, teachers´
formations of professional identities appear to play a significant role, which point to a
need to understand and research teachers´ appropriation of ICT from a participatory
perspective of learning. Secondly, our study shows that to develop an ICT-competent
teachers´ further appropriation might entails more than developing comprehensive,
research-based teaching material with suggestions for teaching practices that integrate
ICT and providing short-term outside support to help teachers develop these practices.
Presumably, a more fruitful way would be to (co-)develop such practices in a long-
term, onsite collaboration between teachers and teacher educators/researchers.

Skott, Østergaard
4–218 PME40 – 2016
References
Charmaz, K. (2014). Constructing Grouded Theory. London, England: SAGE.
Cobb, P. (2001). Supporting the improvement of learning and teaching in social and
institutional context. In S. Carver & D. Klahr (Eds.), Cognition and instruction:
twenty-five years of progress (pp. 455-478). Lawrence Erlbaum Associates.
Cobb, P. (2002). Reasoning With Tools and Inscriptions. The Journal of the Learning
Sciences, 11(2&3), 187-215.
Cobb, P., & McClain, K. (2005). Principles of instructional design for supporting the
development of students’ statistical reasoning. In D. Ben-Zvi & J. Garfield (Eds.),
The challenge of developing statistical literacy, reasoning and thinking (pp. 375-
395). Kluwer Academic Publishers.
Drijvers, P., Doorman, M., Boon, P., Reed, H., & Gravemeijer, K. (2010). The teacher
and the tool: instrumental orchestrations in the technology-rich mathematics
classroom. Educational Studies in Mathematics, 75(2), 213-234.
Grugeon, B., Lagrange, J.-B., & Jarvis, D. (2010). Teacher Education Courses in
Mathematics and Technology: Analyzing Views and Options. In C. Hoyles & J.-
B. Lagrange (Eds.), Mathematics Education and Technology-Rethinking the
Terrain. The 17th ICMI Study (pp. 329-345). New York: Springer.
Healy, L., & Lagrange, J.-B. (2010). Introduction to Section 3. In C. Hoyles & J.-B.
Lagrange (Eds.), Mathematics Education and Technology-Rethinking the Terrain.
The 17th ICMI Study (pp. 287-292). New York: Springer.
NCTM (2000). Principles and Standards for School Mathematics. USA: The National
Council of Teachers of Mathematics, Inc.
OECD (2015). Students, Computers and Learning - Making the connection. PISA.
Paris.
Pierce, R., & Stacey, K. (2013). Teaching with new technology: four “early majority”
teachers. Journal of Mathematics Teacher Education, 16(5), 323-347.
Ruthven, K., Deaney, R., & Hennessy, S. (2009). Using Graphing Software to Teach
about Algebraic Forms : A Study of Technology Supported Practice in Secondary
School Mathematics. Educational Studies in Mathematics, 71(3), 279-97.
Ruthven, K., Hennessy, S., & Deaney, R. (2008). Constructions of dynamic geometry:
A study of the interpretative flexibility of educational software in classroom
practice. Computers & Education, 51(1), 297-317
Sahin, I. (2006). Detailed Review of Rogers’ Diffusion of Innovations Theory and
Educational Technology: Related Studies Based on Rogers’ Theory. The Turkish
Online Journal of Educational Technology, 5(2), 14-23.

2016. In Csíkos, C., Rausch, A., & Szitányi, J. (Eds.). Proceedings of the 40th Conference of the International
Group for the Psychology of Mathematics Education, Vol. 4, pp. 219–226. Szeged, Hungary: PME. 4–219
PROOF VALIDATION ASPECTS AND COGNITIVE STUDENT
PREREQUISITES IN UNDERGRADUATE MATHEMATICS
Daniel Sommerhoff1, Stefan Ufer1, Ingo Kollar2
1University of Munich (LMU), 2University of Augsburg
Proof validation is an important skill to acquire for university students and is also
essential as a monitoring activity during proof construction. Our study analyzes
students’ difficulties with three aspects of proof validation as well as the influence of
domain-specific and domain-general cognitive student prerequisites (CSP) on proof
validation skills. Results indicate that students’ proof validation skills depend on the
type of error in a purported proof and are influenced by conceptual mathematical
knowledge and metacognitive awareness. Overall domain-general and -specific CSPs
affect performance to roughly the same degree, whereas generative CSPs like problem
solving skills have no contribution. These results question the current way of teaching
the concept of proof primarily by proof construction exercises.
INTRODUCTION
Proof construction has been a focus of university mathematics for a long time and
constitutes a research focus within mathematics education. Yet, students often get in
touch with proofs in other ways, e.g. they engage in proof comprehension when reading
textbook proofs or in proof validation when reading and judging the correctness of
their own or other students’ proofs or potentially erroneous lecture notes. Mastering
these activities per se is essential for students, but is even more so since proof
validation, i.e. the ability to evaluate individual arguments and entire proofs, is a crucial
monitoring activity while constructing proofs (Selden & Selden, 2003). Apart from
proof construction, research thus increasingly focuses on proof comprehension and
proof validation (Healy & Hoyles, 2000; Inglis & Alcock, 2012; Selden & Selden,
2003; Weber & Mejía-Ramos, 2011).
Prior research revealed that even university students have severe problems in validating
proofs (Selden & Selden, 2003). Gaining effective means of fostering students’ proof
validation skills therefore is of utmost importance. A prerequisite to design instruction
that is effective for the acquisition of proof validation skills at the university level is a
better understanding of different aspects of proof validation skills and of their relation
to cognitive student prerequisites (CSP). The present study therefore explores students’
proof validation skills in two ways: We analyze which types of errors in purported
proofs are easy to detect for students and which pose difficulties. In addition, we
explore the dependency of proof validation skills on various domain-specific and
domain-general CSPs.

Sommerhoff, Ufer, Kollar
4–220 PME40 – 2016
PROOF VALIDATION
“Reading” proofs comprises three main activities, each having different goals (Selden
& Selden, 2015). Proof comprehension is the activity of reading a proof (e.g. when
studying a textbook proof) that is known to be true with the aim of understanding it.
Proof validation refers to reading a proof and trying to judge its correctness. The third
related activity is proof evaluation, which is not only aimed at assessing the correctness
of a proof, but also at evaluating the proof regarding multiple other properties, e.g. its
clarity or convincingness.
Amongst these three skills, proof validation is closest related to mathematical proof
construction skills, because validation is essential during proof construction for
checking individual inferences as well as the overall structure and conclusiveness of a
constructed proof. Due to this status as a monitoring activity, similar activities can be
found in many domain-general frameworks for argumentation or problem solving, e.g.
as evidence evaluation and drawing conclusions (Fischer et al., 2014) or looking back
(Polya, 1945), or in modern self-regulation frameworks (De Corte et al., 2011).
Recent studies underline the importance of proof validation and unveiled clear
differences in proof validation behavior, e.g. between experts and novices (Inglis &
Alcock, 2012; Weber & Mejía-Ramos, 2011). While novices tend to focus on surface
features of proofs and individual inferences (zooming in), experts rather focus on the
high-level structure (zooming out) and skim proofs to grasp the overall structure before
zooming in and looking at details.
Individual prerequisites of proof validation
Proof validation requires different knowledge facets and skills; e.g., judging the
correctness of a proof is hardly possible without a sufficient mathematical knowledge
base. Proof validation can therefore be seen as a complex cognitive skill that depends
on several CSPs that can roughly be divided into two parts: domain-specific and
domain-general prerequisites (c.f. Figure 1). Prior research on proof construction
(Chinnappan, Ekanayake, & Brown, 2011; Schoenfeld, 1985) indicates that both could
influence students’ proof validation skills, but their relative impact is still unclear. Yet,
in contrast to proof construction, which requires the generation of own, multi-step
arguments, we view proof validation as a non-generative, more evaluative activity so
that the impact of rather generative CSPs is questionable.
On the domain-specific side, it is assumed that students’ conceptual and procedural
mathematical knowledge base as well as mathematical strategic knowledge (Weber,
2001) impact proof construction skills. Transferring this to the non-generative activity
of proof validation, at least the influence of procedural knowledge is questionable, but
also the approach strategies for mathematical proofs encoded in mathematical strategic
knowledge might not be relevant. On the domain-general side, various constructs,
including problem solving skills (Chinnappan et al., 2011) and general inferential
reasoning skills, likely influence proof construction. Again, the influence of students’
problem solving skills on the non-generative proof validation is questionable. Finally,
Sommerhoff, Ufer, Kollar
PME40 – 2016 4–221
prior research (e.g. Yang, 2012) suggests an influence of metacognitive awareness on
students’ proof validation skills since proof validation can be seen as cognitively
demanding, requiring students to reflect the given proof and their proof validation
process on various levels.
Apart from the individual relations to proof validation skills, knowledge of the
contribution of domain-specific vs. domain-general CSPs can be utilized to effectively
foster proof validation skills: E.g., a high impact of domain-general prerequisites
would support the inclusion of instructional support for more general skills, while a
low impact would support trainings mostly focusing on conceptual knowledge of the
corresponding proof content.
Figure 1: Conceptual framework of CSPs and aspects of proof validation skills
Aspects of proof validation
Proof validation is concerned with finding errors in purported proofs. Yet mathematical
proofs can contain different kinds of errors (e.g. unsupported inferences, wrong use of
definitions or cyclic argumentation) that refer to different aspects of a proof and that
are not equally easy to detect (Healy & Hoyles, 2000). Accordingly, these different
aspects of proof can be used to examine proof validation skills more closely, i.e. to
differentiate between students’ proof validation skills to detect specific types of errors.
Heinze and Reiss (2003) put forward three aspects of methodological knowledge that
are inherent to every proof and can be used to structure the different kinds of errors:
Proof scheme refers to the kinds of reasoning used within each argument of a proof,
e.g. inductive and deductive inferences or reference to an authority. Proof structure
refers to the overall argumentative, logical structure of a proof. For a linear, direct
proof, this structure should begin with the given premises and end with the statement
that has to be shown. Finally, logical chain focuses on individual inferences within a
proof. In order to obtain a correct logical chain, the premises for each step have to be
proven beforehand or be part of the theoretical basis and no unknown or unproven
statements may be used.
AIM AND RESEARCH QUESTIONS
The goal of this study was to identify university students’ skills and problems in proof
validation regarding different aspects of proofs and to explore the impact of domain-

Sommerhoff, Ufer, Kollar
4–222 PME40 – 2016
specific and domain-general CSPs on the proof validation skills. We focused on the
following questions:
1. Are there differences in students’ proof validation skills regarding the detection
of the three different errors types? Are students able to relate the reasoning for
their judgment to the (in-)correct aspects of the purported proofs?
2. What is the influence of students’ domain-general and domain-specific cognitive
prerequisites on their proof validation skills?
3. Does this influence depend on the error type contained in a purported proof?
SAMPLE AND METHOD
66 mathematics university students (24 male, 41 female, 1 NA; Mage = 21.19) who had
finished their first semester participated in the study, which is part of a larger
investigation aimed at fostering students’ mathematical proof skills.
To examine students’ proof validation skills, they were asked to judge the correctness
of four purported proofs of one proposition (closed format) and to explain their
decision (open format). To assure an unbiased validation, they were told that fellow
students had created the proofs. Students were given liberal but limited time to think
about the purported proofs. The proposition was taken from elementary number theory
to ensure that a potential lack of advanced mathematical knowledge did not hinder the
proof validation. Two days later the students were asked to judge four purported proofs
of another proposition in order to validate the initial findings.
Figure 2: Proposition 1 and the purported proof with an error in the logical chain
For both propositions, one proof was correct and each of the three other proofs
contained an error corresponding to one of the three error types. A translated version
of proposition 1 and the purported proof containing an error in the logical chain are
shown in Figure 2. Obviously the conclusion that a3+3a2+2a is divisible by 3
independently of a when the sum of the coefficients 1+3+2 is divisible by 3 is both
wrong and unwarranted. Nevertheless, the step is deductive in nature since Martin
seems to refer to some general rule for this (without stating it explicitly).

Sommerhoff, Ufer, Kollar
PME40 – 2016 4–223
To measure their CSPs, students were given paper and pencil tests measuring their
mathematical knowledge base (conceptual and procedural), mathematical strategic
knowledge, inferential reasoning skills (Inglis & Simpson, 2008), metacognitive
awareness (Schraw & Dennison, 1994) and problem solving skills (four non-
mathematical problem solving tasks). The tests used closed and open items. Two raters
coded the open items following theory-based coding schemes. The interrater reliability
was κ > .76 (κMean = .93; SD = .09). All scales had an acceptable internal consistency
with αMean = .70 (SD = .10), only the internal consistency for mathematical strategic
knowledge was a bit low with α= .58 (4 items).
RESULTS
With a total of 59.1 % correct answers, students’ overall performance in judging the
correctness of proofs was moderate, yet significantly greater than chance (t(259) =
3.29, p < 0.001). Comparing the different purported proofs (correct proof and proof
with errors in the proof scheme, proof structure or logical chain) a Conchran’s Q test
determined significant (χ2(3) = 70.97, p < .001) differences between the solution rates
(cf. Figure 3, left; dark-grey). Pairwise comparisons between the four purported proofs
with a Bonferroni correction yielded significant (p < .05) differences for all
comparisons except for correct proof vs. proof scheme.
Students were quite accurate in judging the correct proof as correct (81.8 %) and the
purported proof with an inductive proof scheme as wrong (86.4 %). On the other hand,
students performed about chance on the proof containing an error in the logical chain
(45.5 %) and significantly below chance (t(64) = -5.54, p < 0.001) in the proof
containing an error in the proof structure (22.7%). The delayed test with proposition 2
showed similar patterns regarding students’ judgments (cf. Figure 3, left; light-grey)
as well as for the Conchran’s Q test (χ2(3) = 28.88, p < .001).
Figure 3: Solution rates without (left) and with consideration of explanations (right)
Students’ explanations for their decisions revealed that some students marked faulty
proofs as correct, although they had spotted the error or weakness of the proof. A
typical statement was “Except for the part with ‘only looking at the coefficients’ the
proof seems to be correct”. Counting all answers as correct that showed that the error
Cor
rect P
roof
Pro
of S
chem
e
Pro
of S
truct
ure
Logica
l Cha
in0 %
20 %
40 %
60 %
80 %
100 %
Proposition 1
Proposition 2
Cor
rect P
roof
Pro
of S
chem
e
Pro
of S
truct
ure
Logica
l Cha
in0 %
20 %
40 %
60 %
80 %
100 %
Proposition 1
Proposition 2

Sommerhoff, Ufer, Kollar
4–224 PME40 – 2016
had been detected yielded the same result patterns for both propositions although
numbers change slightly (cf. Figure 3, right).
The number of students stating an explanation for their decisions varies widely
between the purported proofs (43.9 % correct proof, 74.2 % proof scheme, 25.8 %
proof structure, 66.7 % logical chain). For the proofs with an error in the proof scheme
students were best in finding the correct reason for judging the proof as wrong (75.5 %
of the given explanations), for proof structure the worst (29.4 % of the given
explanations). The same pattern was observed for proposition 2.
We employed a generalized linear mixed-effects model (GLMM) analysis using the
lme4 package (Bates, Mächler, Bolker, & Walker, 2015) to analyze the influence of
the CSPs on proof validation. The model includes all six CSPs as well as the aspects
of proof validation as fixed effects and the participant as a random effect. The model
explained 36.8 % of the variance in students’ proof validation performance by the CSPs
and the aspects of proof validation. The model shows that, compared to identifying a
correct proof, it is much harder to identify errors in proof structure (b = -2.91, p < .001)
and logical chain (b = -1.52, p < .001) but easier to identify errors in the proof scheme
(b = 0.35, p > .05). Of the CSPs, only the conceptual mathematical knowledge base
and metacognitive awareness showed significant relations (c.f. Figure 4; stand.
regression weights β = 0.39 and β = 0.33 respectively) to students’ proof validation
skills. Employing the GLMM on data from both propositions yields similar results.
Figure 4: GLMM of CSPs and aspects of proof validation skills
For proposition 1, an analysis of interaction effects revealed that students’ conceptual
knowledge supports the detection of a wrong proof structure (p < .05) more than the
identification of the other proofs. On the other hand, conceptual knowledge shows a
weaker connection to identifying wrong proof schemes as compared to identifying the
other proofs (p < .05). Finally, the impact of metacognitive awareness is stronger for
detecting errors in the proof scheme as compared to evaluating the other proofs (p <
.05). Again, the data from the second proposition showed a similar pattern.
DISCUSSION
The results of our study focusing on the aspects of proof validation skills reveal clear
differences in students’ performance. Students have little problems identifying correct
Sommerhoff, Ufer, Kollar
PME40 – 2016 4–225
proofs and refusing inductive proof schemes, but perform poor when confronted with
other error types. The low success rate in finding errors in the overall logical structure
of the proof can be seen as additional evidence for the results that mathematics students
often focus too narrowly on individual inferences (zooming in) (Mejía-Ramos &
Weber, 2014; Weber & Mejía-Ramos, 2011). Yet, students were also not excellent at
finding errors in the logical chain that refers to the individual inferences and the
zooming in. The analysis of students’ explanations adds to this: How come students
mark proofs as correct although they were able to identify errors? And why do only
few students give reasons for their judgments although they were explicitly prompted?
One answer might be problems in understanding the proofs and giving suitable reasons.
Alternatively, the wrong judgments despite finding the errors could also be a side effect
of good proof constructions skills and students’ insight that the proof could be tackled
with a similar argument. Further evidence on students’ thoughts and views is needed
here, e.g. from interview or think-aloud studies.
So far, the overall results on the aspects of proof validation resemble those from prior
research, e.g. on secondary students in the area of geometry, indicating some
generalizability of these results over content area and age groups. Yet a replication with
propositions from multiple content areas would be beneficial to further assure the
validity and generalizability of the results.
The results regarding the influence of CSPs on proof validation skills indicate complex
relations. Both the domain-specific as well as domain-general CSPs showed significant
relations to students’ proof validation skills of similar magnitude. Therefore, domain-
general interventions, e.g. for metacognitive awareness, could have positive effects on
students’ proof validation skills and, vice versa, interventions on proof validation skills
might be expected to transfer to skills in other domains to a certain extent. Yet, the
results from the GLMMs show, that according interventions have to be created
carefully: Amongst the CSPs, neither the mathematical-strategic knowledge nor the
prerequisites referring to generative activities (procedural mathematical knowledge
and problem solving) show a significant relation to proof validation skills. This missing
relation of generative activities to proof validation is plausible. Beyond that, it indicates
that proof validation might offer a better entry into the learning of proof than proof
construction activities, since proof validation seems to be dependent on fewer
prerequisites, in particular generative skills. This would be an alternative to the current
university teaching style of mathematical proof, which is often mostly based on proof
construction. Although a potential impact of proof validation on proof construction
was not studied here, there are first results showing a significant connection of proof
validation and construction skills. Thinking of proof validation as one prerequisite for
proof construction also warrants such an approach. Still, more research, in particular
from intervention studies would be required to support this strategy.
Overall, our approach using CSPs and aspects of proof validation was applied
successfully and yielded several interesting implications for research on as well as for
the teaching of mathematical proof. The fact, that proof validation seems to depend
Sommerhoff, Ufer, Kollar
4–226 PME40 – 2016
less on some of the CSPs than proof construction (e.g. problem solving) and that proof
validation skills are needed for proof construction underlines the idea of “validation
before construction”.
References
Bates, D., Mächler, M., Bolker, B., & Walker, S. (2015). Fitting Linear Mixed-Effects Models
Using lme4. Journal of Statistical Software, 67(1).
Chinnappan, M., Ekanayake, M., & Brown, C. (2011). Specific and General Knowledge in
Geometric Proof Development. SAARC Journal of Educational Research, 8, 1–28.
De Corte, E., Mason, L., Depaepe, F., Verschaffel, L., Zimmerman, B., & Schunk, D. (2011). Self-regulation of mathematical knowledge and skills. In B. J. Zimmerman & D. H. Shunk (Eds.), Handbook of self-regulation of learning and performance (pp. 155–172). NY: T & F.
Fischer, F., Kollar, I., Ufer, S., Sodian, B., Hussmann, H., Pekrun, R., … Eberle, J. (2014).
Scientific reasoning and argumentation: Advancing an interdisciplinary research agenda.
Frontline Learning Research, 4, 28–45.
Healy, L., & Hoyles, C. (2000). A Study of Proof Conceptions in Algebra. Journal for
Research in Mathematics Education, 21(4), 396–428.
Heinze, A., & Reiss, K. (2003). Reasoning and Proof: Methodological Knowledge as a
Component of Proof Competence. In M. A. Mariotti (Ed.), International Newsletter of
Proof Competence (Vol. 4).
Inglis, M., & Alcock, L. (2012). Expert and novice approaches to reading mathematical
proofs. Journal for Research in Mathematics Education, 43(4), 358–390.
Inglis, M., & Simpson, A. (2008). Conditional inference and advanced mathematical study.
Educational Studies in Mathematics, 67(3), 187–204.
Mejía-Ramos, J., & Weber, K. (2014). Why and how mathematicians read proofs: further
evidence from a survey study. Educational Studies in Mathematics, 85(2), 161–173.
Polya, G. (1945). How to Solve it: A New Aspect of Mathematica Method. Princeton, NJ:
Princeton University Press.
Schoenfeld, A. H. (1985). Mathematical problem solving. New York: Academic press.
Schraw, G., & Dennison, R. S. (1994). Assessing metacognitive awareness. Contemporary
Educational Psychology, 19(4), 460–475.
Selden, A., & Selden, J. (2003). Validations of Proofs Considered as Texts: Can
Undergraduates Tell Whether an Argument Proves a Theorem? Journal for Research in
Mathematics Education, 34(1), pp. 4–36.
Selden, A., & Selden, J. (2015). A comparison of proof comprehension, proof construction,
proof validation and proof evaluation. In KHDM Proceedings Hannover Germany
December 2015.
Weber, K. (2001). Student difficulty in constructing proofs: The need for strategic knowledge.
Educational Studies in Mathematics, 48(1), 101–119.
Weber, K., & Mejía-Ramos, J. (2011). Why and how mathematicians read proofs: an
exploratory study. Educational Studies in Mathematics, 76(3), 329–344.
Yang, K. L. (2012). Structures of cognitive and metacognitive reading strategy use for reading
comprehension of geometry proof. Educational Studies in Mathematics, 80(3), 307-326.
2016. In Csíkos, C., Rausch, A., & Szitányi, J. (Eds.). Proceedings of the 40th Conference of the International
Group for the Psychology of Mathematics Education, Vol. 4, pp. 227–234. Szeged, Hungary: PME. 4–227
POETIC STRUCTURES AS RESOURCES FOR
PROBLEM-SOLVING
Susan Staats
University of Minnesota
Speakers engaged in conversation typically repeat and modify earlier comments. These
repetitions, or poetic structures, are commonplace in mathematical conversations, too.
A close analysis of 90 turns of an algebraic problem-solving conversation suggests
that poetic structures significantly facilitate the discovery of mathematical
relationships. I identify eight types of poetic structures that appear to act as language
resources for learning mathematics.
INTRODUCTION
Speakers of all languages repeat each other. Because repetition is pervasive in daily
speech (Du Bois, 2014), it may contribute to mathematical problem-solving
conversations. This paper highlights ways in which particular types of repetition—
poetic structures—facilitate students’ mathematical learning. Poetic structures occur
when speakers repeat the grammatical structures of phrases spoken before, perhaps
changing words or small aspects of grammar.
This close analysis of poetic structures over 90 conversational turns of an algebraic
problem-solving session seeks to contribute to research on language as a resource for
mathematical learning. This research largely grew from studies of multilingual
classrooms (e.g. Barwell, 2015; Planas & Setati-Phakeng, 2014), and is concerned with
issues such as code-switching, the influences of educational policy on classroom
communicative practice, and language as a resource in formal vs. informal
mathematics discourse. Because repetition is so commonplace, its analysis can deepen
our understanding of language as a resource for learning in multilingual classrooms, or
in monolingual classrooms in any language.
THEORETICAL FOUNDATION
Dialogic syntax, an emerging research focus in linguistics, forms the theoretical
foundation for this analysis (Du Bois, 2014; Sakita, 2006). Dialogic syntax recognizes
that as speakers repeat prior statements—their own or those of others—they reproduce
syntactic arrangements that create meaningful relationships across sentences and
across speakers. Hearers decode and respond to the meanings that are created at these
structural levels beyond the sentence. For example, in the hexagon task described in
this paper, Sheila’s minus 2…times 2 is recast in Joseph’s clarifying question:
78 S: So number of hexagons would be 4 times 6 minus n minus 2. So 4 times 6 would be 24. Number of hexagons would be 1, 2, 3, 4. 4, uh, times 2.
79 J: Times 2 or minus 2?

Staats
4–228 PME40 – 2016
The verbs minus and times shift within and across the speakers’ comments, while
retaining the direct object of 2. Dialogic syntax proposes this coordination as a “new,
higher order linguistic structure…the coupled components recontextualize each other,
generating new affordances for meaning” (Du Bois, 2014, p. 360).
Du Bois (2014) provides a useful review of the theoretical antecedents of dialogic
syntax, which draw from a wide range of fields, including linguistics, anthropology,
literary theory, and cognitive science. He identifies four foundational themes, some of
which resonate with prior research in mathematics education. The first theme,
parallelism, refers to the concrete repetitions within nearby utterances. In the example
above, Joseph’s minus 2 is parallel to his times 2, and both are repetitions of the endings
of Sheila’s sentences. Staats (2007) highlights ways in which these parallel, poetic
structures can express both inductive and deductive mathematical reasoning.
Underlying grammatical parallelism is the principal of indexicality, or the capacity of
language to refer to or point to other words and to elements of the situational context.
Indexical words like this, that, and variable names like n have been associated with
mathematical activities such as generalization and collaborative learning (Barwell,
2014; Radford, 2003). Parallelism occurs when units larger than a word—times 2—
point to corresponding units like minus 2, creating bundles of indexicality.
Du Bois’ second theme, analogy, refers to the meanings created through manipulation
of similar units. For example, times and minus are alternatives within the frame of
mathematical operations. The third theme, priming, is the experimentally-measured
tendency to repeat lexical or syntactic units.
The fourth theme, dialogicality, has received slightly more attention in mathematics
education research. Barwell (2015) following Bakhtin (1981), discusses three
orientations of dialogicality: multivoicedness, multidiscursivity, and linguistic
diversity. The first of these, multivoicedness, recognizes that all speech has a history.
Speakers recast words and meanings from their past interactions each time they talk.
This paper provides a detailed analysis of multivoicedness in a mathematical problem-
solving session. Overall, then, dialogic syntax is a new framework for mathematical
education research, but through its interdisciplinary character, it shares theoretical
antecedents with research on language as a resource for mathematical learning.
PARTICIPANTS AND TASK
Sheila and Joseph are undergraduate students who had recently completed a university
class in precalculus. They participated in a paid problem-solving session outside of
class that was audio- and video-recorded. Their task was to find an equation for the
perimeter of a string of n adjacent hexagons, arranged so that pairs of interior sides are
removed from the perimeter. They worked for about 40 minutes without any teacher
intervention; about nine minutes of the conversation are analysed here. The task
includes diagrams for hexagon strings for n = 1 to n = 4 hexagons, and a table of values
to be completed for n = 1 to n = 5 hexagons. A correct answer is p = 4n + 2. The task
Staats
PME40 – 2016 4–229
was based very closely on a proposed measure of readiness for undergraduate study
and can be viewed at Wilmot, et al (2011, p. 287).
METHODS FOR IDENTIFYING POETIC STRUCTURES
The first 90 turns of the conversation were coded using a spreadsheet to note the ways
in which a phrase formed a poetic structure with a previously spoken phrase. It was
necessary to develop a coding protocol, because a phrase can repeat elements of several
previous phrases. The coding approach relied on a combination of close attention to
poetic structures and grounded theory coding to iteratively improve the choices about
what phrases counted as repetitions of prior statements (Charmaz, 2006). The resulting
system was comparatively conservative. In Gries (2005), for example, any repetition
of syntax counts as repetition, even if all the words change. The phrase 3 times 2 would
be considered a repetition of the phrase 4 minus 1, because both involve a subject-verb-
object construction. However, mathematics education audiences are concerned with
language that facilitates mathematical learning. To better focus on continuity of
mathematical topic, two phrases had to share syntax and at least one word in order to
be considered a repetition. When multiple previous utterances could have been the
foundation of a repetition, I chose the most recent one. This method undercounts poetic
structures in comparison with related linguistics research.
I recorded the most recent previous turn in which the phrase occurred, even if this was
within the same speaker’s conversational turn; what the earlier phrase was; whether
there was a change in speaker; and whether the phrase was a nearly-perfect duplicate
of the previous line or a transformation of it.
I separated the conversation into four episodes, each representing a mathematical
insight that the students achieved together. In episode 1, turns 1- 28, Sheila and Joseph
filled a table of values on the task sheet for n = 1 to 5 hexagons and the corresponding
perimeter. In episode 2, turns 29-58, they determined that they should calculate
perimeter rather than area. In episode 3, turns 59-71, they initiated the idea that the
shared interior sides of the hexagon strings required them to subtract two, but they did
not resolve how many times to subtract two. In episode 4, turns 72-90, they expressed
a correct method, began to check their work, and wrote a formula in which both H and
N stand for the number of hexagons, #H(6) – 2(N – 1) = .
RESULTS: TYPES OF POETIC SPEECH
Close analysis of poetic structures over 90 turns at talk suggested eight types of
repetitions that contributed to the discovery of the mathematical relationships. There
were in addition poetic structures of that didn’t fall into a clear type. It is important to
note that each type is a discursive move that could easily occur in a non-mathematical
conversation. Contrast could occur, for example, as steamed rice or fried rice? A
comment Mark has some advice for you could prompt the Reversal: Well, I have some
advice for Mark! Because these poetic structures are all general discursive options,
when they occur in mathematics conversation, they help us identify moments when
language is a resource for mathematical learning. In the following section, I exemplify

Staats
4–230 PME40 – 2016
each of these types and I highlight moments when these poetic structure types appear
to facilitate mathematical thinking.
Poetic
Structure
Definition and Transcript Example
List Saying a pattern.
Turn 14: 1, 2, 3, 4, 5, 6. 6.
Echo Revoicing a short phrase.
In turn 14, the second 6 is an echo.
Comparison Saying two things are associated.
Turn 27: 22 for 5.
Contrast Posing two things as alternatives.
Turn 79: Times 2 or minus 2?
Interposed List Two lists are collated.
Turn 24: …1 to 6, 2 to 10, 3 to 14…
Consolidation Two previous poetic structures are combined.
Turn 62: …it would be 6L…it would be…10L…
This combines prior repetions in lines 52.2-52.3.
Expansion A previous phrase has a clarifying phrase inserted.
Line 64.5: total number of sides minus 2, 4, 6.
Here, total number of sides had the new phrase 2, 4, 6
inserted.
Reversal Subject and direct object switch places.
Turn 75: So it’d be like 6 times x per se number of hexagons. Here, 6
times … hexagons is a reversal of
Turn 72: hexagons times six
Table 1: Types of repetition in the hexagon conversation
POETIC SPEECH AS RESOURCE FOR MATHEMATICAL LEARNING
Episode 1: Filling the table
Sheila and Joseph found the perimeter of hexagon strings for n = 1 to 5 hexagons in
order to fill the table of values. I use List to refer to Sheila’s statement of 1, 2, 3, 4, 5,
6, as she counts the sides of the n = 1 hexagon case. This habit of naming elements of
a pattern became one of the most robust discursive moves for this conversation. Lists
always form an internal repetition, because the elements 1, 2, 3 suggest the next
element will be 4, but in line 15, Joseph’s List is also a repetition of Sheila’s speech,
because he follows Sheila’s method of noticing a pattern.

Staats
PME40 – 2016 4–231
14 S: 1, 2, 3, 4, 5, 6. 6.
15 J: So, this would be 1, 2, 3, 4, 5, 6, 7, 8, 9, 10. 10.
Both Sheila and Joseph used List to count the perimeter for the n = 3 and n = 4 cases,
and they both used Echoes, in which the terminal number in the list is repeated. At turn
24, they used a new repetition type that coordinates all the previous lists, a type I call
Interposed List, in which the terminal numbers of 5 previous turns are recast in a new
list. At 27, Joseph extends the Interposed List with a Comparison poetics structure.
24 S: Huh, okay, so we’re just putting in the 1 to 6, 2 to 10, 3 to 14, uh, 5, 1, 2. Wait.
27 J: 22 for 5.
The mathematical achievement of episode 1, developing and coordinating a data set,
was facilitated by four types of poetic structures.
Episode 2: Perimeter or Area?
Joseph suggested that they could draw additional interior sides to create interior
triangles. At turn 52, Sheila asserted that they should work on perimeter instead. Here,
I separate turn 52 into sublines, and I use indenting to place syntactically similar units
above each other. This formatting helps draw attention to the poetic structure.
52.1 S: …So then we’re counting all the sides,
52.2 so it’d be 6L.
52.3 For 2 it’d be 1, 2, 3, 4, 5, 6, 7, 8, 9, 10. 10L.
At 52.3, Sheila has used a Consolidation poetic structure, by modifying 52.2 and
inserting the List from 15. Turn 56 established a new List that isolates the perimeters
but that references and simplifies the Interposed List at 24. At turn 56, the Interposed
List was shortened into a new List that focuses only on the perimeters:
56 S: So this was 10L, 14L, 18L, 22L, right?
Episode 2 demonstrates the way in which new poetic structures can emerge from the
interaction of previous ones. Isolating the perimeters into a new list objectifies them
and allows speakers to create conjectures about them more easily. This mathematical
result was facilitated by the interaction of several poetic structures: List, Consolidation,
and Interposed List.
Episode 3: Each intersecting would be a negative 2.
Here, Sheila and Joseph began to consider the interior sides of the hexagon strings.
They grappled with the idea that they must perform a subtraction for these interior
sides, but they did not yet discover that they must subtract two (n – 1) times.
62.1 S: Uh, so this would be 6L. 6.
62.2 And then this would be 10L, minus 2. [Pencil touches 10L for the n = 2 case in the table of values]
62.3 Minus 2.
62.4 This would be 2, 4 minus 4. [Pencil touches n = 3 diagram]
Staats
4–232 PME40 – 2016
62.5 This would be 6. 18L. [Pencil hovers at the n = 4 diagram]
62.6 So the total number of sides minus 2 on this side.
62.7 So it’d be, uh, 6. 6, [Finger touches the n = 1 diagram]
62.8 and then this would be, uh, 12 minus 2. [Hovers at the n = 2 diagram]
62.9 So. [At 63, Joseph responds: Okay.]
There are many poetic structures at play in turn 62. The first mention of minus is at
62.2. The interpretation that accounts for the longest stretch of these words is that 62.1
and 62.2 are a Consolidation of 52.2-52.3 (it’d be 6L…it’d be…10L) with the extension
of minus 2. Line 62.4 repeats and modifies 62.2, and also inserts 2, 4. Lines 62.2 and
62.4 are the first times that Sheila counted the interior sides. Line 62.4 is a new type of
poetic structure, Expansion, because 62.2 is expanded with a novel list.
Turn 64 is largely a repetition of 62, with poetic correspondences (64.2,62.1), (64.3,
62.2), (64.4, 62.4,), (64.5, 62.7).
64.1 S: So that would be like a formula, right?
64.2 So this would be 6L,
64.3 and then this one would be, uh, the total number of sides minus 2.
64.4 And then this one would be the total number of sides minus 4.
64.5 This would be the total number of sides minus 2, 4, 6.
After 64.2, the specific perimeters are replaced with the more generalized though
ambiguous total number of sides, and 64.5 is a consolidation of the poetic structures in
64 and lines 62.4 and 62.7. The generalization may be an attempt to move towards the
use of variables. This generalization at 64.5 was developed through a sequence of
repetitions than spans all three episodes, at turns 62, 52 and 15.
Episode 4: Total number of hexagons minus 1
In turns 72-90, Sheila and Joseph developed a method for correctly calculating the
perimeter. In episode 4, a type of poetic structure that occurs several times is Reversal.
Joseph’s comment at turn 75, for example, was a reversal of Sheila’s comment at 72:
72 S: So, so the total number of hexagons times six.
75 J: So it’d be like 6 times x per se number of hexagons.
Here, Joseph shifted hexagons times six to become 6 times…number of hexagons.
Although Sheila didn’t confirm this reversal verbally or in writing at that moment, it
was still a significant moment mathematically. Joseph’s reversal is a movement
towards discursive standardization, because he suggested a standard variable form, x,
and he suggested writing the coefficient before the variable.
As Sheila and Joseph worked on the n = 4 hexagon case, they knew that there is a two
involved and that there is a subtraction. They worked through several approaches to
writing the formula. At turn 79 (we saw this above), Joseph repeated Sheila’s times 2
with a Contrast poetic structure to clarify her method.

Staats
PME40 – 2016 4–233
During turn 90, Sheila had written a column of formulas on the paper:
4H – N – 2
4(6) – N – 2
24 –
The last of these was edited and erased several times as both students tried various
ways of getting 18 from the n = 4 case. At line 90, Sheila first expressed a correct
method for calculating the perimeter of 18, and completed her writing at 90.7 with 24
– 2(4 – 1) = . Her pencil tip shifted between touching the hexagon diagrams and
writing an equation.
90.1 S: So this would be 2, 4, 6. [touching interior sides for n = 4 diagram]
90.2 So that would be 1, 2, 3, 4, 6. [touching n = 1 to 4 diagrams]
90.3 So let’s see, 1, 2, 3. [touching interior sides for n = 4]
90.4 So number of insides, 4,
90.5 so 4 minus 1 times, uh,
90.6 4 minus 1,
90.7 so this would be 2 into 4 minus 1 equals, right?
90.8 So that would be 3.
90.9 3 times 2 would be 6.
90.10 6 from 24 is 18, right?
The internal poetic structures from 90.1 to 90.3 shift attention across different potential
variables—the number of interior sides, the number of hexagons, and finally, the
number of pairs of interior sides with the new list 1, 2, 3. These three poetic structures
seem to facilitate the shift from 4 to 4 minus 1 that happens at 90.4 to 90.5. A Reversal
from 90.5 to 90.7 in which 4 minus 1 shifts from subject to predicate position seems to
help get the written 2 in front of the written (4 – 1), though there is some ambiguity
here due to erasures and the angle of the video recorder. Turn 90 ends with a number
of Echoes, which may signal a shift into focusing on calculation instead of coordinating
variables and deciding on notation. Some of the clear poetic structures in turn 90, like
4 minus 1 and 3 times 2, were not coded as repetitions for this analysis because they
did not meet the criteria of shared syntax and at least one word in common.
CONCLUSION
This analysis identified poetic structure transformations across most-recent pairs of
utterances. Thus, it allows repetitions to be traced backwards across turns at talk
through many transformations. For example, the list 1, 2, 3, 4 occurred directly in turns
78 and 74. In 74, it was associated with the phrase number of hexagons; this phrase
was transformed from number of sides in 62. This phrase in 62 was a poetic structure
transformation of the specific perimeters 6L, 10L and 18L in the same turn, which trace
to turns 56 and 52 where the students isolated the perimeters, e.g. 10L, 14L, 18L, 22L.
Staats
4–234 PME40 – 2016
Lines 56 and 52 had coded repetitions to the interposed list at turn 24, which grew from
the Lists and Echoes at turn 14: 1, 2, 3, 4, 5, 6. 6.
These very small discursive moves like Lists and Echoes grew, through a series of
repetitions and modifications, into a solution for the hexagon task. Mathematical
achievements that co-occurred with poetic structures included: development of a data
set (List, Echo); coordination of different levels of data (Interposed List, Comparison);
isolating one data level for further analysis (List); generalization (Consolidation);
transformation of the variable n into (n – 1) (general poetic structures); and moving
towards a standard form of mathematical writing (Reversal). In each case, poetic
structures acted as language resources for discovering mathematical relationships.
References
Bakhtin, M. M. (1981). The dialogic imagination: Four essays. (Ed. M. Holquist; Trans., C.
Emerson and M. Holquist). Austin, TX: University of Texas Press.
Barwell, R. (2015). Language as resource: Multiple languages, discourses and voices in
mathematics classrooms. In K. Beswick, T. Muir & J. Wells (Eds.), Proc. 39th Conf. of the
Int. Group for the Psychology of Mathematics Education (Vol. 2, pp. 89-96). Hobart,
Australia: PME.
Charmaz, Kathy. (2006). Constructing grounded theory: A practical guide through
qualitative analysis. London: Sage.
Du Bois, J. (2014). Toward a dialogic syntax. Cognitive Linguistics, 25(3), 359-410.
Gries, S. (2005). Syntactic priming: A corpus-based approach. Journal of Psycholinguistic
Research, 34(4), 365-399.
Planas, N. & Setati-Phakeng, M. (2014). On the process of gaining language as a resource in
mathematics education. ZDM Mathematics Education, 46, 883-893.
Sakita, T. (2006). Parallelism in conversation: Resonance, schematization, and extension
from the perspective of dialogic syntax and cognitive linguistics. Pragmatics & Cognition,
14(3), 467-500.
Staats, S. (2008). Poetic lines in mathematics discourse: A method from linguistic
anthropology. For the Learning of Mathematics, 28(2), 26-32.
Wilmot, D., Schoenfeld, A., Wilson, M., Champney, D., & Zahner, W. (2011). Validating a
learning progression in mathematical functions for college readiness. Mathematical
Thinking and Learning, 13(4), 259-291.

2016. In Csíkos, C., Rausch, A., & Szitányi, J. (Eds.). Proceedings of the 40th Conference of the International
Group for the Psychology of Mathematics Education, Vol. 4, pp. 235–242. Szeged, Hungary: PME. 4–235
DECISION MAKING IN THE CONTEXT OF ENACTING A NEW
CURRICULUM: AN ACTIVITY-THEORETICAL PERSPECTIVE
Konstantinos Stouraitis
National and Kapodistrian University of Athens
In the present paper we study teachers' decision making as response to emerged
contradictions and how these decisions are framed in the context of enacting a new set
of curriculum materials. Our data come from discussions in teachers' group meetings
through one year. We use activity theory to capture the social, temporal, moral and
developmental dimensions of decision making and to interpret two teachers' concrete
decisions. The social and systemic context appear to frame and influence teachers'
decisions of their goals and the undertaken actions.
INTRODUCTION
In the context of curriculum reform efforts, teachers are seen as active agents and
designers, whose instructional actions are influenced by curricular materials, but also
shape the enacted curriculum alongside their students (Remmilard, 2005). Situating
teacher at the centre of the curriculum enactment, highlights the importance of teacher's
decision making. Thus, a number of research studies focus more or less explicitly on
teachers' decisions. For example, Lloyd (2008) concludes that the participating
teacher's perception of students' expectations and his own discomfort associated with
using the new curriculum were key factors in his decisions. Stockero & Van Zoest
(2012) classify as productive teachers' classroom decisions that extend mathematics,
emphasize mathematical meaning and pursue student mathematical thinking.
Schoenfeld (2011) uses the notions of resources (knowledge and other material and
intellectual resources), goals (conscious or unconscious aims) and orientations (beliefs,
values, biases, etc.) to "offer a theoretical account of the decisions that teachers make
amid the extraordinary complexity of classroom interactions" (p. 3). Thomas & Yoon
(2014) describe a teacher's conflictual goals and use Schoenfeld's framework to
interpret his decision to modify these goals in action.
The above studies research in-the-moment teacher decisions, focusing on the
classroom context and emphasizing the individual dimension of deciding.
Nevertheless, the broader social, temporal and cultural dimensions of a teacher's
decisions are not addressed. In our study we seek a better understanding of how
decision making process develops drawing on cultural historical activity theory. The
study is conducted in two secondary schools in Greece at the time of the introduction
of a newly prescribed mathematics curriculum, in years 2012-13. In Stouraitis, Potari
& Skott (2015), we have analysed the contradictions emerged in teaching and discussed
in reflective group meetings of the schoolteachers. In this paper we study teachers’
decisions while dealing with the emerged contradictions in the context of enacting a
new set of curriculum materials. In particular, we focus on teachers who decide to make

Stouraitis
4–236 PME40 – 2016
or not shifts into their teaching and we examine how decision-making is framed and
develops considering social and systemic dimensions.
THEORETICAL CONSIDERATIONS
Activity theory (AT) offers a lens that tries to capture the complexity of teaching, by
integrating dialectically the individual and the social/collective. The activity is driven
by a motive and directed towards an object (Leont'ev, 1978), in our case the motives
of students' learning of mathematics and the fulfilment of teachers' other professional
obligations. From this perspective, the unit of analysis is the activity system (AS)
(Engeström, 2001a) that incorporates social factors (related to the communities, the
rules, and the division of labour within these communities) that frame the relations
between the subject and the object with the mediation of tools (figure 1). In our case,
one of the tools with considerable influence is the new curriculum.
Activity is carried out through actions which
are "relatively discrete segments of behaviour
oriented toward a goal" (Engeström, 2001b).
We conceptualise teaching action as discrete
instructional acts or clusters of acts that
constitute the teaching activity, e.g. the
selection or creation of a task, the enacting of a
lesson plan, etc.
Every AS is characterised by contradictions.
They may emerge when an AS adopts new
elements from the outside, such as a new tool
or a new rule, causing a conflict with how it
functions at present. Contradictions are the driving forces for the development of every
dynamic system. They may create learning opportunities for the subject and may
broaden the activity, for example leading to reconsideration of the actions and goals
(Engeström, 2001a; Potari, 2013). In our study, the introduction and enactment of the
new set of curricular materials produced or revealed contradictions in teaching activity
that emerged in group discussions (Stouraitis, Potari & Skott, 2015).
Dealing with contradictions involves decisions about the goals and the actions to be
undertaken. Of particular importance are decisions related to the "discrete individual
violations and innovations" (Cole & Engeström, 1993), that is the search of novel
solutions as response to the emerged contradictions. Engeström (2001b) argues that:
Decisions are not made alone, they are indirectly or directly influenced by other
participants of the activity. Decisions are typically steps in a temporally distributed chain
of interconnected events. Decisions are not purely technical, they have moral and
ideological underpinnings with regard to responsibility and power. And the content of
decisions is not restricted to the ostensible problem or task at hand; they always also shape
the future of the broader activity system within which they are made. (p. 281)
Figure 1. The activity system
(adapted from Engeström, 2001)
Stouraitis
PME40 – 2016 4–237
Engeström characterizes the four dimensions of decision making described in the
extract respectively as: social-spatial, anticipatory-temporal, moral-ideological and
systemic-developmental. These dimensions are used in this study to capture the nature
of the decisions that teachers make and the underlying reasons.
METHODOLOGY
A new set of reform-oriented curricular materials was introduced and piloted in a small
number of schools in Greece in 2011-12 and 2012-13. The new materials emphasize
students' mathematical reasoning and argumentation, connections within and outside
mathematics, communication through the use of tools, and students’ metacognitive
awareness. It also attributes a central role to the teacher in designing instruction. In
2012-13 we collaborated with teachers in three of the lower secondary schools that
piloted the new materials. The collaboration took place in group meetings at the
respective schools, as the author, who was also a member of the team that developed
the curriculum materials, supported the teachers by providing explanations about the
rationale of curriculum materials. In these meetings the teachers discussed about their
lesson planning and reflected on their experiences from teaching different modules of
the designed curriculum. In this paper, we refer to a group of five teachers working in
school A that participated in eight 2-hour meetings during a school year.
School A is a Greek experimental school with an innovative spirit. Our focus here is
on the teaching decisions of two teachers, Marina and Linda. They both have more
than 25 years of teaching experience and additional qualifications beyond their teacher
certification, as Marina has a masters’ degree in mathematics and Linda has one in
mathematics education. Also, they both have experiences with innovative teaching
approaches, and they have participated in teacher collaborative groups that develop
classroom materials. Further, Marina has written papers for conferences and for
journals for mathematics teachers, maintains links to communities dealing with
mathematics and is more informed than Linda about the recent activities of the
mathematics education community in Greece. Linda has also been involved in
producing materials and offering professional development courses for mathematics
teachers. Both teachers have strong views about their instructional choices and a
critical stance on teaching innovations and materials introduced from various agents.
Concerning the new mandated curriculum, Marina says that she considers it a
"legitimizing umbrella over my practice"(Marina, 1st interview), a comment with
which Linda explicitly agrees.
The data material consists of transcriptions of audiotaped conversations and interviews.
The transcriptions were analysed with methods inspired with grounded theory
(Charmaz, 2006). The initial open coding resulted in the identification of discussion
themes for each meeting, forming thematic units. We used the thematic units to identify
situations that teachers experience contradictions and decide to make or not shifts into
their teaching. We traced teachers' decisions resulting to shifts through different
meetings and interviews to interpret these decisions and the factors influencing them.

Stouraitis
4–238 PME40 – 2016
This interpretation is inspired by AT and Engestrom’s four dimensions of decision
making discussed in our theoretical framework.
RESULTS
Below we present two examples in which Marina and Linda become aware of a
contradiction but decide to deal with it in contrasting ways. In particular, we describe
how decision making evolves in time and is framed in the teachers’ interaction.
First example: teaching congruence involving geometrical transformations
Geometrical transformations are introduced as a distinct topic in the new curricular
materials with the rationale of supporting students’ development of spatial sense and
of using transformations when tackling issues of congruence and similarity. Teaching
issues of the topic are discussed repeatedly in the reflection groups, as the topic has not
been taught before under this new perspective. The use of transformations as a proving
tool is an alternative to the Euclidean perspective on school geometry: the intuitive use
of the moving figure is seen as incompatible with the rigorous deductive rationale of
Euclidean geometry. This issue was highlighted in the discussions in school A. The
discussion below is whether geometrical transformations are to have a role in teaching
congruence of triangles in grade 9.
In the fourth meeting (A4), Marina refers to her introductory lesson on triangle
congruence in grade 9 and to her students response that two triangles are congruent if
they "match after translation or reflection or rotation". She considers using tasks with
geometrical transformations when teaching the congruence of triangles and she
describes her goal saying "I want them [the students] to understand that when we
compare angles or segments or generally elements of polygons, we have two tools.
One is transformations and the other the criteria of triangle congruence". However, she
has not decide, since she is wondering how she can do this, as “there is a need of
investigation and inquiry before doing so". Linda listens to Marina and finds her
thoughts interesting. But she claims that “every topic has its purpose" and that "there
is a purpose to learn how to write [a justification], to observe the shape, to distinguish
the given data from the required claims, to make conclusions, and to prove" implying
that these goals can be achieved through teaching congruence with a Euclidean
perspective, without involving transformations.
In the next meeting (A5) Marina, having made the decision to combine the two
approaches, describes how her students in grade 9 work with the congruence of
triangles in combination with geometrical transformations to prove the congruence of
segments or angles. She notices that this happened regularly in the class she taught last
year, but not very often in the one is teaching now. In this meeting, epistemological
issues concerning the rigor and the intuition inherent in different approaches are also
discussed. Linda follows the discussion, appreciating Marina’s approach as a "nice
idea" and saying that she likes children working in both ways (triangle congruence and
geometrical transformations).

Stouraitis
PME40 – 2016 4–239
In the sixth meeting (A6) Marina has completed the topic of congruence and reflecting
on her use of transformations in the classroom and on students work, explains her
decision as creating an "opportunity to change the framework [of proving] in grade 9"
and to "get away from Euclidean geometry".
In the 8th meeting (A8) Marina mentions a seminar on transformations she attended
three years ago. She also mentions that some students use transformations in other
topics, such as trigonometry, indicating that they use them as an operational tool to
visualize and prove congruence. In this discussion Linda expresses her decision not to
intertwine the different topics saying: "I like transformations per se. I don't like
overusing them later in congruence … I don't find the reason to [do so]".
Examining Marina's approach, as it appears in the discussions, a shift in her teaching
of congruence can be traced. She realizes the possibility of combining congruence and
geometrical transformations, she decides to do so, and later she selects tasks to
highlight the potential of transformations. Her initial goals to highlight the existence
of two proving tools, are later enriched with epistemological dimensions "to get away
from Euclidean geometry" (A6). These shifts seem to have been facilitated through
Marina's work in her classroom and her reflections during the group discussions. Linda
acknowledges that geometrical transformations can be used as proving tools for
congruence, but she prefers not to combine these two perspectives, pursuing the
affordances of Euclidean geometry.
Second example: the use of counters in teaching integer's operations
The new curriculum materials suggest the introduction of operations with positive and
negative numbers by using models, like counters, and intuitive approaches, like the
movement on the number line. In the year of the study this introduction was condensed
in 7th grade with an emphasis on the intuitive basis for the pupils' engagement with
concepts and procedures. The use of intuitive models is seen as a way to deal with the
contradiction between the concrete context on which operations with integers are based
and the abstract (mathematical) definitions of operations of integers. Below we
describe the way Linda and Marina cope with this contradiction.
In the 4th meeting the discussion is about teaching integers and their operations.
Marina and Linda claim that negative numbers are easily introduced because of the
children's experiences and addition of integers is understandable using metaphors such
as profit and loss. However, both teachers recognize the difficulties in teaching
subtraction, especially when a negative is subtracted from another integer.
Linda describes her use of counters in the form of abstract symbols (● for +1 and o for
-1) (A4, 12-15). She explains that for the subtraction 3-(-2), we take 2 o from a set of
3 ●, and that she called children to add two zero-pairs (every zero-pair is consisted
from one ● and one o). In this way they were able to take away the two o. She says that
she found this model "somewhere" and she implemented it, recognizing that the
curriculum materials suggest a similar model with counters in the form of cards.

Stouraitis
4–240 PME40 – 2016
Marina states that she "has a problem with these" (A4, 25), because "for some children
is very difficult to understand the model" (25) and "it is easier to discuss that
subtracting is equivalent to add the opposite" (37). With the counters "you need too
much time to teach a model [that students] may never understand" (42), while "it
sounds very reasonable to tell them that subtraction is the opposite of addition" (46).
Linda, supporting her decision, says that her goal was students' understanding of
operations, "why is done this way" (32), to become "convinced" (34), "not to use it [the
model] for long period of time, but to understand why subtraction is transformed into
addition" (36). When Marina states that her goal in teaching operations is students to
manipulate negative numbers making operations correctly, Linda argues that if we
want this, we must have convinced them. "Unless we teach them in a completely formal
way, that's it and do it. But then, the message you give is that you must do what you
are told to do. It isn't right …" (53). Describing the discussions in the classroom, she
says: "we discussed it in two ways. I told them that after all these I 'm convinced a
little. I didn't t tell them that I 'm fully convinced". Later, another colleague suggested
a model with ice cubes for -1, and Linda responded "I suggested the bullets [● and o
for +1 and -1] to think abstract [the students]. Because if I start describing ice cubes,
they'll be stuck in the ice cubes" (167)
As it appears in the discussions, Linda adopts a model as a tool for teaching operations.
She seems to be aware about the affordances and the limitations of similar models and
she decides to use this one which is compatible with her goal for students'
understanding and for the development of students' abstract thinking. Her decision is
in line with the new curriculum materials, but in opposition with the previous ones and
with her colleagues' decisions. She also exhibits sensitivity to her students' need to
understand and to get involved. Marina prioritizes the goal of quick and error-free
execution of operations by students, and she decides not to use such models.
DISCUSSION AND CONCLUSION
The introduction of the new curricular materials created conflicts with the pre-
established tools and forms of the teaching activity. The emerged contradictions may
provide opportunities for teachers to engage differently in mathematics teaching and
learning. The analysis exemplifies these opportunities and the teachers' decisions to
make or not shifts into their teaching. Furthermore, teacher's decisions of the goals and
the undertaken actions, appear to be socially, historically and systemically influenced.
Below we discuss Marina's and Linda's decisions in the aforementioned examples,
related to the four dimensions of decision making as formed by Engeström (2001b).
The social-spatial dimension is found in the communities influencing the decisions. In
the first example, the group discussions in the meetings appeared to be supportive to
Marina's gradual formulation of goals and means, while students' predisposition to use
geometrical transformations in congruence functioned as trigger for her decision. Linda
had not such experience with her students and she did not adopt Marina's goals and
decisions despite her involvement in the group discussions. But in the second example,
Stouraitis
PME40 – 2016 4–241
Linda's classroom experiences were supportive for her decision to use counters. For
both teachers, participating in communities before the year of the study seem to
influence their decisions. For Marina, her comprehensive experiences with
mathematics and her engagement in a learning community specifically committed to
discuss geometrical transformations may be important. Respectively for Linda,
participating in communities dealing with teaching materials and teachers' guides
supported her fluency in adopting tools such as the counters.
The anticipatory-temporal dimension can be found in the temporally distributed steps
of decisions. Marina's decision to intertwine geometrical transformations with
Euclidean geometry in grade 9, came after her decision to teach systematically
transformations in grade 8. It is also precursor for using transformations in other topics
such as trigonometry in grade 9. Linda's decision to use the model of counters is a link
of the chain including realistic situations modelled by positive and negative integers,
other models for operations and mathematical reasoning for these operations.
The moral-ideological dimension is grounded on issues of power and teacher's
responsibility about students' well-being. In the first example, students' positive
reactions to Marina's attempts to consider transformations as proving tool, were crucial
to her decisions. Similarly in Linda's decision, students' questioning and responding
were supportive for her. In both examples, students' involvement, understanding and
positive dispositions is the ground for teacher's decisions.
The systemic-developmental dimension is found in the possibilities for action based
decisions to shape the future of the broader activity. In both examples, if adopted by
the collective subject (the community of mathematics teachers), Marina's and Linda's
decisions can influence the teaching activity. Using geometrical transformations as
alternative proving tool alongside Euclidean geometry and using models and intuitive
approaches for teaching operations of integers are decisions that can broaden the
horizon of teaching activity, at least in Greek educational context.
Linda and Marina share similar experiences and perspectives with the new set of rules
and tools in the form of the new curricular materials. For them significant communities
include the school they both work at, and the same reflection group that discusses
approaches to teaching according to the new curriculum materials. Both adopt a similar
– but not identical – view for students' learning as the object of the activity: they
prioritize understanding, mathematical reasoning and connections with reality and
within mathematics. Yet, there are significant differences between the goals they are
setting, the decisions they make and, consequently, the actions they undertake. This is
less striking if one considers these two teachers as having "different positions and
histories and thus different angles or perspectives on their shared general object"
(Engeström, 2001b, p. 286). Marina appears more fluent with the mathematics of
geometrical transformations to use them as a proving tool alternative to Euclidean
geometry, while Linda is more informed and familiar with manipulatives and models
as teaching tools to exploit them in teaching operations with integers. The apparent
Stouraitis
4–242 PME40 – 2016
differences may possibly and in part be explained by the different communities they
have participated in and the tools mediating the respective activities.
Schoenfeld's framework (2011) may be fruitful for interpretations about the classroom
in-the-moment decisions of Marina and Linda. But, "traditional views locate decision
making in the heads of individuals at a given point of time in a particular place"
(Engeström, 2001b, p.282) and thus, the social, historical and systemic character of
decision making are out of search. Searching what makes teachers form goals and
what creates the horizon for possible actions under an activity theoretical view
contributes to our understanding of teachers' decisions in social, temporal, moral and
systemic terms.
References
Charmaz, K. (2006). Constructing grounded theory. A practical guide through qualitative
analysis. London: Sage.
Cole, M. & Engeström, Y. (1993). A cultural historical approach to distributed cognition. In
G. Salomon (Ed.), Distributed cognitions: Psychological and educational considerations
(pp. 1-46). Cambridge: Cambridge University Press.
Engeström, Y. (2001a) Expansive Learning at Work: Toward an activity theoretical
reconceptualization. Journal of Education and Work, 14(1), 133-156.
Engeström, Y. (2001b). Making expansive decisions: An activity-theoretical study of
practitioners building collaborative medical care for children. In C. M. Allwood, & M.
Selart (Eds.), Decision making: Social and creative dimensions (pp. 281-301). Dordrecht:
Kluwer.
Lloyd, G. M. (2008): Teaching mathematics with a new curriculum: changes to classroom
organization and interactions, Mathematical Thinking and Learning, 10:2, 163-195.
Leont’ev, A.N. (1978). Activity, Consciousness and Personality. Englewood Cliffs: Prentice
Hall.
Potari, D. (2013). The relationship of theory and practice in mathematics teacher professional
development: an activity theory perspective. ZDM, 45(4), 507–519.
Remillard, J. (2005). Examining key concepts in research on teachers' use of mathematics
curricula. Review of Educational Research, 75(2), 211-246.
Schoenfeld, A. H. (2011). How we think. A theory of goal-oriented decision making and its
educational applications. New York: Routledge.
Stockero, S. L., & Van Zoest, L. R. (2012). Characterizing pivotal teaching moments in
beginning mathematics teachers’ practice. Journal of Mathematics Teacher Education, 16,
125-147.
Stouraitis, K., Potari, D., Skott, J. (2015) Contradictions and shifts in teaching with a new
curriculum: the role of mathematics. Paper presented in CERME9, 2015, Prague.
Thomas, M., & Yoon, C. (2014). The impact of conflicting goals on mathematical teaching
decisions. Journal of Mathematics Teacher Education, 17, 227-243.
2016. In Csíkos, C., Rausch, A., & Szitányi, J. (Eds.). Proceedings of the 40th Conference of the International
Group for the Psychology of Mathematics Education, Vol. 4, pp. 243–250. Szeged, Hungary: PME. 4–243
UNDERSTANDING VARIATION IN ELEMENTARY STUDENTS’
FUNCTIONAL THINKING
Susanne M. Strachota
University of
Wisconsin-Madison
Nicole L. Fonger
University of
Wisconsin-Madison
Ana C. Stephens
University of
Wisconsin-Madison
Maria L. Blanton
TERC
Eric J. Knuth
University of Wisconsin-
Madison
Angela Murphy Gardiner
TERC
This research is part of a larger study that used a learning progressions approach to
characterize students’ algebraic thinking over time in terms of levels of sophistication.
In this paper, we report on analyses of two students’ interviews over a three-year
period and focus on one big idea from our learning progression—functional thinking—
to demonstrate how the development of the two students’ functional thinking varied.
The results of this study lead us to hypothesize that such variation may be due to
differences in the development of students’ understandings of other core algebraic
concepts.
INTRODUCTION
While early algebra researchers have traditionally focused their work on fairly small
samples of students, some large scale and/or longitudinal studies in early algebra
settings have recently been conducted (e.g. Britt & Irwin, 2008; Schliemann, Carraher,
& Brizuela, in press). We have likewise taken a longitudinal approach to early algebra
research, using the construct of learning progressions as a tool to frame our work
(Fonger et al., 2016). This work has included a focus on functional thinking and the
characterization of the development of students’ understandings around this concept
over time (Stephens, Fonger, Blanton, & Knuth, 2016a). Our focus has been on the
identification of shifts in understanding observed across multiple classrooms of
students. One unexplained phenomena in this work, however, has been the variation in
individual students’ progress over time as they develop more sophisticated ways of
thinking about early algebra concepts. Our purpose in this paper is to investigate the
unexplained phenomena of variation in children’s functional thinking as they progress
through a three-year early algebra intervention.
BACKGROUND
This research is part of a larger project concerned with the fundamental question of
how to support students in elementary grades to be prepared for middle grades algebra
and beyond (cf. Blanton et al., 2015). The data described here are situated in the context
of an Early Algebra Learning Progression [EALP] that involves the coordination of a
curricular framework and progression, an instructional sequence, assessments, and

Strachota, Fonger, Stephens, Blanton, Knuth, Murphy Gardiner
4–244 PME40 – 2016
levels of sophistication that characterize student’ understandings over time (Fonger et
al., 2016; Fonger, Stephens, Blanton & Knuth, 2015).
As Fonger et al. (2016) detail, the EALP’s curricular framework guided the
development of an early algebra intervention and associated assessments. The early
algebra intervention consists of an instructional sequence of lessons for Grades 3–5
(ages 8-11 years). Written and interview assessments included anchor items given at
each grade level to track learning over time. We identified levels of sophistication by
coordinating mathematical perspectives, existing literature on students’ understandings
of various algebraic concepts, and our analyses of children’s responses to anchor items.
These levels enabled us to describe trends in students’ understandings of core algebraic
concepts over time in the context of our curricular framework/progression,
instructional sequence, and assessments. Next, we explain the levels of sophistication
used to characterize children’s developing functional thinking (FT) as they participated
in our Grades 3–5 early algebra intervention (see Stephens et al., 2016b for further
elaboration of these levels).
LEVELS OF SOPHISTICATION
We define levels of sophistication as “benchmarks of complex growth that represent
distinct ways of thinking” (Clements & Sarama, 2014, p. 14), capturing patterns in
students’ reasoning over time. It is not uncommon for children to skip levels, or regress
to previous levels of thinking when faced with a new task (Clements & Sarama). See
Table 1 for the levels of sophistication describing children’s functional thinking and
see Stephens et al. (2016b) for elaboration on the research that informed the positing
of these levels of sophistication. In this ongoing work, we found that as a group
students progress “in order” through the levels. Some students, however, demonstrate
variation in their progress over time. In this paper we build on our previous work by
seeking to better understand this variation in students’ thinking.
Level of sophistication Description of Level
Other Student uses alternative or unidentifiable strategy.
L0: Restatement Student restates the given information.
L1: Recursive-
Particular
Student identifies a recursive pattern by referring to particular
numbers only. The pattern may be identified as a value for the
independent or dependent variable, or both.
L2: Recursive-
General
Student identifies a correct recursive pattern. The pattern may be
identified for the independent or dependent variable, or both.
L3: Covariation Student identifies a correct covariational relationship. The two
variables need to be coordinated rather than mentioned separately.
L4: Functional-
Particular
Student identifies a functional relationship using particular numbers
but does not make a general statement relating the variables.

Strachota, Fonger, Stephens, Blanton, Knuth, Murphy Gardiner
PME40 – 2016 4–245
Level of sophistication Description of Level
L5: Functional-
Basic
Student identifies a general relationship between the two variables but
does not identify the transformation between them.
L6: Functional-
Emergent
Variables
Student identifies an incomplete function rule using variables, often
describing a transformation on one variable but not explicitly relating
it to the other. Student might also write several function rules,
indicating an emerging understanding of how to relate two variables.
L7: Functional-
Emergent Words
Student identifies an incomplete function rule in words, often
describing a transformation on one variable but not explicitly relating
it to the other or not clearly identifying one of the variables.
L8: Functional-
Condensed
Variables
Student identifies a function rule using variables in an equation that
describes a generalized relationship between the two variables,
including the transformation of one that would produce the second.
L9: Functional-
Condensed
Words
Student identifies a function rule in words that describes a generalized
relationship between the two variables, including the transformation
of one that would produce the second.
Table 1: Levels of Sophistication Describing FT (from Stephens et al., 2016b).
METHOD AND DATA SOURCES
Five of the students who participated in our intervention were interviewed at the end
of Grades 3, 4, and 5. We selected the five students because their teachers identified
them as belonging to the “upper 30%” of the class mathematically and as students who
were more likely to discuss their thinking.
In the interviews, students were asked to solve problems similar to those posed in the
written assessments so that we could gain further insight into their thinking. Interviews
took place several weeks after the year-end written assessments. In the interviews,
students were presented one problem at a time on paper. Most chose to write their
responses first and then discuss their reasoning with the interviewer. The interviewer
asked additional questions to better understand the students’ thinking. Interviews were
videotaped and transcribed.
We focus here on results generated from a functional thinking item (see figure 1) that
students solved in all three interviews. Students completed parts a-d in the Grade 3
interview and all parts of the item in the Grades 4 and 5 interviews. Although part e
was not included in the Grade 3 interview, we are able to compare students’ thinking
on part e to their thinking on part c in later grades. Part e is more challenging than part
c, because the solution in part e requires another step (adding two). However, like part
c, part e assesses the sophistication of students’ representations of functional
relationships.

Strachota, Fonger, Stephens, Blanton, Knuth, Murphy Gardiner
4–246 PME40 – 2016
Figure 1: Functional Thinking Interview Item.
We analyzed all five students’ interview transcripts and written responses generated
during the interview. In this paper we present results from two of the five students,
whom we call Barry and Meg. We choose to focus on Barry and Meg because their
interview responses provide us with the opportunity to illustrate and explore variation
in how students progressed through the levels of sophistication over time. Responses
were coded based on the sophistication of the thinking demonstrated by the student in
his or her written and verbal responses per Table 1.
RESULTS
In what follows, we share results from interviews conducted at the end of Grades 3, 4
and 5 for two students, focusing on one interview assessment item (figure 1).
Barry: The influence of one concept on another.
In Barry’s Grade 3 interview, he correctly responded to parts a, b and d. When asked
to write the function rule using words (part c), Barry stated, “…you multiply the
number of books she reads by 5,” a general statement describing the transformation
without explicitly relating the number of books to the number of stickers (L7). When
asked to write the function rule using variables (part c), Barry wrote “a×5=b” and
“b×5=c,” two correct but redundant symbolic representations. When asked why he
wrote two equations, Barry explained,
a times 5 would be, since a is the first letter of the alphabet, I did a for 1, and since b is
after a, well, I don’t really know why I put b, but I just wanted to put b, so a times 5 equals
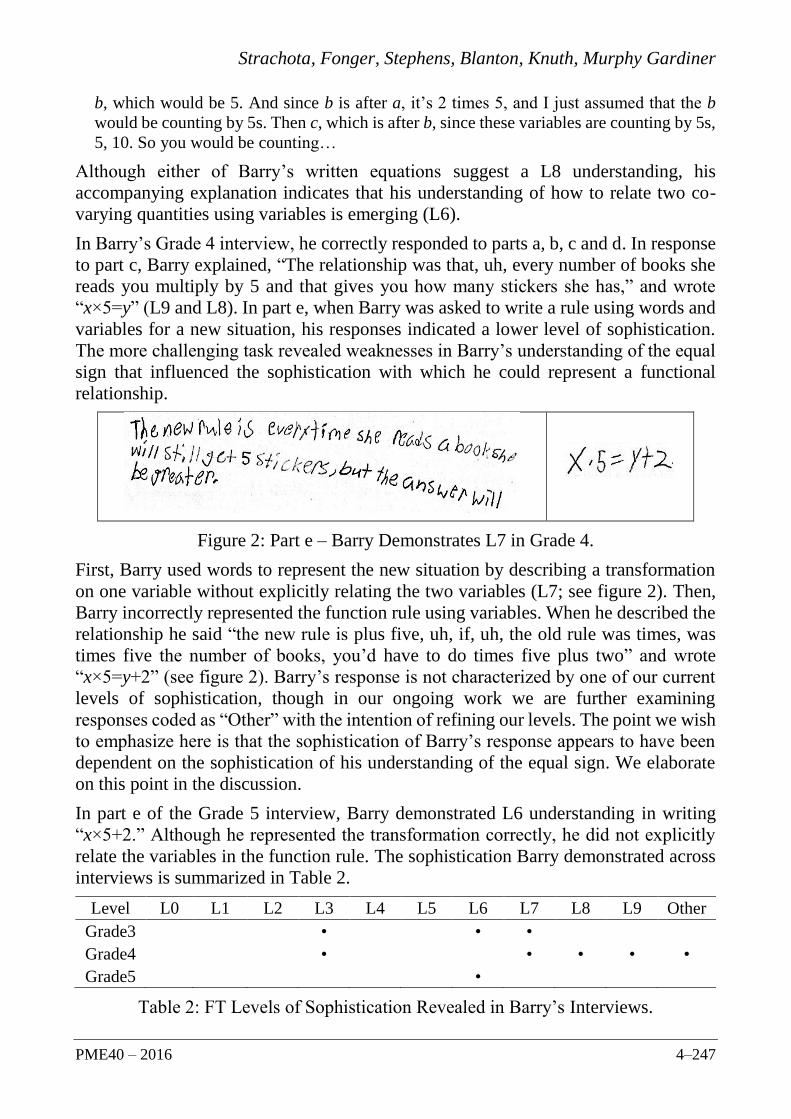
Strachota, Fonger, Stephens, Blanton, Knuth, Murphy Gardiner
PME40 – 2016 4–247
b, which would be 5. And since b is after a, it’s 2 times 5, and I just assumed that the b
would be counting by 5s. Then c, which is after b, since these variables are counting by 5s,
5, 10. So you would be counting…
Although either of Barry’s written equations suggest a L8 understanding, his
accompanying explanation indicates that his understanding of how to relate two co-
varying quantities using variables is emerging (L6).
In Barry’s Grade 4 interview, he correctly responded to parts a, b, c and d. In response
to part c, Barry explained, “The relationship was that, uh, every number of books she
reads you multiply by 5 and that gives you how many stickers she has,” and wrote
“x×5=y” (L9 and L8). In part e, when Barry was asked to write a rule using words and
variables for a new situation, his responses indicated a lower level of sophistication.
The more challenging task revealed weaknesses in Barry’s understanding of the equal
sign that influenced the sophistication with which he could represent a functional
relationship.
Figure 2: Part e – Barry Demonstrates L7 in Grade 4.
First, Barry used words to represent the new situation by describing a transformation
on one variable without explicitly relating the two variables (L7; see figure 2). Then,
Barry incorrectly represented the function rule using variables. When he described the
relationship he said “the new rule is plus five, uh, if, uh, the old rule was times, was
times five the number of books, you’d have to do times five plus two” and wrote
“x×5=y+2” (see figure 2). Barry’s response is not characterized by one of our current
levels of sophistication, though in our ongoing work we are further examining
responses coded as “Other” with the intention of refining our levels. The point we wish
to emphasize here is that the sophistication of Barry’s response appears to have been
dependent on the sophistication of his understanding of the equal sign. We elaborate
on this point in the discussion.
In part e of the Grade 5 interview, Barry demonstrated L6 understanding in writing
“x×5+2.” Although he represented the transformation correctly, he did not explicitly
relate the variables in the function rule. The sophistication Barry demonstrated across
interviews is summarized in Table 2.
Level L0 L1 L2 L3 L4 L5 L6 L7 L8 L9 Other
Grade3 • • •
Grade4 • • • • •
Grade5 •
Table 2: FT Levels of Sophistication Revealed in Barry’s Interviews.

Strachota, Fonger, Stephens, Blanton, Knuth, Murphy Gardiner
4–248 PME40 – 2016
Meg: Co-developing algebraic concepts.
Another student, Meg, demonstrated consistent progress. Like Barry, Meg participated
in all three years of the intervention and interviews. However, due to space constraints,
we only share results from one of Meg’s interviews that provide a contrast to the results
generated in Barry’s interviews.
When Meg was interviewed at the end of Grade 4, she correctly responded to all parts
of the item. Meg described the relationship as “the number of books times 5 equals the
# of stickers” (L9), and she wrote “x×5=y” to correctly represent the function rule using
variables (L8). In part e, Meg wrote “x×5+2=y” to correctly represent the more
complex function rule using variables (L8). When asked how she knew to add the two
to the “x×5,” Meg explained, “Um, because if you get to the y, y + 2, it wouldn’t be,
like, balanced or equal...” The sophistication of Meg’s responses across interviews is
summarized in Table 3.
Level L1 L2 L3 L4 L5 L6 L7 L8 L9 Other
Grade3 • • •
Grade4 • ••• •
Grade5 ••
Table 3: FT Levels of Sophistication Revealed in Meg’s Interviews.
DISCUSSION
Elsewhere (e.g. Stephens et al., 2016a; Stephens et al., 2016b), we examined broad
patterns in students’ responses to functional thinking items in order to discern levels of
sophistication in their thinking. However, one important underlying assumption of how
we take up the notion of levels of sophistication is that not all students’ thinking
develops in the same way. In this study we elaborated a more nuanced story of the
variation in students’ thinking within and across individual students. In what follows,
we discuss how the co-development of core algebraic concepts may influence the
sophistication of a child’s functional thinking.
In Grade 4, the sophistication of Barry’s thinking is not consistent across tasks. On
parts b and c, Barry demonstrates thinking at L8 and L9. However, consistent with
Clements and Sarama (2014), when presented with a new situation (part e), Barry
regressed to an incorrect representation of the function rule. Barry’s explanation and
response indicate an operational view of the equal sign (i.e., notion that the equal sign
is a direction to compute; Carpenter, Franke & Levi, 2003). We hypothesize that
Barry’s co-developing understandings explain the varying levels of sophistication he
demonstrated.
We wondered whether Barry’s operational view of the equal sign was consistent across
tasks, so we conducted an ad hoc analysis of Barry’s responses to the assessment items
that addressed students’ understanding of the equal sign. Interestingly, Barry
demonstrated a relational understanding of the equal sign (i.e., understanding that the

Strachota, Fonger, Stephens, Blanton, Knuth, Murphy Gardiner
PME40 – 2016 4–249
equal sign indicates an equivalence relation rather than a direction to compute;
Carpenter, Franke & Levi, 2003) on two written assessment items and one interview
item in Grades 3, 4, and 5. In other words, Barry’s relational understanding of the equal
sign appears to have not been employed when he was faced with a new and perhaps
more complex context.
In Grade 5, Barry demonstrated a more sophisticated level of functional thinking when
he wrote “x×5+2.” While he now represented the transformation correctly, he did not
explicitly relate the variables in the function rule. Perhaps, Barry’s understanding of
the equal sign in the context of functional thinking was simultaneously emerging and
thus hindering the sophistication of his response.
Interestingly, Meg’s responses also indicated that her understanding of the equal sign
influenced the sophistication of her functional thinking. Meg represented the new
situation (part e) correctly. In response, the interviewer asked Meg about her placement
of “+2,” and revealed that Meg had a relational understanding of the equal sign. We
looked at Meg’s responses to the assessment items that assessed students’
understanding of the equal sign. Not surprisingly, she demonstrated a relational
understanding of the equal sign (Carpenter, Franke & Levi, 2003) on each of these
items in Grades 3, 4, and 5. Unlike Barry, Meg had a relational understanding of the
equal sign that held across contexts.
FUTURE RESEARCH
Moving forward, we suggest that by comparing the levels of sophistication that
describe individual students’ functional thinking to the levels of sophistication that
describe their understanding of the equal sign, we may gain insight about students’ co-
development of core algebraic concepts. We hypothesize that variation may occur due
to factors surrounding the co-development of concepts and suggest that future research
should explore this co-development and the links that exist between students’
understandings of algebraic concepts.
Additional information
The research reported here was supported in part by the National Science Foundation under
DRK-12 Award #1219605/06 (Principal investigators: Maria Blanton, Eric Knuth, and Ana
Stephens). Any opinions, findings, and conclusions or recommendations expressed in this
material are those of the authors and do not necessarily reflect the views of the National
Science Foundation.
References
Blanton, M., Stephens, A., Knuth, E., Gardiner, A., Isler, I., & Kim, J. (2015). The
development of children’s algebraic thinking: The impact of a comprehensive early algebra
intervention in third grade. Journal for Research in Mathematics Education, 46(1), 39-87.
Britt, M. S., & Irwin, K. C. (2008). Algebraic thinking with and without algebraic
representation: A three-year longitudinal study. ZDM, 40(1), 39-53.
Strachota, Fonger, Stephens, Blanton, Knuth, Murphy Gardiner
4–250 PME40 – 2016
Carpenter, T. P., Franke, M. L., & Levi, L. (2003). Thinking mathematically: Integrating
arithmetic and algebra in the elementary school. Portsmouth, NH: Heinemann.
Clements, D. H., & Sarama, J. (2014). Learning trajectories: Foundations for effective,
research-based education. In A. P. Maloney, J. Confrey & K. H. Nguyen (Eds.), Learning
over time: Learning trajectories in mathematics education (pp. 1-30). Charlotte, NC:
Information Age Publishing.
Fonger, N. L. Stephens, A. Blanton, M., Isler, I., Knuth, E., & Gardiner, A. M. (2016).
Developing a learning progression for curriculum, instruction, and student learning: An
example from early algebra research. Manuscript submitted for publication.
Fonger, N. L., Stephens, A., Blanton, M., & Knuth, E. (2015). A learning progressions
approach to early algebra research and practice. In T. G. Bartell, K. N. Bieda, R. T. Putnam,
K. Bradfield & H. Dominguez (Eds.), Proceedings of the 37th annual meeting of the North
American Chapter of the International Group for the Psychology of Mathematics
Education (pp. 201-204). East Lansing, MI: Michigan State University.
Schliemann, A. D., Carraher, D. W., & Brizuela, B. M. (in press). Algebra in elementary
school and its impact on middle school learning. Recherches en Didactique des
Mathématiques, Paris, France.
Stephens, A., Fonger, N. L., Blanton, M., & Knuth, E. (2016a). Elementary Students’
Generalization and Representation of Functional Relationships: A Learning Progressions
Approach. Poster to be presented at the Annual Meeting of the American Education
Research Association, Washington, DC.
Stephens, A. C., Fonger, N. L., Strachota, S., Isler, I., Blanton, M., & Knuth, E. (2016b).
Characterizing students’ understandings of function generalization and representation in
terms of levels of sophistication. Manuscript in preparation.

2016. In Csíkos, C., Rausch, A., & Szitányi, J. (Eds.). Proceedings of the 40th Conference of the International
Group for the Psychology of Mathematics Education, Vol. 4, pp. 251–258. Szeged, Hungary: PME. 4–251
HOW LONG WILL IT TAKE TO HAVE A 60/40 BALANCE IN
MATHEMATICS PHD EDUCATION IN SWEDEN?
Lovisa Sumpter and David Sumpter
Department of Mathematics and Science Education, Stockholm University, Sweden
and Department of Mathematics, Uppsala University, Sweden
We investigate female participation in PhD education in mathematics. Nine of eleven
subject areas for PhD studies in Sweden had reached a 60/40 gender balance in 2010,
the exceptions being mathematics and engineering and technology. Using linear
regression, we fit a growth model to the increase in the proportion of female PhD
students. We show that mathematics has a slower growth rate in female participation
than other subjects, and present differences can’t be attributed simply to a lower initial
female participation. If current trends continue, it will take approximately another 15
years for mathematics to reach a 60/40 gender balance.
INTRODUCTION
In Sweden, at undergraduate level in most subjects, women are in majority. This is true
for many other countries as well (OECD, 2015). During the last decades, female
participation including advanced higher education has not only increased but also in
many areas reached a balance within the 40-60 % span (Lindberg, Riis & Silander,
2011). This balance of 60/40 is the Swedish government’s criteria for equality. The
increase in female participation is a global trend: for 2012, the OECD average was 47
% female doctoral (or equivalent graduates) and the EU21 average was 48 % (OECD,
2015). The situation for mathematics is different. In Sweden, there are 50 % girls in
the most mathematical intense upper secondary school programme, the Natural Science
programme, but only one third of the students at undergraduate level in mathematics
or other mathematics intensive courses including engineering and teacher education
are women (Brandell, 2008). This pattern has been observed in many other western
countries as well e.g. in USA (Herzig, 2004; Piatek-Jimenez, 2015) and the UK
(Burton, 2004). Moreover, there are less women doing doctoral studies. In 2007, 23%
of the doctoral degrees in mathematics in Sweden were completed by females
(Lindberg, Riis & Silander, 2011). Mathematics here includes areas such as
mathematics statistics, applied mathematics, mathematics history, and mathematics
education. Hence, women disappear in mathematics, where the first filter is from upper
secondary school to university and the second filter from undergraduate level to PhD.
How it this ‘disappearance’ compared to other subjects? In this paper, we focus on the
second filter and pose two research questions: (1) Has the proportion female PhD
students in mathematics followed a different growth rate compared to other subjects?;
and, (2) If current trend continues, how long will it take to reach a 40-60 balance?

Sumpter, Sumpter
4–252 PME40 – 2016
BACKGROUND
We see gender as a social construction, meaning that gender is something more than
just a consequence of a biological sex (West & Zimmerman, 1987). Connell (2006)
explained gender as:
“a pattern of social relations in which the positions of women and men are defined, the
cultural meanings of being a man and a woman are negotiated, and their trajectories
through life are mapped out.” (Connell, 2006, p. 839).
The characteristics and culture dependent traits are attributed by the society to men and
women. In the long term, these traits create norms and gender could therefor be thought
of “as socially constructed differences between men and women and the beliefs and
identities that support difference and inequality” (Acker, 2006, p. 444). This is a
dynamic process meaning that the attributions, beliefs, identities etc. are not static
(Damarin & Erchick, 2010). The concept gender can be divided into different aspects
or dimensions. Here, we want to understand structural aspects of gender balance and
we use the four different aspects of gender described by Bjerrum Nielsen (2003):
structural, symbolic, personal, and interactional gender. Structural gender refers to
gender as part of a social structure alongside with other factors e.g. ethnicity and class.
An example of structural gender is the percentage that gets an academic profession. In
organisations, gender together with class and race create the base for inequality (Acker,
2006). Gender is still a main factor for women participation at work and we find old
patterns of gender segregation (Bergström, 2007). The focus in this paper is the number
of female PhD students in mathematics compared to other subjects in Sweden, which
falls into this aspect of gender.
The second aspect is symbolic gender which appears in the shape of symbols and
discourses (Bjerrum Nielsen, 2003). It tells us what is normal and what is deviant such
as the idea of mathematics as a male domain (Brandell, Leder & Nyström, 2007). These
symbols can have very strong impact. The explanation model for success using the two
symbols ‘the hard working female’ (e.g. Hermione Granger) and ‘the male genius’ (e.g.
Sherlock Holmes) is considered one of the main reason for gender imbalance at
university level (Leslie, Cimpian, Meyer & Freeland, 2015). The third aspect, personal
gender, focuses on on how the individual perceive the structure with its symbols
(Bjerrum Nielsen, 2003). As stated earlier, this is a dynamic process and the structure
and its symbols can influence and change in a constant on-going process which affects
personal gender. In her study of female undergraduate students in mathematics,
Solomon (2012) concluded that the students were forced to work with their identity,
their self-concept as ‘a woman in mathematics’, and this work included how they
talked about themselves and their situation. The last aspect described by Bjerrum
Nielsen (2003) is interactional gender. These four aspects are inter-related creating
gender regimes. An example of this is the case of homosociality (Lipman-Blumen,
1976). This is a pattern where primarily men construct and choose situations dominated
by men such as male professors deciding to employ male PhD students similar to
themselves, or male students choosing mathematics since it is a ‘good’ environment.

Sumpter, Sumpter
PME40 – 2016 4–253
Such patterns, or gender regimes, “provides the context for particular events,
relationships, and individual practices.” (Connell, 2006, p. 839). Gender division of
labour is then not just a question of glass ceilings but more a question about gendered
institutions including relations of power and symbolism (Connell, 2006). One result of
gendered institutions could be women leaving mathematics. In previous papers, the
reasons why female mathematicians decide to leave academia after their PhD have
been investigated (Sumpter, 2014a; 2014b). The main reason was the difficulty getting
a job without support which has been reported in previous research (Husu, 2005).
Therefore, the number of women is an important factor when wanting to understand
why some subjects have more women participants than others. This is particularly
central since women in male-dominated professions don’t seem to benefit of the ‘glass
escalator’ as men do in female-dominated professions but instead they hit the glass
ceiling (Budig, 2002; Hultin, 2003). Another reason why female Swedish
mathematicians left the subject was the hostility of the environment (Sumpter, 2014b).
In a summary of the theory of gendered organisations developed by Acker/ Williams,
we read that “woman does not fit the disembodied category of the ideal worker (Budig,
2002, p. 261)”. If we apply the theory of gendered organisations to female in
mathematics with mathematics as a male domain, by default women are not
mathematicians.
METHOD
In order to answer the research questions, we downloaded open access data from SCB
(Statistics Sweden) that has been provided by UKÄ (Swedish Higher Education
Authority). The data had the number of recorded PhD students ordered in research
subject (according to national division of subjects), sex (female/male), and percentages
of activity (full-time/part-time/ null activity). The data set comprised figures from the
second half of the calendar year from 1973 to 2010. Here, we are interested in active
students and therefore students recorded with null activity were removed from the data
set. Given that we use data over almost four decades allows us to give a historical
perspective of the growth rate. Since the data are presented according to the national
division of subjects, mathematics at this level of division means mathematical sciences
and it is not just restricted to pure mathematics. The other subjects are: veterinary
medicine, law, dentistry, medicine, humanities, social sciences, agricultural sciences,
engineering and technology, and natural sciences.
For each time series of proportion of female students, we fitted a logistic growth
equation, commonly used for describing the spread of ‘innovations’ (Rossman, Chiu
& Mol, 2008). We set
𝑝(𝑡) = 1/2
1+exp (𝑎−𝑟𝑡) (1)
where t is number of years since 1973, 𝑝(𝑡) is the proportion of women in each subject,
a= ln (1/(2𝑝(0)) − 1) sets the initial proportion in 1973 (t=0), and r determines the
rate of increase of female PhD students.
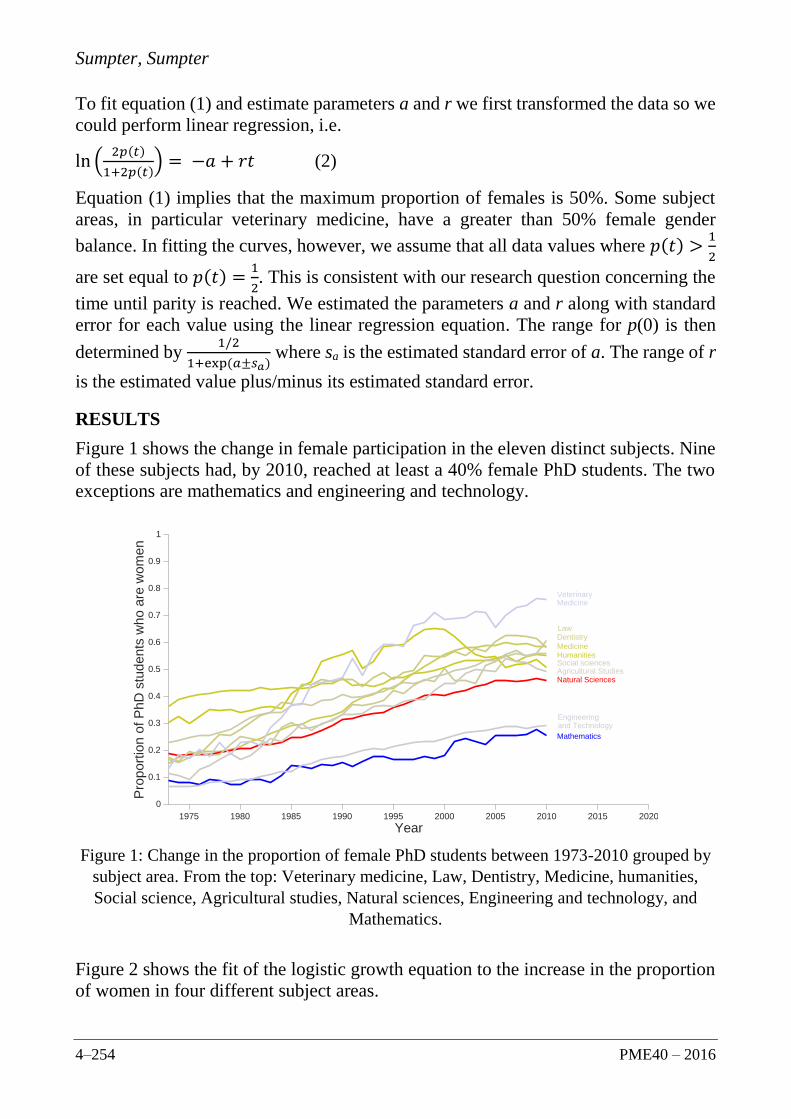
Sumpter, Sumpter
4–254 PME40 – 2016
To fit equation (1) and estimate parameters a and r we first transformed the data so we
could perform linear regression, i.e.
ln (2𝑝(𝑡)
1+2𝑝(𝑡)) = −𝑎 + 𝑟𝑡 (2)
Equation (1) implies that the maximum proportion of females is 50%. Some subject
areas, in particular veterinary medicine, have a greater than 50% female gender
balance. In fitting the curves, however, we assume that all data values where 𝑝(𝑡) >1
2
are set equal to 𝑝(𝑡) =1
2. This is consistent with our research question concerning the
time until parity is reached. We estimated the parameters a and r along with standard
error for each value using the linear regression equation. The range for p(0) is then
determined by 1/2
1+exp (𝑎±𝑠𝑎) where sa is the estimated standard error of a. The range of r
is the estimated value plus/minus its estimated standard error.
RESULTS
Figure 1 shows the change in female participation in the eleven distinct subjects. Nine
of these subjects had, by 2010, reached at least a 40% female PhD students. The two
exceptions are mathematics and engineering and technology.
Figure 1: Change in the proportion of female PhD students between 1973-2010 grouped by
subject area. From the top: Veterinary medicine, Law, Dentistry, Medicine, humanities,
Social science, Agricultural studies, Natural sciences, Engineering and technology, and
Mathematics.
Figure 2 shows the fit of the logistic growth equation to the increase in the proportion
of women in four different subject areas.
1975 1980 1985 1990 1995 2000 2005 2010 2015 2020
Year
0
0.1
0.2
0.3
0.4
0.5
0.6
0.7
0.8
0.9
1
Pro
port
ion o
f P
hD
stu
den
ts w
ho a
re w
om
en
Humanities
Mathematics
Medicine
Natural Sciences
DentistryLaw
Social sciencesAgricultural Studies
Engineering and Technology
Veterinary Medicine
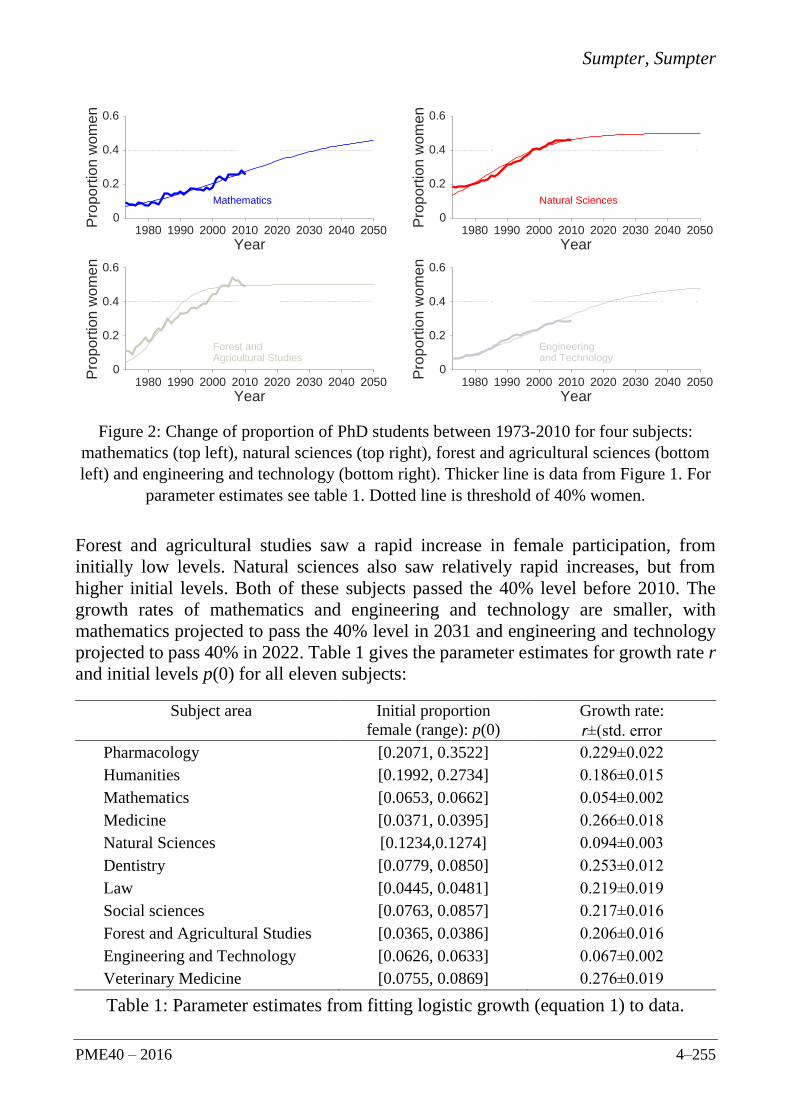
Sumpter, Sumpter
PME40 – 2016 4–255
Figure 2: Change of proportion of PhD students between 1973-2010 for four subjects:
mathematics (top left), natural sciences (top right), forest and agricultural sciences (bottom
left) and engineering and technology (bottom right). Thicker line is data from Figure 1. For
parameter estimates see table 1. Dotted line is threshold of 40% women.
Forest and agricultural studies saw a rapid increase in female participation, from
initially low levels. Natural sciences also saw relatively rapid increases, but from
higher initial levels. Both of these subjects passed the 40% level before 2010. The
growth rates of mathematics and engineering and technology are smaller, with
mathematics projected to pass the 40% level in 2031 and engineering and technology
projected to pass 40% in 2022. Table 1 gives the parameter estimates for growth rate r
and initial levels p(0) for all eleven subjects:
Subject area
Initial proportion
female (range): p(0)
Growth rate:
r±(std. error
Pharmacology [0.2071, 0.3522] 0.229±0.022
Humanities [0.1992, 0.2734] 0.186±0.015
Mathematics [0.0653, 0.0662] 0.054±0.002
Medicine [0.0371, 0.0395] 0.266±0.018
Natural Sciences [0.1234,0.1274] 0.094±0.003
Dentistry [0.0779, 0.0850] 0.253±0.012
Law [0.0445, 0.0481] 0.219±0.019
Social sciences [0.0763, 0.0857] 0.217±0.016
Forest and Agricultural Studies [0.0365, 0.0386] 0.206±0.016
Engineering and Technology [0.0626, 0.0633] 0.067±0.002
Veterinary Medicine [0.0755, 0.0869] 0.276±0.019
Table 1: Parameter estimates from fitting logistic growth (equation 1) to data.
1980 1990 2000 2010 2020 2030 2040 2050
Year
0
0.2
0.4
0.6
Pro
po
rtio
n w
om
en
Mathematics
1980 1990 2000 2010 2020 2030 2040 2050
Year
0
0.2
0.4
0.6
Pro
po
rtio
n w
om
en
Natural Sciences
1980 1990 2000 2010 2020 2030 2040 2050
Year
0
0.2
0.4
0.6
Pro
po
rtio
n w
om
en
Forest and Agricultural Studies
1980 1990 2000 2010 2020 2030 2040 2050
Year
0
0.2
0.4
0.6
Pro
po
rtio
n w
om
en
Engineering and Technology

Sumpter, Sumpter
4–256 PME40 – 2016
A useful interpretation of the logistic growth equation can be made in terms of how the
rate of increase of female PhD students depends upon the current proportion of female
PhD students, i.e. in terms of feedbacks between current levels and further increases.
Equation (1) is the solution to the differential equation dp/dt = rp(1-2p). This equation
implies that the rate at which females are recruited in an area increases with the number
of women already in the subject area, but decreases as equality is reached. The
parameter r thus determines the strength of positive feedback between the current
proportion of women and the growth rate. As p approaches ½ then this positive
feedback is reduced and when p=1/2 the proportion of females reaches equilibrium.
This interpretation allows us to evaluate the strength of the positive feedback in
recruitment of PhD students in the various subject areas.
For mathematics r=0.054 and for engineering and technology r=0.068, giving a slightly
stronger feedback for the latter subject area. In contrast, the positive feedback has been
almost four times as strong in agricultural sciences r=0.206 and almost twice as strong
in the natural sciences r=0.094 than in mathematics. The strength of these positive
feedbacks are important, because they show that Swedish mathematics departments’
failure to increase the proportion of female participation is not simply due to the low
initial levels. Natural sciences had a greater female participation in 1973 than
mathematics, but participation also grew more rapidly over the next 40 years.
Agricultural studies had a similar level of female participation as mathematics and
grew much more rapidly. The rapid feedback experienced in agricultural studies is by
no means an exception. The growth rates r are between 0.186 and 0.276 for other
subjects (Table 1). Independent of the initial level of participation, most subject areas
have seen a similar growth curve for female participation. The clear exceptions are
mathematics and engineering and technology.
DISCUSSION
The aim of this paper was to investigate whether mathematics as a subject has followed
the same trend as other subjects regarding women participation in PhD education, and
if not, (1) in what way the growth rate differed, and (2) given the 60/40 gender policy
in Sweden, how long it would take to reach this bench mark. Mathematics, together
with engineering and technology stood out, showing old patterns of gender segregation
(Bergström, 2007). As gender structures (Bjerrum Nielsen, 2003), they show,
compared to the other subjects, slow dynamics and appears to be strong male gendered
organisations (Acker, 2006; Budig, 2002; Connell, 2006). If mathematics departments
are left to continue in the same way, it will take another 15 years before they pass the
40% level. This is nine years slower than engineering and technology. Just as Connell
(2006) concluded, a result like this indicates that this is more than a question about
glass ceilings, even though the glass ceiling seems to be exceptionally low in
mathematics. Both Connell (2006) and Husu (2005) talk about power relations,
including implicit and explicit power, and symbolism. Compared for instance to natural
sciences, mathematics departments have not been as successful attracting and keeping
Sumpter, Sumpter
PME40 – 2016 4–257
women despite decades with laws and decree of equity and equal opportunity
promotions.
The logistic growth model we have fitted here assumes that female participation
increases due to positive feedback. The model fits the overall pattern in the data,
suggesting that the main difference between maths and other subjects is that the
feedback between current participation and future growth is much weaker in maths. If
current PhD students in mathematics in Sweden follow the conceptions indicated by
female mathematicians that decided to leave partly because of hostility (Sumpter,
2014b), these conclusions gain further support. Considering the data presented here, at
the aggregate level, along with survey results at the micro-level, the clear implication
is that if mathematics departments want to create strong feedback between female
participation and further recruitment then they need to improve their working
environments.
References
Acker, J. (2006). Inequality regimes. Gender, class, and race in organizations. Gender &
Society, 20(4), 441-464.
Bergström, M. (2007). Försök att bryta! Rapport om projekt för att bryta den könsuppdelade
arbetsmarknaden 1993-2005. [Try to change! Report on a project to break the gender-
segregated labour market 1993-2005] Falun: Gender School.
Bjerrum Nielsen, H. (2003). One of the boys? Doing gender in Scouting. Génève: World
Organization of the Scout Movement.
Brandell, G., Leder, G. & Nyström, P. (2007). Gender and mathematics: recent development
from a Swedish perspective. ZDM, 39(3): 235-250.
Brandell, G. (2008). Progress and stagnation of gender equity: Contradictory trends within
mathematics research and education in Sweden. ZDM, 40 (4), 659–672.
Budig, M. J. (2002). “Male Advantage and the Gender Composition of Jobs: Who Rides the
Glass Escalator?” Social Problems, 49 (2), 258-277.
Burton, L. (2004). Mathematicians as Enquirers: Learning about Learning Mathematics.
Dordrecht: Kluwer.
Connell R. (2006) Glass ceilings or gendered institutions? Mapping the gender regimes of
public sector worksites. Public Administration Review, 66(6), 837–849.
Damarin, S., & Erchick, D. B. (2010). Toward clarifying the meanings of gender in
mathematics education research. Journal for Research in Mathematics Education, 41 (4),
310–323.
Herzig, A. H. (2004). “Slaughtering this beautiful math”: Graduate women choosing and
leaving mathematics. Gender and Education, 16(3), 379–395.
Hultin, M. (2003). Some take the glass escalator, some hit the glass ceiling? Work and
Occupations, 30, 30–61.
Husu, L. (2005) “Women’s Work-Related and Family-Related Discrimination and Support
in Academia”. Advances in Gender Research, 9,161-199.

Sumpter, Sumpter
4–258 PME40 – 2016
Leslie, S. J., Cimpian, A., Meyer, M., & Freeland, E. (2015). Expectations of brilliance
underlie gender distributions across academic disciplines. Science, 347 (6219), 262-265.
Lindberg, L., Riis, U. & Silander, C. (2011). Gender equality in Swedish higher education:
patterns and shifts. Scandinavian Journal of Educational Research, 55(2), 165-179.
Lipman-Blumen, J. (1976). Toward a homosocial theory of sex roles: An explanation of the
sex segregation of social institutions. Signs, 1 (3), 15-31.
OECD (2015). Education at a Glance 2015: OECD Indicators, OECD Publishing.
Piatek-Jimenez, K. (2015). On the Persistence and Attrition of Women in Mathematics,
Journal of Humanistic Mathematics, 5(1), 3-54.
Rossman, G., Chiu, M. M., & Mol, J. M. (2008) Modeling diffusion of multiple innovations
via multilevel diffusion curves: Payola in pop music radio. Sociological Methodology, 38
(1), 201-230.
Solomon, Y. (2012). Finding a voice? Narrating the female self in mathematics. Educational
Studies in Mathematics, 80, 171-183.
Sumpter, L. (2014a). Four female mathematicians’ collective narrative: Reasons to leave
academia, Philosophy of Mathematics Education Journal, 28.
Sumpter, L. (2014b). Why Anna left Academia. I Liljedahl, P., Nicol, C., Oesterle, S., &
Allan, D. (Red.). Proceedings of the Joint Meeting of PME 38 and PME-NA 36 (Vol. 5, s
217-224). Vancouver, Canada: PME.
West, C. & Zimmerman, D. H. (1987). Doing Gender. Gender & Society, 1(2), 125-151.

2016. In Csíkos, C., Rausch, A., & Szitányi, J. (Eds.). Proceedings of the 40th Conference of the International
Group for the Psychology of Mathematics Education, Vol. 4, pp. 259–266. Szeged, Hungary: PME. 4–259
TRACES OF CLASSROOM DISCOURSE IN A POSTTEST1
Michal Tabach Rina
Hershkowitz
Shirly
Azmon
Chris
Rasmussen
Tommy
Dreyfus
Tel Aviv
University
The Weizmann
Institute for
Science
Levinsky
College of
Education
San Diego
State
University
Tel Aviv
University
Generally, we use two theoretical frameworks – Documenting Collective Activity
(DCA) and Abstraction in Context (AiC) for investigating knowledge construction and
knowledge shifts in classrooms. In this paper, we show that differences in the depth of
teacher questioning during whole class discussions may leave traces in individual
students' knowledge, which we were able to capture in students' explanations in a
written post-test.
INTRODUCTION
In the course of the last few years we have been investigating knowledge construction
and knowledge shifts among different settings in the classroom: the individual, the
small group and the whole class community. In these investigations, we used two
theoretical frameworks – Documenting Collective Activity (DCA) for investigating the
whole class setting and Abstraction in Context (AiC) for investigating individuals and
small groups (Hershkowitz, Tabach, Rasmussen & Dreyfus, 2014; Tabach,
Hershkowitz, Rasmussen & Dreyfus, 2014). The goal of the current study is to
investigate if and how the teaching-learning discourse in the whole class setting has
some longitudinal effect on individual students' knowledge as expressed in a post-test.
For this goal we analysed data from parallel whole class discussions and from the post-
tests of two classes on the same topic.
THEORETICAL BACKGROUND
Argumentation, and learning from a socio-cultural perspective
A socio-cultural perspective helps us appreciate the reciprocal relationship between
individual thinking and the collective intellectual activities of groups (Vygotsky,
1978). We use different forms of talk, and especially argumentative talk, to transform
individual thought into collective thought and action, and conversely to make personal
interpretations of shared experience. Generally, argumentative talk has a crucial role
for school learning: (1) the process of generating arguments individually or collectively
involves producing explanations/justifications and as such, encourages learning. (2)
Argumentation is often initiated to refute a position, or a claim, and as such deepens
1 This research was supported by THE ISRAEL SCIENCE FOUNDATION (grants No. 1057/12 and
438/15)

Tabach, Hershkowitz, Azmon, Rasmussen, Dreyfus
4–260 PME40 – 2016
understanding of the problem space (Hershkowitz & Schwarz, 1999). (3) The special
structure of argumentative discourse that interweaves data, claims, warrants etc.,
improves knowledge organization (Krummheuer, 1995; Toulmin, 1958).
Research shows that quite often, argumentative talk is not part of classroom
mathematical talk. Teachers have considerable difficulties in guiding classroom
inquiry talk. The dominating genre of talk consists of recitation style discourse patterns
such as Initiation-Response-Evaluate (IRE) (Cazden, 2001). Moreover, teacher
interventions in teacher-led classroom discourse are often not tied to students' ideas.
As Yackel (2002) claimed, to tie her interventions to the students' ideas the teacher
must first identify the students' threads of thought, and then find a way to advance their
reasoning. Some researchers have proposed that teachers provide generic prompts
(e.g., prompts for encouraging argumentation, mostly prompts expressed as questions),
that somehow break the IRE patterns and bring the classroom talk closer to
argumentative forms of talk. Such generic prompts have been organized in what
Mercer calls ground rules that not only encourage students to interact, but also to inter-
think (Mercer, 2000).
Theories for studying classroom discussions
In recent years, researchers have come to realize that understanding learning and
teaching in mathematics classrooms requires coordinated analysis of individual
learning and collective activity in the classroom (Yackel & Cobb, 1996). Four types of
processes are intertwining in the classroom: processes of knowledge construction by
individuals (1) while working alone (these are frequently hidden); (2) while
collaborating in a small group; (3) processes by which knowledge becomes part of the
collective activity of the classroom community; and (4) processes of knowledge shifts
among the different settings in the class. Researchers need to investigate all four types
of processes in parallel, in order to reach a comprehensive understanding of how
knowledge is constructed and becomes part of the collective activity of the classroom
community, while focusing on the roles of the participants, and considering both
cognitive and social processes. This requires a solid background of theoretical-
methodological perspectives. One option for such a background is presented next.
Abstraction in Context
Abstraction in Context (AiC) is a theoretical framework for investigating processes of
constructing and consolidating mathematical knowledge (Hershkowitz, Schwarz, &
Dreyfus, 2001). Abstraction is defined as an activity of vertically reorganizing
(Treffers & Goffree, 1985) previous mathematical constructs within mathematics and
by mathematical means, interweaving them into a single process of mathematical
thinking so as to lead to a construct that is new to the learner.
According to AiC, the genesis of an abstraction passes through a three-stage process,
which includes (i) the need for a new construct, (ii) the emergence of the new construct,
and (iii) the consolidation of that construct. A central component of AiC is a model,
according to which the emergence of a new construct by an individual or a small group

Tabach, Hershkowitz, Azmon, Rasmussen, Dreyfus
PME40 – 2016 4–261
of learners is described and analyzed by means of three observable epistemic actions:
Recognizing (R), Building-with (B) and Constructing (C). Recognizing refers to the
learner seeing the relevance of a specific previous knowledge construct to the problem
at hand. Building-with comprises the combination of recognized constructs, in order to
achieve a localized goal such as solving a problem. The model suggests constructing
as the central epistemic action of mathematical abstraction. Constructing consists of
assembling and integrating previous constructs by vertical mathematization to produce
a new construct.
Documenting Collective Activity
Collective Activity is a sociological construct that addresses the constitution of ideas
through patterns of interaction and is defined as the normative ways of reasoning which
have developed in a classroom community. Such normative ways of reasoning emerge
as learners solve problems, explain their thinking, represent their ideas, etc. A
mathematical idea or a way of reasoning becomes normative when there is empirical
evidence that it functions in the classroom as if it were shared. The phrase “function
as if shared” is similar to “taken as shared” (Cobb & Bauersfeld, 1995) but is intended
to make a stronger connection to the empirical approach which uses Toulmin’s (1958)
model of argumentation to determine when ideas function in the classroom as if they
are mathematical truths (Rasmussen & Stephan, 2008).
The concepts of knowledge agent & uploading and downloading of ideas
A knowledge agent is a member in the classroom community who initiates an idea,
which subsequently is appropriated by another member of the classroom community
(Hershkowitz, et al., 2014; Tabach, et al., 2014). Thus, when a student in the classroom
is the first one to express an idea according to the researchers’ observations, and others
later express this idea, then the first student is considered to be a knowledge agent.
Such shifts of ideas may be observed from a group to the whole class (uploading), or
within the whole class, or within a group, or from a group to a second group, or from
the whole class to a group (downloading).
In the present study we focus on shifts from the whole class to individual students, by
seeking traces of the collective activity of the whole class in the individual students’
knowledge, as it is expressed in post-test responses. We ask: Do the differences in
students' responses in a post-test between two classes reflect at least partially
differences between whole class discussions that occurred in these classrooms in the
course of the learning process? And if yes, how can this be explained?
METHODOLOGY
A 10-lesson learning unit in probability was implemented and video-recorded in
several eighth grade classes. Two of these classes, those of teachers D and M, were
selected for the present study, as the differences between both classes were prominent.
The mathematical theme of the study is calculating probabilities in 2-dimensional
sample space for cases, where each dimension has only two possible simple events

Tabach, Hershkowitz, Azmon, Rasmussen, Dreyfus
4–262 PME40 – 2016
(binomial sample space), which are not necessarily equi-probable. We analysed the
whole class discussion concerning this topic in both classes using AiC and DCA. The
analyses focused on several variables: numbers of turns (total, teacher and students);
identifying arguments in the classroom discourse in terms of claims, data, warrants,
backings, qualifiers and rebuttals and the participants who raised them; the length of
the argumentative chains (the number of utterances in the discussion on an idea); and
characterizing the teachers' questions to conceptual vs. procedural, and also according
to the epistemic action they aim to elicit – Recognizing, Building-with or Constructing.
These variables were categorized and quantified.
In addition, students' responses on the corresponding question in the post-test were
analysed (Azmon, 2010). The question presented a situation and two contradictory
(correct and incorrect) replies of two virtual students about the probability of an event.
Students were asked to choose what they think is the correct reply and to justify their
choice. We analysed the students' responses regarding the correct reply and its correct
justification. We further categorized the correct justifications into procedurally based
justifications and conceptually based justifications, and continued to refine these
analyses. Finally, we interpreted the differences between the post-test findings of the
two classes on the basis of the findings from the whole class discussions.
FINDINGS
Findings from the whole class discussions
A first quantification on turns within the whole class discussion in both classes reveals
quite similar results concerning the total number of turns, the number of teacher turns
and of student turns, and the number of teacher questions (Table 1).
Table 1 – The number of turns of the different categories in the two classes
Total no.
of turns
Students
turns
Teachers
turns
Teacher turns with
questions
Teacher
prompts
Class D 65 39 (60%) 26 (40%) 21 (80%)* 10 (38%)**
Class M 67 32 (48%) 35 (52%) 29 (83%)* 20 (57%)**
* Percentage of questions out of all teacher turns; **Percentage of prompts out of all teacher turns
There was one exception: the difference in the number of teacher prompts. This
difference is especially interesting, taking into account that the numbers of the two
teachers' questions is quite similar. This may point to different patterns of interaction
in the two whole class discussions. We further analysed the teachers’ questions by three
criteria: (1) whether the teacher draws the students’ attention to procedural or
conceptual mathematical issues; (2) what kind of epistemic action the teacher is trying
to elicit – recognizing, building-with or constructing; and (3) whether the elicitation
was for data, warrants or backings? Note: in this paper we didn’t investigate criterion
3. Table 2 summarizes these findings. The distribution of questions by the epistemic
actions they seem to elicit is again similar for both teachers. In both classes conceptual
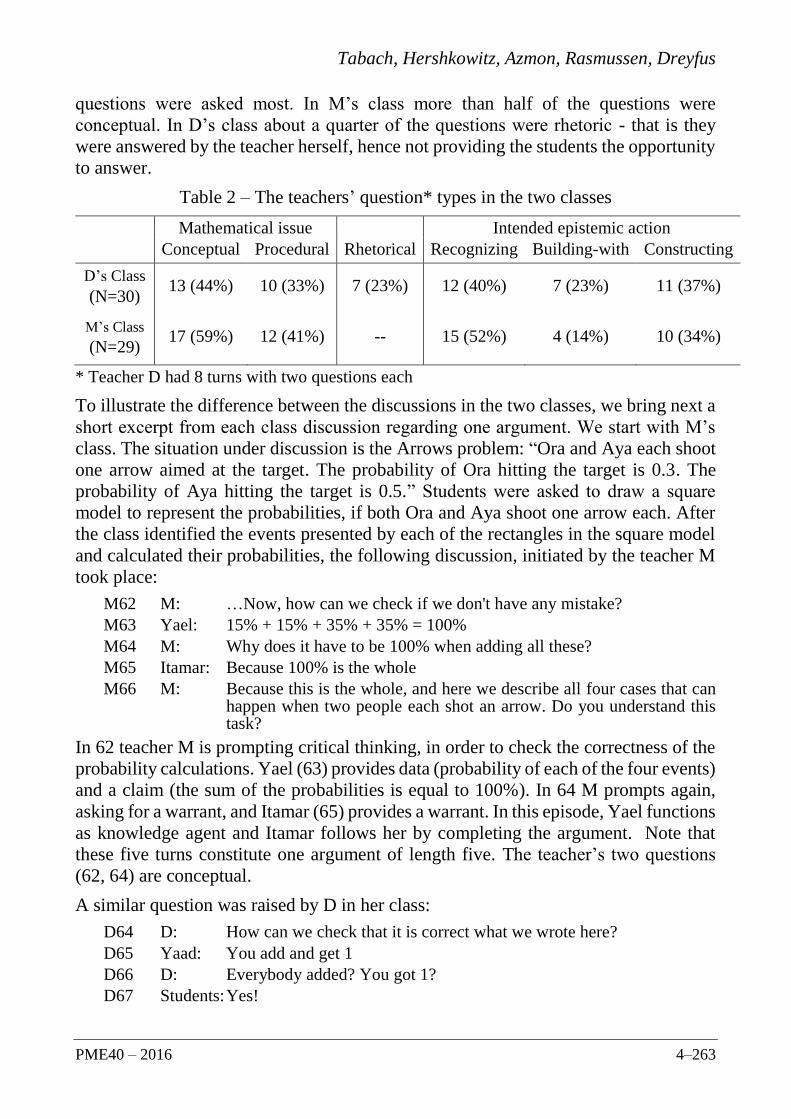
Tabach, Hershkowitz, Azmon, Rasmussen, Dreyfus
PME40 – 2016 4–263
questions were asked most. In M’s class more than half of the questions were
conceptual. In D’s class about a quarter of the questions were rhetoric - that is they
were answered by the teacher herself, hence not providing the students the opportunity
to answer.
Table 2 – The teachers’ question* types in the two classes
Mathematical issue Intended epistemic action
Conceptual Procedural Rhetorical Recognizing Building-with Constructing
D’s Class
(N=30) 13 (44%) 10 (33%) 7 (23%) 12 (40%) 7 (23%) 11 (37%)
M’s Class
(N=29) 17 (59%) 12 (41%) -- 15 (52%) 4 (14%) 10 (34%)
* Teacher D had 8 turns with two questions each
To illustrate the difference between the discussions in the two classes, we bring next a
short excerpt from each class discussion regarding one argument. We start with M’s
class. The situation under discussion is the Arrows problem: “Ora and Aya each shoot
one arrow aimed at the target. The probability of Ora hitting the target is 0.3. The
probability of Aya hitting the target is 0.5.” Students were asked to draw a square
model to represent the probabilities, if both Ora and Aya shoot one arrow each. After
the class identified the events presented by each of the rectangles in the square model
and calculated their probabilities, the following discussion, initiated by the teacher M
took place:
M62 M: …Now, how can we check if we don't have any mistake?
M63 Yael: 15% + 15% + 35% + 35% = 100%
M64 M: Why does it have to be 100% when adding all these?
M65 Itamar: Because 100% is the whole
M66 M: Because this is the whole, and here we describe all four cases that can happen when two people each shot an arrow. Do you understand this task?
In 62 teacher M is prompting critical thinking, in order to check the correctness of the
probability calculations. Yael (63) provides data (probability of each of the four events)
and a claim (the sum of the probabilities is equal to 100%). In 64 M prompts again,
asking for a warrant, and Itamar (65) provides a warrant. In this episode, Yael functions
as knowledge agent and Itamar follows her by completing the argument. Note that
these five turns constitute one argument of length five. The teacher’s two questions
(62, 64) are conceptual.
A similar question was raised by D in her class:
D64 D: How can we check that it is correct what we wrote here?
D65 Yaad: You add and get 1
D66 D: Everybody added? You got 1?
D67 Students: Yes!

Tabach, Hershkowitz, Azmon, Rasmussen, Dreyfus
4–264 PME40 – 2016
Like M, D initiates a discussion on the same issue. But, when Yaad (65) provides the
answer, the teacher D, in contrast to teacher M, does not ask for data or warrant, and
push for procedural action – calculate (66).
We counted the number of arguments and turns in the discussion in each class. In D’s
class we found eight arguments expressed by 22 turns, on average 2.75 turns per
argument. In M’s class we found six arguments and 31 turns, on average 5.17 turns per
argument. That is, in M’s class the discussion around each argument was more
developed. We move next to analyse individual students’ knowledge as reflected in
one relevant post-test item.
Findings from the post-test
The post-test question was: “The ‘Tel-Aviv’ school offers a variety of extracurricular
programs. The probability of encountering a student who is in the drama program is
0.9. The probability of encountering a student who is in the philosophy program is 0.2.
Gal claims that the probability of encountering a student who is in both, the drama
program and the philosophy program is 0.2+0.9. Yam claims that the probability is
0.2x0.9. Which of them do you think is correct? Explain."
Student responses were analysed and categorized with respect to correctness and
explanations. More than 90% of the students in each class answered the question
correctly and determined that Yam is correct. Also, 88% of students in each class
provided correct explanations for their choice. Three categories emerged while
analysing students’ correct explanations (Table 3):
A. Explanations relying on the multiplication principle. These belong to a few sub-
categories relating to the characteristics of explanations:
i. Explanations relying only on the multiplication principle and indicates that the
student is aware of the principle that “in probability we multiply probabilities”,
but shows no evidence of the student’s understanding why a multiplication is
required. Explanations in this category are focusing only on a description of the
solution procedure.
ii. Explanations using the area model, by providing a diagram with partition lines
according to the given probabilities, and calculating the probabilities according
to the relevant rectangle area. This strategy involves more complex processes
than (i). Multiplication reflects calculating the area of the representing
rectangle.
iii. Explanations using “part of ” by calculating the required probability according
to the portion of the second probability out of the first one (e.g., "Cause to find
part of something we have to multiply").
B. Explanation according to the “probability can’t be greater than 1” principle. Many
students chose to support the claim that “Yam is correct” by the claim that “Gal is
wrong - 0.2+0.9, the sum of probabilities, will lead to a probability that is greater
than 1, an impossible situation", or "the square area cannot be more than 100%".

Tabach, Hershkowitz, Azmon, Rasmussen, Dreyfus
PME40 – 2016 4–265
C. Explanation combining both principles. For example, "the result of multiplying 0.9
by 0.2 is 0.18, a probability that is smaller than 1".
Table 3 shows the frequencies in percentages of the explanations of the students in
each class. We can see that there are differences between the two classes: While in M’s
class more students used explanations relating to the area model, in D’s class more
students justified their choices by multiplication only. That is, explanations provided
in M’s class might be used as evidence for an understanding while those provided by
D’s class showed mainly procedures. Also, we can consider explanations from
categories Ai and B to be of superficial nature, as opposed to categories Aii and Aiii
which are of a deeper nature. In this case, for D’s class there are 73% superficial
explanations vs. 11% deep ones, while in M’s class there are 33% superficial
explanations vs. 42% deep ones.
Table 3: categories of explanations in percentages
Class
A B C
i ii iii ii and iii
D 43 3 5 3 30 8
M 12 38 4 0 21 13
DISCUSSION
On the surface, quantitative analysis showed similar patterns in the whole class
discussions of the two classes. The only hints for possible differences were teacher
prompts and questions. However, these differences point to a different nature of the
two whole class discussions (Mercer, 2000). Indeed, our analysis of the two whole
class discussions shows this clearly. Although we could only bring one episode from
each, the difference in depth of argumentation between the two whole class discussions
was consistent over all lessons. The whole class discussion in M’s class throughout the
learning unit included more developed arguments, in terms of students providing data
and warrants to claims raised, and the teacher's prompts asked for explanations.
This depth of argumentation left traces in individual students' knowledge and beliefs
about what constitutes an acceptable explanation, which we were able to capture in
students' explanations in the post-test item. Can we point at a possible explanation for
these differences? We were able to point to differences in the teachers’ moves in terms
of types of questions asked, and in providing prompts to elicit students thinking beyond
the classic IRE. Hence, we think that the way of teaching explains, at least partially,
the difference. More research in this direction is needed.
References
Azmon, S. (2010). The Uniqueness of Teachers' Discourse – Patterns from an Argumentative
Perspective. Un-published PhD dissertation, The Hebrew University, Jerusalem.
Cazden, C. B. (2001). Classroom discourse: The language of teaching and learning (2nd ed.).
Portsmouth, NH: Heinemann.
Tabach, Hershkowitz, Azmon, Rasmussen, Dreyfus
4–266 PME40 – 2016
Cobb, P., & Bauersfeld, H. (Eds.). (1995). Emergence of mathematical meaning: Interaction
in classroom culture. Hillsdale, NJ: Lawrence Erlbaum Associates.
Schwarz, B. B., & Hershkowitz, R. (1999). Prototypes: Brakes or levers in learning the
function concept? The role of computer tools. Journal for Research in Mathematics
Education, 30, 362-389.
Hershkowitz, R., Schwarz, B. B., & Dreyfus, T. (2001). Abstraction in context: Epistemic
actions. Journal for Research in Mathematics Education, 32, 195–222.
Hershkowitz, R., Tabach, M., Rasmussen, C., & Dreyfus, T. (2014). Knowledge shifts in a
probability classroom: a case study coordinating two methodologies. ZDM - The
International Journal on Mathematics Education, 46, 363-387.
Krummheuer, G. (1995). The ethnography of argumentation. In P. Cobb & H. Bauersfeld
(Eds.), The emergence of mathematical meaning: Interaction in classroom cultures.
Hillsdale, NJ: Erlbaum.
Mercer, N. (2000). Words and minds: How we use language to think together. London:
Routledge.
Rasmussen, C., & Stephan, M. (2008). A methodology for documenting collective activity.
In A. E. Kelly, R. A. Lesh, & J. Y. Baek (Eds.), Handbook of innovative design research
in science, technology, engineering, mathematics (STEM) education (pp. 195–215).
London: Taylor & Francis.
Tabach, M., Hershkowitz, R., Rasmussen, C., & Dreyfus, T. (2014). Knowledge shifts and
knowledge agents in the classroom. Journal of Mathematics Behaviour, 33, 192-208.
Toulmin, S. (1958). The Uses of Argument. Cambridge, UK: Cambridge University Press.
Treffers, A., & Goffree, F. (1985). Rational analysis of realistic mathematics education—the
Wiskobas program. In L. Streefland (Ed.), Proceedings of the 9th Conference of the
International Group for the Psychology of Mathematics Education (Vol. 2, pp. 97–121).
Utrecht, The Netherlands: OW&OC.
Vygotsky, L. S. (1978). Mind in Society: The development of higher psychological processes.
Cambridge, Mass.: Harvard University Press.
Yackel, E. (2002). What we can learn from analyzing the teacher’s role in collective
argumentation. The Journal of Mathematical Behavior, 21, 423-440.
Yackel, E., & Cobb, P. (1996). Sociomathematical norms, argumentation, and autonomy in
mathematics. Journal for Research in Mathematics Education, 22, 458-477.

2016. In Csíkos, C., Rausch, A., & Szitányi, J. (Eds.). Proceedings of the 40th Conference of the International
Group for the Psychology of Mathematics Education, Vol. 4, pp. 267–274. Szeged, Hungary: PME. 4–267
IMAGES OF MATHEMATICS LEARNING REVEALED
THROUGH STUDENTS’ EXPERIENCES OF COLLABORATION
Miwa Takeuchi Jo Towers Lyndon Martin
York University University of Calgary University of Calgary
This study focuses on students’ images of mathematics learning and their relationships
with mathematics. In this paper we consider how students described collaboration in
mathematics classrooms, through the examination of students’ autobiographical
interviews and drawings. Our analysis revealed that many students considered
mathematics learning mainly as an individualized and isolated process and did not
perceive peer talk or collective exploration as meaningful. Our cross-analysis with
students’ feelings revealed that those who had positive feelings towards mathematics
tended to find group work less helpful. Our findings illuminate a perceived gap between
teachers’ widespread use of group work as a teaching strategy and students’
understanding and appreciation of the goals of such instruction.
PURPOSE OF THE STUDY AND LITERATURE REVIEW
The study from which the findings presented here are derived explores students’
experiences of learning mathematics in Canadian schools and post-secondary
institutions. This paper focuses specifically on how students perceive group work and
collaboration in mathematics classrooms. Through students’ descriptions of their
experiences of collaboration in mathematics classrooms, we attempt to reveal their
images of, and assumptions about, mathematics learning and how these relate to
students’ emotional relationships with mathematics.
Collaborative working has been implemented across disciplines as a tool for providing
rich academic and social learning opportunities to students and group work is widely
recommended as a teaching strategy in mathematics classrooms. For example, in its
Principles and Standards for School Mathematics, the National Council of Teachers of
Mathematics outlines the importance of group work for communicating, explaining,
and justifying mathematical ideas among learners (National Council of Teachers of
Mathematics, 2000). Collaboration, problem solving, and learning how to learn—
essential components of the 21st century skills needed for navigating a rapidly
changing society—can be developed through group work (Darling-Hammond et al.,
2008; Trilling & Fadel, 2009). The kinds of learning that emerges from group work,
however, cannot be taken for granted in mathematical classrooms. If the physical
conditions and communication space for collaboration are not well prepared, learning
by talking with peers cannot be guaranteed (Barron, 2003; Sfard & Kieran, 2001).
Collaboration and collective mathematical thinking are highly related to students’
mathematical dispositions (Towers, Martin, & Heater, 2013). Over the past 30 years,
researchers in the field of mathematics education and psychology have examined the
interplay between the affective domain (beliefs, attitudes, and emotions) and teaching
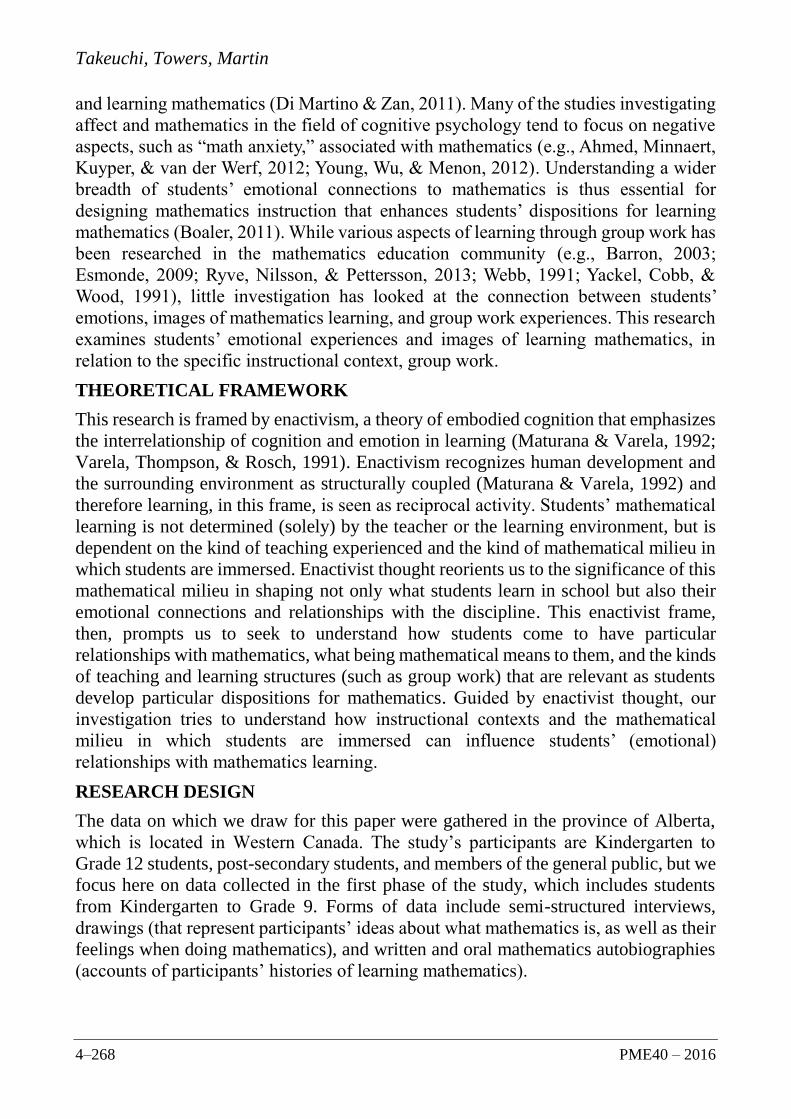
Takeuchi, Towers, Martin
4–268 PME40 – 2016
and learning mathematics (Di Martino & Zan, 2011). Many of the studies investigating
affect and mathematics in the field of cognitive psychology tend to focus on negative
aspects, such as “math anxiety,” associated with mathematics (e.g., Ahmed, Minnaert,
Kuyper, & van der Werf, 2012; Young, Wu, & Menon, 2012). Understanding a wider
breadth of students’ emotional connections to mathematics is thus essential for
designing mathematics instruction that enhances students’ dispositions for learning
mathematics (Boaler, 2011). While various aspects of learning through group work has
been researched in the mathematics education community (e.g., Barron, 2003;
Esmonde, 2009; Ryve, Nilsson, & Pettersson, 2013; Webb, 1991; Yackel, Cobb, &
Wood, 1991), little investigation has looked at the connection between students’
emotions, images of mathematics learning, and group work experiences. This research
examines students’ emotional experiences and images of learning mathematics, in
relation to the specific instructional context, group work.
THEORETICAL FRAMEWORK
This research is framed by enactivism, a theory of embodied cognition that emphasizes
the interrelationship of cognition and emotion in learning (Maturana & Varela, 1992;
Varela, Thompson, & Rosch, 1991). Enactivism recognizes human development and
the surrounding environment as structurally coupled (Maturana & Varela, 1992) and
therefore learning, in this frame, is seen as reciprocal activity. Students’ mathematical
learning is not determined (solely) by the teacher or the learning environment, but is
dependent on the kind of teaching experienced and the kind of mathematical milieu in
which students are immersed. Enactivist thought reorients us to the significance of this
mathematical milieu in shaping not only what students learn in school but also their
emotional connections and relationships with the discipline. This enactivist frame,
then, prompts us to seek to understand how students come to have particular
relationships with mathematics, what being mathematical means to them, and the kinds
of teaching and learning structures (such as group work) that are relevant as students
develop particular dispositions for mathematics. Guided by enactivist thought, our
investigation tries to understand how instructional contexts and the mathematical
milieu in which students are immersed can influence students’ (emotional)
relationships with mathematics learning.
RESEARCH DESIGN
The data on which we draw for this paper were gathered in the province of Alberta,
which is located in Western Canada. The study’s participants are Kindergarten to
Grade 12 students, post-secondary students, and members of the general public, but we
focus here on data collected in the first phase of the study, which includes students
from Kindergarten to Grade 9. Forms of data include semi-structured interviews,
drawings (that represent participants’ ideas about what mathematics is, as well as their
feelings when doing mathematics), and written and oral mathematics autobiographies
(accounts of participants’ histories of learning mathematics).

Takeuchi, Towers, Martin
PME40 – 2016 4–269
To date, 94 interviews with Kindergarten to Grade 9 students (41 girls and 53 boys)
have been conducted. We have also collected 95 mathematics autobiographies from
post-secondary students and members of the general public though an online
submission form.
All of the interviews were transcribed verbatim. In this paper, we mainly focus on
elements of the transcripts that featured students’ descriptions of group work and/or
pair work in mathematics classrooms. In order to reveal students’ images of
mathematics learning, in relation to their experiences of group work, we also conducted
thematic analyses of their drawings and associated descriptions of their feelings when
doing mathematics.
FINDINGS: STUDENTS IMAGES FOR GROUP WORK AND
MATHEMATICAL LEARNING
Across grades, group work or pair work was frequently reported as a classroom
learning structure, although the ways in which, and the extent to which, group work
was used varied. Students reported that they often worked with their desk partners
(those sitting next to them in class), their friends, and project members. Tasks that were
used for group work also varied. In some classes, group work was used only for
projects. In other classes, group work or pair work was used regularly for completing
a worksheet. However, no students reported working on tasks specifically tailored
towards group work [such as group-worthy tasks described in Cohen and Lotan
(2014)].
Overall, students’ preferences were split: 37.3% of the students preferred individual
work to group work and/or pair work and 29.4% of the students preferred group work
and/or pair work to individual work. For 31 % of the students, their preference was
mixed: it depended on types of tasks and peers working together for group work. There
was only one student who reported to have no preference. While slightly more students
talked negatively about group work in elementary grades, the difference across grades
was not outstanding.
Through the cross-analysis focusing on students’ feelings about math and group work
preference, it was revealed that both positive and negative feelings towards
mathematics could influence students’ preferences for group work. Our analysis
suggests that the students who had positive feelings towards mathematics tended not
to find group work very helpful. Among students who preferred individualized learning
to working with peers, 57.8 % (11 out of 19) were good at mathematics and 10.5 % (2
out of 19) had negative relationships with mathematics. Among the students who
preferred group work to individualized learning, 26.6 % (4 out of 15) had positive
relationships with mathematics and 26.6 % (4 out of 15) had negative relationships
with mathematics.
Students preferred individual work for various reasons. For those who are good at
mathematics, they felt group work was unnecessary and could be distracting. They
said, for example, “(I prefer individual work) because I know how to do it and those

Takeuchi, Towers, Martin
4–270 PME40 – 2016
things like math,” or “Sometimes I see people copying and making noise and I can’t
focus on what I’m doing.” When explaining a preference for individualized learning,
a Grade 2 student said it was, “Because you have your own space and people can’t
copy you.” A Grade 3 student described how he felt about being asked for help from
peers as follows:
Interviewer: So do people ever come to you then and ask for help?
Student: Sometimes.
Interviewer: Sometimes, yeah. Do you like helping them or do you find that a bother?
Student: I don’t know what the word is, but yeah it just disturbs me while I’m trying
to work independent.
Similarly, a Grade 1 student said, she preferred individual work “Because when I’m
working with a friend they’re talking and I’m trying to work and I say ‘Please will you
be quiet?’ and they keep talking.” A Grade 2 student said he would not like group work
“Because in groups, it’s not so quiet.” In fact, some students perceived “talk” in the
classroom as noise and distraction. For example, a Grade 5 student compared learning
environments at home and at school and said: “Well, my mother is kind of strict of,
um, getting it. That’s why I always get it right. Because I make up strategies and then
school with my teacher I kind of, you know, have a lot of noise and that’s why I get
sometimes slow in writing.” Another Grade 5 student said, “Sometimes when I don’t
have noise around me I can focus and I like it a bit more but sometimes when it’s noisy
I can’t focus and I can’t do it. But I usually like math when it’s quiet.” Similarly, when
describing group work, a Grade 1 student said, “I sit over with a friend but sometimes
I see people copying and making noise and I can’t focus on what I’m doing.” These
students’ comments depict mathematics classrooms where learning and thinking are
essentially individualized and thus talking with others (and others’ copying their work)
is considered to be a distraction and disturbance.
While group work and pair work were used regularly in our respondents’ mathematics
classrooms, students’ autobiographical interviews and drawings did not communicate
an image of collaboration and collectivity for mathematics learning. In their drawings,
most of the students represented isolated and individualistic images of classroom
mathematics learning—predominantly with the drawings of a student sitting at a desk
working alone (see Figure 1). Only a few early grade students drew drawings of
collaborating with others.
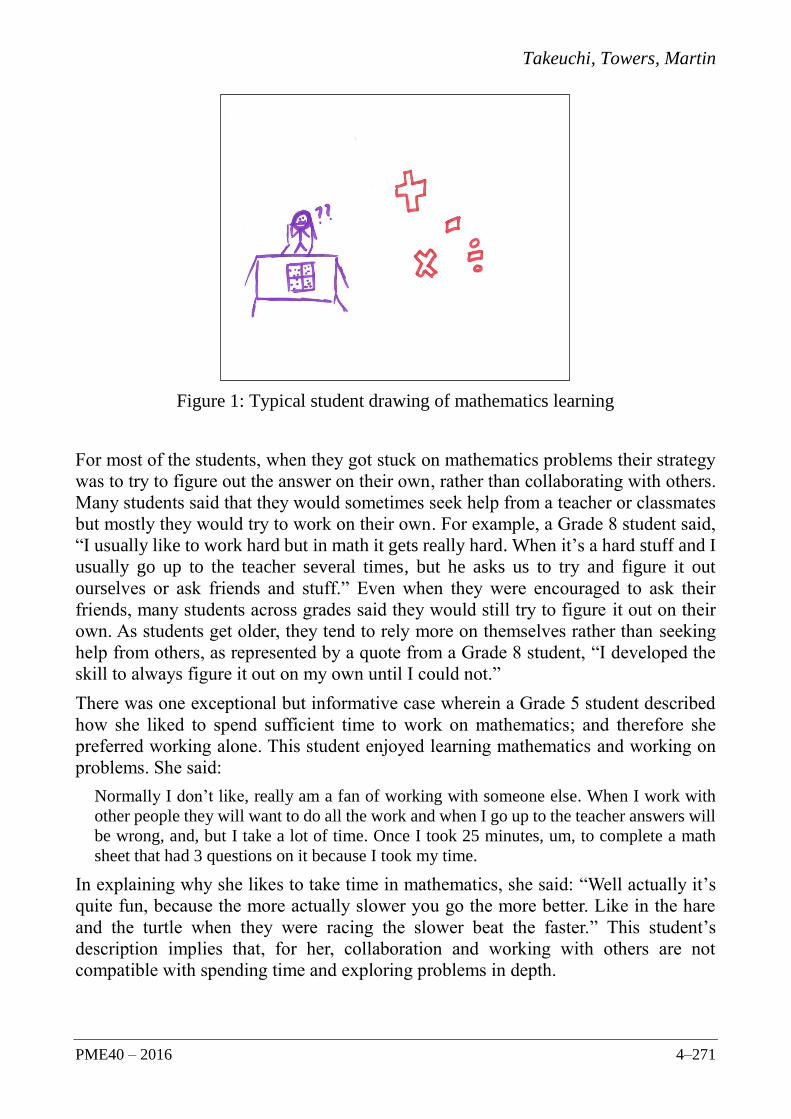
Takeuchi, Towers, Martin
PME40 – 2016 4–271
Figure 1: Typical student drawing of mathematics learning
For most of the students, when they got stuck on mathematics problems their strategy
was to try to figure out the answer on their own, rather than collaborating with others.
Many students said that they would sometimes seek help from a teacher or classmates
but mostly they would try to work on their own. For example, a Grade 8 student said,
“I usually like to work hard but in math it gets really hard. When it’s a hard stuff and I
usually go up to the teacher several times, but he asks us to try and figure it out
ourselves or ask friends and stuff.” Even when they were encouraged to ask their
friends, many students across grades said they would still try to figure it out on their
own. As students get older, they tend to rely more on themselves rather than seeking
help from others, as represented by a quote from a Grade 8 student, “I developed the
skill to always figure it out on my own until I could not.”
There was one exceptional but informative case wherein a Grade 5 student described
how she liked to spend sufficient time to work on mathematics; and therefore she
preferred working alone. This student enjoyed learning mathematics and working on
problems. She said:
Normally I don’t like, really am a fan of working with someone else. When I work with
other people they will want to do all the work and when I go up to the teacher answers will
be wrong, and, but I take a lot of time. Once I took 25 minutes, um, to complete a math
sheet that had 3 questions on it because I took my time.
In explaining why she likes to take time in mathematics, she said: “Well actually it’s
quite fun, because the more actually slower you go the more better. Like in the hare
and the turtle when they were racing the slower beat the faster.” This student’s
description implies that, for her, collaboration and working with others are not
compatible with spending time and exploring problems in depth.

Takeuchi, Towers, Martin
4–272 PME40 – 2016
In contrast to the above-introduced quotes, some students preferred group work
because it helped them understand mathematics better by working with others. For
example, a Grade 5 student said he preferred working with peers, “Just because if I
don’t know something that they know then they can help me. Just, they don’t tell me
the answer but they can tell me how to do it better.” A Grade 7 student said, “I prefer
working in a group because it’s more fun and it just makes everything easier when
there is more than one mind at work.” Similarly, a Grade 8 student said, “I can
understand what they’re thinking and they can understand what I’m thinking and we
can put that together and finish the question.” As these quotes indicate, these students
recognized the benefits of group work and learning with peers. However, the number
of students who recognized the benefits of working collectively with others was rather
small (8.5%, 8 out of 94 students). Furthermore, most of the students perceived group
work as a way of offering and/or receiving help for individualized tasks but not
necessarily as an opportunity for creative collaboration. Our analysis shows that the
majority of Kindergarten to Grade 9 students did not appreciate working with others
and collaborating with others for deeper mathematics learning.
DISCUSSION AND EDUCATIONAL IMPLICATIONS
While collaborative learning and group work have been frequently used in
imathematics classrooms in Canada and other countries, most of the students we
interviewed still held images of mathematics learning that were mostly individualistic
and isolated. Our analysis shows that merely experiencing group work does not
convince all students of its usefulness. In our cross-analysis focusing on students’
feelings, it was revealed that those who had positive feelings towards mathematics
tended not to find group work or pair work very helpful. The students who considered
themselves to be adept at mathematics reported that group work and pair work were
not beneficial because they mainly gave help to others but did not receive much in
return. In fact, many students perceived the talk during group work as distracting and
noisy.
Mathematics activities used during group work and pair work were characterized by
the students as tasks in which finding a solution to the posed problems was the goal,
rather than exploring multiple aspects of the problems and solutions. Because students
considered mathematics mainly as an individualized and isolated process, many
students did not perceive peer talk or collective exploration as meaningful, contrary to
the perception of group work in other classrooms we have studied where the teacher
deliberately structured mathematics learning through group activity (see, e.g., Towers
et al., 2013).
As indicated in the interviews by some students, when they got stuck, trying to figure
things out on their own was a commonly-observed solution. Even when they needed
help and assistance in the very process of “figuring out,” they often did not have access
to sufficient help or collaboration with others. Also, for those who think they are adept
at mathematics, a lack of meanings for collaboration can deprive them of potential

Takeuchi, Towers, Martin
PME40 – 2016 4–273
opportunities to learn, because students can benefit from explaining and participating
in discussions (Chizhik, 2001; Webb, 1985).
The picture of classroom mathematics learning we have described in this paper is
problematic—especially given that some students who require help may hesitate to
seek help in contexts where, despite the use of grouping in the classroom, value is
placed more on individual competence and success. In our analysis focusing on
immigrant students’ mathematics learning experiences in Canadian schools, none of
these students preferred group work over individualized work (Takeuchi & Towers,
2015). These students could not see the benefits of group work, even though newly-
arrived immigrant students could have benefited from group work with peers who can
draw out the expertise of immigrant students (Takeuchi, 2015).
Our research reminds us of the importance of creating a mathematics group work
pedagogy that is deliberate, that embraces students’ questions and dilemmas as a
resource for meaningful mathematical learning, and that helps students to understand
why they are being asked to work together and what they can learn from collaboration.
Our findings suggest that there is a gap between teachers’ use of group work in
mathematics classrooms (which is widespread) and students’ understanding of, and
appreciation for, the potential benefits of this pedagogical approach. We see this as both
a significant concern and a gap that is ripe for further study.
References
Ahmed, W., Minnaert, A., Kuyper, H., & van der Werf, G. (2012). Reciprocal relationships
between math self-concept and math anxiety. Learning and Individual Differences, 22(3),
385-389. doi: 10.1016/j.lindif.2011.12.004
Barron, B. (2003). When smart groups fail. Journal of the Learning Sciences, 12(3), 307-359.
doi: 10.1207/S15327809JLS1203_1
Boaler, J. (2011). Changing students' lives through the de-tracking of urban mathematics
classrooms. Journal of Urban Mathematics Education, 4(1), 7-14. Retrieved from
http://ed-osprey.gsu.edu/ojs/index.php/JUME
Cohen, E. G., & Lotan, R. A. (2014). Designing groupwork: Strategies for the heterogeneous
classroom. (3rd ed.). New York, NY Teachers College Press.
Darling-Hammond, L., Barron, B., Pearson, P. D., Schoenfeld, A. H., Stage, E. K.,
Zimmerman, T. D., . . . Tilson, J. L. (2008). Powerful learning: What we know about
teaching for understanding. San Francisco, CA: Jossey-Bass.
Di Martino, P., & Zan, R. (2011). Attitude towards mathematics: a bridge between beliefs
and emotions. ZDM, 43(4), 471-482. doi: 10.1007/s11858-011-0309-6
Esmonde, I. (2009). Mathematics learning in groups: Analyzing equity in two cooperative
activity structures. Journal of the Learning Sciences, 18(2), 247-284. doi:
10.1080/10508400902797958
Maturana, H. R., & Varela, F. J. (1992). The tree of knowledge: The biological roots of human
understanding. Boston, MA: Shambhala.

Takeuchi, Towers, Martin
4–274 PME40 – 2016
National Council of Teachers of Mathematics. (2000). Principles and standards for school
mathematics. Reston, VA: National Counsil of Teachers of Mathematics.
Ryve, A., Nilsson, P., & Pettersson, K. (2013). Analyzing effective communication in
mathematics group work: The role of visual mediators and technical terms. Educational
Studies in Mathematics, 82(3), 497-514. doi: 10.1007/s10649-012-9442-6
Sfard, A., & Kieran, C. (2001). Cognition as communication: Rethinking learning-by-talking
through multi-faceted analysis of students' mathematical interactions. Mind, Culture, and
Activity, 8(1), 42-76. doi: 10.1207/S15327884MCA0801_04
Takeuchi, M. (2015). The situated multiliteracies approach to classroom participation:
English language learners’ participation in classroom mathematics practices. Journal of
Language, Identity and Education, 14 (3), 159-178.
doi: 10.1080/15348458.2015.1041341
Takeuchi, M., & Towers, J. (2015). Immigrant students’ mathematics learning experiences in
Canadian schools. In T. G. Bartell, K. N. Bieda, R.T. Putnam, K. Bradfield, H. Dominguez
(Eds.), Proceedings of the 37th Annual Meeting of the North American Chapter of the
International Group for the Psychology of mathematics Education (p. 592). East Lansing,
MI: Michigan State University.
Towers, J., & Martin, L. C. (2015). Enactivism and the study of collectivity. ZDM, 47 (2), 1-
10. doi: 10.1007/s11858-014-0643-6
Towers, J., Martin, L. C., & Heater, B. (2013). Teaching and learning mathematics in the
collective. The Journal of Mathematical Behavior, 32(3), 424-433. doi:
10.1016/j.jmathb.2013.04.005
Trilling, B., & Fadel, C. (2009). 21st century skills: Learning for life in our times. San
Francisco, CA: Jossey-Bass.
Varela, F. J., Thompson, E., & Rosch, E. (1991). The embodied mind: Cognitive science and
human experience. Cambridge, MA: MIT Press.
Webb, N. M. (1991). Task-related verbal interaction and mathematics learning in small
groups. Journal for Research in Mathematics Education, 22(5), 366-389. doi:
10.2307/749186
Yackel, E., Cobb, P., & Wood, T. (1991). Small-group interactions as a source of learning
opportunities in second-grade mathematics. Journal for Research in Mathematics
Education, 22(5), 390-408. doi: 10.2307/749187
Young, C. B., Wu, S. S., & Menon, V. (2012). The neurodevelopmental basis of math anxiety.
Psychological Science, 23(5), 492-501. doi: 10.1177/0956797611429134

2016. In Csíkos, C., Rausch, A., & Szitányi, J. (Eds.). Proceedings of the 40th Conference of the International
Group for the Psychology of Mathematics Education, Vol. 4, pp. 275–282. Szeged, Hungary: PME. 4–275
WHEN IS A PROBLEM REALLY SOLVED? DIFFERENCES IN
THE PURSUIT OF MATHEMATICAL AESTHETICS
Hartono Tjoe
The Pennsylvania State University
In the context of looking back, the fourth step of Pólya’s problem-solving process, this
study examined the question of when mathematics problems might be completely
solved. In particular, it investigated the aesthetic principles that guided expert
mathematicians in their professional experience as problem solvers and the aesthetic
considerations that motivated mathematically gifted students in their problem solving
experience. Our findings demonstrated that mathematical aesthetics might be a
learned skill, instead of an innate characteristic of problem solvers.
INTRODUCTION
A number of pedagogical recommendations to improve and assess mathematics
problem-solving experience have focused on the development of aesthetic
appreciations, where learners are to recognize many different approaches and value
those considered to be mathematically “beautiful” (Dreyfus & Eisenberg, 1986; Karp,
2008; Leikin & Lev, 2007). Indeed, affects and meta-affects connected with aesthetics
in mathematics can serve as an indicative, and possibly predictive, measure of problem
solvers’ depth of mathematical comprehensions (Sinclair, 2004). Aesthetic aspects
were particularly considered in many studies connected with mathematicians’
preferences in problem-solving approaches (Hadamard, 1945; Krutetskii, 1976;
Pointcare, 1946). Much less attention, however, was devoted to understanding whether
aesthetic appreciation of mathematical “beauty” might be viewed by grade school level
students. This study examined different aesthetic considerations that might motivate
different groups of problem solvers.
THEORETICAL AND EMPIRICAL BACKGROUND
The seminal work of Pólya (1945) identified four steps in the process of solving
mathematics problems: understanding the problem, devising a plan, carrying out the
plan, and looking back. The fourth step, looking back, was proposed to imply that a
solved problem did not mean the end of problem-solving process. It was necessary to
examine the obtained result by checking the arguments along the way. Alternatively,
it would be valuable to derive the obtained result by using a different approach. Given
the many possible different approaches to solve the same problem, a decision to choose
one approach over other approaches might be less than arbitrary (Leikin & Lev, 2007).
Aesthetic aspects were particularly considered in many studies connected with
preferences in problem-solving approaches (Krutetskii, 1976).
Silver and Metzger (1989) assessed the role of aesthetics in a study involving university
professors in mathematics. They examined the aesthetic influence on mathematical

Tjoe
4–276 PME40 – 2016
problem-solving experience in two assessments. In one assessment, they monitored the
role of aesthetic value in the process of problem-solving as discussed by Poincare
(1946) and Hadamard (1945). In another assessment, they analyzed the sense of
aesthetics in the evaluation of the completed solutions as described by Kruteskii (1976)
or the problems themselves. Silver and Metzger (1989) found that these expert problem
solvers displayed signs of aesthetic emotion. On one occasion, a subject resisted the
temptation to resort to the use of calculus in solving a geometry problem,
acknowledging the possibility of a “messy equation” (p. 66). Only after some
unsuccessful attempts to seek a geometric approach did the subject concede to solving
the problem using calculus. Although successful, he felt that “calculus failed to satisfy
his personal goal of understanding, as well as his aesthetic desire for ‘harmony’ between
the elements of the problem and elegance of solution” (p. 66). On another occasion,
having solved another geometry problem algebraically, the same subject appeared
unsettled, recognizing that a geometric approach could be “more elegant” (p. 66).
Using a similar scope of analysis as Silver and Metzger (1989), Koichu and Berman
(2005) examined how three members of the Israeli team participating in the
International Mathematics Olympiad coped with conflict in their conceptions of
effectiveness and elegance. An effective approach led directly to a final result in
answering a mathematics problem with minimum memory retrieval of concepts and
terms and procedural knowledge. An elegant approach was considered to have clarity,
simplicity, parsimony, and ingenuity in solving a mathematics problem with minimum
intellectual effort and few mathematical tools. In their study, Koichu and Berman
(2005) observed that when solving geometry problems, these mathematically gifted
students consistently directed greater aesthetic appreciations towards geometric
approaches than algebraic or trigonometric approaches. However, when such a
geometric approach was not readily accessible to them, they immediately resorted to
algebraic or trigonometric approaches as long as the approaches effectively solved the
problems. Only later on when students had built up their confidence could they develop
the desired geometric approach to satisfy their need for aesthetic appreciations. This
experience marked the point at which students successfully managed to balance the
need for elegant approaches with the time constraint requiring effective approaches.
In the studies by Silver and Metzger (1989) and Koichu and Berman (2005),
mathematics professors as well as International Mathematics Olympiad team members
did not only find geometric explanations or approaches to problems to be more
appealing than other explanations or approaches, but they also demonstrated
persistence in finding approaches characterized by geometric reasoning or
interpretations even after they had acquired non-geometric solutions to the problems.
The study by Silver and Metzger (1989) demonstrated evidence that there appeared to
be an agreement among mathematics professors with regard to their strong preference
in geometry. Likewise, one might argue that because of the specific training that they
received in preparation for the International Mathematics Olympiad, possibly as a
direct influence of the heavy emphasis on simplicity in the scoring criteria of such

Tjoe
PME40 – 2016 4–277
competitive mathematics pinnacle (Olson, 2004), the three mathematical Olympiads in
the study by Koichu and Berman (2005) would gravitate towards personal preferences
with such guidance, although they might not develop on their own a natural preference
towards geometric approaches.
The present study examined the question of when mathematics problems might be
completely solved. In particular, it investigated the differences in the pursuit of
mathematical aesthetics as perceived by expert mathematicians and mathematically
gifted students. It focused on an under-studied aspect of Pólya’s fourth step because
unlike the other three steps, the fourth step attracted much less consideration in the
mathematics education research (Schoenfeld, 1985). This study might also be of value
because little was known about the extent to which mathematical aesthetics might be
viewed proportionately by different groups of people (Sinclair, 2004).
METHODOLOGY
Three expert mathematicians volunteered to participate in the study (Professors 1, 2,
and 3). They were editors of a number of well-respected professional journals in pure
and applied mathematics, and shared among themselves a total of 48 years of research
experience. Nine mathematically gifted students also participated in the study to take
the paper-and-pencil test consisting of the three non-standard mathematics problems
which could be solved using 15 different approaches (see Table 1). The students were
enrolled in one of the nine specialized high schools in New York City, where less than
five percent of the approximately 30,000 applicants were admitted after passing an
entrance examination (NYCDOE, 2011). These problems were carefully chosen to
allow for many different approaches not immediately apparent to average students, yet
readily accessible with typical high school mathematics knowledge and curriculum,
which included arithmetic, algebra, and geometry (CCSSI, 2010). The first problem
was an arithmetic-inequality problem (Problem 1) with four approaches (P1A1, P1A2,
P1A3, and P1A4), the second problem was an algebra-of-two-variables problem
(Problem 2) with eighth approaches (P2A1, P2A2, P2A3, P2A4, P2A5, P2A6, P2A7,
and P2A8), and the third problem was a geometry-of-angle-measurement problem
(Problem 3) with three approaches (P3A1, P3A2, and P3A3).
Problems Descriptions
Problem 1 Fill in the blank with one of the symbols <, ≤, =, ≥, or >.
2009 + 2011 __________ 2 2010
Problem 2 Given x2 + y2 =1, find maximum of x+ y.
Problem 3 Given triangle ABC with median CD and CD = BD, find
measure angle ACB.
Table 1: Three non-standard mathematics problems

Tjoe
4–278 PME40 – 2016
The researcher interviewed the three expert mathematicians individually. In each
interview, the researcher presented each expert mathematician with the three problems
and 15 approaches. The researcher first asked each expert mathematician to choose his
or her most preferred approach for each of the three problems. The expert
mathematicians were then to rank order the approaches for each problem from the most
preferred to the least preferred, and to provide careful explanations for why they placed
those approaches in such order. A collective choice was determined if at least two of
the expert mathematicians ranked the approach the same, or in the case where each
expert mathematician assessed different ranks for the approach, the mean rank of each
approach was computed and the lowest mean was utilized. Furthermore, the three
expert mathematicians’ explanations as to why they preferred each of the 15
approaches more or less to the others were analyzed qualitatively. The researcher
identified a couple of premises that were shared in these expert mathematicians’
explanations, namely, simplicity and originality, consistent with how mathematical
aesthetics were discussed in earlier studies. With respect to simplicity, the 15
approaches were coded as follows: very simple, somewhat simple, not quite simple,
and not simple were coded as 1, 2, 3, and 4, respectively. With respect to originality,
the 15 approaches were coded as follows: very original, somewhat original, not quite
original, and not original were coded as 1, 2, 3, and 4, respectively. Explanations of the
three expert mathematicians were then synthesized for each of the 15 approaches.
The students were explained that they were to creatively solve the three problems using
as many different approaches as they could without calculator and without time limit.
They were reminded several times that they could take as much time as they needed to
think about and write down in their test as many different approaches as possible. After
the test, the students’ written responses were examined for correctness. The nine
students were interviewed individually to elicit their explanations for the approaches
they supplied in the test. In the interview, they were asked to explain how they came
up with their approaches to the three problems.
Following the interview, the students were provided with the 15 approaches and were
surveyed to examine the students’ thoughts on the 15 approaches for the three
problems, their most preferred approaches, and their overall reactions to the aesthetic
view of expert mathematicians. Some questions included whether they understood each
of the 15 approaches, whether they thought they had learned in their previous
mathematics courses the mathematics content involved in each of the 15 approaches,
which of the 15 approaches would they prefer the most, and whether any of the three
approaches that mathematicians considered to be the most “beautiful” approaches (i.e.,
P1A1, P2A1, and P3A1 for Problems 1, 2, and 3, respectively) appealed to the students
to any extent. In this sense, the students were explicitly informed that mathematicians’
preferred approaches were considered by these mathematicians themselves to be the
most “beautiful” approaches.
The findings of the paper-and-pencil test and the interviews with the students were
analyzed to comprehend similarities in the justifications provided by the nine students

Tjoe
PME40 – 2016 4–279
to supply particular approaches to the three problems. The responses to the survey
items were tallied to determine the students’ understanding of each of the 15
approaches, their acknowledgement of having learned in their previous mathematics
courses the mathematics content involved in each of the 15 approaches, their most
preferred approaches for each of the three problems, and their attraction to each of the
three approaches most preferred collectively by the mathematicians.
FINDINGS
Collectively, P1A1, P2A1, and P3A1 were preferred the most, while P1A4, P1A8, and
P3A3 were preferred the least, by the three expert mathematicians for Problems 1, 2,
and 3, respectively (see Table 2). The approaches that were rated as most simple and
original were characterized mainly by the surprising manner in which the information
given in the problems were interpreted so unusually that the solutions to the problems
revealed themselves naturally. For instance, P1A1 for Problem 1 was considered to be
very simple since it did not treat 2010 as a single number, but rather as an average of
two numbers, namely, 2009 and 2011. P1A1 was also very original because it was
resolved by recalling the visual concavity of the square root function, allowing the
proof to be comprehended effortlessly. The approaches that were rated as least simple
and original were characterized mainly by the blunt manner in which the information
given in the problems were processed without any refinement so that the solutions to
the problems appeared strained. For example, P1A4 for Problem 1 was considered to
be the least simple and original not only because it required tedious arithmetic
calculations of four-digit multiplications, but also because it construed square roots in
a most elementary concept as an arithmetic operator.
P1A1 P1A2 P1A3 P1A4 P2A1 P2A2 P2A3 P2A4 P2A5 P2A6 P2A7 P2A8 P3A1 P3A2 P3A3
Prof 1 1 2 3 4 1 2 3 4 5 6 7 8 1 2 3
Prof 2 3 2 1 4 2 6 3 1 4 7 5 8 1 2 3
Prof 3 1 3 4 2 1 4 2 8 5 6 7 3 3 2 1
Collective 1 2 3 4 1 2 3 4 5 6 7 8 1 2 3
Table 2: Expert mathematicians’ choices of mathematically “beautiful” approaches
The students who took the paper-and-pencil test were generally able to finish the test
in less than one hour. One student successfully solved all three problems, one student
successfully solved Problems 1 and 2, four students successfully solved Problems 1
and 3, one student successfully solved Problem 2, and two students successfully solved
Problem 3. The one student who successfully solved all three problems supplied two
approaches for Problem 3 (i.e., P3A3 and P3A2), but only one approach for Problems
1 and 2 (i.e., P1A2 and P2A6). The other eight students solved Problems 1, 2, and 3
using only one approach (i.e., P1A4, P2A8, and P3A3).
The three problems appeared to pose some challenge for the students to solve, and in
addition, the instruction to supply as many approaches as possible might be something

Tjoe
4–280 PME40 – 2016
that the students were not familiar with. Despite the unrestricted time to work on the
test, the students appeared to be easily content with supplying only one workable, yet
mechanistic approach as long as they obtained a correct answer to each problem. One
might describe such problem-solving experience as lacking in reflective thinking, apart
from flexibility and creativity.
It was clear that the role of aesthetics was limited in the students’ considerations as
they problem-solved. Much more evident in the students’ written responses than
elegance was impulsiveness. During the interviews, several students acknowledged in
preferring P1A4 in Problem 1 that “when dealing with square roots … what usually
comes to me first was squaring both sides,” and then “you just kind of hacked away at
it [because] you do this big multiplication, and you finally get this large number is
bigger than that large number.” In resorting to P2A8 in Problem 2, the students
confirmed that short-term memory recall of their most current mathematics course (i.e.,
AP Calculus) prompted their reflex to take derivative of an objective function for, as
one student explained, “I’m learning calculus right now, so I figure why not use
calculus, which is still fresh, more fresh.” In using P3A3 in Problem 3, many students
revealed their confidence and comfort in building up information step by systematic
step until the solution appeared, as one student said, “I chose [P3A3] because of the
whole logical following it.” The students’ choice of using the approaches in the paper-
and-pencil test might therefore be viewed as an instinctive one with the sole intention
to find, in the shortest amount of time and the least number of steps, the answers to the
problems, albeit without any other meaningful aesthetic considerations.
Furthermore, there was no direct relationship between mathematicians’ and students’
views of “beauty” in mathematics. These views were grounded not only in how they
perceived the three problems, but also in how they approached them. Although
majority of the students indicated that they had no difficulty in understanding the
mathematicians’ most preferred approaches, only a few would prefer them to the rest
of approaches for those three problems. Even those students who were in agreement
with the mathematicians’ choice of most preferred approaches were for the most part
not able to provide adequate explanations for the aesthetic value of those approaches.
They were only able to see the outward appearance of those “beautiful” approaches.
For instance, P1A1 was considered to be “beautiful” because of the relatively shorter
lines of argument, P2A1 because of the “helpful” presence of the graph accompanying
the solution, and P3A1 because of the physical shape of the parallelogram that
resembled “a diamond.” Clearly, the mathematicians’ preferred approaches did not
appeal to the students as “beautiful” in the sense of the deeper structure of the
mathematical arguments involved in those approaches.
CONCLUSION AND DISCUSSION
The present study sought to analyze to what extent mathematical aesthetics might be
viewed different by different groups of people. It demonstrated differences in the
motivations that guided different groups of problem solvers. While the three expert

Tjoe
PME40 – 2016 4–281
mathematicians appeared to be more satisfied after a “beautiful” approach had been
identified, the nine students in general stopped the problem-solving process once any
workable solution was proved to have answered the problem. Unlike expert
mathematicians who saw beauty in mathematics as an exhaustive consequence of
simplicity and originality, students found mathematical elegance only in approaches
that were efficient in terms of time and number of steps to solve the problems. While
expert mathematicians considered students’ most preferred approaches to be the least
“beautiful,” students, showing no enthusiasm, considered expert mathematicians’ most
preferred approaches to be no more attractive than their own approaches.
The mismatch between the students’ most preferred approaches and those of the
mathematicians did not appear to be a consequence of the students’ lack of
mathematical proficiency, but rather, at least partially, the students’ lack of
appreciations of mathematical “beauty.” This evidence suggested that the presence of
such appreciations among mathematicians indicated to a certain extent that such
competence might have been learned, cultivated, shared, and recognized within the
community of professional mathematicians quite possibly beyond the high school
level. To some extent, there appeared to be a profound lacuna in the understanding of
mathematical aesthetics that might inadvertently subdivide the state of mathematics
problem solvers into two groups: one group of professional research mathematicians
and another group of those whose affects might be waiting to be nurtured.
Despite the rigorous selection process of students in the study, it became clear that
mathematical “beauty” was not a consideration that young problem solvers grasped
automatically, but also that they had not been exposed to such aesthetic appreciations,
as defined by expert mathematicians, until much later when serious work of
mathematics might be involved. Related to the findings by Silver and Metzger (1989)
and Koichu and Berman (2005) was the three expert mathematicians’ constant
reference to geometric reasoning in their explanations of their most preferred
approaches for the three problems with respect to simplicity and originality.
Nonetheless, such persistent pursuit of geometric interpretations did not appear greatly
in the ways that the nine students explained their most preferred approaches. To some
extent, therefore, aesthetic appreciations evolved partly around geometric
interpretations, and more importantly, the search for such geometric interpretations, as
part of aesthetic considerations, might be a learned skill, instead of an innate skill.
As the methodology employed in the study suggested, problem-solving experience
using many different approaches, as well as the discussion that compared and
contrasted their advantages or disadvantages, might be facilitated in a mathematics
classroom setting. Given this frequent accumulation of different approaches either
discovered by themselves or presented by their classmates or teachers, students might
begin to grow their sense of mathematical aesthetic appreciations. To this end,
mathematics curriculum might find the consideration of mathematical aesthetics,
conceivably as a measure of flexibility and creativity, to be worthwhile if not exigent.

Tjoe
4–282 PME40 – 2016
References
Dreyfus, T., & Eisenberg, T. (1986). On the aesthetic of mathematical thought. For the
Learning of Mathematics, 6, 2-10.
Hadamard, J. (1945). The psychology of invention in the mathematical field. Princeton, NJ:
Princeton University Press.
Karp, A. (2008). Which problems do teachers consider beautiful? A comparative study. For
the Learning of Mathematics, 28, 36-43.
Koichu, B., & Berman, A. (2005). When do gifted high school students use geometry to solve
geometry problems? The Journal of Secondary Gifted Education, 16, 168-179.
Krutetskii, V. A. (1976). The psychology of mathematical abilities in schoolchildren. (J.
Kilpatrick, I. Wirszup, Eds., & J. Teller, Trans.) Chicago, IL: University of Chicago.
Leikin, R., & Lev, M. (2007). Multiple solution tasks as a magnifying glass for observation
of mathematical creativity. In J. H. Woo, H. C. Lew, K. S. Park, & D. Y. Seo (Eds.),
Proceedings of the 31st Conference of the International Group for the Psychology of
Mathematics Education (3, pp. 161-168). Seoul, Korea: PME.
National Council of Teachers of Mathematics. (2000). Principles and standards for school
mathematics. Reston, VA: Author.
New York City Department of Education. (2011). Specialized high schools student handbook
2011-2012. New York, NY: Author.
Olson, S. (2004). Count down: Six kids vie for glory at the world’s toughest math competition.
New York, NY: Houghton Mifflin Harcourt.
Poincare, H. (1946). The foundations of science. (G. B. Halsted, Trans.) Lancaster, PA:
Science Press.
Pólya, G. (1945). How to solve it. Princeton, NJ: Princeton University Press.
Schoenfeld, A. H. (1985). Mathematical problem solving. Orlando, FL: Academic Press.
Silver, E. A., & Metzger, W. (1989). Aesthetic influences on expert mathematical problem
solving. In D. McLeod, & V. Adams (Eds.), Affect and mathematical problem solving (pp.
59-74). New York, NY: Springer-Verlag.
Sinclair, N. (2004). The roles of the aesthetic in mathematical inquiry. Mathematical Thinking
and Learning, 6, 261-284.
2016. In Csíkos, C., Rausch, A., & Szitányi, J. (Eds.). Proceedings of the 40th Conference of the International
Group for the Psychology of Mathematics Education, Vol. 4, pp. 283–290. Szeged, Hungary: PME. 4–283
TENSIONS IN STUDENTS’ GROUP WORK ON MODELLING
ACTIVITIES
Chrissavgi Triantafillou(1), Dionysia Bakogianni(1) & Georgios Kosyvas(2)
(1)National and Kapodistrian University of Athens, Greece
(2)Education Office of the Greek Embassy in London, United Kingdom.
In this paper we study the modelling activity of secondary school students through the
lens of Cultural Historical Activity Theory (CHAT) perspective. Our focus is on the
tensions emerged throughout students group work. A particular mathematical
modelling task was implemented in a lower and an upper secondary mathematics
classroom (9th and 11th Grade respectively). The analysis of 24 episodes of tensions in
the two classrooms revealed (a) task-based and group-based sources of tensions; (b)
different resolution processes (bringing to the fore a given tool or providing a new
mathematical or non-mathematical tool); and (c) who acted as facilitator in the above
processes, namely the teacher or the group itself. Finally, commonalities and
differences between the lower and the upper students’ group work are also considered
and discussed.
RATIONALE OF THE STUDY
Modelling activities refer to using mathematics to solve realistic situations and open
problems. Among others, students’ involvement in modelling activities provides
opportunities for students to observe, communicate, explain, reflect, and thus build
mathematical concepts based on meaning and inquiry (Maaß, 2006). The importance
of modelling activities in today’s world is highlighted by many researchers (Barbosa,
2006; Blum & Borromeo Ferri, 2009; Sriraman & Lesh, 2006; Wake 2015). In out of
school practices problem solving involves mathematical processes as interpretation,
description, explanation and argumentation more than computation or deduction
(Shiraman & Lesh, 2006; Wake 2015). Also in school practices, as Christiansen (2001)
argues, it is not only the content but the social organization of classroom activity as
well that play a decisive role to the modelling activity outcome. In general, negotiation
of meaning of a specific situation (in school or in out of school joint activities) might
cause tensions and conflicts among the participants. The focus on tensions on
classroom modelling activities is mainly related to tensions experienced by teachers
when developing modelling-based lessons (de Oliveira & Barbosa, 2013) or to tensions
experienced by students when they have to make necessary connections between
abstract mathematical models and physical phenomena (Carrejo & Marshall, 2007).
In this study, we focus on tensions emerged during students’ group discussions while
they are working on solving the same modelling task in a lower and an upper secondary
Greek class. In particular, the study was guided from the following research questions:

Triantafillou, Bakogianni, Kosyvas
4–284 PME40 – 2016
Q1: What are the main sources of tensions identified in student groups’ modelling
activity? How are these tensions resolved?
Q2: How the sources of tensions and the resolution process differentiate between lower
and upper secondary groups’ modelling activities?
THEORETICAL FRAMEWORK
Our main theoretical and methodological tool to explore tensions (dillemas, conflicts)
emerged among group members while participating in a modelling activity is the
expanded model of Cultural Historical Activity Theory (CHΑΤ), and in particular the
work of Engeström (1999). The fundamental recognition of activity theorists is the fact
that in an activity the relationship between the subject and the object of the activity is
mediated by a series of situational factors, including the means of production (tools,
materials), the subjects’ local needs, and the community’s traditions and rules
(Engeström, 1999). The activity as a whole is characterized by inner contradictions
(dilemmas, conflicts, disagreements) which are realized as tensions within the activity
system. According to Engeström (ibid.) contradictions and tensions are important
aspects of activity systems because they lead to change and development.
In this study, we analyze groups' tensions emerged during solving the 'Solar panels'
task (object of the activity) in a lower (Grade 9) and an upper (Grade 11) secondary
school classroom. We consider as subjects the student groups; as tools the means that
mediate groups' discussions (e.g., contextual resources provided by the teacher,
mathematical tools and processes); as rules the social conditions which control groups'
actions and as division of labour the distribution of actions and operations in which
students are engaged. We also consider the two classrooms as two different learning
communities, due to the difference between them regarding students' experiences in
mathematics. Finally, we consider as tensions the conflicts and disagreements emerged
among the group members as well as dilemmas expressed by them throughout their
modelling activity.
Fig. 1: The modelling circle (OECD, 2013, p.26)
In order to analyse students’ modelling activity we adapt the model suggested by PISA
2012 diagram (Fig. 1). This model captures the cyclic nature of the activity and
identifies four main processes that underlie a mathematical modelling route: In
particular, the processes are: Formulating where the problem in context is transformed
into a mathematical problem which is amenable to mathematical treatment; employing
that involves mathematical reasoning that draws on a range of concepts, procedures,

Triantafillou, Bakogianni, Kosyvas
PME40 – 2016 4–285
facts and tools to provide the mathematical solution; Interpreting and evaluating that
involves making sense, and considering the validity, of the mathematical
results/solution obtained.
METHODOLOGY
The context
This paper refers to a study that took place in the context of a European project, Mascil
(see: www.Mascil-project.eu). This program is intended to enhance the mathematical
experience of students through fostering inquiry based learning by using modelling
activities on authentic workplace settings. In this report we concentrate on two
implementations of a particular Mascil task, the Solar panels problem, one in a 9 th
Grade and one in an 11th Grade mathematics classrooms. The two implementations
took place during the school year 2014-15 and lasted two teaching hours each. In both
cases, the students in the classroom were separated into groups of 4-5 students and all
groups worked collaboratively for the solution of the problem.
The task
The Solar panel problem was about the installation of solar panels on a house roof top.
The object of the activity was to calculate the maximum number of solar panels that
could be placed on the roof of a house. Solving the problem required students to
calculate the projected area of the panel on the roof by using trigonometric ratios.
Students in both classrooms have been taught trigonometric ratios, but their familiarity
with applications in geometric solids (e.g., projections) was rather limited. Moreover,
modelling activities are not so common in the Greek Mathematics Curriculum.
In Figure 2 we present a brief description of the task and some of the representations
that were included in the given worksheets.
Fig. 2: Brief description of the task.
A detailed description of the solar panel problem is available in the mascil-project
website (http://www.mascil-project.eu/classroom-material).
Participants and data
In this study, we focused on tensions that emerged while five groups of students were
working on solving the Solar panel problem in two different classrooms, three groups

Triantafillou, Bakogianni, Kosyvas
4–286 PME40 – 2016
in a Grade 9 classroom (13 students) and two groups in a Grade 11 classroom (8
students). These five groups worked as a team and exhibited strong interactions among
their members. The data consisted of the audio recordings from the five groups’
discussions during the two - teaching hour implementation of the task while students’
written work and video recording of the classroom activity were additional sources of
data.
Data analysis
Qualitative content analysis has been employed for the analysis of groups' emerged
tensions (Mayring, 2000). Initially, the data were transcribed so we could distinguish
the main group's modelling actions, namely the central actions followed by the majority
of groups in their attempt to solve the problem. A plurality of right or wrong hypotheses
and ideas could be identified in each modelling action. Some of them were overlooked
by the group, while others caused episodes of tensions (conflicts and dilemmas) within
the group. Our analysis focused on the latter case. We distinguish episodes of tensions
where one or more group members questioned their classmates’ ideas or strategies or
posed an alternative idea under discussion, and the group engaged in a process to
respond or resolve the dispute. In each episode, we were particularly interested in: (a)
what was (were) the source(s) of a tension? (b) who facilitated the resolution process?
and (c) how was the tension finally resolved? We analyzed 24 episodes of tensions in
groups' discussions in total. First we coded the various episodes in terms of what, who
and how, as we described above, and then we classified the emerged codes into general
categories. The produced scheme of the general categories was tested by the three
researchers through the whole set of data. Finally, we traced the above categories as
they appeared in the two learning communities.
FINDINGS
We distinguished three main modelling actions in groups' work that constituted parts
of the students’ routes: (action 1) calculate the useful roof area, the area of the panel
and divide them. This action was faulty since students simplified the problem into a
two - dimensional base by ignoring (consciously or not) that the panels were placed on
the roof top with an inclination; (action 2) translating the problem in the three-
dimensional space by utilizing the projections of the panels on the roof through the use
of trigonometric ratios; and (action 3) examining alternative ways to place the panels
on the roof. All groups engaged in the 1st modelling action but episodes of tensions
among group members acted as catalyst in helping the groups reconsidering their
strategy, re-formulating the problem and continuing successfully with the 2nd action.
This was the case in all groups but one, the one of the 11th Grade groups, where the
members failed to overcome the emerged tension.
In Figure 3, we present the scheme of categories that emerged from the data analysis
as regards the sources of tensions, the facilitators of tensions treatment and the ways
the tensions resolved. As far as the sources of the tensions are concerned, we identified
two main categories: (a) task-based sources and (b) group-based sources. Among the

Triantafillou, Bakogianni, Kosyvas
PME40 – 2016 4–287
task-based sources we distinguished three sub-categories: (i) Neglect given
information, namely when some students in the group overlooked the given contextual
information regarding the panel’s inclination while others had a more global view of
the situation; (ii) Misleading interpretations of a contextual information, as for
example, the group members interpreted the given restriction "the panels should be
placed 1m far from the perimeter line" differently. Particularly, some students
suggested subtracting one meter from each dimension, while others insisted on
subtracting two meters from each dimension; and (iii) Limited understanding of the
underlying mathematical notions (e.g., some students in the group had difficulties to
employ trigonometric ratios in their mathematical solution). The group-based sources
concerns the case that the modelling route was developed at different pace among the
group members, something that also created tensions in group’s activity.
Fig. 3: The scheme of categories
A tension was resolved either internally by the support of some group members or
externally by the support of the teacher. In both cases, two types of actions were
employed by the facilitators: (i) bringing to the fore a given tool (i.e. contextual
information, representation etc.) and (ii) providing a new tool. Among these new tools,
we discerned the use of mathematical tools (e.g., arguments, notions, questions); and
the use of non-mathematical tools (e.g., everyday objects, technologies, drawings,
gestures) in facilitators' actions.
Differences identified between upper and lower secondary learning communities
As regards the sources of tension, the task-based sources were common in both
communities while the group-based source was present only in the case of the upper
secondary class. This could be explained by the fact that in Grade 11 some students
seemed to have a strong mathematical profile and be ahead of the other members, while
in Grade 9 all group members seemed to progress at the same rate. Regarding the
facilitator, there was a clear difference between the two communities. The groups in
Grade 11 resolved the observed tensions internally, either by exchanging ideas or by
the assistance of a leader-student, usually the one with a strong mathematical profile.
The students in this community asked rarely for the teacher’s help and when they did
so, the teacher preferred not to intervene. On the contrary, in Grade 9, in most cases
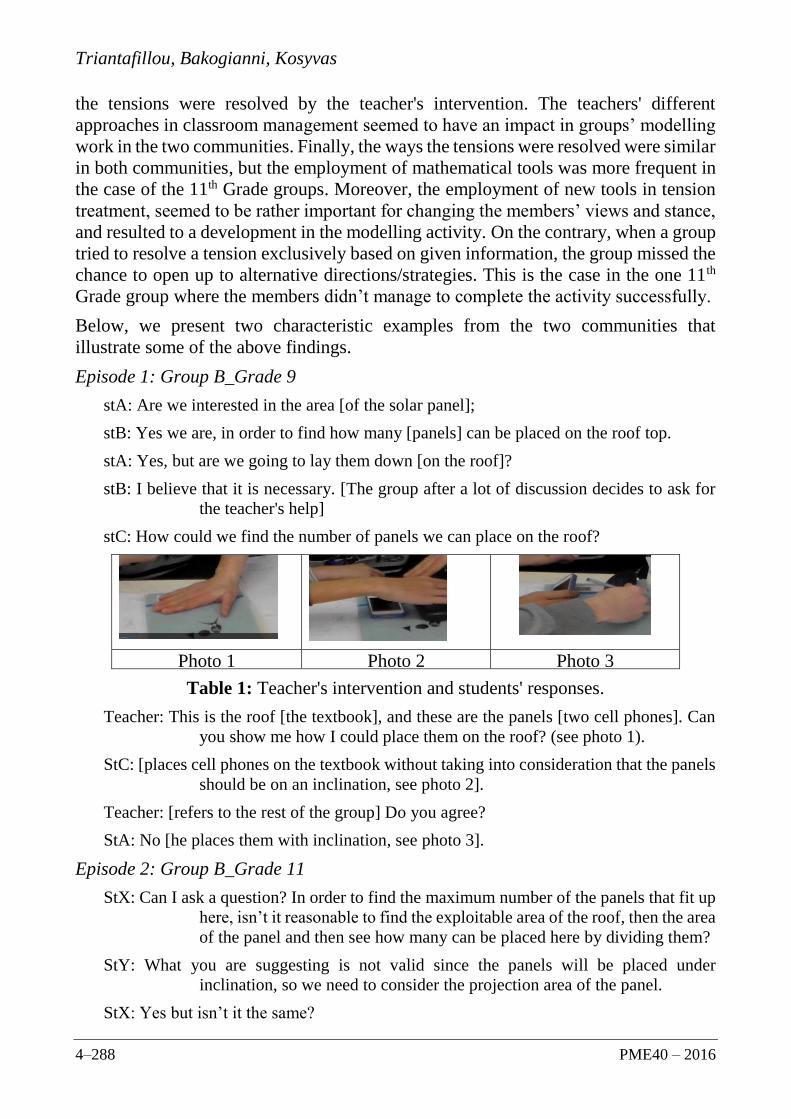
Triantafillou, Bakogianni, Kosyvas
4–288 PME40 – 2016
the tensions were resolved by the teacher's intervention. The teachers' different
approaches in classroom management seemed to have an impact in groups’ modelling
work in the two communities. Finally, the ways the tensions were resolved were similar
in both communities, but the employment of mathematical tools was more frequent in
the case of the 11th Grade groups. Moreover, the employment of new tools in tension
treatment, seemed to be rather important for changing the members’ views and stance,
and resulted to a development in the modelling activity. On the contrary, when a group
tried to resolve a tension exclusively based on given information, the group missed the
chance to open up to alternative directions/strategies. This is the case in the one 11th
Grade group where the members didn’t manage to complete the activity successfully.
Below, we present two characteristic examples from the two communities that
illustrate some of the above findings.
Episode 1: Group B_Grade 9
stA: Are we interested in the area [of the solar panel];
stB: Yes we are, in order to find how many [panels] can be placed on the roof top.
stA: Yes, but are we going to lay them down [on the roof]?
stB: I believe that it is necessary. [The group after a lot of discussion decides to ask for
the teacher's help]
stC: How could we find the number of panels we can place on the roof?
Photo 1 Photo 2 Photo 3
Table 1: Teacher's intervention and students' responses.
Teacher: This is the roof [the textbook], and these are the panels [two cell phones]. Can
you show me how I could place them on the roof? (see photo 1).
StC: [places cell phones on the textbook without taking into consideration that the panels
should be on an inclination, see photo 2].
Teacher: [refers to the rest of the group] Do you agree?
StA: No [he places them with inclination, see photo 3].
Episode 2: Group B_Grade 11
StX: Can I ask a question? In order to find the maximum number of the panels that fit up
here, isn’t it reasonable to find the exploitable area of the roof, then the area
of the panel and then see how many can be placed here by dividing them?
StY: What you are suggesting is not valid since the panels will be placed under
inclination, so we need to consider the projection area of the panel.
StX: Yes but isn’t it the same?

Triantafillou, Bakogianni, Kosyvas
PME40 – 2016 4–289
StY: No it is not. Look at me, you are going to place the panel this way not that way
[makes gestures to show that the panel will be in inclination] Look! Does
the hypotenuse of a triangle have the same length with the one of the
vertical sides?
SBX: Aaa, ok! I understand now.
Both episodes are based on a common task-based source of tension i.e. neglect of using
given information, but the tension was resolved differently in each community. The
11th Grade group resolved the tension internally when StY brought to the fore the
appropriate information and provided new tools (posed a mathematical questions,
provided mathematical arguments and used gestures) in order to convince his
classmate. On the other hand, in the 9th Grade group, StA brought to the fore the panels’
inclination but he did not had the appropriate tools (mathematical arguments) to
convince his classmates, so the group decided to ask for the teacher's help. The teacher
treated the tension by posing inquiry questions and employing non-mathematical tools
(e.g., the cell phones as panels).
CONCLUDING REMARKS
The lens of CHAT helped us to gain insight on the situational and social factors that
influence student groups’ modelling activity. We consider as situational factors the
everyday objects, gestures and arguments employed by the community members as
they were facilitating the emerged tensions. As social factors we consider the teachers'
approaches on classroom management and the group members' interactions. Our
analysis indicated that all student groups faced tensions during the process of
formulating mathematically the real situation. These tensions played a decisive role to
the modelling activity outcome. Moreover, the tensions emerged affected the linearity
of the students' modelling activity, since as shown above, the groups returned in
previous processes before completing the modelling cycle (Fig. 1). The non-linearity
of the modelling cycle have been also discussed by other researchers (e.g., Blum &
Borromeo Ferri, 2009). In addition, what seemed to be rather important for the
resolution of a tension, was the enrichment of the activity with new tools (e.g.,
everyday objects, gestures and mathematical arguments) beyond those given in the
task. Such tools proved to mediate effectively the tensions treatment since they were
acting as a resource for the negotiation of new meanings. In this way, the group
managed to overcome the tensions fruitfully and moved progressively from the one
problem state to the next. The emerged categories of sources of tensions, revealed three
dimensions regarding the complexity inherent in students’ group work on modelling
activities: the mathematical content (use appropriately mathematical tools); the real
context (understand and simplify the real situation); and the social environment
(collaborate fruitfully with peers). Group-based modelling activities can support the
development of a harmonious interplay among these dimensions, and therefore it is
important to strengthen their role in the mathematics classrooms.

Triantafillou, Bakogianni, Kosyvas
4–290 PME40 – 2016
Acknowledgements
The research leading to these results/MASCIL has received funding from the European Union
Seventh Framework Programme (FP7/2013–2016) under Grant Agreement No. 320693. This
paper reflects only the author’s views and the European Union is not liable for any use that
may be made of the information contained herein.
References
Barbosa, J. C. (2006). Mathematical modelling in classroom: a socio-critical and discursive
perspective. ZDM, 38 (3), 293-301.
Blum, W. & Borromeo Ferri, R. (2009). Mathematical modelling: Can it be taught and learnt?
Journal of Mathematical Modelling and Application, 1(1), 45-58.
Carrejo, D., & Marshall, J. (2007). What is mathematical modeling? Exploring prospective
teachers’ use of experiments to connect mathematics to the study of motion. Mathematics
Education Research Journal, 19(1), 45-76.
Christiansen, I. M (2001): The Effect of Task Organization on Classroom Modelling
Activities, in J. P. Matos, W. Blum, K. Houston and S. P. Carreira (eds.), Modelling and
Mathematics Education, ICTMA 9: Applications in Science and Technology (pp. 311-319).
Horwood Publishing Series: Mathematics and Applications, Chichester, England:
Horwood Publishing.
de Oliveira, A.M.P., & Barbosa, J. (2013). Mathematical modeling, mathematical content and
tensions in discourses. In G.A. Stillman, G. Kaiser, W. Blum, & J.P. Brown (Eds.),
Teaching mathematical modeling: Connecting to research and practice (pp. 67-76).
Dordrecht, The Netherlands: Springer.
Engeström, Y. (1999). Expansive visibilization of work: An activity-theoretical perspective.
Computer Supported Cooperative Work, 8, 63-93.
Maaß, K. (2006). What are modelling competencies? ZDM, 38(2), 113-142.
Mayring, P. (2000). Qualitative Content Analysis [28 paragraphs]. Forum Qualitative
Sozialforschung / Forum: Qualitative Social Research, 1(2). Art. 20. http://nbn-
resolving.de/urn:nbn:de:0114-fqs0002204.
OECD. (2013). PISA 2012 Assessment and Analytical Framework- Mathematics, Reading,
Science, Problem solving and Financial literacy. OECD.
DOI: 10.1787/9789264190511-en.
Sriraman, B., & Lesh, R. (2006). Modeling conceptions revisited. ZDM, 38, 247-25.
Wake, G. (2015). Preparing for workplace numeracy: A modelling perspective. ZDM, 47(4),
675-689.

2016. In Csíkos, C., Rausch, A., & Szitányi, J. (Eds.). Proceedings of the 40th Conference of the International
Group for the Psychology of Mathematics Education, Vol. 4, pp. 291–298. Szeged, Hungary: PME. 4–291
A NEW FRAMEWORK BASED ON THE METHODOLOGY OF
SCIENTIFIC RESEARCH PROGRAMS FOR DESCRIBING THE
QUALITY OF MATHEMATICAL ACTIVITIES
Yusuke Uegatani1, 2 Masataka Koyama2
1Fukuyama Junior and Senior High School attached to Hiroshima University
2Graduate School of Education, Hiroshima University
This paper proposes a new framework for describing the quality of mathematical
activities under radical constructivism. It is based on Lakatos’ philosophy of science,
instead of his philosophy of mathematics. We focus on a structural similarity between
mathematical problem-solving activities and scientific research programs. While
Lakatos’ philosophy of mathematics is only a model of a progressive activity, the new
framework can distinguish between progressive and degenerative activities. To show
its usefulness, we provide a sample analysis. Based on the analysis, we hypothesize
that the zig-zag process of solving a mathematical problem is driven by a hard core: A
set of one’s unrevised assumptions that one would like to continue to maintain. The
necessity of further research with the proposed framework is suggested.
INTRODUCTION
Lakatos’ (1976) logic of mathematical discovery (LMD), known as proofs and
refutations, is one of the most cited philosophies in mathematics education research. It
characterized mathematics as an informal repeated process of conjecturing, proving,
and refuting. Based on the LMD, several scholars have advocated a fallibilistic nature
of learning mathematics (e.g., Confrey, 1991; Ernest, 1998; Lampert, 1990). The
application range of the LMD is wide: From problem-solving at the elementary school
level (Lampert, 1990) to theorem reinvention at the undergraduate level (Larsen &
Zandieh, 2007). However, as Sriraman and Mousoulides (2014) point out, “[t]he
didactic possibilities of Lakatos’ thought experiment abound but not much is present
in the mathematics education literature in terms of teaching experiments that try to
replicate the ‘ideal’ classroom conceptualized by Lakatos” (p. 513).
The rare replications of the LMD style in classrooms stem from the gap between naïve
and sophisticated mathematical activities. Although the LMD suggests a fallibilistic
nature of learning mathematics, disagreements about a conjecture do not always
contribute to mathematical development in a classroom. Note that the LMD originates
from sophisticated activities among professionals, not among novices. We need more
empirical data on the relationship between naïve and sophisticated activities.
This paper proposes an alternative theoretical framework for describing mathematical
activities. The proposed framework is based not on Lakatos’ (1976) philosophy of
mathematics, but his philosophy of science (1978): The methodology of scientific
research programs (MSRP). The LMD is useful for describing relatively sophisticated

Uegatani, Koyama
4–292 PME40 – 2016
activities (e.g., Larsen & Zandieh, 2007), but the proposed framework based on the
MSRP will be able to describe both naïve and sophisticated mathematical activities and
will provide a descriptive framework for contrasting the two.
This paper consists of the following sections: (1) an overview of the MSRP, (2) an
overview of radical constructivism (RC) proposed by von Glasersfeld (1995), (3) the
proposal of a new theoretical framework, and (4) a sample analysis. Through the
analysis, we will argue the usefulness of the proposed framework for describing
mathematical activities.
LAKATOS’ PHILOSOPHY OF SCIENCE
The scientific research program (SRP) is a series of activities with the same paradigm
carried out by scientists. An SRP contains a hard core and protective belts. The hard
core is a set of theoretical assumptions and the protective belts are auxiliary hypotheses,
and any scientific claim in the SRP is based on both. If a counterexample of the claim
is observed, either parts of the core or some of the belts are false. Thus, scientists, like
pseudo-scientists, do not have to give up their own hard core and can protect it by
revising some of the belts. This process is called a problem shift. In principle, the
assumptions in the hard core can be arbitrarily selected. Lakatos (1978) abstracted this
methodology from the history of science.
Although Yuxin (1990) pointed out the similarity between the LMD and the MSRP,
there is a significant difference between them: The spirit of the LMD is
“antidemarcationist,” while that of the MSRP is “demarcationist” (Ernest, 1998, p.
111). That is, Lakatos provided a distinction between good and bad scientific activities:
Science must predict the next empirical evidence. If an SRP predicts the next empirical
evidence, its problem shift is called progressive; if not, it is called degenerative. In
principle, the LMD cannot require mathematicians to completely give up a
mathematical research program because the LMD is related to informal mathematics
and not pseudo-mathematics. On the other hand, MSRP requires scientists to
completely give up an SRP if it cannot predict the next empirical evidence.
RADICAL CONSTRUCTIVISM
RC is a philosophy which begins from “the assumption that knowledge, no matter how
it be defined, is in the heads of persons, and that the thinking subject has no alternative
but to construct what he or she knows on the basis of his or her own experience” (von
Glasersfeld, 1995, p. 1). This assumption leads to the possibility that even if an
observed behavior looks irrational from the observer’s perspective, it is rational from
the behaver’s own perspective. Therefore, any learner’s behavior should be interpreted
as at least locally rational from his or her own perspective at that moment (Confrey,
1991; Uegatani & Koyama, 2015).
For our purpose, we introduce two key concepts in RC: viability and action scheme.
The concept of viability is: Pieces of knowledge are viable “if they fit the purposive or
descriptive contexts in which [learners] use them” (von Glasersfeld, 1995, p. 14).
Uegatani, Koyama
PME40 – 2016 4–293
Action schemes (AS) consist of the following three parts: “1 Recognition of a certain
situation; 2 a specific activity associated with that situation; and 3 the expectation that
the activity produces a certain previously experienced result” (von Glasersfeld, 1995,
p. 65).
Let us consider the example of an AS and its viability. Suppose a learner needs to solve
an equation x2 = 3179 (1. Situation). His or her next activity will be to test the
divisibility of 3179 by 2, 3, 5, and 7 (2. Activity) with an expectation that 3179 is
divisible by a certain number (3. Expectation). Using the AS means testing the
consistency between the expected and the actual results of the activity. If the results
are consistent, they will become more viable. If not, they will become less viable or be
revised.
An AS can be revised in certain ways. Importantly, when a learner senses inconsistency,
he or she cannot uniquely determine what causes it. In the above example, since 3179
is divisible by neither 2, 3, 5, nor 7, the learner may sense inconsistency. Then, he or
she can arbitrarily suspect at least either the suitability of divisibility testing in the
situation or the sufficiency of testing integers from 2 to 7. If the learner chooses the
former, he or she may solve the inconsistency by considering the activity not suitable
for the situation. If he or she chooses the latter, he or she may solve the inconsistency
by considering that the activity should test divisibility by 11. The AS can be arbitrarily
revised as long as the inconsistency is solved (Uegatani & Koyama, 2015). “The
viability of concepts […] is not measured by their practical value, but by their non-
contradictory fit into the largest possible conceptual network” (von Glasersfeld, 1995,
p. 68).
A NEW THEORETICAL FRAMEWORK
There is a structural similarity between an AS and an SRP. The concept of viability
corresponds to that of progressiveness. An AS has the following three features. (AS-a)
If the AS predicts the next expected result, it remains viable and if not, becomes less
viable. (AS-b) Even if the AS is viable at one moment, there may not be any
consistency between the expected and the actual results in the next moment. (AS-c)
When dealing with an inconsistency, the AS can be arbitrarily revised whether it
becomes more or less viable. Similarly, an SRP has the following three features. (SRP-
a) If the SRP predicts the next empirical data, it remains progressive, and if not,
becomes degenerative. (SRP-b) Even if the SRP is progressive in one moment, there
may not be any consistency between the predicted and the actual data in the next
moment. (SRP-c) When dealing with an inconsistency, the SRP can be arbitrarily
revised, whether it becomes progressive or degenerative (though a degenerative SRP
is not qualified as science). Thus, in the analogy with an SRP, when we observe a
revision of an AS, we will be able to identify the elements corresponding to “protective
belts” and “a hard core.” In this context, protective belts can be defined as pieces of
knowledge used by the learner to predict a result, but recognized as inappropriately
used; a hard core can be defined as a set of unrevised assumptions the learner would

Uegatani, Koyama
4–294 PME40 – 2016
like to continue to maintain. We propose the MSRP based framework, which focuses
especially on the hard core of a mathematical activity. The advantage of the new
framework compared to the LMD based framework is that it enables us to describe the
quality of mathematical activities as progressive or degenerative, for example, to
understand the variation between progressive and degenerative activities.
SAMPLE ANALYSIS
To show the usefulness of the framework, we provide a sample analysis.
Background of a sample
The sample episode was videotaped in a part of the first author’s mathematics lesson.
This is a transcript of 11th grade students’ group work. The group members (all names
are pseudonyms) were Mr. Ham (leader), Ms. Uts (subleader), Mr. Ike (recorder), Mr.
Tak (calculator), and Ms. Hor (presenter). Although each member was given his or her
role to enhance the group discussion, the roles were often forgotten because of the
heated discussion. The given task was identifying more digits of 254 than other groups.
The following episode is a vignette taken while performing the task.
Episode in a group work
Ike had already predicted the need for a logarithm before the task was presented:
6 Ike: Maybe, we are to refer to the table of common logarithms.
7 Ham: Really? … Like enough.
The reason why they predicted the need for a logarithm seems to be that they had
learned to use the table of common logarithms in the last class. After the task was
presented, Ham immediately decided to use common logarithms.
8 Ham: OK, take the common logarithm. The common logarithm of 2.
17 Ike: OK, well, 0.3010 (Referred to the table of common logarithms).
18 Ham: Calculate 54 times 0.3010. (Said to the student with the calculator, Tak)
22 Tak: (using a pocket calculator) 16.254.
On the other hand, Hor, who observed the boys’ approach in silence, suddenly started
to calculate 254 by paper and pencil with Uts, but independent of the boys:
25 Hor: [Inaudible] … let’s calculate 254. (Said to Uts, and started to calculate)
26 Uts: Oh….
27 Ham: So, is the value between 16th and 17th powers of 10?
28 Ike: Yes, yes.
Ham and Ike continued their approach without paying attention to the girls:
29 Ham: Ah …, so, then …., 16 digits …, Uh ….
30 Ike: So, after that, so, taking the logarithm of it, 16. …, 16.254. So, try to find a value as near as possible to 16.254 repeatedly. Maybe, we should take the antilogarithm of the value.

Uegatani, Koyama
PME40 – 2016 4–295
However, Tak alone started trying to directly calculate 254 with a pocket calculator after
observing the girls’ approach. Hor noticed that, stopped calculating, and tried to
communicate with the boys:
41 Hor: Hey, how many digits can the pocket calculator use? (Said to Tak)
42 Tak: Um …, 1, 2, 3, 4, 5, 6, 7, 8.
43 Ham: So, how can we calculate 1016.3, for example? (Said to Ike)
44 Hor: No way. (Said to Tak)
45 Ike: We can do it if we can calculate 100.3. (Said to Ham)
47 Ham: Wow! Oh! That’s true!
Immediately after hearing Ham’s exclamation, Hor asked Ham:
48 Hor: What did you say? What of 10? (Said to Ham)
49 Ham: So, so, decompose …, in case of 16.3th power …, 100.3…, and what is 1016?
50 Ike: Ah, so, let’s use the table of the common logarithms. If you find the value whose common logarithm is 0.2 in the table, ….
However, Ham and Ike were absorbed in their thinking and perhaps unintentionally
neglected Hor. Then, Hor gave up her communication with them.
After that, Hor and Uts continued to calculate by paper and pencil together. Ike began
to seek the next promising step alone, and Tak proposed his opinion:
58 Ham: Ike might solve alone ….
60 Tak: Let’s calculate 254 in a step-by-step fashion!
61 Ike: (Laugh) I don’t recommend it.
62 All: (Laugh)
63 Uts: But, now she is calculating (Pointing to Hor)
64 Hor: Without thinking difficult math, ah …, simply 10245 times 16.
65 Ike: Do you have enough courage to calculate it?
66 Hor: Yes, let’s calculate it.
67 Uts: Now, she has already been calculating.
68 Hor: Yes, now I am calculating.
Despite this communication, Ike and Ham ignored Hor’s approach. Tak began trying
to directly calculate 254 independent of the other members of the team.
Although Ike had directed Ham in solving the task until that time, Ike’s original plan
started becoming unstable. Consequently, they began supporting each other.
71 Ike: The direct reference (to the table of the common logarithms) might be better. So, the target is 1016.254 …, 0.254, 254, (searching the nearest value of 0.254 in the table of common logarithms) … about 1.8?
72 Ham: No, (the common logarithm of) 1.79 is nearer (to 0.254).
73 Ike: 1.79 …, so, oh, what can we do next?

Uegatani, Koyama
4–296 PME40 – 2016
74 Ham: Multiplying 1016 … (Writing down “17900000000000000”). So, “nearly equal” is not clear. In this case, “equal to or more than” is suitable, isn’t it? “More than,” isn’t it?
75 Ike: But, any further inquiry is impossible because of (the precision of) our table of common logarithms.
76 Ham: Umm, in that case, is it better to calculate this (pointing to the common logarithm of 1.8 in the table). 1.8 means multiplying 2.54? No, it doesn’t.
77 Ike: It means …. (Writing down 1.79 x 10¹⁶ < 254 < 1.80 x 10¹⁶ ). (Note: Their judgment was mathematically incorrect because their consideration to a margin of error is not proper.)
Finally, after identifying some digits of 254, their discussion became deadlocked:
89 Ike: Now, what can we do next? There is no cue (for raising the precision)
90 Ham: Improving is impossible by using our table of common logarithms, isn’t it?
91 Ike: Now what can we do?
Then, Ike noticed Hor and Uts’s progress:
93 Ike: … Oh, you all have been really calculating by paper and pencil!
94 Hor: Really, we are still calculating.
95 Ike: Really?
96 Hor: If our calculation is finished (Hor and Uts had already finished calculating 240 and 214), then we will finish all.
99 Ike: Oh, what can we do? What can we do? (Laughing and looking around)
Discussion
From the beginning of the episode, Ike and Ham seemed to share the same AS.
Although they often found inconsistencies between the expected and actual results of
their activities (e.g., #29, #49, #73, and #75), they immediately tried to change the
interpretations of either their situations, or their activities in order to eliminate their
sensed inconsistency (e.g., #30, #50, #74, and #76). Therefore, we can say that the
pieces of knowledge that formed the rejected interpretations were the protective belts,
while the unrevised assumptions that using logarithms is a better approach were the
hard core, and that using logarithm seemed to be a policy rather than a conclusion.
Although Yuxin (1990) argued that the term “hard core” in the MSRP corresponded to
the term “main conclusion” in the LMD, this correspondence were not observed in the
activity. In addition, when the inconsistency made Ike anxious that they could not find
the next promising step, he tried to communicate with other members (#61, #65, and
#93). Since Ike and Ham’s approach could not predict the next expected result, it
became degenerative (e.g., #89 and #99).
On the other hand, Hor seemed to have a different AS than Ike and Ham. As the
inconsistency made her anxious that her direct calculation might not end in time, she
tried to communicate with other members twice. The first time she tried to use Tak’s
pocket calculator (#41), and the second time she tried to get inspiration from Ike and
Ham’s approach (#48). However, since she was not inspired, she finally continued to

Uegatani, Koyama
PME40 – 2016 4–297
calculate by paper and pencil. She seemed to adhere to her approach not only because
she was in rivalry with Ike and Ham but also because she believed the rationality of
her approach (#64). Thus, we can say the unrevised assumptions that direct calculation
is a better approach were the hard core.
Although Uts and Tak calculated directly, they rarely contributed to the group activity.
Because their cores were not hard enough, that is, because they were not confident
enough of the validity of their cores, they seemed to follow Hor’s lead.
In the above description with the MSRP based framework, we can observe the role of
the hard cores in problem-solving activities. We hypothesize that the zig-zag process,
the repeated process of confronting and eliminating inconsistencies, is driven by a hard
core. Because of their hard cores, Ike, Ham, and Hor could take the initiative in
problem-solving, at least temporarily. On the other hand, since Uts and Tak’s cores
were not hard enough, they could only follow Hor’s lead. In addition, when the
confidence in their cores was shaken, Ike and Hor tried to communicate with others in
the group, and follow them. This suggests that taking the initiative in problem-solving
in group work is related to the hardness of the core. In fact, while both Ike and Ham
and Hor’s ASs were progressive, they were incommensurable, and students did not
need to communicate with the others in the group.
Implication for practice in mathematics education
Of course, a progressive series of the revised ASs offers no more guarantee of success
in problem-solving than a progressive SRP offers of approaching the truth. However,
if our hypothesis is valid, we can say that the existence of a single hard core is a
necessary condition for a progressive mathematical activity. The participants can
discuss and support each other if they share the same core like Ike and Ham, while they
cannot effectively communicate with each other because of the incommensurability of
their own hard cores like Ike and Hor. Thus, if the teacher intends to enhance his or her
students’ progressive mathematical activity, he or she must support them in
constructing an appropriate shared hard core.
The origin of the hard core is not necessarily mathematical. For example, Ike and Ham
created their core by predicting the contents of that day’s lesson. On the other hand,
Hor created her own core because she felt that Ike and Ham’s approach was too
complicated. Although the three students were in almost the same social or cultural
settings, their hard cores were different. This means that RC cannot claim that the social
or cultural settings themselves have an influence on one’s core (cf. Lerman, 1996); it
must state that depending on subjective interpretations of the social or cultural settings,
different hard cores can be created even in the same settings.
Even if a core is created from the other participants’ cores, it might be too weak to
maintain like Uts and Tak. On the other hand, too strong hard cores will make the AS
degenerative. If one wants to keep a progressive mathematical activity, then one may
sometimes need to give up one’s hard core and create a new core. Further empirical
research is needed to explore what helps learners create their own core.

Uegatani, Koyama
4–298 PME40 – 2016
CONCLUSION
In this paper, we proposed the MSRP based framework as an alternative to the LMD
based framework for describing mathematical activities. It enables us to describe the
quality of mathematical activities as progressive or degenerative. We provided one
sample analysis to show the usefulness of the framework. Based on the analysis, we
hypothesized that the zig-zag process of solving a mathematical problem is driven by
a hard core. For this reason, two persons with different hard cores are incommensurable.
Although progressiveness does not always offer a guarantee of success in problem-
solving, a hard core seems to be needed for progressive mathematical activities. The
sample analysis empirically supports the validity of our hypothesis, even though that
is not the purpose of this paper. We need further empirical research with the proposed
framework to explore what helps learners create their own cores and have an
appropriate shared core.
References
Confrey, J. (1991). Learning to Listen: A Student’s Understanding of Powers of Ten. In E.
von Glasersfeld (Ed.), Radical Constructivism in Mathematics Education (pp. 111–138).
Springer Netherlands.
Ernest, P. (1998). Social Constructivism as a Philosophy of Mathematics. SUNY Press.
Lakatos, I. (1976). Proofs and Refutations: The Logic of Mathematical Discovery. Cambridge
University Press.
Lakatos, I. (1978). The methodology of scientific research programmes. (J. Worrall & G.
Currie, Eds.) (Vol. 1). Cambridge University Press.
Lampert, M. (1990). When the Problem Is Not the Question and the Solution Is Not the
Answer: Mathematical Knowing and Teaching. American Educational Research Journal,
27(1), 29–63.
Larsen, S., & Zandieh, M. (2007). Proofs and refutations in the undergraduate mathematics
classroom. Educational Studies in Mathematics, 67(3), 205–216.
Lerman, S. (1996). Intersubjectivity in mathematics learning: A challenge to the radical
constructivist paradigm? Journal for Research in Mathematics Education, 27(2), 133–150.
Sriraman, B., & Mousoulides, N. (2014). Quasi-empirical Reasoning (Lakatos). In S. Lerman
(Ed.), Encyclopedia of Mathematics Education (pp. 511–513). Springer Netherlands.
Uegatani, Y., & Koyama, M. (2015). Third-order viability in radical constructivism. In K.
Beswick, T. Muir, & J. Wells (Eds.), Proceedings of the 39th Conference of the
International Group for the Psychology of Mathematics Education (Vol. 4, pp. 257–264).
Hobart.
Von Glasersfeld, E. (1995). Radical Constructivism: A Way of Knowing and Learning. The
Flamer Press.
Yuxin, Z. (1990). From the logic of mathematical discovery to the methodology of scientific
research programmes. British Journal for the Philosophy of Science, 41(3), 377–399.
2016. In Csíkos, C., Rausch, A., & Szitányi, J. (Eds.). Proceedings of the 40th Conference of the International
Group for the Psychology of Mathematics Education, Vol. 4, pp. 299–306. Szeged, Hungary: PME. 4–299
THE ROLE OF LEARNERS’ EXAMPLE SPACES IN EXAMPLE
GENERATION AND DETERMINATION OF TWO PARALLEL
AND PERPENDICULAR LINE SEGMENTS
Fadime Ulusoy
Kastamonu University
This study examines the role of middle school students’ example spaces in generation
and determination of two parallel and perpendicular line segments. Data was collected
from 83 middle school students in grades 6 and 7 via two tasks having items on the
example generation and determination of parallel and perpendicular two line segments
in the grid paper. Data analysis indicated that many of students could not provide fully
complete and correct responses when generating and determining parallelism and
perpendicularity of two line segments because of limited example spaces under the
influence of prototypicality and overgeneralization and undergeneralization errors.
This study proposes a catalogue on common limitations in students’ example spaces
about parallelism and perpendicularity of line segments.
THEORETICAL BACKROUND
Mathematics educators and mathematicians agree that the use of examples in teaching
and learning as a communication tool between learners and teachers is very useful in
helping students comprehend mathematical concepts (e.g. Bills et. al, 2006; Watson &
Mason, 2005). In this sense, Zaslavsky and Zodik (2014) define example space as “the
collection of examples one associates with a particular concept at a particular time or
context” (p. 527). Example space has been used as a similar term with the concept
image (Tall & Vinner, 1981). Concept image is the set of all the mental representations
associated in the students’ mind with the concept name. The image might be nonverbal
and implicit. According to researchers, if students are encountered limited examples
having common figural features of a geometric concept in school or other context,
these examples lead to prototypes phenomenon. The prototype examples are usually
the subset of examples that had the “longest” list of attributes all the critical attributes
of the concept and those specific (noncritical) attributes that had strong visual
characteristics” (Hershkowitz, 1990, p. 82). By the influence of prototypical examples
and non-examples, learners begin to exhibit two types of common errors as
undergeneralization and overgeneralization (Klausmeier & Allen, 1978).
Undergeneralization error occurs when examples of a concept are encountered but are
not identified as examples. For example, if a learner does not admit a rotated square as
an example of square and he or she take this rotated square as an non-example in square
set, which indicates he or she makes an undergeneralization error. On the other hand,
overgeneralization error occurs when examples of other concepts treated as members
of target concept (Klausmeier & Allen, 1978, p. 217). For example, if a learner treats
Ulusoy
4–300 PME40 – 2016
a regular hexagon as an example of parallelogram without considering the number of
sides, he or she makes an overgeneralization error.
Researchers suggest that it is important to detect all details of the limitations in
students’ examples spaces in order to develop effective examples and tasks when
teaching mathematical concepts. In this regard, asking students to generate examples
of a specific concept and to determine examples of the concept among a set of examples
that involves both examples and non-examples can get more details about students’
comprehension about specific mathematical concepts. By this way, it can be possible
to assert limitations in students’ example spaces because example generation can be
seen as an indicator of example space (e.g. Sağlam & Dost, 2015). Moreover, example
generation and example determination activities help teachers and educators in order
to understand less accessible and more accessible examples in students’ mind
(Zaslavsky & Zodik, 2014). Such activities allow entering learners’ “personal example
spaces” that constitute a collection of examples in learners’ mind when facing a
particular task (Watson & Mason, 2005). Thus, considering students’ personal example
spaces and their accessibility of the examples can give big chance to the teachers in
terms of developing a didactic way when choosing of examples in their teaching
activities in order to construct and enrich learners’ examples spaces.
Many of mathematical concepts depend on lower order concepts (Skemp, 1971) or sub-
concepts. In high school or universities, teachers assume that learners know and
understand these lower order concepts and sub-concepts. However, among the learning
domain of mathematics, students are generally exposed prototypical examples of the
concepts in the instruction of geometrical concepts and textbooks rather than
encountering non-prototypical examples or less-accessible examples. As a result,
studies indicate that students have limited knowledge about the different forms of
geometric concepts and their use of examples is limited (e.g. Moore, 1994). As basic
geometric concepts, parallelism and perpendicularity of line segments have critical
importance in terms of developing correctly and completely students’ conceptions
about the concepts of the altitude, perpendicular bisector, median, angle, slope and the
subjects of quadrilaterals, coordinate system, and three-dimensional figures, as well as
developing students’ proficiencies in proof and argumentation. Many of research
revealed both teachers and students have difficulties in some geometric concepts like
altitude of triangle (e.g. Gutierrez & Jaime, 1999) and trapezoid (e.g. Ulusoy, 2015)
because of inadequate knowledge about parallelism and perpendicularity of two line
segments. As a reasonable argument, Zazkis and Leikin (2007) proposed that students’
example spaces should be examined in terms of different perspectives such as
accessibility, correctness, richness and generality. However, in the literature, there is
limited study that directly focused on students’ examples about parallelism and
perpendicularity of two line segments. Considering the importance of
parallel/perpendicular line segments in geometry and the influences of students’
example spaces in comprehension of geometric concepts, I decided to investigate the
role of middle school students’ example spaces in example generation and
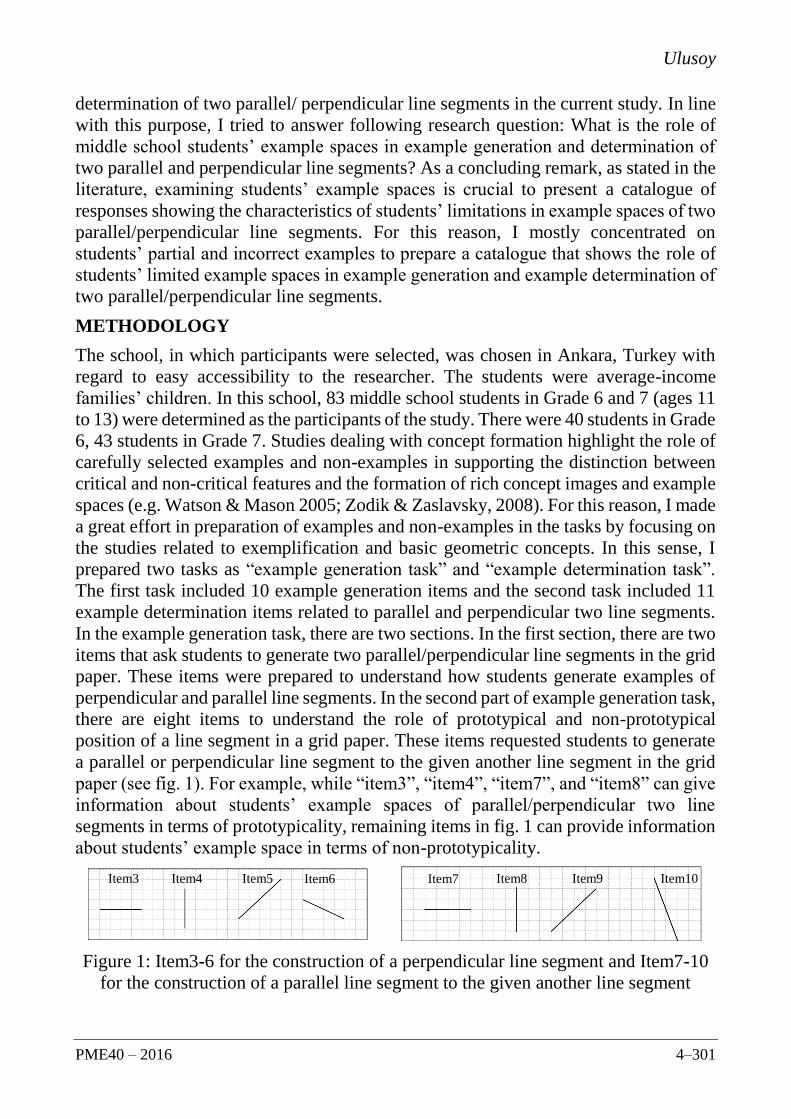
Ulusoy
PME40 – 2016 4–301
determination of two parallel/ perpendicular line segments in the current study. In line
with this purpose, I tried to answer following research question: What is the role of
middle school students’ example spaces in example generation and determination of
two parallel and perpendicular line segments? As a concluding remark, as stated in the
literature, examining students’ example spaces is crucial to present a catalogue of
responses showing the characteristics of students’ limitations in example spaces of two
parallel/perpendicular line segments. For this reason, I mostly concentrated on
students’ partial and incorrect examples to prepare a catalogue that shows the role of
students’ limited example spaces in example generation and example determination of
two parallel/perpendicular line segments.
METHODOLOGY
The school, in which participants were selected, was chosen in Ankara, Turkey with
regard to easy accessibility to the researcher. The students were average-income
families’ children. In this school, 83 middle school students in Grade 6 and 7 (ages 11
to 13) were determined as the participants of the study. There were 40 students in Grade
6, 43 students in Grade 7. Studies dealing with concept formation highlight the role of
carefully selected examples and non-examples in supporting the distinction between
critical and non-critical features and the formation of rich concept images and example
spaces (e.g. Watson & Mason 2005; Zodik & Zaslavsky, 2008). For this reason, I made
a great effort in preparation of examples and non-examples in the tasks by focusing on
the studies related to exemplification and basic geometric concepts. In this sense, I
prepared two tasks as “example generation task” and “example determination task”.
The first task included 10 example generation items and the second task included 11
example determination items related to parallel and perpendicular two line segments.
In the example generation task, there are two sections. In the first section, there are two
items that ask students to generate two parallel/perpendicular line segments in the grid
paper. These items were prepared to understand how students generate examples of
perpendicular and parallel line segments. In the second part of example generation task,
there are eight items to understand the role of prototypical and non-prototypical
position of a line segment in a grid paper. These items requested students to generate
a parallel or perpendicular line segment to the given another line segment in the grid
paper (see fig. 1). For example, while “item3”, “item4”, “item7”, and “item8” can give
information about students’ example spaces of parallel/perpendicular two line
segments in terms of prototypicality, remaining items in fig. 1 can provide information
about students’ example space in terms of non-prototypicality.
Figure 1: Item3-6 for the construction of a perpendicular line segment and Item7-10
for the construction of a parallel line segment to the given another line segment
Item3
Item4
Item5 Item6
Item7
Item8
Item9 Item10

Ulusoy
4–302 PME40 – 2016
On the other hand, example determination task includes 11 items that asked students
to determine whether given two line segments in the grid paper are
perpendicular/parallel or not (see fig. 2). Items were arranged randomly in the task;
however, I arranged and named them as in fig. 2 to provide clear explanation about
their characteristics. While “item11” and “item16” are prototypical examples of
parallel and perpendicular line segments, “item12”, “item14” and “item17” were added
as the main non-prototypical examples. “Item13” was prepared to evaluate students’
example space in terms of verticality and perpendicularity. Furthermore, “item14 and
“item21” were prepared to understand the role length of line segments on their example
spaces about parallelism and perpendicularity of line segments. “Item15”, “item18”,
and “item19” can give idea about students’ limited conceptions. Finally, “item20” was
added to the task to understand students’ example spaces in terms of perpendicularity
and perpendicular bisector. Before conducting data, the suitability of all items was
asked two mathematics teachers and a mathematics educator who makes research on
geometric concepts. Finally, I piloted all items in both tasks with sixteen seventh grade
students in a different school by making semi-structured interviews.
Figure 2: Items on determination of perpendicularity/parallelism of two line segments
Example generation task firstly implemented to the classrooms. After they finished
responding to the task, I started to apply example determination task. The tasks took
totally 40-45 minutes in each classroom. In both tasks, students asked to explain and
justify the reason why they think these two line segments are parallel/ perpendicular or
not. For the data analysis, all student-generated examples and written responses
reflecting their decisions and justifications were analyzed in terms of correctness and
completeness for each item. Then, common limitations in example generation and
determination items were grouped in order to present a catalogue of responses that
shows the characteristic of students’ example spaces involving partial or poor concept
images on parallel and perpendicular line segments. Finally, I made themes for the
common limitations in students’ example spaces.
RESULTS
The role of students’ example spaces in example generation task
Student-generated examples in the example generation task showed that most of the
students generally provided prototypical and more-accessible examples of both parallel
and perpendicular two line segments in first two items of the task. On the other hand,
Item11 Item12 Item13 Item14 Item15
Item16 Item18 Item20 Item21 Item17 Item19

Ulusoy
PME40 – 2016 4–303
while 20 students (24%) generated incorrect parallel line segment examples, 29
students (35%) made incorrect perpendicular line segment examples. In students’
incorrect perpendicular line segments examples, it was observed the negative influence
of mixing verticality and perpendicularity because they generated examples involving
only a line segment or two vertical parallel line segments as an example of
perpendicular two line segments. Besides, the most common two limitations in
students’ examples of parallel line segments were observed as generating only one
inclined line segment or disregarding the properties of grid paper when generating
inclined two parallel line segments. Furthermore, students’ examples to “item3 to 10”
supported the idea of most of students’ examples spaces constitutes only prototypical
examples of two parallel/perpendicular line segments.
The role of students’ limited example spaces about parallelism of two line
segments in example determination task
Limitation to see intersection of line segments by extension. A huge number of students
(n=59) decided the example in “item15” as an example of two parallel line segments
without considering the meaning of parallelism. They partially focused on the
information that two lines on a plane which never meet. However, they made an
overgeneralization error because they could not consider two line segments in “item15”
can eventually cross over each other when extending both straight line segments. Their
constructions in example generation task for especially “item9” and “item10” also
supported the students’ limitations to generate parallelism in two vertical parallel line
segments because they generated two line segments that cross each other in case any
extension.
Limitation to see parallelism in two vertical parallel line segments. Students (n=32)
generally admitted the example in “item13” as a non-example of two parallel line
segments although “item13” constitute an example of two parallel line segments.
Instead, they treated this example as a member of perpendicular line segments. In
written explanations, students made similar comments like in the following: “These
line segments are not parallel. They are perpendicular because they are vertical to the
base”. In this regard, students’ responses indicated their confusion between vertical
line segments and perpendicularity of two line segments. These incorrect responses
showed the presence of undergeneralization errors in students’ example spaces.
Moreover, such errors in learners’ example spaces can be evaluated as an indicator
students’ inadequate knowledge about the meaning of parallelism.
Considering length of line segments as a critical factor. Some students (n=17)
considered the length of line segments as a critical factor when determining the
parallelism of two line segments in some examples like “item14”. For example, these
students made following explanations about the example: “These line segments cannot
be parallel because they are not same length” or “One is short and another one is long,
so they are not parallel”. At this point, they could not establish a relation between a
line and the concept of parallelism. Instead, they merely focused on the visual

Ulusoy
4–304 PME40 – 2016
appearance of line segments in the grid paper. Consequently, students’ statements
clearly showed the students’ limited example spaces that were formed under the
influence of undergeneralization errors. Thus, they treated an example of two parallel
line segments as if they were non-examples because they could make a distinction
between critical and non-critical features of an example.
The role of students’ limited example spaces about perpendicularity of two line
segments in example determination task
Seeing enough the presence of crossing two line segments at an angle close to 90˚. A
number of student’s (n=35) example spaces involved a concept image about
perpendicularity like in “item19”. They made similar written explanations like in the
following: “Because these line segments are crossing each other, they are crossing
perpendicular“. These students were aware of the requirement of crossing of two line
segments for perpendicularity. However, they disregarded the crossing of two line
segments at right angles, which indicated the possible influence of students’ limited
example space on the examples formed by overgeneralization errors.
Verticality vs. perpendicularity. Students’ determination of perpendicularity for the
example in “item13” and their written explanations revealed that a case of student
(n=27) mixed concepts of vertical line segments and perpendicular line segments. This
confusion can be the reason of limited concept image in students’ mind. For this reason,
they overgeneralized perpendicularity situation by admitting a non-example in
“item13” as if it is an example of perpendicular two line segments. They did not
consider perpendicularity of two line segments requires crossing at right angles to each
other. As a result, they treated non-crossing vertical line segments as an example of
perpendicular line segments. On the other hand, when I analyzed students’ decisions
for the example in “item18”, I realized that a case of student found enough the
intersection of a vertical line segment at any angle to another line segment. One of
them made following explanation: “Perpendicularity of two line segments requires a
vertical line segment and crossing of two line segments. In this example, there is a
vertical line segment and another one cross it. So, they are perpendicular.”
Considering length of line segments as a critical factor. Similar to the situation in
parallelism of line segments, some students (n=7) considered the length of line
segments as a deterministic factor for perpendicularity of two line segments. Although
the example in” item21” is a member of the set of two perpendicular line segments,
students did not admit the example in “item21” as perpendicular because of the non-
equal length line segments. This situation showed that they treated an unnecessary
condition as if it is a necessity for the perpendicularity under the influence of partial
concept image, which case an undergeneralization error.
Perpendicularity vs. perpendicular bisector . A few students’ (n=5) example spaces
involved a pell-mell about the concepts of perpendicularity and perpendicular line
segments. For this reason, they thought that perpendicular two line segments have to
form perpendicular bisector. As a result, they treated the example in “item20” as a non-

Ulusoy
PME40 – 2016 4–305
example of perpendicular line segments. In such situations, the students do not have a
wrong concept image of perpendicularity, but they made an unnecessary restriction due
to the limitations in their example spaces.
CONCLUSION
This study aimed to examine the role of students’ example spaces on their example
generation and example determination of two parallel and perpendicular line segments.
The results of this study revealed that there are different limitations in students
‘examples spaces related to parallel and perpendicular line segments. For instance,
student-generated examples generally showed the striking influence of students’
limitations arising from partial concept images based on prototypical examples.
Besides, students’ responses in example determination task mostly allowed seeing
students’ limitations originating from overgeneralization and undergeneralization
errors. For example, many of middle school students are unable to see parallelism in
two vertical parallel line segments, and to see crossing of non-parallel line segments
when making an extension. Another important result showed the role of students’
limitations in example spaces of perpendicular line segments because they generated
incorrect or partial correct examples related to the perpendicularity of two line
segments due to the mixing of perpendicularity and verticality. They generally tended
to treat examples of perpendicular line segments as that of non-examples due to the
inadequate knowledge about the meaning perpendicularity, median, and perpendicular
bisector. Some results resemble similarities with Gutierrez and Jaime’s (1999) study
in which they examined preservice primary teachers’ understanding of the concept of
altitude of a triangle. Students’ limitations in example spaces can be related to their
mathematics teachers’ choices of examples in the instruction of the concepts. Since
teacher choices of example either facilitate or impede students’ example spaces, I
recommend that future studies should concentrate on teachers’ choices and treatment
of examples related to perpendicularity and parallelism. Furthermore, the catalogue I
prepared to show students’ limitations in example spaces of parallelism and
perpendicularity of two line segments can be utilized in prospective teacher education
programs to show the boundaries of students’ example spaces about parallelism and
perpendicularity. Educators can give opportunities prospective teachers to analyse
students’ examples. This kind of an analysis can provide prospective teachers with
insights when they become teachers with the responsibility to teach these concepts to
their students. Thus, they can have a chance to expand and enrich their students’
example spaces beyond the prototypical and more-accessible examples to more
sophisticated examples (Zaslavsky & Zodik, 2014) by purifying students’
overgeneralization and undergeneralization errors (Zodik & Zaslavsky, 2008).
Additionally, further studies can examine learners’ determination process of properties
of quadrilaterals or slope of lines and in making proof and argumentation processes by
selecting participants who have limited example spaces of perpendicularity/parallelism
by referencing the catalogue. Finally, I suggest that it may be useful to ask students
compare their examples in the classroom to enrich their example spaces.

Ulusoy
4–306 PME40 – 2016
References
Bills, L., Dreyfus, T., Mason, J., Tsamir, P., Watson, A., & Zaslavsky, O. (2006).
Exemplification in mathematics education. In J. Novotná, H. Moraová, M. Krátká, & N.
Stehlíková (Eds.), Proceedings of the 30th conference of the international group for the
psychology of mathematics education (Vol. 1, pp. 125-154). Prague, Czech Republic.
Gutiérrez, A., & Jaime, A. (1999). Preservice primary teachers' understanding of the concept
of altitude of a triangle. Journal of Mathematics Teacher Education, 2(3), 253-275.
Hershkowitz, R. (1990). Psychological aspects of learning geometry. In P. Nesher, & J.
Kilpatrick (Eds.), Mathematics and Cognition (pp. 70–95). Cambridge: Cambridge
University Press.
Klausmeier, H.J. & Allen, P.S. (1978). Cognitive Development of Children and Youth: A
Longitudinal Study. New York: Academic Press.
Moore, R. C. (1994). Making the transition to formal proof. Educational Studies in
Mathematics, 27, 249– 266.
Sağlam, Y., & Dost, Ş. A qualitative research on example generation capabilities of university
students. International Journal of Science and Mathematics Education, 1-18.
Skemp, R. R. (1971). The psychology of learning mathematics. Harmondsworth, UK:
Penguin Books, Ltd.
Tall, D. O., & Vinner, S. (1981). Concept image and concept definition in mathematics, with
special reference to limits and continuity. Educational Studies in Mathematics, 12(2), 151–
169.
Ulusoy, F. (2015). A meta-classification for students’ selections of quadrilaterals: the case of
trapezoid. Paper presented at the meeting of the 9th Congress of the European Society for
Research in Mathematics Education (CERME-9), Prague, Czech Republic.
Watson, A., & Mason, J. (2005). Mathematics as a constructive activity: Learners generating
examples. Mahwah, NJ: Lawrence Erlbaum.
Zaslavsky, O., & Zodik, I. (2014). Example-generation as indicator and catalyst of
mathematical and pedagogical understandings. Y. Li et al. (Eds.), Transforming
Mathematics Instruction: Multiple Approaches and Practices, Advances in Mathematics
Education, (pp. 525-546). Springer International Publishing.
Zazkis, R., & Leikin, R. (2007). Generating examples: From pedagogical tool to a research
tool. For the Learning of Mathematics, 27(2), 15–21.
Zodik, I., & Zaslavsky, O. (2008). Characteristics of teachers’ choice of examples in and for
the mathematics classroom. Educational Studies in Mathematics, 69(2), 165-182.
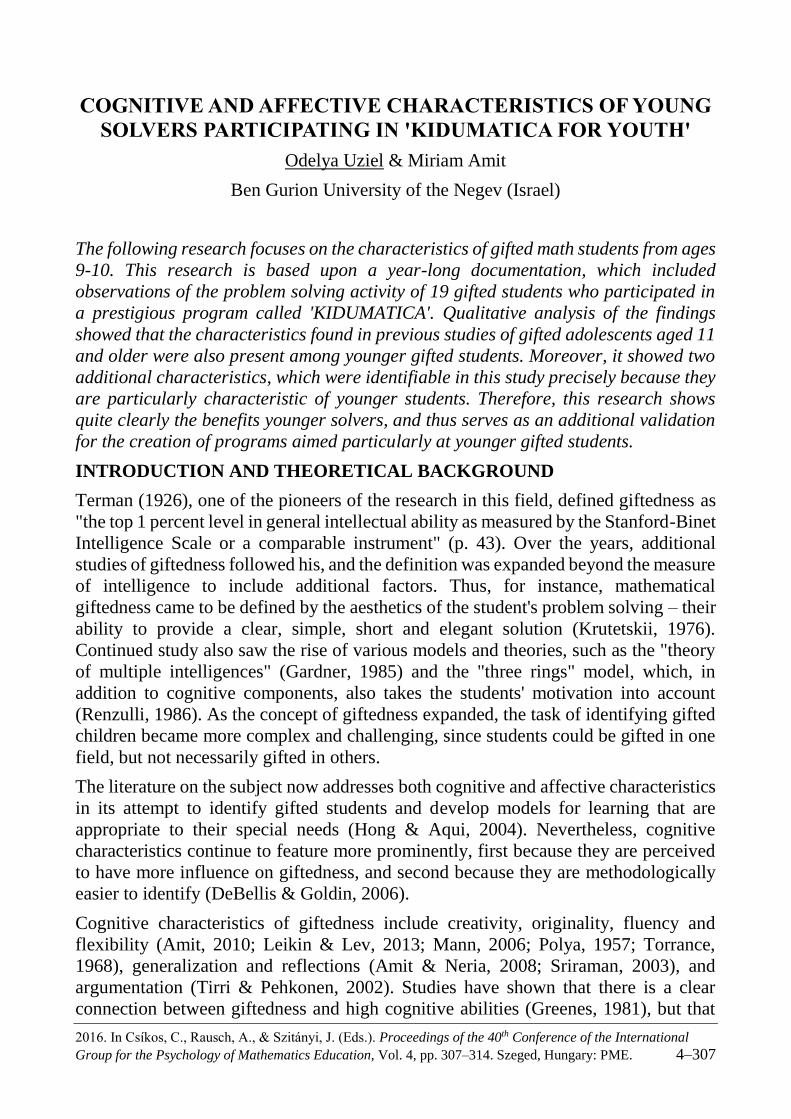
2016. In Csíkos, C., Rausch, A., & Szitányi, J. (Eds.). Proceedings of the 40th Conference of the International
Group for the Psychology of Mathematics Education, Vol. 4, pp. 307–314. Szeged, Hungary: PME. 4–307
COGNITIVE AND AFFECTIVE CHARACTERISTICS OF YOUNG
SOLVERS PARTICIPATING IN 'KIDUMATICA FOR YOUTH'
Odelya Uziel & Miriam Amit
Ben Gurion University of the Negev (Israel)
The following research focuses on the characteristics of gifted math students from ages
9-10. This research is based upon a year-long documentation, which included
observations of the problem solving activity of 19 gifted students who participated in
a prestigious program called 'KIDUMATICA'. Qualitative analysis of the findings
showed that the characteristics found in previous studies of gifted adolescents aged 11
and older were also present among younger gifted students. Moreover, it showed two
additional characteristics, which were identifiable in this study precisely because they
are particularly characteristic of younger students. Therefore, this research shows
quite clearly the benefits younger solvers, and thus serves as an additional validation
for the creation of programs aimed particularly at younger gifted students.
INTRODUCTION AND THEORETICAL BACKGROUND
Terman (1926), one of the pioneers of the research in this field, defined giftedness as
"the top 1 percent level in general intellectual ability as measured by the Stanford-Binet
Intelligence Scale or a comparable instrument" (p. 43). Over the years, additional
studies of giftedness followed his, and the definition was expanded beyond the measure
of intelligence to include additional factors. Thus, for instance, mathematical
giftedness came to be defined by the aesthetics of the student's problem solving – their
ability to provide a clear, simple, short and elegant solution (Krutetskii, 1976).
Continued study also saw the rise of various models and theories, such as the "theory
of multiple intelligences" (Gardner, 1985) and the "three rings" model, which, in
addition to cognitive components, also takes the students' motivation into account
(Renzulli, 1986). As the concept of giftedness expanded, the task of identifying gifted
children became more complex and challenging, since students could be gifted in one
field, but not necessarily gifted in others.
The literature on the subject now addresses both cognitive and affective characteristics
in its attempt to identify gifted students and develop models for learning that are
appropriate to their special needs (Hong & Aqui, 2004). Nevertheless, cognitive
characteristics continue to feature more prominently, first because they are perceived
to have more influence on giftedness, and second because they are methodologically
easier to identify (DeBellis & Goldin, 2006).
Cognitive characteristics of giftedness include creativity, originality, fluency and
flexibility (Amit, 2010; Leikin & Lev, 2013; Mann, 2006; Polya, 1957; Torrance,
1968), generalization and reflections (Amit & Neria, 2008; Sriraman, 2003), and
argumentation (Tirri & Pehkonen, 2002). Studies have shown that there is a clear
connection between giftedness and high cognitive abilities (Greenes, 1981), but that

Uziel, Amit
4–308 PME40 – 2016
these can also be improved and enhanced to some extent in all students. They suggest
that students’ cognitive ability is in part a function of the teaching methods and the
learning environment to which they have been exposed, and even of the problems that
have been selected to be solved in class (Amit & Gilat, 2012; Zohar & Nemet, 2002).
Affective characteristics refer mainly to self-perception, motivation and determination.
While gifted students have been found to have higher levels of these characteristics as
well, here too studies have found that a supportive learning environment can
significantly improve the affect system of all students (Debellis & Goldin, 2006; Hong
& Aqui, 2004).
Most studies of gifted students today focus primarily on adolescents, and most of the
special educational programs that are currently available are for students ages 12-18.
While studies and programs that address younger students do exist, their numbers and
their scope are still too small. This study therefore focuses on mathematically gifted
students at the age of 9-10. Its goal is to identify the characteristics of these younger
students and compare them to the characteristics that earlier studies have found in
adolescents.
METHODOLOGY
Research questions
1) What are the characteristics of gifted students aged 9-10?
2) Which of these characteristics are unique to ages 9-10?
Research population
The study population was composed of 19 gifted 4th grade students aged 9-10, carefully
chosen by their teachers from 10 schools in Southern Israel that were recommended by
the regional coordinator. These students agreed to participate in a pilot program
launched in 2013 as part of the 'Kidumatica' mathematics club.
Setting and teaching program
The 'Kidumatica' Mathematics club includes about 550 students aged 11–16. The
project is aimed at addressing the special needs of students (most of whom come from
underdeveloped or struggling areas), who possess mathematical ability and who are
interested in learning more about mathematics. In 2013 the club expanded to include
younger students, aged 9-10. The first year with the younger students served as a pilot
program, in the sense that the lessons learned from it served as the basis for changes to
the program in years to come.
Research approach (method)
This study was originally designed to employ a mixed methods approach, using an
observation journal to document the students’ lessons, as well as questionnaires with a
variety of problems. Once we got to know the students, however, we decided not to
use the questionnaires, since the lessons had already made clear that there was a gap
between the students’ possession of a correct and interesting mathematical idea and
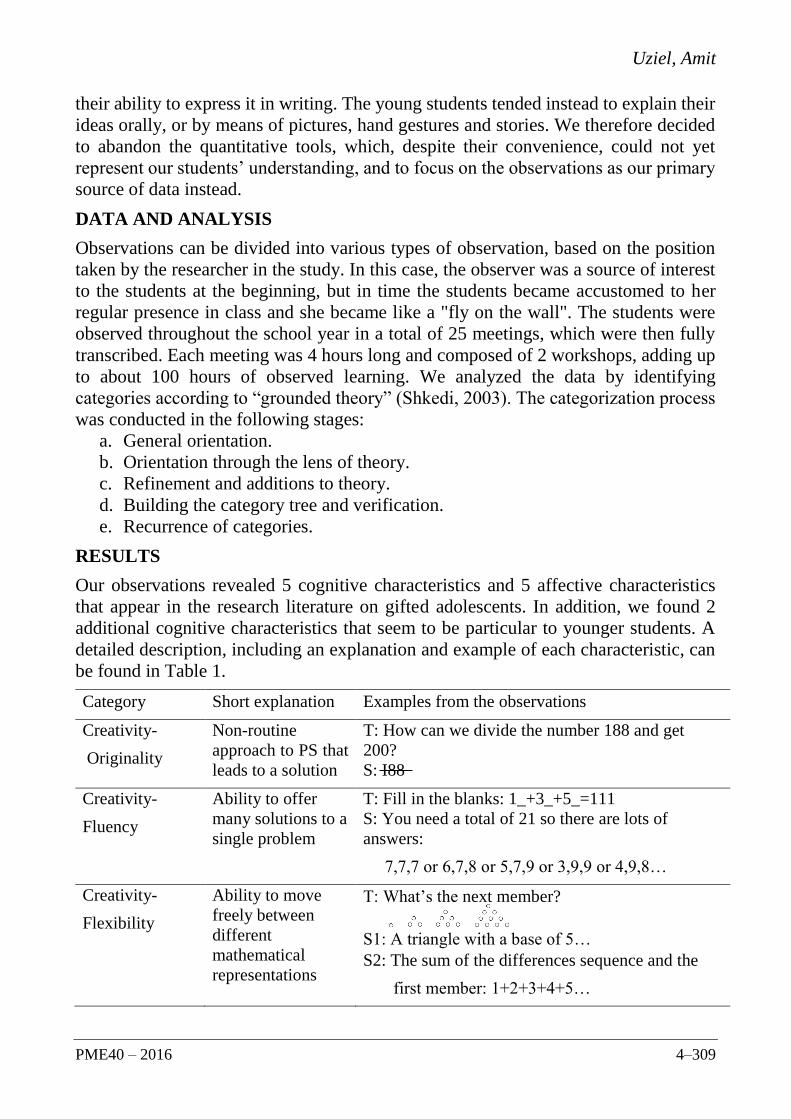
Uziel, Amit
PME40 – 2016 4–309
their ability to express it in writing. The young students tended instead to explain their
ideas orally, or by means of pictures, hand gestures and stories. We therefore decided
to abandon the quantitative tools, which, despite their convenience, could not yet
represent our students’ understanding, and to focus on the observations as our primary
source of data instead.
DATA AND ANALYSIS
Observations can be divided into various types of observation, based on the position
taken by the researcher in the study. In this case, the observer was a source of interest
to the students at the beginning, but in time the students became accustomed to her
regular presence in class and she became like a "fly on the wall". The students were
observed throughout the school year in a total of 25 meetings, which were then fully
transcribed. Each meeting was 4 hours long and composed of 2 workshops, adding up
to about 100 hours of observed learning. We analyzed the data by identifying
categories according to “grounded theory” (Shkedi, 2003). The categorization process
was conducted in the following stages:
a. General orientation.
b. Orientation through the lens of theory.
c. Refinement and additions to theory.
d. Building the category tree and verification.
e. Recurrence of categories.
RESULTS
Our observations revealed 5 cognitive characteristics and 5 affective characteristics
that appear in the research literature on gifted adolescents. In addition, we found 2
additional cognitive characteristics that seem to be particular to younger students. A
detailed description, including an explanation and example of each characteristic, can
be found in Table 1.
Category Short explanation Examples from the observations
Creativity-
Originality
Non-routine
approach to PS that
leads to a solution
T: How can we divide the number 188 and get
200?
S: I88
Creativity-
Fluency
Ability to offer
many solutions to a
single problem
T: Fill in the blanks: 1_+3_+5_=111
S: You need a total of 21 so there are lots of
answers:
7,7,7 or 6,7,8 or 5,7,9 or 3,9,9 or 4,9,8…
Creativity-
Flexibility
Ability to move
freely between
different
mathematical
representations
T: What’s the next member?
S1: A triangle with a base of 5…
S2: The sum of the differences sequence and the
first member: 1+2+3+4+5…
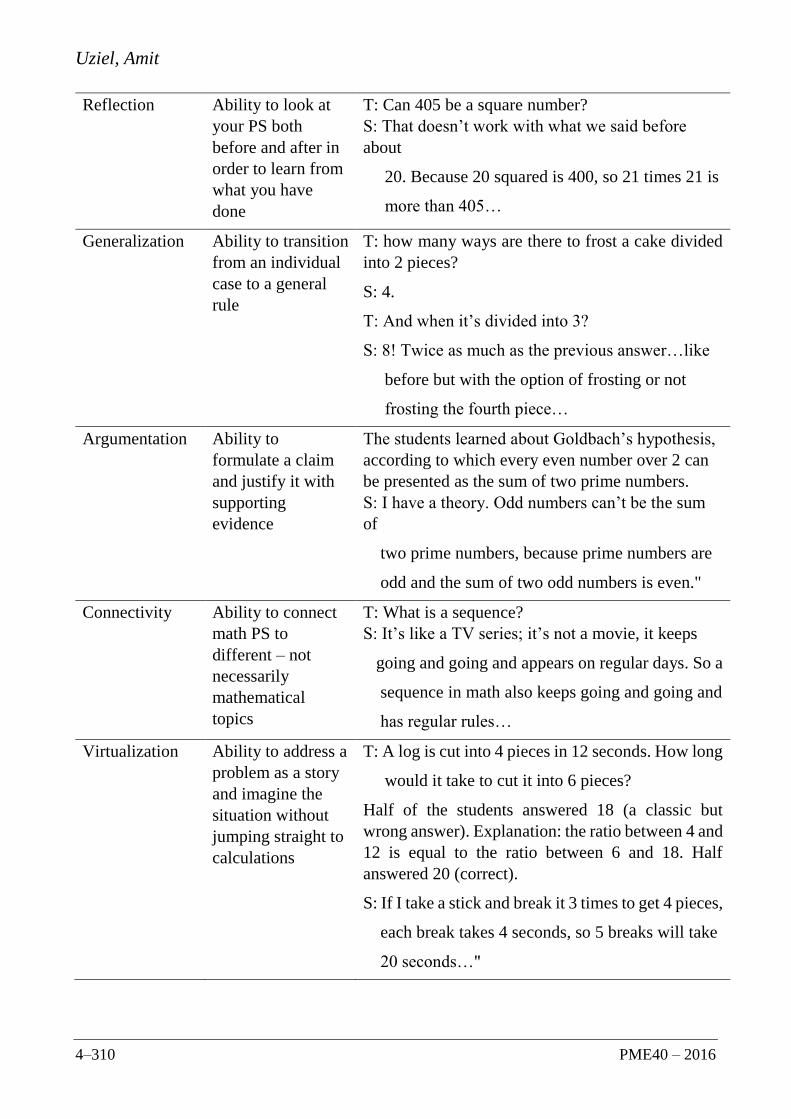
Uziel, Amit
4–310 PME40 – 2016
Reflection Ability to look at
your PS both
before and after in
order to learn from
what you have
done
T: Can 405 be a square number?
S: That doesn’t work with what we said before
about
20. Because 20 squared is 400, so 21 times 21 is
more than 405…
Generalization Ability to transition
from an individual
case to a general
rule
T: how many ways are there to frost a cake divided
into 2 pieces?
S: 4.
T: And when it’s divided into 3?
S: 8! Twice as much as the previous answer…like
before but with the option of frosting or not
frosting the fourth piece…
Argumentation Ability to
formulate a claim
and justify it with
supporting
evidence
The students learned about Goldbach’s hypothesis,
according to which every even number over 2 can
be presented as the sum of two prime numbers.
S: I have a theory. Odd numbers can’t be the sum
of
two prime numbers, because prime numbers are
odd and the sum of two odd numbers is even."
Connectivity Ability to connect
math PS to
different – not
necessarily
mathematical
topics
T: What is a sequence?
S: It’s like a TV series; it’s not a movie, it keeps
going and going and appears on regular days. So a
sequence in math also keeps going and going and
has regular rules…
Virtualization Ability to address a
problem as a story
and imagine the
situation without
jumping straight to
calculations
T: A log is cut into 4 pieces in 12 seconds. How long
would it take to cut it into 6 pieces?
Half of the students answered 18 (a classic but
wrong answer). Explanation: the ratio between 4 and
12 is equal to the ratio between 6 and 18. Half
answered 20 (correct).
S: If I take a stick and break it 3 times to get 4 pieces,
each break takes 4 seconds, so 5 breaks will take
20 seconds…"

Uziel, Amit
PME40 – 2016 4–311
Impronovation Ability to
improvise and find
an innovative
solution despite
lacking the proper
tools
T: The circumference of a rectangle is 144. Its
length is 3 time as long as its width. Find the
length and width of the rectangle.
S: The length and width together are 72. 72 divided
by 4 is 18. So one side is 18 and one is 72 minus
18.
Self confidence The students’
perception of
themselves
The students expressed their opinions, even when in
the minority. Most were unafraid to go up to the
board, and even after making a mistake they
overcame it easily and continued to participate in
class.
Motivation What drives the
student to learn and
succeed
Despite their young age and the difficult hours, the
students came to the club regularly and happily. The
students took an interest in the lessons and most
signed up for another year at the club.
Determination Ability to spend a
long time on a PS
and not give up
until you solve it
The students often asked for more time to work on
riddles, begging not to be told the solution.
Sometimes they even refused to be given a hint.
Competitiveness The strong desire to
be first in any task
The children checked their scores often, and were
very concerned with who won and who lost in any
task or game.
Skepticism Ability to doubt the
words of the
teacher
The students were unafraid to ask questions and
challenge the teacher, or results that did not sit well
with them.
(PS- Problem Solving, T- Teacher, S- Student/s)
Table 1: Categories table
Recurrence of categories
"Significant behavioral event" was defined according to when a student asked a
question or made a comment that reveals one of the characteristics. Throughout the
year, 267 significant behavioral events were observed - 152 in the cognitive context
and 115 in the affective context. The findings were quantified according to the
frequency of the events, as seen in the following tables:
Cognitive characteristics N=152
Creativity Reflection Generalization Argumentation Connectivity Virtualization Impronovation
30%
(N=45)
15%
(N=24)
13%
(N=20)
12%
(N=18)
10%
(N=15)
10%
(N=15)
10%
(N=15)
Table 2: Recurrence of cognitive characteristics
Uziel, Amit
4–312 PME40 – 2016
Affective characteristics N=115
Self confidence Motivation Determination Competitiveness Skepticism
35%
(N=40)
25%
(N=29)
15%
(N=17)
13%
(N=15)
12%
(N=14)
Table 3: Recurrence of affective characteristics
DISCUSSION
Cognitive characteristics
Creativity was the most common of the cognitive characteristics (see table 2). This
corresponds to the findings of previous research, which has claimed creativity as a
central characteristic that sets gifted students apart (Mann, 2006; Torrance, 1968).
Studies of creativity’s components have found that originality is the most influential of
the three, and that it is also the only one of them that cannot be improved by educational
means (Leikin & Lev, 2013). This means that the originality of their solutions can be
used to identify gifted students even at young ages, since time and maturity do not play
a central role. Other cognitive characteristics found in previous studies in adolescents
(Amit & Neria, 2008; Greenes, 1981; Sriraman, 2003) appeared in the current study
too, which provides additional justification for the claim that gifted children can be
identified at an early age.
UNIQUE CHARACTERISTICS
Virtualization- Virtual Reality
Much has been said about visualization. "Virtualization," however, refers not only to a
visual image, but to the creation of virtual reality. Virtualization is the students’ ability
to address a problem as a tangible, visual story. One of the authors of this paper, who
teaches gifted high school students, gave them the “wooden log” problem (see table 1).
When she did so only one student out of 26 gave the correct answer of 20. The older
students’ immediate reliance on familiar algorithms, which interfere with their ability
to see the simple story underlying the problem, is most likely the product of the
educational system. The younger students were able to see the problem as more than
words on paper, while the older students, who had many years of experience with
solving word problems, immediately began to look for a solution by calculating ratios.
In this context it is important to note that students who are still in elementary school
are more strongly exposed to teaching methods based on visual representation, which
could also be a positive influence on the students’ virtualization ability.
Impronovation- Improvisation & Innovation
Impronovation refers to the ability to improvise solutions to a problem when you lack
the customary mathematical tools. This characteristic was revealed in our young
students when they were given a problem for which the classical solution relied on
mathematical tools that they had not yet been taught. Surprisingly, it was this “lack”
that led them to find a successful solution of their own. In other words we can say that

Uziel, Amit
PME40 – 2016 4–313
sometimes "less is more". The “rectangle” problem (see table 1) is a good illustration
of this, where instead of constructing two equations with two variables like older
students would likely have done, they were able to improvise an innovative solution.
Young students are unfamiliar with the various branches of mathematics, and as far as
they are concerned mathematics are not divided into various compartments by topic.
This lack of compartmentalization led them to make more spontaneous connections
between different topics, which often helped them reach a solution more quickly.
Affective characteristics
Self-confidence and motivation were the most common of the affective characteristics
(see table 3). This finding echoes those of other studies (DeBellis & Goldin, 2006;
Hong & Aqui, 2004). Interestingly, this study did not reflect the BFLP phenomenon
(Big Fish Little Pond) - a common negative effect noted in the literature, in which
proximity to other stronger students minimizes the prominence of a student's
qualifications, thereby causing a decline in self-confidence (Marsh & Ahu, 2003). In
the present study BFLP was avoided, and the main reason for this is the supportive
community framework offered by the club.
Conclusion
This study is consistent with other research on gifted students in that it found that
despite their young age – its population showed characteristics commonly noted
amongst older gifted children. The uniqueness of this study is that it found two
additional characteristics, which were revealed due to students' young age. This study
thus reinforces the need to apply special study programs at an early age and promotes
the development of similar models in the future.
References
Amit, M. (2010). Gifted students’ representation: Creative utilization of knowledge, flexible
acclimatization of thoughts and motivation for exhaustive solutions. Mediterranean
Journal for Research in Mathematics Education, 9(1), 135-162.
Amit, M., & Gilat, T. (2012, July). Reflecting upon ambiguous situations as a way of
developing students'mathematical creativity. In 36th Conference of the International
Group for the Psychology of Mathematics Education (p. 19).
Amit, M., & Neria, D. (2008). “Rising to the challenge”: using generalization in pattern
problems to unearth the algebraic skills of talented pre-algebra students.ZDM, 40(1), 111-
129.
DeBellis, V. A., & Goldin, G. A. (2006). Affect and meta-affect in mathematical problem
solving: A representational perspective. Educational Studies in Mathematics, 63(2), 131-
147.
Gardner, H. (1985). Frames of mind: The theory of multiple intelligences. Basic books.
Greenes, C. (1981). Identifying the gifted student in mathematics. The Arithmetic Teacher,
14-17.

Uziel, Amit
4–314 PME40 – 2016
Hong, E., & Aqui, Y. (2004). Cognitive and motivational characteristics of adolescents gifted
in mathematics: Comparisons among students with different types of giftedness. Gifted
Child Quarterly, 48(3), 191-201.
Kruteskii, V. A. (1976). The Psychology of Mathematics Ability in School Children Chicago.
Leikin, R., & Lev, M. (2013). Mathematical creativity in generally gifted and mathematically
excelling adolescents: what makes the difference?. ZDM, 45(2), 183-197.
Mann, E. L. (2006). Creativity: The essence of mathematics. Journal for the Education of the
Gifted, 30(2), 236-260.
Marsh, H. W., & Hau, K. T. (2003). Big-Fish--Little-Pond effect on academic self-concept:
A cross-cultural (26-country) test of the negative effects of academically selective
schools. American psychologist, 58(5), 364.
Polya, G. (1957). How to Solve It: a new aspect of mathematical method, ed. London:
Penguin.
Renzulli, J. S. (1986). The three-ring conception of giftedness: A developmental model for
creative productivity. In R. J. Sternberg & J. E. Davidson (Eds.), Conceptions of giftedness
(pp. 332–357). New York, NY: Cambridge University Press.
Shkedi, A. (2003). Words of meaning: Qualitative research-theory and practice.Tel-Aviv: Tel-
Aviv university Ramot.(Hebrew).
Sriraman, B. (2003). Mathematical giftedness, problem solving, and the ability to formulate
generalizations: The problem-solving experiences of four gifted students. Prufrock
Journal, 14(3), 151-165.
Terman, L. M. (1926). Genetic studies of genius: Mental and physical traits of a thousand
gifted children (Vol. I, 2nd ed.). Stanford, CA: Stanford University Press.
Tirri, K., & Pehkonen, L. (2002). The moral reasoning and scientific argumentation of gifted
adolescents. Prufrock Journal, 13(3), 120-129.
Torrance, E. P. (1968). Torrance tests of creative thinking. Personnel Press, Incorporated.
Toulmin, S. (1969). The Uses of Argument. 1958. SE Toulmin.–2nd ed.–2003.
Zohar, A., & Nemet, F. (2002). Fostering students' knowledge and argumentation skills
through dilemmas in human genetics. Journal of research in science teaching, 39(1), 35-
62.
2016. In Csíkos, C., Rausch, A., & Szitányi, J. (Eds.). Proceedings of the 40th Conference of the International
Group for the Psychology of Mathematics Education, Vol. 4, pp. 315–322. Szeged, Hungary: PME. 4–315
THE NATURAL NUMBER BIAS AND ITS ROLE IN RATIONAL
NUMBER UNDERSTANDING IN CHILDREN WITH
DYSCALCULIA: DELAY OR DEFICIT?
Jo Van Hoof*, Lieven Verschaffel*, Pol Ghesquière**, Wim Van Dooren*
* Centre for Instructional Psychology and Technology, University of Leuven
** Parenting and Special Education, University of Leuven
There exists already a large body of literature both on learners’ struggle with
understanding the rational number system and on the role of the natural number bias
in this struggle. However, little is known about rational number understanding of
learners with dyscalculia. In this study, we investigated the rational number
understanding of learners with dyscalculia, with a specific focus on the role of the
natural number bias in this understanding. The results suggest that in addition to a
delay in their general mathematics achievement, learners with dyscalculia have an
extra delay, but no deficit in their rational number understanding, compared to their
peers.
INTRODUCTION
A good understanding of the rational number domain is of essential importance for
learners’ mathematics achievement (Siegler, Thompson, & Schneider, 2011). At the
same time, rational numbers are known to form a stumbling block for many learners
(Mazzocco & Devlin, 2008; Vamvakoussi, Van Dooren, & Verschaffel, 2012; Van
Dooren, Van Hoof, Lijnen, & Verschaffel, 2012). Previous research indicates that a
large part of learners’ difficulty with rational numbers can be explained by the natural
number bias, which is defined as the tendency to apply natural number properties in
tasks with rational numbers, even when this is inappropriate (Ni & Zhou, 2005).
Learners are found to make systematic and predictable errors in rational numbers tasks
where the use of prior natural number knowledge leads to the incorrect answer
(incongruent tasks), while they are much more accurate in rational number tasks where
reliance on prior natural number knowledge leads to the correct answer (congruent
tasks) (Vamvakoussi et al., 2012).
Previous research on the natural number bias mainly focused on three aspects in which
rational numbers differ from natural numbers and where errors are known to occur:
their dense structure, the way their numerical size can be determined, and the effect of
the four basic operations (Vamvakoussi et al., 2012; Van Hoof, Vandewalle, & Van
Dooren, 2013).
While there exists a large body of literature both on learners’ struggle with
understanding the rational number domain and on the role of the natural number bias
in this struggle, little is known about the rational number understanding of learners
with dyscalculia (further abbreviated with LWD). Nonetheless, a better insight of the
understanding of rational numbers of LWD is important to provide adaptive (remedial)

Van Hoof, Verschaffel, Ghesquière, Van Dooren
4–316 PME40 – 2016
instruction with the aim to increase LWD’s understanding of the rational number
system. One of the few studies that did investigate LWD’s rational number
understanding is the study of Mazzocco and Devlin (2008). They found that learners
with mathematical learning difficulties compared to learners without mathematical
learning difficulties struggle more to accurately order rational numbers, even more than
learners with a low general mathematics achievement.
THE PRESENT STUDY
The goal of the present study is to extend the study of Mazzocco and Devlin (2008) in
several ways. First, in the study of Mazzocco and Devlin (2008) learners were solely
matched on their ‘chronological age’. In this study we will also match learners on their
mathematical ability level. This allows to investigate whether there is a ‘deficit’ or a
‘delay’ in LWD’s rational number understanding (Torbeyns, Verschaffel, &
Ghesquiére, 2004). If LWD’s rational number understanding is significantly lower than
that of learners of the same age (= chronological age match), but not significantly
different from learners without dyscalculia but with the same mathematics
achievement level (= ability match), who are typically younger, this implies that
LWD’s rational number understanding reflects their mathematics achievement level
and thus that the development of LWD’s rational number understanding is only
characterized by a delay rather than deficit. However, if LWD’s rational number
understanding is not only significantly lower than that of learners of the same age but
also significantly lower than (younger) learners with the same mathematics
achievement level, the development of LWD’s rational number understanding does not
represent their mathematics achievement level, thus their rational number
understanding is characterized by a deficit (Torbeyns et al., 2004). This leads to the
first research question (Research Question 1), namely whether LWD’s rational number
understanding is characterized by a ‘delay’ or a ‘deficit’ compared to learners without
dyscalculia. Second, while Mazzocco and Devlin (2008) measured learners’ rational
number understanding in a rather general sense, we will pay particular attention to the
differences between congruent and incongruent rational number tasks to map the
natural number bias in the three groups of learners. This way, we aimed at answering
our second research question (Research Question 2): Is the strength of the natural
number bias in LWD comparable with that of normally developing children? Based on
the available research literature, no specific prediction could be made for both research
questions.
METHOD
Participants
Three different groups of learners were included. A first group consisted of sixth
graders with an official clinical diagnosis of dyscalculia (n = 16). Next to these LWD,
we included two control groups: a chronological age match and an ability match group.
The first control group were sixth graders without dyscalculia (n = 56), further referred
to as the sixth grade control group. The mean age (in months) of the LWD was 143.97
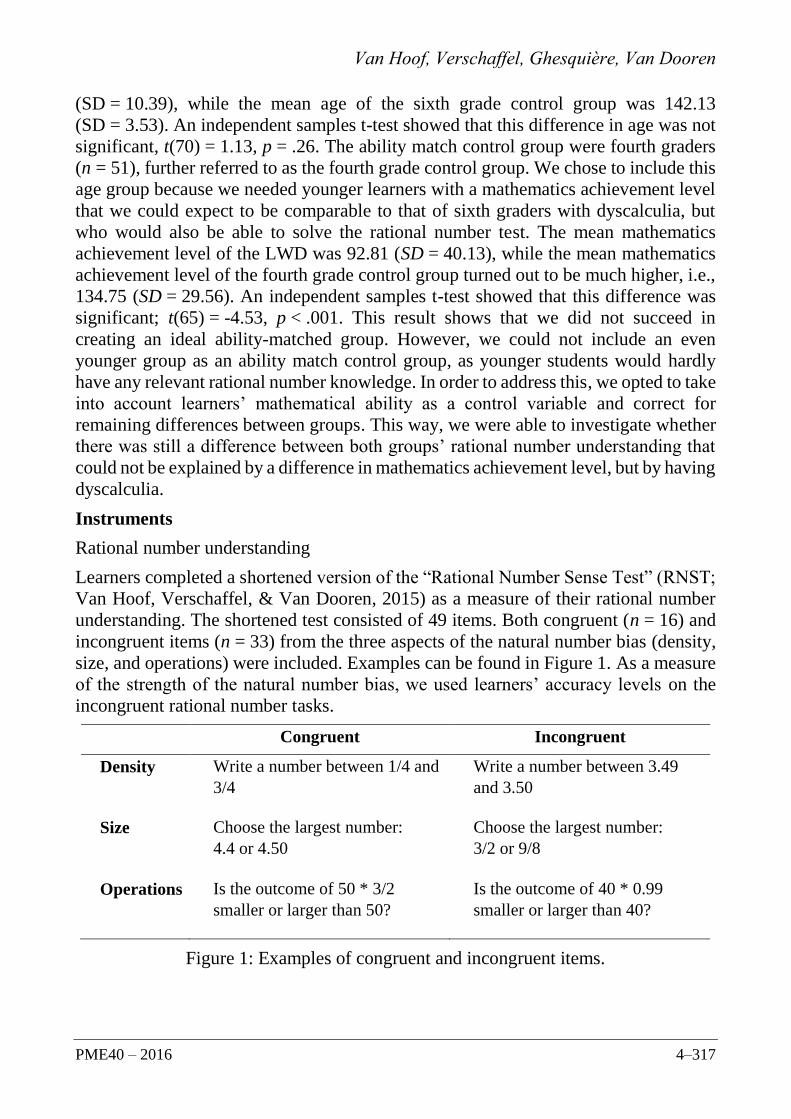
Van Hoof, Verschaffel, Ghesquière, Van Dooren
PME40 – 2016 4–317
(SD = 10.39), while the mean age of the sixth grade control group was 142.13
(SD = 3.53). An independent samples t-test showed that this difference in age was not
significant, t(70) = 1.13, p = .26. The ability match control group were fourth graders
(n = 51), further referred to as the fourth grade control group. We chose to include this
age group because we needed younger learners with a mathematics achievement level
that we could expect to be comparable to that of sixth graders with dyscalculia, but
who would also be able to solve the rational number test. The mean mathematics
achievement level of the LWD was 92.81 (SD = 40.13), while the mean mathematics
achievement level of the fourth grade control group turned out to be much higher, i.e.,
134.75 (SD = 29.56). An independent samples t-test showed that this difference was
significant; t(65) = -4.53, p < .001. This result shows that we did not succeed in
creating an ideal ability-matched group. However, we could not include an even
younger group as an ability match control group, as younger students would hardly
have any relevant rational number knowledge. In order to address this, we opted to take
into account learners’ mathematical ability as a control variable and correct for
remaining differences between groups. This way, we were able to investigate whether
there was still a difference between both groups’ rational number understanding that
could not be explained by a difference in mathematics achievement level, but by having
dyscalculia.
Instruments
Rational number understanding
Learners completed a shortened version of the “Rational Number Sense Test” (RNST;
Van Hoof, Verschaffel, & Van Dooren, 2015) as a measure of their rational number
understanding. The shortened test consisted of 49 items. Both congruent (n = 16) and
incongruent items (n = 33) from the three aspects of the natural number bias (density,
size, and operations) were included. Examples can be found in Figure 1. As a measure
of the strength of the natural number bias, we used learners’ accuracy levels on the
incongruent rational number tasks.
Congruent Incongruent
Density Write a number between 1/4 and
3/4
Write a number between 3.49
and 3.50
Size Choose the largest number:
4.4 or 4.50
Choose the largest number:
3/2 or 9/8
Operations Is the outcome of 50 * 3/2
smaller or larger than 50?
Is the outcome of 40 * 0.99
smaller or larger than 40?
Figure 1: Examples of congruent and incongruent items.

Van Hoof, Verschaffel, Ghesquière, Van Dooren
4–318 PME40 – 2016
Mathematics achievement
Learners’ mathematics achievement was measured by means of the Tempo Test
Automatiseren (De Vos, 2010). This test measures the automated knowledge of the
four basic operations.
Intelligence.
Two measures of intelligence were used. First, Raven’s Progressive Matrices test
(Raven, Court, & Raven, 1995) was used as a measure of learners’ non-verbal
intelligence. Second, the SiBO test measured learners’ verbal intelligence (Hendrikx,
Maes, Magez, Ghesquière, & Van Damme, 2007). Because high correlations were
found between both IQ measures (Raven and SiBo) (r = .41, p < .001), we created one
general intelligence score by first calculating z-scores for each measure separately and
then taking the mean of these two scores for each learner. We standardised the
intelligence score for the sixth graders and fourth graders separately (leading to a mean
score of 0 in both groups), and then calculated the z-scores of the LWD group using
the sixth graders as a reference group.
Reading achievement.
Because comorbidity was allowed, two measures of reading achievement were
included as control variables to ensure that the results were not due to lower reading
achievement. The één-minuut test (one minute test, further abbreviated with EMT) was
used as a measure of learners’ word recognition ability. The goal of the test is that
learners correctly read out loud as many words as possible within one minute.
Standardized scores were used based on existing norm tables (Brus & Voeten, 1972).
The Klepel was used as a second measure of learners’ reading ability. Contrary to the
EMT, the words in this test are pseudowords. Standardized scores were used based on
existing norm tables (van den Bos, Spelberg, Scheepstra, & de Vries, 1994). Also for
the two reading achievement measures, high correlations were found (r = .92,
p < .001). Therefore, we also calculated each learner’s mean standardized score on the
two measures as a general score of reading achievement.
RESULTS
Table 1 presents the descriptive statistics for the control variables. The results for the
dependent variable (performance on congruent and incongruent rational number items)
are shown in Figure 2.

Van Hoof, Verschaffel, Ghesquière, Van Dooren
PME40 – 2016 4–319
LWD 4th graders 6th graders
Age (months) Mean 143.97 119.34 142.13
SD 10.39 3.54 3.53
IQ (Raven + SiBo) Mean -0.99 0 0
SD 1.12 0.79 0.83
Reading achievement
(EMT + KLEPEL)
Mean 7.13 9.99 10.82
SD 3.78 2.49 2.48
Mathematics achievement Mean 92.81 134.75 171.27
SD 40.13 29.56 22.30
Table 1: Descriptive statistics
Comparison between LWD and sixth grade control group
As can be seen in Figure 2, LWD’s accuracy on congruent items was significantly
lower than the accuracy of the sixth grade control group. Because our aim was to
have a chronological age match design, in a next step we added learners’ age (in
months) as control variable in the comparison between both groups’ accuracy on
congruent rational number tasks. Moreover, because both groups differed in their
general IQ and reading achievement, we also included these two as control variables.
An ANCOVA indicated that, even after controlling for learners’ age, IQ, and reading
achievement, the sixth grade control group still significantly outperformed the group
of LWD on congruent rational number tasks, F(1,67) = 4.35, p = .04, ² = .06, but the
effect size was only small.
LWD’s accuracy on incongruent items was also significantly lower than the accuracy
of the sixth grade control group, see Figure 2. In a next step we again additionally
controlled for learners’ age, IQ, and reading achievement. An ANCOVA indicated that,
even after controlling for these variables, the sixth grade control group still
significantly outperformed LWD on incongruent rational number tasks,
F(1,67) = 102.16, p < .001, ² = .60; the effect size was large.
The partial eta squared values reveal that the difference in accuracy between the group
of LWD and the sixth grade control group is much higher in incongruent than in
congruent rational number items.

Van Hoof, Verschaffel, Ghesquière, Van Dooren
4–320 PME40 – 2016
Figure 2: Learners’ accuracy on congruent and incongruent rational number
tasks per group
Note. * = p < .01, ** = p < .001
Comparison between LWD and fourth grade control group
As can be seen in Figure 2, LWD’s accuracy on congruent items was not significantly
different from the accuracy of the fourth grade control group. As stated above, we did
not succeed in realizing an optimal ability match with fourth graders. Therefore, in a
next step we added learners’ mathematics achievement as a control variable in the
comparison between both groups’ accuracy on congruent rational number tasks.
Moreover, because the LWD and the fourth grade control group also differed in their
general IQ and reading achievement, we also included these two measures as control
variables. An ANCOVA indicated that, after controlling for learners’ mathematics
achievement, IQ, and reading achievement, no significant difference was found
between both groups’ accuracy on congruent rational number tasks, F(1,62) = 3.69,
p = .08, ² = .03.
LWD’s accuracy on incongruent items was lower than the accuracy of the fourth grade
control group, see Figure 2. This difference between the two groups was however not
significant F(1,65) = 2.06, p = .16, ² = .03. For the same reasons as above, in a next
step we additionally controlled for learners’ mathematics achievement, IQ, and reading
achievement. An ANCOVA indicated that, after controlling for these three measures,
no significant difference was found between both groups’ accuracy on incongruent
rational number tasks, F(1,62) = 1.75, p = .19, ²< .01.
DISCUSSION
Concerning the first research question, results showed that LWD’s rational number
understanding is significantly lower than that of regular learners, but not significantly
different from younger learners, even after statistically controlling for mathematics
achievement, both in congruent and incongruent rational number tasks. These results
suggest that the development of LWD’s rational number understanding is characterized
by a delay rather than a deficit. Concerning the second research question, there was a

Van Hoof, Verschaffel, Ghesquière, Van Dooren
PME40 – 2016 4–321
big difference in accuracy level between LWD and their peers on incongruent rational
number tasks, while no significant difference could be found with fourth graders’
accuracy on the same incongruent rational number tasks. The difference in accuracy
on incongruent rational number tasks revealed that the strength of the natural number
bias is higher in LWD compared to normally developing learners of the same age, but
is not different from younger learners. This finding confirms that LWD’s rational
number understanding is characterized by a delay rather than a deficit. We further
found that LWD’s rational number understanding is not significantly different from
younger learners with a higher mathematics achievement level. This suggests that the
role of dyscalculia is less strong for learners’ accuracy levels on rational number tasks
compared to learners’ accuracy level on a mathematics achievement test measuring
learners’ automated knowledge of the four basic operations. Moreover, the finding that
LWD’s rational number understanding is not significantly different from younger
learners with a higher mathematics achievement level, gives us reason to hypothesize
that LWD have a lead in their rational number understanding compared to even
younger learners with the same mathematics achievement. Our findings have
implications for mathematics education. Although our results pointed out that LWD
struggle even more with incongruent rational number tasks than their peers, they also
indicated that this struggle is not characterized by a deficit but with a more general
delay. This implies that it is possible for LWD to develop more insight in the rational
number system and, therefore, more (remedial) instructional attention should aim at
the enhancement of LWD’s understanding of the rational number system. As stated
above, LWD are more affected by the natural number bias compared to learners of the
same age. Therefore, more instructional attention should go to the differences between
the natural number system and the rational number system. While this should be
implemented in all classrooms, it deserves especially attention when teaching LWD.
References
Brus, B., & Voeten, M. (1972). Eén-minuut-test: handleiding en verantwoording.[One minute
test: handbook]. Nijmegen, The Netherlands. Berkhout Testmateriaal B.V.
De Vos, T. (1992). Tempo-Test Rekenen. Test voor het vaststellen van het
rekenvaardigheidsniveau der elementaire bewerkingen (automatisering) voor het basis en
voortgezet onderwijs. Handleiding. [Tempo test mathematics. Test to measure the level of
learners’ mathematical competences of the four basic operations in primary and secondary
education]. Lisse, The Netherlands: Swets & Zeitlinger.
Hendrikx, K., Maes, F., Magez, W., Ghesquière, P., & Van Damme, J. (2007). Longitudinaal
onderzoek in het basisonderwijs. Intelligentiemeting (schooljaar 2005-2006)
[Longitudinal research in elementary school. Intelligence (schoolyear 2005-2006)] (SSL-
rapport nr. SSL/OD1/2007.03). Leuven, Belgium: Steunpunt Studie- en Schoolloopbanen.
Mazzocco, M. M. M., & Devlin, K. T. (2008). Parts and ‘holes’: Gaps in rational number
sense among children with vs. without mathematical learning disabilities. Developmental
Science, 11, 681–691.

Van Hoof, Verschaffel, Ghesquière, Van Dooren
4–322 PME40 – 2016
Ni, Y., & Zhou, Y.-D. (2005). Teaching and learning fraction and rational numbers: The
origins and implications of whole number bias. Educational Psychologist, 40, 27-52.
Raven, J. C., Court, J. H., & Raven, J. (1995). Manual for Raven’s progressive matrices and
vocabulary scales. Oxford, England: Psychologists Press.
Siegler, R. S., Thompson, C., & Schneider, M. (2011). An integrated theory of whole number
and fractions development. Cognitive Psychology, 62, 273-296.
Torbeyns, J., Verschaffel, L., & Ghesquière, P. (2004). Strategy development in children with
mathematical disabilities: Insights from the choice/no-choice method and the
chronological-age/ability-level-match design. Journal of Learning Disabilities, 37(2),
119-131.
Vamvakoussi, X., Van Dooren, W., & Verschaffel, L. (2012). Naturally biased? In search for
reaction time evidence for a natural number bias in adults. The Journal of Mathematical
Behavior, 31, 344-355.
van den Bos, K. P., Spelberg, H. C., Scheepstra, A. J. M., & de Vries, J. R. (1994). De klepel:
Een test voor de leesvaardigheid van pseudowoorden.[The Klepel: a test to measure
reading skills with regard to pseudo words]. Nijmegen, The Netherlands.
Van Dooren, W., Van Hoof, J., Lijnen, T., & Verschaffel, L. (2012). Searching for a whole
number bias in secondary school student – A reaction time study on fraction comparison.
In T-Y. Tso (Ed.), Proceedings of the 36th Conference of the International Group for the
Psychology in Mathematics Education (Vol. 4, pp. 187–194). Taipei, Taiwan: PME.
Van Hoof, J., Vandewalle, J., Van Dooren, W. (2013). In search for the natural number bias
in secondary school students when solving algebraic expressions. In A. Lindmeier, & A.
Heinze (Eds.), Proceedings of the 37th Conference of the International Group for the
Psychology of Mathematics Education: Vol. 4. Conference of the International Group for
the Psychology of Mathematics Education. Kiel, Germany, 28 July - 02 August 2013 (pp.
329-336). Kiel, Germany: PME.
Van Hoof, J., Verschaffel, L., & Van Dooren, W. (2015). Inappropriately applying natural
number properties in rational number tasks: Characterizing the development of the natural
number bias through primary and secondary education. Educational Studies in
Mathematics, 90, 39-56.

2016. In Csíkos, C., Rausch, A., & Szitányi, J. (Eds.). Proceedings of the 40th Conference of the International
Group for the Psychology of Mathematics Education, Vol. 4, pp. 323–330. Szeged, Hungary: PME. 4–323
THEORIZING THE MATHEMATICAL POINT OF BUILDING ON
STUDENT MATHEMATICAL THINKING
Laura R. Van Zoest Shari L. Stockero
Western Michigan University Michigan Technological University
Keith R. Leatham Blake E. Peterson
Brigham Young University Brigham Young University
Despite the fact that the mathematics education field recognizes the critical role that
student thinking plays in high quality instruction, little is known about productive use
of the in-the-moment student thinking that emerges in the context of whole-class
discussion. We draw on and extend the work of others to theorize the mathematical
understanding an instance of such student thinking can be used to build towards—the
mathematical point (MP). An MP is a mathematical statement of what could be
gained from considering a particular instance of student thinking. Examples and non-
examples are used to illustrate nuances in the MP construct. Articulating the MP for
an instance of student thinking is requisite for determining whether there is
instructional value in pursuing that thinking.
The field of mathematics education recognizes the critical role student mathematical
thinking plays in planning and implementing quality mathematics instruction
(e.g., National Council of Teachers of Mathematics [NCTM], 2014). Researchers have
made progress on understanding how instruction can be improved by using tasks that
are likely to engage students in meaningful mathematical activity and by working to
maintain the cognitive demand of those tasks throughout instruction (e.g., Stein &
Lane, 1996). We also know many of the benefits of teachers understanding common
ways that students think about and develop mathematical ideas (e.g., Fennema et al.,
1996). We know less, however, about productive ways of taking advantage of the
student mathematical thinking that emerges during instruction. Recent work (e.g.,
Smith & Stein, 2011) has begun to help us understand how to effectively use written
records of student work, but much less is known about how to effectively use the in-
the-moment mathematical thinking that emerges during classroom mathematics
discourse. We need to understand this important aspect of effective use of student
thinking because whole-class discussion is fertile ground for the emergence of valuable
student mathematical thinking (Van Zoest et al., 2015a, 2015b), yet many teachers,
especially novices, fail to notice or to act on opportunities to use this valuable thinking
to further mathematical understanding (Peterson & Leatham, 2009; Stockero, Van
Zoest, & Taylor, 2010).
Our work investigating teachers’ use of in-the-moment instances of high potential
student thinking to further students’ mathematical understanding during whole-class
discussion has led us to conclude that an important reason for the slow pace of reform
in this area is that what exactly can be learned from making a particular instance of

Van Zoest, Stockero, Leatham, Peterson
4–324 PME40 – 2016
student thinking the object of discussion has been under theorized. Thus, the purpose
of this paper is to theorize the mathematical point that an instance of student thinking
can be used to build towards. Before beginning that theorizing, we first outline the
theoretical framework that guides our thinking and then situate our thinking in the
context of other related research.
THEORETICAL FRAMEWORK
The MOST research group (e.g., Leatham, Peterson, Stockero, & Van Zoest, 2015;
Van Zoest, Leatham, Peterson, & Stockero, 2013) defined MOSTs—Mathematically
Significant Pedagogical Opportunities to Build on Student Thinking—as “instances of
student thinking that have considerable potential at a given moment to become the
object of rich discussion about important mathematical ideas” (Leatham et al., 2015,
p. 90). They conceptualized MOSTs as occurring in the intersection of three critical
characteristics of classroom instances: student mathematical thinking, significant
mathematics, and pedagogical opportunities. For each characteristic, two criteria were
provided to determine whether an instance of student thinking embodies that
characteristic. Foundational to our work is the student mathematical thinking
characteristic, for which the two criteria are student mathematics and mathematical
point. To meet the student mathematics criterion, one must have sufficient evidence to
make a reasonable inference about the mathematical thinking a student is expressing.
The articulation of this mathematical thinking is called the student mathematics (SM)
of the instance. To meet the mathematical point criterion, one must be able to
“articulate a mathematical idea that is closely related to the student mathematics of the
instance—what we call a mathematical point” (p. 92). It is this use of mathematical
point (MP) that we theorize in this paper.
MOSTs are instances of student thinking worth building on—that is, “student thinking
worth making the object of consideration by the class in order to engage the class in
making sense of that thinking to better understand an important mathematical idea”
(Van Zoest et al., 2015b, p. 4). Such use encapsulates core ideas of current thinking
about effective teaching and learning of mathematics, including social construction of
knowledge and the importance of mathematical discourse (NCTM, 2014). Thus,
building on MOSTs is a particularly productive way for teachers to engage students in
meaningful mathematical learning. In this paper, we both draw on and extend the
MOST framework by theorizing the MP—the mathematical understanding particular
instances of student thinking can be used to build towards.
RELATED RESEARCH
Perhaps the work most closely related to this theorizing, at least on the surface, is
Laurie Sleep’s 2009 dissertation, Teaching to the Mathematical Point: Knowing and
Using Mathematics in Teaching. Sleep, however, defines mathematical point “to
include the mathematical learning goals for an activity, as well as the connection
between the activity and its goals” (p. 13). This is a broad definition that foregrounds
the meaning of “point” as “something that is the focus of attention, consideration, or
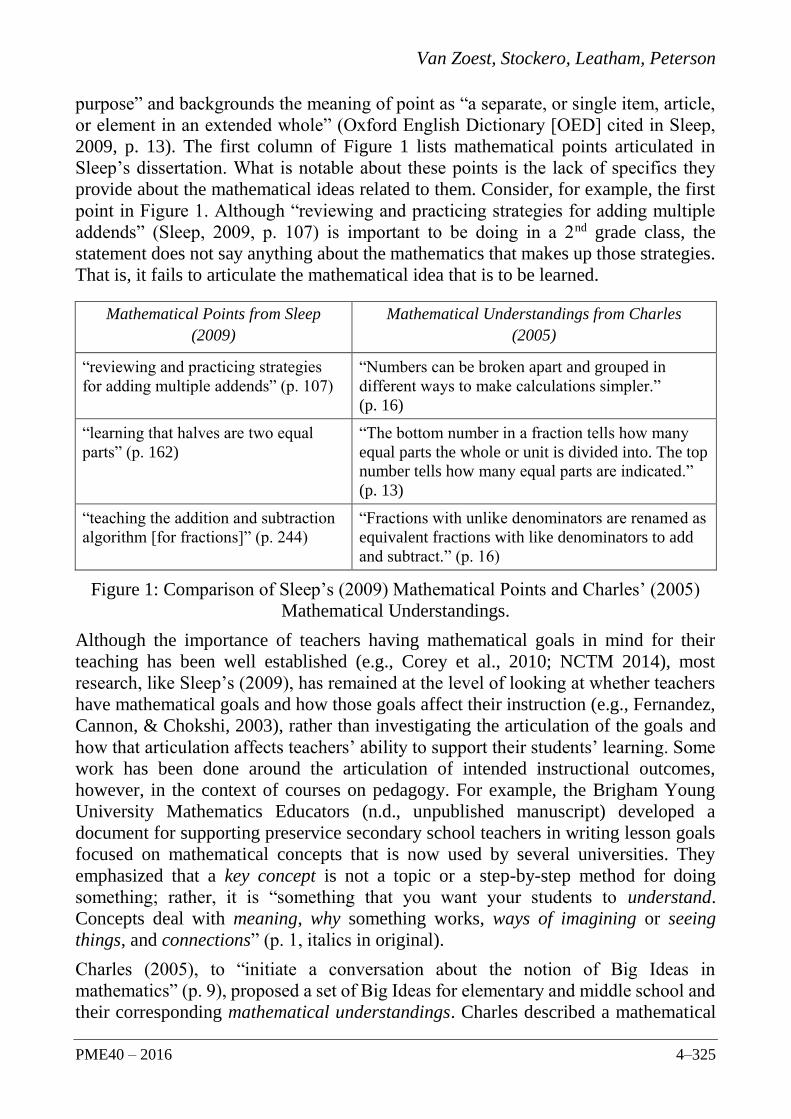
Van Zoest, Stockero, Leatham, Peterson
PME40 – 2016 4–325
purpose” and backgrounds the meaning of point as “a separate, or single item, article,
or element in an extended whole” (Oxford English Dictionary [OED] cited in Sleep,
2009, p. 13). The first column of Figure 1 lists mathematical points articulated in
Sleep’s dissertation. What is notable about these points is the lack of specifics they
provide about the mathematical ideas related to them. Consider, for example, the first
point in Figure 1. Although “reviewing and practicing strategies for adding multiple
addends” (Sleep, 2009, p. 107) is important to be doing in a 2nd grade class, the
statement does not say anything about the mathematics that makes up those strategies.
That is, it fails to articulate the mathematical idea that is to be learned.
Mathematical Points from Sleep
(2009)
Mathematical Understandings from Charles
(2005)
“reviewing and practicing strategies
for adding multiple addends” (p. 107)
“Numbers can be broken apart and grouped in
different ways to make calculations simpler.”
(p. 16)
“learning that halves are two equal
parts” (p. 162)
“The bottom number in a fraction tells how many
equal parts the whole or unit is divided into. The top
number tells how many equal parts are indicated.”
(p. 13)
“teaching the addition and subtraction
algorithm [for fractions]” (p. 244)
“Fractions with unlike denominators are renamed as
equivalent fractions with like denominators to add
and subtract.” (p. 16)
Figure 1: Comparison of Sleep’s (2009) Mathematical Points and Charles’ (2005)
Mathematical Understandings.
Although the importance of teachers having mathematical goals in mind for their
teaching has been well established (e.g., Corey et al., 2010; NCTM 2014), most
research, like Sleep’s (2009), has remained at the level of looking at whether teachers
have mathematical goals and how those goals affect their instruction (e.g., Fernandez,
Cannon, & Chokshi, 2003), rather than investigating the articulation of the goals and
how that articulation affects teachers’ ability to support their students’ learning. Some
work has been done around the articulation of intended instructional outcomes,
however, in the context of courses on pedagogy. For example, the Brigham Young
University Mathematics Educators (n.d., unpublished manuscript) developed a
document for supporting preservice secondary school teachers in writing lesson goals
focused on mathematical concepts that is now used by several universities. They
emphasized that a key concept is not a topic or a step-by-step method for doing
something; rather, it is “something that you want your students to understand.
Concepts deal with meaning, why something works, ways of imagining or seeing
things, and connections” (p. 1, italics in original).
Charles (2005), to “initiate a conversation about the notion of Big Ideas in
mathematics” (p. 9), proposed a set of Big Ideas for elementary and middle school and
their corresponding mathematical understandings. Charles described a mathematical

Van Zoest, Stockero, Leatham, Peterson
4–326 PME40 – 2016
understanding as “an important idea students need to learn because it contributes to
understanding the Big Idea” (p. 10). The second column of Figure 1 lists mathematical
understandings from Charles (2005) that bear some relationship to Sleep’s (2009)
mathematical points. Charles’ mathematical understandings do articulate the
mathematical idea that is to be learned, and thus they are at a grainsize more appropriate
for looking at the mathematical understanding particular instances of student thinking
can be used to build towards.
DEFINING MATHEMATICAL POINT (MP)
Although Charles (2005) did not formally define mathematical understanding in his
paper, drawing on his examples and explanations, we use the term mathematical
understanding to refer to a concise statement of a non-subjective truth about
mathematics. This definition specifies something that students can actually come to
understand, as opposed to a topic for them to study or an outcome of their learning.
Articulating mathematical understandings is useful for a number of teaching-related
activities, such as determining goals of a lesson, analysing the mathematics students
might learn from a task, and guiding the formulation of questions to ask in the midst
of a lesson. Yet another reason for articulating mathematical understandings, and the
one that is the focus of this paper, is to determine whether student thinking is worth
building on in the moment in which it occurs.
Our focus is on instances of student mathematical thinking that emerge during whole-
class discussion. We follow Leatham et al. (2015) in defining an instance as “an
observable student action or small collection of connected actions (such as a verbal
expression combined with a gesture)” (p. 92). In our ongoing research, we have found
that for instances of student thinking for which student mathematics (SM) can be
inferred, one can articulate related mathematical understanding(s). Since student
thinking is not always constrained by the teachers’ plan for the lesson, these
mathematical understandings may or may not be within the confines of the planned
lesson. Additionally, the mathematical understandings that are within the confines of
the planned lesson may or may not be most closely related to the SM. Although we
agree with Hintz and Kazemi (2014) that it is important that “the discussion goal acts
as a compass as teachers navigate classroom talk” (p. 37), we also contend that a
parallel goal is to honor student thinking. That is, making a decision about whether or
not to pursue a particular instance of student mathematical thinking requires first
identifying the SM of the thinking and then identifying the mathematical understanding
most closely related to it. Otherwise, there is a risk of undermining a core principle of
quality mathematics instruction—that of positioning students as legitimate
mathematical thinkers (e.g., NCTM, 2014).
Thus, in the context of our work on productive use of student mathematical thinking
during instruction, a mathematical point (MP) is the mathematical understanding that
(1) students could gain from considering a particular instance of student thinking and
(2) is most closely related to the SM of the thinking. That is, the MP is a mathematical
Van Zoest, Stockero, Leatham, Peterson
PME40 – 2016 4–327
statement of what could be gained as a result of students making sense of the
mathematics contained in the expression of the student thinking. Note that it is only
when the MP is articulated that a clear decision can be made about whether the student
thinking should be pursued. (Leatham et al., 2015, describe a tool for distinguishing
instances of student thinking that provide opportunities to productively build on
students’ mathematical thinking from those that do not—the MOST Analytic
Framework.)
We have identified four things to keep in mind when considering MPs. First, an MP
exists only in relation to a specific instance of student thinking. That is, unlike a
mathematical understanding, which can stand alone, an MP cannot. Specifically, one
must talk about an MP in relation to what can be gained from considering a particular
instance of student thinking. Second, in order to be an MP, the mathematical
understanding must be gained from considering the student thinking itself. An instance
of student thinking may often prompt teachers to ask a question, introduce an idea or
pose a task that furthers student learning of a mathematical understanding related to
the instance. Although these are important teaching tasks that use student thinking, we
want to be clear that we do not consider them building on student thinking. In order for
building to occur, the thinking itself must become the object of discussion. Third, not
all instances of student thinking give rise to an MP. For example, suppose a student
asked, “What is the formula for the volume of a cube?” This instance of mathematical
thinking is related to the mathematical understanding: The formula for the volume of a
cube with side s is s3. That mathematical understanding, however, is not something that
students could gain from considering this particular instance of student thinking. They
might be able to recall it, or they might be able to figure it out from a task that the
teacher poses in response to the instance, but it would not result from considering the
student thinking. Fourth, there are acceptable variations in the articulation of SMs,
mathematical understandings, and MPs. What is presented here is the consensus of the
authors, but other articulations may also be defendable.
To further illustrate our theorizing, Figure 2 contains instances of student mathematical
thinking, the MP that would serve as the discussion goal of the conversation in which
the instance of student thinking is the object of discussion, an example of a
mathematical understanding that does not meet the “most closely related” criteria for
that thinking and an example of a related statement that is not a mathematical
understanding. Recall that MPs are a subset of mathematical understandings, thus both
the second and third column contain examples of mathematical understandings.
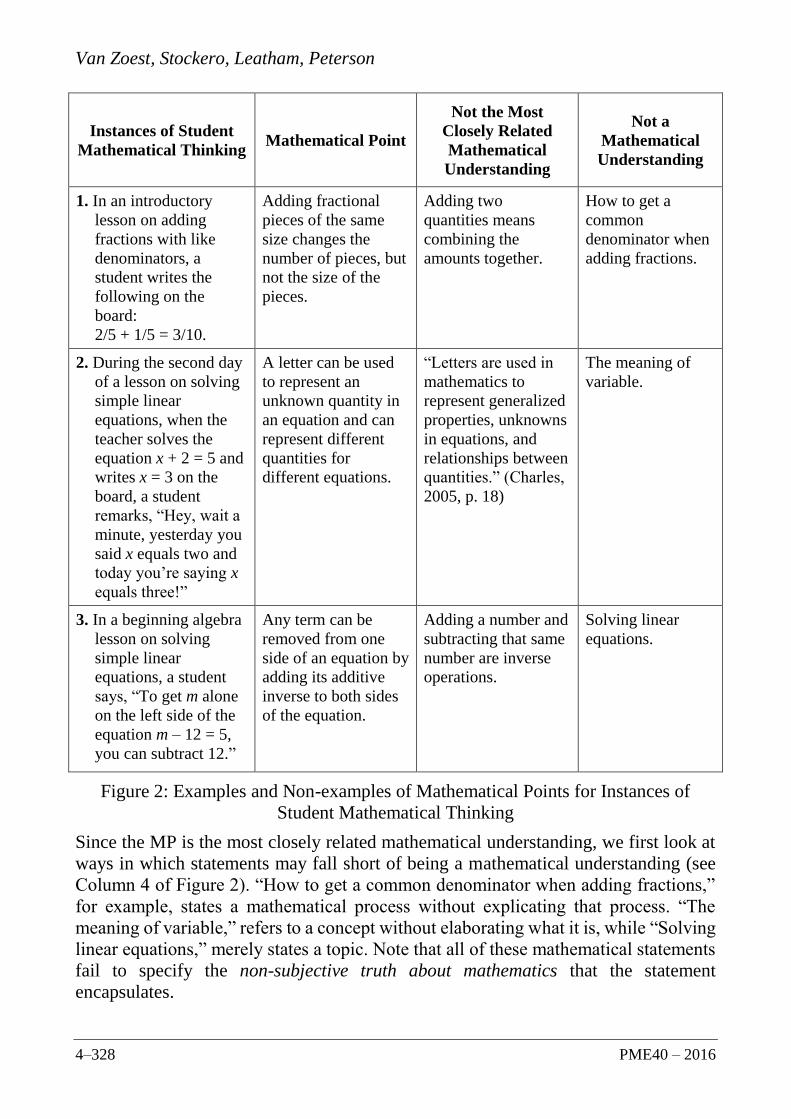
Van Zoest, Stockero, Leatham, Peterson
4–328 PME40 – 2016
Instances of Student
Mathematical Thinking Mathematical Point
Not the Most
Closely Related
Mathematical
Understanding
Not a
Mathematical
Understanding
1. In an introductory
lesson on adding
fractions with like
denominators, a
student writes the
following on the
board:
2/5 + 1/5 = 3/10.
Adding fractional
pieces of the same
size changes the
number of pieces, but
not the size of the
pieces.
Adding two
quantities means
combining the
amounts together.
How to get a
common
denominator when
adding fractions.
2. During the second day
of a lesson on solving
simple linear
equations, when the
teacher solves the
equation x + 2 = 5 and
writes x = 3 on the
board, a student
remarks, “Hey, wait a
minute, yesterday you
said x equals two and
today you’re saying x
equals three!”
A letter can be used
to represent an
unknown quantity in
an equation and can
represent different
quantities for
different equations.
“Letters are used in
mathematics to
represent generalized
properties, unknowns
in equations, and
relationships between
quantities.” (Charles,
2005, p. 18)
The meaning of
variable.
3. In a beginning algebra
lesson on solving
simple linear
equations, a student
says, “To get m alone
on the left side of the
equation m – 12 = 5,
you can subtract 12.”
Any term can be
removed from one
side of an equation by
adding its additive
inverse to both sides
of the equation.
Adding a number and
subtracting that same
number are inverse
operations.
Solving linear
equations.
Figure 2: Examples and Non-examples of Mathematical Points for Instances of
Student Mathematical Thinking
Since the MP is the most closely related mathematical understanding, we first look at
ways in which statements may fall short of being a mathematical understanding (see
Column 4 of Figure 2). “How to get a common denominator when adding fractions,”
for example, states a mathematical process without explicating that process. “The
meaning of variable,” refers to a concept without elaborating what it is, while “Solving
linear equations,” merely states a topic. Note that all of these mathematical statements
fail to specify the non-subjective truth about mathematics that the statement
encapsulates.

Van Zoest, Stockero, Leatham, Peterson
PME40 – 2016 4–329
The mathematical understandings in Column 3 of Figure 2 are mathematical
understandings for the corresponding instances of student thinking, but they are not as
closely related as those in the Mathematical Point column. For example, although
closely related on the surface—Instance 1 is certainly about addition of two
quantities—the MP for this instance better captures the specific non-subjective truth
about mathematics that students could gain by making this instance of thinking the
object of discussion. The importance of the MP being the mathematical understanding
most closely related to the SM of the instance is related to the idea of honoring student
thinking. For example, if the teacher were to turn the student thinking in Instance 2
over to the class and navigate the discussion (Hintz & Franke, 2014) toward the goal
of better understanding how letters are used to represent unknowns in equations, the
student likely would not feel that their thinking was the object of the discussion. Again,
that is not to say that making the student thinking the object of discussion is always the
optimal teaching move; rather, it is to say that articulating the MP allows teachers to
make an informed decision about how best to respond to the thinking. If there is an
MP, the MOST Analytic Framework (Leatham et al., 2015) is a mechanism for
determining whether to make the thinking the object of discussion for the class or to
address it in some other way.
CONCLUSION
An important reason that instruction based on student thinking has not lived up to its
potential may be that our target has been too broad. Focusing on teachers’ goals for the
lesson lends itself to the teacher using student thinking to make the point the teacher
has in mind, rather than building on student thinking. Changing the grainsize to the MP
for the SM in instances of student thinking may be a productive shift in how we think
about using student thinking as part of instruction that will allow us to achieve the full
potential of instruction based on student thinking.
Acknowledgements
This research report is based on work supported by the U.S. National Science Foundation
(NSF) under Grant Nos. 1220141, 1220357, and 1220148. Any opinions, findings, and
conclusions or recommendations expressed in this material are those of the authors and do
not necessarily reflect the views of the NSF. The authors thank Mary Ochieng and Elizabeth
Fraser for their contributions to the ideas in this paper.
References
Brigham Young University Mathematics Educators. (2014). Mathematical concepts and
concept descriptions. Unpublished manuscript.
Charles, R.I. (2005). Big ideas and understandings as the foundation of elementary and middle
school mathematics. Journal of Mathematics Education Leadership, 7(3), 9-24.
Corey, D.L., Peterson, B.E., Lewis, B.M., Bukarau, J. (2010). Are there any places that
students use their heads? Principles of high-quality Japanese mathematics instruction.
Journal for Research in Mathematics Education, 41, 438-478.

Van Zoest, Stockero, Leatham, Peterson
4–330 PME40 – 2016
Fennema, E., Carpenter, T. P., Franke, M. L., Levi, L., Jacobs, V. R., & Empson, S. B. (1996).
A longitudinal study of learning to use children’s thinking in mathematics instruction.
Journal for Research in Mathematics Education, 27, 403-434.
Fernandez, C., Cannon, J., & Chokshi, S. (2003). US-Japan lesson study collaboration reveals
critical lenses for examining practice. Teaching and Teacher Education, 19, 171-185.
Hintz, A., & Kazemi, E. (2014, November). Talking about math. Educational Leadership, 72,
36-40.
Leatham, K. R., Peterson, B. E., Stockero, S. L., & Van Zoest, L. R. (2015). Conceptualizing
mathematically significant pedagogical opportunities to build on student thinking. Journal
for Research in Mathematics Education, 46, 88-124.
National Council of Teachers of Mathematics. (2014). Principles to actions: Ensuring
mathematical success for all. Reston, VA: Author.
Peterson, B. E., & Leatham, K. R. (2009). Learning to use students’ mathematical thinking.
In L. Knott (Ed.), The role of mathematics discourse in producing leaders of discourse (pp.
99-128). Charlotte, NC: Information Age Publishing.
Sleep, L. (2009). Teaching to the mathematical point: Knowing and using mathematics in
teaching (Unpublished doctoral dissertation). University of Michigan, Ann Arbor.
Smith, M. S., & Stein, M. K. (2011). 5 practices for orchestrating productive mathematical
discussions. Reston, VA: National Council of Teachers of Mathematics.
Stein, M. K. & Lane, S. (1996). Instructional tasks and the development of student capacity
to think and reason: An analysis of the relationship between teaching and learning in a
reform mathematics project. Educational Research and Evaluation, 2, 50-80.
Stockero, S. L., Van Zoest, L. R., & Taylor, C. E. (2010). Characterizing pivotal teaching
moments in beginning mathematics teachers’ practice. In Brosnan, P., Erchick, D. B., &
Flevares, L. (Eds.), Proceedings of the 32nd annual meeting of the North American
Chapter of the International Group for the Psychology of Mathematics Education.
Columbus: The Ohio State University.
Van Zoest, L. R., Leatham, K. R., Peterson, B. E., & Stockero, S. L. (2013). Conceptualizing
mathematically significant pedagogical openings to build on student thinking. In A. M.
Lindmeier & A. Heinze (Eds.), Proceedings of the 37th conference of the International
Group for the Psychology of Mathematics Education (Vol. 4, pp. 345-352). Kiel, Germany:
PME.
Van Zoest, L. R., Stockero, S. L., Atanga, N. A., Peterson, B. E., Leatham, K. R., & Ochieng,
M. A. (2015a). Attributes of student mathematical thinking that is worth building on in
whole class discussion. In T. G. Bartell, K. N. Bieda, R. T. Putnam, K. Bradfield, & H.
Dominguez (Eds.), Proceedings of the 37th annual meeting of the North American Chapter
of the International Group for the Psychology of Mathematics Education (pp. 1086-1093).
East Lansing, MI: Michigan State University.
Van Zoest, L. R., Stockero, S. L., Leatham, K. R., Peterson, B. E., Atanga, N. A., & Ochieng,
M. A. (2015b). Attributes of instances of student mathematical thinking that are worth
building on in whole class discussion. Manuscript submitted for publication.
2016. In Csíkos, C., Rausch, A., & Szitányi, J. (Eds.). Proceedings of the 40th Conference of the International
Group for the Psychology of Mathematics Education, Vol. 4, pp. 331–338. Szeged, Hungary: PME. 4–331
INCORPORATING MOBILE TECHNOLOGIES INTO THE PRE-
CALCULUS CLASSROOM: A SHIFT FROM TI GRAPHIC
CALCULATORS TO PERSONAL MOBILE DEVICES
Nathalie Vázquez Monter
University of Bristol
A case study in a high school in Mexico served as a scenario for investigating the
process of incorporating two different kinds of mobile technology into the Mathematics
classroom; the use of TI-Nspire calculators during the first year of the fieldwork and
the use of personal mobile devices in the second one. This research project takes an
instrumental genesis perspective in order to describe the process of mobile technology
incorporation, considering both the individual and social aspects of the instrumental
geneses developed in the classroom. The paper shows the different types of
instrumental orchestrations performed along both stages of the fieldwork, and shows
how the different types of instruments share similarities in their use but imply relevant
differences in the kind of classroom interaction that can be promoted.
RATIONALE OF THE STUDY AND RESEARCH QUESTIONS
Research in the field of mobile technology in education has shown several of the
constraints and possibilities of incorporating different kinds of mobile devices into
Mathematics classroom contexts; from graphic calculators (Artigue, 2002; Drijvers,
Kieran et al., 2010; Robutti, 2009) to the use of student-owned mobile devices (Kim,
Hagashi, et al, 2010). However, as recently pointed out by the OREAL/UNESCO
(United Nations Educational, Scientific and Cultural Organisation, 2013), part of the
research in this field should be focused on how proposals of technology incorporation
are developed by teachers for particular teaching and learning purposes.
This paper presents some of the results of a case study in a high school in Mexico
where a Pre-Calculus teacher decided to explore and incorporate two different mobile
devices into her Mathematics classroom: Texas Instruments graphic calculators (TI-
Nspire calculators) together with a Navigator System along the first year of the study
and personal mobile devices (PMD) a year later when TI-N calculators were not
available any more.
The research questions that guide this project are stated as follows: 1) What are the
different instrumental orchestrations performed along two periods of the fieldwork? 2)
How are the mathematical meanings brought up and developed in relation to the
performance of particular instrumental orchestrations? However, in this paper I will
only show the results and a brief discussion around the first research question.

Vázquez Monter
4–332 PME40 – 2016
THEORETICAL FRAMEWORK AND LITERATURE
In order to give an answer to the first question of research, the study was carried out
under the Theory of Instrumental Genesis, aiming at characterising instrumental
practices (Drijvers, Godino et al., 2013; Guin and Trouche, 2002) in terms of the
constraints and potentialities of the artefacts being used and paying particular attention
to the way mobile devices were used to achieve particular mathematical and didactical
tasks in the classroom.
As described by Drijvers, Godino, Font and Trouche, “an artefact is an -often but not
necessarily a physical - object that is used to achieve a given task. It is a product of
human activity, incorporating both cultural and social experience” (2013, p. 26).
Artefacts in a classroom context can be defined in a wide range of ways from a pencil
to a calculator, a dynamic geometry software or a networking system but its definition
is fundamentally related to the task which is meant to be performed by the user (teacher
or students). An artefact can be described as an instrument “if a meaningful relationship
exists between the artefact and the user for a specific type of task” (Drijvers, Kieran,
et al., 2010, p. 108).
The theory of Instrumental Genesis considers both the individual and the social aspects
of the mediated activity in the classroom. The individual aspect focusses on the process
of instrumental genesis by which an artefact becomes an instrument, defined by the
bilateral influence between artefacts and users, where students’ knowledge influences
the way in which the artefact is being shaped as an instrument (instrumentalisation),
while at the same time the artefact’s affordances and constraints “influence the way the
student carries out a task and the emergence of the corresponding conception”
(instrumentation) (Drijvers, Godino et al., 2013, p. 4).
In relation to the social aspect of the theory of Instrumental Genesis, Guin and Trouche
(2002) introduced the concept of instrumental orchestration, defined as “the intentional
and systemic organization of the various artefacts available in a computerized learning
environment by the teacher for a given mathematical situation, in order to guide
student’s instrumental geneses” (Drijvers, Kieran et al., 2010, p. 112). In other words,
the Instrumental Orchestration is the way in which the teacher decides to use the
different artefacts available in the classrooms in order to attain the learning objectives
of the lesson. The instrumental orchestration consists of three basic elements, namely
the didactic configuration, its exploitation mode and the didactic performance (Trouche
2002, Drijvers 2010).
The Didactic Configuration refers to the arrangement of the learning environment, the
artefacts to be used and the different tasks that students should accomplish along the
lesson. The mode of exploitation of the didactical configuration refers to the decisions
made by the teacher in order to specify how the artefact(s) should be used in order to
accomplish the tasks and therefore the didactical intentions of the lesson. Relevant to
the mode of exploitation is the way in which the teacher introduces the tasks and the
way these tasks are meant to be worked on, considering the schemes and techniques

Vázquez Monter
PME40 – 2016 4–333
that should be developed by students and the roles that the different artefacts play in
the process of instrumentation.
Finally, the Didactical Performance, the third element of the Instrumental
Orchestrations defined by Drijvers (2010) refers to the enactment of the process of
instrumentation in the classroom foreseen and planned in the didactic configuration
and its mode of exploitation. Therefore, the didactic performance includes the ad hoc
decisions taken by the teacher to guide the use of artefacts in the learning environment
(2010).
METHODOLOGY
The fieldwork consisted of two stages carried out in a high school in Xalapa, Mexico,
each of which lasted for four months. The first here referred to as study 1 was carried
out at the beginning of 2013, and the teacher of a pre-Calculus class decided to use
Texas Instruments graphic calculators together with a Navigator System that could
allow her to monitor students’ work on their handheld devices. Study 2 was carried out
a year later with the same teacher and the same course but with a different group and
different technological devices. As TIN calculators and NS were not available any
more along study 2, the teacher decided to ask students to bring personal mobile
devices to the classroom (smartphone, i-pod, i-pad or tablet) where they would have
access to a graphing software such as Geogebra.
The methodological framework incorporates ethnographic strategies for data collection
based on the observation and video recording of ten different lessons along each stage
of the fieldwork, as well as semi-structured interviews with teacher and students.
Lesson plans were used to obtain useful information concerning the didactical
configuration and mode of exploitation of each instrumental orchestration developed
along each lesson, such as the learning goal, a definition of the artefacts to be used, the
teaching setting and the description of the different tasks students should accomplish.
However, for the aims of this paper I will only refer to the video recordings of lessons,
paying particular attention to the description of the techniques developed while using
particular artefacts along the didactic performance and consequently, the interpretation
of the corresponding schemes involved in the instrumental activity (Drijvers, Kieran et
al., 2010, p. 108).
The analysis of the video recorded lessons was carried out under a multimodal
approach (Jewitt, 2013), where teacher and students actions were categorised following
Drijvers’ global inventory of instrumental orchestrations (2010). This inventory was
originally integrated by six different types of orchestrations, namely Technical-demo,
Explain-the-screen, Discuss-the-screen, Link-screen-board, Spot-and-show, and
Sherpa-at-work. The first five orchestrations are concerned with the use of a DME by
the teacher and applets by the students, and as their names state, they are also related
to the way these artefacts are being used in order to either provide a technical
demonstration, explain or discuss what is happening on a main screen (which is usually
an example of student’s work), etc. Sherpa-at-work is a type of orchestration that
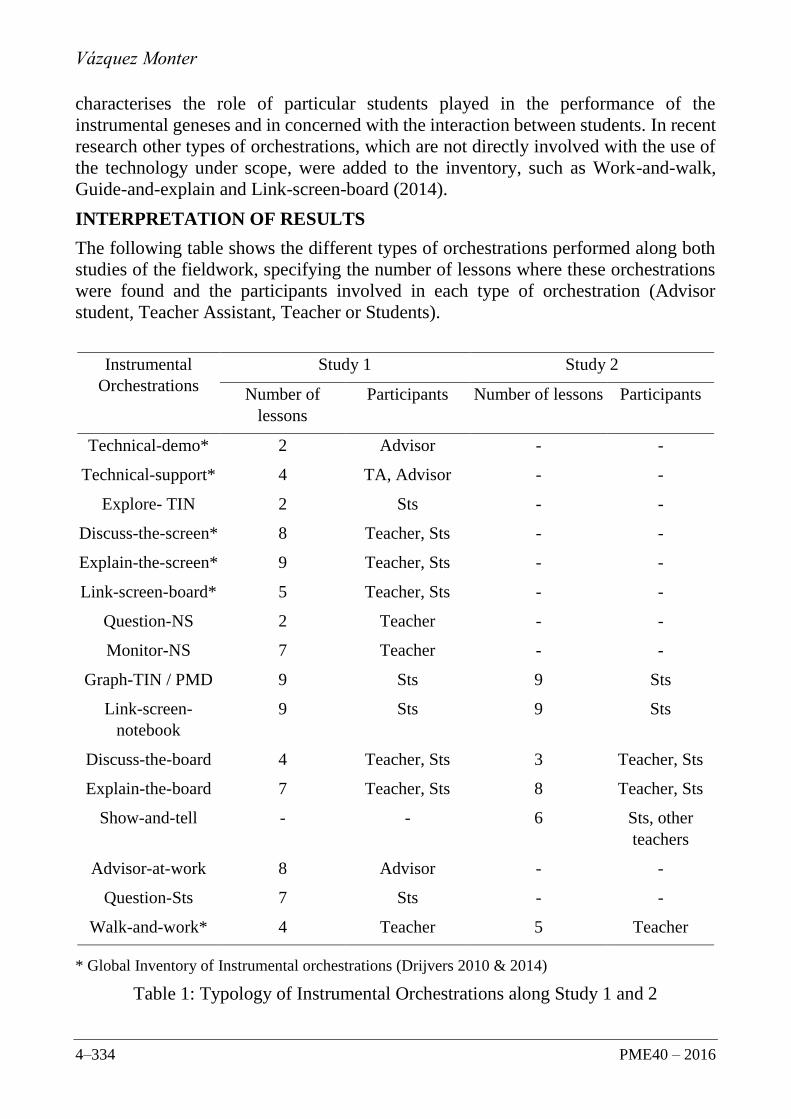
Vázquez Monter
4–334 PME40 – 2016
characterises the role of particular students played in the performance of the
instrumental geneses and in concerned with the interaction between students. In recent
research other types of orchestrations, which are not directly involved with the use of
the technology under scope, were added to the inventory, such as Work-and-walk,
Guide-and-explain and Link-screen-board (2014).
INTERPRETATION OF RESULTS
The following table shows the different types of orchestrations performed along both
studies of the fieldwork, specifying the number of lessons where these orchestrations
were found and the participants involved in each type of orchestration (Advisor
student, Teacher Assistant, Teacher or Students).
Instrumental
Orchestrations
Study 1 Study 2
Number of
lessons
Participants Number of lessons Participants
Technical-demo* 2 Advisor - -
Technical-support* 4 TA, Advisor - -
Explore- TIN 2 Sts - -
Discuss-the-screen* 8 Teacher, Sts - -
Explain-the-screen* 9 Teacher, Sts - -
Link-screen-board* 5 Teacher, Sts - -
Question-NS 2 Teacher - -
Monitor-NS 7 Teacher - -
Graph-TIN / PMD 9 Sts 9 Sts
Link-screen-
notebook
9 Sts 9 Sts
Discuss-the-board 4 Teacher, Sts 3 Teacher, Sts
Explain-the-board 7 Teacher, Sts 8 Teacher, Sts
Show-and-tell - - 6 Sts, other
teachers
Advisor-at-work 8 Advisor - -
Question-Sts 7 Sts - -
Walk-and-work* 4 Teacher 5 Teacher
* Global Inventory of Instrumental orchestrations (Drijvers 2010 & 2014)
Table 1: Typology of Instrumental Orchestrations along Study 1 and 2
Vázquez Monter
PME40 – 2016 4–335
The types of instrumental orchestrations identified along study 1 of the fieldwork were
consistent to the global typology described by Drijvers, as the Navigator System used
by the teacher resembled the DME artefact and the TIN calculators to the handheld
devices used in previous research (2010). However, it was found that the global
inventory of instrumental orchestrations was not sufficient to characterise the different
orchestrations found in the empirical data, considering that the kind of artefacts being
used in both stages of the fieldwork were quite different to the ones that have been
previously investigated. Therefore, new types of orchestrations were characterised.
The following sections shows the types of instrumental orchestrations found along each
of the two stages of the fieldwork.
According to the table, several types of instrumental orchestration were found to be
performed simultaneously and distributed for short periods along the lesson, as in the
case of Explain-the-screen, Discuss-the-screen and Link-screen-board. This situation
made categorising instrumental orchestration a difficult part of the analytical
procedure. and has been previously reported by Drijvers (2014, add reference).
Other types of orchestrations took most of the lesson time, and were very frequent
along several lessons (8 out of 10 lessons in study 1), as in the case of Monitor-NS,
Spot-and-show, Graph-TI and Link-screen-notebook. In this case, it was found that the
teacher used the NS to monitor students work on their TI-N calculators (following a
similar interaction as in the Walk-and-work), and spot some of the problems students
faced while graphing using their handheld devices in order to show to the rest of the
class through the main screen and provide the corresponding feedback. The tasks
performed by students related to these orchestrations were related to the graphing of
different types of functions where students had to analyse the graphs and provide a
written explanation of their findings and conclusions on their notebooks, which in
many cases was performed along with a Link-screen-notebook type of orchestration.
Two other types of orchestrations were characterised in relation to the use of TIN
calculators and the Navigator System: Explore-TIN and Question-NS. Explore-TIN
was found along the first two lessons of study 1 (group A and B), where the main aim
of the lesson was for students to familiarise with their handheld devices. The didactical
configuration for this orchestration considered the exploration of the artefact in terms
of using the graphic function of the calculator in a free-style, so students were able to
choose the kind of functions they wanted to graph. The exploration was not limited to
algebraic functions, as data shows students were also interested in graphing
trigonometric functions on a polar plane and 3D graphs. This orchestration was found
to be performed simultaneously with the Technical-support type of orchestration where
advisor students played a fundamental role. In the following lessons, Explore-TIN
orchestration became less frequent, was only performed by advisor students and took
place simultaneously with a Technical-demo orchestration, where the teacher asked
advisor students to show on the main screen and through the NS what they have found
new about the use of their calculators, so the rest of the students could follow and

Vázquez Monter
4–336 PME40 – 2016
replicate. In any case, the mode of exploitation of the explore-TIN orchestration
attempted to get students familiarised to their handheld devices.
Question-NS in an orchestration where the teacher raises a question to the whole class
and gets an answer from each one of the students. The didactical configuration requires
the teacher to use the Navigator System to pose the question and to provide an account
and statistics of all the students’ answers after 30 seconds. Students use their TIN
calculators to provide their answers. The mode of exploitation for this type of
orchestration was different each time is was performed. The first time the teacher
decided to use this type of orchestration was as a close-up activity at the end of the
lesson where the teacher raised several yes/no questions in order to confirm the
understanding of several mathematical concepts. Once all the answers were shown on
the main screen, the teacher opened a short session to elicit the different answers from
students and to discuss them. During students participation, the teacher never provided
any feedback, but gave the right answers at the end of the discussion. The second time
the Question-NS was performed was as part of the term exam. In this case, students
had to answer to several yes/no questions as part of an evaluation, where feedback was
not provided.
In study 2 of the fieldwork there is a significant variation of instrumental orchestrations
performed along the lessons. As it was expected, some of the orchestrations that
depended on the particular use of the NS and the TIN calculators are not present in
study 2, but some others, as in the case of the Graph-TIN, it was found to be present in
all lessons related to the use of personal mobile devices. This type of orchestration is
characterised by the use of the graphing software as part of a task where students should
analyse different functions graphically or just to get the graph in order to copy it either
on their notebooks or to prepare material to present as in a poster. Therefore, the
orchestration was performed along side with a Link-screen-notebook orchestration as
in study 1.
A common type of instrumental orchestration found in study 2 which is not found along
study 1 is the Show-and-tell orchestration where students should present different
mathematical topics to the rest of the class or to external participants (other teachers or
students in the school). The didactical configuration of this orchestration does not
depend on the use of a technologically enriched environment as in the case of the
orchestrations performed along study 1, and it is not strictly related to the use of a
particular technological device. Instead, students are free to use their personal mobile
devices in any way they find useful. As a mode of exploitation, students participate in
a presentation as a way of review of mathematical concepts in order to help students
get ready for the next exam. The didactical performance showed for example, that
under a project called Mathematical labyrinth, students worked in groups of 5 to 8
students to prepare and present different types of functions and their graphic analysis
to an external audience. Students prepared and presented their work mostly in open
spaces, where personal mobile devices were always available.
Vázquez Monter
PME40 – 2016 4–337
In this case, it was clear how the use of personal mobile devices was not at the centre
of the orchestrations as it was the case of other orchestrations in study 1. However, in
all cases observed along study 2, students used their personal mobile device to graph
different types of functions which were later on sketched either on posters or on their
notebooks.
According to these results, it seems clear that the different types of instrument
orchestrations can be grouped in three ways: 1) around the mobile technology used, as
in the case of Explore-TIN, Monitor-NS, and Question-NS, 2) around typical
classroom technology such as white/black board, notebook, posters such as Explain-
the-board, Link-screen-board or notebook, and 3) instrumental orchestrations not
specifically related to the use of particular technology but closely related to the role
played by participants such as the teacher assistant, the technology coordinator or the
so-called advisor students, as in the case of Sherpa-at-work or Advisor-at-work,
Technical-support and Question-St.
GENERAL DISCUSSION AND CONCLUSIONS
The results at this first stage of the analysis show that the kind of instruments developed
along two different stages of the fieldwork and their geneses share some properties,
particularly concerned with the kind of tasks addressed mainly by students. However,
the way these instrumented practices were organised in each case was significantly
different as was their relation to how teacher orchestrated the activities and the broader
learning tasks in which those instrumental tasks were embedded.
For example, relevant differences were found in terms of the roles played by teacher,
assistant and advisor students in some of the instrumental orchestrations performed in
the classroom. Technical-demo orchestrations, which are related to demonstrations of
the technical issues regarding the use of TI calculators was found to be provided not
by the teacher but by advisor students and in rare cases by teacher assistant.
Nevertheless, in study 2, nor advisor students nor teacher assistant were available, and
even though students were asked to used personal mobile devices as graphing
instruments, technical demonstration and support rely mainly on other students in a
kind of peer support. The role of advisor students became also significant when it
consisted of providing not only technical but mathematical support to the rest of the
students and the teacher. These conclusions raise awareness on the relevance of
considering the role of participants involved in each type of orchestration and shows
that further analysis on the type of interaction and the use of other psychological tools
mediating the action in the classroom should be included in order to better explain the
impact of particular types of orchestrations in the processes of teaching and learning.
The technological teaching setting, also proved to be relevant in order to promote some
types of orchestrations with the specific participants. In study 1, all lessons were
observed in a technologically-enriched classroom where the support of teacher
assistant and technology coordinator are available. Besides, the teacher assigned
specific roles to proficient students as advisor students which participation was not
Vázquez Monter
4–338 PME40 – 2016
limited to technical support but also provided mathematical guidance to other students.
On the contrary, lessons in study 2 were observed in traditional classroom and outdoor
spaces, where the use of personal mobile devices was always accessible.
Finally, a close attention to the types of tasks embedded in the orchestrations show that
the interaction performed in each of them could allow a different kind of participation
from students. As in the case of questions raised by teacher or by students. This
however, requires further analysis in terms of the roles played by each participant.
References
Artigue, M. (2002). Learning Mathematics in a CAS Environment: The Genesis of a
Reflection about Instrumentation and the Dialectics between Technical and Conceptual
Work. International Journal of Computers for Mathematical Learning, 7, 245-274
Drijvers, P., Godino, J. D., Font, V. and Trouche, L. (2013). One episode, two lenses. A
reflective analysis of student learning with computer algebra from instrumental and onto-
semiotic perspectives. Educational Studies in Mathematics, 82(1), 23-49
Drijvers, P., Kieran, C., Mariotti, M. et al. (2010). ‘Integrating Technology into Mathematics
Education: Theoretical Perspectives’ in Mathematics Education and Technology-
Rethinking the Terrain, Springer.
Drijvers, P., Takoma S., et al. (2014). Digital Technology and Mid-Adopting Teachers’
Professional Development: A Case Study in The Mathematics Teacher in the Digital Era,
Springer.
Guin, T. & Trouche, L. (2002). Mastering by the teacher of the instrumental genesis in CAS
environments: necessity of instrumental orchestrations. ZDM, 34(5)
Jewitt, C. (2013) Introduction and Chapter 1. Routledge Handbook of Multimodal Analysis.
Second edition, London.
Kim, P., Hagashi, T. et al. (2010). Socioeconomic strata, mobile technology, and education:
a comparative analysis. in Education Technology Research Dev DOI:DOI
10.1007/s11423-010-9172-3
OREAL/UNESCO (2013). Enfoques Estratégicos sobre las TIC en Educación en America
Latina y el Caribe. DOI: http://creativecommons.org/licenses/by-sa/3.0/igo/
Robutti, O (2009). Las Calculadoras Graficadoras y el Software de Conectividad para
Construir una Comunidad de Practicantes de Matemáticas. Reportes de Investigación,
Texas Instruments Latinoamérica. Doi:
http://education.ti.com/sites/LATINOAMERICA/downloads/pdf/Las_Calculadoras_Graf
icadoras_y_el_Software_de_Conectividad_para_Construir_una_Comunidad_de_Practica
ntes_de_Matematicas.pdf

2016. In Csíkos, C., Rausch, A., & Szitányi, J. (Eds.). Proceedings of the 40th Conference of the International
Group for the Psychology of Mathematics Education, Vol. 4, pp. 339–346. Szeged, Hungary: PME. 4–339
DEVELOPING ALGEBRAIC THINKING: THE CASE OF SOUTH
AFRICAN GRADE 4 TEXTBOOKS
Cornelis Vermeulen
Faculty of Education, Cape Peninsula University of Technology, South Africa
This paper investigates the extent to which three Grade 4 South African mathematics
textbooks attempt to develop learners’ algebraic thinking. Although the current South
African curriculum compares well with international practice in terms of algebraic
thinking development, a need existed to determine the extent to which local textbooks
reflect this. The textbooks reviewed reflect a good understanding of the expectations of
the curriculum. The ways in which this understanding was used to develop teaching
and learning material, however, vary considerably. While two textbooks provide
learners with opportunities to develop conceptual understanding through investigative
activities, one simply states what learners need to know, thus promoting rote learning.
There is a clear development in sophistication of mathematical ideas; however, the
sequencing of some of these raises questions.
BACKGROUND TO THE STUDY
Algebra is a fundamental part of mathematics, since “algebra is the language for
investigating and communicating most of mathematics” (South Africa, 2011). To
improve the quality of learning in algebra, it has been widely recommended that
fundamental knowledge and skills be developed in learners’ primary school years. This
approach is known as early algebra or algebraic thinking. School curricula in many
countries, including South Africa (SA), have been changed accordingly.
In an earlier study, certain requirements for an effective algebra curriculum were
formulated (Vermeulen, 2007). That study concluded that the current South African
curriculum to a large extent satisfies these requirements, is well-aligned with current
international thinking regarding developing algebraic thinking, and should therefore
succeed in developing younger learners’ algebraic thinking.
One of the questions that remain to be answered, is the extent to which SA mathematics
textbooks reflect this curriculum. This paper reports on the extent to which three Grade
4 South African textbooks achieve this.
EARLY ALGEBRA OR ALGEBRAIC THINKING
Early algebra is not an attempt to introduce symbol manipulation earlier to younger
children, but rather an attempt to reform the teaching of arithmetic in a way that stresses
its algebraic character. It requires understanding of how the arithmetic concepts and
skills can be better aligned with the concepts and skills needed in algebra so that
learning and instruction is more consistent with the kinds of knowledge needed in the
learning of formal algebra (Carpenter et al., 2005). Kieran (2004) offers the following
definition of algebraic thinking:
Vermeulen
4–340 PME40 – 2016
Algebraic thinking in the early grades involves the development of ways of thinking within
activities for which letter-symbolic algebra can be used as a tool but which are not
exclusive to algebra and which could be engaged in without using any letter-symbolic
algebra at all, such as, analysing relationships between quantities, noticing structure,
studying change, generalizing, problem solving, modelling, justifying, proving, and
predicting. (p. 149)
For the purpose of this paper, I will focus on the following two key areas of algebraic
thinking, as presented by Blanton (2008:3):
(1) using arithmetic to develop and express generalisations (algebra as generalised
arithmetic), and
(2) identifying numerical and geometric patterns to describe functional relationships
(algebra as functional thinking).
Generalised arithmetic primarily refers to building generalisations about operations on
and properties of numbers (Blanton, 2008). Thus, generalising arithmetic includes
helping children notice, describe (conjecture) and justify patterns and regularities in
operations on and properties of numbers (Blanton, 2008), thus becoming aware of
structure (which includes equivalence).
Under algebra as functional thinking the following can be understood:
“Functional thinking is thinking that focuses on the relationship between two (or more)
varying quantities, specifically the kinds of thinking that lead from specific
relationships (individual incidences) to generalizations for that relationship across
instances.” (Smith, 2008:143). According to the South African curriculum documents
(South Africa, 2011) this type of thinking should be introduced in Grades 4 to 6:
The study of numeric and geometric patterns develops the concepts of variable,
relationship and function. The understanding of these relationships by learners will
enable them to describe the rules generating the patterns. This phase has a particular
focus on different, yet equivalent, representations to describe problems or relationships
by means of flow diagrams, tables, number sentences or verbally (p. 9).
While the focus in Grades 1 to 3 is on recursive thinking (i.e. identifying and applying
the rule within a single sequence of values), from Grade 4 the focus moves towards co-
variational thinking (i.e. analysing how two quantities vary simultaneously), and
describing this co-variation using flow diagrams, number sentences or in words (Smith,
2008).
RESEARCH QUESTIONS
In view of the aforementioned, the following research question was formulated: To
what extent do SA Grade 4 mathematics textbooks succeed in developing learners’
algebraic thinking? In particular, to what extent
Vermeulen
PME40 – 2016 4–341
(i) do they offer learners opportunities to develop generalised arithmetic skills;
specifically, is structure addressed, primarily properties of operations and equivalence?
(Sub-research question 1)
(ii) do they offer learners opportunities to develop functional thinking; specifically, are
the notions of relationship and variable developed, and are relationships between
variables demonstrated in several ways, i.e. in words, using flow diagrams and tables?
(Sub-research question 2)
(iii) do they offer learners learning opportunities that promote investigation,
conjecturing, verification and justification skills? (Sub-research question 3) and
(iv) is there a development in sophistication of mathematical ideas within the
textbooks? (Sub-research question 4)
THE ROLE OF TEXTBOOKS IN THE TEACHING AND LEARNING OF
MATHEMATICS
From literature about textbooks, it is clear that textbooks play an important role in the
teaching and learning of subject matter. Studies on curriculum materials suggest that
textbooks can impact both what and how teachers teach, as well as what and how
learners learn (Herbel-Eisenmann, 2007). Lemmer et al. (2008) state that textbooks
are expected to provide a framework for what is taught, how it may be taught and in
what sequence it can be taught.
Rymartz and Engebretson (2005, in Newton et al., 2006) found that “a textbook made
a big difference to the quality of teaching”. They point out that “Most teachers and
particularly new teachers and those teaching outside their area of expertise found that
they taught better, that they fostered better quality thinking, and assessed more
purposefully”. “Teachers teaching outside their area of expertise” is of importance for
the SA context. Most primary school teachers are generalists rather that specialist
mathematics teachers, and can to a large extent be viewed as “teaching outside their
area of expertise”.
A THEORETICAL FRAMEWORK FOR THE ANALYSIS OF TEXTBOOKS
Herbel-Eisenmann (2007) cites Otte (1983) stating that written materials can be
examined as subjective scheme and as an objectively given structure. When examining
textbook materials as subjective scheme, the focus is on the interaction between a
reader and the material. When analysing textbooks as objectively given structures, the
structure and discourse of the written unit is the focus. According to Herbel-Eisenmann
(2007), this approach allows one to focus on the potential of the textbook material for
supporting or undermining the ideological and epistemological goals of the curriculum
on which it is based. As such, the present study analyses textbooks as objectively given
structures.
LeBrun et al. (2002) emphasise the importance to conduct comparative analyses of
curricula and textbooks, such as the present study attempts to do.
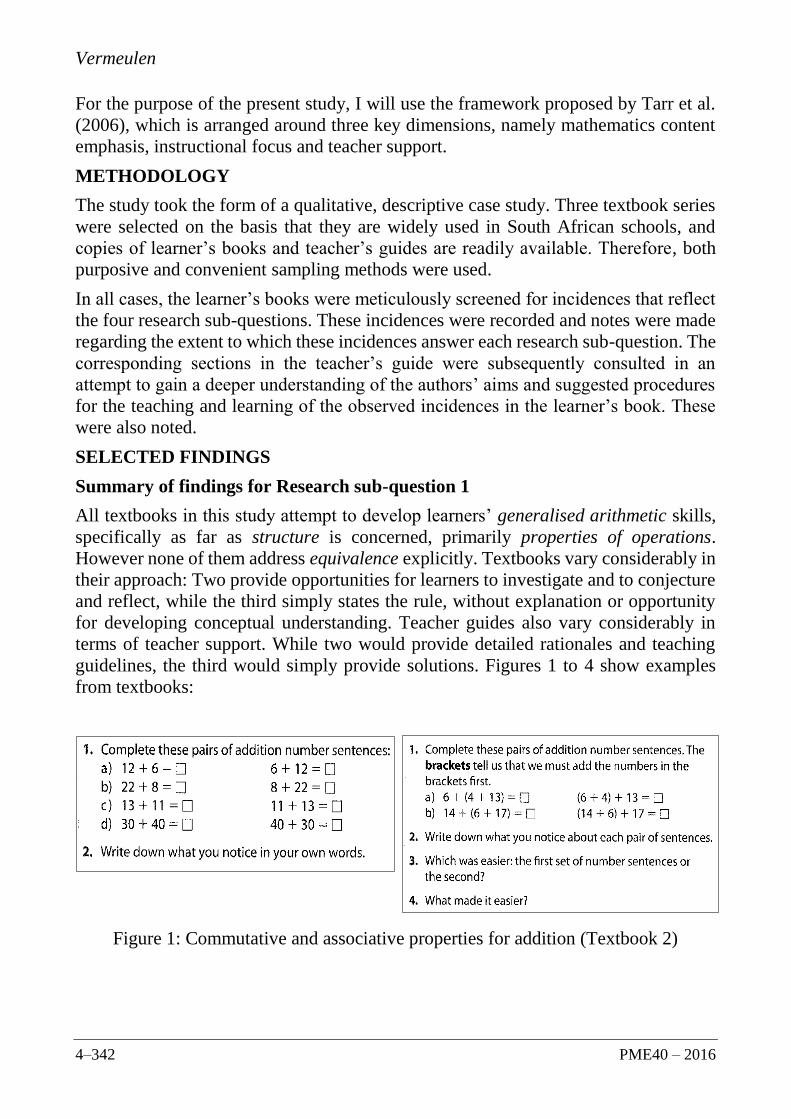
Vermeulen
4–342 PME40 – 2016
For the purpose of the present study, I will use the framework proposed by Tarr et al.
(2006), which is arranged around three key dimensions, namely mathematics content
emphasis, instructional focus and teacher support.
METHODOLOGY
The study took the form of a qualitative, descriptive case study. Three textbook series
were selected on the basis that they are widely used in South African schools, and
copies of learner’s books and teacher’s guides are readily available. Therefore, both
purposive and convenient sampling methods were used.
In all cases, the learner’s books were meticulously screened for incidences that reflect
the four research sub-questions. These incidences were recorded and notes were made
regarding the extent to which these incidences answer each research sub-question. The
corresponding sections in the teacher’s guide were subsequently consulted in an
attempt to gain a deeper understanding of the authors’ aims and suggested procedures
for the teaching and learning of the observed incidences in the learner’s book. These
were also noted.
SELECTED FINDINGS
Summary of findings for Research sub-question 1
All textbooks in this study attempt to develop learners’ generalised arithmetic skills,
specifically as far as structure is concerned, primarily properties of operations.
However none of them address equivalence explicitly. Textbooks vary considerably in
their approach: Two provide opportunities for learners to investigate and to conjecture
and reflect, while the third simply states the rule, without explanation or opportunity
for developing conceptual understanding. Teacher guides also vary considerably in
terms of teacher support. While two would provide detailed rationales and teaching
guidelines, the third would simply provide solutions. Figures 1 to 4 show examples
from textbooks:
Figure 1: Commutative and associative properties for addition (Textbook 2)
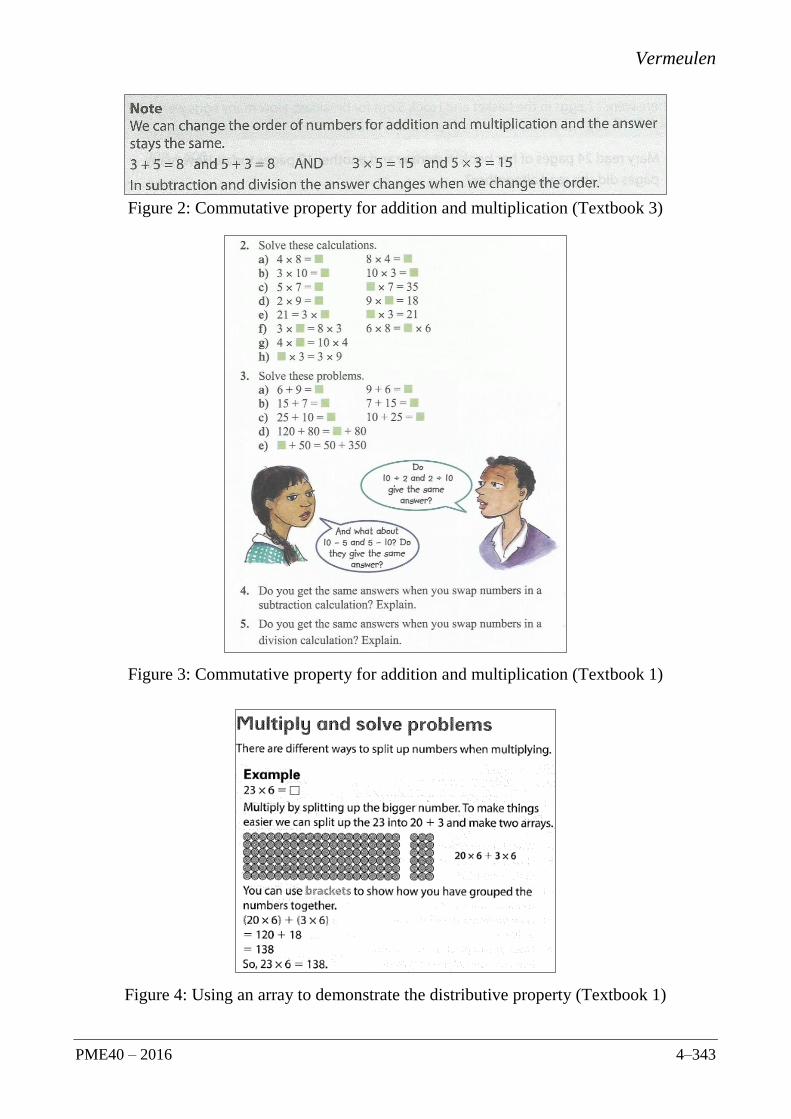
Vermeulen
PME40 – 2016 4–343
Figure 2: Commutative property for addition and multiplication (Textbook 3)
Figure 3: Commutative property for addition and multiplication (Textbook 1)
Figure 4: Using an array to demonstrate the distributive property (Textbook 1)

Vermeulen
4–344 PME40 – 2016
Summary of findings for Research sub-question 2
All textbooks attempt to develop learners’ functional thinking, using words, flow
diagrams and tables to express rules between input and output values. However, the
notions of relationship and variable are not explicitly mentioned. As before, teacher
guides vary considerably in terms of teacher support.
The various textbooks follow more or less the same approach as for Sub-research
question 1: whereas some would allow for investigation or provide opportunities for
conceptual understanding, others would be more direct in their presentation of
knowledge.
One textbook states for example: “Using special rules, you can make patterns with
numbers. The special rule lets you know what numbers will follow in the pattern. We
can use a flow diagram to show a rule. A flow diagram has a starting number, a rule
and an answer.” Elsewhere the textbook also explains the notions of input and output
numbers. The first examples and exercises require learners to express the rule in
words, and to use the rule and the input values to find the corresponding output values
(see Figure 5).
Figure 5: Using a flow diagram to write the rule in words, and to determine output values.
Another textbook would, for the first encounter, simply do the following (Fig. 6):
Figure 6: Using flow diagrams to determine output values and to write the rule as a number
sentence.

Vermeulen
PME40 – 2016 4–345
Some textbooks deal with single operation rules for quite a while, while others include
double operation rules fairly early. All three textbooks develop the notion of functional
relationships in the contexts of number patterns as well as geometric patterns.
While initially rules and input values are given, and learners have to calculate the
output values, gradually activities also appear where input and output values are
provided, and learners need to determine the rule. Rules mostly consist of a single
operation, but a few cases of double operation rules also appear. As elsewhere, the
level of guidance provided by the Teacher’s Guide differs considerably.
Tables are introduced and used as a means to “record” the input and corresponding
output values. Thus, relationships between input and output values are explicitly
represented in various ways, as prescribed by the curriculum.
Summary of findings for Research sub-question 4
There are incidences where it can be questioned whether the sequencing promotes
increasing sophistication, for example: In one textbook, patterns, flow diagrams and
rules are introduced early in Term 1. These concepts are developed within the context
of “Multiplication and division flow diagrams”. Some activities contain one operation,
while others contain two. The two operations invariably are multiplication (e.g. x7 and
then x2), followed by an activity with a single operation (x14) (Refer to Figure 7). The
idea here is for learners to realize that to multiply by the large number (14), one can
break the large number into its factors, and multiply by the factors consecutively.
Figure 7: Multiplication by breaking up bigger numbers into smaller numbers.
However, in the subsequent revision activity flow diagrams with multiplication as well
as addition are included, which seems out of place here, given the discussion above, as
well as the fact that these types of activities are only really dealt with much later in the
year.
In one textbook, the development of learners’ ability to find a rule reaches its peak on
p.137, where two operations, multiplication and addition, are involved. Learners are
required to find co-variational rules, i.e. relating the input and output values, thus
reinforcing the concept of a relationship between two variables. It is therefore strange
to find that in the very next section number sequences are dealt with, where the
relationship concept is absent, and learners need to continue a number pattern, using a

Vermeulen
4–346 PME40 – 2016
recursive strategy. It is also strange to find that later on rules contain only one operation
(multiplication), rather than providing more two-operation rules.
Conclusion
The authors of the textbooks reviewed seem to have a good understanding of the expectations
of the curriculum to develop learners’ algebraic thinking. Two textbooks offer learners
opportunities to develop conceptual understanding through investigative activities, thereby
allowing for important abstractions and generalisations (Watson & Mason, 2006). The third
one simply states what learners need to know, thus not encouraging discourse. This is of
concern given the proven low pedagogical content knowledge of many primary school
mathematics teachers in South Africa and the current research into teachers‘ mathematical
discourse in instruction (Adler & Venkat, 2015). In all cases there is a development in
sophistication of mathematical ideas; however the sequencing of some of these raises
questions. This implies that there are not consistent, clear learning trajectories, showing a
disregard of Rowland’s (2008) argument that “choices of examples and their sequencing are
neither trivial nor arbitrary“ (p. 150).
References
Adler, J. and Venkat, H. (2015). Teachers’ mathematical discourse in instruction. In H.
Venkat, M. Rollnick, J. Loughran & M. Askew (Eds.), Exploring Mathematics and Science
Teachers’ Knowledge. London: Routledge.
Blanton, M.L. (2008). Algebra and the elementary classroom : transforming thinking,
transforming practice. Portsmouth, NH: Heinemann.
Carpenter, T.P., Levi, L., Berman, P. & Pligge, M. (2005). Developing algebraic reasoning
in the elementary school. Understanding mathematics and science matters, 81–98.
Herbel-Eisenmann, B.A. (2007). From intended curriculum to written curriculum: Examining
the “voice” of a mathematics textbook. Journal for Research in Mathematics Education,
38(4), 344-369.
Kieran, C. (2004). Algebraic thinking in the early grades: what is it? The Mathematics
Educator, 8(1), 139-151.
Lemmer, M., Edwards, J. and Rapule, S. (2008). Educators’ selection and evaluation of
natural science textbooks. South African Journal of Education, 28, 175-187.
Rowland, T. (2008). The purpose, design and use of examples in the teaching of elementary
mathematics. Educational Studies in Mathematics, 69(2), 149 – 163.
Tarr, J.E., Reys, B.J., Barker, D.D. & Billstein, R. (2006). Selecting high-quality mathematics
textbooks. Mathematics Teaching in the Middle School, 12(1), 50-54.
South Africa, Department of Basic Education. (2011). Mathematics Curriculum Statement:
curriculum and assessment policy. Grades 4-6 - Mathematics. Pretoria: DBE.
Vermeulen, N. (2007). Does Curriculum 2005 promote successful learning of elementary
algebra? Pythagoras, 66, 14–33.
Watson, A. & Mason, J. (2006). Seeing an exercise as a single mathematical object: Using
variation to structure sense-making. Mathematical Thinking and Learning, 8(2), 91 – 111.

2016. In Csíkos, C., Rausch, A., & Szitányi, J. (Eds.). Proceedings of the 40th Conference of the International
Group for the Psychology of Mathematics Education, Vol. 4, pp. 347–354. Szeged, Hungary: PME. 4–347
PRE-SERVICE TEACHERS’ BELIEFS ABOUT MATHEMATICS
EDUCATION FOR 3-6-YEAR-OLD CHILDREN
Joëlle Vlassis & Débora Poncelet
University of Luxembourg
The objective of this paper is to present the results of a questionnaire aimed at
collecting pre-service teachers’ beliefs about the role of mathematics teaching and
learning in preschool. The questionnaire was mainly structured around four
dimensions identified in the research literature as being important in determining
whether mathematics instruction is implemented in early childhood classrooms. The
results show that, at the beginning of their studies, pre-service teachers prioritise
artistic and physical development over mathematics. By the end of their studies, pre-
service teachers’ beliefs have evolved significantly. In particular, they think that
mathematics is an important goal for preschool, and that the teacher plays an
important role in the development of mathematical competencies.
THEORETICAL BACKGROUND
The importance of early number competencies
Attention has increasingly been drawn to the importance of early mathematics
education in recent years (Chen, McGray, Adams & Leow, 2014; Jordan, Kaplan,
Ramineni & Locuniak, 2009; Platas, 2014). Many authors consider counting as the
most fundamental tool offering access to arithmetical abilities during the first grades
of primary school. However, the numerical competencies do not spontaneously
develop, although there is an innate perceptual process, the so-called “number sense”
(Dehaene, 2001). These competencies have to be learned and, in this context, the role
of preschool education and the part played by families are of crucial importance
(Cannon & Ginsburg, 2008).
From an educational perspective, it is generally acknowledged that the development of
these competencies does not require formal learning, but can be developed through
meaningful activities in everyday situations. However, according to Cannon &
Ginsburg (2008), while everyday situations offer meaningful contexts, these are still
not sufficient to develop the basic number competencies that are necessary for first-
grade children. Consequently, adults need to plan specific goals for young children's
mathematical learning processes and intentionally create opportunities to learn
important mathematical competencies. However, preschool education seems
traditionally to be primarily focused on the development of language and socio-
emotional and motor development (Ginsburg, Kaplan & Cannon, 2006).
Teachers’ beliefs about mathematics in preschool
Few studies have examined preschool teachers’ beliefs about early childhood
mathematics learning and teaching (Chen, McGray, Adams & Leow, 2014; Lee &
Vlassis, Poncelet
4–348 PME40 – 2016
Ginsburg, 2007; Platas, 2014). According to Herron (2010), these beliefs need to be
further investigated in order to achieve high-quality mathematics education in the
preschool classroom. A major cause of failure of reforms has been the failure to take
into account teachers’ pedagogical knowledge and beliefs (Handal and Herrington,
2003). Philipp (2007) compares beliefs to lenses that shape the world we see. This
research suggests that beliefs influence teachers’ perceptions and judgments, thus
shaping their actions in the classroom.
It is important, however, to be aware that promoting the teaching of mathematics in
preschool may represent a significant change of practice for preschool teachers.
Research literature on preschool teachers’ beliefs about mathematics shows that in
general, early childhood teachers experience fear and/or dislike of mathematics
(Hachey, 2013; Lee & Ginsburg, 2007). This research has also shown that teachers do
not attach much value to teaching mathematics or devote much time to this subject;
instead, they tend to see preschool as an environment for encouraging socio-emotional
and physical development rather than giving instruction in academic subjects (Lee,
2006). And on the academic side, teachers regard language as the most important
subject. Such attitudes are obviously not without consequences for the teaching of
mathematics in preschool.
The majority of studies of preschool teachers’ beliefs are qualitative and are based on
semi-directed interviews. Among these studies, those by Lee and Ginsburg, conducted
on a large sample (around 70 teachers) are quite interesting. These authors identified
nine very common misconceptions expressed by teachers in interviews, including,
“Young children are not ready for mathematics education”, “Language and literacy are
more important than mathematics”, “Teachers should provide an enriched physical
environment, step back, and let the children play” (Lee and Ginsburg, 2009).
Incidentally, in overall terms, it is clear from all these qualitative studies that teachers’
beliefs can be structured around four dimensions regarded as decisive for teaching
practices (Lee & Ginsburg, 2009):
1. The primary goals of preschool instruction: This dimension relates to
questionnaire items, which measure whether mathematics is regarded by
teachers as a primary goal of preschool.
2. The age-appropriateness of mathematics instruction: This dimension relates
to questionnaire items asking teachers whether they think that preschool
pupils are mature enough to learn mathematics.
3. The classroom locus of generation of mathematical knowledge (teacher
versus child): Some teachers think that mathematical knowledge is
developed spontaneously in children through experiences and activities – in
other words, that the locus of knowledge generation is situated in the child.
Others think that this knowledge is developed through activities planned and
managed by the teacher. They give an important role to the teacher and
situate then the locus in the teacher.

Vlassis, Poncelet
PME40 – 2016 4–349
4. Confidence in mathematics instruction: This concerns teachers’ confidence
about mathematics and their teaching of it.
Recently, Platas (2014), on the basis of the results of this qualitative work, designed
and validated a quantitative questionnaire measuring these four dimensions. It is on the
basis of this work that we designed our questionnaire for pre-service teachers.
The study presented in this paper is part of a larger project, whose main purpose is to
develop early number competencies in preschool children in school and family
contexts. In particular, the project aims to design, implement and support a play-based
mathematics approach in preschool to the development of early number competencies
by providing tools and a professional development programme as well as a specific
model based on the involvement of parents.
METHOD
Our questionnaire, based on Platas’ work (2014), was submitted to the 258 pre-service
teachers of the “Bachelor en Sciences de l’Education” (BScE) programme of the
University of Luxembourg during the academic year 2013-2014. This programme
takes four years and prepares future primary, preschool and special education teachers.
All students follow the same programme, regardless of the type of education that they
will choose in their professional lives. There is no specialisation. Finally, the training
programme offers few courses directly related to preschool. Three courses are taught,
one on language, a second on science and a third on mathematics. In Luxembourg,
preschool is for children aged three to six years and covers three school years. The first
year is optional, whereas the last two are compulsory.
Our two research questions (RQ) were as follows:
RQ1: How do pre-service teachers’ beliefs regarding mathematics in
preschool evolve from the first to the fourth year of their studies?
RQ2: Do pre-service teachers’ beliefs differ depending on the subject matter,
i.e. mathematics, language, psychomotricity and the arts?
The paper-and-pencil questionnaire, based on that developed by Platas, consists of six-
level Likert items. However, we had to make some changes to the initial questionnaire.
We first translated the items into French, then adapted some of them to the
Luxembourg context. Despite these modifications, each of the four dimensions
presented a high degree of internal consistency for mathematics, with Cronbach's
alphas all greater than 0.70 (see Table 1), the value regarded in the literature as the
minimum acceptance threshold.

Vlassis, Poncelet
4–350 PME40 – 2016
N. of items Cronbach’s
Primary goals of preschool instruction 6 .73
Age-appropriateness of mathematics instruction 5 .83
Classroom locus of generation of mathematical
knowledge 12 .73
Confidence in mathematics instruction 6 .84
Table 1: Cronbach’s of each dimension of the questionnaire
To analyse the students’ development over the course of their studies and answer the
first research question (RQ1), we compared the views of first-year students (N = 72)
with those of fourth-year students (N = 75).
To answer the second research question (RQ2), Platas’ four dimensions were
investigated with regard to mathematics in comparison with the other main areas of the
preschool curriculum, i.e. language, psychomotricity and the arts. In order to validate
the comparison, we had to change our way of constructing variables, as the alphas of
the other areas for the first dimension, “Primary goal of preschool instruction”, unlike
those for mathematics, failed to reach the threshold level of 0.70 and thus could not be
regarded as a one-dimensional scale. We therefore decided to merge the first two
dimensions, calling this new dimension, “Relevance of mathematics in preschool”.
This decision was consistent with the research literature, as is clear in particular from
the work of Koedinger and Nathan (2004), who observed that teachers organise their
teaching according to their (sometimes erroneous) beliefs about the capabilities of their
students. Table 2 below presents the Cronbach’s alphas of this new dimension, all of
which are now higher than 0.70 regardless of the type of activity (Mathematics,
Language, Arts and Psychomotricity).
Dimension Variables Number of items Cronbach’s
Relevance of
mathematics in
preschool
Mathematics 11 0.89
Language 11 0.79
Arts 11 0.75
Psychomotricity 11 0.75
Table 2: Cronbach’s of the new dimension “Relevance of mathematics in
preschool” for the four domains
As well as the dimensions of Platas, we also measured the allocation of time to the
different preschool areas, classroom practices, and mathematical content. Finally we
asked the students to what extent they agreed or disagreed with the nine misconceptions
identified by Lee & Ginsburg (2009), which present a traditional view of mathematics
in preschool.
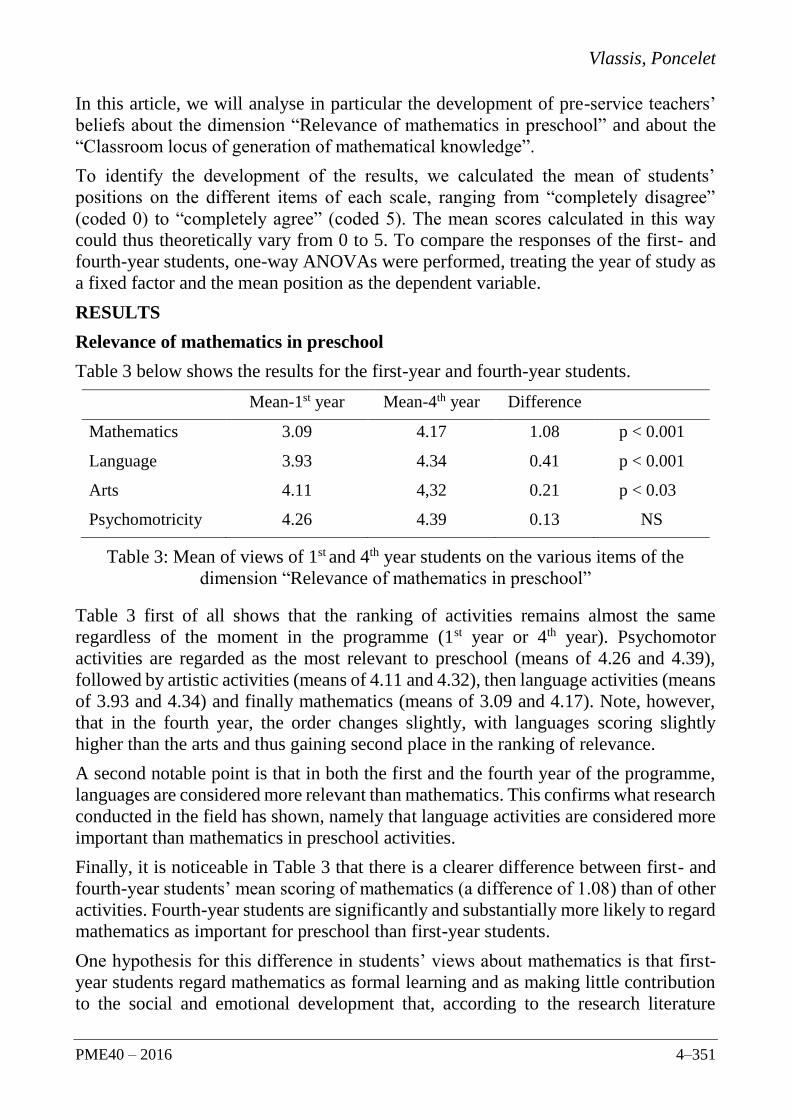
Vlassis, Poncelet
PME40 – 2016 4–351
In this article, we will analyse in particular the development of pre-service teachers’
beliefs about the dimension “Relevance of mathematics in preschool” and about the
“Classroom locus of generation of mathematical knowledge”.
To identify the development of the results, we calculated the mean of students’
positions on the different items of each scale, ranging from “completely disagree”
(coded 0) to “completely agree” (coded 5). The mean scores calculated in this way
could thus theoretically vary from 0 to 5. To compare the responses of the first- and
fourth-year students, one-way ANOVAs were performed, treating the year of study as
a fixed factor and the mean position as the dependent variable.
RESULTS
Relevance of mathematics in preschool
Table 3 below shows the results for the first-year and fourth-year students.
Mean-1st year Mean-4th year Difference
Mathematics 3.09 4.17 1.08 p < 0.001
Language 3.93 4.34 0.41 p < 0.001
Arts 4.11 4,32 0.21 p < 0.03
Psychomotricity 4.26 4.39 0.13 NS
Table 3: Mean of views of 1st and 4th year students on the various items of the
dimension “Relevance of mathematics in preschool”
Table 3 first of all shows that the ranking of activities remains almost the same
regardless of the moment in the programme (1st year or 4th year). Psychomotor
activities are regarded as the most relevant to preschool (means of 4.26 and 4.39),
followed by artistic activities (means of 4.11 and 4.32), then language activities (means
of 3.93 and 4.34) and finally mathematics (means of 3.09 and 4.17). Note, however,
that in the fourth year, the order changes slightly, with languages scoring slightly
higher than the arts and thus gaining second place in the ranking of relevance.
A second notable point is that in both the first and the fourth year of the programme,
languages are considered more relevant than mathematics. This confirms what research
conducted in the field has shown, namely that language activities are considered more
important than mathematics in preschool activities.
Finally, it is noticeable in Table 3 that there is a clearer difference between first- and
fourth-year students’ mean scoring of mathematics (a difference of 1.08) than of other
activities. Fourth-year students are significantly and substantially more likely to regard
mathematics as important for preschool than first-year students.
One hypothesis for this difference in students’ views about mathematics is that first-
year students regard mathematics as formal learning and as making little contribution
to the social and emotional development that, according to the research literature

Vlassis, Poncelet
4–352 PME40 – 2016
presented earlier, is regarded as the most fundamental area of learning by preschool
teachers. Students’ responses to the item worded as follows: “If a teacher spends time
engaging in language / mathematics / arts / psychomotor activities, children’s social
and emotional development will be neglected” support this hypothesis. For language,
arts and psychomotricity, a majority (over 90%) of both first-year and fourth-year
students disagreed with this item. In other words, they did not think that the teaching
of these subjects impairs social and emotional development. This does not hold true
for mathematics, for which only 68% of first-year students disagreed with the
statement. Thus 32% of them thought that the teaching of mathematics in preschool
can hinder social and emotional development. By the end of the programme, 90% of
students disagreed with this statement, in line with the views expressed by all students
in the other areas. This (significant) difference in the position of students with regard
to mathematics probably reflects a more integrated and more social vision of the
learning of subjects, including mathematics.
The locus of the generation of mathematical knowledge
The results of the dimension “Locus of the generation of mathematical knowledge” are
presented in Table 4. It will be recalled that these items measured where the students
located the source of knowledge: with the teacher or with the child.
The continuum goes from the teacher (the minimum score of 0) to the child (the
maximum score of 5). The closer the mean is to zero, the more students favour the idea
that the teacher is the locus of knowledge generation. Conversely, the closer the mean
is to 5, the more the child is favoured as the locus.
1st year (%) 4th year (%) Difference
2.44 2.02 -0.42 p < 0.001
Table 4: Mean of views of 1st and 4th year students on the various items of the
dimension “Locus of the generation of mathematical knowledge”
We can see in Table 4 that in the 1st year, students present a mean position midway
between the two extremes, with a mean of 2.44.
In the fourth year, students favour the teacher as locus more strongly, with a mean of
2.02, which is significantly different from the mean of the first-year students. This
means that the fourth-year students assign a more important role to the teacher. This
“teacher locus” does not mean that these students favour traditional classroom
activities such as completing worksheets or doing exercises, however. We analysed the
choices of activities by students depending on whether they identified a teacher locus
(average ≤ 2) or a child locus (average > 2). The activities listed were of four types: 1)
formal activities such as completing worksheets, 2) activities based on equipment such
as logic blocks, 3) everyday activities such as following a cookery recipe, and 4)
number games such as battleships. The following question was asked: “To what extent
are these activities appropriate for developing pupils’ number competencies?” The

Vlassis, Poncelet
PME40 – 2016 4–353
results show that, regardless of the locus identified by the trainee teachers, the choice
of activities was the same: overall, activities such as following a recipe or games were
more favoured by students; by contrast, formal activities such as completing
worksheets were relatively unpopular. Ultimately, then, the identification of a teacher
or a child locus apparently will not be expressed in a particular choice of activity, but
probably in the way these activities are managed: in the former case, the teacher will
play an important role in the achievement of educational objectives, whereas in the
latter case, children will be left more on their own, without the teacher intervening in
the learning of number competencies, with the idea that these will develop
spontaneously through the performance of activities.
Finally, on the last dimension, “Confidence in mathematics instruction”, we
unsurprisingly find a similar pattern of development to that observed for the other
dimensions. The fourth-year students said that they were significantly more confident
of their ability to teach mathematics in preschool than those at the beginning of their
training.
CONCLUSIONS
The results described above show that first-year students have a rather traditional view
of the role of mathematics and the role of the preschool teacher in learning it. Overall,
it is clear that trainee teachers at the start of their programme share the views of
working teachers revealed in research conducted on the subject (Ginsburg, Kaplan, &
Cannon, 2006; Ginsburg, Lee & Boyd, 2008; Hachey, 2013).
By the end of their programme, students’ beliefs about mathematics in preschool have
been profoundly altered, across all dimensions. Although the mean results observed
for mathematics do not fully coincide with those for other areas of the curriculum, they
have definitely drawn closer to them. Future teachers now say that mathematics is an
essential goal of preschool, almost to the same degree as other areas, and are more
likely to take the view that the teacher should play an important role in learning
mathematics. Their training appears to have played a major role in this. Platas (2014)
also pointed to the importance of the training received by teachers in relation to the
four dimensions measured, with those who had received training that included courses
directly focusing on mathematics in preschool differing significantly from other
teachers. The students of the “Bachelor en Sciences de l’Education” also took a course
on the subject, although only a modest one. However, the change in viewpoints is
probably the result of various factors in the programme, on both the theoretical and the
practical side. As they progress, students have probably developed a more social and
integrated vision of academic learning such as mathematics, reflecting a different and
more appropriate notion of the abilities of young children, whom they now consider
capable of learning mathematics.
Vlassis, Poncelet
4–354 PME40 – 2016
References
Cannon, J., & Ginsburg, H. (2008). “Doing the math”: Maternal beliefs about early
mathematics versus language learning. Early Education and Development, 19(2), 238-260.
Chen, J. Q., McCray, J., Adams, M., & Leow, C. (2014). A Survey Study of Early Childhood
Teachers’ Beliefs and Confidence about Teaching Early Math. Early Childhood Education
Journal, 42(6), 367-377.
Dehaene, S. (2001). Précis of the number sense. Mind & Language, 16(1), 16-36.
Ginsburg H., Lee J. & Boyd J. (2008) Mathematics education for young children: What it is
and how to promote it. Social Policy Report, 22, 3-22.
Ginsburg, H., Kaplan, R., & Cannon, J. (2006). Helping early childhood educators to teach
mathematics. In Zaslow M. and Martinez-Beck I. (Eds), Critical issues in early childhood
professional development. Baltimore, MD: Paul H. Brookes, 171-202.
Jordan, C., Kaplan, D., Ramineni, C., & Locuniak, M. (2009). Early math matters:
kindergarten number competence and later mathematics outcomes. Developmental
Psychology, 45(3), 850-867.
Hachey, A. C. (2013). Teachers’ Beliefs Count: Teacher Beliefs and Practice in Early
Childhood Mathematics Education (ECME). NHSA Dialog, 16(3).
Handal, B. & Herrington, A. (2003). Mathematics’ teachers beliefs and curriculum reform.
Mathematics education research journal, 15(1), 59-69.
Herron, J. (2010). An evolution of mathematical beliefs: A case study of three pre-k teachers.
Journal of Early Childhood Teacher Education, 31(4), 360-372.
Koedinger, K & Nathan, M. (2004). The real story behind story problems. Effects of
representations on quantitative reasoning. Journal of the Learning Sciences, 13(2), 129-
164.
Lee, J. S. (2006). Preschool teachers’ shared beliefs about appropriate pedagogy for 4-year-
olds. Early Childhood Education Journal, 33(6), 433-441.
Lee, J. & Ginsburg, H. (2009). Early Childhood Teachers' Misconceptions about Mathematics
Education for Young Children in the United States. Australasian Journal of Early
Childhood, 34(4), 37-45.
Lee, J. S., & Ginsburg, H. P. (2007). Preschool teachers' beliefs about appropriate early
literacy and mathematics education for low-and middle-socioeconomic status children.
Early Education and Development, 18(1), 111-143.
Philipp, R. A. (2007). Mathematics teachers’ beliefs and affect. In FK Lester, Jr. (ed.): Second
Handbook of Research on Mathematics Teaching and Learning. Charlotte, NC:
Information Age Publishing, 257-315.
Platas, L. M. (2014). The Mathematical Development Beliefs Survey: Validity and reliability
of a measure of preschool teachers’ beliefs about the learning and teaching of early
mathematics. Journal of Early Childhood Research, 1476718X14523746.

2016. In Csíkos, C., Rausch, A., & Szitányi, J. (Eds.). Proceedings of the 40th Conference of the International
Group for the Psychology of Mathematics Education, Vol. 4, pp. 355–362. Szeged, Hungary: PME. 4–355
ENLISTING PHYSICS IN THE SERVICE OF MATHEMATICS:
FOCUSSING ON HIGH SCHOOL TEACHERS
Ilana Waisman
University of Haifa, Israel
Shaanan College, Haifa, Israel
There has always been a deep and close connection between mathematics and physics
throughout history. Nevertheless, the linkage between the two sciences is almost
neglected in mathematics education. In this study I describe an initial analysis of four
types of tasks that connect the subjects and were presented to mathematics in-service
teachers attending a course in mathematics education. Additionally, I show the types
of the problems that were selected by the teachers to give a presentation on and
examine the principles they employed in choosing appropriate tasks. Finally, I discuss
the importance of reciprocal relationship between physics and mathematics, which can
be used in mathematics teacher-education and in the high school mathematics
classroom.
BACKGROUND
NCTM (2000) states that mathematical activities should include problems in context
arising from areas outside mathematics. On the one hand, the literature indicates that
enhancing mathematical understanding can promote one's perception of physical
concepts (Bing & Redish, 2009). On the other hand, there are several studies that
highlight the role of physical understanding on learning mathematical concepts. As an
example, some of these studies propose the integration of calculus and kinematics (e.g.,
Planinic, Milin-Sipus, Katic, Susac & Ivanjek, 2012) in mathematics lessons.
However, the linkage between mathematics and physics is almost neglected in
mathematics education, in spite of the deep interconnection of mathematics and
physics throughout history (e.g., Blum & Niss, 1991; Domínguez, de la Garza &
Zavala, 2015).
Learning mathematical concepts through mathematical modelling and using examples
from physics promote a better understanding of mathematical concepts (Blum & Niss,
1991). Using examples from physics constitutes a type of mathematical modelling, i.e.,
the process of translating the real world into mathematics and vice versa (Blum & Niss,
1991). For example, introducing concepts and arguments from physics into the
teaching of geometry provides a better understanding of the theorems (Hanna &
Jahnke, 2002). Moreover, introducing mathematical concepts with an emphasis on the
interaction between mathematics and physics can provide a meaningful context for a
better understanding of the creation of mathematical knowledge (Kjeldsen & Lützen,
2015).
Regardless of the proven importance of the integration of physics and mathematics,
these subjects are taught separately (e.g., Planinic et al., 2012). The main reason for
this separation is that their teaching applications are highly demanding and require

Waisman
4–356 PME40 – 2016
mathematical and extra-mathematical knowledge (Ferri & Blum, 2010). One way of
promoting teachers’ content knowledge is to offer specific university courses (Kaiser
& Schwarz, 2006) with compulsory hands-on teaching experiences (Ferri & Blum,
2010). This can be done by offering a course in which mathematics and physics are
taught simultaneously (Domínguez, de la Garza & Zavala, 2015).
This study presents different types of problems that were used in a mathematics course
for mathematics teachers. These types of problems were given to the students at the
first part of the course, and later selected by them independently. The selected
problems, in their opinion, represent the desired connection between physics and
mathematics.
METHOD
The present study is based on the Teacher Development Experiment (sf. Simon, 2000)
conducted during a 56-hour course attended by 31 experienced in-service mathematics
teachers. All teachers possess a BA in mathematics, a teaching certificate and went on
to attain an MA degree in mathematics education. The teachers had basic knowledge
of physics and did not teach physics in secondary school.
The setting included two types of sessions. Type A sessions were held during the first
half of the course, while type B sessions were held during the second half,
A: Problem-solving sessions in which the teachers were exposed to problems of
different types from the point of view of the linkage between mathematics and physics.
The teachers were asked to solve the problems under an instructor's guidance, after
which they presented their solutions to the whole group and discussed the solutions.
B: Problem-solving sessions guided by the teachers themselves. The teachers (in pairs)
were asked to select problems from various scientific and educational resources that
connect mathematics and physics and then to teach a session to the other teachers
participating in the course.
All the sessions included use of either technological tools (GeoGebra and applets
available on the internet) or "hands-on" physical experiments. All sessions were
videotaped and all artifacts were collected for later analysis.
The goal of the study
The goal of the study was to analyze development of teachers' conceptions related to
the problems that connect physics and mathematics, paying particular attention to their
views of the mathematical and didactic power of the tasks (Jaworsky, 1992) as well as
development of their success in solving and classifying the problems.
The goal of this paper is twofold: First, I present an initial analysis of the problems as
they were devolved to the teachers. 4 problem types taken from in-service training
courses that served as example problems are analyzed; second, I present the types of
problems chosen by the teachers for the type B sessions.
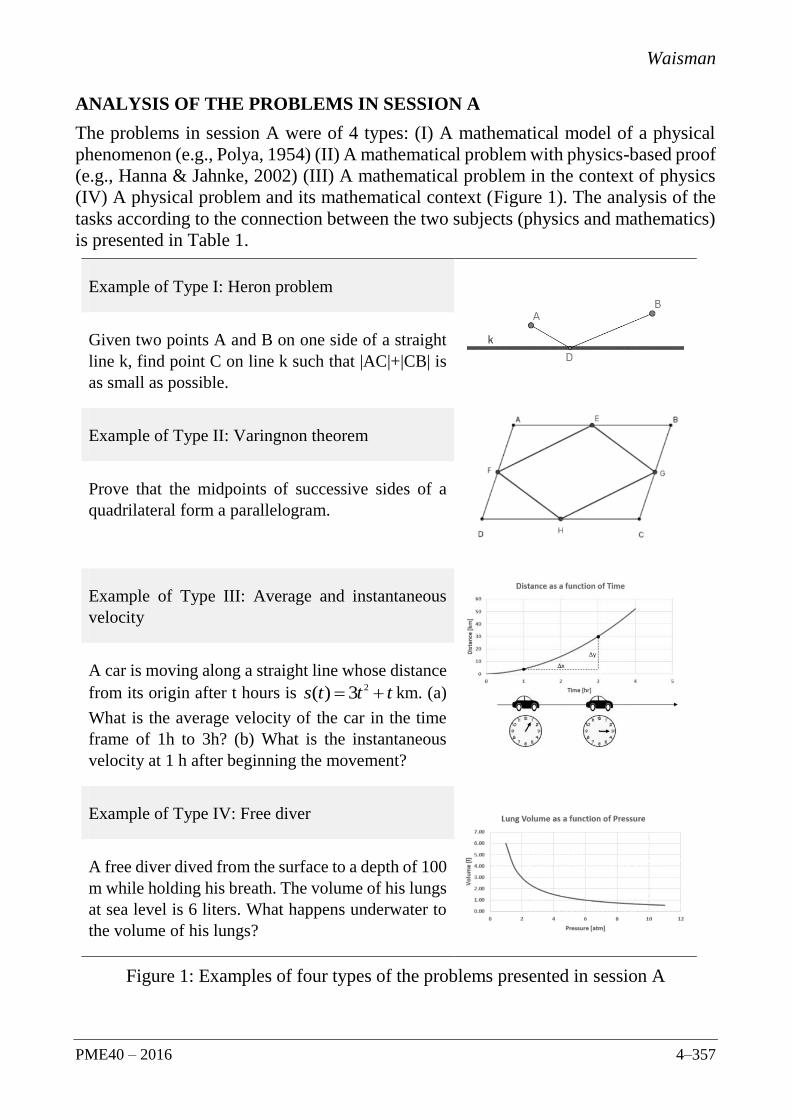
Waisman
PME40 – 2016 4–357
ANALYSIS OF THE PROBLEMS IN SESSION A
The problems in session A were of 4 types: (I) A mathematical model of a physical
phenomenon (e.g., Polya, 1954) (II) A mathematical problem with physics-based proof
(e.g., Hanna & Jahnke, 2002) (III) A mathematical problem in the context of physics
(IV) A physical problem and its mathematical context (Figure 1). The analysis of the
tasks according to the connection between the two subjects (physics and mathematics)
is presented in Table 1.
Example of Type I: Heron problem
Given two points A and B on one side of a straight
line k, find point C on line k such that |AC|+|CB| is
as small as possible.
Example of Type II: Varingnon theorem
Prove that the midpoints of successive sides of a
quadrilateral form a parallelogram.
Example of Type III: Average and instantaneous
velocity
A car is moving along a straight line whose distance
from its origin after t hours is ttts 23)( km. (a)
What is the average velocity of the car in the time
frame of 1h to 3h? (b) What is the instantaneous
velocity at 1 h after beginning the movement?
Example of Type IV: Free diver
A free diver dived from the surface to a depth of 100
m while holding his breath. The volume of his lungs
at sea level is 6 liters. What happens underwater to
the volume of his lungs?
Figure 1: Examples of four types of the problems presented in session A

Waisman
4–358 PME40 – 2016

Waisman
PME40 – 2016 4–359

Waisman
4–360 PME40 – 2016
TYPES OF PROBLEMS SELECTED BY THE TEACHERS
The teachers were instructed to present problems in session B, after the four types of
problems were taught to them in session A. The majority of teachers provided problems
of one of the four types presented. However some of them had chosen problems of a
different type (type V) which describes physical and mathematical problems with the
same keyword in the concept (e.g. a circle). In these cases the teachers were unable to
connect the physical and mathematical facets of the task, so the two problems were
presented separately.
Example of Type V: (M) Given a circular arc AB is rotated through a given angle into
a position AB’. Prove that the straight lines through the pairs of points corresponding
under the rotation all pass through a fixed point. (P) A particle of dust travelling in a
clockwise direction moves uniformly at a speed of 3.5 m/s on a disk in a circle with a
diameter of 10 cm. Calculate its centripetal acceleration.
The mathematical bases of the solution of M-problem are a circle, rotation around a
point, symmetry, reflection in a line and a fixed point. The physical bases of the
solution of P-problem are circular motion and centripetal acceleration.
Interviews with the teachers revealed several principles they employed when choosing
a task for the final work and presentation. These were: (1) The personal interest in the
mathematical facet of the task and its accessible physical connection (2) The
knowledge of mathematical and physical concepts involved in the problem (3) The
ability to demonstrate the physical facet of the problem by an experiment or by means
of technological tool.
The most frequent choice of problem was represented by type I (N=10). The
mathematics educators' second choice was type IV (N=8). The number of teachers
preferring to present problems of either type II or type V was similar (N=3 or N=4,
respectively). Six teachers selected type III.
DISCUSSION
Kaiser & Schwartz (2006) claim that it “is insufficient to simply impart competencies
for applying mathematics only within the framework of school curriculum”. Students
should deal with tasks that stress the relevance of mathematics for the other sciences
(in our case physics) and should acquire competencies that enable them to solve real
mathematics problems.
In the framework of the proposed course, the teachers were introduced to four types of
problems that connect mathematics and physics (session A) and were required to
present a problem drawing connections between the two subjects (session B). All the
problems were based on the topics that are learned in secondary schools. The choice
of problems by the teachers can be subdivided into five types. Type I is a mathematical
problem with a “hidden” physical analogy. This type of problem stresses the physical
aspect of the mathematics. Type II employs the physical proof for mathematical
problems. This type of problem “may reveal the essential features of a complex

Waisman
PME40 – 2016 4–361
mathematical structure or point out more clearly the relevance of a theorem to other
areas of mathematics or to other scientific disciplines” (Hanna & Janke, 2002, p. 40).
Type III is a mathematical problem in a physical problems “suite”. This type of
problem requires transference from a physics-based content to a mathematical one. It
proposes a didactic tool for teaching mathematical concepts in a more illustrative way.
Type IV is a physical problem that points to the mathematical concepts involved in
solving it. It is related to the mathematical knowledge that is essential for success in its
solution. Placing more emphasis on the meaning of these mathematical concepts will
lead to a better understanding of physical concepts (Johansson, 2015). Type V as
proposed by the students focuses on the differences and similarities of mathematical
and physical concepts that contain the same keyword but are not actually conceptually
connected.
For all the mathematics teachers in this study, dealing with the physical aspects of
problems in their mathematics lessons was a totally unfamiliar experience. On the
whole, they perceived physics as a difficult subject and therefore avoided using it. It
can be assumed that their acquaintance and experiences with physical contents as well
as their beliefs about mathematics guided their choice of the problem types for their
final presentations. For example, teachers that are familiar with the physical concepts
started their presentations with an experiment or a demonstration and selected
problems of type II to IV. In contrast, teachers who lacked sufficient knowledge of
physics concentrated on topics of type V. As a result of the course, teachers’
predisposition to using physics in solving mathematical problems was enhanced. For
example, when the teachers were presented with two different solutions to a type II
problem (physical proof to a mathematical problem) all of them agreed that the solution
based on physical intuition was more "elegant." Nevertheless, most of the teachers
considered the solution using mathematical apparatus to be more reliable.
It is my view that integration of physical phenomena in the mathematics curriculum
can foster a more meaningful view of mathematics among teachers and students alike.
However, this cannot be done, in my estimation, without mathematics educators
attaining a satisfactory understanding of the linkage between physics and mathematics.
In addition, the choice of appropriate problems is essential to developing an
understanding of the connections between physics and mathematics.
References
Bing, T. J., & Redish, E. F. (2009). Analyzing problem solving using math in physics:
Epistemological framing via warrants. Physical Review Special Topics-Physics Education
Research, 5(2), 020108.
Blum, W., & Niss, M. (1991). Applied mathematical problem solving, modelling,
applications, and links to other subjects—State, trends and issues in mathematics
instruction. Educational studies in mathematics, 22(1), 37-68.
Domínguez, A., de la Garza, J., & Zavala, G. (2015). Models and modelling in an integrated
physics and mathematics course. In G.A. Stillman, W.Blum & M. S. Biembengut (Eds.),

Waisman
4–362 PME40 – 2016
Mathematical Modelling in Education Research and Practice (pp. 513-522). Springer
International Publishing.
Ferri, R. B., & Blum, W. (2010). Insights into teachers’ unconscious behaviour in modeling
contexts. In R. Lesh, P.L. Galbraith, C.R. Haines & A. Hurford (Eds.), Modeling Students'
Mathematical Modeling Competencies (pp. 423-432). Springer US.
Hanna, G., & Jahnke, H. N. (2002). Arguments from physics in mathematical proofs: An
educational perspective. For the Learning of Mathematics, 38-45.
Jaworski, B. (1992). Mathematics teaching: What is it? For the Learning of Mathematics,
12(1), 8–14.
Johansson, H. (2015). Mathematical Reasoning Requirements in Swedish National Physics
Tests. International Journal of Science and Mathematics Education, 1-20.
Kaiser, G., & Schwarz, B. (2006). Mathematical modelling as bridge between school and
university. ZDM- The International Journal on Mathematics Education, 38(2), 196-208.
Kjeldsen, T. H., & Lützen, J. (2015). Interactions between Mathematics and Physics: The
History of the Concept of Function—Teaching with and About Nature of Mathematics.
Science & Education, 24(5), 543-559.
National Council of Teachers of Mathematics, (2000). Principles and Standards for School
Mathematics. Reston, VA: NCTM.
Planinic, M., Milin-Sipus, Z., Katic, H., Susac, A., & Ivanjek, L. (2012). Comparison of
student understanding of line graph slope in physics and mathematics. International
journal of science and mathematics education, 10(6), 1393-1414.
Polya, G. (1954). Mathematics and Plausible Reasoning (Vol. 1). Princeton, NJ: Princeton
University Press.
Simon, M. A. (2000). Research on the development of mathematics teachers: The Teacher
Development Experiment. In A. E. Kelly & R. A. Lesh (Eds.), Research design in
mathematics and science education. (pp. 335- 359). Hillsdale, NJ: Lawrence Erlbaum
Associates.
2016. In Csíkos, C., Rausch, A., & Szitányi, J. (Eds.). Proceedings of the 40th Conference of the International
Group for the Psychology of Mathematics Education, Vol. 4, pp. 363–370. Szeged, Hungary: PME. 4–363
REFLECTIVE PRACTICE AND TEACHER IDENTITY:
A PSYCHOANALYTIC VIEW
Margaret Walshaw
Massey University, New Zealand
This article explores issues that are central to changed mathematics pedagogy. It
engages general debates about teaching reflexivity and within that, more specific
debates in relation to identity. It uses theoretical concepts derived from Lacanian
psychoanalysis as a way of understanding what structures a teacher’s narrative about
his practice. Thus the article is both a study of one teacher’s reflections on a sequence
of algebra lessons at the secondary school level, and an exploration into a range of
theoretical issues about identity construction, about knowing, and about effective
practice.
INTRODUCTION
A major focus in mathematics education today is the enhancement of pedagogical
effectiveness. The focus is based on the realisation that the teacher is a key resource
for enhancing student achievement (Copur-Gencturk, 2015; Drageset, 2015; Oonk,
Verloop, & Gravemeiger, 2015) and is a critical feature in the promotion of equitable
classrooms (see Anthony & Walshaw, 2007; Norton & McCloskey, 2008, Owens,
2015). A contemporary interest, centred on the teacher as reflective practitioner (for
example, Muir & Beswick, 2007), adds a compelling layer to our understanding of
effective teaching. Teacher reflection, it has been proposed, provides a way of
authoring the teacher’s self into an account of pedagogy and, hence, is a way of
promoting change. The practitioner’s reflective analysis is a reaction “against a view
of practitioners as technicians who merely carry out what others, outside of the sphere
of practice, want them to do” (Zeichner, 1993, p. 204). Specifically, teacher reflection
is presented as a counter to the effects of researcher power, privilege, and perspective,
and as a catalyst for an empowering dialogue focused on pedagogical change.
With its roots in the critical social science of the Frankfurt School, the notion of the
reflective practitioner has been instructive in debates surrounding pedagogical
questions. Personal narratives as experienced and told by teachers about their practice
with a view towards development are propelled by assumptions to the effect that
‘experience’ is self-evident and that pedagogical change is specifiable. However, in the
view of Brown (2008), the reflections and changes proposed merely provide “a mask
for the supposed life behind it, a life with attendant drives that will always evade or
resist full description” (p. 1). They fail to engage in a critical examination of the way
in which change, and hence reflections, are actually produced. In particular, they
overshadow the “relationships and forms of reciprocity and obligation that are
embedded within them for understanding the identities and practices in which [teachers
and researchers] engage” (Thomson, Henderson, & Holland, 2003, p. 44). As a

Walshaw
4–364 PME40 – 2016
transformative strategy that claims emancipation, transcendence and freedom from
ineffectivity, reflective practice fails to theorise how processes of change are lived out
‘experientially’, performatively, at the level of the individual.
In this article, the objective is to provide a vocabulary and a lens for explaining and
analysing shifts in mathematics pedagogical practice, consequent on a practitioner’s
reflective practice. In offering empirical and theoretical insights on what counts as
pedagogical change, I argue for the strategic use of concepts drawn from Lacanian
psychoanalysis (for example, Lacan, 1977) to bring about transformation in the context
of the mathematics classroom. Specifically, Lacan’s arguments about narratives of the
self, and Žižek’s (1989, 1998) related examination of how subjectivities are
constructed across sites and time, are applied to a research project focused on shifts in
pedagogical practice. Thus, this is both a study of one teacher and his reflections on a
sequence of lessons, and an exploration into a range of theoretical issues about identity
construction and change processes in mathematics teaching and research. In theorising
the connection between narrations of the self and wider processes and events, the
analysis provides a counterpoint to current thinking about researcher reflexivity.
CONTEXTUALISING THE EXPLORATION
Data for the project were collected through classroom video records, interviews with
and classroom researcher observations of the teacher (Dave) who had been identified
by the local mathematics teaching community as an effective secondary school
practitioner. In his fourth year of teaching, Dave taught in a large co-educational
school, catering for students from, in the main, the middle socio-economic sector.
Students in his class of 30 formed one of two extension classes at the Year 9 (aged 13
years) level. This was a class that included “some very top students who conceptually
pick things up very quickly” (Interview, post research). The classroom research
component focused on 10 consecutive lessons that represented a unit on algebra—
specifically, formulating linear equations, substitution, and solving linear equations.
In the analysis of Dave’s data, the intent is to unpack the ways in which his identity as
a teacher is mobilised, reconceptualised and reformed through his participation in the
research project. The analysis involves uncovering and exposing the mechanisms
through which he comes to an understanding of his classroom practice (Brown &
England, 2004). The work of Lacan and Žižek allows me to engage critically with the
ideological frameworks through which Dave, as teacher-as-reflective practitioner,
produces a narrative of his classroom work. Methodologically, in taking the reflective
self to task, the psychoanalytic interest in how Dave produces his narrative,
acknowledges the interdependencies and the realities that shape not only classroom
life, but also the research process itself. It will involve looking at the intersection of the
teachers’ subjectivity, the researcher’s subjectivity and intersubjective negotiations
and the place of emotions between both.

Walshaw
PME40 – 2016 4–365
WORKING WITH IDENTITY AND REFLECTIVE PRACTICE
Understanding the self-in-conflict
In interview following teaching of the ten algebra lessons Dave explained that his
teaching goals for the unit were twofold: (i) that students will learn to use and
understand equations to solve problems and (ii) that they will develop an understanding
of the meaning of equality (=). My classroom observations recorded the content of the
ten lessons as follows: Lesson 1 revised understanding of basic understanding of
algebraic terms and fundamental algebra manipulation. Lesson 2 developed a strategy
for writing simple linear equations and for solving them using a ‘1-step’ approach (for
example, x + 17 = 29). Lesson 3 proceeded to a 2-step approach to the solution of
simple linear equations (for example, 3x + 5 = 41). The understanding and solution
process was further developed in lesson 4 (for example, 2x + 5 = 19). In lessons 5 and
6 real-world applications of solving simple linear equations were explored. Lessons 7
and 8 investigated the equals sign further and strategies were extended in Lesson 7 in
order to solve equations with x-terms on both sides (for example, 3x + 4 = 2x + 9) and,
in Lesson 8, negative values (for example, 3x – 3 = -2x + 7) were incorporated. Lesson
9 introduced fraction and decimal solutions (for example, 3x – 1.5 = 12.3). The
sequence of lesson culminated in lesson 10 in which real-world applications of solving
equations with non-integer solutions were explored.
In developing students’ understanding of the equals sign, in lesson 2 Dave drew a
number of balanced scales, weighing icons that represent the four suits of a pack of
cards. For example, in one diagram, the left hand side of the balance scales held five
clubs and the right hand side—a diamond as well as five spades. The task was to
determine the value assigned to a spade and to a diamond. Dave pointed out to the
class: “The puzzle is saying if we have a set of perfectly balanced scales then the left
hand side and the right hand side must be the same.” For this and other similarly rich
open-ended problems in lesson 2, Dave anticipated a range of possible solutions and
accepted a ‘guess and check’ method to find values for a spade and a diamond. He then
proceeded to more difficult problems in which writing an equation was a prerequisite
for a solution.
As a researcher observing his classroom practice, I formed an impression of Dave’s
teaching as immensely effective. I observed the quiet undivided attention he gave to
his students and witnessed the kinds of intellectual exchanges and sophisticated
mathematical argumentation developed within the classroom. Particularly uplifting
was the way he enabled individual students to appreciate for themselves that the values
they had found for a spade and for a diamond were (or were not) mathematically sound.
Because of this, I wanted to observe his teaching, and the positive influence his
teaching had on student outcomes. I wanted to hear about his lesson objectives and
witness their attainment. He said in an interview after lesson 2:
With the balancing of scales, I am trying to sow the seed for later on in terms of
manipulating each side…They got the idea that there were scales that needed to be

Walshaw
4–366 PME40 – 2016
balanced and by manipulating what goes on the sides of the scales was really what it was
all about.
I asked him: “So the balance idea, each side must be different?” He replied:
Yes, because later on they are going to need to understand that the equal sign doesn’t just
mean…and up until now most of them think the equal sign means ‘works out to be’, or ‘I
get this’, whereas later on I am going to have to adjust their view of what that equal sign
means and think in terms of scales. And so later on when I talk about scales, they will have
a reference point for it.
In lesson 3, Dave introduced the ‘magic box’ (sometimes known as the ‘function box’).
He took a step-by-step approach to solving 3x + 5 = 41, taking x first, multiplying it by
3, posting the 3x card into a box, then posting a ‘+5’ card into the box, and exiting the
number 41. He explained to the students about reversing the order of operations, and
proceeded to carry out the reversal process in order to find the unknown variable, and
hence to solve the equation. Dave then repeated the ‘magic box’ trick with ‘2x’, ‘-6’.
He asked students to write the first part of the equation, in the same way that he had
shown them to do during the first magic box episode. Once the right hand side number
had been provided, students then substituted the value obtained for x in the equation to
verify the result. In lesson 4 Dave again used the magic box trick, illustrating the
process of solving equations by reversal using two different equations that students had
already worked on and solved, one of them being 2x + 5 = 19.
In lesson 7, Dave discussed with his students the meaning of equality and the
importance of developing an understanding of ‘equals’ appropriate for the task at hand.
He then used a data projector to show an animation of balance scales for a different
equation: 3x + 2 = 2x + 3. Again, using a step-by-step approach, he placed ‘3 x’s’ and
‘2’ on the left hand side of the balance scales. Students immediately noticed that the
scales became unbalanced. Dave then placed ‘2 x’s’ and ‘3’ on the right hand side, to
achieve equilibrium. He worked through a solution of the equation, using the procedure
of ‘doing the same to both sides’. The visual display illustrated that ‘doing the same to
both sides’ guaranteed to produce balance in the scales.
After lesson 7, I remarked to Dave in interview: “In a couple of earlier lessons you
used a model of the box where you put in something and a process happened and then
got you back to the original. You had to reverse or undo or go backwards. So that is a
different way of thinking about equations.” Dave replied:
When they arrive they tend to have this idea that that’s what an equal sign does. It’s a
command that gives you an answer after you have done certain things. So I was keeping
the traditional view of what an equation is about. You do something to ‘x’, then maybe you
subtract a number from it and then you get an answer. You push the equal button and out
comes this answer. And I was trying to process that if we reverse that idea we can undo
what has happened and get back to ‘x’.

Walshaw
PME40 – 2016 4–367
In lesson 8, Dave used a different piece of software on the data projector to show an
animation of solving equations. The representation was of a set of balanced scales, as
before, but in this case weights corresponded to the addition of an entity.
T: …How do you think we could represent for example ‘minus 3’. How do I get 3x minus
3 on the left hand side of my scale? Plus 3 is a weight blocks pulling down. What do you
reckon minus 3 might be James?
S: Lifting it up.
T: Lifting it up. So what kind of symbol do you think we could use to represent lifting the
side up?
S: A helium balloon.
T: A helium balloon. All right let’s try it.
The class then watched an illustration on the data projector and the use of weights and
balloons for solving 3x – 3 = -2x + 7. More discussion on the process developed and
then the class set to work on examples from their textbook. In our discussion
immediately after the lesson, while watching the video clip of the lesson, Dave pointed
out:
…they could picture if you had two balloons pulling one side up and you take them away,
the impact is going to be the same as if you put something on it to weigh it down.…The
idea of having a balanced scale, having them visually see what is essentially working;
visually step by step is really helpful. To be able to say right ‘we are taking away three
from this side and then go to the software and take three away’ and see it is not balanced
and you need to keep it balanced so what do we do? Step by step process, going from the
working to the visual really works very well.
Just before all these observations were made, I had pointed out that it was not entirely
clear to me what the balloons and the blocks represented. I was also unclear about the
use of multiple representations, namely, the ‘magic box’, the balance scales, in addition
to the balloons and blocks. In response to the balloons and blocks question, he
explained: “If I wanted 3x, I had to have three little blocks built up, and if I wanted
negative 2x each of the two balloons represented a negative x so I needed two of them
to represent the negative.” Reflecting on the lesson he drew attention to “lots of
learning. It was a really packed lesson, the coming together of ideas and putting them
in place.”
In the final interview—the interview requested by him and which took place a few
weeks after the classroom data gathering had concluded—Dave reflected on his
teaching:
The one idea that I haven’t one hundred percent really settled on is again that ‘equals sign’.
My approach was ‘what do they know, and what knowledge have they brought into the
classroom?’ and predominantly it was that ‘equal’ sign…it’s ‘give me the answer’, strike
the calculator and give me the answer and write it down on your paper after the work and
see what the answer is. And that is what they brought into the classroom, so I used that
initially to get them thinking about how to solve the equations, 5 times x plus 3 equals

Walshaw
4–368 PME40 – 2016
something and then we will reverse that process to figure out what the original number for
‘x’ was. And then later I introduced the idea of ‘same’ the two sides of an equation being
the same and you can swap the order around there is no direction from left to right it’s just
a set of scales that are balanced and that is when I brought in more complicated equations
with variables on both sides. And they responded well to that but I have never really been
sure whether I should have brought that idea of ‘same’ straight away and I am still not sure.
At an overt level the research data foreground the construction of a coherent classroom
identity that developed in response to a set of themes to do with pedagogical skills,
knowledge and agency. At a more covert level, Dave’s talk evoked traces of other
events and other interpersonal relations, as well as defences, that created a rationale
and a sense of cohesion to his interview. Together these two levels opened up important
aspects of his subjectification in relation to being a mathematics teacher. It was not
simply the present that factored into the construction of teacher identity: past as well
as anticipated experiences, in a wider range of sites, also played their part in how Dave
lived his subjectivity as a teacher. As Žižek (1989) has claimed: “identification is
always identification on behalf of a certain gaze in the Other” (p. 106).
Dave, like any other effective teacher, was constantly trying to close the gap between
how he sees himself and how he thinks others see him, always attempting to reconcile
what he is with what he might become. It is not an especially obvious procedure, but
nevertheless, in its subtlety, it was extremely powerful in establishing the parameters
along which his identity as a mathematics teacher will be constituted. It is in this sense
that we can understand how the terms that enter into the production of a mathematics
teaching identity are “outside oneself, beyond oneself in a sociality that has no single
author” (Butler, 2004, p. 1). What Dave was looking for is an instance, a moment, or
what Lacan calls a ‘quilting point’, that will provide him with a marker, a strategic
place from where he could make his choices about how to close the gap between his
own and others’ views of him as a teacher.
In Dave’s case, in the instance of the final interview, a ‘quilting point’ was, among
other things, the researcher’s element of doubt over the representation of balloons and
weights during the data show in Lesson 7. Although immediately after the lesson he
had assessed the lesson as productive, in his reflections on his teaching during the final
interview, his ‘true’ sense of self at that moment was betrayed. Fictions and fantasies
of practice competed for Dave’s attention, operating beyond his comprehension,
provided a censoring device as a defence against a set of fears and concerns. They
shaped his lived experience, defending against his anxieties, and informing the kinds
of interpretations he made about his teaching in the future. It is in this sense that we
can understand the psychoanalytic claim that the ‘core’ inner self is not ‘core’ at all;
rather, a sense of self is constructed through language and intersubjective images
projected onto us by others (teachers, students, parents, principals, researchers, and so
forth) of how they would ‘see’ us within a set of given social relations.

Walshaw
PME40 – 2016 4–369
CONCLUSION
Research on teachers’ reflections of practice offers a productive site for exploring
questions of identity and change. Contemporary theories of meaning making and
subject formation remind us of the inadequacy of language to capture lived experience.
In claiming that the narrative of lived experience can never coincide completely with
experience itself, these approaches have been an important resource in this article. I
have taken particular inspiration from psychoanalytic writing as a means of probing
the difficulties of narrating the experience of teaching mathematics, in any
straightforward way, and as a way of problematising the use of experience to initiate
change. In acknowledging the complexity and complicity operating when teachers
engage in reflective moments of their practice, the approach foregrounds the
insufficiency of knowledge, the constitutive interplay of subjectivity, obligation and
reciprocity and the psychical dynamics at play in narrating oneself. In doing so, the
psychoanalytic approach closes the affective-cognitive separation that characterises
conventional notions of reflective practice.
There are significant differences between the conventional approach to reflective
practice and that developed through psychoanalytic theory. For Lacan and Žižek
identity claims can never achieve final or full determination; the past is always
implicated in the present. Since memories of practice are constructed from past
investments and conflicts, always with a gaze towards the Other, “narratives are not
the culmination of experience but constructions made from both conscious and
unconscious dynamics” (Pitt & Britzman, 2003, p. 759). Those constructions are
inevitably destined to miss the mark, continually subverted within a kind of
metaphorical space between people, never fully understood and never fully captured
by language.
Narratives of pedagogical practice will never reveal a fidelity to truth. There can never
be a ‘truthful’ account of the mathematics teacher’s reflections because “the fictions of
subject positions are not linked by rational connections, but by fantasies, by defences
which prevent one position from spilling into another” (Walkerdine, Lucey, & Melody,
2003, p. 180). However, that realisation does not in any way prevent us from working
at understanding how intersections of fictions and fantasies of practice are lived by
teachers. To the contrary, exploring how the subjectivity of the teacher is produced at
the interpersonal level is more pressing than ever in any discussion of teacher change.
It is pressing in that it alerts us to the fact that teachers’ reflections are more than
instruments of change; they are also instruments of social reproduction. Paradoxically,
then, reflective practice is as regulatory as it is emancipatory. For the politically
motivated researcher, the goal will be to make transparent the epistemic constructions
that compete for attention about what will count as mathematics teaching in schools. It
is in that sense that a psychoanalytic approach operates as a test-bed for innovation,
and a catalyst for pushing ideas about teacher change forward.
Walshaw
4–370 PME40 – 2016
References
Anthony, G., & Walshaw, M. (2007). Effective pedagogy in Mathematics/Pāngarau: Best
Evidence Synthesis Iteration [BES]. Wellington: Learning Media.
Brown, T. (2008). Lacan, subjectivity and the task of mathematics education research.
Educational Studies in Mathematics, 68, 227-245.
Brown, T., & England, J. (2005). Identity, narrative and practitioner research: A Lacanian
perspective. Discourse Studies in the Cultural Politics of Education, 26(4), 443-458.
Butler, J. (2004). Undoing gender. New York: Routledge.
Copur-Gencturk, Y. (2015). The Effects of Changes in Mathematical Knowledge on
Teaching: A Longitudinal Study of Teachers’ Knowledge and Instruction. Journal for
Research in Mathematics Education, 46(3), 280-330.
Drageset, O. G. (2015). Student and teacher interventions: A framework for analysing
mathematical discourse in the classroom. Journal of Mathematics Teacher Education,
18(3), 253-272.
Lacan, J. (1977). The four fundamental concepts of psycho-analysis. London: The Hogarth
Press.
Muir, T., & Beswick, K. (2007). Stimulating reflection on practice: Using the supportive
classroom reflection process. Mathematics Teacher Education and Development, 8, 94-
116.
Norton, A., & McCloskey, A. (2008). Teaching experiments and professional development.
Journal of Mathematics Teacher Education, 11, 285-305.
Oonk, W., Verloop N., & Gravemeiger, K. (2015). Enriching practical knowledge:
exploring student teachers’ competence in integrating theory and practice of mathematics teaching. Journal for Research in Mathematics Education, 46(5), 559-598.
Owens, K. (2015). Changing the teaching of mathematics for improved Indigenous education
in a rural Australian city. Journal of Mathematics Teacher Education, 18(1), 53-78.
Pitt, A., & Britzman, D. (2003). Speculations on qualities of difficult knowledge in teaching
and learning: An experiment in psychoanalytic research. Qualitative Studies in Education,
16(6), 755-776.
Thomson, R., Henderson, S., & Holland, J. (2003). Making the most of what you’ve got?
Resources, values and inequalities in young women’s transitions to adulthood. Educational
Review, 55, 33-46.
Walkerdine, V., Lucey, H., & Melody, J. (2003). Subjectivity and qualitative method. In T.
May (Ed.), Qualitative research in action (pp. 179-196). London: SAGE.
Zeichner, K. M. (1993). Action research: Personal renewal and social reconstruction.
Educational Action Research, 1(2), 199-219.
Žižek, S. (1989). The sublime object of ideology. London: Verso.
Žižek, S. (Ed.) (1998). Cogito and the unconscious. Durham: Duke University Press.

2016. In Csíkos, C., Rausch, A., & Szitányi, J. (Eds.). Proceedings of the 40th Conference of the International
Group for the Psychology of Mathematics Education, Vol. 4, pp. 371–378. Szeged, Hungary: PME. 4–371
WHAT TEACHERS SHOULD DO TO PROMOTE AFFECTIVE
ENGAGEMENT WITH MATHEMATICS—FROM THE
PERSPECTIVE OF ELEMENTARY STUDENTS
Ting-Ying Wang, Feng-Jui Hsieh
National Taiwan Normal University
This study surveyed a nationwide sample of elementary school students in Taiwan to
explore students’ perspectives on what teaching behaviors promoted their affective
engagement in learning mathematics. Factors contributing to the teaching behaviors
were identified by conducting exploratory and confirmatory factor analyses on lists of
teaching behaviors obtained from empirical studies. This study identified a three-
factor structure with factors of cognition, extrinsic motivation, and activity. The results
also showed that when considering enhancing affective engagement, Taiwanese
students prefer teacher help on their cognition and teacher management of teacher–
student interaction and relationships compared with working on various hands-on or
explorative activities.
INTRODUCTION
Engagement with mathematics influences students’ development of mathematical
literacy (Attard, 2012). Studies have shown that engaging students is more difficult in
mathematics classes compared with classes for other subjects (Plenty & Heubeck,
2011). Therefore, methods of increasing student engagement in mathematics warrant
research. Engagement is usually considered a multidimensional construct that
encompasses behavioral, affective, and cognitive components (Fredricks, Blumenfeld,
& Paris, 2004). Affective engagement, relating to willingness to learn and enjoyment
in learning, is a crucial consideration in the literature on engagement in mathematics.
However, motivating students to learn in mathematics classes is not easy (Maehr &
Midgley, 1991). Teachers’ instruction has been considered a powerful contributor to
student engagement (Mark, 2000). Students’ low engagement is at least partly due to
teachers’ inability to engage them and maintain their engagement (Bodovski & Farkas,
2007). Therefore, information specific to what teachers should do to increase students’
affective engagement in mathematics is influential and valuable. This was the focus of
the present study.
The significance of this study was to provide national representative lists and latent
factors of teaching behaviors for promoting students’ mathematical engagement from
students’ perspectives. The use of students’ perspectives is an endeavor to adopt a
student-centered view (Murray, 2011), which was advocated by Taiwan’s mathematics
curriculum reform in order to make students “insiders” rather than “guests” in their
mathematics classes (Hsieh, 1997). With the use of a nationwide sample in Taiwan,
the present study addressed the following research questions:
Wang, Hsieh
4–372 PME40 – 2016
(1) What factors contribute to the teaching behaviors that promote students’ affective engagement from students’ perspectives?
(2) Do students consider the factors of teaching behaviors obtained in (1) to be equally influential in promoting students’ affective engagements?
(3) Do students’ perspectives differ with gender, interest in mathematics, and mathematics achievements?
RESEARCH METHOD
Conceptual framework
Affective engagement
Affective engagement plays a major role in activating and maintaining cognitive
engagement (Sancho-Vinuesa, Escudero-Viladoms, & Masià, 2013), and the term has
been used interchangeably with motivation in numerous studies (Fredricks et al.,
2004). Most engagement studies have focused on students’ emotional reactions to the
school, the academic schoolwork, and the people at the school when examining factors
such as interest, enjoyment, preferences, happiness, and curiosity (e.g., Bodovski &
Farkas, 2007). Some research has considered students’ willingness and persistence in
learning as major aspects of affective engagement (Steinberg, Brown, & Dornbush,
1996). In addition, some research has related affective engagement to students’
appreciation and the value of specific subjects (Fredricks et al., 2004).
Teacher instruction effects on student affective engagement
The literature shows that students’ affective engagement is enhanced by teachers’
instructional management such as by using clear, concise, and meaningful explanations
(Cavanagh, 2011); real-life examples (Attard, 2012); timely feedback (Sancho-
Vinuesa et al., 2013); challenging or interesting tasks (Attard, 2012); and hands-on
activities (Blumenfeld and Meece, 1988); and by cooperating with peers in small-group
work or discussion (Bodovski & Farkas, 2007; Cavanagh, 2011).
Studies have suggested that teachers instruct students with various methods to cater to
students with different backgrounds and needs (Attard, 2012; Cavanagh, 2011).
Insufficient empirical research has examined what types and aspects of teacher
performance most effectively promote engagement in students with various
demographic, achievement, and affective backgrounds (Fredricks et al., 2004).
Design and Instrument
This study was conducted in two stages. In the first stage, a qualitative study employing
open-ended questions was conducted on 238 high school students to obtain their
opinions regarding what a great mathematics teacher would do when teaching. A
content analysis of the students’ responses and a literature review were performed to
obtain dimensions and items related to mathematical teaching competence from
university mathematics educators and researchers, school-based supervisors of
prospective mathematics teachers, and expert school mathematics teachers. The

Wang, Hsieh
PME40 – 2016 4–373
dimensions and items obtained in this stage were used to develop the instruments for
the second stage of the study.
In the second stage, two questionnaires with dichotomous items were developed. One
questionnaire was for the secondary school study, and the other was for the elementary
school study. The items in the two questionnaires were identical. In the questionnaires,
students were asked to state whether a great mathematics teacher should perform the
described teaching behaviors in a variety of teaching contexts. The affective
engagement items obtained from the first stage were prompted by “In order to raise our
learning motivation, when teaching mathematics, a great elementary school teacher
should….”
Participants
The sample comprised 1,039 elementary school students from 78 classes in 26 schools
in 25 cities in Taiwan. The sampled schools were randomly selected, and in each, one
Grade 4, one Grade 5, and one Grade 6 class were chosen randomly. The students in
the fourth, fifth, and sixth grades constituted 33.3%, 33.4%, and 33.3% of the sample,
respectively. Table 1 shows some critical characteristics of the sample. Regarding the
demographic, affective, and achievement backgrounds, this study asked students their
gender, interest in mathematics, and usual mathematics grade, respectively.
Data Analysis
The data analyses included exploratory factor analysis (EFA) and confirmatory factor
analysis (CFA). Because our sample was large, we randomly separated it into two
halves, with one half for EFA and the other half for CFA as suggested by the literature
(Reis & Judd, 2000). For the first research question, this study performed EFA with
oblique rotation to determine the factor structures of students’ perceptions of what
teachers should do to promote their affective engagement. EFA, as its title indicates, is
exploratory and data-driven. It was suitable for this study because the hypothesized
structures were absent. For the second and third research questions, clean factor
loadings were required to calculate descriptive information. This study conducted CFA
by using the structures identified through EFA to obtain clean factor loadings.
In this study, EFA and CFA were conducted with M-plus 6.12 by using a robust
weighted least squares estimator that is typically considered robust to nonnormal data.
The model fit for EFA and CFA was evaluated using a comparative fit index (CFI),
Tucker–Lewis Index (TLI), and root mean square error of approximation (RMSEA).
The estimates of CFI ≥ 0.90, TLI ≥ 0.90, and RMSEA ≤ 0.08 indicate a good fit (Kline,
2011). The number of eigenvalues larger than 1 was also examined according to the
Kaiser–Guttman rule to determine the number of latent factors extracted using EFA.
The weighted average percentage of checking (POC) for each latent factor was also
computed. The factor loadings estimated through CFA were employed as the weights
for the indicators when calculating the weighted average POC for each factor (DiStefano, Zhu, & Mîndrilă, 2009). To examine whether students considered the

Wang, Hsieh
4–374 PME40 – 2016
factors equally influential, a paired t test, an independent samples t test, and an analysis
of variance combined with post hoc analysis were conducted. In addition to statistical
significance, Cohen’s d as a measure of effect size was also reported. Values exceeding
0.2, 0.5, and 0.8 indicate a small, medium, and large effect size, respectively (Cohen,
1992).
Characteristics Percentage
Gender Female Male
47.9% 52.1%
Interests in mathematics Like mathematics Dislike mathematics
59.2% 40.8%
Usual mathematics grades High achieving Middle achieving Low achieving
42.6% 33.4% 24.0%
Note. The high-achieving, middle-achieving, and low-achieving students were those whose usual grades were 90 points and above, 80–90 points, and below 80 points, respectively.
Table 1: Sample characteristics
RESEARCH FINDINGS
Factor Structure
Thirteen teaching-behavior items regarding what teachers should do to promote
students’ affective engagement were obtained in the first stage, as listed in Table 2.
The POC of every item was higher than 70%, except for M201 (52%) and M208 (68%).
Five items even received endorsements of more than 90% from the students.
The EFA of the 13 items yielded three factors, as shown in Table 2. The factors
explained 64% of the total variance. The model fit was good (CFI = 0.993, TLI = 0.987,
RMSEA = 0.049). The first factor, cognition, included a group of teaching behaviors
that considered students’ learning regarding understanding, meaning, challenging, and
prompt feedback from teachers. The second factor, activity, included a group of
teaching behaviors related to arranging mathematics activities for students. The third
factor, extrinsic motivation, consisted of teaching behaviors that provide extrinsic
motivation by giving rewards, developing a favorable classroom climate and teacher–
student relations, and applying extra aids or media.
According to Deci, Vallerand, Pelletier, and Ryan (1991), people have three basic
psychological needs: competence, autonomy, and relatedness. The degree to which
students’ perceived classroom context meets their needs affects their engagement
(Fredricks et al., 2004). The three factors identified in the present study reflected these
three basic needs. The approaches of the cognitive factor tended to meet students’ need
for competence involving attaining internal outcomes. The approaches of the activity
factor tended to meet students’ needs for autonomy and relatedness with peers through
classroom discussion or various learning activities such as hands-on explorations and
games. The approaches of the extrinsic motivation factor included facilitating positive

Wang, Hsieh
PME40 – 2016 4–375
teacher–student relationships or meeting students’ need for competence involving
external outcomes. In addition, the three factors could be placed along two continuums:
one relating to the cognition vs. affection teaching objectives (Krathwohl, 2002 ) and
the other relating to interaction with objects (content bound; Piaget, 1936) vs.
interaction with people (social bound; Vygotsky, 1978, see Figure 1).
Teaching-behavior Item CFA
Loading POC
Cognition
M212 Take into account how well we understand in order to keep
us willing to learn 0.786 0.95
M213 Provide us immediate feedback, encouragement, or
suggestions to our test results 0.651 0.93
M207 Tell us why we need to learn a new math idea/concept to
facilitate our learning willingness 0.662 0.88
M204 Give out challenge questions during class to raise our
learning interests 0.417 0.74
Activity
M205 Leave time for us to discuss to help us like learning in class 0.624 0.75
M206 Arrange appropriate activities during class for us to learn
(ex., hands-on, games, groups, and exploration) 0.560 0.70
M201 Make the handouts pretty and organized to help us learn in
a good mood 0.609 0.52
Extrinsic motivation
M211 Be energetic and spirited during class to keep us from
feeling bored 0.543 0.94
M210 Provide appropriate encouragement when we have good
performance 0.716 0.93
M203 Use his/her enthusiasm to spark our interests and keep us
from giving up learning 0.789 0.92
M202 Share his/her academic and life experiences during class
constantly 0.547 0.81
M209 Use various teaching aids or media to arouse our curiosity 0.593 0.79
M208 Tell stories of mathematical history to raise our learning
willingness 0.626 0.68
Note. The CFA loadings were standardized coefficients.
Table 2: CFA loadings and POC

Wang, Hsieh
4–376 PME40 – 2016
Figure 1: Continuums for the factors of teachers’ approaches to enhancing student
affective engagement
Comparison of POCs among Factors and Students with Different Backgrounds
The factor loadings of affective engagement items on the hypothesized factors in CFA
are shown in Table 2. The model fit was good (CFI = 0.991, TLI = 0.988, RMSEA =
0.015). All the factor loadings were adequate (≥ 0.3).
The weighted average POCs of the cognition, activity, and extrinsic motivation factors
were 0.90, 0.72, and 0.87, respectively. These high weighted average POCs showed
that the factors were all influential in promoting students’ affective engagement. The
weighted average POCs of cognition and extrinsic motivation were significantly higher
than that of activity (p < .01 and p < .01, respectively) with a medium effect size (d =
0.63 and d = 0.53, respectively). The difference between the weighted average POCs
of cognition and extrinsic motivation was also significant (p < .01) and almost reached
a small effect size (d = 0.193). The contrastive end, cognition, was the most influential
factor in enhancing affective engagement. Providing autonomy has been reported to be
effective in enhancing elementary school students’ affective engagement (Ryan &
Connell, 1989); this was reflected in our findings with the high weighted average POC
of the activity factor. However, compared with activity, extrinsic motivation registered
a higher endorsement, which means that Taiwanese elementary school students cared
more about their teachers’ management of teacher–student interaction and
relationships than about their autonomy.
Table 3 shows that the weighted average POCs of each factor between students with
different demographic, affective, and achievement backgrounds were not significantly
different except for students with different interests in mathematics in the factor of
cognition (p < .01; d = 0.30). These findings are not consistent with those of other
studies, which have claimed gender as a factor in the degree of student affective
engagement (e.g., Plenty & Heubeck, 2011).
CONCLUSION
What teachers should do to enhance student affective engagement in mathematics
learning is a practical and crucial issue. The present study identified a three-factor
structure by using a Taiwanese national representative sample of elementary school
students. Our results indicated that the cognition and external motivation factors are
more effective than the activity factor in promoting affective engagement. This
Cognition Affection
The extrinsic
motivation
factor
The
activity
factor
Content bound Social bound
The
cognition
factor
Wang, Hsieh
PME40 – 2016 4–377
phenomenon indicates that, when considering enhancing affective engagement,
Taiwanese students prefer their teachers’ help with their cognition and management of
teacher–student interaction and relationships compared with working on various
hands-on or explorative activities. Practically, rather than developing time-consuming
learning activities, a Taiwanese teacher may first focus on teaching approaches
embedded in the cognition and external motivation factors to promote students’
affective engagement. However, further research is required to determine whether this
principle applies to teachers in other counties.
Factor Gender Interest Achievement
Female Male Like Dislike High Middle Low
Cognition 0.91 0.90 0.92 0.87 0.91 0.90 0.89
Activity 0.73 0.71 0.73 0.70 0.73 0.72 0.70
Extrinsic Motivation 0.88 0.86 0.88 0.85 0.88 0.85 0.86
Note. Like = like mathematics. Dislike = dislike mathematics. The shaded pair of values is
significantly different.
Table 3: Weighted average POCs of students with different backgrounds
Another crucial result of the present study is that, for students with different
demographic, affective, and achievement backgrounds, the efficiencies of the factors
are not different except for students with different interests in mathematics in the factor
of cognition. The teaching behaviors involving more mathematics content (the
cognition factor) work equally well for students with different achievement levels, but
work differently for students with different interests in mathematics. It is possible that
students with high achievement understand most of the mathematics content taught by
teachers, and that an increase in understanding would not change their willingness to
participate in class; by contrast, students with a high interest in mathematics benefit
from understanding, which may be a prior barrier to their participation. However,
further research is required to make any additional conclusions.
References
Attard, C. (2012). Applying a framework for engagement with mathematics in the primary
classrooms. Australian Primary Mathematics Classroom, 17(4), 22-27.
Blumenfeld, P. C., & Meece, J. L. (1988). Task factors, teacher behavior, and students’
involvement and use of learning strategies in science. The Elementary School Journal,
88(3), 235-250.
Bodovski, K., & Farkas, G. (2007). Mathematics growth in early elementary school: the roles
of beginning knowledge, student engagement, and instruction. The Elementary School
Journal, 108(2), 115-130.
Cavanagh, M. (2011). Students' experiences of active engagement through cooperative
learning activities in lectures. Active Learning in Higher, 12(1), 23-33.
Cohen, J. (1992). A power primer. Psychological Bulletin, 112, 155-159.
Wang, Hsieh
4–378 PME40 – 2016
Deci, E., Vallerand, R. J., Pelletier, L. G., & Ryan, R. M. (1991). Motivation and education:
The self-determination perspective. Educational Psychologist, 26(3-4), 325-346.
DiStefano, C., Zhu, M., Mîndrilă, D. (2009). Understanding and using factor scores:
considerations for the applied researcher. Practical Assessment, Research & Evaluation,
14(20), 1-11.
Fredricks, J. A., Blumenfeld, P. C., Paris, A. H. (2004). School engagement: Potential of the
concept, state of the evidence. Review of Educational Research, 74(1), 59-109.
Hsieh, F.-J. (1997). 國中數學新課程精神與特色 [The spirits and the characteristics of new
lower secondary mathematical curriculum]. Science Education Monthly, 197, 45-55.
Kline, P. (1994). An easy guide to factor analysis. London: Routledge.
Krathwohl, D. R. (2002). A revision of Bloom’s taxonomy: An overview. Theory in to
Practice, 41(4), 212-218.
Maehr, M. L., & Midgley, C. (1991). Enhancing student motivation: A schoolwide approach.
Educational Psychologist, 26(3-4), 399-427.
Marks, H. M. (2000). Student engagement in instructional activity: Patterns in the elementary,
middle, and high school years. American Educational Research Journal, 37(1), 153-184.
Murray, S. (2011). Secondary students’ descriptions of “good” mathematics teachers. The
Australian Mathematics Teacher, 67(4), 14-20.
Piaget, J. (1936). Origins of intelligence in the child. London: Routledge & Kegan Paul.
Plenty, S, & Heubeck , B. G. (2011). Mathematics motivation and engagement: an
independent evaluation of a complex model with Australian rural high school students.
Educational Research and Evaluation: An International Journal on Theory and Practice,
17(4), 283-299.
Reis, H. T., & Judd, C. M. (2000). Handbook of research methods in social and personality
psychology. UK: Cambridge University Press.
Ryan, R. M., & Connell, J. P. (1989). Perceived locus of causality and internalization:
Examining reasons for acting in two domains. Journal of Personality and Social
Psychology, 57, 749-761.
Sancho-Vinuesa, T., Escudero-Viladoms, N., & Masià, R. (2013). Continuous activity with
immediate feedback: A good strategy to guarantee student engagement with the course,
Open Learning: The Journal of Open, Distance and e-Learning, 28(1), 51-66.
Steinberg, L., Brown, B. B., & Dornbush, S. M. (1996). Beyond the classroom: Why school
reform has failed and what parents need to do. New York: Simon and Schuster.
Vygotsky, L. S. (1978). Mind in society: The development of higher psychological processes.
Cambridge, MA: Harvard University Press.

2016. In Csíkos, C., Rausch, A., & Szitányi, J. (Eds.). Proceedings of the 40th Conference of the International
Group for the Psychology of Mathematics Education, Vol. 4, pp. 379–386. Szeged, Hungary: PME. 4–379
NONLOCAL MATHEMATICAL KNOWLEDGE FOR TEACHING
Nicholas H. Wasserman
Teachers College, Columbia University
The notion of practice-based models for mathematical knowledge for teaching has
played a pivotal role in the conception of teacher knowledge. In this work, teachers’
knowledge of mathematics that is outside the scope of what is being taught is
considered more explicitly. Drawing on a cognitive model for the development of
mathematical knowledge for teaching, this paper explores the implications for the
underlying theory being applied to (nonlocal) knowledge beyond what is being taught
as being influential for the teaching of (local) mathematics.
INTRODUCTION
Teacher’s mathematical knowledge, and the role that it plays in classroom practice, has
been a central question in mathematics education for a long time. Some scholars have
developed frameworks that describe various domains of that knowledge (e.g., Ball,
Thames, & Phelps (2008); others, have focused on its’ development (e.g., Silverman
& Thompson, 2008). Much of this work has focused on how a teacher should
understand the content that they teach; yet, when it comes to knowing content that is
beyond what one teaches, there is little consensus as to its importance or its
implications on classroom practice. In this paper, we draw on Silverman and
Thompson’s (2008) cognitive model for the development of mathematical knowledge
for teaching as a means to adapt and explore the theoretical ramifications when one
considers knowledge of content that is beyond what is being taught. This work has been
informed by five years of research studies and projects with teachers (e.g., Wasserman,
2015a; Wasserman, 2015b).
MATHEMATICAL KNOWLEDGE FOR TEACHING
In one of the more broadly-adopted frameworks, Ball, Thames, and Phelps (2008)
described their conception of Mathematical Knowledge for Teaching (MKT), which
built on Shulman’s (1986) work and proposed three sub-domains of subject-matter
knowledge (SMK) and three sub-domains of pedagogical content knowledge (PCK).
In the realm of SMK, the third category, horizon content knowledge (HCK) – which is
the most associated with knowing mathematics beyond what one teaches – was only
provisionally included. Although others have worked to further conceptualize HCK
(e.g., Wasserman, Mamolo, Ribeiro, & Jakobsen, 2014), it has remained
underdeveloped because of difficulties conceptualizing it in relation to classroom
practice and as distinct from the other sub-domains. Ultimately, we propose a different
division for considering teachers’ mathematical knowledge; but first, we briefly
discuss existing ideas about its’ development.
Wasserman
4–380 PME40 – 2016
Silverman and Thompson (2008) outlined a two-step cognitive model for the
development of mathematical knowledge for teaching. Their model posited that
powerful mathematical understandings – related to Simon’s (2006) notion of key
developmental understandings (KDUs) – were the first step toward the development
of mathematical knowledge for teaching. Simon (2006) described KDUs as a
“conceptual advance… a change in [one’s] ability to think about and/or perceive
particular mathematical relationships” (p. 362). In other words, KDUs are
mathematically powerful understandings that change perceptions about content, effect
ontological shifts in understanding, and influence mathematical connections.
According to Silverman and Thompson (2008), however, while such understandings
are mathematically powerful, they are not intrinsically pedagogically powerful. A
second step, of transforming such understandings into having pedagogical power –
which then affect classroom practice – was necessary for developing mathematical
knowledge for teaching. Ultimately, a teachers’ understanding of the content they teach
is one of the primary mediators for the way that they teach that content.
A MATHEMATICAL LANDSCAPE
This paper proposes a different approach for considering mathematical knowledge for
teaching. In particular, instead of partitioning knowledge into SMK and PCK, we
propose a different division, based on the relative location of mathematical ideas within
a broader mathematical landscape. In particular, such a division more directly tackles
the notion of mathematical knowledge beyond what ones teaches. Indeed, since the act
of teaching deeply involves teachers in the mathematics of what they teach, we regard
such a distinction as incredibly practical. And since there is continued debate around
such knowledge, this work also contributes to the broader conversation about teachers’
content knowledge in mathematics education.
Although knowing ideas beyond what one teaches may be interesting to discuss in
every subject area, in the teaching of mathematics, it takes on an even more important
role. Compared to many other disciplines, mathematics is fairly linear in its
developmental trajectory – new ideas and concepts are progressively built on and
refined from older ones throughout the course (often, over a decade) of one’s
mathematical study. This means that in mathematics what one teaches now is often
revisited at a later point, and thus more directly linked to ideas that are beyond the
current scope – which also has implications in the reverse direction as well.
With this in mind, we define the local mathematical neighbourhood as those
mathematical ideas that are relatively close to the content being taught. “Close” in this
sense entails both the degree to which mathematical ideas are closely connected, but
also temporally close in relation to when mathematical ideas are typically developed
(Wasserman, 2015a; Wasserman, 2015b). In other words, we are using a topological
description about the landscape of mathematical ideas, defining two regions: the local
mathematical neighbourhood of the mathematics being taught, and the nonlocal
mathematical neighbourhood, which consists of ideas that are farther away. This idea

Wasserman
PME40 – 2016 4–381
is connected to and was influenced by the notion of a “mathematical horizon.” Indeed,
the image of a(n) (epsilon) neighbourhood allows for the inclusion of mathematical
ideas that are “behind” as well as “beyond” the content being taught – not just a
forward-looking horizon but also one in the rearview mirror. From Shulman’s (1986)
notion of vertical curricular knowledge, we also might consider the inclusion of a
curricular mathematical neighbourhood, which could separate the nonlocal
mathematical neighbourhood for K-12 teachers into those ideas within the scope of
school mathematics and those in more advanced mathematics (Figure 1).
Figure 3. Mathematical Landscape
Briefly, we elaborate on two aspects of this partitioning. Firstly, as a discipline,
mathematics has been a forerunner in defining both content and process standards as
important educational aims (e.g., NCTM 2000). That is, the local neighbourhood of
mathematics necessarily includes specific content, but it also includes more general
ways of doing and engaging with mathematics. Such processes – e.g., problem solving,
reasoning and proof, etc. – are reminiscent of Shulman’s (1986) portrayal that teachers
should know their subject’s organizing structures, principles of inquiry, core values,
etc. Indeed, both the local and nonlocal neighbourhoods have this dichotomy.
Secondly, describing the set of mathematical ideas within the local neighbourhood can
be difficult: there is no “distance metric” between mathematical ideas by which one
might determine precise boundary regions. However, for many mathematical ideas,
even without explicit definition, which neighbourhood they fall into is clear (e.g.,
groups in abstract algebra are outside the local mathematical neighbourhood for a K-
12 mathematics teacher). Yet there are also advantages in the generality of the
definitions; in particular, it allows for interpretations of various grain sizes. For
example, one might consider not only the neighbourhood of one year of mathematics
(e.g., 6th grade mathematics), but a much smaller neighbourhood of ideas being taught.
This allows for a broader interpretation about how knowledge outside the scope of
what is being taught – even if it is within the scope of content the teacher is going to
teach – may influence teachers’ practices in the classroom.
Finally, two comments more specific to this paper: i) most examples stem from
secondary mathematics education, as this is where the majority of the work has been.
However, the intent is that the model is broad enough to incorporate other levels of
teaching (e.g., elementary, university); and ii) most of the discussion leverages more
advanced mathematics encountered at the university level – e.g., abstract algebra, real

Wasserman
4–382 PME40 – 2016
analysis – as the means to address knowledge beyond what one teaches. But, again, a
more flexible interpretation that would make sense in other contexts is also intended.
NONLOCAL MATHEMATICS AND PEDAGOGICAL POTENTIAL
In this section, we adapt the two-step cognitive model for developing mathematical
knowledge for teaching in consideration for how knowledge of nonlocal mathematics
interacts with the teaching of local mathematics. But first, we make more explicit one
of the inherent difficulties with considering knowledge outside the scope of what one
teaches: teachers should not end up teaching this content to their students. That is, we
are discussing content that should, theoretically, not arise, explicitly, in instruction –
secondary teachers should be teaching algebra, not abstract algebra; however, it should
simultaneously be influential for their teaching. Therein lies the tension.
Key Developmental Understandings
Essentially, in accord with Silverman and Thompson (2008), one of the primary
mechanisms by which we view connections to teaching has to do with teachers’ own
mathematical understandings. More specifically, with regard to mathematics outside
what one teaches – the nonlocal mathematical neighbourhood – we adapt the first step
in their cognitive model in a specific sense: teachers’ understanding about nonlocal
mathematical ideas must serve as a KDU for the (local) content they teach – which
includes both mathematical content and disciplinary processes. This is to say that
knowledge of nonlocal mathematics becomes potentially productive for teaching at the
moment that such knowledge alters teachers’ perceptions of or understandings about
the local content they teach. We see this adaptation as aligned with the development
of mathematical knowledge, and as a natural extension of the cognitive model, but also
as very different from other perspectives. We contrast this (third) view with two other
common perspectives about more advanced mathematics.
Advanced (Nonlocal) Mathematics as being for Mathematics’ sake
First, some would argue that teachers should learn mathematics beyond what they are
going to teach because they should. Mathematics, regardless of whether it relates to
future teaching, is important. The most compelling arguments for this have something
to do with the development of “mathematical confidence.” That is, the essential role of
learning more advanced mathematics – i.e., mathematics beyond what they will be
teaching – is to build a degree of confidence in their knowledge of the subject. Such
confidence, we note, does have potential teaching benefits (Brown & Borko, 1992).
However, particularly after the broad acceptance of PCK, such arguments, which, for
the most part, are completely disconnected from the work that teachers do in the
classroom, are met with a healthy degree of scepticism. It certainly becomes more
difficult to justify that a secondary teacher needs to know that Q(i):Q is a finite field
extension (Heinze, et al., 2015). We depict this perspective – which contends that,
regardless of connection, more advanced mathematics is important to study – by the
two mathematical neighbourhoods being disjoint (Figure 2a).

Wasserman
PME40 – 2016 4–383
Advanced (Nonlocal) Mathematics as related to Local Mathematics
Next, we consider those that view more advanced mathematics as important for
teaching when it is related to the local mathematics. Perhaps the first to popularize this
idea was Felix Klein, who wrote Elementary mathematics from an advanced
standpoint (1932). The Conference Board of Mathematical Sciences’ Mathematical
Education of Teachers II (CBMS, 2012) has a similar position of applying more
advanced mathematics to the content that the teacher will be teaching: for example, it
would be “quite useful for prospective [secondary] teachers to see how C can be ‘built’
as a quotient of R[x]… [and] Cardano’s method, and the algorithm for solving quartics
by radicals can all be developed… as a preview to Galois theory” (p. 59). Cuoco (2001)
summarizes a principle for redesigning the undergraduate experience of prospective
teachers this way: “Make connections to school mathematics” (p. 170). At the heart of
this perspective is a desire to make more advanced mathematical study related to what
a teacher is going to teach. Yet we regard the more general argument, that by the simple
merit of some advanced topic – e.g., Galois Theory – being related to the content of
school mathematics that such knowledge is important for teachers, as tenuous. We do
not presume such a “trickle down” effect to teaching. We depict this perspective –
which contends that more advanced mathematics is important when it is connected to
school mathematics – by the two mathematical neighbourhoods interconnected at
several places (Figure 2b).
Advanced (Nonlocal) Mathematics as related to Teaching Local Mathematics
Although these two perspectives about advanced mathematics both have potential
value, if one adopts Silverman and Thompson’s (2008) model, the powerful
understandings gained from nonlocal mathematics must serve as KDUs not (only) for
their knowledge of nonlocal mathematics, but for the teachers’ understanding of the
local mathematics they teach. Essentially, the first mechanism for bringing about
connections to teaching is by tying the nonlocal mathematical knowledge as not only
connected to but as fundamentally important for their own mathematical understanding
of the local content they teach. We depict this perspective – which contends that more
advanced mathematics becomes potentially important for teachers when it serves as a
KDU for the local content they teach – by the two mathematical neighbourhoods
overlapping, where the overlapping local region has been fundamentally altered (i.e.,
a new colour) by this connection (Figure 2c).
a. b. c.
Figure 2. Depicting three perspectives on advanced mathematics
Having an idea in more advanced mathematics, such as the algebraic structure of a
group, serve as a KDU for local content sets a high bar. That is, a teacher’s
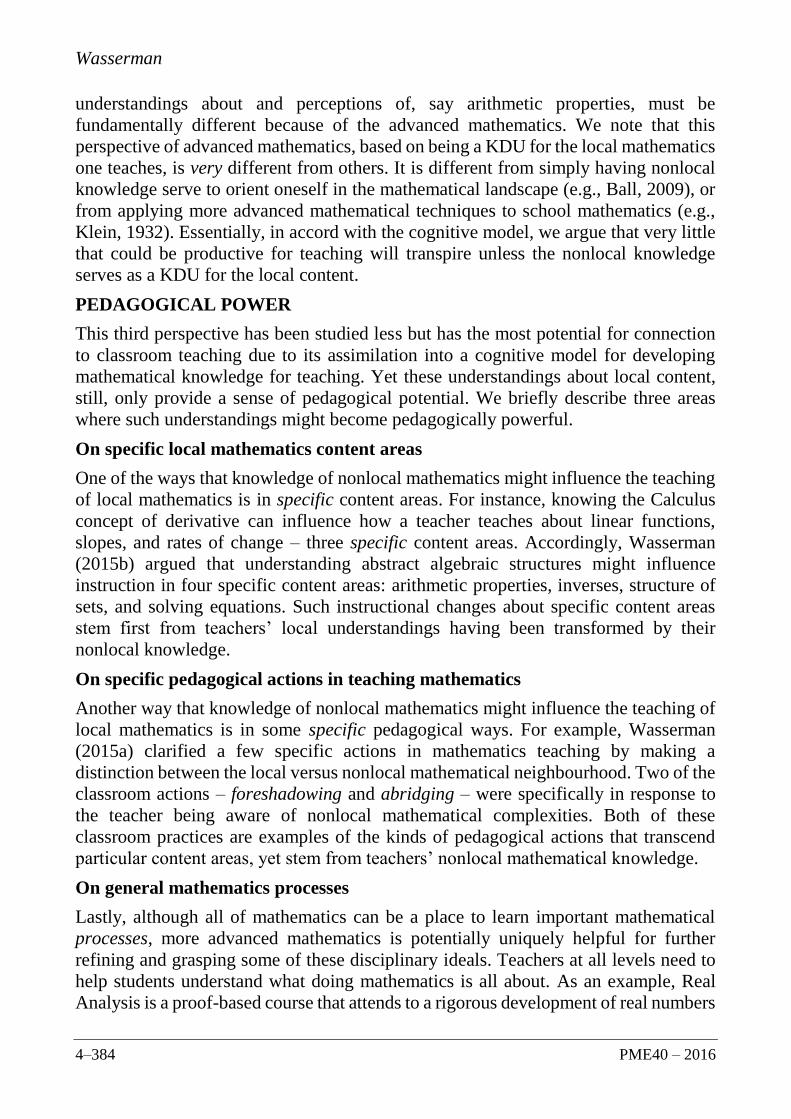
Wasserman
4–384 PME40 – 2016
understandings about and perceptions of, say arithmetic properties, must be
fundamentally different because of the advanced mathematics. We note that this
perspective of advanced mathematics, based on being a KDU for the local mathematics
one teaches, is very different from others. It is different from simply having nonlocal
knowledge serve to orient oneself in the mathematical landscape (e.g., Ball, 2009), or
from applying more advanced mathematical techniques to school mathematics (e.g.,
Klein, 1932). Essentially, in accord with the cognitive model, we argue that very little
that could be productive for teaching will transpire unless the nonlocal knowledge
serves as a KDU for the local content.
PEDAGOGICAL POWER
This third perspective has been studied less but has the most potential for connection
to classroom teaching due to its assimilation into a cognitive model for developing
mathematical knowledge for teaching. Yet these understandings about local content,
still, only provide a sense of pedagogical potential. We briefly describe three areas
where such understandings might become pedagogically powerful.
On specific local mathematics content areas
One of the ways that knowledge of nonlocal mathematics might influence the teaching
of local mathematics is in specific content areas. For instance, knowing the Calculus
concept of derivative can influence how a teacher teaches about linear functions,
slopes, and rates of change – three specific content areas. Accordingly, Wasserman
(2015b) argued that understanding abstract algebraic structures might influence
instruction in four specific content areas: arithmetic properties, inverses, structure of
sets, and solving equations. Such instructional changes about specific content areas
stem first from teachers’ local understandings having been transformed by their
nonlocal knowledge.
On specific pedagogical actions in teaching mathematics
Another way that knowledge of nonlocal mathematics might influence the teaching of
local mathematics is in some specific pedagogical ways. For example, Wasserman
(2015a) clarified a few specific actions in mathematics teaching by making a
distinction between the local versus nonlocal mathematical neighbourhood. Two of the
classroom actions – foreshadowing and abridging – were specifically in response to
the teacher being aware of nonlocal mathematical complexities. Both of these
classroom practices are examples of the kinds of pedagogical actions that transcend
particular content areas, yet stem from teachers’ nonlocal mathematical knowledge.
On general mathematics processes
Lastly, although all of mathematics can be a place to learn important mathematical
processes, more advanced mathematics is potentially uniquely helpful for further
refining and grasping some of these disciplinary ideals. Teachers at all levels need to
help students understand what doing mathematics is all about. As an example, Real
Analysis is a proof-based course that attends to a rigorous development of real numbers
Wasserman
PME40 – 2016 4–385
and real-valued functions, and sets the foundation for important ideas in Calculus.
Since the content of real analysis – indeed more so than many other mathematics
courses – is extremely explicit with both definitions and assumptions, and producing
rigorous deductive arguments, interaction with this nonlocal mathematics can serve as
a place to strengthen these disciplinary practices.
NONLOCAL MATHEMATICS INFLUENCING TEACHING PRACTICE
To summarize, knowledge of nonlocal mathematics can influence both teachers’
understanding of and teaching of local content. The primary mechanism is having such
knowledge serve as a KDU for the content they teach – which can be specific content
as well as general processes. These KDUs then can influence instructional practice
across three different aspects: specific content areas, specific pedagogical actions, and
general mathematics processes. Recently, Stockton and Wasserman (under review)
posited five forms of knowing advanced mathematics that might be particularly
applicable for teaching: peripheral knowledge, evolutionary knowledge, axiomatic
knowledge, logical knowledge, and inferential knowledge. These represent some
particular understandings about more advanced content that might help foster
development as KDUs for local content that also have pedagogical power. Figure 3
summarizes the theoretical considerations for content outside the content being taught
as potentially influential on the teaching of local content.
Figure 3. Nonlocal mathematical knowledge interacting with local teaching
IMPLICATIONS AND CONCLUSIONS
In conclusion, we mention one of the primary implications from this paper: that of
considering how the teaching of more advanced mathematics might take place as a part
of teacher preparation. We do not advocate that teachers need fewer advanced
mathematics courses, but rather that the teaching of these ideas be more informed by
and related to their future professional needs. To that end, these ideas suggest and
support a model for teaching more advanced mathematics that explicitly has course
content “build up from” and “step back down to” teaching practice. In other words,
instead of hoping for a trickle-down effect, one ramification of our adaptation of the
cognitive model is that the teachers’ development of and understandings about

Wasserman
4–386 PME40 – 2016
nonlocal mathematics must not only relate to the content of school mathematics, but to
the teaching of school mathematics content. The field of teacher education as a whole
must better identify and use desired pedagogical changes – in specific content areas,
pedagogical actions, or processes – to help build and develop teachers’ key
understandings about nonlocal content in ways that can be pedagogically powerful.
References
Ball, D. L. (2009). With an eye on the mathematical horizon. Presented at the National
Council of Teachers of Mathematics (NCTM) Annual Meeting, Washington, D.C.
Ball, D. L., Thames, M. H., & Phelps, G. (2008). Content knowledge for teaching: What
makes it special? Journal of Teacher Education, 59(5), 389-407.
Brown, C. & Borko, H. (1992). Becoming a mathematics teacher. In D.A. Grouws (Ed.),
Handbook of Research on Mathematics Teaching and Learning (pp. 209-239). New York:
Macmillan.
Conference Board of the Mathematical Sciences (2012). The mathematical education of
teachers II (MET II). Retrieved from: http://www.cbmsweb.org/MET2/MET2Draft.pdf
Cuoco, A. (2001). Mathematics for teaching. Notices of the AMS, 48(2), 168-174.
Heinze, A., Lindmeier, A., & Dreher, A. (2015). Teachers’ mathematical content knowledge
in the field of tension between academic and school mathematics. Paper presented at
Didactics of Mathematics in Higher Education as a Scientific Discipline.
Klein, F. (1932). Elementary mathematics from an advanced standpoint: Arithmetic, Algebra,
Analysis (trans. Hedrick, E.R. & Noble, C.A.). Mineola, NY: Macmillan.
National Council of Teachers of Mathematics (NCTM) (2000). Principles and standards for
school mathematics. Reston, VA: author.
Shulman, L.S. (1986). Those who understand: Knowledge growth in teaching. Educational
Researcher, 15(2), 4-14.
Silverman, J., & Thompson, P. W. (2008). Toward a framework for the development of
mathematical knowledge for teaching. Journal of Mathematics Teacher Education, 11(6),
499-511.
Simon, M. (2006). Key developmental understandings in mathematics: A direction for
investigating and establishing learning goals. Mathematical Thinking and Learning, 8(4),
359-371.
Wasserman, N. (2015a). Unpacking teachers’ moves in the classroom: Navigating micro- and
macro-levels of mathematical complexity. Educational Studies in Mathematics, 90(1),
75-93.
Wasserman, N. (2015b). Abstract algebra for algebra teaching: Influencing school
mathematics instruction. Canadian Journal of Science Mathematics and Technology
Education (Online first). DOI: 10.1080/14926156.2015.1093200
Wasserman, N., Mamolo, A., Ribeiro, C. M., & Jakobsen, A. (2014). Exploring horizons of
knowledge for teaching (Discussion Group 2). Joint meeting of International Group for the
Psychology of Mathematics Education (PME 38) and North American Chapter of the
Psychology of Mathematics Education (PME-NA 36), Vancouver, Canada.

2016. In Csíkos, C., Rausch, A., & Szitányi, J. (Eds.). Proceedings of the 40th Conference of the International
Group for the Psychology of Mathematics Education, Vol. 4, pp. 387–394. Szeged, Hungary: PME. 4–387
EXPLORING MIDDLE SCHOOL GIRLS’ AND BOYS’
ASPIRATIONS FOR THEIR MATHEMATICS LEARNING
Karina J Wilkie
Monash University
This study sought insights into the aspirations of over 3500 middle school girls and
boys for their mathematics learning, with the intent of not only informing teachers of
the nature of students’ hopes more broadly but also to offer teachers a tool they can
use with their own students and against which their own students’ responses can be
compared. The students responded to a free-format prompt and generated a wide range
of aspirations related to their goals for learning, and their affect, interest and effort,
along with specific insights into the features of tasks, working arrangements, and
interactions with teachers. This paper discusses a comparative analysis of boys’ and
girls’ responses in terms of the nature and frequency of their expressions of
aspirations.
The considerable disengagement of middle school students in mathematics in recent
years (e.g., Middleton, 2013) highlights the importance of finding ways to plan, teach,
and assess mathematics that better align pedagogies with students’ own aspirations.
Middle school students have been described as showing less interest, less self-efficacy,
and poorer achievement over time (Gottfried, Marcoulides, Gottfried, Oliver, &
Guerin, 2007). This study sought to explore this issue from the perspectives of middle
school students themselves (9 to 13 years old) – their own views on what matters to
them, what goals they might hold, and what they perceive as desirable for their
learning. It intended to consider and perhaps challenge assumptions and
preconceptions about middle school students’ engagement and learning. It was
believed that finding out more about aspirations from the students themselves might
allow teachers to respond in productive ways.
Researchers have investigated differences between boys’ and girls’ attitudes,
engagement, and motivation in learning mathematics and have drawn diverse
conclusions. Yet there is consensus that both boys and girls experience decreased
motivation in the middle years. This study provided an opportunity to compare and
explore the self-generated aspirations of boys and girls as another way to investigate
this issue. It was assumed that awareness of students’ own aspirations can help teachers
to reflect on and respond to students’ voice, and broaden their repertoire for teaching
mathematics in ways that positively influence boys’ and girls’ motivation and
achievement. This paper addresses the following research questions: What aspirations
do middle school boys and girls express related to their mathematics learning? What
evidence of mastery or performance goals do boys and girls spontaneously generate?

Wilkie
4–388 PME40 – 2016
BACKGROUND
It was anticipated that the students’ responses might relate to their own goals for
learning mathematics. This paper focuses on the nature of boys’ and girls’ self-
generated aspirations, and evidence of different types of goal orientations. One
theoretical perspective relates to four different types of goals an individual might hold
for their learning in a particular domain: mastery and performance goals (e.g., Ames,
1992) intersecting with another dichotomy of approach and avoidance goals. Mastery
goals focus on improving one’s own learning and making progress in task- or skill-
based outcomes whereas performance goals focus more on comparing oneself with
others, such as through test results or competitive situations. Approach and avoidance
goals describe how competence is valenced: how a situation or experience involves
inherent attraction leading to approach, or aversion leading to avoidance. The resulting
two-by-two goals framework is presented in Figure 1. It has been substantially
supported by empirical research for three out of the four types and more recently also
with mastery-avoidance (e.g., Elliot & Muryama, 2008).
Mastery-approach goal
Interest and curiosity: learning something interesting
Task: mastering a task
Challenge: mastering a challenge
Improvement or attainment: Learning as much as possible; improving my knowledge; understanding the content as thoroughly as possible; acquiring new skills
Performance-approach goal
Appearance: demonstrating competence / ability
Normative: performing better than other students
Evaluative: Demonstrating my ability relative to others in the class (as judged by authority figure such as a teacher)
Mastery-avoidance goal
Task: Avoiding forgetting what I have already learnt
Improvement or attainment: Avoiding losing my skills / abilities / knowledge; avoiding stagnation or lack of development
Performance-avoidance goal
Appearance: avoiding looking incompetent / ‘dumb’
Normative: Avoiding performing poorly in the class
Evaluative: Avoiding demonstration of lack of ability relative to others (as judged by authority figure)
Figure 1: Conceptualising four types of student goals using mastery-performance and
approach-avoidance dichotomies (Ames, 1992; Hulleman et al., 2010)
Brophy (2005) raised the issue that most research using goal theory has involved
measurement with experimental induction procedures or Likert-scale questionnaires,
which do not allow investigation into the degree to which students spontaneously
generate different goal orientations. He suggested that there is very limited evidence to
indicate that students actually do generate performance goals that relate to “looking
good in comparison with their classmates” (p. 171).
Boys’ and girls’ goal orientations in mathematics learning
In recent years, studies on goals and motivation have examined differences between
year levels and gender. Although some have drawn differing conclusions, it is
generally agreed that both boys and girls can experience a decrease of motivation in
the middle years. A review of studies found that overall, boys tend to report a higher
interest in learning mathematics than girls (Meece, Glienke, & Burg, 2006). Chouinard,
Karsenti, and Roy (2007) found that more girls reported mastery goals and higher effort
than boys. A study of 1244 German secondary students found that nearly half reported
Wilkie
PME40 – 2016 4–389
believing that boys achieve more, one fifth reported that girls achieve more, and the
rest indicated no gender difference. Of those students who reported that they believe
girls achieve more, the three most frequently cited reasons were effort, concentration,
and ambition – not ability (Kaiser, Hoffstall, & Orschulik, 2012).
In an Australian context, Watt (2004) found that boys maintained a higher interest in
and liking for mathematics and a higher perception of competence (ability rather than
effort) than girls throughout adolescence. In contrast to these findings, Leder and
Forgasz (2002) studied over 800 lower secondary students and found that the majority
viewed mathematics as a gender-neutral domain in terms of ability or achievement,
and reported believing that girls are more interested in mathematics and enjoy it more,
whereas the boys are more likely to find it difficult and boring – that they need more
help to learn it than girls. Another Australian study of 1801 secondary students found
that the middle school girls demonstrated more mastery goals and more effort than
boys (Green, Martin, & Marsh, 2005). An across-country longitudinal study of
secondary students found that Australian girls had significantly lower intrinsic value
for mathematics than the boys, unlike those in Canada and the US. Yet they did not
show lower perception of ability than the boys, as did the girls in Canada and the US
(Watt et al., 2012).
This study provided the opportunity to consider what boys and girls themselves choose
to focus on when expressing their aspirations for their mathematics learning, evidence
of their spontaneously generated goal orientations and how these findings might give
teachers insight into teaching mathematics at middle school levels.
RESEARCH DESIGN
There seems to be an increasing understanding of the value of consulting learners about
issues that affect them, for making teaching and learning more effective (e.g., Flutter
& Rudduck, 2004). Much of the research literature describes structured surveys and
Likert scales, typically used in large-scale studies, to examine students’ goal
orientations from a normative view (di Martino & Zan, 2010). As a complementary yet
alternative methodological approach, this study invited students to express their
aspirations in their own words. It used an open-response survey to enable inductive and
interpretive analysis for investigating different facets of goals and motivation from
students’ perspectives, and with no use of a priori constructs to influence their
responses. The study’s purpose was not to infer causal relationships but to understand
more about what students choose to focus on when articulating their aspirations and
how these might relate to different goal orientations, motivational issues, or
experiences in mathematics learning. The students were asked: If you had one wish for
your mathematics learning, what would it be? Although seeking qualitative data, the
survey generated responses from 3562 middle school students (93% response rate for
this item within a larger survey as part of the Encouraging Persistence Maintaining
Challenge (EPMC) project funded by the Australian Research Council). Responses
ranged from a few words to long paragraphs.

Wilkie
4–390 PME40 – 2016
The study employed inductive, researcher-driven (Corbin & Strauss, 2008) line-by-
line coding and interpretive analysis, rather than automated software procedures,
despite the large data set. The use of NVivo 10 supported this process and enabled
cyclical comparisons of coding frequencies and adjustments to categories throughout
the process to improve intra- and inter-coding reliability (Miles & Huberman, 1994).
The program documented the process by forming an audit trail of the coding
undertaken (author and research assistant).
DISCUSSION AND IMPLICATIONS
The following discussion focuses on the nature of the aspirations that girls and boys
described spontaneously, and also on evidence of different goal orientations in their
use of language. Table 1 presents the coded categories of the students’ responses, the
percentage frequencies, and comparative ratios.
Table 1: Categories with percentage frequencies for students overall,
boys, and girls, and ratios

Wilkie
PME40 – 2016 4–391
The students’ responses demonstrate a wide range of aspirations, and there are
responses from boys and girls coded in every category. Most are about learning or
achievement (60% overall – 56% of the boys and 64% of the girls). The next most
frequent type of aspiration is about features of tasks, with most referring to a specific
mathematics topic or concept. Fractions, decimals, and percentage, and times tables
were both key areas. The next three most frequent types of aspirations are about affect
or motivation, working arrangements in lessons, and being taught (explicit reference).
Across all of these five categories, a slightly higher proportion of girls made responses,
suggesting that they were more likely to have made survey responses that required
coding in more than one category.
Figures 2 and 3 present the five most frequent categories for boys and girls alongside
comparative percentages for the other gender. It can be seen that two categories relate
to specific topics and the other three to learning and/or achievement.
Figure 2: Five most frequent categories for boys
Figure 3: Five most frequent categories for girls
Wilkie
4–392 PME40 – 2016
Four out of the five categories are common to both genders yet are in a different order.
The girls’ fifth category – about fluency – does not appear in the boys’ list. The boys’
fourth category – about improving (in general) – does not appear in the girls’ list, even
though relatively more girls were coded in this category. The two previously mentioned
topic-specific categories appear in both lists, suggesting that these areas of
mathematics are of concern to both boys and girls.
The framework of different types of goal orientations (Figure 1) was used to look for
evidence of these in the five most frequent categories. Wanting to improve in a
particular concept or skill was the focus of two categories for both genders and is
suggestive of mastery-approach goals. For the girls, the most frequent non-topic-
specific category was about understanding: being able to understand, knowing, or
having knowledge. This is also suggestive of a mastery-approach goal because of the
focus on “understanding the content as thoroughly as possible.” The second most
frequent (non-topic-specific) category for the girls was about performing: marks or
grades or standard, good or smart at maths. This could relate to mastery or
performance goals, depending on whether or not an individual seeks validation through
performing well that they have mastered a task and acquired new skills (mastery) or
that they have demonstrated competence and appear to have ability (performance).
Hulleman et al. (2010) emphasised the need to distinguish between these reasons for
wanting to perform well; even though on the surface such language about grades and
results might look like performance goals, it is important to look explicitly for the
desire to be compared favourably against other people. The girls’ third most frequent
(non-topic-specific) category was about fluency: being able to learn or answer quicker
or more easily or efficiently. It is unclear as to whether they wanted fluency for
improved learning (mastery-approach), or for not wanting to appear incompetent or
dumb to others by being slow to understand or answer (performance-avoidance).
In the boys’ list of five most frequent categories, about performing was more frequent
than about understanding – the reverse of the girls’ list. Their third most frequent
learning category was about improving: becoming smarter or better (in general). It
does not appear on the girls’ list. It was unclear from the students’ responses whether
or not the reason for wanting to improve related to a comparison with other people and
therefore cannot be used as evidence for one particular goal type.
Those categories where students’ spontaneously generated language evidenced a
clearer link to a particular type of goal are presented in Table 5 along with the
percentage frequencies of boys and girls. It can be seen that many more categories
evidenced mastery-approach goals than any other type. Within the mastery goal types,
it appears that interest and curiosity, and challenge were key foci for the boys’
descriptions of their aspirations, whereas learning different approaches and retaining
knowledge were key foci for the girls. Yet both genders spontaneously generated
responses that were coded in every category.

Wilkie
PME40 – 2016 4–393
Mastery-approach goal (% boys, % girls) Interest and curiosity:
About appropriate learning: at my level, more or new or useful things, choice (3.91, 4.92)
More creative / visual / hands-on tasks, games (2.61, 2.31)
More enjoyment, fun (2.73, 2.31)
Teachers making maths fun or interesting (0.25, 0.05)
Task / Challenge:
About wanting to learn multiple strategies, ways to solve, how others solve (2.61, 5.58)
About more challenge: being challenged, doing harder work, being in higher class (6.58, 5.48)
Teachers giving harder or more work or more strategies (0.31, 0.67)
Improvement or attainment:
About understanding: being able to understand, knowing or having knowledge (10.62, 13.11)
About thinking: using mental faculty well, improving ability to think (2.30, 2.25)
Better at a specific topic or concept (33.29, 40.01)
Performance-approach goal
Normative: In comparison with others: being better than, the best (2.24, 0.31)
Appearance: About explaining my understanding, showing what I know (0.56, 0.77)
Mastery-avoidance goal
Improvement or attainment: About retaining: not forgetting, remembering, memorising, off by heart, revising (2.61, 5.48)
Performance-avoidance goal
Appearance or evaluative: Emotional response – explicit reference to feeling embarrassed, left out, left behind, less smart than others (0.19, 0.72)
Table 2: Codes evidencing particular goals with % boys and % girls
The category that provided evidence of mastery-avoidance goals was about retaining:
not forgetting, remembering, memorising, off by heart, revising. Just over 4% of
students made such a response; the girls’ responses were more than twice as frequent
as the boys’. Although this type of orientation has only recently been empirically
validated (e.g., Elliot & Muryama, 2008) this study provides some evidence that more
girls than boys may hold this type of goal.
There is more to be analysed, and other frameworks for analysing the large data set of
middle school students’ own responses to being asked their wish for mathematics
learning. Perhaps a conclusion that can be drawn from the work to date is that boys and
girls both express a wide range of aspirations, which are overwhelmingly positive and
often focussed on mastery-approach goals. Their language is often quite specific,
suggesting that these students do know what they desire for their learning. Rather than
generalising about what matters to middle school students, teachers might do well to
view their classes as comprised of individuals, to seek information about their specific
aspirations, and find ways to incorporate students’ own suggestions for promoting their
engagement, learning, and achievement.

Wilkie
4–394 PME40 – 2016
References
Ames, C. (1992). Classrooms: Goals, structures, and student motivation. Journal of Educational
Psychology, 84, 261-271.
Brophy, J. (2005). Goal theorists should move on from performance goals. Educational
Psychologist, 40(3), 167-176.
Chouinard, R., Karsenti, T., & Roy, N. (2007). Relations among competence beliefs, utility
value, achievement goals, and effort in mathematics. British Journal of Educational
Psychology, 77(3), 501-517.
Corbin, J., & Strauss, A. L. (2008). Basics of qualitative research: Grounded theory procedures
and techniques (3rd ed.). Thousand Oaks, CA: Sage.
Di Martino, P., & Zan, R. (2010). ‘Me and maths’: Towards a definition of attitude grounded on
students’ narratives. Journal of Mathematics Teacher Education, 13(1), 27-48.
Elliot, A. J, & Murayama, Kou. (2008). On the measurement of achievement goals: Critique,
illustration, and application. Journal of Educational Psychology, 100(3), 613-628.
Flutter, J., & Rudduck, J. (2004). Consulting pupils: What's in it for schools? London:
Routledge Falmer.
Gottfried, A. E., Marcoulides, G. a., Gottfried, A. W., Oliver, P. H., & Guerin, D. W. (2007).
Multivariate latent change modeling of developmental decline in academic intrinsic math
motivation and achievement: Childhood through adolescence. International Journal of
Behavioral Development, 31(4), 317-327.
Green, J., Martin, A. J., & Marsh, H. W. (2005). Academic Motivation and Engagement: A
Domain Specific Approach Paper presented at the Australian Association for Research in
Education Annual Conference, Paramatta.
http://www.aare.edu.au/data/publications/2005/gre05384.pdf
Hulleman, C. S., Schrager, S. M., Bodmann, S. M., & Harackiewicz, J. M. (2010). A meta-
analytic review of achievement goal measures: Different labels for the same constructs or
different constructs with similar labels? Psychological Bulletin, 136(3), 422-449.
Kaiser, G., Hoffstall, M., & Orschulik, A. B. (2012). Gender role stereotypes in the perception of
mathematics: An empirical study with secondary students in Germany. In H. J. Forgasz & F.
Rivera (Eds.), Towards equity in mathematics education (pp. 115-140). Berlin: Springer-
Verlag.
Leder, G. C., & Forgasz, H. J. (2002). Two new instruments to probe attitudes about gender and
mathematics (pp. 27): ERIC, Resources in Education (RIE).
Meece, J. L., Glienke, B. B., & Burg, S. (2006). Gender and motivation. Journal of School
Psychology, 44(5), 351-373. doi: http://dx.doi.org/10.1016/j.jsp.2006.04.004
Middleton, J. A. (2013a). Introduction/editorial: the problem of motivation in the middle
grades. Middle Grades Research Journal, 8(1), xi-xiii.
Miles, M. B., & Huberman, A. M. (1994). Qualitative data analysis (2nd ed.). Thousand Oaks,
CA: Sage.
Watt, H. M. (2004). Development of adolescents’ self-perceptions, values, and task perceptions
according to gender and domain in 7th- through 11th-grade Australian Students. Child
Development, 75(5), 1556-1574.
Watt, H. M., Shapka, J.D., Morris, Z. A., Durik, A. M., Keating, D. P., & Eccles, J. S. (2012).
Gendered motivational processes affecting high school mathematics participation,
educational aspirations, and career plans: a Comparison of samples from Australia, Canada,
and the United States. Developmental Psychology, 48(6), 1594-1611.
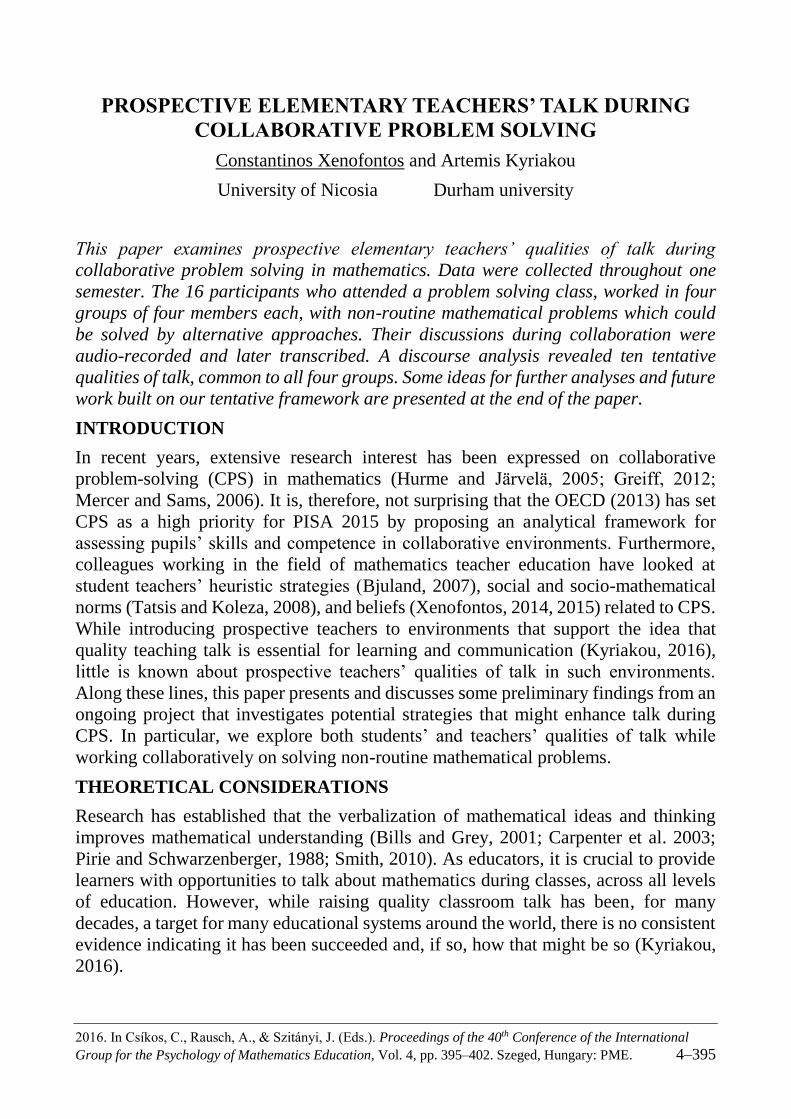
2016. In Csíkos, C., Rausch, A., & Szitányi, J. (Eds.). Proceedings of the 40th Conference of the International
Group for the Psychology of Mathematics Education, Vol. 4, pp. 395–402. Szeged, Hungary: PME. 4–395
PROSPECTIVE ELEMENTARY TEACHERS’ TALK DURING
COLLABORATIVE PROBLEM SOLVING
Constantinos Xenofontos and Artemis Kyriakou
University of Nicosia Durham university
This paper examines prospective elementary teachers’ qualities of talk during
collaborative problem solving in mathematics. Data were collected throughout one
semester. The 16 participants who attended a problem solving class, worked in four
groups of four members each, with non-routine mathematical problems which could
be solved by alternative approaches. Their discussions during collaboration were
audio-recorded and later transcribed. A discourse analysis revealed ten tentative
qualities of talk, common to all four groups. Some ideas for further analyses and future
work built on our tentative framework are presented at the end of the paper.
INTRODUCTION
In recent years, extensive research interest has been expressed on collaborative
problem-solving (CPS) in mathematics (Hurme and Järvelä, 2005; Greiff, 2012;
Mercer and Sams, 2006). It is, therefore, not surprising that the OECD (2013) has set
CPS as a high priority for PISA 2015 by proposing an analytical framework for
assessing pupils’ skills and competence in collaborative environments. Furthermore,
colleagues working in the field of mathematics teacher education have looked at
student teachers’ heuristic strategies (Bjuland, 2007), social and socio-mathematical
norms (Tatsis and Koleza, 2008), and beliefs (Xenofontos, 2014, 2015) related to CPS.
While introducing prospective teachers to environments that support the idea that
quality teaching talk is essential for learning and communication (Kyriakou, 2016),
little is known about prospective teachers’ qualities of talk in such environments.
Along these lines, this paper presents and discusses some preliminary findings from an
ongoing project that investigates potential strategies that might enhance talk during
CPS. In particular, we explore both students’ and teachers’ qualities of talk while
working collaboratively on solving non-routine mathematical problems.
THEORETICAL CONSIDERATIONS
Research has established that the verbalization of mathematical ideas and thinking
improves mathematical understanding (Bills and Grey, 2001; Carpenter et al. 2003;
Pirie and Schwarzenberger, 1988; Smith, 2010). As educators, it is crucial to provide
learners with opportunities to talk about mathematics during classes, across all levels
of education. However, while raising quality classroom talk has been, for many
decades, a target for many educational systems around the world, there is no consistent
evidence indicating it has been succeeded and, if so, how that might be so (Kyriakou,
2016).

Xenofontos, Kyriakou
4–396 PME40 – 2016
This study is built on the Vygotskian premises of social constructivism. According to
this perspective, knowledge is constructed through social interaction, while higher
mental functions are developed through interactions either with adults or more capable
peers (Vygotsky, 1978). For Vygotsky, the use of language as externalized thought acts
both at the social (intermental) and self-directing (intramental) level, eventually
remaining within the mind as inner speech. The view of language as externalized
thought underlines the link between thinking and talking, which mutually act upon
learning (Smith, 2010). Improving understanding through managing classroom talk
can provide more insight into thinking in the classroom.
Based on cross-cultural data, Alexander (2008, p. 30) identifies five types of classroom talk:
Rote (teacher-class): the drilling of facts, ideas and routines through constant
repetition
Recitation (teacher-class or teacher-group): the accumulation of knowledge and
understanding through questions to stimulate recall or to cue pupils to work out
the answer from clues provided in the question
Instruction/ exposition (teacher-class, teacher-group or teacher-individual):
telling the pupil what to do, and/or imparting information and/or explaining facts,
principles or procedures
Discussion (teacher-class, teacher-group or pupil-pupil): the exchange of ideas in
view of sharing information and solving problems
Dialogue (teacher-class, teacher-group, teacher-individual, or pupil-pupil):
achieving common understanding through structured, cumulative questioning and
discussion which guide and prompt, reduce choices, minimize risk and error, and
expedite the ‘handover’ of concepts and principles
According to Alexander, discussion and dialogue are met less frequently within
primary classrooms while the first three types constitute the basic oral teaching
repertoire. More recently, in their systematic review of studies from 1972 onwards,
Howe and Abedin (2013) conclude that the situation remains static for over 40 years,
as classroom talk has not yet refrained from traditional patterns of talking where the
teacher is the one making the questions with a focus on short and predictable answers
by a single pupil. Of course, no lesson can be characterized by a single type of talk, as
the boundaries among types of talk are permeable (Teo, 2013). Discussion and
dialogue have their merit within a larger oral repertoire that might as well include rote,
recitation and exposition (Alexander, 2008). Yet, research needs to find ways of
bringing these two types of talk to the fore.
PARTICIPANTS, DATA COLLECTION AND ANALYSIS
The participants of this study were 16 undergraduate students (11 female, 5 male),
reading for a degree in primary education with a qualified teacher status. Eight of the
students were Greek-Cypriots, six were from Greece, while two of them were half
Greek and Greek-Cypriot. The language of instruction in the Republic of Cyprus (at
public schools, and of the undergraduate programme the students were attending) is

Xenofontos, Kyriakou
PME40 – 2016 4–397
Standard Modern Greek (SMG), and in sociolinguistic terms, Greek-Cypriots can be
labelled as bidialectal (Yiakoumetti and Esch, 2010), since they speak two variations
of the same language (SMG and the Greek-Cypriot dialect).
All participants attended a class on Problem Solving in Primary Mathematics, taught
by the first author. The class lasted 12 weeks and the students and instructor met once
a week for three hours. All lessons included practical workshop elements during which
students worked on solving mathematical problems as learners. For about half of the
classes the lessons were designed to include studying issues from the mathematical
problem-solving literature (i.e. heuristic strategies, affective factors and problem
solving, problem solving and mathematics teaching), while the rest were entirely
practical. During the latter part, students spent the whole class time working in small
groups of four, solving non-routine mathematical problems in order to promote
Alexander’s (2008) last two types of talk, discussion and dialogue. Each student was
randomly assigned to a group at the first meeting. The groups did not change
throughout the semester, while the instructor’s input was kept at a minimal. At various
points, the instructor visited each group to observe its progress, ask questions to clarify
ideas and provide guidance where necessary. At other times, during and at the end of
each class, students were invited to a whole-class discussion, so that each group shared
some of their ideas and approaches with their peers. Each group’s talk during these
practical classes was audio recorded and later transcribed.
Below are presented three of the problems given to the groups. Problem 1 was taken
from www.nrichmaths.org, while problems 2 and 3 were given to the first author by
Prof. Paul Andrews (Stockholm University, Sweden) and are presented in Xenofontos
(2015). In fact, problem 3 is a slightly adapted version of a problem from TIMSS video
study.The problems were carefully chosen so that they could be solved by several
alternative strategies (Borasi, 1986), in order to enable students to engage in discussion
and dialogue.
Problem 1 – The cards problem
I have fifteen cards numbered 1− 15. I put down seven of them in a row on the table.
The numbers on the first two cards add to 15.
The numbers on the second and third cards add to 20.
The numbers on the third and fourth cards add to 23.
The numbers on the fourth and fifth cards add to 16.
The numbers on the fifth and sixth cards add to 18.
The numbers on the sixth and seventh cards add to 21.
What are my cards? Can you find any other solutions? How do you know you've
found all the different solutions?
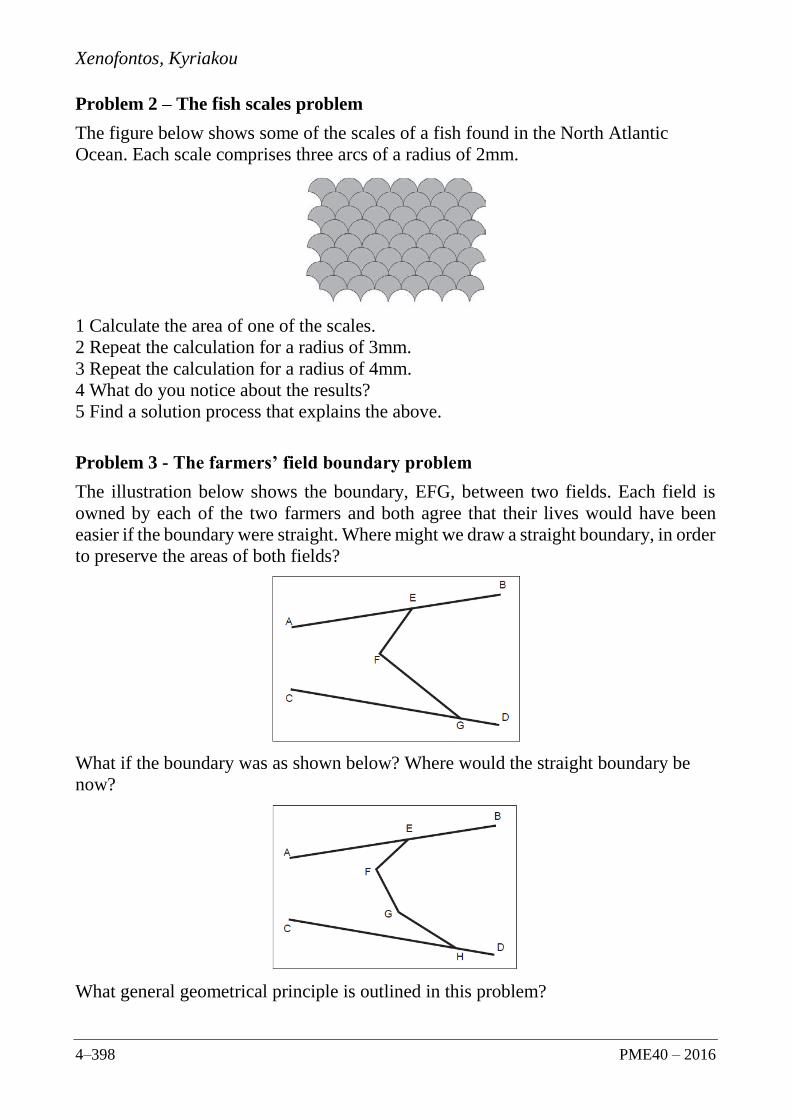
Xenofontos, Kyriakou
4–398 PME40 – 2016
Problem 2 – The fish scales problem
The figure below shows some of the scales of a fish found in the North Atlantic
Ocean. Each scale comprises three arcs of a radius of 2mm.
1 Calculate the area of one of the scales.
2 Repeat the calculation for a radius of 3mm.
3 Repeat the calculation for a radius of 4mm.
4 What do you notice about the results?
5 Find a solution process that explains the above.
Problem 3 - The farmers’ field boundary problem
The illustration below shows the boundary, EFG, between two fields. Each field is
owned by each of the two farmers and both agree that their lives would have been
easier if the boundary were straight. Where might we draw a straight boundary, in order
to preserve the areas of both fields?
What if the boundary was as shown below? Where would the straight boundary be
now?
What general geometrical principle is outlined in this problem?

Xenofontos, Kyriakou
PME40 – 2016 4–399
The data were approached from the perspective of discourse analysis, that is, an
investigation of the purposes for which language is used (Brown and Yule, 1983). By
exploiting the constant comparison process outlined by Strauss and Corbin (1998), as
well as the ideas of coding and categorization (Miles & Huberman, 1994), the two
authors worked individually, trying to identify different qualities of students’ talk.
Later, the authors brought their individual works together, had discussions on identified
qualities of talk, and reached an agreement on ten tentative themes. Readers should be
reminded that this is a work in progress and that these qualities are subject to revision
and alteration.
RESULTS
Table 1 presents the ten identified qualities of talk of our tentative framework. It should
be noted that these qualities are not mutually exclusive, as two or more qualities could
be linked to a particular part of students’ talk.
Quality of talk Description
Brainstorming Students throw in ideas on how to begin or proceed with a
solution process
Explanations Students engage with peers by elaborating on concepts when
they are not clear to other group members, and/or provide
explanations on the method followed
Realization of errors Students spot mistakes in calculations or realize that a
particular method they followed does not work for them
“Aha!” moments Students have insightful moments and bring in an idea that
proves to be effective
Complementarity Students build on and complement peers’ knowledge and
ideas
Decision taking Students reach an agreement on how to proceed
Confusion – blackout Some or all group members experience confusion/blackout
and express it explicitly
Pauses – moments of
silence
Some group members remain silent for a variety of reasons
(i.e. to think, make mental or written calculations, or
experience confusion)
Disagreements –
contradictory ideas
Students explicitly express disagreements with peers and
provide contradictory ideas
External input Students engage in input coming from outside the group, i.e.
the instructor (through direct guidance or questioning) or
members of other groups, during whole-class discussion.
Table 1: The ten tentative qualities of talk

Xenofontos, Kyriakou
4–400 PME40 – 2016
Below are examples of these qualities of talk along with supporting extracts from the
transcripts. These may come from different groups, while the student number indicates
that a different person is speaking each time. In this short paper, examples of all
qualities cannot be presented.
Brainstorming and decision taking
Student 1: Hmm, do you think 16, 18, 21 have something to do with this?
Student 2: You mean if it’s a product or something?
Student 1: Or maybe with the same numbers.
Student 3: I have a thought, let’s, erm, let’s say the first card is a, the second is b,
then…
Student 1: Give them a name.
All together: Give them a name.
Student 4: And then, maybe, find relations between them?
Student 3: Yes, say a+b = 15
Student 4: Yeah, I see what you mean.
Student 3: Then, b+c = 20
Student 4: Yeah, ok
Student 2: Let’s find the equations then, and see their relations.
Student 4: Yeap. Let’s do that!
Disagreement
Student 1: But if we don’t try it, how will we know that it doesn’t work?
Student 2: We don’t have much information, it doesn’t advise, “If you put this with
this you get this”. Are you saying we should try some random values?
Student 1: Are we going to spend more time disagreeing on this? If we don’t try it, we
won’t know. [note: the student starts writing something]
Student 2: What are you writing there?
Student 1: I’m trying this idea. I’ll get back to the previous one later.
Student 2: Pff, you’ll get back to nothing. Absolutely nothing.
CONCLUDING REMARKS
As already indicated, this paper is work in progress and the ten qualities of talk are
tentative. In later analyses, we will be interested in examining a number of issues. For
example, we’d like to see whether there are specific patterns in the ways each quality
is associated with others, especially within discussions and dialogues. Also,
considering that Greek-Cypriot students are bidialectal while Greek students are not,
we’d like to examine whether there are significant differences in how they engage in
Xenofontos, Kyriakou
PME40 – 2016 4–401
mathematical talk. Another interesting idea is to use the emerged framework to analyse
mathematical talks in other age groups, like, primary school pupils, or to investigate
whether these same qualities appear in mathematical talks across countries. Fostering
classroom dialogue is important at all levels of education, and our work intends to
contribute to the identification of strategies that lead towards dialogic teaching and
learning.
References
Alexander, R. (2008). Towards Dialogic Teaching: Rethinking classroom talk (4th ed). York:
Dialogos
Bills, C. & Grey, E. (2001). The ‘particular’, ‘generic’ and ‘general’ in young children’s
mental calculations. In M. van den Heuval-Panhuizen (ed.), Proceedings of the 25th
Annual Conference of the International Group for the Psychology of Mathematics
Education Vol. 2, p. 153–160. Utrecht: PME.
Bjuland, R. (2007). Adult Students’ Reasoning in Geometry: Teaching Mathematics through
Collaborative Problem Solving in Teacher Education. The Montana Mathematics
Enthusiast, 4(1), 1-30.
Borasi, R. (1986). On the nature of problems. Educational studies in mathematics, 17(2), 125-
141.
Brown, G. & Yule, G. (1983). Discourse Analysis. Cambridge: Cambridge University Press.
Carpenter, T. P., Franke, M. L., & Levi, L. (2003). Thinking mathematically: Integrating
arithmetic & algebra in elementary school. Portsmouth, NH: Heinemann.
Greiff, S. (2012). From interactive to collaborative problem solving: Current issues in the
Programme for International Student Assessment. Review of Psychology, 19 (2), 111-121.
Howe, C., & Abedin, M. (2013). Classroom dialogue: a systematic review across four decades
of research. Cambridge Journal of Education, 43 (3), 325–356.
Hurme, T. & Järvelä, S. (2005). Students’ Activity in Computer-Supported Collaborative
Problem Solving in Mathematics. International Journal of Computers for Mathematical
Learning, 10 (1), 49-73.
Kyriakou, A. (2016). Towards Quality Classroom Interaction: Investigating the impact and
potential of the Interactive Whiteboard. Unpublished PhD Thesis. Durham University,
United Kingdom.
Mercer, N. & Sams, C. (2006). Teaching children how to use language to solve maths
problems. Language and Education, 20 (6), 507-528.
Miles, M. B., & Huberman, A.M. (1994). Qualitative Data Analysis: an Expanded
Sourcebook. Thousand Oaks: Sage Publications.
OECD (2013). PISA 2015. Draft collaborative problem solving framework. OECD.
Pirie, S. E. B. & Schwarzenberger, R. L. E. (1988). Mathematical Dicsussion and
Mathematical Understanding. Educational Studies in Mathematics, 19, 459-470.

Xenofontos, Kyriakou
4–402 PME40 – 2016
Smith, J. (2010). Talk, Thinking and Philosophy in the Primary Classroom. Exeter: Learning
Matters.
Strauss, A. L., & Corbin, J. M. (1998). Basics of qualitative research: Techniques and
procedures for developing grounded theory. London: Sage.
Tatsis, K. & Koleza, E. (2008). Social and socio-mathematical norms in collaborative
problem-solving. European Journal of Teacher Education, 31 (1), 89–100.
Teo, P. (2013). ‘Stretch your answers’: Opening the dialogic space in teaching and learning.
Learning, Culture and Social Interaction, 2, 91-101.
Vygotsky, L. S. (1978). Mind in society: The development of higher psychological processes.
Cambridge, MA: Harvard University Press.
Xenofontos, C. (2014). The cultural dimensions of prospective mathematics teachers’ beliefs:
Insights from Cyprus and England. Preschool & Primary Education, 2 (1), 3-16.
Xenofontos, C. (2015). Working collaboratively on unusual geometry problems. Mathematics
Teaching, 248, 12-14.
Yiakoumetti, A. & Esch, E. (2010). Educational complexities inherent in bidialectal
communities and the potential contribution of the Common European Framework of
Reference to second-dialect development. In O'Rourke, B. and L. Carson (eds), Language
Learner Autonomy: Policy, Curriculum, Classroom. Contemporary Studies in Descriptive
Linguistics (pp 291-312). Oxford: Peter Lang.
2016. In Csíkos, C., Rausch, A., & Szitányi, J. (Eds.). Proceedings of the 40th Conference of the International
Group for the Psychology of Mathematics Education, Vol. 4, pp. 403–410. Szeged, Hungary: PME. 4–403
TEACHERS' BELIEFS TOWARDS THE VARIOUS
REPRESENTATIONS IN MATHEMATICS INSTRUCTION
Marijana Zeljić, Olivera Đokić, Milana Dabić
Teacher Education Faculty, University of Belgrade, Serbia
The aim of this paper is to investigate in-service teachers’ beliefs towards the use of
manipulative models, realistic pictures, abstract pictures, word problem tasks and the
symbolic language in mathematics instruction. The focus is on the formation of new
concepts in algebra. The results indicated that neither the cognitive development of
students, nor the abstractness of the content are sufficiently recognized as an important
criterion when choosing representations.
Mathematics teaching theories are based on the consensus that mathematical ideas are
communicated through different representations (manipulatives, pictures, diagrams,
narratives, symbols), which are interiorized in the learning process (Ainsworth, 2006;
Dreyfus 1991; Goldin, 2014; Presmeg, 1997; Terwel et al., 2009). The importance of
multiple representations and the method of their use are emphasized by Dreyfus (1991).
Dreyfus defined the phases of learning (considering the use of representations) as the
use of one representation in the first phase and a flexible use of multiple representations
in the last. In that process, the hierarchical relationship and gradual nature of
representation development from concrete to abstract have an important role
(Goldstone & Son, 2005; Hiebert & Carpenter, 1992; Sfard, 2000; Smith, 2006).
Previous research (Brizuela & Schliemann, 2004; Carraher et al., 2007; Kieran, 1996;
Radford, 2000; Stephens, 2003) showed a tendency toward the use of the symbolic
language as dominant and often the only representation, especially in algebra. In this
paper, we are dealing with the character of pedagogical representations and their
development in the first cycle of mathematics education in Serbia, considering
different topics of school mathematics, with the emphasis on algebraic representations.
THEORETICAL FRAMEWORK
As a starting point, we will take the theoretical view in which the use of symbolic
language is considered as an abstract representation, and the use of physical objects
(e.g. manipulative models) or pictures (e.g. diagrams) and/or the conceptualization of
abstract ideas in real situations (for example through word problems) is considered as
a concrete representation. Recent studies (e.g. Cai, 2004; Koedinger et al., 2008)
showed that abstract representations are more efficient than the concrete ones in the
process of solving complex problems. "Expressive” and communicative
representations assume pointing to what is important, and they are a predecessor to
more abstract representations (Terwel et al. 2009). On the other hand, Goldstone and
Son (2005) emphasized that learning of simple mathematical principles in an abstract
context could be inefficient, because that way pupils could obtain only ready-made
knowledge. The answer to the question of the best level of representation abstractness

Zeljić, Đokić, Dabić
4–404 PME40 – 2016
in the formation of a new concept could be found in the usage of multiple
representations (Mason et al., 2007).
There is no doubt that teachers’ beliefs of what mathematics is are affecting their choice
of representation when introducing mathematical concepts (Huang & Cai, 2007;
Philipp, 2007). The choice of an appropriate representation is an important decision for
which the teacher should consider at least two perspectives: 1) the nature of the
mathematical content which should be learned and 2) the developmental characteristics
of students, i.e. the mind of the students who learn the content (Ball, 1993). A
pedagogical representation should emphasize the important properties of the
mathematical matter that teacher wants to teach and to provide a known and accessible
context for students in which they could expand and develop their capacities for
reasoning and understanding the ideas (Huang & Cai, 2007).
In this paper we will highlight the algebraic representations because numerous authors
consider the use of various representations as an important component of algebraic
thinking (eg. Kieran, 1996). We will consider linear equations and inequalities as the
representatives of algebraic ideas in the first cycle of schooling. Voluminous research
deals with the understanding of the structure of equations (Macgregor & Stacey, 1997;
Stephens, 2003). Panasuk (2011) considers that an important indicator of the
conceptual understanding of a linear equation with one unknown is the pupils’ ability
to identify the same relations presented in different representations and to flexibly
transform one representation into another. Because of the abstractness and difficulties
in understanding the symbolical forms of equations, a number of authors (e. g. Radford,
2000) proposed introducing some sort of a “transitional language” before the standard
the current approach to teaching inequalities does not consider the development of
meaning. The results of research that Verikios and Farmaki (2008) conducted showed
that the use of different representations (graphs, tables, word problems, symbols) when
introducing inequalities helped students to assign meaning to symbols and understand
the procedure of solving inequalities.
The overall goal of our research was to identify types of representations that teachers
use in different topics of mathematics, especially in early algebra. Hence we focused
on several research questions: 1) Does the level of abstraction of representations that
teachers use differ at the beginning and at the end of the first cycle of schooling (1st
and 4th grade)? 2) Are there any preferred topics (Arithmetic, Algebra, Geometry,
Measurement) when teachers use a particular representation? 3) Are teachers’ beliefs
regarding the preferred representation implemented in examples that teachers use when
introducing new algebraic concepts?
METHODOLOGY
In-service teachers voluntarily answered a questionnaire during the Teachers’
Gathering in Belgrade, Jun, 13th 2015. A hundred and three in-service teachers
participated, 55 of them were teachers from urban and 48 from rural schools in Serbia.

Zeljić, Đokić, Dabić
PME40 – 2016 4–405
The questionnaire consisted of ten tasks. Eight tasks were sets of five Likert items,
while the 9th and 10th tasks had an open ended form. All the tasks referred to
representations used in the first or fourth grade when teaching new concepts in one of
the four major topics in primary mathematics. Hence, we are representing three groups
of tasks: the first one refers to the first grade (tasks 1, 3, 5 and 7), the second one refers
to the fourth grade (tasks 2, 4, 6 and 8), and the third group consists of the open ended
tasks (tasks 9 and 10). The first group of tasks is presented in Table 2, the second group
is analogue to the first one. Each of the Likert items presented in Table 2 consists of 5
points ranging from 1- strongly disagree to 5- strongly agree. For example, Task No.3
reads: “When introducing a new concept in algebra in the first grade, I use: A.
Manipulative models, B. Realistic pictures, C. Abstract pictures (e.g. diagrams,
schemes), D. Word problem tasks, E. Symbolic language” (Table 2). Task No.9 reads:
“Write a typical example for introducing equations with an unknown addend in the
first grade”, and task No.10:”Write a typical example for introducing inequalities with
an unknown addend in the fourth grade”.
Task No. Topics Representations
1
3
5
7
Arithmetic
Algebra
Geometry
Measurement
Manipulative models
Realistic pictures
Abstract pictures (e.g. diagrams, schemes)
Word problem tasks
Symbolic language
Table 2: Summarized Likert items in the questionnaire referring to the first grade.
RESULTS AND DISCUSSION
The obtained data are analyzed with Cronbach’s alpha for internal consistency, Median
and Interquartile Range are used as measures of central tendency, and Wilcoxon signed
rank test was used to evaluate the differences in teachers’ opinions. For addressing the
first research question, we have summarized the data regarding the use of various
representations in the first and fourth grades (see Table 3). The results showed that
teachers expressed their attitude towards the use of diverse representations at the
beginning and at the end of the first cycle of schooling (see Med and IQR values in
Table 3). Hence, teachers consider that conceptual understanding is achieved through
the use of multiple representations as proposed by other authors (Goldstone & Son,
2005; Mason et al., 2007). Their opinion about abstract pictures in the first grade is
polarized (Mdn=3, IQR=2, Table 3).
Teachers seem to agree that symbolic language should be used more in the fourth than
in the first grade (Z5, p5, Table 3). We assume that teachers see the use of diagrams
and word tasks as more abstract representations, and so they expressed their belief that
they should rather use them in the fourth than in the first grade (Z4, p4; Z3, p3, Table
3). It is interesting that teachers don’t make distinctions between using manipulative
models and realistic pictures at the beginning and at the end of the first cycle (Z1, p1;

Zeljić, Đokić, Dabić
4–406 PME40 – 2016
Z2, p2, Table 3). Hence, we can’t conclude that the teachers’ beliefs completely go
along with the attitude of various authors that the increase of representation
abstractness should accompany the increment in the difficulty of mathematical
problems (Cai, 2004; Koedinger et al., 2008) and developmental characteristics (Ball,
1993).
First grade Fourth grade Wilc. sign rank
Representation Mdn IQR C. Al. Mdn IQR C. Al. Z p
Man. models
Real. pictures
Diagrams
Word problem
Symbolic
4.0
4.0
3.0
4.0
4.0
1.5
0.5
2.0
0.5
1.0
0.78
0.70
0.84
0.71
0.76
4.0
4.0
4.0
5.0
4.5
1.5
1.0
1.0
1.0
1.0
0.80
0.75
0.80
0.74
0.78
Z1=-0.68a
Z2=-0.47a
Z3=-6.81b
Z4=-4.82b
Z5=-5.51b
p1=0.493
p2=0.637
p3=0.000
p4=0.000
p5=0.000
Table 3: Cronbach’s alpha, Median and Inter Quartile Range values for each
representation. Wilcoxon sign rank test (a-based on positive, b-based on negative
ranks) performed on data obtained in 1st and 4th grade (4th -1st)
To answer the question which representations teachers preferably use when teaching
different topics of mathematics we used Friedman test and Wilcoxon signed rank test
for the post hoc analysis (with Bonferroni correction, p<0.008). The Friedman test
showed that there is a preferred topic when using all but symbolical language and
abstract pictures in the 4th grade (see Sig. values less than 0.05 in Table 4). As the
beliefs about the symbolical language do not vary through the topics, we can say that
teachers’ beliefs go along with the previous findings (Cai, 2004; Koedinger et al.,
2008) that abstract representations are significant for the development of mathematical
ideas in all topics. This is not surprising since the use of symbolical notation is present
to a significant extent in the Serbian mathematics curriculum. Variable as the unknown
is introduced in the first grade, and by the end of the fourth grade, the structure of the
natural number system is introduced including the generalization and symbolical
notation of arithmetic rules.
Man. models Real. pictures Ab. pictures Word context Symbolic
Grade, n 1st,94 4th,95 1st,98 4th,94 1st,95 4th,97 1st,96 4th,94 1st,99 4th,97
χ2(3,n)
Sig.
46.80
.000
51.79
.000
15.04
.002
19.78
.000
17.54
.001
5.38
.146
13.12
.004
11.71
.008
4.95
.175
6.59
.086
Table 4: Results of Friedman test for each representation
We will report here only on the most interesting results of the post hoc analysis.
Teachers expressed that they prefer to use manipulative models when introducing
concepts in geometry and measurement rather than in arithmetic (see val. Z1, p1; Z2,
p2; Z4, p4, Z5, p5, Table 5). This is not surprising since the most natural means of
learning lie in initial geometry and measurement models and their pictures. But, they
Zeljić, Đokić, Dabić
PME40 – 2016 4–407
did not express a significant difference in the opinion towards using manipulative
models (Z3, p3; Z6, p6, Table 5) and realistic pictures (Zrp1=-1.10, prp1=.271; Zrp4=-
2.14, prp4=.032) in arithmetic and in algebra, both in the 1st and 4th grades. This means
that they do not consider that the increment of the level of abstractness in the transition
from arithmetic to algebra should cause a reduction in manipulative models and
realistic pictures use.
First grade Fourth grade
Topic Geo/Ar Meas/Ar Alg/Ar Geo/Ar Meas/Ar Alg/Ar
Man. models Z1=-3.37,
p1=.001
Z2=-4.94
p2=.000
Z3=-0.07
p3=.945
Z4=-3.18
p4=.001
Z5=-4.77
p5=.000
Z6=-1.51
p6=.130
Table 5: Results of post-hoc signed rank Wilcoxon test for use of manipulative
models
We have especially analyzed the teachers’ beliefs about representations in early
algebra. Results showed that in the first grade teachers prefer to use realistic pictures
(RP), word problems (W) and symbols (S) rather than manipulative models (M) (see
RP-M, W-M, S-M values, the 1st and the 2nd row, Table 6), while all representations
are more preferable than abstract pictures (AP) (AP-M, AP-RP, W-AP and S-AP
values, the 1st and the 2nd row, Table 6). In the fourth grade, word problem tasks and
the symbolic language are preferred (see the values in the 3rd and the 4th row in Table
6). Hence, symbolic representations and word tasks are the most preferred
representations in initial algebra. This implies that there is a mismatch between the
practice in Serbia and the previous research (Cai, 2004; Radford, 2000; Verikios &
Farmaki, 2008) which showed that abstract representations are justified in complex
problem solving, but concrete representations should be preferred when introducing
concepts.
Rep. RP-M AP-M W-M S-M AP-RP W-RP S-RP W-AP S-AP S-W
1st Z
p
-4.11b
.000
-3.54a
.000
-4.20b
.000
-3.34b
.001
-5.66a
.000
-1.52b
.128
-.45b
.656
-6.40b
.000
-6.05b
.000
-1.66a
.097
4th Z
p
-4.11b
.000
-3.66b
.000
-6.57b
.000
-6.59b
.000
-.37b
.709
-5.15b
.000
-5.24b
.000
-6.19b
.000
-6.30b
.000
-.16a
.874
Table 6: Wilcoxon signed rank for analyzing the use of different representations in
algebra. a – based on positive and b – based on negative ranks
Through tasks No. 9 and 10, we have analyzed how teachers’ beliefs are implemented
in teaching algebraic topics. Sixty two teachers (60%) provided the example for
introducing an unknown addend in the 1st grade (task No.9). There was no example
with manipulative models, which goes along with their beliefs described in the
previous section. From the 62 reported examples, 2 teachers (3%) used pictures of
realistic objects, 16 (26%) word problem tasks, 12 (19%) algebraic language and 17

Zeljić, Đokić, Dabić
4–408 PME40 – 2016
(27%) transitional language. Multiple representations were used by 15 teachers (24%),
from which 3 used more than two representations. Most of the multiple representations
(5 of 15 i.e. 33%) were the use of word tasks and symbolical (algebraic and transitional)
language. It is interesting that teachers expressed that they prefer realistic pictures in
the first grade, while only 2 of them made such an example, while 5 more used this
kind of pictures with symbols. A classic example in which teachers use realistic
pictures is shown in Fig. 1 A. Only one teacher gave an example with the use of scheme
(Fig.1B). The presented scheme is an appropriate mental image of the structure of
equations that could be suitable for different word tasks, one of which is shown in the
picture.
Fig. 1: Teachers’ example of A) realistic pictures and B) abstract pictures
Still, in the largest number of examples, symbolic language is used – in 29 as the only
representation and in 9 together with the word problem task. Teachers mostly try to
cross the semantic complexity of algebraic forms of equations by introducing
transitional language (number) (in the sense of Kieran, 1991; Radford, 2000).
Regarding the use of representations in the 4th grade, teachers expressed beliefs toward
using symbolical language and word problem tasks in algebra, and in their example for
introducing inequality (task No.10) they used exclusively these representations. No one
gave an example of manipulative models, realistic pictures or schemes. The example
is provided by 50 teachers (48.5%) of whom 14 (28%) used the word problem task,
algebraic language 26 (52%), transitional language 3 (6%), while multiple
representations was used by 7 teachers (14%), all of them word problem tasks with
algebraic notation.
CONCLUSION
The results related to our first research question indicated that the grade in which
teachers teach is not a criterion when choosing representations. There is not enough
difference in their answers regarding the 1st and 4th grades. On the other hand, the
second research question indicates that the abstractness of mathematical content is also
not a significant criterion for choosing a representation. Algebraic concepts are the
most abstract in the curriculum (they are introduced in the 1st grade in Serbia) and for
their introduction teachers choose abstract representations without the attempt of
reducing the level of their abstractness with the use of more concrete representations.
Based on the examples that teachers created, it seems that teachers in Serbia still
primarily use symbolic representations and word problem tasks (Stephens, 2003),
while abstract pictures as schemes, diagrams, and the line segment model (Panasuk,
2011) are neglected. Teachers showed through their beliefs that they do not recognize
Zeljić, Đokić, Dabić
PME40 – 2016 4–409
the importance of using abstract pictures as representations. Future research should
answer the question whether teachers use some of these representations, without
recognizing their designation and classification, or they do not recognize the
importance and effect of their use as representations. In the former case, insufficient
knowledge about the types of representations blocks communication and the exchange
of ideas with colleagues and educators. In the latter case, if all systems of
representations are not included in teaching, the result could be the formation of formal,
semantically empty knowledge.
The use and creation of different systems of representations and their importance in
forming of the mathematical knowledge should be an important part of teachers’
education curriculum in Serbia, and their path of professional development. As
researchers, teacher educators and professional developers we are generally not
interested solely in the measuring of teachers’ beliefs but also in changing them.
References
Ainsworth, S. (2006). DeFT: A conceptual framework for considering learning with multiple
representations. Learning and Instruction, 16 (3), 183–198.
Ball, D. L. (1993). Halves, pieces, and twoths: constructing representational contexts in
teaching fractions. In T. P. Carpenter and E. Fennema (Eds.), Learning, Teaching, and
Assessing Rational Number Concepts (pp. 328-375). Erlbaum, Hillsdale, NJ.
Brizuela, B., & Schliemann, A. (2004). Ten-year-old students solving linear equations. For
the Learning of Mathematics, 24 (2), 33–40.
Cai, J. (2004). Why do U.S. and Chinese students think differently in mathematical problem
solving? Exploring the impact of early algebra learning and teachers’ beliefs. Journal of
Mathematical Behavior, 23, 135–167.
Carraher, D., Schliemann, A., & Schwartz, J. (2007). Early Algebra Is Not the Same as
Algebra Early. In J. Kaput, D. Carraher & M. Blanton (Eds.), Algebra in the Early Grades
(pp. 235–272). Mahwah, NJ: Erlbaum.
Dreyfus, T. (1991). Advanced mathematical thinking processes. In D. Tall (Ed.), Advanced
Mathematical Thinking (pp. 25–41). Dordrecht: Kluwer Academic Publishers.
Goldin, G. (2014). Mathematical Representations. In S. Lerman (Ed.), Encyclopedia of
Mathematics Education (pp. 409-413). Springer: Dordrecht Heidelberg New York
London.
Goldstone, R., & Son, J. Y. (2005). The transfer of scientific principles using concrete and
idealized simulations. The Journal of the Learning Sciences, 14, 69–110.
Hiebert, J., & Carpenter, T. (1992). Learning and teaching with understanding. In D. Grouws
(Ed.), Handbook of research on mathematics teaching and learning (pp. 65-97). New
York: Macmillan.
Huang, Р., & Cai, Ј. (2007). Constructing Pedagogical Representations to Teach Linear
Relations in Chinese and U.S. Classrooms. In J. Woo, H. Lew, K. Park & D. Seo (Eds.),

Zeljić, Đokić, Dabić
4–410 PME40 – 2016
Proc. 31st Conf. of the Int. Group for the Psychology of Mathematics Education, Vol. 3
(pp. 65-72). Seoul: PME.
Kieran, C. (1996). The changing face of school algebra. In C. Alsina, J. Alvares, B. Hodgson,
C. Laborde & A. Pérez (Eds.), ICME 8: Selected lectures (pp. 271–290). Seville, Spain:
S.A.E.M. „Thales‟.
Kieran, C. (2004). Algebraic thinking in the early grades: What is it? The Mathematics
Educator, 8 (1), 139–151.
Koedinger, K., Alibali, M., & Nathan, M. (2008). Trade-offs between grounded and abstract
representations: Evidence from algebra problem solving. Cognitive Science, 32, 366–397.
Macgregor, M., & Stacey, K. (1997). Students' Understanding of Algebraic Notation: 11–15.
Educational Studies in Mathematics, 33, 1–19.
Mason, J., Drury, H., & Bills, E. (2007). Explorations in the Zone of Proximal Awareness. In
J. Watson & K. Beswick (Eds.), Mathematics: Essential Research, Essential Practice, Vol.
1 (pp. 42–58). Adelaide: MERGA.
Panasuk, R. (2011). Taxonomy for assessing conceptual understanding in algebra using
multiple representations. College Student Journal, 45 (2), 219 – 232.
Philipp, R. (2007). Mathematics Teachers’ Beliefs and Affect. In F. Lester (Ed.), Second
Handbook of Research on Mathematics Teaching and Learning (pp. 257-315). NCTM.
Presmeg, N. (1997). Generalization using imagery in mathematics. In L. English (Ed.),
Mathematical reasoning: Analogies, metaphors and images (pp. 299-312). Mahwah, New
Jersey: Lawrence Erlbaum Associates.
Radford, L. (2000). Signs and Meanings in Students' Emergent Algebraic Thinking: A
Semiotic Analysis. Educational Studies in Mathematics, 42, 237–268.
Sfard, A. (2000): Simbolizing mathematical reality into being: How mathematical discourse
and mathematical objects create each other. In P. Coob, K. Yackel, & K. McClain (Eds.),
Simbolizing and communicating: Perspectives on Mathematical Discourse, Tools, and
Instructional Design (pp. 37–98). Mahwh, NJ. Erlbaum.
Smith, E. (2006). Representational thinking as a framework for introducing functions in the
elementary curriculum. In J. Kaput, D. Carraher & M. Blanton (Eds.), Algebra in the early
grades (pp. 133-160). Mahwah NJ: Lawrence Erlbaum.
Stephens, A. C. (2003). Another look at word problems. Mathematics Teacher, 96, 63–66.
Terwel, J., Van Oersa B., Van Dijka, I., & Van den Eeden, P. (2009). Are representations to
be provided or generated in primary mathematics education? Effects on transfer,
Educational Research and Evaluation, 15 (1), 25–44.
Verikios, P., & Farmaki, F. (2008). Approaching the inequality concept via α functional
approach to school algebra in a problem solving context. In A. Gagatsis (Ed.), Research in
Mathematics Education (pp. 191–205). Nicosia – Cyprus.

Volume 4
INDEX OF AUTHORS

4–412 PME40 – 2016

PME40 – 2016 4–413
Index of Authors Vol. 4.
A
Amit, Miriam ....................................... 83, 307
Azmon, Shirly ............................................ 259
B
Baba, Takuya ............................................. 187
Bakogianni, Dionysia ................................. 283
Blanton, Maria L. ....................................... 243
Brezovszky, Boglarka .................................. 75
C
Chadalavada, Ravi ..................................... 163
D
Dabić, Milana ............................................. 403
Diamantidis, Dimitris ................................... 35
Dinç Artut, Perihan ...................................... 51
Đokić, Olivera ............................................ 403
Dreyfus, Tommy ........................................ 259
E
Even, Ruhama ............................................ 203
F
Fonger, Nicole L. ....................................... 243
Fujita, Taro ................................................. 195
G
Ghesquière, Pol .......................................... 315
Giraldo, Victor ........................................... 115
H
Halverscheid, Stefan .................................. 107
Hamanaka, Hiroaki ...................................... 11
Hannula-Sormunen, Minna .......................... 75
Hattermann, Mathias .................................. 147
Hershkowitz, Rina ...................................... 259
Hsieh, Feng-Jui .......................................... 371
K
Kindini, Theonitsa ....................................... 43
Knuth, Eric J. ............................................. 243
Kollar, Ingo .......................................... 19, 219
Kosyvas, Georgios ..................................... 283
Kynigos, Chronis ......................................... 35
Kyriakou, Artemis ..................................... 395
L
Leatham, Keith R. ...................................... 323
Lehtinen, Erno ............................................. 75
Leuders, Timo ............................................ 139
Lilienthal, Achim J. ................................... 163
M
Maculan, Nelson ........................................ 115
Martin, Lyndon .......................................... 267
Miyakawa, Takeshi ...................................... 11
Movshovitz-Hadar, Nitsa ........................... 171
Murphy Gardiner, Angela .......................... 243
N
Nortvedt, Guri A. ......................................... 59
O, Ø,
Osta, Iman ...................................................... 3
Otaki, Koji ................................................... 11
Ottinger, Sarah ............................................. 19
Østergaard, Camilla Hellsten ..................... 211
Ö
Ögren, Magnus ........................................... 163
P
Palmér, Hanna .............................................. 27
Papadopoulos, Ioannis ........................... 35, 43
Pelen, Mustafa Serkan ................................. 51
Peterson, Blake E. ...................................... 323
Pettersen, Andreas ....................................... 59
Pinkernell, Guido ......................................... 67

4–414 PME40 – 2016
Pinto, Márcia M. F. .................................... 155
Poncelet, Débora ........................................ 347
Pongsakdi, Nonmanut .................................. 75
Portnov-Neeman, Yelena ............................. 83
Potari, Despina ............................................. 91
Proulx, Jérôme ............................................. 99
Psycharis, Giorgos ....................................... 91
Pustelnik, Kolja .......................................... 107
R
Rangel, Letícia ........................................... 115
Rasmussen, Chris ....................................... 259
Reinhold, Simone ....................................... 123
Rellensmann, Johanna ................................ 131
Rott, Benjamin ........................................... 139
S
Salle, Alexander ......................................... 147
Scheiner, Thorsten ..................................... 155
Schindler, Maike ........................................ 163
Schukajlow, Stanislaw ............................... 131
Schumacher, Stefanie ................................. 147
Segal, Ruti .................................................. 171
Shahbari, Juhaina Awawdeh ...................... 179
Shimada, Isao ............................................. 187
Shinno, Yusuke .......................................... 195
Shriki, Atara ............................................... 171
Silverman, Boaz ......................................... 203
Simmt, Elaine ............................................... 99
Skott, Charlotte Krog ................................. 211
Sommerhoff, Daniel ................................... 219
Spiliotopoulou, Vassiliki .............................. 91
Staats, Susan............................................... 227
Stephens, Ana C. ........................................ 243
Stockero, Shari L........................................ 323
Stouraitis, Konstantinos ............................. 235
Strachota, Susanne M. ................................ 243
Sumpter, David .......................................... 251
Sumpter, Lovisa ......................................... 251
T
Tabach, Michal .................................. 179, 259
Takeuchi, Miwa ......................................... 267
Thabet, Najwa ................................................ 3
Tjoe, Hartono ............................................. 275
Towers, Jo .................................................. 267
Triantafillou, Chrissavgi ...................... 91, 283
Tsakalaki, Xanthippi .................................... 43
U
Uegatani, Yusuke ....................................... 291
Ufer, Stefan .......................................... 19, 219
Ulusoy, Fadime .......................................... 299
Uziel, Odelya ............................................. 307
V
Van Dooren, Wim ...................................... 315
Van Hoof, Jo .............................................. 315
Van Zoest, Laura R. ................................... 323
Vázquez Monter, Nathalie ......................... 331
Veermans, Koen ........................................... 75
Vermeulen, Cornelis .................................. 339
Verschaffel, Lieven .................................... 315
Vlassis, Joëlle ............................................. 347
W
Waisman, Ilana .......................................... 355
Walshaw, Margaret .................................... 363
Wang, Ting-Ying ....................................... 371
Wasserman Nicholas H. ............................. 379
Wilkie, Karina J ......................................... 387
Wöller, Susanne ......................................... 123
X
Xenofontos, Constantinos .......................... 395
Z
Zachariades, Theodossios ............................ 91
Zeljić, Marijana .......................................... 403
Zoupa, Aggeliki ........................................... 91

Related Documents