1 Pathbreakers? Women’s Electoral Success and Future Political Participation * Sonia Bhalotra University of Essex Irma Clots-Figueras Universidad Carlos III de Madrid Lakshmi Iyer Harvard Business School January 2016 Abstract We investigate whether the event of a woman being competitively elected as a state legislator encourages the subsequent political participation of women, using a regression discontinuity design on constituency level data from India. We find that female incumbents are more likely than male incumbents to re-contest and that there is a decline in the entry of new women candidates. This decline is most pronounced in states with entrenched gender bias and in male-headed parties, suggesting an intensification of barriers against women in these areas. Similar results for (mostly male) Muslim candidates indicate the presence of institutionalized demand-side barriers rather than gender-specific preferences and constraints. Keywords: Political participation, women, candidates, gender bias, backlash, minority representation, regression discontinuity, India JEL Codes: J16, J71, P16 * Email: [email protected]; [email protected]; [email protected]. We thank Siddhartha Bandhyopadhyay, Melissa Dell, Rafael di Tella, Tarun Jain, Akshay Mangla, Anandi Mani, Massimo Morelli, Rohini Pande, Albert Saiz and numerous seminar and conference participants for helpful comments. Damian Clarke, Maya Shivakumar, Ahmad Wahdat and the staff of Paradigm Data Services provided excellent research assistance. We gratefully acknowledge financial support from CMPO (Bhalotra), MEC grants SEJ2004-07861 and SEJ2007-67436 (Clots-Figueras) and Harvard Business School (Iyer). An earlier version of this paper appeared as “Path-Breakers: How Does Women's Political Participation Respond to Electoral Success?” IZA Discussion Paper 7771, November 2013.

Welcome message from author
This document is posted to help you gain knowledge. Please leave a comment to let me know what you think about it! Share it to your friends and learn new things together.
Transcript

1
Pathbreakers?
Women’s Electoral Success and Future Political Participation*
Sonia Bhalotra
University of Essex
Irma Clots-Figueras Universidad Carlos III de Madrid
Lakshmi Iyer
Harvard Business School
January 2016
Abstract
We investigate whether the event of a woman being competitively elected as a state legislator encourages the subsequent political participation of women, using a regression discontinuity design on constituency level data from India. We find that female incumbents are more likely than male incumbents to re-contest and that there is a decline in the entry of new women candidates. This decline is most pronounced in states with entrenched gender bias and in male-headed parties, suggesting an intensification of barriers against women in these areas. Similar results for (mostly male) Muslim candidates indicate the presence of institutionalized demand-side barriers rather than gender-specific preferences and constraints. Keywords: Political participation, women, candidates, gender bias, backlash, minority representation, regression discontinuity, India
JEL Codes: J16, J71, P16
* Email: [email protected]; [email protected]; [email protected]. We thank Siddhartha Bandhyopadhyay, Melissa Dell, Rafael di Tella, Tarun Jain, Akshay Mangla, Anandi Mani, Massimo Morelli, Rohini Pande, Albert Saiz and numerous seminar and conference participants for helpful comments. Damian Clarke, Maya Shivakumar, Ahmad Wahdat and the staff of Paradigm Data Services provided excellent research assistance. We gratefully acknowledge financial support from CMPO (Bhalotra), MEC grants SEJ2004-07861 and SEJ2007-67436 (Clots-Figueras) and Harvard Business School (Iyer). An earlier version of this paper appeared as “Path-Breakers: How Does Women's Political Participation Respond to Electoral Success?” IZA Discussion Paper 7771, November 2013.

2
1. Introduction
Women are under-represented in political office around the world, accounting for
only 23% of the membership of national parliaments globally. In 2015, they comprised 12%
of India’s national legislators, 19% of the United States Congress and 29% of the United
Kingdom’s House of Commons. There is a similar under-representation of women in
leadership positions in other fields, including the corporate sector and academia (Bertrand
and Hallock 2001, Bertrand 2009, Ginther and Kahn forthcoming). For instance, women
comprise 40% of the workforce globally, but only 10% of corporate board members globally
and 4.8% of Fortune 500 CEOs. This numerical under-representation of women in politics
is often associated with substantive under-representation. Several recent papers document
that increasing women’s political representation results in policy choices that are more
favorable to women (Chattopadhyay and Duflo 2004, Rehavi 2012, Iyer et al. 2012), and that
improve investments in children and lower corruption (Brollo and Troiano 2014, Bhalotra
and Clots-Figueras 2014, Clots-Figueras 2012, Dollar, Fisman and Gatti 2001, Miller 2008,
Swamy et al 2001). This suggests that women’s under-representation in political office
disadvantages one half of society, and may have additional social costs.
Using data from India’s state legislative assembly elections, we investigate whether
the electoral success of women leads to subsequent increases in women’s participation as
political candidates. We focus upon women’s candidacy as the data suggest that the small
share of women candidates is an important proximate barrier to the presence of women in
political office: women comprised 5.5% of election winners, but only 4.4% of electoral
candidates.1 A woman’s demonstrated electoral success has the potential to change the views
of voters and parties regarding the role of women in politics, leading to greater demand for
women candidates. Alternatively, a woman winning could create a positive “role model”
effect, encouraging other women to come forward as candidates.2
We use nationwide data from 3473 constituencies over the period 1980-2007 to
investigate whether a woman winning a seat in the state legislative assembly results in greater
1 No previous work has systematically analyzed candidacy for competitive state assembly elections in India. Here we shall focus upon candidate gender and, in particular, on demonstration effects on candidacy. 2 See Casas-Arce and Saiz (2015) for a model in which the roles of voters, parties and candidates are delineated.

3
participation of women from her constituency in subsequent elections. Legislation on many
important topics, including law and order, health and education, is determined at the state
level in India. Importantly, there are no political quotas for women at this level, making our
analysis different from recent studies of the impact of gender quotas on subsequent political
participation. In order to estimate causal effects of women’s electoral victory, we use a
regression discontinuity (RD) design, comparing women’s political participation in places
where a woman narrowly won an election to those in which a woman narrowly lost an
election. We conduct several tests to verify the validity of the RD strategy. These include
showing that that pre-determined political and demographic characteristics, as well as the
characteristics of the candidate pool, are similar across places where women won vs lost in
mixed-gender races. We investigate robustness to controlling for election-specific factors and
using alternative samples, functional forms and bandwidths.
Our analysis yields four main insights. First, a woman’s electoral victory leads to an
increase in the share of women candidates from major parties in the next election. However,
this is primarily driven by an increased propensity of the incumbent woman to contest for
re-election. This intensive-margin response is important in India where, in contrast to the
U.S., incumbents often do not re-contest. Moreover, the baseline probability of women
incumbents re-contesting is smaller than for men: 34% of female incumbents and 28% of
male incumbents do not run for re-election despite the absence of any term limits. The
incumbency effect on women’s candidacy is restricted to the party of the winning candidate:
women incumbents are significantly more likely than male incumbents to re-contest from
the same party, and significantly less likely to switch parties.
Second, we can decisively reject that there is increased entry of new major party
women candidates in constituencies in which a woman won the previous election. In fact, in
most specifications, there is a significant decline in the entry of new women candidates after
a woman wins an election. This is not simply a consequence of the incumbent woman’s
greater probability of re-contesting. There is also no increase in women candidates in nearby
constituencies or from the opposing party.
Third, we find striking evidence that this “discouragement” effect on the entry of
new female candidates emerges from states characterized by entrenched gender bias, proxied

4
by population gender ratios (Sen 2003). In these states, there is a significantly lower
candidacy response overall after a woman wins an election, particularly within male-headed
parties, and the next election is marked by a significant decline in the share of new women
candidates. In sharp contrast, in states with relatively low levels of entrenched prejudice,
there is no decline in new female candidate share (although no increase either), and a larger
probability that the incumbent woman re-contests. In these areas, following women’s
electoral success, we also see significant increases in female and male voter turnout and the
share of votes received by women. These findings are suggestive of a “backlash” effect in
the more gender unequal states, as they indicate intensification of bias against women
following women’s electoral victory. Previous studies have documented evidence of backlash
whereby men react negatively to higher earnings of women or to women performing non-
traditional roles (Schuler et al 1996, Luke and Munshi 2011, Mani 2011, Gagliarducci and
Paserman 2012, Bertrand et al 2013, Gangadharan et al 2015).3
Fourth, our investigations suggest that the failure of new women candidates to
contest after a woman wins in a competitive race is a reflection of institutionalized barriers
to entry rather than of gender-specific constraints. We find that implementation of a gender
quota in local governments, which created a massive increase in the number of women with
political experience increases the overall candidacy response in gender-biased states, but we
continue to see a decline in entry of new candidates. This makes it unlikely that our findings
are driven by a shortage of women who are suitable political candidates. We conduct a
parallel analysis for Muslims, who form India’s largest religious minority, are socio-
economically disadvantaged, and similarly under-represented in political office in India
(Bhalotra et al 2014). Our estimates for Muslims are strikingly similar to our estimates for
women: we find no increase in the entry of new Muslim candidates following a Muslim
winning office and a stronger candidacy response in states in which Muslims are less
disadvantaged. As Muslim candidates are predominantly male, this makes it unlikely that the
3 Gagliarducci and Paserman (2012) report a similar heterogeneity in responses to women mayors in Italy. On average, they find a significantly greater probability of early termination of the legislature when the mayor is a woman, and this tendency is significantly stronger in the Southern regions and when the mayor interacts with an entirely male council.

5
results for women are on account of gender specific constraints such as family commitments
or a reluctance to engage in competitive races.
Our study contributes to two main streams of the literature. The first concerns the
barriers facing women in attaining leadership positions. Most previous research examining
the impact of elected women leaders on future women’s political participation has examined
the impact of gender quotas.4 In contrast, our study investigates the dynamics of women’s
participation in state legislatures, where quotas are absent. The results in a competitive
setting are likely to differ from a quota context for several reasons. For instance, political
parties may strategically place women candidates in races they are unlikely to win (Bagues
and Esteve-Volart 2012, Casas-Arce and Saiz 2015) or selective entry may widen the quality
gap between male and female candidates (Bardhan et al 2010, Besley et al 2012). This may
reinforce negative stereotypes if women in reserved seats are less qualified than men (Coate
and Loury 1993), or generate male backlash with men resentful of women in executive
positions (Gangadharan et al. 2015). Another factor is that quotas may generate negative
spillovers in candidacy, with fewer women being fielded in non-quota constituencies (see
Sekhon and Titiunik 2012’s reanalysis of Bhavnani 2009’s quota results). For all of these
reasons, demonstration effects of women leaders may be greater in competitive elections
than in a quota setting. On the other hand, quotas may have more positive effects on
women’s candidacy if women are more likely to enter competitive activities in a single-sex
environment (Gneezy et al 2003).
The only other study we are aware of in a competitive setting is Broockman (2013)
who, similar to our study, finds no spillover effects of women winning seats in U.S. state
legislatures on women’s candidacy in nearby constituencies. The findings from the analysis
of quotas are mixed. Bertrand et al (2014) analyze corporate board quotas in Norway and
find no impact on the career decisions of the next generation of women, while do Paola et al
(2010) document increased political participation of women after a short-term gender quota
in local government in Italy. Beaman et al (2009) find no tangible improvements in
subsequent candidacy or success among women after a woman has led the village council for
4 Beaman et al (2009), Bhavnani (2009), Deininger and Nagarajan (2011) and Banerjee et al (2013) all examine the impact of local government gender quotas in specific regions of India.

6
one term (five years), but significant increases after a woman has headed the village council
for two consecutive terms. We show that such repeated exposure to female state legislators
is unlikely in a competitive setting, especially in gender-biased states; although incumbent
women are more likely to re-contest than incumbent men, they are not significantly more
likely to win the next time.
The second stream of research that we contribute to is that on incumbency
advantage. This literature has focused upon whether incumbents are more likely to win the
next election, but winning is conditional on re-contesting and by testing whether the
incumbent re-contests, we effectively model this selection process.5 This is important in
many countries outside the US, such as India and Brazil, where a large fraction of
incumbents do not re-contest (De Magalhaes 2015). Studies examining gender differences in
incumbency advantage include Ferreira and Gyourko (2014), who show that female
incumbents exhibit stronger winning chances in the U.S. (a setting where incumbents almost
always re-contest) and Brollo and Troiano (2014) who find weaker winning chances in
Brazil, a setting with term limits. Our study shows that candidacy dynamics after an electoral
victory are strongly dependent on the overall social context, and that therefore there is no
general gender advantage or disadvantage. Another contribution of our work is that we
deviate from the recent tendency to analyze incumbency advantage at the party level. In the
presence of party-switching, such as occurs in India and Brazil for example, it is relevant to
study incumbent behavior at the candidate level.
The rest of the paper is structured as follows. Section 2 provides relevant
background on the Indian political system, Section 3 describes our empirical strategy, and
Section 4 performs many empirical checks on the validity of this strategy. Sections 5 and 6
present our empirical findings, and Section 7 concludes.
5 There is a widely documented incumbency advantage in the U.S. (Lee 2008, Gelman and King 1990, Cox and Katz 1996, Ferreira and Gyourko 2014), but previous work has documented an incumbency disadvantage in India (Linden 2004, Uppal 2009) and other developing countries (Klasnja and Titiunik 2013, MacDonald 2013). Most of these studies do not examine candidacy.
7
2. Women in Indian Politics
2.1. Indian Electoral Politics
India is the world’s largest democracy, with a parliamentary system of government at
both the central and state levels. Elections are held every five years, on a first-past-the-post
system in single-member constituencies. States may occasionally hold midterm elections,
before the five-year term when the government expires, if the governing coalition loses the
confidence of the majority of the state legislature and an alternative government cannot be
formed. We focus on elections to state legislatures. In India’s federal system, state
governments are responsible for several development policy areas including law and order,
health and education, and for the financing of village councils. State level parties play a
significant role in forming governing coalitions at the center, and previous research has
shown that state-level voting behavior is highly correlated with voting in national elections
(Ravishankar 2009).
There are currently no quotas for women in state or national level elections. A one-
third quota for women in district and village level councils was mandated by a constitutional
amendment in 1993.6 In March 2010, a bill proposing to enact a one-third quota for women
in national and state legislatures was passed by the upper house of parliament, but it has not
yet been passed in the lower house, making the analysis in this paper highly topical.
In India’s political system, party leaders decide who their candidate will be in every
constituency. There are no primaries as in the United States, and the process of choosing
candidates is not transparent. We conducted interviews with politicians from several Indian
political parties to understand the candidate selection process. In general, it was described as
follows: parties draw up an initial short list of 2-5 candidates from each constituency, and
then embark on information gathering exercises, including third-party voter surveys, to
assess candidate quality. The candidate quality emphasized by the parties was the ability to
attract votes, termed “winnability” in Indian politics. To this end, several metrics including
candidate name recognition within the constituency, service to the party, financial resources,
caste identity and internal party support were considered relevant. The candidate selection
6 The impact of this reform has been examined in several recent papers including Chattopadhyay and Duflo (2004), Beaman et al (2009) and Iyer et al (2012).

8
process was described as being very constituency specific, with local name recognition and
local resources being important and it being unusual to “parachute” in candidates from
outside the constituency.
2.2. Data on Women’s Political Participation in State Elections
We obtained data on elections to state legislative assemblies in 3473 constituencies
from the Election Commission of India over the period 1980-2007, during which most
states had six elections. Electoral constituency boundaries remained fixed through this
period, so we do not have to worry about concerns such as gerrymandering which might
differentially affect the electoral prospects for women. We have information on the name,
gender, party affiliation and votes obtained by every candidate, as well as gender-specific
voter turnout by constituency. We use data for the 16 major states of India that account for
over 95% of the total population.7 We also obtained relevant demographic data (literacy,
urbanization) at the constituency level from the 2001 census, by matching villages to
constituencies.8
We tracked candidates by name over successive elections to identify whether
candidates in a specific election were present in the previous election.9 Overall, in our
sample, more than three-quarters of all candidates (85% of women and 83% of men) did not
contest the previous election, i.e. are “new” candidates. Systematic data on candidate
attributes are available only after 2004, when the Election Commission made it mandatory
for all candidates to file affidavits giving details of their age, education, asset ownership and
any pending criminal charges. We have this information for candidates in 14 out of 16 states,
which held elections between 2004 and 2007. Compared to male candidates, women
candidates are on average three years younger, less likely to have completed high school, and
7 The states included are: Andhra Pradesh, Assam, Bihar, Gujarat, Haryana, Himachal Pradesh, Karnataka, Kerala, Madhya Pradesh, Maharashtra, Orissa, Punjab, Rajasthan, Tamil Nadu, Uttar Pradesh and West Bengal. In 2001, three new states of Jharkhand, Chhattisgarh and Uttarakhand were carved out of the larger states of Bihar, Madhya Pradesh and Uttar Pradesh respectively. For the new states of Jharkhand and Chhattisgarh, electoral constituency boundaries remained fixed over time. We drop the data from the Uttarakhand state elections of 2002 and 2007 since we are unable to match the electoral constituencies over time. 8 We thank Rikhil Bhavnani and Sandip Sukhtankar for sharing these data with us. 9 Candidate names are often spelt differently across elections and candidates often change party affiliations. We therefore performed a manual matching of candidate names over time.
9
less likely to have any criminal charges filed against them (summary statistics available upon
request). In examining the validity of our regression discontinuity strategy, we will test
whether these characteristics vary across winners and losers in mixed-gender elections.
Despite the institution of universal adult suffrage since 1950, women are still
dramatically under-represented in India’s state legislatures. As mentioned earlier, only 5.5%
of state legislators and 4.4% of candidates were women in our sample period, 1980-2007.
Almost 70% of electoral races had no female candidates at all, and only 7% of races had
more than one woman candidate. Women’s candidacy shows a secular increase over the
period, but varies considerably across the states. For instance, in 2000-2007, the share of
female candidates from major parties ranged from almost 13% in the state of Andhra
Pradesh to only 4% in the neighboring state of Karnataka (Appendix Figure A1).
Major parties (defined as parties that won more than 5 percent of the seats in the
state in any year) are more likely to nominate women candidates, with 5.6% of their
candidates being women. Over this period, only four out of forty major parties in India were
headed by women.10 These parties have a slightly higher share of female candidates, 7%
compared to the 5% share for major parties not headed by women. There is no a priori
evidence that women avoid more competitive races. In fact, electoral races in which a female
candidate is present tend to have larger electorates and a greater number of candidates.
State elections in India are very competitive. In our data, the mean (median) number
of candidates per constituency is ten (eight). Of these, only 34% (2.6 candidates on average)
are from major political parties and only 3 candidates on average manage to obtain more
than 5 percent of the total votes, suggesting that the majority of candidates in India’s
electoral races are not politically viable. In the analysis to follow, we therefore consistently
present results separately for major party candidates and competitive candidates in order to
focus on candidates who are politically meaningful.11
10 These are the Indian National Congress under Sonia Gandhi, the Bahujan Samaj Party under Mayawati, the All India Anna Dravida Munnetra Kazhagam under Jayalalithaa and the All India Trinamul Congress under Mamata Banerjee. 11 There is a strong overlap between these categories. The vast majority (88%) of major party candidates are competitive in the sense of obtaining at least 5% of total votes cast. Similarly, about 73% of competitive candidates belong to a major party.
10
3. Identifying the Effects of Women’s Electoral Success: The Regression
Discontinuity Design
We are interested in how indicators of women’s political participation at the electoral
constituency level respond to a woman having won the previous election. The identification
problem is that a woman’s political victory might be correlated with unobserved
constituency characteristics such as voter preferences, which might directly determine
women’s participation in subsequent elections. We address these problems using a regression
discontinuity (RD) estimator, which focuses on mixed-gender electoral races decided by a
narrow margin. Treatment assignment depends on the running variable, the vote margin
between a woman and a man. The probability of a woman winning an election exhibits a
sharp discontinuity when this vote margin is zero, since the candidate with the most votes
wins, irrespective of how close the runner up stands.12 The identifying assumption is that the
assignment of treatment around the threshold (i.e. a woman winner rather than a man) is
uncorrelated with any observed or unobserved characteristics of the candidate pool or the
constituency.13 The estimated model is of the form:
(1) Yist = a + b WomanWonis, t -1 + f(Mis,t -1) + e ist
Y ist is a measure of female political candidacy for constituency i in state s and year t. We
focus upon the share of women candidates (overall and among major parties) but we also
look at the probability of having at least one female candidate in the constituency and the
fraction of competitive female candidates. The sample is restricted to elections with at least
one female candidate. Similar to the strategy in Meyersson (2014), the running variable Mis,t-1
is defined as the vote share difference between the female and male candidates in the
constituency who obtained the most votes, irrespective of whether they were the winner and
the runner up. The results are similar when we use a more restricted sample of elections
12 See Lee (2008) for the seminal use of the regression discontinuity design using electoral data. Studies that use close elections between men and women include Rehavi (2012), Clots-Figueras (2011 and 2012), Bhalotra and Clots-Figueras (2014), and Brollo and Troiano (2014). 13 We thus implicitly test whether winning matters discontinuously, that is, significantly more than a good electoral performance that falls short of winning (captured by woman being runners-up in the “control group” of constituencies in which women lose mixed-gender elections).

11
selected to ensure that the winner and runner are of opposite gender. WomanWonis, t -1 is a
dummy which equals one if a woman won against a man (Mis,t-1 >0) and zero if a woman
lost against a man (Mis,t-1 <0). The parameter b captures the causal impact of this event on
women’s participation as candidates in the next election. Standard errors are clustered at the
level of the administrative district to allow for correlated outcomes across all constituencies
within the same district and over time. This is more conservative than clustering at the
constituency level, though we shall verify that doing the latter leaves our results unchanged.
We fit a flexible function of the vote margin, f (Mis,t -1) , that is allowed to differ on
each side of the discontinuity, using three approaches to investigate sensitivity of the
estimates to this. First, we fit second-order polynomials (e.g. Lee, Moretti and Butler 2004)
since Gelman and Imbens (2014) argue against the use of higher order polynomials in RD
designs, but we also show that our results are robust to using higher-order polynomials.
Second, we estimate local linear regressions (Hahn et al, 2001; Imbens and Lemieux, 2007),
restricting the sample to an optimal bandwidth around the discontinuity, with the optimal
bandwidth selected by applying the methods in Imbens and Kalyanaraman (2011) and also
the methods in Calonico, Cattaneo and Titiunik (2014). Finally, we also investigate
robustness to using a “discontinuity sample,” restricting the sample to a very small
bandwidth around the discontinuity and testing the differences in means on both sides of the
discontinuity (Angrist and Lavy, 1999).
To investigate area spillovers, we replace the dependent variable in (1) with an
indicator of women’s political participation in constituencies other than the index
constituency i, but within the same administrative district (which typically consists of 9-10
electoral constituencies), or parliamentary constituency (typically covering 6-8 state electoral
constituencies). To examine persistence in the relationship of interest, we estimate equation
(1) replacing the first lag with longer lags. This provides reduced form estimates of how
women’s participation in election t responds to a woman having won in election t-2 or t-3
(ten and fifteen years ago), respectively. We do not condition upon whether a woman won in
each intervening period because this is endogenous.
While regression discontinuity estimates are likely to satisfy internal validity
conditions, they may or may not have external validity. However, there are several
12
indications that our results have considerable external validity. First, Figure 1A shows that
the vote share obtained by all women contesting in constituencies in which the margin of
victory between the male and female candidates is close to zero ranges from less than 20%
to 65%. In favor of external validity, this shows a wide variation in preferences for female
politicians in our sample. Second, we examined the extent to which the identity of
constituencies that have mixed-gender elections changes from one election year to the next
and found that there is a fair degree of churning; among the constituencies which have at
least one mixed-gender election, nearly 60% have had only one or two mixed-gender
elections over this three-decade period. This again points to external validity inasmuch as it
establishes that we are not simply picking up a feature of constituencies that have mixed-
gender elections. In addition, OLS results using the whole sample are fairly similar to the RD
results.14 Since constituencies that have at least one woman candidate vary over time,
restricting to these samples creates an unbalanced panel (Sekhon and Titiunik 2012). We
therefore estimated the coefficient of interest for one pair of election years at a time to
investigate the stability of the relationship across areas and years, and found no significant
differences in the estimates (available on request).
4. Investigating Validity of the RD Design
Before presenting our results, we conduct several checks to ensure the validity of our
empirical strategy, namely that the only variable that varies discontinuously at the vote
margin of zero is the gender of the elected candidate, rather than other area or candidate
characteristics, or the vote margin itself.
4.1. Preferences for Women Politicians and Continuity of the Vote Margin
An assumption underlying the RD strategy is that preferences for female politicians
are similar on both sides of the discontinuity, so that the discontinuity isolates the role of the
gender of the winner. We measure preferences for female politicians as the fraction of votes
14 We run OLS regressions for the full sample, controlling for constituency and election-cycle fixed effects, and district-specific linear time trends. The OLS sample differs primarily in that it introduces elections in which there are no female candidates, thereby extending the “control group” of constituencies to include a wider and more heterogeneous set of areas. These results are available in Appendix Table A2.

13
won by all women contesting in the constituency. Figure 1B shows that the assumption
holds, there being no jump in the female vote share at the zero vote margin.
Another RD assumption is that the density of the running variable, the vote margin
between the female and the male candidate, is continuous at the winning threshold, i.e. at the
zero vote margin. We plotted the density of the vote margin which looks smooth throughout
(Figure 2A) and, following McCrary (2008), we formally verify that there is no significant
discontinuity at the zero point (Figure 2B). Manipulation of the vote margin is unlikely in
our setting, since the Election Commission of India has a well-established reputation for
independence and political neutrality, and Indian elections are considered free and fair.
4.2. Continuity in Candidate Characteristics
We verify that the characteristics of the candidate pool are very similar across places
where women win elections and places where women do not. Figure 3 examines a range of
candidate characteristics including whether any criminal charges have been filed against the
candidate (including corruption charges), education levels, net worth, whether the incumbent
is in the race, and whether there are candidates from women-headed parties.15
Recent studies have questioned the validity of the RD premise that the (party)
identity of the winner is quasi-random in close elections, showing that the incumbent party
in U.S. elections tends to have systematically greater chances of winning even when elections
are close, consistent with incumbents using their greater power to manipulate their chances
(Caughey and Sekhon 2011, Grimmer et al, 2011). However, Eggers et al (2013) argue that
such sorting is unique to the U.S. House in the post-war period, and find no evidence of it in
several other countries including India. Along these lines, we verified that candidate
15 Female politicians may be more likely to have family connections to other politicians than male politicians in India’s national parliament (French 2011) and in the US (Dal Bó et al 2009). Due to the large number of candidates for state legislative assembly elections across the country we are unable to replicate the French (2011) methodology of contacting local journalists in each constituency to assess the extent of such connections at the local level. As French says, “It was not enough to take prominent names and make larger deductions from them. Equally, much of the information did not seem to exist. Only someone who worked at a local level, perhaps as a political journalist, would be likely to know how each MP in their area entered politics.” However, it is unlikely that family connections of the winner matter in mixed-gender close elections, given that we show all other observable characteristics of the winner and the runner-up to be similar.
14
characteristics such as age, gender, education, net worth or incumbency do not predict
success in mixed-gender races (results available upon request).
4.3. Continuity in Demographic and Political Characteristics
We also verified that a range of demographic covariates (population gender ratios,
literacy rates, proportion of lower castes and backward tribes, the male-female literacy
differential) and pre-determined electoral variables (total number of votes polled, the
number of major party female candidates and female voter turnout in the previous election)
do not vary discontinuously at the RD threshold (Figures 4A-4G). This gives us confidence
that our results do not reflect pre-existing trends across places where women won or did not
win elections.
5. Main Results: Does Women’s Political Participation Respond to Prior
Electoral Success?
We first investigate whether women’s electoral success leads to an increase in the
share of female candidates in the next election, and test robustness to varying the RD
specification. We find an increase in the overall share of major party women candidates
following a woman’s electoral victory, primarily driven by women incumbents being more
likely to re-contest than male incumbents. We find no increase in the entry of new women
candidates and, in some specifications, a decline. In section 6, we investigate the potential
mechanisms behind these findings.
5.1. Political Candidacy
The event of a woman winning an election leads to a large and statistically significant
increase of 18.5 percentage points in the probability of a major party fielding at least one
woman candidate in the subsequent election in her constituency (Table 1, Panel A, column
1). This translates into an 8.5 percentage point increase in the female share of major party
candidates (column 2), which corresponds to 40% of a standard deviation in the sample of
constituencies with at least one female candidate. A visual representation of these estimates
is in Figure 5A, which shows a jump in the probability of having a major party female
15
candidate at the zero vote margin, to the left of which a woman narrowly lost the previous
election and to the right of which a woman narrowly won the previous election against a
man. We see a similar discontinuity for the female share of major party candidates (Figure
5B). As the share of female candidates will rise if there are more women or if there are fewer
candidates in all, we investigated candidate numbers. We find an increase in the number of
major party female candidates (column 3); and no significant change in the total number of
candidates from major parties (column 4), which indicates that women candidates effectively
substitute for male candidates.
The share of women among competitive candidates, defined as those who get at least
5% of total votes cast, also increases significantly (column 5). This is consistent with the
strong overlap between major party and competitive candidates, and establishes that the
increase in candidacy that we observe following an electoral victory by a female politician is
of politically viable women fielded by politically relevant parties. In contrast to the observed
increase in women’s candidacy within major parties, the fraction of independent women
candidates—those not affiliated with any party—does not increase (column 6).16 We find no
significant impact of women having won the previous election on the chances of a woman
winning the current election (column 7). This is consistent with previous evidence indicating
an incumbency disadvantage in Indian state elections (Linden 2004, Uppal 2009).
5.2. Robustness of RD Estimates
We investigate robustness of the estimates to varying the functional form of the
running variable in regressions run on the full sample, to estimating local linear regressions
with varying bandwidths (including a very narrow discontinuity sample), to controlling for
election-specific factors, and to restricting the sample to elections in which the top two vote-
getters are a man and a woman. We also present a placebo check in which we vary the
discontinuity point.
16 Given that major parties account for only 30% of candidates overall, we find no increase in overall female candidacy after a woman’s electoral victory.

16
5.2.1. Robustness to functional form and sample for the running variable
The specification in Table 1 (Panel A) controls for a quadratic polynomial in the
victory margin, which is allowed to be different on either side of the discontinuity. We verify
that the coefficients on the suite of outcomes in Table 1 remains similar in size and
significance when a local linear regression is estimated on a sample restricted to an optimal
bandwidth around the discontinuity, using optimal bandwidths as specified by Imbens and
Kalyanaraman (2011) in Panel B and by Calonico, Cattaneo and Titiunik (2014) in Panel C.
We conduct further checks for the female share of major party candidates, which is
the main outcome in Table 1. First we generalize the polynomial in the victory margin to the
third and fourth order, retaining the full sample, and we find very little change in the
coefficient of interest (Appendix Table A3, columns 1 and 2) We then restrict the sample to
small bandwidths of 0.1 and then 0.05, controlling for linear trends on either side of the
discontinuity in the first case and simply comparing the mean of the dependent variable on
both sides of the discontinuity for the smaller bandwidth, along the lines of Angrist and
Lavy (1999), and our results remain unchanged. The estimates in column 5 examine the
stability of the estimated coefficient to inclusion of a vector of state-year fixed effects which
control for all relevant election-specific factors such as whether the previous Chief Minister
was a woman, whether there was a woman party leader in the current election, or whether a
new woman-headed party had been formed. The estimated coefficient retains its size and
significance. Our results are also unchanged if we cluster the standard errors at the finer
constituency level rather than the district level (column 6).
Finally, we restrict the sample to elections where a woman and a man were among
the top two candidates in terms of votes won. The coefficients are similar to the baseline
results in size and significance, both when we control for a second-order polynomial on
either side of the discontinuity (column 7) and when we use the Imbens and Kalyanaraman
optimal bandwidth (column 8).
5.2.2. Fake or placebo discontinuities
We tested for discontinuous increases in candidacy at points of the vote margin
distribution at which there should be no jumps, that is, at points other than zero, as

17
suggested in Imbens and Lemieux (2007). We implemented a placebo check re-computing
the RD estimates using “fake” discontinuities at various points both to the left and to the
right of the discontinuity. Appendix Figure A2 plots the t-statistics obtained from this series
of RD estimates. We see that the largest t-statistic is at the real discontinuity, i.e. at the zero
point, while all other t-statistics at placebo discontinuity points indicate statistical
insignificance.
5.3. New Candidate Entry vs Incumbent Candidacy
In this section, we examine how much of the observed rise in women’s candidacy is
attributable to the entry of new women candidates. We find no evidence of new candidate
entry, in fact, the regression coefficient for the new female share of major party candidates is
negative and statistically significant for two of the three RD estimators (Table 2, column 1,
Panels A and B); we investigate this in more detail below. There is no significant impact of
women’s victory on the entry of new male candidates (column 2).
However, incumbent women are significantly more likely to run for re-election than
incumbent men (column 3). This is an important margin of response, because there is a
gender gap that disfavors women in the baseline probability of women incumbents running
for re-election: 34% of female winners and 28% of male winners do not run for re-election
in the full sample. Since party-switching is frequent in India, we investigated incumbent
candidacy by party. We find that women incumbents are more likely than male incumbents
to contest from the incumbent party (Table 2, column 4), and significantly less likely to
switch parties in the election after they win (column 5). These results retain their size and
significance regardless of the specification or the bandwidth used (Table 2, Panels B and C).
They are consistent with, for instance, the implications of a dynamic model of statistical
discrimination in which, under plausible conditions on post-recruitment behavior, “belief-
flipping” may occur, with successful women being favored over successful men (Fryer
2007).17
17 It is conceivable that new women are less likely to contest when the incumbent is a woman because, if the incumbent woman re-contests and if votes are “gendered” then her contesting would split the vote, making it harder for a new woman to win. While we cannot test this rigorously because the incumbent’s decision to

18
5.4. Candidacy Spillovers across Parties and Constituencies
In this section, we first examine party-level (rather than candidate-level) responses
and then examine whether there are any spillovers of a woman winning in a given
constituency on women’s participation in nearby constituencies. We find that, in
constituencies where women won the previous election, it is strictly only the winner’s party
that is more likely to field a woman candidate in the next election and, as we saw above, this
candidate tends to be the winner herself. Parties that lost the previous election to a woman
are significantly less likely to nominate a woman (Table 3, columns 1 and 2). The losing party
typically fielded a man so this result simply means that in the next election, despite the man
losing to a woman, they continued to field a man. While the presence of an incumbent
woman politician might discourage new female candidates in her constituency (as it would
split the gendered votes), it might nevertheless encourage greater participation in nearby
areas. However, we find no evidence of increased female candidacy, whether from the
incumbent party or other parties, in constituencies within the same district (Table 3, columns
3 and 4) or within the same national parliamentary constituencies (columns 5 and 6). In
separate regressions (not shown), we replaced the female share of candidates with the new
female share and found similar results, i.e., that there is no tendency towards increased entry
of new women in nearby constituencies. Using data from the U.S., Broockman (2013)
similarly finds no impact of a woman being elected on the participation of women in nearby
areas.
In the next section, we push the analysis further by investigating voter, party and
candidate responses to women winning with a view to understanding better the mechanisms
behind our findings.
6. Candidate Demand and Candidate Supply
In this section we investigate whether the weak demonstration effects we find are
driven primarily by “demand-side” factors, such as voter and party attitudes towards women
candidates, or by limitations on the supply of potential candidates, such as a shortage of
contest is endogenous, we have verified that the impact on new female candidate entry does not differ by whether the incumbent chooses to run for re-election.

19
suitable female candidates, or the existence of gender-specific constraints that make women
less likely than men to contest as candidates. We use male and female electoral turnout, votes
cast for women vs men, and women’s winning chances as indicators of voter preferences,18
and the gender of the party leader as an indicator of party preferences over women.
6.1. Heterogeneity by Indicators of Gender Prejudice
Since the views of voters and parties are likely to be shaped by prevailing social norms
regarding the role of women, we investigate whether the candidacy response to electoral
victory varies by indicators of this. India has a long history of gender prejudice that has
resulted in millions of women “missing” on account of sex-selective abortion, female
infanticide and discrimination against girls in terms of nutrition and health care. There were
940 women per 1000 men in India in the 2011 census which translates to about 0.86 million
“missing women.” The population sex ratio is now widely used to proxy for women’s social
disadvantage (Sen 2003, Bhalotra and Cochrane 2010, Jayachandran and Kuzeimko 2011).
The population gender ratio varies widely across states, from 861 in Haryana in the North to
1058 in Kerala in the South. A remarkable division seems to run right across India, splitting
the country into two nearly contiguous halves, with missing women in the North and West
but not in the South and East of the country (Sen 2003, Dyson and Moore 1983), and some
studies have attributed this to time-invariant factors such as soil quality (Carranza 2014). In
view of this marked heterogeneity across states, we re-estimate the response of women’s
candidacy to women winning for the groups of states with sex ratios above and below the
median.
We find a much bigger response of women’s candidacy to women’s electoral victory
in states in which the population sex ratio is less skewed or more favorable to women (Table
4, columns 1 and 2). In particular, the female share of major party candidates increases by
5.2 percentage points in states where the gender ratio is skewed against women, while the
corresponding effect is 13.9 percentage points in states where the gender ratio is less biased,
18 Political scientists often associate group-specific turnout with bias. For instance, Washington (2006) shows that black and white turnout rates increase in response to black men on the ballot in U.S. elections.
20
and this difference in the RD coefficients is statistically significant.19 This remarkable
difference is driven both by a difference in the share of new women candidates, where a
negative effect is observed only in the more gender-biased states (columns 3 and 4 and
Appendix Figure A3), and in the share of non-new female candidates (columns 5 and 6).
This suggests that a social context that disadvantages women leads to a weaker candidacy
response by both new and non-new candidates after a woman demonstrates the ability to
win an election. This finding indicates no decline in statistical discrimination among voters.20
While the results in Table 4 are estimated using state-level gender ratios from the
2001 census, the results are robust to using gender literacy gaps, gender ratios in earlier
census files, or gender ratios at the constituency level. We first show that these patterns hold
up to using a different proxy for women’s status, namely the male-female literacy differential.
Women’s educational outcomes are much poorer than those of men: only 65% of women in
India were recorded as literate in the census of 2011, compared to 82% of men. We find that
the female candidacy response to women winning is weaker in states where the male-female
literacy differential is below the median, and that a significant “discouragement” effect on
new women candidates is present only for these states (Appendix Table A4, columns 1 and
2). Both of these pattern, namely, a lower overall candidacy response and a significant
negative effect on the entry of new women candidates, are present when we use either the
gender ratios from the 1981 census (columns 3 and 4) or gender ratios at the constituency
rather than the state level (columns 5 and 6). Note that the constituency-level gender ratios
are subject to the influence of migration across constituency boundaries, while cross-state
migration in India is extremely low (Mistry 2015).
A potential explanation of the results is backlash, namely that seeing women in
leadership positions intensifies societal bias against women and that this is exhibited in voter
and party leader behavior. This would be more likely to be the case in more gender-biased
areas. We investigate this in the next section.
19 The difference in the coefficients was tested using a difference-in-discontinuities specification following Grembi, Nannicini and Troiano (forthcoming). The assumptions of this model are milder than those required for a cross-sectional RD design or for a difference-in-differences strategy 20 Statistical discrimination involves stereotypes generated by the average performance of a group being applied to individual members of the group, and the reason that groups who are in an effective minority are often discriminated against is that the signal they emit is noisier (Phelps 1972).

21
6.2. Voter and Party Behavior
Since candidates are chosen by political parties with a view to winning elections,
party choices will reflect any gender bias among voters, as well as any bias among party
leaders over and above voter bias. We examine whether voters and parties behave differently
after observing a woman winning, distinguishing the behavior of male and female voters and
male and female party leaders.
Voter behavior is indicated by electoral turnout and by votes cast for female as
opposed to male candidates. We find that both female and male voter turnout are
significantly greater in constituencies that were won by women in the preceding election but
only in states with more equal gender ratios, there being no significant response in the more
gender-prejudiced states (Table 5, Panel A, columns 1-4). A woman’s electoral victory
increases the vote share of all women candidates and the chances of a woman winning the
next election, more in states with better gender ratios compared to states with worse gender
ratios, indicating a preference for women leaders in the better states. However, these
differences in the coefficients are not statistically significant (Table 5, Panel B, columns 1-4).
If voters or party-leaders are more likely to update their views after repeated
exposure to women leaders, we might observe larger effects on political candidacy over time.
However, there are very few constituencies in India in which women win a state assembly
seat in a competitive election for two consecutive terms (less than 5% of our RD sample),
making it hard to test for this repeated exposure effect in our data. Moreover, winning the
second time is endogenous in the competitive setting, so we investigate the reduced form i.e.
the response of candidacy in election t to a woman having won two elections ago (t-2) and
three elections ago (t-3). At the ten-year mark (two elections later), we see a marginally
significant increase in the share of women candidates from major parties in the states with
better gender ratios and no effect at all on overall female candidacy in states with worse
gender ratios (Table 5, Panel C, columns 1 and 2). At the fifteen-year mark, the candidacy
response drops to effectively zero in all states (Table 5, Panel C, columns 3 and 4).
We now examine the role of parties. If the different results we noted in more and
less prejudiced contexts are attributable to intensification of gender bias within parties, and if
male-headed parties are more likely to show such intensification, then we expect a lower

22
candidacy response in male-headed parties in gender-biased areas. This is indeed what we
find: candidacy responses to women’s electoral victory are similar across all states among
parties headed by women (Table 6, Panel A, columns 1 and 2). Among parties headed by
men, however, we see a significantly higher candidacy response in states with better gender
ratios (Table 6, Panel A, columns 3 and 4). The patterns for new female candidates are
similar across male and female headed parties (Table 6, Panel B), suggesting that gender bias
intensification within parties tends to make the path to candidacy more difficult for women
who participated in the previous election.
Overall, the results are consistent with women’s electoral victory leading to an
intensification of gender bias in more gender-prejudiced states, particularly within male-
headed parties. This is of course the opposite of the prediction of a model of statistical
discrimination.21 Our finding that, in less prejudiced states, incumbent women are more
likely than incumbent men to re-contest is consistent with statistical discrimination being
lowered for women who have been selected in (as in Fryer 2007). However, in more
prejudiced states, we see what would appear to be a rise in taste-based discrimination.
In the next section, we examine two alternative explanations related to potential
constraints on the supply of new candidates. First, we examine the extent to which a
shortage of suitably experienced potential women candidates is a binding constraint. Second,
to investigate the extent to which barriers to the entry of new women are gender-specific, we
perform a parallel analysis of candidates belonging to a religious minority group (Muslims),
who are also under-represented in political office.
6.3. Supply of Experienced Candidates
The failure of new women candidates to contest in women-led constituencies may
reflect a shortage of suitably qualified women candidates. In general, it is difficult to find
experimental or exogenous variation, but we are able to exploit a massive shock to the
availability of women with political experience created by the institution of quotas for
women in local government. A constitutional amendment of 1993 set aside one-third of all
21 Statistical discrimination involves stereotypes generated by the average performance of a group being applied to individual members of the group, and the reason that groups who are in an effective minority are often discriminated against is that the signal they emit is noisier (Phelps 1972).
23
seats in village, municipality and district councils for women, a large increase from the pre-
reform share of approximately 5%. This created a cadre of women with the experience,
networks and potentially, the motivation to remain on the fast track and contest for
legislative assembly seats. As in Iyer et al (2012), we use plausibly exogenous state-specific
variation in the implementation of the mandate and obtain separate RD estimates for
women’s candidacy response to women winning for periods before and after the
implementation of the local government quota.
We find a significantly higher candidacy response after quotas are implemented, but
only in states with more biased gender ratios (Table 7, Panel A, columns 1-4). In neither
group of states is the share of new candidates significantly different after the introduction of
quotas (Table 7, Panel B). Overall, there is no evidence that shortages of suitably
experienced women candidates drive our result that there is no new entry after a woman
wins.
6.4. Gender-Specific Constraints
Even if there is a cadre of women politicians in local government councils, they may
be reluctant to compete for the post of state legislator, a post that is far more demanding.
Recent work has highlighted gender-specific barriers to women’s participation in executive
positions, which are competitive and typically involve intensive and inflexible work
schedules (Bertrand, Goldin and Katz 2010). Laboratory evidence suggests that women tend
to be less over-confident and more averse to competition than men (Niederle forthcoming,
Petrie and Segal 2014), and a number of studies underline the role of fertility and family
commitments in limiting women’s careers (Goldin 2014). A related possibility is an increased
reluctance of potential women candidates to enter politics due to “stereotype threat,” which
refers to minority groups behaving in ways that confirm group stereotypes when their group
identity is made salient.22
22 Stereotype threat, often measured by the performance of minority groups in standardized tests or participation in meetings, has been documented for racial minorities (Steele and Aronson 1995), lower castes in India (Hoff and Pandey 2006), women (Kray et al 2002, Marx and Roman 2002) and men in areas of female expertise (Coffman 2014), but it has not been considered in the literature on women’s political participation.

24
We investigate this by conducting a parallel analysis for Muslims, with a view to
isolating the role of women-specific constraints from the role of intensified prejudice against
a group with initially small representation. Muslims are the largest religious minority in India,
constituting 14.2% of the population in 2001 (Hindus constitute the majority). We created a
new data set containing the religious identity of all political candidates in India’s state
elections, identifying Muslim candidates by their name. Our data show that Muslims are
under-represented in almost all major states: over the period 1980-2010, Muslims constituted
9.2% of all election candidates and 7.6% of election winners, and almost all (98%) of Muslim
candidates are men. Similar to the literature on the impact of women representatives, there is
some evidence that increasing the political representation of Muslims alters policy choices,
leading to improved health and education outcomes (Bhalotra et al 2014). Here, we estimate
how the share of Muslim candidates in a constituency changes in response to a Muslim
having won the previous election in a competitive race against a non-Muslim. Just as women
are less educated than men in India on average, Muslims are less educated than non-Muslims
on average. In contrast to the case for women vs men, there is a significant difference in the
party affiliations of Muslim vs non-Muslim candidates,23 so we control for party identity in
order to isolate the effect of the religion of the politician.
The results for Muslims are very similar to the results for women. In the election
after a Muslim wins a state seat, there is an increase in the share of candidates who are
Muslim in that constituency, and this is statistically significant at the 10% level (Table 8,
Panel A, columns 1-4). Importantly, there is no increase in the fraction of new Muslim
candidates and the coefficient estimate is negative though not statistically significant (Table
8, Panel B). So, just as we found for women candidates, the overall effects on Muslim
candidacy are driven by incumbent Muslim candidates being more likely to re-contest and
there is no entry of new candidates.
Also similar to our results for women, the coefficient of interest varies systematically
across the states with indicators of Muslim disadvantage. The positive effects on candidacy
are larger in states where Muslims constitute a higher share of the population (columns 5 and
23 Muslim candidates are significantly less likely to belong to the Bharatiya Janata Party (BJP), which often espouses an explicit ideology of “Hindutva,” and they are significantly more likely to belong to the Indian National Congress (INC) or the Bahujan Samaj Party (BSP).

25
6), and where the literacy differential between Hindus and Muslims is smaller (columns 7 and
8). Using a new dataset we recently created on incidents of religious violence from
newspaper reports in the Times of India (Kaysser et al 2014, an updated version of Varshney
and Wilkinson 2006), we find that the candidacy response is larger in states that experienced
fewer incidents of religious violence over the period 1980-2010 (columns 9 and 10). While
the standard errors are too large to conclude that these estimates are statistically different, it
is clear that the patterns are similar to the patterns observed for women’s political candidacy.
In particular, there is a statistically significant “discouragement” of entry of new candidates
in states where the population share of Muslims is low (Table 8, Panel B, column 5).
The fact that the pattern of results for religious minorities is similar to the pattern we
identified for women suggests that the results for women are unlikely to be predominantly a
reflection of gender-specific factors. Our findings are consistent with backlash or intensified
bias against Muslim candidates after a Muslim politician wins power.24 A related possibility,
which is observationally similar to backlash, is that both religious minorities and women
candidates are reluctant to come forward because of an intensification of “stereotype threat,”
which refers to group members facing social or psychological costs to behaving differently
from the socially accepted group stereotype. The intensification may arise from electoral
victory might making group stereotypes salient, especially in areas where the groups face
significant costs to violating the stereotype.
7. Conclusions
Many reasons have been proposed for the gender gap in leadership positions. These
include “supply-side” factors such as the lower ambition of women (Lawless and Fox 2010),
the lack of women role models (Beaman et al 2012), women’s aversion to competitive
environments (Gneezy et al 2003, Petrie and Segal 2014), their fertility and family
commitments which conflict with intensive and inflexible work schedules (Bertrand, Goldin
and Katz 2010, Goldin 2014) and “stereotype threat,” which refers to minority groups
24 We attempted a similar analysis distinguishing high and low castes, but this was limited by sample size because we are only able to identify caste for individual candidates in elections after 2003. Examining close elections of SC/ST candidates against others in this limited sample, we find a similar absence of “demonstration effects” on candidacy of Scheduled Castes (SC) and Scheduled Tribes (ST), who are the historically disadvantaged caste groups. Results are available upon request.
26
behaving in ways that confirm group stereotypes when their group identity is made salient.
There can also be “demand-side” factors such as parties or voters having greater preferences
for male candidates. It is often argued that the scarcity of female role models reinforces
these preferences and prejudices. If women, voters and party leaders do not see enough
women in a leadership role, demonstrating their success and their social acceptability
(Lawless and Fox 2010, Pande and Ford 2012), then women winning in a competitive race
against men may encourage the participation of the next generation of women. Also, if
women legislators play a direct role in the selection of candidates for the next election, and
are not contesting themselves, then they directly encourage candidacy among other women.
Using quasi-experimental constituency variation in women winning political office,
we identify a large and significant increase in the subsequent share of women candidates
fielded by major parties in Indian state elections, but this is entirely driven by a greater
propensity for incumbent women relative to incumbent men to run for re-election. Given
that a substantial fraction of incumbents in Indian state elections do not re-run and female
incumbents overall are less likely to re-run than male incumbents, this is an important result.
We decisively reject that new women candidate are induced to enter politics, either in
their own constituency or in neighboring constituencies. In fact, a woman winning office
appears to intensify barriers to the entry of new women in areas characterized by relatively
high levels of gender prejudice. We find similar results following a Muslim winning against a
non-Muslim candidate, which undermines the relevance of gender-specific preferences or
constraints.
Ours is the first systematic analysis of political candidacy in competitive elections in
India. Our results suggest that further economic, institutional or policy incentives may be
needed to stimulate the entry of new women into the political arena. Not only are
demonstration effects too weak to generate an endogenous increase in women’s candidacy,
demonstrated success may even intensify barriers to political participation in gender-biased
areas. Initiatives that are likely to have greater success are those targeted towards changing
the attitudes of voters and parties in gender-biased areas, or those enabling women to
overcome societal barriers to political participation.
27
References
Angrist, Joshua and Victor Lavy. 1999. “Using Maimonides' Rule to Estimate the Effect of
Class Size on Scholastic Achievement.” Quarterly Journal of Economics, 114 (2).
Bagues, Manuel and Berta Esteve-Volart. 2012. “Are Women Pawns in the Political Game?
Evidence from Elections to the Spanish Senate,” Journal of Public Economics 96, pp.
387-399.
Banerjee, Abhijit, Esther Duflo, Clement Imbert and Rohini Pande. 2013. “Entry, Exit and
Candidate Selection: Evidence from India.” Working paper.
Bardhan, Pranab, Dilip Mookherjee and Monica Torrado. 2010. “Impact of Political
Reservations in West Bengal Local Governments on Anti-Poverty Targeting.” Journal
of Globalization and Development 1(1):Article 5.
Beaman, Lori, Raghabendra Chattopadhyay, Esther Duflo, Rohini Pande and Petia
Topalova. 2009. “Powerful Women: Does Exposure Reduce Bias?” Quarterly Journal
of Economics 124(4): 1497-1540.
Beaman, Lori, Esther Duflo, Rohini Pande and Petia Topalova. 2012. “Female Leadership
Raises Aspirations and Educational Attainment for Girls: A Policy Experiment in
India.” Science.
Bertrand, Marianne. 2009. “CEOs.” Annual Review of Economics 1:1.1-1.29.
Bertrand, Marianne, Claudia Goldin and Larry Katz. 2010. “Dynamics of the Gender Gap
for Young Professionals in the Financial and Corporate Sectors.” American Economic
Journal: Applied Economics 2(3): 228-55.
Bertrand, Marianne and K.F. Hallock. 2001. “The Gender Gap in Top Corporate Jobs.”
Industrial and Labor Relations Review 55:3–21
Bertrand, Marianne, Sandra Black, Sissel Jensen and Adriana Lleras-Muney. 2014. “Breaking
the Glass Ceiling? The Effect of Board Quotas on Female Labor Market Outcomes
in Norway.” Working Paper.
Bertrand, Marianne, Emir Kamenica and Jessica Pan. 2013. “Gender Identity and Relative
Income within Households.” Chicago Booth Research Paper No. 13-08.
Besley, Timothy, Olle Folke, Torsten Persson and Johanna Rickne. 2012. “Gender Quotas
and the Crisis of the Mediocre Man: Theory and Evidence from Sweden.”Mimeo.

28
Bettinger, Eric P., and Bridget Terry Long. 2005. “Do Faculty Serve as Role Models? The
Impact of Instructor Gender on Female Students.” American Economic Review,
95(2): 152-157.
Bhalotra, Sonia and Irma Clots-Figueras. 2014. “Health and the Political Agency of
Women.” American Economic Journal: Economic Policy.
Bhalotra, Sonia, Guilhem Cassan, Irma Clots-Figueras and Lakshmi Iyer. 2014. “Religion,
Politician Identity and Development Outcomes: Evidence from India.” Journal of
Economic Behavior and Organization 104:4-17.
Bhalotra, Sonia and Tom Cochrane, 2010. “Where Have All the Young Girls Gone?
Identification of Sex Selection in India”, Bonn: IZA Discussion Paper 5831.
Bhavnani, Rikhil. 2009. “Do Electoral Quotas Work After They Are Withdrawn? Evidence
from a Natural Experiment in India.” American Political Science Review 103 (1):23-35.
Broockman, David E. 2013. “Do Female Politicians Empower Women To Vote or Run for
Office? A Regression Discontinuity Approach.” Electoral Studies (34),
http://dx.doi.org/10.1016/j.electstud.2013.10.002.
Brollo, Fernando and Ugo Troiano. 2014. “What Happens When a Woman Wins a Close
Election? Evidence from Brazil.” Mimeograph, Warwick University.
Calonico, S., M. D. Cattaneo, and R. Titiunik. 2014. “Robust Nonparametric Confidence
Intervals for Regression-Discontinuity Designs.” Econometrica, forthcoming.
Carranza, Eliana. 2014. “Soil Endowments, Female Labor Force Participation, and
the Demographic Deficit of Women in India.” American Economic Journal: Applied
Economics 6(4): 197-225.
Casas-Arce, Pablo and Albert Saiz. 2015. “Women and Power: Unwilling, Ineffective, or
Held Back?” Journal of Political Economy. Vol. 123, No. 3 (June), pp. 641-669.
Caughey, Devin and Jasjeet Sekhon (2011). “Elections and the Regression-Discontinuity
Design: Lessons from Close U.S. House Races, 1942-2008.” Political Analysis, 19(4):
385-408.
Chattopadhyay, Raghabendra and Esther Duflo. 2004. “Women as Policy Makers: Evidence
from a Randomized Policy Experiment in India.” Econometrica 72(5): 1409-1443.

29
Coate, Stephen and Glenn Loury. 1993. “Will Affirmative Action Policies Eliminate
Negative Stereotypes?” American Economic Review, Vol. 83, No. 5, December, 1220-
1240.
Clots-Figueras, Irma. 2011. “Women in Politics: Evidence from the Indian States.” Journal of
Public Economics 95: 664-690.
Clots-Figueras, Irma. 2012. “Are Female Leaders Good for Education? Evidence from
India.” American Economic Journal: Applied Economics 4(1), 212-44.
Coffman, Katherine. 2014. “Evidence on Self-Stereotyping and the Contribution of Ideas.”
Quarterly Journal of Economics, forthcoming.
Cox, Gary and Jonathan Katz. 1996. “Why did the incumbency advantage in U.S. House
elections grow?” American Journal of Political Science 40 (May): 478-497.
Deininger, Klaus and Hari Nagarajan. 2011. “Does Female Reservation Affect Long-Term
Political Outcomes? Evidence from Rural India.” World Bank Policy Research
Working Paper 5708.
Dal Bó, E., Dal Bó, P., and Jason Snyder. 2009. “Political Dynasties”. Review of Economic
Studies. 76(1), January 2009.
De Magalhaes, Leandro. 2015. “Incumbency Effects in a Comparative Perspective: Evidence
from Brazilian Mayoral Elections.” Political Analysis 23.
de Paola, Maria, Rosetta Lombardo and Vincenzo Scoppa. 2010. “Can gender quotas break
down negative stereotypes? Evidence from changes in electoral rules.” Journal of
Public Economics, Elsevier, vol. 94(5-6), pages 344-353, June.
Dollar, David, Raymond Fisman, and Roberta Gatti. 2001. “Are Women Really the ‘Fairer’
Sex? Corruption and Women in Government.” Journal of Economic Behavior and
Organization 46 (4): 423 –29.
Dyson, Tim and Mick Moore. 1983. “On Kinship Structure, Female Autonomy, and
Demographic Behavior in India”. Population and Development Review, 9(1), pp. 35-60.
Eggers, Andrew C., Olle Folke, Anthony Fowler, Jens Hainmueller, Andrew B. Hall and
James M. Snyder, Jr. 2015. “On The Validity Of The Regression Discontinuity
Design For Estimating Electoral Effects: New Evidence From Over 40,000 Close
Races.” American Journal of Political Science 59:1.

30
Fairlie, Robert W., Florian Hoffmann, and Philip Oreopoulos. 2014. “A Community College
Instructor Like Me: Race and Ethnicity Interactions in the Classroom.” American
Economic Review, 104(8): 2567-91.
Ferreira and Gyourko. 2014. “Does gender matter for political leadership? The case of U.S.
mayors.” Journal of Public Economics 112: 24-39.
French, Patrick. 2011. “The Princely State of India”. Outlook Magazine, Jan 17 2011.
Fryer, Roland. 2007. “Belief Flipping in a Dynamic Model of Statistical Discrimination.”
Journal of Public Economics.
Gagliarducci, Stefano and Daniele Paserman. 2012. “Gender Interactions within Hierarchies:
Evidence from the Political Arena.” Review of Economic Studies 79(3): 1021-1052.
Gangadharan, Lata, Tarun Jain , Pushkar Maitra and Joseph Vecci. 2015. “Social Norms and
Governance: The Behavioral Response to Female Leadership.” Mimeograph..
Gelman, Andrew and Guido Imbens. 2014. “Why High-order Polynomials Should not be
Used in Regression Discontinuity Designs.” NBER Working Paper 20405.
Gelman, Andrew and Gary King. 1990. “Estimating Incumbency Advantage without Bias.”
American Journal of Political Science 34: 1142-1164.
Ginther, Donna and Shulamit Kahn. Forthcoming. “Women’s Careers in Academic Social
Science: Progress, Pitfalls and Plateaus.” In The Economics of Economists, edited by
Alessandro Lanteri and Jack Vromen. Cambridge: Cambridge University Press.
Gneezy, Uri, Muriel Niederle, and Aldo Rustichini. 2003. “Performance in Competitive
Environments: Gender Differences.” Quarterly Journal of Economics 118(3), 1049-1074.
Goldin C. 2014. “A Grand Gender Convergence: Its Last Chapter.” American Economic Review
104(4):1091-1119.
Grembi, V., Nannicini, T and Ugo Troiano. Forthcoming. “Do Fiscal Rules Matter?”,
American Economic Journal: Applied Economics.
Grimmer, Justin, Eitan Hersh, Brian Feinstein and Dan Carpenter. 2011. “Are Close
Elections Random?” Mimeograph. Harvard School of Government.
Hahn, J., Todd, P., Van Der Klaauw, W., 2001. “Identification and estimation of treatment
effects with a regression discontinuity design.” Econometrica, Vol. 69.

31
Hoff, Karla and Priyanka Pandey. 2006. “Discrimination, Social Identity, and Durable
Inequalities.” American Economic Review 96 (2): 206-211.
Imbens, Guido and Thomas Lemiuex, 2007, “Regression discontinuity designs: A guide to
practice,” Journal of Econometrics, doi:10.1016/j.jeconom.2007.05.001.
Imbens, Guido, and Karthik Kalyanaraman. 2011. “Optimal Bandwidth Choice for the
Regression Discontinuity Estimator.” Review of Economic Studies.
Iyer, Lakshmi, Anandi Mani, Prachi Mishra and Petia Topalova. 2012. “The Power of
Political Voice: Women’s Political Representation and Crime in India.” American
Economic Journal: Applied Economics, 4(4): 165-193.
Jayachandran, Seema and I. Kuziemko, 2011, “Why Do Mothers Breastfeed Girls Less Than
Boys: Evidence And Implications For Child Health In India.” Quarterly Journal of
Economics, August, vol. 126 (3), pp. 1485-1538.
Kaysser, Nina, Sonia Bhalotra, Irma Clots-Figueras and Lakshmi Iyer. 2014. “Hindu-Muslim
Violence in India 1950-2010: An Update of the Varshney-Wilkinson Dataset on
Hindu-Muslim Violence in India.” Mimeo.
Klasnja, Marko and Rocio Titiunik. 2013. “The Incumbency Curse: Weak Parties, Term
Limits, and Unfulfilled Accountability.” Working paper.
Kray, L. J., Galinksy, A. D., & Thompson, L. (2002). “Reversing the gender gap in
negotiations: An exploration of stereotype regeneration.” Organizational Behavior and
Human Decision Processes, 87, 386-409.
Lawless, Jennifer L. and Richard L. Fox. (2010) It Still Takes A Candidate: Why Women Don't
Run for Office, New York: Cambridge University Press.
Lee, David. 2008. “Randomized experiments from non-random selection in U.S. House
elections.” Journal of Econometrics 142 (2): 675–697.
Lee, David S., Enrico Moretti, and Matthew J. Butler. 2004. “Do Voters Affect or
ElectPolicies? Evidence from the U.S. House.” Quarterly Journal of Economics, 119(3),
807-860.
Linden, Leigh. 2004. “Are Incumbents Really Advantaged? The Preference for Non-
Incumbents in Indian National Elections.” Working Paper.

32
Luke, Nancy and Kaivan Munshi. 2011. ““Women as Agents of Change: Female Income
and Mobility in India.” Journal of Development Economics 94(1):1-17.
Macdonald, Bobbie. 2013. “Incumbency Disadvantages in African Politics? Regression
Discontinuity Evidence from Zambian Elections.” Working paper.
Mani, Anandi. 2011. “Mine, Yours or Ours: The Efficiency of Household Investment
Decisions -- an Experimental Approach.” Working Paper, University of Warwick.
Marx, D. M., & Roman, J. S. (2002). “Female role models: Protecting women's math test
performance.” Personality and Social Psychology Bulletin, 28, 1183-1193.
McCrary, Justin. 2008. “Manipulation of the Running Variable in the Regression
Discontinuity Design: A Density Test,” Journal of Economic Literature 142 (2).
Meyersson, E. 2014. “Islamic Rule and the Empowerment of the Poor and Pious”.
Econometrica, Vol. 82, No. 1 (January 2014), pp 229-269.
Miller, Grant. 2008. “Women's suffrage, political responsiveness, and child survival in
American history.” Quarterly Journal of Economics, 123, 1287–1327.
Mistri, Avijit. 2015. “Estimation of Internal Migration in India, 2011 Census based on Life
Table Survival Ratio Method.” Munich: MPRA Paper No. 61577. Online at
http://mpra.ub.uni-muenchen.de/61577/.
Niederle, Muriel. “Gender.” In Handbook of Experimental Economics, second edition, Eds. John
Kagel and Alvin E. Roth, forthcoming.
Pande, Rohini and Deanna Ford. 2012. “Gender Quotas and Female Leadership: A Review,”
Background paper for the World Development Report on Gender.
Petrie, Ragan and Carmit Segal. 2014. “Gender Differences in Competitiveness: The Role of
Prizes.” Working paper.
Phelps, E. 1972. “The statistical theory of racism and sexism.” American Economic Review 62,
659–661.
Ravishankar, Nirmala. 2009. “The Cost of Ruling: Anti-Incumbency in Elections.” Economic
and Political Weekly 54 (10): 92-98.
Rehavi, Marit. 2012. “Sex and Politics: Do Female Legislators Affect State Spending?”
Working Paper, University of British Columbia.

33
Schuler, Sidney Ruth, Hashemi, Syed M., Riley, Ann P., Akhter, Shireen. 1996.
“Credit programs, patriarchy and men's violence against women in rural
Bangladesh.” Social Science and Medicine 43 (12), 1729–1742.
Sekhon, Jasjeet S. and Rocio Titiunik. 2012. “When Natural Experiments are Neither
Natural Nor Experiments.” American Political Science Review 106 (1): 35-57.
Sen, Amartya. 2003. “Missing women—revisited.” BMJ 327:1297.
Steele, C. M., & Aronson, J. (1995). “Stereotype threat and the intellectual test performance
of African-Americans.” Journal of Personality and Social Psychology, 69, 797-811.
Swamy, Anand, Omar Azfar, Steve Knack, and Young Lee. 2001. “Gender and Corruption.”
Journal of Development Economics Vol. 64, 25-55.
Varshney, Ashutosh, and Steven Wilkinson. 2006. “Varshney-Wilkinson Dataset on Hindu-
Muslim Violence in India, 1950-1995, Version 2.” Ann Arbor, MI: Inter-university
Consortium for Political and Social Research, 2006-02-17
http://doi.org/10.3886/ICPSR04342.v1
Uppal, Yogesh. 2009. “The Disadvantaged Incumbents: Estimating Incumbency Effects in
Indian State Legislatures.” Public Choice 138: 9-27.
Washington, Ebonya. 2006. “How Black Candidates Affect Voter Turnout.” Quarterly Journal
of Economics 121(3): 973-998.

Figure1:PreferencesforWomenPoliticians
A.VoteShareofWomenPoliticiansAcrossDifferentVictoryMargins
B.NoDiscontinuityinPreferencesforWomenPoliticians
Notes:Constituency-yearobservationsforthesampleofelectionswithatleastonewomancandidate.
Notes: Constituency-year observations for the sample of elections with at least one woman candidate. Female voteshare is the vote share of all female candidates in the constituency; victory margin is the difference in vote sharebetweenthetoptwovotewinnersofoppositegenders.Thefittedvaluesarealowessline.
-1-.5
0.5
1Fe
male-
Male
vote
margi
n
0 .2 .4 .6 .8 1Vote share of all female candidates
0.2
.4.6
.8
-50 0 50Victory Margin
female vote share Fitted values (male)Fitted values (female)
Victory Margin Aggregated into 2.5% Bins
Mixed-gender election with female winner having margin > 0

Figure2:ContinuityoftheVictoryMarginbetweenFemaleandMaleCandidates
A.Densityofthevictorymargin
B.Testingfordensitydiscontinuitiesatzero(McCraryTest)
DiscontinuityestimateinFigureB(logdifferenceinheight):.0065(s.e.=0.1053)Notes:Samplerestrictedtothoseconstituencieswheretherewasatleastonewomancandidate.
0.5
11.5
22.5
-1 -.5 0 .5 1
0.5
11.
52
2.5
Dens
ity
-1 -.5 0 .5 1margin of victory

Figure3:CharacteristicsofCandidatePool(WinnersandRunners-up)inMixed-GenderElectionsA.Anycriminalchargesfiledagainstcandidate B.Anyseriouscriminalchargesfiledagainstcandidate
C.Candidatehaslessthanhighschooleducation D.Log(networth)
E.Candidateistheincumbent F.Candidatebelongstoawoman-headedparty
G.CandidatebelongstoINCparty H.CandidatebelongstoBJPparty

Figure4:DemographicCharacteristicsandPriorElectionOutcomes
A:Populationfractionofwomen B:Literacyrate
C:PopulationshareofScheduledCastesandScheduledTribes D:Male-femaleliteracydifferential
E:Numberoffemalecandidates(majorparties)inpreviouselection F:Femalevoterturnoutinpreviouselection
G:Totalvotespolledinpreviouselection
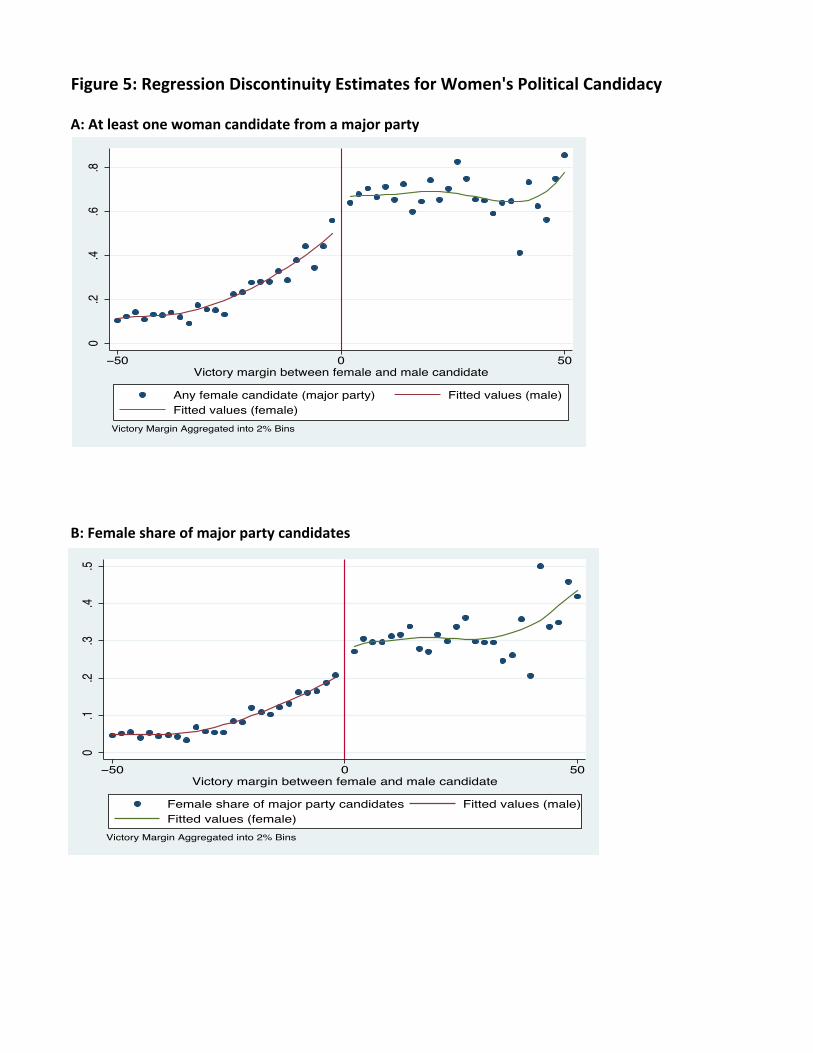
Figure5:RegressionDiscontinuityEstimatesforWomen'sPoliticalCandidacy
A:Atleastonewomancandidatefromamajorparty
B:Femaleshareofmajorpartycandidates
0.1
.2.3
.4.5
−50 0 50Victory margin between female and male candidate
Female share of major party candidates Fitted values (male)Fitted values (female)
Victory Margin Aggregated into 2% Bins
0.2
.4.6
.8
−50 0 50Victory margin between female and male candidate
Any female candidate (major party) Fitted values (male)Fitted values (female)
Victory Margin Aggregated into 2% Bins
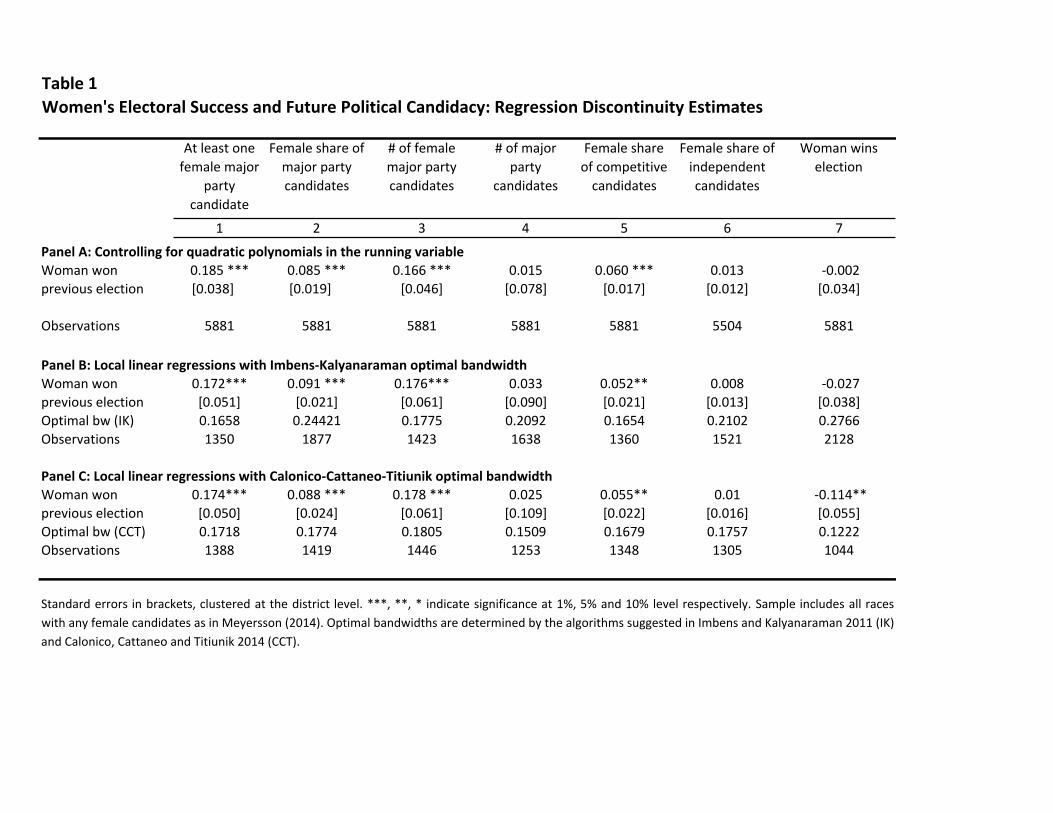
Table1Women'sElectoralSuccessandFuturePoliticalCandidacy:RegressionDiscontinuityEstimates
Atleastonefemalemajor
partycandidate
Femaleshareofmajorpartycandidates
#offemalemajorpartycandidates
#ofmajorparty
candidates
Femaleshareofcompetitivecandidates
Femaleshareofindependentcandidates
Womanwinselection
1 2 3 4 5 6 7
PanelA:ControllingforquadraticpolynomialsintherunningvariableWomanwon 0.185*** 0.085*** 0.166*** 0.015 0.060*** 0.013 -0.002previouselection [0.038] [0.019] [0.046] [0.078] [0.017] [0.012] [0.034]R-squaredObservations 5881 5881 5881 5881 5881 5504 5881
PanelB:LocallinearregressionswithImbens-KalyanaramanoptimalbandwidthWomanwon 0.172*** 0.091*** 0.176*** 0.033 0.052** 0.008 -0.027previouselection [0.051] [0.021] [0.061] [0.090] [0.021] [0.013] [0.038]Optimalbw(IK) 0.1658 0.24421 0.1775 0.2092 0.1654 0.2102 0.2766Observations 1350 1877 1423 1638 1360 1521 2128
PanelC:LocallinearregressionswithCalonico-Cattaneo-TitiunikoptimalbandwidthWomanwon 0.174*** 0.088*** 0.178*** 0.025 0.055** 0.01 -0.114**previouselection [0.050] [0.024] [0.061] [0.109] [0.022] [0.016] [0.055]Optimalbw(CCT) 0.1718 0.1774 0.1805 0.1509 0.1679 0.1757 0.1222Observations 1388 1419 1446 1253 1348 1305 1044
Standard errors in brackets, clustered at the district level. ***, **, * indicate significance at 1%, 5% and 10% level respectively. Sample includes all raceswithanyfemalecandidatesasinMeyersson(2014).OptimalbandwidthsaredeterminedbythealgorithmssuggestedinImbensandKalyanaraman2011(IK)andCalonico,CattaneoandTitiunik2014(CCT).

Table2ImpactofWomen'sElectoralSuccessonNewvsIncumbentCandidates
1 2 3 4 5PanelA:ControllingforquadraticpolynomialsintherunningvariableWomanwonpreviouselection -0.023** -0.025 0.065* 0.149*** -0.084***
[0.010] [0.024] [0.038] [0.038] [0.024]Observations 5874 5874 5881 5881 5881Meanofdependentvariable 0.04735 0.5338 0.6226 0.5092 0.1134
PanelB:LocallinearregressionswithImbens-KalyanaramanoptimalbandwidthWomanwonpreviouselection -0.024** -0.021 0.071 0.159*** -0.091***
[0.011] [0.025] [0.043] [0.044] [0.022]Optimalbw(IK) 0.2731 0.2566 0.2319 0.2352 0.3489Observations 2105 1976 1795 1818 2889
PanelC:LocallinearregressionswithCalonico-Cattaneo-TitiunikoptimalbandwidthWomanwonpreviouselection -0.01 -0.008 0.036 0.162*** -0.094***
[0.017] [0.032] [0.054] [0.053] [0.030]Optimalbw(CCT) 0.1247 0.1647 0.1475 0.1511 0.2112Observations 1059 1344 1229 1254 1648
Incumbentrunsforre-electionfromadifferentparty
Standard errors in brackets, clustered at the district level. ***, **, * indicate significance at 1%, 5% and 10% level respectively. New candidates aredefined as candidates who did not run in the previous election. They were identified by manual matching of candidate names across election years.Sample includes all races with any female candidates as in Meyersson (2014). Optimal bandwidths are determined by the algorithms suggested inImbensandKalyanaraman2011(IK)andCalonico,CattaneoandTitiunik2014(CCT).
Newfemaleshareofmajorpartycandidates
Newmaleshareofmajorpartycandidates
Incumbentrunsforre-election
Incumbentrunsforre-electionfromthe
sameparty

Table3CandidacyEffectsAcrossPartiesandAcrossGeographies
Allmajorparties Incumbentparty Allmajorparties Incumbentparty1 2 3 4 5 6
PanelA:ControllingforquadraticpolynomialsintherunningvariableWomanwonpreviouselection 0.535*** -0.142*** 0.001 -0.002 0.003 -0.007
[0.031] [0.043] [0.005] [0.008] [0.005] [0.008]Observations 5881 5881 5867 5874 5874 5881MeanofdependentvariablePanelB:LocallinearregressionswithImbens-KalyanaramanoptimalbandwidthWomanwonpreviouselection 0.541*** -0.161*** -0.006 -0.004 -0.003 -0.011
[0.031] [0.051] [0.005] [0.008] [0.005] [0.009]Optimalbw(IK) 0.2725 0.2063 0.2666 0.2737 0.2807 0.229Observations 2104 1617 2064 2113 2166 1773
PanelC:LocallinearregressionswithCalonico-Cattaneo-TitiunikoptimalbandwidthWomanwonpreviouselection 0.536*** -0.178*** -0.007 -0.011 -0.007 -0.020
[0.044] [0.053] [0.007] [0.011] [0.007] [0.013]Optimalbw(CCT) 0.133 0.1885 0.1195 0.1371 0.1217 0.1199Observations 1116 1493 1018 1146 1041 1025
Femaleshareofmajorpartycandidatesinnearbyconstituencies(otherconstituenciesinsamedistrict)
Non-incumbentpartieshavea
femalecandidate(dummy)
Incumbentpartyhasafemalecandidate(dummy)
Femaleshareofmajorpartycandidatesinnearbyconstituencies(other
constituenciesinsameparliamentaryconstituency)
Standarderrorsinbrackets,clusteredatthedistrictlevel.***,**,*indicatesignificanceat1%,5%and10%levelrespectively.SampleincludesallraceswithanyfemalecandidatesasinMeyersson(2014).OptimalbandwidthsaredeterminedbythealgorithmssuggestedinImbensandKalyanaraman2011(IK)andCalonico,CattaneoandTitiunik2014(CCT).

Table4Women'sElectoralSuccessandPoliticalCandidacy:HeterogeneitybyStateLevelGenderPrejudice
Low High Low High Low High1 2 3 4 5 6
PanelA:ControllingforquadraticpolynomialsintherunningvariableWomanwonpreviouselection 0.052** 0.139*** -0.032** -0.002 0.085*** 0.141***
[0.023] [0.031] [0.012] [0.020] [0.020] [0.029]Observations 3714 2160 3714 2160 3714 2160
PanelB:LocallinearregressionswithImbens-Kalyanaramanoptimalbandwidth
Womanwonpreviouselection 0.041 0.176*** -0.031** 0.005 0.069*** 0.160***[0.028] [0.028] [0.014] [0.019] [0.025] [0.031]
Observations 929 1039 1195 867 887 825Optimalbw(IK) 0.1982 0.3643 0.254 0.3043 0.1885 0.2877
PanelC:LocallinearregressionswithCalonico-Cattaneo-TitiunikoptimalbandwidthWomanwonpreviouselection 0.030 0.121** -0.035* 0.022 0.054* 0.053
[0.031] [0.049] [0.019] [0.029] [0.030] [0.049]Observations 781 347 648 480 648 342Optimalbw(CCT) 0.1625 0.0992 0.129 0.141 0.1291 0.0973
Non-new(incumbent+losers)femaleshareofmajorpartycandidates
Femalepopulationshare
Standard errors in brackets, clustered at the district level. ***, **, * indicate significance at 1%, 5% and 10% levelrespectively. Sample includes all races with any female candidates as in Meyersson (2014). Optimal bandwidthsare determined by the algorithms suggested in Imbens and Kalyanaraman 2011 (IK) and Calonico, Cattaneo andTitiunik 2014 (CCT). Low and high female population share refer to states with female population share above orbelowthenationalaverage.
Newfemaleshareofmajorpartycandidates
Femalepopulationshare Femalepopulationshare
Femaleshareofmajorpartycandidates
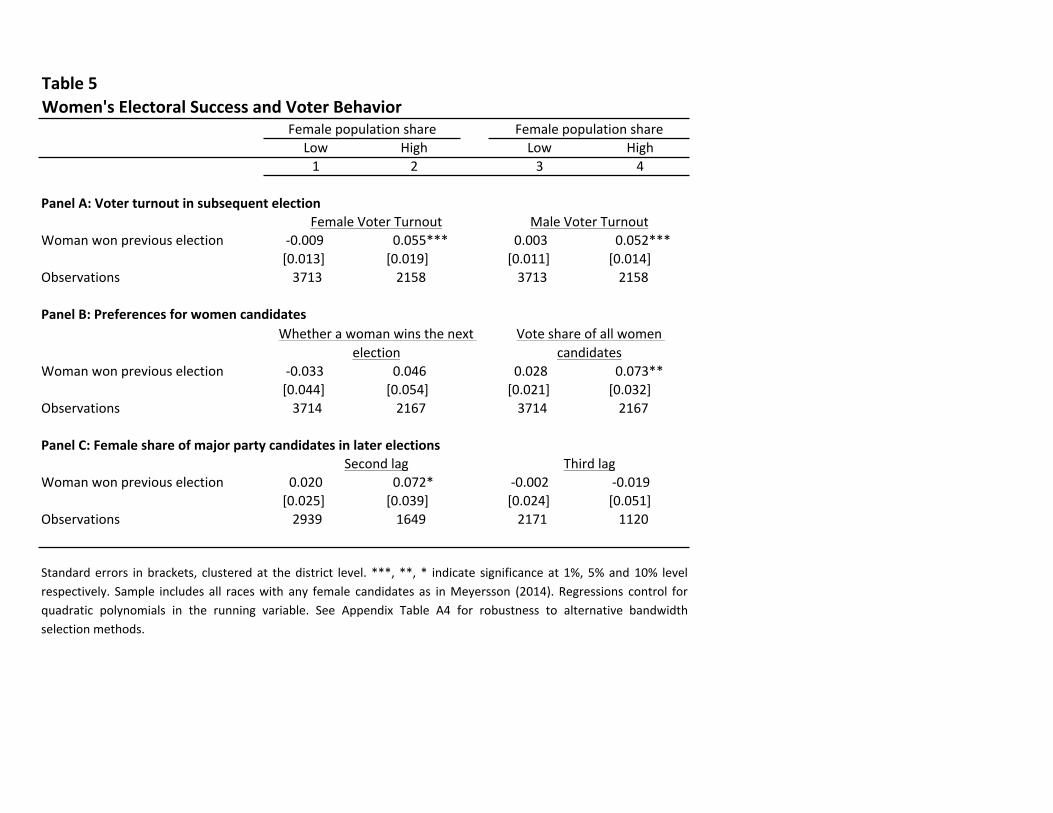
Table5Women'sElectoralSuccessandVoterBehavior
Low High Low High1 2 3 4
PanelA:Voterturnoutinsubsequentelection
Womanwonpreviouselection -0.009 0.055*** 0.003 0.052***[0.013] [0.019] [0.011] [0.014]
Observations 3713 2158 3713 2158
PanelB:Preferencesforwomencandidates
Womanwonpreviouselection -0.033 0.046 0.028 0.073**[0.044] [0.054] [0.021] [0.032]
Observations 3714 2167 3714 2167
PanelC:Femaleshareofmajorpartycandidatesinlaterelections
Womanwonpreviouselection 0.020 0.072* -0.002 -0.019[0.025] [0.039] [0.024] [0.051]
Observations 2939 1649 2171 1120
Femalepopulationshare Femalepopulationshare
Standard errors in brackets, clustered at the district level. ***, **, * indicate significance at 1%, 5% and 10% levelrespectively. Sample includes all races with any female candidates as in Meyersson (2014). Regressions control forquadratic polynomials in the running variable. See Appendix Table A4 for robustness to alternative bandwidthselectionmethods.
Secondlag Thirdlag
Whetherawomanwinsthenextelection
FemaleVoterTurnout MaleVoterTurnout
Voteshareofallwomencandidates
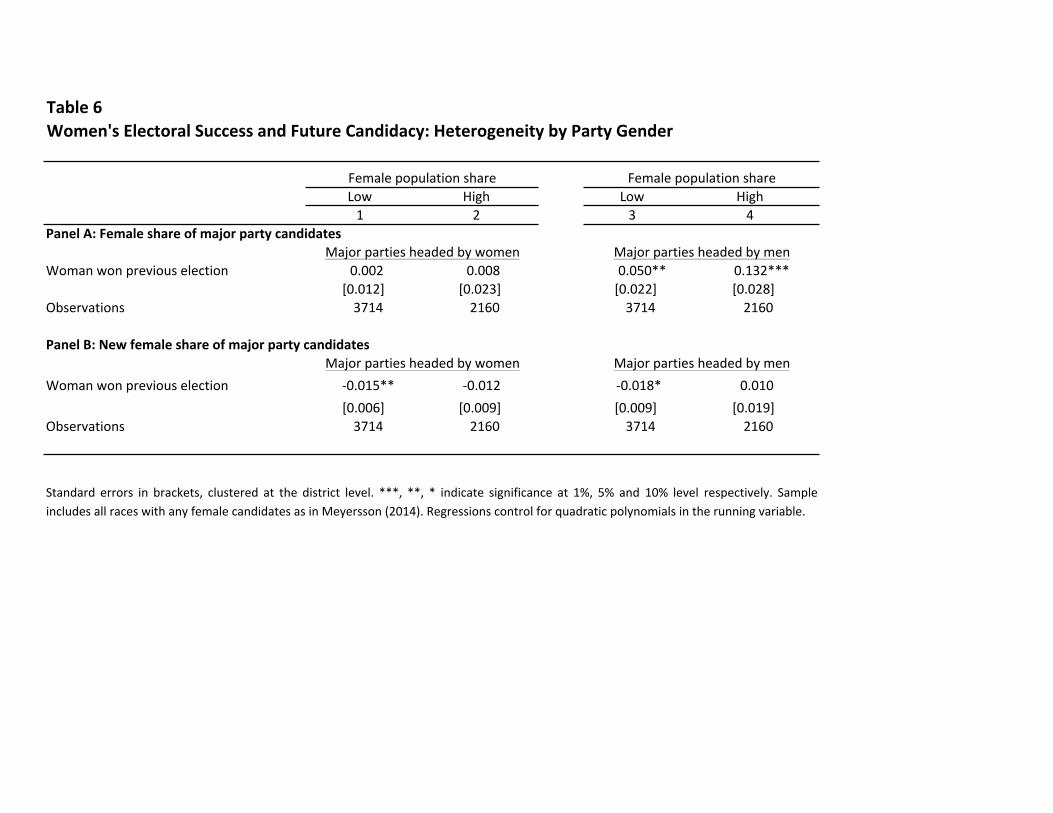
Table6Women'sElectoralSuccessandFutureCandidacy:HeterogeneitybyPartyGender
Low High Low High1 2 3 4
PanelA:Femaleshareofmajorpartycandidates
Womanwonpreviouselection 0.002 0.008 0.050** 0.132***[0.012] [0.023] [0.022] [0.028]
Observations 3714 2160 3714 2160
PanelB:Newfemaleshareofmajorpartycandidates
Womanwonpreviouselection -0.015** -0.012 -0.018* 0.010[0.006] [0.009] [0.009] [0.019]
Observations 3714 2160 3714 2160
Standard errors in brackets, clustered at the district level. ***, **, * indicate significance at 1%, 5% and 10% level respectively. SampleincludesallraceswithanyfemalecandidatesasinMeyersson(2014).Regressionscontrolforquadraticpolynomialsintherunningvariable.
Majorpartiesheadedbywomen Majorpartiesheadedbymen
Femalepopulationshare Femalepopulationshare
Majorpartiesheadedbywomen Majorpartiesheadedbymen
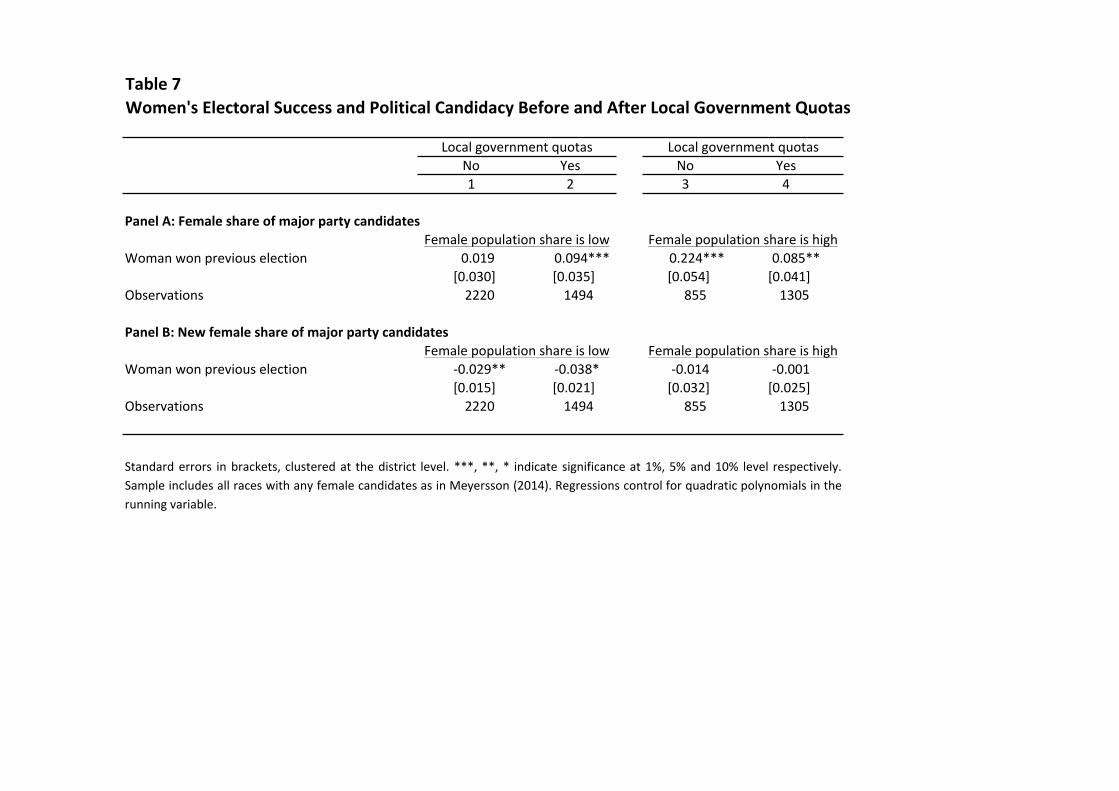
Table7Women'sElectoralSuccessandPoliticalCandidacyBeforeandAfterLocalGovernmentQuotas
No Yes No Yes1 2 3 4
PanelA:Femaleshareofmajorpartycandidates
Womanwonpreviouselection 0.019 0.094*** 0.224*** 0.085**[0.030] [0.035] [0.054] [0.041]
Observations 2220 1494 855 1305
PanelB:Newfemaleshareofmajorpartycandidates
Womanwonpreviouselection -0.029** -0.038* -0.014 -0.001[0.015] [0.021] [0.032] [0.025]
Observations 2220 1494 855 1305
Standard errors in brackets, clustered at the district level. ***, **, * indicate significance at 1%, 5% and 10% level respectively.Sample includes all races with any female candidates as in Meyersson (2014). Regressions control for quadratic polynomials in therunningvariable.
Localgovernmentquotas Localgovernmentquotas
Femalepopulationshareislow Femalepopulationshareishigh
Femalepopulationshareislow Femalepopulationshareishigh

Table8Muslims'ElectoralSuccessandFuturePoliticalCandidacy:RegressionDiscontinuityEstimates
Low High High Low High Low1 2 3 4 5 6 7 8 9 10
0.028 0.037* 0.094*** 0.050 0.015 0.045** 0.033 0.067* 0.02 0.133***[0.020] [0.020] [0.024] [0.031] [0.053] [0.021] [0.023] [0.037] [0.021] [0.045]
Observations 7636 7636 2447 1392 1787 5849 4820 2816 5718 1918
-0.028 -0.023 -0.009 -0.005 -0.085** -0.01 -0.016 -0.04 -0.009 -0.014[0.019] [0.019] [0.017] [0.026] [0.041] [0.020] [0.022] [0.032] [0.018] [0.042]
Observations 7636 7636 3430 1444 1787 5849 4820 2816 5718 1918Polynomial 2ndorder 2ndorder 2ndorder 2ndorder 2ndorder 2ndorder 2ndorder 2ndorder
Bandwidthoptimal(IK)
optimal(CCT)
Partycontrols yes yes yes yes yes yes yes yes yes
Hindu-Muslimliteracydifferential
Muslimwonpreviouselection
Muslimwonpreviouselection
#incidentsofreligiousviolence
Standard errors in brackets, clustered at the district level. ***, **, * indicate significance at 1%, 5% and 10% level respectively. Sample includes all races with anyMuslim candidates. Optimal bandwidths are determined by the algorithms suggested in Imbens and Kalyanaraman 2011 (IK) and Calonico, Cattaneo and Titiunik 2014(CCT). In each case, the first column in a pair indicates a stronger potential Muslim disadvantage. Muslim population share and Hindu-Muslim literacy differential dataare from 2001 state-level census for 16 major states. Classification for population share is bottom 8 states (low population share) versus top 8. Classification forliteracydifferentialislessthan1percentagepoint(lowdifferential)versusothers.Incidentsofreligiousviolencearemeasuredover1980-2010.
PanelB:NewMuslimcandidateshareinmajorparties
Muslimpopulationshare
PanelA:Muslimshareofmajorpartycandidates

AppendixFiguresandTables

FigureA1:Women'sPoliticalCandidacyinMajorIndianStates,1980-2007
A.Women'sPoliticalCandidacyoverTime
B.FemaleShareofMajorPartyCandidatesinMajorIndianStates
noneedtoupdate
.02.04
.06.08
.1
1980
-1984
1990
-1994
1985
-1989
1995
-1999
4
2000
-2004
2005
-2007
5-year election period
Fraction of candidates that are female Fraction of candidates that are female (major parties)
Fraction of winners that are female
0.000
0.020
0.040
0.060
0.080
0.100
0.120
1980-84 2000-07

FigureA2:TestingforDiscontinuitiesat"Fake"DiscontinuityPoints
Note:Graphplotesthet-statisticsofdifferentplacebotestsconductedatalternativeplacebodiscontinuitiesbetweenpercentiles5and95ofthedistribution.Thet-statisticofthediscontinuityatzeroistheoneofourmainestimates.Specificationsrestrictthesampletoobservationseitherattheleftorattherightofthediscontinuityandincludeasplitsecondorderpolynomialaproximation.
01
23
45
t sta
t
-.6 -.4 -.2 0 .2margin
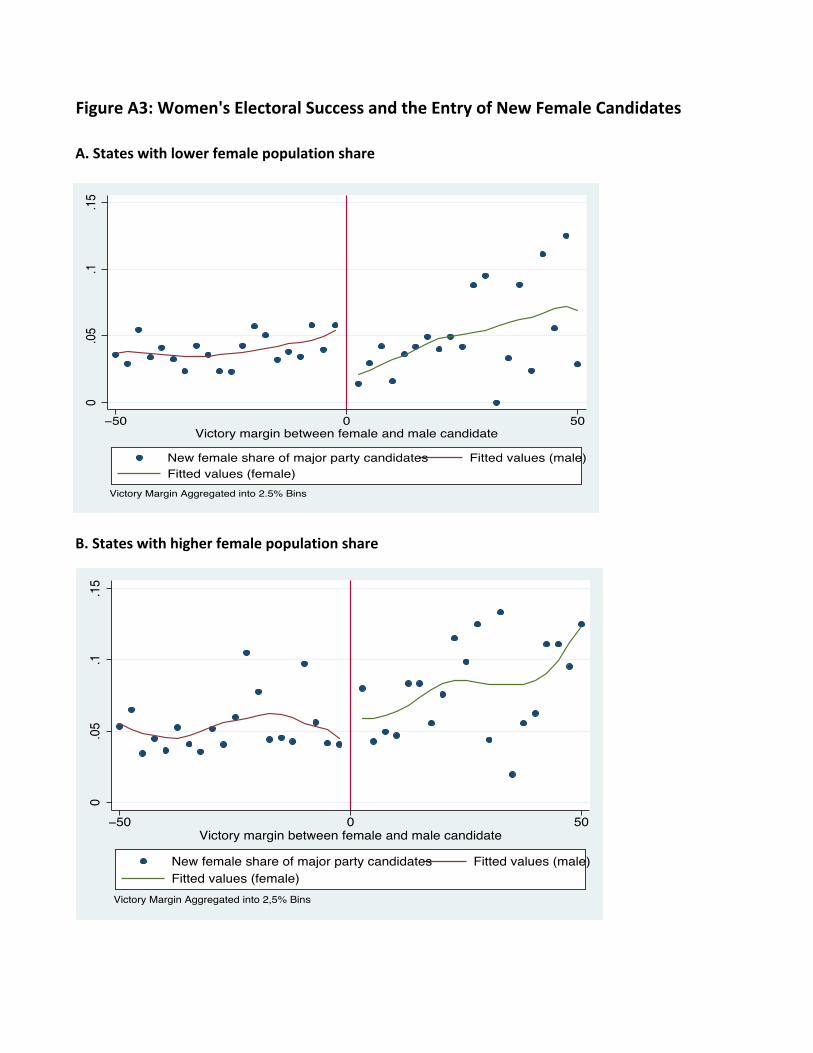
FigureA3:Women'sElectoralSuccessandtheEntryofNewFemaleCandidates
A.Stateswithlowerfemalepopulationshare
B.Stateswithhigherfemalepopulationshare
0.05
.1.15
−50 0 50Victory margin between female and male candidate
New female share of major party candidates Fitted values (male)Fitted values (female)
Victory Margin Aggregated into 2.5% Bins
0.0
5.1
.15
−50 0 50Victory margin between female and male candidate
New female share of major party candidates Fitted values (male)Fitted values (female)
Victory Margin Aggregated into 2,5% Bins
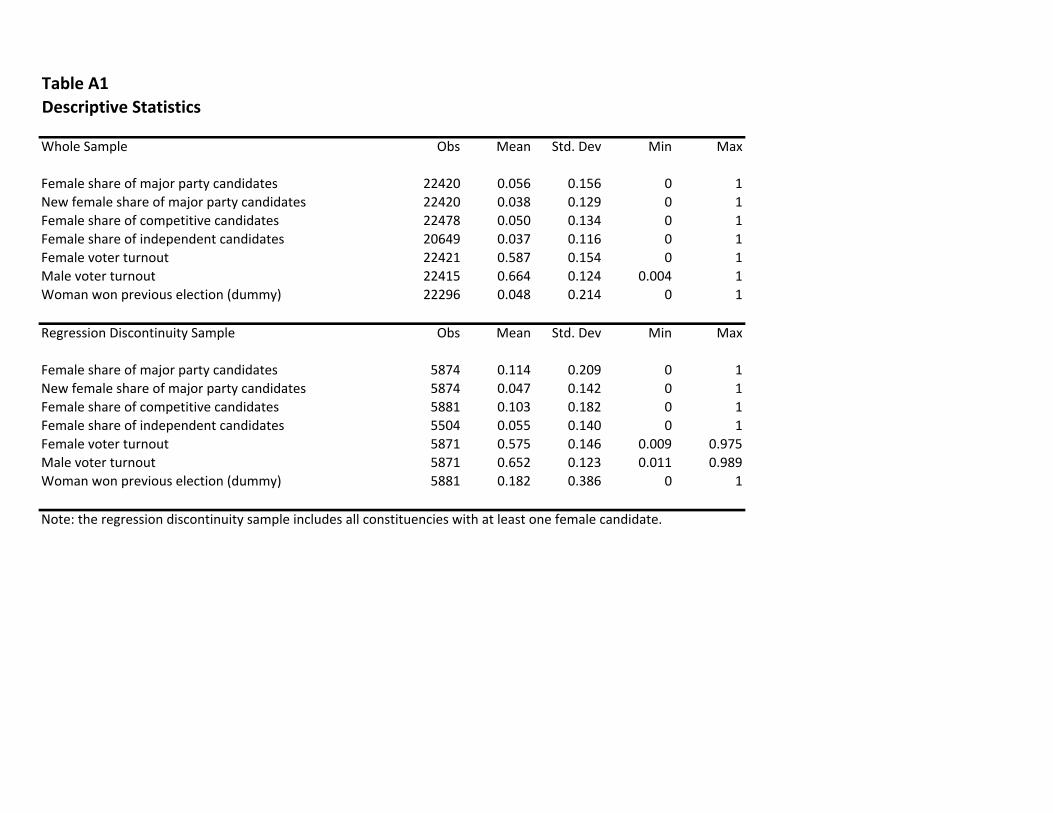
TableA1DescriptiveStatistics
WholeSample Obs Mean Std.Dev Min Max
Femaleshareofmajorpartycandidates 22420 0.056 0.156 0 1Newfemaleshareofmajorpartycandidates 22420 0.038 0.129 0 1Femaleshareofcompetitivecandidates 22478 0.050 0.134 0 1Femaleshareofindependentcandidates 20649 0.037 0.116 0 1Femalevoterturnout 22421 0.587 0.154 0 1Malevoterturnout 22415 0.664 0.124 0.004 1Womanwonpreviouselection(dummy) 22296 0.048 0.214 0 1
RegressionDiscontinuitySample Obs Mean Std.Dev Min Max
Femaleshareofmajorpartycandidates 5874 0.114 0.209 0 1Newfemaleshareofmajorpartycandidates 5874 0.047 0.142 0 1Femaleshareofcompetitivecandidates 5881 0.103 0.182 0 1Femaleshareofindependentcandidates 5504 0.055 0.140 0 1Femalevoterturnout 5871 0.575 0.146 0.009 0.975Malevoterturnout 5871 0.652 0.123 0.011 0.989Womanwonpreviouselection(dummy) 5881 0.182 0.386 0 1
Note:theregressiondiscontinuitysampleincludesallconstituencieswithatleastonefemalecandidate.
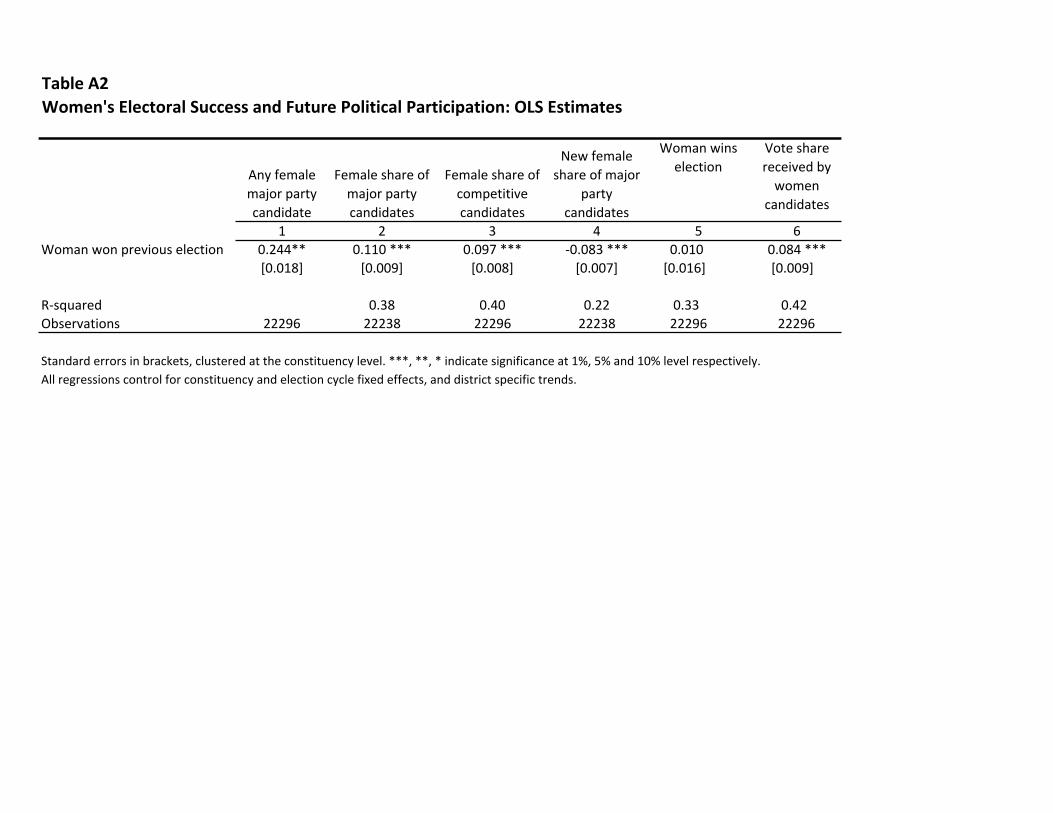
TableA2Women'sElectoralSuccessandFuturePoliticalParticipation:OLSEstimates
Anyfemalemajorpartycandidate
Femaleshareofmajorpartycandidates
Femaleshareofcompetitivecandidates
Newfemaleshareofmajor
partycandidates
Womanwinselection
Votesharereceivedbywomen
candidates
1 2 3 4 5 6Womanwonpreviouselection 0.244** 0.110*** 0.097*** -0.083*** 0.010 0.084***
[0.018] [0.009] [0.008] [0.007] [0.016] [0.009]
R-squared 0.38 0.40 0.22 0.33 0.42Observations 22296 22238 22296 22238 22296 22296
Standarderrorsinbrackets,clusteredattheconstituencylevel.***,**,*indicatesignificanceat1%,5%and10%levelrespectively.Allregressionscontrolforconstituencyandelectioncyclefixedeffects,anddistrictspecifictrends.

TableA3RegressionDiscontinuityEstimates:RobustnesstoChangesinFunctionalForm,BandwidthandSample
1 2 3 4 5 6 7 8Womanwonpreviouselection 0.074*** 0.080*** 0.066** 0.100*** 0.081*** 0.085*** 0.092*** 0.060**
[0.023] [0.028] [0.031] [0.022] [0.019] [0.019] [0.023] [0.031]R-squaredObservations 5874 5874 853 449 5874 5881 1897 931polynomial 3rdorder 4rdorder linear none 2ndorder 2ndorder 2ndorder linear
bandwidth0.1 0.05
optimal(IK)0.121
State*yearfixedeffects yesConstituencylevelclustering yes
Standard errors in brackets, clustered at the district level, except as indicated. ***, **, * indicate significance at 1%, 5% and 10% level respectively. Sample includesall races with any female candidates as in Meyersson (2014). Restricted sample consists of electoral races in which a man and a woman were the top two candidates.OptimalbandwidthsaredeterminedbythealgorithmssuggestedinImbensandKalyanaraman2011(IK).
Dependentvariable:FemaleshareofmajorpartycandidatesRestrictedsample
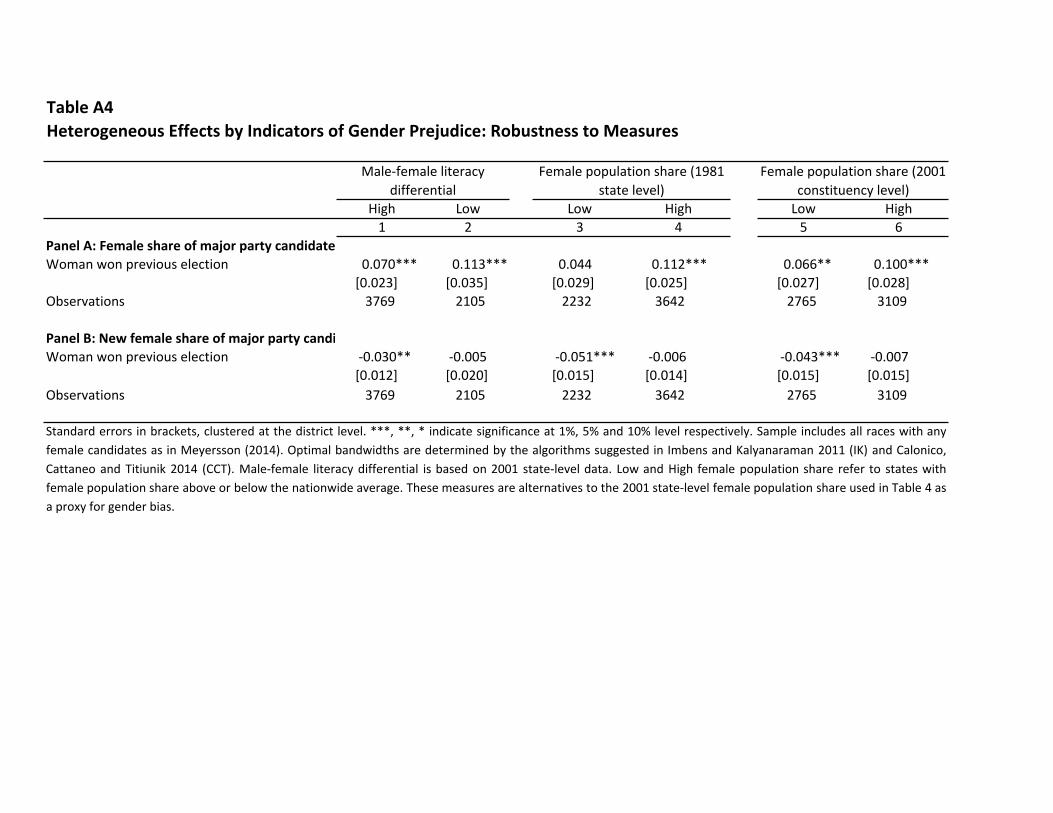
TableA4HeterogeneousEffectsbyIndicatorsofGenderPrejudice:RobustnesstoMeasures
High Low Low High Low High1 2 3 4 5 6
PanelA:FemaleshareofmajorpartycandidatesWomanwonpreviouselection 0.070*** 0.113*** 0.044 0.112*** 0.066** 0.100***
[0.023] [0.035] [0.029] [0.025] [0.027] [0.028]Observations 3769 2105 2232 3642 2765 3109
PanelB:NewfemaleshareofmajorpartycandidatesWomanwonpreviouselection -0.030** -0.005 -0.051*** -0.006 -0.043*** -0.007
[0.012] [0.020] [0.015] [0.014] [0.015] [0.015]Observations 3769 2105 2232 3642 2765 3109
Standard errors in brackets, clustered at the district level. ***, **, * indicate significance at 1%, 5% and 10% level respectively. Sample includes all races with anyfemale candidates as in Meyersson (2014). Optimal bandwidths are determined by the algorithms suggested in Imbens and Kalyanaraman 2011 (IK) and Calonico,Cattaneo and Titiunik 2014 (CCT). Male-female literacy differential is based on 2001 state-level data. Low and High female population share refer to states withfemale population share above or below the nationwide average. These measures are alternatives to the 2001 state-level female population share used in Table 4 asaproxyforgenderbias.
Male-femaleliteracydifferential
Femalepopulationshare(1981statelevel)
Femalepopulationshare(2001constituencylevel)
Related Documents


