© The European Bank for Reconstruction and Development, 2004. Published by Blackwell Publishing, 9600 Garsington Road, Oxford OX4 2DQ, UK and 350 Main Street, Malden, MA 02148, USA. Economics of Transition Volume 12 (1) 2004, 67–102 Blackwell Publishing Ltd Oxford, UK ECOT The Economics of Transition 0967-0750 © The European Bank for Reconstruction and Development 2004 12 1 000 Original Articles Patching up the Pact Buiter and Grafe Patching up the Pact Suggestions for enhancing fiscal sustainability and macroeconomic stability in an enlarged European Union* Willem H. Buiter* and Clemens Grafe** *European Bank for Reconstruction and Development, 1 Exchange Square, London EC1 2AE. **Birkbeck College. Department of Economics, Malet Street. London WC1E 7HX. E-mail: [email protected]. Abstract The paper considers the implications for the EU accession candidates of Central and Eastern Europe of the fiscal-financial constraints imposed by the Stability and Growth Pact and the Maastricht Treaty. Our findings apply also to those current EU members whose initial conditions (e.g., infrastructure and progress in state pension reform) or other structural characteristics (e.g., demographic structure, growth potential, Balassa-Samuelson equilibrium real exchange rate appreciation) differ significantly from the EU average. We find the existing criteria to be seriously flawed and propose an alternative rule, the Permanent Balance Rule, based on a strong form of tax smoothing. JEL classifications: E61, F42, P35. Keywords: Fiscal policy, international policy coordination, European integration. * The views and opinions expressed in this paper are those of the authors alone. They do not necessarily represent the views and opinions of the European Bank for Reconstruction and Development. We would like to thank Mario Buti, Wendy Carlin, Ricardo Lago, an anonymous referee and participants of the EC workshop on monetary and fiscal interaction in Brussels (spring 2002) and the CEPR Workshop in Trans- ition Economics (Nov 2002) for helpful comments on earlier drafts of the paper. This paper is a development of the arguments presented in Buiter and Grafe (2003).

Welcome message from author
This document is posted to help you gain knowledge. Please leave a comment to let me know what you think about it! Share it to your friends and learn new things together.
Transcript
© The European Bank for Reconstruction and Development, 2004.Published by Blackwell Publishing, 9600 Garsington Road, Oxford OX4 2DQ, UK and 350 Main Street, Malden, MA 02148, USA.
Economics of TransitionVolume 12 (1) 2004, 67–102
Blackwell Publishing LtdOxford, UKECOTThe Economics of Transition0967-0750© The European Bank for Reconstruction and Development20041211000Original ArticlesPatching up the PactBuiter and Grafe
Patching up the Pact
Suggestions for enhancing fiscal sustainability and macroeconomic stability in an enlarged European Union
*
Willem H. Buiter* and Clemens Grafe**
*
European Bank for Reconstruction and Development, 1 Exchange Square, London EC1 2AE.
**
Birkbeck College. Department of Economics, Malet Street. London WC1E 7HX. E-mail: [email protected].
Abstract
The paper considers the implications for the EU accession candidates of Centraland Eastern Europe of the fiscal-financial constraints imposed by the Stability andGrowth Pact and the Maastricht Treaty. Our findings apply also to those currentEU members whose initial conditions (e.g., infrastructure and progress in statepension reform) or other structural characteristics (e.g., demographic structure,growth potential, Balassa-Samuelson equilibrium real exchange rate appreciation)differ significantly from the EU average. We find the existing criteria to be seriouslyflawed and propose an alternative rule, the Permanent Balance Rule, based on astrong form of tax smoothing.
JEL classifications: E61, F42, P35.Keywords: Fiscal policy, international policy coordination, European integration.
* The views and opinions expressed in this paper are those of the authors alone. They do not necessarilyrepresent the views and opinions of the European Bank for Reconstruction and Development. We wouldlike to thank Mario Buti, Wendy Carlin, Ricardo Lago, an anonymous referee and participants of the ECworkshop on monetary and fiscal interaction in Brussels (spring 2002) and the CEPR Workshop in Trans-ition Economics (Nov 2002) for helpful comments on earlier drafts of the paper. This paper is a developmentof the arguments presented in Buiter and Grafe (2003).
68
Buiter and Grafe
1. Introduction
The purpose of this paper is to discuss the implications of the fiscal rules thatgovern countries in the European Union (EU) for the Central and Eastern Euro-pean countries that are candidates for early EU accession. We argue that both theStability and Growth Pact and the Broad Economic Policy Guidelines currentlyin place are ill-designed to address the economic realities of countries that differsignificantly from the EU average as regards their expected future inflation andreal GDP growth rates and their inherited stocks of environmental and publicsector capital. While the issues addressed are not unique to the accession candidates,their importance is magnified because enlargement will substantially increasethe structural diversity of the economies inside the European Union, and will doso in ways that are relevant to the cost-benefit balance of adherence to the currentEU fiscal rules. We discuss possible reforms of the current system including the‘
Golden Rule
’ advocated and implemented by the UK, and argue that the bestframework would be a so-called ‘
Permanent Balance
’ rule.Thirteen countries are currently candidates for accession to the European
Union.
1
All except Turkey are formally engaged in accession negotiations. Of thetwelve candidates involved in formal accession negotiations, ten (all except Bul-garia and Romania) are scheduled to become EU members by the middle of 2004.
All new EU members will automatically, upon entry to the EU, be boundby the rules of the
Stability and Growth Pact
(the Pact) and the
Broad EconomicPolicy Guidelines
(BEPGs). Following EU accession the new member countries willgain membership of the Economic and Monetary Union (EMU). EMU membershipis now part of the
Acquis Communautaire
. Of course, a set of conditions (theMaastricht conditions, after the Treaty of Maastricht) have to be satisfied in orderfor the new EU members to qualify for
full
EMU membership, that is, beforethey are allowed to proceed to stage 3 of EMU, by locking into the eurozonethrough the adoption of an ‘irrevocable’ euro conversion rate.
The accession countries will, once they join the EU, have to present annual
Convergence Programmes
to the Commission and the Council of Ministers.
2
Inaddition to the Convergence Programmes mandated under the Pact, any new EUmembers will be expected to follow the annual recommendation of the Council(proposed to the Council by the Commission) on the
Broad Economic Policy Guide-lines
(BEPGs).
3
These BEPGs go well beyond what is required by the Stability andGrowth Pact both in the scope and in the detail of their recommendations, andinclude structural reform, employment and wage developments, in addition to
1
They are Bulgaria, the Czech Republic, Cyprus, Estonia, Hungary, Latvia, Lithuania, Malta, Poland, Romania,the Slovak Republic, Slovenia and Turkey.
2
EMU members present annual
Stability Programmes
.
3
The full name is ‘Broad Guidelines of the Economic Policies of the Member States and the Community.’
Patching up the Pact
69
budgetary issues. Other than ‘naming and shaming’, no sanctions follow a failureto follow the recommendations in the BEPGs.
In this paper we demonstrate the shortcomings of the existing fiscal-financialcriteria and suggest ways of amending and improving the rules of the Stability andGrowth Pact so as to enhance fiscal-financial sustainability and macroeconomicstability.
We argue that the appropriate operational expression of the concepts of
sus-tainable
and
stabilizing
fiscal-financial policies ought to depend on certain key struc-tural economic features. All of these features are quite intuitive and can be givensimple economic justifications. Some, but not all, of these features are observable,identifiable and verifiable in a reasonably objective manner. Others involve ex-pectations of, or plans for, the future. They therefore inherently involve judgementand elements of subjective interpretation. This inevitably means that the deter-mination of whether a country’s fiscal-financial programme is sustainable, orwhether a particular sequence of current and anticipated future deficits is excessive,cannot be reduced to a mechanical test, but will involve judgement, discussion andpotential disagreement. In our view, this is not a weakness but a virtue, becauseit represents recognition of the basic truth that issues of fiscal-financial stabilitycannot be resolved without an explicit, and potentially contestable, judgementabout future plans and expectations about future economic developments. In thelong run, muddled honesty beats spurious precision.
4
We do not argue that countries with very different real economic structuresshould not join together in a monetary union or that there should be any protracteddelay between EU accession and EMU membership for the leading cohort ofcurrent accession candidates. To the contrary, in Buiter and Grafe (2002) we haveargued for the earliest possible EMU membership for all successful EU applicants.
5
They will prosper, provided proper allowance is made in the design of fiscal–financial rules for marked differences in economic structure.
The remainder of this paper is organized as follows. In Section 2, we introducethe notion of fiscal sustainability and present the so-called permanent balancerules. Section 3 summarizes, for current EU member countries and the EasternEuropean candidate countries, the economic fundamentals that matter for thedesign of appropriate fiscal rules. We follow this discussion by giving an overviewin Section 4 of the main fiscal rules existent inside the EU. Section 5 contrasts thepermanent balance rules with the current EU rules in the light of the economicdiversity surveyed in Section 3, which brings us to the conclusion.
4
Or, it is better to be approximately right than precisely wrong – a proposition attributed to many, includingAmory Lovins and Warren Buffet.
5
The key condition that must be satisfied for an accession candidate to benefit from joining the eurozone isthat the country’s fiscal-financial programme, now and in the future, be such as to rule out any possible needfor discretionary monetary financing of government financial deficits. That is, the country can make thecredible commitment that it will not require recourse to the anticipated and/or unanticipated inflation taxes.
70
Buiter and Grafe
2. Fiscal sustainability and the
Permanent Balance Rule
Before presenting our reform proposal we first establish formally the fiscal frame-work we are using and the notion of fiscal sustainability.
2.1 Some simple budgetary arithmetic
The
fiscal-financial programme
of the state consists of the rules governing thesequences of past, current and future public spending (consumption, investment,transfer payments and subsidies), tax structures and revenues (rates, exemptions,bases, allowances, deductions etc.), subsidy and transfer structures, and govern-ment borrowing. Ideally the fiscal-financial framework would apply to the consol-idated general government and central bank, and an explicit distinction would bemade between monetary and non-monetary public debt. However, since the exist-ing EU fiscal framework restricts its attention to the general government, whichexcludes the central bank, we restrict our framework here to the general govern-ment as well. Including the central bank would be important both for countriesthat are not yet members of EMU and thus have independent monetary authoritiesand for the EMU area as a whole.
To get a full and accurate picture of the sustainability of the public finances, itis important that
all
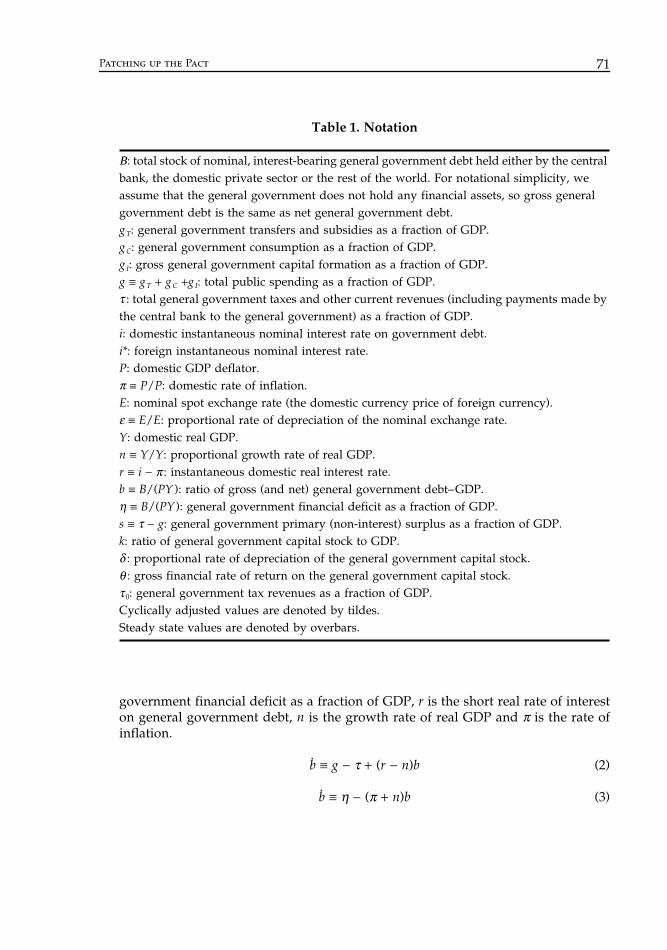
financial assets and liabilities (that is, all contractual claimsand obligations) of the general government be included and consolidated in asingle, comprehensive balance sheet, and that all non-contractual expendituresand receipts also be accounted for comprehensively and fully. All off-budgetexpenditures and receipts (including the outlays and revenues of the state pensionfunds, the social security fund etc. and all off-balance sheet contingent claims andliabilities) must be consolidated and included in a single comprehensive set ofaccounts. For simplicity, we restrict the stylized accounting framework belowto a single, (very) short maturity government debt instrument denominated indomestic currency. The notation to be used in what follows is summarizsed inTable 1.
Equation (1) is the budget identity of the general government. The change inthe amount of nominal government debt (
B)
in comparison to nominal GDP (
PY
)is given by the primary deficit as a share of GDP (
g
−
τ
) plus interest payments onexisting government debt measured as a share of GDP (
iB/(PY
) ). A ‘dot’ over avariable denotes its instantaneous rate of change.
(1)
Using the definitions of Table 1, equation (1) can be rewritten as equation (2)or (3);
b
is (net) general government debt as a fraction of GDP,
η
is the general
BPY
g iB
PY ≡ − +
τ
Patching up the Pact
71
government financial deficit as a fraction of GDP,
r
is the short real rate of intereston general government debt,
n
is the growth rate of real GDP and
π
is the rate ofinflation.
b
≡
g
−
τ
+
(
r
−
n
)
b
(2)
b
≡
η
−
(
π
+
n
)
b
(3)
Table 1. Notation
Β: total stock of nominal, interest-bearing general government debt held either by the central bank, the domestic private sector or the rest of the world. For notational simplicity, we assume that the general government does not hold any financial assets, so gross general government debt is the same as net general government debt.g T: general government transfers and subsidies as a fraction of GDP.gC: general government consumption as a fraction of GDP.g I: gross general government capital formation as a fraction of GDP.g ≡ gT + gC +gI: total public spending as a fraction of GDP.τ : total general government taxes and other current revenues (including payments made by the central bank to the general government) as a fraction of GDP.i: domestic instantaneous nominal interest rate on government debt.i*: foreign instantaneous nominal interest rate.P: domestic GDP deflator.π ≡ P/P: domestic rate of inflation.E: nominal spot exchange rate (the domestic currency price of foreign currency).ε ≡ E/E: proportional rate of depreciation of the nominal exchange rate.Y: domestic real GDP.n ≡ Y/Y: proportional growth rate of real GDP.r ≡ i − π : instantaneous domestic real interest rate.b ≡ B/(PY ): ratio of gross (and net) general government debt–GDP.η ≡ B/(PY ): general government financial deficit as a fraction of GDP.s ≡ τ − g: general government primary (non-interest) surplus as a fraction of GDP.k: ratio of general government capital stock to GDP.δ : proportional rate of depreciation of the general government capital stock.θ : gross financial rate of return on the general government capital stock.τ 0: general government tax revenues as a fraction of GDP.Cyclically adjusted values are denoted by tildes.Steady state values are denoted by overbars.
72 Buiter and Grafe
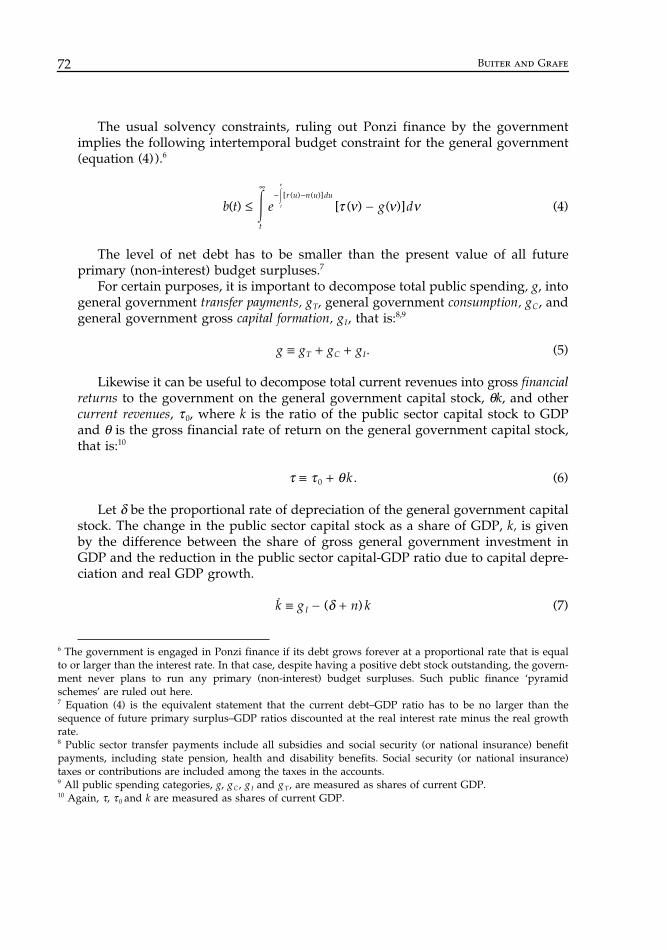
The usual solvency constraints, ruling out Ponzi finance by the governmentimplies the following intertemporal budget constraint for the general government(equation (4)).6
(4)
The level of net debt has to be smaller than the present value of all futureprimary (non-interest) budget surpluses.7
For certain purposes, it is important to decompose total public spending, g, intogeneral government transfer payments, gT, general government consumption, gC, andgeneral government gross capital formation, gI, that is:8,9
g ≡ gT + gC + gI. (5)
Likewise it can be useful to decompose total current revenues into gross financialreturns to the government on the general government capital stock, θk, and othercurrent revenues, τ 0, where k is the ratio of the public sector capital stock to GDPand θ is the gross financial rate of return on the general government capital stock,that is:10
τ ≡ τ 0 + θk . (6)
Let δ be the proportional rate of depreciation of the general government capitalstock. The change in the public sector capital stock as a share of GDP, k, is givenby the difference between the share of gross general government investment inGDP and the reduction in the public sector capital-GDP ratio due to capital depre-ciation and real GDP growth.
k ≡ gI − (δ + n) k (7)
6 The government is engaged in Ponzi finance if its debt grows forever at a proportional rate that is equalto or larger than the interest rate. In that case, despite having a positive debt stock outstanding, the govern-ment never plans to run any primary (non-interest) budget surpluses. Such public finance ‘pyramidschemes’ are ruled out here.7 Equation (4) is the equivalent statement that the current debt–GDP ratio has to be no larger than thesequence of future primary surplus–GDP ratios discounted at the real interest rate minus the real growthrate.8 Public sector transfer payments include all subsidies and social security (or national insurance) benefitpayments, including state pension, health and disability benefits. Social security (or national insurance)taxes or contributions are included among the taxes in the accounts.9 All public spending categories, g, gC, gI and g T, are measured as shares of current GDP.10 Again, τ, τ 0 and k are measured as shares of current GDP.
b t e g dt
r u n u dut( ) [ ( ) ( )][ ( ) ( )]
≤ −∞
− −� �ν
ν ν ντ
Patching up the Pact 73
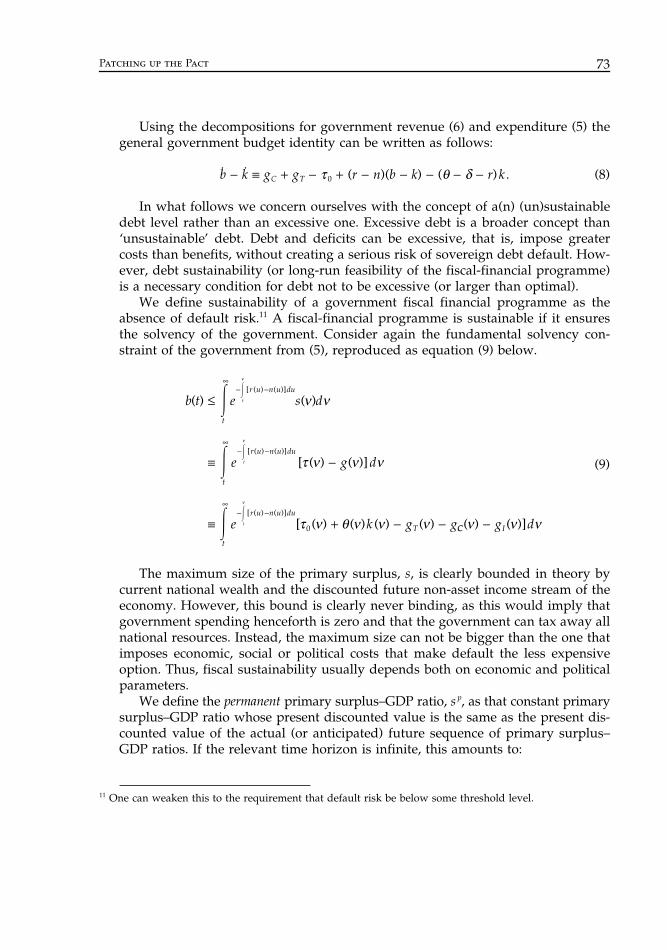
Using the decompositions for government revenue (6) and expenditure (5) thegeneral government budget identity can be written as follows:
b − k ≡ gC + gT − τ 0 + (r − n)(b − k) − (θ − δ − r)k . (8)
In what follows we concern ourselves with the concept of a(n) (un)sustainabledebt level rather than an excessive one. Excessive debt is a broader concept than‘unsustainable’ debt. Debt and deficits can be excessive, that is, impose greatercosts than benefits, without creating a serious risk of sovereign debt default. How-ever, debt sustainability (or long-run feasibility of the fiscal-financial programme)is a necessary condition for debt not to be excessive (or larger than optimal).
We define sustainability of a government fiscal financial programme as theabsence of default risk.11 A fiscal-financial programme is sustainable if it ensuresthe solvency of the government. Consider again the fundamental solvency con-straint of the government from (5), reproduced as equation (9) below.
(9)
The maximum size of the primary surplus, s, is clearly bounded in theory bycurrent national wealth and the discounted future non-asset income stream of theeconomy. However, this bound is clearly never binding, as this would imply thatgovernment spending henceforth is zero and that the government can tax away allnational resources. Instead, the maximum size can not be bigger than the one thatimposes economic, social or political costs that make default the less expensiveoption. Thus, fiscal sustainability usually depends both on economic and politicalparameters.
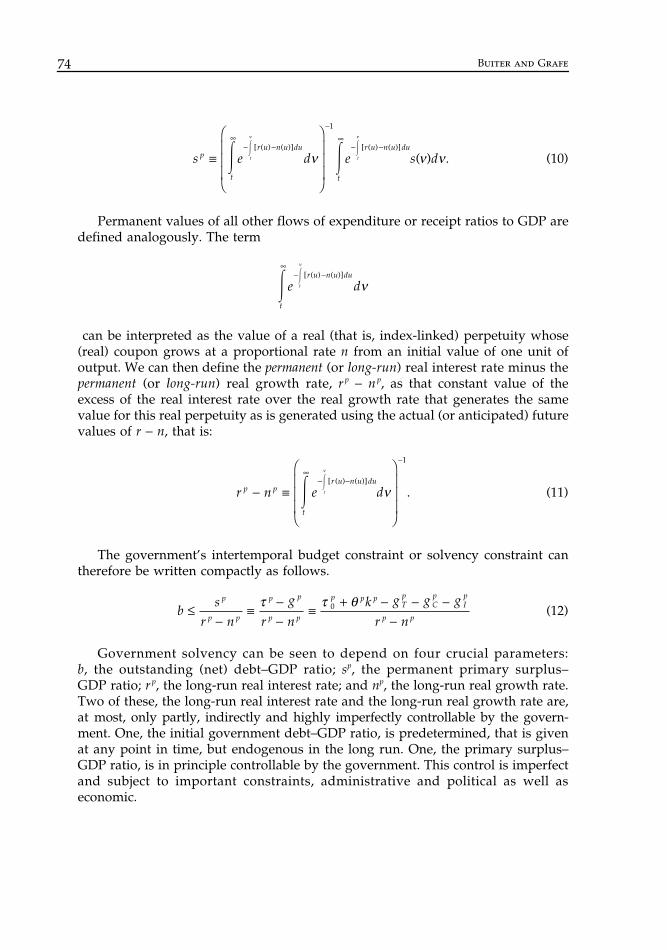
We define the permanent primary surplus–GDP ratio, s p, as that constant primarysurplus–GDP ratio whose present discounted value is the same as the present dis-counted value of the actual (or anticipated) future sequence of primary surplus–GDP ratios. If the relevant time horizon is infinite, this amounts to:
11 One can weaken this to the requirement that default risk be below some threshold level.
b t e s d
e g d
e k g g
t
r u n u du
t
r u n u du
t
r u n u du
T
t
t
t
( ) ( )
[ ( ) ( )]
[ ( ) ( ) ( ) ( )
[ ( ) ( )]
[ ( ) ( )]
[ ( ) ( )]
≤
≡ −
≡ + − −
∞− −
∞− −
∞− −
�
�
�
�
�
�
ν
ν
ν
ν ν
τ ν ν ν
τ ν θ ν ν ν0 CC Ig d( ) ( )]ν ν ν−
74 Buiter and Grafe
(10)
Permanent values of all other flows of expenditure or receipt ratios to GDP aredefined analogously. The term
can be interpreted as the value of a real (that is, index-linked) perpetuity whose(real) coupon grows at a proportional rate n from an initial value of one unit ofoutput. We can then define the permanent (or long-run) real interest rate minus thepermanent (or long-run) real growth rate, rp − np, as that constant value of theexcess of the real interest rate over the real growth rate that generates the samevalue for this real perpetuity as is generated using the actual (or anticipated) futurevalues of r − n, that is:
(11)
The government’s intertemporal budget constraint or solvency constraint cantherefore be written compactly as follows.
(12)
Government solvency can be seen to depend on four crucial parameters:b, the outstanding (net) debt–GDP ratio; sp, the permanent primary surplus–GDP ratio; r p, the long-run real interest rate; and np, the long-run real growth rate.Two of these, the long-run real interest rate and the long-run real growth rate are,at most, only partly, indirectly and highly imperfectly controllable by the govern-ment. One, the initial government debt–GDP ratio, is predetermined, that is givenat any point in time, but endogenous in the long run. One, the primary surplus–GDP ratio, is in principle controllable by the government. This control is imperfectand subject to important constraints, administrative and political as well aseconomic.
s e d e s dp
t
r u n u du
t
r u n u dut t ( ) .
[ ( ) ( )] [ ( ) ( )]
≡
∞− −
−∞
− −� �� �ν ν
ν ν ν
1
� �
t
r u n u du
e dt
∞− −
ν
ν[ ( ) ( )]
r n e dp p
t
r u n u dut .
[ ( ) ( )]
− ≡
∞− −
−
� �ν
ν
1
bs
r n
g
r nk g g g
r n
p
p p
p p
p p
p p pTp
Cp
Ip
p p
≤
−≡
−−
≡+ − − −
−τ τ θ0
Patching up the Pact 75
In the remainder of the paper we present fiscal rules that are supposed toensure the solvency of a government. In doing so we do not address the questionof whether there is a need to explicitly write down these rules and if they needto be enforced by some central agent (external to the national fiscal authorities) orwhether instead debt sustainability is self enforcing. Clearly the authors of the EUrules were of the opinion that explicit rules are necessary. According to the rulesdeficits can be too large but not too small. This asymmetry does not appear to bemotivated primarily by a technical economic judgement about asymmetries inthe transmission mechanism of fiscal policy.12 Instead, the asymmetry appears toreflect a political-economic judgement about a bias towards excessive public debtand deficits in E(MU) countries’ budgetary institutions and political processes.Most of the existing EU member countries have not had national fiscal rules for thecentral governments, thus the bias of concern to the founders appears to be mainlydriven by the fact that there are several national fiscal authorities without a centralgovernment that is able to rein in national budgets but only one central bank.
We review the main arguments brought forward for an upward bias in publicdebt and deficits in Buiter and Grafe (2003), but conclude that the political economycase for a bias towards excessive deficits is by no means overwhelming. Much ofthe theoretical work cited in support of the proposition that there is a bias towardsexcessive deficits is actually about a bias towards an excessive size of government,that is, about a bias towards excessive government spending and revenues, ratherthan about a bias towards excessive deficits, that is, an intertemporal bias towardspostponing tax increases or expenditure cuts.
2.2 A reform proposal: The ‘Permanent Balance’ RuleIn this section we propose a simple tax rule which (1) ensures that the govern-ment’s solvency is guaranteed and (2) has other attractive features, from theperspective of cyclical stabilization and the minimization of the excess burden ofdistortionary taxation. As shown in the literature on tax smoothing (see, for example,Barro, 1979; Deaton, 1981 or Lucas and Stokey, 1983), a constant share of taxes inGDP is optimal under admittedly restrictive conditions, that is, a constant ‘averagemarginal tax rate’ is the least-cost or efficient way of financing a given publicexpenditure programme, allowing for any future financial returns on the generalgovernment capital stock.13
12 The only self-evident asymmetry in the response of the economic system to very high public debt andvery low debt (or very large negative debt), comes from default risk and the real cost associated withgovernment debt default. There is no counterpart to bankruptcy and default for economic agents, includinggovernments, that are very large (‘excessive’) creditors. However, for every creditor there is a matchingdebtor. Lower government debt means either lower domestic private financial wealth and/or lower foreignfinancial wealth. Private default is costly also.13 If there is a single tax with GDP as the base, the marginal tax rate should be constant over time. In a worldwith many different taxes and tax bases, simple rules are harder to establish.
76 Buiter and Grafe
A prudent government borrowing rule is achieved if the share of governmenttaxes in GDP, τ 0 is kept constant14 at a value, , no less than the sum of thepermanent public spending share in GDP (itself the sum of the permanent govern-ment transfer share, the permanent public consumption share and the permanentpublic investment share) plus the long-run growth-adjusted interest cost of thepublic debt (as a fraction of GDP), minus the permanent government capitalincome as a share of GDP. That is:
(13)
This tax smoothing rule means that the inflation-and-real-growth-adjusted perman-ent government budget is in balance or in surplus. We call it the Permanent BalanceRule, because of its analogies with the permanent income hypothesis of householdconsumption. A household’s permanent income is that constant level of consump-tion that has the same present discounted value as the actual (anticipated) futureendowment stream plus initial financial wealth. If a household consumes its perman-ent income, that consumption level is (exante) the highest constant sustainablelevel of consumption over its lifetime. Our Permanent Balance Rule for the shareof taxes in GDP defines it as that constant value of the share of taxes in GDP whosepresent discounted value (over an infinite future time horizon) equals the out-standing stock of public debt plus the present discounted value of actual govern-ment spending minus government capital income, all taken as shares of GDP.
The permanent balance rule given in (13), together with (2), (5) and (6), impliesthe following behaviour of the general government debt–GDP ratio:
(14)
In terms of the conventionally measured general government financial deficit
, equation (14) implies:
(15)
This rule recognises that the debt–GDP ratio will be reduced, ceteris paribus, bynominal income growth, that is, it is an inflation-and real-growth-adjusted meas-ure. It can also be viewed as a modified and generalized version of the golden rule:when actual, current government consumption is above permanent governmentconsumption, or when actual current government transfer payments and subsidies
14 In a stochastic world, it would only be constant exante, or in expectation.
τ 0p
τ τ θ θ0 0 ( ) ( ) .= ≥ + − − ≡ + + + − −p P p p p pTp
Cp
Ip p p p pg r n b k g g g r n b k
b [( ) ( )] [( ) ( )]
≤ − + − + − − −≡ − + − + − + − + − − −
g g k k r r n n bg g g g g g k k r r n n b
p p p p P
T Tp
C Cp
I Ip p p P P
θ θθ θ
η τ ≡ ≡ − +
B
PYg ib
η π θ θ ( ) [( ) ( )] .≤ + + − + − + − + − + − − −n b g g g g g g k k r r n n bT Tp
C Cp
I Ip p p P P
Patching up the Pact 77
exceed their permanent values, the maximum amount of permitted borrowingincreases pari passu. However, the same applies to borrowing for investment:borrowing can only safely finance public investment to the extent that currentpublic sector investment exceeds its permanent level. Finally, the borrowing limitis relaxed (tightened) when the real interest rate is temporarily high (low) or thereal growth rate is temporarily low (high).
The Permanent Balance Rule has four attractive features:1. The Permanent Balance rule is prudent, even cautious: it has government
solvency built in. If the tax rule in (13) holds with equality, the (ex ante)constant share of taxes in GDP is the smallest constant share of taxes inGDP that would satisfy the government’s intertemporal budget con-straint or solvency constraint.
2. The Permanent Balance Rule is consistent both with Keynesian argumentsfor counter-cyclical deficits and with neo-classical (excess burden minimiz-ing) arguments for tax smoothing. It goes beyond them, however, byallowing for any kind of departure of current public transfer payments,public consumption and public investment spending from their long-runaverage or permanent levels. It also allows for the effect on public debt ofdepartures of the current short real interest rate and the current real growthrate from their long-run or permanent values.
3. The Permanent Balance Rule allows for the effects of inflation and real GDPgrowth on the true burden of the public debt. It does not ‘condone’inflation any more than it ‘condones’ real GDP growth. It simply recognisesthe impact of nominal GDP growth on the burden of servicing domestic-currency-denominated general government debt.15
4. The Permanent Balance Rule amends, extends and completes the goldenrule by allowing fully for the degree, if any, to which public sectorinvestment generates future cash flows to the government, either directly,say through user charges, or indirectly by the positive effect of generalgovernment capital on existing government tax bases.
Under the Permanent Balance Rule for taxes, the long-run or steady-stategovernment debt–GDP ratio is constant ex ante. In a simple stochastic setting, thelong-run or steady-state government debt–GDP ratio follows a random walk (seeBarro, 1979).16
Conceptually, the Permanent Balance Rule is both intuitive and simple. Ofcourse, the permanent shares in GDP of public consumption and public investmentare not directly observable. Nor is the long-run growth rate directly observable. In
15 Expressing the debt and primary surplus as shares of GDP is illuminating if GDP is a reasonable indicatorof the government’s ability to tax. If capital income taxation were residence-based rather than source-based,GNP would be a better scale variable than GDP. If taxes on domestic spending are important, aggregatespending (including imports but excluding exports) may be a more appropriate scale variable.16 Long-run means g g g g g g r r n nT T
PC C
PI I
P P P ; ; ; ; .= = = = =
78 Buiter and Grafe
some countries, with index-linked long-dated public debt, reasonable proxies forthe long-run real interest rate may be obtainable. Observance of the PermanentBalance Rule would force governments to make explicit their assumptions about thelong-run paths of public consumption, transfer payments and investment. Thatwould be a positive development from the point of view of informed policy debate.
The Permanent Balance Rule implies that, as long as the growth rate of nominalGDP is positive, a higher ratio of the stock of debt–GDP would imply, other thingsbeing equal, that the government would be able to run a larger financial deficit.When the debt is index-linked, real income growth will, other things being equal,bring down the debt–GDP ratio. When the debt is nominally denominated, nominalincome growth will, other things being equal, bring down the debt–GDP ratio. Thepresence of the term (n + π)b on the right-hand-side of equation (15) makes it clearthat, for a given positive growth rate of nominal income, a higher debt–GDP ratiomeans that the debt–GDP ratio will be coming down faster.
The implication of the Permanent Balance rule that ceteris paribus a higherdebt–GDP ratio permits a higher financial deficit–GDP ratio contrasts sharplywith current suggestions from the EU Commission and from the UK Treasury,that countries with a higher debt–GDP ratio would, ceteris paribus, be expected orrequired to run a smaller deficit. The reason for the difference is that the PermanentBalance Rule has no view on the desirable long-run level of the debt relative toGDP. Its purpose is to find the ‘permanent tax rate’, that constant share of taxes inGDP that will achieve government solvency. The debt–GDP ratio only matters forwhat it implies for the permanent tax rate.
While the Permanent Balance Rule’s treatment of the debt–GDP ratio may beextreme, it is difficult to rationalize the opposite conclusion, that higher debtnecessarily implies the need for a lower deficit, from the government solvencyconstraint given in equation (12) alone. From this representation of the government’sintertemporal budget constraint it follows that, for a given long-run real interestrate and a given permanent growth rate of real GDP, a higher debt–GDP ratiorequires a higher permanent primary surplus–GDP ratio, s p. There are quite a fewslips between the cup of a larger permanent primary surplus–GDP ratio to the lipof a lower current financial deficit–GDP ratio, η ≡ −s + ib.
There are indeed good arguments for arguing that the level of the debt–GDPratio matters for reasons other than, or additional to, what a higher debt–GDP ratioimplies for the permanent tax rate. Sovereign default is costly. Not only does it causearbitrary redistributions of wealth, it also destroys trust throughout the economicsystem and impairs the future ability of governments to borrow. Other things beingequal, the risk of default is increasing in the debt–GDP ratio. The costs of sovereigndefault caused by an excessive debt–GDP ratio are not matched by comparable costsof ‘super-solvency’ associated with a very low or even negative debt–GDP ratio.
Thus, augmenting the permanent balance rule to take this into account makessense. If, on a priori grounds, convergence to a long-run value of the debt–GDP ratiob* is deemed desirable, the tax rule in (13) could be augmented with an ‘error
Patching up the Pact 79
correction’ term that drives the actual debt–GDP ratio towards the target debt–GDPratio, as in equation (16).
(16)
Under this ‘Augmented Permanent Balance Rule’, the financial deficit–GDPratio would be governed by:
η ≤ (n + π)b + g − g p + θ pk p − θ k + [(r − rP) − (n − nP)] b − α (b − b*). (17)
The steady-state value of the debt–GDP ratio would equal b *. If the long-runvalue of the debt–GDP ratio were required not to exceed b *, but could be below it,equation (16) could be replaced by the ‘switching regime’ tax function:
(18)
The behaviour of the deficit–GDP ratio would again be given by equation (17).The appropriate value of b* is anybody’s guess, however.17
The Augmented Permanent Balance Rule with its ‘error-correction’ mechanismdriving the debt–GDP ratio to a long-run target level is consistent with the positionof the European Commission and the UK Treasury provided the ‘error correctioncoefficient’, α, which measures the strength of the imperative to get the debt–GDPratio down, exceeds the growth rate of nominal GDP.18
3. Aspects of four base economic diversity among current and future EU member countries relevant to fiscal sustainability
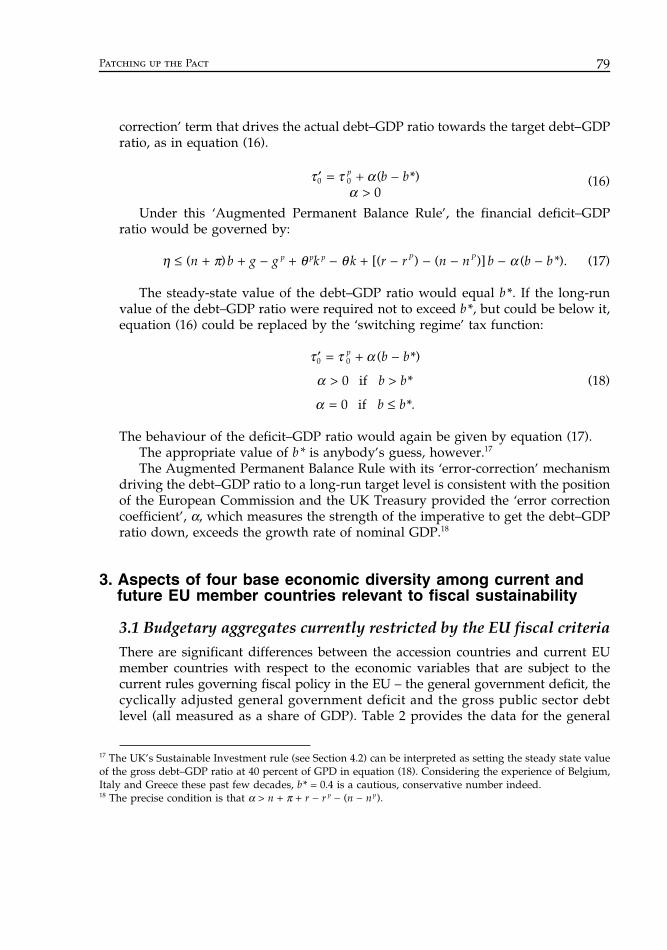
3.1 Budgetary aggregates currently restricted by the EU fiscal criteriaThere are significant differences between the accession countries and current EUmember countries with respect to the economic variables that are subject to thecurrent rules governing fiscal policy in the EU – the general government deficit, thecyclically adjusted general government deficit and the gross public sector debtlevel (all measured as a share of GDP). Table 2 provides the data for the general
17 The UK’s Sustainable Investment rule (see Section 4.2) can be interpreted as setting the steady state valueof the gross debt–GDP ratio at 40 percent of GPD in equation (18). Considering the experience of Belgium,Italy and Greece these past few decades, b* = 0.4 is a cautious, conservative number indeed.18 The precise condition is that α > n + π + r − r p − (n − np).
′ = + −>
τ τ αα
0 0
0 ( *)
p b b
′ = + −
> >
= ≤
τ τ α
α
α
0 0
0
0
( *)
*
*.
p b b
b b
b b
if
if
80 Buiter and Grafe
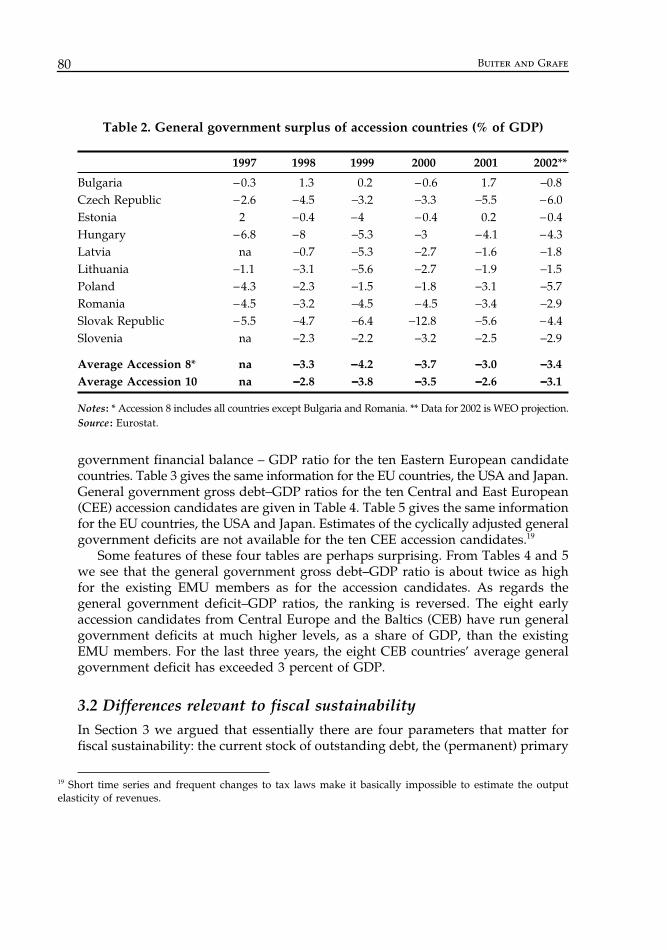
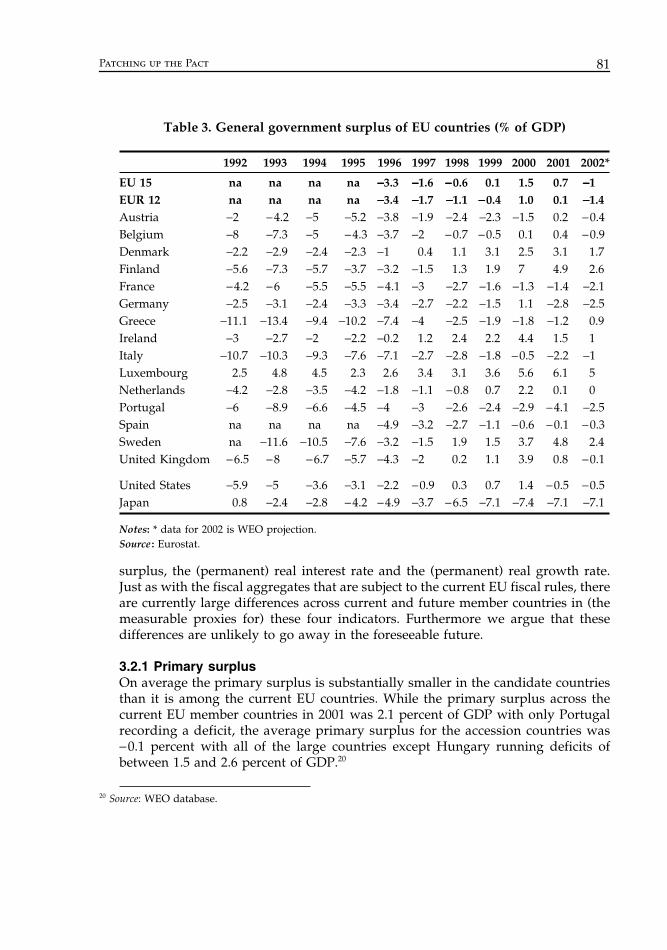
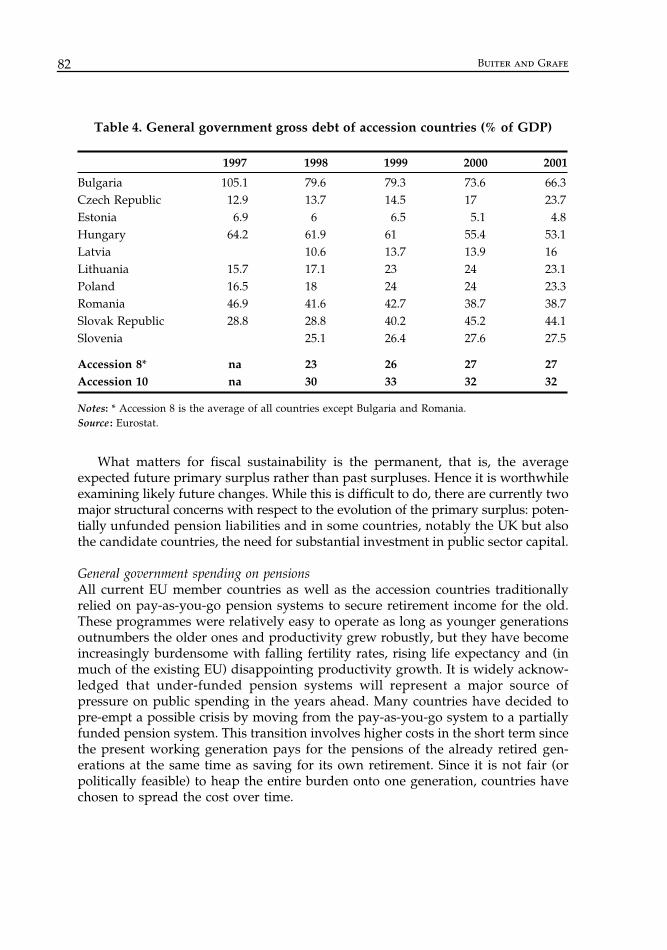
government financial balance – GDP ratio for the ten Eastern European candidatecountries. Table 3 gives the same information for the EU countries, the USA and Japan.General government gross debt–GDP ratios for the ten Central and East European(CEE) accession candidates are given in Table 4. Table 5 gives the same informationfor the EU countries, the USA and Japan. Estimates of the cyclically adjusted generalgovernment deficits are not available for the ten CEE accession candidates.19
Some features of these four tables are perhaps surprising. From Tables 4 and 5we see that the general government gross debt–GDP ratio is about twice as highfor the existing EMU members as for the accession candidates. As regards thegeneral government deficit–GDP ratios, the ranking is reversed. The eight earlyaccession candidates from Central Europe and the Baltics (CEB) have run generalgovernment deficits at much higher levels, as a share of GDP, than the existingEMU members. For the last three years, the eight CEB countries’ average generalgovernment deficit has exceeded 3 percent of GDP.
3.2 Differences relevant to fiscal sustainabilityIn Section 3 we argued that essentially there are four parameters that matter forfiscal sustainability: the current stock of outstanding debt, the (permanent) primary
19 Short time series and frequent changes to tax laws make it basically impossible to estimate the outputelasticity of revenues.
Table 2. General government surplus of accession countries (% of GDP)
1997 1998 1999 2000 2001 2002**
Bulgaria −0.3 1.3 0.2 −0.6 1.7 −0.8Czech Republic −2.6 −4.5 −3.2 −3.3 −5.5 −6.0Estonia 2 −0.4 −4 −0.4 0.2 −0.4Hungary −6.8 −8 −5.3 −3 −4.1 −4.3Latvia na −0.7 −5.3 −2.7 −1.6 −1.8Lithuania −1.1 −3.1 −5.6 −2.7 −1.9 −1.5Poland −4.3 −2.3 −1.5 −1.8 −3.1 −5.7Romania −4.5 −3.2 −4.5 −4.5 −3.4 −2.9Slovak Republic −5.5 −4.7 −6.4 −12.8 −5.6 −4.4Slovenia na −2.3 −2.2 −3.2 −2.5 −2.9
Average Accession 8* na −−−−3.3 −−−−4.2 −−−−3.7 −−−−3.0 −−−−3.4Average Accession 10 na −−−−2.8 −−−−3.8 −−−−3.5 −−−−2.6 −−−−3.1
Notes: * Accession 8 includes all countries except Bulgaria and Romania. ** Data for 2002 is WEO projection.Source : Eurostat.
Patching up the Pact 81
surplus, the (permanent) real interest rate and the (permanent) real growth rate.Just as with the fiscal aggregates that are subject to the current EU fiscal rules, thereare currently large differences across current and future member countries in (themeasurable proxies for) these four indicators. Furthermore we argue that thesedifferences are unlikely to go away in the foreseeable future.
3.2.1 Primary surplusOn average the primary surplus is substantially smaller in the candidate countriesthan it is among the current EU countries. While the primary surplus across thecurrent EU member countries in 2001 was 2.1 percent of GDP with only Portugalrecording a deficit, the average primary surplus for the accession countries was−0.1 percent with all of the large countries except Hungary running deficits ofbetween 1.5 and 2.6 percent of GDP.20
20 Source: WEO database.
Table 3. General government surplus of EU countries (% of GDP)
1992 1993 1994 1995 1996 1997 1998 1999 2000 2001 2002*
EU 15 na na na na −−−−3.3 −−−−1.6 −−−−0.6 0.1 1.5 0.7 −−−−1EUR 12 na na na na −−−−3.4 −−−−1.7 −−−−1.1 −−−−0.4 1.0 0.1 −−−−1.4Austria −2 −4.2 −5 −5.2 −3.8 −1.9 −2.4 −2.3 −1.5 0.2 −0.4Belgium −8 −7.3 −5 −4.3 −3.7 −2 −0.7 −0.5 0.1 0.4 −0.9Denmark −2.2 −2.9 −2.4 −2.3 −1 0.4 1.1 3.1 2.5 3.1 1.7Finland −5.6 −7.3 −5.7 −3.7 −3.2 −1.5 1.3 1.9 7 4.9 2.6France −4.2 −6 −5.5 −5.5 −4.1 −3 −2.7 −1.6 −1.3 −1.4 −2.1Germany −2.5 −3.1 −2.4 −3.3 −3.4 −2.7 −2.2 −1.5 1.1 −2.8 −2.5Greece −11.1 −13.4 −9.4 −10.2 −7.4 −4 −2.5 −1.9 −1.8 −1.2 0.9Ireland −3 −2.7 −2 −2.2 −0.2 1.2 2.4 2.2 4.4 1.5 1Italy −10.7 −10.3 −9.3 −7.6 −7.1 −2.7 −2.8 −1.8 −0.5 −2.2 −1Luxembourg 2.5 4.8 4.5 2.3 2.6 3.4 3.1 3.6 5.6 6.1 5Netherlands −4.2 −2.8 −3.5 −4.2 −1.8 −1.1 −0.8 0.7 2.2 0.1 0Portugal −6 −8.9 −6.6 −4.5 −4 −3 −2.6 −2.4 −2.9 −4.1 −2.5Spain na na na na −4.9 −3.2 −2.7 −1.1 −0.6 −0.1 −0.3Sweden na −11.6 −10.5 −7.6 −3.2 −1.5 1.9 1.5 3.7 4.8 2.4United Kingdom −6.5 −8 −6.7 −5.7 −4.3 −2 0.2 1.1 3.9 0.8 −0.1
United States −5.9 −5 −3.6 −3.1 −2.2 −0.9 0.3 0.7 1.4 −0.5 −0.5Japan 0.8 −2.4 −2.8 −4.2 −4.9 −3.7 −6.5 −7.1 −7.4 −7.1 −7.1
Notes: * data for 2002 is WEO projection.Source : Eurostat.
82 Buiter and Grafe
What matters for fiscal sustainability is the permanent, that is, the averageexpected future primary surplus rather than past surpluses. Hence it is worthwhileexamining likely future changes. While this is difficult to do, there are currently twomajor structural concerns with respect to the evolution of the primary surplus: poten-tially unfunded pension liabilities and in some countries, notably the UK but alsothe candidate countries, the need for substantial investment in public sector capital.
General government spending on pensionsAll current EU member countries as well as the accession countries traditionallyrelied on pay-as-you-go pension systems to secure retirement income for the old.These programmes were relatively easy to operate as long as younger generationsoutnumbers the older ones and productivity grew robustly, but they have becomeincreasingly burdensome with falling fertility rates, rising life expectancy and (inmuch of the existing EU) disappointing productivity growth. It is widely acknow-ledged that under-funded pension systems will represent a major source ofpressure on public spending in the years ahead. Many countries have decided topre-empt a possible crisis by moving from the pay-as-you-go system to a partiallyfunded pension system. This transition involves higher costs in the short term sincethe present working generation pays for the pensions of the already retired gen-erations at the same time as saving for its own retirement. Since it is not fair (orpolitically feasible) to heap the entire burden onto one generation, countries havechosen to spread the cost over time.
Table 4. General government gross debt of accession countries (% of GDP)
1997 1998 1999 2000 2001
Bulgaria 105.1 79.6 79.3 73.6 66.3Czech Republic 12.9 13.7 14.5 17 23.7Estonia 6.9 6 6.5 5.1 4.8Hungary 64.2 61.9 61 55.4 53.1Latvia 10.6 13.7 13.9 16Lithuania 15.7 17.1 23 24 23.1Poland 16.5 18 24 24 23.3Romania 46.9 41.6 42.7 38.7 38.7Slovak Republic 28.8 28.8 40.2 45.2 44.1Slovenia 25.1 26.4 27.6 27.5
Accession 8* na 23 26 27 27Accession 10 na 30 33 32 32
Notes: * Accession 8 is the average of all countries except Bulgaria and Romania.Source : Eurostat.
Patching up the Pact 83
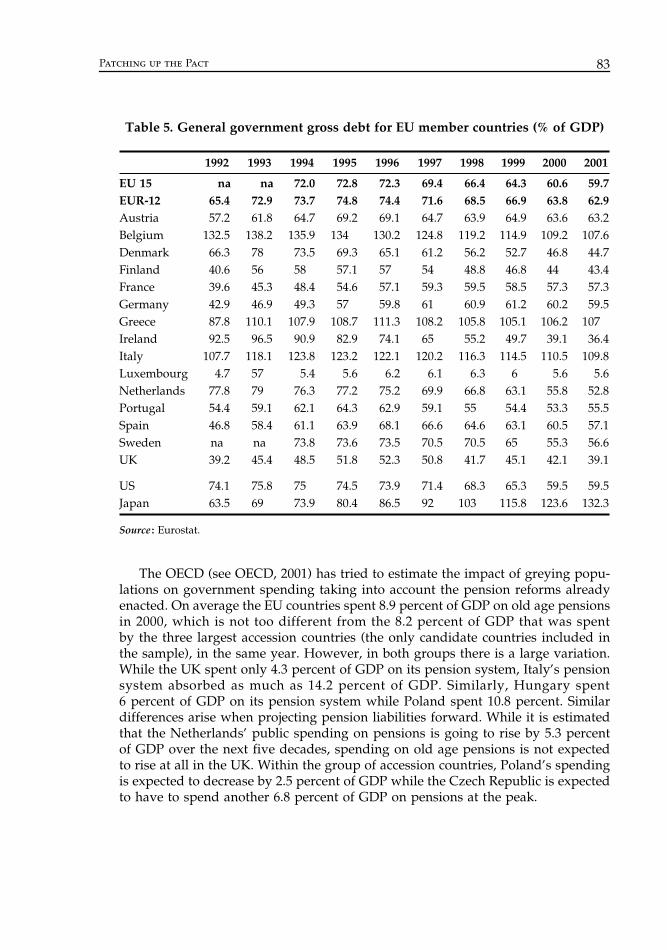
The OECD (see OECD, 2001) has tried to estimate the impact of greying popu-lations on government spending taking into account the pension reforms alreadyenacted. On average the EU countries spent 8.9 percent of GDP on old age pensionsin 2000, which is not too different from the 8.2 percent of GDP that was spentby the three largest accession countries (the only candidate countries included inthe sample), in the same year. However, in both groups there is a large variation.While the UK spent only 4.3 percent of GDP on its pension system, Italy’s pensionsystem absorbed as much as 14.2 percent of GDP. Similarly, Hungary spent6 percent of GDP on its pension system while Poland spent 10.8 percent. Similardifferences arise when projecting pension liabilities forward. While it is estimatedthat the Netherlands’ public spending on pensions is going to rise by 5.3 percentof GDP over the next five decades, spending on old age pensions is not expectedto rise at all in the UK. Within the group of accession countries, Poland’s spendingis expected to decrease by 2.5 percent of GDP while the Czech Republic is expectedto have to spend another 6.8 percent of GDP on pensions at the peak.
Table 5. General government gross debt for EU member countries (% of GDP)
1992 1993 1994 1995 1996 1997 1998 1999 2000 2001
EU 15 na na 72.0 72.8 72.3 69.4 66.4 64.3 60.6 59.7EUR-12 65.4 72.9 73.7 74.8 74.4 71.6 68.5 66.9 63.8 62.9Austria 57.2 61.8 64.7 69.2 69.1 64.7 63.9 64.9 63.6 63.2Belgium 132.5 138.2 135.9 134 130.2 124.8 119.2 114.9 109.2 107.6Denmark 66.3 78 73.5 69.3 65.1 61.2 56.2 52.7 46.8 44.7Finland 40.6 56 58 57.1 57 54 48.8 46.8 44 43.4France 39.6 45.3 48.4 54.6 57.1 59.3 59.5 58.5 57.3 57.3Germany 42.9 46.9 49.3 57 59.8 61 60.9 61.2 60.2 59.5Greece 87.8 110.1 107.9 108.7 111.3 108.2 105.8 105.1 106.2 107Ireland 92.5 96.5 90.9 82.9 74.1 65 55.2 49.7 39.1 36.4Italy 107.7 118.1 123.8 123.2 122.1 120.2 116.3 114.5 110.5 109.8Luxembourg 4.7 57 5.4 5.6 6.2 6.1 6.3 6 5.6 5.6Netherlands 77.8 79 76.3 77.2 75.2 69.9 66.8 63.1 55.8 52.8Portugal 54.4 59.1 62.1 64.3 62.9 59.1 55 54.4 53.3 55.5Spain 46.8 58.4 61.1 63.9 68.1 66.6 64.6 63.1 60.5 57.1Sweden na na 73.8 73.6 73.5 70.5 70.5 65 55.3 56.6UK 39.2 45.4 48.5 51.8 52.3 50.8 41.7 45.1 42.1 39.1
US 74.1 75.8 75 74.5 73.9 71.4 68.3 65.3 59.5 59.5Japan 63.5 69 73.9 80.4 86.5 92 103 115.8 123.6 132.3
Source : Eurostat.
84 Buiter and Grafe
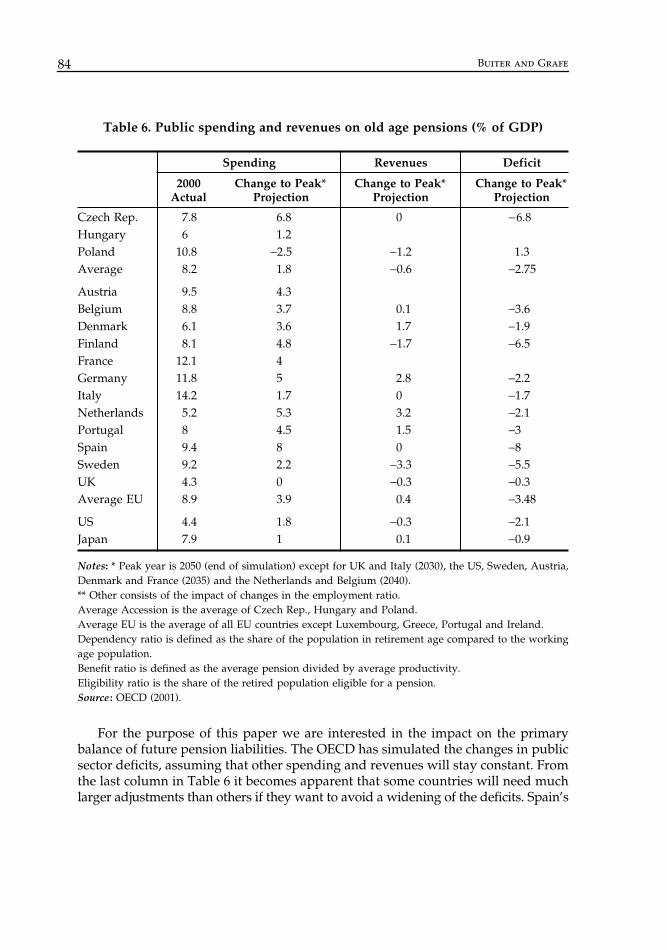
For the purpose of this paper we are interested in the impact on the primarybalance of future pension liabilities. The OECD has simulated the changes in publicsector deficits, assuming that other spending and revenues will stay constant. Fromthe last column in Table 6 it becomes apparent that some countries will need muchlarger adjustments than others if they want to avoid a widening of the deficits. Spain’s
Table 6. Public spending and revenues on old age pensions (% of GDP)
Spending Revenues Deficit
2000 Change to Peak* Change to Peak* Change to Peak*Actual Projection Projection Projection
Czech Rep. 7.8 6.8 0 −6.8Hungary 6 1.2Poland 10.8 −2.5 −1.2 1.3Average 8.2 1.8 −0.6 −2.75
Austria 9.5 4.3Belgium 8.8 3.7 0.1 −3.6Denmark 6.1 3.6 1.7 −1.9Finland 8.1 4.8 −1.7 −6.5France 12.1 4Germany 11.8 5 2.8 −2.2Italy 14.2 1.7 0 −1.7Netherlands 5.2 5.3 3.2 −2.1Portugal 8 4.5 1.5 −3Spain 9.4 8 0 −8Sweden 9.2 2.2 −3.3 −5.5UK 4.3 0 −0.3 −0.3Average EU 8.9 3.9 0.4 −3.48
US 4.4 1.8 −0.3 −2.1Japan 7.9 1 0.1 −0.9
Notes: * Peak year is 2050 (end of simulation) except for UK and Italy (2030), the US, Sweden, Austria,Denmark and France (2035) and the Netherlands and Belgium (2040).** Other consists of the impact of changes in the employment ratio.Average Accession is the average of Czech Rep., Hungary and Poland.Average EU is the average of all EU countries except Luxembourg, Greece, Portugal and Ireland.Dependency ratio is defined as the share of the population in retirement age compared to the workingage population.Benefit ratio is defined as the average pension divided by average productivity.Eligibility ratio is the share of the retired population eligible for a pension.Source : OECD (2001).
Patching up the Pact 85
deficit at the peak will widen by 8 percent of GDP in 2050 if no corrective actionis taken while the deficit in Italy is going to stay basically unchanged. Similarly,without reforms the deficit of the Czech Republic is going to widen by up to6.8 percent of GDP before 2050 while that of Poland is going to narrow by 1.3 percent.
These differences in the impact of the pension system on the public sectorbalance are mostly explained by how far advanced the pension reforms are and bydifferent demographic structures. Thus, in the decomposition of changes in spend-ing, the largest variation across countries is found in the contributions from thedependency ratio and the benefit ratio.
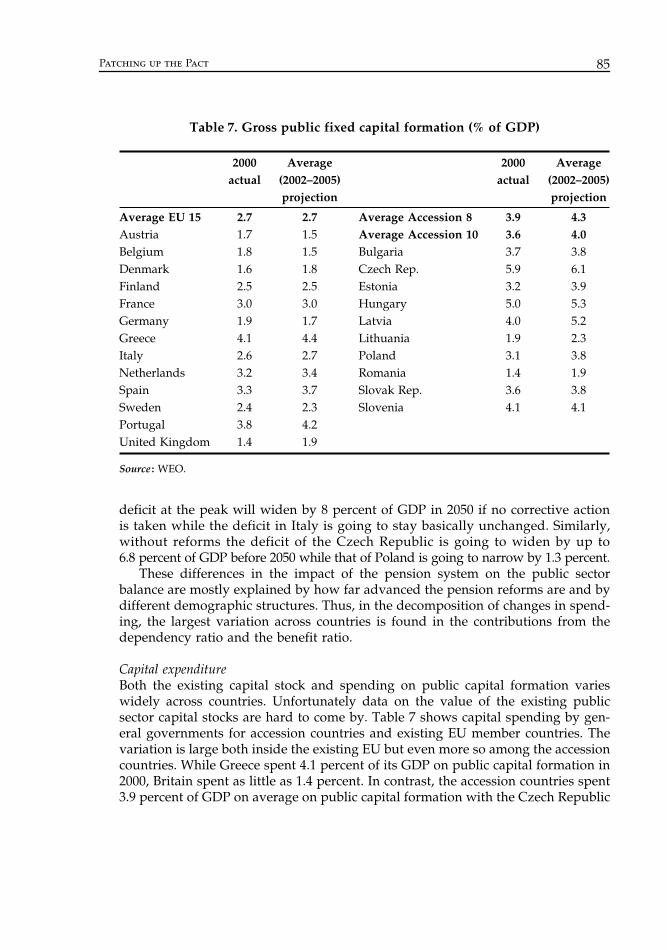
Capital expenditureBoth the existing capital stock and spending on public capital formation varieswidely across countries. Unfortunately data on the value of the existing publicsector capital stocks are hard to come by. Table 7 shows capital spending by gen-eral governments for accession countries and existing EU member countries. Thevariation is large both inside the existing EU but even more so among the accessioncountries. While Greece spent 4.1 percent of its GDP on public capital formation in2000, Britain spent as little as 1.4 percent. In contrast, the accession countries spent3.9 percent of GDP on average on public capital formation with the Czech Republic
Table 7. Gross public fixed capital formation (% of GDP)
2000actual
Average(2002–2005)projection
2000actual
Average(2002–2005)projection
Average EU 15 2.7 2.7 Average Accession 8 3.9 4.3Austria 1.7 1.5 Average Accession 10 3.6 4.0Belgium 1.8 1.5 Bulgaria 3.7 3.8Denmark 1.6 1.8 Czech Rep. 5.9 6.1Finland 2.5 2.5 Estonia 3.2 3.9France 3.0 3.0 Hungary 5.0 5.3Germany 1.9 1.7 Latvia 4.0 5.2Greece 4.1 4.4 Lithuania 1.9 2.3Italy 2.6 2.7 Poland 3.1 3.8Netherlands 3.2 3.4 Romania 1.4 1.9Spain 3.3 3.7 Slovak Rep. 3.6 3.8Sweden 2.4 2.3 Slovenia 4.1 4.1Portugal 3.8 4.2United Kingdom 1.4 1.9
Source : WEO.
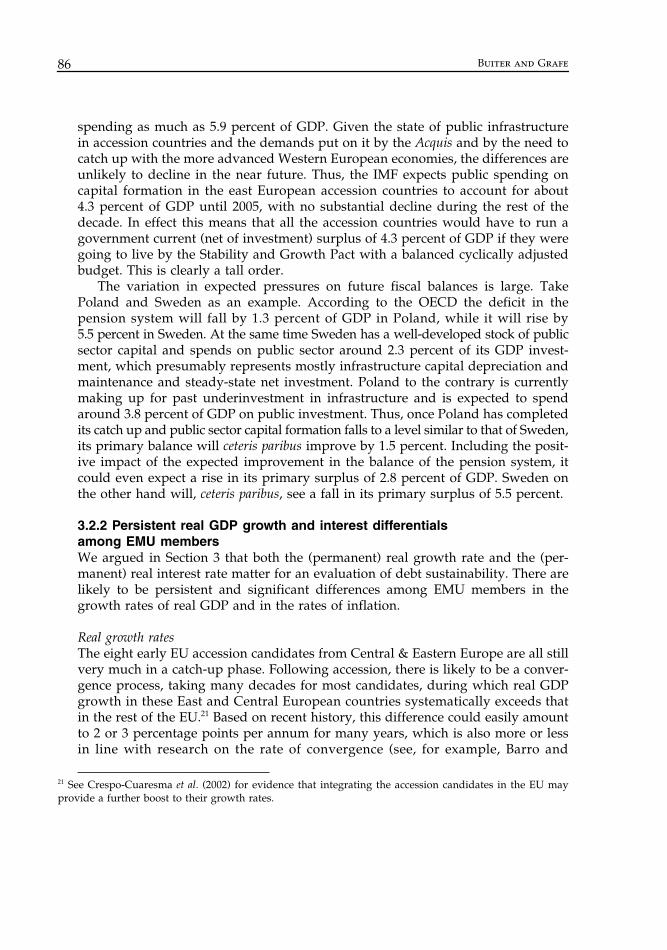
86 Buiter and Grafe
spending as much as 5.9 percent of GDP. Given the state of public infrastructurein accession countries and the demands put on it by the Acquis and by the need tocatch up with the more advanced Western European economies, the differences areunlikely to decline in the near future. Thus, the IMF expects public spending oncapital formation in the east European accession countries to account for about4.3 percent of GDP until 2005, with no substantial decline during the rest of thedecade. In effect this means that all the accession countries would have to run agovernment current (net of investment) surplus of 4.3 percent of GDP if they weregoing to live by the Stability and Growth Pact with a balanced cyclically adjustedbudget. This is clearly a tall order.
The variation in expected pressures on future fiscal balances is large. TakePoland and Sweden as an example. According to the OECD the deficit in thepension system will fall by 1.3 percent of GDP in Poland, while it will rise by5.5 percent in Sweden. At the same time Sweden has a well-developed stock of publicsector capital and spends on public sector around 2.3 percent of its GDP invest-ment, which presumably represents mostly infrastructure capital depreciation andmaintenance and steady-state net investment. Poland to the contrary is currentlymaking up for past underinvestment in infrastructure and is expected to spendaround 3.8 percent of GDP on public investment. Thus, once Poland has completedits catch up and public sector capital formation falls to a level similar to that of Sweden,its primary balance will ceteris paribus improve by 1.5 percent. Including the posit-ive impact of the expected improvement in the balance of the pension system, itcould even expect a rise in its primary surplus of 2.8 percent of GDP. Sweden onthe other hand will, ceteris paribus, see a fall in its primary surplus of 5.5 percent.
3.2.2 Persistent real GDP growth and interest differentials among EMU membersWe argued in Section 3 that both the (permanent) real growth rate and the (per-manent) real interest rate matter for an evaluation of debt sustainability. There arelikely to be persistent and significant differences among EMU members in thegrowth rates of real GDP and in the rates of inflation.
Real growth ratesThe eight early EU accession candidates from Central & Eastern Europe are all stillvery much in a catch-up phase. Following accession, there is likely to be a conver-gence process, taking many decades for most candidates, during which real GDPgrowth in these East and Central European countries systematically exceeds thatin the rest of the EU.21 Based on recent history, this difference could easily amountto 2 or 3 percentage points per annum for many years, which is also more or lessin line with research on the rate of convergence (see, for example, Barro and
21 See Crespo-Cuaresma et al. (2002) for evidence that integrating the accession candidates in the EU mayprovide a further boost to their growth rates.
Patching up the Pact 87
Sala-i-Martin, 1992 or Levine and Renelt, 1992). Aggregate productivity growthdifferentials are likely to be similar to aggregate output growth differentials,because the demographics of the existing EMU members are rather similar to thoseof the eight likely early accession candidates from Central and Eastern Europe.Both regions have greying populations and (in the absence of large-scale migration)stationary or declining populations in the medium term.
Real appreciation and the implication for real interest ratesIf there is gradual catch-up of the accession countries with Euroland on a sector-by-sector basis, the relative price of non-traded goods will rise in the accession countries,since their productivity growth differential between the traded goods sector andthe non-traded sectors can be expected to be larger than the corresponding Eurolandproductivity growth differential (see Balassa, 1964, Samuelson, 1964, 1994 and Heston,Nuxoll and Summers, 1994). A real appreciation of the candidate countries’ currenciesfollows. In a paper prepared by the CEC5 National Banks (CEC5, 2002), a range of‘guestimates’ of the Balassa–Samuelson effect for these five advanced accessioncandidates is presented.22 They range from a low of 0.8 percent per annum forSlovenia (1993–99), to 1 to 2 percent per annum for Slovakia (with 3 percent per annumdeemed a possibility in the future), 1.2 to 1.5 percent per annum for Poland,1.9 percent per annum for Hungary and 1.6 percent per annum for the Czech Republic.
All these estimates have the obvious shortcoming that they are based on veryshort datasets that do not allow the authors to filter out some of the cyclical factors.Despite these shortcomings, it is not unreasonable to estimate the impact ofthe Balassa–Samuelson effect on the real appreciation of the Eastern Europeancurrencies against the EMU to be in the range of 1.5 to 2.5 percent per annum forthe foreseeable future. Thus, with constant nominal exchange rates, this appreci-ation would raise annual inflation rates in accession countries by about 1.5–2.5 percent compared to those in the EMU area.
Obviously a trend real appreciation has important implications for real interestrates. Suppose the peg of an accession country’s currency to the euro is perfectlycredible. Frictionless international financial capital mobility would then imply thatthe risk-free nominal interest rate in the accession country would be the same asin the current EMU area. Given that inflation rates are likely to be higher in theaccession countries under a fixed exchange rate, real interest rates will be lowerthan in the existing EMU area and hence the real cost of servicing the public debtin these countries is likely to be lower for a given debt level. The same implicationsfor real interest rates would follow under a floating exchange rate regime as longas Uncovered Interest Parity holds.
The discussion implies that, at a fixed nominal exchange rate, nominal incomegrowth in the accession countries could, for several decades, exceed that in the
22 The CEC5 countries are Czech Republic, Hungary, Poland, Slovakia and Slovenia.
88 Buiter and Grafe
existing EU members by as much as 3.5 to 5 percent per annum. From equation (3)it is clear that, for any given ratio of outstanding government debt–GDP ratio,b, a higher growth rate of nominal income, π + n, makes a higher governmentdeficit–GDP ratio, η, sustainable, in the (loose) sense that the same future behaviourof the government debt–GDP ratio is implied. Conversely, for any given govern-ment deficit–GDP ratio, a higher growth rate of nominal income suggests that ahigher government debt–GDP ratio is sustainable.
4. Existing fiscal rules in the current EU: The Stability and Growth Pact, the Maastricht Treaty and the Golden Rule
There are essentially two sets of fiscal rules that apply to current EU membercountries, as well as the Golden Rule used in the UK.
4.1 The current EU fiscal frameworkThe fiscal–financial constraints of the Stability and Growth Pact and the MaastrichtTreaty are best viewed as externally imposed constraints aimed at preventing eachindividual member country from ending up on an unsustainable, explosive path ofpublic sector debt and deficits. The paragraph of the Pact that is operationallyrelevant for budgetary policy is (our emphasis added):
‘Adherence to the objective of sound budgetary positions close to balance or in surpluswill allow all Member States to deal with normal cyclical fluctuations while keeping thegovernment deficit within the reference value of 3 percent of GDP.’23
23 The reference value of 3 percent of GDP for the general government financial deficit, which is inheritedfrom the Maastricht Treaty, does not apply to the UK, unless it wishes to join EMU. This is because the UKobtained an opt-out from the obligation to join EMU (to proceed to the ‘third stage’ of the EMU process).While Denmark also has an EMU opt-out, it appears that it is required, unlike the UK, to meet the deficitcriterion. For instance the Council Opinion of 5 March 2002 on the updated convergence programme ofDenmark, 2001–2005, states: ‘Denmark is also expected to be able to withstand a normal cyclical downturnwithout breaching the 3 percent of GDP deficit reference value.’ Sweden does not have an EMU opt-out andtherefore has to be able to withstand a normal cyclical downturn without breaching the 3 percent of GDPdeficit reference value. It is not anticipated that any of the current or future accession candidates will beable to obtain a UK-or Denmark-style EMU opt-out, although for a while they may well have derogations,as Sweden does today, if they are deemed not to have satisfied all the convergence criteria. Despite its opt-out, the UK is required to endeavour to avoid excessive deficits, and the requirements of ‘close to balanceor surplus in the medium term’ contained in the Stability and Growth Pact apply to the UK (see e.g., the‘Council Opinion of 12 February 2002, on the updated convergence programme for the United Kingdom,2000/2001 to 2006/7’, Official Journal of the European Communities, 26.2 2002, C 51/7). For a good descriptionof the Stability and Growth Pact see European Central Bank, 1999, ‘The Implementation of the Stability andGrowth Pact’, pp. 45–72.
Patching up the Pact 89
With one qualification, these fiscal–financial constraints on permissible budget-ary policies apply to all EU members, not just to EMU members. The Stability andGrowth Pact constrains the financial deficit of the general government of every EUmember in two ways. These constraints can be expressed as follows (cyclicallyadjusted variables are denoted by tildes):
η ≡ g − τ + ib ≤ 0.03 (19)
@ ≡ © − # + i ∫ ≤ 0. (20)
The criterion in equation (19), constraining the actual financial deficit of the generalgovernment, will be called the deficit criterion.24 The criterion in equation (20), con-straining the cyclically adjusted or medium-term deficit, will be called the cyclicallyadjusted deficit criterion. For EMU candidates, but not for the existing EMU membersor the existing EU members with an EMU opt-out, the further constraint applies asa condition for full EMU membership, that the general government gross stock ofdebt be less than 60 percent of annual GDP.
b ≤ 0.6 (21)
We shall refer to the criterion in (21) as the debt criterion.25
The reasoning behind the assignment of these three specific numerical valuesfor the deficit and debt ceilings has to our knowledge never been made public.Indeed, the reasons for choosing any fixed numerical values rather than more flexiblestate-contingent rules have never been explained. As regards the 60 percent of GDPgeneral government gross debt to annual GDP ceiling, it may not be a coincidencethat the historical value of that ratio during 1992, the year the Maastricht Treatywas signed, happened to be 63 percent on average for the 15 EU members.26 Thedebt–GDP ratio in 1992 was on a rising trajectory. For the 11 first-wave EMU members,the ratio peaked in 1995 at 72 percent. At the end of 2001 it stood at 59 percent.
24 The three percent of GDP threshold for the general government financial deficit can be breached only inexceptional circumstances, defined as ‘severe recession’. In evaluating whether the economic downturnis severe, the Member States will, as a rule, take as a reference point an annual fall in real GDP of at least0.75 percent. If a Member State is deemed by the European Commission and the Council of Ministers to havetaken inadequate measures to address a situation where the general government deficit exceeds 3 percentof GDP, the Member State may be required to make non-interest-bearing deposits. If the failure to addressthe excessive deficit persists, these deposits will turn into a fine. No financial penalties are imposed as longas the general government financial deficit does not exceed 3 percent of GDP. Neither are financial finesimposed if a country is deemed by the Commission and the Council to have pursued inappropriate policiesin the context of the yearly surveillance exercise, unless of course the general government financial deficitwere to exceed 3 percent of GDP. Ireland was at the receiving end of such a negative assessment in 2001.25 In our notation, b refers to net debt. Some EU governments have significant financial assets, so their grossfinancial debt exceeds their net financial debt by a considerable margin.26 For the 11 EU members that formed the EMU on January 1, 1999, the 1992 figure debt ratio was 63.3 percent.
90 Buiter and Grafe
No obvious historical benchmark can be offered for the 3 percent of GDPnumerical ceiling for the deficit. In 1992 the actual general government deficit–GDPratio averaged 5.1 percent of GDP for the 15 EU members.27 However, two possibleexplanations for the numerical ceiling have been offered. It has been suggestedthat, since a deficit–GDP ratio of three percent stabilizes a (net) debt–GDP ratio of60 percent when the annual growth rate of nominal income is 5 percent, this mightprovide a bridge between the debt ceiling and the deficit ceiling. However, thedebt criterion is defined in terms of gross rather than net debt, and five percentnominal GDP growth is probably somewhat in excess of the long-run expectedgrowth rate of nominal GDP that the authors of the Maastricht criteria hadin mind.28 A second possible explanation is based on the Golden Rule that isenshrined in the German constitution, according to which the public sector deficitis not to exceed public sector investment. In the twenty years preceding theMaastricht Pact, public investment in Germany averaged around 2.3 percent ofGDP rising in some years as high as 2.7 percent of GDP.29 Similarly public capitalformation in the EU member countries accounted for 3.1 percent of GDP onaverage in 1992. Thus, a three percent ceiling for the cyclically adjusted deficit isconsistent with the history of the golden rule in Germany. However the applicationof that three percent ceiling to the actual rather than to the cyclically adjusteddeficit cannot be rationalized in this manner. No economic argument has beenoffered for the requirement that the cyclically adjusted or medium-term generalgovernment budget be close to balance or in surplus.
Of the three numerical criteria, the debt criterion appears, based on the recordthus far, to carry the least weight, both in the decision on whether a country canjoin EMU, or in the stability and convergence programmes that apply to all EUmembers.30 The reason for this could well be that it is not a choice variable of thegovernment in the short run.
4.2 The UK’s Golden RuleThe Stability and Growth Pact criteria do not allow for differences between currentspending and general government capital formation. In the UK, one of the principles
27 Eurostat does not provide data for Sweden and Spain for 1992. The average therefore excludes thesetwo countries.28 The target inflation rate of the European Central Bank is below two percent per annum. This inflation rateis defined in terms of the Harmonised Index of Consumer Prices (HICP), but there is no reason to expectthe inflation rate of the GDP deflator to be systematically different. The long-run growth rate of real GDPin the EU 15 in unlikely to be much more than 2.5 percent per annum.29 The data is taken from the World Bank. Public Investment reached 2.7 percent of GDP in 1976 and was2.4 percent in 1992, when the Maastricht Treaty was finalized.30 At the end of 2000, the general government gross debt–GDP ratios for Belgium, Greece and Italy all werein excess of 100 percent. All three were declining, but none of them is likely to see 60 percent anytimesoon.
Patching up the Pact 91
governing the fiscal–financial programme is the ‘cyclically adjusted Golden Rule’.According to this rule, on a cyclically adjusted basis, government borrowingshould not exceed net government capital formation.
@ ≡ ı + ($ + n)∫ ≤ ©I − %˚ ≡ ; + n˚ (22)
or, equivalently:31
©C + ©T + %˚ − #0 − !˚ + i ∫ ≤ 0 (23)
There are two aspects of this rule that give grounds for concern. First, the nominalamount that can be borrowed for investment is independent of the rate of inflation,or more precisely, independent of the reduction in the real value of the outstand-ing stock of domestic-currency-denominated government interest-bearing debtbrought about by inflation. Inflation (when it is anticipated) increases the nominalinterest rate on the (domestic-currency-denominated) public debt and throughthat the financial deficit of the government. The higher nominal interest paymentsare, however, compensated for, as regards the sustainability of the government’sfiscal–financial programme, by the reduction in the real value of the domestic-currency-denominated stock of public debt outstanding. By measuring the govern-ment financial deficit at real interest rates rather than at nominal rates, we wouldavoid the situation that the permissible change in the real value of the public debtbecomes lower when the inflation rate increases, even when the real interest rateremains constant.
The second obvious weakness of the cyclically adjusted golden rule as aguide to debt sustainability and government solvency is that the amount ofborrowing that is permitted is independent of the real growth rate of the economy.Clearly, other things equal, a higher real growth rate allows more borrowingwithout this adversely affecting debt sustainability. On the other hand, a highergrowth rate calls for a higher rate of investment simply to sustain the capital–output ratio.
This suggests that short of moving to the permanent balance rule an inflation-and-real-growth-adjusted and cyclically adjusted golden rule may be a better guide tosustainable public sector financing. It is given by
ı ≤ ; (24)
or equivalently by:
©C + ©T + %˚ − #0 − !˚ + (® − n)∫ + n˚ ≤ 0. (25)
31 We assume that depreciation, that is, capital consumption, is counted as current expenditure.
92 Buiter and Grafe
A country is only allowed to raise its debt–GDP ratio if the money is spent onraising the public sector capital stock to GDP ratio. For the general governmentdeficit as a share of GDP this implies that
∂ ≤ © I − (% + n)˚ + ($ + n)∫ ≡ ; + (n + $)∫. (26)
Thus, under the cyclically adjusted and inflation-and-real-growth-adjustedGolden Rule, the government’s stock of net liabilities, b − k, with the capital stockvalued at current reproduction costs, will not increase (over the cycle or in themedium and long term). The UK’s cyclically adjusted golden rule is less restrictiveon borrowing than the Pact’s cyclically adjusted deficit criterion, as long as netpublic sector capital formation is positive.
Whether or not either of the two Golden Rules is prudent depends on whether,from the point of view of generating (or freeing up) a future cash flow, publicsector capital formation is more like public sector debt repayment or more likepublic sector consumption.
In the case where public sector investment does not yield any cash income, itshould be treated as consumption for the purpose of financial management. Thefact that public sector capital may not yield any financial returns does not meanthat one should never borrow to finance public sector investment, or even that oneshould not borrow on a cyclically adjusted basis to finance public sector capitalformation. The Permanent Balance Rule implies that, other things being equal,any increase (decrease) in actual public spending relative to permanent publicspending can be financed by borrowing (should be associated with an increase innet debt repayment).
5. The Pact versus the Permanent Balance Rule
Somehow surprisingly, of the four crucial parameters governing government solv-ency according to equation (12), three do not figure in any of the three deficit anddebt criteria of the Stability and Growth Pact. These are the primary surplus–GDPratio, the long-run real interest rate and the long-run real growth rate. The fourth,the (net) debt–GDP ratio, almost makes it into the debt criterion. The debt–GDPratio of the solvency constraint is, however, a net debt–GDP ratio. The Maastrichtdebt criterion involves the gross debt–GDP ratio. In most of what follows we shallassume that gross and net government debt coincide.32
32 In practice, governments with the same net financial asset position but different gross financial assetsand liabilities would be impacted asymmetrically by the debt criterion. This makes little economic sense.This distinction is not just academic as the case of Japan demonstrates, where gross debt exceeds net debtaccording to some estimates by almost 100 percent.
Patching up the Pact 93
Instead of the primary deficit −s, the real interest r and the real growth rate n,the Maastricht Criteria involve the full government deficit as a percentage of GDP,η. Since these are related, the deficit criterion puts some restrictions on sustainabil-ity but does so in a very crude way.
Note that:33
b ≡ η − (π + n)b ≡ −s + (r − n)b (27)
The first line of equation (27) states that the change in the general governmentdebt–GDP ratio equals the general government financial deficit as a fraction ofGDP, minus the reduction in the debt–GDP ratio due to nominal GDP growth. Thesecond line of equation (27) states that the change in the general government debt–GDP ratio equals the primary deficit–GDP ratio plus the outstanding debt–GDPratio times the excess of the real interest rate over the real growth rate.
We have shown in Sections 3 and 4 that both the Permanent Balance Rule andthe Maastricht criteria prevent countries from entering unsustainable debt paths inmost relevant cases.34 If we accept the need for explicit fiscal rules in the EMU toavoid exploding national debt paths, the main concern from an economic stand-point in choosing a rule would be to ensure that fiscal policy does not lose theflexibility that is essential for macroeconomic stabilization and for accommodatingdifferences in economic structure. In this penultimate section of the paper wedemonstrate that the Stability and Growth Pact rules do not fare well under thiscriterion and that this will be a vital concern for the current EU candidate coun-tries. The Stability and Growth Pact rules – unlike the (Augmented) PermanentBalance rule – do not take into account the effect of differences in real and nominalGDP growth rates on countries’ abilities to sustain a given sequence of deficits.Furthermore, the Pact criteria are myopic and backward-looking, ignoring both keydifferences in initial conditions and foreseeable future changes in key parametersdriving future public spending and revenues.
5.1 The Stability and Growth Pact Rules and the Permanent Balance Rules under different nominal GDP growth ratesConsider the first line of (27). Comparing the behaviour of two national economieswith the same outstanding debt–GDP ratio, for any common deficit–GDP ratio, the
33 If the government has issued foreign-currency bonds paying an interest rate i*, equation (27) becomes:b ≡ η − (π + n)b + εαb ≡ −s + (r − n)b + ( i* + ε − i)αb. Here b is total (domestic- and foreign-currency-denominated) general government debt as a fraction of GDP, α is the share of foreign currency debt in totalgeneral government debt and ε is the proportional rate of depreciation of the nominal exchange rate.34 A country’s debt could still explode under the Maastricht rules if it experienced negative nominal GDPgrowth forever.
94 Buiter and Grafe
debt–GDP ratio of the country with the higher growth rate of nominal GDP will befalling faster. It is clear that, other things being equal, the country with the highergrowth rate of nominal GDP should be able to run a larger financial deficit. TheStability and Growth Pact does not allow for this. It interferes with fiscal policy inmore ways than by just preventing countries to enter unsustainable debt paths.
5.2 The treatment of current and future primary deficits under different rulesConsider two countries with the same debt–GDP ratio and the same public sectorconsumption programmes. Country U has a low initial public sector capital stockand low implicit future state pension liabilities. The government of country U nowwishes to build up its public sector capital stock. This means it would like to set
, the permanent public investment rate. The government of country Uought to be able to borrow, and the (Augmented) Permanent Balance Rule wouldpermit it to borrow.35 The Stability and Growth Pact, however, would stop it fromborrowing (on a cyclically adjusted basis).
Now consider country I, which has a large and reasonably efficient generalgovernment capital stock and can therefore scale back its public investment pro-gramme. It does however have large implicit future state pension liabilities.36
For this country, . The last inequality reflects the expectationthat future state pension benefit payments will exceed current levels. The Per-manent Balance Rule implies that, ceteris paribus, country I should be making effortsto reduce its debt–GDP ratio now, in order to make room for these future pensionobligations. The Stability and Growth Pact rules consider only the present and thepast (as summarized in the outstanding stock of (gross) debt). As the rules arenot forward-looking, they will not suggest any need for fiscal restraint until thehigh future pension payments are upon us and show up in excessive currentdeficits and a rising debt ratio.
If this is a serious issue for countries U and I, it could be an even more seriousissue for the accession candidates. Despite eleven years of, by and large, successfultransition, the infrastructure of these countries is in an often woeful state. Theyshould be investing heavily in infrastructure ( ). Indeed the Acquis requiresthem to engage in such investment. Communism and central planning have alsoleft a disastrous environmental legacy in the accession candidates. Both the Acquisand common sense mandate a large-scale environmental clean-up effort. It doesnot matter whether this expenditure is classified as public investment or publicconsumption. There can be little room for doubt that the accession candidates
35 In the case of the UK, the catch-up investment boom in the general government sector could easily lasta couple of decades.36 See European Commission (2001a) for some interesting data on future state pension scenarios in EUmember states. Reform options are reviewed in McMorrow and Roeger (2002).
g gI IP >
g g g gI IP
T TP , ≤ <<and
g gI IP >>
Patching up the Pact 95
should, for the next couple of decades, be in a position where, at least as regardsenvironmental expenditures, . Ceteris paribus, this justifies a risingpublic debt–GDP ratio, according to the (Augmented) Permanent Balance Rule.The Stability and Growth Pact may, however, prevent these essential expendituresfrom occurring, unless they can be financed contemporaneously by cuts in otherexpenditures, tax increases and transfers from the EU budget.
The eight East and Central European early accession candidates have demo-graphic structures rather like those of the existing continental EU members: birthrates are low, the population is greying and total population size is constant ordeclining gently. Some of them, for instance the Czech Republic also have costlyunfunded state pension systems. Extrapolating current benefit entitlement andcontribution rules, there will be a growing ‘social security deficit’ in the comingdecades. In terms of the (Augmented) Permanent Balance rule, . Ceterisparibus this should encourage the accession candidates to reduce their debt–GDPratios now. It is of course essential that, with such large infrastructure and envir-onmental spending programmes mandated by unfortunate initial conditions,every expenditure item and tax exemption in the general government budget bescrutinized carefully.
Finally, consider again two countries, once more labelled U and I. They are thesame, except that U has a low public debt and a small public sector capital stock,while I has a high public debt and a large public sector capital stock. Assume thatb − k is the same for both countries, and assume, to simplify the argument, that thenet financial real rate of return on the public sector capital stock equals the risk-free real rate of interest: θ − δ = r. Assume that the government of country U wishesto raise both k and b, keeping k − b constant; and that the government of countryI wishes to reduce both k and b, again keeping k − b constant. Under the Stabilityand Growth Pact, country U will not be allowed to borrow to invest, while countryI is allowed to run down its capital stock and retire debt. The economics of the twocases requires them to be treated symmetrically. The (Augmented) PermanentBalance Rule handles this case gracefully. With country U can increase itsdebt–GDP ratio according to the Permanent Balance Rule, and with countryI can reduce its debt–GDP ratio.
While the cyclically, inflation- and real-growth-adjusted Golden Rule takes afew steps on the road towards a robust yet flexible government borrowing rule, itfails to recognise that there are many causes for variation over time in governmentcurrent spending and current receipts, ranging from the business cycle and catch-up spending following decades of under-investment in infrastructure capital, towar-related expenditures.
5.3 Simulating the (Augmented) Permanent Balance RuleFor illustrative purposes we have simulated the permanent (PBR) and the aug-mented permanent (APBR) balance rules for the years 2001 and 2002 (see Table 8).
g g g gC I CP
IP + >> +
g gT TP <
g gI IP >
g gI IP <
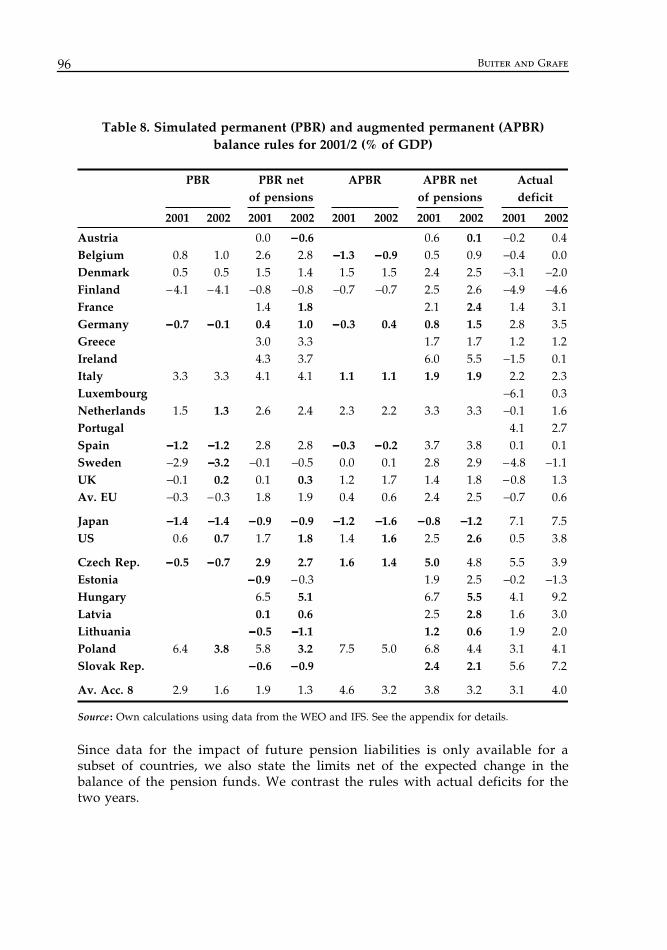
96 Buiter and Grafe
Since data for the impact of future pension liabilities is only available for asubset of countries, we also state the limits net of the expected change in thebalance of the pension funds. We contrast the rules with actual deficits for thetwo years.
Table 8. Simulated permanent (PBR) and augmented permanent (APBR) balance rules for 2001/2 (% of GDP)
PBR PBR net of pensions
APBR APBR net of pensions
Actual deficit
2001 2002 2001 2002 2001 2002 2001 2002 2001 2002
Austria 0.0 −−−−0.6 0.6 0.1 −0.2 0.4Belgium 0.8 1.0 2.6 2.8 −−−−1.3 −−−−0.9 0.5 0.9 −0.4 0.0Denmark 0.5 0.5 1.5 1.4 1.5 1.5 2.4 2.5 −3.1 −2.0Finland −4.1 −4.1 −0.8 −0.8 −0.7 −0.7 2.5 2.6 −4.9 −4.6France 1.4 1.8 2.1 2.4 1.4 3.1Germany −−−−0.7 −−−−0.1 0.4 1.0 −−−−0.3 0.4 0.8 1.5 2.8 3.5Greece 3.0 3.3 1.7 1.7 1.2 1.2Ireland 4.3 3.7 6.0 5.5 −1.5 0.1Italy 3.3 3.3 4.1 4.1 1.1 1.1 1.9 1.9 2.2 2.3Luxembourg −6.1 0.3Netherlands 1.5 1.3 2.6 2.4 2.3 2.2 3.3 3.3 −0.1 1.6Portugal 4.1 2.7Spain −−−−1.2 −−−−1.2 2.8 2.8 −−−−0.3 −−−−0.2 3.7 3.8 0.1 0.1Sweden −2.9 −−−−3.2 −0.1 −0.5 0.0 0.1 2.8 2.9 −4.8 −1.1UK −0.1 0.2 0.1 0.3 1.2 1.7 1.4 1.8 −0.8 1.3Av. EU −0.3 −0.3 1.8 1.9 0.4 0.6 2.4 2.5 −0.7 0.6
Japan −−−−1.4 −−−−1.4 −−−−0.9 −−−−0.9 −−−−1.2 −−−−1.6 −−−−0.8 −−−−1.2 7.1 7.5US 0.6 0.7 1.7 1.8 1.4 1.6 2.5 2.6 0.5 3.8
Czech Rep. −−−−0.5 −−−−0.7 2.9 2.7 1.6 1.4 5.0 4.8 5.5 3.9Estonia −−−−0.9 −0.3 1.9 2.5 −0.2 −1.3Hungary 6.5 5.1 6.7 5.5 4.1 9.2Latvia 0.1 0.6 2.5 2.8 1.6 3.0Lithuania −−−−0.5 −−−−1.1 1.2 0.6 1.9 2.0Poland 6.4 3.8 5.8 3.2 7.5 5.0 6.8 4.4 3.1 4.1Slovak Rep. −−−−0.6 −−−−0.9 2.4 2.1 5.6 7.2
Av. Acc. 8 2.9 1.6 1.9 1.3 4.6 3.2 3.8 3.2 3.1 4.0
Source : Own calculations using data from the WEO and IFS. See the appendix for details.
Patching up the Pact 97
With respect to the current EU member countries the permanent balance rulesare more or less in line with the current judgement of the Commission. Of thecurrent member countries, Germany (in 2001 and 2002) and France and Austria(in 2002) ran deficits that exceed the ones permitted by the PBR and the APBR.Belgium and Italy were violating the APBR given their high net debt burdens.Spain was exceeding the PBR and the APBR in both years if we take the futureimpact of its pension system into account. The Netherlands, Sweden and the UKwere violating the PBR in 2002 if we take future pension payment shortfalls intoaccount. For the UK this was even true net of pension payments.
Among the accession countries deficits were exceeding those permitted underthe permanent balance rule for almost all countries and both years. The exceptionsare Estonia in 2002 and Poland and Hungary in 2001. However, this picturechanges when we take their current low debt levels into account. According to theAPBR only Lithuania and the Slovak Republic were running excessive deficits inboth years, not taking future pension payment shortfalls into account. Hungaryand Latvia were violating the APBR net of pensions in 2002. The Czech Republic’sdeficit was above that permitted by the APBR if taken net of pensions in 2001 andin both years if future pension liabilities are taken into account.
Clearly the simulation should be read with caution, given the ad hoc assump-tions we have made. However, they show that applying the well founded aug-mented permanent balance rule rather than the ad hoc Maastricht Criteria wouldmake a significant difference. While the effects that stem from nominal growth donot have much of an impact on accession countries at this stage (as they have verylittle debt), this might change in the future. The simulation also does not take intoaccount transfers from the EU budget. With respect to the accession countries, thisshould have a considerable impact as these are likely to finance around two per-cent of these countries’ public investment programmes semi-permanently.
6. Conclusion
One (perhaps the) important virtue of the numerical fiscal–financial criteria of thePact and the Treaty is that they are simple, ‘objective’ and verifiable. In principle, thedetermination of whether these criteria are satisfied could be a mechanical exercise,requiring neither political judgement nor significant administrative or analyticalcompetence or sophistication. During the gestation period of the Stability andGrowth Pact, there was indeed quite a bit of support for putting the process ofdetermining compliance with the fiscal–financial criteria on ‘auto-pilot’. Theview that the monitoring of compliance and the imposition of penalties should beturned into a purely technical verification procedure, without any room for polit-ical discretion and negotiation, did not prevail. In many ways, this was just as well.The criteria may be precise, but as we have shown in Section 5, they may well givethe wrong signals.
98 Buiter and Grafe
What the parties negotiating the Pact ultimately agreed upon were not onlythe three numerical ceilings, suggesting a non-discretionary procedure for verifyingcompliance, but also two ways of introducing elements of flexibility and discretion.
The first of these is a procedure for judging members’ performance with respectto the fiscal–financial criteria that leaves the final determination of compliance tothe Council (ECOFIN). By making the Council the final arbiter, the Pact has createdscope for political discussion and negotiation regarding both the ‘findings of fact’and the determination of sanctions and penalties. A striking example is the decisionin April 2002 not to issue a formal warning to Germany and Portugal about therisk of the two countries violating the three percent deficit ceiling. This was fol-lowed in June 2002 by leniency towards France and Italy, both as regards the dateby which the budget was to be close to balance or in surplus (this was postponedby one year), and as regards the meaning of ‘close to balance’ which now hassoftened to encompass a general government deficit of up to 0.5 percent of GDP.
The second element of flexibility and discretion relates to the interpretationof the requirement that the cyclically adjusted budget be ‘close to balance or insurplus’. This flexibility has been mainly exploited so far by allowing countries tosmooth the transition to zero cyclically adjusted budget deficits. When the rulesbecame effective, a number of countries were close to the three percent ceiling forthe budget deficit even though they were far from being in an economic downturn.Given this ‘initial condition’ for the deficit, these countries might have had totighten fiscal policy in the downturn not to breach the deficit criterion. This hasproven politically impossible, and a number of de facto waivers were improvized.
This tinkering with the criteria and the unfocussed discussions about theseadjustments are undermining the credibility of the Pact. All this underlines theimportance of designing a fiscal framework that takes into account, in a systematicmanner, the different economic realities across countries. The time horizon overwhich countries are to achieve balanced budgets has been interpreted with steadilyincreasing flexibility. In a number of cases deadlines in Stabilisation and Conver-gence Programmes have been extended without any substantive economic justi-fication being given (such as, say, unexpected developments in the duration and/or amplitude of the business cycle). In addition, the target ‘close to balance or insurplus’ has, in June 2002, been interpreted as compatible with a deficit of up tohalf a percent of GDP, and it is not at all unlikely that further relaxation is in store.
An optimal rule is both credible and flexible. Flexible need not mean opportun-istic. Credible need not mean rigid and inflexible. Indeed, arbitrary and inflexiblerules are not credible. Commitment is not necessarily sacrificed when a rule ismade contingent on observable, verifiable events or outcomes – preferably eventsor outcomes that cannot be manipulated by those implementing the rule or bythose judging performance under the rule.
The problem with the current ‘flexibility by fudge’ compromise is that thereis still insufficient flexibility but there is also too much scope for opportunistic,politically motivated manipulation of the framework and the process. There is no
Patching up the Pact 99
coherent conceptual framework to structure and focus the assessment of the likeli-hood and significance of one or more of the numerical thresholds being exceeded.The conditions under which warnings will be issued and penalties imposed areobscure and intensely political.
There is a need for the EU and ECB to present to the public a clear conceptualframework to motivate and explain the concepts of fiscal sustainability and excess-ive deficits, and to relate these fundamental notions to concrete quantitative fiscal–financial objectives (which could be time- or state-contingent) and to specific policyactions or rules. Without such a conceptual framework, it will be hard to convincea sceptical public of the economic merits of any ECOFIN decision to condone orpenalize an overshooting of the numerical ceilings. Without it, not only are thePact’s numerical criteria becoming discredited, but also the fundamental notionof fiscal–financial sustainability.
We conclude that the Stability and Growth Pact’s fiscal criteria are not well-designed to deliver their objectives of viable fiscal–financial programmes conduciveto sustainable growth. The aim of preventing excessive government deficits andexcessive public debt is shared by everyone. The Pact, unfortunately, is apt to leadto errors of commission as well as to errors of omission.
Strict enforcement of uniform numerical deficit and debt rules would causeserious problems even for existing EU members whose initial conditions are dif-ferent from the EU average and whose medium-term growth rates and inflationrates may differ significantly from the EU average. The problem of ‘one Pact fitsall’ will be even more serious for the accession candidates.
Formally revising the Stability and Growth Pact rules will not be easy. Takingthe long-term view, however, the cost of sticking with a badly flawed set of rulesis bound to exceed the short-term reputational damage caused by a significantredesign of the rules.
References
Balls, E. and O’Donnell, G. (2002). Reforming Britain’s Economic and Financial Policy: TowardsGreater Economic Stability, Basingstoke, UK: Palgrave Publishers.
Banca D’Italia (2000). Fiscal Sustainability, Essays presented at the Bank of Italy workshop held inPerugia, 20–22 January 2000.
Balassa, B. (1964). ‘The Purchasing Power Parity doctrine: A reappraisal’, Journal of PoliticalEconomy, 72, pp. 584–96.
Barro, R. J. (1979). ‘On the determination of the public debt’, Journal of Political Economy, 87,pp. 940–71.
Barro, R. J. and Sala-i-Martin, X. (1992). ‘Convergence’, Journal of Political Economy, 100,pp. 233–51.
Beetsma, R. and Uhlig, H. (1999). ‘An analysis of the Stability Pact’, The Economic Journal,pp. 546–71.
100 Buiter and Grafe
Blanchard, O. and Perotti, R. (1999). ‘An empirical characterization of the dynamic effects ofchanges in government spending and taxes on output’, NBER Working Paper No. 7269,Cambridge, MA: National Bureau of Economic Research.
Buiter, W. H. (2001). ‘Notes on “A Code for Fiscal Stability” ’, Oxford Economic Papers, 53(1),pp. 1–19.
Buiter, W. H. and Grafe, C. (2002). ‘Anchor, float or abandon ship: Exchange rate regimesfor the accession countries’, Banca Nationale del Lavoro Quarterly Review, 221, pp. 1–32.
Buiter, W. H. and Grafe, C. (2003). ‘Reforming EMU’s fiscal policy rules’, in Buti, M. (ed.),Monetary and Fiscal Policies in EMU: Interactions and Coordination, Cambridge, UK: Cam-bridge University Press.
Buiter, W. H. and Kletzer, K. M. (1991a). ‘Reflections on the fiscal implications of a commoncurrency’, in Giovannini, A. and Mayer, C. (eds.), European Financial Integration, Cam-bridge, UK: Cambridge University Press.
Buiter, W. H. and Kletzer, K. M. (1991b). ‘The welfare economics of cooperative and non-cooperative fiscal policy’, Journal of Economic Dynamics and Control, 15, pp. 215–44.
Buiter, W. H., Corsetti, G. and Roubini, N. (2001). ‘Excessive deficits: Sense and nonsense inthe Treaty of Maastricht’, in de Grauwe, P. (ed.), The Political Economy of Monetary Union,Cheltenham, UK: Edward Elgar Publishing Ltd.
Buti, M., von Hagen, J. and Martinez-Mongay, C. (2002). The behaviour of fiscal authorities:Stabilization, growth and institutions, Basingstoke, UK: Palgrave Publishers.
CEC5 National Banks (2002). ‘On the estimated size of the Balassa–Samuelson effect in CEC5countries’, paper prepared for the Basle Meeting of March 2002, mimeo, National Bankof Hungary.
Chamley, C. (1981). ‘The welfare cost of capital income taxation in a growing economy’,Journal of Political Economy, 89(3), pp. 468–96.
Chamley, C. (1986). ‘Optimal taxation of capital income in general equilibrium with infinitelives’, Econometrica, 54(3), pp. 607–22.
Crespo-Cuaresma, J., Dimitz, M. A. and Ritzberger-Grünwald, D. (2002). ‘Growth, con-vergence and EU membership’, Oesterreichische Nationalbank Working Paper No. 62,Oestereichische Nationalbank, Vienna.
Deaton, A. (1981). ‘Optimal taxes and the structure of preferences’, Econometrica, 49(5),pp. 1245–60.
Eilffinger, S. C. and de Haan, J. (2000). European Monetary and Fiscal Policy, Oxford, UK:Oxford University Press.
European Central Bank (1999). Monthly Bulletin (May).European Central Bank (2002). Monthly Bulletin (April).European Commission (2001a). Directorate-General for Economic and Financial Affairs,
European Economy, Suppement A, Economic Trends, No. 1 ( January).European Commission (2001b). Directorate-General for Economic and Financial Affairs,
European Economy, Suppement A, Economic Trends, No. 2 (March).Giavazzi, F., Jappelli, T. and Pagano, M. (2000). ‘Searching for nonlinear effects of fiscal
policy: Evidence from industrial and developing countries’, European Economic Review,44(7), pp. 1259–89.
Heston, A., Nuxoll, D. A. and Summers, R. (1994). ‘The differential-productivity hypothesisand purchasing-power parities: Some new evidence’, Review of International Economics,2(3), pp. 227–43.
Patching up the Pact 101
Kletzer, K. and von Hagen, J. (2000). ‘Monetary union and fiscal federalism’, ZEI WorkingPaper B1, Zentrum fuer Europaeische Integrationsforschung, Bonn.
Lane, P. R. and Perotti, R. (1999). ‘The importance of composition of fiscal policy: Evidencefrom different exchange rate regimes’, mimeo, Columbia University.
Lucas, R. E. (1983). ‘Optimal fiscal and monetary policy in an economy without capital’,Journal of Monetary Economics, 12(1), pp. 55–94.
Lucas, R. E. (1988). ‘On the mechanics of economic development’, Journal of Monetary Eco-nomics, 22, pp. 3–42.
Levine, R. and Renelt, D. (1992). ‘A sensitivity analysis of cross country growth regressions’,American Economic Review, 82, pp. 942–63.
McMorrow, K. and Roeger, W. (2002). ‘EU pension reform – An overview of the debateand an empirical assessment of the main policy reform options’, EC Directorate-General for Economic and Financial Affairs, Economic Papers No. 162, Brussels, EuropeanCommission.
Melitz, J. (2000). ‘Some cross-country evidence about fiscal policy behaviour and con-sequences for EMU’, European Economy 2 – Reports and Studies, pp. 3–21.
Obstfeld, M. and Peri, G. (1998). ‘Regional non-adjustment and fiscal policy’, EconomicPolicy, 13(26), pp. 205–59.
OECD (2001). ‘Fiscal implications of ageing: Projections of age-related spending’, by ThaiThan Dang, Pablo Antolin and Howard Oxley, OECD working paper ECO/WKB 31,Paris: OECD.
Perotti, R. (1998). ‘Fiscal policy in good times and bad’, Columbia University, mimeo.Samuelson, P. A. (1964). ‘Theoretical notes on trade problems’, Review of Economics and
Statistics, 46, pp. 145–54.Samuelson, P. A. (1994). ‘Facets of Balassa–Samuelson thirty years later’, Review of Inter-
national Economics, 2(3), pp. 201–26.Taylor, J. (2000). ‘Reassessing discretionary fiscal policy’, Journal of Economic Perspectives,
14(3), pp. 21–36.van Wincoop, E. (1995). ‘Regional risk sharing’, European Economic Review, 39(8), pp. 1545–
68.Wyplosz, C. (2002). ‘Fiscal discipline in EMU, rules of institutions’, heiwwww.unige.ch/
~wyplosz/
102 Buiter and Grafe
Appendix
Data and assumptions for the simulation in Table 8The simulation is for the financial deficit given the permanent balance rule(equation 15) and the symmetric augmented permanent balance rule (equation 17).Since the quantitative impact of pensions is only available for a subset of thecountries, we also state the permitted deficits net of the impact of future pensionfund shortfalls. For the augmented permanent balance rule we assume the long-term agreed debt level to be b* = 0.6 and the speed of adjustment α to be 0.05. Thus,it takes about 14 years for a country to halve the initial deviation of its debt–GDPratio from the long term agreed level. The results of the simulation are summarizedin Table 8. Bold numbers indicate that a country’s deficit exceeded the one permit-ted under the rule considered.
The permanent growth rate is approximated by the WEO’s forecast for realgrowth for 2001–2007. The permanent real interest rate is taken from the averageof the real long term bond yield in the WEO’s database. The permanent real inter-est rate for accession countries is simulated to be 2 percent below the average forthe current EU member countries.
Current growth rates, net debt figures, current real interest rates and currentinflation are approximated by the WEO’s estimates of real growth, net generalgovernment debt, real long term bond yields and the change in the GDP deflator.The exception is the real interest rate for accession countries. Since no comparableseries is available, we have used the treasury bill rate (where available) or themoney market rate given by the IFS and deflated the rates using the GDP deflator.
The impact of pension payments is approximated by half the simulated annualshortfall to the peak (see Table 6). The permanent public investment figure is theaverage for 2001–2007 given by the WEO for current member countries and theaverage of those numbers for Greece, Portugal and Spain and for the accessioncountries.
Related Documents