PASTORAL SETTLEMENT, FARMING, AND HIERARCHY IN NORSE VATNAHVERFI, SOUTH GREENLAND PH.D.-DISSERTATION SUBMITTED TO THE UNIVERSITY OF COPENHAGEN 09.07.2014 BY CHRISTIAN KOCH MADSEN

Welcome message from author
This document is posted to help you gain knowledge. Please leave a comment to let me know what you think about it! Share it to your friends and learn new things together.
Transcript

PASTORAL SETTLEMENT, FARMING, AND HIERARCHY IN
NORSE VATNAHVERFI, SOUTH GREENLAND
PH.D.-DISSERTATION
SUBMITTED TO THE UNIVERSITY OF COPENHAGEN
09.07.2014
BY CHRISTIAN KOCH MADSEN

2
ACKNOWDLEGEMENTS
I would like to thank the Northern Worlds research initiative at the National Museum of Denmark for
funding this Ph.D., and the Department of Middle Ages and Renaissance for providing a peaceful workplace
and good everyday company.
I heartily thank my supervisors Ulla Lund Hansen and Jette Arneborg, for their insightful comments,
patience, and the cake brought to the meetings. And to Jette Arneborg especially, I wish to convey my
deepest gratitude for bringing my onboard the project, for trusting and encouraging me, for showing that you
should never stop learning or reaching out!
I thank the researchers of North Atlantic Biocultural Organization, especially Thomas H. McGovern,
Andrew J. Dugmore, and Ian Simpson, for welcoming me into the North Atlantic family, and not at least for
introducing me to a host of good researchers, many of which are now also good friends. These I want to
thank for many good hours spent in, and out of, the field: Seth Brewington, Aron Kendal, Ramona Harrison,
Norrie Manigault, Laura Comeau, Richard Streeter, Michael Nielsen, and many more.
I also wish to convey very special thanks to those colleagues and trusted friends with whom I have spent
so many good, and wet, hours in the landscapes of Greenland: to Niels. A. Møller, thanks for teaching me
about ruins and zodiacs; to Konrad Smiarowski, thanks for long days of hard work and long nights of good
talks; to Poul B. Heide, thanks for the long discussions about landscape and for demonstrating how one
should always take adversity with good spirit and humor.
Finally, I want to most gratefully thank my girlfriend Kirstine E. Møller, for all her help and patience, and
for putting up with me and keeping me going to the end.

3
ABSTRACT
Around AD 1000 two settlements were founded in Greenland by Norse hunter-farmers: the larger Eastern
Settlement in South Greenland and the Western Settlement ca. 500 km north in the inner parts of the Nuuk fjord region.
The Norse settlers had a two stringed economy that combined pastoral livestock farming with cattle, sheep, goats, pigs,
and horses with extensive hunting, the latter also to sustain trade in wildlife luxury exports to Europe. This economy
was based on a settlement pattern of dispersed farmsteads occupying the most fertile niches of the fjords, but extending
the entire range of the landscape from the Ice Sheet to outer coast, and from lowland to highland, through specialized
sites and shielings. This Norse settlement system lasted for around 450 years, the Western Settlement being abandoned
in the mid- to late 14th century, the Eastern Settlement a century later.
In 2005, the Vatnahverfi Project was initiated, a research project under the National Museum of Denmark and
coordinated by senior researcher Jette Arneborg, aimed at investigating regional level Norse settlement-, economic, and
cultural patterns in a core area of the Norse Eastern Settlement: the Vatnahverfi. From 2005-2011 and in 2013,
archaeological ruin group surveys were carried out in the Vatnahverfi, gradually expanding the research area to include
the entire peninsula between the fjords of Igaliku Kangerlua and Alluitsup Kangerlua, an area of some 1560 km2. In
these archaeological surveys, 129 Norse ruin groups – among them 18 newly discovered – and 798 individual ruins
were DGPS-surveyed and uniformly documented. In 2010, a Ph.D.-scholarship was set up as part of the Northern
Worlds initiative at the National Museum of Denmark to investigate this new Norse ruin group survey evidence.
The dissertation Pastoral Settlement, Farming, and Hierarchy in Norse Vatnahverfi, South Greenland concludes on
these investigations and part of the Vatnahverfi-Project: the dissertation presents a detailed analysis of the Vatnahverfi
survey evidence, as well as of comparative sites from elsewhere in the Eastern Settlement, a total of 1308 ruins divided
on 157 ruin groups, abort one third of all the ruin groups registered in the Eastern Settlement. This evidence implies that
the Vatnahverfi constituted a small community of an average ca. 225-533 people, inhabiting some 47 farmsteads and 86
shielings, some of the latter likely being small farmsteads at the peak of settlement. Most of these farmsteads seem to
have been organized around eight evenly distributed larger farms or manors, the remainder probably being subsidiary
farms belonging to cotters and tenants. Overall, analysis of population numbers, settlement- and land use patterns
suggest a pastoral farming system heavily dependent on extensive landscape resources and intensive herding strategies.
New dates generated through the Vatnahverfi Project suggest that this community expanded in to stages: first
settlement occurred just around AD 1000 in the inner and middle fjords, but only at locations near the fjords; the second
state of expansion occurred around AD1050-1100, during which time the outer fjord, inland and highland areas were
occupied. The new dates also suggest that settlement contraction began already from the mid-13th century AD. The
contraction first involved abandonment of the outer fjord farmsteads, as well as closing down of small churches. From
the late-14th century AD, shieling activities appear to have disintensified, and during the 14
th century AD many
farmsteads were apparently abandoned, although a few sites in primary farmlands continued into the 15th century AD.
As an explanatory model for this settlement development, the comparative case study of pre-modern Inuit farming
has been used. Combined with ice core climate proxy evidence, the analysis suggests that a change towards a more
intensive mode of farming was forced by climatic deterioration after AD 1250. Such a change was likely problematic
for cottagers and tenants, which may have become more dependent on the large farms and manors. An analysis of food-
and environmental securities within different societal strata at different times of settlement, coupled with a resilience
theory perspective, suggests such deprivation in lower societal strata caused by poor access to labor and continued
environmental stress could eventually have cascaded up through the system to seriously affect large farms and manors.
If the Norse settlements in Greenland had one major problem, it was apparently shortage of people.

4
ABSTRACT
Omkring år 1000 e.kr. grundlagde norrøne jæger-landmænd to bosættelser i Grønland: den større Østerbygd i
Sydgrønland samt Vesterbygden ca. 500 km nordligere i den indre Nuuk fjord. De norrøne kolonister havde en
tostrenget subsistens økonomi, der kombinerede pastoralt husdyrlandbrug (kvæg, får, geder, svin og heste) med
ekstensivt jagt, hvilket også muliggjorde eksporten af grønlandske luksusvarer til Europa. Denne økonomi var baseret
på et bosættelsesmønster af spredtliggende gårde placeret på de mest fertile områder i fjordene, dækkende fra
Indlandsisen til den ydre kyst, samt fra lavland til højland gennem specialiserede pladser og sætere. Dette norrøne
bosættelsesmønster varede ved i omkring 450 år: Vesterbygden blev forladt i midten til det sene 14. århundrede,
Østerbygden et århundrede senere.
I 2005 blev Vatnahverfi projektet, et forsknings projekt under Danmarks Nationalmuseum og koordineret af senior
forsker Jette Arneborg, iværksat for at undersøge de regionale norrøne bosættelses-, økonomiske og kulturelle mønstre i
et kerneområde af den norrøne Østerbygd: Vatnahverfi. Fra 2005-2011 og i 2013 blev arkæologiske ruingruppe surveys
udført i Vatnahverfi, gradvist udvidende undersøgelsesområdet til at inkludere hele halvøen mellem fjordene Igaliku
Kangerlua og Alluitsup Kangerlua, et område på omkring 1560 km2. Gennem disse arkæologiske undersøgelser blev
129 norrøne ruingrupper, heraf 18 nye, og 798 individuelle ruiner DGPS-indmålt og ensartet dokumenteret. I 2010 blev
et Ph.d.-stipendium slået op, som del af Nordlige Verdener ved Danmarks Nationalmuseum, til at undersøge og
gennemgå denne nye norrøne ruingruppe materiale.
Denne afhandling Pastoral Settlement, Farming, and Hierarchy in Norse Vatnahverfi, South Greenland konkluderer
på disse undersøgelser og en del af Vatnahverfi projektet: afhandlingen præsenterer en detaljeret analyse af Vatnahverfi
opmålingerne og andre komparative lokaliteter i Østerbygden, i alt 1308 ruiner fordelt på 157 ruingrupper bliver
behandlet, hvilket svarer til ca. 1/3 af samtlige ruingrupper registreret i Østerbygden. Undersøgelsen antyder at
Vatnahverfi udgjordes af et lille samfund bestående af gennemsnitligt ca. 225-533 mennesker, fordelt på 47 gårde og 86
sætere, hvoraf nogle af de sidstnævnte muligvis har fungeret som små gårdsanlæg under bosættelsens højdepunkt. De
fleste af disse gårdsanlæg synes at have været organiseret omkring otte større gårde og stormandsgårde. De resterende
gårdsanlæg har formentlig fungeret som subsidiære gårde tilhørende husmænd og lejere. Analyser af befolkningstal,
bosættelses- og landbrugsmønstre indikerer at det pastorale landbrugssystem var yderst afhængigt af ekstensive
landskabsressourcer og intensive hyrde strategier.
Nye dateringer foretaget under Vatnahverfi projektet antyder at dette samfund ekspanderede over to faser:
bosætningen den indre- og mellemfjorden fandt sted omkring 1000 e.kr., men kun på lokaliteter nær fjordene; den
anden ekspansion skete omkring 1050-1100 e.kr., hvor bosættelsen udvidedes til den ydre fjord, indlandet samt
højlandet. De nye dateringer antyder endvidere at en sammentrækning af bosættelsen allerede begyndte omkring midten
af det 13. århundrede e.kr. Til at begynde med involverede denne sammentrækning at gårdene i den ydre fjord blev
forladt, samt at de små kirker blev lukket ned. Aktiviteter omkring sæterne bliver mindre intensive fra slutningen af det
14. århundrede og i løbet af dette århundrede bliver mange gårde tilsyneladende forladt, enkelt lokaliteter i primære
landbrugsområder forblev dog fortsat bosat ind i det 15. århundrede e.kr.
Et komparativt casestudy af præ-moderne Inuit landbrug er blevet brugt som en forklaringsmodel for denne
bosættelsesudvikling, Kombineret med iskerne klima proxy data antyder analysen at en klimaforværring efter ca. 1250
e.Kr. fordrede en mere intensive landbrugspraksis. En sådan forandring var formentlig problematisk for husmænd og
lejere, hvorfor de kan være blevet mere afhængige af de store gårde og stormandsgårde. En analyse, af food- og
environmental securities hos forskellige sociale strata på forskellige tidspunkter i løbet af bosættelsen, parret med et
resilience teoretisk perspektiv, indikerer at forarmelse i lavere sociale strata forårsaget af ringe adgang til arbejdskraft
og fortsat miljømæssige stress kan have vandret op igennem systemet og i sidste ende have haft kraftig indvirkning også
på de store gårde og stormandsgårdenes virkemuligheder. Hvis den norrøne bosættelse i Grønland have ét stort
problem, var det tilsyneladende mangel af arbejdskraft.

5
CONTENTS: 1. INTRODUCTION ........................................................................................................................................ 8
1.1 DISSERTATION RESEARCH QUESTIONS AND PROGRESSION .................................................. 9
1.2 ON SOME CATEGORIES OF (NORSE) LANDSCAPE .................................................................... 10
2. NORSE GREENLAND IN THE NORTH ATLANTIC ............................................................................. 12
2.1 GREEN, WHITE, AND SOFT GOLD – NORTH ATLANTIC HUNTER-FARMERS ...................... 13
2.1.1 EXILES OR ENTREPRENEURS? ............................................................................................... 14
2.1.2 A SMALL COMMUNITY DIVIDED? ......................................................................................... 15
2.1.3 A MEDIEVAL BLOOM AND BUST CYCLE? ........................................................................... 17
2.2 FARMS AND SHIELINGS IN THE NORTH ATLANTIC................................................................. 18
2.2.1 MEDIEVAL FARMSTEADS ....................................................................................................... 18
2.2.2 MEDIEVAL SHIELINGS ............................................................................................................. 20
2.3 NORSE ANIMAL HUSBANDRY AND LIVESTOCK ECONOMY ................................................. 21
2.3.1 ARCTIC HUNTER-FARMERS .................................................................................................... 22
2.3.2 ARCTIC HUNTER-FARMERS ..................................................................................................... 23
3. THE FJORDS OF THE FARMERS – THE EYSTRIBYGGÐ AND VATNAHVERFI ............................ 27
3.1 THE WEATHER AND CLIMATE OF SOUTH GREENLAND ......................................................... 29
3.1.1 SOME OBSERVED WEATHER PATTERNS ............................................................................. 30
3.1.2 REGIONAL WEATHER AND DRIFT ICE ................................................................................. 31
3.1.3 SOME PALEOCLIMATIC OBSERVATIONS ............................................................................ 32
3.1.4 A CLIMATE MODEL .................................................................................................................. 36
3.2 VEGETATIONAL PATTERNS IN THE FJORDS ............................................................................. 39
3.2.1 SUBREGIONAL VEGETATION PATTERNS ............................................................................ 40
3.2.2 LANDSCAPES OF THE VATNAHVERFI .................................................................................. 43
4. THE ARCHAEOLOGY OF GREENLAND AND THE VATNAHVERFI ............................................... 49
4.1 THE ARCHAEOLOGY OF NORSE GREENLAND 1723-2005 ........................................................ 50
4.1.1 SETTLEMENT DISCOVERY – 1721-1832 ................................................................................. 51
4.1.2 LOCALITIES – 1832-1921 ........................................................................................................... 56
4.1.3 EXCAVATIONS – 1921-1962 ...................................................................................................... 61
4.1.4 HIATUS – 1962-1976 ................................................................................................................... 65
4.1.5 CULTURAL HERITAGE MANAGEMENT AND RESEARCH PROJECTS – 1976-2005 ........ 67
4.1.6 SPECIALIZED RESEARCH PROJECTS AND ECODYNAMICS AFTER 2005 ....................... 70
4.1.7 SUMMARY DISCUSSION .......................................................................................................... 71

6
4.2 THE VATNAHVERFI-PROJECT 2006-2011 ..................................................................................... 77
4.2.1 PROJECT BACKGROUND AND DEVELOPMENT .................................................................. 80
4.2.2 VATNAHVERFI-PROJECT 2005-2007 -FIELD WORK SUMMARY ....................................... 83
4.2.3 SURVEY METHODOLOGY ....................................................................................................... 85
4.2.4 SURVEY DATA REPRESENTATIVITY .................................................................................... 88
5. THE ARCHAEOLOGY OF NORSE FARMSTEADS AND SHIELINGS ............................................... 90
5.1 THE ARCHAOLOGY OF NORSE FARMHOUSES AND SHIELING LODGES ............................. 91
5.1.1 THE NORTH ATLANTIC LONGHOUSES ................................................................................. 92
5.1.2 MEDIEVAL FARMHOUSES ....................................................................................................... 97
5.1.3 MEDIEVAL SHIELING LODGES............................................................................................. 106
5.2 MEDIEVAL CHURHES IN NORSE GREENLAND ........................................................................ 109
5.2.1 SMALL MEDIEVAL CHURCHES ............................................................................................ 109
5.2.2 LARGE MEDIEVAL CHURCHES ............................................................................................ 110
5.3 THE ARCHAOLOGY OF OUTBUILDINGS ................................................................................... 112
5.3.1 MEDIEVAL BYRE/BARNS ...................................................................................................... 113
5.3.2 OTHER ROOFED OUTBUILDINGS ......................................................................................... 117
5.3.3 MEDIEAL UNROOFED OUTBUILDINGS .............................................................................. 118
6. THE ARCHEOLOGICAL FEATURES OF NORSE FARMSTEADS AND SHIELINGS IN THE
VATNAHVERFI ......................................................................................................................................... 119
6.1 THE IDENTIFICATION AND DESCRIPTION OF RUINS AS FUNCTIONAL BUILDINGS ...... 120
6.1.1 BUILDING MATERIALS AND TAPHONOMY ....................................................................... 121
6.2 A CLASSIFICATION OF RUINS AS FARMHOUSES, LODGES, AND OUTBUILDINGS ......... 123
6.2.1 ROOFED BUILDINGS ............................................................................................................... 124
6.2.2 ROOFED BUILDINGS SUMMARY DISCUSSION ................................................................. 150
6.2.3 UNROOFED BUILDINGS ......................................................................................................... 153
6.2.4 UNROOFED BUILDINGS SUMMARY DISCUSSION ............................................................ 173
6.2.5 OTHER FARMSTEAD FEATURES .......................................................................................... 175
6.3 CHAPTER SUMMARY .................................................................................................................... 179
7. MEDIEVAL NORSE SETTLEMENT AND ORGANIZATION IN THE VATNAHVERFI .................. 180
7.1 A FUNCTIONAL CLASSIFICATION OF NORSE FARMSTEADS AND SHIELINGS ................ 181
7.1.1 OVERALL ENVIRONMENTAL PATTERNS .......................................................................... 182
7.1.2 OVERALL RUIN DISTRIBUTION ........................................................................................... 184
7.1.3 A FUNCTIONAL CLASSIFICATION OF NORSE RUIN GROUPS ........................................ 189

7
7.1.4 SECTION SUMMARY DISCUSSION ....................................................................................... 199
7.2 THE FUNCTIONAL SETTLEMENT LANDSCAPE OF THE VATNAHVERFI ............................ 202
7.2.1 FARMSTEAD AND SHIELING DISTRIBUTION .................................................................... 203
7.2.2 FARMSTEAD AND SHIELING INTERRELATION ................................................................ 205
7.2.3 SECTION SUMMARY ............................................................................................................... 210
7.3 COMMUNITY AND HIERARCHY IN NORSE VATNAHVERFI.................................................. 213
7.3.1 THE NORSE VATNAHVERFI COMMUNITY......................................................................... 213
7.3.2 VATNAHVERFI SETTLEMENT ORGANIZATION................................................................ 214
7.3.3 SETTLEMENT HIERACHY IN THE VATNAHVERFI ........................................................... 215
8. PASTURES FOUND… FARMING IN GREENLAND (RE)INTRODUCED ........................................ 218
8.1 A BRIEF HISTORY OF FARMING IN GREENAND 1721-2006 .................................................... 219
8.1.1 COLONIAL FARMING – 1721-1906 ........................................................................................ 220
8.1.2 PRE-MODERN FARMING – 1906-1976 ................................................................................... 222
8.1.3 MECHANIZED FARMING AFTER 1976 ................................................................................. 225
8.1.4 SUMMARY DISCUSSION ........................................................................................................ 225
8.2 COMPARATIVE ASPECTS OF FARMING IN GREENLAND ...................................................... 227
8.2.1 FARMING SETTLEMENT DEVELOPMENT .......................................................................... 227
8.2.2 FARMING SETTLEMENT ABANDONMENT ........................................................................ 231
8.2.3 INTENSIVE VERSUS EXTENSIVE FARMING - AND CATASTROPHIC WINTERS.......... 235
8.2.4 SHEEP/GOAT NUMBERS ......................................................................................................... 241
8.2.5 FIELDS AND FORAGE ............................................................................................................. 243
8.3 ON THE SECURITY AND RESILIENCE OF PASTORAL FARMING .......................................... 246
8.3.1 THE HUMAN SECURITIES OF FARMING IN MEDIEVAL VATNAHVERFI ..................... 246
8.3.2 THE RESILIENCE OF PASTORAL FARMING ....................................................................... 251
9. CONCLUSION ........................................................................................................................................ 253
10. BIBLIOGRAPHY .................................................................................................................................. 256
APPENDIX 1………………………………………………………………………………………………..282
APPENDIX 2………………………………………………………………………………………………..315
APPENDIX 3………………………………………………………………………………………………..324

8
1. INTRODUCTION
‘(…) those who have visited Greenland testify that there the cold has received its greatest strength. Moreover, both sea and land bear testimony (…) for both are frozen and covered with ice in summer as well as in winter.
It has been stated as a fact that Greenland lies on the outermost edge of the earth toward the north (…)’.
‘(…) the land has beautiful sunshine and is said to have a rather pleasant climate. When the sun rises highest,
it has abundant power to shine and give light, but very little to give warmth and heat; still, it has sufficient
strength, where the ground is free from ice, to warm the soil so that the earth yields good and fragrant grass.
Consequently, people may easily till the land where the frost leaves, but that is a very small part’.
‘(…) I shall tell you something about the nature of the land. When storms do come, they are more severe than in
most other places, both with respect to keen winds and vast masses of ice and snow. But usually these spells of
rough weather last only a short while and come at long intervals only. In the meantime the weather is fair, the
cold is intense’.
King’s Mirror (royal didactic text, mid-13th cen. A.D.)
The above are excerpt from the King’s Mirror, one of the
few medieval accounts on the geographical and natural
setting of the Norse settlements in Greenland. Although
written more than 750 years ago, the account resounds
with perceptual imagery similar invoked by mention of
Greenland even today: as a place of great and wild
expanses, of majestic landscapes wrought in stone, ice,
and water; of remoteness and isolation, and of dangers,
freezing whiteness, and lost souls. This was the
Greenland that was “conquered” by 19th and early-20
th
century European arctic explorers and forged the cultural
perceptions – visions ab extra – that last to this day as a
“paradigm of arctic marginality”.
However, the King’s Mirror also hints at another and
very contrasting perspective; it refers to those small and
lush niches in the landscapes of Greenland that compare
to parts of Scandinavia and the North Atlantic, and
which never cease to surprise first visitors with their, in
summer, luxuriantly vegetated slopes. In fact, these
niches are where the name Greenland itself originated,
given to it by the Norse settlers – the grænlendinga –
who founded two small colonies around AD 1000 and
survived of its lands until the mid-15th century AD.
Academic and popular accounts of the livelihood in
these Norse communities on the ‘outermost edge of the
world’ seems always to have been caught somewhere in
between these paradoxical perspectives, although the
mysterious end of Norse settlement in Greenland has
clearly become part of the narrative of arctic marginality.
In 2005, the National Museum of Denmark initiated
the Vatnahverfi-Project to reinvestigate one of these
niches of Norse settlement, the Vatnahverfi region in
South Greenland. From 2005 to 2011, 129 Norse sites in
this region – including 18 newly discovered – and some
798 individual ruins were precision surveyed, providing
a digital archaeological survey dataset of hitherto
unprecedented precision and uniformity. In addition to
the surveys, excavations were carried out at 22 sites as
part of collaborating research projects or with the
specific aim of providing a chronological framework for
the interpretation of the survey evidence. In 2010, a 3-
year Ph.D.-scholarship was generously put up by the
National Museum of Denmark’s 'Northern Worlds'
research initiative to investigate the new survey dataset.
This Ph.D.-dissertation thus concludes on the survey-
archaeological part of the Vatnahverfi-Project.
During the prolonged field surveys in the Vatnahverfi
region, my perspective on this landscape has changed
dramatically: from a preconception of arctic marginality
of an isolated “wilderness” full of daunting obstacles and
threats, environmental experience and familiarity gained
through extended travels and interaction with local Inuit
sheep farmers has transformed the Vatnahverfi into a
familiar and rural landscape little different from other
sparsely populated parts of Scandinavia. This, in turn,
has influenced the themes of this dissertation to focus
more on Norse pastoral livelihood rather than simply
issues of Norse pastoral marginality:

9
1.1 DISSERTATION RESEARCH QUESTIONS AND PROGRESSION
The archaeological survey evidence from the
Vatnahverfi region is used to address four main research
questions:
What was the functional layout of the medieval Norse
farmsteads in the Vatnahverfi region?
What was the specific nature and layout of pastoral
settlement and farming in the Vatnahverfi region?
What does this settlement pattern evidence imply in
terms of regional organization and social hierarchies?
What changes did the pastoral farming community go
through during the settlement period; who were affected
the most, how, and when?
To answer these research questions, the dissertation
addresses related themes in following progression:
Chapter 2 – Greenland in the North Atlantic –
provides an introduction to the historical and
archaeological context for the colonization of Greenland
with focus on population size, overall economic
conditions, basic farm and animal husbandry strategies.
The topics are presented in a comparative North Atlantic
settlement perspective to establish a socio-economic
baseline for Norse settlement in Greenland.
Chapter 3 – The Fjords of the Farmers – The
Eystribyggð and Vatnahverfi – provides a detailed
description of the geographical, topographical, and
environmental setting of the Norse Eastern Settlement
with particular focus on the Vatnahverfi region. The
description is specifically aimed at establishing the
nature of these landscapes in terms of their potential for
pastoral farming, but overall observed weather and
paleo-climatic patterns are also discussed. Chapter 3
establishes an environmental baseline for discussing
Norse settlement and farming in Greenland.
Chapter 4 – The Archaeology of Norse Greenland
and the Vatnahverfi – provides a literary review of
archaeological research in the Norse settlement areas of
Greenland. The first part of chapter 4 outlines and
summarizes archaeological investigations up to the
beginning of the Vatnahverfi-Project, where the second
section describes and discusses the field investigations of
the project and issues relating to the survey record.
Chapter 5 – The Archaeology of Norse Farmsteads
and Shielings – presents a summary stand der forschung
and archaeological framework for the interpretation and
classification of Norse architectural features in the
survey evidence from the Vatnahverfi region.
Chapter 6 – The Archaeological Features of Norse
Farmsteads and Shielings in the Vatnahverfi – presents,
analyses, and functionally classifies the archaeological
ruin survey evidence from the Vatnahverfi region. The
empirical data is listed and summarized in Appendix 1:
the Ruin Database (referred to as the RD in the below).
The RD is attached as an access database.
Chapter 7 – Medieval Norse Settlement and
Organization in the Vatnahverfi – presents a functional
classification and settlement pattern analysis of the ruin
group evidence from in the Vatnahverfi region. The
empirical data is listed and summarized in Appendix 2:
the Ruin Group Database (referred to as the RGD in the
below) and site plans of the individual ruin groups are
found in Appendix 3. The first part of chapter 7 analyses
the Vatnahverfi archaeological record in terms of the
functional layout of pastoral settlement and farming in
the region, whereas the second part discusses patterns of
community-level hierarchical organization.
Chapter 8 – Pastures Found – Farming in
Greenland (Re)introduced – discusses the broader
implications of the settlement and hierarchy patterns
established in chapter 7. In the first part of chapter 8,
historic Inuit farming is used as a comparative case study
to explore and discuss Norse settlement and farming
development and change with focus on the new dates
from the ruin groups in the region. The last part of
chapter 8 draws on findings of all the above chapters to
discuss Norse settlement and farming in terms of human
securities and resilience theory
Chapter 9 – Conclusion – Summarizes the main
findings and implications of the dissertation and stakes
out some future research issues and agendas.
Note that the ruin and settlement analysis includes
survey evidence of 24 comparative ruin groups from
elsewhere in the Norse Eastern Settlement. This data is
listed in both the RD and RGD, but only the ruin groups
surveyed by the author are included in appendix 3.
Otherwise I refer to the references in the RD.

10
1.2 ON SOME CATEGORIES OF (NORSE) LANDSCAPE
An archaeological settlement pattern study such as this
dissertation is by default also a landscape study. Over the
last couple of decades, the multifariousness of landscape
approaches has exploded, one simple explanation for the
miscellany of 'landscape' being that it has been adopted
both as term and distinct research area within multiple
academic disciplines: from its introduction through
Renaissance art (Barrel 1972;1, Cosgrove 1985;46),
landscape has grown to range equally freely across such
academic fields such as planetary geology (Tanaka and
Leonard 1995), geography (e.g., Sauer 1925, Coones
1985, Berg et al. 2006), ecology (e.g., Forman and
Godron 1986, Burel and Baury 2003), sociology (e.g.,
Greider and Garkovich 1994, Glenna 1996), and social
anthropology (e.g., Ingold 1993, Hirsch and O'Hanlon
1995). Not at least in archaeology and history has
landscape developed as a full-fletched independent
research area with its own vast corpus of theoretical and
practical literature (e.g., Muir 2000, Anschuetz et al.
2001, Whyte 2002, Thomas and David 2008).
However, as this dissertation concerns landscape
only as perceived on settlement, or at most community,
level, I will not engage in any lengthy theoretical
discussion of the nature and extent of landscape
experience by the individual. Also, since historic records
in fact allow for distinguishing some basic categories of
Norse landscape distinction, this section will only briefly
clarify the meaning behind some key terms and concepts
used throughout the dissertation:
Social-ecological systems (SES’s): was a concept
introduced in 1998 to abolish artificial distinction
between the social and ecological dimensions of
delineated ecosystems with both human and ecological
components, and to stress the complex interaction
between these components on multiple spatial and
temporal scales (Fig.1.1) (Berkes and Folke 1998,
Ostrom 2009). SES’s were at first used in sociology to
discuss related aspects of cultural- and resource
management and was adopted as the main framework for
resilience theory (e.g., Gunderson and Holling 2001,
Walker et al. 2004, Folke 2006). The settlement
evidence from the Vatnahverfi region is discussed in a
resilience theory perspective in chapter 8, but here it
sufficient to clarify that when applied in the below
chapters, SES refers to the entire delineated system of
the Norse Settlements in their Greenland setting.
Fig.1.1 Simplified examples of subsystems within a Social-Ecological System (SES) (after Ostrom et al. 2009:Fig.1).
Traditional Ecological Knowledge (TEK): also
referred to as 'Traditional Environmental Knowledge', is
a concept originally introduced by human ecologists and
anthropologists to refer the way indigenous people
accumulate, organize, apply, and transmit experiential
practice, and belief based knowledge of their
surrounding environment (Berkes et al. 2000, Dugmore
et al. 2012:3660). In other words, TEK is an interface
between the social and ecological components of the
SES’s. In the dissertation, I apply the concept just as
broadly to signify a similar kind of pooled knowledge
base that existed, and expanded or contracted, in the
Greenland Norse communities. However, TEK also had
certain significant limits, for instance how long the
memory of a rare event was stored in the “common
knowledge bank” and how to cope with events that were
unprecedented.
Farming systems: In some recent articles, Ingvild
Øye has argued that North Atlantic farming should be
examined in terms of farming systems, i.e. not only the
structural features of the farmsteads, shielings, fields
etc., but include related components such as available
labor and technology, land use patterns and organization,
ownership rights and management practices etc. (Øye
2003, 2005b, 2005a, 2009, 2013). Although I. Øey has
herself not coupled this idea of farming systems to the
concept of SES’s and TEK, it is clear that it feeds
perfectly into that model: the farming system can simply
be considered a subsystem to the larger SES (cf. Fig.
1.1), governed and directed by the TEK associated with
farming in that system.

11
Fig.1.2 A conceptual model for different and legally regulated use areas of a medieval farm in Norway. This land use model can be almost directly transferred to the Norse settlements in Greenland, the only difference being the absence of 'cattle lanes' and occasionally varying placing of 'distant shielings' (see the text) (after Øye 2013:Fig.4).
The concept of a farm: in continuation of her ideas
on farming systems, I. Øey has argued (Ibid.) that the
concept of a North Atlantic, or at least Norwegian,
medieval farm should also be shifted towards a more
embracive view. Based on Norwegian medieval written
accounts, she has stressed that the farms consisted of
more than the central cluster of buildings and farmyard,
but extended into the surrounding territory with different
use and use rights to different areas (Fig.1.2). Here, I
extended her model to the Norse settlements in
Greenland with minor modification, mainly that her zone
3 and 4 (cf. Fig.1.2) in the outer fjords of Greenland
included shielings at horizontal distance from the home
farmsteads, i.e. a type of horizontal shieling that I return
to in chapter 8.
When I below refer to 'farm' I thus mean to signify
not only the central buildings and infield of an
agricultural unit – I refer to this as a farmstead – but to
all of the adjoining lands and resource areas belonging to
the farm, e.g. outfield meadows, woodlands, shielings,
fishing grounds etc., and to which the farm had
particular legal use rights. After Norwegian historical
parallel (Hougen 1947:96, Myhre and Øye 2002:3622p),
I occasionally refer to Øye’s zone 2 as the heimrast, a
fertile pasture area very near to the farmsteads and which
in Greenland appears to have been of great importance.
The ruin groups and ruin group numbers: in the context
of Norse Greenland archaeology, sites are referred to as
'ruin groups'. As I return to in chapter 4, ruin groups
were earlier numbered consecutively and labeled after
their location in the Eastern-, Western, or Middle
Settlements. Here, I retain this numbering system
because of its simplicity, but stress that I have replaced
the original 'Ø' for 'Østerbygden' by 'E' for the Eastern
Settlement. Also, when specific ruin groups are referred
to in the below, I do not normally supply an explicit
appendix reference, because both appendices are listed
by their 'E' number.

12
2. NORSE GREENLAND IN THE NORTH ATLANTIC
‘So say wise men, that in the same summer, when Eric the Red set out to settle Greenland, then three tens and a half ships (35) sailed out of Breidafirth and Borgarfirth, and fourteen came out thither ; some were driven back and some cast away. That was XV winters, before Christianity was fixed by law in Iceland (…)’.
Eiriks saga Rauða, HB 27-36, late 14 c. AD
‘But in Greenland it is this way, as you probably know, that whatever comes from other lands is high in price, for this land lies so distant from other countries that men seldom visit it. And everything that is needed to improve the land must be purchased abroad, both iron and all the timber used in building houses. In return for their wares the merchants bring back the following products: buckskin, or hides, sealskins, and rope of the kind that we talked about earlier which is called "leather rope" and is cut from the fish called walrus, and also the teeth of the walrus’.
King’s Mirror (142), ca. AD 1250.
In retrospect, Norse settlement of Greenland around
AD 1000 marked an important transition point in the
greater history of Scandinavia: it was the last of the
Viking Age migrations, which over the last two centuries
had introduced Scandinavian culture to most of Europe
and to all the islands of the North Atlantic (Fig.2.1). In
Greenland – on the new arctic frontier of Europe – the
migration ground to a halt, the ensuing Norse excursions
to North America being only of a provisional character.
Yet, in such travels by the Greenland Norse they came
into contact with peoples of North American origin, i.e.
Indian-, Late Dorset-, or Thule-cultures (Gulløv 2000b,
Sutherland 2000, Jakobsson 2001, Gulløv 2008b).
Through these exchanges between continents – and
almost in a testament to the celebrated Viking thirst for
exploration and travel – the colonization of Greenland
came to signify something even more profound: the first
contact in the full circumnavigation of planet earth by
mankind since its parting in Africa.
However, the fate of the Greenland Norse was tied to
the east and the notable changes that unfolded across
Scandinavia. There, the turn of the first millennium A.D.
heralded the end of the Viking Age and was impelled by
two major changes: the formation of the Scandinavian
political and economic kingdoms and their conversion to
Christianity. In that sense, the landnám in Greenland
also coincided with the transition of the Scandinavian
and North Atlantic Iron Age societies to – historically
recognized – integrated political, economic, and
religious parts of medieval Europe.
While the Greenland colonies constituted the extreme
westernmost node in this network – essentially tying the
arctic to the Papal States in Italy and beyond – the
settlements came to be directly influenced by societal,
political, and economic developments on the continent;
and although these developments might have been as
experientially distant to the grænlendinga as their origins
were geographically, some changes would cascade down
through the network to impact the Norse farmers in the
North Atlantic and Greenland.
Chapter 2 sets a brief historic stage for Norse
settlement of and in Greenland, but only as needed to
contextualize those particular aspects and conditions of
settlement and pastoral farming in the Vatnahverfi
region to be investigated in the following chapters:
section 2.1 outlines and discusses some overall economic
and demographic settings for the Greenland colonies;
section 2.2 outlines the basic layout of the settlement-
and farming system and its functional units; and section
2.3 outlines the basic layout and development of the
livestock economy. In other words, chapter 2 traces the
cultural and socio-economic starting point from which
the Greenland Norse were directed along a particular
historical trajectory, as well as such regional develop-
ments that continued to influence, and limit, pathways
open to the Norse grænlendinga. This also involves
looking to developments in the wider North Atlantic and
Scandinavia. Note that unless otherwise stated, all dates
given below refer to years AD.

13
2.1 GREEN, WHITE, AND SOFT GOLD – NORTH ATLANTIC HUNTER-FARMERS
Fig.2.1 Overview map showing the general route and timing of the late Viking Age migrations from Scandinavia across the North Atlantic. The thickness of the “arrow” indicates relative population numbers involved. Kilometers set in parenthesis gives the accumulated distance from the medieval trade capital of Bergen, Norway.
Landnám – ‘the taking of land’ – in the North
Atlantic was by any measure a remarkable feat of the
Scandinavian Viking Age: facilitated by an apex in
maritime technology – the Viking ship – parts of Ireland,
the Hebrides and northern Scotland, the Northern Isles,
the Faroe Islands, Iceland and, finally, Greenland was
colonized by people of Scandinavian descent from ca.
AD 800-1000 (cf. Fig.2.1) (Smith 1995, Ólafsson 2000,
Arneborg 2004, Arge et al. 2005, McGovern et al. 2007,
Harrison 2013). Apart from small populations in the
Faroe Islands and, perhaps, Iceland (Church et al. 2013)
(e..g, Smith 1995:320, Vésteinsson and McGovern
2012:207), the islands of the western North Atlantic
offered virgin territory; in Greenland, the areas settled by
the Norse were completely depopulated by the Dorset-
culture for up to 1000 years prior to their arrival (Park
2000, Appelt 2004).
Push-pull factors traditionally offered to explain the
Viking Age migrations include: perfection in ship
technology; a shortage of young females; the hunt for
plunder; favorable environmental conditions (see section
3.1.3); population pressure and lack of land; external
political weakness and internal political centralization;
and religion based Viking ideologies of honor, fatalism,
and masculinity (for an overview and critical discussion
see: Barret 2008). Some of these factors can obviously
be ruled out in the North Atlantic migrations, while
others seem more credible. Political upheaval and lack of
land in Norway has been common explanatory models
for the settlement of Iceland, but recently some authors
have proposed a new narrative involving cash-crop
hunting organized and directed by societal elites (see
below), a model that perhaps also better explains
landnám in distant Greenland.

14
2.1.1 EXILES OR ENTREPRENEURS?
Lack of arable land – the “green gold” – could seem
a likely reason for the migrations to both Iceland and
Greenland. However, this is partly contradicted by
continued population growth in both Norway and
Iceland into the 13th-14
th centuries, i.e. well after the
migrations had ceased (Thorláksson 2000:176, Myhre
and Øye 2002:252, Þórhallsson 2012:27). Clearly, these
social-ecological systems could – either by a reallocation
or expansion of the existing resource base – adjust to
accommodate larger populations (for a discussion, see
also Dugmore et al. 2007b:16). In addition, compared to
Iceland the areas of arable land in Greenland are
negligible and marginal (see section 3.2.1., 7.2.4). In
short, the “green gold” was in short supply in Greenland
and could at best have attracted a few landnámsmen (as
it essentially seems to have, see below).
Recent investigations into landnám in Iceland from
AD 971/72 have outlined a new narrative with possible
implications also for the colonization of Greenland: first,
walrus bone found in early settlement contexts as well as
place name evidence has established the existence of
small walrus colonies in Iceland around landnám
(Dugmore et al. 2007b:16, Perdikaris and McGovern
2008:192, Pierce 2009:56p). Walrus ivory – “the white
gold” – and skin used to make ropes for ships’ riggings
were low-bulk high-price commodities in increasing
demand on European markets (Roesdahl 1995:10p,
2005:185p, Dugmore et al. 2009:105, Pierce 2009:58,
Keller 2010:3). Second, based on new archaeological
settlement evidence and a high-resolution tephra-
chronology from Mývatnssveit, north Iceland, it has
been projected that a minimum population of 24,000 had
to be relocated from Norway to Iceland over a timespan
of only 20 years to “fill out” the settlement landscape
(Vésteinsson and McGovern 2012). Third, Orri
Vésteinsson (2005) has observed that signs of wealth and
nobility in Iceland, when compared to Scandinavia,
appear very modest until at least the mid-13th century,
which makes him suggest that the initial profits of
landnám were at first not imbedded locally, but returned
to investors in Scandinavia. In combination, this new
evidence suggests that: A) landnám was driven – or at
least spearheaded – by systematic resource exploitation;
which B) was followed by rapid relocation of a large
number of people; that C) still answered to manorial
centers in Scandinavia.
Fig.2.2 Before recent over-hunting, walrus was found on large part of Greenland’s west coast. Greatly treasured by the Norse for their tusks – the “white gold” – and hides, the hunt for walrus could have been a main incentive for early Norse excursions to both Iceland and Greenland (photo: courtesy of the National Museum of Denmark).
Whereas walrus populations in Iceland were quickly
extinct (Dugmore et al. 2007b:105, Perdikaris and
McGovern 2008:192), Greenland had more viable
populations, the largest of which was found in the Disco
Bay region, where they survive to this day despite
centuries of overhunting (Witting and Born 2005:282).
Suggestively, the Disco Bay is usually identified as the
northern hunting grounds – the Norðrseta – of the
Greenland Norse (Seaver 1996:28p, Arneborg 2004:268,
Perdikaris and McGovern 2007:209). In addition,
Greenland had plentiful other wildlife that could supply
furs and skins: from fox, hare, seal, caribou, and polar
bear – the “soft gold” – as well as the tooth of narwhal,
all of which was also in high demand on European
markets (Roesdahl 1995:7p, Arneborg 2003b:170,
Dugmore et al. 2007b:16). Exploitation of walrus tusk,
at least, from onset to end of settlement in Greenland is
amply demonstrated by zooarchaeological evidence
(Fig.2.3) (e.g, McGovern 1985:89p, Perdikaris and
McGovern 2007:210, Dugmore et al. 2009:99).
Combined with signs of early expert tusk extraction
techniques, this has led some authors to suggest that
landnám in both Iceland and Greenland was preceded by
an initial phase of exploration for resources, e.g. the hunt
for walrus (Dugmore et al. 2007b:16, Perdikaris and
McGovern 2008:192, Keller 2010:3). Importantly, early
exploration would have equipped settlers with the TEK
needed for the secondary full-scale and explosive phase
landnám. Such a process of first probing a niche, next
occupying and consolidating it, seems a more likely

15
landnám scenario than farmers setting out headlong
across the North Atlantic with all their possessions for
unknown territory, not at least to distant Greenland. Such
a landnám model has more direct implications for the
themes of this dissertation: because if, as pointed out by
Dugmore et al. (2007:17), a hunt for luxury trade goods
was a main impetus for settling in Greenland and
remained its’ link to the outside world – needed also for
the import of everyday goods such as iron, building
timber etc. (cf. the opening quote) – then farming was, in
a sense, subsidiary, i.e. sustained mainly to support
hunting (?). While this may be exaggerating, the need to
ensure a steady supply of wildlife exports would have
affected the farming system in terms of its access to
labor, but this depended on the available workforce.
2.1.2 A SMALL COMMUNITY DIVIDED?
Questions of population size and available labor are
reoccurring themes in the later chapters, addressed
through archaeological evidence from the Vatnahverfi
region. However, they are to a large extent also
questions of 'when' and for 'how long', aspects which
may be explored in a comparative regional perspective:
The peopling of the western North Atlantic after the
new narrative of landnám may be described as a 'probe-
burst-trickle' model, i.e. initial exploration and resource
extraction by fairly few people, rapid and vast relocation
of fairly many people, and subsequent minor population
inflow. Clearly, labor would have been in relatively short
supply during the first critical phase of landnám, which
was perhaps a reason for the ensuing rapid and vast
relocation of many people. But what was the rate and
extent of the following population development?:
In Norway, it is estimated that the population
doubled, in some areas tripled, since the Viking Age
reaching a maximum of some 530,000 people around
AD 1300 (Tab.2.1) (Øye 2013:298). After landnám in
Iceland involving ca. 8,000-24,000 people (Vésteinsson
and McGovern 2012:217), population growth appears to
have peaked during the Commonwealth Period ca. 930-
1262 with estimated population maxima usually ranging
between 40.000-70.000 people from around AD 1100
(Tab.2.1) (Karlsson 2000:44p, Thorláksson 2000:176),
i.e. again a doubling or close to a tripling of the Viking
Age population.
Fig.2.3 Drill- or awl handle made of walrus molar (length ca. 8 cm) and found in early midden context at ruin group E172 (left). Incised on one side is a depiction of a walrus (middle), recognizable from its “beard”, bulking eyes, and the wrinkles at the neck. The walrus is shown in a bird’s eye perspective, which explains why the tusks are not portrayed (cf. Fig.2.2). The likeness to a later 16th century AD depiction is striking (right: modified after Seaver 2009:Fig.1).

16
We know less of population developments in
Greenland: written evidence is limited to anecdotal saga
accounts, which name only some 8-10 settlers (cf. the
opening quote, ES ch.1, GS ch.1), at best only 1/100 the
number of named landnámsmenn involved in the
settlement of Iceland. Based on the number of ships
mentioned in the sagas, authors have suggested that the
founding population in Greenland consisted of c. 300-
800 people (Meldgaard 1965:43, Keller 1986:146,
Lynnerup 1998:115), i.e. only about 1/10 of the founding
population in Iceland. As to medieval population growth
– based either on the estimated number of farmsteads in
Greenland or population modelling – maxima range
between 1400-6000 people (Nørlund 1934:22, Krogh
1982b:65, Keller 1986, Lynnerup 1998:100). The lower
estimates may seem extremely low. Yet, if the founding
population was 300-800 people – as most authors seem
to agree on – then the largest population peak estimates
would require an almost tenfold population increase
from the late Viking Age, which seems very unrealistic
compared to Norway and Iceland. From this perspective,
at least, maximum population in Greenland of 1400-
2000 seems more believable. Based on comparison with
the other regions, this maximum was probably reached
before 1300.
That this would make for a very different settlement
setting in Greenland is indicated by Tab.2.1 which shows
estimated peak population sizes per square kilometers
for the North Atlantic (and comparative European
regions). As visible from the table, even with the highest
and most unlikely peak population estimates, population
densities in Greenland appear astoundingly low –
especially in the Norse Western Settlement – when
compared to the other regions.
Tab.2.1 thus highlights what is implied in Fig.2.1, i.e.
that the farther removed from economic and political
centers of mainland Scandinavia, the smaller the
populations and -densities. This pattern implies a
subsistence-economic baseline of North Atlantic settle-
ment: i.e. neither in Iceland or Greenland could the
economies be intensified to sustain development of
urban centers, which were accordingly absent. In turn,
their only means absorbing medieval population increase
was – like in Norway - by subdivision of old settlements
or by expansion into more marginal agricultural areas. In
either case, it likely elicited an increase in the number of
smalltime farmers, cottagers, and tenants, whom with
their small livestock herds and marginal farmsteads were
far more susceptible to climatic variability and to the
ambitions and governance of societal elites.
Tab.2.1 – North Atlantic Population Densities 13th Century AD
Region: Estimated max.
Population Area in km
2
Population Density per km
2
Reference:
Greenland, East. Settlement 1,120 - 4,800 12,3001 0.09 - 0.39
(Keller 1986:145p, Lynnerup 1998:100p)
Greenland, West. Settlement 280 - 1,200 7,9001 0.04 - 0.15
(Keller 1986:145p, Lynnerup 1998:100p)
Iceland 40,000 - 70,000 91,500 0.44 - 0.77 (Karlsson 2000:44)
Faroe Islands 4,000 - 5,000 1,400 2.86 - 3.57 (Arge et al. 2005:601)
Norway 400,000 - 530,000 381,220 1.05 - 1.39 (Myhre and Øye 2002:252)
Shetland (AD 1755)2 5,000 - 15,000 1,468 3.41 – 10.22 (Fenton 1997:Fig.4)
Orkney (AD 1755)2
5,000 - 24,000 990 5.95 - 24.24 (Fenton 1997:Fig.4)
Denmark
1.326 million 78,000 17.00 (Hybel and Poulsen 2007:124)
England 2.00-2.45 million 130,395 15.34 - 18.79 (Hybel and Poulsen 2007:124)
Tab.2.1 Ranges of estimated population maxima, areas in square kilometers (omitting glaciated areas), and population densities per square kilometers of Scandinavian and North Atlantic regions c. AD 1200-1300. Clearly visible from the table is the trend that population densities decrease with distance from Northern Europe and the extremely low population densities in Norse Greenland, especially the Western Settlement.
1 : The estimated areas of the Norse Eastern and Western Settlements are shown in Fig.3.2.
2 :
As medieval population maxima for Shetland and Orkney are lacking to the authors knowledge, the suggested ranges refer to the maximum population in the Faroe Islands and the first actual population census in AD 1755).

17
Recent studies suggest that such societal elites were
established from the beginning and that landnám, did
not, as often held before, flow from an egalitarian and
democratic society. Rather, it flowed from a societal
setup with few chieftains or magnate landowners and
many dependent farmers or serfs, meaning that a system
of manorial organization and land tenure was in place
from day one (Vésteinsson 2005b:8, 2007:117, Júlíusson
2010, Skre 2011:201). If manorial organization in the
hands of a small societal elite was the norm in the rest of
the North Atlantic, then it surely also was in Greenland.
Part of this manorial organization involved control over
religious institutions, i.e. the complex proprietary church
system that was the model for early Catholicism in all of
Northern Europe (e.g., Skovgaard-Petersen 1960, Krogh
1982a:274, Arneborg 1991b, Vésteinsson 2000b,
Arneborg 2002, Gjerland and Keller 2009:166p). I will
not go into further discussions of these systems here, but
refer to the above authors and conclude that centralized
manorial and religious organization is considered a
baseline also for the societal setup in Norse Greenland in
the below discussions (e.g., Gad 1964, Arneborg 1991b,
Seaver 1996:61pp, Arneborg 2002, 2004:247pp).
2.1.3 A MEDIEVAL BLOOM AND BUST CYCLE?
Since this dissertation is on livelihood, I will not
discuss causes for the abandonment of the settlements in
Greenland, but rather focus on the workings of the
pastoral farming- and settlement system. Instead, I here
briefly outline a few central points of political and
economic change:
The Middle Ages saw North Atlantic economic
systems based on household production and minor trade
in luxury items change into a full-blown marked oriented
system, which was organized around mass produced
goods – primarily of stockfish and vaðmál (homespun
cloth) – and shipping in the hands of professional
merchants operating on behalf of the king or the Church
(Helle 1982:398p, Magerøy 1993:225p, Arneborg
2000:308, 2004:268, Perdikaris and McGovern
2007:200, 2008:199, Þórhallsson 2012:14pp). Although
some authors have held that the grænlendinga must also
have traded in mass goods (e.g., Ingstad 1960:261, Gad
1965:89, Seaver 1996:48, Østergård 2003:146), there is
presently little evidence to support this. However, there
is evidence of continued trade in the traditional luxury
items of walrus ivory, and probably skins and furs, the
prices and demands were in decline on European
markets (Roesdahl 1995:33, Keller 2010). Overall, this
has led to the suggestion that the continued Greenlandic
emphasis on luxury exports was a 'dinosaur' that left
them exposed to economic stagnation and, eventually,
collapse (Dugmore et al. 2007b:18, Perdikaris and
McGovern 2007:211p, Keller 2010:16p).
Stagnation may also have been a cause for the free
submission of the grænlendinga to the crown of Norway
in AD 1261 (Gad 1964). Through this “alliance”
Greenland became a tax country to Norway, but possibly
secured that the King’s trade ships would visit regularly
or, at least, that trade goods were not impounded upon
reaching Norwegian markets (Arneborg 2004:268).
Iceland made a similar move the year after and it has
recently been argued (Þórhallsson 2012) that this
regional centralization reflected active policy of the
small North Atlantic colonies in seeking economic,
political, and societal shelter of the kingdom of Norway.
Even so, merchant’s ships only appear to have arrived in
Greenland infrequently, often years apart (Gad 1965:86,
Fyllingsnes 1990:95p, Magerøy 1993:81). In short, the
Greenland Norse communication and trade networks
were weak, and it directly affected that trade goods had
to be stored for up to several years before they could be
shipped off.
The Greenland Norse networks became even more
exposed in later stages of the Middle Ages: first, in AD
1350 the plague swept over Norway, in AD 1402-04
Iceland, causing major disruption to the established
systems of organization and commerce (Øye 2004:100p,
Keller 2010:17). Second, in AD 1397 the Scandinavian
kingdoms were unified under the Kalmar Union after
which the political and economic interests of the old sea
empire of Norway shifted to northern Europe (Roesdahl
2004:46). At the same time, the German Hansa
Merchants had gained complete dominance of the trade
in bulk goods in Scandinavia and their medieval ships
were ill-fitted for transatlantic voyages (Þórhallsson
2012:16). English traders may have offered an
alternative trading partner for the Icelanders’, but since
the grænlendinga were not engaged in mass stockfish
production, they could perhaps not attract them either. In
short, Greenland was growing increasingly isolated by
regional events outside their control.

18
2.2 FARMS AND SHIELINGS IN THE NORTH ATLANTIC
Fig.2.4 View of the late-medieval Hvalseyjarfjörður church (E83); in Norse Greenland, the wealth and status of the societal elite seems
mainly to have been signaled through the construction of special architecture, primarily the churches. Considering the labor and materials involved in the construction and maintenance of the churches they undoubtedly constituted a major investment on part of the magnate farmers (photo: C.K. Madsen 2009).
While the sea increasingly became the main source
of North Atlantic medieval prosperity, the profits were
imbedded and invested in the traditional Scandinavian
farming system that was based on land tenure. The
nature, layouts, and complexity of these systems varied
from region to region, although it is beyond both the
scope and purpose of this chapter to provide any
extensive account. Rather, I here offer a brief description
of some fundamental traits of the North Atlantic farms to
contextualize the archaeological survey evidence
presented and discussed in the below, but also to expand
on and clarify some of the terms relating to North
Atlantic farming systems outlined in the introduction.
The section is divided on those two farm units that
formed the core North Atlantic farming: the farmsteads
and the shielings.
2.2.1 MEDIEVAL FARMSTEADS
The hubs of North Atlantic farms were, naturally, the
farmsteads themselves. Generalizing, they were laid out
after a rather similar and simple plan: the occupation-,
livestock-, and storage buildings were situated in the
middle or edge of the infield – the most productive plot
of arable land – all of which was enclosed by an infield
dyke (Fig.2.5). Besides keeping animals from raiding or
trampling the infield, the division inside – innangarðs –
and outside – utangarðs – the infield dyke has been
suggested as a fundamental religious and legal
dichotomy of the Norse worldview (Hastrup 1985:147,
Myhre and Øye 2002:296p, Øye 2003:402, 2005b:10,
2005a:365).

19
In the traditional view of rural North Atlantic
settlement, it was dominated by such separate or single
farmstead units more or less evenly dispersed in the
landscape (Øye 2000:12, Vésteinsson 2007:128p).
However, more recently some authors have exposed a
rural settlement patterns of greater complexity:
In rural Norway, the early Middle Ages saw the
development of multiple, nucleated, or agglomerate
farms and hamlets, i.e. two or more farmsteads sharing
and lying within the same infield, and often without any
physical demarcation of ownership boundaries (Skre
1996:64, Øye 2000:17p, 2009:41p). Multiple farms have
also been noted in Iceland, although there they are
mostly considered a landnám feature (Vésteinsson
1998:16, 2000a:168p). Also in Iceland, systems of
multiple infield enclosures have been noted (Lárusdóttir
2006), as well as equally complex earthworks in the
outfield (Vésteinsson 2005b). This “division” of farms
and outfields echoed a similar change and division in the
farmhouses, referred to as the 'functional fragmentation'
of the longhouse (see section 5.1.2 and: Skre 1996:64).
In broader perspective, one might instead refer to overall
'settlement fragmentation' since it also extended to the
splitting of single farms on multiple, nucleated, or
agglomerate farms and hamlets (Skre 1996:64, Øye
2000:17p, 2009:41p), and to division of the longhouse
and animal housing on functionally specified rooms and
buildings (Myhre and Øye 2002:356).
In short, the complexity and regional variation in
medieval farmsteads layouts and settlement patterns is,
unsurprisingly, far greater than the simple model. In
chapter 7 I propose that double-farms also existed in the
Greenland Norse settlements (although contemporaneity
is at times difficult to establish archaeologically). In
chapter 6, on the other hand, I demonstrate that infield
dykes were very rare in Greenland, which is strongly
suggestive of another, less intensive type of farming
system. However, concluding this brief section, it is
sufficient to note that the North Atlantic farming system
allowed for significant regional adjustments and
variation.
Fig.2.5 Survey plan of ruin group E149 in the Uunartoq fjord, South Greenland, a supposed nunnery. It also one of the few Norse Greenland farmsteads to display a traditional layout with an infield dyke (after Vebæk 1991).

20
2.2.2 MEDIEVAL SHIELINGS
The other core unit of the medieval farms – at least
for a period – was the shielings. Although shielings have
recently come under increased archaeological scrutiny,
they still present a more problematic type of site, partly
because of their much varied nature, partly because
scholars do not always agree on the definition. Again,
any full disclosure of the subject in beyond the present
section and for further discussions I refer to the earlier
investigations (e.g., Hougen 1947, Reinton 1955, 1957,
1961, 1969, Albrethsen and Keller 1986, Mahler 1991,
Sveinbjarnardóttir 1991, Borthwick et al. 2006, Mahler
2007, Lucas 2008).
'Shieling' is also often referred to as 'transhumance' to
indicate the movement of people and animals from
summer to winter activity (pasture) areas. However, in
the North Atlantic version, shieling activities were often
more wide-ranging than that. Some of the functional
variation was enveloped in L. Reinton’s (1961) tripartite
division of shieling types based on Norwegian historic
and ethnological evidence, with:
A) Dairy shielings the main purpose of which was
continued milk production; such shielings were
often situated relatively close to the home farmstead
and their time occupation therefore varied.
B) Haymaking shielings the main purpose of which was
production of winter fodder, although not always –
as suggested by the name – related to the production
of hay-fodder, but also of other fodder types, e.g.
leafy-fodder.
C) Full shielings that combined the functions of the two
former types, but where most or the entire
household took up residence during the entire
summer, or in some areas even in the winter (e.g.
Hougen 1947:87).
As I will return to in chapter 8, all of these shieling
types seem present in the archaeological survey evidence
from the Vatnahverfi region. There are, however, some
shielings that do not fit very neatly in any of these three
historically types, which has also been the experience
elsewhere (e.g., Sveinbjarnardóttir 1991:98) For the
purpose of classifying the archaeological material under
scrutiny here, I therefore suggest a simpler definition:
A shieling is a site (with structural features) related
to a specific and temporary outfield activity.
Two main points of this definition are the temporary
character of the activities on, or occupation of, shielings,
and that these activities – whatever their nature – were
situated in the outfield. 'Structural features' is bracketed
because the documentary mention of the Norðrseta –
translating directly as 'the Northern Shieling' (see above)
– implies that whole areas, rather than only some
particular buildings, could constitute a shieling. When
'structural features' is included in the definition, it is
because shieling activity is nearly impossible to identify
archaeologically if without any physical remains. Based
on the historic record of shieling use and activities, there
were several legal implications to the term, but as we
have no idea of such legislation in the context of Norse
Greenland, I will not discuss this aspect here.
The above definition is admittedly very open, but it
does through this quality allow exactly for the variation
evident in the Vatnahverfi survey record (see section
7.1.4). In addition to Reinton’s types, shieling activities
may more broadly include:
1) Exploitation of extensive terrestrial or marine
resources, either located distant enough from the
home farmstead to make daily transport of products,
materials, or movement of animals inconvenient or
impossible, or where location of a structural facility
at some distance from the home farmstead would
greatly eased a particular task or resource use.
2) To save on the fodder and vegetation reserve of
infields and heimrast by keeping animals from
trampling or grazing them.
3) To continue milk production throughout the period
where the animals were lactating (as opposed to
winter stalling periods).
4) Shieling activity was – like many other farming
activities – predominantly the women’s domain
(Hastrup 1989:74, Myhre and Øye 2002:402p),
freeing the men to fish, hunt, seal etc.
Finally, to this variation must be added the dynamic
character of the shielings in that they could, depending
on conditions and need, change from shieling to
farmstead and back again, from one type of shieling to
another, or any other possible combination. In general,
however, shielings were related to extensive land use in
more marginal resource areas, i.e. fitting very neatly the
overall settlement setting outlined for Norse Greenland
in section 2.1.2.

21
2.3 NORSE ANIMAL HUSBANDRY AND LIVESTOCK ECONOMY
Fig.2.6 Cattle herd grazing at the foot of a mountain in the north Vatnahverfi near ruin group E60. In Greenland cattle can only graze outside during the summer, making the associated facilities – byres, barns, cattle pens, hay infields etc. – defining characteristic features of wealthy farmsteads (photo: C.K. Madsen 2013).
At the time of the North Atlantic landnám, the
emphasis on animal husbandry – especially cattle
husbandry – was in Northern Europe being replaced by
production of bread cereals to sustain the growing
populations and urban centers (Hamerow 2002:134,
Myhre and Øye 2002:315p, Vésteinsson 2005b:22).
Mixed farming with barley crop also featured in the
North Atlantic, but environmental confines greatly
restricted this production (Nørlund and Roussell
1929:140p, Simpson et al. 2002, Edwards 2005:591pp,
Edwards et al. 2005:77p). In Greenland, mixed farming
was probably attempted during earliest settlement: it is
evidenced by historic mention (KS:142), the finds of
quern stones in excavated farmsteads (Holm 1883:83,
87, Nørlund and Roussell 1929:141, Nørlund and
Stenberger 1934:131), macro-fossil evidence (Henriksen
2012, pers. comm.), and patterns of dental caries in
Norse skeletons (Lynnerup et al. 2008:375). However, in
most of the North Atlantic and certainly in Greenland,
the cultivation of barley was at best supplemental and
confined to early settlement, meaning that they were
primarily pastoral farming systems based on livestock.
Detailed zooarchaeological records on subsistence
economies and livestock strategies from the across North
Atlantic have virtually exploded over the last decades.
This denies any prospect of presenting the new results in
the full here and neither is it necessary because of the
many local and regional overviews (see below). Here, I
provide the review needed to discuss the setup of the
Greenlandic farming system and the related settlement
evidence. However, because the Norse depended heavily
on various wild resources, this is where I begin the
review.

22
2.3.1 ARCTIC HUNTER-FARMERS
Fig.2.7 NISP (Number of Identified Specimens) percentages from seven Greenland Norse stratified archaeofaunal assemblages divided upon main species categories and rough site sub-phasing. The notable Norse emphasis on wildlife resource – especially seals – is noted. Except for a moderate gradual increase in the proportion of wildlife species over time, there is overall little change (data after: McGovern et al. 1983:Tab.2-5, McGovern 1993:Tab.1-2, McGovern et al. 1996:Tab.3, Enghoff 2003: Tab.2-4, Edvardsson 2007a:Tab2, E74 unpubl. data of Konrad Smiarowski).
Fig.2.7 displays the relative proportions of various
categories of wildlife species against the total proportion
of domesticates from a selection of Greenland Norse
sites and divided on a rough three-period division (for a
critical evaluation and discussion of the individual
archaeofaunal datasets refer to the cited literature). Two
patterns instantly strike the eye: first, that domesticates
constitute a minor proportion of the total archaeofauna,
emphasizing a great reliance on wildlife species from the
beginning (e.g., McGovern 1985, Dugmore et al. 2005,
Perdikaris and McGovern 2008). Second, that seal
proportionally was the most important of the wildlife
species and, in fact, of all of the species. A stable isotope
study found that 15-50% of the Greenland Norse diet
consisted of marine protein, most of it probably seal
(Arneborg et al. 2012a:128).
Although the archaeofaunal assemblages overlap
somewhat chronologically, the overall pattern is quite
consistent: the grænlendinga became increasingly reliant
on wildlife species, which on average changed from
constituting some 70.9% in the early period, to 73.4% in
the middle, and 78.1% in the late period. The only
deviation from this pattern is E74 phase III (not included
in the latter average), which by this time likely had
transformed from a small farmstead to a shieling (see
section 5.1.3), leading to a quite atypical refuse pattern.
There are many implications to Fig.2.7, but I refer to the
cited authors for a discussion of the wider implications.
The point to make here is that the Greenland Norse were
far from entirely dependent on their livestock, but were
from the start of landnám geared towards on exploitation
of other resources.
0%
10%
20%
30%
40%
50%
60%
70%
80%
90%
100%
% N
ISP
Greenland Norse Archaeofauna: Wild vs. Domestic
OtherMammals
Caribou
Mollusca
Fish
Birds
Seals
Cetacea
Domestic
4790 479 1230 508 276 584 6500 1506 1627 660 1036 361 566 3811 2069 512 2551 2894 1107 = no. NISP

23
2.3.2 ARCTIC HUNTER-FARMERS
The North Atlantic late Viking Age “landnám
package” included cattle, pigs, sheep, goats (the latter
two grouped as caprines), horses, dogs, and cats. In
terms of the first four domesticates, zooarchaeological
analysis have implied that landnám farmers attempted to
adhere to an “ideal livestock model” as it was found at
chiefly manors in the Scandinavian homelands, i.e.
maintaining a cattle to caprine ratio of ca. 2:1
(Vésteinsson et al. 2002:108, Dugmore et al. 2005:27p,
Perdikaris and McGovern 2007:198). From this shared
starting point, however, livestock strategies across the
North Atlantic began increasingly to part ways:
Beginning with cattle, which was a primary rural
currency and measure of status, their numbers in Norway
appear to have remained fairly high from the Viking Age
into the Middle Ages: based on historic evidence, small
farms –cottagers and tenants – would have kept a stock
of around 6 heads of cattle, average farms the double,
and magnate farms up to as many as 200 heads of cattle;
there were, however, large regional differences (Myhre
and Øye 2002:350p, 406)
In Iceland and the Faroe Islands, the number of cattle
husbandry began to decline shortly after landnám and by
the later Middle Ages a cattle to caprine ration of ca. 1:4
was the norm in Iceland (Vésteinsson et al. 2002:110,
Arge et al. 2009:19). Based on zooarchaeological
evidence and byres areas, T.H. McGovern et al. (1988:
Tab.1) have estimated that early medieval middle to high
status farms in south Iceland kept around 20 heads of
cattle and 100 sheep (1:5 ratio), whereas smaller farms
kept around 12 heads of cattle and 72 sheep (1:6 ratio).
However, again there were large status-related and -
regional differences: e.g. some manorial farms upheld
cattle to sheep ratios of c. 1:1.5-3.5 throughout the
Middle Ages and cattle was in general more frequent in
south Iceland than in the north. (Amorosi et al.
1992:Tab.1, Vésteinsson 2004:Tab.1, McGovern 2009:
Tab.4.3, McGovern et al. 2013:12) The steady decline in
cattle has been attributed to climatic and environmental
deterioration slowly setting in from the beginning of the
Middle Ages (Dugmore et al. 2005:27p, McGovern et al.
2007:39p, Dugmore et al. 2012:3659).
The other animal husbandry also went through
changes during the Middle Ages: in Norway, pigs
remained fairly common on the farms and especially in
the urban centers; so too did goats, which in some
coastal and inland areas were so numerous that they
were referred to as 'goat-settlements' ('geitebygder'),
where goat and buck skins constituted the main natural
currency (Myhre and Øye 2002:359). Conversely, in
Iceland pigs rapidly declined and totally disappeared by
the 13th century (Dugmore et al. 2005:28, McGovern et
al. 2007:40). Goats also became rarer, although never
disappeared completely: from a sheep to goat ratio of ca.
2:1 in the Viking Age and early Middle Ages, average
ratios declined to around 10:1 in later assemblages (e.g.,
Amorosi 1992:Tab.3, McGovern and Perdikaris
2003:Tab.3, Brewington et al. 2004:8, McGovern
2009:Tab.4.3, McGovern et al. 2013:13). The decline in
both pig and goat husbandry has been linked to depletion
of scrub wood or intensified wool-production
(Vésteinsson 2005b:22, McGovern et al. 2013:20). .
Based on the scarce available evidence, also sheep
numbers remained stable in medieval Norway (Myhre
and Øye 2002:353). In Iceland, sheep numbers increased
steadily as the other livestock declined and part of this
latter trend was the 13th century AD emergence in north
and northeast Iceland of specialized sheep farms with
only < 10% cattle and the rest sheep, i.e. cattle to sheep
ratios of some 1:20-25. These farms also relied heavily
on fishing and sealing, i.e. subsistence economies similar
to those recorded of early modern Iceland (e.g, Amorosi
1991:Tab.2, Amorosi 1992:Fig.10, Brewington et al.
2004:Fig.3, McGovern et al. 2007:40, Harrison et al.
2008:Fig.6, Hambrecht 2009:Fig.7).
Revising the zooarchaeological and historic evidence
for medieval livestock farming strategies from across the
North Atlantic, it appears clear that not only climatic
deterioration, but also economic change influenced local
practices: the change to less labor intensive sheep
farming in, especially northern, Iceland corresponded
well with the emergence of trade in bulk products such
as vaðmál and stockfish. In Norway, the high proportion
of goats in some marginal areas, and in the cities,
reflected an intentional focus on milk, cheese, and skin
production currency (Bratrein 1996:18, Myhre and Øye
2002:359). It is not unreasonable to suspect that similar
economic motivations could have been part in shaping
the layout of the Greenland Norse husbandry:

24
Fig.2.8 NISP (Number of Identified Specimens) percentages from seven Greenland Norse stratified archaeofaunal assemblages divided upon domestic species and site sub-phasing. Overall, there is only moderate change in the proportion of domesticates, although a trend towards keeping more caprines is noticeable (data after: McGovern et al. 1983:Tab.2-5, McGovern 1993Tab.1-2, McGovern et al. 1996:Tab.3, Enghoff 2003Tab.2-4, Edvardsson 2007a:Tab.2, E74 unpubl. data by Konrad Smiarowski).
Fig.2.8 displays the phased subsamples of domestic
animals of the Greenland Norse archaeofauna displayed
in Fig.2.7, again divided on three main periods with
some temporal overlap between the bone collections (for
a critical evaluation and discussion of the individual
archaeofaunal datasets refer to the cited literature).
Overall, the zooarchaeological data suggests continuity
with gradual change in the layout of the animal
husbandry. However, there were noticeable changes,
especially towards the latest settlement phase:
The earliest period Greenland archaeofaunal
assemblages display likeness with 10th century northern
Iceland: ratios of cattle to other domesticate vary
between c. 1:1.5 at the chiefly estate of V51/Sandnes to
c. 1:4.8 at the very small farmstead or shieling of E74
(McGovern et al. 1996:fig.14, Vésteinsson et al.
2002:fig.4); on average, cattle bones comprise ca. 36.3%
of the early assemblages. This is a somewhat higher
proportion than even in contemporary Iceland (see
above), which has made authors suggest that the
grænlendinga were still trying to adhere to the
Scandinavian “ideal model” (Dugmore et al. 2005:28).
Sheep and goats constituted the other 2/3 of the
livestock (Fig.2.8)(McGovern 1985:Tab.7, Vésteinsson
et al. 2002:fig.4, Dugmore et al. 2005:fig.4). Whereas
goats were in decline in Iceland, they still featured
frequently on contemporary Greenlandic farmsteads at
ratios of between 1.5 sheep to 1 goat (McGovern et al.
1996:fig.15, Enghoff 2003:fig.37). The high proportion
of goats in Greenland could relate to the richly available
shrub- and heathland resources and pollen analysis of
Norse sheep/goat pellets from one farm in the Western
Settlement indicate that they had indeed been feeding on
such vegetation (Ross and Zutter 2007:82). Pigs were
generally fairly uncommon and mainly an early
settlement feature (McGovern 1985:86, Dugmore et al.
0%
10%
20%
30%
40%
50%
60%
70%
80%
90%
100%
NIS
P %
Greenland Norse Animal Husbandry (NISP)
Caprine
Pig
Dog
Horse
Cattle
605 381 190 231 85 101 646 112 214 219 287 168 239 783 375 1075 733 92 298 = Total NISP

25
2005:28, Edvardsson 2007a:26). However, at a few
farmsteads – some of them chiefly estates – pigs were
kept at least into the 13-14th centuries. Although there
were plenty of shrub areas in Greenland for pannage,
isotopic analysis have shown that the pigs were feeding
on substantial quantities of marine protein, most likely
seal offal (Nelson et al. 2012:83). This, and the presence
of quantities of pigs’ dung in Western Settlement byres
(Roussell 1936b:43, 89) suggest that pigs in Greenland
were not – as has been suggested for Iceland, see above
– managed by pannage in scrub forests, but were kept
and fed near the farmsteads and stabled over the winter.
Although caprines were better suited to graze outside
even in harsh weather, tethering pegs, and sheep/goat
coprolites found in several excavated farmsteads suggest
that – at least in a later stage of settlement – some
caprines were periodically stalled (e.g., Roussell
1936b:47, 89, 1941:185).
In Greenland’s middle settlement period, the average
proportion of cattle bones in the archaeofauna had
decline to ca. 30.5%. Although this ca. 6% decline from
the early period is perhaps statistically negligible, it does
correlate with the contemporary decline in cattle in
Iceland and the Faroe Islands (see above). However, the
upper cattle bone percentages in Greenland – found at
church farmsteads E29a and V51 – are actually within
range of high-status sites in later medieval and early-
modern Iceland (c.f., Harrison et al. 2008:Fig.6,
Hambrecht 2009:App.1, McGovern et al. 2013:Fig.12).
Thus, the overall proportion – undoubtedly not actual
numbers – of cattle in Greenland appears on average to
have been higher than in contemporary Iceland, and in
the middle period Greenland archaeofauna (Fig.2.8),
only V48 comes near the low cattle proportions seen on
the late-medieval to early-modern specialized sheep
farms in Iceland (see above).
As visible in Fig.2.8, the proportion of caprines in
Greenland correspondingly increased from an average c.
61% in the early assemblage to c. 69% in the late, a trend
less distinct, but otherwise comparable to the other North
Atlantic areas (see above). In contrast to Iceland and the
Faroes, however, goats remained frequent – at some sites
even increased and became more frequent – relative to
sheep on some Greenlandic farmsteads (McGovern
1985:Tab.7, McGovern 1992b:Fig.138), and new species
identification methods suggest that that goat proportions
may have been 5-18% higher than implied by the older
zooarchaeological analyses (Mainland and Halstead
2005:116). This notable emphasis on goat husbandry in
Greenland has been explained by their high milk yields,
which meant that they could have replaced cattle as milk
producers in marginal agricultural areas (McGovern
1992a:199p, McGovern 1992b:99). This is strongly
corroborated by the ruin evidence from the Vatnahverfi
region (see section 6.2.3).
In the latest assemblages, most of the overall trends
of the previous periods continued, but with increased
severity: cattle bones dropped to constitute an average
ca. 21.2% of the archaeofauna, with a corresponding
increase in caprine husbandry, some sites (E78 and V48)
now approaching the same type of livestock composition
as on the medieval Icelandic “specialized” sheep farms
of the later medieval and early modern period (see
above). Pigs disappeared even on the largest farmsteads
(when they still appear at V51 in Fig.2.8 it is
undoubtedly because the assemblage chronologically
inclines towards the previous period). Goat remained
frequent, or even increased in relative proportion. As
emphasized elsewhere, most of these changes were
likely related to climatic deterioration (e.g., McGovern
1985, 1991, Vésteinsson et al. 2002). The timing of this
most marked change in the Greenland animal husbandry
also corresponds with an abrupt change in climatic
conditions from around AD 1250 (see section 4.3.1).
The overall continuity of this system of pastoral
livestock farming is also echoed in the production from
various livestock throughout the settlement period: cattle
butchery patterns suggest that in Greenland – as in
Iceland – they were kept primarily for a dairy produce,
whereas beef production was mainly a feature of large
farms and manors (e.g., McGovern 1985:102, Enghoff
2003:71pp, Dugmore et al. 2005:28, Edvardsson
2007a:27, McGovern et al. 2007:32, Lucas and
McGovern 2008:20, Zori et al. 2013:159). Norse farmers
in Greenland seems to have managed caprines for a
household-economic produce of meat, milk, and wool in
respective order, i.e. there is no sign of specialization
(McGovern 1985:103, McGovern 1992b:101, Enghoff
2003:54p, Mainland and Halstead 2005:117).
In conclusion, pastoral livestock farming in Norse
Greenland appears to have been a largely household-
economic system of notable stability, although there was
a general and clear trend of gradual adjustment of the
animal husbandry, probably to local and changing
environmental settings. Still, some manors in Greenland

26
were, at least for the first 200 years or so, able to rear
cattle herds proportionally similar to contemporary
Icelandic medieval estates. The question is, however,
whether it was only, or primarily, environmental factors
that determined the layout of the animal husbandry, or if
other economic considerations were in play?
This is evidently a question beyond the scope of this
section, but a single highly pertinent ethno-historic
parallel from northern arctic Norway – which appears to
have a number of other similarities to the Greenland
Norse economic system settlement – may provide some
clues, or at least an interesting comparative perspective:
H.D. Bratrein (1996) has provided an excellent
account of this farming system in Karlsøy, North-Troms,
bordering the Finnmark in northernmost Norway, where
an AD 1723 livestock census provides detailed insights
into the animal husbandry layout: these arctic farmers
relied heavily on marine resources and livestock farming
was of limited scale; there were an average of 3,5 cows
per farm, although large farmsteads would boast as many
20-30 heads (Bratrein 1996:12). However, even
smalltime farmers went far to maintain a full range, but
small stock, of animal husbandry, mainly for a
household production of dairy and meats, but also for a
limited surplus production of butter and (goat) skins for
trade; pigs were very few. This highly intentional
strategy was reflected in an average cattle to sheep to
goat ratio of 1 : 1.4 : 0.86, where the fairly high
proportion of goats was explained by their replacement
of cows as milk animals and by the purposeful
production of goat and buck skins for commerce
(Bratrein 1996:12, 18). Average actual livestock
numbers were small, but a few large farms reared
substantial herds, enabling a surplus production which
was not only traded, but also invested in extra labor for
the increased exploitation of tradable marine resources
(stockfish and blubber), whereby large farms also
became natural centers of wealth and trade.
Agrarian farming was limited to grass cultivation of
small coast-near, and normally unfenced, land strips,
which saw little amendment (plowing, fertilizing etc.).
Instead, the livestock was maintained by nearby summer
pasturing and the foraging of naturally available
terrestrial and marine resources for winter fodder; pigs
especially fed on marine offal. The production of
farming, especially dairying, was limited to the summer
half of the year and demanded constant herding and
milking of the livestock. However, apart from milking
stations ('støl') in the utmark and the use of islands as
naturally delimited grazing areas (see section 6.2.3),
most herding activities took place near the farmsteads
and use of more distant shieling was uncommon. All in
all, the farming strategies practiced in northern Norway
were highly extensive, demanded little capital input, but
were very labor intensive; since fishing was practiced by
the men, farming – e.g. field work, herding, milking etc.
– was predominantly carried out by the women.
The similarity of this north Norwegian fisher-farmer
economic system with conditions in Norse Greenland, or
at least in the setup of the animal husbandry, is obvious,
but so are a few differences. Clearly, such an ethno-
historic record cannot – regardless of the assumed age
and origin of the farming system – automatically be
extended to medieval conditions. However, the fact that
the Karsøy farmers managed to continue this farming
system at least through a later part of the 'Little Ice Age'
(see section 3.1.3) on an almost just as marginal arctic
frontier suggest that environmental impacts were not
alone in determining the layout of the animal husbandry.
Could not, for instance, the observed focus on goat
husbandry in Norse Greenland have served similar
economic interests rather than reflecting environmental
stress? Goat skins and hides would store and stack easily
in the periods between the infrequent arrival of foreign
merchants’ ships (see section 2.1.3), and would fetch a
decent price on the medieval Norwegian markets (Helle
1982:305). Perhaps the specific mention in the King’s
Mirror (see opening quite) of 'buckskins' as a Greenland
main trade commodity is valid? Drawing a parallel
between the Greenland Norse and the north Norwegian
farming system is clearly tempting, but it precedes the
actual analysis of the detailed settings and functions of
Norse pastoral farming and settlement in Greenland.

27
3. THE FJORDS OF THE FARMERS – THE EYSTRIBYGGÐ AND VATNAHVERFI
Fig.3.1 The Vatnahverfi region is characterized by notable and very local variability in landscape and vegetation, as seen for instance in this photo from the north Vatnahverfi. This part of the Vatnahverfi is highly impacted by its proximity to the Ice Cap and a large glacial out wash plain to the north; a completely scoured and barren sandur separates the north Vatnahverfi in two parts, on either sites of which is very lush vegetation. Here in the picture, taken near the Norse farmstead E64C, thick aeolian deposits from the out wash plain have led to the creation of lush meadows around the half-buried rocky knolls (photo: C.K. Madsen 2005).
Chapter 3 presents a description of the geographical
and environmental setting of the Norse Eastern
Settlement – the Eystribyggð – with particular focus on
its central and most densely settled area, of which the
Vatnahverfi region constitutes a substantial part. The
chapter opens with a broad geographical outline and
moves to the description more particular settings:
First, to approach an understanding of the Norse
settlement areas in terms of pastoral farming landscape,
the climatic setting of the Eystribyggð fjords is in section
3.1 discussed in terms of observed weather patterns and
paleoclimatic proxy evidence. In relation to the latter, I
present and compare two models and accentuate issues
relating to the interpretation of their climatic and
environmental implications. In section 3.2, aspects of
regional to local level environmental conditions and
settings in the central Eastern Settlement and the
Vatnahverfi region are outlined; they form the basis for
the later discussions of the archaeological survey
evidence and observed settlement patterns. The final part
of section 3.2 presents a summary outline of the
topographical and vegetational settings local to the
Vatnahverfi region, discussed mostly from the pastoral
farming perspective of pasture distribution and quality.

28
Fig.3.2 Overview map of the approximate areas (red) of the Norse Settlements in Greenland and details of the Eastern Settlement and its central and most densely settled part with indication of ruin group (black dots). Regional areas frequently referred to throughout the dissertation are also indicated.
The Eystribyggð was located between ca. 59-61°
north, i.e. about the same latitude as between Stavanger
and Bergen in Norway. The region is today referred to as
South Greenland, as it will be throughout the text. The
Vestribyggð – the Western Settlement – was located
some 500 km north between ca. 63-65° north, i.e. about
the latitude as Trondheim in Norway. The total area of
Eystribyggð is some 12,300 km2 – i.e. an area only a
little larger than Scania – the Vestribyggð only ca. 7,900
km2 (extent of red areas in Fig.3.2). The northwestern
part of the Eastern Settlement near todays Ivittuit is
sometimes referred to as the Middle Settlement. This is
an archaeological distinction, however, and the Middle
Settlement undoubtedly formed a peripheral part of the
Eastern Settlement. Since the case study explored here is
the central Eastern Settlement and the Vatnahverfi
region (Fig.3.2), I will only occasionally refer to the
other two Norse settlement areas.
As visible from the detailed map of the central
Eastern Settlement (upper right Fig.3.2), South
Greenland is characterized by its deep fjords – between
40-100 km long – that cut into the land separated by
mountainous peninsulas. The highest mountains reach
some 1400-2000 m, but generally they rarely ascend to
more than 1000 m; the mountains are lowest in the outer
fjord and gain altitude as one travels inland. Besides
latitude and supra-regional weather systems, local
weather patterns are determined by proximity to either
the Ice Sheet or the open Atlantic, and the fjords
consequently display notable climatic and environmental
variation on what may be designated the horizontal axis.
As also seen in Fig.3.2, the Norse ruin groups are found
from the edge of the glaciers and all the way out into the
outer fjords, resulting that their particular environmental
settings vary equally (see below).

29
3.1 THE WEATHER AND CLIMATE OF SOUTH GREENLAND
There are probably few places on the earth, where
climate has been ascribed a greater role in the fate of
cultures and lives of peoples than in Greenland. Not at
least has the total depopulation of the Norse settlements
tempted scientists to see a direct link between climatic
and societal change, or collapse (e.g., Dansgaard et al.
1975, McGovern 1991, Barlow et al. 1997, Diamond
2005, Andersen et al. 2006, Ribiero et al. 2012). That
climate is a key, if not the key, element in understanding
what it is, and was, like to inhabit the fjords of South
Greenland is beyond doubt. Yet, anyone who has spent a
reasonable amount time in those landscapes will know
that they can really be “green” and lush lands and far
from the frozen wilderness so often reiterated. On the
other hand, archaeology is, as most other field sciences,
a summer activity, which can equally distort our
experience and perspectives of setting of the Norse
settlements. What I attempt here, then, is simply to find
some reasonable foothold somewhere in between the
archaeologist’s land of ‘perpetual summer’ (Olsen
2012:13) and the climatologist’s, and the 'paradigm of
artic marginality’s' land of perpetual winterʼ.
This section opens with a description of meteoro-
logical records from the Norse settlement areas in South
Greenland. It does so not only because it must have been
critical to the farmers, but also because it provides the
context for interpreting the paleoclimatic record.
Accentuated elsewhere, what people living “in an
environment” are really concerned with – whether in the
past of the present – is weather, whereas climate is more
the domain of scientists; or, in other words: ʻclimate is
recorded, weather is experiencedʼ (Ingold and Kurtilla
2000:187).
This is followed by a brief overview and discussion
of the large set of increasingly detailed paleoclimatic
proxy records available from Greenland or nearby
regions. I began comparing such proxy records in the
hope of identifying short-term regional climatic events –
which to an extent succeeded – but in reality perhaps
learned more about the proxy records than of the climate,
or weather, in the medieval Norse fjords in Greenland.
Concluding, I present the climate model that is used as a
baseline in discussions throughout the dissertation.
Fig.3.3 Early May view of lake Qorlortorsuup Tasia in the Qorlotorsuaq region and the location of ruin group E74. There was no infield to this small farmstead, only the dense, but in spring leafless, willow shrub covering the lacustrine plain in the northeast end of the lake. Surely, spring must have been a critical time on such a marginal farm and it is unsurprising that it changed into a shieling 13th century AD (cf. Tab.8.2)(photo: C.K. Madsen 2006).

30
3.1.1 SOME OBSERVED WEATHER PATTERNS
Tab.3.1 displays observed mean weather patterns at
four meteorological observation stations in Greenland
located at varying proximity to the inland or coast
(indicated over the observation station name), as well as
one in Iceland and one on the Faroe Islands. Tab.3.1
displays several obvious and significant differences
between inner and outer fjord weather: as visible from
the table, there are marked differences between
observation stations located at different latitudes
(Paamiut is located just north of the Eastern Settlement
and Nuuk by the Western Settlement); they clearly imply
the overall more favorable weather conditions in the
Eystribyggð.
Focusing on the two observation stations in the latter
area – Narsarsuaq in the inner fjord and Qaqortoq in the
outer – they also display significant local differences (the
middle fjords are transitional): overall, the inner fjords
are drier and warmer in the summer, while the outer
fjords are colder and get more precipitation. In the
winter, temperatures are slightly milder in the outer
fjords, but they still have longer snow cover. From a
farmer’s perspective, the most important difference is
revealed in the May weather: days with frost and snow
are on average fewer than in the outer fjord, which
essentially means that spring starts a month earlier in the
inner fjord than in the outer. This was essential because
spring was the most critical time in the farmers’ yearly
round: at this time, fodder supplies were expend or at a
critical low, the fat reserves of the livestock was minimal
from nutrition deficiency, pasture vegetation was negible
and poor in nutrients (cf. Fig.3.3), and sheep/goats were
lambing/kidding. Clearly, farmers settled in the inner
fjords were better situated to cope with these problems.
The observation stations in Tab.3.1 are all located
down to the fjord and do thus not only describe weather
variation on a vertical axis, i.e. going upland where some
Norse farms were also located. However, with increasing
altitude, farmers’ also had to face overall poorer (colder)
weather conditions. I will not go into comparative
exploration here, but it is nonetheless worth noting that
summer weather in the South Greenland inner fjords was
– at least historically – fairly similar to elsewhere in the
North Atlantic.
Tab.3.1 North Atlantic Observed Weather Means
Mean: Inner Fjord
(Narsarsuaq) Outer Fjord (Qaqortoq)
Outer Fjord (Paamiut)
Outer Fjord (Nuuk)
Iceland South (Reykjavík)
Faroe Islands (Thorshavn)
Ann. Temp. 0,9°C 0,6°C -0,8°C -1,4°C 5,0°C 6,5°C
Jan. Temp. -6,8°C -5,5°C -6,6°C -7,4°C -0,4°C 3,5°C
July Temp. 10,3°C 7,2°C 5,6°C 6,5°C 11,2°C 10,5°C
Days w. frost 194,8 213,3 233,8 237,5 115 -
Days w. frost, May 9,5 16,9 21,6 23,0 4 -
Frost free days 115 68 61 80 143 -
Acc. Hours of bright sunshine
1431 - - - 1249 840
Annual Precipitation 615mm 858mm 874mm 752mm 805mm 1284mm
Days w. snow cover (> 50% covered)
154,2 178,9 219,0 222,9 157 38
Days w. snow cover (> 50% covered), Jan
27,2 30,3 30,7 30,9 - 9
Days w. snow cover (> 50% covered), May
3,4 8,7 24,6 21,4 - 0
Tab.3.1 Displays selected meteorological mean data from observation stations in Greenland and the North Atlantic (data after: Einarsson 1984, Cappelen et al. 2001, Cappelen 2012).

31
Fig.3.4 The main sea currents of the North Atlantic and normal sea-ice conditions around Greenland at its maximum extent in April-May: triangles indicate the summer drift ice ('storis'), cross-hatching the west ice ('vestis') (modified after Born and Böcher 2001:Fig.5.2, 5.5).
3.1.2 REGIONAL WEATHER AND DRIFT ICE
The main drivers behind local weather and environ-
mental variation in South Greenland were regional level
atmospheric and sea-current circulation systems,
primarily the North Atlantic Oscillation (NAO), sea
currents, and the summer drift ice:
The NAO refers to the development and position of
two opposite northern hemisphere sea-level pressure
systems that have been found to explain up to 60% of
North Atlantic winter temperature, storminess, and
precipitation variability – to a lesser extent summer
variability – although exactly how large an extent is still
disputed (Hurrel 1995:677, Cappelen et al. 2001:24,
Wanner et al. 2001:351p, Vinther et al. 2003:40, Rimbu
and Lohmann 2010:4616). The relative position of the
NAO results in colder and stormier winters in the North
Atlantic and milder and wetter winter weather in
Northern Europe and Scandinavia, or vice versa, why it
is also referred to as the 'temperature seesaw'. Changes
in the NAO are annual, but decadal trends also occur.
However, a more directly perceptible environmental
factor in South Greenland is ice, either in the shape of
fast ice or summer drift or 'storisen', the 'great ice'
(Fig.3.4): today, the winter extent of fast ice is limited to
the innermost parts of the fjords, but earlier in the 20th
century many Eystribyggð fjords were covered by fast
ice from October to May (Bendixen and Bobé
1921:384). Sediment cores from the fjords suggest that
fast ice, or sea ice, in the fjords only became more
extensive from the mid-15th century AD (Jensen et al.
2004, Kuijpers et al. 2014). In any case, winter fast ice
in the fjords may not have been fully disadvantageous to
the Norse, since they offered easy routes of transport.
More problematic is the summer drift ice – and cold
water – which is transported from the Arctic Ocean to
South Greenland with the East and West Greenlandic
Currents (EGC/ WGC, Fig.3.4). The 'storis' normally
rounds the Cape Farewell from around January-February
and reaches its maximum extent off the mouths of the
South Greenlandic fjords in May-June (Born and Böcher
2001:114). The drift ice packs in the outer fjords with
several negative consequences for the Norse farmers
settled there: it impeded sea travel, seal hunting, and
lowered surface air temperatures (Fig.3.8), effecting the
delayed spring seen at the weather data of the outer fjord

32
observation stations in Tab.3.1. The increased presence
of sea ice off the coast after ca. AD 1250 and its
cumulative negative effects on the Norse settlements has
been discussed elsewhere (e.g., Dugmore et al. 2009,
Ogilvie et al. 2009, Kuijpers et al. 2014). In addition to
these adversities caused by the 'storis', it probably also
meant that hunting voyages from the Eastern Settlement
to the Norðrseta had to set off already by April-May as
to avoid being blocked by 'storisen'.
North of the Western Settlement was the 'vestis'
('west ice'), which in the winter forms in the Baffin Bay
and Davis Strait and has its maximum extent in January-
February, at which time it normally reaches just south of
the Disco Bay (Fig.3.4). The stretch of open ocean from
this ice edge and south to around Paamiut –
approximately the stretch of Greenland’s west coast that
separates the Eastern and Western Norse settlements – is
ice-free all year round and is referred to as the West
Greenland Open Water Area (Fig.3.4). This could have
allowed sea travel between the two settlement areas
throughout the winter and until the arrival of 'storisen'.
3.1.3 SOME PALEOCLIMATIC OBSERVATIONS
Although the above described weather and environ-
mental patterns may outline general settings in the fjords
of South Greenland, they can evidently not be extended
directly to the medieval settlement period. Over the last
25 years the number of high resolution paleoclimatic
proxy records from Greenland and neighboring areas
have been accumulating to such an extent that it is today
difficult to get an overview of overlapping trends and
patterns. To achieve some kind of overview, and
possibly identify short-term intermediate climatic events
that could more observably have influenced pastoral
farming in the Eastern Settlement, I compared proxy
records from 30 locations in Greenland and Iceland:
The sampling locations of the investigated proxy
records are shown in Fig.3.5, whereas sampling types
and references are listed in Tab.3.2 (note that some sites
were sampled for multiple proxy evidence). Reviewing
the findings from these investigations, I noted when
authors described a relative change in temperature,
storminess, precipitation, and overall environmental
stability in the proxy records in the period from ca. AD
800-1500, as well as if this change was described
“abrupt”. This information is shown in Fig.3.6a-d.
Revising Fig.3.6a-d, the proxy evidence for change
in overall climatic and environmental regimes has many
implications as well as a good deal of problematic issues.
Most noticeable in Fig.3.6a-d is the precise antiphasing
of some proxy records, which has been noted before, but
not explained (e.g., Meeker and Mayewski 2002,
Kuijpers et al. 2014). To my mind the precise
antiphasing of some proxy records would suggest their
joint correctness on some level. However, as I am not a
climatologist it is beyond me to clarify or discuss these
issues. It does, however, seem fair to state that just about
any past climate scenario can be backed by at least two
or three proxy records, which serves as a warning not to
take the accuracy of single, at times even multiple
agreeing proxy records, for granted. However, some
overall patterns in Fig.3.6a do appear very consistent:
Most obvious is the prevalence of the Medieval
Warm Period (MWP) during the first part of settlement.
The notion of a MWP with generally warmer conditions
prevailing across the northern hemisphere from ca. AD
900-1300 was introduced by climatologist H.H. Lamb,
who also suggested that it could have been a driver in the
Viking Age landnám in the North Atlantic (Lamb
1995:158, Xoplaki et al. 2011). Other authors have since
argued that “optimal” landnám conditions experienced
by colonists during the MWP could even have promoted
over-optimistic expectations and strategies that would
prove unsustainable in ensuing centuries of deteriorating
climate (Keller 1986:152, Amorosi et al. 1997:495p,
Ogilvie and McGovern 2000:392, Dugmore et al.
2006:340p, Dugmore et al. 2007b:14). The general
prevalence of the MWP is clearly displayed by the
“warm” (red) cells in Fig.3.6a.
Equally clear in Fig,3.6a is the transition from the
MWP to the 'Little Ice Age' (LIA) c. AD 1550-1850.
Since the proxy records are listed roughly according to
latitude, it is quite interesting to observe how the LIA
sets in with different timing; in the northernmost proxy
records the LIA appears to set in already around AD
1100-1150, whereas in the more southern latitudes, and
including sample sites near the Eastern Settlement, it
appears to set in fairly abruptly around AD 1250. This is
concomitant with new evidence of climate change
related to the violently explosive eruption of the Samalas
Vulcano on the island of Lombok, Indonesia, in AD
1257 or 1258 (Oppenheimer 2003, Miller et al. 2012,
Lavigne et al. 2013). In sum, the fact that so many of the
proxy records agree on the early onset of the LIA, and
the convincing evidence that it could have been
connected to volcanic activity, lends credibility to the
notion that the MWP-LIA transition in the North
Atlantic ca. AD 1250 may have set in as an abrupt
climate event, or even shock (Dugmore et al. 2012).

33
Fig.3.5 Overview map showing sample locations of the climatic records shown in Fig.3.6a-d and discussed in the text. References and site names are listed in Tab.3.2. Note that some locations include more than one sample or sample type.
Table 3.2 – North Atlantic Climate- and Environmental Proxy Evidence
Reference: Sample type: Location name:
1 (Dahl-Jensen et al. 1998, Fischer et al. 1998, Vinther et al. 2010). 1a: (Andersen et al. 2006) Ice core NGRIP, Greenland Ice Sheet
2 (Dahl-Jensen et al. 1998, Fischer et al. 1998, Andersen et al. 2006, Vinther et al. 2010); 2a: (Stuiver et al. 1995); 2b: (O'Brien et al. 1995); 2c: (Meeker and Mayewski 2002); 2d: (Alastair et al. 2003); 2e:(Kobashi et al. 2011).
Ice core GISP2, Greenland Ice Sheet
3 (Dahl-Jensen et al. 1998, Fischer et al. 1998, Vinther et al. 2010, 3a: Andersen et al. 2006) Ice core GRIP, Greenland Ice Sheet
4 (Dahl-Jensen et al. 1998, Fischer et al. 1998, Vinther et al. 2010, 4a: Andersen et al. 2006) Ice core Crete, Greenland Ice Sheet
5 (Dahl-Jensen et al. 1998, Fischer et al. 1998, Vinther et al. 2010, 5a: Andersen et al. 2006) Ice core Milcent, Greenland Ice Sheet
6 (Dahl-Jensen et al. 1998, Fischer et al. 1998, Vinther et al. 2010); 6a: (Andersen et al. 2006); 6b: (Miller et al. 2012).
Ice core Dye3, Greenland Ice Sheet
7 (Grønnow et al. 2011) Lake sediments Sabine Island, NE Greenland
8 (Christiansen et al. 2002) Terrestrial sediments Zackenberg Delta, NE Greenland
9 (Wagner et al. 2000) Lacustrine sediments
Geographical Society Island, NE Greenland
10 (Jennings and Weiner 1996)Jennings&Weiner 1996 Marine sediments Nansen Fjord, E Greenland
11 (Moros et al. 2006a) Marine sediments North Atlantic
12 12a: (Mernild et al. 2012); 12b: (Andresen et al. 2013) Marine sediments, glaciers
Sermilik Fjord, SE Greenland
13 (Lloyd 2006) Marine sediments Jaobshavn Isfjord, W Greenland
14 (Moros et al. 2006b) Marine sediments Kangersuneq, W Greenland
15 15a: (Moros et al. 2006b); 15b: (Krawczyk et al. 2010) Marine sediments Disko Bay, W Greenland
16 (Ribiero et al. 2012) Marine sediments Outer Disko Bay, W Greenland
17 (D'Andrea et al. 2011)D’Andrea et al. 2011 Lacustrine sediments Kangerlussuaq, W Greenland
18 (Sha et al. 2011) Marine sediments Holsteinburg Dyb, W Greenland
19 19a: (Møller et al. 2006); 19b: (Seidenkrantz et al. 2007) Marine sediments Ameralik Fjord, outer, SW Greenland
20 (Kaplan et al. 2002) Lacustrine sediments Qipisarqo Lake, S Greenland
21 21a: (Jensen et al. 2004), 21b: (Kuijpers and Mikkelsen 2009) Marine sediments Igaliku fjord, inner, S Greenland
22 22a: (Jensen et al. 2004); 22b: (Lassen et al. 2004); 22c: (Roncaglia and Kuijpers 2004) Marine sediments Igaliku fjord, outer, S Greenland
23 (Andresen et al. 2004) Lacustrine sediments Angissoq Island, S Greenland
24 24a: (Andresen et al. 2005), 24b: (Andrews et al. 2009) Marine sediments Djüpall, NW Iceland
25 (Patterson et al. 2010) Mollusks Vestfjords, NW Iceland
26 26a: (Andrews et al. 2001); 26b: (Casteñeda et al. 2004) Marine sediments N Iceland
27 27a: (Jiang et al. 2001); 27b: (Casteñeda et al. 2004); 27c: (Miller et al. 2012) Marine sediments N Iceland
28 (Ólafsdóttir and Guðmundsson 2002) Terrestrial sedimentss Mývatnshedi, N Iceland
29 (Geirsdóttir et al. 2009) Lacustrine sediments Haukadalsvatn, W Iceland
30 (Ogilvie 1991, Ogilvie et al. 2000, Ogilvie and Jónsson 2001, Ogilvie et al. 2009) Historical records Iceland
Tab.3.2 Site location (in Fig.3.5), references, sample type, and location name of the climatic or environmental proxy records illustrated in Fig.3.5; number with letter refers to the individual samples in Fig.3.6a-d.

34
Fig 3.6a North Atlantic Temperature & Ice Regimes AD 775-1525 Lo. No. 800 850 900 950 1000 1050 1100 1150 1200 1250 1300 1350 1400 1450 1500
1-6
6, 27c, 28
7
8
9
10
11
12a
12b
13
14
15a
15b
16
17
18
19a
19b
20
21a
22a
22b
22c
24b
25
26a,
26b, 27b
27a
28
29
30
Warm regime Abrupt warmth Cool regime Abrupt cold Unspecified No data
Fig.3.6a Displays the timing of climatic and environmental proxy record evidence from 30 locations across Greenland and Iceland (shown in Fig.3.5 and listed in Tab.3.2). Note that record no. 30 is based in historic evidence from Iceland. Most apparent in the figure is the prevalence of a Medieval Warm Period and its fairly synchronous termination across the North Atlantic already around AD 1250, and overall climate variability in the following centuries.

35
Fig.3.6b Wind Regimes
Lo. No. 800 850 900 950 1000 1050 1100 1150 1200 1250 1300 1350 1400 1450 1500
2a
2b
14
18
19a
21a, 22a
21b
22b
22c
23
24a
More stormy Abrupt stormy Less stormy Abrupt “calm” Unspecified No data
Fig.3.6b Same as Fig.3.6a, but showing recorded changes in overall wind regimes in the proxy record evidence.
Fig.3.6c Precipitation Regimes
Lo. No. 800 850 900 950 1000 1050 1100 1150 1200 1250 1300 1350 1400 1450 1500
1, 3, 6
7
9
19b
23
Dry regime Abrupt “drier” Wet regime Abrupt “wetter” Unspecified No data
Fig.3.6c Same as Fig.3.6a, but showing recorded changes in overall precipitation regimes in the proxy record evidence.
Fig.3.6d Stability Regimes
Lo. No. 800 850 900 950 1000 1050 1100 1150 1200 1250 1300 1350 1400 1450 1500
7
10
18
20
21a, 22a
More stable Abrupt more stable Less stable Abrupt less stable Unspecified No data
Fig.3.6d Same as Fig.3.6a, but showing recorded changes in overall precipitation regimes in the proxy record evidence.

36
A third consistent pattern visible in Fig.3.6a is,
paradoxically, the general inconsistency of the climatic
proxy records AD after ca. AD 1250, which seems to
point to overall increased climatic and environmental
variability. In terms of weather experienced such
unpredictability in weather patterns would have been a
major problem for the grænlendinga, not at least for their
pastoral farming system – and especially if the weather
changes were of unprecedented and magnitude, i.e.
exceeded the TEK capacity of Norse farmers’. Overall
environmental variability has been attributed a major
critical element in the demise of the Norse settlements
(e.g., Dugmore et al. 2009, Dugmore et al. 2012:3661).
The other proxy records of changing environmental
regimes (Fig.3.6b-d) are fewer and thus less robust.
Nonetheless, the changes in overall wind regimes
(Fig.3.6b) display great conformity, including the precise
antiphasing of some proxy records: the ice core proxies
for storminess indicates an increase ca. AD 1300-1400,
whereas proxies from sediment cores – several of them
from the fjords of South and West Greenland – agree on
a stormier regime from up until ca. AD 1250-1300.
Issues of storminess proxy record antiphasing has been
noted and discussed elsewhere (Meeker and Mayewski
2002, Alastair et al. 2003, Kuijpers et al. 2014), and
some authors have suggested that the pattern is perhaps
explainable by fewer, but more violent storms during the
LIA (Trouet et al. 2012). Again, I will not venture into
such discussion here. Changes in overall precipitation
regimes (cf. Fig.3.6c) are unclear and uninformative,
whereas 'stability' regimes – i.e. authors referring simply
to transition from more to less, or vice versa, “stable
conditions” – display a fairly uniform pattern of
increased instability even a little earlier than the AD
1250 onset of the LIA indicated in Fig.3.6a.
Reiterating, the aim of detecting minor and discrete
climatic events from paleoclimatic proxy records have
largely failed, since there are few visible and consistent
correlations of short-term climatic and environmental
changes (Fig.3.6a-d). This failure has likely more to do
with the chronological resolution of the different proxies
than the actual absence of such climatic events: it can be
noted of Fig.3.6a that even the MWP was characterized
by several very intermittent colder intervals, of which an
abrupt cooling between AD 1100-1150 noted in proxy
samples nos.10, 17, and 21a appear the most
conspicuous. Other similarly brief cold breaks are well
within the range of chronological error, but can for now
not be positively matched.
In conclusion, the intermittent intervals of cold spells
during the MWP – regardless of their exact timing –
would imply that Norse farmers from an early point had
to adjust to fairly rapid climatic and environmental
change. Although the paleoclimatic proxies do not
translate directly into weather experienced, it must be
expected that climatic deterioration occurred across the
entire setting, e.g. the means observed in Tab.3.1 would
simultaneously have been moved to averagely cooler or
warmer temperatures, longer and earlier snow cover etc.
Attempting to convert the “relative” cold breaks of
Fig.3.6a into actual medieval “weather experienced”, a
study of δ18
O values in mollusks in the Westfjords,
northwest Iceland, has suggested that this area over the
120 years between AD 960 and 1080 experienced an
average drop in summer temperatures of ca. 4.5°C
(Patterson et al. 2010:5803). A similar abruptness of
climatic deterioration – ca. 4°C in the 80 years after AD
1100 – was reported from Kangerlussuaq, West
Greenland (D'Andrea et al. 2011:4, Fig.3.6a no.17). In
other words, already before the onset of the LIA,
intermittent climatic events would have equipped
Greenland Norse farmer with sufficient TEK to cope
with some extent of climatic variability. On the other
hand, the abrupt onset of highly variable and prolonged
LIA climatic conditions from ca. AD 1250 was clearly
unprecedented (cf. Fig.3.6a); it could have effected
major change in the Greenland Norse farming system.
3.1.4 A CLIMATE MODEL
Ice core δ18
O climate records provide some of the
most high-resolution climatic proxy records presently
available. In a recent study (Vinther et al. 2010) were
able to evaluate the correlation of several Greenlandic
ice cores with the observed weather by extending
climatological records back into the 19th century (Box
2002). They found the winter temperature reconstruction
from the Dye-3, GRIP, and Crete ice cores to correlate
significantly with observed winter temperatures in
southwest Greenland, whereas constructed summer
temperatures showed less correlation (Vinther et al.
2010:537). Since the winter was the most critical period
of the Norse farmers’ seasonal round, I, in this study, use
the Dye-3 temperature reconstruction as a climatic
baseline for the discussion of climate related aspects of
farming, past and present, in South Greenland, although
I refer to the other proxy evidence as well. The Dye-3
climate record for the three main settlement periods –
AD 980-1160, AD1160-1300, and AD 1300-1350 – are
shown in Fig.3.7.

37
Fig.3.7 Dye-3 δ18O reconstructed temperature for the period AD 980-1500 (separated upon the periodic division used throughout the dissertation) with indication of mean summer and winter temperature, and of volcanic eruptions identified from GISP2-suphate records (data after: Oppenheimer 2003, Vinther et al. 2010).
-3,000
-2,000
-1,000
0,000
1,000
2,000
3,000
4,000
-32,00
-31,00
-30,00
-29,00
-28,00
-27,00
-26,00
-25,00
-24,00
-23,00
98
0
98
5
99
0
99
5
10
00
10
05
10
10
10
15
10
20
10
25
10
30
10
35
10
40
10
45
10
50
10
55
10
60
10
65
10
70
10
75
10
80
10
85
10
90
10
95
11
00
11
05
11
10
11
15
11
20
11
25
11
30
11
35
11
40
11
45
11
50
11
55
No
rmalize D
ye-3
, G
RIP
, an
d C
rete
avera
ge
Dye-3
δ18O
tem
pera
rue
Dye-3 δ18O Temperature Reconstruction: Early Period AD 980-1160
Winter Summer AnnualMean Winter Mean Summer (normalized)
Baitoushan AD1030
-3,000
-2,000
-1,000
0,000
1,000
2,000
3,000
-32,00
-31,00
-30,00
-29,00
-28,00
-27,00
-26,00
-25,00
-24,00
-23,00
11
60
11
64
11
68
11
72
11
76
11
80
11
84
11
88
11
92
11
96
12
00
12
04
12
08
12
12
12
16
12
20
12
24
12
28
12
32
12
36
12
40
12
44
12
48
12
52
12
56
12
60
12
64
12
68
12
72
12
76
12
80
12
84
12
88
12
92
12
96
No
rmalized
Dye-3
, G
RIP
, C
rete
avera
ge
Dye-3
δ1
8O
tem
pera
ture
Dye-3 δ18O Temperature Reconstruction: Middle Period AD 1160-1300
Winter Summer AnnualMean Winter Mean Summer (normalized)
Krafla AD 1179
-4,000
-3,000
-2,000
-1,000
0,000
1,000
2,000
3,000
-32,00
-31,00
-30,00
-29,00
-28,00
-27,00
-26,00
-25,00
-24,00
-23,00
13
00
13
05
13
10
13
15
13
20
13
25
13
30
13
35
13
40
13
45
13
50
13
55
13
60
13
65
13
70
13
75
13
80
13
85
13
90
13
95
14
00
14
05
14
10
14
15
14
20
14
25
14
30
14
35
14
40
14
45
14
50
14
55
14
60
14
65
14
70
14
75
14
80
14
85
14
90
14
95
15
00
No
rmalize D
ye-3
, G
RIP
, C
rete
avera
ge
Dye-3
δ1
8O
tem
pera
rue
Dye-3 δ18O Temperature Reconstruction: Late Period AD 1300-1500
Winter Summer Annual
Mean Winter Mean Summer (normalized)
Kuwae AD 1452
Salamas Volcano
AD1257-1258
Unknown volcano?
AD1100

38
Arguably, any single ice core temperature proxy
recorded cannot be trusted any further than any other
single proxies and I mainly use the Dye-3 climate model
to discuss overall trends. The Dye-3 climate model
unsurprisingly conforms to the outlined transition from a
warmer MWP to a colder LIA (cf. winter- and summer
means in Fig.3.7). Both winter and summer temperatures
were apparently affected, although in the final settlement
period especially the winter. Fig.3.7 also indicates
volcanic eruptions recorded in the GISP2 ice core
(Oppenheimer 2003). An abrupt and distinct both
summer and winter cooling following the AD 1257-1258
Salamas eruption is clearly evident, which again
corresponds with the onset of the LIA in most of the
climatic proxy records (cf., Fig.3.6).
However, additional “blips” in the Dye-3 climate
curve are noticeable: the AD 1030 Baitoushan was
followed by a single year of extremely cold summer
temperature and colder than average winter temperature;
the AD 1100 eruption of an unknown volcano appears to
have caused lower than average summer temperatures,
but had little effect on winter temperatures. The effects
of this eruption may perhaps also be linked to the ca. AD
1100-1150 cooler interval that was implied by several
other proxies (cf. Fig.3.6). This could have been a minor
“climate event”, but as it involved little decrease in
winter temperature, it may not have affected the Norse
farming system significantly. However, already in AD
1179 the Krafla eruption caused another and more
significant blip in the curve, which appears to have
impacted both summer and winter temperatures over a
small decade. Chronologically, the Krafla eruption is not
further offset from the multiproxy evidence for an AD
1100-1150 cooling (see above) than they might reflect
the AD 1179 event rather than an AD 1100-1150 event.
Concluding, the latter two eruptions and the
subsequent temperature cooling is the closest I have
come to identifying potential minor, but abrupt climatic
events that could directly have influenced Norse pastoral
farming. Since the farmers’, as discussed above, were
undoubtedly capable of coping with single- or multiyear
unfavorable seasons, the latter decadal episode seems the
most likely candidate for a minor climate event up until
the AD 1257-1258 extreme event. However, simply
establishing “that it got colder at times” is clearly not
enough to understand the direct impacts on the Norse
farming- or social-ecological system. I will return to a
more lengthy discussion of this issue in chapter 9 after
having presented and discussed the settlement evidence
from the Vatnahverfi.
Fig.3.8 Remains of moored summer drift ice off the shore of Qaarsuatsiaq, the location of ruin group E190. At such outer fjord Norse settlement sites drift ice can completely pack and block access to the site for months. Besides its negative effect on transport and communication, the drift ice lowers surface air temperatures, both delaying and shortening the growing season. In recent times, sheep farming was attempted here, but is now abandoned, which is a testimony to the marginal setting of the site (photo: C.K. Madsen 2009).

39
Fig.3.9 Greenland Norse settlement patterns, to a large, extent appears to be about occupying niches in the landscape that offer rich vegetation: here, in small southern faced valley deep inland from the Sioralik; ruin group E304 is located on a level plain of old fluvial deposits (indicated by the arrow), which have been vegetated by fairly rich meadow hay; the surrounding slopes are covered in dwarf-shrub heath. Undoubtedly, exploitation of these resources was the main reasons for the location of this and many shielings (photo: C.K. Madsen 2006).
3.2 VEGETATIONAL PATTERNS IN THE FJORDS
However, the Norse farmers might not have been as
directly affected by adverse climatic conditions in the
form of cold, storminess, or precipitation as they were by
the effect of deterioration on the vegetation surrounding
their farmsteads: it lowered the productivity of infields
and outfields alike; it simultaneously depraved them of,
and set higher requirements for needed, winter fodder;
and farmers could do little actively to mitigate such
deficiencies. As I will demonstrate below, large and
well-managed infields was a feature mainly reserved for
the largest Norse farmsteads, whereas the more regular
farmsteads probably relied more on natural resources
both for winter fodder and pasture (Fig.3.9).
Norse land use patterns have been in focus since J.
Iversen discovered the first presumed landnám layer in
Greenland, i.e. a thin charcoal-rich horizon related to
initial clearing of shrub by fire to establish infield areas
(Iversen 1934). For a long time, palynologists addressed
Norse land use in terms of the, mostly negative, effects
of introduced farming and grazing livestock on the
Greenlandic landscapes, i.e. overgrazing leading to
erosion (e.g., Jacobsen and Jacobsen 1986, Fredskild
1988, Jacobsen 1991, Fredskild 1992). The decline in
natural shrub vegetation and plant species following
Norse landnám is richly documented from a list of sites
(Fredskild 1988, Edwards et al. 2007, Perren et al.
2012). However, recently some investigators have begun
to reinterpret this evidence: for instance, several authors
have pointed to changes in storminess rather than
overgrazing as an explanation for increased erosion in a
later part of the settlement (e.g, Kuijpers and Mikkelsen
2009, Kuijpers et al. 2014); others scholars have even
suggested some extent of Norse shrub management
(Schofield and Edwards 2011, Ledger et al. 2014b).
However, just as the paleoclimate proxy evidence,
the palynological proxies only provides a relative range
– i.e. more or less shrub, grassland – and the vast
majority of the investigations have been carried out very
near to the Norse farmsteads, in many cases large
farmsteads. In order to better understand the highly
dispersed settlement pattern in the Norse Eystribyggð
(cf. Fig.3.2), I here explore outfield resources based on
present vegetation patterns:

40
Fig.3.10 The regional vegetational zones in the fjords of South Greenland. The inner fjords of this region is the only place in Greenland where one finds a sub-continental, subarctic environmental niche and this was, unsurprisingly, where Norse settlement was most densely concentrated (vegetational zones after: Feilberg 1984a)
3.2.1 SUBREGIONAL VEGETATION PATTERNS
The fjords of South Greenland can be divided on four
vegetational zones (Fig.3.10) which reflect their relative
proximity to the Ice Cap or the North Atlantic (Feilberg
1984a). Each zone is characterized by certain dominating
plant communities (see below). The inner fjords of the
central Eastern Settlement can be described as a sub-
continental, subarctic zone (> +10°C in the warmest
summer months, cf. Tab.3.1); the middle fjords
constitute a transitional sub-oceanic, low- or subarctic
zone; the outer fjords a oceanic, low-arctic zone (July
mean temperature < +10 °C, cf. Tab.3.1); and the coast a
Hyper-oceanic, low arctic zone. The vegetational zones
only describe very general patterns on the horizontal axis
and there is much variability within each zone. Some of
this variability can be approximated by satellite based
vegetation mapping: Fig.3.11 displays a 25x25 m
vegetation mapping, generously provided by the DMU
(Tamstorf 2001). This mapping distinguishes seven
vegetation types (and six non-vegetation surfaces):
Dwarf shrub heath; a varied plant community, but
dominated by shrub of northern willow and glandular
birch; in the inner fjords the dwarf shrub heaths include
sizable patches of grassland, sedges and herbs, whereas
in the outer fjord the shrub is broken by patches of
crowberry and bilberry dominate in the latter.
Lichen heath; is a lichen dominated heath type mostly
found at higher altitudes.
Copse; is a varied plant community, but dominated by
large expands of continuous willow and birch shrub and
thickets of up to 2m (occasionally up to 4-5m) with an
undergrowth of grasses, sedges, and mosses (inland), or
dwarf shrub heath (coast).
Fen/meadow; is dominated by sedges, grasses, and
mosses.
Grassland; is dominated by different species of natural
grasses and sedges; in South Greenland, it is normally
found on somewhat inundated land.

41
Fig.3.11 Satellite based vegetation mapping of the central Norse settlement area in South Greenland. Relative proportions of the most common plant communities in each region are shown with percentages of cultivated/lush land. The white dashed lines indicate the larger vegetational zones. There are few vegetational differences between these core Norse settlement regions.

42
Cultivated/lush; if not actually cultivated fields, these
are areas dominated by lush natural grassland.
Fell-field; is a poor plant community where only the
hardiest plants can survive, e.g. dispersed and low
growing patches of lichens, grasses, and dwarf shrubs.
The six non-vegetation surfaces are: soil/bedrock,
water (lakes and fjords), and snow or ice, clouds, and
shade where no monitoring is possible.
Reviewing Fig.3.11, there are overall no differences
in the proportional regional distribution of the most
common plant communities that cannot be attributed to
local geological and topographical differences: all the
central fjords of South Greenland are heavily dominated
by dwarf-shrub heath and copses. Grassland is also fairly
prevalent, whereas the other vegetation types are poorly
represented, not at least the cultivated land that does not
in any region exceeds more than 0.20% of the total
vegetated area. In chapter 8, I argue that meadows
especially were targeted by the Norse farmers, but as
seen in Fig.3.11 such areas were very small. It should be
noted that fen/meadow areas are expected to be
somewhat underrepresented in the satellite vegetation
mapping: they are mostly found in narrow bands along
lake shores, streams, and rivers, which means that they
are “swallowed up” by the neighboring larger plant
communities in the weighing of 25x25 m cells.
As noted above, landnám was followed by a rapid
decline in natural plant communities, at least nearest to
the farmsteads. Thus present vegetation patterns cannot
be directly transposed on a medieval setting. Although
most palynological studies imply that the vegetation
never fully recovered from Norse farming activities (e.g.,
Fredskild 1988, Edwards et al. 2007, Gauthier et al.
2010), the fact that dwarf-shrub heath and copse is so
dominant, even after ca. 100 years of renewed farming,
must certainly suggest that this resource was never close
to being depleted. On this level, at least, present
vegetation patterns appear to provide a reasonable
analogue. One exception, however, may be fjord near
cultivated/lush areas: recent bathy-metric soundings and
sediment cores at in the South Greenlandic fjords have
implied that relative sea-level rise may have claimed
large extents of the most productive low-land grasslands
and meadows near the farmsteads (Mikkelsen et al.
2001, Mikkelsen and Kuijpers 2008).
While there are few vegetation differences on sub-
regional scale, local variations are more obvious: Fig.
3.12 displays the aggregate areas (in km2) of the most
common plant communities (and soil/bedrock) in the
Vatnahverfi region divided on the vegetational zones.
Whereas the inner- and middle ford appear reasonably
similar, the outer fjords seem to have far greater areas of
dwarf-shrub heath and grassland. This is quite at odds
with settlement densities in the area (see section 7.1.2)
and serves as a warning that this vegetation mapping
displays only vegetation type, not its quality in terms of
pasture or fodder. This could be mitigated by introducing
further gradients, but here I only mean to highlight the
richness of shrub vegetation.
Fig.3.12 Displays the distribution of aggregate areas in km2 of the most common plant communities in the Vatnahverfi
region as they divide on sub regional vegetational zones. The figure is discussed in the text.
0
50
100
150
200
250
300
Inner fjord Middle fjord Outer fjord Coast
Are
a i
n s
q.
km
Vegetation patterns in the Vatnahverfi
Dwarf-shrub heath Copse Fen/meadow Grassland Fell field Soil/bedrock

43
Fig.3.13 Overview map of the Vatnahverfi region and sub-regions separated in the analysis.
3.2.2 LANDSCAPES OF THE VATNAHVERFI
The case study area designated the 'Vatnahverfi
region' comprises the peninsula between the fjords of
Igaliku Kangerlua and Alluitsup Kangerlua (see section
4.2, Fig.3.13, Fig.4.20). The distance from coastal
islands to the inner fjord is some 65 km; there are some
16-18 km across the main peninsula. Including all of its
islands, the region has an area of some 1560 km, i.e. just
a little larger than the Faroe Islands. The background for
the archaeological surveys and definition of this case
study area is described in section 4.2 and this section
only presents a short description of the six sub-regions
distinguished in this study (Fig.3.13). It should be noted
that these sub-regions are arbitrary and do not reflect
delineated medieval or even geographical regions.
However, comparing Fig.3.10-3.11, 3.13 it is clear that
the subdivision corresponds roughly to the vegetational
zones; without design, the sub-regions also largely
correlate with a pasture quality survey of 1977-1988 and
I refer to this work for the below description of sub-
region farming/pasture quality (Thorsteinsson 1983).
Northern Vatnahverfi:
Northern Vatnahverfi is split into three areas by
natural features: the fjord of Kujalleq divides the area in
a northern and southern part, whereas a sandur (Fig.3.1)
divides it on a western and eastern half. The mountains
north of the Kujalleq are high (1660 m) and steep,
confining the settled area to a strip of land along the
fjord (Fig.3.14). A single valley offers access to some
grassland areas closer to the glaciers; otherwise the area
is dominated by dwarf-shrub heath (cf. Fig.3.11).
At the head of the Kujalleq fjord is a small plain –
Igaliku Kujalleq (Fig.3.14) – which opens into the
sandur and inland part of the Vatnahverfi region. This is
one of the most fertile areas in the entire region and the
location of major church farmstead E66. Igaliku Kujalleq
is also where sheep farming was first reintroduced to the
region and the vegetation near the farms, along the entire
south coast of the Kujalleq, and the nearby upland area is
heavily marked by grazing. However, travelling east and
inland from Igaliku Kujalleq, the shrub vegetation is less
affected and fairly rich. The pasture quality is described
as good (Ibid.Tab.76).

44
Fig.3.14 View across the head of the Kujalleq fjord. As visible in the photo, the mountains ascend rather abruptly from the fjord, confining the settlement area to a narrow gravel terrace along the fjord. Ruin groups E64 and E209 are located on the terrace on the far right (photo: C.K. Madsen 2010).
Fig.3.15 View of the plain and farm at Igaliku Kujalleq at the head of the Kujalleq Fjord. The ruins and church of E66 are clearly visible in the front of the picture; the edge of the sandur can be seen in the upper right corner (photo: C.K. Madsen 2005).

45
Fig.3.16 View of the central Vatnahverfi lake basin. Besides the dominant dwarf-shrub vegetation, sizable areas of wetland sedges can be found on many of the lakes shores (photo: C.K. Madsen 2011).
As described above, katabatic winds and aeolian
deposits have created a 1.2-1.5 km wide and almost
completely barren sandur that parts the northern
Vatnahverfi in two; once on the other side of the sandur,
however, the vegetation immediately becomes rich and
lush, especially in copse and dwarf shrub heath, but also
with sizable meadows along the edge of the sandur
(Fig.3.1).
Central Vatnahverfi:
Travelling south along the sandur, it ends rather
abruptly as the terrain lowers into a northeast-southwest
oriented elongated valley basin (10-20m.a.s.l.) with a
series of connected lakes that extent the full length of the
central Vatnahverfi region (Fig.3.16) . The slopes on the
sides of the lake basin are richly vegetated by copse and
dwarf-shrub heath. On lacustrine plains at the edges of
the lakes are considerable patches of meadowland or
mire, most of it today cultivated, and rich sedge
communities are found on the banks of many of the
lakes. Ascending up into the adjoining mountains – here
referred to as the central Vatnahverfi highland – the
copse vegetation is replaced by dwarf-shrub heath and,
at first, sizable tracks of grassland (Fig.3.17). Deeper
into the highlands, however, poorer dwarf-shrub heath is
completely dominant (Fig.3.18). The pasture quality in
the central Vatnahverfi is described as good (Ibid.Tab.
73-74).
Fig.3.17 Rolling fells on the western edge of the central Vatnahverfi highland – just a few hundred meters from ruin group E167 – where considerable extents of natural grassland pastures are found among the dominant dwarf-shrub heath vegetation

46
Fig.3.18 View of lakes in the inner part of the central Vatnahverfi highland, where even grass vegetation becomes limited and is completely replaced by dwarf-shrub heath. Only a few Norse farmsteads – or shielings – are located on the edge of this vegetation poor landscape (photo: C.K. Madsen 2008).
Fig.3.19 View of outer fjord landscape – the Torsukattak – with its many small islets and skerrie. In sheltered valleys in the inner part of the fjords, such as here at ruin group E339 – some shrub-vegetation and grass vegetation is found, but otherwise the outer fjords are completely dominated by crowberry heaths (photo: P.B. Heide 2009).

47
Fig.3.20 In the most exposed parts of the outer fjords, the vegetation is completely dominated by crow-berry heaths and swampy mires, such as here by Torsukattak and close to ruin group E95b (photo: C.K. Madsen 2009).
Outer fjord Vatnahverfi:
The outer fjords are generally dominated by crow-
berry and blueberry heaths (Born and Böcher 2001).
However, at the transition from middle to outer fjord, as
well in the most sheltered places of the outer fjord
(Fig.3.19), some reasonable shrub land pasture can be
found. However, on the exposed stretches of low coast,
even dwarf-shrubs heaths are exceedingly poor (Fig.3.8,
3.20). This is reflected in Thorsteinsson’s pasture quality
survey (1983: Tab.60-62, 68-79), where the vegetation in
the “inner belt” of the outer fjord – including the Island
of Kangeq – is described as average, whereas pasture
quality in “outer belt” ranges from poor to very poor,
such as on the island of Akia (Fig.3.13).
Alluitsup region:
In terms of settlement and farming landscapes, the
first two thirds of the Alluitsup Kangerlua gives off a
poor first impression: the fjord is much more exposed to
the Atlantic and the mountains ascend steeply from the
fjord, so that settlement areas are confined to intermittent
valleys or narrow land strips (Fig.3.21). The vegetation
is dominated by dwarf-shrub heath, but with sheltered
niches with lush copse. The pasture quality ranges from
poor to average (Ibid.Tab.80.81).
Amitsuarsuk and Sioralik regions:
Towards the head of the Alluitsup Kangerlua, it splits
on two fjord arms, the Amitsuarsuk and the Sioralik.
These are treated separately in the settlement pattern
analysis (see chapter 7), but can be treated collectively
since they share topographical and vegetational
characteristics: they are both narrow fjord arms with
steep mountain slopes on either side; however, where
sheltered, the shrub vegetation is lush. At the heads of
both fjords are plains that sustain rich copse and dwarf-
shrub heath vegetation (cf. Fig.3.22). The pasture quality
is described as good (Ibid.Tab.78-79), mostly because of
the dense copse that deeper into the mountains changes
to regular subarctic scrub forest, especially in the valley
that runs parallel with the fjord above Amitsuarsuk.
With this concluding description, the basic environ-
mental setting for the farming settlements, past and
present, in the Vatnahverfi region should have been
clearly established. It should also be clear that a key to
understanding Norse settlement lies in recognizing such
landscape niches that enable pastoral farming. Although
I have not attempted systematic analysis here, I stress
that the agro-ecological field surveys carried out in the
years after 1976 provide highly detailed and quantified
datasets that may be fed into future landscape models.

48
Fig.3.21 View of narrow and poorly vegetated strip of coastal land along the Alluitsup Kangerlua, where ruin group E180 is located. Generally, the Alluitsup Kangerlua presents a poorer settlement landscape than Igaliku Kangerlua, not only because of the vegetation, but also because of the steeply sloped mountains bordering the fjord (photo: C.K. Madsen 2006).
Fig.3.22 View from the (former) waterfall of Qorlortorsuaq towards the head of the Ameralik, where ruin group E91 is located. As seen in the photo, the central part of the plain is today farmed, but the mountain slopes are still vegetated by dense willow scrub (photo: C.K: Madsen 2006).

49
4. THE ARCHAEOLOGY OF GREENLAND AND THE VATNAHVERFI
'It is known (…) that Julianehaab District is the most fertile place in the Western Settlement, that
grass grows everywhere in the fjords, extensive scrub forest by Greenlandic measure, that salmon is
found in every river and also all kinds of other fish (…). Thus, no one can deny that as favorable as
these places must have been to the Norsemen of old, as favorable they are still. Anyone who visits these
pleasing meadows and sees everywhere grass and scrub forest in such an abundance that many families
could it not reduce, less consume, must equally wonder, why the old Europeans did abandon them (…)
and why none after have availed themselves of the profusion that is here brought forth year after year '.
(au. trans. after Thorhallesen 1776;53p)
In 1767-1773 Icelandic priest Eigill Thorhallesen
travelled a large part of Greenland’s West Coast to
evaluate the potentials of the land for resettling it with
Icelandic farmers;the above excerpt is a closing remark
on this journey. E. Thorhallesen’s evaluation stands in
notable contrast to perspectives of the 'paradigm of arctic
marginality' (see chapter 1). Moreover, the quote touches
upon another aspect of Norse culture in Greenland: its
archaeological exploration was tied to prospects of
renewed farming, just as renewed farming was – when it
eventually initiated – tied to the lands and tradition of
Norse farming. Chapter 4 describes the archaeological
aspect of, and background for, this cultural-historical
interaction (the reverse is explored in chapter 8).
Where chapter 2 outlined the wider North Atlantic
cultural and historical context for Norse settlement in
Greenland, and chapter 3 concerned environmental
settings and their changes, chapter 4’s first main section
deals specifically with the development of archaeology
in Norse Greenland: it is a literary review and discussion
of archaeological investigations carried out in Greenland
and the Vatnahverfi in the period 1723-2005 with special
focus on activities in the latter region. In short, the first
section of chapter 4 is the archaeological introduction to
chapters 5. The second section of chapter 4 introduces
and summarizes the archaeological field activities of the
Vatnahverfi-Project 2005-2011 with special focus on the
ruin group surveys, i.e. the settlement survey evidence
that is presented and analyzed in the following chapters.
In short, the second section of chapter 4 is the
archaeological introduction to chapters 7-8.
Fig.4.1 View of Norse (E69) and modern farm at Timerliit in the central Vatnahverfi, South Greenland. Today, all the Inuit sheep farms are located right next to once larger Norse farmsteads, clearly signaling an overlap in farming and land use traditions (photo: C.K. Madsen 2005).

50
4.1 THE ARCHAEOLOGY OF NORSE GREENLAND 1723-2005
‘(…) We have the outmost confidence in him, that he (Maj. Paars) will spare no diligence or effort, neither will be deterred by any danger or difficulty, but will seek in any possible way, by some route across the country, to reach the aforementioned Eastern Settlement; there to learn whether the descendants of the old Norwegians does there still reside, what language they speak, whether they yet are Christian or heathen, and under what law and livelihood they subsist’.
Royal instruction of 1728 (au. trans. after Stenstrup 1885:130)
The above is an extract from a royal instruction of
1728 concerning one of the earliest colonial expeditions
to Greenland: that year, Major C.E. Paars – the first and
last governor of Greenland – was to cross over the Ice
Cap from west to east by the aid of 11 Icelandic horses
(Nansen 1890:392, Ryder 1891:68). Naturally, the
attempt was quickly abandoned, but it reveals how little
was known of Greenland’s geography and environment
at that time, a confusion also noted of E. Thorhallesen’s
report. However, the instruction proves another point:
that the colonization of Greenland was greatly motivated
by the wish to reestablish contact with the old Norse
colonists; by creed of their Norwegian ancestry and
historical links, they were subjects to the Danish-
Norwegian king. For while interest in Greenland faded,
and contact was eventually lost, in the late-medieval
vacuum that followed the joining of the former
kingdoms of Norway and Denmark after the Kalmar
Union (see section 2.1.3), the Norse settlements in
Greenland were never forgotten. In fact, already from
AD 1472 expeditions meant to reestablish contact with
the grænlendinga had been planned, and some even
carried out, with more following from the late 16th
century onwards (Madsen 1907:35, Etting 2010:151).
The cultural-historical links between the Kingdoms
of Scandinavia and the Norse settlements in Greenland
were thus never completely severed; and they came to
influence historical and archaeological research for more
than a century. Unravelling the full extent of these links
is beyond the scope of chapter 4. However, a review of
even the earliest studies and field campaigns is needed to
understand the development of the research area as a
whole, not at least because the early surveys, and even
excavations, helped form subsequent research strategies
and methodologies, and are of significant research value
even today.
Section 4.1 presents a literary review and discussion
of the archaeology of Norse Greenland up to the start of
the Vatnahverfi-Project in 2005, focusing in particular
on the Norse Eastern Settlement and the Vatnahverfi.
The review begins with the very earliest investigations
and progresses over more or less defined research epochs
– each characterized by particular research questions and
methodologies – concluding with a summary discussion.
Key research questions pertaining to each research epoch
were regularly published by leading scholars in Norse
Greenland archaeology; these overviews are presented
for each research epoch, as are the popular or pseudo-
academic monographs that indirectly communicated
contemporary research themes.
For obvious reasons, a review of close to 300 years
of antiquarian or archaeological investigations cannot be
all-inclusive; it is a multifarious record that consists of
imagery covering everything from artistic paintings,
sketch drawings, photographs, to precession survey- and
excavation plans; and documentary records ranging from
newspaper clips, field notes and –reports, to final
academic or popular publications. However, most of
these records have never been published, but are only
found in the archives of the national museums of
Denmark and Greenland. With Greenland’s repatriation
of cultural heritage from 1984-2001, all such records
should – either in original or copied form – be
represented in the archives of both museums. Although
this is far from always the case, throughout the text and
appendices I simply refer jointly to such records as
NMA (National Museum Archives) + author and year on
the assumption that the records are found in both
archives. The below review mainly includes reference to
such published works and unpublished NMA records
that relate specifically to archaeological and antiquarian
investigations in the Vatnahverfi region.

51
Fig.4.2 The image is titled ʻProspect of the Eastern Settlement in Greenland seen 18. May 1787ʼ. However, what the image depicts is the jagged coastline of Greenland’s East Coast with a belt of drift ice in front. Not before this ice barrier had been breached, either from the east or the west, could mistaken notions as to the location of the Norse Eastern Settlement with potentially surviving grænlendinga be conclusively resolved (image: Fridrich 1787, courtesy of the National Museum of Denmark).
4.1.1 SETTLEMENT DISCOVERY – 1721-1832
Because the colonization of Greenland was greatly
motivated by the prospect of reuniting the Norse
grænlendinga with their sovereign and church, it is
unsurprising that the two paramount questions of the
earliest research epoch concerned whether any of the
Norse were still alive?; and where their settlements –
known from the written sources – were to be found?
That this was a very serious and sincere objective is
attested not only by documentary sources such as the
introductory excerpt, but also by the fervor with which
Greenland’s first new colonist, Danish-Norwegian priest
Hans Egede, went about resolving the matter:
Immediately after his arrival in the Nuuk Fjord area –
i.e. the former Western Settlement – in 1721, H. Egede
began questioning the local Inuit, only to learn that the
Norse must had long abandoned the region (Egede
1925:56). However, the Inuit were knowledgeable of
ruins left behind by a different people – qablunaaq –
which at that time referred to any foreign or non-Inuit
person (Thorhallesen 1776:87, Egede 1925:56). Not only
were the local Inuit intricately familiar with the whole
Nuuk Fjord system from their annual settlement cycle,
they had effectively, and fairly systematically, been
mining Norse ruins and middens for metal artifacts for at
least a century (Pingel 1832a:335, 1839:250, Gulløv
1997:395) The local Inuit could therefore direct H.
Egede to the Norse ruins in the Nuuk Fjord, some of
which he already visited in 1723 (Egede 1925:75). The
short description provided by H. Egede from this voyage
into the inner Nuuk fjord is, in fact, the first documented
survey of Norse ruins carried out in Greenland.
Although H. Egede had found the Norse farmsteads
abandoned, chances are that he was not too disconcerted:
according to prevailing notions, the Norse Eastern
Settlement was to be located on Greenland’s East Coast
(Fig.4.2); and since H. Egede was surely well-versed in
the description of Ívarr Bárðarsson that the Western
Settlement had been abandoned already during the
Middle Ages (IB:123), he probably never expected to
find a surviving Norse population in the Nuuk Fjord
region or anywhere on the west coast of Greenland.

52
As persuasively argued by K.J.V. Steenstrup (1885,
see below), the origin of the prevailing faulty notion of
the location of the Norse Eastern Settlement owed to
misinterpretation of medieval sailing directions coupled
with the continued reproduction of an early 17th
century
cartographic error (Ibid.125pp). Combined these errors
had the unfortunate effects of not only displacing the
Eastern Settlement to Greenland’s East Coast, but also of
locating it 100-500 km up the coast between 61-65° N.
This proved to have lasting impact on the study of the
Norse settlements in Greenland: as long as barren
terrain, treacherous waters, and drift ice kept explorers
from reaching that far north – either from the west inside
the drift ice or from the east from outside (Fig.4.2) –
archaeological attention stayed fixed on Greenland’s
East Coast, and the surveys that were carried out in the
Eastern Settlement in South Greenland, a chance result
of their being located on the way.
First to try to reach Greenland’s East Coast from the
west via the Cape Farewell was H. Egede himself: in
1723 – the same year he inspected the Norse ruins in the
Nuuk fjord – H. Egede headed south along the coast and
managed to reach as far as Nanortalik – less than a 100
km from the Cape Farewell – before being forced to turn
back (Egede 1741:19, Madsen 1907:38, Albrethsen
1971:291). On his way back to the Nuuk Fjord, he made
a stop by the Hvalseyjarfjörður church (E83), inside
which he trenched about, but unearthing only bits of
charcoal and bone (Albrethsen 1971:292). H. Egede did
thus not resolve the question of location of the Norse
Eastern Settlement and to his death in 1758 he still
believed it was found on Greenland’s East Coast
(Arneborg 1989:121). However, his contribution was
significant: besides providing the first detailed ethno-
graphic and cartographic records (Fig.4.2), he was – in
deed at least – the first archaeologist in Greenland.
Fig.4.3 H. Egede’s 'Grønlandia Antiqva', a map appendix to his 1741 proto-encyclopedia on Greenland. As was commonly believed at the time, and for more than a 100 years, the Norse Eastern Settlement was allocated to Greenland’s East Coast between 61-65° northern latitude (map: after Egede 1741).

53
It would be more than 100 years after H. Egede
before the question of the location of the Norse Eastern
Settlement would be laid to rest. During this time, a
number of early explorers – several of which are
deserving of specific mention – gradually expanded the
knowledge of the geography and cultural landscapes of
Greenland, their combined efforts pushing towards the
conclusive clarification of the question:
First to succeed in rounding the Cape Farewell from
the west was Peder Olsen Walløe, Danish trader and
hunter. Prudently relying on the native Umiak for
transport, using Inuit guides, and being a skilled hunter
himself, Walløe in the years 1751-53 managed to make it
some 100 km up Greenland’s East Coast to ca. 60°56 N
(Ryder 1891, Walløe 1927:69, 100, Gad 1969:390).
Moreover, on his way to the East Coast, P.O. Walløe
also travelled up the Sermilik, Tunulliarfik, Igaliku, and,
Alluitsup Fjords in South Greenland, providing some of
the first descriptions of the central Norse Eastern
Settlement (Walløe 1927:68pp). Walløe’s travel account
is rich in details on geographical-, topo-graphical-,
weather-, and hunting-conditions. His reports on the
Norse sites are, however, much less detailed. Still,
Walløe’s voyage was an astonishing feat and deserving
of recognition. But because he had not made it far
enough up Greenland’s East Coast to resolve the
question of the location of the Norse settlements, and
because his accounts were published as late as in 1787,
Walløe undeservingly died poor and unrecognized (Bobé
1927:11, Albrethsen 1971:292).
Walløe’s expedition also reflected a new wave of
colonization activity: besides ascertaining the location of
the Eastern Settlement and the fate of the Norsemen, the
expeditions increasingly came to embrace economic
interests of Danish trading companies: first 'Det
almindelige Handelskompagni' ('the Ordinary Trading
Department') established 1747, in 1774 converted into
the state-owned 'Den Kongelige Grønlandske Handel'
(KGH) ('the Royal Greenland Trading Department'
(Sveistrup 1943). A key economic interest of the trading
companies was the prospect of resettling the old Norse
farmlands in Greenland with Icelanders or Faroese (de
Muckadell 1929:100, Gad 1969:438). This had two
favorable effect: first, that expeditions to both Norse
settlements areas on Greenland’s West Coast continued,
even though the Norse were still believed to reside
somewhere on the East Coast. Second, that detailed
reports of environmental conditions became a norm of
survey descriptions. Traditions of Norse and later
farming, as well as archaeological methodologies, stayed
patently linked.
Two of the new double-motive land surveyors stand
out: the first was Norwegian tradesman and pioneer
Anders Olsen: in 1773 he had surveyed central parts of
South Greenland on behalf of the 'Ordinary Trade
Company' to locate a suitable spot for a new colony in
that region; and by 1776 the new colony of Julianehaab
(Qaqortoq) was officially recognized (Gad 1969:552).
Olsen was keenly interested in the Norse ruins and sites
in the region and in his capacity of colony supervisor, he
continued conducting surveys and, in 1776 or 1777, he
even made it around the Cape Farewell and up the East
Coast to about the same latitude, where Walløe had been
forced to turn back (Ibid.554). Such was Olsen’s
familiarity with the land that when he in 1780 resigned
as colony supervisor to set up the first new farm in
Greenland, he did so at present Igaliku (Ibid.557), the
Norse episcopal see of Garðar/E47, and the richest
farmland in all of the settlements.
However, the results of Olsen’s surveys were not
published by himself, but by the second prominent
double-motive explorer of the epoch, Icelandic priest
explorer Eigill Thorhallesen: he spend the years 1767-
1773 surveying large parts of the West Coast, including
Norse sites in the Nuuk fjord system, for the best places
to repopulate Greenland with Icelandic farmers. In
(1776) Thorhallesen published a small study on his
findings, which is remarkable in more than one way:
combining Olsen’s surveys from South Greenland with
his own, and introducing a more systematic method for
environmental site description, Thorhallesen can be
accredited with publishing the first monograph on the
Norse settlements in Greenland: it came complete with a
chapter discussing the failure of the Western Settlement
and the fate of the grænlendinga (Ibid.:58p). As far as I
have been able to learn, he was also the first to formally
compare the ruins with historic Icelandic architecture
(Ibid.:31), to accompany his argument with a
rudimentary house plan (Fig.4.4), and to introduce the
idea that some of the sites in Greenland were so small or
poorly situated that they must have functioned as
shielings, not farms (Ibid.:32). In several respects,
Thorhallesen’s small book was a forerunner for modern
publications.

54
Fig.4.4 In his 1776 publication of a survey in the Nuuk Fjord, E. Thorhallesen for the first time presented a survey plan (of ruin group V36?) of a Norse dwelling based on comparison with contemporary Icelandic architecture. Note the dwelling layout plan with rooms on each sides and end of a central passage and with a few buildings front. It is a farmstead layout scheme close to that presented by much later archaeologists (cf. Fig.5.9) (image: after Thorhallsen 1776:31).
However, it was the third and final of the double-
motive land surveyors that introduced a more stringent
ruin description methodology: in 1777-1779, Norwegian
tradesmen and explorers Aron Arctander and Andreas
Bruhn carried out a survey on behalf of the KGH which
was again aimed at exploring the prospects of
reintroducing farming, this time in South Greenland
(Ostermann 1944:I). Bruhn was to describe environ-
mental conditions, while Arctander was oversee the
description of Norse sites and ruins. This labor division
may explain how he was able to describe in great detail
some 57 ruin groups and 135 ruins in South Greenland
between Nunarsuit to Cape Farewell, i.e. practically all
of the Eastern Settlement (Arctander 1793, Bruun and
Arctander 1944:59pp). Besides providing descriptions of
individual sites and ruins that are valuable even today,
Arctander was the first to hint – based on the observed
richness of the vegetation and sites – that South
Greenland must have been the location of the Norse
Eastern Settlement (Wormskiold 1814:309, 314).
However, it was historical-geographical commentator
Heinrich Peter von Eggers, who went on to press this
claim: having published Arctander’s ruin descriptions in
1793 (Arctander 1793), von Eggers later the same year
used this survey evidence to argue for the verity of the
latter’s supposition (von Eggers 1793): South Greenland
was really the Norse Eastern Settlement. But von Eggers
went even further: although the maps available to him at
the time were deficient and imprecise he tried, and to an
impressive extent succeeded in, allocating the medieval
place names to the fjords of South Greenland (Fig.4.5).
In short, the survey evidence compiled by early land
surveyors allowed von Eggers to introduce the type of
historical archaeology that would gain momentum in the
following research epochs.
However, as long as no one succeeded in penetrating
further up Greenland’s East Coast than the 61° latitude
that Walløe and Olsen had reached, von Egger’s claim
remained disputable. This even though surveys –
although of more random nature - kept adding new sites
to the map: the most significant contribution was surveys
made by German author, actor, and mineralogist Carl
Ludwig Giesecke in 1806-1813 (Giesecke 1910), but
also Danish botanist Morten Wormskjold would on a
1812-1814 expedition (Jessen 1987:7p) embrace the
question of the Norse and was the first of three early 19th
century scholars to oppose von Eggers’ claim:
In addition to a list of other arguments, Wormskjold
(1814) contested von Eggers’ claim that there were by
that time close to more recorded farmsteads in the
Western Settlement than the 90 implied by the medieval
written record (Ibid.309). Wormskjold opposed this
(Ibid.311) by suggesting that a number of Norse sites
were shielings, not farms, thereby being the first to
academically raise this difficult debate (see also section
2.2.2). Next to oppose von Eggers was Danish historian
Hector Frederik Janson Estrup (1824), who launched an
array of historical contra-arguments, provokingly
concluding that the day was near when explorers on
Greenland’s East Coast might be greeted by the Norse
inhabitants themselves shouting ‘this was the place!’ (au.
trans. after Estrup 1824:267). The final opponent to von
Eggers was Giesecke, who in 1824 published his own
treatise on the question, where he took a more moderate
stand by implying that the Eastern Settlement was partly
situated on the Eastern Coast, only not as high a latitude
as previously suggested (Giesecke 1925:57). It was an
interesting change of mind, because Giesecke – who had
himself visited more than 50 Norse sites in both
settlement areas – apparently sided with von Eggers
during his surveys (Johnstrup 1878:21).

55
Fig.4.5 Map appendix to von Egger’s 1793 treatise on the location of the Norse Settlements in Greenland, which for the first time correctly placed the Eastern Settlement in South Greenland. In addition to this novel claim, and in spite of very imprecise maps, von Eggers also succeeded in correctly allocating several place names of the medieval topographies (map: after von Eggers 1793).
However, in 1828-1831, at the same time as this
academic debate was raging, Danish naval lieutenant
Wilhelm August Graah was making his way towards,
and finally up, Greenland’s East Coast. The success of
this expedition was a critical response to successful
foreign explorations in North East Greenland (Ryder
1891:82pp). Besides looking for the grænlendinga, the
aim of Graah’s expedition was also to press Danish
sovereignty over Greenland, the first time, but not the
last, that cultural historical research was influenced by
state politics (see below). Drawing on the experiences
from Walløe’s partial success in 1753, Graah used the
native umiak to make his way up the East Coast and
reached as far as 65°20 N (Graah 1832b, Ryder
1891:85). In his voyage up the coast, W.A. Graah had
seen neither Norse ruins or people, and when he
published his findings in 1832, they all but closed the
debate on the location of the Norse Eastern Settlement,
placing it confidently in South Greenland (Arneborg
1989:121). Even so, some quietly voiced the potential
existence of the settlement beyond 66° N (Steenstrup
1885:131), a contention that would not be definitely
silenced for another 50 years (see section 4.1.2).
Although early explorers had both logistically and
methodologically paved the way for later investigations,
their surveys are to some extent spoiled by the condition
that they were carried out “on the way” to the Eastern
Settlement, by the “double-motives” of the surveys, and
by the lack of proper geographical maps. Often, only the
best preserved ruins were recognized and their relative
placing roughly approximated. As a result, the early ruin
descriptions are inconsistent and hard to compare with
more recent surveys; only where ruins have distinct
preservation or location can they be aligned with newer

56
surveys. For the same reason, it is difficult to ascertain
how many sites that were known at the time of Graah’s
expedition. There were, however, definitely somewhat
more than the some 57 sites in the Eastern Settlement,
hereof ca. 23 in the Vatnahverfi, and 16 in the Western
listed by von Eggers and Thorhallesen (Tab.4.1).
Discovery epoch investigations in the Vatnahverfi
were fairly limited: Walløe visited the Igaliku and
Alluitsup Fjords, but only reported that ʻremains of the old
European dwellings are found by almost every bay or inlet, especially
in the inner part of the fjord, but they have now all turned into
mounds of stone and are overgrown with grassʼ (au. trans. after
Walløe 1927:80). Arctander, however, located and
described some 23 sites and 108 ruins in the Vatnahverfi
region and rightly identified one of them, E66/Igaliku
Kujalleq, as a church farm (Bruun and Arctander
1944:109p). In 1809 Giesecke seems to also have made a
brief inspection of Igaliku Kujalleq/E66 (Giesecke
1910:218) and in 1828 Graah visited the island of Akia
in the outer fjords of the Vatnahverfi region (Fig.3.13)
(Graah 1832b:37p); however, neither of them provided
any detailed descriptions.
4.1.2 LOCALITIES – 1832-1921
After Graah’s expedition to the East Coast had
validated that South Greenland was the location of the
Norse Eastern Settlement and that none of the
grænlendinga were alive, antiquarian and archaeological
research perspectives shifted: investigations instead
became concerned with gathering information on the
existing ruins and sites in order to establish the medieval
topography of the Norse settlements and to explain their
abandonment:
It is no coincidence that the prominent Danish
scientific society 'Det Kongelige Nordiske Oldskrift-
Selskab' in the same year began publishing reports on
archaeological surveys and excavations in Greenland on
regular interval (Pingel 1832b:94). While the field
investigations were carried out by a number different
people in Greenland – colony managers, tradesmen,
missionaries etc. – they were prompted and sponsored by
the society and the findings were edited and summarized
in the society’s periodical by Danish natural historian
and geologist Christian Pingel (Pingel 1832b, 1832a,
1833, 1835, 1837, 1839, 1842). These archaeological
surveys were methodologically similar to ones carried
out by prior investigators. However, to my knowledge,
the first more accurate and scaled ruin and ruin group
plans were published in these reports (e.g. Fig.4.6-4.7).
Also, excavations – or more appropriately various
test trenching – quickly began to supplement the
surveys. In fact, Graah had already in 1828 carried out a
larger and fairly well-documented excavation of the
Hvalseyjarfjörður church (E83, Tab.4.1) (Graah 1832a).
This was the first larger excavation of a Norse church
site, which for the next some 150 years became a prime
focus of archaeological activity (e.g., Pingel 1832b:99,
102, 1832a:319, 1833:219, 1837:122p, 1839:229, 231,
1842:330, 341p). Graah did not find much in his
excavation except for a few pieces of bone and charcoal,
which was enough to make him suggest that the church
had been destroyed by fire (Graah 1832a:154). In the
excavations that followed, similar charcoal finds were
often reported and led to the same interpretation (e.g.,
Pingel 1832a:319, 1833:213, 1837:130, 1839:234),
clearly showing that the investigators were now looking
for explanations for the abandonment of the Norse
settlements.
Fig.4.6 One of the first – if not the first – published accurate and scaled survey plan of a ruin (of enclosure at ruin group E112) (after Pingel 1833:315).

57
Fig.4.7 Early published survey plan of site M20, which was also one of the places to see very early excavations (after Pingel 1837:137).
The publication of archaeological reports from
Greenland summarized by Pingel ceased in 1842 (Pingel
1842:346). At this point, all existing archaeological
evidence was included in the third and last volume of the
monumental 'Grønlands Historiske Mindesmærker'
(GHM I-III) ('Historic Monuments of Greenland')
published by The 'Det Kongelige Nordiske Oldskrift-
Selskab'. In the first two volumes of GHM – published in
1838 – all the documentary evidence on the Greenland
Norse had been compiled and discussed academically by
a list of the most prominent scholars of the time; and in
1845 the archaeological evidence was included in the
last volume (GHM III). Although evidently outmoded in
some respects, the GHM is – with its over 2500 pages –a
most impressive monograph, or rather something akin to
an encyclopedia of Norse Greenland. The archaeological
evidence was edited and summarized by Jens Jacob
Asmussen Worsaae (GHM III:795pp), one of Denmark’s
most celebrated early archaeologists: the evidence now
included reference to, or description of, some 115 sites
in the Eastern Settlement, hereof 17 in the Vatnhverfi
region, 7 in the later recognized Middle Settlement (see
below), as well as some 14 in the Western Settlement
(Fig.4.19, GHM III:795pp).
After the publication of GHM, there was a ca. 30
year hiatus in archaeological investigations. However, in
1875 Johannes Frederik Johnstrup requested the Danish
state to establish a central organ for the purpose of
organizing and funding various scientific investigations
in Greenland; his request for funding was met in 1876
and in 1878 the organ – 'Commisionen for Ledelelsen af
de geologiske og geografiske Undersøgelser i Grønland'
(in the below simply referred to as 'the commission') –
was set up (Johnstrup et al. 1878). 'The commission'
would direct, or influence, practically all scientific
investigations in Greenland up to World War II. In 1876-
1878 the first field studies were carried out and although
these surveys mostly concerned geology and geography,
‘Depiction of Norse ruins with measurements’ were listed among
the main results of the surveys (Ibid.15). It referred to
the fact that Danish geologist Knud Johannes Vogelius
Steenstrup and illustrator Andreas Nicolaus Kornerup in
1876 had surveyed and depicted ruins at five sites in the
Eastern Settlement (Fig.4.8, Steenstrup and Kornerup
1881), while Danish naval officer Jens Arnold Diderich
Jensen in 1878 had inspected an unknown number of
ruins in the Ameralik Fjord in the Western Settlement,
producing simplified, but scaled plans of 8 ruins (Jensen
1879:26p, Fig.2). Although still rather cursory and
published in the brief, these surveys – and the 1878
establishment of 'the commission' –heralded a new epoch
of archaeological research and methodological advance
in Greenland.
Fig.4.8 One of the first Norse ruins surveyed and recorded in detail was the storehouse (ruin no. 36) of Igaliku/Garðar (E47), a ruin that would later spark the first scientific debate on sea-level rise since the occupation of the Norse Settle-ments (after Steenstrup and Kornerup 1881:Fig.6).

58
First to further this development was another Danish
naval officer, Gustav Frederik Holm, who in 1880 was
charged by 'the commission' with the task of carrying out
“topographical-archaeological” investigations in South
Greenland with the specific aim excavating Norse ruins
to elucidate the character of the Norse settlement, as well
as to plan in detail as many sites and their natural
surroundings as possible (Holm 1883:63p). Essentially,
this was the first explicitly formulated research agenda
on the Greenland Norse. G.F. Holm went to the task with
systematic fervor, surveying or visiting some 39 sites in
the Eastern Settlement, 6 of them in Vatnahverfi, as well
excavating 10 sites (Tab.4.1), among them Igaliku
Kujalleq/E66, Qallimiut/E77, and Qorlortorsuup Tasia/
E73 in the Vatnahverfi region (Ibid. 113, 123, 125). The
results of G.F. Holm was published in (1883)
accompanied by meticulous survey and excavation
plans; it was a comprehensive study that set a new
standard for archaeological surveys in Greenland and has
to a large extent been followed ever since (cf. Fig.4.9).
Additionally, G.F. Holm introduced a more interpretive
archaeology, where he combined environmental
description – similar to Thorhallesen and Arctander –
with ethnological parallels to describe the details of the
livelihood on the Norse farms. Finally, G.F. Holm in
1883-1885 carried out the celebrated 'den danske
konebådsekspedition' ('The Danish Umiaq Expedition'),
in which he reached just beyond 65° latitude on
Greenland’s East Coast (Holm and Garde 1887).
Thereby any remaining doubt as to the survival of the
Norsemen was irrefutably quenched.
Fig.4.9 G.F. Holms 1883 survey plan of the church farm at Igaliku Kujalleq/E66 (at that time known as 'Qassiarsuk in Igaliku Fjord'). During an 1880 expedition to South Greenland, G.F. Holm was the first to systematically produce fairly accurate site survey plans of the Norse sites he inspected. In these survey plans, which also included the immediate surroundings of the sites and individual ruin numbering, the basis of a modern archaeological survey methodology is clearly apparent (cf. Fig.5.15-5.16) (after Holm 1883:Tav.XXVIII).

59
In the meantime, J.A.D. Jensen continued the surveys
of Greenland’s West Coast in 1884-1885, in the last year
concentrating on mapping the geography of, and Norse
sites in, the Nuuk Fjord system (Fig.4.10, Jensen
1889:85). Besides inspecting – and in a few instances
mapping or depicting – 14 sites, the most important
contribution of Jensen was the introduction of a
systematic successive numbering system (ruin site no.1,
next no.2 etc.)(Ibid.100pp). This numbering system has
often been attributed to D. Bruun (see below).
Thus a basic systematic survey methodology was in
place when officer Daniel Bruun in 1894 was asked by
'the commission' to lead another archaeological
expedition to South Greenland and there to survey and
excavate as many Norse ruins as possible (Bruun 1895b,
1895a:181). The main aim was to learn about the
character of the Greenland Norse buildings, especially
the farmhouses. In (1889), Dr. phil. Valtýr
Guðmundsson had published a cornerstone study on the
Icelandic dwellings in the Saga time, which provided
sort of a baseline for Bruun’s interpretation of the Norse
farmhouses in Greenland. Assisted by naval officer
Frode Pedersen, they in 1894 between them managed to
survey a staggering 83 ruin groups – a technical term
which seems to have introduced by Bruun – 25 of them
in the Vatnahverfi. Bruun and Petersen also did large-
scale excavations of both structures and middens at E2,
E20, E29, E47, and E66 (Bruun 1895a:434pp), as well as
test excavation at E7, E14, E53, E90, E92, E93
(Tab.4.1).
Considering that Bruun was autodidact and had little
archaeological experience when he came to Greenland in
1894, it is impressive that his (1895) publication of the
investigations should become a cornerstone in the Norse
Greenland archaeology: the descriptions included precise
or estimated measurements of almost all the individual
ruins at each ruin group, which were supplemented by
sketch survey plans including the immediate natural
environs. Bruun also introduced a new by descriptive
methodology by offering functional interpretation of
most individual ruins – most significantly the dwellings
– as well as of the ruin groups as a whole. His
excavations were no less pioneering and are very
informative even today. In the years following 1894 he
would take his experiences from Greenland to do equally
pioneering archaeological and ethnographic studies in
Iceland (e.g., Bruun 1897, 1901, 1903b) and the Faroe
Islands (e.g., Bruun 1896, 1907, Bruun 1929).
Fig.4.10 In the Western Settlement area in the Nuuk Fjord system, J.A.D. Jensen were carrying out ruin sites surveys in the mid-1880’s, here a bird’s eye view of Ujarassuit/Anavik (V7). Besides numbering of individual ruins, J.A.D. Jensen also introduced a similar consecutive numbering system to the sites themselves (after J.A.D. Jensen 1889:Fig.7).

60
Fig.4.11 Left: Sketch survey plan of ruin group E63 and surroundings in the Vatnahverfi, South Greenland. Right: detail survey plan of the main cluster of ruins (nos. 3-5). During his 1894 expedition to South Greenland, D. Bruun made such plans of the majority of the ruin groups he inspected, most of which was in included in his 1895 publication; thereby, he introduced a new level of systematic to the ruin group documentation to Norse Greenland archaeology (modified after Bruun 1895:364-365).
In 1903, Bruun attempted to do a similar survey of
the Western Settlement, but the shortness of the field
season made these surveys more rudimentary (Bruun
1903a, 1917:58): he visited “only” some 22 ruin groups,
but compiled information from earlier surveys on a total
of 88 ruin groups in the Western Settlement. However,
in 1903 he also managed to survey 19 ruin groups, and
was later informed of another 2, on the coast between the
Eastern and Western Settlements (Ibid. 109p), an area
which previously had received limited archaeological
attention (cf. Fig.4.19). This area – comprising the Arsuk
and Ivittut regions – has since been referred to as the
Middle Settlement. Here Bruun restarted the numbering
of ruin groups (with 'M' for Middle Settlement as prefix).
In addition to these archaeological ground works, Bruun
should also be credited with introducig a new form of
publication: synthesizing the archaeological record with
medieval written records and ethnological observations
from his field work in the North Atlantic, he produced
(Bruun 1915, 1928) the first truly overarching cultural-
historical research monographs on the Greenland Norse
– also in popular form – a genre which has since been
reproduced on regular interval (see below).
While D. Bruun may have defined Norse Greenland
archaeology around the turn of the 19th century, it was
Icelandic Dr. Phil. Finnur Jónsson who defined historical
research perspectives: in (1898) he published his
influential study on the medieval topography of the
Norse Settlements. Greatly aided by the now inclusive
settlement evidence produced by Holm, Bruun, and other
early surveyors, as well as by a more precise
geographical record, he was able to identify the location
of many of the topographical place names known from
the medieval accounts; and with the names of the Norse
fjords in place, the search for specifically mentioned
Norse churches and farms could begin. With Jónsson’s
study historical archaeology gained new momentum that
would influence research the next half a century. In fact,
even though Jónsson’s study has not been critically
revised since – except for his own later addendum
(Jónsson 1930) – the historical archaeological agenda of
identifying historically mentioned sites have been in
focus ever since (e.g., Clemmensen 1911, Bjørgmose
1964, 1965, Bjørgmose 1967, Andersen 1982, Bergersen
1997, Guldager 1997, 2000, 2002, Gulløv 2008a).
The reinvigorated agenda of historical archaeology
initiated when Mogens Becker Clemmensen in 1910 was
tasked by 'the commission' with carrying out new
investigations of the churches in the Eastern Settlement
(Clemmensen 1911). Clemmensen was a forerunner for
the new agendas in Greenland Norse archaeology: his
1910 investigations focused mainly on the architectural
history and detail of the churches (Ibid.288, 326, 341), as
well as on locating the churches missing according to

61
Jónsson’s medieval topography. The historical archaeo-
logical approach is also visible from Clemmensen’s
identification of a group of ruins north of the episcopal
farmstead (E47) as the main assembly site ('thing') of the
grænlendinga mentioned in the written sources (Ibid.
334p) (but was later rejected by Nørlund and Roussell
1929:126p). Clemmensen test excavated middens at
Igaliku (E47) and Igaliku Kujalleq (E66) (Tab.4.1),
visited some 20 ruin groups in the region between
Narsaq, Tunnuliarfik, and Sermilik, and located four new
ruin groups (Ibid.354p), three of them (E118, E119,
E120) in the outer fjord Vatnahverfi region. However, as
the aim of M.B. Clemmensen’s surveys was to identify
new churches and none of the new ruin groups seemed to
have one, he provided little detailed information.
The same year Clemmensen reported on his surveys,
Norwegian explorer and scientist Fridtjof Nansen
published his classic 'Into Northern Mists' (Nansen
1911), of which chapter seven concerned Norse
settlement in the North Atlantic. It was essentially the
same kind of popular cultural-historical synthesis that
Bruun had introduced, only with an emphasis on
Norway’s part in the history of the North Atlantic. With
'Into Northern Mists' F. Nansen had introduced a,
somewhat overlooked, parallel narrative on Greenland
Norse settlement stressing Norwegian perspectives.
It was during the research epoch 1832-1921 that the
main foundation for subsequent historical and archaeo-
logical investigations in Norse Greenland was laid. The
site discoveries and descriptions provided by early
explorers – compiled in the monumental GHM (III) – as
well as improved maps, allowed Holm, Jensen, Bruun,
and other surveyors to advance ruin group and settlement
investigations methodologically: anyone who has tried
using – as we did during our surveys in the Vatnahverfi
region – these surveys will know of their continued high
level of applicability, reflecting a robust and systematic
archaeological methodology. These investigations were,
however, not aimed at locating new sites and when
Clemmensen (1911) and Bruun (1917) published the last
surveys of the research epoch, some 120 groups were
recorded in the Eastern Settlement, hereof 31 in the
Vatnahverfi, 19 in the Middle Settlement, and 88 in the
Western Settlement, i.e. in the Eastern Settlement not
significantly more than in the 1845 GHM (III) (cf.
Fig.4.19) (although a number of uncertain sites in GHM
were removed and replaced by new ones, not at least in
the inland of the Vatnahverfi).
Archaeological investigations in the Vatnahverfi
region were also advanced during this research epoch:
excavations began with a small test excavation inside the
church at Igaliku Kujalleq/E66 conducted by Hinrich
Rink in 1854 (unpub. fields notes, the National Museum
of Denmark); in 1837, reverend J.F. Jørgensen carried
out a small test excavation at E120 (Pingel 1839:234)
and in 1839 went on to clear most of the inside of the
church and test excavate the churchyard at E66 (Pingel
1842:345); in 1880, Holm also excavated in several of
the ruins at E66 (Holm 1883:115p), at E73 (Ibid.:126p),
and E77 (Ibid.123); in 1894, Bruun again excavated at
Igaliku Kujalleq/E66, this time mostly in the churchyard
and dwelling (Bruun 1895a:373pp), while Petersen made
small test pits at E90 (Ibid.413), E92 (Ibid.419), E93
(Ibid.).
Of ruin group surveys in the Vatnahverfi region, the
1831-1921 epoch included: the discovery in 1832 of a
new ruin group by botanist J. Vahl in the 'sandur' area
southeast of E66 (Pingel 1835:222), which according to
his description seems to match to the newly registered
ruin group 0502 (App.?) which we located and surveyed
in 2005 on information from local sheep farmers (Møller
and Madsen 2006:31); In 1832-1833, V. Müller – head
of the mission at Friedrichstahl – visited and described in
brief seven of the Norse ruin groups by the Alluitsup
Kangerlua (Pingel 1839:230p), and in 1839 Moravian
Brothers discovered another ruin by Amitsuarsuk (E91)
(Pingel 1842:329), which later seems to have been
destroyed; in between them, Holm, Bruun, and Petersen
described and mapped 31 of the ruins groups in the
Vatnahverfi region in 1880 and 1894, respectively.
Finally, in addition to the three new ruin groups.
Clemmensen added to the Vatnahverfi region in 1910),
reverend Erik Jespersen in 1911 located, and provided
description and plans of, two new ruin groups (E64a,
E64b) in the northern Vatnahverfi region, the former
excavated by C.L. Vebæk in 1939 (see below).
4.1.3 EXCAVATIONS – 1921-1962
That large-scale archaeological activity initiated in
1921 – on the 200 year anniversary of H. Egede’s
landing in Greenland – was not a coincidence: it
coincided with the year that Denmark internationally laid
claim to all of Greenland’s territory, opposed only by
Norway (Blom 1973). This started a feud between
Denmark and Norway over the territorial rights in
eastern Greenland and in 1933 the Norwegians went on

62
to occupy parts of the East Coast. One of the occupied
parts was referred to as 'Erik Raudes Land' ('the Land of
Erik the Red'), a historical linkage that was also invoked
in the political debate (Ibid.13), showing that cultural-
history and politics had once again become intertwined.
In 1933, the dispute was brought before the Hague
Tribunal, which ruled in in favor of Denmark’s territorial
right to all of Greenland.
More importantly, perhaps, in 1921 the National
Museum of Denmark was delegated the responsibility of
overseeing the continued investigations in the Norse
settlements in Greenland, although still under the
direction of 'the commission' (Arneborg 1989:123). It
was a compromise to calm mounting frustration among
scientists from different disciplines with the old setup of
'the commission' headed by a narrow group of geologists
and geographers (Arneborg and Secher 2005:15). How,
and to which extent, these changes in 1921 influenced
the archaeology of Norse Greenland is beyond this
section to discuss, but their convergence was hardly
chance. At any rate, the research epoch 1921-1962 was a
pinnacle for excavations in Greenland, the results of
which still form the backbone of our archaeological
record on the architecture and layout of the Norse
farmsteads, dwellings, and outbuildings. Many results
from these excavations are discussed in relation to
particular topics throughout the dissertation and here I
only list key scholars involved, their investigations, and
associated published research overviews:
The epoch began with historian Poul Nørlund’s 1921
excavation at Ikigaat/Herjólfsnes (E111), where he
unearthed the extremely well-preserved medieval burials
with garments in the churchyard, as well as the church,
part of the dwelling, and the byre/barn (Nørlund 1924).
Thereby Nørlund had initiated what would be the
hallmark of the epoch’s excavations: methodologically
simple, but large-scale excavation of many farmstead
buildings, although with principal focus on the churches,
dwellings, and byres. Nonetheless, this was the epoch
when most outbuildings were excavated (cf. Tab.4.1). It
was also the 1921 excavation that for the first time
brought attention to the issue of climatic deterioration as
a cause of settlement decline (Nørlund 1924:237p,
1934:57). In 1926 Nørlund took the new excavation
methodology to the episcopal see of Igaliku/Garðar
(E47) (Fig.4.12, Tab.4.1) (Nørlund and Roussell 1929).
In 1930, Nørlund was in charge of the first large
excavation in the Western Settlement at Kilaarsarfik/
Sandnes (V51), but eventually left the investigations to
his protégé Aa. Roussell (see below). In 1932, Nørlund,
assisted by Dr. Phil. Marten Stenberger, carried out his
last large excavation in Greenland at Qassiasuk/
Brattahlið (E28, E28a, E29, E29a), where he excavated
church, churchyard, three dwellings, two byres and a
sheep/goat shed (Nørlund and Stenberger 1934).
Besides his excavations, Nørlund also did a large
number of surveys in the Eastern Settlement area, the
details of which, however, are mostly recorded only in
field notes kept in the NMA. Like Clemmensen before
him, Nørlund was working explicitly to clarify the
medieval topography by identifying the churches that
were missing according to the medieval church lists, an
agenda which was explicitly formulated in his research
overview (Nørlund 1928). He was quite successful in
achieving this goal, identifying – and test excavating the
churchyards of – two churches in 1926 (E105 and E140)
(Nørlund 1928:52p) and four in 1932 (E18, E33, E35,
E149) (Nørlund and Stenberger 1934:9p). In 1934,
Nørlund published his popular historical-archaeological
synthesis on the Norse Settlements (Nørlund 1934). At
this time, 148 ruin groups were recorded in the Eastern
Settlement – most of them added during his own surveys
– while the number of ruin groups in the other settlement
areas remained largely unchanged (Fig.4.19).
During Nørlund’s 1926 excavation at Igaliku/
Garðar (E47), architect Aage Roussell had worked as
his assistant, but from 1932 the latter took over the
National Museum of Denmark’s large-scale excavations
in Greenland, first concentrated in the Western Settle-
ment: in 1930 and 1932, Roussell finished and published
the excavations of Kilaarsarfik/ Sandnes (V51) (Roussell
1936b); in 1932, he also conducted a major large-scale
excavation at V7 and V16 (Roussell 1941:32, 78), and
prepared V52a for excavation in 1934 (Roussell
1936b:61p, 1936a); in the same year, he excavated the
small shieling site V53 (Roussell 1936b:60, 1941:228p),
as well as the dwelling of V8 (Roussell 1941:75, 108); in
1937, he carried out excavations of the dwellings at the
inlands farms of V35, V53c, and V53d (Roussell 1938,
1941). These excavations allowed him to later present a
typology on the development of the Norse Greenland
farmhouses and the of the 'centralized farm' (see section
5.1.2).

63
Fig.4.12 Nørlund’s site survey plan of Igaliku/Garðar (E47) from his 1926 excavation at the ruin group. Whereas earlier investigators had mapped the church and the immediately surrounding ruins several times, P. Nørlund was the first to map the entire farmstead, a methodology undoubtedly owing much to G.F. Holm and D. Bruun, but at Garðar advanced to a new standard (after Nørlund 1921:Fig.2).
Roussell was also a very active excavator in the
Eastern Settlement: in 1935 he excavated the dwelling
and several outbuildings at the Hvalseyjarfjörður church
(E83) (Roussell 1941:34p), as well as a couple of ruins
at the neighboring “dairy farm” E83a (Ibid.37p); in the
same year, he excavated in the church, churchyard and
byre at Igaliku Kujalleq/undir Höfða (E66). In between
these large-scale excavations, he also carried out a

64
number of smaller test excavations, as well as surveys in
both settlement areas. Some records from these
investigations are only available as field notes,
descriptions, and plans in the NMA, while others were
published by count Eigill Knuth, who worked as Aa.
Roussell’s assistant in 1932 and 1934 (Knuth 1944).
However, most findings from Roussell’s impressive
archaeological campaigns were included or condensed in
his (1941) doctoral dissertation, perhaps the single most
important publication in Norse Greenland archaeology
since Holm’s and Bruun’s landmark studies (see above),
and in general. In addition to detailed reviews of prior
archaeological investigations, which he compared with
the results of his own surveys and excavations – most of
it accompanied by detailed survey and excavation plans
– Roussell in his study also carried out the first truly
systematic analysis of the archaeological settlement
evidence, e.g. his classical farmhouse typology (see
section 5.1.2). Roussell’s dissertation promoted
comparative perspectives and included observations of
building customs in the rest of the North Atlantic. It also
included a fairly detailed description and discussion of
the farmstead outbuildings (Ibid.214pp), which had not
been done since Bruun’s 1895 publication. With this
addendum – and his excavations of a number of
“ordinary” farmsteads in the Western Settlement –
Roussell had moved Norse Greenland research a step
away from the traditional agenda of historical
archaeology and towards a more balanced settlement
archaeology; it now included some 176 ruin groups in
the Eastern Settlement, hereof 41 in the Vatnahverfi
region, 24 in the Middle Settlement, and 77 in the
Western Settlement (cf. Fig.4.19).
This new archaeological agenda was at the same time
being advanced by the last important scholar of the
1921-1962 research epoch, archaeologist Christian Leif
Vebæk: in 1939, he carried out excavations of three
farmsteads (E64a, E64c, E78a) in the Vatnhaverfi
region, one of them the first truly “centralized farm” in
the Eastern Settlement (Vebæk 1941, 1943); in 1945-
1946 and 1948, he did large-scale excavation of the
church, churchyard, dwelling and most outbuildings at
the supposed Benedictine convent at Narsarsuaq (E149,
Fig.2.5) (Vebæk 1991:21pp); in 1946 he test excavated
the churchyard of the newly discovered church at
Narsaq/Vagar (E162) (Ibid.18p). In 1949-1950, Vebæk
returned to the Vatnahverfi, where he oversaw
excavations of three more farmsteads (E70, E71, E167)
(Vebæk 1952:107p, 1958:110p, 1992:23pp); in 1954, he
carried out the first larger excavation in the Middle
Settlement at ruin group M15, as well as smaller
excavations at two other sites (M10 and M21) (Vebæk
1956, 65, 74, Albrethsen and Arneborg 2004); finally, in
1954, 1958, and 1962, C.L. Vebæk excavated the
'landnáma farm' (E17a) by Narsaq (Vebæk 1965, 1993),
his last large-scale excavation in Greenland. With this
excavation, C.L. Vebæk should be credited with carrying
out the first phased excavation of a Norse dwelling.
While Vebæk’s choice of sites excavated show that
the livelihood on “ordinary” Norse farmsteads were
increasingly in archaeological focus, he was himself still
highly preoccupied with the traditional historical-
archaeological questions of the medieval topography and
church lists. This is clear from a research review
published by him in (1943), and from a number of
subsequent publications (Vebæk 1953a, 1953b, 1966,
1991), as well as, unfortunately, from his very summary
publication of his many surveys of the ordinary farms
(Vebæk 1952, 1953c, 1956, 1982, 1992:14p). Still,
Vebæk’s contribution was tremendous: after World War
II, 'the commission' was disbanded as a central research
organ (Arneborg and Secher 17) and it was mainly by
Vebæk’s efforts that excavations continued and the
number of ruin groups kept increasing: in a later research
overview Vebæk could list some 215 in the Eastern
Settlement, hereof ca. 60 in the Vatnahverfi region, as
well as 28 in the Middle Settlement, and 79 in the
Western Settlement (cf. Fig.4.19. A few of these new
ruin groups had been added by Norwegian explorer
Helge Ingstad during a 1953 expedition to Greenland, an
account of which he had published in his 1959 classic
the 'Land under the Polar Star' (Ingstad 1960); this was
the last historical-archaeological synthesis on the Norse
settlements of the research epoch and, suggestively, the
last to draw primarily on the medieval written evidence.
Reviewing the excavations of the 1921-1962
research epoch, one could easily accuse them of being
methodologically simplistic and inadequate in the sense
that they failed to identify and clarify the multiple and
complex building histories of the excavated structures.
However, it is equally clear that the excavators were
aware of this issue (e.g., Roussell 1941:181, 188, Vebæk
1943:47, 1992:47), and already in 1929 Nørlund, for
instance, attempted to provide a building history of the
church and dwelling at Igaliku/Garðar (E47) (Nørlund
and Roussell 1929:42p, 77p) (although his phasing has

65
since been reevaluated, see Høegsberg 2008). Rather, the
excavations of epoch were simply more concerned with
form and function, i.e. establishing the overall layout of
farmsteads, dwellings, and outbuildings in comparison to
customs elsewhere in the North Atlantic; with
identifying the functional layout of the dwellings; and
retrieving artefacts for illuminating the livelihood of the
grænlendinga. In this concern, the importance of the
1921-1962 excavations cannot be exaggerated. And
although traditional agendas of historical archaeology
remained highly influential throughout the research
epoch, Roussel’s and Vebæk’s investigations did move
Norse Greenland archaeology significantly towards a
more balanced and embracive settlement archaeology.
Not at least in the Vatnahverfi region was the 1921-
1962 research epoch one of major advance: Roussell
(re)excavated the church, parts of the churchyard, and
byre at Igaliku Kujalleq/undir Höfða (E66) in 1926 and
1935 (Roussell 1941:99). In 1932, eskimologist Erik
Holtved test excavated around E91 (NMA: Holtved
1932:6) However, it was Vebæk’s investigations from
1939 onwards that most significantly developed research
in the region.
Vebæk’s surveys were equally important: over some
20 years of field work, he added ca. 20 new ruin groups
to the 41 known in the Vatnahverfi region around the
time of Roussell’s 1941 publication, as well as two more
churches (E78 and E64), in 1951 and 1962 respectively,
and test excavated their churchyards (Vebæk 1953b,
1966, 1991). Unfortunately, most of Vebæk’s surveys
were only hastily recorded in photography, in sketch
surveys, or field notes (kept in the NMA), although he
did publish several overview accounts (Vebæk 1952,
1953c, 1982, 1992). He was, like his contemporaries,
focused on the medieval topography. On the other hand,
his investigations heralded new trends in the archaeology
of Norse Greenland, which would, eventually, emerge.
4.1.4 HIATUS – 1962-1976
Compared to the previous period, the research epoch
1962-1976 must be considered a hiatus in Norse
Greenland archaeology: the only larger excavation of the
epoch was the investigation of Þjóðhildarkirkja at
Qassiasuk/Brattahlið (29a ruin no.59) in 1962 and 1964-
1965, which was a discovered by chance (Meldgaard
1964, Krogh 1965, Meldgaard 1982). The very first
excavation season at Þjóðhildarkirkja was directed by
archaeologist Jørgen Meldgaard, who also published the
first historical-archaeological synthesis of the epoch
(Meldgaard 1965); in spite of its popular style, this
publication clearly hinted at themes of a more developed
archaeology.
However, an even clearer archaeological emphasis
was apparent in the next historical-archaeological
synthesis, which was published just two years later by
another architect-archaeologist from the National
Museum of Denmark, Knud Jepsen Krogh. Krogh had
taken over the excavation of Þjóðhildarkirkja after
Meldgaard, and for the next many years he would
oversee most of the museum’s investigations in
Greenland, including a number of test excavations, as
well a vast number of ruin groups surveys in connection
with the intensification of sheep farming in South
Greenland (see section 9.1.3). Although Krogh was a
highly active and skilled surveyor, only his church
investigations were published and his developmental
typology for small and large churches is still used today
(see section 5.2) (Krogh 1976, 1982a). Of his many other
detailed surveys, only a part are found in the NMA, the
remaining records still being largely unpublished or in
private ownership. Krogh also brought attention to the
irrigation systems on the Greenland Norse farms (Krogh
1974), although it was H. Ingstad who had first noticed
them (Ingstad 1960:78).
On the excavation team at Þjóðhildarkirkja were two
archaeology students, Svend Erik Albrethsen and Jette
Arneborg, both of which would have a great importance
for investigations in Greenland to come. Already during
the research epoch 1962-1976. Albrethsen took part in
archaeological investigations related to intensified sheep
farming (Tab.4.1, field reports in the NMA), and in 1971
he presented the research epochs’ first more academic
research overview (Albrethsen 1971).
However, the perhaps most important contribution to
Norse Greenland archaeology in the 1962-1976 epoch
came from unexpected side: in 1965, local school
teacher in Alluitsup Paa (Sydprøven) Ove Bak began to
search and record Norse ruin groups in the vicinity of his
home settlement, over the next years gradually extending
his surveys to a large part of the Eastern Settlement.
Paying out of his own pocket, or by modest funding,
travelling by foot or small dingy, Bak. in the period
1965-1972 visited and described no less than 305 ruin
groups, 142 of them new (Bak 1969, 1970b, 1971,
1972b, 1972a). His earliest surveys were admittedly

66
basic, but over the years his sketch survey plans and
descriptions improved significantly (Fig.4.13, the
originals are now kept in the NMA). In any case, Bak
must be recognized as one of the great contributors to
Norse settlement archaeology, especially as the one who
extended Norse settlement into formerly blank areas on
the maps, i.e. into the “wilderness” of the outer fjord and
deep inland. Bak was thus the main reason for the great
number of new ruin groups that K.J. Krogh could
include in his 1982 updated research overview (see
below).
The research epoch 1962-1976 was in most concerns
a rather lull phase in Norse Greenland archaeology:
methodologically, and in terms of research questions,
investigations were largely comparable to those of the
previous epoch. On other hand, new research agendas
and trends were emerging and would erupt during the
next research epoch.
In the Vatnahverfi region, the period 1962-1976 was
also one of relative few investigations. Apart from a
1969 test excavation in the midden of E120
(NMA:Albrethsen 1971), it consisted of archaeological
surveys: in 1964 Knud Thorvildsen visited and described
eight ruin groups (E63, E64, E66, E78, E78a, E119,
E184, E196) in the region (NMA:Thorvildsen 1964).
Bak’s 1965-1972 surveys also extended to the
Vatnahverfi region, where he visited and described some
33 ruins, 26 of them new. Also, follow-up surveys were
carried out in the region by Krogh and Albrethsen in
connection with intensified sheep farming: in 1968 of
E63, E64, E66, E76 (NMA: Krogh& Albrethsen 1968),
in 1969 of E119, E120 (NMA: Krogh &Albrethsen
1969), in 1971 of E66, E76, E78, E95b, E169, E172,
E178, E179, E190, E184, E188 (NMA: Albrethsen
1971).
Fig. 4.13 One of O. Bak’s later (1971) sketch survey plans of ruin group E313 (B141 after his numbering system) in the Sioralik in the Vatnahverfi region. Although less detailed than the survey plans of G.F. Holm (cf. Fig.5.9) and D. Bruun (cf. Fig.5.11), O. Bak’s survey plans are precise enough to be a highly valuable tool during ruin group revisits and were frequently used during the Vatnahverfi surveys (after NMA: Bruun 1971:B141).

67
4.1.5 CULTURAL HERITAGE MANAGEMENT AND
RESEARCH PROJECTS – 1976-2005
Following the 1962-1976 hiatus, the research epoch
1976-2005 saw Norse Greenland archaeology finally
emerge as a fully modern discipline, e.g. shedding off
most of the agendas of historical-archaeology (see
above). However, the archaeological investigations were
increasingly divided upon two different spheres of
activity: research projects (initially introduced mainly
from Denmark) and cultural heritage management, the
latter especially related to intensified sheep farming after
1976/1977 (see section 8.2.3) and transfer of archaeo-
logical supervision and responsibility to Greenland’s
Home Rule in 1981 (Arneborg 1989:128). The number
and scale of archaeological investigations in this epoch
preclude any full review, not at least because a number
of research- or heritage management projects concerned
with non-Norse cultures opportunistically, or summarily,
included Norse ruin groups. The below review is limited
to the major archaeological investigations, presenting in
detail only activities in the Vatnahverfi region.
Although cultural heritage management increasingly
came to constitute an important sphere of archaeological
activity, the research epoch 1976-2005 initiated with two
research projects headed by the National Museum of
Denmark, but collaborating internationally: one was the
'Inuit/Norse Project' in 1976-1977 in the Western
Settlement (Meldgaard 1976, 1977). The aim of this
project was to investigate the interaction between Norse
and Inuit in the Nuuk fjord system. In addition to
investigations at two Thule-culture sites, the Inuit/Norse
Project included excavation of the midden at V48/
Niaquusat, most of the dwelling and part of the midden
at Nipaatsoq/V54, and test excavation of the dwelling at
59/Eqaluit (Meldgaard 1976, 1977, Andreasen 1982,
Møhl 1982, McGovern et al. 1983, McGovern 1985,
Arneborg 1991a). Although the Inuit/Norse Project
failed to clarify the question of Inuit and Norse
interaction, it had several other research repercussions:
First, it introduced modern excavation techniques to
Norse Greenland archaeology, i.e. separation and sieving
of stratigraphic sequences. Second, this excavation
technique was applied to both buildings and middens.
This completely revived the research niche of zoo-
archaeology in Greenland, advanced especially through
the studies of Thomas H. McGovern (e.g., McGovern
1980, 1985, 1991, 1992a). In turn, this niche was part of
a larger environmental and land use research agenda,
which was also introduced through Inuit/Norse Project
(e.g., Meldgaard 1977, McGovern and Jordan 1982,
McGovern et al. 1983, McGovern et al. 1988, Barlow et
al. 1997). Climate related and environmental research
approaches to Norse settlement in Greenland have grown
in importance ever since.
Parallel to the Inuit/Norse Project was the 'Nordisk
Arkæologisk Expedition 1976' ('Nordic Archaeological
Expedition' or 'NAE') around Tasiusaq and Qorlortup
Itinnera in the central Eastern Settlement. The aim of this
project was reinvestigate settlement evidence to address
issues of depopulation, also by Nordic comparative
perspective. The project therefore included scholars from
all of the North Atlantic and Scandinavia (Edgren
2002:2p). In 1976, field investigations included detailed
surveys of seven ruin groups in the valley of Qorlortup
Itinnera (E4, E33-E38) – covering some 200 of the then
230 registered ruins – as well as a test trench in the
midden of E38 (Ibid.7), a cut in an irrigation ditch and
phosphate sampling at E4 (Hasselmo 1985:59p). The
project was to run for several years, but for various
reasons ended with a smaller field season in 1977 (Keller
1983:59). Both the Swedish and Finish field teams
handed in interim reports (Hasselmo 1985, Edgren
2002), but otherwise the project did not come together as
planned. On the other hand, the NAE did establish the
foundation – and provided ruin group records – for later
studies by Norwegian archaeologist Christian Keller and
Albrethsen (Keller 1983, Albrethsen and Keller 1986,
Keller 1986, Albrethsen 1991), some of the research
epochs’ most important settlement pattern studies. As
with the research “offshoots” from the Inuit/Norse
Project, C. Keller’s and S.E. Albrethsen’s had a notable
focus on environmental conditions and land use patterns.
Following these projects, there was a pause in larger
archaeological research projects until the Vatnahverfi
Project initiated in 2005 (see section 4.2.1). However,
renewed archaeological investigations at Kilaarsarfik/
Sandnes (V51) in 1984 were to a large extent project
oriented, although they were partly carried out in
response to erosion threat of the ruin group’s midden: in
1981, T.H. McGovern and Richard H. Jordan surveyed
part of the Ameralik to assess erosion threats and midden
preservation (McGovern and Jordan 1982:63), which led
to the excavation by an international team of specialists
of V51’s midden and coast near structures in 1984
(Arneborg 1985, McGovern et al. 1996).

68
Fig.4.14 Example of a 1980 sketch survey plan of ruin group E174 in the southern Vatnahverfi region (cf. appendix ?.?). In terms of method and accuracy, this type of archaeological survey carried out in connection to the development of sheep farming was comparable to the surveys of G.F. Holm and D. Bruun and hundred years earlier (cf. Fig.4.9, 4.11). However, the surveys are still highly valuable for the location of ruins (after NMA: Krogh og Berglund 1980:168).
Also, towards the end of the research epoch two
smaller archaeological projects in the Eastern Settlement
were carried out: one was a Ph.D.-project by Dorte
Veien Christiansen, which involved test trenching of one
ruin and a midden at E221 by the supposed Norse
Sandhavn in 2001-2002 (Tab.4.1) (Christiansen 2002:15,
2004:32). This Ph.D.-project was associated with a
project on the early Thule-culture in South Greenland,
which involved a number of surveys and minor test
excavations (E47, E80, E221) of Norse ruins (Gulløv
2000a, Raahauge et al. 2002, Raahauge et al. 2003,
Gulløv 2008a). The other project was Arneborg’s study
on the smaller types of Norse churches (Arneborg 2002)
and isotopic levels of buried Norsemen (Arneborg et al.
1999, Arneborg et al. 2008, Arneborg et al. 2012a),
which since its beginning in 2001 has involved test
trenching or excavation of five (E33, E35, E48, E64,
E78) churchyards in the Eastern Settlement (Arneborg et
al. 2002, Møller et al. 2007:22p, 25p, Arneborg et al.
2009a:9pp). Related to Arneborgs church project was
also a test excavation in 2002 at E39 (Arneborg 2010,
Edwards et al. 2010), which disproved the identification
of a ruin as a church (Guldager 2000, 2002); and a
follow-up excavation at E83a in 2004 – which identified
a possible early type dwelling (Arneborg et al. 2009b).
However, while the research projects were renewing
the agendas of the archaeology of Norse Greenland,
cultural heritage management accounted for a larger part
of the research epoch’s field investigations: most of the
archaeological surveys were related to the development
of intensive sheep farming, which entailed enlarging
cultivated areas and building large modern sheep stables
(see section 5.2.3), improvements that were preceded by
archaeological inspection. The surveys, and surveyors,
are too many to list and the survey evidence, predictably
of much varying detail and quality (e.g. Fig.4.14), most
of it available only in reports in the NMA. However, it
was these surveys that kept the number of ruin groups,
and not at least ruins, growing throughout the epoch:
when Krogh in (1982) published his updated edition of
his 1967 popular synthesis, the map included some 408
ruin groups in the Eastern Settlement, hereof 143 in the
Vatnahverfi region, as well as 28 in the Middle
Settlement, and 78 in the Western Settlement. (Fig.4.19).
Academic research overviews were published in 1982
and 1989 (Olsen 1982, Arneborg 1989).
Towards the end of the 1976-2005 research epoch,
two more research based archaeological surveys set new,
or in the least revived the old, standards for systematic
archaeological surveys and their publishing: one was the
survey of Albrethsen and Arneborg of the ruin groups in
the Middle Settlement (Albrethsen and Arneborg 2004);
the other the survey of Ole Guldager, Steffen Stummann
Hansen, and Simon Gleie in the region between the
Tunnulliarfik and Sermilik fjords in the central Eastern
Settlement (Guldager et al. 2002). Both these benchmark
surveys are as systematic and thorough as those of Holm
and Bruun (Fig.4.15, see section 4.1.2). Unfortunately,
they are essentially also methodologically similar: most
ruins were only roughly measured or “paced off”, and
overview ruin group survey plans sketched. This makes
direct comparison with later DGPS-surveyed sites
somewhat problematical. Still, the two recent surveys
have set the standard for the methods and visualization
used in the surveys of the Vatnahverfi Project (cf.
Fig.4.15-4.16).

69
Fig.4.15 Example of 2002 sketch survey plan of ruin group E4 by the Tasiusaq in the central Eastern Settlement. Although still based on estimated measurements and placing, archaeological surveys have from the late 1990’s become increasingly detailed, systematic, and precise (cf. Fig.5.16), a methodological improvement especially advanced by O. Guldager et al. (2002) (after Guldager et al. 2002: Fig.82).
Fig.4.16 Example of 2011 DGPS-survey plan of ruin group E4 by the Tasiusaq in the central Eastern Settlement. Apart from a greater number of buildings and features, the precision plan is comparable to the sketch survey plan (cf. Fig.4.15), attesting to the skill of the surveyors of the former. However, while some sketch may provide comparative survey evidence, others may be more imprecise, and there is no way of ascertain this (plan made by C.K. Madsen 2011).

70
Cultural heritage management also accounted for
several excavations during the 1976-2005 research
epoch: one was related to the development of sheep
farming, e.g. test excavation in 1994-1995 of the midden
of E34, which had been discovered in 1993 by a sheep
farmer cutting drainage channels (NMA: Nyegaard
1996). However, the most important excavation of the
period was carried out due to erosion threat: in 1990,
local caribou hunters reported seeing large pieces of
wood being washed out of the brink of a melt-water river
in an unnamed inland area south of the Naajat Kuuat in
the Western Settlement. An inspection by the National
Museum of Greenland the same year confirmed the
presence of an unknown and eroding Norse ruin with
astounding preservation conditions due to sedimentation
and permafrost. Actual excavations of this 'Farm beneath
the Sand' (GUS) were carried out in 1991-1996 and it is
to date the most comprehensively excavated Norse ruin.
However, besides zoo-archaeological evidence (Enghoff
2003), specialist studies (e.g., Panagiotakopulu et al.
2007, Hebsgaard et al. 2009), and several preliminary
reports (e.g., Andreasen and Arneborg 1992, Arneborg
and Berglund 1993, Albrethsen and Ólafsson 1998,
Berglund 1998a, 2000, 2001), the final publication of
GUS is in progress.
Two other excavations of the research epoch related
to industrial development: in connection with the
establishment of a gold mine in 'Kirkespirsdalen' in the
peninsula between the Southern Semilik and Tasermiut
fjords, a presumed Norse shieling site (60V2-II-574) was
excavated in 1997 (see section 5.1.3 and: Berglund
1998b); in 2004, a test excavation was carried out at the
dwelling and byre/staple at E74 and outbuildings at E73
by lake Qorlortorsuup Tasia in the eastern Vatnahverfi
region in connection with the establishment of a hydro-
electrical plant (see section 5.1.3 and: Kapel 2004).
Apart from a number of brief research reviews
presented by Arneborg (e.g., Arneborg 1993, 1999,
2003a, 2003b), it was more than a decade before
Krogh’s 1982 historical-archaeological synthesis was
replaced: first, by a very thorough and critical, but also
very historically oriented monograph by Kirsten Seaver
(1996), latest by an archeologically oriented synthesis by
Arneborg (2004). In this latest study, some 460 sites
were recorded in the Eastern Settlement, hereof ca. 145
in the Vatnahverfi region, as well as ca. 39 in the Middle
Settlement, and ca. 95 in the Western Settlement
(Fig.4.19).
In summary, the 1976-2005 research epoch saw some
of the most important modern excavations in Norse
Greenland to date. Especially midden excavations have
provided detailed information on economic patterns and
-changes on the farmsteads (e.g. see section 2.2). The
significance of the ruin excavations, however, is
somewhat reduced: first, by the circumstance the larger
excavations (V54, GUS) concerned only Western
Settlement centralized dwellings, which were almost, but
not completely, excavated (no outbuildings were
investigated); second, by the – as yet – rather
preliminary and summary publication of the excavations.
More significant, perhaps, was the introduction to the
archaeology of Norse Greenland of modern excavation
methods and environmental research aspects. Although
archaeological activities related to cultural heritage
management did not advance the scope or established
methodologies of ruin group surveys, they did continue
to add ruins and ruin group evidence, much of which has
been invaluable to the surveys of the Vatnahverfi region.
Also, the combined survey records gained from research
projects and cultural heritage management encouraged
and enabled the first regional-level detailed settlement
pattern studies in Norse Greenland archaeology.
Beyond ruin group surveys associated with the
development of intensified sheep farming (e.g. Fig.4.14),
the 1976-2005 research epoch saw few archaeological
investigations in the Vatnahverfi region: in 2004 small-
scale rescue-excavations were carried out at E73 and
E74 Kapel et al. (see above), an investigation that also
involved the first surveys in the Vatnahverfi by Niels
Algreen Møller (Kapel 2004).
4.1.6 SPECIALIZED RESEARCH PROJECTS AND
ECODYNAMICS AFTER 2005
In 2005-2006, a substantial part of the midden at
Qassiasuk/Brattahlið (E29a) was excavated by an
international team in order to secure a stratified faunal
material from the Eastern Settlement (Edvardsson
2007a); also in 2006, most of the dwelling and midden
of ruin group E74 by lake Qorlortorsuup Tasia in the
central Vatnhaverfi region was excavated in connection
with the establishment of a hydro-electrical plant
(Edvardsson 2007b). Otherwise, the bulk of
archaeological activity after 2005 relating to Norse
settlement in Greenland has been by part of, or affiliated
with, the Vatnahverfi-Project, which is described in
detail in section 4.2.

71
Otherwise, smaller and specialized research projects
addressing climatic, environmental, and land use aspects
of Norse settlement have been the trademarks of the
research of the last decade. Since many such studies are
presented throughout the dissertation, they will not be
listed here. However, of special interest to the themes
explored in the dissertation are the new palynological
studies in the Vatnahverfi region (Ledger et al. 2013a,
2014b), and elsewhere in the Eastern Settlement
(Edwards et al. 2007, Schofield et al. 2007, Buckland et
al. 2009, Golding et al. 2011, Schofield and Edwards
2011, Panagiotakopulu et al. 2012, Schofield et al.
2013). The French research project 'Groenland Vert'
('Green Greenland') has since 2010 worked on sediment
cores from lakes in the central Eastern Settlement
(Gauthier et al. 2010, Massa et al. 2012a, Massa et al.
2012b, Perren et al. 2012), latest in the Vatnahverfi
(unpublished).
Also of special value to the dissertation have been the
ruin group surveys by Niels Christian Clemmensen and
Hans Kapel, who since 2008 have been DGPS-surveying
Norse ruin groups (E18, E59, E66, E111) for the
National Museum of Greenland as part of their cultural
heritage management strategy (Clemmensen and Kapel
2008, 2010a, 2010b, Kapel and Clemmensen 2013).
They have kindly provided me with the precision
surveys that constitute most of the comparative Eastern
Settlement survey evidence. Archaeo-agronomist Peter
Steen Henriksen from the National Museum of Denmark
have since 2010 conducted specialized studies of
farming and fertilizing at farmsteads in the central
Eastern Settlement, including E64 in the Vatnahverfi
region; some of his findings are already published
(Henriksen 2012), others are in press. Finally, Icelandic
historian Orri Vésteinsson (2010) have used the prior
survey evidence and interim reports from the
Vatnahverfi Project to carry out a parish-level study of
settlement patterns in the Eastern Settlement (see also
section 7.3.1)
A major research trend since around 2005 has been a
move towards increasingly overarching and comparative
perspectives on North Atlantic settlement and land use:
in these studies of ecodynamics in the North Atlantic,
changes in settlement- and economic patterns across the
North Atlantic are jointly weighed against human
impacts on, and management of, landscapes and
resources, and not at least the impact of natural climatic
and environ-mental changes. It is especially scholars
working with the research network of the 'North Atlantic
Biocultural Organization' (NABO) that have promoted
these new perspectives, not at least by very rich
publication activity (e.g., Dugmore et al. 2005, Dugmore
et al. 2007b, Dugmore et al. 2009, Dugmore et al. 2012,
Dugmore et al. 2013). These studies have been highly
inspirational to the themes investigated and discussed in
the dissertation.
At present, no monograph on Norse Greenland has
been published to update J. Arneborg’s (2004) overview
and to synthesize and summarize all of these new
findings and approaches. However, two historical-
archaeological popular narratives have been presented,
one with a fairly discursive perspective (Seaver 2010),
the other stressing Norwegian perspectives on settlement
in Greenland (Lindval 2011).
4.1.7 SUMMARY DISCUSSION
Reviewing the research history of the archaeology of
Norse Greenland and the Vatnahverfi it developed – as
most scientific disciplines – through steadily advancing
and accelerating research, spearheaded by archaeological
pioneers all the way back to H. Egede’s first 1723
exploration: the surveys of the Vatnahverfi-Project were
only possible because of the prior surveys of Holm,
Bruun, Bak, Krogh, Albrethsen etc., who in turn were
indebted to earlier surveyors Walløe, Olsen, Arctander
etc. I have been able to list far from all contributors to
this development, neither all investigations. However,
although I believe I have outlined the most important
contributors and their investigations, and having thus
provided a stand der forschung over near 300 years of
archaeology in Greenland, a few concluding comments
and perspectives seem in order:
Tab.4.1 and Fig.4.17-4.18 shows most archaeological
excavations carried out on Norse ruins in the settlements
of Greenland, listed after the first year of investigation.
This list of a total of 94 ruin groups is not exhaustive,
but it does include all the investigations described in the
above, as well as others not described. I predict that at
least 90% of the excavations carried out in Greenland, or
at least in the Eastern Settlement, are listed in Tab.4.1; it
indicates what type of ruin or feature was investigated,
whether it was a comprehensive or test excavation, and
references to primary related publications.
There are few striking patterns to Tab.4.1, except for
the most apparent observation that more than two thirds

72
of the excavations were carried out between 1832 and
1962, i.e. prior to the introduction of 14
C-dating (except
for the excavation of E17a: Vebæk 1993). Thus, for two-
thirds of the excavations, there is no chronological
framework. Obviously, this has problematic implications
for tracing building developments and the surface
interpretation of ruins. This issue is aggravated by the
observation in Tab. 4.1 that comprehensive excavations
of ruin groups in the Eastern Settlement has recently
only been carried out at two ruin groups (E74 and 60V2-
II-574), hereof one dwelling (E74 ruin no.4).
Apart from the obvious, but unrealistic, suggestion
that we need to excavate more Norse ruins in Greenland,
I would suggest that several of the previously excavated
buildings could expediently be reinvestigated: the early
excavations were seldom carried through, so floor layers,
deposits, buildings sequences are often preserved; and
since early excavators rarely backfilled excavations,
trenches or larger excavation areas can easily be opened,
sampled, and dated. We have tried this, or test-
excavating naturally eroding ruins, with success during
the Vatnahverfi Project (e.g., Heide and Madsen 2011).
On their own such investigations are of limited value,
but compiled they constitute a valuable chronological
supplement to more detailed stratigraphic records from
larger excavations (see section 8.2.1-8.2.2).
Another clear implication from Tab.4.1 relates to the
excavation of outbuildings: in fact, only at the Norse
shieling site in Kirkespirsdalen has other, and in that
case rather atypical, ruins rather than dwellings been
excavated since the 1921-1962 epoch. The effect is
unmistakable: apart from the byre/barns, we know next
to nothing of chronology, development, or function of
the various types of outbuildings. This is, by my accord,
one of the most problematic issues in regard to the
interpretation of the survey evidence. Finally, the
historical-archaeological agenda relating to the medieval
topography and church lists is also clear from the large
frequency of church excavations visible in Tab.4.1.
Fig.4.19 displays the estimated number of identified
ruin groups in the different settlement areas in Greenland
– with the specified proportion made up by ruin groups
in the Vatnahverfi region – from 1794 and up till today.
Besides notable and expected increases in the first
research epochs, the number of registered ruin groups in
the Eastern Settlement has been growing rather steadily
over the last 250 years, while the numbers of ruin groups
in the Middle and Western Settlement have remained
relative steady and even decreased since the 1903 survey
of Bruun (see above). The reason for the stagnant ruin
group numbers in the Western Settlement is that Bruun
relied on rather vague written or verbal information for
his description of a considerable part of the ruin groups,
many of which later proved to be natural-, Thule-culture-
, or later features; or were simple misplaced on the maps.
The latter was also to some extent the case in the Eastern
Settlement, only there the number of newly discovered
ruin groups kept up with the ones cancelled or replaced.
The circumstance that the number of ruin groups in
the Eastern Settlement – and in the Vatnahverfi region –
has continued to grows raises the question of how many
of the Norse sites that have been discovered? Will ruin
group numbers keep growing? I address issues of ruin
group representativity in relation to the Vatnahverfi
region evidence in section 4.2.4. Here, it is adequate to
note that as long as there are archaeological surveys in
the Norse settlement areas, ruin group numbers will
surely incresase, even in the Eastern Settlement and the
Vatnahverfi. Most of the ruin groups to be discovered,
however, will in all probability be smaller shieling sites
of the type that Bak was so adept at localizing (see
above), and to which type also the 18 new ruin groups
discovered during the Vatnahverfi Project belongs.
In terms of ruin groups waiting to be discovered in
the Middle- and Western Settlements, I have little idea.
However, considering that the surveys in the Middle
Settlement have always been carried out from boat, it
seems likely that upland and inland areas could still hide
a number of shielings sites of the same type as found in
the outer fjords of the Eastern Settlement? During a 2012
in the Western Settlement, we located such a new small
shieling site ca. 2 km inland from farmstead V15 near
the fjord (field report under preparation), clearly
showing that in the remote areas of the Nuuk fjord,
smaller sites are still undiscovered. However, that ruin
group numbers have increased continually in the Eastern
Settlement, while they have remained stable in both the
Middle and Western Settlement areas (Fig.4.19),
undoubtedly also owes to Inuit sheep farming: it was
never reintroduced on any significant scale the latter
areas (see section 8.1.2). Many new ruin groups,
including most of those found during the Vatnahverfi
Project, was located by sheep farmers tending to their
flocks.

73
Tab.4.1 – Excavations of Norse Sites in Greenland 1723-2011
Eastern Settlement:
Ruin Group
No.
Exc. Dwel-
ling
Exc. Mid-
den
Exc. Struc-
ture
Exc. Church
/-yard
Test Dwel-
ling
Test Mid-
den
Test struc-
ture.
Test church
/-yard
Year Primary references:
E83 ● ● ● ● ● 1723, 1828, 1831, 1839, 1880, 1935
Egede 1925, Graah 1932:151, Pingel 1837:128p, Pingel 1842:342p, Holm 1883:97, Clemmensen 1911:289, Roussell 1941:34p
E323 ● ● 1824 Pingel 1836:212
E47 ● ● ● ● ● ● ● 1828, 1830, 1832, 1837, 1839, 1910,
1924, 2000
Pingel 1832:99, 1833:318, 1837:126p, 1839:234p, 1843:340p, Bruun 1895:331pp, Clemmensen 1911:326p, Nørlund and Roussell 1929, NMA: Gulløv 2000:24p, Gulløv 2008:95p
E111 ● ● ● ● ● 1829, 1839-40,
1853, 1880, 1900, 1911, 1921
Pingel 1843:330p, Holm 1880:136p, NMA: Meldorf 1911,Nørlund 1924:40pp, NMA: Kapel&Clemmensen 2013:15
E112 ● 1832 Pingel 1833:316p
E159 ● 1832 Pingel 1837:129
E87 ● 1832 Pingel 1837:130
E106 ● 1832, 1833 Pingel 1833:317, 1836:217
E29a ● ● ● ● ● ●
1832, 1839-40, 1880, 1894, 1932,
1962, 1964-65, 2005-2006
Pingel 1833:323, Pingel 1842:343, Holm 1883:79, Bruun 1985:294, Nørlund&Stenberger 1934, Meldgaard 1964, 1982, Nørlund and Stenberger 1936, Albrethsen 1982:274, Edvardsson 2007
E120 ● ● 1837, 1969 Pingel 1839:234, GHM III:809, NMA: Albrethsen 1969
E66 ● ● ● ● ● ● 1839, 1855, 1880, 1894, 1910, 1926,
1935, 2008
Pingel 1843:341p, Holm 1883:115pp, Bruun 1895:373p, Clemmensen 1911:341p, Roussell 1941:99p, Arneborg et al. 2008:27p
E32 ● 1880 Holm 1883:82
E59 ● ● 1880 Holm 1883:108
E77 ● 1880 Holm 1883:123p
E73 ● ● ● 1880, 2004 Holm 1883:126p, Kapel et al. 2004:10p
E14 ● 1894 Bruun 1895:247
E2 ● ● 1894 Bruun 1895:215pp, 225
E20 ● ● 1894 Bruun 1895:264p
E31 ● 1894 Bruun 1895:302
E53 ● 1894 Bruun 1895:353
E7 ● 1894 Bruun 1895:238
E90 ● 1894 Bruun 1895:413
E92 ● ● 1894 Bruun 1896:419
E93 ● 1894 Bruun 1896:419
E3 ● 1910 Clemmensen 1911:323, Madsen&Smiarowski 2011 (under prepartation)
E105 ● 1926 NMA: Nørlund 1926, 1928:52
E140 ● 1926 Nørlund 1928:52p
E18 ● 1932 Nørlund 1934:11
E28 ● ● 1932 Nørlund&Stenberger 1934:92pp
E29 ● ● 1932 Nørlund&Stenberger 1934:72pp
E40b ● 1932 Hansen 1999:68
E91 ● 1932 NMA:Holtved 1932:6
E149 ● ● ● ● 1932, 1945-46,
1948 Nørlund and Stenberger 1934:9p, Vebæk 1953a, 1958:111, 1991:21
E33 ● 1932, 2001 Nørlund & Stenberger 1934:9p, Arneborg et al. 2001:10
E35 ● 1932, 2001 Nørlund&Stenberger 1934:15p, Arnborg et al. 2001:15
E83a ● 1935, 2004 Roussell 1941:37p, Arneborg et al. 2009
E64a ● ● 1939 Vebæk 1943:18
E64c ● ● 1939 Vebæk 1943:55
E78a ● ● ● 1939 Roussell 1935, Vebæk 1943
E162 ● 1946 Vebæk 1991:18
E71 ● ● ● 1949 Vebæk 1992:23
E167 ● ● ● 1949-50 Vebæk 1992:45
E70 ● ● 1950 Vebæk 1992:70
E188 ● 1950, 2010 Vebæk 1950:22, Heide&Madsen 2010
E78 ● ● 1951, 2007 NMA:Vebæk 1951:39, Møller et al. 2007:25
E17a ● ● ● 1954, 1958, 1962,
2001 Vebæk 1961, 1965, 1993, 52.20/03
E64 ● ● ● 1962, 2007, 2008,
2010 Vebæk 1966:203, Møller et al. 2007:22p, Arneborg et al. 2009:9p,
E137 ● 1969 NMA: Krogh&Albrethsen 1969:18, bilag 4
E23 ● NMA: Vebæk 1969
E24 ● 1969 NMA: Albrethsen 1969
E1 ● ● ● 1971 NMA: Albrethsen 1971

74
Ruin Group No.
Exc. Dwel-ling
Exc. Mid-den
Exc. Struc-ture
Exc. Church/-yard
Test Dwel-ling
Test Mid-den
Test struc-ture.
Test church /-yard
Year Primary references:
E39 ● 1971, 2002 NMA:Albrethsen 1971:bilag I:30, Arneborg 2010:325p, Edwards et al. 2010:91p
E227 ● 1976 NMA: C. Keller 1976
E38 ● 1976 Edgren 2002:7
E4 ● 1976 Hasselmo 1985:52
E34 ● ● 1994-1995 NMA: Nyegaard 1996
60V2-II-574
● 1997 Berlund 1991
E80 ● 2000 NMA: Gulløv 2000:24
E48 ● 2001 NMA_Krogh 1968, Arnborg et al. 1001:5
E221 ● 2001, 2002 NMA: Raahauge et al. 2003:46, NMA: Christiansen 2002:15, Christiansen 2004:32
E74 ● ● ● 2004, 2006 Kapel et al. 2004:15p, Edvardsson (ed.) 2006
E60 2007 Møller et al. 2007:19
E172 ● 2007, 2009, 2010 Smiarowski 2007, 2013
E165 ● 2008 Arneborg et al. 2008:47
E169 ● 2008 Arneborg et al.2008:47
E68 ● 2008 Arneborg et al. 2008:29
E95 ● 2009 Madsen 2009:30å
E329 ● 2010 Heide&Madsen 2010:24
00-2 ● 2011 Madsen et al. (under preparation)
E168 ● 2011 Madsen et al. (under preparation)
E171 ● 2011 Madsen et al. (under preparation)
Middle Settlement:
Ruin Group No.
Exc. Dwel-ling
Exc. Mid-den
Exc. Struc-ture
Exc. Church/-yard
Test Dwel-ling
Test Mid-den
Test struc-ture.
Test church /-yard
Year Primary references:
M20 ● ● 1830 Pingel 1832a:103, 1837:139
M11 ● 1832 Pingel 1833:326
M19 ● 1832 Pingel 1833:330
M26/27 1832 Pingel 1832a:101
M10 ● 1954 Vebæk 1956:94, 1958:111, Albrethsen&Arneborg 2004:50p
M15 ● ● 1954 Vebæk 1956:95, 1958:111, Albrethsen&Arneborg 2004:65p
M21 ● 1954 Vebæk 1956:96, 1958:111, Albrethsen&Arneborg 2004:74p
Western Settlement
Ruin Group No.
Exc. Dwel-ling
Exc. Mid-den
Exc. Struc-ture
Exc. Church/-yard
Test Dwel-ling
Test Mid-den
Test struc-ture.
Test church /-yard
Year Primary references:
V51 ● ● ● ● ● 1903, 1930, 1932,
1984 Bruun 1917:98p, Roussell 1936:11pp, Arneborg 1985, McGovern et. Al 1996
V16 ● 1932 Roussell 1941:78p, 162p
V7 ● ● ● ● 1932 Roussell 1941:32
V8 ● 1934 Roussell 1941:75p, 167p
V53 ● 1934 Roussell 1936:60pp, 1941;228p
V55 ● 1934 Knuth 1944:107p
V52 ● ● 1934 Roussell 1936:59
V53a ● 1934 Roussell 1936:348
V52a ● ● ● ● 1934 Roussell 1936:61pp
V54 ● ● ● ● 1934, 1952, 1976 Meldgaard 1965;90, 1976;41, 1977;165, 2001, Andreasen 1982; Møhl 1982;293
V53c ● ● 1937 Roussell 1941:64p, 171p
V35 ● ● 1937 Roussell 1941:73p, 164p
V53d ● ● 1937 Roussell 1941:66p, 179p
V59 ● 1976 Møhl 1982:290, NMA:J.nr.161
V48 ● 1976 Møhl 1982:290p, McGovern et al. 1983:93, Arneborg 1991
64V2-0IV-529
● 1991 NMA: Kapel 1991
GUS ● ● 1992-1996 Andreasen and Arneborg 1992, Arneborg and Berglund 1993, Albrethsen and Ólafsson 1998, Berglund 1998a, 2000, 2001
Tab.4.1 List of excavated Norse ruin group in the Eastern-, Middle-. and Western Settlement areas in Greenland in the period 1723-2011, listed after the first year of excavation. 'Exc.' - dwelling, midden, structure, church/-yard signifies more comprehensive or complete excavations; 'Test' - dwelling, midden, structure, church/-yard signifies anything from cutting a small pit to carefully laid out test trenches or pits. Note that for the excavation of M25/26 there is no record or description of which type of ruin was excavated. See Fig.4.17-4.18 for the location of the listed excavations.

75
Fig.4.17 Ruin groups in the Norse Eastern and Middle Settlements excavated between 1723 and 2011 (refer to Tab.5.1 for detailed information on the excavations).
Fig.4.18 Ruin groups in the Norse Eastern and Middle Settlements excavated between 1723 and 2011 (refer to Tab.5.1 for detailed information on the excavations).

76
Fig.4.19 Approximate number of registered ruin groups: total number in the Eastern Settlement (blue columns); number in the Vatnahverfi region (dark blue columns); number in the Middle Settlement (green columns); and numbers in the Western Settlement (red columns) (data after: E. Thorhallesen 1776, von Eggers 1793, GHM III, Clemmensen 1911, Bruun 1917, Nørlund 1934, Roussell 1941, Vebæk 1958, Krogh 1967, 1982, Arneborg 2004).
0
50
100
150
200
250
300
350
400
450
500
1794 1845 1917 1934 1941 1958 1967 1982 2004
Number of Registered Norse Ruin Groups 1794-2004
East.Settl. Vatnahverfi Middle Settl. West. Settl.

77
4.2 THE VATNAHVERFI-PROJECT 2005-2011
‘These men took land in Greenland, who went out with Eric : Heriulf Heriulfsfirth, he dwelt at Heriulfsness ; Ketil Ketilsfirth ; Rafn Rafnsfirth ; Sölve Sölvedal ; Helge Thorbrandsson Alptafirth ; Thorbiorn Glora Siglefirth ; Einar Einarsfirth ; Hafgrim Hafgrimsfirth and Vatnahverf ; Arnlög Arnlögsfirth ; but some went to the Western Settlement’.
Eiríks Saga Rauða (Flateyjarbók, 31-36), late-14th c. AD
‘Next lies Eijnerfiord, and between it and Rampnessefiord there is a large farm which belongs to the king; the farm is called Foss, and there stands also a costly church dedicated to Saint Nicholas, which the king holds to rent. Nearby is a large island with huge fish, and near it a great lake. When rains come water flows in and out; there are countless fish lying on the sand.
When one sails into Eijnerfiord there lies on the left a bay which is called Tordzualsviigh, and further into the fjord on the same side is the little promontory which is called Kleinengh, and further still a bay called Grauevigh. Further still is a large farm called Daler which belongs to the cathedral, and on the right side, as one sails into the fjord to the cathedral, which is at the end, there is a large forest that belongs to the cathedral, and that provides all of its income, both large and small. The cathedral owns all of Eijnersfiord, and also the large island which lies off the fjord and is called Renøe, so-called because in autumn countless reindeer run there; hunting is by common rights, but not without the bishop's permission. On this island there is the best soapstone, which in Greenland is of such good quality that it is used to make pots and pans. It is so consistent that fire does not damage it, and it is made into vessels large enough to hold ten or twelve tuns. Further from land lies an island called Langhøø, and on this island are eight large farms; the cathedral owns all of the islands except the tenth, which belongs to Hualzør church’.
Ivárr Bárðarson’s Description of Greenland (75-97), mid-late 14th c. AD
‘Gest stayed at a farm called Vik in Einarsfjord on Longunes (…). Thorgrim Troll, the son of Einar, lived in Einarsfjord on Longunes. He was a godi, a great and powerful chieftain and excellent champion who had many men under his command (…). Thorgrim Troll had another sister, Thorunn, who also lived in Einarsfjord at a farm called Langanes (…). A woman named Sigrid lived at a farm called Hamar, which was a good a profitable homestead (…)’.
Fóstbræðra Saga (373p), 13th c. AD
The Norse place name 'Vatnahverfi' occurs first in the
Icelandic Landnámabók’s ('Book of Settlements') list of
named men who were to have sailed out with Eirik the
Red to colonize Greenland in the year AD 985/986 (LB:
92). From Landnámabók, this list was copied into other
medieval texts, for instance Flateyjarbók’s above
version of Eiríks Saga Rauða (Halldórsson 1978:449).
The first part of the place name – 'vatna-' –refers to
'water', or more specifically 'lakes', whereas '-hverfi' is a
common Icelandic place name which can refer either to a
'cluster' of farms, to a valley, or some form of natural
depression (Lárusdóttir 2006:50p). Whatever reading
one chooses, the place name is highly appropriate and,
one could hardly have found a more suitable name for
this settlement region that most accurately translates as
from Icelandic as 'the Lake District'.
With F. Jónssons (1898) pinpointing of Einarsfjörðr
as present day Igaliku Fjord and the few existing Norse
farmsteads located on the western side of the fjord (Fig.
4.20), a few other medieval place- and farm names must
also be attributed to the Vatnahverfi (e.g., the above
excerpts). However, it is only the church undir Höfða í
Austfirði – ruin group E66 at Igaliku Kujalleq – that has
been identified with any certainty (Ibid.291). Therefore
the medieval Norse settlement in the Vatnahverfi must
mainly be interpreted from the archaeological evidence.
Section 4.1 outlined the archaeological investigations
carried out in the Vatnahverfi region in the context of
research activities in the Norse Greenland, from 1723-
2005. Section 4.2 presents a review of archaeological
activities carried out as part of the Vatnahverfi-Project –

78
2005-2011 – an inter-disciplinary research project
focused on settlement, societal organization, and pastoral
farming this core area of the Norse Eastern Settlement,
South Greenland.
Over its course, the Vatnahverfi-Project developed
multilaterally: geographically, to include the entire
peninsula between the Igaliku Kangerlua (Einarsfjörðr)
and the Alluitsup Kangerlua (Siglufjörðr) – including the
latter’s off-branching fjord arm Sioralik – an area of
some 1560 sq. km (Fig.4.20); archaeologically, to
include both surveys and excavations of churchyards and
middens; interdisciplinarily, to involve a range of paleo-
environmental sciences by collaborating international
research institutions; topically, to concern not only
regional level settlement and socio-economic layouts,
but also to address aspects of human eco-dynamics and
diverting historic trajectories in the North Atlantic, the
latter advanced through collaboration and data sharing
within the North Atlantic Biocultural Organization
(NABO: http://www.nabohome.org/).
Several studies relating explicitly to the Vatnahverfi
or addressing wider comparative themes are already
published (e.g., Møller and Madsen 2007b, Dugmore et
al. 2009, Vésteinsson 2010, Madsen 2011, Arneborg
2012, Arneborg and Madsen 2012, Dugmore et al. 2012,
Madsen 2012, Dugmore et al. 2013, Ledger et al. 2013a,
Schofield et al. 2013, Heide 2014, Kuijpers et al. 2014,
Ledger et al. 2014a, 2014b); several more are under
preparation or in press. Also, interim field reports for
each year of the Vatnahverfi investigations (Møller and
Madsen 2006, Møller et al. 2007, Møller and Madsen
2007a, Arneborg et al. 2009a, Madsen 2009, Smiarowski
2010) can be downloaded from National Museum of
Denmark’s webpeage (http://natmus.dk/).
Fig.4.20 Map of the peninsula and ruin groups between the fjords of Igaliku Kangerlua and Alluitsup Kangerlua (with corresponding Norse place names given italic). The Vatnahverfi-Project began in the area traditionally interpreted as the Vatnahverfi (outlined in blue), but over the years expanded to cover the entire peninsula (outlined in red), an area of some 1560 sq. km and including 129 Norse ruin groups.

79
In other words, by its conclusion in 2011, the
Vatnahverfi-Project had expanded to such a scope that I
will not attempt to summarize the project in its entirety
here. Many of the studies relating specifically to the
Vatnahverfi-Project have been presented and discussed
in the above, or will be so in the following, and I refer to
the cited references for details on the individual affiliated
projects. Section 5.2 instead presents the more regular
archaeological investigations with primary focus on the
many new precision ruin group surveys that have
constituted a core of the Vatnahverfi-project (Fig.4.21),
as well as on the test- and larger excavations that has
been carried out to lend some chronological resolution to
the surface survey evidence (see section 8.2.2-8.2.3).
This survey evidence of Norse farmsteads and settlement
is explored and discussed in detail in chapters 6 and 7.
Section 4.2.1 opens with a summary the Vatnahverfi-
Project surveys as they progressed and developed from
2005-2011 (including a survey in 2013 used here as
comparative evidence). Overall results of the project
surveys are summarized and discussed in section 4.2.2.
In the next section 4.2.3, I outline the methodologies
involved in, directing, and limiting the surveys; from
prior preparation and planning, over the actual field
surveys, and to the final archival, digital processing and
classification of the survey dataset that constitutes the
empirical core data of the dissertation. In conclusion,
section 4.2.4 comments on issues of archaeological
representativity of the Vatnahverfi Project survey
evidence. Thus, the conclusion of chapter 4 sets the
scene for the analysis of the archaeological settlement
evidence in the following chapters 7-8.
Fig.4.21 DGPS-survey of ruin group E325’s ruin no.4 by the fjord of Akulleq in the southernmost and outer fjord zone of the Vatnahverfi region. The primary element of the Vatnahverfi-Project 2005-2011 was to revisit and precision survey all the registered Norse sites in the region, which the seven years the project was running led to the investigation of 124 ruin groups, hereof 15 of them new (photo: K.S. Smiarowski 2009).

80
4.2.1 PROJECT BACKGROUND AND DEVELOPMENT
The Vatnahverfi-Project had very modest beginnings:
the idea for the project grew out of initial discussions in
1998 between Georg Nyegaard – then head of the local
museum in Qaqortoq in South Greenland – and Jette
Arneborg – senior researcher and curator at the National
Museum of Denmark. However, the project only gained
its first concrete form at a small informal meeting on the
island of Bornholm in the spring of 2005: attending this
meeting was project owner and coordinator J. Arneborg,
geologist Carsten Secher, Hans Kapel, N.A. Møller and
myself, both the latter of us at the time students in
prehistoric archaeology at the University of Copenhagen.
The plan decided upon at that spring meeting on
Bornholm was that N. A. Møller was to lead an
archaeological field survey in the traditionally identified
Vatnahverfi area (Fig.4.20), where he and I would
uniformly and precisely survey as many of the known
ruin groups as possible. Although in itself a simple
project goal, it would in fact be the first research-based
and systematic regional Norse settlement analysis since
1976 (see section 4.1.5).
2005 Field Season:
We were to achieve the first survey with minimal
logistic costs: in the field season of 2005 we relied on
our feet, a small zodiac equipped with a 25hp outboard
engine (Fig.4.22), and the aid and helpfulness of local
sheep farmers, while working out from, and logistically
aided by, the local museum in Qaqortoq through G.
Nyegaard. Over one month in the summer of 2005 we
managed to survey a total of 32 ruin groups – including
three newly discovered – and some 189 individual ruins
(Tab.4.2, Fig.4.25-4.26). Already in that first year, the
Vatnahverfi-Project was branching out as we were
joined for a week by geomorphologist Andrew J.
Dugmore, Prof. at the University of Edinburg, the first of
many interactions with scholars in the North Atlantic
Biocultural Organization (for a description of the 2005
field season, see Møller and Madsen 2006).
2006 Field Season:
The 2006 field season of the Vatnahverfi-Project was
preceded by an April-May rescue excavation of ruin
group E74’s ruin no.4 (see above, and Fig.5.14)
(Edvardsson 2007b). After having joined this excavation
for just under a month – and after conducting a brief
survey at Qassiasuk/Brattahlið (E29a) – N.A. Møller and
I set out on what was to be one of the main hauls of the
Vatnahverfi surveys: over two hectic summer months we
managed to survey some 42 ruin groups – including five
newly discovered – and some 259 individual ruins
(Tab.4.2, Fig.4.25-4.26). Still our primary means of
transport was hiking or the small zodiac, and still we
depended heavily on the aid of local sheep farmers and
G. Nyegaard. The summer 2006 we extended the project
survey area to include the southern part of the
Vatnahverfi region – i.e. the northern coast of Alluitsup
Kangerlua and the Sioralik fjord (Fig.4.20) – thereby
defining what was going to become the final research
area comprising the entire peninsula (for a description of
the 2006 field seaso, see: Møller and Madsen 2007a).
Finally, during the 2006 excavation at E74 we came into
contact with two students participating at the excavation
of E74 through the NABO research network, who would
prove invaluable in the future field work in the
Vatnahverfi region: Konrad Smiarowski, Ph.D.-student
in zooarchaeology at City University of New York, and
Poul Baltzer Heide, then Ph.D.-student at Aarhus
Univesity and specializing in landscape studies.
Fig.4.22 Through the years 2005-2006 of the Vatnahverfi-Project, our primary means of transport for visiting ruin groups was a 25hp zodiac (photo: C.K. Madsen 2006).

81
2007 Field Season:
2007 was the first year of the International Polar
Year (IPY). Our participation in the IPY with KVUG
funding allowed us to expand the Vatnahverfi-Project;
and it financed the purchase of a larger zodiac with a
90hp outboard engine (Fig.4.23). This zodiac provided a
logistical basis for more wide-ranging archaeological
activities, the first of which were carried out in just over
one summer month of 2007: a first, brief part of the 2007
field season involved surveys of 5 outer fjord ruin
groups – including one newly discovered – and 46 single
ruins (Tab.4.2, Fig.4.25-4.26). On this survey, Møller
and I were joined by Smiarowski, who oversaw the test
coring and - excavation of middens for preservation.
Test coring since became a standard practice at all sites
visited and led to the discovery of an extremely well-
preserved midden at the farmstead E172/Tatsip Ataa
Killeq that was excavated over the next years (see
below). However, the focus of the 2007 field season was
not surveys, but excavations of the two small, early type
church yards – E78/Eqaluit and E64/Kujalliup Kuua – in
the central Vatnahverfi in order to secure samples for
dating and isotopic analysis, the latter part of a study
coordinated by Arneborg (Arneborg et al. 2012a). Also
that year, the middens at E60, E78, and E172 were test
excavated. The new zodiac allowed us to have two
small teams of archaeologists at several sites at the time
(for a description of the 2007 field season, see: Møller et
al. 2007).
2008 Field Season:
Although the churchyards had provided skeletal
sample material, not all of it was of sufficient quality for
the analysis. Also, the churchyard at E64/Inoqquassaaq
had revealed features worth exploring further. Thus, the
one and half month 2008 field season focused on the
excavation of part of the E64 churchyard by a team of
archaeologists from the National Museum of Denmark
under the direction of Arneborg. However, equipped
with a new zodiac and joined by a group of graduate
students from City University of New York (CUNY)
under the direction of K. Smiarowski, we were also able
to include smaller test excavations in the middens at
E64, Igaliku Kujalleq/E66 and Itilleq/E68. In contrast,
the ruin group surveys in 2008 were limited to follow-up
surveys of 11 ruins at already visited sites (for a
description of the 2008 field season, see: Arneborg et al.
2009a) (Tab.4.2, Fig.4.25-4.26).
Fig.4.23 In 2007, a larger zodiac with a 90hp outboard engine. This significantly increased our range of archaeo-logical activity and made possible the many investigations until 2011 (photo: C.K. Madsen 2013).
2009 Field Season:
The summer of 2009 saw the next major haul of
archaeological surveys in the Vatnahverfi: over the first
month of the field season, Smiarowiski, Heide, and I
visited ruin groups in the outer fjords in the southwest
Vatnahverfi region (Fig.4.20). We managed to survey 30
ruin groups – including 2 newly discovered – and 188
individual ruins. During this survey, middens were
systematically cored where present and a small test
excavation was carried out of the midden at E95a/
Kujalleq (Tab.4.2, Fig.4.25-4.26). This summer, Heide
began systematically surveying for cairns on the
mountain ridges above the ruin groups in order to collect
data for his Ph.D.-project (Heide 2014). Besides yielding
many cairns of possible Norse origin, this extended
surveys some ways beyond the main cluster of ruins also
led to the discovery of ruins we would otherwise have
overlooked. Following the survey in the outer fjord,
Smiarowski and I carried out about one month of
excavation at E172/Tatsip Ataa Killeq, the first of two
major excavation seasons at that site (Smiarowski 2010).

82
Fig.4.24 Evening processing of the days survey evidence under makeshift shelter (left: P.B. Heide; right: T.B. Jensen). Because of the limited storage capacity of the zodiac used for transport, we always tried to minimize the equipment brought with us in the field, relying rather on a bit of opportunistic ingenuity (photo: C.K. Madsen 2009).
2010 Field Season:
Although 2009 officially was the last year of the IPY,
efficient planning, low-coast logistics, and collaboration
with NABO allowed the continuation of the Vatnahverfi-
Project in the summer 2010. This field season had three
main side-projects: first, surveys of remaining outer fjord
and coastal sites, as well as test excavations at sites
where erosion or earlier archaeological work allowed for
minimally intrusive investigations. In 2010, we surveyed
five ruin groups – one of them newly discovered – and
33 individual ruins; and conducted test excavation at
three sites (E182/Kangerluarsorujuk, E188, and E329/
Eqalugaarsuit) (Tab.4.2, Fig.4.25-4.26). Simultaneously
with the survey, excavation of the midden at 172/Tatsip
Ataa Killeq was carried out by a team of CUNY
graduate students under direction of Smiarowski.
Having finished our survey, Heide and I then joined the
excavation for the closing-up of the site. Thereafter, the
team was moved to E64, where we continued the
excavation of the churchyard under the direction of
Arneborg. At that point we were joined by a team of
American surveyors from Boston and Berkeley, who
were to try new geophysical survey methods and who we
helped carry out investigations at E64, E66, and E172
(for a description of the 2010 field season, see: Bolender
et al. 2010, Smiarowski 2010, Heide and Madsen 2011).
2011 Field Season:
The 2011 field season in the Vatnahverfi was made
possible by collaboration with the 'Northern Worlds'
research agenda at the National Museum of Denmark
and the NABO collaboration. Having carried out surveys
and test trenching in the Tasiusaq area (E3, E4, and 00-
2), the small 2011 field team of five people continued on
to Vatnahverfi, where we made a test trench at 171/
Tasilikulooq, only the second midden in the entire region
to display good preservation. We also dug a small test
trench at E168 for the purpose of dating the settlement
and use of that site. Subsequently, both Smiarowski and
I participated as instructors at a Nordic field school near
Narsaq, which included surveys of five Norse ruin
groups (E125, E126, E195, E262, and 60V1_00I_543).
All in all, 11 ruin groups and some 78 ruins were
surveyed, hereof three newly discovered ruin groups and

83
four individual ruins in the Vatnahverfi (Tab.4.2,
Fig.4.25-4.26), including a follow-up survey at E168.
With 2011, the Vatnahverfi-Project was officially
concluded (2011 field report is under preparation).
2013 Field Season:
In 2013, Arneborg and I – as representatives for the
National Museum of Denmark – became part of the
National Science Foundation funded research project
Comparative Island Ecodynamics in the North Atlantic
(CIE), which allowed us to conduct field work also in
that year. Although no longer focusing specifically on
the Vatnahverfi region, but rather a series of case study
areas across the Eastern Settlement, the 2013 short field
season included surveys of six new ruin groups, two of
them (E333 and the newly discovered 1301) in the
Vatnahverfi region; and some 70 individual ruins, hereof
18 ruins in the Vatnahverfi (including follow-up surveys
at E60 and E184) (Tab.4.2, Fig.4.25-4.26). Test-
trenching and sampling of datable material was carried
out in five locations (E60, E80, E89a, E96, E149).
4.2.2 VATNAHVERFI-PROJECT 2005-2007
-FIELD WORK SUMMARY
To conclude, at the end of the Vatnahverfi-Project
(2013), some 11 months and 2 weeks of field work had
been carried out (hereof ca. six months of surveys,
Tab.4.2). Over this time period, 129 ruin groups – 18 of
them newly discovered – and some 798 individual ruins
had been precision surveyed in the Vatnahverfi region
(note that these ruin group- and ruin numbers do not
reflect the grouping of farmsteads in the analysis and
varies a little from numbers stated in the annual field
reports); another 13 ruin groups and some 156 ruins had
been precision surveyed on minor excursions to other
Eastern Settlement areas (Tab.4.2, Fig.4.25).
In addition, a larger excavation was carried out in the
churchyard of E64 and a smaller in the churchyard at
E78. Larger midden excavations were carried out at two
ruin groups (E64 and E172), and test trenches dug at
another eight middens (E60, E66, E68, E71a, E78, E95,
E171, and E168) (Tab.4.1). Finally, judgmental coring
for assessment of midden preservation was carried out at
more than 60 ruin groups (K. Smiarowski 2014, pers.
comm.). The latter examination has had the disturbing
implication that midden deposits with good preservation
of organic material are today virtually nonexistent, even
in places where preservation was noted around World
War II. This unfortunate condition is primarily an effect
of climatic warming, secondarily of midden deposits
being drained of water as sheep farmers cut draining
trenches to expand their fields.
Tab.4.2 The Vatnahverfi-Project Surveys and Excavations
Year Field Season Duration
Ruin Groups
Surveyed
New Ruin Groups
Ruins Surveyed
Excavations/Trenches
Report
20041 20.07. – 24.08. 2004 9 2 50 2 Kapel et al. 2004
2005 20.07. – 24.08. 2005 32 3 189 None Møller&Madsen 2006
2006 26.04. – 26.07. 2006 42 5 259 1 Møller&Madsen 2007
2007 14.07. – 22.08. 2007 5 1 46 4 Møller et al. 2007
2008 15.07. – 25.08. 2008 - - 11 5 Arneborg et al. 2008
2009 24.06. – 19.08. 2009 31 2 188 2 Madsen 2009
2010 07.07. – 24.08.2010 5 1 33 5 Heide&Madsen 2011
2011 29.06. – 26.07. 2011 3 (9) 3 4 (86) 2 (1) Report under prepartion
2013 16.07. – 30.07. 2013 2 (4) 1 18 (70) 1 (4) Madsen et al. 2014
Total: 129 (13) 18 798 (156) 22 (5)
Tab.4.2 Vatnahverfi-Project overview chart displaying annual: duration of field season; no. of new ruin groups surveyed (i.e. not including revisits at ruin groups); no. of new ruin groups located; no. of individual ruins surveyed; no. of excavations or test trenches; and primary reference to the associated field report. Nos. in bracket indicates surveys of ruin groups, ruins,
and excavations in Eastern Settlement areas outside the Vatnahverfi region. Additionally: 1 Ruin groups/ruins surveyed and
excavated in connection the establishment of the hydro-electrical plan at Qorlortorsuaq prior to the Vatnahverfi-Project.

84
Fig.4.25 Overview map of the ruin groups surveyed throughout the Vatnahverfi Project (including 2004 and 2013) and additional comparative sites treated here: full red circles or crosses signify sites surveyed during the Vatnahverfi-Project; open red circles signify sites in the Vatnahverfi region we could locate or get to, but are included only as sketch surveys; full blue circles indicate ruin groups DGPS-surveyed by N.C. Clemmensen and H. Kapel (see section 5.1.6); open blue crosses signify ruin groups, where only old survey- or excavation plans exist.

85
When including ruin groups in the Vatnahverfi
region that we not did not have time to visit, could not
locate, or get to because of natural obstacles (14 ruin
groups, Fig.4.25), as well as comparative ruin group
evidence (9 ruin groups), the entire survey dataset
analyzed in the below amounts to 157 ruin groups and
some 1308 individual ruins. That is more than one
quarter of all the ruin groups registered in the Eastern
Settlement to date (excluding the 18 new ruin groups
discovered in the Vatnahverfi region). This dataset on
Norse sites in the Eastern Settlement is unique and
unmatched in terms of its precision, uniformity, and
magnitude; not at least, is it the first dataset of this size
to be processed digitally, i.e. can easily be distributed
between and analyzed by other scholars. The dataset is
also comparable to recent cultural heritage management
DGPS-surveys in Greenland (section 4.1.6). However,
considering the number of ruin groups and ruins
surveyed, there has naturally been some practical and
methodological limits in regard to how the surveys were
designed and carried out, which in turn has bearing on
the interpretation of the survey dataset.
Fig.4.26 Blue columns display the aggregate number of ruin groups year for year of the surveys in the Vatnahverfi region; red columns display the number of ruins surveyed the individual year. Noticeable are the 'excavation years' with few added ruin groups or ruins.
4.2.3 SURVEY METHODOLOGY
Again, the surveys carried out during the course of
the Vatnahverfi-Project were not designed to involve any
form of complete survey or systematic sampling strategy
over the entire region, but to revisit and resurvey already
registered ruin groups. In effect, it was only because of
prior surveys carried out by archaeologists over close to
300 years that we were able to revisit so many sites.
These prior surveys allowed us to focus on the ruin
groups and ruins without having to spend too much time
locating them, which even equipped with prior survey
maps and plans can be a difficult task. The imposing
scope of prior research also accounts for the three-step
method systematically used in the surveys:
Archival Preparation:
Prior to going into the field we searched publications
and unpublished (NMA) records for all information on
earlier investigations on the ruin groups we meant to
visit the same year. This archivalia consists of
everything from hastily scribbled notes or page-long
accurate descriptions, over pencil drawings and
aquarelles, to sketch- and, a few, precise survey plans.
Accumulated over close to 300 years, these ruin group
records are of course of highly varying quality and
usage. Those records we deemed useable for surveys
were photocopied and brought with us into the field.
Prior ruin group records were also used to plan the field
work, i.e. how long we were to spend at different sites
and basecamps throughout the season.
The Field Surveys:
The logistical setup for the field surveys is outlined
above and this section refers only to the specific on-site
survey methodology: moving out from well-positioned
basecamps – either over land or fjord – we would travel
to designated ruin groups, looking for new features and
speaking to sheep farmers along the way. As the
Vatnahverfi-Project progressed, recording resource areas
surrounding the ruin groups and travel times in between
them also became a standard (although most of this
information is presently only found in the field notes and
– reports) (Fig.4.27). Whenever possible, we would try
to plan travel routes between ruin groups and basecamps
so that new areas were surveyed along the way.
0
50
100
150
200
250
300
2004 2005 2006 2007 2008 2009 2010 2011 2013
Ruin Groups and Ruins Surveyed in the Vatnahverfi region, 2005-2013
Aggregate No. of Ruin Groups No. Ruins

86
Fig.4.27 N.A. Møller in the hills close to E64c in the northeastern Vatnahverfi. Many of the ruin groups in the region are situated inland or on the central highland plateau, where the only way of reaching them is by foot (or horse!). During such hikes, we would increasingly log travel-times and resource areas on the way between ruin groups (photo: C.K. Madsen 2006).
Reaching a ruin group, the surveys followed a fairly
regular scheme: one person would use the prior records
to begin to identify the individual ruins, while the other
began setting up the DGPS-equipment. As soon as a
proper DGPS-signal was established, one person would
then begin to survey and describe the ruins, as far as
possible numbering them according to prior surveys.
Meanwhile, the other person kept on searching for any
remaining or new ruins, thereafter began to photograph
each ruin, in the end catching up with surveyor. This
scheme meant that the survey of a ruin group could be
done by two persons over 2-5 hours, depending upon the
size of the site, which in turn meant that 2-3 ruin groups
could be surveyed per day if located in some proximity.
The survey equipment included handheld GPS’s for
smaller isolated features (fox traps, cairns, shooting
blinds etc.), while larger Norse ruins and features were
surveyed with a Leica SR20 differential GPS, which
under normal conditions provides an accuracy of < 40
cm (after post-processing, see below). However, the
SR20 being an older model DGPS only able to receive a
GPS-satellite signal, working in a northern latitude, and
in a mountainous terrain, multipath signal interference,
shadow, and abscuration were common issues, resulting
in lower survey precession at some ruin groups. Some
inaccuracies could be corrected or decreased through
various forms of post-processing (see below). However,
for the measurement of smaller details – e.g. thickness
and heights of walls, entrances etc. – we instead used
measure tapes or ranging rods. Based on the experience
from post-processing the survey data, ruin groups were
found to float with up to 2-4 meters relative to
geographical coordinate systems, but mostly < 50 cm
within the “local system”, i.e. inaccuracies insignificant
to spatial observation and analysis of ruin group layouts.
Post-Processing and Analysis:
Once back in the National Museum in Copenhagen,
the survey data was post-processed in Leica GeoOffice
v.7.0. Subsequently, the survey data was “cleaned up”
(correcting clearly floating points) in MapInfo v.11.0, at
first only as needed for rough visualization in yearly
interim field reports. Also in these reports, field notes
were transcribed, photographs registered, and, along
with written descriptions, assigned to individual ruins.
One planned outcome of the Vatnahverfi-Project was
the funding of a three-year Ph.D.-scholarship under the
Northern Worlds research agenda at the National
Museum of Denmark, set up to process and analyze the
archaeological surveys data. I applied for, and was
admitted, this Ph.D.-scholarship, which I started in Sept.
2010. Thereafter began a lengthy secondary process of
revisiting, post-processing, analyzing, and visualizing
the survey data of each of the 129 ruin groups, which
were in turn being submitted to:
Archival crosschecking: through the summers 2009-2012
I was periodically leased out from my Ph.D.-scholarship
to do project- and rescue archaeology for National
Museum of Greenland (NKA). This gave me time to go
through the Norse archives there, the records of which
have since largely been digitalized. Following the 1981
repatriation of Greenland’s archeological obligations to

87
the NKA (see section 5.1.5), all archival records and
reports were to be transferred from the National Museum
of Denmark to the NKA, so that they could be found –
either in original or copy – at both museums. However,
having gone through both archives, it is clear that this is
not the case and many records, both old and new, are
only found in one or the other museum. I therefore
photocopied all un-digitalized archaeological ruin group
records and reports regarding Norse sites in the NKA
archive and send them to the National Museum in
Denmark for cross-reference.
Back in the National Museum of Denmark, I went
through the combined archival records on each ruin
group to certify that as much information and as many
ruins as possible were included and rightly numbered
(see below). Once certain that I had retrieved all
available information, I then started going through the
survey data of each ruin group again:
Secondary Post-Processing: using the combined
survey and museum archival records, I went through the
description of each individual ruin, correlating the new
descriptions and photographs with old ruin records,
where needed making adjustments in terms of ruin
dimensions, wall-thicknesses, and building material, and
adjusting the ruin visualization in MapInfo accordingly.
Also, because ruin outlines were surveyed as a polylines
with a minimal number of points – most minimally one
point in each outside corner of the building – the original
raw surveys often had a somewhat angular and squared
appearance. The walls and corners of such ruins were
smoothed and rounded in MapInfo to have more realistic
appearance and dimensions. Finally, ruin that where not
correctly numbered during survey – which was at times
problematic in the field because of inaccuracy of prior
sketch surveys – were renumbered serially and according
to the oldest existing numbering. Correct numbering of
ruins is essential to the identification of specific ruins at
sites where some features have been disturbed or totally
removed subsequent to earlier surveys. However, it also
means that ruin numbering in the survey plans and
appendix (1-3) does not always correspond to the ruin
numbering in the interim field reports (which is noted in
the appendices). Ruins overlooked by us, but recorded
earlier were sketched into the survey plans where
possible. The number of such unnoticed ruins during the
Vatnahverfi surveys account for the discrepancy between
Tab.4.2, Fig.4.27 and appendix 1-2.
Once all the individual ruins had been post-processed
in this manner, I used GoogleEarth satellite imagery and
aerial photography to double-check intra-site accuracy of
the individual ruin group surveys: because the Norse
ruins are visible on the surface, even poorly preserved
examples can often be discerned in the higher quality
satellite imagery and aerial photography, once their
shape and position relative to each other have been
established. At ruin groups where poor GPS-signal had
caused significant displacement of singular ruins, these
were, if plausible, moved to correspond to the satellite
imagery and aerial photography. Otherwise, or when in
doubt, I relied on the original survey data.
Detailed digital maps on Greenland’s topography are
deficient, imprecise, or very costly. Since we most often
did not have time to survey the natural features and
recent buildings in the field, such features were added to
the digital ruin group survey plans from GoogleEarth
satellite imagery and aerial photography: e.g. dimensions
and extent of coast- and lake shores, rivers and streams,
roads and dirt tracks, recent or present sheep farmers’
houses and stables, drainage trenches, cultivated fields,
and relict Norse infields. In a few areas, however, the
GoogleEarth satellite imagery and aerial photography is
still too coarse to allow for observation of smaller
topographical features, in which cases they were
omitted, or drawn from aerial photography generously
provided by the Geological Survey of Denmark and
Greenland (GEUS) towards the end of the project.
The high quality DEM’s used for landscape analysis
and reconstruction throughout the dissertation was also
only acquired towards the end of the project. Thus the
solid 25 m contour lines shown in the ruin group survey
plans, as well as the size and location of smaller lakes,
ponds, and mires, were redrawn from georeferenced
hiking maps (Greenland Tourism a/s 2001). The dashed
5 m contour lines were sketched from a combination of
the 25 m fixed contour lines, GoogleEarth satellite
imagery or aerial photography, overview photographs,
and topographical memory of specific distinct landscape
features. Thus, the sketched 5 m contour lines are not
accurate, but serve only to give an impression of the
local micro-level topography, which often accounts for
the placing of the ruins.
Ruin Group Visualization: all this information was
finally aggregated and visualized systematically in the
ruin group survey plans in appendix 3. For purposes of
consistency and ease of interpretation, the appearance of

88
the ruin group survey plans borrow much from earlier
archaeological sketch or precision examples (see section
4.1), adding only a few new symbols or features (see
legend to App.3). In their digital original, these final ruin
group survey plans were also used for the measurement
of most of the quantitative analytical parameters (see
App.2-3).
4.2.4 SURVEY DATA REPRESENTATIVITY
Some issues regarding ruin group representativity in
the Norse Eastern Settlement were discussed in section
4.1.7 Similar issues clearly also pertain to the survey
evidence generated during Vatnahverfi-Project, not at
least because the principal aim of the project – as
outlined above – was to revisit already known ruin
groups in the region, rather than to systematically search
for new ones. Issues of ruin group representativity falls
on to main questions: how many of the total Norse ruin
groups in the region have been located and surveyed? ;
And how many of the total number of buildings have
been located and recorded on the individual ruin groups?
Both questions are evidently difficult to answer, but
must addressed as they are essential to the interpretation
of the ruin groups and regional-level settlement patterns.
Ruin Group Representativity:
In terms of the number of Norse sites once present in
the Vatnahverfi, the 18 new ruin groups discovered
during the project clearly demonstrate that far from all
the existing sites have been located. Besides ruin groups
still waiting to be discovered in remote or inland
mountain areas (see section 4.1.7), it must also be
expected that some ruin groups have been completely
removed by marine transgression or various forms of
erosion: Coastal erosion is ongoing and today presents
the largest threat to Greenland’s cultural landscapes.
Estimating how many ruin groups or ruins could have
been destroyed by natural erosion is near to impossible,
apart from observing that outer fjord and coastal sites are
more likely to have completely disappeared, since this is
where marine transgression and erosion is historically,
and today, most severe and rapid.
In terms of estimating how many of the existing ruin
groups have been located in the Vatnahverfi, we are
fortunately somewhat better informed: for although 18
new ruin groups were discovered during the project,
these were all – as also observed elsewhere (Vésteinsson
2010:144) – small sites with few ruins, i.e. shielings with
a remote or marginal location rather than farmsteads
lying in favorable agricultural lands. Such small sites
seem to account for most new ruin groups discovered
after 1962 (see section 4.1.4 and the following). Also,
we have regularly questioned local sheep farmers as to
their knowledge of undiscovered ruins, which has led to
the discovery of about 90% of the new ruin groups in the
Vatnahverfi. Considering that these Inuit sheep farmers
are extremely familiar with the landscapes used formerly
and presently by their farms, combined with more than
200 years of archaeological surveys in the Vatnahverfi,
and the observation that no regular farmsteads have been
found throughout the project, and it is a fair to assume
that by far the most, perhaps even all, of the still existing
low-land Norse farmsteads have been located. Certainly,
there is still a considerable number of smaller ruin
groups to be found in the Vatnahverfi highland plateau
and in the remote inland, since archaeological and sheep
farming activities there have been far less. In fact, our
attention has already been directed to a few such sites as
yet unrecorded. However, such shielings sites do not
significantly influence interpretations of overall
settlement patterns and hierarchies, only the functions
and resource areas of specific farms.
The same pattern of representativity holds true even
for the middle- and outer fjord areas, where some 80%
of the larger and low-lying ruin groups is expectedly
identified. However, the representativity of smaller
shieling sites must be assumed to be poorer: first,
because sheep farming has always – as especially today -
been less intense in the middle- and outer fjords, and
mostly absent in the coastal region, so there have been
few informants to back up our site-focused Vatnahverfi
surveys; second, prior archaeological surveys have
always been less frequent in the outer fjord and coastal
areas, and have methodologically been carried out as
coast near surveys from boats. Thus, it is to be expected
that a considerable number of shieling sites, perhaps
even larger examples, remain undiscovered in the outer
fjords and coastal areas, especially deeper inland or
perhaps at some elevation? However, again, the expected
lack of such sites only affect the interpretation of
specific farmstead functions with little impact on the
interpretation of overall regional settlement patterns.

89
Ruin representativity:
Regarding individual ruins, estimating how many of
an unknown total we have identified is impossible.
Certainly, we have found many new ruins, often
noticeably increasing, in some cases more than doubling,
numbers at individual sites. However, the number of new
ruins located depended both upon the thoroughness of
prior investigators and the time we spent surveying a
site, both these factors being highly variable. However,
at almost every ruin group we revisited during the
Vatnahverfi-Project, we found further unregistered ruins.
This attests that our surveys are not in any way complete
and that still more ruins remain undiscovered at most
sites, especially where dense shrub vegetation makes
surface identification challenging, or at greater distance
from the main cluster of farm buildings. In other words,
there is no way of assessing the percentage of existing
ruins located during the project. However, since only
few new ruins turned up upon more than one visit at a
ruin group, it is fair to assume that we actually have
identified a great majority of the ruins that are visible on
the surface, especially those closest to the main dwelling.
As to the contemporaneity and date of these ruins we
are, except for to some extent the dwellings, at a
complete loss because very few outbuildings have been
dated (see section 4.1, Tab.4.2). Thus the surveyed ruins
should be considered to represent up to 450 years of
accumulated settlement at each site. The lack of
outbuilding phasing could in part explain why there are
apparently on average a greater number of outbuildings
on the medieval farmsteads in Greenland than in the rest
of the North Atlantic (see section 5.1.2). Comparative
examples are, however, too few to truly verify this claim.
However, as argued in section 5.1.2 it should also be
noted that certain more easily identifiable ruin types –
i.e. byre/barn and storehouses – are most often only
represented by a single or a few ruins on the farmsteads,
suggesting that outbuildings – like the dwellings – could
occupy the same location for generations, rather than
being built anew in a different location. I will return to
this discussion in the conclusion on the analysis of the
farmstead survey evidence.
Fig.4.28 View looking out of the Igaliku Kangerlua/Einarsfjörðr from the gently rolling slopes over the coast in the northeast Vatnahverfi region (ruin group E63 is located on the first closer headland along the coast). Being located close to Igaliku Kujalleq/undir Höfða í Austfirði (E66), where sheep farming was first reintroduced to the region in 1930’s and where it has been most intense ever since, the vegetation has a noticeable “ovegenic” appearance (Simpson et al. 2001:177), i.e. heavy grazing pressure has transformed much of the dwarf-shrub vegetation into grass cover (photo: C.K. Madsen 2005).

90
5. THE ARCHAEOLOGY OF NORSE FARMSTEADS AND SHIELINGS
Fig.5.1 The church and farm mound at E66 in the Vatnahverfi prior to any excavation. While the stone built church building itself was distinct, the churchyard and nearby building (elevation on the right) were visible on the surface as nothing more than an uneven terrain of grass covered mounds and depressions, in this case exaggerated by later aeolian deposits. Many ruins look just the same today and for their functional interpretation we rely on the few excavated examples (after H.J Rink 1854, courtesy of the National Museum of Denmark).
In chapter 4, the development of Norse Greenland
archaeology as a discipline was outlined. However, all
the named, and unnamed, archaeologists presented there
should not only be accredited with advancing the
discipline in general, by locating hundreds of sites, and
establishing the framework for a medieval Norse
topography in Greenland, they also carried out the
excavations which allow us today to trace more
precisely the functional layout of the Norse farmsteads
and shielings. Although many of the earlier excavations
may appear methodologically outdated today, they,
nonetheless, form the base on which we are able to
functionally interpret the archaeological surface remains
with reasonable confidence.
Chapter 5 summarizes and discusses the findings of
these prior excavations and other investigations such as
relating to the functional interpretation and classification
of farmhouses, shieling lodges, and outbuildings of the
survey evidence presented and analyzed in chapters 6
and 7. Although it would be advantageous if a review
could be separated on developments within a
developmental chronological framework, this is
unfortunately impossible: as shown in Tab.4.1, the
majority of excavations were carried out before the
introduction of 14
C-dating and excavators were largely
not preoccupied with phasing of buildings. Thus, in as a
sense, the excavated Norse architecture also presents at
an “accumulated” record.
Chapter 5 is divided on three main sections, each
reviewing a distinct category of Greenland Norse
architecture: the farmhouses and shielings lodges, the
churches, and the outbuildings. Since the churches have
been treated extensively elsewhere (see below) and are
here mainly used as a well-established indicator of
farmstead status, they are treated less extensively than
the other building categories. Comparative perspectives
to the rest of the North Atlantic are drawn continually to
contextualize the Greenlandic archaeological evidence.

91
5.1 THE ARCHAOLOGY OF NORSE FARMHOUSES AND SHIELING LODGES
Some general traits in the layout schemes of North
Atlantic farmsteads and shielings were presented in
section 2.2. At the core of these farmstead layouts were
of course the farmhouses, or dwellings, why they
unsurprisingly are the buildings to have received far
most archaeological attention in most parts of the North
Atlantic. Not at least the earliest type of farmhouses –
the skálar or longhouses common to all of Viking Age
Scandinavia – have been keenly investigated. The same
is not true in Greenland, however, where only a few
early type longhouses have been identified and even
fewer excavated. This is not because they have not been
sought after, but likely because their remains lie beneath
the later building phases of farmhouses.
Nonetheless, I begin section 5.1 with a brief outline
of the Greenlandic longhouses in a comparative North
Atlantic perspective. I do so not because they are directly
significant to the surface survey evidence analyzed in
chapters 6 and 7, but first because the traditional
rectangular shape of the farmhouses may – as I will
discuss in section 6.2.1 – have remained an “ideal”
layout model for the later farmhouses, and second
because longhouses were central in formulating the
development from more simple to more complex
farmhouses in Greenland. I treat these more complex,
later medieval farmhouses in the next part of section 5.1.
In the final part, I summarize those few excavations that
have been carried out on shielings in Norse Greenland.
Fig.5.2 Viking Age Icelandic type skáli and associated outbuildings excavated at Vatnsfjörður, NW Iceland, from 2003-2010. Interpretation of the structures: no.1 earliest phase skáli, no.3 smithy, no.4 unknown, no.5 workroom/storeroom, no.6 storage (?), and no.7 sheep house or small byre. Red circles outline cooking pits (modified after Milek 2009:fig.3).

92
5.1.1 THE NORTH ATLANTIC LONGHOUSES
To avoid terminological confusion it should be noted
that I in the below refer to 'longhouses' or 'skálar' (pl.) as
farmhouses with the main function of a residence for a
household, not to be confused with similar shaped, but
larger 'hall' type structures known also from all of
Scandinavia and North Atlantic, but which also clearly
served representational functions (see also:Albrethsen
and Ólafsson 1998:note 1).
Briefly summarized, the “classical” North Atlantic
longhouse was a rectangular building with slightly
curved long walls and straight gables; at its’ center was a
long-fire bordered by benches (Fig.5.1) (e.g., Larsen and
Stummann Hansen 2001:117, Vésteinsson 2005b:22).
Usually skálar were partitioned on different functional
sections, i.e. kitchen, pantry, storage etc. (e.g., Ritchie
1993:67, Kaland and Martens 2000:44p, Bond et al.
2008:16p, Zori et al. 2013:155). Often in Scandinavia,
but more rarely in the North Atlantic, the longhouse
included a byre/barn section in one end of the building
(e.g., Hermanns-Auðadóttir 1992:91, Skre 1996:65,
Munch 2007:102, Griffiths and Harrison 2011:16).
Skáli sizes, building techniques, and architectural
details varied greatly from region to region: in the tree-
less North Atlantic, walls were normally built in turf and
stone. In the Northern Isles and the Faroe Islands, box-
walls with stone or stone/turf faces and soil filling was
common (e.g., Cruden 1965:26p, Small 1967:237, Arge
1989:112, Stummann Hansen 1991:47, Matras 2005:101,
Bond et al. 2007:18, Griffiths and Harrison 2011:16). In
Iceland, walls were primarily built in turf, alternatively
turf and stone, on a foundation of stone (e.g., Hermanns-
Auðadóttir 1992:92, Ólafsson 2001:149, Edvardsson
2004:6, Roberts 2004:14p, Lucas 2008:85). Initially
roofing was supported by buried posts (e.g., Small
1967:268, Thorsteinsson 1982:149p, Magnússon
1983:106, Stummann Hansen 1991:47, Kaland and
Martens 2000:44, Herschend and Mikkelsen 2003:43,
Roberts 2004:18, Vésteinsson 2005a:8p, Larsen and
Turner 2010:268, Zori et al. 2013:Fig.2).
However, Landnám in Greenland ca. AD 980
coincided with diversification from the uniformity of the
Viking Age (Vésteinsson 2005b:22), which also
extended to the farmhouses that eventually came to
include whole new house types (Skre 1996:96, Myhre
and Øye 2002:281p, Vésteinsson 2005b, Høegsberg
2009:87), as well as some new shared architectural traits:
First, from the mid-9th-10
th centuries, the curved
longhouses were made straight-walled and narrower –
and roof-bearing posts were moved closer to the walls to
create space - perhaps as a result of more limited access
to building timbers and a new custom of adding annexes
to the sides of the buildings (Fig.5.2) (see below and:
Small 1967:238, Vésteinsson 2005b:22, Larsen and
Turner 2010:167). Second, at the same time or only a
little later, roof-supporting buried posts were raised up
on post pads or sills (e.g., Petersen 1933:82p, Myhre
1982b:112p, Magnússon 1983:106, Skre 1996:63, Myhre
and Øye 2002:277); this new building technique gave
buildings a longer lifespan and could thus also be
interpreted as a response to timber shortage. However,
the change also occurred in tree-rich Norway. Third,
during the ca. 11-12th centuries AD farmhouses became
more nucleated through the adding of annexes to the
gables or long walls (e.g., Thorsteinsson 1982:154,
Ritchie 1993:54, Vésteinsson 2005b:22, Bond et al.
2007:21). The latter development has been referred to by
D. Skre (1996:64) as the functional fragmentation of the
longhouse and which continued into the Middle Ages.
A fifth and major change was the separation of byre/
barn from the farmhouse, which in Norway began about
AD 800 (Myhre 1982a:206, Skre 1996:65, Myhre and
Øye 2002:277). While there are examples of North
Atlantic longhouses with byre in one end (Hamilton
1956:108, Small 1967:238, Bigelow 1989:187,
Hermanns-Auðadóttir 1992:91, Griffiths and Harrison
2011:16), the norm from beginning of landnám seems to
have been to separate farmhouse and byre. They were
often closely situated and aligned (Hamilton 1956:63p,
e.g., Cruden 1965:Fig.3, 26p, Hermanns-Auðadóttir
1992:Fig.2, 91p, Kaland 1993:Fig.17.2, 309, Berson
2002:59, Matras 2005:Fig.9, 106), a layout which signals
both economic and social significance of the byre.
Conversely, skálar connected byre could represent a
poorer class of farmsteads (Myhre 1982a:296).
Only some 11 skálar type farmhouses have been
wholly or test-excavated in Greenland (cf. Tab.5.1). Still,
they establish that building customs there followed the
rest of the North Atlantic: Aa. Roussell early identified a
development from 'simple longhouse' (type I) to 'fully
developed longhouse' (type Ia) with straight walls and
gables, and partition – i.e. functional fragmentation – of
the building including annexes added to the long walls
(Roussell 1941:138p, 149p). S.E. Albrethsen added to
this that the earliest skálar had walls built mainly of turf
on a stone foundation, and that partition walls were made
in perishable material (Albrethsen 1982:284).

93
Fig.5.3 Stöng in Þjórsárdalur, SW Iceland. Excavated in 1939 and its abandonment now, debatedly, dated to AD 1104 by tephra deposits, Stöng has long been considered the prime example of an early medieval farmhouse in Iceland. At this time, the farmhouse still had at its core a central rectangular room, but also annexes with specialed function (sitting room (i.e. stofa), pantry, and meathouse/lavetory). Note also that room seperations are build in heavy turf wall, compared to the earlier wooden partition walls (after Stenberger et al. 1943:Fig.37).
To this there is only to add that some Greenlandic
skálar examples included roof-bearing posts raised up on
post pads and moved out towards the walls (Albrethsen
and Ólafsson 1998:19pp, Edvardsson 2007b:plan 8), and
all the developmental architectural traits of the North
Atlantic are represented in Greenland. In a recent layout
based discussion of the Greenland farmhouses, M.S
Høegsberg (2009) also emphasized association with
Scandinavian farmhouse layout developments. In
addition, he suggested that early medieval farmhouses
constituted a new house type – 'row houses' – and a
break with the skálar tradition (Ibid.89), perhaps
inspired by urban Norwegian architecture through
interaction with town-based merchants (Ibid.94). While
certainly an interesting notion, the excavations of the
landnám era farmhouse at Narsaq (E17a) (Vebæk 1993)
and E74 (see below) demonstrate that, at some farms at
least, the development was a continuation of the old
skálar tradition.
For brief comparative overview, Tab.5.1 presents the
internal length/width and estimated floor areas of 74 ca.
9th to mid-12
th century longhouses from Greenland and
the North Atlantic, as well as a few select examples of
representational halls from Scandinavia. Note that the
Greenland subsample tentatively includes the longhouses
excavated at L’Anse aux Meadows, Newfoundland
(Ingstad 1977, Wallace 1983, 1991, 2009); although the
origin of the settlers is disputable (Smith 2000:217,
Wallace 2009:121) the buildings must certainly be dated
to the period in question. A note of caution: Tab.5.1 lists
longhouses over the period during which they underwent
the above outlined changes, i.e. it does not discriminate
between the earliest type of “one-room” long-houses
(e.g. Vatnsfjörður, Fig.5.2) and later partitioned types
with added end- and side rooms (e.g. Stöng, Fig.5.3);
length/ width and floor measurements in Tab.5.1 only
reflect the “central longhouse building”, which may or
may not have been partitioned in specific functional
rooms.

94
Tab.5.1 – North Atlantic Longhouses, ca. AD 850-1150.
Site name:
Internal length (m)
Internal width (m)
Estimated floor area (m
2)
Reference:
Greenland
1 E83a, ruin no.201 47.6 3.6 171.4 (Arneborg et al. 2009b:25)
2 E17a ruin no.04, phase 2 34.2 5.3 181.3 Vebæk 1993:14
3 E252 ruin no.102 22.8 4.8 109.4 Guldager et al. 2002:Fig.132
4 L'Anse aux Meadows Hall F 22.7 5.4 122.6 Wallace 1991:Fig.9
5 E59 ruin no. 172 18.7 5.6 104.7 Clemmensen & Kapel 2010:15
6 L'Anse aux Meadows Hall D 17.7 5.9 104.4 Wallace 1991:Fig.8
7 E29a ruin no. 60 17.6 5.6 98.6 Albrethsen 1982:274
8 E74 R04, phase 2 16.9 2.9 49.0 Edvardsson et al. 2006:92
9 E209 ruin no. 132
14.4 5.8 83.5 This volume
10 L'Anse aux Meadows Hall A, I3 14.3 5.1 72.9 Wallace 1991:Fig.6
11 E83, ruin no.6, room IX 14.0 4.0 56.0 Roussell 1941:141p
12 GUS hall phase 11
12.0 5.0 60.0 Albrethsen & Ólafsson 1998:19
13 E17a ruin no.04, phase 1 12.0 5.5 66.0 Vebæk 1993:14
14 L'Anse aux Meadows Hall A, II3 11.4 4.6 52.4 Wallace 1991:Fig.6
15 E29a ruin no. A1 11.0 6.0 66.0 Albrethsen 1982:273
16 V52a ruin no 1, earlier phase2 7.5 3.2 24.0 Roussell 1941:65p
Subset Mean 18.4 4.9 88.9
Subset standard deviation (s) 10.0 0.98 43.09
Iceland:
17 Hofstaðir 35.9 7.7 276.4 Zori et al. 2013:Tab.1
18 Skallakot 26.0 5.4 140.4 Zori et al. 2013:Tab.1
19 Stöng 25.6 5.7 145.9 Ágústsson 1982:Fig.4
20 Hrísbrú 25.2 5.1 113.2 Zori et al. 2013:Tab1
21 Glaumbær 23.5 5.3 124.6 Bolender 2005:5, Fig.7
22 Sámsstaðir 22.6 4.0 90.4 Rafnsson 1977:59p
23 Bær í Gjáskógum 21.7 4.1 89.0 Eldjárn 1961:Fig.9
24 Hvítárholt III 20.0 6.3 126.0 Zori et al. 2013:Tab.1
25 Ísleifsstaðir 19.8 5.6 110.9 Zori et al. 2013:Tab.1
26 Hvítárholt VIII 18.0 5.0 90.0 Zori et al. 2013:Tab.1
27 Aðalstræti 16.7 5.8 96.9 Zori et al. 2013:Tab.1
28 Hvítárholt IX 16.3 5.0 81.5 Zori et al. 2013:Tab.1
29 Snjáleifartóttir 16.3 5.5 89.7 Zori et al. 2013:Tab.1
30 Granastaðir 14.7 5.4 79.4 Zori et al. 2013:Tab.1
31 Vatnsfjörður 14.3 4.9 70.1 Zori et al. 2013:Tab.1
32 Herjólfsdalur II 13.5 3.5 47.3 Zori et al. 2013:Tab.1
33 Grelutóttir 13.4 5.4 72.4 Zori et al. 2013:Tab.1
34 Eiríksstaðir 12.3 4.7 46.7 Zori et al. 2013:Tab.1
35 Herjólfsdalur V 10.0 3.5 35.0 Zori et al. 2013:Tab.1
36 Herjólfsdalur V 10.0 3.5 35.0 Hermanns-Auðadóttir 1992:91
37 Herjólfsdalur VIII 9.8 3.4 33.0 Hermanns-Auðadóttir 1992:91
38 Herjólfsdalur I 8.0 3.5 28.0 Hermanns-Auðadóttir 1992:90
39 Herjólfsdalur III 7.5 2.8 21.0 Hermanns-Auðadóttir 1992:90
40 Sveigakot3 - 4.7 - Zori et al. 2013:Tab.1
Subset Mean 17.4 4.8 88.8
Subset standard deviation (s) 6.98 1.12 54.93
Faroe Islands
41 Kvívík phase 1 21.5 5.8 123.6 Matras 2005:101
42 Toftanes II 20.0 5.0 100.0 Stummann Hansen 1991:47
43 Seyrvági 17.6 4.6 80.3 Thorsteinsson 1982:Fig.2
44 Norðuri í Forna3 10.7 3.5 37.5 Thorsteinsson 1982:Fig.4
45 Fuglafirði3 - 4.7 - Thorsteinsson 1982:Fig.3
Subset mean 17.5 4.7 85.3
Subset standard deviation (s) 4.78 0.81 36.49

95
Site name: 2Internal
length (m) Internal
width (m) Estimated floor
area (m2)
Reference:
Northern Isles
46 Westness 34.0 6.0 204.0 Kaland 1993:308
47 Bay of Skaill 26.4 4.9 129.4 Griffiths & Harrison 2011:16
48 Jarlshof phase V, house 1 21.5 5.2 111.8 Small 1982:248, Fig.7
49 Hamar (house 1, phase 1) 20.6 4.6 94.8 Bond et al. 2007:Fig.2.1
50 Jarlshof phase I, house 1 20.4 5.6 114.2 Small 1982:248, Fig.6
51 Underhoull, lower 17.0 4.6 78.2 Small 1967:237
52 Belmont house I 20.0 5.0 100.0 Larsen&Turner 2009:167
53 Stoora Toft 16.0 4.0 64.0 Stummann Hansen 2000:94
54 Watlee, house I 14.0 4.5 63.0 Stummann Hansen 2000:94
55 Gardie I 14.0 4.5 63.0 Stummann Hansen 2000:93
56 Jarlshof phase V, house 6 11.4 4.6 52.4 Small 1982:248, Fig.7
57 Jarlshof phase V, house 7 10.9 4.9 53.4 Small 1982:248, Fig.7
58 Underhoull, upper 10.4 2.5 26.0 Bond et al. 2008:Fig.2.4
Subset mean 18.2 4.7 88.79
Subset standard deviation (s) 6.73 0.83 45.49
Norway
59 Borg I:1a 80.0 9.0 720.0 Herschend & Mikkelsen 2003:51
60 Åker1 40.0 7.9 316.0 Skre 1996:Fig.4
61 Storrsheien av Vigeså, tuft 4 32.5 5.8 188.5 Petersen 1933:PL. XLIX
62 Ytre Moa A-B 22.0 5.1 112.2 Petersen 1933:PL. LIII
63 Oma 21.0 5.0 105.0 Myhre 1982a:Fig.22, 1982b:Fig.5
64 Måkskitmyro 17.5 4.0 70.0 Myhre 1982a:Fig.22, 1982b:Fig.5
65 Søndre Nygård1 15.8 5.2 82.2 Skre 1996:Fig.4
66 Storrsheien av Vigeså, tuft 2 15.5 3.9 60.5 Petersen 1933:PL. XLVIII
67 Rapstad 13.4 3.9 52.3 Petersen 1933:PL. XLV
68 Tjora 1 12.5 3.0 37.5 Myhre 1982a:Fig.22, 1982b:Fig.5
69 Birkelandsstølen 1 10.0 4.5 45.0 Myhre 1982a:Fig.22, 1982b:Fig.5
70 Krågeland 2 9.0 4.0 36.0 Myhre 1982a:Fig.22, 1982b:Fig.5
71 Grødeim 9.0 3.6 32.4 Myhre 1982a:Fig.22, 1982b:Fig.5
72 Tranheim 9,0 3.7 33.3 Myhre 1982a:Fig.22, 1982b:Fig.5
Subset mean 21.9 4.9 126.7
Subset standard deviation (s) 19.06 1.69 49.56
Denmark
73 Gl. Lejre IV 47.5 10.5 498.8 Christensen 2010:243, Fig.9
74 Tissø IV 47.0 11.5 540.5 Jørgensen 2003:Fig.15.23
Dataset Descriptive Statistics
Dataset mean 19.5 5.0 108.0
Dataset standard deviation (s) 11.67 1.51 114.82
Tab.5.1 List of dimensions and estimated floor areas of 74 hall-. skáli-, and traditional type longhouses from late Viking Age/early medieval North Atlantic and Scandinavia, some of them in multiple phases. The longhouses are divided upon regional subsets with means and standard deviations included for each subset, as well as for the entire batch (lowest). The implications of the table are discussed in section 6.1. Note that longhouse dimensions are based both on descriptions and measurements from published house plans (see references). Additional notes:
1 Measurement considers the ruin one single building, although it is likely consisted of two-
three separate buildings; 2 ruins are unexcavated and their interpretation as early longhouses is based on shape and typology only;
3
building dimensions are only approximate as the building is not completely excavated or partially eroded.
In terms of interpreting Tab.5.1, it should also be
noted that the sample includes longhouses excavated
over close to a century and which likely effects
variability due to different excavation methods and
research aims. The Iceland longhouses are well-
represented, because they have been the main focus of
excavation activity (Vésteinsson 2004:73pp). The
Norwegian longhouses are very broadly dated to the late
Viking Age/early Medieval period (Myhre 1982a:98p)
and may represent rather atypical examples, i.e. either
unusually marginal longhouses (e.g., Myhre 2000:39).
The latter may perhaps also apply to the Greenlandic
examples. Finally, Tab.5.1 does not make any temporal
or functional distinctions.

96
Fig.5.4 Length/width scatterplot of 72 late Viking Age/Early Medieval longhouses and chiefly halls from the North Atlantic and Scandinavia (cf. Tab.5.1). Open red squares indicate Greenland ruins tentatively suggested as longhouses. Colored circles approximate the “normal length/width range” for the regional subsample of longhouses (82% cluster within this range). Longhouses numbered and named are outliers described in the text. Data and patterns are discussion in the text.
Fig.5.5 Estimated floor areas of 72 late Viking Age/Early Medieval longhouses and chiefly halls from the North Atlantic and Scandinavia (cf. Tab.5.1). Horizontal numbers refer to individual longhouses in Tab.5.1. Note how the “normal range” longhouses appear very similar across the regional subsets, dwarfed by the examples of chieftain’s or royal halls in Scandinavia. Data and patterns are discussion in the text.
0
2
4
6
8
10
12
0 10 20 30 40 50 60 70 80
Inte
rna
l w
idth
(m
)
Internal lenght (m)
North Atlantic Longhouses, c. AD. 850-1150, lengths/widths
Greenland
Iceland
FaroeIslands
NorthernIsles
Norway
Denmark
59. Borg I:1a
73. Gl. Lejre IV
74. Tissø IV
60. Åker 17. Hofstaðir
1. E83a no.20
2. E17a/Narsaq, phase 2
46. Westness
61. Storrsheien
0
100
200
300
400
500
600
700
1 2 3 4 5 6 7 8 91
01
11
21
31
41
51
61
71
81
92
02
12
22
32
42
52
62
72
82
93
03
13
23
33
43
53
63
73
83
94
14
24
34
44
64
74
84
95
05
15
25
35
45
55
65
75
85
96
06
16
26
36
46
56
66
76
86
97
07
17
27
37
4
Esti
mate
d F
loo
r A
reas (
m2)
North Atlantic Longhouses, c. AD. 850-1150, floor areas

97
Fig.5.4 displays a length/width scatterplot of the
longhouses listed in Tab.5.1, Fig.5.5 their estimated floor
areas. There are many implications to the table and
figures, and many ways they could be critically assailed.
Thus, for the purpose of this discussion I will limit
inferences to some overall and apparently robust trends:
Reviewing longhouse length/widths in Fig.5.4, there
are some notable outliers: in the Greenlandic subsample,
the uniqueness of E83a’s ruin no.20 is undoubtedly
erroneous; a 1935 excavation of the ruin revealed a
single stall stone, which led to its interpretation as a byre
(Roussell 1941:141). A 2004 follow-up excavation
reinterpreted the building a skáli type farmhouse on the
basis of the finds, but also noted that the building was
probaly divided on dwelling and byre, i.e. consisted of
two separate buildings (Arneborg et al. 2009b), which
would account for its extreme length in Fig.5.4. The Bay
of Skaill longhouse (Tab.5.1 no.47) also included a byre
in one end of the farmhouse. The measurements of the
remaining longhouses appear more credible.
The most significant trend of Figs.5.4 which I
accentuate here, is the overall uniformity of the skálar
type farmhouses in this sample. A comparison (single
factor ANOVA-test) of regional variance (grouping the
Faroes and the Northern Isles longhouse and excluding
the Danish examples) in A) lengths, B) widths, and C)
estimate floor areas between the sample longhouses
show them to be statistically insignificant (A) F = 0.54, p
= 0.66, B) F = 0.12, p = 0.95, and C) F = 0.93, p =
0.42). In other words, statistically speaking the long-
houses could all come from a single parent population,
culturally speaking the same pan-Scandinavian tradition.
Thus, there is no indication that the Greenland skálar
were dimensionally different than elsewhere in this
cultural sphere (accepting that the sample is very small).
The second trend to accentuate form this sample of
longhouses (cf. Fig.5.5) is somewhat at odds with the
former observation: there does seem to be a small cluster
of slightly larger than average longhouses in the
Icelandic sample – most prominently the famous hall of
Hofstaðir – which are all interpreted as large farmsteads
or chieftain’s residences, also on the basis of patterning
in the zooarchaeology and artifacts (Vésteinsson 2004,
Lucas and McGovern 2008, Lucas 2009, Zori et al.
2013). In short, there does appear to be some correlation
between farmhouse size and status.
On the other hand, Fig.5.4-5.5 also clearly
demonstrate O. Vésteinsson’s (2005:11) observation that
chiefly longhouses in Iceland were all minor when
compared to the greatest Viking Age halls in
Scandinavia (No.59, Borg, No. 73. Gl. Lejre, and No.74
Tissø). In other words, if the sizes of longhouse indicate
status, then the Icelandic chieftains could not compete
with their Scandinavian counterparts and, as Vésteinsson
continues (Ibid.13), this could suggest that the initial
profits of landnám were going back to mainland
Scandinavia. If E83a’s ruin no.20 is discounted as an
unrepresentative outlier, only E17a’s ruin no.4 (in its
second phase) in the Greenlandic subsample compare
with the chiefly farmhouses in Iceland, which of course
would prompt the same parallel interpretation that the
profits of landnám in Greenland were not, at least at this
early stage of settlement, locally imbedded. However, as
Vésteinsson has also noted of the chiefly farmhouses in
Iceland (Ibid.11), they all date from the mid-10th century
AD (Stummann Hansen and Vésteinsson 2002:15,
Bolender 2005:10, Zori et al. 2013:415), perhaps
implying that some 100 years after landnám a more
distinct local elite was emerging. The question is, then,
whether same can be argued for Greenland?
5.1.2 MEDIEVAL FARMHOUSES
In general, later medieval farmhouses have received
far less archaeological attention in the North Atlantic
than the longhouses, while quite the opposite is the
situation in Greenland. This makes the type of direct
comparison carried out on the longhouses in the above
unfeasible. Nonetheless, I here include some parallels
from elsewhere in the North Atlantic to contextualize the
Greenlandic architectural evidence and to underline the
observation that they essentially were little different:
In Norway, later medieval farmhouse development
was mainly characterized by the completion of the
'functional fragmentation' of the longhouse, which was
noted above (see section 2.2.1 and: Skre 1996:64). As
discussed in section 2.2.1, this development underlay
what I generally termed “settlement fragmentation”,
since it also included the splitting of outbuildings in to
more specific functions and the dividing of infield areas
between multiple farmsteads, as well as increased
regional variation (for an overview see: Skre 1996:63p,
Myhre and Øye 2002:281, Øye 2009:38p). Fig.5.6a-d
displays some of the best examples of excavated late
medieval rural farmhouses and farmsteads from Norway:

98
Fig.5.6 Examples of later medieval Norwegian farmsteads and farmhouses discussed in detail in the text. Note the very similar layout of the farmhouses (modified and room interpretation after: Høybøen and Lurekalven: Kaland 1987: Fig. 2, Fig.4-5, Hellaug: Nesset 2013:Fig.1, Kart 6, Birkeland av Store Eige: Petersen 1933:Pl. XLIII, LVI).

99
Fig.5.7 Two later medieval Icelandic farmsteads and farmhouses discussed in the text. Note the very similar layout of the farmhouses, as well as their similarity with the Norwegian farmhouses in Fig.3.42 (plans and room interpretation after: Gröf: Gestsson 1959, Kúabót: Gestsson 1987).

100
The farmsteads in Fig.5.6 Høybøen (Fig.5.6a), Sotra,
and Lurekaven (Fig.5.6b), Lindås, both in the coastal
Nordhordland region west of Bergen and both timber-
built houses (Kaland 1987). The two other examples are
Hellaug, Stordalen (Fig.5.6c) (Myhre 1982a, Nesset
2013), and Birkeland av Store Eige (Fig.5.6d) (Petersen
1933, Myhre 1982a), Eigersund, both in SW Norway
and built mostly in turf and stone. They were all founded
in the Viking Age, but deserted by the 14th-15
th centuries
and were all located in marginal agricultural areas
(Ibid.). This undoubtedly partly explains their similar
modest character and layout schemes: they all consisted
of a few (1-3) tightly clustered buildings, one of which
was a rectangular farmhouse partitioned on specific
functional rooms, and in three of the cases with a
separate byre/barn. Thus this type of dwelling – whether
rural or urban – was common to most of Norway
(Myhre 1982a:206p, Christophersen 2009:186). A new
building type in medieval Norway was wooden two-
storied houses, mostly in form of the 'loft', where the
lower storey served as a storage for meat and cereals,
while the upper facilitated housing of guests and
representational purposes (Skre 1996:67, Myhre and Øye
2002:281p).
In Iceland, only some 13 medieval farmsteads and
farmhouses have been excavated (for an overview see:
Vésteinsson 2004): 11 date to the 11th-13
th centuries AD,
one to the 14th century AD, and one to the 15
th century
AD. Like in Norway, all of these were derelict farms, but
may represent more normal or even large farmhouses
since most were abandoned following volcanic eruption
(Stenberger 1943:28p, Gestsson 1959:84, Dugmore et al.
2007a). Fig.5.7 displays the layout plans of the two latest
farmhouses, Gröf in Öræfum (Fig.5.7a), southeast
Iceland, and Kúabót in Álftaveri (5.7b), south Iceland.
Apart from differences owing to building materials, the
Icelandic farmhouses are generally similar to the
Norwegian examples: they display the same functional
fragmentation of the farmhouse into more specialized
rooms, only in Iceland this fragmentation entailed adding
annexes to the rectangular dwelling part. One possible
difference in the Icelandic farmsteads that may reflect
their more normal size or status is that their layouts
appear more dispersed than the Norwegian examples, i.e.
the outbuildings lie further removed from the farmhouse
(e.g., Stenberger 1943:Fig.35, 57, 166, Berson
2002:Fig.11, 13), but this is presently a poorly
substantiated observation.
Summarizing medieval farmhouse and farmstead
changes in Norway and Iceland from this admittedly
scarce sample, four points can tentatively be made (for
later comparison with the Greenlandic examples): first,
the farmsteads were characterized by having very few
outbuildings, i.e. at most a byre/barn and 1-3 other
buildings, which probably owes to these being smaller
farmsteads, although not necessarily in the case of the
Icelandic farmhouses (Vésteinsson 2004:Tab.1).
Medieval documentary records show that more buildings
on the farmsteads were becoming the norm in Norway at
least, and the largest could boast as many as 20-30
houses (Skre 1996:64, Myhre and Øye 2002:284, 316,
356). Also, even a “modest” farm like Lurekalven
(Fig.5.6b) is estimated to have kept some 16 heads of
cattle and 26 sheep and goats (Kaland 1987:181pp).
Second, in later medieval Norway farmhouses were
generally getting smaller (Myhre and Øye 2002:277p),
which is suggestive of economic centralization with a
growing stratum of small-scale farmers, some of which
had to share quarters with the livestock (Fig.5.6c)
(Myhre 1982a). Third, a rectangular layout with several
rooms lying in a row seems to have remained the ideal
for farmhouses across the North Atlantic (cf. Fig.5.6-
5.7). If the grænlendinga kept up with developments,
their farmhouses and farmsteads should display similar
characteristics:
The first outline of farmhouse developments in
Greenland was presented Aa. Roussel (1941:136pp),
who suggested a tripartite model, where the Viking Age
skáli was to have developed into a fully developed
longhouse (type Ia, Fig.5.8), a passage house (Fig.5.9),
and finally the centralized farm (Fig.5.10). In the
passage house the rooms of the farmhouse – which did
not include livestock facilities – lay on each site a central
passage forming rectangular block of functionally
specified rooms. This type was mostly based on
Icelandic historic parallels (Nørlund and Roussell
1929:94, Roussell 1941:207). In the centralized farm
most rooms of the farm – including livestock facilities –
were clustered into one united block of connected single
buildings after an apparently rather random scheme
(Fig.5.10-5.11). Roussell held that the centralized farm
was a unique adaptation to the Norse Vestribyggð, i.e. a
measure for keeping animals and people warm during
long cold winters (Roussell 1941:212p, 225). Only few
years later C.L. Vebæk (1943) proved their presence also
in the Eystribyggð , in fact in the Vatnahverfi.

101
Fig.5.8 Plan of farmstead V51 (lower) and its excavated dwelling, ruin no.4 (upper). Roussell (1941) held that ruin no.4 was the archetypical example a 'fully developed longhouse', the type of farmhouse that replaced the Viking Age longhouse and preceded the later Greenlandic (and Icelandic) 'passage house'. However, ruin no.4. is the only farmhouse at the site and the latest dates from both midden (McGovern et al. 1996:Tab.2) and churchyard (Arneborg et al. 2012:Tab.12) fall in 14th century AD, meaning that this dwelling type is also medieval. The layout of farmhouse and outbuildings at V51 has been referred to by Arneborg (2004) as a 'longhouse farm' or 'dispersed farm'. The ruins are identified as: (no. 1) church and churchyard, (nos. 3) earlier building remains, (no. 4) dwelling, (nos. 5-6) stable complexes, (no. 7) smithy, (no. 8) infield dyke, (no. 9) enclosure, and (no. 10) sheep/goat shed; arrowed lines indicate possible irrigation channels (after McGovern et al. 1996:Fig.4), one of which has later proven to be a caribou trail (room and ruin identification after: Roussell 1936, survey plan after Madsen 2014).

102
Fig.5.9 Eastern Settlement ruin groups nos. E2, Tasiusaq, and E73, Amitsuarsuk region, as well as their associated dwellings excavated in 1894 (Bruun 1895:215p) and 1880 (Holm 1883:127), respectively. Ruin group E2’s dwelling (ruin no.6) was Roussell’s (1941:151p) (only) prime example of a Greenlandic 'passage farm'. Although Roussell did not refer to the poorly excavated dwelling (ruin no.13) at ruin group E73 as a 'passage farm', the similarity with E2’s ruin no.6 is striking (modified after: E2: Bruun 1895:216 (right), Guldager et al. 2002:Fig.88 (left); E73: Bruun 1895:396 (right)).

103
Roussell interpreted these farmhouse types in terms a
gradual chronological development (Ibid.211p), but his
model was troubled by limited insights into construction
phases and the lack of absolute dates. Nonetheless, his
typology constitutes one of the most significant
contributions to Greenland Norse building archaeology
and many of his observations are still valid.
However, the excavation of farmhouses during the
Inuit/Norse Project (see section 4.1.5) provided the first
absolute dates for the “centralized farms”, which proved
to span the entire period AD 1000-1400 (Andreasen
1981:182). This made C. Andreasen propose (Ibid.) that
the centralized farms reflected different function rather
than chronology: he suggested that Roussell’s fully
developed longhouse with large separate byres was a
feature of the wealthy church farms, whereas the
centralized farms were inhabited by small-time farmers,
either occupying the inland and having some cattle (byre
included in the nucleated farmhouse); or situated in
coastal niches and having very little cattle (byre not
included in the nucleated farmhouse). In a contemporary
review of early longhouses, Albrethsen (1982: 271)
hinted at the same ideas, both authors thereby
anticipating many of the research themes to be taken up
by later research, including this dissertation.
The excavations of the 'Farm beneath the Sand'
(GUS) 1991-96 proved all of the above authors to be
partially right: this excavation demonstrated a complete
building history from landnám skáli from shortly after
AD 1000 to centralized farm in the 14th century AD
(Arneborg and Berglund 1993, Berglund 1998a:9,
2001:269). The final publication of GUS is still under
preparation, but the initial phasing has already revealed a
highly significant observation, i.e. that several of the
massive centralized farm complexes excavated by
Roussell in the Western Settlement (Roussell 1936b,
1941) were partly an artifact of excavation methods
lumping multiple building phases into one massive
complex (cf. Fig.5.11).The final publication of GUS will
show whether the centralized layout of the farmhouse
trace back to the 13th century AD or earlier, or if it is
only contemporary with the latest phase of the site dated
to ca. AD 1300-1400 (J. Arneborg, unpubl. data).
Lastly, J. Arneborg have presented comprehensive
overviews of the excavated farmhouses in Greenland
(e.g., Arneborg 2004:8pp, 2006:18pp, Arneborg et al.
2012b:238pp), although largely avoiding to discuss
dwelling typologies and focusing instead on the churches
and other buildings relating to farm status. However, in
two of these overviews (Arneborg 2004:240p, 2012:8),
she has introduced terms such as 'longhouse farm' or the
'dispersed farm', both signifying a farmstead layout,
where the outbuildings were dispersed around the
infield. Although Arneborg’s definition for their
differentiation is based only on building counts, the
concepts are highly useful and are implemented in the
analysis in chapter 8. Finally, M.S. Høegsberg (2009)
has revived the discussion of Greenlandic farmhouse
types, but it is unnecessary to go further into this
discussion here.
To summarize some key points from these farmhouse
investigations: first, the 14
C-dates from excavated
dwellings of various type (e.g., Andreasen 1981,
Andreasen 1982, McGovern et al. 1983, Arneborg and
Berglund 1993, McGovern et al. 1996, Arneborg et al.
1998, Berglund 2001, Edvardsson 2007a) adamantly
demonstrate that Roussell’s farmhouse types were
contemporary, or at least greatly overlapping in time;
this implies that particular farmhouse and farmstead
layouts have more to do with the function, economy, and
thereby status, of the farms than with typology. Second,
medieval Greenlandic farmhouses clearly continued to
follow developments in the North Atlantic and
Scandinavia, at least the functional fragmentation of the
farm. While a parallel to Icelandic farmhouses may
perhaps appear most obvious, the Norwegian examples
presented here (Fig.5.6) are little different: “shove” the
farmhouses of either Lurekalven (Fig.5.6a) or Høybøen
(Fig.5.6b) closer together and you essentially have a
centralized farm!
If such nucleated farms in Norway, and perhaps also
in Iceland, reflected a lower societal stratum of farmers,
then they most probably also did in Greenland. This is
important to the interpretation of unexcavated ruin
surface remains, since it implies that nucleated farmstead
layouts – as opposed to the dispersed layouts suggested
by Arneborg as a feature of the largest farms – may help
identify site economy and the status of the site; only in
medieval Greenland, this kind of small farm came in a
variant with a massive dwelling complex with few other
outbuildings, i.e. the centralized farm (cf. Fig.5.10). I
return to explore this potential in chapter 6. Finally, the
increased architectural differentiation implies that in
Greenland – just as in Iceland a little earlier - wealthy
farmers were at least by the 13th century AD able to
display social standing through particular architecture.

104
Fig.5.10 Examples of excavated small 'centralized farms' with combined housing and livestock quarters in one farmhouse and few additional outbuildings. As most farm functions are represented by a single room, the rooms/buildings were probably in contemporary use (contrary to the large 'centralized farms', cf. Fig.3.47) (modified and room identification after Roussell 1941: V8: Fig.53, Fig. 102, V16: Fig.54, Fig.99, V58: Fig.51, Fig.100).

105
Fig.5.11 Above: plan of the partially excavated V52a ruin no. 1 – a large centralized farm – and nearby outbuildings. Below: GUS with indication of preliminary phasing (different colors). When the GUS’s phases are juxtaposed, the plan shows notable resemblance to plans of Roussell’s large 'centralized farms', strongly suggesting that these complexes are, in part, a product of excavation methods (modified and room interpretation after: V52a: Roussell 1943:Fig.46, Fig.47, GUS: Courtesy of Jette Arneborg).

106
Fig.5.12 V53 in the Austmannadal in the Western Settlement. Excavated in 1934 by Aa. Roussell, he believed this ruin to be a shieling (after Roussell 1941:Fig.143).
5.1.3 MEDIEVAL SHIELING LODGES
The basic functions and layouts of shielings in a
North Atlantic context was outlined chapter 2.2.2 and
this section is limited to a presentation of the three
excavated examples of shielings in Norse Greenland.
The term “lodge” is not normally used in the context of
shielings and I do so here mainly to imply their more
temporary character and thereby to distinguish them
functionally from the farmhouses, or dwellings, that
served year round occupation. Although only three
examples have been excavated, they in fact seem to
represent three different shielings types:
The first, possible, shieling is V53 in the
Austmannadal in the Western Settlement, which was
excavated by Roussell in 1934 (Fig.5.12)(Roussell
1941:229): it was a single building of ca. 9x7 m and
consisting of two adjoining rooms, of which one was a
later addition. Each room had a small fire place, but one
room (Fig.5.12 no. I) also had benches and appears to
have been the main occupation room. It should be noted
that the ruin was found on the edge of a gravel terrace
and Roussell speculated that there might have been other
ruins, perhaps a whole farmstead, later eroded by the
nearby river (Ibid.). V53 is an equivalent to ruins
classified as “herders’ huts/shelters” shelters chapter 7.
The next more certain shieling was excavated in the
“Kirkespirsdalen” (“Church Spire Valley”) – 60V2-II-
574 – in 1997 in connection with the establishment of a
goldmine in a valley near the Southern Sermilik
(Fig.5.13) (Berglund 1998b). It consisted of small
stretches of wall built among boulders creating five
small compartments, one of them under a boulder. First
thought to be an Inuit hunter’s shelter/camp, the
excavation unearthed a piece of woven textile – later
dated to AD 1390-1450 – and Igaliku sandstone, which
made the excavators reinterpret the site as a Norse
shieling. The small compartment under the stone was
suggested to be a herders’ shelter, the other
compartments as pens for sheep/goats. Although one of
the more rudimentary examples, this type of shieling
corresponds to the types classified as dairy shielings in
chapter 7, or possibly only a milking station.

107
Fig.5.13 Plan of presumed Norse shieling 60V2-II-574 excavated in 1997 in Kirkespisdalen by Southern Sermilik in the Norse Eastern Settlement. First believed to be an Inuit herding shelter, excavation of the structure unearthed a single piece of woven textile dated to AD 1390-1450 and Igaliku sandstone, one of the most typical sandstones used for whetstones by the grænlendinga. This made the excavators reinterpret the sites as a Norse shieling, presumable for milking sheep/goat husbandry (after Berglund 1998:161).
The final shieling and the perhaps most interesting
one was the dwelling of E74 excavated in the valley of
Qorlortorsuup Tasia in the Vatnahverfi region in 2004
and 2006 (Fig.5.14) (Kapel 2004, Edvardsson 2007b).
Although the excavation was never satisfactorily
finished because of unforeseen events, it still provides an
excellent example of both farmstead and shieling
developments in Norse Greenland:
During the 2004 preliminary investigation the ruin
appeared like a typical small farm mound with visible
outlines of several rooms (Fig.5.14 top left and right).
The 2006 excavation showed the surface contours to be
partially right, but that the building had a more complex
history (Fig.5.14 bottom): it appears to have started out
as a simple longhouse (phase 1), which at some point
was partitioned into two or three rooms by heavily built
walls (phase 2), i.e. it exemplifies the medieval
functional fragmentation of the farmhouses discussed in
section 5.1.1. Later, annexes were added to the sides
(phase 3) giving the building its surface appearance of a
small centralized farm. However, this residence (phase
4) was taken out of use by the mid-13th century (cf.
Tab.8.2) and a small building resembling a herder’s hut
was instead built against one wall of the old dwelling.
Dating of midden remains show this hut continued in use
for another some 100 years before also being abandoned.
Thus, E74 presents an excellent example of both the
change and continuity in farmhouse development, as
well as the transformation of farm to shieling that was
discussed in chapter 3. In the classification in chapter 8,
E74 falls out as a large complex shieling, i.e. exactly the
types of shielings expected to have been small
farmsteads at some point.

108
Fig.5.14 Different stages of ruin documentation of E74’s dwelling (ruin no.4): Top left: surface contour survey prior to excavation (after Kapel et al. 2004:24). Top right: ruin and room surface outlines prior to excavation (after Kapel et al. 2004:23). Middle: site overview plan. Bottom: simplified building plan of ruin no. 4 after excavation and divided on phases (modified after Edvardsson 2007:Plan 8.). The figure is discussed in detail in the text.

109
5.2 MEDIEVAL CHURHES IN NORSE GREENLAND
Fig.5.15 Detail survey plan of the small church at ruin group E64 in the North Vatnahverfi region. The churchyard and church has been partially excavated in 2007-2008 and 2010 as part of the Vatnahverfi Project. The interred Norsemen were dated to between ca. AD 980-1200, suggesting the church was taken out of use by then. Another interesting feature of this church is the midden in front of the dwelling (ruin no.4) seems to have spilled into the churchyard, probably during the occupation of the site since the ground is level.
At present time some 18 or 19 medieval churches
have been identified in the Norse settlements, 16 in the
Eastern Settlement and two or three in the Western, and
all of them closely associated with farmsteads (e.g.,
Fig.2.5) (Krogh 1976:297p, 1982a:266p, Arneborg
2002:21, 2004:248p). The churches and the medieval
church topography has – as outlined in chapter 5 – been
so extensively treated that there is no cause to reiterate
here (e.g., Clemmensen 1911, Roussell 1941, Vebæk
1953a, 1953b, Krogh 1965, Vebæk 1966, Krogh 1976,
1982a, Vebæk 1991, Arneborg 2002, 2006, Vésteinsson
2010, Arneborg et al. 2012b).The main importance of
the churches in this study is as indicators of site status
and, with their gradual abandonment, as indicators of
political and religious centralization. The churches fall in
two distinct groups, the small and the large:
5.2.1 SMALL MEDIEVAL CHURCHES
The small churches were built with an inner wooden
structure and outer protection walls in stone or stone/
turf; the gable was however without protection and
displayed the bare wood (Krogh 1976:306, 1982a:272).
All but two of the small churches have circular or
rounded churchyard enclosure walls (Fig.5.16), which
made C. Keller (1989:215) suggest that they should date
to the 11th century. While
14C-dates have since verified
that interments in the churchyards began around AD
1000, the dates also show that they in several places
continued up into the 12th to mid-13
th centuries (J.
Arneborg, unpubl. data, Tab.8.1). Two such small
churches are found in the Vatnahverfi region E64 and
E78 (Fig.5.15, 5.17).
The small churches have caused the greatest
interpretational problems: when Norse archaeologists in
the first half of the 20th century began locating more
churches than mentioned in the medieval church lists,
and some of them in oddly close proximity, they tried to
explain them either as churches that had been moved or
closed down, or that the smaller churches were annexes
or chapels to the main parish churches, which became a
necessity as Norse settlement and population expanded
(Vebæk 1952:104p, 1953b:300p, 1966:203p).

110
Fig.5.16 Plans of the medieval churches in the Norse Eastern settlement. Left: the group of small early churches. Right: the group of larger presumed parish churches. Left (lowest) and Middle (lower): the group of large Romanesque type churches with nave and choir. Right: the group of later (post AD 1300) Gothic type churches (modified after Keller 1989:Plate 27).
With the excavation of 'Þjóðhildar’s church' at
Qassiarsuk/Brattahlið (E29a) the early date of the small
churches was established definitely (Krogh 1965:15,
Vebæk 1966:205, Keller 1989:188). However, this did
not resolve the question of their function, which is still
debated. Some authors have kept to the interpretation
that they were annexes or chapels – bænhús – a kind
farmstead churches without a permanent priest or tithe
revenues known historically from Iceland (Krogh
1976:310, Vésteinsson 2010:143). As these authors point
out, this would explain why the small churches are not
mentioned in the medieval church lists. Neither does it
exclude that all the churches in Greenland could have
started out as the small type, some later having
developed into parish churches of the larger type (see
below). However, it is certain that some of the small
churches for a period continued to be used parallelly
with the building of the large group of churches.
5.2.2 LARGE MEDIEVAL CHURCHES
The group of larger churches has caused less
interpretational issues: one group of large churches is of
Romanesque type with nave and smaller choir (Fig.5.16
E29a, E105, E111, E47), which are typologically dated
to ca. AD 1000-1200 (Krogh 1976:307, Arneborg
2004:251). These were like the small churches built with
a wooden inner structure or at least wooden gable (Ibid.).
The second group of larger churches (Fig.5.16 E66,
E149, E83, E29a, E23, and E18) is dated to ca. AD 1300
or later. These churches had walls completely built in
stone and it was noted early that they seem influenced by
Norwegian church building traditions (Roussell
1941:122p). The large group of churches undoubtedly
functioned as parish churches. One example of the latest
type – E66/undir Höfða – is located in the north
Vatnahverfi region.

111
Fig.5.17 Detail survey plan of the small and rather poorly preserved church with circular churchyard enclosure wall at ruin group E78 in the central Vatnahverfi region. The placing of a 2007 excavation trench is indicated. Although probably built around AD1000, dates on the latest interments suggest that the church remained in use until ca. 1250 (cf. Tab.8.1).
Although the functions of the different types of
Greenland Norse churches have been remarked on in the
above, there are still many unresolved issues as to their
precise use as well as to their chronology; it is, however,
beyond this section to discuss. What I emphasize in
conclusion is that the churches – especially the later and
larger types – undoubtedly reflected a considerable
investment of labor and economic means for the farmers
who built them: besides the actual work put into the
construction and maintenance, the materials needed –
large building timbers, church bell, glass for windows,
religious furnishings and paraphernalia etc. – all had to
be imported. Thus the medieval churches are the most
explicit and undisputed architectural mark of economic
wealth and status on the Norse farmsteads and are
throughout the analysis used as an upper benchmark
differentiation of the largest farmsteads (note that
representational halls have also been accentuated as
similar signs of status and wealth (Berglund 1982,
Arneborg 2006), but because they are difficult to identify
in the survey evidence I omit further description of them
here). Perhaps, the lack in Greenland of traditional
Viking Age chiefly halls (see section 5.1.1) is
explainable by the condition that by the time the
grænlendinga were able to invest the profits of the
Norðrseta hunt locally, they did so in the new medieval
symbols of grandeur, the churches.

112
5.3 THE ARCHAOLOGY OF OUTBUILDINGS
Fig.5.18 Ruin no. 1 at ruin group E66 in the Vatnahverfi, South Greenland, as it was preserved in the late 19th century; today only a few of the lower courses are left. It is an example of a stone-built store- or warehouse of the type often associated with external trade in Norse Greenland. Because of their frequently excellent preservation, the basic built and function of the storehouses was quickly established. Note also the elevation on the “terrace” in the background; it is the farm mound of E66 (cf. Fig.5.1) (after Holm 1883).
Outbuildings were the only of the farmstead
buildings that were not – at least specifically – meant for
the housing of people. Although they greatly outnumber
farmhouses and churches, outbuildings have received far
less archaeological attention and, to my knowledge,
there exists no systematic overview of outbuildings from
any part of the North Atlantic (although Roussell
(1941:21pp) has provided a summary overview). Except
for a selection of cattle byres (see below), this makes a
comparative approach unfeasible and this section focuses
principally on the Greenlandic outbuildings. Some
general traits of the outbuildings should first be outlined:
Because early investigators regularly excavated all or
most of farmstead buildings (see section 4.1.3) quite a
few outbuildings have been excavated in Greenland (cf.
Tab.4.1). However, just as the dwellings, none of these
outbuildings were dated. As far as I have been able to
establish, only the supposed byre or livestock building to
E74 has been dated (to ca. AD 1160-1215, one sigma
range, i.e. corresponding to the abandonment of phase III
in Fig.5.14). This makes archaeological interpretations
of outbuilding developments, uses, and contemporaneity
highly problematic. In short, the outbuildings – like the
survey evidence and to an extent the dwellings – also
constitute an accumulated record, i.e. a “maximum” of
farm activity.
However, in terms of outbuilding contemporaneity it
can be observed that at many of the excavated
farmsteads specific outbuildings – e.g. storehouses,
smithies, bathhouses – are only represented by a single,
or at maximum a few, examples at each site. If this does
not reflect very short life of the farmstead – which seems
improbable in many cases – then these “few”
outbuildings should reflect several hundred years of
activity. This would either imply that they were a later
settlement feature, or that outbuildings were repaired or
rebuilt on the same spot rather than left and built anew
elsewhere.

113
5.3.1 MEDIEVAL BYRE/BARNS
Of all the outbuildings, the cow byre/barns are the
type most frequently investigated archaeologically. One
explanation for this is their obvious relation to farmstead
wealth, i.e. as a mark of status in the medieval socio-
economic context. Another explanation is that byre/barns
are fairly easily identifiable from three conditions: first,
from their large size, i.e. they are often the second
largest building on a farmstead; second, from partition of
the building on two sizable rooms, i.e. a byre and a barn
part of which it was early observed that the former was
built mainly in turf for insulation and the other in stone
for ventilation (Holm 1883:73p, Bruun 1895a:209p);
third, from the stall stones that separated the cows and
are occasionally visible even on the surface. Thus,
already by 1941 (217pp), Roussell could outline three
basic types of byres in Greenland:
Simple byre/barns, rectangular buildings partitioned
into a byre- and barn-part (Fig.5.19), at times with a
smaller room added to one gable; stable complexes,
rectangular blocks of adjoining rooms of which at least
one was a byre and one a barn with additional rooms for
other livestock and fodder storage (e.g., Fig.5.8 no.5-6);
integral byre/barns which were included in a dwelling
complex (Fig.5.11) – i.e. the centralized farms. In
addition to stall stones, normal features of byres were
stone flagging of the floor, at times with a central gutter
for mucking out the byre, and very thick walls, at times
with additional outer turf padding; some byres had a
“passage-entrance” or small lobby for heat conservation
(cf. Fig.5.19). Roussel recognized that these byre/barn
types reflected a development similar to the dwellings,
i.e. that the simple byre/barns were a precursor to the
stable complexes, but that they existed simultaneously
(1941:218). The categories simple byre/barns and stable
complexes are used in the classification of outbuildings
in chapter 6 (cf. App. I); the integral are not because they
are virtually impossible to identify from other rooms of
the dwellings in surface surveys.
For comparison, Tab.5.2 lists internal lengths/widths,
and estimated floor areas of 40 Greenlandic byres/barns
– 20 of the simple type and 10 of each of the two other
types – as well as of 14 byre/barns from Iceland and
three from Norway. Tab.5.2 also lists the presence of
stalls, floor paving, the position of the entrances, the
distance of the byre/barn to the main associated dwelling
(DMD), and the presumed date of the site (Viking Age
to Middle Ages). The list is obviously not exhaustive;
however, it does include most of excavated examples
from Greenland and Iceland (Berson 2002).
Fig.5.19 Ruin group E29’s ruin no. 19, Qassiarsuk region, an example of a simple byre/barn with its particular features: a byre end with stall stones and paving, and a barn end without, thick turf walls with outer turf padding, and a passage entrance for conservation of heat (after Nørlund and Stenberger 1934:Fig.56).

114
Tab.5.2 – North Atlantic byre/barns
Location: Site no.
Ruin no. Byre
length Byre width
Byre area (m
2)
Barn length
Barn width
Barn area (m
2)
Stalls Pave Add.
rooms Gable
entrance DMD Date Reference:
Greenland simple byre/barns: Nunataaq E1 Ruin 3 6.6 4.1 26.9 8.6 4.1 35.0 Yes ? No Yes 5 Med. Bruun 1895:208
Nunataaq E1 Ruin 5 5.2 3.1 16.4 8.4 3.1 26.4 Yes ? No No 119 Med. Bruun 1895:211, Guldager et al. 2002:Fig.112
Tasiusaq E2 Ruin 5 7.5 3.5 26.3 8.2 3.8 31.2 Yes ? No No 25 Med. Holm 1883:Tavle XIV
Tasiusaq E2 Ruin 13 9.8 3.9 38.2 11.1 3.9 43.3 Yes ? No ? 1 Med. Holm 1883:Tavle XIV
Tasiusaq E4 Ruin 5 13.9 3.8 52.1 14.1 4.7 65.3 Yes ? No No 10 Med. Madsen ????
Eqaluit E9 Ruin 5 3.6 3.1 11.3 ? ? ? Yes ? No ? 5 Med. Bruun 1895:241
Sillisit E23 Ruin 6 9.0 3.7 33.3 9.6 3.7 35.5 Yes ? Yes ? 194 Med. NMA:Albrethsen 1970, bilag I:15, Krogh&Berglund 1980:134
Issormiut E24 Ruin 3 6.1 3.5 21.4 6.6 3.5 23.1 Yes No No No 69 Med. NMA:Albrethsen 1969
Narsap Ilua E18 Ruin 4 10.5 3.4 35.7 14.1 3.7 52.2 Yes ? ? No 15 Med. Clemmensen&Kapel 2008:22
Qassiarsuk E29 Ruin 19 8.8 3.7 32.7 13.1 3.3 43.2 Yes Yes No No 39 Med. Nørlund&Stenberger 1934:89p
Qinngua E39 Ruin 8 9.3 3.3 30.1 9.5 3.4 32.3 Yes ? No No 35 Med. NMA:Albrethsen 1970:bilag I:18, Krogh&Berglund 1980:105
Igaliku E47 Ruin 9 33.3 4.2 138.4 26.4 4.8 126.3 Yes No No ? 12 Med. Nørlund 1929:115
Igaliku E47 Ruin 14 21.2 3.9 83.4 18.7 4.6 86.0 Yes No No ? 35 Med. Nørlund 1929:115
Iterlak E63 Ruin 4 9.4 2.0 18.4 6.8 2.0 13.6 Yes ? Yes ? 9 Med. Bruun 1895:366
Igaliku Kujalleq E66 Ruin 3 10.9 3.8 40.8 7.4 3.5 25.8 Yes Yes Yes No 10 Med. Roussell 1941:219
Russip Kuua E71S Ruin 3 7.0 2.3 15.8 4.0 2.0 8.0 Yes Yes Yes No 9 Med. Vebæk 1993:43
Russip Kuua E71N Ruin 12 (X,
IX) 12.0 2.5 29.4 7.5 2.4 18.0 Yes Yes No No 0 Med. Vebæk 1993:36
Kanassut E80 Ruin 2 6.6 2.5 16.5 7.7 3.3 25.1 Yes ? Yes No 18 Med. Simpson et al. in press
Hvalsey E83 Ruin 7 12.1 2.9 35.4 9.4 4.4 41.5 Yes Yes No No 1 Med. Roussell 1941:218
Narsarsuaq E149 Ruin 9 8.0 3.3 26.0 11.0 3.0 33.0 Yes Yes No Yes 48 Med. Vebæk 1991:55
Subset mean: 10.5 3.3 36.4 10.6 3.5 40.2 - - - - 33.0 - -
Subset standard deviation (s): 6.5 0.6 28.7 5.1 0.8 27.6 47.5
Greenland stable complexes: Tasiusaq E2 Ruin 9 7.2 2.1 15.1 8.0 3.9 31.2 Yes ? Yes No 135 Med. Holm 1883:IXV
Qassiarsuk E29a Ruin 5 (I-II) 7.5 3.7 27.4 9.8 3.4 32.8 Yes Yes Yes No 39 Med. Nørlund&Stenberger 1934:83
Qassiarsuk E29a Ruin 5 (IV-V) 4.8 3.2 15.2 7.0 2.8 29.4 Yes Yes Yes No 59 Med. Nørlund&Stenberger 1934:83
Qinngua E39 Ruin 22 10.5 3.3 34.1 ? ? ? Yes ? Yes ? 34 Med. NMA:Albrethsen 1970:bilag I:18, Krogh&Berglund 1980:105
Igaliku E48 Ruin 1 9.7 4.0 38.3 9.2 4.6 42.4 Yes ? Yes Yes 16 Med. Simpson et al. in press
Vatnahverfi E64c Ruin 2 (III, V) 6.0 1.8 10.5 6.0 2.9 17.4 Yes Yes Yes No 6 Med. Vebæk 1943:71
Hvalsey E83 Ruin 1 6.8 2.7 17.9 6.8 2.7 17.9 Yes Yes Yes Yes 150 Med. Roussell 1941:217
Anavik V7 Ruin 7 8.6 3.3 28.2 12.2 4.5 54.3 Yes Yes Yes ? 5 Med. Roussell 1941:221
Sandnes V51 Ruin 5 (I, III) 9.7 4.5 43.7 9.7 3.8 36.4 Yes Yes Yes No 16 Med. Roussell 1936:36
Sandnes V51 Ruin 6 (I, VI) 10.5 3.9 41.0 9.5 4.4 41.1 Yes Yes Yes No 52 Med. Roussell 1936:49
Subset mean: 8.1 3.2 27.1 8.7 3.6 33.7 - - - - 51.2 - -
Subset standard deviation (s): 2.0 0.8 12.0 1.9 0.8 11.7 51.6

115
Location: Site no. Ruin no. Byre
length Byre width
Byre area (m
2)
Barn length
Barn width
Barn area (m
2)
Stalls Pave Add.
rooms Gable
entrance DMD Date Reference:
Greenland Integral byre/barns: Vatnaverfi E64c Ruin 1 (I-II) 5.5 1.8 9.6 4.8 2.0 9.5 No Yes - - - Med. Vebæk 1943:26
Vatnaverfi E167 Ruin 7 (X) 4.8 2.2 10.5 ? ? ? Yes No - - - Med. Vebæk 1993:60
Vatnaverfi E167 Ruin 7 (XIII) 4.6 1.8 8.1 ? ? ? Yes No - - - Med. Vebæk 1993:60
Puilasoq V8 Ruin 1 (VII,
XI) 3.4 3.0 10.2 3.9 3.6 13.7 Yes Yes - - - Med. Roussell 1941:171
Kangersuneq V16 Ruin 1 (VIII,
X) 5.7 2.8 16.0 4.8 2.4 11.4 Yes Yes - - - Med. Roussell 1941:163
- V35 Ruin 1 (III, X) 3.6 1.2 4.2 4.1 2.7 11.0 Yes Yes - - - Med. Roussell 1941:167
Tummeralik V52a Ruin 1 (XIII,
XVI) 7.4 3.2 23.7 7.5 3.5 25.9 Yes Yes - - - Med. Roussell 1936:81
Austmannadal V53c Ruin 1 (IX, X) 6.6 3.0 19.7 8.4 3.6 30.0 Yes Yes - - - Med. Roussell 1941:178
Austmannadal V53d Ruin 1 (IV, X) 3.6 3.1 11.0 5.9 2.8 16.6 No Yes - - - Med. Roussell 1941:188
Nipaatsoq V54 Ruin 1 (II) 6.2 3.0 18.6 ? ? ? Yes ? - - - Med. Andreasen 1982:180
Subset mean: 5.1 2.5 13.2 5.6 2.9 16.9 - - - - - - --
Subset standard deviation (s): 1.4 0.7 6.1 1.7 0.6 8.0
Greenland total mean: 8.6 3.1 28.8 9.0 3.4 38.5 - - - - 38.5 - -
Greenland total standard deviation (s):
5.2 0.8 24.6 4.4 0.8 23.0 48.8
Iceland byre/barns: Lundur Ruin 3 9.0 3.5 31.5 9.8 3.0 29,3 No Yes Yes Yes ? Med. Berson 2002:37p, Fig.2
Þórarinstaðir Ruin C 8.0 3.8 30.4 6.2 2.2 13,6 Yes Yes Yes No 46 11th c. Berson 2002:42, Fig.4
Bergþórshvoll - 14.2 4.2 59.6 4.0 3.3 13,2 Yes No No Yes ? - Berson 2002:44p, Fig.6
Gröf Ruin E-F 8.0 3.7 29.6 12.6 3.8 47,9 Yes Yes No Yes 42 13th - 14th c.
Berson 2002:46, Fig.8
Gjáskógar - 6.3 3.0 18.9 3.9 3.0 11,7 Yes Yes No Yes 10 11th c. Berson 2002:46, Fig.9
Hvítarholt Ruin VI 10.0 5.0 50.0 14.0 5.0 70,0 Yes Yes No ? 30 VA Berson 2002:50, Fig.12
Sámsstaðir - 9.0 3.6 32.4 4.2 3.0 12,6 Yes Yes No Yes 80 VA Berson 2002:52, Fig.14
Goðatættur Ruin 2 ? ? ? ? ? ? No Yes No Yes 17 VA Berson 2002:52, Fig.15
Herjólfsdalur Ruin VIII 4.5 3.4 15.3 No No - Yes Yes No Yes 0 Berson 2002:54p, Fig.17
Herjólfsdalur Ruin IV 8.0 4.0 32.0 No No - Yes Yes No Yes 2 Berson 2002:55p, Fig.17
Stöng Ruin 6 ? 4.0 ? ? ? ? Yes Yes ? ? 34 11th c. Berson 2002:56p, Fig.18
Laugar - 12.5 4.0 50.0 No No - Yes ? ? ? 0 Med.(?) Berson 2002:57
Áslákstunga - 14.0 4.0 56.0 ? ? ? Yes Yes Yes No 45 Med.(?) Berson 2002:57
Undir Lambhöfða - 10.0 4.0 40.0 ? ? ? Yes ? Yes Yes 40 Med.(?) Berson 2002:57
Iceland mean: 9.5 3.9 37.1 7.8 3.3 28.3 - - - - 29 - -
Iceland standard deviation (s): 2.8 0.5 13.5 4.0 0.8 21.0 23.5
Norway byre/barns: Lurekalven House 3 7.6 4.9 36.9 7.2 4.9 35.3 - - - ? 3 Med. Kaland 1987:Fig.5
Høybøen House 1 8.6 4.7 40.2 - - - - - - ? 6 Med. Kaland 1987:Fig.5
Hellaug House 1 10.0 4.8 47.6 - - - No Yes - Yes 0 Med. Nesset 2013:Fig.1
Norway mean: 8.7 4.8 41.6 7.2 4.9 35.3 - - - - 3 - -
Norway standard deviation (s): - - - - - - - - - - - - -
Tab.5.2: Displays North Atlantic byre/barns from Greeland, Iceland, and Norway. All measuremetns are internal. Stalls = are stalls present?; Pave. = is the byre is paved?; Add. rooms = are there additional rooms besides byre/barn?; Gable entrance = is the main entrance to the building from the gable?; DMD = distance to the associated farmhouse (dwelling. The table is discussed in the tect.

116
The clear association between byre sizes and
farmstead has been clearly established elsewhere and
need not be repeated here (McGovern: 1985:91pp,
1992a:210pp) and the discussion of Tab.5.2 will be
limited to overall trends:
The Greenlandic simple byre/barns were on average
slightly longer and wider than byre/barns in stable
complexes; and were on average over double the size of
the integral byre/barns, even when excluding the massive
byres of Garðar (Igaliko/E47). This of course conforms
perfectly to the generally accepted picture that large-
scale cattle farming was a prerogative and mark of the
largest farms. In contrast, and in accord with the above
interpretation of the centralized farms as the homes of
small-time farmers, some perhaps even shielings, their
byre/barns were of very limited size.
As expected, barn floor areas in Tab.5.2 correspond
perfectly to the associated byre floor areas in the sense
that they increase relative to the byre floor area. Stable
complexes have larger barn areas than the integral
byre/barns. Barn floor areas are consistently larger than
associated byre floor areas, which is significant for the
interpretation of rooms in byres with no visible stall
stones. A general trend of uncertain significance is the
relative increase in barn areas from a near equal 1:1.10
byre to barn ratio in simple byre/barns, to a 1:1.24 ratio
in stable complexes, and a 1:1.28 ratio in integral
byre/barns. The difference could relate to the two latter
byre/barn types housing other livestock than cattle, the
former requiring other fodder (e.g. leafy fodder), which
could have taken up more space than hay?
Since stall stones and paving are defining parameters
of the byre/barn (see above) their occurrence in Tab.5.2
need not be discussed. More interestingly, only four of
the byre/barns had access through the gable (although
the placing of the entrance were not recorded for the
integral byre/barns), which is in stark contrast to the
Icelandic sample. While perhaps a signal of regional
diversification, one may note that Greenlandic byre/
barns with entrance through gable are all found at church
manors with later types of churches (see section 5.2.2),
which could indicate that gable entrances were a late
feature. Another feature of regional diversification not
listed in Tab.5.2, but noted by Roussell (1941:220) is the
presence of passage-entrances (cf. Fig.5.19). Similar
passages are known from dwellings in Norway and
Iceland, but not from byre/barns. The existence of single
row byres also seems unique to Greenland.
The mean distance of the Greenlandic byre/barns to
their associated dwellings (Tab.5.2 DMD) was 38.5 m,
with the simple byre/barns on average lying closer to the
dwelling than the staple complexes. Two distinct outliers
of both types skew average distances somewhat. These
four byre/barns are secondary, however, i.e. there is
another byre/barn at the site. Thus, a more reasonable
mean distance between byre/barn and associated
dwellings is 19.22 m for the simple byre/barns and 28.38
for the staple complexes. This is comparable to the
Icelandic sample. In short, the prestigious byre/barns lay
close to the dwellings, probably both for convenience
and status display: large or multiple byre/barns signaled
many cows, as well as amble access to building materials
and labor, whereas byres hidden inside centralized farms
– for warmth and conservation of building materials –
clearly signaled the direct opposite; an argument that
may of course be extended to all the livestock houses.
In North Atlantic cross comparison, the mean byre
area (28.8 m2) of all the Greenlandic byre/barns is
somewhat smaller than in both the Icelandic (37.1 m2)
and Norwegian sample means (41.6m2), which suggests
that the latter farmers were on average rearing higher
actual cattle numbers. This trend would surely be much
clearer if the Greenland sample was not so heavily
biased towards larger sites and church manors and the
Icelandic sample not biased to towards low to medium
status sites. However, even when only comparing a
subsample of relatively large Greenlandic simple
byre/barns – which most resemble the Icelandic and
Norwegian examples – mean byre floor areas are lower.
In short, only few of the farmsteads in Greenland could
compete with their North Atlantic cousins and most
grænlendinga apparently keept modest cattle stocks.
In contrast, Greenlandic mean barn floor areas of
38.5 m2 – i.e. including the small integral byre/barns –
significantly outsizes the 28.3 m2 mean area for the
Icelandic barns, and to lesser extent also the Norwegian
barns. T. McGovern (1985:93) observed the same
pattern in a comparison of Eastern and Western
Settlement barns, suggesting that it could reflect longer
stalling periods in the latter area. This would seem to be
a valid explanation for the North Atlantic differences in
barn areas as well, although reliance on other fodder
types – as discussed above – could also partly explain
the relatively larger barns in Greenland. Otherwise the
North Atlantic byre/barns are very similar and appear to
have changed very little over the 500 years of settlement.

117
5.3.2 OTHER ROOFED OUTBUILDINGS
The other types of roofed outbuildings on the
Greenlandic farmsteads – as well as in the rest of the
North Atlantic – are archaeologically far less explored
than the byres, affecting that no cross comparison is
possible and here I only outline a few of the Greenlandic
types that have been discussed and are included in the
analysis in chapter 5:
Because of their often frequent excellent preservation
(cf. Fig.5.18), the layout and function of the stone built
storehouses was early established: as summarized by D.
Bruun (1895:430), they were typically square and built
in unsealed dry-stone masonry allowing for a free flow
of air through the building, and placed in the terrain so as
to ensure wind-exposure and thereby ventilation and
drying of stored food, fodder, or goods. Although
buildings of similar function, but different build were
known from historic Iceland – why the Greenlandic
storehouses are frequently referred to as skemmúr (pl.) in
the literature – Bruun noted a clearer parallel to
Norwegian storehouses (Ibid.), which Roussell also
accentuated (1941:236).
Roussell also pointed to the obvious fact that the
different size and placing of the storehouses reflected
different functions (Ibid.231). With little specification,
Roussell differentiated between milk- and food-stores
closely associated with the dwellings, ship-stores lying
close to the fjords and relating to boating and hunting,
and larger warehouses that facilitated storing and
preservation of skins, textiles, and trade goods; in the
case of the bishop’s seat of Igaliku/ Garðar (E47), one
storehouse (ruin no.5) has even been proposed to have
been a 'tithe-barn', where levies, taxes, and tithes in form
of natural products from the diocese were amassed
(Nørlund and Roussell 1929:56, 112). Although latter
suggestion is hard to substantiate, the infrequent arrival
of merchant ships (discussed in section 2.1.3) meant that
trade goods had to be stored for up to several years. The
point that large warehouses were a feature notable of the
largest farms has also recently been made by J. Arnborg
(2004:242). McGovern (1985, 1991, 1992a) has also
included storehouses in his model of hierarchical site
rankings in Greenland, but has done so purely
quantitatively and without distinction of different types.
Neither do I differentiate between types in the analysis in
chapter 6.
Fig.5.20 A double sheep/goat shed excavated at E83, a very
rare outbuilding type mostly found on the church manors
or largest farmsteads (after Roussell 1941:Fig.140).
Norwegian medieval documentary records point to
the presence on the farms of a number of dedicated
outbuildings for the various types of livestock, including
separate sheep and goat buildings (sauða- and geitahús)
(Myhre and Øye 2002:356). The ethnographic record
from Iceland also point to a meticulous dividing, stalling
and feeding of different livestock of different ages (e.g.,
Bruun 1897:80pp, 1928:269p). This was part of the
above mentioned 'functional fragmentation' of the
medieval farms. In Greenland, the older archaeological
literature especially often refers similar sheep/goat sheds
without much specification. Bruun (1895:429)
summarized that they were small and narrow (ca. 2.5-3.1
m inside width) rectangular buildings, built in turf and
stone, and often consisting only of a single room.
Roussell (1941;226pp) elaborated somewhat on the
layout and build of sheep/goat sheds, and introduced the
double-sheep goat sheds (Fig.5.20, section 6.2.1). I have
been unable to find other systematic reviews of medieval
sheep/goat houses from Greenland or elsewhere in the
North Atlantic.
However, summarizing the observations of Bruun
and Roussell, sheep/goats were generally narrow, more
poorly built in turf/stone or stone/turf. The walls were
only ca. 60-100 cm wide, so that the total width of the
sheep/goat shed was no greater than 3.5-4.1m. Sheep and
goats were less sensitive to cold effects and consequently
required less insolation in their housing. The sheds were
mostly single-roomed, but examples with two to four
also occurred. I use these general characteristics for the
classification of sheep/goat related outbuildings in
chapter 6.2.

118
A number of other roofed outbuildings – bathhouses,
smithies etc. – have been identified on the Norse
farmsteads through excavation, but since they are mostly
impossible to verify during surface surveys, I have in
chapter 6 grouped them in a residue category of other
roofed outbuildings. For the same reason, I will not treat
these types of outbuildings further here. In terms of
tentatively identifying and classifying other livestock
outbuildings in chapter 6, I have relied on “the outer
architectural limits” set by the excavated examples of
byres and the sheep/goat sheds – i.e. wall thickness, wall
building material, ruin widths, and ruin placing – to
identify buildings that were more suited for cattle or
more suited for sheep/goat husbandry, although definite
verification of such interpretation is lacking.
5.3.3 MEDIEAL UNROOFED OUTBUILDINGS
The final category to be discussed here are what I
term unroofed outbuildings, i.e. dykes, walls, fences,
pens, folds etc. This group of farmstead buildings is even
less described than the outbuildings – again in all of the
North Atlantic – and has mostly been treated in a matter-
of-fact way, probably because of their obvious function.
However, summary overviews have been provided by
Nørlund and Stenberger (1934) and Roussell (1941).
Most prior authors seem to agree on the use of the large
cattle enclosures, i.e. the type referred to in chapter 6 as
'grazing enclosures'. The use of the smaller pens and
folds for herding and management of sheep/goat
husbandry is obvious, but can be nuanced through the
ethnological observations of Bruun from late 19th
century Iceland (1897:43pp, 1928:278pp), who also
pointed to direct parallels in the Greenland Norse
archaeological record (Ibid.400). From Bruun’s
description five types of enclosures can be outlined:
Rétt (réttir, pl.) were enclosures located either just
outside the infield or somewhere in the outfield, which
were mainly used for the seasonal rounding up the sheep.
Kvíar were smaller enclosures used for daily sheep
herding and milking near the farmsteads; this type of
enclosure was narrow to ease handling of the animals
and was located just inside or outside the infield.
Nátthagi were larger and more substantially built
enclosures that essentially served the same purpose, but
their larger size meant that the sheep could graze and
stay inside the enclosure after being milked. The final
type was a stekkr and lambakró, which were used for
milking the sheep: in the evening ewes and lambs were
driven to the enclosure to spend the night. The ewes
would be places in the stekkr, the lambs in the lambakró,
so that the former could be milked in the morning before
they were let out to graze another day. As will be
demonstrated in chapter 6, this type of milking pen is
very well represented in Greenland Norse architectural
record.
Concluding on the above outline of the various Norse
farmstead and shieling architecture, it is clear that even
after more than 200 years of archaeological surveys and
investigations, there are notable gaps in the record,
especially in terms of the outbuildings and enclosures,
and more generally in terms the chronology and phasing
of all the buildings. As stated above, the excavated
record is in a sense just as “accumulated” as the survey
record. Such issues cannot be resolved in the present
analysis of survey evidence and confirmation of surface
ruin identification must in many cases rely on future
investigations. Nonetheless, at present stage, drawing on
this accumulated architectural, and ethnological, record
seems the best way of advancing perspectives on
Greenland Norse settlement and pastoral farming,
approaches that will be explored and tested in chapters 6
and 7.
Fig.5.21 Historic example of an Icelandic enclosure layout with stekkr (a) and lambakró, i.e. a herding facility used for the milking of sheep (after Bruun 1928:Fig.34).

119
6. THE ARCHEOLOGICAL FEATURES OF NORSE FARMSTEADS AND SHIELINGS
IN THE VATNAHVERFI
In chapter 4, the development of the archaeology of
Norse Greenland and the Vatnahverfi-Project 2005-2011
was outlined; in chapter 5, prior interpretations of this
archaeological evidence on the character and layout of
Norse farmsteads, shielings, and their related buildings
and features were reviewed. Drawing on these findings,
chapter 6 presents and interprets the survey evidence of
1308 ruins and other features in the Vatnahverfi region
and the set of comparative Eastern Settlement sites:
Chapter 6 concludes on one part of the Vatnahverfi -
Project, i.e. presentation and identification of particular
Norse building types and functions in the survey dataset.
Thus chapter 6 forms the basis for the second concluding
part of the Vatnahverfi-Project surveys, i.e. chapter 6’s
analysis of the functional and hierarchical layout of the
farmsteads and shielings on settlement- and community
level.
As reviewed in chapters 4 and 5, archaeological
investigations in Norse Greenland have tended to focus
on the dwellings and churches, the layout and develop-
ment of which are consequently fairly well understood.
The outbuildings, on the other hand, have received far
less attention, especially after 1962 (cf. Tab.4.1); except
for the byre/barns and stable-complexes (see section
5.3.3), we have a very limited understanding of their
development, functions, and chronology. Add to this the
condition that an analysis of survey evidence in terms of
building identification involves interpretation from much
dilapidated and partial surface remains and it is a very
difficult exercise. Moreover, it is also an exercise that
cannot be directly verified without excavation of a large
number of ruins.
The first part of chapter 6 concerns source critical
issues relating to the surface interpretation of the Norse
ruins: it initiates with some brief considerations as to
ruin preservation and taphonomy. The second part of
chapter 6 presents a classification of the 1308 features
included in the total survey dataset upon 25 functional
building types (and 3 residue categories), each presented
and discussed in turn. I conclude chapter 6 by
summarizing overall patterns in relation to the functional
layout of the farmsteads and shielings in the Vatnahverfi
region to be presented in chapter 7.
Fig.6.1 Ruin group E168’s ruin no.7, a storehouse or skemma (left in the photo), situated on an outcrop at some distance from the other ruins, but where it was more wind exposed. Apart from building materials, the identification of certain types of buildings often rests such qualitative assessment (photo: C.K. Madsen 2008).

120
6.1 THE IDENTIFICATION AND DESCRIPTION OF RUINS AS FUNCTIONAL BUILDINGS
The exceptional preservation of Greenland’s cultural
landscapes has been stressed several times in the above,
not at least the fossilized medieval Norse settlement
evidence that remains visible as ruins in the terrain to
this today. However, it should equally be stressed that
this unique state of preservation does far from extent to
all of the ruins. In fact, preservation varies greatly: from
the rare ruins standing several meters high and almost
intact (e.g., Fig.6.4) to those that are nothing more than
indistinct stone heaps or low turf mounds (e.g., Fig.6.2-
6.3). Ruin preservation may vary between sites, but also
within the individual site. Even to the trained eye,
interpretation of much dilapidated ruins is challenging,
as affirmed by the frequent use of denotations such as
“possible ruin?” or “building of unknown function” in
archaeological survey reports. Certain identification of
such poorly preserved ruins always relies on excavation.
Since, however, excavation of even a fraction of the
existing ruins is unfeasible, we primarily have to deal
with them based on what is visible on the surface.
Chapter 7 offers an interpretational framework that
combines qualitative and quantitative observations for
systematic and explicit identification and interpretation
of such surface evidence – the 1308 ruins of the total
survey dataset – as functional features. However, in light
of the ambiguous nature of the surface evidence, this
framework must be weighed against a number of source
critical considerations. Methodological issues relating to
the Vatnahverfi-Project surveys and the resulting both
ruin group and ruin representativity was discussed in
detail in section 4.2. Instead, section 6.1 opens with a
brief and more general discussion of what can and
should be observed on the surface, which is discussed in
terms of building materials, their preservation, and
remains, i.e. offering what one might call a building
taphonomy. Based on these survey archaeological
potentials and limits, section 6.1 concludes with a
presentation and discussion of the parameters used in the
analysis of the ruins in the total survey dataset, i.e. the
parameters listed in appendix ???.
Fig.6.2 View of ruin group E71a’s – central Vatnahverfi region – massive dwelling complex (ruin no.1), which stands out in the terrain as a low farm mound with different vegetation, many depressions (i.e. room outlines), and protruding stones. The farm mound is of such a size that it undoubtedly covers more than one single building, but it is too dilapidated and collapsed to make such a distinction. Note also the largely stone built circular enclosure in the front and to the right of the dwelling (photo: C.K. Madsen 2006).

121
6.1.1 BUILDING MATERIALS AND TAPHONOMY
Like elsewhere in treeless parts of the North Atlantic,
the Greenland Norse built their houses and outbuildings
in turf, stone, and wood, each material having certain
qualities that related to, and even in a severe state of
collapse reflect, the specific function of the building
independently of particular building techniques:
The main quality of turf or sod blocks was to insulate
buildings; or alternatively, but with similar functional
result, to bind together irregular courses of stone wall.
Stone had two main qualities, either working as durable
and stable protection walls for the more degradable turf
walls, or for ventilation of rooms by allowing a free flow
of air through the cracks between the stones. The best
examples of this function are the often well-preserved
store-houses built completely in dry stone masonry
(Fig.6.1, 6.4), i.e. walls built entirely in neatly fitted, but
largely unworked, stones without mortar or any other
means of cohesion. Wood was mainly used for the
support of roofing, as well as for thresholds, frames,
panels, and other architectural details. However, some
buildings – for instance some of the churches (see
section 5.2) and seemingly store-houses (see section
6.2.2) – seem to have incorporated wooden walls or
gables for ventilation or decoration. While there is
considerable architectural variation over the use and
combination of these building materials, the basic
distinction between 'all or mostly turf walls' for the
purpose of insulation versus 'all or mostly stone walls'
for the purpose of ventilation are key in identifying
building functions, also in a ruined state. Once the
buildings were abandoned, these materials would wither
and decay in varying, but fairly regular order, although
depending upon a number of external conditions:
Although wood has been found preserved in many
excavated Norse buildings, the first part of the buildings
to fall into ruin seems to have been the wooden posts
that supported the heavy turf-covered roof (eg., Roussell
1936b:41, 1941:173). This roof cave-in would cover the
inside rooms of the building, with a layer of wooden
beams and wattle superimposed by the turf cover. On
one hand, this cave-in protected and stabilized inside
features and lower walls, on the other hand put pressure
on, especially higher parts, of inside walls. This in part
explains why the course of inside wall lines are often
discernible even where ruins are in a severe state of
decomposition and standing no more than 10-20 cm
above ground, while their outside is surrounded by
substantial amounts of collapse stone: even a slight
amount of pressure on the inside of the walls would have
caused most of the wall material to collapse outwards,
while lower wall causes were at the same time stabilized
by caved-in roof material.
Next, the turf component of the buildings would
decay; whether walls built purely in turf on a stone sill,
intermittent turf and stone layers, box walls with faces of
stone and a core of turf, or turf super-structure on stone
wall or foundation, the gradual decomposition of turf
components caused destabilization of the entire building.
Anyone who has excavated turf buildings with some
preservation will have experienced how a turf wall will
collapse in a very organic, at times almost fluid, manner:
turf mats or blocks of walls will slump, slide, set, and
even flow over and in between each other, sweeping
with them any intermittent stones. This process of
collapse was rather prolonged, occurring over a number
of events as turfs gradually decomposed and collapsed to
expose underlying layers, which would then start to
wither and decompose etc.
Stones do normally not wither or decompose over the
timespan involved since the abandonment of the Norse
ruins. However, as just outlined, any stone building
including wall components of turf would quickly have
destabilized and collapsed, either sliding along with the
turfs or tumbling over. Buildings made in dry stone
masonry were obviously sturdier and some have
survived almost intact until this day (Fig.6.4). However,
even the majority of stone-built store-houses are
collapsed to some extent, an unavoidable result of
frequent violent storms and general weathering. Still,
even where collapsed to a mere pile of stones and ruble,
the sheer volume of collapsed stone implies the original
built of store-houses (see also section 6.2.2).
At some point, however, the processes of gradual
collapse slowed to a more or less complete halt. In case
of the turf-, turf/stone-, and stone/turf buildings, either
when the slopes of collapsed walls were gentle enough
to stabilize and vegetate; or the turf had disintegrated to
such an extent that only stones were left (Fig.6.3). Most
ruins with a turf component are preserved in one of these
two states. If not already entirely collapsed, dry stone
masonry buildings are still in the process of collapsing,
although comparison with earlier records from the last
200 years shows that the process must have slowed
significantly.

122
Final phases in the building taphonomy are natural
attrition (erosion, precipitation, frost-thaw cycles etc.) or
human disturbance (reuse (e.g., Fig.6.3), looting,
farming, industry etc.). These latter processes are still
on-going, but to much varying extent at different ruin
groups. Fortunately, Inuit sheep farmers reoccupying old
Norse farmsteads have, to a great extent, respected the
ruins that are protected by law, although the farming
intensification from the end of the 1970’s (see section
8.1.3) has increased the disturbance, especially of the
middens and re-cultivated Norse infields.
In short, functional interpretation of Norse ruins from
archaeological surface survey evidence is to a large
extent an exercise of identifying the basic functional
qualities – i.e. insulation versus ventilation – of the
original building and assessing them against the visible
taphonomy of the building. While this would seem fairly
straightforward, prior surveys have most often applied
building material descriptions in a largely unspecified
manner, for instance referring to 'turf/stone or turf
building' without defining what this description actually
entails. Of course, earlier surveyors should not be
harshly criticized for using such a vague mode of
description, since it was sufficient for the surveys
involved with the cultural heritage management that has
dominated archaeological survey activities over the last
50 years (see section 4.1.5). However, for the more
specified identification of ruins as functional buildings
attempted here, a more formal and systematic description
key is needed.
Fig.6.3 Ruin group E178’s massive dwelling complex (ruin no.5), outer fjord Vatnahverfi region. At E178, most turf components of the dwelling have almost completely withered away, leaving only a massive area of stone collapse (all the stones visible centrally in the photograph). Additionally, some stone beams originally incorporated in the Norse dwelling have been reused for making a Thule-culture Umiaq support (vertical stone beams to the right) (photo: K. Smiarowski 2009).

123
Fig.6.4 Ruin group E80’s ruin no. 4 (left) and 24 (right). No.4 is one of the best preserved ruins in the Eastern Settlement with dry-stone walls standing more than 2 m high. Clearly, if it had fallen into complete collapse, it would still be preserved as a sizable pile of stones. Thus, although ruin no. 24 was functionally similar to ruin no. 4 – i.e. a storehouse/skemma – the former was either earlier than, and the stones removed for building, ruin no. 4; or ruin no. 24 was not built in stone at all. If not originally built in stone, the primary ventilation function of the storehouse would preclude that it was built in turf, but probably rather in wood (photo: C.K. Madsen 2013).
6.2 A CLASSIFICATION OF RUINS AS FARMHOUSES, LODGES, AND OUTBUILDINGS
Appendix 1 lists the above parameters for 1308
Norse ruins and other features, hereof 1068 ruins in the
Vatnahverfi region and 236 ruins in the comparative set
of Eastern Settlement sites (note that discrepancy
between this number and Tab.4.2 result from ruins being
added by archival post-reference (see section 4.2.3) and
from ruins with clear multiple being split on separate
numbers (see App.1). Section 6.2 presents a
classification of the 1308 ruins upon 26 functional types
of buildings (as well as three residue categories). Some
types are exemplified by several hundred buildings,
others only by a handful. Nonetheless, each type is
defined and discussed in terms of archaeological surface
identification, interpretive issues, functionality, as well
as supplemented by summary descriptive statistics and
patterns within the survey dataset. Overall, the 26 types
can be split on three main groups of buildings: those that
were roofed, those that were not, and features other than
buildings. The building types are presented in this order.
Several of the presented building types borrow from
existing terminology and interpretations of earlier studies
outlined in section 5. Yet, as noted there, outbuildings in
particular have not been treated systematically and there
is no defined framework for their identification. As a
consequence, the below classification will to some extent
introduce a new and slightly different terminology.
Finally, as also discussed in section 5 and visible in
Tab.4.1, few farmhouses and hardly any outbuildings
have been excavated since 1962. Thus, we have little
knowledge as to their contemporaneity and date, except
for the dwellings and churches. In a few cases a limited
extent of building phasing can be inferred from
architectural details visible through surface survey (e.g.,
Fig.6.4), but it is rarely possible to date or even assert
such building histories. In consequence, the classified
buildings are considered to represent up to 450 years of
accumulated settlement at each ruin group. Note that all
cited ruin and ruin group numbers refer to the ruin and
ruin group databases (App.1&2 and will not be described
further). Statistical analyses were performed in PAST
v.3.01.

124
6.2.1 ROOFED BUILDINGS
Dwellings (Tab.6.1):
Definition:
A dwelling is the main habitation building of a
farmstead or shieling, i.e. the main farmhouse or
shieling lodge.
Surface interpretation and issues:
Although dwellings are fairly easy to identify in ruin
surface survey (e.g., Fig.6.2-6.3), it is difficult to provide
any defining metrical parameters for their identification,
because they come in such varied layouts and sizes: for
instance, the areas of the dwellings of centralized farms
can be extremely large, whereas the dwelling areas of
shieling lodges are small, both building types however
facilitate human habitation. Moreover, their substantial
turf component – for insulation – effects that dwellings
are among the most dilapidated ruins, often appearing as
nothing more than a slightly elevated grassy mound
littered with collapse stone (Fig.6.2-6.3). This makes
room, wall, and even ruin outline delineation very
difficult, especially towards the adjoining midden that
always lie down slope from the dwelling and where
collapse material tends to slide down and mix with
midden material. In the Vatnahverfi-Project surveys, we
have systematically tried to survey the outline of the
dwelling structure proper, i.e. ignoring the surrounding
spread of collapse material. However, comparing with
other surveys, it is clear that some surveyors have
included the entire area of dwelling collapse material,
which account for notable difference is dwelling size
estimates and makes metrical comparison impracticable.
The presence of midden is one parameter that makes
the identification of dwellings feasible despite of their
frequent severe state of collapse. However, some smaller
dwellings – e.g. shieling lodges – have no midden
(substantial enough to be visible on the surface, although
sheet-midden could be detected through test-trenching).
Thus a key defining parameter of all types of dwellings,
including those with no midden, is that they are always
the largest ruin of a site (although excavations have
shown that stable-complexes may, in fact, be larger (e.g.
Fig.5.8). Additionally, dwellings tend to occupy a central
and sheltered location among the buildings.
At a few sites, more than one ruin has the appearance
of a dwelling, suggesting the presence of multiple farms
(see section 2.2.1). Excavations of ruin groups E71 and
E167 in the Vatnahverfi (Vebæk 1992:23p) and E28,
E29, and E29a (Nørlund and Stenberger 1934) have
shown that such sites existed in Norse Greenland.
However, identifying multiple farms from ruin surface
evidence is difficult: unless the dwellings are well-
preserved, clearly separated by natural features, or each
accompanied by distinct byre/barns or stable-complexes,
it is almost impossible to distinguish the latter from the
dwellings. Again, there is no way of establishing if
multiple dwellings were contemporary or replaced each
other over time, although arguments for contemporaneity
can be based on their relative locations and associated
outbuildings.
Archaeological definition/surface identification:
Archaeological surface identification of dwellings is
based on a combination of quantitative and qualitative
observation: it must be the largest roofed building in a
ruin group (only in two instances < 50m2 in area); it
must be built in turf/stone, visible on the surface either
as a grass-covered farm mound or slight elevation (e.g.,
Fig.6.2); or where the turf has completely disintegrated,
as a substantial area of stone debris (e.g., Fig.6.3). Often,
outlines of multiple walls rooms are discernable. A
visible midden contiguous to the dwelling indicates a
more permanently occupied farmhouse, while the lack of
midden indicates either a shieling lodge or a briefly
occupied farmhouse.
Dwelling descriptive statistics:
Tab.6.1 displays descriptive statistics for the 111
dwellings in this sample, which show great variation in
shape and size (58 of the smallest dwelling fit inside the
area of the single largest!). The length/width scatterplot
(Tab.6.1A) reveals no distinct clustering or patterns,
except that ruin lengths and widths tend to correlate.
However, the inter-quartile range and area distribution
histogram (Tab.6.1B) shows that the majority of the
dwellings are smaller examples. There are three extreme
outliers – E28 ruin no. 46, E65 ruin no. 1, and E149 ruin
no. 2 – which are all artifacts of preservation conditions,
i.e. ruin outlines interpreted as dwellings, but that
encompass other buildings (Vebæk 1991).

125
Dwelling Discussion:
Considering the dynamic building histories of the
dwellings and the above noted issues relating to their
interpretation, the visible “fuzziness” is unsurprising.
The distinctly positive skeweness of the distribution of
dwelling areas (Tab.6.1A) disfavors a range of statistical
analysis. Various cluster analysis (e.g., Fig.6.5) suggest
4-6 classes of dwellings, but are liable to bias of random
data mining. Other statistical analysis could turn up
patterns, but will not be attempted here. Clearly,
dwelling dimensions alone clearly cannot provide a
convincing classification of farmsteads. This is best
achieved by combining dwelling characteristics with
observation of other farmstead buildings and features.
Despite sample ambiguity, a few notable patterns are
implied: first, it can be seen from Tab.6.1A that the 10
church farms included in the survey dataset all lie in the
higher end of dwelling length/width plots, which denotes
that dwelling size does to some extent imply the status
and class of a site. Interesting in this regard is that the
ruin groups with early small churches (E48, E64, and
E78) all plot towards the lowest length/width range for
the church farms resemble the examples of slightly-
larger-than-average dwellings. This correlates well with
the observation (see section 8.2.2) that the small
churches were taken out of use before AD 1250’s and
that these farmsteads never grew into later medieval
large parish centers. In turn, this would indicate that the
church farms kept expanding in a gradual process of
centralization, a finding that is in general agreement with
prior site classification attempts based on hall area
estimates (McGovern 1985:93p, 1992a:210p). However,
using the total dwelling area as a proxy for farmstead
size and status has the advantage that it can be applied to
ruins not excavated. Still, it should be stressed again that
dwelling area estimates cannot stand alone in such
classification.
Tab.6.1 – Dwelling Descriptive Statistics
N = 111 Maximum Minimum Mean Median IQR Standard dev.
Length in m 74.0 9.6 27.0 25.8 19.9 - 37.4 11.0
Width in m 40.7 4.0 17.0 16.4 11.9 - 22.3 7.0
Area in m2
2048.0 35.0 421.9 336.8 190.4 - 541.2 332.0
L/W-index 3.80 1.00 1.73 1.60 1.30 - 2.0 0.58
Tab.6.1 Above: summary descriptive statistics for the sample of dwellings (all measurements area external). Below: A) XY-plot of dwelling lengths and widths in meters with indication of church farms. B) Histogram of showing the frequency of different sized dwelling in square meters.

126
Fig.6.5 Example of a multivariate (length/width/area/L/W-index cluster analysis (classical paired group) of the dwellings in the sample. Various types of cluster analysis was run on the sample, generally turning up 4-6 clusters dwellings, which would be roughly consistent with the number of identified farmstead types (cf. section ?.?). However, this is liable to random data mining, since it is implied that farmstead dimensions cannot stand alone in such classification.
A significant observation from the sample dwellings
is that 26 have no recorded associated midden (although
at least in the three cases of E95a, E96, and E183 this
could to owe to lacking registration). When furthermore
noting that these dwellings without midden all belong to
the range < 350 m2, it can reasonable be stated that
combined small dwelling size and lacking midden are
likely characteristics of the smallest sites, i.e. shieling
lodges (see section 8.1.4). Lacking surface evidence of
midden can either be interpreted in terms of limited
occupation intensity or short term site use. In any case, it
is a key parameter for distinguishing between larger
permanently and small temporarily occupied sites.
Finally, Fig.6.6 displays dwelling areas (horizontal
axis) plotted against dwelling length/width-indexes (L/W
-index) (vertical axis; the higher the index the more
elongated the ruin). Again, there are few clear patterns to
the scatterplot. However, a group of very small (< 400
m2) and rounded (L/W-index < 1.5) dwellings is visible,
i.e. the farmhouses and shieling lodges without inbuilt
livestock housing. The dwellings associated with church
farms do not display the same kind of clear pattern as in
Tab.6.1A. However, Fig.6.6 does reveal the clear trend
that – as discussed in section 5.1.1 – a rectangular shape
was the “ideal” dwelling layout (i.e. higher up the
vertical axis in Fig.6.6). This is, of course, also implied
by the medians and means of the sample (Tab.6.1).
Simple Byre/Barns (Tab.6.2):
Definition:
A simple byre/barn is livestock outbuilding intended
primarily for the winter stalling of cattle and storage
of winter fodder.
Surface interpretation and issues:
The simple byre/barns (Fig.5.19) were described in
detail by Aa. Roussell (1941: 217p) and presented in
detail in section 5.3.1. Because of their larger component
of turf building material (at least in one end), the simple
byre/barns are liable to the same issues of surface
preservation and identification as described for the
dwellings in the above. In effect, only when excavated
Fig.6.6 Scatterplot of the 111 dwellings with areas on the horizontal axis and length/width-indexes on the vertical axis (an index on 1 implies an almost completely round dwelling, while the higher the index, the more oblong the
dwelling). Fig.6.6 is discussed in the text.

127
or where stall stones are still in place can a ruin be
certainly identified as a simple byre/barn. However,
some surface settings aid in the identification of
simple/byre barns: their high turf component, their
frequent proximity to their associated dwellings, and
their spatial layout (cf. section 5.3.1).
Archaeological definition/surface identification:
Being visible on the surface as a an elevated grass-
covered mound or area with many collapse stones,
simple byre/barns are always one of the largest roofed
buildings in a ruin group (often the second- or third-
largest) and are always built in turf or turf/stone (at least
in the byre half). The walls of the byre part are no less
than 1.5m thick (without outer turf padding, see Fig.
5.19). As a result, simple byre/barns are generally wider
(> 5 m, external dimensions) than other oblong livestock
houses. The simple byre/barns are always rectangular
(L/W-index > 1.6) and divided on two, maximum three,
rooms. Two of these rooms are of roughly the same size,
the barn part normally being slightly larger. In situ or
turned over stall stones and wall materials may imply the
byre part of building. Primary simple byre/barns are
usually situated in proximity (< 60 m) of their associated
dwelling, although secondary simple byre/barns may be
located at further distance from the dwelling.
Simple byre/barn descriptive statistics:
Tab.6.2 displays descriptive statistics for 41 simple
byre/barns identified in this sample of ruins. A length/
width scatterplot (Tab.6.2A) visualizes what is apparent
from the summary statistics (Tab.6.2), i.e. that they form
a fairly homogenous group. This is especially true if
ignoring the outliers: most distinctive and representing
true difference are the two massive byre/barns of the
episcopal see of Igaliku/Garðar (E47), as well as E4’s
ruin no.5. The other simple byre/barns wider than 9 m
are examples where poor preservation makes accurate
surface delineation and measurement of rooms uncertain.
As visible in Tab.6.2B, the sample of simple byre/barns
Tab.6.2 – Simple Byre/Barn Descriptive Statistics
N = 41 Maximum Minimum Mean Median IQR Standard dev.
Length in m 67.4 12.4 22.9 20.0 17.6 – 26.2 9.7
Width in m 11.1 5.0 7.5 7.2 6.5 – 8.6 1.5
Area in m2
69.1 498.5 159.5 123.9 106.6 – 208.0 84.2
L/W-index 8.53 1.60 3.10 2.83 2.29 – 3.62 1.24
Dis_MD in m 400.0 0.0 71.3 38.8 10.4 – 97.1 92.2
Tab.6.2 Above: summary descriptive statistics for the sample of simple byre/barns (all measurements area external). Below: A) XY-plot of simple byre/barn lengths and widths in meters with indication of the extreme outliers of ruin group E47. B) Histogram of showing the frequency of different sized simple byre/barns in square meters.

128
is positively skewed, although less so than the dwellings
(cf. Tab.6.2A), suggesting that the sample represents a
more clearly defined group of buildings, which is also
implied by the small standard deviations for the listed
parameters (Tab.6.2).
As implied by the IQR, the distances of the simple
byre/barns to their associated dwellings (Dis_MD) cover
a large span and is somewhat at odds with what has been
claimed above and in section 5.3.1, i.e. that they should
lie in proximity to the dwellings. However, if excluding
the simple byre/barns that are secondary (i.e. where
another byre/barn or stable complex is found in closer
proximity to the dwelling: E4 no.13, E18 no.2, E29a
no.12&14, E47 no.16, E59 no.19&16, E78 no.12, E149
no.7, E171 no.2, E172 no.1), the distance ranges only
between 0.5-65.9 m with an average distance of 24.4m.
Whether proximity of byre/barns to the dwellings was a
practical measure (i.e. for ease of access to and
supervision of the cattle during their winter stalling), a
matter of prestige (after the churches, the byres were
probably the most prestigious architecture), or both,
distance to associated dwelling is an important parameter
for identifying primary simple byre/barns.
Simple byre/barn discussion:
The 41 simple byre/barns identified in this sample
may seem a small number, especially when compared to
the 111 identified dwellings. The discrepancy between
the number of dwellings and simple/byre barns is partly
explainable by the fact that many classified dwellings –
i.e. mostly the shieling houses and lodges – had no
associated simple byre/barn (or other cattle housing). At
other farmsteads, the housing of cattle was facilitated by
stable-complexes (see below). Finally, the fairly narrow
definition proposed here for the simple byre/barns
effects that quite a few smaller byre/barns are probably
instead included in the category of bipartite livestock
buildings (see below).
Still, there is reason for staying with the above
distinction: among the 41 simple byre/barns in the
sample, no less than 16 are associated with church
farmsteads. Admittedly, 11 of these simple byre/barns
have been excavated (E29 no. 19, E29a no. 12&14, E47
no.9&14, E66 no. 3, E83 no.7, E111 no.3&6, E149
no.7&9) and may therefore to an extent constitute a
sample bias. Still, the fact the simple byre/ barns are
generally associated with larger farmsteads (cf. Tab.7.1)
supports the notion that these large and heavily built
livestock quarters – situated close to the dwellings –
were a trademark of wealth and status. This function has
also ben accentuated elsewhere (Nørlund and Roussell
1929:117, Roussell 1941:217p, McGovern 1985:93p,
1992a:210p).
Stable-complexes (Tab.6.3):
Definition:
A stable-complex is livestock outbuilding intended
primarily for the winter stalling of cattle and storage
of winter fodder, but with annexes added for other
breeds of livestock.
Surface interpretation and issues:
The stable-complexes were also discussed in detail
by Roussell (1941:222p) and presented in section 5.2.1.
In terms of surface remains, the stable-complexes are
quite similar to the two previous building types.
However, due to the added annexes they have a more
rounded shape than the simple byre/barns (cf. Tab.6.3).
This, on the other hand, can make surface differentiation
of stable-complexes from the dwellings extremely
difficult. When in doubt, this classification assumes that
stable-complexes are smaller than the dwellings
(although the V51 stable-complexes show that the
opposite may be the case, cf. Fig.5.8). Also, stable-
complexes tend be less substantial built than the
dwellings (i.e. making for less distinct collapse mounds)
and only rarely have an associated midden. Still, because
their main purpose was for the insulation of the livestock
– including the more susceptible cattle - their walls are
just as wide (1.67 m on average) as those of the simple
byre/barns.
Archaeological definition/surface identification:
Stable-complexes are – like the former two building
types – visible on the surface as a slightly elevated grass-
covered mound or, where the turf has disintegrated, as an
area covered by collapse stone; this ruin area is almost
always rounded of shape. Stable-complexes tend to be
fairly large, i.e. are almost always the second or third
largest roofed building in a site. If room outlines are
visible, there must be at least 4 rooms lying in a row or,
more commonly, the stable complexes appear rounded
due to annexes being added to on one or both sides of
central room(s). Where wall thickness can be measured,
they are at least 1 m wide and always built in turf or turf/

129
/stone. Primary stable-complexes are usually situated in
proximity (< 60 m) of the associated dwellings, although
secondary stable-complexes may be located at up to
several hundred meters distance from the main dwelling.
Stable-complex descriptive statistics:
Tab.6.3 shows descriptive statistics for the 37 stable-
complexes identified in the sample. A length/width
scatterplot reinforces what can be deduced from the
listed parameter descriptive statistics, i.e. that stable-
complexes form a fairly homogenous group of ruins.
This is somewhat surprising when compared to the
dwellings (cf. Tab.6.1A), because both types are liable to
the same difficulties of surface survey identification and
delineation. All in all, this would suggest that the sample
of classified stable-complexes in fact represent a more
clearly defined group of buildings. The outliers in the
sample are either very long stable-complexes (E29a no.5
and E59 no.11) associated with major farmsteads; ruins
that likely consisted of several buildings, but are to
poorly preserved to identify; or in the case of E63 no.4
based on georeference of an old and somewhat uncertain
survey (Bruun 1895a:365), which cannot be validated
because the ruin has since been disturbed (width shown
in bracket in Tab.6.3). As expected, stable-complexes
are averagely larger (Tab. 6.1B) and more rounded in
shape than the simple byre/barns (Tab.6.1)
The stable-complexes are located at distances of 1-
295.7 m from their associated dwellings (Tab.6.3).
However, excluding the stable-complexes that are
secondary (i.e. where another stable complex or simple
byre/barn is found in closer proximity to the dwelling:
E83 no.1, E91 no.7, E171 no.1, and E182 no.8), and the
atypical example from E188 (no.6, Fig.6.7), the distance
ranges only between 0.5-98.5 m with an average distance
of 28.8 m, or about the same as the simple byre/barns.
Tab.6.3 – Stable-Complex Descriptive Statistics
N = 37 Maximum Minimum Mean Median IQR Standard dev.
Length in m 51.1 12.8 23.0 21.7 18.4 – 25.9 8.1
Width in m 21.3 8.2 (5.6) 12.6 12.0 10.2 – 13.4 3.4
Area in m2
436.1 67.4 226.9 208.7 158.3 – 286.7 96.0
L/W-index 4.74 1.08 1.94 1.65 1.42 – 2.38 0.82
Dis_MD in m 295.7 1.0 49.4 27.9 9.5 -71.7 60.1
Tab.6.3 Above: summary descriptive statistics for the sample of stable-complexes (all measurements area external). Below: A) XY-plot of stable-complex lengths and widths in meters with indication of church farms and outliers discussed in the text. B) Histogram of showing the frequency of different sized stable complexes in square meters.

130
Fig.6.7 Ruin group E188’s ruin no.6 in the outer fjord of the Vatnahverfi region. Although one of the best preserved examples of a stable-complex type building in the region, the high component of turf building material effects that the ruin is much collapsed and somewhat difficult to delineate (photo: C.K. Madsen 2010).
Stable-complexes discussion:
With 37 examples, the stable-complexes form a small
group within the total sample. However, combined with
the 41 simple byre/barns, the total 78 buildings related
specifically to cattle winter stalling is not too far from
the 111 identified dwellings, particularly since not all
dwellings had an associated byre. On the other hand,
several farmsteads had more than one stable-complex or
simple/byre barns. For instance, of the 37 stable-
complexes 8 (Tab.6.3A, only three of them fully or
partially excavated: E29a no.5, E83 no.1, E149 no.11)
belonged to church farmsteads which all had additional
cattle housing facilities. Although stable-complexes
associated with church farmsteads comprise just under
one-fifth of the entire sample, this type of cattle housing
facility in general appears more regularly associated also
with moderate sized farmsteads.
The overall similiarity of the stable-complexes with
the simple byre/barns both in terms of relative frequency
on larger farmsteads (including church farmsteads) and
distance to their associated dwelling is unsurprising: as
pointed out by Aa. Roussell (1941:222p) and discussed
in section 5.3.1, the stable-complexes were in fact later
phases of the simple byre/barns, where annexes had been
added to the original building as the needs for livestock
housing demanded. Therefore, the stable-complexes can
also be ascribed the same significance in the surface
survey identification and classification of farmsteads.
Sheep/goat sheds (Tab.6.4):
Definition:
A sheep/goat stable is livestock outbuilding intended
for temporary stalling or sheltering of select sheep/
goats.
Surface interpretation and issues:
Consistent use of the building category of sheep and
goat sheds was introduced, and rather liberally applied,
by D. Bruun (1895) and since him a number of other
authors (see section 5.3.2). These authors provided few
formal guidelines for the identification for this type of
building; and since very few of these proposed
sheep/goat sheds have been excavated (Tab. 4.1), it is
difficult to authenticate their interpretations.

131
Undoubtedly, a number of ruins classified as sheep/goat
sheds in this sample could have had other functions and I
have not found any stronger argument for my
interpretation than the prior investigators.
Nonetheless, it is difficult to find a more plausible
explanation for the small single-roomed buildings that
are present on all farmsteads and occur very abundantly
at some. Of the roofed buildings, the sheep/goat sheds
are among the easiest to identify from surface survey
evidence (e.g., Fig.6.8-6.9), partly because of their
simple construction, partly because of the limited
amount of turf involved in their construction, which
effects that details can be discerned even when the ruins
are very dilapidated. Their small size and simple
construction, however, does not mean that the sheep/goat
sheds are uniform in their surface appearance. Rather,
they were built in much variable materials and sizes.
Archaeological definition/surface identification:
Sheep/goat sheds are always visible on the surface as
singled-room rectangular ruins of limited dimensions,
i.e. normally less than 12 m in length and 6 m in width
(see below). They can be built in turf, turf/stone,
stone/turf, or, where the turf component has completely
disintegrated, be preserved only as a stone foundation.
They can be located at any distance from dwellings and
various other livestock buildings, but some examples at
individual farmsteads are often found in proximity to
enclosures or at the edge of the infield area. Besides their
fairly small size, the most distinctive feature of the
sheep/goat sheds is their fairly thin walls: sheep and
goats are more resilient to cold temperatures than the
cattle (or pigs) and their housing did not need to be so
heavily insulated.
Tab.6.4 – Sheep/goat Sheds Descriptive Statistics
N = 199 Maximum Minimum Mean Median IQR Standard dev.
Length in m 15.6 4.0 7.8 7.5 6.2 – 9.0 2.2
Width in m 2.0 7.0 4.2 4.1 3.5 – 4.8 0.9
Area in m2
91.0 8.0 32.6 29.5 21.8 – 39.0 15.4
L/W-index 3.67 1.06 1.87 1.79 1.58 – 2.07 0.43
Dis_MD in m 567.1 2.3 114.2 81.3 35.4 – 156.3 115.2
Tab.6.4 Above: summary descriptive statistics for the sample of sheep/goat sheds (all measurements area external). Below: A) XY-plot of shep/goat shed lengths and widths in meters with indication of outliers discussed in the text. B) Histogram of showing the frequency of different sized sheep/goat sheds in square meters.

132
Sheep/goat sheds descriptive statistics
With 199 ruin classified as sheep/goat sheds, they are
the most numerous group assigned to a specific building
function. Visible from Tab.6.4 displaying their summary
descriptive statistics, the sheep/goat sheds form a
uniform group with a distribution showing slight positive
skeweness and few extreme outliers (Tab. 6.4A): most
noticeable of the outliers are two sheep/goat sheds at
ruin group E59, as well as a single example from the
Hvalseyfjörður church (E83 no.7). The outliers E78a
no.7 and E126 no.6 are explainable by poor preservation
or survey description. Interestingly, of the 20 largest
sheep/goat sheds, five belong to ruin group E59 and
another nine to church farmsteads. Besides indicating the
special character of the E59 farmstead (see section 7.1.5)
This observation would support the rational contention
that sheep/goat sheds – like the other livestock housing –
were larger than average on the wealthiest farmsteads.
However, the other statistics and especially the IQR
imply that the majority of sheep/goat sheds were far
more modest.
For the sample of 199 sheep/goat sheds, mean wall
thickness is 0.87 m, clearly showing that the insulation
of these buildings was much less substantial than in the
winter housing for humans or cattle. This is also implied
by the general narrowness of the sheep/goat sheds
(Tab.6.4). Of the 177 sheep/goat sheds where building
material is described (96%), 3 % were built in pure turf,
42% in turf/stone, 31% in turf/stone, and 24% preserved
only as a stone foundation for turf walls. The distance of
the sheep/goat sheds to their associated dwelling (Tab.
6.4) clearly show that they were much more dispersed
than the former livestock buildings related to the stalling
of cattle.
Fig.6.8 Ruin group E80a’s ruin no. 11, a typical example of a single-roomed type of ruin here classified as a sheep/goat shed. Although much collapsed, the outline of the walls and internal room are clearly discernible. Building material is here described as stone/turf: while there are many collapse stone, there are clearly not enough for the building to have been built entirely in dry stone masonry. Rather, the turf building component has simply withered away. Finally, noticeable is also how the ruin is dug somewhat into the slope, so that the floor of the inside building appears slightly sunk into the ground (photo: C.K. Madsen 2013).

133
Fig.6.9 Ruin group E4’s ruin nos. 14 (front) and 12 (back), interpreted as a sheep/goat shed and a bipartite livestock building, respectively, with the Tasiusaq in the background. They are among the best preserved examples recorded in the survey evidence with substantial amounts of both stone and turf preserved on the surface. Running down slope just right of the sheep/goat shed is a well-preserved irrigation trench (photo: C.K. Madsen 2011).
Sheep/goat shed discussion:
The large number of sheep/goat sheds implies the
latters’ importance of the Norse livestock economy,
which is also corroborated by the zooarchaeological
evidence (see section 2.3.2). However, it must be
recalled that the ruins classified as sheep/goat sheds
undoubtedly include a number of other outbuildings
functions, since the sheds show considerable variation
over a very basic layout. In any case, their small size,
thin walls, and single and narrow room with no defined
or obvious room for storage of fodder imply that they
were only intended for fairly temporary stalling of
sheep/goats, i.e. functioning just as much as shelters as
stables proper. This is also implied by the larger
distances to their associated dwellings, i.e. the
sheep/goat sheds were located were convenient and often
on the edge of the cultivated infield. Although farmstead
status also to some extent seems expressed also in the
size of the sheep/goat sheds, they generally appear the
most common type of farm building and especially
suited for the surface survey identification of smaller
farmsteads and shielings, and principally those that
emphasized sheep/goat herding.
Bipartite livestock building (Tab.6.5):
Definition:
A bipartite livestock stable is a building intended for
the winter stalling of a select part of the, mostly
smaller, animal husbandry, as well as storage of the
needed winter fodder.
Surface interpretation and issues:
The term “bipartite livestock building” has not, to my
knowledge, been used before in the description of Norse
architecture. The term signifies a livestock building
divided on two parts, one being a stable, the other a barn
or storage area. This could seem to make the bipartite
livestock buildings equivalent to the simple byre/barns
(see above), and certainly some examples could have
housed cattle as well as other livestock (e.g., Fig.6.8).
Still, several surface survey observations suggest that
bipartite livestock buildings constitute a different type of
outbuilding: they are generally smaller and seem less
substantially built than the simple byre/barns and stable-
complexes, and they very rarely appear as large grass-
covered mounds. They are generally narrower than the

134
simple byre/barns, which is partly a result of their
thinner walls. Their less substantial build is also implied
by the condition that their basic two-room partition can
be distinguished on the surface, i.e. there is less collapse
material to obscure room- and wall lines. Basically, the
bipartite livestock buildings seem to be extended sheep/
goat sheds.
Archaeological definition/surface identification:
Bipartite livestock buildings are always visible on the
surface as fairly narrow building partitioned into two
sections, which can be of any relative size. The walls are
always less than 1.5 m thick and can be built in turf, turf/
stone, or be preserved only as a foundation for pure turf
wall. They can be located at any distance from their
associated dwelling, but generally lie closer to the
dwelling than the sheep/goat sheds, but farther removed
than the other cattle housing facilities (cf. Tab.6.2-6.3).
Bipartite livestock building descriptive statistics:
With 94 identified examples, the bipartite livestock
buildings are well-represented in the sample. Their
summary descriptive statistics dislayed in Tab.6.5 show
how they constute a more varied group of outbuildins
than the sheep/goat sheds (cf. Tab.6.4). Still, the bipartite
livestock buildings cluster nicely with only a few
extreme outliers, of which the most distinct is ruin no.24
at Igaliku (E47), again attesting to the singularity of the
bishop’s farm (Tab.6.5A). Another, but less distinct
outlier in the smaller end of the range, is ruin group E76
no.6, which can be explained by uncertain ruin survey
description. Else, histogram Tab. 6.5B displays a sample
of bipartite livestock buildings that is only slightly
positively skewed. 8 of the 20 longest bipartite livestock
buildings are associated with the atypical ruin group E59
(nos.2 & 25), or with church farmsteads (E29a no.7, E47
nos.24&45, E48 no.4, E66 nos.5&19), again suggesting
Tab.6.5 – Bipartite Livestock Building Descriptive Statistics
N = 199 Maximum Minimum Mean Median IQR Standard dev.
Length in m 37.5 4.2 11.5 11.0 8.1. – 11.9 4.4
Width in m 7.8 2.4 5.0 5.0 4.3 – 5.5 1.1
Area in m2
243.8 11.2 56.3 50.7 33.0 – 62.5 31.3
L/W-index 5.8 1.0 2.3 2.2 1.74 – 2.47 0.68
Dis_MD in m 567.5 1.5 109.2 82.0 36.4 – 145.3 103.6
Tab.6.5 Above: summary descriptive statistics for the sample of bipartite livestock buildings (all measurements area external). Below: A) XY-plot of bipartite livestock building lengths and widths in meters with indication of outliers discussed in the text. B) Histogram of showing the frequency of different sized bipartite livestock building in square meters.

135
some correlation between site status and the dimensions
of outbuildings.
Comparing the simple byre/barns (Tab.6.2) and the
bipartite livestock buildings (Tab.6.5), it is clear that
there is a considerable overlap in ruin dimensions.
However, if reviewing averages of the two samples, the
latter clearly stands out as generally shorter (11.5m to
22.9m), narrower (5.0m to 7.5m), and thus smaller in
area (56.3m2 to 159.5m
2). Other differences between the
simple byre/barns and the bipartite livestock buildings
include the latter’s thinner walls (never > 1.5 m and 1.04
in average, compared to walls never < 1.5m and 1.7 m in
average at the simple byre/barns); more varied building
materials (of the 89 described examples, 6% were built
in turf, 61% in turf/stone, 24% in stone/turf, and 9%
preserved only as a stone foundation); and the bipartite
livestock buildings’ greater average distances to their
associated dwellings (cf. Tab.6.2 and 6.5).
Bipartite livestock building discussion:
Unquestionably, several of the bipartite livestock
buildings also housed cattle, perhaps mostly in the form
of the apparently particular version of Greenland Norse
byres, where the cattle were only stalled along one of the
long-walls (see section 5.3.1). At least, this would be
implied by the bipartite livestock building generally
being narrower than the regular simple/byre barns.
However, with their thinner walls built in varying
materials and thus less insulating, the bipartite livestock
buildings probably more frequently housed other
livestock, perhaps in combination with a few heads of
cattle. Although several of the largest bipartite livestock
buildings are associated with large farmsteads (e.g.,
Fig.6.8), the latter always also had larger and primary
and secondary simple byre/barns or stable-complexes.
Thus, there is no strong correlation between bipartite
livestock buildings and farmstead status; rather, they
seem a regularly featured outbuilding also on the more
modest farmsteads and shielings.
Livestock stable (Tab.6.6):
Definition:
A livestock stable partitioned into three rooms or
more and intended for the winter stalling of a select
part of the, mostly smaller, animal husbandry, as
well as storage of the needed winter fodder.
Surface interpretation and issues:
Like the bipartite livestock outbuilding, the category
of livestock stables has not before been singled out and
defined formally by former investigators. Apart from its
additional sections, the buildings interpreted as livestock
stables here are in all respects similar to the bipartite
livestock buildings. In consequence, all conditions and
issues regarding their function, surface appearance, and
construction are the same (see above).
Archaeological definition/surface identification:
Livestock stables are always visible on the surface as
fairly narrow buildings partitioned into three or more
sections, which can be of any relative size. The walls are
always less than 1.5 m thick (excluding outer turf
cladding) and can be built in turf, turf/ stone, or be
preserved only as a foundation for pure turf walls. They
can be located at any distance from their associated
dwelling.
Livestock stable descriptive statistics:
With 43 identified examples, livestock stables are
only moderately represented in the sample. 70% (30) are
partionioned into three sections and 23% (10) into four
sections (for the remaining 7% (3) partions have been
described, but not in number or size). Because of their
changing number of sections, it is unsurprising that the
livestock stables display a good deal of variation in
dimensions and size (Tab.6.6). Although they overlap
dimensionally with some of the simple byre/barns, the
stable complexes are, however, on average shorter and
narrower than the former (cf. Tab.6.2 and 6.6). The
sample includes a few outliers (Tab.6.6A) of which E67
no.5 and E90 no.8 are explainable by sketch survey
description, whereas the others E60 no.5, E74 no.3, and
E171 no.3 are geneuine atypical examples.
The livestock stables separate from the simple byre/
barns on two accounts: first, the are on average located
144.4 m from their associated dwelling, i.e. considerably
more than both the simple byre barns and the stable-
complexes (see above). Even when taking out two
outliers (E47 no.27 and E78 no.8) that are located at
extraodinary distance from their associated dwellings,
the livestock stables are on average located 126.2m
from their associated dwelling. Second, the average
wall-thickness of the livestock stables is 1.2 m and a few
examples with walls wider than 1.5 m can be explained

136
by the ruins being covered in aeolian sediments or
including outer turf cladding. Finally, of the 42 cases
where wall-material is described, 57% (24) are built in
turf/stone, 33% (14) in stone/turf, and only 7% in pure
turf or preserved as a foundation for pure turf walls, i.e.
also significantly more varied than in the simple
byre/barns and stable-complexes.
Livestock stable discussion:
Similar to the bipartite livestock buildings, some of
the livestock stables undoubtedly also functioned as
housing for cattle, again probably most in the form
where cattle was only stalled along one long-wall.
However, with their thinner walls, varying, and less
substantial and thus insulating building materials, the
livestock stables were probably predominantly used for
stalling of other livestock, i.e. housing and specialized
feeding of select parts of the sheep/goat animal
husbandry. Of the 10 largest livestock stables in the
sample, six are associated with church farmsteads (the
rest are the outliers indicated in Tab7.6A), which
suggests that they to some extent reflect the status of
farmsteads and can be used for survey evidence ruin
group classification. On the other hand, livestock stables
were also found on normal-sized farmstead.
Tab.6.6 – Livestock Stable Descriptive Statistics
N = 43 Maximum Minimum Mean Median IQR Standard dev.
Length in m 38.0 8.3 18.9 16.6 8.9 – 14.4 7.2
Width in m 10.4 3.3 6.1 5.9 4.5 – 5.9 1.5
Area in m2
260.6 24.7 110.7 91.4 38.1 – 76.0 57.7
L/W-index 5.86 1.23 3.18 3.1 1.8 – 2.8 1.16
Dis_MD in m 657.2 2.3 120.8 88.8 36.5 -156.0 122.2
Tab.6.6 Above: summary descriptive statistics for the sample of livestock stables (all measurements area external). Below: A) XY-plot of livestock stable lengths and widths in meters with indication of outliers discussed in the text. B) Histogram of showing the frequency of different sized livestock stables in square meters.

137
Fig.6.10 Ruin group E66’s ruin no.10, Kujalleq Fjord, an example of a ruin identified as a double sheep/ goat shed. Similar to the other sheep/goat sheds identified in the survey evidence, the ruin is fairly distinct even though built predominantly in turf (photo: C.K. Madsen 2008).
Double sheep/goat shed (Tab.6.7):
Definition:
A double sheep/goat shed is a livestock building
comprised of two rectangular and narrow rooms
joined parallelly and which is intended for the
stalling of sheep and goats.
Surface interpretation and issues:
The double sheep/goat sheds were described by
Roussell, who excavated one at Hvalseyarfjördur/E83 in
1935 (1941:226). They are among the more distinctive
ruins identifiable during surface survey with two parallel
rectangular rooms (Fig.6.10). All the listed examples are
fairly distinct, which is surprising since they were built
predominantly in turf. In most other concerns, they seem
to have much in common with the sheep/goat sheds,
effectively being nothing more than two of the latter
built together. The fact that they appear so well-
preserved and resemble the surface remains of the sheep/
goat sheds would suggest that a limited amount of turf
went into building the walls (which would otherwise
have been more obscured by collapse material).
Archaeological definition/surface identification:
Double sheep/goat sheds are visible on the surface as
two rectangular, narrow, and parallel rooms with
entrance to both rooms via one or two entrances in the
gable. They are always built in turf/stone (or preserved
as a stone foundation for a turf wall) with wall less than
1.5m thick.
Double sheep/goat shed descriptive statistics:
The double sheep/goat sheds are only exemplified by
eight identified ruins, which limits the significance of
any statistical observations from their observed
parameters. Tab.6.7A-B shows that the double sheep/
goat differ somewhat in sice. Otherwise, the only
relavant information visible from the summary statistics
in Tab.6.7A is the strong affinitiy of double sheep/goat
sheds to the church and largest farmsteads. Wall
thickeness of the double sheep/goat sheds vary between
0.65-1.45m with a mean wall thickness of 1.05m,
implying that their insulation purpose was limited. They
could apparantly be located at any distance from their
associated dwelling.

138
Double sheep/goat shed discussion:
The similarity of the double sheep/goat sheds with a
type of outbuilding used for the same purpose in Iceland
up until recent years (Bruun 1897:109p, 1928:392p) is
striking. The narrowness of the parallel rooms and the
fairly thin walls – like the sheep/ goat sheds – imply that
the double sheep/goat sheds served as housing for this
livestock, although we cannot be certain. However, a
more interesting aspect relating to of the double
sheep/goat sheds is that they are strongly associated with
large or church farmsteads, E95a no.5 being the only,
and smallest (Tab.6.7A), exception. Since it is hard to
imagine that the building of a certain type of sheep/goat
housing was restricted to dominant farms, the double
sheep/goat sheds’ rareness and association with larger
farmsteads more likely reflects chronology, i.e. that they
are a later type of building.
Sheep/goat shelter/pens (Tab.6.8):
Definition:
A sheep/goat shelter/pens is a livestock building
comprised of several small rooms or compartments
built again a vertical cliff and intended for temporary
stalling of sheep/goats; the building may, or may not,
have been roofed.
Surface interpretation and issues:
The sheep/goat shelter/pens have not before been
singled out as particular type of functional outbuilding,
perhaps because they do not appear much different from
other shelters or pens, but from surface appearance
seems to be something in between the two (Fig.6.11). It
is difficult to establish if the sheep/goat shelter/pens
were originally roofed or not. In any case, they were
fairly simple and insubstantial outbuildings.
Tab.6.7 – Double Sheep/Goat shed Descriptive Statistics
N = 8 Maximum Minimum Mean Median IQR Standard dev.
Length in m 12.3 4.8 8.6 8.4 6.7 – 10.4 2.4
Width in m 12.1 4.1 7.5 7.0 5.9 – 9.5 2.5
Area in m2
145.1 19.8 65.8 58.3 34-7 – 88.0 39.4
L/W-index 1.52 0.97 1.17 1.13 1.03 – 1.30 0.18
Dis_MD in m 149.0 17.7 91.9 106.5 31.8 – 136.9 52.5
Tab.6.7 Above: summary descriptive statistics for the sample of double sheep/goat sheds (all measurements area external). Below: A) XY-plot of double sheep/goat shed lengths and widths in meters with indication of specific ruin numbers. B) Histogram of showing the frequency of different sized double sheep/goat sheds in square meters.

139
Archaeological definition/surface identification:
The sheep/goat shelter/pens are visible on the surface
as two or more smallish rooms placed along a vertical
cliff face or slope, which constitutes one of the long
walls. Building materials and size vary.
Sheep/goat shelter/pens descriptive statistics:
Since recorded sheep/goat shelter/pens in the sample
of ruins number only 7, few statistic observations can be
applied with any level of significance. As shown by
Tab.6.8, the small group of sheep/goat shelter/pens seem
to display a fair deal of variation in their dimensions.
Five examples were built in stone/turf, two preserved as
a stone foundation for a turf wall; the number of rooms
vary from two to four. The only consistent oberservation
relating to the sheep/goat shelter/pens is that they lay at
considerable distance from the associated dwellings, i.e.
towards the edge of the infield similar to many of the
enclosure types (see below).
Sheep/goat shelter/pens discussion:
In view of their low number and variation in size,
built, and partitioning, it might be inapt to even separate
sheep/goat shelter/pens as a certain type of outbuilding.
They could simply be a variation of the enclosures
partially delimited by a cliff face with which they share
several traits (see below). The sheep/goat shelter/pens
are mainly separated here because they appear to have
been roofed, or at least some of their sections may have
been. Also, unlike the similar enclosures (see below), the
sheep/goat shelter/pens seem to be randomly oriented,
which suggests that heat absorption was not a major
concern in the function of these outbuildings, which of
course is also explains why they could be built up
against heat-draining cliff faces. This, and the fairly
large distances to their associated farmsteads, strongly
implies that the sheep/goat shelter/pens related to fairly
temporary stalling and herding at the edge of the infield.
Tab.6.8 – Sheep/Goat Shelter/Pens Descriptive Statistics
N = 7 Maximum Minimum Mean Median IQR Standard dev.
Length in m 25.0 6.1 13.8 14.7 9.3 – 16.0 6.1
Width in m 5.2 2.3 2.5 4.5 3.4 – 5.0 1.1
Area in m2
125.0 13.9 61.1 62.9 31.5 – 75.0 37.2
L/W-index 5.00 1.79 3.25 3.00 2.66 – 4.00 1.02
Dis_MD in m 370.3 41.7 250.8 326.6 143.4 - 339.1 124.0
Tab.6.8 Above: summary descriptive statistics for the sample of sheep/goat shelter/pens (all measurements area external). Below: A) XY-plot of sheep/goat shelter/pens lengths and widths in meters. B) Histogram of showing the frequency of different sized sheep/goat shelter/pens in square meters.

140
Fig.6.11 Ruin group E209’s ruin no. 3 north of the Kujalleq fjord arm in the northeast Vatnahverfi region. It is a rare example of a ruin classified as a sheep/goat pens/shelter, i.e. a livestock building for sheep and goats portioned into several smaller compartments built up against a vertical cliff face. In this case, at least some of the rooms could have been roofed, while the compartments in each end were likely unroofed enclosures (photo: C.K. Madsen 2005).
Storehouses (Tab.6.9):
Definition:
A storehouse is a ventilated building intended for the
drying and/or storage foodstuffs or organic wares.
Surface interpretation and issues:
Because many storehouses were constructed in dry
stone masonry and therefore among the best-preserved
ruins (e.g., Fig.6.4), they were – as discussed in section
5.3) – some of first ruins first to be described and
functionally identified by early investigators (e.g., Holm
1883:73p, Bruun 1895a:430, Roussell 1941:230p). After
Icelandic example the storehouses have long and often
been referred to as 'skemmur' (sing. 'skemma'). There is
little reason to debate the storehouses’ similar basic
function of drying and storing foods and other perishable
products since the dry stone masonry construction served
to allow a free flow of air through the building, i.e. the
primary building function was ventilation.
For the same reason, the storehouses are also always
located so as to ensure wind exposure, which seems to
have been more important than placing them close to the
farmsteads’ main cluster of buildings. Besides placing
the storehouses up slope or on top of rocky outcrops or
knolls, maximized ventilation was achieved by, for
instance, locating the storehouses at mouths of valleys or
in open terrain so that the wind could play freely through
the building from multiple directions; on coast near
farms, the storehouses seems to have been placed so as
to exploit the 'fjord-wind', a strong and cool breeze from
the outer fjord that blows incessantly throughout the
summer as long as high-pressure conditions prevail. The
drying-function of the storehouses is also clear from
their placing: they are always being built on drained
foundation, preferably exposed bedrock, or alternatively
on stony, gravelly, and well-drained soils. The latter two
qualitative, but also very obvious, observations are key
to the identification of all types of storehouses.

141
Fig.6.12 Ruin group E72’s ruin no.3 in central highland Vatnahverfi, an example of a storehouse that must have been built predominantly in wood on a stone foundation (photo: C.K. Madsen 2006).
As outline in section 5.3.2, there does indeed seem to
be different types of storehouses: authors has referred to
some especially large dry stone masonry buildings as
warehouses (Nørlund and Roussell 1929:130, Arneborg
2006:13, Arneborg et al. 2012b:6) meaning to signify
buildings used for the storage of other goods than foods,
i.e. the organic commodities for export. Considering the
irregular sailings to Greenland discussed in section 2.1.3,
this would be a reasonable interpretation. There is no
reason to doubt prior investigators that there were
different types of storehouses, and that some were
associated with the largest farmsteads and used for
storing of export commodities. But since no one has tried
to define the difference between store- and warehouses,
they are somewhat ambiguous categories. Here I refer to
them both simply as storehouses.
However, besides size and function storehouses also
seem to have differed in terms of building materials:
based on architectural details and rough estimation of
collapse material, Roussell convincingly argued
(1941:231p) that storehouse no.7 of church farmstead V7
/Ánavík could have had an uppermost storey built partly
in wood. The idea that a larger wood component could
have been part of Norse buildings has otherwise only
been suggested for the churches (see section 5.2). To
suggest that other less prestigious buildings could have
included a substantial wood component is somewhat at
odds with general impressions of wood accessibility in
Greenland. However, the extent of wood shortage may
have been overemphasized and partly forged within a
'paradigm of arctic marginality'.
Whereas the latter claim may be conjectural,
Roussell’s idea of rough quantification of collapse
material quantity lends to a more tangible approach for
the surface identification of mostly wooden storehouses:
if relying on a drained and wind-exposed location in the
terrain as the key parameter for storehouse identification,
even brief surface inspection of ruins with such a placing
in many cases reveals that there is not enough collapse
material for the building to have been constructed in
pure dry stone masonry. In some cases, only a stone
foundation is visible (e.g., Fig.6.12), in other cases the
pile of collapse stone is too small to have comprised an
entire building (e.g., Fig.6.13). In such cases, I suggest
that the main corpus of the storehouse was built in wood,
resting on and supported by courses of stone (and turf?)
wall (e.g., Fig.6.13-6.14).

142
Fig.6.13 Ruin group E4’s ruin no.4 (cf. Fig.5.16), Tasiusaq. Being placed on exposed bedrock on a ridge overlooking the farmstead by the fjord, there can be little doubt that the ruin was a storehouse. However, as visible in the photo there is not enough surrounding collapse material for the building to have been built completely in dry stone masonry, i.e. it was likely a wooden storehouse on a stone foundation (photo: C.K. Madsen 2011).
Archaeological definition/surface identification:
Storehouses are visible on the surface as buildings
either erected in dry stone masonry or in wood
(perished) on a stone sill or foundation (preserved). They
tend to be square or slightly rectangular in form and
walls are fairly thin. Storehouses always occupy a wind-
exposed and drained location in the terrain.
Storehouse descriptive statistics:
With 99 identified examples, the storehouses are
among the most common outbuildings. As visible in
Tab. 6.9, they display a good deal of variability in
dimensions and sizes. However, there is clearly a cluster
of more ordinary storehouses (Tab.6.9A-B) as
summarized by interquartile ranges, medians and means
of the listed ruin parameters (Tab.6.9). As shown in the
histogram of storehouse areas (Tab.6.9B), their
distribution displays a markedly positive skewness,
although without the outliers, the cluster of regular
storehouses would have an almost normal distribution.
This suggests that this cluster reflects a distinct group of
outbuildings, i.e. Roussell’s milk- and food stores (see
section 5.3.2).
Among the extreme outliers in the sample of
storehouses (Tab.6.9A) those belonging to ruin groups
E18, E29a, E47, E59 are most obvious (the dimensions
storehouse no.48 at ruin group 28 is based on rough
description and are somewhat uncertain). In fact, of the
20 largest storehouses in the sample, no less than six are
associated with the episcopal manor at Igaliku/Garðar
(E47), two with the church farmstead of Qassiasuk/
Brattahlið (E29a) (five if ruin groups E28-29 were part
of the Brattahlið church manor), one with church
farmstead of Narsaq/ Dýrnes (E18), as well as three with
singular ruin group E59. This very strong correlation
between the largest storehouses – i.e. the proposed
warehouses – and the largest farmsteads clearly shows
that the surface survey evidence of storehouses is highly
indicative of farmsteads size and function.
The storehouses are located between 3.0-825.9 m –
on average 185 m – from their associated dwellings
(Tab.6.9), clearly attesting to the above contention that
wind-exposure, not proximity to the farmhouse, was the
decisive factor in placing the storehouses; some of them
were likely placed close to the fjord for easy access from
arriving ships boats, i.e. the warehouses. Of the 99
recorded storehouses, 72 are described as built in dry

143
stone masonry and 26 preserved as a stone foundation (1
example is not described). Interestingly, the latter
supposedly wood-built storehouses almost all belong to
the cluster of more moderate storehouses; their average
size is 15.0 m2, i.e. just about half of the mean for the
entire sample and even less when compared exclusively
to the sample of stone built storehouses (mean size =
35.6m2). This is unsurprising, for although limited access
to building timber may have been overemphasized, it
was probably neither an overabundant resource. Wall
thicknesses for the storehouses vary between 0.25-1.75
m, again implying notable variation. However, the
average wall thickness for the entire sample is only 0.83
m, suggestive for the primary ventilation purpose of the
storehouses’ stone built walls.
Storehouses discussion:
Based on their general abundance, the storehouses
were among the most common of functional
outbuildings, which were certainly to be found on all
farmsteads – on the larger manors represented by several
examples – as well as on various types of shielings. The
correlation between storage area and farmstead size and
status is obvious and has been emphasized before
(McGovern 1985:93p, 1992a:212p), an observation that
conforms to the reasonable notion that larger farmsteads
had more foodstuffs and wares to process and store,
whereas storehouses on smaller farmsteads and shielings
probably only served for the processing and storage of
household food provisions. It is clear from the above that
this condition is well-reflected in the surface survey
evidence and a key parameter in ruin group functional
and hierarchical classification. Also, the above statistics
agrees well with my supposition that some (smaller)
storehouses were in fact made in wood rather than stone.
Tab.6.9 – Storehouses Descriptive Statistics
N = 99 Maximum Minimum Mean Median IQR Standard dev.
Length in m 19.1 1.5 6.7 5.6 4.2 – 7.8 3.8
Width in m 0.9 8.4 3.9 3.8 3.0 – 4.5 1.5
Area in m2
125.8 1.6 29.9 19.0 11.4 – 32.7 29.7
L/W-index 3.80 0.91 1.72 1.50 1.30 – 1.91 0.58
Dis_MD in m 825.9 3.0 185.0 131.5 78.9 – 255.5 159.9
Tab.6.9 Above: summary descriptive statistics for the sample of storehouses (all measurements area external). Below: A) XY-plot of storehouse lengths and widths in meters with indication of specific ruins mentioned in the text. B) Histogram of showing the frequency of different sized storehouses in square meters.

144
Fig.6.14 In the text, it has been substantiated that a considerable number of the Norse storehouses could have resembled this wooden-built store- and drying house at Narsarsuaq (?), 1962 (although not necessarily this large or tall). If the wooden part decomposed, only a small heap of stone (and possible turf) would be left (photo: C.L. Vebæk 1962).
Boathouses (Tab.6.10):
Definition:
A boathouse is a building intended for the storage of
a boat and/or associated tackle and fishing gear.
Boathouses may or may not have been roofed.
Surface interpretation and issues:
Although boathouses or (noosts) have been referred
to by several authors (e.g., Bruun 1895a:430, Nørlund
and Roussell 1929:130, Kapel 2004:8), they constitute a
very ambiguous category of outbuildings. In fact, the
only key defining parameter for their surface
identification seems to be their proximity to water or a
good landing place. While boathouses are sure to exist
among the Greenland Norse ruins, no example has ever
been identified through excavation and we thus have
little idea of exactly what they should look like; and
while the argument of water or land place proximity
appears valid, the general proximity of so many
farmsteads to the fjords, as well as unclarified effects of
eustasy and isostasy, renders this argument just as
ambiguous. Still, a few ruins in the sample described as
boathouses have been included as a separate category,
since they were interpreted as such. Surely, other
boathouses could hide in the sample.

145
Boathouses descriptive statistics:
The boathouses identified in this sample only amount
to seven examples, which disqualify their statistical
scrutiny on any level of significance. Although Tab.6.10
points to a fairly diverse group of ruins, the boathouses
recorded in this sample are fairly all small and narrow.
In five of the six cases where building material is
decribed, the boathouses are preserved only as a stone
foundation, the single remaining example being built in
stone/turf; in the three cases where wall thickness is
recorded it is 0.8m, implying limited building insulation,
which is of course in accord with the functional
interpretation (although this wall thickness overlaps with
the very similar looking sheep/goat sheds). Especially
noticeable of the boatsheds is the great distance to their
associated dwellings if present (in four cases).
Boathouses discussion:
The small and varied sample of possible boathouses
included here has few implications for our understanding
of this type of outbuilding. If boathouses or noosts at all
(at least one seems too short to accommodate a boat),
they only seem to suggest that the boats were very short
and fairly narrow. Excavated examples of this building
are needed to identify the layout and built of the
Greenland Norse boathouses.
Lookouts/shelters (Tab.6.11):
Definition:
A lookout/shelter is a small rudimentary building
intended for the temporary shelter of herders or
travelers. Lookouts/shelters may or may not have
been roofed.
Tab.6.10 – Boathouses Descriptive Statistics
N = 7 Maximum Minimum Mean Median IQR Standard dev.
Length in m 10.3 3.6 7.5 7.0 5.3 – 10.0 2.5
Width in m 5.2 2.1 3.9 4.1 3.2 – 4.6 1.0
Area in m2
45.0 7.2 27.2 26.2 18.2 – 42.6 13.3
L/W-index 2.5 1.0 1.8 1.8 1.64 – 2.22 0.47
Dis_MD in m 979.8 101.6 479.3 415.6 158.1 – 864.2 373.55
Tab.6.10 Above: summary descriptive statistics for the sample of boathouses (all measurements area external). Below: A) XY-plot of boathouses lengths and widths in meters with indication of specific ruin numbers. B) Histogram of showing the frequency of different sized boathouses in square meters.

146
Surface interpretation and issues:
The surface interpretation of some ruins as lookouts/
shelters is admittedly uncertain. Although they are also
characterized by being very small and insubstantial
structures and perhaps not even roofed, the identification
of lookouts/shelters rests mainly on the qualitative
assertion that they are located in the terrain so as to
provide a single or few persons a wide-ranging overview
from sheltered location (Fig.6.15). Surely, lookouts/
shelters are underrepresented in the survey evidence,
both because of the insubstantial construction and their
location at considerable distance from other ruins.
Archaeological definition/surface identification:
Lookouts/shelters are visible on the surface as small
features placed in the landscape so as to offer extensive
overview of the surrounding terrain.
Lookout/shelter descriptive statistics:
The four recorded lookouts/shelters recorded are too
few for statisical description to have significance on any
level. However, as a group they are very similar in the
very small dimensions (Tab.6.11). As expected of their
function, the three lookouts/shelters with associated
dwellings all lie quite far removed from it. They can
apparently be built in any material.
Lookout/shelter discussion:
Clearly, the lookouts/shelters included in this sample
are of limited importance. While it is easy to see them as
shelters quickly thrown up to accommodate herder’s
tending the flocks at some distance from the farmsteads,
this interpretation must remain conjectural. Undoubedly,
quite a substantial number of such ruins are stilll to be
found in the landscape between the farmsteads.
Tab.6.11 – Lookout/Shelter Descriptive Statistics
N = 4 Maximum Minimum Mean Median IQR Standard dev.
Length in m 2.7 2.2 2.1 2.2 - 0.3
Width in m 2.2 1.2 1.8 1.7 - 0.4
Area in m2
5.7 2.4 3.7 3.9 - 1.5
L/W-index 1.67 1.12 1.30 1.35 - 0.23
Dis_MD in m 428.8 367.8 400.5 404.8 - 30.7
Tab.6.11 Above: summary descriptive statistics for the sample of lookout/shelters (all measurements area external). Below: A) XY-plot of double sheep/goat shed lengths and widths in meters. B) Histogram of showing the frequency of different sized lookouts/shelters in square meters. Sample size is too small for meaningful calculation of interquartile ranges (IQR).

147
Fig.6.15 Ruin group E125’s ruin no.13, Tuttutooq. The lookout/shelter is located at the top of a small pass some 430
west of the main farmstead ruins from where there is an unobstructed view both towards Narsaq/Dýrnes (E18) on the far side of the strait and back towards the farmstead in the other direction. Such structures are normally interpreted as Inuit shooting blinds, but some have a distinct Norse appearance (photo: M. Nielsen 2011).
Churches and Churchyards (Tab.6.12):
Definition:
A church and surrounding churchyard.
Surface interpretation and issues:
The layout and appearance of the medieval Norse
churches was reviewed in section 5.2 and will not be
discussed further here. In the ruin table, churches and
churchyards have been assigned different numbers
because of their different building materials. However,
because of their evident connection they are treated
together here. The churches are mainly identifiable from
their layout with a church building proper lying about
centrally inside a churchyard enclosure wall, which can
be of any shape. As other ruins also conform to this
pattern – e.g. the grazing enclosures (see below) – most
of the churches have been identified through full- or test
excavation (cf. Tab.4.1). However, the example of the
accidentally discovered so-called Þjóðhildarkirkja (E29a
ruin no.59) shows that earliest churches may not be
preserved so as to be visible on the surface, and neither
could a churchyard enclosure wall be found during the
excavation of the latter. Thus, other small churches could
easily remain undiscovered.
Archaeological definition/surface identification:
Churches and churchyards are visible on the surface
as a central building surrounded by an enclosure wall,
which must enclose a soil surface to allow interment of
corpses (in contrast to some of the animal enclosures
with a building surrounded by an enclosure wall).
Churches and churchyards descriptive statistics:
Tab.6.12 displays summary descriptive statistics for
the churches and churchyards, but will not be discussed
further here, because this have been treated extensively
elsewhere (see section 5.2 and references).

148
Churches and churchyards discussion:
Briefly reviewing Tab.6.12, the churchyards display
notable variation. Still, the different groups of churches
discussed in secton 5.2 are clearly visible (Tab.6.12A-
B): a group of small churches (E48, E64, and E78), a
group of large churches (E18, 29a, E66, E83, E111, and
E149), and the unique Garðar (E47). The association of
churches with the largest manors is well-established and
need not be tested here.
However, the new surveys and test excavations of
churches in the Vatnahverfi (E64, E66, and E78) offer a
chance to briefly revisit N. Lynnerup’s population model
(1998:106p): the new surveys show the churchyard areas
of E64, E66, and E78 to be 303.9 m2, 554.0 m
2, and
136.9 m2, respectively; based on the new excavations,
burial densities (not including disturbed burials) within
these churchyards (excluding the area of the churches) is
calculated to be 1.17 per/m2, 1.25 per/m
2 (referring to
Lynnerup 1998:Tab.27), and 2.0 per/m2. The use of E64
dates to ca. 980-1200 (220 yrs.), E66 likely to the entire
settlement period 980-1450 (470 yrs.), and E78 to ca.
980-1250 (270 yrs.) (cf. Tab.8.2). Following Lynnerup’s
calculation method (and using his average burial density
estimate for E66), a total of 2876 individuals were buried
in the Vatnahverfi churchyards (3739-4026 if assuming
30-40% subadult mortality), which is just a little more
than the 2654 implied by his model (cf. Ibid.Tab.28).
Applying Lynnerup’s next model calculation, the
average population in the Vatnahverfi (over 500 yrs.)
would be just under 200 (194) people. However, burial
densities at E64 and E78 have proven higher than the
estimates used by Lynnerup (0.709 body/sq. m/100 yrs.)
and the same will like prove true for E66 if re-excavated.
Tab.6.12 – Church and Churchyard Descriptive Statistics
N = 10 Maximum Minimum Mean Median IQR Standard dev.
Length in m 27.8 (48.9) 4.4 (15.1) 14.4 (29.3) 15.6 (29.8) 6.8 (21.7) – 17.9 (34.2) 6.9 (10.1)
Width in m 15.6 (36.0) 4.1 (14.8) 8.5 (24.0) 7.9 (24.6) 4.1 (17.9) – 15.6 (27.3) 3.5 (6.5)
Area in m2
852.0 (1713.9) 18.2 (190.1) 196.7( 578.8) 126.5 (399.3) 31.1 (193.8) – 207.6
(834.4) 152.1 (502.3)
L/W-index 2.13 (1.36) 1.07 (0.97) 1.65 (1.15) 1.64 (1.16) 1.37 (1.08) – 2.00
(1.22) 0.35 (0.11)
Dis_MD in m 44.6 (37.8) 5.3 (0.0) 19.8 (12.5) 17.4 (5.5) 7.1 (0.5) – 31.2 (25.2) 13.3 (13.8)
Tab.6.12 Above: summary descriptive statistics for the sample of churches and churchyards (all measurements area external, churchyards shown in brackets). Below: A) XY-plot of church lengths and widths in meters. B) XY-plot of church-yard lengths and widths in meters. Both with indication of ruin numbers (note that ruin group E111’s churchyard is partly eroded and therefore not included in Tab.6.12B.

149
Unspecified roofed outbuilding (Tab.6.13):
Definition:
No other definition than a building that cannot be
assigned to any other functional category, but was
roofed and not a dwelling.
Surface interpretation and issues:
Because the category of uns. roofed outbuildings is a
residue group of ruins which cannot be attributed a
particular function with any certainty, very few shared or
general traits can be outlined. Essentially, the only thing
shared by all the ruins is that their surface appearance
supports the assertion that they were originally roofed.
There are several reasons that some ruins can only be
assigned to this residue group: they may be very poorly
preserved, they may lack adequate survey description,
they may have been removed prior to proper recording,
or they may just be of such uncharacteristic built or
layout that they escape classification. In fact, almost all
Norse buildings display considerable “uniqueness” and
hardly any of them conform to the very straight angled
house plans that early surveyors were in the habit of
presenting. Rather, buildings opportunistically utilized
different micro-topographical features and nearby and
easily available building materials; buildings bent,
bulged, and angled as walls and annexes were added,
rebuilt, or removed; some were sunk below the surface,
and others raised on outcrops or gravelly knolls. To this
original constructional variation must be added various
processes natural degradation following building
abandonment. Many of the ruins described as uns. roofed
outbuildings follow such labile constructional schemes
or are so degraded that they omit functional
identification.
Tab.6.13 – Unspecified Roofed Outbuildings Descriptive Statistics
N = 256 Maximum Minimum Mean Median IQR Standard dev.
Length in m 23.2 (27.5) 1.6 7.4 6.0 4.2 – 9-6 4.2
Width in m 13.3 (17.0) 1.5 4.9 4.5 3.2 – 6.2 2.2
Area in m2
151.6 (467.5) 2.3 38.5 22.8 12.9 – 54.7 35.1
L/W-index 0.00 3.49 1.48 1.36 1.18 – 1.68 0.48
Dis_MD in m 600.3 0.0 92.7 58.4 20.1 – 125.4 102.6
Tab.6.13 Above: summary descriptive statistics for the sample of unspecified roofed outbuildings (all measurements area external). Below: A) XY-plot of uns. roofed outbuilding lengths and widths in meters. B) Histogram of showing the frequency of different sized uns. roofed outbuildings in square meters. Note: numbers shown in bracket indicate the dimensions of the sample outlier ruin E183 no.3, which is not included in Tab.6.13.B.

150
Archaeological definition/surface identification:
Uns. roofed outbuildings are visible on the surface as
the ruins of buildings that would originally have been
roofed, but otherwise cannot be assigned any particular
function.
Unspecified roofed outbuildings descriptive statistics:
With 256 examples, uns. roofed outbuildings are,
unfortunately, the largest single category of roofed
farmstead buildings. As expected from the vague
definition they show considerable variation (Tab.6.13).
However, as visible from Tab.6.13A.B. The single
extreme outlier in the sample is E183 ruin no.3, which in
terms of recorded size and L/W-index could be a stable-
complex. However, as the site was not revisited during
the Vatnahverfi-Project and the only existing survey
description is very brief and uncertain, the ruin has been
classified as an uns. roofed outbuilding. The other
observerd paramters for the uns. roofed outbuildings also
vary: of the 235 ruins where building material is
decribed, 4% (10) were built in pure turf, 46% (109) in
turf/stone, 28% (67) in stone/turf, 2% (9) in dry stone
masonry, and 17% (40) preserved as a stone foundations
for turf wall. The vast majority of turf-built houses in the
sample (Buid_Mat 1-2, 5), and the very few built in
stone, points to the condition that buildings with a large
turf component are much more indistinct in their
collapsed state. In terms of distance to the associated
dwelling, the uns. roofed outbuildings range between
0.0-600.3 m, on average 92.7 m. Otherwise, the uns.
roofed outbuildings display no notable patterns.
Unspecified roofed outbuilding discussion:
Although here described as unspecified, it is among
this large sample of ruins one finds the other functional
outbuildings associated with the Norse farmsteads. For
instance, a few smaller and mostly turf-built buildings
have been identified as smithies through excavation or
surface finds of iron slags (Nørlund and Roussell
1929:111p, Roussell 1936b:54p, Gulløv 2000a:24, Kapel
and Clemmensen 2013:15), and the excavation of a
small house in front of the dwelling of V52a provide it to
be a bathhouse (Roussell 1936b:74p, 1936a). However,
although such buildings were likely common on most
farmsteads they can very rarely be identified from
surface survey and must, at this time, be grouped in a
residue class of buildings. Of the 20 largest uns. roofed
outbuildings in the sample, 7 are associated with church
farmsteads or the atypical E59, suggesting some, but not
strong, correlation between uns. roofed outbuildings and
overall farmstead size and status.
6.2.2 ROOFED BUILDINGS SUMMARY DISCUSSION
A total of 916 individual ruins can be identified as
roofed buildings in the survey dataset. Fig.6.16 displays
aggregate frequencies for the various building types
presented and discussed in the above. As visible, the
various types of roofed buildings are very differently
represented. Still, their distributional pattern has a few
implications: first, the fact that only 111 identified
dwellings – whatever their size – can be identified
among 157 ruin groups is direct evidence that around
30% of the sites are definite shielings, not farmsteads.
Second, the outbuildings that are directly related to cattle
farming – i.e. simple byre/barns and stable-complexes –
are fairly few, whereas buildings related to other
livestock – sheep/goat sheds, bipartite livestock
buildings, and livestock stables – are quite numerous.
This suggests the limited extent of cattle farming in
Greenland that was, as outlined above, primarily a
feature of larger farmsteads. Contrariwise, the abundance
111
41
37
199
94 43
8 7
99 7
4
10
256
Building Type Frequency (n = 916)
Dwellings Simple byre/barnsStable-complexes Sheep/goat shedsBipartite livestock buildings Livestock stablesDouble sheep/goat sheds Sheep/goat shelter/pensStorehouses BoathousesLookouts/shelters Churhces and churchyardsUnspecified roofed outhousesoutbuildings
Fig.6.16 Displays the frequency of the different types of roofed Norse buildings presented in section 7.2.1.

151
0
5
10
15
20
25
30
35
40
45
0 10 20 30 40 50 60 70 80
Building Types Lengths/Widths (m)
Uns. roofed outhouses Dwellings Simple byre/barnsStable-complexes Sheep/goat sheds Bipartite livestock buildingsLivestock stables Storehouses
Simple byre/barns
Stable-complexes
Livestock stables
Bipartite livestock building
Storehouses
Dwellings
of other livestock buildings that were mostly related to
sheep/goat keeping imply that they were more common
buildings with no strong affiliation to any kind of
farmstead. Third, the large number of storehouses
unsurprisingly suggests that they too were of the most
basic type of outbuildings found on all kinds of sites.
Fig.6.17 displays the lengths and widths of the eight
most common types of dwellings and outbuildings, as
well as linear trendlines for six of the types. The figure
may on first glance appear inconclusive, but there are
some overall patterns to the distribution: the dwellings
display the greates variation, which is explainable by
their function as main occupation building of very
different sized farmhouses and shieling lodges, as well
as by their complex building histories. The trendline also
shows dwellings to be the most “round” ruins. The
trendlines for the stable-complexes, simple byre/barns,
and livestock stables summarize what was noted in the
above i.e. that although they display some overlap, each
type forms a “fuzzy”, but visible cluster within the
sample, mainly due to general size (width) differences.
The trendlines also reveal these three livestock buildings
that generally have fairly oblong (rectangular) layouts.
Fig.6.17 Scatterplot showing the length/width distribution of the 8 most common types of buildings identified in the ruin survey dataset (n = 857). Different colors indicate different building types; linear trendlines are shown for six of the building types. Although most of the building types display noticeable overlaps in length/width, the types do appear to stand out as “fuzzy” clusters with differences, which support their functional differentiation.
outbuildings

152
Fig.6.18 Ruin group E59’s ruin no.13, Sissarluttoq on the Qaqortoq Peninsula, an example of a ruin classified as an enclosure with built wall. Note that even where the stone wall appears intact with no extra collapse stone (e.g. just in front of the person) it would not have been high enough to keep sheep/goat from escaping. Thus, the stone wall must have had a turf superstructure which has since disintegrated (photo: C.K. Madsen 2008).
The other building types included in Fig.6.17 seem to
merge in one confused cluster, which partly owe to
dimensional overlap, partly to obscuration by sheer
number of ruins. However, even some of these small
building types form “fuzzy” clusters: for instance, the
storehouses clearly group somewhat differently in Fig.
6.17 than the bipartite livestock buildings (which cluster
somewhat differently from the similar looking simple
byre/barns). A linear trendline for the storehouses also
show them to on average be “squarer” than the bipartite
livestock buildings. However, although the building
types separated here do appear to form overlapping and
fuzzy, but real clusters, they are difficult to substantiate
statistically, mainly because they are identified from
qualitative, not quantitative parameters. Still, the
building types appear distinct enough to support the
differentiation.
Finally, using the church farmsteads as a benchmark
for the farmstead and building layout of the largest
manors, some buildings serve well as indicators of
farmstead wealth and status, while others appear less
suggestive. For instance, sheep/goat sheds, bipartite
livestock buildings, and livestock stables do not appear
strong indicators of farmstead wealth and status, but
were common on all types of farmsteads; neither is
dwelling size in itself a strong indicator of farmstead
status, because it became practice at smaller farmsteads
to combine dwelling and outbuildings into one big
building, i.e. the 'centralized farms'. On the other hand,
buildings such as simple byre/barns, stable-complexes,
and large storehouses seem to be strong indicators of
farmstead wealth and status. Yet, it is also clear from the
above that none of these indicators can stand alone, but
must be assessed against the combined layout of the
farmstead and, not at least, the overall size of all its
buildings. The latter seems to be the most potent
parameter for surface identification of farmstead wealth
and statues, whereas farmstead layouts with different
types of outbuildings relate more to site-specific farming
practices. Both these interpretative potentials are tested
in chapter 7.

153
6.2.3 UNROOFED BUILDINGS
The term applied for the second group of farmstead
buildings is self-explanatory: it comprises various kinds
of enclosures and dykes that were not roofed. Since there
was no collapsing roof material to obscure and disturb
the walls after these enclosures and dykes were taken out
of use, and because they were often built in stone – or on
a stone foundation, cf. Fig.6.18 – many of them are
among the most distinct and best preserved ruins.
However, they have never been submitted to systematic
or detailed archaeological investigation or discussion,
but have only been described in the brief (e.g, Nørlund
and Stenberger 1934:99p, Roussell 1941:230p).
The unroofed buildings all share several features that
are outlined here to avoid unnecessary repetition in the
below: like the other outbuildings, few unroofed
buildings have been excavated; none after the
introduction 14
C-dating (cf. Tab.4.1). At any rate, datable
material would have to be found under or in the walls in
order to tentatively date their construction. However, the
lacking chronological framework for unroofed buildings
can be argued to have less consequences for their
interpretation: because of their lacking roofing,
enclosures and dykes probably had a longer life-span
than the roofed buildings. Essentially, repairing or
enlarging the former would simply have entailed
restacking or -arranging the stones and turfs.
Accordingly, it is not unlikely that the enclosures visible
on the surface today represent close to the actual
maximum number used by the Norse grænlendinga in
the Middle Ages. In relation to the walls, it must be
noted that although a large proportion is described as
built in dry stone masonry, many would have included a
turf component, either as intermittent layers between the
stones or as a turf super structure (cf. Fig.6.18). This is
argued from the same grounds observation outlined for
the storehouses, i.e. often there is not enough stone
collapse for the walls to have stood high, at least not
high enough to keep inside very agile sheep and goats.
In the below classification, I have generally favored
the more neutral term “enclosure” over more explicit
terms such as pen, fold, hay yard, horse paddock, garden
etc. The reason for this is that in many cases there is no
certain way proving what an enclosure originally
enclosed. Also, some enclosures likely had multiple
functions throughout the Norse seasonal round, e.g. an
enclosure could serve as a gathering fold in the spring
and a hay-yard in the fall; a large fold fertilized by cattle
in the early spring could function as a fertilized garden
or small hayfield during the summer etc. During the
Vatnahverfi-Project we have test-trenched several
enclosures for DNA-samples (Arneborg et al.
2009a:45p), but nowhere have we found indications that
they were used as fenced gardens. While other functions
cannot be excluded it is generally assumed in the below
that most enclosures chiefly facilitated livestock herding.
However, functional aspects particular to the various
types of unroofed features is discussed below.
Enclosure with built wall (Tab.6.14):
Definition:
A separate lying enclosure where the entire (or most)
of the circumference is built wall; multiple functions
are possible, but it had a primary function as
livestock herding/management facility.
Surface interpretation and issues:
The enclosures with built wall are some of the most
distinct Norse ruins and many are well-preserved (e.g.,
Fig.6.18). As implied by their label, the enclosures with
built walls are characterized by having circumference
walls that were completely constructed. However, many
of the enclosures with built wall still incorporate natural
features such large boulders or small rocky outcrops,
apparently to minimize the extent of constructed wall.
Some examples are built to be almost perfectly square or
rectangular, but more often they are of more irregular
shape and with somewhat rounded corners.
Archaeological definition/surface identification:
Enclosures with built wall are visible on the surface
as features lying detached from other buildings, and
where the space enclosed by a built wall was not roofed
(estimated from building width and wall construction).
The ruin outline can be any shape, but tend to be square
or rectangular.

154
Enclosures with built wall descriptive statistics:
The enclosures with built wall are represented by 45
examples in the sample. As visible from their summary
statistics (Tab.6.14) they display notable variation: there
are three extreme outliers (Tab.6.14A-B), in all three
cases really constituting atypically massive enclosures
(both of the E90 enclosures in fact circumfere smaller
enclosures, see below) and which all undoutebdly had
different functions than the smaller enclosures with built
wall. The latter are more moderate in size and seem to
form two or three clusters, which also show up in a
cluster analysis of lengths/widths/areas (Fig.6.19). Of the
20 largest enclosures, only three examples (E29a no.8,
E59 no.13, and E47 no.38) are associated with the
largest farmsteds, indicating that this building type relate
more to particular farmstead functions than wealth and
status.
Of the 43 enclosures with built wall where building
material are described, 7% (3) are built in turf, 12% (5)
in turf/stone, 49% (21) in dry stone masonry, and 30%
(13) preserved as a stone foundation for a turf wall. Wall
thicknesse vary accordingly: from 0.35-1.9 m with an
average width of 1.0 m. Only 33 of the 45 enclosures
with built wall have an associated dwelling, from which
the enclosures lie removed by 6.6-517.5 m, on average
124.6m (Tab.6.14). Both latter observations suggest that
the enclosures with built wall served mainly as herding
facilities at the edge of the infield or at shielings. Of the
40 cases where there is sufficient information, 40% (16)
are partitioned into two sections, where one is normally
significantly smaller; large to small section ratios in
these ruins vary between 1:2 to 1:90.8 (omitting the
atypical E90 no.1) with an average of 1:14.4. This
suggests that many of these enclosures were milking
pens.
Tab.6.14 – Enclosure with Built Wall Descriptive Statistics
N = 45 Maximum Minimum Mean Median IQR Standard dev.
Length in m 28.9 (57.8) (5.3) 12.8 (15.3) 10.6 (12.3) 8.1 - 15.8 (8.5 - 16.5) 5.9 (11.2)
Width in m 18.8 (35.1) (2.9) 8.9 (10.3) 7.5 (8.7) 5.8 - 11.1 (6.0-11.5) 4.2 (6.7)
Area in m2
394.4 (1635.5) (14.3) 113.1 (187.7) 82.2 (86.5) 39.6 - 129.0 (41.7-148.4) 100.9 (307.6)
L/W-index (2.57) (1.00) 12.8 (15.3) 1.40 (1.43) 1.12 - 1.82 (1.41-1.82) 0.47 (0.47)
Dis_MD in m (517.5) (6.6) 124.3 (124.6) 96.0 (107.6) 39.3 - 197.0 (41.7-197.5) (110.3)
Tab.6.14 Above: summary descriptive statistics for the sample of enclosures with built wall (all measurements area external). Below: A) XY-plot of enclosures with built wall lengths and widths in meters and with indication of outliers. B) Histogram of showing the frequency of different sized enclosures with built wall in square meters. Note: numbers shown in bracket include the three extreme outliers in the sample (cf. Tab.6.14A).

155
Fig.6.19 Cluster analysis (classical, paired group, two-way) of length/width/area of the sample of 42 enclosures with built wall. Indicated in the dark blue square are the three extreme outliers (discussed in the text); in the red square another distinct cluster (cf. Tab.6.14A). The remaining enclosures seem to group on two or three less distinct clusters.
Enclosure with built wall discussion:
Based on the above summary statistics and especially
their partitioning in two sections, the small to averaged
sized enclosures with built wall functioned either as
folds/pens or hay-yards. This is also supported by the
observation that only 31% (14) enclose a soil surface,
20% (9) a surface described as naked bedrock, and 22%
(10) mixed stone soil surface (27% (12) has no
description); thus at least 44% inclosed a surface that
could not be tilled or gardened. The possibility that some
functioned as hay yards cannot be excluded. For
instance, ruin group E64’s ruin no.5 was built on wind-
exposed bedrock not too far from the nearest livestock
building (Fig.6.20) and the walls equipped with openings
for drainage (Fig.6.21), both conditions suggesing the
function of a well-ventilated and -drained hay-yard.
However, the averagely large distance of the enclosures
with built wall from their assoicated dwellings would
imply that they primarily functioned as pens/folds –
kvíar, nátthagi, stekkr – and as argued from their internal
partitioning, to facilite milking. Again, the possibility of
mulitple and changing function must be considered.
Fig.6.20 Ruin group E64’s ruin no.5, Kujalleq Fjord, an example of an enclosure with built wall. The placing of this enclosure on a slightly elevated and wind-exposed low outcrop, as well as the adding of draining openings to of the sides (cf. Fig.6.21), seems to suggest that this enclosure functioned primarily as a hay-yard. Note also the limited amount of collapse stone which suggests that the original stone walls stood little higher (photo: C.K. Madsen 2008).

156
Fig.6.21 Detail of the southern wall of ruin group E64’s ruin 5 and one of the drainage openings (another is found in the eastern wall (photo: C.K. Madsen 2008).
An excellent example of such changing functions is
the extreme outliers in the sample of enclosures with
built wall E90 ruin nos.1&2, which are some of the most
impressive in the Vatnahverfi region: as will be argued
in secton 7, the western cluster of ruins (Fig.6.22)
registered under ruin group E90c (App.2) in all
likelihood constituted a separate shieling, one function of
which was undoubtedly the biannual gathering of
considerable numbers of livestock, hence the enormous
size of the enclosures. The uneven stony ground inside
them is vegeated by dwarf shrub, which suggests that the
animals gathered were mostly sheep/goats. The lush
vegetation inside the ruin and the nearby stream – which
today has eroded one corner of ruin no.2 – meant that
livestock could be kept in the enclosure for a number of
days without having to worry about feeding them, e.g.
for the duration of the livestock gathering.
Yet, the partitioning of ruin no.2’s southwestern
corner (Fig.6.22 B) – as well as the circular enclosure
with built wall inside (Fig. 6.32 A) – and the tiny room
added to the outside south wall (Fig.6.22 B) suggest
another function, i.e. a classic setup with stekkr and
lambakró for the milking of sheep/goats. Partitioning the
large enclosure with built wall (no.2) undoutebdly made
it easier to capture and milk the sheep/goats. Combined
with fodder production and storeage (represented by
storehouses nos. 3 and 5), this was probably the primary
function of the shieling, where ruin no.8 served as the
main shieling lodge during its summer occupation.
Fig.6.22 Survey plan of ruin group E90’s western group of ruin, which likely formed an independent, and probably later, shieling where: ruin nos. 1 & 2 were large gathering folds, partitioning A, B, and C related to sheep/goat milking, ruins nos. 3 and 5 were storehouses for fodder processing and storage, no. 8 the shieling lodge, and no. 9 rooms or enclosures related to dairy production or separating the sheep. It is an excellent example of an enclosure with multiple functions.

157
Circular enclosure with built wall (Tab.6.15):
Definition:
A separate lying circular or oval enclosure where the
entire circumference is built wall; multiple functions
are possible, but it had a primary function as a
livestock herding/management facility.
Surface interpretation and issues:
Apart from their round or oval shape (Fig.6.23), the
circular enclosures with built wall are identical to the
former type with more square or rectangular outlines.
Archaeological definition/surface identification:
Circular enclosures with built wall are visible on the
surface as features lying detached from other buildings,
and where the space enclosed by a constructed wall was
not roofed. The ruin is always circular or oval in shape.
Circular enclosure with built wall descriptive statistics:
Circular enclosures with built wall number only 11,
which disqualifies statistical examination on any level of
significance. As visible from Tab.6.15 they display
notable variation in dimesions and size, their low
length/width-index being the only constant and natural
effect of the rounded shape. Three of the 11 circular
enclosures with built wall are associated with church
farmsteads and two of them are the largest examples
(Tab.6.15A, E83 no.14 and E149 no.4), but otherwise
any notion (e.g. GHM III:855) of particular association
between the enclosures and the largest farmsteads must
be excluded. Building material is described for 10 of the
circular enclosures with built wall, one being built in
stone/turf, seven in dry stone masonry, and two
preserved as stone foundations for turf wall. Wall
thicknesses vary from 0.65-1.75 m with an average of
1.09 m, i.e. about the same as the previous enclosure
type.
Tab.6.15 – Circular Enclosure with Built Wall Descriptive Statistics
N = 11 Maximum Minimum Mean Median IQR Standard dev.
Length in m 16.0 5.8 10.5 10.0 7.8 – 12.8 3.3
Width in m 14.8 4.7 9.1 8.8 7.0 – 12.0 3.0
Area in m2
175.1 21.8 82.0 81.3 44.2 – 153.2 49.5
L/W-index 1.41 1.00 1.16 1.10 1.04 – 1.33 0.15
Dis_MD in m 122.5 10.7 49.9 39.0 22.9 – 64.9 34.6
Tab.6.15 Above: summary descriptive statistics for the sample of circular enclosures with built wall (all measurements area external). Below: A) XY-plot of circular enclosures with built wall lengths and widths in meters and with indication of outliers. B) Histogram of showing the frequency of different sized circular enclosures with built wall in square meters.

158
Fig.6.23 Newly registered ruin group 0502’s ruin no.1, northeastern Vatnahverfi, an example of a circular enclosure with built wall. Note again the limited amount of collapse stone, which suggests that the enclosure had a superstructure built in turf (photo: C.K. Madsen 2005).
Circular enclosures with built wall lie at distances of
29.2-393.3 m from their associated dwellings, 148.7 m
on average, again quite similar to the former enclosure
type (cf. Tab.6.14). In the seven cases where the
enclosed bedding is described, three enclose soil surface,
two mixed stone and soil, and two naked bedrock. Two
enclosures are built on markedly sloping terrain.
Circular enclosures with built wall discussion:
Although exemplified by too few to substantiate the
claim statistically, the overall similarity of the circular
enclosures with built wall with those of square or
rectangular shape, their general similarity is notecable.
Thus, it is reasonable to assume that they served the
same primary functions related to livestock herding and
management, i.e. as the Icelandic kvíar, nátthagi, and
stekkr ; a possible secondary function as hay-yards is not
unlikely. At any rate, any the notion that they could be
the foundations for bell-towers or babtisteries (e.g.,
Holm 1883:97, Bruun 1895a:337) must be excluded, and
neither does as function as cattle folds or corrals or
paddocks for horses (e.g., Holm 1883:98, Roussell 1941:
35, 47) seem convincing because of their small size,
slope, or bedding.
Enclosure Partly Delimited by Building (Tab.6.16):
An enclosure, where part of the circumference wall
consists of the side or gable of another building;
multiple functions are possible, but it had a primary
function as a hay-yard or livestock herding/
management facility.

159
Surface interpretation and issues:
The enclosures partly delimited by building are just
what the label suggest, i.e. enclosures where one side of
the circumference is constituted by a building (Fig.6.24).
This effects that these ruins are often obscured by
collapse material from the building. Thus it can be
exceedingly hard to establish whether the ruin was a
separate enclosure or simple collapse material from the
adjoining building. There is therefore also a good chance
that enclosures partly delimited by buildings are much
underrepresented in the sample due to many examples
being hidden under and obscured by collapse material.
Archaeological definition/surface identification:
An enclosure partly delimited by building is visible
on the surface as a room or section recognized to have
been unroofed (thin walls) or built in other material than
the building to which it is attached and which forms part
of the enclosures’ circumference.
Enclosure partly delimited by building descriptive
statistics:
Enclosures partly delimited by bulding number 29
examples. Compared to many of the other outbuildings,
they form a rather uniform group of smallish ruins with
some internal variability (Tab.6.16): the sample displays
positive skewness (Tab.6.16B) with the larger share of
enclosures being less than 50 m2 in area; there are no
truly extreme outliers. Tab.6.16B – which is somewhat
similar to Tab.6.14B – seems to imply “fuzzy” clusters,
which are however not emmidieately apparent in Tab.
6.16A. A classical cluster analysis of length/width/area
measurements (paired group, two-way) do suggest four
clusters in the sample, but again the statistical signifance
is limited due to the low number of sample ruins. Of the
10 largest enclosures partly delimited by a building,
three are associated with church farmsteads, but the
corellation does not seem to be strong.
Tab.6.16 – Enclosure Partly Delimited by Building Descriptive Statistics
N = 29 Maximum Minimum Mean Median IQR Standard dev.
Length in m 16.9 2.7 8.1 6.7 5.9 – 10.7 3.4
Width in m 11.6 0.7 4.8 4.1 2.8 – 6.2 2.8
Area in m2
119.4 1.7 34.5 23.9 14.4 – 42.3 27.8
L/W-index 9.63 0.81 2.19 1.72 1.24 – 2.25 1.79
Dis_MD in m 379.0 10.1 108.6 74.6 29.4 – 162.7 96.5
Tab.6.16 Above: summary descriptive statistics for the sample of enclosures partly delimited by building (all measurements area external). Below: A) XY-plot enclosures partly delimited by building lengths and widths in meters. B) Histogram of showing the frequency of different sized enclosures partly delimited by building in square meters.

160
Of the 27 cases where building material is described,
4% (1) are built in pure turf, 26% (7) in turf/ stone, 19%
(5) in stone/turf, 14% (4) in stone, and 37% (10)
preserved as stone foundation for turf wall, i.e. showing
overall variation. Wall thicknesses vary between 0.3-
1.75 m with an average of 0.76 m, i.e. somewhat less
than the previous two enclosure types. This implies a
different function of the enclosures partly delimited by
building, where insulation or sturdyness were not central
to the layout. A difference in function could also be
indicated by the distance to their associated dwellings,
which is somewhat less than the former two types of
enclosures (cf. Tab.6.14-6.15). For the 23 examples
where it is described, the bedding inside the enclosures
in 65% (15) of the cases consist of soil, in 13% (3) of
naked bedrock, and in 22% (5) of mixed stone and soil.
83 % (24) of the enclosures orient towards the southern
hemisphere, showing that solar heating was important in
placing of the enclosure partly delimited by building.
Enclosure partly delimited by building discussion:
Of the different types of enclosures, those delimited
by buildings are most likely to have functioned as hay-
yards, as also suggested by D. Bruun (1895:428). This
can be argued not only from the slightly varying building
details and placing outlined above, but also from the
observation that six of the enclosures partly delimited by
buildings attach to storehouses, i.e. were placed so as to
be wind-exposed. Another 14 attact to buildings mostly
associated with sheep/goot keeping (sheep/goat sheds,
double sheep/goat sheds, bipartite livestock buildings,
and livestock stables), while another 4 attach to small
examples of other roofed outbuildings, which could also
relate to sheep/goat keeping. Livestock was only stabled
during the winter, but was probably let out to graze the
infield as long as weather permitted. Evidently, it would
make little sense to let the animals out into a tiny
enclosure right next to the stable. All in all, this suggest
that the enclosures partly delimited by buildings were
predominantly hay-yards functionally associated with
fodder storage and winter stabling of sheep/goats.
Enclosure Partly Delimited by Cliff (Tab.6.17):
An enclosure, where part of the circumference
consists of a vertical or steep cliff face or slope;
multiple functions are possible, but it had a primary
function as livestock herding/ management facility.
Fig.6.24 Ruin group E64’s ruin no.1, north of the Kujalleq fjord, an example of a storehouse (left) with an attached enclosure part delimited by building (right of the storehouse with vegetation inside). Adjoining the storehouse and being placed on a well-drained, open, and wind-exposed surface, it seems most likely that the enclosure was used as a hay-yard (photo: C.K. Madsen 2005).

161
Surface interpretation and issues:
The enclosures partly delimited by a cliff are also
among the more characteristic ruins. As implied by the
label, one side of these enclosures consists of a natural
boundary formed by a vertical or steep cliff face or slope
(Fig.6.25). Otherwise, these enclosures are identical to
the regular and circular enclosures with built wall and I
refer to these for interpretational issues (see above).
Archaeological definition/surface identification:
An enclosure partly delimited by cliff is visible on
the surface as a ruin recognized (from wall thickness and
ruin width) to be have been unroofed and which is built
up against a vertical or steep cliff or slope, which forms
part of the enclosures’ circumference. The enclosure can
be of any shape, but tends to be either square or semi-
circular.
Enclosure partly delimited by cliff descriptive statistics:
With 128 examples, the enclosures partly delimited
by cliff are the single most numerous type of unroofed
feature in the sample. Unsurprisingly, they also show
dinstinct variation in dimensions and size (Tab.6.17): the
sample is strongly positively skewed (Tab.6.16B) with
the larger share of enclosures partly delimited by cliff
being less than 100 m2 in area. There is only one
noticeable, but not too extreme outlier (Tab.6.17A); ruin
group E64’s no.11 is simply a very large example of the
type. The sample of enclosures partly delimited by cliff
seems to have an overall area distribution (Tab.6.17B)
fairly similar to enclosures with built wall (Tab.6.14B)
and enclosures partly delimited by buildings (Tab.
6.16B), i.e. a large group of smaller examples and small
groups of large examples. Apart from E64’s no.11,
however, there again seems to be no clear association
between large farmsteads and the enclosures.
Tab.6.17 – Enclosure Partly Delimited by Cliff Descriptive Statistics
N = 128 Maximum Minimum Mean Median IQR Standard dev.
Length in m 31.4 3.4 9.9 8.5 6.4 – 10.9 5.4
Width in m 22.3 1.6 6.1 5.0 4.0 – 7.3 3.5
Area in m2
594.8 7.0 58.8 34.0 22.3 – 54.3 83.1
L/W-index 4.48 0.79 1.75 1.64 1.30 – 2.06 0.64
Dis_MD in m 1000.0 16.7 160.6 122.5 69.9 – 199.4 144.3
Tab.7.17 Above: summary descriptive statistics for the sample of enclosures partly delimited by cliff (all measurements area external). Below: A) XY-plot of enclosures partly delimited by cliff lengths and widths in meters with indication of an outlier. B) Histogram of showing the frequency of different sized enclosures partly delimited by cliff in square meters.

162
Fig.6.25 Ruin group E64’s ruin no.11, Kujalleq Fjord, a – very large – example of an enclosure partly delimited by cliff. The enclosure wall forms a half-circle against the cliff and is so large that a few animals could graze inside for shorter periods. In the upper left corner, a smaller enclosure – a lambakró – is visible (photo: C.K. Madsen 2005).
Of the 124 ruins where building material is noted,
7% (9) are built in turf/stone, 38% (48) in stone/turf,
31% (39) in dry stone masonry, and 23% (29) preserved
as a stone foundation for turf wall, i.e. again showing
overall variation. Wall thicknesses vary from 0.3-1.65 m
with an average width of 0.79 m, i.e. a strong indication
that the walls had no roof-bearing or insulation function.
The enclosures lie between 16.7-1000 m from their
associated dwellings, on average 160.6 m, implying that
they related to activities in the edge of or outside the
infield (Tab.6.17). Of the 109 examples where it is
recorded, 18 are divided upon two sections, seven upon
three sections, and five upon four secitons. In all cases,
the addiotional sections are much smaller; the average
large to small section ratio is 1:12.4, i.e. about the same
ratio as for enclosures with built walls. As the latter case,
the enclosures partly deliminted by cliff were used as
milking folds. For the 108 cases where bedding is
described, 32% (35) inclose a soil surface, 9% (10)
naked bedrock, and 58% (63) a surface of mixed soil and
stone. Thus, at least for 67% of the enclosures, a
function as a fenced-in garden can be definetely
excluded. Of the enclosures where orientiation is
recorded (107), 88% open towards the southern
hemisphere, suggesting that solar heating was very
significant in the placing of these enclosures.
Enclosure partly delimited by cliff discussion:
The latter could appear to suggest that the enclosures
partly delimited by cliff – like those delimited by
buildings – served as fodder storage facilities, which has
also been proposed elsewhere (Roussell 1941:230). Yet,
several other conditions imply that the enclosures partly
delimited by cliff instead facilitated livestock herding/
management: besides their subdivision with smaller
compartments, or with nearby small enclosures (see
below) – a layout of stekkr and lambakró – they are on
average larger and located further from their associated
dwellings than the enclosures partly limited by buildings
(160.6 m versus 108.5m). This would suggest that the
former were used for the rounding up of considerable
numbers of livestock, as well as for periodic milking of
select individuals, on the edge or outside the infield.
Also, water tends to leek out through the crakcs in, and
run down, the vertical cliff faces. They therefore do not
provide the dry underlay one would expect of a fodder
storage facility. Other reasons for building enclosures
against cliff faces was that it decreased the labor needed
to built and maintain the walls. Also, the vertical cliff
provided shelter for penned livestock without blocking
for solar heat. Located at distance from the farmsteads,
livestock could have been sheltered and fed here during
periods when they were grazing in the nearby heimrast.

163
Separate lambakró (Tab.6.18):
A separate lambakró is an unroofed compartment,
which can be built in any manner or in any material,
but is so small in size that it can only have been used
as an enclosure for lambs/kids.
Surface interpretation and issues:
The separate lambakró is the only type of enclosure,
where the label is chosen after Icelandic ethnographic
example: as outlined in section 5.3.2, the lambakró was
the smaller part of the bipartite Icelandic milking folds,
where lambs could be separated from the ewes
overnight, so that the latter could be milked in the
morning. I have found no reference to a similar custom
of building the lambakró separately in Iceland, but as I
will demonstrate below, the separate lying Greenlandic
examples (e.g., Fig.6.26) seem to have served the same
purpose, not at least because they are so small that they
could not have facilitated any other livestock. They are
often built after a more random scheme – i.e. exploiting
natural boulders, hollows, crevices etc. – but in all other
respects they resemble the above enclosures – and the
latters’ smaller compartments serving the same purpose
– and I refer to these for issues of ruin identification and
construction.
Archaeological definition/surface identification:
A separate lying lambrakró is visible on the surface
as a separate tiny compartment or enclosure (inside area
< 5m2) which was never roofed. They can be built in any
material or shape. They always lie in proximity to a
larger enclosure. Unlike the sheep/goat shelters, separate
lambakró comprise only one compartment.
Tab.6.18 – Separate Lambakró Descriptive Statistics
N = 31 Maximum Minimum Mean Median IQR Standard dev.
Length in m 5.0 1.2 2.9 2.8 2.0 – 3.3 0.9
Width in m 3.7 0.5 2.1 2.0 1.5 – 2.7 0.8
Area in m2
15.3 0.7 5.9 4.5 3.5 – 8.2 3.8
L/W-index 3.9 1.0 1.5 1.3 1.13 – 1.81 0.61
Dis_MD in m 542.7 11.9 148.9 140.9 54.6 – 218.0 126.5
Tab.6.18 Above: summary descriptive statistics for the sample of separate lambakró (all measurements area external). Below: A) XY-plot of separate lambakró lengths and widths in meters. B) Histogram of showing the frequency of different sized separate lambakró in square meters.

164
Fig.6.26 Ruin group E60’s ruins nos. 12 & 13, northeast Vatnahverfi region, an example of an enclosure with built wall (in front) and a separate lambakró (outside the far right corner of the large enclosure) (photo: C.K. Madsen 2013).
Separate lambakró descriptive statistics:
The separate lambakró is represented by 31 examples
in this sample. Of all the buildings and features in the
entire survey dataset (Tab.6.18), the separate lambakró
sizewise constitute the most uniform sample, which of
course partly owes to their archaeological definition here
(see above). In terms of built and layout, they display
just as much variation as the other building types: of the
26 where building material is recorded, 8% (2) are built
in turf/stone, 46% (12) in stone/turf, 38% (10) in dry
stone masonry, and 8% (2) preserved as stone foundation
for turf wall. Wall thicknesses vary between 0.25-1.0 m
with an average of 0.55 m, which shows what kind of
small and simple features they are. In the 14 cases where
separate lambakró are sheltered on one side, 12 orient
towards the southern hemisphere, showing that exposure
to solar heat was part of the layout scheme.
In the 20 examples where measurement can be made,
the separate lambakró lie between 0.8-29.2 m from the
nearest enclosure (of any type), on average only 8.5 m,
clearly showing that they were functionally related to the
other types of enclosures. It is therefore unsurprising that
the lambakró are located at an avereage distance of
148.7 m from their associated dwellings, i.e. somewhere
in between the enclosures with built wall and those
partly delimited by cliff. In the entire sample, only 4
separate lambakró associate with church farmsteads and
they are thus weak indicators of farmstead status.
Separate lambakró discussion:
The basic function of the separate lambakró for
penning lambs/kids is hardly debatable; the only thing
different from the enclosures with inbuilt lambakró
(Fig.5.21) is the separation of the feature in a separate
building. One reason for this different pattern in the
medieval sample of lambakró from Norse Greenland
could be that they were later features, perhaps built as
the milking of sheep/goat increased in importance? In
several cases where separate lambakró lie near
enclosures with built wall, they are of a distinctly
different built (e.g., Fig.6.26); if not due to their different
function, it could indicate phasing. This would be
supported by the observation – which has unfortunately
not been recorded systematically during the survey – that
many of the “inbuilt” lambakró in the former enclosure
types seem to be later additions as well.

165
Sheep/goat shelter (Tab.6.19):
A sheep/goat shelter is a compartment fully or partly
roofed by a natural overhang, but can otherwise be
built in any manner or in any material; it is of such
small in size that it can only have been used as
shelter for sheep/goats and lambs/kids.
Surface interpretation and issues:
Sheep/goat shelters are transitional types of features,
i.e. buildings that in terms of layout and built fall
somewhere in between the roofed sheep/goat pens/
shelter, the smallest other types of enclosures, and the
separate lambakró. Differentiating sheep/shelters from
the separate lambakró is especially difficult and they
may to a large extent have been used for the same
purpose. However, the sheep/goat shelters are fully or
partly roofed by a natural cliff/boulder overhang (Fig.
6.27). They also seem on average to have been slightly
larger than the separate lambakró allowing the animals,
or at least the lambs/kids, to move around a bit. The
sheep/goat shelters are also of an even simpler and more
makeshift character almost always exploiting natural
crevices, cracks, hollows, or spaces under boulders and
simply blocking any openings with stones or wall.
Archaeological definition/surface identification:
A sheep/goat shelter is visible on the surface as a
separate small compartment or room, which is fully or
partly roofed by a natural cliff or boulder overhang.
They can be built in any material or shape. They are
large enough to allow sheep/goats to move around, but
too small and low to accommodate persons (e.g. Fig.
6.27). Unlike separate lambakró (see above), the sheep/
goat shelters may comprise more than one compartment.
Tab.6.19 – Sheep/goat Shelter Descriptive Statistics N = 28 Maximum Minimum Mean Median IQR Standard dev.
Length in m 10.1 1.2 3.6 3.5 2.2 – 4.7 2.1
Width in m 6.4 0.8 2.5 2.1 1.8 – 3.1 1.3
Area in m2
40.0 1.0 8.2 6.0 4.0 – 9.2 8.1
L/W-index 4.84 1.00 1.62 1.36 1.17 – 1.77 0.83
Dis_MD in m 449.9 3.9 162.2 151.6 83.0 – 215.7 118.2
Tab.6.19 Above: summary descriptive statistics for the sample of sheep/goat shelters (all measurements area external). Below: A) XY-plot of sheep/goat shelter lengths and widths in meters. B) Histogram of showing the frequency of different sized sheep goat shelters in square meters.

166
Fig.6.27 Ruin group E188 ruin’s no.9, outer fjord Vatnahverfi region, an example of a sheep/goat shelter. A roofed space of just under 8 m2 and high enough for sheep/goats to move around (but not people!) have been made by exploiting the hollow space under a massive boulder, the open sides of which have been walled up by stones in a more or less casual manner (photo: C.K. Madsen 2010).
Sheep/goat shelter descriptive statistics:
Sheep/goat shelters are represented by 28 ruins in
this sample. As visible from Tab.6.19 they display
notable variation within an overall small dimensional
range, which is of course a expected effect of their use of
natural features. Accordingly, few relevant implications
are inferrable from statistical observation. One example
is built in turf/stone, six in stone/turf, 12 in pure stone,
and seven preserved as a foundation for turf wall. The
area of their sheltered compartments (only recorded in
19 cases) ranges between 0.7 m2 – 23.2 m
2, on average
5.74 m2, showing their slightly larger size compared to
the lambakró (average compartment area = 2.7 m2). The
sheep/goat shelters also differ in that only eight have an
associated enclosure (compared to 20 of the 30 separate
lambakró), from which they lie removed by an average
of 25.0 m, i.e. more than double than the separate
lambakró. In the entire sample of sheep/goat shelters,
only a single example is associated with a church
farmstead, cleary showing that they belong to more
modest farmsteads.
Sheep/goat shelter discussion:
The sheep/goat shelters seem the most rudimentary
and makeshif of the Norse farmstead outbuildings, i.e
temporary shelters thrown up where easy and convenient
and where there were no other buildings to facilitate
them. It is not by conincident that only 16 of the 28
sheep/ goat shelters belong to sites with no dwelling, and
that only one was associated with a church farmsteads:
with their limited insulation, the sheep/goat shelters
probably only used for the very temporary sheltering of
sheep/goats – perhaps only lambs/kids – on shielings and
modest farmsteads.

167
Enclosure Partly Delimited by Water (Tab.6.20):
An enclosure, where part of the circumference
consists of a water body, either lake or river;
multiple functions are possible, but it had a primary
function as livestock herding/ management facility.
Surface interpretation and issues:
Again the label implies what characterizes these
enclosures, i.e. they were built so that water – most often
lakes, but occasionally a river – formed one part of the
enclosure circumference. In most cases, this was
achieved by exploiting the natural topography, e.g. by
closing off with wall one end of a narrow headland (e.g.,
Fig.6.28), both ends of a narrow isthmus, or by building
stretches of wall up from the lake shores where vertical
cliff faces came close the water and could be exploited to
form part of the barrier. As a result, the location and size
of the enclosures partly limited by water was determined
by natural topography, which in turn invalidates some of
the observed quantitative parameters (e.g., enclosed area,
distance to main dwelling). The enclosures delimited by
water that associated with farmsteads are all located at
some distance from the main cluster of buildings (see
below). Others are not associated with farmsteads at all,
but lie separately in the distant outfield. Thus enclosures
partly delimited by water, especially those of the latter
kind, are likely underrepresented in the sample.
Archaeological definition/surface identification:
An enclosure partly delimited by water is visible on
the surface as a stretch of built wall, occasionally with an
attached building, which functions to close of an area
that is otherwise bounded on all sides, mostly by a
natural body of water (lake/river). At times, a natural
barrier such as a vertical cliff face forms part of the
enclosure boundary.
Tab.6.20 – Enclosure Partly Delimited by Water Descriptive Statistics N = 18 Maximum Minimum Mean Median IQR Standard dev.
Length in m 65.0 5.0 27.0 24.4 12.3 – 33.5 18.2
Width in m 2.0 0.6 1.1 1.0 - 0.4
Area in m2
101.7 2.2 39.5 35.5 13.0 – 62.3 27.1
L/W-index - - - - - -
Dis_MD in m 469.9 86.2 197.5 174.3 151.5 – 211.6 96.6
Tab.6.20 Above: summary descriptive statistics for the sample of enclosures partly delimited by water (all measurements area external). Note width statistics describe only the related wall stretches and that length/width index statistics are omitted for the same reason. Below: A) B) Histogram of showing the frequency of different sized enclosures partly delimited by water in square meters. Note that ruin group E332 is omitted because it has not been surveyed.

168
Fig.6.28 Ruin group E174’s ruin no.8, in the other fjord Vatnahverfi region, an example of a ruin described as an enclosure partly delimited by water. The large enclosure was created by building a wall across the land side of headland (parallel to where the gravel road now runs) (photo: C.K. Madsen 2006).
Enclosure partly delimited by water descriptive
statistics:
Only 18 features in this sample are create enclosures
partly delimited by water. However, some separately
registered features belong to the same enclosure (E169
nos.2&3 and E332 nos.1&4), so that the sample consist
of 16 examples. All of these are found in the Vatnahverfi
region, which is probably a bias of survey intensity and
methodology. Some descriptive statistics for the small
sample is listed in Tab.6.20. Besides the small sample
size, statistical inferences are limited by the fact that
enclosure layouts are determined by natural features, as
well as by the circumstance that the ruin itself consists of
a stretch of wall, i.e. the ruin area only reflects the built
boundary wall and tabled measurents in Tab.6.20 refer
only to these walls (L/W-index and length/width
scatterplot has been omitted, since they are irrelevant in
this case). The average width of the walls is 1.0 m,
which suggests that they were rather sturdily built
features (since none could have been roof-bearing). One
wall was built in pure turf, seven in turf/stone, four in
stone/turf, three in dry stone masonry, and 1 preserved as
a stone foundation for turf wall.
In the examples of enclosures partly delimited by
water (12) where an associated dwelling is present, they
are located 86.2-469.9 m apart, on average 197.5 m
(Tab.6.20), showing that these features were related to
actitivies on the edge of or beyond the infield. Tab.6.20A
displays the enclosed area of the 16 examples, which
show a notable degree of variation ranging between
27,3-2231.0 m2
with an average enclosed area of 582.9
m2, i.e. significantly more than any of the prior types of
enclosures. The variation of these enclosures is partly
explainable by their reliance on natural topograhy, but in
a few cases clearly owing to different function (see
below). In 12 cases, the surface inside the enclosure
partly delimited by water is soil, in three cases mixed
soil and stone (one case is not described). Three of the
enclosures partly delimited by water are associated with
church farmsteads (two of them at E64), but they do not
seem a strong indicator of farmstead wealth and status.
Enclosure partly delimited by water discussion:
The enclosures partly delimited by water appear to
separate on two main groups with somewhat overlapping
functions: four examples – E171 no.14, E64 no.8, E169
no.2, and E184 no.14 – have a distinct layout with stekkr

169
and lambakró and must periodically have been used for
milking. In the three latter cases, however, the enclosed
area is so large that it also, perhaps primarily, served as
gathering folds during annual livestock roundups.
Another and large enclosure partly limited by water next
to E64 no.8 may have served the same purpose. As also
implied by the average distance to their associated
dwellings, all these enclosures were located in the edge
or some way beyond the infield, where livestock could
be separated and culled before reaching the infield. The
remaining enclosures certainly primarily served this
purpose, although E66 no.24, E76 no.17, E164 no.12,
E165 no. 2, and E174 no. lay so close to the main cluster
of farmstead buildings that they conversely could serve
as milking enclosures – kvíar and nátthagi – at times
when the animals grazed in the nearby heimrast.
The enclosures partly delimited by water thus present
other examples enclosures with multiple functions, much
like ruin E90c nos.1&2 (see above). Their main function
as gathering folds was enhanced by the condition that
they enclosed a vegetated surface, which in combination
with the nearby water meant that livestock, at least over
shorter intervals, could feed and drink while being
penned. They were therefore also suitable for use as
kvíar for cattle in periods of summer dairy production.
Conversely, they were only effective during the summer
half of the year, because the lakes would freeze and the
rivers dry up during the winter half; and even during the
summer half of the year, the enclosures partly delimited
by water could hardly have worked to pen livestock for
prolonged periods, since the waters in front of the
enclosures are always shallow.
Grazing enclosure (Tab.6.21):
A large enclosure with, where most or the entire
circumference is built wall, but where a cliff, water
body, or other natural feature may form part of the
enclosure boundary; a building or compartment is
always attached; multiple functions are possible, but
it had a primary function as a cattle fold.
Surface interpretation and issues:
Grazing enclosures combines features of enclosures
with built wall and those partly delimited by buildings/
cliff/water and liable to the same interpretational issues.
However, the former are discernible by their large size
(e.g., Fig.6.29), an attached building or compartment,
and an inside bedding of vegetated soils. These
enclosures were early singled out because of their
impressive size and interpreted as cattle pens (e.g, Holm
1883:73, Bruun 1895a:233, 339, Nørlund and Roussell
1929), an interpretation that still seems to apply.
Fig.6.29 Ruin group E4’s massive ruins nos. 6&7, Tasiusaq, some of the most impressive examples of grazing folds in the Norse Eastern Settlement. The overhanging ledges seen along the back of the enclosure created roofed shelters for the livestock (photo: C.K. Madsen 2013).

170
Archaeological definition/surface identification:
A grazing enclosure is visible on the surface as an
entirely or mostly built wall that encloses a large (>150
m2) open (unroofed) area within which the soil surface is
vegetated; a smaller part of the circumference may
consist of a vertical cliff face, water body, or other built
feature; a building or compartment is always attached to
the enclosure.
Grazing enclosure descriptive statistics:
Only 16 unroofed wall features have been identified
as being part of grazing enclosures, of which two (E59
no.21&39) belong to the same enclosure. Tab.6.21
shows descriptive statistics for the 15 grazing enclosures
in the sample. The small sample and the circumstance
that the grazing enclosure often exploits natural features
as part of their barrier to some extent negates statistical
and measured layout inferences on the same grounds as
discussed for the former type. Tab.6.21A simply shows
their dimensional variability, but little importance should
be attached to the distribution. Tab.6.21B, on the other
hand, displays a histogram of the enclosed areas, which
is more telling of the size of the grazing enclosures;
enclosed areas range from 153.2-10,250.0 m2, 2399.1 m
2
on average, i.e. signifcantly more than the previous type,
which would suggest somewhat differing function. The
great size of the grazing enclosures is also imlied by the
condition that four examples enclose a single entire
building; three are built next to a building and the rest
have two to four compartments forming part of the
enclosure circurmference. Seven of the 15 grazing
enclosures are associated with church farmsteads and the
singular E59, another two with the large farmstead E4,
indicating strong association between these enclosures
and the most weatlhy farmsteads.
Tab.6.21 – Grazing Enclosure Descriptive Statistics N = 15 Maximum Minimum Mean Median IQR Standard dev.
Length in m 132.8 16.8 57.8 48.5 27.1 – 88.8 37.5
Width in m 95.4 13.0 40.3 32.0 19.8 – 63.1 25.6
Area in m2
54.3 9157.3 2093.4 1109.6 284.5 – 1715.4 2589.4
L/W-index 3.03 0.50 1.61 1.36 1.19 – 2.28 0.70
Dis_MD in m 643.8 0.0 171.3 129.4 60.8 – 196.7 189.7
Tab.6.21 Above: summary descriptive statistics for the sample of grazing enclosures (all measurements area external). Below: A) XY-plot of grazing enclosure lengths and widths in meters. B) Histogram of showing the frequency of different sized grazing enclosure square meters.

171
Fig.6.30 Survey plan of ruin group E4’s ruin nos. 6&7 (cf. Fig.6.29).
Wall thicknesses range from 0.6-2.1m, on average
1.31 m, implying that these were sturdy constructions.
Five examples were built in turf/stone, one in stone/turf,
four in dry stone masonry, and five preserved as stone
foundations for turf wall. The distance to their associated
dwellings vary, but they generally lie towards the edge
or beyond the infield (Tab.6.21) and display more
variation than the enclosures partly delimited by water
(cf. Tab.6.20). All the grazing enclosures are discribed as
surrounding a soil surface.
Grazing enclosures discussion:
Their substantial size, associated buildings or
compartments, and the often rather luxuriant grass found
inside the grazing enclosures would suggest that they –
as implied by the label – served for the periodic grazing
of livestock, predominantly cattle. Yet, the enclosures
could only have been used in this manner during certain
parts of the year: during the hardest winter months, the
cattle were stalled in the byres and during the summer
months they would be grazing in the outfield pastures.
This would seem to place the use of this enclosure type
in the spring and fall. It is difficult to explain the
building of such massive facilities solely for the periodic
penning of cattle – e.g. as kvíar used in summer dairy
production, implied for instance by E4 no.6 (Fig.6.29-
6.30) – so they must have had other functions as well.
Since the enclosures had probably been fertilized by
grazing cattle, they could have had a secondary function
as fenced and sheltered hayfields? This would account
for their size and heavy construction. Perhaps the
grazing enclosures provided sheltered grazing grounds
for the cattle in early spring, while at the same making it
easy to collect their manure? In any case, neither of these
functions exclude that the grazing enclosures could have
been used as gathering folds during annual livestock
roundups, i.e. displayed a similar multi-functionality as
suggested for the previous enclosure types.
Delimited grazing area (Tab.6.22):
A delimited grazing area is a pasture area, where a
natural boundary – mostly a water body – forms most
or the entire area circumference; it serves for the
controlled movement and grazing of a select part of
livestock.
Surface interpretation and issues:
A delimited grazing area is – as the label implies – an
area which livestock cannot stray from, but which
provides grazing and water for longer continual upkeep.
They are essentially enlarged versions of the enclosures
partly delimited by water, but they are of such a size that
they do not ease the handling of livestock. The delimited
grazing areas come in two groups: those formed by
peninsulas or headlands, where a built wall cuts off the
area (e.g., Fig.6.31, Bruun 1917:Fig.45), or a natural
boundary – e.g. a ravine or river – makes escape
impossible; or those that relied fully on natural
delineation, i.e. islands where animals were let out to
graze, a practice known from all of the North Atlantic
(e.g, Bruun 1897:53, Bruun 1929:297, Myhre and Øye
2002:376). In the latter cases, the identification of a
grazing enclosure must be inferred from the presence of
ruins relating to livestock herding the island. As it is
rather get to islands in the inland during pedestrian
survey, it is quite likely that some grazing areas remain
undiscovered in the Vatnahverfi region.

172
Fig.6.31 Ruin group E76c in the central Vatnahverfi is located on the peninsula in the central left part of the photo (ruin group E76a is located on the three small islands to the right, but these seem too small to could have facilitated prolonged livestock grazing). A wall blocks off the peninsula at its narrowest point and an enclosure (partly delimited by cliff) is found inside this boundary; the whole peninsula probably served as a delimited grazing area (photo: C.K. Madsen 2009).
Archaeological definition/surface identification:
A delimited grazing area is identifiable on the surface
either as a wall that cuts off a vegetated area too large to
function as a regular enclosure (enabling easy herding
and handling of livestock), or a vegetated island with
ruins serving a herding or sheltering purpose.
Delimited grazing area descriptive statistics:
Since the layout of delimited grazing areas is fully
determined by natural topography, and because only the
group that are bounded by constructed wall have directly
associated features (whereas buildings related to herding
and management are classified under the above types),
providing descriptive stastics really makes little sense.
Thus, Tab.6.22 only shows the variable size of the five
delimited grazing areas (as well as from a few
comparative examples from the Middle Settlement)
indentified in the sample.
Delimited grazing area discussion:
Two of the examples of delimited grazing areas
(E76c and E174 no.13) are of the type, where a narrow
peninsula is blocked by a wall (cf. Fig.6.31): E76c is
another of example of an enclosure with mulitiple
function: against the wall that cuts off the peninsula, two
small rooms are attached, which were likely used during
milking of sheep/goats, i.e. worked as a milking shieling.
Three other delimited grazing areas are islands with
buildings (0604 no.1, E174 no.9, and E184, the latter
was not surveyed or visited, but refferred to by a local
sheep farmer). The last example is a naturally bounded
areas with buildings found on the oblong headland along
the Amitsuarsuk fjord arm, which is bounded in both
ends by ravines and extremely steep slopes; at the
southern edge of the headland ruin roup E310 functions
as a shieling for livestock milking and gathering.
Tab.6.22 – Delimited Grazing Areas
Ruin group no. Approx. extent of
grazing area (ha)
E76c (no.1) 5.58
E174 (no.9) 0.26
E174 (no.13) 1.88
E301 19.44
0604 27.96
Tab.6.22 The approximated area of the five delimited grazing areas in this sample.

173
45
11
29
128
31
28
18
15
5 16
13
11
20 18
Unroofed building type frequency (n = 388)
Enclosure with built wall Circular enclosure with built wall
Enclosure partly delimited by building Enclosure partly delimited by cliff
Separate lambakró Sheep/goat shelter
Enclosure partly delimited by water Grazing enclosure
Delimited grazing area Infield dykes
Other dyke/wall Irrigation feature
Other feature Unknown
In the cases where gathering folds are associated with
the delimited grazing areas (E76c and E310), the
maximum number of livestock (sheep/goats) grazing the
area (i.e. the number the enclosure could pen) can be
tentative estimated: assuming that the minimum space
requiered per individual for sheep/goat gathering was 0.5
m2 (see section 8.2.4), then enclosure E76c could have
facilitated 20 sheep/goats indicating a grazing capacity
of 130 m2 per sheep/goat. In the case of E310, similar
calculation indicates 373 sheep/goats with 750 m2
pasture area per individual, which is a a lot more than at
E76c, but the vegeation is also somewhat poorer and
more broken on the headland with E310. Unfortunately,
there are too few delimited grazing areas in the sample to
follow up this interesting estimation Norse grazing
intensity and must await the inclusion of further such
ruin groups.
6.2.4 UNROOFED BUILDINGS SUMMARY
DISCUSSION
A total of 310 individual ruins can be identified as
unroofed buildings in this ruin group survey dataset.
Fig.6.32 displays aggregate frequencies for the various
feature types presented and discussed in the above. As
seen in the figure, the various types of features are fairly
evenly distributed. The only exception is the enclosures
partly delimited by cliff, which clearly stands out as the
most common type of enclosure in the dataset, followed
by the enclosures with built wall. This overall frequency
distribution has no apparent patterns of significance, but
rather seems to imply the ordinariness of most these of
features – except for the grazing enclosures – which
were basic functional buildings on most farmsteads and
shielings; this is also implied by the observation that
very few of the enclosures show any particular affinity
with the largest- and the church farmsteads.
Fig.6.32 Displays the frequency of the different types of unroofed Norse buildings presented in section 7.2.3.

174
Fig.6.33 Scatterplot showing the length/width distribution of the 5 most common types of enclosures and herding features – as well as the circular enclosures with built wall – identified in the ruin survey dataset (n = 269). Different colors indicate different building types; linear trendlines are shown all building types, but are not discussed separately.
This fairly random distribution also echoes in length/
width scatterplot of the five most common types of
herding related features in the survey dataset (as well as
the circular enclosures with built wall, Fig.6.33). Unlike
the dwellings and outbuildings (cf. Fig.6.17), there are
hardly any visible patterns to their distribution and little
trace even of “fuzzy” cluster; the only visible clusters are
the separate lambakró and the sheep/goat shelters, which
isolate because of their small dimensions. Also in
contrast to the roofed buildings, the linear trendlines for
the enclosures show no significant differences, except
for the small group of circular enclosures with built wall
that make for the steepest sloping trendline as an obvious
effect of their roundedness. In comparison with the
roofed buildings, it can be noted that the enclosure
trendlines are overall more oblique or steep, a clear
indication that the features were indeed unroofed and
could therefore generally be built wider.
As for other general patterns to the enclosures, there
are only four examples in the entire sample where there
is any other internal division inside the enclosure that is
not a separate compartment. Rather, the layout with
stekkr and lambakró was the norm (see above). Only 18
of the enclosures in this sample are recorded as built
over very sloping ground. This implies that the
prevalence of such a type of enclosure – if even a type –
introduced by (Nørlund and Stenberger 1934:99p) is not
very common. A more consistent feature of enclosure
layouts which was also noted above is their orientation:
of all the types (180) that are built against and sheltered
by a steep slope or cliff face, 83% (149) are open and
orient towards the southern hemisphere. Whether in
order to dry stored fodder quicker or to help animals
keep warm when sheltering, influx of solar heat was
evidently important.
0
5
10
15
20
25
30
35
40
0 10 20 30 40 50 60 70
Unroofed buildings length/width (m)
Enclosures with built wall Circular enclosure with built wall
Enclosure partly delimited by building Enclosure part delimited by cliff
Separate lambakró Sheep/goat shelter

175
Since it has been argued (see section 6.2.3) that the
enclosures visible on the surface today reflect the near
maximum number of Norse enclosures in use during the
Middle Age, it is tempting also to try an estimate the
maximum number of livestock they could facilitate.
However, this is a very difficulat estimation to make for
a number of reasons: first, as outlined above, the
enclosures obviously had different and overlapping
function, i.e. some where used for sheep/goats, some for
cattle, some for both, some only periodically, some for
round ups, milking, or grazing etc. Second, there is no
way of knowing how many of the enclosures that were in
contemporary use. Third, an estimate of the number of
livestock an enclosure could facilitate depends on the
enclosed area, not the ruin area, and not all enclosures
are preserved or described so as to allow measuring of
this, some means of conversion are needed for the latter
type of poorly preserved ruins.
Such issues notwithstanding, even a rough estimation
of livestock numbers would provide a welcome insight
into stocking levels on the medieval Norse farmsteads
and grazing pressure on the settlement landscapes. Not at
least because such an estimate based on archaelogical
surface survey evidence would also provide a good
supplement to estimates based on the zooarchaeological
record (McGovern et al. 1988:240), which can evidently
only be applied to excavated sites. The above funcional
distinction of enclosures may counter some of the
problematic issues. However, a central interpretational
interlude is required before such estimation can be made,
i.e. differentiating between the farmsteads, where the
livestock was gathered in the fall and spring, and the
shielings where the livestock was taken during the
summer, both types of sites having associated enclosures
used at different times of the year. The attempt to model
total sheep/goat numbers on the farmsteads in the
Vatnahverfi region is therefore postponed to the
classification in chapter 8.2.4.
As a concluding remark on this section, while few of
the enclosures types in themselves are indicative of
farmstead wealth and status, it is evident that they
provide insights into the functional layout and economy
of the farmsteads. Also, it is a reasonable assumption
that the total area of the enclosures (TAE) must to
notable extent reflect the number of livestock kept on the
individual farmsteads and thereby also their size. I return
to this in section 7.1.3.
6.2.5 OTHER FARMSTEAD FEATURES
The final group of archaeological remains singled out
in this classsificaiton of surface survey evidence includes
archaological features that are not buildings per se, as
well as a remains that are not sufficiently described to
provide any functional explanation, i.e. another residue
group. Only few of these features are treated beyond this
point and the presentation of the other farmstead features
is therefore relatively brief.
Infield dyke (Tab.6.23):
An infield dyke is a functional (and legal) barrier
that separates the cultivated infield from the
uncultivated outfield.
Surface interpretation and issues:
The infield dyke is known from all of the North
Atlantic, where it is described as one of the most
common physical, legal, and symbolic delineations of
the medieval farmsteads (e.g., Hastrup 1985:143, Øye
2003:402, Arge et al. 2005:601, Lárusdóttir 2006:54).
Infield dykes have also been assigned the same general
prevalence and function in the context of the Greenland
Norse (e.g., Holm 1883:74, Roussell 1941:30, Krogh
1982b:74, Arneborg 2004:263). They mainly served to
keep animal husbandry from feeding off and trampling
the cultivated hayfields. Considering that they were
sizable unroofed structural features, most of which
should lie separate from other buildings and features,
one would expect the infield dykes to be fairly obvious
on the surface, i.e. both easy to identify and interpret. To
the contrary, most of the examples identified in this
sample are visible as rows interspersed larger stones
which served as an foundation for a turf wall of which
very little is normally left (e.g., Fig.6.34). In short, the
infield dykes are likely underrepresented in the sample,
and in the Greenland settlement evidence in general.
Archaeological definition/surface identification:
An infield dyke is visible on the surface as a separate
lying stretch of wall (or walls), which on its own or by
connection to natural barriers (water bodies, steep cliffs
etc.) delimits an arable area with farmstead buildings.

176
Fig.6.34 Ruin group E94’s infield dyke, outer fjord Vatnahverfi region, which is today preserved only as low mound covering a stone foundation (photo: C.K. Madsen 2009).
Infield dyke descriptive statistics:
17 features in this survey sample are identifed as
infield dykes. However, some dykes registered under
separate number a part of the same infield enclosure and
total the sample comprises only 14 enclosed infields.
Since the layout of infield dykes is to a considerable
extent determined by natural topography, and the walls
that demarcate the area are in themselves uninteresting,
few descriptive stastics will be provided for them: they
range in thickness from 0.5-2.15 m, with an average of
1.05 m, and were all turf built or preserved only as the
foundation for turf wall. More interesting is the size of
the enclosured areas, which are shown in Tab.6.23 for
the nine examples, where it can be estimated:
All of the fenced infields in this sample are partly
bounded by steep slope or water, which makes precise
delineation problematic. Also, the listed areas include
farmstead buildings, rocky outcrops, meadows etc., i.e.
far from all of the listed area is arable land. Even so, the
small sample present a fairly distinct pattern: apart from
ruin group E59, the largest infield areas are all
asccociated with church farmsteds, and notably all with
churches of the large later type (see section 5.2). Another
infield dyke which cannot be delineated is associated
with church farmstead E78, so that all in all six of the 13
infield dykes are associated with church farmsteds. This
highlights the strong association between infield dykes
and the largest Norse farmsteads. There is a small leap
down to the next group of smaller fenced infields, most
of which still are associated with noticeable farmsteads.
Infield dyke discussion:
With 13 identified examples – eight of them in the
Vatnahverfi region – of fenced infields in a sample of
157 ruin groups and 1308 ruins, the commoness of
infield dykes on the Norse farmsteads in the Eastern
Settlement, or at least in the Vatnahverfi region, must be
reconsidered and probably laid to rest. Even if archaeo-
logically underrepresented, infield dykes would have to
be so in the extreme in order to shift this pattern; and, in
fact, since the dataset includes a relatively larger number
of church farmsteads for compartive cases, and infields
dykes display a strong affinity with such sites, they may
even be said to be somewhat overrepresented in the
sample. Thus, six of the identified infield dykes are from
church or large farmsteads outside the Vatnahverfi.
Tab.6.23 – Infield Areas Ruin group no. Approx. infield area (ha)
E18 (no.17) 10.01
E29a 11.68
E29 12.02
E29a/E29 22.03
E47 (no.47) 20.47
E59 (no.40) 16.96
E66 (no.18) 10.96
E76 (no.9) 5.97
E94 (no.7) 2.96
E111 (no.8) 8.12
E149 (no.22) 4,99
E178 (no. 5.97
Tab.6.23 Approximated areas of land enclosed by the infield dykes identified in the survey sample.

177
The notable absense of infield dykes in Greenland is
in itself a very important observation (which was also
noted, but not commented on by Bruun 1895a:429). It is
difficult to imagine that there were any laws to prevent
farmers from building infield dykes, and medieval
legislation from elsewhere in the North Atlantic would
indeed suggest quite the opposite (Myhre and Øye
2002:296). Thus, the absence of infield fencing on most
farmsteads, but recurrent presence on the largest manors,
must have other implications. One tempting explanation
is that farming practices were fundamentally different in
Greenland, or at least on the more average and modest
farmsteads. However, this is opposed by other evidence
of farming pracitices, such as the zoo-archaeological and
pollen records (see sections 2.3.2 and 8). A more
plausible explanaition could be that on normal and small
farmsteads it was simply not worth the extensive labor
effort to built and maintain infield fences: livestock
herds on such farms were generally small and if herded
intensively – i.e. brough to shielings during the summer
– a single herder or watchman with a dog could have
kept a few stray animals out of the hayfields on the main
farmstead. By this inference, the lack of infields is one of
the strongest implicators of shieling intensity.
Other dyke/wall:
A stretch of dyke or wall that cannot be attributed
any particular function.
Surface interpretation, issues, and discussion:
Occasionally, surveyors happen upon a stretch of
built wall that they cannot associate with any particular
function. They may be found close to the farmsteads or
buildings, or in the outfield; they could be remnants of
buildings, enclosures, fences etc., but it simply cannot be
determined from surface inspection. This survey dataset
includes 13 such ruins, which will not be presented or
discussed in any detail. Instead, I refer to the references
in the ruin database for possible interpretations.
Fig.6.35 The single ruin of ruin group E327 in the outer fjord of the Vatnahverfi region. It is an example of a dyke (runs across the green pass and over the boulder), which cannot be attributed any particular function, but could be related to demarcation of, for instance, resources areas with different ownership rights? (photo: C.K. Madsen 2009).

178
I will briefly introduce two of the more interesting
examples, E327 (Fig.6.35) and B102: both features are
single stretches of wall in the outfield. Neither of them
seem to form enclosures since they lack opposing walls
and because the adjoining slopes can easily by climbed
by both people and animals. The only explanation I can
offer for these features – which are likely much
underrepresented in the survey evidence – is that they
are symbolic delineations, perhaps of the transition from
resource areas with different ownership or use rights,
e.g. transition from privately owned land to commons.
Obviously, this interpretation is highly speculative until
more such walls have been discovered.
Irrigation feature:
A channel, ditch, or dam facilitating irrigation or
other water management.
Surface interpretation, issues, and discussion:
Irrigation features have been noted at six ruin groups
in the sample (e.g, Fig.6.9, 6.36), among them the long
recognized complex system of dams and channels found
at Igaliku/Garðar (E47) (Ingstad 1960, Krogh 1974:78),
the largest church farmstead in the Vatnahverfi region
E66 (Bolender et al. 2010:2), and the large farmstead
E59 (Clemmensen and Kapel 2008:16). Although
irrigation features are very poorly represented in the
sample, this could suggest they were mainly a feature of
the larger farmsteads, which would be consistent with
the seemingly more intensified arable farming implied
by the infield dykes (see above). However, some form of
water management is also witnessed at other sites (e.g.,
Fig.6.36), although normal field irrigation could hardly
have been the purpose in the latter case.
Because irrigation and drainage channels require
frequent maintenance in order not to fill up, they for
obvious reasons tend to appear very indistinctly on the
surface today. There is thus little doubt that irrigation
features are underrepresented in the survey evidence.
Conversely, recent test-trenching of proposed irrigation
channels at Igaliku/Garðar (E47) have proved them to
be natural (Edwards and Schofield 2013); and in 2012,
we test-trenched the southernmost presumed irrigation
channel at Kilaarsarfik/Sandnes (V51) (McGovern et al.
1996:Fig.4) and likewise found it to be a natural feature,
likely an old well-trodden caribou trail (unpubl. field
report). The latter investigations imply that great caution
must apply to surface interpretation of irrigation features.
For a discussion of other examples of Greenland Norse
irrigation features see (Arneborg 2005).
Fig.6.36 2011 survey plan of ruin group 00-2 in the mountains of the Tasiusaq (field report under prep.). The site is a shieling located on small terrace near a stream (right) and small patch of meadow (left). Ruin no.1 is a small enclosure with built wall, no.2 a small shieling lodge, no. 3 a storehouse, and no.4 a large enclosure circling a depression. Ruins Nos. 5 & 6 are small dams that – for unknown purpose – lead water from the stream into the enclosure and two associated reservoirs.

179
Other feature:
A feature that does not conform to the layout or built
of fit any of the above described features.
Surface interpretation, issues, and discussion:
Other features is a residue category that covers those
surface remains that do not match any of the types
described above. This dataset includes 20 examples,
which span from possible manmade pits, cuts, and
hollows, wells, bridge remains, as well as features that
are not buildings, but cannot be explained. These will
not be presented or discussed any further here.
Unknown:
No or inadequate ruin or feature description exists.
Surface interpretation, issues, and discussion:
The survey dataset include 18 ruins or features on
which there is simply too insufficient existing
information to suggest a possible function or even built.
Such features are listed simply as unknown and will not
be discussed further here.
6.3 CHAPTER SUMMARY
In chapter 6, 1308 ruins from 133 sites in the
Vatnahverfi region and 24 sites from elsewhere in the
Norse Eastern Settlement have been functionally defined
and classified on 12 types of roofed buildings, nine types
of unroofed buildings (enclosures and shelters), three
types of other features, and three residue categories. The
classification is based on qualitative and quantitative
observation of archaeological surface survey evidence.
Most of the above building types have been shown to be
characterized by fairly distinct traits that make their
surface identification feasible, even when they are much
collapsed. Most of the building types were known from
prior archaeological investigations (see chapter 5), while
others have been introduced here for the first time. In
any case, the above presents the first formal attempt at
functionally classifying all the different farmstead
buildings and features. As a consequence some building
and feature types have proved statistically significant
and resilient, while other appear less so and call for
future archaeological investigation and revision.
Besides presentation and classification of the raw
survey data, the aim of chapter 6 has been to pinpoint
those buildings and features that reflect both functional
and hierarchical aspects of the medieval farmstead
layouts: it is clear that some buildings and features – for
instance sheep/goat sheds, bipartite livestock, livestock
stables, and various types of enclosures – are very
common farmstead features that relate mostly to basic
functions; they provide detailed information on the
farming practices and economy on the individual sites.
However, using the church farmsteads as a benchmark
for identifying traits of the manorial estates in Norse
Greenland, it is equally clear that some buildings and
features – for instance simple byre/barns, storehouses,
grazing enclosures – are highly characteristic features of
the largest farmsteads. Besides the churches, a few
features – for instance the infield dykes and double
sheep/goat sheds – even appear almost unique to the
highest tier of farmsteads. In combination, the presented
classification provides a defined analytical framework
for site-level functional and hierarchical classification of
both high-, low-, and intermediate status ruin groups
based solely on the archaeological survey evidence. This
approach is explored in the next chapter.
Also, chapter 6 has provided some very important
side-implications deserving of brief recap: first, whereas
large-scale cattle farming has long been related to the
largest farmsteads, the above analysis has for the first
time proven the economic alternative from archaeo-
logical surface survey evidence, i.e. the heavy, and
seemingly increasing, reliance on sheep/goat milking as
reflected in a near standard setup on most average and
modest farmsteads with milking folds (stekkr and
lambakró). Second, reviewing N. Lynnerup’s (1998)
population model against new evidence from churchyard
excavations carried out during the Vatnahverfi-Project,
his model was found to remain valid; only a slight
population increase is noted, suggesting that the
Vatnahverfi, or at least the central part, had an average
population of ca. 200 people. Third, the detailed study of
ruin evidence from 157 ruin groups has managed to
produce only 13 infield dykes. Even if underrepresented,
this must lay to rest any notion that infield dykes were
common in Greenland. This rather suggests that infield
dykes were related to farmstead size and status, and that
the farming system as a whole had a somewhat different
layout than elsewhere in the North Atlantic, probably
reflecting greater intensity in herding practices and
shieling activities.

180
7. MEDIEVAL NORSE SETTLEMENT AND ORGANIZATION IN THE VATNAHVERFI
‘As to whether any sort of grain can grow there, my belief is that the country draws but little profit from
that source. And yet there are men among those who are counted the wealthiest and most prominent
who have tried to sow grain as an experiment; but the great majority in that country do not know what
bread is, having never seen it’.
‘It is reported that the pasturage is good and that there are large and fine farms in Greenland. The
farmers raise cattle and sheep in large numbers and make butter and cheese in great quantities. The
people subsist chiefly on these foods and on beef; but they also eat the flesh of various kinds of game,
such as reindeer, whales, seals, and bears. That is what men live on in that country’.
King’s Mirror 143-145, ca. AD 1250
The above quote is one of the very few written
accounts of Norse farmsteads and farming in Greenland,
which is supplemented only by very general comments
on the settlement layout in Eriks saga Rauða and Ívar
Bárðarson’s Description of Greenland (see introduction
to section 4.2). Both the latter sources would suggest that
most of the land was owned by a few: according to Eriks
saga Rauða by a few pioneering landnámsmen, in Ívar
Bárðarson’s later narrative by a few leading churches. It
is of course very uncertain which of these two versions
are most trustworthy; if any of them can be believed at
all?; or if both hold a grain of truth, only portraying
settlement scenarios at different times (i.e. landnám
versus the later Middle Ages)? In any case, the above
quote is somewhat ambiguous: on one hand, it speaks of
large farms, lush pasturage, and considerable livestock
herds. On the other hand, it also points to agricultural
marginality, i.e. the problems of growing grain and
general dependence of most commoners on wildlife
resources. These contradictory points are probably all
true to an extent, but rather depend on which time period
and social group is in question. Yet, it is obvious that
such questions on medieval Norse settlement layout and
social organization can only be clarified through the
archaeological evidence.
The aim of chapter 7 is to provide such a description
of the Vatnahverfi region based on the ruin group survey
evidence retrieved during the Vatnahverfi-Project. To
achieve this, chapter 7 is divided on three main sections:
section 7.1 builds directly on the description and analysis
of Norse farmstead buildings provided in chapter 7 to
outline a framework for the functional classification of
ruin groups as different types and classes of farmsteads
and shielings. This framework is based on the observed
parameters listed in the Ruin Group Database (RGD,
App.2). The next section 7.2 uses this classification
system to describe functional aspects of settlement
patterns in the Vatnahverfi region, which is discussed for
each of the sub-regions outlined in section 8.2.2). In the
final section 8.3, this functional settlement layout is used
to advance the discussion to community level hierarchy
and organization in the Vatnahverfi region. Chapter 7
concludes with a summary discussion bridging the above
themes.
It is evident that with each analytical step in this
approach, discussions are brought to a higher level of
abstraction and thus uncertainty. The theoretical and
empirical basis for taking these steps is based on the
prior chapters and I will revisit particular topics only
when imperative, but will otherwise refer to the above.
Neither will I take up discussions of chronological issues
in chapter 7. Such issues are discussed on a more general
settlement level in chapter 8. As described in chapter 4,
the chronological framework for understanding settle-
ment development in Norse Greenland is still fragile
and, as accentuated in chapter 6, the archaeological
surface survey evidence is especially problematic in this
concern. Accordingly, the ruin group survey evidence is
in chapter 7 analyzed en mass, i.e. representing some
450 years of accumulated settlement evidence. However,
in some cases relative chronological development can be
discussed solely on the basis of survey evidence,
whereas patterns of absolute chronology will, again, be
postponed to chapter 8.

181
7.1 A FUNCTIONAL CLASSIFICATION OF NORSE FARMSTEADS AND SHIELINGS
In spite of the unique preservation of the medieval
Norse settlement landscapes in Greenland, attempts at
classifying ruin group functionally are relatively few: by
referring to some ruin groups as farmsteads of different
sizes and with particular focus on sheep/goat keeping or
cattle ranging keeping, D. Bruun (1895) was the first to
hint at such classification, although he did so rather
informally and intermittently. Aa. Roussell’s (1941)
treatise on the ruin groups also implied some extent of
functional differentiation, but was again mainly
concerned with clarifying the layout of the dwellings.
After Roussell, it would be some 40 years before
research into functional aspects of Norse settlement were
reinvigorated:
In a short article C. Andreasen (1981) proposed that
the different layout schemes of the dwellings outlined by
Aa. Roussell were not a function of chronology, but of
economic and environmental differentiation (see section
5.2.1). C. Andreasen’s argument was based on the same
Western Settlement ruin group evidence use by Roussell
supplemented by the few new excavations carried out
during the Inuit/Norse-Project 1976-1977 (see section
4.1.5). At about the same time, T.H. McGovern and R.
Jordan (1982) investigated settlement and land use
patterns in the inner Nuuk Fjord. Although restricted to
the Western Settlement area and working from very
general premises, their study did bring attention to the
very unequal distribution of and access to resources.
T.H. McGovern went on (e.g, 1985, 1991, 1992) to
develop his model of site differentiation by combining
zooarchaeological, architectural, and environmental
evidence. However, this model was mostly applicable to
excavated sites and, in any case, more related to
hierarchical than functional differentiation and therefore
discussed below.
In the Norse Eastern Settlement, the only attempt at
functional classification developed as a spin-off of the
1976-1977 'Nordic Archaeological Expedition' (see
section 5.1.5), based on which C. Keller and S.E.
Albrethsen (Keller 1983, Albrethsen and Keller 1986,
Albrethsen 1991) developed a settlement and land use
model for the valley of Qorlortuup Itinnera. This model
of site differentiation was just as novel as T.H.
McGovern’s as it introduced more systematic functional
differentiation between farmsteads and shielings coupled
with environmental (pasture) evidence. The model was,
however, based on survey evidence from a limited and
fairly unique settlement area, and stated in section 5.1.3,
the model since proven difficult to apply on settlement
evidence elsewhere in the North Atlantic (e.g.,
Sveinbjarnardóttir 1991, Mahler 2007:386, Lucas 2008) .
The most recent attempt at providing some extent of
functional differentiation was O. Vésteinsson’s (2010)
discussion of the medieval parish structure in the Eastern
Settlement, where he combined the results of surveys –
not at least those of the Vatnahverfi-Project – with
documentary evidence. While a novel approach, his
study was mostly aimed at clarifying regional church
organization and using existing rudimentary ruin group
terminology and classification.
From this brief recap of archaeological research on
the functional differentiation of ruin groups it is evident
that there are few existing models that can be readily
applied to the survey evidence from the Vatnahverfi-
region. The aim of chapter 7 is therefore to provide such
a functional classification model by relying on the new
survey evidence and the building types outlined in
chapter 6. The empirical basis for the classification is the
Ruin Group Database (RGD, App.2, see section 8.1.1)
that condenses the building evidence and adds some
overall environmental observation parameters.
Before proceeding with the presentation of the RGD
– the above examples of prior research related to
functional differentiation accentuate a central point: that
functional and hierarchical classification of farmsteads
and shielings cannot be clearly separated, since site-
specific activities naturally also reflect farmstead wealth,
and thereby status. For instance, large farms with much
livestock and rearing many heads of cattle required
certain functional facilities not found on smaller farms
that relied mostly on sheep/goat husbandry. Thus,
although I take up hierarchical classification separately
in the below section 7.3, distinctions largely reflect the
functional classification carried out in sections 7.1-7.2.
While this may appear a circular line of argumentation, it
is really the only, and fairly commonsense, way of
approaching the purely archaeological survey evidence.
.

182
7.1.1 OVERALL ENVIRONMENTAL PATTERNS
The first three observed parameters in the RGD –
vegetation zone, elevation m.a.s.l., and ruin group
orientation – confer some very basic and overall environ-
mental characteristics relating to the individual sites. All
three parameters combine to give a good impression of
the fundamental site selection criteria involved in the
placing the Norse sites:
Ruin groups and vegetation zones:
As discussed in section 3.2, four vegetation zones
Fig.3.10 categorizes environmental change on a
horizontal axis going from the sub-continental and
subarctic inner fjord, over the sub-oceanic low-arctic
middle fjord, to the oceanic, low-arctic outer fjord, and
the hyper-oceanic, low-arctic coast. Fig.7.1 displays the
total number of ruin groups (blue column, left vertical
axis) and number of ruin groups per km2 (red color, right
vertical axis) in each of the vegetation zones.
Fig.7.1 Displays the total number of ruin groups in the four vegetation zones after (Feilberg 1984a) (blue columns, left vertical axis), and the corresponding number of ruin groups per sq. km (red columns, right vertical axis).
In considering ruin group numbers (blue columns) a
simple measure for settlement density, it appears from
Fig.7.1 that settlement was densest in the middle fjord,
whereas the inner and outer fjord where about equally
densely settled. This is somewhat surprising considering
the decreasing vegetation quality and total biomass as
one travels out the fjord. The slight difference between
the inner and outer fjord can be explained simply by the
larger area of the latter; when reviewing ruin group
densities per km2, the outer fjord is clearly less densely
settled than the inner fjord. The middle fjord area is
about 30 km2 larger than the inner fjord area, which is
however not enough to shift the observed pattern of
higher general ruin group density in the former area.
However, it should also be realized that larger parts of
the inner fjord area are more uninhabitable because the
landscape becomes far more mountainous and affected
by nearness to the Ice Cap and its glaciers, i.e. the large
areas covered by glacial outwash plains and the sandur.
Disregarding such areas would certainly shift ruin
groups density in the inner fjord towards that of the
middle fjord. Still, a final conclusion from Fig.7.1 must
be that the middle fjord area was generally just as
important a settlement area as the inner fjord, although in
this case perhaps mainly due to the sheltered settlement
area provided by the central Vatnahverfi lake basin (see
section 3.2.2).
Ruin group elevation m.a.s.l.:
Whereas the vegetation zones categorizes environ-
mental change on the horizontal axis, elevation implies
variation on the vertical axis, going from warmer
temperatures and more lush vegetation at lower altitudes
to increasingly colder and barren conditions at higher
altitudes. Fig.7.2 displays the number of ruin groups per
elevation in 25 m intervals from 0-500 m.a.s.l. As
evident from the figure, the vast majority of ruin groups
are located at low altitudes: ca. 80% are located below
100 m.a.s.l – thereof 57% at 0-25 m.a.s.l – ca. 15%
between 100-200 m.a.s.l, and only 5% above 200 m.a.s.l.
Although high altitude ruin groups are surely somewhat
underrepresented because these areas have been much
less intensely surveyed and farmed, the pattern in Fig.7.2
appears definite: Norse settlement was narrowly tied to
the warmer and lush lowlands, whereas higher settlement
activity was – as will be demonstrated below – more
sporadic and seasonal.
0
0,02
0,04
0,06
0,08
0,1
0,12
0,14
0,16
0,18
0,2
0
10
20
30
40
50
60
70
80
Inner fjord MiddleFjord
Outer Fjord Coast
Ruin Groups and Vegetation Zones
Totol no. Ruin Groups Ruin Groups per sq. km

183
Fig.7.2 Histogram showing the number of ruin groups and their elevation above sea level upon 25m intervals (horizontal axis). The figure is discussed in the text.
Ruin group orientation:
The final ruin group parameter recorded and to be
treated here is their general orientation. Fig.7.3 displays
the orientation of the 157 ruin groups divided upon the 8
intercardinal directions, as well as a residue category
(open) for those sites that were not shaded or sheltered
from any angle. The pattern in Fig.7.3 is just as definite
as the elevation. There was a very dominant preference
for a site location that was exposed towards the southern
hemisphere, preferably southeast or totally open,
thereafter declining with the cardinal directions.
Unsurprisingly, north was the least preferred orientation.
The grænlenindga were very selectively locating their
sites – both farmsteads and shielings – so as to maximize
solar heating.
Although the above discussed parameters are very
basic, they nonetheless seem to quite narrowly pinpoint
some of the most important site selection criteria that
determined the placing of Norse sites: whether in the
inner or middle fjord, sites were located at as low
altitude as possible and facing the southern hemisphere.
In the above, this pattern has been explained mainly by
environmental arguments, but other social, economic,
and communicative aspects could have been in play. For
instance, locating farmsteads close to the fjords – which
also meant at low elevation – ensured access to a main
source of transport, communication, trade, and extraction
of marine resources. Another environmental concern not
yet discussed, but which to a large extent may explain at
least the pattern in ruin group elevation is snow cover: in
a recent Ph.D.-study, L. Comeau (2013) has shown that
snow cover during cold years and periods – has a
significantly longer duration even at fairly low altitudes.
Prolonged snow cover had a number of negative effects,
but mainly it delayed and shortened the all-important
growing season (cf. Fig.7.4). There is thus good reason
also to include ruin group elevation in the functional
discussion and classification of ruin groups, as I will
explore later in this chapter.
Fig.7.3 The ruin groups included in the survey dataset (vertical axis) divided on their general orientation (horizontal axis). The figure is discussed in the text.
0
10
20
30
40
50
60
70
80
90
100
No. Ruin Groups and Elevation
No. Ruin Groups
0
5
10
15
20
25
30
35
40
45
Ruin Group Orientation
No. Ruin Groups

184
Fig.7.4 Displays the total number of ruins (TNR) registered at 156 individual ruin groups (note that ruin numbers for ruin groups E29/E29a are joined here). Marked in black are ruin groups with an associated church and in red the ruin groups with an associated infield dyke. The figure is discussed in the text.
7.1.2 OVERALL RUIN DISTRIBUTION
Before attempting to classify the ruin groups in this
survey sample, a brief review of overall ruin distribution
patterns in the RGD serves to highlight those parameters
that are most, and least, revealing of farmstead functions,
size and status. For discussion of this differentiation, I
again rely on the church farmsteads as a benchmark, but
juxtaposed against farmsteads with no church, but infield
dyke, the latter feature having been singled out as a trait
of the largest (or latest) farmsteads (see section 6.2.4):
Fig.7.4 displays the total number of ruins (TNR) per
individual ruin group in a sample of 156 (note that ruin
numbers at E29/E29a have been joined here). The TNR
displays a quite significant spread, ranging from 1-42
ruins at the individual ruin group (with a mean TNR of
8). Most noticeable in the figure is the very high TNR at
ruin groups E59 and E47 (Igaliku/Garðar), which have
stood out as unique in terms of their ruins in most of the
above analyses. The next two ruin groups to separate are
E66 and E29/29a, both multiple church farmsteads. After
these, TNR at the ruin groups decline very continuously
with no apparent interruptions, although it is of course
noted that the remaining church farmsteads (black typo
in Fig.7.4) all lie in a higher end of this regression, as
does farmsteads with no church, but infield dyke (red
typo in Fig.7.4).
There are several observations to Fig.7.4: first, the
gradual regression in TNR demonstrates that it cannot
stand alone in the classification of sites, the main reason
being that it does not differentiate between small and
large, and various types, of buildings. Thus, a small
farmstead or shieling with many rudimentary sheep/goat
sheds and shelters will score as high in TNR as a sizable
farmstead with an equal number of large outbuildings.
Second, still the fact that the church farmsteads (black
typo in Fig.7.4) all lie in the higher, or highest, end of
0
5
10
15
20
25
30
35
40
45
No
. ru
ins
Individual ruin groups
Total Number of Ruins per Ruin Group (TNR) (n = 156)
E59
E47
E66
E149
E29/29a
E78 E64 E18
E83
E48
E111
E76
E94 E178
E63
E28
E77a

185
0
500
1000
1500
2000
2500
3000
3500
4000
Tota
l A
rea o
f R
oofe
d B
uil
din
gs
(sq
. m
)
Individual Ruin Groups
Total Area of Roofed Buildings (Ar_RB) (n=142)
E47
E59 E18
E149
E66
E78
E29a
E83
E64
E111
E48 E178
E94
E77a
E76
E63
E28
the TNR distribution implies that this parameter to some
extent does correlate with farmstead size and status. It
can also be noted that the four farmsteads with highest
TNR all have associated churches of the large type,
whereas ruin groups with small early type churches have
a lower TNR. A similar difference between farmsteads
with early and later type churches was also noted in the
spread of dwellings dimensions in section 6.2.1. Unalike
the spread of dwelling, the three other ruin groups with
large type churches (Fig.7.4, E18, E83, and E111) all
have a TNR comparable to the farmsteads with small
churches (E48, E64, E78), although this may in part be
explained by erosion of ruins at the three former sites.
Third, while ruin misrepresentation could account for
some pattern variation and inconsistency, Fig.7.4 may in
fact imply that some farmsteads without churches were
just as sizable and wealthy as the examples with
churches. This is apparent if inspecting ruin groups with
no church, but with associated infield dyke (red typo in
Fig.7.4). In terms of TNR some of these ruin groups
clearly compete with or excel those with church (note
that E77a is highly eroded, which undoubtedly accounts
for a fairly low TNR). Although the TNR cannot, as
stated, stand alone in ruin group classification, it seems
reasonable to argue from Fig.7.4 that a large farmstead
should have no less than 12 roofed buildings (with the
eroded E77a defining this lower limit).
Fig.7.5 displays the total area of all roofed buildings
(AR_RB, Ruin Database types 1-12, 14) at 142 ruin
groups (14 ruins have no identified roofed building, the
ruins of E29/29a are joined here). The Ar_RB works
from the basic logic assumption that the larger the roofed
area, the greater the number of buildings, functions, and
hence wealth of the farm. It is expected that the Ar_RB
is more resistant to inter-site building variation than the
TNR because large roofed buildings of a given type are
Fig.7.5 Displays the total areas of all roofed buildings (Ar_RB) at 142 individual ruin groups (note that ruin numbers for ruin groups E29/E29a are joined here). Marked in black are ruin groups with an associated church and in red the ruin groups with an associated infield dyke. The figure is discussed in the text.

186
0
50
100
150
200
250
300
Dis
pers
ion
In
dex
Individual Ruin Groups
Farmstead Dispersion Index (FDI) (n=93)
E47
E59
E18
E149
E66
E78
E29a
E83
E111
E48
(E74)
E28
E94 E76
E64
E178 E77a
E63
“weighed” heavier than similar types of small buildings
(see above). Also, the Ar_RB should be more resistant to
cases where poor preservation effects that some multiple
features are surveyed as one ruin, since this should just
increase the total ruin outline. However, because ruin
numbers and area obviously connected the two measures
are still expected to display some overlapping patterns.
The Ar_RB displays great variation and ranges from
1-3947 m2 with an average of 622 m
2. The distribution of
Ar_RB is – as expected – roughly similar to that in
Fig.7.4, i.e. a few extremely high value outliers followed
by a continuous regression in Ar_RB values. Still, the
Ar_RB distribution conforms noticeably more to the
expected overall patterns than the TNR (cf. Fig.7.4-7.5):
The uniqueness of E47 (Igaliku/Garðar) – which has
been stressed elsewhere (McGovern 1992a:220) – is
striking (even though 10 roofed buildings have been
excluded because they lack description of external
dimensions). Apart from E48 and E111 (many buildings
at the latter could have eroded), the church farmsteads –
as well as the singular E59 – display the highest Ar_RB
values, and noticeably those with large type churches
(black typo in Fig.7.5). However, Ar_RB in Fig.7.5 goes
even further nuancing this pattern that was also inferred
from the TNR (Fig.7.4): except for the eroded E111, it
can be noted from Fig.7.5 that all the farmsteads with
small type churches – which likely started out in the top
of the settlement hierarchy – appear more modest in the
accumulated survey evidence and all have lower Ar_RB
values than the farmsteads with large type churches. In
fact, such “old church farmsteads” seem to have been
“outcompeted” by several farmsteads without church,
among these repetitions from Fig.7.4 (and Tab.6.23)
with infield dyke. In terms of the latter examples, some
have been shifted up, and some down, the hierarchy, yet
they all lie in the higher end of Ar_RB values. Based on
these ruin groups, it is reasonable to propose that a large
farmstead should have a total area of roofed buildings no
less than 750 m2.
Fig.7.6 displays the farmstead dispersion index (FDI)
for the 96 ruin groups in the sample that has a dwelling.
The FDI – i.e. the average distance of all roofed
outbuildings (excluding the single most distant one) to
their associated dwelling – reflects how dispersed a
layout scheme a farmstead or shieling has, which in turn
could indicate the size of the cultivated infield area and,
consequently, the function, wealth, and status of a
farmstead. The FDI is expected to be less resistant to
Fig.7.6 Displays the total areas of all roofed buildings (Ar_RB) at 142 individual ruin groups (note that ruin numbers for ruin groups E29/E29a are joined here). Marked in black are ruin groups with an associated church and in red the ruin
groups with an associated infield dyke. The figure is discussed in the text.

187
random inter-site variation than both the total number of
ruins (TNR) and the total area of roofed buildings
(Ar_RB) because it is to a large extent determined by
topography. In addition, at sites with few ruins it only
takes one or two extreme outliers to bias the FDI
significantly, which for instance accounts for the highest
FDI-value in the sample (E74). In this concern, the issue
of separating or joining proximate or distant ruins under
one or two ruin group numbers becomes paramount. The
expected greater variability in this parameter is affirmed
by the overall more even distribution in index values
displayed in Fig.7.6.
Unsurprisingly, the FDI values do not display the
same fairly distinct distribution pattern as the TNR and
Ar_RB (cf. Fig.7.4-7.6), although E47 still stands out as
a unique case. Otherwise ruin group E78 (with early type
church) is the only of the church farmsteads to clearly
follow the above, and expected, distribution. Although
the farmsteads with identified infield dyke, but with and
without church, distribute fairly evenly, they do overall
display overall higher than average FDI values, i.e. are
more dispersed. Thus, these farmsteads have an average
FDI value of 124.6 as compared to 86.6 of the entire
sample. In fact, if excluding the two outliers – the
heavily eroded and therefore probably misguiding E77a
and E111 – among the emphasized ruin groups (black
and red typo in Fig.7.6) all of them have FDI-indexes
higher than the entire sample average. This goes some
way to support the notion that the FDI does captures
some measure of farmstead size and layout. Based on
this, I suggest that no large farmstead (unless eroded)
should have a FDI lower than 85.0, and the largest
farmsteads a FDI over a 100.0. However, while the FDI
does seem to summarize some of the difference between
more and less dispersed farmsteads, it can only be
applied with caution and after qualitative evaluation of
ruin representativity. Neither does the FDI help much in
differentiating the intermediate types of farmsteads.
The final indicator of farmstead function and wealth
to be considered before proceeding with the ruin group
classification is the total area of enclosures (TAE), i.e.
the entire area in m2 of ruins interpreted as enclosures (as
opposed to the actually enclosure area) (Fig.7.7). The
TAE works along the same lines as the total area of
roofed buildings (Ar_RB) in that it assumes that large
enclosed areas – whatever their specific function – must
imply the need and capacity to facilitate large herds of
livestock. To ensure that the TAE only reflects herding
capacity related to individual farmsteads, it only includes
certain types of enclosures (types 15-22 in the RD, and if
type 21, only such that relate directly to farmstead
function, i.e. lie less than 200 m from the dwelling. Note
that the massive enclosures of E90 have been excluded
because of their special function, see section 6.2.3). The
TAE is expected to be a fairly reliable indicator of
farmstead size and functions, because they rarely needed
to be rebuilt and represent a “maximum capacity” (see
section 6.2.3). Conversely, the layout of some enclosure
types was largely decided by local topography, and some
measure of random inter-site variation must be expected.
Reviewing TAE values of the 107 ruin groups with
identified enclosure in this sample (Fig.7.7) the pattern is
again fairly striking: three ruin groups – E47, E76, and
E4 – are excluded in the figure because their TAE’s are
so large (15.224, 10.640, and 6087 m2, respectively) that
they distort the figure. The first two are recurrences from
the above highlighted group of large farmsteads with and
without church (cf., Fig.7.4-7.6). Recurrent and distinct
in Fig.7.7 are also the farmsteads with large churches
that – except for E149 and E111 – all have higher TAE
values than those with small churches (note that both
E78 and E77a lack any recorded enclosures which surely
owes to ruin misrepresentation). Another repetition is
E178, which occupies a middle position, followed by a
suit of ruin groups with larger than average, but
declining, TAE’s, which finally evens out into a large
group with small and more uniform TEA’s. The average
TAE of the entire sample is 234,7 m2, but it is seen in
Fig.7.7 that the church farmsteads rarely have a TAE
lower than 350 m2. This owes to their associated large
grazing enclosures (see section 6.2.3), as well as the
presence of at least 4 different types of enclosures. Thus,
it is realistic to suggest that the largest farmsteads should
display a TAE value of at least 350 m2 divided on at
least 4 enclosures, whereas the subsequent suit of larger
than average farms should display TAE values of at least
150m2 divided on at least two different enclosures.

188
Fig.7.7 Displays the total external areas in sq. m of all enclosures (TAE) at 107 individual ruin groups where enclosures are registered (note that ruin numbers for ruin groups E29/E29a are joined here). Marked in black are ruin groups with an associated church and in red the ruin groups with an associated infield dyke. The figure is discussed in the text.
From the discussion and visualization of the above
four ruin group parameters, it is clear that the sites – just
as observed for the buildings in chapter 7 – display a
notable degree of “fuzziness”, i.e. depending on the
parameter in question most of the ruin groups distribute
differently. This “fuzziness” owes both to different
levels of parameter correlation and, as emphasized
above, issues of preservation. I will return to both
caveats in the below. Despite such issues, some ruin
groups nonetheless persistently show up prominently
regardless which parameter is scrutinized: most
conspicuous is the always exceptional episcopal see of
Igaliku/Garðar (E47), as well as E59. The unique
distinctiveness and geographical proximity of these two
sites strongly indicates a special connection between
them, but this will not be pursued further here, since they
are included only for comparative purposes. The other
ruin groups that stand out recurrently are farmsteads with
large churches, which are also the sites characterized by
massive infield enclosures (cf. Tab. 6.23). All in all, it
seem to demonstrate beyond doubt that these ruin groups
were really the large and wealthy manors – medieval
parish centers – that has been stressed before (e.g.,
Roussell 1941, Berglund 1982, McGovern 1985,
Arneborg 2006), and which stood apart not only in terms
of their large churches, warehouses, and representational
halls, but their entire farmstead layout and setup of farm
buildings.
Just as importantly, the above analysis points to a
recurrent assemblage of ruin groups that show up
distinctly in some parameters, but not as much in others.
Their variation is partly explainable by preservation
conditions and they should undoubtedly be interpreted as
the next substratum of farmsteads that were clearly not
on level with the church manors, but certainly still in the
top of the settlement hierarchy. Interestingly, one finds
in this stratum all of the farmsteads with small churches,
i.e. farmsteads that probably started out in the top of the
0
500
1000
1500
2000
2500
3000
3500
T0ta
l A
rea o
f E
nclo
su
res (
sq
. m
)
Individual Ruin Groups
Total Area of Enclosures (TAE) (n = 107)
E66
E29a E59
E83
E178
E63
E64
E149
E94
(E65)
E28 E48 E111

189
settlement hierarchy, but over time – or at least in the
accumulated survey evidence – declined in prosperity
and was even outcompeted by some farmsteads that had
never had a church. The same development was implied
by the dimensional distribution of the dwellings (see
section 6.2.1). Identifying such large farmsteads without
church from survey evidence is especially pertinent,
because they have so far largely escaped archaeological
recognition and reveal much about overall settlement
patterns. Yet, while the above analysis may have
provided a guideline for the identification of church
manors and large farmsteads, it has only defined an
upper limit for the great majority of lesser farmsteads
and shielings.
7.1.3 A FUNCTIONAL CLASSIFICATION OF NORSE
RUIN GROUPS
It is tempting to approach a functional classification
of the survey data by pure statistics. I argue, however,
that such an approach is impracticable for several
reasons: first, almost no variable in the observed
parameters display a normal distribution, but almost
always display marked positive skewness. The data is
therefore poorly suited for a majority of statistic test- and
exploratory models (different methods of distribution
normalization could of course be applied, but is beyond
scope of this study). Second, at many ruin groups single
parameter variables could not be recorded, either due to
poor preservation or lacking, or varying, archaeological
registration. Consequently, a substantial number of ruins
and some ruin groups would have to be excluded in a
purely statistical approach. Third, a purely statistic
approach has no means of taking into consideration ruin
representativity at the individual site, i.e. to which an
extent ruin numbers reflect survey intensity and erosion
(see section 6.1). Fourth, in the functional classification
of ruins provided in chapter 7 each building type was
assigned a single number in the RD, although some
clearly had multiple functions; this would neither be
picked up in the statistical analysis. In sum, even if a
purely statistic approach was adopted, it would take a
considerable extent of qualitative crosschecking and
interpretation to validate the implications.
In this classification I therefore aim to take a middle
position and combine exploratory statistics with some
basic archaeological and qualitative interpretation and
assessment. The latter primarily involves drawing on the
functional building classification provided in chapter 6
and summarized in App.2. Secondarily, it entails
blocking some “noise” ruin group complexity: the
structural features and layout of the largest church
manors and farmsteads is well established and was also
evident in the above analysis, thereby segmenting the
economic and functional upper stratum of ruin groups. In
the other end of the specter, similar rational argument
may be applied by segmenting those sites that could not
have been farmsteads.
The ruin groups can be split on three basic functional
categories: simple shielings, complex shielings, and
farmsteads. The basic archaeological characteristics of
these functional types were outlined in section 2.2 and
need not be repeated here. Thus, although the below
classification draw extensively on this prior record of
shielings types and activities – not at least those
discussed in the context of Norse Greenland (e.g., Keller
1983, Albrethsen and Keller 1986, Albrethsen 1991) –
the below classification is primarily guided by the
observed parameters (App.2). In consequence, some
suggested site classes are new, while others are familiar
from prior investigations. Each of the basic functional
categories may be subdivided into a few more particular
site types that are discussed in terms of identification,
layout, and function, beginning with the simplest type of
site and working towards increasing site complexity.
Each ruin group type is summarized in terms of their
observed parameter variables in Tab.7.1:
Simple shielings (n = 51):
Of the 157 ruin groups in the sample, 54 have no ruin
identified as a dwelling (either farmhouse or shieling
lodge), i.e. they are per definition shielings and could not
have facilitated human or animal habitation over longer
periods (note that the single ruins of 170a, 0501, and
E300 are assigned to E74, E76b, and E170 in this
analysis; there is no information on E167a and E237).
They must therefore have served some other specialized
outfield activity. I refer to such specialized sites as
simple shielings, and the 50 ruin groups assigned to this
class are treated as a subsample within the total sample
of ruin groups.

190
Fig.7.8 Ruin group E167’s ruin no. 16 in the central Vatnahverfi highland, an example of a rétt, i.e. a large enclosure used for the gathering of considerable herds of livestock, in this case created by building a wall across a peninsula. The enclosure is located some distance from the other ruins of the group, probably implying it’s separate function (photo: C.K. Madsen 2006).
Reviewing the 50 ruin groups with no dwelling in
App.2, they had between 1-8 other ruins, none of which
were cattle housing or grazing enclosures. It should be
noted that the two examples with most ruins (7 at E311
and 8 at E296) are poorly preserved, densely overgrown,
and mixed with Inuit features. The remaining simple
shielings have between 1-6 ruins, none of which were
cattle housing or grazing enclosure (see App.2).
Ar_RB’s of the simple shielings range between 1-130.2
m2, but on average only 23.6 m
2. Thus, it is reasonable to
propose that simplshielings had between 1-6 (8) ruins of
which none were dwelling, cattle housing, or grazing
enclosure, and with a total roofed building area of some
1-150 m2. Based on the functional building classification
in App. 2, simple shielings can be divided on several
different types:
Outfield walls/dykes (n = 3):
A site with only 1-2 stretches of wall/dyke that did
not form an enclosure, i.e. sites that only comprised
features identified as other wall/dyke (see section 6.2.4,
Fig.6.35, type 25 in the RD). As discussed there, this
type of feature is probably heavily under-represented,
which would also account for the low number in this
sample. Outfield walls/dykes were probably related to
land demarcation or herding.
Landing place (n = 3):
A site with 1-2 ruins of which at least one is
identified as a boathouse (type 10 in the RD). As implied
by the label, the site was functionally related to boating,
i.e. storing of boats and equipment and consequently
always located close fjord or lakes. Such sites are
probably also underrepresented as they are most prone to
erosion and disturbance by later Inuit settlement.
Rétt (n = 3):
A site with 1-2 ruins of which at least one is
identified as an enclosure partly delimited by water
(Fig.7.8, type 21 in the RD), whereas the other may be of
any type. As discussed in section 6.2.3, they appear to be
rudimentary versions of the Icelandic and Faeroese rétt
(Bruun 1928:288p, 1929:202p, Aldred 2006), i.e. large
enclosures that mainly facilitated gathering of substantial
numbers of livestock during seasonal roundups.
Additional features at the sites indicate that they were
also used as milking stations (see below). As also
outlined in section 6.2.3, enclosures of this type are
probably heavily underrepresented and could likely be
increased by more systematic scouting for narrow
peninsulas in the outfield. Besides the three separate
lying examples, enclosures with similar function are

191
found at some distance from the other ruins at E64,
E164, E167, E169, E174, E184, and E310 (shown in
Fig.7.13, but not individually numbered). The very large
enclosures with built wall at E90 (see section 7.2.3,
Fig.6.22) undoubtedly also served as réttir (pl.).
Sheep/goat shelter (n = 2):
A site with a single small feature that is identified as
a sheep/goat shelter (type 20 in the RD). With only two
examples it seems a doubtful “type”. Yet, such structures
serving temporary sheltering of livestock in the most
distant outfield are known from both Iceland and the
Faroe Islands (Bruun 1897:65, e.g., Bruun 1928:194,
Joensen 1979:108); and, as discussed in section 6.2.3,
sheep/goat shelters are probably highly underrepresented
because of their small size – the two examples in this
study are only c. 6-6.6 m2 in external area – rudimentary
built, and location far from the farmsteads.
Forage Shieling (n = 4):
A site with 1-2 ruins of which at least one is
identified as a storehouse (Fig.7.9, type 9 in the RD).
With only four examples of this type of simple shieling it
could again be discussed whether it even makes sense to
speak about a “type”, but it does correspond to similar
examples in the Qassiarsuk area that were labeled
haymaking saeters by Keller and Albrethsen (1986:96,
their type C) after Reinton’s Norwegian shieling model
(see section 2.2.2). I envisage the same basic function for
the forage shielings, but prefer to avoid the direct
ethnographic parallel because the examples in this
sample seems to have had little to do with haymaking in
the normal sense, but with use of naturally occurring
fodder resources (e.g. shrub vegetation, meadow-hay, cf.
Fig.7.9). The forage shielings also seem to be placed so
as to be easily accessible, for instance by small boat (cf.
Fig.7.9).
Fig.7.9 E90b’s ruin no. 1 in the Sioralik, an example of a simple shieling classified as a forage shieling, i.e. a ventilated building used for temporary storage of fodder or foods, in this case likely meadow hay from the below outwash plain. The ruin is located on the banks of a small arm of the melt water river, likely for the purpose of transport (photo: C.K. Madsen 2006).

192
Fig.7.10 Ruin group 1103’s single ruin, in the central Vatnahverfi highland, an example of a herder’s hut or shelter. Such ruins were – as evident from the photo – rather unsubstantially built and likely served for very temporary occupation (photo: C.K. Madsen 2011).
Herder’s hut/shelter (n = 8):
A site with a single small building identified either as
a shelter/lookout or unspecified roofed building (Fig.
7.10, type 11 & 14 in the RD). Since the herder’s huts/
shelters provided temporary shelter for a single or a few
herders or travelers, and perhaps a few select sheep/
goats, they had to be somewhat insulated and were all
built in turf/stone, stone/turf, or turf walls on a stone
foundation. Small huts of similar function are known
from Iceland (Bruun 1928:284). The buildings range in
area from 5.4-62.6 m2
and can have up to three small
rooms, or one large. The larger examples herder’s
huts/shelters do resemble tiny versions of the small
complex shielings (see below), but always lie on their
own and appear less substantially built. V53 excavated
by Roussell may represent an example of such a feature
(e.g., Fig.5.12).
Milking Station (n = 5):
A site with 1-4 unroofed buildings that are identified
as enclosures, separate lambakró, or sheep/goat shelters
(types 15-16, 18-20 in the RD). Again, it is a poorly
exemplified type in the sample, although this probably
owes somewhat to archaeological underrepresentation.
The absence of roofed buildings at the milking stations
suggests that there was no occupation of the site and that
milkmaids or herder’s would daily walk back and forth
between the milking station and their place of residence.
This agrees with the observation that the milking stations
are located only between 400-1700m from the nearest
farmstead or complex shieling. Similar milking stations
are also recorded in the Qassiarsuk area (Guldager et al.
2002) and in the ethnographic record from elsewhere in
the North Atlantic (Bruun 1897:53). The larger TAE of
the milking stations appears to set them apart from the
sheep/goat shelters, but they are normally not large
enough to have been able to serve in seasonal roundups.
The shieling excavated in the Kirkespirsdalen (Fig.5.13)
could be an example of a milking station (Berglund
1998b).

193
Dairy shieling (n =15):
A site with at least 1 ruin identified as an enclosure
(types 15-16, 18-20 in the RD) and 1-3 ruins identified
as a roofed buildings that is not a dwelling or livestock
housing (types 1-3 in the RD). This type of simple
shieling corresponds exactly to Keller and Albrethsen’s
dairy saeter (1968: 98, their type B) and there is nothing
to add to their basic functional description: it was a
shieling that primarily facilitated milk production with a
occasional secondary production of fodder. The layout
for this site type seems fairly uniform, as for instance
reflected in very similar enclosure areas: they overall
range between 17.4-72.9 m2, but with an interquartile
range of only 20.9-59.2 m2. The area of the associated
roofed buildings (Ar_RB) is also roughly uniform,
spanning from 9.0-83.8 m2, but with an interquartile
range of only 17.9-35.2 m2. The main reason for
separating dairy shielings from milking stations is that
the former seems more substantial and – as opposed to
the latter type – were intended for temporary habitation
and a greater range of shieling activities.
Large simple shieling (n = 7):
A site with at least 3 ruins identified as roofed
buildings (types 4-9, 14 in the RD) that are not dwellings
or livestock housing (types 1-3 in the RD). With this
type of simple shieling, the layout of the sites, as well as
the number and size of the buildings is beginning to
approach the appearance of a significantly different type
of site or, i.e. a complex shieling (see below). This is
reflected in the generally high Ar_RB (apart from E312,
where half of the ruins could not be located in the dense
shrub) and greater variation in types of functional
buildings, which implies an increased range of outfield
activities. Still, there is no discernable farmhouse or
shieling lodge, neither is there any cattle housing. Also,
the sites appear somewhat marginal locations in terms of
farmland, but often with rich access to other resources
(shrub vegetation, meadow-hay, pasturage). The large
simple shielings seem to fall in between Keller and
Albrethsen’s dairy and hay-making saeters (1968:98,
their type B-C), i.e. the type is best understood as a
transitional type to the complex shielings:
Complex shielings (n = 42):
Having removed the “noise” of the 54 ruin groups
without an identified dwelling in the above, 103 ruin
groups with dwelling are left in this sample. These ruin
groups still present a highly varied batch of survey data,
which must reflect real differences in function and size.
At the same time, it is a batch of ruin groups that share a
lot of the same structural features – i.e. features are
normally associated with farmsteads – although they
appear in quite varying constellations. Although this is
expectable from a survey dataset that consists of
accumulated evidence, the slightly more marginal
placing, smaller size and lower number of ruins, and
more condensed layout schemes of a substantial number
of these farmstead-like sites imply that they were, in
fact, not regular farmsteads, but shielings, or at least
different kinds of farmsteads. Here, I refer to this batch
of not-quite-farmstead ruin groups as complex shielings
and suggest that they came in small and large versions.
While the idea that a considerable number of the
farm-like ruin groups could be shielings rather than
farmsteads has been vaguely hinted at before (e.g.,
Nørlund and Stenberger 1934:45, Roussell 1941:45), but
it is only Keller and Albrethsen (1986) that have
attempted to define a framework for their interpretation.
As outlined in section 2.2.2 and in the above, their
classification model was based on Reinton’s basic, but
pioneering tripartite model of full-shielings, dairy
shielings, and haymaking shielings (with a lot of
ethnographically recorded sub variations (Reinton 1955,
1969). In their study of ruin groups in the Qorlortuup
Itinnera valley, Keller & Albrethsen suggested that a
number of their sites should be interpreted as full-
shielings (1986:Tab.1-2) and proposed following
definition:
‘The ruin group should consist of living quarters and pens,
possibly with barns and byres, and be located where full-time
settlement seems unlikely. Elevation is probably important. Other
conditions may, however, influence its position, such as local weather
conditions that would make even the low country unacceptable for
year-round settlement, but would permit summer settlement ’
(Ibid.96).

194
In my opinion, the definition offered by Keller and
Albrethsen touches upon all the central aspects of the
sites that would appear not to be regular farmsteads, but
shielings of a more complex type; the definition needs
only to be specified to suit the quantitative parameter
variables in this study. Thus, the concept of complex
shielings introduced here is in some concerns, and at
least functionally, parallel to their, and Reinton’s, full-
shieling. Besides evading unqualified parallelism, the
new label term also means to signify the greater range of
economic activities carried on the complex shielings, and
the fact that they very likely changed function over time
(see below).
In the above section 7.1.3, four parameter variables –
the total number of ruins (TNR), the total area of roofed
buildings (Ar_RB), the farmstead dispersion index
(FDI), and the total area of enclosures (TAE) – were
explored and it was demonstrated that these variables at
least isolate the largest farmsteads. Summarizing the
investigated parameter variables it was found that the
church manors and largest farmsteads were characterized
by being ruin groups displaying 1) at least twelve
identified roofed buildings; 2) a total roofed area of at
least 750 m2; 3) a farmstead dispersion index not lower
than 85 m2; and 4) a total area of enclosures no less than
150m2 divided upon least two enclosures (cf. App. II, cf.
Tab.7.1). Since the complex shielings in terms of their
layout and buildings were, as just described, simply
miniature farmsteads it is sensible that they can be
differentiated by the same parameter variables.
However, as visible from the figures in section 8.1.3,
even the church manors and largest farmsteads showed
considerable variation within the different parameters.
As discussed, at least part of this variation is explainable
by varying preservation conditions, survey intensity, and
micro-topography. The variability is reflected in the
varying degree of parameter variables correlation: with
the total number of ruins (TNR) being the independent
variable, the total area of all roofed buildings (Ar_RB),
unsurprisingly, shows the highest correlation coefficient
(r = 0.84), the total area enclosures somewhat less (r =
0.51), and the farmstead dispersion index the least (r =
0.44). In short, while all the parameter variables display
positive correlation, no single parameter can stand on its
own in the – statistically significant – classification of a
site. Joining all of the parameters seems the logical
solution.
Fig.7.11-7.12 displays to runs of multivariate cluster
analysis (hierarchical unweighted pair-group average) of
the TNR, Ar_RB, FDI, and TAE of 98 of the ruin groups
with dwelling (note that five ruin groups that include
only a single dwelling have been excluded because they
provide no FDI-value, which is of little concern because
they cannot have been regular farms in any case). One
run (Fig.7.11) accentuates the FDI before the TAE, the
other run (Fig.7.12) the opposite. Both analyses agree to
considerable extent, but the first run (Fig.7.11) seems to
better summarize the largest sites, the second run
(Fig.7.12) the smaller sites. There is little to be said on
the difference between the two runs, except that it should
be accentuated that cluster analysis is an explorative
statistical approach and can essentially be tweaked to
produce just about any outcome. However, as both
cluster analysis runs are based on average euclidean
distance and not a predetermined number of clusters, the
two runs are, at least statistically, unbiased.
The fact that both runs to notable extent capture – but
display differently – the largest sites with and without
church (cf. section 7.1.3) lends credibility to the model
and to the notion that it can be applied to the ruin groups
in lower settlement substrata as well. Accordingly, I
mainly rely on the cluster analysis in the classification of
farmsteads and shielings. Evidently, the cluster analysis
does not specify exactly where one site class ends and a
new one begins, so a good measure of archaeological
interpretation and assessment is involved in the
differentiation. It should also be noted that the cluster
analysis does not take into consideration the sites with
multiple farmhouses or shieling lodges where the
associated outbuildings cannot be divided on particular
dwellings (E72, E75, E76, E167, and E171). Such sites
record in the analysis as single large sites, which are
separated by argument of their multiple dwellings.
Neither does the cluster analysis take into consideration
issues of ruin representation, sites where réttir were
assigned to a ruin group, but probably different use (e.g.,
E165, E169, E174), or the altitude of a site (a separate
cluster analysis was run including this variable
(ELE_MASL), but showed little apparent difference,
probably because it is recorded as categorical data). In
cases where I depart from the cluster analysis in the
classification, interpretational arguments are explained
individually for each case.

195
Small complex shieling (n = 23):
The small complex shielings show up fairly distinctly
in both cluster analyses (cf. Fig.7.11-7.12). In terms of
function and layout, small complex shielings combine
features of dairy-shielings and large simple shielings (cf.
Tab.7.1), the main difference from the latter being that
the small complex shielings have an associated dwelling,
i.e. could facilitate longer occupation. However, because
of the fairly small size of the dwelling (50-250 m2) and
the lack of any type of cattle housing (cf. Tab.7.1), it is
unlikely that the small complex shielings could have
been occupied throughout the year. This is corroborated
by the fact that no midden is observed at any of the sites
(App.2). On the other hand, the number and size of the
buildings suggest multiple shieling activities, which
seem to have included both milk and fodder production
(both storehouses and caprine enclosures are often found
at the sites, cf. App.2, Tab.7.1). The layout of the small
complex shielings was notably more clustered (average
FDI = 32.8) than the large complex shielings (see
below). They seem to come in two sub-types, one with a
rectangular shieling lodge divided on three rooms (e.g.,
0901, E90c, E175) and another rounded type with 3-6
clustered small rooms (e.g., E80b, E293, E80c). In
short, the small complex shielings were a type of full-
shieling, but probably only facilitated few people and
mostly sheep/goat livestock during summer months.
Large complex shieling (clustered) (n = 19):
The large complex shielings show up fairly distinctly
in both cluster analyses, but require some reclassification
of individual sites in both analyses (cf., Fig.7.11-7.12).
Whereas differentiating the large complex shielings from
the small is fairly straightforward, separating them from
small farmsteads (see below) is more difficult because
they share so many similar traits. However, slight
differences seem to set the large complex shielings apart:
they tend to have fewer and less varied buildings than
the regular farmsteads; they are more clustered (cf.
Tab.7.1), and normally located more marginally in terms
of access to resources. In accordance with the elevation
site selection criteria discussed in section 8.1.2, sites that
would have been classified as a farmstead but are located
above 75-100 m.a.s.l. are instead interpreted as large
complex shielings (e.g., the reclassification of E70 and
E168 in Fig.7.11-7.12). Sites that consist of multiple
dwellings (e.g., E167, E72) have also been reclassified to
better reflect the size of the individual functional units.
The large complex shielings should principally be
interpreted as the most varied and extensive type of
Norse full-shieling, but where shieling activities had the
most comprehensive scope; basically all functions of the
regular farmstead were continued. Besides the above
arguments, the interpretation of these sites as shielings
and not farmsteads rests upon relation to corresponding
lowland farmsteads (see below). That all the normal
types of artifacts normally associated with farmsteads
have been found at excavated large complex shielings
(Vebæk 1992:76p) is expectable; many activities of the
permanent farmstead would have continued and, for
instance, finds of numerous artefacts related to textile
production implements could even be taken as a shieling
indicator because this activity was, in the context of the
North Atlantic, mostly the women’s domain (Hastrup
1989, Bratrein 1996:8, Myhre and Øye 2002:388).
However, with their more substantial buildings and in a
few cases cattle housing, it seems likely that many large
complex shielings could have functioned as regular all-
year small farmsteads during times with a large enough
population to sustain them. Pollen-investigations at E70
(Ledger et al. 2013a) and the excavation of E74 (see
section 5.1.3) have demonstrated exactly this kind of
dynamism to the shielings. Both the small and the large
complex shielings seem to correspond with Keller &
Albrethsen’s full-shieling (1986:98, their type A).
Small (clustered) farmstead (n = 15):
The label for this site class is self-explanatory and its
basic characteristics outlined in chapter 6; they are
simply the smallest examples of farmsteads. Obviously,
the distinction between large complex shielings and
medium farmsteads (see below) is fairly arbitrary and in
this case based on interpretation of the cluster analyses,
both of which imply a fairly distinct group (cf., Fig.7.11-
7.12). Also, reviewing Tab.7.1 the small farmsteads on
average appear slightly larger and more varied in their
functional layout than the large complex shielings.
Medium (dispersed) farmsteads (n = 31):
Medium farmsteads are next in this site graduation
and the first class to display the full range of functional
buildings, often in multiple examples (cf. Tab. 7.1). The
medium farmsteads also seem to separate from the small
by their generally more dispersed layout. It is the most
common site type in the dataset and appears fairly
distinctly in both cluster analyses (Fig.7.11-7.12).

196
Fig.7.11 Multivariate cluster analysis (hierarchical unweighted pair-group average) of the TNR, AR_RB, FDI, and TAE of 98 of the ruin groups with dwelling and other ruins. Blue lines on the left displays the original cluster “dendrogram”, colors on the right the interpretation of these clusters in terms of site classes.

197
Fig.7.12 Multivariate cluster analysis (hierarchical unweighted pair-group average) of the TNR, AR_RB, TAE, and FDI of 98 of the ruin groups with dwelling and other ruins. Blue lines on the left displays the original cluster “dendrogram”, colors on the right the interpretation of these clusters in terms of site classes.

198
Large (dispersed) farmsteads (n = 5):
Five ruin groups display such a number and scale of
functional buildings that they stand out quite distinctly
from the medium farmsteads in the cluster analyses (cf.
Fig.7.11-7.12; note that ruin group E29 classifies within
this group in both analyses, but was reclassified to a
medium farmstead based on its proximity to church
farmstead E29a, which probably was the dominant farm
and owner of several of E29’s buildings). However,
while these were undoubtedly large farmsteads, it is
worth noting from Tab.7.1 that they stand apart from the
medium farmsteads only in terms of building sizes and
numbers, not by building dispersion or basic functional
layout. Consequently, they probably simply constituted
the highest stratum of ordinary farmsteads with few
other functions to set them apart. It is interesting to note
that two examples within this class – E64 and E78 – had
associated small (early) type churches. As discussed
above, this would suggest that these early church farms
never developed into manors or parish centers – E48
seems to have never developed beyond a medium
farmstead – which in turn would imply a process of
centralization, where wealth and influence ended up on
fewer hands as evidenced by the next class of site:
Manors (highly dispersed) (n = 4):
In the analysis, four sites without an identified church
stand out from the large farmsteads to such an extent
(Fig.7.11-7.12) that they call for a separate class, here
designated manors. This label is loosely borrowed from
Icelandic settlement history and archaeology (Júlíusson
2010) – as a rough equivalent to an estate (Vésteinsson
2005b:19, 2007:123p) – but parallel interpretations
should not be taken too far; it seems unlikely that the
small and lightly settled communities of medieval Norse
Greenland could have sustained many manors of the type
known from later-medieval Iceland. The term 'manor'
thus mainly serves to set these sites apart from the three
classes of regular farmsteads. A reason to separate the
manors from the regular farmsteads is that they stand out
in the size and scale of the buildings, as well as in a
notably more dispersed layout (cf. Tab.7.1). Thus, in
terms of their functional setup, the manors appear almost
identical to the church manors, i.e. they only lack the
church. It is therefore not unreasonable to assume that
they had the same supra-local economic importance as
the church manors, i.e. as centers of governance, labor,
fodder, and livestock.
Two of the ruin groups classified as manors – E59
and E76 – are notable repetitions from the above section
7.1.3 discussion of the features of the largest ruin groups.
The other two sites – E65 and E93 – are new: the latter
site stands out as the mostly impressive ruin group in the
Alluitsup Kangerlua/Siglufjörðr; the farmstead layout
with a great number of smaller livestock buildings – in
addition to sizable dwelling and stable-complex (App.2)
– implies that this farmsteads economic wealth was
largely based on large herds of sheep/goat husbandry.
The manor of E65 seems to less convincing and stands
out mostly because of its large grazing enclosure, as well
as its massive dwelling and stable-complex. Otherwise,
E65 seems to lack the many outbuildings of the other
manors, which could owe to erosion. Speaking in favor
of the interpretation of E65 as a manor is also the
presence of a double sheep/goat shed (see section 6.2.1),
a building type mostly recorded at the church manors,
and a very nicely built and preserved large compartment
with inner stone facing that forms part of the dwelling
and could have a representational hall (Fig.7.13).
However, this of course needs to be verified by
excavation.
Church manors (highly dispersed) (n = 7):
The nature and layout of the church manors have
been outlined several times and will not be repeated
here. The cluster analyses (Fig.7.11.-7.12) agree on the
separation of these impressive sites and their great scale
– even compared to the regular manors – is plainly
visible from Tab.7.1 (note that E111 falls into the class
of medium farmsteads in both analyses, a circumstance
that is explained by violent erosion). However, it should
be observed that all the sites classified as church manors
are characterized by having large churches, i.e. parish
churches. Besides their notable scale, the church manors
are characterized by their multiple grazing enclosures
and their much dispersed layout (cf. Tab.7.1). Also, as
described in sections 6.2.3 and 7.1.3, the church manors
stand out by having dykes fencing their massive infields
(only E83 lacks an infield dyke) and irrigation features
(E47 and E66). Whereas the large grazing enclosures
imply significant surplus livestock rearing and reservoir
function, the infield dykes and irrigation features imply
pooling of labor, or labor effort, at the church manors,
although this was also noted for the manors without
identified church.

199
Fig.7.13 Ruin group E65’s dwelling (ruin no. 1) includes a very well-built stone faced room, which could perhaps be an example of the representational halls known from the largest Norse church sites (the room appears to have been cleared or excavated, but I have been able to find no record of such investigation (photo: C.K. Madsen 2005).
7.1.4 SECTION SUMMARY DISCUSSION
The above section 7.1 has presented a classification
of 157 Norse Greenland ruin groups divided into three
main groups: simple shielings, complex shielings, and
farmsteads. The first site class is recognizable from its
lack of dwellings, while the other two classes demand
detailed analysis for their differentiation. Employing
cluster analysis of four parameter variables – total
number ruins, the total area of roofed buildings, the
overall dispersion of farmstead buildings, and the total
area of enclosures – the farmsteads have been divided on
five classes of gradual increasing size and complexity:
shieling that were seasonally occupied – the large
complex shielings probably permanently during
settlement peak – and variously sized farmsteads.
Cluster analysis is an explorative statistical approach
and because the analyzed survey data presents accumu-
lated settlement evidence, class distinctions will remain
speculative and somewhat arbitrary until a more rigorous
framework for the chronological development of the
sites and buildings have been established. Tab.7.1
displays the overall characteristics of the distinguished
classes based on the grouping of the functional buildings
presented in chapter 6. As seen from the table, the sites
display the expected notable overlaps from site class to
site class, but the overall transgression to large and more
complex sites is equally apparent. However, Tab.7.1
should not be envisaged as a strict definitional tool for
the identification of site classes, but more as a helpful
guideline in the sense that the Norse sites should be
fitted into the model based on which class variables they
agree with the most.
In spite of the problematic classification issues, both
Tab.7.1 and the cluster analysis do suggest the presence
of fairly distinct site classes, which in total included 58
farmsteads – hereof 46 in the Vatnahverfi region – and
91 shielings – hereof 89 in the Vatnahverfi region
(Fig.7.14). The site class distinction is also affirmed by
independent additional evidence: it is noted that infield
dykes, double sheep/goat sheds, and irrigation features
are almost exclusively found on the large farmsteads,
manors, and church manors. This distribution pattern
could reflect hierarchical, chronological, or both,
conditions, but would certainly be worth investigating in
the future. However, a more pertinent and readily
applicable method of cross-checking the classification
model is to subject it to a settlement pattern analysis: if
the model is valid, the different functional sites classes
should relate in a meaningful manner in the overall
layout of settlement.

200
Tab.7.1 A Functional Classification of Norse Ruin Groups
TNR No.
Roof.Build.
AR_RB Mean FDI
TAE No.
Dwel-lings
Midden (yes/no)
Cattle house
Live-stock house
Sheep/goat
house
Store-house
Other Roof. Build.
Caprine enclo-sures
Grazing enclo-sure
No. Ruin
Groups5
Simple Shielings:
Outfield wall/dyke 1-2 0 0 - 0 0 No 0 0 0 0 0 0 0 3
Landing Place1 1-2 1-2 < 50 m
2 - - 0 No 0 0 0 0 1-2 0 0 3
Rétt2 1-2 0 0 - > 200m
2 0 No 0 0 0 0 0 1 0 3 (11)
Sheep/goat shelter3 1 0 0 - < 10m
2 0 No 0 0 0 0 0 1 0 2
Forage shieling 1-2 1-2 - - < 75m2 0 No 0 0 0 Min. 1 Max.1 0 0 4
Herder’s shelter/hut4 1 1 < 65m
2 - 0 0 No 0 0 0 0 1 0 0 8
Milking station 1- 4 0 - - 10-80m2 0 No 0 0 0 0 0 1-4 0 5
Dairy shieling 2-6 1-5 < 100m2 - 15-80m
2 0 No 0 0 1 Max.1 Max.4 Min. 1 0 15
Large simple shieling 3-8 1-8 50-
100m2 - - 0 No 0 0 1-2 1-2 2-8 1-2 0 7
Complex shielings
Small complex shieling 1-7 1-6 35-
285m2 32.8 20-200m
2 Min. 1 No 0 1-2 1-2 1-2 1-4 1-2 0 20 (23)
Large complex shieling 4-12 2-8 200-
1000m2 80.0 20-250m
2 Min.1 Yes/no Max.1 1-5 1-3 1-3 1-3 1-8 0 19 (17)
Farmsteads
Small Farmstead 7-16 6-13 200-
1000m2
84.1 30-700m2 Min.1 Yes 1-2 1-2 1-5 1-3 1-6 1-7 0 12 (12)
Medium Farmstead 8-24 6-20 750-
1500m2
102.1 40-700m2
Min.1 Yes 1-4 1-5 1-5 1-4 1-8 1-7 Max. 1 31 (25)
Large Farmstead 12-24 8-20 1000-
2200m2
107.6 100-
1200m2
Min.1 Yes Min.1 1-5 Min.1 Min.2 1-8 2-5 Max. 1 5 (5)
Manors >15 10-30 1000-
3000m2
117.5 2000-
12,000m2
Min.1 Yes Min.1 3-5 Min.1 2-4 2-8 2-8 1-3 4 (2)
Church Manor >15 15-40 1200-
3000m2
125.6 - Min.1 Yes 2-4 3-5 Min.2 2-6 2-10 3-8 1-4 7 (1)
Tab.7.1 Summarizes the characteristics of the functional classification on shielings and farmsteads. As visible, there are notable overlaps between several different site classes. However, they do present a gradual transition from the least to the most complex sites.
1 One ruin must be classified as a boathouse (10).
2 One ruin must be classified as a enclosure partly delimited by water
(21); number in bracket indicates rétt located near farmsteads and not assigned a unique ruin group number. 3 The ruin must be classified as a sheep/goat shelter (20).
4 One ruin classified
either as other roofed building (14) or lookout/shelter (11). 5 numbers in bracket indicate the number of ruin group in the Vatnahverfi region.

201
Fig.7.14 Displays the classification of the ruin group in the survey dataset divided upon three main classes of sites: simple shielings (red, n = 50), complex shielings (blue, n = 39), and farmsteads (green, = 59).

202
7.2 THE FUNCTIONAL SETTLEMENT LANDSCAPE OF THE VATNAHVERFI
Fig.7.15 The landscape setting of ruin group E178 in the innermost part of the Torsukattak, outer fjord Vatnahverfi region. The farmstead – one of the largest in the area – is situated on the isthmus on the far side of the river. The dry grass vegetation on the old infield and in the nearby meadow is plainly visible (photo: P.B. Heide 2009).
Having functionally classified the 157 Norse Eastern
Settlement ruin groups in this survey dataset in section
7.1, section 7.2 explores how the different site classes
distribute in the landscape: as just specified, if the site
classification is valid, the farmsteads and shielings
should display a meaningful functional and relational
distribution in the landscape. However, in order for this
approach to work, it will include only the 133 ruin
groups from the Vatnahverfi region because they
represent an – almost – complete settlement system,
whereas the remaining sites were included for
comparison and cannot be related (geographically).
Section 7.2 splits on two exploratory investigations:
the first is a more formal mathematical approach, where
the sites in the Vatnahverfi region that are classified as
permanently occupied (i.e. the farmsteads) are used to
create voronoi regions (or Thiessen’s polygons) to
investigate how they compare and match up with the
sites that were not permanently occupied (i.e. the
shielings). Besides indicating the validity of the
classification, this analysis provides a framework for
discussion overall functional settlement layout in the
Vatnahverfi. In the second part of section 7.2, the
settlement aspects are approached more “intuitively”, i.e.
using site classes and natural topographical boundaries
to describe settlement patterns in the sub-regions of the
Vatnahverfi. The chapter closes with a summary
discussion of the findings in section 7.3.

203
7.2.1 FARMSTEAD AND SHIELING DISTRIBUTION
Based on the North Atlantic setup of transhumance, it
gives that a seasonally occupied shieling should always
have a matching “permanently” occupied farmstead.
Thus, one way of checking if the site classification
presented in section 7.1 is valid is by crosschecking it
with the relational distribution of farmsteads and
shielings in the Vatnahverfi region. One way of doing
this, is by separating the landscape on voronoi regions:
Voronoi regions – also known as Thiessen’s
polygons – are regions created from points, where each
polygon contains the area closest to that point. If the
permanently occupied farmsteads are the points in this
analysis, then one would expect its associated shielings
to lie within the region, i.e. “the area of the farm”. The
simplicity of this approach is beguiling, but it also comes
with issues:
First, the analysis is purely mathematical and does
not take into consideration the natural and topographical
features of the landscape. The fjords of south Greenland
extent after a fairly random pattern; and since we know
that natural features were often used to define ownership
boundaries in the Middle Ages (e.g., Myhre and Øye
2002:309), the simplicity of mathematically defined the
Voronoi regions is problematic. Second, the Voronoi
regions are of course based on the assumption that all the
points are present, something we cannot be sure of in
terms of the Norse sites, although I have argued for a
general high level of representativity in the Vatnahverfi
region in the above (see section 4.2.4). Third, the
voronoi regions do not consider that some area could
have been commons. However, often such issues are not
more aggravating than they can be resolved – at least on
basic level – by interpretation.
Fig.7.16 displays a voronoi region analysis of the 133
ruin groups in the Vatnahverfi, where regions have been
built around the 45 sites classified as “permanently”
occupied farmsteads in the Vatnahverfi region. Even a
first brief inspection shows that a model as simple as the
voronoi regions captures a notable extent of settlement
cohesion and there are several implications from the
figure:
The model clearly seems to work best in the outer
fjord, which is likely an effect of decreased settlement
intensity in this sub-region to distort patterns. However,
the model also seems to work agreeably in the central
Vatnahverfi region, although there is clearly more
settlement “noise” to distort the picture. However,
lowland farmsteads (E69, E71N/S, E78a/E196, and
E166) match up nicely with complex shielings at higher
altitude (E70, E167, E175, 1104). The correlation model
seems to work most poorly in the northern Vatnahverfi,
except for E64/E209’s upland complex shieling E293
and E60’s two associated shieling simple and small
complex shielings. Notably the three small farmsteads of
E64a, E64b, E64c all seem to lack shielings (although
E168 could relate to E64c). If not a flaw of the
classification- or the voronoi regions models, this lack is
so conspicuous that it would be tempting to search for
shielings in the highlands above these farmsteads, even
though they are fairly steep and high.
Of the 11 farmsteads with no clearly associated
shielings, this can at least in a couple of the cases be
explained by the layout of the fjords, while in other cases
there are shielings lying so close to “territory”
boundaries that they could easily belong to the
neighboring farmsteads. Still, the lack of shielings at
E65, E71a, and E171 in a well-surveyed and presently
settled area is puzzling, and one would be tempted to
view the medium sized farmstead of E71a serving a
similar function of shieling for the manor of E65. In
regard to boundaries, it is interesting to observe how
many of the shielings – especially the complex examples
– lie just on the verge of two “territories”. One
explanation for this distribution pattern could be that the
complex shielings were really small farmsteads, which
one would expect to display a fairly even dispersion, i.e.
occupying land in between other existing farms. Another
explanation could be that the distribution pattern is real
and intentional, i.e. that shielings were located on the
border of farmsteads, perhaps a way of asserting private
ownership boundaries.
Finally, it is also clear from brief visual inspection of
Fig.7.16 that farmstead “territories” increase as one
move out from the inner to the outer fjord. This is not
because the farmsteads in the outer fjord were larger, but
rather because their associated pasture- and resource
land was of poorer quality (see section 3.2.2) and larger
areas were needed to maintain the same number
livestock as in the middle and inner fjord. It serves as
warning that voronoi regions cannot stand on their own
in classifying farmsteads. One interesting aspect of
different settlement patterns in the outer fjords that is
plainly visible from Fig.7.16 is how the shielings shift

204
from being located upland from the farmsteads to being
located at horizontal distance instead. This practice of
horizontal shieling seems the most clear and conspicuous
aspect of outer fjord settlement in the Norse Eastern
Settlement, which I will return to in the below.
The voronoi region model to some extent confirms
the classification of the ruin groups, although there are
clearly also some that fall outside any explainable
pattern. Using the voronoi model as a guideline, the aim
of section 7.2.2 is to explore if these inconsistence can
be resolved by a more traditional interpretive approach
of the farmstead shieling interrelationship.
Fig.7.16 Displays the a voronoi region (Thiessen’s polygons) analysis of the ruin groups functionally classified as farmsteads to compare their distribution with ruin groups identified as shielings. Optimally, these two main site classes should match up, which they do in the majority of cases, thereby certifying the validity of the classification model.

205
Fig.7.17 Farmsteads and associated shielings in the north Vatnahverfi region (conf. text).
7.2.2 FARMSTEAD AND SHIELING INTERRELATION
The issues relating to interpretation of the voronoi
regions were outlined above and section 7.2.2 takes a
more straightforward approach to the model by trying to
functionally match the site classes that are indicated by
the voronoi analysis. In the below, 'voronoi territories'
simply signify the areas indicated by Fig.7.17.
Northern Vatnahverfi region (Fig.7.17):
The northern Vatnahverfi region and the Kujalleq
fjord present two fairly well-defined settlement areas
divided by the near impassable melt water river from the
inland glaciers: on the north side of this river and the
Kujalleq are four farmsteads, two of medium size, one
small, and one large. It appears a fairly simple settlement
layout, where E64 was the dominating church farm and
the nearby E209 a subsidiary farmstead lying in such
close proximity that they should likely be interpreted in
terms of a double- (multiple-) farm. Belonging to this
farm was an upland small complex shieling (E293). It
seems likely that the two medium farmsteads E60 and
E63 were also subsidiary to E64; otherwise it is hard to
explain the presence of such a relatively large farm in
this fairly marginal resource area. E60 had two
associated shielings – one small complex shieling and a
conveniently located forage shieling in between, whereas
E63 seems to lack a shieling.
South of the melt water and the Kujalleq, the
northern Vatnahverfi region is completely dominated by
the church manor of E66, which voronoi territory is
fairly large (Fig.7.17). E66 is a double-farm with the
church manor located on the western of the river and
small farmstead on the eastern. This is, in fact, exactly
the same setup as at E64, only there the ruin groups have
been assigned different numbers although the distances
between the related dwellings at E66 and E64/E209 is
about the same. Part of the double farm E66 was
undoubtedly the large complex shieling E169, which
additionally served as rétt when the livestock of the
church manor had to be rounded up. Again, the setup is
identical to the north side of the Kujalleq.
Moving east from E66, there is quite a distance to the
next farmsteads, which is probably testimony to the great
size of the church manor: on the other side of the sandur,
E64a-E64c form the northernmost part of the chain of
farmsteads that run through the entire length of the
Vatnahverfi; they are all small farmsteads, none of them
with a clearly associated shieling, although seems quite

206
likely that large complex shieling E168 could have
belonged to E64c, while 0901 was the complex shieling
of medium farmstead E67, which appears to have had an
additional associated simple milking shieling (0502). In
support of the latter interpretation is the peculiar and
slightly upland farmstead E75, which is a triple-multiple
farm with three centralized dwellings (which accounts
for its classification as a small farmstead although both
cluster model runs suggest it was a medium farmstead,
cf. Fig.7.11-7.12). The reason that E75 is not associated
with either the closer 0901 or E168, but the instead more
distant complex shieling E72 is that the latter ruin group
is a triple-shieling, i.e. has three identified shieling
lodges (and similarly to E75 should probably be
classified as a small complex shieling, although I have
decided to stay with the cluster analysis in this case). It is
reasonable to assume that this triple farmstead and
shieling was related.
Central Vatnahverfi region (Fig.7.18):
Moving into the central Vatnahverfi region, it overall
appears the most regularly and densely settled area of the
Vatnahverfi region with farmsteads neatly organized
along the length of the central lake basin: from the north,
medium farmstead E68 appears to have no associated or
located shieling, but its voronoi region (Fig.7.16)
extends upland to the north and E169, which could have
been related to it. The next medium farmstead E69 is
clearly associated with small complex shieling E70.
Equally clear is the relation between the double
farmstead of E71 (N/S) and the upland double large
complex shieling E167, which additionally served as a
rétt. The next to medium farmsteads E71a and E171 both
lack shielings and the lake between them seem to
exclude a direct relation between the two. Considering
the blank area from E171 to the next farmstead or
shieling to the south, this lack would appear an artifact
of survey intensity, i.e. there could be an undetected
shieling somewhere southeast of E171. E71a is harder to
explain, but it could have been a subsidiary farmstead to
manor E65, which also lacks any shieling, but is
characterized by a rather large voronoi territory. If truly
a manor, then E71a could be its subsidiary farmstead.
Fig.7.18 Farmsteads and associated shielings in the central Vatnahverfi region (conf. text).

207
The farmstead over is manor E76 – another double
farm – which has four simple shielings within its fairly
large voronoi territory. The special status of this site is
corroborated by the observation that it is one of the
farmsteads to lie at greatest distance from any
neighboring farmstead. The next farmstead along the
coast is medium sized E172, which appears to have had
two associated shielings, of which one was a large
simple shieling and the other a rétt conveniently placed
for rounding up livestock grazing in the hills to the
south. On the other side of the same hills and on the far
side of lake Tasersuaq is a small farmstead, E166, which
seem to have had two small complex shielings; this may
seem too much for a small farmstead, but 1102 consists
only of a single large building and could have been used
at certain shorter intervals, whereas B139 on the other
side of the fjord was intended for longer occupation.
Next along the lake shore is medium farmstead E165,
which appears to have two shielings within its voronoi
territory: one is a herder’s hut/shelter (0602), the other a
large complex shieling across the lake (E78b). The
association with shieling E78b is not quite clear, but
would correspond to the farmstead shieling layout of
E166/B139. In addition, E165 has an associated rétt
conveniently placed for driving of livestock herds along
the lake shore. South and upland from this farmstead is
E164, a medium farmstead with many small livestock
buildings, suggesting that this was a farm based on a
sheep/goat livestock economy, which also corresponds
with its associated rétt and milking station (0602).
At the end of the central Vatnahverfi lake basin lies
large farmstead E78 – with early small church – which
has no apparent associated shieling (unless small
complex shieling E173 near to its southern voronoi
territory boundary had this function). However, the next
medium farmstead E78a lies so close to E78 that it could
– similarly to the other large farmsteads and manors –
have been a directly subsidiary farmstead, which would
also make E78 a double-farm. E78a has no directly
associated shieling although the local sheep farmer
claims that one should be located in the mountains just
above. The last medium farmstead of the central
Vatnahverfi region – E196 – has an associated small
complex shieling (E175) lying upland from the coast.
Yet, the proximity to E78a is unusual; and since the
ruins of E196 are poorly preserved (and registered)
would question the interpretation of this site.
Outer fjord Vatnahverfi region (Fig.7.19):
On the edge of E78’s voronoi territory lies complex
shieling E173, which is an example of a shieling which
probably functioned as a small farmstead at some point.
It is however within the voronoi territory of medium
farmstead E174 with which it is tentatively associated
here. To the north, herder’s hut/shelter seems
conveniently placed for any of the three neighboring
farmsteads. At the very head of the Kangerluarsorujuk
lies medium sized farmstead E182, which has no
shieling within its own voronoi territory. However, if
E173 was the shieling to E174, E331 could have served
this function to E182, although this would be a
somewhat atypical setup. According to the local sheep
farmer at E331, an unregistered ruin group should be
located in the hills above E174, which could change this
picture. Further out the same fjord is medium farmstead
E184, which has a nicely associated dairy shieling lying
a bit inland.
Northwest over the hills from E184 lies E183, a
supposedly medium farmstead (this site was not
surveyed and the existing information on the site is
rather vague), a combined dairy-shieling/rétt lies across
from the farmstead and a small complex shieling up the
valley to the east. At the head of the peninsula are two
sites, one a small farmstead (E120) and the other a
medium (E119), both with diary-shieling nicely situated
within their voronoi territories. On the islands off the
Vatnahverfi peninsula, Akia has a single small farmstead
(E188) with an associated small complex shieling, which
extended further to a milking station (E273); on the other
side of the island is a forage shieling (1001) at a site
which is even still today used for harvesting (meadow)
hay. South on the island of Kangeq is a single medium
farmstead (E181) with two large complex shielings
within its voronoi territory, which appears to be an error
of the model (unless E119 could have had a shieling on
the island in addition to its dairy-shieling E333) or still
missing ruin groups.
The southern part of the outer fjord Vatnahverfi
region is where farmstead-shieling interrelation appears
most persuasive: beginning at the sheltered inlet
Tasiusaq at the very head of the Torsukattak fjord is the
large farmstead E178, which has nicely associated large
complex shieling within its voronoi territory (E179).
There is an extraordinarily long distance to the next
medium farmstead on the head of the peninsula (E190).
This farmstead appears to have two associated shielings:

208
a large simple shieling (E328) within its voronoi territory
and a small complex shieling further into the fjord
(E330) and outside its territory. However, seeing as there
are no other shielings on the peninsula (E327 is an
outfield wall) it is fair to assume that E330 functioned as
a shieling to E190, although further removed than
usually. Across the Torsukattak fjord from E190 is large
complex shieling (E95b) with no apparent farmstead.
This is of course an unlikely scenario and is likely a flaw
with the model, because E326 would aptly locate to be
the diary-shieling to E95b if this was rather interpreted
as a small farmstead. On the other hand, the marginal
setting and poor pastureland of E95b is unmistakable
(see section 3.2.2).
Moving overland from E95b to head of the Akulleq
fjord, one finds first a small farmstead (E95a) and further
out a medium farmstead (E95). The first has no
associated shieling within its voronoi territory, the other
has two; assuming the access and transport would have
been along the coast of the fjord, small complex shieling
E324 undoubtedly belonged to E95a and E325 to E95.
The next small fjord of Serfartusoq has only a single
medium farmstead (E94). Although its voronoi region
suggests that E237 (black point) across land and down to
Alluitsup Kangerlua could have been a shieling to the
farmstead, it is doubtful because E237 was highly
disturbed by the Moravian mission station founded there
in the 18th century and appears a more likely candidate
for a larger site (little information exists on the single
ruin of E237).
The Alluitsup Kangerlua region (Fig.7.19):
At the extreme outer end of this fjord is a small
farmstead (E322) with a nicely associated dairy shieling
across the inlet (E322a). About half way in to the fjord is
the large farm E93 which has a small complex shieling
located agreeably within its voronoi territory (E323). In
the next bay lies medium farmstead E92, which has both
milking station and herder’s hut/shelter within its
territory. Close to where the Alluitsup Paa divides on
two arms is the large farmstead E77a which has large
complex shieling E180 and large simple shieling E311
within its voronoi territory. Located only some 990m
distant, it is not improbable that E190 was instead a
subsidiary farmstead to E77a and E311 its shieling. This
would be consistent with the pattern at the other large
farmsteads and manors (see above). Inland from E77a
lies medium farmstead E77, which has no apparent
associated shieling, which is best explained by the
condition that it simply has not been located yet.
Fig.7.19 Farmsteads and associated shielings in the outer fjord and Alluitsup regions (conf. text).

209
Fig.7.20 Farmsteads and associated shielings in the Sioralik and Amitsuarsuk regions (conf. text).
The Amitsuarsuk region (Fig.7.20):
The western fjord arm of the Alluitsup Kangerlua –
the Amitsuarsuk – is occupied by a single medium
farmstead (E91) with no less than four (almost five)
shielings within its voronoi territory including two dairy
shielings, one milking station and a rétt. This layout with
multiple small shielings is highly consistent with the fact
that the E91 is characterized by many small livestock
buildings, i.e. was a farm based on a sheep/goat
economy. This corresponds well with the surrounding
vegetation, which presents some of the richest and
densest shrub in the entire region (see section 3.2.2).
Although it is outside its voronoi territory, I believe that
E74 could have been the main full-shieling of E91
because a fairly large rétt is located in the southeast
corner of the lake and south of the river, suggesting that
livestock were herded down this lake bank and towards
E91 rather than towards E73. If so, it is possible that the
outfield wall B102 could have marked the boundary
between the territories of E91 and E73.
The Sioralik (Fig.7.20):
In the other fjord arm at the head of the Alluitsup
Kangerlua – the Sioralik – a single medium farmstead
(E90) is found on the shrubby slope at the head of the
fjord. It has several shielings within its voronoi regions
and no less than five small complex shielings and three
simple shielings could have belonged to the farmstead,
which seems an unlikely scenario. E303, E304, and
E305 are all small complex shielings of the classical
upland type, whereas E313 follows the horizontal pattern
of the outer fjord shielings. In this case, the site
distribution pattern is likely a result of chronological
difference. E303-305 could well have been the original
shielings to E90, E399 a closer milking station, E90b a
forage shieling, 0605 a landing place, and the sites
further out the Sioralik related to intermittent sheep/goat
herding. The small complex shieling close to E90 –
labelled E90c – probably replaced E90 after its
abandonment (and of most of its shielings), thereafter
working as a rétt and dairy-shieling, perhaps under E91.
Alternatively, E90 should be a major farmstead, where
many ruins are hidden in the surrounding dense shrub
vegetation.
The Qorlortorsuaq region (Fig.7.21):
The last farmstead in the Vatnahverfi region is the
medium farmstead E73 on the north side of lake
Qorlortorsuup Tasia. This is again a farmstead with
many smaller livestock buildings suggestive of a sheep/

210
goat livestock economy. This also matches the dense
shrub vegetation in the valley. The farmstead has one of
the large voronoi regions in the survey sample and with
no less than seven different shielings. Comparing with
E91 and E90, it seems likely that a very complex layout
with many different shielings was characteristic of
sheep/goat farms in areas with heavy shrub vegetation. It
strongly suggests a high extensive herding strategy,
where herds were moved from shieling to shieling
throughout the year.
7.2.3 SECTION SUMMARY
Having submitted the functional classification model
of section 7.1 to two interpretive approaches, it appears
in general to be fairly accurate in describing overall
settlement patterns: Tab.7.2 lists the farmsteads in the
Vatnahverfi region, the distance to the nearest other (and
more inland) farmstead, as well as to their related
shielings. As seen from the table, it is possible to fairly
confidently match farmstead with shieling in 32 of the
45 examples. In some examples, “missing” associated
shielings are probably to be explained by ruin groups
waiting to be located; this can of course be tested in the
future by surveying areas where shielings appear to be
missing. If this proves successful, the model can perhaps
be used to predict new sites in other settlement areas.
Some of the “missing” shielings can be explained by
the observation that all the middle and inner fjord large
farmsteads and manors (except for E65) appear to be
double-farms, at least accepting that in some cases (E78/
E78a, E77a/E180, E64/E209) subsidiary farmsteads are
located just distant enough to have been given separate
ruin group number. At these double farms there is
always only one associated shieling, which suggests a
setup with a large farmstead/manor, a subsidiary
farmstead, and a shieling which together constituted one
farm unit. In turn, this suggests governance centralized
on the largest farms and manors. It was also noted of the
classification model that some farmsteads had multiple
shielings, which especially seems to have characterized
the inner fjord farmsteads specialized in sheep/goat
keeping in areas dominated by shrub vegetation. Another
key feature demonstrated above is how there existed two
simultaneous shieling systems: one which involved
moving vertically from lowland to highland (in the inner
and middle fjord) and one that involved moving
horizontally along the coast (in the outer fjord). This
settlement layout pattern has not before been implied for
Norse Greenland.
Fig. 7.21 Farmsteads and associated shielings in the Qorlortorsuaq regions (conf. text).

211
However, the above also clearly demonstrates that
the model is not flawless, which is only natural
considering the nature of the evidence. One recurrent
issue arising in the coupling of farmsteads and shielings
is that a few of the large complex shielings seems to
have had their own associated smaller shielings, which
would suggest that the former were small farmsteads
rather than large complex shielings. However, this is of
minor consequence because, as already stated above, this
was expected of the large complex shielings. Thus,
differentiating them from the small farmsteads offers an
opportunity of estimating settlement and population at
different times, i.e. settlement climax versus decline (see
below).
In conclusion, considering the character of the survey
evidence, the settlement classification and –pattern
models outlined in the above appear to work with
considerable reliability, or at least provides one explicit
framework exploring class- and functional site
differences. Such exploration could be furthered by
“tweaking”, adding, or removing parameters, cross-
checking and -testing the various categories and
parameters etc. The material and evidence is similar to
that explored by prior archaeologists; the real difference
is that the evidence is digital, which through data sharing
will allow other research to approach the material from
different angles and with different questions.
One final – and rather conclusive – way of testing the
model is to go into the field to systematically survey for
A) those shielings that appear to be missing; and B)
searching for churches and churchyards at those sites
that compare in size and layout to the identified church
sites. The latter is especially pertinent in the Alluitsup
Kangerlua where a church farmstead has yet to be
identified. According to this model, the most obvious
places to search would be E93 or E77a (although erosion
may have moved any signs of church and churchyard at
the latter). In the central Vatnahverfi region, E65 and
E76 appear the most likely candidates. Leaving this for
future investigation, I believe the model has provided
adequate bases for some higher-level discussions:

212
Tab.7.2 – Farmstead and shieling distances
Ruin group
no.
Distance to next nearest
farmstead (km)
Distance to
associated
shieling (km)
Ruin group no.
Distance to next nearest farmstead
(km)
Distance to associated
shieling (km)
Northern Vatnahverfi Outer fjord Vatnahverfi
E60-E62 3.12 2.10 E174 (E173) 7.18 3.37
E209/64 (E293) 1.97 3.06 E182 (E331?) 3.08 2.07
E66 (E169) 2.91 2.05 E184 (1301) 4.40 1.78
E64b 3.01 - E183 (B136) 4.94 3.35
E64a 2.82 - E120 (E334) 3.56 3.11
E64c (E168) 2.86 2.31 E119 (E333) 1.67 1.03
E67 (0901?) 4.44 2.02 E188 (E273) 9.15 2.41
E75 (E72) 1.96 5.41 E181 (E329) 6.08 2.89
Central Vatnahverfi E178 (E179) 4.57 4.02
E68 1.20 - E190 (E330) 9.35 7.81
E69 (E70) 1.20 1.10 E95a (E324) 4.78 4.5
E71N/S (E167) 3.59 1.91 E95 (E325) 4.85 4.27
E71a 2.13 - E94 4.21 -
E171 1.33 - Alluitsuup Kangerlua
E65 2.51 - E322 (E322a) 3.99 0.81
E76 (E76b) 3.45 0.77 E93 (E323) 5.91 1.48
E172 (E210) 4.81 1.77 E92 (E315) 10.51 1.23
E166 (B139) 3.55 0.8 E77a (E180) 3.6 0.90
E165 (78b) 2.29 2.81 E77 4.18 -
E164 (0602) 2.49 Amitsuarsuk and Sioralik
E78 6.16 - E91 (E74) 4.43 4.51
E78a 1.25 - E90 (E305) 6.05 3.41
E196 (E176) 0.91 1.74 E73 (E170) 5.58 3.62
Tab.7.2 Approximated areas of land enclosed by the infield dykes identified in the survey sample.

213
7.3 COMMUNITY AND HIERARCHY IN NORSE VATNAHVERFI
Having substantiated in the two above sections that
the settlement classification model appears to credibly
describe the main features of medieval Norse settlement
in the Vatnahverfi region, section 7.3 concludes by
exploring some wider aspects and perspectives of the
observed settlement patterns. Three main questions are
addressed; how many people constituted the community
(-ies) of the region and how does this compare to other
areas of the Eastern Settlement? How was the settlement
layout and organization? And how does this reflection
reflect social and hierarchical organization?:
7.3.1 THE NORSE VATNAHVERFI COMMUNITY
Having made probable how many ruin groups in the
Vatnahverfi region were farmsteads and how many were
shielings, a next logical step is to try and estimate how
many people made up this community. Such estimation
relies on the estimated average size of the households,
which is a highly problematic issue, since such numbers
were not recorded in the medieval documentary records.
We do know a little about “household” sizes at the late
medieval episcopal manors in Iceland: in AD 1388 there
were no less than 64 “working people” at Hólar and in
AD 1502 at Skálholt 63 people; the largest aristocratic
farms may have had 40-50 people (Júlíusson 2010:19).
However, these people did not all live under “the same
roof”, but were spread out on subsidiary farmsteads of
the manors. Thus, average households on the latter
farmsteads, and on those of free-holders, would have
been more moderate. A 1703 Icelandic population
census from various districts around the island imply a
mean population of 6.14 person per household
(Vésteinsson 2006:Tab.5.1) Although a low estimate, it
is in fact higher than mean 4.5-5.5 household size
modelled for Medieval Norway around AD 1300
(Pulsiano and Volf 1993:182). The safest approach
seems to be to explore a reasonable range and I suggest
for Norse Greenland a minimum of 4.5 and maximum
7.5 person per household (the latter is the highest district
average in the Icelandic population census, Vésteinsson
2006:Tab.5.1).
45 sites in the Vatnahverfi region survey were
classified farmsteads with a “permanently” occupied
farmhouse; of these three (E66, E76, E171) were double-
farms and one (E75) a triple-farm, summing up to 50
farmhouses in total. With a low estimate of 4.5 persons
per household this corresponds to a community of some
225 souls, or 375 with a 7,5 persons household estimate.
This is a little more than the average population estimate
of 194 inferred from burial densities in the churchyards
(see section 6.2.1). It is, however, not far off the mark,
especially not if recalling that the 225-375 population
estimate reflects the entire Vatnahverfi region. However,
it is unlikely that the grænlendinga living on the
Alluitsup Kangerlua side of the peninsula were buried in
the churches in northern and central Vatnahverfi. Also,
the estimate assumes that the sites were all occupied
simultaneously, which is far from certain. In fact,
archaeo-entomological evidence from GUS suggests
several phases of occupation and abandonment
(Panagiotakopulu et al. 2007). Thus, even if it is
accepted that the large complex shielings could have
functioned as small farmsteads during the peak of
settlement – adding another 21 farmhouses to the
equation (including one double- and one triple large
complex shieling) – a maximum population of some 533
does not significantly change the impression of a very
small community. All in all, the settlement and burial
evidence seems to correlate well.
It is therefore reasonable to extend the population
estimates to the rest of the Eastern Settlement: of the 133
ruin groups recorded in the Vatnahverfi region, only
between 45 to 63 ruin groups are classified as farmsteads
(excluding double- and triple farms), i.e. a shieling to
farmstead ratio of between 1:0.34 and 1:0.47. As
outlined in chapter 5 (cf., Fig.4.19), the total number of
registered ruin groups in 2004 was about 550 (including
the Vatnahverfi region known prior to the Vatnahverfi-
Project). If shielings to farmstead ratios in the latter area
are representative of other parts of the Eastern
Settlement, then only between 187.0 and 258.5 of the
total 550 ruin groups were regular farmsteads.
In a fairly similar calculation by Vésteinsson
(2010:144p) the total number of farmsteads (small and
large) in the Eastern Settlement was estimated at 345, i.e.
somewhat higher than my above estimate. Two reasons
can be given for Vésteinsson’s higher estimate: first that
he adjusts for suspected higher survey intensity in the
central Eastern Settlement and the Vatnahverfi, and
second that he differentiates differently between

214
farmsteads and shielings (see below). However, I believe
that his adjustment for survey intensity is exaggerated: as
outlined in section 4.1.4, O. Bak was highly active in
surveying remote areas of, especially the southern,
Eastern Settlement and the vast majority of the 142 sites
added to the list by him and other after 1960 are not
farmsteads proper, but various types of shielings. Thus,
the later intense surveys in the central Eastern Settlement
that Vésteinsson’s assumes should be subtracted from
the calculation should rather be considered belated
versions of the surveys of Bak in the southern Eastern
Settlement, which implies that farmstead numbers
should, if anything, be adjusted in the other direction.
Retaining that “permanently” occupied farmsteads of
the total 550 sites in the Eastern Settlement numbered
between 187.0 and 258.5, and assuming an average
household size of 4.5-7.5, the total minimum population
in the entire Eastern Settlement can be estimated to ca.
842-1403 persons and a total maximum population ca.
1163-1939 persons. The first estimate seems rather low
on account of the large complex shielings not being
included as farmsteads, which they probably were at the
peak of settlement (see above). Although the high
estimate is more credible, it is still clearly very far from
the 6000 people suggested in the most optimistic
population estimates (see section 2.1.2). In fact, it is
again very close to the maximum population estimates of
N. Lynnerup (1998) of 1400-2200 people if the ca. 90
ruin groups in the Western Settlement is added (i.e. 138-
317 people). The fact that the two population models,
one based on archaeological settlement evidence and the
other on burial densities, are completely independent,
but highly matching, lends credibility to their combined
correctness.
7.3.2 VATNAHVERFI SETTLEMENT ORGANIZATION
As outlined in the introduction, there are relatively
few studies on settlement patterns in Norse Greenland.
However, it is clear from the above analysis that the
basic settlement layout in the Vatnahverfi consisted of
single farmsteads with associated – in several cases
multiple – shielings. This basic settlement layout is
directly comparable to the system of lowland farmsteads
and highland shielings that Keller & Albrethsen (Keller
1983, Albrethsen and Keller 1986, Albrethsen 1991)
observed in the Qorlortup Itinnera, and is known from all
over the North Atlantic. The only difference in the
Vatnahverfi region is that shieling in the outer fjord was
horizontal instead of vertical, i.e. transhumance moving
along the coast. This change is explainable by
deteriorating environmental conditions in the outer fjord,
especially at higher altitudes. Also, as seen from Tab.7.2,
settlement was more dispersed in the outer fjord with an
average distances between farmsteads of 5.22 km
compared to 3.04 km in the middle and inner fjord. In
short, there was more available horizontal space.
In terms of the local settlement layout very few of the
farmsteads seem truly isolated, i.e. there is not one
farmstead from which it is not possible to reach the
neighboring farmstead in an hour or two of walking: in
the north Vatnahverfi region, the average distance
between the farmsteads is 2.89 km, in the central
Vatnahverfi 2.63 km, in the outer fjord 5.22 km, and in
the Alluitsup Kangerlua/Siglufjörðr 5.53 km. Any notion
of (local) isolation is ascribable to unfamiliarity with the
landscapes or a paradigm of arctic marginality; it is
possible to walk from one side of the Vatnahverfi region
to the other in about half a day, which the local sheep
farmers do regularly for coffee visits! Still, overall
settlement densities in the central Vatnahverfi are similar
to the most dispersed settlements areas historically
recorded in Iceland (Vésteinsson 2006:Tab5.1), and
settlement in the outer fjord and Alluitsup Kangerlua/
Siglufjörðr considerably more dispersed.
Staying with Icelandic parallels, O. Vésteinsson has
argued (Vésteinsson 1998:19p, Vésteinsson et al.
2002:117p, Vésteinsson 2006:109) that settlements there
came in three basic types: A) large clustered or complex
settlements, B) large simple settlements, and C) planned
settlements. Briefly summarized, A) was farmsteads first
established on prime agricultural lands with access to
meadows and other natural resources, and which later
turned into large estates and parish centers with a large
number of associated cottages at the edge of their
property. The large simple settlements B) reflected a
second wave of colonizers, who occupied the next best
farmlands with less access to meadow, but decent access
to pastureland and other resources. Central to such a
holding was a large farmstead, often with a small church
and with 1-3 cottages located on its periphery. Planned
settlements C) constituted the final stage in subsequent
settlement development, where the agriculturally poorer
valleys which had to first be cleared of shrub and lands
improved before it could sustain small single-household
cottages under the authority of the chieftains on the first
two types of settlement. Vésteinsson et al. (2002)

215
suggested that similar settlement layouts characterized
Greenland, but were hesitant to specify. However, based
on the above analysis, I think there is good reason to take
up their idea of such a settlement model in the
Vatnahverfi region, where settlement patterns appear
similar to the first two Icelandic types, only adjusted to
the local Greenlandic topography and environment. Yet,
as this hypothesis rests on hierarchical distinctions I
delay this discussion to section 7.3.3.
In terms of overall settlement patterns, Roussell
based on his own archaeological investigations, and
probably also the written accounts, assumed that the first
pioneer farmers had claimed the best agricultural areas in
the inner fjords, which ever since constituted the core of
the settlements (Roussell 1941:12). Nuancing this settle-
ment layout, C. Keller introduced (1991:31p) the idea
that there existed two separate concentration of settle-
ment, one in the inner fjord and one in the middle fjord,
each with their own churches (Ibid.Fig.1). The settle-
ment concentration in the middle fjord was aimed at
exploiting marine resources, whereas the settlement
concentration in the inner fjord was more agrarian; and
through economic exchange and interdependence these
two settlement areas could exploit the different environ-
mental niches, claimed Keller (Ibid.32).
There is nothing in the new Vatnahverfi evidence to
directly oppose Keller’s idea. However, it should be
remembered that the new dates from E78 (J. Arneborg,
unpubl. data) suggest that E78 was closed down around
AD 1250. This would imply that at least in the
Vatnahverfi region, political and probably economic
authority shifted towards the inner fjord at the very same
time that the grænlendinga were becoming increasingly
dependent on seal (Arneborg et al. 2012a:121p). This is
also implied by the circumstance that all the farms here
classified as manors are situated towards the inner fjord.
Although Keller’s idea should probably not be
completely rejected, I suggest that the concentration of
church farmsteads in the middle fjord, which is only
truly dominant in the southern part of the Eastern
Settlement, has another simpler explanation: south of
Igalikup Kangerlua/Einarsfjördr, the heads of the fjords
do not present the same favorable conditions for cattle
based farming as in the central Eastern Settlement.
Rather, as in the Alluitsup Kangerlua/ Siglufjörðr, these
inner fjord areas are dominated by rich shrub vegetation
better suited for sheep/goat husbandry, i.e. as implied for
the farmsteads in the Amitsuarsuk and Sioralik. I instead
suggest that the placing of church farmsteads in the
middle fjords was probably more determined by the
decent pasturage and meadows often found there.
7.3.3 SETTLEMENT HIERACHY IN THE
VATNAHVERFI
With this final section of chapter 7, we return to the
question posed in its introduction, i.e. who could claim
authority and governance over the Vatnahverfi and its
community? This is of course a difficult question, and
one that depends on interpretation of the above site
classification in terms of hierarchy. Although the labels
of the site classes (cf. Tab.7.1) – especially the large
ones – are strongly indicatory of hierarchical distinction.
I have so far refrained from commenting on what these
distinctions means in terms of hierarchy, but this issue
must be addressed in order to answer the final question:
excluding sites classified as shielings in the above, there
are five classes of farmsteads to consider (where the
small farmsteads could include large complex shielings):
Naturally, there have been earlier discussions of site
class differences and hierarchy (Roussell 1941:189,
Keller 1989:168, p306p). However, a more thorough site
ranking system was developed by T.H. McGovern on the
basis of combined zoo-archaeological and architectural
records, mainly from the Western Settlement (McGovern
1985, McGovern et al. 1988, McGovern 1991, 1992a).
Comparing his ranking model with the above, they seem
to correspond fairly well: beginning in the upper stratum
of society, the farmsteads classified as church manors
correspond quite directly to McGovern’s ranks 1-2, the
only difference being that I have not separated
Igaliku/Garðar (E47), although I fully agree with him on
the uniqueness of the episcopal see (and its supposedly
related E59). However, there is no equivalent in
McGovern’s model to the farmsteads here classified as
large. While this could be an error within the
classification model, it could perhaps also be explained
by the absence of this type of farmstead in McGovern’s
sample, or perhaps even generally in the Western Settle-
ment? His rank 3-4 rank farmsteads correspond to those
classified as medium and small farmsteads (and large
complex shielings. Thus, there is no conflict between the
two farmstead ranking models, the main advantage of
the present one simply being that it can be extended to
farmsteads that have not been excavated.

216
Recently O. Vésteinsson has proposed a simpler site
class differentiation between permanent farms, minor
farms, and other sites (Vésteinsson 2010:Tab.2).
According to his description of the site classes, his
permanent farms appear to correspond to all the site
types here classed anywhere between large complex
shielings to church manors, whereas his minor farms
correspond to the small complex shielings, and his other
sites to the various types of simple shielings. It should be
noted that in this study Vésteinsson was not attempting
to produce a hierarchical model, but only to establish
how many farms belonged to the individual parish
centers. In light of the above analysis, there can be little
doubt that Vésteinsson’s minor farms – which he also
holds functioned as “short-term experiments or as
cottages” (Ibid.144) – are really small complex shielings.
Otherwise, there is little conflict between the two models
that simply have different agendas.
However, site rankings such as the above are relative
and have no direct historical implications, i.e. do not
clarify what types of farmsteads they really were within
medieval societal organization. This may be approached
by viewing the farmstead classes (cf. Tab.7.1) as a
ranking system: standing out as the single church manor,
there is no doubt that Igaliku Kujalleq/ undir Höfða was
the magnate farmstead of the region, i.e. a parish center
with supra-local authority and economy, at least in a
later stage of settlement (see below). Reviewing the
voronoi regions in Fig.7.16, it seems quite probable that
the adjoining small and medium farmsteads E64a, E64C,
E67, E75, and perhaps also E68 and E69 – with their
associated shielings – could have been subsidiary
farmsteads or cottages to E66. Since E66 in addition was
a double-farm, it would fit well the characteristics of an
estate and large complex settlement (see above); the
fairly large distance to the subsidiary farmsteads is
explainable the sandur that divides the area in two. On
the other side of the Kujalleq is large farmstead with
small early church E64, which has three associated
smaller farmsteads or cottages, which would make it a
perfect example of a large simple settlement
(Vésteinsson’s type B, see section 7.3.2).
Moving into the central Vatnahverfi, the next large
site is the – somewhat uncertain – manor E65, which has
two smaller farmsteads or cottages adjoining its voronoi
territory (E71a and E71N/S). Again, this would make
E65 a good example of a large simple settlement. The
next manor is E76, which is surrounded by multiple
shielings as well as number of smaller farmsteads (E71a,
E166, E171, E172) that could have been cottages under
this major farmstead. The fact that E76 has no identified
church could simply mean that it was established slightly
later than the other church sites. This, and its layout as a
double farmstead, would seem to make E76 something
in between the Icelandic large complex and large simple
settlement (Vésteinsson’s type A) and-B), see section
7.3.2). The next large farm E78 fits perfectly the
description of large simple settlement with smaller
farmsteads evenly distributed around its periphery and
two (E78a, E196) more closely related. It seems to have
been a larger holding than E64, which may explain why
it managed to hold on to its church function for a while
longer (see below).
Moving out into the outer fjord, the two large
farmsteads E178 and E93 seem quite perfectly located to
dominate the entire sub-region of more scattered small
farmsteads or cottages. They both seem to be examples
of large simple settlements. Moving into the Alluitsup
Kangerlua/Siglufjörðr, the next large farmstead over is
E77a, which is again surrounded by a number of smaller
farmsteads, and was perhaps even a double-farm (see
above). This makes E77a another good example of a
large simple settlement. As to the farmsteads in the
Amitsuarsuk and the Sioralik, the pattern is less clear
and this might simply have been small independent
farmsteads.
If this interpretation model is valid, then only 8-10 of
the farmsteads in the Vatnahverfi region would have
been independent, which makes nearly all the farmsteads
classified as medium and small the homes of cottagers
and tenants. While this may seem an excessive number,
it is a rather striking pattern in Fig.7.16 that apart from
E66 and E64, which may be explained by natural
topography (see above), direct interface of the voronoi
regions of the large farmsteads or manors is either non-
existent or very small, i.e. a settlement pattern strongly
in favor of the above interpretation of the site classes.
Neither is it inconsistent with settlement layout in
Iceland, where it has been estimated that in 11-12th
century there were about 3300 householders under the
authority of some 730 estates (Vésteinsson 2007:131),
i.e. 1 estate to 4.5 subsidiary farm. According to the
classification model for the Vatnahverfi region there are
8 large farmsteads or manors to 37 small or medium
farmsteads, i.e. one independent farm to 4.6 subsidiary
farmsteads. This would suggest an almost identical land

217
tenure system in Greenland. If so, there is amble reason
to suspect that the Greenlandic land tenure system was
built on the same foundation as the Icelandic system, i.e.
the renting of livestock (Ibid.131). This, in turn, would
explain why the largest farmsteads are characterized by
their large cattle grazing enclosures: the reservoir
function of these large farmsteads were perhaps not so
much meant to sustain settlement as it was to sustain and
fortify their own status and authority. The apparent lack
of planned settlements (Vésteinsson’s type C), see
section 7.3.2) in the Vatnahverfi region seems a likely
result of low population densities: there were probably
never enough people to ever warrant the need, and
provide the labor, for extending settlement into more
marginal areas.
On a concluding note, while these settlement patterns
seem very persuasive they have so far failed to consider
chronology and change. Also, the settlement pattern with
several large farmsteads is somewhat in conflict with the
documentary record that a single large farmer, or that the
cathedral, owned all of Einarsfjörðr (see the introduction
to chapter 5). As to the first issue, it has already been
pointed out how the two other churches in the
Vatnahverfi were taken out of use, E64 around AD 1200
and E78 about half a century later (J. Arneborg unpubl.
data, Tab.8.2). Again, this is strongly suggestive of a
growing centralization gathering on the parish center of
undir Höfða (E66), which perhaps gave this farm the
means to construct a large gothic style church around or
after AD 1300. It is not unlikely that E64, along with its
cottages, thereafter became a subsidiary farm to E66,
whereas E78 maintained its position as a large
independent farm. At least, the infield dyke registered at
this farmstead suggests that it was still a farm of some
means and status. That no church has been identified at
E76 or E65 could owe to lacking archaeological
identification. However, an even more convincingly
scenario would be that there was still room for a certain
extent of social mobility and that these farmsteads
prospered after the habit of building small churches at
the farmsteads was abandoned. Both these manors are
characterized by having a double-sheep shed, which as
discussed in section 7.2.3 appears to be a late feature.
Thus in conclusion, the question asked in the
introduction may be answered with both yes and no: yes,
the first landnámsmen may have claimed the whole
territory of the Vatnahverfi, but other farmsteads later
grew in wealth and prosperity. And yes, the church
(manor) later became the major landowner in the district,
but again probably supported by a few independent
farms.

218
8. PASTURES FOUND… FARMING IN GREENLAND (RE)INTRODUCED
‘Summer pastures are everywhere, especially outside the coastal areas, so abundant that there is sustenance for thousands of sheep and a not insignificant number of cattle.
ʻWith Icelandic conditions in mind Sigurdsson asserts that there are pastures in Greenland, which can supply just as much and valuable grazing as 15,000 of Iceland’s rural population use now, in other
words, that Greenland’s entire population, in terms of pasture, can subsist solely on animal husbandry'.
Therefore the cultivation and exploitation of Greenland’s soils by Danish initiative and by Danish citizens is not only an economic concern, but equally a concern of national importance.'
(au. trans after Bendixen 1927:89, 91, 105)
The above excerpts are part of the concluding results
of a field investigation in 1925 that evaluated the
qualities of Greenland as 'pioneer country' for livestock
farming (Bendixen 1927). Just as in the report of E.
Thorhallesen (see the introduction to chapter 4) some
150 years earlier, such prospects were portrayed as very
favorable indeed, and very much at odds with the
perceived marginality of the Greenland settlements. And,
just as Thorhallesen, the author of the latter report –
settlement deputy O. Bendixen – held that reintroduced
farming in Greenland had to involve resettlement of the
Norse farms by Scandinavian farmers (Ibid.102 and
above). This is surprising since locally based sheep
farming had already been introduced in 1906 and, at the
time of Bendixen’s report, was rapidly expanding, not
through involvement of Scandinavian farmers, but
through local Inuit pioneers. Key in their success was the
targeted resettling and exploitation of primary Norse
farmlands. This was just what Bendixen called for, and
the reason that he devoted an entire chapter of his report
to descriptions of Norse farmsteads and farming
practices. Thus, traditions of farming in Greenland –
separated by a 400 year intermission – continued to
interconnect.
However, although the two farming traditions were
certainly related, they should not be thought of in terms
of direct continuity, but rather in terms of parallel
traditions: some aspects were shared, i.e. the livestock
and environmental settings and confines, other aspects
were not: the TEK, the tools and implements of farming,
the economic context etc. The latter of course changed as
farming matured throughout the 20th century. Chapter 8
aims to review aspects of the archaeological settlement
evidence from the Vatnahverfi region against the
comparative case study of pre-modern Inuit sheep
farming in the same region of South Greenland. It is
argued that this case study provides a guideline for the
functional interpretation of the settlement evidence and
for pinpointing the farming potentials and confines of
this special environmental setting, i.e. approaching
Greenlandic farming system-environment dynamics
from a farmer’s perspective.
Chapter 8 first presents a historic overview of the
redevelopment of farming in Greenland. The overview is
not extensive, but simply the outline needed to establish
similarities and differences over time between the two
farming traditions, and to mine for those comparative
aspects that may realistically be explored against the
archaeologically induced settlement and farming
evidence from the Vatnahverfi region and Eastern
Settlement. The second part of chapter 8 discusses
comparative aspects of farming in South Greenland:
settlement expansion and decline, fields and forage,
herding strategies, and intensive versus extensive
farming practices. Chapter 8’s third section brings all of
these comparative perspectives together in a summary
discussion of the combined evidence in terms of
resilience and human securities.

219
8.1 A BRIEF HISTORY OF FARMING IN GREENAND 1721-2006
Fig.8.1 Prospect of the Juliaanehaab Colony – todays Qaqortoq – about 1830. During the era of colonial era, farming in Greenland was mainly limited to gardening (fenced in gardens to the left) and keeping a few heads of livestock, mostly cattle and goats (right of the large colonial building) (water-color by J.M. Mathiesen 1800-1860).
Providentially, renewed farming in Greenland,
especially after 1906, makes for a very well described
comparative case study: because the endeavors of early
Inuit farmers received much attention by colonial
Denmark for both economic and social reasons, the
development of farming is richly documented and
commented: first by a number of local or visiting
observers and stakeholders, as well as local farmers, later
by more systematic surveys and studies carried out and
published in connection with professionalization and
intensification of farming. Also, issues and advances in
farming were frequent topics in Greenlandic newspapers,
which often provide firsthand accounts to supplement to
the more academic sources.
However, section 8.1 is nowhere near an attempt to
describe and summarize this documentary evidence in its
entirety: rather, I here outline in brief the development of
renewed farming in Greenland divided on three main
periods: colonial farming 1721-1906, pre-modern
farming 1906-1976, and mechanized farming 1976-2006.
Since the period of pre-modern farming is the most
potent comparative case study – the aspects of which are
explored in section 8.2 – I devote more space to the
historic outline of that period. Finally, as the history of
pre-modern sheep farming in Greenland in itself presents
an excellent example of adaptive change in response to
environmental impacts – and crossed thresholds – I take
up this issue in terms of resilience and adaptive cycles
specifically in section 8.3.

220
8.1.1 COLONIAL FARMING – 1721-1906
Colonial farming began soon after H. Egede’s arrival
in the Nuuk fjord in 1721; and as colonies, trading posts,
and mission stations were established along Greenland’s
West Coast, European livestock and garden crops were
reintroduced. Fairly little is recorded about farming
activities and practices in this period, but there is enough
retrospective accounts to outline a general picture (e.g.,
Erslev 1877, Rink 1877:93p, Meldorf 1906, Jespersen
1915, Bendixen and Bobé 1921, Ostermann and Porsild
1921, Andersen 1969, Gad 1969:557p, Kleivan 1983):
Clearly, to speak of farming on any significant scale
during the period 1721-1906 would be an exaggeration.
By all accounts, it was a very subsidiary activity upon
two domains: keeping a small number of livestock
(cattle, horses, pigs, chickens, sheep, and quite a few
goats, Fig.8.2); and small-scale gardening (cultivating
chervil, cress, lettuce, radishes, parsley, leek, and turnips
etc., Fig.8.1). Both activities only served to supplement
imports and locally recovered foods, as well as probably
to provide colonists with “a taste of home”. Such cultural
motivation would at least explain why these farming
activities were attempted, and most often succeeded,
well beyond the arctic circle (Ostermann and Porsild
1921:113, 465). Even sheep and goats could apparently
be kept and fed with no excessive difficulty far up
Greenland’s West Coast. The latter is, however, likely a
greater testimony to the low livestock numbers involved,
since the gathering of fodder did not entail any form of
cultivation, but relied on that which could be procured
from “naturally” lush areas in the landscape, i.e. former
Norse and Inuit habitation sites (Bruun 1895b:322,
Walsøe 1919:37, Bendixen 1927:49). Livestock was kept
mainly for a small outcome of milk and meat (Knuthsen
1906:45, Jespersen 1915:76, Bentzen 1920:35, Bendixen
1927:48, Kammp 1964:85). However, a few domestic
animals bones found in Inuit archaeological contexts
(Gulløv 1997:40) Møhl 1997;497) could also suggest
limited trade or exchange.
Fig.8.2 Numbers of cattle (blue), goats (red), and horses (green) in Greenland in the period 1855-2006; dashed line implies years with no counting (data after: Rink 1877, Steenstrup 1881, Bruun 1895, Meldorf 1906, Knuthsen et al. 1906, Jespersen 1915, Bendixen 1921, Hansen 1926, Danmarks statestik, Statistisk Årbog 1928-1985, Grønland: statistisk årbog 1970-2006).
0
50
100
150
200
250
Livestock Numbers in Greenland, 1855-2006
Cattle Goats Horses

221
Fig.8.3 The number of sheep in Greenland 1855-2006; dashed lines imply years with no counts. Because most of the annual counts were made at the end of the year and after the slaughtering of lambs (at least after 1951), the given numbers mostly reflect the numbers of ewes and the summer maximum sheep population would have been substantially higher (data after: Chemnitz 1920, Walsøe 1918, Bendixen 1921, Kammp 1964, Hansen 1926, Danmarks statestik, Statistisk Årbog 1928-1985, Grønland: Statistisk Årbog 1970-2006).
Between 1721-1906, there were only two places in
Greenland were farming was practiced on a larger scale:
at Igaliku/Garðar (E47) where A. Olsen (see section
4.1.1) had reestablished farming in 1780-1782 (Rink
1877, Bendixen and Bobé 1921:96p) and the outpost of
Narsaq – close to Norse Dýrnes (E18) – where cattle
farming was taken up in the 1880’s (Bendixen and Bobé
1921:460). There are few sources describing farming at
Igaliku and Narsaq, but cattle seems to have been the
primary livestock at both places, although at Igaliku
there were also some sheep (Rink 1877:96p, Bruun
1895b:252p, Giesecke 1910:32). Because of the early
archaeological, geological, and geographical surveys in
the Eastern Settlement (see section 5.1.1-5.1.2) in South
Greenland, it is possible to roughly trace the numbers of
cattle and other livestock at Igaliku, Narsaq, and the
colonies for a later part of the 1721-1906 period:
Fig.8.2 displays the total numbers of cattle, goats, and
horses in Greenland in the period 1855-2006. Reviewing
here only the period up to 1906, it is clear that cattle
numbers lay fairly steadily around 40-50, since part of
the visible fluctuation is an artifact of uncertain and
unsystematic population counts. However, part of the
fluctuation can also be attributed to the irrational mode
of farming, in which little winter fodder was produced
and the cattle simply slaughtered if they could not be fed
(Rink 1877:97). Still, considering that most, if not all, of
the cattle in this period descended from five heads of
cattle imported in 1782 and 1784 (Ibid.96), and that
cattle farming from this small stock was successfully
practiced over some 150 years, does call into question,
or at least moderate, the acuteness of retaining livestock
reservoirs, a function suggested for the largest Norse
church manors and farms (see above and: e.g.,
McGovern 1992a:212p, Dugmore et al. 2012:3659).
0
5000
10000
15000
20000
25000
30000
35000
40000
45000
50000
18
55
18
59
18
63
18
67
18
71
18
75
18
79
18
83
18
87
18
91
18
95
18
99
19
03
19
07
19
11
19
15
19
19
19
23
19
27
19
31
19
35
19
39
19
43
19
47
19
51
19
55
19
59
19
63
19
67
19
71
19
75
19
79
19
83
19
87
19
91
19
95
19
99
20
03
Number of sheep (ewes) in Greenland, 1855-2006

222
Before 1906, about 100 goats and 20 sheep were kept
throughout Greenland (cf. Fig.8.2-8.3). Seeing that there
were generally double the number of goats to cattle, it is
surprising that when the debates on renewing farming
stirred towards the close of the period, emphasis was on
cattle rearing, not goat herding (e.g, Knuthsen et al.
1906, Meldorf 1906, Jespersen 1915, Simony 1918). It
almost appears to reflect a cultural predisposition similar
to that of the Norse, i.e. stressing both the economic- and
sociocultural value of cattle husbandry. In any case,
when large-scale farming eventually was renewed in
Greenland, it involved neither cattle nor goats, but sheep:
8.1.2 PRE-MODERN FARMING – 1906-1976
The initiation of the period of pre-modern farming
can accurately be set to 1906: this year reverend Jens
Chemnitz in Narsaq Kujalleq/Frederiksdal (E223) at the
head of the Narsap Saqqaa fjord and only some 50 km
from the Cape Farewell – i.e. the southernmost part of
the Eastern Settlement – received 2 rams and 9 lambs of
Faroese stock, replenished in 1908 by another 8 sheep
(Chemnitz 1920:30, Bak 1970a:370). Although a Dr.
Deichman in the Qaqortoq (Julianehaab) colony had
from 1904-1907 imported a few sheep of Scottish breed
(Walsøe 1919:42), Chemnitz’ 1906 sheep shipment
represented a new and more organized initiative: for he
received them on behest of the Danish governmental
department concerned with Greenlandic affairs in order
for him to conduct an actual sheep breeding experiment
(Chemnitz 1920:30). This marked the onset a new era of
farming in Greenland: specialized sheep farming, at first
modestly subsidized by the Danish government.
J. Chemnitz’ efforts showed promising results and in
1915 a more comprehensive sheep farming experiment
was instigated by government initiative (Walsøe 1936):
this year, Lt. L. Walsøe founded a sheep breeding station
in Qaqortoq and brought in 170 sheep from northern
Iceland. In addition, Walsøe also took over most of
Chemnitz’ Faroese flocks, which had grown to some 60
animals. Chemnitz was allowed to keep seven sheep,
which four years later had already increased to around
50 (Chemnitz 1920:32, Walsøe 1936:167). Except for a
few rams later imported from Iceland (Austrheim et al.
2008:49), the present Greenlandic sheep population all
descent from these first ca. 230 sheep.
Although the sheep flock of J. Chemnitz had grown
rapidly and sheep numbers were to increase even more
dramatically, the first expansive phase of pre-modern
farming after 1915 and up until the mid-1920’s was
characterized by a steady, but fairly slow increase in the
sheep population (Fig.8.3). There was even a slight
decline from 1922 to 1923, the first winter to clearly
affect sheep numbers. The initial slow increase in the
sheep population was due to the sheep breeding station
first having to consolidate: in the beginning, the station
would work as a stock reservoir and once sheep numbers
were sufficiently high, animals should be distributed to
able local Inuit at no immediate cost. In return, however,
they were to repay the sheep breeding station an equal
number of yearlings within 3 years (Hansen 1926:73).
Also, the sheep breeding station was to educate local
Inuit in farming and to aid in the construction of stables
and barns. Initially, sheep were given only to the places
were livestock was already being reared, i.e. Igaliku and
Narsaq, which soon showed good results and aroused the
attention of many locals (Walsøe 1936:161p).
Thus, the way was paved for a second expansive
phase of pre-modern farming that can be described as
Greenland’s second landnám: the reclaiming of principal
Norse farmlands in the inner fjords of South Greenland.
Apart from Igaliku and Narsaq, these fjord areas had not
seen permanent occupation since the Norse, because the
seal- and fish based subsistence economy of the Inuit
prevented them from staying in the inner fjord over the
winter. However, in 1924 O. Frederiksen – a former
apprentice at the sheep breeding station – moved to
Qassiarsuk/Brattahlið (E29a) with his family and 145
sheep to subsist solely on sheep farming (Ibid.:163). The
choice of site – one of the largest Norse farms – was not
accidental, but a clear testimony to the careful selection,
and limited extent, of the primary niches for farming, i.e.
those formerly occupied by the grænlendinga. By 1935,
sheep numbers had risen to 6691 individuals (Fig.8.3)
and farming was practiced as a primary means of living
at around 24 locations in South Greenland, as well as by
a few farmers around Arsuk and Nuuk (Ibid. 170). In the
latter area, a new sheep breeding station was established
1932 to promote sheep farming, but it never seriously
caught on (Christiansen 1963:8, Kammp 1964:90p).

223
Fig.8.4 Number of sheep owners in Greenland at intervals in the period 1936-2006. Blue columns show total number of sheep owners, whereas the red columns show only those with sheep farming as their main occupation. Note the rapid decline in sheep owners after 1947 (data after: Walsøe 1936, Christiansen 1963, Grønland: Statistisk Årbog 1970-2006).
The period 1924-1948 thus witnessed rapid growth in
both the number of both sheep and -farmers in
Greenland (Fig.8.3-8.4). This increase owed partly to the
larger and more specialized farms established in the
inner fjords, and partly to an upsurge in the number of
sheep owners living further out the fjord, who combined
sheep rearing with fishing and sealing. By 1947, they
made up more than three thirds of the sheep owners in
South Greenland (Fig.8.3). The increase in such part-
time sheep owners was undoubtedly stimulated by a
need to be self-supporting in Greenland’s isolation from
Denmark during World War II, as well as by generally
favorable conditions for extensive sheep farming (see
below). Although the number of part-time sheep owners
declined steadily after 1948 – while sheep owners with
farming as their main occupation staid constant –
combined fishermen/farmers even by the early 1960’s
still constituted close to a third of all sheep owners
(Fig.8.4) in Greenland.
After the critical winter of 1966/1967 this changed
drastically: although harsh winters had caused minor
sheep population setbacks in 1932-1934, 1937-1938, and
especially in 1948/1949 and 1956/1957, sheep number
had generally increased: in 1966 they reached a thitherto
peak of just below 48.000 ewes (Fig.8.3). However, the
catastrophic winter of 1966/1967 more than halved that
population; another harsh winter in 1971/1972 brought
sheep numbers even lower, and with the catastrophic
winter of 1975/1976, the total sheep population had been
brought to a low it had not seen since before World War
II.
Notable oscillations also extended to the number of
other livestock (Fig.8.2), but for various reasons. Part of
the visible fluctuation after 1906 owes to their numbers
generally being so small that minor decreases or
increases appear fairly marked. However, some of the
fluctuation in their number must be ascribed to actual
change: from being the most numerous livestock in
Greenland through the entire period of colonial farming,
goats quickly declined in numbers after 1919 and
continued to do so until their total disappearance in 1957
(the marked increase after 1925 seems to be an artifact,
probably of faulty or varying method of counting
numbers). The only stated reason for the decline in goats
is that the Inuit seems to have had little liking for goat
milk (Jespersen 1915:78).
In contrast, the number of horses displayed an almost
directly opposite trend: they increased with the
resettlement of the inner fjord areas after 1924, where
they were used for transport and draft. Until 1948, the
increase appears to have been steady, but the winter of
1948/1949 broke this profile, where after horse numbers
fluctuated even more frequently and noticeably than the
sheep numbers (cf. Fig.8.2-8.3). The fluctuation in
number of horses is unsurprising, since they were herded
even more extensively than the sheep. Cattle numbers
were fairly stable up until World War II, around which
time there was a minor intensification so as to be self-
supplied during Germany’s occupation of Denmark
(Christensen 1946:149). Cattle numbers peaked in 1948
with 98 heads across Greenland, but the winter of
1948/1949 also broke that positive curve. Although
cattle numbers grew again during the early 1950’s, they
never recovered and after the winter of 1956/1957
declined steadily until their, preliminary, disappearance
in 1974.
0
50
100
150
200
250
Number of sheep owner in South Greenland, 1935-2006
No. sheep owners

224
Fig.8.5 The aggregate area (in ha) of cultivated land in Greenland at intervals 1928-2006. Noticeable is the initial slow increase in the cultivated area, which persisted throughout the entire period of pre-modern farming. However, attempts at increasing the cultivated area after the catastrophic winter 1966/1967 are also evident (data after: Walsøe 1936, Christiansen 1963, Heerford et al. 1980, Grønland: Statistisk Årbog 1970-2006).
The isolation from Denmark during World War II
also resulted in small-scale diversification of farming
traditions in Greenland: a few farmers experimented
with pig-keeping, but it never caught on; registered
numbers never exceeded nine and after 1952 pig-keeping
was completely given up (Christensen 1946:148, 152,
Danmarks statestik, Statistisk Årbog 1945-1952).
Chickens were being raised at many of the new Inuit
sheep farms, a production that also intensified during
World War II (Christensen 1946:152, Jensen 1951:68);
in 1952 there were about 2500 chickens in Greenland
(Danmarks statestik, Statistisk Årbog 1952), but
thereafter they declined steadily in number until the 157
registered in 2006 (Høegh 2007:4). Besides the classical
breeds of domestic livestock, pre-modern farmers in
Greenland also experimented with raising rabbits, geese,
and reindeer (Hansen 1926:75, Christensen 1946:170,
Kammp 1964:75), of which only the latter production
has proven successful. However, none of the above
livestock experiments have any significance on our
understanding of Norse farming and practices.
The boom-and-crash progress renewed farming in
farming – which affected especially sheep farming, but
also to some extent cattle and horses – is fairly easy to
explain: throughout the first two phases of pre-modern
farming – and indeed all the way up the critical winter of
1975/1976 – farming practices were markedly extensive,
i.e. relying mainly on all-year outside grazing with
limited winter fodder supplements (Jensen 1951:70,
Christiansen 1963:7, Heerfordt et al. 1980:7p, Austrheim
et al. 2008:48). This extensive mode of production did
not owe to lacking knowledge. In fact, already the first
sheep farmers were acutely aware of the importance of
procuring sufficient winter fodder (e.g. (Knuthsen
1906:48, Hansen 1926:76, Bendixen 1927:89, Walsøe
1936:160). However, although Norse infields were being
re-cultivated to meet this end, they were done so
unsystimatically (Knuthsen et al. 1906:51, Christensen
1946:152, Jensen 1951:71p, Christensen 1955:149p);
and even by the mid-20th century, sheep farmers still
relied on the procurement of fodder from dispersed plots
in the fjords with “naturally” rich vegetation, foremost
the still unoccupied Norse sites (Walsøe 1919, Bentzen
1920:34p, Jensen 1951:71, Christensen 1953,
Kristiansen 1955:464, Kammp 1964:86). This laborious
work was carried out by foot, with horses, or small boats
(Jensen 1951:71, Kristiansen 1955:464p).
Comparing the number of sheep owners (Fig.8.4), the
number of sheep (Fig.8.3), and the aggregate cultivated
area (Fig.8.5) up till 1960’s there was a clear imbalance:
for while the former two had increased dramatically, the
aggregate area of cultivated land had not. Naturally, it
became increasingly hard to procure enough fodder as
sheep numbers increased and more farmers (and sheep)
were competing for the same natural resource areas (e.g.,
Christensen 1946:152, Jensen 1951:71); and when the
critical winters set in – as they had done earlier – their
impact on sheep losses were proportionally higher, i.e.
truly catastrophic winters. Thus, from the critical winter
of 1948/1949 it became increasingly clear that the
persisting farming system was highly unstable and with
the catastrophic winter of 1966/ 1967, pre-modern sheep
farming in Greenland went into its third reorganizational
phase.
0
100
200
300
400
500
600
700
800
900
1000
19
28
19
62
19
63
19
72
19
77
19
88
19
90
19
92
19
94
19
96
20
01
20
02
20
03
20
04
20
05
20
06
Aggregate cultivated area (ha) in Greenland, 1928-2006

225
The solution was to cultivate more land to grow more
winter fodder. But the remoteness of, and logistic issues
with, farming in the fjords of South Greenland slowed
this process: it was not until the 1950’s that two tractors
were purchased by the sheep breeding station, which
local farmers could then hire cheaply to expand their
infields (Christiansen 1963:10, Kammp 1964:87p,
1967:108). In addition, the sheep breeding station was in
1956 moved to Upernaviarsuk halfway into the Igaliku
Fjord – Norse ruin group E82 – where there was space to
expand cultivated fields for a surplus fodder production,
which would – at a cheap price – serve as a fodder
reservoir for sheep farmers in need (Kammp 1964:85p).
Still, as displayed in Fig.8.5 the increase in aggregate
cultivated land was still slow before 1976/1977 and was
outmatched by the still high number of farmers and
sheep (cf. Fig.8.3-8.4) relying on extensive farming.
Although the harsh winters were thus bound to take
their toll, they did not affect all sheep farmers equally:
reviewing Fig.8.4 it was clearly the fishermen/farmers in
the middle and outer fjords that suffered most and their
numbers continually dwindled after World War II. By
1975 – the year before the last catastrophic winter – they
only outnumbered full-time sheep farmers only by one
third. It is a clear indication of the lesser quality of the
farmland in the outer fjords. In contrast, sheep farmers in
the primary Norse farmlands in the inner and middle
fjords suffered to far less extent and that is where many
farms has survived and thrived to this day (Fig.8.8). In
sum, throughout its third phase, climatic stress and
environmental confines were pushing pre-modern
farming in Greenland towards becoming a modern and
specialized occupation.
8.1.3 MECHANIZED FARMING AFTER 1976
The last catastrophic winter of 1975/1976 set in
motion a number of measures that would speed up the
transformation of sheep farming in Greenland into the
modern enterprise it is today: in 1975, a sheep farmer
education had been set up at Upernaviarsuk (Grønland:
statistisk årbog 1975:53) and in 1976, the sheep breeding
station was converted into an independent institution
(Heerfordt et al. 1980:10). In 1982, a 10-year
developmental plan for sheep farming was outlined
(Grønland: statitisk årbog 1988:125), which focused
principally on stabilizing the sheep production by
increasing winter fodder production and stable facilities,
as well as initiating general modernization and mechani-
zation of sheep farming by subsidizing it heavily. Part of
the modernization agenda after 1976 was also a number
of extensive surveys and monitoring of pasture areas and
their carrying capacity (e.g., Laursen and Ørnsholt 1979,
Heerfordt et al. 1980, Egede et al. 1982, Thorsteinsson
1983, Feilberg 1984b). Not at least, planning for an
increase of cultivated and stables also involved
archaeological inspection of sites of farming potential,
since they were always marked by the ruins of earlier
Norse activity.
The effect of the modernization Greenlandic farming
after 1976 is clearly apparent in Figs.8.3-8.5: first, the
total sheep population has stabilized significantly and
lacks the truly drastic sudden declines of the pre-modern
period (Fig.8.3). Second, the number of sheep owners
has decreased continually, but seems to have found a
fairly steady level after 1980 with very few active part-
time farmers (Fig.8.4). Third, the aggregate cultivated
area has multiplied by six since 1977 (Fig.8.5). The latter
increase, however, has been achieved not primarily by
extension of old Norse infields, but rather by claiming
and draining meadows around the Norse farmsteads for
cultivation (Fig.8.6). The latter was a clear break with
pre-modern farming and, probably, also with Norse
farming practices (see section 8.2.5).
8.1.4 SUMMARY DISCUSSION
Although only a cursory outline of the development
of farming in Greenland after 1721, the above review is
sufficient to establish that none of the described periods
are directly parallel to farming in the medieval Norse
Eastern Settlement:
The period of colonial farming 1721-1906 clearly has
limited value as a comparative case study to medieval
farming in Norse Greenland: livestock herding and
gardening along Greenland’s West Coast was subsidiary
and supplemental, i.e. clearly not on the scale of Norse
farming activities. Also, colonial period farming was
geographically and environmentally associated with
Inuit coastal habitation, i.e. a settlement pattern quite
opposite to Norse occupation of inner fjords. However,
the fact that both instances of larger-scale farming – at
Igaliku (E47/Garðar) and Narsaq (E18/ Dýrnes) – first
occurred at the largest Norse church farms does call for
two observations: first, it implies an overlap in land use
patterns and environmental boundaries, comparative
aspects of settlement that I explore further in section 8.2.
Second, the fact that these farms succeeded in keeping

226
low cattle numbers with no back-up livestock reservoirs
or intensified fodder production over ca. 150 years
implies that even low-intensity farming can be sustained
in South Greenland, at least in the best agricultural areas.
The period of pre-modern farming would seem to
offer the most comparative case study to Norse farming:
the Inuit farmers of this period tended the same livestock
as the Norse grænlendinga, occupied the same sites –
including almost all of the largest Norse farmsteads –
cultivated the same infields, initially with the same tools
and technology, and summer grazed the same mountain
pastures. However, there were also notable differences
between the two farming systems: the Norse livestock
included the full range of domestic animals, whereas the
Inuit specialized in sheep farming, Norse farming was
self-sustained, whereas Inuit farming was subsidized and
increasingly marked oriented (a butchery was established
in Julianehaab in 1929, replaced by a larger modern one
in Narsaq in 1952 (Christiansen 1963:8); Norse farmers
largely relied on the same tools and resources throughout
the entire settlement period, whereas Inuit farmers
increasingly had access to mechanical (agricultural
machinery) and chemical (fertilizers, vaccines etc.) aids.
After 1976 the latter advances effected that the
period of mechanized farming generally is an ill-fitted
comparative case study to medieval Norse farming.
However, as I will explore further in section 8.2.1, the
stabilization of Inuit sheep farming in this period around
relatively few sites, several of which were also the first
to be reoccupied, implies that these constituted the
principal and most sustainable farmlands in all of
Greenland. Characteristic of these persisting sites is the
associated substantial areas of former meadow – now
drained (e.g., Fig.8.6) – which must have been a critical
fodder resource to the Norse.
To conclude, although none of the above periods of
farming in Greenland provide direct comparative case
studies to farming practices in the Norse settlements,
several particular aspects of farming in this specific
environment may be explored – as they are in section 8.2
– through the experiences, successes, and failures of the
Inuit farmers.
On a closing note, and offering another kind of
comparative perspective, the history of reintroduced
farming in Greenland also provides an example of “long-
term” changing farming practices that may be discussed
within the framework of resilience theory and its
adaptive, and transformative cycles (see section 8.3.2,
Fig.8.17): the transition from colonial to the pre-modern
farming was a major transformation, i.e. (re)introduction
of a “new” extensive farming system. After an initial
period of growth up to 1966/1967 (r-phase), followed a
period of conservation (K-phase) until the catastrophic
winter of 1976/1977, which caused major reorganization
(α-phase) of sheep farming (after 1976). The latter
transformation was preceded by the completion of
multiple lower-scale small-and-fast adaptive cycles
which involved critical sheep population depletions and
subsequent regrowth, each time pushing closer towards
the final and major reorganization of the farming system
as a whole. This is of course a simplified explanation for
the development of the modern farming system, but
nonetheless one that introduces aspects worth exploring:
to which extent, when, and for how long, the Norse
could rely on extensive grazing and farming contra more
labor costly intensive farming.
Fig.8.6 Hay-stacking at Qassiarsuk/Brattahlið (E29a). Until the late 1960’s, Inuit sheep farming was largely unmechanized and relied on the same labor and tools as used by the Norse (photo: Vebæk 1962).

227
8.2 COMPARATIVE ASPECTS OF FARMING IN GREENLAND
In section 8.2, I explore select comparative aspects of
Norse and pre-modern farming in Greenland based on
the environmental, archaeological, and historical outlines
presented in the above chapters: first, I compare the
development of settlement on the two farming systems to
identify similarities and differences that may inform us
further on the nature of the Norse settlement and farming
system. Second, I compare the two farming systems in
terms of their range of relative “extensiveness” and
“intensiveness” to identify the main obstacles of farming
expansion and conservation facing farmers past and
present. This is explored mainly through the discussion
and analysis of the frequency of critical and catastrophic
winters. Third, I address the related issue of how the
farmers did, and could have, responded to stresses
imposed by environmental confines in terms of feeding
their livestock.
8.2.1 FARMING SETTLEMENT DEVELOPMENT
In the above, I have mostly treated the archaeological
record as accumulated evidence, a natural consequence
of the character of the surface survey evidence. It is
clear, however, that this could be a major issue with the
proposed classification and settlement model, and that
chronological depth is the final dimension needed to
verify its overall correctness. Yet, the lack of a robust
chronological framework has always posed a major
obstacle to Norse Greenland archaeology, first because
most larger excavations were carried out prior to the
introduction of 14
C-dating (cf. Tab.4.1), second because
of the complex use histories of the sites, which could
change from shieling to farmstead and back again, could
be reoccupied and abandoned several times. Thus even
with new dating methods, the inevitable question always
remains: what are we actually dating?
While this will always be a highly problematic issue
in the excavations of architecture, the focus on middens
since the late 1970’s – and in the Vatnhverfi-Project –
has in part alleviated the problem: middens present
stratified layers of refuse that must, at a minimum,
represent the beginning and end of site occupation.
However, it does not help at the sites without midden (or
without midden preservation, cf. section 4.2.2 and 7.1.4).
In recent years, palynological investigations in the
Eastern Settlement have also gone a long way to help
date local and regional activities and impacts (Edwards
et al. 2007, Schofield et al. 2007, Gauthier et al. 2010,
Schofield and Edwards 2011, Massa et al. 2012a, Massa
et al. 2012b, Perren et al. 2012, Ledger et al. 2013b,
2013a, Schofield et al. 2013, Ledger et al. 2014a).
Combining all this dating evidence provides us with a
much more robust chronological overview.
Tab.8.1 presents a list of 56 “landnám dates” from 31
different Norse sites in the central Eastern Settlement,
most of them in or near the Vatnahverfi region, and
spanning the entire settlement dispersion from inner to
outer fjord (Fig.8.7). The dated samples derive from
different contexts: human bones from churchyards,
animal bones (only terrestrial mammals are included)
and textiles from middens and buildings, and charcoal
from infields and peat deposits (cf. Tab.8.1). Where the
archaeological context is uncertain or multiple dates are
available, the two earliest dated samples have been
selected. Despite of the diversity of these samples, the
chronological implications are convincing:
Although there are inevitably overlaps, the dates
generally seem to divide on two fairly distinct groups:
those that fall before or shortly after AD 1000 and those
that fall from around or shortly after AD 1000 but incline
towards a later date (Tab.8.1). Note that E78 is included
as an early site although the dates incline towards the
second group on grounds that the dated burials overlay
earlier undated graves (Møller et al. 2007). In Fig.8.7 the
early group of dated sites is indicated with bright green
dots, the later group with red dots. According to Fig.8.7,
Roussel was apparently right when he claimed (1941:12)
that the first Norse farmers settled at the heads of the
fjords. But he was not completely right. For equally
plain from Fig.8.7 is the observation that also the middle
fjord farmsteads appear to have been occupied during the
first settlement wave. All the earliest farmsteads were
located close to the fjord, likely because these were the
easiest places to settle (Ledger et al. 2013b:37) and also
where the most extensive pastures and meadows were
found, i.e. a landnám scenario quite similar to that
suggested for Iceland (Vésteinsson 1998, Vésteinsson et
al. 2002:120). Certainly, the scenario in Fig.8.7 seems
quite at odds with the one-chieftain to one-fjord scenario
portrayed by written narrative.

228
Tab.8.1 Landnám dates of Norse sites in the central Eastern Settlement8
Ruin group No. Lab. No 14C-age
BP Cal-age
AD 1-sigma
range AD 2-sigma
range AD Reference:
E2 (mire) UERC-8916 - - - 950-1020 Edwards et al. 2007
E17a (ruin 1) AAR-6108 955+/-30 1035-1145 1025-1155 - Arneborg et al. 2012:Tab.2
E17a (ruin 1) AAR-6109 1140+/-35 0895-0935 0885-0975 - Arneborg et al. 2012:Tab.2
E29a (ruin no.59a) AAR-1273 1040+/-80 1011 0960-1040 - Arneborg et al. 2012:Tab.3
E29a (ruin no.59a) AAR-1275 1229+/-41 976 0894-0996 - Arneborg et al. 2012:Tab.3
E29a (ruin no.59a) AAR-1571 1225+/-51 985 0909-1017 - Arneborg et al. 2012:Tab.3
E33 (ruin no.16a) AAR-7885 1095+/-29 978 0897-0988 - J. Arneborg unpubl. data
E33 (ruin no.16a) AAR-7886 1017+/-30 1019 0997-1024 - J. Arneborg unpubl. data
E34 (midden) K-7047 1030+/-40 1005-1015 0985-1025 - Nyegaard et al. unpubl. data
E34 (midden) K-7049 880+/-40 1160-1180 1060-1220 - Nyegaard et al. unpubl. data
E34 (midden) K-7050 679+/-37 1295 1060-1220 - Nyegaard et al. unpubl. data
E39 (mire) SUERC-10507 - 933 - 780-1020 Schofield and Edwards 2011:Tab.1
E47 (midden) AAR-17478 983+/-25 - 1017-1148 - Nyegaard et al. unpubl. data
E48 (ruin 3a) AAR-7876 912+/-34 1069-1158 1038-1186 - J. Arneborg unpubl. data
E48 (ruin 3a) AAR-7877 880+/-33 1163-1180 1067-1215 - J. Arneborg unpubl. data
E48 (ruin 3a) AAR-7878 906+/-46 1074-1159 1036-1209 - J. Arneborg unpubl. data
E48 (ruin 3a) AAR-7879 1008+/-35 1037 1025-1155 - J. Arneborg unpubl. data
E60 (infield) SUERC-52504 1108 ± 25 - 897-975 887-991 Simpson et al. unpubl. data
E60 (infield) SUERC-52508 1070 ± 29 - 906-1016 896-1021 Simpson et al. unpubl. data
E64 (ruin no.6a) AAR-12967 1089+/-30 - 0898-0990 893-1014 J. Arneborg unpubl. data
E64 (ruin no.6a) AAR-12968 1153+/-31 - 0784-0965 779-972 J. Arneborg unpubl. data
E64 (ruin no.6a) AAR-12969 1089+/-30 - 0898-0990 893-1014 J. Arneborg unpubl. data
E64a Ua-1121 820+/-65 1220 1160-1280 - J. Arneborg unpubl. data
E64a Ua-1122 635+/-65 1300-1380 1290-1400 - J. Arneborg unpubl. data
E64c Ua-1120 695+/-55 1290 1280-1380 - J. Arneborg unpubl. data
E65 (mire) - - 1000 975–1095 - Ledger et al. 2014b:37
E70 (mire) - - 1090 - 1050-1150 Ledger et al. 2014b:37
E71 AAR-0909 945+/-60 - 1015-1165 0980-1220 J. Arneborg unpubl. data
E71 (ruin 12) AAR-6145 965+/-35 1030 1020-1151 1015-1160 Arneborg et al. 2012:Tab.7
E71 (lake) - - - - 880-1000 Ledger et al. 2014b:37
E74 (ruin no.4) KIA-25971 - 1022 1003-1032 0996-1050 J. Arneborg unpubl. data
E74 (ruin no.4) SUERC-17590 - - 1040-1160 1020-1210 J. Arneborg unpubl. data
E78 (ruin 2a) AAR-12598 942+/-36 - 1032-1153 1020-1170 J. Arneborg unpubl. data
E78 (ruin 2a) AAR-12600 919+/-36 - 1043-1159 1028-1207 J. Arneborg unpubl. data
E78a (mire) - - 970 - 775-1015 Ledger et al. 2014b:37
E80b (infield) SUERC-52509 1105 ± 29 - 897-980 885-1012 Simpson et al. unpubl. data
E80b (infield) SUERC-52510 1037 ± 26 - 990-1020 906-1031 Simpson et al. unpubl. data
E89a (infield) SUERC-52532 1138 ± 29 - 882-970 856-983 Simpson et al. unpubl. data

229
Ruin group No. Lab. No 14C-age
BP Cal-age
AD 1-sigma
range AD 2-sigma
range AD Reference:
E96 (infield) SUERC-52533 1061 ± 26 - 973-1017 900-1023 Simpson et al. unpubl. data
E96 (infield) SUERC-52534 946 ± 24 - 1032-1050 1027-1155 Simpson et al. unpubl. data
E119 (midden) SUERC-52512 886 ± 29 - 1052-1210 1042-1219 Simpson et al. unpubl. data
E119 (midden) SUERC-52513 990 ± 29 - 999-1147 989-1153 Simpson et al. unpubl. data
E167 (ruin no.1) AAR-6132 970+/-40 1030 1020-1155 - Arneborg et al. 2012:Tab.8
E167 (ruin no.1) AAR-6133 940+/-35 1040-1150 1025-1160 - Arneborg et al. 2012:Tab.8
E167 (ruin no.1) AAR-6134 1090+/-30 0980 0900-0995 - Arneborg et al. 2012:Tab.8
E171 (midden) SUERC-45392 921 ± 45 - 1040-1160 1025-1209 C.K. Madsen et al. unpubl. data
E171 (midden) SUERC-45396 868 ± 45 - 1051-1222 1040-1259 C.K. Madsen et al. unpubl. data
E172 (midden) SUERC-33587 1050+/-35 - 0900-1030 0890-1030 K. Smiarowski unpubl. data
E172 (midden) SUERC-33588 1080+/-35 - 0890-1020 0890-1020 K. Smiarowski unpubl. data
E172 (midden) SUERC-33589 1035+/-35 - 0975-1025 0890-1120 K. Smiarowski unpubl. data
E174 (midden) SUERC-52519 899 ± 29 - 1047-1186 1040-1211 Simpson et al. unpubl. data
E182 (ruin no.7) AAR-15506 979+/-40 - 1016-1152 992-1157 J. Arneborg and C.K Madsen unpubl. data
E182 (infield) SUERC-52521 981 ± 24 - 1018-1147 997-1153 Simpson et al. unpubl. data
E184 (midden) SUERC-52522 890 ± 29 - 1050-1206 1042-1217 Simpson et al. unpubl. data
E188 (ruin no.1) AAR-15508 899+/-24 - 1048-1180 1042-1211 J. Arneborg and C.K Madsen
unpubl. data
E329 (ruin no.1) AAR-15509 938+/-23 - 1037-1152 1031-1156 J. Arneborg and C.K Madsen unpubl. data
Tab..8.1 List of dates from Norse ruin groups in the central Eastern Settlement with indication of the sample context (added to the ruin group number in bracket) and references: ruin number followed by an “a” indicates dates on human bones from churchyards (except E33 which is on charcoal from a grave); ruin groups with no bracket indicates dates with no additional information.
Also noticeable in Tab.8.1 and Fig.8.7 is that
landnám seems to haveunfolded in two steps: the second
and slightly later group of dates suggests that the
settlement of inland (E71, E171), upland (E34, E70,
E74, E167), and outer fjord (E119, E182, E184, E188,
E329) sites was delayed with some 50-100 years. This is
also well in accord with other pollen evidence from the
region (Schofield et al. 2013:Fig.4-6). Moreover, this
delayed settlement expansion also seems reasonable
seeing that these areas often were of poorer farming and
grazing quality or required more work (clearing of shrub
vegetation) before they could be settled. Still, at least by
the end of the 11th century, the entire landscape between
the Icecap and the arctic North Atlantic appears to have
been claimed by the Norse. This is a quite different
scenario than that forwarded by J. Berglund (1991), who
held that settlement development was fairly gradual and
continued into the 14th century with the major expansion
occurring in the 13-14th centuries (Ibid.156). Rather, the
dates seem to reflect exactly the kind of burst-and-trickle
landnám outlined in section 2.1.1
There are also some inconsistences in the dates: for
instance, it seems highly unlikely that Igaliku/Garðar
(E47) should have been occupied in a second phase of
landnám. The single recent date is from a 2012
excavation of refuse layers at some distance from the
dwelling, which are probably not the earliest deposits.
The slightly later date of E48 could be real, although the
dated samples are all human bones from the churchyard,
which may not have been established at very first
landnám. In any case, this new settlement expansion
evidence can be put into perspective by crosschecking
with expansion of Inuit historic farming:
Fig.8.8 displays the distribution of sheep farms in the
same area of the central Eastern Settlement in 1936
(bright green dots), 1963 (red dots), and 2008 (blue
dots). There are both some obvious differences and
similarities when compared with Fig.8.7: in 1935, the
sheep farms were clearly concentrated in the outer
fjords, the middle fjords oddly vacant, while the best
inner fjord sites (E29a, E47, E66) had been reclaimed.
Among the few middle fjord sites that had been resettled

230
Fig.8.7 The geographical distribution of the dated settlement evidence listed in Tab.8.1 Green dots indicate the earliest group dates, the red dots the slightly later group. The figure is discussed in the text.
Fig.8.8 The distribution of Inuit sheep farms in 1935 (green dots), 1963 (red dots), and 2008 (blue dots). The gradual shift of the sheep farms towards the middle and inner fjord, and eventually to inland and upland areas, has some similarities with, and implications for, Norse settlement expansion (cf. Fig.8.7, conf. text).

231
was E18 and E77a, the first being classified as a church
manor in the above, the second as a large farmstead.
Thus, there seems to be a strong correlation between the
first Inuit sheep farms established and the largest Norse
sites, which needs little explanation: full-time sheep
farmers settled the best Norse farmlands. Conversely, the
sites in the outer fjords belonged to the small-scale
fishermen-farmers, which for obvious reasons were
bound to their old Inuit settlement pattern. One part of
reintroduced Inuit farming followed the Norse landnám
pattern, whereas the other did not. Considering how
dependent the Norse were on seal from the beginning of
settlement, it is a rather curious and interesting
circumstance that their early settlement pattern did not
resemble more that of the early Inuit farmers.
By 1963 the distribution of Inuit sheep farms had
shifted noticeably: the concentration of farms (red dots
in Fig.8.8) was now found in the middle and inner fjords.
In the Qassiarsuk /Brattahlið area another three Norse
church farmsteads had been resettled; in the Vatnahverfi
region the two farmsteads with early small churches
(E64 and E78) – large farmsteads according to the
classification model – as well as manor E76 had been
reclaimed. In addition, sheep farms had been established
by the two church manors of E83 and 149, while farming
continued at all the first inner fjord sites resettled.
Combined with the abandonment of outer fjord part time
sheep farms, the Inuit settlement pattern was obviously
starting to look more like the Norse. This is again strong
testimony to the marginality of the outer fjords sites over
those in the middle and inner fjord in terms of livestock
farming. Moreover, a significant observation from Fig.
8.8 is that even by 1963 the Inuit sheep farms were tied
to the fjord, i.e. even such fertile inland or upland areas
as the central Vatnahverfi and the Qorlotup Itinnera had
not yet been claimed. This seems a direct parallel to
Norse settlement development.
By 2008 the pattern of 1963 had solidified: the Inuit
sheep farms now clustered in the Qassiarsuk/Brattahlið
(E29a) area, around Igaliku/Garðar (E47), and at
sheltered middle fjord sites. In addition, by this time we
see the inland and upland areas – such as the central
Vatnahverfi and the Qorlortup Itinnera – resettled. By
this time then, the settlement pattern of the Inuit sheep
farmers seems to have converged more or less fully with
Norse settlements patterns.
It is evident that the distribution of Inuit sheep farms
was never exactly identical to the Norse, and part of the
settlement pattern should undoubtedly also be explained
by other than environmental causes, for instance the
presence of colonies, trade- and mission stations (e.g.
Qaqortoq, Alluitsuup Paa, Lichtenau etc.). However, the
gradual convergence of Norse and Inuit settlement
patterns is a striking indication of settlement processes
large guided by environmental possibilities and confines
for livestock farming. Overall, the later Inuit settlement
pattern lends credibility to the settlement pattern
suggested by dated evidence. Also, the correlation
between early and lasting Inuit sheep farms and the
principal farmsteads of the Norse is so strong that it is
both tempting and not completely unreasonable to
extend the Inuit settlement distribution to the undated
Norse sites: in short, the more colored dots a
corresponding Norse site have in Fig.8.8, the more likely
it is to have been settled early. Thus, although we have
no founding dates for E66 and E77a in the Vatnahverfi
region, it seems highly likely that these sites were among
the first to be settled, whereas those with only two dots
were perhaps only settled in the second phase of
landnám. The question is if the Norse farmsteads with
most dots were also the ones to survive the longest?
8.2.2 FARMING SETTLEMENT ABANDONMENT
The chronological framework for the abandonment
of the Norse settlements is less developed and consistent.
This owes in part to a notable plateau on the calibration
curve, but even more so the trouble in pinpointing
exactly what is being dated. For instance, in a recent
palynological analysis of E70, a site in the central
Vatnahverfi classified as a large complex shieling, it was
demonstrated that there was a notable disintensification
in site activities already from AD 1300-1390, but site
abandonment only after AD 1325-1415 (Ledger et al.
2013a). Generally, the palynological investigations are
far less adamant in dating settlement abandonment than
they are in dating landnám (e.g, Edwards et al. 2007:15,
Schofield and Edwards 2011:192, Massa et al.
2012a:122), among other reasons because the footprints
of Norse settlement – introduced apophytes, increased
soil erosion rates, coprophilous fungi, charcoal – was
only gradually erased after site abandonment (e.g.,
Schofield et al. 2013:Fig.4-6). In short, interpreting the
timing of settlement abandonment is far more difficult
than interpreting the evidence for landnám.

232
Tab.8.2 “Terminal” dates of Norse sites in the central Eastern Settlement
Ruin group No. Lab. No 14C-age
BP Cal-age
AD 1-sigma
range AD 2-sigma
range AD Reference:
E1 (ruin 1a) AAR-8585 845+/-25 1426 1412-1438 - J. Arneborg unpubl. data
E1 (ruin 1a) AAR-8586 890+/-25 1308 1299-1324 - J. Arneborg unpubl. data
E23 (ruin 3a) AAR-8589 925+/-30 1320 1304-1388 - J. Arneborg unpubl. data
E23 (ruin 3a) AAR-8590 930+/-35 1299 1288-1314 - J. Arneborg unpubl. data
E23 (ruin 3a) AAR-8591 695+/-30 1448 1436-1469 - J. Arneborg unpubl. data
E29a (midden) SUERC-11552 775±35 - - 1185-1285 Edvarsson et al. 2006:Tab.8
E29a (midden) SUERC-11559 775±35 - - 1185-1285 Edvarsson et al. 2006:Tab.8
E34 (midden) CAMS-54416 770+/-30 1256+/-22 1229-1277 1214-1287 Nyegaard et al. unpubl. data
E34 (midden) CAMS-54417 830+/-40 1214+/-47 1170-1255 1073-1276 Nyegaard et al. unpubl. data
E34 (mire) SUERC-6391 590+/-35 . . 1290-1420 Schofield et. al. 2007:Tab.3
E34 (mire) SUERC-8906 665+/-35 - - 1270-1440 Schofield et. al. 2007:Tab.3
E39 (mire) SUERC-4311 615 ± 35 - - 1290–1400 Schofield and Edwards 2011:Tab.1
E39 (mire) SUERC-16819 845 ± 35 - - 1050–1270 Schofield and Edwards 2011:Tab.1
E47 (midden) SUERC-8576 625+/-35 - 1290-1400 - Nyegaard et al. 2013 unpubl. data
E47 (ruin ) AAR-1438 880+/-90 1295 1256-1392 - J. Arneborg unpubl. data
E48 (ruin 3a) AAR-7877 880+/-33 1163-1180 1067-1215 J. Arneborg unpubl. data
E48 (ruin 3a) AAR-7878 906+/-46 1074-1159 1036-1209 - J. Arneborg unpubl. data
E65 (mire, modeled) - - 1215 - 1115–1300 Ledger et al. 2014:42
E66 (ruin 1a) AAR-1441 880+/-55 1392 1312-1417 - Arneborg et al. 2012:Tab.6
E66 (ruin 1a) AAR-1442 890+/-45 1297 1279-1317 - Arneborg et al. 2012:Tab.6
E70 (mire) SUERC-33442 535±30 - - 1320–1440 Ledger et al. 2013a:Tab.I
E70 (mire) SUERC-33443 655±30 - - 1280–1395 Ledger et al. 2013a:Tab.I
E71 (ruin 12) AAR-6143 735+/-35 1280 1257-1289 1219-1377 Arneborg et al. 2012:Tab.7
E71 (ruin 12) AAR-6144 700+/-40 1290 1268-1381 1229-1391 Arneborg et al. 2012:Tab.7
E71 (mire) - - - 1350-1420 Ledger et al. 2014:13
E71a (mire) SUERC-36590 705 ± 35 - - 1250–1390 Ledger et al. 2014:Tab.1
E71a (mire) SUERC-36591 730 ± 35 - - 1220-1380 Ledger et al. 2014:Tab.1
E74 (ruin 4) SUERC-17585 - - 1155-1225 1040-1270 K. Smiarowski (unpubl. data)
E74 (midden) SUERC-17582 - - 1315-1415 1290-1430 K. Smiarowski (unpubl. data)
E78 (ruin no.2a) AAR-12603 819+/-39 - 1186-1262 1155-1278 J. Arneborg unpubl. data
E78a (mire, modeled)
- - 1285 - 1235–1320 Ledger et al. 2014:42
E89a (infield) SUERC-52531 659 ± 29 - 1285-1385 1278-1392 Simpson et al. unpubl. data
E119 (midden) SUERC-52511 612 ± 29 - 1301-1396 1295-1403 Simpson et al. unpubl. data
E119 (midden) SUERC-52512 886 ± 29 - 1052-1210 1041-1219 Simpson et al. unpubl. data
E149 (ruin no.1a) AAR-1263 845+/-50 1404 1329-1428 - Arneborg et al. 2012:Tab.9
E149 (ruin no.1a) AAR-1266 852+/-44 1399 1325-1418 - Arneborg et al. 2012:Tab.9
E149 (infield) SUERC-52539 587 ± 26 - 1316-1404 1301-1413 Simpson et al. unpubl. data
E150 (infield) SUERC-52540 643 ± 26 - 1292-1387 1283-1394 Simpson et al. unpubl. data

233
Ruin group No. Lab. No 14C-age
BP Cal-age
AD 1-sigma
range AD 2-sigma
range AD Reference:
E167 (ruin no.1) K-5889 710+/-50 1275 1265-1285 - Sidste nordbo".
E167 (ruin no.1) AAR-6137 675+/-35 1295 1285-1380 - Arneborg et al. 2012:Tab.8
E168 (midden) AAR-16869 371+/-25 - 1454-1618 1447-1634 J. Arneborg and C.K Madsen unpubl. data
E168 (midden) AAR-16870 849+/-25 - 1169-1219 1155-1259 J. Arneborg and C.K Madsen unpubl. data
E171 (midden) SUERC-45397 736 ± 45 - 1227-1291 1210-1387 C.K. Madsen et al. unpubl. data
E171 (midden) SUERC-45398 908 ± 45 - 1042-1172 1029-1214 C.K. Madsen et al. unpubl. data
E172 (midden) Beta-320125 560+/-30 1400 1320-
1340/1390-1410
1310-1360/1390-
1430 K. Smiarowski unpubl. data
E172 (midden) Beta-320126 600+/-30 - 1300-
1360/1380-1400
1290-1410 K. Smiarowski unpubl. data
E174 (midden) SUERC-52514 692 ± 26 - 1275-1377 1362-1386 Simpson et al. unpubl. data
E174 (midden) SUERC-52518 588 ± 29 - 1315-1404 1299-1414 Simpson et al. unpubl. data
E182 (infield) SUERC-52520 606 ± 29 - 1304-1397 1297-1405 Simpson et al. unpubl. data
E184 (midden) SUERC-52523 648 ± 29 - 1290-1387 1281-1395 Simpson et al. unpubl. data
E184 (infield) SUERC-52528 652 ± 24 - 1290-1385 1282-1392 Simpson et al. unpubl. data
E188 (ruin no.1) AAR-15507 659+/-24 - 1286-1385 1280-1390 J. Arneborg and C.K Madsen unpubl. data
Tab.8.2 List of dates from Norse ruin groups in the central Eastern Settlement with indication of the sample context (added to the ruin group number in bracket) and references: ruin number followed by an “a” indicates dates on human bones from churchyards; ruin groups followed by 'modeled' in bracket indicates dates based on age-depth model from
14C-dated benchmarks.
Tab.8.2 presents a list of 52 “terminal” dates from 22
sites in the same part of the central Eastern Settlement,
and selected by the same criteria, as those listed in
Tab.8.1 and shown in Fig.8.7. However, whereas most of
the landnám dates provide a terminus post quem onset,
the dates listed in Tab.8.2 do not necessarily provide a
terminus ante quem, and are harder to interpret. Issues
with the palynological dates were noted above, but the
other contexts wherefrom the dates samples derive
should equally be considered: for instance, several of the
listed dates are from anthropogenic infields soils, i.e.
cultural refuse material either purposefully or naturally
deposited. However, if infields were no longer being
cultivated and fertilized, the dates may effectively only
date the abandonment of infield cultivation.
Issues with the midden dates are similar: the date of
the latest deposits only pinpoints when no more refuse
was added to a particular dump, but it may have been
deposited elsewhere or used as fertilizer. This may
explain why the latest dates from the midden at a prime
farming location such as Qassiarsuk/Brattahlið (E29a)
all fall before AD1300 (Tab.8.2.). Burials offer some of
the best end dates for site abandonment, but as outlined
in the above, some churchyards were closed down before
others, while the farmsteads they were associated with
may have continued. However, at sites where there are
multiple agreeing dates from various context such issues
are less deterring. Still the chronological framework for
settlement abandonment is clearly not as rigorous as for
the development of landnám.
The final abandonment of the Eastern Settlement is
traditionally dated to around AD 1450 (Arneborg 1996),
and there is nothing in Tab.8.2 to oppose this. However,
it is clear from Tab.8.2 that relatively few of the
“terminal” dates extend that far up in time. In fact the
majority seem to fall already in the late 13th
to14th
centuries. Although the dates display notable overlaps
one can – just as for the landnám dates – tentatively
distinguish between those dates that fall considerately
before or just barely creep into the 15th century AD, but
are clearly inclined towards an earlier date, contra those
dates that clearly fall after AD 1400. Fig.8.9 displays the
geographical distribution of the “terminal” dates listed in
Tab.8.2 in the same manner as in Fig.8.7, only in Fig.8.9
the bright green dots indicate sites where the dates fall
mostly after AD 1400, the red dots those that mostly fall
before.

234
Fig.8.9 The geographical distribution of the dated settlement evidence listed in Tab.8.2 Green dots indicate sites abandoned ca. post AD 1400, the red dots the sites abandoned ca. pre AD 1400. The figure is discussed in the text.
There are clearly some aspects to Fig.8.9 that causes
apprehension, for instance the early abandonment of
Qassiarsuk/Brattahlið (E29a) and Igaliku/Garðar (E47)
(note that for the latter site there is no indication that the
dated contexts should be the latest). However, although
the scenario implied by Fig.8.9 is perhaps uncertain in
that it is built on rather few dates from several individual
ruin groups, it is noted that several dates from different
contexts generally correlate (cf. Tab.8.2); and even if
some sites were extended into the early 15th century it
would not change the overall picture: that the Norse
settlement was contracting markedly already some time
before AD 1400, in the outer fjord perhaps already
during the late 13th century (cf. Tab.8.2).
Evident from Fig.8.9 is that all the sites with clear
post-AD 1400 abandonment dates are located in the
inner to middle fjord, and four of the sites to survive into
the 15th century AD are church farmsteads (E1, E23,
E66, and E149). Two of the sites with post-AD 1400
abandonment dates are large complex shielings E70 and
E178, which could appear to contradict the classification
of them as shielings. However, as already noted above,
the latest activities at E70 were of another, less intensive
nature than prior to AD 1300 (Ledger et al. 2013a:818).
The same could apply to E168 which we test trenched in
2011: the lower layers were clearly midden deposits, the
upper layers – from where late dated sample Tab.8.2 was
retrieved – a layering of undisturbed peat and aeolian
deposits with charcoal inclusions (Madsen et al., interim
report under preparation). That both sites continued to be
in use at least into the 14th century is only natural if they
were shielings (or cottages) under still operative church
manor E66, as suggested in section 7.3.3. The unburied,
supposed Norse skeleton from E167 (Vebæk 1992)
constitutes a rather problematic sample and pre-AMS
date (Tab.8.2 K-5889). However, even if adding 50-100
years to margin of the date, the deposition of a skeleton
in the hallway would certainly suggest that the building
was taken out of use prior to AD 1400. Suggestively, the
terminal dates from E71 – which I have argued was the
parent farm to E167 - also imply its abandoned pre-AD
1400.

235
This notion of a Norse Eastern Settlement contracting
rather rapidly from some time during the 13th century is
new and unexpected. However, it is corroborated by
other evidence. As observed by J. Arneborg (pers.
comm.), the small churches were apparently taken out
use at the onset of this settlement contraction. Small
churches included (in Tab.8.2, but not Fig.8.9) in this
sample of dated sites are E48, E64, and E78, of which
the former two were seemingly taken out use around AD
1200, the latter around AD 1250, after which E66 was
the only (parish) church in the Vatnahverfi region. In
addition, recent palynological and sediment studies have
documented a notable decline in grazing pressure and
erosion, and a rebound of the natural vegetation, already
from the mid-14th century (Edwards et al. 2007:12,
Gauthier et al. 2010, Schofield and Edwards 2011:194,
Massa et al. 2012a:127, Ledger et al. 2013a:816,
2014a:6, 2014b:46). A regional investigation of pollen
frequencies from species introduced by the Norse also
display peak values around AD 1300 (Schofield et al.
2013:Fig.4-6). And finally, such a timing of the settl-
ement contraction correlates perfectly with the AD 1257-
58 climate event, or shock, discussed in section 3.1.3. In
total, this evidence lends significant credibility to a
scenario of a settlement and community changing fairly
dramatically at latest from the 14th century.
Even if this settlement decline cannot be extended
directly to the individual ruin groups and settlement
patterns deduced from the classification model in chapter
7, it has notable implications: for if settlement in the
outer fjord, inland, and upland occurred only in a second
phase of landnám – as implied by Tab.8.1 and Fig.8.7 –
and settlement contraction began already during the 14th
century AD, then the most extensive settlement pattern –
proposed in chapter 7 (cf. Fig.7.17) – had a maximum
lifespan of 200-250 years, in the outer fjord perhaps even
shorter. In other words, if the suggested settlement
layout with manors, cottages, and shielings ever did exist
contemporaneously, then it only did for a short time. The
relatively short lifespan of the outer fjord settlement may
also explain why these ruins often appear much less
substantial than ruins found in the middle and inner fjord
(cf. Fig.6.2-6.3). The implications of this new
chronological framework is significant and it is clear that
with continued multi-disciplinary dating efforts, the
possibility of outlining settlement dynamics and social
(re)organization on both regional and local scale is not
an unrealistic future perspective.
Comparing Norse settlement abandonment dates with
Inuit sheep farm development (cf., Fig.8.8-8.9) the two
settlement patterns appear to have less in common than
the landnám scenarios. Still, it is worth noting that the
few farmsteads – i.e. not including the shielings –
postdating AD1400 mostly have two or three dots in
Fig.8.8, i.e. are where modern sheep farming has proven
viable. Thus, there again seems to be some correlation
between Norse and Inuit settlement patterns.
8.2.3 INTENSIVE VERSUS EXTENSIVE FARMING
- AND CATASTROPHIC WINTERS
In the context of the North Atlantic and Greenland,
farming practices past and present can be graded on a
scale that has two extreme ends: completely intensive
farming, where all the livestock was stalled and fed
throughout the entire winter, mostly on fodder from
cultivated fields, and herded throughout the summer; or,
completely extensive, where all the livestock had to fend
for itself in the terrain throughout the entire year, only to
be rounded up seasonally. One may think of this as a
scale of farming intensity, where the extreme ends are
unviable in the North Atlantic setting and where historic
(and archaeological) examples of farming systems are
always somewhere in between.
Another reason to think of farming practices in such
terms is that a farming system’s relative position on the
scale has several other repercussions: the more intensive
the farming system, the more labor demanding it is:
livestock housing has to be built and maintained,
sufficient fodder has to be procured and stored, fields
have to be extended, amended, irrigated, and fenced off
to keep livestock from trampling and diminishing
cultivated fields, livestock has to be tended constantly.
Conversely, the more extensive the farming system, the
less labor demanding it is: animal handling and herding
is basically confined to single seasonal events. Finally, a
farming system’s position on a scale of farming intensity
also has productive repercussions: the more intensive,
the higher, or at least more stable, the productivity: the
livestock has higher survival rates, and can potentially
produce meat, milk, manure, and traction throughout the
entire year. Conversely, the more extensive the farming
system the less productive, or stable, it is: substantial
livestock numbers can be lost to harsh (winter) weather
or decease, milk production is negible, and meat and
wool crops are limited to single event harvesting.

236
North Atlantic farming systems have traditionally –
or at least since the “sheep revolution” in the 12th-13
th
centuries AD (see section 2.3.2) – always been fairly
extensive (Bruun 1897, Kammp 1967, Joensen 1979,
Austrheim et al. 2008); and as noted in section 8.2.1, so
was pre-modern Inuit farming: although there were local
variations, generally only the cattle husbandry and a
select part of the sheep were stalled, whereas the
remainder were left to fend for themselves in the terrain
most of the year. In terms of a scale of farming intensity,
such a general farming system layout was well-adjusted
to, perhaps even necessitated off, the “fishing
revolution” that was parallel to the “sheep revolution, i.e.
freeing labor from farming to enable fishing.
In view of Greenland Norse subsistence economic
reliance on wild resources, foremost seal (see section
2.3.1), and the very limited available labor force (see
section 8.3.1), one would expect the grænlendinga to
have adopted a similar strategy, i.e. a farming system
adjusted towards the extensive end of the scale in order
to free labor for sealing and hunting. On the other hand,
however, the identification of functional buildings on the
Norse farms outlined in Chapter 6 leave little doubt that
a substantial number of livestock, including sheep/goat
husbandry, was stalled, at least periodically. The first
question is, then, if this more intensive farmstead layout
reflected a later development? Was it ever possible for
the grænlendinga to maintain farming system inclined
towards an extensive mode of production? As noted in
Chapter 7, there is little direct chronological basis for
answering this question. Here, I propose to use the case
study of pre-modern farming for comparative inference:
In the extensive mode of farming generally practiced
throughout the North Atlantic, summer and fall pasturing
is unproblematic: in most areas of the North Atlantic
there is sufficient summer biomass to sustain large herds
of livestock (Austrheim et al. 2008). The same goes for
Greenland, where the evaluation of summer vegetation
or biomass potential has led to optimistic predictions of
maximum grazing capacity: estimates of the carrying
capacity of the Eastern Settlement pastures has ranged
between at between 60,000-900,000 ewes, not at least
because of the rich shrub vegetation (Kammp 1964:93,
Laursen and Ørnsholt 1979:77p, Egede et al.
1982:Tab.46, Hansen 1988:99).
Reviewing Fig.8.3 it is seen that the number of ewes
never reached the lowest maximum estimate and was
nowhere near of approaching the higher. The reason for
this discrepancy is simple: summer biomass was not the
issue. Rather the perpetual bottleneck of North Atlantic
livestock farming was the winter and early spring: for
the animals stalled, this was the time when stored fodder
resources were almost expended; and for the animals
grazing freely, the time when their fat reserves and
available pasturage was at an absolute minimum. In
short, in terms of defining the limits of the Greenlandic
farming system on a scale of farming intensity, we need
mainly concentrate on the winter half of the year.
As noted in the above, Inuit pre-modern farming was
very extensive and thus provides us with an excellent
example of such a mode of farming production in the
specific environmental setting of Greenland. As visible
in Fig.8.3, the sheep population 1906-1976 displayed
intermittent drastic declines, a direct result of especially
harsh winters, among them the so called 'catastrophic
winters'. The harsh winters came in two different forms
(Christensen 1959:359, Kammp 1964:89):
First, there were the winters that were more than
usually cold and characterized by prolonged thick snow
cover, especially if it set in towards the lambing season
in spring. In such years, the sheep had difficulties
digging through the snow to get to the vegetation
underneath. Also, unable to find sufficient sustenance on
land, the sheep would instead venture to the banks of the
fjords to feed on the seaweed exposed at low tide. In
order to do so, the sheep had to jump down from the
snow-shelf along the coast. However, when the tide
came back in the sheep – especially lambs – were unable
to get back up on the snow-shelf, which would result in
mass drowning. I have heard several sheep farmers
recount how they, before they went to school, had to
patrol kilometers of coastline searching for such sheep in
distress and throw them back up on the snow-shelf.
The second type of harsh winters was also more than
usually cold, but caused high sheep mortality for another
reason: normally warm katabatic winds from the Ice Cap
were vital to the extensively grazing sheep as such winds
would thaw the snow cover in a few of hours, exposing
the underlying vegetation. However, at times these
katabatic winds would thaw most, but not all, of the
snow cover, which would then freeze to a hard shell
immediately afterwards. The sheep could not dig through
by this ice shell and would die by starvation.
Undoubtedly, such harsh winters were experienced by
the Norse as well, but how and when did they occur?

237
Fig.8.10 displays the Greenlandic sheep population
in the pre-modern period of farming 1906-1976
juxtaposed by the annual ice core proxy climate data
from the climate model introduced in section 3.14;
Tab.8.3 summarizes the years with livestock declines.
Looking first at the sheep population, there are 15 years
with decline, among them one instances of two
consecutive years of decline (1932-1934) and one case
of three years of consecutive decline (1936-1939, 1973--
1976). Sheep population declines occurred every 4.6
years and with a trend of increasing severity as sheep
numbers increased (cf. Fig.8.3). However, as seen from
the population decline percentages in Tab.8.3, not of all
these 15 years of decline can be characterized as
catastrophic or even severe. Rather, the small declines (<
10%) seem natural fluctuations or occurred in the wake
of catastrophic winters, likely as some sheep farmers
gave up. Those winters with population declines between
10-20% we can describe as severe winters and those
with > 20% die-off as catastrophic winters.
In this 70 year period, severe or catastrophic winters
occurred every 7 year, both types occurring at an equal
rate, i.e. once every 14 year. Although the sample of
sheep die-off years is small, an expected correlation
between magnitude of population decline and recovery is
visible, i.e. the larger the decline the longer recovery.
The recovery time for the sheep population after severe
or catastrophic winters varied from 2-7 years, on average
4 years. Thus, when the population die-off rate exceeded
the rebound time, there was an overall decline. This is
what happened after the most catastrophic winter of
1966/67, after which sheep number never recovered to
the level of the former period (which is the reason no
rebound period is listed for these declines in Tab.8.3).
The severe and catastrophic winters did not only
impact the sheep, but also the cattle and horses: as
visible in Tab.8.3, even though the cattle were stalled,
they nonetheless followed the sheep declines even to the
extent of similar of relative magnitude. Also the horse
population – which was herded even more extensively
than the sheep (see section 8.1.2) – generally died off
along with the sheep, although there are unexplained
exceptions. Although it would be advantageous to
include the cattle and horses in the below analysis, their
population censuses are not as consistent as that for the
sheep, and their small numbers (cf. Fig.8.2) cause that
they are naturally liable to violent fluctuation. However,
their synchronous population fluctuations imply that the
catastrophic winter modelling below can be extended to
the other Norse livestock as well.
Returning to Fig.8.10 and contrasting the severe and
catastrophic winters against the Dye-3 δ18
O climate
curve an extent of correlation is immediately apparent.
The correlation is only clear with the “winter curve”,
which is unsurprising since it reflects exactly the critical
period in extensive farming and furthermore is the data
that best reflect observed South Greenland temperatures
(Vinther et al. 2010:597). I therefore discount the
“summer” and average curves in this analysis. However,
even the correlation with the “winter curve” is somewhat
difficult to substantiate and statistically it displays small
correlation (r = 0.13). On the other hand, all the sheep
population declines – disregarding their magnitude –
Tab.8.3 Winters with sheep decline
Winter Sheep
decline Sheep
recovery Cattle
Decline
Horse
Decline
1922/23 16.7% 1 year - -
1932/33 19.4% - 1.8% -
1933/34 11.0% 2 years 9.1% 11.0%
1936/37 11.1% - - -
1937/38 16.3% 3 years No No
1938/39 0.2% - 7.3% No
1942/43 6.7% 2 years - -
1948/49 55.1% 7 years 37.8% 12.5%
1954/55 2.4% 1 year 6.6% No
1956/57 27.5% 4 years 10.3% 2.3%
1966/67 53.8% - 31.2 11.8%
1971/72 40.5% - - 10.6%
1973/74 5.5% - - No
1974/75 2.0% - - 8.7%
1975/76 26.1% - - 11.7%
Tab.8.3 Displays proportional declines (from the previous year) of Greenlandic sheep, cattle, and horse populations in the period 1906-1976. Winters with no censuses are marked '-'; winters where there was no decline is marked 'No'.

238
correlate with lower than average δ18
O winter
temperatures, as reflected in their mean temperature of -
29.27 as compared to the mean -28.70 of the entire 70
year period. There even seems to be a difference
between the severe and the catastrophic winters, the
former displaying a mean -28.49 winter temperature, the
latter a mean -30.04.
Based on this, and taking a somewhat conservative
stance, I find it reasonable to propose that years with
δ18
O winter temperatures colder than -30.00 are highly
likely to effect population declines in sheep, and to some
extent other livestock, ranging free in South Greenland;
and that the magnitude of the sheep population decline is
expected to exceed at least 20%. With such a small
sample of population declines, this claim must still be
regarded as highly theoretical and simply a means data
exploration. But seeing that there was only one winter
(1963/64) with lower than -30.00 δ18
O temperature that
did not correlate with a sheep decline, the model seems
to identify most adverse winters, although perhaps not
always catastrophic ones. The fortitude of this model is,
of course, that the assumption may be extrapolated as far
back in time the Dye-3 ice core temperature data allows:
Fig.8.10 Displays the number of ewes in Greenland 1906 (black line and squares) against Dye-3 δ18O summer (red line), winter (blue line), and annual average (grey dotted line) temperatures. It is noticeable how the decline in sheep numbers generally correspond to declines d18O winter temperatures. The historically recorded catastrophic sheep declines in 1948/19, 1956/57, 1966/67, 1971/72, and 1975/76 has been used to define a critical threshold at -30.00 (dashed dark blue line) for the likely occurrence of catastrophic winters (Dye-3 data after: Vinther et al. 2010).
-32,00
-31,00
-30,00
-29,00
-28,00
-27,00
-26,00
-25,00
-24,00
-23,00
-22,00
0
5000
10000
15000
20000
25000
30000
35000
40000
45000
50000
19
06
19
08
19
10
19
12
19
14
19
16
19
18
19
20
19
22
19
24
19
26
19
28
19
30
19
32
19
34
19
36
19
38
19
40
19
42
19
44
19
46
19
48
19
50
19
52
19
54
19
56
19
58
19
60
19
62
19
64
19
66
19
68
19
70
19
72
19
74
19
76
δ18O
te
mp
era
ture
Nu
mb
er
of
ew
es
Ewes and Climate (δ18O)
No. ewes Winter d18O Summer d18O Annual d18O Catastrophic winter limit

239
Fig.8.11 Displays Dye-3 δ18O summer (red line), winter (blue line), and annual average (grey dotted line) temperatures with demarcation of the catastrophic winter limit (dashed dark blue line): d18O temperatures below this -30.00 threshold are likely to corresponded with sheep declines in a free-ranging population in South Greenland (Dye-3 data after: Vinther et al. 2010).
Fig.8.12 Displays Dye-3 δ18O summer (red line), winter (blue line), and annual average (grey dotted line) temperatures with demarcation of the catastrophic winter limit (dashed dark blue line): d18O temperatures below this -30.00 threshold are likely to corresponded with sheep declines in a free-ranging population in South Greenland (Dye-3 data after: Vinther et al. 2010)
-32,00
-31,00
-30,00
-29,00
-28,00
-27,00
-26,00
-25,00
-24,00
98
098
699
299
810
04
10
10
10
16
10
22
10
28
10
34
10
40
10
46
10
52
10
58
10
64
10
70
10
76
10
82
10
88
10
94
11
00
11
06
11
12
11
18
11
24
11
30
11
36
11
42
11
48
11
54
11
60
11
66
11
72
11
78
11
84
11
90
11
96
12
02
12
08
12
14
12
20
12
26
12
32
12
38
12
44
Dy
e-3
δ1
8O
te
mp
era
ture
AD 980-1250 Dye-3 δ18O climate data and the catastrophic winter limit
Winter d18O Summer d18O Annual d18O Catastrophic winter limit
-32,00
-31,00
-30,00
-29,00
-28,00
-27,00
-26,00
-25,00
-24,00
12
50
12
56
12
62
12
68
12
74
12
80
12
86
12
92
12
98
13
04
13
10
13
16
13
22
13
28
13
34
13
40
13
46
13
52
13
58
13
64
13
70
13
76
13
82
13
88
13
94
14
00
14
06
14
12
14
18
14
24
14
30
14
36
14
42
14
48
14
54
14
60
14
66
14
72
14
78
14
84
14
90
14
96
Dye-3
δ1
8O
tem
pera
ture
AD 1250-1500 Dye-3 δ18O climate data and the catastrophic winter limit
Winter d18O Summer d18O Annual d18O Catastrophic winter limit

240
Fig.8.11-8.12 displays a Dye-3 δ18
O temperature
reconstruction for the period AD 980-1500 with
demarcation of the -30.00 catastrophic winter d18O
temperature limit, whereas Tab.8.4 shows the how many
times this limit was exceeded in 25 year intervals over
the same total period, i.e. the frequency of catastrophic
winters. Contrasted against the historically recorded
catastrophic winters that occurred every 14th year, the
frequencies for the 25 year intervals in the period AD
980-1500 seem rather high. However, grouping the first
70 years of Norse settlement in Greenland, catastrophic
winters are in Fig.8.11 and Tab.8.3 implied to have
occurred every 11.7 year, which is not far from the pre-
modern scenario, especially not considering that perhaps
one out 5 years with below -30.00 winter Dye-3 d18O
temperatures did not result in a sheep decline (cf.,
Fig.8.10 1963/64). Also, all the historically catastrophic
winters only occurred over an interval of just some 30
years, i.e. once every sixth years, which would make the
historic frequency even higher than during the first half
of the Norse settlement. In short, while the catastrophic
winter model is not accurate or trustworthy in the sense
that it can pinpoint individual years or even decades of
major sheep population die-off, it does seem to provide a
50-100 year resolution of catastrophic winter trends.
Emphasizing caution in the use of this simple model,
it does have some very interesting implications: taking
the example of pre-modern Inuit sheep farming, the
frequency of catastrophic winters once every 14th year
seems to have been a threshold for viable extensive
farming, and towards the latter half of the pre-modern
period where catastrophic winters increased in frequency
to every sixth year, the threshold had been crossed,
effecting total reorganization of the entire farming
system into its later modern form. The threshold seems
to have been when catastrophic winter frequencies came
close to exceeding sheep population recovery rates of ca.
5.5 years (note that there are only two catastrophic
winters to set this rate). Reviewing the catastrophic
winter frequencies in Tab.8.4 against this 5.5 year
population recovery rate, it appears that in an early stage
of settlement, and especially during landnám, the
grænlendinga could have relied on fairly extensive mode
of farming. This could have been essential in freeing
labor during early settlement expansion and for the
hunting voyages to the Norðrseta.
However, the potential for labor efficient extensive
farming seems to have diminished fairly quickly: from
AD 1175-1199, the sheep population recovery rate was
almost exceeded by catastrophic winter frequencies; and
after an intermittent amelioration between ca. AD 1200-
1250, extensive farming became increasingly unviable,
or at least risky. Thus, at least from the 14th century AD
and continuing into the Little Ice Age, a fully extensive
herding strategy must seem practically impossible.
The timing of when catastrophic winters could have
made it impossible to maintain an extensive farming
system is concomitant with both the settlement abandon-
ment dates (cf., Fig.8.9) and the palynological evidence
Tab.8.4 Catastrophic winters AD 980-1500
Year AD No. of
Catastrophic winter
Catastrophic winter
frequency per 25 yrs.
980-999 1 20.0
1000-1024 3 8.3
1025-1049 2 12.5
1050-1074 3 8.3
1075-1099 3 8.3
1100-1124 1 20.0
1125-1149 2 12.5
1150-1174 3 8.3
1175-1199 6 4.2
1200-1224 3 8.3
1225-1249 3 8.3
1250-1274 4 5.0
1275-1299 3 8.3
1300-1324 5 4.0
1325-1349 4 5.0
1350-1374 5 4.0
1375-1399 2 12.5
1400-1424 5 4.0
1425-1449 7 2.9
1450-1474 10 2.0
1475-1500 4 5.0
Tab.8.4 Displays the number and frequency of potentially catastrophic winters at 25 year intervals for the period AD 980-1450.

241
for decreased land use intensity, and the AD 1257-1258
climatic event, and it is hard not draw a connection: the
unfeasibility of extensive farming would have meant that
farmers had to stall and feed a higher proportion of their
livestock – perhaps reflected in large Greenland barn
areas (see section 5.3.1) – which was likely a difficult
prospect, especially for the cottagers or petty farmers
who neither had access to the infields areas, nor the extra
hands, needed to sustain intensified farming with the
same number of livestock. Such problems would have
been even more pertinent to farmers in the outer fjords –
just as it was to the pre-modern Inuit farmers (see section
9.1.2) – who were additionally increasingly besieged by
summer drift ice effecting a shorter growth season and
lowered biomass productivity (Ogilvie et al. 2000,
Ogilvie et al. 2009, Kuijpers et al. 2014).
To these farmers, only three choices, or a
combination, would have been feasible: to cut down on
the animal husbandry in favor of wild resources, which
is what is suggested by the palynological (see above) and
isotopic evidence (Arneborg et al. 2012a); to adjust the
composition of the livestock to more hardy and frugal
breeds, a change implied by the zooarchaeological
evidence (see section 2.3.2); or to move to locations with
better access to natural fodder resources, which is
perhaps what the new farmstead abandonment dates
suggest. However, the latter option would probably not
have been completely open, but required acceptance of
those who owned the more favorable land in the middle
and inner fjords, i.e. the large farms and manors. Yet, the
presence of some even fairly large farmsteads with many
livestock building in the outer fjord Vatnahverfi region
(cf. Fig.7.15, 7.17) implies that some farmers must have
attempted the first solution and clung on to their land.
In the other end of the societal, and geographical,
spectrum of the Norse Eastern Settlement, large farms
and manors could for a while have tackled, perhaps even
benefitted from, the change of the farming system from a
more extensive to a more intensive mode of production:
they were less effected by deteriorating environmental
conditions, they owned the most productive infields and
meadows, they had surplus husbandry to replenish
diminished stocks, and could have made use of this
resource to tie farmers to their service by a (cattle-)
renting system similar to that in Iceland (Vésteinsson
2007:131). They also had access to a greater labor force,
which they culd call on as payment of debths, taxes, or
tithes (Júlíusson 2010:19p).
The latter scenario must for now remain speculative,
although the convergence of site abandonment dates,
land use patterns, and environmental changes must at
least prompt new explanatory scenarios if future
evidence points in the same directions. On a concluding
note, however, it is redolent to observe that extensive
farming succeeded in other North Atlantic regions under
almost as harsh and deteriorating environmental
conditions: catastrophic or severe winters, combined
with decease which has not even been discussed for the
Greenlandic scenario, took an equal toll on the sheep
population in Iceland and the Faroes (Bruun 1897:67,
1928:276, Joensen 1979:107, Austrheim et al. 2008). A
lesson from the latter is, perhaps, that changing
environmental conditions do not necessarily effect
immediate change in a farming system; rather a
considerable delay is expected as new TEK is build and
imprinted on the system within the boundaries of social
and economic possibilities. In terms of the Norse
grænlendinga the question is really how, and to what
extent, they could have tackled a shift to towards more
intensive farming?
8.2.4 SHEEP/GOAT NUMBERS
The question of to which extent environmental
deterioration could have been forcing the Norse farming
system into a more of intensive regime depends on the
number of actual livestock kept on the farmsteads.
Where they more or less abundant than during the period
of pre-modern Inuit farming? The classification of
outbuildings in chapter 7 tempts such estimation. There
are several ways this could be approached, but here I
only focus on the survey architectural evidence that
provides the least unproblematic conversion into actual
livestock numbers, i.e. the enclosures:
However, as stressed in section 6.2.4 even this more
“unproblematic” evidence calls for critical consideration,
such as for instance which type of livestock the
enclosure was meant to facilitate, for which specific
purpose and at what time of the year etc. These issues
are discussed in connection with the description of the
different types of enclosures in section 6.2.4 and I will
not reiterate here. Here, I only attempt to estimate the
maximum number of sheep/goats in the Vatnahverfi
region based on the functional grouping of enclosures
that were most likely to be related to sheep/goat herding,
i.e. those grouped as caprine enclosures (Cap_Encl.) in
the Ruin Group Database (see section 7.1.1, App.2):

242
The first step in the calculation is to consider which
enclosures were in contemporary use: clearly enclosures
used at the shielings cannot be grouped with enclosures
at the farmsteads since these were facilitating the same
herds of livestock, only at different times at year. Thus
only the total enclosed area of farmsteads is considered
and the classification from chapter 7 is used in this
differentiation. However, since the aim is to estimate the
maximum number of sheep/goats in the Vatnahverfi
region and the large complex shielings, as discussed
above, likely function as small farmsteads at the peak of
settlement, they too must be included in the calculation.
The next step is to estimate the actual enclosed area
at all the farmsteads and large complex shielings. For
this calculation, the total area of the enclosures (TAE)
used for the site classification is unsuited, because it
comprises the whole area of the ruin, as opposed to the
actually enclosed area, which varies with wall
thicknesses of the enclosures. Because of their often fine
preservation (see section 6.2.3), the areas enclosed by
the various types of folds can often be established quite
accurately. However, there are some enclosures too
collapsed to establish this measure (cf. App.1). Thus, the
areas of such poorly preserved enclosures need to be
converted in actual enclosed area. To achieve this, I have
used the average ratio of ruin area to enclosed area of the
well-preserved examples to adjust the enclosed areas of
the poorly preserved examples of the same type. Based
on this calculation, the total enclosed area of the caprine
enclosures in the Vatnahverfi region is 5564.26 m2.
The final step in the calculation is to estimate how
much livestock could be gathered in this total enclosed
area. This estimate is rather flexible and depends on
prevalent local herding practices, as well as how long the
animals needed to be penned. Estimates of needed
penning areas range from 0.4 m2 per ewe with lamb(s)
during the large and short annual round ups (Joensen
1979:38) to 1.75 - 2.0 m2 per goat in a loose pen (Pyndt
1919:42, Mowlem 1992:23). Applying this range to the
total enclose area of 5564.26 m2, a maximum of 13,911
animals (ewes) could have been rounded up (0.4 m2 per
animal) in the farm near enclosures of the Vatnahverfi
region, but there was only room to facilitated prolonged
penning of some 2782 ewes/goats (2.0 m2 per animal).
Divided on the 60 farmsteads and large simple shielings
were the folds were located, they could on average
facilitate brief round ups of some 232 ewes/goats, and
have penned for longer periods some 46 animals.
Again we are dealing with highly theoretical numbers
and on the assumption that all of the sites were in
contemporary use, which they seem to have been only
for a brief time period (see section 8.2.2). Compared to
the sheep numbers involved in pre-modern farming (cf.
Fig.8.3), 13,911 animals is well within the range of pre-
World War II numbers and does not seem completely
unrealistic, especially not if considering that the 13,911
animals reflect the peak of Norse settlement, while pre-
modern numbers reflect a farming system in an early
stage. On the other hand, the sheep numbers in Fig.8.3
reflect all of South Greenland, which would make
13,911 animals a rather high estimate for the Vatnahverfi
region on its own. It must of course be stressed that
13,911 is an absolute maximum, i.e. it is highly unlikely
to reflect real numbers, although it can more confidently
be considered an upper limit.
Only T.H. McGovern has attempted to model Norse
Greenland livestock numbers from archaeological
evidence, in this case on three Western Settlement
farmsteads (McGovern et al. 1988:Tab.1, McGovern
1991:Fig.3): in his estimation, a second rank farmstead
like V51/Sandnes (parallel to a church manor in my
classification) would have kept ca. 28-37 sheep/goats; a
third rank farmstead like V54/Nipaatsoq (parallel to a
medium farmstead in my classification) ca. 30 ewes/
goats; and a fourth rank farmstead like V48/Niaqussat
(parallel to a small farmstead/large complex shieling in
my classification) ca. 18 ewes/goats. This is somewhat
lower than my lowest estimate of an average 46 animals
per farmstead in the Vatnahverfi region. However,
considering that the environmental conditions for
farming were more favorable in the Eastern Settlement,
46 animals per farmstead seems far from unlikely. This
suggests that a 2 m
2 penning area per ewe/goat is a
reasonable estimate and it also corresponds better to the
function of the enclosures, many of which seemed to
have been used for temporary sheltering of sheep/goats,
i.e. were “loose pens” (see section 6.2.3). This would in
turn suggest a total population of only some maximum
2782 ewes/goats for the entire Vatnahverfi region.
2782 ewes/goats would constitute a fairly small and
fairly fragile sheep/goat population. However, the large
réttir in the Vatnahverfi outfield (see section 6.2.3) were
clearly able to facilitate greater animal numbers, which
could indicate either they were higher at some point
during settlement, if so undoubtedly in the early half of
settlement; or that the grænlendinga in part relied on

243
storage on the hoof, i.e. allowing part of the sheep/goats
– presumable the most hardy individuals such as
rams/wethers – as it is known from Iceland and the
Faroes (Bruun 1897:58, Joensen 1979) – to graze outside
throughout most of or the entire year and hope for the
best. As substantiated in section 8.2.3, this labor efficient
herding practice would probably have been viable until
the 14th century AD.
While this sheep/goat herding strategy may to some
extent have enabled transition to a more intensive mode
of farming, it did not help much in regard to the cattle.
As outlined in section 2.3.2, even the smallest
farmsteads kept a few heads of cattle. Since the cattle
required higher quality fodder during winter stalling and
climatic deterioration probably effected that they had to
be stalled for longer, the need of procuring sufficient
high quality fodder would have been a significant issue.
8.2.5 FIELDS AND FORAGE
The primary source of high quality fodder for the
Norse farmers was infields and meadows. Although
accurate measuring of infield and meadow areas was
attempted both during the Vatnahverfi field surveys and
following from satellite imagery during post processing,
such areas could only be satisfactorily established in a
handful of cases (cf. App.2): whereas the areas of the
fenced in infields are fairly easy to establish and measure
(cf. Tab.6.23), the vast majority of Norse farmsteads had
– as noted above – no infield boundary; and due to
regrowth of natural vegetation or cultivation by present
farmers, determining their original extent is often
difficult. I therefore here take a more general approach:
As noted in section 8.1.4 (Fig.8.5) the aggregate area
of cultivated fields in Greenland in 2006 – after some 25
years of mechanized farming and field expansion –
amounts to 966 ha, which according to the vegetation
classification in chapter 4 is less than 1 % of the total
vegetated area in the central Eastern Settlement. Just to
emphasize the extremely minute extend of this cultivated
area, it covers only ca. 0.8% of the 116,000 ha presently
cultivated in Iceland (Jóhannesson 2010:22). Seeing that
most primary Norse farmlands had been occupied by
pre-modern Inuit sheep farmers by the 1960’s (cf. Fig.
8.8) and that the present cultivated area largely owes to
prior meadows being drained, it is fair to assume that the
Norse area of cultivated land hardly could have been
larger than before the 1976/77 intensification, i.e. about
100 ha, 200 ha at most. According to an 1964 estimate –
i.e. before farmers had easy and cheap access to field
fertilizers and nutrients – one Greenlandic ha hayfield
would winter feed about 100 sheep (Kammp 1964:88),
meaning that the area cultivated prior to 1976/77 could
winter feed a maximum of 10,000-20,000 sheep, and
only sheep. However, as noted in section 8.1.2, pre-
modern Inuit farmers were cultivating their fields
irrationally. Thus, whether 10,000-20,000 sheep/goats
could have been a limit for the Norse farmers as well
depended on how intensively their cultivated their
infields, as well as who had the option of doing so:
The difficulty of expanding, or even establishing,
infields in the Greenlandic landscape was an obstacle in
itself. Clearing of shrub vegetation by burning was noted
early and has since been recorded at many Norse sites
(e.g., Iversen 1934, Fredskild and Hulme 1991, Edwards
et al. 2007, Ledger et al. 2013a). However, this was only
the first part of the process and the laborious next part is
vividly recorded by pre-modern farmers in Greenland:
drained land had to be cleared of stones and without
mechanical aids (Fig.8.13), but resorting to ʻ…spades,
levers, hardy grips and dynamite…ʼ (au. trans. after
Christensen 1951:408) and transforming the land was the
most “…tiresome and laborious work and even under the
most favorable circumstances, not many square feet can
be added every year” (au. trans. after Walsøe 1919:37).
It was a lengthy process where ʻ…what was left
unfinished by the farther, was attained by the sonʼ
(Ibid.48). Meadowland and small lacustrine plains had
fewer stones, but had to be: “…drained by open trenches
that later require much maintenance” (au. trans. after
Christensen 1951;408).
Once the infield was established there were a number
of other issues: on drained land, the most problematic
issue was water evaporation (Christensen 1953:408),
which have recently been demonstrated to have been a
significant problem to the Norse as well (Adderley and
Simpson 2006). The answer was, of course, irrigation
which, as already stated above, have been recorded at a
number of ruin groups (Krogh 1974, Arneborg 2005,
Adderley and Simpson 2006, Buckland et al. 2009,
Panagiotakopulu et al. 2012). However, maintaining
dams and irrigation trenches was labor demanding. This
may explain why irrigation systems have mostly been
found at medium or large farmsteads.
Increased infield productivity was achieved by
fertilizing the soils with animal dung and household

244
waste, which have been documented both directly and
indirectly at several ruin groups in both the Eastern and
Western Settlements (e.g., Schweger 1998, Commiso
and Nelson 2006, 2007, 2008, Buckland et al. 2009,
Commiso and Nelson 2010, Bishop et al. 2013). Most
likely, the fertilizing was done either by lifting turf
blocks in the infield, depositing the manure and waste on
the exposed soil, and then replacing the turf, or by using
turfs as matting in the byres, where they would soak up
the droppings of the animals and could then be placed in
the infield. Both fertilizing methods would crease the so-
called 'plaggen soils', which have also been recorded in
Greenland (Schweger 1998, Panagiotakopulu et al.
2012). Alternatively, livestock could be allowed to graze
infield over certain times of year, thereby “naturally”
fertilizing it, or manure was simply spread in a thin layer
in the infield. Both practices are known historically from
Iceland (Bruun 1897:32, Lárusdóttir 2006:54) and may
also be implied by isotopic nitrogen values recorded in
some Greenlandic livestock (Nelson et al. 2012:81).
In any case, fertilizing infields required manure or
other nutrients. Although fertilizing with sea-weed is
fairly commonly reported from elsewhere in the historic
North Atlantic (e.g., Fenton 1997:276, Kaland 2009) – a
resource which was also close at hand to most fjord-near
Norse farmsteads in Greenland – its use as fertilizer has
not yet been documented in the latter place. Thus, it
seems grænlendinga must mainly have relied on their
livestock for manure, which in turn must have effected
that those farmers with most livestock also had the most
fertilizer. Also, the task of gathering and spreading
manure was labor demanding, although perhaps only
periodically.
In the light of the above, there is probably little doubt
that the first Norse grænlendinga very selectively would
have searched out the niches in the landscape which – in
addition to the site selection criteria outlined in section
7.1.1 – provided them with a labor-efficient and stable
fodder resource, i.e. meadows in the lacustrine plains,
naturally inundated slopes along the fjords and lakes.
Vésteinsson has repeatedly pointed to this resource as a
prime factor in the selection of early settlement sites in
Iceland, which were also often the sites to develop into
estates and parish centers, i.e. the large complex settle-
ments discussed in the above section 7.3.3 (Vésteinsson
1998:7p, Vésteinsson et al. 2002:102). This was surely
also the case in Greenland, which can be substantiated
from the ruin group sample: of the total 157 ruin groups,
only around 62 of the 157 are located in proximity to
meadow or lush mire. However, considering only the
sites could have had permanent occupation at some
point, percentages are much higher: seven (37%) of 19
large complex shielings are located in proximity to
meadow/ mire compared to eight (67%) of the 12 small
farmsteads, 22 (76%) of the 29 medium farmsteads, four
(60%) of the five large farmsteads, three (75%) of the
four manors, and five (71%) of the seven church manors.
Note the distinct leap in access to meadow/mire from the
large complex shielings to the farmsteads, which again
suggests a real difference between these types of sites.
Fig.8.13 Wooden spade found at V51/Sandnes (length 29.8 cm). Besides such spades and whale-bone shovels, the Norse had few technological aids to ease cultivation and amendment of fields (photo: courtesy of the National Museum of Denmark).

245
For those farmers not so fortuitously situated there
were other resources they could resort to if short of hay
fodder: in the textbook on sheep farming in Greenland
(Jensen 1958) a number of such resources are listed,
including various naturally occurring sedges and grasses,
heather, moss, seaweed, dried and fresh fish, and not at
least willow and birch leaf fodder. The abundance of
leafy shrub shown by the modern vegetation patterns in
the settlements (see section 3.2) suggest that it must have
been especially important. This is also supported by new
palynological evidence of medieval shrub woodland
management, pollarding or coppicing, for instance in the
willow rich central Vatnahverfi region (Schofield and
Edwards 2011:193, Ledger et al. 2014a:13). The use of
seaweed and fish as supplemental fodder is known
historically from elsewhere in the North Atlantic (Bruun
1897:73, Fenton 1997:428).
Both seaweed and fish were abundant, not at least the
herring-like ammassat (capelin/Mallotus villosus), which
can at many places close to the Norse farmsteads be
“scooped” out of the water with buckets. It is therefore
surprising that a study of isotopic nitrogen and carbon
values in Norse animal husbandry show them – apart
from the pigs and dogs – to have a minimal marine
intake (Nelson et al. 2012). Although marine fodder
could taint the taste of meat and milk, it is hard to
believe that the Norse would have led the valuable and
hard-to-replace livestock starve to death rather than to
have them survive with an unpleasant aftertaste. If
disbanding with a paradigm of arctic marginality, could
this be taken to indicate that other supplemental fodder
resources were preferred and sufficient? However,
foraging for other fodder sources at distance from the
farmsteads must also have been labor intensive.
To summarize, there seems have been some options,
even for small-scale cottagers with minimal infield areas,
for coping with adverse environmental conditions.
However, increasing infield productivity would clearly
not have been open to smalltime farmers and since the
above mentioned fodder sources were at best supple-
mental when it came to winter feeding cattle, they really
only had the choice of adjusting the composition of their
livestock towards the more frugal sheep and goats. At
least, the timing of the increase in catastrophic winter
frequency (cf. Tab.8.3) corresponds markedly well with
the major change in the domestic archaeofauna towards
keeping more caprines; and although there are at this
point no dates to support the claim, one could speculate
if not some of the lambakró that appear to be later
additions to the folds (see section 6.2.3) were built at this
point as some farmers became more dependent on the
milk from sheep and goats?
Fig.8.14 'Peat-cutter’s' in late 19th century Faroe Islands. Note the resemblance of their spades with the example from V51/Sandnes (Fig.8.13) (photo: courtesy of the National Museum of Denmark).

246
8.3 ON THE SECURITY AND RESILIENCE OF PASTORAL FARMING
Reviewing chapters 7 and 8, it is difficult not to
notice that the societal and economic setup of the small
Norse community of the Vatnahverfi region was
characterized by several self-reinforcing mechanisms
that to a notable extent only benefitted the upper stratum
of society. Those who first occupied the most favorable
environmental niches were from the onset poised to
govern, or at least influence, subsequent developments;
they had principal access to land and resources; they had
the extra livestock numbers to provide surplus products
in the good years and built up new stocks in the wake of
the bad; they had access to extra labor for both
improvement of their own farms and for the ships
needed for the cash-crop hunt in the Norðrseta; they
controlled contacts with and access to the world outside
Greenland, and through their religious authority, to the
world beyond. Although the settlement pattern analysis
of the Vatnahverfi survey evidence implied that there
was room for some social mobility, the major part of the
community must largely have been at the mercy of the
manorial centers.
In the final section of chapter 8 I explore dynamics of
such societal mechanisms that related to the layout of the
pastoral farming system, and to the Eastern Settlement in
general. Summarizing the findings in the above chapters,
I first briefly review aspects of pastoral farming in the
Vatnahverfi region in a perspective of human securities,
i.e. accentuating how farmers of different social strata
could have experienced the deterioration of conditions
for farming against their specific economic and social
background. In the last section, I zoom out to explore
how the observed larger changes in the Norse farming
community of the Vatnahverfi may be understood within
the framework of resilience theory.
8.3.1 THE HUMAN SECURITIES OF FARMING IN
MEDIEVAL VATNAHVERFI
The human securities approach or paradigm grew out
of a 1994 Human Development Report published by the
United Nations Development Programme (UNDP) on
the main issues facing the people and cultures around the
world at that, and present, time, i.e. hunger, violence,
disease, political and gender oppression etc. (UNDP
1994). The aim of the report was to inform and influence
policy makers and NGO’s and to raise general awareness
of these problems. The novelty of Human Securities idea
or paradigm was that it stressed specifically the unique
human experience of these problems, i.e. how they –
whether economic, environmental, religious etc. –
directly influenced peoples’ lives.
Since 1994, the Human Securities approach has
developed rapidly – unsurprisingly mainly in the
humanistic disciplines – and now comes with a vast
corpus of literature and its own journal (Journal of
Human Securities). Although the approach may on the
surface seem a far cry from archaeology, it has recently
gained a foothold (e.g., Brewington 2013, Hegmon 2013,
Hegmon et al. in press). While some of the Human
Securities listed in the 1994 UNDP report (24p) seem
unapproachable themes from the point of archaeology
others – such as food securities, environmental
securities, community securities – are clearly not; and
certainly, a fundamental focus on the human experience
can be extended to the people of the past as a common
agenda of archaeology.
In terms of human securities, the Norse Greenland
settlements provide an intriguing and potent case study:
it was a fairly closed and delineated social-ecological
system, which was facing major environmental and
economic changes over a short time span, many aspects
of which are with present and many other recent
investigations documented in such resolution that they
may be explored in detail. Here, however, I will limit the
inquiry to exploring food-security aspects of pastoral
farming in the Vatnahverfi-region.
Since 2013, I have had the privilege and enrichment
of working with a group of collaborating archaeologists
of the two research networks North Atlantic Biocultural
Organization and the Long-term Vulnerability and
Transformation Project (LTVTP). The collaboration
aims to compare major changes and transformations in
widely different societies facing acute environmental and
social challenges in order to identify underlying similar
mechanisms, which may in turn help us understand the
key drivers of social and cultural change. As a tool for
formal comparison of these very different archaeological
cultures, we have adopted Qualitative Comparative
Analysis (QCA):

247
QCA is an analytical and exploratory approach
introduced by sociologist C. Ragin in (1987) and
designed specifically to help social scientists working
with “fuzzy sets”, i.e. sets that are not dichotomous
(“crisp”), e.g. religious (1) versus atheist (0). In all
simplicity, QCA allow for partial membership in the
interval between the two groups – “occasionally”
religious, agnostic etc. – by scoring or scaling
membership between 1 and 0. If religious is 1 and atheist
is 0, then “occasionally” religious may be scored 0.5,
agnostic at 0.1 etc. The approach thus quantifies
complex categories and phenomena so that they may be
analyzed and compared regardless of their categorical
difference. QCA’s has become a widely accepted
approach with many angles and applications (e.g., Ragin
1987, Ragin and Pennings 2005, Berk-Schlosser et al.
2009, Breiger 2009). However, here I adopt a very
simple QCA-approach aimed mainly to explore issue of
labor and fodder accessibility in a Norse farming system
facing increasing difficulties in maintaining an extensive
mode of production, and perhaps to stake out some new
lines of future inquiry:
Inspired by the approach applied in our collaborative
network I ask three questions relating to above discussed
aspects of pastoral farming in Norse Greenland and that
relate to food- and environmental securities:
Was the impact of deteriorating environmental
conditions severe enough to force a shift towards
more intensive farming for any given societal
class of farmers?
Was the given societal class of Norse farmers
facing increasing problems with continuing a
low labor-input extensive mode of farming and
shifting to more labor-costly intensive farming?
Was the given societal class of Norse farmers
increasingly facing problems with providing the
labor needed to exploit other available fodder
resources?
Normally, such questions would be answered rather
indeterminately with for instance “possibly”, “to some
extent” etc. Applying a QCA approach to the questions
forces a more determinate answer and while this answer
may still be difficult, or even impossible, to substantiate
with our present knowledge, it at least has the potential
of raising some research issues that may be worth
pursuing in the future.
Each of the above questions is asked for three
tentatively separated social classes of farmers in the
Norse settlements, in this case consisting of cottagers/
tenants (who were limited in their possibility of action
by contract or tenure of larger farms, or did not own their
own land); free-holders (who owned their land and
potentially a few associated cottages); and magnates
(who owned their own their land, several cottages, and
had religious and political hegemony). In the context of
this simple exercise I will not go into lengthy discussion
of these terms or their historical implications. Suffice to
note that the class stratum designated cottagers/tenants
could correspond archaeologically to the small and
medium farmsteads, free-holders to the large farmsteads,
and magnates the manors and church manors.
Each question is asked for each of the three time
periods AD 980-1160, 1160-1300, 1300-1450. The
answers to these questions are scored accordingly: “yes”
(1.0), “more yes than no” (0.75), “more no than yes”
(0.25), and “no” (0.0) (cf. Tab.8.4). From the experience
of our network workshops, such a four partite
membership attribution evades the tendency for answers
to strand in a little informative middle category of
“either or”. Tab.8.5 displays the QCA scoring of the
three questions asked for each social class for each of the
three time periods, Fig.8.15 displays the aggregate mean
scores for each time period. To elucidate the scoring of
each question in turn:
The scoring of the first question is based on the
catastrophic winter modeling (cf. section 8.2.3, Tab.8.3)
and the general climate model (cf. section 3.1.4): these
records indicate that few Norse farmers would have
experienced problems in maintaining an extensive mode
of production in the period AD 980-1160. When I still
have scored cottagers/tenants at 0.25 it is based on the
parallel with pre-modern Inuit farming, where extensive
farming even in this fairly favorable climatic period was
liable to some fluctuation, which would have impacted
marginally situated cottagers/tenants the most (cf.
section 8.1.3). In period AD 1160-1300, the catastrophic
winter modelling implies that it became increasingly
problematic to maintain an extensive mode of farming,
although mostly for cottagers/tenants in marginal
farmlands, which is why they are scored at 0.75 (as
compared to the 0.25 of the other social classes). In the
final period AD 1300-1450, or at least in its latter part,
extensive farming overall became unviable and the
societal classes all score at 1.0.

248
Fig.8.15 Graphic visualization of (aggregate means) the scoring of the QCA-questions listed in Tab.8.5, estimating temporal change the in food-securities of different societal class Norse Greenland farmers. The figure is discussed in the text.
0
0,2
0,4
0,6
0,8
1
1,2
AD 980-1160 AD 1160-1300 AD1300-1450
Mean
secu
irty
le
vel
Norse Food- and Environmenal Securities
Cottagers Free-holders Magnates
Tab.8.5 QCA-scoring of societal differences in food-securities
Societal Class AD 980-1160 AD 1160-1300 AD 1300-1450
QCA question: Was the impact of deteriorating environmental conditions severe enough to force a shift towards more intensive farming for any given societal class of farmers?
Cottagers 0.25 0.75 1.00
Free-holders 0.00 0.25 1.00
Magnates 0.00 0.25 1.00
QCA question: Was the given societal class of Norse farmers facing increasing problems with continuing a low labor-input extensive mode of farming and shifting to more labor-costly intensive farming?
Cottagers 0.25 1.00 1.00
Free-holders 0.00 0.75 1.00
Magnates 0.00 0.25 0.75
QCA question: Was the given societal class of Norse farmers increasingly facing problems with providing the labor needed to exploit other available fodder resources?
Cottagers 0.25 0.75 1.00
Free-holders 0.00 0.25 1.00
Magnates 0.00 0.00 0.75
Aggregate mean:
Cottagers 0.25 0.83 1.00
Free-holders 0.00 0.42 1.00
Magnates 0.00 0.17 0.92
Tab.8.5 Displays the QCA-scoring of three questions asked of each of three tiers of Norse Greenland farmers for each of three periods, where: 0.00 = no, 0.25 = more no than yes, 0.50 = more yes than no, and 1.00 = yes. The individual scorings are discussed in the text.

249
The next question relates to the above discussion of
infield and livestock intensification in response to the
decreasing environmental conditions for extensive
farming: in the period AD 980-1160, there is nothing to
suggest that upper stratum farmers would have had
problems adjusting to minor local conditions, and are
scored at 0.0. The cottagers/tenants are again scored at
0.25 because of their smaller infields and more marginal
pasture and resource areas, which meant that their fodder
production was limited from the beginning of settlement.
In the period AD 1160-1300, the latter problem could
have become highly aggravating since the cotter/tenants
probably had fairly little livestock (cf. section 8.2.4) and
limited labor resources, which effected that infields
could neither be expanded or fertilized, which in turn
effected that little animal husbandry could be stalled for
prolonged periods; hence the cottagers/tenants are scored
at 1.0. The free-holders likely had less problems in this
concern since they could draw on their larger infields
and the labor of subsidiary farms; they are scored 0.25.
The magnates probably had even better access to both
resources and are consequently scored at 0.0.
In the period AD 1300-1450, shifting to more
intensive farming had become largely unviable even to
free-holders, which may have lost their subsidiary farms.
At least the settlement contraction implied by the new
abandonment dates (see section 8.2.2, Fig.8.9) suggest
that there was less access to labor, which would have
affected both free-holders and magnates. However, the
late settlement dates for some manorial centers, and
indicated economic and political centralization (see
section 7.3.3) could indicate that the latter still had
access to surplus labor; the free-holders are consequently
scored at 1.0 as compared to 0.75 of the magnates.
The final question addressed the possibility of
different societal class farmers on facilitating more
intensive farming by relying on other natural fodder
resources (see section 8.2.5): in the period AD 980-1160,
the low labor force available to the cottagers/tenants
again probably meant that even procuring sufficient
natural fodder resources could have been problematic;
they are scored at 0.25. The free-holders and magnates
probably had no such issues, neither needed a large input
of other fodder resources, and are both scored at 0.0. In
the period AD 1160-1300, the inability of cottagers/
tenants in increasing infield production – cf. the scoring
of the previous question – meant that they had to rely
increasingly on natural fodder resources, which was
again unfeasible due to their limited access to labor; they
are scored at 0.75. Free-holders and magnates are scored
at 0.25 and 0.00 respectively, since they still had the
means of intensifying their infield production – cf. the
scoring of the previous question – and thus relied less on
natural fodder resources; and if needed, these resources
could be easier exploited with their better labor
accessibility, magnates having somewhat better access
than the free-holders. In the period AD 1300-1450, the
difficulties of procuring fodder from other sources must
have become aggravating to all social classes of farmers,
mainly as a result of labor deficiency and the limits to
which infield production could be intensified (cf. the
above scoring). Cottagers/tenants and freeholders are
scored at 1.0, the magnates at 0.75.
The above must be regarded as a very tentative
exploration and should not by any means be understood
categorically. The model concerns only the possibility of
intensifying farming in the settlements based on the
assumption that it was forced to shift from a more to a
less extensive mode production. Thus, the model says
nothing about the other possibilities of the societal
classes, i.e. intensifying hunting and sealing, adjusting
the livestock composition etc. In short, the model has
limited implication for overall settlement changes.
However, interpretively reviewing Fig.8.15 only in
terms of food- and environmental securities some
interesting conditions nonetheless appear visualized: if
the scale from 0.0-1.0 is read as a measure of security –
0 being a high level of security and 1 of insecurity –the
societal strata clearly followed different trajectories:
cottagers/tenants started out with even some measure of
insecurity and quickly moved into a regime of relatively
high food- and environmental insecurity. The same
transition in the other societal strata was delayed as they
could draw on resources and labor from the lower strata,
which perhaps further exacerbated the experience of
food insecurity for the latter. In the end, however, the
combined weight of environmental stress and
accumulated labor deficiency may have affected an
equally high level of insecurity in all societal strata.
On a final note, the comparison between this cursory
security discussion and the isotopic study of Arneborg et
al. (2013) has a very enticing point of convergence: As
seen in Fig.8.16 the range of δ13
C values in the Norse
skeletons varied; in the early period AD 980-1160 there
was notable difference in the intake of marine foods, but
overall everyone were more terrestrial; in the period AD

250
1160-1300 variation became greater as some were
consuming a high marine diet, while others still fed on
terrestrial resources; in the final period AD 1300-1450
everyone became more dependent on marine foods. The
authors argued this could reflect social differences with
lower societal strata increasingly changing to a more
marine diet, whereas the upper societal strata for a while
continued to have a higher terrestrial diet. In the end,
however, everyone became very dependent on marine
foods (Arneborg et al. 2012a:126p). This overall pattern
in the isotope evidence compares precisely with the
above food- and environmental securities model (cf.
Fig.8.15), i.e. the “distance” or level in securities
between farmers of different societal class mimics the
distance of the d13
C isotope values.
Evidently, this would also make perfect sense: with
the increasing insecurity in maintaining their original
farming system, cottagers/tenants would have been the
first to resort to other food sources. The same effect was
delayed in the other societal strata and for a while they
managed to maintain a significant level of terrestrial
food- and environmental security, among other things by
tapping into the securities of the cottagers/tenants. In
other words, they could maintain a higher intake of
terrestrial foods, but were pushing cottagers/tenants even
more towards the marine. In the end, however, labor
deficiency and environmental stress had accumulated to
such an extent that all social strata had to resort to a very
marine diet. If this scenario is valid, then it is clear that
self-reinforcing or acerbating mechanisms were an equal
factor in driving change of Norse Greenland society. I
suggest these mechanisms may be outlined by the
framework of resilience theory.
Fig.8.16 Graph showing then mean and range of Norse Greenland δ13C values for three settlement periods(compared to values in Iceland individuals). The trends for the Greenland Norse in this graph is comparable to the estimated food-security development shown in Fig.8.15 (conf. text) (after Arneborg et al. 2012:Fig.7).

251
8.3.2 THE RESILIENCE OF PASTORAL FARMING
Briefly summarized, the conceptual framework of
Resilience theory, or the Panarchy, first grew out of
ecology as an explanatory model for describing and
understanding changes and transformations in social-
ecological systems (SES’s, see section 1.2) (Gunderson
and Holling 2001). Resilience theory is founded on four
basic observations:
First, that change and transformation in SES’s are
rarely gradual, but often highly episodic. Second, that
such episodic change occurs on different scales which
concentrate and reorganize resources in different ways
and across different levels. Third, that SES’s are
characterized by change on multiple different scales,
some of which are in equilibrium, while others are not.
Fourth, change and transformation in SES’s must be
understood as the dynamic interaction by these different
scales feeding or tapping into each other. It is clear that
such a complex model of change has potential for a great
number of scientific disciplines and it has also been
widely accepted in archaeology (e.g, Redman and Kinzig
2003, Redman 2005, Folke 2006, Hegmon et al. 2008,
Øye 2013).
While complex and multifarious in its use and
underlying concepts, the core concept of resilience
theory is epitomized in the model of adaptive cycles
(Fig.8.17). Briefly explained, an adaptive cycle consist
of four phases: a (r) phase of exploitation, where any
population (of people, plants, animals) rapidly occupy
and fill out a niche; a (K) phase of conservation, where
storage and energy is slowly accumulated in that niche; a
(Ω) phase of release, where the population in a niche
quickly declines due to changed conditions, and a (α)
phase of reorganization, where the storage and energy is
reorganized around the surviving population. As
visualized in Fig.8.17, SES’s are characterized by
changes on many levels (adaptive cycles), some of
which are small and fast, while other are large and slow.
When change in a small and fast adaptive cycle
overwhelms a large and slow cycle, it may affect change
or transformation also in the latter, and thus even minor
changes in lower scale adaptive cycles may cascade up
to cause major transformation in the whole SES.
Conversely, a change in a small and fast adaptive cycle
can be absorbed, slowed, and reorganized by a lager
adaptive cycle.
Although the resilience model in its full extent is
much more complex, further detailed elaboration it is not
necessary for the purpose of this discussion. Here I
simply propose that one may think of resilience, adaptive
cycles and the changes in the Norse Greenland farming
system, and perhaps the settlements as a whole, along
two lines:
First, one may consider the adaptive cycles in terms
of regional Norse settlement scales (cf. Fig.8.17 left): in
the more marginal farming areas in the outer fjord,
environmental changes could already from the mid-13th
century AD onwards have effected fast and major
changes, as smalltime farmers (cottagers/tenants) were
forced to adjust and reorganize their farming practices. If
the settlement abandonment dates are credible (see
section 8.2.2) these areas were depopulated from around
AD 1250-1350, which meant that overall settlement
level access to labor and resources diminished even at
the larger farms situated in the more favorable middle
and inner fjord. Thus lower scale fast changes in the
marginal settlement areas could have cascaded up the
system to eventually affect the large farmsteads and
manors. This change may not have been gradual, but
could have spiraled as some critical threshold was
exceeded. For instance, the occurrence of several sudden
and unprecedented catastrophic winters – such as for
instance between AD 1180-1200 (cf. Fig.8.11) or the AD
1257-1258 climatic event – could have pushed the
farming system beyond a threshold of no return: some
farmers may either have been totally deprived of their
livestock and had to tie themselves to the large
farmsteads and manors, others may have had to rent
animals to replenish their stocks. Whereas this could
perhaps stabilize (reorganize) the system for a period, it
would in the long run have undermined the possibility of
maintaining the original farming system depending on
the labor of the smalltime farmers.
As discussed above, environmentally related changes
to the farming system such as the latter would probably
not have affected all social strata at the same time, and
one may therefore also consider the change in terms of
social scales (cf. Fig.8.17 right): the idea is basically the
same as described for the regional scales, i.e.
environmental deterioration would – as discussed above
– have hit the cottagers and tenants hardest, but
eventually their deprivation would cascade up to affect

252
higher levels of the Norse community. Whether or not
the grænlendinga ever had a chance of foreseeing the
ultimate long-term diametrical effects of such
development is uncertain, and even if they had, it is not
certain that they would have adjusted their system to
avoid it. It appears that for a long time, the large farmers
and estate holders could even have benefited from the
cascading deprivation and increasing insecurities of the
smalltime farmers, and once this was realized, it may
already have been too late to recover or even uphold the
farming system in general.
Fig.8.17 Greenland Norse pastoral farming and settlement development visualized in terms of resilience theory’s adaptive cycles. Left: the development could be considered on a regional level scale, where farmers situated in marginal agricultural areas were quick to come under climatic and environmental stress, which would eventually cascade up through the system to affect the magnate farmers. Right: the same scenario can be conceived in terms of societal class differences, i.e. where cottagers and tenants were least resilient to various environmental adversities, but with their declining numbers, upper stratum farmers would be deprived of labor, taxes etc.

253
9. CONCLUSION
This Ph.D.-dissertation concludes eight years of
archaeological surveys and excavations carried out
between 2005-2011, and 2013 in the Vatnahverfi region,
South Greenland, a core area of the medieval Norse
Eastern Settlement. These investigations have been a
major part of the Vatnahverfi Project, a research project
initiated by J. Arneborg on behalf of the National
Museum of Denmark, the first in more than three
decades to approach questions of Greenland Norse
settlement, economy, and cultural identity from a
regional-level perspective and involving a range of
collaborating interdisciplinary and international research
teams (Chap. 4.). Many preliminary results of these
investigations have been presented, discussed, and used
in the above, but this dissertation has mainly concerned
the archaeological record on Norse pastoral settlement,
farming, and hierarchy in the Vatnahverfi region
between ca. AD 980-1450 (Chaps. 6-7), a Ph.D.-project
under the Northern Worlds research initiative at National
Museum of Denmark, funded by the Augustinus
Foundation.
The archaeological record investigated consists of
129 Norse ruin groups – including 18 newly discovered
sites – and 798 individual ruins precision surveyed in the
Vatnahverfi region during the Project, as well as a
comparative record of 28 ruin groups from elsewhere in
the Norse Eastern Settlement, surveyed either by the
Vatnahverfi-Project team (survey plan are found in
App.3) or by prior investigators (section 4.2). The survey
evidence was cross-checked against archival records in
both the National Museums of Denmark and Greenland,
at the end of which the dataset included 1308 individual
ruins at 157 ruin groups, which is about one third of all
the ruin groups registered in the Eastern Settlement.
This impressive record was used to answer four key
questions posed in the introduction of the dissertation,
the first of which was:
What was the functional layout of the medieval Norse
farmsteads in the Vatnahverfi region?
Answering this question involved classifying the
1308 ruins on 23 different functional categories of farm
buildings, as well as three residue categories, presented
and described in chapter 6 and summarized in App.1.
This functional interpretation was based on a few
existing prior investigations, and with outlook to other
North Atlantic areas, outlined in chapters 5 and 6. It was
argued that the Greenlandic farmsteads and buildings in
most concerns followed developments in the medieval
North Atlantic, including a functional fragmentation of
the farmsteads, i.e. splitting farmstead functions on more
specialized rooms and buildings. In this comparative
perspective, the “unique” Greenlandic 'centralized farm'
appears a local variation of poor to moderate farmsteads
elsewhere in the North Atlantic.
Although the ruin classification was an intermediate
step in approaching the layout of the Greenland
farmsteads, it provided some significant implications:
first, a strong emphasis on sheep/goats as milk animals,
especially on smaller farmsteads, was implied by the
frequent identification of milking folds with further
architectural indication that this production became more
important over time (section 6.2.3), likely as farming
was adjusted to local environmental conditions. Second,
it was adamantly demonstrated that 'infield dykes' – a
feature commonly thought of as absolutely defining to
North Atlantic farmsteads in general – is extremely rare
on the Greenland farmsteads: among the 157 ruin
groups, infield dykes were only recorded at 14 locations,
significantly most of them church farmsteads; it suggests
a different farming and land use system focused on
intensive herding of livestock.
The infield dykes in most cases appear along with
other particular farmstead features: e.g. grazing
enclosures related to cattle keeping and double sheep-
sheds, another uncommon, but distinct building type.
Generally, it was noted that the outbuildings are poorly
understood, especially in terms of chronology and
contemporaneity (section 5.3.2): in a comparative North
Atlantic perspective, many Greenland farmsteads appear
to have an extraordinarily large number of outbuildings,
but this may simply be explained as an “accumulated”
record of up to 450 years (section 5.1.2). In order to
clarify such issues, and the lineup of particular farmstead
features, it was advised that future excavations should
target outbuildings, fences, and dykes. Still, the ruin
classification was sufficient to answer the second main
research question of the dissertation:
What was the specific nature and layout of pastoral
settlement and farming in the Vatnahverfi region?

254
This question was approached by classifying the
combined ruin group evidence, presented and discussed
in chapter 7 and summarized in App.2. Drawing on the
interpretation of the ruin evidence, the ruin group
classification was based on cluster analysis weighing
four key parameters: the total number of ruins at a site
(TNR), the total area of roofed buildings (Ar_RB), the
farmstead dispersion index (FDI), and the total area of
enclosures (TAE). The analysis indicated a classification
of the ruin groups on 51 simple shielings, 42 complex
shielings, and 59 farmsteads. The simple shielings could
be divided on nine sub-types relating to extensive
resource exploitation. The concept of 'complex shielings'
was introduced here to differentiate sites with a more
marginal location, but characterized by having a
dwelling. Of these, small complex shielings were
probably never used for year-round occupation, but were
a type of full-shielings associated with summer pasturing
and farming production. The large complex shielings, on
the other hand, may have been permanently occupied
small farmsteads at the height of settlement, but were
more marginally placed than normal small farmsteads;
suggestively, none of the large complex shielings were
ever reoccupied by Inuit sheep farmers.
The farmsteads seem to divide on five classes
(section 7.1.3): small, medium, and large farmsteads,
characterized by the same basic layout and building
types, but differing in their number and size. Manors
were differentiable not only by many and large
buildings, but by including rare building types such as
large (cattle) enclosures, infield dykes, and/or double
sheep/goat sheds. The last class of farmsteads – the
church manors – is only separable from the manors by
the presence of a church. Both types of manor were often
found to be 'double-farms', i.e. with a small farmstead
associated. A voronoi-region settlement pattern analysis
(section 7.2.1) showed the large farmsteads and manors
to be evenly distributed in the landscape with ordinary
farmsteads situated in between. It was emphasized that
it is a working site classification model, which through
quality of its digital record can easily be reanalyzed,
adjusted, and extended by input of future evidence.
In terms of overall settlement and farming patterns in
the Vatnahverfi region, the new survey records implies
the following (section 7.1.2): first, that site selection
criteria for the location of sites was narrowly tied to low-
lying areas (80% are situated < 100 m.a.s.l.), on southern
facing slopes or in the open (ca. 82% of the sites), and in
proximity to fen/meadow vegetation (ca. 70% of the
farmsteads). Farmsteads in inner fjord areas dominated
by shrub vegetation, or located at slightly higher altitude
appear to have specialized in sheep/goat keeping, which
included use of multiple shielings (milking stations,
forage-, and dairy shielings). Second, that shieling
activity appears to have been fundamental to Norse
farming (section 7.2.2); based on the classification
model, 32 of 45 farmsteads could be confidently
associated with at least one shieling. Two shieling
systems were observed: in the inner and middle fjords
shieling was vertical, i.e. moving from lowland to
highland areas as known from elsewhere in the North
Atlantic. However, in the outer fjords, shieling appears
to have been horizontal, i.e. moving along the fjords.
Such a system has not been observed or commented on
before, but corresponds well with the lower settlement
density and pasture quality observed for this sub-region
(the latter discussed in Chap. 3). All in all, the settlement
evidence suggests a farming system heavily invested in
the use of extensive landscape resources, which
corresponds with estimated population densities and
settlement-level organization:
What does the settlement pattern evidence imply in
terms of regional organization and social hierarchy?
The site classification model and the settlement
pattern analysis in chapter 7 was interpreted to reflect a
community in the Vatnahverfi region, where only 8-10
farmsteads were independent, the remainder probably
being subsidiary or dependent farmsteads, i.e. cottagers
and tenants (section 7.3.3). The presented hierarchy
model is in high agreement with earlier ranking models,
the strength of the dissertation model mainly being that it
may be extended to unexcavated farmsteads. The
voronoi-region analysis suggested that the overall
organizational setup in the Vatnahverfi region resembled
evenly distributed examples of the type of large simple
settlements that have been implied for early medieval
Iceland (Vésteinsson 1998, Vésteinsson et al. 2002,
Vésteinsson 2006). Based on the site classification, the
average population of the Vatnahverfi region was
estimated at between 225-533 people (section 7.2.3.).
This is a little higher, but well within the range, of an
average population of 194 people estimated from burial
densities and new dates from churchyards excavated
during the Vatnahverfi project (section 6.2.2).
Extrapolating the site-class based population calculation
model to the rest of the Norse Eastern Settlement

255
suggests an average maximum population of 1403-1939
persons, which is almost identical to population
estimates overall settlement burial densities (Lynnerup
1998). The realism of such a population scenario is also
substantiated by comparative settlement development in
the North Atlantic (section 2.1.2). In sum, all the
evidence outlines the Vatnahverfi region as a very small
and fairly dispersed community organized around a few
dominating farmsteads.
What changes did the pastoral farming community go
through during the settlement period, who were affected
the most, how, and when?
In addition to the archaeological settlement pattern
evidence, these questions were investigated along two
lines of evidence: a comparative case study of pre-
modern Inuit sheep farming (section 8.1) and new dates
from Norse sites in the Vatnahverfi region (section 8.2).
The new dates imply a two-staged settlement expansion;
with a first landnám around AD 1000 at fjord-near
locations in the inner and middle fjords, and a secondary
expansion around AD 1050-1100 in which the outer
fjord, inland, and upland sites were occupied. Most
surprisingly, the new dates imply settlement contraction
setting already from, at least the second half of, the 13th
century AD. This contraction involved abandonment of
the outer fjord farmsteads, disintensification of shielings
activities, as well as the closing down of small churches,
in the Vatnahverfi region leaving only one parish church
(E66) in a final stage of settlement. Besides the new
archaeological dates, the overall change in settlement
patterns is corroborated by palynological evidence of
decreased grazing pressure and several climatic proxy
records that imply an abrupt climatic change around AD
1250 (section 3.1.3).
Juxtaposing Inuit sheep farming experiences against
local ice core temperature records (section 8.2.3), it was
suggested that a Norse low-labor input extensive pastoral
farming strategy was large unviable after ca. AD 1250.
Based on the case study of Inuit farming (section 8.2.5)
and vegetational patterns (section 3.2), this would at first
most seriously have affected the smalltime farmers and
tenants in the outer fjord. To explore class differentiated
experience and dynamics of this change, section 8.3
provided an analysis and discussion of farming system in
terms of food-securities and resilience: the former
analysis implied that cottagers and tenants would quickly
have struggled with maintaining an extensive mode or
farming, and because they – based on the comparative
case of the Inuit sheep farmers – had little possibility of
intensifying production, they probably either had to
submit to the governance of larger and wealthier farms,
or abandon farming in the outer fjord; the latter is
implied by the AD 1250 settlement contraction. In the
long term, however, a resilience theory perspective
(section 8.3.2) suggests that this deprivation in the lower
societal strata of farmers could eventually have cascaded
up through the system so that at the time when climatic
and environmental deterioration became aggravating
even to magnate farmers, whatever available resources
there were could not be fully exploited due to lack of
labor.
Although the topic of settlement abandonment has
been explicitly avoided throughout the dissertation,
which has instead focused on settlement, farming, and
livelihood, the latter discussion opens this theme: while
climatic deterioration and a marginal environment were
serious challenges to Norse settlement in Greenland,
there is no reason to assume that they were so much
more aggravating than elsewhere in the North Atlantic
that they should have caused a complete collapse. The
grænlendinga adapted on several fronts, adjusting their
livestock to resources and climate, cutting down on their
number in favor of wild (marine) resources (section 2.3).
Rather, emerging adamantly from this study is the key
issue of small population size and low available labor
force: it meant that, even if the Greenlandic landscapes
could supply ample food and fodder resources to sustain
people and livestock, there was no labor to extract these
resources; at least not while maintaining a foreign trade
and communication system that was based on luxury
wild life exports (section 2.2). In several ways, the
Greenland settlements would appear to have remained
little more than a colony, and when political, economic,
and climatic tides changed to disfavor continuation of
the venture, it was perhaps simply abandoned. It would
be a settlement process with many historic parallels.

256
10. BIBLIOGRAPHY
Primary sources:
ES: Eiríks Saga Rauða, The Flatey Book and Recently Discovered Vatican Manuscripts Concerning America as Early
as the Tenth Century, trans. by Smart, T.H., 1906, London, Norræna Society.
Fóstbræðra Saga: The Complete Sagas of Icelanders, Including 49 Tales, ed. by Hreinsson, Viðar, 1997,
Reykjavík, Leifur Eriksson Publishing Ltd.
IB: A Fourteenth-Century Description of Greenland by Ívarr Bárðarson, trans. by Mathers, D., 2009, Saga-Book, Vol.
XXXIII, Viking Society for Northern Research, University Collage London: 67-92.
King’s Mirror (Speculum regale – Konungs Skuggsjá), trans. by Larson, L.M., 1917, London, Humphrey Milfort.
Adderley, P. W. and I. A. Simpson (2006). "Soils and
palaeo-climate based evidence for irrigation
requirements in Norse Greenland." Journal of
Archaeological Science 33: 1666-1679.
Alastair, D. G., L. Elliot, P. Mayewski, P. Locket, S.
Noone, K. Hickey, T. Holt, P. Wadhams and I. Foster
(2003). "Late-Holocene North Atlantic climate
‘seesaws’, storminess changes and Greenland ice sheet
(GISP2) palaeoclimates." The Holocene 13(3): 381-392.
Albrethsen, S. E. (1971). "Træk af nordboarkæologiens
historie." Tidsskriftet Grønland 10: 289-302.
Albrethsen, S. E. (1982). Træk af den norrøne gårds
udvikling på Grønland. Vestnordisk byggeskikk
gjennom to tusen år: Tradisjon og forandring fra
romertid til det 19. årh. B. Myhre, B. Stoklund and P.
Gjærder. Stavanger, Arkeologisk museum i Stavanger:
269-287.
Albrethsen, S. E. (1991). "Sæterbrug in the Norse
Eastern Settlement "Østerbygden" in South-West
Greenland." Acta Borealia 1991(1): 15-28.
Albrethsen, S. E. and J. Arneborg (2004). Norse ruin of
the southern Paamiut and Ivittuut region. Copenhagen,
SILA - The Greenland Research Centre at the National
Museum of Denmark and the Danish Polar Center.
Albrethsen, S. E. and C. Keller (1986). "The Use of
Saeter in Medieval Norse Farming in Greenland." Arctic
Anthropology 23(1&2): 91-107.
Albrethsen, S. E. and G. Ólafsson (1998). A viking age
hall. Man, Culture and Enviroment in Ancient
Greenland: Report on a research programme. J.
Arneborg and H. C. Gulløv. Viborg, Danish Polar Center
& the Danish National Museum: 19-30.
Aldred, O. (2006). Réttir in the Landscape. A Study on
the Context of Focal Points. Dynamics of Northern
Societies: Proceedigs of the SILA/NABO Conference on
Arctic and North Atlantic Archaeology, Copenhagen,
May 10th-14th, 2007. J. Arneborg and B. Grønnow.
Copenhagen, The National Museum of Denmark: 355-
363.
Amorosi, T. (1991). "Icelandic Archaeofauna: A
Preliminary Review." Acta Archaeologica 61(1990):
272-284.
Amorosi, T. (1992). Climate Impact and Human
Response in Northeast Iceland: Archaeological
Investigations at Svalbarð. Norse and later settlement
and subsistence in the North Atlantic. C. D. Morris and
D. J. Rackham. Glasgow, University of Glasgow: 103-
138.
Amorosi, T., P. C. Buckland, A. J. Dugmore, J. H.
Ingimundarson and T. H. McGovern (1997). "Raiding
the Landscape: Human Impact in the Scandinavian
North Atlantic." Human Ecology 25(3): 491-518.

257
Amorosi, T., P. C. Buckland, Ó. Guðmundur, J. P.
Sadler and P. Skidmore (1992). Site Status and the
Palaeoecological Record: A Discussion of the Results
from Bessastaðir, Iceland. Norse and Later Settlement
and subsistence in the North Atlantic. C. D. Morris and
D. J. Rackham. Glasgow, Department of Archaeology,
University of Glasgow: 169-191.
Andersen, E. L. (1982). "De norrøne stednavne i
Østerbygden." Tidsskriftet Grønland 5(1982): 163-176.
Andersen, K. K., P. D. Ditlevsen, S. O. Rasmussen, H.
B. Clausen, B. M. Vinther, S. J. Johnsen and J. P.
Steffensen (2006). "Retrieving a common accumulation
record from Greenland ice cores for the past 1800 years."
Journal of Geophyscial Research 111(D15106):
doi:10.1029/2005JD006765.
Andersen, P. (1969). "Herrnhuterne i Grønland."
Tidsskriftet Grønland 2(1969): 50-64.
Andreasen, C. (1981). "Langhus - ganghus - centraliseret
gård. Nogle betragtninger over de norrøne gårdtyper."
Hikuin 7(1981): 179-184.
Andreasen, C. (1982). "Nipaitsoq og Vesterbygden."
Tidsskriftet Grønland 1982(5): 177-188.
Andreasen, C. and J. Arneborg (1992). "Gården under
sandet. Nye nordboundersøgelser i Vesterbygden."
Grønlandsk kultur- og samfunds forskning 92: 11-49.
Andresen, C. S., S. Björk, O. Bennike and G. Bond
(2004). "Holocene climate changes in southern
Greenland: evidence from lake sediments." Journal of
Quaternary Science 19(8): 783-795.
Andresen, C. S., G. Bond, A. Kuijpers, P. C. Knutz and
S. Björk (2005). "Holocene climate variability at
multidecadal time scales detected by sedimentological
indicators in a shelf core NW off Iceland." Marine
Geology 214: 323-338.
Andresen, C. S., M. J. Hansen, M. S. Seidenkrantz, A. E.
Jennings, M. F. Knudsen, N. Nørgaard-Pedersen, N. K.
Larsen, A. Kuijpers and C. Pearce (2013). "Mid- to late-
Holocene oceanographic variability on the Southeast
Greenland shelf." The Holocene 23(2): 167-178.
Andrews, J. T., S. T. Belt, S. Olafsdottir, G. Massé and
L. L. Vare (2009). "Sea ice and marine climate
variability for NW Iceland/Denmark Strait over the last
2000 cal. yr BP." The Holocene 19(5): 775-784.
Andrews, J. T., C. Caseldine, N. J. Weiner and J. Hatton
(2001). "Late Holocene (ca. 4 ka) marine and terrestrial
environmental change in Reykjarfjördur, north Iceland:
climate and/or settlement?" Journal of Quaternary
Science 16(2): 133-143.
Anschuetz, K. F., R. H. Wilshusen and C. L. Scheick
(2001). "An Archaeology of Landscapes: Perspectives
and Directions." Journal of Archaeological Research
9(2): 157-211.
Appelt, M. (2004). De sidste dorsetfolk. Grønlands
forhistorie. H. C. Gulløv. København, Nordisk Forlag:
175-217.
Arctander, A. (1793). "Udskrift af en Dagbog, holden i
Grønland af Aaron Arctander paa en Rekognoscerings-
Reise i Julianehaabs District i Aarene 1777-1779."
Samleren bd. 6: 1105-1242.
Arge, S. V. (1989). "Om landnamet på Færøerne."
Hikuin 15: 103-127.
Arge, S. V., M. J. Church and S. D. Brewington (2009).
"Pigs in the Faroe Islands: An Ancient Facet of the
Islands’ Paleoeconomy." Journal of the North Atlantic
2(2009): 19-32.
Arge, S. V., G. Sveinbjarnardóttir, K. J. Edwards and P.
C. Buckland (2005). "Viking and Medieval Settlement in
the Faroes: People, Place and Environment." Human
Ecology 33(5): 597-620.
Arneborg, J. (1985). "Nordboarkæologiske
undersøgelser ved Kilaarsarfik i nordboernes
Vesterbygd." Forskning/tusaat i Grønland 2(1985): 2-9.
Arneborg, J. (1989). "Nordboarkæologiens historie - og
fremtid." Tidsskriftet Grønland 5(37): 121-137.

258
Arneborg, J. (1991a). "The Niaquusat excavations
reconsidered: A contribution to the discussion of the
stratigraphy of the midden at the Norse Niaquusat farm."
Acta Borealia 1(1991): 82-92.
Arneborg, J. (1991b). "The Roman Church in Norse
Greenland." Acta Archaeologica 61(1990): 142-150.
Arneborg, J. (1993). Vikingerne i Nordatlanten. De
nordiske samfund i Island og Grønland og Europa.
Norden og Europa i Vikingetid og Middelalder. N. Lund.
Københavns Universitet, Museum Tusculanums Forlag:
180-194.
Arneborg, J. (1996). "Burgunderhuer, baskere og døde
nordboer i Herjolfsnæs, Grønland." Nationalmuseets
Arbejdsmark 1996: 75-83.
Arneborg, J., Ed. (1999). Nordboliv i Grønland.
Dagligliv i danmarks middelalder. En arkæologisk
kultur-historie. København, Gyldendal.
Arneborg, J. (2000). Greenland and Europe. Vikings.
The North Atlantic Saga. W. W. Fitzhugh and E. E.
Ward. London, Smithsonian Institution Press: 304-317.
Arneborg, J. (2002). Kirke, kristendom og storbønder i
det norrøne Grønland - et nyt forskningsprojekt.
Kristningen af norden - et 1000 års jubilæum. L.
Bisgaard and R. S. Christensen. Odense, Center for
Middelalderstudier, Syddansk Universitet: 8-25.
Arneborg, J. (2003a). Norse Greenland Archaeology:
The Dialogue Between the Written and the
Archaeological Records. Viking Millennium
International Symposium, 15-24 September 2000. S.
Lewis-Simpson. Newfound&Labrador, Historic Sites
Association of Newfoundland and Labrador, Inc.: 111-
122.
Arneborg, J. (2003b). Norse Greenland: Reflections on
Settlement and Depopulation. Contact, Continuity, and
Collapse. The Norse Colonization of the North Atlantic.
J. H. Barret. Turnhout, Belgium, Brepols: 163-181.
Arneborg, J. (2004). Det Europæiske Landnam -
Nordboerne i Grønland. Grønlands forhistorie. H. C.
Gulløv. København, Nordisk Forlag: 219-278.
Arneborg, J. (2005). Greenland irrigation systems on a
west Nordic background. An overview of the evidence
of irrigation systems in Norse Greenland c. 980–1450
AD. Water management in medieval rural economy. J.
Klápste. Prague, Institute of Archaeology, Academy of
Sciences of the Czech Republic. Památky
Archeologicke´—Supplementum 17.: 137-145.
Arneborg, J. (2006). Saga trails. Copenhagen, Linde
Tryk.
Arneborg, J. (2010). "Brattahlids beliggenhed."
Tidsskriftet Grønland 4(2010): 320-328.
Arneborg, J. (2012). Churches, Christianity and magnate
farmers in the Norse Eastern Settlement. Challenges and
solutions: Northern Worlds - Report from workshop 2 at
the National Museum, 1 November 2011. H. C. Gulløv,
P. A. Toft and C. P. Hansgaard. Copenhagen, The
National Museum of Denmark: 167-170.
Arneborg, J. and J. Berglund (1993). "Gården under
Sandet." Forskning/tusaat i Grønland 4(1993): 7-19.
Arneborg, J., J. T. Hansen and C. Paulsen (2002).
Kirkearkæologiske undersøgelser (unpubl. field report).
København, SILA - Nationalmuseets center for
grønlandsforskning.
Arneborg, J., M. B. Hebsgaard, N. Lynnerup, C. K.
Madsen, C. P. Paulsen and K. Smiarowski (2009a).
Ressources, mobility, and cultural identity in Norse
Greenland, Vatnahverfi-Project - Report from the Field
Work 2008 (unpubl. field report). Nationalmuseet,
Danmarks Middelalder og Renæssance, Nationalmuseet.
Arneborg, J., J. Heinemeier and N. Lynnerup (2008).
""... Husk at folk lever af flere ting end bare af brød" -
De norrøne grønlænderes kost." Nationalmuseets
Arbejdsmark 2008: 149-160.
Arneborg, J., J. Heinemeier, N. Lynnerup, H. L. Nielsen,
N. Rud and Á. E. Sveinbjarnardóttir (1999). "Change of
diet of the Greenland Vikings determined from stable

259
carbon isotope analysis and 14C dating of their bones."
Radiocarbon 41(5): 157-168.
Arneborg, J., J. Heinemeier and A. Sveinbjarnardóttir
(1998). AMS Dates from the hall (XVII). Man, Culture
and Environment in Ancient Greenland - Report on a
Research Programme. J. Arneborg and H. C. Gulløv.
Copenhagen, The Danish National Museum & Danish
Polar Center: 27-30.
Arneborg, J., F. Larsen and N. C. Clemmensen (2009b).
"The “Dairy Farm” of the Hvalsey Fjord Farm." Journal
of the North Atlantic Special Volume 2(Norse
Greenland: Selected Papers from the Hvalsey
Conference 2008): 24-29.
Arneborg, J., N. Lynnerup and J. Heinemeier (2012a).
"Human Diet and Subsistence Patterns in Norse
Greenland AD c.980–AD c.1450: Archaeological
Interpretations." Journal of the North Atlantic Special
Volume 3 - Greenland Isotope Project: Diet in Norse
Greenland AD 1000–AD 1450: 119-133.
Arneborg, J., N. Lynnerup, J. Heinemeier, J. Møhl, N.
Rud and Á. E. Sveinbjarnardóttir (2012b). "Norse
Greenland Dietary Economy ca. AD 980-ca. AD 1450:
Introduction." Journal of the North Atlantic Special
Volume 3(Greenland Isotope Project: Diet in Norse
Greenland AD 1000–AD 1450): 1-39.
Arneborg, J. and C. K. Madsen (2012). Resources,
mobility and cultural identity in Norse Greenland 2005-
2010. Challenges and solutions: Northern Worlds -
Report from workshop 2 at the National Museum, 1
November 2011. H. C. Gulløv, P. A. Toft and C. P.
Hansgaard. Copenhagen, The National Museum of
Denmark: 137-141.
Arneborg, J. and C. Secher (2005). Forskning i Grønland
– forskning for Grønland: Hovedtræk af Kommissionens
historie. København, Det Grønlandske Selskab.
Austrheim, G., L.-J. Asheim, G. Bjarnason, J. Feilberg,
A. M. Fosaa, Ø. Holand, K. Høegh, I. S. Jónsdóttir, B.
Magnússon, L. E. Mortensen, A. Mysterud, E. Olsen, A.
Skonhoft, G. Steinheim and A. G. Thórhallsdóttir
(2008). Sheep grazing in the North-Atlantic region – A
long term perspective on management, resource
economy and ecology. Trondheim, Norges teknisk-
naturvitenskapelige universitet Vitenskapsmuseet.
Bak, O. (1969). "Sommerdage ved Kap Farvel."
Tidsskriftet Grønland 1969(8): 229-248.
Bak, O. (1970a). "Bygden Lichtenau i Sydgrønland."
Tidsskriftet Grønland 12(1970): 367-373.
Bak, O. (1970b). "Nordboernes land ved Kap Farvel."
Tidsskriftet Grønland 1970(8): 229-236.
Bak, O. (1971). "Kortlægning af nordbobebyggelsen i
sydlige Østerbygd." Tidsskriftet Grønland 1971(11):
321-340.
Bak, O. (1972a). "Nordboruiner ved Kap Farvel."
Tidsskriftet Grønland 1972(11): 347-351.
Bak, O. (1972b). "Nordboundersøgelser i Østerbygden
1971." Tidsskriftet Grønland 1972(7): 193-213.
Barlow, L. K., J. P. Sadler, A. E. J. Ogilvie, P. C.
Buckland, T. Amorosi, J. H. Ingimundarson, P.
Skidmore, A. J. Dugmore and T. H. McGovern (1997).
"Interdisciplinary investigations of the end of the Norse
Western Settlement in Greenland." The Holocene 7(4):
489-499.
Barrel, J. (1972). The Idea of Landscape and the Sence
of Place 1730-1840. Cambridge, Cambridge University
Press.
Barret, J. H. (2008). "What caused the Viking Age?"
Antiquity 82(2008): 671-685.
Bendixen, O. (1927). Grønland som nybyggerland.
København, H. Aschehoug & Co.
Bendixen, O. and L. Bobé (1921). "Distrikterne i
Sydgrønland." Meddelelser om Grønland 61: 1-537.
Bentzen, B. (1920). "Faareavl og Kohold i Grønland."
Det grønlandske Selskabs Årsskrift 1919: 32-36.
Berg, J., U. Jansson and A. Wästfelt (2006). Landscape,
history and people in a geographical perspective. Studies
of land-use, settlement and livelihood in Oskarshamn

260
and Forsmark. Kulturgeografiska institutionen,
Stockholms universitet.
Bergersen, R. (1997). "Hvor ligger Foss?" Tidsskriftet
Grønland 4(1997): 171-172.
Berglund, J. (1982). "Kirke, hal og status." Tidsskriftet
Grønland 8(1982): 275-285.
Berglund, J. (1998a). The Excavations at the Farm
beneath the Sand introduction. Man, Culture and
Environment in Ancient Greenland - Report on a
Research Programme. J. Arneborg and H. C. Gulløv.
Copenhagen, Danish Polar Center and the National
Museum of Denmark: 7-13.
Berglund, J. (2000). The Farm beneath the Sand. Vikings
- The North Atlantic Saga. W. W. Fitzhugh and E. E.
Ward. London, Smithsonian Institution Press: 295-303.
Berglund, J. (2001). "Omkring dagliglivet på Gården
under Sandet." Tidsskriftet Grønland 7(2001): 267-278.
Berglund, M. H. (1998b). "Red sandstone and
Greenlandic wool. Two diagnostic artefacts in the
interpretation of a newly discovered Saeter in southern
Greenland." Acta Borealia 15(2): 153-174.
Berk-Schlosser, D., G. De Meur, B. Rihoux and C.
Ragin (2009). Qualitative Comparative Analysis(QCA)
as an Approach. Configurational Comparative Methods:
Qualitative Comparative Analysis (QCA) and Related
Techniques. B. Rihoux and C. Ragin. London, SAGE
Publications, Inc: 1-18.
Berkes, F., J. Colding and C. Folke (2000). "Rediscovery
of Traditional Ecological Knowledge as Adaptive
Management." Ecological Applications 10(5): 1251-
1262.
Berkes, F. and C. Folke, Eds. (1998). Linking Social and
Ecological Systems. Management Practices and Social
Mechanisms for Building Resilience. Cambridge,
Cambridge University Press.
Berson, B. (2002). "A Contribution to the Study of the
Medieval Icelandic Farm: the Byres." Archaeologia
Islandica 2: 37-64.
Bigelow, G. F. (1989). "Life in Medieval Shetland: An
Archaeological Perspective." Hikuin 15: 183-192.
Bishop, R., M. Church, A. J. Dugmore, C. K. Madsen
and N. A. Møller (2013). "A charcoal-rich horizon at
Ø69, Greenland: evidence for vegetation burning during
the Norse landnám?" Journal of Archaeological Science
40(11): 3890-3902.
Bjørgmose, R. (1964). "Vesterbygdens fjorde: et biddrag
til forståelsen af nordboernes navngivning." Tidsskriftet
Grønland 7(1964): 252-258.
Bjørgmose, R. (1965). "Nyt lys over Vesterbygden.
Grønlands første domkirke og vesterbygdens tingsted
fundet." Tidsskriftet Grønland 4(1965): 131-138.
Bjørgmose, R. (1967). Stensnæs - den glemte kirke:
Gåden om Vesterbygdens fjerde kirke - Grønlands og
Amerikas første domkirke? Odense, Nordisk Litteratur
Forlag.
Blom, I. (1973). Kampen om Eirik Raudes Land:
Pressgruppepolitikk i grønlandsspørgsmålet 1921-1931.
Oslo, Gyldendal Norsk Forlag.
Bobé, L. (1927). Indledning. Peder Olsen Walløes
Dagbøger fra hans Rejser i Grønland 1739-53. L. Bobé.
København, G.E.C. Gad: 3-12.
Bolender, D. J. (2005). Excavations at Glaumbær 2005:
Preliminary Report of the Skagafjörður Archaeological
Settlement Survey. Evanston, Illinois, Northwestern
University.
Bolender, D. J., J. M. Steinburg, B. N. Damiata, J. W.
Schoenfelder and K. Caitlyn (2010). Preliminary Report:
Evaluating the Potential of Archaeogeophysical
Surveying on Viking Age and Medieval Sites in
Greenland, 2 – 16 August, 2010 (unpubl. field report).
Boston, Fiske Center for Archaeological Research.
Bond, J. M., Z. Outram and C. M. Freeth, Eds. (2007).
Viking Unst Project: Field Season 2006 Interim Report
No.1. Bradford, Shetland Amenity Trust/University of
Bradford.

261
Bond, J. M., Z. Outram and C. M. Freeth, Eds. (2008).
Viking Unst Project. Excavations at Hamar and the
Upper House, Underhoull: Field Season 2009 Interim
Report No.3. Bradford, Shetland Amenity
Trust/University of Bradford.
Born, E. W. and J. Böcher (2001). The Ecology of
Greenland. Schmidt Grafisk, Vojens, Greenland Ministry
of Environment and Natural Resources.
Borthwick, D. M., K. J. Edwards and G. T. Cook (2006).
Shieling activity during the Norse Period in the Faro
Islands: a Palynological Approach. Dynamics of
Northern Societies: Proceedigs of the SILA/NABO
Conference on Arctic and North Atlantic Archaeology,
Copenhagen, May 10th-14th, 2007. J. Arneborg and H.
C. Gulløv. Copenhagen, The National Museum of
Denmark: 299-305.
Box, J. E. (2002). "Survey of Greenland Instrumental
Temperature Records: 1873-2001." International Journal
of Climatology 22: 1829-1847.
Bratrein, H. D. (1996). "Det nordnorske jordbruket -
noen generelle trekk." Jord og Gjerning - Årbok for
Norsk Landbruksmuseum 1994/95: 7-21.
Breiger, R. L. (2009). On the Duality of Cases and
Variables: Correspondence Analysis (CA) and
Qualitative Comparative Analysis (QCA). The SAGE
Handbook of Case-Based Methods. D. Byrna and C.
Ragin. London: 243-259.
Brewington, S. D. (2013). "The Social Costs of
Sustainability in the Faroe Islands." The SAA
archaeological record 13(5): 24-27.
Brewington, S. D., R. Harrison, C. Amundson and T. H.
McGovern (2004). An Early 13th c Archaeofauna from
Steinbogi, Mývatn District, Northern Iceland.
Bruun, A. and A. Arctander (1944). Dagbøker af
Nordmenn på Grønland før 1814: Andreas Bruuns og
Aron Arctanders dagbøker fra undersøkelsesreisen i
Julianehaab distrikt 1777-1779, v. H. Ostermann. Olso, I
kommisjon hos Jacob Dybwad.
Bruun, D. (1895a). "Arkæologiske Undersøgelser i
Julianehaabs Distrikt." Meddelelser om Grønland 16:
173-461.
Bruun, D. (1895b). "Den arkæologiske Expedition til
Julianehaabs Distrikt 1894." Geografisk Tidsskrift
13(1895-96): 37-47.
Bruun, D. (1896). "Premierløjtnant Daniel Bruuns
arkæologiske Undersøgelsesrejse til Færøerne og Island
1896." Geografisk Tidsskrift 13(1895-96): 175-177.
Bruun, D. (1897). Fortidsminder og Nutidshjem paa
Island. København, Det nordiske Forlag.
Bruun, D. (1901). "Ved Vatna Jökulls Nordrand.
Undersøgelser foretagne i Sommeren 1901 paa Islands
Østland." Geografisk Tidsskrift 1(1901): 155-173.
Bruun, D. (1903a). "Arkæologiske Undersøgelser i
Godthaabs og Frederikhaabs Distrikter i Grønland."
Geografisk Tidsskrift 17: 187-206.
Bruun, D. (1903b). "Udgravninger paa Island."
Geografisk Tidsskrift 17(1903): 13-25.
Bruun, D. (1907). Gammel Bygningsskik paa Færøerne.
København, Grøndahl & søns bogtrykkeri.
Bruun, D. (1915). Erik den Røde og Nordbokolonierne i
Grønland. København, Nordisk Forlag.
Bruun, D. (1917). "Oversigt over Nordboruiner i
Godthaab- og Frederikshaab-Distrikter." Meddelelser om
Grønland LVI: 57-147.
Bruun, D. (1928). Fortidsminder og Nutidshjem paa
Island. Nordisk Forlag, København.
Bruun, D. (1929). Fra de Færøske Bygder. Samlede
Afhandlinger om gammeldags Sæd og Skik. København,
Nordisk Forlag.
Buckland, P. C., K. J. Edwards, E. Panagiotakopulu and
E. J. Schofield (2009). "Palaeoecological and historical
evidence for manuring and irrigation at Garðar (Igaliku),

262
Norse Eastern Settlement, Greenland." The Holocene
19(1): 105-116.
Burel, F. and J. Baury (2003). Landscape Ecology:
Concepts, Methods and Applications New Hampshire,
Science Publishers, Inc.
Cappelen, J., Ed. (2012). The Faroe Islands - DMI
Historical Climate Data Collection 1873-2011. Technical
Report 12-05. Copenhagen, Danish Meteorological
Institute.
Cappelen, J., B. V. Jørgensen, E. V. Laursen, L. S.
Stannius and R. S. Thomsen (2001). The Observed
Climate of Greenland, 1958-99 - with Climalogical
Standard Normals, 1961-90. Technical Report.
Copenhagen, DMI. 00-18: 1-150.
Casteñeda, I. S., L. M. Smith, G. B. Kristjánsdóttir and J.
T. Andrews (2004). "Temporal changes in Holocene
δ18O records from the northwest and central North
Iceland Shelf." Journal of Quaternary Science 19(4):
321-334.
Chemnitz, J. (1920). "Faareavl og Kohold i Grønland."
Det grønlandske Selskabs Årsskrift 1919: 30-32.
Christensen, K. N. (1946). "Faareavlen og Landbruget i
Grønland under krigen." Det grønlandske Selskabs
Årsskrift 1946: 146-154.
Christensen, K. N. (1953). "Grønlands jord under
kultur." Tidsskriftet Grønland 4(1951): 407-413.
Christensen, K. N. (1955). "Græsavl i Grønland."
Tidsskriftet Grønland 4(1955): 147-154.
Christensen, K. N. (1959). "Husdyrenes tilpasning til det
grønlandske klima." Tidsskriftet Grønland 9(1953): 356-
360.
Christiansen, D. V. (2002). Handel og kommunikation i
Nordatlanten. Rapport om prøveundersøgelser på den
formodede atlanthavn, Sandhavn ved Maakkereq,
Nanortalik kommune, sommeren 2001 (unpubl. field
report). København, Nationalmuseet.
Christiansen, D. V. (2004). "Fra Europa til Verdens
Ende." Nationalmuseets Arbejdsmark 2008: 27-39.
Christiansen, H., C., Ed. (1963). Redegørelse vedr.
fåreavl i Grønland. København, Det jordbrugsfaglige
udvalg for Statens forsøgsvirksomhed i Grønland.
Christiansen, H. H., O. Bennike, J. Böcher, B. Elberling,
O. Humlum and B. H. Jacobsen (2002). "Holocene
environmental reconstruction from deltaic deposits in
northeast Greenland." Journal of Quaternary Science
17(2): 145-160.
Christophersen, A. (2009). Gård og grunn. Kaupangen
ved Nidelva. A. Christophersen and S. W. Nordeide.
Trondheim, Riksantikvaren: 113–212.
Church, M. J., S. V. Arge, K. J. Edwards, P. L. Ascough,
J. M. Bond, G. T. Cook, S. J. Dockrill, A. J. Dugmore,
T. H. McGovern, C. Nesbitt and I. A. Simpson (2013).
"The Vikings were not the first colonizers of the Faroe
Islands." Quaternary Science Reviews 77(2013): 228-
232.
Clemmensen, M. (1911). "Kirkeruiner fra Nordbotiden i
Julianehaab Distrikt." Meddelelser om Grønland 47:
283-358.
Clemmensen, N. C. and H. Kapel (2008). Ruingrupperne
ved Sissarluttoq og Narsap Ilua - Digital opmåling og
fotodokumentation (unpubl. field report). Narsaq, Narsaq
Museum.
Clemmensen, N. C. and H. Kapel (2010a). Opmåling af
ruiner ved Igaliku kujalleq - nordboernes Undir Höfdir?
(unpubl. field report). Narsaq, Narsaq Museum.
Clemmensen, N. C. and H. Kapel (2010b). Ruingruppen
Sissarluttoq i Igaliku Fjord - Ruinkatalog og
oversigtskort (unpubl. field report). Narsaq, Narsaq
Museum.
Commiso, R. G. and D. E. Nelson (2006). "Modern plant
d15N values reflect ancient human activity." Journal of
Archaeological Science 33: 1167-1176.

263
Commiso, R. G. and D. E. Nelson (2007). "Patterns of
plant d15N values on a Greenland Norse farm." Journal
of Archaeological Science 34: 440-450.
Commiso, R. G. and D. E. Nelson (2008). "Correlation
between modern plant d15N values and activity areas of
Medieval Norse farms." Journal of Archaeological
Science 35.
Commiso, R. G. and D. E. Nelson (2010). "Stable
nitrogen isotopic examination of Norse sites in the
Western settlement of Greenland." Journal of
Archaeological Science 37: 1233-1240.
Coones, P. (1985). "One landscape of many? A
geographical perspective." Landscape History 7: 5-12.
Cosgrove, D. (1985). "Prospect, perspective and the
evolution of the landscape ide." Transactions of the
Institute of British Geographers, New Series 10(1): 45-
62.
Cruden, S. (1965). Excavations at Birsay, Orkney. The
Fourth Viking Congress, York, August 1961, Olivor and
Boyd, Aberdeen.
D'Andrea, W. J., Y. Huang, S. C. Fritz and N. J.
Anderson (2011). "Abrupt Holocene climate change as
an important factor for human migration in West
Greenland." PNAS 108(24): 9765-9769.
Dahl-Jensen, D., K. Mosegaard, N. Gundestrup, G. D.
Clow, S. J. Johnsen, A. W. Hansen and N. Balling
(1998). "Past Temperatures Directly from the Greenland
Ice Sheet." Science 282(5387): 268-271.
Dansgaard, W., S. J. Johnsen, N. Reeh, N. Gundestrup,
H. B. Clausen and C. U. Hammer (1975). "Climatic
changes, Norsemen and modern man." Nature 225(May
1): 24-28.
de Muckadell, C. S. (1929). Grønland i forvandlingens
tegn. København, Nordisk Forlag.
Diamond, J. (2005). Collapse: How Societies Choose to
Fail or Succeed, Penguin.
Dugmore, A. J., P. C. Buckland, K. J. Edwards, I. T.
Lawson, T. H. McGovern, E. Panagiotakopulu, I. A.
Simpson, P. Skidmore and G. Sveinbjarnardóttir (2005).
"The Norse landnám on the North Atlantic islands: an
environmental impact assessment." Polar Record
41(216): 21-37.
Dugmore, A. J., M. Church, K.-A. Mairs, T. H.
McGovern, A. J. Newton and S. Guðrún (2006). An
Over-Optimistic Pioneer Fringe? Environmental
Perspectives on Medieval Settlement Abandonment in
Þórsmörk, South Iceland. Dynamics of Northern
Societies - Proceedings of the SILA/NABO Conference
on Arctic and North Atlantic Archaeology, Copenhagen,
May 10th-14th, 2004. J. Arneborg and B. Grønnow.
Copenhagen, The National Museun of Denmark: 335-
345.
Dugmore, A. J., M. J. Church, K.-A. Mairs, T. H.
McGovern, S. Perdikaris and O. Vésteinsson (2007a).
"Abandoned Farms, Volcanic Impacts, and Woodland
Management: Revisiting Pjórsárdalur, the "Pompeii of
Iceland"." Arctic Anthropology 44(1): 1-11.
Dugmore, A. J., C. Keller and T. H. McGovern (2007b).
"Norse Greenland Settlement: Reflections on Climate
Change, Trade, and the Contrasting Fates of Human
Settlements in the North Atlantic Islands." Arctic
Anthropology 44(1): 12-36.
Dugmore, A. J., C. Keller, T. H. McGovern, A. F.
Casely and K. Smiarowski (2009). Norse Greenland
settlement and limits to adaptation. Adapting to Climate
Change: Thresholds, Values, Governance. N. Adger, I.
Lorenzoni and K. O'Brien. Cambridge, Cambridge
University Press.
Dugmore, A. J., T. H. McGovern, R. Streeter, C. K.
Madsen, K. Smiarowski and C. Keller (2013). 'Clumpsy
solutions' and 'elegant failures': lessons on climate
change adaptation from the settlement of the North
Atlantic islands A Changing Environment for Human
Security: Transformative approaches to research, policy
and action. L. Sygna, K. O'Brien and J. Wolf. New York,
Routledge: 435-451.
Dugmore, A. J., T. H. McGovern, O. Vésteinsson, J.
Arneborg, R. Streeter and C. Keller (2012). "Cultural
adaptation, compounding vulnerabilities and
conjunctures in Norse Greenland." PNAS 109(10): 3658-
3663.

264
Edgren, T., Ed. (2002). NAE 1976 till Grønland (unpubl.
field report). Helsingfors, Torsten Edgren.
Edvardsson, R. (2004). Fornleifarannsókn í Vatnsfirði
við Ísafjarðardjúp. Reykjavík, Fornleifastofnun Íslands.
Edvardsson, R., Ed. (2007a). Archaeological
Excavations at Qassiarsuk 2005 – 2006. Field report.
Bolungarvík, Náttúrustofa Vestfjarða/Grønlands
Nationalmuseum & Arkiv.
Edvardsson, R., Ed. (2007b). Archaeological
Excavations at Qorlortorsuaq 2006 (unpubl. field report).
Nuuk, Nunatta Katersugaasivia Allagaatequarfialu/The
National Museum and Archives of Greenland.
Edwards, K. J. (2005). "“On the Windy Edge of
Nothing”: A Historical Human Ecology of the Faroe
Islands." Human Ecology 33(5).
Edwards, K. J., I. T. Lawson, E. Erlendsson and A. J.
Dugmore (2005). "Landscapes of contrast in Viking Age
Iceland and the Faroe Islands." Landscape 6: 63-81.
Edwards, K. J. and E. J. Schofield (2013). "Investigation
of proposed Norse irrigation channels and dams at
Garðar/Igaliku, Greenland." Water History 5(1): 71-92.
Edwards, K. J., E. J. Schofield and J. Arneborg (2010).
"Was Erik the Red's Brattahlið Located at Qinngua? A
Dissenting View." Viking and Medieval Scandinavia
6(2010): 83-99.
Edwards, K. J., E. J. Schofield and D. Mauquoy (2007).
"High resolution paleoenvironmental and chronological
investigations of Norse landnám at Tasiusaq, Eastern
Settlement, Greenland." Quaternary Science Reviews
69(2008): 1-15.
Egede, H. (1741). Det Gamle Grønlands nye
Perlustration. København.
Egede, H. (1925). Relationer fra Grønland, 1721-36, og
Det gamle Grønlands ny perlustration 1741. L. Bobé.
København, B. Lunos bogtrykkeri: 442.
Egede, T. K., I. Køller-Jørgensen and K. J. Krogh
(1982). Detailplan for fåreavlen i Sydgrønland. Rapport
udarbejdet af Fåreavlskonsulent-tjenesten for De
samvirkende Fåreholder-foreninger i Grønland og
Grønlandsministeriet. København, Fåreavlskonsulent-
tjenesten og Grønlandsministeriet.
Einarsson, M. Á. (1984). Climate of Iceland. World
Survey of Climatology: 15: Climates of the Oceans. H.
van Loon. Amsterdam, Elsevier: 673-607.
Enghoff, I. B. (2003). "Hunting, Fishing and animal
husbandry at the Farm Beneath the Sand, Western
Greenland." Meddelelser om Grønland, Man & Society
28: 3-104.
Erslev, E. (1877). "Om Havedyrkning i nordlige Egne."
Geografisk Tidsskrift 1(1877): 87-95.
Estrup, H. F. J. (1824). "Nogle Bemærkninger angaaende
Grönlands Österbygd." Det skandinaviske
Litteraturselskabs Skrifter 20: 243-300.
Etting, V. (2010). "The Rediscovery of Greenland during
the Reign of Christian IV." Journal of the North Atlantic
Special Volume 2(Norse Greenland: Selected Papers
from the Hvalsey Conference 2008): 151-160.
Feilberg, J. (1984a). "A phytogeographical study of
South Greenland." meddelelser om Grønland -
Bioscience 15: 1-72.
Feilberg, J. (1984b). Økologisk-botanisk feltarbejde i
1984 (unpubl. interim report). Nuuk, Grønlands
Botaniske Undersøgelse, Ministeriet for Grønland.
Fenton, A. (1997). The Northern Isles: Orkeney and
Shetland. East Linton, Tuckwell Press.
Fischer, H., M. Werner, D. Wagenbach, M. Schwager, T.
Thorsteinnson, F. Wilhelms, J. Kipfstuhl and S. Sommer
(1998). "Little ice age clearly recorded in northern
Greenland ice cores." Geophysical Research Letters
25(10): 1749-1752.
Folke, C. (2006). "Resilience: The emergence of a
perspective for social–ecological systems analyses."
Global Environmental Change 16((2006)): 253-267.

265
Forman, R. T. T. and M. Godron (1986). Landscape
Ecology. New York, Wiley.
Fredskild, B. (1988). Agriculture in a Marginal Area -
South Greenland from the Norse Landnam (985 A.D.) to
the Present (1985 A.D.). The Cultural Landscape - Past,
Present and Future. H. H. Birks, H. J. B. Birks, P. E.
Kaland and D. Moe. Cambrigde, Cambridge University
Press: 381-393.
Fredskild, B. (1992). "Erosion and Vegetational Changes
in South Greenland Caused by Agriculture." Geografisk
Tidsskrift 92(1992): 14-22.
Fredskild, B. and L. Hulme (1991). "Plant remains from
the Norse farm Sandnes in the Western Settlement."
Acta Borealia 1: 69-81.
Fyllingsnes, F. (1990). Undergongen til dei norrøne
bygdene på Grønland i seinmellomalderen. Et
forskningshistorisk oversyn. Bergen, Grafisk Hus.
Gad, F. (1964). "Grønland's tilslutning til norgesvældet
1261." Tidsskriftet Grønland 7(1964): 259-272.
Gad, F. (1965). ""Sjældent farer Mænd Did"."
Tidsskriftet Grønland 1965(3): 81-91.
Gad, F. (1969). Grønlands Historie II. 1700-1782.
København, Nyt Nordisk Forlag Arnold Busck.
Gauthier, E., V. Bichet, C. Massa, C. Petit, B. Vannière
and H. Richard (2010). "Pollen and non-pollen
palynomorph evidence of medieval farming activities in
southwestern Greenland." Vegetation History and
Archaeobotany 19(5-6): 427-438.
Geirsdóttir, Á., G. H. Miller, T. Thordarson and K. B.
Ólafsdóttir (2009). "A 2000 year record of climate
variations reconstructed from Haukadalsvatn, West
Iceland." Journal of Paleolimnology 41(2009): 95-115.
Gestsson, G. (1959). "Gröf í Öræfum." Árbók hins
Íslenzka Fornleifafélags 1959: 5-87.
Giesecke, C. L. (1925). "On the Norwegian Settlements
on the Eastern Coast of Greenland, or Osterbygd, and
their Situation." The Transactions of the Royal Irish
Academy XIV: 47-56.
Giesecke, K. L. (1910). "Mineralogisches Reisejournal
über Grönland." Meddelelser om Grønland 35: 1-478.
Gjerland, B. and C. Keller (2009). "Graves and Churches
of the Norse in the North Atlantic: A Pilot Study."
Journal of the North Atlantic Special Volume 2(Norse
Greenland: Selected Papers from the Hvalsey
Conference 2008): 161-177.
Glenna, L. L. (1996). "Rationality, Habitus, and
Agricultural Landscapes: Ethnographic Case Studies in
Landscape Sociology." Agriculture and Human Values
13(4): 21-38.
Golding, K. A., I. A. Simpson, E. J. Schofield and K. J.
Edwards (2011). "Norse–Inuit Interaction and Landscape
Change in Southern Greenland? A Geochronological,
Pedological, and Palynological Investigation."
Geoarchaeology: An International Journal 26(3): 315-
345.
Greider, T. and L. Garkovich (1994). "Landscapes: The
Social Construction of Nature and the Environment."
Rural Sociology 59(1): 1-24.
Griffiths, D. and J. Harrison (2011). "Settlement under
the sand: new Viking discoveries in Orkney." Current
Archaeology April: 12-19.
Grønnow, B., H. C. Gulløv, B. H. Jacobsen, A. B.
Gotfredsen, L. H. Kauffmann, A. Kroon, J. B. T.
Pedersen and M. Søresen (2011). "At the edge: High
Arctic Walrus hunters during the Little Ice Age."
Antiquity 85(2011): 960-977.
Graah, W. A. (1832a). "Undersøgelse af Kirkeruinen in
Kakortok." Nordisk Tidsskrift for Oldkyndighed 1: 94-
108.
Graah, W. A. (1832b). Undersøgelses-Reise til
Østkysten af Grønland: efter kongelig Befaling udført i
Aarene 1828-31. København, Nordisk Forlag.

266
Guldager, O. (1997). "Qallunaattsiaqarfik. Et gammelt
mysterium opklaret?" Tidsskriftet Grønland 3(1997):
122-130.
Guldager, O. (2000). "Hvor lå Brattahlid?" Tidsskriftet
Grønland 5(2000): 161-172.
Guldager, O. (2002). "Brattahlid Reconsidered. Some
thoughts on the Social Structure of Medieval Norse
Greenland, and the Location of Brattahlid."
Archaeologia Islandica 2(2002): 74-97.
Guldager, O., S. S. Hansen and S. Gleie (2002).
Medieval Farmsteads in Greenland. The Brattahlid
Region 1999-2000. Copenhagen, Danish Polar Center.
Gulløv, H. C. (1997). "From Middle Age to Colonial
Times." Meddelelser om Grønland 23(199).
Gulløv, H. C. (2000a). Arkæologiske undersøgelser i
Sydgrønland: Rapport om berejsningen af Narsaq,
Qaqortoq og Nanortalik kommuner, sommeren 2000
(unpubl. field report). Copenhagen, The National
Museum of Denmark.
Gulløv, H. C. (2000b). Natives and Norse in Greenland.
Vikings - The North Atlantic Saga. W. W. Fitzhugh and
E. E. Ward. London, Smithsonian Institution Press: 318-
326.
Gulløv, H. C. (2008a). Booths from early Norse
Greenland - or tjaldat búðir from landnáma Greenland.
Símunarbók. C. Paulsen and H. D. Michelsen. Tórshavn,
Fródskapur - Faroe University Press: 90-105.
Gulløv, H. C. (2008b). "The Nature of Contact between
Native Greenlanders and Norse." Journal of the North
Atlantic 1(2008): 16-24.
Gunderson, L. H. and C. S. Holling (2001). Panarchy:
Understanding Transformations in Human and Natural
Systems. Washington, Island Press.
Halldórsson, Ó. (1978). Grænland í miðaldaritum.
Reykjavík, Sögufélag.
Hambrecht, G. (2009). "Zooarchaeology and the
Archaeology of Early Modern Iceland:." Journal of the
North Atlantic Special Volume 1(Archaeologies of the
Early Modern North Atlantic): 3–22.
Hamerow, H. (2002). Early Medieval Settlements: The
Archaeology of Rural Communities in Northwest Europe
400-900. New York, Oxford University Press.
Hamilton, J. R. C. (1956). Excavations at Jarlshof,
Shetland. Edinburgh, H.M. Stationery Office.
Hansen, B. U. (1988). "Satellite Monitoring of the
Biomass Production in Southern Greenland." Geografisk
Tidsskrift 88: 94-99.
Hansen, K. (1926). "Om Mulighed for Landbrug i
Grønland." Det grønlandske Selskabs Årsskrift 1925-
1926: 70-88.
Harrison, J. (2013). "Settlement Landscapes in the North
Atlantic: The Northern Isles in context, ca. 800-1500
AD." Journal of the North Atlantic Special Volume 4:
129-147.
Harrison, R., H. M. Roberts and W. P. Adderley (2008).
"Gásir in Eyjafjörður: International Exchange and Local
Economy in Medieval Iceland." Journal of the North
Atlantic 1(2008): 99-119.
Hasselmo, M., Ed. (1985). Nordisk Arkeologisk
Expedition 1976, delrapport: Ruingrupp 4, Österbygden
Grönland (Unpubl. field report). Stockholm,
Riksantikvarieämbetet.
Hastrup, K. (1985). Culture and History in Medieval
Iceland. Oxford, Clarendon Press.
Hastrup, K. (1989). "Saeters in Iceland 900-1600. An
anthropological analysis of economy and cosmology."
Acta Borealia 1(1989): 71-85.
Hebsgaard, M. B., T. P. Gilbert, J. Arneborg, P. Heyn,
M. Allentoft, M. Bunce, K. Munch, C. Scheweger and E.
Willerslev (2009). "‘The Farm Beneath the Sand’ – an
archaeological case study on ancient ‘dirt’ DNA."
Antiquity 83(2009): 430-444.

267
Heerfordt, L., N. Holmquist, B. Kiens and F. Wille
(1980). Fåreavl i Grønland. Project i arktisk biologi ved
biologistudiet på Københavns Universitet. København,
H.C.Ø.-tryk.
Hegmon, M. (2013). "The Archaeology of the Human
Experience." The SAA archaeological record 13(5): 16-
19.
Hegmon, M., J. Arneborg, A. J. Dugmore, G.
Hambrecth, S. Ingram, K. Kintigh, T. H. McGovern, M.
C. Nelson, M. A. Peeples, I. Simpson, K. Spielmann, R.
Streeter and O. Vésteinsson (in press). "The Human
Experience of Social Change and Continuity: The
Southwest and North Atlantic in "Intersting Times"
ca.1300."
Hegmon, M., M. A. Peeples, A. P. Kinzig, S. Kulow, C.
M. Meegan and M. C. Nelsen (2008). "Social
Transformation and Its Human Costs in the Prehispanic
U.S. Southwest." American Anthropologist 110(3): 313-
324.
Heide, P. B. (2014). "Man and Land: Cairns as the
Materalization of Relationships between Settlement and
Landscape in the Norse World." Home Cultures 11(1):
65-78.
Heide, P. B. and C. K. Madsen (2011). Norse Coastal
Landscapes. Field report on surveys and excavations in
the coastal area of Vatnahverfi Summer 2010 (unpubl.
field report). Nationalmuseet: 55.
Helle, K. (1982). Bergen by historie, bind I. Bergen,
Univestitetsforlaget.
Henriksen, P. S. (2012). Agriculture on the edge - the
first finds of cereals in Norse Greenland. Challenges and
solutions. Northern Worlds - Report from Workshop 2 at
the National Museum, 1 November 2011. H. C. Gulløv,
P. A. Toft and C. P. Hansgaard. Copenhagen, The
National Museum: 174-177.
Hermanns-Auðadóttir, M. (1992). "The beginning of
settlement in Iceland from an archaeological point of
view." Acta Borealia 1992(2): 85-135.
Herschend, F. and D. K. Mikkelsen (2003). The main
building at Borg (I:1). Borg in Lofoten: A Chieftain's
farm in North Norway. G. S. Munch, O. S. Johansen and
E. Roesdahl. Trondheim, Tapir Academic Press: 41-74.
Hirsch, E. and M. O'Hanlon (1995). The Anthropology
of Landscape. Perspectives on Place and Space. Oxford,
Oxford University Press.
Holm, G. (1883). "Beskrivelse af Ruiner i Julianehaabs
Distrikt." Meddelelser om Grønland 6: 57-145.
Holm, G. F. and T. V. Garde (1887). Den danske
konebådsekspedition til Grønlands østkyst. København,
Forlagsbureauet.
Hougen, B. (1947). Fra seter til gård: Studier i norsk
bosætningshistorie. Oslo, Norsk arkeologisk selskap.
Hurrel, J. W. (1995). "Decadal Trends in the North
Atlantic Oscillation: Regional Temperatures and
Precipitation." Science 269(5224): 676-679.
Hybel, N. and B. Poulsen (2007). The Danish Resources
ca. 1000-1550. Growth and Recession. Leiden, BRILL.
Høegh, K., Ed. (2007). Årsberetning 2006/2007 fra
Konsulenttjenesten for Landbrug, august 2007. .
Qaqortoq, Nunalerinermut
Siunnersorteqarfik/Konsulenttjenesten For Landbrug.
Høegsberg, M. S. (2008). "A reassessment of the
development of the cathedral at Gardar, Greenland."
Archaeologia Islandica 6: 73-95.
Høegsberg, M. S. (2009). "Continuity and Change: The
Dwellings of the Greenland Norse." Journal of the North
Atlantic Special Volume 2(Norse Greenland: Selected
Papers from the Hvalsey Conference 2008): 82-101.
Ingold, T. (1993). "The Temporality of Landscape."
World Archaeology 25(2): 152-174.
Ingold, T. and T. Kurtilla (2000). "Percieving the
Environment in Finnish Lapland." Body & Society 6((3-
4)): 183-196.

268
Ingstad, A. S., Ed. (1977). The Discovery of a Norse
Settlement in North America: Excavation at L'Anse Aux
Meadows, Newfound, 1961-1968. Oslo,
Universitetsforlaget.
Ingstad, H. (1960). Landet under Polarstjernen.
København, Forlaget Fremad.
Iversen, J. (1934). "Moorgeologische Untersuchungen
auf Grönland." Meddelelser fra Dansk Geologisk
Forening 8: 341–358.
Jacobsen, B. H. (1991). "Soil resources and soil erosion
in the Norse settlement area Østerbygden in Southern
Greenland." Acta Borealia 1991(1): 56-68.
Jacobsen, N. K. and B. H. Jacobsen (1986). "14C
datering af en fossil overfladehorisont ved Igaliku
Kujalleq, Sydgrønland, set i relation til nordboernes
landnam." Geografisk Tidsskrift 86: 74-77.
Jakobsson, S. (2001). 'Black men and malignant-
looking': The Place of the Indigenous Peoples of North
America in the Icelandic World View. Approaches to
Vinland: A conference on the written and archaeological
sources for the Norse settlements in the North-Atlantic
region and exploration of America, the Nordic House,
Reykjavík 9-11 August 1999. A. Wawn and Þ.
Sigurðardóttir. Reykjavík, Sigurður Nordal Institute.
Sigurður Nordal Institute Studies 4: 88-104.
Jennings, A. E. and N. J. Weiner (1996). "Environmental
change in eastern Greenland during the last 1300 years:
evidence from foraminifera and lithofacies in Nansen
Fjord, 68°N." The Holocene 6(2): 179-191.
Jensen, J. A. D. (1879). "Premierleutenant J.A.D.
Jensens Indberetning om den af ham ledede Ekspedition
i 1878." Meddelelser om Grønland 8(2): 17-76.
Jensen, J. A. D. (1889). "Undersøgelse af Grønlands
Vestkyst fra 64o til 67
" Meddelelser om Grønland
8: 33-122.
Jensen, K. G., A. Kuijpers and K. Nalân (2004). "Diatom
evidence of hydrographic changes and ice conditions in
Igaliku Fjord, South Greenland, during the past 1500
years." The Holocene 14: 152-164.
Jensen, L. (1951). "Det grønlandske landbrugs
udviklingsmuligheder." Det grønlandske Selskabs
Årsskrift 1951: 67-77.
Jensen, L. (1958). Fåreavl på Grønland. København, Den
kongelige grønlandske handel.
Jespersen, E. (1915). "Lidt om Kvægacl i Julianehaabs
Distrikt." Det grønlandske Selskabs Årsskrift 1915: 74-
82.
Jessen, P. (1987). Morten Wormskjoldden glemte
opdagelsesrejsende En oversigt over hans
forskerindsatsog en bibliografi. København, Agitryk.
Jiang, H., M.-S. Seidenkrantz, K. L. Knudsen and J.
Eiríksen (2001). "Late-Holocene summer sea-surface
temperatures based on a diatom record from the north
Icelandic shelf." The Holocene 12(2): 137-147.
Joensen, R. (1979). Fåreavl på Færøerne. København,
Societatis Litterarum Færoensium Hafniensis.
Jóhannesson, T. (2010). Agriculture in Iceland:
Conditions and Characteristics. Hvanneyri, The
Agricultural University of Iceland.
Johnstrup, F., Ed. (1878). Gieseckes mineralogiske Rejse
i Grønland: Med Tillæg om de Grønlandske Stednavnes
Retskrivning og Etymologi. København, B. Lunos
bogtrykkerei.
Johnstrup, J. F., N. F. Ravn and H. Rink (1878).
"Indberetning til Indenrigsministeriet om
Undersøgelserne i Aarene 1876, 1877 og 1878."
Meddelelser om Grønland 1(1): 1-15.
Jónsson, F. (1930). Det gamle Grønlands beskrivelse af
Ívar Bárðarson. København, Levin & Munksgaard
Forlag.
Júlíusson, Á. D. (2010). "Signs of Power: Manorial
Demesnes in Medieval Iceland." Viking and Medieval
Scandinavia 6(2010): 1-29.

269
Kaland, P. E. (2009). "Prescribed Burning of Coastal
Heathlands in Western Norway: History and Present Day
Experiences." International Forest Fire News 38(Jan.-
Dec. 2009): 35-30.
Kaland, S. H. H. (1987). Viking/Medieval Settlement in
the Heathland Area of Nordhordland. Proceedings of the
Tenth Viking Congress, Larkollen, Norway, 1985. J. E.
Knirk. Oslo, Universitetets Oldsaksamling.
Kaland, S. H. H. (1993). The Settlement of Westness,
Rousay. The Viking Age in Caithness, Orkney and The
North Atlantic: select papers from the proceedings of the
Eleventh Viking Congress, Thurso and Kirkwall 22
August- 1 Septemper 1989, Edinburgh University Press.
Kaland, S. H. H. and I. Martens (2000). Farming and
Daily Life. Vikings. The North Atlantic Saga. W. W.
Fitzhugh and E. E. Ward. London, Smithsonian
Institution Press: 42-54.
Kammp, A. H. (1964). "Fåreavl i Grønland." Geografisk
Tidsskrift 63(1964): 82-98.
Kammp, A. H. (1967). "Fåreavl på Grønland og i nogle
andre nordatlantiske områder." Tidsskriftet Grønland
4(1967): 97-109.
Kapel, H., Ed. (2004). Vandkraftværket ved
Qorlortorsuaq. Rapport om arkæologiske undersøgelser
udført for Grønlands Nationalmuseum & Arkiv
sommeren 2004 (unpubl. field report). Nuuk, Nunatta
Katersugaasusivia Allagaateqarfialu/The National
Museum and Archives of Greenland.
Kapel, H. and N.-C. Clemmensen (2013). Ruinerne på
Ikigaat - nordboernes Herjolfsnæs (unpubl. field report).
Nanortalik, Nanortalik Museum.
Kaplan, M. R., A. P. Wolfe and G. H. Miller (2002).
"Holocene Environmental Variability in Southern
Greenland Inferred from Lake Sediments." Quaternary
Research 58: 149-159.
Karlsson, G. (2000). Iceland's 1100 Years: The History
of a Marginal Society. London, C. Hurst & Co.
Publishers.
Keller, C. (1983). Gård og seter på Grønland - et forsøk
på å analysere ressurstilgangen i middelalderen ved hjelp
af satelittbilder. Hus, gård och bebyggelse - Föredrag
från det XVI nordiska arkeologmötet, Island 1982. G.
Ólafsson. Reykjavík, Þjóðminjasafn Íslands: 59-66.
Keller, C. (1986). "Nordboern på Grønland 985-1350. -
Bidrag til en demografisk økologisk diskusjon."
Universitetets Oldsakssamling Årbok 1984/1985: 145-
157.
Keller, C. (1989). The Eastern Settlement Reconsidered.
Some analyses of Norse Medieval Greenland. (Unpubl.
Ph.D.-Thesis). Oslo, University of Oslo.
Keller, C. (2010). "Furs, Fish, and Ivory: Medieval
Norsemen at the Arctic Fringe." Journal of the North
Atlantic 3(2010): 1-23.
Kleivan, I. (1983). "Herrnhuterne eller
brødremeningheden i Grønland 1733-1900 " Tidsskriftet
Grønland 8(1969): 221-235.
Knuth, E. (1944). "Bidrag til Vesterbygdens Topografi."
Det grønlandske Selskabs Årsskrift 1944: 81-124.
Knuthsen, H. (1906). "Om Mulighederne for Kvægavl i
Grønland." Det grønlandske Selskabs Årsskrift 1906: 42-
46.
Knuthsen, H., R. Müller, C. Brummerstedt, G. Meldorf
and S. Casterns (1906). "Husdyrhold i Grønland." Det
grønlandske Selskabs Årsskrift(1906): 42-66.
Kobashi, T., K. Kawamura, J. P. Severinghaus, J. M.
Barnola, T. Nakaegawa, B. M. Vinther, S. J. Johnsen and
J. E. Box (2011). "High variability of Greenland surface
temperature over the past 4000 years estimated from
trapped air in an ice core." Geophysical Research Letters
38(21): 1-6.
Krawczyk, D., A. Witkowski, M. Moros, J. M. Lloyd, A.
Kuijpers and A. Kierzek (2010). "Late-Holocene diatom-
inferred reconstruction of temperature variations of the
West Greenland Current from Disko Bugt, central West
Greenland." The Holocene 20(5): 659-666.

270
Kristiansen, A. (1955). "Fra fangererhverv til fåreavl."
Tidsskriftet Grønland 12(1955): 464-470.
Krogh, K. J. (1965). "Tjodhildes kirke på Brattahlid."
Nationalmuseets Arbejdsmark 1963-65: 5-18.
Krogh, K. J. (1974). "Kunstvanding - hemmeligheden
bag Grønlandsbispens hundrede køer." Nationalmuseets
Arbejdsmark 1974: 71-81.
Krogh, K. J. (1976). Om grønlands middelalderlige
kirkebygninger. Minjar og menntir. Afmælisrit helgað
Kristjáni Eldjárn 6. Desember 1976. B. Vilhjálmsson, J.
Kristjánsson and Þ. Magnússon. Reykjavík, Bókaútgáfa
Menningarsjóð: 294-310.
Krogh, K. J. (1982a). "Bygdernes kirker. Kirkerne i de
middelalderlige, norrøne grønlandske bygder."
Tidsskriftet Grønland 1982(8): 263-274.
Krogh, K. J. (1982b). Erik den Rødes Grønland.
Herning, Nationalmuseets Forlag.
Kuijpers, A. and N. Mikkelsen (2009). "Geological
records of changes in wind regime over south Greenland
since the Medieval Warm Period: a tentative
reconstruction." Polar Record 45((232)): 1-8.
Kuijpers, A., N. Mikkelsen, S. Ribiero and M.-S.
Seidenkrantz (2014). "Impact of Medieval Fjord
Hydrography and Climate on the Western and Eastern
Settlements in Norse Greenland." Journal of the North
Atlantic Special Volume 6(In the Footsteps of Vebæk -
Vatnahverfi Studies 2005-2011): 1-13.
Lamb, H. H. (1995). Climate, History and the Modern
World (2nd ed.). New York, Routledge.
Larsen, A.-C. and S. Stummann Hansen (2001). Viking
Ireland and the Scandinavian Communities in the North
Atlantic. The Vikings in Ireland. A.-C. Larsen. Roskilde,
The Viking Ship Museum: 115-126.
Larsen, A.-C. and V. Turner (2010). Belmont, Unst
Excavation. Discovery and Excavation in Scotland 2009.
P. Milburn. Tisbury, England, Archaeology Scotland.
Lárusdóttir, B. (2006). Settlement Organization and
Farm Abandonment: The Curious Landscape of
Reykjahverfi, North-East Iceland. People and Space in
the Middle Ages, 300-1300. W. Davies, G. Halsall and
A. Reynolds. Turnhout, Belgium, Brepols: 45-63.
Lassen, S. J., A. Kuijpers, H. Kunzendorf, G. Hoffmann-
Wieck, N. Mikkelsen and P. Konradi (2004). "Late-
Holocene Atlantic bottom-water variability in Igaliku
Fjord, South Greenland, reconstructed from foraminifera
faunas." The Holocene 14(2): 165-171.
Laursen, O. and H. Ørnsholt (1979). Naturmæssige
betingelser for fåreavl i Qagssiarssuk-området
(Sydgrønland). Roskilde, Publikationer fra Institut for
Georgrafi, Samfundsanalyse og Datalogi.
Lavigne, F., J.-P. Degeai, J.-C. Komorowski, S. Guillet,
V. Robert, P. Lahitte, C. Oppenheimer, M. Stoffel, C. M.
Vidal, Surono, I. Pratomo, P. Wassmer, I. Hajdas, D. S.
Hadmoko and E. d. Belizal (2013). "Source of the great
A.D. 1257 mystery eruption unveiled, Samalas volcano,
Rinjani Volcanic Complex, Indonesia." PNAS 110(42):
16742–16747.
Ledger, P. M., K. J. Edwards and E. J. Schofield
(2013a). "Shieling activity in the Norse Eastern
Settlement: Palaeoenvironment of the ‘Mountain Farm’,
Vatnahverfi, Greenland." The Holocene 23(6): 810-822.
Ledger, P. M., K. J. Edwards and E. J. Schofield
(2013b). "Vatnahverfi: A Green and Pleasant land?
Palaeoecological Reconstructions of Environmental and
Land-use Change." Journal of the North Atlantic Special
Volume 6(In The Footsteeps of Vebæk—Vatnahverfi
Studies 2005-2011): 29-46.
Ledger, P. M., K. J. Edwards and E. J. Schofield
(2014a). "A multiple profile approach to the
palynological reconstruction of Norse landscapes in
Greenland's Eastern Settlement." Quaternary Research
http://dx.doi.org/10.1016/j.yqres.2014.04.003: 1-16.
Ledger, P. M., K. J. Edwards and E. J. Schofield
(2014b). "Vatnahverfi: A Green and Pleasant land?
Palaeoecological Reconstructions of Environmental and
Land-use Change." Journal of the North Atlantic Special
Volume 6: In The Footsteeps of Vebæk—Vatnahverfi
Studies 2005-2011: 29-46.

271
Lindval, M.-B. (2011). De nordiska grönlänningarna.
Visby, Nomen Förlag.
Lloyd, J. M. (2006). "Late Holocene environmental
change in Disko Bugt, west Greenland: interaction
between climate, ocean circulation and Jakobshavn
Isbrae." Boreas 35: 35-49.
Lucas, G. (2008). "Pálstóftir: A Viking Age Shieling in
Iceland." Norwegian Archaeological Review 41(1): 87-
100.
Lucas, G., Ed. (2009). Hofstaðir. Excavation of a Viking
Age Feasting Hall in North-Eastern Iceland. Institute of
Archaeology Monograph Series. Reykjavík, Institute of
Archaeology, Reykjavík.
Lucas, G. and T. H. McGovern (2008). "Bloody
Slaughter: Ritual Decapitation and Display at the Viking
Settlement of Hofstaðir, Iceland." European Journal of
Archaeology 10(1): 7-30.
Lynnerup, N. (1998). "The Greenland Norse. A
Biological-Anthropological Study." meddelelser om
Grønland - Man & Society 24: 3-149.
Lynnerup, N., P. Bennike and E. Iregren, Eds. (2008).
Biologisk antropologi - med human osteologi.
København, Gyldendal.
Madsen, C. K. (2009). Norse Coastal Farms. Field
Report of a Survey in the Southwest “Vatnahverfi
Peninsula” Summer 2009. Nationalmuseet: 95.
Madsen, C. K. (2011). Landskab og levevej, økonomi og
hierarki - pastoralt landbrug i det norrøne Grønland.
Ændringer og udfordringer. Rapport fra workshop 1 på
Nationalmuseet 29. september 2010. H. C. Gulløv, C.
Paulsen and B. Rønne. Copenhagen, The National
Museum of Denmark: 71-77.
Madsen, C. K. (2012). Pastures Found... Farming in
Greenland (re)introduced. Challenges and solutions:
Northern Worlds - Report from workshop 2 at the
National Museum, 1 November 2011. H. C. Gulløv, P.
A. Toft and C. P. Hansgaard. Copenhagen, The National
Museum of Denmark: 142-166.
Madsen, E. (1907). "De vigtigste af danske i artiske
Egne udførte Rejser og Forskninger." Geografisk
Tidsskrift 19: 33-40.
Magerøy, H. (1993). Soga om austmenn. Nordmeen som
siglde til Island og Grønland i mellomalderen. Oslo, Det
Norske Samlaget.
Magnússon, Þ. (1983). Isländska boningshus under
vikingatid och medeltid. Föredrag från det XVI nordiska
arkeologmötet, Island 1982. Hus, Gård. G. Ólafsson.
Reykjavík, Þjóðminjasafn Íslands: 105-108.
Mahler, D. L. (1991). Sæterdrift på Færøerne i
Vikingetid og tidlig middelalder? - En model. Seminar
om nordatlantisk kulturforskning i Nordens Hus på
Færøerne. J. P. Joensen, R. Johansen and J. Kløvstad.
Tórshavn, Norðurlandahúsið i Føroyum. Nordatlantiske
foredrag: 29-45.
Mahler, D. L. (2007). Sæteren ved Argisbrekka.
Tórshavn, Fróðskapur - Faroe University Press.
Mainland, I. and P. Halstead (2005). "The Economics of
Sheep and Goat Husbandry in Norse Greenland." Arctic
Anthropology 42(1): 103-120.
Massa, C., V. Bichet, E. Gauthier, B. B. Perren, O.
Mathieu, C. Petit, F. Monna, J. Giraudeau, R. Losno and
H. Richard (2012a). "A 2500 year record of natural and
anthropogenic soil erosion in South Greenland."
Quaternary Science Reviews 32(2012): 119-130.
Massa, C., B. B. Perren, E. Gauthier, V. Bichet, C. Petit
and H. Richard (2012b). "A multiproxy evaluation of
Holocene environmental change from Lake Igaliku,
South Greenland." Journal of Paleolimnology 48(2012):
241-258.
Matras, A. K. (2005). The Viking Settlement "Niðri á
Toft", Kvívík, Faroe Islands - a reanalysis. Viking and
Norse in the North Atlantic - Select Papers from the
Proceedings of the Fourteenth Viking Congress,
Tórshavn, 19-30 Juli 2001. A. Mortensen and S. V.
Arge. Tórshavn, Føroya Fróðskaparfelag: 99-108.

272
McGovern, T. H. (1980). "Cows, Harps Seals, and
Churchbells: Adaptation and Extinction in Norse
Greenland." Human Ecology 8(3): 245-275.
McGovern, T. H. (1985). "Contributions to the
Paleoeconomy of Norse Greenland." Acta Archaeologica
54: 73-122.
McGovern, T. H. (1991). "Climate, Correlation, and
Causation in Norse Greenland." Arctic Anthropology
28(2): 77-100.
McGovern, T. H. (1992a). Bones, Buildings, and
Boundaries: Palaeoeconomic Approaches to Norse
Greenland. Norse and Later Settlement and subsistence
in the North Atlantic. C. D. Morris and D. J. Rackham.
Glasgow, Department of Archaeology, University of
Glasgow.
McGovern, T. H. (1992b). "The zooarchaeology of the
Vatnahverfi." meddelelser om Grønland - Man &
Society 17(1992): 93-107.
McGovern, T. H. (1993). "The zooarchaeology of
Ø17a." Meddelelser om Grønland Man&Society 18: 58-
74.
McGovern, T. H. (2009). The Archaeofauna. Hofstaðir.
Excavation of a Viking Age Feasting Hall in North-
Eastern Iceland. G. Lucas. Reykjavík, Institute of
Archaeology, Reykjavík: 168-252.
McGovern, T. H., T. Amorosi, S. Perdikaris and J.
Wollett (1996). "Vertebrate Zooarchaeology of Sandnes
V51: Economic Change at a Chieftain's Farm in West
Greenland." Arctic Anthropology 33(2): 94-121.
McGovern, T. H., G. F. Bigelow, T. Amorosi and D.
Russell (1988). "Northern Islands, Human Error, and
Environmental Degradation: A View of Social and
Ecological Change in the Medieval North Atlantic."
Human Ecology 16(3): 225-270.
McGovern, T. H., P. C. Buckland, D. Savory, G.
Sveinbjarnardóttir, C. Andreasen and P. Skidmore
(1983). "A Study of the Faunal and Floral Remains from
Two Norse Farms in the Western Settlement,
Greenland." Arctic Anthropology 2(1983): 93-120.
McGovern, T. H. and R. H. Jordan (1982). "Settlement
and Land Use in the Inner Fjords of the Godthaab
District, West Greenland." Arctic Anthropology 19(1):
63-79.
McGovern, T. H. and S. Perdikaris (2003). Report of
Animal Bones from Selhagi, Mývatn District, Northern
Iceland. New York, CUNY Northern Science and
Education Center.
McGovern, T. H., K. Smiarowski and R. Harrison
(2013). Hard Times at Hofstaðir? An Archaeofauna circa
1300 AD from Hofstaðir in Mývatnssveit, N Iceland.
New York, Hunter College Zooarchaeology Laboratory.
McGovern, T. H., O. Vésteinsson, A. Fridriksson, M.
Church, I. T. Lawson, I. A. Simpson, A. Einarsson, A. J.
Dugmore, G. T. Cook, S. Perdikaris, K. J. Edwards, A.
M. Thomson, W. P. Adderley, A. Newton, G. Lucas, R.
Edvardsson, O. Aldred and E. Dunbar (2007).
"Landscapes of Settlement in Northern Iceland:
Historical Ecology of Human Impact and Climate
Fluctuation on the Millennial Scale." American
Anthropologist 109(1): 27-51.
Meeker, L. D. and P. A. Mayewski (2002). "A 1400-year
high-resolution record of atmospheric circulation over
the North Atlantic and Asia." The Holocene 12(3): 257-
266.
Meldgaard, J. (1964). "Tjodhildes Kirke på Brattalid."
Tidsskriftet Grønland 1964(8): 281-299.
Meldgaard, J. (1965). Nordboerne i Grønland - En
Vikingebygds Historie. København, Munksgaards
Forlag.
Meldgaard, J. (1976). "Inuit-Norbo Undersøgelsen, 1976
" Tidsskriftet Grønland 1976(2): 33-44.
Meldgaard, J. (1977). "Inuit-Nordbo projektet.
Arkæologiske undersøgelser i Vesterbygden."
Nationalmuseets Arbejdsmark 1977: 159-169.
Meldgaard, J. (1982). "Tjodhildes Kirke - den første
fundberetning." Tidsskriftet Grønland 1982(5): 151-162.

273
Meldorf, G. (1906). Husdyrhold i Grønland. København,
Nielsen & Lydiche.
Mernild, S. H., M.-S. Seidenkrantz, P. Chylek, G. E.
Liston and B. Hasholt (2012). "Climate-driven
fluctuations in freshwater flux to Sermilik Fjord, East
Greenland, during the last 4000 years." The Holocene
22(2): 155-164.
Mikkelsen, N. and A. Kuijpers (2008). "The Norse in
Greenland and late Holocene sea-level change." Polar
Record 44((228)): 45-50.
Mikkelsen, N., A. Kuijpers, S. Lassen and J. Vedel
(2001). "Marine and terrestrial investigations in the
Norse Eastern Settlement, South Greenland." Geology of
Greenland Survey Bulletin 189: 65-69.
Miller, G. H., Á. Geirsdóttir, Y. Zhong, D. J. Larsen, B.
L. Otto-Bliesner, M. M. Holland, D. A. Bailey, K. A.
Refsnider, S. J. Lehman, J. R. Southon, C. Anderson, H.
Björnsson and T. Thordarson (2012). "Abrupt onset of
the Little Ice Age triggered by volcanism and sustained
by sea-ice/ocean feedbacks." Geophysical Research
Letters 39(2): 1-5.
Moros, M., J. T. Andrews, D. D. Eberl and E. Jansen
(2006a). "Holocene history of drift ice in the northern
North Atlantic: Evidence for different spatial and
temporal modes." Paleoceanography 21(2): 1-10.
Moros, M., K. G. Jensen and A. Kuijpers (2006b). "Mid-
to late-Holocene hydrological and climatic variability in
Disko Bugt, central West Greenland." The Holocene
16(3): 357-367.
Mowlem, A. (1992). Goat farming (2nd edition).
London, Farming Press.
Muir, R. (2000). The new reading the landscape :
fieldwork in landscape history. Exeter, University of
Exeter Press.
Munch, G. S. (2007). Borg in Lofoten. A chieftain's farm
in north Norway. Ohthere's Voyages: A Late 9th Century
Account of Voyages along the Coasts of Norway &
Denmark and its Cultural Context. J. Bately and A.
Englert. Roskilde, Viking Ship Museum. Maritime
Culture of the North: 100-105.
Myhre, B. (1982a). Bolighusets utvikling fra jernalder til
middelalder i Sørvest-Norge. Vestnordisk byggeskikk
gjennom to tusen år: Tradisjon og forandring fra
romertid til det 19. årh. B. Myhre, B. Stoklund and P.
Gjærder. Stavanger, Arkeologisk Museum i Stavanger:
195-215.
Myhre, B. (1982b). Synspunkter på huskonstruksjon i
sørvestnorske gårdshus fra jernalder og middelalder.
Vestnordisk byggeskikk gjennom to tusen år: Tradisjon
og forandring fra romertid til det 19. årh. B. Myhre, B.
Stoklund and P. Gjærder. Stavanger, Arkeologisk
Museum i Stavanger: 98-118.
Myhre, B. (2000). "The Early Viking Age in Norway."
Acta Archaeologica 71: 35-47.
Myhre, B. and I. Øye (2002). Norges Landbrukshistorie I
- 4000 f.Kr. - 1350 e.Kr. Jorda blir levevei. Oslo, Det
Nordiske Samlaget.
Møhl, J. (1982). "Ressourceudnyttelse fra norrøne og
eskimoiske affaldslag belyst igennem knoglematerialet."
Tidsskriftet Grønland 1982(Nr.8-9): 286-295.
Møller, H. S., K. G. Jensen, A. Kuijpers, S. Aagaard-
Sørensen, M. S. Seidenkrantz, M. Prins, R. Endler and
N. Mikkelsen (2006). "Late-Holocene environment and
climatic changes in Ameralik Fjord, southwest
Greenland: evidence from the sedimentary record." The
Holocene 16(5): 685-695.
Møller, N. A., L. L. Johansen, C. K. Madsen, L. Felding,
P. B. Heide and K. Smiarowski (2007). Vatnahverfi
2007 - Udgravninger i norrøne kirkegårde og møddinger.
Rapport om opmålinger og udgravning i Vatnahverfi,
sommeren 2007 (unpubl. field report). Nationalmuseet,
SILA - Nationalmuseets Center for Grønlandsforkning &
Danmarks Middelalder og Renæssance.
Møller, N. A. and C. K. Madsen (2006). Nordboerne i
Vatnahverfi - Rapport om rekognoscering og opmåling
af nordboruiner i Vatnahverfi Sommeren 2005.
Feltrapport 24. Nationalmuseet, SILA - Nationalmuseets
Center for Grønlandsforkning: 36.

274
Møller, N. A. and C. K. Madsen (2007a). Gård og Sæter,
Hus og Fold - Vatnahverfi 2006. Rapport om
besigtigelser og opmålinger i Vatnahverfi, sommeren
2006 (unpubl. field report). Nationalmuseet, SILA -
Nationalmuseet Center for Grønlandsforskning.
Møller, N. A. and C. K. Madsen (2007b). "Med friske
skridt i forgængeres fodspor." Tidsskriftet Grønland
2007(5-6): 307-314.
Nansen, F. (1890). Paa ski over Grønland : en skildring
af Den norske Grønlands-ekspedition 1888-89.
Kristiania, H. Ascheoug & Co.s Forlag.
Nansen, F. (1911). In Northern Mists - Arctic
Explorations in Early Time. London, Ballantine Press.
Nelson, D. E., J. Heinemeier, J. Møhl and J. Arneborg
(2012). "Isotopic Analyses of the Domestic Animals of
Norse Greenland." Journal of the North Atlantic Special
Volume 3(Greenland Isotope Project: Diet in Norse
Greenland AD 1000–AD 1450): 77-92.
Nesset, T. (2013). Øydegarden på Hellaug – ein
arkeologisk studie av eit øydegardsanlegg på Hellaug i
Etne kommune, Hordaland. Unpubl. Master's Thesis
from Bergen University. Bergen, Bergen University.
Nørlund, P. (1924). "Buried Norsemen at Herjolfsnes."
Meddelelser om Grønland 67: 1-270.
Nørlund, P. (1928). "Nordboproblemer i Grønland."
Geografisk Tidsskrift 31(1928): 46-61.
Nørlund, P. (1934). De gamle Nordbobygder ved
Verdens Ende - Skildringer fra Grønlands Middelalder.
København, G.E.C. Gad.
Nørlund, P. and A. Roussell (1929). "Norse Ruins at
Gardar: The Episcopal Seat of Medieval Greenland."
Meddelelser om Grønland 76(1): 1-170.
Nørlund, P. and M. Stenberger (1934). "Brattahlid."
Meddelelser om Grønland 88(1): 1-161.
O'Brien, S. R., P. A. Mayewski, L. D. Meeker, D. A.
Meese, M. S. Twickler and S. I. Whitlow (1995).
"Complexity of Holocene Climate as Reconstructed from
a Greenland Ice Core." Science 270(5244): 1962-1964.
Ogilvie, A. E. J. (1991). "Climate Changes in Iceland
A.D. c. 865 to 1598." Acta Archaeologica 61(1990):
233-251.
Ogilvie, A. E. J., L. K. Barlow and A. E. Jennings
(2000). "North Atlantic climate c. AD 1000: Millennia1
reflections on the Viking discoveries of Iceland,
Greenland and North America." Weather 55: 34-45.
Ogilvie, A. E. J. and T. Jónsson (2001). ""Little Ice Age"
Research: A Perspective from Iceland." Climate Change
48(2001): 9-52.
Ogilvie, A. E. J. and T. H. McGovern (2000). Sagas and
Science: Climate and Human Impacts in the North
Atlantic. Vikings - The North Atlantic Saga. W. W.
Fitzhugh and E. E. Ward. London, Smithsonian
Institution Press. 385-393.
Ogilvie, A. E. J., J. Wollet, K. Smiarowski, S. Troelstra,
A. Kuijpers, A. Pálsdóttir and T. H. McGovern (2009).
"Seals and Sea Ice in Medieval Greenland." Journal of
the North Atlantic 2: 60-80.
Ólafsdóttir, R. and H. H. Guðmundsson (2002).
"Holocene land degradation and climatic change in
northeastern Iceland." The Holocene 12(2): 159-167.
Ólafsson, G. (2001). Eiríksstaðir: The Farm of Eiríkr the
Red. Approaches to Vinland: A conference on the
written and archaeological sources for the Norse
settlements in the North-Atlantic region and exploration
of America, the Nordic House, Reykjavík 9-11 August
1999. A. Wawn and Þ. Sigurðardottir. Reykjavík,
Sigurður Nordal Institute. Sigurður Nordal Institute
Studies 4: 147-153.
Ólafsson, H. (2000). Sagas of Western Expansion.
Vikings: The North Atlantic Saga. W. W. Fitzhugh and
E. E. Ward. London, Smithsonian Institution Press: 143-
145.

275
Olsen, B. (2012). A Sense of Snow? Archaeology,
weather and the conception of northernness. Northern
Worlds - Report from 2. workshop. H. C. Gulløv, P. A.
Toft and C. P. Hansgaard. the Danish National Museum,
Rosendahls - Schultz Grafisk: 9-23.
Olsen, O. (1982). "Nordboforskning." Tidsskriftet
Grønland 5(1982): 141-134.
Oppenheimer, C. (2003). "Ice Core and Palaeoclimatic
Evidence for the Timing and Nature of the great Mid-
13th Century Vulcanic Eruption." International Journal
of Climatology 23: 417-426.
Ostermann, H. (1944). Indledning. Dagbøker av
nordmenn på Grønland før 1814: Andreas Bruuns og
Aron Arctanders dagbøker fra undersøkelsesreisen i
Julianehaab distrikt 1777-1779, ved H. Osterman. H.
Ostermann. Oslo, I kommisjon hos Jacob Dybwad: III-
IV.
Ostermann, H. and M. P. Porsild (1921). "Beskrivelse af
Distrikterne i Nordgrønland." Meddelelser om Grønland
60: 1-516.
Ostrom, E. (2009). "A General Framework for
Analyzing Sustainability of Social-Ecological Systems."
Science 325(419): 419-422.
Panagiotakopulu, E., M. T. Greenwood and P. C.
Buckland (2012). "Insect Fossils and irrigation in
Medieval Greenland." Geografiska Annaler: Series A,
Physical Geography 94(4): 531-548.
Panagiotakopulu, E., P. Skidmore and P. Buckland
(2007). "Fossil insect evidence for the end of the
Western Settlement in Norse Greenland."
Naturwissenschaften 94: 300-306.
Park, R. W. (2000). The Dorset-Thule Succession
Revisited. Identities and Cultural Contacts in the Arctic -
Proceedings from a Conference at the Danish National
Museum, Copenhagen, Danish Polar Center.
Patterson, W. P., K. A. Dietrich, C. Holmden and J. T.
Andrews (2010). "Two millennia of North Atlantic
seasonality and implications for Norse colonies." PNAS
107(12): 5306-5310.
Perdikaris, S. and T. H. McGovern (2007). Codfish,
Walrus and Chieftains: Economic intensification in the
Norse North Atlantic. Seeking a Richer Harvest - The
Archaeology of Subsistence Intensification, Innovation,
and Change. T. L. Thurston and C. Fisher. New York,
Springer: 193-216.
Perdikaris, S. and T. H. McGovern (2008). Codfish and
Kings, Seals and Subsistence. Human Impacts on Marine
Environments. J. Erlandson and T. Rick. California,
UCLA Press: 187-214.
Perren, B. B., C. Massa, V. Bichet, E. Gauthier, O.
Mathieu, C. Petit and H. Richard (2012). "A
paleoecological perspective on 1450 years of human
impacts from a lake in southern Greenland." The
Holocene 22(9): 1025-1034.
Petersen, J. (1933). Gamle gårdsanlegg i Rogaland. Fra
forhistorisk tid og middelalder. Oslo, H. Aschehoug &
Co.
Pierce, E. (2009). "Walrus Hunting and the Ivory Trade
in Early Iceland." Archaeologia Islandica 7(2009): 55-
53.
Pingel, C. (1832a). "Antiquariske Efterretninger.
Grønland." Nordisk Tidsskrift for Oldkyndighed 1: 221-
225.
Pingel, C. (1832b). "Om nogle mindre bekjendte Ruiner
paa Vestkysten af Grønland." Nordisk Tidsskrift for
Oldkyndighed 1: 94-108.
Pingel, C. (1833). "Antiquariske Efterretninger.
Grønland." Nordisk Tidsskrift for Oldkyndighed 2: 313-
343.
Pingel, C. (1835). "Antiquariske Efterretninger.
Grønland." Nordisk Tidsskrift for Oldkyndighed 3(1):
211-225.
Pingel, C. (1837). "Antiquariske Efterretninger fra
Grønland." Annaler for Nordisk Oldkyndighed 1367-
1837: 122-141.

276
Pingel, C. (1839). "Antiquariske Efterretninger fra
Grønland." Annaler for Nordisk Oldkyndighed 1838-
1839: 219-261.
Pingel, C. (1842). "Antiquariske Efterretninger fra
Grønland." Annaler for Nordisk Oldkyndighed 1842-
1843: 326-347.
Pulsiano, P. and K. Volf, Eds. (1993). Medieval
Scandinavia: An Encyclopedia. New York, Garland.
Pyndt, O. P. (1919). Gedeavl og Gedehold (Anden
omarbejdede udgave). Købenavn, August Bangs
Boghandels Forlag.
Ragin, C. (1987). The Comparative Method. Moving
Beyond Qualitative and Quantitative Strategies.
Berkeley, University of California Press.
Ragin, C. and P. Pennings (2005). "Fuzzy Sets and
Social Research." Sociological Methods and Research
33(4): 423-430.
Redman, C. L. (2005). "Resilience Theory in
Archaeology." American Anthropologist 107(1): 70-77.
Redman, C. L. and A. P. Kinzig (2003). "Resilience of
Past Landscapes: Resilience Theory, Society, and the
Longue Durée." Conservation Ecology 7((1)).
Reinton, L. (1955). Sæterbruket i Noreg I. Sætertypar og
driftsformer. Oslo, H. Aschehough & Co.
Reinton, L. (1957). Sæterbruket i Noreg II. Anna arbeid
på sætra. Sætra i haustingsbruket og i matnøytsla elles.
Oslo, H. Aschehough & Co.
Reinton, L. (1961). Seterbruk i Norge III. Oslo, H.
Aschehough & Co.
Reinton, L. (1969). Til seters: Norsk seterbruk og
seterstell. Oslo, Det Norske Samlaget.
Ribiero, S., M. Moros, M. Ellegaard and A. Kuijpers
(2012). "Climate variability in West Greenland during
the past 1500 years: evidence from a high-resolution
marine palynological record from Disko Bay." Boreas
41(1): 68-83.
Rimbu, N. and G. Lohmann (2010). "Decadal Variability
in a Central Greenland High-Resolution Deuterium
Isotope Record and Its Relationship to the Frequency of
Daily Atmospheric Circulation Patterns from the North
Atlantic Region." Journal of Climate 23(17): 4608-4618.
Rink, H. (1877). Danish Greenland: Its People and Its
Products. London, Henry S. King & Co.
Ritchie, A. (1993). Viking Scotland. London, Batsford
Ltd.
Roberts, H. M., Ed. (2004). Excavations at Aðalstræti,
2003. Reykjavík, Fornleifastofnun Íslands.
Roesdahl, E. (1995). Hvalrostand, elfenben og
nordboerne i Grønland. Odense, Odense
Universitetsforlag.
Roesdahl, E. (2004). Dagligliv i Danmarks middelalder -
en arkæologisk kulturhistorie. Aarhus, Aarhus
Universitetsforlag.
Roesdahl, E. (2005). Walrus Ivory - demand, supply,
workshops, and Greenland. Viking and Norse in the
North Atlantic - Select Papers from the Proceedings of
the Fourteenth Viking Congress, Tórshavn, 19-30 Juli
2001. A. Mortensen and S. V. Arge. Tórshavn, Føroya
Fróðskaparfelag: 182-207.
Roncaglia, L. and A. Kuijpers (2004). "Palynofacies
analysis and organic-walled dinoagellate cysts in late-
Holocene sediments from Igaliku Fjord, South
Greenland." The Holocene 14(2): 172-184.
Ross, J. M. and C. Zutter (2007). "Comparing Norse
Animal Husbandry Practices: Paleoethnobotanical
Analyses from Iceland and Greenland." Arctic
Anthropology 44(1): 62-85.
Roussell, A. (1936a). "En middelalderlig badstue i
Grønlands nordbobygder." Fra Nationalmuseets
Arbejdsmark 1936: 67-70.

277
Roussell, A. (1936b). "Sandnes and the Neighboring
Farms." Meddelelser om Grønland 88(2): 5-232.
Roussell, A. (1938). "Udgravninger i en afsides
grønlandsk nordbobygd." Fra Nationalmuseets
Arbejdsmark 1938: 55-64.
Roussell, A. (1941). "Farms and Churches in the
Medieval Norse Settlements of Greenland." Meddelelser
om Grønland 89: 1-354.
Ryder, C. H. (1891). "Tidligere Expeditioner til
Grønlands Østkyst nordfor 66° N. Br." Geografisk
Tidsskrift 11(1891): 62-107.
Raahauge, K., M. Appelt, H. C. Gulløv, H. Kapel, C.
Krause and N. A. Møller (2002). Tidlig Thulekultur i
Nanortalik kommune, sommeren 2001 (unpubl. field
report). København, SILA - Nationalmuseets center for
grønlandsforskning.
Raahauge, K., P. Høegh-Knudsen, H. C. Gulløv, J.
Møhl, C. Krause and N. A. Møller (2003). Tidlig
Thulekultur i Sydgrønland: Rapport om undersøgelserne
i Nanortalik kommune, sommeren 2002. København,
SILA - Nationalmuseets center for grønlandsforskning.
Sauer, C. (1925). "The Morphology of Landscape."
University of California Publications in Geography 2:
19-54.
Schofield, E. J. and K. J. Edwards (2011). "Grazing
impacts and woodland management in Eriksfjord:
Betula, coprophilous fungi and the Norse settlement of
Greenland." Vegetation History and Archaeobotany
20(2011): 181-197.
Schofield, E. J., K. J. Edwards, E. Erlendsson and P. M.
Ledger (2013). "Palynology supports ‘Old Norse’
introductions to the flora of Greenland." Journal of
Biogeography 40(6): 1119-1130.
Schofield, E. J., K. J. Edwards and A. J. McCullen
(2007). "Modern pollen–vegetation relationships in
subarctic southern Greenland and the interpretation of
fossil pollen data from the Norse landnám." Journal of
Biogeography 34: 473-488.
Schweger, C. E. (1998). Geoarchaeology of the GUS
site: A preliminary framework. Man, Culture and
Environment in Ancient Greenland. Report on a
Research Programme. J. Arneborg and H. C. Gulløv.
Copenhagen, The Danish National Museum: 14-18.
Seaver, K. A. (1996). The Frozen Echo. Stanford,
California, Stanford University Press.
Seaver, K. A. (2009). "Desirable teeth: the medieval
trade in Arctic and African ivory." Journal of Global
History 4: 271-292.
Seaver, K. A. (2010). The Last Vikings. London,
I.B.Tauris & Co. Ltd.
Seidenkrantz, M. S., S. Aagaard-Sørensen, H. Sulsbrück,
A. Kuijpers, K. G. Jensen and H. Kunzendorf (2007).
"Hydrography and climate of the last 4400 years in a SW
Greenland fjord: implications for Labrador Sea
palaeoceanography." The Holocene 17(3): 387-401.
Sha, L., H. Jiang and K. L. Knudsen (2011). "Diatom
evidence of climatic change in Holsteinsborg Dyb, west
of Greenland, during the last 1200 years." The Holocene
22(3): 347-358.
Simony, C. (1918). "Om Kohold i Grønland." Det
grønlandske Selskabs Årsskrift 1917: 61-65.
Simpson, I., A. J. Dugmore, A. Thomson and O.
Vésteinsson (2001). "Crossing the thresholds: human
ecology and historical patterns of landscape
degradation." Catena 42((2001)): 175-192.
Simpson, I. A., W. P. Adderley, G. Guðmundsson, M.
Hallsdóttir, M. A. Sigurgeirsson and M. Snæsdóttir
(2002). "Soil Limitations to Agrarian Land Production in
Premodern Iceland." Human Ecology 30(4): 423-443.
Skovgaard-Petersen, I. (1960). "Islandsk
egenkirkevæsen." Scania 26: 230-296.
Skre, D. (1996). "Rural Settlements in Medieval
Norway, AD 400-1400." Ruralia I: 53-71.

278
Skre, D. (2011). Centrality, Landholding, and Trade in
Scandinavia c. AD 700-900. Settlement and Lordship in
Viking and Early Medieval Scandinavia. S. M. Sindbæk
and B. Poulsen. Turnhout, Brepols Publishers: 197-212.
Small, A. (1967). "Excavations at Underhoull, Unst,
Shetland." Proceedings of the Society of Antiquaries of
Scotland 98(1964-65, 1965-66): 225-248.
Smiarowski, K. (2010). E172 Tatsip Ataa Midden
Excavation 2009 & 2010 Preliminary Excavation Report
(unpubl. field report). New York, Hunter College.
Smith, K. P. (1995). "Landnam: The Settlement of
Iceland in Archaeological and Historical Perspective."
World Archaeology 26(3): 319-347.
Smith, K. P. (2000). Who Lived at L'Anse aux
Meadows. Vikings. The North Atlantic Saga. W. W.
Fitzhugh and E. E. Ward. London, Smithsonian
Institution Press: 217.
Steenstrup, K. J. V. (1885). "Om Østerbygden."
Geografisk Tidsskrift 8: 123-132.
Steenstrup, K. J. V. and A. N. Kornerup (1881).
"Beretning om Expeditionen til Julianehaabs Distrikt i
1876." Meddelelser om Grønland 2(1): 1-41.
Stenberger, M., Ed. (1943). Forntida Gårdar i Island.
Meddelan från den nordiska arkeologiska
Undersökningen i Island Sommaren 1939. Ejnar
Munksgaard, København.
Stuiver, M., P. M. Grootes and T. Braziunas (1995).
"The GISP2 δ18
O Climate Record of the Past 16,500
Years and the Role of the Sun, Ocean, and Vulcanoes."
Quaternary Research 44((1995)).
Stummann Hansen, S. (1991). "Toftanes: A Faroese
Viking Age Farmstead from the 9-10th Centuries A.D."
Acta Archaeologica 61(1990): 44-53.
Stummann Hansen, S. and O. Vésteinsson, Eds. (2002).
Archaeological investigations in Þjórsárdalur 2001.
Reykjavík, Fornleifastofnun Íslands
Sutherland, P. D. (2000). The Norse and Native North
Americans. Vikings - The North Atlantic Saga. W. W.
Fitzhugh and E. E. Ward. London, Smithsonian
Institution Press: 238-247.
Sveinbjarnardóttir, G. (1991). "Shieling in Iceland - An
Archaeological and Historical Survey." Acta
Archaeologica 61(1990): 73-96.
Sveistrup, P. P. (1943). "Det almindelige
Handelskompagni 1747—1774 med særligt Henblik paa
dets Virksomhed i Grønland." Meddelelser om Grønland
131(9): 9-131.
Tamstorf, M. P. (2001). Satellitbaseret
vegetationskortlægning i Vestgrønland. Danmarks
Miljøundersøgelser. Naturvidenskabeligt Fakultet,
Københavns Universitet. Doctoral dissertation: 50.
Tanaka, K. L. and G. J. Leonard (1995). "Geology and
landscape evolution of the Hellas region of Mars."
Journal of Geophyscial Research 100(E3): 5407-5432.
Thomas, J. and B. David, Eds. (2008). Handbook of
landscape archaeology World Archaeological Congress
research handbooks in archaeology. Walnut Creek,
California, Left Coast Press.
Thorhallesen, E. (1776). Efterretning om Rudera eller
Levninger af de gamle Nordmænds og Islænderes
Bygninger paa Grønlands Vester-Side tillige med et
Anhang om deres Undergang Sammesteds. København,
August Friderich Stein.
Þórhallsson, B. (2012). "Iceland’s external affairs in the
Middle Ages: The shelter of Norwegian sea power."
Stjórnmál & stjórnsýsla 1 tbl.(8. árg.): 5-37.
Thorláksson, H. (2000). The Icelandic Commonwealth
Period. Vikings - The North Atlantic Saga. W. W.
Fitzhugh and E. E. Ward. London, Smithsonian
University Press: 175-185.
Thorsteinsson, A. (1982). Færøske huskonstruktioner fra
vikingetid til 1800-årene. Vestnordisk byggeskikk
gjennom to tusen år: Tradisjon og forandring fra
romertid til det 19. årh. B. Myhre, B. Stoklund and P.

279
Gjærder. Stavanger, Arkeologisk Museum i Stavanger:
149-161.
Thorsteinsson, I., Ed. (1983). Undersøgelser af de
naturlige græsgange i Syd-Grønland 1977-1981,
Landbrugets Forskningsinstitut Island og
Forsøgsstationen Upernaviarsuk Grønland.
Trouet, V., J. D. Scourse and C. C. Raible (2012).
"North Atlantic storminess and Atlantic Meridional
Overturning Circulation during the last Millennium:
Reconciling contradictory proxy records of NAO
variability." Global and Planetary Change 84-85(2012):
48-55.
UNDP (1994). Human Development Report 1994. U. N.
D. Programme. New York, United Nations Development
Programme (UNDP).
Vebæk, C. L. (1941). "Middelalderlige Bondegaarde paa
Grønland." Nationalmuseets Arbejdsmark 1941: 39-48.
Vebæk, C. L. (1943). "Inland farms in the Norse East
Settlement." Meddelelser om Grønland 90(1): 1-120.
Vebæk, C. L. (1952). "Vatnahverfi - En middelalders
Bondebygd i Grønland." Nationalmuseets Arbejdsmark
1952: 101-114.
Vebæk, C. L. (1953a). "Klostre i de grønlandske
nordbobygder." Tidsskriftet Grønland 1958(5): 195-200.
Vebæk, C. L. (1953b). "Nordbobygdernes kirker."
Tidsskriftet Grønland 1953(8): 300-304.
Vebæk, C. L. (1953c). "Vatnahverfi." Tidsskriftet
Grønland 1953(6): 219-224.
Vebæk, C. L. (1956). "Mellembygden." Tidsskriftet
Grønland 1956(3): 92-98.
Vebæk, C. L. (1958). Topographical and Archaeological
Investigations in the Norse Settlements in Greenland.
Third Viking Congress. K. Eldjárn. Reykjavík 1956,
Árbók Hins Íslanzka Fornleifafélags Fylgirit. 1958: 107-
122.
Vebæk, C. L. (1965). An Eleventh-Century Farmhouse
in the Norse Colonies in Greenland. Fourth Viking
Congress. A. Small. York, The University of Aberdeen,
Oliver and Boyd: 112-118.
Vebæk, C. L. (1966). "Kirke-Topografien i nordboernes
Østerbygd." Tidsskriftet Grønland 1966(5): 198-212.
Vebæk, C. L. (1982). "Vatnahverfi - en
Indlandsbebyggelse i Nordboernes Østerbygd."
Tidsskriftet Grønland 5(1982): 207-217.
Vebæk, C. L. (1991). "The Church Topography of the
Eastern Settlement and the Excavation of the
Benedictine Convent at Narsarsuaq in the Uunartoq
Fjord." Meddelelser om Grønland Man&Society(14): 1-
81.
Vebæk, C. L. (1992). "Vatnahverfi - An inland district of
the Eastern Settlement in Greenland." meddelelser om
Grønland - Man & Society 17: 1-132.
Vebæk, C. L. (1993). "Narsaq - a Norse landnáma
farm." Meddelelser om Grønland, Man & Society 18: 1-
47.
Vésteinsson, O. (1998). "Patterns of Settlement in
Iceland: A Study in Prehistory." Saga-Book XXV: 1-29.
Vésteinsson, O. (2000a). The Archaeology of Landnam.
Vikings. The North Atlantic Saga. W. W. Fitzhugh and
E. E. Ward. London, Smithsonian Institution Press: 164-
174.
Vésteinsson, O. (2000b). The Christianization of
Iceland: Priests, Power, and Social Change 1000-1300.
Oxford, Oxford University Press.
Vésteinsson, O. (2004). "Icelandic Farmhouse
Excavations: Methods and Site Choices." Archaeologia
Islandica 3: 71-100.
Vésteinsson, O., Ed. (2005a). Archaeological
investigations at Sveigakot 2004. Reykjavik,
Fornleifastofnun Íslands.

280
Vésteinsson, O. (2005b). Archaeology of Economy and
Society. A Companion to Old Norse-Icelandic Literature
and Culture. R. McTurk. Malden, MA, Blackwell
Publishing: 7-26.
Vésteinsson, O. (2006). Communities of Dispersed
Settlements: Social Organization at the Ground Level in
Tenth to Thirteenth Century Icenland. People and
Spance in the Middle Ages, 300-1300. W. Davies, G.
Halsall and A. Reynolds. Turnhout, Belgium, Brepols:
87-113.
Vésteinsson, O. (2007). "A Divided Society: Peasants
and the Aristocracy in Medieval Iceland." Viking and
Medieval Scandinavia 3(2007): 117-139.
Vésteinsson, O. (2010). "Parishes and Communities in
Norse Greenland." Journal of the North Atlantic Special
Volume 2(Norse Greenland: Selected Papers from the
Hvalsey Conference 2008): 138-150.
Vésteinsson, O. and T. H. McGovern (2012). "The
Peopling of Iceland." Norwegian Archaeological Review
45(2): 206-218.
Vésteinsson, O., T. H. McGovern and C. Keller (2002).
"Enduring Impacts: Social and Environmental Aspects of
Viking Age Settlement in Iceland and Greenland."
Archaeologia Islandica 2: 98-136.
Vinther, B. M., S. J. Johnsen, K. K. Andersen, H. B.
Clausen and A. W. Hansen (2003). "NAO signal
recorded in the stable isotopes of Greenland ice cores."
Geophysical Research Letters 30(7, 1387):
doi:10.1029/2002GL016193.
Vinther, B. M., P. D. Jones, K. R. Briffa, H. B. Clausen,
K. K. Andersen, D. Dahl-Jensen and S. J. Johnsen
(2010). "Climatic signals in multiple highly resolved
stable isotope records from Greenland." Quaternary
Science Reviews 29((2010)): 522-538.
von Eggers, H. P. (1793). Priisskrift om Grønlands
Østerbygds sande Beliggenhed. København,
Hofbogtrykkerne R. Møller og Søn.
Wagner, B., M. Melles, J. Hahne, F. Niessen and H.-W.
Hubberten (2000). "Holocene climate history of
Geographical Society Ø, East Greenland—evidence
from lake sediments." Palaeogeography,
Palaeoclimatology, Palaeoecology 160(2000): 45-68.
Walker, B., C. S. Holling, S. R. Carpenter and A. P.
Kinzig (2004). "Resilience, Adaptability and
Transformability in Social–ecological Systems."
Ecology and Society 9(2).
Wallace, B. (1983). Resultaten av de senere
grävningarna vid L'Anse aux Meadows. Hus, Gård och
bebyggelse - Föredrag från det XVI nordiske
arkeologmötet, Island 1982. G. Ólafsson. Reykjavík,
Þjóðminjasafn Íslands: 259-270.
Wallace, B. (1991). "L'Anse aux Meadows: Gateway to
Vinland." Acta Archaeologica 61(1990): 166-197.
Wallace, B. (2009). "L'Anse Aux Meadows, Leif
Eriksson's Home in Vinland." Journal of the North
Atlantic Special Volume 2(Norse Greenland: Selected
Papers from the Hvalsey Conference 2008): 114–125.
Walløe, P. O. (1927). Peder Olsen Walløes Dagbøger fra
hans Rejser i Grønland 1739-53.
Walsøe, L. (1919). "Om Faareavl i Grønland." Det
grønlandske Selskabs Årsskrift 1918: 41-46.
Walsøe, L. (1936). "Den grønlandske Faareavls
nuværende standpunkt." Det grønlandske Selskabs
Årsskrift 1936: 160-171.
Wanner, H., S. Brönnimann, C. Casty, D. Gyalistras, J.
Luterbacher, C. Schmutz, D. B. Stephenson and E.
Xoplaki (2001). "North Atlantic Oscilliation - Concepts
and Studies." Surveys in Geophysics 22(4): 321-381.
Whyte, I. D. (2002). Landscape and History since 1500.
London, Reaktion Books Ltd.
Witting, L. and E. W. Born (2005). "An assessment of
Greenland walrus populations." ICES Journal of Marine
Science 62(2005): 266-284.
Wormskiold, M. (1814). "Gammelt og Nyt om
Grönlands, Viinlands og nogle fleere af Forfædrene

281
kiendte Landes formeentlige Beliggende." Det
skandinaviske Litteraturselskabs Skrifter 10: 298-403.
Xoplaki, E., D. Fleitmann and H. F. Diaz (2011).
"Editorial: Medieval Climate Anomaly." PAGES News
19(1): 4.
Zori, D., J. Byock, E. Erlendsson, S. Martin, T. Wake
and K. J. Edwards (2013). "Feasting in Viking Age
Iceland: sustaining a chiefly political economy in a
marginal environment." Antiquity 87(2013): 150-165.
Østergård, E. (2003). Som syet til jorden. Tekstilfund fra
det norrøne Grønland. Aarhus, Aarhus
Universitetsforlag.
Øye, I. (2000). "Norway in the Middle Ages: Farms or
Hamlets - and Villages Too?" Ruralia III: 12-13.
Øye, I. (2003). Outfields as part of the Medieval Farm.
Scandinavian archaeological practice - in theory:
Proceedings from the 6th Nordic TAG, Oslo 2001. J.
Bergstøl. Oslo, University of Oslo. Oslo Arkeologiske
Serie: 400-411.
Øye, I. (2004). Agricultural conditions and rural
societies ca. 800–1350 – an introduction. Norwegian
Agricultural History. R. Almås. Trondheim, Tapir: 79-
140.
Øye, I. (2005a). Farming and farming systems in Norse
societies of the North Atlantic. Viking and Norse in the
North Atlantic - Select Papers from the Proceedings of
the Fourteenth Viking Congress, Tórshavn, 19-30 Juli
2001. A. Mortensen and S. V. Arge. Tórshavn, Føroya
Fróðskaparfelag: 359-370.
Øye, I. (2005b). Introduction. ‘Utmark’. The Outfield as
Industry and Ideology inthe Iron Age and the Middle
Ages. I. Holm, S. Innselet and I. Øye. Bergen, University
of Bergen. UBAS (University of Bergen
Archaeological Series) International 1: 9-20.
Øye, I. (2009). "Settlement patterns and field systemsin
medieval Norway." Landscape History 30(2): 37-54.
Øye, I. (2013). Technology, Land Use and
Transformations in Scandinavian Landscapes, c. 800-
1300 AD. Economic archaeology: from structure to
performance in European archaeology. T. Kerig and A.
Zimmermann. Bonn, Habelt: 295-309.

282
APPENDIX 1 – RUIN DATABASE PARAMETERS DESCRIPTION
The following defines and describes the parameters
observed for the ruin survey evidence from the
Vatnahverfi region and the other comparative Eastern
Settlement sites, the Ruin Database (RD, App.1). Some
parameters are referential or quantitative and need little
explanation, others are more, or purely, qualitative and
call for consideration.
Ruin Identification Number (Ruin_ ID):
The unique identification number of each individual
ruin. The Ruin_ID consists of two numbers: first the
number (after the old registrant) of the ruin group to
which the ruin belongs and the unique number of the
ruin following the oldest existing survey. Where a ruin
consists of two or more parts of clearly different built
and function – e.g. an enclosure built against a stable or
a building inside an enclosure – they are recorded
separately, one ruin under the original Ruin_ID, any
other under the same number with an added letter to the
end: for instance, ruins nos. E178_01 and E178_01a,
where the former is an enclosure built against a vertical
cliff face, the latter a building inside this enclosure.
Ruin Group Number (RG_NO):
The number of the ruin group (after the old
registrant) to which the ruin belongs. Repetition of this
number is redundant, but served as referential link to the
Ruin Group Database (App.2) and for quick sorting and
enquiry in the Ruin Database.
Ruin Length (R_Length):
The longest external distance in meters between two
opposing walls (or outlines) of a ruin, i.e. most often the
greatest outside distance between the two opposing
gables measured along a roughly medial axis through the
ruin. However, where the ruins were very collapsed and
indistinct – as for instance often the dwellings – the
R_Length is measured as the longest distance between
the interpreted outer boundary of the ruin along a
roughly medial axis through the ruin. In cases of
irregular shaped ruins that were not DGPS-surveyed, an
average of noted maximum and minimum outer length
measurements is used.
Ruin Width (R_Width)):
The longest measured external distance in meters
between two opposing walls (or ruin outlines) along an
axis set at a ca. 90° angle against the R_Length and
roughly medially through the building, i.e. most often
the greatest outside distance between the middle of two
ruin long walls or, as noted for R_Length, in cases where
the ruin is very indistinct (see above), simply the outer
ruin outline. In cases of irregular shaped ruins that were
not DGPS-surveyed, an average of noted maximum and
minimum outer width measurements is used.
Ruin Length/Width Index (RLW_Index):
Is simply the R_Length divided by the R_Width. The
RLW_Index essentially expresses and quantifies the
“roundedness” of the ruin, i.e. the lower the RLW_
Index, the more rounded the ruin. As discussed and
analyzed in section 6.2.1, this value is mostly used in the
discussion of different dwelling types.
Ruin Area (R_Area):
The precise area of the total ruin outline measured in
square meters from the digitalized survey data; only in
cases where ruin description is not based on DGPS-
survey, but on prior sketch survey or description has the
R_Area been calculated from the recorded R_Length and
R_Width. Precise digital measurement of the ruin area is
preferable because many ruins, especially the dwellings
and other larger ruins, are irregular of shape, and have
added annexes or projecting features. In short, DGPS-
surveyed precise ruin outlines are more accurate.
Wall Thickness (Wall_Th):
The thickness of the walls measured in meters. While
key in the identification of building function and on the
face of it a simple measure, establishing the Wall_Th can
be problematic for two reasons: First, walls often vary in
thickness within the same building and the gables
especially seem to have been wider than the long walls,
probably because the former were roof supporting.
Second, walls that include a lot of turf, or turf padding,
tend to “flow out” when they collapse, making them
narrow at the top and wide at the bottom. Long walls
comprise the larger proportion of buildings and have
limited roof-supporting function. They therefore better
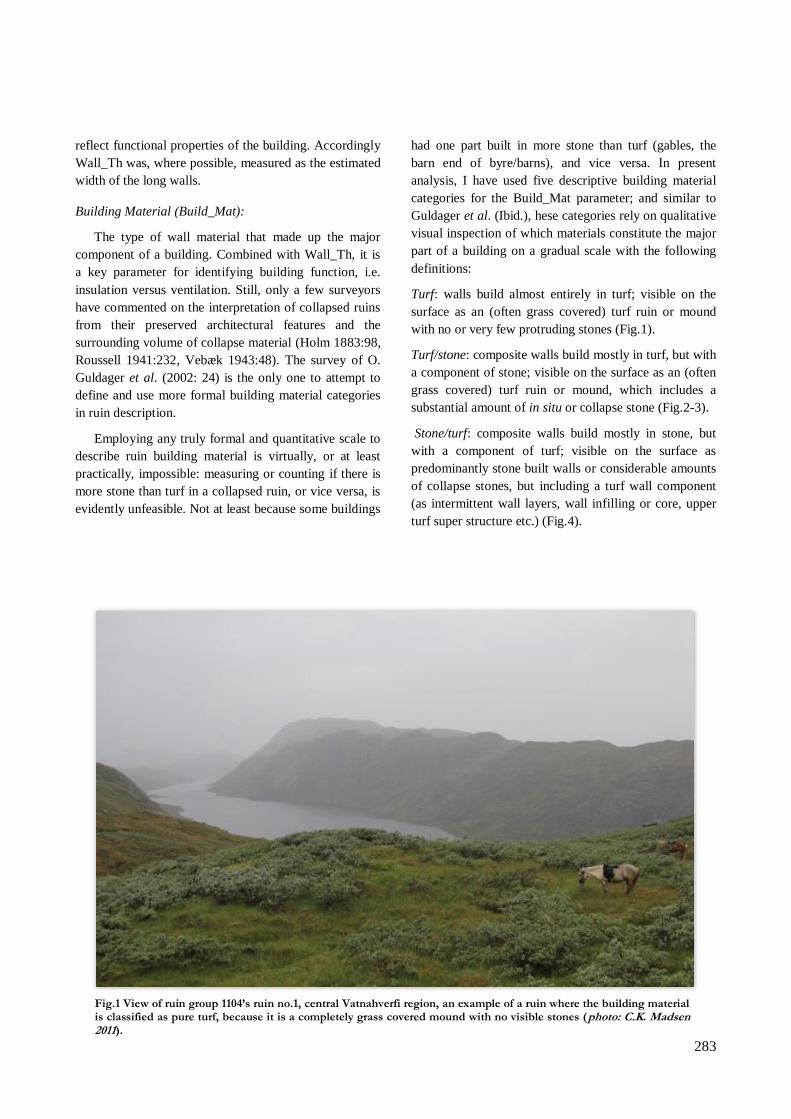
283
reflect functional properties of the building. Accordingly
Wall_Th was, where possible, measured as the estimated
width of the long walls.
Building Material (Build_Mat):
The type of wall material that made up the major
component of a building. Combined with Wall_Th, it is
a key parameter for identifying building function, i.e.
insulation versus ventilation. Still, only a few surveyors
have commented on the interpretation of collapsed ruins
from their preserved architectural features and the
surrounding volume of collapse material (Holm 1883:98,
Roussell 1941:232, Vebæk 1943:48). The survey of O.
Guldager et al. (2002: 24) is the only one to attempt to
define and use more formal building material categories
in ruin description.
Employing any truly formal and quantitative scale to
describe ruin building material is virtually, or at least
practically, impossible: measuring or counting if there is
more stone than turf in a collapsed ruin, or vice versa, is
evidently unfeasible. Not at least because some buildings
had one part built in more stone than turf (gables, the
barn end of byre/barns), and vice versa. In present
analysis, I have used five descriptive building material
categories for the Build_Mat parameter; and similar to
Guldager et al. (Ibid.), hese categories rely on qualitative
visual inspection of which materials constitute the major
part of a building on a gradual scale with the following
definitions:
Turf: walls build almost entirely in turf; visible on the
surface as an (often grass covered) turf ruin or mound
with no or very few protruding stones (Fig.1).
Turf/stone: composite walls build mostly in turf, but with
a component of stone; visible on the surface as an (often
grass covered) turf ruin or mound, which includes a
substantial amount of in situ or collapse stone (Fig.2-3).
Stone/turf: composite walls build mostly in stone, but
with a component of turf; visible on the surface as
predominantly stone built walls or considerable amounts
of collapse stones, but including a turf wall component
(as intermittent wall layers, wall infilling or core, upper
turf super structure etc.) (Fig.4).
Fig.1 View of ruin group 1104’s ruin no.1, central Vatnahverfi region, an example of a ruin where the building material is classified as pure turf, because it is a completely grass covered mound with no visible stones (photo: C.K. Madsen 2011).

284
Fig.2 Detail of well-preserved turf-stone built wall of ruin group E4’s simple byre/barn (ruin no.5), an example of a ruin where the building material is classified as turf-stone (the stone part of the wall have here set into the building) (photo: C.K Madsen 2011).
Fig.3 Ruin group E64’s ruin no.2, Kujalleq fjord, an example of a very collapsed ruin (bipartite livestock building) where the building material is classified as turf-stone, but is visible on the surface mainly as a grass covered mount with many protruding stones (photo: C.K. Madsen 2005).

285
Fig.4 Ruin group E174’s ruin no.5, southern Vatnahverfi region, an example of a collapsed ruin (sheep/goat shed) where the building material is classified as stone-turf. Although stone clearly comprised a substantial component of the building material, there is not enough collapse stone for the building to have been purely in stone. Rather, the turf has here largely withered away, leaving only the stone component (photo: C.K. Madsen 2006).
Fig.5 Ruin group E167’s ruin no. 4, central highland Vatnahverfi region, an example of a very well-preserved ruin (storehouse/skemma), where the building material is classified as dry stone masonry. As seen, the stones are neatly fitted with no mortar or other adhesive (photo: C.K. Madsen 2006).

286
Fig.6 Ruin group E209’s ruin no. 5, Kujalleq Fjord, an example of a more collapsed ruin (storehouse/ skemma) where the building material is classified as dry stone masonry. Although fairly collapsed, the amount of surrounding collapse stone implies the function of the building (photo: C.K. Madsen 2005).
Fig.7 Ruin group E90’s ruin no. 1, Sioralik, an example of a well-preserved ruin (enclosure wall) where the building material is classified as dry stone masonry (for a vertical view see Fig.8) (photo: C.K. Madsen 2006).

287
Fig.8 Detail of ruin group E90’s ruin no.1, vertical view. Here the dry stone wall is built with two neatly fitted faces of larger stones and a wall-core filled with lesser rounded stones (photo: C.K. Madsen 2006).
Dry stone masonry: walls were built entirely in stone;
visible on the surface either as preserved in situ walls
(Fig.5-8, 6.1, 6.14) or a sufficient amount of collapse
stone to comprise the complete walls of a dry stone
masonry building. Having gone through prior surveys
records from the Vatnahverfi region, it seems clear that
the descriptive term 'dry stone masonry' has been applied
to describe a great number of ruins, which upon closer
inspection do not seem to include enough collapse stone
for the walls to have stood to any height. Such ruins
were probably, as they are interpreted here, built in
stone/turf, but the turf component since completely
disintegrated.
Stone foundation: walls built entirely in turf, but resting
on a stone sill or foundation; visible on the surface either
as a single or a few courses of in situ wall with little or
no preserved turf superstructure. Essentially, stone
foundations represent the same type of ruin and building
material as the pure turf category, only here the turf
components have since completely disintegrated
(Fig.6.9-6.10).
Where a ruin consisted of two parts built in distinctly
different material – for instance the turf-built insulated
stable area and the ventilated stone-built storage area of
byre/barns – it has only been attributed one Build_Mat
category based on its preserved surface appearance.
Number of Compartments (No_Comp):
The number of identifiable sections or rooms in a
ruin. Although multiple room outlines are often seen in
the dwellings, they have not been recorded separately
because they are almost impossible to define.
Area of Compartment + Number (Ar_Comp + No.):
The precise area in square meters of any identifiable
section or room in a ruin; section or rooms are listed
according to size from largest to smallest and attributed a
serial compartment number. Areas are measured in
MapInfo from the digitalized survey data; only in cases
where ruin description is not based on DGPS-survey, but
on prior sketch surveys or description has the Ar_Comp
been calculated from average R_Length and R_Width.
Sunk (yes/no):
A parameter which describes if a ruin has been dug
into the ground? However, it should be noted that a ruin
described as 'sunk' is not equivalent to a 'pit house',
although differentiating between the two is problematic:
while the latter is a rather distinct building type in all of
late Iron Age/Viking Age northern Europe, 'sunk' here
only describes if a building had a floor buried to any
depth below surface level. While 'sunken' ruins thus
could be 'pit houses' in the traditional sense, most are
not. In fact, judging from the excavated Norse ruins,
sinking buildings slightly into the surface seems to have
been the norm rather than the exception. Often it was a
natural side effect of the houses being built on somewhat
sloping ground whereby even leveling of the floors
would cause, at least part of, the ruin to be sunk below
the surrounding surface.

288
Fig.9 Ruin group E167’s ruin no. 5, central highland Vatnahverfi region, an example of a ruin (storehouse /skemma or enclosure) where the building material is classified as a stone foundation. Since there is no stone collapse lying about, the ruin must clearly have had a superstructure of another building material, probably turf, but perhaps even wood (photo: C.K. Madsen 2006).
Fig.10 Ruin group E172 ruin no. 20, central Vatnahverfi region, an example of a ruin (storehouse /skemma) where the building material is classified as a stone foundation. Again, the lack of surrounding collapse stone precludes a larger original stone component and the superstructure of the building must consequently have been built in turf or wood (photo: C.K. Madsen 2007).

289
However, some buildings seem to have been more
purposefully sunk into the ground, probably for the
purpose of insulation, while at the same time conserving
on turf building material. A large part of the surveyed
ruins described as 'sunk' could belong to the latter
category; for if the lowered floor layer of ruins – with
caved-in roof and perhaps wall material – are visible
from surface observation, then they must originally have
been sunk more than a little into the surrounding surface.
Unfortunately, neither prior surveyors, nor we during the
Vatnahverfi-Project, have been completely consistent in
the observation of this ruin parameter. At any rate, the
observation of a ruin being sunk into the ground implies
its primary function of insulation.
Ruin Interpretation (Ruin_Int):
The functional interpretation of the ruin after the
building classes presented in section 6.2.
Distance to Main Dwelling (Dis_MD):
The distance in meters of a ruin to its associated
dwelling. Where there is only one dwelling taking this
measurement is unproblematic. However, at ruin groups
with more than one dwelling, a good deal of qualitative
assessment is involved, i.e. ascribing ruins to particular
dwellings based on their location, proximity, or natural
dividing features (e.g. streams, outcrops, bluffs, ravines
etc.). The interpretation presumes that all the ruins, or at
least the dwellings, were contemporary. As will be
presented below, the Dis_MD uses the assumed
centrality of the dwelling in farmstead activities to
approximate functions of related outbuildings. This
relationship is summarized in the farmstead dispersion
index, which implies how nucleated or dispersed a
farmstead is (see section 7.1.1).
Distance to nearest enclosure (Dis_Encl):
A parameter only recorded for buildings interpreted
as enclosures that measures the distance to the nearest
other enclosure; the parameter is used to identify
functionally related enclosures, e.g. stekkr and lambakró.
Enclosure Facing (Encl_Face):
A parameter only observed for enclosures of the
types built against a steep or vertical cliff face or against
the side of a building. It describes the general heading
towards which the enclosure is open (or is not sheltered).
The Encl_Fac was included for the functional discussion
of these enclosures (section 6.2.4). Rarely described in
neither prior survey reports or those produced during the
Vatnahverfi-Project, the Encl_Face was observed from
the survey-data during digital post-processing.
Enclosure Bedding (Encl_Bed):
A parameter only recorded for enclosures, which
separates the character of the enclosed surface on four
categories: soil surface, naked bedrock, mixed stone and
soil, and unknown. The Encl_Bed was included for the
functional discussion of the enclosures, where examples
with a soil surface could have been gardened, whereas
the others could not, but had a draining function. Rarely
noted in prior survey reports or those produced during
the first part of Vatnahverfi-Project, the Encl_Face was
recorded from field notes of vegetation, photographs, or
simply omitted there was insufficient information.
Enclosure Slope (Encl_Slope, yes/no):
A parameter only observed for the enclosures, which
describes whether or not the ruin was built on markedly
sloping ground. Because precise measurement of the
actual angle of Encl_Slope was unfeasible during the
field surveys, 'markedly sloped' refers simply to the
observation of the ruin runs over fairly steeply sloped
ground, likely for the purpose of water run-off or
drainage.
Survey from differential GPS (DGPS, yes/no):
A parameter that describes whether the ruin was
DGPS surveyed or if listed observations are based on
written description/sketch survey only. Ruins not DGPS-
surveyed were added during the secondary post-
processing (see section 4.2.3).
Reference (Ref.):
The primary literary reference(s) regarding the ruin
and on which listed observations are based.
Additional Notes (Add.note):
Additional notes relating to the interpretation of or
observations on the ruin, most often referring to the
partial preservation of the ruin or renumbering of ruins
to match earlier survey reports).
Wherever possible (ruin checked off as DGPS-
surveyed), all of the above parameters were established
from digital measurement or observation.

290
Ruin Data
Ruin_Id RG NO R_Length R_Width R_Area L/W_Index Build_mat/style Wall_Th No_Comp Ar_Comp
1
Ar_Comp 2
Ar_Comp 3
Ar_Comp 4
Ar_Comp 5
Ar_Comp 6
Sunk Ruin_Int Dis_MD Dis_Encl Encl_Fac Encl_Bed Slope DGPS Ref Add
00-2_ 00-2
No 26
No Yes Field report under preparation
00-2_01 00-2 7,04 5,61 38,28 1,25 5 0,6 1 24,63
No 15 2,3 3,8
2 No Yes Field report under preparation
00-2_02 00-2 11,69 7,35 57,76 1,59 5 0,5 4 10,86 7,51 5,17 3,51
No 1
No Yes Field report under preparation
00-2_03 00-2 3,21 2,94 10,78 1,09 5
No 9 18,9
No Yes Field report under preparation
00-2_04 00-2 28,89 16,6 376,03 1,74 5 0,8 1 318,79
No 15 6,7 3,8
1 No Yes Field report under preparation Note that R_Area and Ar_Comp1 is only somewhat accurate, because enclosure wall is not fully
preserved.
00-2_05 00-2 3,59 0,92 3,27 3,90 4 0,9
No 27
No Yes Field report under preparation
00-2_06 00-2 2,27 0,6 3 3,78 4 0,6
No 27
No Yes Field report under preparation
0403_01 0403 14 6 84 2,33 2
No 15
4 No No Kapel et al. 2004;49
0405_01 0405 5 3 15 1,67 2
No 14
No No Kapel et al. 2004;49
0501_01 0501 4,28 2,75 11,61 1,56 1 0,5 1 5,94
Yes 4
No Yes Møller&Madsen 2006;31
0502_01 0502 10 9,1 72,92 1,10 3 0,75 1 48,69
No 16
2 No Yes Møller&Madsen 2006;31
0502_02 0502 7,48 4,3 31,93 1,74 2 0,65 1 14,96
No 4
No Yes Møller&Madsen 2006;31
0502_03 0502 8,33 4,8 37,79 1,74 5 0,5 1 24,41
No 4
No Yes Møller&Madsen 2006;31 Note that wall dimensions has been altered according to photo/description
0502_04 0502 4,65 3,12 14,04 1,49 4 0,6 1 5,83
No 9
No Yes Møller&Madsen 2006;31
0503_01 0503 12,11 0,8 9,86 15,14 5 0,8
No 25
No Yes Møller&Madsen 2006;32
0601_01 0601 2,56 2,1 5,4 1,22 3 0,5 1 2,39
No 14
No Yes Møller&Madsen 2007;36
0602_01 0602 2 2 4 1,00 4
No 20
No No Møller&Madsen 2007;36 No other information on the ruin could be found
0602_02 0602 6 4 18 1,50 3 1
Yes 14
No No Møller&Madsen 2007;36 No other information on the ruin could be found
0602_03 0602 5 2 20 2,50 4 1 3 20 6 4
No 18
1 No No Møller&Madsen 2007;36 No other information on the ruin could be found
0603_01 0603 7,54 6,9 32,24 1,09 2 0,75 3 5,62 4,49 3,91
No 14
No Yes Møller&Madsen 2007;36
0604_01 0604 3 2 6 1,50 4
No 20
No No Møller&Madsen 2007;37 No other information on the ruin could be found
0605_01 0605 6,3 5,34 27,58 1,18
0,75 3 5,33 3,47 1,44
No 14
No Yes Møller&Madsen 2007;37
0605_02 0605 7,53 4,58 26,2 1,64
0,8 1 15,67
Yes 10
No Yes Møller&Madsen 2007;37
0701_01 0701 6,52 4,18 24,61 1,56 2
No 14
No Yes Møller et al. 2007;9 Note that the western part of ruin 1 is here considered a later disturbance, like reuse of the structure by Inuit
0701_02 0701 3,97 3,19 12,02 1,24 2 0,95 1 3,56
No 14
No Yes Møller et al. 2007;9
0701_03 0701 2,45 2,4 5,28 1,02 2 0,8 1 1,44
No 20
No Yes Møller et al. 2007;9
0901_01 0901 13,6 5,32 62,04 2,56 1 1,8 3 6,03 4,14 3,53
No 1
No Yes Madsen 2009;92
0901_02 0901 10,57 5,06 46,68 2,09 1 1,8 2 5,63 4,54
No 5 0,7
No Yes Madsen 2009;92
0902_01 0902 24,75 1,9 45,91 13,03 1 1,9 1 1649
No 21
1 No Yes Madsen 2009;93 Note that Ar_Comp1 is measured from GoogleEarth satellite imagery
1001_01 1001 4,91 3,31 14,46 1,48 2 1,1 2 4,56 2,5
No 14
No Yes Heide&Madsen 2010;36
1001_02 1001 4,38 2,42 9,14 1,81 5 0,8 1 4,02
No 14
No Yes Heide&Madsen 2010;37 Note that R_Area, R_Width, Ar_Comp1 are only somewhat accurate because the structure is partially eroded.
1102_01 1102 4,84 1,5 6,15 3,23 6 0,5 1 4,22
No 20
No Yes Field report under preparation
1103_01 1103 4,85 3,47 14,73 1,40 3 0,8 1 5,49
No 14
No Yes Field report under preparation
1104_01 1104 11,95 4,77 49,92 2,51 1 1,2 3 9,71 5,21 3,29
No 1
No Yes Field report under preparation
1301_01 1301 3,38 3,2 9,03 1,06 2 0,8 1 5,04
No 14
No Yes Field report under preparation
1301_02 1301 18,28 13,71 135,14 1,33 5 1 4 78,32 9,83 8,73 1,76
No 18
1 NW 1 No Yes Field report under preparation
1301_03 1301 7,17 1,6 9,66 4,48 4
1 8,74
No 18
1
1 No Yes Field report under preparation
1301_04 1301 5,88 5,5 28,23 1,07 4 0,6 2 12,89 2,43
No 18
12,3
3 No Yes Field report under preparation
1301_05 1301 8,73 7,61 54,81 1,15 4 0,5 1 40,71
No 18
9,2 SE 3 No Yes Field report under preparation
1301_06 1301 4 4
1,00 4 0,5 4 1 1 1 1
No 28
No No Field report under preparation
1301_07 1301 5 4
1,25 4 0,5 2 4 2
No 20
101,4
No No Field report under preparation
60V1_00I_543_01
60V1_00I_543
10,33 4,14 42,75 2,50 5 0,8 1 19,96
No 10
No Yes Madsen 2010 (under preparation)
B10_01 B10 3,5 2 7 1,75 3
1
No 20
No No NMA:Bak1969;B10 Ruin description after rough survey sketch and description only
B10_02 B10 1,5 1 1,5 1,50 5
1
No 20
No No NMA:Bak1969;B10 Ruin description after rough survey sketch and description only
B10_03 B10 5,1 2,5 13,4 2,04 3
2 8,35 5
No 20
No No NMA:Bak1969;B10 Ruin description after rough survey sketch and description only
B10_04 B10 2,5 2 5 1,25 3
1
No 20
No No NMA:Bak1969;B10 Ruin description after rough survey sketch and description only
B102_01 B102 22,5 1,59 5,76 14,15 2 1,5
No 25
No Yes NMA:Bak 1970;B102, Møller&Madsen 2007;21
B136_01 B136 8 4 32 2,00 4 1 1 12 6
No 15
4 No No NMA:Bak 1971;B136-4 Ruin measurements from rough sketch and survey only.
B136_02 B136 4 3 12 1,33 3
1
No 4
No No NMA:Bak 1971;B136-2 Note that the surrounding turf collapse is not measured as part of the ruin. Ruin measurements from rough sketch and survey only.
B136_03 B136 10 4,5 45 2,22 4 1,25 1
No 15
4 No No NMA:Bak 1971;B136-4 Ruin measurements from rough sketch and survey only.
B136_04 B136 15 15 225 1,00 2
No 1
No No NMA:Bak 1971;B136-3 Ruin measurements from rough sketch and survey only.
B139_01 B139 10,22 3,97 34,97 2,57 2 1 3 5,77 3,76 3,13
No 1
No Yes NMA:Bak 139;B10, Møller&Madsen 2007;36
B139_02 B139 5,04 4,09 19,93 1,23 5 0,5 2 8,02 5,26
No 18 39,7
SW 1 No Yes Møller&Madsen 2007;36 Note that Ar_Comp1 is only roughly accurate as the walls are not completely preserved
B139_03 B139 1,86 0,48 1,09 3,88 4
1 0,81
No 19 45,9 2,29
2 No Yes Møller&Madsen 2007;36 Wall thickness not described
E111_01 E111 17,74 10,27 156,17 1,73 4 1,8 1 88,12
No 12 44,6
No Yes Kapel&Clemmensen 2013;14 Note that the ruin is slightly eroded
E111_01a E111 39,3
3 1,45 1
No 13 37,8
No Yes Kapel&Clemmensen 2013;14 Note that the ruin is eroded and R_Width and R_Area cannot be estimated
E111_02 E111 42,95 16,44 523,2 2,61 2
No 1
No Yes Kapel&Clemmensen 2013;14
E111_03 E111 29,08 7,74 240,3 3,76 2 2 2 56,53 30,9
No 2 16,9
No Yes Kapel&Clemmensen 2013;14
E111_04 E111 13,46 5,1 67,23 2,64 3 0,95 1 22,64
No 4 76
No Yes Kapel&Clemmensen 2013;14
E111_05 E111 10,76 4,47 44,17 2,41 4 0,9 1 21,35
No 18 60,7
SE
Yes Yes Kapel&Clemmensen 2013;15 Note that Kapel&Clemmensen interpret ruin as outbuilding or storehouse
E111_06 E111 24,45 7,41 174,63 3,30 1 2 2 26,94 19,48
No 2 25,8
No Yes Kapel&Clemmensen 2013;15
E111_07 E111 12,96 6,98 85,47 1,86 3 1,4 1 31,38
No 14 49,8
No Yes Kapel&Clemmensen 2013;15
E111_08 E111 150,4 2,11 317,34 71,28
2,15 1 81209
No 24 29,9
No Yes Kapel&Clemmensen 2013;15 Note that Area_Comp 1 is only roughly accurate and based on an estimated projection of the homefield dyke

291
Ruin Data
Ruin_Id RG NO R_Length R_Width R_Area L/W_Index Build_mat/style Wall_Th No_Comp Ar_Comp
1
Ar_Comp 2
Ar_Comp 3
Ar_Comp 4
Ar_Comp 5
Ar_Comp 6
Sunk Ruin_Int Dis_MD Dis_Encl Encl_Fac Encl_Bed Slope DGPS Ref Add
E111_09 E111 12,29 5,24 60,95 2,35 4
No 18 170,4
SE
No Yes Kapel&Clemmensen 2013;15
E111_10 E111 12,95 7,26 79,88 1,78 2 0,85 2 29,02 16,83
No 5 185,8
No Yes Kapel&Clemmensen 2013;15
E111_11 E111 12,73 4,12 45,54 3,09 2 1,05 1 19,21
No 17 94,2
W
No Yes Kapel&Clemmensen 2013;15
E111_12 E111
4,42
0,00
1 1
Yes 14 126,6
No Yes Kapel&Clemmensen 2013;15 Ruin is partially eroded and R_Length cannot be measured
E118_01 E118 6 3,35 19,18 1,79 2 0,6 1 6,89
No 4 14
No Yes Heide&Madsen 2010;12, Krogh&Berglund 1980;162
E118_02 E118 25,8 14,7 313,49 1,76 2
No 1
No Yes Heide&Madsen 2010;12, Krogh&Berglund 1980;162
E118_03 E118 5,1 2,66 13,49 1,92 5 0,5 1 5,97
No 14 75,3
No Yes Heide&Madsen 2010;13, Krogh&Berglund 1980;162
E118_04 E118 5,97 3,23 19,01 1,85 5
No 9 75,2
No Yes Heide&Madsen 2010;13, Krogh&Berglund 1980;162
E118_05 E118 4,77 4,26 19,16 1,12 2
No 14 55,8
No Yes Heide&Madsen 2010;13, Krogh&Berglund 1980;162
E118_06 E118 6,45 4,12 24,34 1,57 2 0,75 1 7,57
Yes 4 62,7
No Yes Heide&Madsen 2010;13, Krogh&Berglund 1980;162
E118_07 E118 7,89 4,68 21,69 1,69 5 0,5 1 14,43
No 18 146,9
SW 3 No Yes Heide&Madsen 2010;14, Krogh&Berglund 1980;163
E119_01 E119 3,8 3,19 12,75 1,19 4 0,9 1 2,9
No 9 118,5
No Yes NMA:Albrethsen 1969, Møller et al. 2007;10
E119_02 E119 9,53 4,22 31,88 2,26 3 0,5 1 26,8
No 18 94,7 128,8 NE 3 No No NMA:Albrethsen 1969, Møller et al. 2007;10
E119_03 E119 12,41 5,56 68,77 2,23 2 1,2 2 14,38 13,68
No 5 65,3
No Yes NMA:Albrethsen 1969, Møller et al. 2007;10
E119_04 E119 8,54 5,16 36,07 1,66 3
No 4 65,1
No Yes NMA:Albrethsen 1969, Møller et al. 2007;10
E119_05 E119 33,1 21 507,74 1,58 2
No 1
No Yes NMA:Albrethsen 1969, Møller et al. 2007;10
E119_06 E119 6,6 3 19,74 2,20 5 0,6 1 8,9
No 4 72,7
No Yes NMA:Albrethsen 1969, Møller et al. 2007;10, ??? 2013
E119_07 E119 4,99 6,33 20,7 0,79 5 0,65 1 14,88
No 18 58,6 118,1 SE 3 No Yes NMA:Albrethsen 1969, Møller et al. 2007;10, ???
2013
E119_08 E119 7,16 5,83 33,8 1,23 2
No 14 9,5
No Yes NMA:Albrethsen 1969, Møller et al. 2007;11
E119_09 E119 13,26 11,04 121,22 1,20 2
No 3 54,8
No Yes NMA:Albrethsen 1969, Møller et al. 2007;11
E119_10 E119 5,9 4,25 24,82 1,39 5 0,5 1 15,14
Yes 9 94,1
No Yes NMA:Albrethsen 1969, Møller et al. 2007;11
E119_11 E119 13,44 5,42 70,44 2,48 2 1,1 2
No 5 89
No Yes NMA:Albrethsen 1969, Møller et al. 2007;11, 2013 ????
E119_12 E119 10,25 5,42 43,89 1,89 2 0,9 1 29,85
No 18 142,5 118,1 S 1 No Yes NMA:Albrethsen 1969, Møller et al. 2007;11
E119_14 E119 2,31 1,94 4,38 1,19 5 0,3 1 2,33
No 14 186,7
No Yes NMA:Albrethsen 1969, Møller et al. 2007;11
E120_01 E120 9,34 5,68 102,35 1,64 4 0,55 1 29,31
No 9 128,3
No Yes NMA:Abrethsen 1969, Møller et al. 2007;12
E120_01a E120 10,68 9,45 63,54 1,13 5 0,75 1 45,13
No 17 132,4
SW 2 No No NMA:Abrethsen 1969, Møller et al. 2007;12 Note that ruin dimensions are only roughly accurate, as they are based on descriptuin and rough
survey sketch only (NMA:Albrethsen 1969)
E120_02 E120 10,47 4,28 33,88 2,45 3 0,8 1 23,7
No 18 157
S 1 No Yes NMA:Abrethsen 1969, Møller et al. 2007;12
E120_03 E120 7,67 5,86 38,43 1,31 2
No 14 140,1
No Yes NMA:Abrethsen 1969, Møller et al. 2007;12
E120_04 E120 30 15 450 2,00 2
No 1
No No NMA:Abrethsen 1969, Møller et al. 2007;12 Note that ruin dimensions are only roughly accurate, as they are based on descriptuin and rough survey sketch only (NMA:Albrethsen 1969)
E120_05 E120 5,57 3,37 14,44 1,65 5
Yes 4 19,2
No Yes NMA:Abrethsen 1969, Møller et al. 2007;12
E120_06 E120 6 4,26 20,43 1,41 5
No 14 39,7
No Yes NMA:Abrethsen 1969, Møller et al. 2007;12
E120_07 E120 9,61 3,99 35,79 2,41 3
No 4 79,3
No Yes NMA:Abrethsen 1969, Møller et al. 2007;12 Note that ruin dimensions are very approximate, because ruin is highly disturbed.
E120_08 E120 9,3 1 10,66 9,30 2 1
No 25 13,8
No Yes NMA:Abrethsen 1969, Møller et al. 2007;12 Disturbed stretch of dike
E125_01 E125 11,2 5,05 52,27 2,22 2 0,85 2 19,65 5,31
No 5 67,5
No Yes Field report under preparation Note that Ar_Comp1 is slightly approximate, because the walls are not entirely preserved
E125_02 E125 22,64 5,16 108,58 4,39 2 1,2 3 21,18 16,58 6,88
No 6 25
No Yes Field report under preparation Note that Ar_Comp1 and Ar_Comp2 are approximate, because the walls are not entirely preserved
E125_03 E125 16,18 8,63 108,06 1,87 2
No 1
No Yes Field report under preparation
E125_04 E125 7,29 5,43 38,36 1,34 5 0,65 1 22,51
No 14 14,2
No Yes Field report under preparation
E125_05 E125 5,23 3,28 16,75 1,59 2 0,8 2 5,84
No 4 20,2
No Yes Field report under preparation
E125_05a E125 2,73 2,24 5,95 1,22 5 0,35 1 4,03
No 17 20 105 SW 1 No Yes Field report under preparation
E125_06 E125 5,7 5,15 27,27 1,11 1 1,25 1 8,62
Yes 14 42,5
No Yes Field report under preparation
E125_09 E125 11,49 4,5 50,41 2,55 2 1 2 13,19 6,32
No 5 105,4
No Yes Field report under preparation
E125_10 E125 3,65 2,1 7,59 1,74 2
Yes 14 9,4
No Yes Field report under preparation
E125_11 E125 5,16 4,88 15,14 1,06 3 0,6 2 7,1 1,14
No 18 127,2 105 SW 1 No Yes Field report under preparation
E125_13 E125 2,26 2,01 4,32 1,12 4 0,5 1 1,59
No 11 428,8
No Yes Field report under preparation Note that ruin could be Inuit
E126_01 E126 18,9 17,1 295,61 1,11 2
No 1
No Yes Field report under preparation
E126_02 E126 7,65 4,26 32,4 1,80 3
No 4 34,2
No Yes Field report under preparation
E126_03 E126 8,36 5,4 44,62 1,55 5
No 4 31,2
No Yes Field report under preparation
E126_04 E126 19 9,97 113,57 1,91 3 0,8 1 85,98
No 18 124,8
SE 3 No Yes Field report under preparation
E126_05 E126 5,67 3,21 18,15 1,77 3 0,8 1 6,9
No 10 313,6
No Yes Field report under preparation
E126_06 E126 12,78 6,21 78,83 2,06 2
No 2 0,5
No Yes Field report under preparation Note that measurements are only very approximate, because the ruin is almost indistinguishable from ruin 01
E126_07 E126 9,5 7 66,5 1,36
No 4
No No Field report under preparation Measurements from discription only (NMA: Nørlund 1921); included because it cannot be any of the registered ruins
E126_08 E126 10,25 5 51,25 2,05
No 4
No No Field report under preparation Measurements from discription only (NMA: Nørlund 1921); included because it cannot be any of the registered ruins
E149_01 E149 14,94 9,71 142,32 1,54 4 1,5 1 76,98
No 12 30,1
No No From description and georeferenced survey plan: Vebæk 1991:25, Fig.24
E149_01a E149 28,8 23,8 192,79 1,21 5 1,6 1 372,2
No 13 23,2
No No From description and georeferenced survey plan: Vebæk 1991:33, Fig.24
E149_02 E149 74 25,1 1587,62 2,95 2
No 1
No No From description and georeferenced survey plan: Vebæk 1991:46, Fig.24
E149_03 E149 25,3 12,9 286,74 1,96 2
No 3 9,5
No No From description and georeferenced survey plan: Vebæk 1991:54, Fig.24
E149_04 E149 12,65 12,43 127,77 1,02 5 1,75 1 55,06
No 16 160,1 4,8
4 No No From description and georeferenced survey plan:
Vebæk 1991:54, Fig.24
E149_05 E149 10,65 5,16 49,01 2,06 5 1,75 1 27,6
No 17 166 4,8 SW 4 No No From description and georeferenced survey plan:

292
Ruin Data
Ruin_Id RG NO R_Length R_Width R_Area L/W_Index Build_mat/style Wall_Th No_Comp Ar_Comp
1
Ar_Comp 2
Ar_Comp 3
Ar_Comp 4
Ar_Comp 5
Ar_Comp 6
Sunk Ruin_Int Dis_MD Dis_Encl Encl_Fac Encl_Bed Slope DGPS Ref Add
Vebæk 1991:54, Fig.24
E149_06 E149 6,04 5,3 31,37 1,14 4 1 1 11,28
No 17 152,9 26,6 SW 1 No No From description and georeferenced survey plan:
Vebæk 1991:54, Fig.24
E149_07 E149 15,48 6,78 116,14 2,28 2 1,3 1 47,61
No 2 139,2
No No From description and georeferenced survey plan: Vebæk 1991:54, Fig.24
E149_08 E149 17,13 5,45 85,15 3,14 2 1,15 1 40,54
No 14 122,8
No No From description and georeferenced survey plan: Vebæk 1991:55, Fig.24
E149_09 E149 25,58 5,91 132,29 4,33 2 1,6 2 37,56 11,88
No 2 47
No No From description and georeferenced survey plan: Vebæk 1991:55, Fig.24
E149_10 E149 11,48 5,14 62,54 2,23
1,3 1 20,09
No 4 61,3
No No From description and georeferenced survey plan: Vebæk 1991:56, Fig.24
Note that Vebæk (191:56) interpreted the ruin as a pen
E149_11 E149 25,2 23,3 349,91 1,08 2
No 3 75,6
No No From description and georeferenced survey plan: Vebæk 1991:56, Fig.24
E149_12 E149 9,54 7,97 69,99 1,20 2
No 14 66
No No From description and georeferenced survey plan: Vebæk 1991:57, Fig.24
E149_13 E149 29,38 5,87 166,2 5,01
No 6 25,5
No No From description and georeferenced survey plan: Vebæk 1991:57, Fig.24
E149_14 E149 9,58 5,7 39,4 1,68 4
1 24,88
No 17 144,2 22,7 SE 4 No No From description and georeferenced survey plan:
Vebæk 1991:57, Fig.24
E149_15 E149 4,77 3,74 15,27 1,28
1 1 4,59
No 19 170 22,7 SE 4 No No From description and georeferenced survey plan:
Vebæk 1991:57, Fig.24
E149_16 E149 12,62 6,08 77,18 2,08 5 1,2 1 33
No 4 121,7
No No From description and georeferenced survey plan: Vebæk 1991:57, Fig.24
E149_17 E149 9,18 8,99 78,75 1,02
No 14 114,8
No No From description and georeferenced survey plan: Vebæk 1991:57, Fig.24
E149_18 E149 6,68 3,66 23,92 1,83 3 1 1 4,5
No 4 186,5
No Yes Vebæk 1991:57, Fig.24, Field report under preparation
E149_19 E149 7,96 4,99 35,29 1,60 3 1,15 1 17,16
Yes 4 280
No Yes Vebæk 1991:57, Field report under preparation
E149_20 E149 3,77 2,71 9,24 1,39 3 0,5 2 4,72 1
No 19 331,5 9,4 E 3 No Yes Vebæk 1991:57, Field report under preparation
E149_21 E149 11,95 8,19 77,7 1,46 4 0,9 4 23,56 18,26 3,96 2,84
No 18 334,5 9,4 SE 3 No Yes Vebæk 1991:57, Field report under preparation
E149_22 E149 848,8 1 461 848,80 5 1 1 49870
No
No Yes Vebæk 1991:57, Field report under preparation
E150_01 E150 6,75 5,35 37,27 1,26 3 0,9 1 7,14
No 14
No Yes NMA: Bak 1969, Field report under preparation
E150_02 E150 3,32 2,51 8,29 1,32 5 0,6 1 4,52
No 14
No Yes NMA: Bak 1969, Field report under preparation
E150_03 E150 11,61 4,73 58,49 2,45 2 1 2 8,67 5,92
No 5
No Yes NMA: Bak 1969, Field report under preparation
E150_05 E150 4,71
No 27
No Yes NMA: Bak 1969, Field report under preparation Short stretch of possible damn
E150_06 E150 6,73 3,46 22,59 1,95 2 0,8 1 9,47
No 4
No Yes NMA: Bak 1969, Field report under preparation
E150_07 E150 8,61 3,67 28,4 2,35 2 0,95 2 7,35 2,63
No 5
No Yes NMA: Bak 1969, Field report under preparation
E150_08 E150 15,88 11,33 177,08 1,40 4 0,9 1 129,04
No 15
2 No Yes NMA: Bak 1969, Field report under preparation
E164_01 E164 19,2 10,72 159,19 1,79 2
No 1
No Yes NMA:Vebæk 1948;7, 8, Kapel et al. 2004;41, Møller&Madsen 2007;23
E164_02 E164 13,77 7,39 75,88 1,86 2 1,1 3 14,69 12,71
No 6 8
No Yes NMA:Vebæk 1948;7, 8, Kapel et al. 2004;41, Møller&Madsen 2007;23
A third room is likely present, but cannot be measured. Ar_Comp measurements from Vebæk 1948 description and GoogleEarth© satellite imagery
E164_04 E164 8,12 4,86 36,45 1,67
1,05 1 16,28
No 14 145,9
No Yes NMA:Vebæk 1948;7, 8, Kapel et al. 2004;41, Møller&Madsen 2007;24
Note: Møller&Madsen 2007 ruin 17. Ruin measurements partly from GoogleEarth© satellite imagery
E164_05 E164 9,49 5,02 45,59 1,89
Yes 14 120,4
No Yes NMA:Vebæk 1948;7, 8, Kapel et al. 2004;41, Møller&Madsen 2007;24
Note: Møller&Madsen 2007 ruin 15. Ruin measurements partly from GoogleEarth© satellite imagery
E164_06 E164 9,74 6,19 52,11 1,57
No 14 56,9
No Yes NMA:Vebæk 1948;7, 8, Kapel et al. 2004;42, Møller&Madsen 2007;23
Note: Kapel et al. 2004 ruin 8 , Møller&Madsen 2007 ruin 8
E164_07 E164 12,17 4,17 50,31 2,92 3 0,9 2 11,76 10,65
No 5 84,5
No Yes NMA:Vebæk 1948;7, 8, Kapel et al. 2004;43, Møller&Madsen 2007;23
Note: Kapel et al. 2004 ruin 12 , Møller&Madsen 2007 ruin 6
E164_07a E164 5,56 2,35 15,51 2,37 5 0,45 1 9,46
No 17 85,1 153,5 S 1 No Yes NMA:Vebæk 1948;7, 8, Kapel et al. 2004;43,
Møller&Madsen 2007;23
Note: Kapel et al. 2004 ruin 12 , Møller&Madsen 2007 ruin 6. Note that ruin is built against ruin 164_07
E164_08 E164 5,8 3,37 19,2 1,72 4 0,95 1 6,71
No 9 43,1
No Yes NMA:Vebæk 1948;7, 8, Kapel et al. 2004;42, Møller&Madsen 2007;23
Note: Kapel et al. 2004 ruin 10 , Møller&Madsen 2007 ruin 4.
E164_09 E164 5,02 3,88 19,08 1,29 3 0,55 1 9,03
No 14 23,9
No Yes NMA:Vebæk 1948;7, 8, Kapel et al. 2004;42, Møller&Madsen 2007;24
Note: Møller&Madsen 2007 ruin 3.
E164_10 E164 10 5 53,39 2,00 2 1,1 2 10,84 9,89
No 5 41,4
No No NMA:Vebæk 1948;7, 8 Ruin dimensions and location based on rough survey sketch and description only (NMA:Vebæk 1948;8)
E164_11 E164 2,46 2,41 4,09 1,02 6 0,45 3 3,33
No 20 90,1
No Yes Kapel et al. 2004;42, Møller&Madsen 2007;24 Note: Møller&Madsen 2007 ruin 5.
E164_12 E164 28,63 1,1 64,36 26,03 3 1,1 1 329,51
No 21 188,8 15,1
1 No Yes Møller&Madsen 2007;24
E164_13 E164 10,3 3,73 36,22 2,76 3 0,55 2 9,68 9,59
No 5 230,9
No Yes Kapel et al. 2004;43, Møller&Madsen 2007;25 Note: Møller&Madsen 2007 ruin 21.
E164_14 E164 4,81 3,32 13,94 1,45 3
No 14 232
No Yes Kapel et al. 2004;43, Møller&Madsen 2007;24 Note: Kapel et al. 2004 ruins 14 and 15 have been switched. Møller&Madsen 2007 ruin 19.
E164_15 E164 7,71 4,13 30,77 1,87 2 1,05 1 11,02
No 4 247,2
No Yes Kapel et al. 2004;43, Møller&Madsen 2007;25 Note: Kapel et al. 2004 ruins 14 and 15 have been switched. Møller&Madsen 2007 ruin 22.
E164_16 E164 3,86 2,57 9,47 1,50 2 0,65 1 3,89
Yes 14 156,1
No Yes Møller&Madsen 2007;24
E164_17 E164 7,65 3,77 25,92 2,03 3 0,95 1 10,31
No 4 163,6
No Yes Møller&Madsen 2007;24 Note: Møller&Madsen 2007 ruin 11
E164_18 E164 5,74 4,18 22,45 1,37 3
No 14 136,5
No Yes Møller&Madsen 2007;24
E164_19 E164 10,45 5,72 47,87 1,83 5 1,15 1 26,75
No 18 163,7 15,1 SE 3 No Yes Møller&Madsen 2007;24 Note: Møller&Madsen 2007 ruin 13
E164_20 E164 15,1 4,48 60,1 3,37 3 0,85 3 10,44 9,96 5,86
No 6 136,5
No Yes Møller&Madsen 2007;24 Note: Møller&Madsen 2007 ruin 14
E164_21 E164 5,52 3,09 17,27 1,79 3 0,65 1 5,78
No 4 126,2
No Yes Møller&Madsen 2007;24 Note: Møller&Madsen 2007 ruin 10
E164_22 E164 4,46 3,17 13,21 1,41 3 1 1 3,28
No 4 242,7
No Yes Møller&Madsen 2007;24 Note: Møller&Madsen 2007 ruin 20
E164_23 E164 6,21 4,14 23,09 1,50 2 1,05 1 8,18
No 4 91,3
No Yes Møller&Madsen 2007;23 Note: Møller&Madsen 2007 ruin 7
E164_24 E164 2,97 1,88 4,91 1,58
No 14 245,3
No Yes Møller&Madsen 2007 Ruin DGPS surveyed but not described or photographed
E164_25 E165 7,31 4,5 28,42 1,62 3
No 4 92,7
No Yes Møller&Madsen 2007;23 Note: Møller&Madsen 2007 ruin 9
E165_01 E165 34,5 32,9 839,87 1,05 2
No 1
No Yes NMA:Krogh 1981;ruin A, Møller&Madsen 2007 Note that note description exists; ruin measurements and detail is based solely on DGPS-survey and

293
Ruin Data
Ruin_Id RG NO R_Length R_Width R_Area L/W_Index Build_mat/style Wall_Th No_Comp Ar_Comp
1
Ar_Comp 2
Ar_Comp 3
Ar_Comp 4
Ar_Comp 5
Ar_Comp 6
Sunk Ruin_Int Dis_MD Dis_Encl Encl_Fac Encl_Bed Slope DGPS Ref Add
photograph
E165_02 E165 27,7 125 60,91 0,22 3 1,25 1 447,94
No 21 104,5
1 No Yes NMA:Krogh 1981;ruin B, Møller&Madsen 2007 Note that note description exists; ruin measurements and detail is based solely on DGPS-survey and
photograph
E165_03 E165 5,63 3,32 16,23 1,70 5 0,6 1 7,59
No 4 119,7
No Yes Møller&Madsen 2007 Note that note description exists; ruin measurements and detail is based solely on DGPS-survey and photograph
E165_04 E165 1,93
No 27 225,5
No Yes Møller&Madsen 2007 Note that note description or photograph exist; ruin measurements from DGPS survey only. Ruin is only partially preserved and R_Width cannot be estimated.
E165_05 E165
1,04
0,00
No 27 229,6
No Yes Møller&Madsen 2007 Note that note description or photograph exist; ruin measurements from DGPS survey only. Ruin is only partially preserved and R_length cannot be estimated.
E166_01 E166 45,8 22,9 706,82 2,00 2
No 1
No Yes NMA:Krogh 1981, Møller&Madsen 2007;25 Krogh 1981 ruin C
E166_02 E166 7,57 7,33 54,67 1,03 3
No 14 7,9
No Yes Møller&Madsen 2007;25
E166_03 E166 10,53 5,41 45,54 1,95 4 0,9 2 21,97 1,48
No 18 98,2
SW 1 No Yes NMA:Krogh 1981, Møller&Madsen 2007;25 Krogh 1981 ruin A
E166_04 E166 9 5,31 46,96 1,69 2 0,8 2 10,06 9,7
Yes 5 42,8
No Yes Møller&Madsen 2007;25
E166_05 E166 10,24 3,41 31,46 3,00 3 0,45 4 5,35 4,61 4,35 2,66
No 8 201,7
W 1 No Yes NMA:Krogh 1981, Møller&Madsen 2007;25 Krogh 1981 ruin D
E166_06 E166 5,29
5 0,5 1
No 14 94,8
No Yes Møller&Madsen 2007;25 Ruin is partially eroded by lake and R_Width, R_Area, and Ar_Comp1 cannot be measured
E166_07 E166 2,24 2,22 4,06 1,01 5 0,4 1 2
No 27 248,7
No Yes Møller&Madsen 2007;25 Ruin is partially eroded by lake and measurements are only somewhat accurate
E166_08 E166 6 5 35 1,20
Yes 14 97
No No NMA:Krogh 1981 Krogh 1981 ruin B; ruin observations from summary description and sketch survey plan only
E167_01 E167 41,25 15,08 436,01 2,74 2
No 1
No Yes NMA:Vebæk 1949;13, Vebæk 1993;46pp, Møller&Madsen 2007;26
Note that ruin 2 is here considered part of ruin 1, despite that they where separated during excavation (Vebæk 1993;46)
E167_03 E167 17,73 3,74 67,4 4,74 3 0,6 3 18,29 9,7 7,46
No 6 30,7
No Yes NMA:Vebæk:1948;8, 1950;21, Vebæk 1993;58, Møller&Madsen 2007;26
E167_04 E167 7,79 3,75 28,89 2,08 4 0,8 2 8,74 3,08
No 9 143,3
No Yes NMA:Vebæk:1948;8, Vebæk 1993;58, Møller&Madsen 2007;26
E167_05 E167 4,8 3,34 16,16 1,44 5 0,8 1 5,98
No 9 86
No Yes NMA:Vebæk:1948;8, 1950;21, Vebæk 1993;60, Møller&Madsen 2007;26
Note: NMA:Vebæk 1948;8 ruin 6
E167_06 E167 8,94 8,13 46,3 1,10 3 0,7 1 30,11
No 18 70,3 356,5 SE 3 Yes Yes NMA:Vebæk: 1948;8, 1950;21, Vebæk 1993;69,
Møller&Madsen 2007;69
Note: NMA:Vebæk 1948 ruin 5
E167_07 E167 31,75 18,47 520,8 1,72 2
No 1
No Yes Vebæk 1993;60pp, Møller&Madsen 2007;26
E167_08 E167 6,92 3,55 24,21 1,95 3 0,65 2 7,44 3,26
No 5 5,7
No Yes NMA:Vebæk:1948;8, 1950;21, Vebæk 1993;69, Møller&Madsen 2007;69
E167_09 E167 4,65 4,4 16,14 1,06 2 0,9 1 5,88
No 4 47,9
No Yes NMA:Vebæk: 1950;21, Vebæk 1993;69, Møller&Madsen 2007;69
Measurements after Vebæk:1950;21
E167_10 E167 5,12 3 15,79 1,71 5 1 1 5,06
Yes 4 96,9
No Yes NMA:Vebæk: 1950;21, Vebæk 1993;69, Møller&Madsen 2007;69
E167_11 E167 7,88 3,21 22,79 2,45 4 0,75 1 9,41
No 9 177,1
No Yes NMA:Vebæk: 1950;21, Vebæk 1993;69, Møller&Madsen 2007;69
E167_12 E167 7,36 5,6 32,46 1,31 2 1 1 20,15
No 18 192,5 356,5 NW 1 No Yes NMA:Vebæk: 1950;21, Vebæk 1993;69,
Møller&Madsen 2007;69
E167_13 E167 5,33 4,54 24,5 1,17 5 0,75 1 12,64
No 14 188
No Yes NMA:Vebæk: 1950;21, Vebæk 1993;69, Møller&Madsen 2007;69
E167_14 E167 10,42 3,54 36,89 2,94 2 0,65 1
No 4 37
No Yes NMA:Vebæk 1950;21, Vebæk 1992;69, Møller&Madsen2007;26
E167_15 E167 4,3 3,39 13,85 1,27 3 0,8 1 4,22
No 14 30,2
No Yes NMA:Vebæk 1950;21, Vebæk 1992;69, Møller&Madsen2007;26
E167_16 E167 55,8 2 101,74 27,90 2 2 1 2230,98
No 21 234,7
1 No Yes Madsen 2009;44 Dike cuts off small headland
E168_01 E168 31,35 18,87 484,83 1,66 2
No 1
No Yes NMA: Vebæk 1948;7, Møller&Madsen 2006;23 Note: Vebæk 1948 ruin 2
E168_02 E168 11,13 5,05 50,53 2,20 1
No 14 6,8
No Yes Møller&Madsen 2006;23
E168_03 E168 29,1 19,8 436,05 1,47 2
No 3 25
No Yes NMA: Vebæk 1948;7, Møller&Madsen 2006;23 Note: Vebæk 1948 ruin 1
E168_04 E168 15,64 7,2 92,24 2,17 1 1,5 2 20,84 12,65
No 5 3,8
No Yes Møller&Madsen 2006;23
E168_05 E168 10,36 6,47 38,85 1,60 3 0,55 2 28,74 2,14
No 18 79
SE 3 No Yes Møller&Madsen 2006;23
E168_06 E168 14,54 4,74 63,61 3,07 2 1,25 2 13,46 5,88
No 5 298,1
No Yes Møller&Madsen 2006;23
E168_07 E168 6,08 4,6 28,04 1,32 4 1,1 1 9,02
No 9 360,7
No Yes NMA: Vebæk 1948;7, Møller&Madsen 2006;23 Note: Vebæk 1948 ruin 3
E169_01 E169 23,5 20 339,49 1,18 2
No 1
No Yes NMA:Vebæk:1948:8, NMA:Albrethsen 1971, Møller&Madsen 2006;24
E169_02 E169 24,06 1 28,2 24,06 2 1 2 177,12 7,04
No 21 162 0
1 No Yes Møller&Madsen 2006;24 Stretch of dike bounding small headland
E169_03 E169 16,5 1 16,5 16,50 2 1 1 468,7
No 21 141 0
1
No Yes Møller&Madsen 2006;24 Note that the stated R_Length only includes the DGPS-surveyed (Møller&Madsen 2006;24) part of the ruin; GoogleEarth© satellite imagery shows an additional stretch of dike partially exploiting a natural difference in elevation. Ar_Comp1 reflects the area inside this supposed stretch of dike joining ruin 2's western part
E169_04 E169 7,95 4,36 31,89 1,82 3 0,85 1 16,29
No 4 177,9
No Yes Møller&Madsen 2006;25
E170_01 E170 6,89 3,72 24,92 1,85 4 0,8 2 5,62 3,9
Yes 9 283,3
No Yes Møller&Madsen 2007;26
E170_02 E170 6,04 3,36 20,24 1,80 4 0,65 2 5,94 2,75
No 9 132,3
No Yes Møller&Madsen 2007;26
E170_03 E170 26,6 13,9 282,14 1,91 2
No 1
No Yes Møller&Madsen 2007;26
E170_04 E170 5,77 5,24 22,01 1,10
No 14 46,5
No Yes Møller&Madsen 2007;26 Further description and photograph lacks
E170_05 E170 15,58 9,76 117,6 1,60 2 1,5 3 27,04 5,56
No 3 45,5
No Yes Møller&Madsen 2007;26 The ruin comprises at least 3 compartments, but only two could be clearly dinstiguished on the surface
E170_06 E170 14,3 7,48 95,82 1,91 3 1,05 1 58,15
No 15 331,4
3 No Yes Møller&Madsen 2007;26 Ruin description lacks
E170a_01 E170 15,3 7,3 109 2,10 2 1,5 2 23,33 17,26
No 14 481,9
No Yes Berglund 2001;2, Kapel et al. 2004;13, Møller&Madsen 2007;26
Note ruin has been reinterpreted from Kapel et al. 2004. Dis_MD is distance measured to ruin 3 of ruin group E170 to which ruin group E170a could likely belong
E171_01 E171 12,84 10,15 108,92 1,27 2 1,5 6 1,1 7,9 6,04 4,95 4,7 2,28 No 3 155,9
No Yes NMA:Vebæk 1948;8, Møller&Madsen 2007;26
E171_02 E171 29,1 11,1 265,71 2,62 1
No 2 119,1
No Yes NMA:Vebæk 1948;8, Møller&Madsen 2007;26
E171_03 E171 10,74 8,7 88,99 1,23 1 1,5 3 12,48 9,02 6,69
No 6 44,9
No Yes NMA:Vebæk 1948;8, Møller&Madsen 2007;26
E171_03a E171 5,61 4,48 19,62 1,25 1 0,8 1 12,57
No 17 49,7 55,3 NE 1 No Yes NMA:Vebæk 1948;8, Møller&Madsen 2007;26
E171_04 E171 22,32 6,48 108,54 3,44 3 0,75 1 87
No 18 96,1 55,3 S 3 No Yes NMA:Vebæk 1948;8, Møller&Madsen 2007;26

294
Ruin Data
Ruin_Id RG NO R_Length R_Width R_Area L/W_Index Build_mat/style Wall_Th No_Comp Ar_Comp
1
Ar_Comp 2
Ar_Comp 3
Ar_Comp 4
Ar_Comp 5
Ar_Comp 6
Sunk Ruin_Int Dis_MD Dis_Encl Encl_Fac Encl_Bed Slope DGPS Ref Add
E171_05 E171 13,98 13,25 117,66 1,06 2 1,16 3 23,1 7,91 4,54
No 14 17,9
No Yes NMA:Vebæk 1948;8, Møller&Madsen 2007;27 Note: Møller&Madsen 2006 ruin 7 & 8, here interpreted as one ruin, see report description
E171_06 E171 21,6 15,5 243,78 1,39 2
No 1
No Yes NMA:Vebæk 1948;8, Møller&Madsen 2007;27 Note: Møller&Madsen 2006 ruin 9
E171_07 E171 14 6,58 69,11 2,13 2
No 2 54
No Yes NMA:Vebæk 1948;8, Møller&Madsen 2007;27 Note that ruin dimensions from are from DGPS-survey, photograph, and Vebæk survey description
E171_08 E171 26,02 11 203,2 2,37 1 1,5 4 33,71 22,94 16,78 4,38
No 3 7,9
No Yes NMA:Vebæk 1948;8, Møller&Madsen 2007;27 Note: Møller&Madsen 2006 ruin 10
E171_09 E171 25,46 17,82 350,8 1,43 2
No 1 0
No Yes NMA:Vebæk 1948;8, Møller&Madsen 2007;27
E171_10 E171 7,46 4,37 31,81 1,71 2 0,8 1 16,85
No 4 30,1
No Yes NMA:Vebæk 1948;8, Møller&Madsen 2007;27, Madsen et al. 2012;??
Note: Møller&Madsen 2006 ruin 6
E171_11 E171 6,59 4,14 26,08 1,59 2 0,7 1 13,31
No 4 38,7
No Yes NMA:Vebæk 1948;8, Møller&Madsen 2007;27, Madsen et al. 2012;??
Note: Møller&Madsen 2006 ruin 5
E171_12 E171 7,69 6,91 44,53 1,11 2
Yes 14 51,9
No Yes Møller&Madsen 2007;27
E171_13 E171 11,21 5,35 51,75 2,10 2 1,2 2 10,07 7,92
Yes 5 67
No Yes Møller&Madsen 2007;27
E171_14 E171 12,87 0,9 11,66 14,30 2 0,9 1 109,93
No 21 174,3 225,1 NW 1 No Yes Møller&Madsen 2007;28 Note: Møller&Madsen 2006 ruin 15
E171_15 E171 4,04 3,58 13,36 1,13 2 0,9 1 4,17
No 19 169,9 0,8
1 No Yes Møller&Madsen 2007;28 Note: Møller&Madsen 2006 ruin 16
E172_01 E172 16,6 5,5 91 3,02 2
No 2 72,9
No Yes NMA:Vebæk 1948, NMA:Albrethsen 1971, Madsen 2009;47
Madsen 2009 ruin 20
E172_03 E172 9,7 9,6 73,76 1,01 5 0,7 1 49,24
No 15 9 166,9
2 No Yes NMA:Vebæk 1948, NMA:Albrethsen 1971, Madsen
2009;47
Madsen 2009 ruin 11
E172_04 E172 38,8 17,1 535,19 2,27 2
No 1
No Yes NMA:Vebæk 1948, NMA:Albrethsen 1971, Møller&Madsen 2005;26
Møller&Madsen 2005 ruin 10
E172_06 E172 25,4 11,4 246,71 2,23 2
No 3 12,1
No Yes NMA:Vebæk 1948, NMA:Albrethsen 1971, Møller&Madsen 2005;25
Møller&Madsen 2005 ruin 08
E172_07 E172 9,1 5,85 38,32 1,56 2 1,25 1 26,17
No 14 112,3
No Yes NMA:Vebæk 1948, NMA:Albrethsen 1971, Møller&Madsen 2005;26
Møller&Madsen 2005 ruin 12
E172_08 E172 20,4 7,1 123,69 2,87 2 1,4 3 13,57 29,64 11,9
No 6 123,4
No Yes NMA:Vebæk 1948, NMA:Albrethsen 1971, Møller&Madsen 2005;26
E172_09 E172 13,37 3,37 32,61 3,97 3 0,75 1 17,3
No 18 142,2
S 1 No Yes NMA:Vebæk 1948, Albrethsen 1971,
E172_10 E172 21,53 6,87 133,9 3,13 2 1,2 2 34,55 13,82
Yes 5 139,5
No Yes NMA: Vebæk 1948, NMA:Albrethsen 1971, Møller&Madsen 2005;25
Møller&Madsen 2005 ruin 05
E172_11 E172 6,77 4,56 25,61 1,48 3 1 1 12,63
No 4 162,6
No Yes NMA: Vebæk 1948, NMA:Albrethsen 1971, Møller&Madsen 2005;25
Møller&Madsen 2005 ruin 06
E172_12 E172 29,46 7,16 198,8 4,11 2 1,4 4 31,72 20,53 17,21 6,18
Yes 6 120,6
No Yes NMA: Vebæk 1948, NMA:Albrethsen 1971, Møller&Madsen 2005;25
Møller&Madsen 2005 ruin 04
E172_13 E172 15,8 6,91 102,2 2,29 2 1,08
No 14 115
No Yes NMA: Vebæk 1948, NMA:Albrethsen 1971, Møller&Madsen 2005;25
Møller&Madsen 2005 ruin 03
E172_14 E172 9,46 4,18 39,2 2,26 2
Yes 4 112,6
No Yes NMA: Vebæk 1948, NMA:Albrethsen 1971, Møller&Madsen 2005;25
Møller&Madsen 2005 ruin 01
E172_15 E172 7,13 3,98 26,03 1,79 5 0,9 1 14,32
No 4 142,8
No Yes NMA: Vebæk 1948, Madsen 2009;47, Madsen 2009 ruin 21
E172_16 E172 11,21 4,75 51,54 2,36 2
No 4 112,7
No Yes NMA: Vebæk 1948, NMA:Albrethsen 1971, Møller&Madsen 2005;25
E172_17 E172 9,12 7,42 54,57 1,23 2 0,55 1 48,77
No 18 255,9 252,8 N 2 No Yes Møller&Madsen 2006;26
E172_18 E172 46,59 0,75 11,88 62,12 3 0,75 1 585,5
No 21 469,9 338,6
3 No Yes Møller&Madsen 2006;26
E172_19 E172 6,45 0,67 4,32 9,63 2 0,6 1 25,38
No 17 122,1 14,6 S 1 No Yes Møller&Madsen 2006;26
E172_20 E172 5,12 2,46 11,41 2,08 5 0,35 1 7,39
No 9 189,2
No Yes Madsen 2009;47 Madsen 2009 ruin 22
E172_21 E172 4,15 3,48 10,38 1,19 3
No 14 136,3
No Yes Møller&Madsen 2006;25 Møller&Madsen 2005 ruin 07
E172_22 E172 8,09 6,09 34,74 1,33 3 0,68 1 31,02
No 18 229,2 162,9 S 3 Yes Yes Møller&Madsen 2006;26 Møller&Madsen 2005 ruin 15
E172_23 E172 5,12 0,4 1,35 12,80 2 0,4
No 25 117,1
No Yes Møller&Madsen 2006;26 Short strech of dike
E173_01 E173 17,1 12,6 190,37 1,36 2
No 1
No Yes NMA:Vebæk 1948;8, Møller&Madsen 2007;29
E173_02 E173 10,16 6,58 58,33 1,54 2
No 14 6,1
No Yes NMA:Vebæk 1948;8, Møller&Madsen 2007;29
E173_03 E173 14,41 6,39 65,05 2,26 2
No 14 17,4
No Yes NMA:Vebæk 1948;8, Møller&Madsen 2007;29
E173_04 E173 12,34 5,23 74,04 2,36 3 1,2 3 12,5 12,3 5,1
No 6 52,2
No Yes NMA:Vebæk 1948;8, Møller&Madsen 2007;29
E173_05 E173 4,66 4,01 17,33 1,16 5 0,9 1 7,43
No 14 33,4
No Yes NMA:Vebæk 1948;8, Møller&Madsen 2007;29 Møller&Madsen 2007 ruin 6
E173_06 E173 4,88 4 19,37 1,22 5 0,6 1 9,96
No 4 27,9
No Yes NMA:Vebæk 1948;8, Møller&Madsen 2007;29 Møller&Madsen 2007 ruin 5
E173_07 E173 4,16 2,7 11,19 1,54 3 0,45 2 2,04 2,02
No 5 139,2
No Yes Møller&Madsen 2007;29
E173_08 E173 4,98 3,25 15,91 1,53 2 0,8 1 5,83
No 4 165,1
No Yes Møller&Madsen 2007;29
E173_09 E173 6,45 6,29 33,81 1,03 3 0,85 1 20,35
No 18 64,3
W 1 No Yes Møller&Madsen 2007;29
E173_10 E173 12,35 3,15 32,23 3,92 6 0,5 1 31,38
No 18 55,5
3 No Yes Møller&Madsen 2007;30
E173_11 E173 0,77 0,68 0,4 1,13 4 0,15
No 27 53,7
No Yes Møller&Madsen 2007;30 Ruin should more likely be interpreted as later Inuit feature
E173_12 E173 5,57 4,43 22,8 1,26 4 0,6 1 12,94
No 9 248,4
No Yes Møller&Madsen 2007;30
E174_01 E174 7,58 4,5 31,99 1,68 4 0,5 1 23,03
No 9 171,6
No Yes NMA:Krogh&Albrethsen 1980;38, Møller&Madsen 2007;29
E174_02 E174 9,22 6,9 55,3 1,34 2 1,45 2 9,21 7,26
No 5 84,4
No Yes NMA:Vebæk 1948;8, NMA:Krogh&Albrethsen 1980;38, Møller&Madsen 2007;29
Vebæk 1948 ruin 3
E174_03 E174 9,37 10,52 75,56 0,89 2 1,5
No 14 9,9
No Yes NMA:Vebæk 1948;8, NMA:Krogh&Albrethsen 1980;38, Møller&Madsen 2007;29
Vebæk 1948 ruin 2, Wall are not well enough preserved to establish Ar_Comp
E174_04 E174 31,17 24,47 632,47 1,27 2
No 1
No Yes NMA:Vebæk 1948;8, NMA:Krogh&Albrethsen 1980;38, Møller&Madsen 2007;29
Vebæk 1948 ruin 1
E174_05 E174 10,5 5,14 45,89 2,04 3 1 1 21,05
No 4 146,3
No Yes NMA:Krogh&Albrethsen 1980;38, Møller&Madsen 2007;29
E174_06 E174 7,71 5,9 38,28 1,31 2 1 1 17,59
Yes 4 144,3
No Yes NMA:Vebæk 1948;8, NMA:Krogh&Albrethsen 1980;38, Møller&Madsen 2007;29
E174_07 E174 7,73 5,68 38,01 1,36 4 1 1 23,12
No 18 208,8
SW 4 No Yes NMA:Krogh&Albrethsen 1980;38, Møller&Madsen
2007;29
E174_08 E174 29,19 1 28,08 29,19 5 1 1 1502,9
No 21 86,2
1 No Yes Krogh&Albrethsen 1980;38, Ar_Comp1 = area of bounded peninsula

295
Ruin Data
Ruin_Id RG NO R_Length R_Width R_Area L/W_Index Build_mat/style Wall_Th No_Comp Ar_Comp
1
Ar_Comp 2
Ar_Comp 3
Ar_Comp 4
Ar_Comp 5
Ar_Comp 6
Sunk Ruin_Int Dis_MD Dis_Encl Encl_Fac Encl_Bed Slope DGPS Ref Add
Møller&MaNMA:Krogh&Albrethsen 1980;38, Møller&Madsen 2007;29
E174_09 E174
4
2612,76
No 23 583,7
No No NMA:Vebæk 1948;8, NMA:Krogh&Albrethsen 1980;38
Note DIS_MD is only rougly accurate. Ruin dimenstions are lacking. Ar_Comp2 = area of islet
E174_10 E174 7,66 4,19 29,3 1,83 2 0,8
No 4 40
No Yes Møller&Madsen 2007;30 Wall are not well enough preserved to establish Ar_Comp
E174_11 E174 10,8 5,75 55,86 1,88 2 1,35 2 11,04 6,31
No 5 58,7
No Yes NMA:Vebæk 1948;8, Møller&Madsen 2007;30 Vebæk 1948 ruin 4
E174_12 E174 8 4 24 2,00
No 4 75
No No NMA:Vebæk 1948;8 Vebæk 1948 ruin 5. Ruin dimensions and location from rough survey sketch and description only
E174_13 E174 13,7
1 18783
No 23 490
No No NMA:Vebæk 1948;8 Ruin dimensions and location from rough survey sketch and description only
E175_01 E175 14,8 6,75 87,61 2,19 1 1,4 3 14,24 11,77 6,07
No 1
No Yes Møller&Madsen 2006;27
E178_01 E178 46,63 32,93 1109,55 1,42 4 1,2 2 1008,19 17,62
No 22 151,5
SW 1 No Yes NMA:Vebæk 1948, NMA:Bak 1968;N178-2, NMA:
Albrethsen 1971, Madsen 2009;52
Bak 1968 ruin 8
E178_01a E178 5,92 3,33 19,52 1,78 4
No 9 161,6
No Yes NMA:Vebæk 1948, NMA: Albrethsen 1971, Madsen 2009;52
Building is too collapsed to estimate Wall_Th
E178_02 E178 7,35 3,69 26,93 1,99 5 0,8 1 11,12
No 4 59
No Yes NMA:Vebæk 1948, NMA:Bak 1968;178-1, NMA: Albrethsen 1971, Madsen 2009;52
Bak 1968 ruin 6
E178_03 E178 8,5 3,96 33,32 2,15 4 1,1 1 12,53
No 9 46
No Yes NMA:Vebæk 1948, NMA:Bak 1968;178-1, NMA: Albrethsen 1971, Madsen 2009;52
Bak 1968 ruin 5
E178_03a E178 5,78 3,79 21,91 1,53 5 0,3 1 14,97
No 17 49,5 26,3 SW 3 No Yes NMA:Vebæk 1948, NMA: Albrethsen 1971, Madsen
2009;52
Note that the dike is only partially preserved and measurements only roughly accurate
E178_04 E178 7,84 4,56 34,41 1,72 5 0,8 1 17,33
No 4 48,6
No Yes NMA:Vebæk 1948, NMA: Albrethsen 1971, Madsen 2009;53
E178_04a E178 7,68 3,65 23,14 2,10 5 0,35 1 18,55
No 17 48,8 26,3 SW 3 No Yes NMA:Vebæk 1948, NMA: Albrethsen 1971, Madsen
2009;53
E178_05 E178 46,98 22,95 737,25 2,05 2
No 1
No Yes NMA:Vebæk 1948, NMA:Bak 1968;178-1, NMA: Albrethsen 1971, Madsen 2009;53
Bak 1968 ruin 4, Ruin 01 undoubtedly consists of several buildings, including also the byre; however, the ruin is so collapsed as to make any further partition impossible
E178_06 E178 14,93 5,71 78,01 2,61 5 1,35 2 20,51 10,36
No 5 9,6
No Yes NMA:Vebæk 1948, NMA: Albrethsen 1971, Madsen 2009;53
Note that ruin dimension are very approximate, because of the ruins poor state of preservation
E178_08 E178 7,3 3,53 22,94 2,07 2
No 4 181,3
No Yes NMA:Vebæk 1948, NMA: Albrethsen 1971, Madsen 2009;54
E178_09 E178 7,82 3,33 21,94 2,35 2
No 4 130,6
No Yes NMA:Vebæk 1948, NMA: Albrethsen 1971, Madsen 2009;54
Feature could be Inuit
E178_10 E178 58,9
5
No 24 226,8
No Yes NMA Vebæk 1948, NMA: Albrethsen 1971, Madsen 2009;54
Ruin dimensions and placement from rough survey sketch and description only. For enclosed area see ruin 11
E178_11 E178 198 0,5
396,00 5 0,5 1 59740
No 24
No Yes NMA Vebæk 1948, NMA:Bak 1968;N178-2, NMA: Albrethsen 1971, Madsen 2009;54
Bak 1968 ruin 7, Note that Ar_Comp1, i.e. bounded homefield area, is only roughly accurate, because the dike is not wholly preserved
E178_12 E178 3,37 2,67 8,1 1,26 5
No 14 49,3
No Yes NMA: Albrethsen 1971, Madsen 2009;54
E178_13 E178 7,43 4,47 31,94 1,66 3 0,8 1 15,19
No 4 62,6
No Yes NMA:Vebæk 1948, NMA:Bak 1968;N178-1, NMA: Albrethsen 1971, Madsen 2009;54
Bak 1968 ruin 3, Ruin is likely Vebæk's (NMA: Vebæk 1948) ruin 7
E178_14 E178 9,01 5,26 37,3 1,71 5 0,35 2 10,1 9,27
No 15 83,5 31
3 No Yes NMA: Albrethsen 1971, Madsen 2009;55 Madsen 2009 ruin 15
E178_15 E178 6,04 2,93 18,07 2,06 2
No 4 92,3
No Yes NMA: Albrethsen 1971, Madsen 2009;55 Madsen 2009 ruin 14
E178_16 E178 3,43 3,52 11,82 0,97 2
No 14 115,5
No Yes NMA: Albrethsen 1971, Madsen 2009;55
E178_17 E178 5,18 2,77 10,09 1,87 5 0,5 1 4,27
No 18 122,2 31
3 No Yes NMA: Albrethsen 1971, Madsen 2009;55 Madsen 2009 ruin 16
E179_01 E179 26,05 13,85 336,76 1,88 2
No 1
No Yes Madsen 2009;56 Note that the ruin likely consists of more than one building
E179_02 E179 3,26 2,39 6,06 1,36 2
No 14 10,2
No Yes Madsen 2009;57
E179_03 E179 4,17 2,37 9,83 1,76 5 0,4 1 5,8
No 14 71,8
No Yes Madsen 2009;57
E18_01 E18 10,86 6,51 67,19 1,67 4 1 2 18,37 12,61
No 9 241,5
No Yes Clemmensen&Kapel 2008;21
E18_02 E18 21,89 8,65 177,43 2,53 2 1,55 3 38,64 26,19 26,06
No 2 203,4
No Yes Clemmensen&Kapel 2008;21
E18_03 E18 5,66 3,94 21,34 1,44 4 0,75 1 9,63
No 9 127
No Yes Clemmensen&Kapel 2008;21
E18_04 E18 28,25 7,01 187,72 4,03 2 1,8 4 26,88 23,39 21,95 9,62
Yes 2 15,1
No Yes Clemmensen&Kapel 2008;22
E18_05 E18 44,1 28,2 1097,58 1,56 2
No 1
No Yes Clemmensen&Kapel 2008;22
E18_06 E18 18,21 11,89 190,42 1,53 3
No 12 6,6
No Yes Clemmensen&Kapel 2008;23
E18_06a E18 32,46 26,65 662,95 1,22 5
No 13 1
No Yes Clemmensen&Kapel 2008;23
E18_07 E18 11,48 5,89 65,33 1,95 3 0,85 1 37,17
No 4 48,7
No Yes Clemmensen&Kapel 2008;24 Note that ruin is here interpreted as a stone/turf building based on the photograph in the 2008 report.
E18_08 E18 12,58 5,9 69,42 2,13 2 0,9 2 21,51 13,98
No 5 162,2
No Yes Clemmensen&Kapel 2008;24
E18_09 E18 26,12 5,34 134,81 4,89 2 1,3 4 19,04 16,5 11,76 9,43
Yes 6 165,1
No Yes Clemmensen&Kapel 2008;25
E18_10 E18 11,99 4,49 53,37 2,67 2 0,75 2 15,51 14,2
No 5 132,8
No Yes Clemmensen&Kapel 2008;25
E18_12 E18 9,74 6,15 54,18 1,58 5
No 14 41,8
No Yes Clemmensen&Kapel 2008;26
E18_13 E18 5,4
3 1,05
No 14 89
No Yes Clemmensen&Kapel 2008;26 Ruin is eroded and R_length cannot be determined
E18_14 E18 10,79 5,21 52,88 2,07 3 0,8 1 30,14
No 4 160,1
No Yes Clemmensen&Kapel 2008;26 Note that ruin is here interpreted as a stone/turf building based on the photograph in the 2008 report.
E18_15 E18 0,85 0,82 0,7 1,04 6
No 27 37,5
No Yes Clemmensen&Kapel 2008;26
E18_16 E18 11,07 4,81 48,97 2,30 2
No 4 93,3
No Yes Clemmensen&Kapel 2008;27
E18_17 E18 46,77
5
101000
No 24 280,6
No Yes Clemmensen&Kapel 2008;27 Dyke width not described
E18_18 E18 9,31 3,95 20,91 2,36 5
No 18 69,9
SE 1 No Yes Clemmensen&Kapel 2008;27 Wall_Th not described or surveyed
E180_01 E180 8,98 4,93 42,62 1,82 3 1,35 1 13,16
No 4 18,8
No Yes NMA:Krogh 1968, NMA:Bak 1969;N180-2, Møller&Madsen 2007;30,
Møller&Madsen 2007a ruin 3
E180_02 E180 24,53 14,04 251,27 1,75 2
Yes 1
No Yes NMA:Krogh 1968, NMA:Bak 1969;N180-2, Møller&Madsen 2007;30,
E180_03 E180 8,61 6,03 42,93 1,43 3 1,5 1 9,99
No 4 31,2
No Yes NMA:Krogh 1968, NMA:Bak 1969;N180-2, Møller&Madsen 2007;30,
Møller&Madsen 2007a ruin 1
E180_04 E180 8,57 7,35 52,66 1,17 5 1,1 1 34,54
No 18 156,9
S 1 No Yes NMA:Krogh 1968, NMA:Bak 1969;N180-2,
Møller&Madsen 2007;30, Note that ruin dimensions have been corrected using Bak's sketch survey, because of poor GPS signal during the 2006 survey

296
Ruin Data
Ruin_Id RG NO R_Length R_Width R_Area L/W_Index Build_mat/style Wall_Th No_Comp Ar_Comp
1
Ar_Comp 2
Ar_Comp 3
Ar_Comp 4
Ar_Comp 5
Ar_Comp 6
Sunk Ruin_Int Dis_MD Dis_Encl Encl_Fac Encl_Bed Slope DGPS Ref Add
E181_01 E181 10,76 4,66 41,85 2,31 2
No 4 143,1
No Yes NMA:Bak 1968;N181-1, Gulløv 2000;19, Madsen 2009;59,
E181_02 E181 7,76 4,07 31,23 1,91 3 0,6 1 17,15
No 4 127,6
No Yes NMA:Bak 1968;N181-1, Gulløv 2000;19, Madsen 2009;60,
E181_03 E181 8,95 3,59 31,01 2,49 3 0,75 1 14,43
No 4 92
No Yes NMA:Bak 1968;N181-2, Madsen 2009;60, Note that Wall_Th and ruins dimensions are uncertain, because of reuse of stones by later Thule-culture grave.
E181_08 E181 31,3 26,21 532,72 1,19 2
No 1
No Yes NMA:Vebæk 1950;16, NMA:Bak 1968;N181-3, Gulløv 2000;19, Madsen 2009;60,
E181_09 E181 8,77 7,29 50,43 1,20 2
No 14 13,2
No Yes NMA:Bak 1968;N181-3, Gulløv 2000;19, Madsen 2009;61,
E181_10 E181 9,14 5,4 46,56 1,69 3 0,8 1 23,47
No 4 46,2
No Yes NMA:Bak 1968;N181-3, Gulløv 2000;19, Madsen 2009;61,
Note that Wall_Th and ruins dimensions are somewhat uncertain, because of reuse of stones by later Thule-culture grave.
E181_11 E181 4,47 3,7 27,97 1,21 5 0,8 1 12,08
No 9 114
No Yes NMA:Bak 1968;N181-3, Madsen 2009;61, Note that ruin dimensions are only rouchly accurate, because of poor ruin preservation.
E181_14 E181 10,8 5,68 49,17 1,90 3
No 18 62,8
E 1 No Yes Madsen 2009;62 Note that ruin is here interpreted as enclosure, because the Thule-culture Inuit not costumarily
build winter houses against cliff surfaces
E182_01 E182 6,66 3,89 24,6 1,71 2 1,05 1 7,69
No 4 225,4
No Yes Krogh&Berglund 1980;172, Møller&Madsen 2007;30
E182_02 E182 5,71 5,59 28,31 1,02 2 1,25 2 4,24 3,66
No 14 218,4
No Yes Krogh&Berglund 1980;172, Møller&Madsen 2007;30 Note: Møller&Madsen 2007 ruin 10. Structure can Inuit winterhouse
E182_03 E182 26,57 18,09 304,3 1,47 3 1 3 213,31 18,88 12,04
No 18 137 8,8 SE 3 Yes Yes Krogh&Berglund 1980;172, Møller&Madsen 2007;31
E182_04 E182 4,87 3,73 17,64 1,31 4 0,8 1 6,07
No 9 50,4
No Yes Krogh&Berglund 1980;172, Møller&Madsen 2007;31 Note: Møller&Madsen 2007 ruin 5
E182_04a E182 6,71 5,6 25,93 1,20 5 0,8 1 16,17
No 17 50,4 75,1 NE 3 No Yes Møller&Madsen 2007;31 Note: Møller&Madsen 2007 ruin 5. Possible addition to ruin 04.
E182_05 E182 23,25 19,15 357,46 1,21 2
No 1
No Yes Krogh&Berglund 1980;173, Møller&Madsen 2007;31 Note: Møller&Madsen 2007 ruin 6
E182_06 E182 10 7 70 1,43 3
No 14 30,7
No No Krogh&Berglund 1980;173 Structure has since been removed and given dimensions are only estimate
E182_07 E182 18,84
142,75
2
No 3 98,5
No Yes Krogh&Berglund 1980;173, Møller&Madsen 2007;31, Heide&Madsen 2010;19
Ruin is partly eroded and R_Width is unknown
E182_08 E182 21,34 15,97 261,63 1,34 2
No 3 130,2
No Yes Krogh&Berglund 1980;173, Møller&Madsen 2007;31, Heide&Madsen 2010;19
E182_09 E182 9,18 6,38 51,77 1,44 3
No 14 123,8
No Yes Krogh&Berglund 1980;173, Møller&Madsen 2007;31, Heide&Madsen 2010;19
E182_11 E182 10 7 70 1,43 3
No 14 201,6
No No Krogh&Berglund 1980;174 Ruin dimensiones from description and rough survey plan only
E182_12 E182
No 14
No Yes NMA:Krogh 1987;81 Ruins mentioned, but no survey plan or accurate description provided
E182_13 E182
2
No 14
No Yes NMA:Krogh 1987;81 Ruins mentioned, but no survey plan or accurate description provided
E182_14 E182 24,08 7,61 129,47 3,16 3 1,25 4 58,06 9,2 7,86 2,66
No 18 97,7 8,8 SE 3 No Yes Krogh&Berglund 1980;172, Møller&Madsen 2007;31 Note: Krogh&Berglund 1980 ruin 3, Møller&Madsen ruin 4. Ruin here treated seperately
E182_15 E182 19,13 7,05 124,76 2,71 2
No 14 284,7
No Yes Møller&Madsen 2007;30 Note: Møller&Madsen 2007 ruin 2
E182_16 E182 7,68 3,57 26,45 2,15 2 0,6 2 8,36 4,27
No 5 82
No Yes Heide&Møller 2010;18
E182_17 E182 10,15 7,83 76,1 1,30
No 28 375,6
No No Ruin identified and described from GoogleEarth satellite imagery, but not surveyed
E183_01 E183 27,5 17 467,5 1,62 2
No 1
No No NMA:Vebæk 1950;16 Ruin measurements based on rough survey description only
E183_02 E183 12,5 5 62,5 2,50 2
No 5
No No NMA:Vebæk 1950;16 Ruin measurements based on rough survey description only
E183_03 E183 27,5 17 467,5 1,62
No 14
No No NMA:Vebæk 1950;16 Ruin measurements based on rough survey description only
E183_04 E183 12,5 5 62,5 2,50
No 28
No No NMA:Vebæk 1950;16 Ruin measurements based on rough survey description only
E183_05 E183
No 28
No No NMA:Vebæk 1950;16 Ruin measurements based on rough survey description only
E184_01 E184 19 12 228 1,58 2
No 3
No No NMA:Vebæk;1950, NMA:Albrethsen 1971 Note that ruin was not relocated in 2007 and ruin description is based on sketch survey descritption only
E184_02 E184 42,4 34,9 946,06 1,21 2
No 1
No No NMA:Vebæk 1950, NMA:Albrethsen 1971, Møller&Madsen 2007;14
Møller&Madsen 2007 ruin 5
E184_03 E184 20,5 12,1 191,74 1,69 2
No 3 9,5
No Yes NMA:Vebæk 1950, NMA:Albrethsen 1971, Møller&Madsen 2007;14
Møller&Madsen 2007 ruin 4
E184_04 E184 5,29 2,9 14,26 1,82 4 0,95 1 5,39
No 15 55,3 16,4
3 No Yes NMA:Vebæk 1950, NMA:Albrethsen 1971,
Møller&Madsen 2007;14
Møller&Madsen 2007 ruin 7
E184_05 E184 16,74 9,2 122,26 1,82 3 0,9 2 89,02 0,98
No 15 73,4 79,3
3 No Yes NMA:Vebæk 1950, NMA:Albrethsen 1971,
Møller&Madsen 2007;15
Møller&Madsen 2007 ruin 9
E184_06 E184 4,5 3,12 13,25 1,44 3
No 4 73,8
No Yes Møller&Madsen 2007;14
E184_07 E184 4,3 3,1 12,64 1,39 2 0,5 1 7,02
No 4 179
No Yes Møller&Madsen 2007;14 Møller&Madsen 2007 ruin 3
E184_08 E184 3,25 3,06 7,71 1,06 3 0,53 1 4,25
No 19 60,3 1
3 No Yes Møller&Madsen 2007;14
E184_09 E184 3,4 2,7 7,23 1,26 2 0,5 2 2,8 0,67
No 14 185,6
No Yes Møller&Madsen 2007;14 Møller&Madsen 2007 ruin 2
E184_10 E184 7,23 3,15 22,16 2,30 2 0,85 1 8,81
No 4 54,8
No Yes Møller&Madsen 2007;15
E184_11 E184 2,42 1,78 3,64 1,36 2
Yes 14 39
No Yes Møller&Madsen 2007;15
E184_12 E184 17,07 11,63 132,11 1,47 2
No 14 92,5
No Yes Møller&Madsen 2007;15
E184_13 E184 5,26 3,57 18,07 1,47 5 0,5 1 11,3
No 9 189,1
No Yes Møller&Madsen 2007
E184_14 E184 60 1,05 51,87 57,14 2 1,05 3 820,6 320,87 3,41
No 21 290,6 350,4 N 1 No Yes Madsen et al. 2013;
E188_01 E188 19,9 11,9 201,17 1,67 2
No 1
No Yes Heide&Madsen 2010;29
E188_02 E188 3,16 1,99 5,41 1,59 3 0,3 1 1,96
No 19 11,9 11,8
1 No Yes Heide&Madsen 2010;29
E188_03 E188 1,7 1,37 1,94 1,24 3 0,4 1 1,01
No 19 27,2 7,67 SW 1 No Yes Heide&Madsen 2010;29
E188_04 E188 3,74 2,56 8,09 1,46 2 0,5 1 4,93
No 14 33,9
No Yes Heide&Madsen 2010;29 Note that R_Area and Ar_Comp 1 are only rougly accurate, because the ruin is not fully preserved.
E188_05 E188 9,55 4,2 38,52 2,27 4 1 2 11,27 4,33
No 9 27,9
No Yes Heide&Madsen 2010;30
E188_05a E188 12,97 11,57 78,32 1,12 5 0,95 1 58
No 17 23,4 7,67 W 3 No Yes Heide&Madsen 2010;30
E188_06 E188 24,02 10,78 180,78 2,23 2 1,5
No 3 295,7
No Yes Heide&Madsen 2010;30
E188_07 E188 8,06 4,84 32,45 1,67 2 1,2 2 7,15 4,15
No 5 296,6
No Yes Heide&Madsen 2010;31
E188_08 E188 7,78 5,63 34,07 1,38 3 0,8 1 24,78
No 18 314,6 357,6 NW 3 No Yes Heide&Madsen 2010;31
E188_09 E188 3,51 3,39 9,79 1,04 6
1 7,82
No 20 333,6 38,7
No Yes Heide&Madsen 2010;31
E188_10 E188 4,2 3,32 12,63 1,27 3
No 14 59,3
No Yes Heide&Madsen 2010;32
E190_01 E190 26,48 16,24 303,3 1,63 2
No 1
No Yes NMA:Vebæk 1950, NMA:Albrethsen 1971, Madsen 2009;66

297
Ruin Data
Ruin_Id RG NO R_Length R_Width R_Area L/W_Index Build_mat/style Wall_Th No_Comp Ar_Comp
1
Ar_Comp 2
Ar_Comp 3
Ar_Comp 4
Ar_Comp 5
Ar_Comp 6
Sunk Ruin_Int Dis_MD Dis_Encl Encl_Fac Encl_Bed Slope DGPS Ref Add
E190_02 E190 18,25 11,46 180,43 1,59 2
No 3 27,9
No Yes NMA:Vebæk 1950, NMA:Albrethsen 1971, Madsen 2009;66
E190_03 E190 25,18 10,63 223,76 2,37 2
No 2 65,9
No Yes NMA:Vebæk 1950, NMA:Albrethsen 1971, Madsen 2009;66
E190_04 E190 18,04 10,04 149,26 1,80 3 0,8 1 112,61
No 18 115,4 34,8 E 1 No Yes NMA:Vebæk 1950, NMA:Albrethsen 1971, Madsen
2009;66
Enclosure could have a small internal compartment, but this part of the ruins has been disturbed by recent activities
E190_05 E190 8,11 5,86 40,36 1,38 3 0,55 1 30,64
No 18 135,8 34,8 E 1 No Yes NMA:Vebæk 1950, NMA:Albrethsen 1971, Madsen
2009;67
E190_06 E190 8,87 4,23 34,74 2,10 2 1,25 1 15,88
No 4 42,9
No Yes NMA:Albrethsen 1971, Madsen 2009;67
E190_07 E190 3,96 3,2 11,78 1,24 5
No 14 21,1
No Yes Madsen 2009;67 Wall_Th and Ar_Comp1 cannot be estimated, because the ruin is too poorly preserved
E190_08 E190 16,32 13,78 174,35 1,18 2
No 3 40,5
No Yes Madsen 2009;67
E190_09 E190 7,23 6,14 40,85 1,18 2
No 14 130,5
No Yes Madsen 2009;67
E190_10 E190 8,02 7,29 46,89 1,10 4 0,8 2 24,95 1,61
No 18 188,7 177,4 E 3 No Yes Madsen 2009;67
E195_01 E195 21,6 5,8 122,23 3,72 2
No 1
No Yes Field report under preparation
E195_02 E195 7,84 6,04 40,86 1,30 2 1,25 2 8,33 4,82
No 5 20,2
No Yes Field report under preparation
E195_03 E195 3,83 2,75 10,33 1,39 5 0,5 1 4,87
No 9 51
No Yes Field report under preparation
E195_04 E195 7,58 9,54 52,83 0,79 5 1 1 37,61
No 18 83,5 58,6 S 3 No Yes Field report under preparation Note that measurements are only roughly accurate because the walls are not wholly preserved
E195_05 E195 7,68 3,54 24,06 2,17 3 1,1 1 15,74
No 18 54,2 58,6 SW 3 No Yes Field report under preparation
E195_06 E195 6,26 4,38 13,14 1,43 4 0,8 2 2,67 2,46
No 20 190,7 1,3 SE 3 No Yes Field report under preparation
E195_07 E195 4,4 2,41 8,89 1,83 4 0,75 1 4,45
No 20 189,4 1,3 S 2 No Yes Field report under preparation
E196_01 E196 30 11,1 275,62 2,70 2
No 2 34
No Yes Møller&Madsen 2006;27 D_MD is only approximate as the main dwelling was not DGPS surveyed.
E196_02 E196 15,5 11,8 136,78 1,31 2 1,8 2 50,82 14,92
No 14 33,8
No Yes Møller&Madsen 2006;27 D_MD is only approximate as the main dwelling was not DGPS surveyed.
E196_03 E196 8,74 5,49 42,49 1,59 2 1,5 1 13,57
No 14 38,1
No Yes Møller&Madsen 2006;27 D_MD is only approximate as the main dwelling was not DGPS surveyed.
E196_04 E196 21,7 18,2 284,52 1,19 5 1,1 1 232,07
No 22 67,9
1 No Yes Møller&Madsen 2006;27 D_MD is only approximate as the main dwelling was not DGPS surveyed.
E196_05 E196 12,14 4,7 63,3 2,58 2
No 4 13,9
No Yes Møller&Madsen 2006;27 D_MD is only approximate as the main dwelling was not DGPS surveyed.
E196_06 E196 30 25 623,03 1,20 2
No 1
No No NMA:Thorvildsen 1964;14 Note that location and dimensions of dwelling is based on description and photographs.
E196_07 E196
No 28
No No NMA:Thorvildsen 1964;14 No additional description of ruin
E196_08 E196
No 28
No No NMA:Thorvildsen 1964;14 No additional description of ruin
E209_01 E209 20,2 15,3 239,6 1,32 2 1,5
No 1
No Yes NMA:Krogh 1968, Møller&Madsen 2006;28
E209_02 E209 10,1 7,2 66,73 1,40 2 1,2 2 8,04 13,23
Yes 5 8,5
No Yes NMA:Krogh 1968, Møller&Madsen 2006;28
E209_03 E209 9,33 5,2 55,41 1,79 5 1,2 2 9,28 15,12
No 8 41,7
No Yes NMA:Krogh 1968, Møller&Madsen 2006;28
E209_03a E209 7,66 6,29 41,84 1,22 3 0,8 1 37
No 18 67,4
SE 1 No Yes NMA:Krogh 1968, Møller&Madsen 2006;28
E209_03b E209 8,83 4,6 25,36 1,92 4 1 1 22,27
No 18 264,4 10,1 SE 1 No Yes NMA:Krogh 1968, Møller&Madsen 2006;28
E209_04 E209 4,74 2,15 10,48 2,20 5 0,8 1 4,36
No 18 16,7 10,1 SE
No Yes Møller&Madsen 2006;28
E209_05 E209 4,6 3,6 16,06 1,28 4 1,1 1 7,33
No 9 88,5
No Yes Møller&Madsen 2006;28
E209_06 E209 5,55 3,05 15,61 1,82 2 1,2
Yes 4 15,4
No Yes Møller&Madsen 2006;28
E209_07 E209 5,37 3,23 15,76 1,66 2 0,6
No 4 16,9
No Yes Møller&Madsen 2006;28
E209_08 E209 5,45 2,1 10,94 2,60 3 0,7 1 8,12
No 18 25,8 27,8 SE 1 No Yes Møller&Madsen 2006;28
E209_09 E209 21,1 17,7 327,34 1,19 5 0,7 1 283,85
No 15 55,5 27,8
2 Yes Yes Arneborg et al. 2009;43
E209_10 E209 10,12 4,15 23,29 2,44 4 0,4 1 23,29
No 20 86,9 16,8 SE 1 No Yes Arneborg et al. 2009;43
E209_11 E209 24,18 17,01 205,74 1,42 4 0,6 1 205,74
No 18 264,4 218,7 S 2 Yes Yes Arneborg et al. 2009;43
E209_12 E209 6 3 18 2,00
No 14
No No NMA: Krogh 1968 Note ruin measurements are only approximate
E209_16 E209 16,69 0,8 13,11 20,86 4 0,8
No 25 312,9
No Yes Guldager 1999, Madsen 2009 Guldager 1999 R23. Stretch of dike, associated with E209 R17
E209_17 E209 8,16 0,8 6,99 10,20 4 0,8
No 25 329,2
No Yes Madsen 2009 Stretch of dike, associated with E209 R16
E209a_13 E209a 15,9 7,14 94,27 2,23 5 0,75 2 58,1 6,91
No 1
No Yes Guldager 1999, Bolender 2010;46 Guldager 1999 R20. Note that ruin is likely an early phase dwelling
E209a_14 E209a 4,24 4,02 16,45 1,05 3
No 14 3,9
No Yes Guldager 1999, Bolender 2010;46 Guldager 1999 R21. Note that Dis_MD is measured to ruin 13, to which phase the structure is interpreted to belong
E209a_15 E209a 5,98 4,72 25,81 1,27 3
No 14 7,2
No Yes Guldager 1999, Bolender 2010;46 Guldager 1999 R22. Note that Dis_MD is measured to ruin 13, to which phase the structure is interpreted to belong
E210_01 E210 4,01 2,82 9,99 1,42 1 0,7 1 5,38
Yes 14
No Yes NMA:Krogh 1968 Ruin description based on sketch survey and photograph only
E210_02 E210 6,53 3,31 21,93 1,97 2 0,6 1 14,73
No 18
4,97 E 3 No Yes NMA:Krogh 1968, Møller&Madsen 2006;28 Note Møller&Madsen 2006 ruin 1
E210_03 E210 8,88 4,02 34,98 2,21 2
No 4
No Yes Møller&Madsen 2006;29
E210_04 E210 2,74 1,48 3,53 1,85 2 0,5 1 1,73
No 19
4,97 N 3 No Yes Møller&Madsen 2006;29 Note Møller&Madsen 2006 ruin 2
E210_05 E210 10,22 4,8 42,62 2,13 2 1,05 1 18,83
No 4
No Yes Ruin description based on 2006 DGPS survey and photograph only
E210_06 E210 13,76 6,03 81,84 2,28 5 1,2 2 28,1 8,83
No 5
No Yes Ruin description based on 2006 DGPS survey and photograph only
E210_07 E210 5,02 4,31 21,51 1,16 2 0,6 1 11,78
No 14
No Yes Ruin description based on 2006 DGPS survey and photograph only
E237_01 E237
No 28
No No Krogh&Berglund 1980;49 No information on ruin exists
E262_01 E262 22,45 6,84 141,91 3,28 1 1,2 3 39,91 11,7 8,37
Yes 1
No Yes Kapel 1994;22, Madsen et al. 2011 The ruin has an additional, indistinct collapse area in the SE corner, which has been measured as part of the ruin area
E273_01 E273 21,43 11,15 184,52 1,92 2
No 1
No Yes Heide&Madsen 2010;39
E273_02 E273 4,48 3,57 16,06 1,25 4 0,65 1 6,55
No 9 106,2
No Yes Heide&Madsen 2010;39
E273_03 E273 8,73 4,6 30,33 1,90 4 0,5 3 16,68 0,99 0,31
No 18 110,3 40,4 S 3 No Yes Heide&Madsen 2010;39
E273_04 E273 4,76 3,21 15,09 1,48 4 0,7 1
No 9 150,6
No Yes Heide&Madsen 2010;40
E273_05 E273 6,74 4,1 24,34 1,64 4 0,65 1 15,45
No 18 128,5 40,4 S 4 No Yes Heide&Madsen 2010;40
E273_06 E273 7,39 3,95 26,94 1,87 2 1,2 1 8,93
No 4 43,6
No Yes Heide&Madsen 2010;40 Note that Ar_Comp1 is only roughly accurate, because of ruin might have been seperated in two rooms
E273_07 E273 3,9 2,56 10,07 1,52 2 0,5 1 6,57
No 14 79,8
No Yes Heide&Madsen 2010;40
E274_01 E274 5,33 3,18 14,2 1,68 4 0,8 1 8,41
No 18
SE 3 No Yes Heide&Madsen 2010;44
E28_102 E28
No 24 97,3
No No Guldager et al.2002:Fig.105 No details on dyke are recorded

298
Ruin Data
Ruin_Id RG NO R_Length R_Width R_Area L/W_Index Build_mat/style Wall_Th No_Comp Ar_Comp
1
Ar_Comp 2
Ar_Comp 3
Ar_Comp 4
Ar_Comp 5
Ar_Comp 6
Sunk Ruin_Int Dis_MD Dis_Encl Encl_Fac Encl_Bed Slope DGPS Ref Add
E28_46 E28 64 32 2048 2,00 2
No 1
No No Bruun 1895:284p, Nørlund & Stenberger 1934:160, Guldager et al. 2002:Fig.105
Ruin is likely a combined dwelling and byre
E28_47 E28 23,33 17,14 325,53 1,36 2
No 1
No No Nørlund&Stenberger 1934:Fig.59 Measurements based on referenced excavation plan
E28_48 E48 10 8 80 1,25 4
No 9 39,3
No No Nørlund&Stenberger 1934:160, Guldager et al. 2002:Fig.105
Measurements based on rough survey description. Dis_MD is the distance to ruin 47
E28_49 E28 20 5 100 4,00 2
3 23,4 12 9
No 6 181,5
No No Nørlund&Stenberger 1934:160, Guldager et al. 2002:Fig.105
Measurements based on rough survey description. Dis_MD is the distance to ruin 47
E28_50 E28 11 5 55 2,20
1 25,5
No 4 175,8
No No Nørlund&Stenberger 1934:160, Guldager et al. 2002:Fig.105
Measurements based on rough survey description. Dis_MD is the distance to ruin 47
E28_51 E28
4
1
No 9 396
No No Nørlund&Stenberger 1934:160, Guldager et al. 2002:Fig.105
Measurements based on rough survey description. Dis_MD is the distance to ruin 47
E28_52 E28 25 5 125 5,00 3
3
No 8 332,8
No No Nørlund&Stenberger 1934:160, Guldager et al. 2002:Fig.105
Measurements based on rough survey description. Dis_MD is the distance to ruin 47
E28_52a E52 15 5 75 3,00 3
2
No 8 326,6
No No Nørlund&Stenberger 1934:160, Guldager et al. 2002:Fig.105
Measurements based on rough survey description. Dis_MD is the distance to ruin 47
E28_53 E28 16 4 64 4,00 3
2 22 10,8
No 8 339,1
No No Nørlund&Stenberger 1934:160, Guldager et al. 2002:Fig.105
Measurements based on rough survey description. Dis_MD is the distance to ruin 47
E28_54 E28 22 6 132 3,67
2
No 5 72,2
No No Nørlund&Stenberger 1934:160, Guldager et al. 2002:Fig.105
Measurements based on rough survey description. Dis_MD is the distance to ruin 47
E28_55 E28 10 4 40 2,50 4
1 20
No 18 122,5
N 4 No No Nørlund&Stenberger 1934:160, Guldager et al.
2002:Fig.105
Measurements based on rough survey description. Dis_MD is the distance to ruin 47
E28_56 E28
No 18 62,8
No No Nørlund&Stenberger 1934:160, Guldager et al. 2002:Fig.105
Measurements based on rough survey description. Dis_MD is the distance to ruin 47. Ruin could simply be part of infield dyke
E28_57 E28 13 4 52 3,25
2
No 5 147,5
No No Nørlund&Stenberger 1934:161, Guldager et al. 2002:Fig.105
Measurements based on rough survey description. Dis_MD is the distance to ruin 47
E28_58 E28 18 5 90 3,60 3
3 19,5 12,5 7,5
No 6 188,4
No No Nørlund&Stenberger 1934:161, Guldager et al. 2002:Fig.105
Measurements based on rough survey description. Dis_MD is the distance to ruin 47
E29_18 E29 23,38 15,15 309,45 1,54 2
No 1
No No Nørlund&Stenberger 1934:Fig.42 Measurements based on referenced excavation plan
E29_19 E29 26,53 6,64 194,82 4,00 2 1,65 2 41,72 35,29
No 2 40,5
No No Nørlund&Stenberger 1934:89, Fig.56 Measurements based on referenced excavation plan. Note that only the wall proper is included in the measurements, not the outer turf padding
E29_20 E29 9,83 3,2 37,95 3,07 3 0,9 1 12,91
No 4 61,3
No Yes Nørlund&Stenberger 1934:89, Fig.56, Clemmensen&Kapel 2014 (unpubl. Survey-data)
E29_21 E29
1
1 46,2
No 4 53,3
No No Nørlund&Stenberger 1934:159, Guldager et al. 2002:Fig.99
E29_22 E29 10,84 3,94 42,71 2,75 4 0,8 1 27,97
No 9 119,3
No No Holm 1883:Tavle III, Nørlund&Stenberger 1934:159, Guldager et al. 2002:Fig.99
Note ruin measurements based on old survey plan
E29_24 E29 11 3 33 3,67
1 12,5
No 4 128,7
No No Nørlund&Stenberger 1934:159, Guldager et al. 2002:Fig.99
Note that ruin has been removed and measurements are based on rough description
E29_25 E29 16,87 6,31 105,1 2,67 2 1,9 2 19,81 16,78
No 2 65,9
No Yes Nørlund&Stenberger 1934:159, Fig.56, Clemmensen&Kapel 2014 (unpubl. Survey-data)
E29_26 E29 9,02 4,82 44,14 1,87 4 0,85 1 19,11
No 9 155,5
No Yes Nørlund&Stenberger 1934:159, Guldager et al. 2002:Fig.99
E29_27 E29 28,5 17,3 516,1 1,65 4 1,2 1 481,7
No 18 305,4
E 1 No Yes Nørlund&Stenberger 1934:102, Clemmensen&Kapel
2014 (unpubl. Survey-data)
E29_28 E29 36,9 29,1 859 1,27 2 1,3 1 708,2
No 15 202,3
No Yes Nørlund&Stenberger 1934:101p, Guldager et al. 2002:Fig.99
E293_01 E293 13,83 7,27 88,79 1,90 3 0,8 1 70,07
No 18 26,6
SE 2 Yes Yes NMA:Bak 1971;B118-2, Møller&Madsen 2006;29
E293_02 E293 7,88 6,43 40,18 1,23 3 0,55 2 9,2 4,25
No 20 11,5
1 No Yes NMA:Bak 1971;B118-3, Møller&Madsen 2006;29
E293_03 E293 4,08 3,5 9,55 1,17 3 0,55 1 4,14
No 20 3,9
1 No Yes NMA:Bak 1971;B118-3, Møller&Madsen 2006;29
E293_04 E293 16,04 15,03 173,59 1,07 2
No 1
No Yes NMA:Bak 1971;B118-3, Møller&Madsen 2006;29
E294_01 E294 3,5 2 7 1,75 3
1
Yes 14
No No NMA:Bak 1970;B104, Møller&Madsen 2006;29 Ruin measurements from rough survey sketch and description only
E295_01 E295 25,65 1 28,39 25,65 4 1 1 268,83
No 21
2 No Yes NMA:Bak 1970;B105-1, Møller&Madsen 2006;29
E295_02 E295 2
4
No 19
2 No No NMA:Bak 1970;B105-2
E296_01 E296 3,8 2,5 9,3 1,52 5 0,5 1 4,28
No 14
No Yes NMA:Bak 1969;B68-2, Møller&Madsen 2006;30
E296_02 E296 3,02 1,84 5,44 1,64 5 0,45 1 1,88
No 14
No Yes NMA:Bak 1969;B68-2, Møller&Madsen 2006;30 Møller&Madsen 2006 ruin 4
E296_03 E296 1,93 1,46 2,66 1,32 3
No 14
No Yes NMA:Bak 1969;B68-2, Møller&Madsen 2006;30
E296_04 E296 2,93 2,41 6,36 1,22 5 0,55 1 2,26
No 14
No Yes NMA:Bak 1969;B68-2, Møller&Madsen 2006;30 Møller&Madsen 2006 ruin 2
E296_05 E296 3,87 3,12 11,76 1,24 5 0,5 1 6,14
No 14
No Yes NMA:Bak 1969;B68-2, Møller&Madsen 2006;30
E296_06 E296 4,71 2,73 12,33 1,73 5 0,55 1 5,99
No 14
No Yes NMA:Bak 1969;B68-2, Møller&Madsen 2006;30
E296_08 E296 3,94 3,7 14,62 1,06 5 0,6 1 6,35
No 14
No Yes NMA:Bak 1969;B68-2, Møller&Madsen 2006;30
E296_09 E296 3,77 2,78 10,87 1,36 5 0,6 1 5,22
No 14
No Yes NMA:Bak 1969;B68-2, Møller&Madsen 2006;30
E297_01 E297 7,95 5,22 20,16 1,52 3
Yes 14
No Yes NMA:Bak 1969;B67-2, Møller&Madsen 2006;30
E298_01 E298 20 15,7 250,41 1,27 2
Yes 1
No Yes NMA:Bak 1970;B106-2, Møller&Madsen 2006;33
E298_02 E298 5,32 4,6 12,06 1,16 4
2 6,49 5,56
No 18
SE 4 No No NMA:Bak 1970;B106-3 Note that ruins measurements are based on a rough sketch and are only approximate; no wall
thickness is given and the area of the compartments is somewhat less than stated
E299_01 E299 5,59 2,12 11,03 2,64 4 0,5 1 6,23
No 9
4 No Yes NMA:Bak 1969;B103-1, Møller&Madsen 2006;31
E29a_01 E29a 15,02 7,45 119,1 2,02 3 1,45 1 57,78
No 12 22,4
No Yes Nørlund&Stenberger 1934:29p, Clemmensen&Kapel 2014 (unpubl. Survey-data)
E29a_01a E29a 24,98 24,55 609,4 1,02 3 0,95 1 420,5
No 13 12,6
No Yes Nørlund&Stenberger 1934:34p, Clemmensen&Kapel 2014 (unpubl. Survey-data)
E29a_02 E29a 51,18 16,89 717,49 3,03 2
No 1
No No Nørlund&Stenberger 1934:Fig.26 Measurements based on referenced excavation plan
E29a_03 E29a 13,1 4,55 57,81 2,88 4 1 1 28,03
No 9 4,6
No Yes Nørlund&Stenberger 1934:157, Clemmensen&Kapel 2014 (unpubl. Survey-data)
E29a_04 E29a 12,5 4,28 54,13 2,92 3 0,8 1 33,93
No 4 11,4
No Yes Nørlund&Stenberger 1934:157, Clemmensen&Kapel 2014 (unpubl. Survey-data)

299
Ruin Data
Ruin_Id RG NO R_Length R_Width R_Area L/W_Index Build_mat/style Wall_Th No_Comp Ar_Comp
1
Ar_Comp 2
Ar_Comp 3
Ar_Comp 4
Ar_Comp 5
Ar_Comp 6
Sunk Ruin_Int Dis_MD Dis_Encl Encl_Fac Encl_Bed Slope DGPS Ref Add
E29a_05 E29a 51,1 11,8 424,76 4,33 2 1,7 6 34,07 33,4 29,77 18,68 14,86 13,51 No 3 39,1
No Yes Nørlund&Stenberger 1934:83, Fig.49 Measurements based on referenced excavation plan. Note that only the wall proper is included in the measurements, not the outer turf padding
E29a_06 E29a
No 14 28,2
No No Nørlund&Stenberger 1934:157, Guldager et al. 2002:Fig.99
E29a_07 E29a 14,69 7,75 70,75 1,90 2 1,15 2 21,62 17,92
No 5 65,9
No Yes Nørlund&Stenberger 1934:159, Guldager et al. 2002:Fig.99, Clemmensen&Kapel 2014 (unpubl. Survey-data)
E29a_08 E29a 27,56 18,57 394,4 1,48 3 1,1 1 280,5
No 15 37
2
No Yes Nørlund&Stenberger 1934:100p, Guldager et al. 2002:Fig.99, Clemmensen&Kapel 2014 (unpubl. Survey-data)
E29a_09 E29a 12 4 48 3,00 4
1 19
No 9 111,5
No Yes Nørlund&Stenberger 1934:158, Guldager et al. 2002:Fig.99, Clemmensen&Kapel 2014 (unpubl. Survey-data)
E29a_10 E29a 12,19 5,21 63,28 2,34
1,1 1 27,3
No 4 174,9
No Yes Nørlund&Stenberger 1934:158, Guldager et al. 2002:Fig.99, Clemmensen&Kapel 2014 (unpubl. Survey-data)
E29a_11 E29a 9,52 4,49 43,83 2,12
0,8 1 30,39
No 17 182,9
NW 4
No Yes Nørlund&Stenberger 1934:158, Guldager et al. 2002:Fig.99, Clemmensen&Kapel 2014 (unpubl. Survey-data)
E29a_12 E29a 19 6,52 118,9 2,91 2 1,7 2
No 2 279,9
No Yes Nørlund&Stenberger 1934:158, Guldager et al. 2002:Fig.99, Clemmensen&Kapel 2014 (unpubl. Survey-data)
Note that ruin is partially excavated, which has removed part of the ruin, which cannot be measured in the full
E29a_13 E29a 6 4 24 1,50 4
1
No 9 291,2
No Yes Nørlund&Stenberger 1934:158, Guldager et al. 2002:Fig.99, Clemmensen&Kapel 2014 (unpubl. Survey-data)
E29a_14 E29a 15,9 6,92 107,5 2,30 2 1,8 2 18,01 15,17
No 2 328,7
No Yes Nørlund&Stenberger 1934:158, Guldager et al. 2002:Fig.99, Clemmensen&Kapel 2014 (unpubl. Survey-data)
E29a_15 E29a 7,2 3,97 27,92 1,81 4 0,7 1 13,23
No 9 387,9
No Yes Nørlund&Stenberger 1934:158, Guldager et al. 2002:Fig.99, Clemmensen&Kapel 2014 (unpubl. Survey-data)
E29a_16 E29a 12,22 11,19 124,6 1,09 3 0,8 1 93,59
No 15 302,9
S 1
No Yes Nørlund&Stenberger 1934:99p, Guldager et al. 2002:Fig.99, Clemmensen&Kapel 2014 (unpubl. Survey-data)
E29a_17 E29a 18,2 14,05 219,48 1,30 3 0,8 3 105,57 30,23 11,71
No 18 1000
SE 1 No No Nørlund&Stenberger 1934:102p, Fig.68 Measurements based on referenced survey plan. Dis_MD is only approximate
E29a_61 E29a 178,5 1,1 86,35 162,27 2 1,1 1 116800
No 24 84,2
No Yes Nørlund&Stenberger 1934:Plate 1, Guldager et al. 2002:Fig.99, Clemmensen&Kapel 2014 (unpubl. Survey-data)
Area_Comp 1 is a rough estima based on the preserved stretches of infield dyke, isolines, and the stream separating E29a from E29
E3_01 E3 8,2 4,3 32,25 1,91 5 0,65 1 21,92
No 18 130,1 109,9 N 2 No Yes Field report under preparation
E3_02 E3 9,56 8,7 69,22 1,10 4 0,8 2 34,21 1,79
No 15 218 163,6
2 No Yes Field report under preparation Note that ruin has small opening
E3_03 E3 10,37 9,84 89,02 1,05 5 0,8 1 58,08
No 15 43,4
1 No Yes Field report under preparation
E3_04 E3 21,9 8,2 150,95 2,67 2 1,6 5 31,96
No 3 17,5
No Yes Field report under preparation Note that the smaller rooms are very uncertain
E3_05 E3 7,95 4,02 30,59 1,98 5 0,75 2 6,52 3,66
No 4 25,3
No Yes Field report under preparation
E3_06 E3 34,7 22,3 414,51 1,56 2
No 1
No Yes Field report under preparation
E3_07 E3 8,1 4,91 38,85 1,65 5 0,75 1 21,2
No 4 23,2
No Yes Field report under preparation
E3_08 E3 7,08 4,2 28,28 1,69 2 1 1 10,47
Yes 4 20,5
No Yes Field report under preparation
E3_09 E3 6,27 5,02 27,32 1,25 2 0,8 1 11,11
No 14 10,7
No Yes Field report under preparation
E3_10 E3 22,7 14,9 228,38 1,52 2
No 3 71,7
No Yes Field report under preparation
E3_11 E3 8,17 6,2 48,59 1,32 2 0,65 2 18,71 9,43
No 7 125,9
No Yes Field report under preparation
E3_11a E3 16,87 10,5 119,43 1,61 5 0,7 1 94,79
No 17 131 107,3 SW 1 No Yes Field report under preparation
E3_12 E3 16,02 11,69 150,24 1,37 5 0,55 1 111,64
No 18 45 24,8 SW 3 Yes Yes Field report under preparation
E3_13 E3 3,81 3 9,58 1,27 4 0,5 1 6,29
No 9 33,9
No Yes Field report under preparation
E3_14 E3 9,5 3,38 28,84 2,81 2 0,65 2 8,11 6,05
No 5 65,8
No Yes Field report under preparation
E3_15 E3 4,85 2,92 13,84 1,66 5 0,5 1 6,65
No 9 243
No Yes Field report under preparation
E3_16 E3 14,25 5,03 65,55 2,83 3 0,6 4 10,9 8,91 8,52 7,76
No 6 388
No Yes Field report under preparation
E3_17 E3 11,09 6,68 66,58 1,66 5 0,8 1 50,95
No 18 49,8 24,9 S 3 No Yes Field report under preparation
E3_18 E3 9,91 4,12 33,46 2,41 3 0,55 1 24
No 18 206,5 108,7 N 2 No Yes Field report under preparation
E3_19 E3 5,8 2,4 12,8 2,42 4 0,6 1 7,72
No 9 169,9
No Yes Field report under preparation
E3_20 E3 3,34 0,93 2,48 3,59 4 0,4 1 2,07
No 9 180
No Yes Field report under preparation
E3_21 E3 2,77 1,56 2,29 1,78 4 0,3 1 2,15
No 14 24,1
No Yes Field report under preparation
E3_22 E3 5,12 3,46 17,86 1,48 2 0,6 1 8,83
No 14 13,7
No Yes Field report under preparation Note that Ar_Comp1 is only roughly accurate, because S longwall could not be measured
E300_01 E300 7,58 4,57 31 1,66 3 1 2 6,99 5,99
No 5 322,3
No Yes NMA: Bak 1969 (B66), Kapel et al. 2004;9
E301_01 E301 6,04 5,84 24,46 1,03 3 0,85 1 9,46
No 14 32,9
No Yes NMA:Bak 1970;B101-2, Kapel et al. 2004;12, Møller&Madsen 2007;31
E301_02 E301 4,31 2,56 9,78 1,68 5
No 4 6,7
No Yes NMA:Bak 1970;B101-2, Kapel et al. 2004;12, Møller&Madsen 2007;32
E301_03 E301 11,87 11,04 88,54 1,08 5 0,5
No 1
No Yes NMA:Bak 1970;B101-2, Kapel et al. 2004;12, Møller&Madsen 2007;32
Note: Møller&Madsen 2007 ruin 03 and 04 are here interpreted as one ruin (ruin 3)
E301_05 E301 10,35 5,29 21,44 1,96 3 0,55
No 14 2,4
No Yes NMA:Bak 1970;B101-2, Kapel et al. 2004;12, Møller&Madsen 2007;32
Note: Bak 1970 ruin 4-7 are here interpreted as one ruin
E301_08 E301 3,11 1,6 4,52 1,94
0,5 1 2,18
No 19 49,3
SE 3 No Yes NMA:Bak 1970;B101-2, Kapel et al. 2004;12,
Møller&Madsen 2007;32
Note: Ruin measurements are somewhat uncertain as detailed description is lacking
E302_01 E302 3,63 2,08 7,21 1,75 5
1
No 10
No Yes NMA:Bak1969;B11, Kapel et al. 2004;8 Note that ruin measurements assumes the shape first interpreted by Bak and not the possible extention recorded in the 2004 survey
E303_01 E303 22 6,5 143 3,38 2
No 1
No No NMA:Bak 1969;B69-1 Ruin measurements from rough survey sketch and description only
E304_01 E304 14,51 8,46 98,15 1,72 1
Yes 1
No Yes NMA:Bak 1969;B65, Møller&Madsen 2007;32

300
Ruin Data
Ruin_Id RG NO R_Length R_Width R_Area L/W_Index Build_mat/style Wall_Th No_Comp Ar_Comp
1
Ar_Comp 2
Ar_Comp 3
Ar_Comp 4
Ar_Comp 5
Ar_Comp 6
Sunk Ruin_Int Dis_MD Dis_Encl Encl_Fac Encl_Bed Slope DGPS Ref Add
E304_02 E304 4,07 3,49 13,12 1,17 1 0,8 1 4,54
Yes 14 4,4
No Yes NMA:Bak 1969;B65, Møller&Madsen 2007;32
E305_01 E305 13,69 11 97,6 1,24 4 0,8 2 53,34 6,52
No 15 13,6
3 No Yes NMA:Bak 1969;B64-2, Møller&Madsen 2007;32 Note that second compartment is from rough survey sketch and description only
E305_02 E305 4,4 3,25 13,92 1,35 2 1 1 5,34
No 14 7,2
No Yes NMA:Bak 1969;B64-2, Møller&Madsen 2007;32
E305_03 E305 16,32 11,94 164,96 1,37 2
No 1
No Yes NMA:Bak 1969;B64-2, Møller&Madsen 2007;32
E305_04 E305 3,53 2,72 9,51 1,30 2 0,85 1 2,15
No 14 6,9
No Yes NMA:Bak 1969;B64-2, Møller&Madsen 2007;33
E305_05 E305 3,76 3,2 11,84 1,18 2 0,9 1 3,13
Yes 14 9,3
No Yes NMA:Bak 1969;B64-2, Møller&Madsen 2007;33 Ruin could be partially eroded
E305_06 E305 8,81 3,45 29,51 2,55 3 0,6 2 8,63 7,2
No 5 10,4
No Yes NMA:Bak 1969;B64-2, Møller&Madsen 2007;33
E305_07 E305 8,69 5,8 37,66 1,50 2 1 2 8,88 7,36
No 5 15,5
No Yes NMA:Bak 1969;B64-2, Møller&Madsen 2007;33 Note that all state dimensions except R_length&Ar_Comp1 are somewhat uncertain, because the ruin is partially eroded
E308_01 E308 2 1,5 3 1,33 5 0,5 1
No 11
No Yes NMA:Bak 1967;B13-1, Møller&Madsen 2006;33
E309_01 E309 4,5 4,25 19,01 1,06 4 0,95 1 6,4
No 9
No Yes NMA:Bak 1968;B12-1, Møller&Madsen 2006;21
E309_02 E309 5,4 2,7 14,58 2,00
1
No 14
No No NMA:Bak 1968;B12-2 Note that the ruin was not included in the 2006 survey
E309_03 E309 9,55 4,63 39,52 2,06 4 0,4 1 29,17
No 18
NW 3 No Yes NMA:Bak 1968;B12-2, Møller&Madsen 2006;21 Møller&Madsen 2006 ruin 2
E310_01 E310
6
0,00 3
Yes 14
No No NMA:Bak 1968;B9-1 Sketch survey description only
E310_02 E310 3 4 12 0,75 3
No 14
No No NMA:Bak 1968;B9-1
E310_03 E310 10,4 1,1 10,43 9,45 3 1,1 1 186,66
No 21
SW 1 No Yes NMA:Bak 1968;B9-1, Møller&Madsen 2006;34 Møller&Madsen 2006 ruin 1
E310_04 E310 3,68 3,15 11,5 1,17 3 0,75 1 4,42
No 19
W
No Yes NMA:Bak 1968;B9-1, Møller&Madsen 2006;34
E310_05 E310 2,84 2,34 5,85 1,21 6 0,4 1 2,11
No 19
1 No Yes NMA:Bak 1968;B9-1, Møller&Madsen 2006;34
E311_01 E311 6,96
33,09
3 1,5
No 14
No Yes NMA:Bak 1968/69;B76, Møller&Madsen 2007;35 The ruin is partially eroded and its excact dimensions cannot be determined. Note that the indistinct collapse area w of the ruin described in the 2007a survey report is here considered collapse/later disturbance.
E311_01a E311 6,15 0,9 4,34 6,83 3 0,85
No 17
SE
No Yes NMA:Bak 1968/69;B76, Møller&Madsen 2007;35 Møller&Madsen 2007a ruin 3. The ruin is a short stretch of possible dike
E311_02 E311
5,14 14,57 0,00 2 1
No 14
No Yes NMA:Bak 1968/69;B76, Møller&Madsen 2007;35 The ruin is partially eroded and its excact dimensions cannot be determined.
E311_03 E311 10 5,03 43,45 1,99 1 1,5 1 10,9
No 4
No Yes NMA:Bak 1968/69;B76, Møller&Madsen 2007;35 Møller&Madsen 2007a ruin 4.
E311_04 E311
4,78
2 1
No 14
No Yes NMA:Bak 1968/69;B76, Møller&Madsen 2007;35 Møller&Madsen 2007a ruin 5. The ruin is almost completely eroded and its excact dimensions cannot be determined.
E311_05 E311 6,09 3,55 20,72 1,72 1 0,95 1 6,67
No 4
No Yes Møller&Madsen 2007;35 Møller&Madsen 2007a ruin 6.
E311_06 E311 1,2 0,93 4,76 1,29 5 0,3
0,74
No 20
No Yes Møller&Madsen 2007;35 Møller&Madsen 2007a ruin 7. Note that ruin dimensions are only roughly accurate due to poor GPS signal
E312_01 E312 2,5 2 5 1,25 5 0,8 1 1,4
No 14
No Yes NMA:Bak 1967;B15-1, Møller&Madsen 2007;33 Note that ruin dimensions are only roughly accurate, because of poor GPS signal and survey
E312_02 E312 4 3 12 1,33 5 0,7 1
No 14
No No NMA:Bak 1967;B15-1 Ruin measurements based on sketch survey, Bak 1967 ruin 4
E312_05 E312 3,8 1 3,8 3,80 5
1
No 9
No Yes NMA:Bak 1967;B15-1 Ruin measurements based on sketch survey, Bak 1967 ruin 5
E312_06 E312
3
0,00 5
1
No 28
No Yes NMA:Bak 1967;B15-1 Ruin measurements based on sketch survey, Bak 1968 ruin N4
E313_01 E313 6
4
No 14
No No NMA:Bak 1971;B141-2 Ruin is partially eroded, no further description exits
E313_02 E313 16,66 7,21 101,45 2,31 4 1 1 64,25
No 15 6,6
No No NMA:Bak 1971;B141-2 Ruin measurements from Google Earth© satellite imagery and Bak 1971 description
E313_03 E313 1
No 20
No No NMA:Bak 1971;B141-2 Shelter under boulder, likely a lambakró. No further description exits
E313_04 E313 11,38 8,03 67,48 1,42 2
No 1
No No NMA:Bak 1971;B141-2 Ruin measurements from Google Earth© satellite imagery and Bak 1971 description
E313_05 E313 8 4 32 2,00 4 1 1 12
Yes 14
No No NMA:Bak 1971;B141-3 No further description exits
E313_06 E313 4 3 12 1,33 3
No 19
No No NMA:Bak 1971;B141-3 No further description exits
E313_07 E313 4,5 3,5 15,75 1,29 3
No 28
No No NMA:Bak 1971;B141-3 No further description exits
E314_07 E314 11,35 6,03 62,58 1,88 3 1,45 1 25,09
No 14
No Yes NMA:Bak 1967;B8-2, Madsen 2009;71
E315_01 E315 13,59 5,49 74,61 2,48 4 0,75 2
No 15
No No NMA:Petersen 1894;19, Bruun 1895;419 Ruin observations based on rough survey sketch and description only
E322_01 E322 32,4 16,8 354,2 1,93 2
No 1
No Yes NMA:Bak 1966;B7-4, Madsen 2009;73 Note: Bak 1966;B7 & Madsen 2009 ruin 9
E322_02 E322 7,44 3,34 23,81 2,23 5 0,4 2 9,4 4,17
No 5 25
No Yes NMA:Bak 1966;B7-4, Madsen 2009;73 Note: Bak 1966;B7 & Madsen 2009 ruin 10
E322_03 E322 7,43 3,07 22,19 2,42 5 0,4
No 4 69,5
No Yes Madsen 2009;74 Note: Madsen 2009 ruin 15. Poor ruin preservation excludes estimation of other dimensions/partitions
E322_04 E322 7,16 3,46 24,56 2,07 5 0,45 1
No 4 79,9
No Yes NMA:Bak 1966;B7-3, Madsen 2009;72
E322_05 E322 13,4 8,6 91,09 1,56 2
Yes 14 52
No Yes NMA:Bak 1966;B7-3, Madsen 2009;73
E322_06 E322 6,83 3,25 22,07 2,10 5 0,4 1 14,79
No 4 40,9
No Yes NMA:Bak 1966;B7-3, Madsen 2009;73 Note: Bak 1966;B7 & Madsen 2009 ruin 11
E322_07 E322 11,66 8,36 82,03 1,39 3 0,8 1 53,12
No 18 100,1
S 3 No Yes Madsen 2009;74 Note: Madsen 2009 ruin 16
E322a_01 E322a 4,12 2,92 11,88 1,41 5 0,5 1 6,07
No 14
No Yes NMA:Bak 1966;B7, Madsen 2009;75
E322a_02 E322a 4,35 3,2 13,87 1,36 3
No 14
No Yes NMA:Bak 1966;B7, Madsen 2009;75
E322a_03 E322a 5,81 4,69 21,57 1,24 4 0,75 1 10,66
No 16
No Yes NMA:Bak 1966;B7, Madsen 2009;75 Note that the ruin is very collapsed and that stated measurements are only roughly accurate
E323_01 E323 19 5 95 3,80 2
No 1
No No NMA:Bak 1971;B140-2, Krogh&Berlund 1980;45, 192 Ruin description based on rough survey plan and description. Note that ruin 1 has here been seperated in two seperate structures, ruin 1 & 4. Ruin measurements from Krogh&Berlund 1980;193
E323_02 E323 9,5 6 57 1,58 4 0,9 1
No 15
No No NMA:Bak 1971;B140-2, Krogh&Berlund 1980;45, 192 Ruin description based on rough survey plan and description only.
E323_03 E323 3,5 2,5 8,75 1,40 5
1
No 14
No No NMA:Bak 1971;B140-2, Krogh&Berlund 1980;45, 192 Ruin description based on rough survey plan and description only.
E324_01 E324 6,97 3,75 23,75 1,86 5
No 10 106,2
No Yes NMA:Bak 1968:B5-1, Madsen 2009;76 Note that ruin is slightly eroded and R_Width is only roughly accurate
E324_03 E324 8,63 3,87 28,99 2,23 3 0,5 2 13,15 0,9
No 18 27,7
S 3 No Yes NMA:Bak 1968:B5-2, Madsen 2009;77
E324_04 E324 13,33 11,45 101,03 1,16 2
No 1
No Yes NMA:Bak 1968:B5-2, Madsen 2009;77
E324_05 E324 4,77 2,61 12,33 1,83 2 0,75 1 3,28
Yes 14 0,9
No Yes NMA:Bak 1968:B5-2, Madsen 2009;77
E324_07 E324 4,04 4,01 15,97 1,01 2
No 14 9,8
No Yes NMA:Bak 1968:B5-3, Madsen 2009;77
E324_07a E324 3,67 2,04 7,49 1,80 2 0,4
No 17 10,1
SE 1 No Yes Madsen 2009;77 Short stretch of dike or wall
E324_08 E324 6,12 3,9 21,1 1,57 2
No 4 12,6
No Yes NMA:Bak 1968:B5-3, Madsen 2009;77
E324_09 E324 4,06 2,09 7,48 1,94 2 0,6 1 1,93
Yes 14 23,5
No Yes NMA:Bak 1968:B5-3, Madsen 2009;77
E324_10 E324 1,62 1,55 2,33 1,05 3 0,45 1 0,98
Yes 14 104,4
No Yes Madsen 2009;78
E325_01 E325 20,86 15,16 288,11 1,38 2
No 1
No Yes NMA:Bak 1969;B6-2, Madsen 2009;79
E325_02 E325 12,99 7,19 79,87 1,81 2
No 14 17,4
No Yes NMA:Bak 1969;B6-2, Madsen 2009;79

301
Ruin Data
Ruin_Id RG NO R_Length R_Width R_Area L/W_Index Build_mat/style Wall_Th No_Comp Ar_Comp
1
Ar_Comp 2
Ar_Comp 3
Ar_Comp 4
Ar_Comp 5
Ar_Comp 6
Sunk Ruin_Int Dis_MD Dis_Encl Encl_Fac Encl_Bed Slope DGPS Ref Add
E325_03 E325 4,94 3 14,5 1,65 5 0,45 1 8,04
No 14 106,3
No Yes NMA:Bak 1969;B6-2, Madsen 2009;79
E325_04 E325 4,81 3,82 18,25 1,26 5 0,7 1 7,7
No 9 118,5
No Yes NMA:Bak 1969;B6-2, Madsen 2009;79
E325_05 E325 7,46 4,29 22,35 1,74 4 0,8 1 14,03
No 18 167,4 6,5 N 3 No Yes NMA:Bak 1969;B6-2, Madsen 2009;80
E325_06 E325 3 2,12 5,56 1,42 6 0,7 1 2,57
No 19 172,5 6,5 N 2 No Yes NMA:Bak 1969;B6-2, Madsen 2009;80
E326_01 E326 5,28
5 0,35 1
No 14
No Yes NMA:Bak 1967;B4-1, Madsen 2009;81 Ruin is partially eroded and R_Width and Ar_Comp cannot be estimated
E326_02 E326 6,27 3,2 19 1,96 4 0,55 1 12,91
No 18
N 3 No Yes Madsen 2009;81
E327_01 E327 13,91 1 10,36 13,91 4 1
No 25
No Yes Madsen 2009;82 Feature is a single stretch of dike
E328_01 E328 6,9 4,1 32,16 1,68 5 1 1 9,15
No 14
No Yes NMA:Bak 1967;B2-1, Madsen 2009;84
E328_02 E328 5,26 2,8 14,58 1,88 2
No 14
No Yes Madsen 2009;84
E328_03 E328 3,3 2,37 7,34 1,39 2
No 14
No Yes Madsen 2009;84
E329_01 E329 18,4 14,07 193,21 1,31 2
No 1
No Yes NMA:Bak 1968;B1-2, Madsen 2009;86
E329_02 E329 18,09 8,77 143,35 2,06 2
No 2 17,5
No Yes NMA:Bak 1968;B1-2, Madsen 2009;86
E329_03 E329 12,75 9,54 87,94 1,34 4 1,8 2 35,19 4,75
No 16 40,7 24,2
3 No Yes NMA:Bak 1968;B1-2, Madsen 2009;86
E329_04 E329 2,57 1,7 4,03 1,51 6 0,65 1 2,38
No 19 57,7
1 No Yes NMA:Bak 1968;B1-2, Madsen 2009;86
E329_05 E329 5,91 3,89 21,32 1,52 5 0,75 1 9,74
No 4 28,8
No Yes NMA:Bak 1968;B1-2, Madsen 2009;86
E329_06 E329 13,7 7,67 103,17 1,79 3 1,1 3 18,42 7,87 7,63
No 6 52,4
No Yes NMA:Bak 1968;B1-2, Madsen 2009;86
E329_07 E329 7,88 3,72 26,14 2,12 5 0,65 1 12,13
No 18 61,3 24,2 S 1 No Yes Madsen 2009;87
E329_08 E329 3,45 2,61 4,89 1,32 4 0,5 1 3,04
No 19 60,4 10,8 S 1 No Yes Madsen 2009;87
E329_09 E329 3,14 1,75 5,01 1,79 4 1 1 2,05
No 19 64,1 14,4 S 3 No Yes Madsen 2009;87
E329_10 E329 3,66 3,01 8,93 1,22 4
1 8,82
No 20 83 14,3
2 No Yes Madsen 2009;87
E329_11 E329 5,37 4,77 19,15 1,13 5 1 1 8,43
No 18 68,6 5,11 S 3 No Yes Madsen 2009;87
E329_12 E329 5,12 4,38 18,08 1,17 5 1 1 7,62
No 18 72,4 5,11 S 3 No Yes Madsen 2009;87
E330_01 E330 9,7 8,2 64,62 1,18 2
No 1
No Yes NMA: Bak 1968;B3-2, Madsen 2009;88
E330_02 E330 4,53 3,93 17,63 1,15 5 0,5 1 10,41
No 9 37,3
No Yes NMA: Bak 1968;B3-2, Madsen 2009;89
E330_03 E330 3,73 0,77 2,06 4,84 6 0,4 1 1,2
No 20 88,5 8 S 3 No Yes NMA: Bak 1968;B3-2, Madsen 2009;89
E330_04 E330 4,63 2,82 10,17 1,64 4 0,55 1 5,52
No 18 78,9 8 E 3 No Yes NMA: Bak 1968;B3-2, Madsen 2009;89
E330_05 E330 7,19 3,85 25,15 1,87 4 0,8 1 16,27
No 18 74,6 29,6 SE 3 No Yes NMA: Bak 1968;B3-2, Madsen 2009;90
E330_06 E330 4,17 2,05 8,3 2,03 5 0,5 1 3,35
No 9 81,3
No Yes NMA: Bak 1968;B3-2, Madsen 2009;90 Note that Ar_Comp1 is slightly uncertain because the ruin is not wholly preserved
E331_01 E331 18,95 17,33 219,39 1,09 2
No 1
No Yes Møller&Madsen 2007;34
E332_01 E332 8
No 21
No No NMA:Bak 1971;B123 No additional information on ruin. Dike probably forms enclouse with R04
E332_02 E332 6 3 18 2,00 3
2
No 14
No No NMA:Bak 1971;B123 No additional information on ruin
E332_03 E332 2 2 4 1,00
No 20
No No NMA:Bak 1971;B123 No additional information on ruin. It is likely a lambakró to R01&04
E332_04 E332 5
4
No 21
No No NMA:Bak 1971;B123 No additional information on ruin. Dike probably forms enclouse with R01
E333_01 E333 7,61 4,13 28,25 1,84 2 0,8 2 5,86 4,35
No 14
No Yes NMA:Bak 1971;B122-2, Madsen et al. 2013
E333_02 E333 3,5 3,2 9,26 1,09 5 0,75 1 4,15
No 9
No Yes NMA:Bak 1971;B122-2, Madsen et al. 2013
E333_03 E333 8,75 4,44 31,36 1,97 4 0,8 1 15,82
No 18
SE 3 No Yes NMA:Bak 1971;B122-2, Madsen et al. 2013
E334_02 E334 7 4 28 1,75 3
No 4
No No NMA:Bak 1971:B117-2 Ruin observations from rough survey sketch and description only. Note that Møller et al. 2007 ruin 02 was reinterpreted as the foundation of a recent feature
E334_03 E334 2 2 4 1,00 3
No 19
No No NMA:Bak 1971:B117-2 Ruin observations from rough survey sketch and description only. Note that Møller et al. 2007 ruin 03 was reinterpreted as Inuit communal house
E334_04 E334 5 3,5 17,5 1,43 3
No 4
No No NMA:Bak 1971:B117-2 Ruin observations from rough survey sketch and description only. Note that Møller et al. 2007 ruin 04 was reinterpreted as Inuit communal house
E334_04a E334 7 3 29,94 2,33 4
No 15
No Yes NMA:Bak 1971:B117-2 Ruin observations from rough survey sketch and description only. Note that Møller et al. 2007 ruin 04 was reinterpreted as Inuit communal house
E399_01 E399 4 3 12 1,33 3
No 14
No No NMA:Krogh 1981-84;16 Ruin observations from rough survey description only
E399_02 E399 5 5 25 1,00 4
No 18
No No NMA:Krogh 1981-84;16 Ruin observations from rough survey description only
E4_ E4
No 26
No Yes Madsen et al. , field report under preparation
E4_01 E4 12,09 6,42 79,86 1,88 4 1,5 2 27,96 6,11
No 9 78,1
No Yes Madsen et al. , field report under preparation
E4_01a E4 19 37,8 602,16 0,50 5 0,6 2 571,16 10,12
No 22 60,8 6,7 S 1 Yes Yes Madsen et al. , field report under preparation The enclosure is bounded to the north by ruin 1 & 2.
E4_02 E4 11,2 5,27 57,22 2,13 4 1,1 1 31,85
No 9 65
No Yes Madsen et al. , field report under preparation
E4_03 E4 7,2 4,09 29,12 1,76 4 0,75 1 14,35
No 9 22,3
No Yes Madsen et al. , field report under preparation
E4_03a E4 6,11 7,55 36,93 0,81 2 0,6 1 28,12
No 17 16,7 6,5 W 1 No Yes Madsen et al. , field report under preparation
E4_04 E4 37,6 16,5 543,57 2,28 2
No 1
No Yes Madsen et al. , field report under preparation
E4_05 E4 34,74 9,5 297,59 3,66 2 2,4 2 64,47 50,29
No 2 9,7
No Yes Madsen et al. , field report under preparation
E4_06 E4 95,3 71 4716,07 1,34 4 1,35 4 4048,15 246,03 151,57 6,84
No 22 575
E 1 No Yes Madsen et al. , field report under preparation
E4_07 E4 39,26 12,95 430,63 3,03 5 1,1 1 356,57
No 22 643,8
E 1 No Yes Madsen et al. , field report under preparation
E4_08 E4 13,06 7,54 89,41 1,73 2 1,4 2 29,7 10,51
No 5 83,5
No Yes Madsen et al. , field report under preparation
E4_09 E4 4,44 2,26 9,76 1,96 5
No 9 324,2
No Yes Madsen et al. , field report under preparation
E4_10 E4 20,25 4,65 88,62 4,35 2 1,4 3 11,35 10,62 10,02
No 6 217,4
No Yes Madsen et al. , field report under preparation Note that comp 3 is connected with comp 1
E4_11 E4 23,17 14,85 260,67 1,56 5 0,6 2 180,18 9,54
No 15 30,9 6,7 S 1 Yes Yes Madsen et al. , field report under preparation
E4_12 E4 14,52 5,9 79,69 2,46 2 1,35 2 19,86 15,25
No 5 121,6
No Yes Madsen et al. , field report under preparation
E4_13 E4 25,11 6,94 148,67 3,62 2 1,6 3 29,47 23,64 8,06
No 2 106,5
No Yes Madsen et al. , field report under preparation
E4_14 E4 13,22 5,65 71,91 2,34 2 1,2 1 26,99
No 4 138,7
No Yes Madsen et al. , field report under preparation
E4_15 E4 15,47 5 75,98 3,09 1 1,1 2 22,54 8,8
No 5 11,7
No Yes Madsen et al. , field report under preparation
E4_16 E4 9,72 4,44 40,42 2,19 5 0,6 1 26,74
No 18 297,4 310 SW 3 No Yes Madsen et al. , field report under preparation
E4_17 E4 3,03 3,43 9,61 0,88 2 0,6 1 2,84
No 14 12,1
No Yes Madsen et al. , field report under preparation
E4_18 E4 10,51 1,22 13,48 8,61 2 1,2
No 25 0
No Yes Madsen et al. , field report under preparation
E4_19 E4 6,72 6,09 40,92 1,10 2 1,7 1
No 14 134,2
No No Culling et al 1976;50, Madsen et al. 2011 Culling et al 1976 ruin 15, measurements from 1976 report. Dis_Md only roughly accurate

302
Ruin Data
Ruin_Id RG NO R_Length R_Width R_Area L/W_Index Build_mat/style Wall_Th No_Comp Ar_Comp
1
Ar_Comp 2
Ar_Comp 3
Ar_Comp 4
Ar_Comp 5
Ar_Comp 6
Sunk Ruin_Int Dis_MD Dis_Encl Encl_Fac Encl_Bed Slope DGPS Ref Add
E47_01 E47 27,75 15,57 362,02 1,78 4 1,8 4 146,46 32,32 15,06 9,72
No 12 7,3
No No Nørlund 1929:32, Fig.51 Measurements based on referenced excavation plan
E47_01a E47 48,92 36,03 1713,94 1,36 4 1,35 1 1180,88
No 13 0
No No Nørlund 1929:53, Fig.51 Measurements based on referenced excavation plan
E47_02 E47 4,83 4,54 21,58 1,06 4 1 1 6,42
No 14 1,9
No No Nørlund 1929:47, Fig.51 Measurements based on referenced excavation plan
E47_03 E47 8,71 7,54 65,88 1,16 3 1,4 1 26,85
No 14 3,2
No No Nørlund 1929:54, Fig.51 Measurements based on referenced excavation plan
E47_04 E47 8,1 6,93 57,23 1,17 5 1,05 1 28,22
No 14 16,7
No No Nørlund 1929:50, Fig.51 Measurements based on referenced excavation plan
E47_05 E47 13,63 7,98 110,77 1,71 4 1,45
No 9 24,6
No No Nørlund 1929:55, Fig.51 Measurements based on referenced excavation plan
E47_06 E47 7,29 5,25 39,5 1,39 5 1,3 1 12,76
No 9 18,4
No No Nørlund 1929:112, Fig.51 Measurements based on referenced excavation plan
E47_07 E47 6,82 4,72 31,62 1,44 3 0,95 1 13,22
No 14 12,4
No No Nørlund 1929:113, Fig.51 Measurements based on referenced excavation plan
E47_08 E47 52,32 24,09 934,93 2,17 2
No 1
No No Nørlund 1929:77, Fig.42 Measurements based on referenced excavation plan
E47_09 E47 67,4 7,9 498,46 8,53 2 1,95 2 136,31 125,08
No 2 10,8
No No Nørlund 1929:115, Fig.51 Measurements based on referenced excavation plan. Note that only the wall proper is included in the measurements, not the outer turf padding
E47_10 E47 10,9 5,42 60,08 2,01 6 1,5 1 19,62
No 14 19,5
No No Nørlund 1929:114, Fig.51 Measurements based on referenced excavation plan
E47_11 E47 8,71 5,92 52,65 1,47 3 1,3 1 16,55
No 14 33,8
No No Nørlund 1929:111, Fig.51 Measurements based on referenced excavation plan
E47_12 E47 18,84 6,65 125,37 2,83 4 1,75 1 54,99
No 9 46,4
No No Nørlund 1929:114, Fig.51 Measurements based on referenced excavation plan. Note that only the later stone building has been included.
E47_13 E47 13,96 7,11 99,28 1,96 6 1,65 1 39,95
No 14 51,7
No No Nørlund 1929:103, Fig.51
E47_14 E47 44,76 7,18 316,83 6,23 2 1,5 2 88,47 84,21
No 2 38,8
No No Nørlund 1929:115, Fig.51 Measurements based on referenced excavation plan. Note that only the wall proper is included in the measurements, not the outer turf padding
E47_15 E47 2,55 2,44 6,22 1,05 4
No 27 92,6
No No Nørlund 1929:109, Fig.51 Measurements based on referenced excavation plan.
E47_16 E47 20
No 2 136,4
No No Nørlund 1929:118 Ruin width not described
E47_17 E47 28,68 5,93 171,65 4,84 2 1,1 3 42,04 22,76 16,87
No 6 238,1
No No Nørlund 1929:120, Fig.66 Measurements based on referenced excavation plan
E47_18 E47
No 5 229,5
No No Nørlund 1929:120 Ruin dimensions not described
E47_19 E47
5
1 6,21
No 14 362,3
No No Nørlund 1929:132 Only inside ruin dimensions are recorded
E47_20 E47 16,3 5,38 94,01 3,03 4 1,5 1 54,35
No 9 366,4
No No Nørlund 1929:131, Fig.75 Measurements from referenced survey plan
E47_21 E47 10 4,5 45 2,22 5
No 10 517,5
No No Nørlund 1929:132 Wall_Th not described
E47_22 E47
4
1 21,28
No 9 538,2
No No Nørlund 1929:132 Only inside ruin dimensions are recorded
E47_23 E47
No 4 308,4
No No Nørlund 1929:118 Ruin measurements not recorded
E47_24 E47 37,5 6,5 243,75 5,77 2 1,25 2
No 5 331,5
No No Nørlund 1929:118 Ruin measurements based on rough description
E47_25 E47 8 8 200 1,00 4 1,25 1 50,27
No 16 393,3
No No Nørlund 1929:108 Ruin measurements based on rough description
E47_26 E47
No 27
No No Nørlund 1929:127 Likely not ruin, but could be other feature
E47_27 E47 21,15 6,08 130,31 3,48 5 1,65 3 14,26 13,22 11,99
No 6 527,9
No No Nørlund 1929:128, Fig.74 Measurements based on referenced excavation plan
E47_28 E47
No 27
No No Nørlund 1929:127 Likely not ruin, but could be other feature
E47_29 E47
No 27
No No Nørlund 1929:127 Likely not ruin, but could be other feature
E47_30 E47
2
No 4 533
No No Nørlund 1929:127p Ruin measurements not recorded
E47_31 E47
No 15 517,5
No No Nørlund 1929:127p Ruin measurements not recorded
E47_32 E47
No 4 538,2
No No Nørlund 1929:127p Ruin measurements not recorded
E47_33 E47
No 4 567,1
No No Nørlund 1929:127p Ruin measurements not recorded
E47_34 E47 20,13 7,18 139,89 2,80 5 1,35 1 74,2
No 14 600,3
No No Bruun 1895;343, Nørlund 1929:120, NMA:Krogh&Albrethsen 1968
Ruin measurements based on rough description
E47_35 E47 32,91 6,63 221,38 4,96 2 1,35 3 66,76 23,71 21,94
No 6 657,2
No No Nørlund 1929:120, Fig.66 Measurements based on referenced excavation plan
E47_36 E47 14,75 8,44 125,78 1,75 4 1,35 1 67,27
No 9 825,9
No No Nørlund 1929:132, Fig.76 Measurements from referenced survey plan
E47_37 E47
62,5
No 14 212,2
No Yes Nørlund 1929:118
E47_38 E47 22,16 14,33 273,92 1,55 4 1,85 2 106,06 16,84
No 15 124,2
4 No No Nørlund 1929:122p, Fig.70 Measurements from referenced survey plan
E47_39 E47 132,8 48,3 5592,78 2,75 4 1,75 2 4782,24 42,42
No 22 129,4
NE 1 No No Nørlund 1929:123p, Fig.72 Measurements from referenced survey plan
E47_40 E47 116,4 85,7 9157,33 1,36 4 1,9 2 6664,32 1701,96
No 22 196,7
1 No No Nørlund 1929:124p, Fig.72 Measurements from referenced survey plan
E47_41 E47
No 26
No No
E47_42 E47
No 26
No No
E47_43 E47
No 26
No No
E47a_44 E47
No 5
No No Nørlund 1929:122 Ruin measurements not recorded
E47a_45 E47a 19,13 6,51 122,42 2,94 4 1,45 1 50,22
No 9
No No Nørlund 1930:121, Fig.66 Measurements based on referenced excavation plan. Note that the ruin is built together with ruin E47a_45a, which together constitute a type 21 ruin
E47a_45a E47a 19,98 6,01 119,59 3,32 3 1,45 2 32,32 20,68
No 5
No No Nørlund 1930:121, Fig.66 Measurements based on referenced excavation plan. Note that the ruin is built together with ruin E47a_45, which together constitute a type 21 ruin
E48_01 E48 23,78 10,26 224,96 2,32 2 1,8 4 41,77 38,68 16,34 5,64
No 3 15,7
No Yes Bruun 1895;344, NMA:Krogh&Albrethsen 1968, NMA:Krogh 1983, Arneborg 2001, Kapel 2005
E48_02 E48 32,88 16,41 500,62 2,00 2
No 1 0
No Yes Bruun 1895;344, NMA:Krogh&Albrethsen 1968, NMA:Krogh 1983, Arneborg 2001, NMA: Kapel 2005
The room visible in the back (NE) of the ruin is likely a seperate building
E48_03 E48 4,42 4,13 18,24 1,07 3 0,8 1 9,49
No 12 11
No Yes Bruun 1895;344, NMA:Krogh&Albrethsen 1968, NMA:Krogh 1983, 1986, Arneborg 2001, NMA: Kapel 2005
E48_03a E48 16,91 14,83 240,02 1,14 2 1,2 1 168,03
No 13 5
No Yes Bruun 1895;344, NMA:Krogh&Albrethsen 1968, NMA:Krogh 1983, 1986, Arneborg 2001, NMA: Kapel 2005
E48_04 E48 14,64 5,03 69,19 2,91 2 1,2 2 20,04 12,68
No 5 28,9
No Yes Bruun 1895;344, NMA:Krogh&Albrethsen 1968, NMA:Krogh 1983, 1986, Arneborg 2001, NMA: Kapel 2005
E48_05 E48 6,15 4,79 26,23 1,28
0,8 1 11,35
Yes 4 84,5
No Yes Bruun 1895;344, NMA:Krogh&Albrethsen 1968, NMA:Krogh 1983, 1986
E48_06 E48 6 5,5 33 1,09
Yes 4 88,8
No No Bruun 1895;344, NMA:Krogh&Albrethsen 1968, NMA:Krogh 1983, 1986
Ruin measurements based on rough survey sketch and description only
E48_07 E48 9,58 6,69 40,31 1,43 3 0,9
No 18 88,1
SW 3 No Yes Bruun 1895;344, NMA:Krogh&Albrethsen 1968,
NMA:Krogh 1983, 1986

303
Ruin Data
Ruin_Id RG NO R_Length R_Width R_Area L/W_Index Build_mat/style Wall_Th No_Comp Ar_Comp
1
Ar_Comp 2
Ar_Comp 3
Ar_Comp 4
Ar_Comp 5
Ar_Comp 6
Sunk Ruin_Int Dis_MD Dis_Encl Encl_Fac Encl_Bed Slope DGPS Ref Add
E48_08 E48 5,09 4,15 20,99 1,23 2
No 14 347,1
No Yes Bruun 1895;343, NMA:Krogh&Albrethsen 1968 Ruin could be part of a small, independent milking shieling
E48_08a E48 6,09 3,11 19,03 1,96 3 0,65 1 9,58
No 17 350
SE
No Yes Bruun 1895;343, NMA:Krogh&Albrethsen 1968 Ruin could be part of a small, independent milking shieling
E48_09 E48 1,2 0,55 0,66 2,18 4
No 19 262,9 24,19 SW 2 No No Bruun 1895;343, NMA:Krogh&Albrethsen 1968 Ruin measurements based on rough survey sketch and description only
E48_11 E48 12 7 84 1,71 2
No 14 62,1
No No Bruun 1895;343, NMA:Krogh&Albrethsen 1968 Ruin measurements based on rough survey sketch and description only
E48_12 E48 4,14 3,69 14,65 1,12 4 0,6 1 7,6
No 14 332,6
No Yes Field report under preparation Ruin could be part of a small, independent milking shieling
E59_01 E59 6 4 24 1,50 4
No 9 470
No Yes Holm 1883:106, Clemmensen&Kapel 2010:7
E59_02 E59 18,34 4,94 82,05 3,71 3 0,75 2
No 5
No Yes Holm 1883:107, Clemmensen&Kapel 2010:7
E59_03 E59 16,83 6,54 112,07 2,57 4 1,15 1 61,9
No 9 130,7
No Yes Holm 1883:107, Clemmensen&Kapel 2010:8
E59_04 E59 8,98 5,73 51,04 1,57 4 1,2 1 20,3
No 14 56,4
No Yes Holm 1883:107, Clemmensen&Kapel 2010:9
E59_05 E59 10,75 5,58 16,17 1,93 4 0,95 1 31,97
No 9 42,8
No Yes Holm 1883:107, Clemmensen&Kapel 2010:9
E59_06 E59 8,8 5,58 48,75 1,58 3 1,05 1 22,15
No 14 32,1
No Yes Holm 1883:107, Clemmensen&Kapel 2010:10
E59_07 E59 16,38 5,89 93,76 2,78 4 1,25 1 44,16
No 9 196,3
No Yes Holm 1883:107, Clemmensen&Kapel 2010:10
E59_08 E59 22,86 14,39 240,71 1,59 2 1,8
No 3 90,4
No Yes Holm 1883:107, Clemmensen&Kapel 2010:10
E59_09 E59 12,7 5,51 66,89 2,30 3 0,75 1 41,15
No 4 3,6
No Yes Holm 1883:107, Clemmensen&Kapel 2010:11
E59_10 E59 36,63 23,61 529,83 1,55 2
No 1
No Yes Holm 1883:110, Clemmensen&Kapel 2010:11
E59_11 E59 44,34 9,35 391,28 4,74 2 1,6 4
No 3 17,9
No Yes Holm 1883:107, Clemmensen&Kapel 2010:12
E59_12 E59 17,36 5,52 93,53 3,14 3 1,25 3 16,68 13,03 8,26
No 6 81,9
No Yes Holm 1883:110, Clemmensen&Kapel 2010:13
E59_13 E59 10,55 10,06 105,4 1,05 4 1,9 1 45,95
No 15 198,6
1 No Yes Holm 1883:110, Clemmensen&Kapel 2010:13
E59_14 E59 15,44 5,74 75,91 2,69 3 0,75 1 59,96
No 18 119,2
SW 1 No Yes Holm 1883:107, Clemmensen&Kapel 2010:14
E59_15 E59 14,43 6,98 90,96 2,07 5 1,15 1 40,17
No 4 112,4
No Yes Holm 1883:107, Clemmensen&Kapel 2010:14
E59_16 E59 20,21 6,63 123 3,05 2 1,6 2 46,05 17,03
No 2 87,7
No Yes Holm 1883:107, Clemmensen&Kapel 2010:14
E59_17 E59 20,94 7,66 140,8 2,73 1 0,31 1 76,64
No 14 129,8
No Yes Holm 1883:107, Clemmensen&Kapel 2010:15 Note that ruin is considered an early longhouse type dwelling
E59_18 E59 15,6 1,2 16,25 13,00 5 1,2
No 25 179,4
No Yes Holm 1883:107, Clemmensen&Kapel 2010:15
E59_19 E59 17,82 5,88 100,24 3,03 2 1,6 2 39,68 17,8
No 2 184,1
No Yes Holm 1883:107, Clemmensen&Kapel 2010:15
E59_20 E59 11,27 4,29 43,64 2,63 5 0,5 1 35,33
No 18 213,7
S 1 No Yes Holm 1883:107, Clemmensen&Kapel 2010:16
E59_21 E59 61,3 26,9 1408 2,28 5 0,9 2 1359
No 22 123,1
S 1 No Yes Holm 1883:110, Clemmensen&Kapel 2010:16 Note that Ar_Comp 1 is the estimated area between ruin 21 and 39, which are considered part of
the same enclosure
E59_22 E59 7,51 4,08 30,24 1,84 5 0,6 1 16,5
No 4 237,2
No Yes Clemmensen&Kapel 2010:16
E59_23 E59 4,82 4,53 16,64 1,06 1 0,75 1 9,67
No 14 157,4
No Yes Clemmensen&Kapel 2010:17
E59_24 E59 6,66 6,64 41 1,00 1 1,1 1 17,44
No 14 141,1
No Yes Clemmensen&Kapel 2010:17
E59_25 E59 13,82 5,48 74,99 2,52 2 0,9 2 21,4 18,75
No 5 51,1
No Yes Clemmensen&Kapel 2010:17
E59_26 E59 6,72 5,27 34,57 1,28 1 0,95 1 17,07
No 14 57,7
No Yes Clemmensen&Kapel 2010:17
E59_27 E59 12,36 11,56 143,9 1,07 5 1,5 1 74,85
No 15 113,2
1 No Yes Clemmensen&Kapel 2010:17
E59_28 E59 10 6,43 57,08 1,56 5 0,9 2 26,94 2,93
No 18 128,1
1 No Yes Clemmensen&Kapel 2010:18 Ar_Comp 1 and 2 assumes that there was a partition of the small annex
E59_29 E59 7,76 4,62 44,2 1,68 3 0,55 2 23,18 4,44
No 18 91,8
S 1 No Yes Clemmensen&Kapel 2010:18 Ruin is here interpreted as an enclosure
E59_30 E59 10,65 3,66 36,42 2,91 3 0,55 1 25,82
No 18 134,1
NW 4 No Yes Clemmensen&Kapel 2010:18
E59_31 E59 10,87 6,11 57,04 1,78 2 1,1 3 11,82 7,19 6,23
No 6 274,8
No Yes Clemmensen&Kapel 2010:18
E59_32 E59 22,18 6,35 128,1 3,49 1 1 1 74,96
No 14 361,3
No Yes Clemmensen&Kapel 2010:19 Note that ruin could be considered an early longhouse type dwelling
E59_33 E59 11,82 6,25 68,5 1,89 5 1,1 1 36,08
No 4 417,2
No Yes Clemmensen&Kapel 2010:19
E59_34 E59 11,81 6,64 75,37 1,78 2 1,05 1 38,72
No 4 36,5
No Yes Clemmensen&Kapel 2010:19
E59_35 E59 5,92 3,97 21,5 1,49 2 0,65 1 13,03
No 4 90,2
No Yes Clemmensen&Kapel 2010:19
E59_36 E59 5,78 3,97 18,13 1,46 5 0,45 1 14,45
No 18 377
NW 4 No Yes Clemmensen&Kapel 2010:19
E59_37 E59 7,55 4,2 30,16 1,80 5 0,65 1 17,45
No 4 177,7
No Yes Clemmensen&Kapel 2010:20
E59_38 E59 5,37 3,49 17,71 1,54 5 0,85 1 7,5
No 4 187,1
No Yes Clemmensen&Kapel 2010:20
E59_39 E59 27
5
No 22
No Yes Clemmensen&Kapel 2010:20 Ruin is considered part of ruin 21
E59_40 E59 180,6
5
1 169600
No 24 167,9
No Yes Clemmensen&Kapel 2010:21 Area_Comp 1 is the estimate homefield area
E59_41 E59
No 26
No Yes Clemmensen&Kapel 2010:21
E59_42 E59 8,93 4,76 40,52 1,88 1 0,65 1 22,87
No 4 159,9
No Yes Clemmensen&Kapel 2010:22
E59_43 E59 15,63 6,43 89,37 2,43 2 1,05 1 47,44
No 4 8,8
No Yes Clemmensen&Kapel 2010:22
E60_01 E60 16,71 13,23 190,58 1,26 2
No 3 33,2
No Yes NMA;Bruun 1894 II;78p, Bruun 1895;362, Møller&Madsen 2006;8
Møller&Madsen 2006 ruin 4
E60_01a E60 8,75 3,46 27,61 2,53 2 0,8 1 22,65
No 17 47,6 101,2 N 1 No Yes Møller&Madsen 2006;8 Møller&Madsen 2006 ruin 4
E60_02 E60 6,08 2,29 13,92 2,66 2 0,5 2 5,31 5,98
No 8 143,4 101,2 SW 1 No Yes NMA;Bruun 1894 II;78p, Møller&Madsen 2006;7 Møller&Madsen 2006 ruin 3
E60_02a E60 1,4 1,46 1,75 0,96 3 0,4 1 1,5
No 19 140,9 1,63 SW 2 No Yes Møller&Madsen 2006;7 Møller&Madsen 2006 ruin 3
E60_03 E60 40,2 27,8 909,84 1,45 2
No 1
No Yes NMA;Bruun 1894 II;78p, Bruun 1895;362, NMA:Krogh et al. 1968, Møller&Madsen 2006;7
Møller&Madsen 2006 ruin 1
E60_04 E60 3,29 2,68 8,87 1,23 2
No 14 0
No Yes NMA:Bruun 1894 II:78, Krogh et al. 1968, Madsen et al. 2014:
Madsen et al. 2014 ruin 13_1
E60_05 E60 29,6 9,55 252,67 3,10 2 1,2 3 53,65 48,9 46,57
No 6 14,3
No Yes NMA;Bruun 1894 II;78p, Bruun 1895;362, NMA:Krogh et al. 1968, Møller&Madsen 2006;7
Møller&Madsen 2006 ruin 2
E60_06 E60 16 12 153,94 1,33
1
No 16
4 No No NMA;Bruun 1894 II;78p, Bruun 1895;362 No DGPS survey exists, measurements only approximate
E60_07 E60 10 4 40 2,50
No 4
No No NMA:Bruun 1894 II;78, Bruun 1895;362
E60_08 E60 2 2 4 1,00
1
No 19
No No NMA:Bruun 1894 II;78, Bruun 1895;362
E60_09 E60 8,05 5,7 39,94 1,41 4 0,75 1 25,36
No 18 206,3 1,77 NW 3 No Yes NMA:Bruun 1894 II:78, Krogh et al. 1968, Madsen et
al. 2014: Madsen et al. 2014 ruin 13_2
E60_10 E60 4,71 3,12 14,53 1,51 4 0,6 1 7,62
No 9 329,1
No Yes Møller&Madsen 2006;8 Møller&Madsen 2006 ruin 5
E60_11 E60 3,19 3,51 11,17 0,91 4 0,7 1 3,65
No 9 436,5
No Yes Madsen et al. 2014: Madsen et al. 2014 ruin 13_1
E60_12 E60 2,47 2,4 5,79 1,03 5 0,35 1 3,51
No 28 262,2 141,8 SE 2 No Yes Madsen et al. 2014: Madsen et al. 2014 ruin 13_4
E60_13 E60 2,31 1,41 3,25 1,64 5 0,3 1 1,58
No 19 211,9 1,17
2 No Yes Madsen et al. 2014: Madsen et al. 2014 ruin 13_2

304
Ruin Data
Ruin_Id RG NO R_Length R_Width R_Area L/W_Index Build_mat/style Wall_Th No_Comp Ar_Comp
1
Ar_Comp 2
Ar_Comp 3
Ar_Comp 4
Ar_Comp 5
Ar_Comp 6
Sunk Ruin_Int Dis_MD Dis_Encl Encl_Fac Encl_Bed Slope DGPS Ref Add
E61_01 E61 10,71 3,61 34,56 2,97 5 0,65 1 17,75
No 14
No Yes Bruun 1895;363; Møller&Madsen 2006;8
E61_02 E61 6,59 2,66 16,29 2,48 5 0,8 1 7,13
No 14
No Yes Bruun 1895;363; Møller&Madsen 2006;8
E62_01 E62 15,54 10,89 114,62 1,43 5 0,9 3 27,08 24,63 11,23
No 1
No Yes Bruun 1895;363, Møller&Madsen 2006;8 Annex described in Møller&Madsen 2006;8 is interpreted as a seperate room
E62_02 E62
No 14
No No Bruun 1895;363, Møller&Madsen 2006;8 No DGPS survey or skecth of the ruin exists, but it is described by Bruun as being somewhat like ruin 01.
E63_01 E63 7,1 5,07 34,97 1,40 3
No 4 202,1
No Yes Bruun 1895;364, Møller&Madsen 2006;9 Møller&Madsen 2006 ruin 6
E63_01a E63 11,81 6,86 67,59 1,72 4 1 2 46,21 3,87
No 17 202,1 6,1 SE 2 No Yes Bruun 1895;364, Møller&Madsen 2006;9 Møller&Madsen 2006 ruin 7-8
E63_01b E63 13,68 8,91 63,72 1,54 3 1,65 1 48,11
No 17 202,1 0 SE 2 No Yes Bruun 1895;364, Møller&Madsen 2006;9 Møller&Madsen 2006 ruin 9
E63_02 E63 4,27 3,35 14,3 1,27 4
1
No 9 343
No No Bruun 1895;364 No DGPS survey exists, measurements only approximate
E63_03 E63 30 14 355,77 2,14 2 1 4
No 1
No Yes Bruun 1895;364, Krogh et al. 1968*, Møller&Madsen 2006;9
Møller&Madsen 2006 ruin 1. Ruin 1 was surveyed as a single farm mound, but this clearly covered several ruins identified by D. Bruun (1894;364pp), which also showed clearly after his survey plan was georeferenced from satelite imagery. Measurements are only approximate and based on a combination of the new and the Bruun survey.
E63_03a E63 28,27 21,4 528,85 1,32 3 0,9
494,8
No 22 0 217,5
1 No No Bruun 1895;364, Krogh et al. 1968* Ruin observations are based on georeference of old survey plan (Bruun 1894;364) and
measurements are only approximate
E63_04 E63 17,62 5,6 67,41 3,15 2 1,1 3 12,91 12,62 2,38
No 3 8,4
No No Bruun 1895;366 Ruin observations are based on georeference of old survey plan (Bruun 1894;364) and measurements are only approximate
E63_05 E63 10,83 3,66 38,82 2,96 2 1 1 16,46
No 4 2,3
No No Bruun 1895;366 Ruin observations are based on georeference of old survey plan (Bruun 1894;364) and measurements are only approximate
E63_06 E63 8,27 5,19 37,61 1,59 2 1 1 19,65
No 4 15,5
No Yes Bruun 1895;366, Møller&Madsen 2006;9 Møller&Madsen 2006 ruin 2
E63_07 E63 9,74 4,71 46,66 2,07 2 0,93 1 23,31
No 4 90,3
No Yes Bruun 1895;366, Møller&Madsen 2006;9 Møller&Madsen 2006 ruin 11
E63_08 E63 3,6 3,75 12,74 0,96 2 0,9 1 3,55
No 14 2,3
No No Bruun 1895;366 Ruin observations are based on georeferencing of old survey plan (Bruun 1894;364) and measurements are only approximate
E63_09 E63 8,51 0,8 7,66 10,64 5 0,8
No 25 0
No No Bruun 1895;366 Ruin observations are based on georeferencing of old survey plan (Bruun 1894;364) and measurements are only approximate
E63_10 E63 10,9 5,07 54,96 2,15 2 1,04 1 29,95
No 4 204,9
No Yes Møller&Madsen 2006;9 Møller&Madsen 2006 ruin 4
E63_10a E63 12,79 7,72 85,37 1,66 2 1 1 76,62
No 17 204,9 6,1 SE 3 No Yes Møller&Madsen 2006;9 Møller&Madsen 2006 ruin 5
E63_11 E63 25,5 0,8 20,67 31,88 5 1
No 24 137,4
No Yes Møller&Madsen 2006;9 Stretch of homefield dike. Møller&Madsen 2006 ruin 10
E64_01 E64 4,02 2,82 11,32 1,43 4 0,7 1 3,95
No 9 379
No Yes Bruun 1895;367, Krogh 1968, Møller&Madsen 2006;11,
Note. Møller&Madsen 2006 ruin 5
E64_01a E64 4,33 2,19 9,46 1,98 3 0,65 1 4,41
No 17 379 280,3 E 1 No Yes Bruun 1895;367, Krogh 1968, Møller&Madsen
2006;11
Note. Møller&Madsen 2006 ruin 5
E64_02 E64 19,14 6,34 109,62 3,02 2 1,4 2 24 21,01
No 5 80,1
No Yes Bruun 1895;367, Krogh 1968, Møller&Madsen 2006;11
Note. Møller&Madsen 2006 ruin 9
E64_03 E64 38,21 13,03 380,14 2,93 2
No 3 4,1
No Yes Bruun 1895;367, Krogh 1968, Møller&Madsen 2006;11
Note. Møller&Madsen 2006 ruin 7
E64_04 E64 37,24 18,43 561,37 2,02 2
No 1
No Yes Bruun 1895;367, Krogh 1968, Møller&Madsen 2006;11
E64_05 E64 6,48 5,27 32,39 1,23 5 0,55 1 21,71
No 15 119,3 33,2
2 No Yes Bruun 1895;367, Krogh 1968, Møller&Madsen
2006;11
Note. Møller&Madsen 2006 ruin 15
E64_06 E64 7,01 5,61 36,05 1,25 3 0,85 1 17,17
No 12 13,8
No Yes Bruun 1895;367, Krogh 1968, Møller&Madsen 2006;11
E64_06a E64 23,23 20,29 399,32 1,14 5 1 1 303,86
No 13 5,5
No Yes Bruun 1895;367, Krogh 1968, Møller&Madsen 2006;11
Note that ruin measurments are only roughly accurate, because churchyard wall is only partially preserved
E64_07 E64 5,5 1,75 9,63 3,14
No 28
No No Bruun 1895;368 Note: ruin measurements based on rough survey description only
E64_08 E64 10,71 10,72 62,64 1,00 4 0,55 2 27,03 8,53
No 21 183,8 11,8
3 No Yes Bruun 1895;368, Krogh 1968, Møller&Madsen
2006;11
Note. Møller&Madsen 2006 ruin 12
E64_09 E64 21,43 8,96 168,4 2,39 2
No 3 2,8
No Yes Bruun 1895;368, Krogh 1968, Møller&Madsen 2006;10
Note. Møller&Madsen 2006 ruin 13
E64_10 E64 14,78 9,48 132,19 1,56 3
No 14 19,8
No Yes Bruun 1895;368, Krogh 1968, Møller&Madsen 2006;10
Note. Møller&Madsen 2006 ruin 1
E64_11 E64 31,44 22,33 594,78 1,41 4 1,1 2 505,65 12,42
No 18 466,4 345,7 S
No Yes Bruun 1895;368, Krogh 1968, Møller&Madsen 2006;10
Note. Møller&Madsen 2006 ruin 16
E64_12 E64 6,54 3,56 22,34 1,84 5
No 9 106,7
No Yes Bruun 1895;368, Krogh 1968, Møller&Madsen 2006;10
Note. Møller&Madsen 2006 ruin 2
E64_13 E64 3,76 4,35 15,26 0,86 5 0,65 1 10,85
No 18 108,8 33,2 S
No Yes Møller&Madsen 2006;10
E64_14 E64 9,3 5,16 47,87 1,80 3 0,85 2 16,32 9,32
No 5 107,1
No Yes Møller&Madsen 2006;10
E64_15 E64 8,47 3,26 26,07 2,60 2 0,8 1 16,68
No 4 32,6
No Yes Møller&Madsen 2006;10 Note. Møller&Madsen 2006 ruin 8
E64_16 E64 18,24 0,75 2,15 24,32 2 0,7 1 77
No 21 173,6 11,9
3 No Yes Arneborg et al. 2008;44 Arneborg et al. 2008 ruin 12
E64_17 E64 1,93 1,34 2,11 1,44 1 0,25 1 0,89
No 27 35,8
No Yes Møller&Madsen 2007 Note: feature seems more a cut or pit than a structure
E64a_01 E64a 32,85 18,87 419,31 1,74 2
Yes 1
No Yes Vebæk 1943;23, Møller&Madsen 2007;10 Ruin dimensions measured after georeference of Vebæk survey plan (1943;fig.15)
E64a_02 E64a 5,1 3,18 16,48 1,60 3 0,85 1 4,5
No 14 1
No Yes Vebæk 1943;48, Møller&Madsen 2007;10 Ruin dimensions measured after georeference of Vebæk survey plan (1943;fig.15)
E64a_03 E64a 10,33 3,58 37,79 2,89 3 0,8 2 6,17 4,44
No 5 1,5
No Yes Vebæk 1943;48, Møller&Madsen 2007;10 Ruin dimensions measured after georeference of Vebæk survey plan (1943;fig.15)
E64a_04 E64a 8,31 6,11 44,47 1,36 4 0,9 1 30,98
No 18 141,2
SE 2 No Yes NMA:Vebæk 1939, Vebæk 1943;50, Møller&Madsen
2007;10
Ruin dimensions measured after georeference of original Vebæk survey plan (1939)
E64a_05 E64a 4,55 4,16 17,85 1,09 4 0,95 1 5,24
No 9 261,2
No Yes NMA:Vebæk 1939, Vebæk 1943;50, Møller&Madsen 2007;10
Ruin dimensions measured after georeference of original Vebæk survey plan (1939)
E64a_06 E64a 6,03 3,95 20,96 1,53 3 1,1 1 5,48
No 4 180,9
No Yes NMA:Vebæk 1939, Vebæk 1943;51, Møller&Madsen 2007;10
Ruin dimensions measured after georeference of original Vebæk survey plan (1939)
E64a_07 E64a 5,76 3,64 18,95 1,58 3 0,9 1 4,65
No 4 162,5
No Yes NMA:Vebæk 1939, Vebæk 1943;52, Møller&Madsen 2007;10
Ruin dimensions measured after georeference of original Vebæk survey plan (1939)
E64a_08 E64a 4,96 3,19 13,87 1,55 5 0,6 1 6,02
No 4 142,7
No Yes NMA:Vebæk 1939, Vebæk 1943;52, Møller&Madsen 2007;10
Ruin dimensions measured after georeference of original Vebæk survey plan (1939)
E64b_01 E64b 24,63 17,29 323,11 1,42 2
No 1
No No Jespersen 1912;101, NMA:Roussell 1926, Roussell 1941;70
Note that because of the poor quality of Roussell's 1926 sketch survey, present ruin description is based on Google Earth© satellite imagery and the very corresponding Jespersen 1912 survey. Note

305
Ruin Data
Ruin_Id RG NO R_Length R_Width R_Area L/W_Index Build_mat/style Wall_Th No_Comp Ar_Comp
1
Ar_Comp 2
Ar_Comp 3
Ar_Comp 4
Ar_Comp 5
Ar_Comp 6
Sunk Ruin_Int Dis_MD Dis_Encl Encl_Fac Encl_Bed Slope DGPS Ref Add
that the ruin has been divided into three separate structures (ruin 1, 8 & 9)
E64b_02 E64b 6,4 3,33 19,84 1,92 5 0,95 1 6,29
No 4 25,1
No No Jespersen 1912;104, NMA:Roussell 1926, Roussell 1941;70
Ruins description from Google Earth© satellite imagery, and NMA:Roussell 1926 description and photograph. Jespernsen 1912 (fig.3a) ruin 6.
E64b_03 E64b 3,57 2,19 7,94 1,63 4 1 1 1,31
No 9 126,1
No No Jespersen 1912;104, NMA:Roussell 1926, Roussell 1941;70
Ruins description from Google Earth© satellite imagery, and NMA:Roussell 1926 description and photograph. Jespernsen 1912 (fig.3a) ruin 8.
E64b_04 E64b 8,94 3,94 32,79 2,27 3 0,9 1 20,31
Yes 18 152,4
SE 1 No No Jespersen 1912;104, NMA:Roussell 1926, Roussell
1941;70
Ruins description from Google Earth© satellite imagery, and NMA:Roussell 1926 description and photograph. Jespernsen 1912 (fig.3a) ruin 7.
E64b_05 E64b
3 0,8 1
No 4
No No NMA:Roussell 1926, Roussell 1941;70 Ruin dimensions not described
E64b_06 E64b
5
1
No 4 50
No No NMA:Roussell 1926, Roussell 1941;70 Ruin dimensions not described
E64b_07 E64b
No 27
No No NMA:Roussell 1926, Roussell 1941;70 Well or other feature
E64b_08 E64b 5,29 4,01 19,8 1,32
0,95 1 6,92
No 9 9,2
No No Jespersen 1912;101, NMA:Roussell 1926, Roussell 1941;70
Note that because of the poor quality of Roussell's 1926 sketch survey, present ruin description is based on Google Earth© satellite imagery and the very corresponding Jespersen 1911 survey. Note that the ruin has been divided into three separate structures (ruin 1, 8 & 9)
E64b_09 E64b 14,95 9,34 114,04 1,60 2 1,7 3 17,48 10,44 6,5
No 3 1
No No Jespersen 1912;101, NMA:Roussell 1926, Roussell 1941;70
Note that because of the poor quality of Roussell's 1926 sketch survey, present ruin description is based on Google Earth© satellite imagery and the very corresponding Jespersen 1911 survey. Note that the ruin has been divided into three separate structures (ruin 1, 8 & 9)
E64b_10 E64b 6,91 4,39 30,33 1,57
1
No 4
No No Jespersen 1912;104 Note Jespersen 1912 ruin 4; further description lacks
E64b_11 E64b 5,02 4,39 22,04 1,14
1
No 4
No No Jespersen 1912;104 Note Jespersen 1912 ruin 5; further description lacks
E64c_01 E64c 18,15 12,75 146,01 1,42 2 2,3
No 1
No Yes Vebæk 1939;fig.41, Møller&Madsen 2006;12 Ruin dimensions measured after georeference of Vebæk (1943;fig.41) survey plan
E64c_02 E64c 22,01 14,82 208,66 1,49 2 2,2
No 3 5,5
No Yes Vebæk 1939;fig.41, Møller&Madsen 2006;12 Ruin dimensions measured after georeference of Vebæk (1943;fig.41) survey plan
E64c_03 E64c 20,72 14,74 186,17 1,41 2 2,1
No 3 40
No Yes Vebæk 1939;fig.51, Møller&Madsen 2006;12 Ruin dimensions measured after georeference of Vebæk (1943;fig.51) survey plan
E64c_04 E64c 5 3,5 17,5 1,43 4 0,5 1 5,32
No 9 94,2
No No NM:Vebæk 1940, 1940, Vebæk 1943;79 Ruin dimensions and situation only from description (NM:Vebæk 1940 unpublished excavation report) georeferenced survey plan (Vebæk;1943.fig.40).
E64c_05 E64c 5,3 4,1 21,02 1,29 5 1 1 6,57
No 4 94,6
No Yes NM:Vebæk 1939, 1940, Vebæk 1943;79, Møller&Madsen 2006;11
Ruin dimensions measured after georeference of original Vebæk survey plan (NM; Vebæk 1939;R05 original survey plan)
E64c_06 E64c 6,2 2,4 14,88 2,58 5 0,6 1
No 9
No No NM:Vebæk 1940, 1940, Vebæk 1943;79 Ruin dimensions, construction, and situation on only from description (NM:Vebæk 1940 unpublished excavation report) and photo (C.K. Madsen 2006), and therefore only appromiximate.
E64c_07 E64c 6,5 4,2 28,21 1,55 5 0,65 1 21,12
No 18 213,8
Nw 3 No Yes NM:Vebæk 1940, 1940, Vebæk 1943;79,
Møller&Madsen 2006;12
Note that Wall_th is based on fotograph (C.K. Madsen 2006) and only roughly accurate
E64c_08 E64c 10,45 4,75 41,01 2,20 3 1 2 20,04 1,03
No 18 260,6
N 1 No Yes NM:Vebæk 1939, 1940, Vebæk 1943;79,
Møller&Madsen 2006;11
Møller&Madsen 2006 ruin 03. Ruin dimensions measured after georeference of original Vebæk survey plan (NM; Vebæk 1939;R08 original survey plan)
E64c_09 E64c 8,9 3,7 31,09 2,41 3 0,65 1 21,52
No 18 327,1
N 3 No Yes NM:Vebæk 1940, 1940, Vebæk 1943;79,
Møller&Madsen 2007
Note that Wall_th is based on fotograph (C.K. Madsen 2006), and sketch survey plan (NM:Vebæk 1940), and only roughly accurate
E64c_10 E64c 4,92 3,75 18,26 1,31
0,95 1 5,72
No 14 101,8
No Yes NM:Vebæk 1939, 1940, 1943;79, Møller&Madsen 2006;11
Ruin dimensions measured after georeference of original Vebæk survey plan (NM; Vebæk 1939;R10 original survey plan)
E65_01 E65 43,3 40,7 1322,96 1,06 2
No 1
No Yes Møller&Madsen 2006;12 Note that Møller&Madsen Ruin 1 & 2 are interpreted and described as one
E65_02 E65 2,71 2,15 5,72 1,26 3 0,6 1 1,93
No 11 404,8
No Yes Møller&Madsen 2006 Note that there is no ruin description, only DGPS-survey and photograph
E65_03 E65 69,2 63,1 3115,42 1,10 2 0,6 1 3515,42
No 22 11
No Yes Møller&Madsen 2006;12 Stretch of dike. Ar_Comp has been estimated by continuing DGPS-surveyed lines
E65_04 E65 6,42 3,64 22,34 1,76 3
No 14 20,2
No Yes Møller&Madsen 2006;12
E65_05 E65 21,67 12,36 226,51 1,75 2
No 3 5,7
No Yes Møller&Madsen 2006;12
E65_06 E65 6,19 5,64 30,03 1,10 2 1 2 6,64 5,28
Yes 7 68
No Yes Møller&Madsen 2006;12
E65_07 E65 5,25 3,4 17,39 1,54 3
Yes 14 62,3
No Yes Møller&Madsen 2006;13
E65_08 E65 12,99 6,92 60,62 1,88 2 1 1 30,09
Yes 14 41,4
No Yes Møller&Madsen 2006;13
E65_09 E65 9,52 5,34 45,21 1,78 6
Yes 27 82,2
No Yes Møller&Madsen 2006;13 Possible boathouse foundation cut into the slope
E65_10 E65 12,55 4,37 54,36 2,87 6
Yes 27 69,2
No Yes Møller&Madsen 2006;13 Possible boathouse foundation cut into the slope
E65_11 E65 11,87 9,71 75,77 1,22 3 0,85 1 57,19
No 18 165,6 182 NW 3 No Yes Møller&Madsen 2006;13
E65_12 E65 10,85 8,91 57,47 1,22 3 0,8 2 42,66 1,54
No 18 314,5 182 NW 3 No Yes Møller&Madsen 2006;13
E66_ E66
No 26
No Yes Bolender et al. 2010:13
E66_01 E66 5,18 4,33 22,45 1,20 4 1,1 1 6,15
No 9 451,1
No Yes Holm 1883;114, Bruun 1895;370, Møller&Madsen 2006;14, NMA: Clemmensen&Kapel 2009;9
E66_02 E66 16,3 7,67 122,14 2,13 4 1,45 1 64,44
No 12 5,3
No Yes Holm 1883;115, Bruun 1895;372, Møller&Madsen 2006;14, NMA: Clemmensen&Kapel 2009;9
E66_02a E66 32,5 28 875,94 1,16 4 1,9 1 553,96
No 13 0
No Yes Holm 1883;116, Møller&Madsen 2006;14, NMA: Clemmensen&Kapel 2009;9
E66_03 E66 27,4 7,64 202,81 3,59 2 2,05 3 45,13 28,78 7,58
No 2 9,9
No Yes Holm 1883;116, Møller&Madsen 2006;14, NMA: Clemmensen&Kapel 2009;11
E66_04 E66 16,75 5,65 84,65 2,96 2 1,4 3 13,32 13,19 4,15
No 6 113,2
No Yes Holm 1883;116, Møller&Madsen 2006;14, NMA: Clemmensen&Kapel 2009;11
E66_05 E66 13,81 5,28 68,29 2,62 2 1,2 2 13,83 11,53
No 5 18,2
No Yes Holm 1883;117, Møller&Madsen 2006;14, NMA: Clemmensen&Kapel 2009;12
E66_06 E66 11,28 5,76 60,39 1,96 3 1,2 2 15,41 8,48
No 5 35,5
No Yes Holm 1883;117, Møller&Madsen 2006;15, NMA: Clemmensen&Kapel 2009;13
E66_07 E66 12,6 5,61 66,17 2,25 2 1,25 2 18,58 11,11
No 5 36,2
No Yes Holm 1883;117, Møller&Madsen 2006;15, NMA: Clemmensen&Kapel 2009;13
E66_08 E66 8,27 7,24 49,74 1,14 2 1,25 1 23,93
No 15 61,9 141,9 W 1 No Yes Holm 1883;117, Møller&Madsen 2006;15, NMA:
Clemmensen&Kapel 2009;14
Ruin dimensions are somewhat uncertain because the ruin has been disturbed
E66_09 E66 13,62 5,31 66,49 2,56 2 0,9 3 13,13 13,07 5,25
No 6 41,8
No Yes Holm 1883;118, Møller&Madsen 2006;15, NMA: Clemmensen&Kapel 2009;14
E66_10 E66 9,64 9,95 92,8 0,97 2 1,2 2 25,81 18,82
No 7 139,9
No Yes Holm 1883;118, Møller&Madsen 2006;15, Bruun 1895;384, NMA: Clemmensen&Kapel 2009;14
E66_11 E66 8,49 7,65 54,75 1,11 3 0,85 1 40,04
No 18 175,1 141,9 E 1 No Yes Holm 1883;117, Møller&Madsen 2006;15, Bruun
1895;384, NMA: Clemmensen&Kapel 2009;15
E66_12 E66 6 3 18 2,00 2 1,25 1
No 14 196,1
No Yes Holm 1883;118, Møller&Madsen 2006;15, NMA: Clemmensen&Kapel 2009;15
Note that ruin is partially eroded and all measurements are uncertain
E66_13 E66 9,78 9,37 80,08 1,04 2 1,35 1 37,07
No 14 181,5
No Yes Holm 1883;118, Møller&Madsen 2006;15, NMA:

306
Ruin Data
Ruin_Id RG NO R_Length R_Width R_Area L/W_Index Build_mat/style Wall_Th No_Comp Ar_Comp
1
Ar_Comp 2
Ar_Comp 3
Ar_Comp 4
Ar_Comp 5
Ar_Comp 6
Sunk Ruin_Int Dis_MD Dis_Encl Encl_Fac Encl_Bed Slope DGPS Ref Add
Clemmensen&Kapel 2009;16
E66_15 E66 36,3 28,14 737,46 1,29 2
No 1
No Yes Holm 1883;118, Møller&Madsen 2006;15, NMA: Clemmensen&Kapel 2009;17
Note that Ar of ruin is only a rough estimta as ruin is very collapsed
E66_16 E66 15,05 4,68 64,73 3,22 2
No 14 48
No Yes Holm 1883;118, Møller&Madsen 2006;15, NMA: Clemmensen&Kapel 2009;17
E66_17 E66
No 4
No No Holm 1883;118, Møller&Madsen 2006;15, NMA: Clemmensen&Kapel 2009;18
Ruin was never accurately described and could not be relocated in 2009 (see Clemmensen&Kapel 2009;18)
E66_18 E66 144,3 1,8 259,74 80,17 2 1,5 1 109600
No 24 110,3
No Yes NMA: Clemmensen&Kapel 2009;18
E66_19 E66 16,42 5,9 69,9 2,78 3 1,5 2 25,1 17,04
No 5 215,4
No Yes NMA: Clemmensen&Kapel 2009;18
E66_20 E66 14,66 4,48 62,93 3,27 3 0,9 3 15,56 9,75 5,66
No 8 370,3
No Yes NMA: Clemmensen&Kapel 2009;18
E66_21 E66 50,45 31,95 1591,7 1,58 2 1,85 2 675,08 646,72
No 22 132,8 14,9
1 No Yes Bruun 1895;388, Møller&Madsen 2006;16, NMA:
Clemmensen&Kapel 2009;19
Bruun 1895 ruin 8, Møller&Madsen 2006 ruin 25,Note that ruin dimensions are somewhat uncertain, as ruin is partially eroded; ruin measurements include the area until the river gorge.
E66_22 E66 12,26 12,05 145,08 1,02 2 1,25 2 40,59 36,32
No 7 127,9
No Yes Bruun 1895;388, NMA: Clemmensen&Kapel 2009;20 Bruun 1895 ruin 7, Møller&Madsen 2006 ruin 224
E66_23 E66 16,78 13,39 221,7 1,25 2 1,5 1 153,2
No 22 124,8 14,9
1 No Yes Bruun 1895;388, NMA: Clemmensen&Kapel 2009;20 Bruun 1895 ruin 6
E66_24 E66 17,1 1,5 42,69 11,40 2 1,15 1 214,96
No 21 186,7 15,7 W 1 Yes Yes Bruun 1895;388, NMA: Clemmensen&Kapel 2009;20 Bruun 1895 ruin 5, Møller&Madsen 2006 ruin 22, Ruin dimensions are somewhat uncertain as part
of it is eroded;ruin measurements include the area until the river.
E66_25 E66 27,61 19,77 473,57 1,40 2 1,8 2 306,05 19,2
No 22 202,1 15,7 SW 1 Yes Yes Bruun 1895;388, Møller&Madsen 2006;16,
Clemmensen&Kapel 2009;20
Bruun 1895 ruin 4, Møller&Madsen 2006 ruin 21
E66_26 E66 8,75 9,38 81,62 0,93 2 1,6 1 39,2
No 14 205,3
No Yes Bruun 1895;388, Møller&Madsen 2006;16, Clemmensen&Kapel 2009;21
Bruun 1895 ruin 4, Møller&Madsen 2006 ruin 21
E66_27 E66 8,27 3,11 24,15 2,66 6
Yes 27 42,6
No Yes Møller&Madsen 2006;16, Clemmensen&Kapel 2009;21
E66_28 E66 9,9 3,99 37,76 2,48 6
Yes 27 36,4
No Yes Møller&Madsen 2006;16, Clemmensen&Kapel 2009;21
E66_29 E66 8,91 3,04 26,52 2,93 5 0,8 1 16,78
No 18 46,5
SW 3 No Yes Clemmensen&Kapel 2009;21
E66_30 E66 45,7 25,69 993,22 1,78 2
No 1 0
No Yes Møller&Madsen 2006;16, NMA:Clemmensen&Kapel 2009;22
Møller&Madsen 2006 ruin 26. Note that ruin is here interpreted as dwelling; midden was found on the slope below by coring.
E66_31 E66 33,84 5,77 193,13 5,86 2 1,15 4 38,65 32,62 19,62 9,72
No 6 9,2
No Yes Bruun 1895;388, Møller&Madsen 2006;16 Bruun 1895 ruin 3
E66_32 E66 8 8 64 1,00 2
No 18 34,4
SW
No No NMA: Albrethsen (in Bruun 1895;385 Note that ruin is sketched in on Bruun 1895's survey in the copy kept at the National Museum, Middle Ages and Renaissance
E67_01 E67 24,46 17,3 357,77 1,41 2
No 1
No Yes Møller&Madsen 2006;17 Redrawn after Møller&Madsen 2006 and georeferenced Google Earth © satellite imagery
E67_02 E67 2,22 1,59 2,69 1,40 5
No 9 165,7
No Yes Madsen 2009;10 The ruin can alternative be interpreted as a recent collapsed cairn
E67_03 E67 6,49 2,75 16,76 2,36 5 0,4
No 4 156,5
No Yes Madsen 2009;10 Note the ruin dimensions are only roughly approximate because the structure is only partially preserved
E67_04 E67 10,92 5,8 57,31 1,88 2 1,4 1 22,35
No 14 8,9
No No Møller&Madsen 2006;17 Redrawn after Møller&Madsen 2006 and georeferenced Google Earth © satellite imagery
E67_05 E67 38 7 260,62 5,43 2 1,2 4 57,16 48,39 37,59 24,56
No 6 2,5
No No NMA:Bruun 1894 II, Møller&Madsen 2006;17 Redrawn after Bruun 1894 sketch plan, Møller&Madsen 2006 and georeferenced Google Earth © satellite imagery. Ruin measurements are very uncertain
E67_06 E67 13,23 6,43 76,6 2,06 2 1,6 1 27,89
No 14 11,3
No No Møller&Madsen 2006;17 Redrawn after Bruun 1894 sketch plan, Møller&Madsen 2006 and georeferenced Google Earth © satellite imagery. Ruin measurements are very uncertain
E67_07 E67 11,97 6,02 64,28 1,99 2 1,25 1 27,45
No 14 38,6
No No Møller&Madsen 2006;17 Redrawn after Bruun 1894 sketch plan, Møller&Madsen 2006 and georeferenced Google Earth © satellite imagery. Ruin measurements are very uncertain
E68_01 E68 17,68 8,01 134,09 2,21 2
1
No 14 142,3
No Yes NMA:Bruun 1894 III;34, Bruun 1895;391, Møller&Madsen 2006:17
Note: Part of Møller&Madsen 2006 ruin 3. Two rooms visible, but the extent is uncertain due to poor preservation
E68_02 E68 13,47 6,84 81,56 1,97 2
1
No 14 125,7
No Yes NMA:Bruun 1894 III;34, Bruun 1895;391, Møller&Madsen 2006:17
Note: Part of Møller&Madsen 2006 ruin 3. Two rooms visible, but the extent is uncertain due to poor preservation
E68_03 E68 31,1 17,8 449,26 1,75 2
No 1
No Yes NMA:Bruun 1894 III;34, Bruun 1895;391, Møller&Madsen 2006:18
Note: Møller&Madsen ruin 6. Ruin has been divided on four individual structures (ruin 3, 4, 9, 11) based on Bruun description and GoggleEarth satellite imagery
E68_04 E68 24,4 9,6 215,62 2,54 2
No 2 4,8
No Yes NMA:Bruun 1894 III;34, Bruun 1895;391, Møller&Madsen 2006:18
Note: Part of Møller&Madsen ruin 6. Ruin has been seperated from ruin 3 based on Bruun description and GoggleEarth satellite imagery, and its dimensions are only roughly accurate
E68_05 E68
No 28
No No NMA:Bruun 1894 III;34, Bruun 1895;391 Ruin mentined by Bruun, but not described further
E68_06 E68 9,78 8,43 69,39 1,16 3 0,8 2 29,12 12,32
No 15 71,2 57,5
1 No Yes NMA:Bruun 1894 III;34, Bruun 1895;391,
Møller&Madsen 2006:18
Note: Møller&Madsen ruin 7
E68_07 E68 15,78 9,52 132,99 1,66 5 1,1 1 95,04
No 15 28,1 57,5 W 1 No Yes Møller&Madsen 2006;17 Note: Møller&Madsen ruin 4
E68_08 E68 6,44 4,3 27,66 1,50 4 0,8 1 12,18
No 9 341,6
No Yes Møller&Madsen 2006;18
E68_09 E68 5,37 4,66 20,79 1,15 3 1,05 1 8,34
Yes 14 19,6
No Yes Møller&Madsen 2006;18 Note: Møller&Madsen ruin 5
E68_10 E68 8,74 6,19 46,83 1,41 2
No 14 2,5
No Yes NMA:Bruun 1894 III;34, Bruun 1895;391, Møller&Madsen 2006:17
Note: Part of Møller&Madsen ruin 6. Ruin has been seperated from ruin 3 based on Bruun description and GoggleEarth satellite imagery, and its dimensions are only roughly accurate
E68_11 E68 11,68 8,77 87,46 1,33 2
No 14 9,9
No Yes NMA:Bruun 1894 III;34, Bruun 1895;391, Møller&Madsen 2006:17
Note: Part of Møller&Madsen ruin 6. Ruin has been seperated from ruin 3 based on Bruun description and GoggleEarth satellite imagery, and its dimensions are only roughly accurate
E69_01 E69 8,56 6,07 46,99 1,41 4 1,5 1 22,93
No 14 290,4
No Yes Bruun 1895;392, Møller&Madsen 2006:19 Note: Møller&Madsen 2006 ruin 9
E69_02 E69
No 28
No No NMA: Bruun 1894 III;33 Ruin mentioned by Bruun, probably removed
E69_04 E69 37,5 22,4 661,01 1,67 2
No 1
No Yes Bruun 1895;392, Møller&Madsen 2006:18 Note: Møller&Madsen 2006 ruin 2
E69_05 E69 14,68 5,23 71,5 2,81 2 1,2 4 11,78 7,98 5,76 5,38
No 6 31,2
No Yes Bruun 1895;392, Møller&Madsen 2006:18 Note: Møller&Madsen 2006 ruin 3
E69_06 E69 10,48 5,82 53,16 1,80 2
No 14 59,1
No Yes NMA: Bruun 1894 III;33, Møller&Madsen 2006:18 Note: Møller&Madsen 2006 ruin 1, ruin has been divided on three individual structures based on Bruun description and GoggleEarth satellite imagery
E69_07 E69 6,5 5,34 27,64 1,22 2 1 1 14,75
Yes 14 79,7
No Yes Bruun 1895;392, Møller&Madsen 2006:19
E69_08 E69 24,99 18,66 350,5 1,34 3 0,5 3 220,76 65,86 4,32
No 18 638,6
S 3 Yes Yes Bruun 1895;392, Arneborg et al. 2008;41 Note: Arneborg et al. 2008 ruin 0822
E69_09 E69 6,98 4,88 29,43 1,43 3 1,5 1 12,36
No 4 448,7
No Yes Bruun 1895;392, Arneborg et al. 2008;41 Note: Arneborg et al. 2008 ruin 0821
E69_10 E69 20,53 6,51 128,12 3,15 2 1,5 3 37,58 11,5 5,03
No 6 119,4
No Yes Bruun 1895;392, Møller&Madsen 2006:19 Note: Møller&Madsen 2006 ruin 8
E69_11 E69 11,07 6,86 74,71 1,61 2 1 1 37,72
No 14 144,6
No Yes Bruun 1895;392, Møller&Madsen 2006:19 Note: Møller&Madsen 2006 ruin 6
E69_12 E69 10,8 5,13 49,19 2,11 2
No 4 70,2
No Yes NMA: Bruun 1894 III;33, Møller&Madsen 2006:18 Note: Møller&Madsen 2006 ruin 1, ruin has been divided on three individual structures based on Bruun description and GoggleEarth satellite imagery
E69_13 E69 10,3 5,9 56,63 1,75 2
No 4 59,4
No Yes NMA: Bruun 1894 III;33, Møller&Madsen 2006:18 Note: Møller&Madsen 2006 ruin 1, ruin has been divided on three individual structures based on Bruun description and GoggleEarth satellite imagery

307
Ruin Data
Ruin_Id RG NO R_Length R_Width R_Area L/W_Index Build_mat/style Wall_Th No_Comp Ar_Comp
1
Ar_Comp 2
Ar_Comp 3
Ar_Comp 4
Ar_Comp 5
Ar_Comp 6
Sunk Ruin_Int Dis_MD Dis_Encl Encl_Fac Encl_Bed Slope DGPS Ref Add
E70_01 E70 32,55 12,15 330,3 2,68 2
No 1
No Yes Bruun 1895;393, NMA:Vebæk 1948;8, 1950;21, Vebæk 1992;72, Møller&Madsen 2006;19
Ruin has been partially excavated (Vebæk 1993;72). Possible extension to the W
E70_02 E70 22,27 7,2 153,52 3,09 2 2 3 17,31 13,54 11,94
No 6 16,5
No Yes Bruun 1895;393, NMA:Vebæk 1948;8, Vebæk 1992;72, Møller&Madsen 2006;20
Note: Møller&Madsen 2006 ruin 3. Possile extension to the W (see ruin E70_02a): an enclosure. Ruin measurements partly from DGPS-survey, GoogleEarth©satellite imagery, and Bruun 1895 survey
E70_02a E70 6,88 3,97 23,85 1,73
No 17 21,8
W 1 No Yes Bruun 1895;393 Ruin dimensions from rough description and rough survey sketch only
E70_03 E70 7,02 4,55 31,31 1,54 2 1 1 11,89
No 4 38,3
No Yes Bruun 1895;393, NMA:Vebæk 1948;8, Vebæk 1992;72, Møller&Madsen 2006;20
Note: Møller&Madsen 2006 ruin 4. Ruin measurements partly from DGPS-survey, GoogleEarth©satellite imagery, and Bruun 1895 survey
E70_04 E70 19,65 8,7 148,29 2,26 2
No 2 28,8
No Yes Bruun 1895;393, NMA:Vebæk 1948;8, Vebæk 1992;72, Møller&Madsen 2006;20
Note: Møller&Madsen 2006 ruin 5
E70_05 E70 7,42 4,54 30,58 1,63 2 1,2 1 9,54
No 4 67
No Yes Bruun 1895;393, NMA:Vebæk 1948;8, Vebæk 1992;72, Møller&Madsen 2006;20
Note: Møller&Madsen 2006 ruin 6
E70_06 E70 6 2,95 17,92 2,03 4 0,65 1 6,32
No 9 123,2
No Yes Bruun 1895;393, NMA:Vebæk 1948;8, Vebæk 1992;72, Møller&Madsen 2006;20
Note: Møller&Madsen 2006 ruin 8
E70_07 E70 4,26 3,7 13,65 1,15 2 1,05 1 3,88
No 14 51,9
No Yes Møller&Madsen 2006;20 Ruin measurements partly from DGPS-survey and GoogleEarth©satellite imagery
E70_08 E70 6,62 4,7 27,77 1,41 2 1,25 1 7,42
Yes 14 8,7
No Yes Møller&Madsen 2006;19 Note: Møller&Madsen 2006 ruin 2. Ruin measurements partly from DGPS-survey, GoogleEarth©satellite imagery, and Bruun 1895 survey
E70_09 E70 2,18 1,88 3,22 1,16 5 0,3 1 1,93
No 20 77,5
No Yes Arneborg et al. 2008;42
E71a_01 E71a 48,11 31,89 1072 1,51 2
No 1
No Yes NMA:Vebæk 1948;8, Møller&Madsen 2007;11
E71a_02 E71a 10,13 5,14 47,33 1,97 3
No 14 9
No Yes NMA:Vebæk 1948;8, Møller&Madsen 2007;11
E71a_03 E71a 19,98 10,58 148,27 1,89 2 1,5
No 3 6,4
No Yes NMA:Vebæk 1948;8, Møller&Madsen 2007;11 Note that the ruin has several visible rooms, but too collapsed to measure them with any accuracy
E71a_04 E71a 11,64 5,49 71,28 2,12 2 1,3 2 12,61 7,24
No 5 54,4
No Yes NMA:Vebæk 1948;8, Møller&Madsen 2007;11
E71a_05 E71a 9,36 8,8 64,26 1,06 4 1,1 1 33,49
No 16 29,2
1 No Yes NMA:Vebæk 1948;8, Møller&Madsen 2007;11 Note: Møller&Madsen 2006 ruin 7
E71a_06 E71a 10,27 5,5 51,03 1,87 2 1,25 2 11,74 6,49
No 5 124,6
No Yes NMA:Vebæk 1948;8, Møller&Madsen 2007;12 Note: Møller&Madsen 2006 ruin 9
E71a_07 E71a 6,72 4,51 28,91 1,49 5 1,1 1 10,43
No 9 218,9
No Yes NMA:Vebæk 1948;8, Møller&Madsen 2007;11 Note: Møller&Madsen 2006 ruin 6
E71a_08 E71a 9,17 5,92 47,14 1,55 2 1,1 2 12,73 8,48
Yes 5 92,2
No Yes NMA:Vebæk 1948;8, Møller&Madsen 2007;11
E71a_10 E71a 17,58 1 17,58 17,58 2 1
No 25 68
No Yes Møller&Madsen 2007;11 Stretch of homefield dike
E71N_08 E71N 6,04 3 16,59 2,01
0,8 1 5,75
No 4 113,1
No Yes Vebæk 1993;37, Møller&Madsen 2006;11 Note description Build_Mat or photograph
E71N_09 E71N 6,05 2,45 14 2,47 3 0,8 1 6,32
No 18 79 345,8 S 1 No Yes Vebæk 1993;37, Møller&Madsen 2006;11
E71N_10 E71N 6,61 3,04 20,74 2,17 2 0,95 1 7,41
Yes 4 60,8
No Yes Vebæk 1993;37, Møller&Madsen 2006;11
E71N_11 E71N 6,46 3,74 21,71 1,73 2 0,8 1 9,3
Yes 4 53,8
No Yes Vebæk 1993;37, Møller&Madsen 2006;11
E71N_12 E71N 26,05 11,89 228,59 2,19 2 1,5
No 1
No Yes Vebæk 1993;25pp, Møller&Madsen 2006;11
E71N_12a E71N 21,18 7,73 112,11 2,74 2 1,6 3 27,22 5,77 9,46
No 2 0
No Yes Vebæk 1993;36pp, Møller&Madsen 2006;11 Note that the byre is here treated as a separate building. Dimensions of the two smallest rooms are somewhat uncertain as the ruin is not wholle preserved
E71N_13 E71N 5,08 3,54 14,94 1,44 5
No 14 17,3
No Yes Vebæk 1993;38pp, Møller&Madsen 2006;11 Poor ruin preservation and description excludes further estimates of dimensions
E71N_14 E71N 6,16 4,67 25,55 1,32
0,95 1 10,29
No 4 5,8
No Yes Vebæk 1993;38pp, Møller&Madsen 2006;11 Area_Comp is somewhat uncertain, because ruin is not wholly preserved. Build_Mat unknown
E71N_15 E71N 9,76 4,78 46,79 2,04 4 0,85 1 25,75
No 9 36,8
No Yes Vebæk 1993;38pp, Møller&Madsen 2006;11
E71N_16 E71N 16,31 5,17 83,3 3,15 2 1,2 3 14,61 11,98 7,38
No 6 52,5
No Yes Vebæk 1993;38pp, Møller&Madsen 2006;11
E71N_17 E71N 8,41 5,22 41,56 1,61 5 1,2 1 16,68
No 18 81,1 147,4 SW 4 No Yes Vebæk 1993;38pp, Møller&Madsen 2006;11
E71N_18 E71N 5,1 2,94 14,62 1,73 2 0,6 1 4,87
Yes 14 119,6
No Yes Vebæk 1993;38pp, Møller&Madsen 2006;11
E71N_19 E71N 6,95 5,42 29,5 1,28 3 1,05 1 8,31
No 4 156
No Yes Vebæk 1993;38pp, Møller&Madsen 2006;11
E71N_20 E71N 15,28 11,8 145,53 1,29 3 1,1 4 71,72 26,21 2,07 1,86
No 18 242,5 18 S 2 Yes Yes NMA:Vebæk 1949;13, Vebæk 1993;38pp,
Møller&Madsen 2006;11
E71N_21 E71N 4,39 2,78 7,82 1,58 6 0,4 1 5,38
No 20 222,5 18 SE 1 No Yes NMA:Vebæk 1949;13, Vebæk 1993;38pp,
Møller&Madsen 2006;11
E71N_22 E71N 3,2 1,2 3,84 2,67
No 19
S
No Yes Bruun 1895;394 Note: ruin lacks further description, but cannot be mistaken for any of the ruins descriped by Vebæk (1993)
E71S_01 E71S 4,84 4,33 19,3 1,12 2 0,9 1 5,91
No 14 18,7
No Yes Vebæk 1993;43, Møller&Madsen 2006;11
E71S_02 E71S 21,05 10,85 193,89 1,94 2
No 1
No Yes Vebæk 1993;38p, Møller&Madsen 2006;11
E71S_03 E71S 14,1 7,01 78,78 2,01 2 1,25 3 15,07 7,3 5,34
No 2 5
No Yes Vebæk 1993;38p, Møller&Madsen 2006;11
E71S_04 E71S 8,78 3,89 32,87 2,26 3 1 1 10,9
No 4 15,2
No Yes Vebæk 1993;44, Møller&Madsen 2006;11 Note that the stated dimensions are somewhat uncertain as ruin is not wholly preserved
E71S_05 E71S 7,99 4,58 34,49 1,74 2 0,85 1 14,91
No 4 32,2
No Yes Vebæk 1993;44, Møller&Madsen 2006;11
E71S_06 E71S 4,74 3,99 15,99 1,19 2 0,65 2 3,26 1,53
Yes 14 27,9
No Yes Vebæk 1993;44, Møller&Madsen 2006;11
E71S_07 E71S 5,28 2,68 13,91 1,97 3 0,65 1 4,67
No 4 33,5
No Yes Vebæk 1993;44, Møller&Madsen 2006;11
E72_01 E72 20,02 6,54 113,54 3,06 2 1,75 2 23,18 16,26
No 2 5,1
No Yes Bruun 1895;395, Møller&Madsen 2007;12 Note: Møller&Madsen 2007 ruin 6. Ruin measurements partly from DGPS-survey, GoogleEarth©satellite imagery, and Bruun 1895 survey
E72_02 E72 5,99 4,09 22 1,46 3 1,1 1
No 18 56,7 170,4 SE 1 No Yes Bruun 1895;396, Møller&Madsen 2007;12 Note: Møller&Madsen 2007 ruin 7. Dis_Encl is only approximate
E72_03 E72 3,47 3,15 8,62 1,10 5 0,5 1 3,7
No 9 132,8
No Yes Bruun 1895;396, Møller&Madsen 2007;12 Note: Møller&Madsen 2007 ruin 8
E72_04 E72 25,89 10,4 186,14 2,49 2 1,55 4 33,53 15,66 11,39 9,85
No 1
No Yes Bruun 1895;395, Møller&Madsen 2007;12 Note: Møller&Madsen 2007 ruin 4. Ruin measurements partly from DGPS-survey, GoogleEarth©satellite imagery, and Bruun 1895 survey
E72_05 E72 13,75 4,77 63,35 2,88 2 1,25 2 17,2 7,54
No 5 21,9
No Yes Bruun 1895;395, Møller&Madsen 2007;13 Note: Møller&Madsen 2007 ruin 12. Ruin measurements partly from DGPS-survey, GoogleEarth©satellite imagery, and Bruun 1895 survey
E72_06 E72 9,21 4,78 40,71 1,93 2 1,2 1 14,34
No 4 25,2
No Yes Bruun 1895;395, Møller&Madsen 2007;13 Note: Møller&Madsen 2007 ruin 10. Ruin measurements partly from DGPS-survey, GoogleEarth©satellite imagery, and Bruun 1895 survey
E72_07 E72 16,24 5,93 88,34 2,74 2 1,5 2 19,83 8,84
No 5 32,6
No Yes Bruun 1895;395, Møller&Madsen 2007;13 Note: Møller&Madsen 2007 ruin 13. Ruin measurements partly from DGPS-survey, GoogleEarth©satellite imagery, and Bruun 1895 survey
E72_08 E72 6,9 4,46 28,84 1,55 2 1,15 1 9,21
No 4 68,2
No Yes Bruun 1895;395, Møller&Madsen 2007;13 Note: Møller&Madsen 2007 ruin 16. Ruin measurements partly from DGPS-survey, GoogleEarth©satellite imagery, and Bruun 1895 survey
E72_09 E72 46,27 17,34 530,69 2,67 2
No 1
No Yes Bruun 1895;395, Møller&Madsen 2007;13 Note: Møller&Madsen 2007 ruin 15. Ruin measurements partly from DGPS-survey, GoogleEarth©satellite imagery, and Bruun 1895 survey. Some rooms corresponding with Bruun's description (1896;395) are clearly visible on satellite imagery, but others are burried beneath collapse: No_Comp have therefor been omitted
E72_10 E72 5,65 4,39 24,8 1,29
1
No 18 69,2 317,9 NE
No No Bruun 1895;395 Ruin measurements from Bruun description and rough survey sketch only

308
Ruin Data
Ruin_Id RG NO R_Length R_Width R_Area L/W_Index Build_mat/style Wall_Th No_Comp Ar_Comp
1
Ar_Comp 2
Ar_Comp 3
Ar_Comp 4
Ar_Comp 5
Ar_Comp 6
Sunk Ruin_Int Dis_MD Dis_Encl Encl_Fac Encl_Bed Slope DGPS Ref Add
E72_11 E72 8,38 4,3 34,25 1,95 3 0,95 2 8,88 3,84
No 5 116,8
No Yes Bruun 1895;396, Møller&Madsen 2007;13
E72_13 E72 9,41 4,08 38,39 2,31
No 28
99,5
2 No No Bruun 1895;395 Ruin measurements from Bruun description and rough survey sketch only
E72_14 E72 14,37 5,52 72,34 2,60 2 1,15 2 17,7 9,11
No 5 23
No Yes Møller&Madsen 2007;12 Note: Møller&Madsen 2007 ruin 1. Ruin measurements partly from DGPS-survey and GoogleEarth©satellite imagery.
E72_15 E72 4,09 3,34 12,56 1,22 2 1,05 1 2,18
Yes 14 20
No Yes Møller&Madsen 2007;12 Note: Møller&Madsen 2007 ruin 3. Ruin measurements partly from DGPS-survey and GoogleEarth©satellite imagery.
E72_16 E72 6,14 5,24 27,49 1,17 2 1,25 1 6,67
No 14 21,7
No Yes Møller&Madsen 2007;12 Note: Møller&Madsen 2007 ruin 2. Ruin measurements partly from DGPS-survey and GoogleEarth©satellite imagery.
E72_17 E72 21,47 10,09 176,35 2,13 2
No 1
No Yes Møller&Madsen 2007;12 Note: Møller&Madsen 2007 ruin 4. Ruin measurements partly from DGPS-survey and GoogleEarth©satellite imagery.
E72_18 E72 9,13 4,36 38,34 2,09 2 0,95 2 7,53 6,68
No 5 14,8
No Yes Møller&Madsen 2007;12 Note: Møller&Madsen ruin 5
E72a_01 E72a 5 3 15 1,67
No 18
No No NMA:Vebæk 1948;8, Møller&Madsen 2006;13 Ruin not reidentified in 2006
E73_01 E73 9,62 8,18 61,02 1,18 5 0,9
No 1
No Yes Holm 1883;126, Kapel 2004;11, Møller&Madsen 2007
E73_02 E73 16,37 9,87 104,45 1,66 3 0,9 3 45,85 21,71 10,43
No 18 186,2 310,9 SE 3 No Yes Holm 1883;126, Kapel 2004;10, Møller&Madsen 2007
E73_03 E73 6,19 4,12 21,24 1,50 4 0,9 1 12,09
No 18 186,3
SE
No Yes Holm 1883;126, Kapel 2004;10, Møller&Madsen 2007
E73_04 E73 9,56 3,76 33,87 2,54
1 2 7,94 3,73
No 5 166,5
No Yes Holm 1883;126, Kapel 2004;11, Møller&Madsen 2007 Build_Mat not described
E73_05 E73 8,14 3,52 28,58 2,31
0,9 1 10,37
No 4 177,8
No Yes Holm 1883;127, Kapel 2004;11, Møller&Madsen 2007 Build_Mat not described
E73_06 E73 6,68 3,43 22,72 1,95 3 0,65 1 10,95
No 4 196,5
No Yes Holm 1883;127, NMA:Petersen 1894;12, Kapel 2004;10, Møller&Madsen 2007
Note: NMA:Petersen ruin VII
E73_07 E73 11,16 3,5 39,14 3,19 3 0,75 2 6,25 5,56
No 5 159,3
No No Holm 1883;127, NMA:Petersen 1894;12, Kapel 2004;10, Møller&Madsen 2007
Note: NMA:Petersen ruin VI. Ruin was not DGPS surveyed or identified in the Kapel et al. or Møller&Madsen surveys, but is clearly visible on GoogleEarth© satellite imagery, from which ruin has been placed and measured
E73_08 E73 15,7 7,15 109,96 2,20 5 1,5 1 50,73
Yes 14 97,9
No Yes Holm 1883;127, NMA:Petersen 1894;12, Kapel 2004;10, Møller&Madsen 2007
Note: NMA:Petersen ruin VIII, Kapel et al. & Møller&Madsen R07
E73_09 E73 4,9 4,57 21,72 1,07 2 0,9 1 8,89
Yes 14 108,9
No Yes Holm 1883;127, NMA:Petersen 1894;12, Kapel 2004;10, Møller&Madsen 2007
Note: Kapel et al. & Møller&Madsen R08
E73_10 E73 13,1 5,4 67,73 2,43 3 1,15 1 28,43
No 4 134,6
No Yes Holm 1883;127, NMA:Petersen 1894;12, Kapel 2004;10, Møller&Madsen 2007
Note: NMA:Petersen ruin V(?), Kapel et al. & Møller&Madsen R09
E73_11 E73 15,93 7,02 98,02 2,27 5 1,05 2 45,91 7,57
No 15 108,4 314,1
1 No Yes Holm 1883;126, NMA:Petersen 1894;11, Kapel
2004;10, Møller&Madsen 2007
Note: NMA:Petersen ruin IV,Kapel et al. & Møller&Madsen R10
E73_12 E73 9,41 4,75 44,16 1,98 3 0,85 1 21,53
No 14 76,4
No Yes Holm 1883;127, NMA:Petersen 1894;11, Kapel 2004;10, Møller&Madsen 2007
Note: NMA:Petersen ruin III
E73_13 E73 22,68 20,64 288,35 1,10 2
No 1
No Yes Holm 1883;127, NMA:Petersen 1894;11, Kapel 2004;10, Møller&Madsen 2007
Note: NMA:Petersen ruin I
E73_14 E73 4,34 3,87 15,62 1,12 3 0,7 1 6,93
No 14 62,4
No Yes Holm 1883;127, NMA:Petersen 1894;13, Kapel 2004;10, Møller&Madsen 2007
Note: NMA:Petersen ruin XI
E73_15 E73 5,59 4 22,76 1,40 3 0,85 1 9,22
No 14 105,4
No Yes Holm 1883;127, Kapel 2004;10, Møller&Madsen 2007
E73_16 E73 13,39 4,9 63,21 2,73 3 1 3 10,02 9,92 9,12
No 6 97,3
No Yes Holm 1883;127, NMA:Petersen 1894;13, Kapel 2004;10, Møller&Madsen 2007
Note: NMA:Petersen ruin X
E73_17 E73 11,61 7,76 66,94 1,50 3 1 4 8,54 8,05 8,05 3,96
No 6 116,3
No Yes Holm 1883;127, NMA:Petersen 1894;13, Kapel 2004;10, Møller&Madsen 2007
Note: NMA:Petersen ruin IX
E73_18 E73 9,13 4,36 39,03 2,09 2 1,05 1 16,2
No 4 247
No Yes Holm 1883;127, Kapel 2004;10, Møller&Madsen 2007
E73_19 E73 4,5 4 18 1,13 4
1 18
No 9 129,2
No No Kapel et al. 2004;11 Ruin is too collapsed to estimate dimensions. Ar_Comp 1 from ruin description
E73_20 E73 4,37 3,71 15,85 1,18 2 0,9 1 5,05
No 14 245,1
No Yes Møller&Madsen 2007 Note that ruin description is lacking and the measurements are based on ruin description and photograph
E73_21 E73 9,59 3,98 36,92 2,41
1,05 2 7,05 5,97
No 5 57,7
No Yes Kapel et al. 2004;10 Note: Kapel et al. ruin XI
E74_01 E74 22,7 12 232,11 1,89 4 0,9 2 189,09 10,07
No 18 374
S 3 No Yes Bruun 1895;397, NMA:Bak 1969;N74, Kapel et al.
2004;8
Note that the structure is here, based on photographs and visual inspection (2006), reinterpreted as having compartment in the NE corner
E74_02 E74 8,26 3,25 24,66 2,54 2 1,05 3 4,65 3,79 1,4
No 6 325,8
No Yes Bruun 1895;397, NMA:Bak 1969;N74, Kapel et al. 2004;8
E74_03 E74 14,62 7,7 106,31 1,90 2
No 2 23,4
No Yes Bruun 1895;397, Kapel et al. 2004;8
E74_04 E74 20,12 17,69 298,41 1,14 2
No 1
No Yes Bruun 1895;397, Kapel et al. 2004;8 Note: Bak 1969 ruin 2
E74_05 E74 6,54 3,56 21,21 1,84
No 28
No Yes NMA:Bruun 1894;85, Berglund 2001;3; Kapel et al. 2004;8
E74_06 E74 4 3 12 1,33
No 28
No No NMA:Bruun 1894;85, Berglund 2001;3, Kapel et al. 2004;8
E74_07 E74 8,12 6,3 44,2 1,29 2 0,75 3 10,46 5,47 4,9
No 14 381,4
No Yes Bruun 1895;397, Kapel et al. 2004;9
E74_08 E74 1,32 0,9 0,96 1,47 6 0,3 1 0,81
No 20 449,9
No Yes Møller&Madsen 2007
E75_01 E75 25,14 17,84 376,88 1,41 2
No 1
No Yes Bruun 1895;398, Møller&Madsen 2006;20
E75_02 E75 8,84 4,9 41,7 1,80 3 0,5 2 9,48 7,56
Yes 5 56,1
No Yes Bruun 1895;398, Møller&Madsen 2006;20
E75_03 E75 8,31 5,52 46 1,51 5 1 1 19,96
No 14 54,1
No Yes Bruun 1895;398, Møller&Madsen 2006;20
E75_04 E75 31,2 23,3 541,15 1,34 2
No 1
No Yes Bruun 1895;398, Møller&Madsen 2006;20
E75_05 E75 26,5 13,9 325,79 1,91 2
No 1
No Yes Bruun 1895;399, Møller&Madsen 2006;21
E75_06 E75 5,65 3,15 16,53 1,79 3 1 1 5,53
No 4 18,8
No Yes Bruun 1895;399, Møller&Madsen 2006;21
E75_07 E75 7,53 3,49 24,04 2,16 3 0,95 1 7,69
Yes 4 28,8
No Yes Bruun 1895;399, Møller&Madsen 2006;21
E75_08 E75 6,84 3,55 22,97 1,93 3 0,85 1 8,37
No 4 77,8
No Yes Møller&Madsen 2006;21
E75_09 E75 3,58 3,37 11,69 1,06 2 0,6 1 4,1
Yes 14 54,1
No Yes Møller&Madsen 2006;21
E75_10 E75 5,48 4,31 22,57 1,27 2 1 1 6,5
Yes 14 9,4
No Yes Møller&Madsen 2006;21
E75_11 E75 9,6 6,12 50,73 1,57 2 1,2 2 8,7 1,4
Yes 14 19,5
No Yes Møller&Madsen 2006;21
E75_12 E75 14,35 6,43 88,31 2,23 2 1 2 21,79 19,64
Yes 5 35,4
No Yes Møller&Madsen 2006;21
E75_13 E75 5,83 3,22 24,13 1,81 3 0,65 1 7,76
No 14 75,9
No Yes Møller&Madsen 2006;21
E75_14 E75 3,06 2,92 7,64 1,05 1 0,8 1 2,76
Yes 27 37,4
No Yes Møller&Madsen 2006;21
E75_15 E75 3,69 2,82 10,28 1,31 3 0,7 1 3,53
No 14 135,1
No Yes Field report under preparation

309
Ruin Data
Ruin_Id RG NO R_Length R_Width R_Area L/W_Index Build_mat/style Wall_Th No_Comp Ar_Comp
1
Ar_Comp 2
Ar_Comp 3
Ar_Comp 4
Ar_Comp 5
Ar_Comp 6
Sunk Ruin_Int Dis_MD Dis_Encl Encl_Fac Encl_Bed Slope DGPS Ref Add
E75_16 E75 5,43 3,95 21,06 1,37 3 0,8 1 9,09
No 4 539,3
No Yes Field report under preparation
E75_17 E75 17,87 8,66 116,12 2,06 5 0,6 2 96,04 1,45
No 18 573,1
SE 2 No Yes Field report under preparation
E76_01 E76 22 16 352 1,38 2
No 1
No No Bruun 1895;400, NMA:Krogh&Albrethsen 1968/71 Note that ruin has been removed and all measurements are based on prior roough survey sketches. There is notable disagreement between the prior surveys as to the size and type of structure
E76_02 E76 20 5 100 4,00
No 2 39,6
No No Bruun 1895;400 Measurements based on rough survey sketch and description
E76_03 E76 18 5 90 3,60
No 2 32,6
No No Bruun 1895;400 Measurements based on rough survey sketch and description
E76_04 E76 4,2 3,93 15,63 1,07 3 1 1 3,11
No 14 29,8
No Yes Bruun 1895;400, NMA:Krogh&Albrethsen 1968/71, Møller&Madsen 2007;14
E76_05 E76 9,6 2,4 23,04 4,00 3 0,55 2 5,97 3,13
No 5 67,5
No No Bruun 1895;400, NMA:Krogh&Albrethsen 1968/71, Møller&Madsen 2007;14
Measurements based on rough survey sketch and description
E76_06 E76 18 10 180 1,80 2
No 1
No No Bruun 1895;400, NMA:Krogh&Albrethsen 1968/71, Møller&Madsen 2007;14
Note that ruin has been removed and all measurements are based on prior roough survey sketches. There is some disagreement between the prior surveys as to the size and type of structure
E76_07 E76 13,56 5,09 63,65 2,66 1 1,25 2 13,93 8,62
No 5 214,9
No Yes NMA:Krogh&Albrethsen 1968/71, Møller&Madsen 2007;14
E76_07a E76 3,95 3,58 15,59 1,10 1
No 25 228,7 119,9 E 1 No No NMA:Krogh&Albrethsen 1968/71, Møller&Madsen
2007;14
Dike built against stable, measurements based on rough survey plan
E76_08 E76 15,52 5,74 78,86 2,70 1 1,75 1 25,11
No 14 253,2
No Yes NMA:Krogh&Albrethsen 1968/71, Møller&Madsen 2007;14
E76_09 E76 70 1 70 70,00 2 1 1 59680
No 24 253,6
No Yes NMA:Krogh&Albrethsen 1968/71, Møller&Madsen 2007;14
Stretch of homefield dike (see also ruin 17-18)
E76_10 E76 7,78 4,34 27,92 1,79 3 0,65 1 21,22
No 18 545,4 315,3 SE 3 No Yes NMA:Krogh&Albrethsen 1968/71, Møller&Madsen
2007;14
E76_11 E76 10,74 4,29 40,83 2,50 2 1,05 2 8,28 5,98
No 5 109
No Yes NMA:Krogh&Albrethsen 1968/71, Møller&Madsen 2007;14
E76_11a E76 6,29 5,19 29,83 1,21 2 1 1 20,28
No 25
119,9 S 1 No Yes NMA:Krogh&Albrethsen 1968/71, Møller&Madsen
2007;14
Dike built against stable, measurements based on rough survey plan
E76_12 E76 7,1 7,07 43,01 1,00 2 1 1 26,59
No 18 44,7 7,4 S
Yes Yes NMA:Krogh&Albrethsen 1968/71, Møller&Madsen 2007;14
Distance to dwelling is only roughly accurate, as the position of the latter is based on rough survey sketch
E76_13 E76 8,36 8,07 60,13 1,04 2 1,45 2 14,1 9,24
Yes 7 149
No Yes NMA:Krogh&Albrethsen 1968/71, Møller&Madsen 2007;14
E76_14 E76 15 5 75 3,00 3
1
No 14 210,2
No No NMA:Krogh&Albrethsen 1968/71 Measurements based on rough survey sketch and description
E76_15 E76 11,78 8,45 82,8 1,39 3 1,5 1 52,27
No 18 75,4 6,1 S 3 No Yes NMA:Krogh&Albrethsen 1968/71, Møller&Madsen
2007;15
Distance to dwelling is only roughly accurate, as the position of the latter is based on rough survey sketch
E76_16 E76 2,53 2,12 5,41 1,19 3 0,45 1 2,03
No 19 92,4 6,1 S 3 No Yes NMA: Krogh&Albrethsen 1968/71, Møller&Madsen
2007;15
Distance to dwelling is only roughly accurate, as the position of the latter is based on rough survey sketch
E76_17 E76 64,95 1 64,95 64,95 2 1 1 230,29
No 21 171,1 79,9
1
No Yes NMA: Krogh&Albrethsen 1968/71, Møller&Madsen 2007;15
Stretch of homefield dike; for enclosed area Ar_Comp 1 see ruin 9. Note Møller&Madsen 2006 ruin 14. istance to dwelling is only roughly accurate, as the position of the latter is based on rough survey sketch
E76_18 E76 109,1 95,4 54,3 1,14 2 1 1 10250
No 22 151,2
S 1 No Yes NMA: Krogh&Albrethsen 1968/71, Møller&Madsen
2007;15
Strech of homefield dike; Ar_Comp1 measures area between ruin 17 & 18.
E76_19 E76 20 10
2,00
1 200
No 18 39,2 7,1 S 3 No Yes NMA: Krogh&Albrethsen 1968/71, Møller&Madsen
2007;14
Likely enclosure. Measurements based on rough survey sketch and description
E76a_01 E76a 6,64 3,8 25,23 1,75 2 0,8 1 9,67
No 4
No Yes Bruun 1895;401, Møller&Madsen 2007;15 Note that ruin dimensions are somewhat estimate and based on Bruun's survey description (1896;401), because the ruin is not wholly preserved.
E76a_02 E76a 5,45 3,42 18,16 1,59 2 0,85 1 7,26
No 4
No Yes Bruun 1895;401, Møller&Madsen 2007;15 Note that ruin dimensions are somewhat estimate and based on Bruun's survey description (1896;401), because the ruin is not wholly preserved.
E76a_03 E76a 11,99 6,21 65,33 1,93 2 1,05 3 14,03 8,88 5,78
No 6
No Yes Bruun 1895;401, Møller&Madsen 2007;15 Note that ruin dimensions are somewhat estimate and based on Bruun's survey description (1896;401), because the ruin is not wholly preserved.
E76a_04 E76a 4,2 3,09 12,89 1,36 3 0,5 1 6,64
No 14
No Yes Bruun 1895;401 Note that ruin dimensions are based on 2006 DGPS and photograph only
E76a_05 E76a 3,66 2,34 8,54 1,56 3 0,5 1 3,86
No 14
No Yes Bruun 1895;401 Note that ruin dimensions are based on 2006 DGPS and photograph only
E76b_01 E76b 6,4 4 25,6 1,60
No 4
No No Bruun 1895;399 All ruin observations based on Bruun's rough survey description (1895;399) and the estimation of "one pace" as 0,8m
E76b_02 E76b 10,4 6,4 66,56 1,63
No 15
No No Bruun 1895;399 All ruin observations based on Bruun's rough survey description (1895;399) and the estimation of "one pace" as 0,8m
E76c_01 E76c 30,96 1,5 49,86 20,64 2 1,5 1 55788
No 23
No Yes Møller&Madsen 2007;15 Stretch of dike bounding peninsula
E76c_01a E76c 5,95 3,15 19,17 1,89 2 0,65 2 5,02 4,28
No 5
No Yes Møller&Madsen 2007;15 Structure built against dike E76c_01
E76c_02 E76c 8,43 3,68 25,4 2,29 2 1,65 1 9,98
No 18
NW 1 No Yes Møller&Madsen 2007;15
E76c_03 E76c 1,7 1,17 1,97 1,45 5
No 9
No Yes Møller&Madsen 2007;15
E77_01 E77 8,2 5,19 42,58 1,58 4 1 1 20,25
No 9 149,9
No Yes Holm 1883;123, NMA:Bak 1969;N77-3, NMA:Krogh 1981, Møller&Madsen 2007;17
Note: Bak 1977 ruin 11, Krogh 1981 ruin I, Møller&Madsen 2007 ruin 12
E77_02 E77 4,53 3,94 15,44 1,15 4 0,55 2 9,35 0,86
No 18 141,3
S 3 No Yes Holm 1883;123, NMA:Bak 1969;N77-3, NMA:Krogh
1981, Møller&Madsen 2007;17
Note: Bak 1977 ruin 9, Krogh 1981 ruin H, Møller&Madsen 2007 ruin 11
E77_03 E77 9,27 6,71 49,38 1,38 4 0,8 1 33
No 18 130,7
S 3 No Yes Holm 1883;123, NMA:Bak 1969;N77-2, NMA:Krogh
1981, Møller&Madsen 2007;16
Note: Bak 1977 ruin 8, Krogh 1981 ruin G, Møller&Madsen 2007 ruin 10
E77_04 E77 4,66 3,29 14,52 1,42 5 0,9 1 6,62
Yes 14 96,8
No Yes Holm 1883;123, NMA:Bak 1969;N77-2, NMA:Krogh 1981, Møller&Madsen 2007;16
Note: Bak 1977 ruin 6, Krogh 1981 ruin F, Møller&Madsen 2007 ruin 8
E77_05 E77 5,91 3,67 21,75 1,61 4 0,8 1 9,11
No 9 95,5
No Yes Holm 1883;123, NMA:Bak 1969;N77-2, NMA:Krogh 1981, Møller&Madsen 2007;16
Note: Krogh 1981 ruin E, Møller&Madsen 2007 ruin 9
E77_06 E77 12,52 6,96 82,24 1,80 3 0,8 4 10,98 9,58 9,02 8,68
No 6 58,3
No Yes Holm 1883;123, NMA:Bak 1969;N77-2, NMA:Krogh 1981, Møller&Madsen 2007;16
Note: Bak 1969 ruin 4, Krogh 1981 ruin E. Note that ruin room division and dimensions has been reconstructed from Holm 1883, Bak 1969, and 2006 DGPS survey
E77_07 E77 20,02 12,51 204,64 1,60 2
No 1
No Yes Holm 1883;123, NMA:Bak 1969;N77-1, NMA:Krogh 1981, Møller&Madsen 2007;16
Note: Bak 1969 ruin 1, Krogh 1981 ruin A, Møller&Madsen 2007 ruin 9. Ruin dimensions has been reconstructed from Bak 1969 sketch and 2006 DGPS survey
E77_08 E77 9,65 4,85 43,29 1,99 2
No 4 7,4
No Yes NMA:Bak 1969;N77-1, NMA:Krogh 1981, Møller&Madsen 2007;16
Note: Bak 1969 ruin 2, Krogh 1981 ruin A, Møller&Madsen 2007 ruin 2.
E77_09 E77 6,86 4,4 28,01 1,56 2
No 4 13
No Yes NMA:Bak 1969;N77-1, NMA:Krogh 1981, Møller&Madsen 2007;16
Note: Bak 1969 ruin 3, Krogh 1981 ruin A, Møller&Madsen 2007 ruin 3.
E77_10 E77 2 2 4 1,00 6
1 4
No 19 153,6 7,5
No No NMA:Bak 1969;N77-3 Note ruin location, dimensions, and desciption from sketch survey plan only

310
Ruin Data
Ruin_Id RG NO R_Length R_Width R_Area L/W_Index Build_mat/style Wall_Th No_Comp Ar_Comp
1
Ar_Comp 2
Ar_Comp 3
Ar_Comp 4
Ar_Comp 5
Ar_Comp 6
Sunk Ruin_Int Dis_MD Dis_Encl Encl_Fac Encl_Bed Slope DGPS Ref Add
E77_11 E77 6,08 3,86 23,61 1,58 2 0,95 1 10,72
No 4 96,2
No Yes NMA:Bak 1969;N77-2, NMA:Krogh 1981, Møller&Madsen 2007;16
Note: Bak 1969 ruin 7, Krogh 1981 ruin E, Møller&Madsen 2007 ruin 7.
E77_12 E77 3,5 2,5 8,75 1,40 3
1
No 14 244,9
No No NMA:Bak 1969;N77-3 Note ruin location, dimensions, and desciption from sketch survey plan only
E77_13 E77 4,85 2,58 12,26 1,88 5 0,5 1 5,34
No 4 217,4
No Yes NMA:Bak 1969;N77-3, Møller&Madsen 2007;17
E77_14 E77 4,02 2,78 10,89 1,45 4 0,6 1 6,15
No 9 161,6
No Yes Møller&Madsen 2007;17
E77_15 E77 6,06 3,7 21,48 1,64 2 0,9 1 8,14
No 4 49,6
No Yes Møller&Madsen 2007;16 Note: Krogh 1981 ruin C, Møller&Madsen ruin 4
E77_16 E77 4,61 3,81 16,86 1,21 2 1,05 1 4,33
No 14 60,1
No Yes Møller&Madsen 2007;16 Note: Krogh 1981 ruin D, Møller&Madsen ruin 5
E77a_01 E77a 45,1 26,18 764,11 1,72 2
No 1
No Yes NMA: Krogh&Albrethsen 1968, Møller&Madsen 2006;17
Ruin 01 likely consists of several indistinguishable buildings. The ruin is being eroded by the sea in the N end.
E77a_02 E77a 11,5 10 150 1,15 3
No 14 41,2
No No NMA: Krogh&Albrethsen 1968 Ruin 02 has completely eroded; stated description is basen on rough survey sketch and 1968 photograph; ruin measurements are only roughly accurate
E77a_03 E77a 22,39 11,83 230,64 1,89 2
No 3 5,5
No Yes NMA: Krogh&Albrethsen 1968, Møller&Madsen 2006;17
E77a_04 E77a 13,93 11,51 116,83 1,21 2
No 14 41,9
No Yes NMA: Krogh&Albrethsen 1968, Møller&Madsen 2006;17
Note: Møller&Madsen 2007 ruin 5
E77a_05 E77a 13,03 8,69 94,83 1,50 3
No 14 60,6
No Yes NMA: Krogh&Albrethsen 1968, Møller&Madsen 2006;17
Note: Møller&Madsen 2007 ruin 4
E77a_06 E77a 8 4 32 2,00 3
Yes 4 230,8
No No NMA: Krogh&Albrethsen 1968 Ruin 06 was not located during the Møller&Madsen 2006 survey; stated description is basen on rough survey sketch and 1968 photograph; ruin measurements are only roughly accurate
E77a_07 E77a 10,73 9,18 85,78 1,17 3
No 14 105,1
No Yes NMA: Krogh&Albrethsen 1968, Møller&Madsen 2006;17
E77a_08 E77a 7,09 4,82 33,25 1,47 3 1,2 1 11,12
No 4 123,6
No Yes NMA: Krogh&Albrethsen 1968, Møller&Madsen 2006;17
E77a_09 E77a 9 4 36 2,25 3
No 4 98,7
No No NMA: Krogh&Albrethsen 1968 Ruin 09 was not located during the Møller&Madsen 2006 survey; stated description is basen on rough survey sketch and 1968 photograph; ruin measurements are only roughly accurate
E77a_10 E77a 14,4 6,72 91,74 2,14 3
No 14 60,3
No Yes NMA: Krogh&Albrethsen 1968, Møller&Madsen 2006;18
E77a_11 E77a 16,54 1 16,54 16,54 5 1
No 24 290,9
No Yes Møller&Madsen 2007;18 Short stretch of dike
E77a_12 E77a 7,64 5,08 36,2 1,50 3
No 4 23,7
No Yes Møller&Madsen 2007;18
E78_01 E78 34,36 23,53 636,74 1,46 2
No 1
No Yes NMA:Albrethsen 1968/71, NMA:Krogh 1981, Møller&Madsen 2006;22, Møller et al.2007;28
Note that ruin 1 has been redefined/reinterpreted on basis of georeferenced 2007 1:20 drawing (Møller et al.2007;28) and test trenches.
E78_02 E78 6,3 4,48 28,44 1,41 3
No 12 21
No Yes NMA:Albrethsen 1968/71, NMA:Krogh 1981, Møller&Madsen 2006;22
Note that ruin description is based on the 2007 1:20 scale drawing.
E78_02a E78 15,07 15,6 194,73 0,97 2 1,3 1 136,85
No 13
No Yes NMA:Albrethsen 1968/71, NMA:Krogh 1981, Møller&Madsen 2006;22
Note that ruin description is based on the 2007 1:20 scale drawing. The dike is only partially preserved and stated measurements are only roughly accurate (assuming Wall_Th and shape of the preserved parts of the dike). Area_Comp 1 excludes the area of the church building itself.
E78_03 E78 10,6 4,3 41,97 2,47 5 0,5 1
No 4 32,8
No Yes NMA:Albrethsen 1968/71, NMA:Krogh 1981, Møller&Madsen 2006;22
A division was noted, but not surveyed
E78_04 E78 13,2 6,82 82,02 1,94 3
No 14 44,8
No Yes NMA:Albrethsen 1968/71, NMA:Krogh 1981, Møller&Madsen 2006;22
The enclosure noted by Albrethsen could not be relocated.
E78_05 E78 78,8 1,5 114,16 52,53 5 1
No 24 92,5
No Yes NMA:Albrethsen 1968/71, NMA:Krogh 1981, Møller&Madsen 2006;22
E78_06 E78 12,77 5,03 60,01 2,54 3 1 1 28,32
Yes 4 208,7
No Yes NMA:Albrethsen 1968/71, NMA:Krogh 1981, Møller&Madsen 2006;22
E78_07 E78 13,74 3,91 49,83 3,51 3 1 3 7,06 6,8 4,77
Yes 6 231,8
No Yes NMA:Albrethsen 1968/71, NMA:Krogh 1981, Møller&Madsen 2006;23
E78_07a E78 2,95 2,58 4,56 1,14 4 0,6 1 2,68
No 14 242,2
No Yes NMA:Albrethsen 1968/71, NMA:Krogh 1981, Møller&Madsen 2006;23
E78_08 E78 28,07 7,5 203,83 3,74 5 1,1 4 64,84 23,97 12,42 12,23
No 6 490,3
SW
No Yes NMA:Albrethsen 1968/71, NMA:Krogh 1981, Møller&Madsen 2006;23
E78_09 E78 5,29 3,56 18,2 1,49 5
No 4 414
No Yes NMA:Albrethsen 1968/71, NMA:Krogh 1981, Møller&Madsen 2006;23
Note: Møller&Madsen 2006 ruin 11
E78_10 E78 11,9 5,17 59,56 2,30 2
2
No 5 43,1
No Yes NMA:Albrethsen 1968/71, NMA:Krogh 1981, Møller&Madsen 2006;23
Note: Møller&Madsen 2006 ruin 13. A division in two rooms was surveyed, but a lacking of Wall_Th precludes measurement of Ar_Comp
E78_11 E78 6,62 5,57 35,44 1,19 3
No 14 56,7
No Yes Møller&Madsen 2006;23 Note: Møller&Madsen 2006 ruin 10
E78_12 E78 25,84 6,38 149,24 4,05 2 2 3 28,17 14,64 8,23
No 2 410
No Yes Møller&Madsen 2006;23
E78_13 E78 4,06 3,59 13,9 1,13 2 1,5 1 2,27
Yes 14 481,1
No Yes Møller&Madsen 2006;23 Note: Møller&Madsen 2006 ruin 9
E78_14 E78 7,35 4,78 32,54 1,54 2 1,2 1 11,33
No 4 548,5
No Yes Møller&Madsen 2007;18 Note: Møller&Madsen 2007 ruin 13
E78_15 E78 26,2 12,7 279,69 2,06 2
No 3 11
No Yes Møller et al.2007;28 Note that ruin 15 has been redefined/reinterpreted on basis of georeferenced 2007 1:20 drawing (Møller et al.2007;28) and test trenches.
E78_16 E78 18,8 8,9 124,88 2,11 2
No 2 2,4
No Yes Møller et al.2007;28 Note that ruin 16 has been redefined/reinterpreted on basis of georeferenced 2007 1:20 drawing (Møller et al.2007;28) and test trenches.
E78a_01 E78a 34,7 22,3 726,55 1,56 2
No 1
No No Vebæk 1943;8 Measurements from georeferenced Vebæk (1939) survey plan
E78a_02 E78a 15,4 6,72 92,91 2,29 2 2,2 3 9,08 5,09 4,79
No 6 13,4
No No Vebæk 1943;8 Measurements from georeferenced Vebæk (1939) excavation plan
E78a_03 E78a 11,74 6,43 70,89 1,83 2 1,9 2 9,03 4,93
No 5 58,9
No No Vebæk 1943;8 Measurements from georeferenced Vebæk (1939) excavation plan
E78a_04 E78a 13,4 5,6 71,46 2,39 2 1,85 2 8,87 7,88
No 5 27,4
No No Vebæk 1943;8 Measurements from georeferenced Vebæk (1939) excavation plan
E78a_05 E78a 4,54 3,2 13,98 1,42 4 1 1 3,15
No 9 188,7
No No Vebæk 1943;8 Measurements from georeferenced Vebæk (1939) excavation plan
E78a_06 E78a 14,07 11,56 126,88 1,22 2
No 3 18,8
No No Vebæk 1943;8 Measurements from georeferenced Vebæk (1939) excavation plan
E78a_07 E78a 4 2 8 2,00 5
No 4
No No Vebæk 1943;11 Ruin is described by Vebæk (1939;11) but not mapped. Measurements are only approximate.
E78a_08 E78a 8,79 8,08 52,07 1,09 3 1,6 3 21,65 6,84 0,71
No 18 540,3
3 No Yes Heide&Madsen 2010;8, Vebæk 1943;11 Note that Heide&Madsen 2010 ruin 9 is here considered part of ruin 8 (compartment 3)
E78a_09 E78a 6,6 5,6 30,47 1,18 3 1
No 14 67,1
No Yes Møller&Madsen 2007a;18 Møller&Madsen 2007a ruin 3. Note that the ruin has been partially disturbed by modern road and its full dimensions cannot be estimated.
E78a_10 E78a 14,5 7,9 103,6 1,84
1,4 3 31,72 22,66 8,12
No 6 110,4
No Yes Møller&Madsen 2006;23 Møller&Madsen 2007a ruin 2.
E78a_11 E78a 9,45 6,57 52,22 1,44 5 0,9 1 39,14
No 18 65,7
SW 2 No Yes Møller&Madsen 2007a;18 Møller&Madsen 2007a ruin 7. Note that this ruin could be Vebæk's (1943;11) ruin 7, although that
the stated dimensions are very different from the measured

311
Ruin Data
Ruin_Id RG NO R_Length R_Width R_Area L/W_Index Build_mat/style Wall_Th No_Comp Ar_Comp
1
Ar_Comp 2
Ar_Comp 3
Ar_Comp 4
Ar_Comp 5
Ar_Comp 6
Sunk Ruin_Int Dis_MD Dis_Encl Encl_Fac Encl_Bed Slope DGPS Ref Add
E78a_12 E78a 6,52 4,58 27,46 1,42 2 1,4 2 2,89 2,85
Yes 5 182,5
No Yes Heide&Madsen 2010;9 Heide&Madsen ruin 12. Note that the collapse area in front of the ruin has here been omitted.
E78a_13 E78a 2,61 1,43 3,11 1,83 3 0,3 1 2,03
No 19 542,7
No Yes Heide&Madsen 2010;8 Heide&Madsen ruin 10.
E78a_14 E78a 8,16 6,38 49,32 1,28 2 2 1 15,69
Yes 14 316,6
No Yes Heide&Madsen 2010;8 Heide&Madsen ruin 11.
E78b_01 E78b 23,5 19 344,58 1,24 2
No 1
No Yes NMA:Krogh 1981, Møller&Madsen 2007;19 Krogh 1981 ruin B
E78b_02 E78b 7,99 4,95 34,95 1,61 3 0,8
No 4 37,3
No Yes NMA:Krogh 1981, Møller&Madsen 2007;19 Krogh 1981 ruin C
E78b_03 E78b 5,81 3,84 20,52 1,51 2 1 2 3,19 2,6
No 5 62,6
No Yes NMA:Krogh 1981, Møller&Madsen 2007;19 Krogh 1981 ruin A
E78b_03a E78b 6,41 4,06 22,77 1,58 4 0,8 1
No 17 64,1
NW 1 No Yes NMA:Krogh 1981, Møller&Madsen 2007;19 Møller&Madsen 2007 ruin 4
E78b_04 E78b 5,5 3,5 19,25 1,57 2
No 4
No No NMA:Krogh 1981 Krogh 1981 ruin D. Ruin description and measurements from rough sketch plan only
E78b_05 E78b 4,8 2,87 13,59 1,67 2 0,1 1 3,65
Yes 14 60,5
No Yes Møller&Madsen 2007;19
E78b_06 E78b 1,53 1,04 1,61 1,47 4 0,25 1 0,76
No 9 87,3
No Yes Møller&Madsen 2007;19
E80a_11 E80a 6,95 3,92 25,34 1,77 3 0,75 1 11,74
No 4 96,1
No Yes Madsen et al., field report under preparation
E80a_12 E80a 26,3 13,66 271,38 1,93 2
No 1
No Yes Madsen et al., field report under preparation
E80a_19 E80a 6,45 3,63 23,16 1,78 3 0,65 1 12,03
No 4 36,8
No Yes Madsen et al., field report under preparation
E80a_20 E80a 4,97 3,84 17,68 1,29 5 0,6 1 10,46
No 18 53,8
SW 1 No Yes Madsen et al., field report under preparation
E80b_04 E80b 3,2 3,02 9,27 1,06 4 0,7 1 3,19
No 9 630
No Yes Madsen et al., field report under preparation Note that the ruin is interpreted as part of E80b, although lying in closer proximity to E80c
E80b_05 E80b 17,3 5,38 112,56 3,22 2 1,6 3 25,89 15,77 2,01
No 2 18,1
No Yes Madsen et al., field report under preparation
E80b_07 E80b 22 12,7 241,95 1,73 2
No 1
No Yes Madsen et al., field report under preparation
E80b_08 E80b 7,17 4,1 28,49 1,75 3 0,7 1 14,39
No 4 26,4
No Yes Madsen et al., field report under preparation
E80b_09 E80b 5,71 4,33 24,46 1,32 2 0,9 1 9,72
No 4 53,7
No Yes Madsen et al., field report under preparation
E80b_10 E80b 10,35 7,35 61,01 1,41 4 0,65 1 42,9
No 16 153,9
2 Yes Yes Madsen et al., field report under preparation
E80b_13 E80b 8,52 6,91 56,54 1,23 2 1,1 2 11,04 10,47
No 7 17,7
No Yes Madsen et al., field report under preparation
E80b_14 E80b 6,39 3,12 19,57 2,05 2 0,75 1 11,74
No 18 55,4
SW 1 No Yes Madsen et al., field report under preparation
E80b_15 E80b 4,71 3,15 13,87 1,50 2 0,8 1 5,73
No 18 69,9
SW 1 No Yes Madsen et al., field report under preparation
E80b_16 E80b 5,91 6,04 35,12 0,98 5 0,85 2 8,52 7,46
No 5 123,8
No Yes Madsen et al., field report under preparation
E80b_17 E80b 5,73 4,91 28,24 1,17 5 0,5 1 18,4
No 15 163,9
1 No Yes Madsen et al., field report under preparation
E80b_18 E80b 4,45 2,78 12,37 1,60 2 0,7 1 4,8
Yes 14 77,2
No Yes Madsen et al., field report under preparation
E80b_21 E80b 7,22 6,79 46,16 1,06 2
Yes 14 3,6
No Yes Madsen et al., field report under preparation
E80b_22 E80b 7,37 6,22 38,56 1,18 5 0,6 1 25,27
No 15 27,4
2 No Yes Madsen et al., field report under preparation
E80b_23 E80b 4,12 3,68 16,57 1,12 2 0,75 1 5,6
No 14 114,8
No Yes Madsen et al., field report under preparation
E80b_24 E80b 3,61 3,45 11,8 1,05 5 0,5 1 7,22
No 9 631,1
No Yes Madsen et al., field report under preparation
E80c_01 E80c 10,28 9,22 87,26 1,11 2
No 1
No Yes Madsen et al., field report under preparation
E80c_02 E80c 5,3 3,77 18,53 1,41 4 0,65 1 11,04
No 18 21,6
SE 3 No Yes Madsen et al., field report under preparation
E80c_03 E80c 4,54 3,34 13,94 1,36 2 0,9 1 4,68
No 14 28,6
No Yes Madsen et al., field report under preparation
E80c_25 E80c 3,58 2,82 8,03 1,27 2 0,75 1 3,23
No 14 51,1
No Yes Madsen et al., field report under preparation
E83_01 E83 21,36 12,57 250,63 1,70 2 1,95 3 56,94 22,19 20,32
No 3 152,2
No Yes Roussell 1941:34p, Clemmensen 2004, by permission
E83_02 E83 7,86 4,92 37,48 1,60 2 0,95 1 15,12
No 4 116,8
No Yes Roussell 1941:34p, Clemmensen 2004, by permission
E83_03 E83 8,16 5,29 41,83 1,54 2
No 4 110,8
No Yes Roussell 1941:34p, Clemmensen 2004, by permission
E83_04 E83 15,7 7,8 111,52 2,01 2
No 14 60,3
No Yes Roussell 1941:34p, Clemmensen 2004, by permission
E83_05 E83 5,81 4,57 24,36 1,27 2 0,95 1 9,67
No 4 59
No Yes Roussell 1941:34p, Clemmensen 2004, by permission
E83_06 E83 35,6 27,4 794,44 1,30 2
No 1
No Yes Roussell 1941:34p, Clemmensen 2004, by permission
E83_06a E83 65,8 25,9 1715,41 2,54 5 2,1 1 1569,82
No 22 0
S 1 No Yes Roussell 1941:34p, Clemmensen 2004, by permission
E83_07 E83 26,85 8,58 207,5 3,13 2 1,8 2 36,45 36,02
No 2 1
No Yes Roussell 1941:34p, Clemmensen 2004, by permission
E83_08 E83 16,21 8,11 130,89 2,00 4 1,3 1 74,61
No 12 34,6
No Yes Roussell 1941:34p, Clemmensen 2004, by permission
E83_08a E83 30,8 26,3 792,8 1,17 5 1,5 1 509,22
No 13 27,1
No Yes Roussell 1941:34p, Clemmensen 2004, by permission
E83_09 E83 5,04 4,03 20,31 1,25 4
No 9 44,2
No Yes Roussell 1941;36, Fig.18
E83_10 E83 12,11
4
No 9 118,9
No Yes Roussell 1941:34p, Clemmensen 2004, by permission Note that the ruin is partially eroded and the R_Width cannot be measured
E83_11 E83 10,7 7,02 73,72 1,52 2 0,95 2 15,94 13,25
No 7 87
No Yes Roussell 1941:34p, Clemmensen 2004, by permission
E83_12 E83 14,95 4,2 60,19 3,56 2
No 4 126,7
No Yes Roussell 1941:34p, Clemmensen 2004, by permission
E83_13 E83 23,2 6,72 142,37 3,45 2 1,2 1 67,81
No 14 221,9
No Yes Roussell 1941:34p, Clemmensen 2004, by permission
E83_14 E83 15,34 14,81 175,11 1,04 4 0,85 1 122,54
No 16 211,4 11,2
3 Yes Yes Roussell 1941:34p, Clemmensen 2004, by permission
E83_15 E83 4,98 2,67 12,07 1,87 5 0,6 1 4,87
No 19 233,7 11,2
No Yes Roussell 1941:34p, Clemmensen 2004, by permission Note that ruin was interpreted as a grave by Roussell (1941:95)
E89a_01 E89a 15,4 14,36 192,34 1,07 2
No 1
No Yes NMA: Holtved 1932, Madsen et al., field report under preparation
E89a_02 E89a 9,25 5,66 48,41 1,63 2 1,1 1 22,17
No 4 34,1
No Yes NMA: Holtved 1932, Madsen et al., field report under preparation
E89a_03 E89a 4,77 4,14 19,46 1,15 5 0,6 1 10,02
No 14 63,8
No Yes NMA: Holtved 1932, Madsen et al., field report under preparation
E89a_04 E89a 14,03 6,01 80,24 2,33 2 1,45 2 19,78 13,81
No 5 64,4
No Yes NMA: Holtved 1932, Madsen et al., field report under preparation
E89a_05 E89a 7,95 4,09 31,35 1,94 5 0,8 2 6,67 5,92
No 5 81,6
No Yes NMA: Holtved 1932, Madsen et al., field report under preparation
E90_01 E90 52,9 23,5 1129,66 2,25 4 1,8 2 903,3 4,06
No 15 73,3 13,1
3
No Yes Bruun 1895;412, Møller&Madsen 2007;20 Møller&Madsen 2007 ruin 06. Note that the corner of the enclosure have collapsed and measurements in that area are only roughly accurate. Note that the interior compartment is built in stone/turf. Ruin is interpreted as part of E90c (see this)
E90_02 E90 57,88 35,11 1635,45 1,65 4 1,5 3 1265,77 92,69 2,51
No 15 107,6 13,1
1
No Yes Bruun 1895;412, Møller&Madsen 2007;19 Møller&Madsen 2007 ruin 01. Note that compartment 3 is a separate round enclosure (Møller&Madsen 2007 R02). The NW corner of R02 has eroded away and measurements from this area are only roughly accurate. Ruin is interpreted as part of E90c (see this)
E90_02a E90 7,79 6,56 42,24 1,19 4 0,95 1 22,92
No 16 114 2,41
1 No Yes Bruun 1895;412, Møller&Madsen 2007;19 Ruin is interpreted as part of E90c (see this)
E90_03 E90 7,08 4,98 33,94 1,42 4 0,9 1 16,5
No 9 91
No Yes Bruun 1895;413, Møller&Madsen 2007;19 Møller&Madsen 2007 ruin 04. Ruin is interpreted as part of E90c (see this)
E90_05 E90 6,8 3,6 21,75 1,89 5 0,5 1 13,75
No 4 123,6
No Yes Bruun 1895;413, Møller&Madsen 2007;19 Møller&Madsen 2007 ruin 03. Ruin is interpreted as part of E90c (see this)

312
Ruin Data
Ruin_Id RG NO R_Length R_Width R_Area L/W_Index Build_mat/style Wall_Th No_Comp Ar_Comp
1
Ar_Comp 2
Ar_Comp 3
Ar_Comp 4
Ar_Comp 5
Ar_Comp 6
Sunk Ruin_Int Dis_MD Dis_Encl Encl_Fac Encl_Bed Slope DGPS Ref Add
E90_08 E90 21,09 10,35 190,76 2,04 3 1,5 3
No 1
No Yes Bruun 1895;413, Møller&Madsen 2007;20 The ruin is so collapsed that although rooms are visible, they cannot be measured acurately. Ruin is interpreted as part of E90c (see this)
E90_09 E90 9,43 7,06 38,77 1,34 4 0,9 4 5,22 4,4 3,38 3
No 14 103,1
No Yes Bruun 1895;413, Møller&Madsen 2007;20 The structure is built against R02; it is probably milking enclosures. Ruin is interpreted as part of E90c (see this)
E90_10 E90 28,94 27,24 584,33 1,06 2
No 1
No Yes Møller&Madsen 2007;20 Møller&Madsen 2007 ruin 09.
E90_11 E90 11,85 6,15 63,16 1,93 2 0,95 1 37,81
No 14 4,3
No Yes Møller&Madsen 2007;20 Møller&Madsen 2007 ruin 10.
E90_12 E90 7,92 4,03 28,58 1,97 2 0,75 2 6,63 5,33
No 5 163,9
No Yes Møller&Madsen 2007;20
E90_13 E90 8,52 5,24 38,38 1,63 2 1 1 18,76
No 4 182,1
No Yes Møller&Madsen 2007;20 Møller&Madsen 2007 ruin 11.
E90_14 E90 11 6 66 1,83 4
1
No 9 257,9
No No NMA:Bak 1969:N90-3 Note that ruin location and dimension is based on description and rough sketch plan only. There is a chance that Bak ruin N90-3 is the same as R13; however, this seems unlike based on building material and placing.
E90a_01 E90a 13,61 5,3 65,73 2,57 4 0,9 1 43,81
No 15
3 No Yes NMA:Bak 1969;N90a-2, Møller&Madsen 2007;20
E90a_02 E90a 7,26 2,92 20,03 2,49 3
No 4
No Yes Møller&Madsen 2007;21
E90a_03 E90a 3,7 3 10,92 1,23 5 0,4 1 8,71
No 14
No Yes Møller&Madsen 2007;21
E90b_01 E90b 11,48 6,4 70,01 1,79 4 1,3 1 30,75
No 9
No Yes NMA:Krogh&Albrethsen 1968, NMA:Bak 1969;B19-2, N90-3, Møller&Madsen 2007;21
E91_01 E91 7,27 5,03 31,2 1,45 3 0,5 1 21,76
No 18 279,2 242,4 SE 3 No Yes NMA:Bak 1969;N91-3, Møller&Madsen 2007;21
E91_02 E91 2,92 2,08 6,32 1,40 3 0,5 1 1,81
No 14 286,3
No Yes NMA:Bak 1969;N91-3, Møller&Madsen 2007;21
E91_03 E91 8,88 3,69 32,79 2,41 3 0,75 2 11,63 1,79
No 5 245,5
No Yes Møller&Madsen 2007;21
E91_04 E91 17,8 9,5 151,64 1,87 2
No 14 197,9
No Yes NMA:Bak 1969;N91-3, Møller&Madsen 2007;21
E91_07 E91 10,11 7,47 61,75 1,35 2
No 14 136,5
No Yes NMA:Bak 1969;N91-4, Møller&Madsen 2007;22,
E91_08 E91 6,92 3,95 24,9 1,75 3 0,8 1 10,87
No 4 201,5
No Yes NMA:Bak 1969;N91-4, Møller&Madsen 2007;22
E91_09 E91 8,1 3,82 27,7 2,12 5 0,85 2 7,11 3,85
No 5 130,8
No Yes NMA:Bak 1969;N91-4, Møller&Madsen 2007;22
E91_10 E91 8,39 4,69 39,5 1,79 2 0,8 2 9,57 4,93
No 5 131,3
No Yes NMA:Bak 1969;N91-5, Møller&Madsen 2007;22
E91_11 E91 11,19 4,52 41,91 2,48 5 1 1 27,01
No 18 89,2 242,4 S 4 No Yes NMA:Bak 1969;N91-5, Møller&Madsen 2007;22
E91_12 E91 7,66 3,83 29,13 2,00 3 0,8 1 13,79
No 4 79
No Yes NMA:Bak 1969;N91-5, Møller&Madsen 2007;22
E91_13 E91 12,04 7,51 78,56 1,60 2
No 2 48,3
No Yes NMA:Bak 1969;N91-5, Møller&Madsen 2007;22
E91_14 E91 22,6 20,6 394,97 1,10 2
No 1
No Yes Bruun 1895;416, NMA:Bak 1969;N91-5, Møller&Madsen 2007;22
Bruun 1895 ruin 4
E91_15 E91 2,88 2,06 5,85 1,40 4
No 9 3
No Yes NMA:Bak 1969;N91-5, Møller&Madsen 2007;22
E91_16 E91 3,58 3,02 10,19 1,19 5
No 9 8,1
No Yes NMA:Bak 1969;N91-5, Møller&Madsen 2007;22
E91_17 E91 15,48 11,96 158,34 1,29 2
No 3 111,6
No Yes Møller&Madsen 2007;22
E92_01 E92 13 5,5 71,5 2,36 2
2
Yes 14 119,5
No No NMA: Petersen 1894;19, NMA:Krogh 1981 Ruin observations from rough survey sketch and description only
E92_02 E92 7,43 7,03 44,2 1,06 5 1 1 22,92
No 16 86,6 178,9
1 No Yes NMA: Petersen 1894;19, NMA:Krogh 1981, Madsen
2009;15
Note: Madsen 2009 ruin 13
E92_03 E92 57,6 23,6 1042,26 2,44 2
No 1
No Yes NMA: Petersen 1894;19, Bruun 1895;419, Krogh&Berglund 1980;178, NMA:Krogh 1981, Madsen 2009;13
Ruin likely consists of more than one building
E92_04 E92 4,29 3,34 14,1 1,28 2
No 14 39,2
No Yes NMA: Petersen 1894;19, Krogh&Berglund 1980;178, NMA:Krogh 1981, Madsen 2009;13
E92_05 E92 13,11 12,64 128,95 1,04 2
No 14 54,5
No Yes NMA: Petersen 1894;19, Krogh&Berglund 1980;178, NMA:Krogh 1981, Madsen 2009;13
E92_06 E92
No 28
No No NMA: Petersen 1894;19 Ruin has been completely eroded away
E92_07 E92 7,77 4,34 30,63 1,79 3 0,9 2 6,8 5,29
No 5 168,8
No Yes NMA: Petersen 1894;19, Krogh&Berglund 1980;178, NMA:Krogh 1981, Madsen 2009;14
Western gable of ruin has eroded and ruin measurements are only approximate
E92_08 E92 5,8 5,34 25,72 1,09 2 0,85 2 10,46 1,95
No 5 143,4
No Yes NMA: Petersen 1894;19, Krogh&Berglund 1980;178, NMA:Krogh 1981, Madsen 2009;14
E92_09 E92 8,5 5,5 46,75 1,55 2
No 28 70,8
No No Krogh&Berglund 1980;179, NMA:Krogh 1981 Ruin observations based on rough survey sketch and description only
E92_10 E92 7,7 7,16 40,54 1,08 4 1 2 14,3 0,97
No 15 224,4 0,9
1 No Yes Krogh&Berglund 1980;179, NMA:Krogh 1981,
Madsen 2009;15
E92_11 E92 8,42 4,03 33,65 2,09 2 0,75 2
No 5 47,1
No Yes NMA:Krogh 1981, Madsen 2009;12 Note: Madsen 2009 ruin 01. Room partition noticed, but not surveyed or described
E92_12 E92 11,68 5,52 62,06 2,12 3 1,05 2 21,81 7,28
No 5 104
No Yes NMA:Krogh 1981, Madsen 2009;15
E92_13 E92 4,92 3,07 14,89 1,60 5 0,55 1 7,8
No 4 53
No Yes Madsen 2009;12 Note: Madsen 2009 ruin 02
E92_14 E92 5 3,8 16,59 1,32 2
No 14 68,3
No Yes Madsen 2009;16
E92_15 E92 3,23 3,01 8,69 1,07 3 0,7 1 3,27
No 19 224,1 0,9
1 No Yes Madsen 2009;14 Note: Madsen 2009 ruin 09
E92_16 E92 2,23 1,88 3,25 1,19
No 27
No Yes Madsen 2009;16 Note: Madsen 2009 ruin 11; it is not a structure, rather a pit or other man-made feature
E93_01 E93 15,28 14,16 149,89 1,08 4 1,4 2 77,7 10,4
No 15 132 115,8
3 Yes Yes NMA:Petersen 1894;20, Bruun 1895;421,
Krogh&Berglund 1980;181, 187, Madsen 2009;18
E93_02 E93 8,92 4,36 38,28 2,05 3 0,75 1 18,95
No 4 93,3
No Yes NMA:Petersen 1894;20, Bruun 1895;421, Krogh&Berglund 1980;181, Madsen 2009;18
E93_03 E93 9,44 4,33 40,21 2,18 3 0,75 1 20,25
No 4 83,1
No Yes NMA:Petersen 1894;20, Bruun 1895;421, Krogh&Berglund 1980;181, Madsen 2009;18
E93_04 E93 6,71 4,23 27,48 1,59 2 0,9 1 12,6
No 4 25,8
No Yes NMA:Petersen 1894;20, Bruun 1895;421, Krogh&Berglund 1980;181, Madsen 2009;18
E93_04a E93 7,94 3,1 22,04 2,56 5 0,5 2 10,71 4,36
No 17 28,5 115,8 SE 1 No Yes Madsen 2009;18 Feature is part of ruin 04. The wall is not fully preserved and its dimensions can only be estimated
approximately
E93_05 E93 44,55 22,21 896,83 2,01 2
No 1
No Yes NMA:Petersen 1894;20, Bruun 1895;421, Krogh&Berglund 1980;181, Madsen 2009;19
E93_05a E93 18,38 7,13 119,28 2,58 2
No 2 5,6
No Yes NMA:Petersen 1894;20, Bruun 1895;421, Krogh&Berglund 1980;182, 188, Madsen 2009;19
Note that Petersen (NMA:1984) and Bruun (1896;421) interpreted ruin 05 and 05a as one ruin
E93_06 E93 10,82 8,15 68,2 1,33 2 0,8
No 14 25,6
No Yes NMA:Petersen 1894;20, Bruun 1895;422, Krogh&Berglund 1980;182, Madsen 2009;19
E93_07 E93 7,99 3,08 31,85 2,59 2 0,75 2 8,66 4,27
No 5 29,5
No Yes NMA:Petersen 1894;20, Bruun 1895;422, Krogh&Berglund 1980;182, Madsen 2009;19

313
Ruin Data
Ruin_Id RG NO R_Length R_Width R_Area L/W_Index Build_mat/style Wall_Th No_Comp Ar_Comp
1
Ar_Comp 2
Ar_Comp 3
Ar_Comp 4
Ar_Comp 5
Ar_Comp 6
Sunk Ruin_Int Dis_MD Dis_Encl Encl_Fac Encl_Bed Slope DGPS Ref Add
E93_08 E93 8,39 4,95 41 1,69 3 0,65 2 11,05 6,88
No 5 51
No Yes NMA:Petersen 1894;20, Bruun 1895;422, Krogh&Berglund 1980;182, 188, Madsen 2009;20
E93_09 E93 15,33 7,51 91,47 2,04 2 1
No 6 40,5
No Yes NMA:Petersen 1894;20, Bruun 1895;422, Krogh&Berglund 1980;182, 188, Madsen 2009;20
E93_10 E93 7,48 5,78 41,88 1,29 5 0,9 1 23,17
No 4 94,9
No Yes NMA:Petersen 1894;20, Bruun 1895;422, Krogh&Berglund 1980;183, 189, Madsen 2009;20
E93_11 E93 8,84 6,23 49,41 1,42 2 1,15 1 22,38
No 4 89,9
No Yes NMA:Petersen 1894;21, Bruun 1895;422, Krogh&Berglund 1980;183, Madsen 2009;20
E93_12 E93 6,74 6,19 40,73 1,09 3 1,05 1 18,9
Yes 14 124,6
No Yes NMA:Petersen 1894;21, Bruun 1895;422, Krogh&Berglund 1980;183, 189, Madsen 2009;20
E93_13 E93 31,58 13,1 384,05 2,41 2
No 3 30,5
No Yes NMA:Petersen 1894;21, Bruun 1895;422, Krogh&Berglund 1980;183, 189, Madsen 2009;20
E93_14 E93 10,73 6,11 65,57 1,76 3 1 1 36,01
No 14 45,5
No Yes NMA:Petersen 1894;21, Bruun 1895;422, Krogh&Berglund 1980;183, Madsen 2009;21
Note: Krogh&Berlund 1980 ruin 15
E93_15 E93 6,09 3,58 21,46 1,70 5 0,95 1 7,95
No 9 105,6
No Yes NMA:Petersen 1894;21, Bruun 1895;422, Krogh&Berglund 1980;184, 190, Madsen 2009;21
Note: Krogh&Berlund 1980 ruin 16
E93_16 E93 9,39 7,46 66,55 1,26 3
No 14 121,6
No Yes NMA:Petersen 1894;21, Bruun 1895;423, Krogh&Berglund 1980;184, 190, Madsen 2009;21
Note: Krogh&Berlund 1980 ruin 19. Note that walls can be discerned but not measured with any accuracy
E93_17 E93 10,1 9,61 82,2 1,05 5 0,95 1 55,95
No 15 196,4 257,4
2 No Yes Krogh&Berglund 1980;184, 190, Madsen 2009;21 Note: Madsen 2009 ruin 21
E93_18 E93 4,2 4 16,8 1,05
No 14 106,1
No No Krogh&Berglund 1980;184 Ruin observations based on rough survey sketch and description only
E93_19 E93 10 4,7 47 2,13 1
2
No 5 37,4
No No Krogh&Berglund 1980;184, 191 Note: Krogh&Berlund 1980 ruin 14, Ruin observations based on rough survey sketch and description only
E93_21 E93 5,55 4,73 24,49 1,17 5 1,05 1 8,23
No 14 22,3
No Yes NMA:Petersen 1894;21, Bruun 1895;422, Krogh&Berglund 1980;184, Madsen 2009;22
Note: Madsen 2009 ruin 17
E93_22 E93 5,27 5,18 27,12 1,02 5
No 10 979,8
No Yes NMA:Petersen 1894;21, Bruun 1895;423, Madsen 2009;22
Very uncertain ruin by the fjord
E93_23 E93 2,7 1,83 4,63 1,48 5 0,4 1 2
No 9 275,2
No Yes Madsen 2009;22 Note: Madsen 2009 ruin 19
E94_01 E94 30,2 21,28 385,25 1,42 2 1,65
25,96
No 3 61,2
No Yes Bruun 1895;423, NMA:Bak 1967;N94-2, Madsen 2009;25
Note that the ruin has several rooms, but only 1 could be firmly measured (probably a byre)
E94_02 E94 11,78 5,98 70,9 1,97 2 0,9
No 14 36,3
No Yes Bruun 1895;423, Madsen 2009;25 Note that only a short stretch of wall is measurable.
E94_03 E94 26,8 24,5 484,79 1,09 2
No 1
No Yes Bruun 1895;423, Madsen 2009;25
E94_04 E94 9,21 5 44,26 1,84 5 1 2 11,14 7,92
No 5 41,2
No Yes Bruun 1895;423, Madsen 2009;25
E94_05 E94 9,11 5,37 47,55 1,70 5 1,4 2 7,73 4,84
No 5 142,3
No Yes Bruun 1895;423, Madsen 2009;26
E94_06 E94 12,7 8,21 101,67 1,55 3 1,3
No 14 136,9
No Yes Bruun 1895;423, Madsen 2009;26 Note that only a short stretch of wall is measurable.
E94_07 E94 24,5 0,6 14,28 40,83 5 0,6
29620
No 24 151,5
No Yes Madsen 2009;27 Stretch of homefield dike
E94_08 E94 3,47 2,12 7,34 1,64 2 0,6 1 1,9
No 14 110,1
No Yes Madsen 2009;27
E94_09 E94 2,9 2,64 6,7 1,10 3 0,65 1 2,09
No 14 91,3
No Yes NMA:Bak 1967;N94-2, Madsen 2009;27
E94_10 E94 3,42 2,72 6,98 1,26 3 0,8 1 3,81
No 18 81,1 17,4 SE 3 No Yes NMA:Bak 1967;N94-2, Madsen 2009;27
E94_11 E94 9,57 4,22 36,18 2,27 3 0,75 3 6,31 2,73 1,12
No 6 73,2
No Yes NMA:Bak 1967;N94-2, Madsen 2009;27 Note that there are at least 4 rooms, but the latter was to collapsed to measure its dimensions
E94_12 E94 5,48 3,23 12,51 1,70 3 0,75 1 7,81
No 18 70,4 17,4 SW 3 No Yes NMA:Bak 1967;N94-2, Madsen 2009;27
E94_13 E94 72,9 0,7 60,93 104,14 5 0,8
No 24 47,4
No Yes Madsen 2009;28 Stretch of homefield dike
E94_14 E94 51,8 0,7 40,94 74,00 5 0,8
No 24 93,3
No Yes Madsen 2009;28 Stretch of homefield dike
E94_15 E94 7,39 5,97 30,32 1,24 4 1,15 2 9,28 1,58
No 15 226,8 11,78 W 3 No Yes NMA:Bak 1967;N94-3, Madsen 2009;28
E94_16 E94 7,24 4,5 28,81 1,61 3 1,2 2 15,81 1,2
No 18 244,8 6,5 W 3 No Yes NMA:Bak 1967;N94-3, Madsen 2009;28
E94_17 E94 6,73 5,35 28,3 1,26 4 1 1 15,68
No 18 257,4 6,5 NW 3 No Yes NMA:Bak 1967;N94-3, Madsen 2009;29
E94_18 E94 9,87 5,11 50,13 1,93 5 0,8 1 29,43
No 4 348,1
No Yes NMA:Bak 1967;N94-3, Madsen 2009;29
E94_19 E94 2 1,2 2,4 1,67 4
1
No 11 367,8
No No Madsen 2009;29 Ruin measurements from description and photograph only
E94_20 E94 6 6 36 1,00 4 1 1
No 15
No Yes NMA:Bak 1967;N94-3 Ruin measurements from sketch survey plan and description only. Distance to dwelling unknown
E95_01 E95 18,44 8,96 114,52 2,06 2
No 2 40,4
No Yes Bruun 1895;424, Madsen 2009;32
E95_02 E95 36,77 26,01 646,43 1,41 2
No 1
No Yes Bruun 1895;424, Madsen 2009;32
E95_03 E95 6,96 3,82 23,53 1,82 2
Yes 4 59,8
No Yes Bruun 1895;424, Madsen 2009;32
E95_04 E95 5,24 2,95 15,44 1,78 5 0,4 1 10,62
No 4 100,9
No Yes Bruun 1895;424, Madsen 2009;32
E95_05 E95 9,03 7,76 45,1 1,16 3 0,5
No 14 106,4
No Yes Madsen 2009;32 Ruin preservation and erosion does not allow for detailed measurements
E95_06 E95 2,28 2,01 4,5 1,13 3 0,45 1 1,67
No 19 36
1 No Yes Madsen 2009;33
E95_06a E95 4,3 3,91 13,27 1,10 2 0,4 1 8,9
No 17 31,6 154,4 S 1 No Yes Madsen 2009;33
E95_07 E95 12,42 7,44 77,58 1,67 2
No 14 3,3
No Yes Madsen 2009;33
E95_08 E95 4,02 1,98 7,69 2,03 5
No 20 195,1
No Yes Madsen 2009;33
E95_09 E95 2,79 2,25 4,7 1,24 3 0,35 1 2,31
No 20 269,2
3 No Yes Madsen 2009;33
E95_10 E95 7,19 3,3 25,67 2,18 4 0,5 1 14,22
No 18 191,9 2,49 S 3 No Yes Madsen 2009;34
E95_11 E95 4,09 2,48 8,04 1,65 4 0,4 1 3,81
No 18 187,5 2,49 S 2 No Yes Madsen 2009;34
E95a_01 E95a 22,86 17,4 292,83 1,31 2
No 1
No Yes NMA:Bak 1968;N95a-1, Madsen 2009;36 NMA:Bak 1968;N95a-1, ruin 1
E95a_02 E95a 5,8 4,53 26,29 1,28 2
No 14 2,1
No Yes NMA:Bak 1968;N95a-1, Madsen 2009;36 NMA:Bak 1968;N95a-1, ruin 2
E95a_03 E95a 10,9 4,32 37,73 2,52 5 0,6 1 20,15
No 4 2,4
No Yes NMA:Bak 1968;N95a-2, Madsen 2009;37 NMA:Bak 1968;N95a-1, ruin 6?
E95a_04 E95a 7,2 5,62 38,84 1,28 2 0,5
No 14 17,1
No Yes Madsen 2009;37
E95a_05 E95a 4,8 4,14 19,79 1,16 2 0,65 2 4,92 4,21
No 7 19,7
No Yes Madsen 2009;37
E95a_06 E95a 7,93 4,83 33,29 1,64 2 1 1 13,41
No 4 28,6
No Yes Madsen 2009;37
E95a_06a E95a 6,02 2,51 10,69 2,40 3 0,5 1 7,24
No 17 28,6 44,4 SE 1 No Yes Madsen 2009;37 Ruin dimensions are only roughly accurate, because the feature is not wholly preserved
E95a_07 E95a 11,36 8,62 76,08 1,32 3 0,5 1 59,2
No 18 116,7 93,3 W 3 No Yes Madsen 2009;38
E95a_08 E95a 6,3 5,05 24,93 1,25 4 0,8 1 12,29
No 18 78,2 18,4 SE 3 No Yes NMA:Bak 1968;N95a-2, Madsen 2009;38 NMA:Bak 1968;N95a-1, ruin 10
E95a_09 E95a 2,49 1,55 3,48 1,61 6 0,25 1 2,2
No 19 51,5 8,3 E 3 No Yes Madsen 2009;38
E95a_10 E95a 24,03 18,8 357,51 1,28 4 1,1 1 290,21
No 15 40 8,3
1 No Yes NMA:Bak 1968;N95a-2, Madsen 2009;38 NMA:Bak 1968;N95a-1, ruin 9

314
Ruin Data
Ruin_Id RG NO R_Length R_Width R_Area L/W_Index Build_mat/style Wall_Th No_Comp Ar_Comp
1
Ar_Comp 2
Ar_Comp 3
Ar_Comp 4
Ar_Comp 5
Ar_Comp 6
Sunk Ruin_Int Dis_MD Dis_Encl Encl_Fac Encl_Bed Slope DGPS Ref Add
E95a_11 E95a 14,11 9,88 113,32 1,43 4 1,15 2 50,98 11,53
No 15 114,5 79,78 SE 3 No Yes Madsen 2009;38
E95a_12 E95a 4,78 2,59 12,41 1,85 2 0,55 1 5,55
No 4 67,4
No Yes Madsen 2009;39
E95a_13 E95a 11,36 4,06 46,86 2,80 3 0,8 2 12,35 11,14
No 5 52,1
No Yes Madsen 2009;39 NMA:Bak 1968;N95a-1, ruin 3
E95a_14 E95a 8,9 5,01 40,15 1,78 2
No 4 13,3
No Yes NMA:Bak 1968;N95a-1, Madsen 2009;39 NMA:Bak 1968;N95a-1, ruin 2
E95a_15 E95a 3 2,5 7,5 1,20 4
No 9
No No NMA:Bak 1968;N95a-3 NMA:Bak;N95a-1, ruin 11. Ruin measurements from rough sketch survey only.
E95b_01 E95b 32,3 14,9 376,01 2,17 2
No 1
No Yes NMA:Bak 1968;N95b-2, Gulløv 1999;19, Madsen 2009;41
NMA:Bak 1968;N95b-2, ruin 3
E95b_02 E95b 7 4,42 30,43 1,58 5
No 4 81,3
No Yes Madsen 2009;41
E95b_03 E95b 10,97 6,01 54,01 1,83 5 0,5 1 41,34
No 18 30,5
S 3 No Yes Madsen 2009;42 Madsen 2009 ruin 05
E95b_04 E95b 3,92 3,16 8,78 1,24 3 0,7 1 3,67
No 14 87,2
No Yes NMA:Bak 1968;N95b-2, Madsen 2009;42 NMA:Bak 1968;N95b-2, ruin 9
E96_01 E96 11,57 4,2 48,82 2,75 2 0,95 2 12,1 9,46
No 5 152,2
No Yes Madsen et al., field report under preparation
E96_02 E96 7,67 4,16 30,73 1,84 2 0,8 1 14,88
No 4 183,1
No Yes Madsen et al., field report under preparation
E96_03 E96 2,7 1,74 4,3 1,55 4 0,75 1 1,3
No 20 184,2
No Yes Madsen et al., field report under preparation
E96_04 E96 19,14 7,73 118,25 2,48 2
No 2 146,1
No Yes Madsen et al., field report under preparation
E96_05 E96 3,79 2,1 7,77 1,80 4
No 9 227,6
No Yes Madsen et al., field report under preparation
E96_06 E96 14,67 11,83 131,05 1,24 2
No 1
No Yes Madsen et al., field report under preparation
E96_07 E96 9,61 2,86 25,96 3,36 5
No 4 111,5
No Yes Madsen et al., field report under preparation
E96_08 E96 21,13 5,63 112,33 3,75 3 0,9 4 17,97 10,94 10,6 10,16
No 6 119,7
No Yes Madsen et al., field report under preparation
E96_09 E96 7,96 4,21 33,15 1,89 5 0,65 1 19,31
No 4 124,3
No Yes Madsen et al., field report under preparation
E96_10 E96 3,56 2,83 10,04 1,26 4
No 9 97,1
No Yes Madsen et al., field report under preparation
E96_11 E96 3,72 3,07 11,54 1,21 5 0,65 1 5,13
No 14 131,1
No Yes Madsen et al., field report under preparation
E96_12 E96 7,68 3,8 29,46 2,02 2 0,8 1 13,82
No 4 26,5
No Yes Madsen et al., field report under preparationMadsen et al., field report under preparation
E96_13 E96 8,25 4,73 38,78 1,74 3 0,8 1 19,94
No 4 149
No Yes Madsen et al., field report under preparation
E96_14 E96 5,55 4,84 26,82 1,15 3
No 14 135,1
No Yes Madsen et al., field report under preparation
E96_15 E96 6,02 5,77 25,51 1,04 4 0,65 1 18,53
No 18 105
W 3 No Yes Madsen et al., field report under preparation

315
APPENDIX 2 – RUIN GROUP DATABASE PARAMETERS DESCRIPTION
A few introductory points should be made in regard
to the RGD (App.2): first, it should be recognized that a
ruin group is a nominal category (of archaeological
registration), i.e. it is not directly equivalent to a discrete
and defined Norse functional unit or site. Fortunately,
most ruin groups do in fact seem to correspond to
discrete sites. However, in a few cases – for instance E71
and E90 – two functionally distinctive sites are grouped
under one ruin group number. In a few other cases the
problem is just the opposite, i.e. separate ruin group
numbers have been ascribed to archaeological features
that are obviously part of the same functional unit. In
such cases, the RGD attempts to either split or assemble
ruin group evidence on functional units – for instance
E71N, E71S, and E90c – although it is not feasible in all
cases – for instance E167 – because there are no
topographic features to guide such distinction.
Second, unlike the Ruin Database (RD, see section
6.1.2, App.1) most of the parameters observed for the
sites in the Ruin Group Database were recorded during
survey data post processing and drawing on various
digital geographic and topographic data. The different
parameters are explored in the following sections, but
described together here for convenience. Some
parameters are referential or quantitative and need little
explanation, others are more, or purely, qualitative and
call for extended explanation:
Ruin Group Identification Number (Ruin Group_ ID):
The unique identification number of each individual
ruin group. Ruin group numbering follows the old
registration system. In the RGD this number refers
directly to the RD.
Nunatta Katersugaasivia Allagaateqarfialu Number
(NKA_No.):
Ruin group unique identification number after the
new registrant of the National Museum of Greenland.
Note that ruin groups located after 1982 only have a
NKA number and are numbered with this also under the
Ruin Group_ID.
Location Name (Loc_Name):
The current Greenlandic place name of the location
of a ruin group.
Survey Category (Survey_Cat):
Describes whether the main ruin group survey
evidence is based on: 1) DGPS-survey; 2) published
modern surveys (carried out with basic analogue survey
equipment, but aimed at uniform and precise ruin
description, e.g., Fig.4.15); 3) georeferenced/digitalized
surveys (of the former type of survey evidence for digital
measuring); 4) surveys based on satellite imagery or
aerial photography without ground thruthing; and 5)
survey based on sketch plans/description only. This
parameter is included for quick overview and survey
quality assessment.
Region (Reg.):
The larger geographical region where the ruin group
is located (cf. Fig.3.2) and where: 1) is the Vatnahverfi
region; 2) is the Qaqortoq Peninsula; 3) is the
Qassiarsuk/Brattahlid region; 4) is the Uunartoq Fjord;
and 5) the southern Eastern Settlement. This parameter
was included for general overview, sorting, and for any
future develop-ment and extension of the RGD.
Vegetation Zone (Veg_Zone):
The vegetation zone (Fig.3.10) after Feilberg (1984)
in which the ruin group is located and where zones are
described as: 1) sub-continental, subarctic; 2) sub-
continental, low-arctic zone; 3) sub-oceanic, low- or
subarctic; 4) oceanic, low-arctic; 5) hyper oceanic, low-
artic; or 6) residual zone. These nature of these
vegetation zones are described in section 3.2.1
Elevation in meters above sea level (Ele_m.a.s.l.):
The elevation of a ruin group in meters above sea
level. Because ruin groups mostly consist of several
ruins that can be located at different altitude, the
parameter is divided on 25m categories, within which
the majority of the ruins are located. The 0-25 m
category is labelled '1' in the Ruin Group Database, the
next 25-50m category '2' etc.
Ruin Group Orientation (RG_OR):
If sheltered and shaded from one or more sides by
steep mountain slopes, ruin group orientation signifies
the general orientation towards which the ruin group is

316
lies exposed divided on 8 intercardinal directions
(beginning with '1' for north and increasing clockwise)
and 9 if the ruin groups lies in open terrain.
Ruin Group Excavation (Exc., yes/no):
Binary parameter that describes if a ruin group in the
sample has been excavated at any point. For details on
the excavation and references, see Tab.4.1.
Total Number of Ruins (TNR):
The total number of ruins (including building types
1-25 in the RD, but excluding irrigation features, other
features, and unknown features, since these to a limited
extent and somewhat arbitrarily reflect site functions.
Number of Roofed Buildings (No_RB):
The total number buildings are classified as roofed in
the RD (1-12).
Total Area of Roofed Buildings (Ar_RB):
The summed up area of all buildings classified as
roofed in the RD (1-12, 14).
Total Area of Enclosures (TAE):
Is the total enclosed area of enclosures with built wall
(15-16), enclosures partly delimited by building and cliff
(17-18), separate lambrakró (19), sheep/goat shelters
(20), and grazing enclosures (22). Although these
enclosures, as discussed in chapter 7, clearly had
different functions they all relate to individual farmstead
activities and must on some level reflect the overall scale
of livestock farming on a given site after the assumption
that much livestock equals large enclosures.
Farmstead Dispersion Index (FDI):
The average distance of all outbuildings to the main
farmhouse. As presented in chapter 6, the distance of
various outbuildings to their associated dwellings seem
fairly distinctly associated with function. At the same
time, it was outlined in section 5.1.2 how some
farmsteads have a noticeably more dispersed layout
schemes than others that appear more nucleated. It was
argued there that these different layout schemes reflect
different farmstead types. Thus it seems reasonable that
the overall dispersion of outbuildings is applicable as a
measure for farmstead function and size. The FDI is
simply the total average distance of outbuildings to their
associated dwellings excluding the single ruin that lies
most distant, because one or a few ruins quite often are
located atypically remote. Where there is only one ruin
apart from the dwelling, their inter-distance is used.
Number of Dwellings (No_Dwell):
The numbers of buildings classified as dwellings (1)
in the RD.
Area of Main Dwelling (Ar_MD):
The area of the dwelling (cf. App.1); in cases where
there two dwellings, only the largest is indicated.
Midden (Midd., yes/no):
Is a midden registered at the site?
Number of Cattle Houses (Cattle_House.):
The numbers of buildings that primarily facilitated
housing and stalling of cattle (classified as simple
byre/barns (2) and stable-complexes (3) in the RD).
Number of Livestock Houses (Livestock_House.):
The numbers of buildings that could facilitate cattle,
but was primarily related to the housing and stalling of
other livestock (buildings classified as bipartite livestock
buildings (5) and livestock stables (6) in the RD).
Number of Sheep/Goat Houses (Sheep/Goat_House.):
The numbers of buildings that solely facilitated
housing and stalling of sheep/goats (buildings classified
as sheep/goat sheds (4), double sheep/goat sheds (7), and
sheep/goat shelter/pens (8) in the RD).
Number of Storehouses (Storehouse.):
The numbers of buildings classified as storehouses
(9) in the RD.
Number of Other Roofed Houses (Roof_House):
The numbers of buildings classified as unspecified
roofed outbuildings (14) in the RD.
Number of Caprine Enclosures (Cap_Encl.):
The number of enclosures at a ruin group that
primarily facilitated herding and milking of sheep/goat
husbandry (buildings classified as enclosures with built
wall, enclosures partly limited building or cliff, separate
lambakró, and sheep/goat shelters types 17-21 in the
RD). Enclosures partly delimited by building are

317
included here because they could have functioned as
pens/folds, and were mainly associated with minor
sheep/goat houses, i.e. facilitated management and
housing of the latter livestock (see section 6.2.3).
Number of Grazing Enclosures (Graz_Encl):
The numbers of buildings at a ruin group that
primarily facilitated cattle herding and milking
(buildings classified as enclosures with partly delimited
by water (21) and grazing enclosures (22) in the RD).
Infield Area (Ar_Infield):
The approximate area of land at a ruin group that
could be cultivated (infield). Although DGPS-surveyed
in a few instances, most of the Ar_Infield have been
measured from GoogleEarth satellite imagery.
Meadow (yes/no?):
Is fen/meadow vegetation found within 500m of the
site?
Additional notes (Add.):
Additional description or notes on a ruin group, most
often stressing if a ruin group was split or assembled
differently from earlier registration.
In conclusion, it is obvious from the above outline
that the RGD condenses some of the categories of
livestock outbuildings and enclosure and “fuzzy”
clusters outlined in chapter 6. As discussed there, the
building types to some extent overlap in functions and
dimensions. Thus, the grouping of outbuildings offered
in the RGD should be understood as a transitional
guideline: the simple byre/barns and stable complexes
were more specifically associated with cattle housing
than the bipartite livestock buildings and livestock
stables; the latter were associated more with general
livestock housing than the sheep/goat sheds and
shelter/pens, which were more specifically associated
with sheep/goat housing. The grouping of enclosures is
explained along the same lines: enclosures with built
wall, partly delimited by cliff, the separate lambakró,
and sheep/goat shelters were functionally more related to
milking and farm-near livestock herding than the
enclosures partly delimited by water that were related to
large-scale livestock roundups or cattle grazing, the latter
function being even more significant at the cattle grazing
enclosures etc. The grouping of farmstead buildings is
explored in section 7.1.4)

318
Ruin Group Info
RG_No NKA_NO Loc_Name Surv_
Cat Reg
Vege_Zon
e
Ele_ASL
RG_Or
RG_Class
Exc TNR No_RB
Ar_RB TAE Dis_In
dex No_D
w Ar_MD Midd
Cattle_House
Livestock_House
Sheep/goat_
House
Storehouse
Roof_House
Cap_Encl
Graz_En
cl
Ar_HF Meadow Add
00-2
1 3 1 9 4 10 Yes 4 2 10,78 207,16 4,5 1 57,76 No 0 0 0 1 0 2 0
Yes
0403
2 1 3 8 4 7 No 1 0 0 84 0 0 0 No 0 0 0 0 0 1 0 0 No
0405
5 1 4 1 8 6 No 1 1 15 0 0 0 0 No 0 0 0 0 1 0 0 0 No
0501
1 1 3 1 8 1 No 1 1 11,61 0 0 0 0 No 0 0 1 0 0 0 0 0 No
0502
Yessletten 1 1 1 4 8 8 No 4 3 83,76 72,92 0 0 0 No 0 0 2 1 0 1 0 0 Yes
0503
Snesø 1 1 1 19 4 1 No 1 0 0 0 0 0 0 No 0 0 0 0 0 0 0 0 No
0601
1 1 1 7 2 6 No 1 1 5,4 0 0 0 0 No 0 0 0 0 1 0 0 0 No
0602
5 1 3 8 8 8 No 3 1 18 24 0 0 0 No 0 0 0 0 1 1 0 0 No
0603
Tasersuaq 1 1 3 1 8 6 No 1 1 32,24 0 0 0 0 No 0 0 0 0 1 0 0 0 No
0604
5 1 3 1 5 4 No 1 0 0 6 0 0 0 No 0 0 0 0 0 1 0 0 No
0605
Sioralik 1 1 3 1 3 2 No 2 2 53,78 0 0 0 0 No 0 0 0 0 1 0 0 0 No
0701 60V2-0IV-44 Karrarmiut 1 1 4 1 5 8 No 3 2 36,63 5,28 0 0 0 No 0 0 0 0 2 1 0 0 No
0901
Taseq
Ammolortoq 1 1 1 7 5 10 No 2 2 46,68 0 0,7 1 0 No 0 1 0 0 0 0 0 0 No
0902
1 1 3 1 9 3 No 1 0 0 0 0 0 0 No 0 0 0 0 0 0 0
No
1001
Akia 1 1 4 1 9 5 No 2 2 23,6 0 0 0 0 No 0 0 0 0 2 0 0 0 Yes
1102
Tasikulooq 1 1 3 9 9 4 No 1 0 0 6,15 0 0 0 No 0 0 0 0 0 1 0 0 No
1103
Naasaangitsup
Tasia 1 1 3 13 9 6 No 1 1 14,73 0 0 0 0 No 0 0 0 0 1 0 0 0 No
1104
Tasersuaq 1 1 3 9 6 10 No 1 1 0 0 0 1 49,92 No 0 0 0 0 0 0 0 0 No
1301
1 1 4 2 4 8 No 6 1 9,03 56,96 0 0 0 No 0 0 0 0 1 5 0
No
60V1_00I_
543 60V1_00I_543
1 4 3 1 2 2 No 1 1 42,75 0 0 0 0 No 0 0 0 0 0 0 0 0 No
B10
5 1 3 9 6 7 No 4 0 0 26,9 0 0 0 No 0 0 0 0 0 4 0
No
B102 60V2-I0V-527 Qorlortuup Tasia 1 1 3 5 7 1 No 1 0 0 0 0 0 0 No 0 0 0 0 0 0 0 0 No
B136
5 1 3 4 4 10 No 4 2 12 77 0 1 225 No 0 0 1 0 0 2 0
No
B139
Tasersuaq 5 1 3 1 3 10 No 3 1 0 21,2 39,7 1 34,97 No 0 0 0 0 0 2 0
No
E111 59V1-0IV-502 Ikigaat 1 6 4 1 4 16 Yes 13 8 803,68 50,22 73,3 1 523,2 Yes 2 1 1 0 2 3 0
No
E118 60V2-0IV-572 Sarfarmiut 1 1 4 1 5 11 No 7 6 95,18 21,69 70,8 1 313,49 Yes 0 0 2 1 2 1 0 4558 Yes
Note that only the area nearest the dwelling
(R02) is counted as
homefield proper, as the other areas are deemed
to wet.
E119 60V2-0IV-575 Illorsuit 1 1 4 2 5 13 No 13 10 391,99 96,47 86,5 1 507,74 Yes 1 2 2 2 2 3 0 10713 Yes
E120 60V2-0IV-574 Tasiluk 1 1 4 1 6 12 No 9 6 211,44 97,42 92,1 1 450 Yes 0 0 2 1 2 2 0
Yes
Note that several ruins
have been removed before proper
registration; Ar_Mid,
Ar_HF cannot be estimated as these have
been removed and are now cultivated
E125 60V1-00I-531 Asorutit 1 4 4 2 5 11 No 11 9 305,55 21,09 53,9 1 108,06 No 0 3 1 0 3 2 0
No
E126 60VI-00I-529 Igannaq 1 4 3 1 5 12 No 8 7 291,75 113,57 47,7 1 295,61 Yes 1 0 4 0 0 1 0
Yes
E149 60V2-0IV-504 Narsarsuaq 3 5 4 1 9 16 Yes 22 14 1626,42 349,76 127,8 1 1587,62 Yes 4 1 4 0 3 7 0
Yes
E150 60V2-0IV-506 Puiattuaraq 1 5 4 1 4 9 No 6 5 155,04 177,08 0 0 0 No 0 2 1 0 2 1 0
Yes
E164 60V2-0IV-590 Kallunatsiaq 1 1 3 5 4 13 No 24 20 637,78 116,32 126,3 1 159,19 Yes 0 5 5 1 8 3 0
Yes Ar_HF could not be
measured
E165 60V2-0IV-591 Tasersuaq 1 1 3 1 1 13 No 4 3 16,23 396,98 149,9 1 839,87 Yes 0 0 2 0 0 0 0 1486 No
Note: only the DGPS-survey exists from the
2006 survey, no
description
E166 60V2-0IV-592 Tasersuaq 1 1 3 1 7 12 No 7 6 168,09 45,54 90,4 1 707,82 Yes 0 1 1 0 3 1 0 2462 No
E167 60V2-0IV-603 Tasikulooq
(Abel's Farm) 1 1 3 10 4 11 Yes 15 12 266,62 45,54 92,1 2 520,8 Yes 0 0 3 3 2 2 0 5301 Yes
E167a 60V2-0IV-604
5 1 3 10 9
No 1 0 0 78,76 0 0
No 0 0 0 0 0 0 0 0 No Ruins are very uncertain, only sketch description
exists
E168 60V2-0IV-541 Zucerip Tasia 1 1 1 11 4 11 Yes 7 6 670,47 38,85 82,5 1 484,83 Yes 1 2 0 1 1 1 0 3262 Yes
E169 60V2-0IV-610 Hestespor Sø 1 1 1 4 9 11 Yes 4 2 31,39 177,12 160,3 1 339,44 Yes 0 0 1 0 0 2 0 0 Yes

319
Ruin Group Info
RG_No NKA_NO Loc_Name Surv_
Cat Reg
Vege_Zon
e
Ele_ASL
RG_Or
RG_Class
Exc TNR No_RB
Ar_RB TAE Dis_In
dex No_D
w Ar_MD Midd
Cattle_House
Livestock_House
Sheep/goat_
House
Storehouse
Roof_House
Cap_Encl
Graz_En
cl
Ar_HF Meadow Add
E170 60V2-0IV-547 Saarap Qoorua 1 1 3 7 4 11 No 7 6 293,77 95,82 167,8 1 282,14 Yes 1 0 0 2 2 1 0 1 No Note that ruin group E170a is here treated as
part of E170
E170a 60V2-0IV-546 Saarap Qoorua 1 1 2 5 9
No 1 1 109 0 0 0
No 0 0 0 0 0 0 0
No
E171 60V2-0IV-601 Tasilikulooq 1 1 3 1 9 13 Yes 16 12 1007,76 251,45 64,5 2 350,8 Yes 4 2 2 0 2 3 1
Yes Note that Ar_HF cannot be measuret as it is now
cultivated
E172 60V2-0IV-593 Tatsip Ataa 1 1 3 1 9 13 Yes 21 14 1098,79 198,88 127,8 1 535,19 Yes 2 3 4 1 3 5 0 7761 Yes
E173 60V2-0IV-583 Ammassiviup Tasia
1 1 4 3 9 11 No 11 9 284,02 66,04 61,48 1 190,37 Yes 0 2 2 1 3 2 0 0 Yes
E174 60V2-0IV-580 Qemertut Tasia 1 1 4 1 5 13 No 13 9 356,18 66,09 137,7 1 632,47 Yes 0 2 4 1 1 1 0
Yes
Note that Ar_HF cannot
be measuret as it is now cultivated
E175 60V2-0IV-588
1 1 3 7 5 10 No 1 1 0 0 0 1 87,61 No 0 0 0 0 0 0 0 0 No
E178 60V2-0IV-569 Tasiusaq 1 1 4 1 9 14 No 19 12 307 1201,99 88,24 1 737,25 Yes 0 1 6 2 2 4 1 622556 Yes
Note that ruin 1 in all likelihood covers several
buildings and midden, but was too poorly
preserved to establish
E179 60V2-0IV-568 Torsukattak 1 1 4 1 5 11 No 3 3 15,89 0 10,2 1 336,76 No 0 0 0 0 2 0 0 2305 No
E18 60V1-00I-520 Narsaq 1 4 3 1 4 16 Yes 17 14 1784,59 20,91 99,7 1 1097,58 Yes 2 3 3 2 2 1 0
Yes
E180 60V2-0IV-549 Qallimiut Imaa 1 1 3 1 4 11 No 4 3 85,55 52,66 25 1 251,27 No 0 0 2 0 0 1 0 0 No
E181 60V2-0IV-571 Itilleq 1 1 4 1 3 13 No 8 7 229,05 49,17 76 1 532,72 No 0 0 4 1 1 1 0 8220 No Note that ruin 1 could
hide midden
E182 60V2-0IV-582 Kangerluarsorujuup Qinngua
1 1 4 1 6 13 No 16 13 817,91 454,99 133,1 1 357,46 Yes 2 1 1 1 7 3 0
Yes Note that Ar_HF cannot be measuret as it is now
cultivated
E183 60V2-0IV-577
5 1 4 2 4 13 No 3 3 530 0 0 1 467,5 No 0 1 0 0 1 0 0
No Note that only rough a survey description exists
from this ruingroup
E184 60V2-0IV-579 Tasiluaraq 1 1 4 1 6 13 No 14 10 628,84 144,23 92 1 946,06 Yes 2 0 3 1 3 3 0
Yes
Note that midden could not be distinguished from
ruin. Note that Ar_HF cannot be measuret as it
is now cultivated.
E188 60V2-0IV-637 Akia 1 1 4 1 4 12 Yes 10 6 272,47 129,53 121,2 1 201,17 Yes 1 1 0 1 2 4 0 1975 Yes
E190 60V2-0IV-564 Qaarsutsiaq 1 1 4 1 4 13 Yes 10 7 665,91 236,51 72,5 1 303,3 Yes 3 0 1 0 2 3 0 15634 Yes
Note that midden could not be distinguished from
ruin. Note that Ar_HF does not include recently
cultivated field that was likely meadow
E195 60V1-00I-530 Igannaq 1 4 3 1 4 10 No 7 3 51,19 98,92 52,2 1 122,23 No 0 1 0 1 0 2 0
No
E196 60V2-0IV-587 Nimerialik 1 1 3 1 4 13 No 6 5 518,19 284,52 30 1 623,03 No 1 0 1 0 2 1 1
Yes
E209 60V2-0IV-614 Kallunatsiaq 1 1 1 2 5 12 No 16 7 187,57 644,99 97,3 1 239,6 Yes 0 1 3 1 1 7 0 737 No
E209a
Kallunatsiaq 1 1 1 2 6 12 No 3 3 42,26 0 3,9 1 94,27 No 0 0 0 0 2 0 0
No
E210 60V2-0IV-594 Tatsip Ataa Kangilleq
1 1 3 1 5 5 No 7 5 190,94 25,46 0 0 0 No 0 1 2 0 2 2 0 0 No
E237 60V2-0IV-556 Eqaluqaarsuit 5 1 4 1 4
No 1 0 0 0 0 0 0 No 0 0 0 0 0 0 0 0 No
E262 60VI-00I-521 Nuummiut 1 4 3 1 9 10 No 1 1 0 0 0 1 141,91 No 0 0 0 0 0 0 0
Yes
E273 60V1-00I-502 Akia 1 1 4 2 5 10 No 7 5 68,16 54,67 93,7 1 184,52 No 0 0 1 2 1 2 0 3465 No
E274 60V1-00I-501 Nuuk Qaqortoq 1 1 4 1 4 7 No 1 0 0 14,2 0 0 0 No 0 0 0 0 0 1 0 0 No
E28 61V3-III-541 Qassiarsuk 2 3 1 1 9 13 Yes 13 10 773 40 173,8 1 325,53 Yes 0 4 3 1 0 2 0
Yes
E29 60V3-III-540 Qassiarsuk 3 3 1 1 9 13 Yes 10 8 457,72 1375,1 103,4 1 309,45 Yes 2 0 3 2 0 2 0
Yes
E293 60V2-0IV-613 Inoqquassaap
Kuua 1 1 1 8 7 10 No 4 1 0 138,53 15,4 1 173,59 No 0 0 0 0 0 3 0 0 Yes
E294 60V2-0IV-537 Ulvesøen 5 1 1 9 4 6 No 1 1 7 0 0 0 0 No 0 0 0 0 1 0 0 0 No
E295 60V2-0IV-535 Snesø 1 1 1 19 9 3 No 2 0 0 0 0 0 0 No 0 0 0 0 0 1 0 0 No
E296 60V2-0IV-536 Amaqqup Tasia 1 1 1 8 4 9 No 8 8 73,34 0 0 0 0 No 0 0 0 0 8 0 0 0 No
E297 60V2-0IV-534 Amaqqup Tasia 1 1 1 7 9 6 No 1 1 10,16 0 0 0 0 No 0 0 0 0 1 0 0 0 Yes
E298 60V2-0IV-533 Petrusip Tasia 1 1 1 7 8 10 No 2 1 0 12,06 0 1 250,41 No 0 0 0 0 0 1 0 0 No
E299 60V2-0IV-532 Daniel Bruun 1 1 1 8 4 5 No 1 1 1 0 0 0 0 No 0 0 0 1 0 0 0 0 No

320
Ruin Group Info
RG_No NKA_NO Loc_Name Surv_
Cat Reg
Vege_Zon
e
Ele_ASL
RG_Or
RG_Class
Exc TNR No_RB
Ar_RB TAE Dis_In
dex No_D
w Ar_MD Midd
Cattle_House
Livestock_House
Sheep/goat_
House
Storehouse
Roof_House
Cap_Encl
Graz_En
cl
Ar_HF Meadow Add
Qoorua
E29a 61V3-III-539 Qassiarsuk 3 3 1 1 9 16 Yes 19 13 1116,15 782,31 139,1 1 717,49 Yes 3 1 2 4 1 5 0
Yes
E3 61V3-III-535 Tasiusoq 1 3 1 1 9 13 Yes 23 14 706,2 527,95 88 1 414,51 Yes 2 2 4 4 3 7 0
Yes
E300 60V2-0IV-531 Daniel Bruunip
Qoorua 1 1 1 5 8
No 1 1 31 0 0 0 0 No 0 1 0 0 0 0 0
No
E301 60V2-0IV-545 Qorlortorsuup Tasia
1 1 3 5 4 10 No 5 4 55,58 4,52 14 1 88,54 No 0 0 1 0 2 1 0 0 No
E302 60V2-0IV-529 Qorlortorsuup
Tasia 5 1 3 5 8 2 No 1 1 7,21 0 0 0 0 No 0 0 0 0 0 0 0 0 No
E303 60V2-0IV-517 Siorallit Qoorua 5 1 1 16 6 10 No 1 1 0 0 0 1 143 No 0 0 0 0 0 0 0 0 No
E304 60V2-0IV-518 Isortoq 1 1 1 15 6 10 No 2 2 13,12 0 4,4 1 98,15 No 0 0 0 0 1 0 0 0 Yes
E305 60V2-0IV-519 Isortoq 1 1 3 14 4 10 No 7 6 102,44 97,6 9,48 1 164,96 No 0 2 0 0 3 1 0 0 Yes
E308 60V2-0IV-522 Itilleq 5 1 3 8 9 6 No 1 1 3 0 0 0 0 No 0 0 0 0 0 0 0 0 No
E309 60V2-0IV-523 Amitsuarsuk 1 1 3 1 8 8 No 3 2 33,59 39,52 0 0 0 No 0 0 0 1 1 1 0 0 No
E310 60V2-0IV-527 Uluammittariaq 1 1 3 1 5 3 No 5 2 17,85 17,35 0 0 0 No 0 0 0 0 2 2 0 0 No
E311 60V2-0IV-548 Qallukasik 1 1 3 1 5 11 No 7 5 111,83 9,1 0 0 0 No 0 0 2 0 3 2 0 9511 No
Note that several ruins, including a dwelling
could have eroded completely away
E312 60V2-0IV-524 Akuliarusinnguaq
5 1 3 1 6 9 No 3 3 20,8 0 0 0 0 No 0 0 0 1 2 0 0
No
Note that the area and
ruins are rather poorly surveyed and heavily
overgrown with scrub
vegetation
E313 60V2-0IV-525 Akuliarusersuaq 4 1 3 1 5 10 No 6 3 32 113,45 6,6 1 67,48 No 0 0 0 0 2 2 0 336 No
E314 60V2-0IV-551 Nuuluk 1 1 3 1 5 6 No 1 1 62,58 0 0 0 0 No 0 0 0 0 1 0
0 No
Note that there are most
likely more Norse structures, some
disturbed by later Inuit features (see Mathiassen
1936)
E315 60V2-0IV-522 Nipisat Kuuat 5 1 3 3 6 7 No 1 0 0 74,61 0 0 0 No 0 0 0 0 0 1 0
No
E322 60V2-III-530 Illunnguaq Qinngorleq
1 1 4 1 4 12 No 7 6 183,72 82,03 53,5 1 354,2 No 0 1 3 0 1 1 0 7781 No Note that the existing Inuit features could hide
more Norse ruins
E322a
Iliversuit 1 1 4 1 9 8 No 3 2 25,75 21,57 0 0 0 No 0 0 0 0 2 1 0 0 No
E323 60V2-0IV-555 Ujarasussuit 5 1 4 1 9 10 No 3 2 8,75 57 0 1 95 No 0 0 0 0 1 1 0 0 No
E324 60V2-0IV-560 Qoornukasik
Saqqarleq 1 1 4 1 4 10 No 9 7 82,96 36,48 27 1 101,3 No 0 0 1 0 4 2 0 0 No
E325 60V2-0IV-558 Qanisartuut 1 1 4 1 8 11 No 6 4 112,62 27,91 102,4 1 288,11 No 0 0 0 1 2 2 0 0 No
E326 60V2-0IV-562 Kallit Illua 1 1 4 1 8 8 No 2 1 1 19 0 0 0 No 0 0 0 0 1 1 0 0 No
E327 60V2-0IV-565 Sarfakasia Kujalleq
1 1 4 2 6 1 No 1 0 0 0 0 0 0 No 0 0 0 0 0 0 0 0 No
E328 60V2-0IV-566 Sarfaa Avannarleq
1 1 4 1 4 9 No 3 3 54,08 0 0 0 0 No 0 0 0 0 3 0 0 0 Yes
E329 60V2-0IV-570 Eqalugaarsuit 1 1 4 1 5 11 Yes 12 4 267,84 174,17 52,4 1 193,21 No 1 1 1 0 0 8 0 1432 Yes
E330 60V2-0IV-567 Suilaasaq 1 1 4 1 6 10 No 6 3 25,93 37,38 68 1 64,62 No 0 0 0 2 0 3 0 0 No
E331 60V2-0IV-581 Kangerluarsoruj
uk 1 1 4 1 9 10 No 1 1 0 0 0 1 219,39 No 0 0 0 0 0 0 0 2474 No
Note that several ruins
have likely eroded away
E332 60V2-0IV-578
5 1 4 2 8 8 No 4 1 18 0 0 0 0 No 0 0 0 0 1 1 0 0 No
E333 60V2-0IV-576
5 1 4 2 4 8 No 3 2 37,51 31,36 0 0 0 No 0 0 0 1 1 1 0
No Note that there could be
a small homefield area
E334 60V2-0IV-573 Upernaviarsuk 1 1 4 1 6 8 No 4 2 45,5 33,94 0 0 0 No 0 0 2 0 0 2 0 0 Yes
Note that several Norse are likely disturbed by
later Inuit settlement or have eroded
E399 60V2-0IV-663 Itilleq 5 1 3 8 5 8 No 2 1 12 25 0 0 0 No 0 0 0 0 1 1 0 0 No
E4 61V3-III-534 Tasiusaq 1 3 1 1 9 15 Yes 22 14 780,77 6086,88 121,4 1 543,57 Yes 2 4 1 4 2 3 3
No
E47 60V2-0IV-621 Igaliku 2 2 1 1 4 16 Yes 38 31 3013,04 15224,0
3 233,4 1 934,93 Yes 3 6 4 6 10 3 2
Yes
E48 60V2-0IV-620 Igaliku 1 2 1 1 6 13 Yes 14 11 491,26 60 110,6 1 500,62 Yes 1 1 2 1 3 3 0
Yes
E59 60V2-0IV-626 Sissarluttoq 1 2 2 3 5 15 Yes 42 30 2400,96 2060,78 137,3 1 529,83 Yes 4 4 10 4 7 8 2
Yes

321
Ruin Group Info
RG_No NKA_NO Loc_Name Surv_
Cat Reg
Vege_Zon
e
Ele_ASL
RG_Or
RG_Class
Exc TNR No_RB
Ar_RB TAE Dis_In
dex No_D
w Ar_MD Midd
Cattle_House
Livestock_House
Sheep/goat_
House
Storehouse
Roof_House
Cap_Encl
Graz_En
cl
Ar_HF Meadow Add
E60 60V2-0IV-618 Isotarfik 1 1 1 1 9 13 Yes 15 8 531,74 230,49 113,6 1 909,84 Yes 1 1 2 2 1 6 0 16205 Yes
E61 60V2-0IV-617 Fox Bay 1 1 1 1 9 5 No 2 2 50,85 0 0 0 0 No 0 0 0 0 2 0 0 0 Yes
E62 60V2-0IV-616 Kujalleq 1 1 1 1 5 10 No 2 2 0 0 0 1 114,62 No 0 0 0 0 1 0 0 0 No
E63 60V2-0IV-615 Iterlak 1 1 1 1 5 13 No 15 9 307,47 745,53 97,9 1 355,77 Yes 1 0 5 1 1 3 1
No
E64 60V2-0IV-612 Inoqquaasaq 1 1 1 1 6 14 No 17 10 966,39 716,68 109,5 1 561,37 Yes 2 2 1 2 1 5 1 40875 No
E64a 60V2-0IV-539 Enok's Ruins 1 1 1 4 4 12 Yes 8 7 125,9 44,47 105 1 419,31 Yes 0 1 3 1 1 1 0 3363 No
Midden is hidden under
aeolian deposists and cannot be delimited
E64b 60V2-0IV-538 Enok's Ruins 3 1 1 4 5 12 No 10 9 213,99 32,79 42,3 1 323,11 Yes 1 0 5 2 0 1 0 6068 No
Midden is hidden under
aeolian deposists and cannot be delimited
E64c 60V2-0IV-540
3 1 1 4 6 12 Yes 10 7 466,49 100,31 115,8 2 146,01 Yes 2 0 1 2 0 3 0
Yes
Midden is hidden under
aeolian deposists and cannot be delimited.
Homefield area has been revegetated by willow
scrub and cannot be estimated
E65 60V2-0IV-599 Atikerleq 1 1 1 1 7 15 Yes 10 7 362,61 3248,66 84 1 1322,96 Yes 1 0 1 0 3 2 1 22515 Yes
Note that Ar_HF only
includes the lush patch centrally around the
dwellling, not the stretch
of grassland trailing along the coast
E66 60V2-0IV-611 Igaliku Kujalleq 1 1 1 1 4 16 Yes 30 20 1501,66 2524,67 107,7 2 737,46 Yes 1 0 3 1 4 4 4
Yes
E67 60V2-0IV-542 Qorlortukasik 4 1 1 4 7 13 No 7 7 478,26 0 43,6 1 357,77 Yes 0 0 1 1 3 0 1
Yes Note that several ruins are probably
undiscovered
E68 60V2-0IV-609 Skyggesø 1 1 1 2 6 13 Yes 10 8 614,01 202,38 56,3 1 449,26 Yes 1 0 0 1 5 2 0
Yes
Note that Ar_Midd, Ar_HF cannot be
measuret as it is now cultivated; survey is
partially baed on
georeferenced Google Earth satellite imagery
E69 60V2-0IV-608 Timerliit 1 1 1 2 7 13 No 12 10 537,37 350,5 144,7 1 661,01 Yes 0 2 3 0 4 1 0
Yes
Note that Ar_HF cannot
be measuret as it is now cultivated; survey is
partially baed on georeferenced Google
Earth satellite imagery
E70 60V2-0IV-607 The Mountain Farm
1 1 1 11 6 11 Yes 10 8 423,04 23,85 38,8 1 330,3 Yes 1 1 2 1 2 2 0 2704 Yes
E71a 60V2-0IV-600 Saqqaata Tasia 1 1 3 2 4 13 No 9 7 393,96 64,26 54,8 1 1072 Yes 1 3 0 1 1 1 0 8793 Yes
E71N 60V2-0IV-602 Saqqaata Tasia 1 1 3 2 9 13 Yes 16 11 385,85 171,19 83,2 1 228,59 Yes 1 1 5 1 2 5 0
Yes Note that Ar_HF cannot be measuret as it is now
cultivated
E71S 60V2-0IV-602 Saqqaata Tasia 1 1 3 2 9 12 Yes 7 7 195,34 41,56 19,8 1 193,89 Yes 1 0 3 0 2 0 0
Yes
Note that Ar_HF cannot be measuret as it is now
cultivated. Note that one part of enclosure E71N
R20 is considered part of
E71s
E72 60V2-0IV-606 Tasikulooq 1 1 3 10 6 11 No 16 14 528,38 46,8 39,6 3 530,69 Yes 1 5 2 1 2 2 0 2962 No
E72a 60V2-0IV-605
5 1 3 8 5 7 No 1 0 0 0 0 0 0 No 0 0 0 0 0 1 0 0 No
Note that the
Møøer&Madsen 2006 ruin may not be identical
to Vebæk's 1948
registration
E73 60V2-0IV-544 Qorlortorsuup Tasia
1 1 3 5 5 13 Yes 21 18 646,21 223,71 134 1 288,35 Yes 0 5 4 1 6 3 0
Yes
Note that if there ever
was a homefield, it is
now completely revegetated by willow
scrub
E74 60V2-0IV-530 Qorlortorsuup
Tasia 1 1 1 5 8 11 Yes 9 4 175,17 233,07 276,2 1 232,11 Yes 0 1 0 0 1 2 0 0 No
Note that ruin group
E300 is here considered
part of E74

322
Ruin Group Info
RG_No NKA_NO Loc_Name Surv_
Cat Reg
Vege_Zon
e
Ele_ASL
RG_Or
RG_Class
Exc TNR No_RB
Ar_RB TAE Dis_In
dex No_D
w Ar_MD Midd
Cattle_House
Livestock_House
Sheep/goat_
House
Storehouse
Roof_House
Cap_Encl
Graz_En
cl
Ar_HF Meadow Add
E75 60V2-0IV-543 Taseq Ammalortoq
1 1 1 8 4 12 No 16 15 380,1 116,12 87,8 3 541,15 Yes 0 2 4 0 6 1 0 6714 Yes
E76 60V2-0IV-597 Qanisartuut 1 1 3 1 5 15 No 21 11 547,14 10639,4
3 127,2 2 352 Yes 2 3 1 0 3 5 2 48685 Yes
Note that Ar_HF, Ar_Mid
cannot be measured because the ruins have
been removed. Note that
the structures of ruin group E76a is here
considered part of E76
E76a 60V2-0IV-596 Tasersuaq 1 1 3 1 9 9 No 5 3 130,15 0 0 0 0 No 0 1 2 0 2 0 0
No
E76b 60V2-0IV-598 Qanisartuut 1 1 3 1 7 8 No 2 1 25,6 66,56 0 0 0 No 0 0 1 0 0 1 0 0 No
Note that ruin 0501 is
interpreted as part of E76b
E76c 60V2-0IV-595 Qeqertarooq 1 1 3 1 9 8 No 4 2 21,14 25,4 0 0 0 No 0 1 0 1 0 1 0 0 No
E77 60V2-0IV-584 Ukkusip
Saqqaata Tasia 1 1 3 2 6 12 Yes 16 13 326,24 68,82 102,2 1 204,64 Yes 0 1 5 3 3 3 0 0 Yes
Note that Ar_HF cannot
be measuret as it is now cultivated
E77a 60V2-0IV-550 Qallimiut 1 1 3 1 9 14 No 12 11 907,27 0 79,1 1 764,11 Yes 1 0 4 0 5 0 0
Yes
Note that Ar_HF, Ar_Mid
cannot be estimated because the areas are
either cultivated or have eroded
E78 60V2-0IV-585 Eqaluit 1 1 3 1 9 14 Yes 18 16 1184,11 0 185,5 1 636,74 Yes 3 3 4 0 4 0 0
Yes
Note that Ar_HF cannot
be measuret as it is now cultivated
E78a 60V2-0IV-586 Eqaluit 1 1 3 1 6 13 Yes 14 11 594,97 107,4 144,5 1 726,55 Yes 1 5 1 1 2 3 0
Yes
Note that Ar_HF cannot
be measuret as it is now cultivated
E78b 60V2-0IV-589 Tasersuaq 1 1 3 1 4 11 No 7 6 89,92 22,77 56,1 1 344,58 No 0 1 2 1 1 1 0 1977 No
E80a 60V2-0IV-634 Kanassut 1 2 3 1 4 11 No 4 3 48,5 17,68 45,3 1 271,38 Yes 0 0 2 0 0 1 0
No
E80b 60V2-0IV-634 Kanassut 1 2 3 1 4 13 No 16 11 353,34 161,25 109,7 1 241,95 Yes 1 1 3 2 3 5 0
Yes
E80c 60V2-0IV-634 Kanassut 1 2 3 2 6 10 No 4 3 21,97 18,53 25,1 1 87,26 No 0 0 0 0 2 1 0
No
E83 60V2-0IV-646 Qaqortukulloq 1 2 3 1 5 16 Yes 17 14 1110,8 1902,52 98 1 794,44 Yes 2 0 5 2 2 2 1
No
E89a 60V2-0IV-507 Tasiusaarsuup
Kilua 1 5 3 1 9 11 Yes 5 5 179,46 0 49 1 192,34 Yes 0 2 1 0 1 0 0
No
E90 60V2-0IV-521 Sioralik 1 1 3 1 5 13 No 5 5 196,12 0 116,8 1 584,33 Yes 0 1 1 1 1 0 0
No
Note that if there ever was a homefield, it is
now completely revegetated by willow
scrub. Note that ruin
description does not include ruins 1-9, which
has been treated seperatedly as E90c
E90a 60V2-0IV-526 Sioralik 1 1 3 1 4 8 No 3 2 30,95 65,73 0 0 0 No 0 0 1 0 1 1 0 0 No
E90b 60V2-0IV-520 Sioralik 1 1 3 1 5 5 No 1 1 70,01 0 0 0 0 No 0 0 0 1 0 0 0 0 No
E90c
Sioralik 1 1 3 1 5 10 No 6 4 94,46 44,75 97,8 1 190,76 No 0 0 1 1 1 3 0 0 No
Note that the westernmost structures
of ruin group E90 has
here bere seperated as E90c; only R02a is
considered part of the TEA
E91 60V2-0IV-528 Amitsuarsuk 1 1 3 1 6 13 Yes 15 13 626,67 41,91 127,8 1 394,97 Yes 2 3 2 2 3 2 0 3187 Yes
Note that the
surrounding area is presently being farmed
E92 60V2-0IV-553 Nipisat 1 1 4 1 6 13 No 14 10 438,63 93,43 98,3 1 1042,26 Yes 2 4 1 0 4 3 0 12193 No
E93 60V2-0IV-554 Kangerluluup 1 1 4 2 6 14 No 24 20 1247,46 104,24 80,2 1 896,83 Yes 2 4 5 2 6 3 0
Yes
E94 60V2-0IV-557 Serfartusup Qinngua
1 1 4 1 7 13 No 20 11 752,38 112,6 130,2 1 484,79 Yes 1 3 1 0 4 6 0 24430 No
E95 60V2-0IV-559 Amitsuarsuk 1 1 4 1 9 13 No 12 6 276,17 63,87 93,3 1 646,43 Yes 1 0 2 0 2 6 0 7077 Yes
E95a 60V2-0IV-561 Akulliip Qinngua 1 1 4 1 4 12 No 16 10 262,86 586,01 39,7 1 292,83 No 0 1 5 1 2 6 0 14495 Yes
Note that the wet area is
treated as homefield here
E95b 60V2-0IV-563 Kapiivik 1 1 4 1 6 11 No 4 3 39,21 54,01 55,9 1 376,01 Yes 0 0 1 0 1 1 0 1871 No

323
Ruin Group Info
RG_No NKA_NO Loc_Name Surv_
Cat Reg
Vege_Zon
e
Ele_ASL
RG_Or
RG_Class
Exc TNR No_RB
Ar_RB TAE Dis_In
dex No_D
w Ar_MD Midd
Cattle_House
Livestock_House
Sheep/goat_
House
Storehouse
Roof_House
Cap_Encl
Graz_En
cl
Ar_HF Meadow Add
E96 60V2-0IV-505 Portusooq 1 5 3 1 5 12 Yes 15 12 493,65 29,81 128,1 1 131,05 Yes 1 2 5 2 2 2 0 181818 Yes

324

325
0501 No place name App.3.1
1 R
uin
U
ncla
ssifie
d/I
nuit

326
0502 ’Sandsletten’ App.3.2
4 R
uin
s
Dairy s
hie
ling

327
0503 ’Snesø’ App.3.3
1 R
uin
s
Outf
ield
wall/
dyke

328
0601 No place name App.3.4
1 R
uin
H
erd
er’
s h
ut/
she
lter

329
0603 Tasersuaq App.3.5
1R
uin
H
erd
er’
s h
ut/
she
lter

330
0605 Sioralik App.3.6
2 R
uin
s
Land
ing p
lace

331
0701 Karrarmiut App.3.7
3 R
uin
s
Dairy s
hie
ling
60V
2-0
IV-4
4

332
0901 Taseq Ammalortoq App.3.8
2 R
uin
s
Sm
all
com
ple
x s
hie
ling

333
1001 Akia App.3.9
2 R
uin
s
Fora
ge s
hie
ling

334
1102 Tasikulooq App.3.10
1 R
uin
S
heep/g
oat
she
lter

335
1103 Naasaangitsup Tasia App.3.11
1 R
uin
H
erd
er’
s h
ut/
she
lter

336
1104 Tasersuaq App.3.12
1 R
uin
S
mall
com
ple
x s
hie
ling

337
B102 Qorlortuup Tasia App.3.13
1 R
uin
O
utf
ield
wall/
dyke
60V
2-0
IV-5
27

338
B139 Tasersuaq App.3.14
3 R
uin
s
Sm
all
com
ple
x s
hie
ling

339
E60 Isortarfik App.3.15
15 R
uin
s
Mediu
m F
arm
ste
ad
60V
2-0
IV-6
18

340
E61 Fox Bay App.3.16
2 R
uin
s
Fora
ge s
hie
ling
60V
2-0
IV-6
17

341
E62 Kujalleq App.3.17
2
Ruin
s
Sm
all
com
ple
x s
hie
ling
60V
2-0
IV-6
16

342
E63 Iterlak App.3.18
15 R
uin
s
Mediu
m F
arm
ste
ad
60V
2-0
IV-6
15

343
E64 Inoqquaasaq App.3.19
17 R
uin
s
Larg
e F
arm
ste
ad
60V
2-0
IV-6
12

344
E64a Enok’s Ruins App.3.20
8 R
uin
s
Sm
all
Farm
ste
ad
60V
2-0
IV-5
39

345
E64b Enok’s Ruins App.3.21
10 R
uin
s
Sm
all
Farm
ste
ad
60V
2-0
IV-5
38

346
E64c No place name App.3.22
10 R
uin
s
Sm
all
Farm
ste
ad
60V
2-0
IV-5
40

347
E65 Atikerleq App.3.23
10 R
uin
s
Manor
60V
2-0
IV-5
99

348
E66 Igaliku Kujalleq App.3.24
30 R
uin
s
Churc
h M
anor
60V
2-0
IV-6
11

349
E67 Qorlortukasik App.3.25
7 R
uin
s
Mediu
m F
arm
ste
ad
60V
2-0
IV-5
42

350
E68 Skyggesø App.3.26
10 R
uin
s
Mediu
m F
arm
ste
ad
60V
2-0
IV-6
09

351
E69 Timerliit App.3.27
12 R
uin
s
Mediu
m F
arm
ste
ad
60V
2-0
IV-6
08

352
E70 ”The Mountain Farm” App.3.28
10 R
uin
s
Larg
e c
om
ple
x s
hie
ling
60V
2-0
IV-6
07

353
E71N & E71S Saqqaata Tasia App.3.29
23 R
uin
s
Mediu
m F
arm
ste
ad &
Sm
all
Farm
ste
ad
60V
2-0
IV-6
02

354
E71a Saqqaata Tasia App.3.30
9 R
uin
s
Mediu
m F
arm
ste
ad
60V
2-0
V-6
00

355
E72 Tasikulooq App.3.31
16 R
uin
s
Larg
e c
om
ple
x s
hie
ling
60V
2-0
IV-6
06

356
E73 Qorlortorsuup Tasia App.3.32
21 R
uin
s
Mediu
m F
arm
ste
ad
60V
2-0
IV-5
44

357
E74 Qorlortorsuup Tasia App.3.33
9 R
uin
s
Larg
e c
om
ple
x s
hie
ling
60V
2-0
IV-5
30

358
E75 Taseq Ammalortoq App.3.34
16 R
uin
s
Sm
all
Farm
ste
ad
60V
2-0
IV-5
43

359
E76 Qanisartuut App.3.35
21 R
uin
s
Manor
60V
2-0
IV-5
97

360
E76a Tasersuaq App.3.36
5 R
uin
s
Larg
e s
imple
shie
ling
60V
2-0
IV-5
96

361
E76b Qanisartuut App.3.37
2 R
uin
s
Dairy s
hie
ling
60V
2-0
IV-5
98

362
E76c Qeqertarooq App.3.38
4 R
uin
s
Dairy s
hie
ling
60V
2-0
IV-5
95

363
E77 Ukkusip Saqqaata Tasia App.3.39
16 R
uin
s
Sm
all
Farm
ste
ad
60V
2-0
IV-5
84

364
E77a Qallimiut App.3.40
12 R
uin
s
Larg
e F
arm
ste
ad
60V
2-0
IV-5
50

365
E78 Eqaluit App.3.41
18 R
uin
s
Larg
e F
arm
ste
ad
60V
2-0
IV-5
85

366
E78a Eqaluit App.3.42
14 R
uin
s
Mediu
m F
arm
ste
ad
60V
2-0
IV-5
86

367
E78b Tasersuaq App.3.43
7 R
uin
s
Larg
e c
om
ple
x s
hie
ling
60V
2-0
IV-5
89

368
E90 Sioralik App.3.44
5 R
uin
s
Mediu
m F
arm
ste
ad
60V
2-0
IV-5
21

369
E90a Sioralik App.3.45
3 R
uin
s
Dairy s
hie
ling
60V
2-0
IV-5
26

370
E90b Sioralik App.3.46
1 R
uin
F
ora
ge s
hie
ling
60V
2-0
IV-5
20

371
E91 Amitsuarsuk App.3.47
15 R
uin
s
Mediu
m F
arm
ste
ad
60V
2-0
IV-5
28

372
E92 Nipisat App.3.48
14 R
uin
s
Mediu
m F
arm
ste
ad
60V
2-0
IV-5
53

373
E93 Kangerluluup App.3.49
24 R
uin
s
Larg
e F
arm
ste
ad
60V
2-0
IV-5
54

374
E94 Serfartusup Qinngua App.3.50
20 R
uin
s
Mediu
m F
arm
ste
ad
60V
2-0
IV-5
57

375
E95 Amitsuarsuk App.3.51
12 R
uin
s
Mediu
m F
arm
ste
ad
60V
2-0
IV-5
59

376
E95a Akulliip Qinngua App.3.52
16 R
uin
s
Sm
all
Farm
ste
ad
60V
2-0
IV-5
61

377
E95b Kapiivik App.3.53
4 R
uin
s
Larg
e c
om
ple
x s
hie
ling
60V
2-0
IV-5
63

378
E118 Sarfarmiut App.3.54
7 R
uin
s
Larg
e c
om
ple
x s
hie
ling
60V
2-0
IV-5
72

379
E119 Illorsuit App.3.55
13 R
uin
s
Mediu
m F
arm
ste
ad
60V
2-0
IV-5
75

380
E120 Tasiluk App.3.56
9 R
uin
s
Sm
all
Farm
ste
ad
60V
2-0
IV-5
74

381
E164 Kallunatsiaq App.3.57
24 r
uin
s
Mediu
m F
arm
ste
ad
60V
2-0
IV-5
90

382
E165 Tasersuaq App.3.58
4 R
uin
s
Mediu
m F
arm
ste
ad
60V
2-0
IV-5
91

383
E166 Tasersuaq App.3.59
7 R
uin
s
Sm
all
Farm
ste
ad
60V
2-0
IV-5
92

384
E167 Tasikulooq (Abel’s Farm) App.3.60
15 R
uin
s
Larg
e c
om
ple
x s
hie
ling
60V
2-0
IV-6
03

385
E168 Zucerip Tasia App.3.61
7 R
uin
s
Larg
e c
om
ple
x s
hie
ling
60V
2-0
IV-5
41

386
E169 Hestespor Sø App.3.62
4 R
uin
s
Larg
e c
om
ple
x s
hie
ling
60V
2-0
IV-6
10

387
E170 Saarap Qoorua App.3.63
7 R
uin
s
Larg
e c
om
ple
x s
hie
ling
60V
2-0
IV-5
47

388
E170a Saarap Qoorua App.3.64
1 R
uin
Larg
e c
om
ple
x s
hie
ling
60V
2-0
IV-5
46

389
E171 Tasilikulooq App.3.65
16 R
uin
s
Mediu
m F
arm
ste
ad
60V
2-0
IV-6
01

390
E172 Tatsip Ataa App.3.66
21 R
uin
s
Mediu
m F
arm
ste
ad
60V
2-0
IV-5
93

391
E173 Ammassiviup Tasia App.3.67
11 R
uin
s
Larg
e c
om
ple
x s
hie
ling
60V
2-0
IV-5
83

392
E174 Qemertut Tasia App.3.68
13 R
uin
s
Mediu
m F
arm
ste
ad
60V
2-0
IV-5
80

393
E175 No place name App.3.69
1 R
uin
S
mall
com
ple
x s
hie
ling
60V
2-0
IV-5
88

394
E178 Tasiusaq App.3.70
19 R
uin
s
Larg
e F
arm
ste
ad
60V
2-0
IV-5
69

395
E179 Torsukattak App.3.71
3 R
uin
s
Larg
e c
om
ple
x s
hie
ling
60V
2-0
IV-5
68

396
E180 Qallimiut Imaa App.3.72
4 R
uin
s
Larg
e c
om
ple
x s
hie
ling
60V
2-0
IV-5
49

397
E181 Itilleq App.3.73
8 R
uin
s
Mediu
m F
arm
ste
ad
60V
2-0
IV-5
71

398
E182 Kangerluarsorujuup Qinngua App.3.74
16 R
uin
s
Mediu
m F
arm
ste
ad
60V
2-0
IV-5
82

399
E184 Tasiluaraq App.3.75
14 R
uin
s
Mediu
m F
arm
ste
ad
60V
2-0
IV-5
79

400
E188 Akia App.3.76
10 R
uin
s
Sm
all
Farm
ste
ad
60V
2-0
IV-6
37

401
E190 Qaarsutsiaq App.3.77
10 R
uin
s
Mediu
m F
arm
ste
ad
60V
2-0
IV-5
64

402
E195 Igannaq App.3.78
7 R
uin
s
Sm
all
com
ple
x s
hie
ling
60V
1-0
0I-
53
0

403
E196 Nimerialik App.3.79
6 R
uin
s
Mediu
m F
arm
ste
ad
60V
2-0
IV-5
87

404
E210 Tatsip Ataa Kangilleq App.3.80
7 R
uin
s
Fora
ge s
hie
ling
60V
2-0
IV-5
94

405
E262 Nuummiut App.3.81
1 R
uin
S
mall
com
ple
x s
hie
ling
60V
1-0
IV-5
21
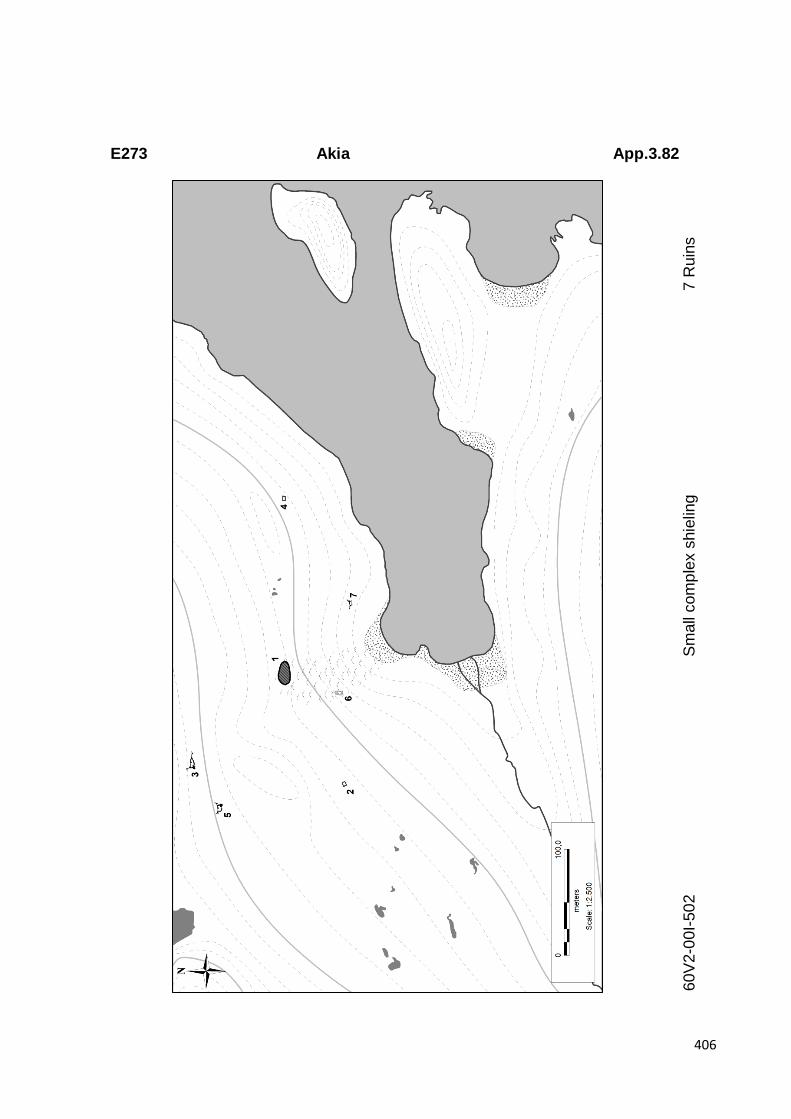
406
E273 Akia App.3.82
7 R
uin
s
Sm
all
com
ple
x s
hie
ling
60V
2-0
0I-
50
2

407
E274 Nuuk Qaqortoq App.3.83
1 R
uin
M
ilkin
g s
tation
60V
2-0
0I-
50
1

408
E293 Inoqquassaap Kuua App.3.84
4 R
uin
s
Sm
all
com
ple
x s
hie
ling
60V
2-0
IV-6
13

409
E295 Snesø App.3.85
2 R
uin
s
Rétt
60V
2-0
IV-5
35

410
E296 Amaqqup Tasia App.3.86
8 R
uin
s
Larg
e s
imple
shie
ling
60V
2-0
IV-5
36

411
E297 Amaqqup Tasia App.3.87
1 R
uin
H
erd
er’
s H
ut/
she
lter
60V
2-0
IV-5
34

412
E298 Petrusip Tasia App.3.88
2 R
uin
s
Sm
all
com
ple
x s
hie
ling
60V
2-0
IV-5
33

413
E299 Daniel Bruun Qoorua App.3.89
1 R
uin
F
ora
ge s
hie
ling
60V
2-0
IV-5
32

414
E301 Qorlortorsuup Tasia App.3.90
5 R
uin
s
Sm
all
com
ple
x s
hie
ling
60V
2-0
IV-5
45

415
E304 Isortoq App.3.91
2 R
uin
s
Sm
all
com
ple
x s
hie
ling
60V
2-0
IV-5
18

416
E305 Isortoq App.3.92
7 R
uin
s
Sm
all
com
ple
x s
hie
ling
60V
2-0
IV-5
19

417
E308 Itilleq App.3.93
1 R
uin
H
erd
er’
s H
ut/
she
lter
60V
2-0
IV-5
22

418
E309 Amitsuarsuk App.3.94
3 R
uin
s
Dairy s
hie
ling
60V
2-0
IV-5
23

419
E310 Uluammittariaq App.3.95
5 R
uin
s
Rétt
60V
2-0
IV-5
27

420
E311 Qallukasik App.3.96
7 R
uin
s
Larg
e c
om
ple
x s
hie
ling
60V
2-0
IV-5
48

421
E312 Akuliarusinnguaq App.3.97
3 R
uin
s
Larg
e s
imple
shie
ling
60V
2-0
IV-5
24

422
E313 Akuliarusersuaq App.3.98
6 R
uin
s
Sm
all
com
ple
x s
hie
ling
60V
2-0
IV-5
25

423
E314 Nuuluk App.3.99
1 R
uin
H
erd
er’
s H
ut/
she
lter
60V
2-0
IV-5
51

424
E322 Illunnguaq Qinngorleq App.3.100
7 R
uin
s
Sm
all
Farm
ste
ad
60V
2-I
II-5
30

425
E322a Iliversuit App.3.101
3 R
uin
s
Dairy S
hie
ling

426
E324 Qoornukasik Saqqarleq App.3.102
9 R
uin
s
Sm
all
com
ple
x s
hie
ling
60V
2-0
IV-5
60

427
E325 Qanisartuut App.3.103
6 R
uin
s
Larg
e c
om
ple
x s
hie
ling
60V
2-0
IV-5
58

428
E326 Kallit Illua App.3.104
2 R
uin
s
Dairy s
hie
ling
60V
2-0
IV-5
62

429
E327 Sarfakasia Kujalleq App.3.105
1 R
uin
O
utf
ield
Wall/
dyke
60V
2-0
IV-5
65

430
E328 Sarfaa Avannarleq App.3.106
3 R
uin
s
Larg
e s
imple
shie
ling
60V
2-0
IV-5
66

431
E329 Eqalugaarsuit App.3.107
12 R
uin
s
Larg
e c
om
ple
x s
hie
ling
60V
2-0
IV-5
70

432
E330 Suilaasaq App.3.108
6 R
uin
s
Sm
all
com
ple
x s
hie
ling
60V
2-0
IV-5
67

433
E331 Kangerluarsorujuk App.3.109
1 R
uin
S
mall
com
ple
x s
hie
ling
60V
2-0
IV-5
81

434
E334 Upernaviarsuk App.3.110
4 R
uin
s
Dairy s
hie
ling
60V
2-0
IV-5
73

435
00-2 No place name App.3.111
4 R
uin
s
Sm
all
com
ple
x s
hie
ling

436
E3 Tasiusoq App.3.112
23 R
uin
s
Mediu
m F
arm
ste
ad
61V
3-I
II-5
35

437
E4 Tasiusaq App.3.113
22 R
uin
s
Manor
61V
3-I
II-5
34

438
E48 Igaliku App.3.114
14 R
uin
s
Mediu
m F
arm
ste
ad
60V
2-0
IV-6
20

439
E125 Asorutit App.3.115
11 R
uin
s
Larg
e c
om
ple
x s
hie
ling
60V
1-0
0I-
53
1

440
E126 Igannaq App.3.116
8 R
uin
s
Sm
all
Farm
ste
ad
60V
1-0
0I-
52
9
Related Documents