Past and Future Forcing of Beaufort Sea Coastal Change Gavin K. Manson * and Steven M. Solomon Geological Survey of Canada - Atlantic 1 Challenger Drive, Dartmouth NS B2Y 4A2 [Original manuscript received 9 December 2005; in revised form 22 January 2007] ABSTRACT Changes to the Beaufort Sea shoreline occur due to the impact of storms and rising relative sea level. During the open-water season (June to October), storm winds predominantly from the north-west generate waves and storm surges which are effective in eroding thawing ice-rich cliffs and causing overwash of gravel beaches. Climate change is expected to be enhanced in Arctic regions relative to the global mean and include accelerated sea-level rise, more frequent extreme storm winds, more frequent and extreme storm surge flooding, decreased sea-ice extent, more frequent and higher waves, and increased temperatures. We investigate historical records of wind speeds and directions, water levels, sea-ice extent and temperature to identify variability in past forcing and use the Canadian Global Coupled Model ensembles 1 and 2 (CGCM1 and CGCM2) climate modelling results to develop a scenario forcing future change of Beaufort Sea shorelines. This scenario and future return periods of peak storm wind speeds and water levels likely indicate increased forcing of coastal change during the next cen- tury resulting in increased rates of cliff erosion and beach migration, and more extreme flooding. RÉSUMÉ [Traduit par la rédaction] Des changements dans la ligne de rivage de la mer de Beaufort se produisent sous l’effet des tempêtes et de la hausse relative du niveau de la mer. Durant la saison d’eau libre (de juin à octobre), les vents des tempêtes, principalement du nord-ouest, produisent des vagues et des marées de tempêtes qui parviennent à éroder les falaises riches en glace fondante et à produire un ennoiement des plages de gravier. On s’attend à ce que le changement climatique soit accentué dans les régions arctiques par rapport à la moyenne globale et qu’il entraîne une hausse accélérée du niveau de la mer, des vents de tempêtes extrêmes plus fréquents, des inondations causées par des marées de tempêtes plus fréquentes et plus extrêmes, une plus faible étendue de la glace de mer, des vagues plus fréquentes et plus hautes et des températures plus élevées. Nous étudions les relevés historiques de vitesse et de direction du vent, de niveaux d’eau, d’étendue de la glace de mer et de température pour déterminer la variabilité dans le forçage passé et nous utilisons les résultats de modélisation du climat des modèles couplés climatiques globaux 1 et 2 (MCCG1 et MCCG2) pour élaborer un scénario forçant le changement futur des lignes de rivages de la mer de Beaufort. Ce scénario et les périodes de retour futures des vitesses de vent de tempête et des niveaux d’eau de pointe indiquent selon toute probabilité un forçage accru du changement côtier durant le prochain siècle produisant de plus forts taux d’érosion des falaises et de migration des plages ainsi que des inondations plus extrêmes. ATMOSPHERE-OCEAN 45 (2) 2007, 107–122 doi:10.3137/ao.450204 Canadian Meteorological and Oceanographic Society *Corresponding author’s e-mail: [email protected] 1 Introduction Long-term retreat of shorelines bordering the Beaufort Sea (Fig. 1) is considered to be driven by relative sea-level (RSL) rise (Héquette et al., 1995; Shaw et al., 1998; Solomon et al., 2000) caused by both isostatic subsidence and eustatic rise (Hill et al., 1993; Peltier, 1994; Manson et al., 2005). In the short-term (i.e., sub-decadal), rates of shoreline retreat are influenced by variability in external forcing and characteris- tics of the coastal morphosedimentary system (e.g., sediment availability, geotechnical properties, morphologic arrange- ment) (Héquette et al., 2001; Ruz et al., 1992; Hill et al., 1994). During the October to June ice season, wave and surge development may be suppressed (Murty and Polavarapu, 1979), cliffs consisting of ice-bonded sediments are frozen, and shorelines are protected by shorefast and groundfast ice (Forbes and Taylor, 1994). In contrast, during the June to October open-water season, storm waves and surges may cause damage to coastal infrastructure (DPW, 1971; Berry et al., 1975; Lewis, 1987; Harper et al., 1988; Eid and Cardone, 1992). Waves superimposed on high water levels act upon thawed cliffs causing notch formation or reactivation of ret- rogressive thaw failures (Hill and Solomon, 1999; Dallimore et al., 1996). At the same time, depending partly upon the amount of beach-forming sediments delivered from eroding cliffs, barrier beaches and spits may grow or shrink in length and height (Hill et al., 1994; Forbes and Syvitski, 1994; Forbes et al., 1995).

Welcome message from author
This document is posted to help you gain knowledge. Please leave a comment to let me know what you think about it! Share it to your friends and learn new things together.
Transcript
Past and Future Forcing of Beaufort Sea Coastal Change
Gavin K. Manson* and Steven M. Solomon
Geological Survey of Canada - Atlantic 1 Challenger Drive, Dartmouth NS B2Y 4A2
[Original manuscript received 9 December 2005; in revised form 22 January 2007]
ABSTRACT Changes to the Beaufort Sea shoreline occur due to the impact of storms and rising relative sea level.During the open-water season (June to October), storm winds predominantly from the north-west generate wavesand storm surges which are effective in eroding thawing ice-rich cliffs and causing overwash of gravel beaches.Climate change is expected to be enhanced in Arctic regions relative to the global mean and include acceleratedsea-level rise, more frequent extreme storm winds, more frequent and extreme storm surge flooding, decreasedsea-ice extent, more frequent and higher waves, and increased temperatures. We investigate historical records ofwind speeds and directions, water levels, sea-ice extent and temperature to identify variability in past forcing anduse the Canadian Global Coupled Model ensembles 1 and 2 (CGCM1 and CGCM2) climate modelling results todevelop a scenario forcing future change of Beaufort Sea shorelines. This scenario and future return periods ofpeak storm wind speeds and water levels likely indicate increased forcing of coastal change during the next cen-tury resulting in increased rates of cliff erosion and beach migration, and more extreme flooding.
RÉSUMÉ [Traduit par la rédaction] Des changements dans la ligne de rivage de la mer de Beaufort se produisentsous l’effet des tempêtes et de la hausse relative du niveau de la mer. Durant la saison d’eau libre (de juin àoctobre), les vents des tempêtes, principalement du nord-ouest, produisent des vagues et des marées de tempêtesqui parviennent à éroder les falaises riches en glace fondante et à produire un ennoiement des plages de gravier.On s’attend à ce que le changement climatique soit accentué dans les régions arctiques par rapport à la moyenneglobale et qu’il entraîne une hausse accélérée du niveau de la mer, des vents de tempêtes extrêmes plus fréquents,des inondations causées par des marées de tempêtes plus fréquentes et plus extrêmes, une plus faible étendue dela glace de mer, des vagues plus fréquentes et plus hautes et des températures plus élevées. Nous étudions lesrelevés historiques de vitesse et de direction du vent, de niveaux d’eau, d’étendue de la glace de mer et detempérature pour déterminer la variabilité dans le forçage passé et nous utilisons les résultats de modélisationdu climat des modèles couplés climatiques globaux 1 et 2 (MCCG1 et MCCG2) pour élaborer un scénario forçantle changement futur des lignes de rivages de la mer de Beaufort. Ce scénario et les périodes de retour futures desvitesses de vent de tempête et des niveaux d’eau de pointe indiquent selon toute probabilité un forçage accru duchangement côtier durant le prochain siècle produisant de plus forts taux d’érosion des falaises et de migrationdes plages ainsi que des inondations plus extrêmes.
ATMOSPHERE-OCEAN 45 (2) 2007, 107–122 doi:10.3137/ao.450204Canadian Meteorological and Oceanographic Society
*Corresponding author’s e-mail: [email protected]
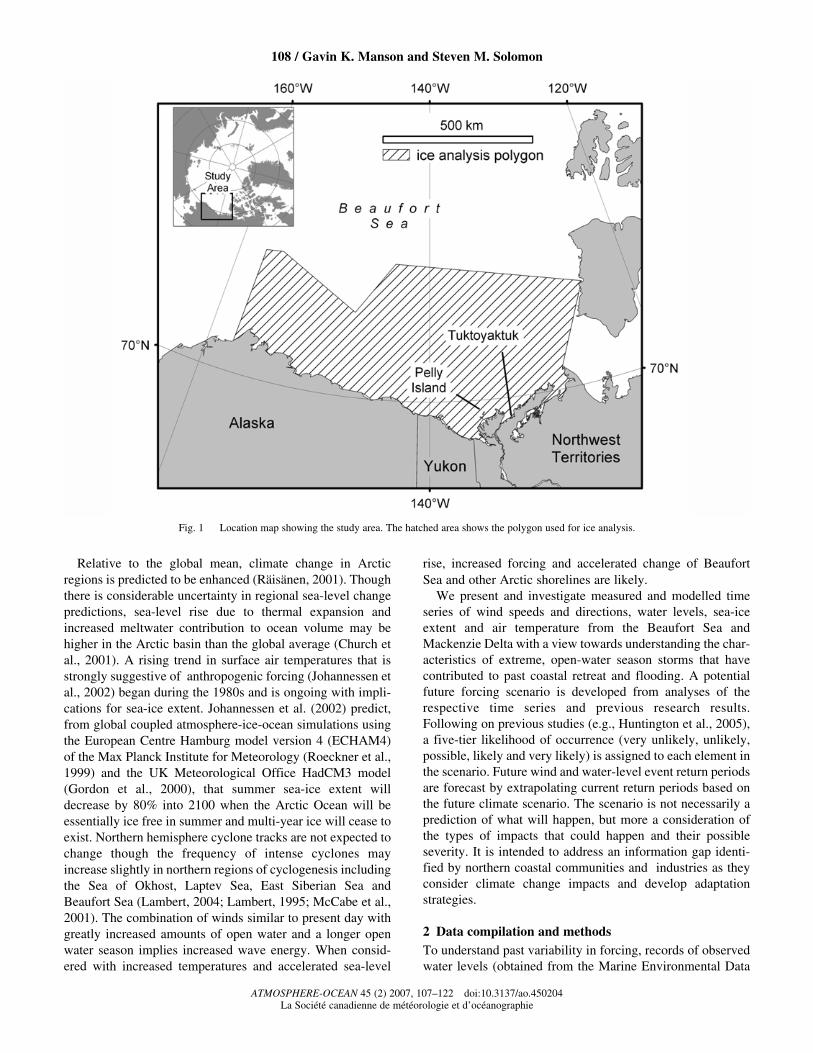
1 IntroductionLong-term retreat of shorelines bordering the Beaufort Sea(Fig. 1) is considered to be driven by relative sea-level (RSL)rise (Héquette et al., 1995; Shaw et al., 1998; Solomon et al.,2000) caused by both isostatic subsidence and eustatic rise(Hill et al., 1993; Peltier, 1994; Manson et al., 2005). In theshort-term (i.e., sub-decadal), rates of shoreline retreat areinfluenced by variability in external forcing and characteris-tics of the coastal morphosedimentary system (e.g., sedimentavailability, geotechnical properties, morphologic arrange-ment) (Héquette et al., 2001; Ruz et al., 1992; Hill et al.,1994).
During the October to June ice season, wave and surgedevelopment may be suppressed (Murty and Polavarapu,1979), cliffs consisting of ice-bonded sediments are frozen,
and shorelines are protected by shorefast and groundfast ice(Forbes and Taylor, 1994). In contrast, during the June toOctober open-water season, storm waves and surges maycause damage to coastal infrastructure (DPW, 1971; Berry etal., 1975; Lewis, 1987; Harper et al., 1988; Eid and Cardone,1992). Waves superimposed on high water levels act uponthawed cliffs causing notch formation or reactivation of ret-rogressive thaw failures (Hill and Solomon, 1999; Dallimoreet al., 1996). At the same time, depending partly upon theamount of beach-forming sediments delivered from erodingcliffs, barrier beaches and spits may grow or shrink in lengthand height (Hill et al., 1994; Forbes and Syvitski, 1994;Forbes et al., 1995).
Relative to the global mean, climate change in Arcticregions is predicted to be enhanced (Räisänen, 2001). Thoughthere is considerable uncertainty in regional sea-level changepredictions, sea-level rise due to thermal expansion andincreased meltwater contribution to ocean volume may behigher in the Arctic basin than the global average (Church etal., 2001). A rising trend in surface air temperatures that isstrongly suggestive of anthropogenic forcing (Johannessen etal., 2002) began during the 1980s and is ongoing with impli-cations for sea-ice extent. Johannessen et al. (2002) predict,from global coupled atmosphere-ice-ocean simulations usingthe European Centre Hamburg model version 4 (ECHAM4)of the Max Planck Institute for Meteorology (Roeckner et al.,1999) and the UK Meteorological Office HadCM3 model(Gordon et al., 2000), that summer sea-ice extent willdecrease by 80% into 2100 when the Arctic Ocean will beessentially ice free in summer and multi-year ice will cease toexist. Northern hemisphere cyclone tracks are not expected tochange though the frequency of intense cyclones mayincrease slightly in northern regions of cyclogenesis includingthe Sea of Okhost, Laptev Sea, East Siberian Sea andBeaufort Sea (Lambert, 2004; Lambert, 1995; McCabe et al.,2001). The combination of winds similar to present day withgreatly increased amounts of open water and a longer openwater season implies increased wave energy. When consid-ered with increased temperatures and accelerated sea-level
rise, increased forcing and accelerated change of BeaufortSea and other Arctic shorelines are likely.
We present and investigate measured and modelled timeseries of wind speeds and directions, water levels, sea-iceextent and air temperature from the Beaufort Sea andMackenzie Delta with a view towards understanding the char-acteristics of extreme, open-water season storms that havecontributed to past coastal retreat and flooding. A potentialfuture forcing scenario is developed from analyses of therespective time series and previous research results.Following on previous studies (e.g., Huntington et al., 2005),a five-tier likelihood of occurrence (very unlikely, unlikely,possible, likely and very likely) is assigned to each element inthe scenario. Future wind and water-level event return periodsare forecast by extrapolating current return periods based onthe future climate scenario. The scenario is not necessarily aprediction of what will happen, but more a consideration ofthe types of impacts that could happen and their possibleseverity. It is intended to address an information gap identi-fied by northern coastal communities and industries as theyconsider climate change impacts and develop adaptationstrategies.
2 Data compilation and methodsTo understand past variability in forcing, records of observedwater levels (obtained from the Marine Environmental Data
108 / Gavin K. Manson and Steven M. Solomon
ATMOSPHERE-OCEAN 45 (2) 2007, 107–122 doi:10.3137/ao.450204La Société canadienne de météorologie et d’océanographie
Fig. 1 Location map showing the study area. The hatched area shows the polygon used for ice analysis.
Service), predicted tides (obtained from Fisheries and OceansCanada, Central Arctic Region Data Acquisition Section),storm wave heights (Eid and Cardone, 1992), sea-ice extent(obtained from the Canadian Ice Service), wind speeds anddirections, surface air pressures and surface air temperatures(obtained from the Meteorological Service of Canada) werecollated in a database. Meteorological Station InspectionReports were also obtained from the Meteorological Serviceof Canada. To contribute to a scenario of future forcing ofcoastal erosion, outputs from the Canadian Global CoupledModel ensembles 1 and 2 (CGCM1 and CGCM2; obtainedfrom the Canadian Centre for Climate Modelling andAnalysis; McFarlane et al., 1992; Flato et al., 2000; Flato andBoer, 2001) were similarly collated. Variables include pre-dicted decadal sea-level rise, daily mean 10 m U and V windspeeds, monthly mean sea-ice concentrations and daily mean2 m screen temperatures for the IS92a Greenhouse Gas plusAerosol (GHG+A) scenario. In this scenario, CO2 increasesat the observed rate until 1996 and by 1% per annum there-after (IPCC WG1, 2001) and the direct effect of sulphateaerosols is included by increasing albedo (Reader and Boer,1998). Use of a single model and scenario does not demon-strate the large variability in model results (e.g., Wang andSwail, 2006; Räisänen, 2001) yet, in a five-model comparisonincluding CGCM2 and specifically relating to the Arctic, allmodels tested were qualitatively consistent (Kattsov et al.,2005). More scatter was found between scenarios thanbetween models; the IS92a scenario produced relatively smalltemperature changes (IPCC WG1, 2001). Since steric sea-level rise, decreasing sea ice and changing storminess can beconsidered derivative impacts of increasing temperature, thefuture forcing scenario could be considered conservative.
a Water Levels and SurgesMeasurements in the hourly water level record from theTuktoyaktuk tide gauge between 1961 and 1997 are oftenmissing (approximately 45% of measurements) or spurious;obviously erroneous measurements consisting of spikes andother anomalies were removed. The record is most completeand accurate during the open-water season upon which ouranalyses focus. Open-water season water-level events definedby at least one hour of water level in excess of 1.25 m abovechart datum were extracted along with corresponding windand sea-ice statistics. Water levels were converted to surgeheights using predicted astronomical tides and a list of open-water season surges greater than 0.7 m for at least six hourswas compiled. Surge heights were used in the correlation andmultiple regression analyses, whereas water level above chartdatum was used in the flooding analyses.
Three CGCM1 ensembles of decadal steric sea-levelchange for 30 marine grid cells in the Beaufort Sea (71.81oNto 75.57°N and 127.46°W to 144.38°W) were averaged toobtain mean estimates of decadal sea-level rise between 1901and 2091. Model results were referenced to chart datum usingthe average of annual mean sea levels for years with mostlycomplete data, and referenced to 1981 near the mid-point ofthe time series.
b Wave EnergyIn a previous study of extreme wave events in the BeaufortSea (Eid and Cardone, 1992), hindcast wave heights weredetermined for 30 storms between 1957 and 1988. Maximumsignificant hindcast wave heights at a grid node north of PellyIsland (node 411) were obtained for each of these storms thatcoincided with a wind event in our list (Appendix). For con-siderations of future wave climate, because no reliable wavepredictions are available for the study area, we use open-water extent and wind speed as proxy data.
c Wind Speed and DirectionThree stations at Tuktoyaktuk were merged (with preferencegiven to the Distant Early Warning (DEW) Line and auto-matic stations) to give a record from 1958 to 2000. Data priorto 1997 are irregular, either taken hourly, every four or sixhours or with no data archived between 23:00 and 06:00 MST.
Hourly winds with little missing data are available from anautomated station on Pelly Island beginning in 1994. PellyIsland winds have considerably higher speeds and variabilitythan at Tuktoyaktuk and thus are likely to be more represen-tative of marine winds. To extend the Pelly Island record backin time, the merged Tuktoyaktuk wind speed record was firstnormalized using its 1958–2000 mean and standard deviationand then reconstructed to the 1994–2000 mean and standarddeviation of the Pelly Island record, thus creating aTuktoyaktuk wind history with the mean and variance ofPelly Island. Wind directions were not altered. The resultingsynthetic Pelly Island wind record utilizes the normalized andreconstructed Tuktoyaktuk DEW Line station (#2203910,1958 to June 1993), the normalized and reconstructedTuktoyaktuk Airport station (#2203912, July to October1993) and the Pelly Island automatic station (#2203095, 1994to 2000). In a six-year period of overlap, synthetic PellyIsland data fall within a mean of 1.6 km h–1 of measured PellyIsland data although individual hourly readings may differ byas much as 60 km h–1, likely reflecting differing arrival timesof storms at Pelly Island and Tuktoyaktuk.
The Station Inspection Reports show that between 1958and 1993, the DEW Line station anemometer was actuallylocated at Tuktoyaktuk airport at an elevation of 10.9 m aboveground; it is not known to have been moved. In 1993, the air-port station was located within a few hundred metres of theDEW Line anemometer at an elevation of 10 m above ground,but with a different type of anemometer. The Pelly Island sta-tion was never moved during the time interval of interest, butthe anemometer type was changed. Changing anemometertypes is assumed to have a negligible effect on record quality.
Wind events defined by at least six hours of speeds greaterthan 50 km h–1 were extracted from the synthetic Pelly Islandwind record and a subset of open-water season events (Juneto October) and north-westerly open-water (NWOW) seasonevents with a mean direction from the north-west (270o to360o). The speed and direction criteria were selected to reflectthe finding that winds greater than 50 km h–1 have a modalnorth-westerly direction, the wind direction associated with
Past and Future Forcing of Beaufort Sea Coastal Change / 109
ATMOSPHERE-OCEAN 45 (2) 2007, 107–122 doi:10.3137/ao.450204Canadian Meteorological and Oceanographic Society
storm surges and resulting coastal impacts. A six-hour dura-tion was selected because most of the record consists of six-hourly readings and to limit aliasing event frequenciestowards hourly data; nevertheless, event frequencies werefound to be lower in a six-hourly decimated dataset comparedto the undecimated hourly dataset, suggesting that morestorms occurred prior to 1994 than are identified here, andparticularly during the open-water season of 1993 when theairport station was not operating at night. No attempt wasmade to correct for aliasing due to measurement spacing.
If available, corresponding information including stormduration, mean storm wind speeds, directions and waterlevels, peak storm wind speeds and their directions, maxi-mum storm water levels, maximum hindcast wave heights,minimum storm air pressure, and the amount of open waterthe week of the storm were also extracted.
Daily mean U and V wind speeds at an elevation of 10 moutput from CGCM1 (ensemble 1) were obtained for a marinegrid cell in the Beaufort Sea north of Pelly Island centred at72.36oN, 135.00oW. To render modelled and measured windscomparable, the model wind speeds were first normalized totheir 1961 to 1990 mean and then reconstructed using the1961 to 1990 mean of the synthetic Pelly Island wind record.We analyse the model output with respect to deviations fromits 1961 to 1990 mean.
d Sea Ice ConcentrationWeekly digital ice charts between mid-June and mid-Octoberfrom 1968 to 1998 were obtained from the Canadian IceService. In a Geographic Information System (GIS)-basedanalysis, a polygon was superimposed over an area of interest(Fig. 1) approximately covering the summer extent of theBeaufort Sea coastal polyna and, for each weekly chart, theareas of open water (considered to be ≤ 5/10 ice cover) andice (considered to be >5/10 ice cover) were determined (onice charts, 0/10 ice is completely open water and 10/10 ice iscomplete ice cover). Charts were not produced betweenNovember and May and ice cover is assumed to be total.
Three CGCM2 ensembles of monthly mean sea-ice con-centrations were obtained for nine grid cells closely matchingthe area of the GIS-based analysis and averaged.
e Air TemperatureSurface air temperatures obtained for the three Tuktoyaktukstations were combined into a record spanning 1958 to 2000with missing data during the winter of 1993/94. The DEWLine station temperature screen was located about 1.6 kmnorth-east of the automatic and airport stations and shows a0.2°C mean difference (cooler at the airport station) in over-lapping values (H. Melling, personal communication, 2006);no alterations were made to the air temperatures during themerging of records. Preference was given to the DEW Lineand automatic stations rather than the irregularly operated air-port station.
Screen temperatures at an elevation of 2 m for threeCGCM2 ensembles of the same grid cell as the modelledwind data were also obtained and averaged. No adjustmentswere made to modelled surface air temperatures. Model
results are considered with respect to deviations from their1961 to 1990 mean.
f Air PressureAir pressures were also obtained from the three Tuktoyaktukstations and combined in a record corresponding to the airtemperature record. As with temperature, there may be differ-ences between stations due to spatial separation of the barom-eters; over 1.6 km the mean difference is assumed to benegligible and no alterations were made to station pressure.Air pressure is used in the correlation and multiple regressionanalyses to attempt to explain some of the variability in stormsurge heights.
g Correlation and RegressionTo identify which storm characteristics contribute to largesurges, we tested the correlation between peak storm windspeed, mean storm wind direction, sea-ice extent, minimumstorm air pressure, and peak storm surge height for identifiedopen-water season wind events. Significantly correlated vari-ables were chosen for stepwise multiple regression to deter-mine the influence of wind speed, wind direction, air pressureand sea-ice extent on peak storm surge heights.
h Return Period AnalysisBecause of the relatively limited number of years of overlap-ping wind, water level and sea-ice records (1971 to 1997) andlengthy periods of missing data, we adopted the Peaks-Over-Threshold (POT) method (Heckert and Simiu, 1996; Pandeyet al., 2001) as opposed to the Annual Maxima method (e.g.,Eid and Cardone, 1992) to predict wind and water level returnperiods. In the POT method, all available events are utilizedinstead of a single event per given time interval.
The Method of L-Moments (e.g., Reiss and Thomas, 2001)was used to fit the three-parameter Generalised ParetoDistribution (GPD) to wind events with a peak speed≥ 60 km h–1 and water level events ≥ 1.25 m above CD asgiven by (Pandey et al., 2001):
(1)
where c and a denote the shape and scale parameters deter-mined during distribution fitting and h, the location parame-ter, is equal to the threshold, r is the annual mean crossing rateof the threshold (i.e., the mean number of times the thresholdis exceeded per year) and T is the return period in years. Boththe wind speed and water level peaks over threshold werewell fit by the GPD. Equation (1) can be rearranged to solvefor the value of y at each return period T following
(2)
Return periods of water level and wind events were calcu-lated for 2000, 2050 and 2100. For water-level return periods
110 / Gavin K. Manson and Steven M. Solomon
ATMOSPHERE-OCEAN 45 (2) 2007, 107–122 doi:10.3137/ao.450204La Société canadienne de météorologie et d’océanographie
Prob( ) –( – )
Y yc y h
a rT
c< = +
= −
−
1 1 11
1
ya rT
ch
c
=( ) −
+
1.
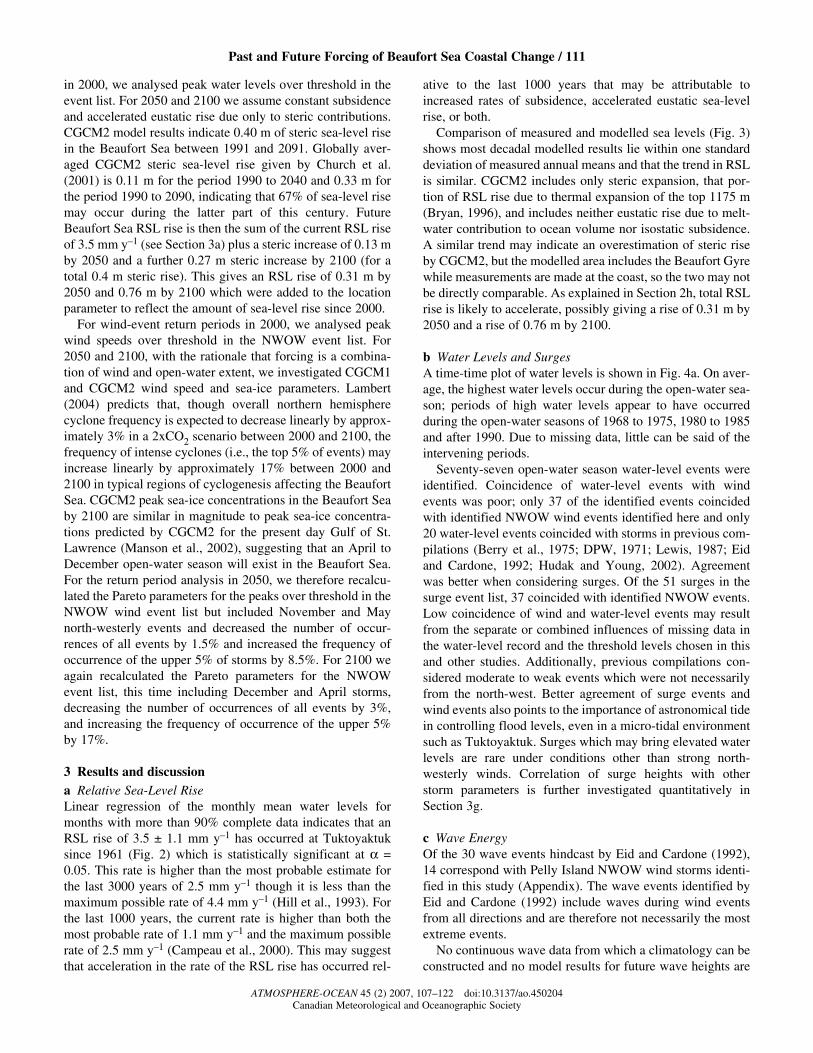
in 2000, we analysed peak water levels over threshold in theevent list. For 2050 and 2100 we assume constant subsidenceand accelerated eustatic rise due only to steric contributions.CGCM2 model results indicate 0.40 m of steric sea-level risein the Beaufort Sea between 1991 and 2091. Globally aver-aged CGCM2 steric sea-level rise given by Church et al.(2001) is 0.11 m for the period 1990 to 2040 and 0.33 m forthe period 1990 to 2090, indicating that 67% of sea-level risemay occur during the latter part of this century. FutureBeaufort Sea RSL rise is then the sum of the current RSL riseof 3.5 mm y–1 (see Section 3a) plus a steric increase of 0.13 mby 2050 and a further 0.27 m steric increase by 2100 (for atotal 0.4 m steric rise). This gives an RSL rise of 0.31 m by2050 and 0.76 m by 2100 which were added to the locationparameter to reflect the amount of sea-level rise since 2000.
For wind-event return periods in 2000, we analysed peakwind speeds over threshold in the NWOW event list. For2050 and 2100, with the rationale that forcing is a combina-tion of wind and open-water extent, we investigated CGCM1and CGCM2 wind speed and sea-ice parameters. Lambert(2004) predicts that, though overall northern hemispherecyclone frequency is expected to decrease linearly by approx-imately 3% in a 2xCO2 scenario between 2000 and 2100, thefrequency of intense cyclones (i.e., the top 5% of events) mayincrease linearly by approximately 17% between 2000 and2100 in typical regions of cyclogenesis affecting the BeaufortSea. CGCM2 peak sea-ice concentrations in the Beaufort Seaby 2100 are similar in magnitude to peak sea-ice concentra-tions predicted by CGCM2 for the present day Gulf of St.Lawrence (Manson et al., 2002), suggesting that an April toDecember open-water season will exist in the Beaufort Sea.For the return period analysis in 2050, we therefore recalcu-lated the Pareto parameters for the peaks over threshold in theNWOW wind event list but included November and Maynorth-westerly events and decreased the number of occur-rences of all events by 1.5% and increased the frequency ofoccurrence of the upper 5% of storms by 8.5%. For 2100 weagain recalculated the Pareto parameters for the NWOWevent list, this time including December and April storms,decreasing the number of occurrences of all events by 3%,and increasing the frequency of occurrence of the upper 5%by 17%.
3 Results and discussiona Relative Sea-Level RiseLinear regression of the monthly mean water levels formonths with more than 90% complete data indicates that anRSL rise of 3.5 ± 1.1 mm y–1 has occurred at Tuktoyaktuksince 1961 (Fig. 2) which is statistically significant at α =0.05. This rate is higher than the most probable estimate forthe last 3000 years of 2.5 mm y–1 though it is less than themaximum possible rate of 4.4 mm y–1 (Hill et al., 1993). Forthe last 1000 years, the current rate is higher than both themost probable rate of 1.1 mm y–1 and the maximum possiblerate of 2.5 mm y–1 (Campeau et al., 2000). This may suggestthat acceleration in the rate of the RSL rise has occurred rel-
ative to the last 1000 years that may be attributable toincreased rates of subsidence, accelerated eustatic sea-levelrise, or both.
Comparison of measured and modelled sea levels (Fig. 3)shows most decadal modelled results lie within one standarddeviation of measured annual means and that the trend in RSLis similar. CGCM2 includes only steric expansion, that por-tion of RSL rise due to thermal expansion of the top 1175 m(Bryan, 1996), and includes neither eustatic rise due to melt-water contribution to ocean volume nor isostatic subsidence.A similar trend may indicate an overestimation of steric riseby CGCM2, but the modelled area includes the Beaufort Gyrewhile measurements are made at the coast, so the two may notbe directly comparable. As explained in Section 2h, total RSLrise is likely to accelerate, possibly giving a rise of 0.31 m by2050 and a rise of 0.76 m by 2100.
b Water Levels and SurgesA time-time plot of water levels is shown in Fig. 4a. On aver-age, the highest water levels occur during the open-water sea-son; periods of high water levels appear to have occurredduring the open-water seasons of 1968 to 1975, 1980 to 1985and after 1990. Due to missing data, little can be said of theintervening periods.
Seventy-seven open-water season water-level events wereidentified. Coincidence of water-level events with windevents was poor; only 37 of the identified events coincidedwith identified NWOW wind events identified here and only20 water-level events coincided with storms in previous com-pilations (Berry et al., 1975; DPW, 1971; Lewis, 1987; Eidand Cardone, 1992; Hudak and Young, 2002). Agreementwas better when considering surges. Of the 51 surges in thesurge event list, 37 coincided with identified NWOW events.Low coincidence of wind and water-level events may resultfrom the separate or combined influences of missing data inthe water-level record and the threshold levels chosen in thisand other studies. Additionally, previous compilations con-sidered moderate to weak events which were not necessarilyfrom the north-west. Better agreement of surge events andwind events also points to the importance of astronomical tidein controlling flood levels, even in a micro-tidal environmentsuch as Tuktoyaktuk. Surges which may bring elevated waterlevels are rare under conditions other than strong north-westerly winds. Correlation of surge heights with otherstorm parameters is further investigated quantitatively inSection 3g.
c Wave EnergyOf the 30 wave events hindcast by Eid and Cardone (1992),14 correspond with Pelly Island NWOW wind storms identi-fied in this study (Appendix). The wave events identified byEid and Cardone (1992) include waves during wind eventsfrom all directions and are therefore not necessarily the mostextreme events.
No continuous wave data from which a climatology can beconstructed and no model results for future wave heights are
Past and Future Forcing of Beaufort Sea Coastal Change / 111
ATMOSPHERE-OCEAN 45 (2) 2007, 107–122 doi:10.3137/ao.450204Canadian Meteorological and Oceanographic Society

112 / Gavin K. Manson and Steven M. Solomon
ATMOSPHERE-OCEAN 45 (2) 2007, 107–122 doi:10.3137/ao.450204La Société canadienne de météorologie et d’océanographie
Fig. 2 Daily and monthly mean water levels measured at the Tuktoyaktuk tide gauge with gaps indicating missing data. Regression of the monthly means ofyears with nearly complete data indicates a statistically significant relative sea-level rise of 3.5±1.1 mm y–1.
Fig. 3 Modelled and measured sea-level rise. Modelled includes only the steric portion while measurements include the components of RSL rise due to bothland subsidence and the contribution of meltwater.
wat
er le
vel (
m a
bove
cha
rt d
atum
)

Past and F
uture Forcing of B
eaufort Sea Coastal C
hange / 113
AT
MO
SPH
ER
E-O
CE
AN
45 (2) 2007, 107–122doi:10.3137/ao.450204
Canadian M
eteorological and Oceanographic Society
a) b)
c) d)
weekly percentage of open water
monthly mean wind speed (km h–1)
Fig. 4 Time-time plots of a) monthly mean water levels at Tuktoyaktuk, b) monthly mean wind speed in the synthetic Pelly Island record, c) weekly percentage of open water (defined here as ≤ 5/10 ice cover)during the Beaufort Sea open-water season, and d) monthly mean air temperatures at Tuktoyaktuk.
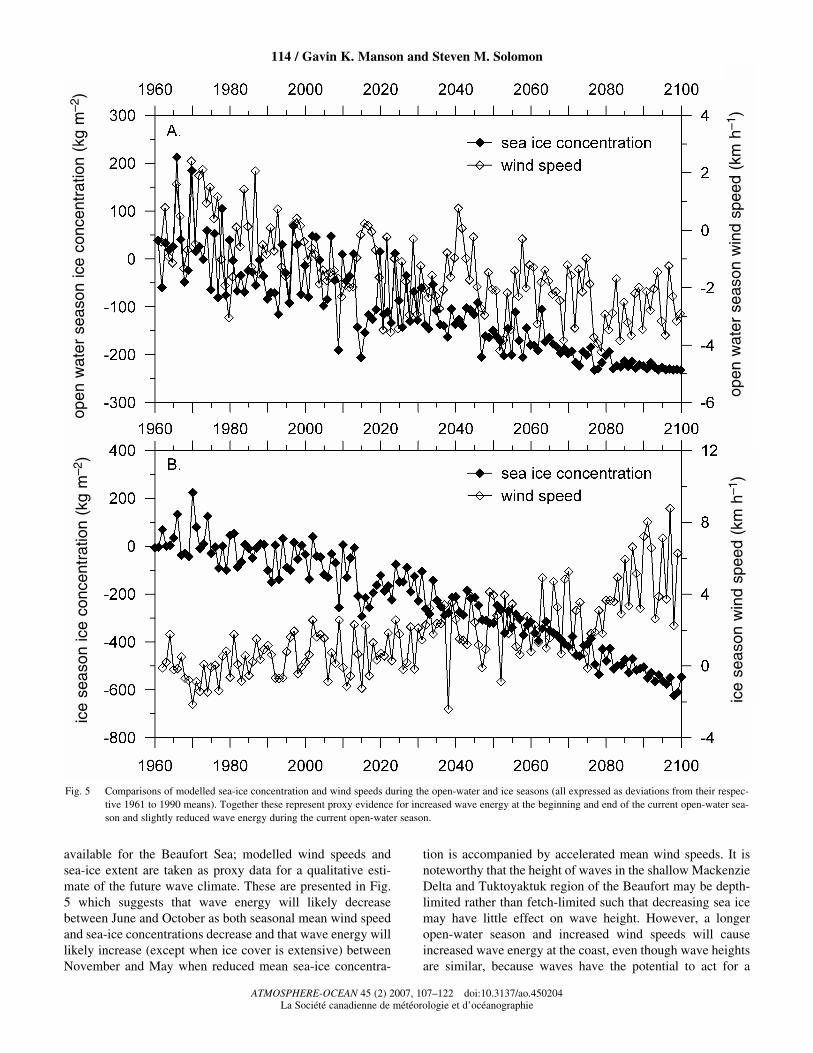
available for the Beaufort Sea; modelled wind speeds and sea-ice extent are taken as proxy data for a qualitative esti-mate of the future wave climate. These are presented in Fig.5 which suggests that wave energy will likely decreasebetween June and October as both seasonal mean wind speedand sea-ice concentrations decrease and that wave energy willlikely increase (except when ice cover is extensive) betweenNovember and May when reduced mean sea-ice concentra-
tion is accompanied by accelerated mean wind speeds. It isnoteworthy that the height of waves in the shallow MackenzieDelta and Tuktoyaktuk region of the Beaufort may be depth-limited rather than fetch-limited such that decreasing sea icemay have little effect on wave height. However, a longeropen-water season and increased wind speeds will causeincreased wave energy at the coast, even though wave heightsare similar, because waves have the potential to act for a
114 / Gavin K. Manson and Steven M. Solomon
ATMOSPHERE-OCEAN 45 (2) 2007, 107–122 doi:10.3137/ao.450204La Société canadienne de météorologie et d’océanographie
Fig. 5 Comparisons of modelled sea-ice concentration and wind speeds during the open-water and ice seasons (all expressed as deviations from their respec-tive 1961 to 1990 means). Together these represent proxy evidence for increased wave energy at the beginning and end of the current open-water sea-son and slightly reduced wave energy during the current open-water season.
open
wat
er s
easo
n ic
e co
ncen
trat
ion
(kg
m–2
)
ice
seas
on w
ind
spee
d (k
m h
–1)
ice
seas
on ic
e co
ncen
trat
ion
(kg
m–2
)
open
wat
er s
easo
n w
ind
spee
d (k
m h
–1)
longer portion of each year. Overall, wave energy impactingBeaufort Sea shorelines is likely to increase.
d Wind Speed and EventsA time-time plot of wind speeds (Fig. 4b) shows that highwinds generally occur during the fall and winter and lowwinds occur during the summer, however, this pattern canvary and prominent calm periods can occur during the fall orwinter and periods of increased winds can occur during thesummer. A prominent period of elevated wind speedsoccurred between 1960 and 1966 and a more subdued andvariable period of elevated speeds occurred from 1986 to1995. A period of increased wind speeds during the open-water season as well as several short periods of high windsduring the ice season contributed to the 1960 to 1966 stormyperiod. The 1986 to 1995 stormy period is initially character-ized by increased wind speeds throughout the open-water sea-son but during the 1990s winds are generally calm during theearly open-water season and stronger during the ice season.Periods of low wind speeds occurred during 1983 and 1984and again after 1995. Calm periods are characterized by lowwind speeds during both the open-water and ice seasons.
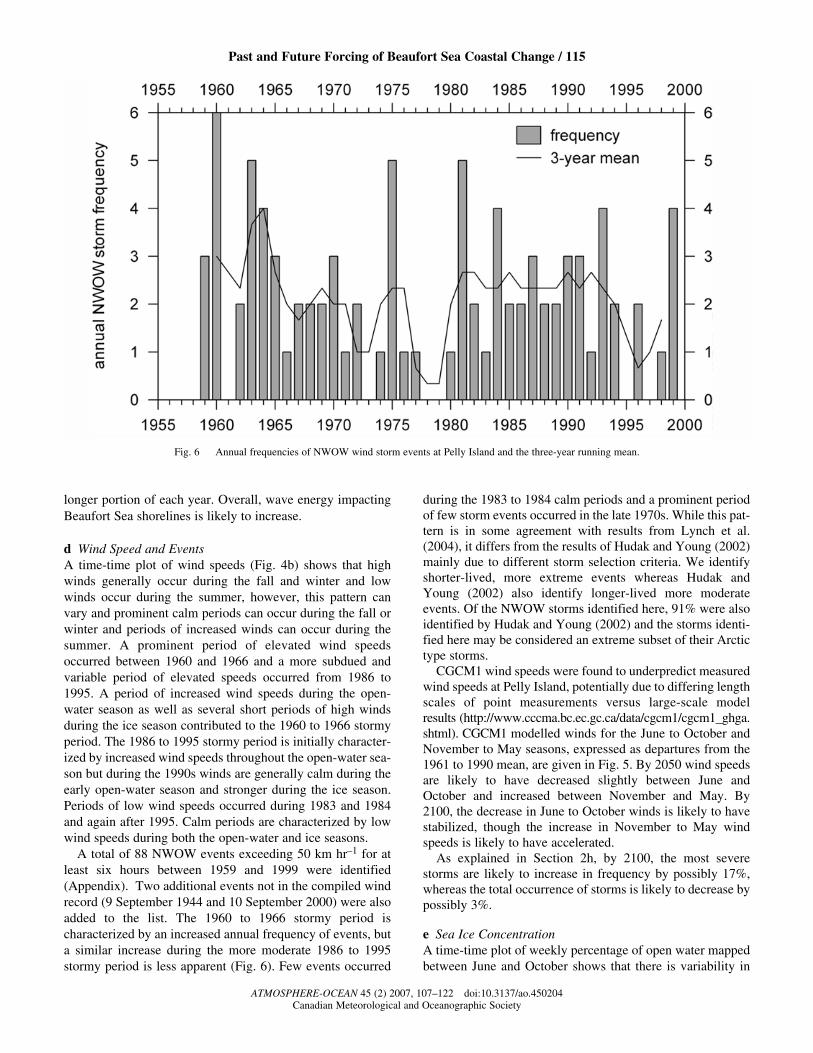
A total of 88 NWOW events exceeding 50 km hr–1 for atleast six hours between 1959 and 1999 were identified(Appendix). Two additional events not in the compiled windrecord (9 September 1944 and 10 September 2000) were alsoadded to the list. The 1960 to 1966 stormy period ischaracterized by an increased annual frequency of events, buta similar increase during the more moderate 1986 to 1995stormy period is less apparent (Fig. 6). Few events occurred
during the 1983 to 1984 calm periods and a prominent periodof few storm events occurred in the late 1970s. While this pat-tern is in some agreement with results from Lynch et al.(2004), it differs from the results of Hudak and Young (2002)mainly due to different storm selection criteria. We identifyshorter-lived, more extreme events whereas Hudak andYoung (2002) also identify longer-lived more moderateevents. Of the NWOW storms identified here, 91% were alsoidentified by Hudak and Young (2002) and the storms identi-fied here may be considered an extreme subset of their Arctictype storms.
CGCM1 wind speeds were found to underpredict measuredwind speeds at Pelly Island, potentially due to differing lengthscales of point measurements versus large-scale modelresults (http://www.cccma.bc.ec.gc.ca/data/cgcm1/cgcm1_ghga.shtml). CGCM1 modelled winds for the June to October andNovember to May seasons, expressed as departures from the1961 to 1990 mean, are given in Fig. 5. By 2050 wind speedsare likely to have decreased slightly between June andOctober and increased between November and May. By2100, the decrease in June to October winds is likely to havestabilized, though the increase in November to May windspeeds is likely to have accelerated.
As explained in Section 2h, by 2100, the most severestorms are likely to increase in frequency by possibly 17%,whereas the total occurrence of storms is likely to decrease bypossibly 3%.
e Sea Ice ConcentrationA time-time plot of weekly percentage of open water mappedbetween June and October shows that there is variability in
Past and Future Forcing of Beaufort Sea Coastal Change / 115
ATMOSPHERE-OCEAN 45 (2) 2007, 107–122 doi:10.3137/ao.450204Canadian Meteorological and Oceanographic Society
Fig. 6 Annual frequencies of NWOW wind storm events at Pelly Island and the three-year running mean.
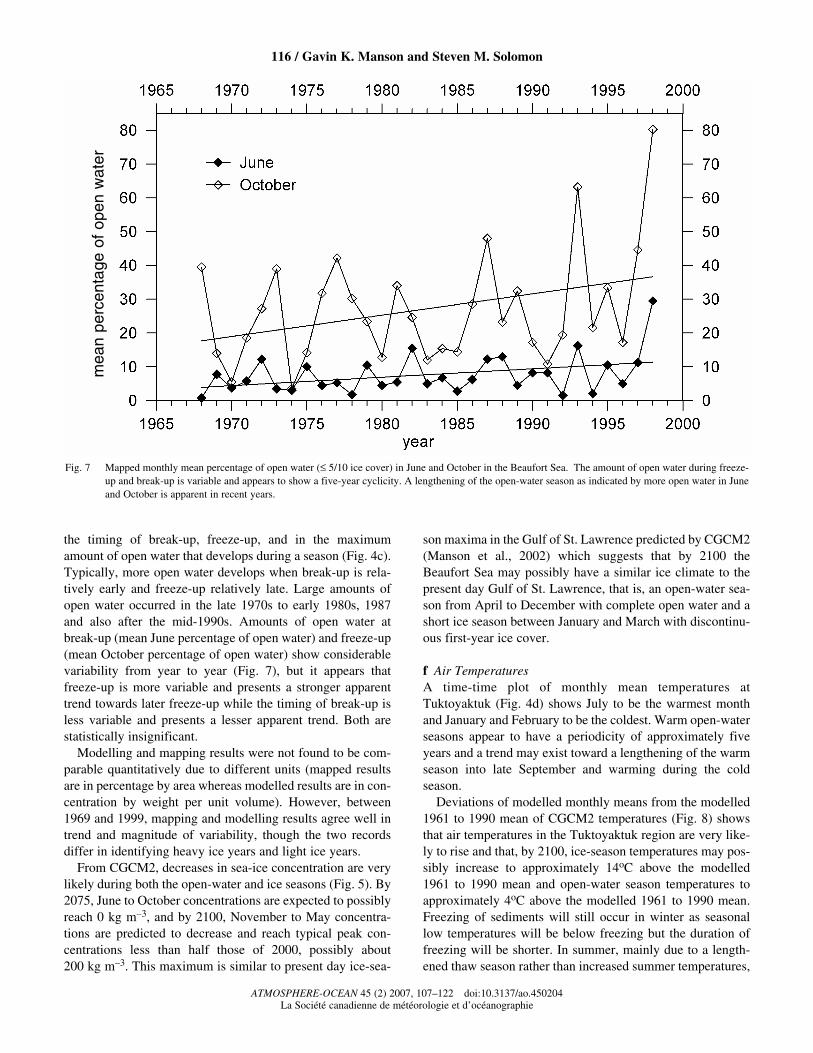
the timing of break-up, freeze-up, and in the maximumamount of open water that develops during a season (Fig. 4c).Typically, more open water develops when break-up is rela-tively early and freeze-up relatively late. Large amounts ofopen water occurred in the late 1970s to early 1980s, 1987and also after the mid-1990s. Amounts of open water atbreak-up (mean June percentage of open water) and freeze-up(mean October percentage of open water) show considerablevariability from year to year (Fig. 7), but it appears thatfreeze-up is more variable and presents a stronger apparenttrend towards later freeze-up while the timing of break-up isless variable and presents a lesser apparent trend. Both arestatistically insignificant.
Modelling and mapping results were not found to be com-parable quantitatively due to different units (mapped resultsare in percentage by area whereas modelled results are in con-centration by weight per unit volume). However, between1969 and 1999, mapping and modelling results agree well intrend and magnitude of variability, though the two recordsdiffer in identifying heavy ice years and light ice years.
From CGCM2, decreases in sea-ice concentration are verylikely during both the open-water and ice seasons (Fig. 5). By2075, June to October concentrations are expected to possiblyreach 0 kg m–3, and by 2100, November to May concentra-tions are predicted to decrease and reach typical peak con-centrations less than half those of 2000, possibly about200 kg m–3. This maximum is similar to present day ice-sea-
son maxima in the Gulf of St. Lawrence predicted by CGCM2(Manson et al., 2002) which suggests that by 2100 theBeaufort Sea may possibly have a similar ice climate to thepresent day Gulf of St. Lawrence, that is, an open-water sea-son from April to December with complete open water and ashort ice season between January and March with discontinu-ous first-year ice cover.
f Air TemperaturesA time-time plot of monthly mean temperatures atTuktoyaktuk (Fig. 4d) shows July to be the warmest monthand January and February to be the coldest. Warm open-waterseasons appear to have a periodicity of approximately fiveyears and a trend may exist toward a lengthening of the warmseason into late September and warming during the coldseason.
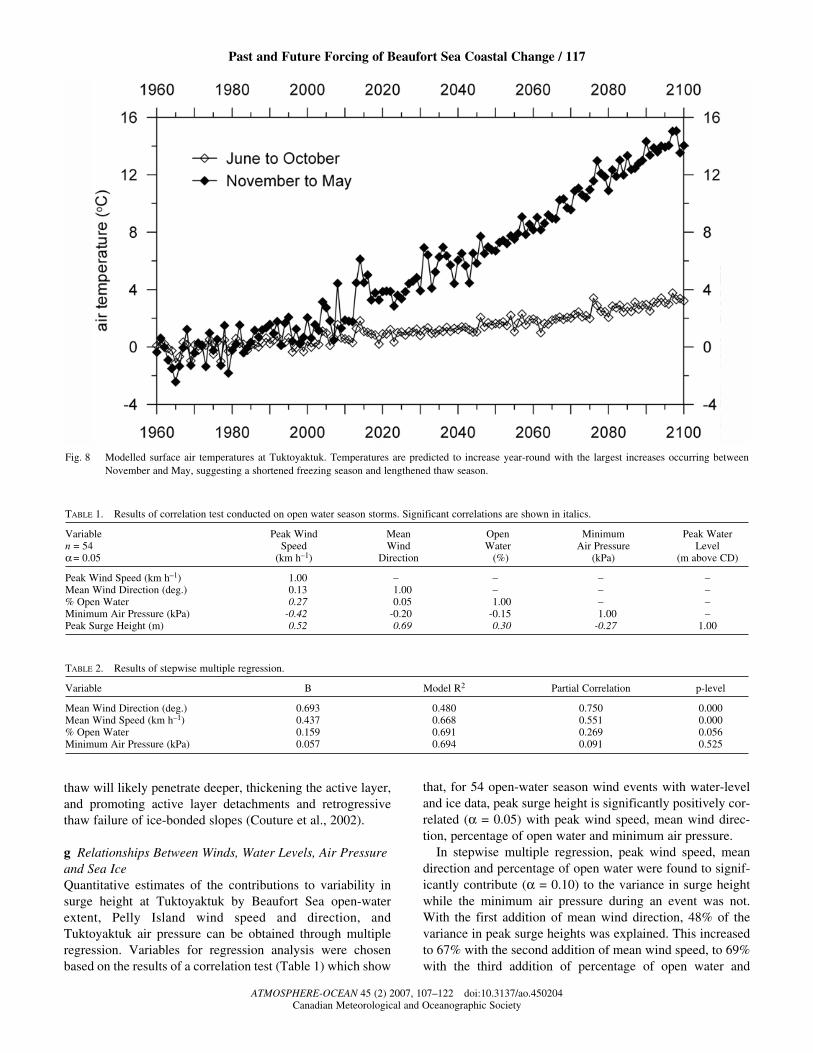
Deviations of modelled monthly means from the modelled1961 to 1990 mean of CGCM2 temperatures (Fig. 8) showsthat air temperatures in the Tuktoyaktuk region are very like-ly to rise and that, by 2100, ice-season temperatures may pos-sibly increase to approximately 14oC above the modelled1961 to 1990 mean and open-water season temperatures toapproximately 4oC above the modelled 1961 to 1990 mean.Freezing of sediments will still occur in winter as seasonallow temperatures will be below freezing but the duration offreezing will be shorter. In summer, mainly due to a length-ened thaw season rather than increased summer temperatures,
116 / Gavin K. Manson and Steven M. Solomon
ATMOSPHERE-OCEAN 45 (2) 2007, 107–122 doi:10.3137/ao.450204La Société canadienne de météorologie et d’océanographie
Fig. 7 Mapped monthly mean percentage of open water (≤ 5/10 ice cover) in June and October in the Beaufort Sea. The amount of open water during freeze-up and break-up is variable and appears to show a five-year cyclicity. A lengthening of the open-water season as indicated by more open water in Juneand October is apparent in recent years.
mea
n pe
rcen
tage
of
open
wat
er
thaw will likely penetrate deeper, thickening the active layer,and promoting active layer detachments and retrogressivethaw failure of ice-bonded slopes (Couture et al., 2002).
g Relationships Between Winds, Water Levels, Air Pressureand Sea IceQuantitative estimates of the contributions to variability insurge height at Tuktoyaktuk by Beaufort Sea open-waterextent, Pelly Island wind speed and direction, andTuktoyaktuk air pressure can be obtained through multipleregression. Variables for regression analysis were chosenbased on the results of a correlation test (Table 1) which show
that, for 54 open-water season wind events with water-leveland ice data, peak surge height is significantly positively cor-related (α = 0.05) with peak wind speed, mean wind direc-tion, percentage of open water and minimum air pressure.
In stepwise multiple regression, peak wind speed, meandirection and percentage of open water were found to signif-icantly contribute (α = 0.10) to the variance in surge heightwhile the minimum air pressure during an event was not.With the first addition of mean wind direction, 48% of thevariance in peak surge heights was explained. This increasedto 67% with the second addition of mean wind speed, to 69%with the third addition of percentage of open water and
Past and Future Forcing of Beaufort Sea Coastal Change / 117
ATMOSPHERE-OCEAN 45 (2) 2007, 107–122 doi:10.3137/ao.450204Canadian Meteorological and Oceanographic Society
Fig. 8 Modelled surface air temperatures at Tuktoyaktuk. Temperatures are predicted to increase year-round with the largest increases occurring betweenNovember and May, suggesting a shortened freezing season and lengthened thaw season.
TABLE 1. Results of correlation test conducted on open water season storms. Significant correlations are shown in italics.
Variable Peak Wind Mean Open Minimum Peak Watern = 54 Speed Wind Water Air Pressure Levelα = 0.05 (km h–1) Direction (%) (kPa) (m above CD)
Peak Wind Speed (km h–1) 1.00 – – – –Mean Wind Direction (deg.) 0.13 1.00 – – –% Open Water 0.27 0.05 1.00 – –Minimum Air Pressure (kPa) -0.42 -0.20 -0.15 1.00 –Peak Surge Height (m) 0.52 0.69 0.30 -0.27 1.00
TABLE 2. Results of stepwise multiple regression.
Variable B Model R2 Partial Correlation p-level
Mean Wind Direction (deg.) 0.693 0.480 0.750 0.000Mean Wind Speed (km h–1) 0.437 0.668 0.551 0.000% Open Water 0.159 0.691 0.269 0.056Minimum Air Pressure (kPa) 0.057 0.694 0.091 0.525
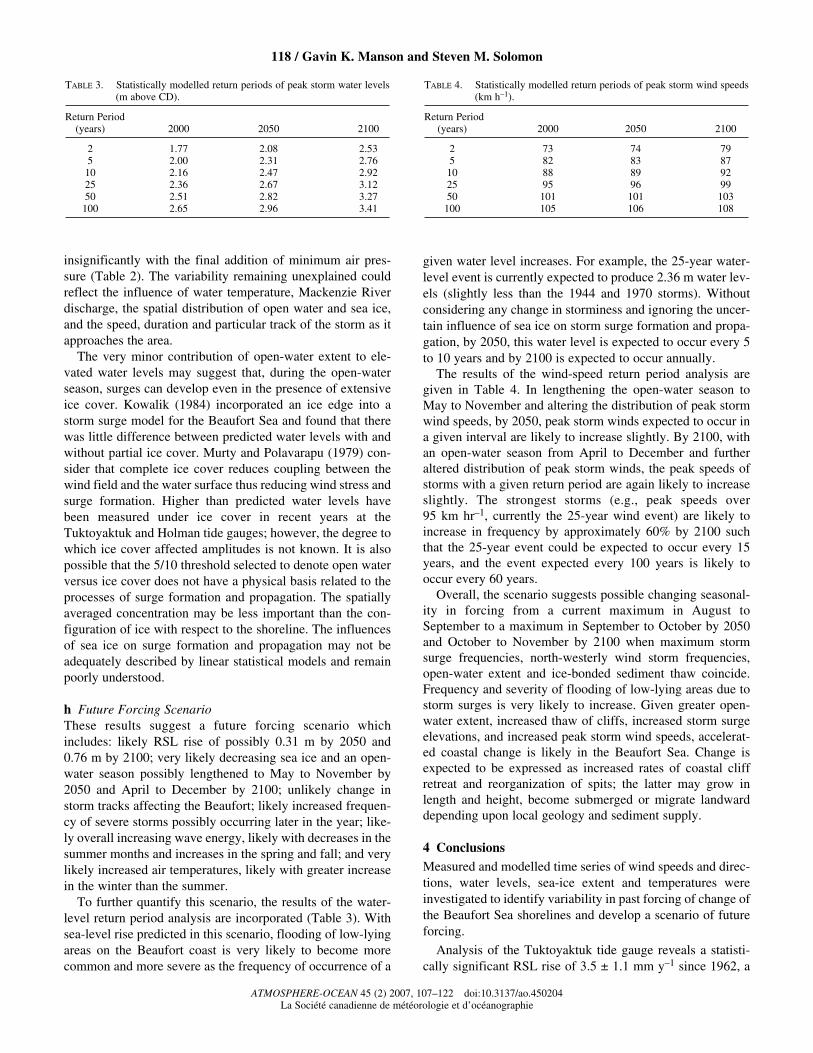
insignificantly with the final addition of minimum air pres-sure (Table 2). The variability remaining unexplained couldreflect the influence of water temperature, Mackenzie Riverdischarge, the spatial distribution of open water and sea ice,and the speed, duration and particular track of the storm as itapproaches the area.
The very minor contribution of open-water extent to ele-vated water levels may suggest that, during the open-waterseason, surges can develop even in the presence of extensiveice cover. Kowalik (1984) incorporated an ice edge into astorm surge model for the Beaufort Sea and found that therewas little difference between predicted water levels with andwithout partial ice cover. Murty and Polavarapu (1979) con-sider that complete ice cover reduces coupling between thewind field and the water surface thus reducing wind stress andsurge formation. Higher than predicted water levels havebeen measured under ice cover in recent years at theTuktoyaktuk and Holman tide gauges; however, the degree towhich ice cover affected amplitudes is not known. It is alsopossible that the 5/10 threshold selected to denote open waterversus ice cover does not have a physical basis related to theprocesses of surge formation and propagation. The spatiallyaveraged concentration may be less important than the con-figuration of ice with respect to the shoreline. The influencesof sea ice on surge formation and propagation may not beadequately described by linear statistical models and remainpoorly understood.
h Future Forcing ScenarioThese results suggest a future forcing scenario whichincludes: likely RSL rise of possibly 0.31 m by 2050 and0.76 m by 2100; very likely decreasing sea ice and an open-water season possibly lengthened to May to November by2050 and April to December by 2100; unlikely change instorm tracks affecting the Beaufort; likely increased frequen-cy of severe storms possibly occurring later in the year; like-ly overall increasing wave energy, likely with decreases in thesummer months and increases in the spring and fall; and verylikely increased air temperatures, likely with greater increasein the winter than the summer.
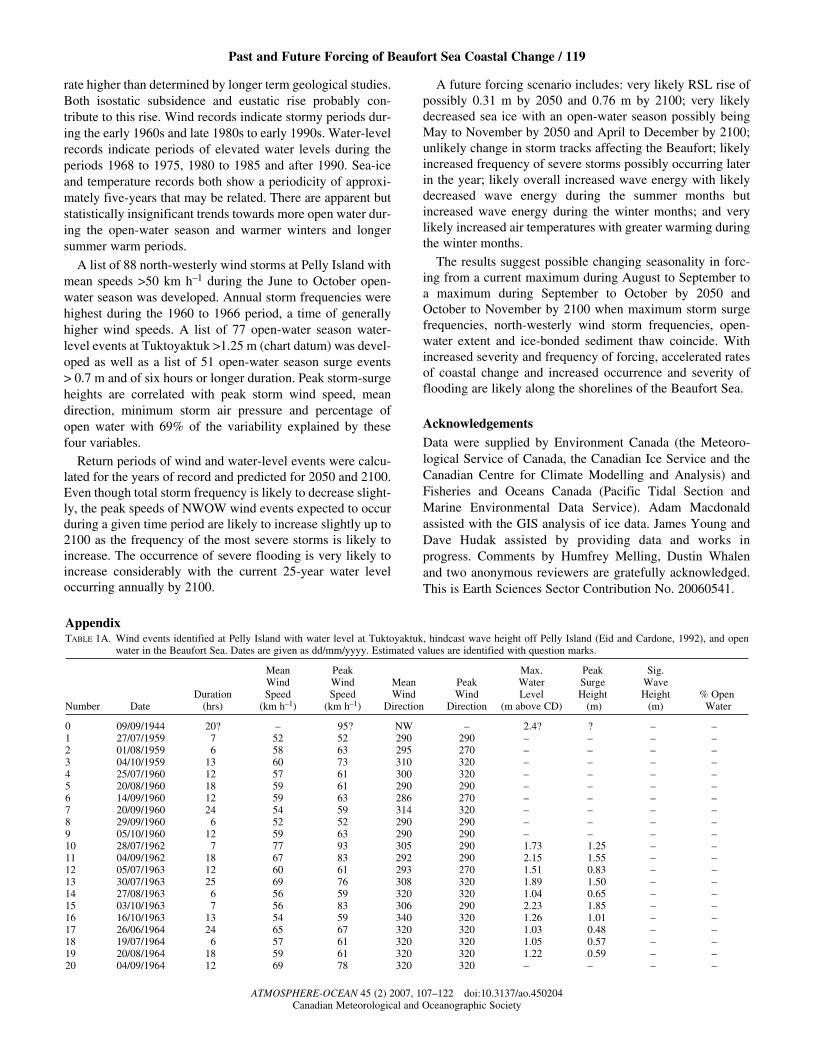
To further quantify this scenario, the results of the water-level return period analysis are incorporated (Table 3). Withsea-level rise predicted in this scenario, flooding of low-lyingareas on the Beaufort coast is very likely to become morecommon and more severe as the frequency of occurrence of a
given water level increases. For example, the 25-year water-level event is currently expected to produce 2.36 m water lev-els (slightly less than the 1944 and 1970 storms). Withoutconsidering any change in storminess and ignoring the uncer-tain influence of sea ice on storm surge formation and propa-gation, by 2050, this water level is expected to occur every 5to 10 years and by 2100 is expected to occur annually.
The results of the wind-speed return period analysis aregiven in Table 4. In lengthening the open-water season toMay to November and altering the distribution of peak stormwind speeds, by 2050, peak storm winds expected to occur ina given interval are likely to increase slightly. By 2100, withan open-water season from April to December and furtheraltered distribution of peak storm winds, the peak speeds ofstorms with a given return period are again likely to increaseslightly. The strongest storms (e.g., peak speeds over95 km hr–1, currently the 25-year wind event) are likely toincrease in frequency by approximately 60% by 2100 suchthat the 25-year event could be expected to occur every 15years, and the event expected every 100 years is likely tooccur every 60 years.
Overall, the scenario suggests possible changing seasonal-ity in forcing from a current maximum in August toSeptember to a maximum in September to October by 2050and October to November by 2100 when maximum stormsurge frequencies, north-westerly wind storm frequencies,open-water extent and ice-bonded sediment thaw coincide.Frequency and severity of flooding of low-lying areas due tostorm surges is very likely to increase. Given greater open-water extent, increased thaw of cliffs, increased storm surgeelevations, and increased peak storm wind speeds, accelerat-ed coastal change is likely in the Beaufort Sea. Change isexpected to be expressed as increased rates of coastal cliffretreat and reorganization of spits; the latter may grow inlength and height, become submerged or migrate landwarddepending upon local geology and sediment supply.
4 ConclusionsMeasured and modelled time series of wind speeds and direc-tions, water levels, sea-ice extent and temperatures wereinvestigated to identify variability in past forcing of change ofthe Beaufort Sea shorelines and develop a scenario of futureforcing.
Analysis of the Tuktoyaktuk tide gauge reveals a statisti-cally significant RSL rise of 3.5 ± 1.1 mm y–1 since 1962, a
118 / Gavin K. Manson and Steven M. Solomon
ATMOSPHERE-OCEAN 45 (2) 2007, 107–122 doi:10.3137/ao.450204La Société canadienne de météorologie et d’océanographie
TABLE 3. Statistically modelled return periods of peak storm water levels(m above CD).
Return Period(years) 2000 2050 2100
2 1.77 2.08 2.535 2.00 2.31 2.7610 2.16 2.47 2.9225 2.36 2.67 3.1250 2.51 2.82 3.27100 2.65 2.96 3.41
TABLE 4. Statistically modelled return periods of peak storm wind speeds(km h–1).
Return Period(years) 2000 2050 2100
2 73 74 795 82 83 8710 88 89 9225 95 96 9950 101 101 103100 105 106 108
rate higher than determined by longer term geological studies.Both isostatic subsidence and eustatic rise probably con-tribute to this rise. Wind records indicate stormy periods dur-ing the early 1960s and late 1980s to early 1990s. Water-levelrecords indicate periods of elevated water levels during theperiods 1968 to 1975, 1980 to 1985 and after 1990. Sea-iceand temperature records both show a periodicity of approxi-mately five-years that may be related. There are apparent butstatistically insignificant trends towards more open water dur-ing the open-water season and warmer winters and longersummer warm periods.
A list of 88 north-westerly wind storms at Pelly Island withmean speeds >50 km h–1 during the June to October open-water season was developed. Annual storm frequencies werehighest during the 1960 to 1966 period, a time of generallyhigher wind speeds. A list of 77 open-water season water-level events at Tuktoyaktuk >1.25 m (chart datum) was devel-oped as well as a list of 51 open-water season surge events> 0.7 m and of six hours or longer duration. Peak storm-surgeheights are correlated with peak storm wind speed, meandirection, minimum storm air pressure and percentage ofopen water with 69% of the variability explained by thesefour variables.
Return periods of wind and water-level events were calcu-lated for the years of record and predicted for 2050 and 2100.Even though total storm frequency is likely to decrease slight-ly, the peak speeds of NWOW wind events expected to occurduring a given time period are likely to increase slightly up to2100 as the frequency of the most severe storms is likely toincrease. The occurrence of severe flooding is very likely toincrease considerably with the current 25-year water leveloccurring annually by 2100.
A future forcing scenario includes: very likely RSL rise ofpossibly 0.31 m by 2050 and 0.76 m by 2100; very likelydecreased sea ice with an open-water season possibly beingMay to November by 2050 and April to December by 2100;unlikely change in storm tracks affecting the Beaufort; likelyincreased frequency of severe storms possibly occurring laterin the year; likely overall increased wave energy with likelydecreased wave energy during the summer months butincreased wave energy during the winter months; and verylikely increased air temperatures with greater warming duringthe winter months.
The results suggest possible changing seasonality in forc-ing from a current maximum during August to September toa maximum during September to October by 2050 andOctober to November by 2100 when maximum storm surgefrequencies, north-westerly wind storm frequencies, open-water extent and ice-bonded sediment thaw coincide. Withincreased severity and frequency of forcing, accelerated ratesof coastal change and increased occurrence and severity offlooding are likely along the shorelines of the Beaufort Sea.
AcknowledgementsData were supplied by Environment Canada (the Meteoro-logical Service of Canada, the Canadian Ice Service and theCanadian Centre for Climate Modelling and Analysis) andFisheries and Oceans Canada (Pacific Tidal Section andMarine Environmental Data Service). Adam Macdonaldassisted with the GIS analysis of ice data. James Young andDave Hudak assisted by providing data and works inprogress. Comments by Humfrey Melling, Dustin Whalenand two anonymous reviewers are gratefully acknowledged.This is Earth Sciences Sector Contribution No. 20060541.
Past and Future Forcing of Beaufort Sea Coastal Change / 119
ATMOSPHERE-OCEAN 45 (2) 2007, 107–122 doi:10.3137/ao.450204Canadian Meteorological and Oceanographic Society
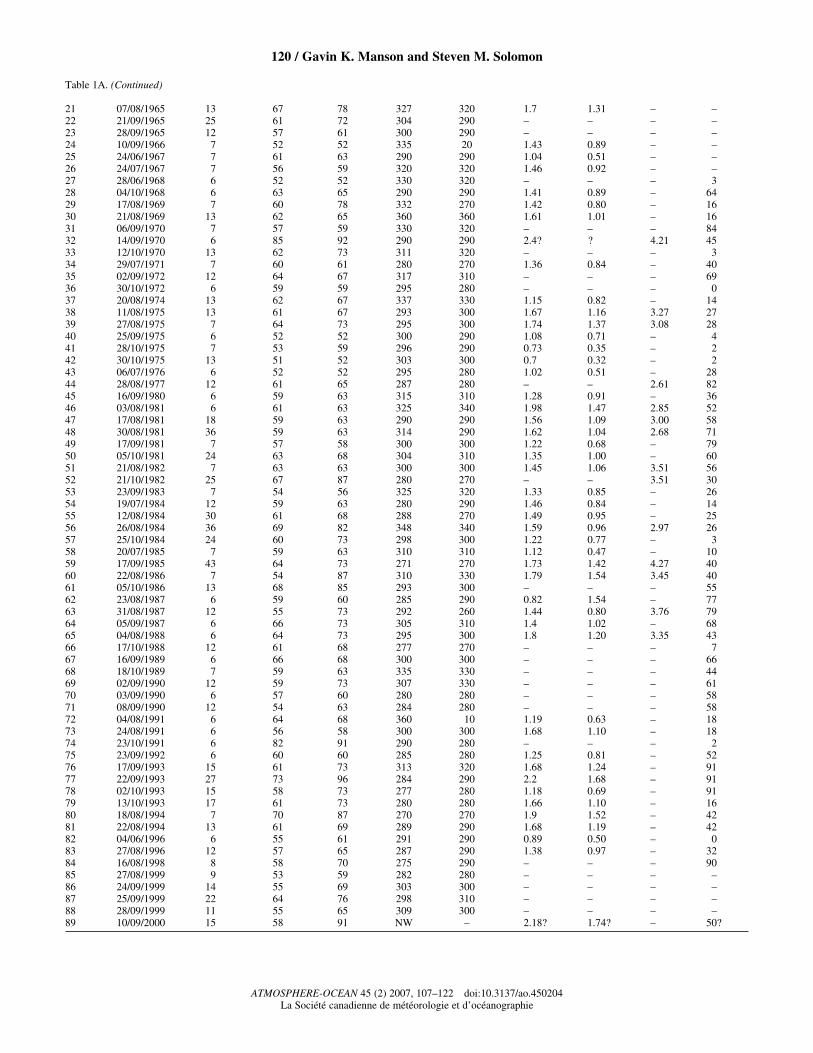
AppendixTABLE 1A. Wind events identified at Pelly Island with water level at Tuktoyaktuk, hindcast wave height off Pelly Island (Eid and Cardone, 1992), and open
water in the Beaufort Sea. Dates are given as dd/mm/yyyy. Estimated values are identified with question marks.
Mean Peak Max. Peak Sig.Wind Wind Mean Peak Water Surge Wave
Duration Speed Speed Wind Wind Level Height Height % Open Number Date (hrs) (km h–1) (km h–1) Direction Direction (m above CD) (m) (m) Water
0 09/09/1944 20? – 95? NW – 2.4? ? – –1 27/07/1959 7 52 52 290 290 – – – –2 01/08/1959 6 58 63 295 270 – – – –3 04/10/1959 13 60 73 310 320 – – – –4 25/07/1960 12 57 61 300 320 – – – –5 20/08/1960 18 59 61 290 290 – – – –6 14/09/1960 12 59 63 286 270 – – – –7 20/09/1960 24 54 59 314 320 – – – –8 29/09/1960 6 52 52 290 290 – – – –9 05/10/1960 12 59 63 290 290 – – – –10 28/07/1962 7 77 93 305 290 1.73 1.25 – –11 04/09/1962 18 67 83 292 290 2.15 1.55 – –12 05/07/1963 12 60 61 293 270 1.51 0.83 – –13 30/07/1963 25 69 76 308 320 1.89 1.50 – –14 27/08/1963 6 56 59 320 320 1.04 0.65 – –15 03/10/1963 7 56 83 306 290 2.23 1.85 – –16 16/10/1963 13 54 59 340 320 1.26 1.01 – –17 26/06/1964 24 65 67 320 320 1.03 0.48 – –18 19/07/1964 6 57 61 320 320 1.05 0.57 – –19 20/08/1964 18 59 61 320 320 1.22 0.59 – –20 04/09/1964 12 69 78 320 320 – – – –
120 / Gavin K. Manson and Steven M. Solomon
ATMOSPHERE-OCEAN 45 (2) 2007, 107–122 doi:10.3137/ao.450204La Société canadienne de météorologie et d’océanographie
Table 1A. (Continued)
21 07/08/1965 13 67 78 327 320 1.7 1.31 – –22 21/09/1965 25 61 72 304 290 – – – –23 28/09/1965 12 57 61 300 290 – – – –24 10/09/1966 7 52 52 335 20 1.43 0.89 – –25 24/06/1967 7 61 63 290 290 1.04 0.51 – –26 24/07/1967 7 56 59 320 320 1.46 0.92 – –27 28/06/1968 6 52 52 330 320 – – – 328 04/10/1968 6 63 65 290 290 1.41 0.89 – 6429 17/08/1969 7 60 78 332 270 1.42 0.80 – 1630 21/08/1969 13 62 65 360 360 1.61 1.01 – 1631 06/09/1970 7 57 59 330 320 – – – 8432 14/09/1970 6 85 92 290 290 2.4? ? 4.21 4533 12/10/1970 13 62 73 311 320 – – – 334 29/07/1971 7 60 61 280 270 1.36 0.84 – 4035 02/09/1972 12 64 67 317 310 – – – 6936 30/10/1972 6 59 59 295 280 – – – 037 20/08/1974 13 62 67 337 330 1.15 0.82 – 1438 11/08/1975 13 61 67 293 300 1.67 1.16 3.27 2739 27/08/1975 7 64 73 295 300 1.74 1.37 3.08 2840 25/09/1975 6 52 52 300 290 1.08 0.71 – 441 28/10/1975 7 53 59 296 290 0.73 0.35 – 242 30/10/1975 13 51 52 303 300 0.7 0.32 – 243 06/07/1976 6 52 52 295 280 1.02 0.51 – 2844 28/08/1977 12 61 65 287 280 – – 2.61 8245 16/09/1980 6 59 63 315 310 1.28 0.91 – 3646 03/08/1981 6 61 63 325 340 1.98 1.47 2.85 5247 17/08/1981 18 59 63 290 290 1.56 1.09 3.00 5848 30/08/1981 36 59 63 314 290 1.62 1.04 2.68 7149 17/09/1981 7 57 58 300 300 1.22 0.68 – 7950 05/10/1981 24 63 68 304 310 1.35 1.00 – 6051 21/08/1982 7 63 63 300 300 1.45 1.06 3.51 5652 21/10/1982 25 67 87 280 270 – – 3.51 3053 23/09/1983 7 54 56 325 320 1.33 0.85 – 2654 19/07/1984 12 59 63 280 290 1.46 0.84 – 1455 12/08/1984 30 61 68 288 270 1.49 0.95 – 2556 26/08/1984 36 69 82 348 340 1.59 0.96 2.97 2657 25/10/1984 24 60 73 298 300 1.22 0.77 – 358 20/07/1985 7 59 63 310 310 1.12 0.47 – 1059 17/09/1985 43 64 73 271 270 1.73 1.42 4.27 4060 22/08/1986 7 54 87 310 330 1.79 1.54 3.45 4061 05/10/1986 13 68 85 293 300 – – – 5562 23/08/1987 6 59 60 285 290 0.82 1.54 – 7763 31/08/1987 12 55 73 292 260 1.44 0.80 3.76 7964 05/09/1987 6 66 73 305 310 1.4 1.02 – 6865 04/08/1988 6 64 73 295 300 1.8 1.20 3.35 4366 17/10/1988 12 61 68 277 270 – – – 767 16/09/1989 6 66 68 300 300 – – – 6668 18/10/1989 7 59 63 335 330 – – – 4469 02/09/1990 12 59 73 307 330 – – – 6170 03/09/1990 6 57 60 280 280 – – – 5871 08/09/1990 12 54 63 284 280 – – – 5872 04/08/1991 6 64 68 360 10 1.19 0.63 – 1873 24/08/1991 6 56 58 300 300 1.68 1.10 – 1874 23/10/1991 6 82 91 290 280 – – – 275 23/09/1992 6 60 60 285 280 1.25 0.81 – 5276 17/09/1993 15 61 73 313 320 1.68 1.24 – 9177 22/09/1993 27 73 96 284 290 2.2 1.68 – 9178 02/10/1993 15 58 73 277 280 1.18 0.69 – 9179 13/10/1993 17 61 73 280 280 1.66 1.10 – 1680 18/08/1994 7 70 87 270 270 1.9 1.52 – 4281 22/08/1994 13 61 69 289 290 1.68 1.19 – 4282 04/06/1996 6 55 61 291 290 0.89 0.50 – 083 27/08/1996 12 57 65 287 290 1.38 0.97 – 3284 16/08/1998 8 58 70 275 290 – – – 9085 27/08/1999 9 53 59 282 280 – – – –86 24/09/1999 14 55 69 303 300 – – – –87 25/09/1999 22 64 76 298 310 – – – –88 28/09/1999 11 55 65 309 300 – – – –89 10/09/2000 15 58 91 NW – 2.18? 1.74? – 50?
ReferencesBERRY, M.O.; P.M. DUTCHAK, M.E. LALONDE, J.A.W. MCCULLOCH and I. SAVDIE.
1975. Weather, waves and icing in the Beaufort Sea. Beaufort SeaTechnical Report 21, Department of the Environment, Ottawa, 123 pp.
BRYAN, K. 1996. The steric component of sea level rise associated withenhanced greenhouse warming: a model study. Clim. Dyn. 12: 545–555.
CAMPEAU, S.; A., HEQUETTE and R. PIENITZ. 2000. Late Holocene diatom bios-tratigraphy and sea-level changes in the southeastern Beaufort Sea. Can. J.Earth Sci. 37: 63–80.
CHURCH, J.A.; J.M. GREGORY, P. HUYBRECHTS, M. KUHN, K. LAMBECK, M.T. NHUAN, D.
QIN, P.L. WOODWORTH, O.A. ANISIMOVM, F.O. BRYAN, A. CAZENAVE, K.W. DIXON,
B.B. FITZHARRIS, G.M. FLATO, A. GANOPOLSKI, V. GORNITZ, J.A. LOWE, A. NODA,
J.M. OBERHUBER, S.P. O’FARRELL, A. OHMURA, M. OPPENHEIMER, W.R. PELTIER,
S.C.B. RAPER, C. RITZ, G.L. RUSSELL, E. SCHLOSSER, C.K. SHUM, T.F. STOCKER, R.J.
STOUFFER, R.S.W. VAN DE WAL, R. VOSS, E.C. WIEBE, M. WILD, D.J. WINGHAM andH.J. ZWALLY. Climate change 2001: the scientific basis. Contribution ofWorking Group I to the Third Assessment Report of the IntergovernmentalPanel on Climate Change. Cambridge University Press, Cambridge UK,pp. 639–693.
COUTURE, R.; S. ROBINSON, M. BURGESS and S. SOLOMON. 2002. Climate change,permafrost, and community infrastructure: a compilation of backgroundmaterial from a pilot study of Tuktoyaktuk, Northwest Territories.Geological Survey of Canada Open File D3867, 89 pp.
DALLIMORE, S.R.; S.A. WOLFE and S.M. SOLOMON. 1996. Influence of ground iceand permafrost on coastal evolution, Richards Island, Beaufort Sea coast,N.W.T. Can. J. Earth Sci. 33: 664–675.
DPW. 1971. Beaufort Sea storm, September 13–16, 1970: Investigation ofeffects in the Mackenzie Delta Region. Engineering Programs BranchReport.
EID, B.M. and V.J. CARDONE. 1992. Beaufort Sea extreme waves study.Environmental Studies Research Funds Report 114. Calgary, 143 pp. and5 Appendices.
FLATO, G.M.; G.J. BOER, W.G. LEE, N.A. MCFARLANE, D. RAMSDEN, M.C. READER andA.J. WEAVER. 2000. The Canadian Centre for Climate Modelling andAnalysis global coupled model and its climate. Clim. Dyn. 16: 451–467.
FLATO, G.M. and G.J. BOER. 2001. Warming asymmetry in climate change sim-ulations. Geophys. Res. Lett. 28: 195–198.
FORBES, D.L. and J.P.M. SYVITSKI. 1994. Paraglacial coasts. In: CoastalEvolution: Late Quaternary Shoreline Morphodynamics. R.J.W. Carterand C.D. Woodroffe (Eds), Cambridge University Press, Cambridge UK,pp. 373–424.
FORBES, D.L. and R.B. TAYLOR. 1994. Ice in the shore zone and the geomor-phology of cold coasts. Prog. Phys. Geogr. 18: 59–89.
FORBES, D.L.; J.D. ORFORD, R.W.G. CARTER, J. SHAW and S.C. JENNINGS. 1995.Morphodynamic evolution, self-organisation, and instability of coarse-clastic barriers on paraglacial coasts. Mar. Geol. 126: 63–85.
GORDON, C.; C. COOPER, C.A. SENIOR, H.T. BANKS, J.M. GREGORY, T.C. JOHNS, J.F.B.
MITCHELL and R.A. WOOD. 2000. Simulation of SST, sea ice extents andocean heat transports in a version of the Hadley Centre coupled modelwithout flux adjustments. Clim. Dyn. 16: 147–168.
HARPER, J.R.; R.F. HENRY and G.G. STEWART. 1988. Maximum storm surge eleva-tions in the Tuktoyaktuk region of the Canadian Beaufort Sea. Arctic, 41:48–52.
HECKERT, N.A. and E. SIMIU. 1996. Extreme wind distribution tails: A peaksover threshold approach. J. Structural Engin. 122: 539–547.
HÉQUETTE, A.; M.H. RUZ and P.R. HILL. 1995. The effects of Holocene sea-levelrise on the evolution of the southeast coast of the Canadian Beaufort Sea.J. Coastal Res. 11: 494–507.
HÉQUETTE, A.; M. DESROSIERS, P.R. HILL and D.L. FORBES. 2001. The influence ofcoastal morphology on shoreface sediment transport under storm-com-bined flows, Canadian Beaufort Sea. J. Coastal Res. 17: 507–516.
HILL, P.R.; A. HÉQUETTE and M.-H. RUZ. 1993. Holocene sea-level history of theCanadian Beaufort shelf. Can. J. Earth Sci. 30: 103–108.
HILL, P.R.; P.W. BARNES, A. HÉQUETTE and M.-H. RUZ. 1994. Arctic Coastal PlainShorelines. In: Coastal Evolution: Late Quaternary Shoreline
Morphodynamics, R.W. Carter and C.D. Woodroffe (Eds), CambridgeUniversity Press, Cambridge UK, pp. 341–372.
HILL, P.R. and S.M. SOLOMON. 1999. Geomorphologic and sedimentary evolu-tion of a transgressive thermokarst coast, Mackenzie Delta region,Canadian Beaufort Sea. J. Coastal Res. 15: 1011–1029.
HUDAK, D.R. and J.M.C. YOUNG. 2002. Storm climatology of the southernBeaufort Sea. ATMOSPHERE-OCEAN, 40: 145–158.
HUNTINGTON, H.; G. WELLER, E. BUSH, T.V. CALLAGHAN, V.M. KATTSOV and M.
NUTALL. 2005. An introduction to the Arctic Climate Impact Assessment.In: Arctic Climate Impact Assessment, C. Symon, L. Arris and B. Heal(Eds), Cambridge University Press, Cambridge, UK, pp. 1–19.
IPCC WG1. 2001. Climate change 2001: the scientific basis. Contribution ofWorking Group I to the Third Assessment Report of the IntergovernmentalPanel on Climate Change. J.T. Houghton, Y. Ding, D.J. Griggs, M.Noguer, P. van der Linden, X. Dai, K. Maskell and C.I. Johnson (Eds),Cambridge University Press, Cambridge, UK, 882 pp.
JOHANNESSEN, O.M.; L. BENGTSSON, M.W. MILES, S.I. KUZMINA, V.A. SEMENOV, G.V.
ALEEKSEEV, A.P. NAGURNYI, V.F. ZAKHAROV, L. BOBYLEV, L.H. PETTERSSON, K.
HASSELMANN and H.P. CATTLE. 2002. Arctic climate change – observed andmodelled temperature and sea ice variability. Nansen Environmental andRemote Sensing Centre Technical Report 218, 22 pp.
KATTSOV, V.M.; E. KÄLLÉN, H. CATTLE, J. CHRISTENSEN, H. DRANGE, I. HANSSEN-
BAUER, T. JÓHANNESEN, I. KAROL, J. RÄISÄNEN. G. SVENSON, S. VAVULIN, D. CHEN,
I. POLYAKOV and A. RINKE. 2005. Future climate change: modeling and sce-narios for the Arctic. In: Arctic Climate Impact Assessment, C. Symon, L.Arris and B. Heal (Eds), Cambridge University Press, Cambridge, UK, pp.100–144.
KOWALIK, Z. 1984. Storm surges in the Beaufort and Chukchi Seas. J.Geophys. Res. 89: 10570–10578.
LAMBERT, S.J. 1995. The effect of enhanced greenhouse warming on wintercyclone frequencies and strengths. J. Clim. 8: 1447–1452.
LAMBERT, S.J. 2004. Changes in winter cyclone frequencies and strengths intransient enhanced greenhouse warming simulations using two coupledclimate models. ATMOSPHERE-OCEAN, 42: 173–181.
LEWIS, P.J. 1987. Severe storms over the Canadian High Arctic: A cataloguesummary for the period 1957 to 1983. Environment Canada, Ottawa, 285pp.
LYNCH, A.H.; J.A. CURRY, R.D. BRUNNER and J.A. MASLANIK. 2004. Toward an inte-grated assessment of the impacts of extreme wind events on Barrow,Alaska. Bull. Am. Meteorol. Soc. 85: 202–221.
MANSON, G.K.; D.L. FORBES and G.S. PARKES. 2002. Wave climatology. In:Coastal Impacts of Climate Change and Sea-Level Rise on Prince EdwardIsland. D.L. Forbes and R.W. Shaw (Eds), Geological Survey of Canada,Open File 4261, 31 pp. (on CDROM).
MANSON, G.K.; S.M. SOLOMON, D.L. FORBES, D.E. ATKINSON and M. CRAYMER. 2005.Spatial variability of factors influencing coastal change in the westernCanadian Arctic. Geomar. Lett. 25: 138–145.
MCCABE, G.J; M.P. CLARK and M.C. SERREZE. 2001. Trends in northern hemi-sphere surface cyclone frequency and intensity. J. Clim. 14: 2763–2768.
MCFARLANE, N.A.; G.J. BOER, J.-P. BLANCHET and M. LAZARE. 1992. The CanadianClimate Centre second-generation general circulation model and its equi-librium climate. J. Clim. 5: 1013–1044.
MURTY, T.S. and R.J. POLAVARAPU. 1979. Influence of an ice layer on the prop-agation of long waves. Mar. Geodesy, 2: 99–125.
PANDEY, M.D.; P.H.A.J.M. VAN GELDER and J.K. VRIJLING. 2001. The estimation ofextreme quantiles of wind velocity using L-moments in the peaks-over-threshold approach. Structural Safety, 23: 179–192.
PELTIER, W.R. 1994. Ice age paleotopography. Science, 265: 195–201.RÄISÄNEN. J. 2001. CO2-induced climate change in CMIP2 experiments:
Quantification of agreement and role of internal variability. J. Clim. 14:2088–2104.
READER, C.M. and G.J. BOER. 1998. The modification of greenhouse gas warm-ing by the direct effect of sulphate aerosols. Clim. Dyn. 14: 593–608.
REISS, R.-D. and M. THOMAS. 2001. Statistical Analysis of Extreme Values.Birkhauser, Boston USA. 316 pp.
Past and Future Forcing of Beaufort Sea Coastal Change / 121
ATMOSPHERE-OCEAN 45 (2) 2007, 107–122 doi:10.3137/ao.450204Canadian Meteorological and Oceanographic Society

ROECKNER, E.; L. BENGTSSON, J. FEICHTER, J. LELIEVELD and H. RODHE. 1999.Transient climate change simulations with a coupled atmosphere-oceanGCM including the tropospheric sulfur cycle. J. Clim. 12: 3004–3032.
RUZ, M.-H.; A. HÉQUETTE and P.R. HILL. 1992. A model of coastal evolution in atransgressed thermokarst topography, Canadian Beaufort Sea. Mar. Geol.106: 251–278.
SHAW, J.; R.B. TAYLOR, S.M. SOLOMON, H.A. CHRISTIAN and D.L. FORBES.
1998. Potential impacts of global sea-level rise on Canadian coasts. Can.Geographer, 42: 365–379.
SOLOMON, S.M.; P.J. MUDIE, R. CRANSTON, T. HAMILTON, S.A. THIBAUDEAU and E.S.
COLLINS. 2000. Characterisation of marine and lacustrine sediments in adrowned thermokarst embayment, Richards Island, Beaufort Sea, Canada.Int. J. Earth Sci. 89: 503–521.
WANG, X.L. and V.R. SWAIL. 2006. Climate change signal and uncertainty in pro-jections of ocean wave heights. Clim. Dyn. 26: 109–126.
122 / Gavin K. Manson and Steven M. Solomon
ATMOSPHERE-OCEAN 45 (2) 2007, 107–122 doi:10.3137/ao.450204La Société canadienne de météorologie et d’océanographie
Related Documents