BEFORE THE HON' BLE NATIONAL GREEN TRIBUNAL, Princi pal Bench, New Delhi In Original Appl icat ion No. 593/2017 With Original Application No. 148/2016 In the Matter of: - Paryavaran Suraksha Samiti & Anr. Union of India & Ors. Mahesh Chandra Saxena South Delhi Municipal Corporation & Ors. Applicant(s) Vs. Respondent(s) With Applicant Vs. Respondent(s) S. No. Particulars Page No. 1. Status Report of CPCB in compliance to Hon'ble NGT, PB order dated 21.05.2020 in the matt er of O.A. No. 593/2017 titled as Paryavaran Suraksha Samiti & Anr. Vs. Union of India & Ors. 2. Annexure-1: State-wise compliance status of all industries generating trade effl uent and requiring ETPs as report ed by SPCBs/ PCCs. 3. Annexure-11: Copy of correspondences vide email/ lett er dated 03.06.2020, 24.06.2020 and 24.08.2020 by CPCB to all States/UTs to submit action plans as per the format and compliance report s. 4. Annexure-111: The gap analysis of action plans. 5. Annexure-lV: Copy of letter dated 15.07.2020 by CPCB to all SPCBs/PCCSs to provide information on STPs inventory. 6. Annexure-V: Information on STPs regarding National inventory of sewage treatment plant. 7. Annexure-VI: Details of river basins associ ated with the concerned States, as adopted from River Basin Classifi cation, 2019 of Central Water Commission. 8. Annexure-VII (a to c): Copy of correspondences dated 12.05.2020, 30.07.2020 and 25.08.2020 (email) by CPCB to SPCBs/PCCs to facilitate river basin-wise status of ETPs. 9. Annexure-VIII (a to d): Copy of correspondences dated 07.09.2020, and 09.09.2020 by CPCB to SPCBs/PCCs to communication of

Welcome message from author
This document is posted to help you gain knowledge. Please leave a comment to let me know what you think about it! Share it to your friends and learn new things together.
Transcript
BEFORE THE HON'BLE NATIONAL GREEN TRIBUNAL,
Principal Bench, New Delhi
In
Original Application No. 593/2017 With
Original Application No. 148/2016
In the Matter of: - Paryavaran Suraksha Samiti & Anr.
Union of India & Ors.
Mahesh Chandra Saxena
South Delhi Municipal Corporation & Ors.
Applicant(s)
Vs. Respondent(s)
With Applicant
Vs. Respondent(s)
S. No. Particulars Page No.
1. Status Report of CPCB in compliance to Hon'ble NGT, PB order dated
21.05.2020 in the matter of O.A. No. 593/2017 titled as Paryavaran
Suraksha Samiti & Anr. Vs. Union of India & Ors. 2. Annexure-1: State-wise compliance status of all industries generating
trade effluent and requiring ETPs as reported by SPCBs/ PCCs.
3. Annexure-11: Copy of correspondences vide email/letter dated 03.06.2020, 24.06.2020 and 24.08.2020 by CPCB to all States/UTs to submit action plans as per the format and compliance reports.
4. Annexure-111: The gap analysis of action plans.
5. Annexure-lV: Copy of letter dated 15.07.2020 by CPCB to all SPCBs/PCCSs to provide information on STPs inventory.
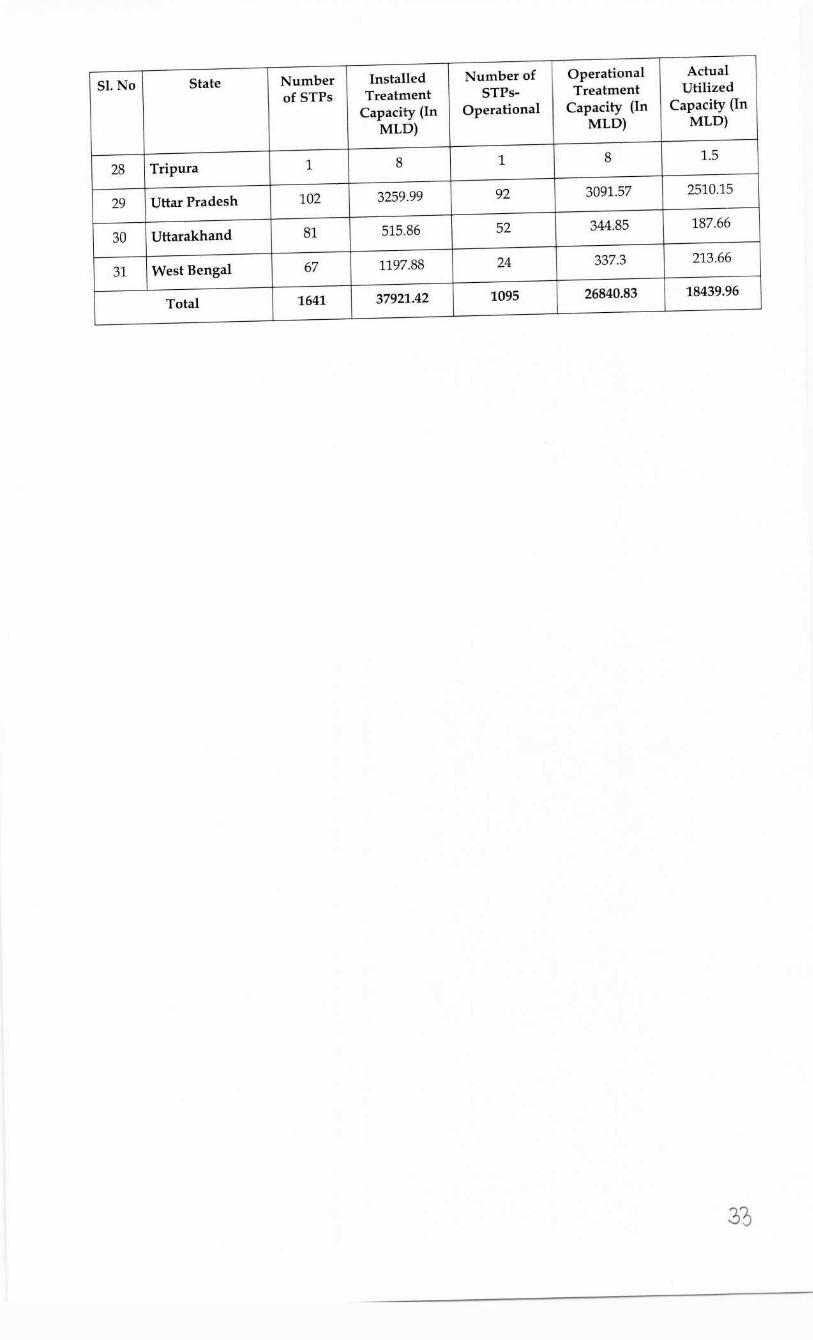
6. Annexure-V: Information on STPs regarding National inventory of
sewage treatment plant.
7. Annexure-VI: Details of river basins associated with the concerned States, as adopted from River Basin Classification, 2019 of Central Water Commission.
8. Annexure-VII (a to c): Copy of correspondences dated 12.05.2020, 30.07.2020 and 25.08.2020 (email) by CPCB to SPCBs/PCCs to facilitate river basin-wise status of ETPs.
9. Annexure-VIII (a to d): Copy of correspondences dated 07.09.2020, and 09.09.2020 by CPCB to SPCBs/PCCs to communication of
shortcomings observed in the data.
10. Annexure-lX: Copy of letter dated 31.07.2020 by CPCB to SPCBs/PCCs for circulation of formats.
11. Annexure-X: Assessment report prepared by CPCB for Assessment of Impact of Lockdown on Water Quality of Major Rivers.
12. Annexure-XlrA copy of Hon'ble NGT order dated 21.05.2020.
{Ajay Aggarwal)
Scientist 'E' Central Pollution Control Board
Parivesh Bhawan, East Arjun Nagar
Delhi-110032 Place: Delhi
Date: is" September, 2020
'·
Status Report in the matter of Hon'ble NGT order dated 21st
May, 2020 in Original Application No. 593/2017 (Paryavaran
Suraksha Samiti & Anr. v/s Union of India & Ors.)
with
Original Application No. 148/2016 (Mahesh Chandra Saxena
v/s South Delhi Municipal Corporation & Ors.)
15th Septemer, 2020
CENTRAL POLLUTION CONTROL BOARD
"Parivesh Bhawan", East Arjun Nagar,
Delhi-110032
Contents
1.0 Background 1
2.0 Compliance Status of ETPs, CETPs & STPs reported by SPCBs/PCCs 2
3.0 Steps taken by CPCB in compliance of the Hon'ble NGT directions dated 21.05.2020 3
3.1 Sewage Management. 3
3.1.1 Compliance status w.r.t. the directions at Para 24 and 26 (iv) 3
3 .1.2 Compliance to directions at Para 26 (i) of Hon 'ble NGT .4
3.2 River basin-wise macro picture of ETPs, CETPs, STPs, MSW facilities and Legacy Waste Sites 4
3.2.1 River basin-wise status of ETPs .4
3 .2.2 River basin-wise status of CETPs 6
3.2.3 River basin-wise status of STPs 6
3.2.4 River basin-wise status of MSW facilities and legacy waste sites 6
3.3 Assessment of Impact of Lockdown on Water Quality of Major Rivers 9
1.0 Background
The last hearing by the Hon'ble NGT in the matter of OA No. 593/2017 (Paryavaran Suraksha
Samiti & Anr. v/s Union of India & Ors.) was held on 21.05.2020, wherein NGT reviewed the
compliance report dated 15.05.2020, submitted by CPCB, regarding status of ETPs, CETPs &
STPs in the country. Subsequently, the Tribunal passed the following directions:
i. All States/UTs through their concerned departments such as Urban/Rural
Development, Irrigation & Public Health, Local Bodies, Environment, etc. may ensure
formulation and execution of plans for sewage treatment and utilization of treated
sewage effluent with respect to each city, town and village, adhering to the time line as
directed by Hon'ble Supreme Court. STPs must meet the prescribed standards,
including faecal coliform.
CPCB may further continue efforts on compilation of River Basin-wise data. Action
plans be firmed up with Budgets/Financial tie up. Such plans be overseen by Chief
Secretary and forwarded to CPCB before 30.6.2020. CPCB may consolidate all action
plans and file a report accordingly.
Ministry of Jal Shakti and Ministry of Housing and Urban Affairs may facilitate
States/UTs for ensuring that water quality of rivers, lakes, water bodies and ground
water is maintained.
100% treatment of sewage/effluent must be ensured and strict coercive action taken for
any violation to enforce rule of law. Any party is free to move the Hon 'ble Supreme
Court for continued violation of its order after the deadline of 31. 3.2018. This order is
without prejudice to the said remedy as direction of the Hon 'ble Supreme Court cannot
be diluted or relaxed by this Tribunal in the course of execution. PCBs/PCCs are free
to realise compensation for violations but from 1.7.2020, such compensation must be
realised as per direction of this Tribunal failing which the erring State PCBs/PCCs
will be accountable.
ii. The CPCB may study and analyse the extent of reduction of industrial and sewage
pollution load on the environment, including industrial areas and rivers and other
water bodies and submit its detailed report to the Tribunal.
iii. During the lockdown period there are reports that the water quality of river has
improved, the reasons for the same may be got studied and analysed by the CPCB and
report submitted to this Tribunal. If the activities reopen, the compliance to standards
must be maintained by ensuring full compliance of law by authorities statutorily
responsible for the same.
1
iv. Accordingly, we direct that States which have not addressed all the action points with
regard to the utilisation of sewage treated water may do so promptly latest before
30.06.2020, reducing the time lines in the action plans. The time lines must coincide
with the timelines for setting up of STPs since both are interconnected. The CPCB
may compile further information on the subject accordingly.
v. Needless to say that since the issue of sources of funding has already been dealt with
in the orders of the Hon 'ble Supreme Court, the States may not put up any excuse on
this pretext in violation of the judgment of the Hon 'ble Supreme Court.
2.0 Compliance Status of ETPs, CETPs & STPs reported by SPCBs/PCCs
In compliance of the directions of Hon'ble NGT issued vide order dated 03.08.2018 and
14.08.2019, CPCB has been collecting the monthly compliance status report with regard to ETPs,
CETPs & STPs from all the SPCBs/PCCs and examining the same for shortcomiongs and
required corrective measures. The shortcomings/actions pending at the end of SPCBs/PCCs are
communicated on monthly basis.
As on 31.08.2020, all SPCBs/PCCs have responded to the communication of CPCB and provided
the compliance status reports. However, Uttar Pradesh Pollution Control Board has not submitted
the status report for ETPs, till date. Arunachal Pradesh, Assam, and Manipur have not furnished
the updated compliance status for the last few months.
The state-wise details of the compliance status as reported by SPCBs/PCCs are given at
Annexure-1 (Table No. 1 to 9). However, the summary of the compliance status is as follow:
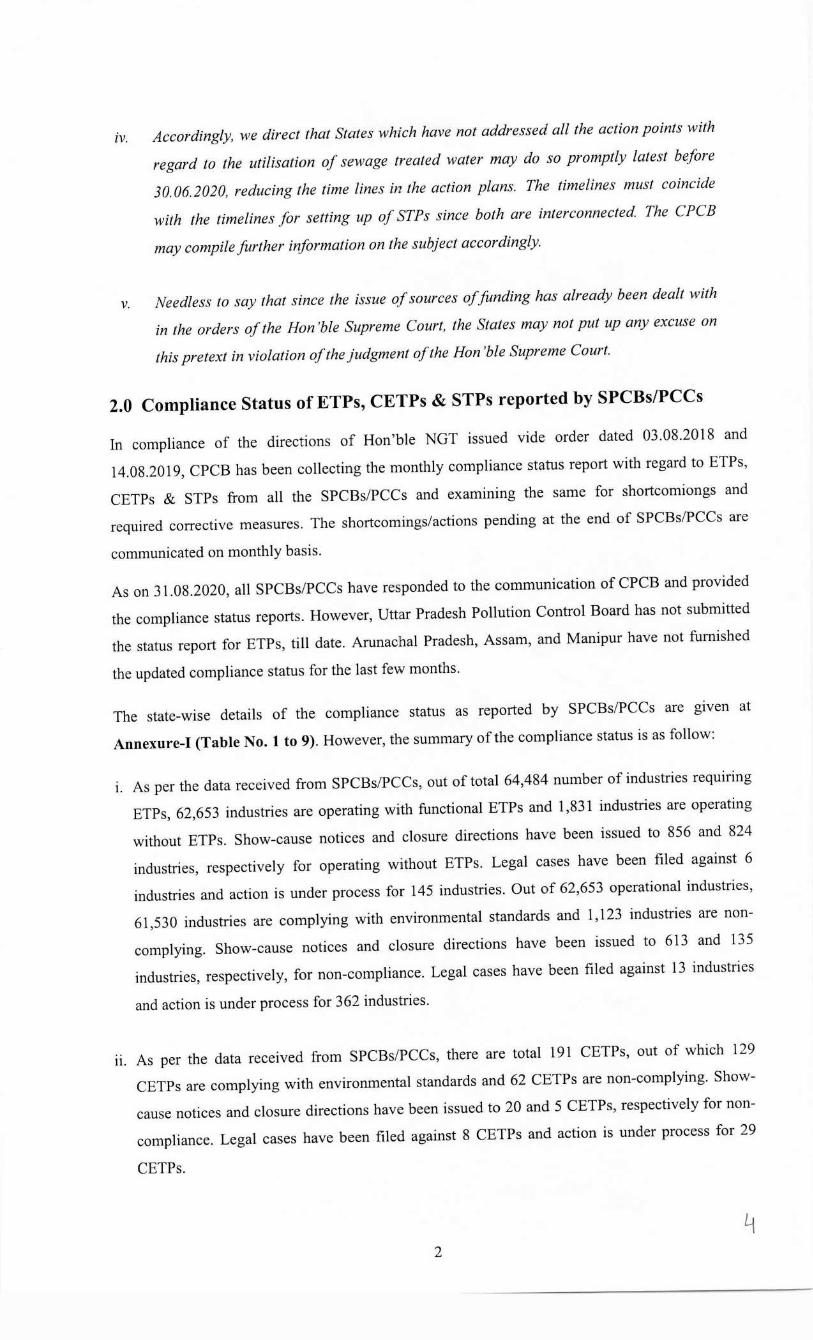
1. As per the data received from SPCBs/PCCs, out of total 64,484 number of industries requiring
ETPs, 62,653 industries are operating with functional ETPs and 1,831 industries are operating
without ETPs. Show-cause notices and closure directions have been issued to 856 and 824
industries, respectively for operating without ETPs. Legal cases have been filed against 6
industries and action is under process for 145 industries. Out of 62,653 operational industries,
61,530 industries are complying with environmental standards and 1,123 industries are non
complying. Show-cause notices and closure directions have been issued to 613 and 135
industries, respectively, for non-compliance. Legal cases have been filed against 13 industries
and action is under process for 362 industries.
11. As per the data received from SPCBs/PCCs, there are total 191 CETPs, out of which 129
CETPs are complying with environmental standards and 62 CETPs are non-complying. Show
cause notices and closure directions have been issued to 20 and 5 CETPs, respectively for non
compliance. Legal cases have been filed against 8 CETPs and action is under process for 29
CETPs.
2
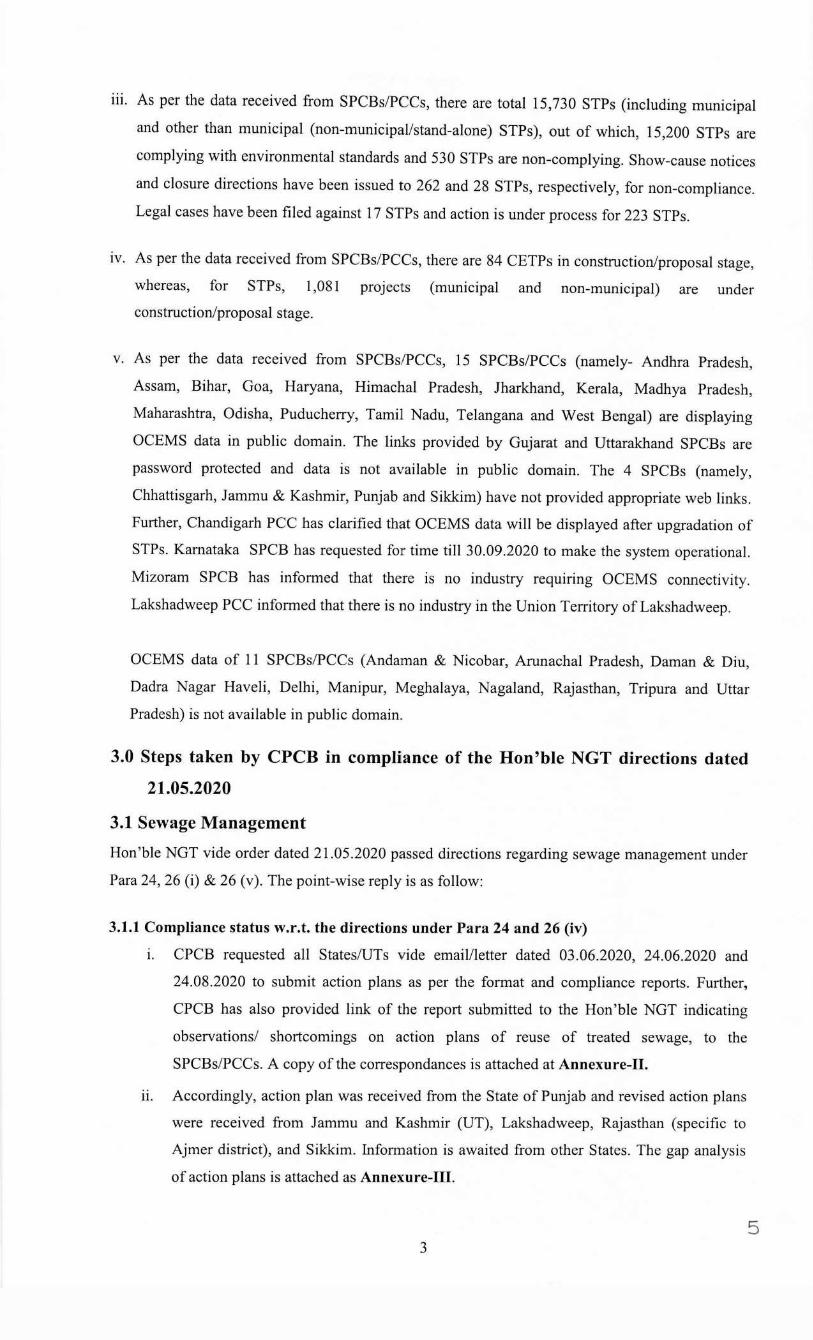
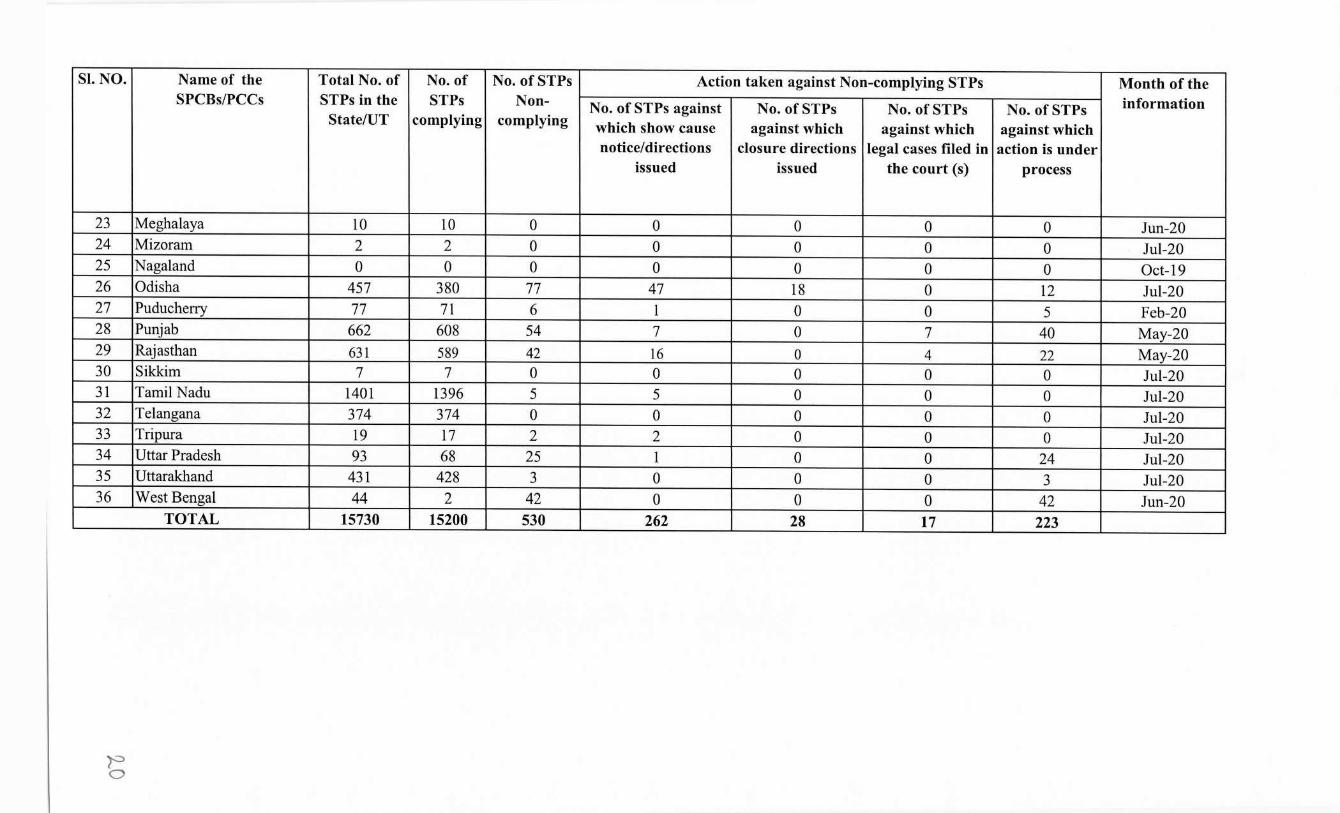
111. As per the data received from SPCBs/PCCs, there are total 15,730 STPs (including municipal
and other than municipal (non-municipal/stand-alone) STPs), out of which, 15,200 STPs are
complying with environmental standards and 530 STPs are non-complying. Show-cause notices
and closure directions have been issued to 262 and 28 STPs, respectively, for non-compliance.
Legal cases have been filed against 17 STPs and action is under process for 223 STPs.
1v. As per the data received from SPCBs/PCCs, there are 84 CETPs in construction/proposal stage,
whereas, for STPs, 1,081 projects (municipal and non-municipal) are under
construction/proposal stage.
v. As per the data received from SPCBs/PCCs, 15 SPCBs/PCCs (namely- Andhra Pradesh,
Assam, Bihar, Goa, Haryana, Himachal Pradesh, Jharkhand, Kerala, Madhya Pradesh,
Maharashtra, Odisha, Puducherry, Tamil Nadu, Telangana and West Bengal) are displaying
OCEMS data in public domain. The links provided by Gujarat and Uttarakhand SPCBs are
password protected and data is not available in public domain. The 4 SPCBs (namely,
Chhattisgarh, Jammu & Kashmir, Punjab and Sikkim) have not provided appropriate web links.
Further, Chandigarh PCC has clarified that OCEMS data will be displayed after upgradation of
STPs. Kamataka SPCB has requested for time till 30.09.2020 to make the system operational.
Mizoram SPCB has informed that there is no industry requiring OCEMS connectivity.
Lakshadweep PCC informed that there is no industry in the Union Territory of Lakshadweep.
OCEMS data of 11 SPCBs/PCCs (Andaman & Nicobar, Arunachal Pradesh, Daman & Diu,
Dadra Nagar Haveli, Delhi, Manipur, Meghalaya, Nagaland, Rajasthan, Tripura and Uttar
Pradesh) is not available in public domain.
3.0 Steps taken by CPCB in compliance of the Hon'ble NGT directions dated
21.05.2020
3.1 Sewage Management
Hon'ble NGT vide order dated 21.05.2020 passed directions regarding sewage management under
Para 24, 26 (i) & 26 (v). The point-wise reply is as follow:
3.1.1 Compliance status w.r.t. the directions under Para 24 and 26 (iv)
1. CPCB requested all States/UTs vide email/letter dated 03.06.2020, 24.06.2020 and
24.08.2020 to submit action plans as per the format and compliance reports. Further,
CPCB has also provided link of the report submitted to the Hon'ble NGT indicating
observations/ shortcomings on action plans of reuse of treated sewage, to the
SPCBs/PCCs. A copy of the correspondances is attached at Annexure-11.
11. Accordingly, action plan was received from the State of Punjab and revised action plans
were received from Jammu and Kashmir (UT), Lakshadweep, Rajasthan (specific to
Ajmer district), and Sikkim. Information is awaited from other States. The gap analysis
of action plans is attached as Annexure-111.
5 3
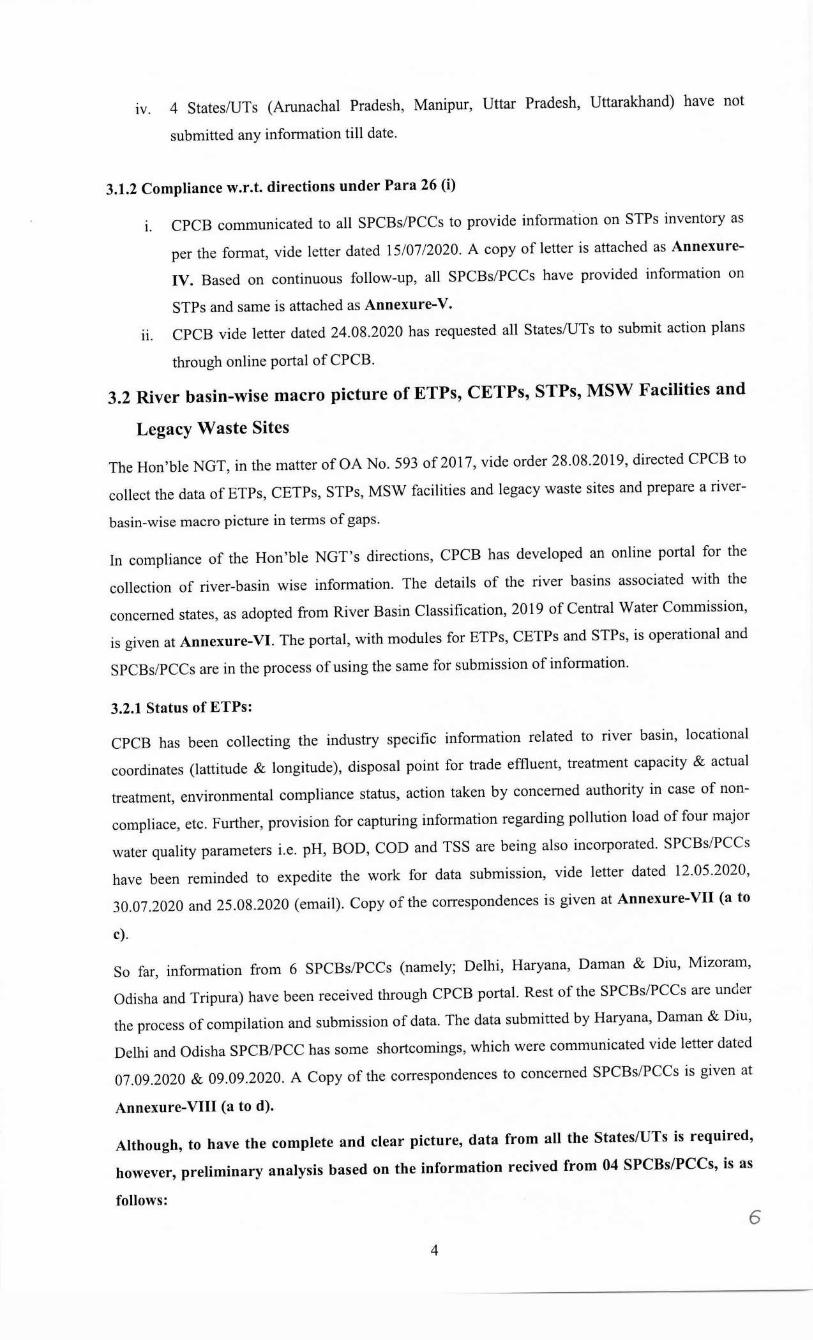
1v. 4 States/UTs (Arunachal Pradesh, Manipur, Uttar Pradesh, Uttarakhand) have not
submitted any information till date.
3.1.2 Compliance w.r.t. directions under Para 26 (i)
1. CPCB communicated to all SPCBs/PCCs to provide information on STPs inventory as
per the format, vide letter dated 15/07/2020. A copy of letter is attached as Annexure
IV. Based on continuous follow-up, all SPCBs/PCCs have provided information on
STPs and same is attached as Annexure-V.
11. CPCB vide letter dated 24.08.2020 has requested all States/UTs to submit action plans
through online portal of CPCB.
3.2 River basin-wise macro picture of ETPs, CETPs, STPs, MSW Facilities and
Legacy Waste Sites
The Hon'ble NGT, in the matter of OA No. 593 of 2017, vide order 28.08.2019, directed CPCB to
collect the data of ETPs, CETPs, STPs, MSW facilities and legacy waste sites and prepare a river
basin-wise macro picture in terms of gaps.
In compliance of the Hon'ble NGT's directions, CPCB has developed an online portal for the
collection of river-basin wise information. The details of the river basins associated with the
concerned states, as adopted from River Basin Classification, 2019 of Central Water Commission,
is given at Annexure-VI. The portal, with modules for ETPs, CETPs and STPs, is operational and
SPCBs/PCCs are in the process of using the same for submission of information.
3.2.1 Status of ETPs:
CPCB has been collecting the industry specific information related to river basin, locational
coordinates (lattitude & longitude), disposal point for trade effluent, treatment capacity & actual
treatment, environmental compliance status, action taken by concerned authority in case of non
compliace, etc. Further, provision for capturing information regarding pollution load of four major
water quality parameters i.e. pH, BOD, COD and TSS are being also incorporated. SPCBs/PCCs
have been reminded to expedite the work for data submission, vide letter dated 12.05.2020,
30.07.2020 and 25.08.2020 (email). Copy of the correspondences is given at Annexure-VII (a to
c).
So far, information from 6 SPCBs/PCCs (namely; Delhi, Haryana, Daman & Diu, Mizoram,
Odisha and Tripura) have been received through CPCB portal. Rest of the SPCBs/PCCs are under
the process of compilation and submission of data. The data submitted by Haryana, Daman & Diu,
Delhi and Odisha SPCB/PCC has some shortcomings, which were communicated vide letter dated
07.09.2020 & 09.09.2020. A Copy of the correspondences to concerned SPCBs/PCCs is given at
Annexure-VIII (a to d).
Although, to have the complete and clear picture, data from all the States/UTs is required,
however, preliminary analysis based on the information recived from 04 SPCBs/PCCs, is as
follows: 6
4
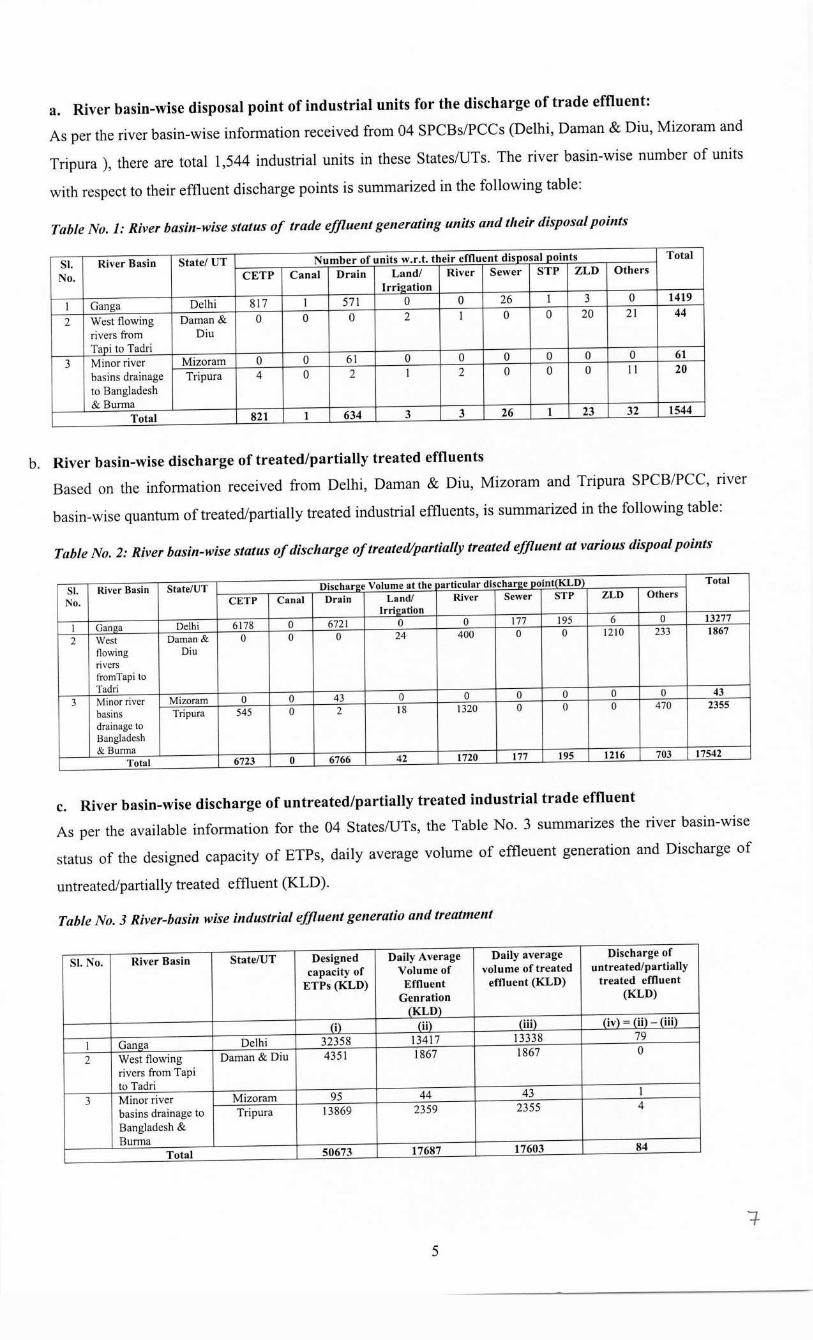
a. River basin-wise disposal point of industrial units for the discharge of trade effluent:
As per the river basin-wise information received from 04 SPCBs/PCCs (Delhi, Daman & Diu, Mizoram and
Tripura ), there are total 1,544 industrial units in these States/UTs. The river basin-wise number of units
with respect to their effluent discharge points is summarized in the following table:
Table No. 1: River basin-wise status of trade effluent generating units and their disposal points
SI. River Basin State/ UT Number of units w.r.t. their effluent disoosal ooints Total
No. CETP Canal Drain Land/ River Sewer STP ZLD Others Irrigation
I Ganga Delhi 817 I 571 0 0 26 I 3 0 1419
2 West flowing Daman & 0 0 0 2 I 0 0 20 21 44
rivers from Diu Taoi to Tadri
3 Minor river Mizoram 0 0 61 0 0 0 0 0 0 61
basins drainage Tripura 4 0 2 I 2 0 0 0 11 20
to Bangladesh & Burma
Total 821 1 634 3 3 26 1 23 32 1544
b. River basin-wise discharge of treated/partially treated effluents Based on the information received from Delhi, Daman & Diu, Mizoram and Tripura SPCB/PCC, nver
basin-wise quantum of treated/partially treated industrial effluents, is summarized in the following table:
Table No. 2: River basin-wise status of discharge of treated/partially treated effluent at various dispoal points
SI. River Basin State/UT Discharze Volume at the particular dtscharze noint(KLD) Total
No. CETP Canal Drain Land/ River Sewer STP ZLD Others Irrieation
I Ganga Delhi 6178 0 6721 0 0 177 195 6 0 13277
2 West Daman & 0 0 0 24 400 0 0 1210 233 1867
flowing Diu rivers fromTapi to Tadri
3 Minor river Mizoram 0 0 43 0 0 0 0 0 0 43
basins Tripura 545 0 2 18 1320 0 0 0 470 2355
drainage to Bangladesh & Burma
Total 6723 0 6766 42 1720 177 195 1216 703 17542
c. River basin-wise discharge of untreated/partially treated industrial trade effluent As per the available information for the 04 States/UTs, the Table No. 3 summarizes the river basin-wise
status of the designed capacity of ETPs, daily average volume of effleuent generation and Discharge of
untreated/partially treated effluent (KLD).
Table No. 3 River-basin wise industrial effluent generatio and treatment
SI. No. River Basin State/UT Designed Daily Average Daily average Discharge of
capacity of Volume of volume of treated untreated/partially
ETPs (KLD) Effluent effluent (KLD) treated effluent Gen ration (KLD) (KLD)
(i) (ii) (iii) (iv) = (ii) - (iii)
l Ganza Delhi 32358 13417 13338 79
2 West flowing Daman & Diu 4351 1867 1867 0
rivers from Tapi to Tadri
3 Minor river Mizoram 95 44 43 1
basins drainage to Tripura 13869 2359 2355 4
Bangladesh & Burma
Total 50673 17687 17603 84
5
3.2.2 River basin-wise status of CETPs:
So far, river basin-wise information of CETPs have been received from 6 SPCBs/PCCs (namely
Chandigarh, Delhi, Mizoram and Tripura, Daman & Diu and Dadra Nagar Haveli). The
Chandigarh, Mizoram Daman & Diu and Dadra Nagar Haveli, have informed that there is no
CETP in their State/UT. The information from other SPCBs/PCCs is awaited.
3.2.3 River basin-wise status of STPs:
CPCB has developed a portal to facilitate submission of river basin-wise data for STPs. CPCB vide
letter dated 24.08.2020 has requested all States/UTs to submit action plans and river basin-wise
data through portal. The information from SPCBs/PCCs is awaited.
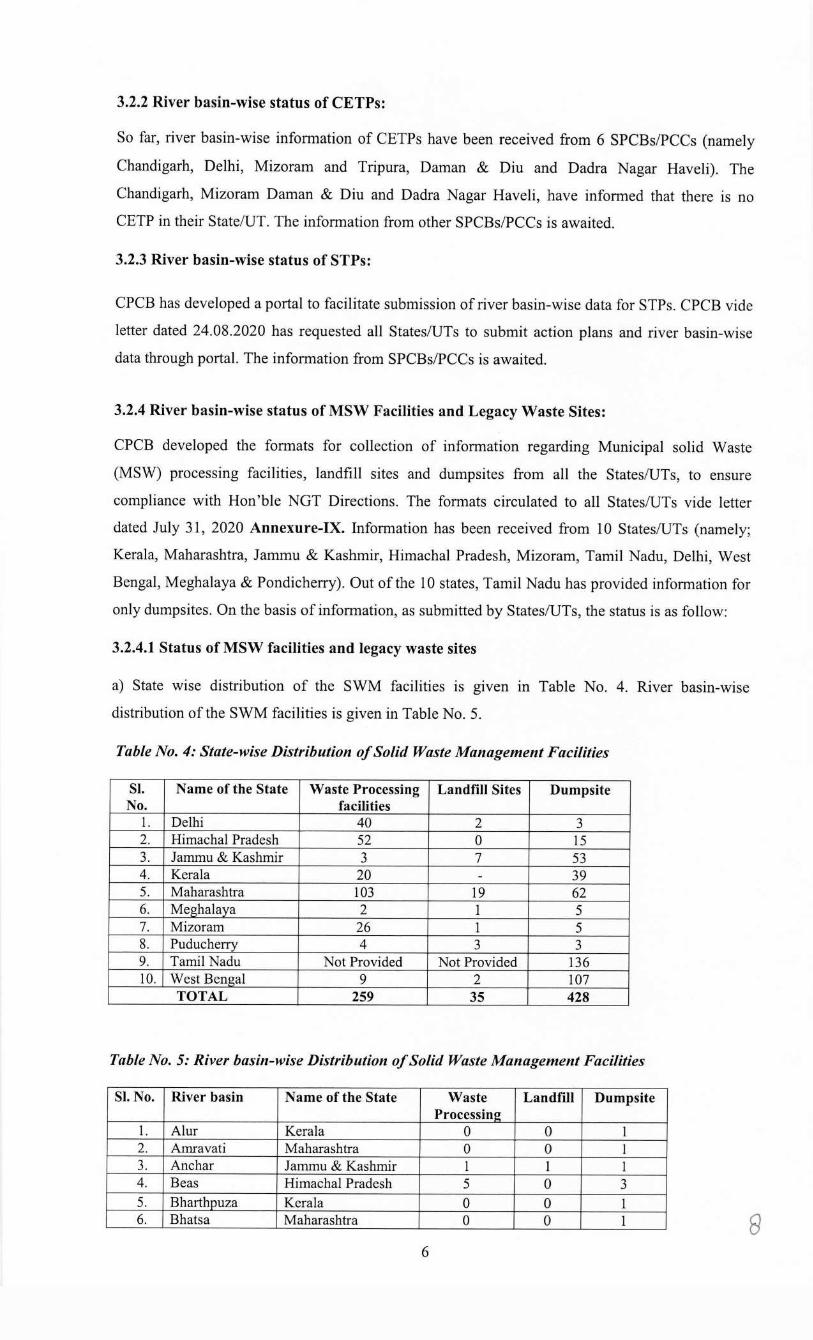
3.2.4 River basin-wise status of MSW Facilities and Legacy Waste Sites:
CPCB developed the formats for collection of information regarding Municipal solid Waste
(MSW) processing facilities, landfill sites and dumpsites from all the States/UTs, to ensure
compliance with Hon 'ble NGT Directions. The formats circulated to all States/UTs vide letter
dated July 31, 2020 Annexure-IX. Information has been received from 10 States/UTs (namely;
Kerala, Maharashtra, Jammu & Kashmir, Himachal Pradesh, Mizoram, Tamil Nadu, Delhi, West
Bengal, Meghalaya & Pondicherry). Out of the 10 states, Tamil Nadu has provided information for
only dumpsites. On the basis of information, as submitted by States/UTs, the status is as follow:
3.2.4.1 Status of MSW facilities and legacy waste sites
a) State wise distribution of the SWM facilities is given m Table No. 4. River basin-wise
distribution of the SWM facilities is given in Table No. 5.
Table No. 4: State-wise Distribution of Solid Waste Management Facilities
SI. Name of the State Waste Processing Landfill Sites Dumpsite No. facilities
1. Delhi 40 2 3 2. Himachal Pradesh 52 0 15 3. Jammu & Kashmir 3 7 53 4. Kerala 20 - 39 5. Maharashtra 103 19 62 6. Meghalaya 2 I 5 7. Mizoram 26 1 5 8. Puducherry 4 3 3 9. Tamil Nadu Not Provided Not Provided 136 10. West Bengal 9 2 107
TOTAL 259 35 428
Table No. 5: River basin-wise Distribution of Solid Waste Management Facilities
SI. No. River basin Name of the State Waste Landfill Dumpsite Processing
1. Alur Kerala 0 0 I 2. Amravati Maharashtra 0 0 I 3. Anchar Jammu & Kashmir I I I 4. Beas Himachal Pradesh 5 0 3 5. Bharthpuza Kerala 0 0 1 6. Bhatsa Maharashtra 0 0 I 8
6
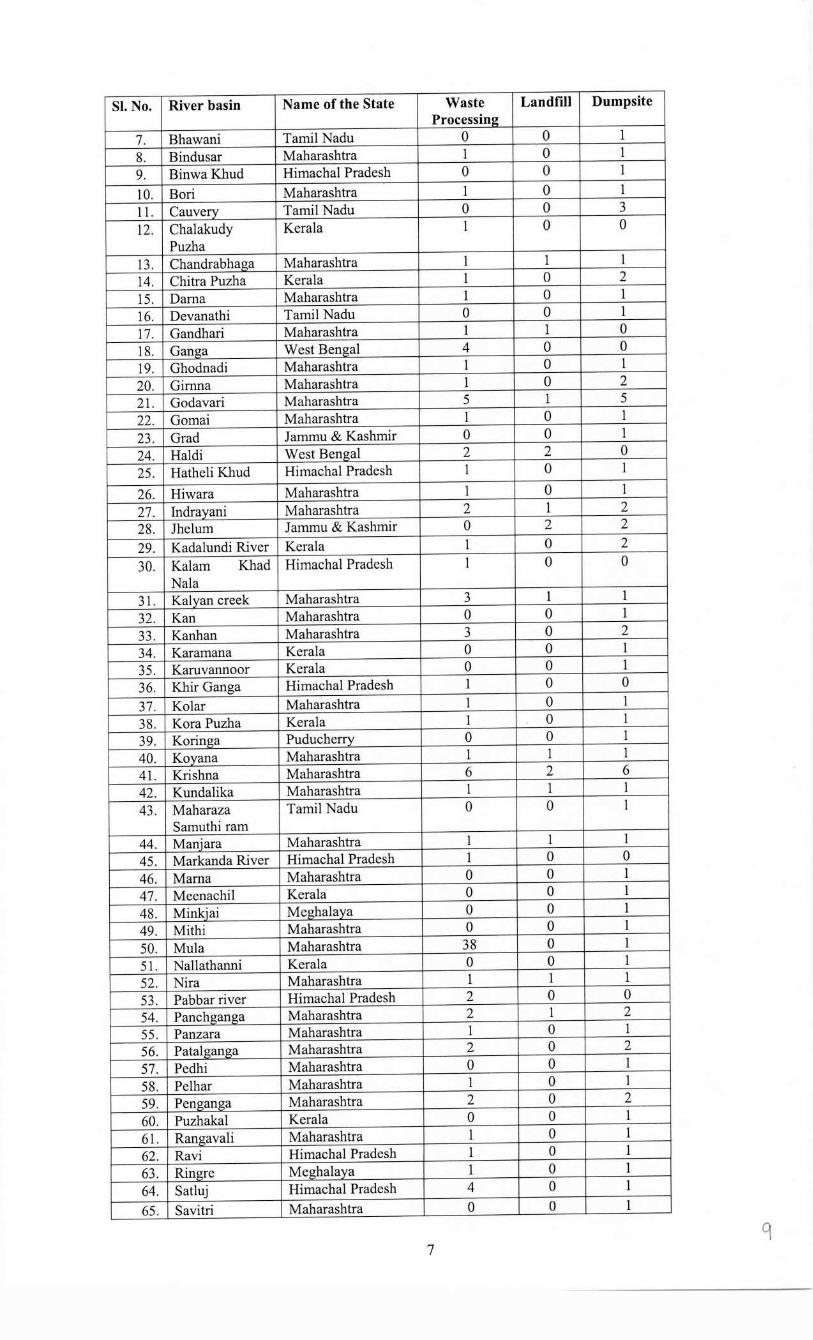
SI. No. River basin Name of the State Waste Landfill Dumpsite Processinz
7. Bhawani Tamil Nadu 0 0 1
8. Bindusar Maharashtra 1 0 1
9. Binwa Khud Himachal Pradesh 0 0 1
10. Bori Maharashtra 1 0 1
11. Cauverv Tamil Nadu 0 0 3
12. Chalakudy Kerala 1 0 0 Puzha
13. Chandrabhaga Maharashtra 1 1 1
14. Chitra Puzha Kerala 1 0 2
15. Dama Maharashtra 1 0 1
16. Devanathi Tamil Nadu 0 0 1
17. Gandhari Maharashtra 1 1 0
18. Ganga West Bengal 4 0 0 19. Ghodnadi Maharashtra 1 0 1
20. Gimna Maharashtra 1 0 2
21. Godavari Maharashtra 5 1 5
22. Gomai Maharashtra 1 0 1
23. Grad Jamrnu & Kashmir 0 0 1
24. Haldi West Bengal 2 2 0
25. Hatheli Khud Himachal Pradesh 1 0 1
26. Hiwara Maharashtra 1 0 1
27. Indravani Maharashtra 2 1 2
28. Jhelum J amrnu & Kashmir 0 2 2
29. Kadalundi River Kerala 1 0 2
30. Kalam Khad Himachal Pradesh 1 0 0
Nala 31. Kalvan creek Maharashtra 3 1 1
32. Kan Maharashtra 0 0 1 33. Kanhan Maharashtra 3 0 2
34. Karamana Kerala 0 0 1
35. Karuvannoor Kerala 0 0 1
36. Khir Ganga Himachal Pradesh 1 0 0
37. Kolar Maharashtra 1 0 1
38. Kora Puzha Kerala 1 0 1 39. Korinza Puducherry 0 0 1
40. Kovana Maharashtra 1 1 1 41. Krishna Maharashtra 6 2 6
42. Kundalika Maharashtra 1 1 1 43. Maharaza Tamil Nadu 0 0 1
Samuthi ram 44. Maniara Maharashtra 1 1 1 45. Markanda River Himachal Pradesh 1 0 0
46. Mama Maharashtra 0 0 1 47. Meenachil Kerala 0 0 1
48. Minkiai Mezhalaya 0 0 1
49. Mithi Maharashtra 0 0 1 50. Mula Maharashtra 38 0 1
51. Nallathanni Kerala 0 0 1 52. Nira Maharashtra 1 1 1
53. Pabbar river Himachal Pradesh 2 0 0
54. Panchganga Maharashtra 2 1 2
55. Panzara Maharashtra 1 0 1
56. Patalganga Maharashtra 2 0 2
57. Pedhi Maharashtra 0 0 1 58. Pelhar Maharashtra 1 0 1 59. Penaanza Maharashtra 2 0 2
60. Puzhakal Kerala 0 0 1 61. Ranzavali Maharashtra 1 0 1
62. Ravi Himachal Pradesh 1 0 1 63. Rinzre Meghalaya 1 0 1
64. Satluj Himachal Pradesh 4 0 1
65. Savitri Maharashtra 0 0 1
9 7
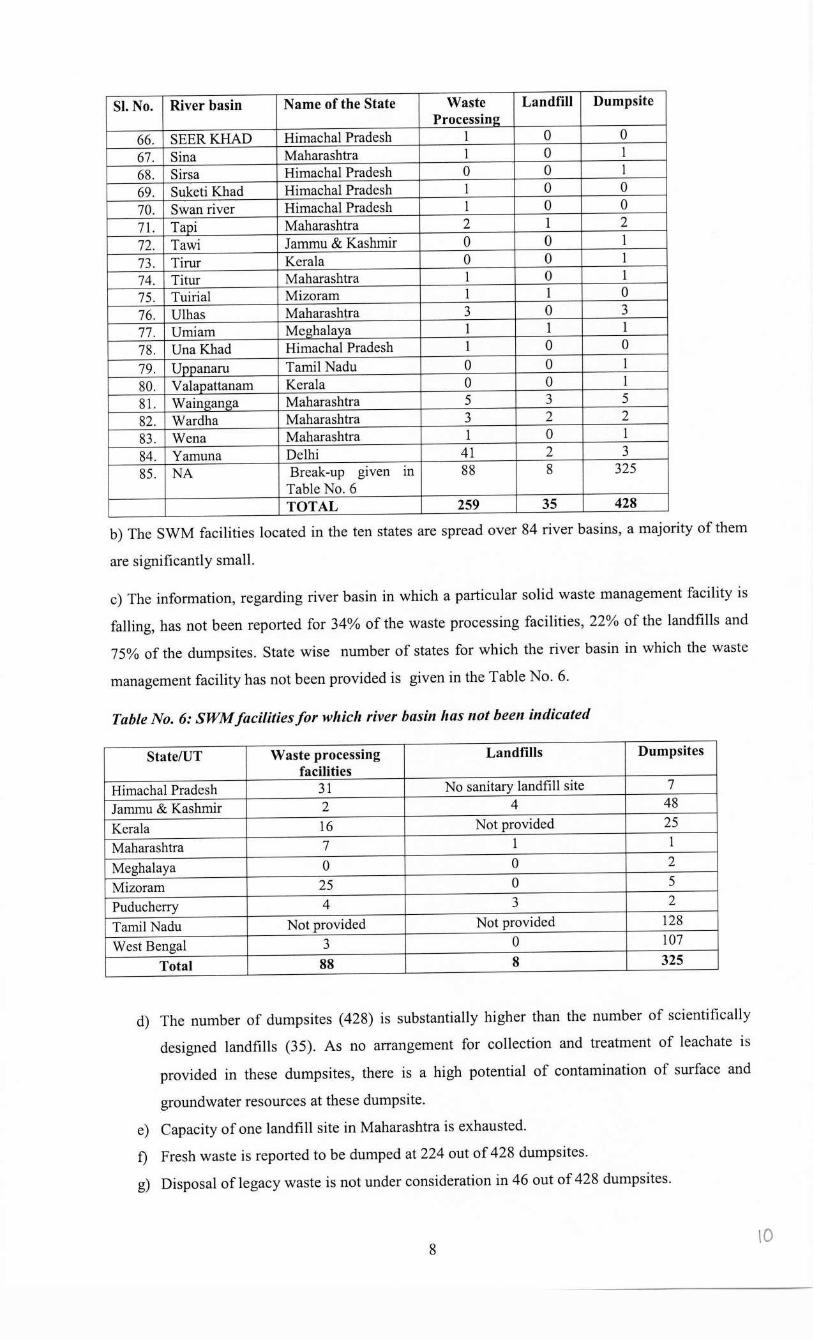
SI. No. River basin Name of the State Waste Landfill Dumpsite Processing
66. SEERKHAD Himachal Pradesh 1 0 0
67. Sina Maharashtra 1 0 1 68. Sirsa Himachal Pradesh 0 0 1
69. Suketi Khad Himachal Pradesh 1 0 0
70. Swan river Himachal Pradesh 1 0 0
71. Tani Maharashtra 2 1 2
72. Tawi Jammu & Kashmir 0 0 1 73. Tirur Kerala 0 0 1
74. Titur Maharashtra 1 0 1
75. Tuirial Mizoram 1 1 0
76. Ulhas Maharashtra 3 0 3
77. Umiam Meghalaya 1 1 1
78. Una Khad Himachal Pradesh 1 0 0
79. Unnanaru Tamil Nadu 0 0 1
80. Valaoattanam Kerala 0 0 1
81. Wainganga Maharashtra 5 3 5
82. Wardha Maharashtra 3 2 2
83. Wena Maharashtra 1 0 1 84. Yamuna Delhi 41 2 3
85. NA Break-up given Ill 88 8 325 Table No. 6 TOTAL 259 35 428
b) The SWM facilities located in the ten states are spread over 84 river basins, a majority of them
are significantly small.
c) The information, regarding river basin in which a particular solid waste management facility is
falling, has not been reported for 34% of the waste processing facilities, 22% of the landfills and
75% of the dumpsites. State wise number of states for which the river basin in which the waste
management facility has not been provided is given in the Table No. 6.
Table No. 6: SWM facilities for which river basin has not been indicated
State/UT Waste processing Landfills Dumpsites facilities
Himachal Pradesh 31 No sanitary landfill site 7
J amrnu & Kashmir 2 4 48
Kerala 16 Not provided 25
Maharashtra 7 1 1
Meghalaya 0 0 2
Mizoram 25 0 5
Puducherry 4 3 2
Tamil Nadu Not provided Not provided 128
West Bengal 3 0 107
Total 88 8 325
d) The number of dumpsites ( 428) is substantially higher than the number of scientifically
designed landfills (35). As no arrangement for collection and treatment of leachate is
provided in these dumpsites, there is a high potential of contamination of surface and
groundwater resources at these dumpsite.
e) Capacity of one landfill site in Maharashtra is exhausted.
f) Fresh waste is reported to be dumped at 224 out of 428 dumpsites.
g) Disposal of legacy waste is not under consideration in 46 out of 428 dumpsites.
8 10
h) Bio-remediation in 72 out of 428 dumpsites is not being done in accordance with CPCB
guidelines.
i) Ground water analysis report is not available for 215 out of the 259 waste processing sites,
26 out of 35 landfill sites, 222 of the 428 dumpsites.
j) 174 out of the 259 waste processing facilities, 16 out of35 landfill sites and 422 out of 428
dumpsites have not provided leachate treatment facilities.
k) Only 22 out of the 259 waste processing facilities, 14 out 3 5 landfill sites and 109 out of
428 dumpsites have confirmed that the leachate complies with the stipulated norms.
l) Locational coordinates for waste processing facilities have not been provided for 60 out of
259 facilities and point of disposal for 214 out of 259 facilities; 8 out of 35 landfill sites and
20 out of 35 point of disposal of leacheates; 80 out of 428 dumpsites and 376 out of 428
point of disposal of leachates.
3.3 Assessment of Impact of Lockdown on Water Quality of Major Rivers
A nationwide lockdown was being imposed by Government of India (GoI) since midnight of 24th
March 2020 as a preventive measure to restrict the spread of Coronavirus (COVID-19) infections
and thereafter extended further. During the lockdown period, human activities were restricted and
most of the activities came to stand still including industrial operations.
The Central Pollution Control Board (CPCB) has requested State Pollution Control Boards
(SPCBs) and Pollution Control Committees (PCCs) to assess water quality of 19 major rivers
(viz., river Beas, Brahmaputra, Baitami & Brahmani, Cauvery, Chambal, Ganga, Ghaggar,
Godavari, Krishna, Mahanadi, Mahi, Narmada, Pennar, Sabarmati, Sutlej, Swamarekha, Tapi,
Yamuna) at the existing monitoring locations under National Water Quality Monitoring
Programme (NWMP) vide letter dated 09.04.2020 with a view to (i) study the impact of lockdown
on water quality of major rivers due to restriction of activities in the country, (ii) compare the
water quality of major Rivers during pre-lockdown (March 2020) and lockdown period (April
2020), and (iii) assess water quality of major rivers for compliance to the parameters prescribed
under Primary Water Quality Criteria for Outdoor Bathing. Accordingly, 20 State Pollution
Control Boards (SPCBs) have participated in the assessment and collected water samples from 19
major rivers and analysed collected water samples for the parameters viz. pH, Dissolved Oxygen
(DO), Biochemical Oxygen Demand (BOD), Fecal Coliform (FC) and the results were compared
with the Primary Water Quality Criteria for Outdoor Bathing notified under Environment
(Protection) Rules, 1986.
During the pre-lockdown period (March 2020), SPCBs have collected samples from 388 locations
whereas 366 number of samples from the monitoring locations during lockdown (April 2020) from
afore-said 19 major rivers and collected samples were analysed for Primary Water Quality Criteria
for Bathing Water Quality Criteria notified under the Environment (Protection) Rules, 1986. The
assessment report prepared by CPCB is given as Annexure-X and is submitted before Hon 'ble
NGT for consideration.
********
11 9
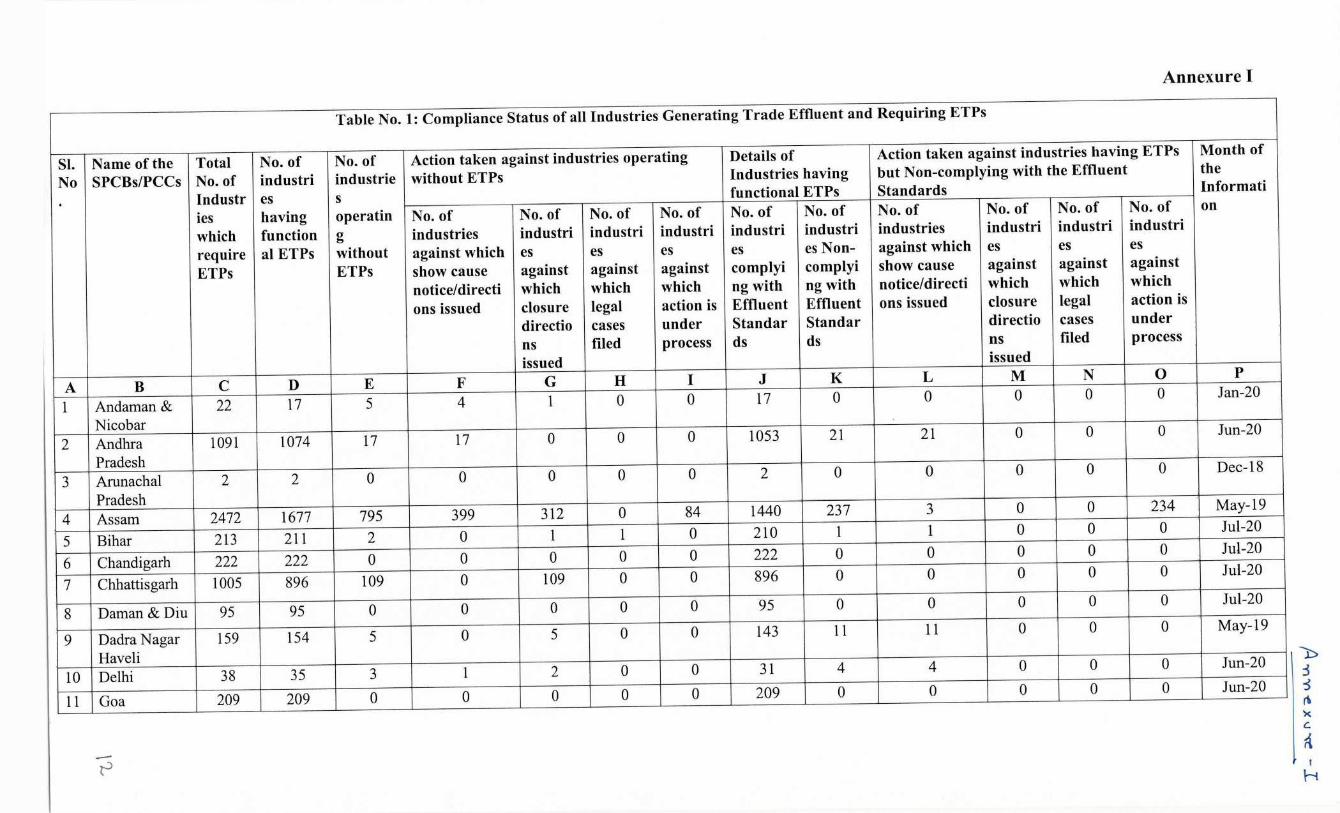
Annexure I
Table No. 1: Compliance Status of all Industries Generating Trade Effluent and Requiring ETPs
SI. Name of the Total No. of No. of Action taken against industries operating Details of Action taken against industries having ETPs Month of
No SPCBs/PCCs No. of industri industrie without ETPs Industries having but Non-complying with the Effluent the
. Industr es s functional ETPs Standards lnformati
ies having operatin No. of No. of No. of No. of No. of No. of No. of No. of No. of No. of on
which function g industries industri industri industri industri industri industries industri industri industri
require al ETPs without against which es es es es es Non- against which es es es
ETPs ETPs show cause against against against complyi complyi show cause against against against
notice/directi which which which ng with ng with notice/directi which which which
ons issued closure legal action is Effluent Effluent ons issued closure legal action is
directio cases under Standar Standar directio cases under
ns filed process ds ds ns filed process
issued issued
A B C D E F G H I J K L M N 0 p
1 Andaman & 22 17 5 4 1 0 0 17 0 0 0 0 0 Jan-20
Nicobar 2 Andhra 1091 1074 17 17 0 0 0 1053 21 21 0 0 0 Jun-20
Pradesh 3 Arunachal 2 2 0 0 0 0 0 2 0 0 0 0 0 Dec-18
Pradesh 4 Assam 2472 1677 795 399 312 0 84 1440 237 3 0 0 234 May-19
5 Bihar 213 211 2 0 1 1 0 210 1 1 0 0 0 Jul-20
6 Chandigarh 222 222 0 0 0 0 0 222 0 0 0 0 0 Jul-20
7 Chhattisgarh 1005 896 109 0 109 0 0 896 0 0 0 0 0 Jul-20
8 Daman & Diu 95 95 0 0 0 0 0 95 0 0 0 0 0 Jul-20
9 Dadra Nagar 159 154 5 0 5 0 0 143 11 11 0 0 0 May-19
Haveli 10 Delhi 38 35 3 1 2 0 0 31 4 4 0 0 0 Jun-20
11 Goa 209 209 0 0 0 0 0 209 0 0 0 0 0 Jun-20
- ~
"1:::> :3 ~ (\ )(
C. a ' \--i
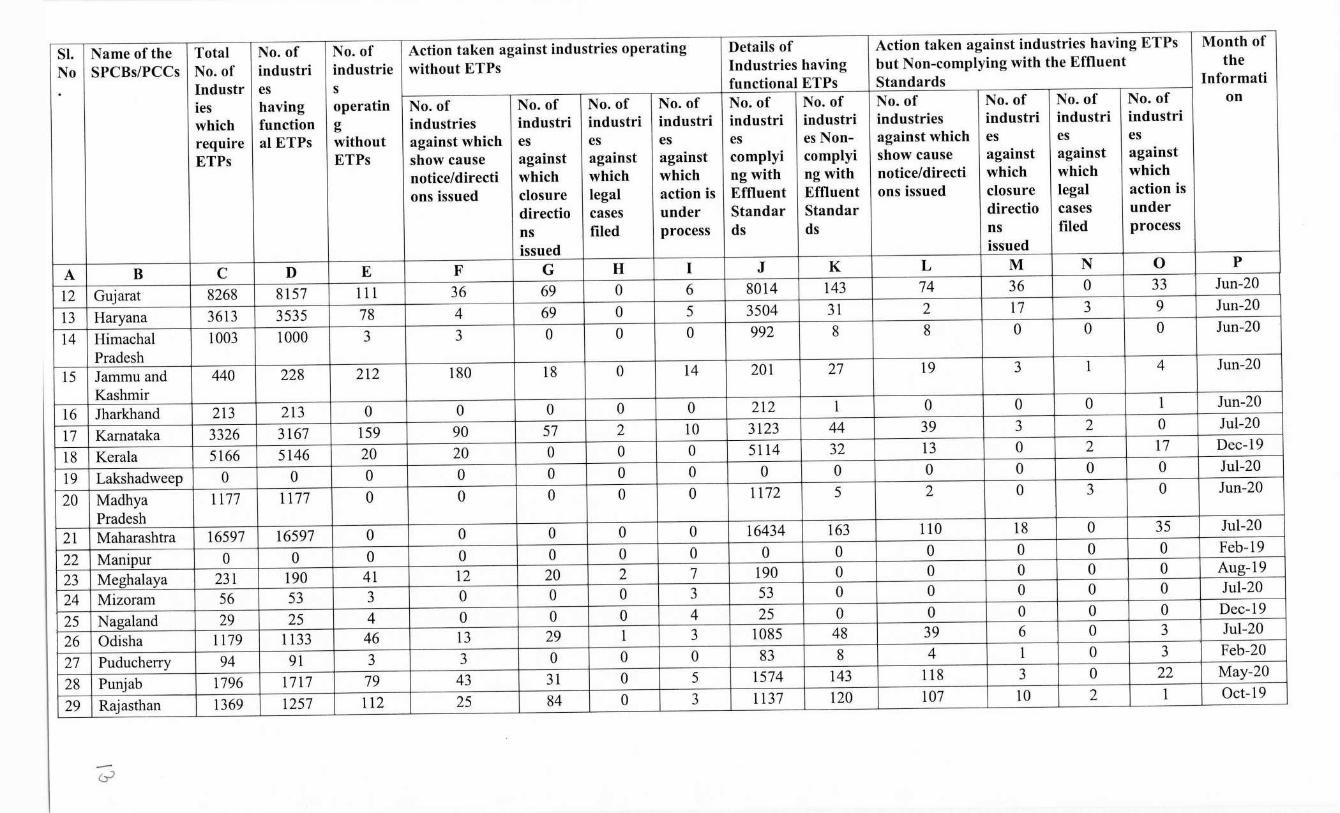
SL Name of the Total No. of No. of Action taken against industries operating Details of Action taken against industries having ETPs Month of
No SPCBs/PCCs No. of industri industrie without ETPs Industries having but Non-complying with the Effluent the
. lndustr es s functional ETPs Standards Informati
ies having operatin No. of No. of No. of No. of No. of No. of No. of No. of No. of No. of on
which function g industries industri industri industri industri industri industries industri industri industri
require al ETPs without against which es es es es es Non- against which es es es
ETPs ETPs show cause against against against complyi complyi show cause against against against
notice/directi which which which ng with ng with notice/directi which which which
ons issued closure legal action is Effluent Effluent ons issued closure legal action is
directio cases under Standar Standar directio cases under
ns filed process ds ds ns filed process
issued issued
A B C D E F G H I J K L M N 0 p
12 Gujarat 8268 8157 111 36 69 0 6 8014 143 74 36 0 33 Jun-20
13 Haryana 3613 3535 78 4 69 0 5 3504 31 2 17 3 9 Jun-20
14 Himachal 1003 1000 3 3 0 0 0 992 8 8 0 0 0 Jun-20
Pradesh 15 Jammu and 440 228 212 180 18 0 14 201 27 19 3 1 4 Jun-20
Kashmir 16 Jharkhand 213 213 0 0 0 0 0 212 1 0 0 0 1 Jun-20
17 Kamataka 3326 3167 159 90 57 2 10 3123 44 39 3 2 0 Jul-20
18 Kerala 5166 5146 20 20 0 0 0 5114 32 13 0 2 17 Dec-19
19 Lakshadweep 0 0 0 0 0 0 0 0 0 0 0 0 0 Jul-20
20 Madhya 1177 1177 0 0 0 0 0 1172 5 2 0 3 0 Jun-20
Pradesh 21 Maharashtra 16597 16597 0 0 0 0 0 16434 163 110 18 0 35 Jul-20
22 Manipur 0 0 0 0 0 0 0 0 0 0 0 0 0 Feb-19
23 Meghalaya 231 190 41 12 20 2 7 190 0 0 0 0 0 Aug-19
24 Mizoram 56 53 3 0 0 0 3 53 0 0 0 0 0 Jul-20
25 Nagaland 29 25 4 0 0 0 4 25 0 0 0 0 0 Dec-19
26 Odisha 1179 1133 46 13 29 1 3 1085 48 39 6 0 3 Jul-20
27 Puducherry 94 91 3 3 0 0 0 83 8 4 1 0 3 Feb-20
28 Punjab 1796 1717 79 43 31 0 5 1574 143 118 3 0 22 May-20
29 Rajasthan 1369 1257 112 25 84 0 3 1137 120 107 10 2 1 Oct-19
t..:?
SI. Name of the Total No. of No. of Action taken against industries operating Details of Action taken against industries having ETPs Month of No SPCBs/PCCs No. of industri industrie without ETPs Industries having but Non-complying with the Effluent the
Industr es s functional ETPs Standards lnformati ies having operatin No. of No. of No. of No. of No. of No. of No. of No. of No. of No. of on which function g industries industri industri industri industri industri industries industri industri industri require al ETPs without against which es es es es es Non- against which es es es ETPs ETPs show cause against against against complyi complyi show cause against against against
notice/directi which which which ng with ng with notice/directi which which which ons issued closure legal action is Effluent Effluent ons issued closure legal action is
directio cases under Standar Standar directio cases under ns filed process ds ds ns filed process issued issued
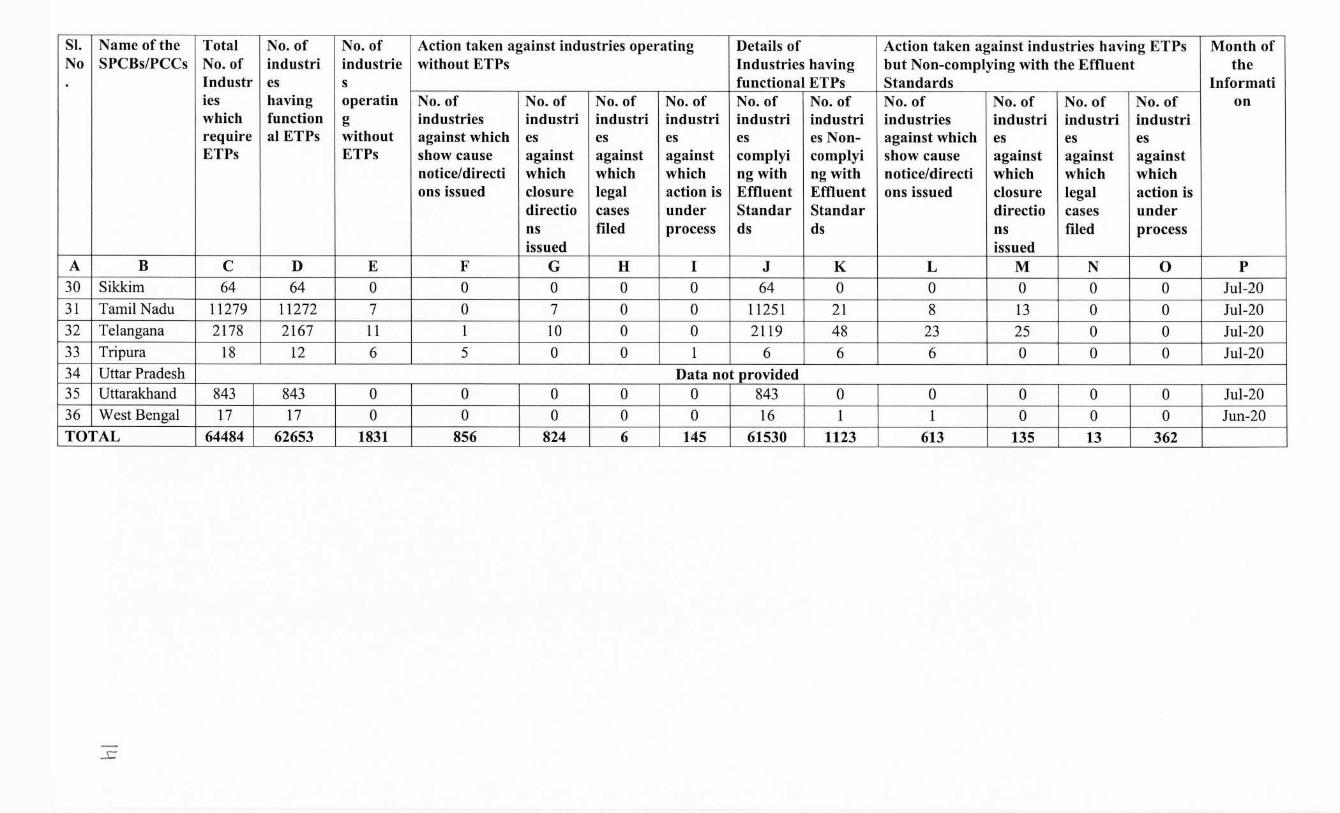
A B C D E F G H I J K L M N 0 p 30 Sikkim 64 64 0 0 0 0 0 64 0 0 0 0 0 Jul-20 31 Tamil Nadu 11279 11272 7 0 7 0 0 11251 21 8 13 0 0 Jul-20 32 Telangana 2178 2167 11 1 10 0 0 2119 48 23 25 0 0 Jul-20 33 Tripura 18 12 6 5 0 0 1 6 6 6 0 0 0 Jul-20 34 Uttar Pradesh Data not provided 35 Uttarakhand 843 843 0 0 0 0 0 843 0 0 0 0 0 Jul-20 36 West Bengal 17 17 0 0 0 0 0 16 1 1 0 0 0 Jun-20 TOTAL 64484 62653 1831 856 824 6 145 61530 1123 613 135 13 362
..s=
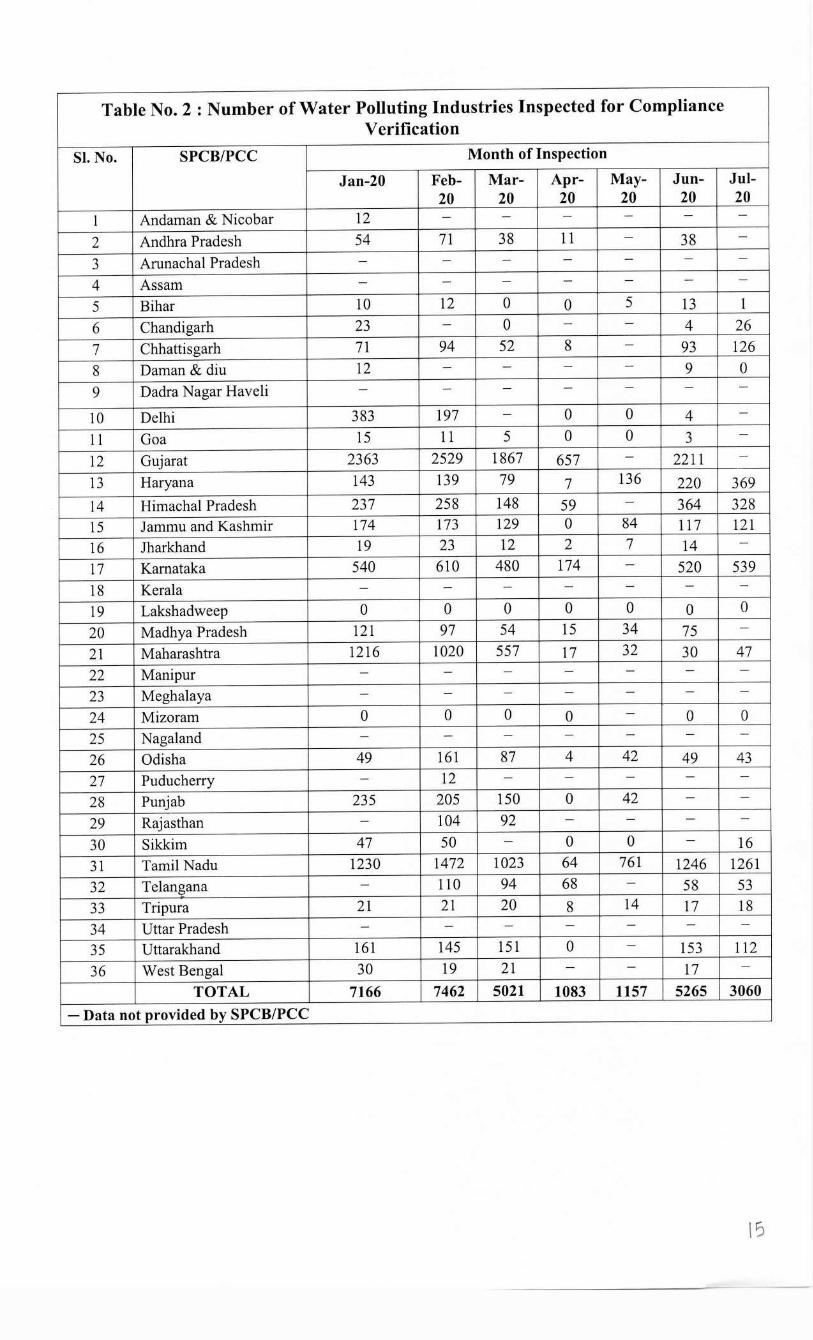
Table No. 2 : Number of Water Polluting Industries Inspected for Compliance Verification
SI. No. SPCB/PCC Month of Inspection
Jan-20 Feb- Mar- Apr- May- Jun- Jul- 20 20 20 20 20 20
1 Andaman & Nicobar 12 - - - - - -
2 Andhra Pradesh 54 71 38 11 - 38 -
3 Arunachal Pradesh - - - - - - -
4 Assam - - - - - - -
5 Bihar 10 12 0 0 5 13 1 6 Chandigarh 23 - 0 - - 4 26 7 Chhattisgarh 71 94 52 8 - 93 126 8 Daman & diu 12 - - - - 9 0 9 Dadra Nagar Haveli - - - - - - -
10 Delhi 383 197 - 0 0 4 -
11 Goa 15 11 5 0 0 3 -
12 Gujarat 2363 2529 1867 657 - 2211 -
13 Haryana 143 139 79 7 136 220 369 14 Himachal Pradesh 237 258 148 59 - 364 328 15 J ammu and Kashmir 174 173 129 0 84 117 121 16 Jharkhand 19 23 12 2 7 14 -
17 Kamataka 540 610 480 174 - 520 539 18 Kerala - - - - - - -
19 Lakshadweep 0 0 0 0 0 0 0
20 Madhya Pradesh 121 97 54 15 34 75 -
21 Maharashtra 1216 1020 557 17 32 30 47 22 Manipur - - - - - - -
23 Meghalaya - - - - - - -
24 Mizoram 0 0 0 0 - 0 0 25 Nagaland - - - - - - -
26 Odisha 49 161 87 4 42 49 43 27 Puducherry - 12 - - - - -
28 Punjab 235 205 150 0 42 - -
29 Rajasthan - 104 92 - - - -
30 Sikkim 47 50 - 0 0 - 16 31 Tamil Nadu 1230 1472 1023 64 761 1246 1261 32 Telangana - 110 94 68 - 58 53 33 Tripura 21 21 20 8 14 17 18 34 Uttar Pradesh - - - - - - -
35 Uttarakhand 161 145 151 0 - 153 112 36 West Bengal 30 19 21 - - 17 -
TOTAL 7166 7462 5021 1083 1157 5265 3060 - Data not provided by SPCB/PCC
\S
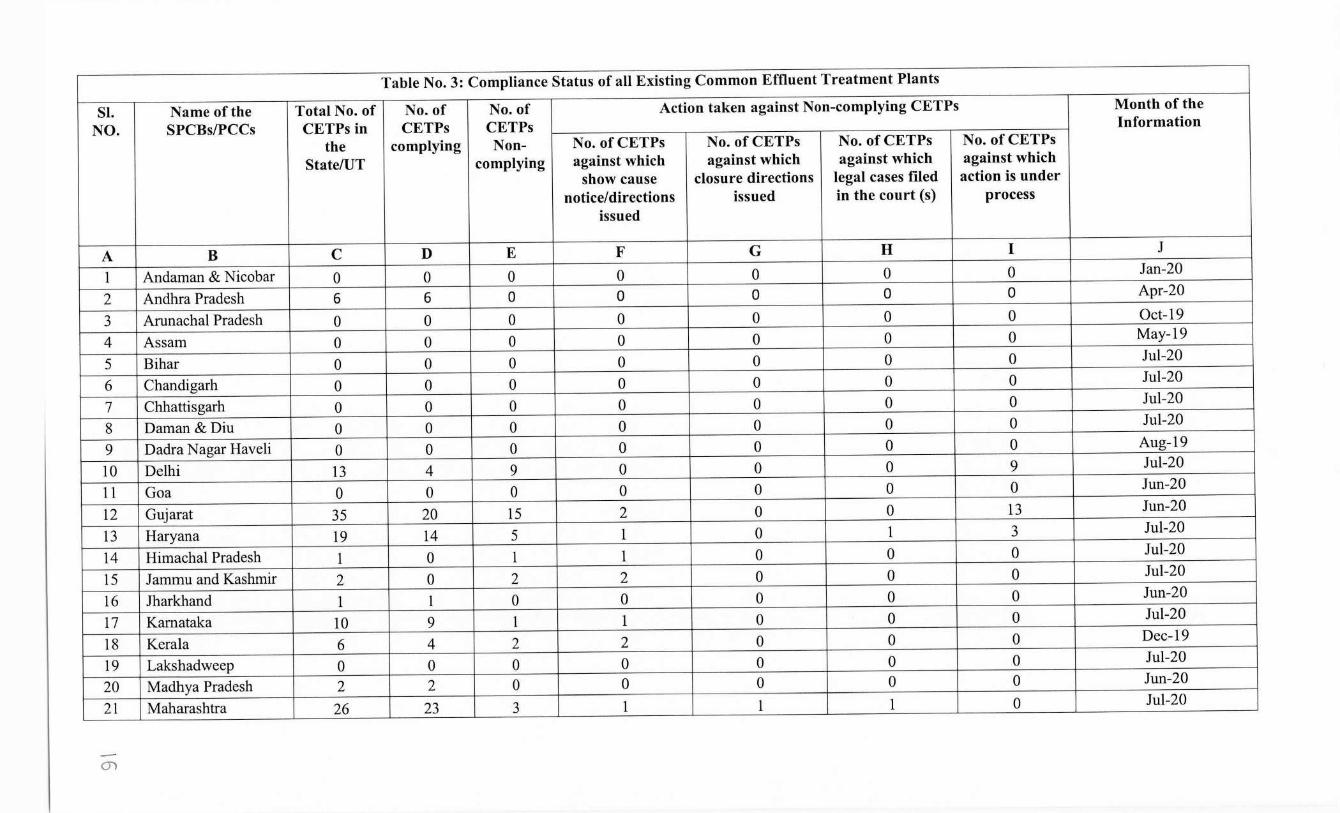
Table No. 3: Compliance Status of all Existing Common Effluent Treatment Plants
SI. Name of the Total No. of No. of No. of Action taken against Non-complying CETPs Month of the
NO. SPCBs/PCCs CETPs in CETPs CETPs Information
the complying Non- No. ofCETPs No. ofCETPs No. ofCETPs No. ofCETPs
State/UT complying against which against which against which against which show cause closure directions legal cases filed action is under
notice/directions issued in the court (s) process issued
A B C D E F G H I J
1 Andaman & Nicobar 0 0 0 0 0 0 0 Jan-20
2 Andhra Pradesh 6 6 0 0 0 0 0 Apr-20
3 Arunachal Pradesh 0 0 0 0 0 0 0 Oct-19
4 Assam 0 0 0 0 0 0 0 May-19
5 Bihar 0 0 0 0 0 0 0 Jul-20
6 Chandigarh 0 0 0 0 0 0 0 Jul-20
7 Chhattisgarh 0 0 0 0 0 0 0 Jul-20
8 Daman &Diu 0 0 0 0 0 0 0 Jul-20
9 Dadra Nagar Haveli 0 0 0 0 0 0 0 Aug-19
10 Delhi 13 4 9 0 0 0 9 Jul-20
11 Goa 0 0 0 0 0 0 0 Jun-20
12 Gujarat 35 20 15 2 0 0 13 Jun-20
13 Haryana 19 14 5 1 0 1 3 Jul-20
14 Himachal Pradesh 1 0 l 1 0 0 0 Jul-20
15 J ammu and Kashmir 2 0 2 2 0 0 0 Jul-20
16 Jharkhand 1 1 0 0 0 0 0 Jun-20
17 Kamataka 10 9 1 1 0 0 0 Jul-20
18 Kerala 6 4 2 2 0 0 0 Dec-19
19 Lakshadweep 0 0 0 0 0 0 0 Jul-20
20 Madhya Pradesh 2 2 0 0 0 0 0 Jun-20
21 Maharashtra 26 23 3 1 l 1 0 Jul-20
m
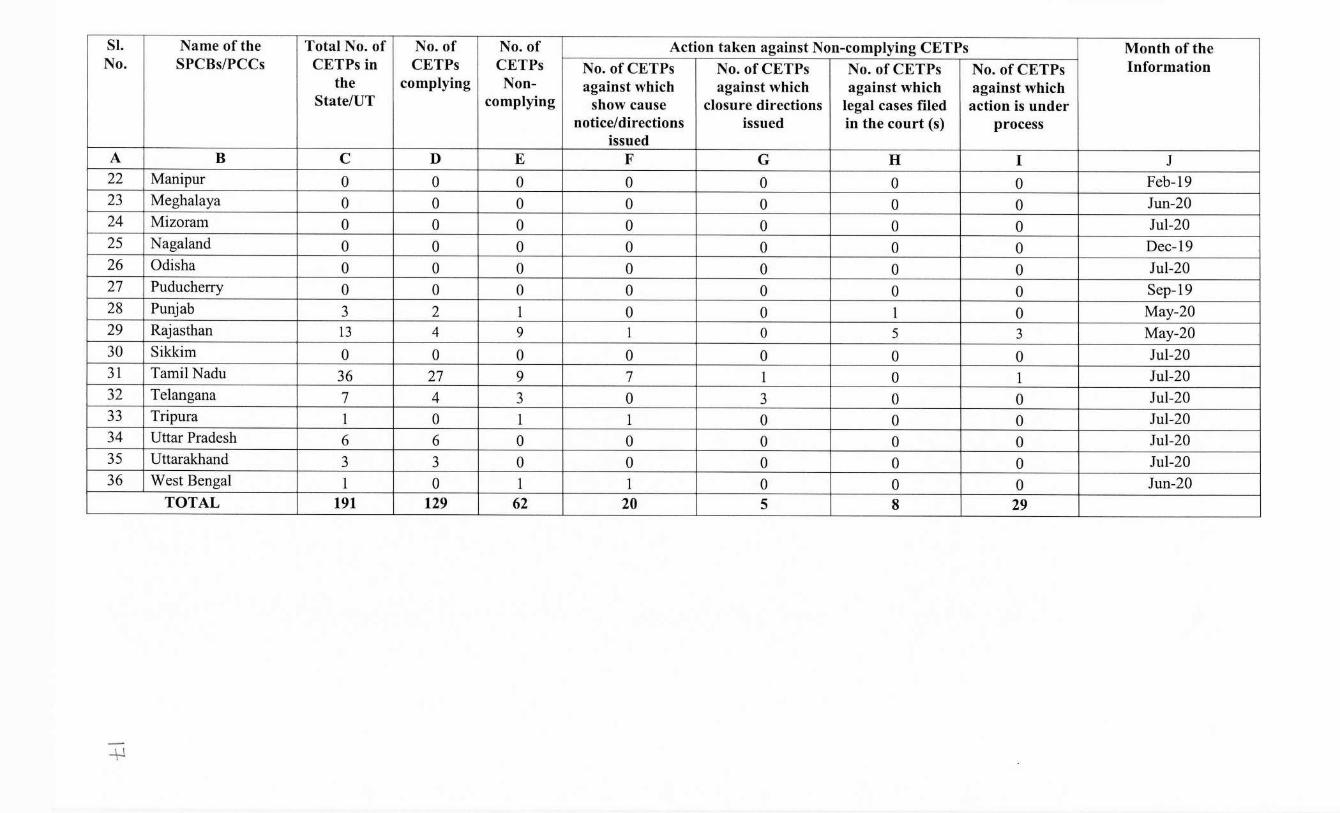
SI. Name of the Total No. of No. of No. of Action taken against Non-complying CETPs Month of the No. SPCBs/PCCs CETPs in CETPs CETPs No. of CETPs No. ofCETPs No. of CETPs No. of CETPs Information
the complying Non- against which against which against which against which State/UT complying show cause closure directions legal cases filed action is under
notice/directions issued in the court (s) process issued
A B C D E F G H I J 22 Manipur 0 0 0 0 0 0 0 Feb-19 23 Meghalaya 0 0 0 0 0 0 0 Jun-20 24 Mizoram 0 0 0 0 0 0 0 Jul-20 25 Nagaland 0 0 0 0 0 0 0 Dec-19 26 Odisha 0 0 0 0 0 0 0 Jul-20 27 Puducherry 0 0 0 0 0 0 0 Sep-19 28 Punjab 3 2 l 0 0 1 0 May-20 29 Rajasthan 13 4 9 I 0 5 3 May-20 30 Sikkim 0 0 0 0 0 0 0 Jul-20 31 Tamil Nadu 36 27 9 7 1 0 1 Jul-20 32 Telangana 7 4 3 0 3 0 0 Jul-20 33 Tripura 1 0 1 1 0 0 0 Jul-20 34 Uttar Pradesh 6 6 0 0 0 0 0 Jul-20 35 Uttarakhand 3 3 0 0 0 0 0 Jul-20 36 West Bengal 1 0 1 1 0 0 0 Jun-20
TOTAL 191 129 62 20 5 8 29
+i
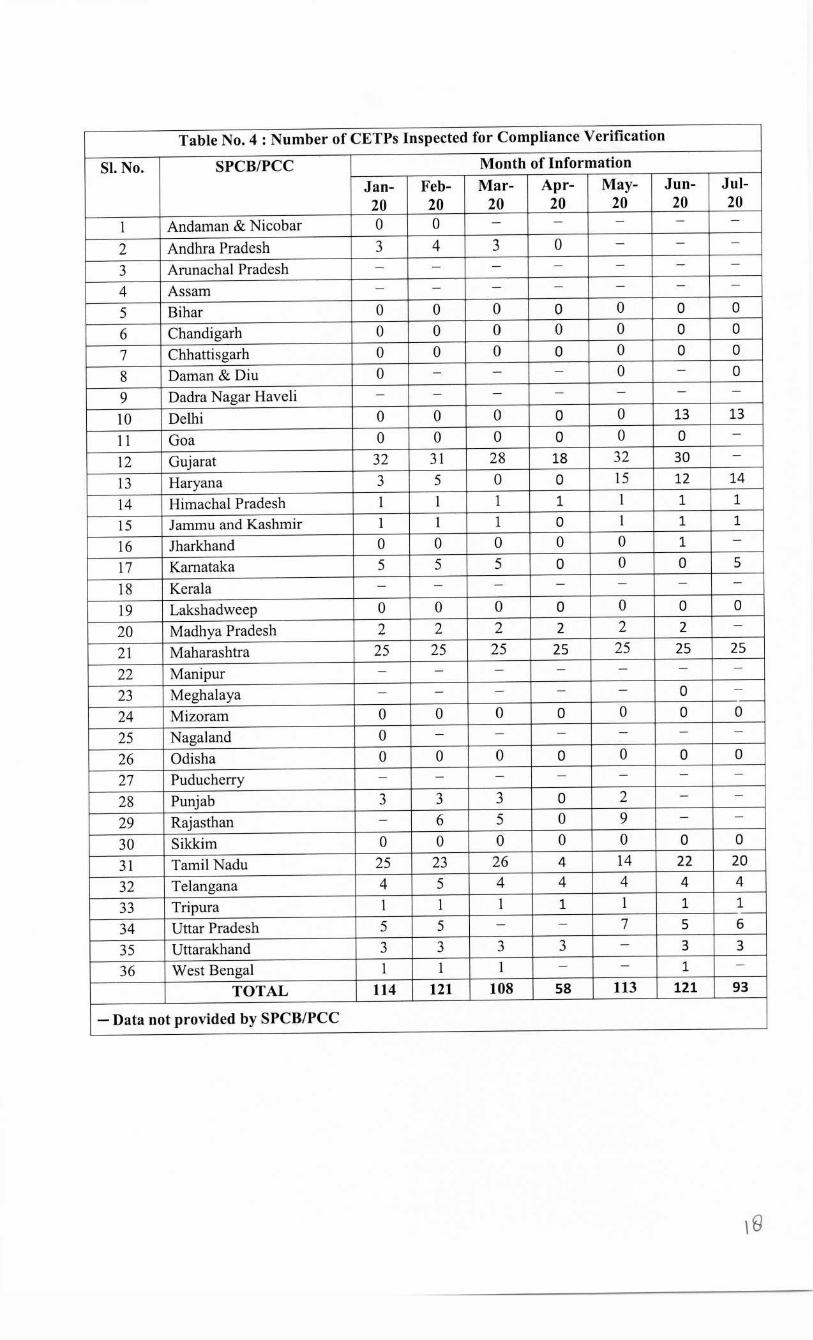
Table No. 4: Number of CETPs Inspected for Compliance Verification
SL No. SPCB/PCC Month of Information Jan- Feb- Mar- Apr- May- Jun- Jul- 20 20 20 20 20 20 20
1 Andaman & Nicobar 0 0 - - - - -
2 Andhra Pradesh 3 4 3 0 - - -
3 Arunachal Pradesh - - - - - - -
4 Assam - - - - - - -
5 Bihar 0 0 0 0 0 0 0
6 Chandigarh 0 0 0 0 0 0 0
7 Chhattisgarh 0 0 0 0 0 0 0
8 Daman & Diu 0 - - - 0 - 0
9 Dadra Nagar Haveli - - - - - - -
10 Delhi 0 0 0 0 0 13 13
11 Goa 0 0 0 0 0 0 -
12 Gujarat 32 31 28 18 32 30 -
13 Haryana 3 5 0 0 15 12 14
14 Himachal Pradesh 1 1 1 1 1 1 1
15 Jammu and Kashmir 1 1 1 0 1 1 1
16 Jharkhand 0 0 0 0 0 1 -
17 Kamataka 5 5 5 0 0 0 5
18 Kerala - - - - - - -
19 Lakshadweep 0 0 0 0 0 0 0
20 Madhya Pradesh 2 2 2 2 2 2 -
21 Maharashtra 25 25 25 25 25 25 25
22 Manipur - - - - - - -
23 Meghalaya - - - - - 0 - -
24 Mizoram 0 0 0 0 0 0 0
25 Nagaland 0 - - - - - -
26 Odisha 0 0 0 0 0 0 0
27 Puducherry - - - - - - -
28 Punjab 3 3 3 0 2 - -
29 Rajas than - 6 5 0 9 - -
30 Sikkim 0 0 0 0 0 0 0
31 Tamil Nadu 25 23 26 4 14 22 20
32 Telangana 4 5 4 4 4 4 4
33 Tripura 1 1 1 1 1 1 1 -
34 Uttar Pradesh 5 5 - - 7 5 6
35 Uttarakhand 3 3 3 3 - 3 3
36 West Bengal 1 1 1 - - 1 -
TOTAL 114 121 108 58 113 121 93
- Data not provided by SPCB/PCC
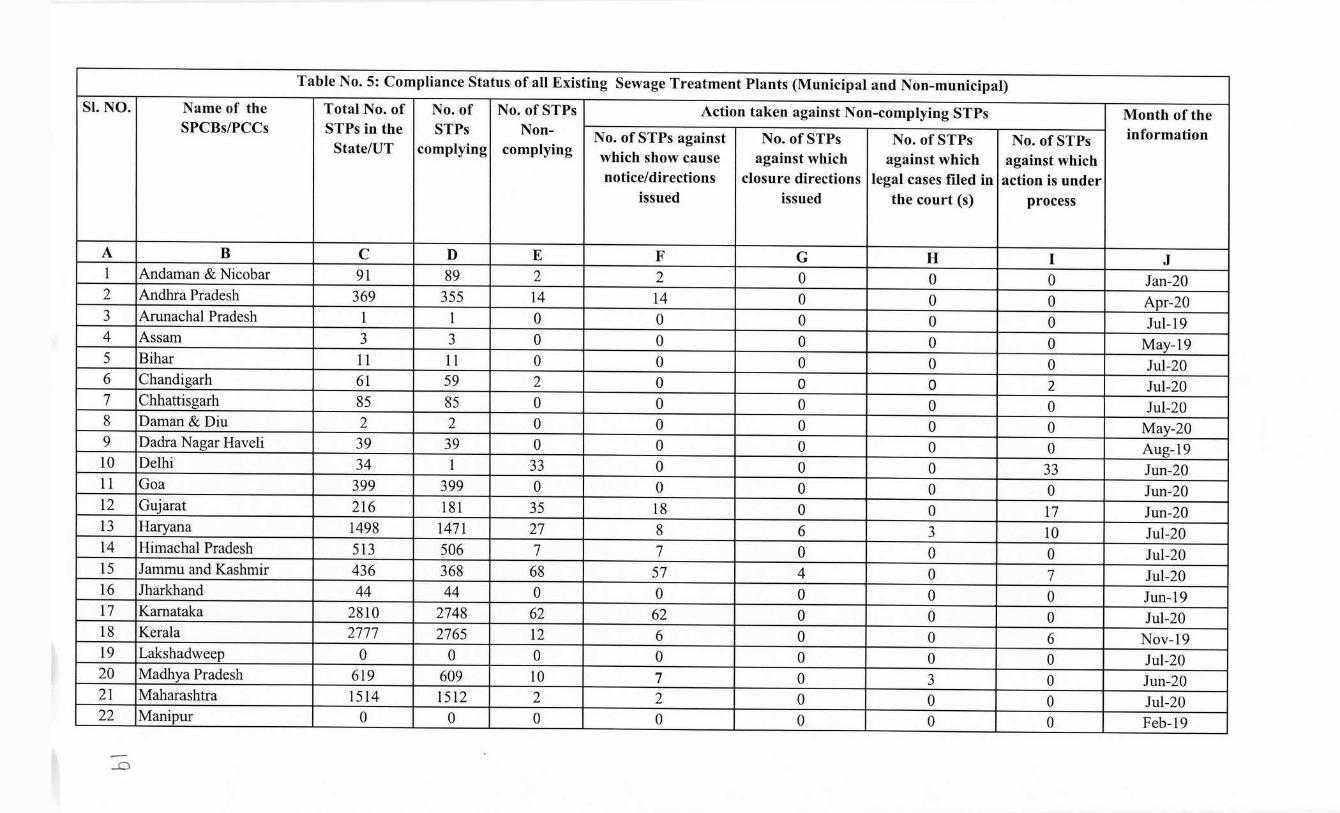
Table No. 5: Compliance Status of all Existing Sewage Treatment Plants (Municipal and Non-municipal) SI.NO. Name of the Total No. of No. of No. of STPs Action taken against Non-complying STPs Month of the
SPCBs/PCCs STPs in the STPs Non- No. of STPs against No. of STPs No. of STPs No. of STPs information State/UT complying complying which show cause against which against which against which
notice/directions closure directions legal cases filed in action is under issued issued the court (s) process
A B C D E F G H I J 1 Andaman & Nicobar 91 89 2 2 0 0 0 Jan-20 2 Andhra Pradesh 369 355 14 14 0 0 0 Apr-20 3 Arunachal Pradesh 1 1 0 0 0 0 0 Jul-19 4 Assam 3 3 0 0 0 0 0 May-19 5 Bihar 11 11 0 0 0 0 0 Jul-20 6 Chandigarh 61 59 2 0 0 0 2 Jul-20 7 Chhattisgarh 85 85 0 0 0 0 0 Jul-20 8 Daman & Diu 2 2 0 0 0 0 0 May-20 9 Dadra N agar Haveli 39 39 0 0 0 0 0 Aug-19 10 Delhi 34 1 33 0 0 0 33 Jun-20 11 Goa 399 399 0 0 0 0 0 Jun-20 12 Gujarat 216 181 35 18 0 0 17 Jun-20 13 Haryana 1498 1471 27 8 6 3 10 Jul-20 14 Himachal Pradesh 513 506 7 7 0 0 0 Jul-20 15 J ammu and Kashmir 436 368 68 57 4 0 7 Jul-20 16 Jharkhand 44 44 0 0 0 0 0 Jun-19 17 Karnataka 2810 2748 62 62 0 0 0 Jul-20 18 Kerala 2777 2765 12 6 0 0 6 Nov-19 19 Lakshadweep 0 0 0 0 0 0 0 Jul-20 20 Madhya Pradesh 619 609 10 7 0 3 0 Jun-20 21 Maharashtra 1514 1512 2 2 0 0 0 Jul-20 22 Manipur 0 0 0 0 0 0 0 Feb-19
_o
SI. NO. Name of the Total No. of No. of No. of STPs Action taken against Non-complying STPs Month of the SPCBs/PCCs STPs in the STPs Non- No. of STPs against No. ofSTPs No. of STPs No. of STPs information
State/UT complying complying which show cause against which against which against which notice/directions closure directions legal cases filed in action is under
issued issued the court (s) process
23 Meghalaya 10 10 0 0 0 0 0 Jun-20 24 Mizoram 2 2 0 0 0 0 0 Jul-20 25 Nagaland 0 0 0 0 0 0 0 Oct-19 26 Odisha 457 380 77 47 18 0 12 Jul-20 27 Puducherry 77 71 6 1 0 0 5 Feb-20 28 Punjab 662 608 54 7 0 7 40 May-20 29 Rajasthan 631 589 42 16 0 4 22 May-20 30 Sikkim 7 7 0 0 0 0 0 Jul-20 31 Tamil Nadu 1401 1396 5 5 0 0 0 Jul-20 32 Telangana 374 374 0 0 0 0 0 Jul-20 33 Tripura 19 17 2 2 0 0 0 Jul-20 34 Uttar Pradesh 93 68 25 1 0 0 24 Jul-20 35 Uttarakhand 431 428 3 0 0 0 3 Jul-20 36 West Bengal 44 2 42 0 0 0 42 Jun-20
TOTAL 15730 15200 530 262 28 17 223
~ 0
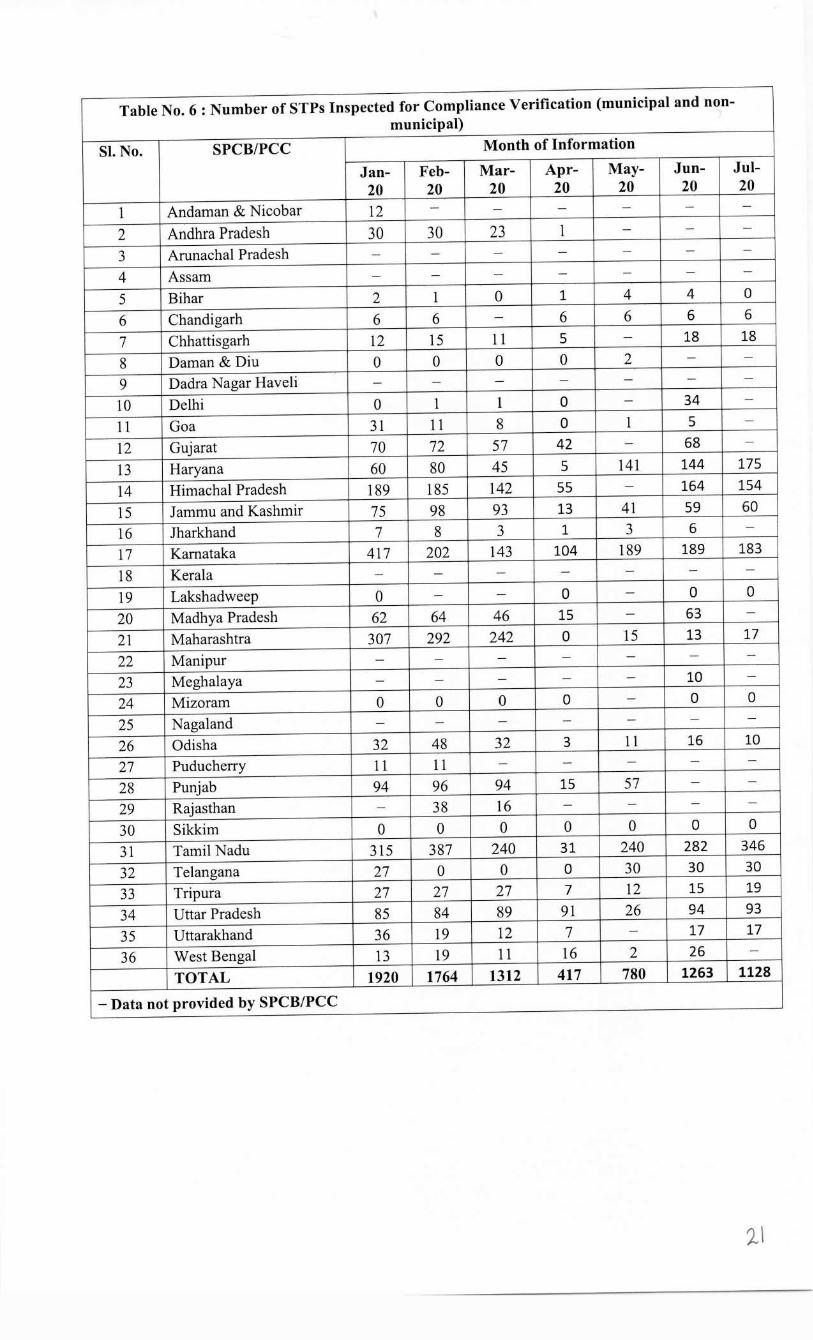
Table No. 6: Number of STPs Inspected for Compliance Verification (municipal and non- municipal)
SI.No. SPCB/PCC Month of Information
Jan- Feb- Mar- Apr- May- Jun- Jul- 20 20 20 20 20 20 20
1 Andaman & Nicobar 12 - - - - - -
2 Andhra Pradesh 30 30 23 1 - - -
3 Arunachal Pradesh - - - - - - -
4 Assam - - - - - - -
5 Bihar 2 1 0 1 4 4 0
6 Chandigarh 6 6 - 6 6 6 6
7 Chhattisgarh 12 15 11 5 - 18 18
8 Daman & Diu 0 0 0 0 2 - -
9 Dadra Nagar Haveli - - - - - - -
10 Delhi 0 1 1 0 - 34 -
11 Goa 31 11 8 0 1 5 -
12 Gujarat 70 72 57 42 - 68 -
13 Haryana 60 80 45 5 141 144 175
14 Himachal Pradesh 189 185 142 55 - 164 154
15 Jammu and Kashmir 75 98 93 13 41 59 60
16 Jharkhand 7 8 3 1 3 6 -
17 Kamataka 417 202 143 104 189 189 183
18 Kerala - - - - - - -
19 Lakshadweep 0 - - 0 - 0 0
20 Madhya Pradesh 62 64 46 15 - 63 -
21 Maharashtra 307 292 242 0 15 13 17
22 Manipur - - - - - - -
23 Meghalaya - - - - - 10 -
24 Mizoram 0 0 0 0 - 0 0
25 Nagaland - - - - - - -
26 Odisha 32 48 32 3 11 16 10
27 Puducherry 11 11 - - - - -
28 Punjab 94 96 94 15 57 - -
29 Rajasthan - 38 16 - - - -
30 Sikkim 0 0 0 0 0 0 0
31 Tamil Nadu 315 387 240 31 240 282 346
32 Telangana 27 0 0 0 30 30 30
33 Tripura 27 27 27 7 12 15 19
34 U ttar Pradesh 85 84 89 91 26 94 93
35 Uttarakhand 36 19 12 7 - 17 17
36 West Bengal 13 19 11 16 2 26 -
TOTAL 1920 1764 1312 417 780 1263 1128
- Data not provided by SPCB/PCC
i1
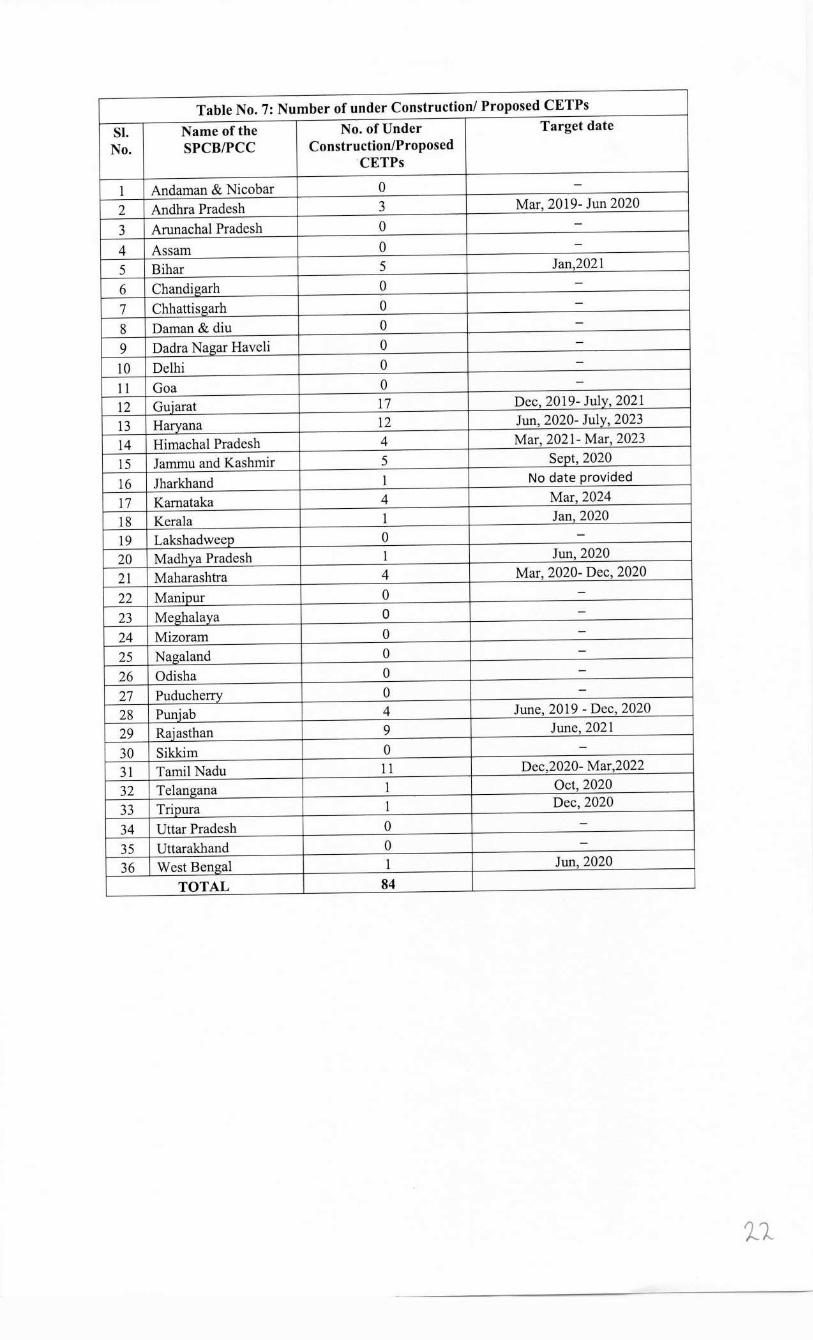
Table No. 7: Number of under Construction/ Proposed CETPs
SI. Name of the No. of Under Target date
No. SPCB/PCC Construction/Proposed CETPs
1 Andaman & Nicobar 0 -
2 Andhra Pradesh 3 Mar, 2019- Jun 2020
3 Arunachal Pradesh 0 -
4 Assam 0 -
5 Bihar 5 Jan,2021
6 Chandigarh 0 -
7 Chhattisgarh 0 -
8 Daman & diu 0 -
9 Dadra Nagar Haveli 0 -
10 Delhi 0 -
11 Goa 0 -
12 Gujarat 17 Dec, 2019- July, 2021
13 Harvana 12 Jun, 2020- July, 2023
14 Himachal Pradesh 4 Mar, 2021- Mar, 2023
15 Jammu and Kashmir 5 Sept, 2020
16 Jharkhand 1 No date provided
17 Kamataka 4 Mar, 2024
18 Kerala 1 Jan, 2020
19 Lakshadweep 0 - 20 Madhya Pradesh 1 Jun, 2020
21 Maharashtra 4 Mar, 2020- Dec, 2020
22 Manipur 0 -
23 Mezhalava 0 -
24 Mizoram 0 -
25 Nazaland 0 -
26 Odisha 0 -
27 Puducherry 0 -
28 Punjab 4 June, 2019 - Dec, 2020
29 Raiasthan 9 June, 2021
30 Sikkim 0 -
31 Tamil Nadu 11 Dec,2020- Mar,2022
32 Telangana 1 Oct, 2020
33 Trinura 1 Dec, 2020
34 Uttar Pradesh 0 -
35 Uttarakhand 0 -
36 West Bengal 1 Jun,2020
TOTAL 84
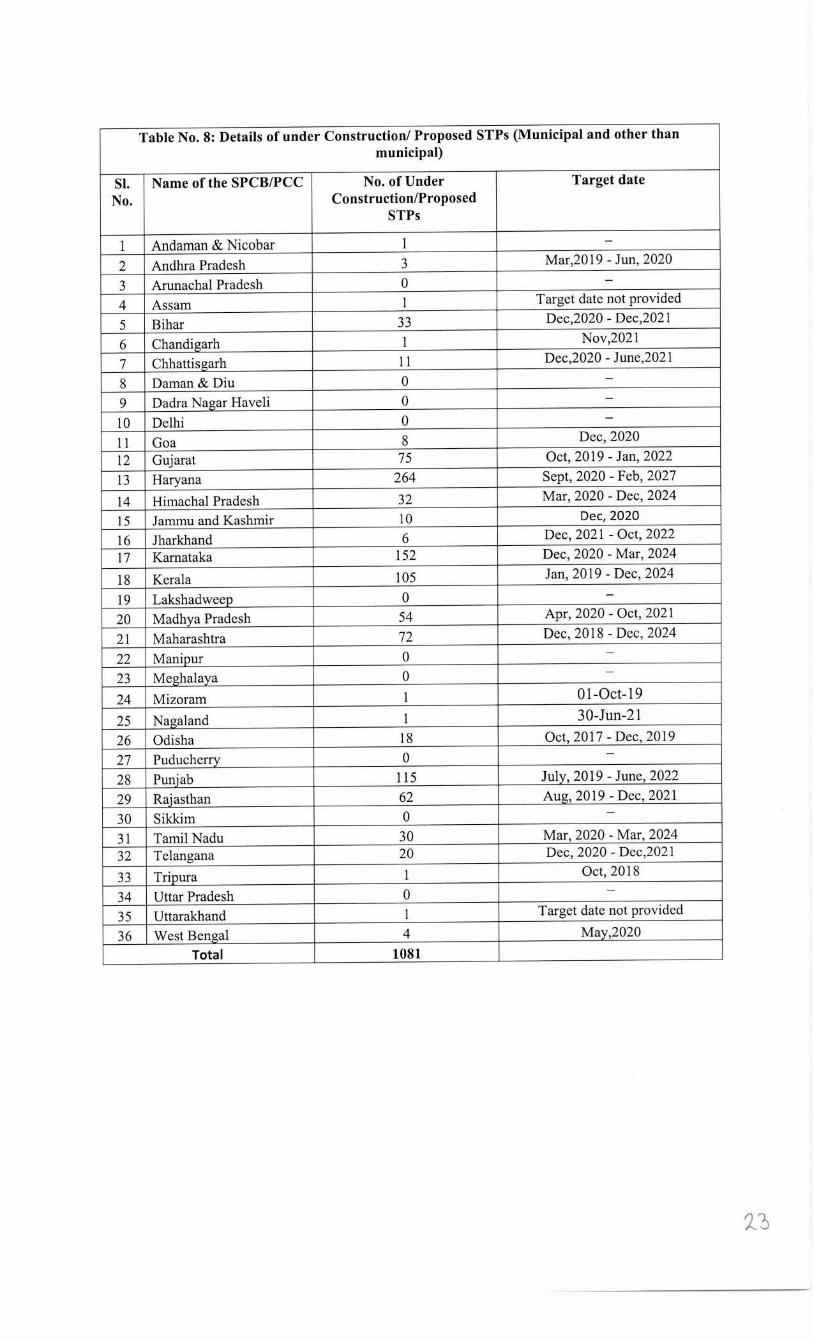
Table No. 8: Details of under Construction/ Proposed STPs (Municipal and other than municipal)
SI. Name of the SPCB/PCC No. of Under Target date No. Construction/Proposed
STPs
1 Andaman & Nicobar 1 - 2 Andhra Pradesh 3 Mar,2019 - Jun, 2020
3 Arunachal Pradesh 0 -
4 Assam I Target date not provided
5 Bihar 33 Dec,2020 - Dec,2021
6 Chandigarh 1 Nov,2021
7 Chhattisgarh 11 Dec,2020 - June,2021
8 Daman& Diu 0 - 9 Dadra Nagar Haveli 0 - 10 Delhi 0 -
11 Goa 8 Dec, 2020
12 Gujarat 75 Oct, 2019 - Jan, 2022
13 Haryana 264 Sept, 2020 - Feb, 2027
14 Himachal Pradesh 32 Mar, 2020 - Dec, 2024
15 Jammu and Kashmir 10 Dec, 2020
16 Jharkhand 6 Dec, 2021 - Oct, 2022
17 Kamataka 152 Dec, 2020 - Mar, 2024
18 Kerala 105 Jan, 2019 - Dec, 2024
19 Lakshadweeo 0 - 20 Madhya Pradesh 54 Apr, 2020 - Oct, 2021
21 Maharashtra 72 Dec, 2018 - Dec, 2024
22 Manipur 0 -
23 Mezhalava 0 -
24 Mizoram 1 0l-Oct-19
25 Nagaland 1 30-Jun-21 26 Odisha 18 Oct, 2017 - Dec, 2019
27 Puducherrv 0 -
28 Punjab 115 July, 2019 - June, 2022
29 Raiasthan 62 Aug, 2019 - Dec, 2021
30 Sikkim 0 -
31 Tamil Nadu 30 Mar, 2020 - Mar, 2024 32 Telangana 20 Dec, 2020 - Dec,2021
33 Tripura 1 Oct, 2018
34 Uttar Pradesh 0 -
35 Uttarakhand 1 Target date not provided
36 West Bengal 4 May,2020
Total 1081
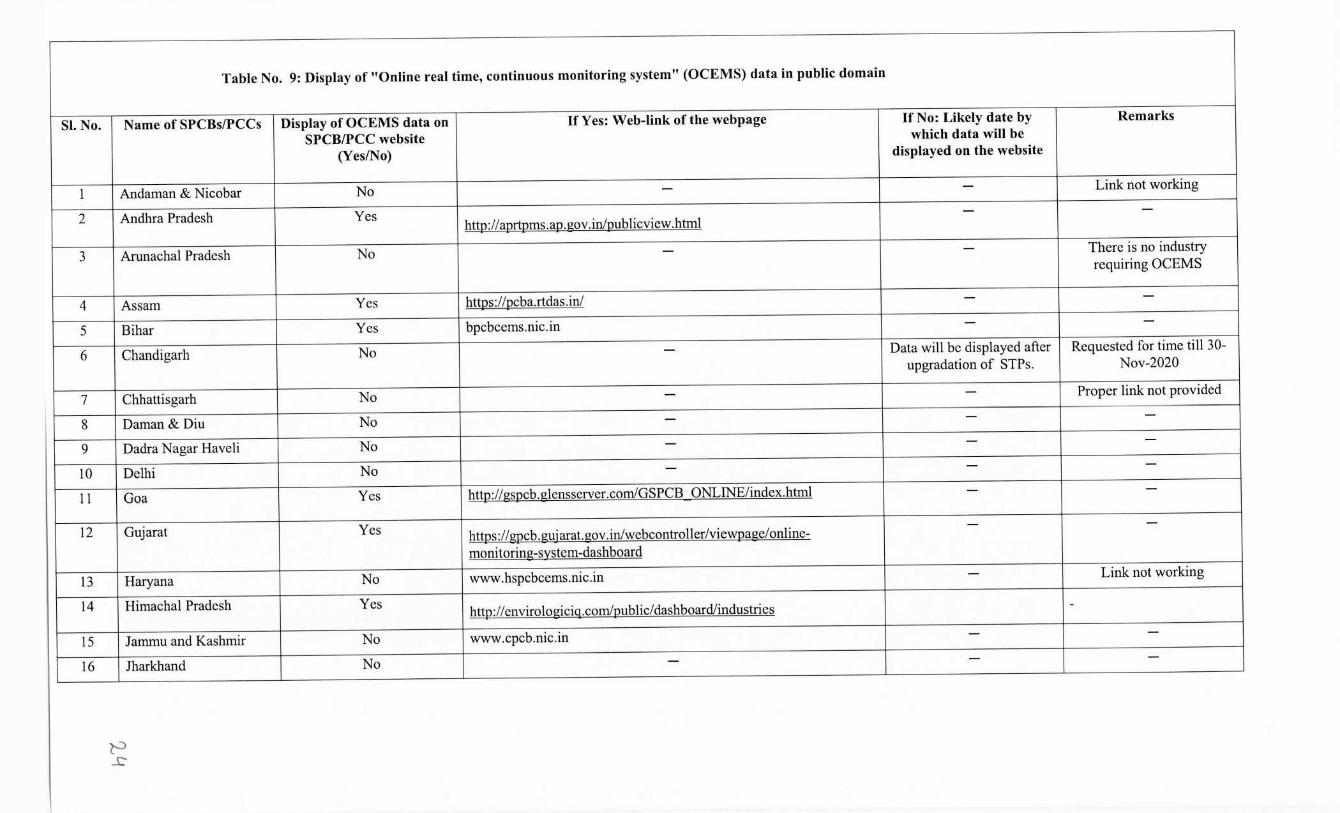
Table No. 9: Display of "Online real time, continuous monitoring system" (OCEMS) data in public domain
SI. No. Name of SPCBs/PCCs Display of OCEMS data on If Yes: Web-link of the webpage If No: Likely date by Remarks
SPCB/PCC website which data will be
(Yes/No) displayed on the website
1 Andaman & Nicobar No - - Link not working
2 Andhra Pradesh Yes - - httg://agrtgms.ag.gov.in/gublicview.html
3 Arunachal Pradesh No - - There is no industry requiring OCEMS
4 Assam Yes httgs :/ /gcba.rtdas. in/ - -
5 Bihar Yes bpcbcems.nic. in - -
6 Chandigarh No - Data will be displayed after Requested for time till 30- upgradation of STPs. Nov-2020
7 Chhattisgarh No - - Proper link not provided
8 Daman & Diu No - - -
9 Dadra Nagar Haveli No - - -
10 Delhi No - - -
11 Goa Yes httg://gsgcb.glensserver.corn/GSPCB ONLINE/index.html - -
12 Gujarat Yes httgs://gucb.gujarat.gov.in/webcontroller/viewgage/online- - -
monitoring-system-dashboard
13 Haryana No www.hspcbcems.nic.in - Link not working
14 Himachal Pradesh Yes httg://envirologicig.corn/gublic/dashboard/industries -
15 Jamrnu and Kashmir No www.cpcb.nic.in - -
16 Jharkhand No - - -
~ _c:-
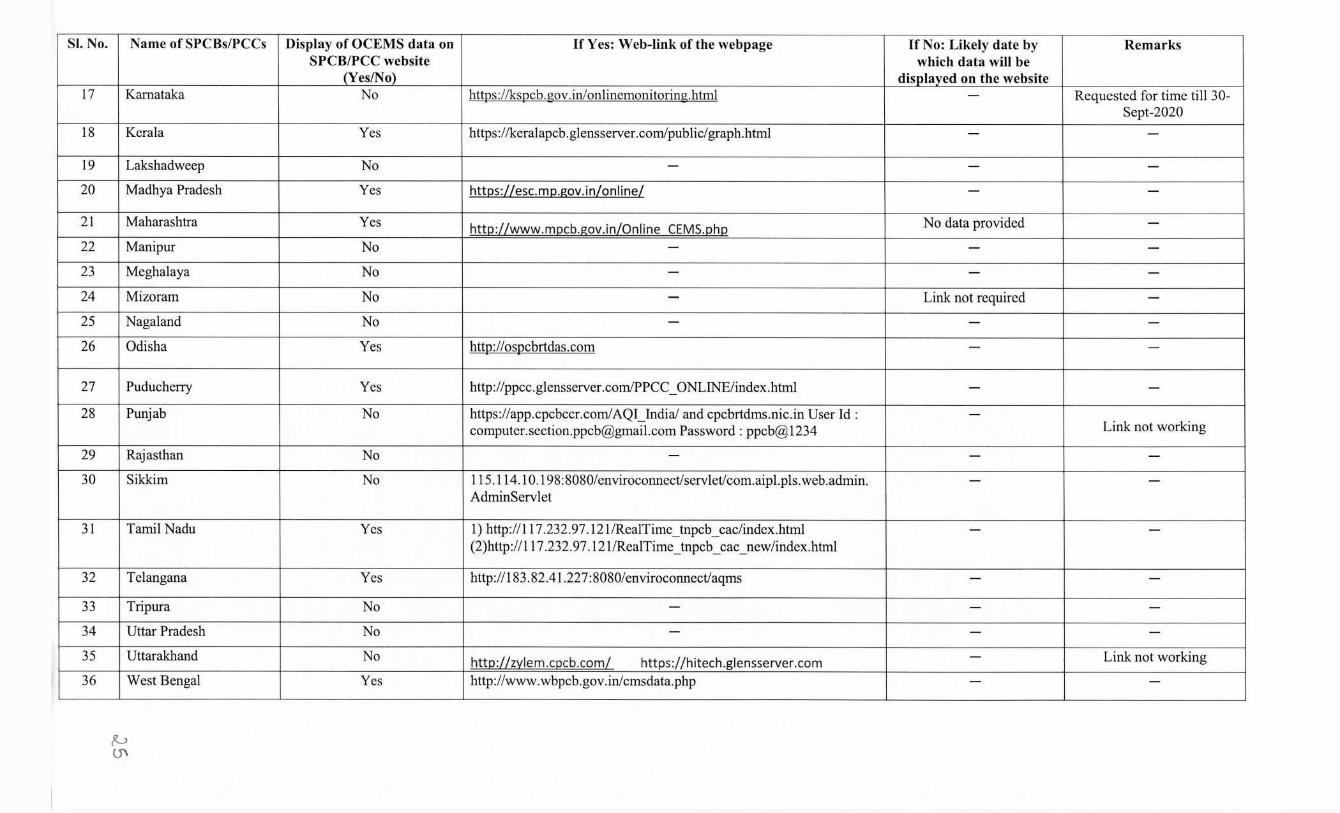
SI. No. Name of SPCBs/PCCs Display of OCEMS data on If Yes: Web-link of the webpage If No: Likely date by Remarks SPCB/PCC website which data will be
(Yes/No) displayed on the website 17 Kamataka No httgs://ksgcb.gov.in/onlinemonitoring.html - Requested for time till 30-
Sept-2020 18 Kerala Yes h ttps ://keralapc b. glensserver. corn/pub lie/ graph. html - -
19 Lakshadweep No - - - 20 Madhya Pradesh Yes htt1::1s:LLesc.m1::1.gov.inLonlineL - -
21 Maharashtra Yes htt1::1:LLwww.m1::1cb.gov.inLOnline CEMS.QhQ No data provided - 22 Manipur No - - - 23 Meghalaya No - - - 24 Mizoram No - Link not required - 25 Nagaland No - - - 26 Odisha Yes httg://osgcbrtdas.com - -
27 Puducherry Yes http:/ /ppcc.glensserver .corn/PPCC _ ONLINE/index.html - - 28 Punjab No https://app.cpcbccr.corn/AQI_India/ and cpcbrtdms.nic.in User Id: -
[email protected] Password: ppcb@l234 Link not working
29 Rajasthan No - - - 30 Sikkim No 115.114.10.198:8080/enviroconnect/servlet/com.aipl.pls.web.admin. - -
AdminServlet
31 Tamil Nadu Yes 1) http:/1117.232.97.121/RealTime_tnpcb_cac/index.html - - (2)http://l l 7 .232.97 .121/RealTime_tnpcb_cac_new/index.html
32 Telangana Yes http:l/183.82.41.227:8080/enviroconnect/aqms - -
33 Tripura No - - - 34 Uttar Pradesh No - - - 35 Uttarakhand No htt1::1:LLzyJem.c1::1cb.comL https://hitech.glensserver.com - Link not working
36 West Bengal Yes http://www.wbpcb.gov.in/cmsdata.php - -
/lv U\
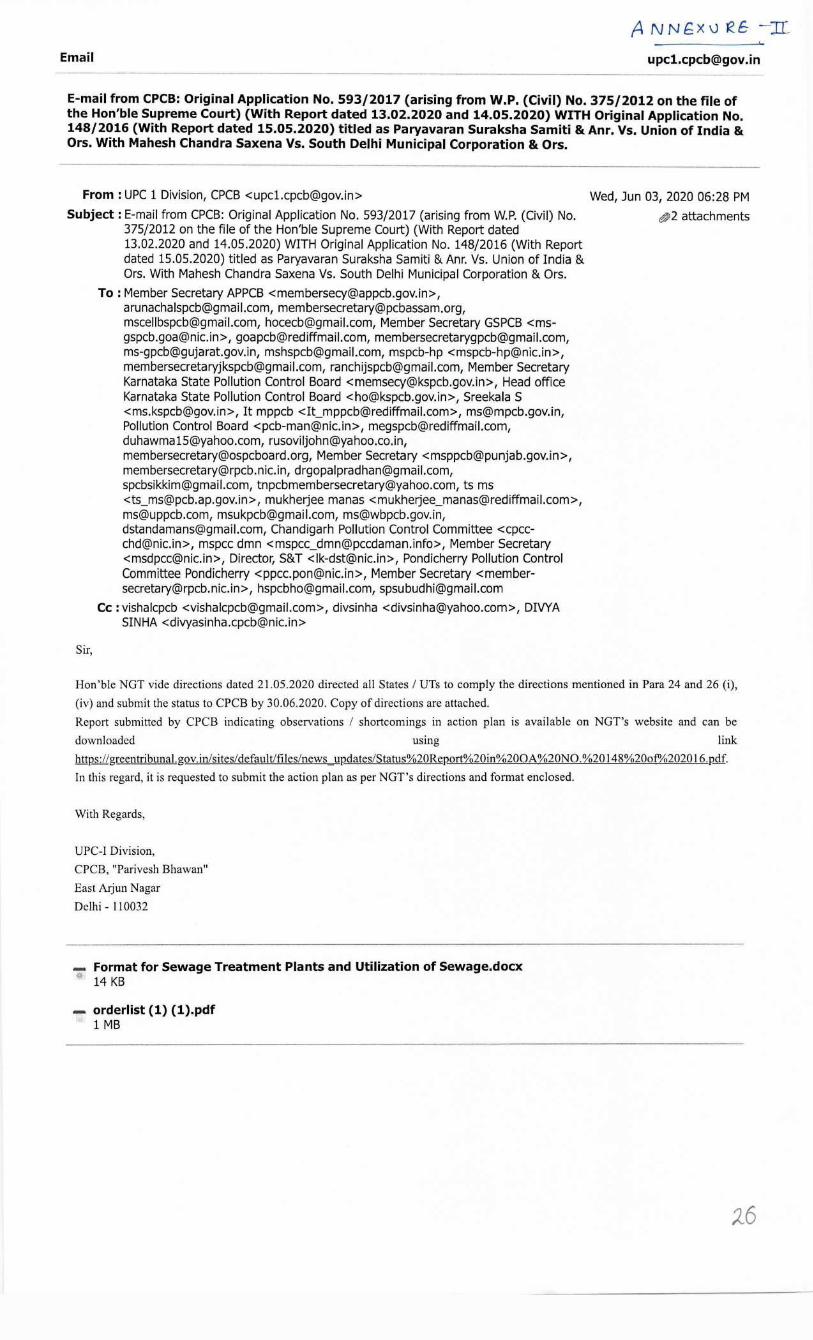
A N N 6X \J f?..& -ar Email [email protected]
E-mail from CPCB: Original Application No. 593/2017 (arising from W.P. (Civil) No. 375/2012 on the file of the Hon'ble Supreme Court) (With Report dated 13.02.2020 and 14.05.2020) WITH Original Application No. 148/2016 (With Report dated 15.05.2020) titled as Paryavaran Suraksha Samiti & Anr. Vs. Union of India & Ors. With Mahesh Chandra Saxena Vs. South Delhi Municipal Corporation & Ors.
From : UPC 1 Division, CPCB <[email protected]> Wed, Jun 03, 2020 06:28 PM Subject: E-mail from CPCB: Original Application No. 593/2017 (arising from W.P. (Civil) No. &2 attachments
375/2012 on the file of the Hon'ble Supreme Court) (With Report dated 13.02.2020 and 14.05.2020) WITH Original Application No. 148/2016 (With Report dated 15.05.2020) titled as Paryavaran Suraksha Samiti & Anr. Vs. Union of India & Ors. With Mahesh Chandra Saxena Vs. South Delhi Municipal Corporation & Ors.
To: Member Secretary APPCB <[email protected]>, [email protected], [email protected], [email protected], [email protected], Member Secretary GSPCB <ms [email protected]>, [email protected], [email protected], [email protected], [email protected], mspcb-hp <[email protected]>, [email protected], [email protected], Member Secretary Karnataka State Pollution Control Board <[email protected]>, Head office Karnataka State Pollution Control Board <[email protected]>, Sreekala S <[email protected]>, It mppcb <[email protected]>, [email protected], Pollution Control Board <[email protected]>, [email protected], [email protected], [email protected], [email protected], Member Secretary <[email protected]>, [email protected], [email protected], [email protected], [email protected], ts ms <[email protected]>, mukherjee manas <[email protected]>, [email protected], [email protected], [email protected], [email protected], Chandigarh Pollution Control Committee <cpcc [email protected]>, mspcc dmn <[email protected]>, Member Secretary <[email protected]>, Director, S&T <[email protected]>, Pondicherry Pollution Control Committee Pondicherry <[email protected]>, Member Secretary <member [email protected]>, [email protected], [email protected]
Cc: vishalcpcb <[email protected]>, divsinha <[email protected]>, DIVYA SINHA <[email protected]>
Sir,
Hon 'ble NGT vide directions dated 21.05.2020 directed all States/ UTs to comply the directions mentioned in Para 24 and 26 (i), (iv) and submit the status to CPCB by 30.06.2020. Copy of directions are attached. Report submitted by CPCB indicating observations / shortcomings in action plan is available on NGT's website and can be downloaded using link httP-S :/ /greentribunal.gov. in/sites/default/files/news UP-dates/Status%20ReP-ort%20in%20OA %20NO.%20148%20of%202016. P-df. In this regard, it is requested to submit the action plan as per NGT's directions and format enclosed.
With Regards,
UPC-I Division, CPCB, "Parivesh Bhawan" East Arjun Nagar Delhi - 110032
- Format for Sewage Treatment Plants and Utilization of Sewage.docx 0 14 KB
orderlist (1) (1).pdf 1 MB
914/2020 Gmail - E-ma il from CPCB: Origina l Applica tion No. 593/2017 (aris ing from W.P. (Civil) No. 375/2 012 on the file of the Hon'ble Su pre ...
MGmail Vlshal Gandhi <[email protected]>
E-mail from CPCB: Original Application No. 593/2017 (arising from W.P. (Civil) No. 375/2012 on the file of the Hon'ble Supreme Court) (With Report dated 13.02.2020 and 14.05.2020) WITH Original Application No. 148/2016 (With Report dated 15.05.2020) titled as Paryavaran Suraksha Samiti & Anr. Vs. Union of India & Ors. With Mahesh Chandra Saxena Vs. South Delhi Municipal Corporation & Ors.
UPC 1 Division, CPCB <[email protected]> Wed, Jun 24, 2020 at 6:08 PM To: CS AP <[email protected]>, [email protected], Kumar Sanjay Krishna IAS <[email protected]>, Chief Secretary Bihar <[email protected]>, Chief Secretary Office <[email protected]>, [email protected], [email protected], Chief Secretary <[email protected]>, KESHNI ANAND ARORA <[email protected]>, Anil Khachi <[email protected]>, cs-jandk <cs [email protected]>, [email protected], [email protected], "Chief Secretary, Government of Kerala" <[email protected]>, Iqbal Singh Bains <[email protected]>, [email protected], [email protected], cs manipur <[email protected]>, Mr TALI TOY <[email protected]>, Asit Kumar Tripathy <[email protected]>, "Chief Secretary, Punjab" <[email protected]>, [email protected], [email protected], [email protected], [email protected], [email protected], Somesh Kumar IAS <[email protected]>, cs-tripura <[email protected]>, CHIEF SECRETARY GoUP <[email protected]>, [email protected], Shri Vijay Kumar Dev <[email protected]>, "Shri. Dineshwar Sharma IPS" <lk [email protected]>, [email protected], [email protected], "Chief Secretary CS, Puducherry" <[email protected]>, MSRao <[email protected]>, cs miz <[email protected]> Cc: vishalcpcb <[email protected]>, Nalin Gupta <[email protected]>
Sir,
Hon 'ble NGT vide directions dated 21.05.2020 directed all States / UTs to comply the directions mentioned in Para 24 and 26 (i), (iv) and submit the status to CPCB by 30.06.2020. Copy of directions are attached. Report submitted by CPCB indicating observations I shortcomings in action plan is available on NGT's website and can be downloaded using link https://greentribunaJ.gov.in/sites/default/files/ news_ updates/Status%20Report%120in%20OA %20NO. %20l48%20of%202016.pdf. In this regard, it is requested to submit the action plan as per NGT's directions and format enclosed.
With Regards,
UPC-I Division, CPCB, "Parivesh Bhawan" East Arjun Nagar Delhi - 110032
YEAISOF CllHIAIING THEMAHATMA
"Cleanlln1m Is next lo Godllness"
2 attachments
~ Format for Sewage Treatment Plants and Utilization of Sewage.docx 15K
~ orderllst (1) (1).pdf 1146K
https://mail .google.com/maiUu/0?ik=6d0668364a& view=pt&search=all&permmsgid=msg-f%3A 1670383981407517000&simpl =msg-f%3A 1670383.. . 1 /2
Fit:.: 1o: .-\ • 14 .1 r 113/2(1 !20-.\.fw1
T~1, TILr Me111 bi:?r .S~'CN!l1tiry.1 SPCJl:.-,J!'(.'C~ All Sf,lt{.!..w'IJTs
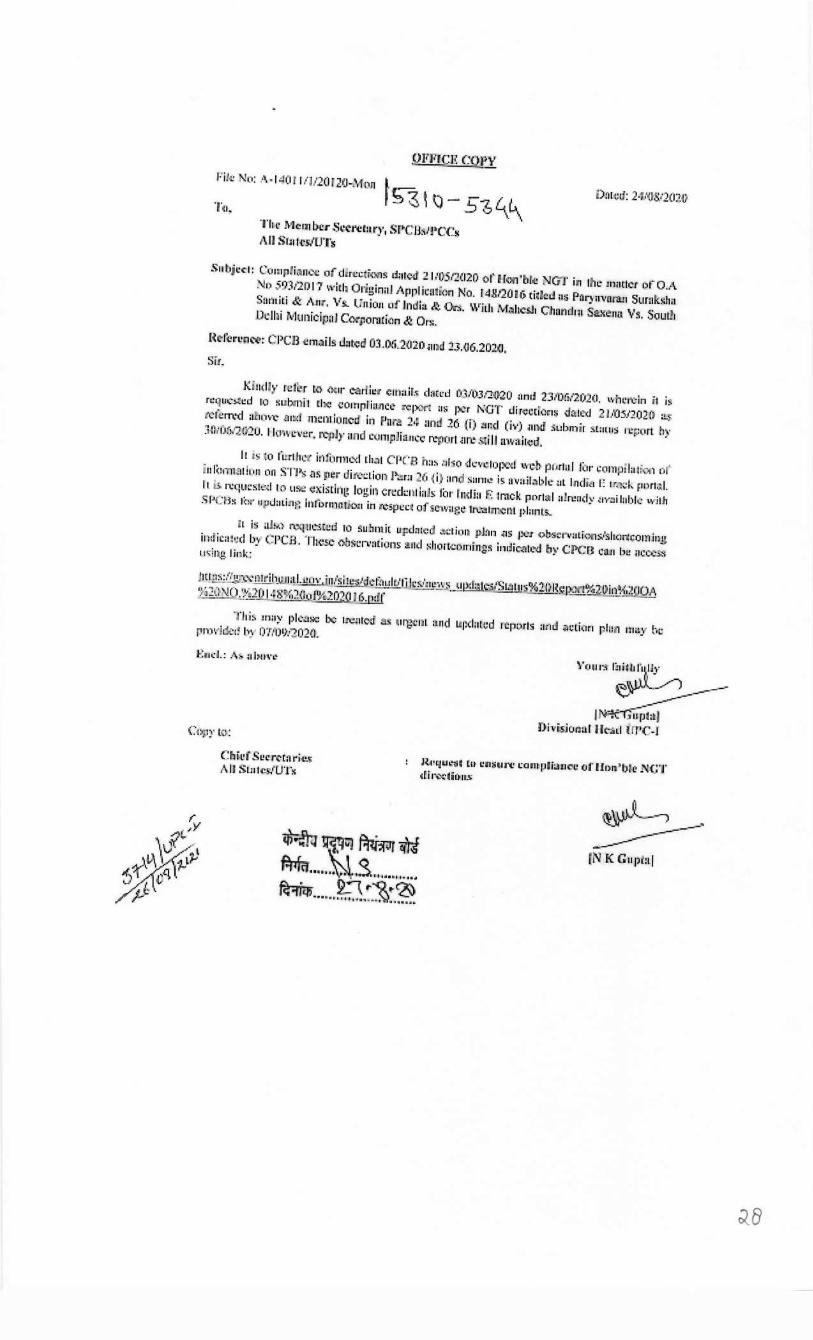
Su bjl!cl: Cump ianee of d rec ro;ns d.1l<XI! .2 I t'l)5.'2f.l20 01 Hoo 'bk! NGT i;n ttii: m;1ttCJ 1:)f" 0.A \JI) .593/21) 1 "7 with 01i!;im1J Appl ic:llo:i11 No. F4:8.t20 ! 6 m~-cu as Pnr1 nvnran Surnkstm Snnriti & Anr, Vs.. Un_iou ud"lndia & 0.-S. W,ith l\f~h.cs.11 C'lumd1;1 Saxe:n!l Vs, Saul~, Ddlai Mcmicipal C~r,ornrian & o-,
He-fcri:riee: C'PCB emails di!t:ed 03.05.2(1:ZO .m,d 2J,(16.201{1, Si1.
Kf11dly r~:l1 r to <'klir Cl:lrtlL"l c:mair.t dacn:J 1rVOJ,!J:-0-20 .-,mi 2.3/D.fit202o. wi1crein ;i i rcquc~cd LO !l11bl11i1 rl:;c co1t1pPi1111ce- ~l:>:lt:1 as per l\"{JT dir<:ccf,.r.1~ daie-d 21/05/202' ~ {(-ft"!rn.'d ;f 11.1-..-c- Md ncm ion.c· Ir; Pill'a 2,f and 26 ,(i) .!!!Id ( i-.·) ml<ll SLibn1ir sruurs I t;;:ort hy .t f}tt1:i.'2 1U. I kHI CV2r. !:e4.i]y and C{l111i!JJi3.11Cc l"l.1J0rl ,lrl!" ~jU llW:lil~d.
It is ~o fl!Ill11.:-;r iMun ml cli.,1. CPC"U fl:,~ .:ii o dcv ·loped well- pfarlul for i;,:m1prl;J1f-D;) 1 r' in l(!/Til !ll !c II on s·, ·1~ m; pi:r dik'l:Lio,~ J'-~r.i 26 { 1, ;111 ' xurnc is ll'Y;dl';il>lc .il lmlii) I: '"". " Flllrl I. IL t5. n:,1u;::-.1c:,I to l1. ~ e:-.:istli1g lo~i1~ credent iii s for· fn:,;Jia f. truck pnrlal ulrendy m·ai tublc wilh Sf-'(."Bs lei• U uali P, i11thrn111~K:<.11 in reSpti:~ of Sc:\Yas~ 11\.'7!!1111·:e,u plants..
EL i • uAs..> n.'1(1111 .. ':m!d 10 su1h1Ttic u:r,d:n<:d ~:.:Lic111 pfa11 .,s J:Vr 4.).b<;:r,.•ati(Jfls/sh()r~comi,~J.! irufo::.-r~·xl by CPCIB. Tltese: o'.bs::11:mions an I :-.J1ortc1xrnin~s im!iCflll!"d by CPCO c;1,11 b~ nco:-sg u~i1~ I i11l;
JJU ll. ~x-111rilw.JJal. ww .~lsl ,~;;.':lfcfo~,!!ill. ~r1;:fc;1c;;.<Sii11 m;%20 ,~~L~ ..... %2:0ir:!}i,:i · A %Y 1 .'f 2.f!HS%I(lo,iJ%:W20i6.pdf
'Jr is ma}' r;kw.e be: 1re.1to::i1 as 11rg-;:1iL ,u1d 1.1,pd;1t,,,;ci rl'!pC,Jls :Jr,)i:j .ii.:tkm r lc 121.i.y [-.:; m1.:wide1. b:r lrf.1)1N302O.
Cflit:f Sl!CTCt;l r'i<!!.~ · II SLJ11cs/UT!1 R~·11ui,.'11C [u c11su1-c, i:ampli.11101: of U1m'bZc NCT
di l\'.:('jil)11s
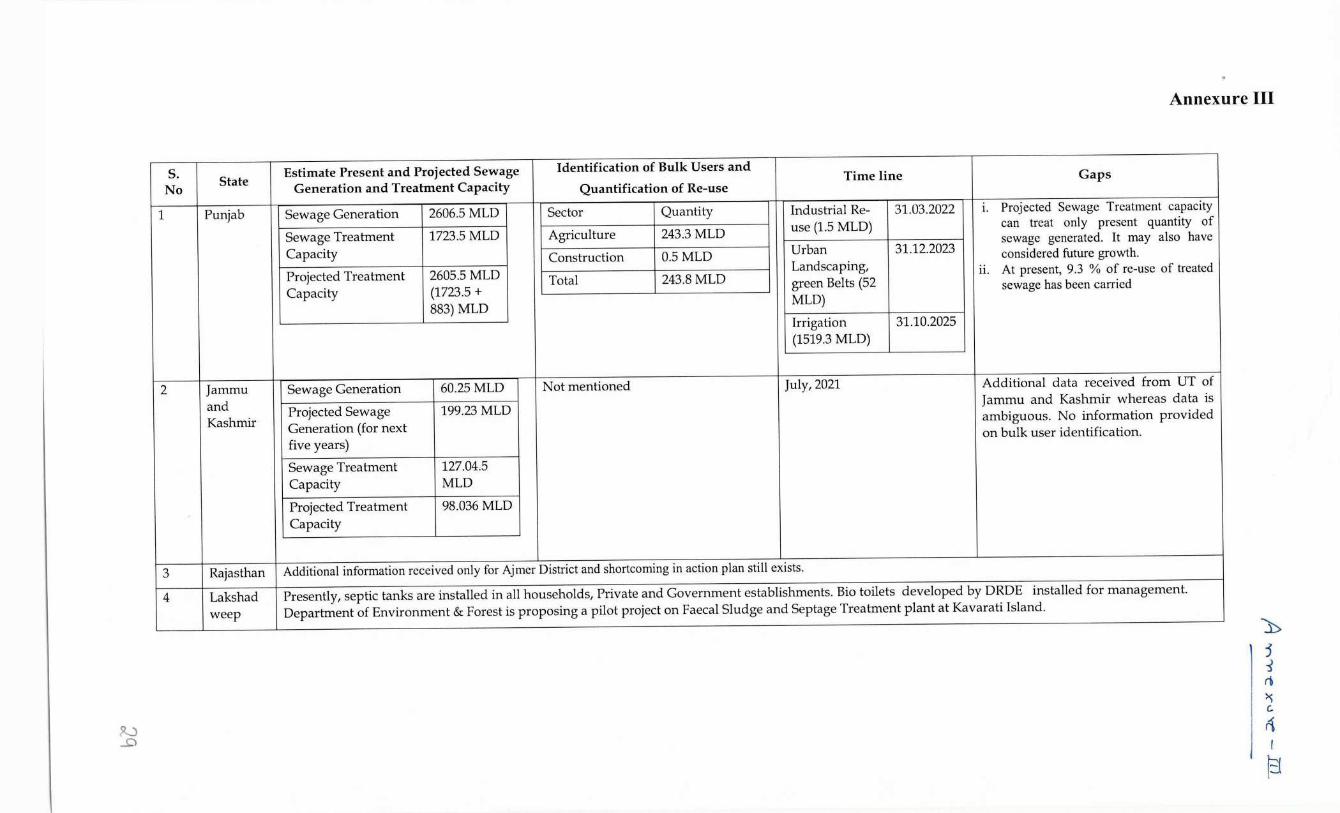
Annexure III
s. Estimate Present and Projected Sewage Identification of Bulk Users and State Time line Gaps
No Generation and Treatment Capacity Quantification of Re-use
1 Punjab Sewage Generation 2606.5 MLD Sector Quantity Industrial Re- 31.03.2022 I. Projected Sewage Treatment capacity
Sewage Treatment 1723.5 MLD Agriculture 243.3 MLD use (1.5 MLD) can treat only present quantity of
Capacity Urban 31.12.2023 sewage generated. It may also have
Construction 0.5 MLD considered future growth. Landscaping,
Projected Treatment 2605.5 MLD Total 243.8 MLD 11. At present, 9.3 % of re-use of treated
Capacity (1723.5 + green Belts (52 sewage has been carried
883) MLD MLD)
Irrigation 31.10.2025 (1519.3 MLD)
2 Jammu Sewage Generation 60.25 MLD Not mentioned July, 2021 Additional data received from UT of
and Projected Sewage 199.23 MLD Jammu and Kashmir whereas data is
Kashmir Generation (for next ambiguous. No information provided
five years) on bulk user identification.
Sewage Treatment 127.04.5 Capacity MLD
Projected Treatment 98.036 MLD Capacity
3 Rajas than Additional information received only for Ajmer District and shortcoming in action plan still exists.
4 Lakshad Presently, septic tanks are installed in all households, Private and Government establishments. Bio toilets developed by DRDE installed for management. weep Department of Environment & Forest is proposing a pilot project on Faecal Sludge and Septage Treatment plant at Kavarati Island.
~ ..5:)
~ j ~ r1 ~ C. ,, !
~
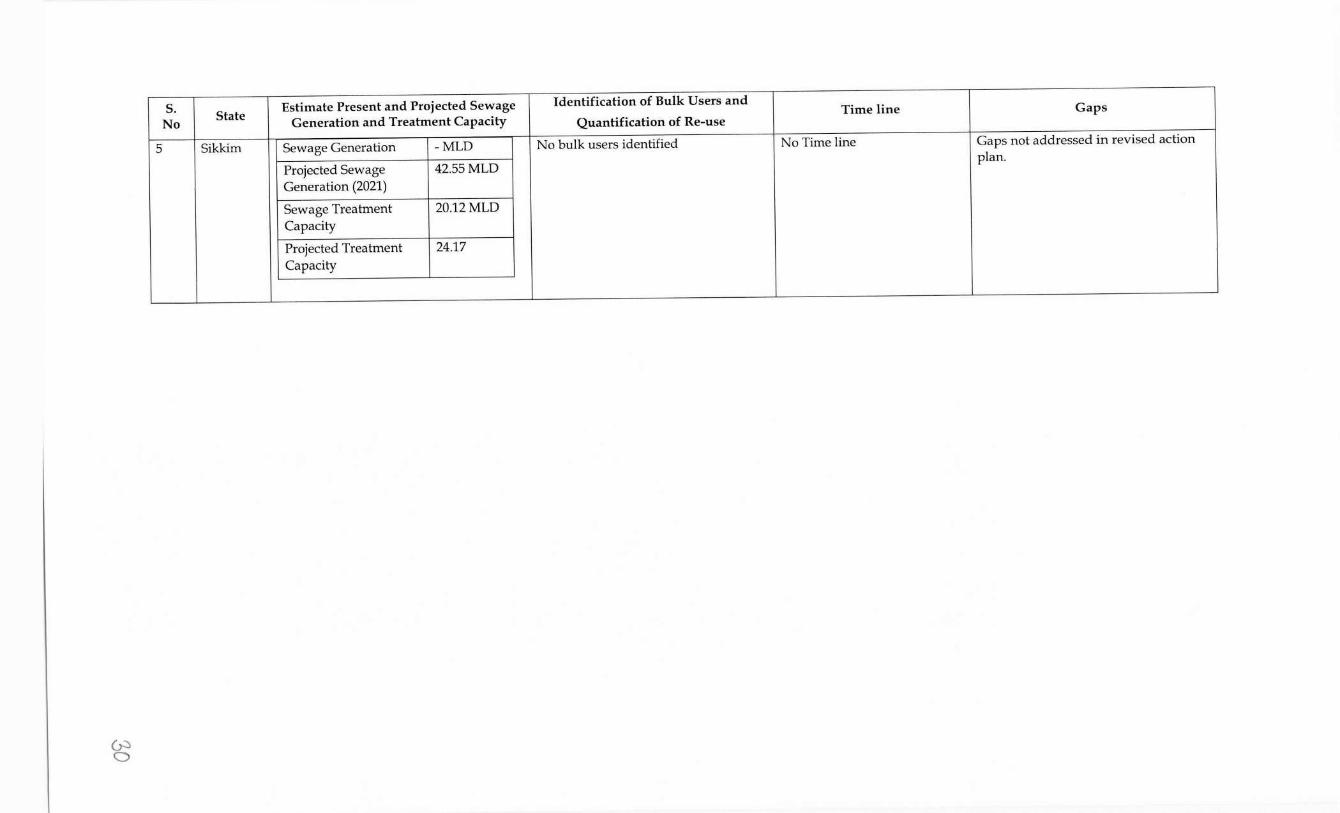
s. Estimate Present and Projected Sewage Identification of Bulk Users and State Time line Gaps
No Generation and Treatment Capacity Quantification of Re-use
5 Sikkim Sewage Generation -MLD No bulk users identified No Time line Gaps not addressed in revised action
Projected Sewage 42.55 MLD plan.
Generation (2021)
Sewage Treatment 20.12MLD Capacity
Projected Treatment 24.17 Capacity
~ 0
Annexure IV
~. f ,Ii
·~ ~
~~~mi CENTRAL POLLUTION CONTROL BOARD ~. cR TJ:i ~ 'IJfhra;f tf:m;yu 'llJ7il l'.fl<lifl
IIINiSTRY OF EHIIIRONNEHT, FOREST & CLIMATE CHANG[ GO . OF mo•~
Office Copy
No. A-14011/1/2020-UPC-l July 15, 2020
To,
Subject: Preparation of National Inventory of Sewage Treatment Plants.
Sir,
An inventory of Sewage Treatment Plants was prepared during 2017-18 with the help of SPCBs/PCCs and State Urban Bodies (enclosed for ready reference). The same needs to be updated for reviewing current status of Sewage Management.
In this context, a standard format is devised and attached herewith. It is requested that updatedinformation as of 30.06.2020 as per the format may please be forwarded to this office by 31.07.2020. Soft copy may also be sent to email-ids : ~l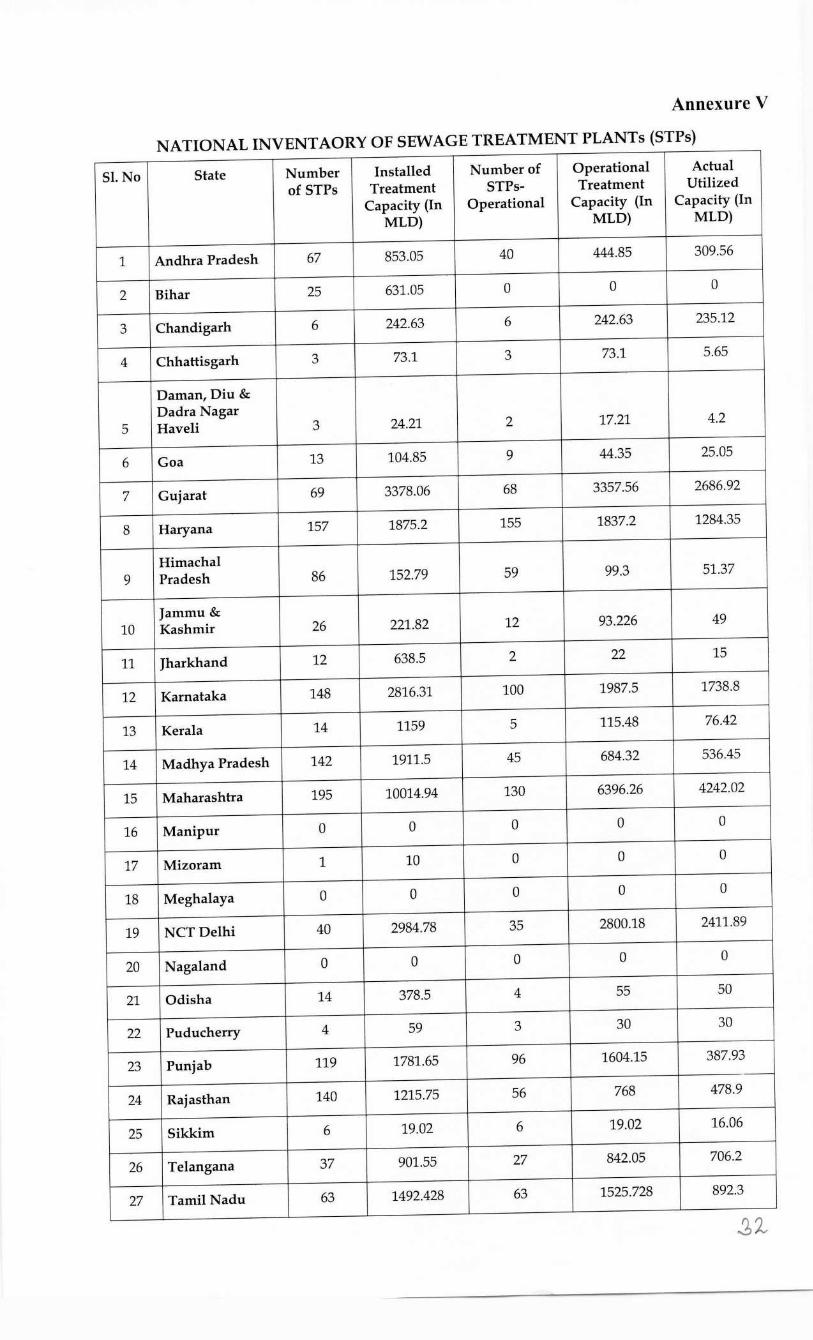
Annexure V
NATIONAL INVENTAORY OF SEWAGE TREATMENT PLANTs (STPs)
SI.No State Number Installed Number of Operational Actual
of STPs Treatment STPs- Treatment Utilized Capacity (In Operational Capacity (In Capacity (In
MLD) MLD) MLD)
1 Andhra Pradesh 67 853.05 40 444.85 309.56
2 Bihar 25 631.05 0 0 0
3 Chandigarh 6 242.63 6 242.63 235.12
4 Chhattisgarh 3 73.1 3 73.1 5.65
Daman, Diu & Dadra Nagar
5 Haveli 3 24.21 2 17.21 4.2
6 Goa 13 104.85 9 44.35 25.05
7 Gujarat 69 3378.06 68 3357.56 2686.92
8 Haryana 157 1875.2 155 1837.2 1284.35
Himachal 9 Pradesh 86 152.79 59 99.3 51.37
Jammu & 10 Kashmir 26 221.82 12 93.226 49
11 Jharkhand 12 638.5 2 22 15
12 Karnataka 148 2816.31 100 1987.5 1738.8
13 Kerala 14 1159 5 115.48 76.42
14 Madhya Pradesh 142 1911.5 45 684.32 536.45
15 Maharashtra 195 10014.94 130 6396.26 4242.02
16 Manipur 0 0 0 0 0
17 Mizoram 1 10 0 0 0
18 Meghalaya 0 0 0 0 0
19 NCT Delhi 40 2984.78 35 2800.18 2411.89
20 Nagaland 0 0 0 0 0
21 Odisha 14 378.5 4 55 50
22 Puducherry 4 59 3 30 30
23 Punjab 119 1781.65 96 1604.15 387.93
24 Rajasthan 140 1215.75 56 768 478.9
25 Sikkim 6 19.02 6 19.02 16.06
26 Telangana 37 901.55 27 842.05 706.2
27 Tamil Nadu 63 1492.428 63 1525.728 892.3
SI. No State Number Installed Number of Operational Actual
of STPs Treatment STPs- Treatment Utilized
Capacity (In Operational Capacity (In Capacity (In
MLD) MLD) MLD)
28 Tripura 1 8 1 8 1.5
29 Uttar Pradesh 102 3259.99 92 3091.57 2510.15
30 Uttarakhand 81 515.86 52 344.85 187.66
31 West Bengal 67 1197.88 24 337.3 213.66
Total 1641 37921.42 1095 26840.83 18439.96
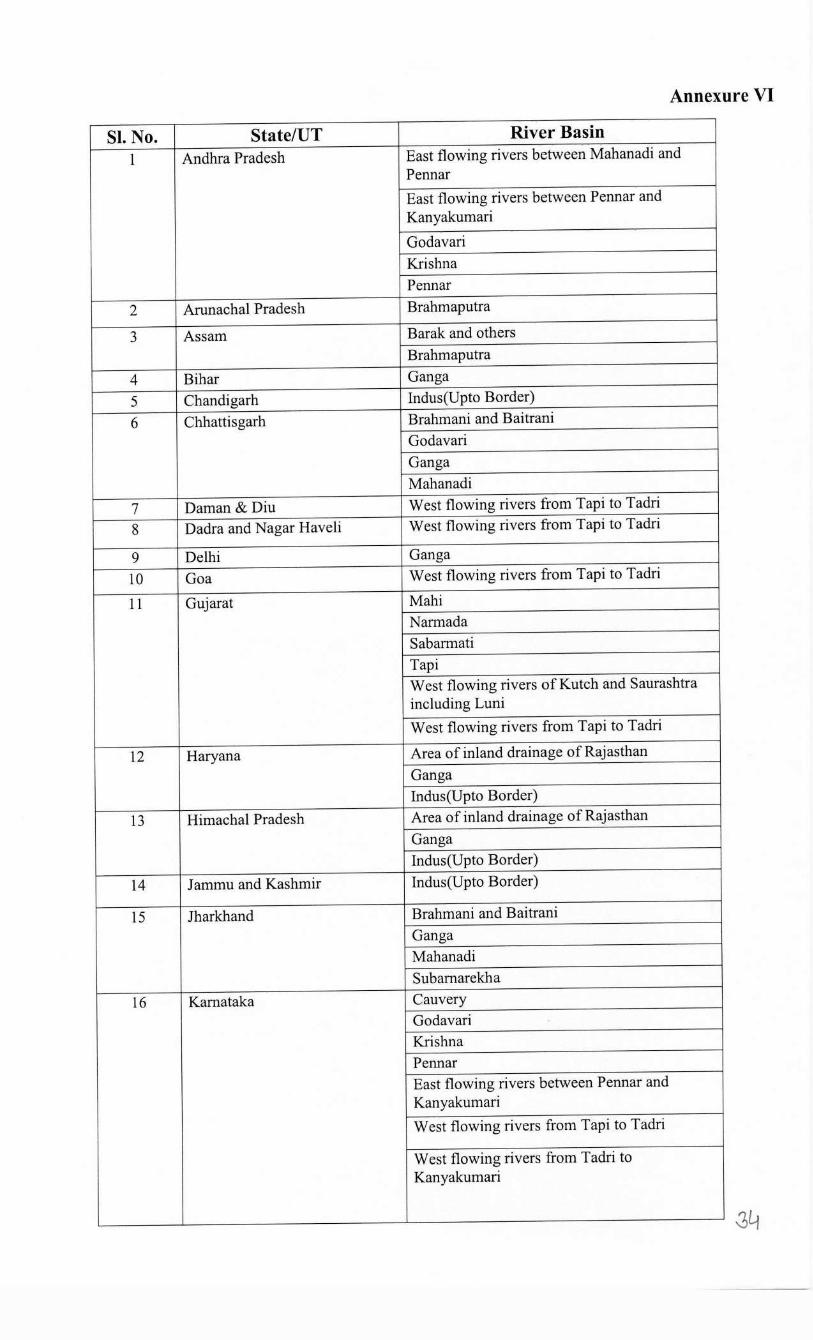
Annexure VI
SI. No. State/UT River Basin 1 Andhra Pradesh East flowing rivers between Mahanadi and
Pennar East flowing rivers between Pennar and Kanyakumari
Godavari Krishna Pennar
2 Arunachal Pradesh Brahmaputra
3 Assam Barak and others Brahmaputra
4 Bihar Ganga
5 Chandigarh lndus(Upto Border)
6 Chhattisgarh Brahmani and Baitrani Godavari Ganga Mahanadi
7 Daman & Diu West flowing rivers from Tapi to Tadri
8 Dadra and Nagar Haveli West flowing rivers from Tapi to Tadri
9 Delhi Ganga
10 Goa West flowing rivers from Tapi to Tadri
11 Gujarat Mahi Narmada Sabarmati Tapi West flowing rivers of Kutch and Saurashtra including Luni West flowing rivers from Tapi to Tadri
12 Haryana Area of inland drainage of Rajasthan Ganga Indus(Upto Border)
13 Himachal Pradesh Area of inland drainage of Rajasthan Ganga Indus(Upto Border)
14 J ammu and Kashmir Indus(Upto Border)
15 Jharkhand Brahmani and Baitrani Ganga Mahanadi Subamarekha
16 Kamataka Cauvery Godavari Krishna Pennar East flowing rivers between Pennar and Kanyakumari West flowing rivers from Tapi to Tadri
West flowing rivers from Tadri to Kanyakumari
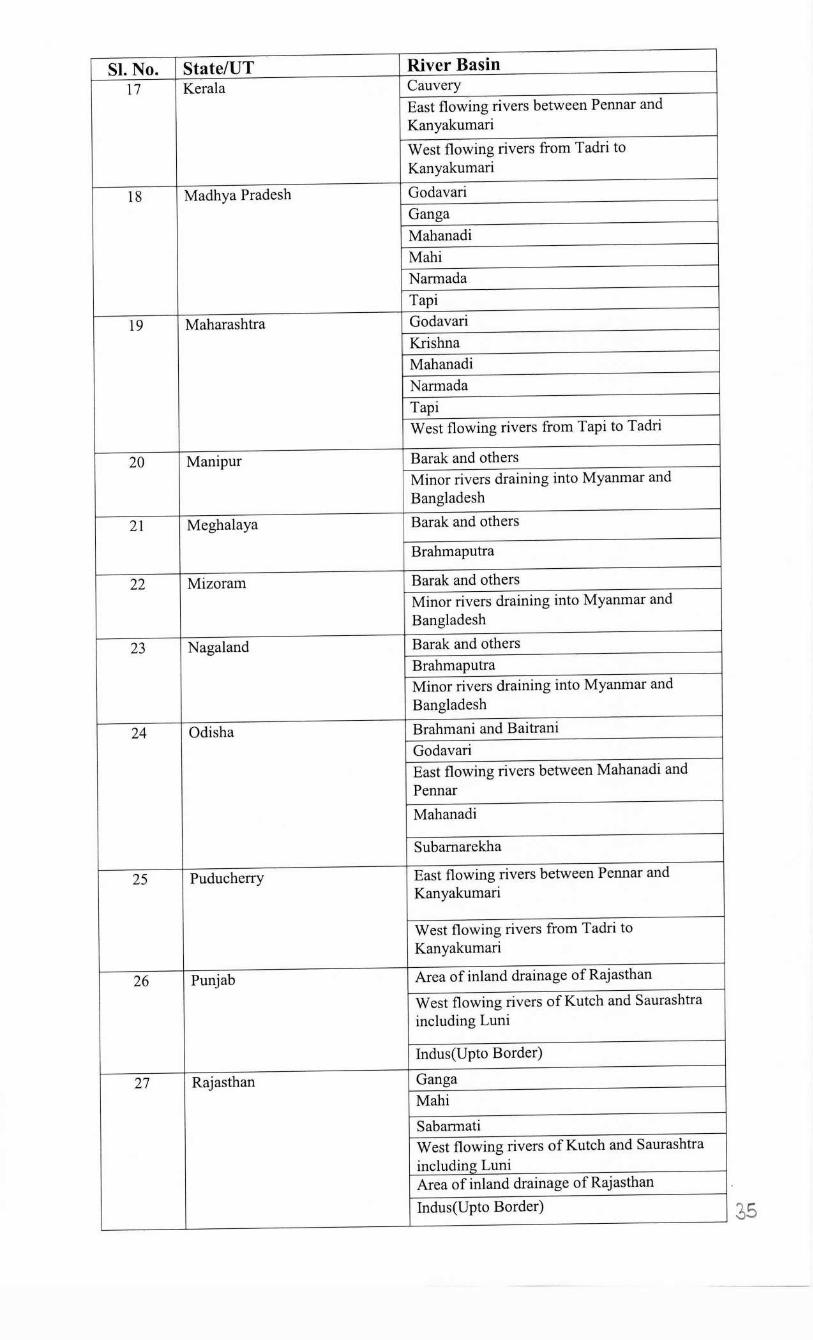
SI. No. State/UT River Basin 17 Kerala Cauvery
East flowing rivers between Pennar and Kanyakumari West flowing rivers from Tadri to Kanyakumari
18 Madhya Pradesh Godavari Ganga Mahanadi Mahi Narmada Tapi
19 Maharashtra Godavari Krishna Mahanadi Narmada Tapi West flowing rivers from Tapi to Tadri
20 Manipur Barak and others Minor rivers draining into Myanmar and Bangladesh
21 Meghalaya Barak and others
Brahmaputra
22 Mizoram Barak and others Minor rivers draining into Myanmar and Bangladesh
23 Nagaland Barak and others Brahmaputra Minor rivers draining into Myanmar and Bangladesh
24 Odisha Brahmani and Baitrani Godavari East flowing rivers between Mahanadi and Pennar Mahanadi
Subamarekha
25 Puducherry East flowing rivers between Pennar and Kanyakumari
West flowing rivers from Tadri to Kanyakumari
26 Punjab Area of inland drainage ofRajasthan
West flowing rivers of Kutch and Saurashtra including Luni
Indus(Upto Border)
27 Rajas than Ganga Mahi
Sabarmati West flowing rivers of Kutch and Saurashtra including Luni Area of inland drainage ofRajasthan Indus(Upto Border)
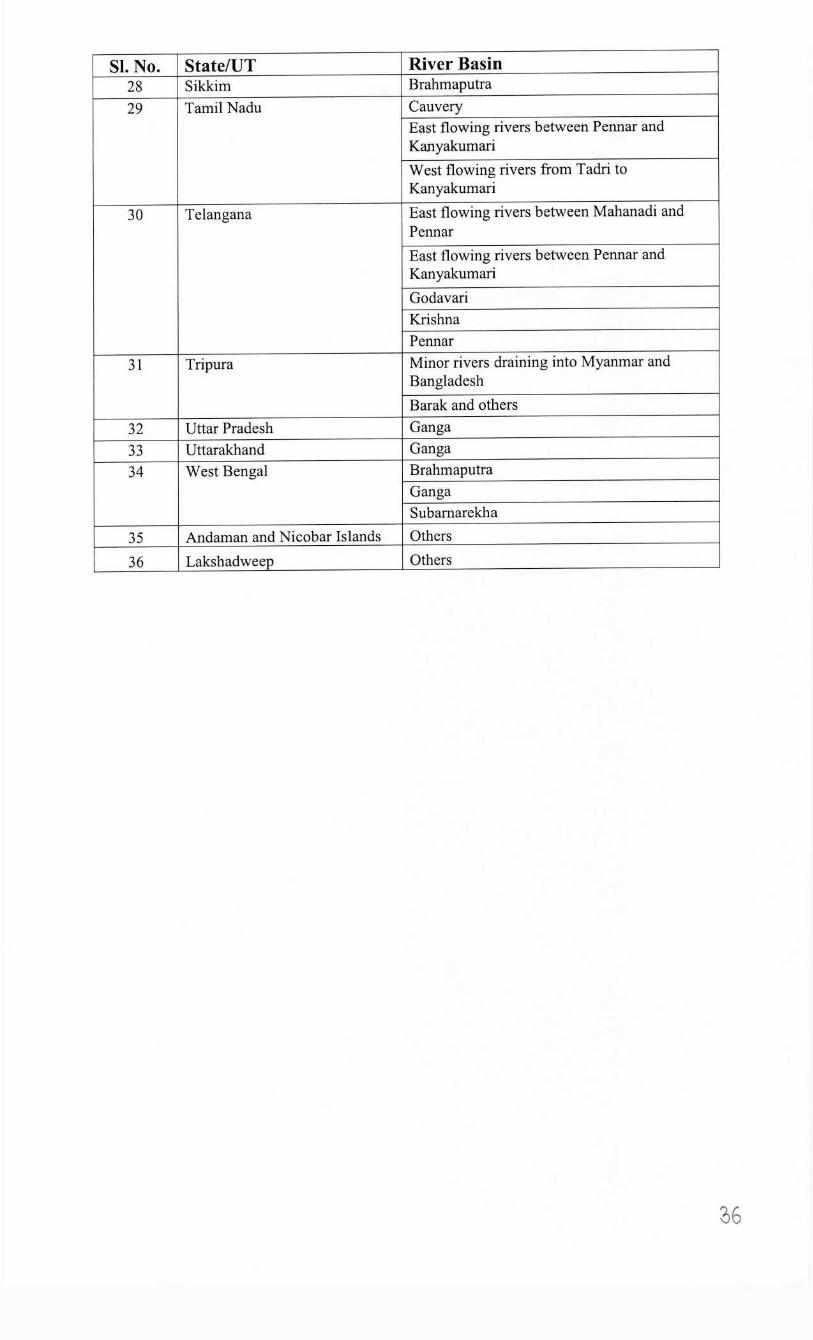
SI. No. State/UT River Basin 28 Sikkim Brahmaputra
29 Tamil Nadu Cauvery East flowing rivers between Pennar and Kanyakumari West flowing rivers from Tadri to Kanyakumari
30 Telangana East flowing rivers between Mahanadi and Pennar East flowing rivers between Pennar and Kanyakumari
Godavari Krishna Pennar
31 Tripura Minor rivers draining into Myanmar and Bangladesh Barak and others
32 Uttar Pradesh Ganga 33 Uttarakhand Ganga 34 West Bengal Brahmaputra
Ganga Subamarekha
35 Andaman and Nicobar Islands Others
36 Lakshadweep Others
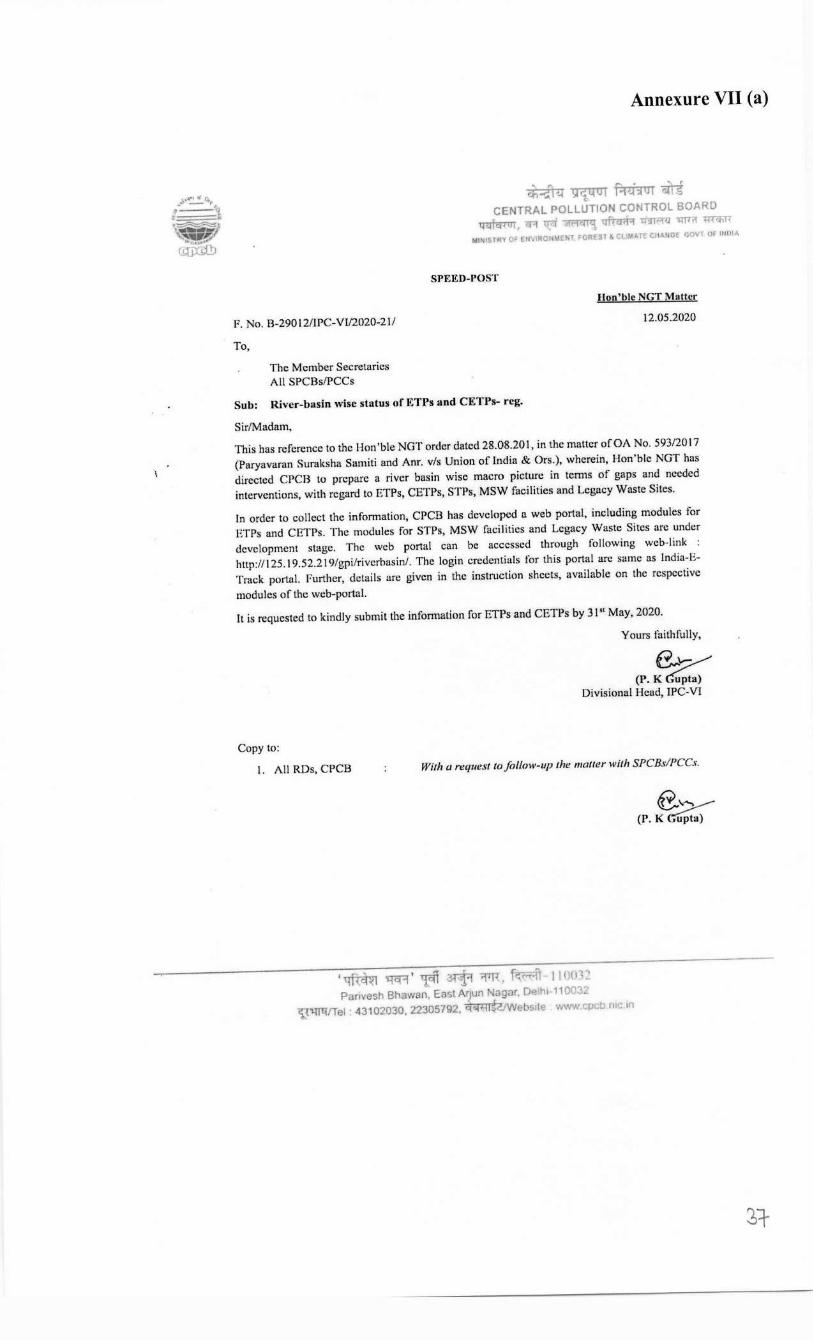
Annexure VII (a)
~ ~ f.fwT mi CENTRAL POLLUTION CONTROL BOARD ~' cA mi ~ qfra-;;;i trJf."f'l 'ITTTif l:f<7fiTT
MINISTRY 0~ N,1RO 'i!E"l,T FOREST & Ct "TE CH .. IIGE GOVT Of INDIA
SPEIW-POST
F. No. B-29012/!PC-VI/2020-21/
Jlon'ble NGT Matter
12.05.2020
To,
The Member Secretaries All SPCBs/PCCs
Sub: River-basin wise status of ETPs and CETPs- reg.
Sir/Madam, This has reference to the Hon 'ble NGT order dated 28.08.20 I, in the matter of OA No. 593/2017 (Paryavaran Suraksha Samiti and Anr. v/s Union of India & Ors.), wherein, Hon'blc NGT has directed CPCB to prepare a river basin wise macro picture in terms of gaps and needed interventions, with regard to ETPs, CETPs, STPs, MSW facilities and Legacy Waste Sites.
In order to collect the information, CPCB has developed a web portal, including modules for ETPs and CETPs. The modules for STPs, MSW facilities and Legacy Waste Sites are under development stage. The web portal can be accessed through following web-link : http:/1125.19.52.219/gpi/riverbasin/. The login credentials for this portal are same as lndia-E Track portal. further, details are given in the instruction sheets, available on the respective modules of the web-portal.
It is requested to kindly submit the information for ETPs and CETPs by 31st May, 2020. Yours faithfully,
(P.~ Divisional Head, lPC-VI
Copy to:
I. All RDs, CPCB With a request to follow-up the mailer with SPCBs/PCCs.
€,,~ (P. K ~pta)
'~ <qq=1' ~ ~ -:;rJ7. ~ I I ()(I 12 Panvesh Bhawan, East AfJun Nagar. Delh1-110032
~"1f!.1/Tel · 43102030, 22305792. ~Jebs1\e www.coco rue 1n
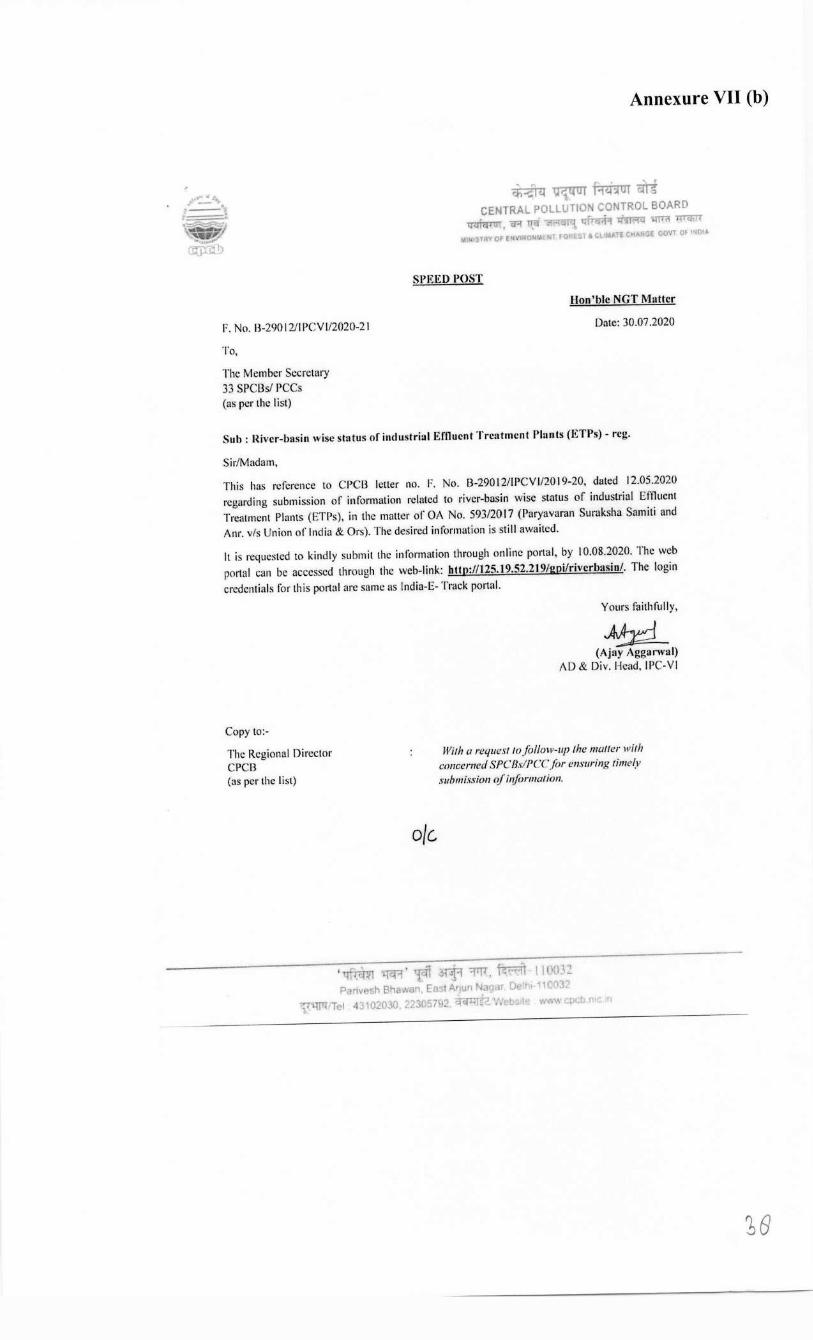
Annexure VII (b)
···.:: .:_• r • ·~, ,_.... ... ,
""' ..... ~ .-· J 1,:b
~~tmurmi CENTRAL POLLUTION CONTROL BOARD
i:nmrra;. cR n:a' ~ qpcfii'I 'tfITi'l'!J ,mil W<F.TT \IIMSl~Y or £•N• O~',j T roRE & Cluu.re CH~sc.E C,QVT OF l~OIA
SPEED POST
F. No. B-29012/1 PCYl/2020-21
Hon'blc NGT Matter
Date: 30.07.2020
To,
The Member Secretary 33 SPCl3s/ PCCs (as per the I isl)
Sub: River-basin wise status of industrial Effluent Treatment Plan ls (ETPs)- reg.
Sir/Madam,
This has reference to CPCB letter no. F. No. B-290 \ 2/IPCY\/2019-20, dated 12.05.2020 regarding submission of information related to river-basin wise status of industrial Effluent Treatment Plants (ETPs). in the matter of OA No. 593/2017 (Paryavaran Suraksha Samiti and Anr. vls Union of India & Ors). The desired information is still awaited.
It is requested to kindly submit the information through online portal, by 10.08.2020. The web portal can be accessed through the web-link: hltp://125.19.52.219/gpi/riverbasin/. The login credentials for this portal are same as \ndia-E-Track portal.
Yours faithfully,
~ (Ajay Aggarwal)
/\D & Div. Head. IPC-VI
Copy to:-
The Regional Director CPCl3 (as per the list)
With a request tofollow-up the ma/fer with concerned SPC/1.1/PCC.fi.)r ensuring timely submission of informal ion.
o/c,
',wirn '>fcR' 1fil ~ -:;,rr. Kr:r:IT l l I l12 P nv;,sh Sha.van, Ell"l A•Jun N.ic; rr De 1- 10 32
~'Wl Tel 4 1020.30 ::~3L 5792 ~ 't,eu ..
Annexure VII ( c)
[email protected] Email
River-basin wise status of ETPs, CETPs & STPs-reg.
From : CPCB IPC VI DIV <ipc:[email protected]> Subject : River-basin wise status of ETPs, CETPs & STPs-reg.
To: MS Andaman and Nicobar <[email protected]>, MS Assam <[email protected]>, MS Arunachal Pradesh <[email protected]>, Member Secretary APPCB <[email protected]>, MS Bihar <[email protected]>, MS Chattishgarh <[email protected]>, MS Chandigarh <[email protected]>, MS Dadra and Nagar Haveli <[email protected]>, MS Goa <[email protected]>, MS Gujarat <[email protected]>, mspcb-hp <[email protected]>, MS Jammu and Kashmir <[email protected]>, MS Jharkhand <[email protected]>, Head office Kamataka State Pollution Control Board <[email protected]>, Sreekala S <[email protected]>, MS Madhya Pradesh <[email protected]>, MS Maharashtra <[email protected]>, Pollution Control Board <[email protected]>, MS Meghalaya <[email protected]>, MS Nagaland <[email protected]>, MS Orissa <[email protected]>, Pondidlerry Pollution Control Committee Pondicherry <[email protected]>, MS Punjab <[email protected]>, Member secretary <[email protected]>, MS Sikkim <[email protected]>, Neetu Kumari Prasad <[email protected]>, MS Tamil Nadu <[email protected]>, Manas <[email protected]>, MS Uttar Pradesh <[email protected]>, MS Uttarakhand <[email protected]>, MS West Bengal <[email protected]>
Cc: Murali Sanku <[email protected]>, [email protected], rhythm aggarwal87 <[email protected]>, [email protected], [email protected], [email protected], Pollution Control Board <[email protected]>, [email protected], [email protected], [email protected], rasika ragu <[email protected]>, [email protected], [email protected]
To
Tue, Aug 25, 2020 04:44 PM
The Member Secretary, SPCBs/PCCs ( as per the list)
Sir/Madam, This has reference to CPCB letter no. F. No. B-29012/IPCVI/2019-20, dated 12.05.2020 & 30.07.2020, regarding submission of information related to river-basin wise status of ETPs (effluent treatment plants), in the matter of OA No. 593/2017 (Paryavaran Suraksha Samiti and Anr. v/s Union of India & Ors).
In this regard, it is to inform that the desired information is still awaited. Further, this issue will be reviewed by the Chairman, CPCB, during the meeting with SPCBs/PCCs, to be held on 01.09.2020, through video conferencing.
It is requested to submit the information about, river-basin wise status of ETPs, CETPs & STPs, through online portal, by 30.08.2020. The web portal can be accessed through the web-link: httP.://125.19.52.219/gP.i/riverbasin/. The login credentials for this portal are
same as India-E- Track portal.
Yours faithfully. Ajay Aggarwal AD & Div. Head IPC-VI Central Pollution Control Board Parivesh Bhawan. New Delhi
An nex.u.re vn1 (o.)
' r -f:ntm mi ~~ CENTRAL POLLUTION CONTROL BOARD
m:TfelTUT. Q"l 11:<' ~ ,:rfrWR -rr;rr,=r1l 'IWn -.:rm;rr NINISlRY Of E',lVH'ONM NT fORfST 4 ":lltii_.T" CHANCE GOV\ .Jf IN IA
SPEED-POST
8-290 I 2/IPCVl/2020-21
Hon'blc NGT Matter
Date: 07.09.2020
To,
The Member Secretary Delhi Pollution Control Committee 4•h floor, ISBT Building, Kashmeri Gate, Delhi - I I 0006.
Sub: Shortcomings in river-b11sin wise status of ETPs- reg.
Sir, This has reference to the information provided by DPCC on CPCB's online portal regarding river basin-wise status of ETPs for the quarter Apr-June, 2020, in the Hon'blc NGT matter of OA No. 593/20 I 7 (Paryavaran Suraksha Samiti and Anr. vis Union of India & Ors.).
It is observed that data provided by DPCC has some shortcomings, which are pointed out in the
enclosure. It is requested to submit correct information on the web portal. The web portal can be accessed through following web-link: http://l2S.J9.52.2l9/gpi/riverbasin/. The login credentials for this portal are same as lndia-E- Track portal.
Yours faithfully,
~ (Ajay Aggarwal)
AD & Div. Head !PC-VI
Encl: as above
'i:rftcrn ~· ~ ~ -:::rrrr, ~ 11(10 ~ Pan esh Bh wan, Eds! Ar jun Nagar. Delhr-110032
~'1f(l el· 43102030, 22305792. ~'Website w.· .. v coco rue 1n
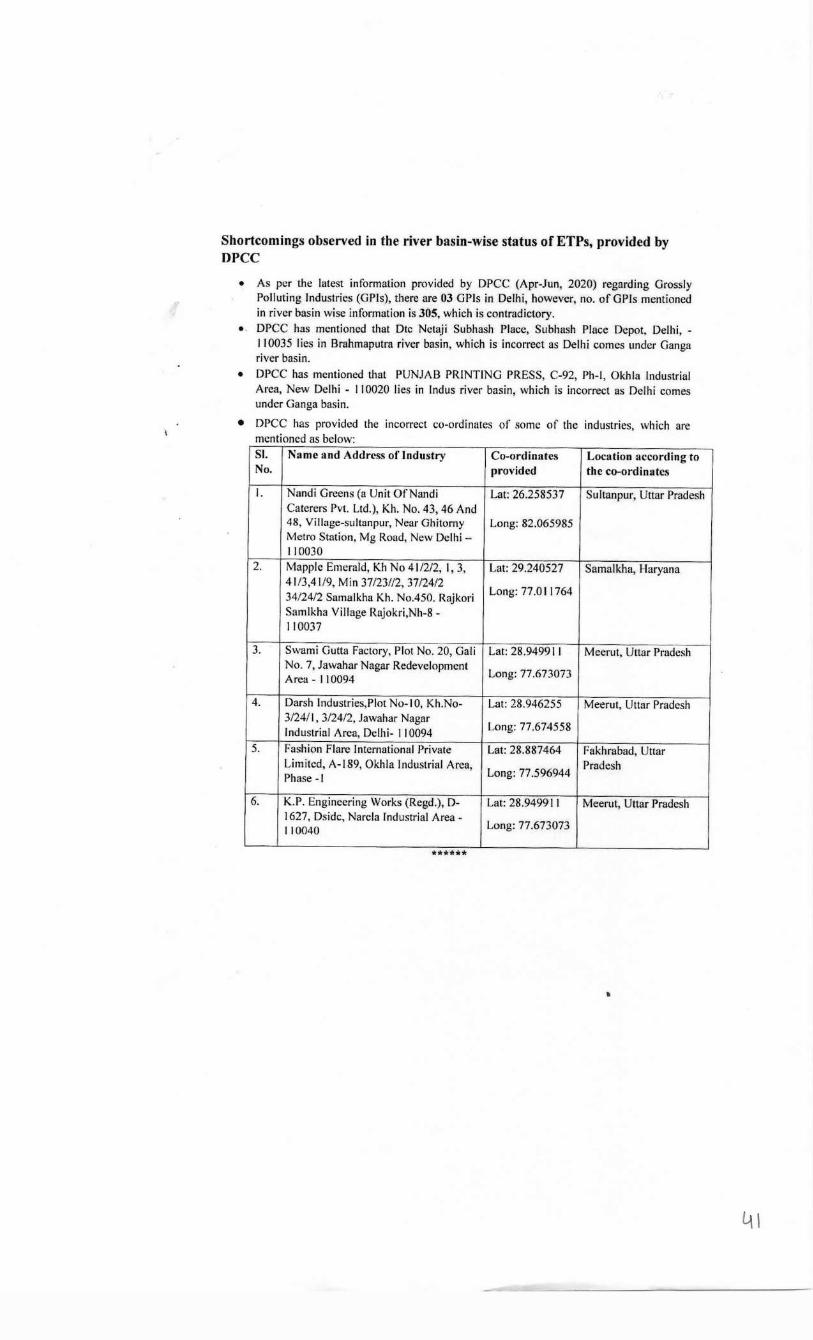
Shortcomings observed in the river basin-wise status of ETPs, provided by DPCC
• As per the latest information provided by DPCC (Apr-Jun, 2020) regarding Grossly Polluting Industries (GPJs), there are 03 GPls in Delhi, however, no. of GPis mentioned in river basin wise information is 305, which is contradictory.
•. DPCC has mentioned that Dtc Netaji Subhash Place, Subhash Place Depot, Delhi, - 110035 I ies in Brahmaputra river basin, which is incorrect as Delhi comes under Ganga river basin.
• DPCC has mentioned that PUNJAB PRINTING PRESS, C-92, Ph-I, Okhla Industrial Area, New Delhi - 110020 lies in Indus river basin, which is incorrect as Delhi comes under Ganga basin.
• DPCC has provided the incorrect co-ordinates of some of the industries, which are mentioned as below· SI. Name and Address of Industry Co-ordinates Location according to No. provided the co-ordinates
I. Nandi Greens (a Unit OfNandi Lat: 26.258537 Sultanpur, Uttar Pradesh Caterers Pvt. Ltd.), Kh. No. 43, 46 And 48, Village-sultanpur, Near Ghitorny Long: 82.065985 Metro Station, Mg Road, New Delhi - 110030
2. Mapple Emerald, Kh No 41/2/2, I, 3, Lat: 29.240527 Samalkha, Haryana 41/3,41/9, Min 37/23//2, 37/24/2
Long: 77.011764 34/24/2 Samalkha Kh. No.450. Rajkori Sarnlkha Village Rajokri,Nh-8 - 110037
3. Swami Gutta Factory, Plot No. 20, Gali Lat: 28.94991 I Meerut, Uttar Pradesh No. 7, Jawahar Nagar Redevelopment
Long: 77.673073 Area - I I 0094
4. Darsh lndustries,Plot No- I 0, Kh.No- Lat: 28.946255 Meerut, Uttar Pradesh 3/24/ I, 3/24/2, Jawahar Nagar
Long: 77.674558 Industrial Arca, Delhi- 110094 5. Fashion Flare International Private Lat: 28.887464 Fakhrabad, Uttar
Limited, A-189, Okhla Industrial Arca, Long: 77.596944
Pradesh Phase -1
6. K.P. Engineering Works (Regd.), D- Lat: 28.949911 Meerut, Uuar Pradesh 1627, Dsidc, Narela Industrial Area -
Long: 77.673073 110040
******
•
Annexure VIII (b)
~ ~mt -~ CENTRAL POLLUTION CONTROL BOARD ~' ?("I n:a ~ i:rfra;A i:hrFTII Wll ~
M!HISIAV Of [NVIRQ~l,\tHT FO~E5T I CLl'jATf CHANC.f covr OF !IIOIA
SPEED-POST
B-290 I 2/!PCVl/2020-21
To,
The Member Secretary Haryana Pollution Control Board C-11, Sector 6, Panchkula, Haryana 1341 09
Sub: Shortcomings in river-basin wise status of ETPs- reg.
Sir,
Hon'blc NGT Matter
Date: 07.09.2020
This has reference to the information provided by SPCB, Haryana on CPCB's online portal regarding river basin-wise status of ETPs for the quarter Apr-June, 2020, in the 1-Ion'ble NGT matter ofOA No.593/2017 (Paryavaran Suraksha Samiti and Anr. vis Union oflndia & Ors.).
It is observed that in the earlier information, submitted on India E-Track portal, Haryana SPCB has mentioned that total 3613 units in the State are generating trade effluent and requires ETPs, however in river has in wise in formation it is mentioned that there is no trade effluent generating unit in Haryana.
It is requested to provide river basin wise information for all the trade effluent generating units. The web portal can be accessed through following web-link: http:/1125.19.52.219/gpi/rivcrhasin/. The login credentials for this portal are same as lndia-E Track portal.
Yours faithfully,
~ (Ajay Agganval)
AD & Div. Head IPC-VI
'im,ir.n \ft'R1 ~ ~ 1'1TT, f.,<"'·il-llfllJJ_
Panvesh Bhawan. E st Aqun Nagar. Delhi-1100 2 ~.\ITQITel: 43102030. 22305792. ~,Webs,t w..• • cpcb m in
Annexure VIII (c)
~1R{fUT~m"i CENTRAL POLLUTION CONTROL BOARD
w.ria-nn 1,-1 n:a ~ qfrcik-1 ~ \11Til mcfiTT MHIISfR{ OF EH\fll!Otl'~Wl FOPEST & CLll,l"TE CMAIIGE GOVT OF !NOIA
SPF.ED-POST
B-29012/IPCVl/2020-21/
Hon'ble NGT Matter
Dale: 07.09.2020
To,
The Member Secretary Daman and Diu Pollution Control Committee Office of the Deputy Conservator of Forests Moti Daman, Daman - 396220.
Sub: Shortcomings in river-basin wise status of ETPs- reg.
Sir,
This has reference to the information provided by PCC, Daman & Diu on CPCB's online portal regarding river basin-wise status of ETPs for the quarter Jan-Mar, 2020, in the Hon'ble NGT matter of OA No.593/2017 (Paryavaran Suraksha Samiti and Anr. vls Union of India & Ors.).
It is observed that in the earlier information, submitted on India E-Track portal, Daman & Diu, PCC has mentioned that total 98 units in the Union Territory are generating trade effluent and requires ETPs, however, river basin wise information for only 44 industries has been provided.
It is requested to provide river basin wise information for all the trade effluent generating units. The web portal can be accessed through following web-link: http:/1125.19.52.219/gpi/riverbasin/. The login credentials for this portal are same as lndia-E Track portal.
Yours faithfully,
~ (Ajay Aggarwal)
AD & Div. I-lead IPC-VI
• TfficM iqq,;' 1lcIT ~ "i1TI, ~ I 1 00, ~ Panvesh Bhawa,~. East Aqun Nagar o ... :t-i-110032
<i7tfl11/Tel: 43102030, 22305792, ~ Website Va " • ., c ,, c_m
L(3
Annexure VIII ( d)
~VcQ'UT~~ e
CENTRAL POLLUTION CONTROL BOARD ~' cR ~ ~ qf;;:r;t:i lffiRtl 1TTTn l=[T'1.fiTT 1N1SIR¥ Of E~VlROIIMEkT FOREST & CU' ATE CH~1,CE GOVT Of· IIICIA
SPEED-POST
B-29012/IPCVl/2020-21/
To,
TI1e Member Secretary Odisha State Pollution Control Board Paribcsh Bhawan A-118, Nilakanta Nagar, Unit -Vlfl, Bhubaneshwar - 751012.
Hon'blc NGT Matter
Date: 09.09.2020
Sub: Shortcomings in river-basin wise status of ETPs- reg.
Sir,
This has reference to the information provided by Odisha SPCB, on CPCB's online portal regarding river basin-wise status ofETPs for the quarter Apr-June, 2020, in the Hon'ble NGT matter of OA No. 593/2017 (Paryavaran Suraksha Samiti and Anr. v/s Union of India & Ors.).
It is observed that data provided by Odisha SPCB has some shortcomings, which are pointed out in the enclosure.
It is requested to kindly look into the matter and provide correct and complete information at the earl icst.
Yours faithfully,
~ (Ajay Aggarwal)
AD & Div. Head !PC-VI
Encl: as above
1ttf$.l \f.A1 ~ -~ W, ~ 1 IIHJ'2
Parivesh Bhav,an, East Arjun Nagar, Oelh1-11 OOJL ~'q'fq/Tel : 43102030, 22305792, ~ 'Website vw cpcb n c.m

Shortcomings observed in the river basin-wise status of ETPs, provided by
Odisha SPCB
• As per the latest infonnation provided by OSPCB (Apr-Jun, 2020) regarding Grossly Polluting Industries (GPls}, there are 06 GPls in Odisha, however, number of GPls mentioned in river basin wise information is 16, which is different.
• It is observed that in the earlier infom1ation, submitted on India E-Track portal, Odisha, SPCB has mentioned that total 1179 units in the State, are generating trade effluent and requires ETPs, however, river basin wise information for only 149 industries has been
provided. • The latitudes and longitudes of 107 industries are mentioned as 0.0, which is incorrect
as state of Odisha extends from 17.31 ° N latitude to 22.31 ° N latitude and from 81.31 ° E longitude to 87 .29° E longitude.
• In the portal, for units having zero discharge, ZLD option is provided, however, Odisha SPCB has mentioned discharge point as "No discharge, Nil (ETP treated waste reused and recycled) etc.", for 31 industries. Odisha SPCB should adhere to the options
provided in the portal. • For all the units, designed capacity of ETP, average volume of Effluent Generation,
daily average volume of treated eflluent and treatment capacity gap is mentioned a~
Zero. Odisha SPCB needs to provide the actual figures.
45
Annexure IX
SPEED-POST I E-mail ~ ~ Rm11J1 i§t'hi CENTRAl.. POLLUTION COtH~OL fl OARD ~tr[' ~ '(f_;i ~ ~ ~ t:ITffi ~
WTl!eTRV OF Et,"\ll~'lrAE!fi". FORE.ti rt. cur~,.n CH .. ~GE GO\" I. OF INDI ...
Dated: 31 .07. 202:0
To, The Member Secretary, (All SPCBa/PCCs}
Sub: lnforrnatlOll on MSW facilities and Legacy Waste sites in the matter of
Par avaran SuraksJ1a Samiti & Anr. vis Union f India&, Oro. OA No. 593/2017
before Hon'blc NCH-reg
S"r/ Madam. Viae Order dated 26-8-2019 m the matter cf Paryavara Suraksha Sarni & .Anr. v/s
nion cf lnd·a & Ors. (0.A No. 593/:2.0 7), lo1ble NGT directed as follows: -
"TI18 C:PCB lieer!s to co!.rate ihe avai!ab/e dfit.J base ·,vi//1 nigc:rd to ETi's, CETP:s. STPs_ ,\>fSl!V
fac,'/it,;c:s, L~!ia~y 1/Va:ste sltes ;ind prepare cJ river bssi'n wiss macro ploture in ieans o.f gaps
:in--:t ri~edec! infcn·e,.,uons.'
In 'J~.,w of above. C?CB has prepared following 3 formats (~nclosetl) 'or collecting
infcrrn atlo n:
Format 1. MS\N processing faciliti8s
Format 2. ,•131N Land 111 Sl:es. ~orrnat 3_ MS1/,'Durnpsl'.e& (Lo;;acy 'Nasta)
It is requested ,o provide informaticn o 1 •1S\N f5!~iilties and lega~y Waste sites i11
gi·1en formats in Excel sheet Eon 11;11 through err.all to divyasinha.cp-::[email protected] by 15111 August,
202D so tr-at consolidated report r-,ay be filed in Ho11'ble NGi within stipulaied time rrarne. It
may be noted tha: next date of hearing in the rnattar is on 21 '1 Sept.202::>, and th@ compiled
rseort has to be sebrrrted to Hon'ble NGT b~· 15" sepierncer 2020. by C-PCB.
Yours f.;1ith'1:lly
k_::;\- . {Divya Sll'lha)
Additional Director & 1/c, UPC-II
Encl: As above
'i:::ft;ffi 'i¥R' ~ ~ .flTr, tey;::&,fl....: 11 oo 31 Parivesh Bh aw:.m, E;istiXrj u n Nagar. CP-lhii-110032
cri;:IWf/T~I: 4310:2.000, 2:2'.iGS"'.792, ~,W;,ln;ite _ vt1,w.q:cb.nic.in
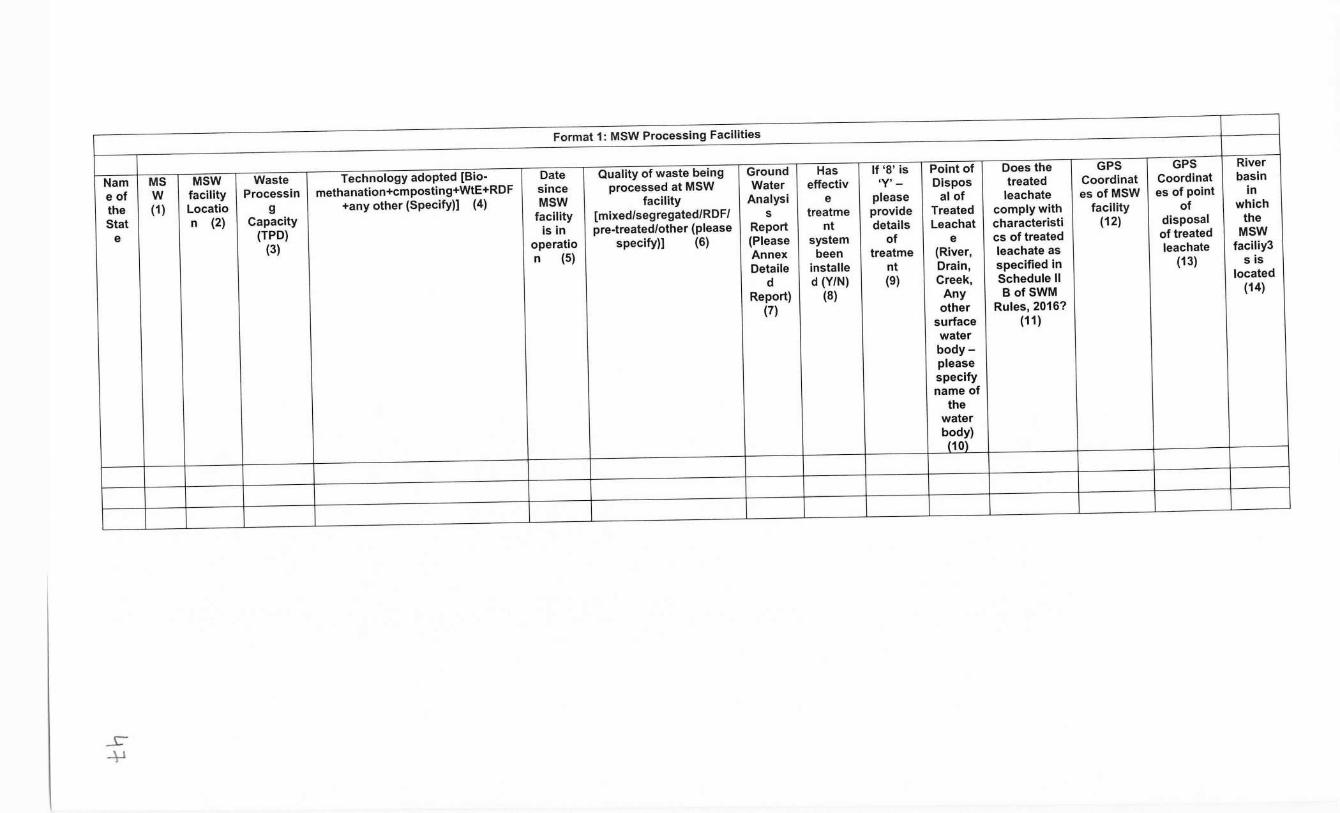
Format 1: MSW Processing Facilities
Nam MS MSW Waste Technology adopted [Bio- Date Quality of waste being Ground Has If '8' is Point of Does the GPS GPS River
e of w facility Process in methanation+cmposting+WtE+RDF since processed at MSW Water effectiv 'Y'- Dispos treated Coordinat Coordinat basin
the (1) Locatio g +any other (Specify)] (4) MSW facility Analysi e please al of leachate es of MSW es of point in
Stat n (2) Capacity facility [mixed/segregated/RDF/ s treatme provide Treated comply with facility of which
e (TPD) is in pre-treated/other (please Report nt details Leachat characteristi (12) disposal the
(3) operatio specify)] (6) (Please system of e cs of treated of treated MSW
n (5) Annex been treatme (River, leachate as leachate faciliy3
Detaile installe nt Drain, specified in {13) sis
d d (Y/N) (9) Creek, Schedule II located
Report) (8) Any B ofSWM (14)
(7) other Rules, 2016? surface (11) water body- please specify name of the water body) (10)
r 4-J
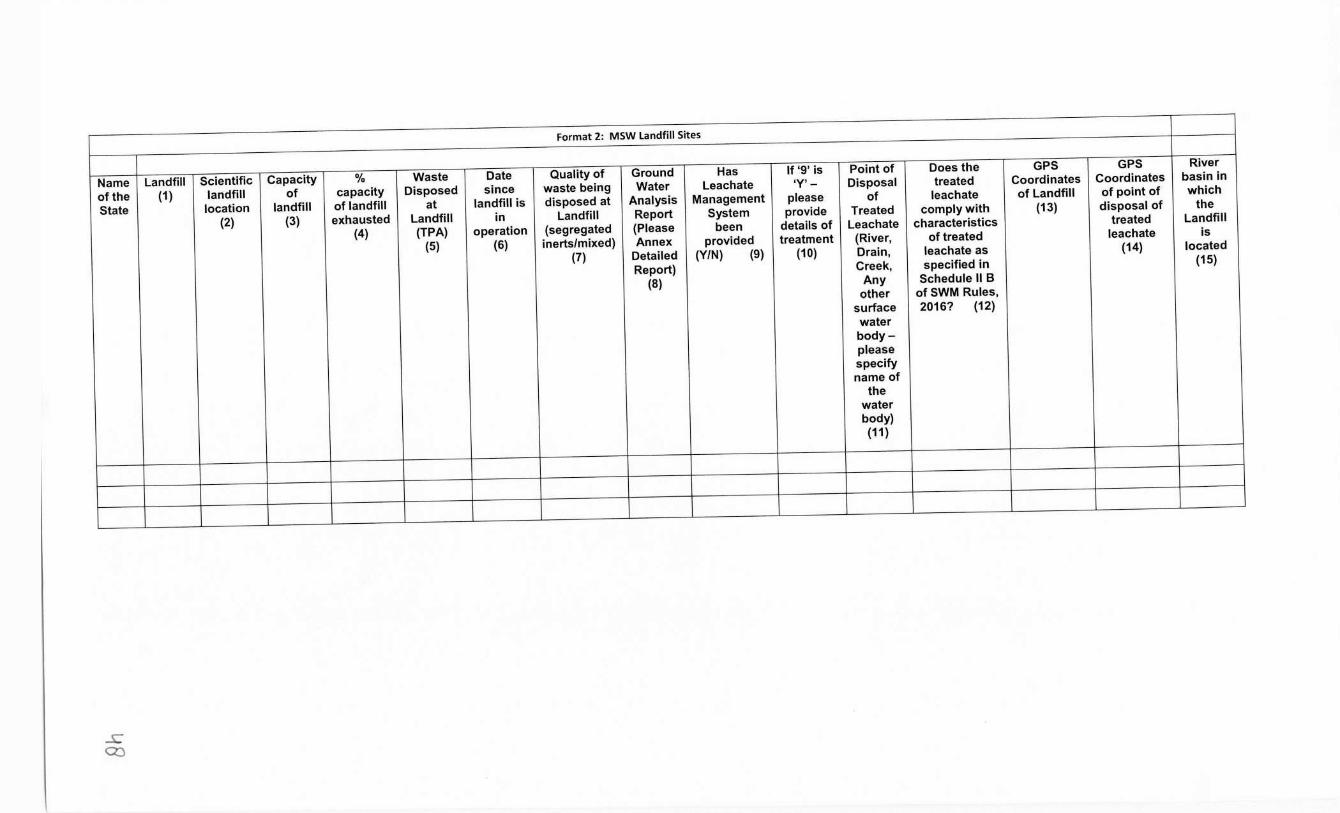
Format Z: MSW Landfill Sites
Name Landfill Scientific Capacity % Waste Date Quality of Ground Has If '9' is Point of Does the GPS GPS River
of the (1) landfill of capacity Disposed since waste being Water Leachate 'Y'- Disposal treated Coordinates Coordinates basin in
State location landfill of landfill at landfill is disposed at Analysis Management please of leachate of Landfill of point of which
(2) (3) exhausted Landfill in Landfill Report System provide Treated comply with (13) disposal of the
(4) (TPA) operation (segregated (Please been details of Leachate characteristics treated Landfill
(5) (6) inerts/mixed) Annex provided treatment (River, of treated leachate is
(7) Detailed (Y/N) (9) (10) Drain, leachate as (14) located
Report) Creek, specified in (15)
(8) Any Schedule II B other of SWM Rules, surface 2016? (12) water body- please specify name of the water body) (11)
..s;: Q)
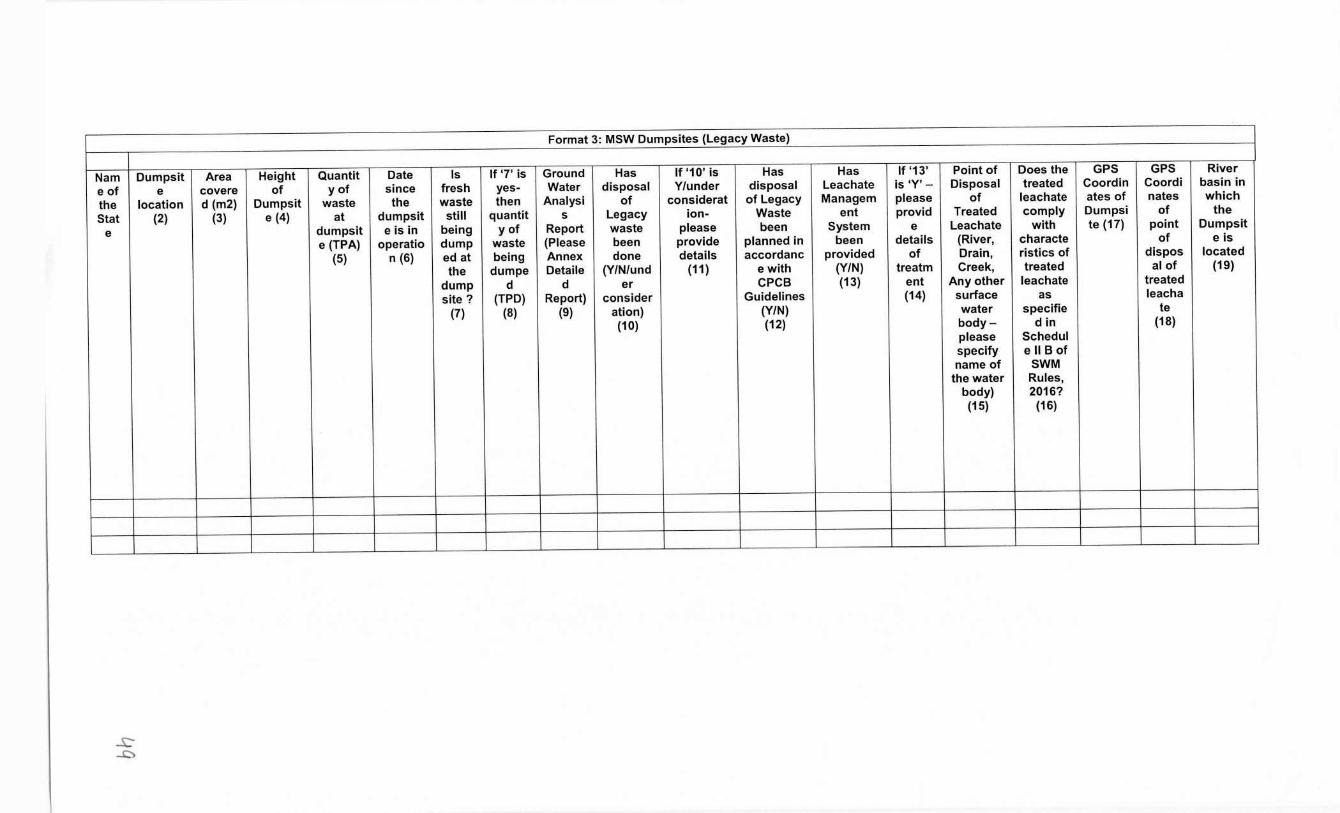
Format 3: MSW Dumpsites (Legacy Waste)
Nam Dumpsit Area Height Quantit Date Is If '7' is Ground Has If '10' is Has Has If '13' Point of Does the GPS GPS River
e of e covere of y of since fresh yes- Water disposal Y/under disposal Leachate is 'Y'- Disposal treated Coordin Coordi basin in
the location d (m2) Dumpsit waste the waste then Analysi of considerat of Legacy Managem please of leachate ates of nates which
Stat (2) (3) e (4) at dumpsit still quantit s Legacy ion- Waste ent provid Treated comply Dumpsi of the
e dumpsit eisin being y of Report waste please been System e Leachate with te (17) point Dumpsit
e (TPA) operatio dump waste (Please been provide planned in been details (River, characte of eis
(5) n (6) ed at being Annex done details accordanc provided of Drain, ristics of dispos located the dumpe Detaile (Y/N/und (11) e with (Y/N) treatm Creek, treated al of (19)
dump d d er CPCB (13) ent Any other leachate treated site? (TPD) Report) consider Guidelines (14) surface as leacha (7) (8) (9) ation) (Y/N) water specifie te
(10) (12) body- din (18) please Schedul specify e II B of name of SWM the water Rules, body) 2016? (15) (16)
..s:
....C)
Assessment of Impact of Lockdown on Water Quality of Major Rivers
CENTRAL POLLUTION CONTROL BOARD (Ministry of Environment, Forest & Climate Change) Parivesh Bhawan, East Arjun Nagar DELHl-110032
50
ABBREVIATIONS
BOD
COD
CPCB
ewe DO
FC
Gal
GPI
Km
MoEF & CC -
NABL
NWMP
PCCs
RTWQMS
SPCBs
WHO
Biochemical Oxygen Demand
Chemical Oxygen Demand
Central Pollution Control Board
Central Water Commission
Dissolved Oxygen
Fecal Coliform
Government of India
Grossly Polluting Industries
Kilometre
Ministry of Environment, Forest and Climate Change
National Accreditation Board for Testing and Calibration Laboratories
National Water Quality Monitoring Programme
Pollution Control Committees
Real Time Water Quality Monitoring Station
State Pollution Control Boards
World Health Organisation
61
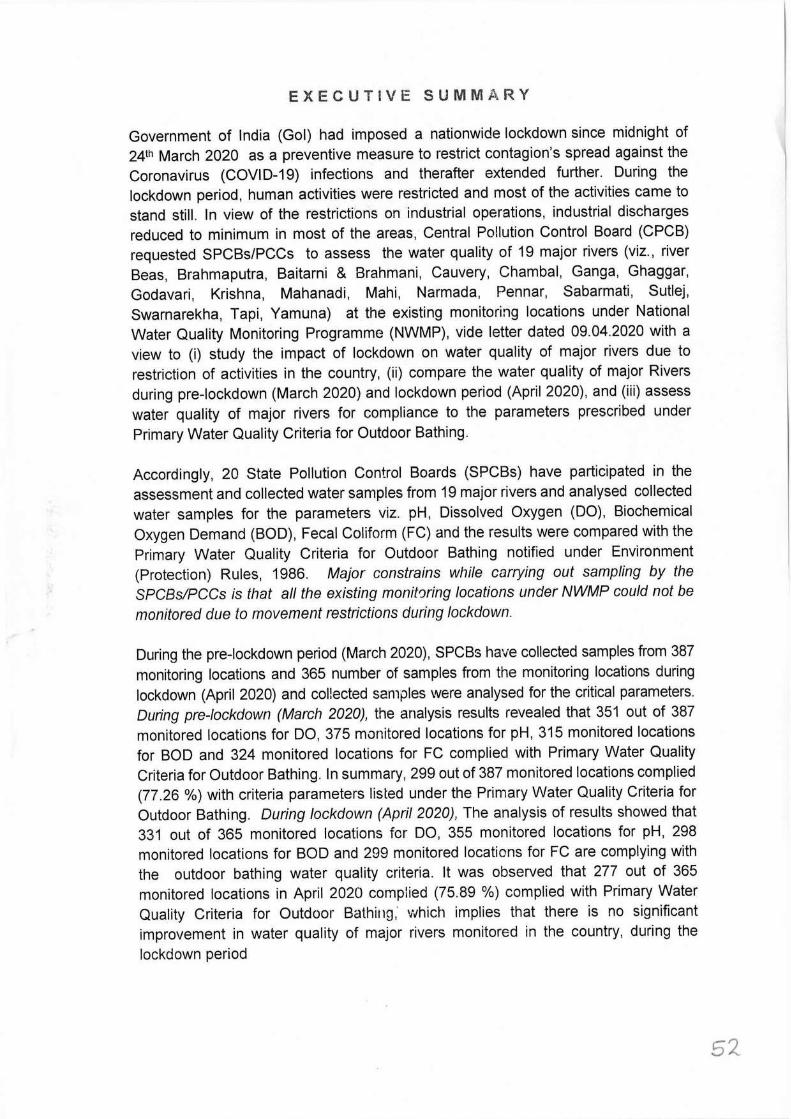
EXECUTIVE SUMMARY
Government of India (Gol) had imposed a nationwide lockdown since midnight of 24th March 2020 as a preventive measure to restrict contagion's spread against the Coronavirus (COVI D-19) infections and the rafter extended further. During the lockdown period, human activities were restricted and most of the activities came to stand still. In view of the restrictions on industrial operations, industrial discharges reduced to minimum in most of the areas, Central Pollution Control Board (CPCB) requested SPCBs/PCCs to assess the water quality of 19 major rivers (viz., river Beas, Brahmaputra, Baitarni & Brahmani, Cauvery, Chambal, Ganga, Ghaggar, Godavari, Krishna, Mahanadi, Mahi, Narmada, Pennar, Sabarmati, Sutlej, Swarnarekha, Tapi, Yamuna) at the existing monitoring locations under National Water Quality Monitoring Programme (NWMP), vide letter dated 09.04.2020 with a view to (i) study the impact of lockdown on water quality of major rivers due to restriction of activities in the country, (ii) compare the water quality of major Rivers during pre-lockdown (March 2020) and lockdown period (April 2020), and (iii) assess water quality of major rivers for compliance to the parameters prescribed under Primary Water Quality Criteria for Outdoor Bathing.
Accordingly, 20 State Pollution Control Boards (SPCBs) have participated in the assessment and collected water samples from 19 major rivers and analysed collected water samples for the parameters viz. pH, Dissolved Oxygen (DO), Biochemical Oxygen Demand (BOD), Fecal Coliform (FC) and the results were compared with the Primary Water Quality Criteria for Outdoor Bathing notified under Environment (Protection) Rules, 1986. Major constrains while carrying out sampling by the SPCBs/PCCs is that all the existing monit0ring locations under NWMP could not be monitored due to movement restrictions during lockdown.
During the pre-lockdown period (March 2020), SPCBs have collected samples from 387 monitoring locations and 365 number of samples from the monitoring locations during lockdown (April 2020) and col!ected samples were analysed for the critical parameters. During pre-lockdown (March 2020), the analysis results revealed that 351 out of 387 monitored locations for DO, 375 monitored locations for pH, 315 monitored locations for BOD and 324 monitored locations for FC complied with Primary Water Quality Criteria for Outdoor Bathing. In summary, 299 out of 387 monitored locations complied (77.26 %) with criteria parameters listed under the Primary Water Quality Criteria for Outdoor Bathing. During lockdown (April 2020), The analysis of results showed that 331 out of 365 monitored locations fer DO, 355 monitored locations for pH, 298 monitored locations for BOD and 299 monitored locations for FC are complying with the outdoor bathing water quality criteria. It was observed that 277 out of 365 monitored locations in April 2020 complied (75.89 %) complied with Primary Water Quality Criteria for Outdoor Bathing, which implies that there is no significant improvement in water quality of major rivers monitored in the country, during the lockdown period
5:Z.
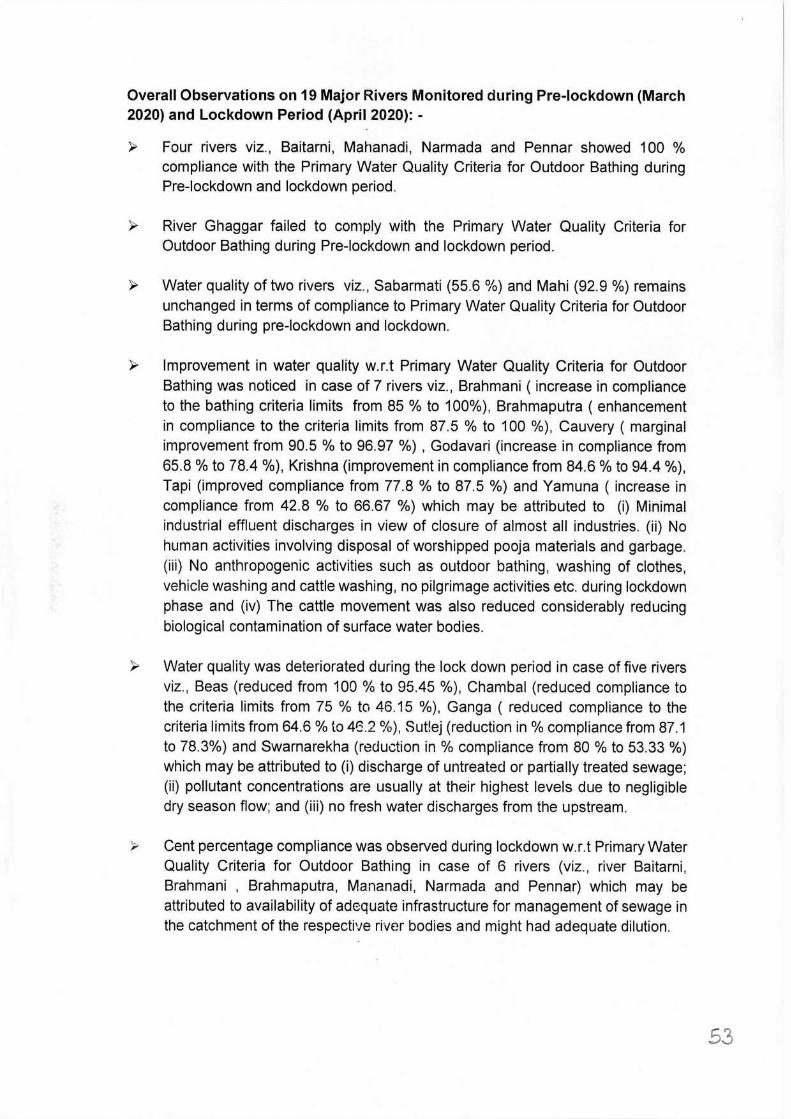
Overall Observations on 19 Major Rivers Monitored during Pre-lockdown (March 2020) and Lockdown Period (April 2020): -
~ Four rivers viz., Baitarni, Mahanadi, Narmada and Pennar showed 100 % compliance with the Primary Water Quality Criteria for Outdoor Bathing during Pre-lockdown and lockdown period.
~ River Ghaggar failed to comply with the Primary Water Quality Criteria for Outdoor Bathing during Pre-lockdown and lockdown period.
~ Water quality of two rivers viz., Sabarmati (55.6 %) and Mahi (92.9 %) remains unchanged in terms of compliance to Primary Water Quality Criteria for Outdoor Bathing during pre-lockdown and lockdown.
~ Improvement in water quality w.r.t Primary Water Quality Criteria for Outdoor Bathing was noticed in case of 7 rivers viz., Brahmani ( increase in compliance to the bathing criteria limits from 85 % to 100%), Brahmaputra ( enhancement in compliance to the criteria limits from 87.5 % to 100 %), Cauvery ( marginal improvement from 90.5 % to 96.97 %) , Godavari (increase in compliance from 65.8 % to 78.4 %), Krishna (improvement in compliance from 84.6 % to 94.4 %), Tapi (improved compliance from 77.8 % to 87.5 %) and Yamuna ( increase in compliance from 42.8 % to 66.67 %) which may be attributed to (i) Minimal industrial effluent discharges in view of closure of almost all industries. (ii) No human activities involving disposal of worshipped pooja materials and garbage. (iii) No anthropogenic activities such as outdoor bathing, washing of clothes, vehicle washing and cattle washing, no pilgrimage activities etc. during lockdown phase and (iv) The cattle movement was also reduced considerably reducing biological contamination of surface water bodies.
~ Water quality was deteriorated during the lock down period in case of five rivers viz., Beas (reduced from 100 % to 95.45 %), Chambal (reduced compliance to the criteria limits from 75 % to 46.15 %), Ganga ( reduced compliance to the criteria limits from 64.6 % to 4G.2 %), Sut!ej (reduction in% compliance from 87.1 to 78.3%) and Swarnarekha (reduction in % compliance from 80 % to 53.33 %) which may be attributed to (i) discharge of untreated or partially treated sewage; (ii) pollutant concentrations are usually at their highest levels due to negligible dry season flow; and (iii) no fresh water discharges from the upstream.
;, Cent percentage compliance was observed during lockdown w.r.t Primary Water Quality Criteria for Outdoor Bathing in case of 6 rivers (viz., river Baitarni, Brahmani , Brahmaputra, Mananadi, Narmada and Pennar) which may be attributed to availability of adequate infrastructure for management of sewage in the catchment of the respective river bodies and might had adequate dilution.
53
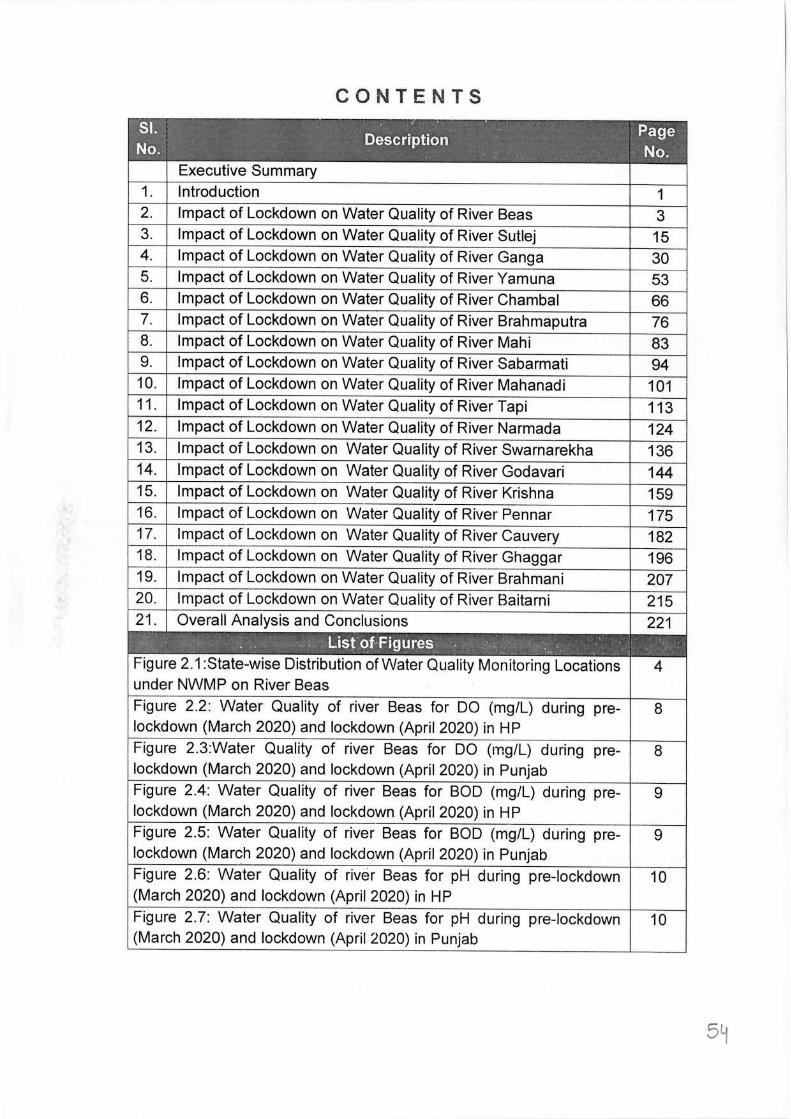
CONTENTS I' SI.
Description Page No. No.
Executive Summary 1. Introduction 1 2. Impact of Lockdown on Water Quality of River Beas 3 3. Impact of Lockdown on Water Quality of River Sutlej 15 4. Impact of Lockdown on Water Quality of River Ganga 30 5. Impact of Lockdown on Water Quality of River Yamuna 53 6. Impact of Lockdown on Water Quality of River Chambal 66 7. Impact of Lockdown on Water Quality of River Brahmaputra 76 8. Impact of Lockdown on Water Quality of River Mahi 83 9. Impact of Lockdown on Water Quality of River Sabarmati 94 10. Impact of Lockdown on Water Quality of River Mahanadi 101 11. Impact of Lockdown on Water Quality of River Tapi 113 12. Impact of Lockdown on Water Quality of River Narmada 124 13. Impact of Lockdown on Water Quality of River Swarnarekha 136 14. Impact of Lockdown on Water Quality of River Godavari 144 15. Impact of Lockdown on Water Quality of River Krishna 159 16. Impact of Lockdown on Water Quality of River Pennar 175 17. Impact of Lockdown on Water Quality of River Cauvery 182 18. Impact of Lockdown on Water Quality of River Ghaggar 196 19. Impact of Lockdown on Water Quality of River Brahmani 207 20. Impact of Lockdown on Water Quality of River Baitarni 215 21. Overall Analysis and Conclusions 221 , .. . . . Li$fO,f-Fig~res.: . ..
'·. ~ .,. ' . I• • • - ''1,,.
Figure 2.1 :State-wise Distribution of Water Quality Monitoring Locations 4 under NWMP on River Beas Figure 2.2: Water Quality of river Beas for DO (mg/L) during pre- 8 lockdown (March 2020) and lockdown (April 2020) in HP Figure 2.3:Water Quality of river Beas for DO (mg/L) during pre- 8 lockdown (March 2020) and lockdown (April 2020) in Punjab Figure 2.4: Water Quality of river Beas for BOD (mg/L) during pre- 9 lockdown (March 2020) and lockdown (April 2020) in HP Figure 2.5: Water Quality of river Beas for BOD (mg/L) during pre- 9 lockdown (March 2020) and lockdown (April 2020) in Punjab Figure 2.6: Water Quality of river Beas for pH during pre-lockdown 10 (March 2020) and lockdown (April 2020) in HP Figure 2.7: Water Quality of river Beas for pH during pre-lockdown 10 (March 2020) and lockdown (April 2020) in Punjab
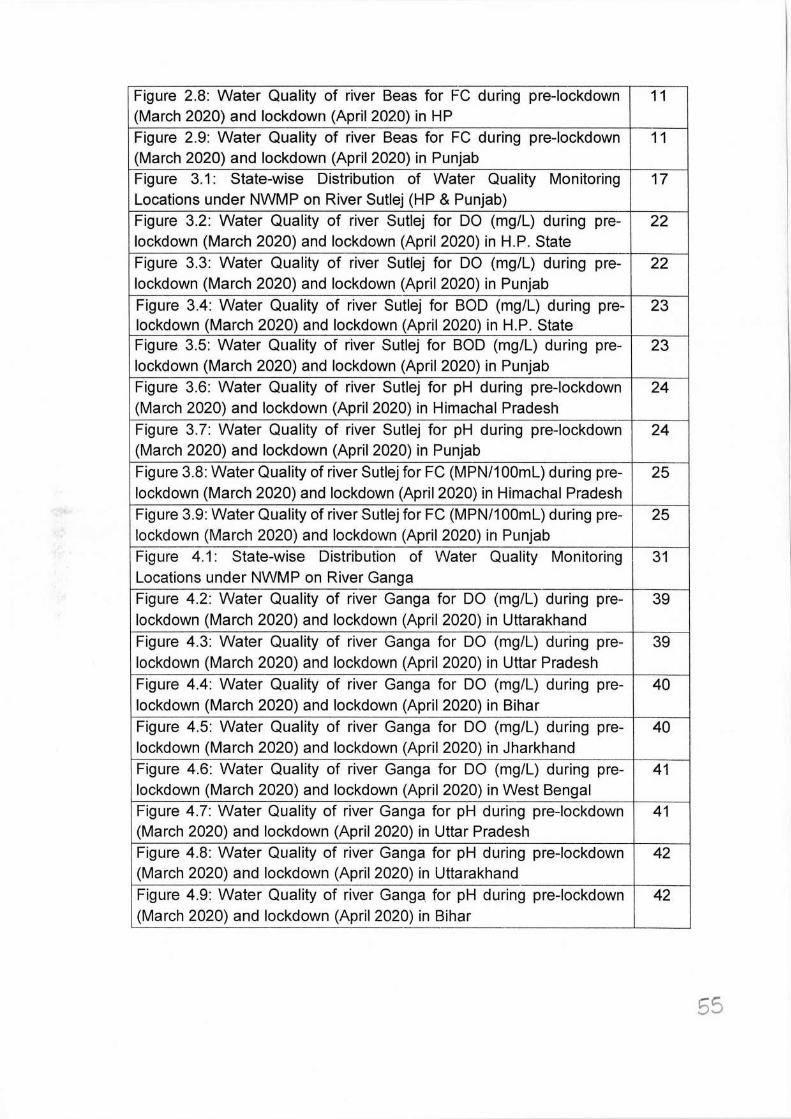
Figure 2.8: Water Quality of river Beas for FC during pre-lockdown 11 (March 2020) and lockdown (April 2020) in HP Figure 2.9: Water Quality of river Beas for FC during pre-lockdown 11 (March 2020) and lockdown (April 2020) in Punjab Figure 3.1: State-wise Distribution of Water Quality Monitoring 17 Locations under NWMP on River Sutlej (HP & Punjab) Figure 3.2: Water Quality of river Sutlej for DO (mg/L) during pre- 22 lockdown (March 2020) and lockdown (April 2020) in H.P. State Figure 3.3: Water Quality of river Sutlej for DO (mg/L) during pre- 22 lockdown (March 2020) and lockdown (April 2020) in Punjab Figure 3.4: Water Quality of river Sutlej for BOD (mg/L) during pre- 23 lockdown (March 2020) and lockdown (April 2020) in H.P. State Figure 3.5: Water Quality of river Sutlej for BOD (mg/L) during pre- 23 lockdown (March 2020) and lockdown (April 2020) in Punjab Figure 3.6: Water Quality of river Sutlej for pH during pre-lockdown 24 (March 2020) and lockdown (April 2020) in Himachal Pradesh Figure 3.7: Water Quality of river Sutlej for pH during pre-lockdown 24 (March 2020) and lockdown (April 2020) in Punjab Figure 3.8: Water Quality of river Sutlej for FC (MPN/1 00mL) during pre- 25 lockdown (March 2020) and lockdown (April 2020) in Himachal Pradesh Figure 3.9: Water Quality of river Sutlej for FC (MPN/100mL) during pre- 25 lockdown (March 2020) and lockdown (April 2020) in Punjab Figure 4.1: State-wise Distribution of VVater Quality Monitoring 31 Locations under NWMP on River Ganga Figure 4.2: Water Quality of river Ganga for DO (mg/L) during pre- 39 lockdown (March 2020) and lockdown (April 2020) in Uttarakhand Figure 4.3: Water Quality of river Ganga for DO (mg/L) during pre- 39 lockdown (March 2020) and lockdown (April 2020) in Uttar Pradesh Figure 4.4: Water Quality of river Ganga for DO (mg/L) during pre- 40 lockdown (March 2020) and lockdown (April 2020) in Bihar Figure 4.5: Water Quality of river Ganga for DO (mg/L) during pre- 40 lockdown (March 2020) and lockdown (April 2020) in Jharkhand Figure 4.6: Water Quality of river Ganga for DO (mg/L) during pre- 41 lockdown (March 2020) and lockdown (April 2020) in West Bengal Figure 4.7: Water Quality of river Ganga for pH during pre-lockdown 41 (March 2020) and lockdown (April 2020) in Uttar Pradesh Figure 4.8: Water Quality of river Ganga for pH during pre-lockdown 42 (March 2020) and lockdown (April 2020) in Uttarakhand Figure 4.9: Water Quality of river Ganga_ for pH during pre-lockdown 42 (March 2020) and lockdown (April 2020) in Bihar
55
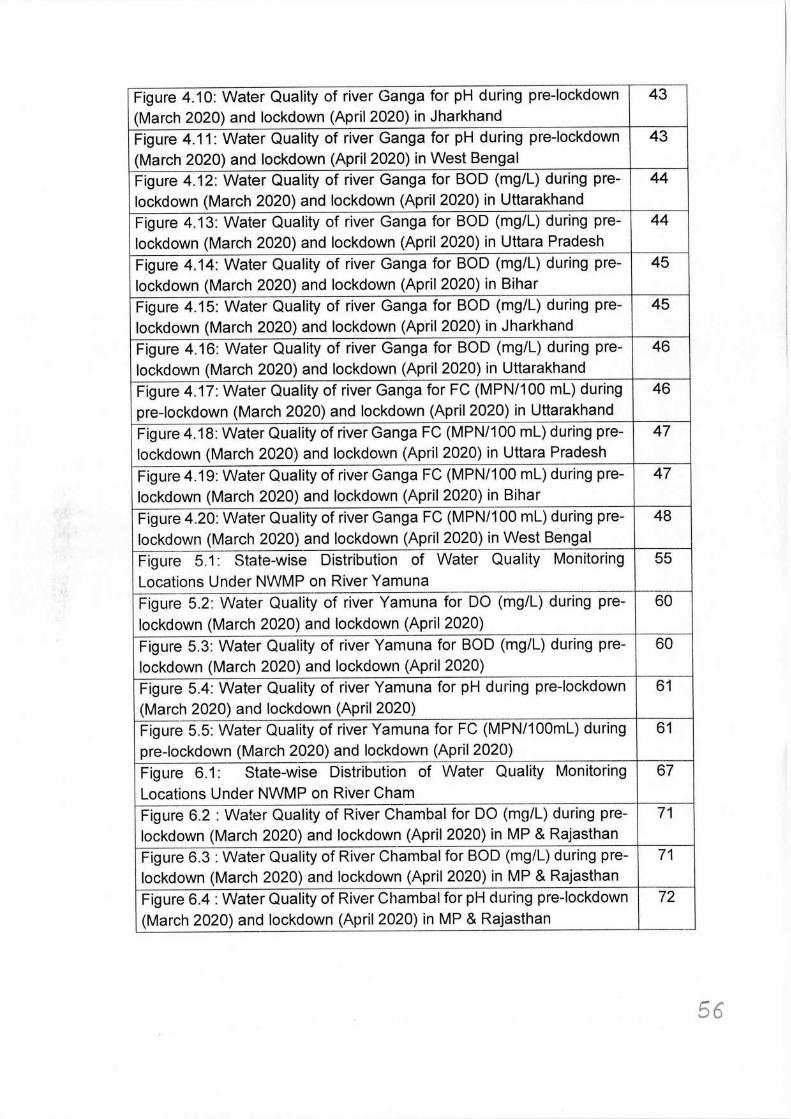
Figure 4.10: Water Quality of river Ganga for pH during pre-lockdown 43 (March 2020) and lockdown (April 2020) in Jharkhand Figure 4.11: Water Quality of river Ganga for pH during pre-lockdown 43 (March 2020) and lockdown (April 2020) in West Bengal Figure 4.12: Water Quality of river Ganga for BOD (mg/L) during pre- 44 lockdown (March 2020) and lockdown (April 2020) in Uttarakhand Figure 4.13: Water Quality of river Ganga for BOD (mg/L) during pre- 44 lockdown (March 2020) and lockdown (April 2020) in Uttara Pradesh Figure 4.14: Water Quality of river Ganga for BOD (mg/L) during pre- 45 lockdown (March 2020) and lockdown (April 2020) in Bihar Figure 4.15: Water Quality of river Ganga for BOD (mg/L) during pre- 45 lockdown (March 2020) and lockdown (April 2020) in Jharkhand Figure 4.16: Water Quality of river Ganga for BOD (mg/L) during pre- 46 lockdown (March 2020) and lockdown (April 2020) in Uttarakhand Figure 4.17: Water Quality of river Ganga for FC (MPN/100 ml) during 46 pre-lockdown (March 2020) and lockdown (April 2020) in Uttarakhand Figure 4.18: Water Quality of river Ganga FC (MPN/100 ml) during pre- 47 lockdown (March 2020) and lockdown (April 2020) in Uttara Pradesh Figure 4.19: Water Quality of river Ganga FC (MPN/100 ml) during pre- 47 lockdown (March 2020) and lockdown (April 2020) in Bihar Figure 4.20: Water Quality of river Ganga FC (MPN/100 ml) during pre- 48 lockdown (March 2020) and lockdown (April 2020) in West Bengal Figure 5.1: State-wise Distribution of Water Quality Monitoring 55 Locations Under NWMP on River Yamuna Figure 5.2: Water Quality of river Yamuna for DO (mg/L) during pre- 60 lockdown (March 2020) and lockdown (April 2020) Figure 5.3: Water Quality of river Yamuna for BOD (mg/L) during pre- 60 lockdown (March 2020) and lockdown (April 2020) Figure 5.4: Water Quality of river Yamuna for pH during pre-lockdown 61 (March 2020) and lockdown (April 2020) Figure 5.5: Water Quality of river Yamuna for FC (MPN/100ml) during 61 pre-lockdown (March 2020) and lockdown (April 2020) Figure 6.1: State-wise Distribution of Water Quality Monitoring 67 Locations Under NWMP on River Cham Figure 6.2 : Water Quality of River Chambal for DO (mg/L) during pre- 71 lockdown (March 2020) and lockdown (April 2020) in MP & Rajasthan Figure 6.3 : Water Quality of River Chambal for BOD (mg/L) during pre- 71 lockdown (March 2020) and lockdown (April 2020) in MP & Rajasthan Figure 6.4: Water Quality of River Chambal for pH during pre-lockdown 72 (March 2020) and lockdown (April 2020) in MP & Rajasthan
56
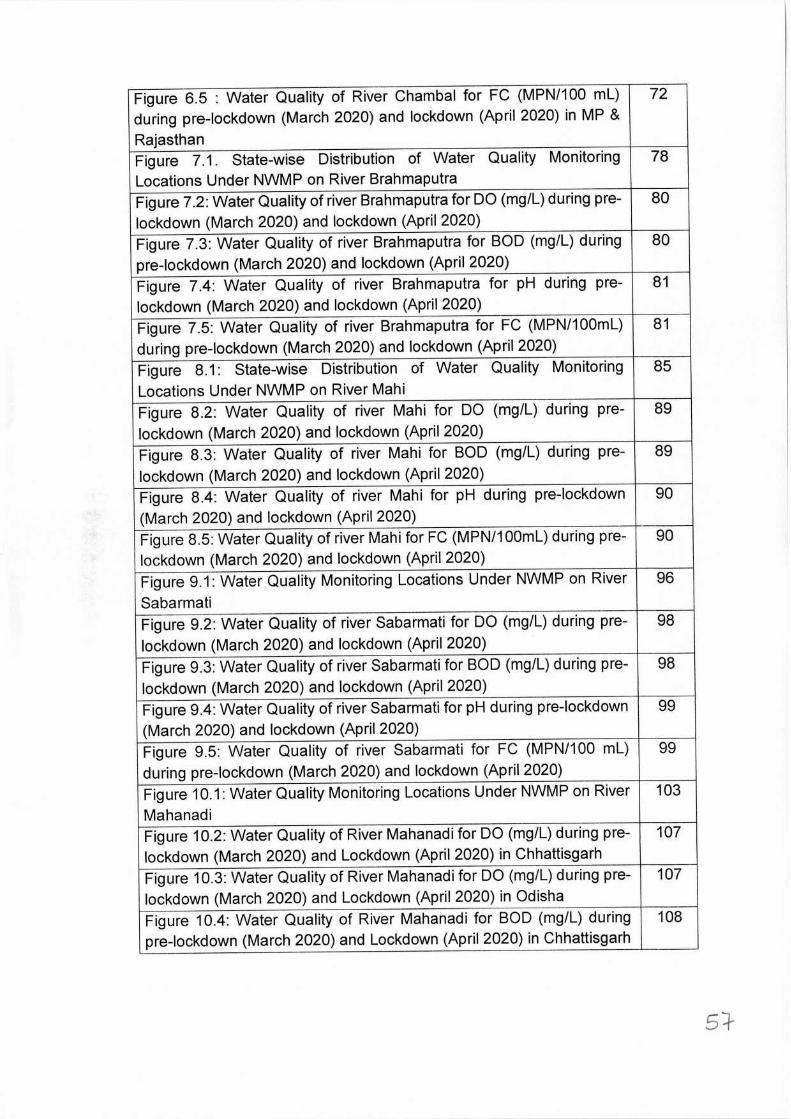
Figure 6.5 : Water Quality of River Chambal for FC (MPN/100 ml) 72 during pre-lockdown (March 2020) and lockdown (April 2020) in MP & Rajasthan Figure 7.1. State-wise Distribution of Water Quality Monitoring 78 Locations Under NWMP on River Brahmaputra Figure 7.2: Water Quality of river Brahmaputra for DO (mg/L) during pre- 80 lockdown (March 2020) and lockdown (April 2020) Figure 7.3: Water Quality of river Brahmaputra for BOD (mg/L) during 80 pre-lockdown (March 2020) and lockdown (April 2020) Figure 7.4: Water Quality of river Brahmaputra for pH during pre- 81 lockdown (March 2020) and lockdown (April 2020) Figure 7.5: Water Quality of river Brahmaputra for FC (MPN/100ml) 81 during pre-lockdown (March 2020) and lockdown (April 2020) Figure 8.1: State-wise Distribution of Water Quality Monitoring 85 Locations Under NWMP on River Mahi Figure 8.2: Water Quality of river Mahi for DO (mg/L) during pre- 89 lockdown (March 2020) and lockdown (April 2020) Figure 8.3: Water Quality of river Mahi for BOD (mg/L) during pre- 89 lockdown (March 2020) and lockdown (April 2020) Figure 8.4: Water Quality of river Mahi for pH during pre-lockdown 90 (March 2020) and lockdown (April 2020) Figure 8.5: Water Quality of river Mahi for FC (MPN/100ml) during pre- 90 lockdown (March 2020) and lockdown (April 2020) Figure 9.1: Water Quality Monitoring Locations Under NWMP on River 96 Sabarmati Figure 9.2: Water Quality of river Sabarmati for DO (mg/L) during pre- 98 lockdown (March 2020) and lockdown (April 2020) Figure 9.3: Water Quality of river Sabarmati for BOD (mg/L) during pre- 98 lockdown (March 2020) and lockdown (April 2020) Figure 9.4: Water Quality of river Sabarmati for pH during pre-lockdown 99 (March 2020) and lockdown (April 2020) Figure 9.5: Water Quality of river Sabarmati for FC (MPN/100 ml) 99 during pre-lockdown (March 2020) and lockdown (April 2020) Figure 10.1: Water Quality Monitoring Locations Under NWMP on River 103 Mahanadi Figure 10.2: Water Quality of River Mahanadi for DO (mg/L) during pre- 107 lockdown (March 2020) and Lockdown (April 2020) in Chhattisgarh Figure 10.3: Water Quality of River Mahanadi for DO (mg/L) during pre- 107 lockdown (March 2020) and Lockdown (April 2020) in Odisha Figure 10.4: Water Quality of River Mahanadi for BOD (mg/L) during 108 pre-lockdown (March 2020) and Lockdown (April 2020) in Chhattisgarh
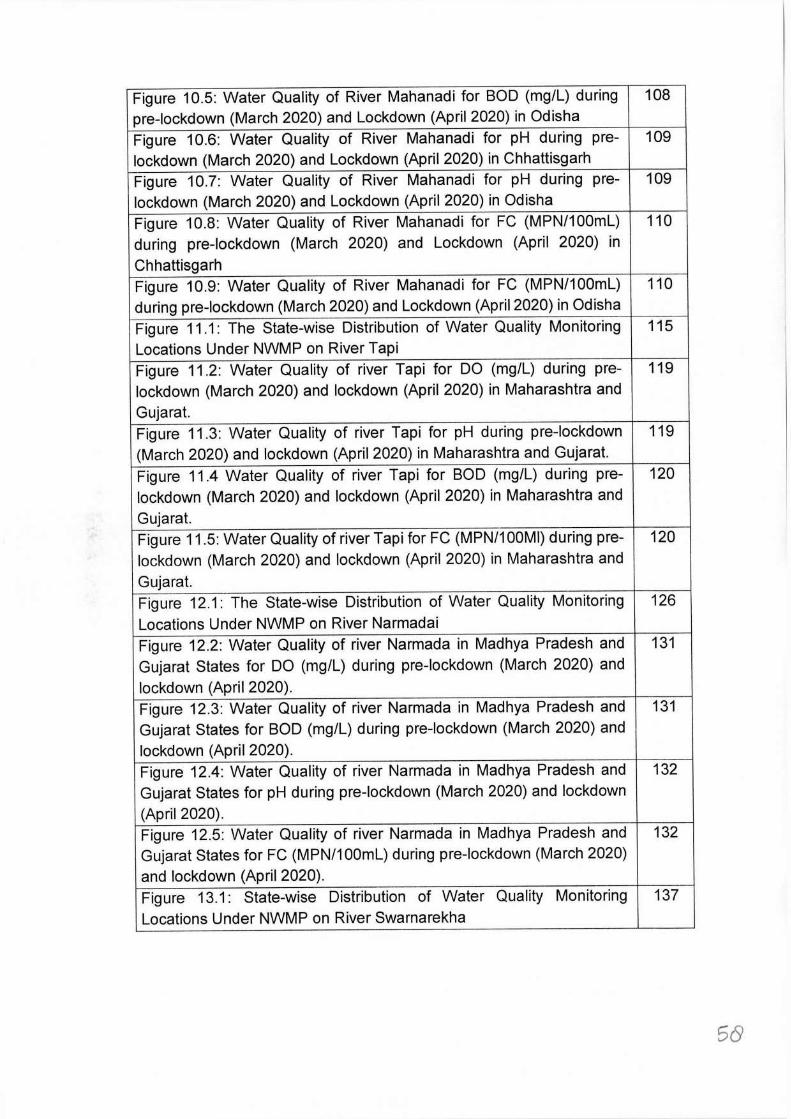
Figure 10.5: Water Quality of River Mahanadi for BOD (mg/L) during 108 pre-lockdown (March 2020) and Lockdown (April 2020) in Odisha Figure 10.6: Water Quality of River Mahanadi for pH during pre- 109 lockdown (March 2020) and Lockdown (April 2020) in Chhattisgarh Figure 10.7: Water Quality of River Mahanadi for pH during pre- 109 lockdown (March 2020) and Lockdown (April 2020) in Odisha Figure 10.8: Water Quality of River Mahanadi for FC (MPN/1 00mL) 110 during pre-lockdown (March 2020) and Lockdown (April 2020) in Chhattisgarh Figure 10.9: Water Quality of River Mahanadi for FC (MPN/100mL) 110 during pre-lockdown (March 2020) and Lockdown (April 2020) in Odisha Figure 11.1: The State-wise Distribution of Water Quality Monitoring 115 Locations Under NWMP on River Tapi Figure 11.2: Water Quality of river Tapi for DO (mg/L) during pre- 119 lockdown (March 2020) and lockdown (April 2020) in Maharashtra and Gujarat. Figure 11.3: Water Quality of river Tapi for pH during pre-lockdown 119 (March 2020) and lockdown (April 2020) in Maharashtra and Gujarat. Figure 11.4 Water Quality of river Tapi for BOD (mg/L) during pre- 120 lockdown (March 2020) and lockdown (April 2020) in Maharashtra and Gujarat. Figure 11.5: Water Quality of river Tapi for FC (MPN/1 00MI) during pre- 120 lockdown (March 2020) and lockdown (April 2020) in Maharashtra and Gujarat. Figure 12.1: The State-wise Distribution of Water Quality Monitoring 126 Locations Under NWMP on River Narmadai Figure 12.2: Water Quality of river Narmada in Madhya Pradesh and 131 Gujarat States for DO (mg/L) during pre-lockdown (March 2020) and lockdown (April 2020). Figure 12.3: Water Quality of river Narmada in Madhya Pradesh and 131 Gujarat States for BOD (mg/L) during pre-lockdown (March 2020) and lockdown (April 2020). Figure 12.4: Water Quality of river Narmada in Madhya Pradesh and 132 Gujarat States for pH during pre-lockdown (March 2020) and lockdown (April 2020). Figure 12.5: Water Quality of river Narmada in Madhya Pradesh and 132 Gujarat States for FC (MPN/1 00mL) during pre-lockdown (March 2020) and lockdown (April 2020). Figure 13.1: State-wise Distribution of Water Quality Monitoring 137 Locations Under NWMP on River Swarnarekha
Sc9
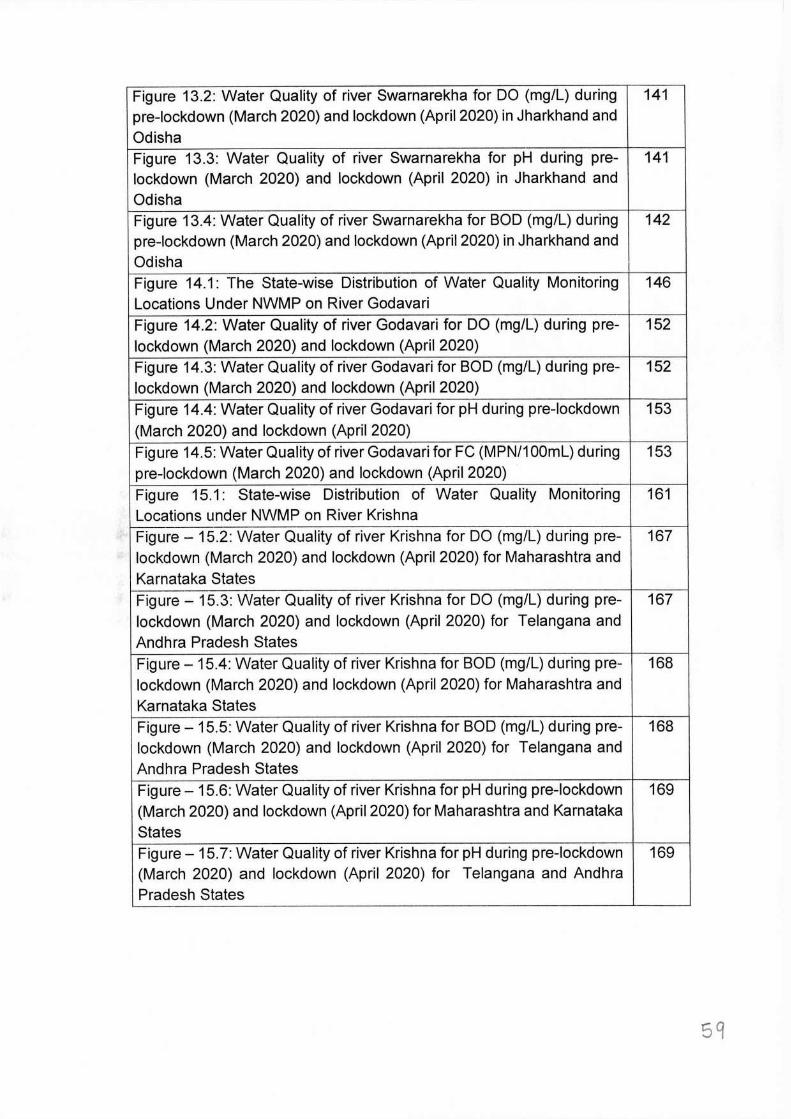
Figure 13.2: Water Quality of river Swarnarekha for DO (mg/L) during 141 pre-lockdown (March 2020) and lockdown (April 2020) in Jharkhand and Odisha Figure 13.3: Water Quality of river Swarnarekha for pH during pre- 141 lockdown (March 2020) and lockdown (April 2020) in Jharkhand and Odisha Figure 13.4: Water Quality of river Swarnarekha for BOD (mg/L) during 142 pre-lockdown (March 2020) and lockdown (April 2020) in Jharkhand and Odisha Figure 14.1: The State-wise Distribution of Water Quality Monitoring 146 Locations Under NWMP on River Godavari Figure 14.2: Water Quality of river Godavari for DO (mg/L) during pre- 152 lockdown (March 2020) and lockdown (April 2020) Figure 14.3: Water Quality of river Godavari for BOD (mg/L) during pre- 152 lockdown (March 2020) and lockdown (April 2020) Figure 14.4: Water Quality of river Godavari for pH during pre-lockdown 153 (March 2020) and lockdown (April 2020) Figure 14.5: Water Quality of river Godavari for FC (MPN/1 00mL) during 153 pre-lockdown (March 2020) and lockdown (April 2020) Figure 15.1: State-wise Distribution of Water Quality Monitoring 161 Locations under NWMP on River Krishna Figure - 15.2: Water Quality of river Krishna for DO (mg/L) during pre- 167 lockdown (March 2020) and lockdown (April 2020) for Maharashtra and Karnataka States Figure - 15.3: Water Quality of river Krishna for DO (mg/L) during pre- 167 lockdown (March 2020) and lockdown (April 2020) for Telangana and Andhra Pradesh States Figure - 15.4: Water Quality of river Krishna for BOD (mg/L) during pre- 168 lockdown (March 2020) and lockdown (April 2020) for Maharashtra and Karnataka States Figure - 15.5: Water Quality of river Krishna for BOD (mg/L) during pre- 168 lockdown (March 2020) and lockdown (April 2020) for Telangana and Andhra Pradesh States Figure - 15.6: Water Quality of river Krishna for pH during pre-lockdown 169 (March 2020) and lockdown (April 2020) for Maharashtra and Karnataka States Figure-15.7: Water Quality of river Krishna for pH during pre-lockdown 169 (March 2020) and lockdown (April 2020) for Telangana and Andhra Pradesh States
59
Figure - 15.8: Water Quality of river Krishna for FC (MPN/100ml) 170 during pre-lockdown (March 2020) and lockdown (April 2020) for Maharashtra and Karnataka States Figure - 15.9: Water Quality of river Krishna for FC (MPN/100ml) 170 during pre-lockdown (March 2020) and lockdown (April 2020) for Telangana and Andhra Pradesh States Figure 16.1 Distribution of Water Quality Monitoring Locations under 176 NWMP on River Pennar (Andhra Pradesh) Figure 16.2 : Water Quality of river Pennar for DO (mg/L) during pre- 178 lockdown (March 2020) and lockdown (April 2020) Figure 16.3 : Water Quality of river Pennar for BOD(mg/L) during pre- 178 lockdown (March 2020) and lockdown (April 2020) Figure 16.4: Water Quality of river Pennar for pH during pre-lockdown 179 (March 2020) and lockdown (April 2020) Figure 16.5 : Water Quality of river Pennar for FC (MPN/100 ml) during 179 pre-lockdown (March 2020) and lockdown (April 2020) Figure 17.1: Water Quality Monitoring Locations under NMWP on River 183 Cauvery (within Karnataka State) Figure 17.2: Water Quality Monitoring Locations under NMWP on River 184 Cauvery (within Tamil Nadu State) Figure 17.3: Water Quality of river Cauvery in Karnataka for DO (mg/L) 189 during pre-lockdown (March 2020) and lockdown (April 2020) Figure 17.4: Water Quality of river Cauvery in Karnataka for BOD (mg/L) 189 during pre-lockdown (March 2020) and lockdown (April 2020) Figure 17 .5: Water Quality of river Cauvery in Karnataka for pH during 190 pre-lockdown (March 2020) and lockdown (April 2020) Figure 17.6: Water Quality of river Cauvery in Karnataka for FC 190 (MPN/100ml) during pre-lockdown (March 2020) and lockdown (April 2020) Figure 17. 7: Water Quality of river Cauvery in Tamil Nadu for DO (mg/L) 191 during pre-lockdown (March 2020) and lockdown (April 2020). Figure 17.8: Water Quality of river Cauvery in Tamil Nadu for BOD 191 (mg/L) during pre-lockdown (March 2020) and lockdown (April 2020). Figure 17.9: Water Quality of river Cauvery in Tamil Nadu for pH during 192 pre-lockdown (March 2020) and lockdown (April 2020) Figure 17.10: Water Quality of river Cauvery in TN for FC (MPN/100ml) 192 during pre-lockdown (March 2020) and lockdown (April 2020) Figure 18.1: State-wise Distribution Water Quality Monitoring Locations 198 under NWMP on River Ghaggar Figure 18.2: Water Quality of river Ghaggar for DO (mg/L) during pre- 202 lockdown (March 2020) and lockdown (April 2020)
60
Figure 18.3: Water Quality of river Ghaggar for BOD (mg/L) during pre- 202 lockdown (March 2020) and lockdown (April 2020) Figure 18.4: Water Quality of river Ghaggar for pH during pre-lockdown 203 (March 2020) and lockdown (April 2020) Figure 18.5: Water Quality of river Ghaggar for FC (MPN/1 00mL) during 203 pre-lockdown (March 2020) and lockdown (April 2020) Figure 19.1: Distribution of Water Quality Monitoring Locations under 209
NWMP on River Brahmani Figure 19.2: Water Quality of River Brahmani for DO (mg/L) during pre- 212 lockdown (March 2020) and Lockdown (April 2020) Figure 19.3: Water Quality of River Brahmani for BOD(mg/L) during pre- 212 lockdown (March 2020) and Lockdown (April 2020) Figure 19.4 : Water Quality of River Brahmani for pH during pre- 213 lockdown (March 2020) and Lockdown (April 2020) Figure 19.5 : Water Quality of River Brahmani for FC(MPN/1 00mL) 213 during pre-lockdown (March 2020) and Lockdown (April 2020) Figure 20.1 :Distribution of Water Quality Monitoring Locations under 216
NWMP on River Baitarni Figure 20.2: Water Quality of River Baitarni for DO (mg/L) during pre- 218 lockdown (March 2020) and Lockdown (April 2020) Figure 20.3: Water Quality of River Baitarni for BOD (mg/L) during pre- 218 lockdown (March 2020) and l.ockdown (April 2020) Figure 20.4: Water Quality of River Baitarni for pH during pre-lockdown 219
(March 2020) and Lockdown (April 2020) Figure 20.5: Water Quality of River Baitarni for FC (MPN/1 00mL) during 219 pre-lockdown (March 2020) and Lockdown (April 2020) List of Tables Table - 2.1: Water Quality of River Beas during Pre (March 2020) and 5
Lockdown Period (April 2020) Table-3.1: Water Quality of River Sutlej during Pre (March 2020) and 18
Lockdown Period (April 2020) Table-4.1: Water Quality of River Ganga during Pre (March, 2020) and 32 lockdown period (April, 2020) (5 States- Uttarakhand, Uttar Pradesh, Bihar, Jharkhand and West Bengal) Table-5.1 Water Quality of River Yamuna during Pre (March 2020) and 56 Lockdown Period (April 2020) _ Table-6.1: Water Quality of River Chambal during Pre (March 2020) and 68 Lockdown Period (April 2020) Table 7.1: Water Quality of River Brahmaputra during Pre (March, 2020) 79 and Lockdown Period (April, 2020)
61
Table-8.1: Water Quality of River Mahi during pre (March 2020) and 86 during lockdown (April 2020) Table-9.1: Water Quality of River Sabarmati during pre (March 2020) 97 and lockdown period (April 2020) Table-10.1 Water Quality of River Mahanadi during Pre (March, 2020) 104 and Lockdown- period (April, 2020) in Chhattisgarh and Odisha States Table-11.1: Water Quality of River Tapi (Maharashtra and Gujarat) 116 during Pre (March 2020) and Lockdown Period (April 2020) Table-12.1: Water Quality of River Narmada (MP & Gujarat) during Pre 127 (March 2020) and Lockdown Period (April 2020) Table-13.1: Water Quality of River Swarnarekha (Jharkhand & Odisha) 138 during Pre (March 2020) and Lockdown (April 2020) Table-14.1: Water Quality of River Godavari during Pre (March 2020) 147
and Lockdown Period (April 2020) Table-15.1: Water Quality of River Krishna during Pre (March 2020) and 162
Lockdown (April 2020) Table 16.1: Water Quality of River Pennar during Pre (March 2020) and 177
Lockdown Period ( April 2020) Table-17.1: Water Quality of River Cauvery during Pre (March 2020) 185 and during Lockdown (April 2020) Table-18.1 Water Quality of River Ghaggar during Pre (March 2020) and 199
Lockdown Period (April 2020) Table-19.1 : Water Quality of River Brahmani during Pre (March, 2020) 210
and Lockdown period (April, 2020) Table-20.1: Water Quality of River Baitarni during pre (March, 2020) and 217
Lockdown period (April, 2020) in Odisha Table 21.1. River-wise minimum and maximum values for DO, BOD and 221 FC as observed during the pre-locl<down and lockdown period Table 21.2. The State-wise and river-wise status of compliance to the 222 Primary Water Quality Criteria for Outdoor Bathing List of Annexures Annexure - I State-wise and water body-wise water quality monitoring 226 locations under NWMP Annexure - II Primary Water Quality Criteria for Bathing Waters 227 Notified under Environment (Protection) Rules, 1986 Annexure - Ill State-wise and River-Wise Compliance Status of 228 Monitored Locations
62
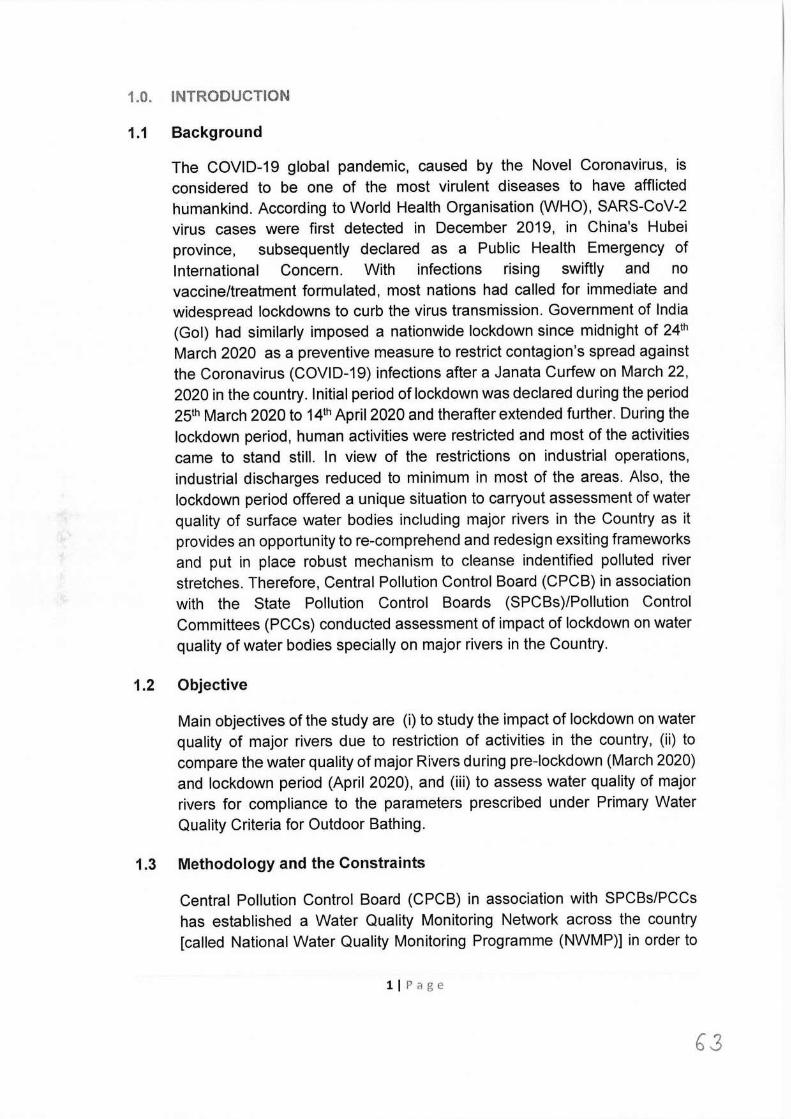
1.0. INTRODUCTION
1.1 Background
The COVID-19 global pandemic, caused by the Novel Coronavirus, is considered to be one of the most virulent diseases to have afflicted humankind. According to World Health Organisation (WHO), SARS-CoV-2 virus cases were first detected in December 2019, in China's Hubei province, subsequently declared as a Public Health Emergency of International Concern. With infections rising swiftly and no vaccine/treatment formulated, most nations had called for immediate and widespread lockdowns to curb the virus transmission. Government of India (Gol) had similarly imposed a nationwide lockdown since midnight of 24th
March 2020 as a preventive measure to restrict contagion's spread against the Coronavirus (COVID-19) infections after a Janata Curfew on March 22, 2020 in the country. Initial period of lockdown was declared during the period 25th March 2020 to 14th April 2020 and therafter extended further. During the lockdown period, human activities were restricted and most of the activities came to stand still. In view of the restrictions on industrial operations, industrial discharges reduced to minimum in most of the areas. Also, the lockdown period offered a unique situation to carryout assessment of water quality of surface water bodies including major rivers in the Country as it provides an opportunity to re-comprehend and redesign exsiting frameworks and put in place robust mechanism to cleanse indentified polluted river stretches. Therefore, Central Pollution Control Board (CPCB) in association with the State Pollution Control Boards (SPCBs)/Pollution Control Committees (PCCs) conducted assessment of impact of lockdown on water quality of water bodies specially on major rivers in the Country.
1.2 Objective
Main objectives of the study are (i) to study the impact of lockdown on water quality of major rivers due to restriction of activities in the country, (ii) to compare the water quality of major Rivers during pre-lockdown (March 2020) and lockdown period (April 2020), and (iii) to assess water quality of major rivers for compliance to the parameters prescribed under Primary Water Quality Criteria for Outdoor Bathing.
1.3 Methodology and the Constraints
Central Pollution Control Board (CPCB) in association with SPCBs/PCCs has established a Water Quality Monitoring Network across the country [called National Water Quality Monitoring Programme (NWMP)] in order to
r l r a g e
prepare strategies including plans and requisite policies for prevention and control of water pollution. Present water quality monitoring network comprises 4111 locations which include surface and groundwater in 28 States and 8 Union Territories. Among these, 2021 locations are monitored on rivers under NWMP in the country. Under, NWMP, monitoring is carried out with a frequency of monthly, quarterly, half yearly and yearly basis for some high altitude locations depending on the type of water body, seasons and the locations. State-wise and water body- wise water quality monitoring locations under NWMP is given at Annexure -1.
In order to assess impact on water quality of major rivers due to lockdown since midnight of 24th March 2020, Central Pollution Control Board (CPCB) vide letter dated 09.04.2020 requested concerned State Pollution Control Boards (SPCBs)/ Pollution Control Committees (PCCs) to carryout water quality of all major rivers preferably river Beas, Brahmaputra, Baitarni & Brahmani, Cauvery, Chambal, Ganga, Ghaggar, Godavari, Krishna, Mahanadi, Mahi, Narmada, Pennar, Sabarmati, Sutlej, Swarnarekha, Tapi, Yamuna at the existing monitoring locations under National Water Quality Monitoring Programme (NWMP) and for further analysis of the collected samples in accordance with the Guidelines for Water Quality Monitoring, 2017 (GWQM, 2017) issued by Ministry of Environment, Forest and Climate Change (MoEF&CC). Accordingly, SPCBs/PCCs have carried out analysis of collected water samples at laboratories of respective SPCBs/PCCs or National Accreditation Board for Testing and Calibration Laboratories (NABL) accredited or laboratories approved under the Environment (Protection) Act, 1986. Analysis results received from SPCBs/PCCs till first week of June 2020 have been considered and prepared this report. Analysis results of March 2020 data (Pre-lockdown) are compared with April 2020 (lockdown) water quality data of all the monitored rivers. The critical water quality parameters viz. pH, Dissolved Oxygen (DO), Biochemical Oxygen Demand (BOD), Fecal Coliform (FC) and the results were compared with the Primary Water Quality Criteria for Outdoor Bathing notified under Environment (Protection) Rules, 1986 (Annexure - II).
Major constrains while carrying out sampling by the SPCBs/PCCs is that all the existing monitoring locations under NWMP could not be monitored due to movement restrictions during lockdown. Also, SPCBs/PCCs, generally do not monitor flow details under NWMP, therefore, this study is confined to comparison of water quality during the lockdown period (April 2020)with the pre-lockdown period (March 2020) to assess percent variation or increasing trend or decreasing trend in water quality only for bathing criteria parameters such as pH, DO, BOD and FC and also to assess compliance
21Page
64
status with the Primary Water Quality Criteria for Outdoor Bathing notified under Environment (Protection) Amendment Rules, 2000.
River-wise samples collected, water quality observed during pre-lockdown (March 2020) and lockdown period (April 2020), number of sampling locations complying with the Primary Water Quality Criteria for Outdoor Bathing, location-wise and parameter-wise variation or increasing or decreasing trend in water quality and other related details are given in subsequent paras of the report.
2.0 IMPACT OF LOCKDOWN ON WATER QUALITY OF RIVER BEAS
2.1 About Beas River
The River Beas originates from Beas Kund, near Rohtang Pass, on the southern end of the Pir Panjal Range of District Kullu in Himachal Pradesh (HP) and flows a distance of about 245 km in HP and merge with the river Sutlej at Harike Pattan, south of Amritsar, Punjab after traversing a total distance of 470 km. Major towns on the banks of River Beas are Manali, Kullu, Shamshi, Shunter in HP & Amritsar in Punjab. Major tributaries of the river Beas are river Bain, Banganga, Luni and Uhal, Banner, Chakki, Gaj, Harla, Mamuni, Parvati, Patlikuhlal, Sainj, Suketi and Tirthan. Major industrial establishments on the banks of river Beas within Punjab jurisdiction are Brewery, Distillery, Sugar, Paper Board, Gluten, Thermal Power Plant and few screening plants. In Punjab State, there are 16 local bodies and 75 villages which are discharging wastewater directly or indirectly into river Beas, 12 water polluting industries mainly located at Pathankot, Gurdaspur, Mukerian and Dasuya are the major concern.
2.2 Water Quality Monitoring Locations under National Water Quality Monitoring Programme (NWMP)
The Water Quality of river Beas is monitored at 31 locations by Central Pollution Control Board (CPCB) in association with H.P. State Pollution Control Boards (HPSPCB) and Punjab Pollution Conrol Board (PPCB) under National Water Quality Monitoring Programme (NWMP). State-wise Distribution of Water Quality Monitoring Locations under NWMP on River Beas is depicted in Figure 2.1.
2.3 Analytical Results:-
Water quality of river Beas was carried out at 22 locations during pre lockdown (March 2020) and 22 locations during lockdown period (April 2020) to assess the impact of lock-down on water quality of river Beas. Water quality of river Beas for the Primary Water Quality Criteria for Outdoor Bathing (PWQCOB) parameters viz. Dissolved Oxygen (DO), pH, Biochemical Oxygen Demand (BOD) and Fecal Coliform (FC) are presented in Table - 2.1. Based on the monitoring & analysis of collected samples, the water quality trend of river Beas with respect to DO, pH, BOD and FC as observed during pre-lockdown (March 2020) and lockdown period (April 2020) are depicted in Figure 2.2 to Figure 2.9.
3IPage
65
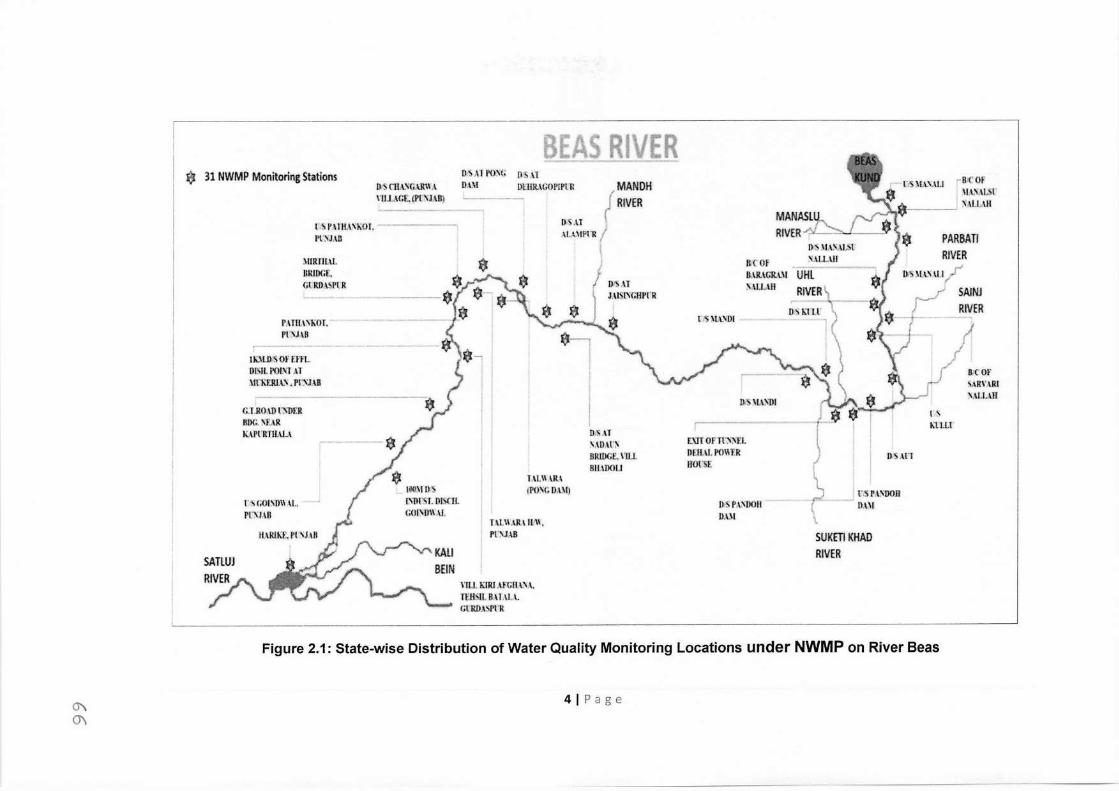
t 31 NWMP Monitoring Stations
BEAS RIVER D:S CIL\:'iG,\R\\ A 11JJ.AGl:. ll'C'iJ,\ll)
-scor · \U.\,\LSr
:I...H . ,ALUH
r"> P,\llL\\l..01. 111.'.SJ\tl
)IIRl1t\L 11.RJ.OC.f, GrRDASPfR ·-·-·--·--------
DISAT JAISI\GHPl1! SAINJ
RIVER l'.\fll\\KOT. Pl'\JA8
IK.11.D'SOHffL DNI. POl\1.H \ll'KrRl.l\. Pl':'.\UB
G.T .RO.ID l ':\1)ER lilJG.\f..iR MPl'Rl!L\L1
rs COI\DI\AL Pt~J.\B
IIARH>J:. Pl \JAB
SATLUJ
O'SAI PO\\, DA.\I
[l'S.\1 Ul::JJRAGOPJPtR
!MANDH RIVER
CIS~L\c\'lll
IH'Of B.IIUCR\.\1 :'-ALUH
Ht\\..\ll1 IMI, l'C\JAB
DIS 11,\\l)l
PARBATI RIVER
ll'SP,L\1)011 D.l\l
lliCOf' SARl'ARI '.\AU.All
DiSAT \.\OAt:> IlRlllCf.\ltt BILIOOIJ
J ~ \
ls Kl LL!"
rxrr orn"~n. DUU.lPOWtR UO!'SE
DSA!1'
TAL\\All\ /1'0\G 0 .. \.\1) • t:>S P,\~'l)Oll
DAIi
SUKHIKHAO RIVER
nu 1-IJU ,\fGIIA'.\ I, IF.IISILBUALl. Gl'RDA~Pl'R
Figure 2.1: State-wise Distribution of Water Quality Monitoring Locations under NWMP on River Beas
CJ'\ 0\
41Page
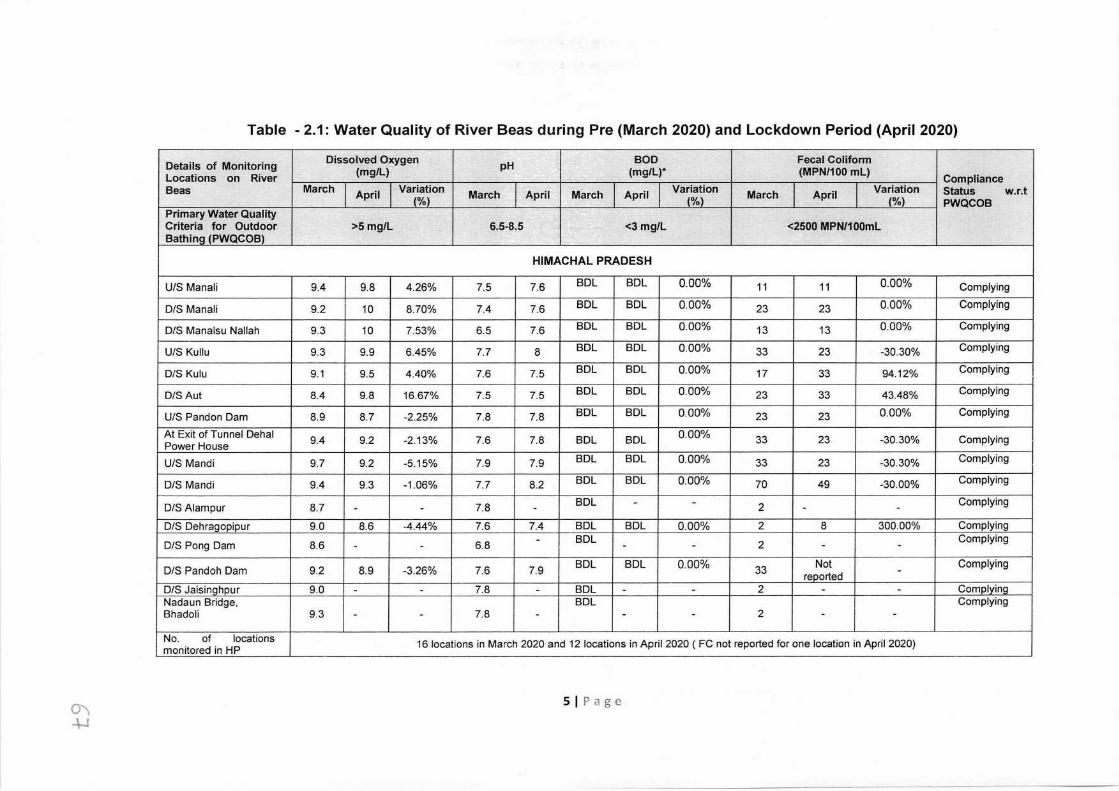
Table - 2.1: Water Quality of River Beas during Pre (March 2020) and Lockdown Period (April 2020)
Details of Monitoring Dissolved Oxygen pH BOD Fecal Coliform
Locations on River (mg/L) (mg/L)* (MPN/100 ml) Compliance Beas March April Variation March April March April Variation March April Variation Status w.r.t
(%\ (%) (%) PWQCOB Primary Water Quality Criteria for Outdoor >5 mg/L 6.5-8.5 <3 mg/L <2500 MPN/100mL Bathing (PWQCOB)
HIMACHAL PRADESH
U/S Manali 9.4 9.8 4.26% 7.5 7.6 BDL BDL 0.00% 11 11 0.00% Complying
D/S Manali 9.2 10 8.70% 7.4 7.6 BDL BDL 0.00% 23 23 0.00% Complying
D/S Manalsu Nallah 9.3 10 7.53% 6.5 7.6 BDL BDL 0.00% 13 13 0.00% Complying
UIS Kullu 9.3 9.9 6.45% 7.7 8 BDL BDL 0.00% 33 23 -30.30% Complying
D/S Kulu 9.1 9.5 4.40% 7.6 7.5 BDL BDL 0.00% 17 33 94.12% Complying
D/S Aut 8.4 9.8 16.67% 7.5 7.5 BDL BDL 0.00% 23 33 43.48% Complying
U/S Pandon Dam 8.9 8.7 -2.25% 7.8 7.8 BDL BDL 0.00% 23 23 0.00% Complying
At Exit of Tunnel Dehal 9.4 9.2 -2.13% 7.6 7.8 BDL BDL 0.00% 33 23 -30.30% Complying Power House UIS Mandi 9.7 9.2 -5.15% 7.9 7.9 BDL BDL 0.00% 33 23 -30.30% Complying
D/S Mandi 9.4 9.3 -1.06% 7.7 8.2 BDL BDL 0.00% 70 49 -30.00% Complying
D/S Alampur 8.7 7.8 BDL - - 2 Complying - - - - - D/S Dehragopipur 9.0 8.6 -4.44% 7.6 7.4 BDL BDL 0.00% 2 8 300.00% Complying
D/S Pong Dam 8.6 6.8 - BDL 2 Complying - - - - - -
D/S Pandoh Dam 9.2 8.9 -3.26% 7.6 7.9 BDL BDL 0.00% 33 Not Complying reported -
D/S Jaisinghpur 9.0 - - 7.8 - BDL - - 2 - - Cornplyinq Nadaun Bridge, BDL
I Complying
Bhadoli 9.3 - - 7.8 - - - 2 - -
No. of locations 16 locations in March 2020 and 12 locations in April 2020 ( FC not reported for one location in April 2020) monitored in HP
0\ ..µ SI Page
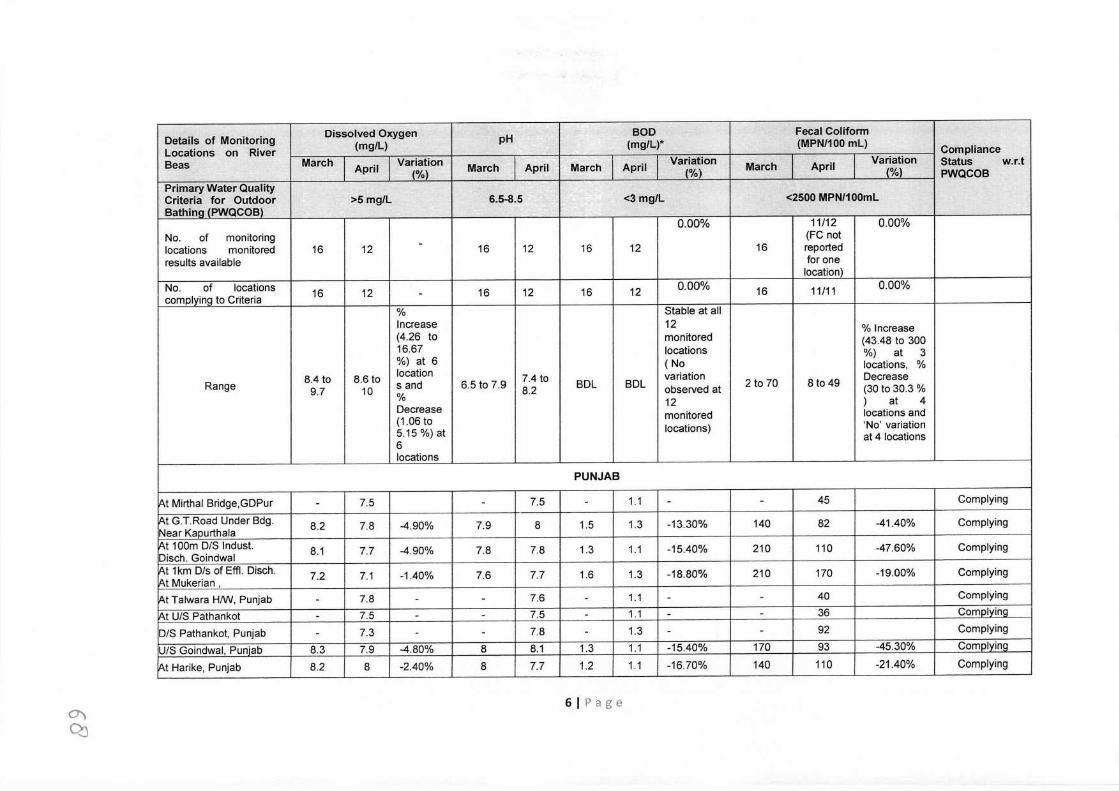
Deta ils of Monitoring Dissolved Oxygen pH BOD Fecal Coliform
Locations on River (mg/L) (mg/L)* (MPN/100 ml) Compliance Beas March April Variation March April March April Variation March April Variation Status w.r.t
(%) (%) (%) PWQCOB Primary Water Quality Criteria for Outdoor >5 mg/L 6.5-8.5 <3 mg/L <2500 MPN/100mL Bathina (PWQCOB)
0.00% 11/12 0.00% No. of monitoring (FC not locations monitored 16 12 - 16 12 16 12 16 reported results available for one
location) No. of locations 16 12 16 12 16 12 0.00% 16 11/11 0.00% cornolvino to Criteria -
% Stable at all Increase 12 % Increase (4.26 to monitored (43.48 to 300 16.67 locations %) at 3 %) at 6 ( No locations, %
8.4 to 8.6 to location 7.4 to variation Decrease Range 9.7 10 sand 6.5 to 7.9 8.2 BDL BDL observed at 2 to 70 8 to49 (30 to 30.3 %
% Decrease 12 ) at 4
(1.06 to monitored locations and locations) 'No' variation
5.15%)at at 4 locations 6 locations
PUNJAB
lA.t Mirthal Bridge,GDPur - 7.5 - 7.5 - 1.1 - - 45 Complying
lA.t G.T.Road Under Bdg. 8.2 7.8 -4.90% 7.9 8 1.5 1.3 -13.30% 140 82 -41.40% Complying Near Kaourthala At 1 00m D/S Indus!. 8.1 7.7 -4.90% 7.8 7.8 1.3 1.1 -15.40% 210 110 -47.60% Complying Disch. Goindwal At 1km D/s of Effl. Disch. 7.2 7.1 -1.40% 7.6 7.7 1.6 1.3 -18.80% 210 170 -19.00% Complying At Mukerian , At Talwara HM/, Punjab - 7.8 - - 7.6 - 1.1 - - 40 Complying
At U/S Pathankot - 7.5 - - 7.5 - 1.1 - - 36 Cornplyinq
D/S Pathankot, Punjab - 7.3 - - 7.8 - 1.3 - - 92 Complying
UIS Goindwal, Punjab 8.3 7.9 -4.80% 8 8.1 1.3 1.1 -15.40% 170 93 -45.30% Comolvina
~t Harike, Punjab 8.2 8 -2.40% 8 7.7 1.2 1.1 -16.70% 140 110 -21 .40% Complying
0) Q)
GI Page
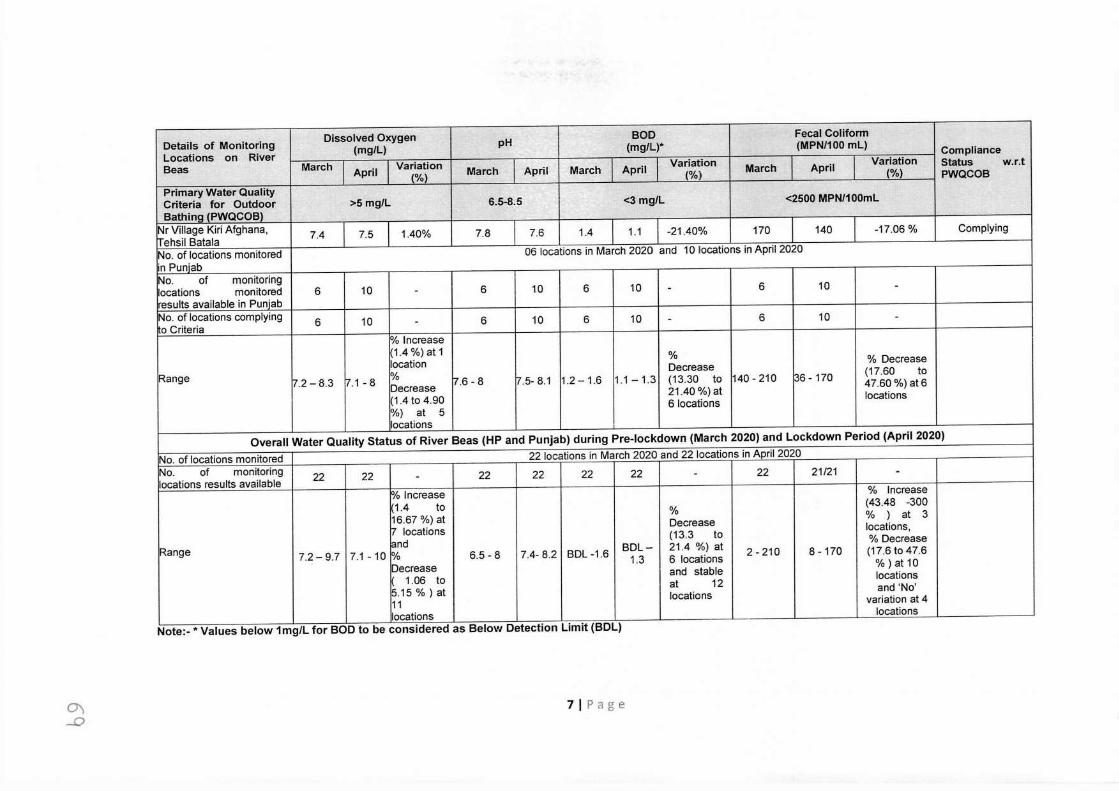
Details of Monitoring Dissolved Oxygen pH BOD Fecal Coliform
Locations on River (mg/L) (mg/L)* (MPN/100 ml) Compliance
Beas March April Variation March April March April Variation March April Variation Status w.r.t (%) (%) (%) PWQCOB
Primary Water Quality Criteria for Outdoor >5 mg/L 6.5-8.5 <3 mg/L <2500 MPN/100ml Bathina lPWQCOBl
Nr Village Kiri Afghana, 7.4 7.5 1.40% 7.8 7.6 1.4 1.1 -21.40% 170 140 -17.06 % Complying Tehsil Batala No. of locations monitored 06 locations in March 2020 and 10 locations in April 2020 in Puniab No. of monitoring locations monitored 6 10 - 6 10 6 10 - 6 10 - results available in Punjab No. of locations complying 6 10 - 6 10 6 10 - 6 10 - o Criteria
% Increase 1.4 %) at 1 %
location Decrease % Decrease
Range 7.2 - 8.3 7.1 - 8 % 7.6-8 7.5- 8.1 1.2-1.6 1.1 - 1.3 (13.30 to 140-210 36 - 170 (17.60 to Decrease 21.40 %) at
47.60 %) at6 1.4 to 4.90 locations 1/o) at 5
6 locations
locations Overall Water Quality Status of River Beas (HP and Punjab) during Pre-lockdown (March 2020) and Lockdown Period (April 2020)
No. of locations monitored 22 locations in March 2020 and 22 locations in April 2020 No. of monitoring 22 22 22 22 22 22 22 21/21 locations results available
- - -
1/o Increase % Increase (1.4 to %
(43.48 -300 16.67 %) at Decrease
% ) at 3 17 locations (13.3 to
locations, land % Decrease
Range 7.2- 9.7 7.1-10% 6.5 - 8 7.4- 8.2 BDL-1.6 BDL- 21.4 %) at 2 - 210 8- 170 (17.6 to 47.6
Decrease 1.3 6 locations % ) at 10
1.06 to and stable locations
5.15 % ) at at 12 and 'No'
11 locations variation at 4
locations locations
Note:-* Values below 1mg/L for BOD to be considered as Below Detection Limit (BDL)
0\ ....0
71Page
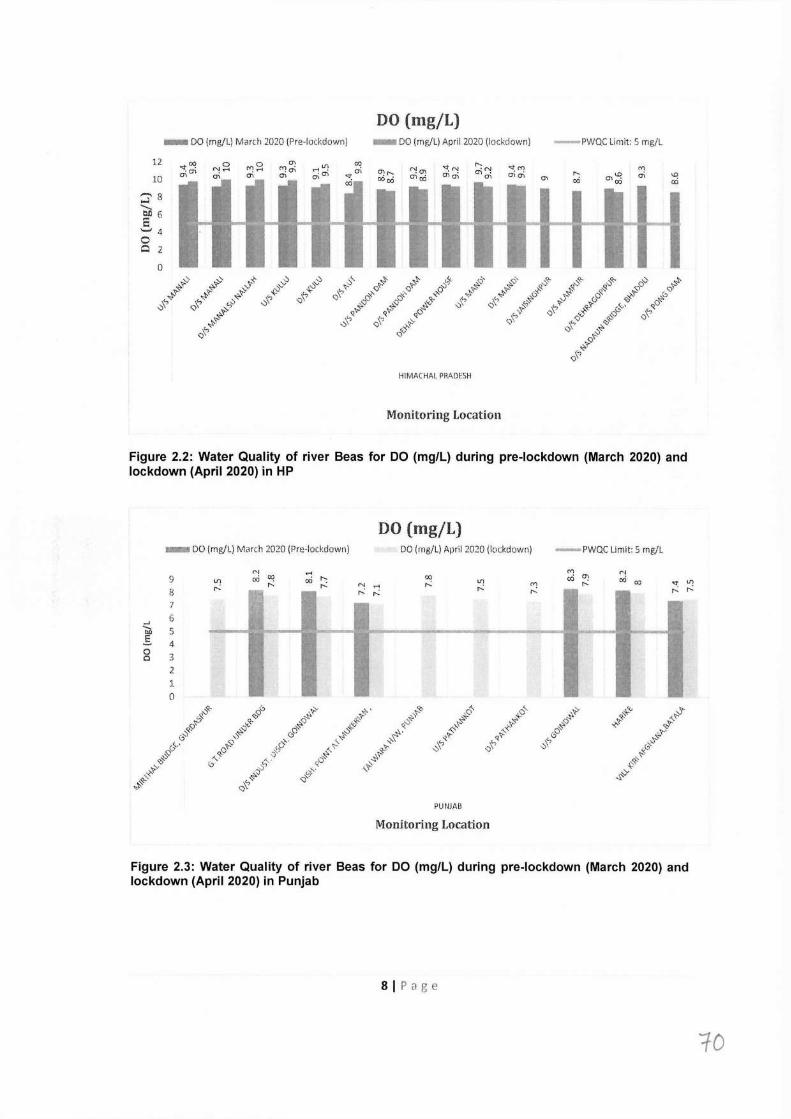
- DO (mg/L) March 2020 (Pre-lockdown)
DO (mg/L) - DO (mg/L) April 2020 (lockdown) -PWQC Limit: 5 mg/L
12
10
=8 ' bl) 6 s '-' 4 0 Q 2
0
O'> CY) • .O'>
O'>
00
a,'-" 00
CY)
oi
HIMACHAI. PHAOcSH
Monitoring Location
Figure 2.2: Water Quality of river Beas for DO (mg/L) during pre-lockdown (March 2020) and lockdown (April 2020) in HP
- DO (rng/L) March 2020 (Pre .. lockdown)
DO (mg/L) DO (mg/L) April 2020 (lockdown) -PWQC Limit: 5 rng/L
"' rl CY) "' 9 00 IX! cxi r--- 00 co O'> cxi U') ,...: 00 1/'l r--- ,...: "' rl r--- ,...: M ": 8 ,...: ,...: r--- r---
7
...I G .. 5 .§. 4 0 3 0
2 l 0
y_v,O;- ~f' ,.,,, ,,.. ~,{!? .o'' o'- ,,.... <P"'°'<, ~ 0~ ~·
""" ~- .._. ... Q.i;> ~ ~{) ,$' .;r .;:-
~Q ,._<J '< ~,t.- '<''<' c...~'i. <c ~~ (_~ ,;s -.,.\· ~ .,..
&· ,~ (j' ~':- ,- ~\ ~.,_
·t-.>" (j' .,.'<i'
(3" Q , ..... o"< o"< ,._x· o"' ~-{i <. ,,_...,. 0 "(; f! ,._'I:' ;:y"<" .i;>'?- ,'?- <c~ :1s}· _J· ,,,, Q,- '1 ,'?'
,-<:' ~-fJ ~':-" ~~ .$'0;- ,;'::' <J'
PUNJAB
Monitoring Location
Figure 2.3: Water Quality of river Beas for DO (mg/L) during pre-lockdown (March 2020) and lockdown (April 2020) in Punjab
SI Page
10
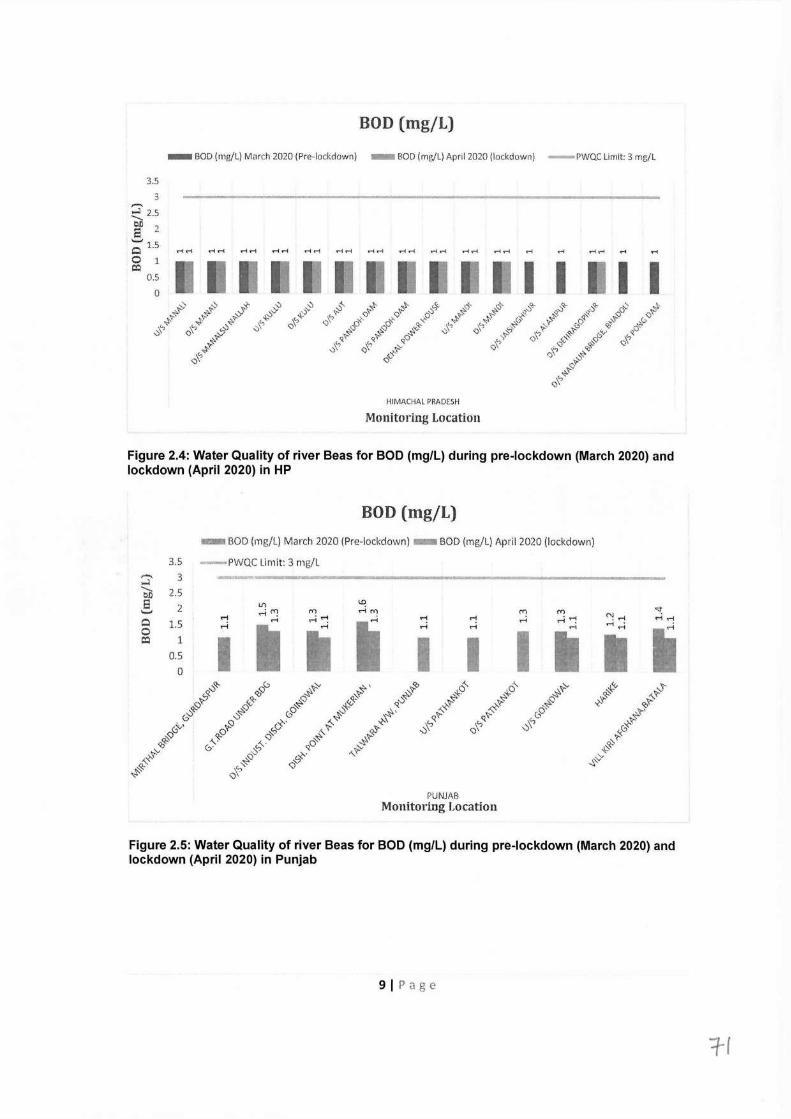
BOD (mg/L)
- BOD (rng/L) March 2020 (Pre-lockdown) - BOD (mg/L) April 2020 (lockdown) -PWQC Limit: 3 mg/L
3.5
3
~ 2.5
rt 2
'o' 1.5 0 1 0:1
0.5
0 I I I I
HI MAC HAL PRADESH
Monitoring Location
Figure 2.4: Water Quality of river Beas for BOD (mg/L) during pre-lockdown (March 2020) and lockdown (April 2020) in HP
BOD (mg/L) - BOD (rng/L) March 2020 (Pre-lockdown) - BOD (mg/L) April 2020 (lockdown)
3.5 -PWQC Limit: 3 rng/L ,....., 3 ...l ..____
2.5 0.0 s 2 LI) I.O <:I: '-' . rr, rr, rl CY) rr, rr,
rl rl . ~ ':
Ii rl rl ....; • rl N rl rl rl Q 1.5 ,....j rl ....; ....; rl . rl ....;
Ii II rl .-i 0 • I • I 0:1 1 I I I 0.5
0 ,::;~ SJ<:, -0' "'' ~ o' o" -0' "!:'+"' ~' c!} ~Qj Q.:i, '<''1' ~'1' # '<:"~ Q.:i, .;:- ,t !(; O'~ x;· q-::5 X''I' X''I' O'~ X'~
~ ,::;-.;. <o ,::i</;- ~- {- ,::. <:, ,,.'I'' 0 -::5 c.~ ,l' x-'- i~ <,<l ,}'°' 0'1' 0"-' ~ x-· .::- C </;-'1' <:,\ '<(j </;-0 <J'"l " fi:,<) 0~ ~·'1' ,__'1' -<..· ,:.:,t,- ~<:/;- Qj 0· <l ,._-0' '!?-" :,(- ' ~~ "~ ~.f; <J'"l
""'</;- Qt ,~ PUNJAB
Monitoring Location
Figure 2.5: Water Quality of river Beas for BOD (mg/L) during pre-lockdown (March 2020) and lockdown (April 2020) in Punjab
9IPage
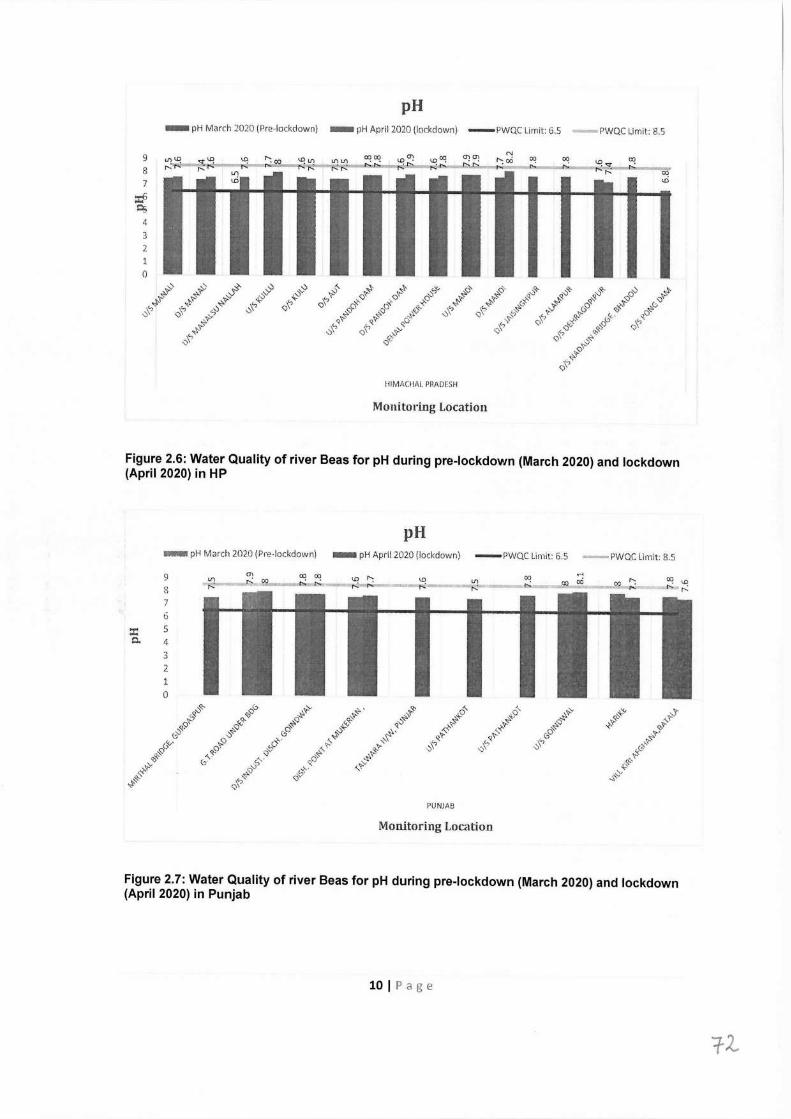
pH - pH March 2020 (Pre-lockclown) - pH April 2020 (lockdown) -PWQC Limit: 6.5 PWQC Limit: 8.5
9 oqoq oq oq
8 -"'--~·~' 7
::rjj =t; 4 3 2 1 0
HIMACHAI. PHAD[;SH
Monitoring Location
Figure 2.6: Water Quality of river Beas for pH during pre-lockdown (March 2020) and lockdown (April 2020) in HP
pH - pH March 2020 (Pre-lockdown) - pH April 2020 (lockdown) -PWQC Limit: 6.5 -PWQC Limit: 8.5
9 oq 8 7 6
::i:: s 0.. 4
3 2 1 0
~ ,:)0 i" .._,., _,.\~ ,.,o" ,o" ~"?"y (f:''\-'<., ~ <1.'- !8~ ,:,~ 0~"' ~- ~ ~"" ~ .,., " -,:-'?- ;- ,~9 _,.'v CT~ ,:f ,.__0 -<..'<' CT~ 'o ~-- '?-' t:;-' "" (3 "~ '-'' ~~~- ~.,. 0 .,. ... c}· ~ 0· {~ ~{> &~ "l· ~- 'I.'!" ~\ 9,§i <P <:;f· ~ 'J' ~~ "-.. · .J} "(f' ~'<' ~~ 'o 0· ,;,, ~
v:,,$) .,._. <..·
~~y ,.__Cl:' <::)-!:_,· ,$'°'" :{' <;)
PUNJAB
Monitoring Location
Figure 2.7: Water Quality of river Beas for pH during pre-lockdown (March 2020) and lockdown (April 2020) in Punjab
10 I Page
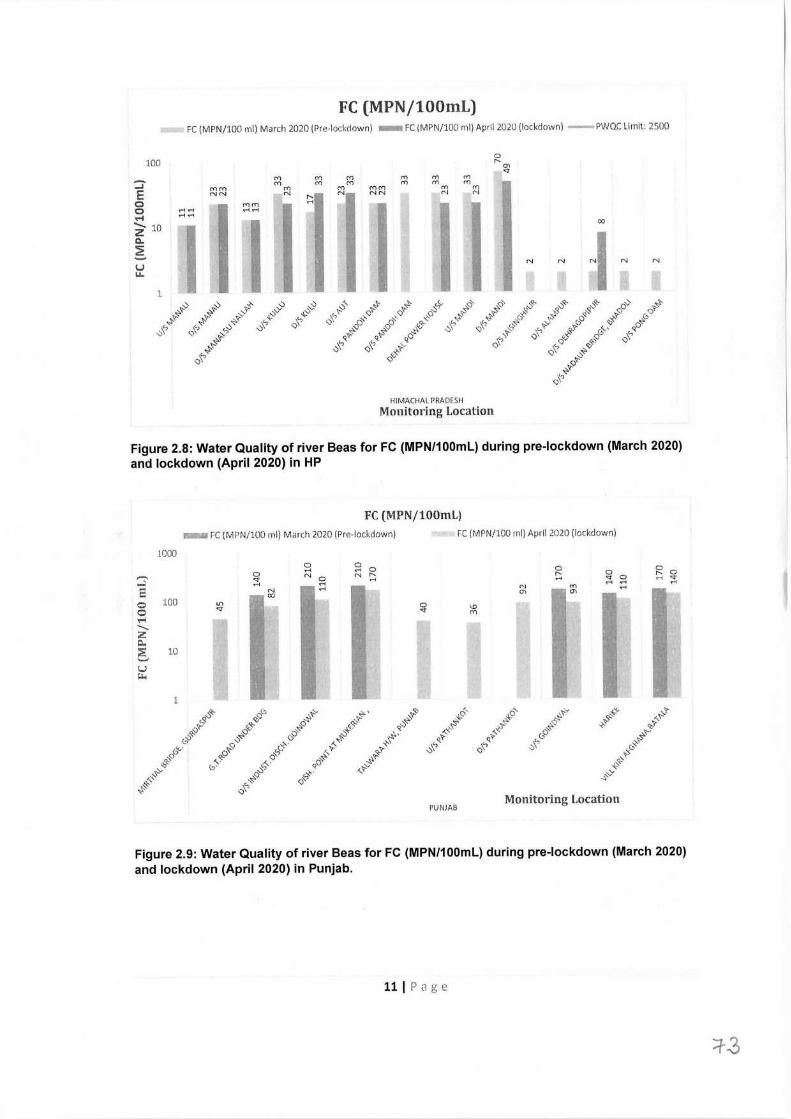
FC (MPN/100mL) FC (MPN/100 ml) March 2020 (Pre-lockdown) - FC (MPN/100 rnl) April 2020 (lockdown) -PWQC Limit: 2500
100
::. rn rn
E MM rn NN N
0 mrn 0 ........ .... .... .-1 ........ - 10 z 0.
~ u u..
1
rn rn rn rn rn rn rn rn rn N NN
HIMACHAL PRADESH Monitoring Location
Figure 2.8: Water Quality of river Beas for FC (MPN/100mL) during pre-lockdown (March 2020) and lockdown (April 2020) in HP
FC (MPN/100mL) - FC (MPN/100 rnl) March 2020 (Pre-lockdown) FC (MPN/100 ml) April 2020 (lockdown)
1000
,....._ -l E o 100 0 .-1
---- z Q. :,;: 10 ..... u r...
0 ... rl
N 00
0 .... N 0 .... ....
~ 0 N r-
.-<
0 ..... .... N 0)
0 <r 0 ........
"'q,. ;;,(> >t-\~ ~- ~ o' o' '?" ~'y ~ '~ i~ (j~ <i::-'?" ~ \~~ .;f {J~ ,,.'I' .;:- ,0'<" S) o~-:;. ,::,"<;; qv ,-<- -<-'?" 0~ ~ ~
r.:.'?~ v"' ~,, ~ ,~· 0 .... ~ ~\ q_~ ""' ',0 ,t'
0"-' 01 -<-· 0\" .§, 0-<- c,l• ..._.,. '<-" ,§ ~(j '1.-0 ,J" ;,.~ ~\'<"
~'$ -<.· ,,<,· qO -1,1' "<q c,· S' "~ ~'1' ~<:!
,J:-· --~ <; ,P ,l ~o <:!
PUNJAB Monitoring Location
Figure 2.9: Water Quality of river Beas for FC (MPN/100mL) during pre-lockdown (March 2020) and lockdown (April 2020) in Punjab.
111Page
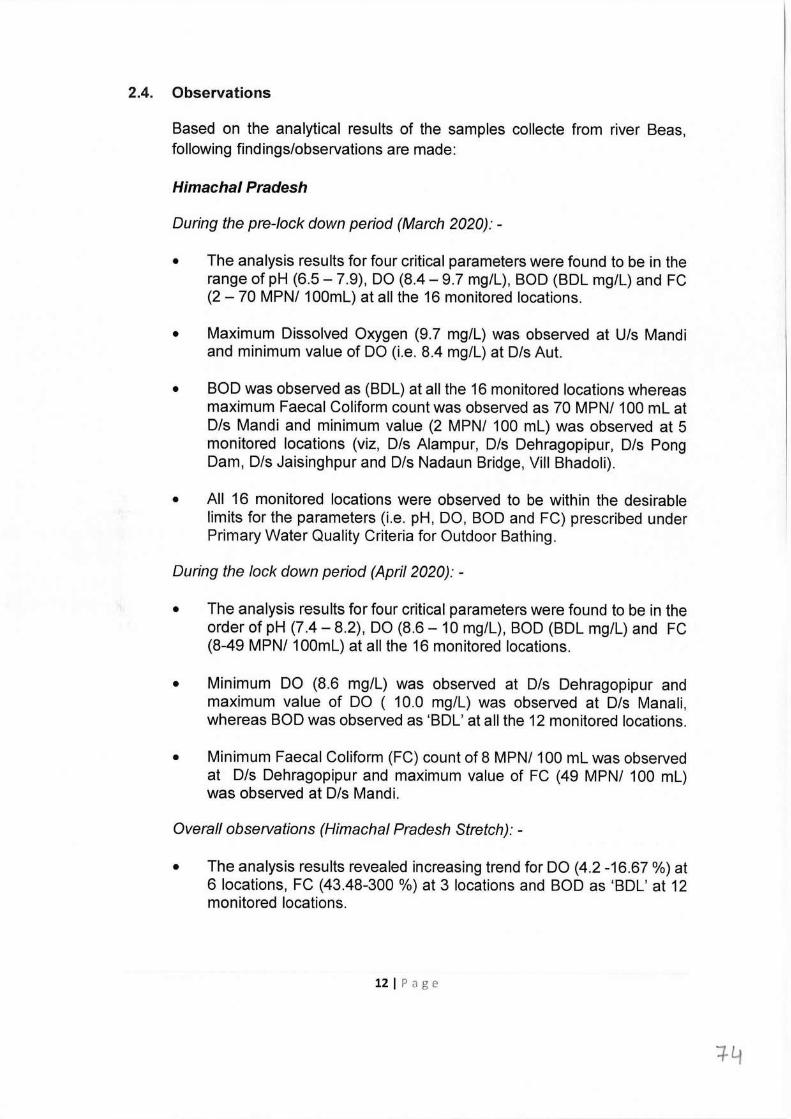
2.4. Observations
Based on the analytical results of the samples collecte from river Beas, following findings/observations are made:
Himachal Pradesh
During the pre-lock down period (March 2020): -
• The analysis results for four critical parameters were found to be in the range of pH (6.5 - 7.9), DO (8.4- 9.7 mg/l), BOD (BDl mg/l) and FC (2 - 70 MPN/ 100ml) at all the 16 monitored locations.
• Maximum Dissolved Oxygen (9.7 mg/l) was observed at U/s Mandi and minimum value of DO (i.e. 8.4 mg/l) at D/s Aut.
• BOD was observed as (BDl) at all the 16 monitored locations whereas maximum Faecal Coliform count was observed as 70 MPN/ 100 ml at D/s Mandi and minimum value (2 MPN/ 100 ml) was observed at 5 monitored locations (viz, D/s Alampur, D/s Dehragopipur, D/s Pong Dam, Dis Jaisinghpur and D/s Nadaun Bridge, Viii Bhadoli).
• All 16 monitored locations were observed to be within the desirable limits for the parameters (i.e. pH, DO, BOD and FC) prescribed under Primary Water Quality Criteria for Outdoor Bathing.
During the lock down period (April 2020): -
• The analysis results for four critical parameters were found to be in the order of pH (7.4 - 8.2), DO (8.6 - 10 mg/l), BOD (BDl mg/L) and FC (8-49 MPN/ 100ml) at all the 16 monitored locations.
• Minimum DO (8.6 mg/L) was observed at D/s Dehragopipur and maximum value of DO ( 10.0 mg/L) was observed at Dis Mana Ii, whereas BOD was observed as 'BDL' at all the 12 monitored locations.
• Minimum Faecal Coliform (FC) count of 8 MPN/ 100 ml was observed at D/s Dehragopipur and maximum value of FC (49 MPN/ 100 ml) was observed at D/s Mandi.
Overall observations (Himachal Pradesh Stretch): -
• The analysis results revealed increasing trend for DO (4.2 -16.67 %) at 6 locations, FC (43.48-300 %) at 3 locations and BOD as 'BDL' at 12 monitored locations.
12 I P c1 g e
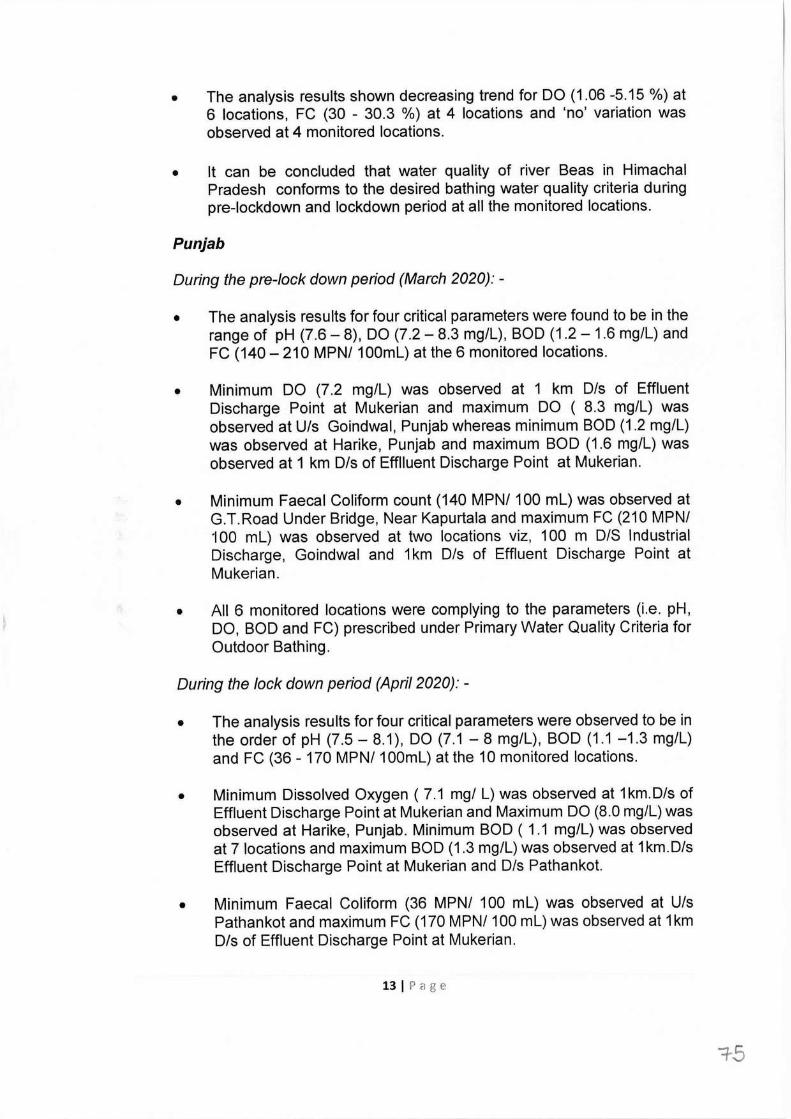
• The analysis results shown decreasing trend for DO (1.06 -5.15 %) at 6 locations, FC (30 - 30.3 %) at 4 locations and 'no' variation was observed at 4 monitored locations.
• It can be concluded that water quality of river Beas in Himachal Pradesh conforms to the desired bathing water quality criteria during pre-lockdown and lockdown period at all the monitored locations.
Punjab
During the pre-lock down period (March 2020): -
• The analysis results for four critical parameters were found to be in the range of pH (7.6 - 8), DO (7.2 - 8.3 mg/l), BOD (1.2 - 1.6 mg/l) and FC (140- 210 MPN/ 100ml) at the 6 monitored locations.
• Minimum DO (7.2 mg/l) was observed at 1 km D/s of Effluent Discharge Point at Mukerian and maximum DO ( 8.3 mg/l) was observed at U/s Goindwal, Punjab whereas minimum BOD (1.2 mg/l) was observed at Harike, Punjab and maximum BOD (1.6 mg/l) was observed at 1 km D/s of Efflluent Discharge Point at Mukerian.
• Minimum Faecal Coliform count (140 MPN/ 100 ml) was observed at G.T.Road Under Bridge, Near Kapurtala and maximum FC (210 MPN/ ·100 ml) was observed at two locations viz, 100 m D/S Industrial Discharge, Goindwal and 1 km D/s of Effluent Discharge Point at Mukerian.
• All 6 monitored locations were complying to the parameters (i.e. pH, DO, BOD and FC) prescribed under Primary Water Quality Criteria for Outdoor Bathing.
During the lock down period (April 2020): -
• The analysis results for four critical parameters were observed to be in the order of pH (7.5 - 8.1), DO (7.1 - 8 mg/l), BOD (1.1 -1.3 mg/l) and FC (36 - 170 MPN/ 100ml) at the 10 monitored locations.
• Minimum Dissolved Oxygen ( 7.1 mg/ l) was observed at 1 km.Dis of Effluent Discharge Point at Mukerian and Maximum DO (8.0 mg/l) was observed at Harike, Punjab. Minimum BOD ( 1.1 mg/l) was observed at 7 locations and maximum BOD (1.3 mg/l) was observed at 1 km.Dis Effluent Discharge Point at Mukerian and D/s Pathankot.
• Minimum Faecal Coliform (36 MPN/ 100 ml) was observed at U/s Pathankot and maximum FC (170 MPN/ 100 ml) was observed at 1km Dis of Effluent Discharge Point at Mukerian.
13 I P n g e
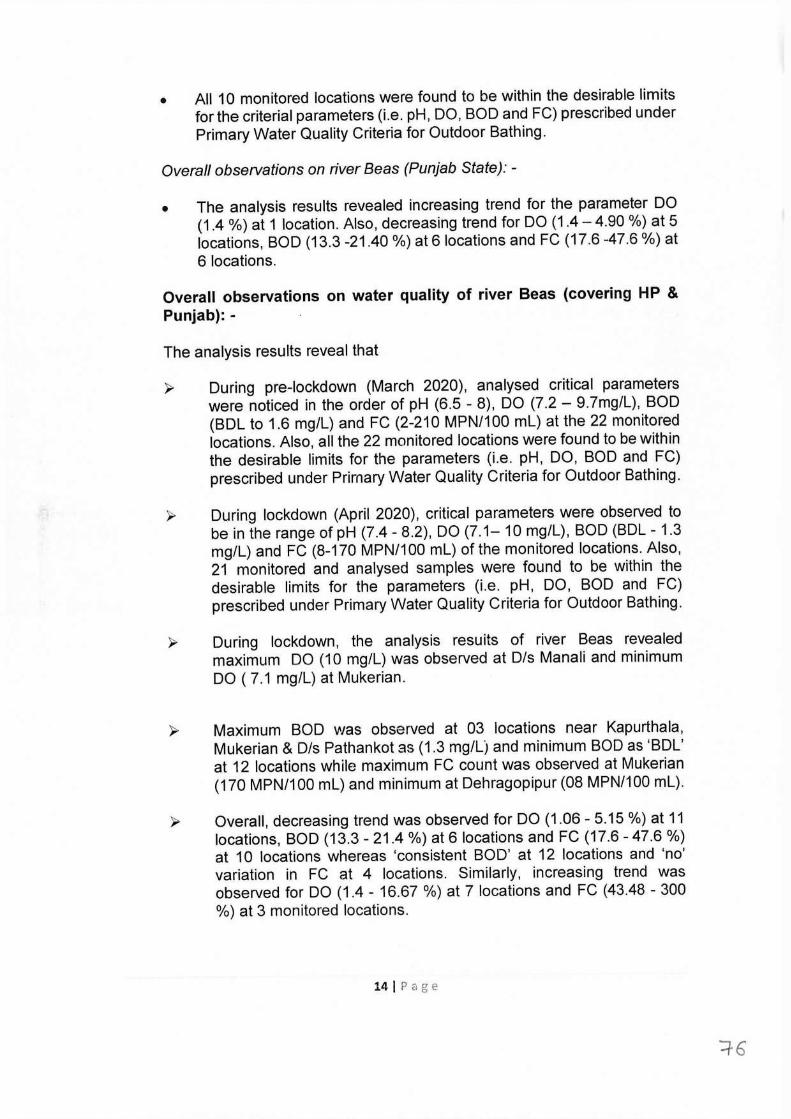
• All 10 monitored locations were found to be within the desirable limits for the criteria! parameters (i.e. pH, DO, BOD and FC) prescribed under Primary Water Quality Criteria for Outdoor Bathing.
Overall observations on river Beas (Punjab State): -
• The analysis results revealed increasing trend for the parameter DO (1.4 %) at 1 location. Also, decreasing trend for DO (1.4 - 4.90 %) at 5 locations, BOD (13.3 -21 .40 %) at 6 locations and FC (17.6 -47.6 %) at 6 locations.
Overall observations on water quality of river Beas (covering HP & Punjab): -
The analysis results reveal that
~ During pre-lockdown (March 2020), analysed critical parameters were noticed in the order of pH (6.5 - 8), DO (7.2 - 9.7mg/l), BOD (BDl to 1.6 mg/l) and FC (2-210 MPN/100 ml) at the 22 monitored locations. Also, all the 22 monitored locations were found to be within the desirable limits for the parameters (i.e. pH, DO, BOD and FC) prescribed under Primary Water Quality Criteria for Outdoor Bathing.
During lockdown (April 2020), critical parameters were observed to be in the range of pH (7.4 - 8.2), DO (7.1-10 mg/l), BOD (BDl - 1.3 mg/l) and FC (8-170 MPN/100 ml) of the monitored locations. Also, 21 monitored and analysed samples were found to be within the desirable limits for the parameters (i.e. pH, DO, BOD and FC) prescribed under Primary Water Quality Criteria for Outdoor Bathing.
During lockdown, the analysis resuits of river Beas revealed maximum DO (10 mg/l) was observed at D/s Manali and minimum DO ( 7 .1 mg/l) at Mukerian.
Maximum BOD was observed at 03 locations near Kapurthala, Mukerian & O/s Pathankot as (1.3 mg/l) and minimum BOD as 'BDl' at 12 locations while maximum FC count was observed at Mukerian (170 MPN/100 ml) and minimum at Dehragopipur (08 MPN/100 ml).
Overall, decreasing trend was observed for DO (1.06-5.15 %) at 11 locations, BOD (13.3 - 21.4 %) at 6 locations and FC (17.6 - 47.6 %) at 10 locations whereas 'consistent BOD' at 12 locations and 'no' variation in FC at 4 locations. Similarly, increasing trend was observed for DO (1.4 - 16.67 %) at 7 locations and FC (43.48 - 300 %) at 3 monitored locations.
14 I r c:1 g e
2.5 Conclusion
All the 22 monitored locations during Pre-lockdown and 21 out of 22 monitored locations during lockdown on river Beas were observed to be complying with the Primary Water Quality Criteria for Outdoor Bathing. During lockdown, 95.45 % compliance was observed in terms of monitored locations for the paramters prescribed under Primary Water Quality Criteria for Outdoor Bathing.
3.0. IMPACT OF LOCKDOWN ON WATER QUALITY OF RIVER SUTLEJ
3.1 Sutlej River
The River Sutlej rises from beyond Indian borders in the Kailash mountain near Mansarover lake from Rakas lake (as Longcchen Khabab river in Tibet). River Sutlej enters India near Mansarover and flows North Westwards. It enters Himachal at Shipkila and flows in the South-Westerly direction and it leaves Himachal Pradesh State to enter the plains of Punjab State at Bhakhra. About 14 km (kilometre) downstream of Bhakra Dam, Nangal, the river takes southern direction. After flowing for another about 50 km, it enters the plains near Ropar in Punjab. The river Sutlej finally reaches Harike where it meets river Beas. During the monsoon period, the river leaves Punjab plains near Ferozepur and finally drains into the river Indus. The tributaries of River Sutlej are river Baspa, Spiti, and Beas. In Himachal Pradesh, river Sutlej passes through Kinnaur, Shimla, Kullu, Solan, Mandi and Bilaspur districts. Its coarse in Himachal Pradesh is 320 km from Rakastal, with the tributaries viz. the river Spiti, Ropa, Taiti, Kashang, Mulgaon, Yula, Wanger, Throng and the Rupi as right bank tributaries, whereas the river Tirung, Gayathing, Baspa, Duling and the Soldang are left bank tributaries. In Punjab, main cities and towns along the river Sutlej are Nangal, Anandpur Sahib, Kiratpur Sahib, Ropar, Kurali, Machhiwara, Ludhiana, Phillaur, Phagwara, Jalandhar, Cantonment Jalandhar, Nawanshahar, Banga and Hoshiarpur. There are two major drains i.e. Buddha Nallah and East Bein, which carry domestic as well as industrial effluents of Ludhiana, Jalandhar, Phagwara, Phillaur, Nawanshahar etc. and merge with river Sutlej at village Wallipur and near village Malsian, respectively. The Buddha Nallah is a non-perennial natural drain of about 51 km length, which traverses about 14 km across Ludhiana city from East to West and finally meets river Sutlej near village Wallipur in district Ludhiana. The total waste water of Ludhiana city discharged into river Sutlej is estimated about 700 MLD which include industrial effluent. East Bein passes through Nawanshahar, Kapurthala and Jalandhar. It is a natural storm water drain which originates near village Bhairon Mazra, District Nawanshahar. After travelling through a length of around 40 km, it passes
15 I Page
through Jalandhar district near village Phadrana. As East Bein traverses through Jalandhar district, number of drains out fall into it. East Bein falls into river Sutlej at Village Mundi Kalan few kilometres upstream of Harike lake.
3.2. Water Quality Monitoring Locations under National Water Quality Monitoring Programme (NWMP)
The Water Quality of river Sutlej is measured at 42 locations by Central Pollution Control Board (CPCB) in association with H.P. State Pollution Control Board (HPPCB) and Punjab Pollution Control Board (PPCB) under National Water Quality Monitoring Programme (NWMP). State-wise Distribution of Water Quality Monitoring Locations under NWMP on River Sutlej is depicted in Figure 3.1.
3.3. Analytical Results
Water quality monitoring of river Sutlej was carried out at 32 locations during pre-lockdown (March 2020) and 23 locations during lockdown period (April 2020) to assess the impact of lock-down on water quality of river Sutlej. Water quality of river Sutlej for Primary Water Quality Criteria for Outdoor Bathing (PWQCOB) parameters viz. Dissolved Oxygen (DO), pH, Biochemical Oxygen Demand (BOD) and Fecal Coliform (FC) are presented in Table-3.1.
Based on the monitoring & analysis of collected water samples from river Sutlej, the graphical presentation of water quality of river Sutlej with respect to DO, pH, BOD and FC as observed during pre-lockdown (March 2020) and lockdown period (April 2020) are presented in Figure 3.2 to Figure 3.9.
16 I Page
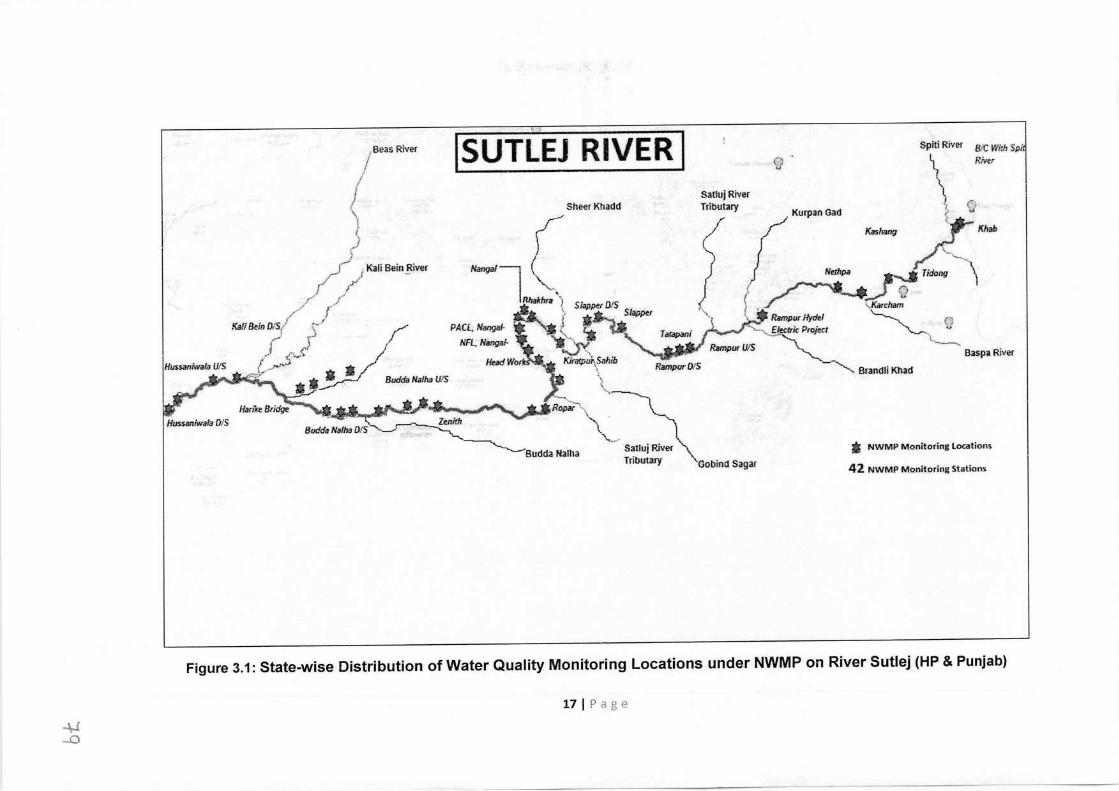
Beas River 1suTLEJ RIVER I
1/ ""' "''" B""' K.a/l&in.7 __ l_ ~) . .
,~. r ft * ~- *- * • . Budda Na/hall.IS
SheerKhadd
( Nanga/- ~
I Rhakhra- 'lJ I Slapper DIS Slapper
PACL, Nangal· t ~.,. NFL,Nangal- "a
Head Wot • Kirat;,Jr\Sahib \ RampurD!S
\_.
0 8!C Wirh Sp· River
Hussaniwafa DIS
Satluj River Tributary
Satluj River Tributa.ry
Gobiod Sagar
Kurpao Gad
Baspa River
* NWMP Monitoring Locations
42 NWMP Monitoring Stations
Figure 3.1: State-wise Distribution of Water Quality Monitoring Locations under NWMP on River Sutlej (HP & Punjab)
17 I Page 4J -0
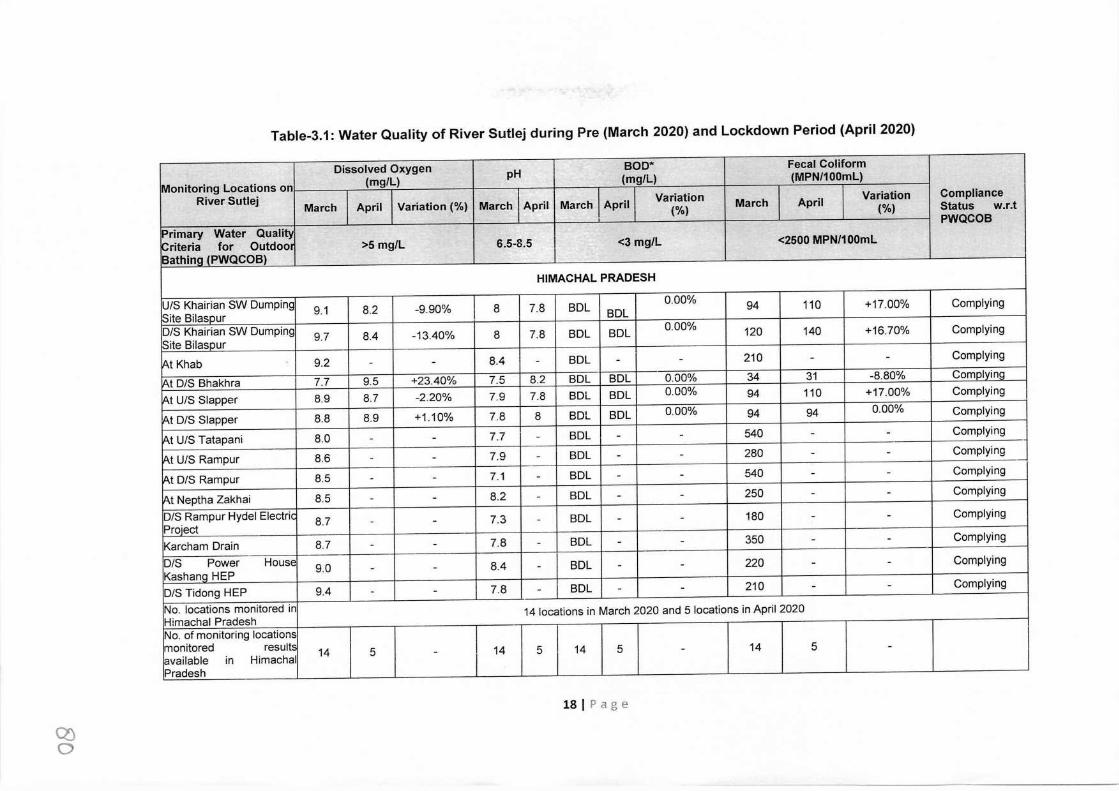
Table-3.1: Water Quality of River Sutlej during Pre {March 2020) and Lockdown Period {April 2020)
Dissolved Oxygen pH BOD* Fecal Coliform
Monitoring Locations on (mg/L) (mg/L) (MPN/100mL)
River Sutlej March April Variation (%) March April March April Variation March April Variation Compliance (%) (%) Status w.r.t
Primary Water Quali~ PWQCOB
Criteria for Outdoor >5 mg/L 6.5-8.5 <3 mg/L <2500 MPN/100mL
Bathinq (PWQCOB) HIMACHAL PRADESH
U/S Khairian SW Dumping 9.1 8.2 -9.90% 8 7.8 BDL 0.00% 94 110 +17.00% Complying
Site Bilasour BDL D/S Khairian SW Dumping 9.7 8.4 -13.40% 8 7.8 BDL BDL 0.00% 120 140 +16.70% Complying ISite Bilasour
!At Khab 9.2 - - 8.4 - BDL - - 210 - - Complying
At D/S Bhakhra 7.7 9.5 +23.40% 7.5 8.2 BDL BDL 0.00% 34 31 -8.80% Comolying
At U/S Slapper 8.9 8.7 -2.20% 7.9 7.8 BDL BDL 0.00% 94 110 +17.00% Complying
At D/S Slapper 8.8 8.9 +1.10% 7.8 8 BDL BDL 0.00% 94 94 0.00% Complying
At U/S Tatapani 8.0 - - 7.7 - BDL - - 540 - - Complying
IAt U/S Rampur 8.6 - - 7.9 - BDL - - 280 - - Complying
IAt D/S Rampur 8.5 - - 7.1 - BDL - - 540 - - Complying
IAt Neptha Zakhai 8.5 - - 8.2 - BDL - - 250 - - Complying
D/S Rampur Hydel Electric 8.7 - - 7.3 - BDL - - 180 - - Complying Project Karcham Drain 8.7 - - 7.8 - BDL - - 350 - - Complying
D/S Power House 9.0 8.4 BDL 220 Complying Kashana HEP
- - - - - - -
D/S Tidong HEP 9.4 - - 7.8 - BDL - - 210 - - Complying
No. locations monitored in 14 locations in March 2020 and 5 locations in April 2020 Himachal Pradesh No. of monitoring locations monitored results 14 5 14 5 14 5 14 5 available in Himachal
- - -
Pradesh
1s I Page
Q) 0
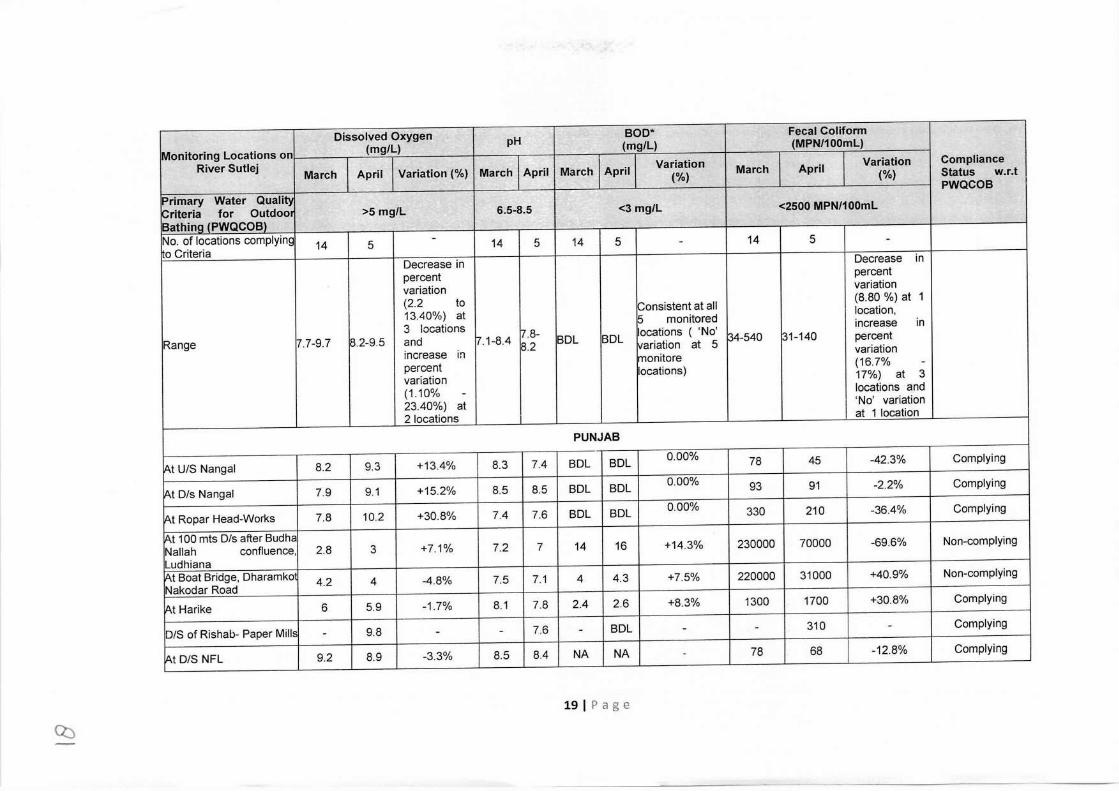
Dissolved Oxygen pH BOD* Fecal Coliform
Monitoring Locations on (mg/L) (mg/L) (MPN/100ml)
River Sutlej March April Variation (%) March April March April Variation March April Variation Compliance (%) (%) Status w.r.t
Primary Water Qualify PWQCOB
Criteria for Outdoor >5 mg/L 6.5-8.5 <3 mg/L <2500 MPN/100ml
Bathing (PWQCOBl No. of locations complying 14 5
- 14 5 14 5 14 5 o Criteria
- -
Decrease in Decrease in
percent percent
variation variation
(2.2 to !Consistent at all (8.80 %) at 1
13.40%) at 15 monitored location,
3 locations 7.8- locations ( 'No' increase in
Range 17.7-9.7 8.2-9.5 and 7.1-8.4 8.2 BDL BDL !variation at 5 34-540 31-140 percent
increase in monitore variation
percent locations) (16.7% -
variation 17%) at 3
(1.10% - locations and
23.40%) at 'No' variation
2 locations at 1 location
PUNJAB
At U/S Nangal 8.2 9.3 +13.4% 8.3 7.4 BDL BDL 0.00% 78 45 -42.3% Complying
At D/s Nangal 7.9 9.1 +15.2% 8.5 8.5 BDL BDL 0.00% 93 91 -2.2% Complying
At Ropar Head-Works 7.8 10.2 +30.8% 7.4 7.6 BDL BDL 0.00% 330 210 -36.4% Complying
At 100 mts D/s after Budha Nallah confluence, 2.8 3 +7.1% 7.2 7 14 16 +14.3% 230000 70000 -69.6% Non-complying
Ludhiana IAt Boat Bridge, Dharamko 4.2 4 -4.8% 7.5 7.1 4 4.3 +7.5% 220000 31000 +40.9% Non-complying Nakodar Road
lA.t Harike 6 5.9 -1.7% 8.1 7.8 2.4 2.6 +8.3% 1300 1700 +30.8% Complying
D/S of Rishab- Paper Mills - 9.8 - - 7.6 - BDL - - 310 - Complying
lA.t D/S NFL 9.2 8.9 -3.3% 8.5 8.4 NA NA 78 68 -12.8% Complying
19 I Page
Cb
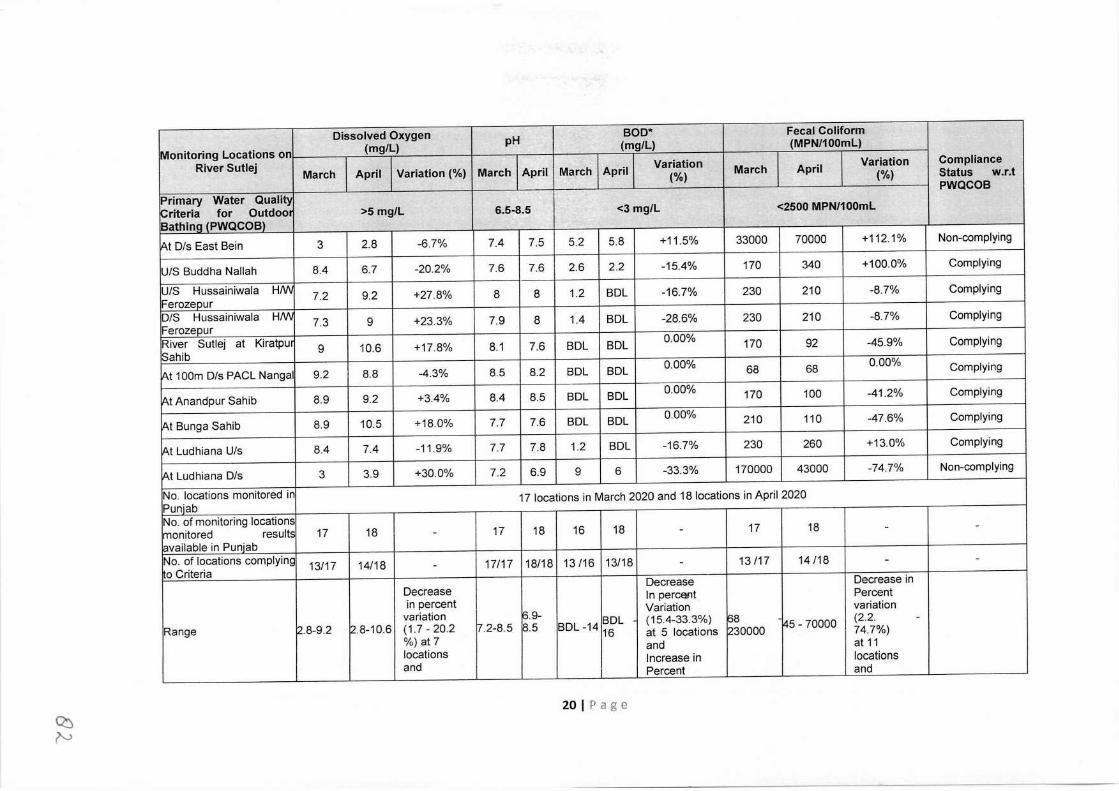
Dissolved Oxygen pH BOD* Fecal Coliform
Monitoring Locations on (mg/L) (mg/L) (MPN/100ml)
River Sutlej March April Variation (%) March April March April Variation March April Variation Compliance (%) (%) Status w.r.t
Primary Water Quality PWQCOB
Criteria for Outdoor >5 mg/L 6.5-8.5 <3 mg/L <2500 MPN/100ml
Bathina f PWQCOB)
~t Dis East Bein 3 2.8 -6.7% 7.4 7.5 5.2 5.8 +11.5% 33000 70000 +112.1% Non-complying
U/S Buddha Nallah 8.4 6.7 -20.2% 7.6 7.6 2.6 2.2 -15.4% 170 340 +100.0% Complying
U/S Hussainiwala HM 7.2 9.2 +27.8% 8 8 1.2 BDL -16.7% 230 210 -8.7% Complying Ferozeour D/S Hussainiwala HMJ 7.3 9 +23.3% 7.9 8 1.4 BDL -28.6% 230 210 -8.7% Complying Ferozepur River Sutlej at Kiratpur 9 10.6 +17.8% 8.1 7.6 BDL BDL
0.00% 170 92 -45.9% Complying Sahib
~t 1 00m D/s PACL Nangal 9.2 8.8 -4.3% 8.5 8.2 BDL BDL 0.00% 68 68 0.00% Complying
At Anandpur Sahib 8.9 9.2 +3.4% 8.4 8.5 BDL BDL 0.00% 170 100 -41.2% Complying
At Sunga Sahib 8.9 10.5 +18.0% 7.7 7.6 BDL BDL 0.00% 210 110 -47.6% Complying
lA.t Ludhiana U/s 8.4 7.4 -11.9% 7.7 7.8 1.2 BDL -16.7% 230 260 +13.0% Complying
At Ludhiana D/s 3 3.9 +30.0% 7.2 6.9 9 6 -33.3% 170000 43000 -74.7% Non-complying
No. locations monitored in 17 locations in March 2020 and 18 locations in April 2020 Puniab No. of monitoring locations monitored results 17 18 - 17 18 16 18 - 17 18 - -
available in Puniab No. of locations complying 13/17 14/18 - 17/17 18/18 13 /16 13/18 - 13 /17 14 /18 - - o Criteria
Decrease Decrease Decrease in In percent Percent
in percent Variation variation variation 6.9- BDL (15.4-33.3%) 68 (2.2. -
Range 2.8-9.2 2.8-10.6 (1.7-20.2 7.2-8.5 8.5 BDL -14 16 at 5 locations 230000 45 - 70000 74.7%)
%) at 7 and at 11 locations Increase in locations and Percent and
20 I Page Cc ?'v
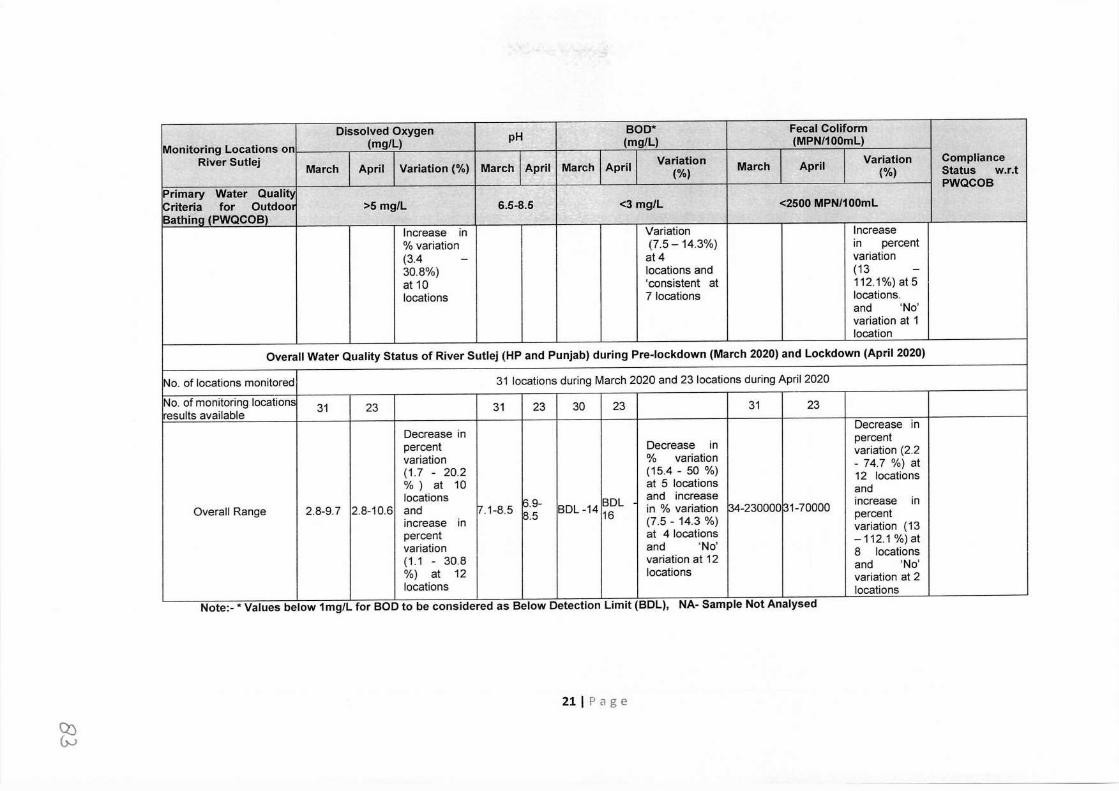
Dissolved Oxygen pH BOD* Fecal Coliform
Monitoring Locations on (mg/L) (mg/L) (MPN/100ml)
River Sutlej March April Variation (%) March April March April Variation March April Variation Compliance (%) (%) Status w.r.t
Primary Water Qualify PWQCOB
Criteria for outdoor >5 mg/L 6.5-8.5 <3 mg/L <2500 MPN/100ml Bathina (PWQCOB)
Increase in Variation Increase % variation (7.5 - 14.3%) in percent (3.4 - at 4 variation 30.8%) locations and (13 - at 10 'consistent at 112.1%)at5 locations 7 locations locations.
and 'No' variation at 1 location
Overall Water Quality Status of River Sutlej (HP and Punjab) during Pre-lockdown (March 2020) and Lockdown (April 2020)
No. of locations monitored 31 locations during March 2020 and 23 locations during April 2020
No. of monitoring locations 31 23 31 23 30 23 31 23 results available
Decrease in Decrease in
percent Decrease in percent
variation % variation variation (2.2
(1.7 - 20.2 (15.4 - 50 %) - 74.7 %) at 12 locations
%) at 10 at 5 locations and locations !3.9- BDL and increase increase in
Overall Range 2.8-9.7 2.8-10.6 and 17.1-8.5 ~-5 BDL -14 16 in % variation ~-230000 t31-70000 percent
increase in (7.5 - 14.3 %) variation ( 13 percent at 4 locations -112.1%)at variation and 'No' 8 locations (1.1 - 30.8 variation at 12 and 'No' %) at 12 locations variation at 2 locations locations
Note:-* Values below 1 mg/L for BOD to be considered as Below Detection Limit (BDL), NA- Sample Not Analysed
21 I Page
~
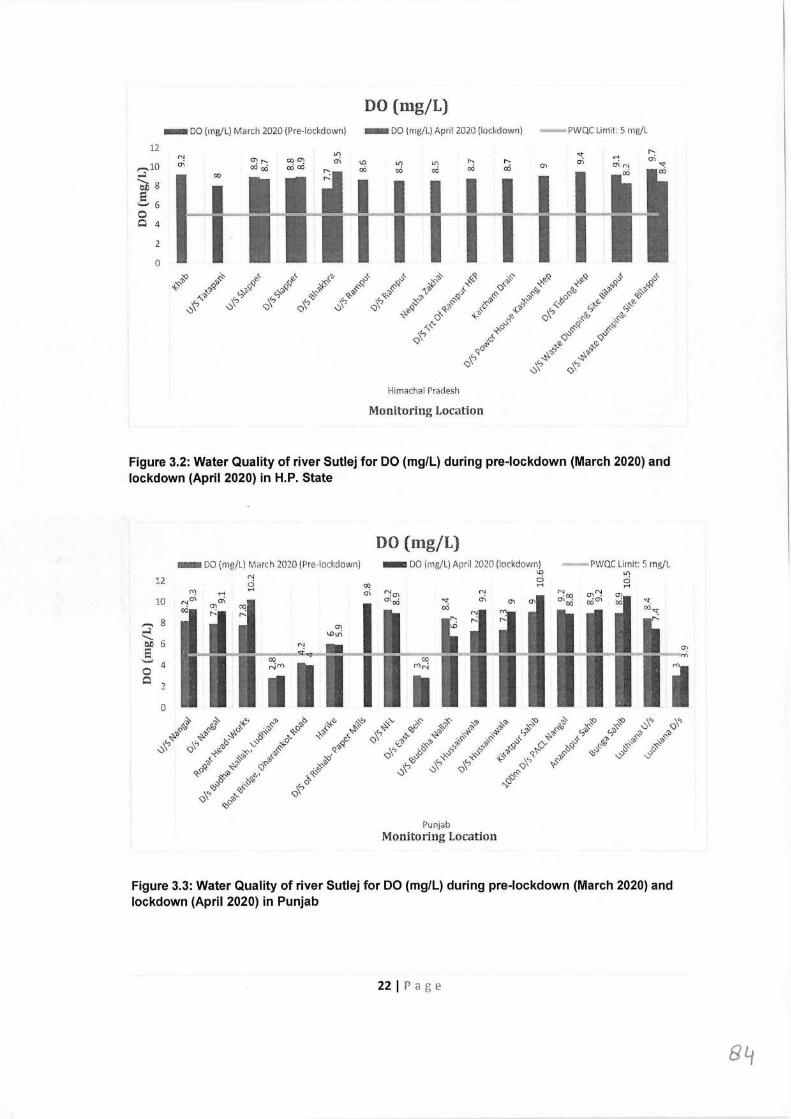
DO (111g/L) - DO (mg/L) March 2020 (Pre-lockdown)
12
,....._10 ,-l
bi 8 .§, 6 0 Q 4
2
0
N a;
- DO {rng/L) April 2020 (lockdown) -PWQC Limit: 5 rng/L
LI)
cxi Lf1 co
Himachal Pradesh
" co
Monitoring Location
Figure 3.2: Water Quality of river Sutlej for DO (mg/L) during pre-lockdown (March 2020) and lockdown (April 2020) in H.P. State
1.2
10
- DO (rng/L) March 2020 (Pre-lockdown) N ci .....
DO (mg/L) -. DO (mg/L) April 2020 (lockdown)
co ci -~ -PWQC Limit: 5 mg/L
Lf1 ci .....
,..... 8 ,-l ....._ tl.O 6 s ._, 0 4
Q 2
0
Punjab Monitoring Location
Figure 3.3: Water Quality of river Sutlej for DO (mg/L) during pre-lockdown (March 2020) and lockdown (April 2020) in Punjab
22 I Page
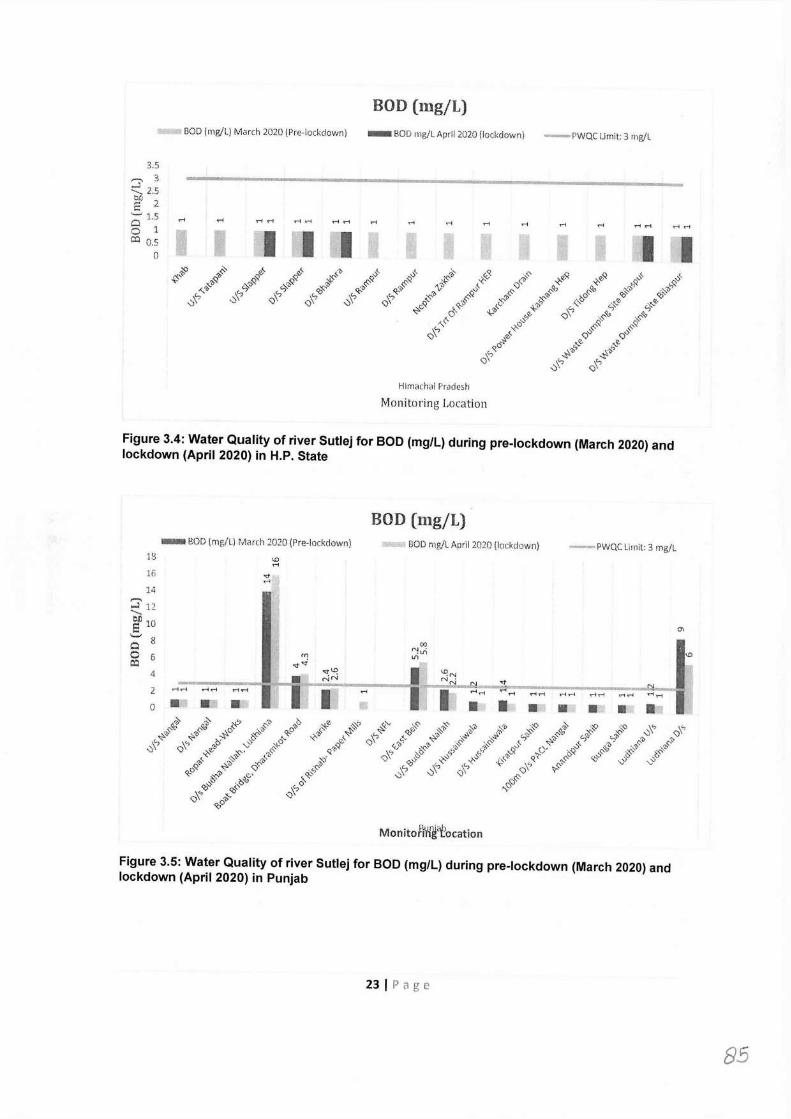
BOD (mg/L) BOD (mg/l.) March 2020 (Pre-lockclown) - BOD mg/L April 2020 (lockdown) -PWQC Limit: 3 mg/L
3.5 ,-., 3 ::::. 2.S eo 2 E __, 1.5
rl rl rl rl rl rl rl rl ..... rl rl ~· rl rl rl rl 0 0 1 I I I I I co 0.5
()
Himacha) Pradesh
Monitoring Location
Figure 3.4: Water Quality of river Sutlej for BOD (mg/L) during pre-lockdown (March 2020) and lockdown (April 2020) in H.P. State
BOD (mg/L) - BOD (mg/L) March 2020 (Pre-lockdown) BOD mg/L April 2020 (lockdown)
13
16
-PWQC Limit: 3 mg/L
14 ...... ~ 12 Ef 10
°' C 8
1· 0 00 "' . • LI) 0 6 ,,,
Lil ~ "'"' "'"' I "'"' 4 • NN NN " --'l! 2 rlrl rl rl rl..-< I I I rl I I rlrl "" ..... .......... Mrl .......... ..... ..... ......... I 0 • • • • I • fll • • •
Mon ito fiWtf ocation
Figure 3.5: Water Quality of river Sutlej for BOD (mg/L) during pre-lockdown (March 2020) and lockdown (April 2020) in Punjab
23 I Page
85
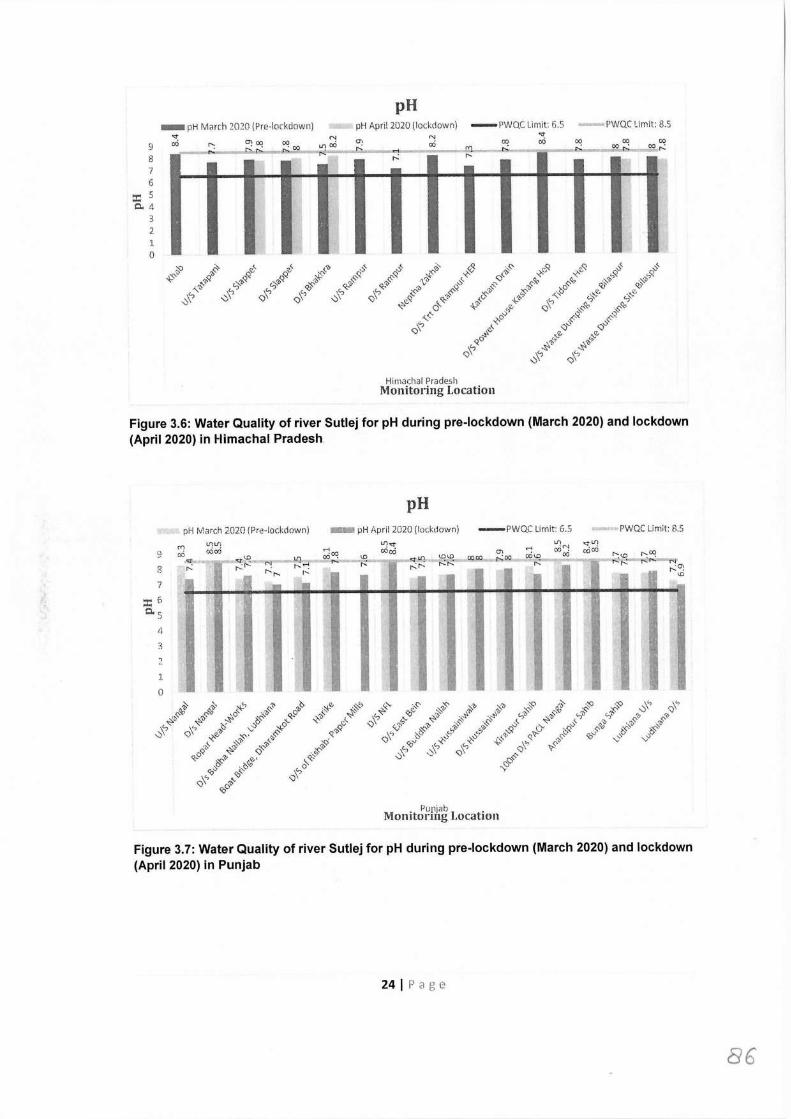
9 8 7 6
::e 5 0.. 4
3 2 1 0
- pH March 2020 (Pre-lockdown) st eo r-... 0:00 00
pH pH April 2020 (lockdown) -PWOC Limit: 6.5
st 00 00
PWQC Limit: 8.5
00
"" - , 00 ,.;:...,, - .... ~,..;, 00 r,; 00
..: r--
I
00 00 ..:
Himachal Pradesh Monitoring Location
Figure 3.6: Water Quality of river Sutlej for pH during pre-lockdown (March 2020) and lockdown (April 2020) in Himachal Pradesh.
pH pH March 2020 (Pre-lockdown) - pH April 2020 (lockdown) -PWQC Limit: 6.5 PWQC Umit: 8.5
9
8 7
::e 6 C. 5
4 3 2
l
0
rl ·oo _cor-,..:
Punjab Monitormg Location
Figure 3.7: Water Quality of river Sutlej for pH during pre-lockdown (March 2020) and lockdown (April 2020) in Punjab
24 I Page
86
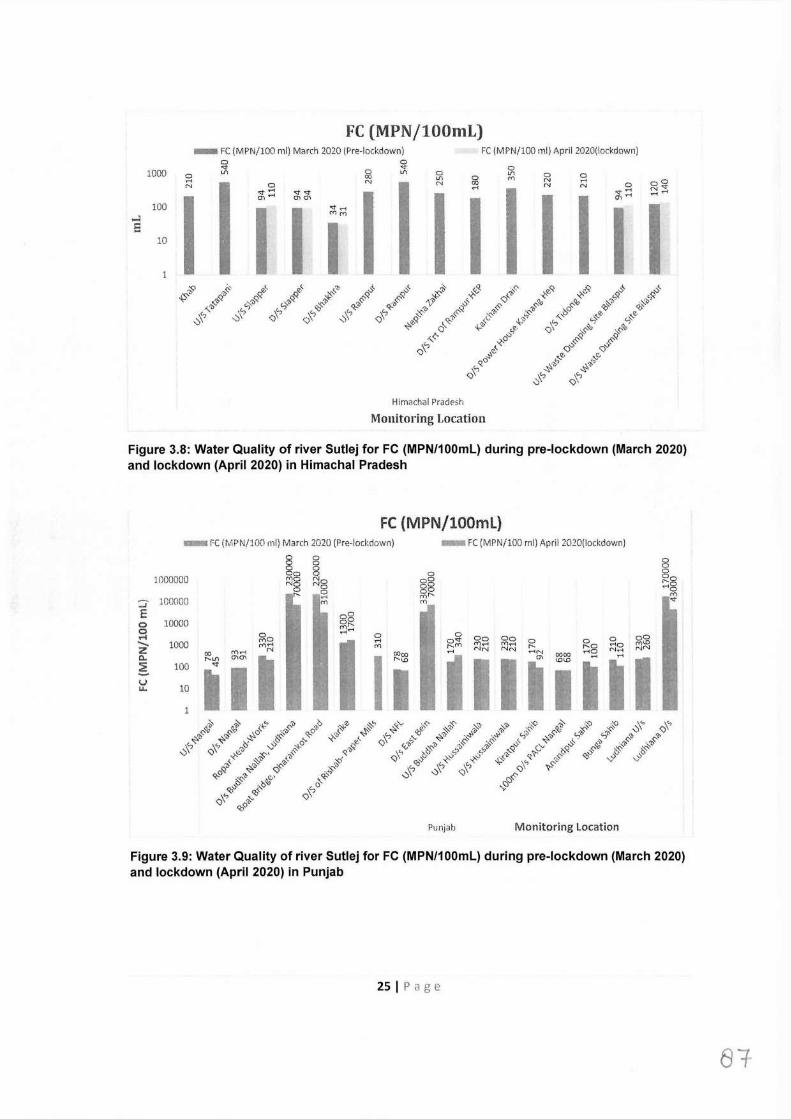
FC (MPN/l00mL) - FC (MPN/100 ml) March 2020 (Pre-lockdown) FC (MPN/100 ml) April 2020(Iockdown)
0 0 '<t
0 " 0 1000 s LI\ Vl 0 Vl 0 0 o:J Vl 0 M N rl N 0 N N CX) N N 0 oO
rl N ST ,...-a " '<t
I " rl rl rl
I en .-a en en
I I I en ,...
100
I I "rl
I I ,-l """' s I 10
Himachal Pradesh
Monitoring Location
Figure 3.8: Water Quality of river Sutlej for FC (MPN/100mL) during pre-lockdown (March 2020) and lockdown (April 2020) in Himachal Pradesh
FC (MPN/lOOmL) - FC (MPN/100 ml) March 2020 (Pre-lockdown) - re (MPN/100 rnl) April 2020(Iockdown)
1000000
::; 100000 E o 10000 ~ z' 1000 0.. ! 100
~ 10
~o Mrl
iii
0 0 0 oo MO NO 0
"
§ 0 NO NO 0 rl M
g8 ..,,:::;
I ii iiiliiii Punjab Monitoring Location
Figure 3.9: Water Quality of river Sutlej for FC (MPN/100mL) during pre-lockdown (March 2020) and lockdown (April 2020) in Punjab
25 I Page
3.4. Observations
Based on the analytical results of the samples collected from river Sutlej, following findings/observations are made:
Himachal Pradesh
During the pre-lock down period (March 2020): -
• The analysis results revealed four critical parameters are in the order of pH (7.1 - 8.4), DO (7.7 - 9.7 mg/l), BOD (BDl mg/l) and FC (34 - 540 MPN/ 100ml) at the 14 monitored locations.
• Maximum Dissolved Oxygen (9.7 mg/l) was observed at D/s Khairian Solid Waste Dumping Site Bilaspur and minimum DO ( 7.7 mg/l) was at D/s Bhakra and BOD (BDl) was consistatnt at all the 14 monitored locations whereas minium Faecal Coliform count was observed (34 MPN/ 100 ml) at D/s Bhakra and maximum FC (540 MPN/100 ml) observed at U/s Tatapani and D/s Rampur.
• All the 14 monitored locations were observed to be within desirable limits for the parameters (i.e. pH, DO, BOD and FC) prescribed under Primary Water Quality Criteria for Outdoor Bathing.
During the lock down period (April 2020):-
• The analysis results of four critical parameters indicates pH (7.8 - 8.2), DO (8.2 - 9.5 mg/l), BOD (BDl mg/l) and FC (31-140 MPN/ 100ml) at the 5 monitored locations.
• Maximum DO (9.5 mg/l) was observed at D/s Bhakra and minimum DO (8.2 mg/l) was observed at U/s Khairian Solid Waste Dumping Site Bilaspur whereas BOD (BDl mg/l) was observed at all the 5 monitored locations.
• Minimum FC (31 MPN/100 ml) was observed at D/s Bhakra and maximum FC (140 MPN/100 ml) was observed at D/s Khairian Solid Waste Dumping Site Bilaspur.
• All the 5 monitored locations were found to be complying to the parameters (i.e. pH, DO, BOD and FC) prescribed under Primary Water Quality Criteria for Outdoor Bathing.
26 I Page
Overall Observations (Himacha/ Pradesh):-
• The analysis results revealed decreasing trend for the parameters i.e., DO (2.2 -13.40 %) at 3 locations, FC (8.8 %) at 1 location while increasing trend were shown for the parameters i.e., DO (1.1-23.40 %) at 2 locations, FC (16.7-17 %) at3 locations
• 'No' variation in FC at one location and consistent 'BOD' at all the 5 monitored locations were noticed.
Punjab
During the pre-lock down period (March 2020):-
• The analysis results for four critical parameters were found to be in the order of pH (7.2 - 8.5), DO (2.8 - 9.2 mg/L), BOD (BDL -14 mg/L) and FC (68- 230000 MPN/ 100ml) at the 18 monitored locations.
• Minimum Dissolved Oxygen (2.8 mg/L) was observed at 100 m D/s after Budha Nallah confluence (clearly confirms main source of pollution from Budha Nallah carrying untreated/partially treated wastewater from Ludhiana) and maximum DO (9.2 mg/L) was observed at 100m D/s PACL Nangal which indicates no discharge from the industry).
• Minimum BOD (BDL mg/L) was observed at 7 monitored locations (viz, U/s Nangal, Dis Nangal, Ropar Head-Works, D/s NFL, Kiratpur Sahib, 100m Dis PACL Nangal & Anandpur Sahib) and maximum BOD (14.0 mg/L) was observed at 100 m D/s after Bud ha Nallah confluence, Ludhiana, which is the main source of pollution in river Sutlej.
• Minimum Faecal Coliform count (68 MPN/ 100 ml), was observed at 100 m D/s PACL Nangal and maximum FC (230000 MPN/100 ml) was observed at 100 m D/s after Bud ha Nallah confluence, Ludhiana, which indicates untreated sewage discharge through Budha Nallah generated from Ludhiana.
• 13 monitored locations were found to be within the desirable limits for the parameters prescribed under Primary Water Quality Criteria for Outdoor Bathing whereas pH was complying at all the 17 monitored locations.
21 I Page
09
During the lock down period (April 2020):-
• The analysis results for four critical parameters found to be in the order of pH (6.9 - 8.5), DO (2.8 - 10.6 mg/L), BOD (BDL- 16 mg/L) and FC (45 - 70000 MPN/ 100ml) at the 18 monitored locations. 13 out of 18 monitored locations were complying to the parameters (i.e. DO, BOD and FC).
• Minimum DO (2.8 mg/L) was observed at 100 m D/s after E.Bein and maximum DO (10.6 mg/L) was observed at Kiratpur Sahib whereas BOD (BDL mg/L) was observed at 11 locations (viz, U/s Nangal, D/s Nangal, Ropar Head-Works, D/s of Rishab- Paper Mills, U/s and U/s Hussainiwala Head Works, Ferozepur, Kiratpur Sahib, 1 00m D/s PACL Nangal, Anandpur Sahib, Sunga Sahib & at Ludhiana U/s) and maximum BOD (16.0 mg/L) was observed at 100 mts D/s after Budha Nallah confluence, Ludhiana, which is the main source of pollution.
• Minimum FC (45 MPN/100 ml) was observed at U/s Nangal and maximum FC (70000 MPN/100 ml) was observed at 100 m D/s after Budha Nallah confluence, Ludhiana, which indicates contamination due to municipal sewage from Ludhiana through Budha Nallah.
Overall Observations (Punjab): -
• The analysis results of the monitored locations shown decreasing trend for the parameters i.e., DO (1.7 -20.2 %) at 7 locations, BOD (15.4 - 33.33 %) at 7 locations and FC (2.2 -74.7 %) at 11 locations whereas increasing trend were shown for the parameters i.e., DO (3.4-30.78 %) at 10 locations, BOD (7.5 -14.3 %) at 4 locations, FC (13-112.1 %) at 5 locations.
• 'No' variation was observed in FC at one location and consistent 'BOD was observed at 7 locations.
Overall Observations on River Sutlej (covering Himachal Pradesh and Punjab):-
~ During Pre-lockdown period (March 2020), the analysis results of four critical parameters were observed to be in the order of pH (7.1 - 8.5), DO (2.8 - 9.7 mg/L), BOD (BDL - 14 mg/L) and FC (34 - 230000 MPN/ 100ml) at the 31 monitored locations. 27 monitored locations were found to be within the desirable limits for the parameters (i.e. pH, DO, BOD and FC) prescribed under Primary Water Quality Criteria for Outdoor Bathing.
28 I Page
90
During lockdown period (April 2020), the analysis results of four critical parameters were observed to be in the order of pH (6.9 - 8.5), DO (2.8-10.6mg/L), BOD (BDL-16 mg/L) and FC (31-70000 MPN/ 100ml) at 23 monitored locations. 18 monitored locations were observed to be complying with the Outdoor Bathing Primary Water Quality Criteria.
During lockdown, on rver Sutlej, maximum DO was observed at Kiratpur Sahib (10.6 mg/L)) and minimum at Dis East Bein (2.8 mg/l). Maximum BOD was observed at 0/s Budha Nallah (16.0 mg/l) and minimum as 'BDl' at 16 locations while maximum FC count was observed at two (02) locations i.e., D/s Bud ha Nall ah and D/s East Bein (70000 MPN/100 ml) and minimum FC (31 MPN/100 ml) at Dis Bhakra.
Decreasing trend were shown for DO (1.7 - 20.2 %) at 10 monitored locations, BOD (15.4 - 50 %) at 7 locations and FC (2.2 - 74.7 %) at 12 monitored locations.
Increasing trend was observed for DO (1.1 - 30.8 %) at 12 locations, BOD (7.5 -14.3 %) at4 locations and FC (13-112.1 %) at 8 locations.
'No' variation in FC at 2 locations and consistent 'BOD' at 12 monitored locations were observed.
3.5 Conclusion
27 out of 31 monitored locations during pre-lockdown (March 2020) and 18 out of 23 monitored locations during lockdown (April 2020) were found to be within desirable limits for the parameters (i.e. pH, DO, BOD and FC) prescribed under Primary Water Quality Criteria for Outdoor Bathing.
Water Quality of river Sutlej marginally deteriorated during the lockdown period which may be due to inadequate infrastructure for treatment of generated municipal sewage in the catchment of river Sutlej.
Also, 78.3 % of compliance in terms of monitored locations for the paramters prescribed under Primary Water Quality Criteria for Outdoor Bathing was observed during lockdown.
29 I Page
91
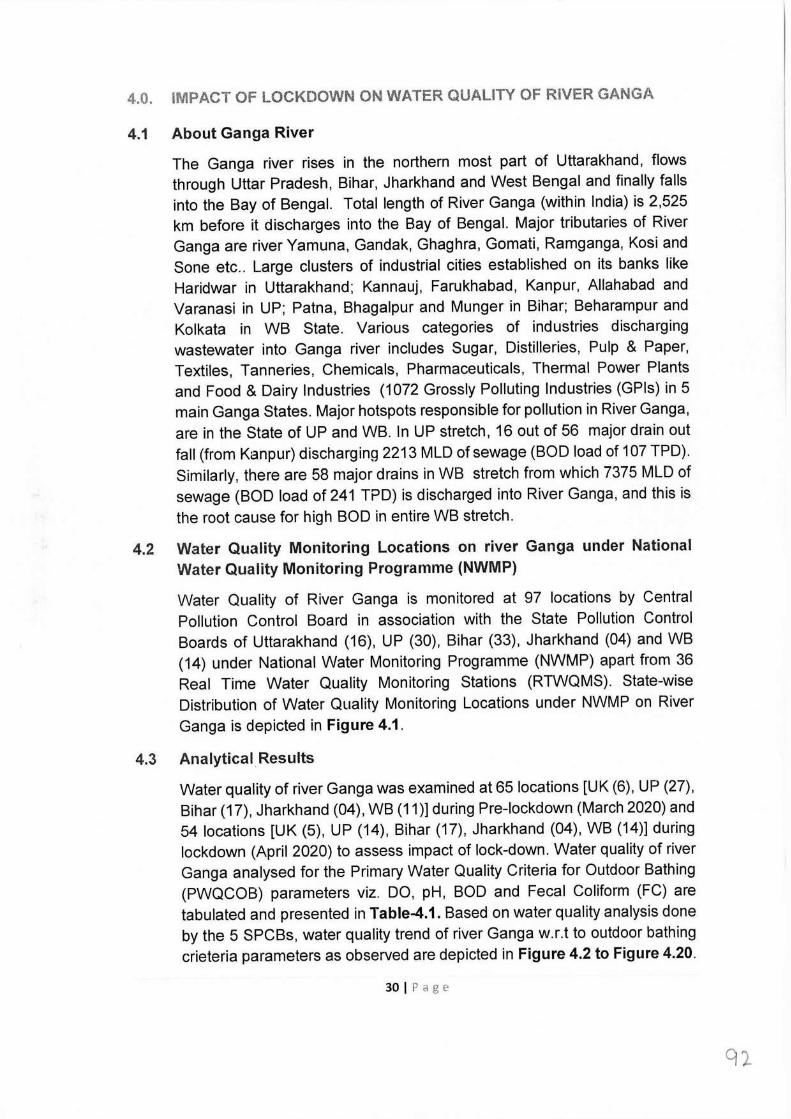
4.0. IMPACT OF LOCKDOWN ON WATER QUALITY OF RIVER GANGA
4.1 About Ganga River
The Ganga river rises in the northern most part of Uttarakhand, flows through Uttar Pradesh, Bihar, Jharkhand and West Bengal and finally falls into the Bay of Bengal. Total length of River Ganga (within India) is 2,525 km before it discharges into the Bay of Bengal. Major tributaries of River Ganga are river Yamuna, Gandak, Ghaghra, Gomati, Ramganga, Kasi and Sane etc .. Large clusters of industrial cities established on its banks like Haridwar in Uttarakhand; Kannauj, Farukhabad, Kanpur, Allahabad and Varanasi in UP; Patna, Bhagalpur and Munger in Bihar; Behararnpur and Kolkata in WB State. Various categories of industries discharging wastewater into. Ganga river includes Sugar, Distilleries, Pulp & Paper, Textiles, Tanneries, Chemicals, Pharmaceuticals, Thermal Power Plants and Food & Dairy Industries (1072 Grossly Polluting Industries (GPls) in 5 main Ganga States. Major hotspots responsible for pollution in River Ganga, are in the State of UP and WB. In UP stretch, 16 out of 56 major drain out fall (from Kanpur) discharging 2213 MLD of sewage (BOD load of 107 TPD). Similarly, there are 58 major drains in WB stretch from which 7375 MLD of sewage (BOD load of 241 TPD) is discharged into River Ganga, and this is the root cause for high BOD in entire WB stretch.
4.2 Water Quality Monitoring Locations on river Ganga under National Water Quality Monitoring Programme (NWMP)
Water Quality of River Ganga is monitored at 97 locations by Central Pollution Control Board in association with the State Pollution Control Boards of Uttarakhand (16), UP (30), Bihar (33), Jharkhand (04) and WB (14) under National Water Monitoring Programme (NWMP) apart from 36 Real Time Water Quality Monitoring Stations (RTWQMS). State-wise Distribution of Water Quality Monitoring Locations under NWMP on River Ganga is depicted in Figure 4.1.
4.3 Analytical.Results
Water quality of river Ganga was examined at 65 locations [UK (6), UP (27), Bihar (17), Jharkhand (04), WB (11)] during Pre-lockdown (March 2020) and 54 locations [UK (5), UP (14), Bihar (17), Jharkhand (04), WB (14)] during lockdown (April 2020) to assess impact of lock-down. Water quality of river Ganga analysed for the Primary Water Quality Criteria for Outdoor Bathing (PWQCOB) parameters viz. DO, pH, BOD and Fecal Coliform (FC) are tabulated and presented in Table-4.1. Based on water quality analysis done by the 5 SPCBs, water quality trend of river Ganga w.r.t to outdoor bathing crieteria parameters as observed are depicted in Figure 4.2 to Figure 4.20.
30 I Page
91
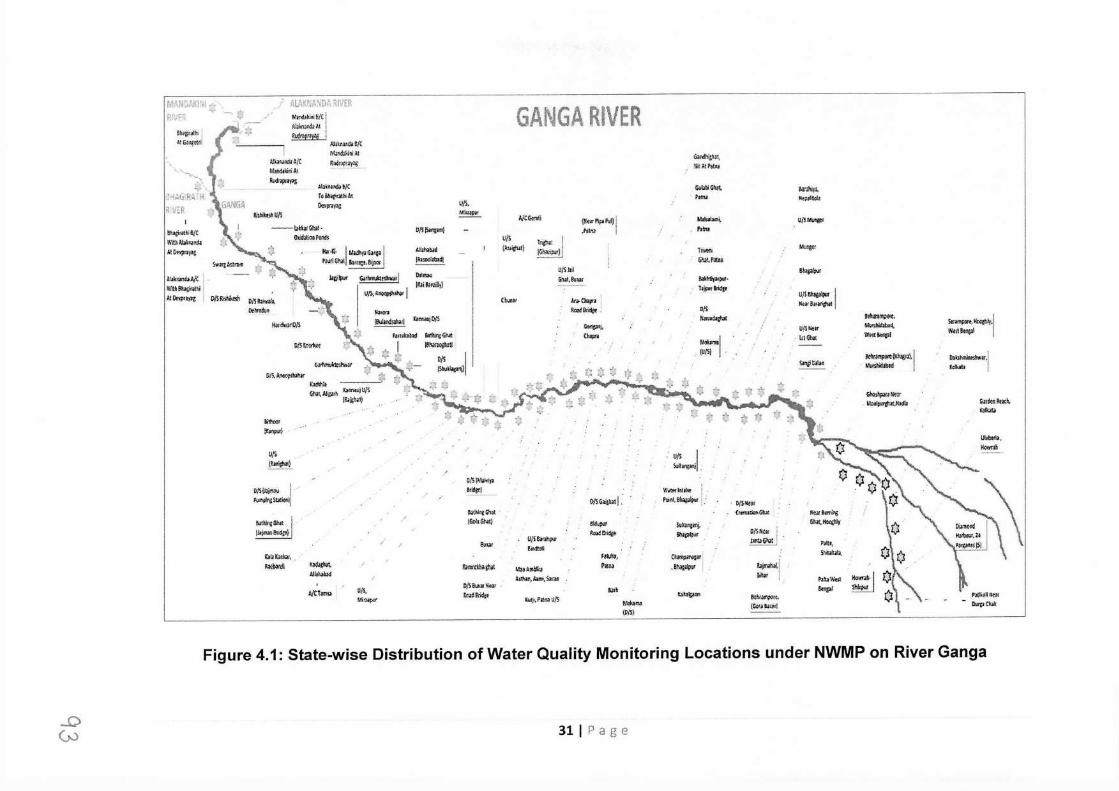
MMC,,Kr,1 •• .. P.,T
Bhilpr,Jlti .\tG~i1fe!fi
.41.A~I;~ \[),~ ,!;,rn l.il1~1t.iniB/Ci Abw:J.l.\1 ! Ru!r.>f~Y¥ !
14ii,-,,o,!/(
GANGA RIVER
·-. •' y, J~AG R4 H ~ VtR
~!ud1itWS/C Vtti>Jal11~ At~1r;J;
.1.'l:J~n!UA/( t1ta:i)dlkil'.i.\l Rudnp,ip:
~rid~oi.\l R~r.lPl'.l'f~
Abt11,!!ld.llJC roil!,r,atl'A.\1 Deol.-:r.iro
~sJ,;to!hU/l
--uth1Gt1>1- 0J.'(!:ilt9otondi
!<,,-fl. j 1.1,Jhy,G>,1• ! ,.,,i.ti.1J11,,,.;,.Bij,orl
1,,,1p .. ~,k.und.l.;<'. Vtd:b Bh,pfllili Al Ohpr,m OMilllikah D/l R,Jw.>i,,
Otll td!i"
H.lti:ft-12:0lS
0/11\ffl :,ml
.AlbhaWd
'"'""'b"I °'"""'
Ufi. """"'...,., I IVJi J:r<,11J) "''"""'kl......,1
tblOf'i IB14r4"11arl b,-jO/S
Dnripsi, Ch.Jpra
0/S !t>-:.i.< ,
GJth~t1,1r 0/;,Anacr,bl'!,r
K>tt.hli Ghit, Al\;,r!t bnNuj IJ/5
,,,~1,1j
li1!,o,,
!~111~1
U/'> (R,ni'"'t)
I O/SIJ:ijf!IJU I •• .,..s.., ... ,, MhintGrnt ll:tjlrw 8116;ti}
/ /
KataK.:tka1,. i.tbortli Klrl>M
All>\ab,d
A/CT,rnu a,'S, Mi:npcr
U/S, MIUi,)llf
Ckunar
,1/CGcoo
V/S (~"i(iul}
1nou: I fG_~y;ir)/
(Nnr!JipP-i:IJj ,ht.'\1 !
U/lliJ Gh•l,9\lUf
Afa.Cti:tpt, RcadBr~;
Gindhi;~J1, Nii\tP--4iftil
C.,b~ ... ~ 5.lllhirl,
''"' Nf~ll~t, - U/l""""" h!:,,
Mtlntet Trilffi Gl-.>t.P.nN
II~ &il<h1iy.,pur- hi,P¥1ridp
U/!Sl!Ji> lpur I Nut k•"V"I o/5
,,11.11l!lflOl'e. fur1Jd1tfw 1,'kr,:hidtbid, U/1,Nur WHta..pl •l<IGh>! Mokn,
1 --
. (U/SI it!l!"'1> ... ~"11Jl,1 5'i\;iCJI» •lmhid•btd
r• , .. rt J- ~.~t; !J {": ,A., r:- _,.._ ..,.
·;:"'!' Gho~tr«:x '· .. ___, 11..-aipl.lrgt.lit1''Jlfia
S••mi:crt,liooth~., Wu~!are,1
DabhEnal tsJNur,J Kclk.ob I
U/5 I /
S..ll"""j.
D,lll1'1iMy, llid(,,I Wo1twl111,i.e, I.
0/lGaij>atj. Foiot,Bh.,j,lp,, !: ·0/Sllttr S41)if11:£hil . CrnitiatiGl!.ls: llt¥1fflw\; (GoLIGNt) ,i;,.~ Solanc,rii, GhJt,"'°'11lr ,,...s,~ Sfl1pl;ur 0/SNcai (
81,w U/S61flhpiJr J>lll>Gl\lt! Pilt11 iio;jl .. 1,._ .. _
F•OJh11 CUmp,~.v .r.lmrtlh,glilt '-UtAll"~ft.J P1ti\i ,&Njilpi, t,j,NN(I
AitNI\ Aw,Siun C(ll,t
h!t.lW<tt Ho ... h·j D/S81.11.u Stll a,,h S..pl lh.,., too1diridtt li.l r,:,P~naU/S
bh~M Be:htim'¢rt. P/dl.N (G0t,1&a11,1 (D/5)
GarkflRnt~ Koll®
Ukll:tri1, ;towr,ah
P)llii,111i1C"JI Du,pCUI
Figure 4.1: State-wise Distribution of Water Quality Monitoring Locations under NWMP on River Ganga
-0 (,-) 31 I Page
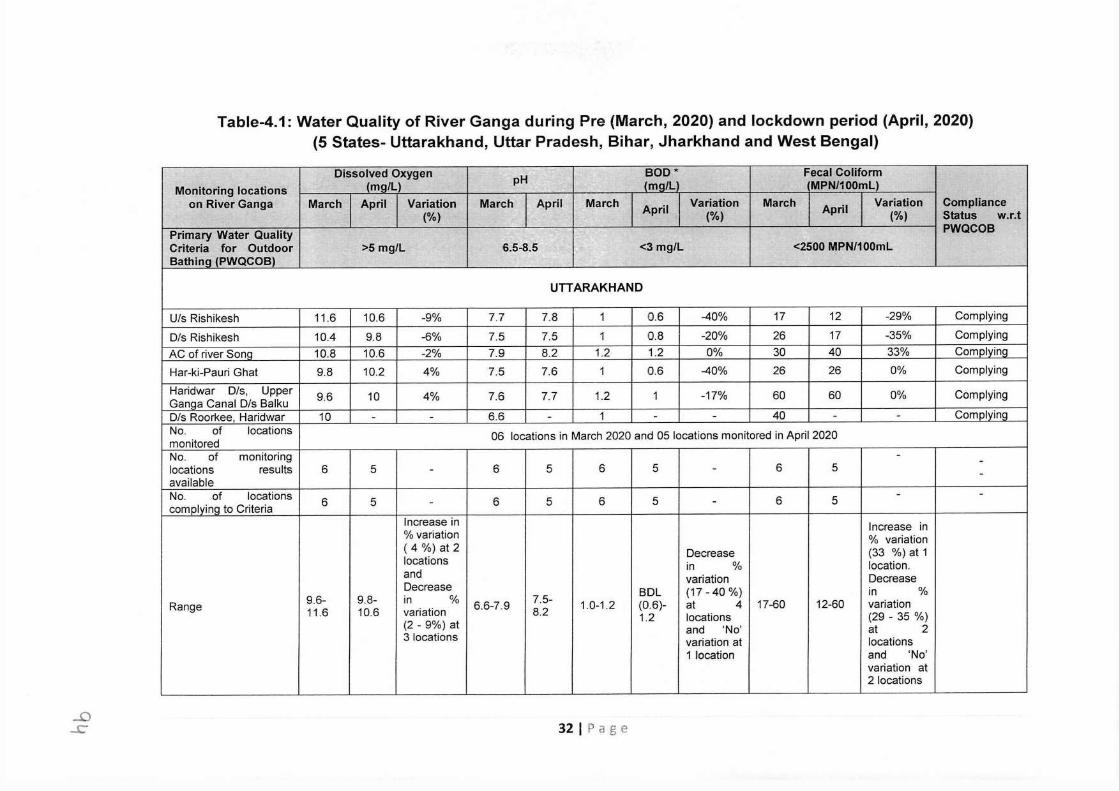
Table-4.1: Water Quality of River Ganga during Pre (March, 2020) and lockdown period (April, 2020) (5 States- Uttarakhand, Uttar Pradesh, Bihar, Jharkhand and West Bengal)
Dissolved Oxygen pH BOD" Fecal Coliform Monitoring locations (mg/L (mf.1/L MPN/100ml)
on River Ganga March April Variation March April March April Variation March April Variation Compliance (%) (%) (%) Status w.r.t
Primary Water Quality PWQCOB
Criteria for Outdoor >5 mg/L 6.5-8.5 <3 mg/L <2500 MPN/100ml Bathinq (PWQCOB)
UTTARAKHAND
U/s Rishikesh 11.6 10.6 -9% 7.7 7.8 1 0.6 -40% 17 12 -29% Complying
D/s Rishikesh 10.4 9.8 -6% 7.5 7.5 1 0.8 -20% 26 17 -35% Complying
AC of river Sona 10.8 10.6 -2% 7.9 8.2 1.2 1.2 0% 30 40 33% Cornolvinq
Har-ki-Pauri Ghat 9.8 10.2 4% 7.5 7.6 1 0.6 -40% 26 26 0% Complying
Haridwar D/s, Upper 9.6 10 4% 7.6 7.7 1.2 1 -17% 60 60 0% Complying Ganaa Canal D/s Balku D/s Roorkee, Haridwar 10 - - 6.6 - 1 - - 40 - - Comolying No. of locations 06 locations in March 2020 and 05 locations monitored in April 2020 monitored No. of monitoring - locations results 6 5 6 5 6 5 6 5 - - - available
- No. of locations 6 5 6 5 6 5 6 5 - - complvinq to Criteria - -
Increase in Increase in % variation ( 4 %) at 2
% variation
locations Decrease (33 %) at 1
and in % location. variation Decrease
Decrease BDL (17-40 %) in % 9.6- 9.8- in % 7.5-
Range 11.6 10.6 variation 6.6-7.9 8.2 1.0-1.2 (0.6)- at 4 17-60 12-60 variation
(2 - 9%) at 1.2 locations (29 - 35 %) and 'No' at 2
3 locations variation at locations 1 location and 'No'
variation at 2 locations
...0 ...c- 32 I Page
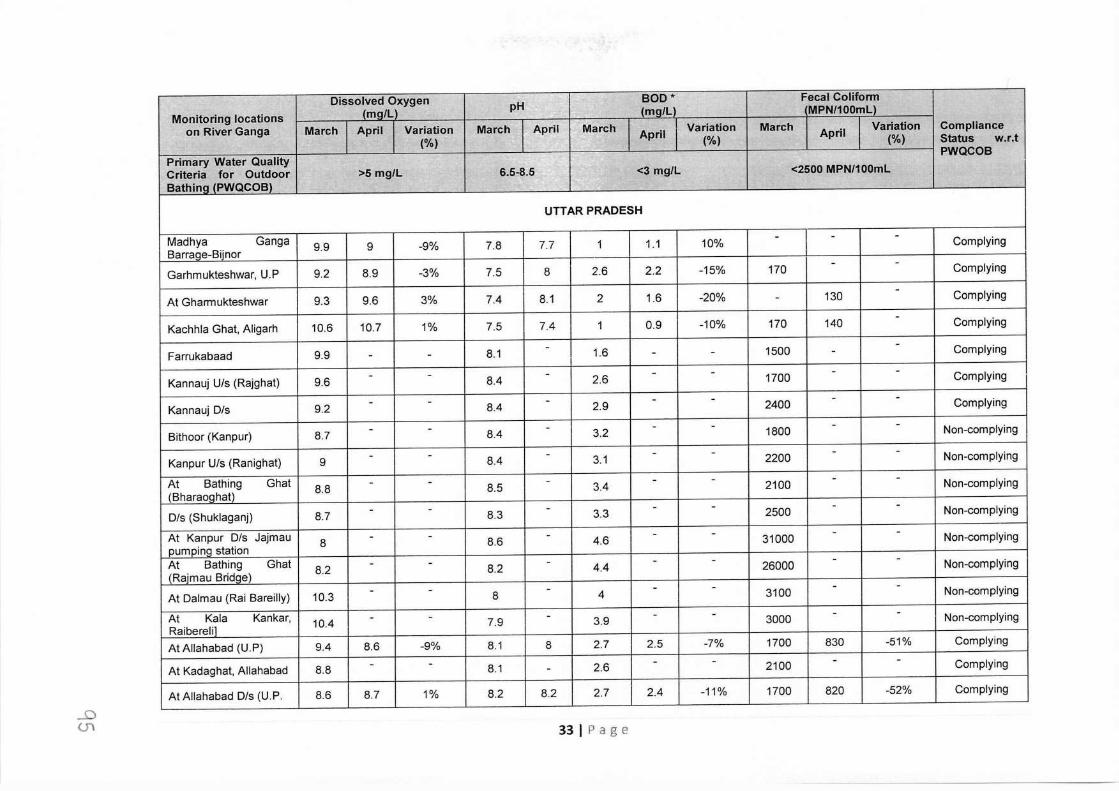
_o (Ji
Dissolved Oxygen pH BOD" Fecal Coliform
Monitoring locations (mall) (mg/L MPN/100mU
on River Ganga March April Variation March April March April Variation March April Variation Compliance (%) (%) (%) Status w.r.t
Primary Water Quality PWQCOB
Criteria for Outdoor >5 mg/L 6.5-8.5 <3 mg/L <2500 MPN/100ml Bathlnq (PWQCOBl
UTTAR PRADESH
Madhya Ganga 9.9 9 -9% 7.8 7.7 1 1.1 10% - - - Complying Barrage-Biinor
Garhmukteshwar, U.P 9.2 8.9 -3% 7.5 8 2.6 2.2 -15% 170 - - Complying
At Gharmukteshwar 9.3 9.6 3% 7.4 8.1 2 1.6 -20% 130 - Complying -
Kachhla Ghat, Aligarh 10.6 10.7 1% 7.5 7.4 1 0.9 -10% 170 140 - Complying
Farrukabaad 9.9 8.1 - 1.6 1500
- Complying - - - - -
Kannauj U/s (Rajghat) 9.6 - - 8.4
- 2.6 - - 1700 - - Complying
Kannauj Dis 9.2 - - 8.4 - 2.9
- - 2400 - - Complying
Bithoor (Kanpur) 8.7 - - 8.4 - 3.2 - - 1800 - - Non-complying
Kanpur U/s (Ranighat) 9 - - 8.4 - 3.1 - - 2200 - - Non-complying
At Bathing Ghat 8.8 - - 8.5 - 3.4
- - 2100 - - Non-complying
(Bharaoahat)
D/s (Shuklaganj) 8.7 - - 8.3 - 3.3
- - 2500 - - Non-complying
At Kanpur D/s Jajmau 8 - - 8.6
- 4.6 - - 31000 - - Non-complying
pumping station At Bathing Ghat 8.2
- - 8.2 - 4.4 - - 26000
- - Non-complying (Rajmau Bridae)
At Dalmau (Rai Bareilly) 10.3 - - 8 - 4
- - 3100 - - Non-complying
At Kala Kankar, 10.4 - - 7.9 - 3.9 - - 3000 - - Non-complying
Raiberelil At Allahabad (U.P) 9.4 8.6 -9% 8.1 8 2.7 2.5 -7% 1700 830 -51% Complying
At Kadaghat, Allahabad 8.8 - - 8.1 2.6 - - 2100 - - Complying -
At Allahabad D/s (U.P. 8.6 8.7 1% 8.2 8.2 2.7 2.4 -11% 1700 820 -52% Complying
33 I Page
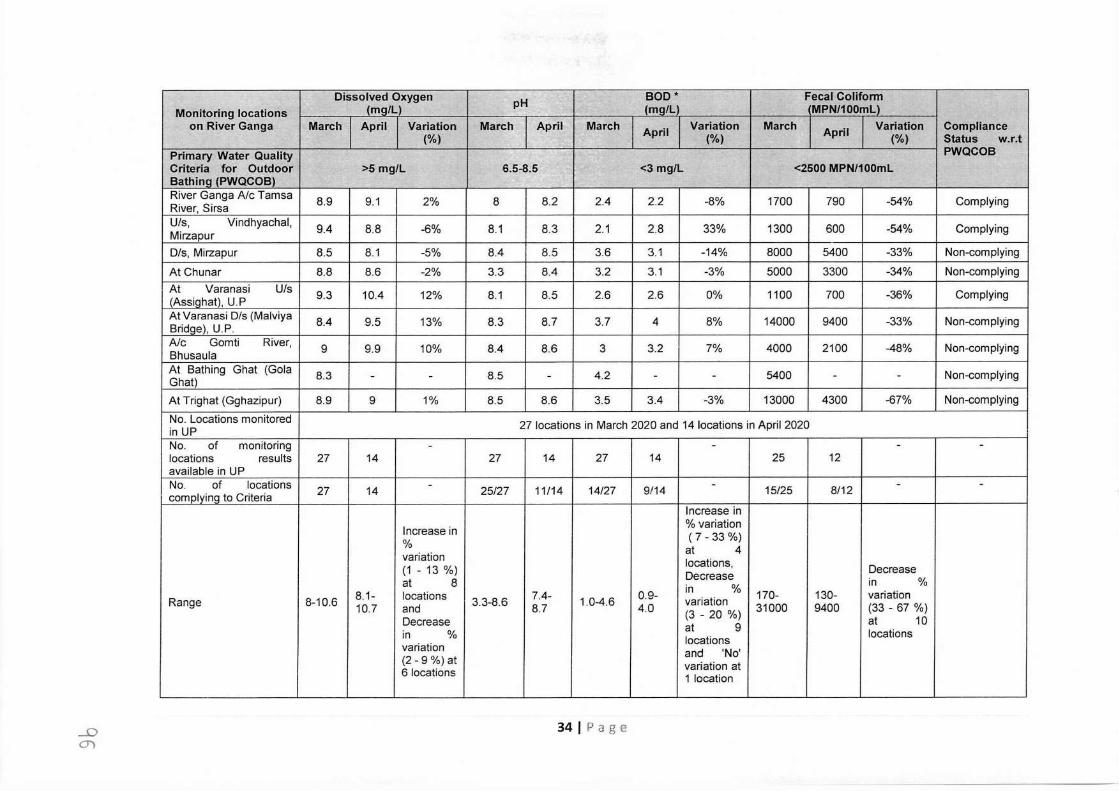
Dissolved Oxygen pH BOD* Fecal Colifonn Monitoring locations (mg/L) (mg/L MPN/100mL)
on River Ganga March April Variation March April March April Variation March April Variation Compliance (%) (%) (%) Status w.r.t
Primary Water Quality PWQCOB Criteria for Outdoor >5 mg/L 6.5-8.5 <3 mg/L <2500 MPN/100mL Bathing (PWQCOB) River Ganga A/c Tamsa 8.9 9.1 2% 8 8.2 2.4 2.2 -8% 1700 790 -54% Complying River, Sirsa U/s, Vindhyachal, 9.4 8.8 -6% 8.1 8.3 2.1 2.8 33% 1300 600 -54% Complying Mirzapur D/s, Mirzapur 8.5 8.1 -5% 8.4 8.5 3.6 3.1 -14% 8000 5400 -33% Non-complying
At Chunar 8.8 8.6 -2% 3.3 8.4 3.2 3.1 -3% 5000 3300 -34% Non-complying At Varanasi U/s 9.3 10.4 12% 8.1 8.5 2.6 2.6 0% 1100 700 -36% Complying (Assiqhat), U.P At Varanasi D/s (Malviya 8.4 9.5 13% 8.3 8.7 3.7 4 8% 14000 9400 -33% Non-complying Bridge), U.P. A/c Gomti River, 9 9.9 10% 8.4 8.6 3 3.2 7% 4000 2100 -48% Non-complying Bhusaula At Bathing Ghat (Gola 8.3 - - 8.5 - 4.2 - - 5400 - - Non-complying Ghat)
At Trighat (Gghazipur) 8.9 9 1% 8.5 8.6 3.5 3.4 -3% 13000 4300 -67% Non-complying
No. Locations monitored 27 locations in March 2020 and 14 locations in April 2020 in UP No. of monitoring - - - - locations results 27 14 27 14 27 14 25 12 available in UP No. of locations - 11/14 14/27 9/14 - 15/25 8/12 - - complying to Criteria 27 14 25/27
Increase in
Increase in % variation
% ( 7 - 33 %) at 4 variation locations, (1 - 13 %) Decrease Decrease
at 8 in % in %
Range 8-10.6 8.1- locations 3.3-8.6 7.4- 1.0-4.6 0.9- variation 170- 130- variation 10.7 and 8.7 4.0 31000 9400 (33 - 67 %)
Decrease (3 - 20 %) at 10 in % at 9 locations locations variation and 'No' (2 - 9 %) at variation at 6 locations 1 location
_o en
34 I Page
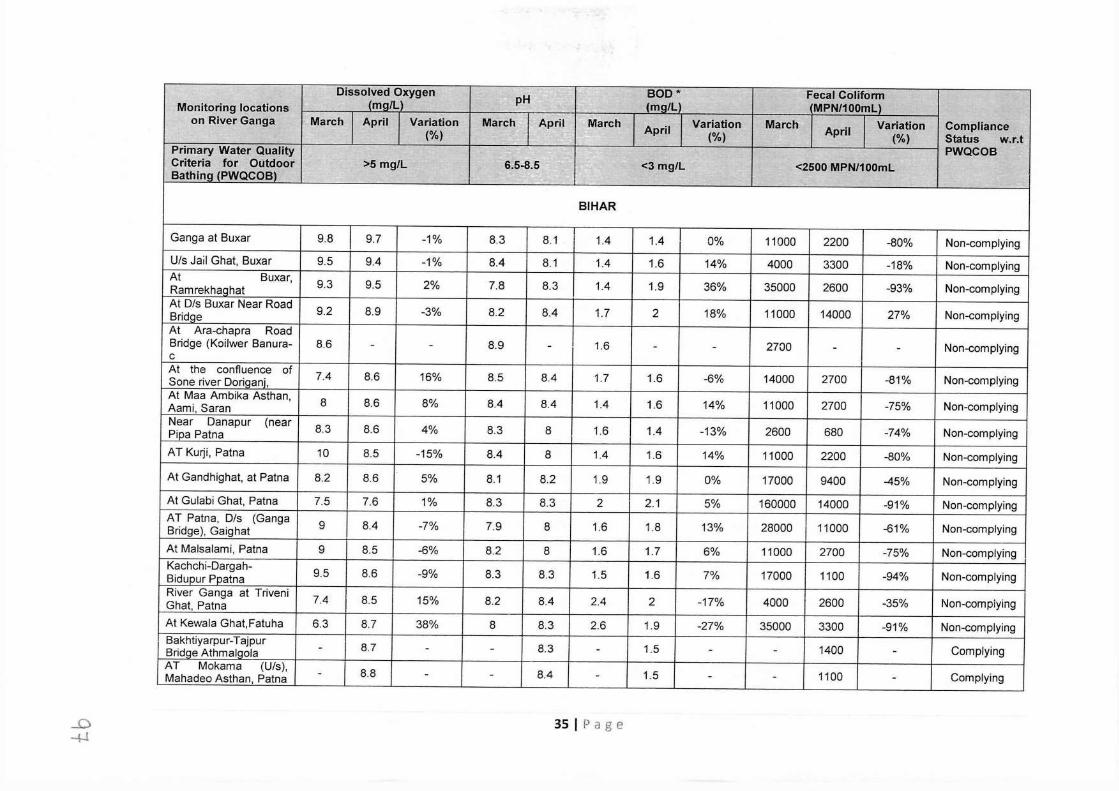
Dissolved Oxygen pH BOD" Fecal Colifonn Monitoring locations (mg/L) (ma/L (MPN/100mL)
on River Ganga March April Variation March April March April Variation March April Variation Compliance (%) (%) (%) Status w.r.t
Primary Water Quality . PWQCOB Criteria for Outdoor >5 mg/L 6.5-8.5 · <3 mg/L <2500 MPN/100ml Bathing (PWQCOB)
BIHAR
Ganga at Buxar 9.8 9.7 -1% 8.3 8.1 1.4 1.4 0% 11000 2200 -80% Non-complying U/s Jail Ghat, Buxar 9.5 9.4 -1% 8.4 8.1 1.4 1.6 14% 4000 3300 -18% Non-complying At Buxar, 9.3 9.5 2% 7.8 8.3 1.4 1.9 36% 35000 2600 -93% Non-com plying Ramrekhaghat At Dis Buxar Near Road
9.2 8.9 -3% 8.2 8.4 1.7 2 18% 11000 14000 27% Non-compiying Bridge At Ara-chapra Road Bridge (Koilwer Banura- 8.6 - - 8.9 - 1.6 - - 2700 - - Non-complying C
At the confluence of 7.4 8.6 16% 8.5 8.4 1.7 1.6 -6% 14000 2700 -81% Non-com plying Sane river Dorigani, At Maa Ambika Asthan,
8 8.6 8% 8.4 8.4 1.4 1.6 14% 11000 2700 -75% Non-com plying Aami, Saran Near Danapur (near 8.3 8.6 4% 8.3 8 1.6 1.4 -13% 2600 680 -74% Non-complying Pipa Patna AT Kurji, Patna 10 8.5 -15% 8.4 8 1.4 1.6 14% 11000 2200 -80% Non-complying
At Gandhighat, at Patna 8.2 8.6 5% 8.1 8.2 1.9 1.9 0% 17000 9400 -45% Non-complying
At Gulabi Ghat, Patna 7.5 7.6 1% 8.3 8.3 2 2.1 5% 160000 14000 -91% Non-complying AT Patna, Dis (Ganga
9 8.4 -7% 7.9 8 1.6 1.8 13% 28000 11000 -61% Non-complying Bridge), Gaighat
At Malsalami, Patna 9 8.5 -6% 8.2 8 1.6 1.7 6% 11000 2700 -75% Non-complying Kachchi-Dargah-
9.5 8.6 -9% 8.3 8.3 1.5 1.6 7% 17000 1100 -94% Non-complying Biduour Ppatna River Ganga at Triveni 7.4 8.5 15% 8.2 8.4 2.4 2 -17% 4000 2600 -35% Non-compiying Ghat, Patna At Kewala Ghat,Fatuha 6.3 8.7 38% 8 8.3 2.6 1.9 -27% 35000 3300 -91% Non-complying Bakhtiyarpur-Tajpur - 8.7 - - 8.3 - 1.5 - - 1400 - Complying Bridge Athmalqola AT Mokama (U/s),
8.8 8.4 1.5 1100 Complying Mahadeo Asthan, Patna - - - - - - -
_o -+I
35 I Page
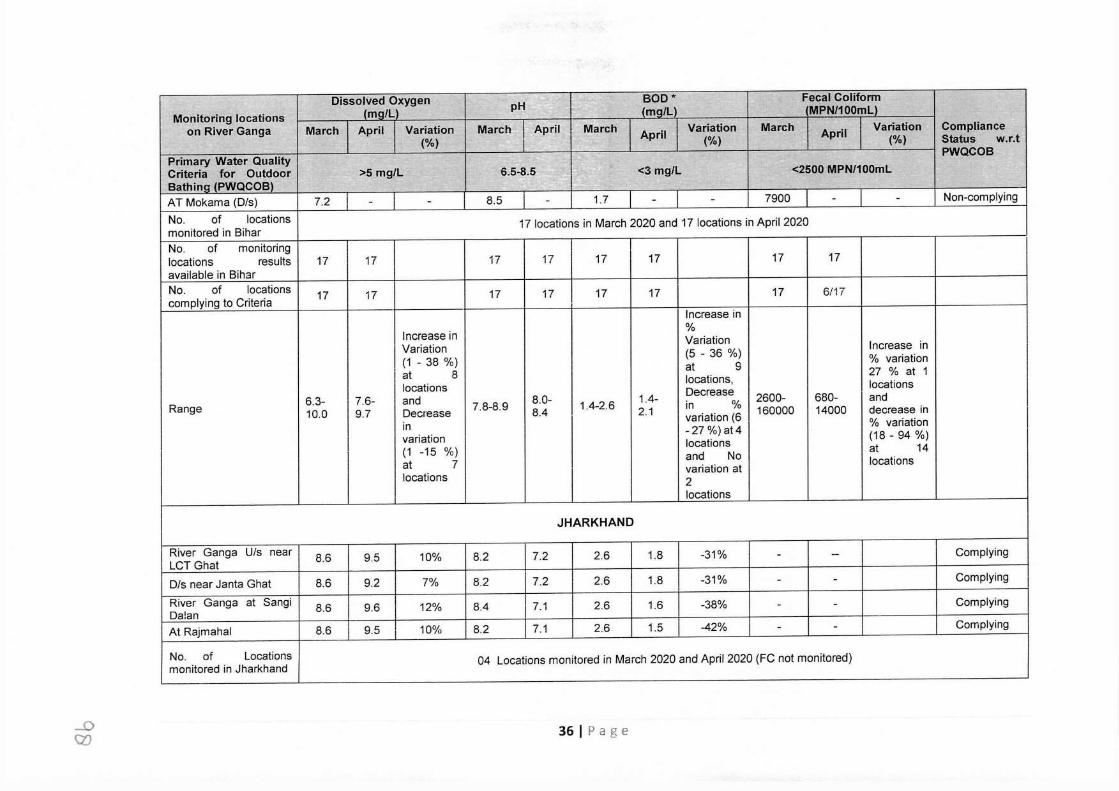
Dissolved Oxygen I ~ BOD" Fecal Colifonn pH -
Monitoring locations (mg/L fmg/L MPN/100ml)
on River Ganga March April Variation March April March April Variation March April Variation Compliance (%) (%) (%) Status w.r.t
Primary Water Quality PWQCOB
Criteria for Outdoor >5 mg/L 6.5-8.5 ~·- <3 mg/L <2500 MPN/100ml Bathinci IPWQCOBl AT Mokama (D/s) 7.2 - - 8.5 - 1.7 - - 7900 - - Non-complying
No. of locations 17 locations in March 2020 and 17 locations in April 2020 monitored in Bihar No. of monitoring locations results 17 17 17 17 17 17 17 17 available in Bihar No. of locations 17 17 17 17 17 17 17 6/17 complying to Criteria
Increase in
Increase in %
Variation Variation Increase in
(1 - 38 %) (5 - 36 %) % variation at 9
at 8 locations, 27 % at 1
locations locations 6.3- 7.6- and 8.0- 1.4- Decrease 2600- 680- and
Range 10.0 9.7 Decrease 7.8-8.9 8.4 1.4-2.6 2.1 in % 160000 14000 decrease in in
variation (6 % variation variation
-27 %) at4 (18 - 94 %) locations
(1 -15 %) and No at 14
at 7 variation at locations
locations 2 locations
JHARKHAND
River Ganga U/s near 8.6 9.5 10% 8.2 7.2 2.6 1.8 -31% - - Complying LCT Ghat
D/s near Janta Ghat 8.6 9.2 7% 8.2 7.2 2.6 1.8 -31% - - Complying
River Ganga at Sangi 8.6 9.6 12% 8.4 7.1 2.6 1.6 -38% - - Complying Da!an At Rajmahal 8.6 9.5 10% 8.2 7.1 2.6 1.5 42% - - Complying
No. of Locations 04 Locations monitored in March 2020 and April 2020 (FC not monitored) monitored in Jharkhand
_o Q'.)
36 I Page
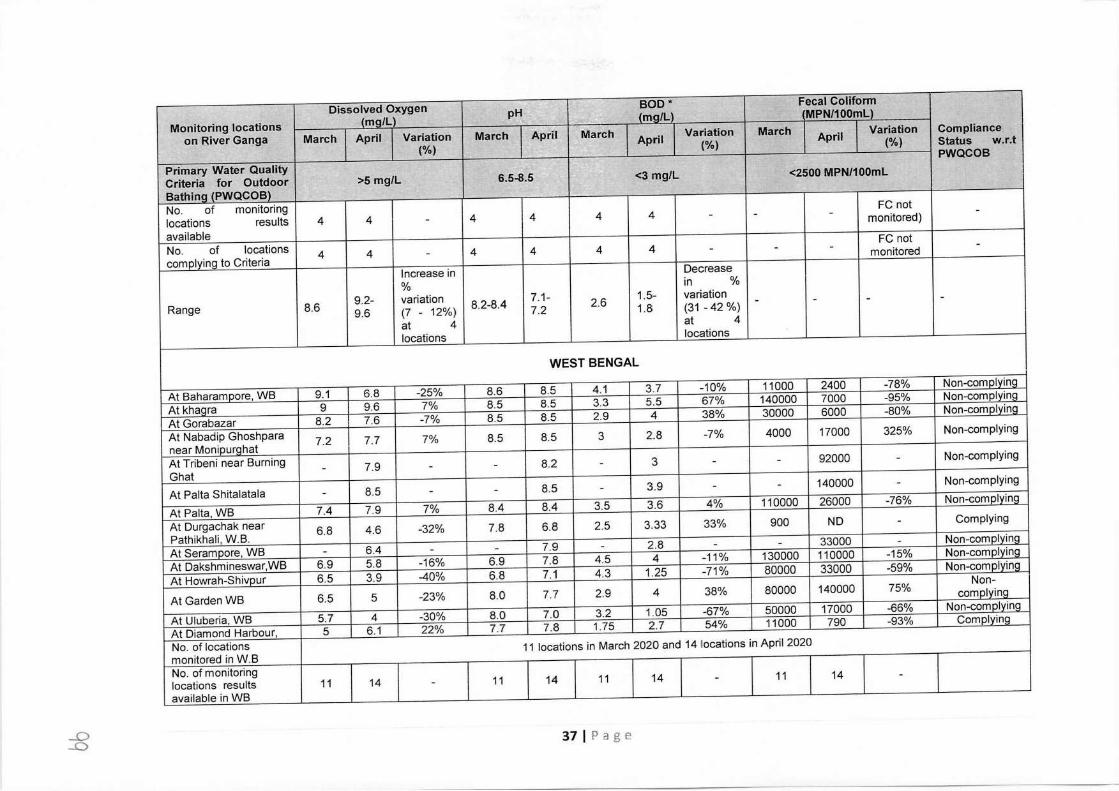
Dissolved Oxygen pH BOD* Fecal Colifonn
Monitoring locations (mq/L) (mq/L MPN/100ml)
on River Ganga March April Variation March April March April Variation March April
Variation Compliance
(%) (%) (%) Status w.r.t
Primary Water Quality PWQCOB
Criteria for Outdoor >5 mg/L 6.5-8.5 <3 mg/L <2500 MPN/100ml
Bathinq (PWQCOB) No. of monitoring FC not
locations results 4 4 - 4 4 4 4 - - - monitored) -
available No. of locations 4 4 4 4 4 4
FC not
complying to Criteria - - - - monitored -
Increase in Decrease
% in %
Range 8.6 9.2- variation 8.2-8.4
7.1- 2.6 1.5- variation
9.6 (7 - 12%) 7.2 1.8 (31 -42 %) - - - -
at 4 at 4
locations locations
WEST BENGAL
At Baharampore, WB 9.1 6.8 -25% 8.6 8.5 4.1 3.7 -10% 11000 2400 -78% Non-com Divina
At khaara 9 9.6 7% 8.5 8.5 3.3 5.5 67% 140000 7000 -95% Non-complvina
At Gorabazar 8.2 7.6 -7% 8.5 8.5 2.9 4 38% 30000 6000 -80% Non-com Divina
At Nabadip Ghoshpara 7.2 7.7 7% 8.5 8.5 3 2.8 -7% 4000 17000 325% Non-complying
near MoniourQhat At Tribeni near Burning - 7.9 - - 8.2 - 3 - - 92000 - Non-complying
Ghat At Palta Shitalatala - 8.5 - - 8.5 - 3.9 - - 140000 - Non-complying
At Palta, WB 7.4 7.9 7% 8.4 8.4 3.5 3.6 4% 110000 26000 -76% Non-com Divina
At Durgachak near 6.8 4.6 -32% 7.8 6.8 2.5 3.33 33% 900 ND - Complying
Pathikhali, W.B. At Seramoore, WB - 6.4 - - 7.9 - 2.8 - - 33000 - Non-comolvina
At Dakshmineswar,WB 6.9 5.8 -16% 6.9 7.8 4.5 4 -11% 130000 110000 -15% Non-complvina
At Howrah-Shivour 6.5 3.9 -40% 6.8 7.1 4.3 1.25 -71% 80000 33000 -59% Non-comolvina
At Garden WB 6.5 5 -23% 8.0 7.7 2.9 4 38% 80000 140000 75% Non-
comotvinc
At Uluberia, WB 5.7 4 -30% 8.0 7.0 3.2 1 05 -67% 50000 17000 -66% Non-comolvina
At Diamond Harbour, 5 6.1 22% 7.7 7.8 1.75 2.7 54% 11000 790 -93% Complyina
No. of locations 11 locations in March 2020 and 14 locations in April 2020 monitored in W.B No. of monitoring locations results 11 14 - 11 14 11 14 - 11 14 -
available in WB
-D -0
37 I Page
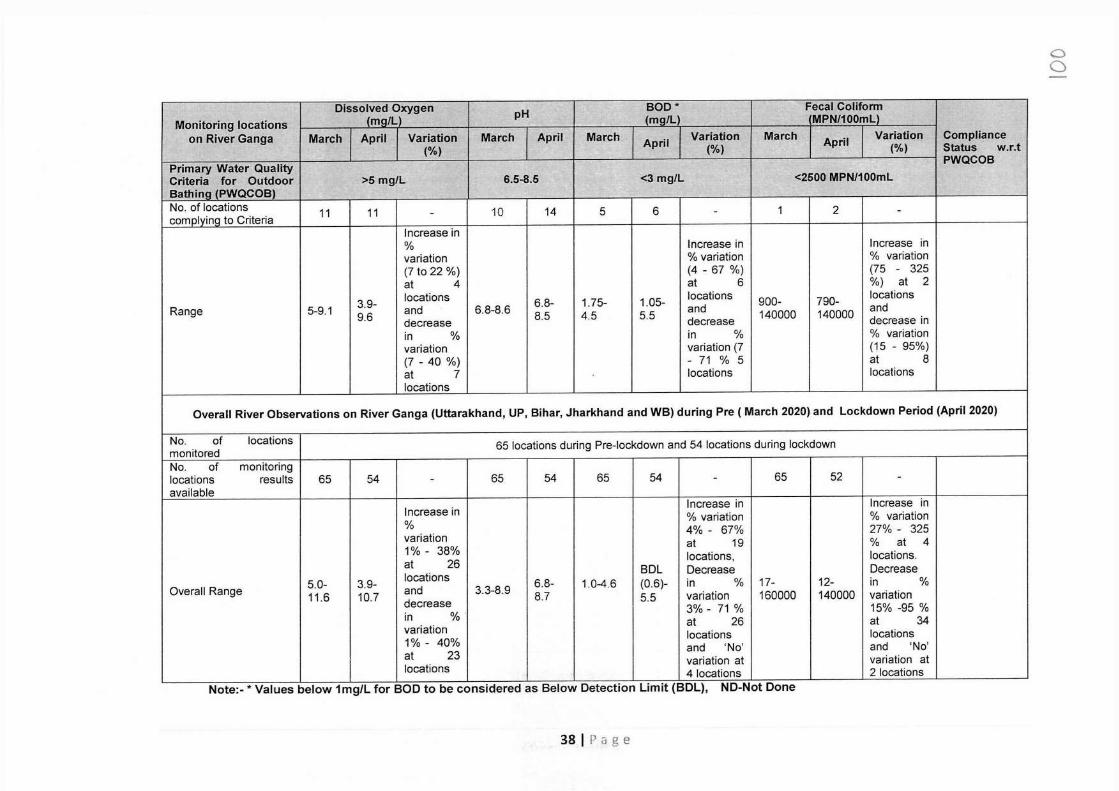
0 0
Dissolved Oxygen pH BOD* Fecal Colifonn Monitoring locations (mQ/Ll (mg/L MPN/100ml)
on River Ganga March April Variation March April March April Variation March April Variation Compliance (%) (%) (%) Status w.r.t
Primary Water Quality PWQCOB
Criteria for Outdoor >5 mg/L 6.5-8.5 <3 mg/L <2500 MPN/100ml BathinQ (PWQCOB) No. of locations 11 11 10 14 5 6 1 2 comolvina to Criteria - - -
Increase in % Increase in Increase in variation % variation % variation (7 to 22 %) (4 - 67 %) (75 - 325 at 4 at 6 %) at 2
3.9- locations 6.8- 1.75- 1.05- locations 900- 790- locations Range 5-9.1 9.6 and 6.8-8.6 8.5 4.5 5.5 and 140000 140000 and
decrease decrease decrease in in % in % % variation variation variation (7 (15 - 95%) (7 - 40 %) - 71 % 5 at 8 at 7 locations locations locations
Overall River Observations on River Ganga (Uttarakhand, UP, Bihar, Jharkhand and WB) during Pre ( March 2020) and Lockdown Period (April 2020)
No. of locations 65 locations during Pre-lockdown and 54 locations during lockdown monitored No. of monitoring locations results 65 54 - 65 54 65 54 - 65 52 - available
Increase in Increase in Increase in
% % variation % variation
variation 4% - 67% 27% - 325
1% - 38% at 19 % at 4
at 26 locations, locations.
locations BDL Decrease Decrease
Overall Range 5.0- 3.9- and 3.3-8.9 6.8- 1.0-4.6 (0.6)- in % 17- 12- in % 11.6 10.7 decrease 8.7 5.5 variation 160000 140000 variation
in %' 3% - 71 % 15% -95 %
variation at 26 at 34
1% - 40% locations locations
at 23 and 'No' and 'No' variation at variation at
locations 4 locations 2 locations Note:-* Values below 1mg/L for BOD to be considered as Below Detection Limit (BDL), ND-Not Done
38 IP age
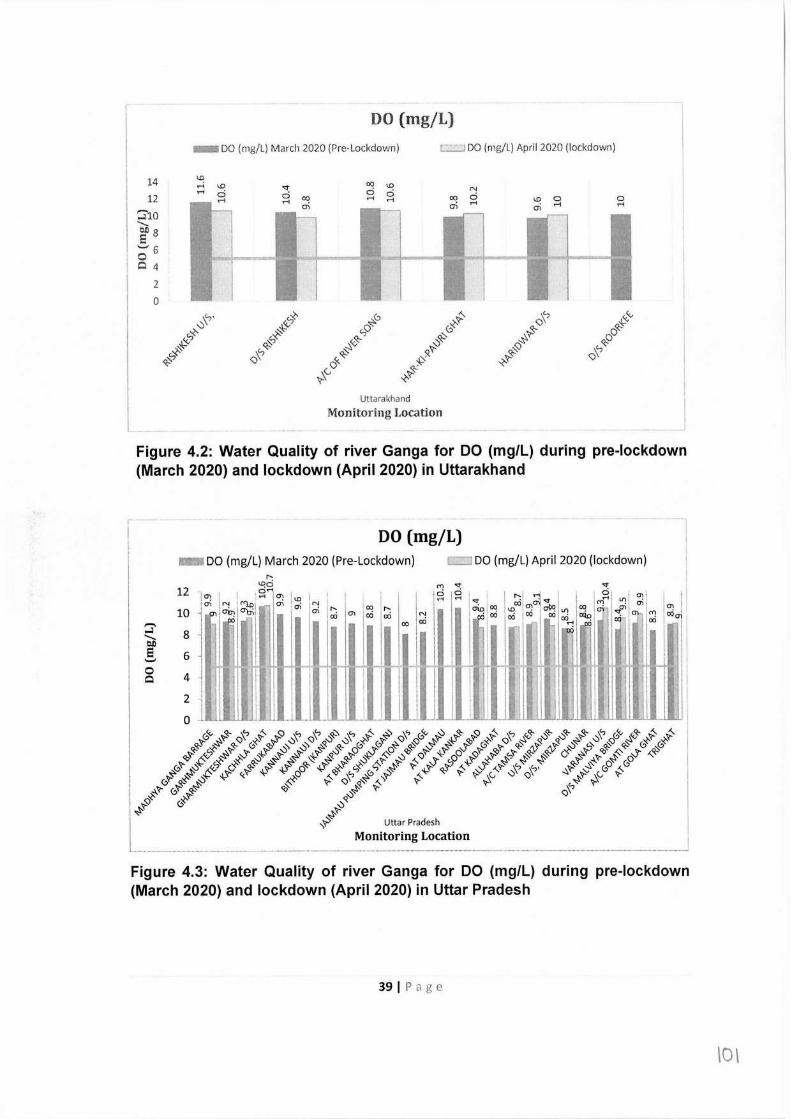
DO (mg/L) -DO (mg/L) March 2020 (Pre-Lockdown)
14 <D ..-i 00 .-i ci
12 .-i
:iio ..___ t)J) 8
= ._, 6 0 Q 4
2 0
i----, DO (mg/L) April 2020 (lockdown)
Uttarakhand Monitoring Location
Figure 4.2: Water Quality of river Ganga for DO (mg/L) during pre-lockdown (March 2020) and lockdown (April 2020) in Uttarakhand
!'"
! DO (mg/L) ... DO (mg/L) March 2020 (Pre-Lockdown)
0 Q
12
10
8
6 -
4
2
0 -'··
I 00 r-- 00 cxi N
00 cxi
_____ J DO (mg/L) April 2020 (lockdown)
m <t ci ci .-< .-<
<t r,-. H ' i ~ C) , ! oci .oi <t Im ") oi ,
1 u, ") olX?in oq oi <ta,o m ")
cxi 00 00 cxi OClo o·1 . ,000 I ; e_' 00 I
IJ ,-
-- - - LJ -
Figure 4.3: Water Quality of river Ganga for DO (mg/L) during pre-lockdown (March 2020) and lockdown (April 2020) in Uttar Pradesh
39 I Page
\0\
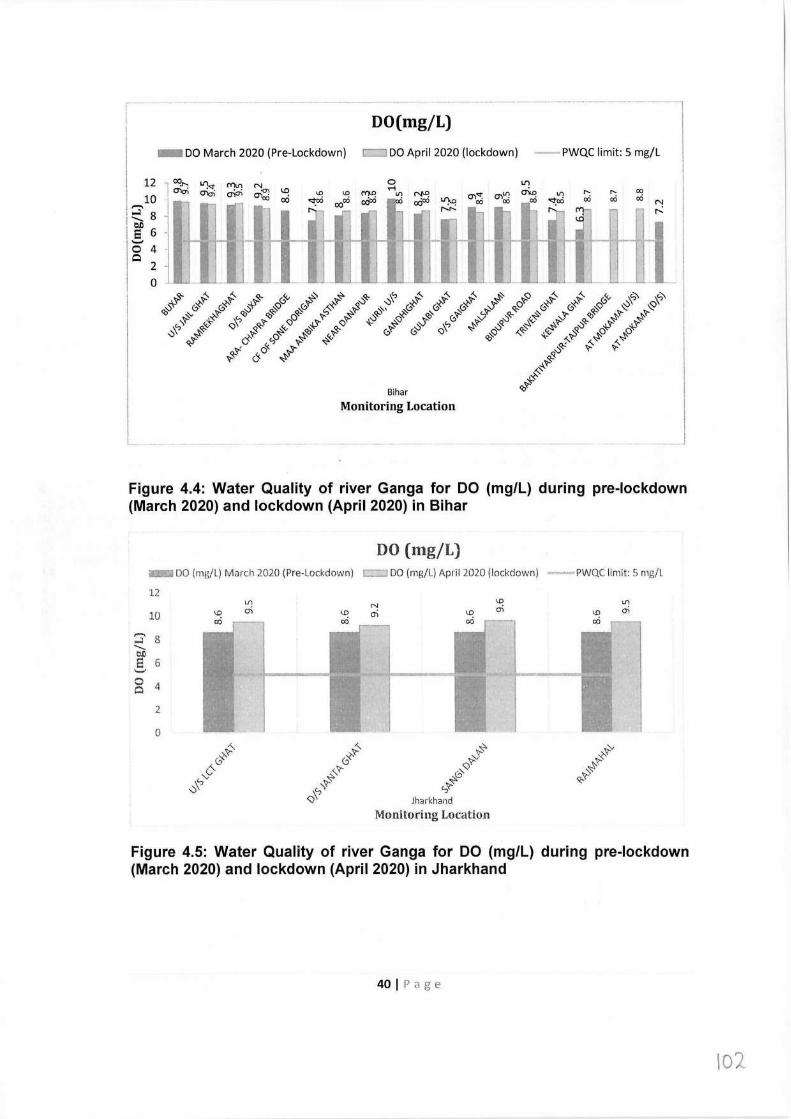
,· DO(mg/L)
- DO March 2020 (Pre-Lockdown) r.::=J DO April 2020 (lockdown) -- PWQC limit: 5 mg/L
12 00
10 2: 8 b.0 e 6 '-' 0 4 Q
2 0
- ,.._ "1<:t mu, N LI)
O'\cn M m-o O'\cn Cl)Cl) en~ lO <D <D rr,.D "' NL! Cl'\": Cl'\"! "' ,.._ ,.._ CX)
cxi ~ 0000 c,:ioo ~ cxi<Xl ~ 00 <:1:00 00 oo 00 .... CX) CX) N .... r--- n ... - r--r-- I- I- .... r- CY)- ,--:
~
<.Ci
- - ,- ..... t- - i-,- - - - - - - I I
0
Bihar Monitoring Location
Figure 4.4: Water Quality of river Ganga for DO (mg/L) during pre-lockdown (March 2020) and lockdown (April 2020) in Bihar
DO (mg/L) DO (mg/L) March 2020 (Pre-Lockdown) c-·-1 DO (mg/L) April 2020 (lockdown) -PWQC limit: 5 mg/L
12
10 N
lO oi oci
0 4 0
2
0
~ Q~
0' c,"<"~
Jharkhand Monitoring Location
Figure 4.5: Water Quality of river Ganga for DO (mg/L) during pre-lockdown (March 2020) and lockdown (April 2020) in Jharkhand
40 I Page
102
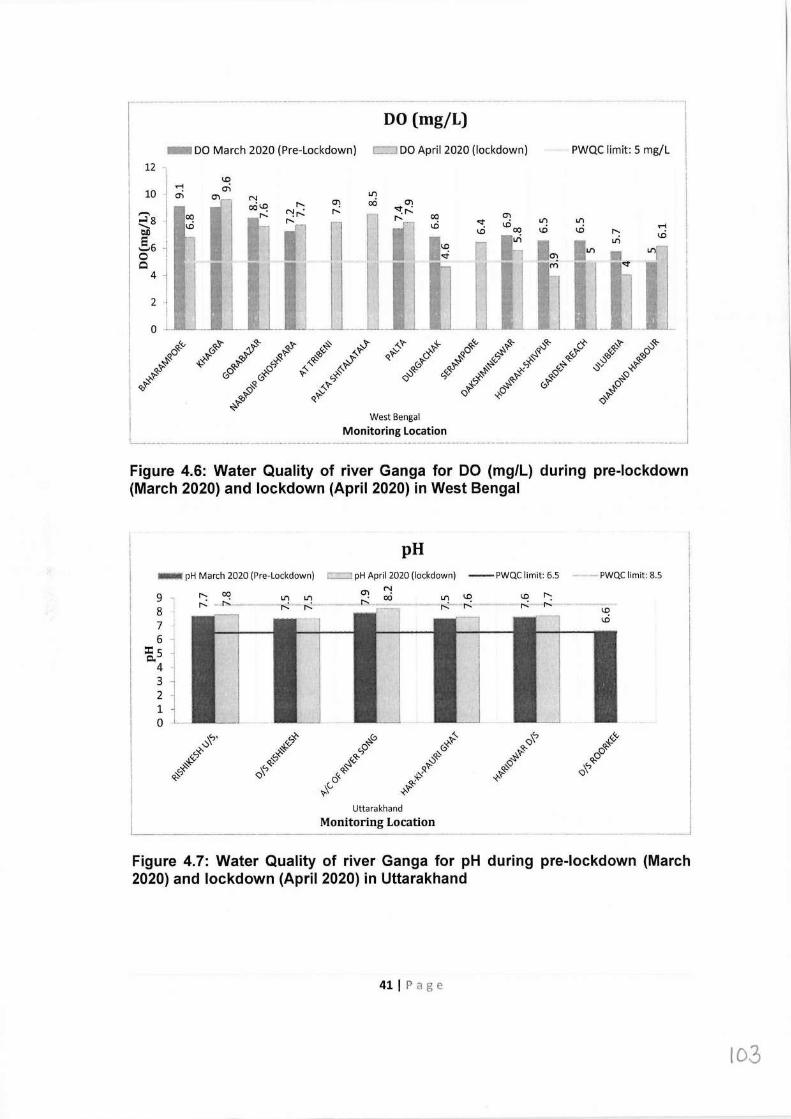
DO (mg/L)
- DO March 2020 (Pre-Lockdown) L. J DO April 2020 (lockdown) PWQC limit: 5 mg/L 12
10
~8 ........ t)I)
SG . 0 Q
4 .
2
0
00 \D l/1
\D l/1 I.D r--
l/1
West Bengal Monitoring Location
Figure 4.6: Water Quality of river Ganga for DO (mg/L) during pre-lockdown (March 2020) and lockdown (April 2020) in West Bengal
pH - rH March 2020 (Pre-Lockdown) L. J pH April 2020 (lockdown) --PWQC limit: 6.5 • -PWQC limit: 8.5
en ~ - r-'. 00 9 00
r-,; 8 7 6
~ ::c 5 Q,
4 I
3 l 2 1 0 ~- -1:--0
'<,'-j .j:-~
~'-j
Uttarakhand Monitoring Location -- --- _,
Figure 4.7: Water Quality of river Ganga for pH during pre-lockdown (March 2020) and lockdown (April 2020) in Uttarakhand
41 I Page
103
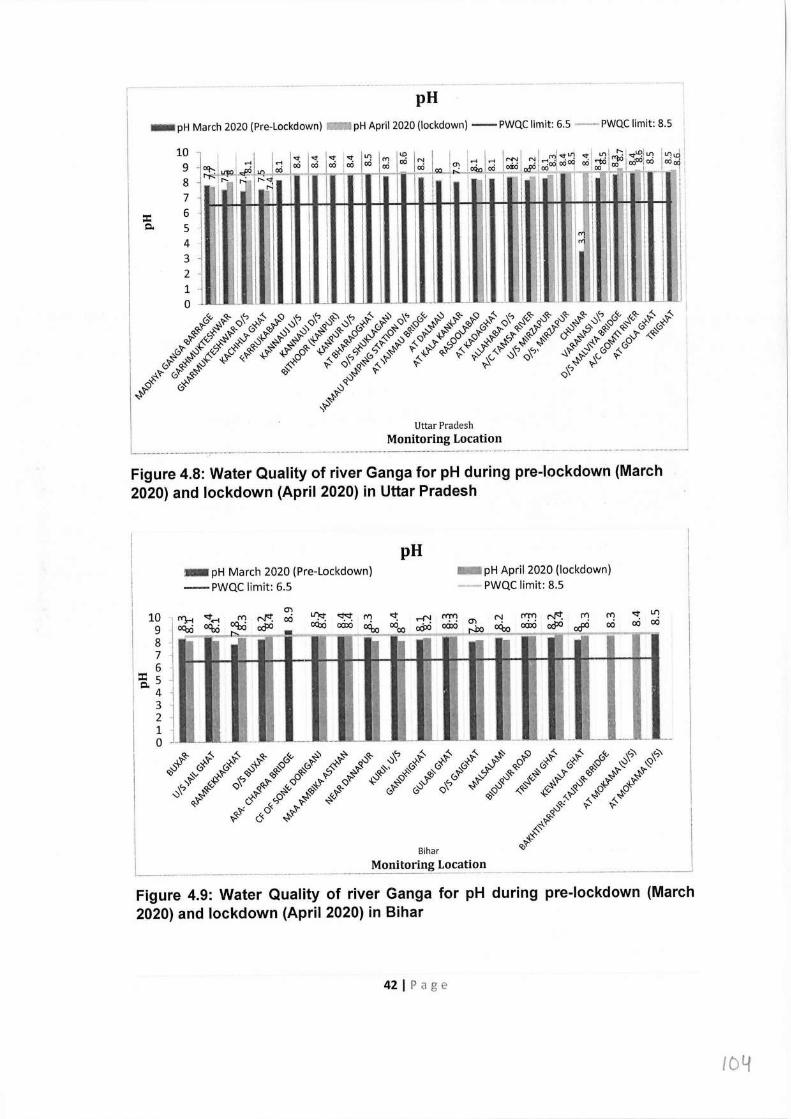
,·- I pH -pH March 2020 (Pre-Lockdown) pH April 2020 (lockdown) - PWQC limit: 6.5 -- PWQC limit: 8.5 '
::c Q.
4 3 2 1 0
I I
I .1
I I I· I I I
<:t "': I"': 00 CX) CX)
\ I I
I I
...... I 1
Uttar Pradesh Monitoring Location
--------------- -----··-·-····-········-··-·······-·····-····
Figure 4.8: Water Quality of river Ganga for pH during pre-lockdown (March 2020) and lockdown (April 2020) in Uttar Pradesh
pH -pH March 2020 (Pre-Lockdown) -- PWQC limit: 6.5
10 9 8 7 6
::c 5 Q. 4
3 2 1 0
- pH April 2020 (lockdown) --- PWQC limit: 8.5
<:t l/)
oci co ...
1- ... i.. ..... l..11 ..• • ........ ,. ...... l.,11 ••····•·
. ........ '- .
I Ir
,r
l
···--· .. ········-····~ ···-··-····
-·---- ·-------
Bihar
Monitoring Locati~f!
Figure 4.9: Water Quality of river Ganga for pH during pre-lockdown (March 2020) and lockdown (April 2020) in Bihar
42 I Page
104
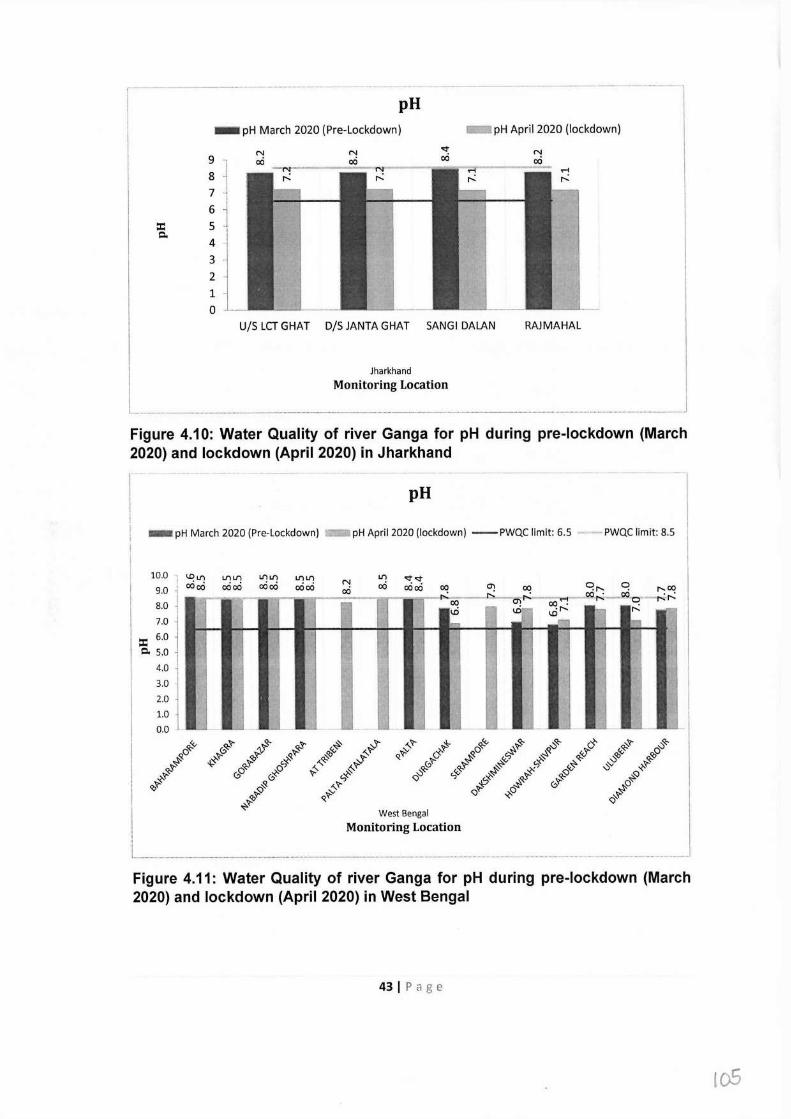
.............. ···-··~····-·· .. -···· .. -··· .. -······-······· --··--···· -··--····· ---
pH -pH March 2020 (Pre-Lockdown)
9 8 7 6
::c 5 Q.
4 3 2 1 0
pH April 2020 (lockdown)
U/S LCT GHAT D/S JANTA GHAT SANGI DALAN RAJMAHAL
Jharkhand Monitoring Location
Figure 4.10: Water Quality of river Ganga for pH during pre-lockdown (March 2020) and lockdown (April 2020) in Jharkhand
pH
- pH March 2020 (Pre-Lockdown)
10.0 ·
9.0 · 8.0
7.0
::C 6.0 · Q. 5.0 -
4.0 3.0 ·
2.0 · 1.0.
0.0
pH April 2020 (lockdown) --PWQC limit: 6.5 - -PWQC limit: 8.5
L/H/"\ N LI"\ <:t <:t oo oo 00 oo oci oci oo m
-~---.--.·--..-.--.__...,-----,.-,-.,__,..,..-P~~--- • - 00 \D
LI) LI)
oci oci
_ ... -- ..
- 00 q,..._ q ,-...oo
m,...;-~.-1-119-,-...-'-QQ,,o~-r-s-,...; lri- ~,...; ,_ ,...; - - ,_
I
.... I
... .._ L- -- 1.- '-- - ·-
West Bengal Monitoring Location
Figure 4.11: Water Quality of river Ganga for pH during pre-lockdown (March 2020) and lockdown (April 2020) in West Bengal
43 I Page
!oS
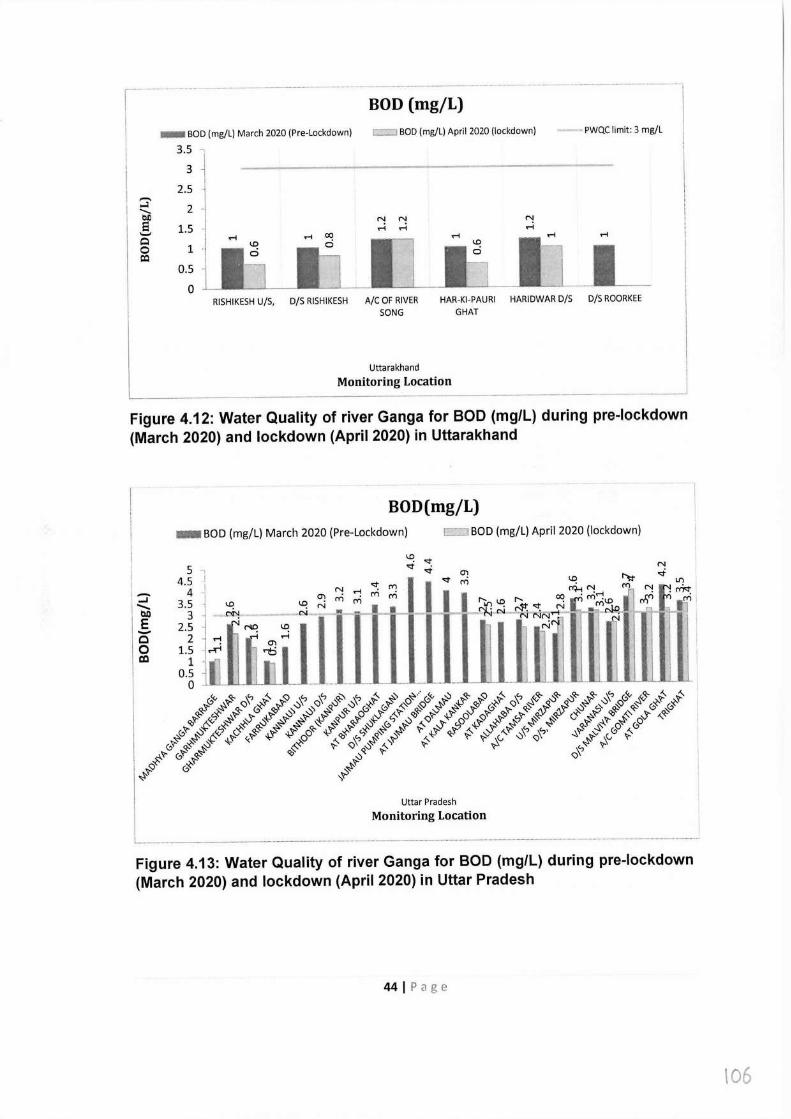
BOD (mg/L) - BOD (mg/L) March 2020 (Pre-Lockdown) c:::::::::::i BOD (mg/L) April 2020 (lockdown) -- PWQC limit: 3 mg/L
3.5 ~
3
2.5
2
1.5
1
0.5
0
N .-i
RISHIKESH U/5, D/S RISHIKESH A/C OF RIVER HAR-KI-PAURI HARIDWAR D/S D/S ROORKEE SONG GHAT
Uttarakhand
Monitoring Location
Figure 4.12: Water Quality of river Ganga for BOD (mg/L) during pre-lockdown (March 2020) and lockdown (April 2020) in Uttarakhand
BOD(mg/L) - BOD (mg/L) March 2020 (Pre-Lockdown) r··--1 BOD (mg/L) April 2020 (lockdown)
::i' - bl) E 0 0 co
5 ... , 4.5 : 4
3.5 3
2.5 2
1.5 1
0.5 0
Uttar Pradesh
Monitoring Location
Figure 4.13: Water Quality of river Ganga for BOD (mg/L) during pre-lockdown (March 2020) and lockdown (April 2020) in Uttar Pradesh
441Page
\06
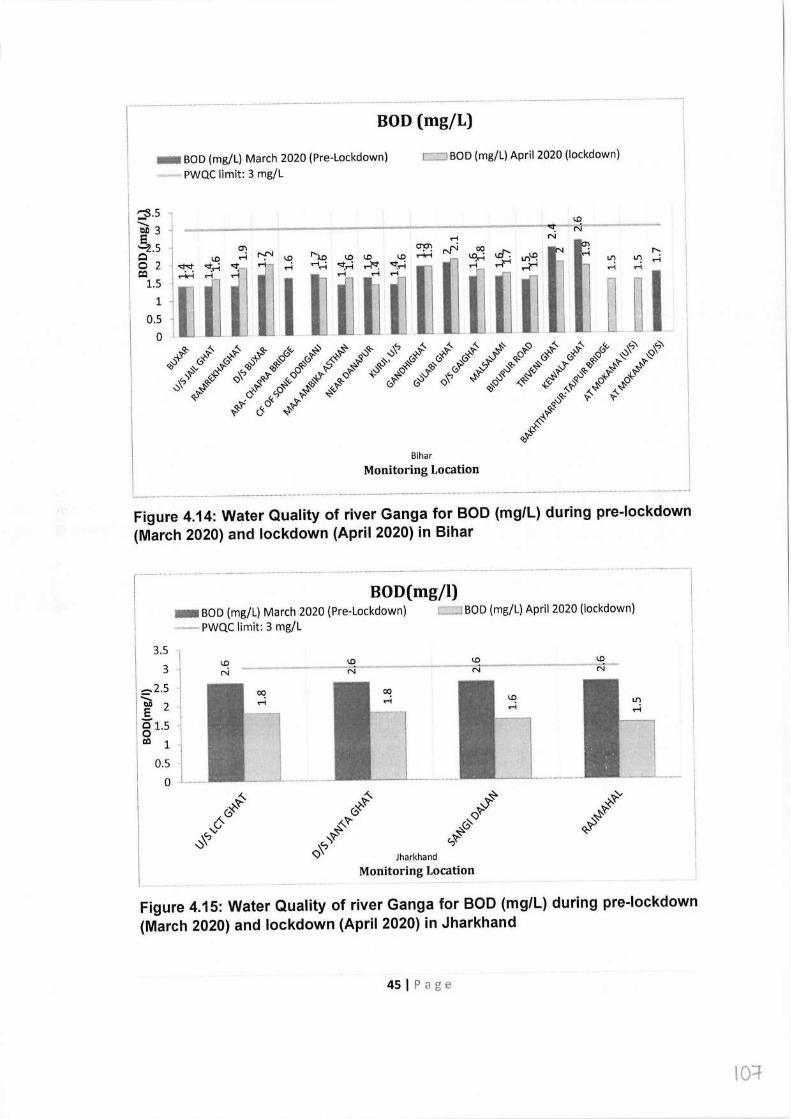
-······- ··--· ···········-------·
BOD (mg/L)
- BOD (mg/L) March 2020 (Pre-Lockdown) PWQC limit: 3 mg/L
~-5 ....... cc 3 e "-2.5 0 0 2 ··<:t-.:t CQ rl<-t 1.5
.~
1 0.5 0
c::::JBOD (mg/L) April 2020 (lockdown)
\!) -----------------------::t---·-·l,----- N '" ~
n~~ i U ~.i1~ ~-'i~.E E Bihar
Monitoring Location
Figure 4.14: Water Quality of river Ganga for BOD (mg/L) during pre-lockdown (March 2020) and lockdown (April 2020) in Bihar
·········-·······-······-··-------
BOD(mg/1) - BOD (mg/L) March 2020 (Pre-Lockdown) -PWQC limit: 3 mg/L
3.5 -!
3 I.'! N
-2.5
' QI) 2 E g1.5 Cll 1
0.5 0
~ 0X' 6-
c.," -0'
\!)
c···1 BOD (mg/L) April 2020 (lockdown)
\!)
N N
. -·-·······-···-· I I
I l I I
I I I
\!)
N
Jharkhand
Monitoring Location
Figure 4.15: Water Quality of river Ganga for BOD (mg/L) during pre-lockdown (March 2020) and lockdown (April 2020) in Jharkhand
45 I Page
10:f
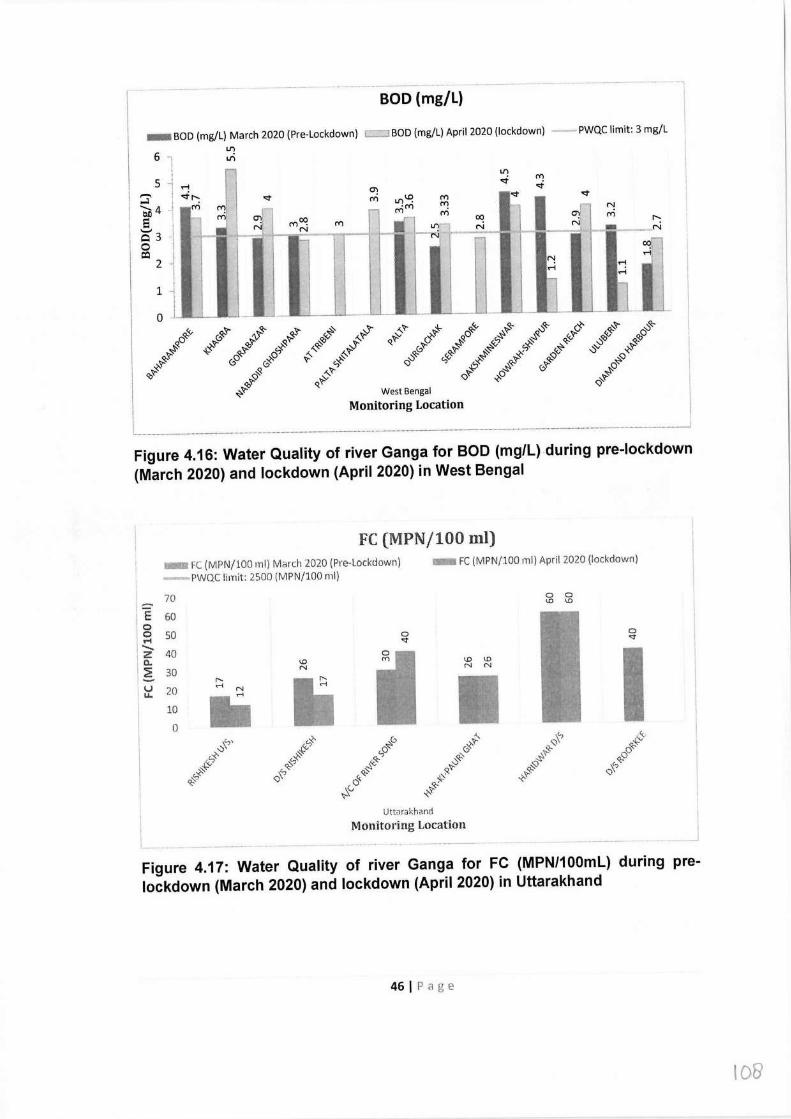
BOD (mg/L)
- BOD (mg/L) March 2020 (Pre-Lockdown) i---·--1 BOD (mg/L) April 2020 (lockdown) --PWQC limit: 3 mg/L
6
5 :i' bn4 8 Q3 0 c:Q
2
1
0
Ll)
Ll)
I Ll)
,,i m .-i ,,i ,,i r-. ~
I ml <:t m u-,1.C! m <:t
I <:t
m m' mm m ,_ a,1 N - ~
~ m m~ ~ m
N! m .- LI)-
N' r--: ~ N N _N - i-- i--~· .... N ~ oor
·' ~ .-i·
.-i .-i .-i
7 n '-•-
West Bengal
Monitoring Location
Figure 4.16: Water Quality of river Ganga for BOD (mg/L) during pre-lockdown (March 2020) and lockdown (April 2020) in West Bengal
FC (MPN/100 ml) - FC (MPN/100 ml) March 2020 (Pre-Lockdown)
PWQC limit: 2500 (MPN/100 ml)
- FC (MPN/100 ml) April 2020 (lockdown)
70 - E 60 0 0 50 .-1 - z 40 0. :E 30 - r-- I~ 20
..... N
10 • 0 ~,,
./' 0 ~~ <i;:,c.;
I.O N
I.O I.O N N
0 0 \D \1)
0 <:t
I Uttarakhand
Monitoring Location L .. ~. ······· ..
Figure 4.17: Water Quality of river Ganga for FC (MPN/100ml) during pre lockdown (March 2020) and lockdown (April 2020) in Uttarakhand
46 I Page
10&
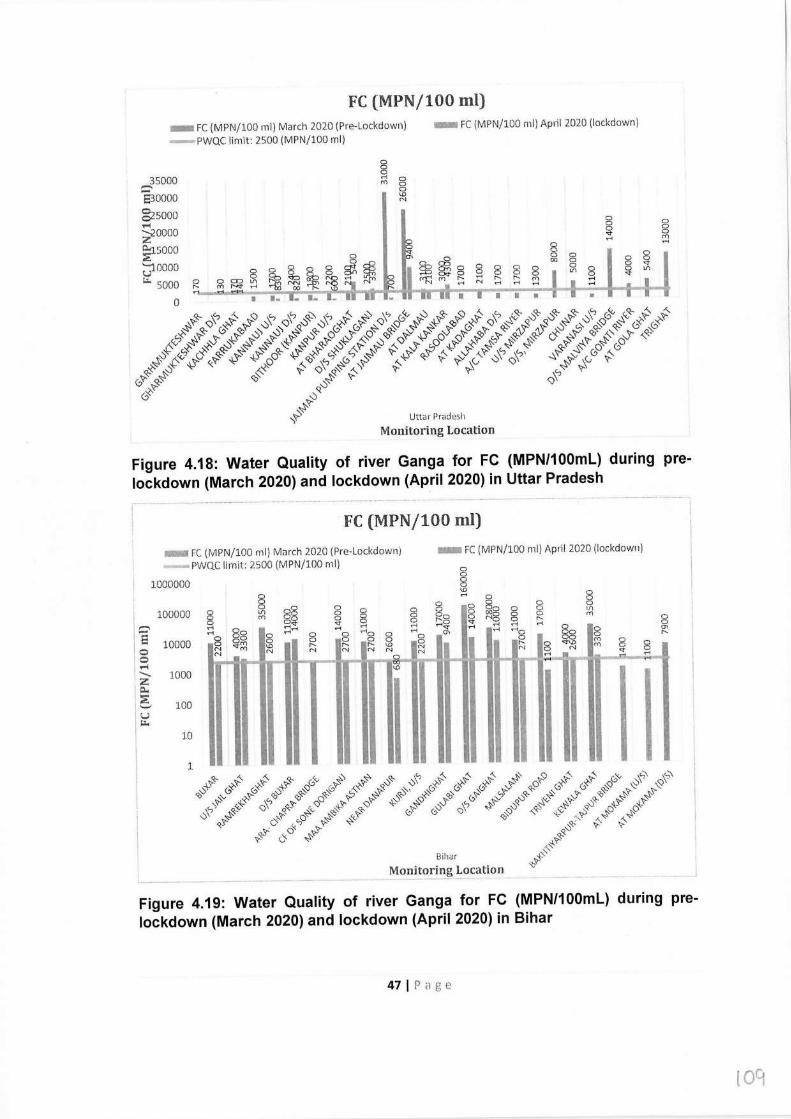
FC (MPN/100 ml) - FC (MPN/100 ml) March 2020 (Pre-Lockdown) -PWQC limit: 2500 (MPN/100 ml)
35000 ,..... 530000
82sooo .... ;iOOOO ::i..1sooo :;: :::;ioooo ""' 5000
0
8 0 .... 0 M 0
0
'° "'
- FC (MPN/100 ml) April 2020 (lockdown)
D D ~ ....
D D 0 (Y) ~,
Figure 4.18: Water Quality of river Ganga for FC (MPN/100ml) during pre lockdown (March 2020) and lockdown (April 2020) in Uttar Pradesh
FC (MPN/100 ml)
- FC (MPN/100 ml) March 2020 (Pre-Lockdown) PWQC limit: 2500 (MPN/100 ml)
- FC (MPN/100 ml) April 2020 (lockdown)
1000000 0 0 0 00 D
100000 0 "' 0 D 0 rn DO D 0 DO 0 D "' ....
Oo ..-<"' .... .... .... ........ '"O 0 Do 0 0 0 0
10000 0 S?~ 0 0 0 D 0
'° ..... ..... ..... '° N N N N N N "' - - 0 00
1000 '°
100
8 D
"' rn
10
0 DO DO
'""'° N 0 0 M M
0 D "' r--
l
0 D ....
Bihar
!'401~torinj ~ocation
Figure 4.19: Water Quality of river Ganga for FC (MPN/100ml) during pre lockdown (March 2020) and lockdown (April 2020) in Bihar
47 I Page
l09
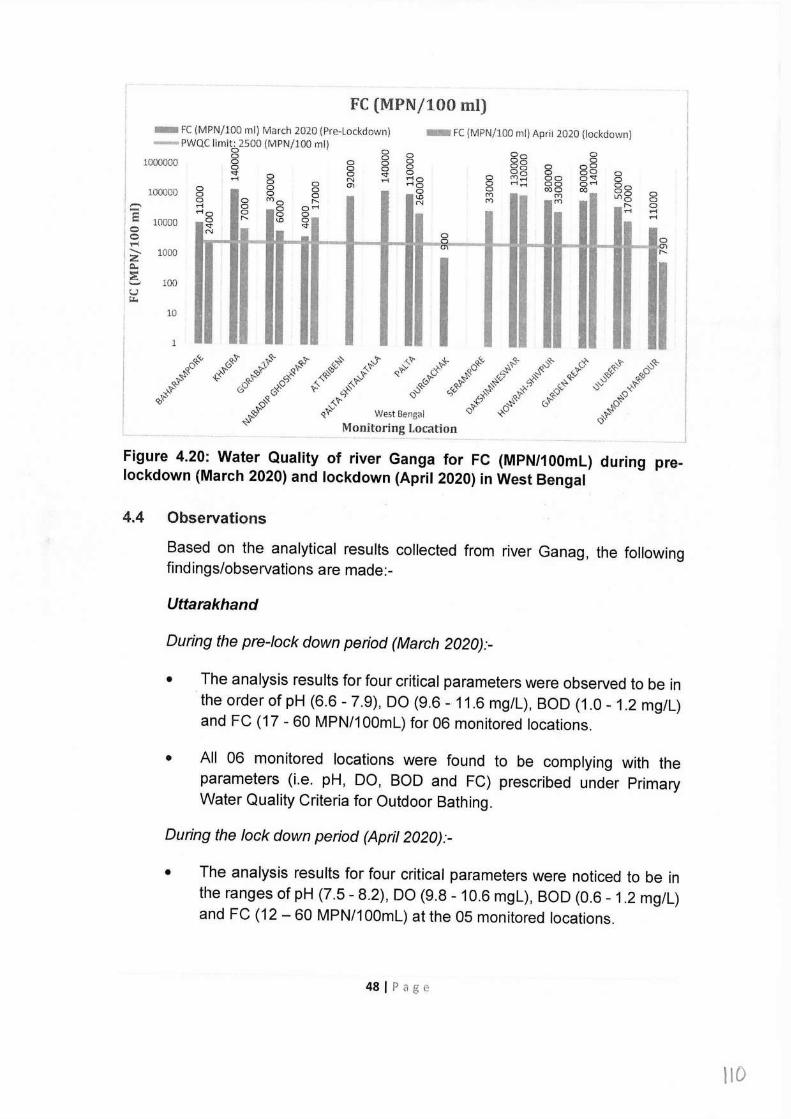
FC (MPN/100 ml) - FC (MPN/100 ml) March 2020 (Pre-Lockdown) -PWQC limi\~i2soo (MPN/100 ml)
0 0 0
1000000 8 8 8 'Sf" 0 0 'Sf" ...--1 0 N ,---t
0 0 O'I 0 8 ""o r--- o QM 0 0 I.D 0
'Sf"
100000 I,....._ 0
0 ,_ 0 E 10000 r---
0 0 ..-I ........ 1000 :z
I~ 100 ._,
u ~ 10
1
- FC (MPN/100 ml) April 2020 (lockdown)
0 0 0 0 rlo rlo 0 I.D N
Oo 0 Oo 0 Oo 0 oO Do 0 oO
0 ..,.,M 00 Q'S!" 0 rl rl 00 QM 0 000 co "" "" m m
0 0 0 rl ,-j
0 O'\ r---
West Bengal
Monitoring Location
Figure 4.20: Water Quality of river Ganga for FC (MPNl100ml) during pre lockdown (March 2020) and lockdown (April 2020) in West Bengal
4.4 Observations
Based on the analytical results collected from river Ganag, the following findings/observations are made:-
Uttarakhand
During the pre-lock down period (March 2020):-
• The analysis results for four critical parameters were observed to be in · the order of pH (6.6 - 7.9), DO (9.6 - 11.6 mg/L), BOD (1.0 - 1.2 mg/L) and FC (17 - 60 MPN/100ml) for 06 monitored locations.
• All 06 monitored locations were found to be complying with the parameters (i.e. pH, DO, BOD and FC) prescribed under Primary Water Quality Criteria for Outdoor Bathing.
During the lock down period (April 2020):-
• The analysis results for four critical parameters were noticed to be in the ranges of pH (7.5 - 8.2), DO (9.8 - 10.6 mgl), BOD (0.6 - 1.2 mg/L) and FC (12 - 60 MPN/100ml) at the 05 monitored locations.
481Page
110
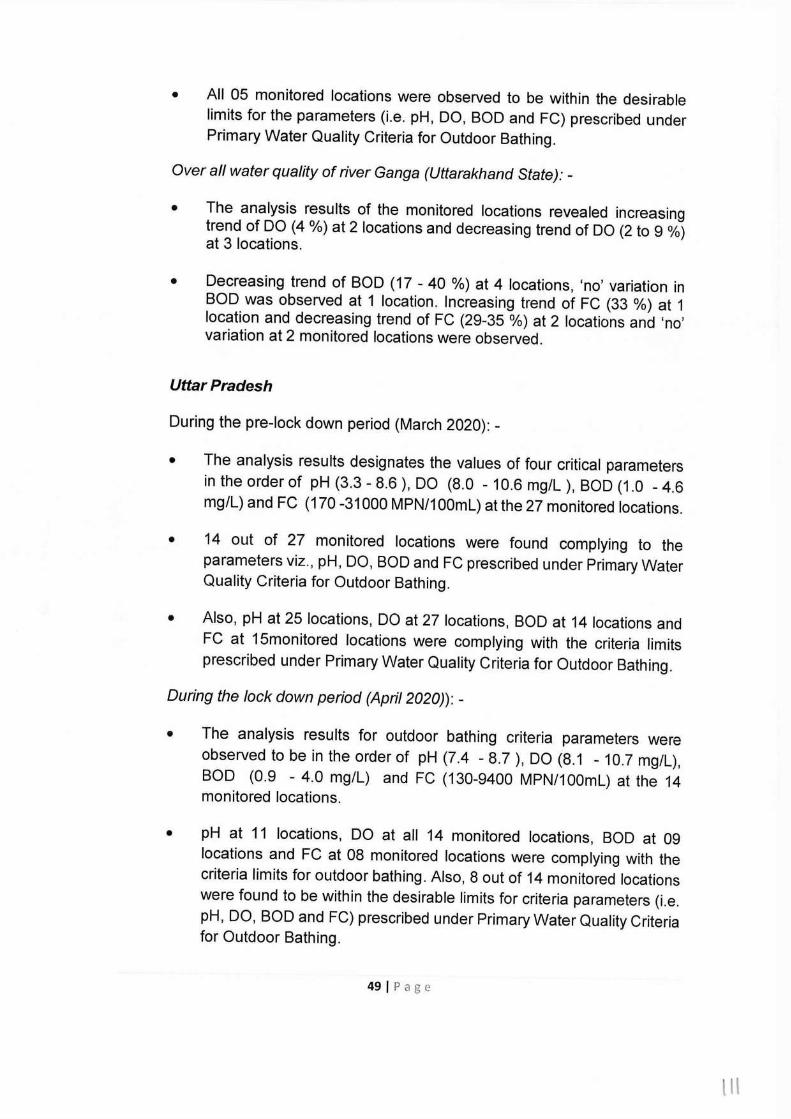
• All 05 monitored locations were observed to be within the desirable limits for the parameters (i.e. pH, DO, BOD and FC) prescribed under Primary Water Quality Criteria for Outdoor Bathing.
Over all water quality of river Ganga (Uttarakhand State): -
• The analysis results of the monitored locations revealed increasing trend of DO (4 %) at 2 locations and decreasing trend of DO (2 to 9 %) at 3 locations.
• Decreasing trend of BOD (17 - 40 %) at 4 locations, 'no' variation in BOD was observed at 1 location. Increasing trend of FC (33 %) at 1 location and decreasing trend of FC (29-35 %) at 2 locations and 'no' variation at 2 monitored locations were observed.
Uttar Pradesh
During the pre-lock down period (March 2020): -
• The analysis results designates the values of four critical parameters in the order of pH (3.3 - 8.6 ), DO (8.0 - 10.6 mg/L ), BOD (1.0 - 4.6 mg/L) and FC (170 -31000 MPN/100ml) at the 27 monitored locations.
• 14 out of 27 monitored locations were found complying to the parameters viz., pH, DO, BOD and FC prescribed under Primary Water Quality Criteria for Outdoor Bathing.
• Also, pH at 25 locations, DO at 27 locations, BOD at 14 locations and FC at 15monitored locations were complying with the criteria limits prescribed under Primary Water Quality Criteria for Outdoor Bathing.
During the lock down period (April 2020)): -
• The analysis results for outdoor bathing criteria parameters were observed to be in the order of pH (7.4 - 8.7 ), DO (8.1 - 10.7 mg/L), BOD (0.9 - 4.0 mg/L) and FC (130-9400 MPN/100ml) at the 14 monitored locations.
• pH at 11 locations, DO at all 14 monitored locations, BOD at 09 locations and FC at 08 monitored locations were complying with the criteria limits for outdoor bathing. Also, 8 out of 14 monitored locations were found to be within the desirable limits for criteria parameters (i.e. pH, DO, BOD and FC) prescribed under Primary Water Quality Criteria for Outdoor Bathing.
49 IP age
1 l
Overall observations on river Ganga (UP):-
• The analysis results revealed increasing trend of DO (1 -13 %) at 8 locations and decreasing trend of DO (2 - 9 %) at 6 locations, increasing trend of BOD (7 - 33 %) at 4 locations and decreasing trend of BOD (3 - 20 %) at 9 locations. 'No' variation was observed at 1 location. Also, decrease in variation of FC (33 - 67 %) at 10 monitored locations were observed.
Bihar
During the pre-lock down period (March 2020):-
• The analysis results for four critical parameters were found to be in the order of pH (7.8- 8.9), DO (6.3 -10 mg/L ), BOD (1.4 - 2.6 mg/L) and FC (2600-160000 MPN/100ml) at the 17 monitored locations.
• All the 17 monitored locations were found complying with the criteria limits outdoor bathing parameters viz., pH, DO, BOD.
During the lock down period (April 2020):
• The analysis results for four criteria parameter were noticed to be in the order of pH (8.0 - 8.4 ), DO (7.6 - 9.7 mg/L), BOD (1.4 -2.1 mg/L) and FC (680-14000 MPN/100ml) at the 17 monitored locations. All 6 monitored locations were observed to be within the desirable limits for parameters (i.e. pH, DO and BOD ) prescribed under Primary Water Quality Criteria for Outdoor Bathing and FC was complying at 06 monitored locations.
Overall observations on river Ganga (Bihar State):-
• The analysis results revealed increasing trend for DO (1 -38 %) at 8 locations whereas decreasing trend for DO (1 - 15 %) at 7 locations.
• Increasing trend were shown for BOD (5 -36 %) at 9 locations and FC (27 %) at 1 monitored location.
• Decreasing trend for BOD (6-27 %) at 4 locations and 'no' variation was observed at 2 monitored locations whereas decreasing trend for FC (18 -94 %) at 14 monitored locations were observed.
• There is significant reduction in FC during lockdown period in all the monitoring location. In terms of BOD, slight reduction at Kewala Ghat Patna (from 2.6 mg/I to 1.9 mg/I) was observed, however, no clear pattern of change in DO and BOD could be seen for all the stations.
50 I Page
l l l
Jharkhand
During the pre-lock down period (March 2020): -
• The analysis results indicate four critical parameters were found to be in the order of pH (8.2 - 8.4), DO (consistent as 8.6 mg/L) and BOD (consistent as 2.6 mg/L) at all the 04 monitored locations.
• 04 monitored locations complying with the analysed parameters (i.e. pH, DO and BOD) prescribed under Primary Water Quality Criteria for Outdoor Bathing. However, FC was not been analysed and reported by the Jharkhand SPCB.
During the lock down period (April 2020): -
• The analysis results for the analyzed parameters were observed to be in the order of pH (7.1 - 7.2), DO (9.2 - 9.6 mg/L), BOD (1.5 -1.8 mg/L) at the 04 monitored locations
• All the 04 monitored locations were found to be complying with the Primary Water Quality Criteria for Outdoor Bathing for analysed parameters viz., pH, DO & BOD.
Overall observations on river Ganga (Jharkhand State): -
• The analysis results reveal that increasing trend for DO (7 -12 %) and decreasing trend for BOD (31 -42 %) at all the 4 monitored locations. Jharkhand SPCB has not monitored FC parameter.
• There was a marginal improvement in terms of DO at all the monitored locations (8.6 mg/I in pre lockdown to 9.6 mg/I in lockdown period) and BOD ( Max. 2.6 mg/I in pre lockdown period and minimum at 1.8 mg/L during lockdown period).
West Bengal
During the pre-lock down period (March 2020):-
• The analyzed parameters are in the order of pH (6.8 - 8.6), DO (5.0 - 9.1 mg/L), BOD (1.75-4.5 mg/L) and FC (900 -140000 MPN/100ml) at the 11 monitored locations.
• Also, pH at 10 locations, DO at all 11 monitored locations, BOD at 05 locations whereas FC at 01 location were found to be complying with the criteria limits. Only 1 out of 11 monitored locations were found to be within the desirable limits for outdoor bathing criteria.
51 I Page
111
During the Jock down period (April 2020): -
• During the lockdown period (April, 2020), the analysis results of four critical parameters were found to be in the order of pH (6.8 - 8.5), DO (3.9 - 9.6 mg/l), BOD (1.05 - 5.5 mg/l) and FC (790 - 140000 MPN/100ml) at the 14 monitored locations
• Also, pH at all 14 locations, DO at 11 locations, BOD at 06 locations and FC at 02 monitored locations were observed to be within the desirable limits as per Primary Water Quality Criteria for Outdoor Bathing
• Only 2 out of 14 monitored locations were found to be complying with the Primary Water Quality Criteria for Outdoor Bathing.
Overall observations on river Ganga (West Bengal): -
• The analysis results revealed increasing trend were shown for DO (7-22 %) at 4 locations, BOD (4 -67 %) at 6 locations and FC (75 -325 %) at 2 monitored locations whereas decreasing trend were shown for DO (7-40 %) at 7 locations, BOD (7 -71 %) at 5 locations and FC (15 - 95%) at 8 monitored locations.
• Except at one location (Garden reach), all other monitored locations reveal reduction in FC in WB State except at two locations ( at Gorabazar and Garden) during lockdown period whereas significant reduction in FC was at Khagra (40,000 to 7000 MPN/100 ml) and Palta (110,000 to 26,000 MPN/100 ml).
• In terms of BOD value, not much change has been observed except at Howrah-shivpur (4.3 mg/l to 1.25 mg/l) and Ulberia (3.2 to 1.05 mg/L) where there was a significant reduction in BOD.
Overall Observations on river Ganga (covering 5 States- Uttarakhand, U.P, Bihar, Jharkhand and West Bengal): -
The analysis results revealed that
~ During pre-lockdown period (March, 2020), in Uttarakhand (6 out of 6 monitored locations), in Uttar Pradesh (14 out of 27 monitored locations), in Bihar (17 out of 17 monitored locations), in Jharkhand (all 4 monitored locations (FC not monitored)) and in West Bengal (1 out of 11 monitored locations) and overall, 42 out of 65 monitored
52 I Page
\14
locations were found to be complying with the Primary Water Quality Criteria for Outdoor Bathing.
During lockdown period (April 2020), in Uttarakhand (5 out of 5 monitored locations), in Uttar Pradesh (8 out of 14 monitored locations), in Bihar (6 out of 17 monitored locations), in Jharkhand (all 4 monitored locations (FC not moniotred)) and in West Bengal (2 out of 14 monitored locations) and overall, 25 out of 54 monitored locations were found to be within the desirable limits for Primary Water Quality Criteria for Outdoor Bathing.
~ During lockdown (April 2020), maximum Dissolved Oxygen (DO) was observed at Kachhla Ghat, Aligarh (10. 7mg/l) and minimum DO (3.9 mg/l) at Howrah-Shivpur, West Bengal. Maximum BOD (5.5 mg/l) was observed at Khagra and minimum as 'BDl' at 04 locations viz., Rishikesh U/s, D/s Rishikesh and Har-ki-pauri Ghat, Kachhla Ghat, Aligarh, while maximum FC count was observed at Garden Reach, West Bengal and Palta Shitalatala (140000MPN/100 ml) and minimum at Rishikesh U/s (12 MPN/100 ml) ..
Increasing trend were observed for DO (1% - 38 %) at 26 locations, BOD (4-67 %) at 19 locations while FC (27 - 325 %) at 4 monitored locations. Decreasing trend w.r.t DO (1 % -40%) at 23 locations, BOD (3-71 %) at 26 locations whereas FC (15 - 95 %) at 34 locations were observed. 'No' variation in BOD at 4 monitored locations while 'No' variation in FC was observed at 2 monitored locations.
4.5. Conclusion
During pre-lockdown, 42 out of 65 monitored locations and during lockdown, 25 out of 54 monitored locations (46.3 %) were found to be within the desirable limits prescribed under outdoor bathing criteria limits. Overall moderate improvement was observed w.r.t the parameters i.e., DO, BOD and FC.
5.0. IMPACT OF LOCKDOWN ON WATER QUALITY OF RIVER YAMUNA
5.1 About Yamuna River
The Yamuna river originates from Yamunotri glacier in the Bandarpunch in the Himalayas in Uttarakhand State. From its source, the river Yamuna flows south through the Himalayan foothills of Uttarakhand into the lndo-Gangetic Plains. The Yamuna river traverses a distance of 1,376 km through the States of Himachal Pradesh, Haryana, Delhi and Uttar Pradesh and finally
53 I Page
115
confluences with River Ganga at Prayagraj. The main urban centres on the banks of River Yamuna are Yamunanagar, Kamal, Panipat and Sonepat, Baghpat,Delhi, Naida, Mathura, Agra, Firozabad, Etawah, Kalpi, Hamirpur, and Prayagraj. Major tributaries of river Yamuna are River Tons, Hindon, Ken, Chambal, Sasur Khedri, Betwa or Betravati. River Yamuna is polluted mainly due to discharge of treated/partially treated industrial effluents, municipal sewage generated from Haryana, Delhi and U.P States apart from lack of adequate infrastructure for management of wastes from the afore said States.
5.2 Water Quality Monitoring Locations under National Water Quality Monitoring Programme (NWMP)
The Water Quality of river Yamuna is examined at 30 locations by Central Pollution Control Board (CPCB) in association with the State Pollution Control Boards of Uttarakhand, Himachal Pradesh, Haryana, Uttar Pradesh and CPCB HQ. State-wise Distribution of Water Quality Monitoring Locations under NWMP on river Yamuna is depicted in Figure 5.1.
5.3 Analytical Results
Monitoring of river Yamuna was carried out by the 4 States at 14 locations [(HP (04), Harysna (04), Delhi (05) and UP (1)] during Pre-Lockdown (March 2020) and 12 locations [(HP (04), Haryana (04), Delhi (03) and UP (1)] during Lockdown period (April 2020) to assess impact of lock-down on water quality of river Yamuna. Primary Water Quality Criteria for Outdoor Bathing (PWQCOB) parameters viz. Dissolved Oxygen (DO), pH, Biochemical Oxygen Demand (BOD) and Fecal Coliform (FC) are presented in Table-5.1.
Based on the monitoring & analysis of collected water samples from river Yamuna, the graphical presentation of river Yamuna with respect to DO, pH, BOD and FC as observed during pre-lockdown (March 2020) and lockdown period (April 2020) are presented in Figure 5.1 to Figure 5.5.
54 IP age
l f 6
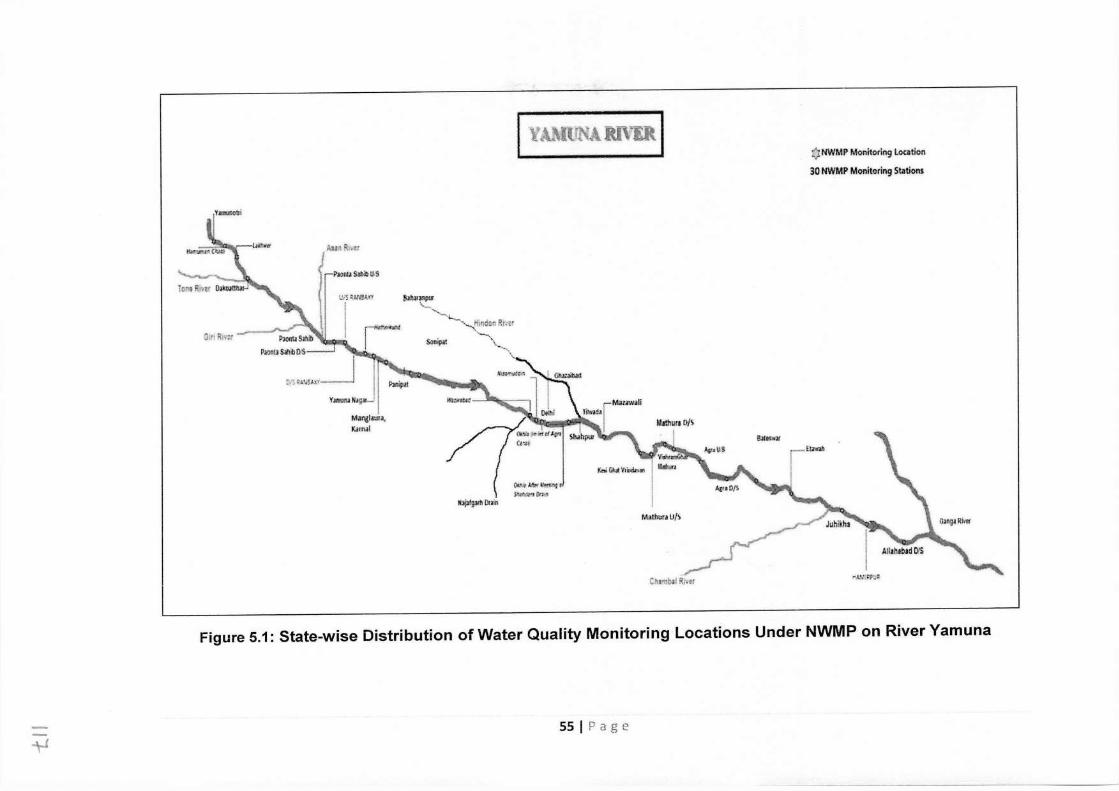
I YA.m!NA ffl'ER I i:)NWMP Monitoring location 30 NWMP Monitori119 Stlltlons
~(,/1,u AUI\Rhtf
~Sat.il>U'S
OiriR,r.r ?lOtllJSJ.'ub P1Ml1Saf!\b!),'S__::J
O,'S~"'~·''_J v ..... naK~
Mangl•u••, K.ltn.11
11,1u11npur
~'--...~'"d~o Rr,,;t '--, S.nip,:
~t- n,n~
Mathur• U/S
Ch>'llb,l RJm .. ~·~FU~
Figure 5.1: State-wise Distribution of Water Quality Monitoring Locations Under NWMP on River Yamuna
55 I Page -\J
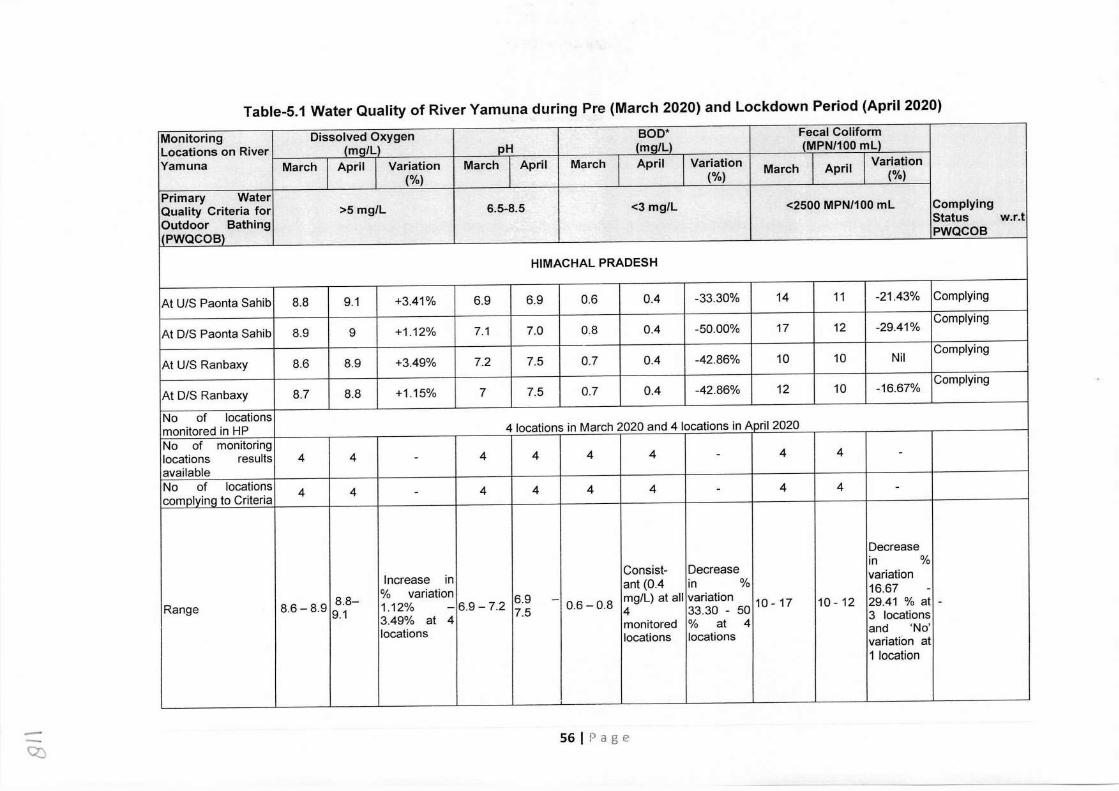
Table-5.1 Water Quality of River Yamuna during Pre (March 2020) and Lockdown Period (April 2020)
Monitoring Dissolved Oxygen BOD* Fecal Coliform Locations on River (mall) pH (mg/L) (MPN/100 ml) Yamuna March April Variation March April March April Variation Variation
(%) (%) March April (%)
Primary Water Quality Criteria for >5 mg/L 6.5-8.5 <3 mg/L <2500 MPN/100 ml Complying
Outdoor Bathing Status w.r.t
(PWQCOB) PWQCOB
HIMACHAL PRADESH
At U/S Paonta Sahib 8.8 9.1 +3.41% 6.9 6.9 0.6 0.4 -33.30% 14 11 -21.43% Complying
At D/S Paonta Sahib 8.9 9 +1.12% 7.1 7.0 0.8 0.4 -50.00% 17 12 -29.41% Complying
At UIS Ranbaxy 8.6 8.9 +3.49% 7.2 7.5 0.7 0.4 -42.86% 10 10 Nil Complying
At D/S Ranbaxy 8.7 8.8 +1.15% 7 7.5 0.7 0.4 -42.86% 12 10 -16.67% Complying
No of locations monitored in HP 4 locations in March 2020 and 4 locations in April 2020 No of monitoring locations results 4 4 - 4 4 4 4 - 4 4 - available No of locations 4 4 4 4 4 4 4 4 comolvina to Criteria
- - -
Decrease
Consist- Decrease in %
Increase in ant (0.4 in % variation
8.8- % variation 6.9 mg/L) at all variation 16.67 -
Range 8.6 -8.9 1.12% 6.9 - 7.2 - 0.6 -0.8 10 - 17 10 - 12 29.41 % at - 9.1 7.5 4 33.30 - 50
3.49% at 4 monitored % at 4 3 locations
locations and 'No' locations locations variation at
1 location
Q) 56 I Page
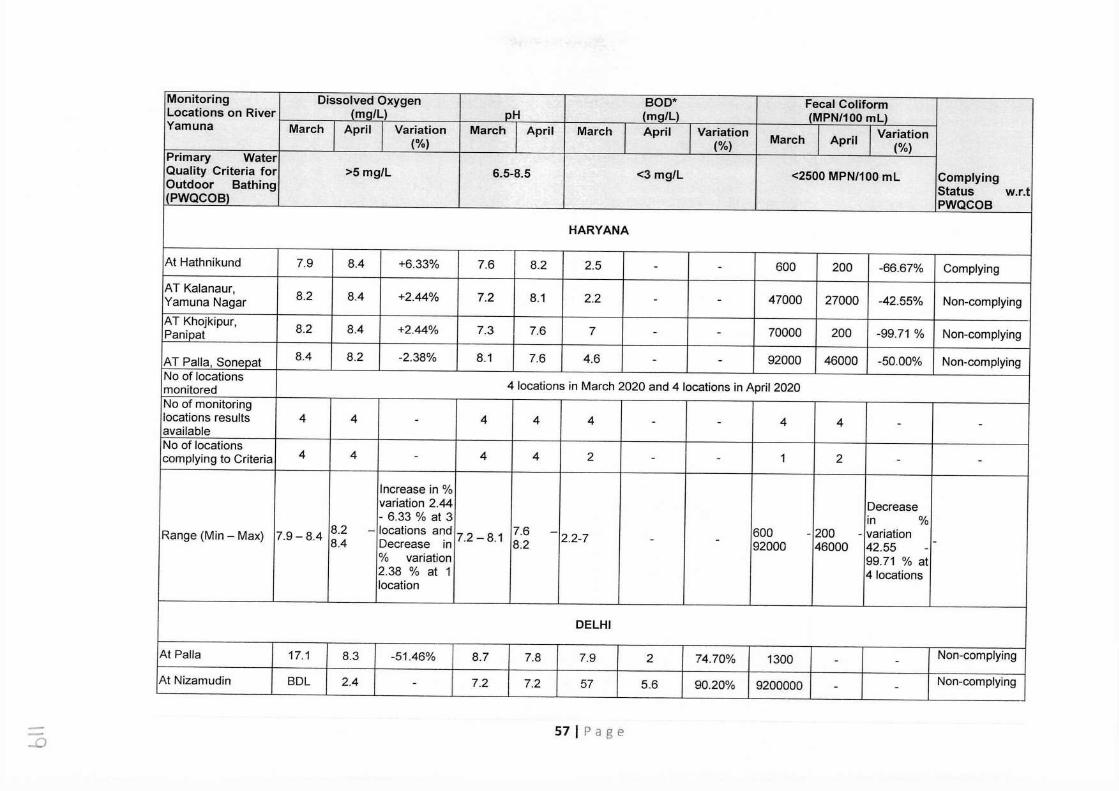
Monitoring Dissolved Oxygen BOD* Fecal Coliform Locations on River (mg/L) pH (mg/L) (MPN/100 ml) Yamuna March April Variation March April March April Variation Variation
(%) (%) March April (%)
Primary Water Quality Criteria for >5 mg/L 6.5-8.5 <3 mg/L <2500 MPN/100 ml Complying Outdoor Bathing Status w.r.t (PWQCOB) PWQCOB
HARYANA
At Hathnikund 7.9 8.4 +6.33% 7.6 8.2 2.5 - - 600 200 -66.67% Complying AT Kalanaur, 8.2 8.4 +2.44% 7.2 8.1 2.2 - - 47000 27000 -42.55% Non-complying Yamuna Nagar AT Khojkipur, 8.2 8.4 +2.44% 7.3 7.6 7 - - 70000 200 -99.71 % Non-complying Panipat
AT Palla, Sonepat 8.4 8.2 -2.38% 8.1 7.6 4.6 - - 92000 46000 -50.00% Non-complying No of locations
4 locations in March 2020 and 4 locations in April 2020 monitored No of monitoring locations results 4 4 - 4 4 4 - - 4 4 - - available No of locations
1 complying to Criteria 4 4 - 4 4 2 - - 2 - -
Increase in % variation 2.44 Decrease - 6.33 % at 3 in %
Range (Min - Max) 7.9-8.4 8.2 - locations and 7.2-8.1 7.6 - 2.2-7 600 - 200 - variation 8.4 Decrease in 8.2 - - 92000 46000 42.55 - -
% variation 99.71 % at 2.38 % at 1 4 locations location
DELHI
At Palla 17.1 8.3 -51.46% 8.7 7.8 7.9 2 74.70% 1300 - - Non-complying
At Nizamudin BDL 2.4 - 7.2 7.2 57 5.6 90.20% 9200000 - - Non-complying
...0 57 I Page
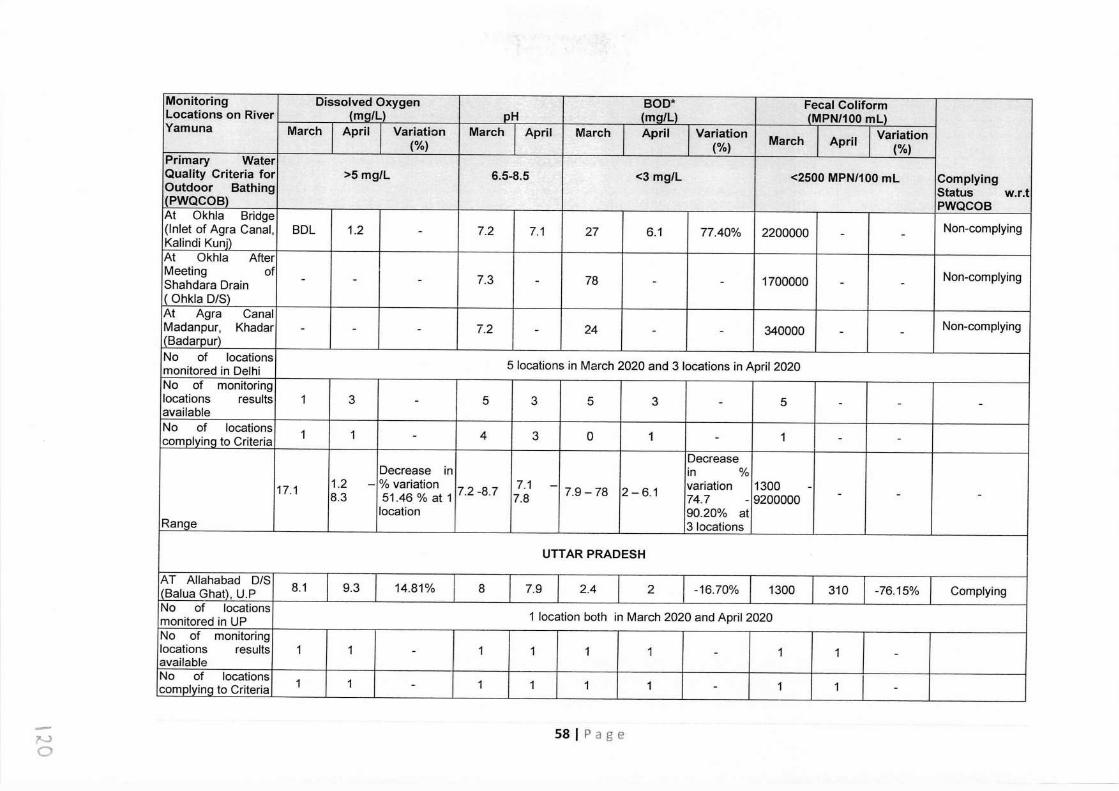
Monitoring Dissolved Oxygen BOD* Fecal Coliform Locations on River (mg/L) pH (mg/L) (MPN/100 mL) Yamuna March April Variation March April March April Variation Variation
(%) (%) March April (%) Primary Water Quality Criteria for >5 mg/L 6.5-8.5 <3 mg/L <2500 MPN/100 mL Complying Outdoor Bathing Status w.r.t (PWQCOB) PWQCOB At Okhla Bridge
Non-complying (Inlet of Agra Canal, BDL 1.2 - 7.2 7.1 27 6.1 77.40% 2200000 - - Kalindi Kuni) At Okhla After Meeting of
7.3 78 1700000 Non-complying Shahdara Drain - - - - - - - - ( Ohkla D/S) At Agra Canal
Non-complying Madanpur, Khadar - - - 7.2 - 24 - - 340000 - - (Badarpur) No of locations
5 locations in March 2020 and 3 locations in April 2020 monitored in Delhi No of monitoring locations results 1 3 - 5 3 5 3 - 5 - - - available No of locations 1 1 4 3 0 1 1 complying to Criteria - - - -
Decrease Decrease in in %
17.1 1.2 - % variation 7.2 -8.7 7.1 - 7.9- 78 2-6.1 variation 1300 - 8.3 51.46%at1 7.8 74.7 - 9200000 - - -
location 90.20% at Range 3 locations
UTT AR PRADESH
AT Allahabad D/S 8.1 9.3 14.81% 8 7.9 2.4 2 -16.70% 1300 310 -76.15% Complying (Balua Ghat), U.P No of locations
1 location both in March 2020 and April 2020 monitored in UP No of monitoring locations results 1 1 - 1 1 1 1 - 1 1 - available No of locations 1 1 1 1 1 1 1 1 complying to Criteria - - -
7-.J 0
58 I Page
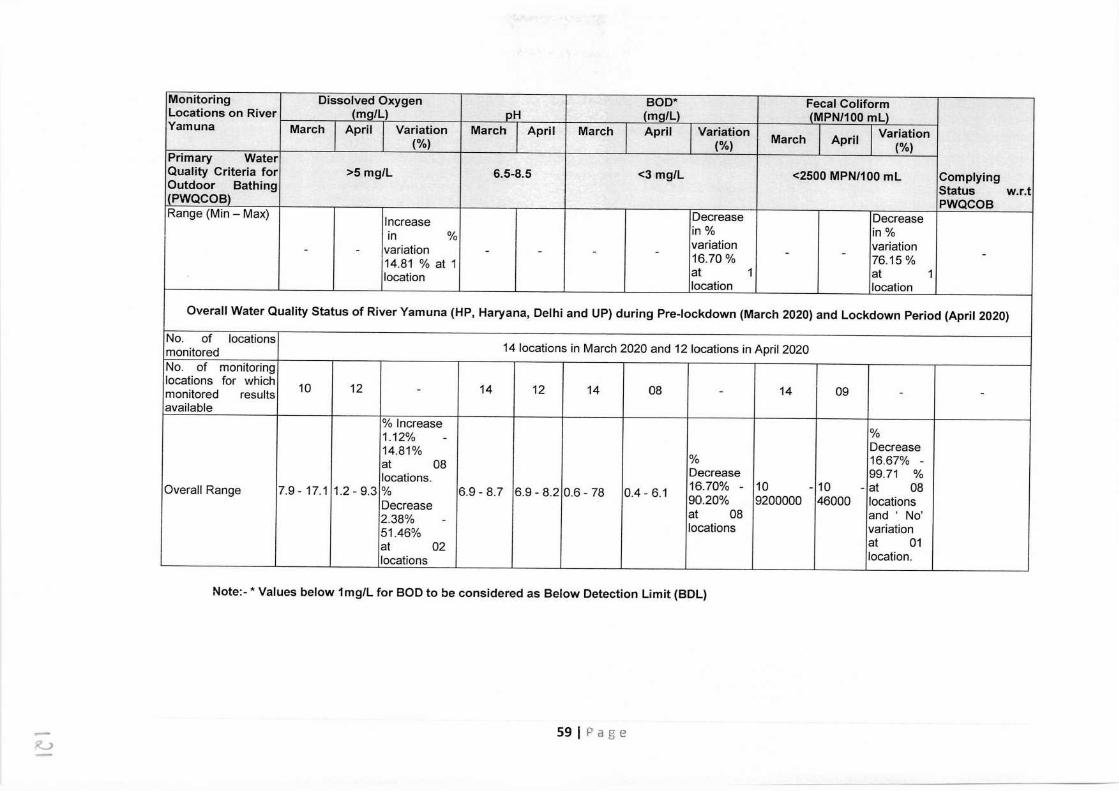
Monitoring Dissolved Oxygen BOD* Fecal Coliform Locations on River (mg/L) pH (mg/L) (MPN/100 ml) Yamuna March April Variation March April March April Variation
March April Variation (%) (%) (%)
Primary Water Quality Criteria for >5 mg/L 6.5-8.5 <3 mg/L <2500 MPN/100 ml Complying Outdoor Bathing Status w.r.t (PWQCOB) PWQCOB Range (Min - Max)
Increase Decrease Decrease in % in% in%
variation variation - - variation - - - - 16.70 % - - 76.15 % - 14.81 % at 1
at 1 at 1 location location location
Overall Water Quality Status of River Yamuna (HP, Haryana, Delhi and UP) during Pre-lockdown (March 2020) and Lockdown Period (April 2020)
No. of locations 14 locations in March 2020 and 12 locations in April 2020 monitored
No. of monitoring locations for which 10 12 14 12 14 08 14 09 - - - - monitored results available
% Increase % 1.12% - Decrease 14.81%
% 16.67% - at 08 Decrease 99.71 % locations. 16.70% - 10 - 10 - at 08 Overall Range 7.9-17.1 1.2 - 9.3 % 6.9 - 8.7 6.9 - 8.2 0.6 - 78 0.4 - 6.1 90.20% 9200000 46000 locations Decrease at 08 and ' No' 2.38% - locations variation 51.46%
at 01 at 02 location. locations
Note:-* Values below 1mg/L for BOD to be considered as Below Detection Limit (BDL)
R.J 59 I Page
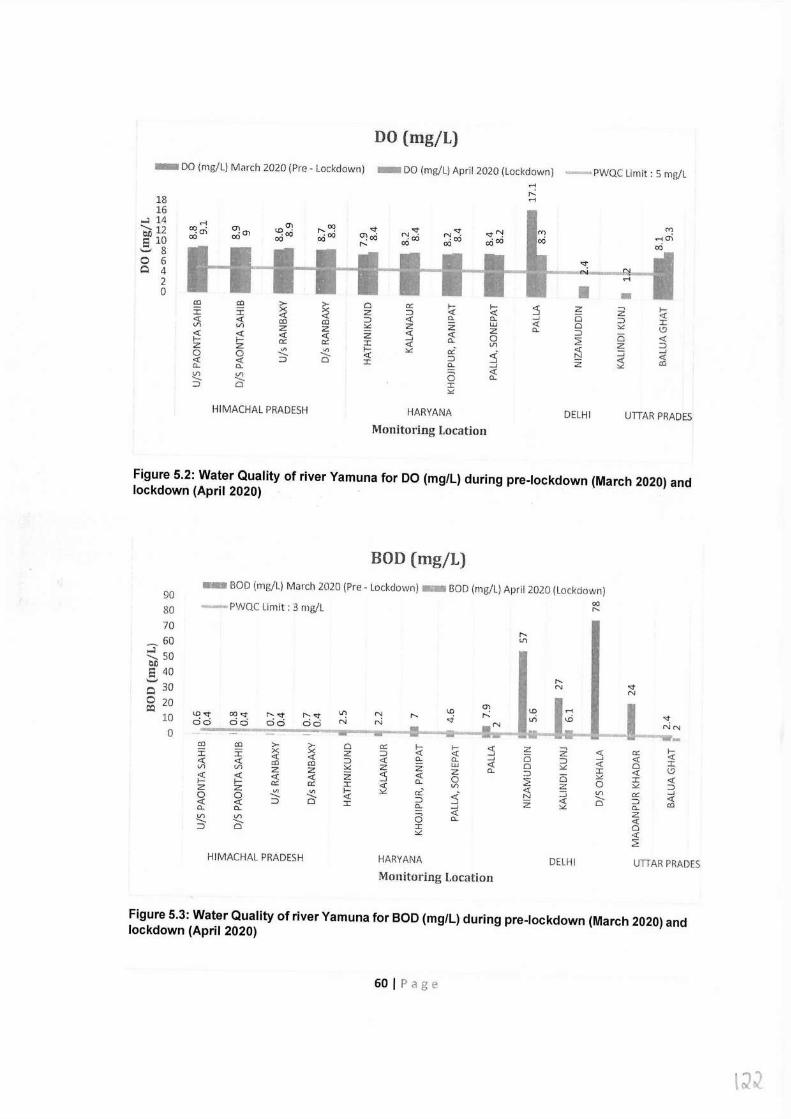
DO (mg/L)
- DO (mg/L) March 2020 (Pre - Lockdown) - DO (mg/L) April 2020 (Lockdown) -PWQC Limit: S mg/L
18 16
..l 14 rl er, "~ ......_ 12 00 • ~er, <D . "' "' N<l'. stN rn . er, • 0() cxi 00 O:cxi N .
cxi tlll 10 00 00 cxi 00 cxioo cxi 00 ..§., 8 " 0 6 c:i 4
2 0
co co >- >- 0 a:: f- f- '.:i :r: :r: X ~ z ::) <( <( <( ::) <( a. a.. ...J <( <( al co lJJ <( VI V) z z "' z z z a. <( ~ <( <( z <( <( 0 ....J 0.. f- a:: a:: :r: <( VI z z V, V) f- ""' a::' j' 0 0
----- ----- <( ::) <( <( ::) 0 :r: 0.. ...J 0.. 0.. a <( VI Vl 0..
----- ----- :c ::) 0 "'
HIMACHAL PRADESH HARYANA
Monitoring Location
(Y')
rlO)
cxi
"' oi ....; - z z f- ci <(
::) :c 0 Y- I.cl ::) i3 <( 2 z ::) <( ::::; ....J
t::! <( <( z "' al
DELHI UTTAR PRADES
Figure 5.2: Water Quality of river Yamuna for DO (mg/L) during pre-lockdown (March 2020) and lockdown (April 2020)
BOD (mg/L)
90
80 70
- 60 ~ 50 t)I) S 40 ~ 30 0 CQ
- BOD (mg/L) March 2020 (Pre - Lockdown) -- BOD (rng/L) April 2020 (Lockdown)
- PWQC Limit : 3 mg/L 00
" " lJ)
20 10 <D"' 00 st "st ""' cici c:ic:i ci c:i c:ic:i 0
al al >- >- 0 er:: ~ f- j ':i:: :c X X z ::) <( <( <( ::) <( 0.. 0.. ....J <( <( co co w <( VI Vl z z "' z z z 0.. ;:!: ~ <( <( z <( <( 0 ...J a.. er:: a:: :c <( VI z z V, V) f- "' a::' ::s 0 0
----- o' <( ::) <( <( ::) :c ~ ...J 0.. 0.. <( !Q Vl a 0..
---- I :::, 0 "'
HIMACHAL PRADESH HARYANA
Monitoring Location DELHI
<( a:: f-
~ <( <( 0 :c
I <( 1..9 "' :c <( 0 "' ::) VI er:: ...J
----- ::) <( 0 0.. co
z <( 0 <( 2
UTTAR PRADES
Figure 5.3: Water Quality of river Yamuna for BOD (mg/L) during pre-lockdown (March 2020) and lockdown (April 2020)
60 I P c1 g e
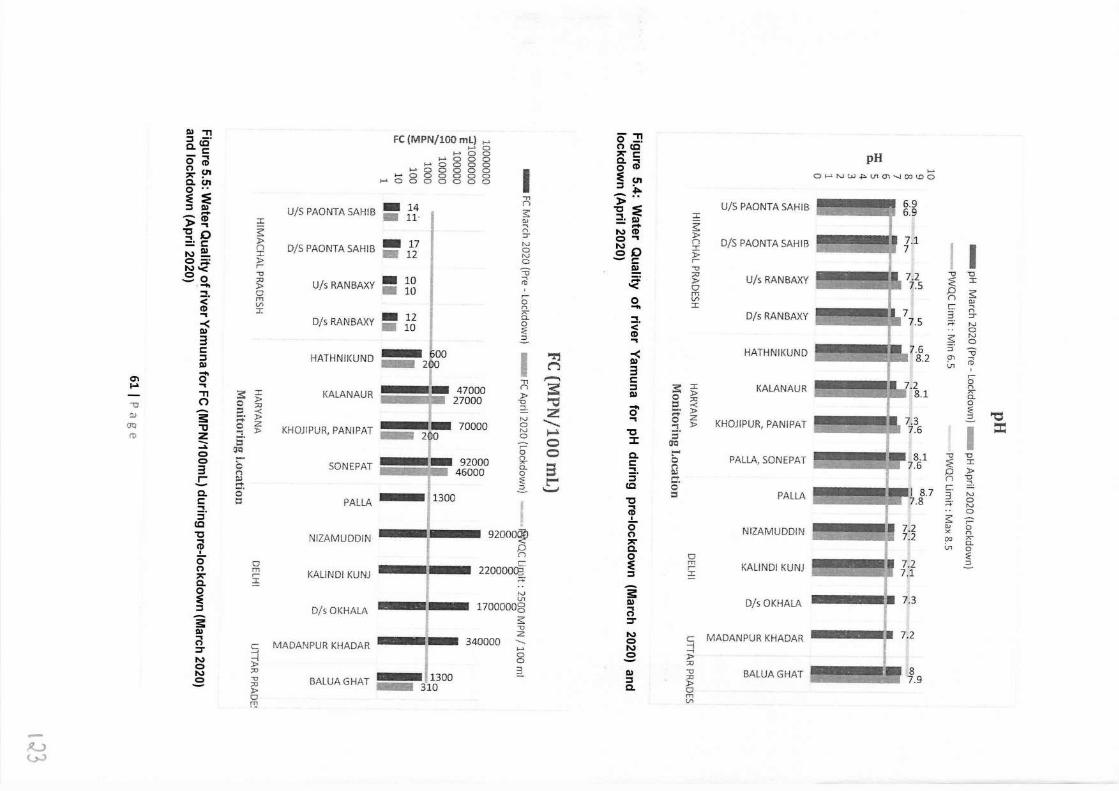
II) "Tl ::I -· c.<g - .., 0 ~ C') (JI :,,;- . C. (JI 0 .. ~ :E ::I II) - -~ )> .., -c D ~ C: N~ o_ N'< .8g_
:::::!. < ~ .., -< II)
3 C: ::I II) .... 0 (1\ .., ... "Tl - (') -0
"i :i.,
(IQ "'C z ro -- .... 0 0 3 .r: C. C: :::::!. ::I (C
"C .., 'P 0 C') :,,;- C. 0 ~ ::I
"i II) .., C') :::r N 0 N .8
- 14 U/S PAONTA SAHIB - 11· I ~
- 17 )>
D/S PAONTA SAHIB - 12 Q > r-
- 10
-c, :0
U/s RANBAXY - 10 > 0 m (/l
- 12 I
D/s RANBAXY - 10
3\: I 0 > - :0 ~ t 0 Z -: > 5· (l'Q
C n Ill 0-. 0 :::s
0 m S:
HATHNll<UND - 600 - 200
KALANAUR
KHOJIPUR, PANIPAT
SONEPAT
PALLA
NIZAMUDDIN
KALINDI KUNJ
D/s OKHALA
FC (MPN/100 ml) ,_. ,_. 0
,_. 0 0 ...,..i. 0 0 0
t--l O O O 0 ,_. 0 0 0 0 0
l---"000000 >-' 0 0 0 0 0 0 0
0 0
0
00 0
I ..,, n s "; n ::T N 0 N Q
~ "' c n s: 0 :;; 2-
I ~ n .,, ,...., n :: > ~ "ti N :z 0 ......... N 0 ~ -;:: 0 0 0 n ?<' 0. 3 0 :;; I:"'" 2.. ...__,
92000~ 0 n
220000(§° ;:;:
N Ln
7000008 s " z
- "Tl 0 -· C') (C :,,;- C: C. .., 0 ~ ~ (JI ::I • >~ -g :E = CJ N S° 0..,
~ .0 -,- ~ ~ 0 .... .., :.:· ~ ..,
~ 3 C: ::I II)
o' ..,
c MADANPURKHADAR
~ :0
] BALUA GHAT - 3·10 l> 0 rJ
000 ..___ I-' 0 0
~
"C :I: C. C: .., :i" (C
"C
~ 0 C') :,,; c. 0 ~ ::I
"i II)
~ :::r N 0 N .8 II) ::I C.
I $ )> n ~ r " $ 0 m (/l I
3\: I 0 > :::s :;_: ~- :t:,, 0 Z ~- l>
~ t""' 0 n Ill ,... 5· :::s
0 m ,- I
U/S PAONTA SAHIB
D/S PAONTA SAHIB
U/s RANBAXY
D/s RANBAXY
HATHNIKUND
KALANAUR
KHOJIPUR, PANIPAT
PALLA, SONEPAT
PALLA
NIZAMUDDIN
KALINDI KUNJ
D/s OKHALA
pH .....
0}----1-NW+:i.V,01"'-JCOI..DO
7.6 8.2
I I -c, 7CJ :'f I 0 n ' ::} ;:;:
s "; n ::T N
s ~ -· 0 :::, - 01 " t.,., (ti
' 0 n " 0. 0 :;; :::,
I "'O ::c:
-c, 7CJ :'f I 0 > n ~ C -· 3 ;::;·
s "' X
!)' ot
N 0 N 0
' 0 n " Cl. 0 :;; :::,
c MADANPURKHADAR
~ :0
] BALUAGHAT l> 0 m (/l
r 7.2 ' .8
7.9
/u <..,.J
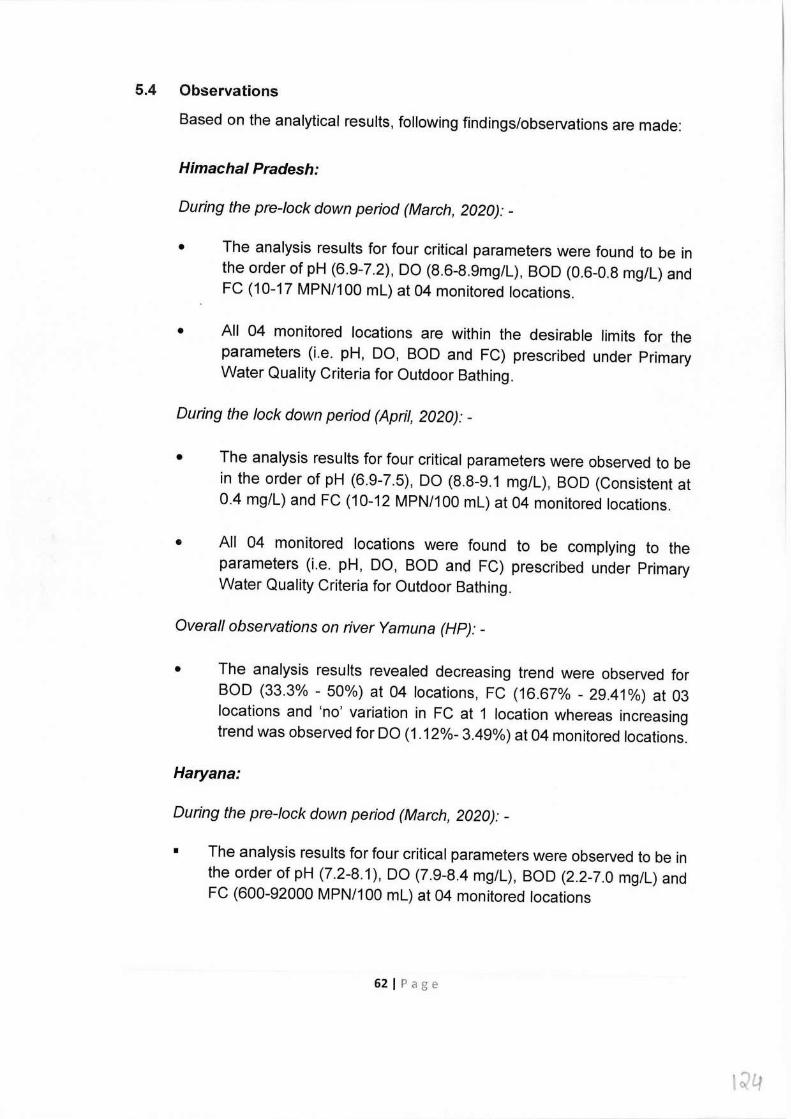
5.4 Observations
Based on the analytical results, following findings/observations are made:
Himachal Pradesh:
During the pre-lock down period (March, 2020): -
• The analysis results for four critical parameters were found to be in the order of pH (6.9-7.2), DO (8.6-8.9mg/l), BOD (0.6-0.8 mg/l) and FC (10-17 MPN/100 ml) at 04 monitored locations.
• All 04 monitored locations are within the desirable limits for the parameters (i.e. pH, DO, BOD and FC) prescribed under Primary Water Quality Criteria for Outdoor Bathing.
During the lock down period (April, 2020): -
• The analysis results for four critical parameters were observed to be in the order of pH (6.9-7.5), DO (8.8-9.1 mg/l), BOD (Consistent at 0.4 mg/l) and FC (10-12 MPN/100 ml) at 04 monitored locations.
• All 04 monitored locations were found to be complying to the parameters (i.e. pH, DO, BOD and FC) prescribed under Primary Water Quality Criteria for Outdoor Bathing.
Overall observations on river Yamuna (HP): -
• The analysis results revealed decreasing trend were observed for BOD (33.3% - 50%) at 04 locations, FC (16.67% - 29.41 %) at 03 locations and 'no' variation in FC at 1 location whereas increasing trend was observed for DO (1.12%- 3.49%) at 04 monitored locations.
Haryana:
During the pre-lock down period (March, 2020): -
• The analysis results for four critical parameters were observed to be in the order of pH (7.2-8.1 ), DO (7.9-8.4 mg/l), BOD (2.2-7.0 mg/l) and FC (600-92000 MPN/100 ml) at 04 monitored locations
62 I Page
1;?4
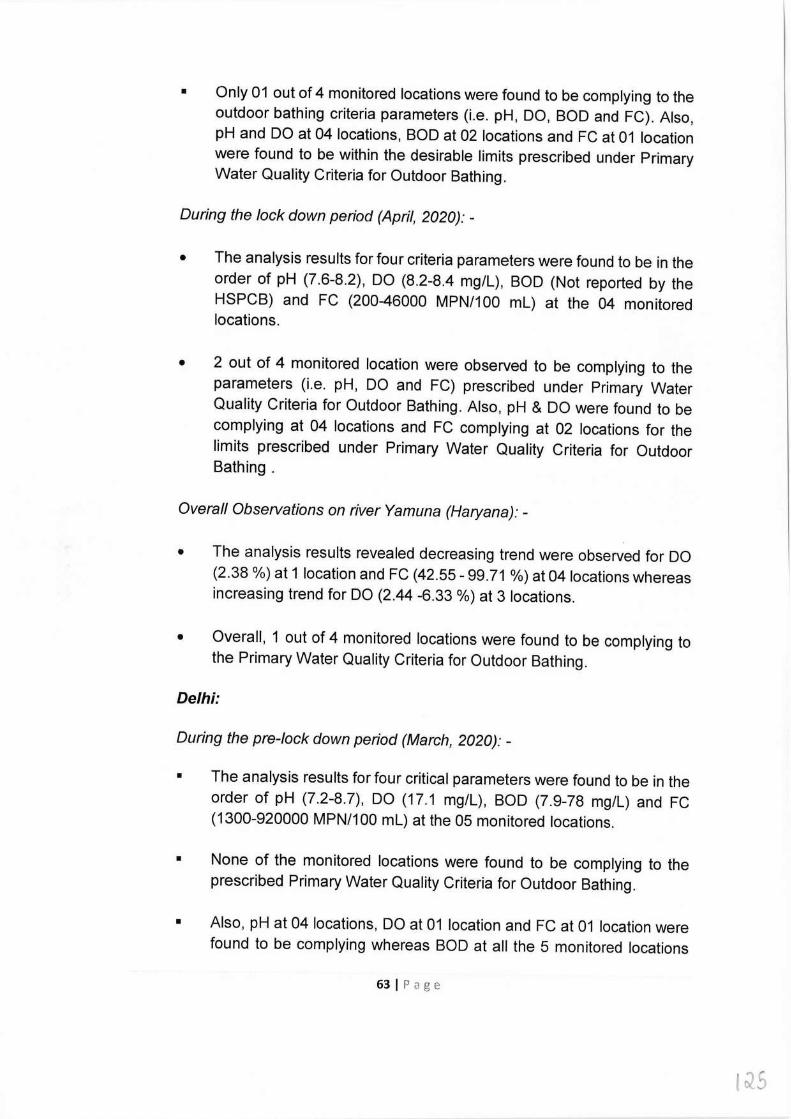
• Only 01 out of 4 monitored locations were found to be complying to the outdoor bathing criteria parameters (i.e. pH, DO, BOD and FC). Also, pH and DO at 04 locations, BOD at 02 locations and FC at 01 location were found to be within the desirable limits prescribed under Primary Water Quality Criteria for Outdoor Bathing.
During the lock down period (April, 2020): -
• The analysis results for four criteria parameters were found to be in the order of pH (7.6-8.2), DO (8.2-8.4 mg/l), BOD (Not reported by the HS PCB) and FC (200-46000 MPN/100 ml) at the 04 monitored locations.
• 2 out of 4 monitored location were observed to be complying to the parameters (i.e. pH, DO and FC) prescribed under Primary Water Quality Criteria for Outdoor Bathing. Also, pH & DO were found to be complying at 04 locations and FC complying at 02 locations for the limits prescribed under Primary Water Quality Criteria for Outdoor Bathing .
Overall Observations on river Yamuna (Haryana): -
• The analysis results revealed decreasing trend were observed for DO (2.38 %) at 1 location and FC (42.55 - 99.71 %) at 04 locations whereas increasing trend for DO (2.44 -6.33 %) at 3 locations.
• Overall, 1 out of 4 monitored locations were found to be complying to the Primary Water Quality Criteria for Outdoor Bathing.
Delhi:
During the pre-lock down period (March, 2020): -
• The analysis results for four critical parameters were found to be in the order of pH (7.2-8.7), DO (17.1 mg/l), BOD (7.9-78 mg/l) and FC (1300-920000 MPN/100 ml) at the 05 monitored locations.
• None of the monitored locations were found to be complying to the prescribed Primary Water Quality Criteria for Outdoor Bathing.
• Also, pH at 04 locations, DO at 01 location and FC at 01 location were found to be complying whereas BOD at all the 5 monitored locations
63 I Page
tJS
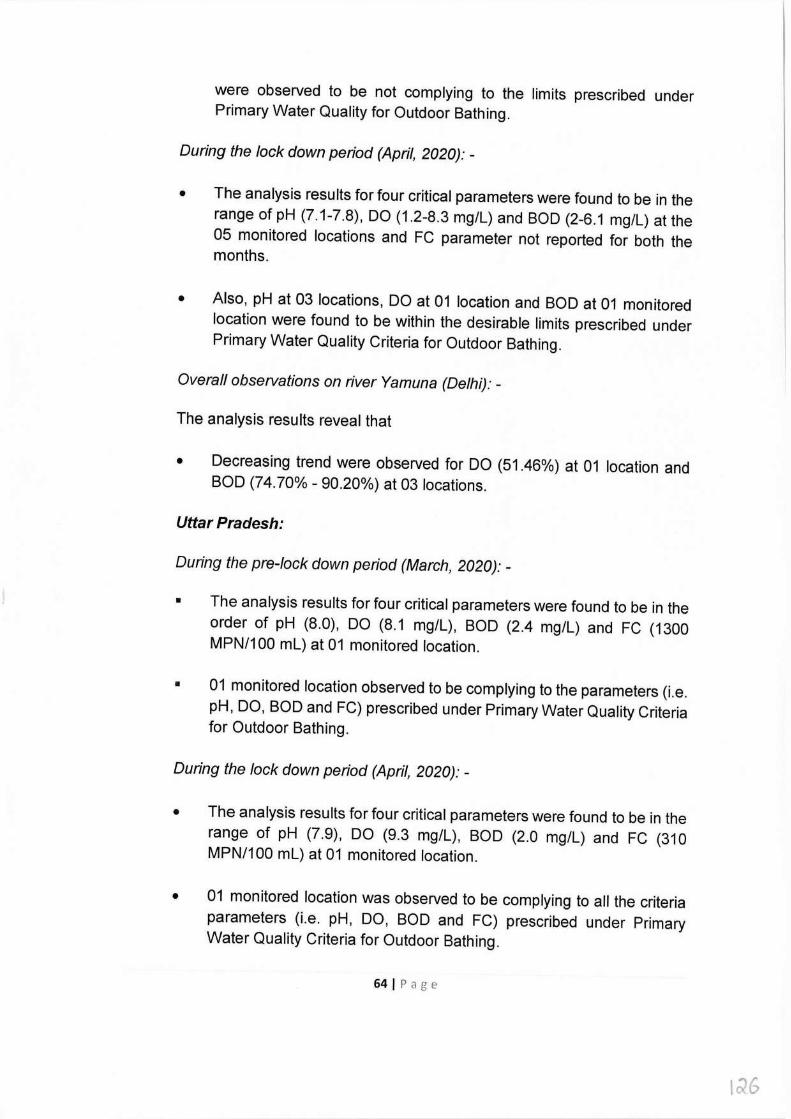
were observed to be not complying to the limits prescribed under Primary Water Quality for Outdoor Bathing.
During the lock down period (April, 2020): -
• The analysis results for four critical parameters were found to be in the range of pH (7.1-7.8), DO (1.2-8.3 mg/l) and BOD (2-6.1 mg/l) at the 05 monitored locations and FC parameter not reported for both the months.
• Also, pH at 03 locations, DO at 01 location and BOD at 01 monitored location were found to be within the desirable limits prescribed under Primary Water Quality Criteria for Outdoor Bathing.
Overall observations on river Yamuna (Delhi): -
The analysis results reveal that
• Decreasing trend were observed for DO (51.46%) at 01 location and BOD (74.70% - 90.20%) at 03 locations.
Uttar Pradesh:
During the pre-lock down period (March, 2020): -
• The analysis results for four critical parameters were found to be in the order of pH (8.0), DO (8.1 mg/l), BOD (2.4 mg/l) and FC (1300 MPN/100 ml) at 01 monitored location.
• 01 monitored location observed to be complying to the parameters (i.e. pH, DO, BOD and FC) prescribed under Primary Water Quality Criteria for Outdoor Bathing.
During the lock down period (April, 2020): -
• The analysis results for four critical parameters were found to be in the range of pH (7.9), DO (9.3 mg/l), BOD (2.0 mg/l) and FC (310 MPN/100 ml) at 01 monitored location.
• 01 monitored location was observed to be complying to all the criteria parameters (i.e. pH, DO, BOD and FC) prescribed under Primary Water Quality Criteria for Outdoor Bathing.
64 I Page
1'16
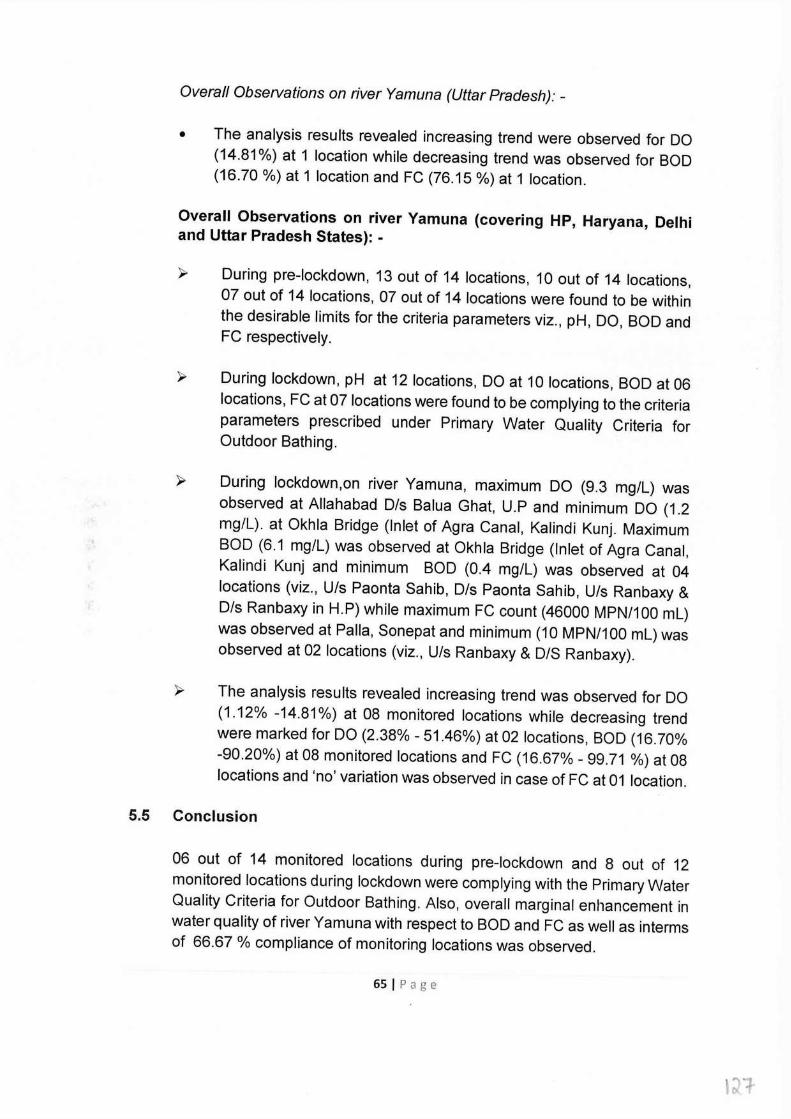
Overall Observations on river Yamuna (Uttar Pradesh): -
• The analysis results revealed increasing trend were observed for DO (14.81 %) at 1 location while decreasing trend was observed for BOD (16.70 %) at 1 location and FC (76.15 %) at 1 location.
Overall Observations on river Yamuna (covering HP, Haryana, Delhi and Uttar Pradesh States}: -
};l,, During pre-lockdown, 13 out of 14 locations, 10 out of 14 locations, 07 out of 14 locations, 07 out of 14 locations were found to be within the desirable limits for the criteria parameters viz., pH, DO, BOD and FC respectively.
During lockdown, pH at 12 locations, DO at 10 locations, BOD at 06 locations, FC at 07 locations were found to be complying to the criteria parameters prescribed under Primary Water Quality Criteria for Outdoor Bathing.
During lockdown,on river Yamuna, maximum DO (9.3 mg/l) was observed at Allahabad D/s Balua Ghat, U.P and minimum DO (1.2 mg/l). at Okhla Bridge (Inlet of Agra Canal, Kalindi Kunj. Maximum BOD (6.1 mg/l) was observed at Okhla Bridge (Inlet of Agra Canal, Kalindi Kunj and minimum BOD (0.4 mg/l) was observed at 04 locations (viz., U/s Paonta Sahib, O/s Paonta Sahib, U/s Ranbaxy & O/s Ranbaxy in H.P) while maximum FC count (46000 MPN/100 ml) was observed at Palla, Sonepat and minimum (10 MPN/100 ml) was observed at 02 locations (viz., U/s Ranbaxy & D/S Ranbaxy).
The analysis results revealed increasing trend was observed for DO (1.12% -14.81 %) at 08 monitored locations while decreasing trend were marked for DO (2.38% - 51.46%) at 02 locations, BOD (16.70% -90.20%) at 08 monitored locations and FC (16.67% - 99.71 %) at 08 locations and 'no' variation was observed in case of FC at 01 location.
5.5 Conclusion
06 out of 14 monitored locations during pre-lockdown and 8 out of 12 monitored locations during lockdown were complying with the Primary Water Quality Criteria for Outdoor Bathing. Also, overall marginal enhancement in water quality of river Yamuna with respect to BOD and FC as well as interms of 66.67 % compliance of monitoring locations was observed.
65 I Page
6.0. IMPACT OF LOCKDOWN ON WATER QUALITY OF RIVER CHAMBAL
6.1. About River Chambal
The River Chambal, is 960 kilometre long and one of the cleanest perennial river and originates in the Vindhya Range in Madhya Pradesh State. The river flows north-northeast through Madhya Pradesh, running for a time through Rajasthan then forming the boundary between Rajasthan and Madhya Pradesh before turning southeast to join the river Yamuna in Uttar Pradesh. Major left bank tributaries of river Chambal are Banas, Mej and right bank tributaries are Parbati, Kali Sindh and Shipra. Kota, Nagda, Sawai Madhopur, Karauli, Dholpur are the major cities on the banks of Chambal river. Kota is one of the industrial hubs in Northern India where chemical, cement and power plants industries are located.
6.2. Water Quality Monitoring Locations under National Water Quality Monitoring Programme (NWMP)
Water quality of river Chambal is assessed at 18 locations by Central Pollution Control Board (CPCB) in association with M.P. Pollution Control Board (MPPCB), Rajasthan State Pollution Control Board (RSPCB) and U.P. Pollution Control Board (UPPCB) under National Water Quality Monitoring Programme (NWMP). State-wise Distribution of Water Quality Monitoring Locations under NWMP on River Chambal is depicted in Figure 6.1.
6.3 Analytical Results
Monitoring of river Chambal was carried out at 8 locations [ MP (07) and Rajasthan (01 )] during Pre-Lockdown (March 2020) and 13 locations [ MP (06) and Rajasthan (07)] during Lockdown period (April 2020) to assess the impact of lockdown on water quality of river Chambal. The water quality of river Chambal for the Primary Water Quality Criteria for Outdoor Bathing (PWQCOB) parameters viz. Dissolved Oxygen (DO), pH, Biochemical Oxygen Demand (BOD) and Fecal Coliform (FC) are presented in Table-6.1.
Based on the monitoring & analysis of collected water samples from river Chambal, the water quality tendency of river Chambal with respect to DO, pH, BOD and FC as observed during pre-lockdown (March 2020) and lockdown period (April 2020) are depicted in Figure 6.2 to Figure 6.5.
66 I Page
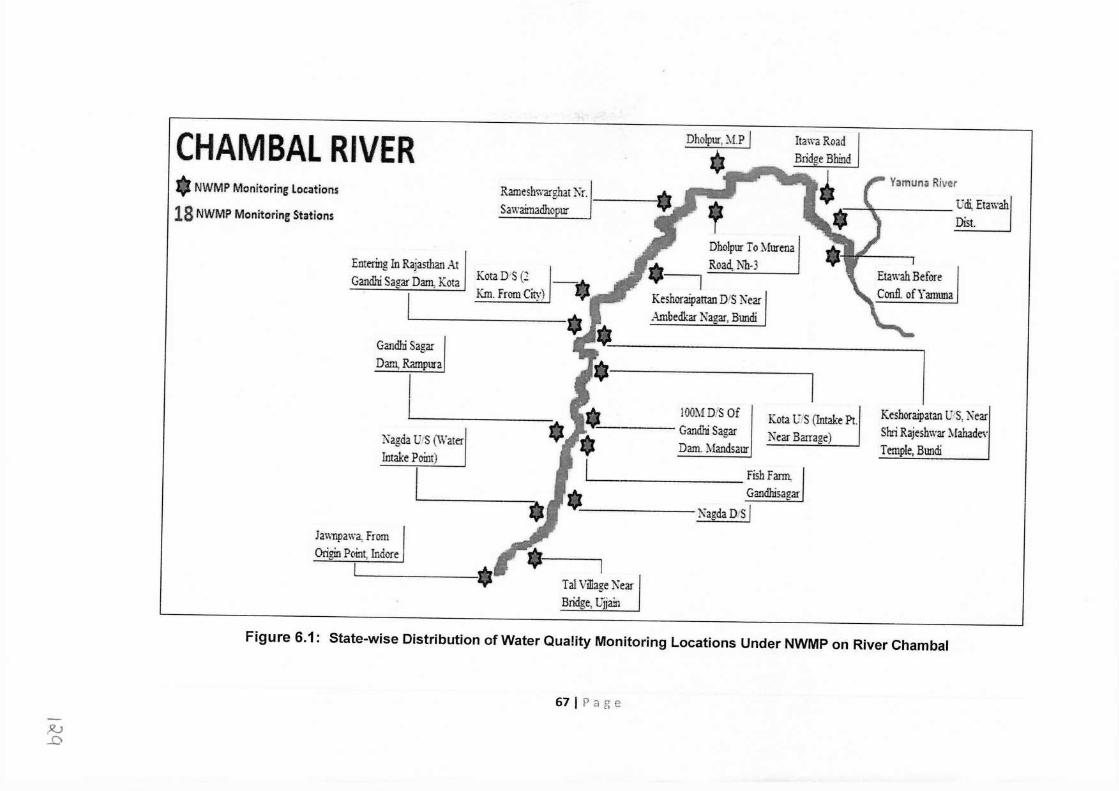
CHAMBAL RIVER NWMP Monitoring Locations
18 NWMP Monitoring Stations
Entering In Rajasthan At Gandhi Sagar Dam, Kota
[
Rameshwarghat Kr. 1
•
Sawaimadhopur
Yamuna Rlver
Udi. Etawah ,.-------- . Dist.
KotaD·s (2 Km. From City)
Gandhi Sagar Dam, Rampura
I Nagda U1S (Water Intake Point)
[
Dholpur To }[urena Road, :Nh-3 -,
Keshoraipattan D1S Near Ambedkar Nagar, Bundi
100~1 DJS Of ~ Gandhi Sagar
Dam. Mandsaur
Kota L"1S (Intake Pt. Near Barrage)
Jawnpawa, From Origin Poin~ Indore
._ Fish Fann, Gandhisagar
------- Kagda D1S I
Tal Village Near Bridge, Uiiain
Keshoraipatan U1S, Near Sbri Rajeshwar Mahadev Temple, Bundi
Figure 6.1: State-wise Distribution of Water Quality Monitoring Locations Under NWMP on River Chambal
67 I Page
~ ...0
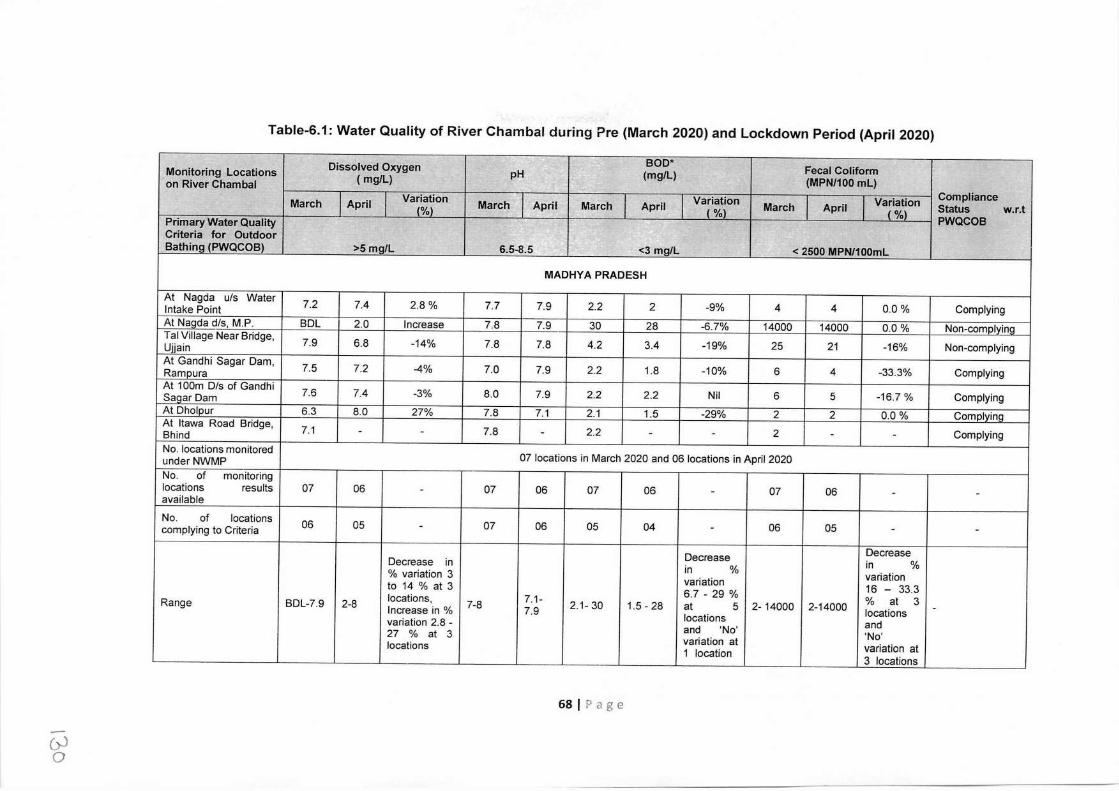
Table-6.1: Water Quality of River Chambal during Pre (March 2020) and Lockdown Period (April 2020)
' - BOD• Dissolved Oxygen - Fecal Coliform Monitoring Locations ( mg/L) pH (mg/L) (MPN/100 ml) on River Chambal
Variation Variation Variation Compliance March April (%) March April March April ( %) March April (%) Status w.r.t Primary Water Quality PWQCOB Criteria for Outdoor Bathing (PWQCOB) >5 mg/L 6.5-8.5 <3 mg/L < 2500 MPN/100ml
MADHYA PRADESH
At Nagda u/s Water 7.2 7.4 2.8 % 7.7 7.9 2.2 2 -9% 4 4 0.0% Complying Intake Point At Nanda d/s, M.P. BDL 2.0 Increase 7.8 7.9 30 28 -6.7% 14000 14000 0.0 % Non-comolvino Tai Village Near Bridge, 7.9 6.8 -14% 7.8 7.8 4.2 3.4 -19% 25 21 -16% Non-complying Uiiain At Gandhi Sagar Dam, 7.5 7.2 -4% 7.0 7.9 2.2 1.8 -10% 6 4 -33.3% Complying Rampura At 1 00m Dis of Gandhi 7.6 7.4 -3% 8.0 7.9 2.2 2.2 Nil 6 5 -16.7 % Complying Saqar Dam At Dholpur 6.3 8.0 27% 7.8 7.1 2.1 1.5 -29% 2 2 0.0 % Complying At ltawa Road Bridge, 7.1 - - 7.8 - 2.2 - - 2 - - Complying Bhind No. locations monitored
07 locations in March 2020 and 06 locations in April 2020 under NWMP No. of monitoring locations results 07 06 - 07 06 07 06 - 07 06 - - available
No. of locations 06 05 07 06 05 04 06 05 - complying to Criteria - - -
Decrease Decrease Decrease in
in % in % % variation 3
variation variation to 14 % at 3
6.7 - 29 % 16 - 33.3 locations, 7.1- % at 3 Range BDL-7.9 2-8 Increase in % 7-8 7.9 2.1- 30 1.5 - 28 at 5 2-14000 2-14000 locations - variation 2.8 - locations and 27 % at 3 and 'No' 'No' locations variation at
variation at 1 location 3 locations
68 I Page
()J 0
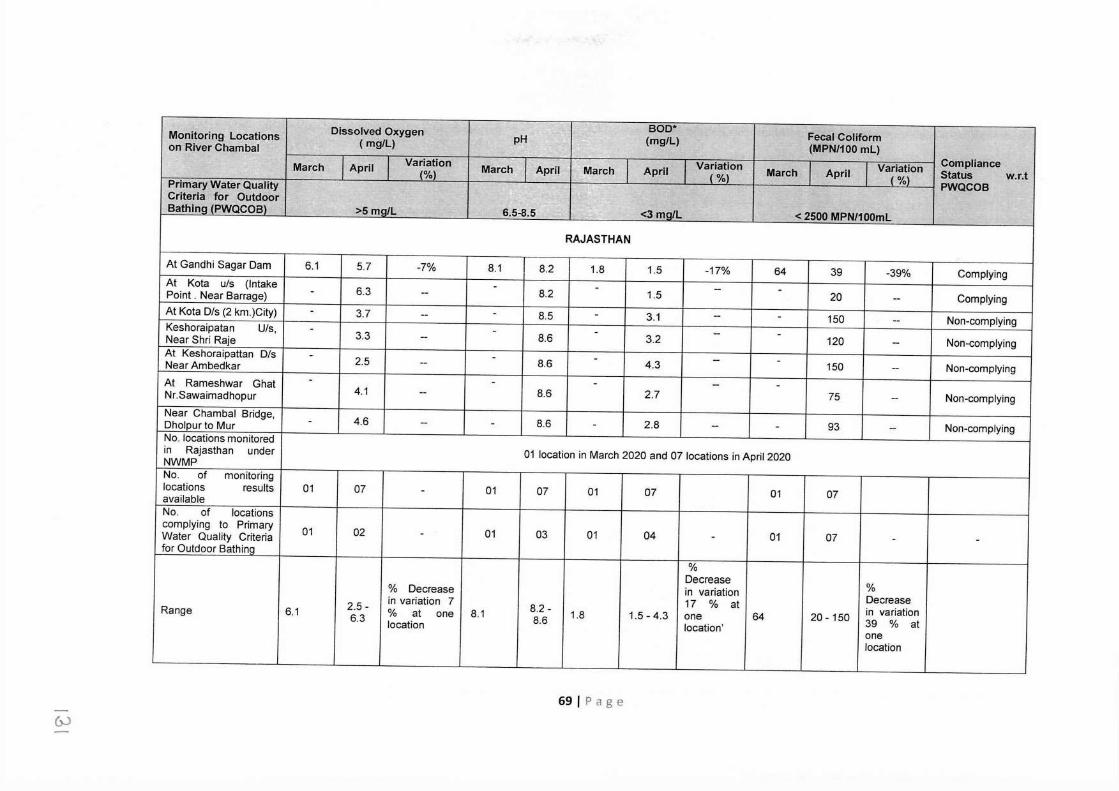
Dissolved Oxygen BOD* Feca l Coliform Monitoring Locations pH (mg/L)
on River Chambal ( mg/L) (MPN/100 ml) Variation Variation Variation Compliance March April {%) March April March April
( %) March April (%) Status w.r.t
Primary Water Quality PWQCOB Criteria for Outdoor Bathing (PWQCOB) >5 mg/L 6.5-8.5 ' <3 mQ/L < 2500 MPN/100ml
RAJASTHAN
At Gandhi Sagar Dam 6.1 5.7 -7% 8.1 8.2 1.8 1.5 -17% 64 39 -39% Complying At Kota uls (Intake
6.3 - 8.2 - 1.5 - - 20 Complying Point . Near Barrage) - -- -- At Kota Dis (2 km.)City) - 3.7 -- - 8.5 - 3.1 - - 150 -- Non-complying Keshoraipatan U/s, - 3.3 -
8.6 - 3.2 - - 120 Non-complying Near Shri Raje -- -- At Keshoraipattan Dis - 2.5 - 8.6 - 4.3 - - 150 Non-complying Near Ambedkar -- - At Rameshwar Ghat - - - - - Nr.Sawaimadhopur 4.1 - 8.6 2.7 75 -- Non-complying Near Chambal Bridge, - 4.6 -- - 8.6 - 2.8 - - 93 -- Non-complying Dholpur to Mur No. locations monitored in Rajasthan under 01 location in March 2020 and 07 locations in April 2020 NWMP No. of monitoring locations results 01 07 - 01 07 01 07 01 07 available No. of locations complying to Primary
01 02 - 01 03 01 04 - 01 07 - - Water Quality Criteria for Outdoor Bathinq
% Decrease
% % Decrease in variation Decrease 2.5 - in variation 7
8.2 - 17 % at in variation Range 6.1 6.3 % at one 8.1 8.6 1.8 1.5 - 4.3 one 64 20 - 150 39 % at location location' one location
69 I Page 6J
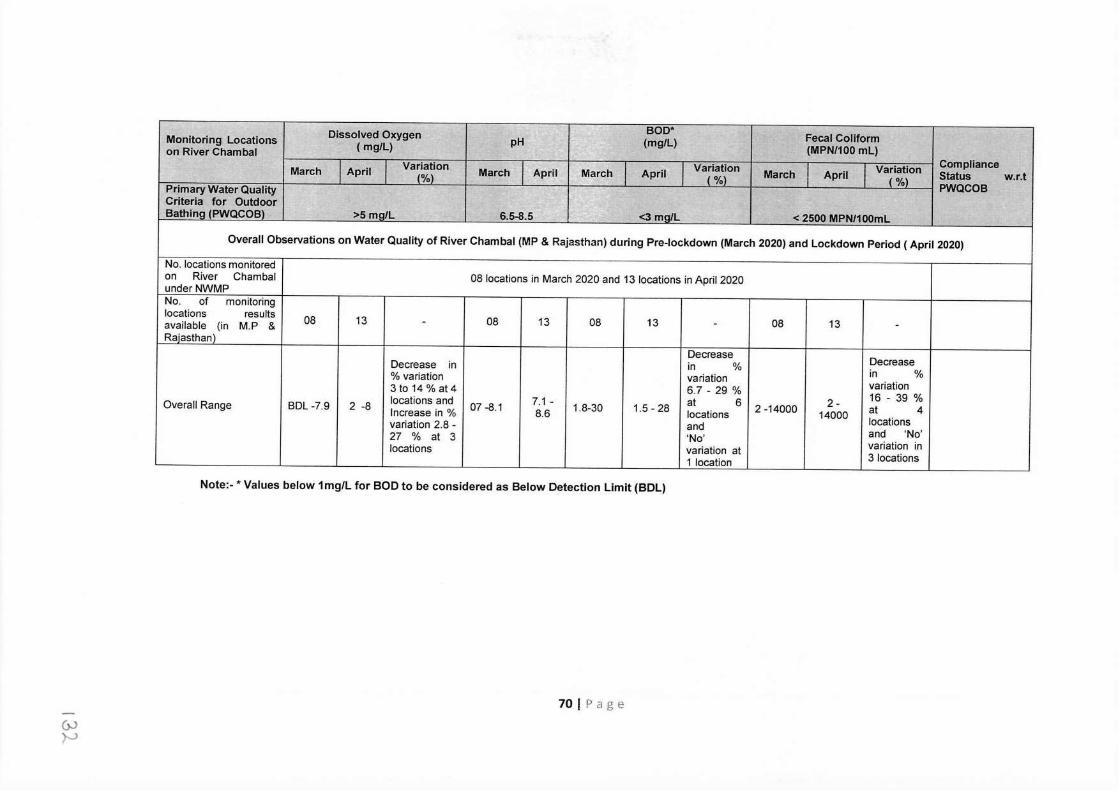
- BOD* Dissolved Oxygen ~ Fecal Coliform Monitoring Locations pH - (mg/L) (mg/L) . (MPN/100 ml) on River Chambal
Variation Variation Variation Compliance March April (%) March April March April (%) March April (%) Status w.r.t Primary Water Quality PWQCOB Criteria for Outdoor Bathing (PWQCOB) >5 mg/L 6.5-8.5 <3 mg/L < 2500 MPN/100ml
Overall Observations on Water Quality of River Chambal (MP & Rajasthan) during Pre-lockdown (March 2020) and Lockdown Period ( April 2020)
No. locations monitored on River Chambal 08 locations in March 2020 and 13 locations in April 2020 under NWMP No. of monitoring locations results 08 13 08 13 08 13 08 13 available (in M.P & - - - Rajasthan)
Decrease Decrease Decrease in in % in % % variation variation variation 3 to 14 % at 4 6.7 - 29 % 16 - 39 % Overall Range BDL-7.9 2 -8 locations and 07 -8.1 7.1 - 1.8-30 1.5 - 28 at 6 2 -14000 2- at 4 Increase in % 8.6 locations 14000
variation 2.8 - and locations and 'No' 27 % at 3 'No' variation in locations variation at 3 locations 1 location
Note:-* Values below 1 mg/L for BOD to be considered as Below Detection Limit (BDL)
70 I Page 6J ~
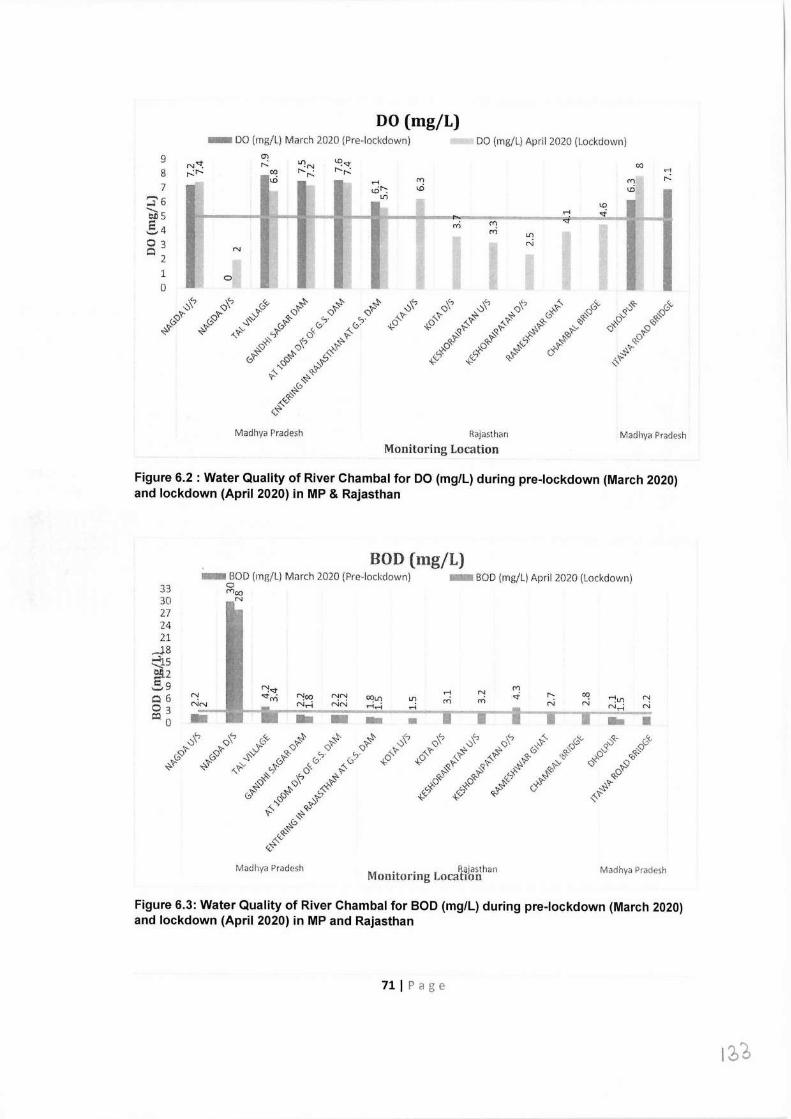
DO (mg/L) - DO (mg/L) March 2020 (Pre-lockdown) DO (mg/L) April 2020 (l.ockdown)
9 8 7
::3' 6 ~s !4 03 02
1 0
N
0
00
m I.D
rl r--
rl
LI)
N
,o\"' 0'v #" ~ ~ vt' <::i\' v'\' ~ ,::- 0'<- ,::,"<- 0"- Q'?- -s· <1:-Q '?Q '?Q c,.'?- c,.'?- ,t ~Q 00 'FQ ,3 ~(j ~~ ..._'?' 9:- ~ p Q<;tj '?-(j
.... ~ 0"?' 0· 0· +O -.9 ~ ~'?- ~'?' ,;,, Q ~ "''?' o"- ~ '2- 'ii r:f --~ ,j:i'?' ;:- 't' ,,. f<-'?' 0~ ~ 0"?' ~Q ~Q ..._0'?' .p ~'?' <O cf «-'?-""° C 0"?' ,J5 ',.;:., ~ c,.'?- *' .... "-.; "<-'?- '?- ~
,.0 ~ c-.<,;
0""
Madhya Pradesh Rajasthan
Monitoring Location Madhya Pradesh
Figure 6.2 : Water Quality of River Chambal for DO (mg/L) during pre-lockdown (March 2020) and lockdown (April 2020) in MP & Rajasthan
BOD (mg/L) 33 30 27 24 21
_.J.8 ~5 ;:A2 59 06 03 Q:l 0
- BOD (mg/L) March 2020 (Pre-lockdown) 0 mC() N
- BOD (mg/L) April 2020 (Lockdown)
rl m
Noa NN OOLI) LI) N <i r-: ~ rill) C'! Nr-t NN rirl .-i m m N N N,-i N .. - - • .. •
Madhya Pradesh R;ijasthan Monitoring Location Madhya Pradesh
Figure 6.3: Water Quality of River Chambal for BOD (mg/L) during pre-lockdown (March 2020) and lockdown (April 2020) in MP and Rajasthan
711Page
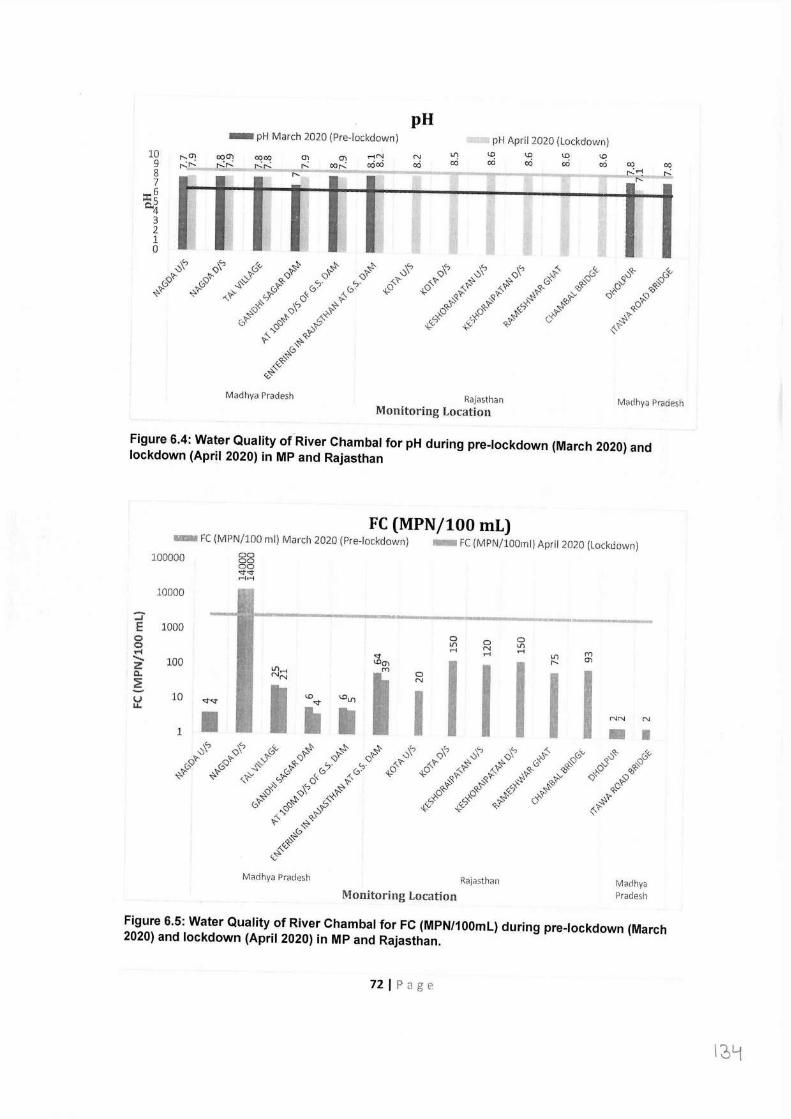
pH - pH March 2020 (Pre-lockdown) pH April 2020 (lockdown)
10 9 8 7
:::::6 o.5 4 3 2 1 0
0000 ,--: . N o:5
Madhya Pradesh Rajasthan Monitoring Location
Madhya Pradesh
Figure 6.4: Water Quality of River Chambal for pH during pre-lockdown (March 2020) and lockdown (April 2020) in MP and Rajasthan
.._ FC (MPN/100 rnl) March 2020 (Pre-lockdown) FC (MPN/100 mL)
100000 00 00 00 s:tst .-lrl
.10000
::r E 1000 0 0 0 0
l/1 l/1 0 rl N rl rn ....
"'" rl l/1 0) ....... 100 "'m
I I r-- z ll1,-; rn
0 I I I 0. NN I N ~ I I 10 U) U)l/1 u "'""'" "'" I.I.
II I NN N
1 I - •
- FC (MPN/100ml) April 2020 (Lockdown)
Madhya Pradesh Rajasthan
Monitoring Location Madhya Pradesh
Figure 6.5: Water Quality of River Chambal for FC (MPN/100ml) during pre-lockdown (March 2020) and lockdown (April 2020) in MP and Rajasthan.
721Page
6.4 Observations
Based on the analytical results collected from river Chambal, following findings/observations are made:
Madhya Pradesh
During the pre-lock down period (March 2020):-
• The analysis results for four critical parameters were observed in the order of pH (7 - 8), DO (BDl-7.9 rng/l), BOD (2 -30 mg/l) and FC (2- 14000 MPN/100 ml) at the 07 monitored locations.
• 5 out of 7 monitored locations were found to be complying to the outdoor bathing limits. BOD at 2 monitored locations and FC at 1 monitored location (D/s Nagda) were not complying to the Primary Water Quality Criteria for Outdoor Bathing whereas pH was complying at all the 07 monitored locations.
• Minimum DO as 'Nil', maximum BOD as 30 mg/land maximum FC ( 14000 MPN/100 ml) were observed at Dis Nagda, which could be due to discharge of untreated municipal sewage or industrial discharge from Nagda.
During the lock down period (April 2020): -
• The analysis results for four critical parameters indicate pH (7.1-7.9), DO (2 - 8 mg/l), BOD (1.5 -28 mg/l) and FC (2 - 14000 MPN/100 ml) at the 06 monitored locations.
• 4 out of 6 monitored locations were found to be complying to the Primary Water Quality Criteria for Outdoor Bathing. Also, pH at 06 locations, DO & FC at 05 locations each and BOD at 04 locations were found to be within the desirable limits prescribed under Primary Water Quality Criteria for Outdoor Bathing.
• Minimum DO as '2 mg/l', maximum BOD as 28 mg/l and maximum FC ( 14000 MPN/100 ml) were observed at Dis Nagda, which could be due to discharge of untreated municipal sewage discharge from Nagda city in .
Over all observations on river Chambal (M.P): -
• The minimum value of DO observed was 'BDl' at Nagda D/s and maximum DO (7.9 mg/l) at Tai Village, Near Bridge, Ujjain during pre-
73 I Page
lockdown whereas, minimum DO ( 2 mg/l) was observed at Nagda D/s and maximum DO (8.0 mg/I) at Dholpur during lockdown period reflecting industrial activity or domestic waste water discharge.
• Minimum BOD (2.1 mg/l) was observed at Dholpur and maximum BOD (30 mg/l) at Nagda Dis during pre-lockdown period whereas, minimum BOD (1.5 mg/l) was observed at Dholpur and maximum BOD (28 mg/l) at Nagda D/s during lockdown. High values of BOD at Nagda can be attributed to high industrial activity or domestic waste water discharge in the region. However, due to restriction in industrial activity during lockdown period, marginal reduction in BOD was observed from 30 mg/l to 28 mg/l at Nagda Dis.
• Fecal Coliform (2 MPN/100 ml) was minimum at ltawa Road Bridge and at Dholpur and maximum FC (14000 MPN/100 ml) at Nagda D/s during pre-lockdown period whereas, minimum FC (2 MPN/100 ml) was observed at Dholpur and maximum FC (14000 MPN/100 ml) at Nagda Dis during lockdown period. High value of FC during both lockdown and pre-lockdown period at Nagda D/s indicates domestic waste water discharge into the river Chambal in the region.
• The analysis results showed decreasing trend for DO (3-14 %) at 3 locations, BOD (6.7 -29 %) at 5 locations and FC (16 -33 %) at 3 locations whereas increasing trend for DO (2.8 - 27 %) at 3 locations was observed. 'No' variation in BOD at 1 location and FC at 3 locations were observed.
Rajasthan
During the pre-lock down period (March 2020): -
• The analysis results of one monitored location indicate pH (8.1 ), DO (6.1 mg/l), BOD (1.8 mg/l) and FC (64 MPN/ 100 ml) and complied to the four critical parameters (i.e. pH, DO, BOD and FC) limits prescribed under Primary Water Quality Criteria for Outdoor Bathing.
• Minimum DO as '6.1 mg/l', maximum BOD as 1.8 mg/land maximum FC ( 64 MPN/100 ml) at Gandhi Sagar Dam were observed and complying to bathing criteria limits.
During the lock down period (April 2020): -
• The analysis results of seven monitored locations for four critical parameters were found to be in the ranges of pH (8.2-8.6), DO (2.5 -
74 I Page
6.3 mg/l), BOD (1.5 - 4.3 mg/l) and FC (20 - 150 MPN/100 ml) at 07 monitored locations.
• 02 monitored locations were observed to be complying with the analysed critical parameters (i.e. pH, DO, BOD and FC) prescribed under Primary Water Quality Criteria for Outdoor Bathing.
• Also, pH at 03 locations, DO at 02 locations, BOD at 04 locations and FC at all the 07 monitored locations were observed to be within the desirable limits prescribed under Primary Water Quality Criteria for Outdoor Bathing.
• Minimum DO as '2.5 mg/l', maximum BOD as 4.3 mg/land maximum FC ( 150 MPN/100 ml) were observed at Keshoripattan.
Over all observations on water quality of river Chambal (Rajasthan): -
• The analysis results shown decreasing trend of DO (7 %) at one location, BOD (17 %) at one location and FC (39 %) at one monitored location.
Overall Observations on River Chambal (covering MP & Rajasthan): -
} The minimum value of DO observed was 'BDl' at Nagda Dis and maximum DO (7.9 mg/l) at Tai Village, Near Bridge, Ujjain during pre-lockdown whereas, minimum DO ( 2 mg/L) was observed at Nagda Dis and maximum DO (8.0 mg/I) at Dholpur during lockdown period.
} Minimum BOD (1.8 mg/l) was observed at Gandhi Sagar Dam and maximum BOD (30 mg/l) at Nagda D/s during pre-lockdown period whereas, minimum BOD (1.5 mg/l) was observed at Dholpur, Gandhi Sagar Dam and at Kata U/s and maximum BOD (28 mg/l) at Nagda D/s during lockdown. High values of BOD at Nagda can be attributed to high industrial activity or domestic waste water discharge in the region. However, due to restriction in industrial activity during lockdown period, marginal BOD reduction was observed from 30 mg/l to 28 mg/l at Nagda D/s.
} Fecal Coliform count (2 MPN/100 ml) was observed as minimum at Dholpur and ltawa Road Bridge and maximum at Nagda D/s (14000 MPN/100 ml) during pre-lockdown period whereas, minimum FC was observed at Dholpur (2 MPN/100 ml) and maximum at Nagda Dis (14000 MPN/100 ml) during lockdown period. High value of FC during both lockdown and pre-lockdown period at Nagda D/s indicates high
75 I Page
13:+-
domestic waste water discharge into the river Chambal in the region.
~ The analysis results revealed decreasing trend of DO (3 -14 %) at 4 locations, BOD (6.7 - 29 %) at 6 locations and FC (16 -39 %) at 4 locations. Increasing trend of DO (2.8 - 27 %) at 3 monitored locations while 'no' variation in BOD at 1 location and FC at 3 monitored locations.
6.5 Conclusion
During Pre-lockdown (March 2020), 6 out of 8 monitored locations and 6 out of 13 monitored locations during lockdown (April 2020) were found to be complying with the Primary Water Quality Criteria for Outdoor Bathing. Althorugh,marginal improvement in water quality of river Chambal was observed with respect to DO, BOD and FC parameters, the water quality of river Chambal was deteriored in terms of % compliance of moniotored locations for the Primary Water Quality Criteria for Outdoor Bathing.
7. IMPACT OF LOCKDOWN ON WATER QUALITY OF RIVER BRAHMAPUTRA
7.1 About Brahmaputra River
The Brahmaputra river originates from the Kailash ranges of Himalayas in Tibet and runs for about 2900 km through China, India and Bangladesh. After flowing through Tibet it enters India through Arunachal Pradesh and flows through Assam valley. After joining of two tributaries viz. the Dibang or Sikang and the Lohit, from here onwards the river is known as 'Brahmaputra', it then enters in Bangladesh and finally makes a delta along with river Ganga before its out fall in to Bay of Bengal. Out of the total length of 2900 km, its length in India is 916 Km. The major ion chemistry of the Brahmaputra is characterized by high bi-carbonate content and source rock influence. While higher values of Total Suspended Matter (TSM) than Total Dissolved Solids (TDS) during monsoon indicate predominance of physical weathering over chemical weathering, chemical weathering is relatively more pronounced during the dry season. On average, 60 % of the bicarbonates in the Brahmaputra water come from silicate weathering and the rest from the carbonates. During its course in Assam valley from Kobo to Dhubri the river is joined by about 20 (twenty) important tributaries on its North bank which includes river Subansiri, Ronganadi, Dikrong, Buroi, Borgong, Jiabharali, Dhansiri (North) Puthimari, Manas, Beki, Aie, Sonkosh while the Noadehing, Buridehing, Desang, Dikhow, Bhogdoi, Dhansiri (South), Kopilli, Kulsi, Krishnai, Dhdhnoi, Jinjiran are the main
76 I Page
tributaries on the south bank of the river Brahmaputra. In Assam, major towns located on the bank of Brahmaputra are Dibrugarh, Dhubri, Jorhat, Tezpur, Guwahati. There are no major/minor industrial estate/cluster located on the 500 m periphery of the Brahmaputra river bank. Sewage generated from Tezpur and Guwahati City are directly discharged and are the major sources of pollution in river Brahmaputra.
7.2 Water Quality Monitoring Locations under National Water Quality Monitoring Programme (NWMP)
Water quality of river Brahmaputra is evaluated at 11 locations by Central Pollution Control Board in association with Pollution Control Board, Assam under National Water Quality Monitoring Programme (NWMP). State-wise Distribution of Water Quality Monitoring Locations under NWMP on River Brahmaputra is depicted in Figure 7.1.
7.3 Analytical Results
Water quality monitoring of river Brahmaputra was carried out at 8 locations during pre-lockdown and at 10 locations during lockdown period by Pollution Control Board, Assam to assess the impact on water quality of river Brahmaputra. The analysis results of Primary Water Quality Criteria for Outdoor Bathing (PWQCOB) parameters viz i.e. Dissolved Oxygen (DO), pH, Biochemical Oxygen Demand (BOD) and Fecal Coliform (FC) are presented below in Table-7.1.
Based on the monitoring & analysis of collected water samples from river Brahmaputra, the graphical presentation of river Brahmaputra with respect to DO, pH, BOD and FC as observed during pre-lockdown (March 2020) and lockdown period (April 2020) are presented in Figure 7.2 to Figure 7.5.
771Page
12'9
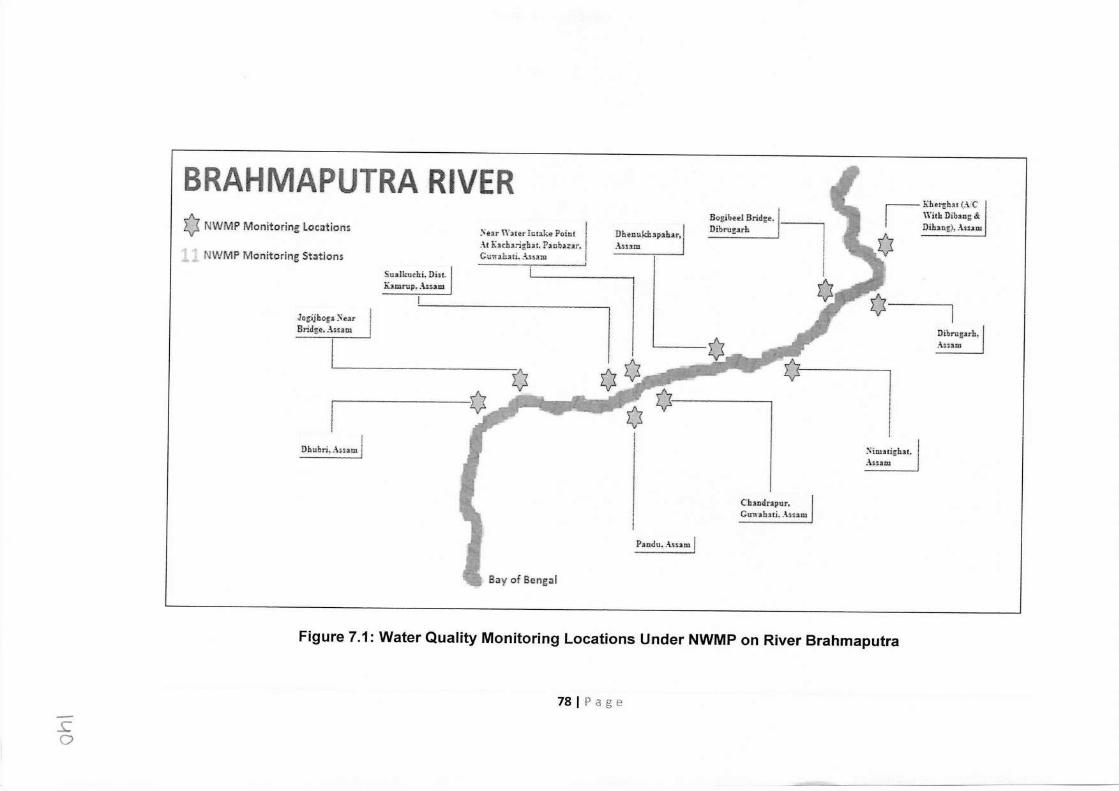
BRAHMAPUTRA RIVER Q NWMP Monitorfng Locations
NWMP Monitoring Stations
S@.:ir \Y:uer !ntak,e. Point f .-\! Kadw-iglw. P•obu•t. I Cu1r•ha1i .• \>,3.ro !
Scalkuehi. Dist. Kunrup, .usam
Jog:ijhog• :-;.,, Bridge:. M\uam
Dbubri, :\.,.uru
DhenuJ.:b•p~bar, I .\!Jum
Bog_ih,el =. Dihrug.trh
0
K'1,ri;b>< (:\. C r-- Wit.Ji Dib•ng & I D.ihan!), .-\.saw
0
CJ,u,drapur. Ctrnah•ti..\u•m
~im:.tti~h:at . .-1..uam
Dib.rugirh~ .-\,um
P•ndu, .-\sum I Bay of Bengal
Figure 7.1: Water Quality Monitoring Locations Under NWMP on River Brahmaputra
78 I Page .£ 0
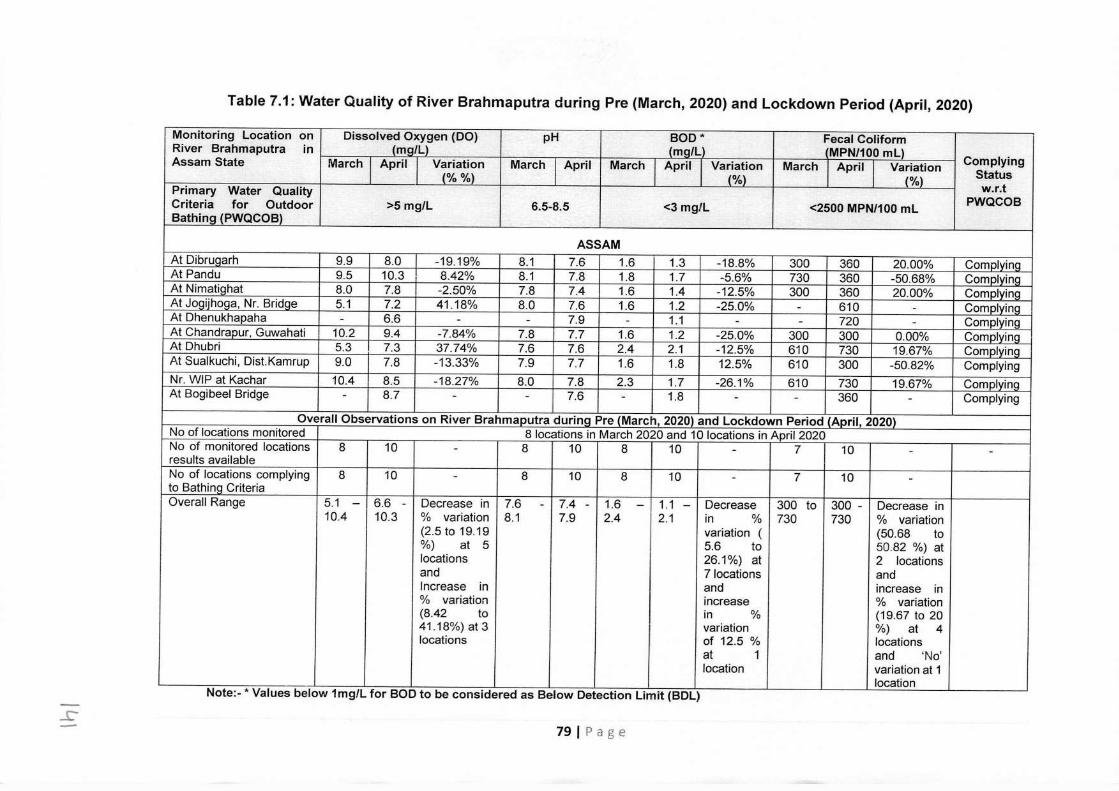
Table 7.1: Water Quality of River Brahmaputra during Pre (March, 2020) and Lockdown Period (April, 2020)
Monitoring Location on Dissolved Oxygen (DO) pH BOD* Fecal Coliform River Brahmaputra in (mg/L) (mg/L MPN/100 mL)
Complying Assam State March April Variation March April March April Variation March April Variation (%%) (%) (%) Status
Primary Water Quality w.r.t Criteria for Outdoor >5 mg/L 6.5-8.5 <3 mg/L <2500 MPN/100 mL PWQCOB Bathing (PWQCOB)
ASSAM At Dibru_garh 9.9 8.0 -19.19% 8.1 7.6 1.6 1.3 -18.8% 300 360 20.00% Complying At Pandu 9.5 10.3 8.42% 8.1 7.8 1.8 1.7 -5.6% 730 360 -50.68% Complying At Nirnatichat 8.0 7.8 -2.50% 7.8 7.4 1.6 1.4 -12.5% 300 360 20.00% Complying At Jogijhoga, Nr. Bridge 5.1 7.2 41.18% 8.0 7.6 1.6 1.2 -25.0% - 610 - Complying At Dhenukhapaha - 6.6 - - 7.9 - 1.1 - - 720 - Complying At Chandrapur, Guwahati 10.2 9.4 -7.84% 7.8 7.7 1.6 1.2 -25.0% 300 300 0.00% Complying At Dhubri 5.3 7.3 37.74% 7.6 7.6 2.4 2.1 -12.5% 610 730 19.67% Complying At Sualkuchi, Dist.Kamrup 9.0 7.8 -13.33% 7.9 7.7 1.6 1.8 12.5% 610 300 -50.82% Complying Nr. WIP at Kachar 10.4 8.5 -18.27% 8.0 7.8 2.3 1.7 -26.1% 610 730 19.67% Complying At Bogibeel Bridge - 8.7 - - 7.6 - 1.8 - - 360 - Complying
Overall Observations on River Brahmaputra during Pre (March, 2020) and Lockdown Period April, 2020) No of locations monitored 8 locations in March 2020 and 10 locations in April 2020 No of monitored locations 8 10 - 8 10 8 10 - 7 10 - - results available No of locations complying 8 10 - 8 10 8 10 - 7 10 - to Bathinq Criteria Overall Range 5.1 - 6.6 - Decrease in 7.6 - 7.4 - 1.6 - 1.1 - Decrease 300 to 300 - Decrease in
10.4 10.3 ~'c, variation 8.1 7.9 2.4 2.1 in % 730 730 % variation (2.5 to 19.19 variation ( (50.68 to %) at 5 5.6 to 50.82 %) at locations 26.1%) at 2 locations and ? locations and Increase in and increase in % variation increase % variation (8.42 to in % (19.67 to 20 41.18%) at 3 variation %) at 4 locations of 12.5 % locations
at 1 and 'No' location variation at 1
location Note:-* Values below 1mg/L for BOD to be considered as Below Detection Limit (BDL)
.r 79 I Page
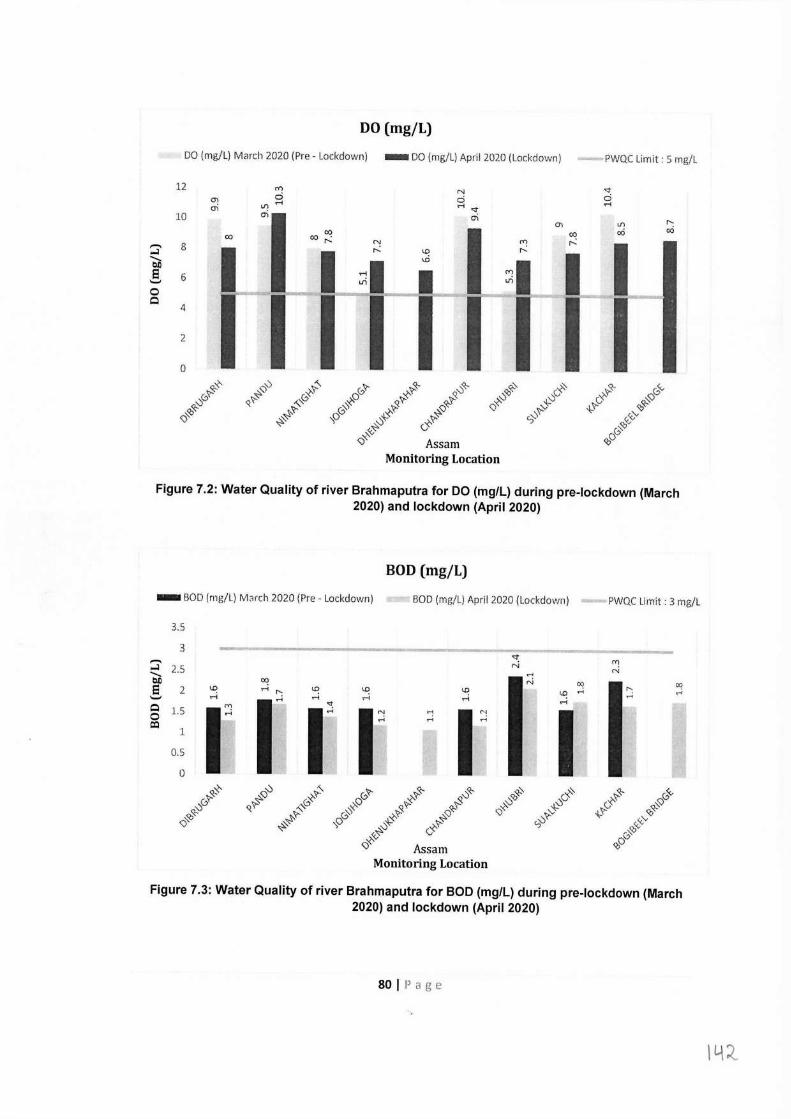
DO (mg/L)
DO (mg/L) March 2020 (Pre - Lockdown) - DO (mg/L) April 2020 (Lockdown) -PWQC Limit: 5 mg/L
12 N 'st 0) c::i c::i
rl rl oi 'st 10 oi r--- 0) cl'\
co co eo co co co ,-..: m r--- '""' 8 co r--- ...;i ......_ I.D
bl)
8 6 ._, 0 Q
4
2
0
Assam Monitoring Location
Figure 7.2: Water Quality of river Brahmaputra for DO (mg/L) during pre-lockdown (March 2020) and lockdown (April 2020)
BOD (mg/L)
- BOD (rng/L) March 2020 (Pre - Lockdown)
3.5
3
;:3' 2.5 ~ e 2 ._, § 1.5
c:Q 1
0.5
0
BOD (mg/L) April 2020 (Lockdown) PWQC Limit : 3 mg/L
co
i" f i! i" I Monitoring Location
Figure 7.3: Water Quality of river Brahmaputra for BOD (mg/L) during pre-lockdown (March 2020) and lockdown (April 2020)
80 I Page
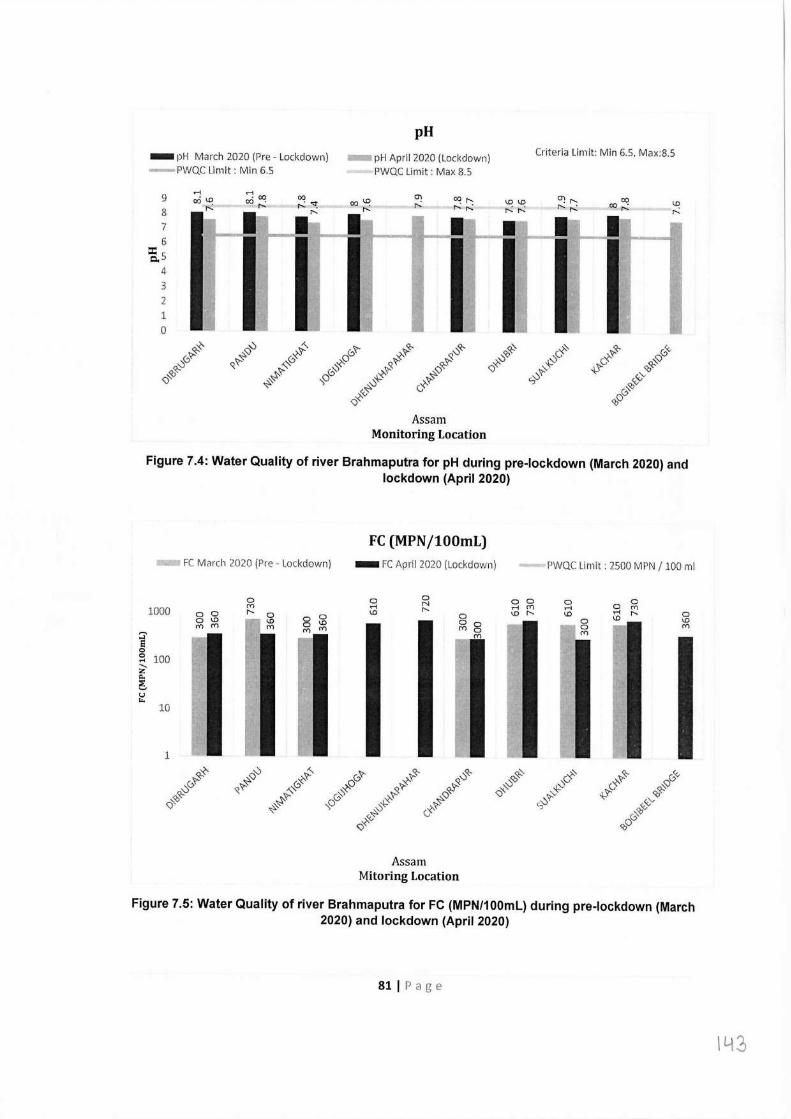
pH
- pH March 2020 (Pre - Lockdown) -PWQC Limit: Min 6.S
- pH April 2020 (Lockdown) PWQC Limit : Max 8.5
9 8 7 6
=a 5 4 3 2 1 0
Criteria Limit: Min 6.5. Max:8.5
Assam Monitoring Location
Figure 7.4: Water Quality of river Brahmaputra for pH during pre-lockdown (March 2020) and lockdown (April 2020)
FC March 2020 (Pre - Lockdown)
FC (MPN/100mL) - FC April 2020 (Lockdown) PWQC Limit: 2500 MPN / 100 ml
0 0 0 0 0 0 0 M ri N ri M ri 0 M 1000 r-- '° r-- '° r-- '° ri r-- 0 0 0
0 0 0 '° '° 0 '° 0 '° 0 0 M M M M M M 0 :::;- M
E 0 0 100 ... ..... z 0.. e u "' 10
1
<J;.'<' <:)'0 ~ 0'?- '?-<:/;, 0(/,, ~ ~ '?-~ 0"- ,::;"o G 0'<' ,t ~ ,t ,J {-0 <.,~ ~'v "''0 0 9:-v 'x ~,:f, ~ ~~ ,>"'' ~ *-'?' ':v<o Q~ ~~'?- 00 ':'<,.~ ,t c,v <;,'<J " ~) <.,'<:- 0<:o '«'<,; <oo Q
Assam Mitoring Location
Figure 7.5: Water Quality of river Brahmaputra for FC (MPN/100ml) during pre-lockdown (March 2020) and lockdown (April 2020)
81 I Page
I L.!3
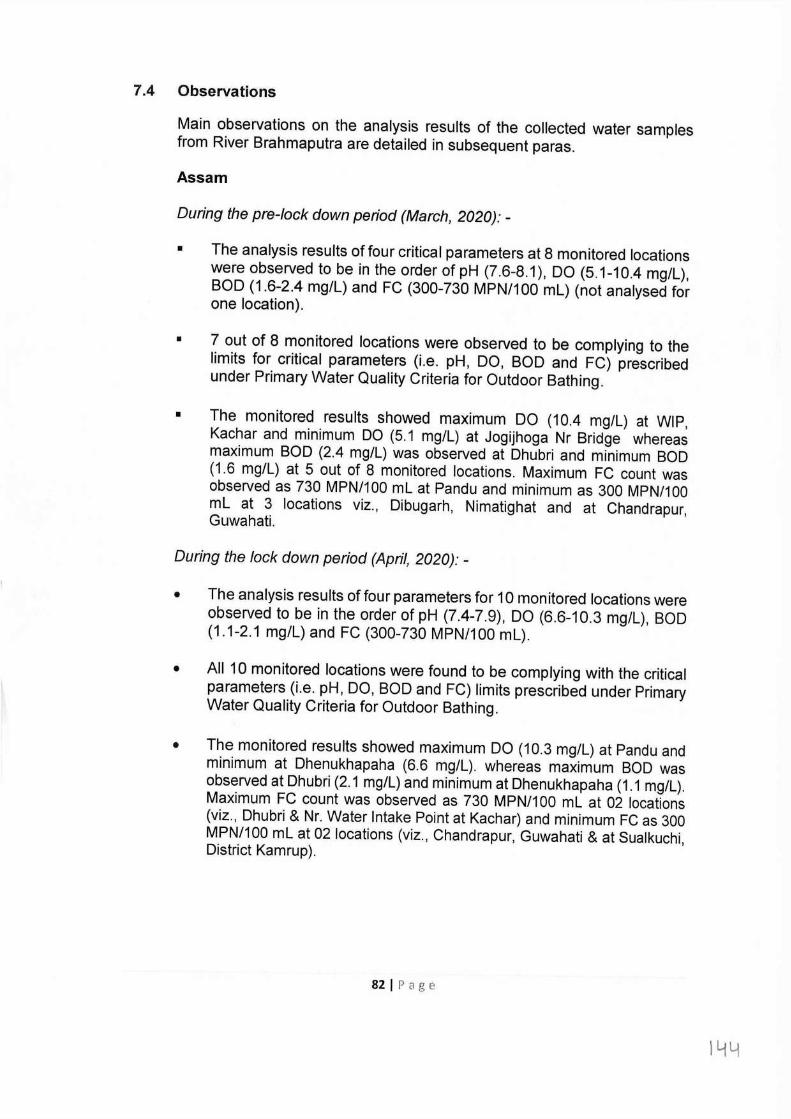
7.4 Observations
Main observations on the analysis results of the collected water samples from River Brahmaputra are detailed in subsequent paras.
Assam
During the pre-lock down period (March, 2020): -
• The analysis results of four critical parameters at 8 monitored locations were observed to be in the order of pH (7.6-8.1), DO (5.1-10.4 mg/l), BOD (1.6-2.4 mg/l) and FC (300-730 MPN/100 ml) (not analysed for one location).
• 7 out of 8 monitored locations were observed to be complying to the limits for critical parameters (i.e. pH, DO, BOD and FC) prescribed under Primary Water Quality Criteria for Outdoor Bathing.
• The monitored results showed maximum DO (10.4 mg/l) at WIP, Kachar and minimum DO (5.1 mg/l) at Jogijhoga Nr Bridge whereas maximum BOD (2.4 mg/L) was observed at Dhubri and minimum BOD (1.6 mg/L) at 5 out of 8 monitored locations. Maximum FC count was observed as 730 MPN/100 ml at Pandu and minimum as 300 MPN/100 ml at 3 locations viz., Dibugarh, Nimatighat and at Chandrapur, Guwahati.
During the lock down period (April, 2020): -
• The analysis results of four parameters for 10 monitored locations were observed to be in the order of pH (7.4-7.9), DO (6.6-10.3 mg/l), BOD (1.1-2.1 mg/l) and FC (300-730 MPN/100 ml).
• All 10 monitored locations were found to be complying with the critical parameters (i.e. pH, DO, BOD and FC) limits prescribed under Primary Water Quality Criteria for Outdoor Bathing.
• The monitored results showed maximum DO (10.3 mg/l) at Pandu and minimum at Dhenukhapaha (6.6 mg/l). whereas maximum BOD was observed at Dhubri (2.1 mg/L) and minimum at Dhenukhapaha (1.1 mg/L). Maximum FC count was observed as 730 MPN/100 ml at 02 locations (viz., Dhubri & Nr. Water Intake Point at Kachar) and minimum FC as 300 MPN/100 ml at 02 locations (viz., Chandrapur, Guwahati & at Sualkuchi, District Kamrup).
82 I Page
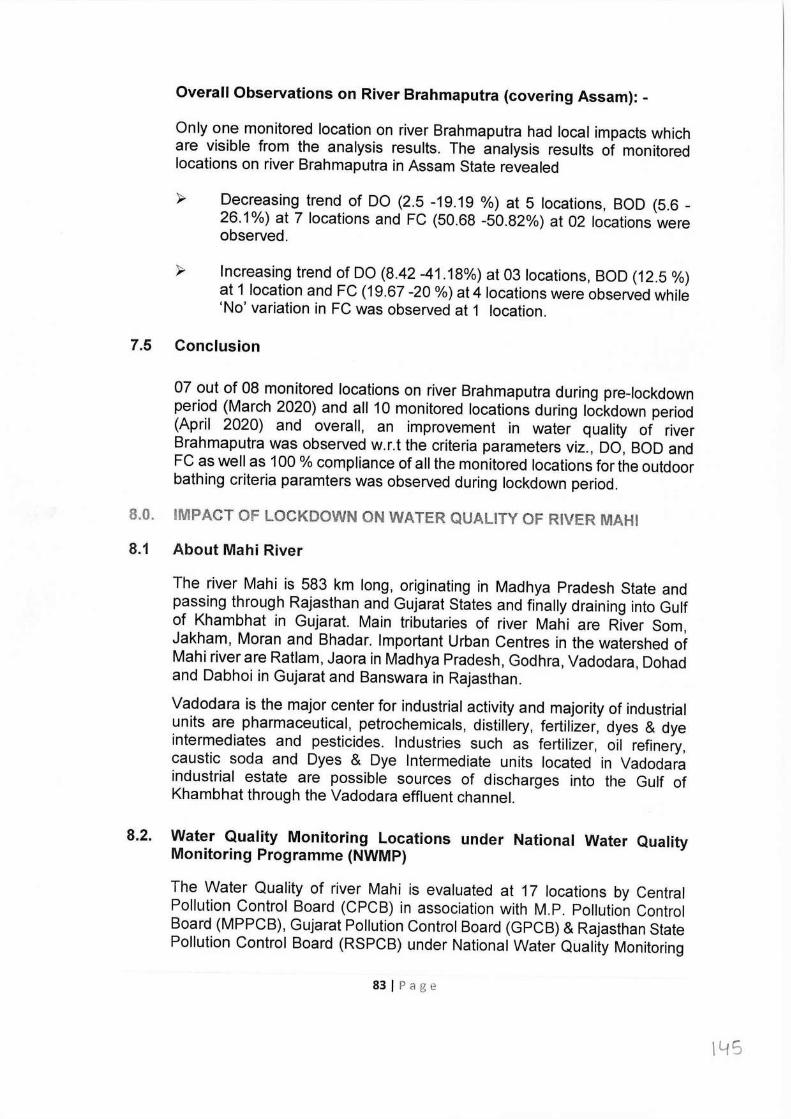
Overall Observations on River Brahmaputra (covering Assam): -
Only one monitored location on river Brahmaputra had local impacts which are visible from the analysis results. The analysis results of monitored locations on river Brahmaputra in Assam State revealed
~ Decreasing trend of DO (2.5 -19.19 %) at 5 locations, BOD (5.6 - 26.1 %) at 7 locations and FC (50.68 -50.82%) at 02 locations were observed.
Increasing trend of DO (8.42 -41.18%) at 03 locations, BOD (12.5 %) at 1 location and FC (19.67 -20 %) at 4 locations were observed while 'No' variation in FC was observed at 1 location.
7.5 Conclusion
07 out of 08 monitored locations on river Brahmaputra during pre-lockdown period (March 2020) and all 10 monitored locations during lockdown period (April 2020) and overall, an improvement in water quality of river Brahmaputra was observed w.r.t the criteria parameters viz., DO, BOD and FC as well as 100 % compliance of all the monitored locations for the outdoor bathing criteria paramters was observed during lockdown period.
8.0. IMPACT OF LOCKDOWN ON WATER QUALITY OF RIVER MAHI
8.1 About Mahi River
The river Mahi is 583 km long, originating in Madhya Pradesh State and passing through Rajasthan and Gujarat States and finally draining into Gulf of Khambhat in Gujarat. Main tributaries of river Mahi are River Som, Jakham, Moran and Bhadar. Important Urban Centres in the watershed of Mahi river are Ratlam, Jaora in Madhya Pradesh, Godhra, Vadodara, Dohad and Dabhoi in Gujarat and Banswara in Rajasthan.
Vadodara is the major center for industrial activity and majority of industrial units are pharmaceutical, petrochemicals, distillery, fertilizer, dyes & dye intermediates and pesticides. Industries such as fertilizer, oil refinery, caustic soda and Dyes & Dye Intermediate units located in Vadodara industrial estate are possible sources of discharges into the Gulf of Khambhat through the Vadodara effluent channel.
8.2. Water Quality Monitoring Locations under National Water Quality Monitoring Programme (NWMP)
The Water Quality of river Mahi is evaluated at 17 locations by Central Pollution Control Board (CPCB) in association with M.P. Pollution Control Board (MPPCB), Gujarat Pollution Control Board (GPCB) & Rajasthan State Pollution Control Board (RSPCB) under National Water Quality Monitoring
83 I Page
ILfS
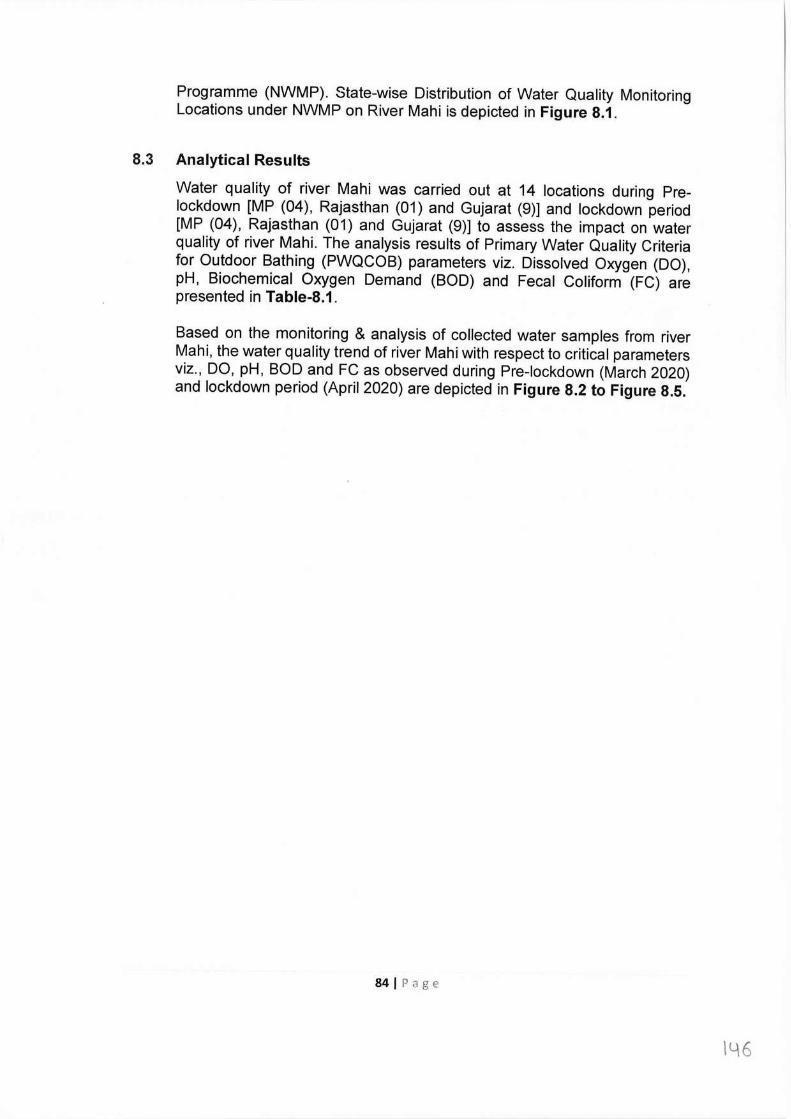
Programme (NWMP). State-wise Distribution of Water Quality Monitoring Locations under NWMP on River Mahi is depicted in Figure 8.1.
8.3 Analytical Results
Water quality of river Mahi was carried out at 14 locations during Pre lockdown [MP (04 ), Rajasthan (01) and Gujarat (9)] and lockdown period [MP (04), Rajasthan (01) and Gujarat (9)] to assess the impact on water quality of river Mahi. The analysis results of Primary Water Quality Criteria for Outdoor Bathing (PWQCOB) parameters viz. Dissolved Oxygen (DO), pH, Biochemical Oxygen Demand (BOD) and Fecal Coliform (FC) are presented in Table-8.1.
Based on the monitoring & analysis of collected water samples from river Mahi, the water quality trend of river Mahi with respect to critical parameters viz., DO, pH, BOD and FC as observed during Pre-lockdown (March 2020) and lockdown period (April 2020) are depicted in Figure 8.2 to Figure 8.5.
841Page
IL\6
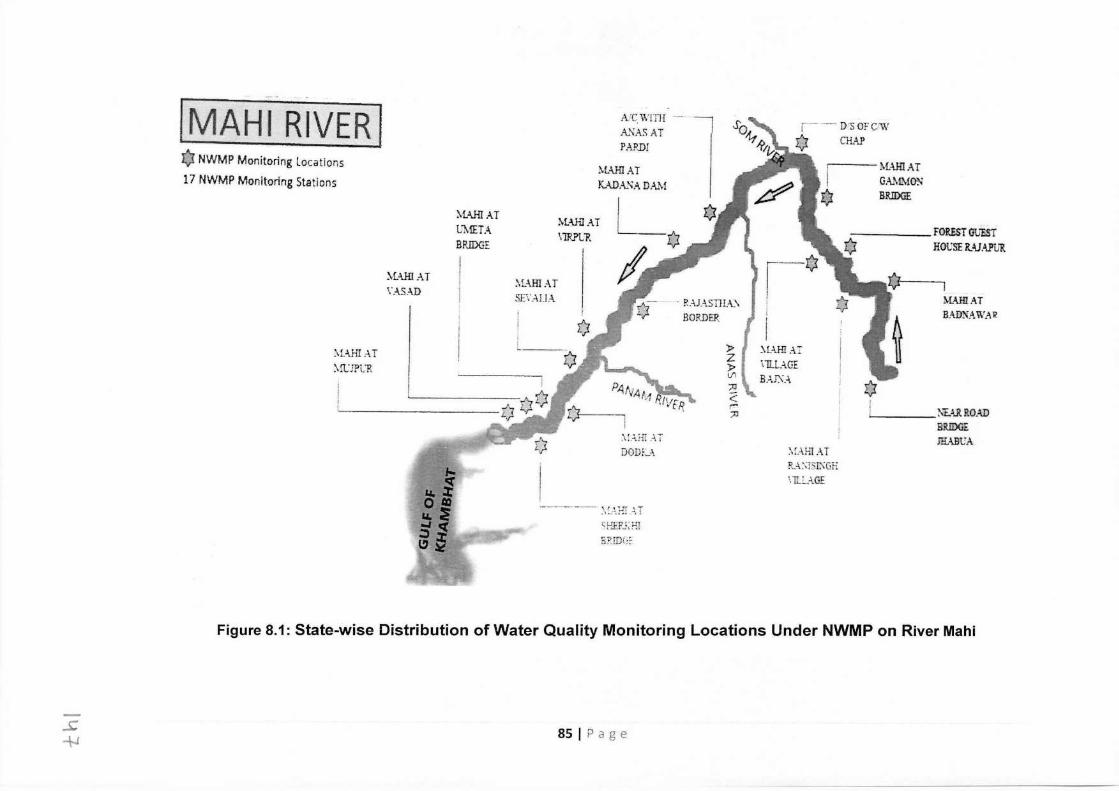
[MAHI RIVER] I) NWMP Monitoring locations 17 NWMP Monitoring Stations
A'CWITH -- 1 AXASAT PARDI
lvU.HlAT K.WA. '-i.A. DA11
MAHIAT GAMMO~ BRIDGE
MA.HIAT L"\1ETA BRIDGE
M:\HlAT \ 1R.Pt:R.
~{A.HIAT \'ASAD
;-.i-\HI.-\T Sl:\".-\JJA ·· R.-U.-\.STilA\
BORDER
\Hi-HAT :-S!U?L'R
)> z l> I.fl ::0 < "" ::0
.\l-\.Hi AT '11I.L\GE B.i.JX-\
_____ FOREST GUEST A HOt:SE RAJAPliR.
MAHlAT B..-\.DNAWAl1
\~.-i .. Hf .~ T
.__ NEAR ROAD BRIDGE iHABt!A
DOD?:...1. \f.-lHIAT ~.:...s1s~GH \lE .. -\GE
·- \~/:.f!! ~ T ~t""IP.!:~' 5RID(:t
Figure 8.1: State-wise Distribution of Water Quality Monitoring Locations Under NWMP on River Mahi
..c -\-J 85 I Page
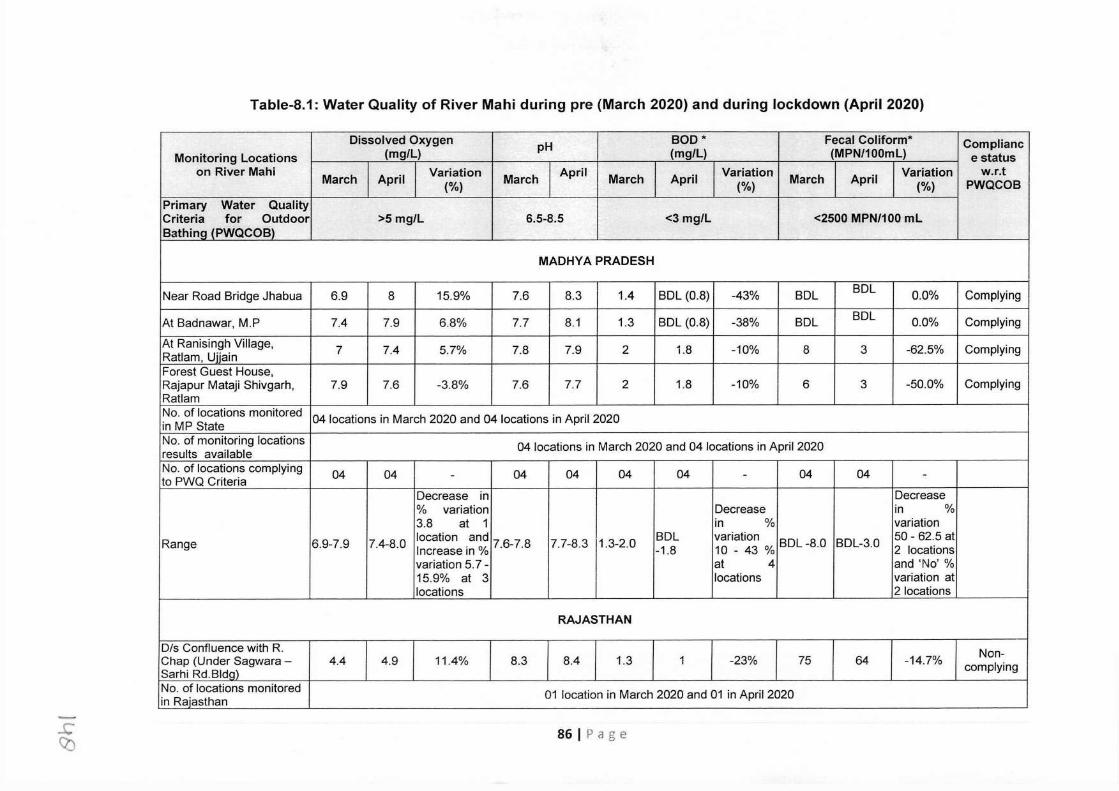
Table-8.1: Water Quality of River Mahi during pre (March 2020) and during lockdown (April 2020)
Dissolved Oxygen pH BOD* Fecal Coliform* Complianc Monitoring Locations (mg/L) (mg/L) (MPN/100ml) e status
on River Mahi March April Variation March April March April Variation March Variation w.r.t (%) (%) April (%) PWQCOB
Primary Water Quality Criteria for Outdoor >5 mg/L 6.5-8.5 <3 mg/L <2500 MPN/100 ml Bathing (PWQCOB)
MADHYA PRADESH
Near Road Bridge Jhabua 6.9 8 15.9% 7.6 8.3 1.4 BDL (0.8) -43% BDL BDL 0.0% Complying
At Badnawar, M.P 7.4 7.9 6.8% 7.7 8.1 1.3 BDL (0.8) -38% BDL BDL 0.0% Complying
At Ranisingh Village, 7 7.4 5.7% 7.8 7.9 2 1.8 -10% 8 3 -62.5% Complying Ratlam, Uiiain Forest Guest House, Rajapur Mataji Shivgarh, 7.9 7.6 -3.8% 7.6 7.7 2 1.8 -10% 6 3 -50.0% Complying Ratlam No. of locations monitored 04 locations in March 2020 and 04 locations in April 2020 in MP State No. of monitoring locations 04 locations in March 2020 and 04 locations in April 2020 results available No. of locations complying 04 04 - 04 04 04 04 - 04 04 - to PWQ Criteria
Decrease in Decrease % variation Decrease in % 3.8 at 1 in % variation
Range 6.9-7.9 7.4-8.0 location and 7.6-7.8 7.7-8.3 1.3-2.0 BDL variation BDL-8.0 BDL-3.0 50 - 62.5 at Increase in% -1.8 10 - 43 % 2 locations variation 5. 7 - at 4 and 'No'% 15.9% at 3 locations variation at locations 2 locations
RAJASTHAN
D/s Confluence with R. Non- Chap (Under Sagwara - 4.4 4.9 11.4% 8.3 8.4 1.3 1 -23% 75 64 -14.7% Sarhi Rd.Bldq) complying
No. of locations monitored 01 location in March 2020 and 01 in April 2020 in Rajasthan
s; Q) 86 I Page
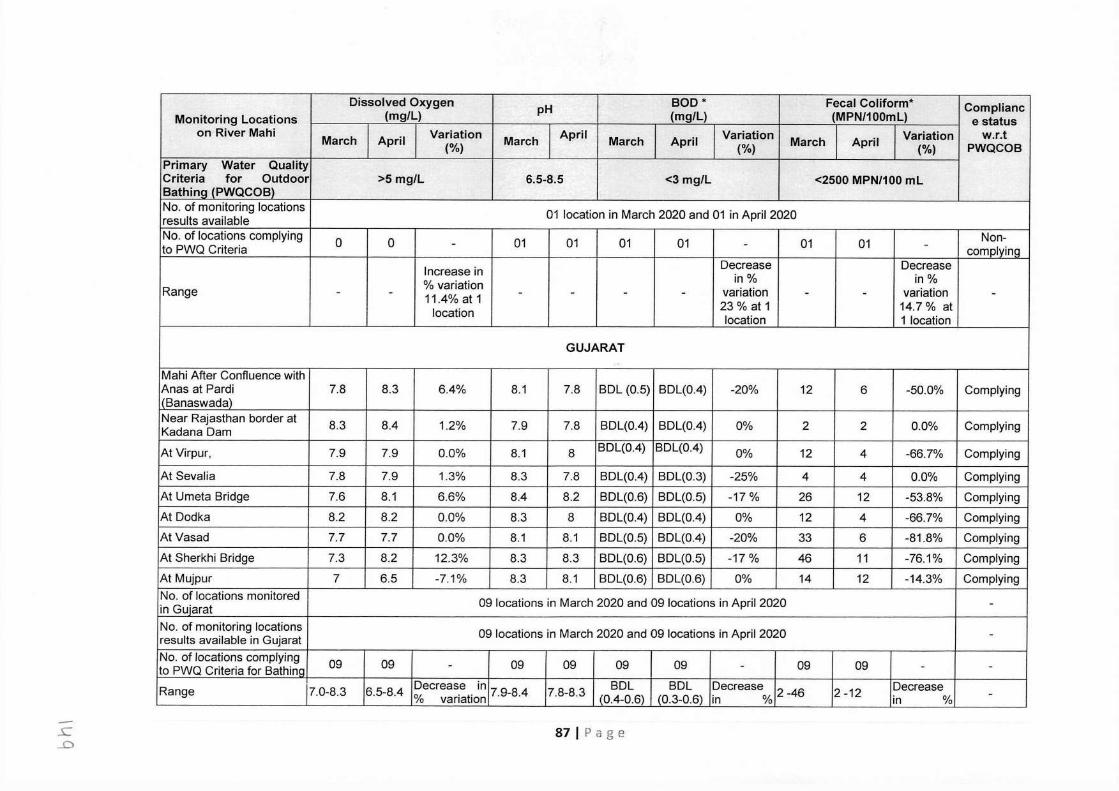
Dissolved Oxygen pH BOD* Fecal Coliform* Complianc Monitoring Locations (mg/L) (mg/L) (MPN/100ml) e status
on River Mahi March April Variation March April March April Variation March April Variation w.r.t (%) (%) (%) PWQCOB
Primary Water Quality Criteria for Outdoor >5 mg/L 6.5-8.5 <3 mg/L <2500 MPN/100 ml Bathing (PWQCOB) No. of monitoring locations 01 location in March 2020 and 01 in April 2020 results available No. of locations complying 0 0 01 01 01 01 01 01 Non- to PWQ Criteria - - - complyinq
Increase in Decrease Decrease % variation in% in%
Range - - 11.4% at 1 - - - - variation - - variation -
location 23 % at 1 14.7 % at location 1 location
GUJARAT
Mahi After Confluence with Anas at Pardi 7.8 8.3 6.4% 8.1 7.8 BDL (0.5) BDL(0.4) -20% 12 6 -50.0% Complying i(Banaswada) Near Rajasthan border at 8.3 8.4 1.2% 7.9 7.8 BDL(0.4) BDL(0.4) 0% 2 2 0.0% Complying Kadana Dam
At Virpur, 7.9 7.9 0.0% 8.1 8 BDL(0.4) BDL(0.4) 0% 12 4 -66.7% Complying
At Sevalia 7.8 7.9 1.3% 8.3 7.8 BDL(0.4) BDL(0.3) -25% 4 4 0.0% Complying At Umeta Bridge 7.6 8.1 6.6% 8.4 8.2 BDL(0.6) BDL(0.5) -17 % 26 12 -53.8% Complying At Dodka 8.2 8.2 0.0% 8.3 8 BDL(0.4) BDL(0.4) 0% 12 4 -66.7% Complying At Vasad 7.7 7.7 0.0% 8.1 8.1 BDL(0.5) BDL(0.4) -20% 33 6 -81.8% Complying At Sherkhi Bridge 7.3 8.2 12.3% 8.3 8.3 BDL(0.6) BDL(0.5) -17 % 46 11 -76.1% Complying At Mujpur 7 6.5 -7.1% 8.3 8.1 BDL(0.6) BDL(0.6) 0% 14 12 -14.3% Complying No. of locations monitored 09 locations in March 2020 and 09 locations in April 2020 in Gujarat -
No. of monitoring locations 09 locations in March 2020 and 09 locations in April 2020 - results available in Gujarat No. of locations complying 09 09 - 09 09 09 09 - 09 09 - - to PWQ Criteria for Bathinq
Range 7.0-8.3 6.5-8.4 Decrease in 7.9-8.4 7.8-8.3 BDL BDL Decrease 2 -46 2 -12 Decrease % variation (0.4-0.6) (0.3-0.6) in % in % -
.s:: __o
87 I Page
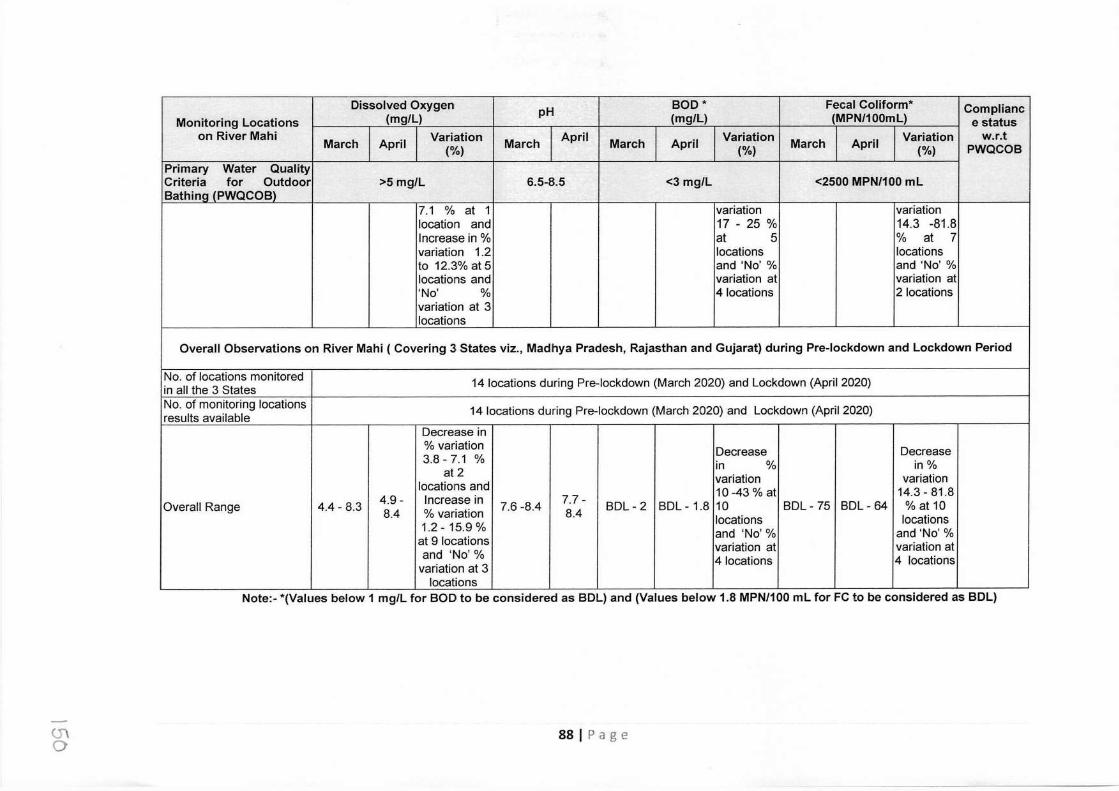
Dissolved Oxygen pH BOD* Fecal Coliform* Complianc Monitoring Locations (mg/L) (mg/L) (MPN/100mL) e status
on River Mahi March April Variation April Variation Variation w.r.t (%) March March April (%) March April (%) PWQCOB
Primary Water Quality Criteria for Outdoor >5 mg/L 6.5-8.5 <3 mg/L <2500 MPN/100 ml Bathina (PWQCOB)
7.1 % at 1 variation variation location and 17 - 25 % 14.3 -81.8 Increase in% at 5 % at 7 variation 1.2 locations locations to 12.3% at 5 and 'No' % and 'No'% locations and variation at variation at 'No' % 4 locations 2 locations variation at 3 locations
Overall Observations on River Mahi ( Covering 3 States viz., Madhya Pradesh, Rajasthan and Gujarat) during Pre-lockdown and Lockdown Period
No. of locations monitored 14 locations during Pre-lockdown (March 2020) and Lockdown (April 2020) in all the 3 States No. of monitoring locations 14 locations during Pre-lockdown (March 2020) and Lockdown (April 2020) results available
Decrease in % variation Decrease Decrease 3.8 - 7.1 % in % in% at 2 variation variation locations and 10 -43 % at 14.3-81.8
Overall Range 4.4 - 8.3 4.9- Increase in 7.6 -8.4 7.7 - BDL-2 BDL - 1.8 10 BDL- 75 BDL- 64 % at 10 8.4 % variation 8.4
1.2- 15.9 % locations locations
at 9 locations and 'No'% and 'No'%
and 'No'% variation at variation at
variation at 3 4 locations 4 locations
locations Note:- *(Values below 1 mg/L for BOD to be considered as BDL) and (Values below 1.8 MPN/100 ml for FC to be considered as BDL)
<..n 0
88 I Page
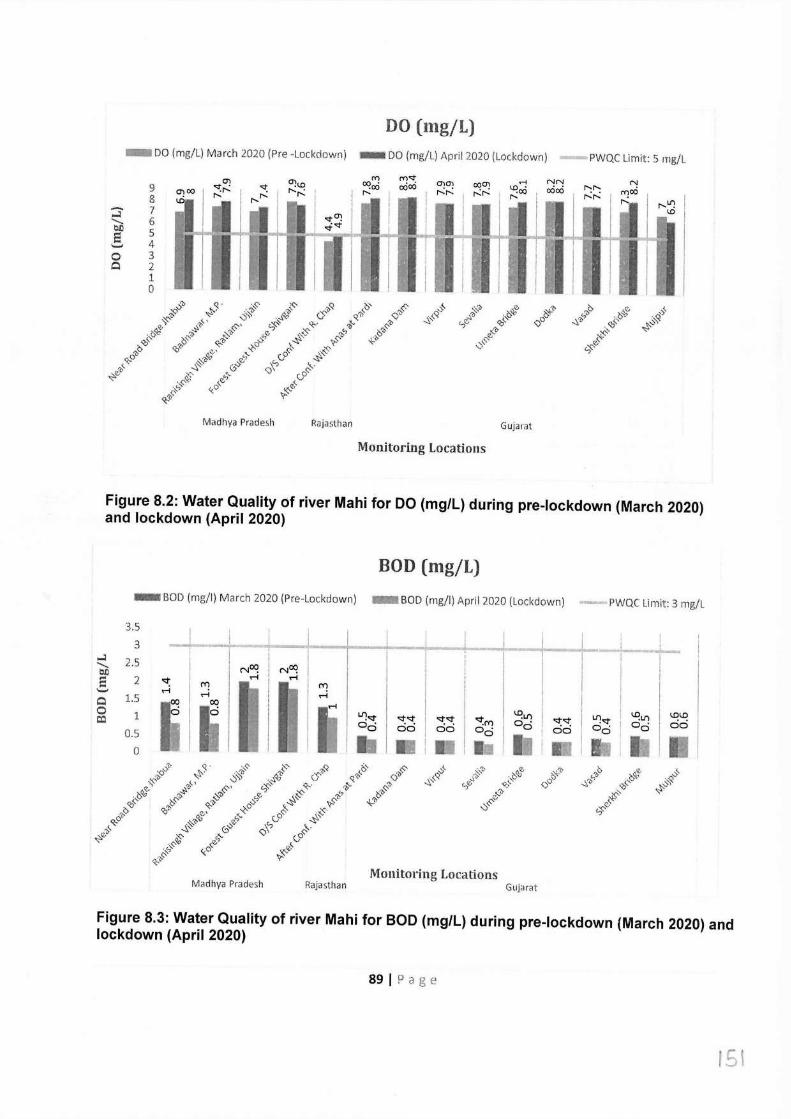
DO (mg/L) - DO (mg/L) March 2020 (Pre -Lockdown) - DO (mg/L) April 2020 (Lockdown} PWQC Limit: 5 mg/I.
('() rn'<t cncn CX!Cl"? co . cxicxi 9 . co r-..:r-..: r-- r--r-- 8 ::; 7 ---... 6 0J) 5 s ._, 4 0 3 Q 2
1 0
.§> q· .;/' ~ 7:,'< o' '/)(:' ,:} 'f:.._.:_b 0~ :iJ' 7)0 0~ ,)' ~"'::{,) ~- -S~ :ff (J' '<~ Q .:,,~'I ,,,1, o'iS .:;'I>" & .,:,
"1:>'' ;.' ~"' ,l' cf ~- ~ '/) r.,"' (j . <o ~- ,$:'' .it ,._'1' :<:-' ~,o"'° ,:-'I> ;;;;_.7> s'f; .;s '/)', ,.._e l*' -~'iS 'ic-7, ~' "?'<:' "" .:::,,:- q:-((; o</;j '(-0 ~'::- ~~ o'lf <o "'?,~· ,} cP ._'l:' .:::,'$- ,::,fl- ,}:: "-·
~'t,'1> G e,0<:' .,.. .~ -~$,; fl,"
~"" o' ,;_,'- '< ~ ~'1>
Madhya Pradesh Rajasthan Gujarat
Monitoring Locations
Figure 8.2: Water Quality of river Mahi for DO (mg/L) during pre-lockdown (March 2020) and lockdown (April 2020)
BOD (mg/L)
- BOD (mg/I) March 2020 (Pre-Lockdown) - BOD (mg/I) April 2020 (Lockdown} PWQC Limit: 3 mg/L
3.5 i I 3 --+-·
...l 2.5 ---... NOC! NOC! b.O .. 2 <:I: rl rl = rt') rt") ._, rl rl rl Q 1.5 00 00 rl 0 1 ci ci co
0.5 0
+--+---+---1---+---+--,;...---1i.----!,---i.--..i--.,,
~Lil IJ:,;r ~Lil -01.D '-T'-T o· '-T'-T o· cici cici 0 cici o· 0 0
,$- ~~ -0~ ~.'P "''/>o ,,o<lf .;,' ,s/'-< 'q 9 c.-,Co..), qJ" ,P .:;-c· . '<I' ~""' ,._'o ~ ~., ~ '-J -s:-"' '-5
Madhya Pradesh Rajasthan Monitoring Locations
Gujarat
Figure 8.3: Water Quality of river Mahi for BOD (mg/L) during pre-lockdown (March 2020) and lockdown (April 2020)
89 I Page
51
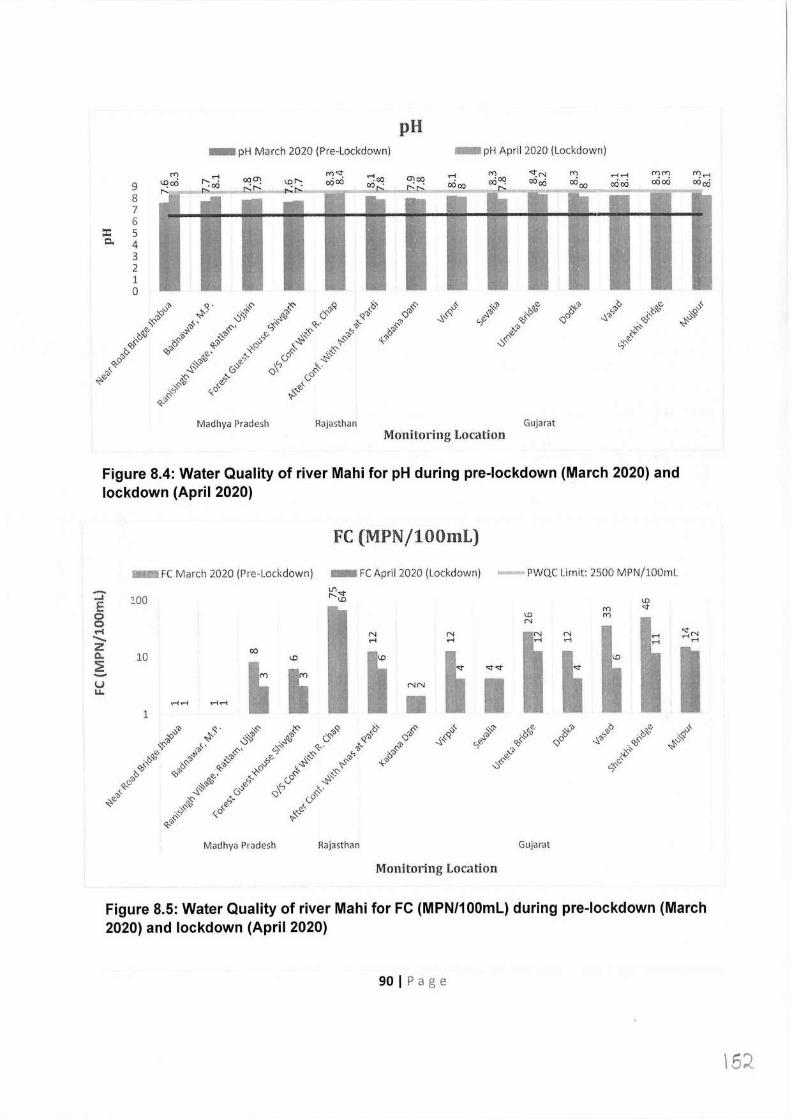
pH - pH March 2020 (Pre-Lockdown) - pH April 2020 {Lockdown)
9 8 7 6
::i:: 5 0.. 4
3 2 1 0
,l' <l.' ·,S- ~ 'l>q <:>' 'I>,$' ,§ ~'b 0,//; ~'I> 'I>'/:, o<f: ,)\
'~ ~- -:s:!t .it Q' f <) .. ::,,/:J. ~'Ii ...::,.'l>"i :::,~ -7$' ~' "i,.~ ~·
,.._<l. ,::."' '-,f/, q:f Qo .<1:f ~ ~' 'I> ·~ ~ -o~ '/JCS' <-j ~ 'I>" o'li ~ ,t:-'li .f;>f/, ~~ ~ ~' o<:- "?-<:- ~"' ~~ ~-? o'<i '<-' o'· ~ q,'I> 'l,' _.....,.:f. 0,::- ~~ 'I> -,,_'lil/J e? '-,(J q,-0 " ....s.~ 0~ <)\ ~- 1 ,::.
~f/, if f} (,0 ~f/, ,,t ~"'" <,_0
</:-'Ii '?'
Madhya Pradesh Rajasthan Gujarat Monitoring Location
Figure 8.4: Water Quality of river Mahi for pH during pre-lockdown (March 2020) and lockdown (April 2020)
FC (MPN/l00mL)
:? E 0 0 .-i - z Q. ~ -
.... FC March 2020 (Pre-Lockdown) - FC April 2020 (Lockdown)
100
PWQC Limit: 2500 MPN/l00mL
u u...
\.0 N
N N
I N
ri ri ri
10 00
\.0 'St'-l"
NN I riri riri • 1
Madhya Pradesh Rajasthan Gujarat
Monitoring Location
Figure 8.5: Water Quality of river Mahi for FC (MPN/100ml) during pre-lockdown (March 2020) and lockdown (April 2020)
90 I Page
1si
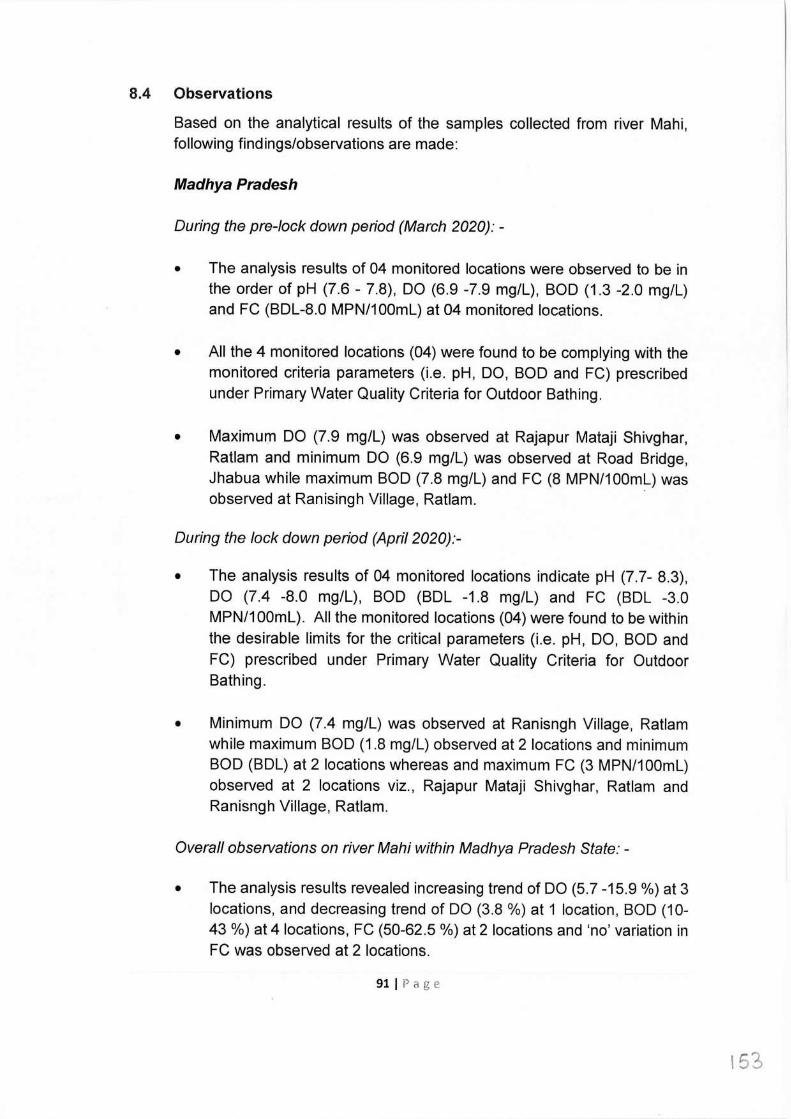
8.4 Observations
Based on the analytical results of the samples collected from river Mahi, following findings/observations are made:
Madhya Pradesh
During the pre-Jock down period (March 2020): -
• The analysis results of 04 monitored locations were observed to be in the order of pH (7.6 - 7.8), DO (6.9 -7.9 mg/L), BOD (1.3 -2.0 mg/L) and FC (BDL-8.0 MPN/100ml) at 04 monitored locations.
• All the 4 monitored locations (04) were found to be complying with the monitored criteria parameters (i.e. pH, DO, BOD and FC) prescribed under Primary Water Quality Criteria for Outdoor Bathing.
• Maximum DO (7.9 mg/L) was observed at Rajapur Mataji Shivghar, Ratlam and minimum DO (6.9 mg/L) was observed at Road Bridge, Jhabua while maximum BOD (7.8 mg/L) and FC (8 MPN/100ml) was observed at Ranisingh Village, Ratlam.
During the lock down period (April 2020):-
• The analysis results of 04 monitored locations indicate pH (7.7- 8.3), DO (7.4 -8.0 mg/L), BOD (BDL -1.8 mg/L) and FC (BDL -3.0 MPN/100ml). All the monitored locations (04) were found to be within the desirable limits for the critical parameters (i.e. pH, DO, BOD and FC) prescribed under Primary Water Quality Criteria for Outdoor Bathing.
• Minimum DO (7.4 mg/L) was observed at Ranisngh Village, Ratlam while maximum BOD (1.8 mg/L) observed at 2 locations and minimum BOD (BDL) at 2 locations whereas and maximum FC (3 MPN/100ml) observed at 2 locations viz., Rajapur Mataji Shivghar, Ratlam and Ranisngh Village, Ratlam.
Overall observations on river Mahi within Madhya Pradesh State: -
• The analysis results revealed increasing trend of DO (5.7 -15.9 %) at 3 locations, and decreasing trend of DO (3.8 %) at 1 location, BOD (10- 43 %) at 4 locations, FC (50-62.5 %) at 2 locations and 'no' variation in FC was observed at 2 locations.
91 I Page
153
Rajasthan
During the pre-lock down period (March 2020): -
• The analysis result of one monitored location shown pH (8.3), DO (4.4 mg/L), BOD (1.3 mg/L) and FC (75 MPN/100ml) at 01 location. pH, BOD and FC were observed to be complying with the bathing criteria limits whereas DO was not complying with the limit prescribed under Primary Water Quality Criteria for Bathing.
During the lock down period (April 2020): -
• The analysis result of one monitored location indicate pH (8.4), DO (4.9 mg/L), BOD (1 mg/L) and FC (64 MPN/100ml). One monitored location complying to the bathing criteria limits for the parameters (i.e. pH, BOD and FC) and DO was non-complying to the limit prescribed under Primary Water Quality Criteria for Bathing.
Overall observations on river Mahi within Rajasthan State: -
• The analysis results of one monitored location revealed increasing trend of DO (11.4 %), decreasing trend of BOD (23 %) and FC (14.7 %) was observed.
Gujarat
During the pre-lock down period (March 2020): -
• The analysis results of 9 monitored locations for four critical parameters were observed to be in the range of pH (7.9 -8.4), DO (7.0 -8.3 mg/L), BOD (0.4 -0.6 mg/L) and FC (2.0 -46 MPN/100ml).
• All the monitored locations (09) were found to be complying with the limits for criteria parameters (i.e. pH, DO, BOD and FC) prescribed under Primary Water Quality Criteria for Outdoor Bathing.
• Minimum DO (7 mg/L) was observed at Majpur while maximum and minimum BOD was observed as 'BDL' at all the monitored locations whereas maximum FC (46 MPN/100ml) observed at Sherkhi Bridge.
92 I Page
During the lock down period (April 2020): -
• The analysis results of 9 monitored locations for four critical parameters were observed to be in the order of pH (7.8-8.3), DO (6.5 -8.4 mg/L), BOD (0.3 -0.6 mg/L) and FC (2 -12 MPN/100ml).
• All the 9 monitored locations were complying within the limits for the parameters (i.e. pH, DO, BOD and FC) prescribed under Primary Water Quality Criteria for Outdoor Bathing.
• Minimum DO (6.5 mg/L) was observed at Majpur while maximum and minimum BOD observed as 'BDL' at all the monitored locations whereas maximum FC (12 MPN/100ml) observed at 2 locations viz., Umeta Bridge and Majpur.
Overall observations on river Mahi (Gujarat): -
• The analysis results reveal increasing trend of DO (1.2 to 12.3 %) at 5 locations while decreasing trend of DO (7.1 %) at 1 location, BOD (17 -25 %) at 5 locations, FC (14.3-81.8 %) at 7 locations
• 'No' variation was observed w.r.t DO at 3 locations, BOD at 4 locations and FC at 2 locations.
Overall Observations on River Mahi (covering Madhya Pradesh, Rajasthan and Gujarat): -
};a- During lockdown, maximum DO was observed at Rajasthan Border at Katana Dam (8.4 mg/L)) and minimum at D/s Confluence with River Chap (4.9 mg/L). Maximum BOD (1.8 mg/L) was observed at 02 locations Ranisingh Village, Ratlam and Forest Guest house, Ratlam and minimum BOD was observed at Sevalia (0.3 mg/L) whereas maximum FO count was observed at D/s Confluence with River Chap (64 MPN/100 ml) and minimum as 'BDL' at 02 locations- Road Bridge, Jhabua and Badnawar.
};a- Overall, decreasing trend of DO (3.8 -7.1%) at 2 locations, BOD (10% to 43%) at 10 locations, FC (14.3%-81.8%) at 10 locations while increasing trend of DO (1.2% -15.9%) at 09 locations and 'No' variation in DO at 03 locations, BOD & FC at 04 locations were observed.
};a- 13 out of 14 locations on river Mahi within MP and Gujarat states were observed to be complying with the limit for parameters viz., pH, DO,
93 I Page
,ss
BOD and FC prescribed under Primary Water Quality Criteria for Outdoor Bathing and one location in Rajasthan was found to be non complying with the DO parameter for outdoor bathing criteria limit.
8.5 Conclusion
13 out of 14 monitored locations on river Mahi during pre-lockdown (March 2020) and lockdown (April 2020) were observed to be complying with the Primary Water Quality Criteria for Outdoor Bathing. Also, an improvement in water quality of river Mahi was observed with respect to DO, BOD and FC and consistent% compliance of monitored loctions to Primary Water Quality Criteria for Outdoor Bathing was observed during pre-lockdown and lockdown period.
9.0. IMPACT OF LOCKDOWN ON WATER QUALITY OF RIVER SABARMATI
9.1 About Sabarmati River
The Sabarmati river is one of the major west-flowing rivers in India. It originates in the Aravalli Range, Udaipur District of Rajasthan and meets the Gulf of Cambay of Arabian Sea after traversing 371 km in a south-westerly direction across Rajasthan and Gujarat States. 48 km of the river length is in Rajasthan, while 323 km is in Gujarat. The Right bank tributaries of river Sabarmati are river Sei, Siri and Dhamni, while left bank tributaries are Wakal, Harnav, Hathmati, Khari, Watrak etc. Ahmedabad city is located on the banks of the Sabarmati River. It has emerged as an important economic and industrial hub in the state of Gujarat having large, medium and small scale industries of various types. A large number of industries related to textiles, leather and leather goods, dyes & dye intermediates, chemicals, thermal power plant, pulp and paper, machinery, metal products, engineering, news print, automobile, plastic, rubber goods, drugs and pharmaceutical, etc. are located in the Ahmedabad city. There are 04 major industrial estates, and two major textile industrial clusters in Ahmedabad city.
9.2 Water Quality Monitoring Locations under National Water Quality Monitoring Programme (NWMP)
The Water quality of river Sabarmati is evaluated at 13 locations by Central Pollution Control Board in association with Gujarat Pollution Control Board (GPCB) under National Water Quality Monitoring Programme (NWMP). Distribution of Water Quality Monitoring Locations under NWMP on River
94 IP age
J56
Sabarmati in Gujarat State is depicted in Figure 9.1.
9.3 Analytical Results
Water quality of river Sabarmati was carried out at 9 locations in Gujarat during Pre-lockdown (March 2020) and during lockdown period (April 2020) to assess the impact on water quality of river Sabarmati. The analysis results of Primary Water Quality Criteria for Outdoor Bathing (PWQCOB) parameters viz. Dissolved Oxygen (DO), pH, Biochemical Oxygen Demand (BOD) and Fecal Coliform (FC) are presented below in Table-9.1.
Based on the monitoring & analysis of collected water samples from river Sabarmati, the graphical presentation of river Sabarmati with respect to DO, pH, BOD and FC as observed during pre-lockdown (March 2020) and lockdown period (April 2020) are presented in Figure 9.2 to Figure 9.5.
95 I Page
15:f-
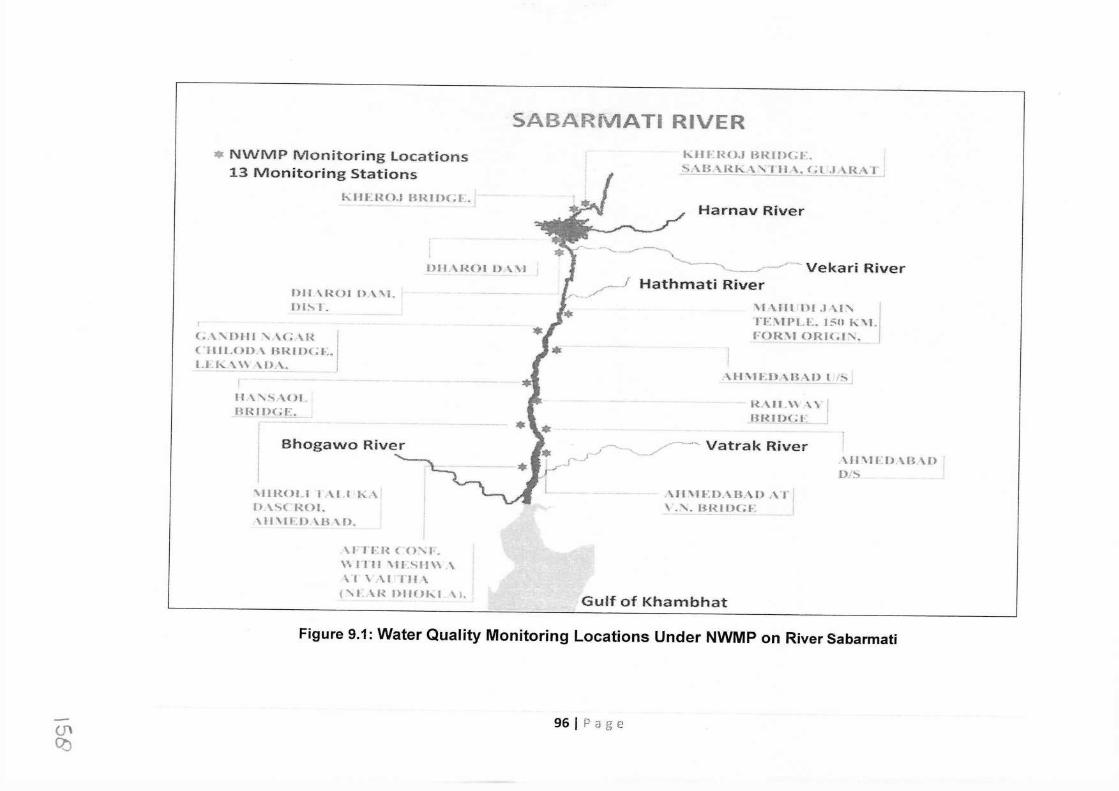
SABARfVIATi RIVER • NWMP Monitoring Locations
13 Monitoring Stations
h:IIElH).J BR1nc1-:.
DH.\1{01 I) \'\I
nu \ROI n.vvr. nrx r .
C.\ ,1>111 '- \C.\I{ CUii.OD.\ BRIDCL. r.r.«. \\\ \[).\,
11 \ '·°' \01. BR[l)(;E,.
Bhogawo River
'\lll{OLI l .\I I h.-\ I)\'-,( ROI. \ ll vn:n \.B \ f>.
h:llf'RO.J URIHGE. S,\B \Rh...\YI tJ \, <~l ,L\RAT
Harnav River
---...__..._,_____.~-~ Vekari River ,-,-1 Hathmati River ,.,.
'\l-\111 HI ,J \I' TI-::\IPLI-.. l:.'-0 K'\1. FOR'\t ORI<.('\,.
AH'\H.D.-\BAI> l 1:-,
R\11.\\\YJ _B8 I l!G I: j
· J- /.--.._ '---.....,/,,--- Vatrak River ..r·
.\11\ll-:O.\B.\I) .\.Ti \. "-· HRHJGE
.\11\JEI) \B \D D1~
.\l·TFR < 0'-1·. w r ru '\fl.SIi\\ \ \'I \.\ITH\
<'L \I{ 1)1101<..I \}. Gulf of Khambhat
Figure 9.1: Water Quality Monitoring Locations Under NWMP on River Sabarmati
(J\ Cb
96 I Page
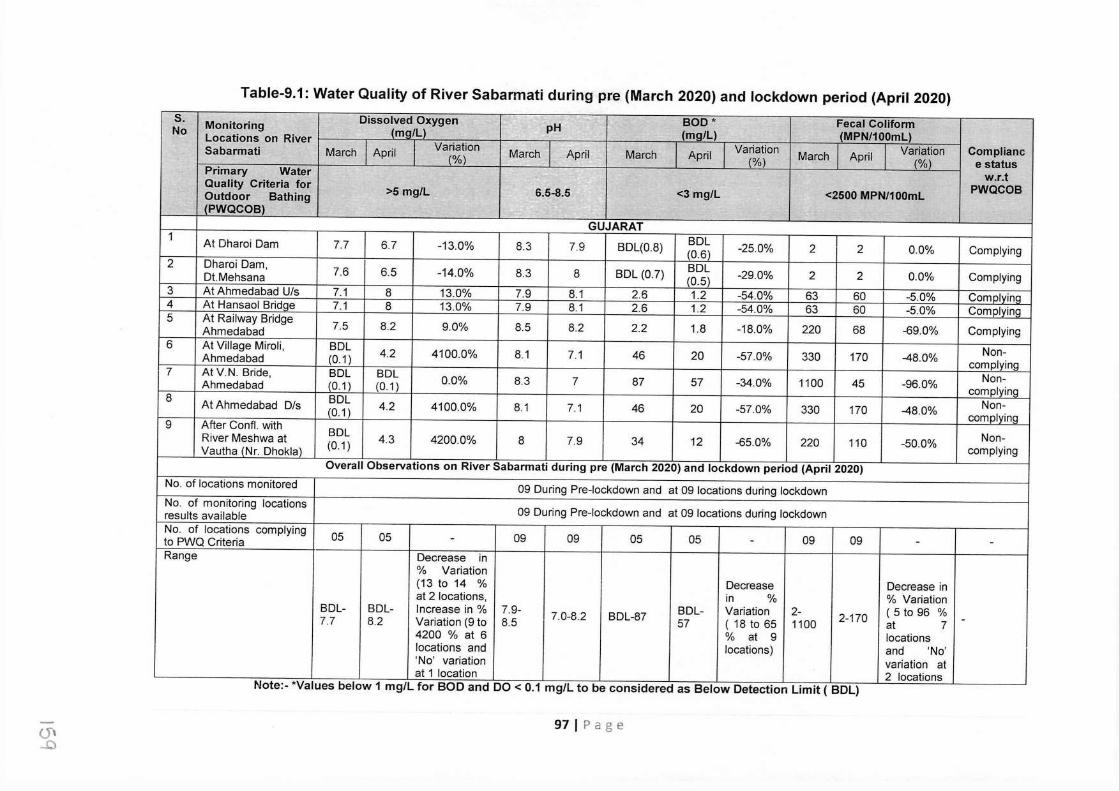
Table-9.1: Water Quality of River Sabarmati during pre (March 2020) and lockdown period (April 2020) 5. Monitoring Dissolved Oxygen pH BOD* Fecal Coliform f..lo (mg/L) (mg/L) (MPN/100mL) Locations on River
Variation Variation Variation Complianc Sabarmati March April (%) March April March April (%) March April (%) e status Primary Water w.r.t Quality Criteria for >5 mg/L 6.5-8.5 <3 mg/L <2500 MPN/100ml PWQCOB Outdoor Bathing
(PWQCOB) GUJARAT
1 At Dharoi Dam 7.7 6.7 -13.0% 8.3 7.9 BDL(0.8) SOL -25.0% 2 2 0.0% Complying (0.6) 2 Dharoi Dam,
7.6 6.5 -14.0% 8.3 8 BDL (0.7) SOL -29.0% 2 2 0.0% Complying Dt.Mehsana (0.5) 3 At Ahmedabad U/s 7.1 8 13.0% 7.9 8.1 2.6 1.2 -54.0% 63 60 -5.0% Cornplvinq 4 At Hansaol Bridge 7.1 8 13.0% 7.9 8.1 2.6 1.2 -54.0% 63 60 -5.0% Complying 5 At Railway Bridge
7.5 8.2 9.0% 8.5 8.2 2.2 1.8 -18.0% 220 68 -69.0% Complying Ahmedabad 6 At Village Miroli, BDL
4.2 4100.0% 8.1 7.1 46 20 -57.0% 330 170 -48.0% Non- Ahmedabad (0.1) complying 7 At V.N. Bride, BDL BDL 0.0% 8.3 7 87 57 -34.0% 1100 45 -96.0% Non- Ahmedabad (0.1) (0.1) complying 8 At Ahmedabad D/s BDL 4.2 4100.0% 8.1 7.1 46 20 -57.0% 330 170 -48.0% Non-
(0.1) cornplylnq 9 After Conti. with BDL Non- River Meshwa at 4.3 4200.0% 8 7.9 34 12 -65.0% 220 110 -50.0%
Vautha (Nr. Dhoklaj (0.1) complying Overall Observations on River Sabarmati during pre (March 2020) and lockdown period (April 2020)
No. of locations monitored 09 During Pre-lockdown and at 09 locations during lockdown No. of monitoring locations
09 During Pre-lockdown and at 09 locations during lockdown results available No. of locations complying
05 05 - 09 09 05 05 - 09 09 - - to PWQ Criteria Range Decrease in
% Variation (13 to 14 % Decrease Decrease in at 2 locations, in % % Variation
BDL- BDL- Increase in % 7.9- 7.0-8.2 BDL-87 BDL- Variation 2- 2-170 ( 5 to 96 % 7.7 8.2 Variation (9 to 8.5 57 ( 18 to 65 1100 at 7 -
4200 % at 6 % at 9 locations locations and locations) and 'No' 'No' variation variation at at 1 location 2 locations
Note:- "Values below 1 mg/L for BOD and DO < 0.1 mg/L to be considered as Below Detection Limit ( BDL)
(J\ ...0
97 I Page
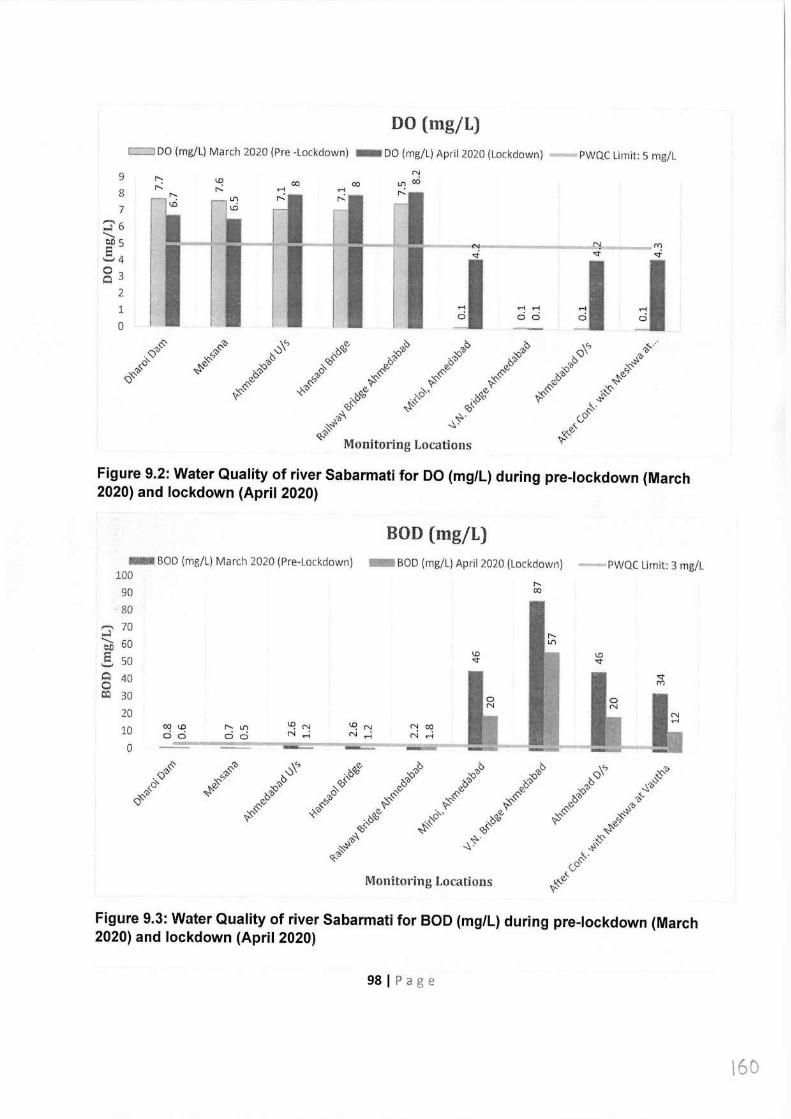
DO (mg/L) c::::::J DO (mg/L) March 2020 {Pre -Lockdown) -DO (rng/L) April 2020 (Lockdown) -PWQC Limit: 5 rng/L
9 r--: lO
8 r-- r--: 7
:i' 6 '- ~5 C.4
83 2 1 0
'/J(:' ,::-7' ,;:}"' <:) c,'11 7,0 o' ~ ~ ~ ~ <::>"' e,O:
::<::-(:' '?'
00 00
1----<N~-------c,J,---"'1
J cici J J Figure 9.2: Water Quality of river Sabarmati for DO (mg/L) during pre-lockdown (March 2020) and lockdown (April 2020)
BOD (mg/L) - BOD (mg/L) March 2020 (Pre-Lockdown) - BOD (rng/L) April 2020 (Lockdown)
100
90 80
,...., 70 ...l bJ3 60 S 50 Q 40 0 0:l 30
20
lO 0
PWQC Limit: 3 mg/L
00 lO ci ci
r-- V')
ci ci ~N N ,....j
Monitoring Locations
Figure 9.3: Water Quality of river Sabarmati for BOD (mg/L) during pre-lockdown (March 2020) and lockdown (April 2020)
98 I Page
160
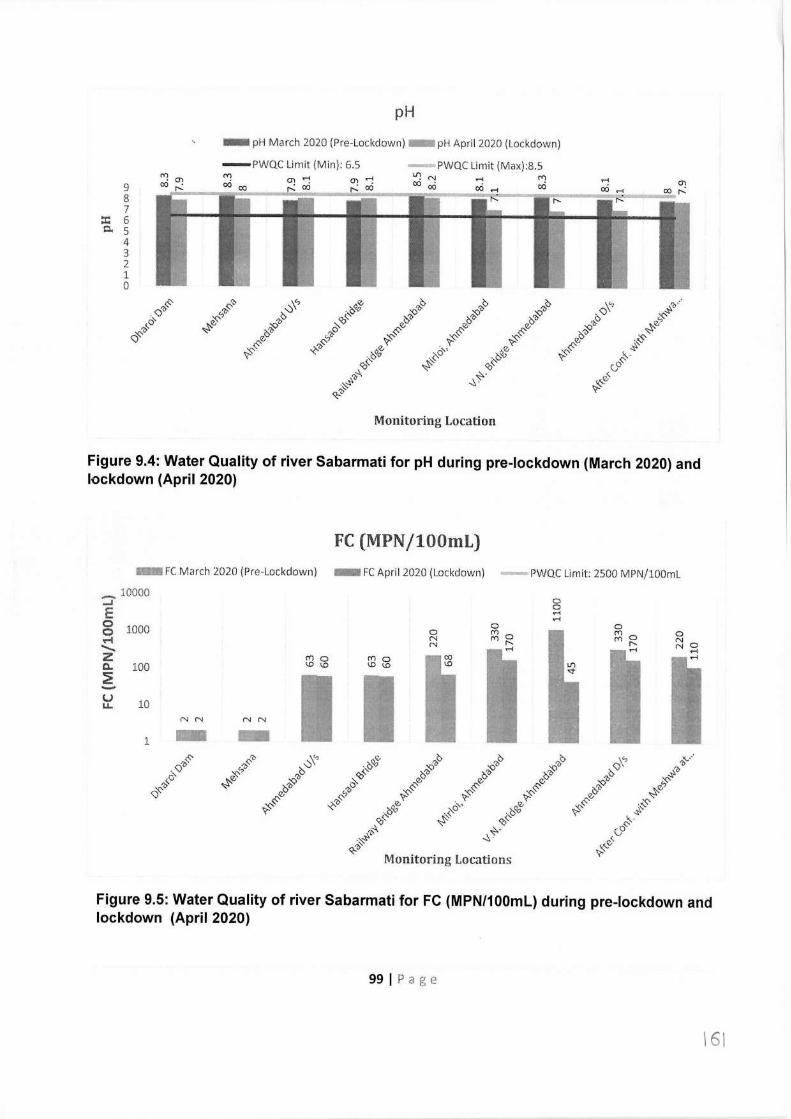
pH
- pH March 2020 (Pre-Lockdown) - pH April 2020 (Lockdown)
-PWQC Limit (Min): 6.5
9 8 7
::i:: 6 Q. 5
4 3 2 1 0
-PWQC Limit (Max):8.5 Lf: N "") OO 00 00
Monitoring Location
Figure 9.4: Water Quality of river Sabarmati for pH during pre-lockdown (March 2020) and lockdown (April 2020)
FC (MPN/100mL) FC March 2020 (Pre-Lockdown) - FC April 2020 (Lockdown) -PWQC Limit: 2500 MPN/lO0rnL
_ 10000 ..., E g 1000 ..-4 ........ z C.. 100 2
0 0 .-< .-<
0 N N
('() 0 <D <D
('() 0 <D <D
N N NN
l - Monitoring Locations
Figure 9.5: Water Quality of river Sabarmati for FC (MPN/100ml) during pre-lockdown and lockdown (April 2020)
99 I Page
161
9.4 Observations
Based on the analytical results of samples collected from river Sabarmati in Gujarat, following findings/observations are made:
Gujarat
During the pre-lock down period (March 2020):-
• The analysis results of 09 monitored locations indicate pH (7.9 -8.5), DO (0.1 (BDl) -7.7 mg/l), BOD ( BDl (0.7) -87 mg/l) and FC (2 -1100 MPN/100ml). DO and BOD (at 5 locations), pH and FC (9 monitored locations) were found to be within the desirable limits for primary water quality criteria for outdoor bathing.
• Also, the water quality of river Sabarmati at Dharoi Dam after confluence with Meshwa at Vautha (Near Dhokla) was observed that DO (deteriorated from 7.7- BDl mg/l), BOD (increased from 0.8-34 mg/l) whereas FC ( increased from 2 -220 MPN/100 ml)
During the lock down period (April 2020):-
• The analysis results of 09 monitored locations indicate pH (7.0 to 8.2), DO (0.1 (BDl) -8.2 mg/l), BOD ( (BDl) 0.5 -57 mg/l) and FC ( 2 - 170 MPN/100ml) . pH and FC were found to be complying at all 09 monitored locations whereas DO and BOD were observed to be complying only at 05 locations.
• The water quality of river Sabarmati at Dharoi Dam after confluence with Meshwa at Vautha (Near Dhokla) observed that DO (deteriorated from 6.7 -4.3 mg/l), BOD (increased from 0.6 -12 mg/l), FC (increased from 2 -110 MPN/100 ml).
Overall observations on River Sabarmati (Gujarat State): -
~ During lockdown, maximum DO was observed at Railway Bridge, Ahmedabad (8.2 mg/l)) and minimum observed as 'BDl' at V.N. Bridge, Ahmedabad. Maximum BOD was observed at V.N Bridge, Ahmedabad (57 mg/L) and minimum at Dharoi Dam, Dt. Mehsana (0.5 mg/L) whereas maximum FC count (170 MPN/100 ml) was observed at 02 locations viz., Viii. Maroli, Taluka Dascrol and Ahemdabad D/s and minimum of 02 MPN/100 ml at 02 locations i.e., at Dharoi Dam and Dharoi Dam, Dt Mehsana.
lOOIPage
Despite the water quality of river Sabarmati after confluence with Meshwa at Vautha ( Near Dhokla-bottom most monitored location) observed as DO (increased to 4200%), BOD (decreased to 65%) and FC (decreased to 50 %). Both DO and BOD parameters are not complying with the limits for primary water quality criteria for outdoor bathing during pre-lockdown (in March 2020) and lockdown period in April 2020.
Overall decreasing trend of DO (13% - 14%) at 02 locations, BOD (18% -65%) at 09 monitored locations and FC (5% -96%) at 07 locations whereas increasing trend of DO (9.0% - 4200%) at 06 locations and 'No' percent variation in DO at 01 location and FC at 02 locations were observed.
9.5 Conclusion
05 out of 09 monitored locations on river Sabarmati during pre and lockdown were observed to be complying with the Primary Water Quality Criteria for Outdoor Bathing. Also, an improvement in water quality of river Sabarmati was observed with respect to the criteria parameters viz., DO, BOD & FC at the monitored locations and consistent % compliance of monitored loctions on river Sabarmati to Primary Water Quality Criteria for Outdoor Bathing was observed during pre-lockdown and lockdown period.
10.0. IMPACT OF LOCKDOWN ON WATER QUALITY OF RIVER MAHANADI
10.1 Mahanadi River
The Mahanadi River is a major river in East Central India which rises in Dhamtari district of Chhattisgarh. It is 858 kilometers long river flows through Chhattisgarh and Odisha States. The Mahanadi river empties into Bay of Bengal via several channels near Paradeep at False Point, Jagat Singhpur in Odisha. Total length of the river Mahanadi from origin to its outfall into Bay of Bengal is 851 km of which 357 km lies in Chattisgarh and 494 km in Odisha. The principal tributaries of the Mahanadi river on left bank of river Mahanadi are River Shivnath, Mand, lb, Hasdeo and right bank tributaries are River Ong, Parry, Jonk, Teien. Hirakud Dam across the river Mahanadi is longest major earthen dam in India. The industrialized towns on the bank of Mahanadi River are Jagatpur, Paradeep, Sambalpur, Nayagarh and Cuttack consisting of major industries such as paper, textiles, thermal power plants, fertilizers, breweries, Sugar industries, Cement, coal mining, and aluminium smelter etc. From the point of view of significant environmental impacts, the
101 I Page
163
important medium scale industries are the chemical, textile, paper, cement, and leather tanning which consume large quantities of water.
10.2 Water Quality Monitoring Locations under National Water Quality Monitoring Programme (NWMP)
The Water Quality of River Mahanadi is monitored at 27 locations by Central Pollution Control Board (CPCB) in association with State Pollution Control Boards of Chhattisgarh (09) and Odisha (18) under National Water Quality Monitoring Programme (NWMP). State-wise Distribution of Water Quality Monitoring Locations under NWMP on River Mahanadi is depicted in Figure 10.1.
10.3 Analytical Results
Water quality of river Mahanadi was carried out at 13 locations [Chhattisgarh State (5) and Odisha State (8)] during Pre-lockdown (March 2020) and at 22 locations [Chhattisgarh State (5) and Odisha State (17)] during lockdown period (April 2020) to assess the impact on water quality of river Mahanadi. The analysis results of Primary Water Quality Criteria for Outdoor Bathing (PWQCOB) parameters viz. Dissolved Oxygen (DO), pH, Biochemical Oxygen Demand (BOD) and Fecal Coliform (FC) are presented below in Table-10.1.
Based on the monitoring & analysis of collected water samples from river Mahanadi, the water quality trend of river Mahanadi with respect to DO, pH, BOD and FC as observed during pre-lockdown (March 2020) and lockdown period (April 2020) are depicted in Figure 10.2 to Figure 10.9.
102 I Page
\64
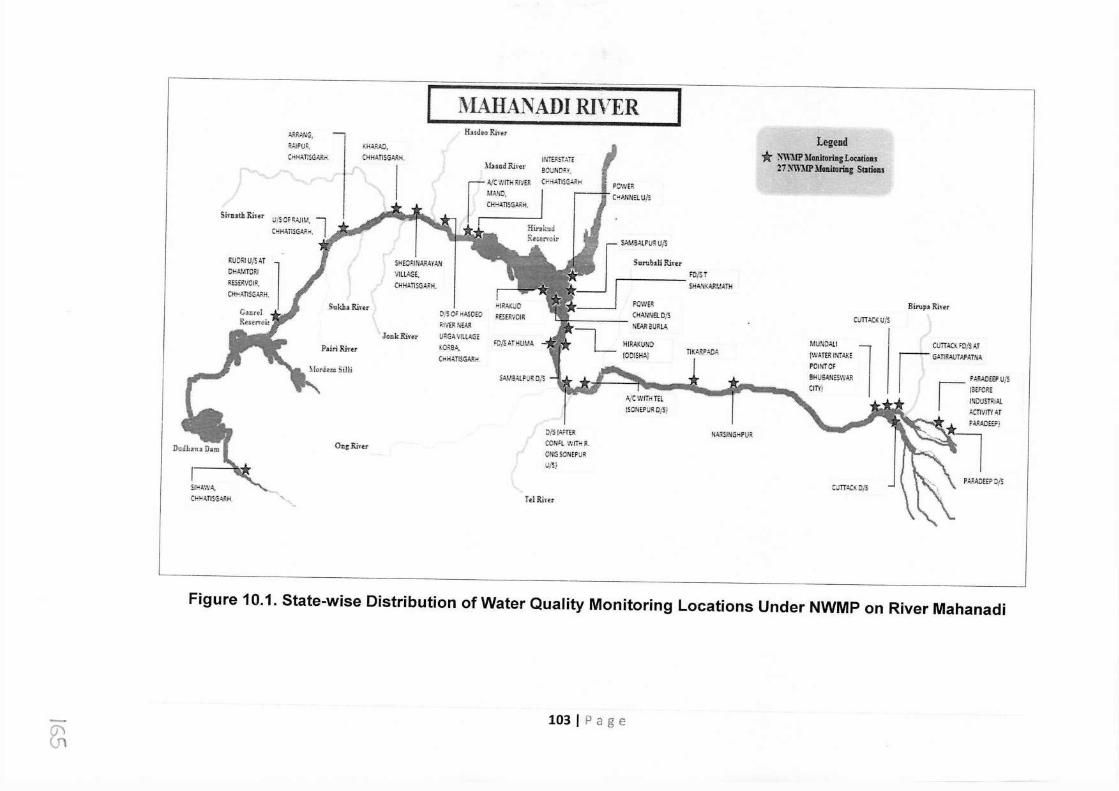
iVIAHA.NADI RIVER A.t;.AANG, AA!PUR, CliHAli5GARri
Hudt-oRin!r I
~HAR,>J), CHH.!iTl~GAf{H.
\luod Rfrer
AiC1/,1ITH~IVER MA.'-iO,
CH!"!"TI~.5.A;;!H. Si,.-astb R.irtr
f:UD'1U/!•T CHAMTORI RLl:RVOIR, CHHATI!G4.,H.
Su.khl1. Ri,·er 0/SCF HA50EO l'E5ERVOIR Xl'/ER tlE.!,R
Joaklu,er Piir-iRirtr
SHEO!<lliARAYAN VllL:.GE. CliHA.ilSE-'JH.
URGAVfllAG: KOR!!."', CliHATISGAAH.
lf.ff'J4.5J.:.Tf a::n.r:-.o~·t, CHM.~TISG.AA:H
'0/! AT HUl.t', -
~
SAMSALPv,u;s
!# Surub,ii Ri'°r , FD/H .__J r--- !HA.~Wl.lATH
,__J F"CWt,,; CHAtmaots NEAR OU?.LA
MU/ID~ll {WATER INT A..'-:~ POiNTOF BHU3AN:S\\1.~l:!; l I- ~:.:i:i:::4 PWDW' U[S ' l'oEfOP.E
;NOVSTRIAL ACTIVITY 4T
OD:;_Rinr
D/SIAFTER CONFl.WITi-1:il:. ON~SONEPUR U/S)
!IHAWA, CH~~TISGARH It.I RiT,r
(_,
HIR.;U:UND
NA.~INGHPU;
Legend * \\'WMP Monitoring L~;1ti0J1S 27 ~"\\'llP Mmrorbtg Stations
ClJTT"-Ot U,'S
curr;.c~ots
Birupa R.i,·e.t
PA.AADHPD/!
Figure 10.1. State-wise Distribution of Water Quality Monitoring Locations Under NWMP on River Mahanadi
0 (f\
103IPage
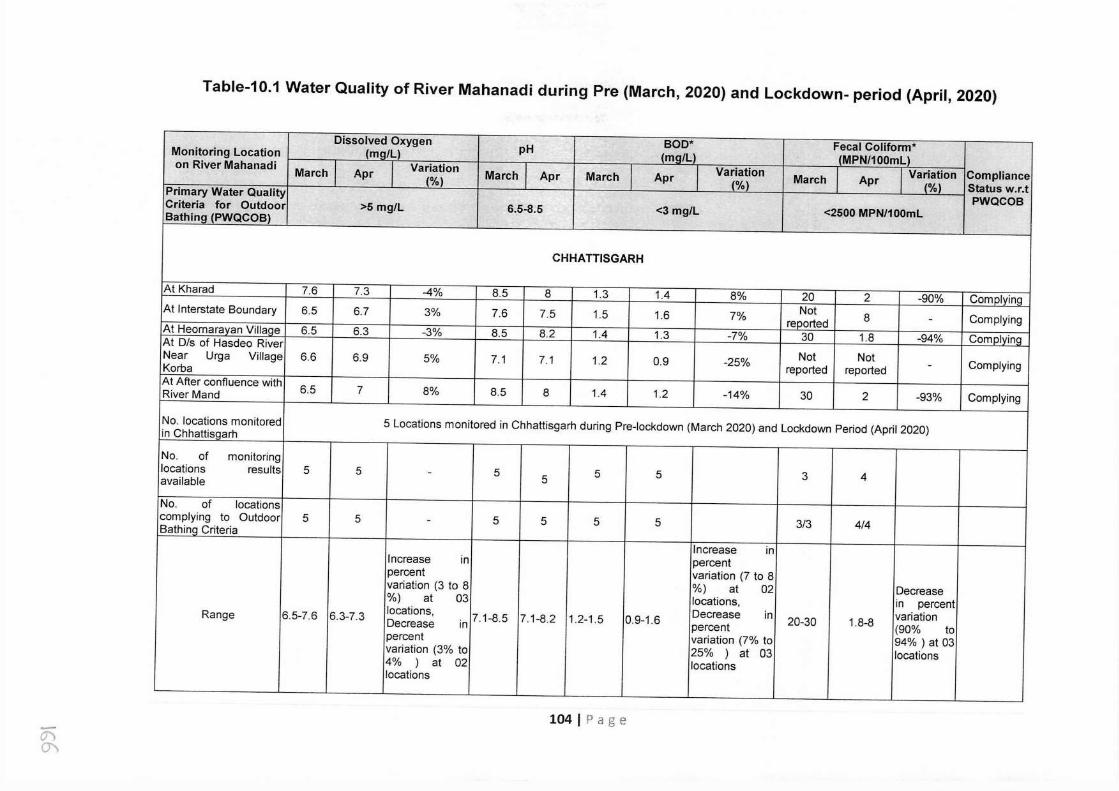
Table-10.1 Water Quality of River Mahanadi during Pre (March, 2020) and Lockdown- period (April, 2020)
Dissolved Oxygen pH BOD* Fecal Coliform* Monitoring Location (mq/L) (ma/L) (MPN/100ml) on River Mahanadi
March Apr Variation March Apr March Apr Variation March Apr Variation Compliance (%) (%) (%) Status w.r.t Primary Water Quality
PWQCOB Criteria for Outdoor >5 mg/L 6.5-8.5 <3 mg/L <2500 MPN/100ml Bathing (PWQCOB)
CHHATTISGARH
At Kharad 7.6 7.3 -4% 8.5 8 1.3 1.4 8% 20 2 -90% Cornplyinq At Interstate Boundary 6.5 6.7 3% 7.6 7.5 1.5 1.6 7% Not 8 Complying reported - At Heornaravan Villace 6.5 6.3 -3% 8.5 8.2 1.4 1.3 -7% 30 1.8 -94% Complying At Dis of Hasdeo River
Not Not Near Urga Village 6.6 6.9 5% 7.1 7.1 1.2 0.9 -25% reported reported - Complying Korba
At After confluence with 6.5 7 8% 8.5 8 1.4 1.2 -14% 30 2 -93% Complying River Mand
No. locations monitored 5 Locations monitored in Chhattisgarh during Pre-lockdown (March 2020) and Lockdown Period (April 2020) in Chhattisqarh
No. of monitoring locations results 5 5 - 5 5 5 5 3 4 available
No. of locations complying to Outdoor 5 5 - 5 5 5 5 3/3 4/4 Bathing Criteria
Increase in Increase in percent percent variation (7 to 8 variation (3 to 8 %) at 02 Decrease %) at 03 locations, in percent
Range 6.5-7.6 6.3-7.3 locations, in 7.1-8.5 7.1-8.2 1.2-1.5 0.9-1.6 Decrease in 20-30 1.8-8 variation Decrease percent (90% to percent variation (7% to 94%) at 03 variation (3% to 25% ) at 03 locations 4% ) at 02 locations
locations
- ~ O',
1041Page
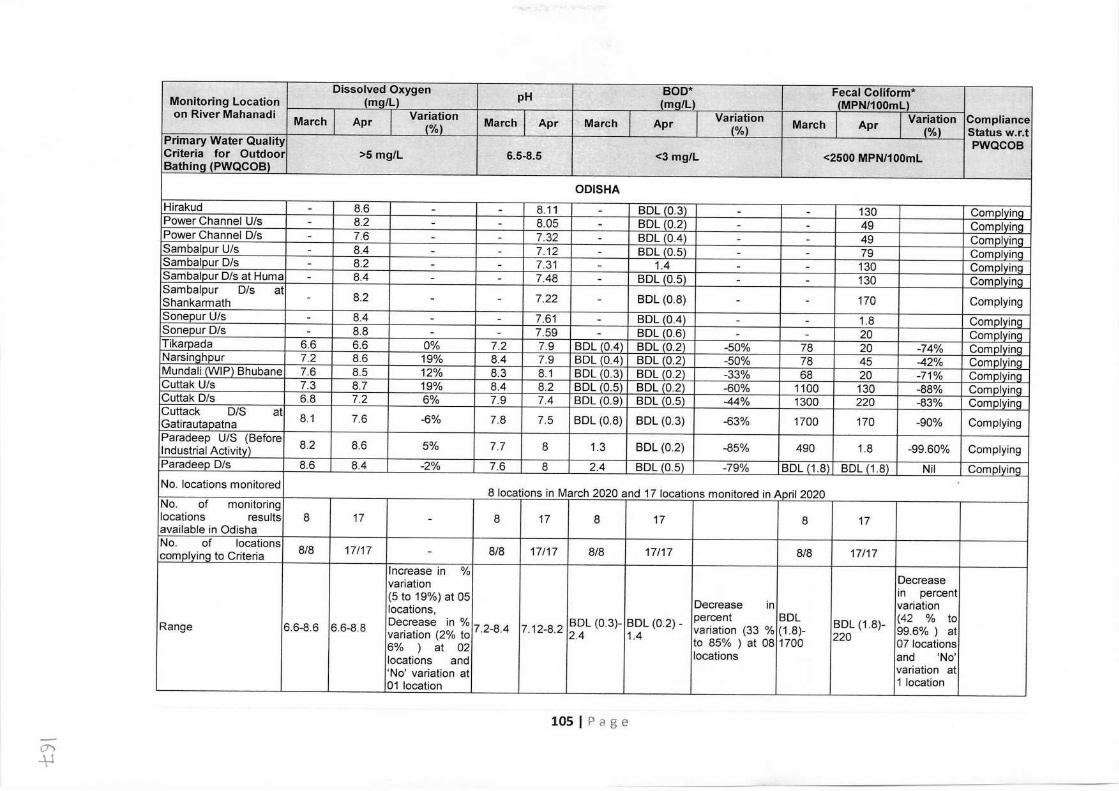
Dissolved Oxygen pH BOD* Fecal Coliform* Monitoring Location (mg/L) (mall) (MPN/100mll on River Mahanadi
March Apr Variation March Apr March Apr Variation March Apr Variation Compliance (%) (%) (%) Status w.r.t
Primary Water Quality PWQCOB Criteria for Outdoor >5 mg/L 6.5-8.5 <3 mg/L <2500 MPN/100ml Bathing (PWQCOB)
ODISHA Hirakud - 8.6 - - 8.11 - BDL (0.3) - - 130 Complying Power Channel Uls - 8.2 - - 8.05 - BDL (0.2) - - 49 Complying Power Channel Dis - 7.6 - - 7.32 - BDL (0.4) - - 49 Complvinq Sambalpur Uls - 8.4 - - 7.12 - BDL (0.5) - - 79 Complying Sambalpur Dis - 8.2 - - 7.31 - 1.4 - - 130 Complying Sambalpur Dis at Huma - 8.4 - - 7.48 - BDL (0.5) - - 130 Cornplvinq Sambalpur Dis at 8.2 7.22 BDL (0.8) 170 Complying Shankarmath - - - - - - Sonepur Uls - 8.4 - - 7.61 - BDL (0.4) - - 1.8 Complying Sonepur Dis - 8.8 - - 7.59 - BDL (0.6) - - 20 Complying Tikarpada 6.6 6.6 0% 7.2 7.9 BDL (0.4) BDL (0.2) -50% 78 20 -74% Cornolvino Narsinghpur 7.2 8.6 19% 8.4 7.9 BDL (0.4) BDL (0.2) -50% 78 45 -42% Complying Mundali (WIP) Bhubane 7.6 8.5 12% 8.3 8.1 BDL (0.3) BDL (0.2) -33% 68 20 -71% Cornolvino Cuttak Uls 7.3 8.7 19% 8.4 8.2 BDL (0.5) BDL <0.2) -60% 1100 130 -88% Complvinq Cuttak Dis 6.8 7.2 6% 7.9 7.4 BDL (0.9) BDL (0.5) -44% 1300 220 -83% Complying Cuttack DIS at 8.1 7.6 -6% 7.8 7.5 BDL (0.8) BDL (0.3) -63% 1700 170 -90% Complying Gatirautapatna Paradeep UIS (Before
8.2 8.6 5% 7.7 8 1.3 BDL (0.2) -85% 490 1.8 -99.60% Complying Industrial Activity) Paradeep Dis 8.6 8.4 -2% 7.6 8 2.4 BDL (0.5) -79% BDL (1.8) BDL (1.8) Nil Complying No. locations monitored
8 locations in March 2020 and 17 locations monitored in April 2020 No. of monitoring locations results 8 17 - 8 17 8 17 8 17 available in Odisha No. of locations 818 17117 818 17117 818 17117 818 17117 complying to Criteria -
Increase in % Decrease variation
(5 to 19%) at 05 in percent Decrease in variation locations, percent BDL (42 % to Decrease in % BDL (0.3)- BDL (0.2) - BDL (1.8)- Range 6.6-8.6 6.6-8.8 variation (2% to 7.2-8.4 7.12-8.2 2.4 1.4 variation (33 % (1.8)- 220 99.6% ) at
6% ) at 02 to 85% ) at 08 1700 07 locations locations and 'No' locations and
variation at 'No' variation at 01 location 1 location
105 I Page ~ +1
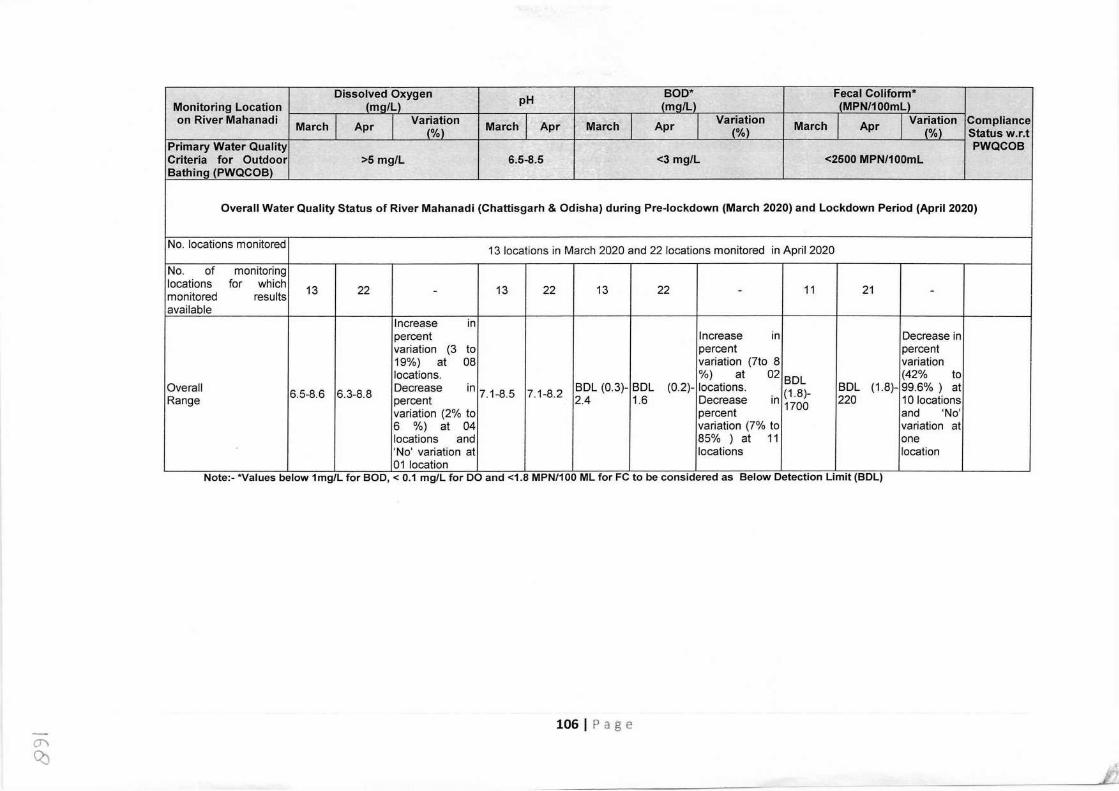
Dissolved Oxygen pH BOD* Fecal Colifonn* Monitoring Location (mg/L) (ma/L) (MPN/100mL) on River Mahanadi March Apr Variation March Apr March Apr Variation March Apr Variation Compliance
(%) (%) (%) Status w.r.t Primary Water Quality PWQCOB Criteria for Outdoor >5 mg/L 6.5-8.5 <3 mg/L <2500 MPN/100mL Bathinq (PWQCOB)
Overall Water Quality Status of River Mahanadi (Chattisgarh & Odisha) during Pre-lockdown (March 2020) and Lockdown Period (April 2020)
No. locations monitored 13 locations in March 2020 and 22 locations monitored in April 2020
No. of monitoring locations for which 13 22 13 22 13 22 11 21 monitored results - - - available
Increase in percent Increase in Decrease in variation (3 to percent percent 19%) at 08 variation (?to 8 variation locations. %) at 02 BDL (42% to
Overall 6.5-8.6 6.3-8.8 Decrease in 7.1-8.5 7.1-8.2 BDL (0.3)- BDL (0.2)- locations. . (1.8)- BDL (1.8)- 99.6% ) at Range percent 2.4 1.6 Decrease in 1700 220 10 locations
variation (2% to percent and 'No' 6 %) at 04 variation (7% to variation at locations and 85% ) at 11 one 'No' variation at locations location 01 location
Note:- *Values below 1mg/L for BOD,< 0.1 mg/L for DO and <1.8 MPN/100 ML for FC to be considered as Below Detection Limit (BDL)
106IPage
°' Q)
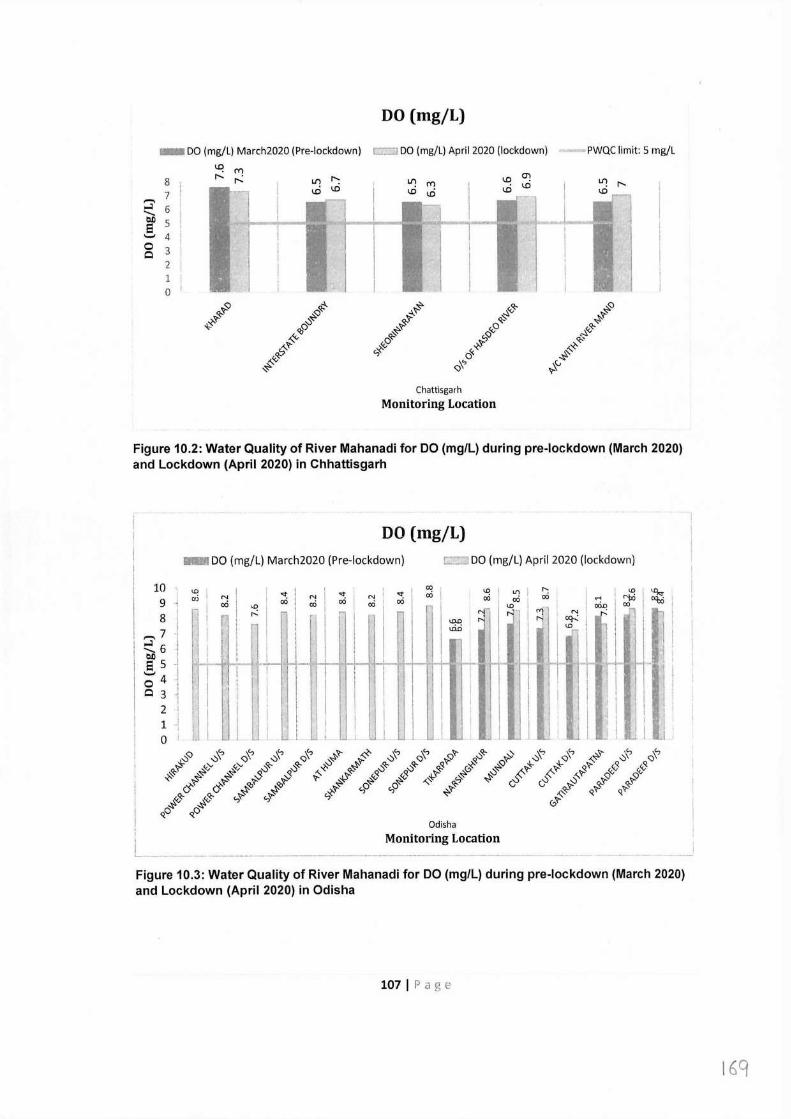
DO (mg/L)
- DO (mg/L) March2020 (Pre-lockdown) c::=J DO (mg/L) April 2020 (lockdown)
'-C? m 8 r-- r-- LI') ~ LI') <.D Cl'?
<.D <.D CY) <.D <.D 7 <.D <.D ,-.. .... 6 -·-, ....... ~ 5 e
'--' 4 0 3 Q
2 1 0
PWQC limit: 5 rng/L
Chattisgarh Monitoring Location
Figure 10.2: Water Quality of River Mahanadi for DO (mg/L) during pre-lockdown (March 2020) and Lockdown (April 2020) in Chhattisgarh
DO (mg/L) - DO (mg/L) March2020 {Pre-lockdown) C:--=:J DO (mg/L) April 2020 (lockdown)
10 l[)
9 i c,;
8 j ,-.. 7 I ~6 ] ~ e 5 '--' 4 0 I
Q 3 I
i I
2 ! 1 ·i 0 !
! NI
~
i I I 00 i l[) i I r-. ! <t N <t I N I <t <Xi <Xi
U'l I <Xi co I co I co co I rl l[) I <Xi I <Xi l[) I -· i edo ,...: " r--'' "" I N ....:
( ' r-- l eq-;
I <DD uiri l[) l I
I _Jlt 1 loo<•~
,__ i-1--- I-I- I- I- i I
I
~
I i ' ! ! I
LIi I I I
I ! I I h 1
I I I
u; I LJ i '
I l .... -----·---- ,,, ......
Odisha Monitoring Location
Figure 10.3: Water Quality of River Mahanadi for DO (mg/L) during pre-lockdown (March 2020) and Lockdown (April 2020) in Odisha
107 I Page
169
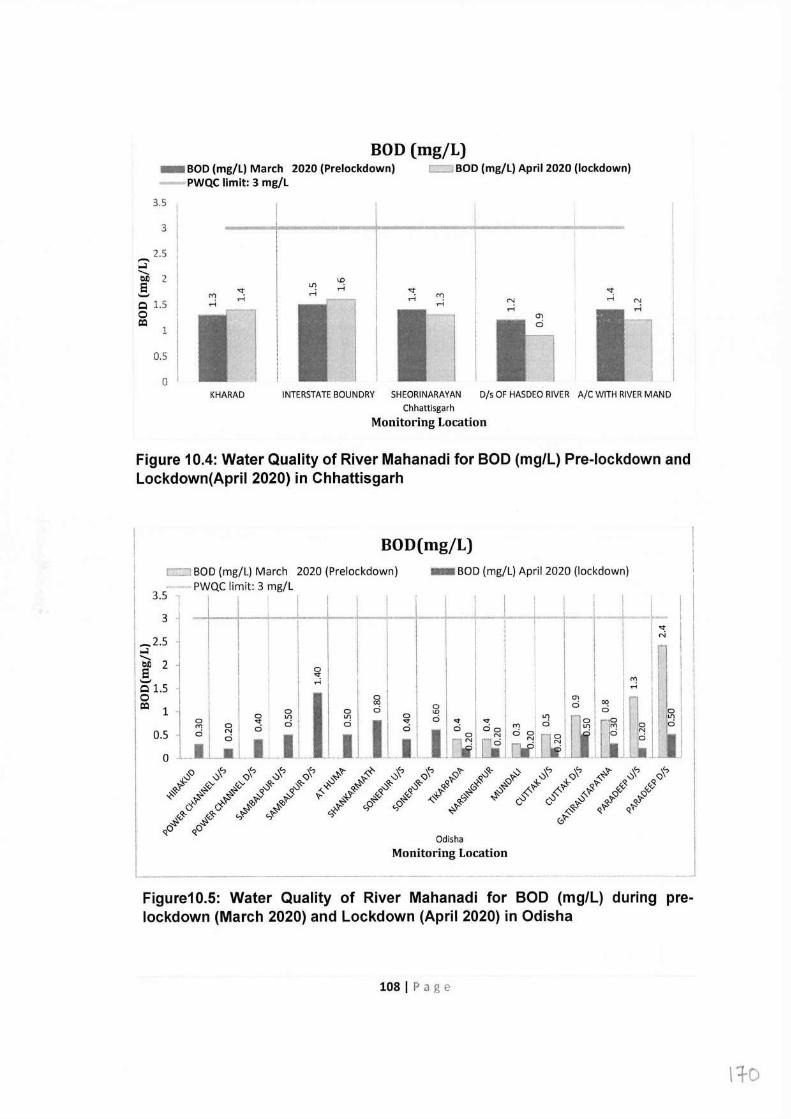
BOD (mg/L) -BOD (mg/L) March 2020 (Prelockdown)
PWQC limit: 3 mg/L r:::=JBOD (mg/L) April 2020 (lockdown)
3.5
3 ----+------•------+--------,-- 2.5 ,......
..;j ........ Ol) 2 <.D e lJ) ,..; tj' ,..; '-' rY'I ,..; Q 1.5 ,..; 0 CQ
1
0.5
0
N ,..;
Cl)
ci
tj'
M N
11 KHARAD INTERSTATE BOUNDRY SHEORINARAYAN D/s OF HASDEO RIVER A/C WITH RIVER MAND
Chhattisgarh Monitoring Location
Figure 10.4: Water Quality of River Mahanadi for BOD (mg/L) Pre-lockdown and Lockdown(April 2020) in Chhattisgarh
BOD(mg/L) r:::.::::i BOD (mg/I.) March 2020 (Prelockdown) - , PWQC limit: 3 mg/L
3.s I 3
_2.s ..;j ........ it 2 01.S
i 0: .1.! _ _i:_;JJ1J.1.~~ .. ~ .. ~lci ~
- BOD (mg/L) April 2020 (lockdown)
st ....,;
Q'\ ci
Odisha Monitoring Location
Figure10.5: Water Quality of River Mahanadi for BOD (mg/L) during pre lockdown (March 2020) and Lockdown (April 2020) in Odisha
108 I Page
l:'.f-0
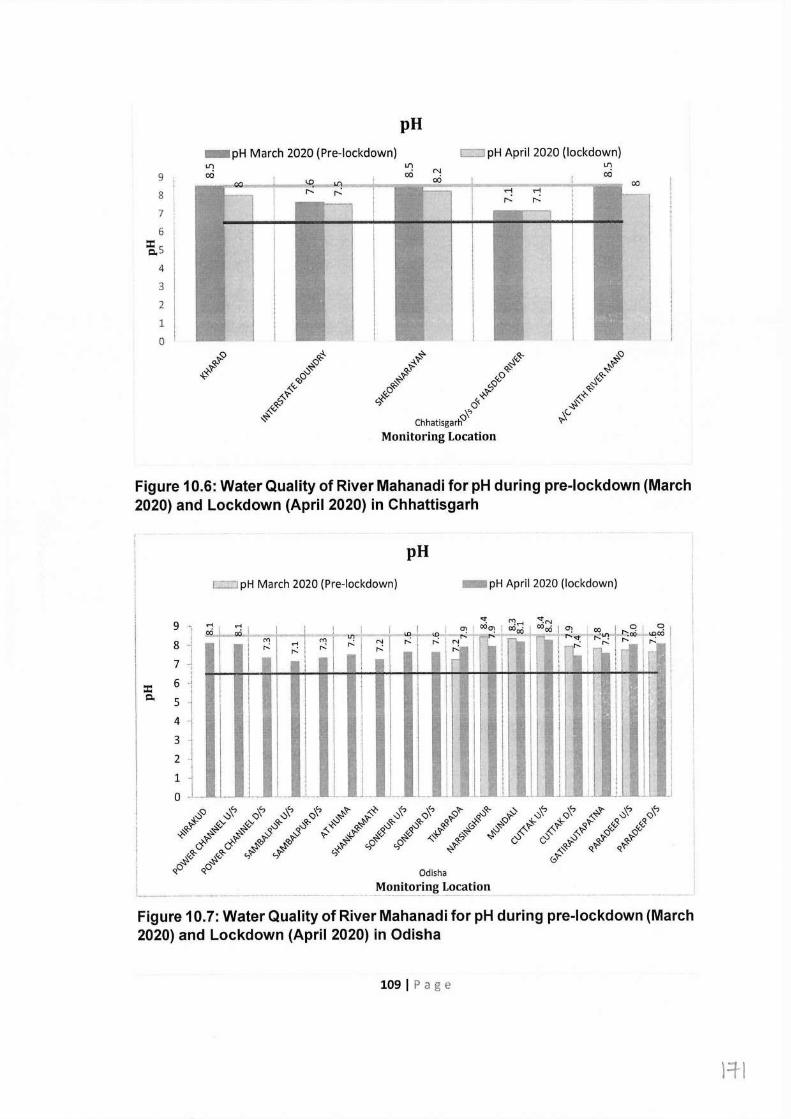
pH
9
8
7
6 =[s
4
3
2
1
0
-pH March 2020 (Pre-lockdown) LI') co
LI)
cxi -- \0 -
~--· r--- r--- ~ ...... rl l r--- r--- , I I I 1, I
'
L...--.1 - - - ...___. - i....- i.....-
N 00
c:::3 pH April 2020 (lockdown) LI') co
co
~<f: <iS
!<,Q <,<:)
~'?' & ~"
Chhatisgar~ Monitoring Location
Figure 10.6: Water Quality of River Mahanadi for pH during pre-lockdown (March 2020) and Lockdown (April 2020) in Chhattisgarh
pH
c=:JpH March 2020 (Pre-lockdown) -pH April 2020 (lockdown)
::c C.
9
8
7
6
5
4
3 2 1 0
b
11 1,
I,
m l 1,
I
Odisha
~onitorin~ L.?.~~ti~~
Figure 10.7: Water Quality of River Mahanadi for pH during pre-lockdown (March 2020) and Lockdown (April 2020) in Odisha
109IPage
\=ti
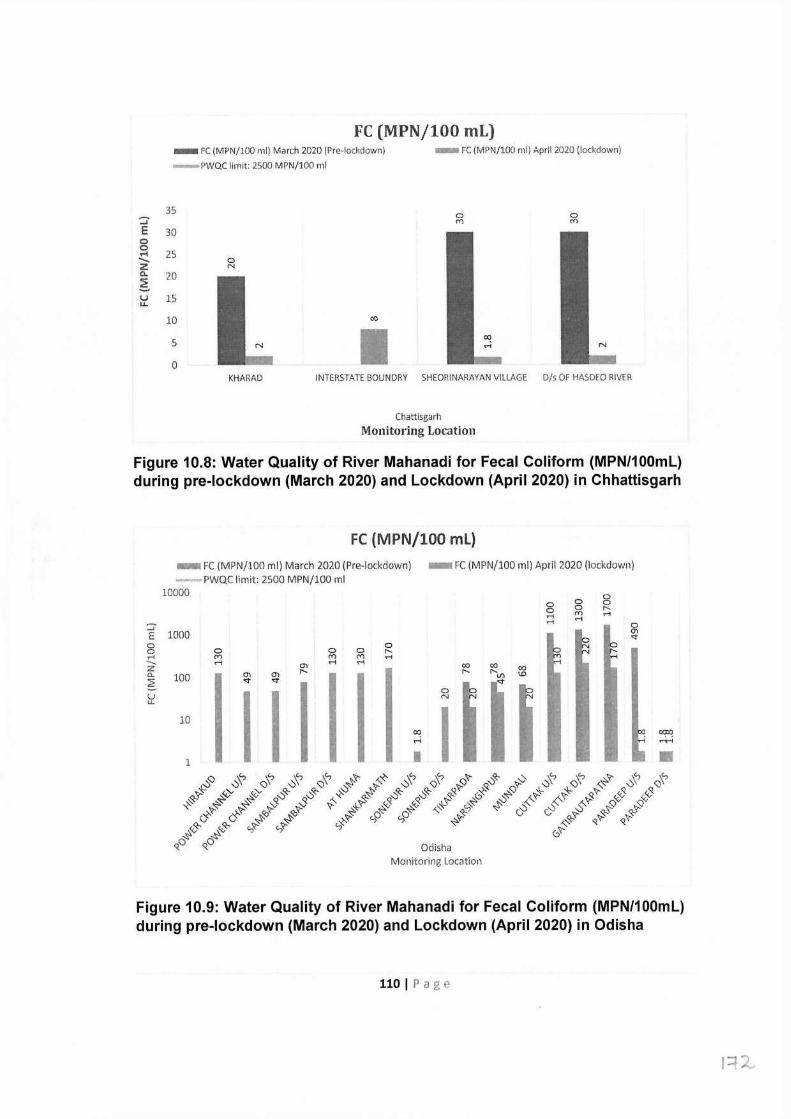
FC (MPN/100 ml) - FC (MPN/100 rnl) March 2020 (Pre--lockclown) -PWQC limit: 2500 MPN/100 ml
- FC (MPN/100 ml) April 2020 (lockdown)
35 -:;- E 30 0 0 M 25 ...... 0 z N 0.. 20 ! u 15 u.
10
5
0 KHARAD
0 m 0 m
00
I INTERSTATE BOUNDRY SHEORINARAYAN VILL,\GE D/s OF HASDEO RIVER
Chattlsgarh Monitoring Location
Figure 10.8: Water Quality of River Mahanadi for Fecal Coliform (MPN/100ml) during pre-lockdown (March 2020) and Lockdown (April 2020) in Chhattisgarh
FC (MPN/100 ml} - FC (MPN/100 ml) March 2020 (Pre-lockdown) - FC (MPN/100 ml) April 2020 (lockdown) -PWQC limit: 2500 MPN/100 ml
10000 0 0 rl
:::;- rl
E 1000 0 0 0 0 0 0 r-. g rl m m m rl
----- rl O"\ rl rl 00 00 z 00
a.. 100 0) O"\ r-. r-. r-.L/) <D ~ '<t '<t
I I I I 0 u N N
u..
10 I 00 ,...;
1 I
0 0 0 0 r-. m rl
rl 0 0) tj-
g ,....,
Figure 10.9: Water Quality of River Mahanadi for Fecal Coliform (MPN/100ml) during pre-lockdown (March 2020) and Lockdown (April 2020) in Odisha
110 I Page
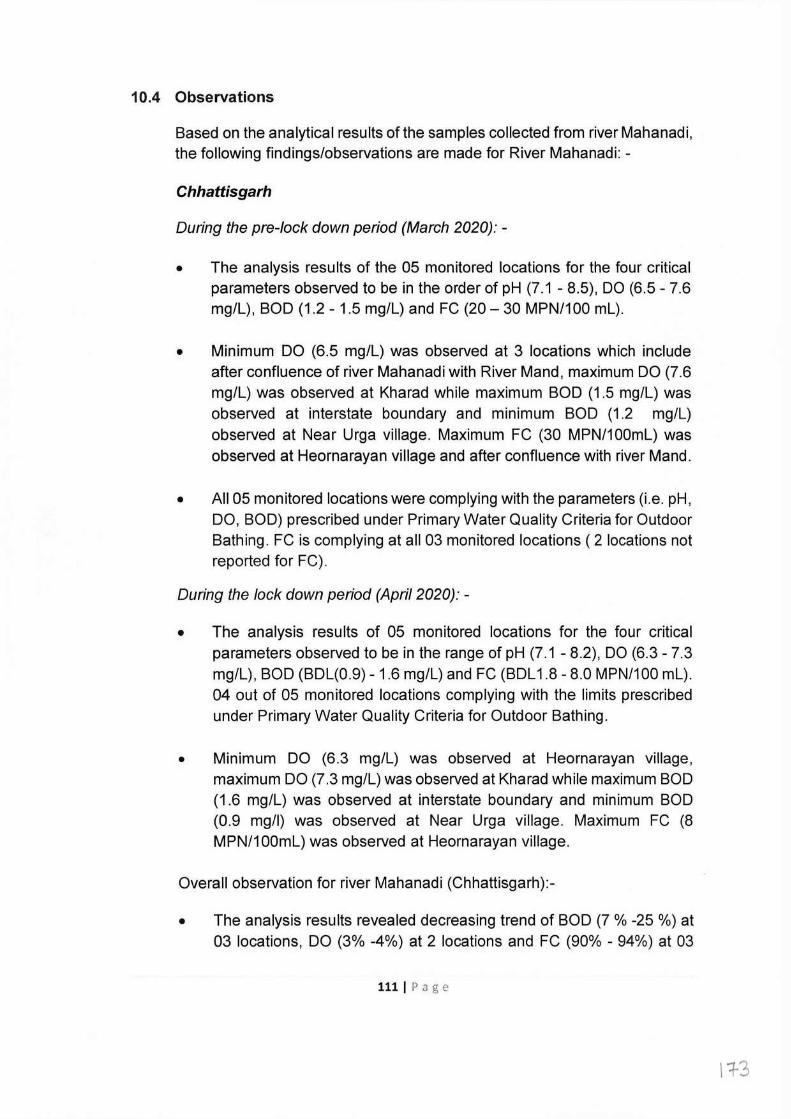
10.4 Observations
Based on the analytical results of the samples collected from river Mahanadi, the following findings/observations are made for River Mahanadi: -
Chhattisgarh
During the pre-lock down period (March 2020): -
• The analysis results of the 05 monitored locations for the four critical parameters observed to be in the order of pH (7.1 - 8.5), DO (6.5 - 7.6 mg/l), BOD (1.2 - 1.5 mg/l) and FC (20- 30 MPN/100 ml).
• Minimum DO (6.5 mg/l) was observed at 3 locations which include after confluence of river Mahanadi with River Mand, maximum DO (7.6 mg/l) was observed at Kharad while maximum BOD (1.5 mg/l) was observed at interstate boundary and minimum BOD (1.2 mg/l) observed at Near Urga village. Maximum FC (30 MPN/100ml) was observed at Heornarayan village and after confluence with river Mand.
• All 05 monitored locations were complying with the parameters (i.e. pH, DO, BOD) prescribed under Primary Water Quality Criteria for Outdoor Bathing. FC is complying at all 03 monitored locations ( 2 locations not reported for FC).
During the lock down period (April 2020): -
• The analysis results of 05 monitored locations for the four critical parameters observed to be in the range of pH (7.1 - 8.2), DO (6.3 - 7.3 mg/l), BOD (BDl(0.9)- 1.6 mg/l) and FC (BDl 1.8 - 8.0 MPN/100 ml). 04 out of 05 monitored locations complying with the limits prescribed under Primary Water Quality Criteria for Outdoor Bathing.
• Minimum DO (6.3 mg/l) was observed at Heornarayan village, maximum DO (7.3 mg/l) was observed at Kharad while maximum BOD (1.6 mg/l) was observed at interstate boundary and minimum BOD (0.9 mg/I) was observed at Near Urga village. Maximum FC (8 MPN/100ml) was observed at Heornarayan village.
Overall observation for river Mahanadi (Chhattisgarh):-
• The analysis results revealed decreasing trend of BOD (7 % -25 %) at 03 locations, DO (3% -4%) at 2 locations and FC (90% - 94%) at 03
111 I Page
\1-3
monitored locations whereas increasing trend of DO (3% to 8%) at 3 locations and BOD (7% to 8%) at 02 monitored locations.
Odisha
During the pre-lock down period (March 2020):-
• The analysis results of 08 monitored locations for the four critical parameters observed to be in the order of pH (7.2 - 8.4), DO (6.6 - 8.6 mg/l), BOD (0.3 - 2.4 mg/l) and FC (1.8- 1700 MPN/100ml).
• Minimum DO (6.6 mg/l) was observed at Tikarpada, maximum DO (8.6 mg/l) was observed at Paradeep D/s while maximum BOD (2.4 mg/l) was observed at Paradeep D/s and minimum BOD (BDl mg/I) was observed at 6 out of 8 monitored locations. Maximum FC (1700 MPN/100ml) was observed at Cuttack D/s at Gatirautapatna and minimum FC (BDl MPN/100 ml) was observed at Paradeep D/s.
• All the 08 monitored locations were observed to be complying with the parameters (i.e. pH, DO, BOD and FC) prescribed under Primary Water Quality Criteria for Outdoor Bathing.
During the lock down period (April 2020):-
• The analysis results of the 17 monitored locations for the four critical parameters were observed to be in the order of pH (7.12 - 8.2), DO (6.6 - 8.8 mg/l), BOD (0.2 -1.4 mg/l) and FC (1.8 - 220 MPN/100ml).
• Minimum DO (6.6 mg/l) was observed at Tikarpada, maximum DO (8.8 mg/l) was observed at Sonepur D/s while maximum BOD (1.4 mg/l) was observed at Samabalpur Dis and minimum BOD (BDl mg/I) was observed at 16 out of 17 monitored locations. Maximum FC (220 MPN/100ml) was observed at Cuttack D/s and minimum FC (BDl MPN/100 ml) was observed at Paradeep D/s.
• All 17 monitored locations complying with the parameters (i.e. pH, DO, BOD and FC) prescribed under Primary Water Quality Criteria for Outdoor Bathing.
112 I Page
Overall observations on river Mahanadi (Odisha):-
• The analysis results revealed that decreasing trend of DO (2% -6%) at 02 locations, BOD (33%-85 %) at 08 monitored locations and FC (42 - 99.6%) at 07 locations whereas increasing trend of DO (5% -19%) at 05 locations were observed.
Overall Observations on river Mahanadi (Covering Chhattisgarh and Odisha States): -
~ The analysis results revealed that during pre-lockdown, the monitored values were in the ranges of pH (7.1 -8.5), DO (6.5- 8.6 mg/L), BOD (0.3 - 2.4 mg/L) and FC (1.8- 1700 MPN/100ml) at the 13 monitored locations.
During lockdown, the values were in the ranges of pH (7.1 -8.2), DO (6.3- 8.8 mg/L), BOD (BDL (0.2) - 1.6 mg/L) and FC (BDL(1.8) - 220 MPN/100ml) at the 22 monitored locations.
The analysis results shown increasing trend of DO (3-19%) at 8 locations, BOD (7-8 %) at 2 locations while decreasing trend of DO (2-6 %) at 4 locations, BOD (7-8.5 %) at 11 locations and FC (42% - 99.6 % ) at 10 locations and 'no' variation in DO & FC was observed at 1 monitored location.
10.5 Conclusion: -
13 monitored locations on River Mahanadi during lockdown (05 in Chhattisgarh and 8 locations in Odisha) during pre-lockdown and 22 monitored locations on River Mahanadi (05 in Chhattisgarh and 17 locations in Odisha) during lockdown were observed to be complying with the Primary Water Quality Criteria for Outdoor Bathing. Also, overall improvement in water quality of River Mahanadi was observed with respect to BOD and FC parameters and 100 % compliance of monitored locations to outdoor bathing criteria was observed.
11.0. IMPACT OF LOCKDOWN ON WATER QUALITY OF RIVER TAPI
11.1 About Tapi River
Tapi River (also known as the Tapti) is the second largest westward inter state flowing rivers of the Peninsular India. The river Tapi originates in the Betul district from a place called Multai in the eastern Satpura Range of southern Madhya Pradesh (MP). The Tapi River flows for about 724 km over
1131Page
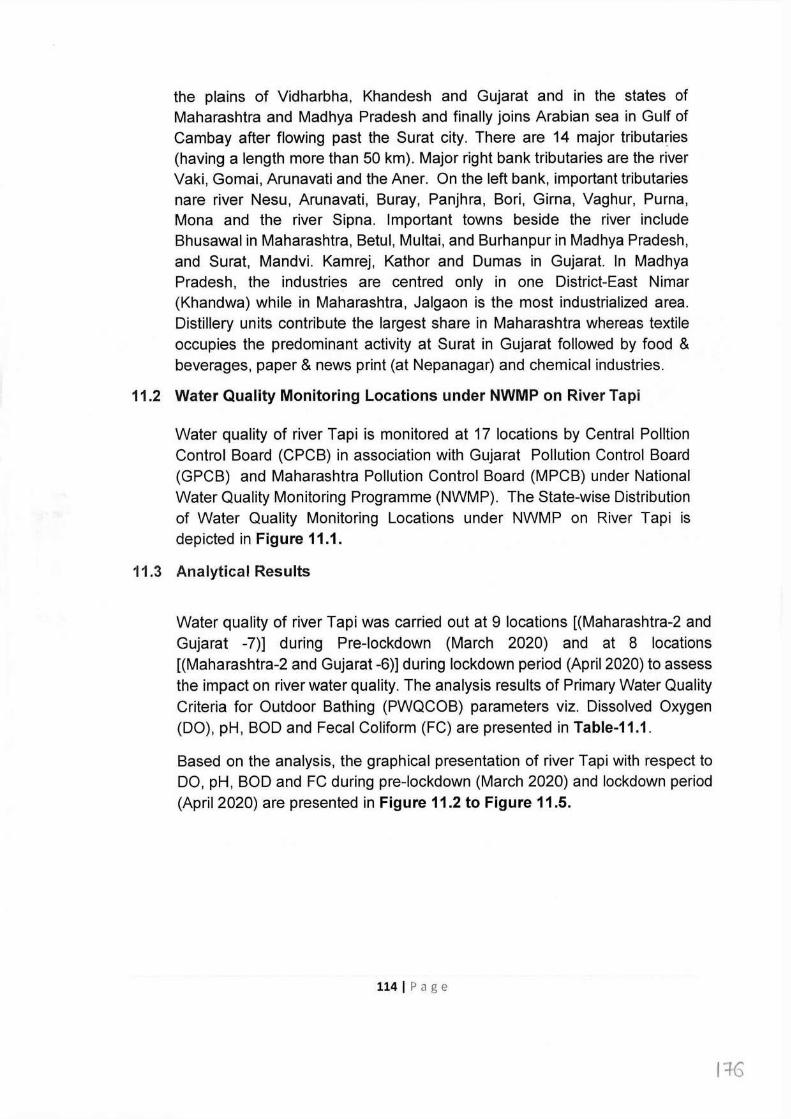
the plains of Vidharbha, Khandesh and Gujarat and in the states of Maharashtra and Madhya Pradesh and finally joins Arabian sea in Gulf of Cambay after flowing past the Surat city. There are 14 major tributaries (having a length more than 50 km). Major right bank tributaries are the river Vaki, Gomai, Arunavati and the Aner. On the left bank, important tributaries nare river Nesu, Arunavati, Buray, Panjhra, Bori, Girna, Vaghur, Puma, Mona and the river Sipna. Important towns beside the river include Bhusawal in Maharashtra, Betul, Multai, and Burhanpur in Madhya Pradesh, and Surat, Mandvi. Kamrej, Kathor and Dumas in Gujarat. In Madhya Pradesh, the industries are centred only in one District-East Nimar (Khandwa) while in Maharashtra, Jalgaon is the most industrialized area. Distillery units contribute the largest share in Maharashtra whereas textile occupies the predominant activity at Surat in Gujarat followed by food & beverages, paper & news print (at Nepanagar) and chemical industries.
11.2 Water Quality Monitoring Locations under NWMP on River Tapi
Water quality of river Tapi is monitored at 17 locations by Central Polltion Control Board (CPCB) in association with Gujarat Pollution Control Board (GPCB) and Maharashtra Pollution Control Board (MPCB) under National Water Quality Monitoring Programme (NWMP). The State-wise Distribution of Water Quality Monitoring Locations under NWMP on River Tapi is depicted in Figure 11.1.
11.3 Analytical Results
Water quality of river Tapi was carried out at 9 locations [(Maharashtra-2 and Gujarat -7)] during Pre-lockdown (March 2020) and at 8 locations [(Maharashtra-2 and Gujarat -6)] during lockdown period (April 2020) to assess the impact on river water quality. The analysis results of Primary Water Quality Criteria for Outdoor Bathing (PWQCOB) parameters viz. Dissolved Oxygen (DO), pH, BOD and Fecal Coliform (FC) are presented in Table-11.1.
Based on the analysis, the graphical presentation of river Tapi with respect to DO, pH, BOD and FC during pre-lockdown (March 2020) and lockdown period (April 2020) are presented in Figure 11.2 to Figure 11.5.
1141Page
I :J-6
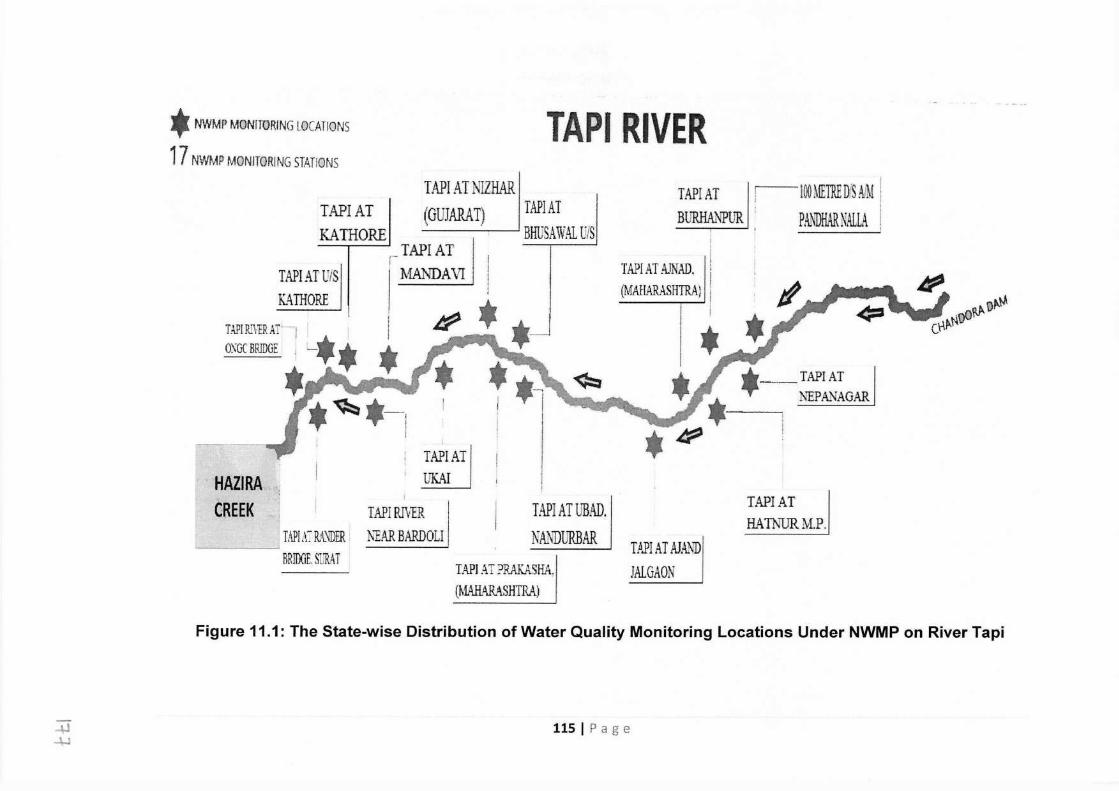
* NWMP MONIIDRING LOCATIONS
17 NWMP MONITORING STATIONS TAPI RIVER
TAPIAT KATHORE
TAPIATU/S KATHORE
TAPI AT NIZHAR (GUJARAT) I TAPI AT -----,..-- ___J · BHUSA WAL U/S
TAPIAT 11ANTIAVI
TAPIAT BlJ'F.HANPlJ'R
100 METRE DjS AIM
PANDHAR NALLA
TAP! AT AJNAD, I i (MAHARASHTRA}
HAZIRA._, ' CREEK
TAPIAT UK.AI
TAPIRIVER
• TAPIAT .--NEPANAGAR
TAP! A~ RA.~]ER ---~
RRJOOE. SURAT
TAPl AT UBAD. :NEAR BARDOLI I NMIDURBAR
TAPIAT HA IlHJR M.P.
TAP! AT PR.AKASKA., (MAHARASHTRA)
TAPIAT AJAL¾'D JALGAON
Figure 11.1: The State-wise Distribution of Water Quality Monitoring Locations Under NWMP on River Tapi
.+J 4-J
llSIPage
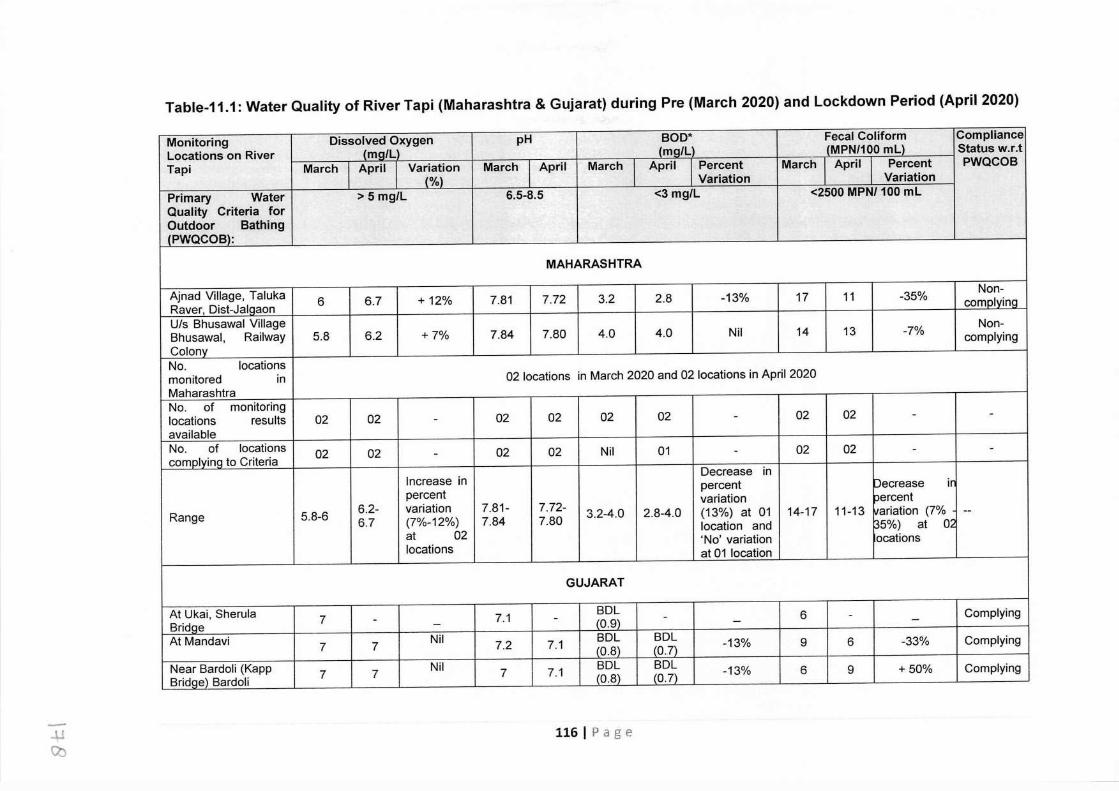
Table-11.1: Water Quality of River Tapi (Maharashtra & Gujarat) during Pre (March 2020) and Lockdown Period (April 2020)
Monitoring Dissolved Oxygen pH BOD* Fecal Coliform Compliance
Locations on River (ma/L (ma/L) (MPN/100 mu Status w.r.t
Tapi March April Variation March April March April Percent March April Percent PWQCOB (%) Variation Variation
Primary Water > 5 mg/L 6.5-8.5 <3 mg/L <2500 MPN/ 100 ml Quality Criteria for Outdoor Bathing (PWQCOB):
MAHARASHTRA
Ajnad Village, Taluka 6 6.7 +12% 7.81 7.72 3.2 2.8 -13% 17 11 -35% Non-
Raver, Dist-Jalaaon cornolvinq
U/s Bhusawal Village Non- Bhusawal, Railway 5.8 6.2 +7% 7.84 7.80 4.0 4.0 Nil 14 13 -7% complying Colonv No. locations monitored in 02 locations in March 2020 and 02 locations in April 2020 Maharashtra No. of monitoring locations results 02 02 - 02 02 02 02 - 02 02 - -
available No. of locations 02 02 02 02 Nil 01 02 02 comolvina to Criteria
- - - -
Increase in Decrease in
percent percent Decrease in
6.2- variation 7.81- 7.72- variation oercent
Range 5.8-6 6.7 (7%-12%) 7.84 7.80 3.2-4.0 2.8-4.0 (13%) at 01 14-17 11-13 i1ariation (7% --
at 02 location and 35%) at o ..
locations 'No' variation ocations at 01 location
GUJARAT
At Ukai, Sherula 7 7.1 BDL 6 Complying Bridae
- - (0.9) - - - - - At Mandavi 7 7 Nil 7.2 7.1 BDL BDL -13% 9 6 -33% Complying
<0.8) (0.7) Near Bardoli (Kapp 7 7 Nil 7 7.1 BDL BDL -13% 6 9 +50% Complying Bridae) Bardoli (0.8) (0.7)
..u Cb
116 I Page
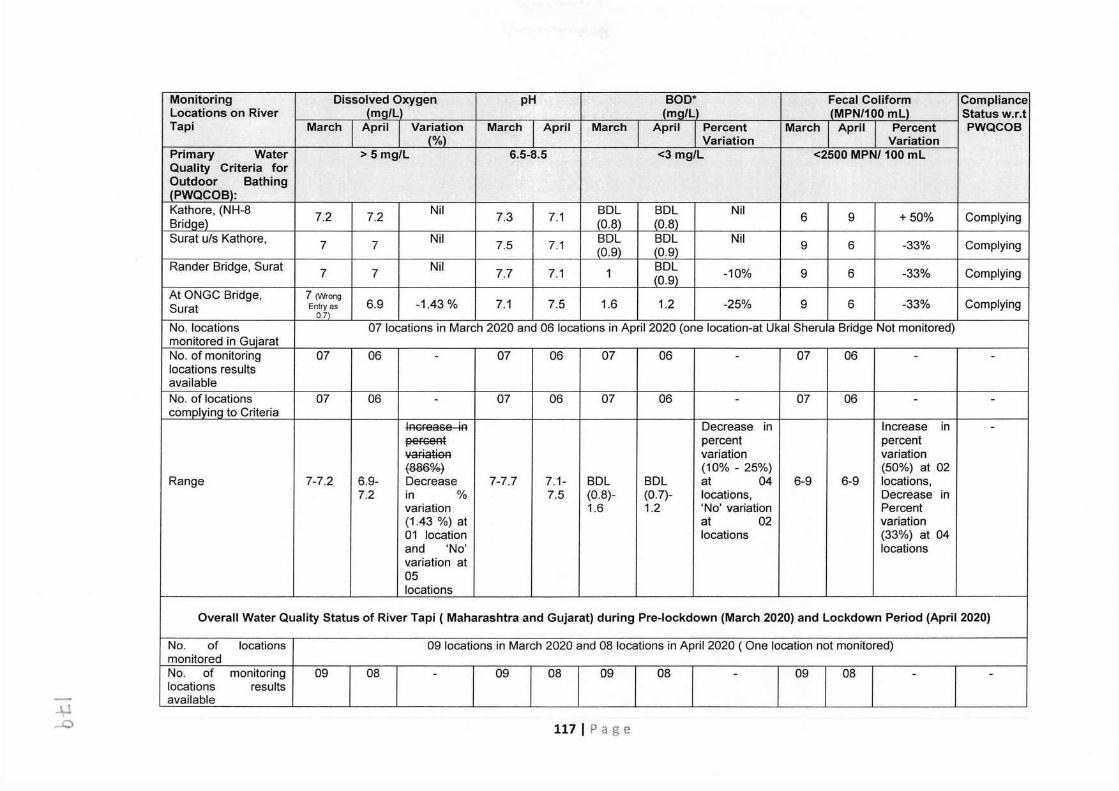
...w _.O
Monitoring Dissolved Oxygen pH BOD* Fecal Coliform Compliance Locations on River (mg/L) (mg/L) (MPN/100 ml) Status w.r.t Tapi March April Variation March April March April Percent March April Percent PWQCOB
(%) Variation Variation Primary Water > 5 mg/L 6.5-8.5 <3 mg/L <2500 MPN/ 100 ml Quality Criteria for Outdoor Bathing (PWQCOB): Kathore, (NH-8 7.2 7.2 Nil 7.3 7.1 BDL BDL Nil 6 9 +50% Complying Bridge) (0.8) (0.8) Surat u/s Kathore, 7 7 Nil 7.5 7.1 BDL BDL Nil 9 6 -33% Complying (0.9) (0.9) RanderBridge,Surat 7 7 Nil 7.7 7.1 1 BDL -10% 9 6 -33% Complying (0.9) At ONGC Bridge, 7 (Wrong
6.9 -1.43 % 7.1 7.5 1.6 1.2 -25% 9 6 -33% Complying Surat Entry as 0.7l
No. locations 07 locations in March 2020 and 06 locations in April 2020 (one location-at Ukal Sherula Bridge Not monitored) monitored in Gujarat No. of monitoring 07 06 - 07 06 07 06 - 07 06 - - locations results available No. of locations 07 06 - 07 06 07 06 - 07 06 - - cornplvinq to Criteria
IRGFease iR Decrease in Increase in - pefGeAt percent percent vaFiatieR variation variation ~ (10% - 25%) (50%) at 02
Range 7-7.2 6.9- Decrease 7-7.7 7.1- BDL BDL at 04 6-9 6-9 locations, 7.2 in % 7.5 (0.8)- (0.7)- locations, Decrease in
variation 1.6 1.2 'No' variation Percent (1.43 %) at at 02 variation 01 location locations (33%) at 04 and 'No' locations variation at 05 locations
Overall Water Quality Status of River Tapi ( Maharashtra and Gujarat) during Pre-lockdown (March 2020) and Lockdown Period (April 2020)
No. of locations 09 locations in March 2020 and 08 locations in April 2020 ( One location not monitored) monitored No. of monitoring 09 08 - 09 08 09 08 - 09 08 - - locations results available
117 I Page
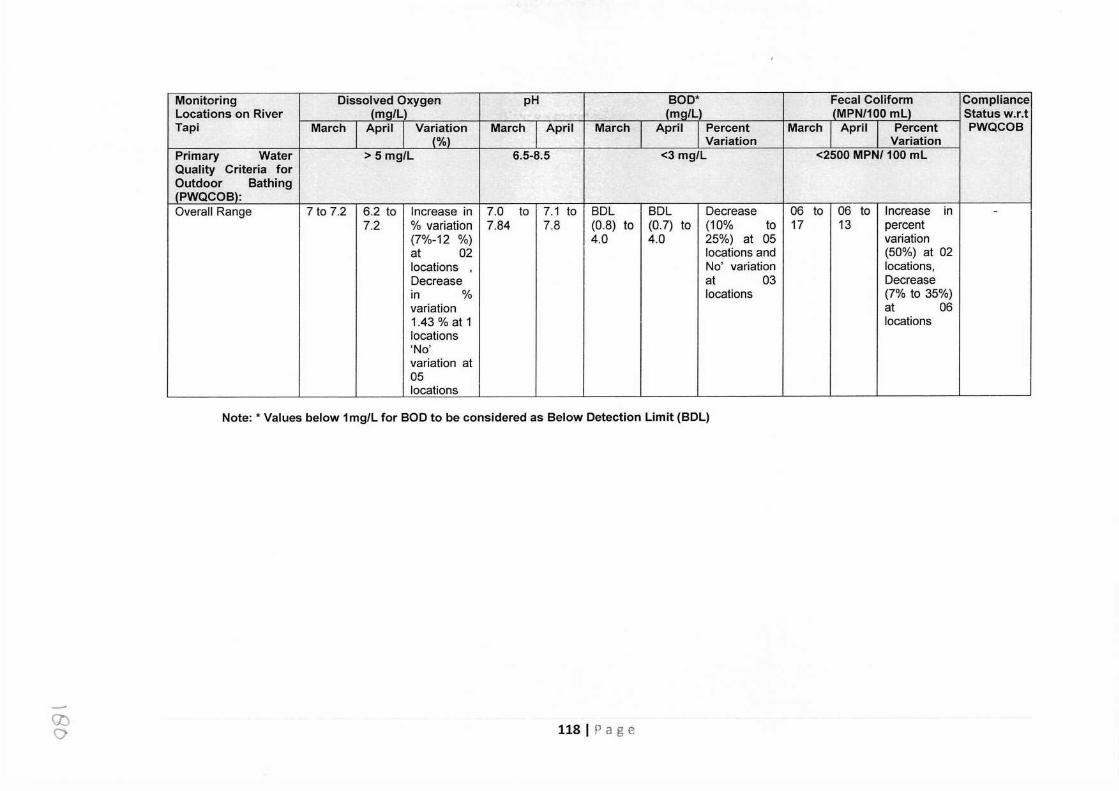
Monitoring Dissolved Oxygen pH BOD* Fecal Coliform Compliance Locations on River (ma/L) (mg/L) (MPN/100 ml) Status w.r.t Tapi March April Variation March April March April Percent March April Percent PWQCOB
(%) Variation Variation Primary Water > 5 mg/L 6.5-8.5 <3 mg/L <2500 MPN/ 100 ml Quality Criteria for Outdoor Bathing (PWQCOB): Overall Range 7 to 7.2 6.2 to Increase in 7.0 to 7.1 to BDL BDL Decrease 06 to 06 to Increase in -
7.2 % variation 7.84 7.8 (0.8) to (0.7) to (10% to 17 13 percent (7%-12 %) 4.0 4.0 25%) at 05 variation at 02 locations and (50%) at 02 locations No' variation locations, Decrease at 03 Decrease in % locations (7% to 35%) variation at 06 1.43 % at 1 locations locations 'No' variation at 05 locations
Note: * Values below 1 mg/L for BOD to be considered as Below Detection Limit (BDL)
Q:) 0 1181Page
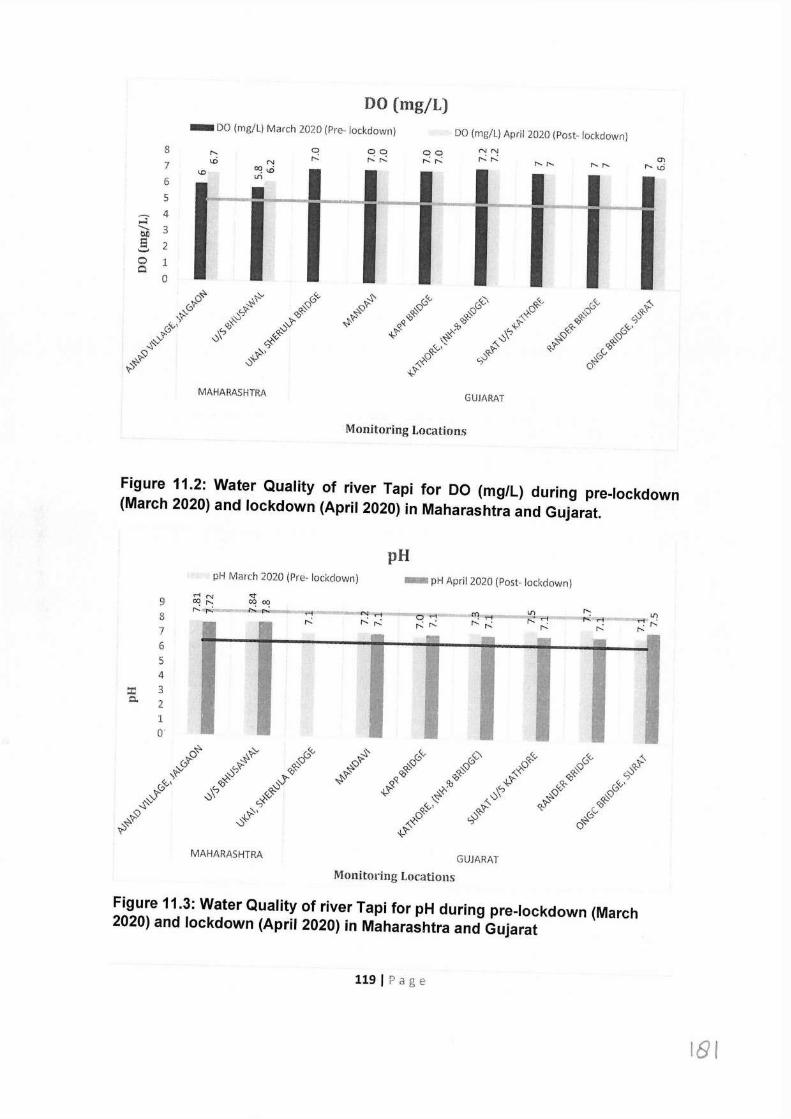
DO (mg/L) - DO (mg/L) March 2020 (Pre- lockdown) DO (mg/L) April 2020 (Post- lockdown)
8 0 00 00 NN ,-... r-,.: I' cr, '° "' r--: ,-....: ,...: ,-....: ,-....: ,-... ,-... ,-... ,-... ,-... lD 7 co .
I I I I I <D • <D
Lf) 6
5 • ~ 4 I I I I I I I I ....,__
3 01)
5 2 ._, 0 1 0
0
MAHARASHTRA GUJARAT
Monitoring Locations
Figure 11.2: Water Quality of river Tapi for DO (mg/L) during pre-lockdown (March 2020) and lockdown (April 2020) in Maharashtra and Gujarat.
pH pH March 2020 (Pre- lockdown) - pH April 2020 (Post- lockdown)
9 8 7 6 5 4
::r: 3 C. 2
1 o·
.... (I"" ,-... - - ,- - - ,- I
I I
II • ' ' - - - - - - - -
-=---·cN ,"11--.-,.0 ,-t r--: r--: r--: . r--:
MAHARASHTRA GUJARAT
Monitoring Locations
Figure 11.3: Water Quality of river Tapi for pH during pre-lockdown (March 2020) and lockdown (April 2020) in Maharashtra and Gujarat
1191Page
181
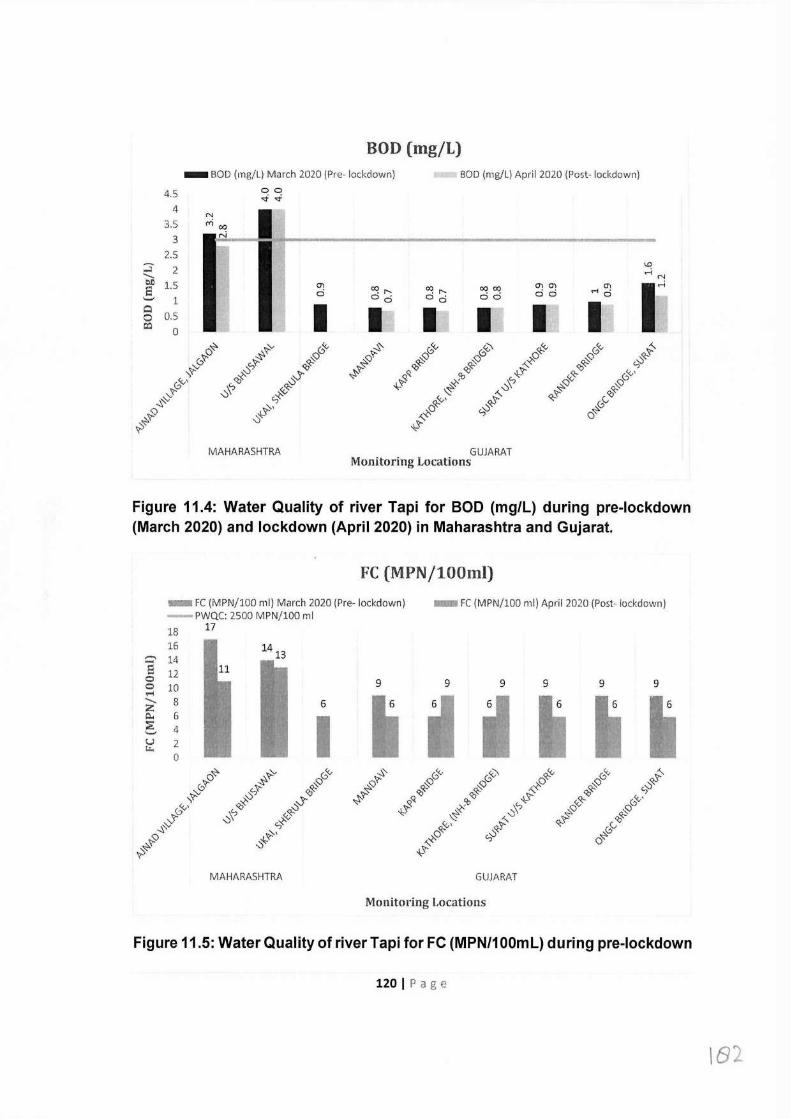
BOD (mg/L) - BOD (mg/L) March 2020 (Pre- lockdown) BOD (mg/L) April 2020 (Post- lockdown)
4.5 00 <i <i
4 N I 3.5 rri 00
3 r-i
2.5 :3" 2 ....... 1:)1) 1.5 0) E ci '-' 1 Q
0.5 I 0 CQ
0
MAHARASHTRA
\J:)
,....j N
'X!r--- CC! r--- 00 00 0) 0) 0)
I" 0 ci 0 ci ci ci ci ci ri ci
I I I I I ~' 0'v r.§> # 0"' ;:-
0'?- ~<J ~<J .p ~Q 0"" ':?-'<f- ~'<) ,:.: '<:--<,j '-? <,j 0'<.,' ~ ~'b
{- {-.~ :v ~«) i>(J ~ ,,__0 "?-~
~t,_,, ~'?- Q;' (,<,j
x:-0 ~ ~(3
~ 0
GUJARAT Monitoring Locations
Figure 11.4: Water Quality of river Tapi for BOD (mg/L) during pre-lockdown (March 2020) and lockdown (April 2020) in Maharashtra and Gujarat.
FC (MPN/100ml) - FC (MPN/100 ml) March 2020 (Pre- lockdown) -PWQC: 2500 MPN/100 ml 18 17
- FC (MPN/100 ml) April 2020 (Post- lockdown)
16 1413 ,...., 14 s 12 11 0 0 10 ,-1 ....... 8 6 :z Q. 6 I ~ 4 '-' u 2 r.r.
0
9 9 9 9 9 9
Ii i i Ii Ii ~' 0'<., 00 ~'<, 0'<- ;:- 0'?- ~Q ~Q x:-0 ~Q 0~
~ N <o {-.~ ~qj '-? <,j
0""' ~ ~ ~q, ,t> 0«) ~ ~ "'-J "" ~Q ~<,,,, c1;-"?-
Q;-"f (,<,j ,,_0 -<-o 00 o" ~ ~
MAHARASHTRA GUJARAT
Monitoring Locations
Figure 11.5: Water Quality of river Tapi for FC (MPN/100ml) during pre-lockdown
120 I Page
\B2
(March 2020) and lockdown (April 2020) in Maharashtra and Gujarat. 11.4 Observations
Based on the analytical results of samples collected from river Tapi, following findings/observations are made:
Maharashtra
During the pre-lock down period (March 2020): -
• The analysis results of 02 monitored locations for the four critical parameters observed to be in the order of pH (7.81-7.84), DO (5.8 - 6.0 mg/l), BOD (3.2 - 4.0 mg/l) and FC (14 - 17 MPN/100 ml).
• Minimum DO (5.8 mg/l) was observed at U/s Bhusawal Village, maximum DO (6 mg/l) was observed at Ajnad Village while maximum BOD (4 mg/l) was observed at U/s Bhusawal Village and minimum BOD (3.2 mg/l) was observed at Ajnad Village. Maximum FC (17 MPN/100ml) was observed at Ajnad Village and minimum FC (14 MPN/100 ml) was observed at U/s Bhusawal Village.
• 2 monitored locations complying with the parameters (i.e. DO, pH and FC) prescribed under Primary Water Quality Criteria for Outdoor Bathing while BOD found to be not complying at any of the 02 monitored locations.
During the lock down period (April 2020):
• The analysis results of the 02 monitored locations for the four critical parameters observed to be in the range of pH (7.72-7.80), DO (6.2- 6.7 mg/l), BOD (2.8 -4.0 mg/l) and FC (11- 13 MPN/100ml).
• Minimum DO (6.2 mg/l) was observed at U/s Bhusawal Village, maximum DO (6.7 mg/l) was observed at Ajnad Village while maximum BOD (4 mg/l) was observed at U/s Bhusawal Village and minimum BOD (2.8 mg/l) was observed at Ajnad Village. Maximum FC (13 MPN/100ml) was observed at U/s Bhusawal Village and minimum FC (11 MPN/100 ml) was observed at Ajnad Village.
• 1 location is not complying to BOD limit prescribed under bathing criteria limit i.e., one out of 2 monitored location is complying to the bathing criteria limit for DO, pH, BOD and FC parameters
121 I Page
\83
Overall observations on river Tapi (Maharashtra):-
• The analysis results shown increasing trend of DO (7 -12 %) at 2 locations and decreasing trend of BOD (13 %) at 1 location, FC (7-35 %) at 2 locations and 'no' variation in BOD was observed at 1 location.
Gujarat
During the pre-lock down period (March 2020): -
• The analysis results of the 07 monitored locations for four critical parameters observed to be in the order of pH (7-7.7), DO (7 - 7.2 mg/l), BOD (0.8 to 1.6 mg/l) and FC (06- 09 MPN/100 ml).
• Minimum DO (7 mg/l) was observed at 6 monitored locations, maximum DO (7.2 mg/l) was observed at Kathore (NH-8 Bridge) while maximum BOD (1.6 mg/l) was observed at ONGC Bridge and minimum BOD (BDl mg/l) was observed at 5 monitored locations. Maximum FC (9 MPN/100ml) and minimum FC (6 MPN/100 ml) was observed at 3 monitored locations each.
• All 7 monitored locations complying to the parameters (i.e. DO, pH, BOD and FC) prescribed under Primary Water Quality Criteria for Outdoor Bathing.
During the lock down period (April 2020): -
• The analysis results of the 06 monitored locations for the four critical parameters observed to be in the order of pH (7.1-7.5), DO (6.9- 7.2 mg/l), BOD (0.7 -1.2 mg/l) and FC (6-9 MPN/100ml).
• Minimum DO (6.9 mg/l) was observed at ONGC Bridge, maximum DO (7.2 mg/l) was observed at Kathore (NH-8 Bridge) while maximum BOD (1.2 mg/l) was observed at ONGC Bridge and minimum BOD (BDl mg/l) was observed at 5 monitored locations. Maximum FC (9 MPN/100ml) was observed ar 2 locations and minimum FC (6 MPN/100 ml) was observed at 4 monitored locations.
• All the 06 monitored locations complying to the parameters (i.e. pH, DO, BOD and FC) prescribed under Primary Water Quality Criteria for Outdoor Bathing.
122 I Page
\ 84
Overall observations on river Tapi (Gujarat):-
• The analysis results revealed increasing trend of FC (50 %) at 2 locations whereas decreasing trend of DO (1.42 %) at 1 location, BOD (10-25 %) at 4 locatios, FC (33 %) at 4 locations .'No' variation in DO at 5 locations and BOD at 2 locations was observed within Gujarat stretch of river Tapi.
Overall observations on river Tapi (Covering Maharashtra and Gujarat): -
~ During pre-lockdown period (April 2020), 9 monitored locations for the four critical parameters observed to be in the order of pH (7 -7.84), DO (7- 7.2 mg/l), BOD (BDl(0.8)-4.0 mg/l) and FC (6-17 MPN/100ml).
~ During lockdown period (March 2020), 8 monitored locations for the four critical parameters observed to be in the range of pH (7.1 -7.8), DO (6.2- 7.2 mg/l), BOD (0.7-4.0 mg/l) and FC (6-13 MPN/100ml). The analysis results also revealed maximum DO was observed at Kathore (NH-8 bridge) (7.2 mg/l) and minimum observed at U/s Bhusawal Village, Railway Colony (6.2 mg/l). Maximum BOD was observed at U/s Bhusawal Village, Railway Colony (4.0 mg/l) and minimum at 02 locations- Mandavi and Bardoli (Kapp Bridge) (0.7 mg/l). Maximum FC count was observed at U/s Bhusawal Village, Railway Colony (13 MPN/100 ml) and minimum at 04 locations Mandavi, Surat U/s Kathore, Rander Bridge and ONGC bridge (6 MPN/100 ml).
~ Over all increasing trend of DO (7 to 12 %) at 2 locations, FC (50 %) at 2 locations and decreasing trend of DO (1.43%) at 1 location, BOD (10-25 %) at 5 locations, FC (7-35 %) at 6 locations and 'no' variation in DO at 5 locations & BOD at 3 locations were observed.
11.5 Conclusion
During pre-lockdown (March 2020), 7 out of 9 monitored locations, 7 out of 8 monitored locations during lockdown period (April 2020) were observed to be complying with the Primary Water Quality Criteria for Outdoor Bathing parameters viz., pH, DO, BOD and FC.
Overall, marginal improvement in water quality of river Tapi was observed during the lockdown period with respect to DO, BOD and FC as well as in terms of compliance of monitoring locations (87.5 %) to the bathing criteria limits, during the lockdown period.
123 I Page
tB5
12.0. IMPACT OF LOCKDOWN ON WATER QUALITY OF RIVER NARMADA
12.1 About Narmada River
The Narmada River rises from Amarkantak Hill in Anuppur District of East Madhya Pradesh forming the traditional boundary between North India and South India. It is one of only three major rivers in peninsular India that run from east to west (longest west flowing river). It flows over a length of 1,312 km through Deccan trap in between Vindhya and Satpura ranges of hills before draining through the Gulf of Khambhat into the Arabian Sea, in west of Bharuch city of Gujarat. It runs through the states of Madhya Pradesh, Maharashtra and Gujarat. The left bank tributaries of River Narmada are river Burhner, Banjar, Sher, Shakkar, Dudhi, Tawa (longest tributary), Ganjal, Kundi, Goi , Karjan & right bank tributaries are river Barna, Hiran, Tendoni, Choral, Man, Uri, Hatni & Orsang. Major cities or towns located on the banks of River Narmada are Dindori, Jabalpur, Harda, Hoshangabad, Barwani, Omkareshwar, Maheshwar, Narnada Nagar, Dewas, Mandia and Bharuch & Rajpipla in Gujarat State. The industrialized districts on the bank of Narmada river are Dhar, Jabalpur and Bharuch consisting of cluster of pharmaceuticals, pesticides, dyes & distilleries, leather & fertilizer units whereas in Jabalpur, Khandwa and Hoshangabad, the main industrial activities are the paper mills.
12.2 Water Quality Monitoring Locations under National Water Quality Monitoring Programme (NWMP)
The Water Quality of river Narmada is assessed at 54 locations by Central Pollution Control Board (CPCB) under National Water Quality Monitoring Programme (NWMP) in association with MPPCB (48), GPCB (05) and one location monitored by CPCB RD-Vadodara. State-wise Distribution of Water Quality Monitoring Locations under NWMP on River Narmada is depicted in Figure 12.1.
12.3 Analytical Results
Water quality of river Narmada was carried out at 32 locations during Pre Lockdown (March 2020) and Lockdown period (April 2020) to assess the impact on water quality of river Narmada. The analysis results of Primary Water Quality Criteria for Outdoor Bathing (PWQCOB) parameters viz. Dissolved Oxygen (DO), pH, Biochemical Oxygen Demand (BOD) and Fecal Coliform (FC) are presented below in Table-12.1.
124 I Page
106
Based on the monitoring & analysis of collected water samples from river Narmada, the water quality trend of river Narmada with respect to Primary Water Quality Criteria for Outdoor Bathing Parameters viz., DO, pH, BOD and FC as observed during pre-lockdown (March 2020) and lockdown period (April 2020) are depicted in Figure 12.2 to Figure 12.5.
125 I Page
\8+-
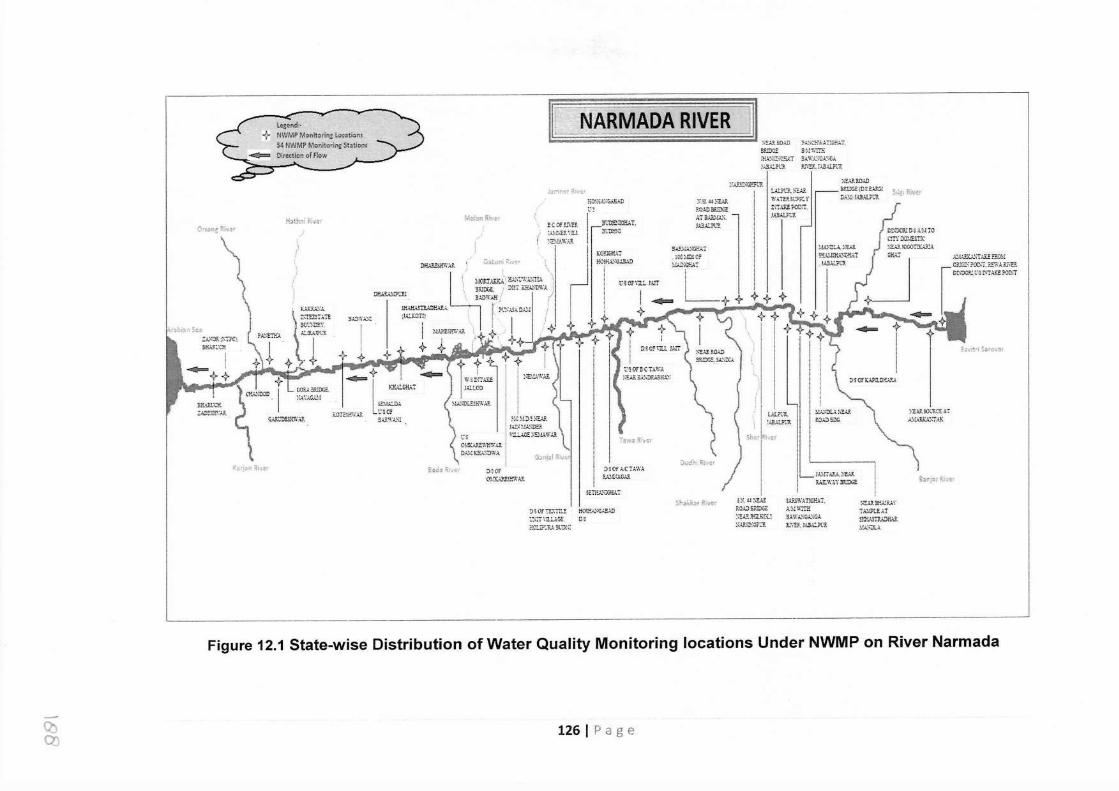
legend;- NWM.P Monitorlnll' LO!oti~ns 54 NWMP Monitoring StatioM Direction of FJow
NARMADA RIVER ~~ E.OAD ?:...~.::-.·w.:..7!C-a.:..T, S~E 8).!'.>'!'!':-i ~~~~STh"tF.AT SAwx:~.~((;A JABA:,?1,."! ?l'.=J;,L:..au.?.,"R
h:--i~r Rr-...-'-, ;>:A.".5!X~iIFL"F.
~ltt°mii<:>sN fr~abn Rrver c,~~an! Pi"er
U~hmi ~-~'"'
F.~:-i.e~ . ...s.W: ~-' ,·
E{:Of?..:'\"EK I ( ~~~-::t i
J
z..;cSi.~"\·;s .. KOTil.J.iV.'.U 8.~~W;-!<!,
f,)r1.-.n ~i"wt''
:!H.:1ll-:?\1C-F .. ;T, :3'..'DlfJ.
KC>ElC-H,H ECSHJ.:.;CA.3A!'.l
C!OH'.l.l J;JT
!.A!.?1.-?~}-:.Af:. :t-S.-~-H•'l.AR I WA7E~:'?:? ?.O.:iDB?JX.:: ATBA.i;.\~'i. J.8..U.:-"'l'!
SAP.:'1.l:;GYJ.7 . !001IDSOf ~GEA:
1:'l."!A.Y.E ?OJ?:!, JA3lli!.'.R
:-,u.~:.o.w B?..ID'"..2(01C..:i!..G! S,l~r Ri\itr ON-CJASillt,~
~U..\~U. l,UF. S~~~~+:~:..T .JA3AL.~?.
.t\~'iTill ~I:
[
c,1.;r,?On:r. I!\'\·_;,r,n ~r,.w..w,:.:..sr--rA.~ ?O~"T
-
D~Of (l\~;?='H,"",VA..;,
1HOfA.CTAWA lliNAC)..R
::crt.A."1fH,;.r ~h~i!.hr ?1vcr
D!OfIT...,:TI!.~ :.-:,;:r:.a1.ue,:_ ~OZ.i?:Ust"D::Z.
HO:EA!-\:.:.:S>..e Cl
)1.;dh, 'Ri'"cr
LU.?1,.1., JABAL?":."R
'"l" S~. :~ SE.Ai RO.~Sil>:.Z :~JHJ.Kc-L! x.t.-:m :~CT
~~...,"'!iu~u, ~ADSDG.
J~IT.;.R.;.,;'1-u;. :U!i,.W;.Ya.t!DGE:
~r._11,,.;;_ :Ot.:"RC! AT .UU.FU\.1"AK
UJ.SWAl!GP.AT. A';;.!W~Ti 3AW;.."i(i,t;G;. li\"E.",J:.3~?t.:F:
a:ir.p; ;;,;;·.-.-:~
:~3i"..U?..:..r T.UGtEAT t-;..-..:~r-;n~;p :-.u.:aA
Figure 12.1 State-wise Distribution of Water Quality Monitoring locations Under NWMP on River Narmada
Q) 126 I Page
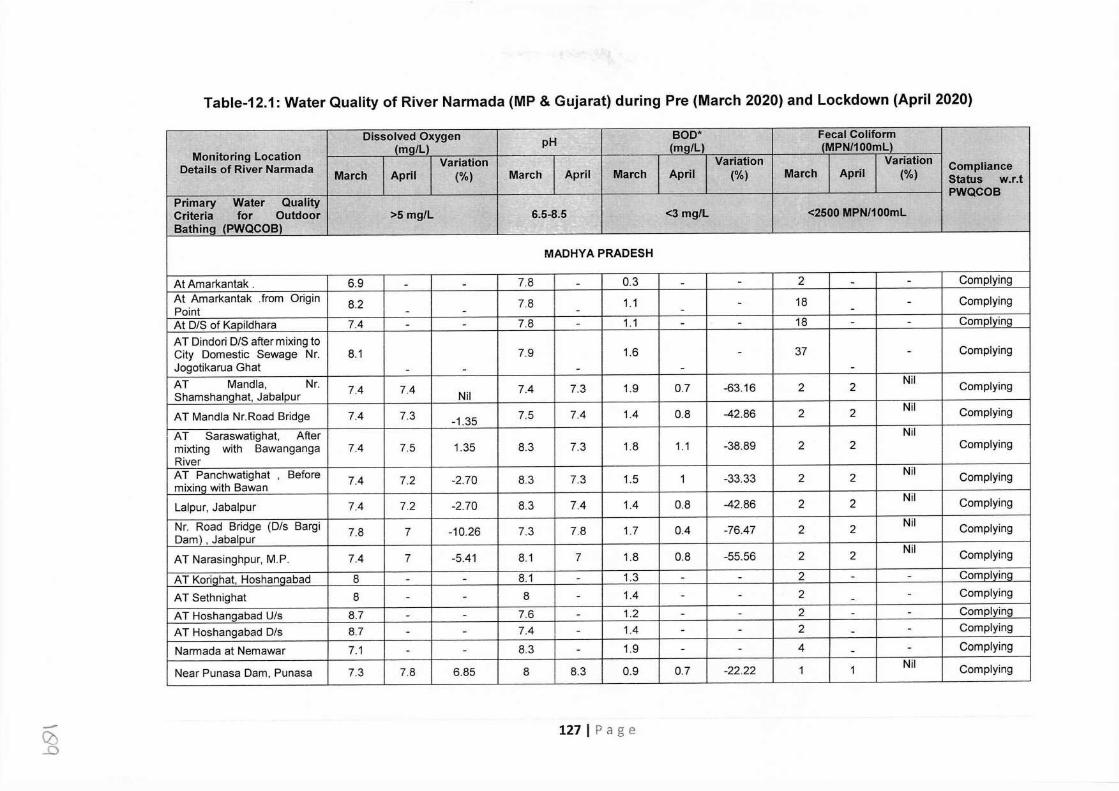
Table-12.1: Water Quality of River Narmada (MP & Gujarat) during Pre (March 2020) and Lockdown (April 2020)
Dissolved Oxygen pH BOD'" Fecal Colifonn
Monitoring Location (mq/L) (mg/L) (MPN/100mL)
Details of River Narmada Variation Variation Variation Compliance March April (%) March April March April (%) March April (%) Status w.r.t
Primary Water Quality PWQCOB
Criteria for Outdoor >5 mg/L 6.5-8.5 <3 mg/L <2500 MPN/100ml Bathina (PWQCOB)
MADHYA PRADESH
At Amarkantak . 6.9 - - 7.8 - 0.3 - - 2 - - Complying
At Amarkantak . from Origin 8.2 7.8 1.1 - 18 - Complying Point - - - - - At D/S of Kapildhara 7.4 - - 7.8 - 1.1 - - 18 - - Complvina
AT Dindori D/S after mixing to City Domestic Sewage Nr. 8.1 7.9 1.6 - 37 - Complying Jogotikarua Ghat - - - - - AT Mandia, Nr. 7.4 7.4 7.4 7.3 1.9 0.7 -63.16 2 2 Nil Complying Shamshanghat, Jabalpur Nil
AT Mandia Nr.Road Bridge 7.4 7.3 7.5 7.4 1.4 0.8 -42.86 2 2 Nil Complying -1.35
AT Saraswatighat, After Nil mixting with Bawanganga 7.4 7.5 1.35 8.3 7.3 1.8 1.1 -38.89 2 2 Complying River AT Panchwatighat , Before 7.4 7.2 -2.70 8.3 7.3 1.5 1 -33.33 2 2 Nil Complying mixina with Bawan
Lalpur, Jabalpur 7.4 7.2 -2.70 8.3 7.4 1.4 0.8 -42.86 2 2 Nil Complying
Nr. Road Bridge (D/s Bargi 7.8 7 -10.26 7.3 7.8 1.7 0.4 -76.47 2 2 Nil Complying Dam) , Jabalpur
AT Narasinghpur, M.P. 7.4 7 -5.41 8.1 7 1.8 0.8 -55.56 2 2 Nil Complying
AT Koriahat, Hoshanqabad 8 - - 8.1 - 1.3 - - 2 - - Comolvina
AT Sethnighat 8 - - 8 - 1.4 - - 2 - - Complying
AT Hoshangabad U/s 8.7 - - 7.6 - 1.2 - - 2 - - Complying
AT Hoshangabad Dis 8.7 - - 7.4 - 1.4 - - 2 - - Complying
Narmada at Nemawar 7.1 - - 8.3 - 1.9 - - 4 - - Complying
Near Punasa Dam, Punasa 7.3 7.8 6.85 8 8.3 0.9 0.7 -22.22 1 1 Nil Complying
- Q) _Q
127 I Page

Dissolved Oxygen pH BOD* Fecal Colifonn
(ma/Ll (mg/L] (MPN/100mU Monitoring Location , Variation Variation Variation
Details of River Narmada March April (%) March April March April (%) March April (%) Compliance
I Status w.r.t
Primary Water Quality PWQCOB
Criteria for Outdoor >5 mg/L 6.5-8.5 <3 mg/L <2500 MPN/100ml Bathing (PWQCOBl
AT D/s of Omkareshwar, MP 7.2 7.6 5.56 7.8 8 1.1 0.9 -18.18 1 1 Nil Complying
Near Mortakka Bridge, 7.7 7.8 1.30 8.1 8.1 1.1 0.8 -27.27 1 1 Nil Complying Badwah. AT Lalpur, Naer water Supply 7.5 7.2 -4.00 8.1 7.2 1.8 0.8 -55.56 2 2 Nil Complying Intake Point AT Mandaleshwar - 8 - - 8.1 - 1 - - 1 - Comolvinq
AT Maheshwar, MP 7.9 7.8 -1.27 8 8 1.3 1.1 -15.38 1 1 Nil Complying
Near Bhairav Temple at 7.6 7.4 -2.63 7.6 7.4 1.6 0.9 -43.75 2 2 Nil Complying Shastradhar Mandia
AT Dharampuri 7.8 7.8 Nil 8.1 8 1.4 1.2 -14.29 1 1 Nil Complying
AT Semalda U/s Barwani 7.9 8 1.27 8.1 8.2 0.9 0.8 -11.11 1 1 Nil Complying
AT Barwani 7.6 7.8 2.63 8 7.8 1.1 0.9 -18.18 1 1 Nil Complying
AT Koteswar 7.8 7.9 1.28 8.2 8.3 1 0.8 -20.00 1 1 Nil Complying
AT Kakrana, I nteerstate 7.8 7.9 1.28 8.3 8.3 1.1 0.7 -36.36 1 1 Nil Complying boundary, Aliraipur
No of locations monitored 27 locations during Pre-lockdown (March 2020) and 19 locations during Lockdown (April 2020)
No of monitoring locations 27 19 27 19 27 19 27 19
monitored results available - -
No of locations complying to 27 19 - 27 19 27 19 - 27 19 Criteria
Decrease (1.27 % to 10.26%) at 8 Decrease 'No'
7.0- location, 7.0- BDL BDL (11.1% to 1.0- variation Range 6.9-8.7 8.0 Increase 7.3-8.3 8.3 (0.3)- (0.4)- 76.47%) 1.0-37.0 2.0 at 18
(1.27% to 1.9 1.2 at 18 locations 6.85%) at locations 8 locations and 'No"
,S:) 0
128 I Page
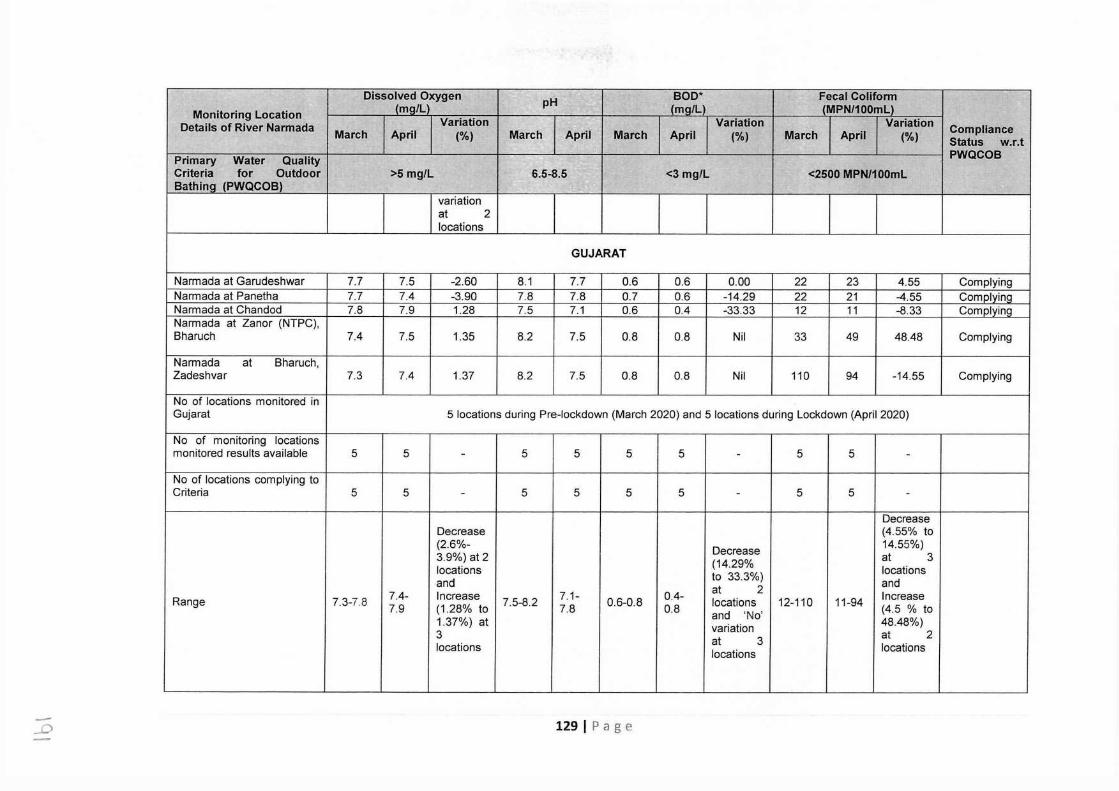
Dissolved Oxygen ., BOD* Fecal Colifonn - (mQ/Ll pH {ma/Ll (MPN/100mL) Monitoring Location Variation Variation Variation Details of River Narmada March April (%) March April March April (%) March April (%)
Compliance Status w.r.t
Primary Water Quality PWQCOB Criteria for Outdoor >5 mg/L 6.5-8.5 <3 mg/L <2500 MPN/100mL Bathlna {PWQCOB)
variation at 2 locations
GUJARAT
Narmada at Garudeshwar 7.7 7.5 -2.60 8.1 7.7 0.6 0.6 0.00 22 23 4.55 Complying Narmada at Panetha 7.7 7.4 -3.90 7.8 7.8 0.7 0.6 -14.29 22 21 -4.55 Complying Narmada at Chandod 7.8 7.9 1.28 7.5 7.1 0.6 0.4 -33.33 12 11 -8.33 Cornolvino Narmada at Zaner (NTPC), Bharuch 7.4 7.5 1.35 8.2 7.5 0.8 0.8 Nil 33 49 48.48 Complying
Narmada at Bharuch, Zadeshvar 7.3 7.4 1.37 8.2 7.5 0.8 0.8 Nil 110 94 -14.55 Complying
No of locations monitored in Gujarat 5 locations during Pre-lockdown (March 2020) and 5 locations during Lockdown (April 2020)
No of monitoring locations monitored results available 5 5 - 5 5 5 5 - 5 5 -
No of locations complying to Criteria 5 5 - 5 5 5 5 - 5 5 -
Decrease Decrease (4.55% to (2.6%- Decrease 14.55%) 3.9%) at 2 (14.29% at 3 locations locations and to 33.3%) and
7.4- Increase 7.1- 0.4- at 2 Increase Range 7.3-7.8 7.9 (1.28% to 7.5-8.2 7.8 0.6-0.8 0.8 locations 12-110 11-94 (4.5 % to and 'No' 1.37%) at variation 48.48%) 3 at 3 at 2 locations locations locations
....0 129 I Page
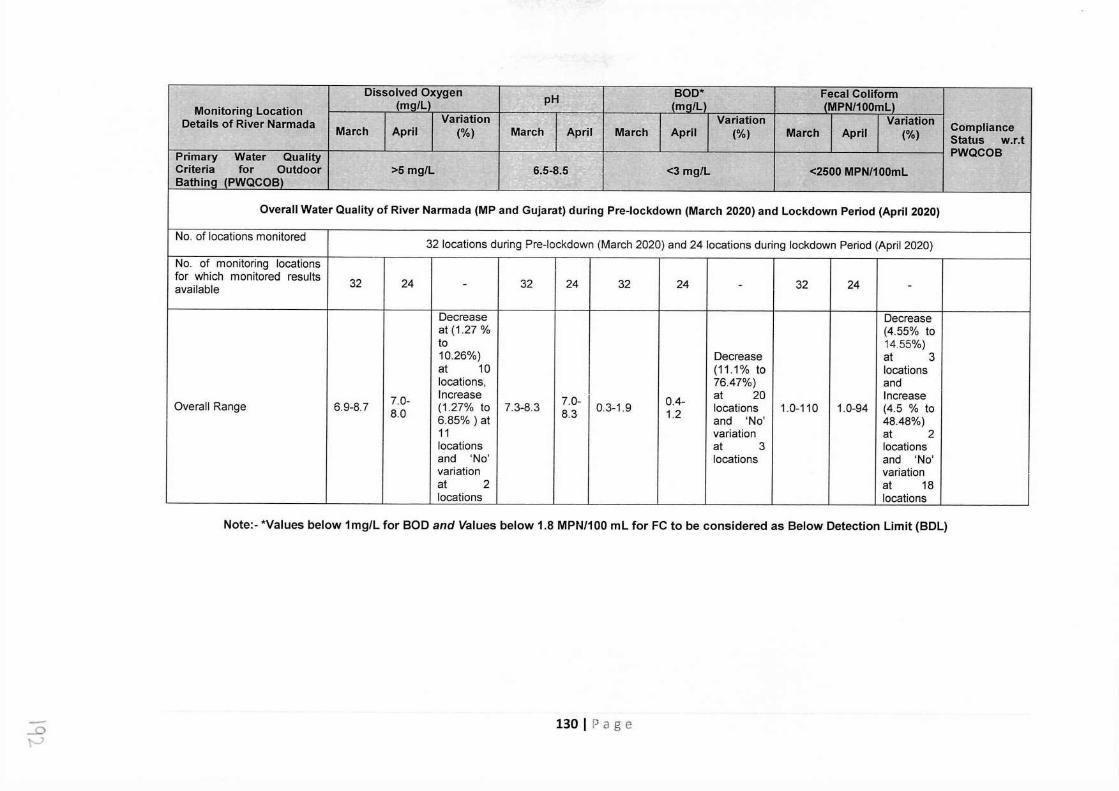
Dissolved Oxygen . , . BOD* Fecal Coliform (ma/Ll pH
Cma/Ll (MPN/100mL) Monitoring Location Details of River Narmada Variation Variation Variation Compliance March April (%) March April March April (%) March April (%) Status w.r.t
Primary Water Quality PWQCOB Criteria for Outdoor >5 mg/L 6.5-8.5 <3 mg/L <2500 MPN/100mL Bathing (PWQCOB)
Overall Water Quality of River Narmada (MP and Gujarat) during Pre-lockdown (March 2020) and Lockdown Period (April 2020)
No. of locations monitored 32 locations during Pre-lockdown (March 2020) and 24 locations during lockdown Period (April 2020)
No. of monitoring locations for which monitored results 32 24 32 24 32 24 32 24 available - - -
Decrease Decrease at (1.27 % (4.55% to to 14.55%) 10.26%) Decrease at 3 at 10 (11.1 % to locations locations, 76.47%) and
7.0- Increase 7.0- 0.4- at 20 Increase Overall Range 6.9-8.7 8.0 (1 27% to 7.3-8.3 8.3 0.3-1.9 1.2 locations 1.0-110 1.0-94 (4.5 % to
6.85%) at and 'No' 48.48%) 11 variation at 2 locations at 3 locations and 'No' locations and 'No' variation variation at 2 at 18 locations locations
Note:- *Values below 1mg/L for BOD and Values below 1.8 MPtmoo ml for FC to be considered as Below Detection Limit (BDL)
_£)
\'---' 130 I Page
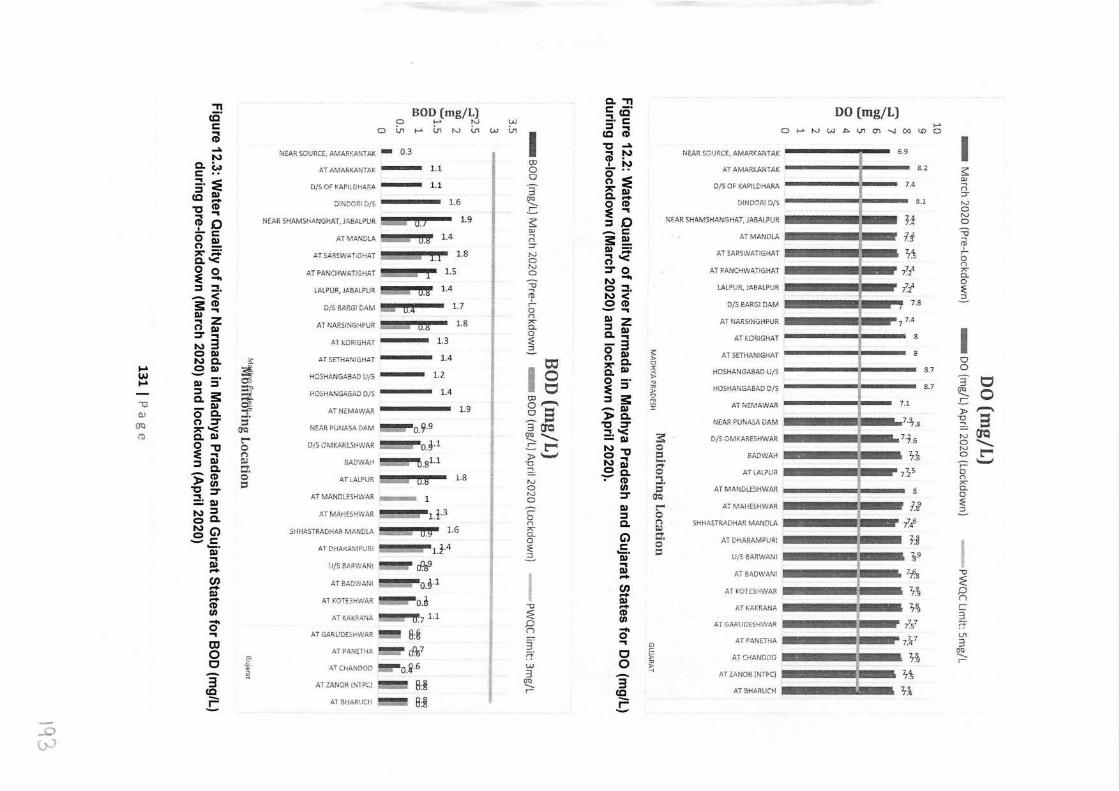
"T1 cc· s:: ... (1) .... N
a. w s:: .. ::!. :E ::s SI) (0 .... 'O (1) ... ... ci,o -s:: 0 SI) 0 - ~;:.: Q.'< 0 0 :::e - ::s ::!. -< s: (1) SI) ... ... z 0 SI) ::r ... N3 0 SI) N Q. s .... .e SI) ~ UJ .... SI) :i' ai a s: =:? - v _ SI) ~
ru 0 a. :f ()Q 0 ::r = ~'< ac: 11) a. SI) c:- 0 "'ti 0
:::e ... n ::s SI) ~ Q. t:J', -(1) 0 )> "' = ~ ::r = SI) N ::S 0 Q. N G) .es:: --· SI) ...
SI) .... CJ) .... SI) .... (1)
"' - 0 ... CD 0 G)
C f - §: 3 ca .c - ..0
(>J
BOD (mg/L) 0 ,_. N
ovi ...... vir-vu,w
NEAR SOURCE, AMARKANTAK - 0.3
ATAMARKANTAK - 1.1
OjS Of KAPILDHAR~ - 1.1
DINDCRI D/S 1.6
NE,.'\R SHAMSHANGHAT, J.4BALPUR 1.9
AT MANDLA L .... Ii 6 1.4
A.T SARSWATiGHAT 1.8
AT PANCHWATiGHAT 1.5
LALPUR, JABALPUR
D/SBARGIDAM !1111-----· 1.7 AT NARSINGHPUH E!!5 6.§ 1.8
AT KORIGHAT 1. 3
AT SETHAN!GHAT 1.4
HCSHANGABAD U/5 1.2
HOSHANGAEAD D/S l.4
AT NC:MA\.VAR 1.9
NEAP.PUNASADAM -o.9·9 D/SOMKARESHWAR ~oJ·l
6AOVJAH
AT MAHESHWAR
SHHASTRADHAR MANDLA
ATCHANDOD
_gl,l
ATLALPUR
AT MANDLESHWAR - l
AT DHARAMPUR! 1.t-4
U/S eARWANi ~ rPs9 AT BAD'/./AM
Ai KOTESi-!\tJAR
AT KAKR.4.NA . .7 1.1
AT GARUDESHWAR ~ 8:8 AT?ANITHA ~ cP.r,7
Ai ZANOR {NTFC) ::::::::= 8:§ Al BHARUCH ~ 8:§
1.8
1.P 'll'!!"' 1.6
w VI I
OJ 0 0
3 (]Q
----- .c s "' -, g.. N 0 "-' 0
"O
in b n "" D.. 0 ~ 2..
I t:0 0 0
OJ o- ~= 3~ ~ ......... .c l:""' J> -......,; "O -,
N 0 N 0 ;::: 0 n "' D.. 0 ~ :::;
I "'O :2i: 0 n ~i' ?!. w 3
Q'::,
----- r
a. "T1 s:: -· ... (0 -· s:: ::s ... (0 (1)
'O .... -. N (1) • IN
g~ ~ SI) Q. .... 0 (1) :::e ... ::::s 0 -s:: s: !!!. Ill-· 6 '< ::r 0 N O::!. N< 0 (1) --. SI) z ::s SI) Q. ... -3 0 SI) 0 C. all) 0 -· :::e ::s ::s s: -111 )> a. 'O ::r ::!. '< -SI)
~ ""C 0 ... N Ill 0 a. -(1)
"' ::r Ill ::s a. G) s:: ._, Ill cl .... CJ) .... Ill .... (1)
"' o' ... C 0 3 (0 .c
s. :,, 0 ~ l> V
"' :,,
~ :c
NEAR SOURCE, AMARKANTAK
AT AMARKANTAK --------::a---- 0/S Of- KAPE.DHARA -------.::,,--
DlNDOR! 0/) --------::•----
NEAR SHAMSHANGHAT, JABALPUR -
ATMANDLA __.
AT SARSWArGHAT
AT PANCHWATiGHAT
3: g g· ., s·
Cl<:)
c-' 0 I"> t,,)
e. 0 =
G1 C
~ ,, ·-I
LAL?UR, J.AB.AI.PUR
D/S BARG: DAM
AT NARS/NGHPUR
AT KORIGHAT
AT SITHANIGHAT
HO,HANGABAD U/S
HOSHANGAEAD D/~
ATNEMAWAR~
NEAR PU NASA DAM
0/S Oi-..11-:ARESHWAR
BADWl\H
AT LALPUR
AT MANDLE5HWAR
AT MAHESHWAR
SHHASTR.t..DHAR MANOI.A
Ai f.,HAHMv1PURl
U/S BARWANi
AT 8ADWAN!
AT KOTE.SHWAR
ATKAKRANA
kf GARUDESHWf.,R
AT PANETHA
AT'CHANDOD
AT ZANOR {NTPCj
AT BHARUCH
DO (mg/L) ,_. 0~1'-JWbVlC')-..J00\.00
6.9
8.2
7.4
8.1
H If
7.1
I s: O.I -, n -:::r
"' 0 N 0
"O -, 'P r 0 n .,,_. D.. 0 i :::,
H ~9
lf:a
1,~ 7,fg
7?57
7_'tf7
7,fg
I 0
8.7 0
8.7 3 0 °" ----- 0 .s )> - ~ a N~ ~ ......... 0 l:""' ;::: -......,; 0 n 7' a. 0 ~ :::
I "O
~ 0 n r 3 ~: VI
J ----- r
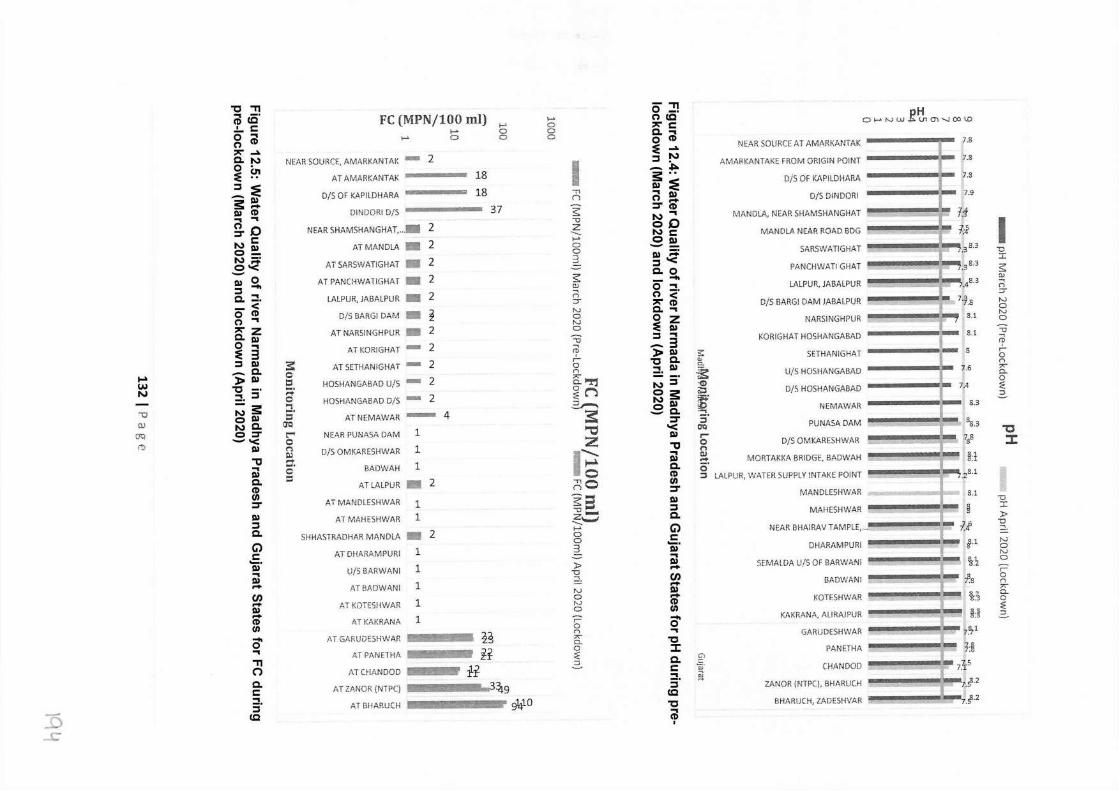
'O .,, "'I -· (D cc .!.. C: 0 "'I 0 (D ;,,;- .... Q. N 0 0, :E .. ~ :E -111 3: .... Ill (D "'I "'I g. D NC 0~ N;:::;: O'< -0 ....
.... w N
-0 Ill (IQ
ro
Ill ~ a. ::!. -< 0 (D 0 "'I ;,,;- z a. Ill 0 "'I :E 3 ~ Ill - a. )> Ill 'O -· ::!. ~ ;::; 3: 0 Ill N Q. 0~ --<
Ill "'C @ a. (D f/1 ~ Ill ~ a. G') C: m· "'I Ill .... en .... Ill .... (D f/1
o' "'I .,, n a. C ::!. ~ cc
NEAH SOURCE, AMARKANTAK - 2 AT AMARKANTAK
D/S OF KAPILDHARA
DINDORI D/S
NEAR SHAMSHANGHAT. ..• 2 ATMANDLA .. 2
AT SARSWATIGHAT - 2 AT PANCHWATIGHAT - 2
LALPUR, JABALPUR - 2 D/S BARGI DAM - 2
AT NARSINGHPUR - 2
AT KORIGHAT - 2
AT SETHANIGHAT - 2
HOSHANGABAD U/5 - 2 :s: 0 ::, ;:. 0 "'I s· 00 I:""' 0 n ~ O'. g
FC (MPN/100 ml) ......
..... 0
HOSH;\NGABAD D/S - 2
AT NEMAWAR - 4 NEAR PUNASA DAM 1 D/S OMKARESHWAR 1
BADWAH 1
ATLALPUR - 2 AT MANDLESHWAR 1
AT MAHESHWAR 1
SHHASTRADHAR MANDLA - 2 AT DHARAMPURI 1
U/5 BARWANI 1 ATBADWANI 1
AT KOTESHWAR 1 AT KAKRANA 1
18 18
..... 0 0
37
AT GARUDESHWAR i~ AT PAN ETHA ----- B ATCHANDOD ---- ff
AT Zt,NOR (NTPCj -------3~9 AT BHARUCH g¼lO
..... 0 0 0
I ;:; $ -a z --- ...... 0 0 3 $ CJ '"' n :,- N 0 N 0
-a '"' 'P r 0 n s:: '"'-"'.l ~n 2.-. ::
"'C:! z I~ nO ~= --o_ z._. --- ..... 0 0 3 )> -0 :::! .
N 0 N 0 ? 0 n "' a. 0 :i: ::,
- .,, 0 -· 0 CC ;,,;- C: a. "'I 0 (D :E .... ~ !'J -.&::,,. 3: .. Ill :E "'I Ill 0 .... ~ (D N-. oD NC: -8~ Ill ;:::;: ~ '< a. 0 - .... 0 ::!. 0 < ;,,;- (D a. "'I ~ ~ z Ill "'I
)> ~ 'O a. ::!. Ill - - N~ 0 3: N Ill -8 a. ~
'< Ill '"C @ a. (D f/1 ~ Ill ~ a. G') C: m· @ .... en iil' .... ~ o' "'I 'O :I: a. C ::!. ~ cc 'O iil I
s.: "" a. ~ -ill ~ 1s -::!. ::, (IQ
0 f-' NW glj, O'\ -..J CO <.O
NEAH SOURCE AT AM1\RKANTAK [
AMARKANTAKE FROM ORIGIN POINT L D/S OF KAPiLDHARA
D/S DINDORI
MANDLA, NEAR SHMv1SH,\NGHAT
MAND LA NEAR ROAD BOG --· _ ---
SARSWATIGHAT
PANCHWATI GHAT
LALPUR, JABALPUR
D/S BARG! DAM JABALPUR
1,1 N
NARSINGHPUR
KORIGHAT HOSHANGABAD -----~
SETHANIGHAT ------~•
U/S HOSHANGABAD
D/S HOSHANGABAD
NEMAWAR
PUNASA DAM
.38.3
b D/S OMKARESHWAR n ~ MORTAKK.O. BRIDGE. BADWAH o· ::J l.ALPUR, WAT EH SUPPLY INTAKE POINT
MANDLESHW.t..R
MAH ESH WAR
NEAR BHAIRAV TAMPLE, ...
DHARAMPURI ~ SEMAI.DA U/5 Of BARWANI -
BADWANi
KOTESHWAR ~
KAKRANA. ALIRNPUR
GARUDESH\NAR
PANETHA
7.8
7.8
7.S
7.9
I
s.i
8.l
8.l
-0 I $ "' ..., r. :::, N a N 0
-0
~ r 0 n "' 0. 0 ~ ::,
"C :c
tJ I
fl 1/i-.~
)>
~- "' a N 0
H ~J
r 0 n ;,;- 0. 0 :i: ::,
Cl C: ~- ~
CHANDOD
ZANOR (NTPC), BHARUCH I
BHARUCH, ZADESHVAR
..D
..r
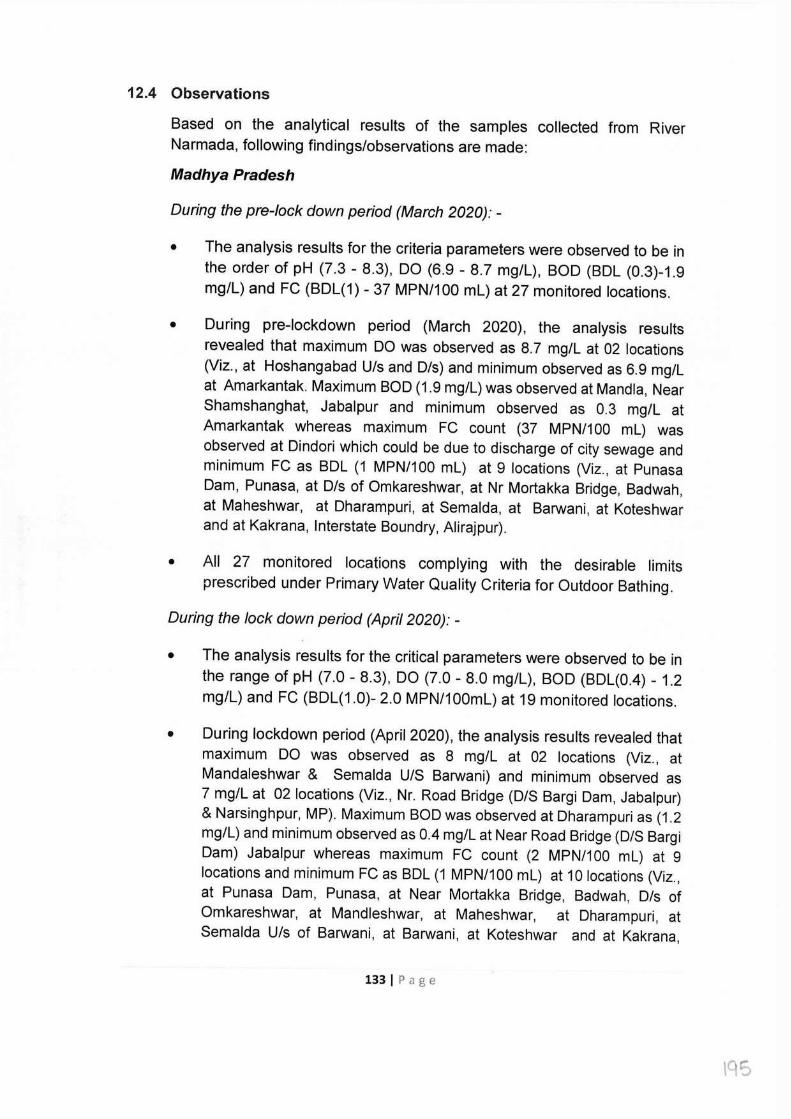
12.4 Observations
Based on the analytical results of the samples collected from River Narmada, following findings/observations are made:
Madhya Pradesh
During the pre-lock down period (March 2020): -
• The analysis results for the criteria parameters were observed to be in the order of pH (7.3 - 8.3), DO (6.9 - 8.7 mg/l), BOD (BDl (0.3)-1.9 mg/l) and FC (BDl(1) - 37 MPN/100 ml) at 27 monitored locations.
• During pre-lockdown period (March 2020), the analysis results revealed that maximum DO was observed as 8.7 mg/l at 02 locations (Viz., at Hoshangabad U/s and D/s) and minimum observed as 6.9 mg/l at Amarkantak. Maximum BOD (1.9 mg/l) was observed at Mandia, Near Shamshanghat, Jabalpur and minimum observed as 0.3 mg/l at Amarkantak whereas maximum FC count (37 MPN/100 ml) was observed at Dindori which could be due to discharge of city sewage and minimum FC as BDl (1 MPN/100 ml) at 9 locations (Viz., at Punasa Dam, Punasa, at D/s of Omkareshwar, at Nr Mortakka Bridge, Badwah, at Maheshwar, at Dharampuri, at Semalda, at Barwani, at Koteshwar and at Kakrana, Interstate Boundry, Alirajpur).
• All 27 monitored locations complying with the desirable limits prescribed under Primary Water Quality Criteria for Outdoor Bathing.
During the lock down period (April 2020): -
• The analysis results for the critical parameters were observed to be in the range of pH (7.0 - 8.3), DO (7.0 - 8.0 mg/l), BOD (BDl(0.4) - 1.2 mg/l) and FC (BDl(1.0)- 2.0 MPN/100ml) at 19 monitored locations.
• During lockdown period (April 2020), the analysis results revealed that maximum DO was observed as 8 mg/l at 02 locations (Viz., at Mandaleshwar & Semalda U/S Barwani) and minimum observed as 7 mg/lat 02 locations (Viz., Nr. Road Bridge (D/S Bargi Dam, Jabalpur) & Narsinghpur, MP). Maximum BOD was observed at Dharampuri as (1.2 mg/l) and minimum observed as 0.4 mg/lat Near Road Bridge (D/S Bargi Dam) Jabalpur whereas maximum FC count (2 MPN/100 ml) at 9 locations and minimum FC as BDl (1 MPN/100 ml) at 10 locations (Viz., at Punasa Dam, Punasa, at Near Mortakka Bridge, Badwah, D/s of Omkareshwar, at Mandleshwar, at Maheshwar, at Dharampuri, at Semalda U/s of Barwani, at Barwani, at Koteshwar and at Kakrana,
133 I Page
195
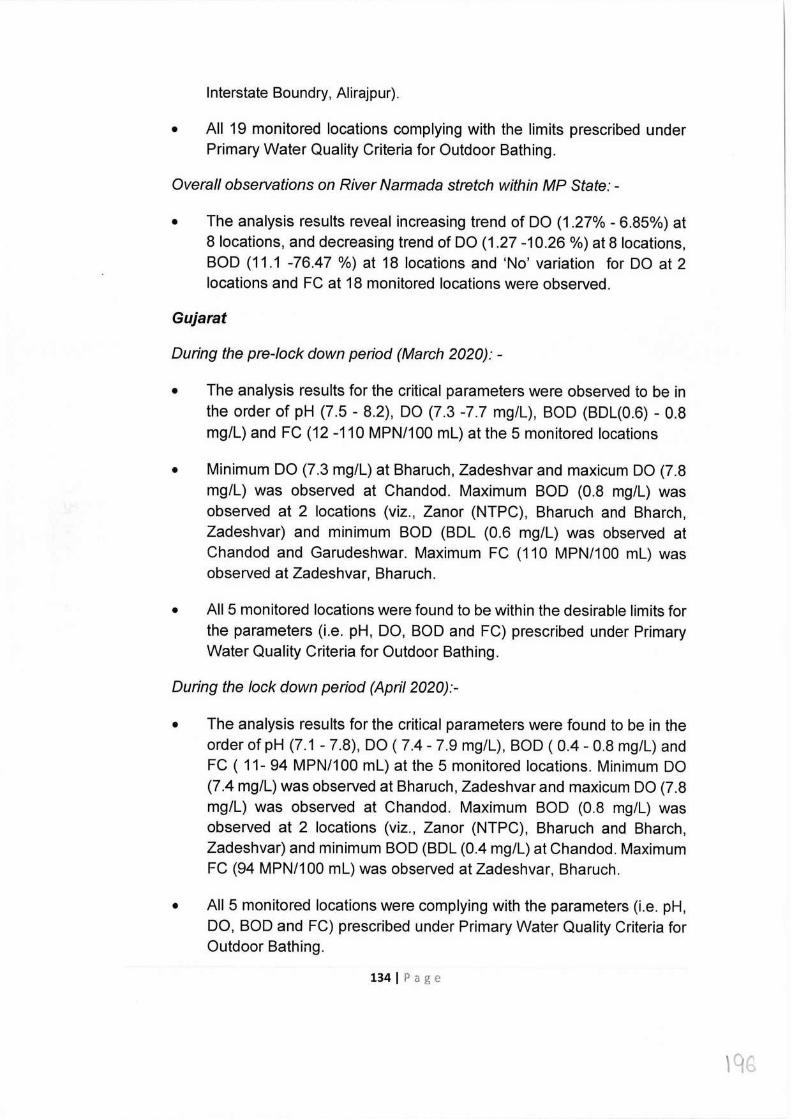
Interstate Boundry, Alirajpur).
• All 19 monitored locations complying with the limits prescribed under Primary Water Quality Criteria for Outdoor Bathing.
Overall observations on River Narmada stretch within MP State: -
• The analysis results reveal increasing trend of DO (1.27% - 6.85%) at 8 locations, and decreasing trend of DO (1.27 -10.26 %) at 8 locations, BOD (11.1 -76.47 %) at 18 locations and 'No' variation for DO at 2 locations and FC at 18 monitored locations were observed.
Gujarat
During the pre-lock down period (March 2020): -
• The analysis results for the critical parameters were observed to be in the order of pH (7.5 - 8.2), DO (7.3 -7.7 mg/L), BOD (BDL(0.6) - 0.8 mg/L) and FC (12 -110 MPN/100 ml) at the 5 monitored locations
• Minimum DO (7.3 mg/l) at Bharuch, Zadeshvar and maxicum DO (7.8 mg/l) was observed at Chandod. Maximum BOD (0.8 mg/l) was observed at 2 locations (viz., Zanor (NTPC), Bharuch and Bharch, Zadeshvar) and minimum BOD (BDl (0.6 mg/l) was observed at Chandod and Garudeshwar. Maximum FC (110 MPN/100 ml) was observed at Zadeshvar, Bharuch.
• All 5 monitored locations were found to be within the desirable limits for the parameters (i.e. pH, DO, BOD and FC) prescribed under Primary Water Quality Criteria for Outdoor Bathing.
During the lock down period (April 2020):-
• The analysis results for the critical parameters were found to be in the order of pH (7.1 - 7.8), DO ( 7.4 - 7.9 mg/l), BOD ( 0.4 - 0.8 mg/l) and FC ( 11- 94 MPN/100 ml) at the 5 monitored locations. Minimum DO (7.4 mg/l) was observed at Bharuch, Zadeshvar and maxicum DO (7.8 mg/l) was observed at Chandod. Maximum BOD (0.8 mg/l) was observed at 2 locations (viz., Zanor (NTPC), Bharuch and Bharch, Zadeshvar) and minimum BOD (BDl (0.4 mg/l) at Chandod. Maximum FC (94 MPN/100 ml) was observed at Zadeshvar, Bharuch.
• All 5 monitored locations were complying with the parameters (i.e. pH, DO, BOD and FC) prescribed under Primary Water Quality Criteria for Outdoor Bathing.
134 I Page
\9G
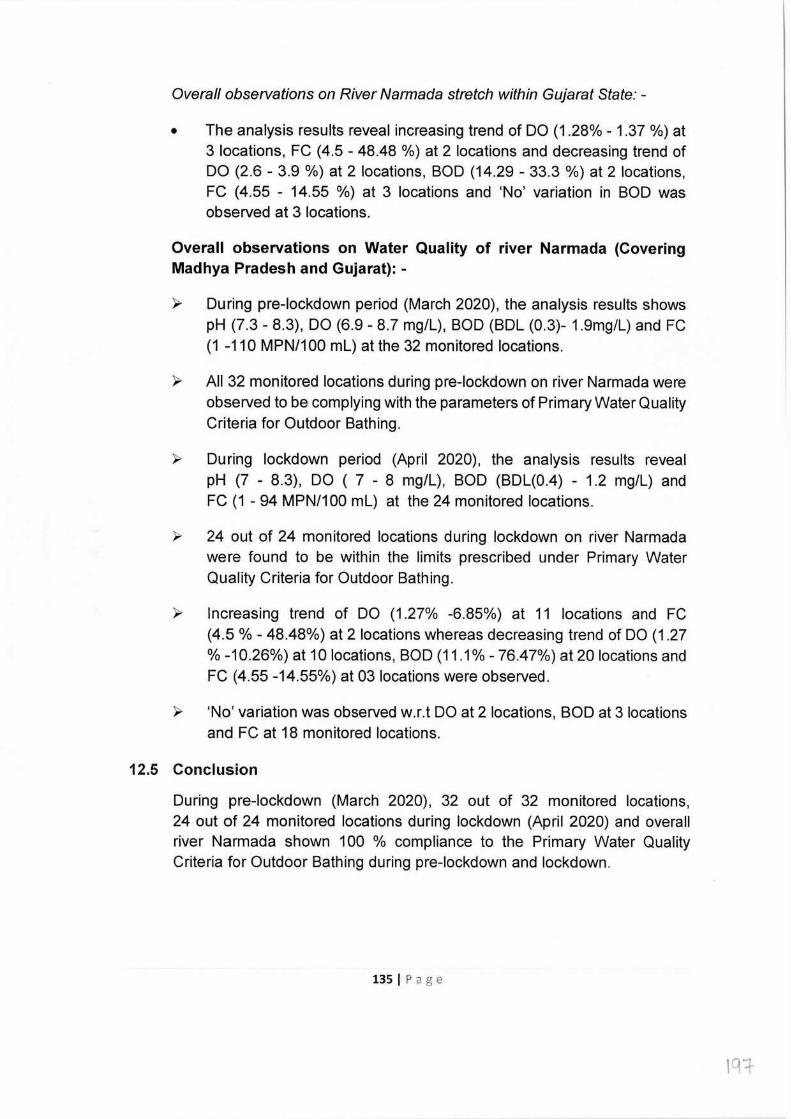
Overall observations on River Narmada stretch within Gujarat State: -
• The analysis results reveal increasing trend of DO (1.28% - 1.37 %) at 3 locations, FC (4.5 - 48.48 %) at 2 locations and decreasing trend of DO (2.6 - 3.9 %) at 2 locations, BOD (14.29 - 33.3 %) at 2 locations, FC (4.55 - 14.55 %) at 3 locations and 'No' variation in BOD was observed at 3 locations.
Overall observations on Water Quality of river Narmada (Covering Madhya Pradesh and Gujarat): -
~ During pre-lockdown period (March 2020), the analysis results shows pH (7.3 - 8.3), DO (6.9 - 8.7 mg/l), BOD (BDl (0.3)- 1.9mg/l) and FC (1 -110 MPN/100 ml) at the 32 monitored locations.
~ All 32 monitored locations during pre-lockdown on river Narmada were observed to be complying with the parameters of Primary Water Quality Criteria for Outdoor Bathing.
~ During lockdown period (April 2020), the analysis results reveal pH (7 - 8.3), DO ( 7 - 8 mg/l), BOD (BDl(0.4) - 1.2 mg/l) and FC (1 - 94 MPN/100 ml) at the 24 monitored locations.
)" 24 out of 24 monitored locations during lockdown on river Narmada were found to be within the limits prescribed under Primary Water Quality Criteria for Outdoor Bathing.
~ Increasing trend of DO (1.27% -6.85%) at 11 locations and FC (4.5 % - 48.48%) at 2 locations whereas decreasing trend of DO (1.27 % -10.26%) at 10 locations, BOD (11 .1 % - 76.4 7%) at 20 locations and FC (4.55 -14.55%) at 03 locations were observed.
~ 'No' variation was observed w.r.t DO at 2 locations, BOD at 3 locations and FC at 18 monitored locations.
12.5 Conclusion
During pre-lockdown (March 2020), 32 out of 32 monitored locations, 24 out of 24 monitored locations during lockdown (April 2020) and overall river Narmada shown 100 % compliance to the Primary Water Quality Criteria for Outdoor Bathing during pre-lockdown and lockdown.
135 I Page
19:J-
13.0. IMPACT OF LOCKDOWN ON WATER QUALITY OF RIVER SWARNAREKHA
13.1 About Swarnarekha (Subarnarekha) River
The river Swarnarekha originates south of Ranchi. Before falling in the Bay of Bengal near Talsari, the river flows through Ranchi and Singhbhum Districts of Jharkhand State. Thereafter, it flows for shorter distances through Paschim Midnapore district in West Bengal and Balasore district of Odisha. Swarnarekha river flows for a total length of 395 kilometres. Out of this, 269 km lies in Bihar, 64 km in West Bengal, and 62 km in Odisha. The prominent tributaries of the Swarnarekha are river Kharkai, Roro, Kanchi, Harmu Nadi, Damra, Karru, Chinguru, Karakari, Gurma, Garra, Singaduba, Kodia, Dulunga and river Khaijori. Jamshedpur is the largest Industrial city of Jharkhand, situated in the middle of the Swarnarekha river valley. Between Mayurbhanj and Singhbhum districts, on the right banks of the Subarnarekha, are the country's richest copper deposits. Mining activities are taking place near Jaduguda areas of Singhbhum district.
13.2 Water Quality Monitoring Locations under National Water Quality Monitoring Programme (NWMP)
The Water Quality of river Swarnarekha is monitored at 24 locations by Central Pollution Control (CPCB) Board in association with State Pollution Control Boards of Jharkhand (20 locations), West Bengal (02 locations) and Odisha (02 locations) under National Water Quality Monitoring Programme (NWMP). State-wise Distribution of Water Quality Monitoring Locations under NWMP on River Swarnarekha is depicted in Figure 13.1.
13.3 Analytical Results
Water quality of river Swarnarekha was carried out at 05 locations (Jharkhand-04 and Odisha-01) during Pre-Lockdown (March 2020) and 15 locations (Jharkhand-14 and Odisha-01) during Lockdown period (April 2020) to assess the impact on water quality of river Swarnarekha. The analysis results of Primary Water Quality Criteria for Outdoor Bathing (PWQCOB) parameters viz. Dissolved Oxygen (DO), pH, Biochemical Oxygen Demand (BOD) and Fecal Coliform (FC) are presented in Table-13.1. Based on the monitoring & analysis of collected water samples from river Swarnarekha, the graphical presentation of river Swarnarekha with respect to DO, pH, BOD and FC as observed during pre-lockdown (March 2020) and lockdown period (April 2020) by the Jharkhand and Odisha States are presented in Figure 13.2 to Figure 13.5
136 I Page
\90
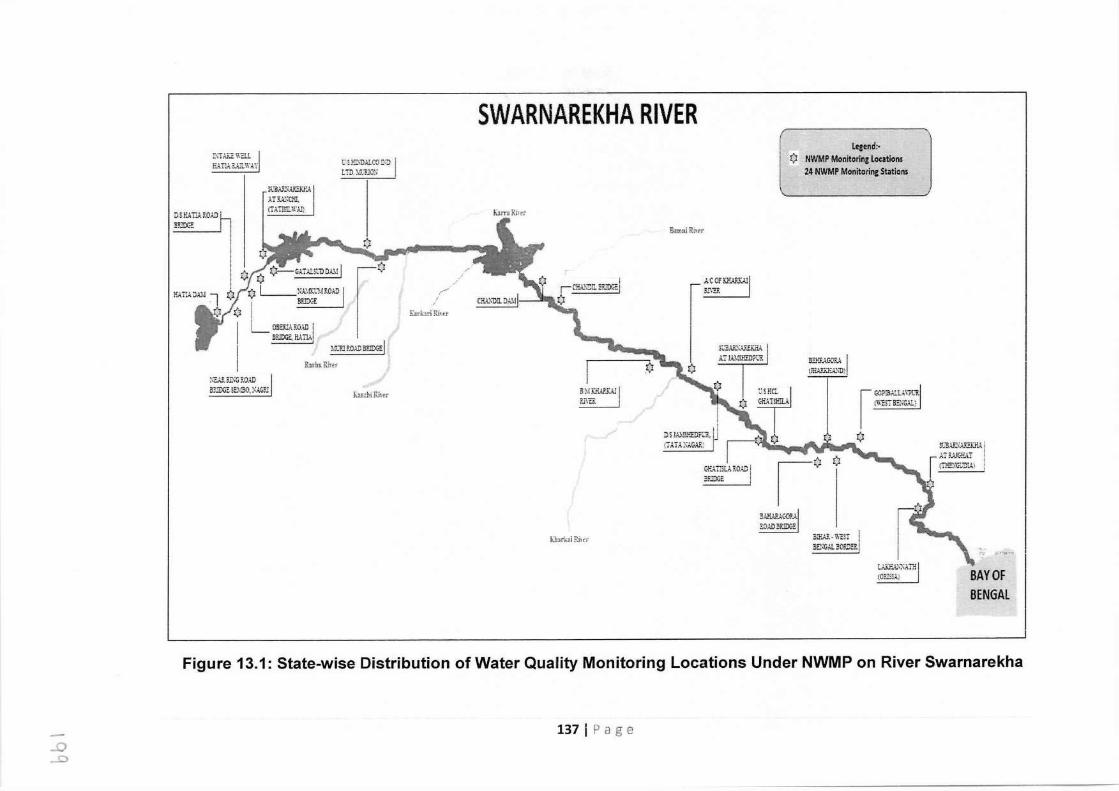
SWARNAREKHA RIVER t,1".l.KE WELL EAil~R.l.II.WAY t'.frI\1J.l.LCO!D I
LTDXcR.iO, I Sl'BA:SAF3(1!A .l.TR,l'..;C-J, (IATrsIL\1.',Ui
B.1.mni Ruer
r·~
L OSEf-l.-\ RO.\D I B:.!DGE,f.\TIAI
.-;t.;.!..~~G?.OAD B?JDGE. -SEMSO, ~ACRI
l.!'f_"Rl F.0).DB~E,
R:irhuRinr B::l-:R.!.C-OR.~ I (Jli~EF.A.\1)) -,---
lun,hiRher
Katk.c-iRiu:r
K,m,R,,,r
[ i
B!,IK!'.l.'Y.,\J ! Fj~"ER ,
S1,3AR.'\A.~aA
D-S J.l..\51-:ED?I3, (7A.TA~AG.~J St.1VJ:.\:.:..,,~.A
I AE.\JGl'.AT I cr:eGi.,"DV.)
KhirkJi Fj1t•r
Letend:· (I NWMP Monitoring Locations
24 NWMP Monitorinc Stations
3.1.P..\F.lC-OKl 3.0AD3:;.!DGE
I GC?i3.:..U. .\\?t"F. I (11 -srr a2;c;.L;
¢
3!!'.AR-\\'W' !I
BE!~G . .U.BO~E.r..
!,_.O,KH.A.\~\1U'H (OillilJ BAY OF
BENGAL
Figure 13.1: State-wise Distribution of Water Quality Monitoring Locations Under NWMP on River Swarnarekha
137 I Page ..!) ..s:::,
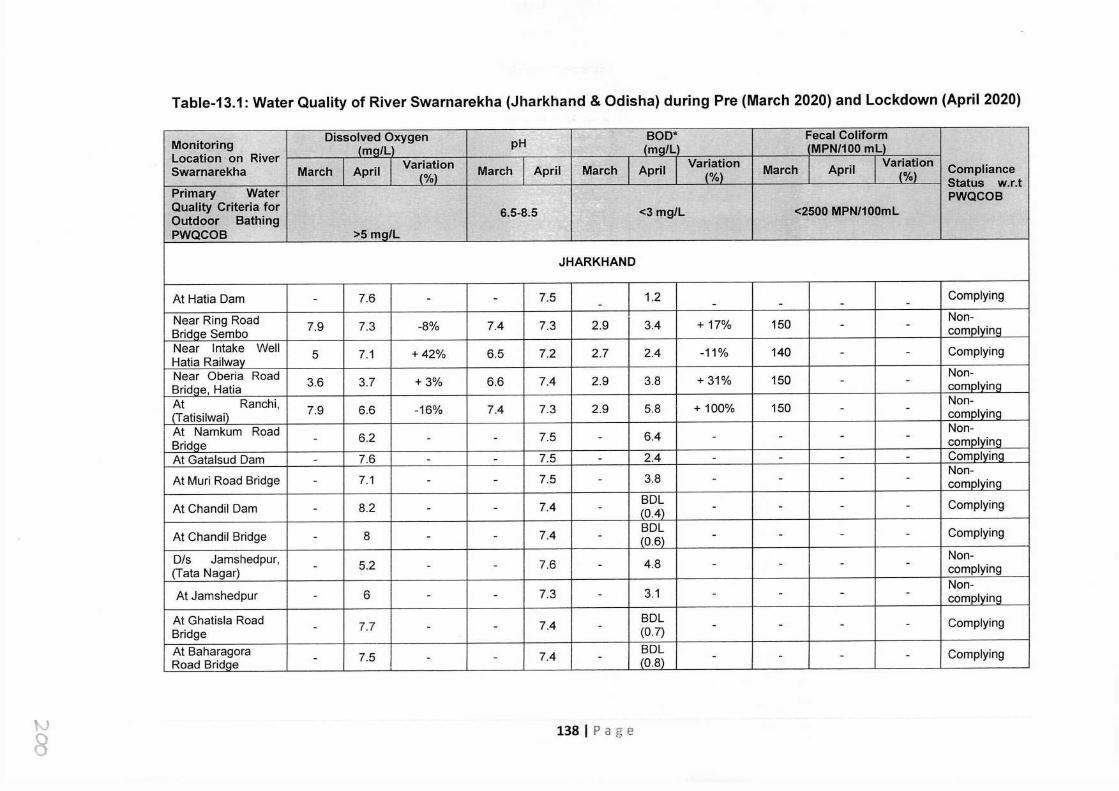
Table-13.1: Water Quality of River Swarnarekha (Jharkhand & Odisha) during Pre (March 2020) and Lockdown (April 2020)
Dissolved Oxygen c:, BOD* Fecal Coliform Monitoring (mg/L pH fmg/L (MPN/100 mu Location on River Variation Variation Variation Swarnarekha March April (%) March April March April (%) March April (%) Compliance
Primary Water Status w.r.t PWQCOB
Quality Criteria for ~ <2500 MPN/100ml Outdoor Bathing 6.5-8.5 - <3 mg/L
PWQCOB >5 mg/L L
JHARKHAND
At Hatia Dam - 7.6 - - 7.5 1.2 Complying - - - - -
Near Ring Road 7.9 7.3 -8% 7.4 7.3 2.9 3.4 +17% 150 Non-
Bridqe Sembo - - comolving
Near Intake Well 5 7.1 +42% 6.5 7.2 2.7 2.4 -11% 140 Complying Hatia Railwav
- -
Near Oberia Road 3.6 3.7 +3% 6.6 7.4 2.9 3.8 + 31% 150 Non-
Bridae, Hatia - - cornplvinq
At Ranchi, 7.9 6.6 -16% 7.4 7.3 2.9 5.8 + 100% 150 Non-
(Tatisilwai) - - complvinq
At Namkum Road 6.2 7.5 6.4 Non-
Bridae - - - - - - - - cornplvinq
At Gatalsud Dam - 7.6 - - 7.5 - 2.4 - - - - Cornplvinq
At Muri Road Bridge 7.1 7.5 3.8 Non-
- - - - - - - - cornplvinq
At Chandil Dam 8.2 7.4 BDL Complying - - - - (0.4) - - - -
At Chandil Bridge 8 7.4 BDL Complying - - - - <0.6) - - - -
Dis Jamshedpur, 5.2 7.6 4.8 Non-
(Tata Nagar) - - - - - - - - complying
At Jamshedpur 6 7.3 3.1 Non-
- - - - - - - - comolving
At Ghatisla Road 7.7 7.4 BDL Complying Bridge
- - - - (0.7) - - - -
At Baharagora 7.5 7.4 BDL Complying Road Bridqe - - - - <0.8) - - - -
"' 8 138IPage
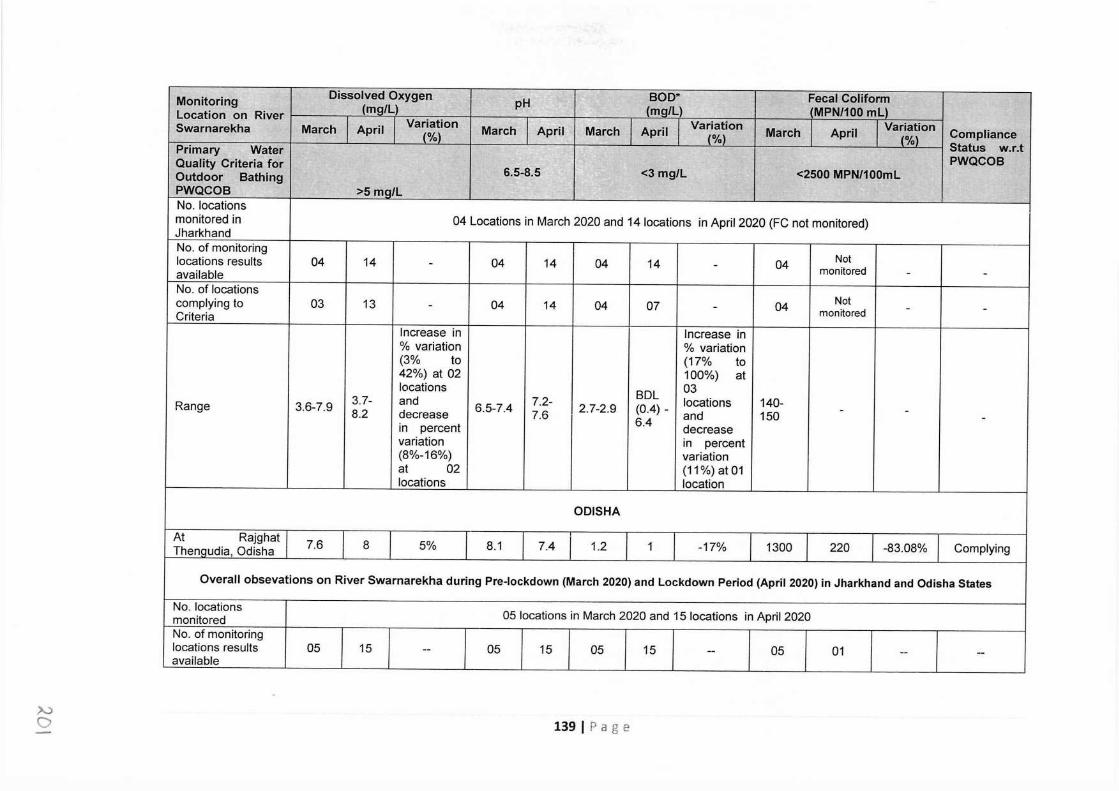
Monitoring Dissolved Oxygen pH BOD* Fecal Coliform
(mg/L) (mQ/L) (MPN/100 ml) Location on River Variation Variation Variation Swarnarekha March April (%) March April March April (%) March April {%) Compliance
Primary Water Status w.r.t PWQCOB Quality Criteria for
6.5-8.5 <3 mg/L <2500 MPN/100ml Outdoor Bathing PWQCOB >5 mg/L -· No. locations monitored in 04 Locations in March 2020 and 14 locations in April 2020 (FC not monitored) Jharkhand No. of monitoring
Not locations results 04 14 - 04 14 04 14 - 04 monitored available - - No. of locations
Not complying to 03 13 - 04 14 04 07 - 04 monitored - - Criteria Increase in Increase in % variation % variation (3% to (17% to 42%) at 02 100%) at locations BDL 03
3.7- and 7.2- locations 140- Range 3.6-7.9 8.2 decrease 6.5-7.4 7.6 2.7-2.9 (0.4) - and 150 - - 6.4 -
in percent decrease variation in percent (8%-16%) variation at 02 (11%)at01 locations location
ODISHA
At Rajghat 7.6 8 5% 8.1 7.4 1.2 1 -17% 1300 220 -83.08% Complying Thengudia, Odisha
Overall obsevations on River Swarnarekha during Pre-lockdown (March 2020) and Lockdown Period (April 2020) in Jharkhand and Odisha States
No. locations 05 locations in March 2020 and 15 locations in April 2020 monitored
No. of monitoring locations results 05 15 -- 05 15 05 15 -- 05 01 -- -- available
,)..;) 0 139IPage
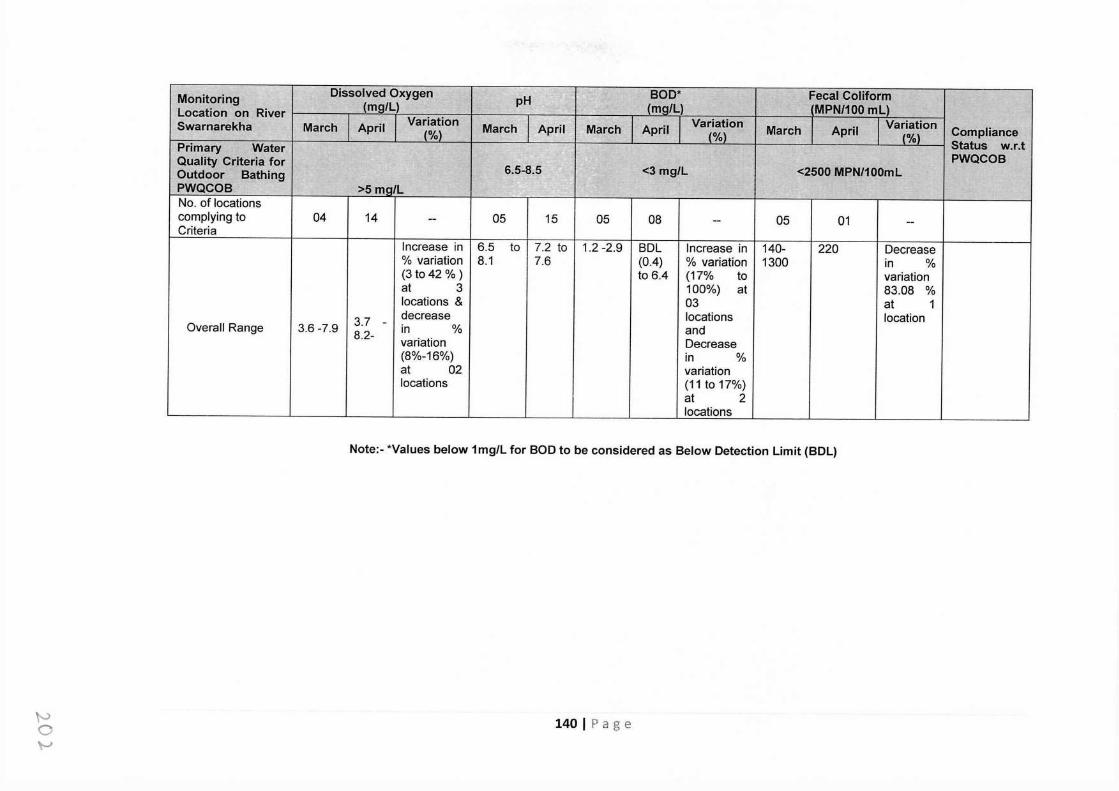
Monitoring Dissolved Oxygen pH BOD* Fecal Coliform
(mg/L) (mCI/L) MPN/100 ml) Location on River Variation Variation Variation Swarnarekha March April (%) March April March April (%) March April (%) Compliance
Primary Water Status w.r.t PWQCOB Quality Criteria for
6.5-8.5 <3 mg/L <2500 MPN/100ml Outdoor Bathing PWQCOB >5 mg/L No. of locations complying to 04 14 -- 05 15 05 08 -- 05 01 -- Criteria
Increase in 6.5 to 7.2 to 1.2 -2.9 BDL Increase in 140- 220 Decrease % variation 8.1 7.6 (0.4) % variation 1300 in % (3 to 42 % ) to 6.4 (17% to variation at 3 100%) at 83.08 % locations & 03 at 1
3.7 decrease locations location Overall Range 3.6 -7.9 - in % and 8.2- variation Decrease
(8%-16%) in % at 02 variation locations (11 to 17%)
at 2 locations
Note:- *Values below 1mg/L for BOD to be considered as Below Detection Limit (BDL)
~ 0 ~
140 IP age
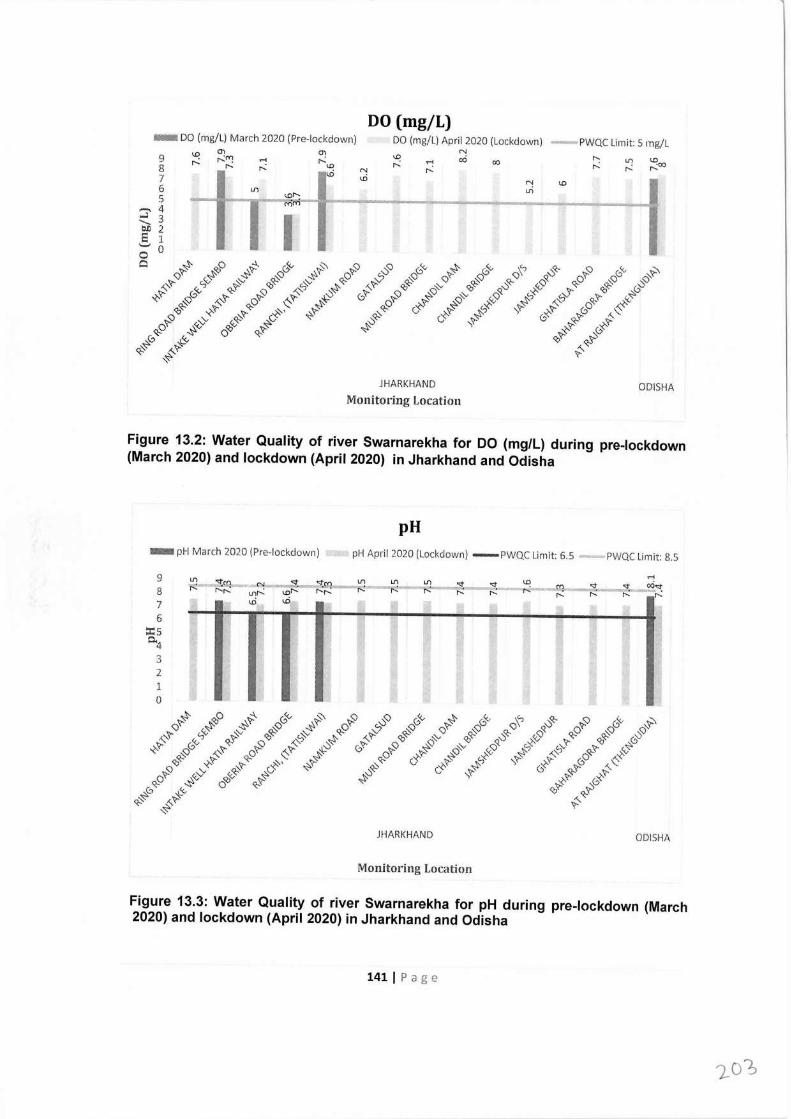
- DO (mg/L) March 2020 (Pre-lockdown) en
"'° I..()
lO en 9 " ,....:"! .--< 8 ,-.. " 7 6 L/'\ 5 4 3 I 2 1 0
DO (mg/L) DO (mg/l) April 2020 (Lockdown) -PWQC Limit 5 mg/L
00
N LJl
JHARKHAND
Monitoring Location ODISHA
Figure 13.2: Water Quality of river Swarnarekha for DO (mg/L) during pre-lockdown (March 2020) and lockdown (April 2020) in Jharkhand and Odisha
pH - pH March 2020 (Pre-lockdown) pH April 2020 (Lockdown) -PWQC Limit: 6.5 PWQC Limit 8.5
9 _N
8 LJ)" 7 I..()
6 ::C:5 °'4
3 2 1 0
LI'\
JHARKHAND ODISHA
Monitoring Location
Figure 13.3: Water Quality of river Swarnarekha for pH during pre-lockdown (March 2020) and lockdown (April 2020) in Jharkhand and Odisha
141 I Page
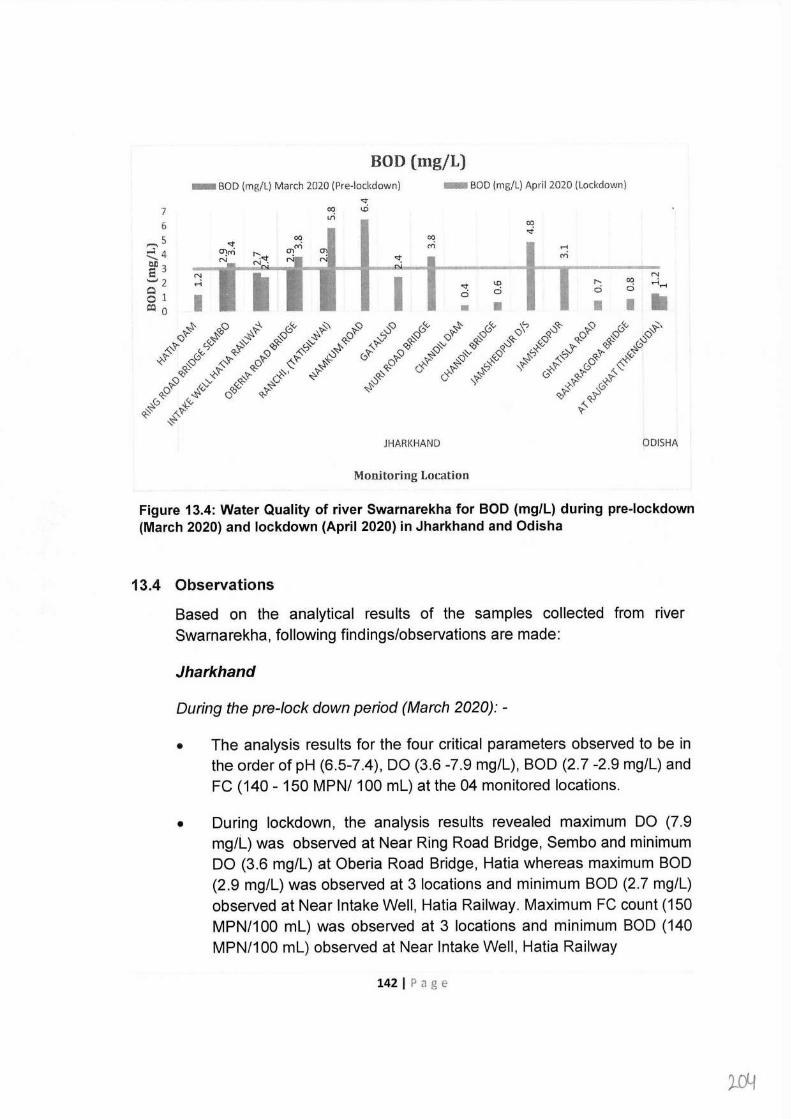
BOD (mg/L) - BOD (mg/L) March 2020 (Pre-lockdown)
7 6
...... 5 ::::. 4 e113 '-' 2 0 O 1 Q:;i 0
- BOD (mg/L) April 2020 (Lockdown)
00 m
I 'St ci
• \D ci
• • N
~ .--i,....
I II
JHARKHAND ODISHA
Monitoring Location
Figure 13.4: Water Quality of river Swarnarekha for BOD (mg/L) during pre-lockdown (March 2020) and lockdown (April 2020) in Jharkhand and Odisha
13.4 Observations
Based on the analytical results of the samples collected from river Swarnarekha, following findings/observations are made:
Jharkhand
During the pre-lock down period (March 2020): -
• The analysis results for the four critical parameters observed to be in the order of pH (6.5-7.4), DO (3.6 -7.9 mg/l), BOD (2.7 -2.9 mg/l) and FC (140 - 150 MPN/ 100 ml) at the 04 monitored locations.
• During lockdown, the analysis results revealed maximum DO (7.9 mg/L) was observed at Near Ring Road Bridge, Sembo and minimum DO (3.6 mg/l) at Oberia Road Bridge, Hatia whereas maximum BOD (2.9 mg/l) was observed at 3 locations and minimum BOD (2.7 mg/l) observed at Near Intake Well, Hatia Railway. Maximum FC count (150 MPN/100 ml) was observed at 3 locations and minimum BOD (140 MPN/100 ml) observed at Near Intake Well, Hatia Railway
142 I Page
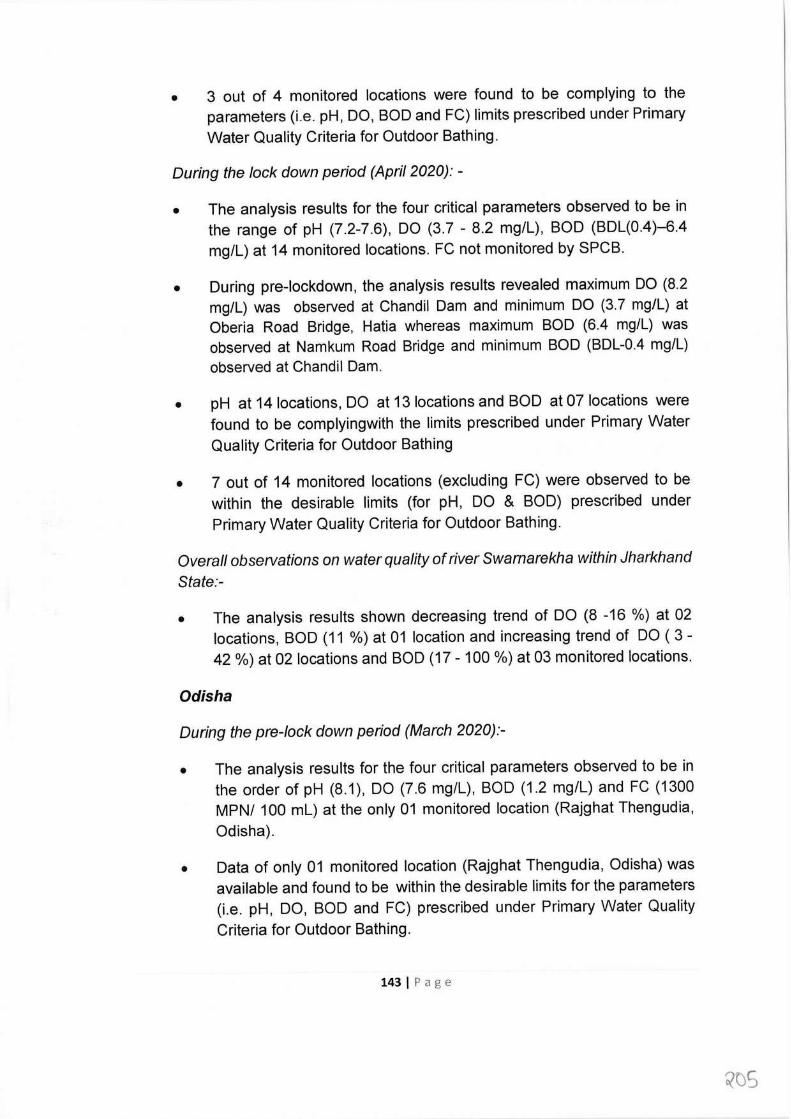
• 3 out of 4 monitored locations were found to be complying to the parameters (i.e. pH, DO, BOD and FC) limits prescribed under Primary Water Quality Criteria for Outdoor Bathing.
During the lock down period (April 2020): -
• The analysis results for the four critical parameters observed to be in the range of pH (7.2-7.6), DO (3.7 - 8.2 mg/L), BOD (BDL(0.4)-6.4 mg/L) at 14 monitored locations. FC not monitored by SPCB.
• During pre-lockdown, the analysis results revealed maximum DO (8.2 mg/L) was observed at Chandil Dam and minimum DO (3.7 mg/L) at Oberia Road Bridge, Hatia whereas maximum BOD (6.4 mg/L) was observed at Namkum Road Bridge and minimum BOD (BDL-0.4 mg/L) observed at Chandil Dam.
• pH at 14 locations, DO at 13 locations and BOD at 07 locations were found to be complyingwith the limits prescribed under Primary Water Quality Criteria for Outdoor Bathing
• 7 out of 14 monitored locations (excluding FC) were observed to be within the desirable limits (for pH, DO & BOD) prescribed under Primary Water Quality Criteria for Outdoor Bathing.
Overall observations on water quality of river Swarnarekha within Jharkhand State:-
• The analysis results shown decreasing trend of DO (8 -16 %) at 02 locations, BOD (11 %) at 01 location and increasing trend of DO ( 3 - 42 %) at 02 locations and BOD (17 - 100 %) at 03 monitored locations.
Odisha
During the pre-lock down period (March 2020):-
• The analysis results for the four critical parameters observed to be in the order of pH (8.1 ), DO (7.6 mg/L), BOD (1.2 mg/L) and FC (1300 MPN/ 100 ml) at the only 01 monitored location (Ra jg hat Thengudia, Odisha).
• Data of only 01 monitored location (Rajghat Thengudia, Odisha) was available and found to be within the desirable limits for the parameters (i.e. pH, DO, BOD and FC) prescribed under Primary Water Quality Criteria for Outdoor Bathing.
143 I Page
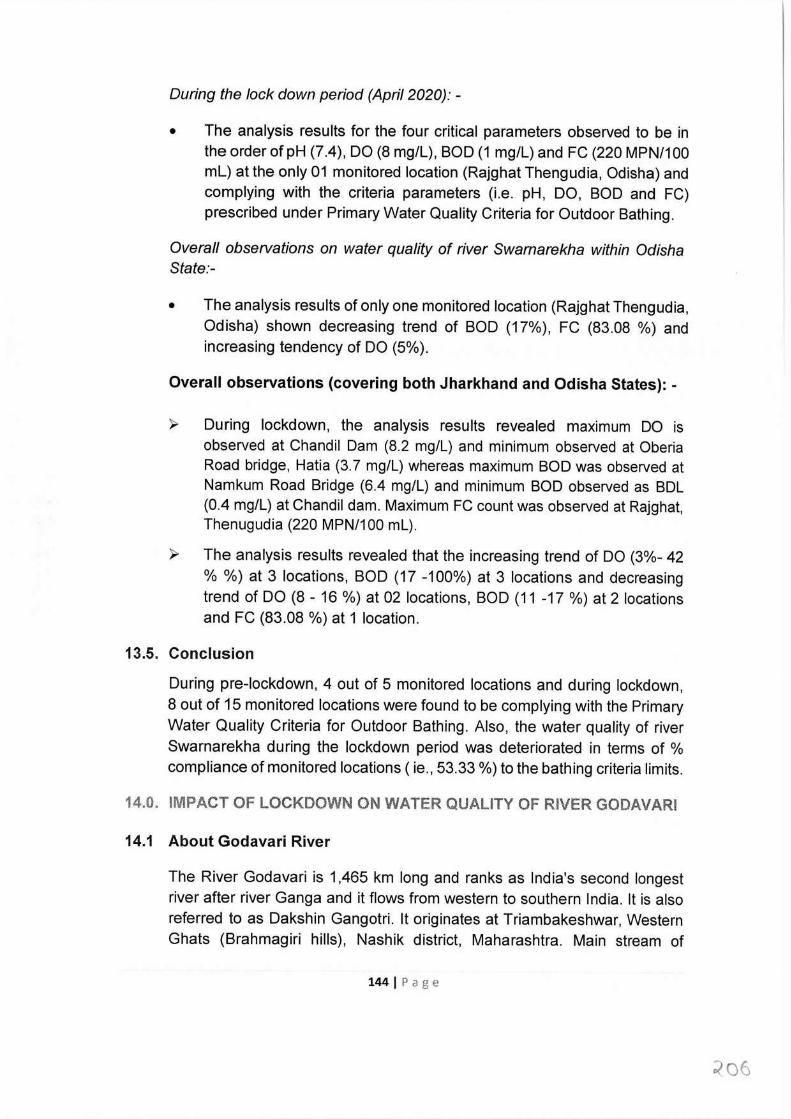
During the lock down period (April 2020): -
• The analysis results for the four critical parameters observed to be in the order of pH (7.4), DO (8 mg/L), BOD (1 mg/L) and FC (220 MPN/100 ml) at the only 01 monitored location (Rajghat Thengudia, Odisha) and complying with the criteria parameters (i.e. pH, DO, BOD and FC) prescribed under Primary Water Quality Criteria for Outdoor Bathing.
Overall observations on water quality of river Swarnarekha within Odisha State:-
• The analysis results of only one monitored location (Rajghat Thengudia, Odisha) shown decreasing trend of BOD (17%), FC (83.08 %) and increasing tendency of DO (5%).
Overall observations (covering both Jharkhand and Odisha States): -
~ During lockdown, the analysis results revealed maximum DO is observed at Chandil Dam (8.2 mg/L) and minimum observed at Oberia Road bridge, Hatia (3. 7 mg/L) whereas maximum BOD was observed at Namkum Road Bridge (6.4 mg/L) and minimum BOD observed as BDL (0.4 mg/L) at Chandil dam. Maximum FC count was observed at Rajghat, Thenugudia (220 MPN/100 ml).
>,- The analysis results revealed that the increasing trend of DO (3%- 42 % %) at 3 locations, BOD (17 -100%) at 3 locations and decreasing trend of DO (8 - 16 %) at 02 locations, BOD (11 -17 %) at 2 locations and FC (83.08 %) at 1 location.
13.5. Conclusion
During pre-lockdown, 4 out of 5 monitored locations and during lockdown, 8 out of 15 monitored locations were found to be complying with the Primary Water Quality Criteria for Outdoor Bathing. Also, the water quality of river Swarnarekha during the lockdown period was deteriorated in terms of % compliance of monitored locations ( ie., 53.33 %) to the bathing criteria limits.
14.0. IMPACT OF LOCKDOWN ON WATER QUALITY OF RIVER GODAVARI
14.1 About Godavari River
The River Godavari is 1,465 km long and ranks as India's second longest river after river Ganga and it flows from western to southern India. It is also referred to as Dakshin Gangotri. It originates at Triambakeshwar, Western Ghats (Brahmagiri hills), Nashik district, Maharashtra. Main stream of
144 I Page
~06
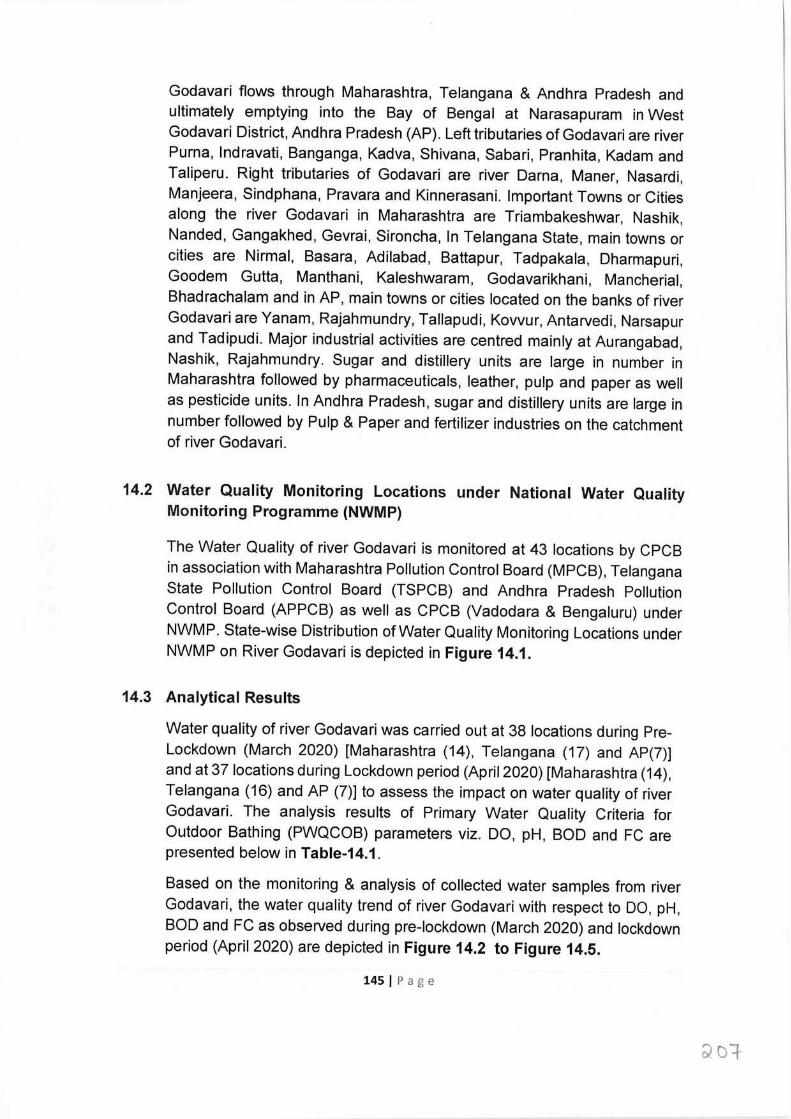
Godavari flows through Maharashtra, Telangana & Andhra Pradesh and ultimately emptying into the Bay of Bengal at Narasapuram in West Godavari District, Andhra Pradesh (AP). Left tributaries of Godavari are river Purna, lndravati, Banganga, Kadva, Shivana, Sabari, Pranhita, Kadam and Taliperu. Right tributaries of Godavari are river Darna, Maner, Nasardi, Manjeera, Sindphana, Pravara and Kinnerasani. Important Towns or Cities along the river Godavari in Maharashtra are Triambakeshwar, Nashik, Nanded, Gangakhed, Gevrai, Sironcha, In Telangana State, main towns or cities are Nirmal, Basara, Adilabad, Battapur, Tadpakala, Dharmapuri, Goodem Gutta, Manthani, Kaleshwaram, Godavarikhani, Mancherial, Bhadrachalam and in AP, main towns or cities located on the banks of river Godavari are Yanam, Rajahmundry, Tallapudi, Kovvur, Antarvedi, Narsapur and Tadipudi. Major industrial activities are centred mainly at Aurangabad, Nashik, Rajahmundry. Sugar and distillery units are large in number in Maharashtra followed by pharmaceuticals, leather, pulp and paper as well as pesticide units. In Andhra Pradesh, sugar and distillery units are large in number followed by Pulp & Paper and fertilizer industries on the catchment of river Godavari.
14.2 Water Quality Monitoring Locations under National Water Quality Monitoring Programme (NWMP)
The Water Quality of river Godavari is monitored at 43 locations by CPCB in association with Maharashtra Pollution Control Board (MPCB), Telangana State Pollution Control Board (TSPCB) and Andhra Pradesh Pollution Control Board (APPCB) as well as CPCB (Vadodara & Bengaluru) under NWMP. State-wise Distribution of Water Quality Monitoring Locations under NWMP on River Godavari is depicted in Figure 14.1.
14.3 Analytical Results
Water quality of river Godavari was carried out at 38 locations during Pre Lockdown (March 2020) [Maharashtra (14), Telangana (17) and AP(?)] and at 37 locations during Lockdown period (April 2020) [Maharashtra (14), Telangana (16) and AP(?)] to assess the impact on water quality of river Godavari. The analysis results of Primary Water Quality Criteria for Outdoor Bathing (PWQCOB) parameters viz. DO, pH, BOD and FC are presented below in Table-14.1.
Based on the monitoring & analysis of collected water samples from river Godavari, the water quality trend of river Godavari with respect to DO, pH, BOD and FC as observed during pre-lockdown (March 2020) and lockdown period (April 2020) are depicted in Figure 14.2 to Figure 14.5.
145 I Page
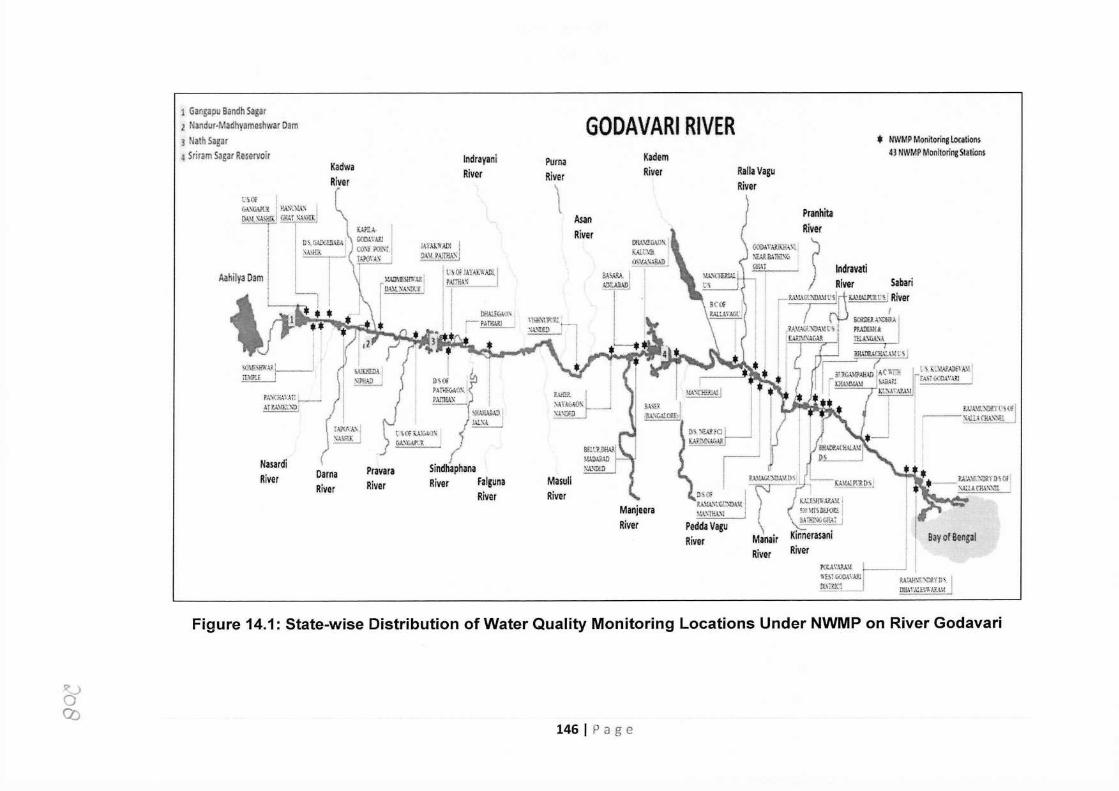
1 Gangapu Bandh Sagar 2 Nandur-Madhyameshwar Dam 3 Nath Sagar 4 Sriram Sagar Reservoir
GODAVARI RIVER Kadwa River
lndrayani River
u;,:u. Asan River
Aahilya Dam
* NWMP Monitoring LocatioM 43 NWMP Monitoring Sia lions
Pranhita River
? d . )
I~ rava11 . River Saban
r'.A.1~.\G~=ttj~Ul.!.W>',n~!/River
/ rLl ~A\,-.J.A ,'IA.lt\tn1l,o1:n ,1 ,un.!.H, t:AL-R ' IB!.ASGA.V.
~<if,\·,,;: i iE\il'if :
PJSOiJSAr. __
~
Nasardi River
Pravara River
!AVAl(~'.Ull 0.-\Jl.PAi'l"i'..\!;i
I f \ Of /A'f.JJ:W.>.Dl. , I PAfll'.,'£.._ __ ' I i D!'.\ll&,o,
i :. • I I
nsor ' t
Sindhaphana River Falguna
River
Purna River
\ a.1~:J.\, I :!:'~
K.adem Ralla Vagu River River
Masuli River
Bay of Bengal
i'O!.,l,l'A:-V.11 I ! '.\t.S~ tJOOA \J;J. OC>>RlCl
RA;,\.t{\5,"\'7)?.\' i)~ OHA \'.t\.U:S\\'A?N!
Figure 14.1: State-wise Distribution of Water Quality Monitoring Locations Under NWMP on River Godavari
& Q)
146 I Page
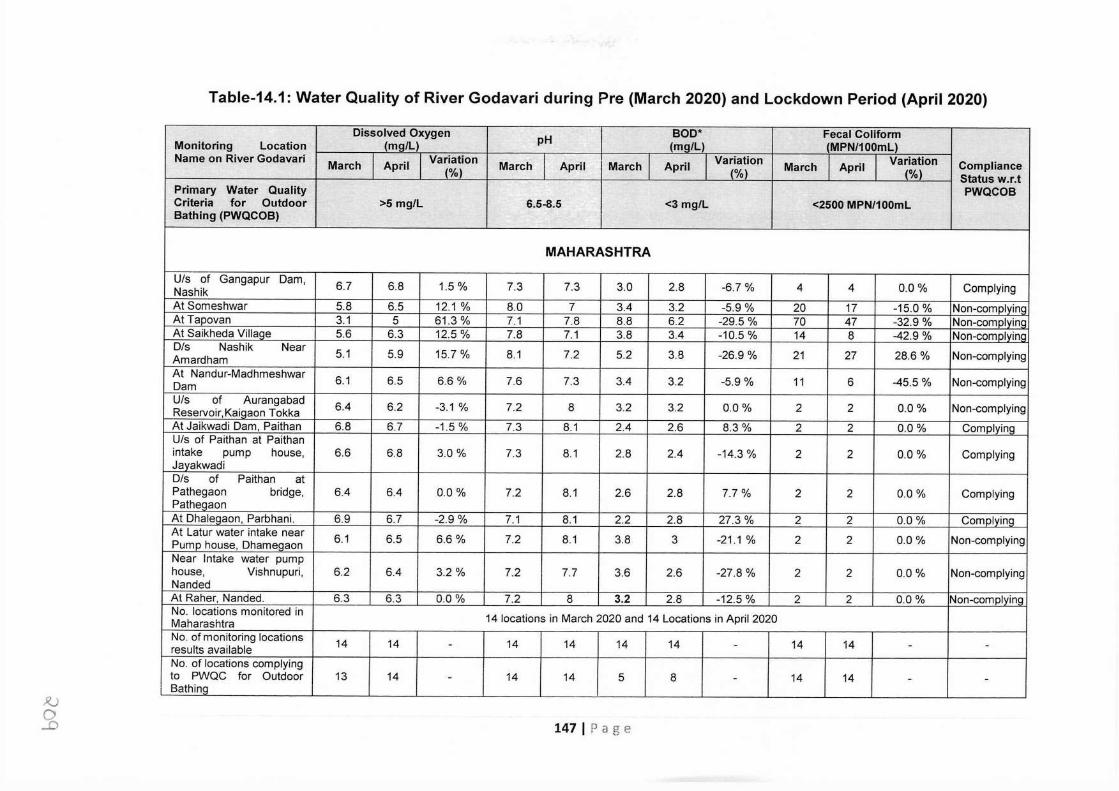
Table-14.1: Water Quality of River Godavari during Pre (March 2020) and Lockdown Period (April 2020)
Jl..J
£
Dissolved Oxygen pH BOD* Fecal Coliform Monitoring Location (mg/L) (mg/L) (MPN/100ml) Name on River Godavari March Ap;il Variation March April March April Variation March April Variation Compliance (%) (%) (%) Status w.r.t Primary Water Quality PWQCOB Criteria for Outdoor >5 mg/L 6.5-8.5 <3 mg/L <2500 MPN/100ml Bathing (PWQCOB)
MAHARASHTRA
U/s of Gangapur Dam, 6.7 6.8 1.5 % 7.3 7.3 3.0 2.8 -6.7 % 4 4 0.0% Complying Nashik At Someshwar 5.8 6.5 12.1 % 8.0 7 3.4 3.2 -5.9 % 20 17 -15.0 % Non-cornplyinq At Tapovan 3.1 5 61.3 % 7.1 7.8 8.8 6.2 -29.5 % 70 47 -32.9 % Non-comolvina At Saikheda Villaqe 5.6 6.3 12.5 % 7.8 7.1 3.8 3.4 -10.5 % 14 8 -42.9 % Non-comolvina D/s Nashik Near 5.1 5.9 15.7 % 8.1 7.2 5.2 3.8 -26.9 % 21 27 28.6 % Non-complying Amardham At Nandur-Madhmeshwar 6.1 6.5 6.6% 7.6 7.3 3.4 3.2 -5.9 % 11 6 -45.5 % Non-complying Dam U/s of Aurangabad 6.4 6.2 -3.1 % 7.2 8 3.2 3.2 0.0% 2 2 0.0% Non-complying Reservoir,Kaiqaon Tokka At Jaikwadi Dam, Paithan 6.8 6.7 -1.5 % 7.3 8.1 2.4 2.6 8.3% 2 2 0.0% Complyina U/s of Paithan at Paithan intake pump house, 6.6 6.8 3.0 % 7.3 8.1 2.8 2.4 -14.3 % 2 2 0.0% Complying Javakwadi Dis of Paithan at Pathegaon bridge, 6.4 6.4 0.0 % 7.2 8.1 2.6 2.8 7.7% 2 2 0.0% Complying Patheqaon At Dhaleqaon, Parbhani. 6.9 6.7 -2.9 % 7.1 8.1 2.2 2.8 27.3 % 2 2 0.0% Comolvinq At Latur water intake near 6.1 6.5 6.6% 7.2 8.1 3.8 3 -21.1 % 2 2 0.0% Non-complying Pump house, Dhamegaon Near Intake water pump house, Vishnupuri, 6.2 6.4 3.2 % 7.2 7.7 3.6 2.6 -27.8 % 2 2 0.0% Non-complying Nanded Al Raher, Nanded. 6.3 6.3 0.0 % 7.2 8 3.2 2.8 -12.5% 2 2 0.0% Non-cornplyinq No. locations monitored in 14 locations in March 2020 and 14 Locations in April 2020 Maharashtra No. of monitoring locations 14 14 - 14 14 14 14 - 14 14 - - results available No. of locations complying to PWQC for Outdoor 13 14 - 14 14 5 8 - 14 14 - - Bathinq
147 IP age
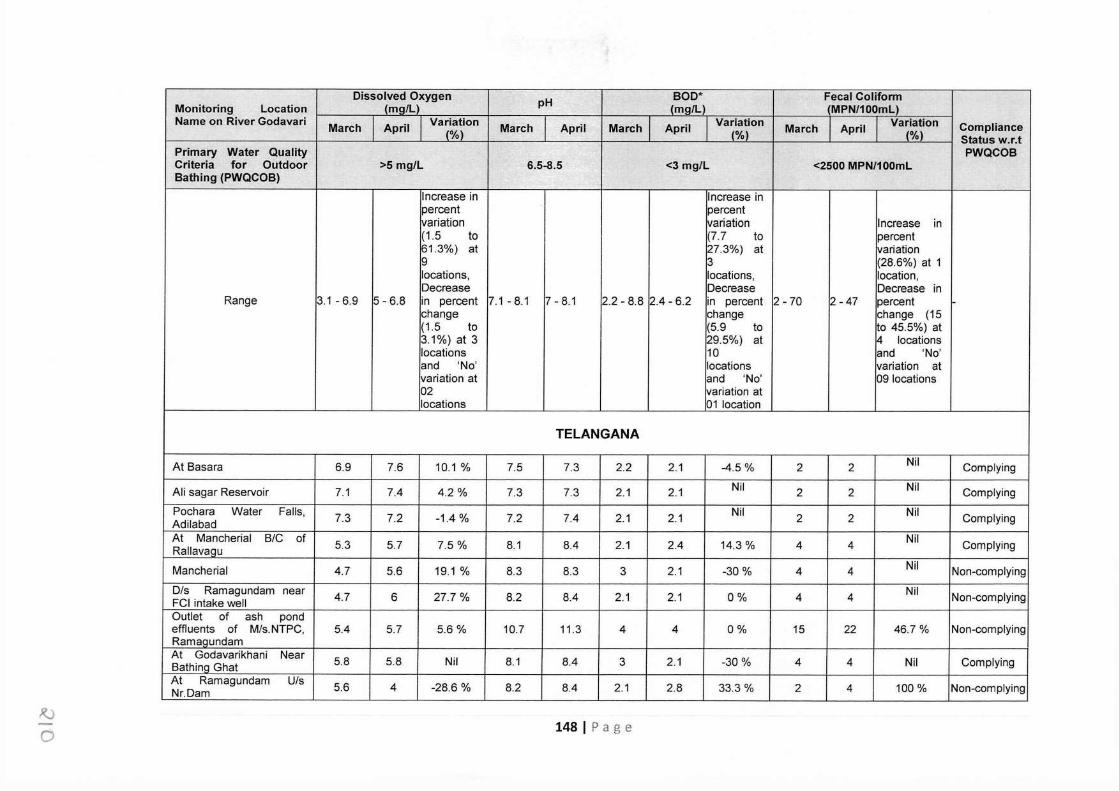
Dissolved Oxygen pH BOD"' Fecal Coliform Monitoring Location (rnq/L) (ma/Ll (MPN/100mL) Name on River Godavari March April Variation March April March April Variation March April Variation Compliance (%) (%) (%) Status w.r.t Primary Water Quality PWQCOB Criteria for Outdoor >5 mg/L 6.5-8.5 <3 mg/L <2500 MPN/100mL Bathing (PWQCOB)
Increase in Increase in percent percent variation variation Increase in (1.5 to (7.7 to percent 61.3%) at 127.3%) at variation 9 3 (28.6%) at 1 locations, locations, location, Decrease Decrease Decrease in
Range 3.1 - 6.9 5-6.8 in percent 7.1-8.1 7 - 8.1 2.2 - 8.8 12.4 - 6.2 in percent 2 - 70 12 - 47 percent change change change (15 (1.5 to (5.9 to •o 45.5%) at 3.1%) at 3 129.5%) at ~ locations locations 10 and 'No' and 'No' locations variation at variation at and 'No' 09Iocations 02 !variation at locations 01 location
TELANGANA
At Basara 6.9 7.6 10.1 % 7.5 7.3 2.2 2.1 -4.5 % 2 2 Nil Complying
Ali sagar Reservoir 7.1 7.4 4.2% 7.3 7.3 2.1 2.1 Nil 2 2 Nil Complying
Pochara Water Falls, 7.3 7.2 -1.4 % 7.2 7.4 2.1 2.1 Nil 2 2 Nil Complying Adilabad At Mancherial B/C of 5.3 5.7 7.5 % 8.1 8.4 2.1 2.4 14.3 % 4 4 Nil Complying Raltavaqu
Mancherial 4.7 5.6 19.1 % 8.3 8.3 3 2.1 -30 % 4 4 Nil Non-complying
Dis Ramagundam near 4.7 6 27.7 % 8.2 8.4 2.1 2.1 0% 4 4 Nil Non-complying FCI intake well Outlet of ash pond effluents of Mis.NTPC, 5.4 5.7 5.6 % 10.7 11.3 4 4 0% 15 22 46.7 % Non-complying Ramaaundam At Godavarikhani Near 5.8 5.8 Nil 8.1 8.4 3 2.1 -30 % 4 4 Nil Complying Bathina Ghat At Ramagundam U/s 5.6 4 -28.6 % 8.2 8.4 2.1 2.8 33.3 % 2 4 100 % Non-complying Nr.Dam
R.)
0 148 IP age
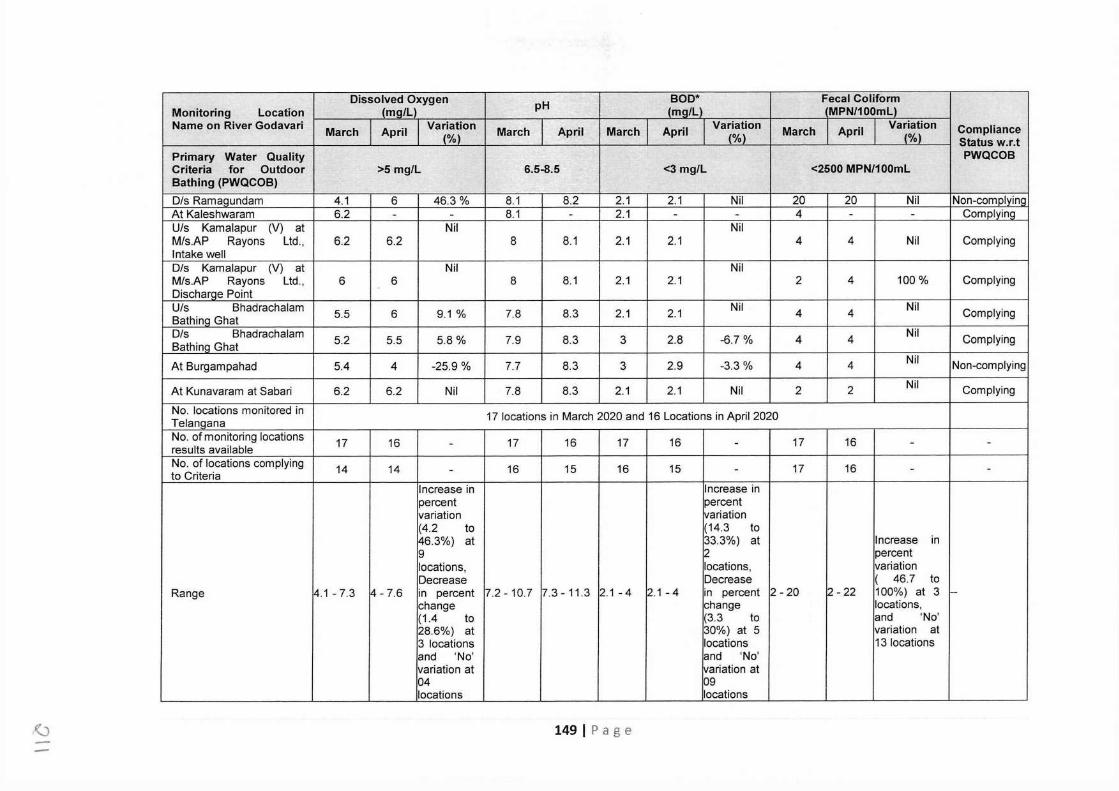
Dissolved Oxygen pH BOD* Fecal Coliform Monitoring Location (mq/L) (mq/L) (MPN/100mL) Name on River Godavari March April Variation March April March April Variation March April Variation Compliance
(%) (%) (%) Status w.r.t Primary Water Quality PWQCOB Criteria for Outdoor >5 mg/L 6.5-8.5 <3 mg/L <2500 MPN/100mL Bathing (PWQCOB) Dis Ramaqundam 4.1 6 46.3% 8.1 8.2 2.1 2.1 Nil 20 20 Nil Non-complyinq At Kaleshwaram 6.2 - - 8.1 - 2.1 - - 4 - - Comolvina U/s Kamalapur (V) at Nil Nil Mis.AP Rayons Ltd., 6.2 6.2 8 8.1 2.1 2.1 4 4 Nil Complying Intake well Dis Kamalapur (V) at Nil Nil Mis.AP Rayons Ltd., 6 6 8 8.1 2.1 2.1 2 4 100 % Complying Discharue Point Uls Bhadrachalam 5.5 6 9.1 % 7.8 8.3 2.1 2.1 Nil 4 4 Nil Complying Bathinq Ghat Dis Bhadrachalam 5.2 5.5 5.8% 7.9 8.3 3 2.8 -6.7 % 4 4 Nil Complying Bathing Ghat
At Burgampahad 5.4 4 -25.9 % 7.7 8.3 3 2.9 -3.3 % 4 4 Nil Non-complying
At Kunavaram at Sabari 6.2 6.2 Nil 7.8 8.3 2.1 2.1 Nil 2 2 Nil Complying
No. locations monitored in 17 locations in March 2020 and 16 Locations in April 2020 Telanoana No. of monitoring locations 17 16 - 17 16 17 16 - 17 16 - - results available No. of locations complying 14 14 - 16 15 16 15 - 17 16 - - to Criteria
Increase in Increase in percent percent variation variation (4.2 to (14.3 to 46.3%) at 33.3%) at Increase in 9 2 percent locations, locations, variation Decrease Decrease ( 46.7 to
Range 4.1 - 7.3 4- 7.6 in percent 7.2 - 10.7 7.3-11.3 2.1 - 4 2.1 - 4 in percent 2 -20 2 - 22 100%) at 3 - change change locations, (1.4 to (3.3 to and 'No' 28.6%) at 30%) at 5 variation at 3 locations locations 13 locations and 'No' and 'No' variation at r;ariation at 04 09 locations locations
,(.) 149 I Page
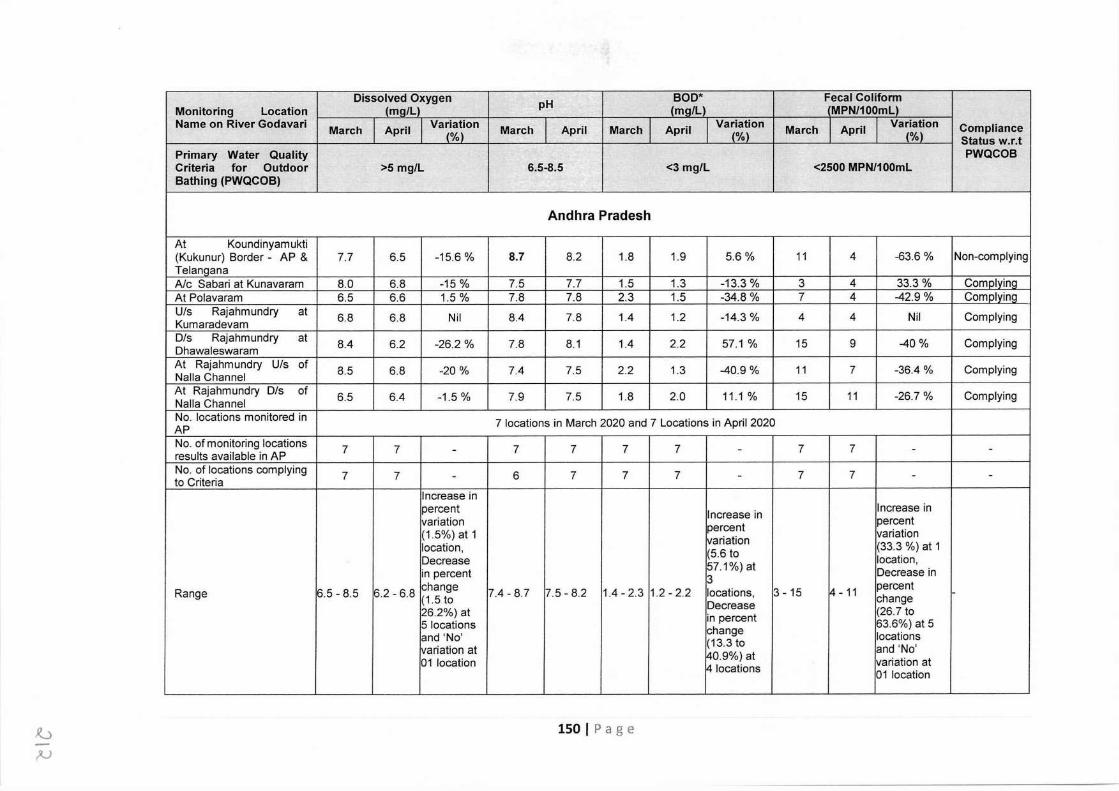
Dissolved Oxygen pH BOD* Fecal Coliform Monitoring Location (mq/Ll (mq/L) (MPN/100ml) Name on River Godavari March April Variation March April March April Variation March April Variation Compliance
(%) (%) (%) Status w.r.t Primary Water Quality PWQCOB Criteria for Outdoor >5 mg/L 6.5-8.5 <3 mg/L <2500 MPN/1 00mL Bathing (PWQCOB)
Andhra Pradesh
At Koundinyam ukti (Kukunur) Border - AP & 7.7 6.5 -15.6 % 8.7 8.2 1.8 1.9 5.6 % 11 4 -63.6 % Non-complying Telangana A/c Sabari at Kunavaram 8.0 6.8 -15 % 7.5 7.7 1.5 1.3 -13.3 % 3 4 33.3 % Comolvina At Polavaram 6.5 6.6 1.5 % 7.8 7.8 2.3 1.5 -34.8 % 7 4 -42.9 % Comolvina U/s Rajahmundry at 6.8 6.8 Nil 8.4 7.8 1.4 1.2 -14.3 % 4 4 Nil Complying Kumaradevam Dis Rajahmundry at 8.4 6.2 -26.2 % 7.8 8.1 1.4 2.2 57.1 % 15 9 -40 % Complying Dhawaleswaram At Rajahmundry U/s of 8.5 6.8 -20 % 7.4 7.5 2.2 1.3 -40.9 % 11 7 -36.4 % Complying Nalla Channel At Rajahmundry D/s of 6.5 6.4 -1.5 % 7.9 7.5 1.8 2.0 11.1 % 15 11 -26.7 % Complying Nalla Channel No. locations monitored in 7 locations in March 2020 and 7 Locations in April 2020 AP No. of monitoring locations 7 7 - 7 7 7 7 - 7 7 - - results available in AP No. of locations complying 7 7 - 6 7 7 7 - 7 7 - - to Criteria
Increase in percent Increase in Increase in variation percent percent (1 5%) at 1 variation location, variation (33.3 %) at 1 Decrease (5.6 to location, in percent 57.1%)at Decrease in
3 Range 6.5 - 8.5 6.2 - 6.8 change 7.4 - 8.7 7.5 - 8.2 1.4-2.3 1.2 - 2.2 locations, 3 - 15 4 - 11 percent
(1.5 to Decrease change 26.2%) at in percent (26.7 to 5 locations 63.6%) at 5 and 'No' change locations variation at
(13.3 to and 'No' 01 location 40.9%) at variation at 14 locations 01 location
,'l) ;u
150 I Page
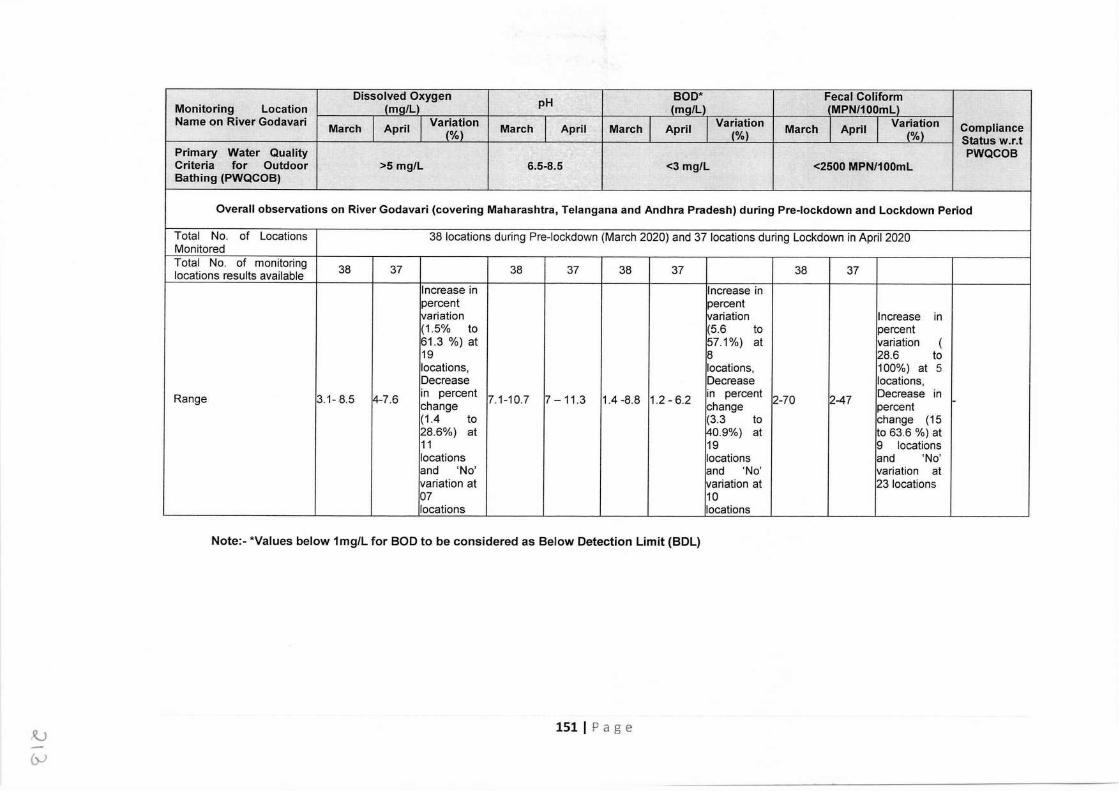
Dissolved Oxygen pH BOD* Fecal Coliform Monitoring Location (mQ/L) (mQ/L) (MPN/100mll Name on River Godavari March April Variation March April March April Variation March April Variation Compliance (%) (%1 (%) Status w.r.t Primary Water Quality PWQCOB Criteria for Outdoor >5 mg/L 6.5-8.5 <3 mg/L <2500 MPN/100ml Bathing (PWQCOB)
Overall observations on River Godavari (covering Maharashtra, Telangana and Andhra Pradesh) during Pre-lockdown and Lockdown Period
Total No. of Locations 38 locations during Pre-lockdown (March 2020) and 37 locations during Lockdown in April 2020 Monitored Total No. of monitoring 38 37 38 37 38 37 38 37 locations results available
Increase in Increase in percent percent variation vananon Increase in (1.5% to (5.6 to percent 61.3 %) at 57.1%) at variation ( 19 8 28.6 to locations, locations, 100%) at 5 Decrease Decrease locations,
Range 3.1- 8.5 14-7.6 in percent 7.1-10.7 7 - 11.3 1.4 -8.8 1.2 - 6.2 in percent 2-70 2-47 Decrease in change change percent (1.4 to (3.3 to change (15 28.6%) at 140.9%) at ~o 63.6 %) at 11 19 9 locations locations locations and 'No' and 'No' and 'No' variation at variation at !variation at 23 locations 07 10 locations 1locations
Note:- *Values below 1mg/L for BOD to be considered as Below Detection Limit (BDL)
,tJ
().J
151 I Page
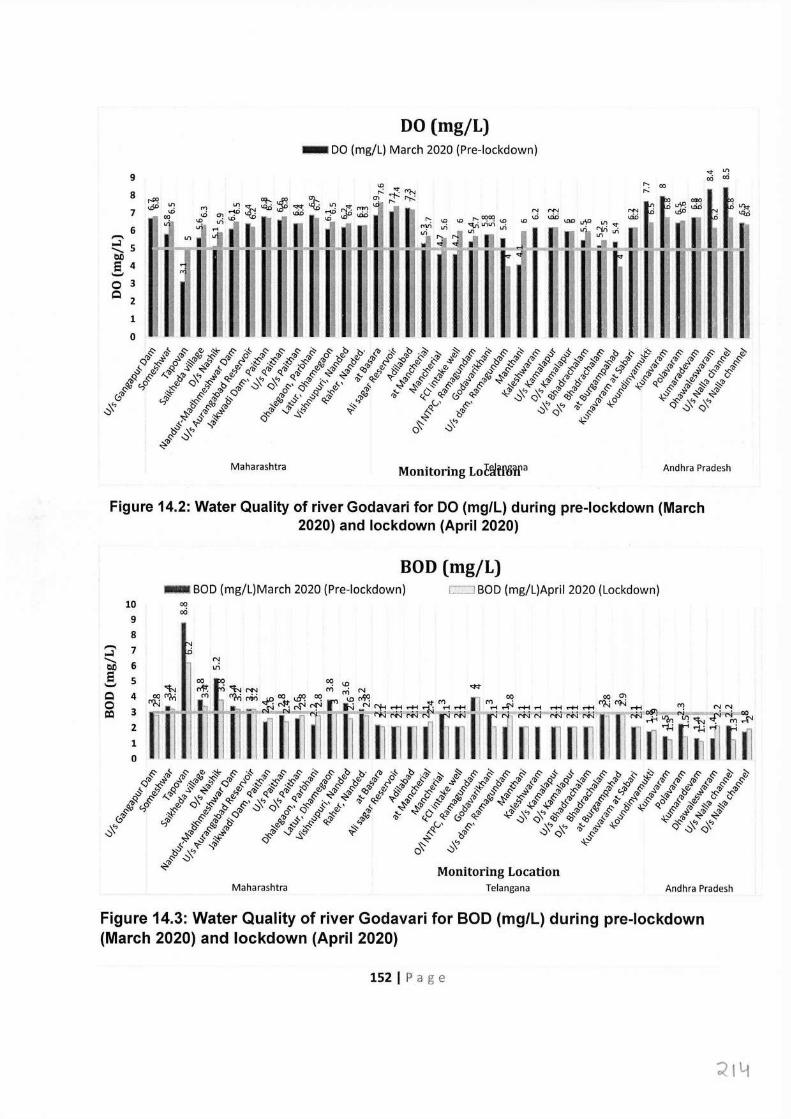
DO (mg/L) - DO (mg/L) March 2020 (Pre-lockdown)
9
8
7
6 ,..... ,..;i
5 ........ bl)
8 4
i '-' 0 3 Q
2
1
0
Maharashtra Monitoring Lota!ffoti1a Andhra Pradesh
Figure 14.2: Water Quality of river Godavari for DO (mg/L) during pre-lockdown (March 2020) and lockdown (April 2020)
BOD (mg/L)
10 9 8 ,..... 7 ,..;i ........ 6 bl)
8 5 '-' Q 4 0 3 CQ
2 1 0
- BOD (mg/L)March 2020 (Pre-lockdown) 00 oci
L J BOD (mg/L)April 2020 (Lockdown)
"! "'
Maharashtra Monitoring Location
Telangana Andhra Pradesh
Figure 14.3: Water Quality of river Godavari for BOD (mg/L) during pre-lockdown (March 2020) and lockdown (April 2020)
152 I Page
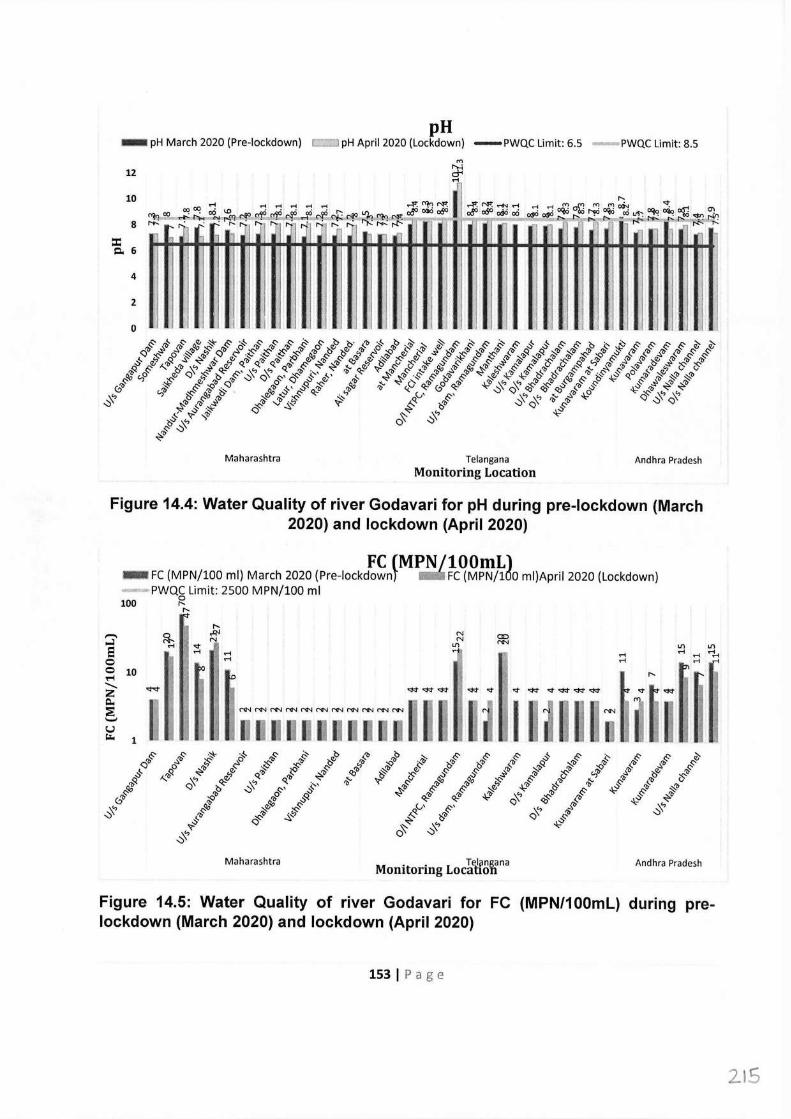
pH -pH March 2020 (Pre-lockdown) t=:J pH April 2020 (Lockdown) -PWQC Limit: 6.5 -PWQC Limit: 8.5
12
10
:c C. 6
4
2
0
,, 1: i ,
"" ~ .....
..... ..¥."'l<]M':I ..¥.M':~'""! . ,,r:-ccl'l~"l<>~cff'-oo" cff'oo"O<!IOoo ~~· ~~~
1,
1,
1, ,,
• • ' I. I.
II
Maharashtra Telangana Monitoring Location
Andhra Pradesh
Figure 14.4: Water Quality of river Godavari for pH during pre-lockdown {March 2020) and lockdown (April 2020)
FC fMPN - FC (MPN/100 ml) March 2020 (Pre-lockdownJ
PWQC Limit: 2500 MPN/100 ml 100 ~
"
100mLl FC (MPN/160 ml)April 2020 (Lockdown)
" ,-'I" N
st ..... ..... .....
~
--- N N
L/1 CJD NN
I I NN -
Maharashtra • • Telangana Momtormg Location Andhra Pradesh
Figure 14.5: Water Quality of river Godavari for FC (MPN/100mL) during pre lockdown (March 2020) and lockdown (April 2020)
153 I Page
215
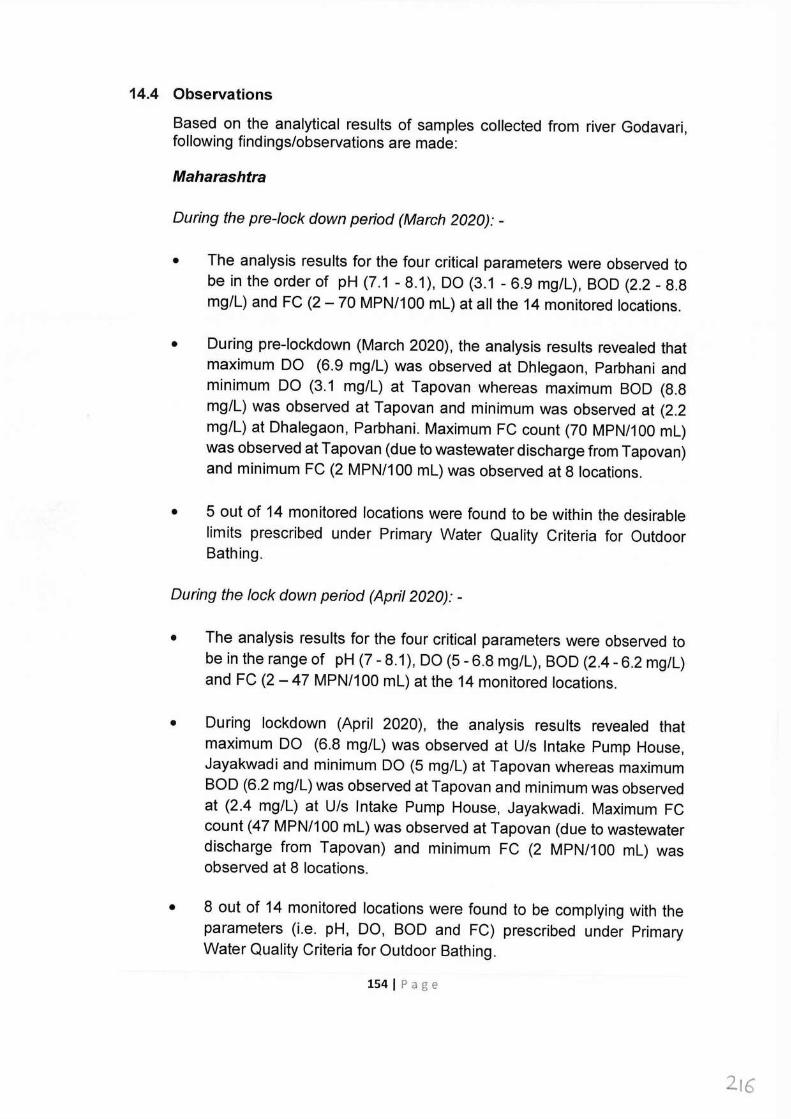
14.4 Observations
Based on the analytical results of samples collected from river Godavari, following findings/observations are made:
Maharashtra
During the pre-lock down period (March 2020): -
• The analysis results for the four critical parameters were observed to be in the order of pH (7.1 - 8.1 ), DO (3.1 - 6.9 mg/l), BOD (2.2 - 8.8 mg/l) and FC (2 - 70 MPN/100 ml) at all the 14 monitored locations.
• During pre-lockdown (March 2020), the analysis results revealed that maximum DO (6.9 mg/l) was observed at Dhlegaon, Parbhani and minimum DO (3.1 mg/l) at Tapovan whereas maximum BOD (8.8 mg/L) was observed at Tapovan and minimum was observed at (2.2 mg/l) at Dhalegaon, Parbhani. Maximum FC count (70 MPN/100 ml) was observed at Tapovan (due to wastewater discharge from Tapovan) and minimum FC (2 MPN/100 ml) was observed at 8 locations.
• 5 out of 14 monitored locations were found to be within the desirable limits prescribed under Primary Water Quality Criteria for Outdoor Bathing.
During the lock down period (April 2020): -
• The analysis results for the four critical parameters were observed to be in the range of pH (7 - 8.1 ), DO (5 - 6.8 mg/l), BOD (2.4 - 6.2 mg/l) and FC (2 -47 MPN/100 ml) at the 14 monitored locations.
• During lockdown (April 2020), the analysis results revealed that maximum DO (6.8 mg/l) was observed at U/s Intake Pump House, Jayakwadi and minimum DO (5 mg/l) at Tapovan whereas maximum BOD (6.2 mg/l) was observed at Tapovan and minimum was observed at (2.4 mg/l) at U/s Intake Pump House, Jayakwadi. Maximum FC count (47 MPN/100 ml) was observed at Tapovan (due to wastewater discharge from Tapovan) and minimum FC (2 MPN/100 ml) was observed at 8 locations.
• 8 out of 14 monitored locations were found to be complying with the parameters (i.e. pH, DO, BOD and FC) prescribed under Primary Water Quality Criteria for Outdoor Bathing.
154 I Page
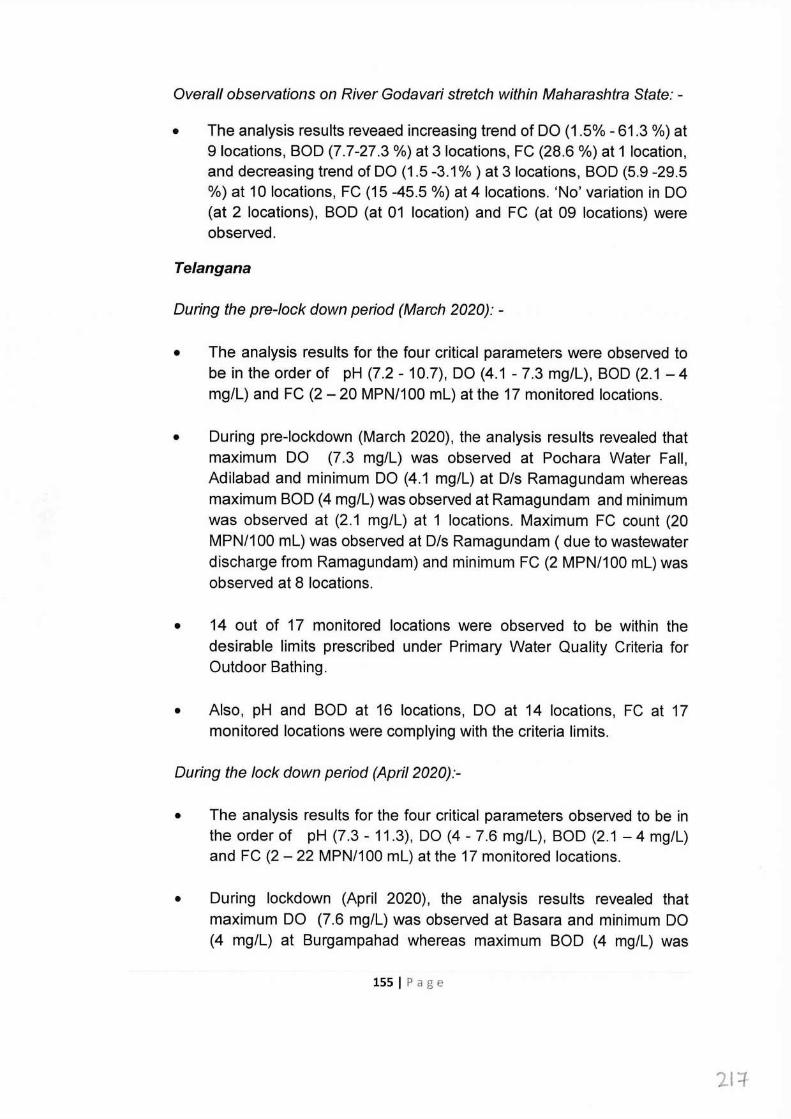
Overall observations on River Godavari stretch within Maharashtra State: -
• The analysis results reveaed increasing trend of DO (1.5% - 61.3 %) at 9 locations, BOD (7.7-27.3 %) at 3 locations, FC (28.6 %) at 1 location, and decreasing trend of DO (1.5 -3.1 % ) at 3 locations, BOD (5.9 -29.5 %) at 10 locations, FC (15 -45.5 %) at 4 locations. 'No' variation in DO (at 2 locations), BOD (at 01 location) and FC (at 09 locations) were observed.
Telangana
During the pre-lock down period (March 2020): -
• The analysis results for the four critical parameters were observed to be in the order of pH (7.2 - 10.7), DO (4.1 - 7.3 mg/l), BOD (2.1 - 4 mg/l) and FC (2 - 20 MPN/100 ml) at the 17 monitored locations.
• During pre-lockdown (March 2020), the analysis results revealed that maximum DO (7.3 mg/l) was observed at Pochara Water Fall, Adilabad and minimum DO (4.1 mg/l) at Dis Ramagundam whereas maximum BOD (4 mg/l) was observed at Ramagundam and minimum was observed at (2.1 mg/l) at 1 locations. Maximum FC count (20 MPN/100 ml) was observed at Dis Ramagundam ( due to wastewater discharge from Ramagundam) and minimum FC (2 MPN/100 ml) was observed at 8 locations.
• 14 out of 17 monitored locations were observed to be within the desirable limits prescribed under Primary Water Quality Criteria for Outdoor Bathing.
• Also, pH and BOD at 16 locations, DO at 14 locations, FC at 17 monitored locations were complying with the criteria limits.
During the lock down period (April 2020):-
• The analysis results for the four critical parameters observed to be in the order of pH (7.3 - 11.3), DO (4 - 7.6 mg/l), BOD (2.1 - 4 mg/L) and FC (2 - 22 MPN/100 ml) at the 17 monitored locations.
• During lockdown (April 2020), the analysis results revealed that maximum DO (7.6 mg/L) was observed at Basara and minimum DO (4 mg/L) at Burgampahad whereas maximum BOD (4 mg/L) was
155 I Page
2l ::f
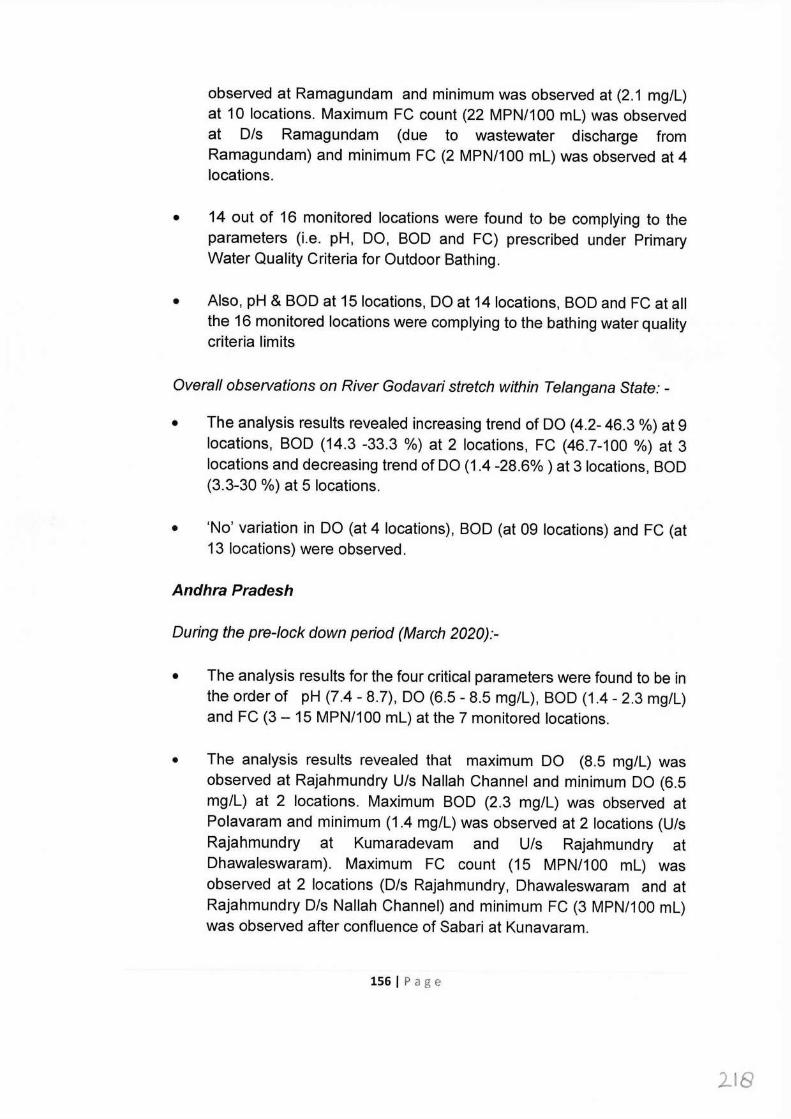
observed at Ramagundam and minimum was observed at (2.1 mg/l) at 10 locations. Maximum FC count (22 MPN/100 ml) was observed at Dis Ramagundam (due to wastewater discharge from Ramagundam) and minimum FC (2 MPN/100 ml) was observed at 4 locations.
• 14 out of 16 monitored locations were found to be complying to the parameters (i.e. pH, DO, BOD and FC) prescribed under Primary Water Quality Criteria for Outdoor Bathing.
• Also, pH & BOD at 15 locations, DO at 14 locations, BOD and FC at all the 16 monitored locations were complying to the bathing water quality criteria limits
Overall observations on River Godavari stretch within Telangana State: -
• The analysis results revealed increasing trend of DO (4.2- 46.3 %) at 9 locations, BOD (14.3 -33.3 %) at 2 locations, FC (46.7-100 %) at 3 locations and decreasing trend of DO (1.4 -28.6%) at 3 locations, BOD (3.3-30 %) at 5 locations.
• 'No' variation in DO (at 4 locations), BOD (at 09 locations) and FC (at 13 locations) were observed.
Andhra Pradesh
During the pre-lock down period (March 2020):-
• The analysis results for the four critical parameters were found to be in the order of pH (7.4 - 8.7), DO (6.5 - 8.5 mg/l), BOD (1.4 - 2.3 mg/l) and FC (3 - 15 MPN/100 ml) at the 7 monitored locations.
• The analysis results revealed that maximum DO (8.5 mg/l) was observed at Rajahmundry U/s Nallah Channel and minimum DO (6.5 mg/l) at 2 locations. Maximum BOD (2.3 mg/l) was observed at Polavaram and minimum (1.4 mg/l) was observed at 2 locations (U/s Rajahmundry at Kumaradevam and U/s Rajahmundry at Dhawaleswaram). Maximum FC count (15 MPN/100 ml) was observed at 2 locations (D/s Rajahmundry, Dhawaleswaram and at Rajahmundry D/s Nallah Channel) and minimum FC (3 MPN/100 ml) was observed after confluence of Sabari at Kunavaram.
156 I Page
218
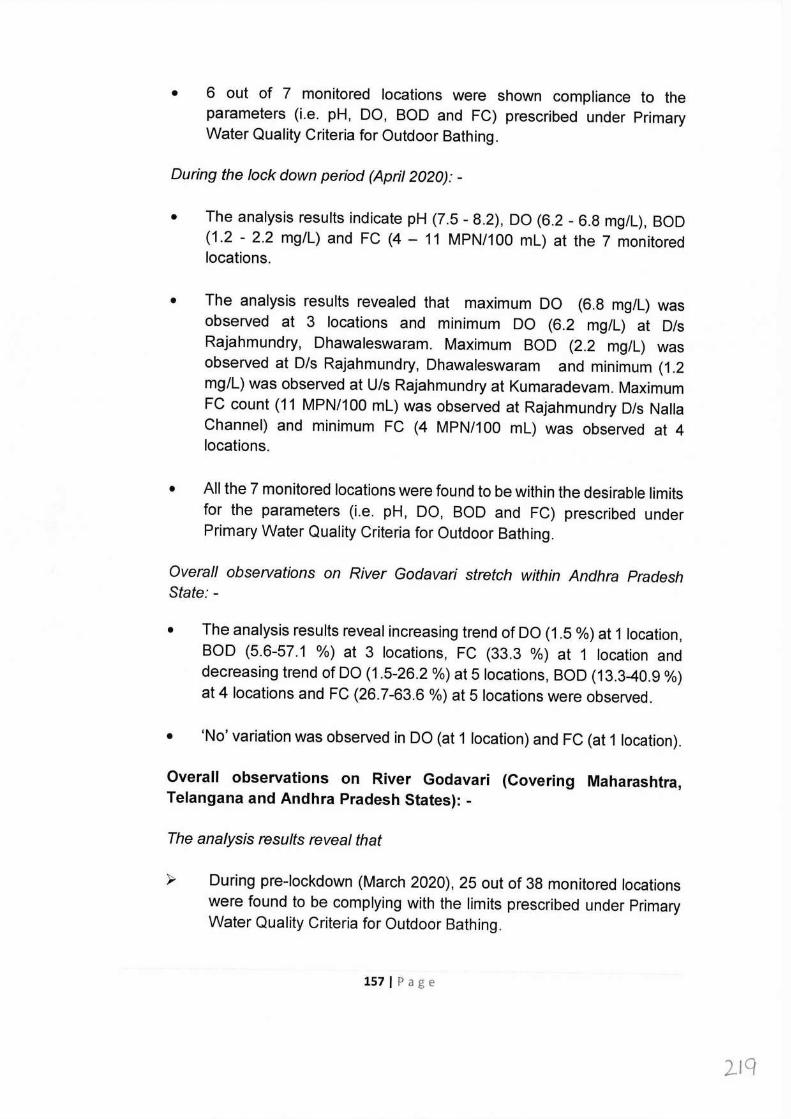
• 6 out of 7 monitored locations were shown compliance to the parameters (i.e. pH, DO, BOD and FC) prescribed under Primary Water Quality Criteria for Outdoor Bathing.
During the lock down period (April 2020): -
• The analysis results indicate pH (7.5 - 8.2), DO (6.2 - 6.8 mg/l), BOD (1.2 - 2.2 mg/l) and FC (4 - 11 MPN/100 ml) at the 7 monitored locations.
• The analysis results revealed that maximum DO (6.8 mg/l) was observed at 3 locations and minimum DO (6.2 mg/l) at Dis Rajahmundry, Dhawaleswaram. Maximum BOD (2.2 mg/l) was observed at D/s Rajahmundry, Dhawaleswaram and minimum (1.2 mg/L) was observed at U/s Rajahmundry at Kumaradevam. Maximum FC count (11 MPN/100 ml) was observed at Rajahmundry Dis Na Ila Channel) and minimum FC (4 MPN/100 ml) was observed at 4 locations.
• All the 7 monitored locations were found to be within the desirable limits for the parameters (i.e. pH, DO, BOD and FC) prescribed under Primary Water Quality Criteria for Outdoor Bathing.
Overall observations on River Godavari stretch within Andhra Pradesh State: -
• The analysis results reveal increasing trend of DO (1.5 %) at 1 location, BOD (5.6-57.1 %) at 3 locations, FC (33.3 %) at 1 location and decreasing trend of DO (1.5-26.2 %) at 5 locations, BOD (13.3-40.9 %) at 4 locations and FC (26.7-63.6 %) at 5 locations were observed.
• 'No' variation was observed in DO (at 1 location) and FC (at 1 location).
Overall observations on River Godavari (Covering Maharashtra, Telangana and Andhra Pradesh States): -
The analysis results reveal that
};;> During pre-lockdown (March 2020), 25 out of 38 monitored locations were found to be complying with the limits prescribed under Primary Water Quality Criteria for Outdoor Bathing.
157 I Page
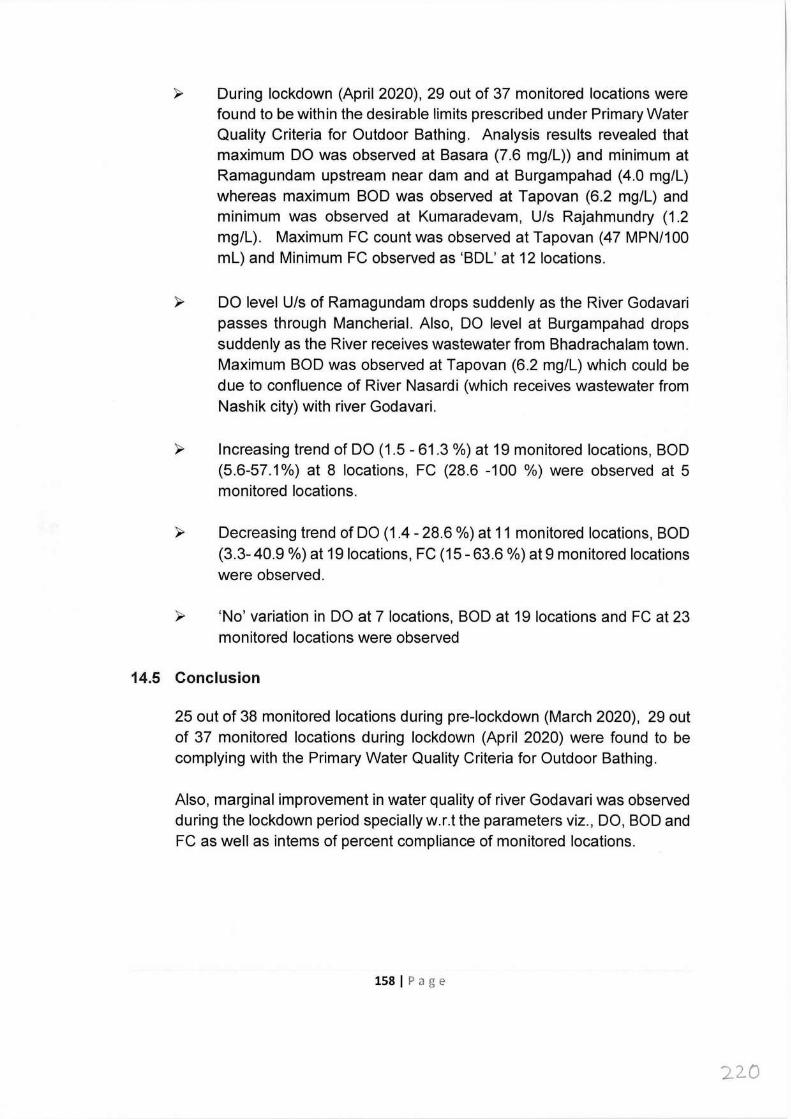
During lockdown (April 2020), 29 out of 37 monitored locations were found to be within the desirable limits prescribed under Primary Water Quality Criteria for Outdoor Bathing. Analysis results revealed that maximum DO was observed at Basara (7.6 mg/L)) and minimum at Ramagundam upstream near dam and at Burgampahad (4.0 mg/L) whereas maximum BOD was observed at Tapovan (6.2 mg/L) and minimum was observed at Kumaradevam, U/s Rajahmundry (1.2 mg/L). Maximum FC count was observed at Tapovan (47 MPN/100 ml) and Minimum FC observed as 'BDL' at 12 locations.
DO level U/s of Ramagundam drops suddenly as the River Godavari passes through Mancherial. Also, DO level at Burgampahad drops suddenly as the River receives wastewater from Bhadrachalam town. Maximum BOD was observed at Tapovan (6.2 mg/L) which could be due to confluence of River Nasardi (which receives wastewater from Nashik city) with river Godavari.
Increasing trend of DO (1.5 - 61.3 %) at 19 monitored locations, BOD (5.6-57.1%) at 8 locations, FC (28.6 -100 %) were observed at 5 monitored locations.
Decreasing trend of DO (1.4 - 28.6 %) at 11 monitored locations, BOD (3.3-40.9 %) at 19 locations, FC (15 - 63.6 %) at 9 monitored locations were observed.
'No' variation in DO at 7 locations, BOD at 19 locations and FC at 23 monitored locations were observed
14.5 Conclusion
25 out of 38 monitored locations during pre-lockdown (March 2020), 29 out of 37 monitored locations during lockdown (April 2020) were found to be complying with the Primary Water Quality Criteria for Outdoor Bathing.
Also, marginal improvement in water quality of river Godavari was observed during the lockdown period specially w.r.t the parameters viz., DO, BOD and FC as well as interns of percent compliance of monitored locations.
158 I Page
220
15.0. IMPACT OF LOCKDOWN ON WATER QUALITY OF RIVER KRISHNA
15.1 About Krishna River
The Krishna river originates in the Western Ghats near Mahabaleshwar in the State of Maharashtra and is one of the longest rivers in India. The Krishna river is 1288 km long and flows through Maharashtra, Karnataka before entering Telangana State and finally empties into the Bay of Bengal at Hamasala Deevi (near Koduru) in Andhra Pradesh, on the east coast. Vijayawada is the largest city on the bank of River Krishna. Main tributaries on the left bank of river Krishna are river Shima, Dindi, Peddavagu, Musi, Paleru, Munneru and right bank tributaries are river Kundali, Venna, Konya, Panchganga, Dudhaganga, Ghataprabha, Malaprabha and Tungabhadra. The industrialized urban cities are Satara, Kolhapur, Solapur, Pune, and Sangli in Maharashtra State, Raichur, Hubli-Dharwad, Bijapur, Gulbarga, Bhadravati, Davangere, Belgaum, Chitradurga, Bagalkot are in Karnataka, Nalgonda and Suryapet in Telangana and Kurnool, Guntur, Vijayawada in Andhra Pradesh State consisting of leather & fertilizer units, Chemicals, Thermal Power plants, etc. Krishna river basin is endowed with rich mineral deposits such as oil & gas, coal, iron, limestone, dolomite, gold, granite, laterite, uranium, diamonds, etc. High alkalinity water is discharged from the ash dump areas of many coal fired power stations into the river Krishna which further increases the alkalinity of the river water whose water is naturally of high alkalinity since the river basin is draining vast area of basalt rock formations.
15.2 Water Quality Monitoring Locations under National Water Monitoring Programme (NWMP)
Water quality of river Krishna is monitored at 30 locations by Central Pollution Control Board (CPCB) in association with the State Pollution Control Boards of Maharashtra, Karnataka, Telangana and Andhra Pradesh under National Water Quality Monitoring Programme (NWMP). State-wise Distribution of Water Quality Monitoring Locations under NWMP on River Krishna is depicted in Figure -15.1.
15.3 Analytical Results
Water quality of river Krishna was carried out at 26 locations [Maharashtra (09), Karnataka (05), Telangana (04) and AP (08)] during Pre-Lockdown (March 2020) and at 18 locations [Maharashtra (04 ), Karnataka (06), and AP (08)] during Lockdown period (April 2020) to assess the impact on water quality of river Krishna. The analysis results of Primary Water Quality Criteria for Outdoor
159 I Page
221
Bathing (PWQCOB) parameters viz. Dissolved Oxygen (DO), pH, Biochemical Oxygen Demand (BOD) and Fecal Coliform (FC) are presented in Table- 15.1.
Based on the monitoring & analysis of collected water samples from river Krishna, the graphical presentation of water quality of river Krishna with respect to DO, pH, BOD and FC as observed during pre-lockdown (March 2020) and lockdown period (April 2020) are presented in Figure 15.2 to Figure 15.9.
160 I Page
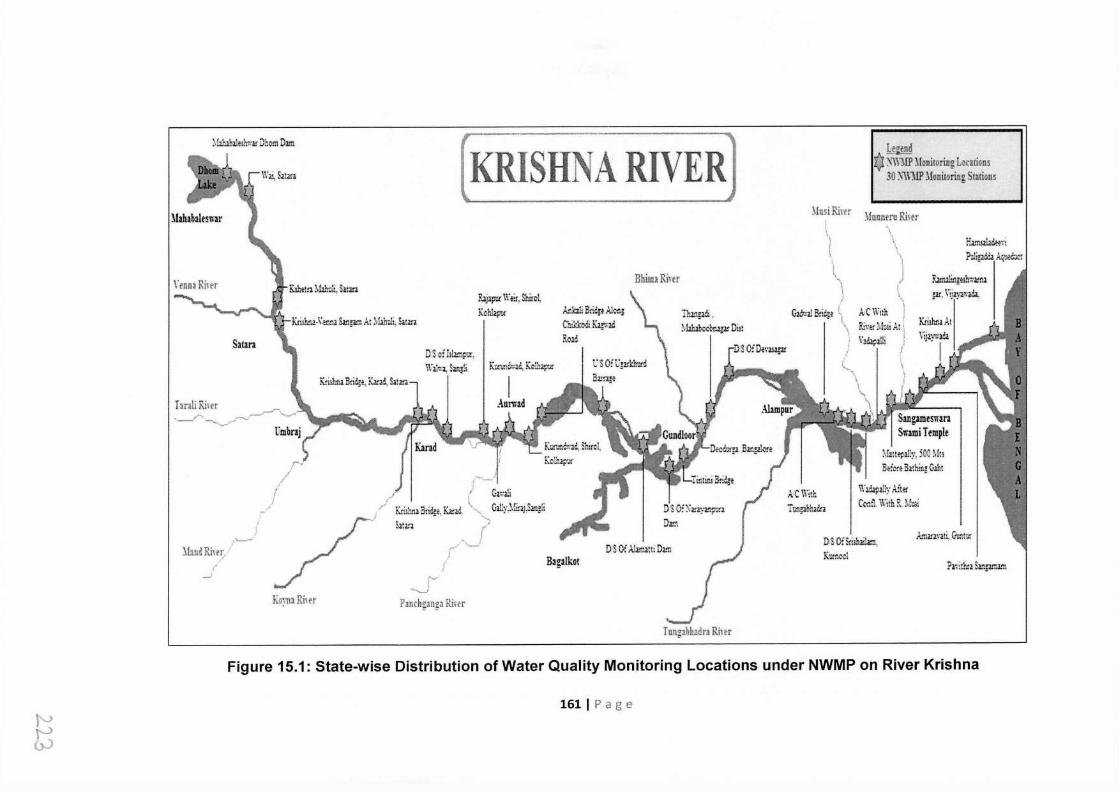
~fa.i.~.!,;lr.. ·ar Dhom Dim
llahabalmnr
YennaRim
Kru.lir.aX~i:i.2. S1.1~ At ~Wn:lli SitL'l
Satan
( KRISHNA RIVER]
D.S ofl!lampui,
Rljapll! W.Z.t, Shiro~ K~hi.])1)! .. t~kzli Brid;t Alon1
Chil:l:o& K.r-,ad Ro2G
Kll!l.-ncs:.d, Kc!lufll!
TmliRim _.,...,,--...__,,. ,.,-.. _--.., ·- -..._r
;
Gid-s'Zi &idg, \
I
J
\ ' \ \
// I
/ I
.I ,..__...
1fand Rht;/'
' _,
Ko:113 Rher
r' I ! - r: ~ Kri1hna 3:ic:,, Karil '·-.. Gllly,1li.-.;,Slll!li
S1tar, "';> . r r - /
Gmli
,_ i ·-·-·
Panchginga Rim
B3galkot D~ Of AIW2ni Den
11'.Jng.di, ~Wubcot"~ Diit
\lusiRim
'i l \
\ \ J \ ' A-C \iith j
Rit,r ~fai .-l.t ', \'Jdi;,illi i
i
kC\\'ith T unµbhlefl
le,rnd r) \'\\1[P ~!oniloring Lornions
30 X\\1!P ~lcnitoring Stations
~1unneru Rhet·
D -S Of S,,1.~am.'!l, K,;moc!
H1.'1Ul.U~rt ?cli~~.A,~t
K.1miliq,i.½,·1.'!U flt\ \\j~,,':",4~
luiJhn2At
~-fatt!l)iily, 500 Mt1 &:c-r, Bath:.'l! Gaht
'1:lQPlliy Aftt1 Confl. With R. Mi;;i
A.'!!2fant~G-;::i;;t
P1-:.·ith.~ S1.~1.'?U.~
Tu.ngabll3dra Rim
Figure 15.1: State-wise Distribution of Water Quality Monitoring Locations under NWMP on River Krishna
161 I Page
~
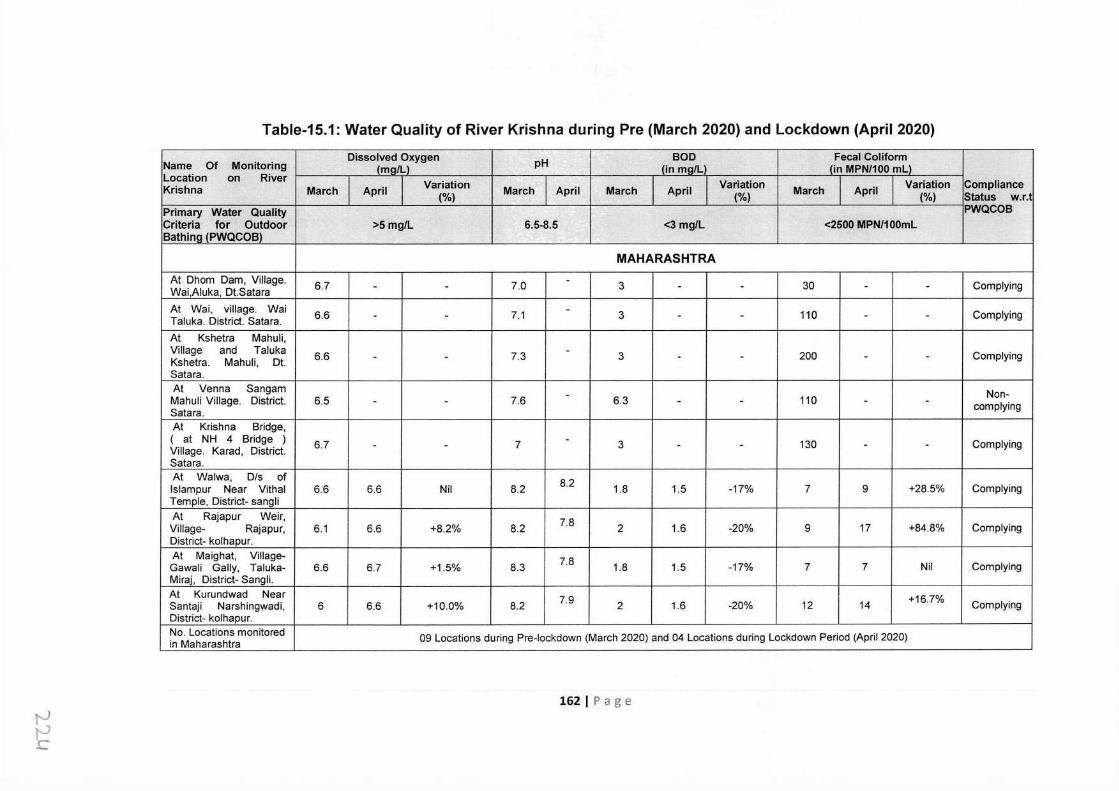
Table-15.1: Water Quality of River Krishna during Pre (March 2020) and Lockdown (April 2020)
Of Monitoring Dissolved Oxygen pH BOD Fecal Coliform
Name {ma/Ll (in mg/L (in MPN/100 ml) Location on River Variation Variation Variation Compliance Krishna March April March April March April March April (%) (%) (%) Status w.r.t Primary Water Quality PWQCOB Criteria for Outdoor >5 mg/L 6.5-8.5 <3 mg/L <2500 MPN/100mL Bathing (PWQCOB)
MAHARASHTRA At Dhom Dam, Village. 6.7 7.0 - 3 30 Complying Wai,Aluka, Dt.Satara - - - - - -
At Wai, village. Wai 6.6 7.1 - 3 110 Complying Taluka. District. Satara. - - - - - - At Kshetra Mahuli, Village and Taluka 6.6 7.3 - 3 200 Complying Kshetra. Mahuli, Dt. - - - - - - Satara. At Venna Sangam Non- Mahuli Village. District. 6.5 7.6 - 6.3 110 - - - - - - complying Satara. At Krishna Bridge, ( at NH 4 Bridge ) 6.7 7 - 3 130 Complying Village. Karad, District. - - - - - - Satara. At Walwa, D/s of 8.2 lslampur Near Vithal 6.6 6.6 Nil 8.2 1.8 1.5 -17% 7 9 +28.5% Complying Temple, District- sangli At Rajapur Weir, 7.8 Village- Rajapur, 6.1 6.6 +8.2% 8.2 2 1.6 -20% 9 17 +84.8% Complying District- kolhapur. At Maighat, Village- 7.8 Gawali Gally, Taluka- 6.6 6.7 +1.5% 8.3 1.8 1.5 -17% 7 7 Nil Complying Miraj, District- Sangli. At Kurundwad Near 7.9 +16.7% Santaji Narshingwadi, 6 6.6 +10.0% 8.2 2 1.6 -20% 12 14 Complying District- kolhapur. No. Locations monitored 09 Locations during Pre-lockdown (March 2020) and 04 Locations during Lockdown Period (April 2020) in Maharashtra
162 I Page r-J ~
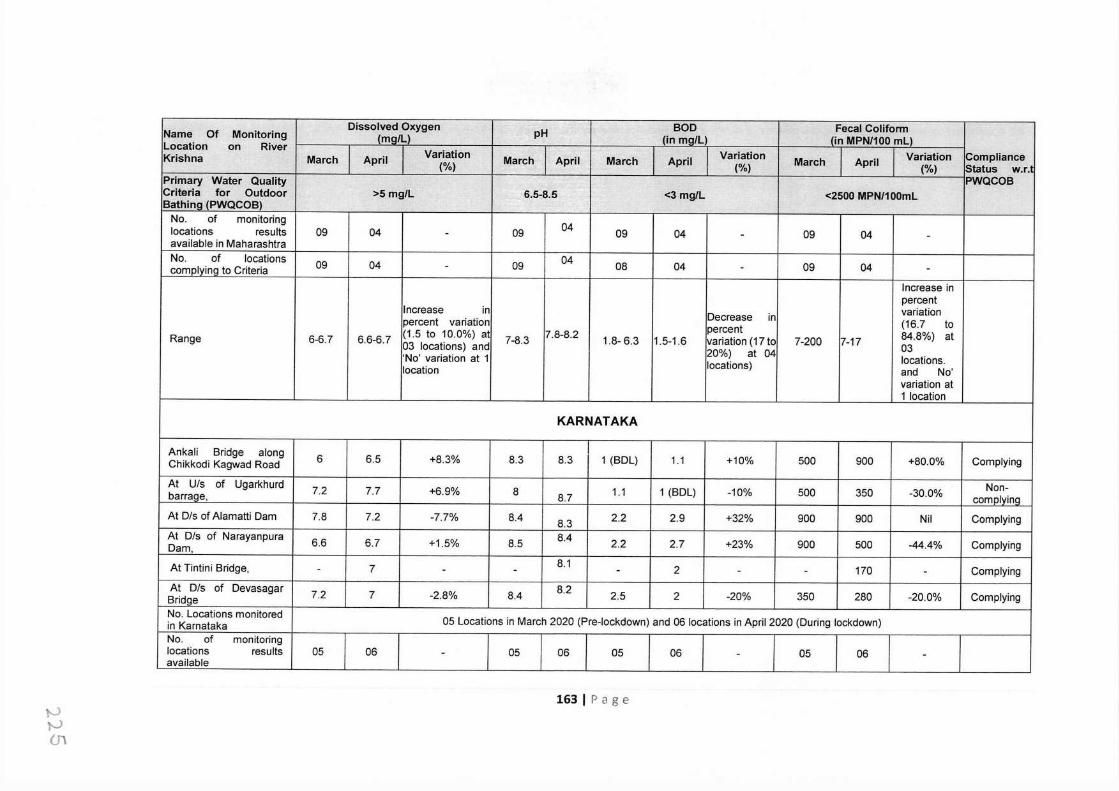
Dissolved Oxygen pH BOD Fecal Colifonn Name Of Monitoring (ma/Ll (in mall (in MPN/100 ml) Location on River
Variation Variation Variation Compliance Krishna March April (%) March April March April (%) March April (%) Status w.r.1 Primary Water Quality PWQCOB Criteria for Outdoor >5 mg/L 6.5-8.5 <3 mg/L <2500 MPN/100ml Bathing (PWQCOB) No. of monitoring
04 locations results 09 04 - 09 09 04 - 09 04 - available in Maharashtra No. of locations 09 04 09 04 08 04 09 04 comotvinq to Criteria - - -
Increase in percent
Increase in Decrease in variation
percent variation percent (16.7 to
Range 6-6.7 6.6-6.7 (1.5 to 10.0%) at 7-8.3 7.8-8.2 1.8- 6.3 1.5-1.6 variation (17 to 7-200 7-17 84.8%) at 03 locations) and 20%) at 04 03 'No' variation at 1 locations. location locations) and No'
variation at 1 location
KARNATAKA
Ankali Bridge along 6 6.5 +8.3% 8.3 8.3 1 (BDL) 1.1 +10% 500 900 +80.0% Complying Chikkodi Kagwad Road
At U/s of Ugarkhurd 7.2 7.7 +6.9% 8 1.1 1 (BDL) -10% 500 350 -30.0% Non- barraqe, 8.7 cornolvino At Dis of Alamatti Dam 7.8 7.2 -7.7% 8.4 8.3 2.2 2.9 +32% 900 900 Nil Complying At Dis of Narayanpura 6.6 6.7 +1.5% 8.5 8.4 2.2 2.7 +23% 900 500 -44.4% Complying Dam,
At Tintini Bridge, 7 8.1 2 170 Complying - - - - - - - At Dis of Devasagar 7.2 7 -2.8% 8.4 8.2 2.5 2 -20% 350 280 -20.0% Complying Bridge No. Locations monitored
05 Locations in March 2020 (Pre-lockdown) and 06 locations in April 2020 (During lockdown) in Karnataka No. of monitoring locations results 05 06 - 05 06 05 06 - 05 06 - available
µ ,-.J (j\
163 I Page
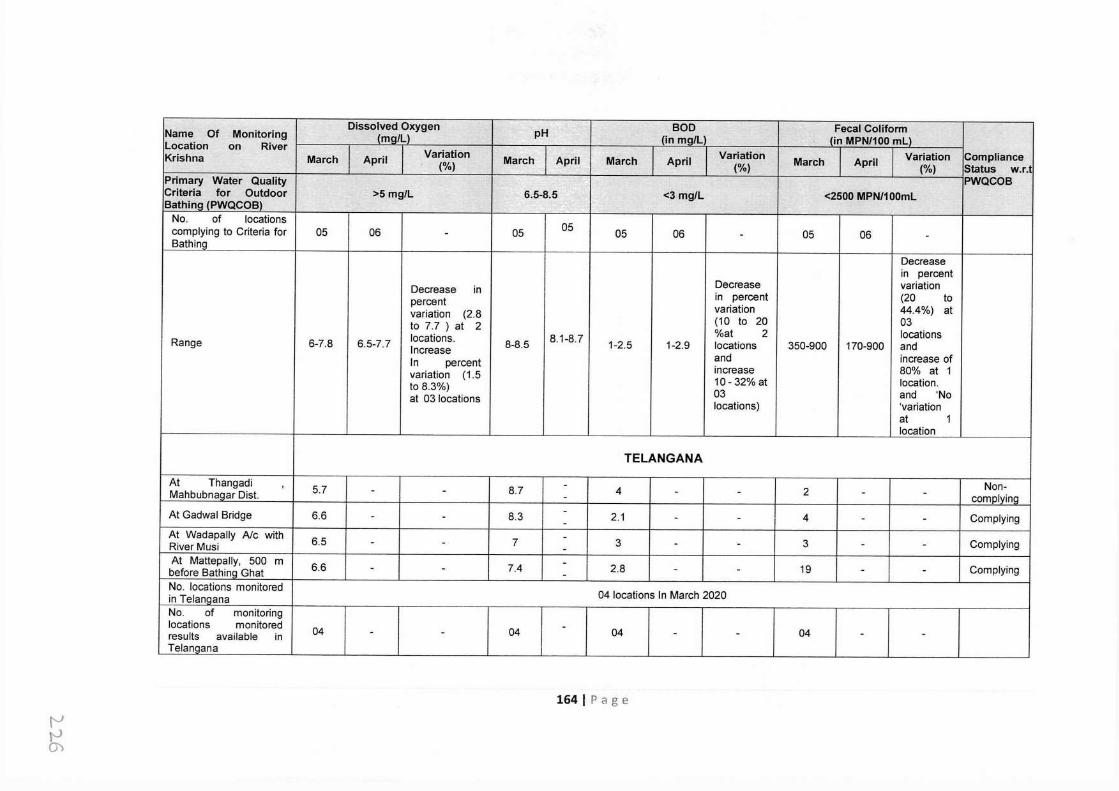
Dissolved Oxygen pH BOD Fecal Coliform Name Of Monitoring (mg/L) (in mall) (in MPN/100 ml) Location on River
Variation Variation Variation Compliance Krishna March April (%) March April March April (%) March April (%) Status w.r.t Primary Water Quality PWQCOB Criteria for Outdoor >5 mg/L 6.5-8.5 <3 mg/L <2500 MPN/100ml Bathing (PWQCOB) No. of locations
05 complying to Criteria for 05 06 - 05 05 06 - 05 06 - Bathing
Decrease in percent
Decrease in Decrease variation in percent (20 to percent variation 44.4%) at variation (2.8 (10 to 20 03 to 7.7 ) at 2 %at 2 locations
Range 6-7.8 6.5-7.7 locations. 8-8.5 8.1-8.7 1-2.5 1-2.9 locations 350-900 170-900 and Increase In percent and increase of
increase 80% at 1 variation (1.5 10- 32% at location. to8.3%) 03 and 'No at 03 locations locations) 'variation
at 1 location
TELANGANA
At Thangadi 5.7 8.7 - 4 2 Non- Mahbubnaoar Dist. - - - - - - complying - At Gadwal Bridge 6.6 8.3 - 2.1 4 Complying - - - - - - - At Wadapally Ale with 6.5 7 - 3 3 Complying - - - - - - River Musi - At Mattepally, 500 m 6.6 7.4 - 2.8 19 Complying - - - - - - before Bathino Ghat - No. locations monitored
04 locations In March 2020 in Telangana No. of monitoring locations monitored 04 04 - 04 04 in - - - - - - results available Telangana
164 I Page I'--' t-J 0)
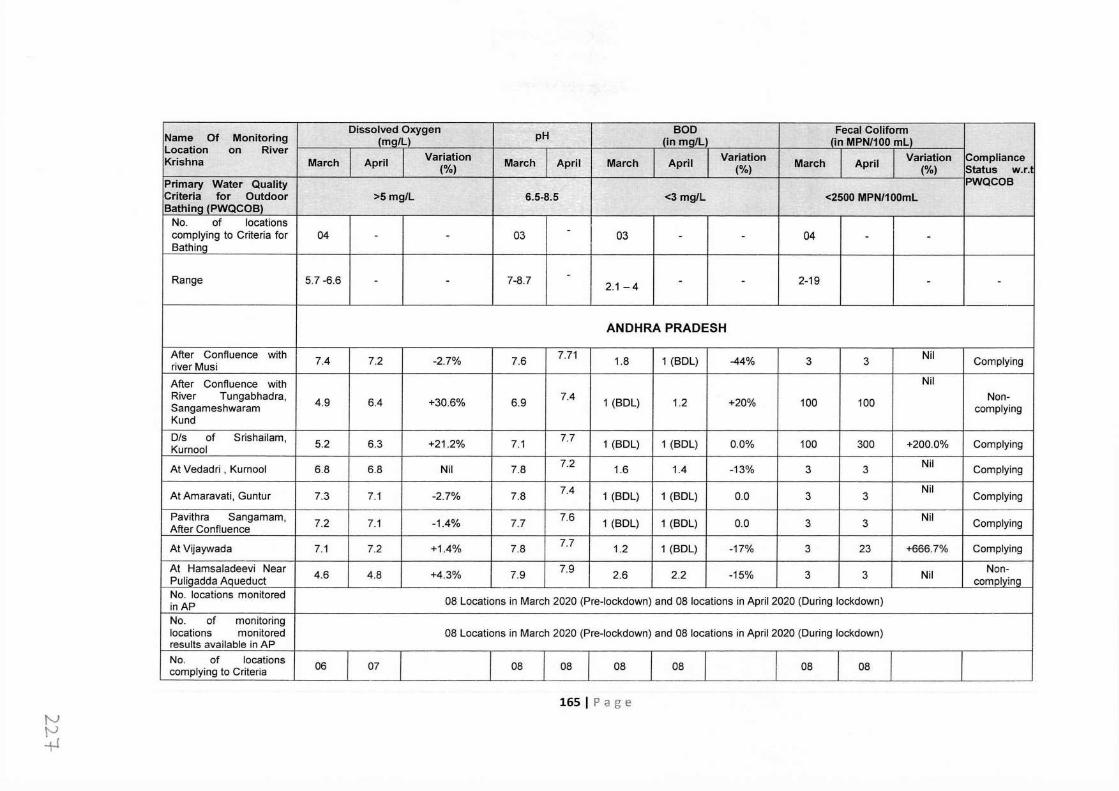
Dissolved Oxygen pH BOD Fecal Colifonn
Name Of Monitoring lma/L) (in mg/L (in MPN/100 ml) Location on River Variation Variation Krishna March April March April March April March April Variation Compliance
(%) (%) (%) Status w.r.t Primary Water Quality PWQCOB Criteria for Outdoor >5 mg/L 6.5-8.5 <3 mg/L <2500 MPN/100ml Bathing (PWQCOB) No. of locations complying to Criteria for 04 03 - 03 04 - - - - - - Bathing
Range 5.7 -6.6 7-8.7 - 2-19 - - 2.1 -4 - - - -
ANDHRA PRADESH
After Confluence with 7.4 7.2 -2.7% 7.6 7.71 1.8 1 (BDL) -44% 3 3 Nil Complying river Musi After Confluence with Nil River Tungabhadra, 4.9 6.4 +30.6% 6.9 7.4 1 (BDL) 1.2 +20% 100 100 Non- Sangameshwaram complying Kund Dis of Srishailam, 5.2 6.3 +21.2% 7.1 7.7 1 (BDL) 1 (BDL) 0.0% 100 300 +200.0% Complying Kurnool
At Vedadri , Kurnool 6.8 6.8 Nil 7.8 7.2 1.6 1.4 -13% 3 3 Nil Complying
At Amaravati, Guntur 7.3 7.1 -2.7% 7.8 7.4 1 (BDL) 1 (BDL) 0.0 3 3 Nil Complying
Pavithra Sangamam, 7.2 7.1 -1.4% 7.7 7.6 1 (BDL) 1 (BDL) 0.0 3 3 Nil Complying After Confluence
At Vijaywada 7.1 7.2 +1.4% 7.8 7.7 1.2 1 (BDL) -17% 3 23 +666.7% Complying
At Hamsaladeevi Near 4.6 4.8 +4.3% 7.9 7.9 2.6 2.2 -15% 3 3 Nil Non- Puligadda Aqueduct complying No. locations monitored 08 Locations in March 2020 (Pre-lockdown) and 08 locations in April 2020 (During lockdown) in AP No. of monitoring locations monitored 08 Locations in March 2020 (Pre-lockdown) and 08 locations in April 2020 (During lockdown) results available in AP No. of locations 06 07 08 08 08 08 08 08 complying to Criteria
165 I Page tv l'-1 +I
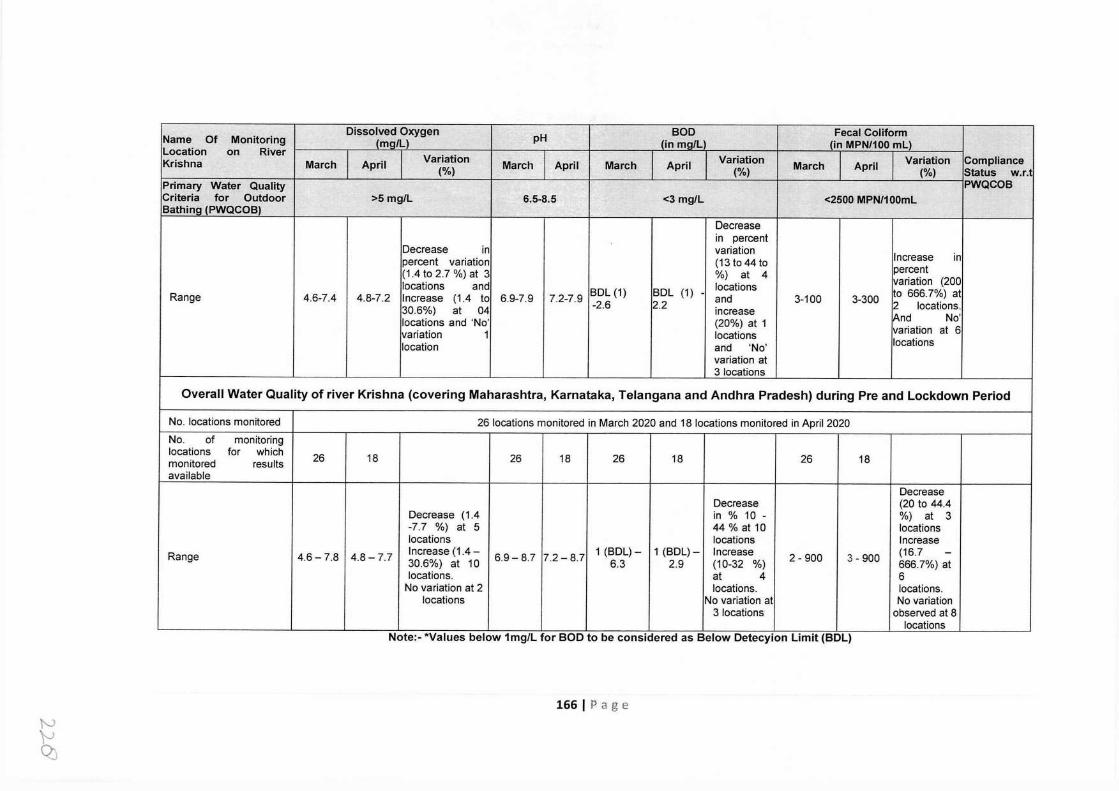
Dissolved Oxygen pH BOD Fecal Colifonn
Name Of Monitoring (mQ/L) /in mall (in MPN/100 ml) Location on River Variation Variation Variation Compliance Krishna March April (%) March April March April (%) March April (%) Status w.r.t Primary Water Quality PWQCOB Criteria for Outdoor >5 mg/L 6.5-8.5 <3 mg/L <2500 MPN/100ml Bathlnq (PWQCOB)
Decrease in percent
Decrease in variation Increase in percent variation (13 to 44 to (1.4 to 2.7 %) at 3 %) at 4 percent locations and locations variation (200
Range 4.6-7.4 4.8-7.2 Increase (1.4 to 6.9-7.9 7.2-7.9 BDL (1) BDL (1) - and 3-100 3-300 to 666.7%) at -2.6 2.2 2 locations. 30.6%) at 04 increase IAnd No' locations and 'No' (20%) at 1 variation at 6 variation 1 locations
location and 'No' locations variation at 3 locations
Overall Water Quality of river Krishna (covering Maharashtra, Karnataka, Telangana and Andhra Pradesh) during Pre and Lockdown Period
No. locations monitored 26 locations monitored in March 2020 and 18 locations monitored in April 2020 No. of monitoring locations for which 26 18 26 18 26 18 26 18 monitored results available
Decrease Decrease (20 to 44.4
Decrease (1.4 in % 10 - %) at 3 -7.7 %) at 5 44%at10 locations locations locations Increase
Range 4.6- 7.8 4.8- 7.7 Increase (1.4 - 6.9- 8.7 7.2-8.7 1 (BDL)- 1 (BDL)- Increase 2 - 900 3- 900 (16.7 - 30.6%) at 10 6.3 2.9 (10-32 %) 666.7%) at locations. at 4 6 No variation at 2 locations. locations.
locations No variation at No variation 3 locations observed at 8
locations Note:- *Values below 1mg/L for BOD to be considered as Below Detecyion Limit (BDL)
166 I Page N }-' Q)
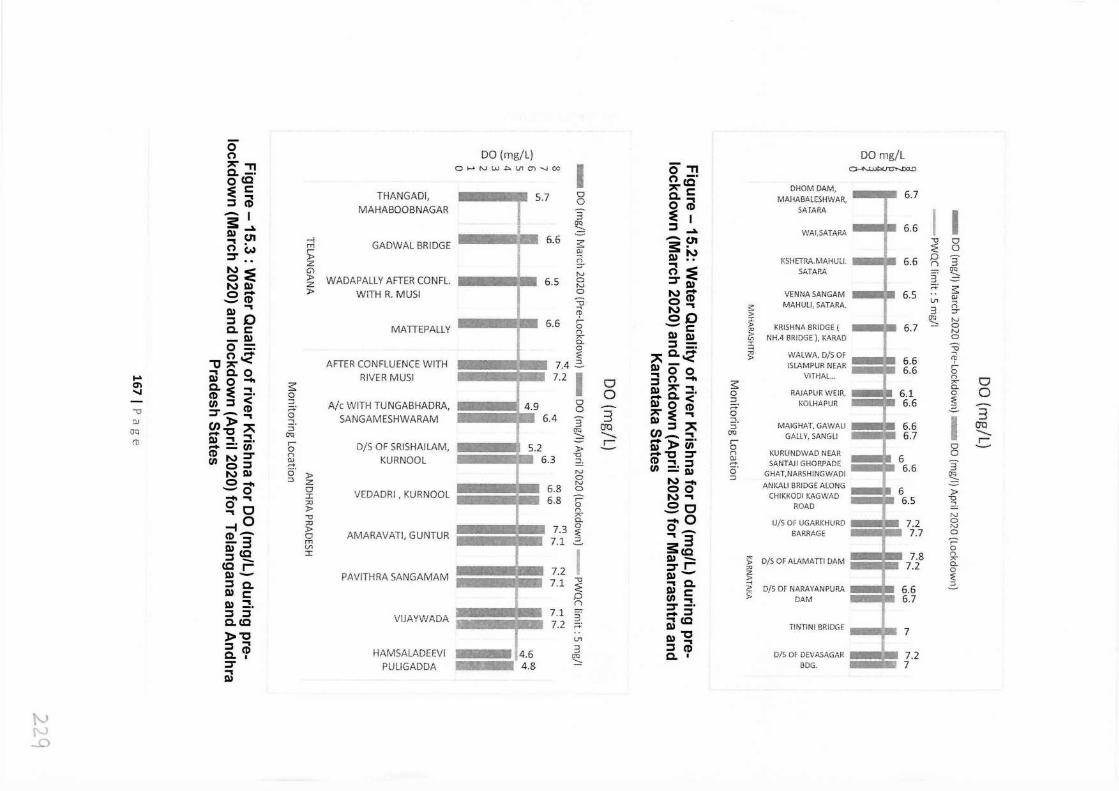
0 0 "' 'Tl Q. -· occ :E C THANGADI, ::::J al -1 MAHABOOBNAGAR
s: - Ill 0, -i ri <,.) m GADWAL BRIDGE r ::r .. )> z
~:E G) )> WADAPALLY AFTER CONFL.
"' Ill z
c- )> WITH R. MUSI - ct) Ill ... ::::J 0 Q. C MATTEPALLY - Ill o= o-
"'tJ "''< AFTER CONFLUENCE WITH .... ... Q. 0 RIVER MUSI Ill O - en Q. :e ... :s:: " ct) -· 0
CJ) ::::J < :::, A/c WITH TUNGABHADRA, v :::T-~ g~ ~ en l> :,;; SANGAMESHWARAM OQ ::,
- i:, ... OQ !'O Ill ... -· r- D/S OF SRISHAILAM, - = en 0
ct) "' :::T (")
KURNOOL CJ) C ::::J ~ "' Ill 6' )> c- ::, z -o 0 VEDADRI , KURNOOL - ... I
Qo :,:, >
--f 0 "O ;i::, )>
ct) - 0 AMARAVATI, GUNTUR -3 rn Ill (Q V1
::::J - I
(Q r- Ill - PAVITHRA SANGAMAM ::::J Q. Ill C Ill :::::!. ::::J ::J VUAYWADA Q.(Q
)> i:, ::::J ... Q. C? HAMSALADEEVI :::T PULIGADDA ... Ill
tv I'-' -D
DO (mg/L) 0 ~ N W .P. l,7 0) ~ C¢ I
..
7
6.6
6.5
0 0 3 ~ s ru g. N a N 0
"O ;;; 6.6 5"
r, .,,,,. a.. 0 ~
7.4 2, 7.2 I
0 0
.4
.3
6.8 6.8
3 9s, )> -g_ N 0 N a ,- 0 n 7'" Cl.
7.3 ~ 7.1 ::::
7.2 "O 7.1 ~ 0 n
7.1 ~~ 7.2 ~ U'1
:::J cii5 -:::,
DO mg/L 0 'Tl ~ 0 -· "'(Q DHOM DAM, Q. C
MAHABALESHWAR, 6.7 0 ... :e ct) SATARA I I ::::J I 6.6 - WAl,SATARA - 0, "O 0 s:. ~ 0 Ill !':? KSHETRA.MAHULI. 6.6 0
~ ri :E n SATAP.A ~i' -:::, ::r Ill ;:;: s "' - VEN NA SANGAM 6.5 C ct) ru
MAHULI, SATARA. u, ri "' ... s: 3 co )> :,-
?; OQ N -c KHISHNA BRIDGE ( 6.7 -:::, 0
~ N Ill Ill NH.4 BRIDGE). KARAD 0
::::J = :i: -=o -< :,;; Q. '< "' WMWA,D/SOF ;;; > 6.6 Ill O 0 151.AMPUR NEAR 6.6 5"
0 ... 0 - VITHAL... n 0 ::::J "' :s:: 7'"
C. 0 Ill Q. :::::!. 0 RAJ.APUR WEIR, 6.1 0 0 iif'o< ::,
KOLHAPUR 6.6 ~ - "' :e ~ 0 :::; - 3 Ill ::::J :,;; ..., I 3
(JQ 5· MAIGHAT, GAWALI 6.6 (JQ -..... en_.., OQ GALLY, SANGL! 6.7 -..... .c S" )> u;· r- .c 0 0
- i:, ::r n KURUNDWAD NEAR 0 ~ :::::!. ::::J
QJ 6 ,-+ SANTAII GHORPADE 6.6 3 - Ill 6' GHAT,NARSHINGWADI OQ
"' - :::, -:::, co ANKALI BRIDGE ALONG
6 )> "' ... CHIKKODI K,\GWAD 6.5 "O
.9 0 llOAD ...,
-o N U/S OF UGARKHURD 7.2 0 o_ N
... 3 BARRAGE 7.7 0
S:cc b 7.8 n
Ill - " DiS OF ALt,MA TTI DAM 7'"
:::T r- > 7.2 C. "' 0 Ill -
z > :.: ... Q. -< :::;
Ill )> D/S OI' NARAYANPURA 6.6 C " en ... > DAM 6.7 :::T -· -::::J DI cc TINTINI BRIDGE 7 Ill i:, ::::J al
D/S OF DEVASAGAR Q. I 7.2 BOG. 7
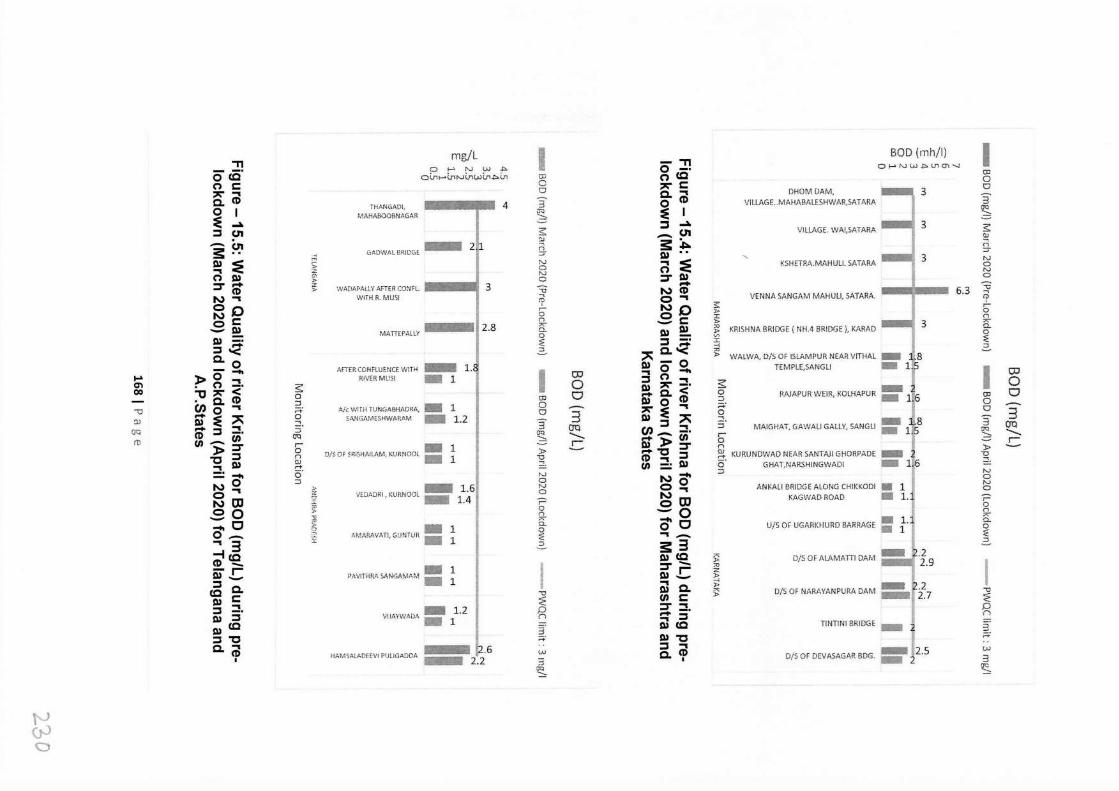
,, mg/L I BOD (mh/1) I - ,, O.,_.NW,P.VlO)-...J 0 I-' N w .,. 0 -· 0 CC oV,.....,.l/1NV"lwLn~in Cil (") cc Cil 0
0 C: 0 " C:
0 " ., 0 C. ., DHOMDAM, 3 C. (D
;•AAcoo,, :r 4 3 0 (D VILLAGE .. MAHABALESHWAR,SATARA 3 0 I (JQ :E I
(JQ
:e tv1AHABOOBNA.GAR ':::, 2 ~ ::I ~ 3 s :::s c.n s - c.n V!LLAGE. WAl,SATAHA QJ ~
- c.n GADWAL BRIDGE - 2 [)_ ;:; s: ~ 9- s: :=;- I» ..... 3 I» :E N
N
0 ., :E KSHETPA.MAHULI. SATARA 0 .,
N (") N
0 I» 0 ::r I» 0
::r - 3 - ~ (D WADAPALLY AFTER CON FL ,:j N CD 6.3 N-, WiiH R. MUSI re 0., VENNA SANGAM MAHULI, SATARA. rp co ,.!- "'O :s: ,-
0 l> 0 NC: n .8 C: ~ n
.8 I» 2.8 ,._.. 3
,._.. 0.. I» ~ KRISHNA BRIDGE ( NH.4 BRIDGE i. KARAD 0..
I» = MATTEPALLY 0 I» 0
:E :::s ;::::;: :5 :E :::s~ ::, :,;: C. '< ;ti 2.. C. 0
)> WAL WA, D/S OF ISLAMPUR NEAR VITHAL - .8 :\FTERCC:NFl.UENCEWITH - 1. I» - 0 TEMPLE,SANGLI - 115 )>, 0 :;- I ., 0 - I OJ .... Ri'/ERMUSI - [l OJ :::s (") .,
~ RAJAPUR WEIR, KOLHAPUR : J6 0 CTI . 0 -· ~ 0 I» " -· 00 .,, " < 0 - C. < 0 - . C. (D 0 0:, I» 0 (D Cil
en o ., ::J A/c WI TH TUNGABHADRA, 1111 [l 0
[ MAIGHAT, GAWALI GALLY, SANGLI =- llS 0 - "'O
~ 0 " :e ., 0 3
OJ s- :e :,;: SANGAMESHWARAM - [.2 3 3 I» ::I :,;: 3 <D :::s ::::!. OQ OQ (TQ ~ "" en_::::!. "" -.....
t/1 - t/1 ':::, -..... - )>, t/1 ......
(I) r D/5 O> SR'5HAILAM, KURNOOL = ,- g KURUNDWAO NEAR SANTAII GHORPADE - I = ..c )>, ::r 0 [l J> - ~ "'C ::r J>
"'C :::s r, [l -g_ (D ., :::s "O a., ., I» .... t/1 = I» o· GHAT,NARSHINGWADI - 116 -
=- o· N N o'
:;:J ANKALI BRIDGE ALONG CHIKKODI • [l I N
NO ::J 0 0
V'DADRI KVRNOO• - 1·6
N N 0., 0 0., 0
NCIJ - . -- 1.4 -;:o ~ [IJ KAGWAD ROAD - 1. -;:o
$0 0
U/5 Of UG.t.RKHURD BARRAGE = :f' ~ 0 n -o n ,.,. ,.,.
-c AMA?.AVATI, GUNTJR = a.. o' CJ 0..
1 0 0
0- 1 :a: ., - :a: ., 3 2.. s: 3 2.. --i cc I» cc "' D/S OF ALAMATTI DAM .2 (D -
l> 2.9 I -r- PAVITHRA 5ANGAMAM = 1 I ::r - ~
I» - 1 I» ..c l> :::s C.
., ,: D/S Of NARAYANPURA DAM =- .. 2 cc -u I» C. "" -0
I» C: ~ t/1 C: l> 2.7 ~ :::s ::::!.
V "YW ,, - 1.2 0 ::r ::::!. 0 a, :::s u,. A,),.- l n ~ :::s r,
a, cc 3 I» cc TINTINI BRIDGE - 3· :::s "'C ;:;· I» "'C
D/S OF DEVASAGAR BDG. :-12.5 ;::.: C. .,
HAMSAL'-DEEVI PUUGAODA - 2_2·6 :::s ., w (D w C. (D
I 3 I 3 "" "" ':::, ':::,
~ C,
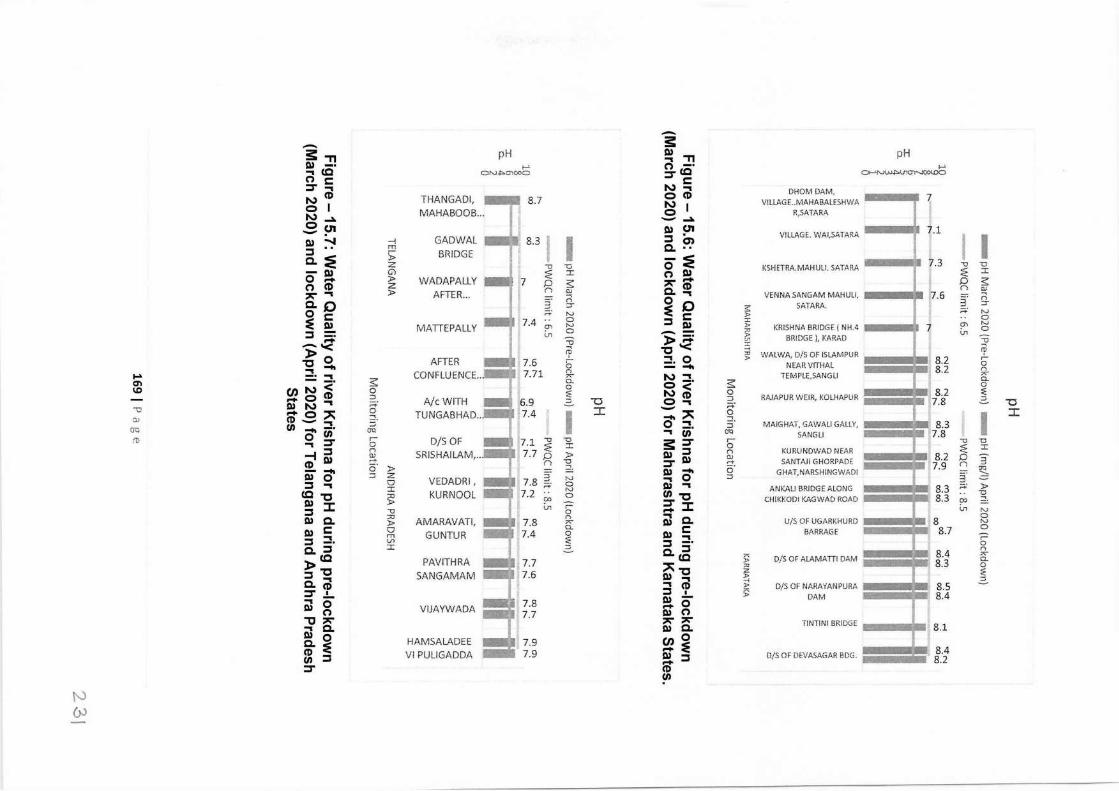
- - ~ ~ "T1 pH ~ "T1 pH Q) -· l--' C') -· I-' ""I (C ON-t>0-,000 ::::r (C 0>--NW.r,.cr,O"l-..JOO<DO C') C: C: ::::r ""I ~ ~ DHOMDAM, N C'D THANGADI, 8.7 N VILLAGE..MAHABALESH\NA 7 ~ ~ MAHABOOB... "9 ~ R,SATAR,, i ~ iii G.ADWAL 8.31 I [ ~ VILLAGE. WAl,SATARA
7-1 I I
< > BRIDGE _ < C. < G)Z u tl O :::: KSHETRA.MAHUU. SATARA 7·3 ~ 't;?. -Q) ~I C'>- <- 0 CD ~ WADAPALLY · 7 o 3;: ,,_.. CD ' 0 :S: i ""I > AFTER... '.::: ~ g- ""I VENNASANGAM MAHULI, ---·· (7.6 ; ~ c. D 2. ;;;- :E D :;: SATARA. ;;, ~ Oc: -l:3 :le: '.:'. • i3 :E e!_ MATTEPALLY 7·4 °' t, _ e!,_ ?:; KRISHNABRIDGE(NHA ••••0 7 E: o :::S ;:i: ~ -u )> ;::;: ~ BH!OGE ), KARAD ~ --< ~ -c'< :::; ro )> O 'J' ""I O j;: WAI.WA, D/S OF ISLAMPUR 8 2 ,!- "C - AFTER 7.6 i:, :: - NEAHVITHAL 8.2 g
..,. :::!. -. CONFLUENCE... 7.71 * N -. TEMPLE,SANGU I . & O'I - -· $ a. 0 -· $ O
ID en N < O ~ N ~ o , =====- 8.2 :,: - 0 ~ ::'.. A/c WITH ::, -0 0 ... ::'.. RAJAPUR WEIR, KOLHAPUR 17.8 ::, -0 Ill N ,.,. ~ - ,... , ;' - O :,;; S; TUNGABHAD... I :C - :,;; Q I :C "' m - :::!. :5· 0 :::!. :::, MAIGHAT, GAWALI GALLY, ====r 8.3 at. - UI cm ""I t/1 OQ SANGLI 7.8 !'t> Q ::::r b D/S OF 7.1 :E ~ ~ ::::r b , cl ~
--i :::l Q SRISHAILAM,... 7.7 O > Q) :::l Q KURUNDWAD NEAR 8 2 ~ ':, (D Q) c!. r, -g :::,- Q) c!, SANT.'JI GHORPADE ===== 7 g n ~ - - g ~ Q) -0 O GHAT,NARSHINGWADI . -· ~ Q) 0 VEDADRI 7 8 3 "' -. :::, 3 .:::: :::l ""I ~ ' . ;::;: i3 Q) ""I MJK,,u BRIDGE ALONG =~~~~- 8.3 ;:;: ~ (C "C ~ KURNOOL 7.2 ?> ~ ~ "C CHIKKODI KAGWAD ROAD . 8.3 00 ~
~ :::c cl V1 i:, - :::c <,a N
Q) C. <': AMARAVATI 7 8 * ~ C. U/SOFUGARKHURD ====r:. 8 i3 - ' . a. C: ' 0 Q) ~ ~ GUNTUR 7.4 o Ill -, BARRAGE 8.7 -;:: :::l -· V, :,: :::l -· 0
Q. :::l I 2.. Q. :::l ===== 84 ~ )> cc PAVITHRA :,;; cc 01s os ALAMArn DAM 1 8:3 g- :::l °Q SANGAMAM Q) °Q ~ C. C'D 3 C'D D/S OF NARAYMJPUHA ====~' 8.5 ~ :::T .!. Q) .!. DAM 8.4 ~ O VIJAYWADA 7·8 - O C'> 7.7 Q) C'> ~ [ @ [ TINTINI BRIDGE ----·, 8.1 ~ 0 HAMSALADEE 7.9 en ~ m ~ VI PULIGADDA 7.9 ~ :::l D/SOFDEVASAGAHBDG. ===== ff ::::r C'D
UI
N (>J
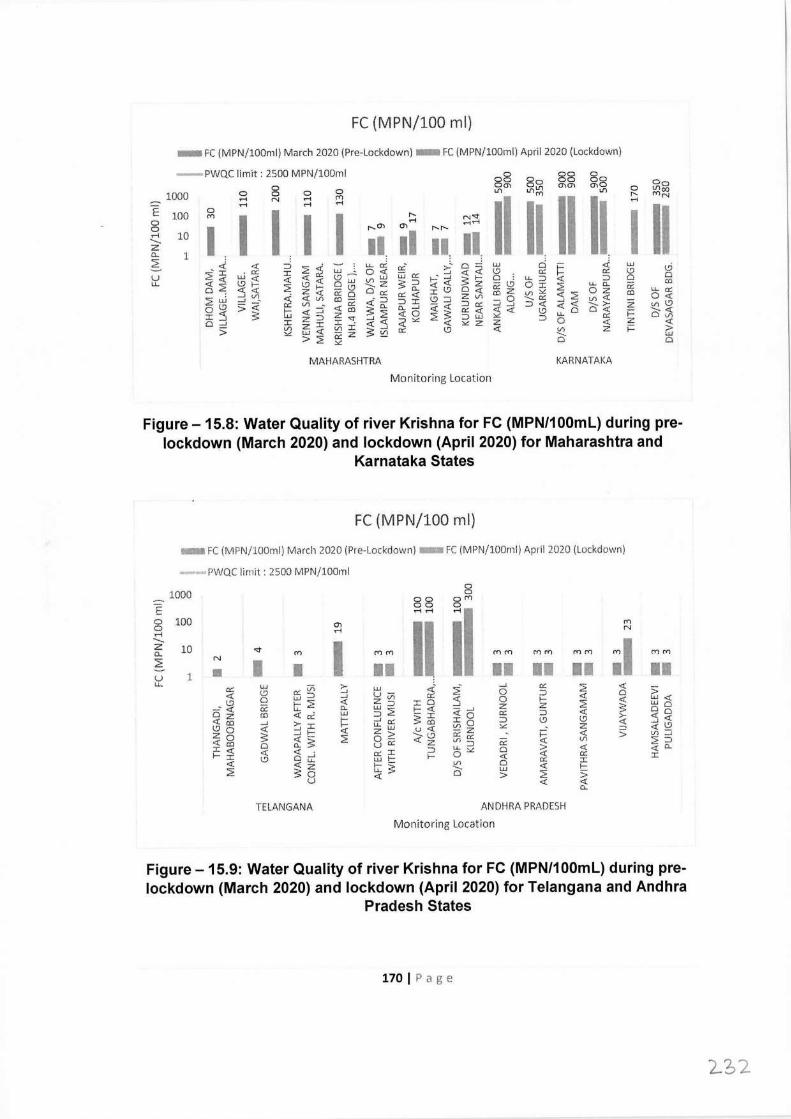
FC (MPN/100 ml)
- FC (MPN/lO0ml) March 2020 (Pre-Lockdown) - FC (MPN/100ml) April 2020 (Lockdown)
-PWQC limit: 2500 MPN/lO0ml 0 00 0 00 Do 00 00 Oo
0 00') oll'l (J'\(J'\ 0')0 0 0 l/'l l/'l ll'loo 1000 0 0 0 l/'lr'l t-- MN ,...., N .-< r'l
II II II rl - .-< .-< rl
II II E 100 0
I I r'l
I I I t-- r,J'St
0 rl .-<rl 0 I ,-._O'> (J'\ t--t-- .-< 10 II II II ---- II z c.. 1 : ~ - <i <( ::::i 2 <:( I.J... a:'. cc' >-' o- UJ ci i= <i LU 0 2I . r:r. I LU C 0 <( w r:r.
___, <:(~ (.'.) c:'. r:r. (.'.) u <:( <:( ~;:: <:( <:( r:r. (.'.)- V, UJ ~-;;t sf- 0 : I.J...::) <:( :::, 0 0 LL \.? <:( 0 UJ 3 ~ co
o2 2 .___z oz - (.'.) 0 :r.: 2 I.J... c.. a'. <( <( z f- - (.'.) 0 er:: I(.'.) ~ z oz I.J... er:: __, V1 <i <( ;ji cc 0 c:'. <:( z:Ji l/1 "" <:( 2 co 0 <:( 2w co - - ::) (.'.)::::; -0 ----cc V, <( _, -- cc V1 <( ~ <( c.. ::) I ::) c:'. ___, ___, ::) <( ;;t <( ---- >- z V1 (.'.) 0 (.'.) - <( c.. ___, - <:(
I :') >5 tu ~~ 52 <( 0 <( s er:<:( <:( <( (.'.) LL Q 0<( i= ----<:( z"'" _, <( ~ "" 2 <( ::) LJ.J "" ::) 0 cc 0 V)
0 ___, I zI I . <( ___, ""z z <( z <(
> <.I) l/1 I er: (.'.) <( ~ z ~ > ::<'. LU <( ii: z 5~ LJ.J
>2 "" 0 0
MAHARASHTRA KARNATAKA
Monitoring Location
Figure -15.8: Water Quality of river Krishna for FC (MPN/100ml) during pre lockdown (March 2020) and lockdown (April 2020) for Maharashtra and
Karnataka States
FC (MPN/100 ml)
- FC (MPN/100ml) March 2020 (Pre-Lockdown) - FC (MPN/l00ml) April 2020 (Lockdown)
PWQC limit: 2500 MPN/l00rnl 0
1000 0 00 o"'
E 00 0 .-< .-<
II 0 100 (J'\ II r'l
0 .--, N rl
---- I ;I z 10 'St CL r'l r'lr'l r'lr'l r'lr'l r'lr'l r'l r'l
2: N
I u 1 • I II II II II II I.J... UJ er: vi >- <t' :i
___, er:: 2 <( r:r. (.'.) ___, L.U 0 ::) 0 > <:( LJ.J::) ___, u- cc <( 0 z V) <( 0 f- <:( L.U <(
\.? ii: t;: 2 <( L.U ::J :i:O ___, z z 2 3 UJ 0
-- <( c.. ::) 2 f- <( <i: 0 Oo Oz co <( a:'. LJ.J -:i: er:: ::) <( >- <( <( <( co ___, >- I ~ _, er:: 3 co Io ::) (.'.) (.'.) '.:!; ;;t ~ (.'.) 0 <:( ::::: f- <( U... LL u <( ~z "" z Zo 5 z>
---- \.? er:: cc - i= <( > <.I)___,
~~ 2 0- <( z l/1 ::) - <( l/1 2::) <( co 0 u er:: r:r. I <( <( <( . er: I ::) 0 "" 0 > <( <( CL <( cc f- I (.'.) 0 ___, w f- f- <:( I
<( <( I.J... l/1 0 er: I t;: - <( f- 2 s~ <( 3 ---- w 0 > 2 > u <( <(
c..
TELANGANA ANDHRA PRADESH
Monitoring Location
Figure -15.9: Water Quality of river Krishna for FC (MPN/100ml) during pre lockdown (March 2020) and lockdown (April 2020) for Telangana and Andhra
Pradesh States
110 I Page
15.4 Observations
Based on the analytical results of the samples collected from river Krishna, following findings/observations are made on river Krishna:
Maharashtra
During the pre-lock down period (March 2020):-
• The analysis results of the 9 monitored locations for the four critical parameters of outdoor bathing showed pH (7 -8.3), DO (6 -6.7 mg/l), BOD (1.8 -6.3 mg/l) and FC (7 -200 MPN/100ml).
• The alysis results of river Krishna showed minimum DO ( 6 mg/l) at Kurundwad whereas maximum BOD (6.3 mg/l) was observed at Venna Sang am. Maximum FC (200 MPN/100 ml) was observed at Kshetra Mahuli.
• 08 out of 09 monitored locations were found to be with the complying with the parameters (i.e. pH, DO, BOD and FC) prescribed under Primary Water Quality Criteria for Outdoor Bathing.
During the Jock down period (April 2020):- The analysis results indicate
• The analysis results for the four critical parameters of outdoor bathing observed to be in the order of pH (7.8 -8.2), DO (6.6 -6.7 mg/l), BOD (1.5 -1.6 mg/l) and FC (7 -17 MPN/100ml) at 04 monitored locations.
• The alysis results of river Krishna shows minimum DO ( 6.6 mg/l) at 3out of 4 monitored locations whereas maximum BOD (1.6 mg/l) was observed at Kurundwad. Maximum FC (17 MPN/100 ml) was observed at Rajapur Weir, Vilage Rajapur.
• All the 04 monitored locations were observed to be within the desirable limits for the parameters (i.e. pH, DO, BOD and FC) prescribed under Primary Water Quality Criteria for Outdoor Bathing.
Overall observations on River Krishna stretch within Maharashtra State: -
• The analysis results revealed increasing trend of DO (1.5 -10 %) at 3 locations, FC (16.7-84.8 %) at 3 locations and decreasing trend of BOD (17-20 %) at 4 locations were observed.
• 'No' variation in DO (at 1 location) and FC (at 1 location) were observed.
171 I Page
Karnataka
During the pre-lock down period (March 2020): -
• The analysis results for the four critical parameters were observed to be in the order of pH (8.0 -8.5), DO (6.0-7.8 mg/L), BOD (1.0-2.5 mg/L) and FC (350 -900 MPN/100ml) at 05 monitored locations.
• The alysis results of river Krishna showed minimum DO ( 6 mg/L) at Ankali Bridge whereas maximum BOD (2.5 mg/L) was observed at Devasagar Bridge. Maximum FC (900 MPN/100 ml) was observed at 2 locations ( which needs reverification).
• All 05 monitored locations were found to be complying with the parameters (i.e. pH, DO, BOD and FC) prescribed under Primary Water Quality Criteria for Outdoor Bathing.
During the lock down period (April 2020):-
• The analysis results for the four critical parameters were found to be in the order of pH (8.1 - 8.7), DO (6.5 -7.7 mg/L), BOD (1.0 -2.9 mg/L) and FC (170 -900 MPN/100ml) at 06 monitored locations.
• The alysis results of river Krishna showed minimum DO (6.5 mg/L) at Ankali Bridge whereas maximum BOD (BDL mg/L) was observed at U/s of Ugarkhurd Barrage. Maximum FC (900 MPN/100 ml) was observed at D/s Almatti Dam ( which needs re-verification)
• 5 out of 6 monitored locations were observed to be within the criteria limits for the parameters (i.e. pH, DO, BOD and FC) prescribed under Primary Water Quality Criteria for Outdoor Bathing except pH non complying at one location.
Overall observations on River Krishna stretch within Kamataka State: -
• The analysis results revealed increasing trend of DO (1.5 -8.3 %) at 3 locations, BOD (10-32%) at 3 locations, FC (80 %) at 1 location.
• Decreasing trend of DO (2.8-7.7 %) at 2 locations, BOD (10-20 %) at 2 locations, FC (20-44.4 %) were observed.
• 'No' variation in FC (at 1 location) was observed.
172 I Page
Telangana
During the pre-lock down period (March 2020):-
• The analysis results for the four critical parameters were observed to be in the order of pH (7 -8.7), DO (5.7 - 6.6 mg/L), BOD (2.1 -4 mg/L) and FC (2 -19 MPN/100ml) at 04 monitored locations.
• 3 out of 4 monitored locations were found to be complying with the parameters (i.e. pH, DO, BOD and FC) prescribed under Primary Water Quality Criteria for Outdoor Bathing.
During the lock down period (April 2020):- Data not available/No monitoring done.
Andhra Pradesh
During the pre-lock down period (March 2020):-
• The analysis results for the four critical parameters were observed to be in the order of pH (6.9 -7.9), DO (4.6-7.4 mg/L), BOD (1.0 -2.6 mg/L) and FC (3-100 MPN/100ml) at 08 monitored locations.
• 6 out of 8 monitored locations are complying to the parameters (i.e. pH, DO, BOD and FC) prescribed under Primary Water Quality Criteria for Outdoor Bathing.
During the lock down period (April 2020):-
• The analysis results for the four critical parameters were found to be in the order of pH (7.2-7.9), DO (4.8-7.2 mg/L), BOD (01-2.2 mg/L) and FC (3 -300 MPN/100ml) at 8 monitored locations.
• 7 out of 8 monitored locations were observed to be complying with the parameters (i.e. pH, DO, BOD and FC) prescribed under Primary Water Quality Criteria for Outdoor Bathing.
Overall observations on River Krishna stretch within Andhra Pradesh State:-
• The analysis results revealed increasing trend of DO (1.4 -30.6 %) at 4 locations, BOD (20 %) at 1 location, FC (200-666.7 %) at 2 locations and decreasing trend of DO (1.4-2.7 %) at 3 locations, BOD (13-44 %) at 4 locations were observed. '
173 I Page
2.35
• 'No' variation in DO at 1 location, BOD at 3 locations and FC at 6 locations were observed.
Overall observations on River Krishna (covering Maharashtra, Karnataka, Telangana and A.P): -
).,, During pre-lockdown (March 2020), analysis results were found to be in the order of pH (6.9-8.7), DO (4.6 -7.8 mg/L), BOD (1- 6.3 mg/L) and FC (2-900 MPN/100 ml). Also, 22 out of 26 monitored locations were found to be complying to the limits prescribed under Primary Water Quality Criteria for Outdoor Bathing.
).,, During lockdown (April 2020), analysis results were observed to be in the order of pH (7.2-8.7), DO (4.8 -7.7 mg/l), BOD (1-2.9 mg/L) and FC (3-900 MPN/100 ml). Also, 16 out of 18 monitored locations were found to be within the desirable limits prescribed under Primary Water Quality Criteria for Outdoor Bathing. Analysis results of river Krishna shows maximum DO at U/S Ugarkhurd Barrage (7.7 mg/l)) and minimum at Hamsala Deevi, Puligadda Aqueduct (4.8 mg/l) whereas maximum BOD was observed at D/S Almatti Dam (2.9 mg/l) and minimum as 'BDl' at 06 locations viz U/S Ugarkhurd Barrage, at A/C Confluence with River Musi, D/S Srisailam Kurnool, Amravati, Guntur, Pavitra Sangam A/C & at Vijyawada. Maximum FC was observed at 2 locations viz Ankali Bridge & D/S Almatti Dam (900 MPN/100 ml) and minimum at 05 locations viz. Confluence with River Musi , Vedradri Kurnool , Amravati Guntur , Pavitra Sangam A/C & Hamsala Devi Puligada Aqueduct (03 MPN/100 ml).
).,, Overall, decreasing trend of DO (1.4 -7.7 %) at 05 locations, BOD (10 -44%) at 10 locations, FC (20-44.4%) at 3 locations were observed.
).,, Overall increasing trend of DO (1.4% -30.6%) at 10 locations, BOD (10 -32 %) at 4 locations and FC (16.7-666.7 %) at 6 locations were observed. 'No' variation was observed w.r.t DO (at 2 locations), BOD (at 3 locations) and FC (at 8 locations).
15.5 Conclusion
During pre-lockdown, 22 out of 26 monitored locations, 16 out of 18 monitored locations during lockdown were found to be complied with the Primary Water Quality Criteria for Outdoor Bathing. Overall, 16 monitored locations complied with the Primary Water Quality Criteria for Outdoor Bathing. Also, marginal improvement in water quality of river Krishna was observed with respect to parameters viz., DO & BOD.
174 I Page
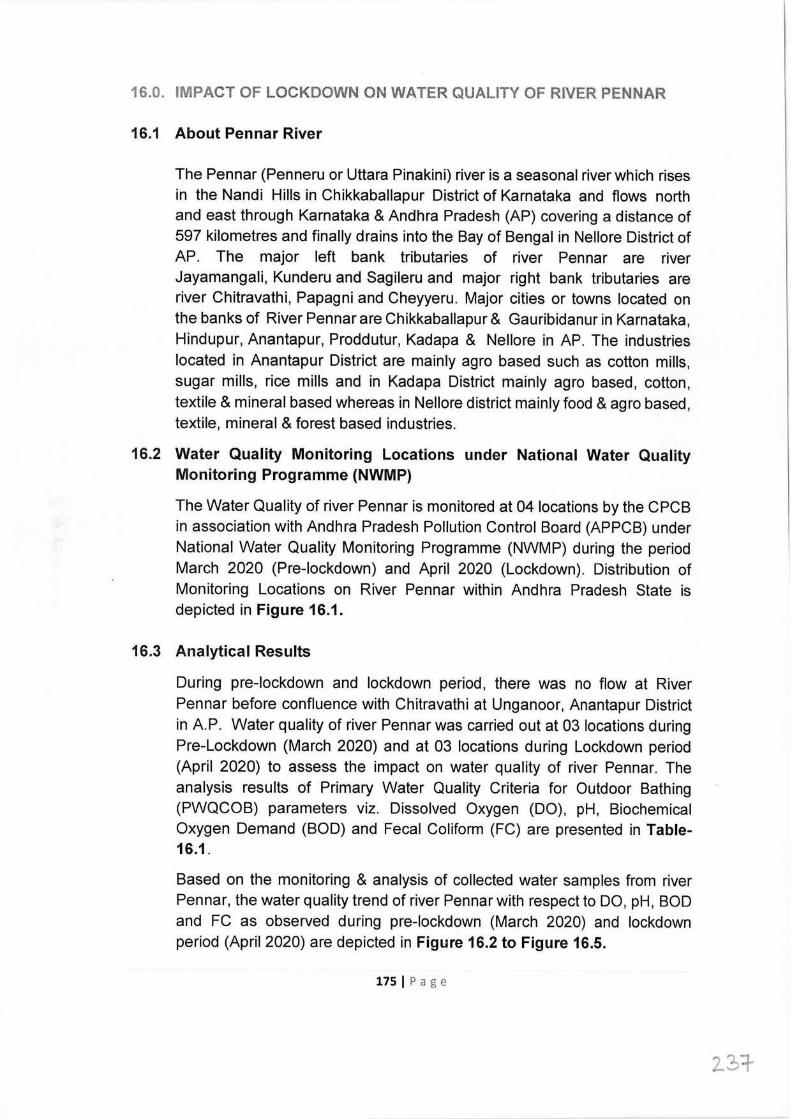
16.0. IMPACT OF LOCKDOWN ON WATER QUALITY OF RIVER PENNAR
16.1 About Pennar River
The Pennar (Penneru or Uttara Pinakini) river is a seasonal river which rises in the Nandi Hills in Chikkaballapur District of Karnataka and flows north and east through Karnataka & Andhra Pradesh (AP) covering a distance of 597 kilometres and finally drains into the Bay of Bengal in Nellore District of AP. The major left bank tributaries of river Pennar are river Jayamangali, Kunderu and Sagileru and major right bank tributaries are river Chitravathi, Papagni and Cheyyeru. Major cities or towns located on the banks of River Pennar are Chikkaballapur & Gauribidanur in Karnataka, Hindupur, Anantapur, Proddutur, Kadapa & Nellore in AP. The industries located in Anantapur District are mainly agro based such as cotton mills, sugar mills, rice mills and in Kadapa District mainly agro based, cotton, textile & mineral based whereas in Nellore district mainly food & agro based, textile, mineral & forest based industries.
16.2 Water Quality Monitoring Locations under National Water Quality Monitoring Programme (NWMP)
The Water Quality of river Pennar is monitored at 04 locations by the CPCB in association with Andhra Pradesh Pollution Control Board (APPCB) under National Water Quality Monitoring Programme (NWMP) during the period March 2020 (Pre-lockdown) and April 2020 (Lockdown). Distribution of Monitoring Locations on River Pennar within Andhra Pradesh State is depicted in Figure 16.1.
16.3 Analytical Results
During pre-lockdown and lockdown period, there was no flow at River Pennar before confluence with Chitravathi at Unganoor, Anantapur District in A.P. Water quality of river Pennar was carried out at 03 locations during Pre-Lockdown (March 2020) and at 03 locations during Lockdown period (April 2020) to assess the impact on water quality of river Pennar. The analysis results of Primary Water Quality Criteria for Outdoor Bathing (PWQCOB) parameters viz. Dissolved Oxygen (DO), pH, Biochemical Oxygen Demand (BOD) and Fecal Coliform (FC) are presented in Table- 16.1.
Based on the monitoring & analysis of collected water samples from river Pennar, the water quality trend of river Pennar with respect to DO, pH, BOD and FC as observed during pre-lockdown (March 2020) and lockdown period (April 2020) are depicted in Figure 16.2 to Figure 16.5.
175 I Page
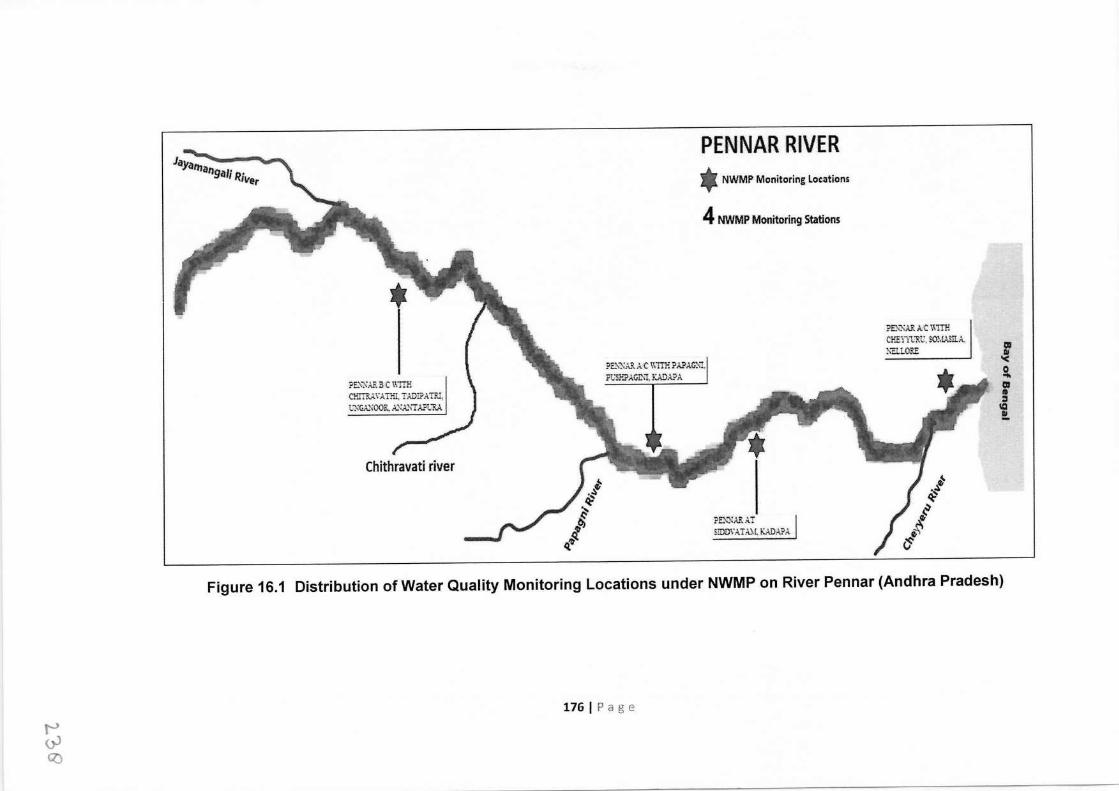
PENNAR RIVER layatriang,l(; Rive, * NWMP Monitoring locations
4 NWMP Monitoring Stations
PE:,,X~ AC \\TI!i Cf.EYYt7.U, !O!,l.\Sll..!, :-."EI.l.ORE
?E.\");Ai'. 3 C \\TI!i C:-iITR.-4.YA T.~ T ID!?ATR.11
t,-:-;G.'-.\OOR, .l..\.>.XT.l.?1.'RA
Chithravati river
?EXKAR A'C wrrs PA?AG:-.1. ?USI-:?AGIXI, K.ADA?A
?EX:>:ARAT S!DD,·AT . .\..\~ K.-'.DA?A
f a f ::, IQ !.
Figure 16.1 Distribution of Water Quality Monitoring Locations under NWMP on River Pennar (Andhra Pradesh)
176 I Page t-' oJ GO
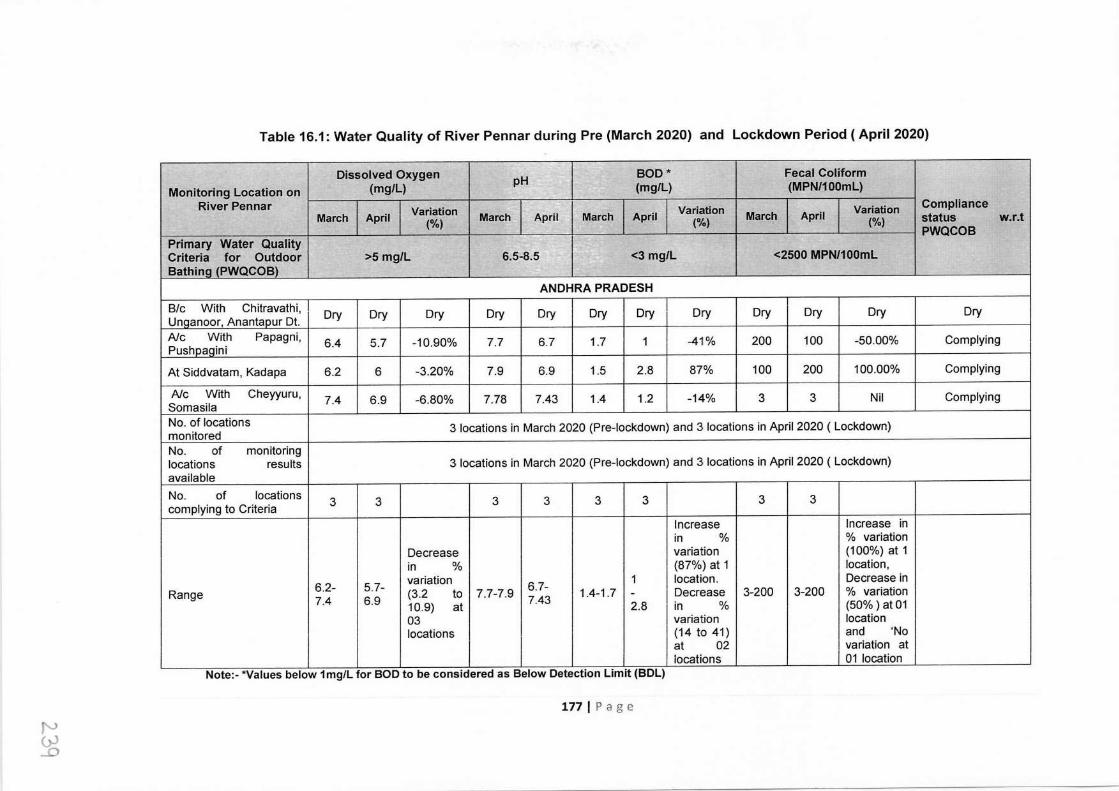
Table 16.1: Water Quality of River Pennar during Pre (March 2020) and Lockdown Period ( April 2020)
Dissolved Oxygen pH BOD* Fecal Coliform Monitoring Location on (mg/L) -~ (mg/L) (MPN/1 00mL)
River Pennar Variation Variation Variation Compliance March April (%) March April March April (%) March April (%) status w.r.t
Primary Water Quality PWQCOB
Criteria for Outdoor >5 mg/L 6.5-8.5 ":'- <3 mg/L <2500 MPN/100mL Bathinq (PWQCOB)
ANDHRA PRADESH B/c With Chitravathi, Dry Dry Dry Dry Dry Dry Dry Dry Dry Dry Dry Dry Unaanoor, Anantapur Dt. Ale With Papagni, 6.4 5.7 -10.90% 7.7 6.7 1.7 1 -41% 200 100 -50.00% Complying Pushoaaini
At Siddvatam, Kadapa 6.2 6 -3.20% 7.9 6.9 1.5 2.8 87% 100 200 100.00% Complying
Ale With Cheyyuru, 7.4 6.9 -6.80% 7.78 7.43 1.4 1.2 -14% 3 3 Nil Complying Somasila No. of locations 3 locations in March 2020 (Pre-lockdown) and 3 locations in April 2020 ( Lockdown) monitored No. of monitoring locations results 3 locations in March 2020 (Pre-lockdown) and 3 locations in April 2020 ( Lockdown) available No. of locations 3 3 3 3 3 3 3 3 complying to Criteria
Increase Increase in in % % variation
Decrease variation (100%) at 1 in % (87%) at 1 location,
6.2- 5.7- variation 6.7- 1 location. Decrease in Range 7.4 6.9 (3.2 to 7.7-7.9 7.43 1.4-1.7 - Decrease 3-200 3-200 % variation
10.9) at 2.8 in % (50%) at 01 03 variation location locations (14 to 41) and 'No
at 02 variation at locations 01 location
Note:- *Values below 1 mg/L for BOD to be considered as Below Detection Limit (BDL)
177 I Page JV ~
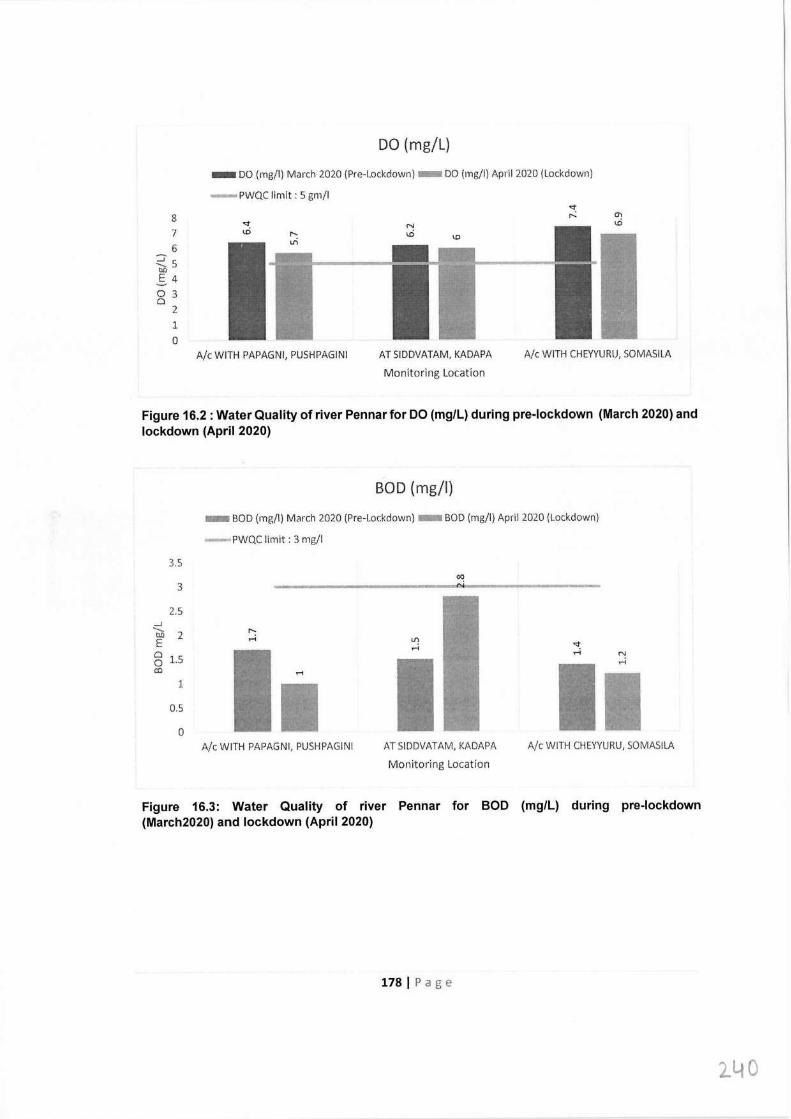
DO (mg/L)
- DO (rng/1) March 2020 (Pre-Lockdown) - DO (rng/1) April 2020 (Lockdown)
-PWQC limit: 5 gm/I
8 7 6
.:::::'.. 5 tll) s 4 0 3 a
2 1 0
A/c WITH PAPAGNI, PUSHPAGINI AT SIDDVATAM, KADAPA
Monitoring Location
BOD (mg/I)
A/c WITH CHEYYURU, SOMASILA
Figure 16.2: Water Quality of river Pennar for DO (mg/L) during pre-lockdown (March 2020) and lockdown (April 2020)
- BOD (rng/1) March 2020 (Pre-1.ockdown) - BOD (rng/1) April 2020 (Lockdown)
-PWQC limit: 3 mg/I
3.5
3
2.5 ...1
----- 2 ": tll)
E .-<
0 1.5 0 co
l
0.5
0 A/c WITH PAPAGNI, PUSHPAGINI
LI)
.-t
ATSIDDVATAM, KADAPA
Monitoring Location
A/c WITH CHEYYURU, SOMASILA
Figure 16.3: Water Quality of river Pennar for BOD (mg/L) during pre-lockdown (March2020) and lockdown (April 2020)
178 I Page
2.40
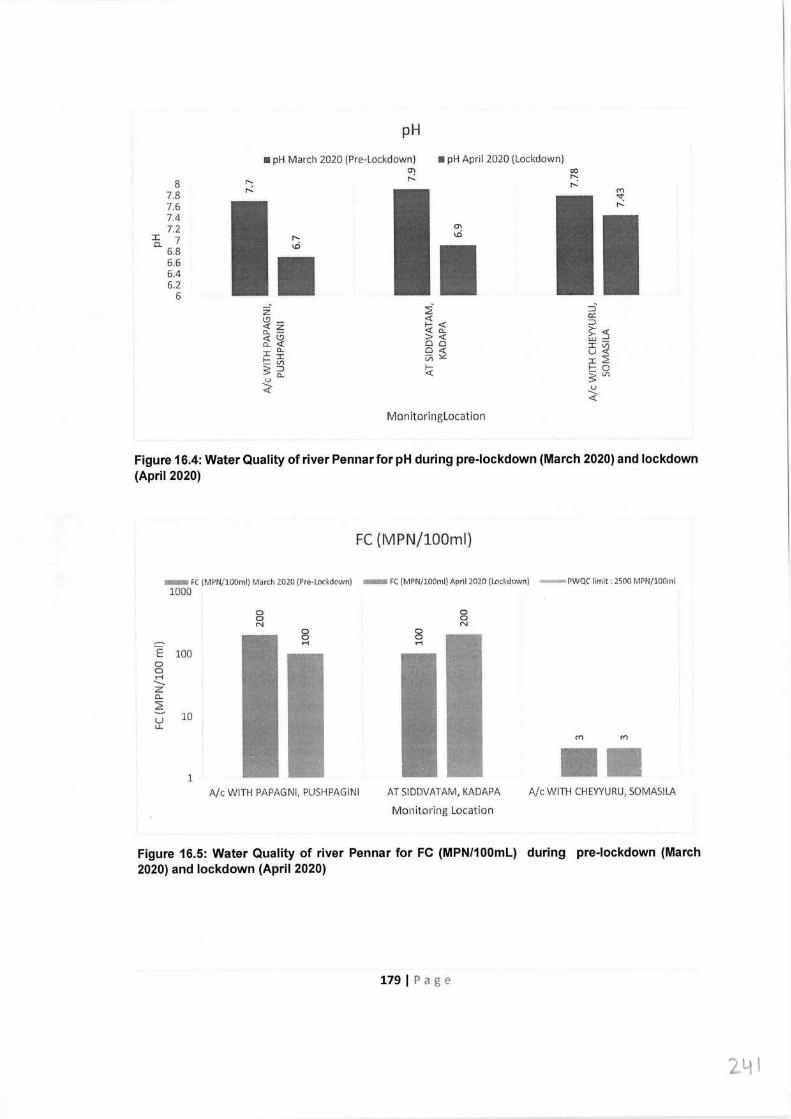
pH
8 7.8 7.6 7.4 7.2
~ 7 6.8 6.6 6.4 6.2 6
• pH March 2020 (Pre-Lockdown) CJ'\ ,..._
-- z L'.l - <l'. z a.. - <l'. {,9 c, <l'. I a.. f- I - VI 5~ ~
Figure 16.4: Water Quality of river Pennar for pH during pre-lockdown (March 2020) and lockdown (April 2020)
- FC iMPNilOOml) March 2020 (Pre-Lockdown) - FC (MPN/lOOml) April 2.020 (Lor.kdown) -rwoc limit: 2500 MPN/lOOml 1000
a a N
E 100 0 0 ,-i .._,, z a.. ~ u u..
10
1
• pH April 2020 (Lockdown)
FC (MPN/100ml)
A/c WITH PAPAGNI, PUSHPAGINI
i <l'. ..... <l'. <l'. o, > <l'. 00 0 <[_ vi "" :;;:
Monitoringlocation
a a N
AT SIDDVATAM, KADAPA
Monitoring Location
A/c WITH CHEYYURU, SOMASILA
Figure 16.5: Water Quality of river Pennar for FC (MPN/100ml) during pre-lockdown (March 2020) and lockdown (April 2020)
179 I Page
241
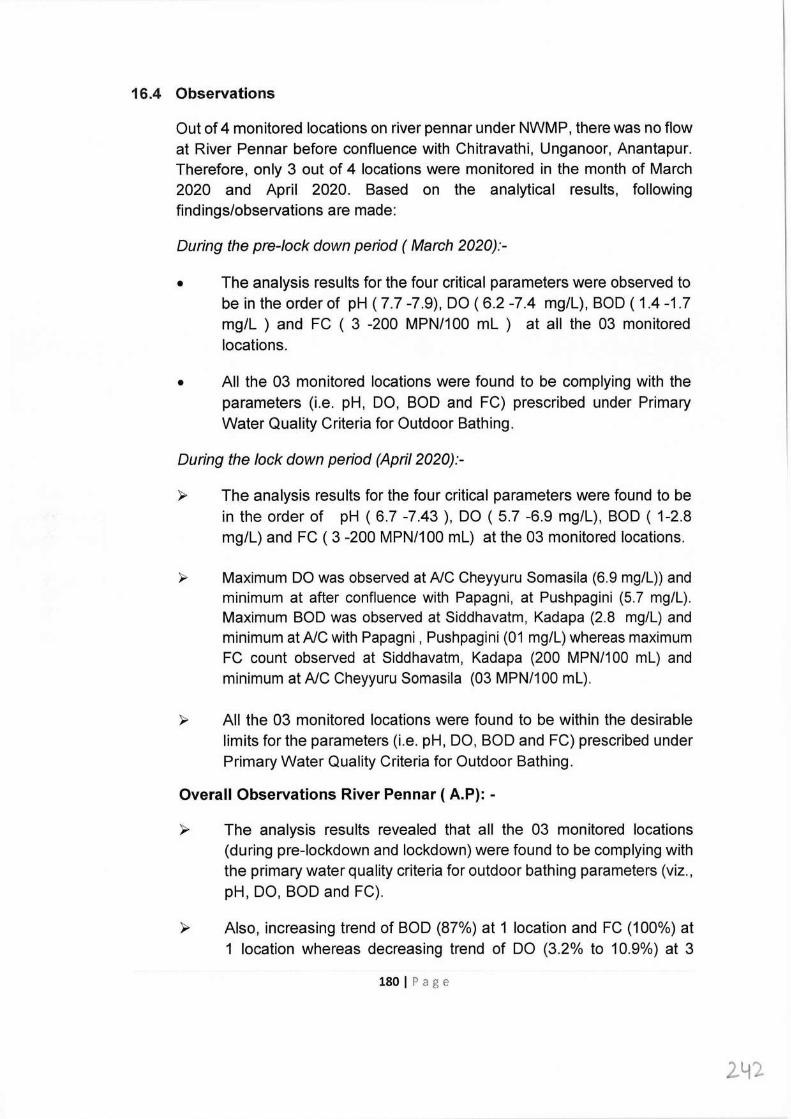
16.4 Observations
Out of 4 monitored locations on river pennar under NWMP, there was no flow at River Pennar before confluence with Chitravathi, Unganoor, Anantapur. Therefore, only 3 out of 4 locations were monitored in the month of March 2020 and April 2020. Based on the analytical results, following findings/observations are made:
During the pre-Jock down period ( March 2020):-
• The analysis results for the four critical parameters were observed to be in the order of pH ( 7.7 -7.9), DO ( 6.2 -7.4 mg/l), BOD ( 1.4 -1.7 mg/l ) and FC ( 3 -200 MPN/100 ml ) at all the 03 monitored locations.
• All the 03 monitored locations were found to be complying with the parameters (i.e. pH, DO, BOD and FC) prescribed under Primary Water Quality Criteria for Outdoor Bathing.
During the Jock down period (April 2020):-
>"' The analysis results for the four critical parameters were found to be in the order of pH ( 6.7 -7.43 ), DO ( 5.7 -6.9 mg/l), BOD ( 1-2.8 mg/l) and FC ( 3 -200 MPN/100 ml) at the 03 monitored locations.
Maximum DO was observed at A/C Cheyyuru Somasila (6.9 mg/l)) and minimum at after confluence with Papagni, at Pushpagini (5.7 mg/l). Maximum BOD was observed at Siddhavatm, Kadapa (2.8 mg/l) and minimum at A/C with Papagni, Pushpagini (01 mg/l) whereas maximum FC count observed at Siddhavatm, Kadapa (200 MPN/100 ml) and minimum at A/C Cheyyuru Somasila (03 MPN/100 ml).
All the 03 monitored locations were found to be within the desirable limits for the parameters (i.e. pH, DO, BOD and FC) prescribed under Primary Water Quality Criteria for Outdoor Bathing.
Overall Observations River Pennar ( A.P): -
>"' The analysis results revealed that all the 03 monitored locations (during pre-lockdown and lockdown) were found to be complying with the primary water quality criteria for outdoor bathing parameters (viz., pH, DO, BOD and FC).
Also, increasing trend of BOD (87%) at 1 location and FC (100%) at 1 location whereas decreasing trend of DO (3.2% to 10.9%) at 3
180 I Page
242
locations, BOD (14 % -41%) at 2 locations and FC (50%) at 1 location were observed. 'No' variation was observed w.r.t parameter FC at 1 monitored location.
16.5 Conclusion
03 out of 03 monitored locations on river Pennar during pre and lockdown period were observed to be complying (100 % compliance) with the Primary Water Quality Criteria for Outdoor Bathing limits notified under Environment (Protection) Rules, 1986. Also, considerable improvement in water quality of river Pennar was observed with respect to the parameters viz., DO, BOD and FC.
17.0. IMPACT OF LOCKDOWN ON WATER QUALITY OF RIVER CAUVERY
17.1 About River Cauvery
River Cauvery originates from southwestern part of Karnataka at Talakaveri on the Brahmagiri range in the Western Ghats, Kodagu District, Karnataka State. It traverses through Tamil Nadu (TN) before its outfall into the Bay of Bengal covering a total distance of about 800 km. Before emptying into the Bay of Bengal south of Cuddalore in Tamil Nadu, it distributes into a large number of distributaries forming a wide delta known as "Daksina Ganga". It is the third largest river after Godavari and Krishna in Southern India and the largest in the State of Tamil Nadu which, on its course, bisects the TN State into North and South. The left bank tributaries of river Cauvery are Harangi, Hemavati, Shimsha, Arkavathy & right bank tributaries are river Lakshmana Tirtha, Kabini, Bhavani, Noyyal, Amaravati & Moyar.
Industrialized cities include Bangalore (Karnataka) and the towns Mettur, Pallipalayam, Komarapalayam in Tamil Nadu followed by the districts of Mysore and Mandya in Karnataka; Erode, Namakkal and Salem in Tamil Nadu. Various categories of industries located in these cities/towns include chemical, dyeing, leather/tanneries, pulp & paper, sugar mills, printing and bleaching industries.
17.2 Water Quality Monitoring Locations on River Cauvery under National Water Quality Monitoring Programme (NWMP)
The Water Quality of river Cauvery is monitored at 64 locations by Central Pollution Control Board (CPCB) in association with State Pollution Control Boards of Karnataka (at 24 locations) and Tamil Nadu (at 40 locations) under National Water Quality Monitoring Programme (NWMP). State-wise
181 I Page
Distribution of Water Quality Monitoring Locations under NWMP on River Cauvery is depicted in Figure 17.1 and Figure 17.2.
17.3 Analytical Results
Water quality of river Cauvery was carried out at 42 locations (Karnataka- 22 and Tamilnadu-20) during Pre-Lockdown and at 33 locations (i.e., Karnataka (22) and Tamilnadu (11)) during Lockdown period to assess impact on water quality.
The water quality of river Cauvery for Primary Water Quality Criteria for Outdoor Bathing (PWQCOB) parameters viz. Dissolved Oxygen (DO), pH, Biochemical Oxygen Demand (BOD) and Fecal Coliform (FC) are presented below in Table-17 .1.
Based on the monitoring & analysis of collected water samples from river Cauvery, the graphical presentation of water quality of river Cauvery with respect to DO, pH, BOD and FC as observed during pre-lockdown (March 2020) and lockdown period (April 2020) are presented in Figure 17.3 to Figure 17.10.
182 I Page
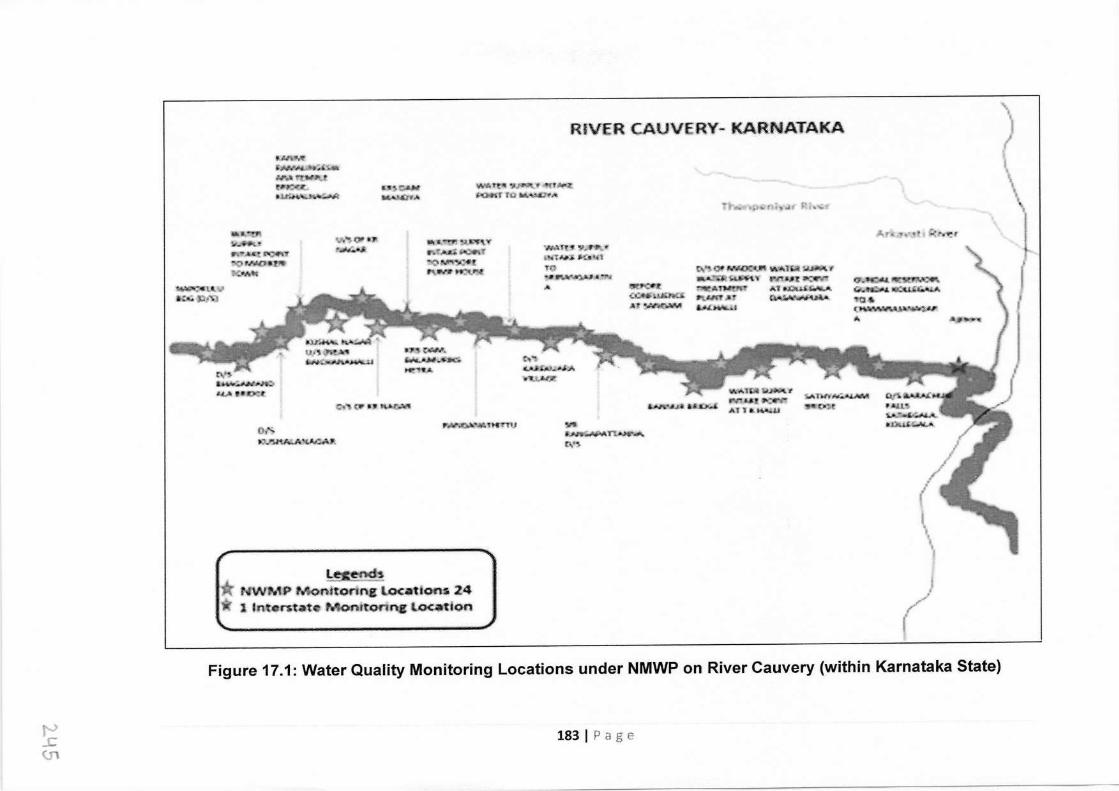
R!V£.R CAUVERY- KARNATAKA
.... ,.~ -~A -.,\,'l1'H\'<f"i!,110Qt'<'-'l'ff ... ~tc.1--.~ ...
l ( I
\ 1,lw-
•J!r""<l"'*l> t,H;...,.
!111,""'tflt~E"f'\V r.t.U::.~f "ICl~.0-l "--·~~
~·u.\...• a;:;,.;, -,,,.1
~fl'l Y;.._,J t~ J(!ocl;(t I ... ~ .. .,., ~
~w Sff~~
n
•••v~
.~111,-.n.t~, •-'71'<~" ~ur. ~ ... Ttiilt,ff •• ~ •• ~ ~ "'· '-'~
-o• ~~, ""
r;;.n,,v..,.:.u.'lil!! 'lro-1
O,"'i ~}CN"'-AJ!:
l"N'~&nrrn YI uw-~n....t.r...._ t\'
A,~ ..,." .. ~ltK{"','!t
\ 1,
~~ NWMP Mot\Jtonns l.OC.ation.s 24 1 tnt.or5't.t1e Mon1tonn.- l,QQJtion (.!
Figure 17.1: Water Quality Monitoring Locations under NMWP on River Cauvery (within Karnataka State)
t-' ..c 0,
183 I Page
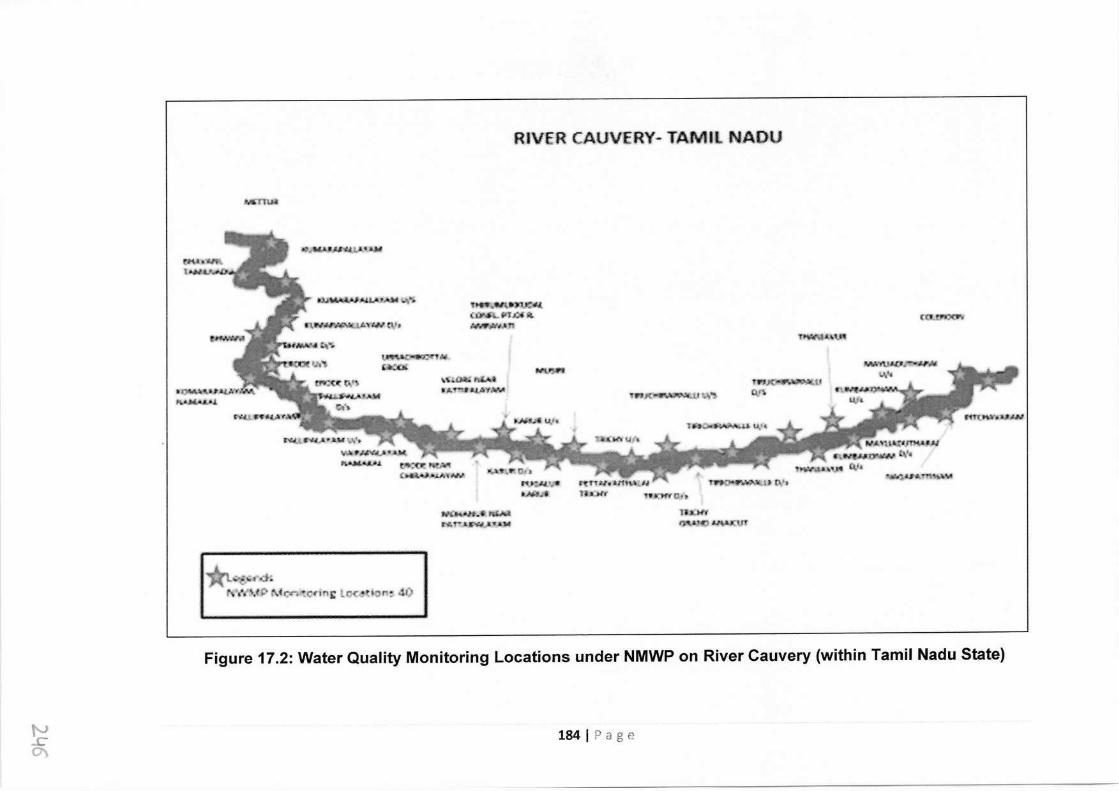
R11VER CAUVERY- TAMIL NADU
., ... ,~,QI
.l-'1/:WC\'•
"' \'(~~ tl.'"'tJ~,,..,.
11'):\J:""4.
~
ni•~u-..,~ ,·nJO-~J I ,1,
tl"U()'I,.
T~\1.,lW
f~N4>")(W \.\ .. v.i.•~v•.-v. "'~ ~~
~>,tAY#N> ,:,;i;.""'l:~1'1
~,·~--~ "11,T"',•.S'l/io#.>,.•M l(;w'f ~~-0~'1'
,•ti.;r: 4
Figure 17.2: Water Quality Monitoring Locations under NMWP on River Cauvery (within Tamil Nadu State)
~ ~
184 I Page
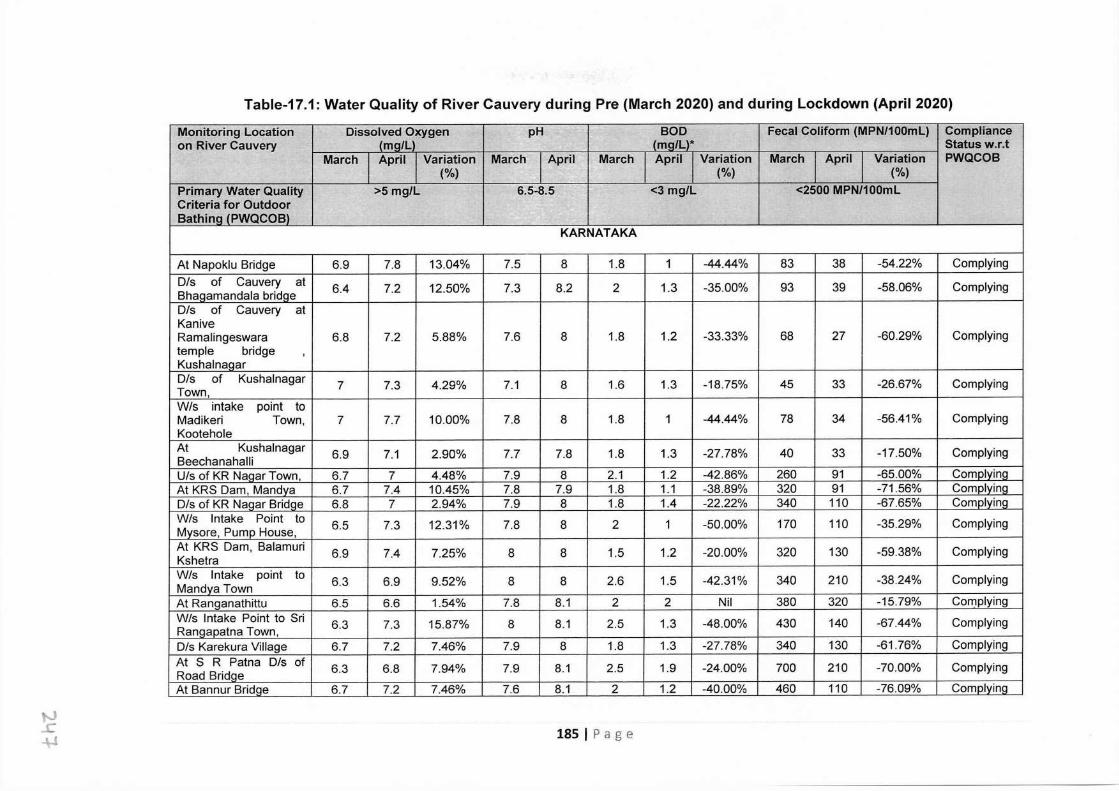
Table-17.1: Water Quality of River Cauvery during Pre (March 2020) and during Lockdown (April 2020)
Monitoring Location Dissolved Oxygen pH BOD Fecal Coliform (MPN/100ml) Compliance on River Cauvery (mci/L (mci/L)* Status w.r.t
March April I Variation March April March April Variation March April Variation PWQCOB (%) (%) (%)
Primary Water Quality >5 mg/L 6.5-8.5 <3 mg/L <2500 MPN/100ml Criteria for Outdoor Bathina (PWQCOB)
KARNATAKA
At Napoklu Bridge 6.9 7.8 13.04% 7.5 8 1.8 1 -44.44% 83 38 -54.22% Complying Dis of Cauvery at 6.4 7.2 12.50% 7.3 8.2 2 1.3 -35.00% 93 39 -58.06% Complying Bhagamandala bridge Dis of Cauvery at Kanive Ramalingeswara 6.8 7.2 5.88% 7.6 8 1.8 1.2 -33.33% 68 27 -60.29% Complying temple bridge Kushalnaaar Dis of Kushalnagar 7 7.3 4.29% 7.1 8 1.6 1.3 -18.75% 45 33 -26.67% Complying Town, Wis intake point to Madikeri Town, 7 7.7 10.00% 7.8 8 1.8 1 -44.44% 78 34 -56.41% Complying Kootehole At Kushalnagar 6.9 7.1 2.90% 7.7 7.8 1.8 1.3 -27.78% 40 33 -17.50% Complying Beechanahalli Uls of KR Naqar Town, 6.7 7 4.48% 7.9 8 2.1 1.2 -42.86% 260 91 -65.00% Comolvina At KRS Dam, Mandva 6.7 7.4 10.45% 7.8 7.9 1.8 1.1 -38.89% 320 91 -71.56% Comolvina Dis of KR Nacar Bridue 6.8 7 2.94% 7.9 8 1.8 1.4 -22.22% 340 110 -67.65% Complvinq Wis Intake Point to 6.5 7.3 12.31% 7.8 8 2 1 -50.00% 170 110 -35.29% Complying Mysore, Pump House, At KRS Dam, Balamuri 6.9 7.4 7.25% 8 8 1.5 1.2 -20.00% 320 130 -59.38% Complying Kshetra Wis Intake point to 6.3 6.9 9.52% 8 8 2.6 1.5 -42.31% 340 210 -38.24% Complying Mandva Town At Ranganathittu 6.5 6.6 1.54% 7.8 8.1 2 2 Nil 380 320 -15.79% Complying Wis Intake Point to Sri 6.3 7.3 15.87% 8 8.1 2.5 1.3 -48.00% 430 140 -67.44% Complying Ranqapatna Town, D/s Karekura Village 6.7 7.2 7.46% 7.9 8 1.8 1.3 -27.78% 340 130 -61.76% Complying At S R Patna D/s of 6.3 6.8 7.94% 7.9 8.1 2.5 1.9 -24.00% 700 210 -70.00% Complying Road Bridae At Bannur Bridae 6.7 7.2 7.46% 7.6 8.1 2 1.2 -40.00% 460 110 -76.09% Cornolvinq
"' ..c ;.J 185 I Page
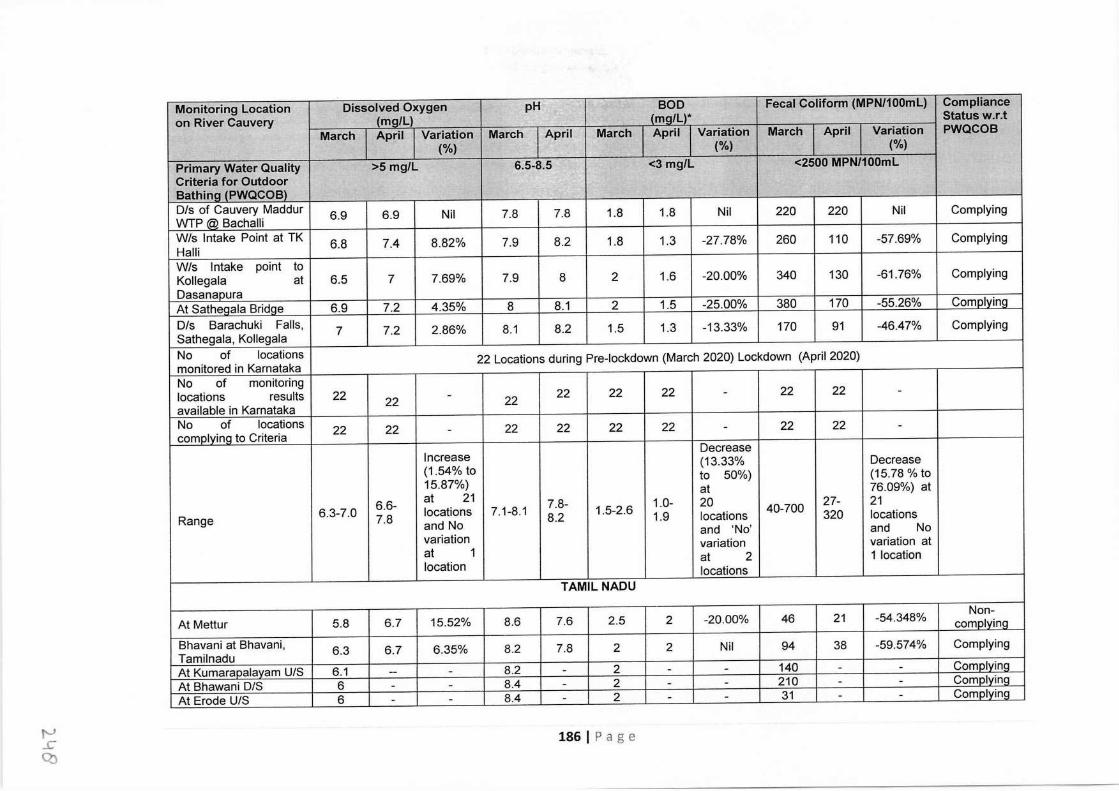
Monitoring Location Dissolved Oxygen pH ~ . BOD Fecal Coliform (MPN/100ml) Compliance on River Cauvery (mg/L) (mg/L)* Status w.r.t
March April Variation March April March April Variation March April Variation PWQCOB (%) (%) (%)
Primary Water Quality >5 mg/L 6.5-8.5 <3 mg/L <2500 MPN/100mL Criteria for Outdoor Bathina f PWQCOB) Dis of Cauvery Maddur 6.9 6.9 Nil 7.8 7.8 1.8 1.8 Nil 220 220 Nil Complying WTP (@ Bachalli W/s Intake Point at TK 6.8 7.4 8.82% 7.9 8.2 1.8 1.3 -27.78% 260 110 -57.69% Complying Halli W/s Intake point to Kollegala at 6.5 7 7.69% 7.9 8 2 1.6 -20.00% 340 130 -61.76% Complying
Dasanapura At Satheaala Bridqe 6.9 7.2 4.35% 8 8.1 2 1.5 -25.00% 380 170 -55.26% Comolvina
Dis Barachuki Falls, 7 7.2 2.86% 8.1 8.2 1.5 1.3 -13.33% 170 91 -46.47% Complying Sathegala, Kollegala No of locations 22 Locations during Pre-lockdown (March 2020) Lockdown (April 2020) monitored in Karnataka No of monitoring locations results 22 22 - 22 22 22 22 - 22 22 -
available in Karnataka No of locations 22 22 22 22 22 22 22 22 comolvina to Criteria
- - -
Increase Decrease
(1.54% to (13.33% Decrease to 50%) (15.78 % to
15.87%) at 76.09%) at at 21
6.3-7.0 6.6- locations 7.1-8.1 7.8- 1.5-2.6 1.0- 20 40-700 27- 21
Range 7.8 and No 8.2 1.9 locations 320 locations
variation and 'No' and No variation variation at
at 1 at 2 1 location location locations
TAMIL NADU
At Mettur 5.8 6.7 15.52% 8.6 7.6 2.5 2 -20.00% 46 21 -54.348% Non- comolvina
Bhavani at Bhavani, 6.3 6.7 6.35% 8.2 7.8 2 2 Nil 94 38 -59.574% Complying Tamilnadu At Kumaraoalavam U/S 6.1 -- - 8.2 - 2 - - 140 - - Comolvina
At Bhawani D/S 6 - - 8.4 - 2 - - 210 - - Comolvina
At Erode U/S 6 - - 8.4 - 2 - - 31 - - Comolvina
I'--' ...r Q)
186 I Page
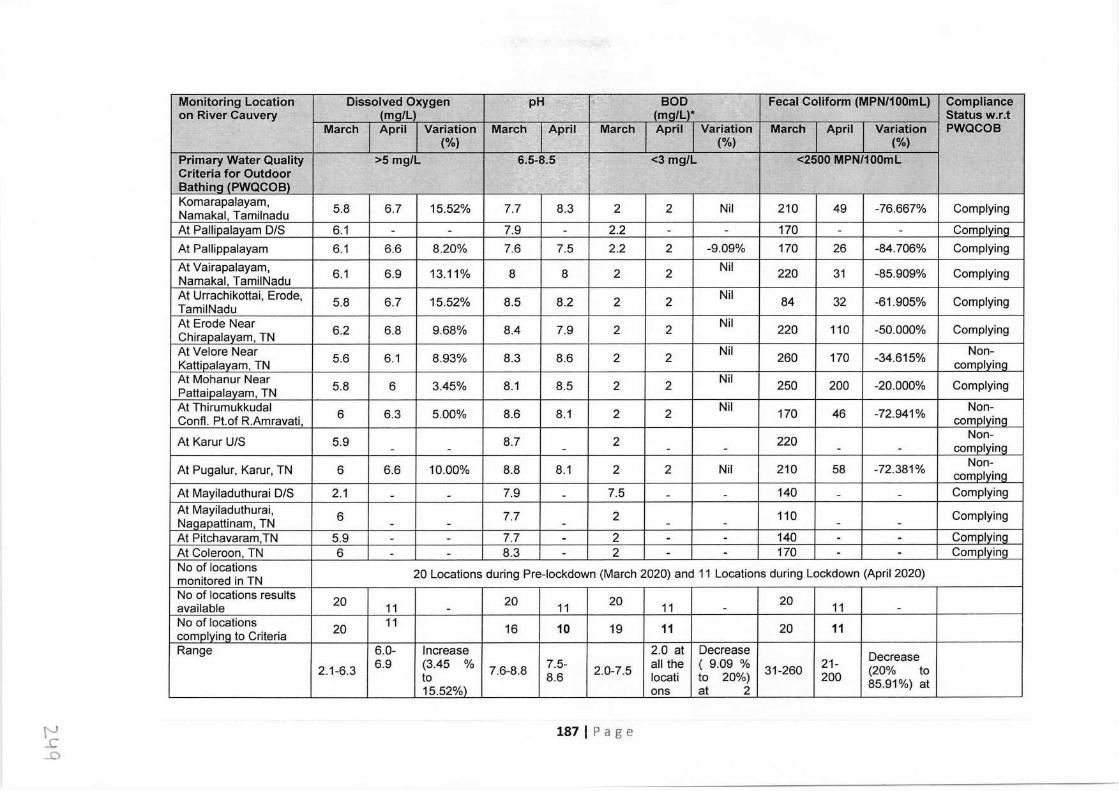
Monitoring Location Dissolved Oxygen pH - BOD Fecal Coliform (MPN/100mL) Compliance on River Cauvery (mg/L' (mg/L)* Status w.r.t
March April Variation March April March April Variation March April Variation PWQCOB (%) (%) (%)
Primary Water Quality >5 mg/L 6.5-8.5 <3 mg/L <2500 MPN/100mL Criteria for Outdoor Bathing (PWQCOB) Komarapalayam, 5.8 6.7 15.52% 7.7 8.3 2 2 Nil 210 49 -76.667% Complying Namakal, Tamilnadu At Pallioalavam D/S 6.1 - - 7.9 - 2.2 - - 170 - - Cornolvinq At Pallippalayam 6.1 6.6 8.20% 7.6 7.5 2.2 2 -9.09% 170 26 -84.706% Complying At Vairapalayam, 6.1 6.9 13.11% 8 8 2 2 Nil 220 31 -85.909% Complying Namakal, TamilNadu At Urrachikottai, Erode, 5.8 6.7 15.52% 8.5 8.2 2 2 Nil 84 32 -61.905% Complying TamilNadu At Erode Near 6.2 6.8 9.68% 8.4 7.9 2 2 Nil 220 110 -50.000% Complying Chirapalavarn, TN At Velore Near 5.6 6.1 8.93% 8.3 8.6 2 2 Nil 260 170 -34.615% Non- Kattipalavarn, TN complyina At Mohanur Near 5.8 6 3.45% 8.1 8.5 2 2 Nil 250 200 -20.000% Complying Pattaipalayam, TN At Thirumukkudal 6 6.3 5.00% 8.6 8.1 2 2 Nil 170 46 -72.941% Non- Confl. Pt.of R.Amravati, comolvino
At Karur U/S 5.9 8.7 2 220 Non- - - - - - - - cornplvinq
At Pugalur, Karur, TN 6 6.6 10.00% 8.8 8.1 2 2 Nil 210 58 -72.381% Non- complying
At Mayiladuthurai D/S 2.1 - - 7.9 - 7.5 - - 140 - - Complying At Mayiladuthurai, 6 7.7 2 110 Complying Naqapattinam, TN - - - - - - - At Pitchavaram,TN 5.9 - - 7.7 - 2 - - 140 - - Complying At Coleroon, TN 6 - - 8.3 - 2 - - 170 - - Complying No of locations 20 Locations during Pre-lockdown (March 2020) and 11 Locations during Lockdown (April 2020) monitored in TN No of locations results 20 20 20 20 available 11 - 11 11 - 11 - No of locations 20 11 16 10 19 11 20 11 complvino to Criteria Range 6.0- Increase 2.0 at Decrease Decrease
2.1-6.3 6.9 (3.45 % 7.6-8.8 7.5- 2.0-7.5 all the ( 9.09 % 31-260 21- (20% to to 8.6 locati to 20%) 200 15.52%) ans at 2 85.91%) at
~ ....0
187 I Page
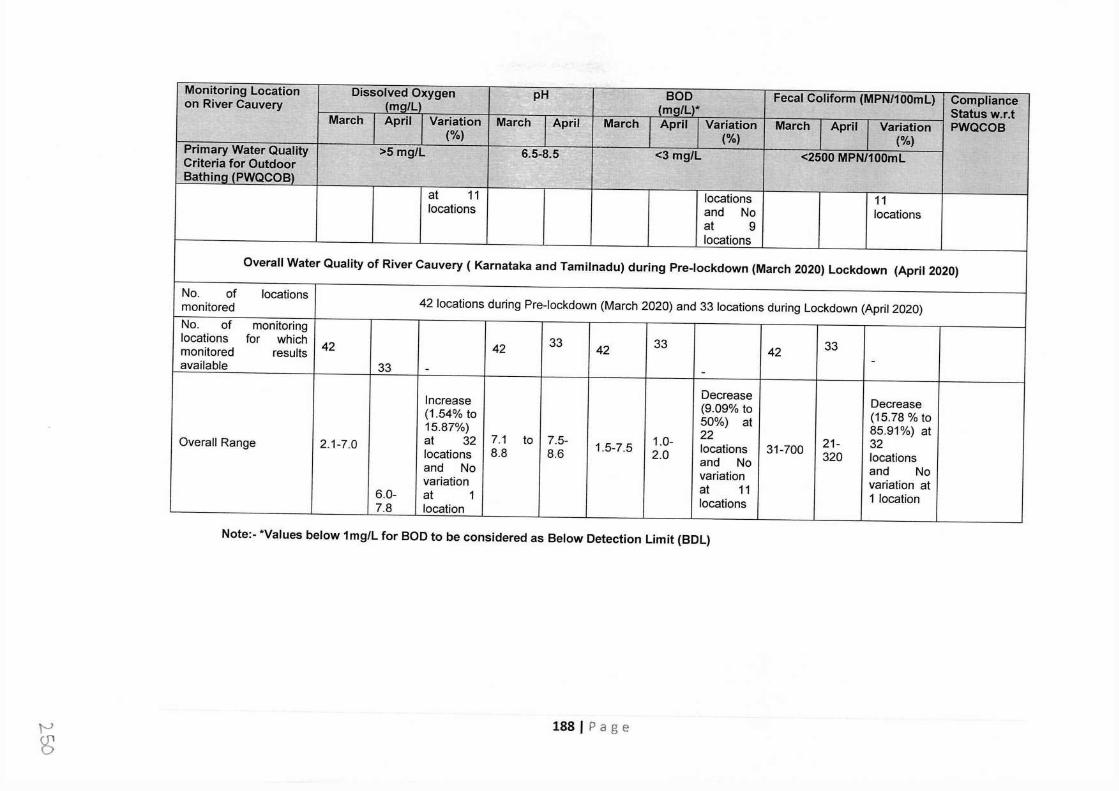
Monitoring Location Dissolved Oxygen pH BOD Fecal Coliform (MPN/100mL) Compliance on River Cauvery (met/LI (ma/L)* Status w.r.t March April Variation March April March April Variation March April Variation PWQCOB (%) (%) (%)
Primary Water Quality >5 mg/L 6.5-8.5 <3 mg/L <2500 MPN/100mL Criteria for Outdoor Bathina (PWQCOB)
at 11 locations 11 locations and No locations
at 9 locations
Overall Water Quality of River Cauvery ( Karnataka and Tamilnadu) during Pre-lockdown (March 2020) Lockdown (April 2020)
No. of locations 42 locations during Pre-lockdown (March 2020) and 33 locations during Lockdown (April 2020) monitored
No. of monitoring locations for which 42 42 33 42 33
42 33 monitored results - available 33 - -
Increase Decrease Decrease (9.09% to (1.54% to 50%) at (15.78 % to
15.87%) 22 85.91%) at Overall Range 2.1-7.0 at 32 7.1 to 7.5- 1.5-7.5 1.0- locations 31-700 21- 32
locations 8.8 8.6 2.0 and No 320 locations and No variation and No variation
at 11 variation at 6.0- at 1
locations 1 location 7.8 location
Note:- *Values below 1mg/L for BOD to be considered as Below Detection Limit (BDL)
t-J g; 188 I Page
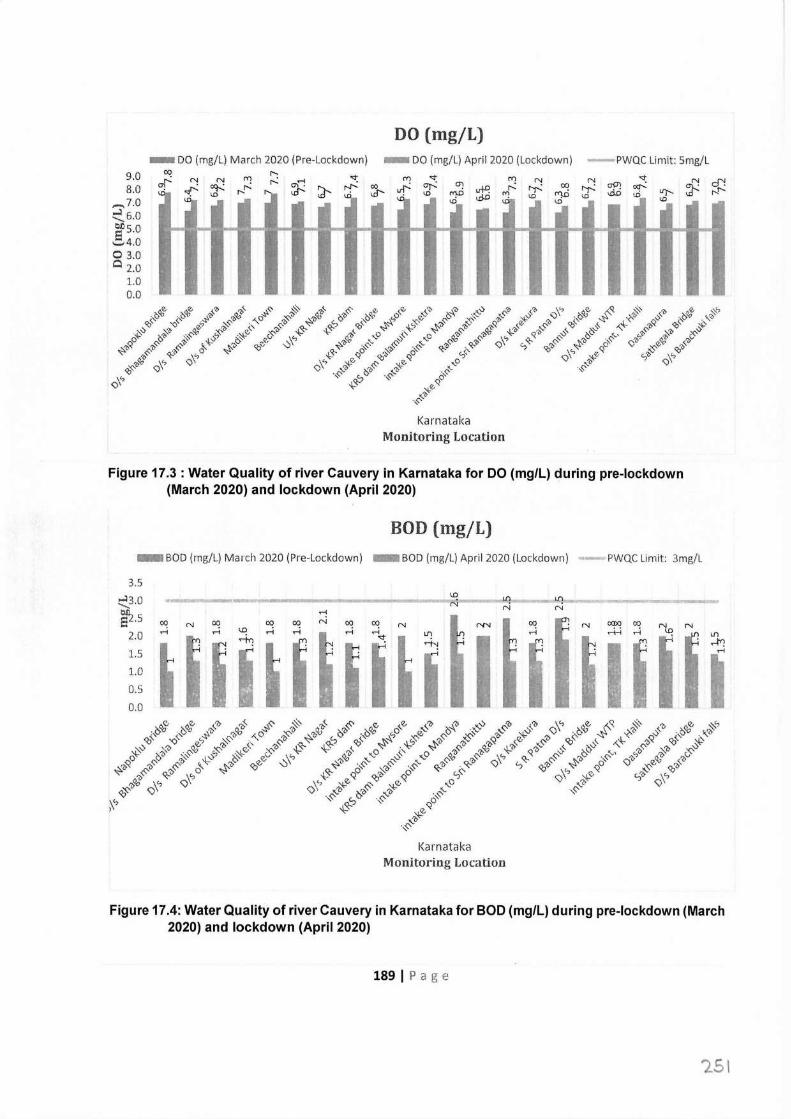
DO (mg/L) - DO (mg/L) March 2020 (Pre-Lockdown) - DO (mg/L) April 2020 (Lockdown) -PWQC Limit: Smg/L
9.0 8.0
,_J.0 :::::_6.0 ef5,0 ....... 4.0 0 3.0 Ci 2.0
1.0 0.0
Karnataka Monitoring Location
Figure 17.3: Water Quality of river Cauvery in Karnataka for DO (mg/L) during pre-lockdown (March 2020) and lockdown (April 2020)
BOD (mg/L) - BOD (mg/L) March 2020 (Pre-Lockdown) - BOD (mg/L) April 2020 (Lockdown) - PWQC Limit: 3mg/L
3.5
:::::_3.0 <.D "'! r-l N N sz.s .-i
00 N 00 00 00 N oq N r-N 00 fl N ~ oq "'lo N 2.0
,-; ,-; ,-; ,-; .-i Lf) ,-; .--+-i .-i Lf)
.-t-;
I "'! .-I": 1.5 .-< H .-I
I 1.0
0.5
0.0
Karnataka Monitoring Location
Figure 17.4: Water Quality of river Cauvery in Karnataka for BOD (mg/L) during pre-lockdown (March 2020) and lockdown (April 2020)
189 I Page
'251
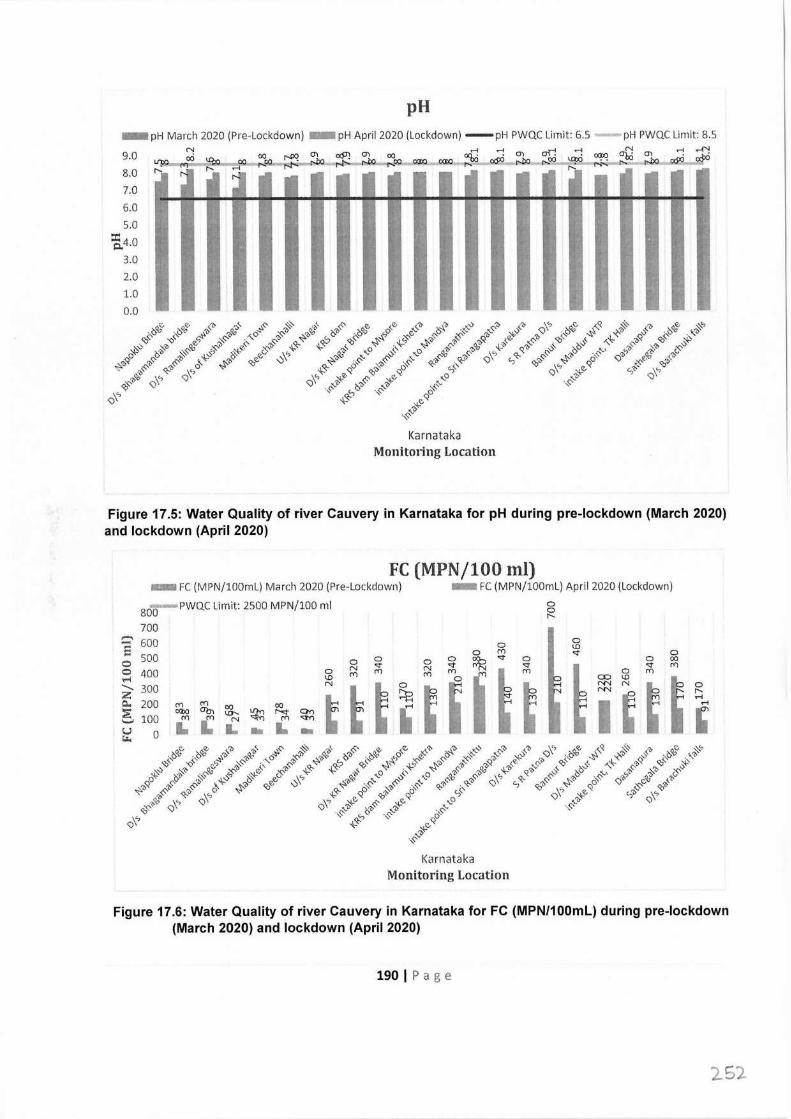
pH -pH March 2020 (Pre-Lockdown) - pH April 2020 (Lockdown) -pH PWQC Limit: 6.5 9.0 C'! 00 NXl er, ocjJ\ 0) 00 cxQ ..... 0) or! ..... <XIX)
8.0 7.0 6.0 5.0
~4.0 3.0 2.0 1.0 0.0
pH PWQC Limit: 8.5
00 ,,.,__ .-lQQ
..,.. t,,QQ ,_ --- ~ ~ r,,.00 =:i ·f"'i-.; r,,. r,kg ,.,.,,; q;lXl
' j I"' "" I"'
'.) :r .I _, - ..r J _, _, .... ... r-! .., - - ...,, _,,. ..., - - - j ~
' It
I Ill m I, ,,
'
- - - - - - ,_ - - .... .... - - L..o .... .... .... .... .... .... - -
Karnataka Monitoring Location
Figure 17.5: Water Quality of river Cauvery in Karnataka for pH during pre-lockdown (March 2020) and lockdown (April 2020)
FC (MPN/100 ml) - FC (MPN/lOOmL) March 2020 (Pre-Lockdown) - FC (MPN/lO0mL) April 2020 (Lockdown)
80~PWQC Limit: 2500 MPN/100 ml 0 0 I"-
700 c:' 600 0
0 = <.O ... 500 0 rt) <::t 0
0 0 0 0 0 ~ <::t 0 0 00
<::t st <:t <:t rt) 0 400 N m N rt) rt) m .., m m 0 i = ........ 300 0 ('N 0 z ~ B ('N I"-
.-l c... 200 m m 00 00
' I ..... :E = Ob, \J)'- ~ r-st %l ' ......, 100 rt) ' N rt)
u 0 .. L .. L - t...
Karnataka Monitoring Location
Figure 17.6: Water Quality of river Cauvery in Karnataka for FC (MPN/100ml) during pre-lockdown (March 2020) and lockdown (April 2020)
190 I Page
252
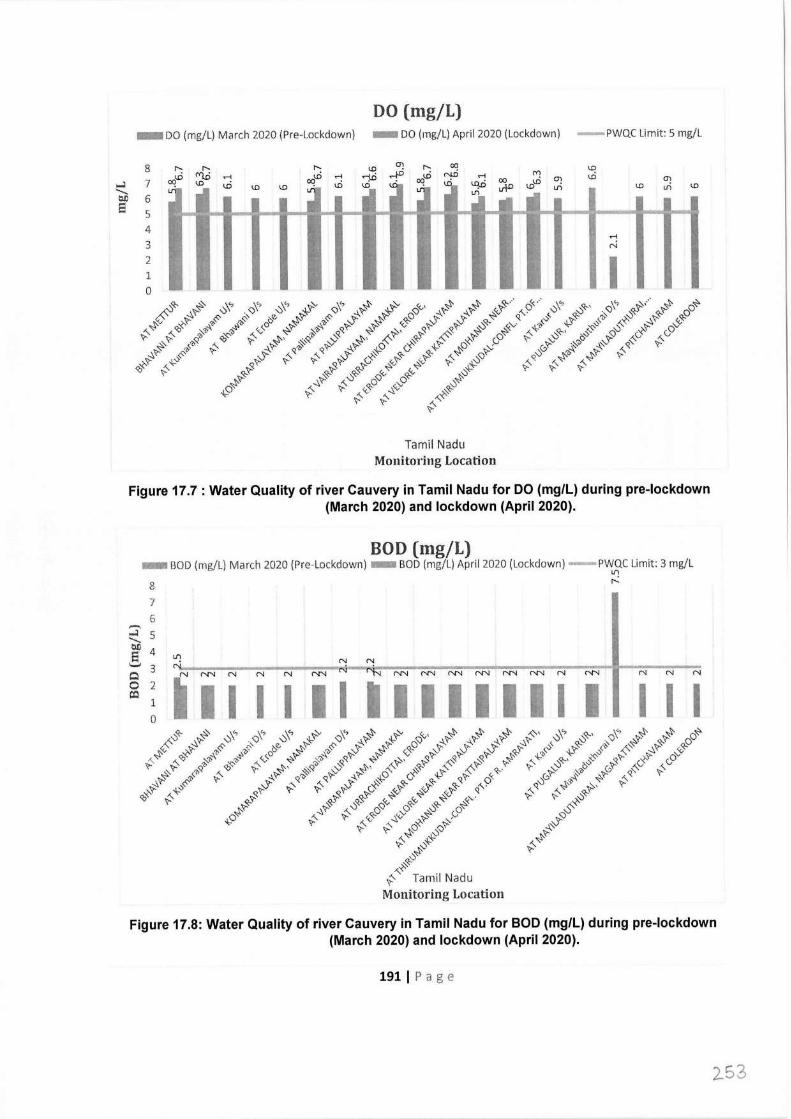
DO (mg/L) -DO (mg/L) March 2020 (Pre-Lockdown) - DO (mg/L) April 2020 (Lockdown) -PWQC Limit: 5 mg/L
8 ,-J 7 - ::.0 6 E 5
4 3 2 l 0
'° <.D '° '° j <.D <D j' l ~ cnD '°'° l/) '° l/) '° j Lfi, J - - ,_ - - - - ....
! .--< N
1,
- ... .,_ '"- I
co '° <D "'
Tamil Nadu Monitoring Location
Figure 17.7: Water Quality of river Cauvery in Tamil Nadu for DO (mg/L) during pre-lockdown (March 2020) and lockdown (April 2020).
BOD (mg/L) - BOD (mg/L) March 2020 (Pre-Lockdown) - BOD (mg/L) April 2020 (Lockdown) -PWQC Limit: 3 mg/L
l/")
8 ~
7 6 - ...:i 5
---- ::.0 4 s '-': N N '-' 3 N N N-..J M~ N-..J N"J N"J N"J N"J N"J N Q N N-..J N N"J
0 2 ~ 11 I I I I 11111111 I i:o 1 0
N N N
I I I
Figure 17.8: Water Quality of river Cauvery in Tamil Nadu for BOD (mg/L) during pre-lockdown (March 2020) and lockdown (April 2020).
191 I Page
253
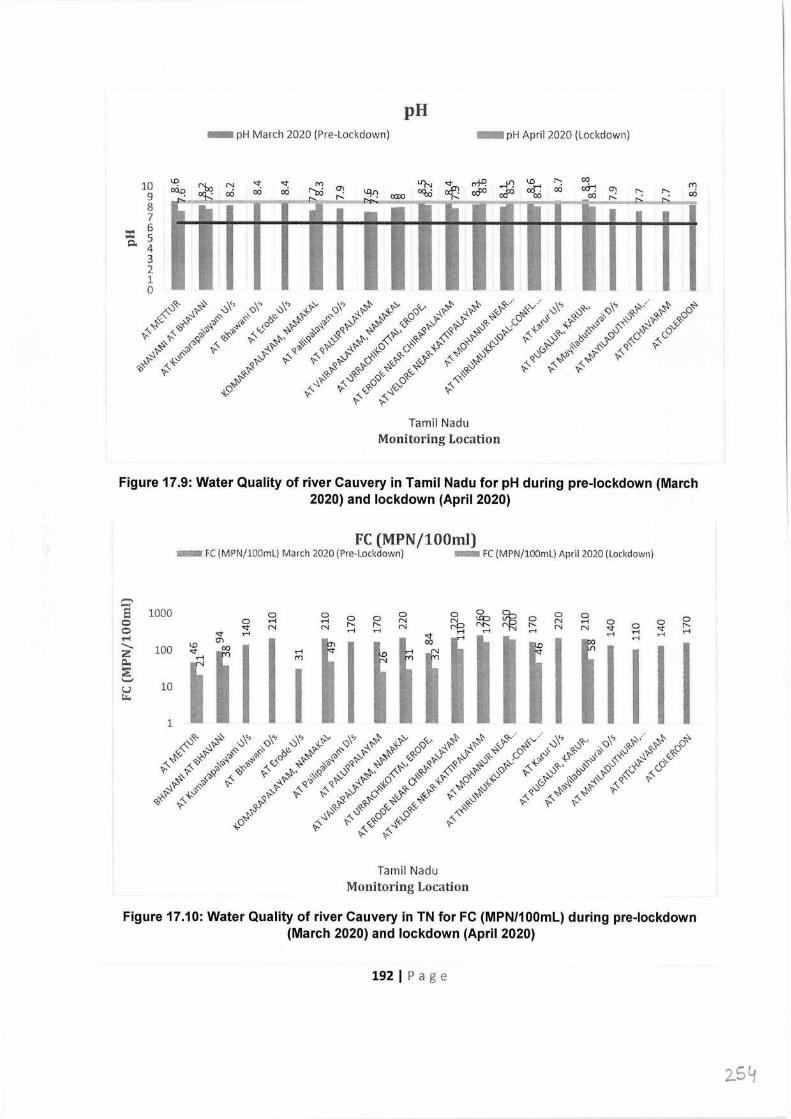
pH - pH March 2020 (Pre-Lockdown) - pH April 2020 (Lockdown)
10 9 8 7
:t ~ Q. 4
3 2 l 0
<D «io
Tamil Nadu Monitoring Location
<D r-- co~ cx5 oq._: co - ,.,.: .. = co co r--: r,; r,;
L r,. .J - ·- IL ... ... .. - .... 1· n
,,_ - - - - - - - - - - -
Figure 17.9: Water Quality of river Cauvery in Tamil Nadu for pH during pre-lockdown (March 2020) and lockdown (April 2020)
FC (MPN/100ml) - FC (MPN/lOOmL) March 2020 (Pre-1.ockdown) - FC (MPN/lOOmL) April 2020 (l.ockdown)
,-., s 1000 0 0 0 0 0
~ 0 0
Q 0 ,.... ,.... 0 0 N ~ = 0 N ,.... 0 0 0
<:t N N r-- r-- N N--- r-- N N <:t 0 <:t r-- Q ,.... ...... .-< ...... ,.... ...... <:t ,.... -st ...... ,.... r-1 ~ 0)
I 00
I ---... 100 co 00
I I I z -st r-1 H
I ,.... ("() Q.,
i ~ I ._, u 10 r.:.
1
Tamil Nadu Monitoring Location
Figure 17.10: Water Quality of river Cauvery in TN for FC (MPN/100ml) during pre-lockdown (March 2020) and lockdown (April 2020)
192 I Page
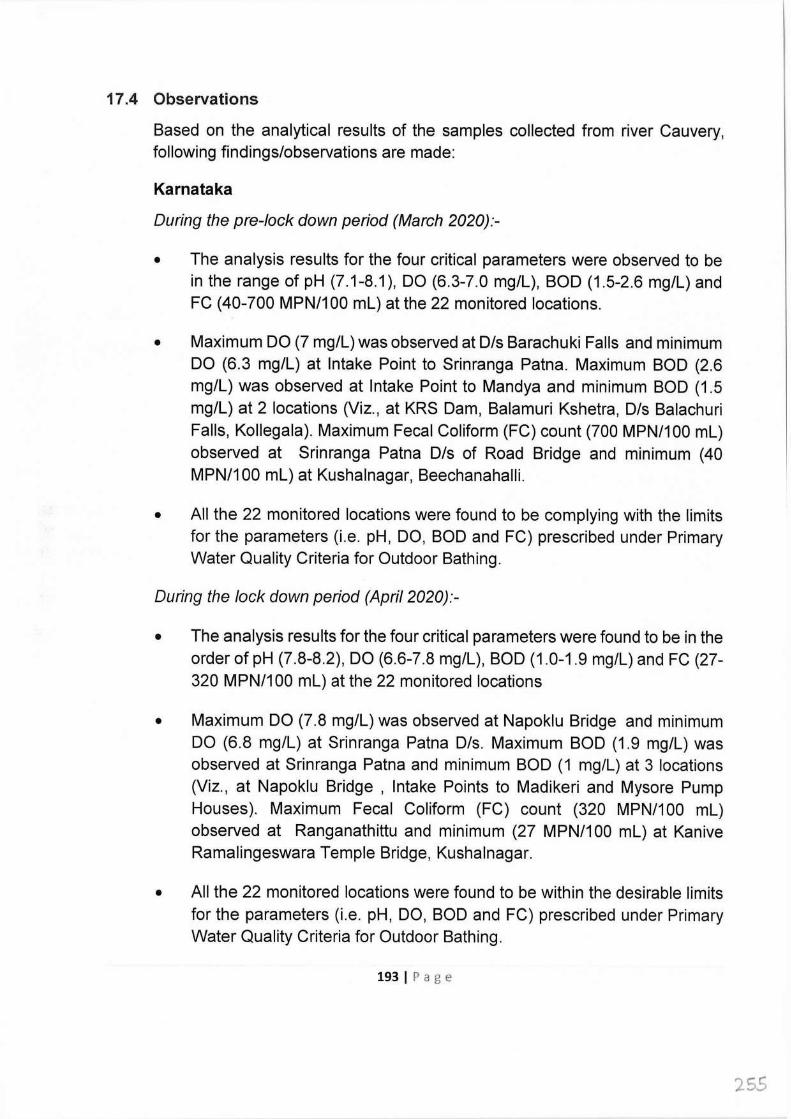
17 .4 Observations
Based on the analytical results of the samples collected from river Cauvery, following findings/observations are made:
Karnataka
During the pre-lock down period (March 2020):-
• The analysis results for the four critical parameters were observed to be in the range of pH (7.1-8.1 ), DO (6.3-7.0 mg/l), BOD (1.5-2.6 mg/l) and FC (40-700 MPN/100 ml) at the 22 monitored locations.
• Maximum DO (7 mg/l) was observed at O/s Barachuki Falls and minimum DO (6.3 mg/l) at Intake Point to Srinranga Patna. Maximum BOD (2.6 mg/l) was observed at Intake Point to Mandya and minimum BOD (1.5 mg/l) at 2 locations (Viz., at KRS Dam, Balamuri Kshetra, D/s Balachuri Falls, Kollegala). Maximum Fecal Coliform (FC) count (700 MPN/100 ml) observed at Srinranga Patna D/s of Road Bridge and minimum (40 MPN/100 ml) at Kushalnagar, Beechanahalli.
• All the 22 monitored locations were found to be complying with the limits for the parameters (i.e. pH, DO, BOD and FC) prescribed under Primary Water Quality Criteria for Outdoor Bathing.
During the lock down period (April 2020):-
• The analysis results for the four critical parameters were found to be in the order of pH (7.8-8.2), DO (6.6-7.8 mg/l), BOD (1.0-1.9 mg/l) and FC (27- 320 MPN/100 ml) at the 22 monitored locations
• Maximum DO (7.8 mg/l) was observed at Napoklu Bridge and minimum DO (6.8 mg/l) at Srinranga Patna D/s. Maximum BOD (1.9 mg/l) was observed at Srinranga Patna and minimum BOD (1 mg/l) at 3 locations (Viz., at Napoklu Bridge , Intake Points to Madikeri and Mysore Pump Houses). Maximum Fecal Coliform (FC) count (320 MPN/100 ml) observed at Ranganathittu and minimum (27 MPN/100 ml) at Kanive Ramalingeswara Temple Bridge, Kushalnagar.
• All the 22 monitored locations were found to be within the desirable limits for the parameters (i.e. pH, DO, BOD and FC) prescribed under Primary Water Quality Criteria for Outdoor Bathing.
193 I Page
255
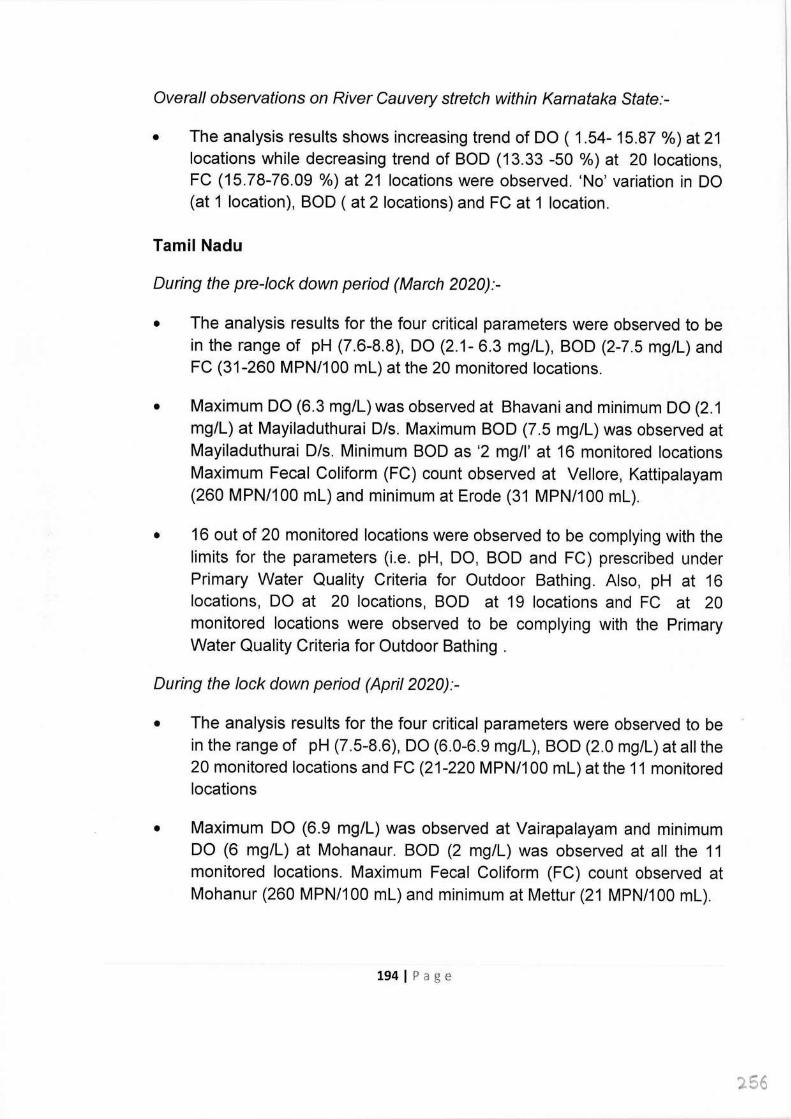
Overall observations on River Cauvery stretch within Kamataka State:-
• The analysis results shows increasing trend of DO ( 1.54-15.87 %) at 21 locations while decreasing trend of BOD (13.33 -50 %) at 20 locations, FC (15.78-76.09 %) at 21 locations were observed. 'No' variation in DO (at 1 location), BOD ( at 2 locations) and FC at 1 location.
Tamil Nadu
During the pre-lock down period (March 2020):-
• The analysis results for the four critical parameters were observed to be in the range of pH (7.6-8.8), DO (2.1- 6.3 mg/l), BOD (2-7.5 mg/l) and FC (31-260 MPN/100 ml) at the 20 monitored locations.
• Maximum DO (6.3 mg/l) was observed at Bhavani and minimum DO (2.1 mg/l) at Mayiladuthurai D/s. Maximum BOD (7 .5 mg/l) was observed at Mayiladuthurai D/s. Minimum BOD as '2 mg/I' at 16 monitored locations Maximum Fecal Coliform (FC) count observed at Vellore, Kattipalayam (260 MPN/100 ml) and minimum at Erode (31 MPN/100 ml).
• 16 out of 20 monitored locations were observed to be complying with the limits for the parameters (i.e. pH, DO, BOD and FC) prescribed under Primary Water Quality Criteria for Outdoor Bathing. Also, pH at 16 locations, DO at 20 locations, BOD at 19 locations and FC at 20 monitored locations were observed to be complying with the Primary Water Quality Criteria for Outdoor Bathing .
During the lock down period (April 2020):-
• The analysis results for the four critical parameters were observed to be in the range of pH (7.5-8.6), DO (6.0-6.9 mg/l), BOD (2.0 mg/l) at all the 20 monitored locations and FC (21-220 MPN/100 ml) at the 11 monitored locations
• Maximum DO (6.9 mg/l) was observed at Vairapalayam and minimum DO (6 mg/l) at Mohanaur. BOD (2 mg/l) was observed at all the 11 monitored locations. Maximum Fecal Coliform (FC) count observed at Mohanur (260 MPN/100 ml) and minimum at Mettur (21 MPN/100 ml).
194 I Page
'l56
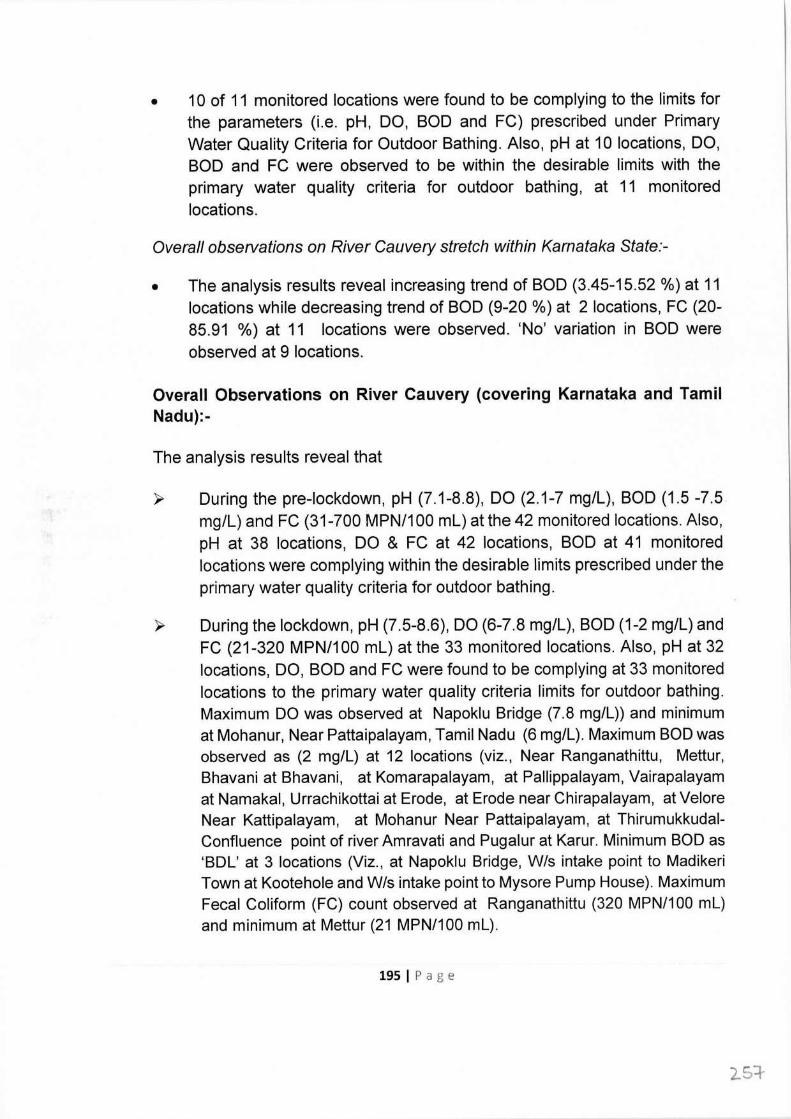
• 1 O of 11 monitored locations were found to be complying to the limits for the parameters (i.e. pH, DO, BOD and FC) prescribed under Primary Water Quality Criteria for Outdoor Bathing. Also, pH at 10 locations, DO, BOD and FC were observed to be within the desirable limits with the primary water quality criteria for outdoor bathing, at 11 monitored locations.
Overall observations on River Cauvery stretch within Kamataka State:-
• The analysis results reveal increasing trend of BOD (3.45-15.52 %) at 11 locations while decreasing trend of BOD (9-20 % ) at 2 locations, FC (20- 85.91 %) at 11 locations were observed. 'No' variation in BOD were observed at 9 locations.
Overall Observations on River Cauvery (covering Karnataka and Tamil Nadu):-
The analysis results reveal that
~ During the pre-lockdown, pH (7.1-8.8), DO (2.1-7 mg/l), BOD (1.5 -7.5 mg/l) and FC (31-700 MPN/100 ml) at the 42 monitored locations. Also, pH at 38 locations, DO & FC at 42 locations, BOD at 41 monitored locations were complying within the desirable limits prescribed under the primary water quality criteria for outdoor bathing.
During the lockdown, pH (7.5-8.6), DO (6-7.8 mg/l), BOD (1-2 mg/l) and FC (21-320 MPN/100 ml) at the 33 monitored locations. Also, pH at 32 locations, DO, BOD and FC were found to be complying at 33 monitored locations to the primary water quality criteria limits for outdoor bathing. Maximum DO was observed at Napoklu Bridge (7.8 mg/l)) and minimum at Mohanur, Near Pattaipalayam, Tamil Nadu (6 mg/l). Maximum BOD was observed as (2 mg/l) at 12 locations (viz., Near Ranganathittu, Mettur, Bhavani at Bhavani, at Komarapalayam, at Pallippalayam, Vairapalayam at Namakal, Urrachikottai at Erode, at Erode near Chirapalayam, at Velore Near Kattipalayam, at Mohanur Near Pattaipalayam, at Thirumukkudal Confluence point of river Amravati and Pugalur at Karur. Minimum BOD as 'BDl' at 3 locations (Viz., at Napoklu Bridge, W/s intake point to Madikeri Town at Kootehole and Wis intake point to Mysore Pump House). Maximum Fecal Coliform (FC) count observed at Ranganathittu (320 MPN/100 ml) and minimum at Mettur (21 MPN/100 ml).
195 I Page
2.s:i-
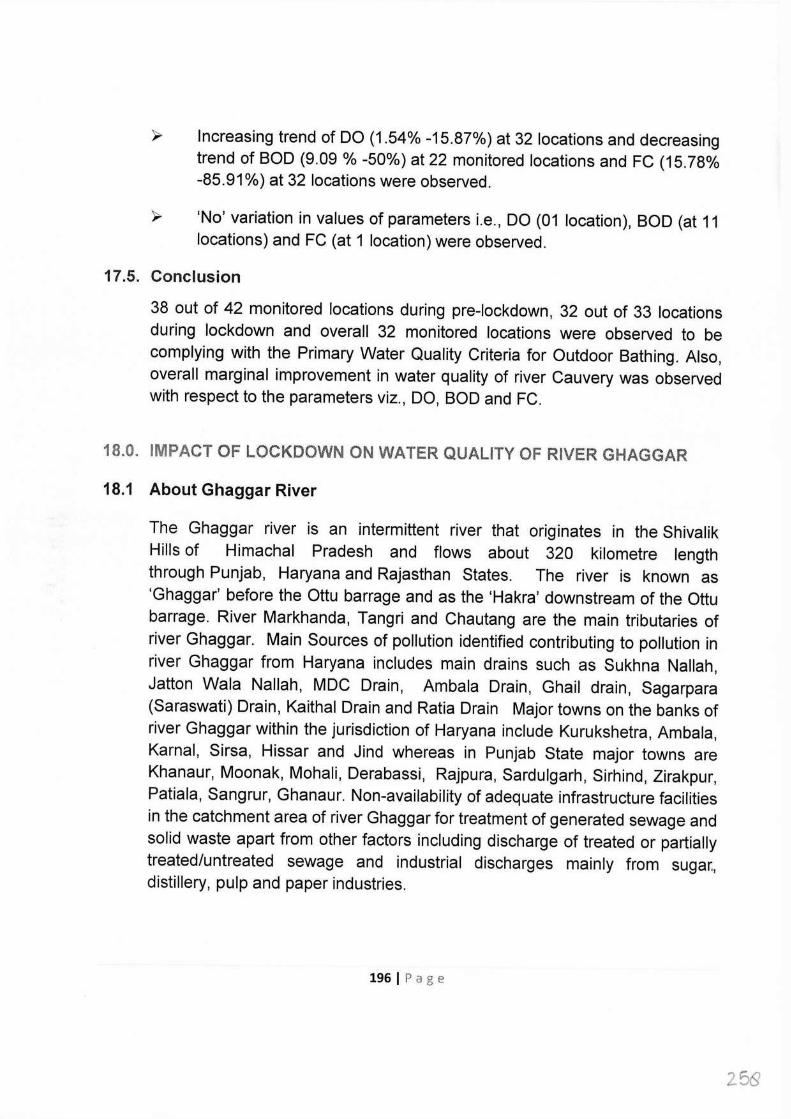
Increasing trend of DO (1.54%-15.87%) at 32 locations and decreasing trend of BOD (9.09 % -50%) at 22 monitored locations and FC (15.78% -85.91%) at 32 locations were observed.
'No' variation in values of parameters i.e., DO (01 location), BOD (at 11 locations) and FC (at 1 location) were observed.
17.5. Conclusion
38 out of 42 monitored locations during pre-lockdown, 32 out of 33 locations during lockdown and overall 32 monitored locations were observed to be complying with the Primary Water Quality Criteria for Outdoor Bathing. Also, overall marginal improvement in water quality of river Cauvery was observed with respect to the parameters viz., DO, BOD and FC.
18.0. IMPACT OF LOCKDOWN ON WATER QUALITY OF RIVER GHAGGAR
18.1 About Ghaggar River
The Ghaggar river is an intermittent river that originates in the Shivalik Hills of Himachal Pradesh and flows about 320 kilometre length through Punjab, Haryana and Rajasthan States. The river is known as 'Ghaggar' before the Ottu barrage and as the 'Hakra' downstream of the Ottu barrage. River Markhanda, Tangri and Chautang are the main tributaries of river Ghaggar. Main Sources of pollution identified contributing to pollution in river Ghaggar from Haryana includes main drains such as Sukhna Nallah, Jatton Wala Nallah, MDC Drain, Ambala Drain, Ghail drain, Sagarpara (Saraswati) Drain, Kaithal Drain and Ratia Drain Major towns on the banks of river Ghaggar within the jurisdiction of Haryana include Kurukshetra, Ambala, Kamal, Sirsa, Hissar and Jind whereas in Punjab State major towns are Khanaur, Moonak, Mohali, Derabassi, Rajpura, Sardulgarh, Sirhind, Zirakpur, Patiala, Sangrur, Ghanaur. Non-availability of adequate infrastructure facilities in the catchment area of river Ghaggar for treatment of generated sewage and solid waste apart from other factors including discharge of treated or partially treated/untreated sewage and industrial discharges mainly from sugar., distillery, pulp and paper industries.
196 I Page
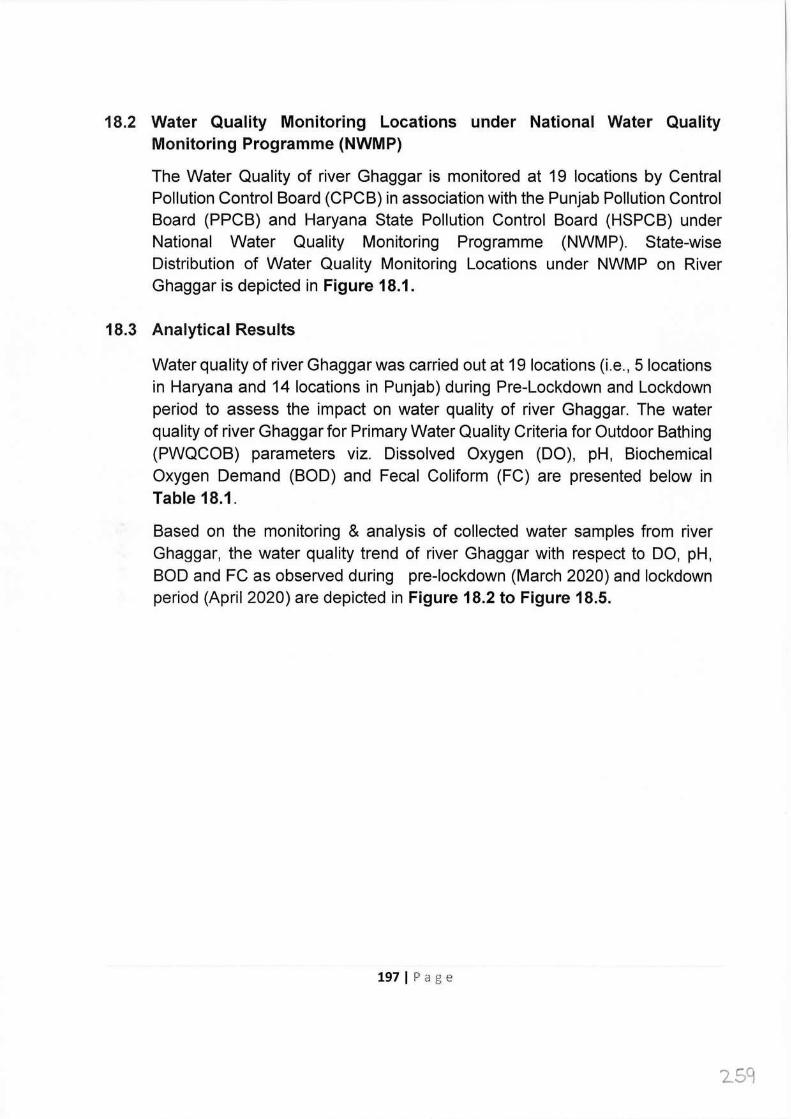
18.2 Water Quality Monitoring Locations under National Water Quality Monitoring Programme (NWMP)
The Water Quality of river Ghaggar is monitored at 19 locations by Central Pollution Control Board (CPCB) in association with the Punjab Pollution Control Board (PPCB) and Haryana State Pollution Control Board (HSPCB) under National Water Quality Monitoring Programme (NWMP). State-wise Distribution of Water Quality Monitoring Locations under NWMP on River Ghaggar is depicted in Figure 18.1.
18.3 Analytical Results
Water quality of river Ghaggar was carried out at 19 locations (i.e., 5 locations in Haryana and 14 locations in Punjab) during Pre-Lockdown and Lockdown period to assess the impact on water quality of river Ghaggar. The water quality of river Ghaggar for Primary Water Quality Criteria for Outdoor Bathing (PWQCOB) parameters viz. Dissolved Oxygen (DO), pH, Biochemical Oxygen Demand (BOD) and Fecal Coliform (FC) are presented below in Table 18.1.
Based on the monitoring & analysis of collected water samples from river Ghaggar, the water quality trend of river Ghaggar with respect to DO, pH, BOD and FC as observed during pre-lockdown (March 2020) and lockdown period (April 2020) are depicted in Figure 18.2 to Figure 18.5.
197 I Page
259
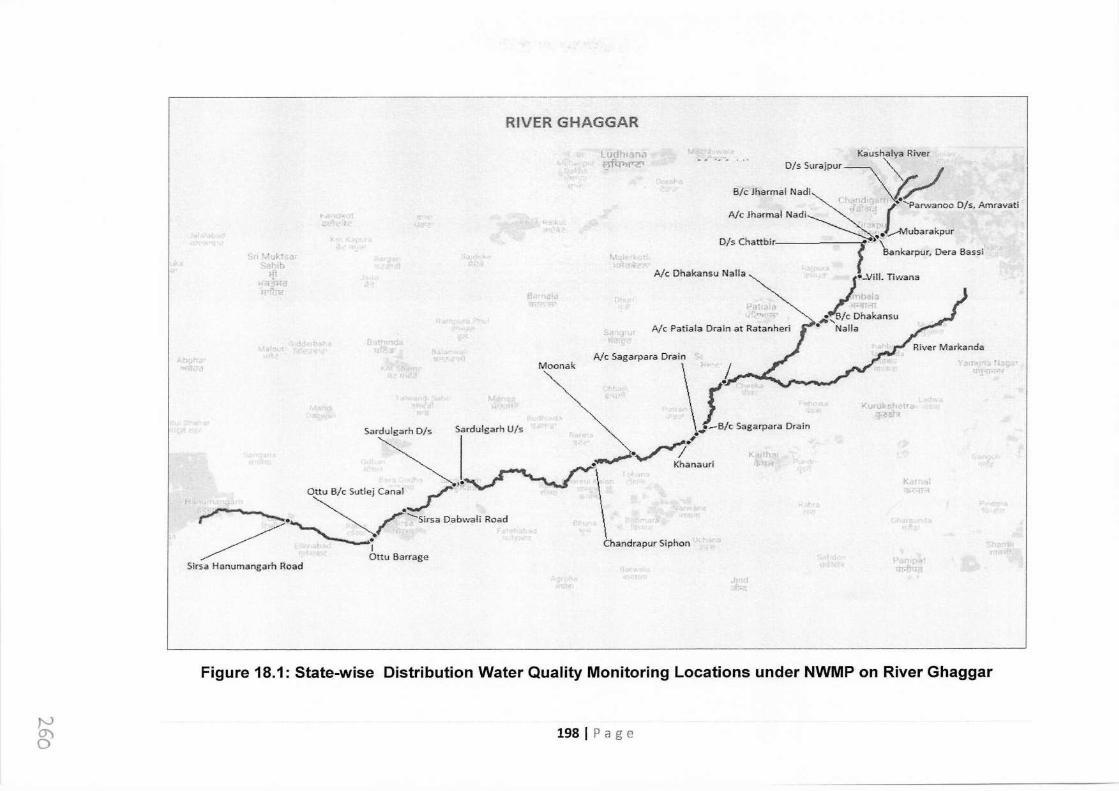
RIVER GHAGGAR
tudtwin.:i ~~
~,, ~ .. ~uJ..!.-;£1 <i;!h:t. ,ii .-;1:0 r,s'!;.i
r,1:;
f!.,, ,;.
.;-..,·".,·;,
Moonak
0/s s . Kaushal . urajpur "-.ya River
B/c Jharmal Nadi ~ Y / A/c Jharmal Nad, ~· ,;"'d't,' vc ---.___ ~> · { Parwanoo DI
D/s Chattbir ---- ~ ~J ~ 's, Amravati A/ r -~ ,_,.,. " .... ,,.,.
c Ohakansu Nalla '- n . Bankarpur D ' - " ' era Bassi
}
•-Viii. Tiwana
'T\b,tl:J - • .I:, 8/c Ohakansu
Nalla
~'~ Sardulgarh U/s
, Ott" B/cS"tlojCaoal / 1~\ ~- ·--· ~ ~~ · s,,., Dabwali Road ' ,
Sirsa Hanumangarh Road Ortu Barrage Chandrapur Siphon
A/c Sagarpara Drain\' _ /
to Sagarpara Drain ~-;·
:•-v _/ ~.ruth Khanauri ';..,,
~,· .. I·•
K,
q-.• ,J1,,1;
Figure 18.1: State-wise Distribution Water Quality Monitoring Locations under NWMP on River Ghaggar
@ 198 I Page
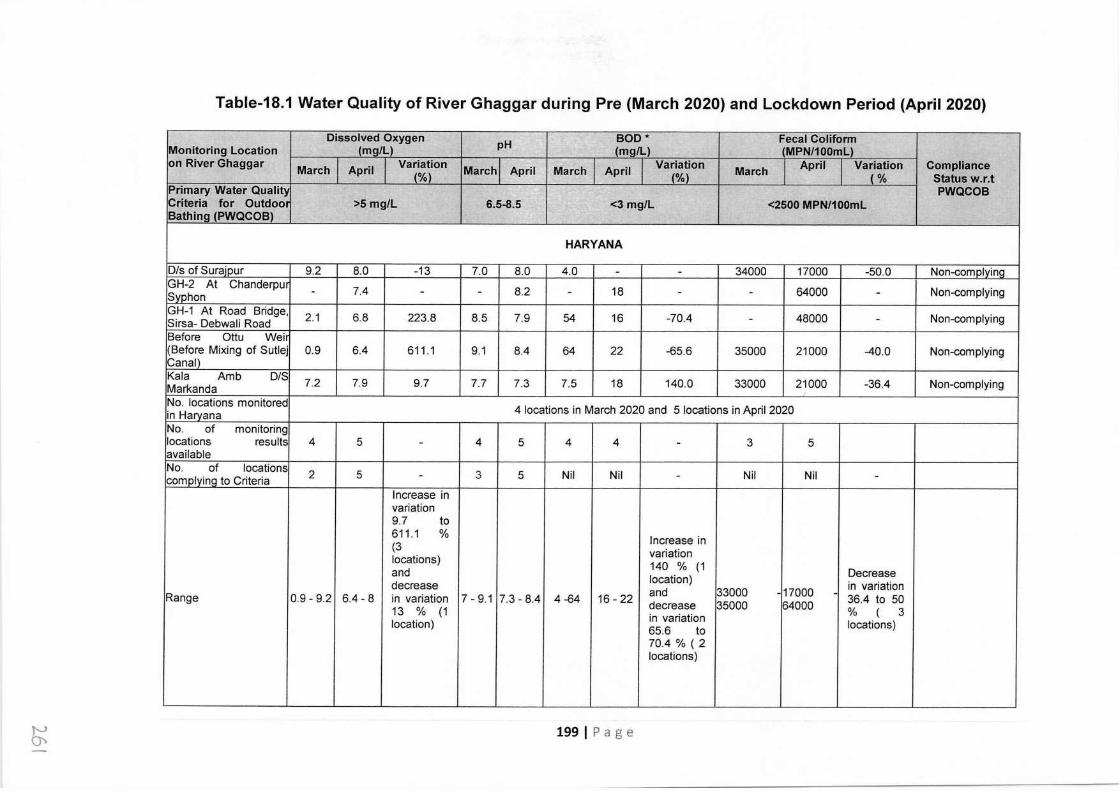
Table-18.1 Water Quality of River Ghaggar during Pre (March 2020) and Lockdown Period (April 2020)
Dissolved Oxygen pH BOD* Fecal Colifonn Monitoring Location (mg/L) (mg/L) (MPN/100ml) on River Ghaggar March April Variation March April March April Variation March April Variation Compliance
(%) (%) (% Status w.r.t Primary Water Qualit) PWQCOB Criteria for Outdoor >5 mg/L 6.5-8.5 . <3 mg/L <2500 MPN/100ml Bathing (PWQCOB)
HARYANA
D/s of Suraipur 9.2 8.0 -13 7.0 8.0 4.0 - - 34000 17000 -50.0 Non-cornplyinq GH-2 At Chanderpur 7.4 8.2 18 64000 Non-complying Svohon
. - - - . - .
GH-1 At Road Bridge, 2.1 6.8 223.8 8.5 7.9 54 16 -70.4 - 48000 - Non-complying Sirsa- Debwali Road Before Ottu Weir (Before Mixing of Sutlej 0.9 6.4 611.1 9.1 8.4 64 22 -65.6 35000 21000 -40.0 Non-complying Canal) Kala Amb D/S 7.2 7.9 9.7 7.7 7.3 7.5 18 140.0 33000 21000 -36.4 Non-complying Markanda No. locations monitored
4 locations in March 2020 and 5 locations in April 2020 in Harvana No. of monitoring locations results 4 5 - 4 5 4 4 - 3 5 available No. of locations 2 5 3 5 Nil Nil Nil Nil comolvina to Criteria - - -
Increase in variation 9.7 to 611.1 % Increase in (3 variation locations) 140 % (1 and Decrease decrease location) in variation
Range 0.9 - 9.2 6.4 - 8 in variation 7 - 9.1 7.3 - 8.4 4-64 16 - 22 and 33000 -17000 - 36.4 to 50 decrease 35000 64000 13 % (1 in variation % ( 3 location) 65.6 to locations)
70.4 % ( 2 locations)
~ 199 IP age
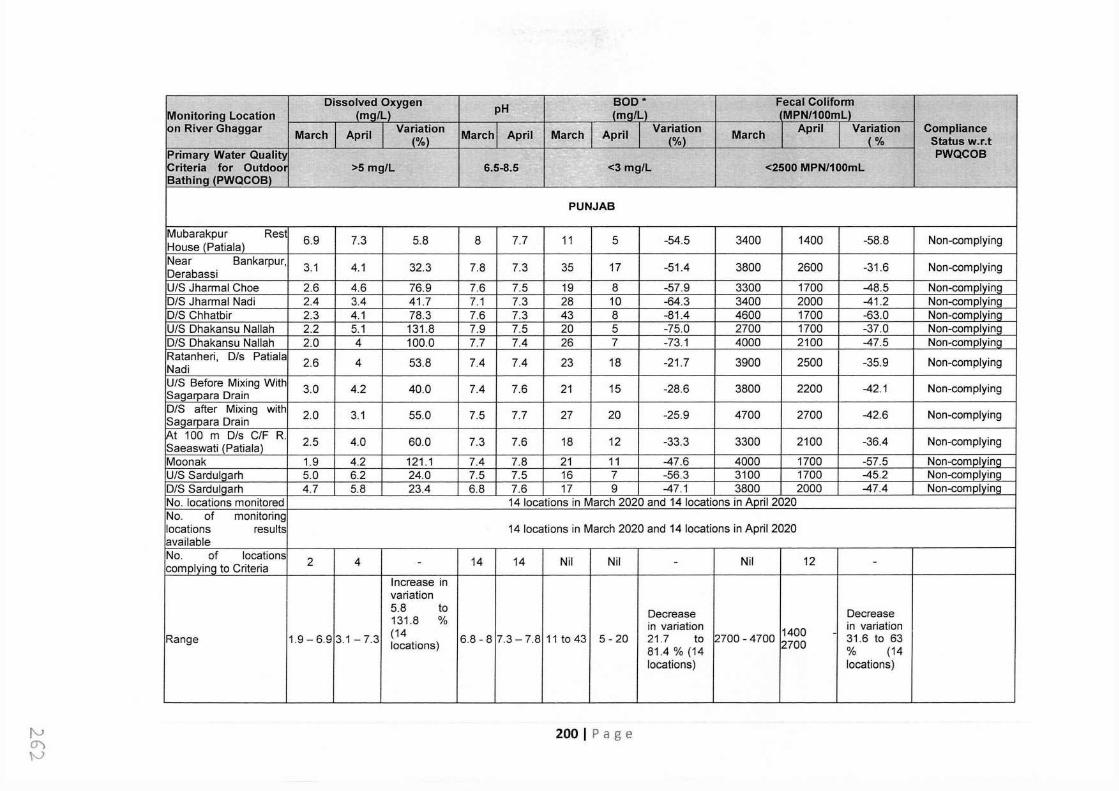
Dissolved Oxygen pH BOD* Fecal Colifonn Monitoring Location (mg/L) (mg/L) (MPN/100ml) on River Ghaggar March April Variation March April March April Variation March April Variation Compliance
(%) (%) (% Status w.r.t I
Primary Water Quality PWQCOB Criteria for Outdoor >5 mg/L 6.5-8.5 <3 mg/L <2500 MPN/100ml Bathing (PWQCOB)
PUNJAB
Mubarakpur Rest 6.9 7.3 5.8 8 7.7 11 5 -54.5 3400 1400 -58.8 Non-complying House (Patiala) Near Bankarpur, 3.1 4.1 32.3 7.8 7.3 35 17 -51.4 3800 2600 -31.6 Non-complying Derabassi U/S Jharmal Choe 2.6 4.6 76.9 7.6 7.5 19 8 -57.9 3300 1700 -48.5 Non-complvino D/S Jharmal Nadi 2.4 3.4 41.7 7.1 7.3 28 10 -64.3 3400 2000 -41.2 Non-complyina D/S Chhatbir 2.3 4.1 78.3 7.6 7.3 43 8 -81.4 4600 1700 -63.0 Non-complyina U/S Dhakansu Nallah 2.2 5.1 131.8 7.9 7.5 20 5 -75.0 2700 1700 -37.0 Non-complyina D/S Dhakansu Nallah 2.0 4 100.0 7.7 7.4 26 7 -73.1 4000 2100 -47.5 Non-complying Ratanheri, D/s Patiala 2.6 4 53.8 7.4 7.4 23 18 -21.7 3900 2500 -35.9 Non-complying Nadi UIS Before Mixing With 3.0 4.2 40.0 7.4 7.6 21 15 -28.6 3800 2200 -42.1 Non-complying Sagarpara Drain D/S after Mixing with 2.0 3.1 55.0 7.5 7.7 27 20 -25.9 4700 2700 -42.6 Non-complying Saaarpara Drain ~t 100 m Dis C/F R. 2.5 4.0 60.0 7.3 7.6 18 12 -33.3 3300 2100 -36.4 Non-complying Saeaswati (Patiala) Moonak 1.9 4.2 121.1 7.4 7.8 21 11 -47.6 4000 1700 -57.5 Non-complying U/S Sardulgarh 5.0 6.2 24.0 7.5 7.5 16 7 -56.3 3100 1700 -45.2 Non-complying D/S Sardulqarh 4.7 5.8 23.4 6.8 7.6 17 9 -47.1 3800 2000 -47.4 Non-complyina No. locations monitored 14 locations in March 2020 and 14 locations in April 2020 No. of monitoring locations results 14 locations in March 2020 and 14 locations in April 2020 available No. of locations 2 4 14 14 Nil Nil Nil 12 cornplyinq to Criteria - - -
Increase in variation 5.8 to Decrease Decrease 131.8 % in variation in variation
Range 1.9-6.9 3.1 - 7.3 (14 6.8 - 8 7.3- 7.8 11 to 43 5-20 21.7 to 2700 - 4700 1400 - 31.6 to 63 locations) 81.4 % (14 2700 % (14 locations) locations)
f'J CJ') µ
200 I Page
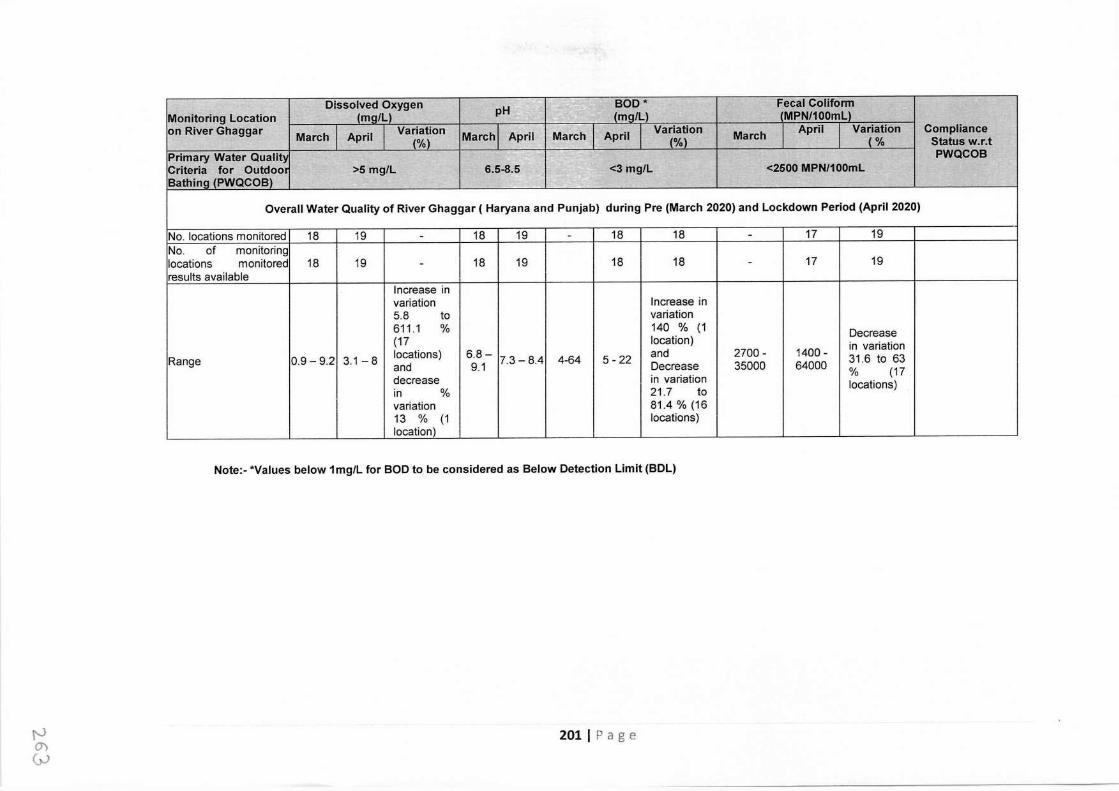
Dissolved Oxygen ~ BOD .. Fecal Coliform Monitoring Location (mg/L) pH (ma/Ll (MPN/100mll on River Ghaggar March April Variation March April March April Variation March April Variation Compliance
(%) (%) (% Status w.r.t Primary Water Quality PWQCOB Criteria for Outdoor >5 mg/L 6.5-8.5 <3 mg/L <2500 MPN/100ml Bathina (PWQCOB)
ra.
Overall Water Quality of River Ghaggar ( Haryana and Punjab) during Pre (March 2020) and Lockdown Period (April 2020)
No. locations monitored 18 19 - 18 19 - 18 18 - 17 19 No. of monitoring locations monitored 18 19 - 18 19 18 18 - 17 19 results available
Increase in variation Increase in 5.8 to variation 611.1 % 140 % (1 Decrease (17 location) in variation
Range 0.9-9.2 3.1 - 8 locations) 6.8- 7.3- 8.4 4-64 5- 22 and 2700- 1400 - 31.6 to 63 and 9.1 Decrease 35000 64000 decrease in variation % (17
in % 21.7 to locations)
variation 81.4 % (16 13 % (1 locations) location)
Note:- .. Values below 1mg/L for BOD to be considered as Below Detection Limit (BDL)
t-J 0) C,J
201 IP age
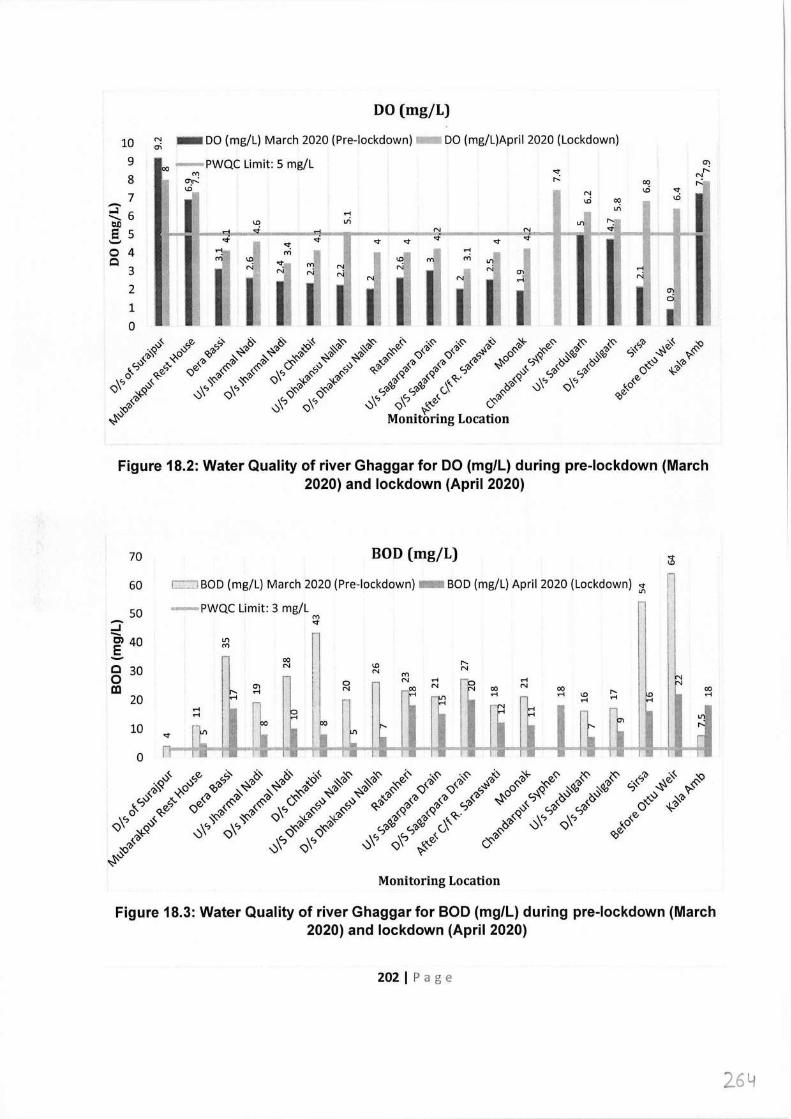
10 9 8 7
~6 0.1) e s ._, 0 4 Q
3
2
1 0
DO (mg/L)
:;:; - DO (mg/L) March 2020 (Pre-lockdown) - DO (mg/L)April 2020 (Lockdown)
00 -PWQC Limit: 5 mg/L M
en,-.: \0
i ('j
<t <t <t <t .... \0 M ..,;
LI'! N
00 \0
Figure 18.2: Water Quality of river Ghaggar for DO (mg/L) during pre-lockdown (March 2020) and lockdown (April 2020)
70
60
so ::. - C> 40 .s C 30 0 cc
20
10
0
BOD (mg/L)
l __ .J BOD (mg/L) March 2020 (Pre-lockdown) - BOD (mg/L) April 2020 (Lockdown) <t "'
-PWQC Limit: 3 mg/L M <t
~-
"' M
00 N \0
N M N
00 .... N p
00 .... .... N 00 .... \0 ....
N 00 ....
Monitoring Location
Figure 18.3: Water Quality of river Ghaggar for BOD (mg/L) during pre-lockdown (March 2020) and lockdown (April 2020)
202 I Page
2.64
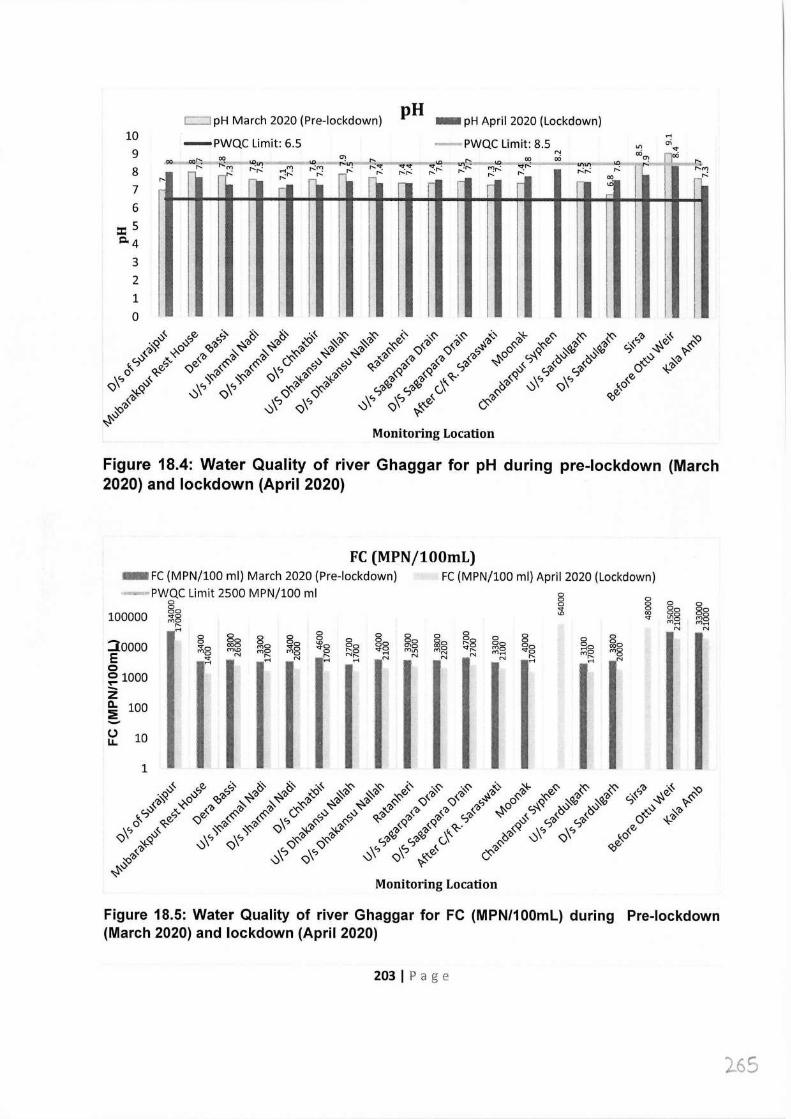
10
9 8 7 6
:c: 5 i=i.4
3 2
1 0
,oo
r--
c:J pH March 2020 (Pre-lockdown)
-PWQC Limit: 6.5 ~l/.\,,-~-ID r---.,...: ~~ "~
~
:::;:""'<f:-,:.<t,:.<t-="d"M:! . ~ ,-... ,...:r-,: ....:,-... r-,.:1"--
~
pH - pH April 2020 (Lockdown)
.... -PWQC Limit: 8.5 ~ en.,
CX) : IX) J: ID!-~ .. ~~----~~,,----~~:.- ~~M ~,...: ,...: ,...:,...: 00,...: ,...:
" r
Monitoring Location
Figure 18.4: Water Quality of river Ghaggar for pH during pre-lockdown (March 2020) and lockdown (April 2020)
- FC (MPN/100 ml) March 2020 (Pre-lockdown) -'"PWQC Limit 2500 MPN/100 ml
0 80 100000 ;;18
r- .... 30000 E 0 ~ 1000 z Cl. 100 ~ - (.) LL 10
1
0 00 000 m«> N
0 0 mo mo
r- ....
FC (MPN/100mL) FC (MPN/100 ml) April 2020 (Lockdown)
0 oa mo m.,, N
0 0 0 0 0 0 0
<t 0 Do Oo "' (X) Oo Oo <t "'a mo
"''"' m.-. N N
0 0 0 0 0
Oo Oo Oo 0 0 ~8 r--0 Oo ~g 000 <t,-.. mo
'°N m.-. <ta mo N N N r-- m,.._
N .... ....
Monitoring Location
Figure 18.5: Water Quality of river Ghaggar for FC (MPN/100mL) during Pre-lockdown (March 2020) and lockdown (April 2020)
203 I Page
2.65
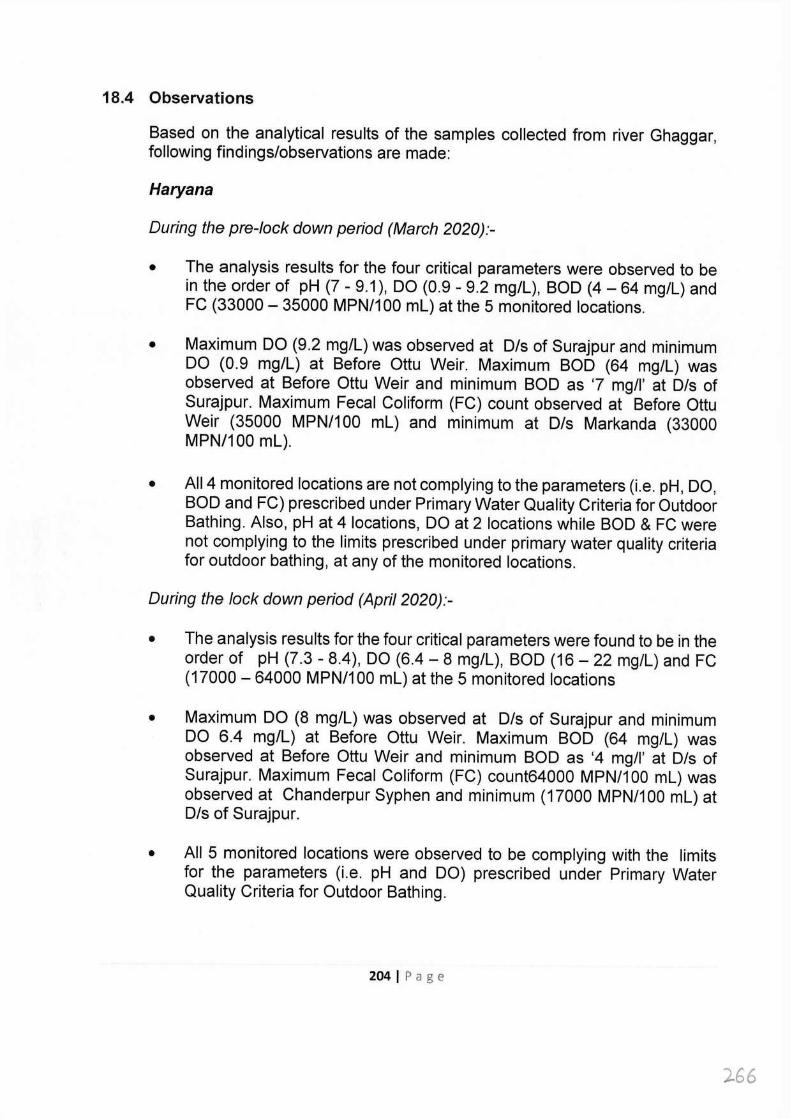
18.4 Observations
Based on the analytical results of the samples collected from river Ghaggar, following findings/observations are made:
Haryana
During the pre-lock down period (March 2020):-
• The analysis results for the four critical parameters were observed to be in the order of pH (7 - 9.1 ), DO (0.9 - 9.2 mg/l), BOD (4 - 64 mg/l) and FC (33000 - 35000 MPN/100 ml) at the 5 monitored locations.
• Maximum DO (9.2 mg/l) was observed at D/s of Surajpur and minimum DO (0.9 mg/l) at Before Ottu Weir. Maximum BOD (64 mg/l) was observed at Before Ottu Weir and minimum BOD as '7 mg/I' at Dis of Surajpur. Maximum Fecal Coliform (FC) count observed at Before Ottu Weir (35000 MPN/100 ml) and minimum at Dis Markanda (33000 MPN/100 ml).
• All 4 monitored locations are not complying to the parameters (i.e. pH, DO, BOD and FC) prescribed under Primary Water Quality Criteria for Outdoor Bathing. Also, pH at 4 locations, DO at 2 locations while BOD & FC were not complying to the limits prescribed under primary water quality criteria for outdoor bathing, at any of the monitored locations.
During the lock down period (April 2020):-
• The analysis results for the four critical parameters were found to be in the order of pH (7.3 - 8.4), DO (6.4 - 8 mg/l), BOD (16 - 22 mg/l) and FC (17000 - 64000 MPN/100 ml) at the 5 monitored locations
• Maximum DO (8 mg/l) was observed at D/s of Surajpur and minimum DO 6.4 mg/l) at Before Ottu Weir. Maximum BOD (64 mg/l) was observed at Before Ottu Weir and minimum BOD as '4 mg/I' at D/s of Surajpur. Maximum Fecal Coliform (FC) count64000 MPN/100 ml) was observed at Chanderpur Syphen and minimum (17000 MPN/100 ml) at Dis of Surajpur.
• All 5 monitored locations were observed to be complying with the limits for the parameters (i.e. pH and DO) prescribed under Primary Water Quality Criteria for Outdoor Bathing.
204 I Page
l66
Overall observations on river Ghaggar stretch within Haryana State: -
• During the lockdown and pre-lockdown period, the analysis results indicate increasing trend of DO (9.7 -611.1 %) at 3 locations and BOD (140 %) at 1 location were observed.
• Also, the analysis results indicate decreasing trend of DO (13 % ) at 1 location, BOD (65.6 -70.4 %) at 2 locations and FC (36.4 -50 %) at 3 monitored locations were observed.
Punjab
During the pre-lock down period (March 2020):-
• The analysis results for the four critical parameters were observed to be in the order of pH (6.8 - 8), DO (1.9 - 6.9 mg/l), BOD (11 - 43 mg/L) and FC (2700 - 4700 MPN/100 ml) at the 14 monitored locations.
• Maximum DO (6.9 mg/l) was observed at Mubarakpur and minimum DO (1.9 mg/l) at Moonak. Maximum BOD (43 mg/L) was observed at D/s Chatbir and minimum BOD as '11 mg/I' at Mubarakpur. Maximum Fecal Coliform (FC) count (4700 MPN/100 ml) was observed at D/s after mixing with Sagarpara Drain and minimum (2700 MPN/100 ml).at U/s Dhakansu Nallah
• All 14 monitored locations were observed to be not complying with the parameters (i.e. pH, DO, BOD and FC) prescribed under Primary Water Quality Criteria for Outdoor Bathing. Also, pH is complying at all 14 monitored locations, DO at 1 location whereas BOD & FC were found to be not complying to the bathing criteria limits at any of the monitored location.
During the lock down period (April 2020):-
• The analysis results for the four critical parameters observed to be in the order of pH (7.3- 7.8), DO (3.1 - 7.3 mg/l), BOD (5- 20 mg/l) and FC (1400 - 2700 MPN/100 ml) at the 14 monitored locations
• The analysis results of samples collected from River Ghaggar revealed that maximum DO was observed at Mubarakpur (7.3 mg/L)) and minimum at D/s after mixing with Sagarpara Drain (3.1 mg/L). Maximum BOD was
205 I Page
26":f-
observed at Dis after mixing with Sagarpara Drain (20 mg/l). Minimum BOD (5 mg/l) was observed Mubarakpur Rest House (Patiala) and U/s Dhakansu Nallah. Maximum Fecal Coliform (FC) count observed at D/s after mixing with Sagarpara Drain (2700 MPN/100 ml) and minimum at Mubarakpur Rest House (Patiala) (1400 MPN/100 ml).
• All 14 monitored locations are not complying to the parameters (i.e. pH, DO, BOD and FC) prescribed under Primary Water Quality Criteria for Outdoor Bathing. Also, pH is complying at 14 locations, DO is complying at 4 locations, BOD not complying at any location and FC complying at 12 out of 14 monitored locations.
Overall observations on river Ghaggar stretch within Punjab State: -
• The analysis results showed increasing trend of DO (5.8 -131.8 %) at 14 monitored locations, decreasing trend of BOD (21.7-81.4 %) at 14 locations and FC (31.6-63 %) at 14 monitored locations were observed.
Overall Observations on River Ghaggar (covering Haryana and Punjab States):-
The analysis results reveal that
>-" During the pre-lockdown, pH (6.8-9.1 ), DO (0.9-9.2 mg/l), BOD (4-64 mg/l) and FC (2700-47000 MPN/100 ml) at the 19 monitored locations. Also, pH at 19 locations and DO at 4 locations were within the desirable limits prescribed under the primary water quality criteria for outdoor bathing whereas BOD & FC were not complied to the criteria limits at all 19 monitored locations.
~ During the lockdown, pH (7.3-8.4 ), DO (3.1-8 mg/l), BOD (4-64 mg/l) and FC (1400-64000 MPN/100 ml) at the 19 monitored locations. Also, pH at 19 locations, DO at 9 locations and FC at 12 monitored locations were found to be complying to the primary water quality criteria for outdoor bathing. Increasing trend of DO (5.8 to 611.1 %) at 17 locations, BOD (140%) at 1 location and decreasing trend of DO (13 %) at 1 location, BOD (21.7 to 81.4 %) at 16 locations, FC (31.6 % to 63 %) at 17 monitored locations were observed.
~ During lockdown period (April, 2020), the analysis results of samples collected from River Ghaggar revealed that maximum DO was observed
206 I Page
268
at Dis Surajpur (8 mg/L)) and minimum at D/s after mixing with Sagarpara Drain (3.1 mg/L). Maximum BOD is observed at Ottu Weir (Before Mixing of Sutlej) (22 mg/L). Minimum BOD observed Mubarakpur Rest House (Patiala) and U/s Dhakansu Nallah (5 mg/L). Maximum Fecal Coliform (FC) count observed at Chandarpur Syphen (64000 MPN/100 ml) and minimum at Mubarakpur Rest House, Patiala (1400 MPN/100 ml).
18.5 Conclusion
None of the monitored locations on river Ghaggar during pre and lockdown period were complying with the Primary Water Quality Criteria for Outdoor Bathing. However, decreasing trend of BOD & FC values during lockdown period indicate marginal improvement in water quality of river Ghaggar.
19.0. IMPACT OF LOCKDOWN ON WATER QUALITY OF RIVER BRAHMAN!
19.1 About Brahmani River
The Brahmani River, in north-eastern Odisha State, is formed by the confluence of the Sankh and South Koel rivers at Vedvyas. The Brahmani river flows for 480 km and enroute join northern branches of the Mahanadi River, which then empties into the Bay of Bengal at Palmyras Point in Odisha. The industrial complex of Talcher city in Odisha is located in the catchment of Brahmani river. The wastewaters generated from the industries such as aluminium, thermal power station and mining operations are primarily responsible for deterioration of water quality of Brahmani river. River Brahmani and Baitarni outfall in the Bay of Bengal, forming a common delta.
19.2 Water Quality Monitoring Locations under National Water Quality Monitoring Program (NWMP)
The Water Quality of River Brahmani is monitored at 20 locations by Central Pollution Control Board (CPCB) in association with State Pollution Control Board, Odisha (OSPCB) under National Water Quality Monitoring Programme (NWMP). Distribution of Water Quality Monitoring Locations Under NWMP within Odisha State on River Brahmani is depicted in Figure 19.1.
207 I Page
269
19.3 Analytical Results-Brahmani
Water quality of river Brahmani was carried out at 20 locations during Pre Lockdown and Lockdown period to evaluate the impact on water quality of river Brahmani. The water quality of river Brahmani for Primary Water Quality Criteria for Outdoor Bathing (PWQCOB) parameters viz. Dissolved Oxygen (DO), pH, Biochemical Oxygen Demand (BOD) and Fecal Coliform (FC) are presented below in Table-19.1.
Based on the monitoring & analysis of collected water samples from river Brahmani, the graphical presentation of water quality of river Brahmani with respect to DO, pH, BOD and FC as observed during pre-lockdown (March 2020) and lockdown period (April 2020) are presented in Figure 19.2 to Figure 19.5.
208 I Page
210
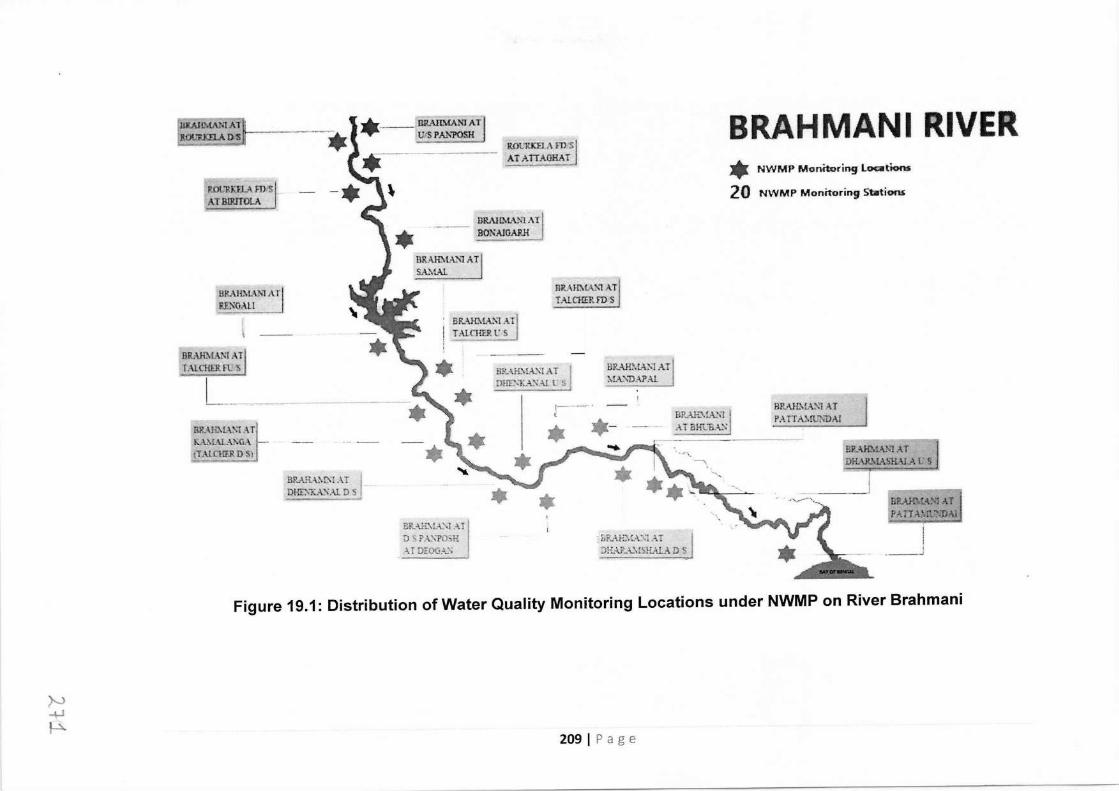
IUtAI IMAM AJ 11.ooam.A °'SIi------- BRAHMANI RIVER ROtJ!tKfl A Fl) 5 ATATIAOHAT
ROl.l!Kl'J.A fl)/$ A TBIR.lT(lt.A
• NWMP Moruroring Locations
20 NWMP Monrtorin9 Stations
OR.,\lU,.W<l AT . --- BONAJGARH
URAH.\-IA..'\1 AT
!lRA}{;\IA~1 A f l!.ENOAL!
BRJ\1-t\Ul\1 AT TAlCHERrD S
Bl'-.\HMA:S.1 AT T Al.Cl!ER l: S
B~UNI AT T.\lCHDlFL S SR.-\h;,l).;.'1 AT
DHDK.\~Al.. I: S
BRA.l-!..\tA.'1.1 AT !\lAXD . .\J>Al
811.AJ-t\l.\!\1 AT f;.AM .. UA~C.A •-· (f AlC-H'fJl D Sl
BRAH .. -\.\N.\T DHr:-;;.;.,.i.-. . .\l P S
Blt~"\l.-1....'\I Al D~PAXPO-.H .-\ T DEOGA.. \'
,---· , BR.~:'.'.t.~ '>l I ATB!H .. i'!A..'-l
BR..\H:-.i.>..'-1 ,H J' A IT A:\n..-~1.>AI
..... '\. I'\. -----. . ··--~-
:f>!V,!0.:.-\'\l . .\T JH.Af_-1....\l',H.~.lA D S
Slt-\H.\1..~-:tAT DlU.R. .. L-\.SHAI.A t; S
BR.Af{\t:\ .. ~ A f NTTA~!'t-~:0."1
Figure 19.1: Distribution of Water Quality Monitoring Locations under NWMP on River Brahmani
N ..µ 1-4-
209 I Page
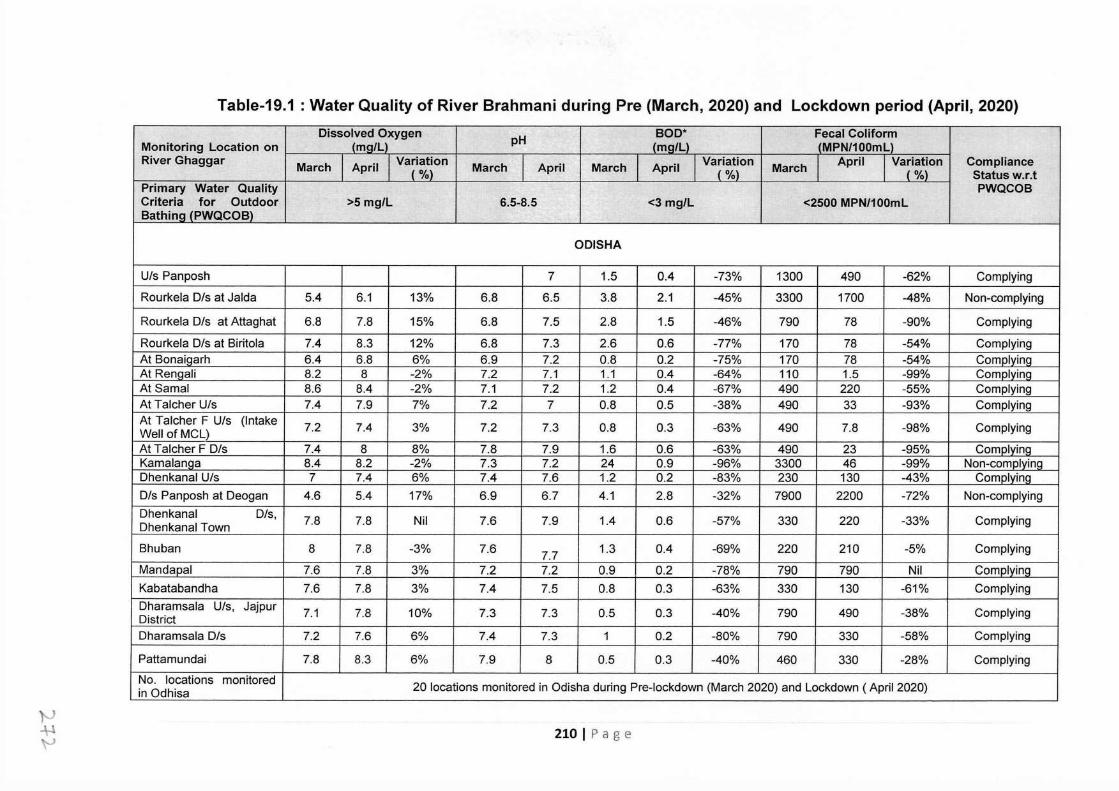
Table-19.1 : Water Quality of River Brahmani during Pre (March, 2020) and Lockdown period (April, 2020)
Dissolved Oxygen pH BOD* Fecal Coliform Monitoring Location on (mg/L) (mg/L) (MPN/100mL) River Ghaggar March April Variation March April March April Variation March April Variation Compliance
( %) ( %) ( %) Status w.r.t Primary Water Quality PWQCOB Criteria for Outdoor >5 mg/L 6.5-8.5 <3 mg/L <2500 MPN/100mL Bathing (PWQCOB)
ODISHA
Uls Panposh 7 1.5 0.4 -73% 1300 490 -62% Complying
Rourkela Dis at Jalda 5.4 6.1 13% 6.8 6.5 3.8 2.1 -45% 3300 1700 -48% Non-complying
Rourkela Dis at Attaghat 6.8 7.8 15% 6.8 7.5 2.8 1.5 -46% 790 78 -90% Complying
Rourkela Dis at Biritola 7.4 8.3 12% 6.8 7.3 2.6 0.6 -77% 170 78 -54% Complying At Bonaigarh 6.4 6.8 6% 6.9 7.2 0.8 0.2 -75% 170 78 -54% Complying At Rengali 8.2 8 -2% 7.2 7.1 1.1 0.4 -64% 110 1.5 -99% Complying At Samal 8.6 8.4 -2% 7.1 7.2 1.2 0.4 -67% 490 220 -55% Complying At Talcher Uls 7.4 7.9 7% 7.2 7 0.8 0.5 -38% 490 33 -93% Complying At Talcher F Uls (Intake 7.2 7.4 3% 7.2 7.3 0.8 0.3 -63% 490 7.8 -98% Complying Well ofMCL) At Talcher F Dis 7.4 8 8% 7.8 7.9 1.6 0.6 -63% 490 23 -95% Complying Kamalanga 8.4 8.2 -2% 7.3 7.2 24 0.9 -96% 3300 46 -99% Non-complying Dhenkanal Uls 7 7.4 6% 7.4 7.6 1.2 0.2 -83% 230 130 -43% Complying Dis Panposh at Deogan 4.6 5.4 17% 6.9 6.7 4.1 2.8 -32% 7900 2200 -72% Non-complying Dhenkanal Dis, 7.8 7.8 Nil 7.6 7.9 1.4 0.6 -57% 330 220 -33% Complying Dhenkanal Town
Bhuban 8 7.8 -3% 7.6 7.7 1.3 0.4 -69% 220 210 -5% Complying
Mandapal 7.6 7.8 3% 7.2 7.2 0.9 0.2 -78% 790 790 Nil Complying Kabatabandha 7.6 7.8 3% 7.4 7.5 0.8 0.3 -63% 330 130 -61% Complying Dharamsala Uls, Jajpur 7.1 7.8 10% 7.3 7.3 0.5 0.3 -40% 790 490 -38% Complying District Dharamsala Dis 7.2 7.6 6% 7.4 7.3 1 0.2 -80% 790 330 -58% Complying
Pattamundai 7.8 8.3 6% 7.9 8 0.5 0.3 -40% 460 330 -28% Complying No. locations monitored 20 locations monitored in Odisha during Pre-lockdown (March 2020) and Lockdown ( April 2020) in Odhisa
}J +1 "'-'
210 I Page
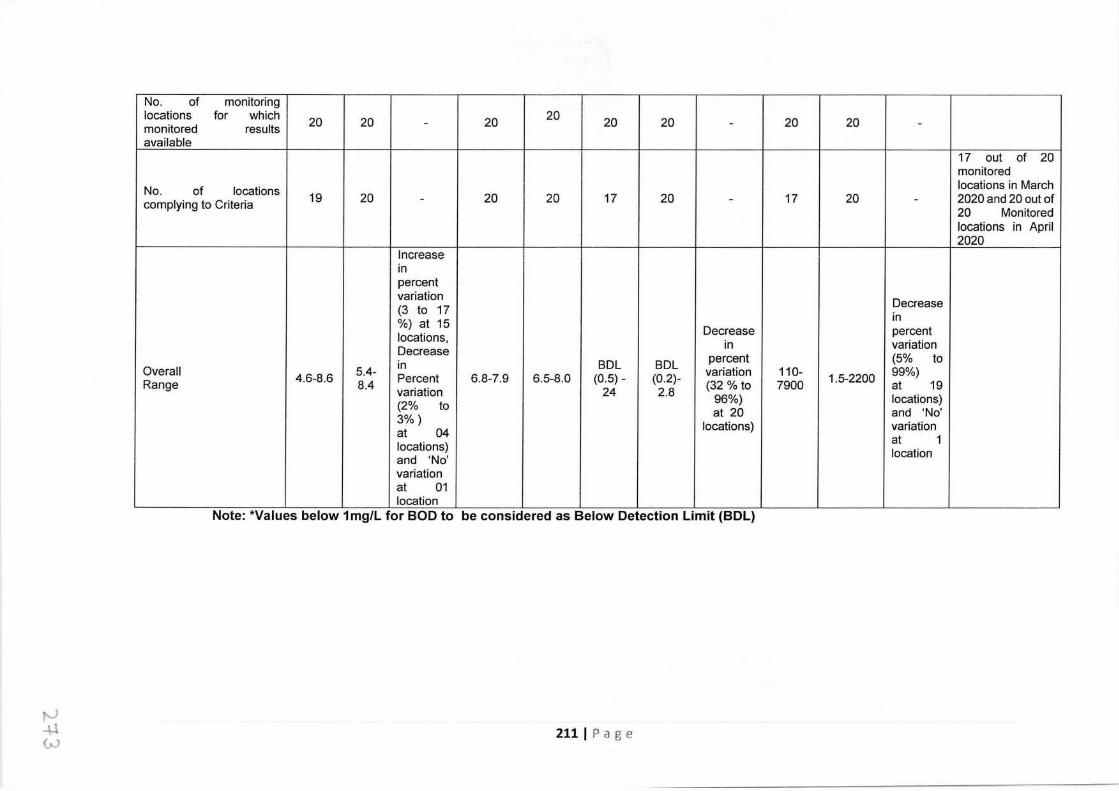
No. of monitoring locations for which 20 20 monitored results 20 - 20 20 20 - 20 20 -
available 17 out of 20 monitored
No. of locations 19 locations in March
complying to Criteria 20 - 20 20 17 20 - 17 20 2020 and 20 out of - 20 Monitored locations in April
Increase 2020
in percent variation (3 to 17 Decrease
%) at 15 in
locations, Decrease percent Decrease in variation
Overall 5.4- in BDL BDL percent (5% to
Range 4.6-8.6 Percent 6.8-7.9 6.5-8.0 (0.5) - (0.2)- variation 110- 1.5-2200 99%) 8.4 (32 % to 7900 at 19 variation 24 2.8
(2% to 96%) locations) 3%) at 20 and 'No'
at 04 locations) variation
locations) at 1
and 'No' location
variation at 01 location
Note: *Values below 1 mg/L for BOD to be considered as Below Detection Limit (BDL)
t----' ..µ w 211 IP age
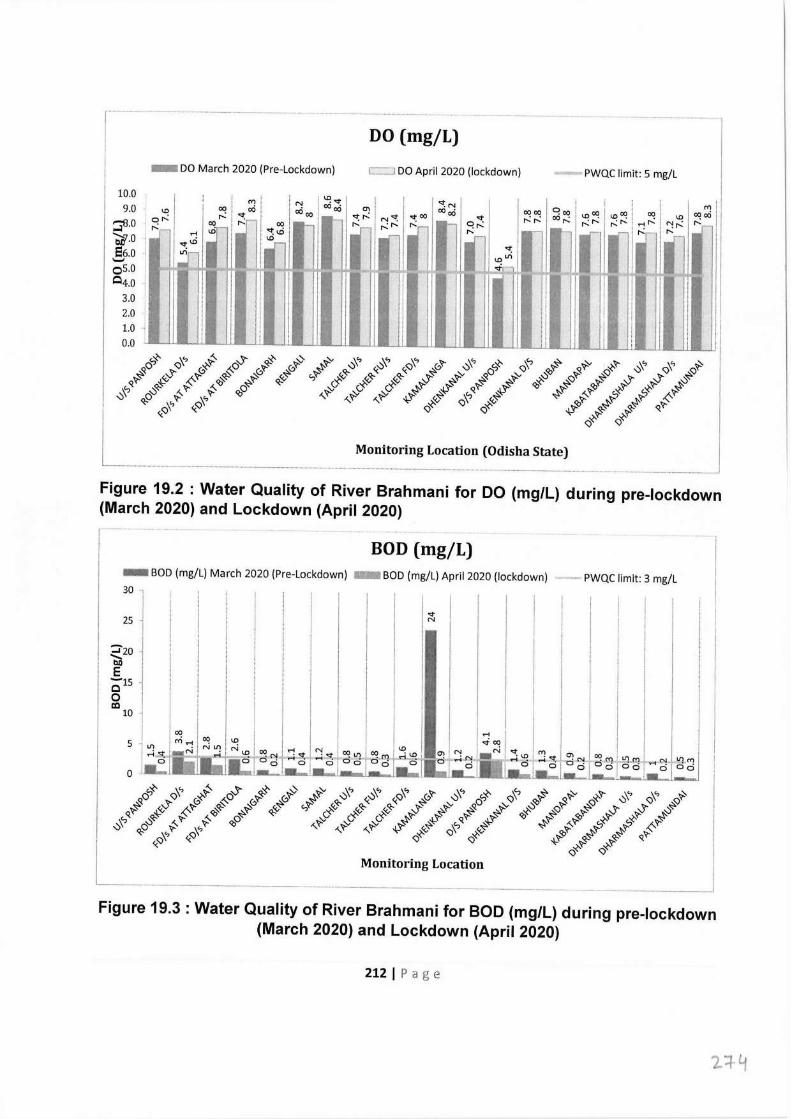
DO (mg/L)
- DO March 2020 (Pre-Lockdown) c::::J DO April 2020 (lockdown) PWQC limit: 5 mg/L
10.0 9.0 <!l
__, ,or-: ;,..,;io.0 1 ,..: _
~-0 I 66.0 -, ._, ' os.o I C4_0
3.0 2.0 1.0 i 0.0
00 ,..:
00
'° 00 00 "r--: C?oo 00 • r--
m 00 cxi ,..:
Monitoring Location (Odisha State) ..................... ·--------··--·-··-······ --~
Figure 19.2 : Water Quality of River Brahmani for DO (mg/L) during pre-lockdown (March 2020) and Lockdown (April 2020)
BOD (mg/L) - BOD (mg/L) March 2020 (Pre-Lockdown) - BOD (mg/L) April 2020 (lockdown) 30 ·
.;- 25 N
::i'20 · tio E 015 0 co
10 ·
5
PWQC limit: 3 mg/L
Monitoring Location
----- ---------~ Figure 19.3 : Water Quality of River Brahmani for BOD (mg/L) during pre-lockdown
(March 2020) and Lockdown (April 2020)
212 I Page
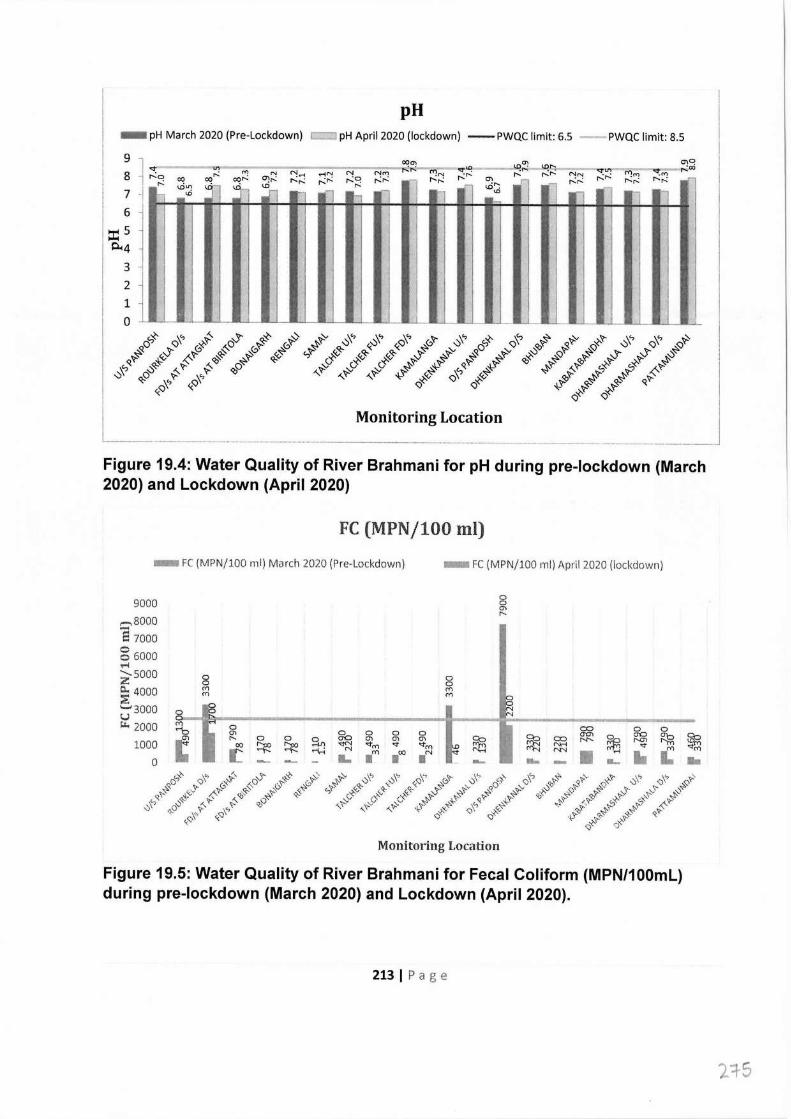
pH - pH March 2020 (Pre-Lockdown) c::::J pH April 2020 (lockdown) -- PWQC limit: 6.5 --PWQC limit: 8.5
98 j <t.-~---"!•--e---..--------001<2'~·-m=N-<t~'---"!;!J ~ n"l N N ..-tN N Nrt"l ·r--,.. r-.. r--,:r--:' NN
7
6
::c: 5 P..4
3
2 1 0
r--o 00 oo" oor-: "'. ..... ,....:r--: ,....:~ ,...:r--: r--:r-,: ,-.. "' r--:r--: ,-..r-- r---: ,-..: r--,-: - I r-: ·" r--r-: l ·r-- n \C~ cc·~ cc·- \D " ~ \D<D ..... j ,_ "' ri .__ n ..... n '
'
'
o,O m ~00
Monitoring Location
Figure 19.4: Water Quality of River Brahmani for pH during pre-lockdown (March 2020) and Lockdown (April 2020)
FC (MPN/100 ml)
- FC (MPN/1.00 ml) March 2020 (Pre-Lockdown) - FC (MPN/lO0 ml) Apnl 2020 (lockdown)
9000 .-,8000 8 7000 5 6000 "'" zsooo ~ 4000 ~3000 .., 2000
1000 0
8 "' ,-..
0 0 m m
0 "' r-- o a 00 ~ ~
0 0 m m
~ N
0 = 0 a §?o 0 0 ~
am ~
ere» ~ ~ ~ "' CJ) CJ)
~ = ,-..,-.. NJ'\ ~ <tm <t <tm Nrl <t ""\-< "'N N--< .... L m m loo N • • L I I - - - - •
Monitoring Location
Figure 19.5: Water Quality of River Brahmani for Fecal Coliform (MPN/100mL) during pre-lockdown (March 2020) and Lockdown (April 2020).
213 I Page
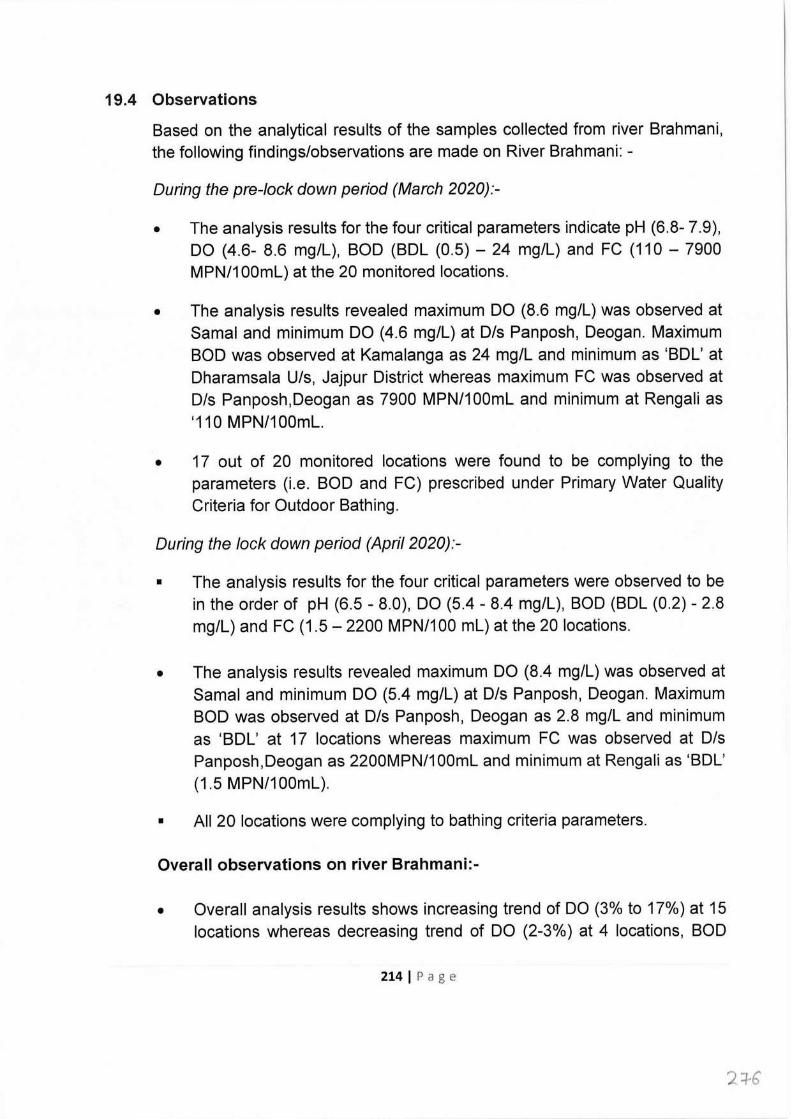
19.4 Observations
Based on the analytical results of the samples collected from river Brahmani, the following findings/observations are made on River Brahmani: -
During the pre-lock down period (March 2020):-
• The analysis results for the four critical parameters indicate pH (6.8- 7.9), DO (4.6- 8.6 mg/L), BOD (BDL (0.5) - 24 mg/L) and FC (110 - 7900 MPN/100ml) at the 20 monitored locations.
• The analysis results revealed maximum DO (8.6 mg/L) was observed at Samal and minimum DO (4.6 mg/L) at D/s Panposh, Deegan. Maximum BOD was observed at Kamalanga as 24 mg/L and minimum as 'BDL' at Dharamsala U/s, Jajpur District whereas maximum FC was observed at D/s Panposh,Deogan as 7900 MPN/100ml and minimum at Rengali as '110 MPN/100ml.
• 17 out of 20 monitored locations were found to be complying to the parameters (i.e. BOD and FC) prescribed under Primary Water Quality Criteria for Outdoor Bathing.
During the lock down period (April 2020):-
• The analysis results for the four critical parameters were observed to be in the order of pH (6.5 - 8.0), DO (5.4 - 8.4 mg/L), BOD (BDL (0.2) - 2.8 mg/L) and FC (1.5 - 2200 MPN/100 ml) at the 20 locations.
• The analysis results revealed maximum DO (8.4 mg/L) was observed at Samal and minimum DO (5.4 mg/L) at D/s Panposh, Deegan. Maximum BOD was observed at D/s Panposh, Deegan as 2.8 mg/L and minimum as 'BDL' at 17 locations whereas maximum FC was observed at D/s Panposh,Deogan as 2200MPN/100ml and minimum at Rengali as 'BDL' (1.5 MPN/100ml).
• All 20 locations were complying to bathing criteria parameters.
Overall observations on river Brahmani:-
• Overall analysis results shows increasing trend of DO (3% to 17%) at 15 locations whereas decreasing trend of DO (2-3%) at 4 locations, BOD
214 I Page
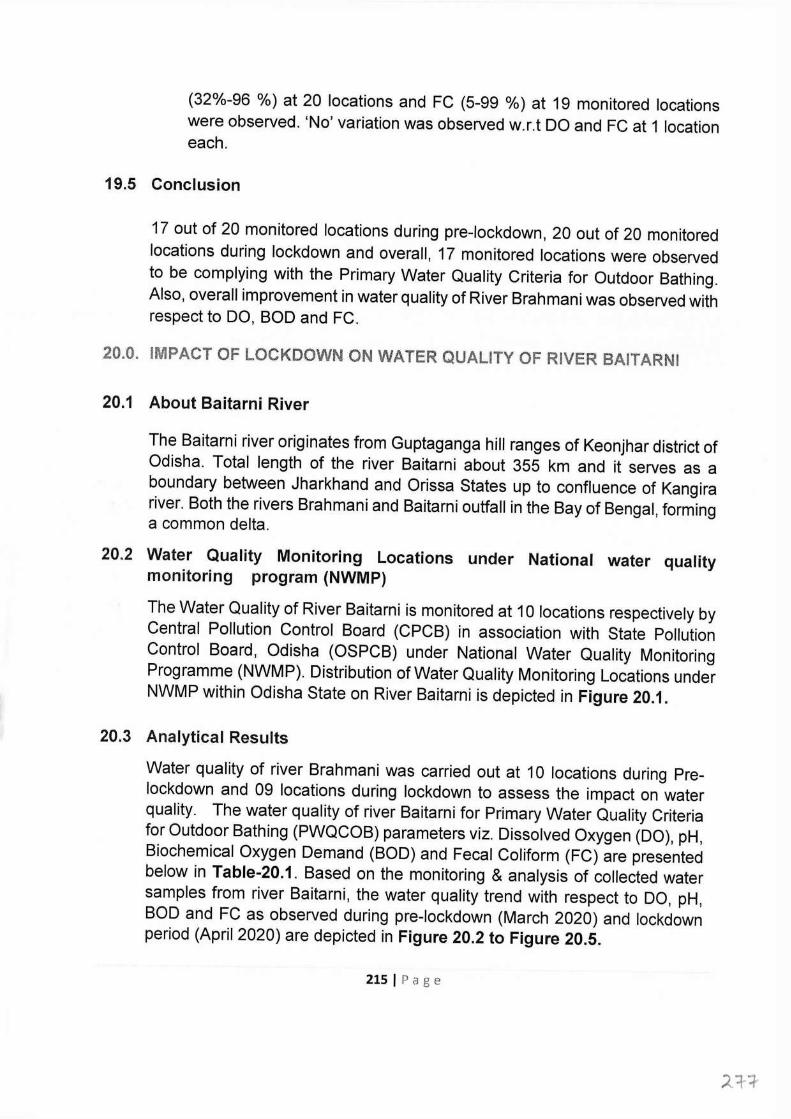
(32%-96 % ) at 20 locations and FC (5-99 % ) at 19 monitored locations were observed. 'No' variation was observed w.r.t DO and FC at 1 location each.
19.5 Conclusion
17 out of 20 monitored locations during pre-lockdown, 20 out of 20 monitored locations during lockdown and overall, 17 monitored locations were observed to be complying with the Primary Water Quality Criteria for Outdoor Bathing. Also, overall improvement in water quality of River Brahmani was observed with respect to DO, BOD and FC.
20.0. IMPACT OF LOCKDOWN ON WATER QUALITY OF RIVER BAITARNI
20.1 About Baitarni River
The Baitarni river originates from Guptaganga hill ranges of Keonjhar district of Odisha. Total length of the river Baitarni about 355 km and it serves as a boundary between Jharkhand and Orissa States up to confluence of Kangira river. Both the rivers Brahmani and Baitarni outfall in the Bay of Bengal, forming a common delta.
20.2 Water Quality Monitoring Locations under National water quality monitoring program (NWMP)
The Water Quality of River Baitarni is monitored at 10 locations respectively by Central Pollution Control Board (CPCB) in association with State Pollution Control Board, Odisha (OSPCB) under National Water Quality Monitoring Programme (NWMP). Distribution of Water Quality Monitoring Locations under NWMP within Odisha State on River Baitarni is depicted in Figure 20.1.
20.3 Analytical Results
Water quality of river Brahmani was carried out at 10 locations during Pre lockdown and 09 locations during lockdown to assess the impact on water quality. The water quality of river Baitarni for Primary Water Quality Criteria for Outdoor Bathing (PWQCOB) parameters viz. Dissolved Oxygen (DO), pH, Biochemical Oxygen Demand (BOD) and Fecal Coliform (FC) are presented below in Table-20.1. Based on the monitoring & analysis of collected water samples from river Baitarni, the water quality trend with respect to DO, pH, BOD and FC as observed during pre-lockdown (March 2020) and lockdown period (April 2020) are depicted in Figure 20.2 to Figure 20.5.
215 I Page
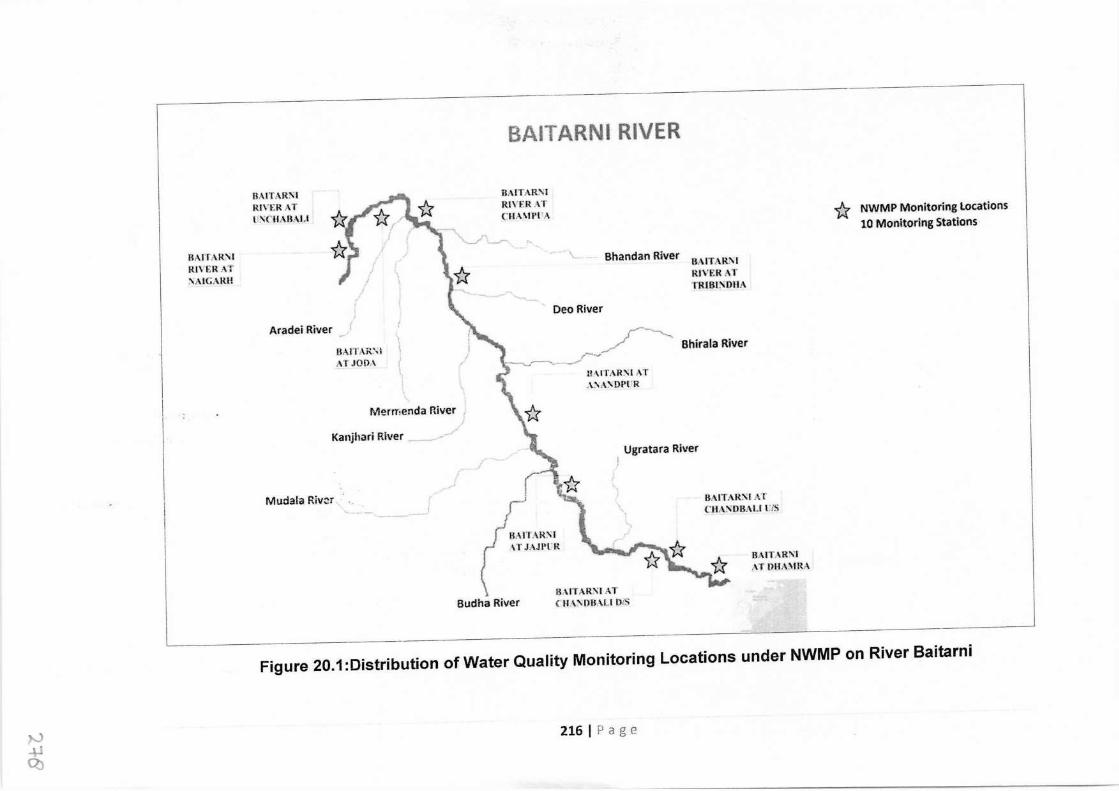
BAITARNI RIVER
UAITAR"I Rtn:RAT :-.CHAf!ALI
BAlTARSI Rl\'f.R AT CHA\ll'l'A
~ /' i "---- ~...r-
llAITAR'lil Rl\'ER AT '.\AlGARH
Bhandan River SAlTAR'I RJVERAT TRIBl~OHA
Oeo River
Aradei River
13AITAR',l ,:\TJOOA
/-~ ,,-~ ~------ :!•\rl'AR'<I AT A'.\A'.\Dl'!'R
Bhirala River
Mermenda River 1
Kanjhari River _ _ Ugratara River
!
Mudala Riv~r
1{ NWMP Monitoring locations 10 Monitoring Stations
f !. BAITAR~r
.\T JAJl'l'R
\ Budha River
8AITAlt:-il AT CtlASOBAl . .1 l'IS
BAITAR:\'lAT CHA'DllALl ors
BAIT,\R!':I ,.\ T OH A,nu
Figure 20.1 :Distribution of Water Quality Monitoring Locations under NWMP on River Baitarni
,-J ..µ Q)
216 I Page
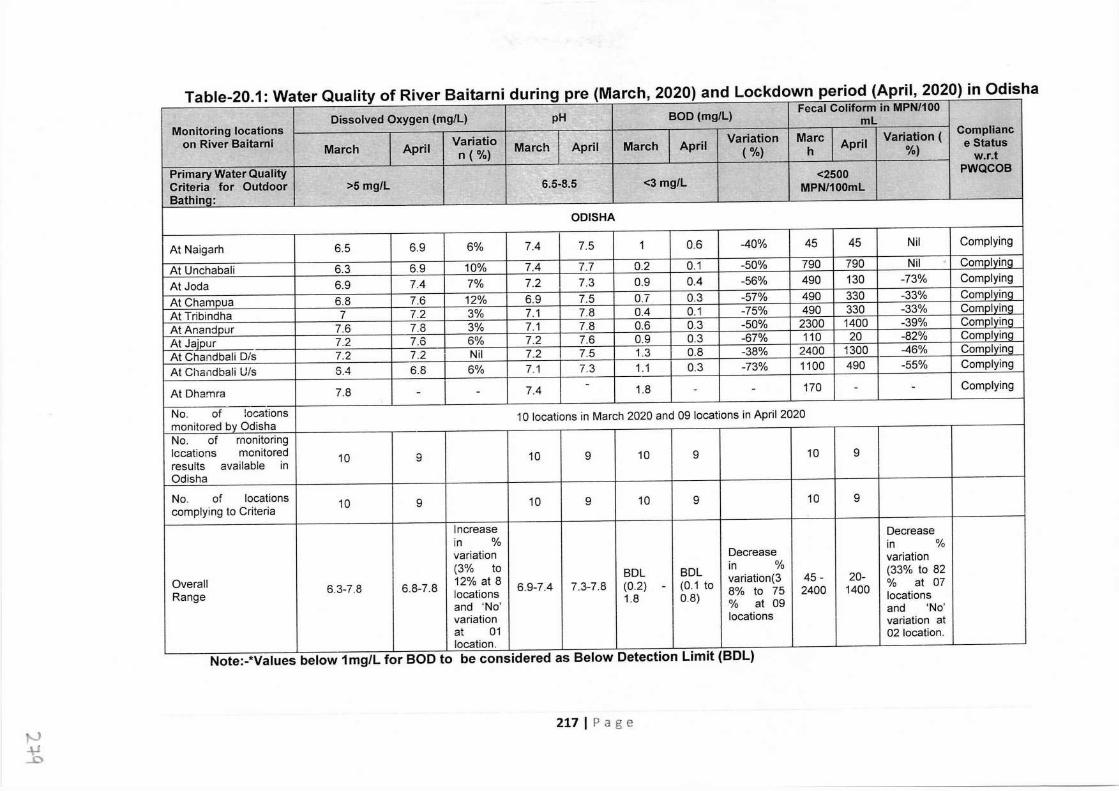
Table-20.1: Water Quality of River Baitarni during pre (March, 2020) and Lockdown period (April, 2020) in Odisha Dissolved Oxygen (mg/L) pH BOD (mg/L)
Fecal Coliform in MPN/100
Monitoring locations ml
on River Baitarni Variatio Variation Marc Variation ( Complianc
March April n ( %) March April March April ( %) h April %) e Status w.r.t
Primary Water Quality <2500 PWQCOB Criteria for Outdoor >5 mg/L 6.5-8.5 <3 mg/L MPN/100mL Bathing:
ODISHA
At Naigarh 6.5 6.9 6% 7.4 7.5 1 0.6 -40% 45 45 Nil Complying
At Unchabali 6.3 6.9 10% 7.4 7.7 0.2 0.1 -50% 790 790 Nil Comolvina
AtJoda 6.9 7.4 7% 7.2 7.3 0.9 0.4 -56% 490 130 -73% Complying
At Chamoua 6.8 7.6 12% 6.9 7.5 0.7 0.3 -57% 490 330 -33% Comolvina
At Tribindha 7 7.2 3% 7.1 7.8 0.4 0.1 -75% 490 330 -33% Comolvina
At Anandour 7.6 7.8 3% 7.1 7.8 0.6 0.3 -50% 2300 1400 -39% Comolvina
At Jajpur 7.2 7.6 6% 7.2 7.6 0.9 0.3 -67% 110 20 -82% Complvina
At Chandbali D/s 7.2 7.2 Nil 7.2 7.5 1.3 0.8 -38% 2400 1300 -46% Complvina
At Chandbali U/s 5.4 6.8 6% 7.1 7.3 1.1 0.3 -73% 1100 490 -55% Complying
At Dharnra 7.8 7.4 - 1.8 170 Complying - - - - - -
No. of locations 10 locations in March 2020 and 09 locations in April 2020 monitored bv Odisha No. of monitoring locations monitored 10 9 10 9 10 9 10 9 results available in Odisha
No. of locations 10 9 10 9 10 9 10 9 complying to Criteria
Increase Decrease in % in % variation Decrease variation (3% to BDL BDL in % (33% to 82
Overall 6.3-7.8 6.8-7.8 12% at 8 6.9-7.4 7.3-7.8 (0.2) (0.1 to variation(3 45- 20- % at 07 Range locations
- 8% to 75 2400 1400 1.8 0.8) locations
and 'No' % at 09 and 'No' variation locations variation at at 01 02 location. location.
Note:-*Values below 1 mg/L for BOD to be considered as Below Detection Limit (BDL)
217 I Page
"' ~
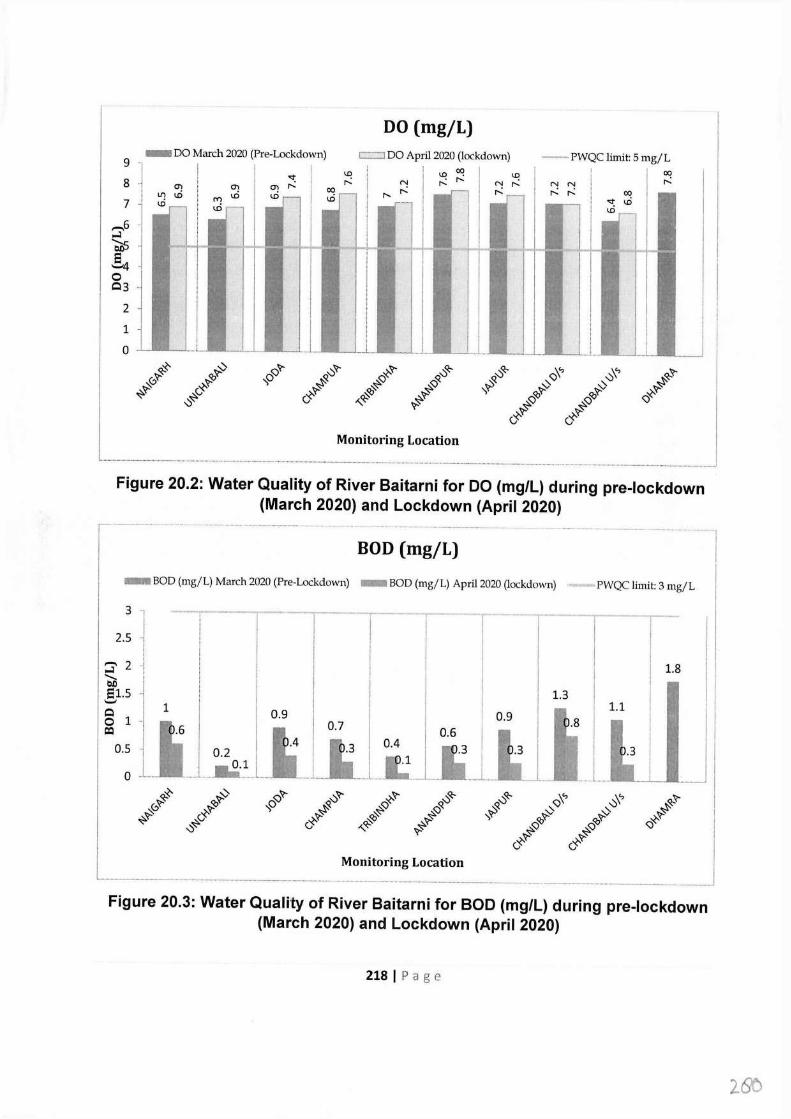
DO (mg/L) - DO March 2020 (Pre-Lockdown)
9
8
7
,....,6 ..i ~ -.§4 0 Q3
2
1
0
c:=i DO April 2020 (lockdown) --PWQC limit: 5 mg/L 00 ,-.:
't--<:- v ~"?- ~"?- ~"?- ~~ ~~ :,.._c., -0\" ~"?- 0~ '<>"?' "o $ ~ ~Q. ',/ ,<::i ~ -<:-~ ~~ ~ v ~ .j!. ';_(t ~ ~c -<:-~ "'~ ~'<> <:)X'-
" C ,t- .j!. ~<:j
<J -<:-~ (J
Monitoring Location
Figure 20.2: Water Quality of River Baitarni for DO (mg/L) during pre-lockdown (March 2020) and Lockdown (April 2020) --········-······ ......
BOD (mg/L)
- BOD (mg/L) March 2020 (Pre-Lockdown) - BOD (mg/L) April 2020 (lockdown) PWQC limit: 3 mg/L
3
1 2.5
,...., 2 ..i ....... b.0 si.s '-' 1 Q 0.9 0 1 0::i 0.5 0.2
0 ..........• :=····· 't--<:- v ~"?-
0"?' '<>"?' "o ~ -<:-~ ~ ~c
"
1.8
1.3 1.1
0.9 I ,8 0.7 0.6
0.4 I .3
I .1 J __ ~"?- ~"?- ~~ ~~ :,.._c., -0\" ~"?- $ ~ ~Q. ',/ ,<::i v ~ ~~ ~ -<:-~ .j!. ~<o ~"?' <:)X'- (J "'~ ,t- .j!. ~<:j
<J -<:-~ C Monitoring Location
Figure 20.3: Water Quality of River Baitarni for BOD (mg/L) during pre-lockdown (March 2020) and Lockdown (April 2020)
218 I Page
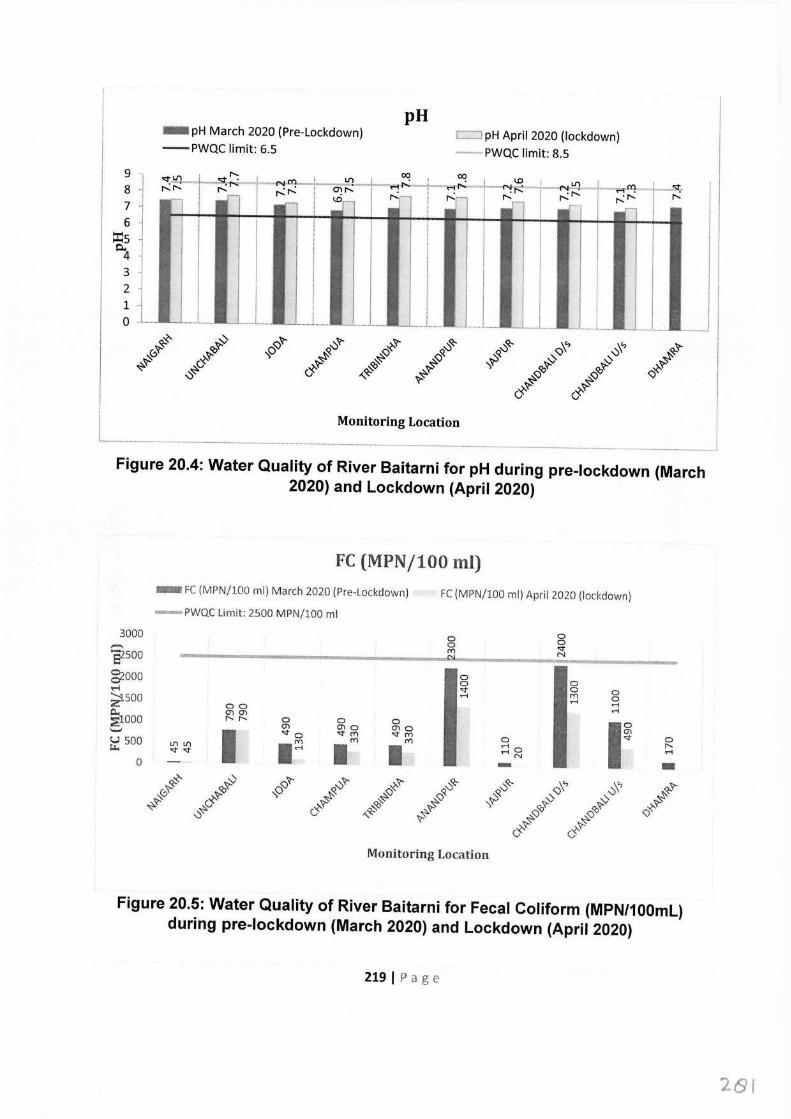
- pH March 2020 (Pre-Lockdown) - PWQC limit: 6.5
pH L. 1 pH April 2020 (lockdown) -PWQC limit: 8.5
9 8 7 6
il:5 i::i..4 3 2 - 1 - 0 ,...__ ···-·······
Monitoring Location
Figure 20.4: Water Quality of River Baitarni for pH during pre-lockdown (March 2020) and Lockdown (April 2020)
FC (MPN/100 ml) - FC (MPN/100 ml) March 2020 (Pre-Lockdown)
-PWQC Limit: 2500 MPN/100 ml
FC (MPN/100 ml) April 2020 (lockdown)
3000 0 0 0 0 <t --- ('(') N s2soo
gzooo 0 0 0
<t 0 0 ... ,.... ('(') 0 z3-soo ,.... .... 00 ,.... ~1000
en en r--- r--- 0 0 0 ,~ en en o O'\Q '-' I <to <t ('(') <t ('(') 0 0 ~ 500 .~ ('(') ('(') ,.... 0 r--- Lf'l Lf'l I I ,.... <t <t .-< N
0 - - q;.V:- v 0"?- ~"?- ~"?- 0(/;- 0'<;- ~', .::}" ~"?- 0'?' (o'?' -.,o .$- 0 ~ \~ ...._(;) v :I ~ v:-'?' v:-'?' %'~ ~ ~ ~'?' (;)~ ~ ~C, C, "~ '?-.;::,.. 0<:/:)
~0 v ~
(.,~ '0'?' C
Monitoring Location
Figure 20.5: Water Quality of River Baitarni for Fecal Coliform (MPN/100ml) during pre-lockdown (March 2020) and Lockdown (April 2020)
219 I Page
201
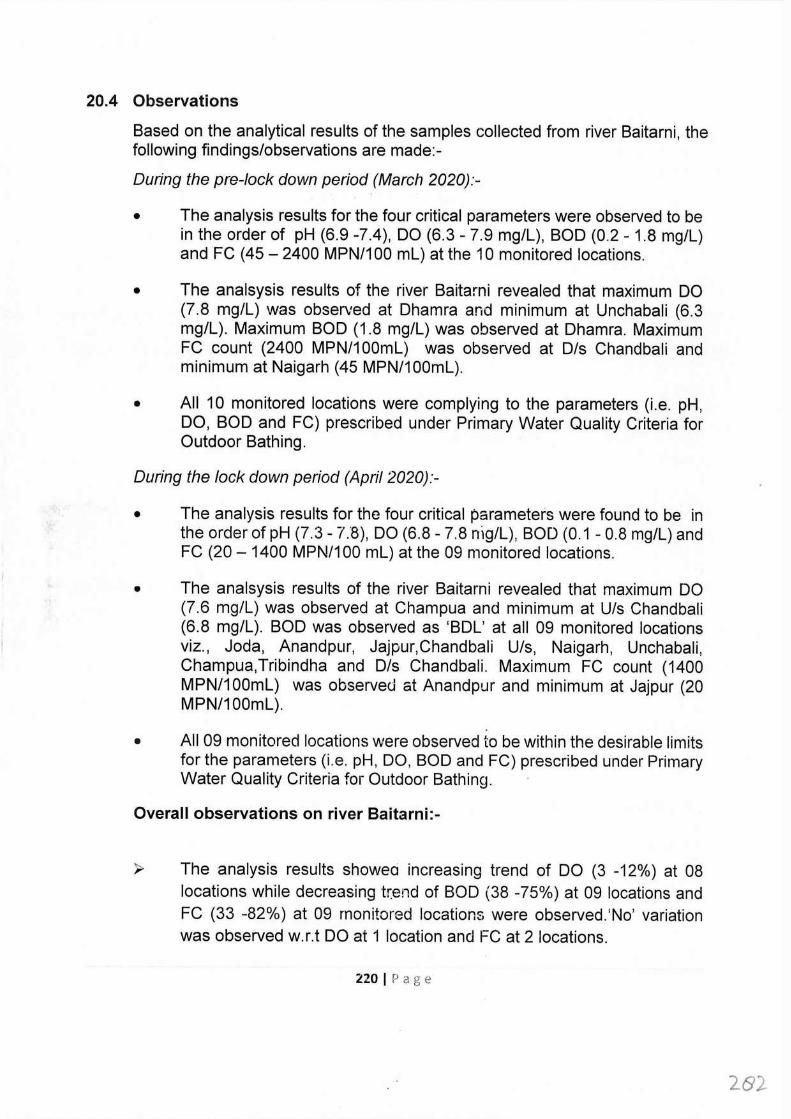
20.4 Observations
Based on the analytical results of the samples collected from river Baitarni, the following findings/observations are made:-
During the pre-lock down period (March 2020):-
• The analysis results for the four critical parameters were observed to be in the order of pH (6.9 -7.4), DO (6.3 - 7.9 mg/l), BOD (0.2 - 1.8 mg/l) and FC (45 - 2400 MPN/100 ml) at the 10 monitored locations.
• The analsysis results of the river Baitarni revealed that maximum DO (7.8 mg/l) was observed at Dhamra and minimum at Unchabali (6.3 mg/l). Maximum BOD (1.8 mg/l) was observed at Dhamra. Maximum FC count (2400 MPN/100ml) was observed at D/s Chandbali and minimum at Naigarh (45 MPN/100ml).
• All 10 monitored locations were complying to the parameters (i.e. pH, DO, BOD and FC) prescribed under Primary Water Quality Criteria for Outdoor Bathing.
During the lock down period (April 2020):-
• The analysis results for the four critical parameters were found to be in the order of pH (7.3 - 7.'8), DO (6.8 - 7.8 nig/l), BOD (0.1 - 0.8 mg/l) and FC (20 - 1400 MPN/100 ml) at the 09 monitored locations.
• The analsysis results of the river Baitarni revealed that maximum DO (7.6 mg/l) was observed at Champua and minimum at U/s Chandbali (6.8 mg/l). BOD was observed as 'BDl' at all 09 monitored locations viz., Joda, Anandpur, Jajpur,Chandbali U/s, Naigarh, Unchabali, Champua,Tribindha and D/s Chandbali. Maximum FC count (1400 MPN/100ml) was observed at Anandpur and minimum at Jajpur (20 MPN/100ml).
• All 09 monitored locations were observed to be within the desirable limits for the parameters (i.e. pH, DO, BOD and FC) prescribed under Primary Water Quality Criteria for Outdoor Bathing.
Overall observations on river Baitarni:-
The analysis results showeci increasing trend of DO (3 -12%) at 08 locations while decreasing trend of BOD (38 -75%) at 09 locations and FC (33 -82%) at 09 monitored locations were observed.'No' variation was observed w.r.t DO at 1 location and FC at 2 locations.
220 I Page
202.
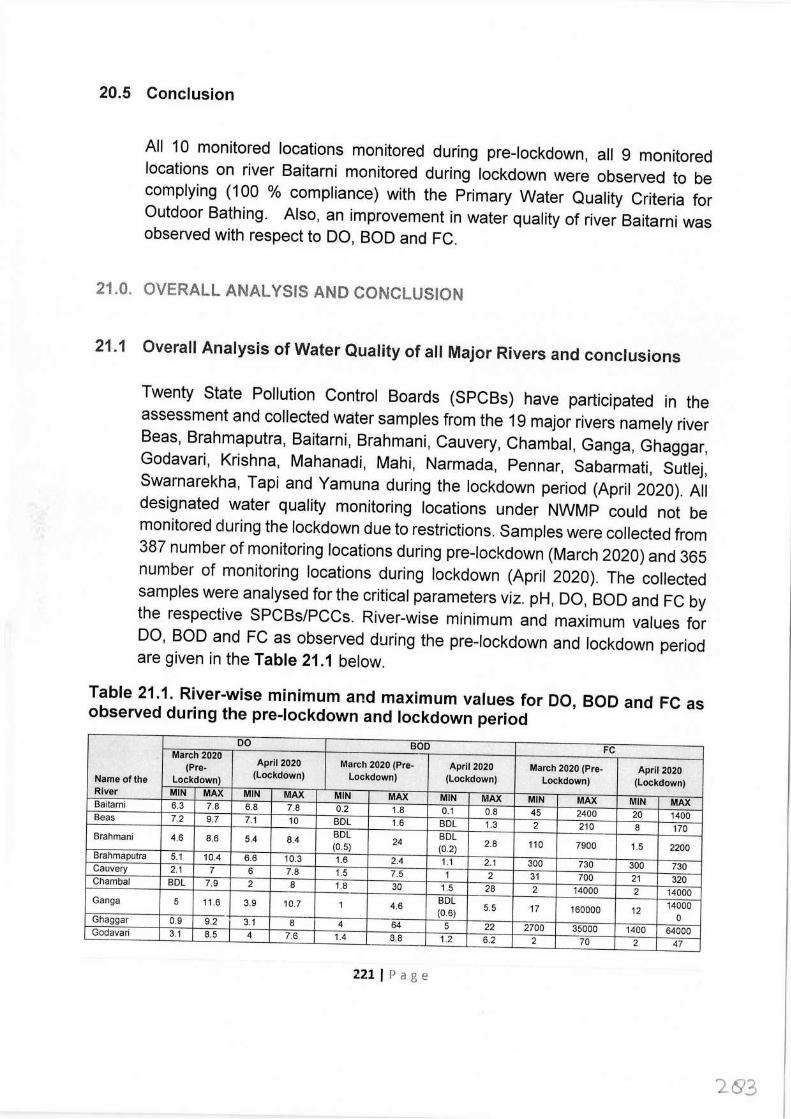
20.5 Conclusion
All 10 monitored locations monitored during pre-lockdown, all 9 monitored locations on river Baitarni monitored during lockdown were observed to be complying (100 % compliance) with the Primary Water Quality Criteria for Outdoor Bathing. Also, an improvement in water quality of river Baitarni was observed with respect to DO, BOD and FC.
21.0. OVERALL ANALYSIS AND CONCLUSION
21.1 Overall Analysis of Water Quality of all Major Rivers and conclusions
Twenty State Pollution Control Boards (SPCBs) have participated in the assessment and collected water samples from the 19 major rivers namely river Beas, Brahmaputra, Baitarni, Brahmani, Cauvery, Chambal, Ganga, Ghaggar, Godavari, Krishna, Mahanadi, Mahi, Narmada, Pennar, Sabarmati, Sutlej, Swarnarekha, Tapi and Yamuna during the lockdown period (April 2020). All designated water quality monitoring locations under NWMP could not be monitored during the lockdown due to restrictions. Samples were collected from 387 number of monitoring locations during pre-lockdown (March 2020) and 365 number of monitoring locations during lockdown (April 2020). The collected samples were analysed for the critical parameters viz. pH, DO, BOD and FC by the respective SPCBs/PCCs. River-wise minimum and maximum values for DO, BOD and FC as observed during the pre-lockdown and lockdown period are given in the Table 21.1 below.
Table 21.1. River-wise minimum and maximum values for DO, BOD and FC as observed during the pre-lockdown and lockdown period
DO BOD FC March 2020 April 2020 March 2020 (Pre- April 2020 March 2020 (Pre- April 2020 (Pre-
Name of the Lockdown) (Lockdown) Lockdown) (Lockdown) Lockdown) (Lockdown) River MIN MAX MIN MAX MIN MAX MIN MAX MIN MAX MIN MAX Baitarni 6.3 7.8 6.8 7.8 0.2 1.8 0.1 0.8 45 2400 20 1400 Beas 7.2 9.7 7.1 10 BDL 1.6 BDL 1.3 2 210 8 170 Brahmani 4.6 8.6 5.4 8.4 BDL
24 BDL 2.8 110 7900 1.5 2200 (0.5) (0.2)
Brahmaputra 5.1 10.4 6.6 10.3 1.6 2.4 1.1 2.1 300 730 300 730 Cauvery 2.1 7 6 7.8 1.5 7.5 1 2 31 700 21 320 Chambal BDL 7.9 2 8 1.8 30 1.5 28 2 14000 2 14000 Ganga 5 11.6 3.9 10.7 1 4.6 BDL
5.5 17 160000 12 14000 (0.6) 0 Ghaggar 0.9 9.2 3.1 8 4 64 5 22 2700 35000 1400 64000 Godavari 3.1 8.5 4 7.6 1.4 8.8 1.2 6.2 2 70 2 47
221 I Page
203
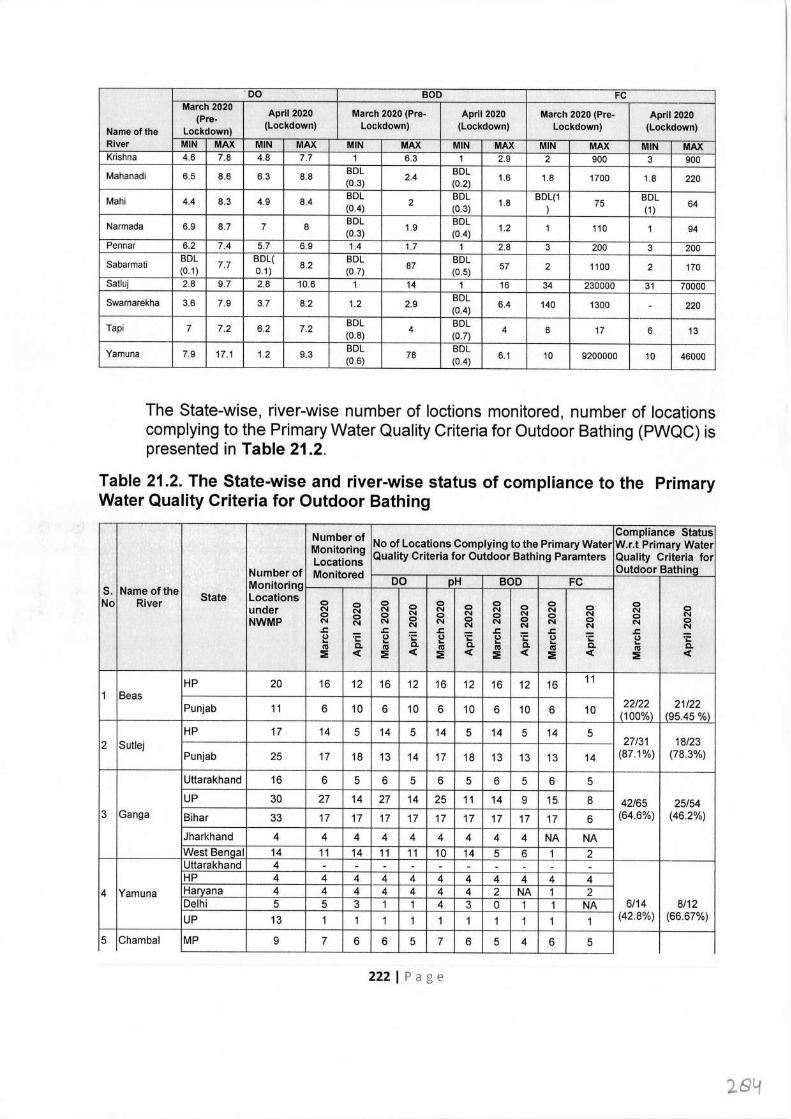
'DO BOD FC March 2020
April 2020 March 2020 (Pre- April 2020 March 2020 (Pre- April 2020 (Pre- Name of the Lockdown)
(Lockdown) Lockdown) (Lockdown) Lockdown) (Lockdown)
River MIN MAX MIN MAX MIN MAX MIN MAX MIN MAX MIN MAX Krishna 4.6 7.8 4.8 7.7 1 6.3 1 2.9 2 900 3 900
Mahanadi 6.5 8.6 6.3 8.8 BDL 2.4 BDL 1.6 1.8 1700 1.8 (0.3) (0.2) 220
Mahi 4.4 8.3 4.9 8.4 BDL 2 BDL
1.8 BDL(1 75 BDL
(0.4) (0.3) ) (1) 64
Narmada 6.9 8.7 7 8 BDL 1.9 BDL 1.2 1 110 94 (0.3) (0.4) 1
Pennar 6.2 7.4 5.7 6.9 1.4 1.7 1 2.8 3 200 3 200
Sabarmati BDL 7.7 BDL( 8.2 BDL
87 BDL 57 (0.1) 0.1) (0.7) (0.5) 2 1100 2 170
Satluj 2.8 9.7 2.8 10.6 1 14 1 16 34 230000 31 70000
Swarnarekha 3.6 7.9 3.7 8.2 1.2 2.9 BDL 6.4 140 1300 220 (0.4) -
Tapi 7 7.2 6.2 7.2 BDL 4 BDL 4 6 17 (0.8) (0.7) 6 13
Yamuna 7.9 17.1 1.2 9.3 BDL 78 BDL
6.1 10 9200000 10 (0.6) (0.4) 46000
The State-wise, river-wise number of loctions monitored, number of locations complying to the Primary Water Quality Criteria for Outdoor Bathing (PWQC) is presented in Table 21.2.
Table 21.2. The State-wise and river-wise status of compliance to the Primary Water Quality Criteria for Outdoor Bathing
Number of Compliance Status Monitoring No of Locations Complying to the Primary Water W.r.t Primary Water Locations Quality Criteria for Outdoor Bathing Paramters Quality Criteria for
Number of Monitored Outdoor Bathina Monitoring DO pH BOD FC s. Name of the
No River State Locations 0 0 0 0 0 0 under N 0 N 0 N 0 N 0 N 0 N 0 N N N N N N 0 0 0 0 0 0 0 NWMP N N N 0 N 0 N 0 N 0 N 0 N N N N N .c: .c: .c: .c: .c: .c: (.) ·.:: (.) ·.:: (.) ·.:: ~ ·.:: (.) ·.:: (.) ·.:: ..
C. .. C. .. C. C. .. C. .. C. n, n, n, n, n, n,
:!! < :!! < :!! < :!! < :!! < :!! <
HP 20 16 12 16 12 16 12 16 12 16 11 1 Beas
22/22 21/22 Punjab 11 6 10 6 10 6 10 6 10 6 10 (100%) (95.45 %) HP 17 14 5 14 5 14 5 14 5 14 5
Sutlej 27/31 18/23 2 (87.1%) (78.3%) Punjab 25 17 18 13 14 17 18 13 13 13 14
Uttarakhand 16 6 5 6 5 6 5 6 5 6 5 UP 30 27 14 27 14 25 11 14 9 15 8 42/65 25/54
3 Ganga Bihar 33 17 17 17 17 17 17 17 17 17 6 (64.6%) (46.2%)
Jharkhand 4 4 4 4 4 4 4 4 4 NA NA West Benaal 14 11 14 11 11 10 14 5 6 1 2 Uttarakhand 4 - - - - - - - - . - HP 4 4 4 4 4 4 4 4 4 4 4
4 Yamuna Harvana 4 4 4 4 4 4 4 2 NA 1 2 Delhi 5 5 3 1 1 4 3 0 1 1 NA 6/14 8/12 UP 13 1 1 1 1 1 1 1 1 1 1 (42.8%) (66.67%)
5 Chambal MP 9 7 6 6 5 7 6 5 4 6 5
222 I Page
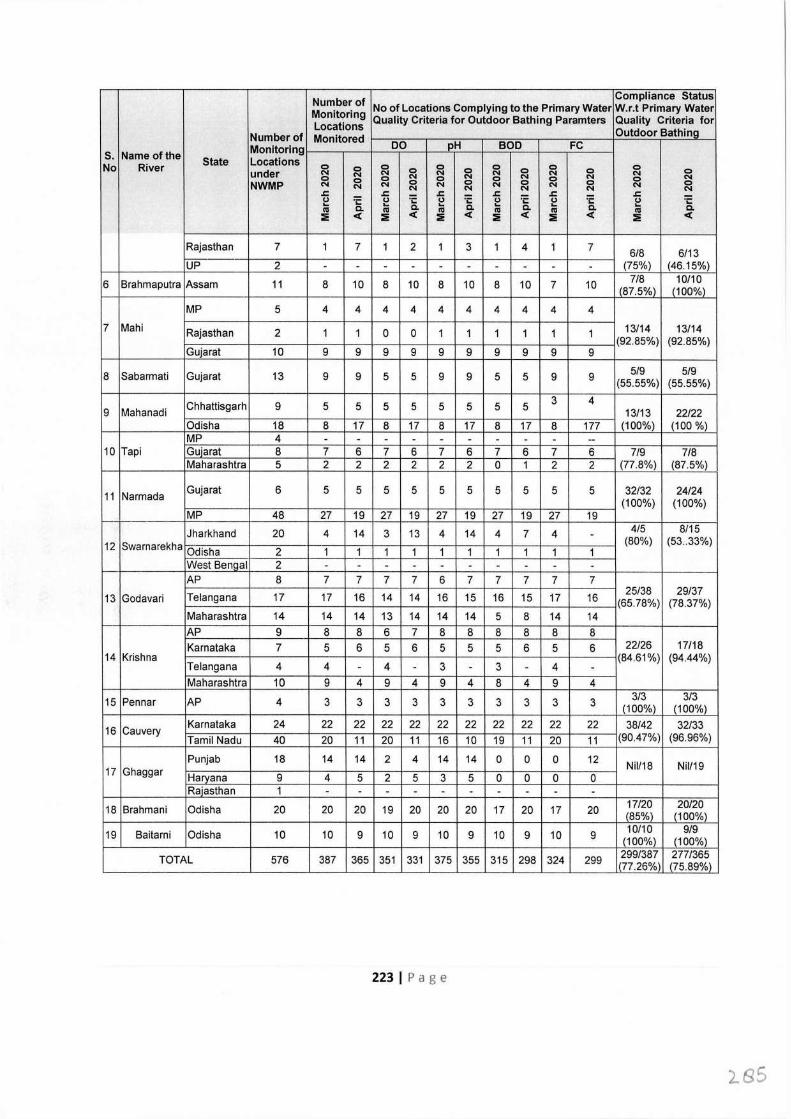
Number of Compliance Status
Monitoring No of Locations Complying to the Primary Water W.r.t Primary Water
Locations Quality Criteria for Outdoor Bathing Paramters Quality Criteria for
Number of Monitored Outdoor Bathing
Monitoring DO pH BOD FC s. Name of the State Locations No River 0 0 0 0 0 0 0 0 0 0 0 0 under N N N N N N N 0 0 N 0 N 0 N 0 N 0 N
NWMP N 0 N 0 N 0 N 0 N 0 N 0 N N N N N N .J::. .J::. .J::. .J::. .J::. .J::. u ·;:: u ·;:: u ·;:: u ·;:: u ·;:: u ·;:: ... 0. ... 0. ... 0. ... 0. ... 0. ... 0. cu cu cu cu cu cu ::iE < ::iE < ::iE < ::iE < ::iE < ::iE <
Rajasthan 7 1 7 1 2 1 3 1 4 1 7 6/8 6/13 UP 2 - - - - - - - - - - (75%) (46.15%)
6 Brahmaputra Assam 11 8 10 8 10 8 10 8 10 7 10 7/8 10/10 (87.5%) (100%)
MP 5 4 4 4 4 4 4 4 4 4 4 7 Mahi Rajasthan 2 1 1 0 0 1 1 1 1 1 1 13/14 13/14
(92.85%) (92.85%) Gujarat 10 9 9 9 9 9 9 9 9 9 9
8 Sabarmati Gujarat 13 9 9 5 5 9 9 5 5 9 9 5/9 5/9 (55.55%) (55.55%)
Chhattisgarh 9 5 5 5 5 5 5 5 5 3 4 9 Mahanadi 13/13 22/22
Odisha 18 8 17 8 17 8 17 8 17 8 177 (100%) (100 %) MP 4 - - - - - - - - - --
10 Tapi Guiarat 8 7 6 7 6 7 6 7 6 7 6 7/9 7/8 Maharashtra 5 2 2 2 2 2 2 0 1 2 2 (77.8%) (87.5%)
11 Narmada Gujarat 6 5 5 5 5 5 5 5 5 5 5 32/32 24/24 (100%) (100%)
MP 48 27 19 27 19 27 19 27 19 27 19 Jharkhand 20 4 14 3 13 4 14 4 7 4 - 4/5 8/15
12 Swarnarekha (80%) (53 .. 33%) Odisha 2 1 1 1 1 1 1 1 1 1 1 West Benoal 2 - - - - - - - - - - AP 8 7 7 7 7 6 7 7 7 7 7
13 Godavari Telangana 17 17 16 14 14 16 15 16 15 17 16 25/38 29/37 (65.78%) (78.37%)
Maharashtra 14 14 14 13 14 14 14 5 8 14 14 AP 9 8 8 6 7 8 8 8 8 8 8 Karnataka 7 5 6 5 6 5 5 5 6 5 6 22/26 17/18
14 Krishna (84.61%) (94.44%) Telangana 4 4 - 4 - 3 - 3 - 4 - Maharashtra 10 9 4 9 4 9 4 8 4 9 4
15 Pennar AP 4 3 3 3 3 3 3 3 3 3 3 3/3 3/3 (100%) (100%)
16 Cauvery Karnataka 24 22 22 22 22 22 22 22 22 22 22 38/42 32/33 Tamil Nadu 40 20 11 20 11 16 10 19 11 20 11 (90.47%) (96.96%)
Punjab 18 14 14 2 4 14 14 0 0 0 12 Nil/18 Nil/19 17 Ghaggar Haryana 9 4 5 2 5 3 5 0 0 0 0 Raiasthan 1 - - - - - - - - - -
18 Brahmani Odisha 20 20 20 19 20 20 20 17 20 17 20 17/20 20/20 (85%) (100%)
19 Baitarni Odisha 10 10 9 10 9 10 9 10 9 10 9 10/10 9/9 (100%) (100%)
TOTAL 576 387 365 351 331 375 355 315 298 324 299 299/387 277/365 '77.26%) (75.89%)
223 I Page
2.85
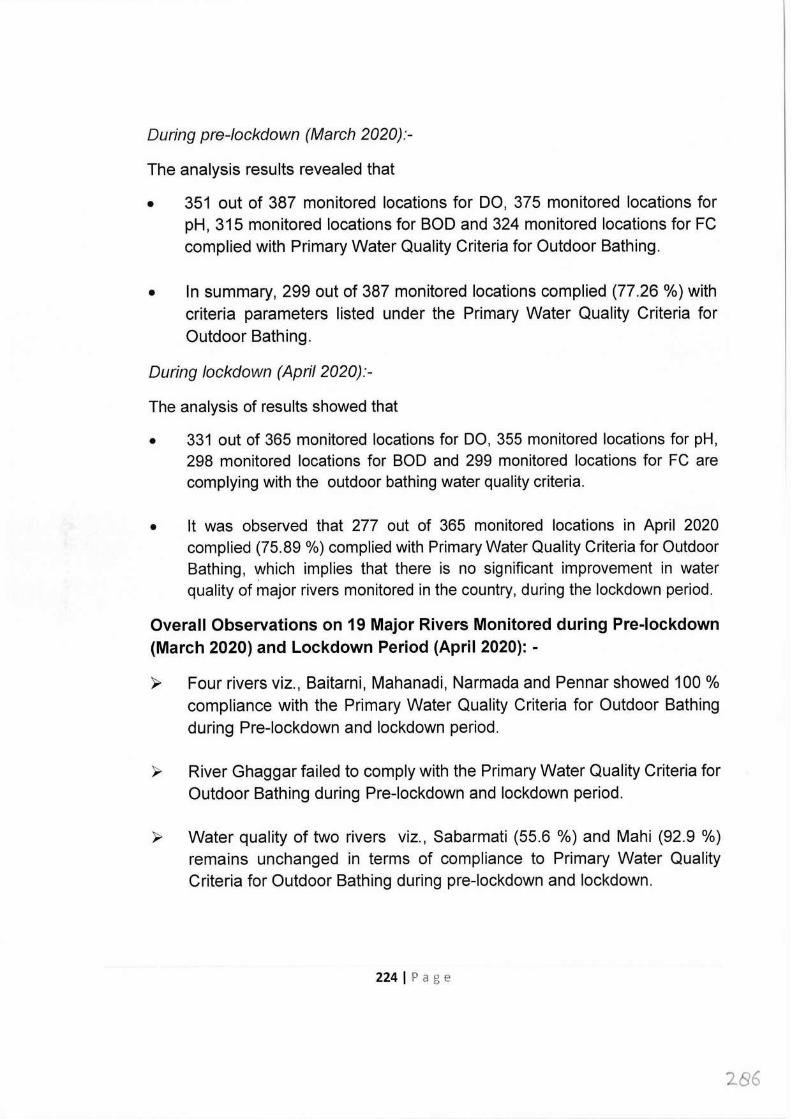
During pre-lockdown (March 2020):
The analysis results revealed that
• 351 out of 387 monitored locations for DO, 375 monitored locations for pH, 315 monitored locations for BOD and 324 monitored locations for FC complied with Primary Water Quality Criteria for Outdoor Bathing.
• In summary, 299 out of 387 monitored locations complied (77.26 %) with criteria parameters listed under the Primary Water Quality Criteria for Outdoor Bathing.
During /ockdown (April 2020):
The analysis of results showed that
• 331 out of 365 monitored locations for DO, 355 monitored locations for pH, 298 monitored locations for BOD and 299 monitored locations for FC are complying with the outdoor bathing water quality criteria.
• It was observed that 277 out of 365 monitored locations in April 2020 complied (75.89 %) complied with Primary Water Quality Criteria for Outdoor Bathing, which implies that there is no significant improvement in water quality of major rivers monitored in the country, during the lockdown period.
Overall Observations on 19 Major Rivers Monitored during Pre-lockdown (March 2020) and Lockdown Period (April 2020): -
~ Four rivers viz., Baitarni, Mahanadi, Narmada and Pennar showed 100 % compliance with the Primary Water Quality Criteria for Outdoor Bathing during Pre-lockdown and lockdown period.
~ River Ghaggar failed to comply with the Primary Water Quality Criteria for Outdoor Bathing during Pre-lockdown and lockdown period.
~ Water quality of two rivers viz., Sabarmati (55.6 %) and Mahi (92.9 %) remains unchanged in terms of compliance to Primary Water Quality Criteria for Outdoor Bathing during pre-lockdown and lockdown.
224 I Page
2S6
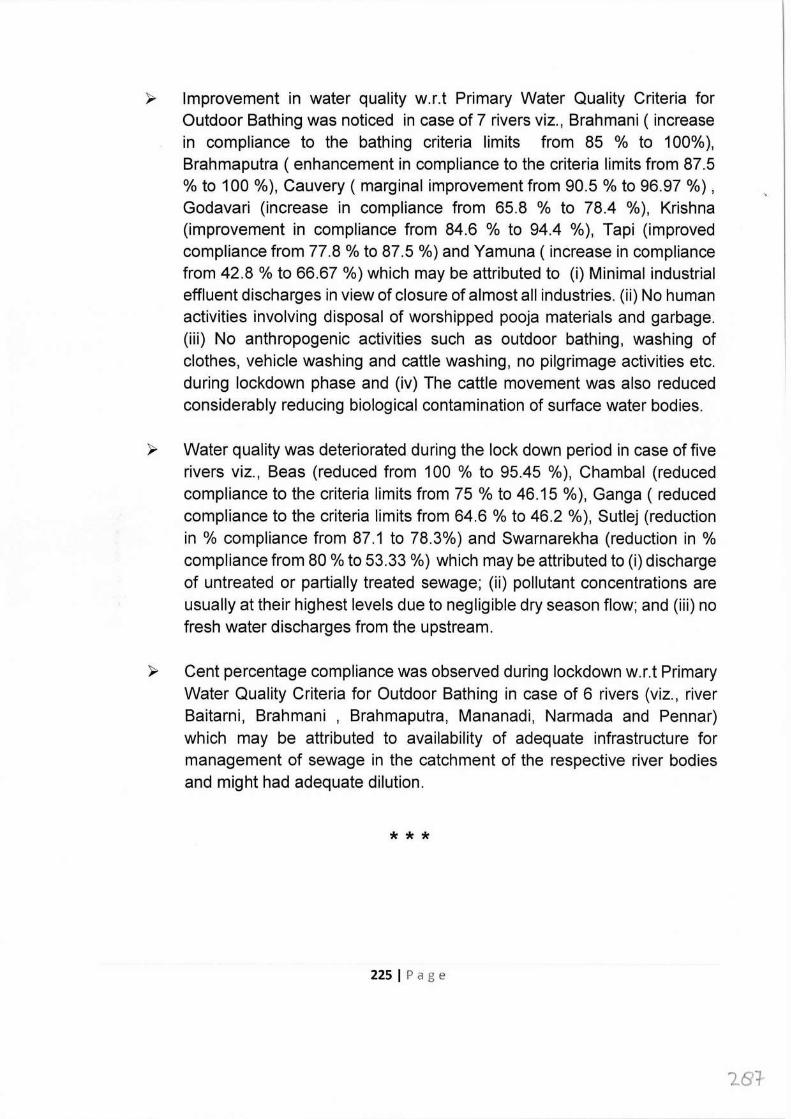
)"' Improvement in water quality w.r.t Primary Water Quality Criteria for Outdoor Bathing was noticed in case of 7 rivers viz., Brahmani ( increase in compliance to the bathing criteria limits from 85 % to 100%), Brahmaputra ( enhancement in compliance to the criteria limits from 87.5 % to 100 %), Cauvery ( marginal improvement from 90.5 % to 96.97 %) , Godavari (increase in compliance from 65.8 % to 78.4 %), Krishna (improvement in compliance from 84.6 % to 94.4 %), Tapi (improved compliance from 77.8 % to 87.5 %) and Yamuna ( increase in compliance from 42.8 % to 66.67 %) which may be attributed to (i) Minimal industrial effluent discharges in view of closure of almost all industries. (ii) No human activities involving disposal of worshipped pooja materials and garbage. (iii) No anthropogenic activities such as outdoor bathing, washing of clothes, vehicle washing and cattle washing, no pilgrimage activities etc. during lockdown phase and (iv) The cattle movement was also reduced considerably reducing biological contamination of surface water bodies.
)"' Water quality was deteriorated during the lock down period in case of five rivers viz., Beas (reduced from 100 % to 95.45 % ), Chambal (reduced compliance to the criteria limits from 75 % to 46.15 % ), Ganga ( reduced compliance to the criteria limits from 64.6 % to 46.2 %), Sutlej (reduction in % compliance from 87.1 to 78.3%) and Swarnarekha (reduction in% compliance from 80 % to 53.33 %) which may be attributed to (i) discharge of untreated or partially treated sewage; (ii) pollutant concentrations are usually at their highest levels due to negligible dry season flow; and (iii) no fresh water discharges from the upstream.
)"' Cent percentage compliance was observed during lockdown w.r.t Primary Water Quality Criteria for Outdoor Bathing in case of 6 rivers (viz., river Baitarni, Brahmani , Brahmaputra, Mananadi, Narmada and Pennar) which may be attributed to availability of adequate infrastructure for management of sewage in the catchment of the respective river bodies and might had adequate dilution.
* * *
225 I Page
2Bt
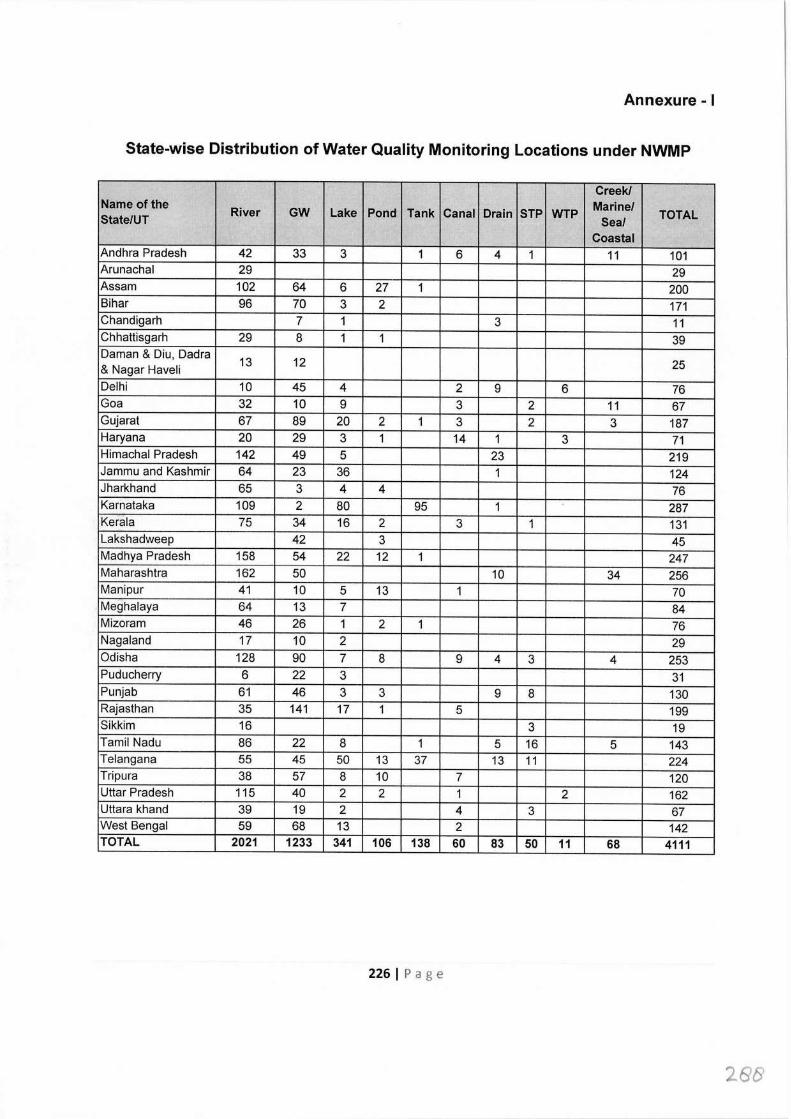
Annexure - I
State-wise Distribution of Water Quality Monitoring Locations under NWMP
Creek/ Name of the River GW Lake Pond Tank Canal Drain STP WTP Marine/ TOTAL State/UT Sea/
Coastal Andhra Pradesh 42 33 3 1 6 4 1 11 101 Arunachal 29 29 Assam 102 64 6 27 1 200 Bihar 96 70 3 2 171 Chandigarh 7 1 3 11 Chhattisgarh 29 8 1 1 39 Daman & Diu, Dadra
13 12 25 & Nagar Haveli Delhi 10 45 4 2 9 6 76 Goa 32 10 9 3 2 11 67 Gujarat 67 89 20 2 1 3 2 3 187 Haryana 20 29 3 1 14 1 3 71 Himachal Pradesh 142 49 5 23 219 Jammu and Kashmir 64 23 36 1 124 Jharkhand 65 3 4 4 76 Karnataka 109 2 80 95 1 287 Kerala 75 34 16 2 3 1 131 Lakshadweep 42 3 45 Madhya Pradesh 158 54 22 12 1 247 Maharashtra 162 50 10 34 256 Manipur 41 10 5 13 1 70 Meghalaya 64 13 7 84 Mizoram 46 26 1 2 1 76 Nagaland 17 10 2 29 Odisha 128 90 7 8 9 4 3 4 253 Puducherry 6 22 3 31 Punjab 61 46 3 3 9 8 130 Rajasthan 35 141 17 1 5 199 Sikkim 16 3 19 Tamil Nadu 86 22 8 1 5 16 5 143 Telangana 55 45 50 13 37 13 11 224 Tripura 38 57 8 10 7 120 Uttar Pradesh 115 40 2 2 1 2 162 Uttara khand 39 19 2 4 3 67 West Bengal 59 68 13 2 142 TOTAL 2021 1233 341 106 138 60 83 50 11 68 4111
226 I Page
20B
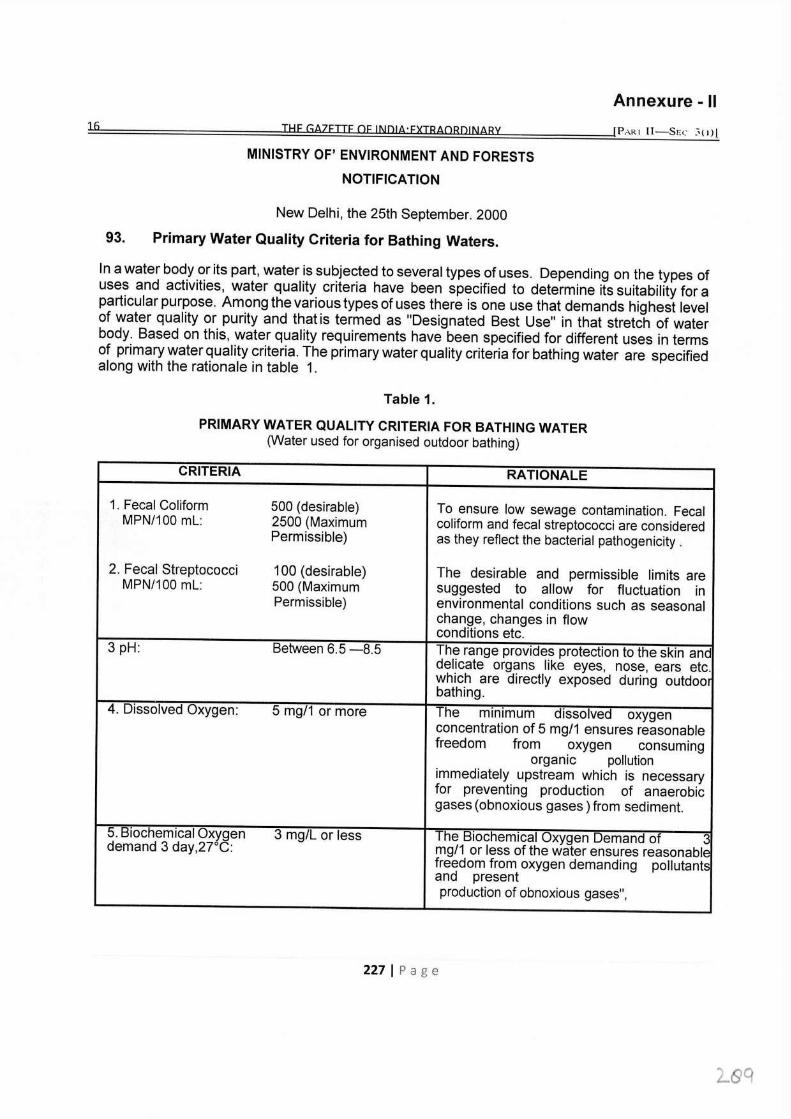
Annexure - II 16 THE GAZETTE DE INDIA·EXIBAQRQINARY [P.-\.Rl II-SEc: :;, 1)[
MINISTRY OF' ENVIRONMENT AND FORESTS
NOTIFICATION
New Delhi, the 25th September. 2000
93. Primary Water Quality Criteria for Bathing Waters.
In a water body or its part, water is subjected to several types of uses. Depending on the types of uses and activities, water quality criteria have been specified to determine its suitability for a particular purpose. Among the various types of uses there is one use that demands highest level of water quality or purity and that is termed as "Designated Best Use" in that stretch of water body. Based on this, water quality requirements have been specified for different uses in terms of primary water quality criteria. The primary water quality criteria for bathing water are specified along with the rationale in table 1.
Table 1.
PRIMARY WATER QUALITY CRITERIA FOR BATHING WATER (Water used for organised outdoor bathing)
CRITERIA RATIONALE
1. Fecal Coliform 500 (desirable) To ensure low sewage contamination. Fecal MPN/100 ml: 2500 (Maximum coliform and fecal streptococci are considered
Permissible) as they reflect the bacterial pathogenicity .
2. Fecal Streptococci 100 (desirable) The desirable and permissible limits are MPN/100 ml: 500 (Maximum suggested to allow for fluctuation in
Permissible) environmental conditions such as seasonal change, changes in flow conditions etc.
3 pH: Between 6.5 -8.5 The range provides protection to the skin and delicate organs like eyes, nose, ears etc. which are directly exposed during outdoor bathing.
4. Dissolved Oxygen: 5 mg/1 or more The .. dissolved oxygen minimum
concentration of 5 mg/1 ensures reasonable freedom from oxygen consuming
organic pollution immediately upstream which is necessary for preventing production of anaerobic gases ( obnoxious gases) from sediment.
5. Biochemical Oxygen 3 mg/L or less The Biochemical Oxygen Demand of 3 demand 3 day,27°C: mg/1 or less of the water ensures reasonable freedom from oxygen demanding pollutants and present production of obnoxious gases",
227 I Page
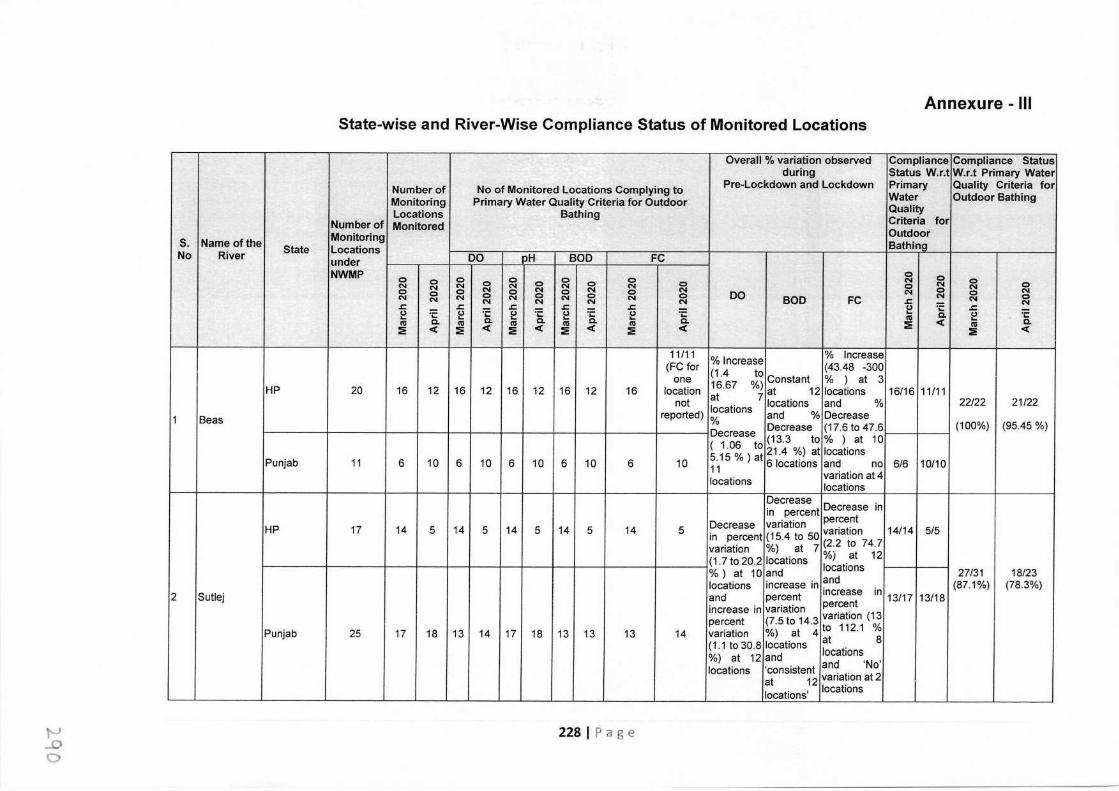
Annexure - Ill State-wise and River-Wise Compliance Status of Monitored Locations
Overall % variation observed Complianc e Compliance Status during Status W.r. t W.r.t Primary Water
Number of No of Monitored Locations Complying to Pre-Lockdown and Lockdown Primary Quality Criteria for Monitoring Primary Water Quality Criteria for Outdoor Water Outdoor Bathing Locations Bathing Quality
Number of Monitored Criteria for
s. Name of the Monitoring Outdoor
No River State Locations Bathina under DO pH BOD FC NWMP 0
0 0 0 0 0 0 0
N N N 0 N 0 N 0 N 0 N N 0 0 0 N 0 N N N 0 N 0
N 0 0 0 0 0 0 0 DO N 0 0 N N N N N N N
N N N N BOD FC .c N 0 .c .c .c .c .c N u ·;:: u ·;:: u ·;:: 0 ·;:: e ·;:: 0 ·;:: .c .. .. .. .. .. C. 0 ·;:: cu C. cu C. cu C. cu C. cu C. cu c( .. C. :.i: c( :.i: c( :.i: c( :.i: c( :.i: c( :.i: cu
:.i: c(
11 /11 % Increase % Increase (FC for (1.4 to (43.48 -300 one 16.67 %) Constant % ) at 3
HP 20 16 12 16 12 16 12 16 12 16 location at 12 locations 16/16 11 /11 not at 7 locations and % 22/22 21/22 locations
1 Beas reported) % and % Decrease Decrease Decrease (17.6 to 47.6 (100%) (95.45 %)
( 1.06 to (13.3 to % ) at 10
Punjab 11 5.15%)at 21.4 %) at locations 6 10 6 10 6 10 6 10 6 10 6 locations and no 6/6 10/10 11
locations variation at 4 locations
Decrease Decrease in in percent HP 17 14 5 14 5 14 5 14 Decrease variation percent
5 14 5 variation 14/14 5/5 in percent (15.4 to 50 (2.2 to 74.7 variation %) at 7 (1.7 to 20.2 locations ¾j at 12
% ) at 10 and locations 27/31 18/23 and 2 Sutlej
locations increase in . . (87.1%) (78.3%) and percent increase rn 13/17 13/18 increase in variation percent percent (7.5 to 14.3 variation (13
Punjab 25 17 18 13 14 17 18 13 13 13 14 variation %) at 4 to 112.1 % (1.1 to 30.8 locations at 8
%) at 12 and locations
locations 'consistent and 'No' at 12 variation at 2
locations' locations
,..._, ....0 0
228 I Page
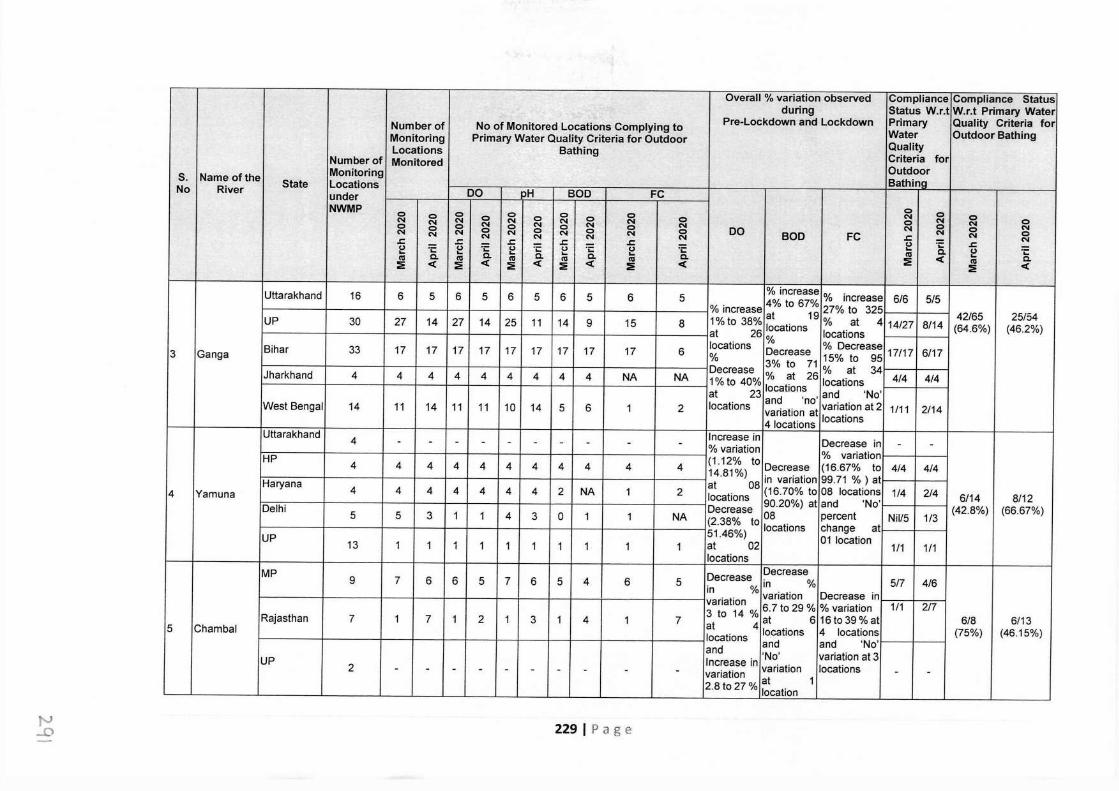
Overall % variation observed Compliance Compliance Status during Status W.r.t W.r.t Primary Water
Number of No of Monitored Locations Complying to Pre-Lockdown and Lockdown Primary Quality Criteria for Monitoring Primary Water Quality Criteria for Outdoor Water Outdoor Bathing Locations Bathing Quality
Number of Monitored Criteria for Monitoring Outdoor s. Name of the State Locations Bathinq No River under DO pH BOD FC NWMP 0 0 0 0 0 0 0 N 0 N 0 N 0 N 0 N 0 N 0 0 N N 0 N N N N N 0 N 0 0 0 0 0 0 DO N 0 N N 0 N 0 N 0 N 0 BOD FC N N 0 N N N N N .r:. N .r:. u .r:. .r:. .r:. e Q. .r:. I.) ·;: I.) I.) ·;: I.) ·;: e ·;: ... a. ... Q. ... Q. ... a. ... a. cu <( a. cu cu cu cu cu ~ cu ~ <( ~ <( ~ <( ~ <( ~ <( ~ <(
Uttarakhand 16 6 5 6 6 6 6 5 % increase % increase 6/6 5/5 5 5 5 4% to 67% % increase 27% to 325
1% to 38% at 19 % at 4 42/65 25/54 UP 30 27 14 27 14 25 11 14 9 15 8 locations 14/27 8/14 (64.6%) (46.2%) at 26 locations locations % % Decrease
3 Ganga Bihar 33 17 17 17 17 17 17 17 17 17 6 % Decrease 15% to 95 17/17 6/17 3% to 71 Decrease % at 26 % at 34 Jharkhand 4 4 4 4 4 4 4 4 4 NA NA 1% to 40% locations 4/4 4/4
at 23 locations and 'No' and 'no' West Bengal 14 11 14 11 11 10 14 5 6 1 2 locations variation at variation at 2 1 /11 2/14 4 locations locations
Uttarakhand 4 Increase in Decrease in - - - - - - - - - - % variation - - HP (1.12% to % variation
4 4 4 4 4 4 4 4 4 4 4 14.81%) Decrease (16.67% to 4/4 4/4 Haryana at 08 in variation 99.71 % ) at
4 4 4 4 4 4 4 2 NA 1 2 (16.70% to 08 locations 1/4 2/4 4 Yamuna locations 90.20%) at and 'No' 6/14 8/12 Delhi Decrease 08 percent (42.8%) (66.67%) 5 5 3 1 1 4 3 0 1 1 NA (2.38% to Nil/5 1/3
locations change at UP 5146%) 01 location 13 1 1 1 1 1 1 1 1 1 1 at 02 1 /1 1 /1
locations MP Decrease Decrease
9 7 6 6 5 7 6 5 4 6 5 in % 5/7 4/6 in % variation Decrease in variation 6.7 to 29 % % variation 1/1 2/7 Rajasthan 7 1 7 1 2 1 3 1 4 1 7 3 to 14 % at 6 16to 39% at 6/8 6/13 at 4 5 Chambal
locations locations 4 locations (75%) (46.15%) and and and 'No'
UP Increase in 'No' variation at 3 2 - - - - - - - - - - variation variation locations - -
2.8 to 27 % at 1 location
"' -D 229 IP age
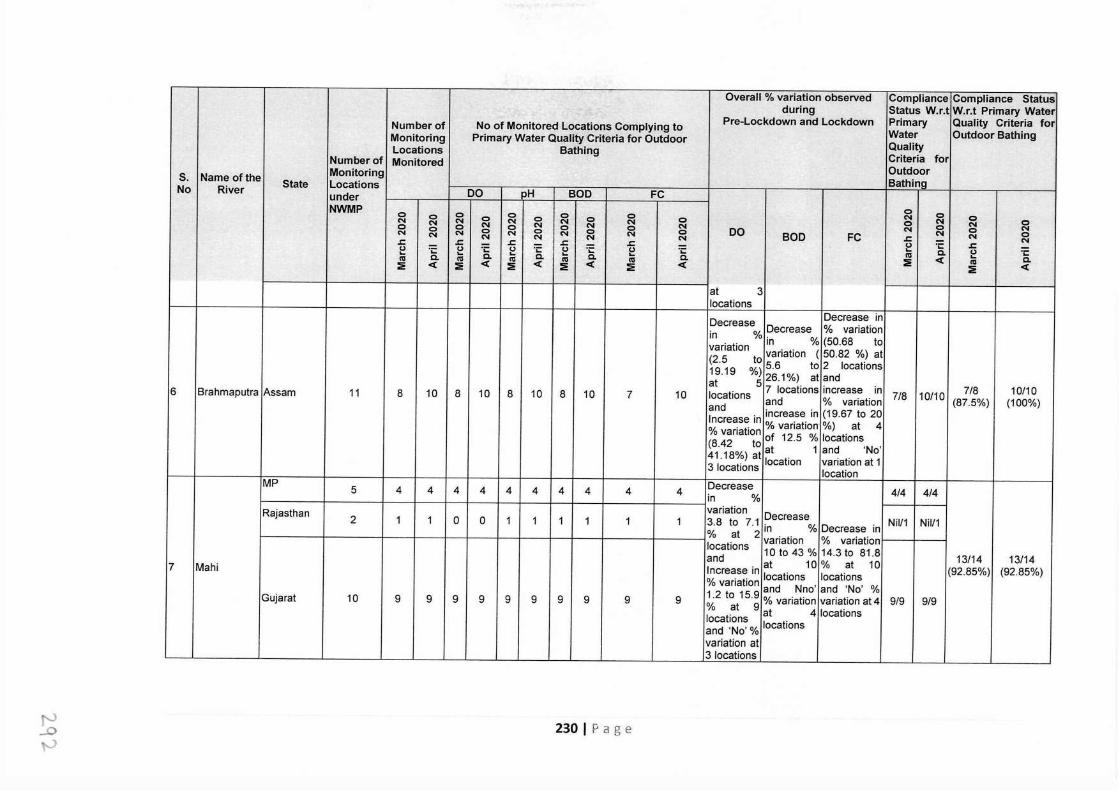
Overall % variation observed Compliance Compliance Status during Status W.r. t W.r.t Primary Water
Number of No of Monitored Locations Complying to Pre-Lockdown and Lockdown Primary Quality Criteria for Monitoring Primary Water Quality Criteria for Outdoor Water Outdoor Bathing Locations Bathing Quality
Number of Monitored Criteria for
s. Name of the Monitoring Outdoor
No River State Locations Bathina under DO pH BOD FC NWMP
0 0 0 0 0 0 0 0
N N N 0 N 0 N 0 N 0 N N 0 0 0 0 N 0 N 0 N 0 N 0 0 N 0 N N N 0 N 0 N 0 N 0 DO N N 0 N
N N N N BOD FC N 0 .r:: .r:: .r:: .r:: .r:: .r:: =c N (J ·;: (J ·;: (J ·;: (J ·;: (J ·;: (J .r:: ... ... ... ... ... C. (J
C. C. C. C. ... C. n, ·;: n, n, n, n, n, ... ~ < ~ < ~ < ~ < ~ < ~ < n, C.
~ <
at 3 locations
Decrease Decrease in in % Decrease % variation variation in % (50.68 to (2.5 to variation ( 50.82 %) at 19.19 %) 5.6 to 2 locations at 5 26.1%) at and
6 Brahmaputra Assam 11 8 10 8 10 8 10 8 10 7 10 locations 7 locations increase in 7/8 10/10 7/8 10/10 and and % variation (87.5%) (100%) Increase in increase in (19.67 to 20 % variation % variation %) at 4 (8.42 to of 12.5 % locations 41.18%) at at 1 and 'No'
location variation at 1 3 locations location MP 5 4 Decrease 4 4 4 4 4 4 4 4 4 4/4 4/4 in % Rajasthan variation Decrease 2 1 1 0 0 1 1 1 1 1 1 3.8 to 7.1 Nil/1 Nil/1
% at 2 in % Decrease in locations variation % variation and 10 to 43 % 14.3 to 81.8 13/14
7 Mahi at 10 % at 10 13/14 Increase in locations locations (92.85%) (92.85%) % variation and Nno' and 'No' %
Gujarat 10 9 9 9 9 9 9 9 9 9 9 1.2 to 15.9 % variation variation at 4 9/9 9/9 % at 9 at 4 locations locations and 'No'% locations variation at 3 locations I
t--J ..D ,-.J
230 IP age
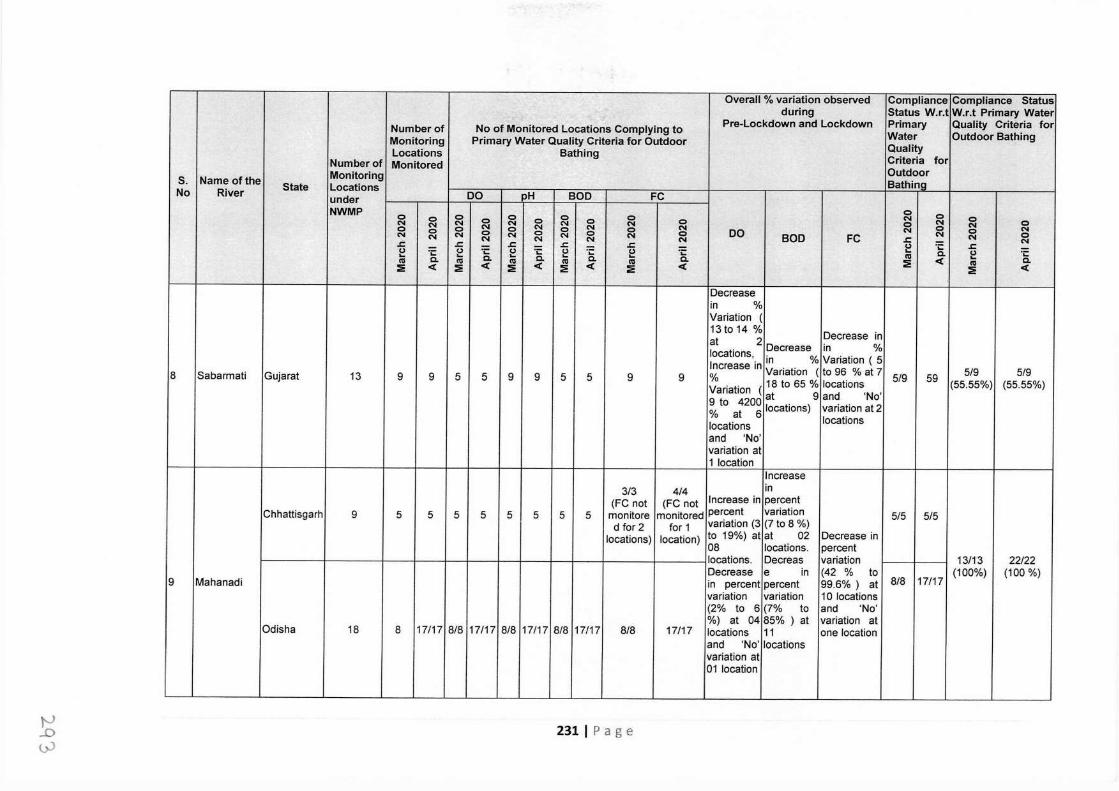
Overall % variation observed Compliance Compliance Status during Status W.r. t W.r.t Primary Water
Number of No of Monitored Locations Complying to Pre-Lockdown and Lockdown Primary Quality Criteria for
Monitoring Primary Water Quality Criteria for Outdoor Water Outdoor Bathing
Locations Bathing Quality Number of Monitored Criteria for
s. Name of the Monitoring Outdoor
No River State Locations Bathina under DO :>H BOD FC NWMP 0 0
0 0 0 0 0 0 N N N 0 N 0 N 0 N 0 N N 0 0 0 0 N 0 N 0 N 0 N 0 0 N 0 N N N 0 N 0 N 0 N 0 DO N N 0 N
N N N N BOD FC N 0 .r: .r: .r: .r: .r: .r: N CJ ·;: CJ ·;: CJ ·;: CJ ·;: CJ ·;: l:? ·;: .r: ...
C. ... C. ... C. ... C. ... Ill C. l:? ·;:
Ill Ill Ill Ill Ill C. c( C. ::!!: c( ::!!: c( ::!!: c( ::!!: c( ::!!: c( ::!!: Ill
::!!: c(
Decrease in % Variation ( 13 to 14 % Decrease in at 2 locations, Decrease in % Increase in in % Variation ( 5
8 Sabarmati Gujarat 13 9 9 5 5 9 9 5 5 9 9 % Variation ( to 96 % at 7 5/9 59 5/9 5/9 Variation ( 18 to 65 % locations (55.55%) (55.55%) 9 to 4200 at 9 and 'No' % at 6 locations) variation at 2 locations locations
and 'No' variation at 1 location
Increase 3/3 414 in
(FC not (FC not Increase in percent Chhattisgarh 9 5 5 5 5 5 5 5 5 monitore monitored percent variation 5/5 5/5
d for 2 for 1 variation (3 (7to8%) locations) location) to 19%) at at 02 Decrease in
08 locations. percent locations. Decreas variation 13/13 22/22
9 Mahanadi Decrease e in (42 % to (100%) (100 %) in percent percent 99.6%) at 8/8 17/17 variation variation 1 O locations (2% to 6 (7% to and 'No'
Odisha 18 %) at 04 85%) at variation at
8 17/17 8/8 17/17 8/8 17/17 8/8 17/17 8/8 17/17 locations 11 one location and 'No' locations variation at 01 location
,.._., ..0 uJ
231 I Page
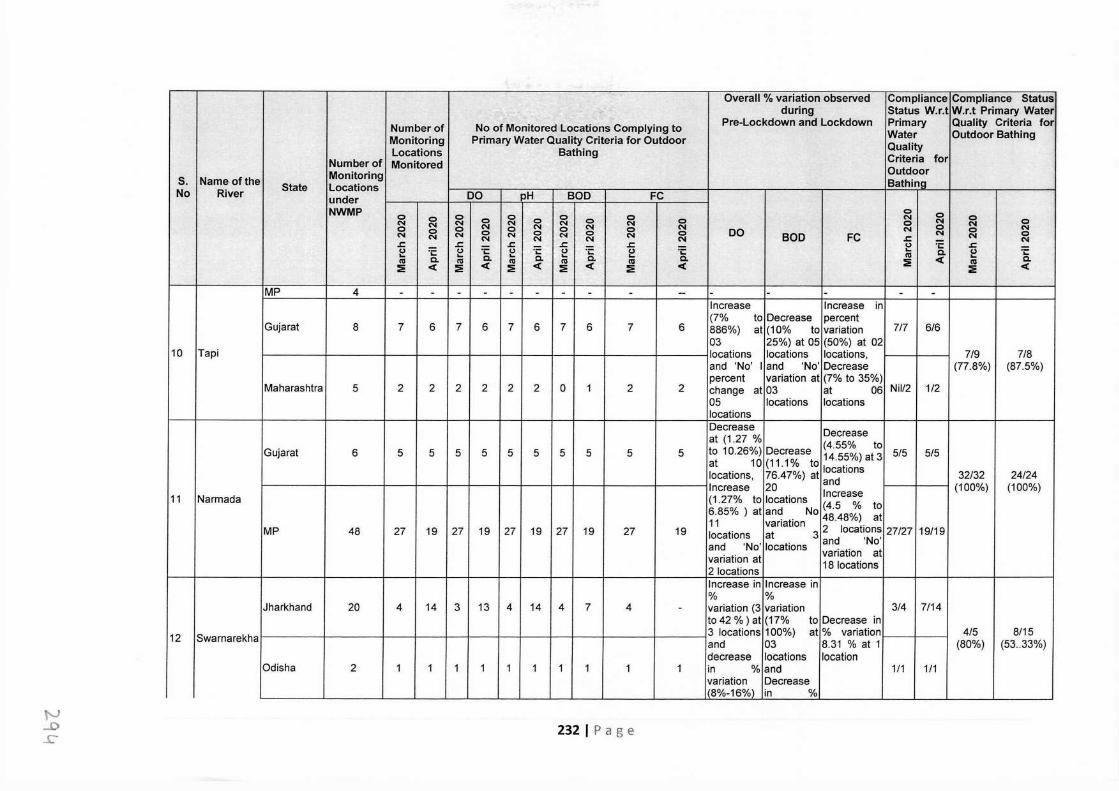
Overall % variation observed Compliance Compliance Status during Status W.r.t W.r.t Primary Water
Number of No of Monitored Locations Complying to Pre-Lockdown and Lockdown Primary Quality Criteria for
Monitoring Primary Water Quality Criteria for Outdoor Water Outdoor Bathing Locations Bathing Quality
Number of Monitored Criteria for Monitoring Outdoor
s. Name of the State Locations Bathinq No River under DO :,H BOD FC
NWMP 0 0 0 0 0 0 0 0 N 0 N N N 0 N 0 N 0 N 0 0 N N 0 0 0 0 N 0 N 0 N 0 N DO N 0 0 N N N 0 N 0 N 0 N 0 BOD FC N N 0 N N N N N J: N J: J: J: J: J: '-' C. J: '-' ·;:: '-' ·;:: '-' ·;:: '-' ·;:: '-' ·;:: ... '-' ·;:: ...
0. .... 0. ... 0. ... 0. ... 0. (II < ... 0. (II (II (II (II (II ::!!!: (II
::!!!: < ::!!!: < ::!!!: < ::!!!: < ::!!!: < ::!!!: < MP 4 - - - - - - - - - -- - - - - -
Increase Increase in (7% to Decrease percent
Gujarat 8 7 6 7 6 7 6 7 6 7 6 886%) at (10% to variation 717 6/6 03 25%) at 05 (50%) at 02
10 Tapi locations locations locations, 7/9 7/8 and 'No' I and 'No' Decrease (77.8%) (87.5%) percent variation at (7% to 35%)
Maharashtra 5 2 2 2 2 2 2 0 1 2 2 change at 03 at 06 Nil/2 1/2 05 locations locations locations Decrease Decrease at (1.27 % (4.55% to
Gujarat 6 5 5 5 5 5 5 5 5 5 5 to 10.26%) Decrease 14.55%) at 3 5/5 5/5 at 10 (11.1% to locations locations, 76.47%) at and 32/32 24/24 Increase 20 Increase (100%) (100%)
11 Narmada (1.27% to locations (4.5 % to 6.85% ) at and No 48.48%) at 11 variation MP 48 27 19 27 19 27 19 27 19 27 19 locations at 3 2 locations 27/27 19/19
and 'No' locations and 'No'
variation at variation at
2 locations 18 locations
Increase in Increase in % %
Jharkhand 20 4 14 3 13 4 14 4 7 4 - variation (3 variation 3/4 7/14 to42 % ) at (17% to Decrease in
12 Swarnarekha 3 locations 100%) at % variation 4/5 8/15 and 03 8.31 % at 1 (80%) (53 .. 33%) decrease locations location
Odisha 2 1 1 1 1 1 1 1 1 1 1 in % and 1/1 1 /1 variation Decrease (8%-16%) in %
t-J -D ...c- 232 I Page
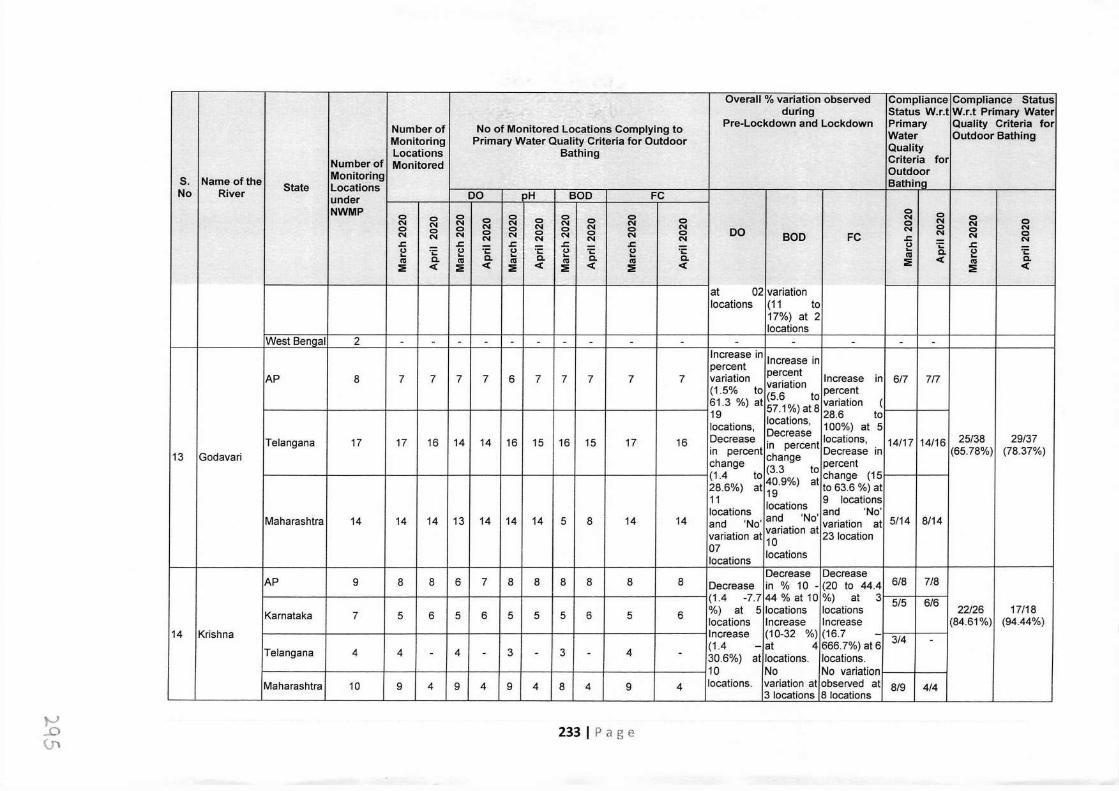
Overall % variation observed Complianc e Compliance Status during Status W.r. t W.r.t Primary Water
Number of No of Monitored Locations Complying to Pre-Lockdown and Lockdown Primary Quality Criteria for Monitoring Primary Water Quality Criteria for Outdoor Water Outdoor Bathing Locations Bathing Quality
Number of Monitored Criteria for
s. Name of the Monitoring Outdoor
No River State Locations Bathina under DO pH BOD FC NWMP 0 0
0 0 0 0 0 0
N N N 0 N 0 N 0 N 0 N N 0
0 0 0 N 0 N 0 N 0 N 0 0 N 0
N N N 0 N 0 N 0 N 0 DO N N 0 N N N N N BOD FC N 0
.s= .s= .s= .s= .s= .s= N (.) ·;: (.) 0. (.) (.) ·;: (.) ·;: ~ ·;: .s= .. .. .. 0. .. .. 0. (.) ·;: cu a. cu cu cu 0. cu 0. cu <( .. 0. :ii: <( :ii: <( :ii: < :ii: <( <( :ii: cu
:i: :ii: <(
at 02 variation locations (11 to
17%) at 2 locations
West Benaal 2 - - - - - - - - - - - - - - - Increase in Increase in percent
AP 8 7 7 7 7 6 7 7 7 7 7 variation percent Increase in 6/7 717 (1.5% to variation percent (5.6 to 61.3 %) at 57.1%)at8 variation ( 19 28.6 to locations, locations, 100%) at 5 Decrease
Telangana 17 17 16 14 14 16 15 16 15 17 16 Decrease in percent locations, 14/17 14/16 25/38 29/37
13 Godavari in percent change Decrease in (65.78%) (78.37%) change (3.3 to percent (1.4 to 40.9%) at change (15 28.6%) at 19 to 63.6 %) at 11 locations 9 locations locations and 'No'
Maharashtra 14 14 14 13 14 14 14 5 8 14 14 and 'No' and 'No' variation at 5/14 8/14 variation at variation at 23 location 10 07 locations locations
AP 9 8 8 6 7 8 8 8 8 8 8 Decrease Decrease
Decrease in % 10 - (20 to 44.4 618 718 (1.4 -7.7 44 % at 10 %) at 3 515 6/6
Karnataka 7 5 6 5 6 5 5 5 6 5 6 %) at 5 locations locations 22/26 17/18 locations Increase Increase (84.61%) (94.44%)
14 Krishna Increase (10-32 %) (16.7 (1.4 -at 4 666.7%) at 6 3/4 -
Telangana 4 4 - 4 - 3 - 3 4 - - 30.6%) at locations. locations. 10 No No variation
Maharashtra 10 9 4 9 4 9 4 8 4 9 4 locations. variation at observed at 8/9 4/4 3 locations 8 locations
~
°' 233 I Page
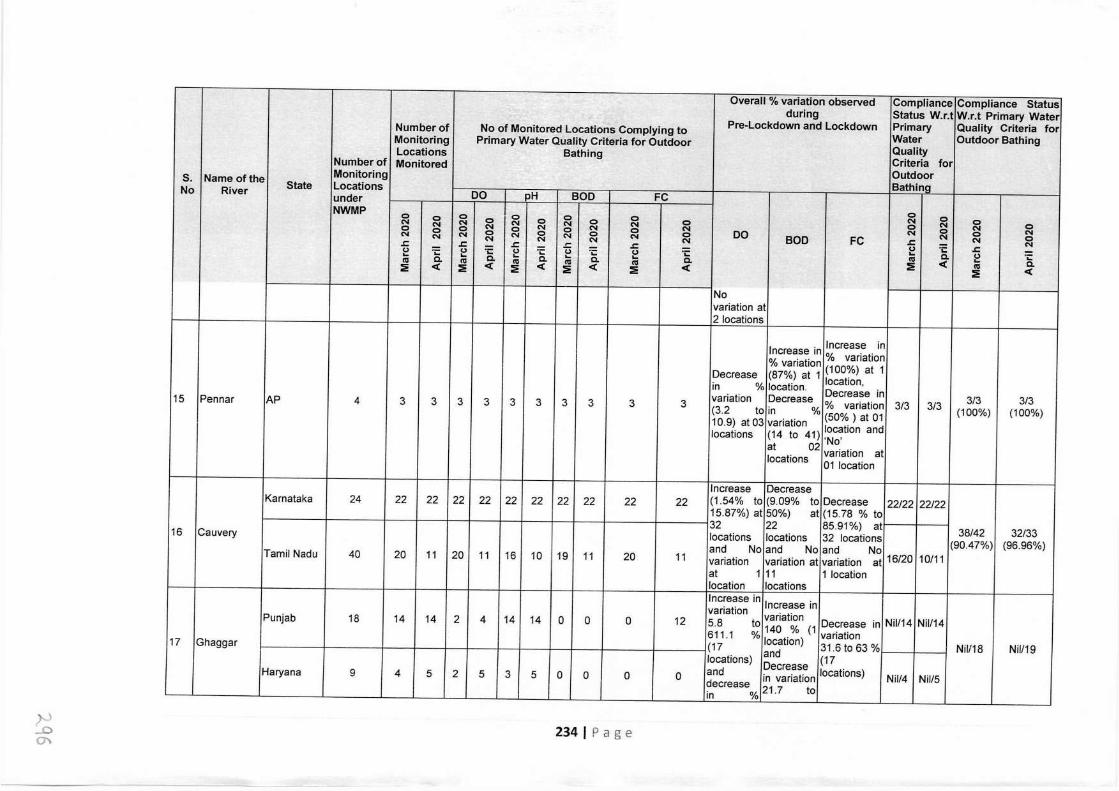
Overall % variation observed Compliance Compliance Status during Status W.r.t W.r.t Primary Water
Number of No of Monitored Locations Complying to Pre-Lockdown and Lockdown Primary Quality Criteria for Monitoring Primary Water Quality Criteria for Outdoor Water Outdoor Bathing Locations Bathing Quality
Number of Monitored Criteria for Monitoring Outdoor 5. Name of the State Locations Bathina No River under DO pH BOD FC NWMP 0 0 0 0 0 0 0 0 0 0 0 0 N N 0
0 N N N N N N 0 N 0 0 0 N 0 N 0 N 0 N DO N 0 0 N N N 0 N 0 N 0 N 0 BOD FC N N 0 N N N N N .s::. N .s::. .s::. ~ .s::. .s::. .s::. =E u ·;: .s::. u ·;: u u ·;: u ·;: u ... Q. u ·;: ...
Q. ... Q. ... Q. ... Q. ... Q. cu <C .. Q. cu cu cu cu cu ~ cu ~ <C ~ <C ~ <C ~ <C ~ <C ~ <C
No variation at 2 locations
Increase in Increase in % variation % variation (100%) at 1 Decrease (87%) at 1
in % location. location, variation Decrease Decrease in 3/3 3/3 15 Pennar AP 4 3 3 3 3 3 3 3 3 3 3 (3.2 to in % % variation 3/3 3/3 (100%) (100%) (50%) at 01 10.9) at 03 variation location and locations (14 to 41) 'No' at 02 variation at locations 01 location
Increase Decrease Karnataka 24 22 22 22 22 22 22 22 22 22 22 (1.54% to (9.09% to Decrease 22/22 22/22
15.87%) at 50%) at (15.78 % to 32 22 85.91%) at 38/42 32/33 16 Cauvery locations locations 32 locations (90.47%) (96.96%) and No and No and No Tamil Nadu 40 20 11 20 11 16 10 19 11 20 11 variation variation at variation at 16/20 10/11 at 1 11 1 location location locations Increase in Increase in variation Punjab 18 14 14 2 4 14 14 0 0 0 12 5.8 to variation Decrease in Nil/14 Nil/14 611.1 % 140 % (1 variation 17 Ghaggar (17 location) 31.6 to 63 % Nil/18 Nil/19 and locations)
Decrease (17 Haryana 9 4 5 2 5 3 5 0 0 0 0 and in variation locations) Nil/4 Nil/5 decrease 21. 7 to in %
~ ~ 234 IP age
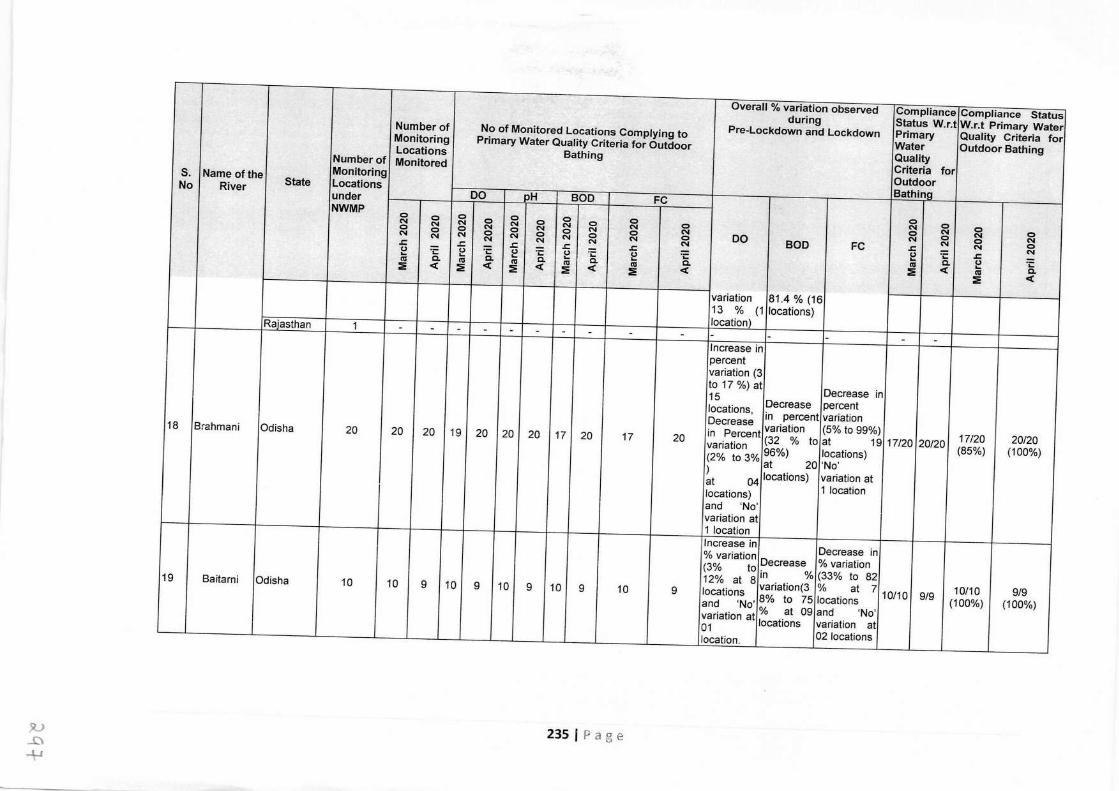
Overall % variation observed Compliance Compliance Status during Status W.r. t W.r.t Primary Water Number of No of Monitored Locations Complying to Pre-Lockdown and Lockdown Primary Quality Criteria for Monitoring Primary Water Quality Criteria for Outdoor Water Outdoor Bathing Locations Bathing Quality Number of Monitored Criteria for s. Name of the Monitoring Outdoor No River State Locations Bathi'!.9_ under DO pH BOD FC
NWMP 0 0
0 0 0 0 0 0 N 0 0
N N N N 0 N 0 N 0 N
N N N 0 N 0 0 0 0 0 0 0 N
0 N N N 0 N 0 0 0 DO N 0
N N N BOD N 0 N N N N FC .r. N
N .r. u .r. .r. .r.
~ .r. (.) :e (.) ~ ·.: (.)
C. =E: .. .. C. .. C. .. C. "' (.) "' C. "' "' "' C. "' < ..
C. :ii: < :ii: < :ii: < :ii: < :ii: < :ii: "' < :ii: variation 81.4 % (16 13 % (1 locations) location) Rajasthan 1 - - - - - - - - - - - - - - - Increase in percent variation (3 to 17 %) at
Decrease in 15 locations, Decrease percent Decrease in percent variation
18 Brahmani in Percent variation (5% to 99%)
17/20 20/20 Odisha 20 20 20 19 20 20 20 17 20 17 20 (32 % to at 19 17/20 20120 variation
96%) locations) (85%) (100%) (2% to 3% ) at 20 'No' at 04 locations) variation at locations) 1 location and 'No' variation at 1 location Increase in
Decrease in % variation (3% to Decrease % variation 12% at 8 in % (33% to 82 19 Baitarni Odisha 10 10 9 10 9 10 9 10 9 10 9 locations variation(3 % at 7
10/10 9/9 10/10 9/9 and 'No' 8% to 75 locations (100%) (100%) variation at % at 09 and 'No' 01 locations variation at location. 02 locations
~ _a -LI
235 IP age
Item Nos. 01 & 02 Court No. 1
BEFORE THE NATIONAL GREEN TRIBUNAL PRINCIPAL BENCH, NEW DELHI
(By Video Conferencing)
Original Application No. 593/2017
(arising from W.P. (Civil) No. 375/2012 on the file of the Hon'ble Supreme Court)
(With Report dated 13.02.2020 and 14.05.2020)
WITH
Original Application No. 148/2016
(With Report dated 15.05.2020)
Paryavaran Suraksha Samiti & Anr.
Versus
With
Union of India & Ors.
Mahesh Chandra Saxena
Versus
South Delhi Municipal Corporation & Ors.
Applicant(s)
Respondent(s)
Applicant(s)
Respondent(s)
Date of hearing: 21.05.2020
CORAM: HON'BLE MR. JUSTICE ADARSH KUMAR GOEL, CHAIRPERSON HON'BLE MR. JUSTICE SHEO KUMAR SINGH, JUDICIAL MEMBER HON'BLE DR. NAGIN NANDA, EXPERT MEMBER
Applicant(s): Mr. Rahul Khurana, Advocate
Respondent(s): Mr. Raj Kumar, Advocate for CPCB Mr. Balendu Shekhar, Advocate for EDMC Mr. A.K. Prasad, Advocate for CGWA Mr. Narendra Pal Singh, Advocate for DPCC
1
ORDER
INDEX
Background: Transfer of proceedings to this Tribunal by the Para 1 Hon 'ble Supreme Court vide order in (2017) 5 SCC 326 to monitor compliance of directions to set up STPs/ETPs/CETPs by 31.3.2018 (as per para 10 of the order of Hon'ble Supreme Court) by concerned Industries and Local Bodies to prevent water pollution.
Proceedings before this Tribunal: Significant orders dated Para 2 - 8 3.8.2018, 19.2.2019 and 28.8.2019 in the light of data furnished by the CPCB based on information furnished by State PCBs/PCCs.
Latest CPCB report dated 14.5.2020 furnishing status of compliance.
Para 9 - 12
Analysis of the report dated 14.5.2020 Para 13 - 15
Directions Para 16 - 18
Consideration of consequential issue of utilization of treated Para 19 -21 water: Earlier proceedings leading to order dated 11.9.2020
Report of the CPCB dated 15.5.2020 Para 22
ORIGINAL APPLICATION NO. 593/2017 (PARYAVARAN SURAKSHA SAMITI & ANR. VS. UNION OF INDIA & ORS.)
Background: Transfer of proceedings to this Tribunal by the Hon'ble Supreme Court vide order in (2017) 5 sec 326 to monitor compliance of directions to set up STPs/ETPs/CETPs by 31.3.2018 (as per para 10 of the order of Hon'ble Supreme Court) by concerned Industries and Local Bodies to prevent water pollution:
1. Proceedings in this matter are consequential to the order of the
Hori'ble Supreme Court dated 22.02.2017 in Paryavaran Suraksha
2
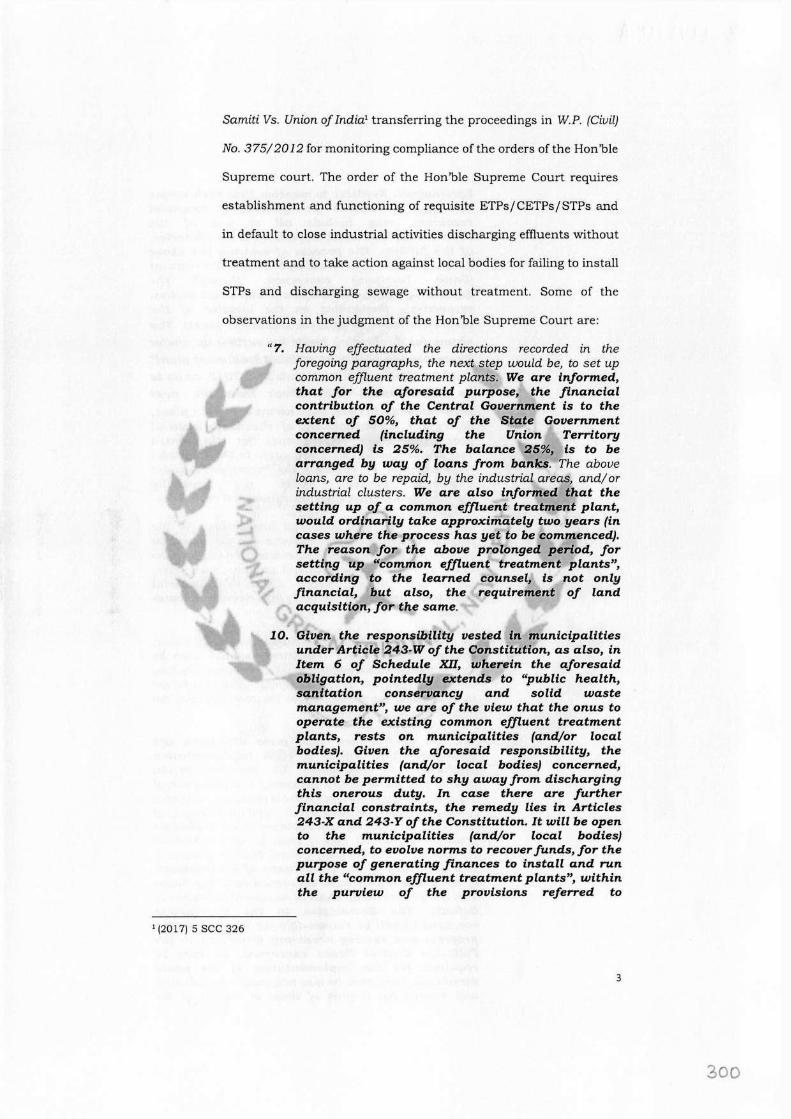
Samiti Vs. Union of India1 transferring the proceedings in W.P. (Civil)
No. 375/2012 for monitoring compliance of the orders of the Hon'ble
Supreme court. The order of the Hon 'ble Supreme Court requires
establishment and functioning of requisite ETPs/CETPs/STPs and
in default to close industrial activities discharging effluents without
treatment and to take action against local bodies for failing to install
STPs and discharging sewage without treatment. Some of the
observations in the judgment of the Hon 'ble Supreme Court are:
"7. Having effectuated the directions recorded in the foregoing paragraphs, the next step would be, to set up common effluent treatment plants. We are informed, that for the aforesaid purpose, the financial contribution of the Central Government is to the extent of 50%, that of the State Government concerned (including the Union Territory concerned} is 25%. The balance 25%, is to be arranged by way of loans from banks. The above loans, are to be repaid, by the industrial areas, and/ or industrial clusters. We are also informed that the setting up of a common effluent treatment plant, would ordinarily take approximately two years (in cases where the process has yet to be commenced). The reason for the above prolonged period, for setting up "common effluent treatment plants", according to the learned counsel, is not only financial, but also, the requirement of land acquisition, for the same.
10. Given the responsibility vested in municipalities under Article 243-W of the Constitution, as also, in Item 6 of Schedule XII, wherein the aforesaid obligation, pointedly extends to ''public health, sanitation conservancy and solid waste management", we are of the view that the onus to operate the existing common effluent treatment plants, rests on municipalities (and/or local bodies}. Given the aforesaid responsibility, the municipalities (and.for local bodies} concerned, cannot be permitted to shy away from discharging this onerous duty. In case there are further financial constraints, the remedy lies in Articles 243-X and 243-Y of the Constitution. It will be open to the municipalities (and/or local bodies} concerned, to evolve norms to recover funds, for the purpose of generating finances to install and run all the "common effluent treatment plants", within the purview of the provisions ref erred to
1 (2017) s sec 325
3
300
hereinabove. Needless to mention that such norms as may be evolved for generating financial resources, may include all or any of the commercial, industrial and domestic beneficiaries, of the facility. The process of evolving the above norms, shall be supervised by the State Government (Union Territory) concerned, through the Secretaries, Urban Development and Local Bodies, respectively (depending on the location of the respective common effluent treatment plant). The norms for generating funds for setting up and/or operating the "common effluent treatment plant" shall be finalised, on or before 31-3-2017, so as to be implemented with effect from the next financial year. In case, such norms are not in place, before the commencement of the next financial year, the State Governments (or the Union Territories) concerned, shall cater to the financial requirements, of running the "common effluent treatment plants", which are presently dysfunctional, from their own financial resources.
11. Just in the manner suggested hereinabove, for the purpose of setting up of "common effluent treatment plants", the State Governments concerned (including, the Union Territories concerned) will prioritise such cities, towns and villages, which discharge industrial pollutants and sewer, directly into rivers and water bodies.
We are of the view that in the manner suggested above, the malady of sewer treatment, should also be dealt with simultaneously. We, therefore, hereby direct that "sewage treatment plants" shall also be set up and made functional, within the timelines and the format, expressed hereinaboue.
13. We are of the view that mere directions are inconsequential, unless a rigid implementation mechanism is laid down. We, therefore, hereby provide that the directions pertaining to continuation of industrial activity only when there is in place afunctional "primary effluent treatment plants", and the setting up of functional "common effluent treatment plants" within the timelines, expressed above, shall be of the Member Secretaries of the Pollution Control Boards concerned. The Secretary of the Department of Environment, of the State Government concerned (and the Union Territory concerned), shall be answerable in case of default. The Secretaries to the Government concerned shall be responsible for monitoring the progress and issuing necessary directions to the Pollution Control Board concerned, as may be required, for the implementation of the above directions. They shall be also responsible for collecting and maintaining records of data, in respect of the
4
?,01
directions contained in this order. The said data shall be furnished to the Central Ground Water Authority, which shall evaluate the data and shallfumish the same to the Bench of the jurisdictional National Green Tribunal.
14. To supervise complaints of non-implementation of the instant directions, the Benches concerned of the National Green Tribunal, will maintain running and numbered case files, by dividing the jurisdictional area into units. The abovementioned case files will be listed periodically. The Pollution Control Board concerned is also hereby directed to initiate such civil or criminal action, as may be permissible in law, against all or any of the defaulters."
(emphasis supplied)
Proceedings before this Tribunal: Significant orders dated 3.8.2018, 19.2.2019 and 28.8.2019 in the light of data furnished by the CPCB based on information furnished by State PCBs/PCCs:
2. Accordingly, on 25.05.2017, notice was issued to the Central
Pollution Control Board (CPCB), the State Pollution Control Boards
(SPCBs)/ Pollution Control Committees (PCCs) and the Ministry of
Environment, Forest and Climate Change (MoEF&CC). They filed
their status reports showing gaps in waste generated and treatment
capacity. It was further stated that action had been initiated to
remedy the situation. After considering the status report, the
Tribunal, vide orders dated 04.07.2017, 18.09.2017 and
11.10.2017, sought information about the steps taken by the
SPCBs/PCCs.
3. Vide order dated 03.08.2018, the matter was reviewed and after
noting that in absence of functional ETPs/CETPs/STPs, untreated
effluents were being discharged in water bodies leading to
contamination of surface and ground water which causes various
diseases and also has adverse consequence on aquatic organism
due to decreased level of oxygen. The Tribunal directed the CPCB to
5
30'2.
prepare an action plan. Direction was also given for monitoring by a
Committee of two officers - one each representing MoEF&CC and
CPCB at least once in every month. CPCB was required to place the
progress report every three months on the website and take penal
action for failure by way of recovery of compensation for damage to
the environment, apart from other steps.
4. Vide order dated 19.02.2019, after considering the status report
furnished by the CPCB, based on the reports furnished by the
States/UTs, this Tribunal after referring to orders passed in O.A NO.
673/2018 for remedial action in respect of 351 polluted river
stretches, which had direct nexus with the steps for
ETPs/CETPs/STPs and order passed in O.A No. 606/2018 requiring
Chief Secretaries to monitor progress inter alia on the subject of
control of pollution of the river stretches, directed that the Chief
Secretaries may look into the subject of setting up and proper
functioning of ETPs/CETPs/STPs in their respective States/ UTs.
Further direction issued was to prepare a report on assessment of
compensation on account of discharge of untreated sewage and
dumping of solid waste, loss to ecological services due to illegal I
mining, deforestation, after taking inputs from expert bodies. The
Tribunal also directed the CPCB to compile its monitoring report
with regard to 97 CETPs (assuming the total number of CETPs in
the country to be 97) installed in different States. CPCB was also
directed to furnish its report in O.A. No. 95/ 2018, Aryavart
Foundation Vs. M/ s Vapi Green Enviro Ltd. & Ors. which concerned
the issue of inadequate functioning CETP leading to water pollution.
6
Further proceedings:
5. In the light of directions of this Tribunal dated 19.02.2019, the
CPCB furnished reports dated 30.05.2019 updated on 19.07.2019
and 14.08.2019 giving the status of setting up of ETPs/
CETPs/STPs with regard to methodology for assessment of
environmental compensation and monitoring of CETPs. The reports
were considered exhaustively vide order dated 28.08.2019. Before
we advert to the observations of this Tribunal with regard to the
reports, we may refer to the observations on the main issue:
"1. The issue for consideration is establishment and functioning of ETPs/ CETPs/ STPs to prevent untreated sewage/ effluents being discharged in water bodies, including rivers and canals meeting such rivers or otherwise. The magnitude of the problem is well acknowledged. In the year 1962 Go! set up a Committee for prevention of water pollution. The recommendations led to enactment of the Water (Prevention and Control of Pollution) Act, 1974 ("Water Act") in pursuance of Article 252 of the Constitution. The Water Act provides for the constitution of a Central Board and State Boards/ Committees. No polluted matter can be discharged into a stream or well or on land, and no industry, operation or process can be established and no out-let for discharge of sewage used without consent of the State Board. The Water Act provides powers to give directions for closing any such activity as well as for prosecution. Power to give directions implicitly includes recovery of compensation on 'Polluter Pays' principle.
2. Inspite of above statutory regime we are faced with serious problem of water pollution. The Hon'ble Supreme Court noted2 that the water pollution caused serious diseases, including Cholera and Typhoid. Water pollution could not be ignored and adequate measures for prevention and control are necessary. Polluting industries were directed to be shifted on 'Precautionary' principle. It is not necessary to ref er to all the judgments of the Hon'ble Supreme Court dealing with the significance of water and need to prevent pollution of water. We may only refer to the observations that everyone has right to have access to drinking water in quantum and equality equal to the basic needs. This is fundamental to life and part of Article 21. 3
2 (1988) 1 sec 471 3 APPCB vs. Prof. M.V Nayudu (2001) 2 SCC 62 at para 3, 4, State of Orissa Vs. Government of India (2009) 5 SCC 492, at para 58 "Rivers in India are drying up, groundwater is being
7
304
3. As per CPCB's report 20164, it has been estimated that 61,948 million liters per day (mld) sewage is generated from the urban areas of which treatment capacity of 23,277 mld is currently existent in India. Thereby the deficit in capacity of waste treatment is of 62%. There is no data available with regard to generation of sewage in the rural areas.
4. We may note that discharge of untreated effluents and sewage is the principal cause of water pollution in the country as noted in cases relating to pollution of rivers.5 Similarly, in the case of 100 polluted industrial clusters being dealt with by this Tribunal6, water pollution is one of the factors polluting the said industrial clusters. As already noted, official data of CPCB is to the effect that 351 river stretches in the Country are polluted. The Tribunal held that remedial action for restoration of the said river stretches is necessary. 7 In the said order, it was observed:
"As already noted, well known causes of pollution of rivers are dumping of untreated sewage and industrial waste, garbage, plastic waste, e waste, bio-medical waste, municipal solid waste, diversion of river waters, encroachments of catchment areas and floodplains, over drawl of groundwater, river bank erosion on account of illegal sand mining. In spite of directions to install Effluent Treatment Plants (ETPs), Common Effluent Treatment Plants (CETPs}, Sewage Treatment Plants (STPs), and adopting other anti pollution measures, satisfactory situation has not been achieved. Tough governance is the need of the hour. If pollution does not stop, the industry has to be stopped. If sewage dumping
rapidly depleted, and canals are polluted. Yamuna in Delhi looks like a black drain. Several perennial rivers like Ganga and Brahmaputra are rapidly becoming seasonal. Rivers are dying or declining, and aquifers are getting over pumped. Industries, hotels, etc. are pumping out groundwater at an alarming rate, causing sharp decline in the groundwater levels." 4http://www.sulabhenvis.nic.in/Database/STST wastewater 2090.aspx July 16, updated on December 6, 2016 5 O.A No. 673 of 2018 this Tribunal is considering remedial action to rejuvenate 351 polluted river stretches. Therein, other cases of river pollution are mentioned thus "This Tribunal also considered the issue of pollution of river Yamuna, in Manoj Mishra Vs. Union of India, river Ganga in M.C. Mehta Vs. Union of India, river Ramganga which is a tributary of river Ganga in Mahendra Pandey Vs. Union of India & Ors., rivers Sutlej and Beas in the case of Sobha Singh & Ors. Vs. State of Punjab & Ors., river Son in Nityanand Mishra Vs. State of M.P. & Ors., river Ghaggar in Stench Grips Mansa's Sacred Ghaggar River (Suo-Moto Case)", river Hindon in Doaba Paryavaran Samiti Vs. State of U.P. & Ors., river Kasardi in Arvind Pundalik Mhatre Vs. Ministry of Environment, Forest and Climate Change & Ors., River Ami, Tapti, Rohani and Ramgarh lake in Meera Shukla Vs. Municipal Corporation, Gorakhpur & Ors., rivers Chenab and Tawi in the case of Amresh Singh Vs. Union of India & Ors. and Subarnarekha in Sudarsan Das Vs. State of West Bengal & Ors. and issued directions from time to time" 6 O.A No. 1038/2018 7 0. A No.673/2018, order dated 08.04.2019
305 8
does not stop, local bodies have to be made accountable and their heads are to be prosecuted. Steps have to be taken for awareness and public involvement."
5. All the States and UTs where polluted river stretches exist are required to constitute River Rejuvenation Committees to prepare actions plans for restoration (which are to be reviewed by the highest authority in the States, i.e Chief Secretary) to be monitored by CPCB and thereafter to be further monitored by this Tribunal. Accordingly, the action plans have been prepared which broadly envisage action to prevent discharge of untreated effluent/ sewage. The same are being monitored by the CPCB and by this Tribunal and the matter is now listed for hearing on 29.11.2019. In O.A 606/2018 while dealing with the compliance of Solid Waste Management Rules, 2016, this Tribunal vide order dated 16.01.2019 directed personal appearance of all the Chief Secretaries with their monitoring reports on major environment issues including the rejuvenation of polluted river stretches. The Chief Secretaries of all StatesfUTs have accordingly appeared and furnished their reports which envisages steps for setting up of ETPs/CETPs/STPs to prevent water pollution. The Chief Secretaries have to appear before this Tribunal with further progress reports on the subjects.
6. Further, control of pollution of river Ganga is being monitored by this Tribunal in 0. A No. 200/2014 after transfer from the Hon'ble Supreme Court. Therein timelines have been prescribed to the effect that STPs be set up in time bound manner and no a drop of pollution be discharged in the river. The Tribunal observed:
"Bioremediation and/ or phytoremediation or any other remediation measures may start as an interim measure positively from O 1.11.2019, failing which the State may be liable to pay compensation of Rs. 5 Lakhs per month per drain to be deposited with the CPCB. This however, is not to be taken as an excuse to delay the installation of STPs. For delay of the work, the Chief Secretary must identify the officers responsible and assign specific responsibilities. Wherever there are violations, adverse entries in the ACRs must be made in respect of such identified officers. For delay in setting up of STPs and sewerage network beyond prescribed timelines, State may be liable to pay Rs. 10 Lakhs per month per STP and its network. It will be open to the State to recover the said amount from the erring officers/ contractors.
With regard to works under construction, after 01.07.2020, direction for payment of environmental compensation of Rs. 10 lakhs per month to CPCB for discharging untreated sewage in any drain
9
306
connected to river Ganga or its tributaries and Rs. 10 lakhs per month to CPCB per incomplete STP and its sewerage network will apply. Further with regard to the sectors where STP and sewerage network works have not yet started, the State has to pay an Environmental Compensation of Rs. 10 lakhs per month after 31.12.2020. The NMCG will also be equally liable for its failure to the extent of 50% of the amount to be paid. Till such compliance, bioremediation or any other appropriate interim measure may start from O 1.11.2019."
(emphasis supplied)
6. We now refer to the observations of this Tribunal while considering
the reports dated 30.05.2019 updated on 19.07.2019 and
14.08.2019:
"I. Report dated 30.05.2019 updated on 19.07.2019
13. According to updated report datedl 9.07.2019, out of 62,897 number of industries requiring ETPs, 60,944 industries are operating with functional ETPs and 1949 industries are operating without ETPs. 59,258 industries are complying with environmental standards and 1,524 industries are noncomplying. There are total 192 CETPs, out of which 133 CETPs are complying with environmental standards and 59 CETPs are non-complying. There are total 13, 709 STPs (Municipal and other than municipal), out of which, 13, 113 STPs are complying with environmental standards and 637 STPs are non-complying 73 CETPs in construction/proposal stage, whereas, for STPs, 1164 projects (municipal and non- municipal) are under construction/proposal stage.
14. A report has also been prepared on the scale of environmental ci:Jmpensation to be recovered from individual/ authorities for causing pollution or failure for preventing causing pollution, apart from illegal extraction of ground water,failure to implement Solid waste Management Rules, damage to environment by mining and steps taken to explore preparation of an annual environmental plan for the country. Extracts from the report which are considered significant for this order are:
"I. Environment Compensation to be levied on Industrial Units
Recommendations The Committee made following recommendations: 1.5.1 To begin with, Environmental Compensation may be levied by CPCB only when CPCB has issued the directions under the Environment (Protection) Act, 1986. In case of a, band c, Environmental Compensation may be calculated based on the formula "EC= Pl x N x Rx S x LF", wherein, Pl
10
may be taken as 80, 50 and 30 for red, orange and green category of industries, respectively, and R may be taken as 250. Sand LF may be taken as prescribed in the preceding paragraphs
1.5.2 In case of d, e and f, the Environmental Compensation may be levied based on the detailed investigations by Expert Institutions/ Organizations.
1.5.3 The Hon'ble Supreme Court in its order dated 22.02.2017 in the matter of Paryavaran Suraksha Samiti and another vis Union of India and others {Writ Petition (Civil) No. 375 of 2012), directed that all running industrial units which require "consent to operate" from concerned State Pollution Control Board, have a primary effluent treatment plant in place. Therefore, no industry requiring ETP, shall be allowed to operate without ETP. 1. 5. 4 EC is not a substitute for taking actions under EP Act, Water Act or Air Act. In fact, units found polluting should be closed/prosecuted as per the Acts and Rules.
II. Environmental Compensation to be levied on all violations of Graded Response Action Plan (GRAP) in NCR.
Table No. 2.1: Environmental Compensation to be levied on all violations of Graded Response Action Plan (GRAP) in Delhi-NCR.
~ Activity - State Of Air Quality Environmental Compensation 0
Industrial Emissions Severe + I Emergency - Rs 1.0 Crore Severe :, Rs so uo» ,~ Very Poor _ . ., Rs 25 Lakh Moderate to Poor Rs lOLakh
Vapour Recovery System (VRS) at Outlets of Oil Companies
i. Not Target Date Rs 1.0 Crore installed
ii. Non functional Very poor to Severe + ., Rs 50.0Lakh Moderate to Poor Rs 25.0 Lakh
Construction sites Severe +/Emergency Rs 1.0 Crore Severe Rs 50 Lakh
(Offending plot more Very Poor Rs 25 Lakh than 20,000 Sq.m.)
Moderate to Poor Rs 10 Lakh
Solid waste/ garbage Very poor to Severe + Rs 25.0 Lakh dumping in Industrial
Moderate to Poor Rs 10.0Lakh Estates Failure to water sprinkling on unpaved roads
a) Hot-spots Very poor to Severe + Rs 25.0Lakh
b) Other than Hot- Very poor to Severe + Rs 10.0Lakh spots
11
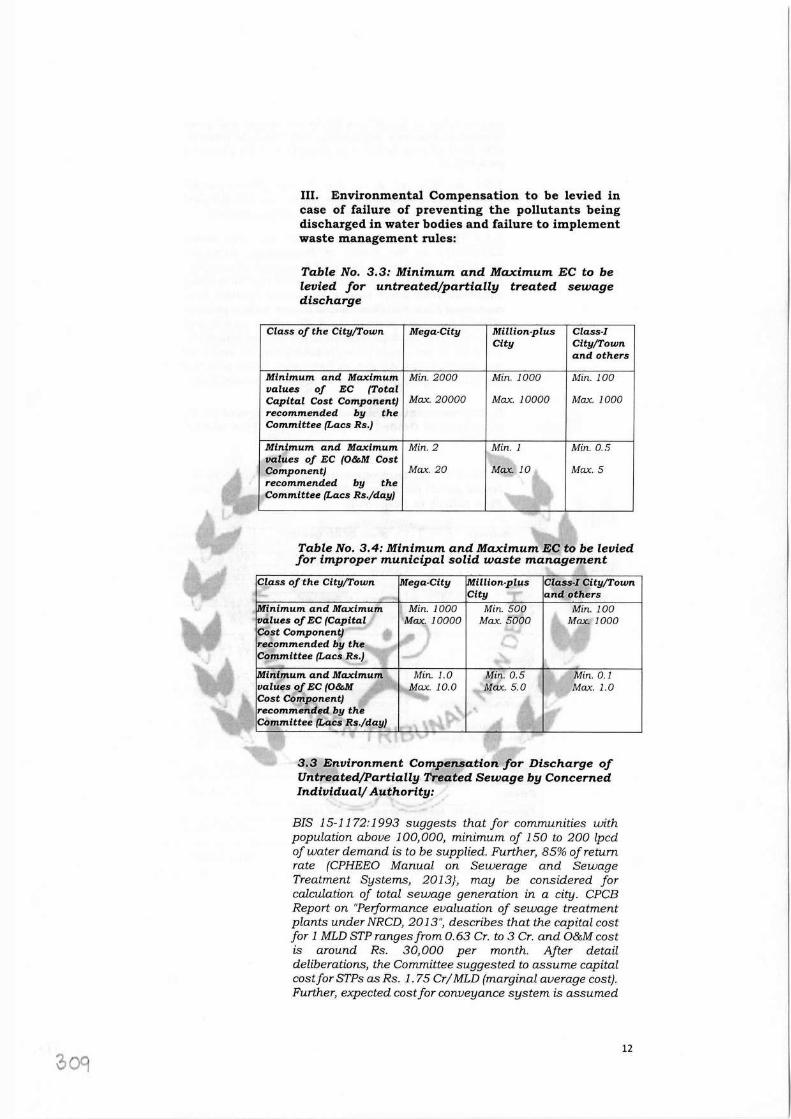
III. Environmental Compensation to be levied in case of failure of preventing the pollutants being discharged in water bodies and failure to implement waste management rules:
Table No. 3.3: Minimum and Maximum EC to be levied for untreated/partially treated sewage discharge
Class of the City/Town Mega-City Million-plus Class-I City City/Town
and others
Minimum and Maximum Min. 2000 Min. 1000 Min. 100 values of EC (Total Capital Cost Component) Max. 20000 Max. 10000 Max. 1000 recommended by the Committee (Lacs Rs.)
Minimum and Maximum Min.2 Min. 1 Min. 0.5 values of EC (O&M Cost Component) Max. 20 Max.JO Max. 5 recommended by the Committee (Lacs Rs./day)
~F -
Table No. 3.4: Minimum and Maximum EC to be levied for improper municipal solid waste management
Class of the City/Town illion-plus City
Class-I City/Town and others
inimum and Maximum values of EC (Capital Cost Component) recommended by the Committee (Lacs Rs.)
Min. 1000 Min. 500 Max. 10000 Max. 5000
Min. 100 Max. 1000
inimum and Maximum values of EC (O&M Cost Component) recommended by the Committee (Lacs Rs./day)
Min. 1.0 Min. 0.5 Max. 10.0 Max. 5.0
Min. 0.1 Max. 1.0
3.3 Environment Compensation for Discharge of Untreated/Partially Treated Sewage by Concerned Individual/ Authority:
BIS 15-11 72: 1993 suggests that for communities with population above 100,000, minimum of 150 to 200 lpcd of water demand is to be supplied. Further, 85% of re tum rate (CPHEEO Manual on Sewerage and Sewage Treatment Systems, 2013}, may be considered for calculation of total sewage generation in a city. CPCB Report on "Performance evaluation of sewage treatment plants under NRCD, 2013", describes that the capital cost for 1 MLD STP ranges from 0. 63 Cr. to 3 Cr. and O&M cost is around Rs. 30,000 per month. After detail deliberations, the Committee suggested to assume capital cost for STPs as Rs. 1. 75 Cr/ MLD (marginal average cost). Further, expected cost for conveyance system is assumed
12
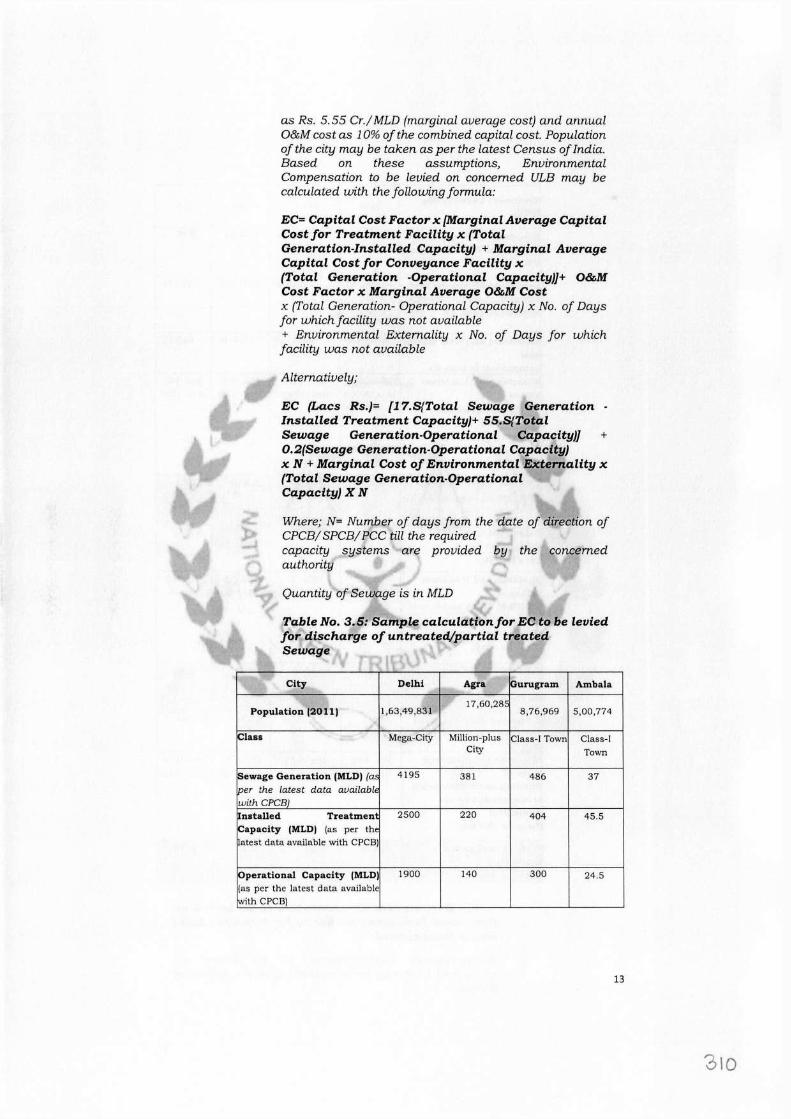
as Rs. 5. 55 Cr./ MLD (marginal average cost) and annual O&M cost as 10% of the combined capital cost. Population of the city may be taken as per the latest Census of India. Based on these assumptions, Environmental Compensation to be levied on concerned ULB may be calculated with the following formula:
EC= Capital Cost Factor x [Marginal Average Capital Cost for Treatment Facility x (Total Generation-Installed Capacity) + Marginal Average Capital Cost for Conveyance Facility x (Total Generation -Operational Capacity)]+ O&M Cost Factor x Marginal Average O&M Cost x (Total Generation- Operational Capacity) x No. of Days for which facility was not available + Environmental Externality x No. of Days for which facility was not available
Alternatively;
EC (Lacs Rs.)= [17.S{Total Sewage Generation - Installed Treatment Capacity)+ 55.S{Total Sewage Generation-Operational Capacity)] + 0.2(Sewage Generation-Operational Capacity) x N + Marginal Cost of Environmental Externality x (Total Sewage Generation-Operational Capacity) X N
Where; N= Number of days from the date of direction of CPCB/ SPCB/ PCC till the required capacity systems are provided by the concerned authority
Quantity of Sewage is in MLD
Table No. 3.5: Sample calculation/or EC to be levied for discharge of untreated/partial treated
l Sewage
• City Delhi Agra Gurugram Ambala
Population (2011) 1,63,49,831 17,60,285
8,76,969 5,00,774
~lass Mega-City Million-plus Class-! Town Class-I City Town
~ewage Generation (MLD) (cu 4195 381 486 37 IPer the latest data available withCPCBJ ~nstalled Treatment 2500 220 404 45.5 K;apacity (MLD) (as per the atest data available with CPCB)
Operational Capacity (MLD) 1900 140 300 24.5 (as per the latest data available with CPCB)
13
310
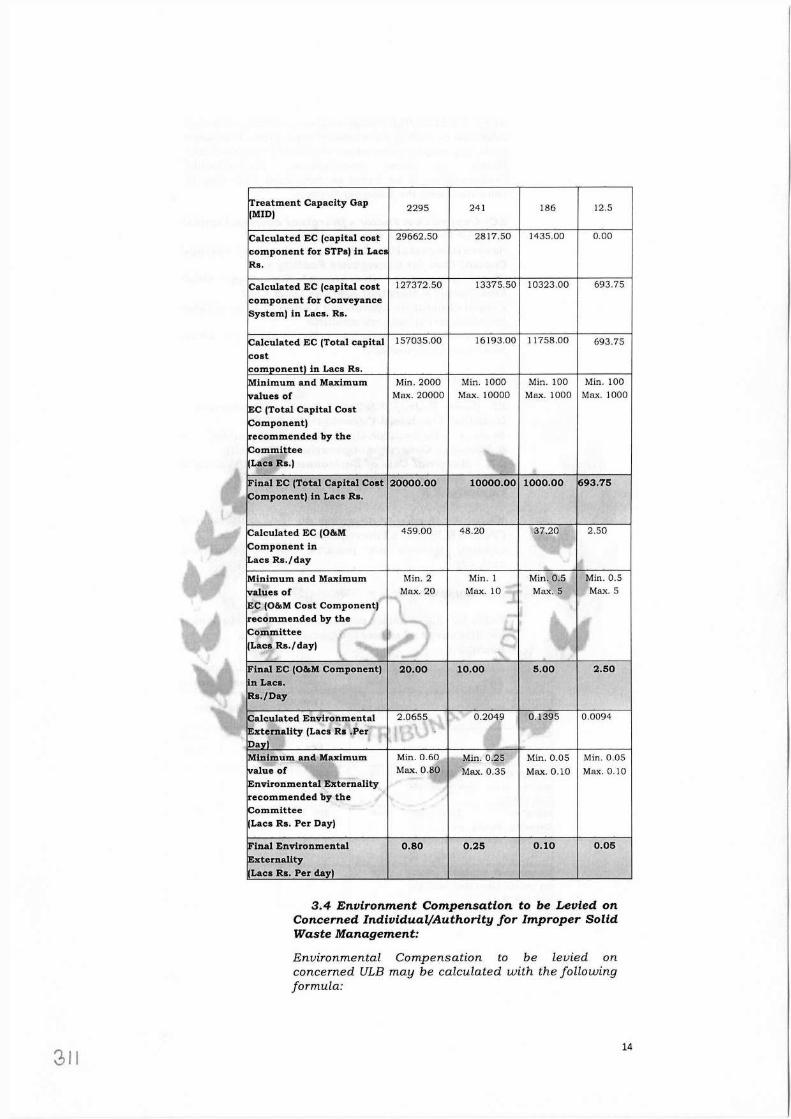
!Treatment Capacity Gap 2295 241 186 12.5 (MID)
!Calculated EC (capital cost 29662.50 2817.50 1435.00 0.00
component for STPs) in Lac! Rs.
Calculated EC (capital cost 127372.50 13375.50 10323.00 693.75
component for Conveyance System) in Lacs. Rs.
Calculated EC (Total capital 157035.00 16193.00 11758.00 693.75 cost comoonentl in Lacs Rs. Minimum and Maximum Min. 2000 Min. 1000 Min. 100 Min. 100 values of Max. 20000 Max. 10000 Max. 1000 Max. 1000 EC (Total Capital Cost Component) recommended by the !Committee (Lacs Rs.)
!Final EC (Total Capital Cost 20000.00 10000.00 1000.00 693.75 !Component) in Lacs Rs.
Calculated EC (0&M 459.00 48.20 37.20 2.50
Component in Lacs Rs./day
Minimum and Maximum Min. 2 Min. 1 Min. 0.5 Min. 0.5 values of Max. 20 Max. 10 Max. 5 Max. 5 EC (0&M Cost Component) recommended by the - '\, 1 4' Committee ti) .....: (Lacs Rs./day)
!Final EC (0&M Component) 20.00 10.00 5.00 2.50 ltn Lacs. IRa./Day
!Calculated Environmental 2.0655 0.2049 0.1395 0.0094 !Extemallty (Lacs Rs .Per Davi Minimum and Maximum Min. 0.60 Min. 0.25 Min. 0.05 Min. 0.05 rvalue of Max. 0.80 Max. 0.35 Max. 0.10 Max. 0.10 Environmental Externality recommended by the . !Committee (Lacs Rs. Per Day)
!Final Environmental 0.80 0.25 0,10 0.05 IExtemality (Lacs Rs. Per day)
3.4 Environment Compensation to be Levied on Concerned Individual/Authority for Improper Solid Waste Management:
Environmental Compensation to be levied on concerned ULB may be calculated with the following formula:
311 14
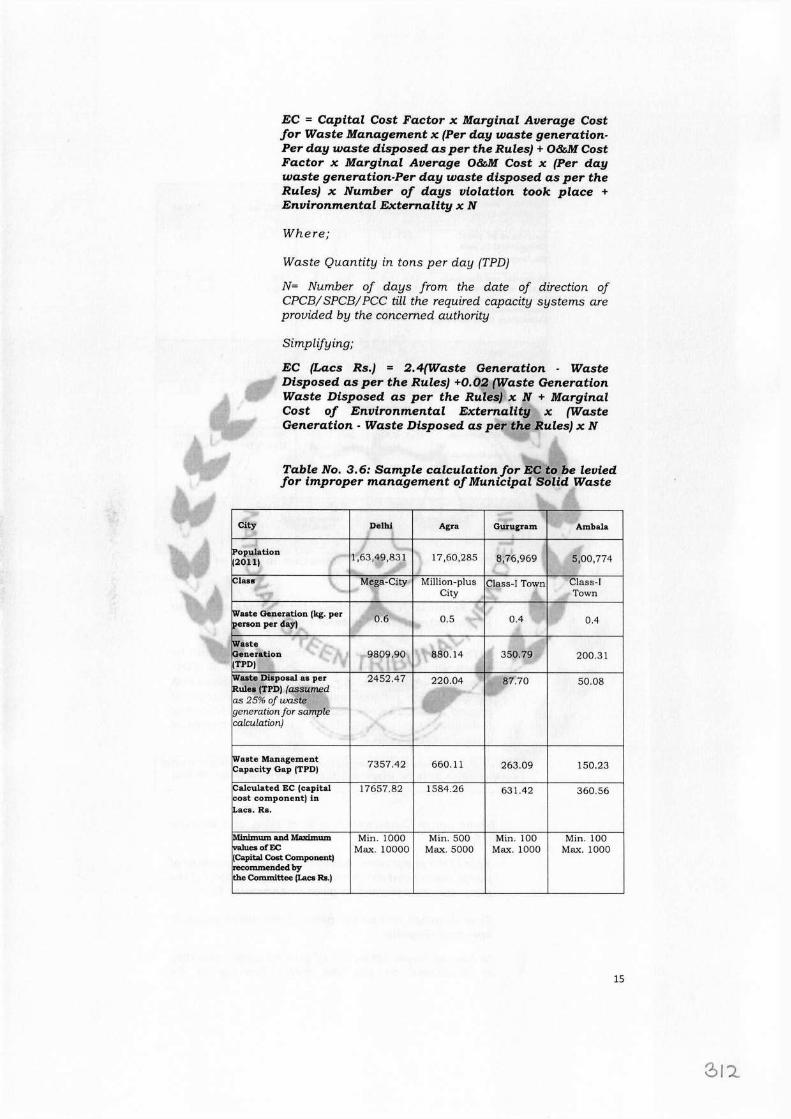
EC = Capital Cost Factor x Marginal Average Cost for Waste Management x (Per day waste generation Per day waste disposed as per the Rules) + O&M Cost Factor x Marginal Average O&M Cost x {Per day waste generation-Per day waste disposed as per the Rules) x Number of days violation took place + Environmental Externality x N
Where;
Waste Quantity in tons per day (TPD)
N= Number of days from the date of direction of CPCB/ SPCB/ PCC till the required capacity systems are provided by the concerned authority
Simplifying;
EC (Lacs Rs.) = 2.4(Waste Generation - Waste Disposed as per the Rules) +0.02 (Waste Generation Waste Disposed as per the Rules) x N + Marginal Cost of Environmental Extemality x (Waste Generation · Waste Disposed as per the Rules) x N
Table No. 3. 6: Sample calculation for EC to be levied for improper management of Municipal Solid Waste
City Delhi Agra Gurugram Ambala I
IPopulatlon 1,63,49,831 17,60,285 8,76,969 5,00,774 ~2011)
IClaH Mega-City Million-plus Class-I Town Class-I City Town
!Waste Generation (kg. per 0.6 0.5 0.4 0.4 1Peraon per day)
!Waste ~). !Generation 9809.90 880.14 350.79 200.31 ~TPD) I !Waste Dlapoaal as per 2452.47 220.04 87.70 50.08 IRuiea (TPD) (assumed as 25% of waste ~ 19eneration for sample calculation)
!Waste Management 7357.42 660.11 263.09 150.23 !Capacity Gap (TPD)
Calculated EC (capital 17657.82 1584.26 631.42 360.56 cost component) In uacs. Ra.
~um and Maximum Min. 1000 Min. 500 Min. 100 Min. 100 i,,aluea of EC Max. 10000 Max. 5000 Max. 1000 Max. 1000 (CapiW Coat Component) ~mmended by ~e Commi ttee (Lacs lu.)
15
2'12
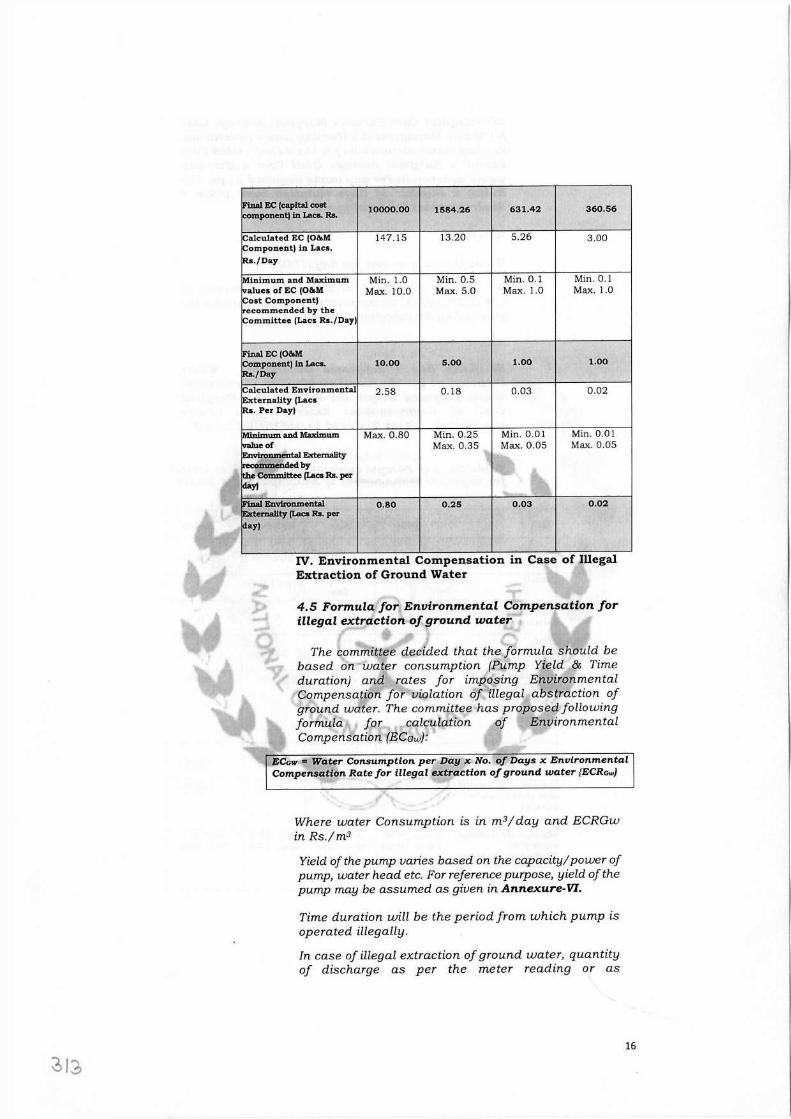
10000.00 1584.26 631.42 360.56
147.15 13.20 5.26 3.00
inimum and Maximum Min. 1.0 Min. 0.5 Min. 0.1 Min. 0.1 alues of EC (O&M Max. 10.0 Max. 5.0 Max. 1.0 Max. 1.0 ost Component} ecommended by the ommittee (Lacs Rs./Day}
10.00 5.00 1.00 1.00
2.58 0.18 0.03 0.02
Max. 0.80 Min. 0.25 Min. 0.01 Min. 0.01 Max. 0.35 Max. 0.05 Max. 0.05
0.80 0.25 0.03 0.02
IV. Environmental Compensation in Case of Illegal Extraction of Ground Water
4. 5 Formula for Environmental Compensation for illegal extraction of ground water
The committee decided that the formula should be based on water consumption (Pump Yield & Time duration) and rates for imposing Environmental Compensation for violation of illegal abstraction of ground water. The committee has proposed following formula for calculation of Environmental Compensation (ECaw):
ECaw = Water Consumption per Day x No. of Days x Environmental Compensation Rate for illegal extraction of ground water {ECRaw}
Where water Consumption is in m3 I day and ECRGw in Rs./m3
Yield of the pump varies based on the capacity/power of pump, water head etc. For reference purpose, yield of the pump may be assumed as given in Annexure-Vl.
Time duration will be the period from which pump is operated illegally.
In case of illegal extraction of ground water, quantity of discharge as per the meter reading or as
16
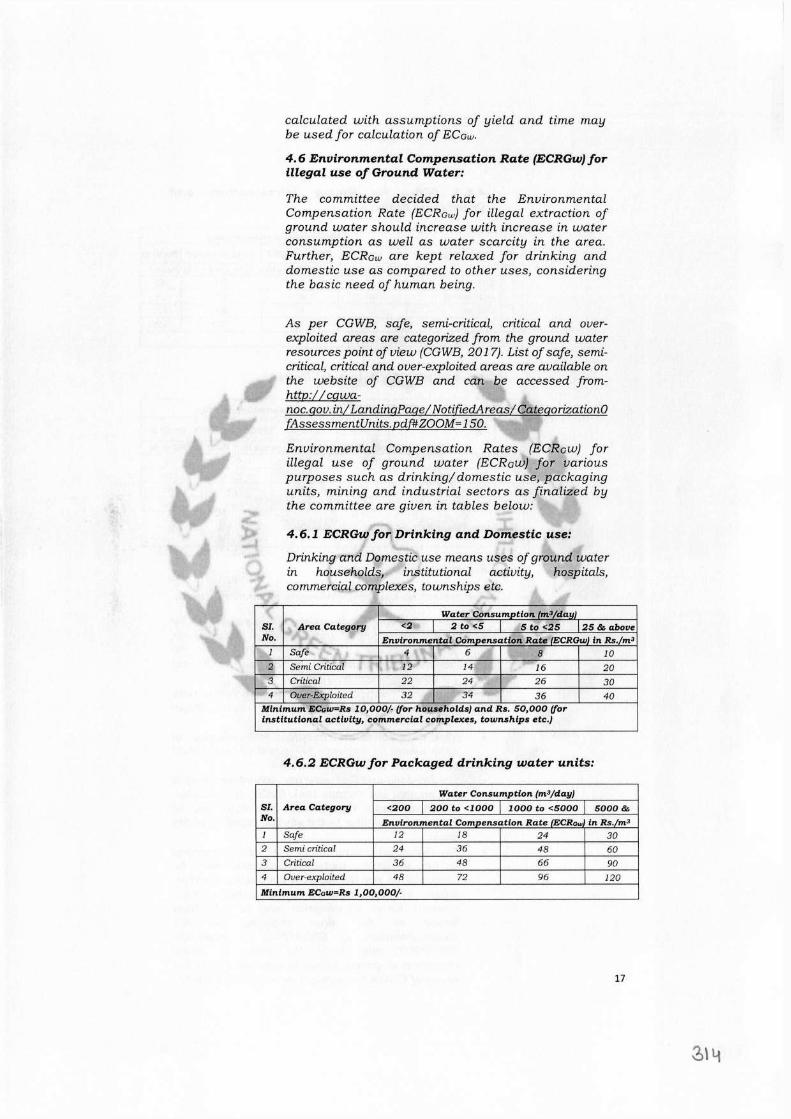
calculated with assumptions of yield and time may be used for calculation of ECcw.
4. 6 Environmental Compensation Rate (ECRGw) for illegal use of Ground Water:
The committee decided that the Environmental Compensation Rate (ECRcw) for illegal extraction of ground water should increase with increase in water consumption as well as water scarcity in the area. Further, ECRcw are kept relaxed for drinking and domestic use as compared to other uses, considering the basic need of human being.
As per CGWB, safe, semi-critical, critical and over exploited areas are categorized from the ground water resources point of view (CGWB, 2017). List of safe, semi critical, critical and over-exploited areas are available on the website of CGWB and can be accessed from http:// cgwa- noc. gov. in/ Landing Page/ NotifiedAreas/ Categorization0 f AssessmentUnits. pdf#ZOOM= 150.
Environmental Compensation Rates (ECRcw) for illegal use of ground water (ECRaw) for various purposes such as drinking/ domestic use, packaging units, mining and industrial sectors as finalized by the committee are given in tables below:
4. 6.1 ECRGw for. Drinking and Domestic use:
Drinking and Domestic use means uses of ground water in households, institutional activity, hospitals, commercial complexes, townships etc.
SI. Area Category No.
1 Safe 2 Semi Critical 3 Critical 4 Over-Exploited
Water Consumption (m3/da11) <2 2 to <5 5 to <25 25 & above
Environmental Comoensatlon Rate fECRGwl in Rs./m3
4 6 8 JO
12 14 16 20 22 24 26 30 32 34 36 40
Minimum ECow=Rs 10,000/· {for households) and Rs. 50,000 {for institutional activity, commercial complexes, townships etc.)
4.6.2 ECRGw for Packaged drinking water units:
Water Consumption (m3/day/ SI. Area Category <200 200 to <1000 l 000 to <5000 5000& No. Environmental Compensation Rate (ECRGw in Rs./m3
1 Safe 12 18 24 30 2 Semi critical 24 36 48 60 3 Critical 36 48 66 90 4 Over-exploited 48 72 96 120 Minimum ECGw=Rs l,00,000/-
17
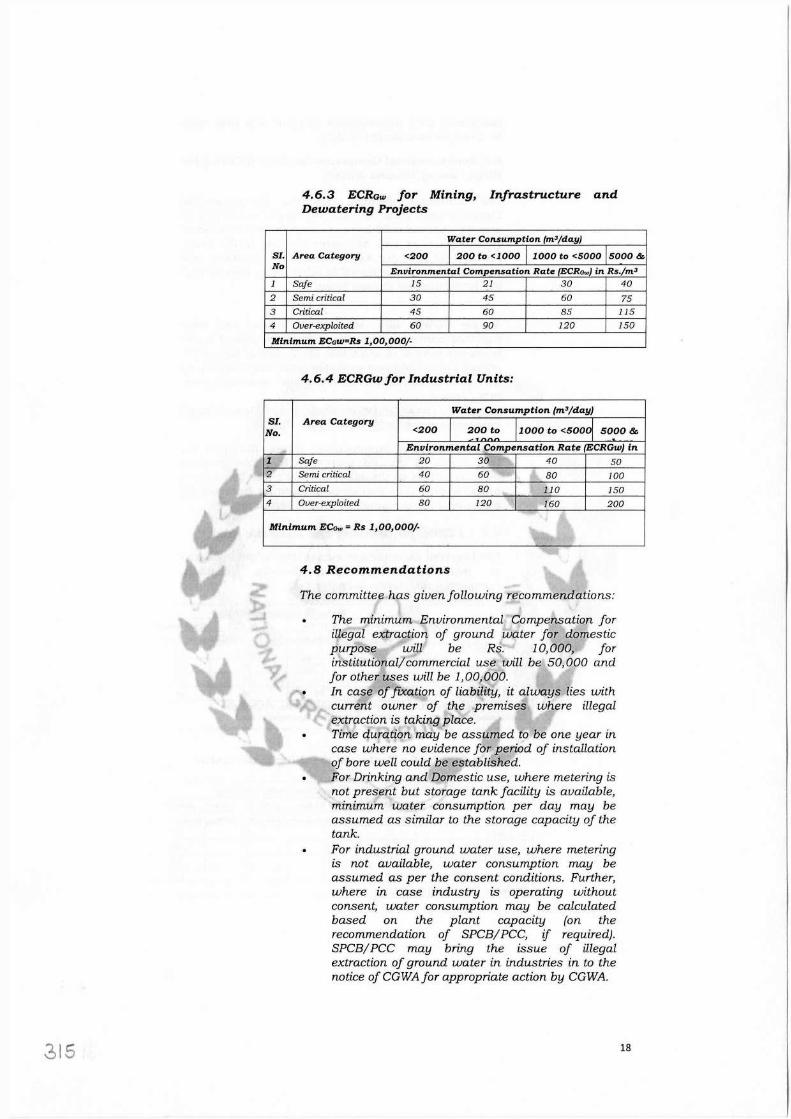
4.6.3 ECRGw for Mining, Infrastructure and Dewatering Projects
Water Consumption (m3/day)
SI. Area Category <200 200 to <1000 1000 to <5000 5000& No Environmental Compensation Rate (ECRaw) in Rs./m3
1 Safe 15 21 30 40
2 Semi critical 30 45 60 75
3 Critical 45 60 85 115
4 Over-exploited 60 90 120 150
Minimum ECow=Rs 1,00,000/-
4. 6. 4 ECRGw for Industrial Units:
Water Consumption (m3/day) SI. Area Category
1000 to <Soool No. <200 200 to 5000& ,,. ___ Environmental Compensation Rate (ECRGw) in
1 Safe 20 30 40 50 2 Semi critical 40 60 80 100 3 Critical 60 80 110 150 4 Over-exploited 80 120 160 200
Minimum ECow = Rs 1,00,000/· '\'. Ji ~ -
4.8 Recommendations
The committee has given following recommendations:
The minimum Environmental Compensation for illegal extraction of ground water for domestic purpose will be Rs. 10,000, for institutional/commercial use will be 50,000 and for other uses will be 1,00,000. In case of fixation of liability, it always lies with current owner of the premises where illegal extraction is taking place. Time duration may be assumed to be one year in case where no evidence for period of installation of bore well could be established. For Drinking and Domestic use, where metering is not present but storage tank facility is available, minimum water consumption per day may be assumed as similar to the storage capacity of the tank. For industrial ground water use, where metering is not available, water consumption may be assumed as per the consent conditions. Further, where in case industry is operating without consent, water consumption may be calculated based on the plant capacity (on the recommendation of SPCB/ PCC, if required). SPCB/ PCC may bring the issue of illegal extraction of ground water in industries in to the notice of CG WA for appropriate action by CG WA.
315 18
Authorities assigned for levy EC and taking penal action are listed below:
S. No. Actions Authority 1. To seal the illegal bore-well/ tube- District Collector
well to stop extraction of water and further closure of project
2. To levy ECcw as per prescribed method District Collector, 3. To levy EC on water pollution, as per CPCBiSPCB/PCC
the method prescribed in report of CPCB- "EC on industrial pollution"
4. Prosecution of violator CGWA under EP Act SPCB/ PCC under Air and Water Act
CGWA may maintain a separate account for collection and utilization of fund, collected through the prescribed methodology in this report."
"Discussion on the report dated 30.05.2019 updated on 19.07.2019
15. It is clear from the order of the Hon'ble Supreme Court8 that the responsibility of operating STPs under Article 243W and item 6 of Schedule XII to the Constitution is of local bodies who have to evolve norms to recover funds for the purpose which is to be supervised by the States/ UTs. The norms were to be finalized upto 31.03.2017 to be implemented from the next year, i. e 0 1. 04.2018. In absence thereof, the States/ UTs have to cater to the financial requirement from its own resources. The States/ UTs are to prioritize the cities, towns, villages discharging effluents/ sewage directly into the water bodies. Industrial activity without proper treatment plants (ETPs and CETPs) is not to be allowed by the State PCBs and the Secretaries, Environment of the States/ UTs are to be answerable. Thus, the source for financial resources for the STPs, stands finalized under the binding judgment of the Hon'ble Supreme Court. Authorities and persons accountable are identified. Rigid implementation has been laid down. This Tribunal has been required to monitor compliance of the directions and timelines.
16. It is in this background that the present report needs to be appraised and further directions given. As regards the Environmental compensation regime fixed for industrial units, GRAP, solid waste, sewage and ground water is accepted as an interim measure. With regard to setting up of STPs, while we appreciate the extensive work of the CPCB based on information furnished by States/ UTs, the challenge remains about verification of the said data on the one hand and analysis of the steps taken and required on
8 Para l 0-13 in Paryavaran Suraksha Samiti Vs. Union of India, Supra
19
316
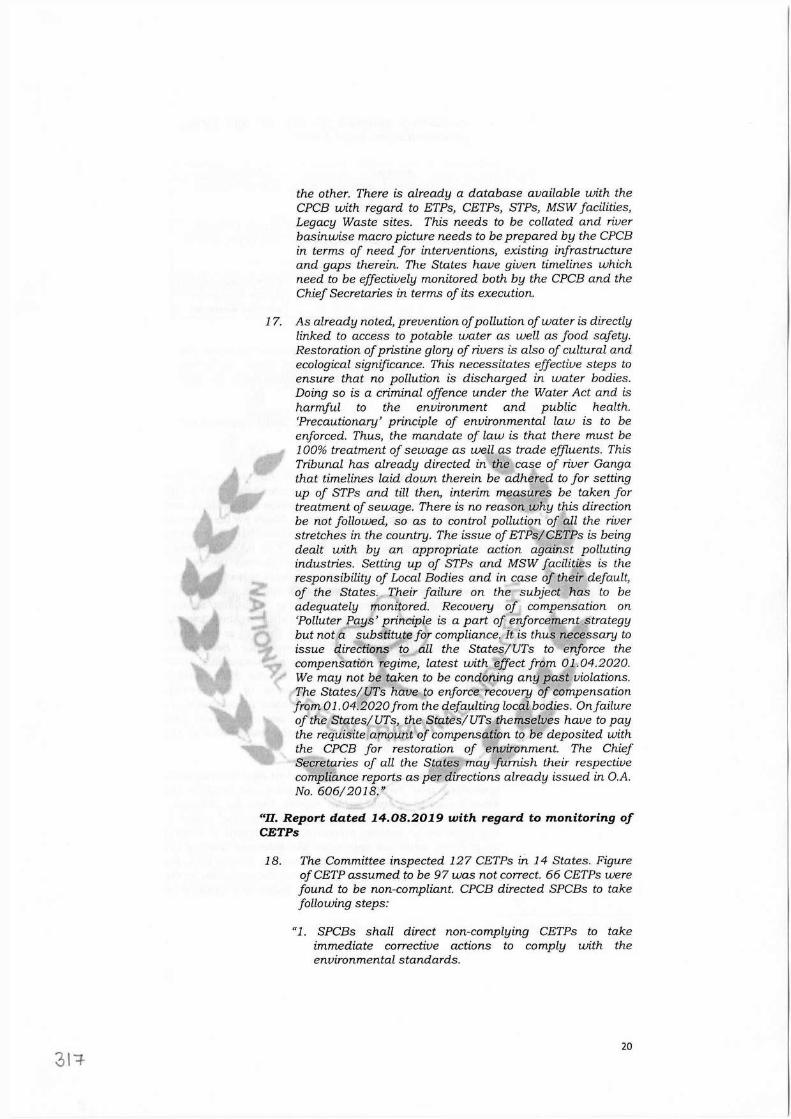
the other. There is already a database available with the CPCB with regard to ETPs, CETPs, STPs, MSW facilities, Legacy Waste sites. This needs to be collated and river basinwise macro picture needs to be prepared by the CPCB in terms of need for interventions, existing infrastructure and gaps therein. The States have given timelines which need to be effectively monitored both by the CPCB and the Chief Secretaries in terms of its execution.
17. As already noted, prevention of pollution of water is directly linked to access to potable water as well as food safety. Restoration of pristine glory of rivers is also of cultural and ecological significance. This necessitates effective steps to ensure that no pollution is discharged in water bodies. Doing so is a criminal offence under the Water Act and is harmful to the environment and public health. 'Precautionary' principle of environmental law is to be enforced. Thus, the mandate of law is that there must be 100% treatment of sewage as well as trade effluents. This Tribunal has already directed in the case of river Ganga that timelines laid down therein be adhered to for setting up of STPs and till then, interim measures be taken for treatment of sewage. There is no reason why this direction be not followed, so as to control pollution of all the river stretches in the country. The issue of ETPs/CETPs is being dealt with by an appropriate action against polluting industries. Setting up of STPs and MSW facilities is the responsibility of Local Bodies and in case of their default, of the States. Their failure on the subject has to be adequately monitored. Recovery of compensation on 'Polluter Pays' principle is a part of enforcement strategy but not a substitute for compliance. It is thus necessary to issue directions to all the States/UTs to enforce the compensation regime, latest with effect from 01.04.2020. We may not be taken to be condoning any past violations. The States/ UTs have to enforce recovery of compensation from 01.04.2020 from the defaulting local bodies. On failure of the States/UTs, the States/UTs themselves have to pay the requisite amount of compensation to be deposited with the CPCB for restoration of environment. The Chief Secretaries of all the States may furnish their respective compliance reports as per directions already issued in O.A. No. 606/ 2018."
"II. Report dated 14.08.2019 with regard to monitoring of CETPs
18. The Committee inspected 127 CETPs in 14 States. Figure of CETP assumed to be 97 was not correct. 66 CETPs were found to be non-compliant. CPCB directed SPCBs to take following steps:
"l. SPCBs shall direct non-complying CETPs to take immediate corrective actions to comply with the environmental standards.
20 31+
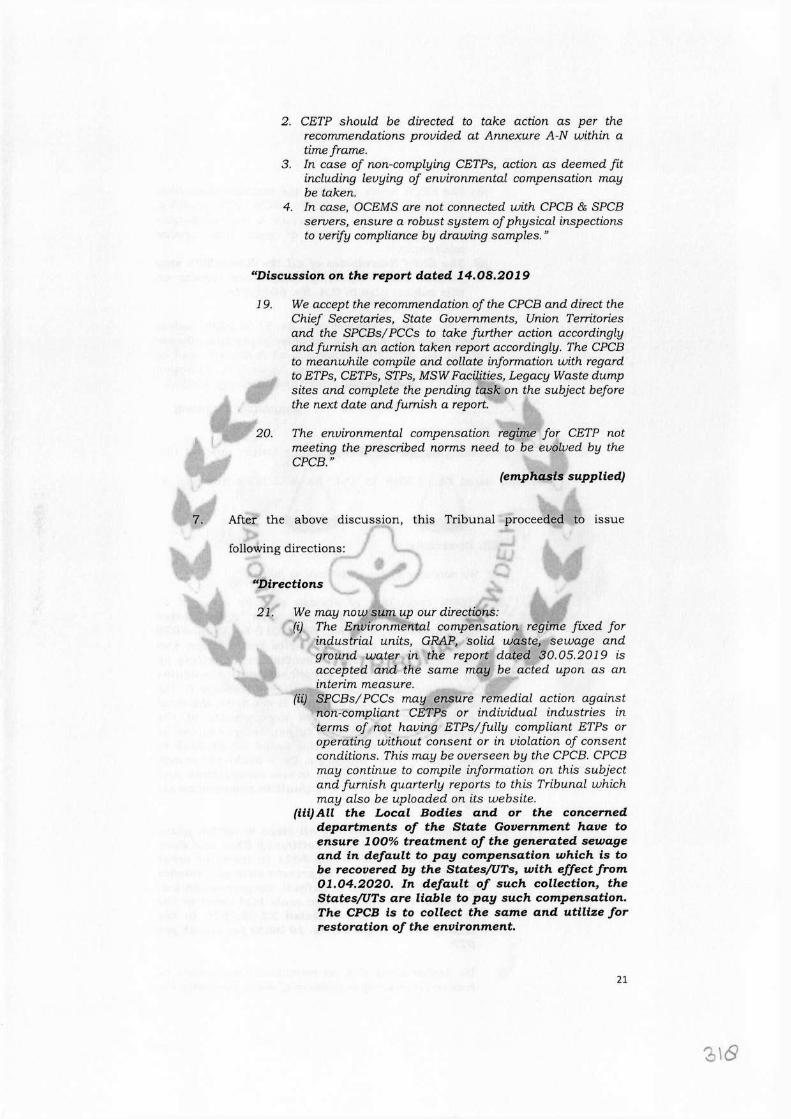
2. CETP should be directed to take action as per the recommendations provided at Annexure A-N within a time frame.
3. In case of non-complying CETPs, action as deemed fit including levying of environmental compensation may be taken.
4. In case, OCEMS are not connected with CPCB & SPCB servers, ensure a robust system of physical inspections to verify compliance by drawing samples. "
"Discussion on the report dated 14.08.2019
19. We accept the recommendation of the CPCB and direct the Chief Secretaries, State Governments, Union Territories and the SPCBs/ PCCs to take further action accordingly and furnish an action taken report accordingly. The CPCB to meanwhile compile and collate information with regard to ETPs, CETPs, STPs, MSW Facilities, Legacy Waste dump sites and complete the pending task on the subject before the next date and furnish a report.
20. The environmental compensation regime for CETP not meeting the prescribed norms need to be evolved by the CPCB."
(emphasis supplied)
7. After the above discussion, this Tribunal proceeded to issue
following directions:
"Directions
21. We may now sum up our directions: (i) The Environmental compensation regime fixed for
industrial units, GRAP, solid waste, sewage and ground water in the report dated 30. 05.2019 is accepted and the same may be acted upon as an interim measure.
(ii) SPCBs/ PCCs may ensure remedial action against non-compliant CETPs or individual industries in terms of not having ETPs/ fully compliant ETPs or operating without consent or in violation of consent conditions. This may be overseen by the CPCB. CPCB may continue to compile information on this subject and furnish quarterly reports to this Tribunal which may also be uploaded on its website.
(iii) All the Local Bodies and or the concerned departments of the State Government have to ensure 100% treatment of the generated sewage and in default to pay compensation which is to be recovered by the StatesfUTs, with effect from 01.04.2020. In default of such collection, the States/UTs are liable to pay such compensation. The CPCB is to collect the same and utilize for restoration of the environment.
21
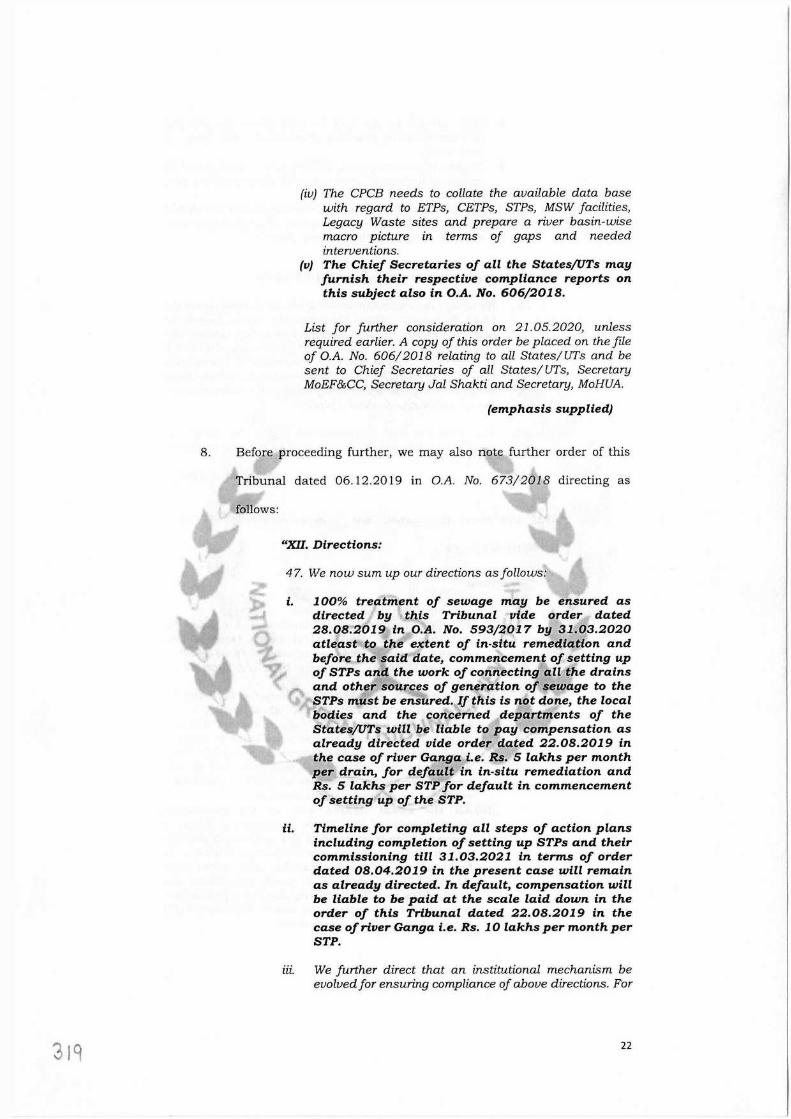
(iv) The CPCB needs to collate the available data base with regard to ETPs, CETPs, STPs, MSW facilities, Legacy Waste sites and prepare a river basin-wise macro picture in terms of gaps and needed interventions.
(v) The Chief Secretaries of all the States/UTs may furnish their respective compliance reports on this subject also in O.A. No. 606/2018.
List for further consideration on 21.05.2020, unless required earlier. A copy of this order be placed on the file of O.A. No. 606/2018 relating to all States/UTs and be sent to Chief Secretaries of all States/ UTs, Secretary MoEF&CC, Secretary Jal Shakti and Secretary, MoHUA.
(emphasis supplied)
8. Before proceeding further, we may also note further order of this
Tribunal dated 06.12.2019 in O.A. No. 673/2018 directing as
"XII. Directions:
47. We now sum up our directions as follows:
100% treatment of sewage may be ensured as directed by this Tribunal vide order dated 28.08.2019 in O.A. No. 593/2017 by 31.03.2020 atleast to the extent of in-situ remediation and before the said date, commencement of setting up of STPs and the work of connecting all the drains and other sources of generation of sewage to the STPs must be ensured. If this is not done, the local bodies and the concerned departments of the StatesjUTs will be liable to pay compensation as already directed vide order dated 22.08.2019 in the case of river Ganga i.e. Rs. 5 lakhs per month per drain, for default in in-situ remediation and Rs. 5 lakhs per STP for default in commencement of setting up of the STP.
ii. Timeline for completing all steps of action plans including completion of setting up STPs and their commissioning till 31.03.2021 in terms of order dated 08.04.2019 in the present case will remain as already directed. In default, compensation will be liable to be paid at the scale laid down in the order of this Tribunal dated 22.08.2019 in the case of river Ganga i.e. Rs. 10 lakhs per month per STP.
iii. We further direct that an institutional mechanism be evolved for ensuring compliance of above directions. For
319 22
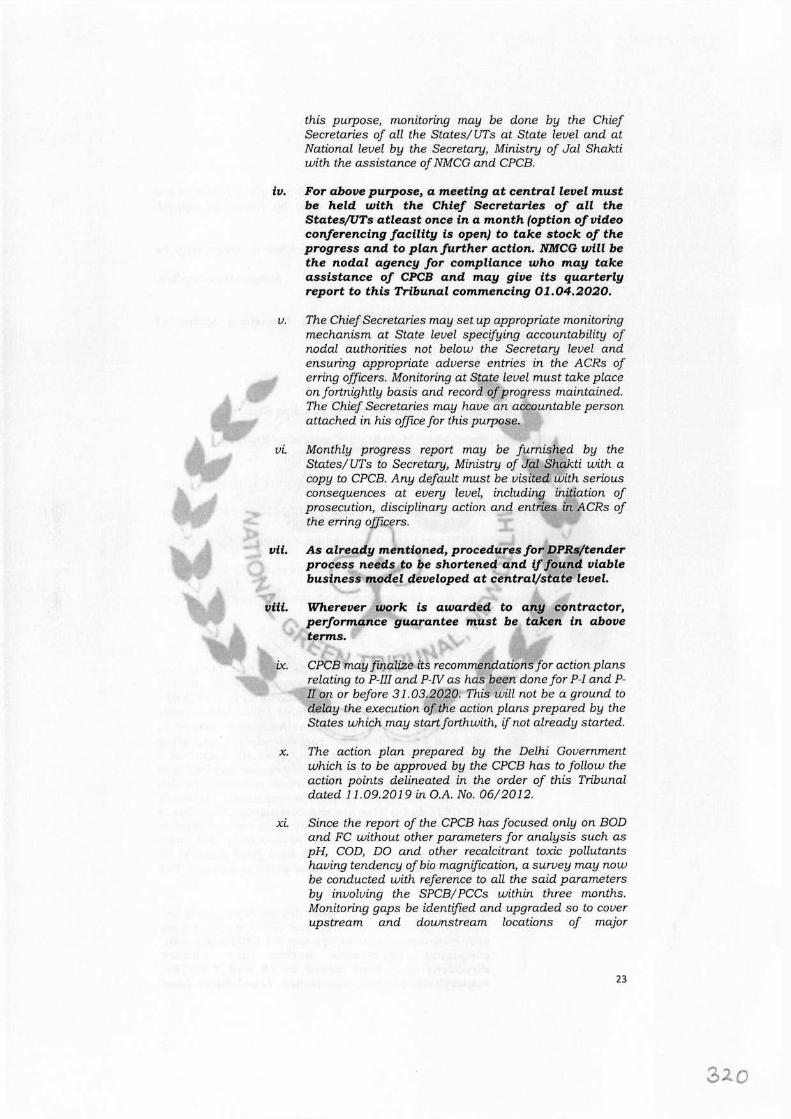
this purpose, monitoring may be done by the Chief Secretaries of all the States/ UTs at State level and at National level by the Secretary, Ministry of Jal Shakti with the assistance of NMCG and CPCB.
iv. For above purpose, a meeting at central level must be held with the Chief Secretaries of all the States/UTs atleast once in a month (option of video conferencing facility is open) to take stock of the progress and to plan further action. NMCG will be the nodal agency for compliance who may take assistance of CPCB and may give its quarterly report to this Tribunal commencing 01.04.2020.
v. The Chief Secretaries may set up appropriate monitoring mechanism at State level specifying accountability of nodal authorities not below the Secretary level and ensuring appropriate adverse entries in the ACRs of erring officers. Monitoring at State level must take place on fortnightly basis and record of progress maintained. The Chief Secretaries may have an accountable person attached in his office for this purpose.
vi. Monthly progress report may be furnished by the States/ UTs to Secretary, Ministry of Jal Shakti with a copy to CPCB. Any def a ult must be visited with serious consequences at every level, including initiation of prosecution, disciplinary action and entries in ACRs of the erring officers.
vii. As already mentioned, procedures for DPRs/tender process needs to be shortened and if found viable business model developed at central/state level.
viii. Wherever work is awarded to any contractor, performance guarantee must be taken in above terms.
I
ix. CPCB may finalize its recommendations for action plans relating to P-III and P-JV as has been done for P-I and P I! on or before 31.03.2020. This will not be a ground to delay the execution of the action plans prepared by the States which may start forthwith, if not already started.
x. The action plan prepared by the Delhi Government which is to be approved by the CPCB has to fallow the action points delineated in the order of this Tribunal dated 11.09.2019 in O.A. No. 06/2012.
xi. Since the report of the CPCB has focused only on BOD and FC without other parameters for analysis such as pH, COD, DO and other recalcitrant toxic pollutants having tendency of bio maqnification, a survey may now be conducted with reference to all the said parameters by involving the SPCB/ PCCs within three months. Monitoring gaps be identified and upgraded so to cover upstream and downstream locations of major
23
32.0
discharges to the river. CPCB may file a report on the subject before the next date by e-mail at iudicial [email protected].
xii. Rivers which have been identified as clean may be maintained."
(emphasis supplied)
Latest CPCB report dated 14.5.2020 furnishing status of compliance:
9. The CPCB has filed two reports:
(i). Report dated 13.02.2020 titled "Steps taken Report".
(ii). Report dated 14.05.2020 titled "Compliance Report".
10. Since report dated 14.05.2020 covers the entire subject, it is not
necessary to refer to the report dated 13.02.2020 in detail. Report
dated 14.05.2020 mentions the compliance status of ETPs/CETPs
& STPs, as reported by State PCBs/PCCs as on 05.05.2020, which
has been given in a tabular form and the summary is given as
As per the data received from SPCBs/ PCCs, out of total 65,135 number of industries requiring ETPs, 63,108 industries are operating with functional ETPs and 2,027 industries are operating without ETPs. Show-cause notices and closure directions have been issued to 968 and 881 industries, respectively for operating without ETPs. Legal cases have been filed against 7 industries and action is under process against 269 industries. Out of 63,108 operational industries, 61,346 industries are complying with environmental standards and 1,616 industries are non-complying. Show-cause notices and closure directions have been issued to 921 and 260 industries, respectively for non compliance. Legal cases have been filed against 22 industries and action is under process against 798 industries.
ii. As per the data received from SPCBs/ PCCs, there are total 191 CETPs, out of which 128 CETPs are complying with environmental standards and 63 CETPs are non complying. Show-cause notices and closure directions have been issued to 18 and 4 CETPs, respectively, for non-compliance. Legal cases have
24
been filed against 9 CETPs and action is under process against remaining 32 CETPs.
iii. As per the data received from SPCBs/ PCCs, there are total 15,403 STPs (Municipal and other than municipal), out of which, 14, 795 STPs are complying with environmental standards and 608 STPs are non complying. Show-cause notices and closure directions have been issued to 340 and 38 STPs, respectively for non-compliance. Legal cases have been filed against 15 STPs and action is under process against 215 STPs.
iv. As per the data received from SPCBs/PCCs, there are 82 CETPs in construction/proposal stage, whereas, for STPs, l 084 projects (municipal and non municipal) are under construction/proposal stage.
v. As per the data received from 36 SPCBs/ PCCs, 14 SPCBs/ PCCs (namely- Andhra Pradesh, Assam, Bihar, Goa, Haryana, Himachal Pradesh, Jharkhand, Kerala, Madhya Pradesh, Odisha, Puducherry, Tamil Nadu, Telangana, West Bengal) are displaying OCEMS data in public domain. The link provided by Maharashtra and Gujarat is password protected and data is not available in public domain. The 4 SPCBs (namely, Chhattisgarh, Jammu & Kashmir, Punjab and Sikkim) have not provided appropriate web links. Further, Chandigarh PCC has clarified that Data will be displayed after upgradation of STPs. Mizoram SPCB has informed that there is no industry requiring OCEMS connectivity. Lakshadweep PCC informed that there is no industry in the Union Territory of Lakshadweep.
13 SPCBs/PCCs (Andaman & Nicobar, Arunachal Pradesh, Daman & Diu, Dadra Nagar Haveli, Delhi, Kamataka, Manipur, Meghalaya, Nagaland, Rajasthan, Tripura, Uttar Pradesh and Uttarakhand) are not displaying OCEMS data in public domain.,,
(emphasis supplied)
11. Action taken has been mentioned as 'river basin-wise data collection
and analysis by CPCB for compliance of Hon 'ble NGT directions
dated 28.08.2019'; Status of Non-complying CTEPs; Meeting of the
Monitoring Committee and Quarterly Steps Taken Reports. Extracts
from the report are:
"3.0 Action taken by CPCB for compliance of Hon'ble NGT directions dated 28.08.2019:
25
i. River basin wise macro picture of ETPs, CETPs, STPs, MSW facilities, Legacy Waste sites:
The issue was deliberated in the meetings of the Monitoring Committee, wherein, it was observed that specific river basin wise data regarding location (latitude & longitude), waste generation and treatment etc. for each and every industry, CETP, STP, MSW facility and Legacy Waste Site is not available with CPCB. Further, to find out river-basin wise gaps in treatment system and needed interventions for particular sector, unit-wise data regarding actual generation, treatment and discharge of effluent/ waste etc. is required. Therefore, to compile such a compressive database, it was decided that information will be collected through online portal, by developing specific formats for each sector. This database will also be helpfulfor policy makers and regulators to critically analyse the needed interventions/ measures for abatement and control of pollution.
CPCB has finalized the formats for collection of information from concerned SPCBs/ PCCs, for preparation of river basin wise macro picture related to ETPs and CETPs (Annexure-11 & HI}. An online portal has also been developed by CPCB, which is available on the following we blink: http:// 125.19. 52.219/qpi/riverbasin/. CPCB vide email dated 12.05.2020 (Annexure-IV) requested all SPCBs/ PCCs to provide the information on the portal by st= May, 2020. The formats for STPs, MSW facilities and Legacy Waste Sites have been finalized and the same are given at Annexure-V, Annexure-VI and Annexure-VII, respectively. However, portal development for STPs, MSW facilities, Legacy Waste sites is in the process.
It is to be noted that following river basin, as classified by Central Water Commission, Ministry of Jal Shakti, Government of India, are being considered for the data collection and analysis:
1. Indus 2(a). Ganga (Upto Border) 2(b). Brahmaputra (Upto Border) 2(c). Barak etc. (Upto Border) 3. Godavari 4. Krishna 5. Cauvery 6. Pennar 0. East flowing rivers between Krishna and
Pennar and between Mahanadi and Godavari 7. East flowing rivers between Krishna and
Kanyakumari 8. Mahanadi 1. Brahmani and Baitarani
26
2. Subernarekha 3. Sabarmati 4. Mahi 5. West flowing ivers of Kutch and Kathiawar
including Luni 6. Narmada 7. Tapi 8. West flowing rivers from Tapi to Tadri 9. Westjlowing rivers from Tadri to Kanyakumari 10. Area of Inland drainage in Rajas than 11. Minor river basins drainage to Bangladesh &
Burma (Source: http://www. ewe. gov. in/ river-basin-planning)
ii. Status of Non-complying CTEPs:
a) In compliance of Hon'ble NGT directions, during March-May, 2019, CPCB inspected a total number of 144 CETPs in 14 states, out of which 1 7 were found closed. As per the monitoring, 66 CETPs were found non complying in terms of outlet standards. The compiled inspection-cum-monitoring reports and action taken by CPCB were submitted to Hon'ble NGT on 14.08.2019. CPCB has directed all concerned SPCBs, through directions u/ s l B(l)(b) of Air and Water Act, issued on 13. 08.2019, to take following actions against defaulting CETPs:
1. SPCBs shall direct non-complying CETPs to take immediate corrective actions to comply with the environmental standards.
2.
3.
4.
SPCBs shall direct all non-complying CETPs to take action as per the recommendations of CPCB, within a time frame.
In case of non-complying CETPs, action as deemed fit including levying of environmental compensation may be taken.
In case, OCEMS are not connected with CPCB & SPCB servers, ensure a robust system of physical inspections to verify compliance by drawing samples.
CPCB has been following-up the matter with the concerned SPCBs/ PCCs. Action Taken Reports, w. r. t. 66 non-complying CETPs has been received from all the 14 SPCBs. The dates of ATRs submitted by SPCBs/PCCs, are given at Annexure-VIII.
As per the information received from concerned SPCBs, out of 66 noncomplying CETPs, 26 CETPs have complied the directions, however, 40 CETPs are still non-complying. Environmental compensation has been levied on 13
27
CETPs. Actions for levying EC I legal action are under process against 1 0 CETPs. The state-wise summary status of 66 non-complying CETPs and action taken by concerned SPCBs is given at Annexure-IX. Further, CETP-wise compliance status of CPCB's directions and recommendations is attached at Annexure-X.
b) Regarding evolving environmental compensation regime for CETPs, it is to submit that in compliance of Hon'ble NGT order dated 03.08.2017, in the matter of OA No. 593/ 2017 (Paryavaran Suraksha Samiti vis UoI), CPCB has earlier finalized the following formula, which is primarily based on the Pollution Index (PI) of the concerned sector, for levying environmental compensation on a defaulting industry:
EC =PIX N X RX s X LF
Where, EC is Environmental Compensation in ! PI= Pollution Index of industrial sector N = Number of days of violation took place R = A factor in Rupees (!)for EC S = Factor for scale of operation LF = Location factor Presently, considering the PI value as 80, the same formula is being used for levying EC on non-complying CETPs. Further, as per the Hon'ble NGT directions CPCB is in the process of revising EC regime for non-complying CETPs. The issue was discussed in the Committee, dealing with the EC matter, on 17.02.2020 and 04.03.2020. CPCB will finalize the revised EC regime for non-complying CETPs, shortly.
Meeting of the Monitoring Committee:
CPCB has been conducting meetings of the Monitoring Committee on regular basis to review the compliance status of ETPs/ CETPs/ STPs submitted by SPCBs/ PCCs and to deliberate on issues for ensuring the compliance of Hon 'ble NG T's directions. So far, fifteen meetings of the Monitoring Committee have been conducted. Since the date last hearing i.e. 28.08.2019, meetings of the Monitoring Committee were held on 27th September 2019, 9th December 2019, 13th February, 2019 at CPCB Head Office, Delhi.
iv. Quarterly Steps Taken Reports:
CPCB has been uploading Steps Taken Reports on its website, as directed by the Hon'ble Tribunal. The reports can be accessed through the URL-https:// cpcb. nic. in/nqt court-cases/. So far, six reports with the status as on 26.10.2018, 23.01.2019, 15.04.2019, 19.07.2019, 22.10.2019 and 04.02.2020 have been uploaded. The copies of the Steps Taken Report i.e. 22.10.2019 and
28
04.02.2020 were also submitted to the Hon'ble NGT through e-filinq."
12. The report further mentions preparation of formats for collection of
information from concerned States PCBs/PCCs, development of
online portal. Compliance status is found to be as follow:
"As per the information received from concerned SPCBs, out of 66 noncomplying CETPs, 26 CETPs have complied the directions, however, 40 CETPs are still non-complying. Environmental compensation has been levied on 13 CETPs. Actions for levying EC / legal action are under process against 10 CETPs. The state-wise summary status of 66 non-complying CETPs and action taken by concerned SPCBs is given at Annexure-IX. Further, CETP-wise compliance status of CPCB's directions and recommendations is attached at Annexure-X."
Analysis of the report dated 14.5.2020:
13. The above report shows that some steps have been initiated against
non-compliant ETPs/CETPs/STPs while further steps need to be
taken. With regard to industries not having ETP or not connected to
CETP, pending construction of CETPs as mentioned in the above
report, the State PCBs/PCCs may ensure that there is no discharge
of any untreated pollutants by the industries and such polluting
activities must be stopped and compensation recovered for the non-
compliance, if any, apart from any other legal action in accordance
with law. As regards non-compliant STPs, further action may be
completed by the State PCBs/PCCs and it may be ensured that there
is 100% treatment of sewage and till STPs are set up, atleast in-situ
remediation takes place. However, on account of Corona pandemic
which has affected several on-going activities, the timeline of levy of
compensation in terms of order dated 28.08.2019 in O.A. No.
593/2017 read with order dated 06.12.2019 in O.A. No. 673/2018,
of 01.04.2020 may be read as 01.07.2020 and 01.04.2021 may be
29
read as 01.07.2021. Further reports may be taken by the CPCB
from all the State PCBs/PCCs as per the system evolved by the
CPCB from time to time.
14. At this stage, it will also be appropriate to mention the proceedings
in another matter pending before this Tribunal which have bearing
on the present case namely O.A. No. 1038, News item published in
"The Asian Age" Authored by Sanjay Kaw Titled "CPCB to rank
industrial units on pollution levels" which was last dealt with on
14.11.2019. Brief reference to same has been made in earlier order
also. The issue therein was remedial action against pollution of
industrial clusters, classified as such, based on Comprehensive
Environmental Pollution Index (CEPI) prepared by CPCB on the
basis of data furnished by the State PCBs/PCCs. The said data
shows that 100 industrial clusters are polluted in terms of air, water
and soil. Some of the salient observations in the said order are as
follows:
"9. In view of the above, since the data compiled so far shows increasing trend of air, water and soil pollution, meaningful action must result in reversing such trend and the violators of law cannot be allowed to have a free run at the core of environment and public health. Inaction by the statutory authorities is also at the cost of Rule of Law which is the mandate of the Constitution and is necessary for meaningful enforcement of legitimate constitutional rights of citizens and basic duty of a welfare State under the Constitution.
10. We may note the observation of the Hon'ble Supreme Court in the subject of accountability of authorities for failing to discharge their duties. In MC. Mehta v. UOI & Ors., WP CTvil. No. 13029/ 1985 vide order dated 04.11.2019, the Hon 'ble Supreme Court observed:
" ..... Obviously, it is usii: large that the State Governments, GovemmentofNCTofDelhi and civic bodies have miserab ly failed to discharge their 1i.abiJ1ty as per the directive principles of State
30
Policy which luwefound st.abJtory expression, they are being made s1:atuto,y mockery and also the directions of this Cowt and High Courts in this regard are being viDlat:ed with impwuty .
. . . . Time has rome uhen. iw have to fix the acrountability for this kind of situation uhich. has arisen and is destroying right to life itself in gross violation of Artide 21 of the Constitution of Indin..
.... Everybody has t.o be answerable including the t.op state machinery percolating down t.o the level of gram panchayat. The very purpose of gMng administration power up t.o the panchayat level is that there has t.o be proper administra tion and there is no room for such a.ctivitia. The action is clearly tortuous one and is clearly punishable under statutnry provisions, besides the violation of the Court's order."
In Techi Tagi. Tara vs. Rajendra Singh Bhandari and Ors., (2018) 11 SSC 734, it was observed:
"2 ...... There can be no doubt that the prot.ection and presenx,. tion of the erwironment is ex:tnmll!1y vital for all of us and unless this responsibility is taken very seriously, particularly by the Sta. t.e Governments and the SJ'CBs, LW are inlliting trouble that wr1l have adverse consequences for future generations. Issues of sustainable development, public trust and intergeneralio nal. equity are nDt mere catch UXJrds, but are concepts of great importance in environmentaljwispruden.ce.
4. One of the principal attributes of good govemanre is the establishment of viable institutions comprising professionally compeieni persons and the strengthening of such institutions so that the duties and responsibilities ccrfered on them are performed uith ded.irotion and sincerity in public interest This is applicab le rot only ID adminis trative bodies but more so ID statutory authorities more so, because statutnry authorities are the creation of a law made by a rompetent legislatwe, representing the wr1l of the people."
11. The Tribunal has thus no option except to reiterate that meaningful action has to be taken by the State PCBs/PCCs as already directed and action taken report furnished showing the number of identified polluters in polluted industrial areas mentioned above, the extent of closure of polluting activities, the extent of environmental compensation recovered, the cost of restoration of the damage to the environment of the said areas, otherwise there will be no meaningful environmental governance. This may be failure of rule of law and breach of trust reposed in statutory authorities rendering their existence useless and burden on the society.
31
On default, the Tribunal will have no option except to proceed against the Chairmen and the Member Secretaries of the State PCBs/ PCCs by way of coercive action under Section 25 of the National Green Tribunal Act, 2010 read with Section 51 CPC. Such action may include replacement of persons heading such PCBs/ PC Cs or direction for stopping their salaries till meaningful action for compliance of order of this Tribunal. The Tribunal may also consider deterrent compensation to be recovered from the State PCBs/ PCCs. Such action taken reports strictly in terms of law and order of this Tribunal referred to above may be furnished by the State PCBs/PCCS on or before 31.01.2020 to the CPCB. The CPCB may prepare a tabulated analysis of the same and file a consolidated report before this Tribunal before February 15, 2020 by email [email protected]. The CPCB may also revise its mechanism for expansion and new activities by red and orange category of industries in critically/ severely polluted areas consistent with the spirit of the earlier orders of this Tribunal and principles of environmental law to bring down the pollution load and ensure that activities do not further add to such load. "
We may also refer to the proceedings in another connected matter
being O.A. No. 606/2018 dealing with the solid waste management
and other issues. The same has also been briefly referred to earlier.
The said matter was taken up in pursuance of the order of the
Hon'ble Supreme Court dated 02.09.2014 in Writ Petition No.
888/ 1996, Almitra H. Patel Vs. Union of India & Ors. 9 In the said
matter, this Tribunal flagged important environmental issues
including solid waste and liquid waste management in the light of
orders of the Hon'ble Supreme Court. On account of continuous
non-compliance for a long period, the Chief Secretaries of all
States/UTs were required to appear before this Tribunal vide order
9 Operative part of the order of the Hon 'ble Supreme Court reads: "Enforcement of the Rules and efforts to upgrade the technology relevant to the handling of solid municipal waste is a perennial challenge and would require constant efforts and monitoring with a view to making the municipal authorities concerned accountable, taking note of dereliction, if any, issuing suitable directions consistent with the said Rules and direction incidental to the purpose underlying the Rules such as upgradation of technology wherever possible. All these matters can, in our opinion, be best left to be handled by the National Green Tribunal established under the National Green Tribunal Act, 2010. The Tribunal, it is common ground, is not only equipped with the necessary expertise to examine and deal with the environment related issues but is also competent to issue in appropriate cases directions considered necessary for enforcing the statutory provisions."
32
dated 16.01.2019. The Tribunal issued directions in the presence of
the Chief Secretaries of all the States/UTs by separate orders. Since
Chief Secretaries sought time for compliance, they were required to
appear again with progress report on crucial issues, including water
pollution leading to pollution of rivers and industrial clusters and
other issues. Further order dated 12.09.2019 was passed with
regard to the schedule of appearance of the Chief Secretaries in
second round. Some of the Chief Secretaries have already appeared.
It may be sufficient to refer to order dated 28.02.2020 (other orders
be almost on same lines) inter-alia directing as follows:
"3. The matter was earlier considered by the Hon'ble Supreme Court inter-alia vide judgments reported in (2000) 2 sec 679 and (2004) 13 sec 538 directing scientific disposal of waste by setting up of compost plants/ processing plants, preventing water percolation through heaps of garbage, creating focused 'solid waste management cells' in all States and complying with the Municipal Solid Waste Management Rules, 2016 (SWM Rules, 2016) on urgent basis. It was observed that the local authorities constituted for providing services to the citizens are lethargic and insufficient in their functioning which is impermissible. Non-accountability has led to lack of effort on the part of the employees. Domestic garbage and sewage along with poor drainage system in an unplanned manner contribute heavily to the problem of solid waste. The number of slums have multiplied signifkantly occupying large areas of public land. Promise of free land attracts more land grabbers. Instead of "slum clearance" there is "slum creation" in cities which is further aggravating the problem of domestic waste being strewn in the open. Accordingly, the Court directed that provisions pertaining to sanitation and public health be complied with, streets and public premises be cleaned daily, statutory authorities levy and recover charges from any person violating laws and ensure scientific disposal of waste, landfill sites be identified keeping in mind requirement of the city for next 20 years and environmental considerations, sites be identified for setting up of compost plants, steps be taken to prevent fresh encroachments and compliance report be submitted within eight weeks.
33
330
4. Further observations in the judgment of the Hon'ble Supreme Court'vare:
"3. The petitioner has handed over a note in the Court showing the progress that has been made in some of the States and also setting out some of the suggestions, including the suggestion for creation of solid waste management cell, so as to put a focus on the issue and also to provide incentives to those who perform well as was tried in some of the States. The said note states as under:
"1. As a result of the Hon'ble Supreme Court's orders on 26-7-2004, in Maharashtra the number of authorisations granted for solid waste management (SWM) has increased from 32% to 98%, in Gujarat from 58% to 92% and in M.P. from NIL to 34%. No affidavits at all have been received from the 24 other States/ UTs for which CPCB reported NIL or less than 3% authorisations in February 2004. All these States and their SPCBs can study and leamfrom Kamataka, Maharashtra and Gujarat's successes.
2. All States/UTs and their SPCBs/PCCs have totally ignored the improvement of existing open dumps, due by 31-12-2001, let alone identifying and monitoring the existing sites. Simple steps can be taken immediately at almost no cost by every single ULB to prevent monsoon water percolation through the heaps, which produces highly polluting black run-off (leachate). Waste heaps can be made convex to eliminate standing water, upslope diversion drains can prevent water inflow, downslope diversion drains can capture leachate for recirculation onto the heaps, and disused heaps can be given soil cover for vegetative healing.
Lack of funds is no excuse for inaction. Smaller towns in every State should go and learn from Suryapet in A.P. (population 103,000} and Namakkal in T.N. (population 53,000} which have both seen dustbin-free 'zero garbage towns' complying with the MSW Rules since 2003 with no financial inputfrom the State or the Centre, just good management and a sense of commitment.
4. States seem to use the Rules as an excuse to milk funds from the Centre, by making that a precondition for action and inflating waste processing costs 2-3 fold. The Supreme Court Committee recommended 1/3 contribution each from the city, State and Centre. Before
10 (2004) 13 sec 538
34
:,31
seeking 70-80% Centre's contribution, every State should first ensure that each city first spends its own share to immediately make its wastes non-polluting by simple sanitising/ stabilising, which is always the first step in composting viz. inoculate the waste with cow dung solution or bio culture and placing it in windrows (long heaps) which are turned at least once or twice over a period of 45 to 60 days.
5. Unless each State creates a focussed 'solid waste management cell' and rewards its cities for good performance, both of which Maharashtra has done, compliance with the MSW Rules seems to be an illusion.
6. The admitted position is that the MSW Rules have not been complied with even after four years. None of the functionaries have bothered or discharged their duties to ensure compliance. Even existing dumps have not been improved. Thus, deeper thought and urgent and immediate action is necessary to ensure compliance in future. "
26. As per available statistics, there is huge gap in generation and treatment of solid and liquid waste in the country. As per CPCB report 2016 (06.12.2016), as against 61948 MLD sewage generated in urban areas in India, the treatment capacity is 23277 MLD. The deficit in capacity is 62%. There is no data of sewage generation in rural areas. As per CPCB estimate of solid waste11, about 65 million tonnes of waste is generated annually in the country out of which about 62 million tonnes is Municipal Solid Waste (MSW). Only about 75-80% of the municipal waste gets collected and out of this only 22- 28% is processed and treated and remaining is deposited indiscriminately at dump yards. It is projected that by the year 2031, the MSW generation shall increase to 165 million tonnes and to 436 million tonnes by 2050. There are more than 4000 dump sites as per CPCB data12 which need to be remediated to avoid harmful impact on environment and public health.
37. The Chief Secretaries mentioned that the central assistance was inadequate which cannot be a justification for failure of the State in managing its waste. Waste management is responsibility of the State and Local Bodies, as already held by the Hon'ble Supreme Court in the judgments referred to above. If the funds available are inadequate, the State has to raise the same from the generators of waste.
11
http:// 164.100.47.193/lsscommittee/Urban%20Development/ 16 Urban Development 25.pdf 12 Order dated 18.10.2019 in O.A. No. 606/2018 para 6
35
3?>2
38. The Chief Secretaries must ensure adverse entries in the service records of erring officers in respect of liquid waste management at/east from OJ. 04. 2020.
41. In view of above, consistent with the directions referred to in Para 29 issued on 10.01.2020 in the case of UP, Punjab and Chandigarh which have also been repeated for other States in matters already dealt with, we direct:
a. In view of the fact that most of the statutory timelines have expired and directions of the Hon'ble Supreme Court and this Tribunal to comply with Solid Waste Management Rules, 2016 remain unexecuted, interim compensation scale is hereby laid down for continued failure after 31.03.2020. The compliance of the Rules requires taking of several steps mentioned in Rule 22 from Serial No. 1 to 10 (mentioned in para 12 above). Any such continued failure will result in liability of every Local Body to pay compensation at the rate of Rs. 10 lakh per month per Local Body for population of above 10 lakhs, Rs. 5 lakh per month per Local Body for population between 5 lakhs and 10 lakhs and Rs. 1 lakh per month per other Local Body from 01.04.2020 till compliance. If the Local Bodies are unable to bear financial burden, the liability will be of the State Governments with liberty to take remedial action against the erring Local Bodies. Apart from compensation, adverse entries must be made in the ACRs of the CEO of the said Local Bodies and other senior functionaries in Department of Urban Development etc. who are responsible for compliance of order of this Tribunal. Final compensation may be assessed and recovered by the State PCBs/ PCCs in the light of Para 33 above within six months from today. CPCB may prepare a template and issue an appropriate direction to the State PCBs/ PC Cs for undertaking such an assessment in the light thereof within one month.
b. Legacy waste remediation was to 'commence' from 01.11.2019 in terms of order of this Tribunal dated 17.07.2019 in O.A. No. 519/2019 para 2813 even though statutory timeline for 'completing' the said step is till 07.04.2021 (as per serial no. 11 in Rule 22), which direction remains unexecuted at most of the places and delay in clearing legacy waste is causing huge damage to environment in monetary terms as noted in para 33 above, pending assessment and
13 The Chief Secretaries may ensure allocation of funds for processing of legacy waste and its disposal and in their respective next reports, give the progress relating to management of all the legacy waste dumpsites. Remediation work on all other dumpsites may commence from 01.11.2019 and completed preferably within six months and in no case beyond one year. Substantial progress be made within six months. We are conscious that the SWM Rules provide for a maximum period of upto five years for the purpose, however there is no reason why the same should not happen earlier, in view of serious implications on the environment and public health.
36
recovery of such damage by the concerned State PCB within four months from today, continued failure of every Local Body on the subject of commencing the work of legacy waste sites remediation from 01.04.2020 till compliance will result in liability to pay compensation at the rate of Rs. 1 0 lakh per month per Local Body for population of above 10 lakhs, Rs. 5 lakh per month per Local Body for population between 5 lakhs and 10 lakhs and Rs. 1 lakh per month per other Local Body. If the Local Bodies are unable to bear financial burden, the liability will be of the State Governments with liberty to take remedial action against the erring Local Bodies. Apart from compensation, adverse entries must be made in the ACRs of the CEO of the said Local Bodies and other senior functionaries in Department of Urban Development etc. who are responsible for compliance of order of this Tribunal. Final compensation may be assessed and recovered by the State PCBs/ PCCs in the light of Para 33 above within six months from today.
c. Further, with regard to thematic areas listed above in para 20, steps be ensured by the Chief Secretaries in terms of directions of this Tribunal especially w.r.t. plastic waste, bio-medical waste, construction and demolition waste which are linked with solid waste treatment and disposal. Action may also be ensured by the Chief Secretaries of the States/UTs with respect to remaining thematic areas viz. hazardous waste, e-ioaste, polluted industrial clusters, reuse of treated water, performance of CETPs/ ETPs, groundwater extraction, groundwater recharge, restoration of water bodies, noise pollution and illegal sand mining.
d. The compensation regime already laid down for failure of the Local Bodies and/ or Department of Irrigation and Public Health/ In-charge Department to take action for treatment of sewage in terms of observations in Para 36 above will result in liability to pay compensation as already noted above which are reproduced for ready reference:
i. Interim measures for phytoremediation/ bioremediation etc. in respect of 100% sewage to reduce the pollution load on recipient water bodies 31.03.2020. Compensation is payable for failure to do so at the rate of Rs. 5 lakh per month per drain by concerned Local Bodies/States (in terms of orders dated 28.08.2019 in O.A. No. 593/2017 and 06.12.2019 in O.A. No. 673/2018) w.e.f. 01.04.2020.
ii. Commencement of setting up of STPs - 31.03.2020. Compensation is payable for
37
failure to do so at the rate of Rs. 5 lakh per month per STP by concerned Local Bodies/States (in terms of orders dated 28.08.2019 in O.A. No. 593/2017 and 06.12.2019 in O.A. No. 673/2018) w.e.f. 01.04.2020.
iii. Commissioning of STPs 31.03.2021. Compensation is payable for failure to do so at the rate of Rs. 10 lakh per month per STP by concerned Local Bodies/States (in terms of orders dated 28.08.2019 in O.A. No. 593/2017 and 06.12.2019 in O.A. No. 673/2018) w.e.f. 01.04.2021.
Directions:
e. Compensation in above terms may be deposited with the CPCB for being spent on restoration of environment which may be ensured by the Chief Secretaries' of the States/ UTs.
f. An 'Environment Monitoring Cell' may be set up in the office of Chief Secretaries of all the States/ UTs within one month from today, if not already done for coordination and compliance of above directions which will be the responsibility of the Chief Secretaries of the States/ UTs."
g. Compliance reports in respect of significant environmental issues may be furnished in terms of order dated 07.01.2020 quarterly with a copy to CPCB."
(emphasis supplied)
16. All States/UTs through their concerned departments such as
Urban/Rural Development, Irrigation & Public Health, Local
Bodies, Environment, etc. may ensure formulation and
execution of plans for sewage treatment and utilization of
treated sewage effluent with respect to each city, town and
village, adhering to the timeline as directed by Hon'ble Supreme
Court. STPs must meet the prescribed standards, including
faecal coliform. CPCB may further continue efforts on
compilation of River Basin-wise data. Action plans be firmed up
with Budgets/Financial tie up. Such plans be overseen by Chief
Secretary and forwarded to CPCB before 30.6.2020. CPCB may
38
consolidate all action plans and file a report accordingly.
Ministry of Jal Shakti and Ministry of Housing and Urban Affairs
may facilitate States/UTs for ensuring that water quality of
rivers, lakes, water bodies and ground water is maintained. As
observed in para 13 above, 100% treatment of sewage/effluent
must be ensured and strict coercive action taken for any
violation to enforce rule of law. Any party is free to move the
Hon'ble Supreme Court for continued violation of its order after
the deadline of 31.3.2018. This order is without prejudice to
the said remedy as direction of the Hon'ble Supreme Court
cannot be diluted or relaxed by this Tribunal in the course of
execution.
The CPCB may study and analyse the extent of reduction of
industrial and sewage pollution load on the environment,
including industrial areas and rivers and other water bodies and
submit its detailed report to the Tribunal.
18. During the lockdown period there are reports that the water
quality of river has improved, the reasons for the same may be
got studied and analysed by the CPCB and report submitted to
this Tribunal.14 If the activities reopen, the compliance to
standards must be maintained by ensuring full compliance of
law by authorities statutorily responsible for the same.
ORIGINAL APPLICATION NO. 148/2016 (MAHESH CHANDRA SAXENA VS. SOUTH DELHI MUNICIPAL CORPORATION & ORS.)
Consideration of consequential issue of utilization of treated water: Earlier proceedings leading to order dated 11.9.2020:
14 https://www.indiatoday.in/ india/ story/ coronavirus-lockdown-india-fresh-air-clean-rivers- 1669726-2020-04-22
39
336
19. This matter is connected with and incidental to the setting up of
STPs. In the course of operation of STPs, treated water is generated
and proper use of such water for secondary purposes can lead to
availability of more clean water for drinking purposes. Right to
access fresh drinking water is part of right to life. There is huge
shortage of drinking water in the country. This Tribunal noted that
in absence of proper planning, fresh water was being used for
purposes for which treated water could easily be used. Some the
statistics noted by the Tribunal and other pertinent observations in
the order dated 11.09.2019 are as follows:
Delhi is an urbanized city state having a population of about 20 millions which is expected to increase to 23 million by the year 2021. Present total water requirement for domestic purposes for population of 20 million @ 60 GPCD works out to 1200 MGD. Present average potable water production by Delhi Jal Board is about 936 MGD and includes about 80-85 MGD of ground water. Thus, there is a gap of 204 MGD. Only 81.3 households have piped water supply. Reuse of water both in domestic and industrial sectors is essential. Around 150 billion liters of sewage water is produced in India annually. 70% of Singapore drinks treated sewage water.15 There appears to be no satisfactory plan with any of the States/Union Territories (UTs) in the country. This Tribunal monitored the matter with reference to the NCT of Delhi for more than two years and passed several orders.
2. Finally, on 27.11.2018, the Tribunal considered the report of the Delhi Jal Board (DJB) dated 16.11.2018 to the effect that 460 MGD waste water was being treated but reuse of such water was not being ensured.
(emphasis supplied)
20. The Tribunal further noted:
"3. As per CPCB's report 201616, it has been estimated that 61,948 million liters per day (mld) sewage is generated from the urban areas of which treatment capacity of 23,277 mld is currently existent in India.
15 Second interim report dated 31.07.2019 of Monitoring Committee constituted under O.A. No. 496/2016. 16http: //www.sulabhenvis.nic.in/Database /STST wastewater 2090.aspx July 16, updated on December 6, 2016
40
Thereby the deficit in capacity of waste treatment is of 62%. There is no data available with regard to generation of sewage in the rural areas. To remedy this situation orders have been passed by the Hori'ble Supreme Court'? as well as this Tribunal18 directing 100% treatment of the sewage and industrial effluents by installing requisite ETPs/ CETPs/ STPs. Proper utilization of treated water has implications not only to save potable water but also to prevent illegal extraction of groundwater and conservation of water bodies. Timelines have been laid down for ensuring treatment of sewage and effluents for preventing pollution of river Ganga19 as well as other polluted river stretches which will result in more treated water being available.
4. Having regard to the necessity to ensure utilization of treated waste water to reduce pressure on the ground water resources throughout the country, the Tribunal directed all the States/UTs in India to prepare and furnish their action plans within three months to the Central Pollution Control Board (CPCB) so that CPCB could review the same and issue further directions.
5. Report dated 01.05.2019 furnished by the CPCB was considered by this Tribunal on 10.05.2019 and it was noted that some of the States did not furnish their action plans and the action plans furnished by some of the States needed improvements. The Tribunal directed that the States/ UTs which had not yet furnished their action plans may do it by 30.06.2019 and such action plans may have monitoring mechanism for coordination with the local bodies which will be the responsibility of the Chief Secretaries of the States/ UTs.
6. The Tribunal observed:
"7. It is well known that absence of plan for reuse of treated water affects recharge of ground water and also results in fresh water being used for purposes for which treated water can alternatively be used. Proper plans for reuse of waste water can add to availability of potable water which is many times denied this basic need or has to travel long distances to fetch clean water. This being a substantial question of environment, direction is issued to the States/ UTs which have not yet submitted their action plans to do so latest by 30.06.2019, failing which the Tribunal may have to consider coercive measures, including compensation for loss to the environment. The plans may include a monitoring mechanism in the States for coordination with the local bodies. This will be the
17 Paryavaran Suraksha Sarniti Vs. Union of India, (2017) 5 SCC 326 18 Paryavaran Suraksha Samiti Vs. Union of India, 0.A No. 593/2017 order dated 28.08.2019 19 O.A No. 200/2014
41
responsibility of the Chief Secretaries of all the States/ UTs.
8 The issue is also connected with the rejuvenation of 351 river stretches. The States/UTs may include this subject in the deliberations with the Central Monitoring Committee constituted in terms of orders dated 08.04.2019 in O.A. No. 673/ 201 8, News item published in The Hindu authored by Shri Jacob Koshy titled More river stretches are now critically polluted CPCB and order dated 24.04.2019 in 0.A.606/2018, Compliance of Municipal Solid Waste Management Rules, 2016. The Chief Secretaries may also include this subject in their reports to this Tribunal in pursuance of orders passed in O.A. No. 606/2018 on 16.01.2019 and further orders in their presence.
9. The CPCB may place on its website guidelines for preparing an appropriate plan within two weeks from today and also furnish its final report after analysis of gaps in the plans by 31.07.2019 by e-mail at [email protected]."
In respect of Delhi, this Tribunal noted the stand of the DJB that Municipal Corporations and the DDA may lift the treated water by tankers till the pipelines are laid for which time bound plans have been prepared and included in the action plan submitted to the CPCB. On this aspect, it was directed:
"10 .... We understand that about 103 MGD of treated water is not being effectively used by DJB out of the total 459 MGD. This is a colossal waste of our precious natural resources and cannot be permitted. This in our view needs to be expeditiously sorted out by Chief Secretary Delhi, Municipal Corporations and DDA by way of intersectoral coordination. We also direct that laying of pipelines be expedited in a time bound manner and revised plan to this regard be submitted which is duly vetted and ratified by CPCB."
8. As per the Monitoring Committee on Yamuna, a fiat recovery rate towards collection and treatment of sewage can be an option towards viable sewage management.
"A strong direction is needed to be given in order to make everyone pay a flat rate for sewage collection and treatment whether using below or upto 20 KL, as those using more than 20 KL in any case are paying for sewage treatment. The DJB charges Rs. 11. 93 per KL for the sewage it treats on behalf of NDMC
339 42
and the Cantonment Board. A specialized institution like the National Institute of Financial Policy & Planning or the C&AG may be directed to examine the costs involved and revenue generated as it is leading to mindless pollution of the environment and depletion of ground water".
(emphasis supplied)
21. The Tribunal considered the report of the CPCB furnished in
pursuance of earlier order as follows:
"9. Accordingly,further report has beenfurnished by the CPCB on 31.07.2019 to the effect that guidelines have been prepared for utilization of treated sewage from the STPs and uploaded on the website of CPCB on 24.04.2019. 23 States/UTs have furnished their action plans but 13 States/UTs have yet to submit .. The action plans of 23 States/UTs needed further improvements. 'Major observations and shortcomings' are mentioned as follows:
"1. Action plan received from State of Andhra Pradesh, Madhya Pradesh and NCT of Delhi has mentioned schemes for utilization of treated sewage in different sectors like horticulture, Metro washing, Power Plants, Construction activity, rejuvenation of water bodies (Pond/lakes), industrial sectors. Action plan also include firmed time lines for implementation of various schemes.
2. Action plan of Delhi covers all aspects as per suggested action plan. However, wastewater demand from bulk users like DDA, PWD, CPWD, DMCs, DMRC are comparative on lower side and same need to be enhanced. Chief Secretary may take up said matter with bulk users to increase the utilization of treated sewage. Option of restricted uses of bore wells by said stakeholders may explore to compel more demand of treated sewage.
3. Public Health Engineering Department, Manipur mentioned that they do not have any specific policy of utilization of treated wastewater from STPs.
4. Union Territory of Lakshadweep has mentioned that no STPs was installed in their territory and no action plan was provided.
5. Department of Urban Development and Municipal Affairs vide letter dated 29.04.2019 requested for extension of 02 months (June, 2019)for submission of action plan. However, no action plan has been received till date.
6. State of Gujrat has only submitted action plan related to Surat city which indicate use of treated sewage for industrial purpose.
43
7. Only three states have adequate capacity for sewage treatment - Himachal Pradesh and Chandigarh.
8. Utilization of treatment in industrial sector has been indicated by few states (Andhra Pradesh Steel, Thermal Power Plant and Oil Refinery), Chhattisgarh & Odisha (Thermal Power Plant). Surat and Daman have indicated reuse of treated waste water in industrial clusters.
9. In most of the remaining states/ UTs, Utilization of treated sewage has been indicated in activities like Horticulture and Irrigation. Other potential users of treated sewage like Industrial Clusters, Metro Rail, Indian Railways, Infrastructure Projects, Agriculture and Bus Depots have not been explored
10. Projection of future Sewage Generation and Treatment Capacity has not been done and same has not been taken into consideration in the utilization plan.
11. Timelines for implementation of proposed schemes have not been indicated. "
Some of the salient features of the guidelines which highlight suggestive actions for formulation of action plan for usage of treated waste water from sewage treatment plants are as fallows:
"1. Estimate Present and Projected Sewage Generation and Treatment Capacity.
2. Identify bulk users of Water: Industrial Clusters, Metro Rail, Indian Railways, Infrastructure Projects, Agriculture, Bus Depots and PWD.
3. Quantify their potential Water Demand. 4. Development of Dead Water Aquatic Sources (Lake,
Pond etc). 5. Time line for establishing such infrastructure
(Treatment, Conveyance and Utilization of Treated Sewage).
6. To promote use of treated waste water for various usage.
7. To promote supply of treated sewage to industrial clusters
8. Industrial clusters can set up treatment facility to meet their raw water requirement instead of drawing groundwater.
9. Maximizing re-use of treated waste- water will minimize groundwater abstraction."
The States/ UTs must submit their Action Plans to CPCB in terms of timelines and measurable indicators with regard to utilization of treated sewage water and institutional set up in the States/ UTs validating the use of treated water in terms of its safety to human health and environment.
44
1 0. This Tribunal has held that standards of Faecal coliform need to be adhered to by the STPs so that treated sewage water can be safely utilized/",
11. In view above, we direct that the States/ UTs which have not yet furnished their action plans may do so on or before 30.11.2019, failing which defaulting States/ UTs will be liable to pay compensation @ of Rs. 1 Lakh per month till action plans are filed. The States/ UTs which have furnished the action plans may remove the deficiencies noticed above by 30.11.2019, failing which they will be liable to pay compensation @of Rs. 1 Lakh per month. The compensation may be deposited with the CPCB which may be used for restoration of the environment.
12. The CPCB may furnish a consolidated report on or before 31.01.2020 by e-mail at [email protected]. Information about the quantum of sewage generated and treated may also be furnished. The Chief Secretaries of the concerned States/ UTs may monitor compliance of the order."
(emphasis supplied)
Report of the CPCB dated 15.5.2020:
22. Accordingly, status report dated 15.05.2020 has been filed by the
CPCB giving the gap analysis as follows:
"3.0 GAP ANALYSIS
As per Hon 'ble NGT Directions dated 10. 5.2019, suggestive measures for action plan for use of treated sewage was uploaded on CPCB's website. The same was also sent to all States/UTs vide letter dated 16.07.2019. CPCB had directed all States I UTs to cover the following action points in the Action Plan to be prepared for use of treated sewage:
i. Estimation of quantity of present and projected sewage generation,
ii. Estimation of Present and planned treatment capacity iii. Identification of Bulk users (Irrigation, horticulture,
Industries, PWD and Railways etc) and to quantify the usage
iv. Estimation of quantity of treated sewage to be used by the bulk users
v. Specification time lines to meet the target.
Accordingly, action plan submitted by 31 States I UTs were assessed based on its adequacy in addressing the above-mentioned points. The overview of the assessment is given in Table-1. Following are the major observations based on the assessment:
20 Order dated 21.12.2018 and 30.04.2019 in 0.A. No. 1069/2018, Nitin Shankar Deshpande vs. UOI & Ors.
45
i. 06 States/ UTs (Andhra Pradesh, Delhi, Puducherry , Haryana, Tamil Nadu, Madhya Pradesh) have addressed all the five action points as listed above in their action plan.
ii. 10 States/UTs have partially addressed the above- listed action points in their action plan. 09 States / UTs (Gujrat, Chhattisgarh, Jharkhand, Goa, Daman & Diu, Dadar Nagar Havelli, Jammu and Kashmir, Maharashtra and Rajasthan) have identified bulk users However, quantity of treated sewage to be used by these bulk-users as well as time lines for meeting these targets have not been specified. Chandigarh has not estimated the presented / projected qty of Sewage generation and not specified timelines for meeting the target.
iii. 08 States / UTs (Assam, Bihar, Himachal Pradesh, Mizoram, Nagaland, Meghalaya, Orissa and West Bengal) have submitted very limited information in the action plan.
iv. Action plan received from 03 States (Kerala (Trivandrum), Karnataka (Bangalore), Telangana (Hyderabad) are city specific. Action plan for treated sewage reuse in the state not provided.
Apart from above, it has been informed 4 States I UTs that due to local terrain and technical issues and action plan could not be conceptualized., 02 UTs (Lakshadweep, Andaman and Nicobar Islands) do not have STPs and having only septic management. Fecal Sludge Treatment Plant has been planned in these UTs. 02 States (Sikkim, Tripura) have high water table and therefore plan to discharge treated water to rivers.
vi. 5 States/ UTs (Arunachal Pradesh, Manipur, Uttar Pradesh, Uttarakhand, Punjab) have not submitted any information.
CPCB's observations on the action plan submitted by the individual states/ UTs have been enumerated in Table 1. Additional observations on the action plan submitted by the States I UTs are as follows:
i. Only 14 StatesjUTs ( Andhra Pradesh, Daman & Diu, Delhi, Gujarat, Haryana, Himachal Pradesh, J&K, Madhya Pradesh, Maharashtra, Nagaland, Rajasthan, Tripura, Puducherry, A&N) have estimated present quantity of Sewage generated in their States/UTs.
46
ii. Only 3 StatesjUTs (Haryana, Himachal Pradesh, Jammu & Kashmir) have adequate capacity of Sewage treatment w.r.t to present quantity of sewage generated.
iii. Major bulk users identified include- Irrigation, horticulture,, Rejuvenation of water bodies, Construction, Recreation, Railways, Vehicles and Coach washing, firefighting, recreation and industry.
iv. 13 States/UTs (Andhra Pradesh, Maharashtra, Chhattisgarh, Goa, Delhi, Rajasthan, Tamil Nadu, Puducherry, Odisha, Madhya Pradesh, Gujarat, Haryana, Jharkhand) plan to use treated sewage in industries which include Steel Plant, Thermal Power Plant, Refineries and Railways.
v. Percentage of reuse of treated sewage planned maximum in Haryana (80 %) followed by Puducherry (55 %), Delhi (50 %), Chandigarh (35 %), Tamil Nadu (25%), Madhya Pradesh (20 %), Andhra Pradesh (5 %).
vi. NCT of Delhi has set target to increase their re usage from 12.5 % to 60 %. Infuture, utilization of 341 MGD treated sewage are proposed for drinking purpose (197 MGD), Irrigation (112 MGD) and 10 MGD in rejuvenation of water bodies.
vii. Time-line specified by States/UT& for implementation of Action Plan varies between 2020 -2030."
(emphasis supplied)
Analysis of report dated 15.5.2020:
23. The above shows serious deficiencies on the part of several
States/UTs in performing their constitutional obligation of properly
and rationally managing the treated water so as to make more
potable water available for drinking purposes. Some States have
shown apathy and indifference in giving appropriate response.
Further Directions:
24. Accordingly, we direct that States which have not addressed all
the action points may do so promptly latest before 30.06.2020,
47
reducing the time lines in the action plans. The timelines must
coincide with the timelines for setting up of STPs since both
the issues are interconnected. All the States may take steps
accordingly. The CPCB may compile further information on the
subject. The compliance for action plans will be the
responsibility of the Secretaries of Urban Development/ other
concerned, including Irrigation & Public Health, Local Bodies,
Rural Development Departments of all the States/UTs and to be
overseen by the Chief Secretaries. The Ministry of Jal Shakti
and Ministry of Housing and Urban Affairs, Government of India
may also monitor and coordinate the situation appropriately in
the interest of water qualities of rivers, lakes, water bodies and
protection of groundwater.
25. Needless to say that since the issue of sources of funding has
already been dealt with in the orders of the Hon'ble Supreme
Court, the States may not put up any excuse on this pretext in
violation of the judgment of the Hon'ble Supreme Court.
26. Summary of directions:
i. All States/UTs through their concerned departments such
as Urban/Rural Development, Irrigation & Public Health,
Local Bodies, Environment, etc. may ensure formulation
and execution of plans for sewage treatment and
utilization of treated sewage effluent with respect to each
city, town and village, adhering to the timeline as directed
by Hon'ble Supreme Court. STPs must meet the prescribed
standards, including faecal coliform.
CPCB may further continue efforts on compilation of River
Basin-wise data. Action plans be firmed up with
Budgets/Financial tie up. Such plans be overseen by Chief
Secretary and forwarded to CPCB before 30.6.2020. CPCB
48
may consolidate all action plans and file a report
accordingly.
Ministry of Jal Shakti and Ministry of Housing and Urban
Affairs may facilitate States/UTs for ensuring that water
quality of rivers, lakes, water bodies and ground water is
maintained.
As observed in para 13 above, 100% treatment of
sewage/effluent must be ensured and strict coercive
action taken for any violation to enforce rule of law. Any
party is free to move the Hon'ble Supreme Court for
continued violation of its order after the deadline of
31.3.2018. This order is without prejudice to the said
remedy as direction of the Hon'ble Supreme Court cannot
be diluted or relaxed by this Tribunal in the course of
execution. PCBs/PCCs are free to realise compensation for
violations but from 1.7.2020, such compensation must be
realised as per direction of this Tribunal failing which the
erring State PCBs/PCCs will be accountable.
The CPCB may study and analyse the extent of reduction
of industrial and sewage pollution load on the
environment, including industrial areas and rivers and
other water bodies and submit its detailed report to the
Tribunal.
iii. During the lockdown period there are reports that the
water quality of river has improved, the reasons for the
same may be got studied and analysed by the CPCB and
report submitted to this Tribunal. If the activities reopen,
the compliance to standards must be maintained by
ensuring full compliance of law by authorities statutorily
responsible for the same.
iv. Accordingly, we direct that States which have not
addressed all the action points with regard to the
utilisation of sewage treated water may do so promptly
latest before 30.06.2020, reducing the time lines in the
action plans. The timelines must coincide with the
49
3½6
timelines for setting up of STPs since both the issues are
interconnected. The CPCB may compile further
information on the subject accordingly.
v. Needless to say that since the issue of sources of funding
has already been dealt with in the orders of the Hon'ble
Supreme Court, the States may not put up any excuse on
this pretext in violation of the judgment of the Hon'ble
Supreme Court.
27. The CPCB may furnish its report by 15.09.2020 giving the
status of furnishing of action plans and their execution as on
31.08.2020 by e-mail at [email protected] preferably in the
form of searchable PDF/ OCR Support PDF and not in the form
of Image/PDF.
A copy of this order be sent to the Chief Secretaries of all States/UTs,
Secretaries of MoHUA and Ministry of Jal Shakti, Govt. of India,
CPCB and all the State PCBs/PCCs by e-mail.
A copy of this be also sent to the Secretary General, Supreme Court
of India with reference to the order of the Hon'ble Supreme Court
Supreme Court in (2017) 5 SCC 326, for information and record.
List for further consideration 21.09.2020.
Adarsh Kumar Goel, CP
Sheo Kumar Singh, JM
Dr. Nagin Nanda, EM
May 21, 2020 Original Application No. 593/2017 Original Application No. 148/2016 DV
50
Related Documents