1 Party Rules, Party Resources, and the Politics of Parliamentary Democracies: How Parties Organize in the 21st Century 1 Thomas Poguntke, Heinrich-Heine University, Germany Susan Scarrow, University of Houston, USA Paul D. Webb, Sussex University, UK Paper prepared for the ECPR General Conference, Université de Montréal, 26-29 August 2015 ABSTRACT This paper introduces the first descriptive findings of the Political Party Database (PPDB) project, a major survey of party organizations in parliamentary and semi-presidential democracies. The survey takes in 122 parties in 19 countries, covering numerous variables. This paper describes the scope of the database, before presenting a number of initial findings relating to the resources, structures and internal processes of parties. Results are broken down by country and party family, and where possible, temporal comparisons with older datasets are made. Our analyses suggest a remarkable coexistence of uniformity and diversity. In terms of the major organizational resources on which parties can draw, such as members, staff and finance, the new evidence largely confirms the continuation of trends identified in pervious research, ie, declining membership, but enhanced financial resources and paid staff. Yet, substantial differences between party families and, more importantly, between counties persist. On the other hand, we find remarkable uniformity regarding the core architecture of party organizations. If they survive, parties adapt their organizational skeleton to what are apparently the functional exigencies of modern party politics. At the same time, however, we find substantial variation between countries and party families in terms of their processes, with particular regard to how internally democratic they are.

Welcome message from author
This document is posted to help you gain knowledge. Please leave a comment to let me know what you think about it! Share it to your friends and learn new things together.
Transcript
1
Party Rules, Party Resources, and the Politics of Parliamentary Democracies: How Parties Organize in the 21st Century1
Thomas Poguntke, Heinrich-Heine University, Germany
Susan Scarrow, University of Houston, USA Paul D. Webb, Sussex University, UK
Paper prepared for the ECPR General Conference, Université de Montréal, 26-29 August 2015
ABSTRACT
This paper introduces the first descriptive findings of the Political Party Database (PPDB) project, a major survey of party organizations in parliamentary and semi-presidential democracies. The survey takes in 122 parties in 19 countries, covering numerous variables. This paper describes the scope of the database, before presenting a number of initial findings relating to the resources, structures and internal processes of parties. Results are broken down by country and party family, and where possible, temporal comparisons with older datasets are made. Our analyses suggest a remarkable coexistence of uniformity and diversity. In terms of the major organizational resources on which parties can draw, such as members, staff and finance, the new evidence largely confirms the continuation of trends identified in pervious research, ie, declining membership, but enhanced financial resources and paid staff. Yet, substantial differences between party families and, more importantly, between counties persist. On the other hand, we find remarkable uniformity regarding the core architecture of party organizations. If they survive, parties adapt their organizational skeleton to what are apparently the functional exigencies of modern party politics. At the same time, however, we find substantial variation between countries and party families in terms of their processes, with particular regard to how internally democratic they are.
2
Introduction
How do parties organize, and how much do parties’ organizational differences matter? The aim of the Political Party Database Project (PPDB) is to provide systematic answers to the first question so that we are better able to answer the second question, the crucial “so what?” question about party organizational variations. Other questions we seek to answer are to what extent, and why, do parties retain certain structural features despite changes in their competitive environments? For instance, are some traditional organizational features of parties in parliamentary democracies outmoded, such as party conferences and party membership, merely quaint relics and nostalgic remnants? To use Bagehot’s terminology (1963/1867), have parties’ extra-parliamentary organizations become the “dignified” elements of party constitutions, with the real work of party politics being done by the “efficient” parts of the organization, be these the professionalized party staffs or the party officeholders? Bagehot wrote that the dignified elements were theatrical and often old elements which helped “to excite and preserve the reverence of the population” (61); similarly, some party practices might be remnants of earlier conditions which nevertheless contribute to the legitimacy of party government.
Generating legitimacy is not a small thing, as Bagehot himself was aware, but is this all that extra-parliamentary party organizations contribute to contemporary politics? Another possibility is that parties retain these institutions because they continue to contribute in other ways. We do not expect to find simple or universal answers to any of these questions, but we do expect that we can gain traction in answering them by using systematic data to test posited relationships. This conviction has inspired the establishment of the PPDB. In the remainder of this article we introduce this database, and present some of our initial findings regarding the resources and structures of contemporary party organizations in 19 parliamentary and semi-presidential democracies.
I. The Long Tradition of Comparative Party Scholarship: Concepts, Categories and Data
The comparative study of political parties’ extra-legislative organizations and activities is more than 150 years old, having arisen alongside the emergence of political parties as organizations that mobilize popular support. Many of the classics in the field were primarily descriptive and categorizing (for instance, Lowell 1897; Overacker 1932; Pollock 1932), but some offered more theoretical arguments about the origins and functioning of political parties (including Ostrogorski 1902 and Michels 1912). In the middle third of the 20th century, the comparative study of political parties was stimulated and re-defined by authors who ambitiously constructed new categories and who posited causal theories to explain organizational differences between political parties in multiple democracies, and to explain changes over time (including Neumann
3
1954; Duverger 1954; Heidenheimer 1964; Lipset and Rokkan 1967; Kirchheimer 1966; Epstein 1968; Sartori 1976) More recent contributors have continued to develop this approach (cf Ware 1987; von Beyme 1988; Panebianco 1988; Schlesinger 1994). A common feature of these multi-country studies of party practices, particularly the older ones, is that they are largely non-quantitative, relying heavily on thick description to buttress their arguments. Their authors are polymaths who knew a great deal about the history and politics of multiple parties and countries, and who laboriously pieced together elusive evidence on party origins and organizations. Some of their most enduring contributions are now-familiar labels (e.g., mass, catch-all, electoral professional, etc.) Much of the theoretical speculation in these classic studies treats parties and party organizations as dependent variables, explaining how contemporary parties bear the marks of their origins, and how organizational differences reflect institutional contexts and ideological (party family) similarities. Some researchers in the 1950s and 1960s sought to construct theories of political parties that would apply across a wide range of regime types (including non-democratic regimes) (e.g., the contributions in LaPalombara and Weiner 1969). For the most part, however, it is the mid-century comparative parties’ literature which focused on parliamentary democracies - the “most similar systems” approach - which has had the most lasting impact.
Echoing more general trends in political science, recent decades have witnessed the rise of more systematically evidence-driven studies of political parties’ organizations and activities outside the legislative arena. Research of this type usually relies on party statutes and documents for evidence about party structures, and/or on expert judgments about how parties actually work. One notable investigation that combined both approaches was Kenneth Janda’s pioneering study of party organization and practices in 53 countries (1980). This massive endeavor categorized and quantified information that was sub-divided into eleven broad aspects of party life (e.g., “autonomy”, “centralization of power”, etc). In his preface to the volume, Janda challenged others to follow him in constructing a more truly cross-national study of political parties, one that went beyond a most-similar-systems approach. Janda and his colleague Robert Harmel later proposed a different framework for collecting and interpreting data about party organizational change, one that was aimed more squarely at understanding practices in democratic regimes (1994). They collected only a limited amount of data using this framework, but other scholars continue to adopt their categories for their own data collection efforts. The 1980s also brought the start of another ambitious effort to gather cross-party and longitudinal data on party organizational development, what became the 12-country Party Organizations: a Data Handbook on Party Organizations in Western Democracies, 1960-90 (Katz and Mair 1992). This effort focused on what the editors dubbed the “official story” approach, primarily reporting published data and formal rules. Data collected in this Handbook have been used for a variety of studies, including ones that update parts of its data (for instance Caul 1999; Poguntke 2000; Bille 2001).
4
II. Introducing the PPDB2
The PPDB project falls squarely within this tradition of evidence-driven approaches to the comparative study of political parties. It deliberately builds on and extends past efforts. In some cases it replicates questions that have been used in earlier studies, making it easier to use some of PPDB’s snapshot data for longitudinal comparisons. In forming what was essentially a data-gathering collaborative endeavour, members of this project agreed to pool our efforts and standardize variables in order to maximize the utility of our individual data gathering efforts. When the organizers assembled the initial team, we deliberately sought out members with varied theoretical and methodological approaches to the study of political parties, and who came from various academic generations. These include (but are not limited to) interests in political finance, gender and politics, political participation, electoral politics, executive-legislative relations, public opinion, regional politics, party-state relations, and political leadership. This diversity is reflected in the data that we chose to gather. (A full list of those involved in this data collection effort is included in Appendix 2.) Our choices about which data to gather, and what coding schemes to use, were driven in part by the diverse interests of group members.
We decided early on to primarily follow an “official story”, in order to facilitate future replication; this decision also constrained our choice of variables.3 At our initial organizational meeting, generously sponsored by the European Consortium for Political Research, we identified as one of our priorities the aim of gathering data that would be useful for studying parties and their resources as independent variables – in other words, that would help us get better answers to the questions of why and how organizational variations matter.
Another priority from the outset has been to facilitate the more general study of political parties by making the data easily accessible. Those who have collected the data obviously hope to use it in our own research projects, but we have worked to quickly make the data available to others with the aim of stimulating research in this field. We particularly hope that it will be of interest to those who study elections and legislatures, and who in the past may have ignored party agency and party organizational capacity because of the difficulty of finding good cross-national party data. The PPDB project is one of many contemporary efforts to facilitate access to cross-national political data. As much as possible we have sought to complement, not duplicate, other contemporary efforts to gather data on elections and representation. Thus, our data includes match keys that enable easy integration with several other major data sources.
III. Scope and Coverage
The PPDB Round 1 data provides information on 121 parties in 19 countries during the 2010-2014 period. For some parties and some variables we have readings for more than one year; for most, however, we have just one data point for each party and variable so far. The four modules of the database include over 300 variables that collectively describe some of the most important aspects of party structures and practices.
5
The conceptual roadmap that guided our choice of indicators was the view that party organizations can usefully be described in terms of their structures, their resources, and their linkages. We further subdivided each of these dimensions with the aim of answering specific questions. For instance, a recurring question for scholars is the extent to which parties should be viewed as unitary actors. In order to better answer this question, we incorporated indicators derived from four structural sub-dimensions which illuminate the formal location of decision-making within the party, and at what level (if at all) these decisions are enforced (leadership autonomy, centralization, coordination, and territorial dispersion). Similarly, we sub-divided the resource dimension into three categories of resources (money, members and staff) in order to better identify dependency relationships and resource control (for more details see Scarrow and Webb forthcoming). We assume that these three aspects of party organizational development are related, and indeed, that some measures may have multiple meanings. For example, if party members provide funding or volunteer labour, party membership numbers may be interpreted as a measure of party resources. If party members act as ambassadors to their communities, membership numbers may be used as an indicator of one type of linkage. Thus, conceiving of parties in terms of structures, resources and linkages does not require analysts to assume that particular measures fit only a single category. It does, however, help to ensure that we have gathered sufficient data to test the predictions of the many theories of party organizational change, including those which posit that the locus of power shifts in parties as their resource bases shift.
The data in the PPDB are divided into four modules. These divisions are made on both practical and thematic grounds. The Core Module and Module A focus on variables related to what might be described as the “everyday life” of extra-parliamentary parties. These modules include information on resources (party membership, party staff, party finance), and structures (including basic party units, party executive composition, and formal links to collateral organizations). Reflecting our hope that we or others will be able to regularly update some of these variables, the division of variables between the Core Module and Module A reflects our initial assessment of the cost and benefit of more frequent updates. The Core Module contains the basic organizational information that seems likely to change more often, and which should be relatively easy to gather. For some parties the PPDB already contains Core Module data for multiple years. For most countries we have Core and Module A data for all parties for one or more of the years 2011, 2012, or 2013. Variables in these modules reflect the state of affairs on December 31 of the collection year, unless otherwise designated. For instance, some parties publish party finance information with a lag of one or more years; for these variables, there is a supplemental question clarifying the year to which the information refers.
Our other modules give information about rules and outcomes associated with more specific procedures and events. Module B variables cover candidate selection and elections. Module C variables cover party decision-making, including leadership selection, manifesto construction and approval, and intra-party referendums. We collected data on rules for candidate
6
selection and leadership selection only in the years in which these events occurred, to ensure that we describe the procedures that were used (which might differ from the procedures that were previously on the rule books). Because the data in Modules B and C refer to specific events, the reporting years necessarily vary by country (Module B) and/or by party (Module C). In almost all cases, the Module B or C data come from the 2010-2014 period.
The PPDB Round 1 release will present data on 121 parties in 19 countries. Our data collection has focused almost exclusively on parties which had have representation in their national legislatures at the point when the data was gathered. Due to resource constraints, in some cases our country teams were unable to gather information on all the parties with legislative representation; this was particularly true in countries with many small parties, and with parties that first entered or exited the legislature during the course of our study. Each country team made its own decisions on which parties to include. The full list of countries and parties can be found in Appendix 3. These countries are mostly parliamentary democracies (with the exception of semi-presidential France), and most are European, except for Australia, Canada, and Israel. Like our choice of variables, our choice of countries was guided by both theoretical and pragmatic considerations. We have deliberately included a large number of the countries included in the Katz/Mair Data Handbook to maximize the value of the data; we assume that scholars (including ourselves) will combine data from both collections to make longitudinal comparisons. Because of this overlap, our snapshot of party organizational data enables researchers to continue the Data Handbook’s endeavour “to see how, if at all, party organizations were changing, and to understand how they were adapting to the challenges posed by the new institutional, cultural, social, and political environments within which they operated” (1992: 9).
Yet the PPDB does more than merely update some of the Data Handbook indicators, even though this would be a useful project in itself. In addition to the updates (primarily about rules and practices related to party decision-making), for theoretical reasons we wanted to go beyond the universe of the earlier project to include both newer democracies, and non-European democracies. On pragmatic grounds we limited ourselves to 19 cases for this initial round of data collection: this admittedly arbitrary but pragmatic figure represents our estimate of the number of participants who could be funded to attend the necessary coordinating meetings, and who could physically sit in a room together. We expect to add a limited number of new cases in a Round 1a release. Our hope is to eventually include some presidential democracies in our sample. However, ensuring that our variables make sense across multiple regime types is a formidable challenge, and it is one that we are pursuing as a separate step.
Even without this regime type variation, our countries display a wide range of institutional differences. For instance, they have different electoral systems, different electoral thresholds, a mixture of federal and unitary structures, varied lengths of democratic experience, population size differences, and different levels of state funding for political parties. In short, this collection offers multiple opportunities to test questions about how institutional settings can affect the ways that parties organize, and about when and how this matters. Taken as a whole,
7
this collection provides an extraordinarily detailed snapshot of how extra-parliamentary parties function today in both established and newer democracies.
IV. Extra-Parliamentary Parties in Contemporary Democracies: Structural Similarities, Resource Differences?
In other publications we will use PPDB data to study the impact of party organizational differences, and to study the development of party organizations over time. As such, it will entail the testing of hypotheses. However, our aim in the current paper is a more straightforwardly descriptive one: we want to highlight some important similarities between - and key differences across - party organizations in established party democracies. In what follows, we will investigate differences across countries, as well as across party families. Parties are moulded by their social and institutional environments (Harmel 2002, Janda Harmel/Janda 1994). As a matter of fact, all major party typologies refer to these factors as an explanation of party organizational decisions and party change. While the major contributions towards the literature on party types identify a developmental trajectory leading from cadre to mass to catch-all to cartel parties as the dominant pattern (Duverger 1964; Katz/Mair 1995; Kirchheimer 1966; Neumann 1956), and to emphasise the impact of similarities across ideological tendencies (party families), they tend to underestimate the impact of country-specific institutional and social factors. In a way, this is not surprising as the main focus of these contributions is on the identification of parallel change across countries and this necessarily leads to a lack of attention to variation between countries. In the following investigation we consider whether there continues to be strong evidence of party family organizational tendencies. With our comprehensive cross-national data, we are now in a position to also focus on the impact of national factors on the way parties organize. Thus, we also look for cross-national similarities and differences, expecting that we will find some similarities, but not assuming that we are likely to find evidence of a single dominant type. In what follows we present a few of the key findings from the PPDB, pointing out important patterns of practice in terms of resources, structures, and linkages.
IVa - Resources: Money, Staff, Members
In this section, we seek to assess the strength of contemporary party organizations across the democratic world through analysis of three different types of resource: money, staff and members. This is not to overlook the obvious fact that party members might also be considered a form of linkage between parties and society, but here they will be examined from the perspective of organizational resources. Discussion of party structures and linkages follows in subsequent sections. The PPDB dataset takes in 121 parties from 19 different countries for which we have data (although inevitably there are missing cases on each of the resources), and describes the situation across nations and party families. Variables are reported in terms of absolute values, and relative to the size of national electorates or other appropriate benchmarks.
8
Money
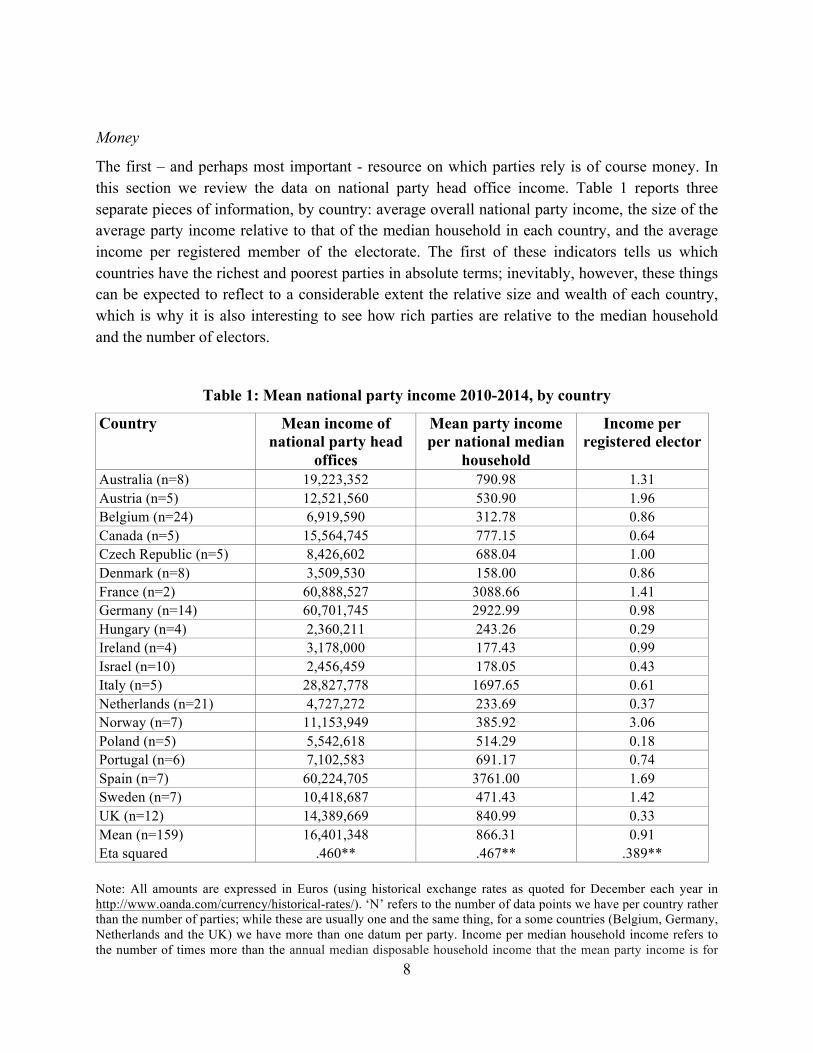
The first – and perhaps most important - resource on which parties rely is of course money. In this section we review the data on national party head office income. Table 1 reports three separate pieces of information, by country: average overall national party income, the size of the average party income relative to that of the median household in each country, and the average income per registered member of the electorate. The first of these indicators tells us which countries have the richest and poorest parties in absolute terms; inevitably, however, these things can be expected to reflect to a considerable extent the relative size and wealth of each country, which is why it is also interesting to see how rich parties are relative to the median household and the number of electors.
Table 1: Mean national party income 2010-2014, by country
Country Mean income of national party head
offices
Mean party income per national median
household
Income per registered elector
Australia (n=8) 19,223,352 790.98 1.31 Austria (n=5) 12,521,560 530.90 1.96 Belgium (n=24) 6,919,590 312.78 0.86 Canada (n=5) 15,564,745 777.15 0.64 Czech Republic (n=5) 8,426,602 688.04 1.00 Denmark (n=8) 3,509,530 158.00 0.86 France (n=2) 60,888,527 3088.66 1.41 Germany (n=14) 60,701,745 2922.99 0.98 Hungary (n=4) 2,360,211 243.26 0.29 Ireland (n=4) 3,178,000 177.43 0.99 Israel (n=10) 2,456,459 178.05 0.43 Italy (n=5) 28,827,778 1697.65 0.61 Netherlands (n=21) 4,727,272 233.69 0.37 Norway (n=7) 11,153,949 385.92 3.06 Poland (n=5) 5,542,618 514.29 0.18 Portugal (n=6) 7,102,583 691.17 0.74 Spain (n=7) 60,224,705 3761.00 1.69 Sweden (n=7) 10,418,687 471.43 1.42 UK (n=12) 14,389,669 840.99 0.33 Mean (n=159) 16,401,348 866.31 0.91 Eta squared .460** .467** .389** Note: All amounts are expressed in Euros (using historical exchange rates as quoted for December each year in http://www.oanda.com/currency/historical-rates/). ‘N’ refers to the number of data points we have per country rather than the number of parties; while these are usually one and the same thing, for a some countries (Belgium, Germany, Netherlands and the UK) we have more than one datum per party. Income per median household income refers to the number of times more than the annual median disposable household income that the mean party income is for
9
each country. 4 Eta squared refers to the between-groups variance explained by country differences. ** = p<.01, * =p<.05. In terms of absolute levels of income, it is plain from Table 1 that the German, French and Spanish parties are much wealthier than those of any other country on average, while the Italians also receive well above the overall average of 16.4 million euros per year. The Israeli, Hungarian, Irish and Danish parties feature among the poorest in these terms. When we control for the size and distribution of the national economy by comparing party funds to that of the median household, we see that this same pattern is confirmed: on average, the Spanish, French and German parties all receive an income that is around 3000-4000 times greater than that of the median household in their respective countries, while the Italian parties also enjoy an average income that is approximately 1700 times more the median household in their country. Relative to the income of their median national households, parties in Belgium, Denmark, Ireland, Israel and Netherlands fare rather poorly – that is, well below the sample mean. And when we correct for the number of registered electors – the size of the active citizenry or body politic, as it were – we find that the Poles, British and Dutch are the most impecunious, their parties only attracting 18, 33, and 37 cents per registered elector, respectively; at the other end of the scale, the Norwegians and Austrians stand out as being in a league of their own, the former country's parties earning a little over 3 euros and the latter’s slightly under 2 euros per elector. Even so, we might reasonably reflect that even two or three euros per elector is not such a high price to pay for one’s democracy: arguably, the world’s parliamentary democracies get their party politics on the cheap. It is not easy to get a clear sense of what these figures might represent about change over time given the limited amount of historical data, but we can draw on Katz-Mair data for a few countries, and compare the changing relationship between average national head office income and median household income in the late-1980s and the contemporary PPDB years. The six countries for which we can do this are Denmark, (West) Germany, the Netherlands, Norway, Sweden and Britain. Analysis suggests that average party head office income has increased relative to median household income since the late 1980s in four of these cases, and declined in just two (Germany and the Netherlands). One cannot really make confident generalisations on the basis of such a limited sample of cases, of course, but they do at least constitute a prime facie suggestion that party income is unlikely to be declining in real terms in the established democracies, and is more likely to be increasing overall.5
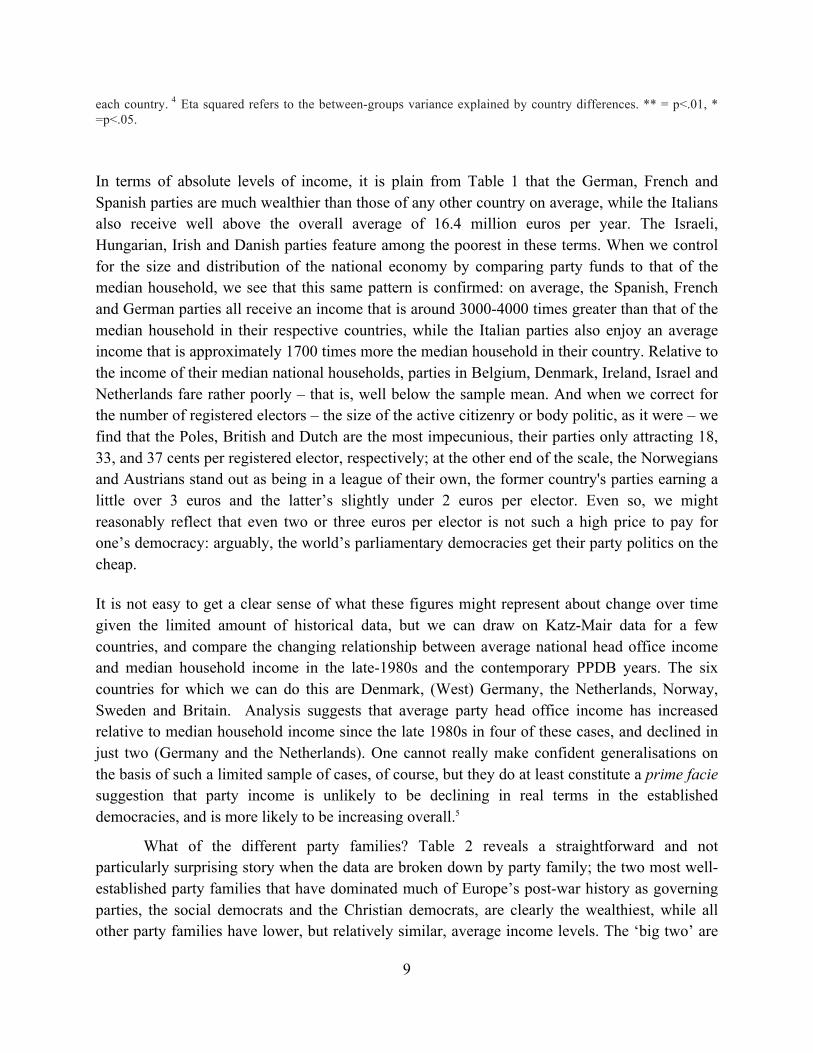
What of the different party families? Table 2 reveals a straightforward and not particularly surprising story when the data are broken down by party family; the two most well-established party families that have dominated much of Europe’s post-war history as governing parties, the social democrats and the Christian democrats, are clearly the wealthiest, while all other party families have lower, but relatively similar, average income levels. The ‘big two’ are
10
well above the overall mean income of 16.8 million euros per year (indeed, virtually twice that level in the case of the social democrats), while the remainder are considerably below it. This pattern remains broadly true, no matter how you look at it – in raw currency values, relative to median household income, or per elector. The social democrats do best in each of these regards, while the regionalist parties fare poorest. Analysis of variance suggests that differences between countries explain more of the variance in party income than differences between party families, in so far as eta-squared is higher for the inter-country variation in Table 1 than for the inter-family variations in Table 2. This is, of course, only preliminary evidence: multivariate modelling would be required to draw more definitive conclusions. Nevertheless, it points to the likelihood that patterns of party funding converge around national models more than they do around typical party family models.
Table 2: Mean national party income 2010-2014, by party family
Party Family Mean income
of national parties
Party income per median household
Income per elector
Christian Democrats/Conservatives (n=41) 23,794,304 1279.94 1.14 Social Democrats (n=27) 32,800,215 1739.88 1.75 Liberals (n=25) 8,952,383 446.80 0.65 Greens (n=18) 7,141,201 338.27 0.45 Left socialists (n=13) 8,692,216 478.37 0.57 Right-wing populists (n=7) 6,200,249 320.34 1.06 Extreme right (n=6) 8,147,919 463.57 0.58 Regionalist (n=10) 5,043,659 273.58 0.33 Overall mean (n=147) 16,797,606 889.06 0.95 Eta squared .131** .136** .205** Note: Eta squared refers to the between-groups variance explained by party family differences. ** = p<.01, * =p<.05. In summary, the German, French and Spanish parties seem to be the richest in terms of absolute levels of funding, even when we correct for the size and distribution of national economies. When we allow for the size of national electorates, we find that parties in several other countries are as strong or indeed stronger (Austria and Norway being good examples). The biggest party families – the social democrats, Christian democrats and conservatives - fare prominently in financial terms, but we suspect that nationality counts for more than party family in explaining patterns of funding.
11
Staff
One of the most under-researched fields in the study of political parties is that of party employees. This is curious given how much we now know about most other significant aspects of party life, including developments in party ideology and policy; the role, powers and social background of party members and leaders; the recruitment and sociology of legislators and candidates; and the marketing of parties. By contrast, relatively little is known of the men and women on the organizational payroll who run the day-to-day operations of parties. This is a significant oversight, which leaves us with a deficient understanding of an important aspect of party organizational development.
This is particularly so since it seems likely that the importance of payroll staff may well be greater now than ever before. In part this is because it is clear that the modern age of election campaigning and political marketing makes certain types of professional expertise all the more pertinent. In addition (and relatedly), it is likely that parties have come to rely increasingly on paid professionals in the context of the overwhelming evidence of party membership decline which we have revisited in this paper and ‘de-energization’ (Seyd and Whiteley, 1992; Whiteley et al, 1994) around the democratic world. As the voluntary wings of party organizations have gone into decline, it would seem likely that the resources available through paid professionals have increased.
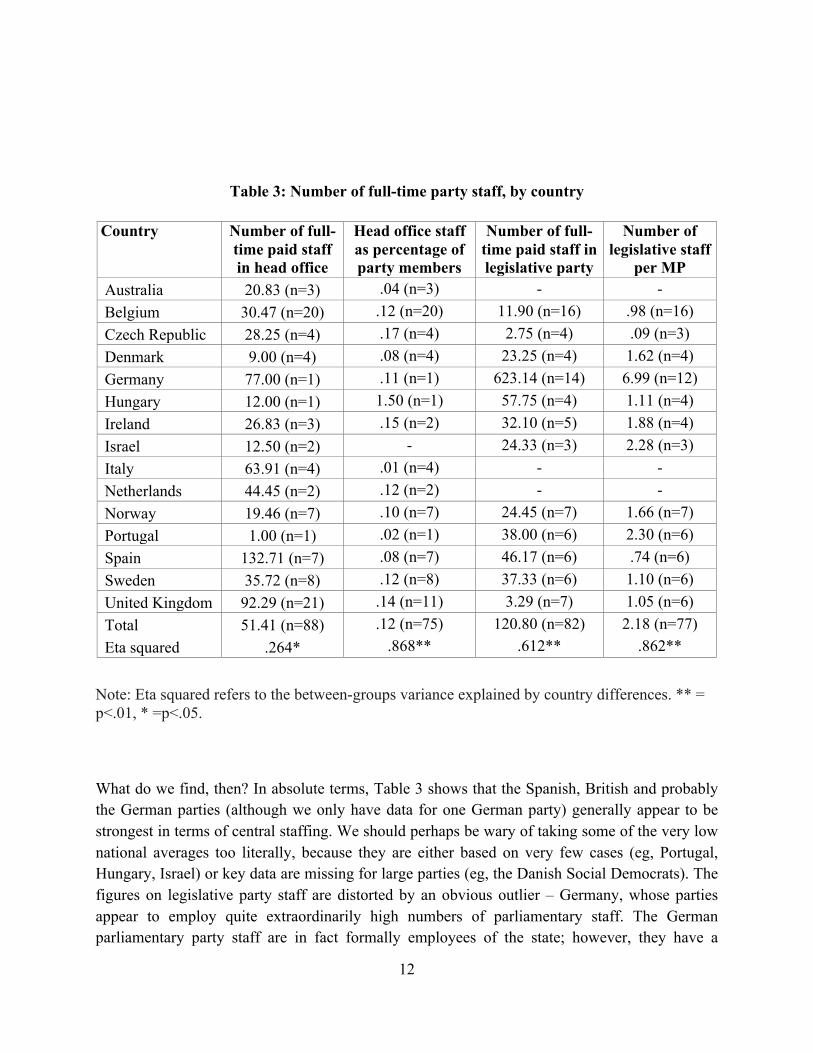
What evidence does our database provide that this supposed substitution of paid for voluntary labour might indeed be the case? It is important to note that, in investigating this issue, we immediately become aware of one of the main reasons for the relative lack of research into party employees: the sheer difficulty of getting the relevant data. For whatever reason, many parties tend to be reluctant to provide data on the number of payroll employees that they have. That said, we believe that we have sufficient information to generate meaningful evidence. We have central party staffing data for 15 countries, and legislative party staffing data for 12 countries. This includes 10 Belgian parties for which we have two years of central staffing data (for 2011 and 2012), and 7 British parties for which we have three years of central staffing data (2011-2013), which gives us a total of 88 data points from 62 parties (ie, more than half the parties in the dataset). For legislative parties we have two years of staffing data for 8 Belgian parties, and 7 German parties, giving us 82 data points in all (from 66 parties).6 There is also a risk that any snapshot of party payroll figures across countries could be misleading because the number will usually vary systematically according to whether it is an election year or not. For most parties, it is safe to assume that they will employ more staff in election than non-election years, for obvious reasons. As it happens, in only three cases in the database does the staffing information that we have come from parties contesting a national election in the year to which that information pertains – Denmark, Ireland (for Fine Gael and Fianna Fail) and Portugal. This means that the particular snapshot we have can be regarded as largely representative of parties' 'normal' mode of operation in non-election years.
12
Table 3: Number of full-time party staff, by country
Country Number of full-time paid staff in head office
Head office staff as percentage of party members
Number of full-time paid staff in legislative party
Number of legislative staff
per MP Australia 20.83 (n=3) .04 (n=3) - - Belgium 30.47 (n=20) .12 (n=20) 11.90 (n=16) .98 (n=16) Czech Republic 28.25 (n=4) .17 (n=4) 2.75 (n=4) .09 (n=3) Denmark 9.00 (n=4) .08 (n=4) 23.25 (n=4) 1.62 (n=4) Germany 77.00 (n=1) .11 (n=1) 623.14 (n=14) 6.99 (n=12) Hungary 12.00 (n=1) 1.50 (n=1) 57.75 (n=4) 1.11 (n=4) Ireland 26.83 (n=3) .15 (n=2) 32.10 (n=5) 1.88 (n=4) Israel 12.50 (n=2) - 24.33 (n=3) 2.28 (n=3) Italy 63.91 (n=4) .01 (n=4) - - Netherlands 44.45 (n=2) .12 (n=2) - - Norway 19.46 (n=7) .10 (n=7) 24.45 (n=7) 1.66 (n=7) Portugal 1.00 (n=1) .02 (n=1) 38.00 (n=6) 2.30 (n=6) Spain 132.71 (n=7) .08 (n=7) 46.17 (n=6) .74 (n=6) Sweden 35.72 (n=8) .12 (n=8) 37.33 (n=6) 1.10 (n=6) United Kingdom 92.29 (n=21) .14 (n=11) 3.29 (n=7) 1.05 (n=6) Total 51.41 (n=88) .12 (n=75) 120.80 (n=82) 2.18 (n=77) Eta squared .264* .868** .612** .862**
Note: Eta squared refers to the between-groups variance explained by country differences. ** = p<.01, * =p<.05.
What do we find, then? In absolute terms, Table 3 shows that the Spanish, British and probably the German parties (although we only have data for one German party) generally appear to be strongest in terms of central staffing. We should perhaps be wary of taking some of the very low national averages too literally, because they are either based on very few cases (eg, Portugal, Hungary, Israel) or key data are missing for large parties (eg, the Danish Social Democrats). The figures on legislative party staff are distorted by an obvious outlier – Germany, whose parties appear to employ quite extraordinarily high numbers of parliamentary staff. The German parliamentary party staff are in fact formally employees of the state; however, they have a
13
number of functions, some of which are party-related, so we think that it is justified to regard them as a party resource.7 If the German parties are excluded, then the average number of legislative party employees is just 25.76, which is perhaps a more generally representative figure of the database countries as a whole. From this perspective, parties in countries such as Hungary, Spain, Portugal, and Ireland can be regarded as placing their human resources more in Parliament than in the national headquarters, while parties in countries such as Britain tend to opt for the opposite approach. Of course, the number of staff that parties employ to service their MPs might reasonably be expected to reflect the number of legislators that they return to Parliament, so it is also useful to control for the size of parliamentary parties in assessing staffing establishments. Hence, Table 3 also reports the mean number of legislative employees per MP that parties maintain in each country. Overall, this produces a rather modest figure: the German parties are of course substantially higher than any others, being able to call on the support of nearly 7 support staff for each MP, but for all other the countries the norm is only about 1 or 2.
It is difficult to say anything authoritative about over time trends given the dearth of earlier studies on party staff, but once again some data are available from the Katz-Mair project on party organization (Katz & Mair 1992), with which we can offer limited comparisons. There are eight countries for which we have data on head office staffing levels in both the Katz-Mair study and our own party organization database: Denmark, Germany, Ireland, Italy, Netherlands, Norway, Sweden and Britain. Given the fact that we only have head office staffing data for one German party in the PPDB (and the relatively small Left Party at that) the inclusion of Germany in a longitudinal comparison is questionable. However, bearing that caveat in mind we can see that the average number of head office staff in these eight countries has risen from 34.23 in the late 1980s8 to 46.08, and if we exclude the German case for being unrepresentative of the general picture in the country, then the average number of staff has actually increased more markedly, from 19.37 to 41.66. The average number of central party employees rose in 6 of the 8 countries, and was stable in one other: only in Germany does there appear to have been a decline, but this is likely to be a misleading inference given that we would be comparing the two major parties of the 1960s with one of the minor parties of the present day. All in all, it is reasonable to conclude, if a little tentatively from this limited number of cases, that central party staffing levels have generally been augmented since the 1960s and 1970s.
Earlier, we posed the question of whether or not paid staff might be substituting for voluntary labour. We can get a handle on this by examining their changing numbers relative to each other. Table 3 (column 2) shows that on average the parties in our sample only employed 0.12 members of staff in their head offices for every hundred individual party members they have – which hardly strikes one as an imposing number. The variation is not great around this mean: Hungary produces the highest figure, at 1.5 employees per hundred party members, but even this is based on only 1 party, so it is hardly a robust measure. Nevertheless, if we go back to the countries for which we have earlier data from the Katz-Mair project, we can observe an interesting pattern: between the mid-1970s and the late 1980s, the Katz-Mair data show a
14
consistent growth in the central party staff/membership ratio: in all seven cases for which it is possible to calculate this, the ratio increased (such that the overall mean grew from .028% to .053%) in this period. This trend seems to have continued since then, with the mean percentage having further increased in six out of the seven cases; only in Ireland has it dropped.9
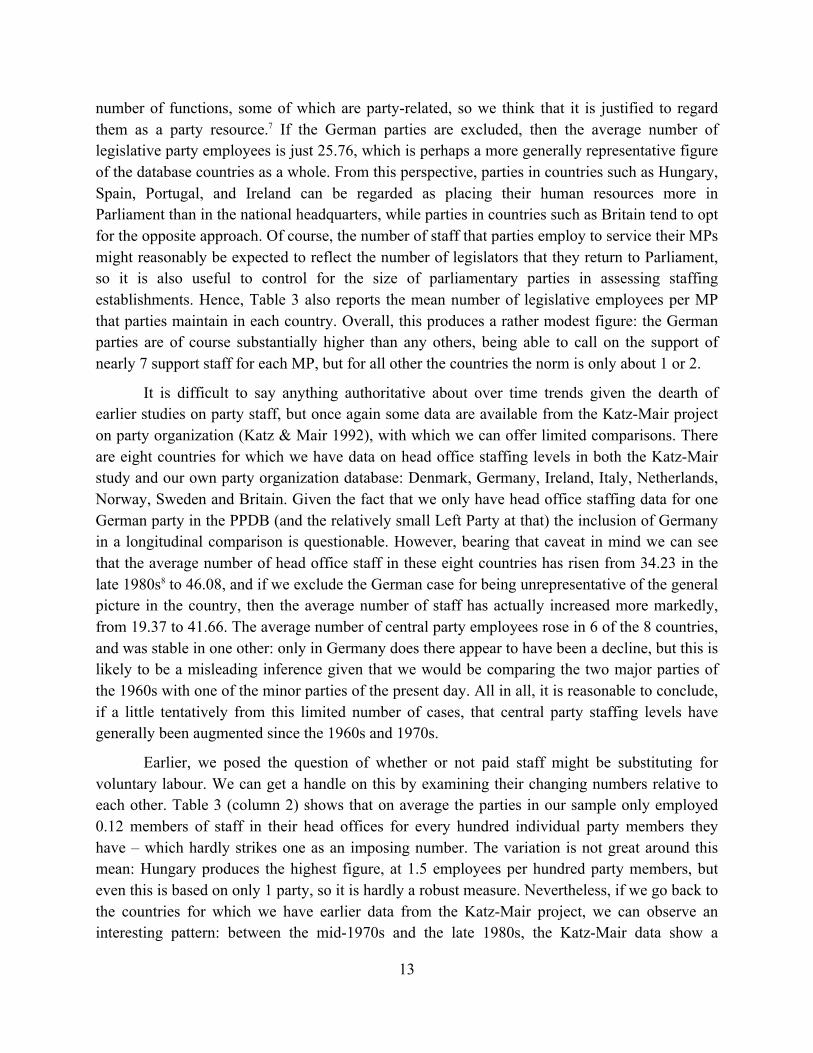
What of trends by party family? Table 4 shows a pattern that is broadly familiar from the analysis of financial data. Once again, the major parties of the Christian democratic/conservative and social democratic families predominate. The right-wing populist category appears to score highly on the score for total staffing, but this is based on just one party (the Belgian New Flemish Alliance). The figures in this table deliberately exclude German parties, which are such outliers on legislative party staffing that they tend to distort general patterns that would otherwise be apparent; if they are added, it drives up the overall mean for legislative party staffing to 129.11.
Table 4: Number of full-time party staff, by party family
Party Family Number of full-
time paid staff in head office
Number of full-time paid staff in legislative party
Christian Democrats/Conservatives 74.32 (n=21) 48.55 (n=14) Social Democrats 121.40 (n=17) 33.30 (n=11) Liberals 37.07 (n=15) 16.45 (n=13) Greens 12.03 (n=12) 16.88 (n=10) Left socialists 19.58 (n=4) 26.44 (n=8) Right-wing populists 31.00 (n=1) 35.00 (n=1) Extreme right 14.25 (n=6) 21.83 (n=6) Regionalist 20.18 (n=11) 8.43 (n=7) Overall mean 54.50 (n=86) 26.64 (n=70) Eta squared .304** .273**
NB: This table deliberately excludes German parties as outliers that distort the general pattern. See text for further details. Eta squared refers to the between-groups variance explained by party family differences. ** = p<.01, * =p<.05.
Parties and members
The literature on party members has grown considerably over the past two decades, seemingly in inverse relationship to the numbers of the subject under investigation (Heidar 1994; Katz, Mair et al 1992; Mair & Van Biezen 2001; Scarrow 1994; Scarrow 1996; Scarrow 2000; Seyd & Whiteley 1992; Van Haute 2011; Van Haute & Carty 2012; Van Biezen, Mair & Poguntke 2011; Weldon 2006; Whiteley 2011; Whiteley, Seyd & Richardson 1994; Widfeldt 1999). The evidence on the decline of party membership numbers across the democratic world is
15
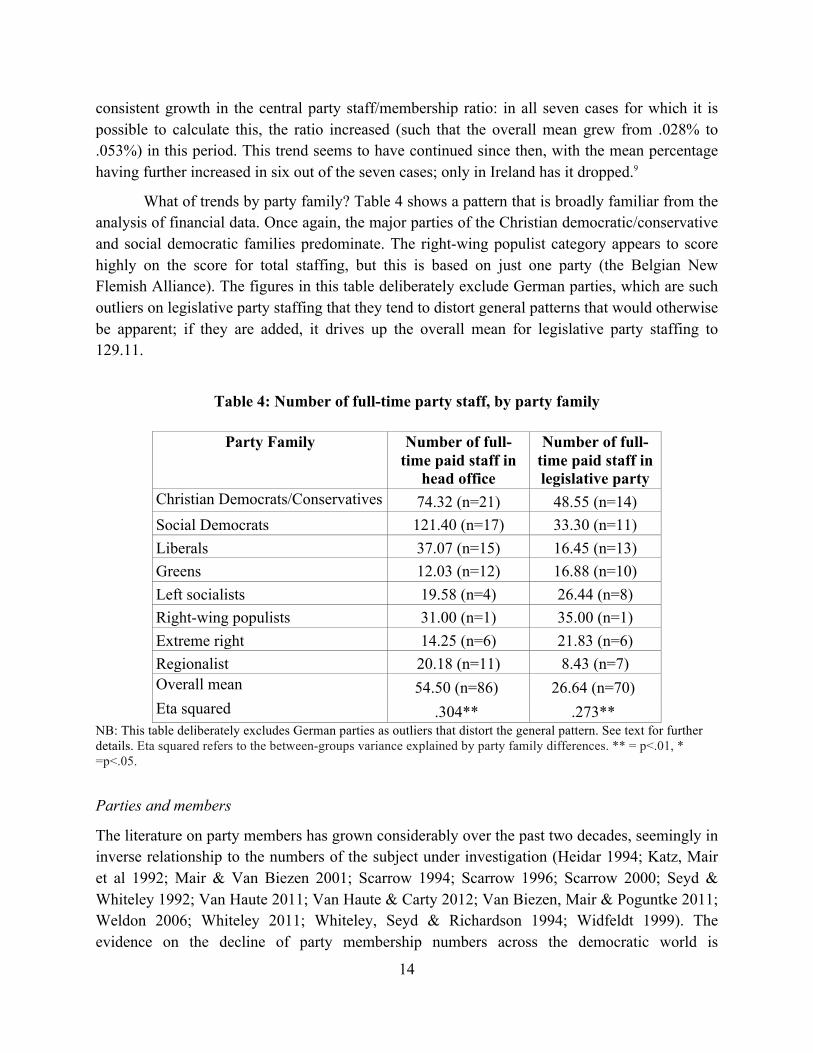
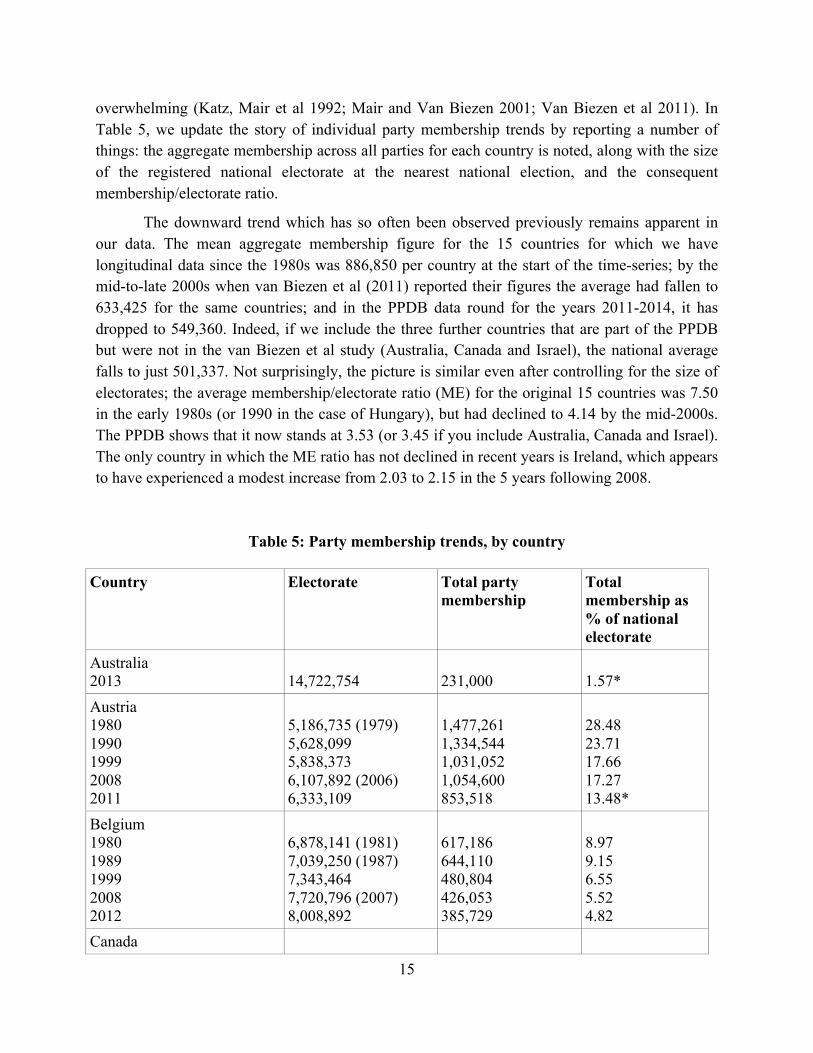
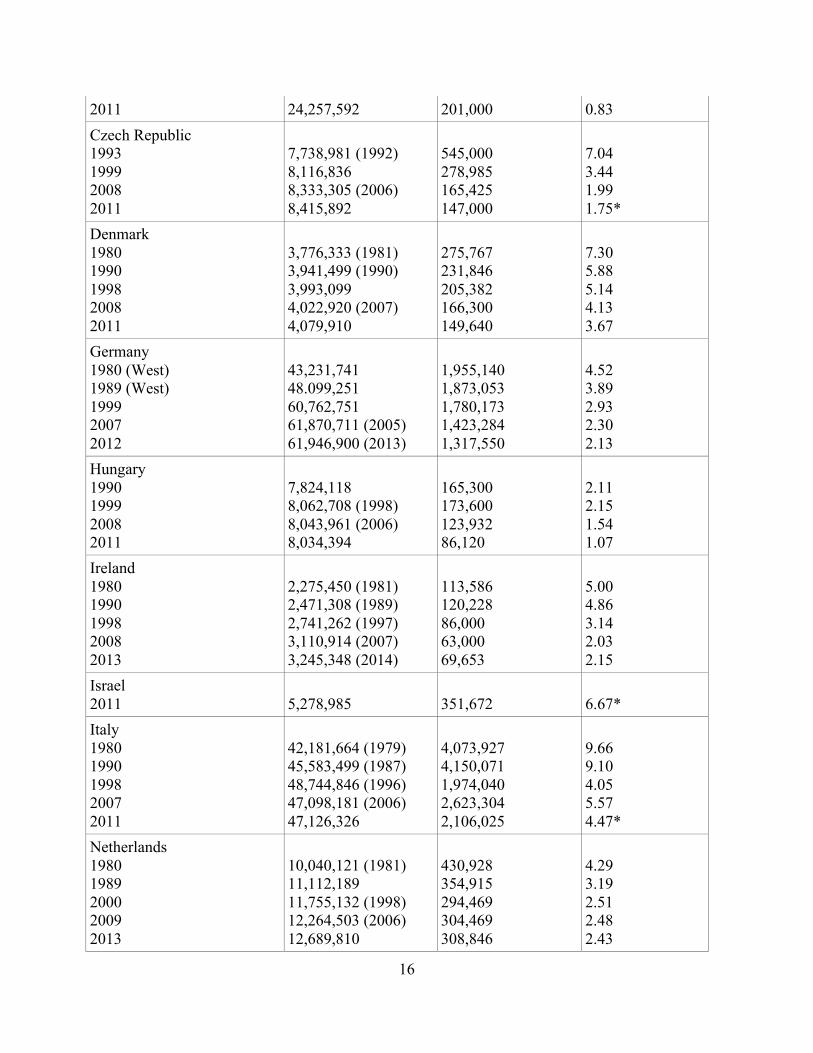
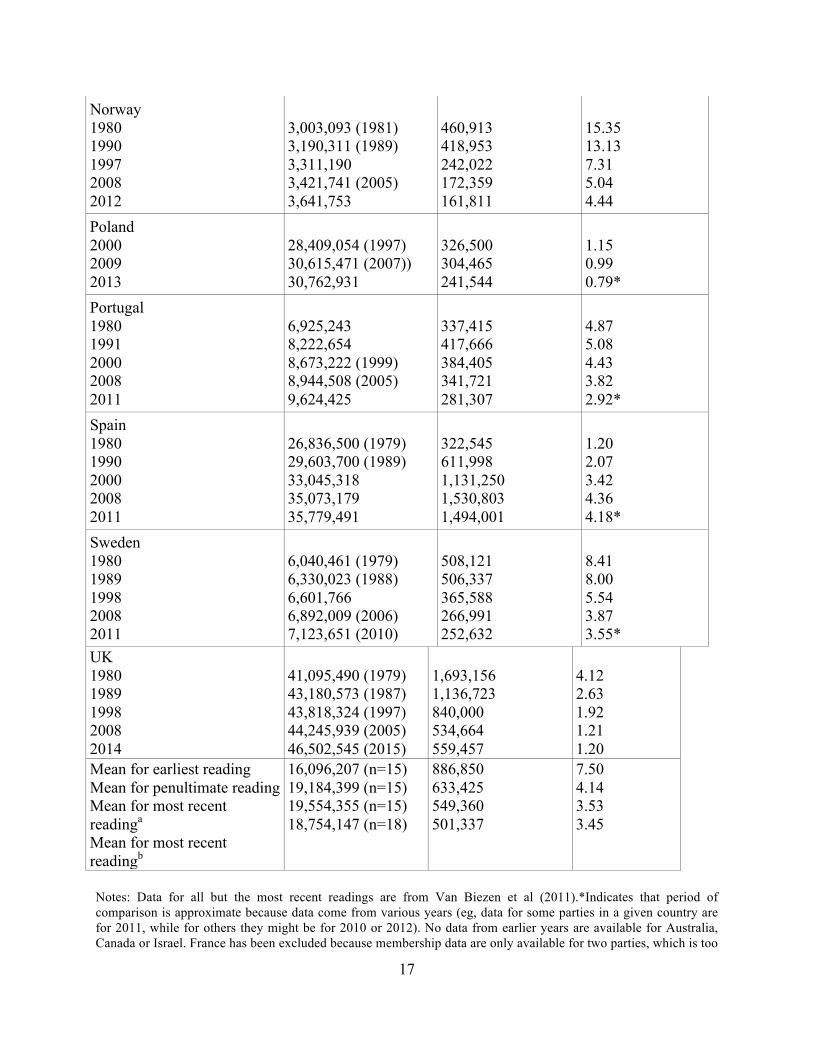
overwhelming (Katz, Mair et al 1992; Mair and Van Biezen 2001; Van Biezen et al 2011). In Table 5, we update the story of individual party membership trends by reporting a number of things: the aggregate membership across all parties for each country is noted, along with the size of the registered national electorate at the nearest national election, and the consequent membership/electorate ratio.
The downward trend which has so often been observed previously remains apparent in our data. The mean aggregate membership figure for the 15 countries for which we have longitudinal data since the 1980s was 886,850 per country at the start of the time-series; by the mid-to-late 2000s when van Biezen et al (2011) reported their figures the average had fallen to 633,425 for the same countries; and in the PPDB data round for the years 2011-2014, it has dropped to 549,360. Indeed, if we include the three further countries that are part of the PPDB but were not in the van Biezen et al study (Australia, Canada and Israel), the national average falls to just 501,337. Not surprisingly, the picture is similar even after controlling for the size of electorates; the average membership/electorate ratio (ME) for the original 15 countries was 7.50 in the early 1980s (or 1990 in the case of Hungary), but had declined to 4.14 by the mid-2000s. The PPDB shows that it now stands at 3.53 (or 3.45 if you include Australia, Canada and Israel). The only country in which the ME ratio has not declined in recent years is Ireland, which appears to have experienced a modest increase from 2.03 to 2.15 in the 5 years following 2008.
Table 5: Party membership trends, by country
Country Electorate Total party membership
Total membership as % of national electorate
Australia 2013
14,722,754
231,000
1.57*
Austria 1980 1990 1999 2008 2011
5,186,735 (1979) 5,628,099 5,838,373 6,107,892 (2006) 6,333,109
1,477,261 1,334,544 1,031,052 1,054,600 853,518
28.48 23.71 17.66 17.27 13.48*
Belgium 1980 1989 1999 2008 2012
6,878,141 (1981) 7,039,250 (1987) 7,343,464 7,720,796 (2007) 8,008,892
617,186 644,110 480,804 426,053 385,729
8.97 9.15 6.55 5.52 4.82
Canada
16
2011 24,257,592 201,000 0.83 Czech Republic 1993 1999 2008 2011
7,738,981 (1992) 8,116,836 8,333,305 (2006) 8,415,892
545,000 278,985 165,425 147,000
7.04 3.44 1.99 1.75*
Denmark 1980 1990 1998 2008 2011
3,776,333 (1981) 3,941,499 (1990) 3,993,099 4,022,920 (2007) 4,079,910
275,767 231,846 205,382 166,300 149,640
7.30 5.88 5.14 4.13 3.67
Germany 1980 (West) 1989 (West) 1999 2007 2012
43,231,741 48.099,251 60,762,751 61,870,711 (2005) 61,946,900 (2013)
1,955,140 1,873,053 1,780,173 1,423,284 1,317,550
4.52 3.89 2.93 2.30 2.13
Hungary 1990 1999 2008 2011
7,824,118 8,062,708 (1998) 8,043,961 (2006) 8,034,394
165,300 173,600 123,932 86,120
2.11 2.15 1.54 1.07
Ireland 1980 1990 1998 2008 2013
2,275,450 (1981) 2,471,308 (1989) 2,741,262 (1997) 3,110,914 (2007) 3,245,348 (2014)
113,586 120,228 86,000 63,000 69,653
5.00 4.86 3.14 2.03 2.15
Israel 2011
5,278,985
351,672
6.67*
Italy 1980 1990 1998 2007 2011
42,181,664 (1979) 45,583,499 (1987) 48,744,846 (1996) 47,098,181 (2006) 47,126,326
4,073,927 4,150,071 1,974,040 2,623,304 2,106,025
9.66 9.10 4.05 5.57 4.47*
Netherlands 1980 1989 2000 2009 2013
10,040,121 (1981) 11,112,189 11,755,132 (1998) 12,264,503 (2006) 12,689,810
430,928 354,915 294,469 304,469 308,846
4.29 3.19 2.51 2.48 2.43
17
Norway 1980 1990 1997 2008 2012
3,003,093 (1981) 3,190,311 (1989) 3,311,190 3,421,741 (2005) 3,641,753
460,913 418,953 242,022 172,359 161,811
15.35 13.13 7.31 5.04 4.44
Poland 2000 2009 2013
28,409,054 (1997) 30,615,471 (2007)) 30,762,931
326,500 304,465 241,544
1.15 0.99 0.79*
Portugal 1980 1991 2000 2008 2011
6,925,243 8,222,654 8,673,222 (1999) 8,944,508 (2005) 9,624,425
337,415 417,666 384,405 341,721 281,307
4.87 5.08 4.43 3.82 2.92*
Spain 1980 1990 2000 2008 2011
26,836,500 (1979) 29,603,700 (1989) 33,045,318 35,073,179 35,779,491
322,545 611,998 1,131,250 1,530,803 1,494,001
1.20 2.07 3.42 4.36 4.18*
Sweden 1980 1989 1998 2008 2011
6,040,461 (1979) 6,330,023 (1988) 6,601,766 6,892,009 (2006) 7,123,651 (2010)
508,121 506,337 365,588 266,991 252,632
8.41 8.00 5.54 3.87 3.55*
UK 1980 1989 1998 2008 2014
41,095,490 (1979) 43,180,573 (1987) 43,818,324 (1997) 44,245,939 (2005) 46,502,545 (2015)
1,693,156 1,136,723 840,000 534,664 559,457
4.12 2.63 1.92 1.21 1.20
Mean for earliest reading Mean for penultimate reading Mean for most recent readinga Mean for most recent readingb
16,096,207 (n=15) 19,184,399 (n=15) 19,554,355 (n=15) 18,754,147 (n=18)
886,850 633,425 549,360 501,337
7.50 4.14 3.53 3.45
Notes: Data for all but the most recent readings are from Van Biezen et al (2011).*Indicates that period of comparison is approximate because data come from various years (eg, data for some parties in a given country are for 2011, while for others they might be for 2010 or 2012). No data from earlier years are available for Australia, Canada or Israel. France has been excluded because membership data are only available for two parties, which is too
18
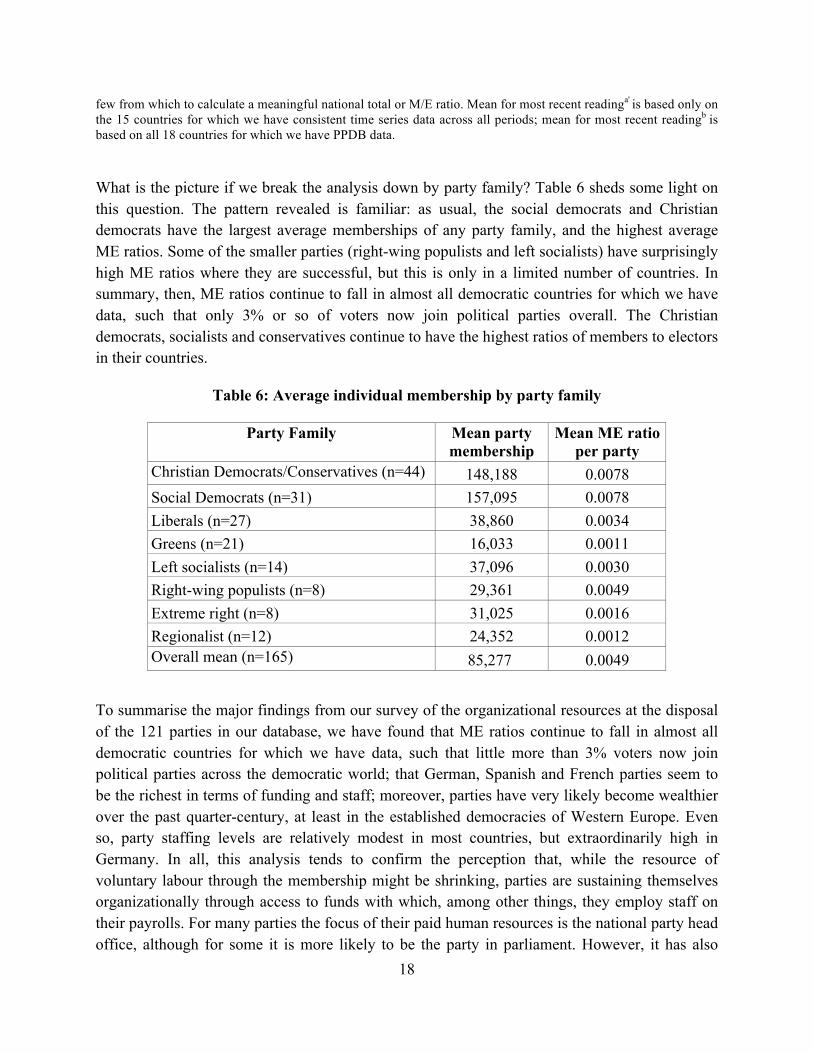
few from which to calculate a meaningful national total or M/E ratio. Mean for most recent readinga' is based only on the 15 countries for which we have consistent time series data across all periods; mean for most recent readingb is based on all 18 countries for which we have PPDB data. What is the picture if we break the analysis down by party family? Table 6 sheds some light on this question. The pattern revealed is familiar: as usual, the social democrats and Christian democrats have the largest average memberships of any party family, and the highest average ME ratios. Some of the smaller parties (right-wing populists and left socialists) have surprisingly high ME ratios where they are successful, but this is only in a limited number of countries. In summary, then, ME ratios continue to fall in almost all democratic countries for which we have data, such that only 3% or so of voters now join political parties overall. The Christian democrats, socialists and conservatives continue to have the highest ratios of members to electors in their countries.
Table 6: Average individual membership by party family
Party Family Mean party membership
Mean ME ratio per party
Christian Democrats/Conservatives (n=44) 148,188 0.0078 Social Democrats (n=31) 157,095 0.0078 Liberals (n=27) 38,860 0.0034 Greens (n=21) 16,033 0.0011 Left socialists (n=14) 37,096 0.0030 Right-wing populists (n=8) 29,361 0.0049 Extreme right (n=8) 31,025 0.0016 Regionalist (n=12) 24,352 0.0012 Overall mean (n=165) 85,277 0.0049
To summarise the major findings from our survey of the organizational resources at the disposal of the 121 parties in our database, we have found that ME ratios continue to fall in almost all democratic countries for which we have data, such that little more than 3% voters now join political parties across the democratic world; that German, Spanish and French parties seem to be the richest in terms of funding and staff; moreover, parties have very likely become wealthier over the past quarter-century, at least in the established democracies of Western Europe. Even so, party staffing levels are relatively modest in most countries, but extraordinarily high in Germany. In all, this analysis tends to confirm the perception that, while the resource of voluntary labour through the membership might be shrinking, parties are sustaining themselves organizationally through access to funds with which, among other things, they employ staff on their payrolls. For many parties the focus of their paid human resources is the national party head office, although for some it is more likely to be the party in parliament. However, it has also
19
become apparent that general trends have not wiped out considerable differences between countries and ideological families. It seems likely to us that those differences are usually better explained by country rather than party family. IVb. Structures: Surprising Uniformity? Extra-parliamentary organizations first developed in late 19th and early 20th centuries, stimulated by the organizational efforts of opposition parties (socialists and workers in Germany, Austria and the UK, Liberals in the UK, farmers’ parties in Scandinavia, religious parties in Belgium and the Netherlands). These parties had widely differing aims, but many of them adopted very similar organizational structures: they operated as clubs with statutes, membership procedures and annual dues, local branches, annual or biennial national congresses as the nominally highest party organ, and a smaller executive committee that held broad decision-making authority between meetings of the national conference. This “subscriber democracy” model was particularly well-suited to parties which began as extra-parliamentary organizations, or which had small legislative delegations; in such parties there was less chance for conflict between a party’s legislative delegation and the party congress as the top authority (Morris 2000; Scarrow 2014: ch. 2.).
By the middle of the twentieth century, parties in most parliamentary democracies had adopted some variant of the subscriber democracy model of party organization. Of course, similarity in structures can accommodate multiple practices, and in political parties (as in many other organizations) informal channels can be at least as important as the formal decision-making process. Nevertheless, the adoption and spread of the individual member/congress model may be politically consequential. It use signals acceptance of the norm of parties as micro-polities: parties and their leaders gain legitimacy from their relationships with a self-defined polis, in addition to their relationship with the wider electorate. It also signals recognition of the utility of permanent organization for policy and mobilization, tasks that might otherwise be done solely by elected representatives and ad hoc campaign organizations.
The extent to which extra-parliamentary organizations contribute to legitimacy, or help electoral mobilization, are empirical questions. In both areas we would expect that some types of arrangement are more effective than others, and that their impact may vary by circumstances, and according to fashion. As a result, even if many parties adhere to a basically similar model, we would expect to find cross-party organizational variation, and experimentation within single parties over time. After all, we know that a string of parties have made headlines in recent years by claiming that they are going to do politics in a new way, and therefore will have different kinds of party structures and organizational practices. (These are sometimes given poetic names, like the “liquid democracy” of the German Pirates Party, or the “Operating System” software of the Italian Five Star Movement.) If novel party organization can increase a party’s election prospects, we would expect organizational experimentation to flourish, as parties compete for marginal advantages.
20
Partly confounding this prediction is one striking finding from our survey of contemporary party organizations in parliamentary democracies: the sheer uniformity in basic organizational structures and rules. Old parties and new continue to adhere to a subscriber democracy organizational model in which dues-paying members are the polis for most or all important decisions, and in which the party conference is (formally) the party’s highest organ. Thus, not only do all but one of the PPDB parties seek to enrol dues paying members (with the exception being the Dutch right populist Freedom Party, led by Geert Wilders)., but almost all of these parties (95%) keep national membership registers, meaning that national parties are able to contact members directly. This is a big change from practices in pre-computer days, when membership enrolment and communication were generally handled by local parties.
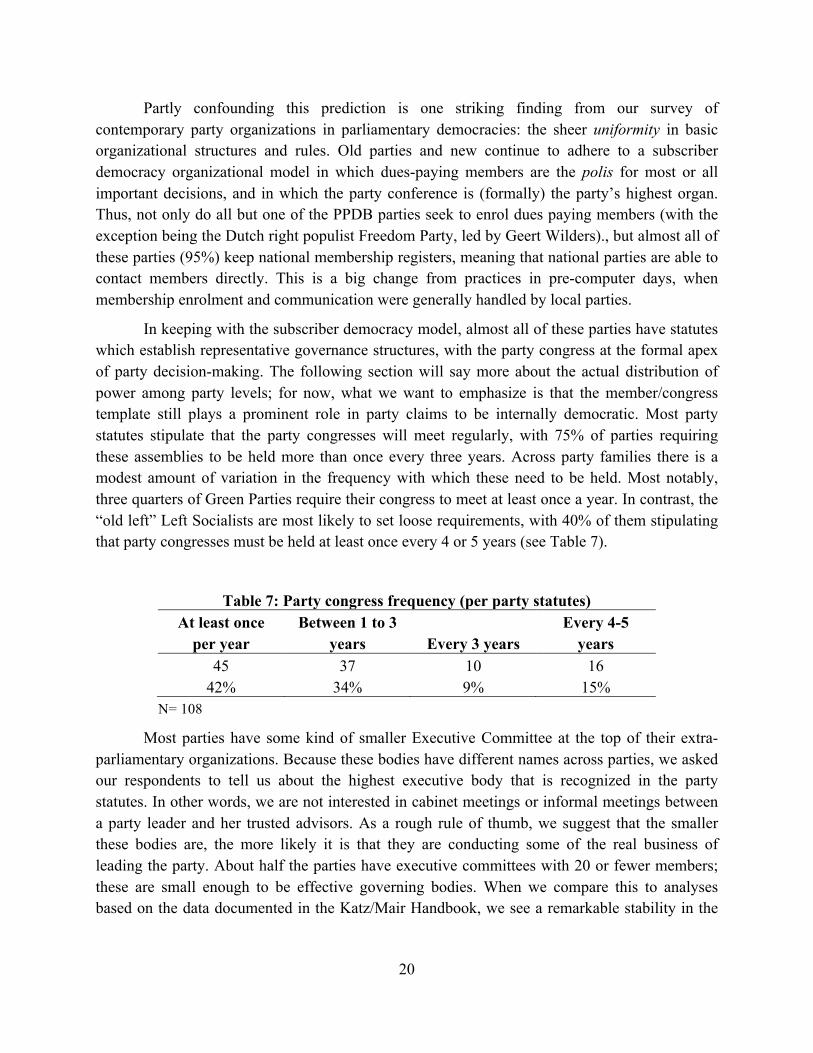
In keeping with the subscriber democracy model, almost all of these parties have statutes which establish representative governance structures, with the party congress at the formal apex of party decision-making. The following section will say more about the actual distribution of power among party levels; for now, what we want to emphasize is that the member/congress template still plays a prominent role in party claims to be internally democratic. Most party statutes stipulate that the party congresses will meet regularly, with 75% of parties requiring these assemblies to be held more than once every three years. Across party families there is a modest amount of variation in the frequency with which these need to be held. Most notably, three quarters of Green Parties require their congress to meet at least once a year. In contrast, the “old left” Left Socialists are most likely to set loose requirements, with 40% of them stipulating that party congresses must be held at least once every 4 or 5 years (see Table 7).
Table 7: Party congress frequency (per party statutes) At least once
per year Between 1 to 3
years Every 3 years Every 4-5
years 45 37 10 16
42% 34% 9% 15% N= 108
Most parties have some kind of smaller Executive Committee at the top of their extra-parliamentary organizations. Because these bodies have different names across parties, we asked our respondents to tell us about the highest executive body that is recognized in the party statutes. In other words, we are not interested in cabinet meetings or informal meetings between a party leader and her trusted advisors. As a rough rule of thumb, we suggest that the smaller these bodies are, the more likely it is that they are conducting some of the real business of leading the party. About half the parties have executive committees with 20 or fewer members; these are small enough to be effective governing bodies. When we compare this to analyses based on the data documented in the Katz/Mair Handbook, we see a remarkable stability in the
21
configuration of the basic intra-party bodies. In other words, organizational innovation has been very limited over time (Poguntke 2000: ch 6).
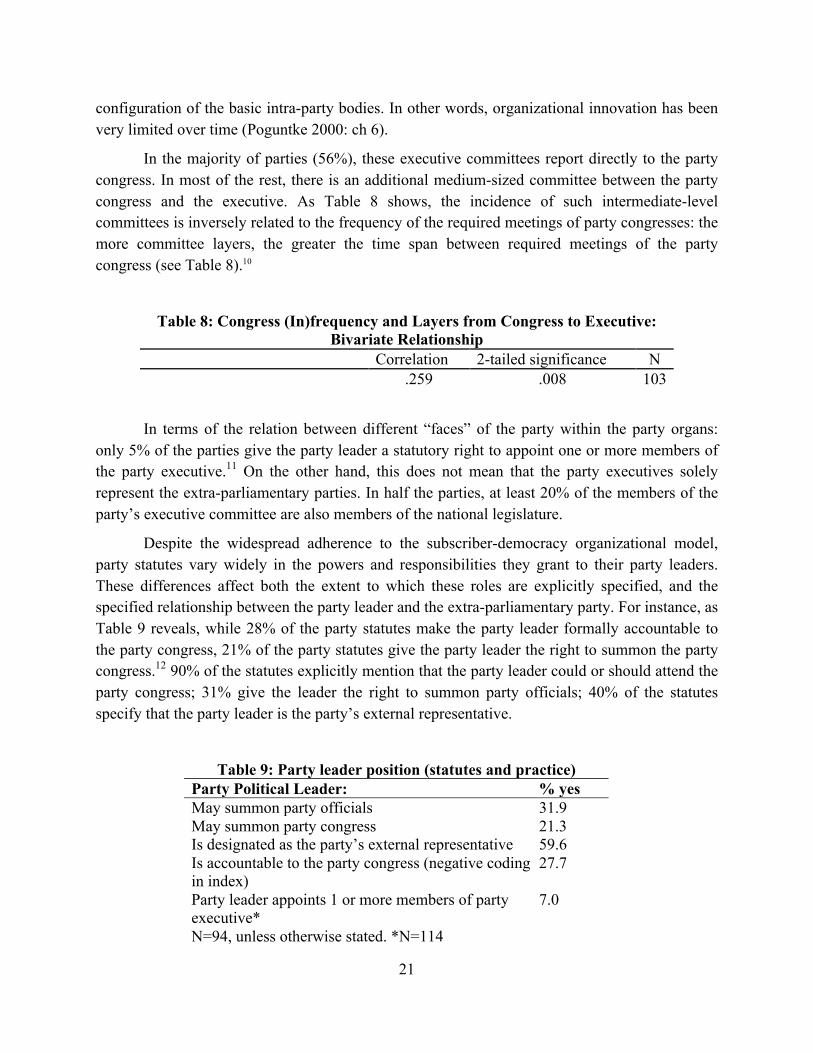
In the majority of parties (56%), these executive committees report directly to the party congress. In most of the rest, there is an additional medium-sized committee between the party congress and the executive. As Table 8 shows, the incidence of such intermediate-level committees is inversely related to the frequency of the required meetings of party congresses: the more committee layers, the greater the time span between required meetings of the party congress (see Table 8).10
Table 8: Congress (In)frequency and Layers from Congress to Executive: Bivariate Relationship
Correlation 2-tailed significance N .259 .008 103
In terms of the relation between different “faces” of the party within the party organs: only 5% of the parties give the party leader a statutory right to appoint one or more members of the party executive.11 On the other hand, this does not mean that the party executives solely represent the extra-parliamentary parties. In half the parties, at least 20% of the members of the party’s executive committee are also members of the national legislature.
Despite the widespread adherence to the subscriber-democracy organizational model, party statutes vary widely in the powers and responsibilities they grant to their party leaders. These differences affect both the extent to which these roles are explicitly specified, and the specified relationship between the party leader and the extra-parliamentary party. For instance, as Table 9 reveals, while 28% of the party statutes make the party leader formally accountable to the party congress, 21% of the party statutes give the party leader the right to summon the party congress.12 90% of the statutes explicitly mention that the party leader could or should attend the party congress; 31% give the leader the right to summon party officials; 40% of the statutes specify that the party leader is the party’s external representative.
Table 9: Party leader position (statutes and practice) Party Political Leader: % yes May summon party officials 31.9 May summon party congress 21.3 Is designated as the party’s external representative 59.6 Is accountable to the party congress (negative coding in index)
27.7
Party leader appoints 1 or more members of party executive*
7.0
N=94, unless otherwise stated. *N=114
22
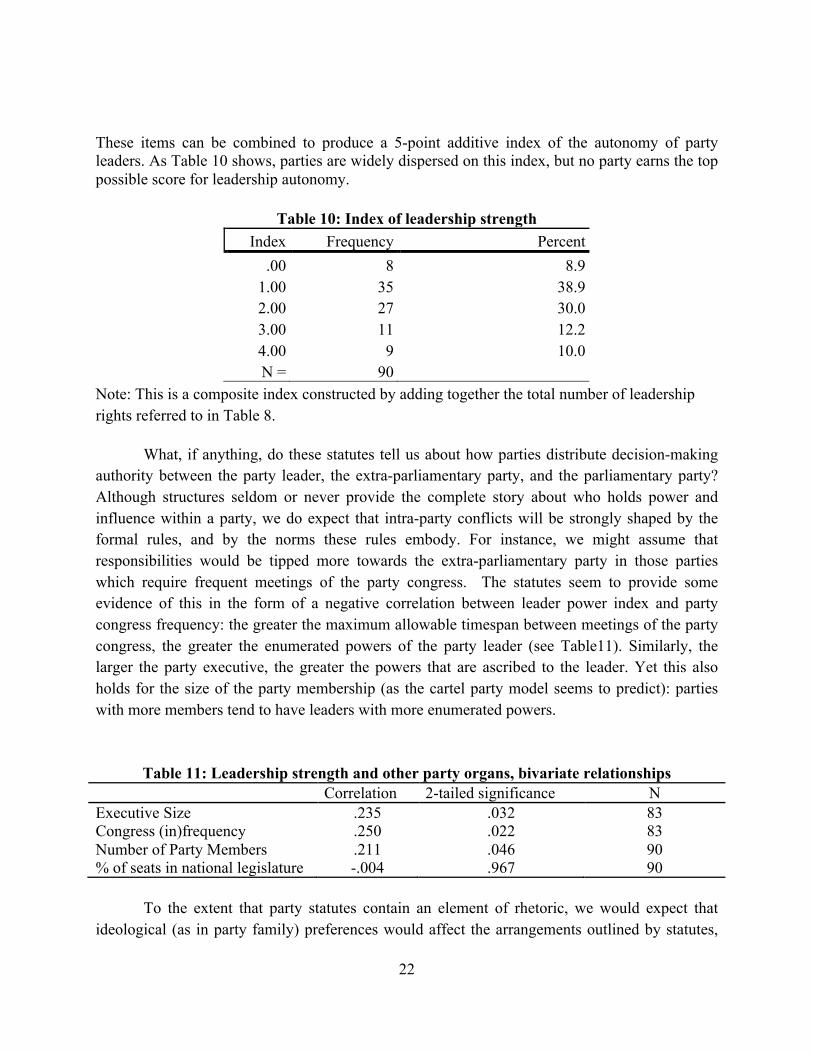
These items can be combined to produce a 5-point additive index of the autonomy of party leaders. As Table 10 shows, parties are widely dispersed on this index, but no party earns the top possible score for leadership autonomy.
Table 10: Index of leadership strength Index Frequency Percent
.00 8 8.9 1.00 35 38.9 2.00 27 30.0 3.00 11 12.2 4.00 9 10.0 N = 90
Note: This is a composite index constructed by adding together the total number of leadership rights referred to in Table 8.
What, if anything, do these statutes tell us about how parties distribute decision-making authority between the party leader, the extra-parliamentary party, and the parliamentary party? Although structures seldom or never provide the complete story about who holds power and influence within a party, we do expect that intra-party conflicts will be strongly shaped by the formal rules, and by the norms these rules embody. For instance, we might assume that responsibilities would be tipped more towards the extra-parliamentary party in those parties which require frequent meetings of the party congress. The statutes seem to provide some evidence of this in the form of a negative correlation between leader power index and party congress frequency: the greater the maximum allowable timespan between meetings of the party congress, the greater the enumerated powers of the party leader (see Table11). Similarly, the larger the party executive, the greater the powers that are ascribed to the leader. Yet this also holds for the size of the party membership (as the cartel party model seems to predict): parties with more members tend to have leaders with more enumerated powers.
Table 11: Leadership strength and other party organs, bivariate relationships Correlation 2-tailed significance N Executive Size .235 .032 83 Congress (in)frequency .250 .022 83 Number of Party Members .211 .046 90 % of seats in national legislature -.004 .967 90
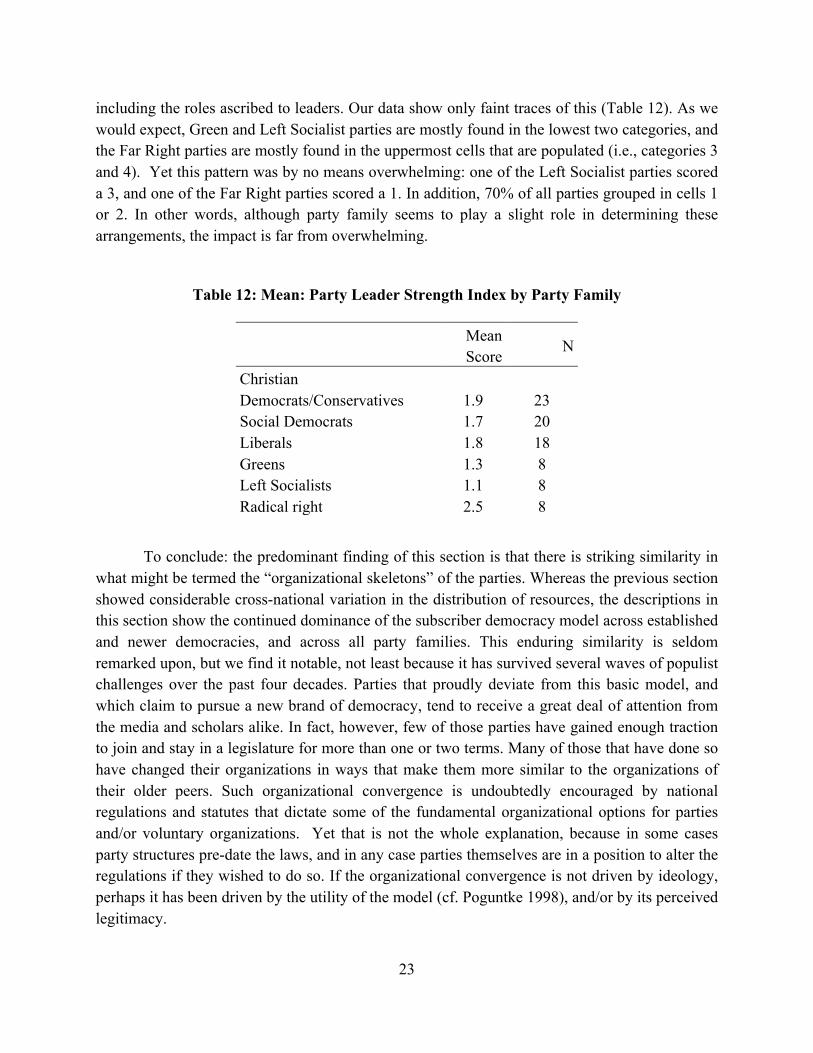
To the extent that party statutes contain an element of rhetoric, we would expect that ideological (as in party family) preferences would affect the arrangements outlined by statutes,
23
including the roles ascribed to leaders. Our data show only faint traces of this (Table 12). As we would expect, Green and Left Socialist parties are mostly found in the lowest two categories, and the Far Right parties are mostly found in the uppermost cells that are populated (i.e., categories 3 and 4). Yet this pattern was by no means overwhelming: one of the Left Socialist parties scored a 3, and one of the Far Right parties scored a 1. In addition, 70% of all parties grouped in cells 1 or 2. In other words, although party family seems to play a slight role in determining these arrangements, the impact is far from overwhelming.
Table 12: Mean: Party Leader Strength Index by Party Family
Mean Score
N
Christian Democrats/Conservatives 1.9 23 Social Democrats 1.7 20 Liberals 1.8 18 Greens 1.3 8 Left Socialists 1.1 8 Radical right 2.5 8
To conclude: the predominant finding of this section is that there is striking similarity in what might be termed the “organizational skeletons” of the parties. Whereas the previous section showed considerable cross-national variation in the distribution of resources, the descriptions in this section show the continued dominance of the subscriber democracy model across established and newer democracies, and across all party families. This enduring similarity is seldom remarked upon, but we find it notable, not least because it has survived several waves of populist challenges over the past four decades. Parties that proudly deviate from this basic model, and which claim to pursue a new brand of democracy, tend to receive a great deal of attention from the media and scholars alike. In fact, however, few of those parties have gained enough traction to join and stay in a legislature for more than one or two terms. Many of those that have done so have changed their organizations in ways that make them more similar to the organizations of their older peers. Such organizational convergence is undoubtedly encouraged by national regulations and statutes that dictate some of the fundamental organizational options for parties and/or voluntary organizations. Yet that is not the whole explanation, because in some cases party structures pre-date the laws, and in any case parties themselves are in a position to alter the regulations if they wished to do so. If the organizational convergence is not driven by ideology, perhaps it has been driven by the utility of the model (cf. Poguntke 1998), and/or by its perceived legitimacy.
24
IVc Parties as Democratic Linkage Measuring Intra-Party Democracy
We have seen in the previous section that political parties largely resemble each other when it comes to the configuration of their core party bodies. Yet, when we take a closer look at how their organizations provide for linkage to the citizenry, we find remarkable variation which put the major typologies in perspective.
The membership organization of political parties is one of their principal ways of generating linkage to society (Poguntke 2000). While adherents of a Schumpeterian view of democracy would argue that democracy does not necessarily require democratic linkage through parties, others maintain that it is virtually unthinkable save in terms of democratic linkage through party. Obviously, we cannot decide this debate here. However, our data allows us to investigate the empirical realities irrespective of normative desirability. We have collected data on a considerable number of variables that are related to the democratic quality of political parties’ internal politics. While many of them are not very interesting individually, they can be combined in a meaningful way to create valid measures of intra-party democracy (IPD).13
The benchmark of IPD is that it should facilitate the involvement of as many party members as possible in the decisions that are central to a party’s political life, namely, programme writing, personnel selection and general intra-organizational decision-making. From this perspective, it seems plausible to argue that the degree of organizational decentralization represents an independent component of IPD that should be measured independently of general inclusiveness, a point we have made elsewhere (Scarrow 2005: 6; von dem Berge et al. 2013). Upon reflection and closer inspection of our data, however, we have come to the conclusion that it is preferable to focus solely on the degree of inclusiveness as a measure on IPD because there is very little gained by also constructing a measure of decentralization. As a matter of fact, in one sense, a higher degree of decentralization automatically leads to a higher degree of inclusiveness because more party bodies (like the German Land parties or the British constituency parties) play a role in certain crucial decisions. We have, however, constructed theoretically distinct IPD indices, for discursive and plebiscitary variants of IPD, each of which represents a different approach to realizing inclusiveness.
Two Variants of Intra-Party Democracy
Drawing on the insights of democratic theory, we distinguish two variants of IPD, namely discursive and plebiscitary intra-party democracy:14
1. The comprehensive Discursive IPD index (DIPD) measures the democratic inclusiveness of intra-party decision-making for the three essential components of intra-party democracy, namely programme writing, personnel selection (leaders and candidates) and organizational structure. In a nutshell, our discursive IPD-index measures the inclusiveness of
25
decision-making inside parties that is based on discussions within party bodies and assemblies. In other words, it combines two aspects, namely the maintenance of organizational boundaries and decision-making based on the exchange of arguments within designated party bodies. To be sure, this includes also assemblies of all members (e.g., at the constituency level). Hence it is not confined to representative decision-making, but it requires the temporal coincidence of discussion and decision. A higher index score indicates that a more inclusive party body has the final say over a certain aspect.
2. A Plebiscitary IPD Index (PIPD) measures the degree to which parties allow for decision-making based on the plebiscitary logic of one member one vote. This means that here we are interested in decisions which are not at the end of a discussion within representative or membership assemblies but are eventually made by the lone party member at his or her desk or computer screen. We contend that this is a fundamentally different logic as there is no way to deliberate and reach compromise (frequently through repeated rounds of voting). It is the politics of ‘either/or’. It is dichotomous politics which arguably gives a lot of power to the leaders (Katz/Mair 1995: 21). It may, however, also be used as a leadership-challenging device. This is an empirical question. What counts for us now is that it follows an inherently different logic (Cross/Katz 2013).
This index includes all parties which envisage such procedures in their rules. These procedures may be optional or only compulsory in certain situations. This is logically necessary as it is virtually impossible to envisage a party organization which is exclusively based on plebiscitary decision-making (even though the Italian Five Star Movement may be a case in point). We found a surprisingly high number of parties which score on this scale: Only 43.6 per cent of the parties included in our study have no provision for plebiscitary decision-making.
Conceptually, our one-dimensional DIPD indices represents a formative index (Diamantopoulos et al. 2008; Diamantopoulos/Winklhofer 2001) consisting of three components: programme writing, personnel selection and organizational structure. This would require deleting all cases where we have no valid data for all three components. As this would lead to a substantial reduction of the number of cases, we have tested different variants of calculating the index and have found that they are so highly correlated that we have decided to include all cases where we have valid data for at least 2 of our 3 components.15 Our indices are mainly based on items covering the ‘official story’ complemented by few items reporting ‘real story’ of IPD.16 Our calculations are based on data for the years 2011 to 2014 using the most recent measurement point for which data was available.
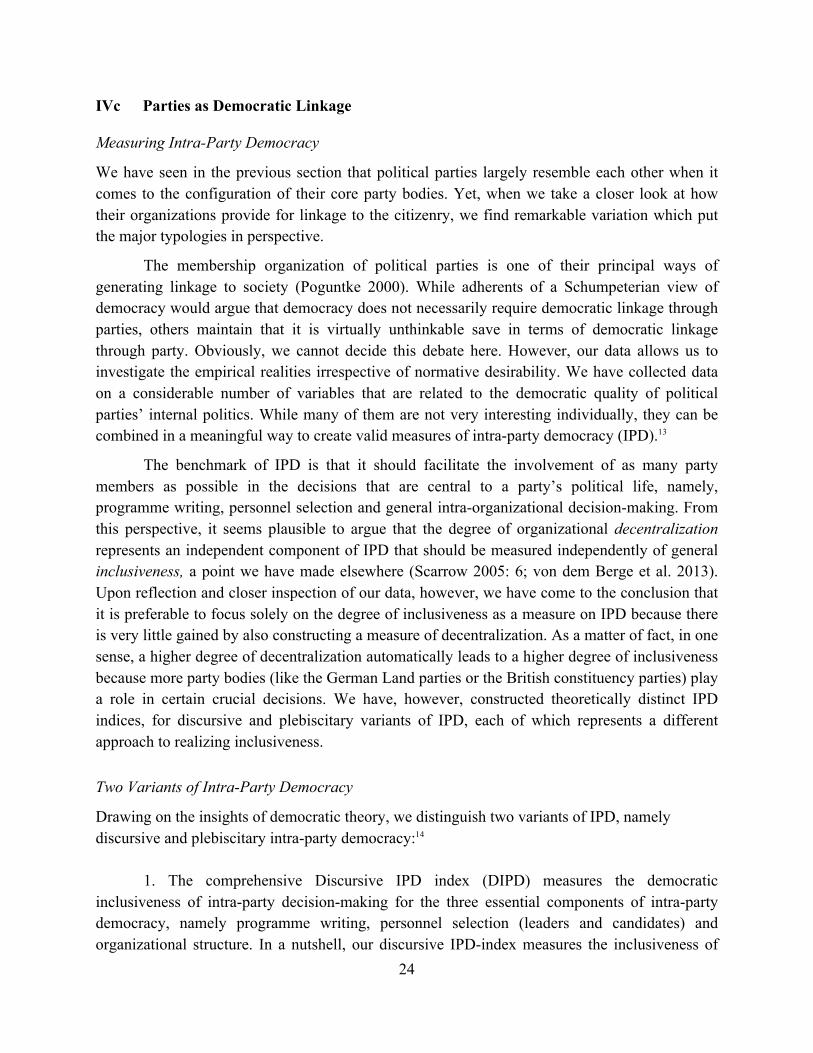
We will now analyse whether our conceptual distinction between plebiscitary and discursive intra-party democracy holds empirically. First, the correlation coefficient of 0.37 (Pearson) indicates that both indices are related yet most likely measure separate dimensions. Also, Figure 1 plots both index values of all parties in our study and it is evident that both variants exist empirically.
26
Figure 1: The relationship between discursive and plebiscitary IPD
Patterns of Intra-party Democracy: Divergence rather than Uniformity
When we turn to simple descriptive statistics, we also see substantial differences between our two measures. Both indices have a theoretical minimum of 0 and a maximum of 1. The mid-point of 0.5 indicates a neutral position vis-à-vis our two IPD measures in that such a party is neither particularly inclusive nor elitist in its intra-party politics (see Appendix I for details). The results for the discursive IPD index show that all but one of the 122 parties included in our study have internal structures that satisfy a minimum level of internal democracy. The exception is the one-man Dutch Freedom Party of Geert Wilders which has no party members and hence no internal structure to speak of. It has therefore been coded missing for our IPD indices.
27
Table 13: Descriptive Statistics of IPD-index-scores
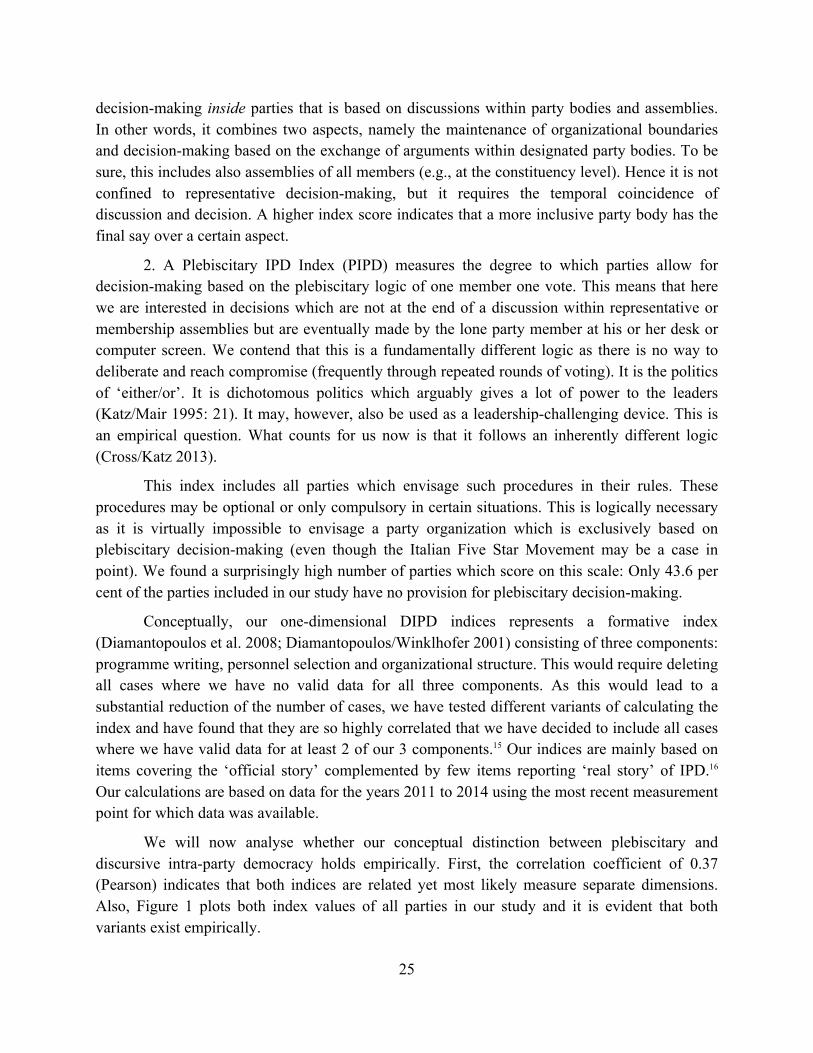
N Range Min. Max. Mean DIPD (discursive IPD) 121 0.71 0.26 0.97 0.63 PIPD (plebiscitary IPD 117 1.0 0.00 1.00 0.31 Source: PPDB Data Set I Our data provide a strong support for our contention that the DIPD index, which is designed to measure what we conceptualize as intra-party democracy based on meetings and exchange of arguments within party bodies, represents the essential core of intra-party democracy: We have a valid measurement for all parties, and none of the parties comes close to the minimum value of our index (the lowest value is .26) while some parties go all the way towards almost perfectly democratic internal procedures (see Table 13 and figure 2). The picture changes substantially for the plebiscitary variant of IPD. While more than 40 per cent of the parties in our study have not institutionalized any plebiscitary mechanisms, some parties reach our maximum value of 1.0. For both indices, we find substantial variation between parties.
Figure 2: Frequency Distributions of DIPD and PIPD indices
Source: PPDB Data Set I
Patterns of IPD by Party Family
This section examines the degree to which the two variants of IPD can be found in different party families and countries. It is easy to imagine how plebiscitary and discursive democracy can be combined in various ways. Think, for example, of a populist party which is likely to use
28
plebiscites for the legitimation of the policies of its leadership while there may be little space for genuine internal discussion and open decision-making. Rightly, Richard Katz and Peter Mair have alluded to the fact that one effect of plebiscitary modes of decision-making may be the by-passing of middle level elites and the empowerment of the leadership. Indeed, this is an important element of their cartel party argument (Katz/Mair 1995: 21). However, the introduction of plebiscitary measures is equally likely for parties which have a strong tradition of discursive internal democracy and feel the need to adapt to the pressure of a public discourse which has tends to regard plebiscitary decision-making as inherently superior to discursive or purely representative modes of democracy (Fuchs 2007; Pappi 2015: 224-25; Zittel 2006). In the populist case, we would expect a very low DIPD score to go together with a high PIPD value, while in the latter case we would expect a positive correlation.
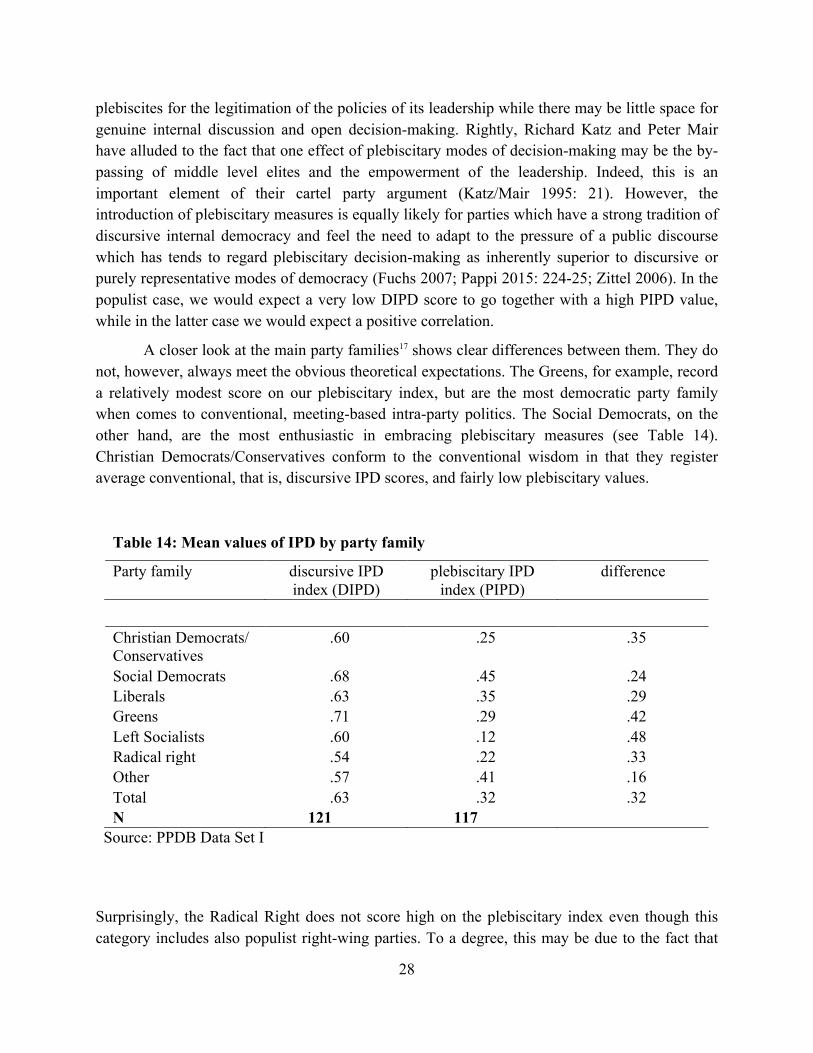
A closer look at the main party families17 shows clear differences between them. They do not, however, always meet the obvious theoretical expectations. The Greens, for example, record a relatively modest score on our plebiscitary index, but are the most democratic party family when comes to conventional, meeting-based intra-party politics. The Social Democrats, on the other hand, are the most enthusiastic in embracing plebiscitary measures (see Table 14). Christian Democrats/Conservatives conform to the conventional wisdom in that they register average conventional, that is, discursive IPD scores, and fairly low plebiscitary values.
Table 14: Mean values of IPD by party family
Party family discursive IPD index (DIPD)
plebiscitary IPD index (PIPD)
difference
Christian Democrats/ Conservatives
.60
.25 .35
Social Democrats .68 .45 .24 Liberals .63 .35 .29 Greens .71 .29 .42 Left Socialists .60 .12 .48 Radical right .54 .22 .33 Other .57 .41 .16 Total .63 .32 .32 N 121 117
Source: PPDB Data Set I
Surprisingly, the Radical Right does not score high on the plebiscitary index even though this category includes also populist right-wing parties. To a degree, this may be due to the fact that
29
we have lumped together two party groups which analytically belong to separate categories, namely extreme right and populist right-wing parties. We have chosen to do so because the distinction, even though theoretically meaningful, is frequently empirically fuzzy as many parties meander between extreme right-wing and more ‘acceptable’ right-wing populist appeals. If we look at the two groups separately, we can see that populists record higher PIPD values (.32 and .14). However, they are still not conspicuously high and we must read these results with some care as the number of cases is fairly low. Finally, the most notable result is that Left Socialist parties are by far the most reluctant party family when it comes to plebiscitary measures. It seems plausible to speculate that traditional left-wing organizational thinking with its considerable emphasis on party discipline has left its mark here.
In sum, our data show that the traditional party families all combine discursive, meeting-based intra party politics with a considerable degree of plebiscitary measures. Remarkably, parties which tend to lean towards populist appeals like those on the right and left end of the political spectrum do not practice what they preach in internal party politics. Most notably, however, there are considerable differences regarding the balance between discursive and plebiscitary forms of IPD, which reminds us that we should not too readily generalize about one dominant organizational model of party organization.
Patterns of IPD by Country
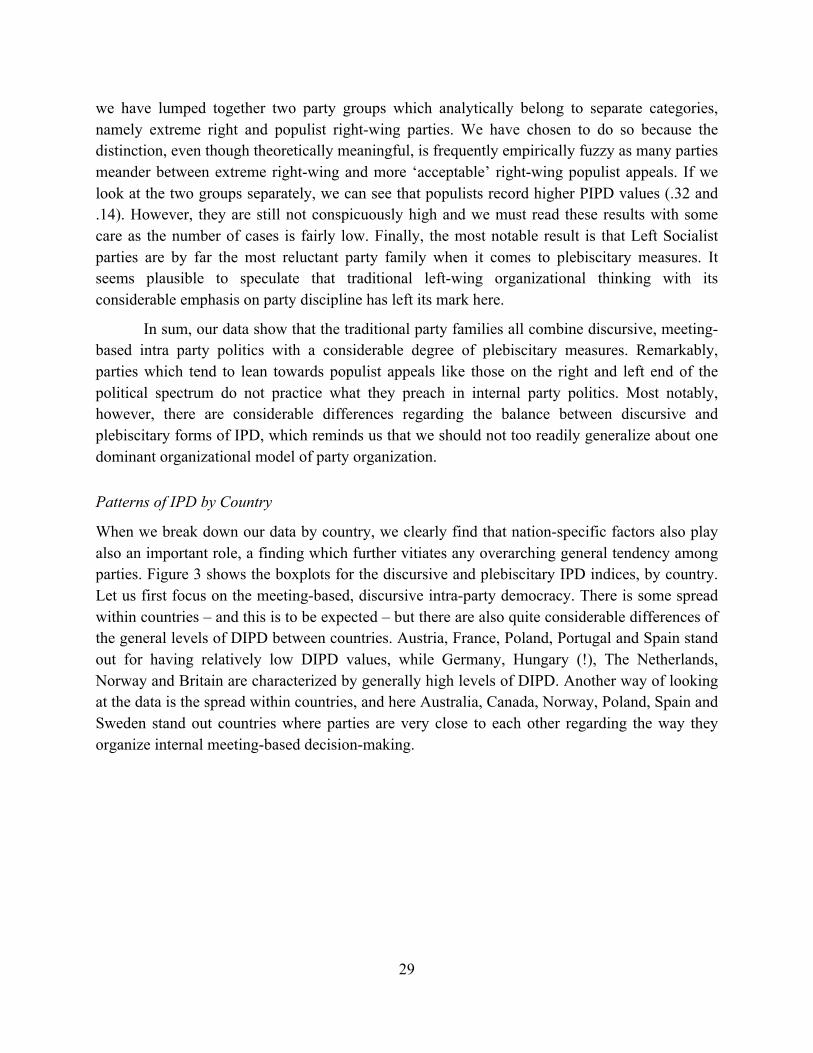
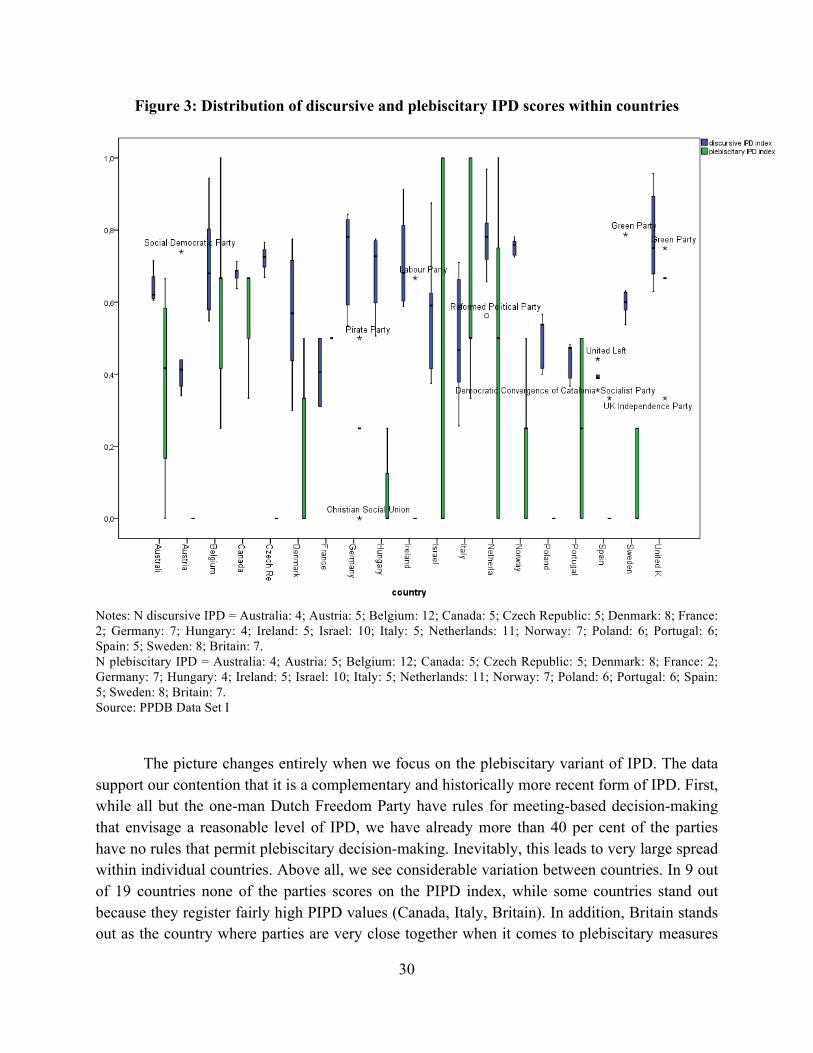
When we break down our data by country, we clearly find that nation-specific factors also play also an important role, a finding which further vitiates any overarching general tendency among parties. Figure 3 shows the boxplots for the discursive and plebiscitary IPD indices, by country. Let us first focus on the meeting-based, discursive intra-party democracy. There is some spread within countries – and this is to be expected – but there are also quite considerable differences of the general levels of DIPD between countries. Austria, France, Poland, Portugal and Spain stand out for having relatively low DIPD values, while Germany, Hungary (!), The Netherlands, Norway and Britain are characterized by generally high levels of DIPD. Another way of looking at the data is the spread within countries, and here Australia, Canada, Norway, Poland, Spain and Sweden stand out countries where parties are very close to each other regarding the way they organize internal meeting-based decision-making.
30
Figure 3: Distribution of discursive and plebiscitary IPD scores within countries
Notes: N discursive IPD = Australia: 4; Austria: 5; Belgium: 12; Canada: 5; Czech Republic: 5; Denmark: 8; France: 2; Germany: 7; Hungary: 4; Ireland: 5; Israel: 10; Italy: 5; Netherlands: 11; Norway: 7; Poland: 6; Portugal: 6; Spain: 5; Sweden: 8; Britain: 7. N plebiscitary IPD = Australia: 4; Austria: 5; Belgium: 12; Canada: 5; Czech Republic: 5; Denmark: 8; France: 2; Germany: 7; Hungary: 4; Ireland: 5; Israel: 10; Italy: 5; Netherlands: 11; Norway: 7; Poland: 6; Portugal: 6; Spain: 5; Sweden: 8; Britain: 7. Source: PPDB Data Set I
The picture changes entirely when we focus on the plebiscitary variant of IPD. The data support our contention that it is a complementary and historically more recent form of IPD. First, while all but the one-man Dutch Freedom Party have rules for meeting-based decision-making that envisage a reasonable level of IPD, we have already more than 40 per cent of the parties have no rules that permit plebiscitary decision-making. Inevitably, this leads to very large spread within individual countries. Above all, we see considerable variation between countries. In 9 out of 19 countries none of the parties scores on the PIPD index, while some countries stand out because they register fairly high PIPD values (Canada, Italy, Britain). In addition, Britain stands out as the country where parties are very close together when it comes to plebiscitary measures
31
(with the exception of the populist UKIP). It seems reasonable to speculate that we are seeing the effect of institutional diffusion here.
V. Conclusions Our analyses of the PPDB data have demonstrated a remarkable coexistence of uniformity and diversity. When it comes to some of the main indicators of party organizational capacity such as party members, staff and finance, we can show that all evidence points in the direction of continuing trends that have been diagnosed for many years. Even though we have, for the time being, only have collected cross-sectional data, comparisons with previous studies clearly show that party membership has continued to decline while financial resources and paid labour have continued to grow in most cases. Yet, substantial differences between party families and, more importantly, between counties persist.
On the other hand, we find truly remarkable uniformity regarding the core architecture of party organizations. Despite the enormous attention some groups of new parties have attracted in scholarly literature, the evidence is clear: If they survive, they adapt their organizational skeleton to what is apparently a functional necessity of modern party politics. Virtually all have regular party conferences which function as supreme ‘law making’ intra-party body; they normally have one (some two) party leaders with clearly defined powers, and they tend to have a supreme executive body.
This image of overwhelming uniformity changes again when we combine a large number of detailed rules on the functioning of these seemingly similar organisations into indices for two variants of intra-party democracy, namely IPD based on meetings and discussions and IPD that involves all members, usually by means of postal ballots. To be sure, both variants of IPD can be combined. Frequently, we find that some pre-selection or agenda setting process is the result of discursive IPD while the final approval or choice is then deferred to the membership at large. In addition, many parties allow for plebiscitary measures without making them compulsory.
Here, we find substantial variation between countries and party families. While discursive, meeting-based IPD is the standard model of intra-party democracy, the provisions for plebiscitary IPD vary substantially. They are simply non-existent in a considerable number of countries. Furthermore, of both kinds of IPD shows a great deal of variation
In sum, our data clearly show that there is still a lot of mileage in closer examination of the details of party organization. Uniformity, which is all too often in the limelight, is clearly only part of the story. Party organizations across modern democracies have much in common now, but there is more diversity, particularly between countries, than many classics of the party literature imply.
32
APPENDICES
Appendix 1 Project Supporters This project has been supported by funding from the following institutions and associations, listed in alphabetical order. We are grateful for their support, which was essential to the success of this multi-national collaboration. Main grant: Open Research Area Project (ORA) funded by:
Deutsche Forschungsgesellschaft (Germany) PO 370/11-1 Economic and Social Research Council (UK) ES/L016613/1 National Science Foundation (USA) 106498
Additional support provided by: European Consortium for Political Research (Research Sessions 2011) Fritz-Thyssen-Foundation (Germany) Israel Studies Collaborative (ISC) at the Schusterman Center for Jewish Studies, University of Texas at Austin (USA) Levi Eshkol Institute for Social, Economic and Political Research (Israel) Düsseldorf Party Research Institute (PRuF), Heinrich Heine University, Düsseldorf (Germany) University of Houston Small Grants Fund (USA) University of Oslo Småforsk (Norway) University of Leiden (Netherlands) University of Sydney – International Program Development Fund (Australia)
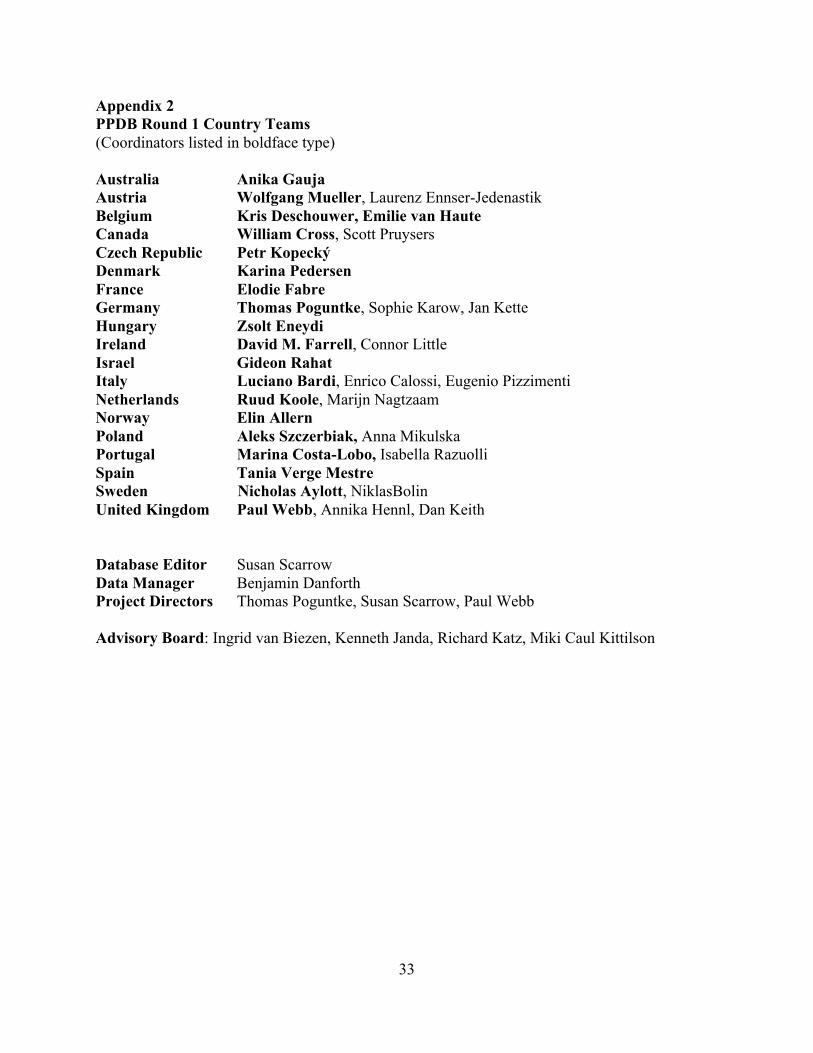
33
Appendix 2 PPDB Round 1 Country Teams (Coordinators listed in boldface type) Australia Anika Gauja Austria Wolfgang Mueller, Laurenz Ennser-Jedenastik Belgium Kris Deschouwer, Emilie van Haute Canada William Cross, Scott Pruysers Czech Republic Petr Kopecký Denmark Karina Pedersen France Elodie Fabre Germany Thomas Poguntke, Sophie Karow, Jan Kette Hungary Zsolt Eneydi Ireland David M. Farrell, Connor Little Israel Gideon Rahat Italy Luciano Bardi, Enrico Calossi, Eugenio Pizzimenti Netherlands Ruud Koole, Marijn Nagtzaam Norway Elin Allern Poland Aleks Szczerbiak, Anna Mikulska Portugal Marina Costa-Lobo, Isabella Razuolli Spain Tania Verge Mestre Sweden Nicholas Aylott, NiklasBolin United Kingdom Paul Webb, Annika Hennl, Dan Keith Database Editor Susan Scarrow Data Manager Benjamin Danforth Project Directors Thomas Poguntke, Susan Scarrow, Paul Webb Advisory Board: Ingrid van Biezen, Kenneth Janda, Richard Katz, Miki Caul Kittilson
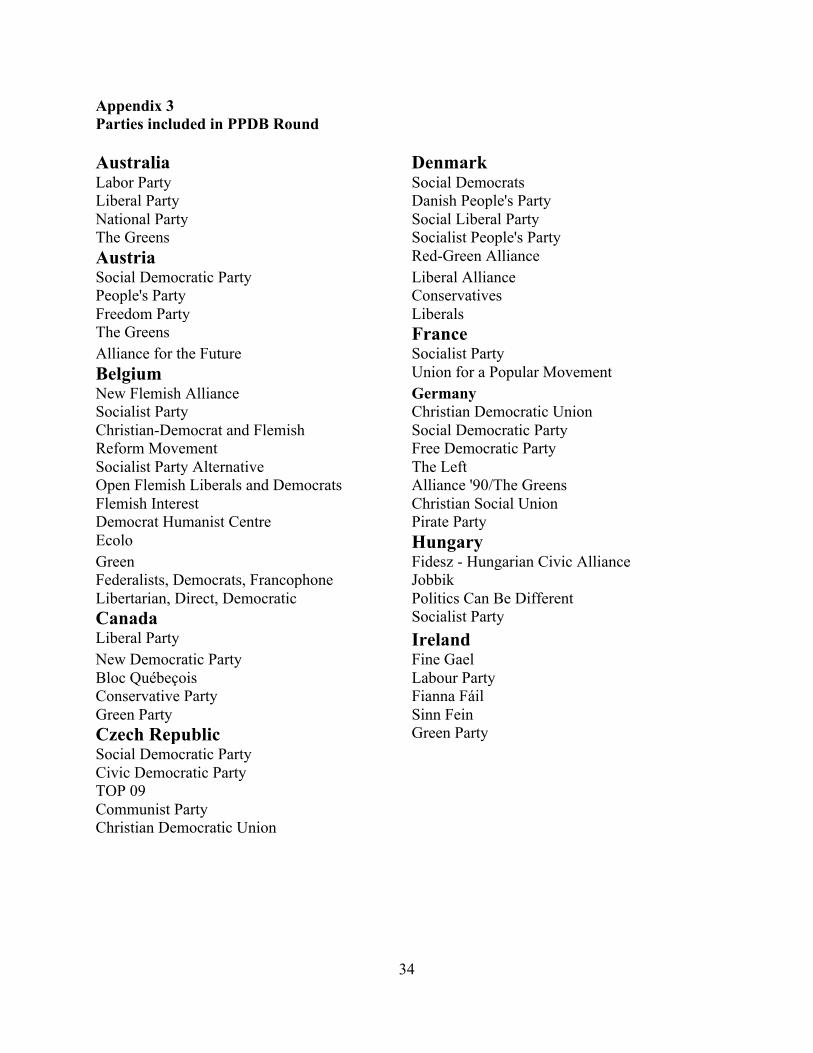
34
Appendix 3 Parties included in PPDB Round Australia Denmark Labor Party Social Democrats Liberal Party Danish People's Party National Party Social Liberal Party The Greens Socialist People's Party Austria Red-Green Alliance Social Democratic Party Liberal Alliance People's Party Conservatives Freedom Party Liberals The Greens France Alliance for the Future Socialist Party Belgium Union for a Popular Movement New Flemish Alliance Germany Socialist Party Christian Democratic Union Christian-Democrat and Flemish Social Democratic Party Reform Movement Free Democratic Party Socialist Party Alternative The Left Open Flemish Liberals and Democrats Alliance '90/The Greens Flemish Interest Christian Social Union Democrat Humanist Centre Pirate Party Ecolo Hungary Green Fidesz - Hungarian Civic Alliance Federalists, Democrats, Francophone Jobbik Libertarian, Direct, Democratic Politics Can Be Different Canada Socialist Party Liberal Party Ireland New Democratic Party Fine Gael Bloc Québeçois Labour Party Conservative Party Fianna Fáil Green Party Sinn Fein Czech Republic Green Party Social Democratic Party Civic Democratic Party TOP 09 Communist Party Christian Democratic Union
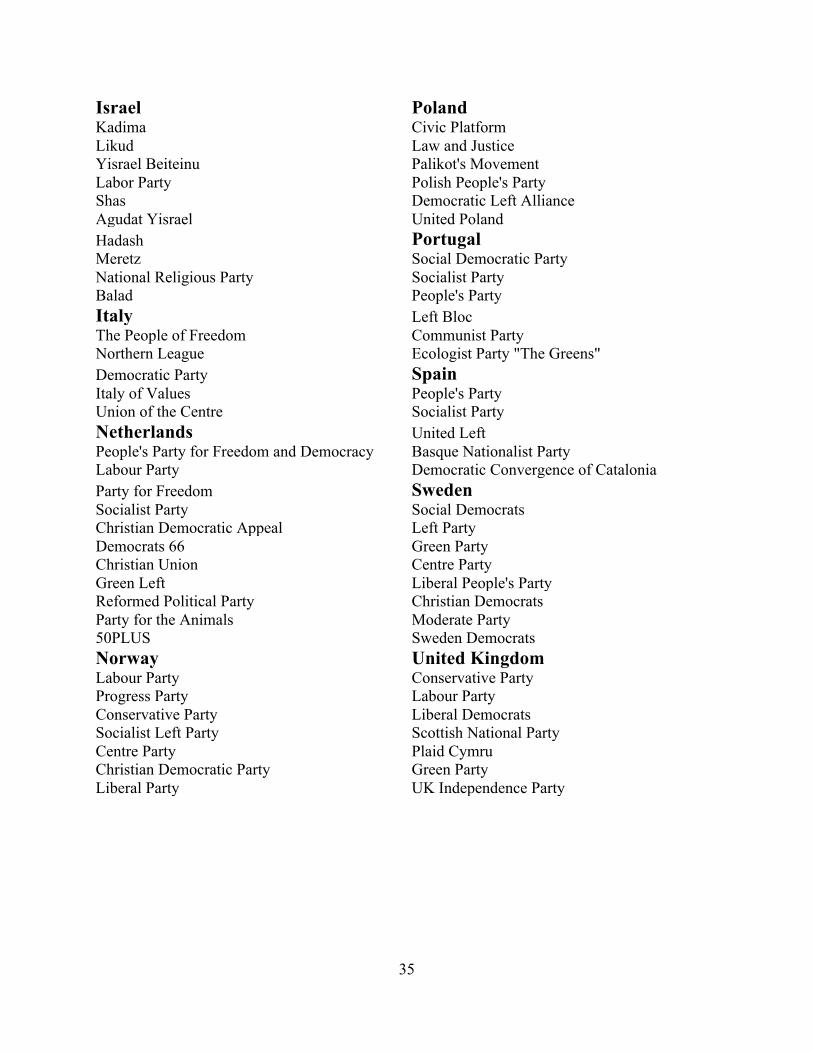
35
Israel Poland Kadima Civic Platform Likud Law and Justice Yisrael Beiteinu Palikot's Movement Labor Party Polish People's Party Shas Democratic Left Alliance Agudat Yisrael United Poland Hadash Portugal Meretz Social Democratic Party National Religious Party Socialist Party Balad People's Party Italy Left Bloc The People of Freedom Communist Party Northern League Ecologist Party "The Greens" Democratic Party Spain Italy of Values People's Party Union of the Centre Socialist Party Netherlands United Left People's Party for Freedom and Democracy Basque Nationalist Party Labour Party Democratic Convergence of Catalonia Party for Freedom Sweden Socialist Party Social Democrats Christian Democratic Appeal Left Party Democrats 66 Green Party Christian Union Centre Party Green Left Liberal People's Party Reformed Political Party Christian Democrats Party for the Animals Moderate Party 50PLUS Sweden Democrats Norway United Kingdom Labour Party Conservative Party Progress Party Labour Party Conservative Party Liberal Democrats Socialist Left Party Scottish National Party Centre Party Plaid Cymru Christian Democratic Party Green Party Liberal Party UK Independence Party
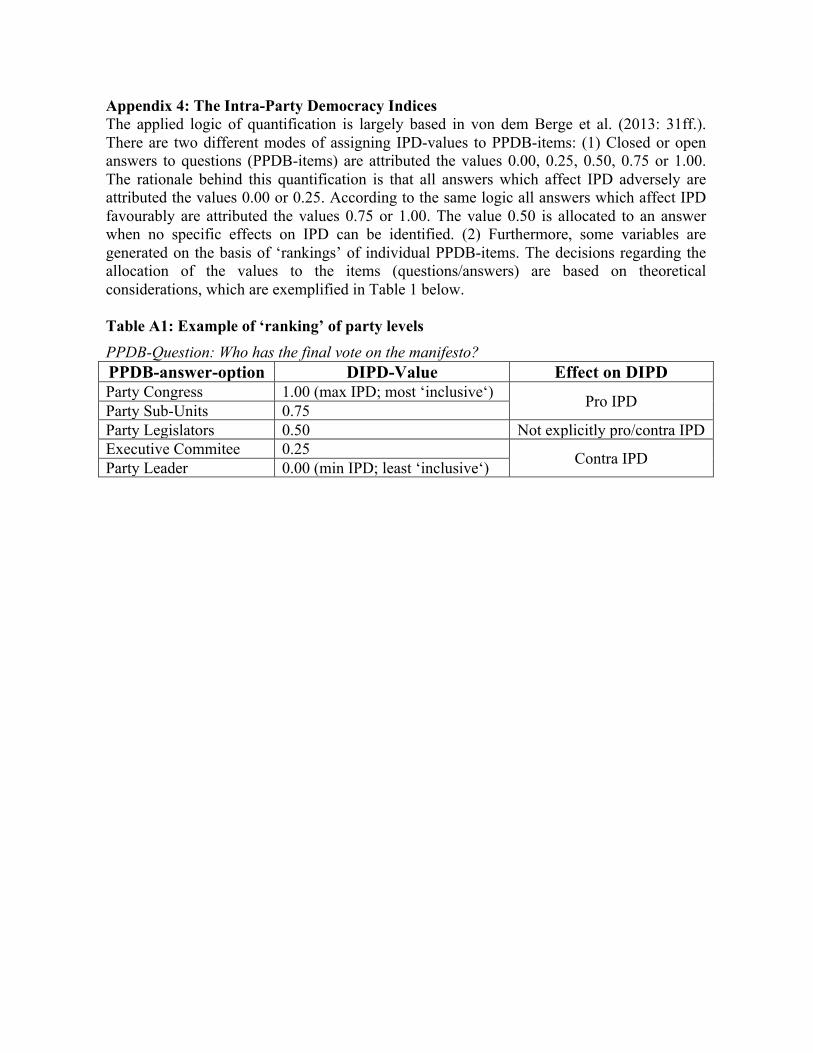
36
Appendix 4: The Intra-Party Democracy Indices The applied logic of quantification is largely based in von dem Berge et al. (2013: 31ff.). There are two different modes of assigning IPD-values to PPDB-items: (1) Closed or open answers to questions (PPDB-items) are attributed the values 0.00, 0.25, 0.50, 0.75 or 1.00. The rationale behind this quantification is that all answers which affect IPD adversely are attributed the values 0.00 or 0.25. According to the same logic all answers which affect IPD favourably are attributed the values 0.75 or 1.00. The value 0.50 is allocated to an answer when no specific effects on IPD can be identified. (2) Furthermore, some variables are generated on the basis of ‘rankings’ of individual PPDB-items. The decisions regarding the allocation of the values to the items (questions/answers) are based on theoretical considerations, which are exemplified in Table 1 below. Table A1: Example of ‘ranking’ of party levels PPDB-Question: Who has the final vote on the manifesto? PPDB-answer-option DIPD-Value Effect on DIPD Party Congress 1.00 (max IPD; most ‘inclusive‘) Pro IPD Party Sub-Units 0.75 Party Legislators 0.50 Not explicitly pro/contra IPD Executive Commitee 0.25 Contra IPD Party Leader 0.00 (min IPD; least ‘inclusive‘)
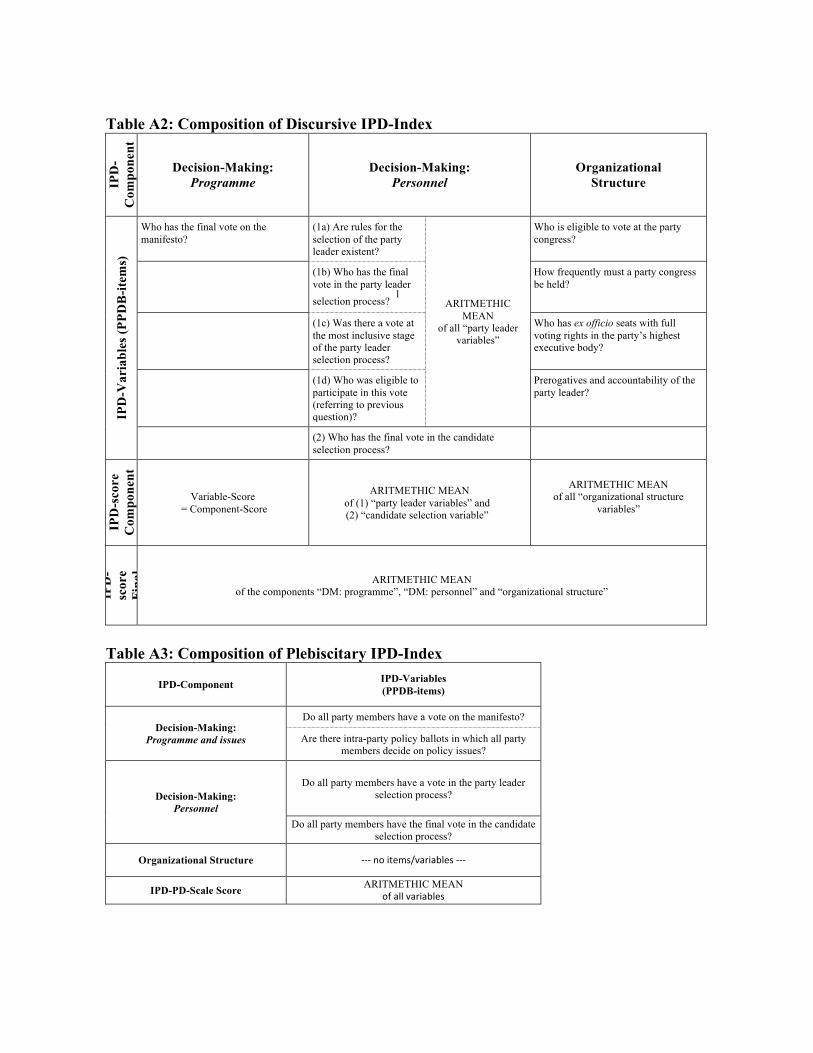
37
Table A2: Composition of Discursive IPD-Index
IPD
- C
ompo
nent
Decision-Making: Programme
Decision-Making: Personnel
Organizational Structure
IPD
-Var
iabl
es (P
PDB
-item
s)
Who has the final vote on the manifesto?
(1a) Are rules for the selection of the party leader existent?
ARITMETHIC MEAN
of all “party leader variables”
Who is eligible to vote at the party congress?
(1b) Who has the final vote in the party leader selection process?
1
How frequently must a party congress be held?
(1c) Was there a vote at the most inclusive stage of the party leader selection process?
Who has ex officio seats with full voting rights in the party’s highest executive body?
(1d) Who was eligible to participate in this vote (referring to previous question)?
Prerogatives and accountability of the party leader?
(2) Who has the final vote in the candidate selection process?
IPD
-sco
re
Com
pone
nt
Variable-Score = Component-Score
ARITMETHIC MEAN of (1) “party leader variables” and (2) “candidate selection variable”
ARITMETHIC MEAN of all “organizational structure
variables”
IPD
-sc
ore
Fina
l
ARITMETHIC MEAN of the components “DM: programme”, “DM: personnel” and “organizational structure”
Table A3: Composition of Plebiscitary IPD-Index
IPD-Component IPD-Variables (PPDB-items)
Decision-Making: Programme and issues
Do all party members have a vote on the manifesto?
Are there intra-party policy ballots in which all party members decide on policy issues?
Decision-Making: Personnel
Do all party members have a vote in the party leader selection process?
Do all party members have the final vote in the candidate selection process?
Organizational Structure -‐-‐-‐ no items/variables -‐-‐-‐
IPD-PD-Scale Score ARITMETHIC MEAN of all variables
1 1b and d partially overlap. We have decided to keep both variables to improve precision.
38
Notes 1 We are grateful to all funders, especially our national funding bodies (the NSF, the ESRC and the DFG), and our universities who
have supported primary research, travel and meetings for all project members. A full listing of funders to date is included in Appendix 1.
2 Those using PPDB Round 1 data should reference this article for a full introduction to the data set and to those who contributed
to it.
3 We consciously violated this rule in a few places, for instance when we ask team members to not only give the official rules for
candidate selection, but to also give an expert opinion about which levels of the party had the most influence in the most recent round of
candidate selections. In these places, those who distrust the judgment of a single expert can ignore these variables and rely solely on the
official stories.
4 This is based on the ‘annual median equivalence disposable household income’ for each country, which refers to the disposable
income of an ‘equivalent’ adult in a household in the middle of the income distribution in a given year. This is stated in terms of the current
purchasing power parity in Euros for private consumption for the relevant years (https://en.wikipedia.org/wiki/Median_household_income)
It is therefore intended to account for ‘equivalent purchasing power’ of the median household in each country.
5 The historical data for median disposable household income are taken from the OECD website at
http://stats.oecd.org/Index.aspx?DataSetCode=IDD#. The relevant year is 1989, or as near as possible. The mean party income per national
median household figures for each country are as follows:
Late 1980s 2011
Denmark 66.99 158.00
(West) Germany 3371.80 2922.99
Netherlands 345.32 233.69
Norway 98.57 385.92
Sweden 284.43 471.43
Britain 654.27 840.99
Each figure in the table represents the number of times greater than the median national household disposable income that the average party
head office income was for each period.
6 Unfortunately, there are rather fewer cases for which we have both central and legislative party staffing data, approximately one-
third of the total number of parties, which we feel is too few from which to gain a clear picture, so we do not report those figures here.
7 The extraordinary number of staff employed by parliamentary parties in Germany owes something to the difficulty of attracting
state funding beyond a fixed ‘absolute ceiling’ which limits the overall sum of money that can go from the state to political parties. This
ceiling did not change for many years until the Bundestag introduced indexation in 2013. The way around this for the parties was to increase
the number of their parliamentary staff, all of whom are paid for by the state. According to German legal doctrine, their work pertains to the
sphere of the state rather than the parties, since formally the parliamentary parties are not supposed to do things that directly benefit the
extra-parliamentary party. The reality, however, is that these personnel split their time between working for MPs as personal assistants and
working for the parliamentary (and sometimes extra-parliamentary) parties. In this way they clearly constitute a resource of the party, then;
however, it does render the German situation somewhat unique, so readers may prefer to exclude the German figures when reflecting on the
overall averages for parliamentary party staff.
8 The exact year cited varies slightly in the Katz-Mair dataset; most figures are for 1989, though a few are for 1988 or 1990, or
even for 5-year averages around 1989.
9 The detailed figures for these central party staff/individual membership ratios are as follows:
Mid-1970s Late-1980s 2011-14
Denmark .017 .032 .08
Germany .015 .017 .11
Ireland .091 .216 .15
Netherlands .035 .048 .12
Norway .022 .023 .10
Sweden .012 .019 .12
Britain .002 .017 .14
Overall mean .028 .053 .12
39
10 The congress frequency variable refers to how often party statutes require the party to hold congresses. Note that this variable is coded such that a low number indicates that they must hold them more frequently (eg, 1 = every year), whereas a higher number (2) means they have to hold them only once every 4-5 years. Hence the positive figure for the correlation in Table 8 actually indicates an inverse relationship between the two variables in substantive terms.
11 Two of the seven parties where this is not the case are Spanish; in these two countries, the party leader appoints at least three
quarters of the executive committee members (in the PP and PSOE).
12 Perhaps unexpectedly, there are no large differences between party families in terms of the leader’s accountability to the party
conference. Green parties were slightly more likely to specify this, but all party families were in the range from 25-37%.
13 See von dem Berge/Poguntke 2016 for details of index construction.
14 See Appendix and von dem Berge/Poguntke 2016 for details on how the indices were constructed.
15 The situation is different for the plebiscitary index which includes only two components. Here we have simply used all available
data.
16 For the conceptualization of ‘official’ vs. ‘real’ story see Katz and Mair 2005.
17 The parties have been categorized on the basis of their membership in supranational party bodies and expert judgments. Details
can be obtained from the authors.
References Bagehot, Walter. 1963/1867. The English Constitution. Ithaca, New York: Cornell University Press. Bille, Lars. 2001. “Democratizing a Democratic Procedure: Myth or reality? Candidate Selection in Western European parties, 1960-1990.” Party Politics 7 no. 3: 363-380. Caul, Miki. 1999. “Women's Representation in Parliament. The Role of Political Parties.” Party Politics 5 no. 1: 79-98. Cross, William P. and Richard S. Katz. 2013. The Challenges of Intra-Party Democracy. Oxford: Oxford University Press. Diamantopoulos, Adamantios, Riefler, Petra and Katharina P. Roth. 2008. “Advancing formative measurement models.” Journal of Business Research 61 no. 12: 1203-1218. Diamantopoulos, Adamantios and Heidi M. Winklhofer. 2001. “Index construction with formative indicators. An alternative to scale development.” Journal of Marketing Research 38 no. 2: 269-277. Duverger, Maurice. 1954. Political Parties, trans. Barbara and Robert North. New York: John Wiley & Sons. --------. 1964. Political Parties. London: Methuen. Epstein, Leon. 1968. Political Parties in Western Democracies. New York: Praeger.
40
Fuchs, Dieter. 2007. “Participatory, Liberal and Electronic Democracy.” In Thomas Zittel and Dieter Fuchs (eds), Participatory Democracy and Political Participation: Can Participatory Engineering Bring Citizens Back in? Oxford: Routledge, 29-54. Harmel, Robert. 2002. “Party Organizational Change: Competing Explanations?” In Kurt Richard Luther and Ferdinand Müller-Rommel (eds), Political Parties in the New Europe: Political and Analytical Challenges. Oxford: Oxford University Press, 119-142. Harmel, Robert and Kenneth Janda. 1994. “An Integrated Theory of Party Goals and Party Change.” Journal of Theoretical Politics 6 no. 3: 259-287. Heidar, Knud. 1994. “The Polymorphic Nature of Party Membership.” European Journal of Political Research 25 no. 1: 61-86.
Heidenheimer, Arnold. 1963. “Comparative Party Finance: Notes on Practices and Toward a Theory.” Journal of Politics 25 no.4: 790–811. Janda, Kenneth. 1980. Political Parties: A Cross-National Survey. New York: The Free Press. Katz, Richard S. and Peter Mair. 1992. Party Organizations: A Data Handbook. London: Sage Publications. --------. 1995. “Changing Models of Party Organization and Party Democracy: the Emergence of the Cartel Party.” Party Politics 1 no.1: 5-28. Katz, Richard, Mair, Peter, et al. 1992. “Membership of Political Parties in European Democracies, 1960-1990.” European Journal of Political Research 22 no. 3: 329-345.
Kirchheimer, Otto. 1966. “The Transformation of the Western European Party Systems.” In Joseph LaPalombara and Myron Weiner (eds), Political Parties and Political Development, Princeton NJ: Princeton University Press, 177–200. LaPalombara, Joseph and Myron Weiner. 1969. Political Parties and Political Development. Princeton: Princeton University Press. Lipset, Seymour M. and Stein Rokkan. 1967. Party System and Voter Alignments. New York: Free Press. Lowell, A. Lawrence. 1895. Governments and Parties in Continental Europe. 2 Vol. Boston: Houghton, Mifflin. Mair, Peter and Ingrid van Biezen. 2001. “Party Membership in Twenty European Democracies: 1980-2000.” Party Politics 7 no. 1: 5-21.
Michels, Robert. 1959 (1915). Political parties: A Sociological Study of the Oligarchical Tendencies of Modern Democracy. New York: Dover.
41
Morris, Robert J. 2000. “Civil Society, Subscriber Democracies, and Parliamentary Government in Great Britain.” In Nancy Bermeo and Philip Nord (eds), Civil Society Before Democracy. Princeton: Princeton University Press, 111–33. Neumann, Sigmund. 1954. “Toward a Theory of Political Parties.” World Politics 6 no. 4: 549-563. Neumann, Sigmund. 1956. “Towards a Comparative Study of Political Parties” In Sigmund Neumann (ed), Modern Political Parties. Approaches to Comparative Politics. Chicago/London: University of Chicago Press, 395-421. Ostrogorski, Mosei. 1902. Democracy and the Organization of Political Parties. 2 Vol. New York: Macmillan. Overacker, Louise. 1932. Money in Elections. New York: Macmillan. Panebianco, Angelo. 1988. Political Parties: Organization and Power, trans. Marc Silver. Cambridge: Cambridge University Press. Pappi, Franz Urban. 2015. “Representative vs direct Democracy in Germany: A Contribution to an Ongoing Debate.” In Thomas Poguntke, et al. (eds), Citizenship and Democracy in an Era of Crisis. Essays in Honour of Jan W. van Deth. London and New York: Routledge, 224-240. Poguntke, Thomas. 2000. Parteiorganisation im Wandel. Gesellschaftliche Verankerung und organisatorische Anpassung im europäischen Vergleich. Wiesbaden: Westdeutscher Verlag. Pollock, James Kerr. 1932. Money and Politics Abroad. New York: A. A. Knopf. Sartori, Giovanni. 1976. Parties and Party Systems: A Framework for Analysis. New York: Cambridge University Press. Scarrow, Susan. 1994. “The ‘Paradox of Enrolment’: Assessing the Costs and Benefits of Party Membership.” European Journal of Political Research 25 no.1: 41-60.
--------. 1996. Parties and Their Members. Oxford: Oxford University Press. --------. 2000. “Parties without members?” In Russell Dalton and Martin P. Wattenberg (eds), Parties Without Partisans. Oxford: Oxford University Press. --------. 2005. Political Parties and Democracy in Theoretical and Practical Perspectives. Implementing Intra-Party Democracy. National Institute for International Affairs (NDI), retrieved March 3, 2010 from: hhtp://www.ndi.org/files/1951_polpart_scarrow_1101.05.pdf.
--------. 2014. Beyond Party Members. Oxford: Oxford University Press. Scarrow, Susan and Paul D. Webb. Forthcoming. “The Impact of Party Organization: Participation, Representation and Power.” In Susan E. Scarrow, Paul D. Webb, Thomas
42
Poguntke (eds), Organizing Representation: Political Parties, Participation, and Power. Oxford: Oxford University Press. Schlesinger, Joseph A. 1994. Political Parties and the Winning of Office. Ann Arbor: University of Michigan Press. Seyd, Patrick and Paul Whiteley. 1992. Labour’s Grassroots: The Politics of Party Membership. Oxford: Clarendon Press. Tavits, Margit. 2013. Post-Communist Democracies and Party Organisation. Cambridge: Cambridge University Press. Van Haute, Emilie and R. Kenneth Carty. 2012. “Ideological Misfits: A Distinctive Class of Party Members.” Party Politics 18 no. 6: 885-895. Van Haute, Emilie. 2011. Party Membership in Europe: Exploration into the Anthills of Party Politics. Brussels: Ed. de l’Université de Bruxelles. Van Biezen, Ingrid, et al. 2011. “Going, Going, Gone? The Decline of Party Membership in Contemporary Europe.” European Journal of Political Research 51 no. 1: 24-56.
Von Beyme, Klaus. 1985. Political Parties in Western Democracies, trans. Eileen Martin. Aldershot UK: Gower Publishing. Von dem Berge, Benjamin, et al. 2013. Measuring Intra-Party Democracy. A Guide for the Content Analysis of Party Statutes with Examples from Hungary, Romania and Slovakia. Heidelberg: Springer. Von dem Berge, Benjamin and Thomas Poguntke. 2016. Intra-Party Democracy: Conceptualization, Data and Measurement. A Research Note. Forthcoming. Ware, Alan. 1987. Citizens, Parties, and the State: a Reappraisal. Cambridge: Polity Press. Webb, Paul D. 1995. “Are British Political Parties in Decline?” Party Politics 1 no. 3: 299-322. --------. 2000. The Modern British Party System. London: Sage. Webb, Paul D. and Justin J. Fisher. 2003. “Professionalizing the Millbank Tendency: The Political Sociology of New Labour’s Employees.” Politics 23: 10-20. Weldon, Steven. 2006. “Downsize My Polity? The Impact of Size on Party Membership and Member Activism.” Party Politics 12 no. 4: 467-481. Whiteley, Paul. 2011. “Is the Party Over? The Decline of Party Activism and Membership Across the Democratic World.” Party Politics 17 no. 1: 21-44. Whiteley, Paul, Patrick Seyd and Jeremy Richardson. 1994. True Blues: The Politics of Conservative Party Membership. Oxford: Clarendon Press.
43
Widfeldt, Anders. (1999). Linking Parties with People? Party Membership in Sweden 1960-1997. Aldershot: Ashgate. Zittel, Thomas. 2006. “Participatory Democracy and Political Participation”. In Thomas Zittel and Dieter Fuchs (eds), Participatory Democracy and Political Participation: Can Participatory Engineering bring Citizens back in? London: Routledge, 9-22.
Related Documents