Queensland Digital Industry Survey 2014 Prepared for Department of Science, Information Technology and Innova

Partners in Technology (PiT) - Queensland Digital Industry Survey 2014 - 21 July 2015
Aug 16, 2015
Welcome message from author
This document is posted to help you gain knowledge. Please leave a comment to let me know what you think about it! Share it to your friends and learn new things together.
Transcript

Queensland DigitalIndustry Survey 2014
Prepared for Department of Science, Information Technology and Innovation

• provide a snapshot of the current state of the digital (ICT) industries, the future intentions of its members and their views on Government policy directions
• obtain current data on industry – business size, structure, location, products / services, skills, markets, growth and future intentions
• inform ongoing development of Queensland Government ICT / Digital / Knowledge Economy Strategies
Objectives

Survey Administration
• Independently conducted by QGSO
• Secure web-based survey
• 2077 businesses and contractors working in the digital industry in 2013 – 14 financial year

• Approximately half of
respondents 51.1% were non-
employing
• 40.4% of employing businesses
were headquartered in
Queensland
Business size and type
Business Location
• 50.5% located in Brisbane
• 22.1% located in Brisbane
Inner City
• 49.5% non-Brisbane based
• 12.9% Gold Coast

• 77.9% of responding businesses were less than 15 years old
• 12.5% were more than 20 years old
• Over half of all contracting businesses were less than five years old
• 39% of micro businesses commenced operating in the last five years
Age of Business
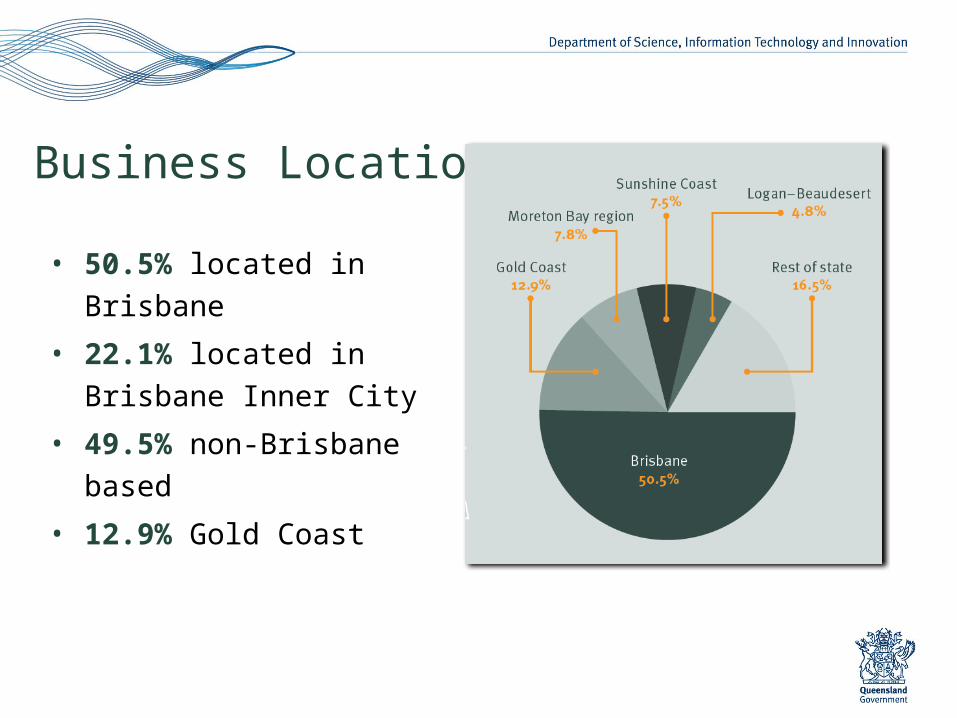
Five most commonly reported primary
products & services:
• 47.8% software development and
publishing and computer
programming
• 47.2% consulting services
• 42.4% software services
• 22.5% digital marketing / content
• 20.7% hardware sales / maintenance
Products and services
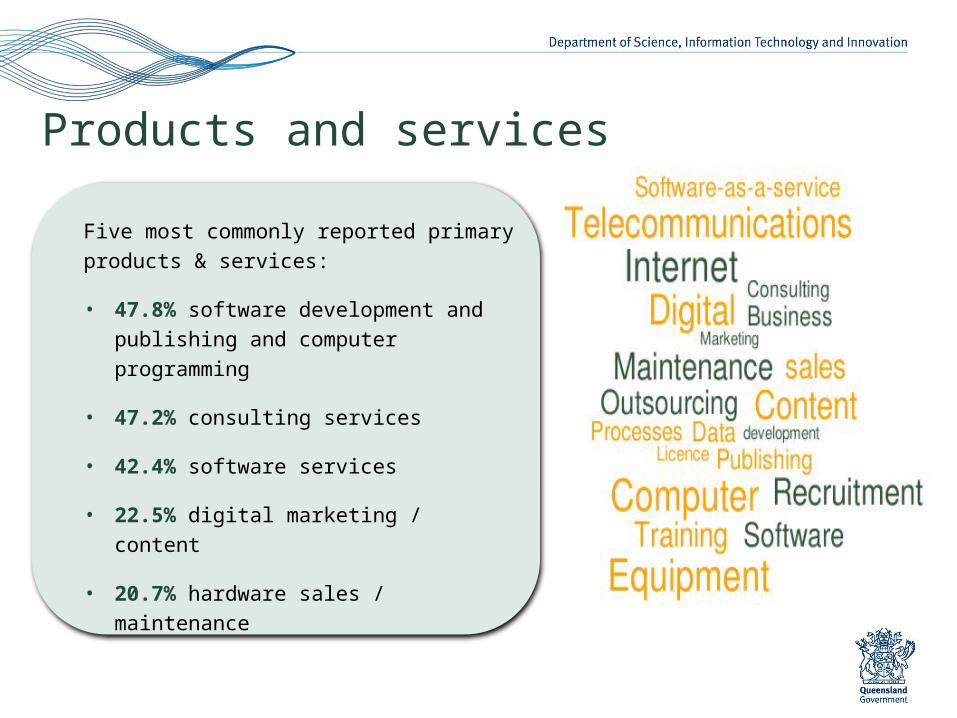
Five most reported target markets
across responding businesses of
varying size and services provided
included:
• 25% information technology
• 18.8% state government
• 17.9% general public
• 16.6% retail and wholesale
• 13.5% health and community
services
The most important for
businesses headquartered
in Queensland were state
government (22.4%),
information technology
(20.4%) and health and
community services
(16.1%)
Target markets
• 1,813 businesses provided sales
data (avg $2.04M in 2013 – 14)
• 77.8% Queensland
• 16.3% Interstate
• 5.9% Overseas
Sales

• 73.5% of Queensland
headquartered businesses did not
export
• 44.7% medium to large businesses
exported ICT
• 48.4% Queensland exporting
businesses exported to the United
States
Businesses with QLD offices/staff exporting products & services
exported to :Export Markets
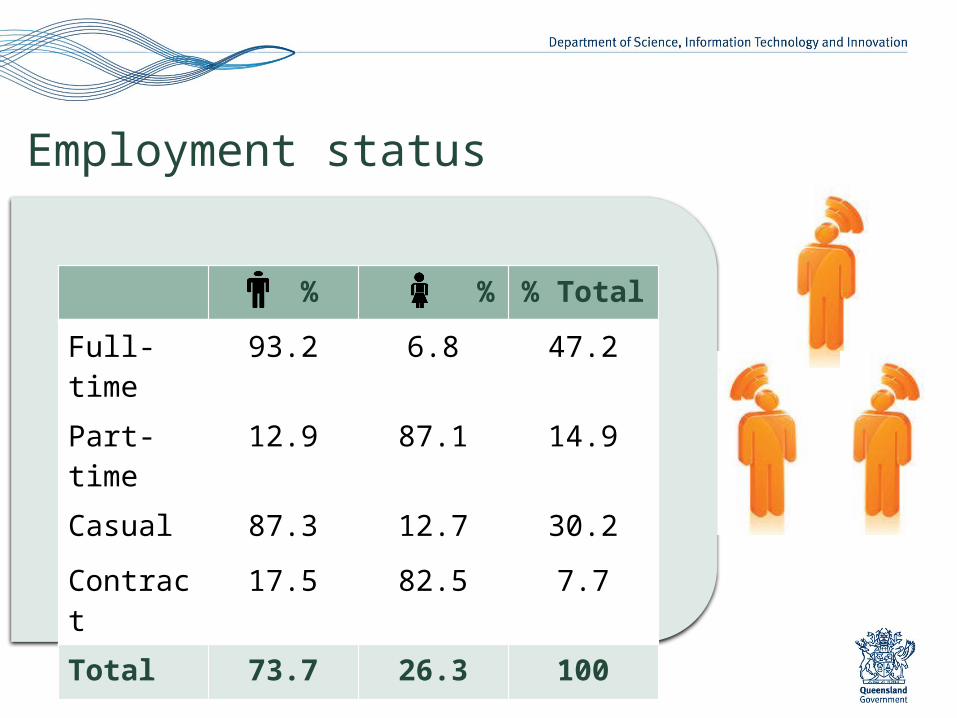
Employment status
% % % Total
Full-time 93.2 6.8 47.2
Part-time 12.9 87.1 14.9
Casual 87.3 12.7 30.2
Contract 17.5 82.5 7.7
Total 73.7 26.3 100
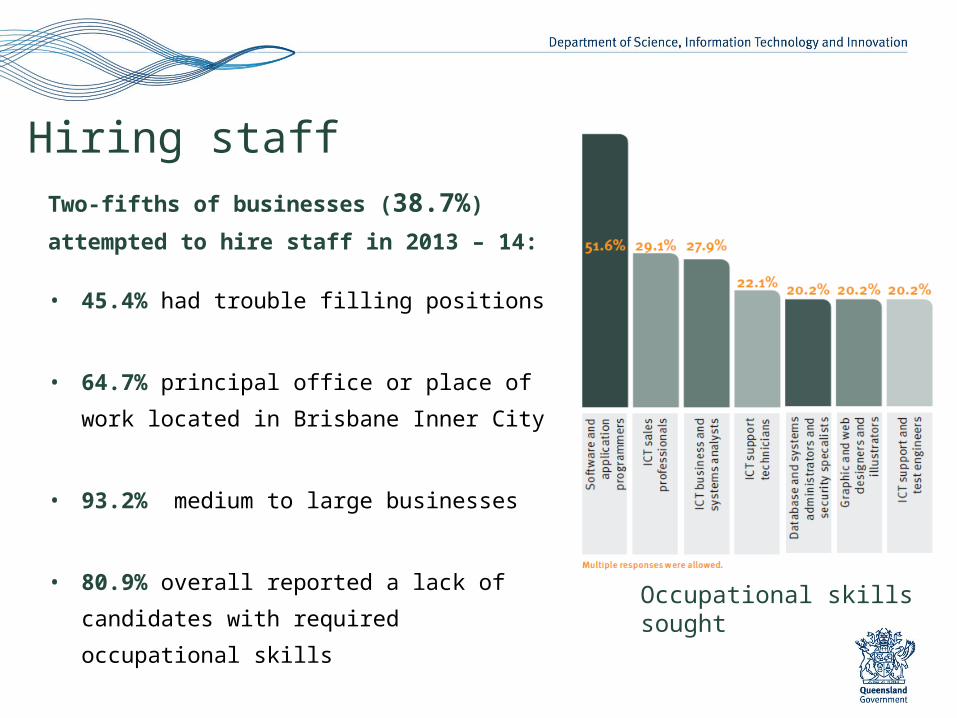
Hiring staffTwo-fifths of businesses (38.7%) attempted to hire staff in 2013 – 14:
• 45.4% had trouble filling positions
• 64.7% principal office or place of work located in Brisbane Inner City
• 93.2% medium to large businesses
• 80.9% overall reported a lack of candidates with required occupational skills
Occupational skills sought

• 39.2% of all respondents owned
all intellectual property (IP) of
products or services they sell
• 60.2% of medium to large
businesses owned all IP of
products or services they sell
Ownership of Intellectual property

• 86% spent time and/or money
on research and development
(R&D) and innovation
• 97% small business spent
time/money on R&D
• 96.1% medium to large
businesses spent time/money on
R&D
Research and development
• 65.5% increasing Queensland sales
• 49.5% new product development
• 49.4% increasing interstate sales
• 38.0% increasing overseas sales
• 18.3% no plans to grow
Outlook for business growth

Outlook for profitability
Expected profitability change in the next
two years
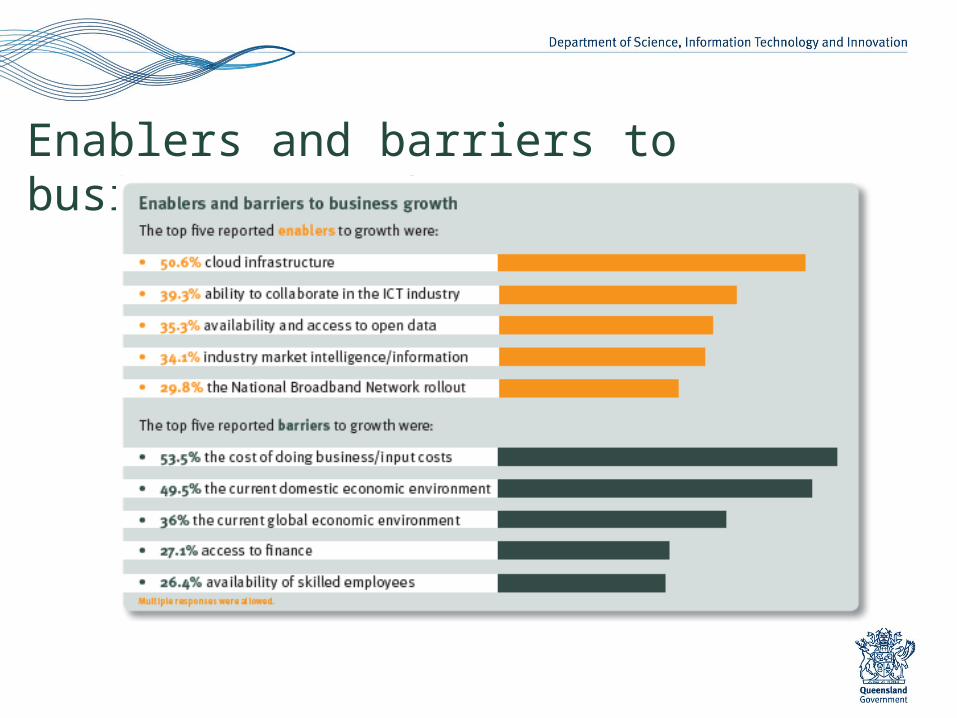
Enablers and barriers to business growth
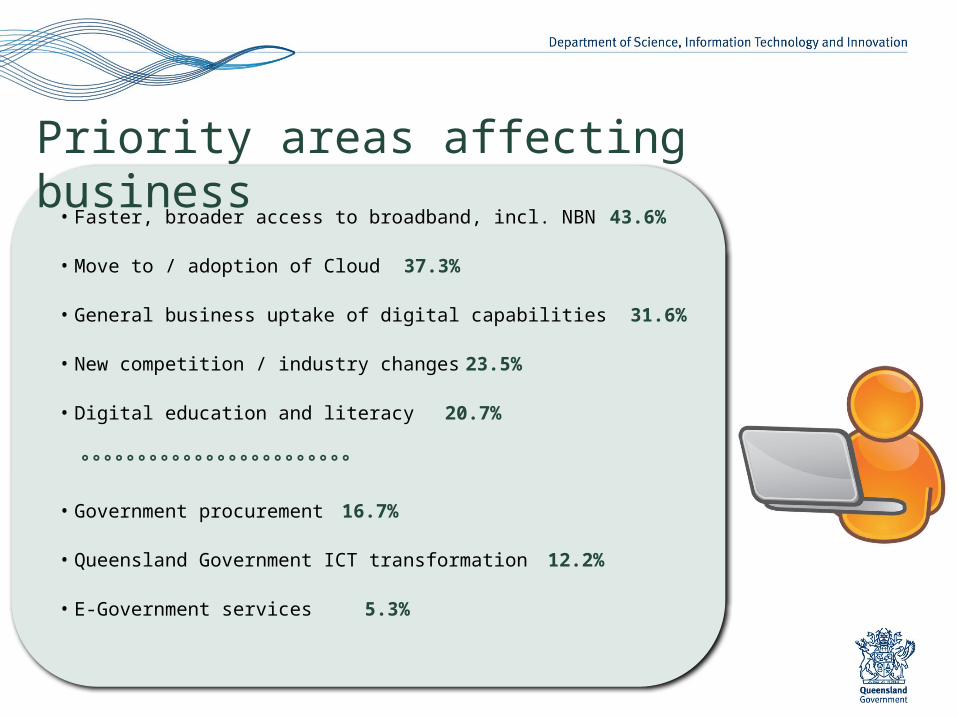
• Faster, broader access to broadband, incl. NBN 43.6%
• Move to / adoption of Cloud 37.3%
• General business uptake of digital capabilities 31.6%
• New competition / industry changes 23.5%
• Digital education and literacy 20.7%
°°°°°°°°°°°°°°°°°°°°°°°°
• Government procurement 16.7%
• Queensland Government ICT transformation 12.2%
• E-Government services 5.3%
Priority areas affecting business

Government initiatives
Help received from Government
initiatives in the last two years:
• 12.2% federal government initiatives
• 8.5% state government initiatives
• 3.4% local government
As business size increased, the percentage of
businesses that had received help also increased.

• Printed copies available today• Online
– Summary: www.qld.gov.au/digitalprofile– Full Report:
http://www.qld.gov.au/dsitia/digital/qld-digital-industry/
Accessing the information
Connect with us on:
facebook.com/digitalqueenslandtwitter.com/digitalqldqld.gov.au/[email protected]
Related Documents