A n n u a l R e p o r t 2010-11 Partnering for Value Creation in Life Sciences

Welcome message from author
This document is posted to help you gain knowledge. Please leave a comment to let me know what you think about it! Share it to your friends and learn new things together.
Transcript
A n n u a l R e p o r t 2010-11
Partnering for Value Creationin Life Sciences

Annual Report 2010-11 | Jubilant Life Sciences Limited
1
Contents
Global Presence 2
Jubilant Life Sciences Takes Shape 4
Our Vision, Values & Promise 5
Awards & Recognition 6
Board of Directors 7
Senior Leadership Team 8
Chairmen’s Message 10
Management Discussion & Analysis 14
Life Science Products 17
Life Science Services 24
Business Enablers 27
Annual Accounts
Directors’ Report 35
Corporate Governance Report 52
Auditors’ Report & Annexure 70
Balance Sheet and Profit & Loss Account 74
Cash Flow Statement 76
Schedules 77
Notes to Accounts 85
Auditors’ Report to Consolidated Accounts 107
Consolidated Balance Sheet and Profit & Loss Account 108
Consolidated Cash Flow Statement 110
Schedules to Consolidated Accounts 111
Notes to Consolidated Accounts 120
Details of Subsidiary Companies 140
Corporate Information
2
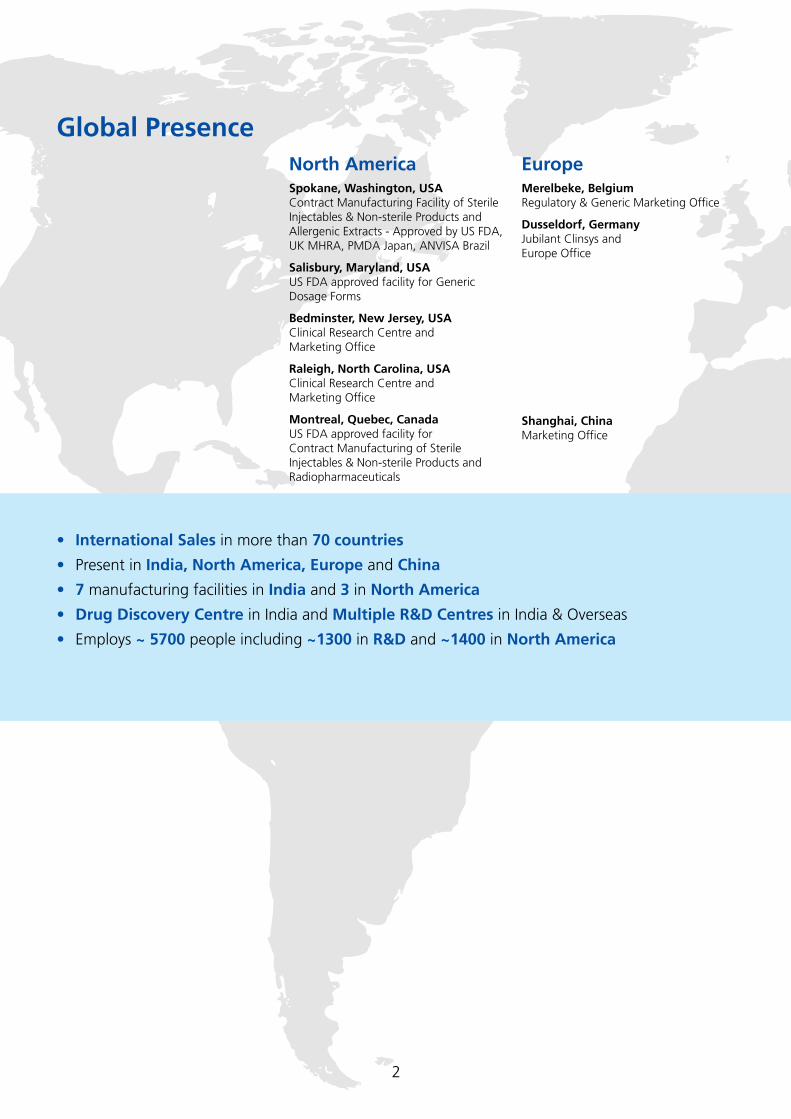
Global PresenceNorth AmericaSpokane, Washington, USA Contract Manufacturing Facility of Sterile Injectables & Non-sterile Products and Allergenic Extracts - Approved by US FDA, UK MHRA, PMDA Japan, ANVISA Brazil
Salisbury, Maryland, USA US FDA approved facility for Generic Dosage Forms
Bedminster, New Jersey, USA Clinical Research Centre and Marketing Office
Raleigh, North Carolina, USA Clinical Research Centre and Marketing Office
Montreal, Quebec, Canada US FDA approved facility for Contract Manufacturing of Sterile Injectables & Non-sterile Products and Radiopharmaceuticals
EuropeMerelbeke, Belgium Regulatory & Generic Marketing Office
Dusseldorf, Germany Jubilant Clinsys and Europe Office
Shanghai, China Marketing Office
• International Sales in more than 70 countries
• Present in India, North America, Europe and China
• 7 manufacturing facilities in India and 3 in North America
• Drug Discovery Centre in India and Multiple R&D Centres in India & Overseas
• Employs ~ 5700 people including ~1300 in R&D and ~1400 in North America
Annual Report 2010-11 | Jubilant Life Sciences Limited
3
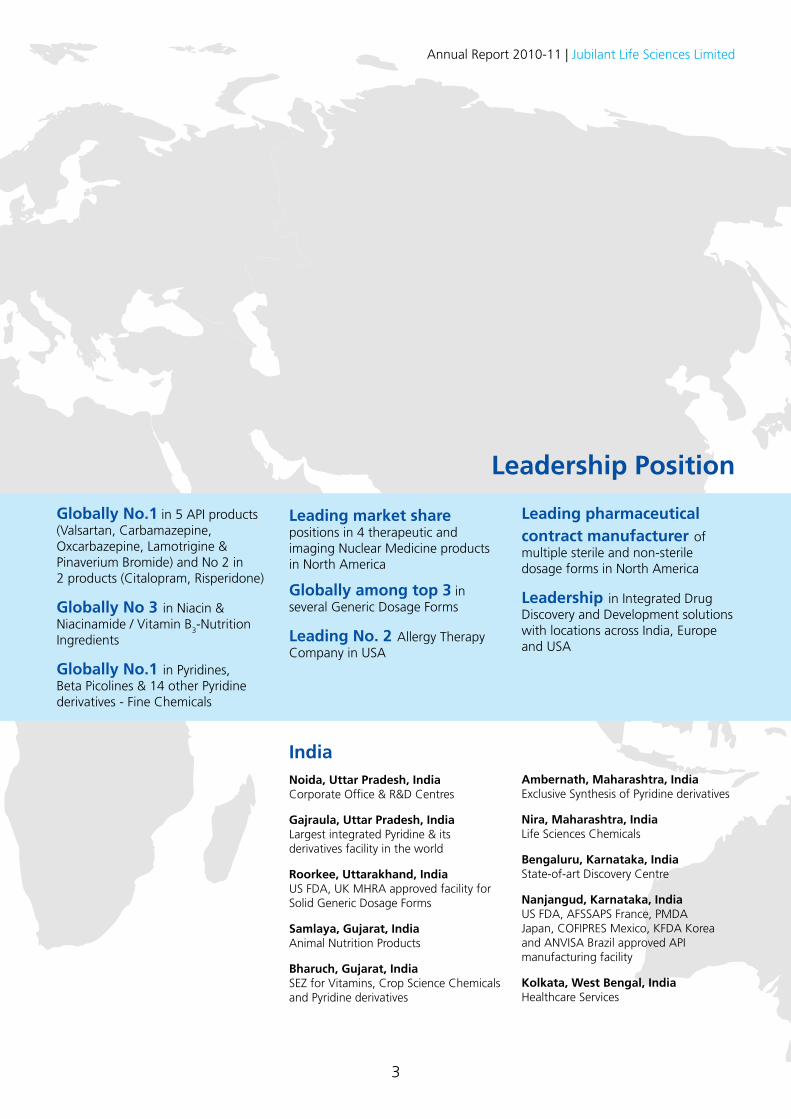
Leadership Position
IndiaNoida, Uttar Pradesh, India Corporate Office & R&D Centres
Gajraula, Uttar Pradesh, India Largest integrated Pyridine & its derivatives facility in the world
Roorkee, Uttarakhand, India US FDA, UK MHRA approved facility for Solid Generic Dosage Forms
Samlaya, Gujarat, India Animal Nutrition Products
Bharuch, Gujarat, India SEZ for Vitamins, Crop Science Chemicals and Pyridine derivatives
Globally No.1 in 5 API products (Valsartan, Carbamazepine, Oxcarbazepine, Lamotrigine & Pinaverium Bromide) and No 2 in 2 products (Citalopram, Risperidone)
Globally No 3 in Niacin & Niacinamide / Vitamin B3-Nutrition Ingredients
Globally No.1 in Pyridines, Beta Picolines & 14 other Pyridine derivatives - Fine Chemicals
Leading market share positions in 4 therapeutic and imaging Nuclear Medicine products in North America
Globally among top 3 in several Generic Dosage Forms
Leading No. 2 Allergy Therapy Company in USA
Leading pharmaceutical contract manufacturer of multiple sterile and non-sterile dosage forms in North America
Leadership in Integrated Drug Discovery and Development solutions with locations across India, Europe and USA
Ambernath, Maharashtra, India Exclusive Synthesis of Pyridine derivatives
Nira, Maharashtra, India Life Sciences Chemicals
Bengaluru, Karnataka, India State-of-art Discovery Centre
Nanjangud, Karnataka, India US FDA, AFSSAPS France, PMDA Japan, COFIPRES Mexico, KFDA Korea and ANVISA Brazil approved API manufacturing facility
Kolkata, West Bengal, India Healthcare Services
4
Jubilant Life Sciences Takes Shape
Almost a decade ago the Company had stepped onto this path of trans-formation from a Chemicals Company to a diversified Specialty Chemicals & Pharma Company offering a wide range of products. In the year 2010, the Company has successfully transcended onto the next phase of evolu-tion into an Integrated Pharma and Life Sciences Company.
The Company’s success so far is an outcome of its strategic focus on the pharma and life sciences industry, moving up the value chain for products and services across geographies, constantly investing in various growth platforms and promoting a culture of innovation.
With this change, Jubilant Life Sciences is now the flagship Company of pharma and life sciences sector of the Jubilant Bhartia Group, which has interest in diverse sectors.
The Company provides Life Science Products and Services across the Value Chain and is committed to deliver value to its customers across 70 countries.
The Company renews its focus on its vision, core values, and stays committed to its promise of Caring, Sharing and Growing.
2001
2010
Annual Report 2010-11 | Jubilant Life Sciences Limited
5
Our Vision and Promise Our Values
We will carefully select, train and develop our people to be creative and empower
them to take decisions, so that they respond to all stakeholders with agility,
confidence and teamwork.
We stretch ourselves to be cost effective and efficient in all aspects of our opera-tions and focus on flawless delivery to
create and provide the best value to our stakeholders.
By sharing our knowledge and learning from each other and from the markets
we serve, we will continue to surprise our stakeholders with innovative solutions.
With utmost care for the environment and safety, we will always strive to excel in the quality of our processes, our products and
our services.
Annual Report 2010-11 | Jubilant Life Sciences Limited
6
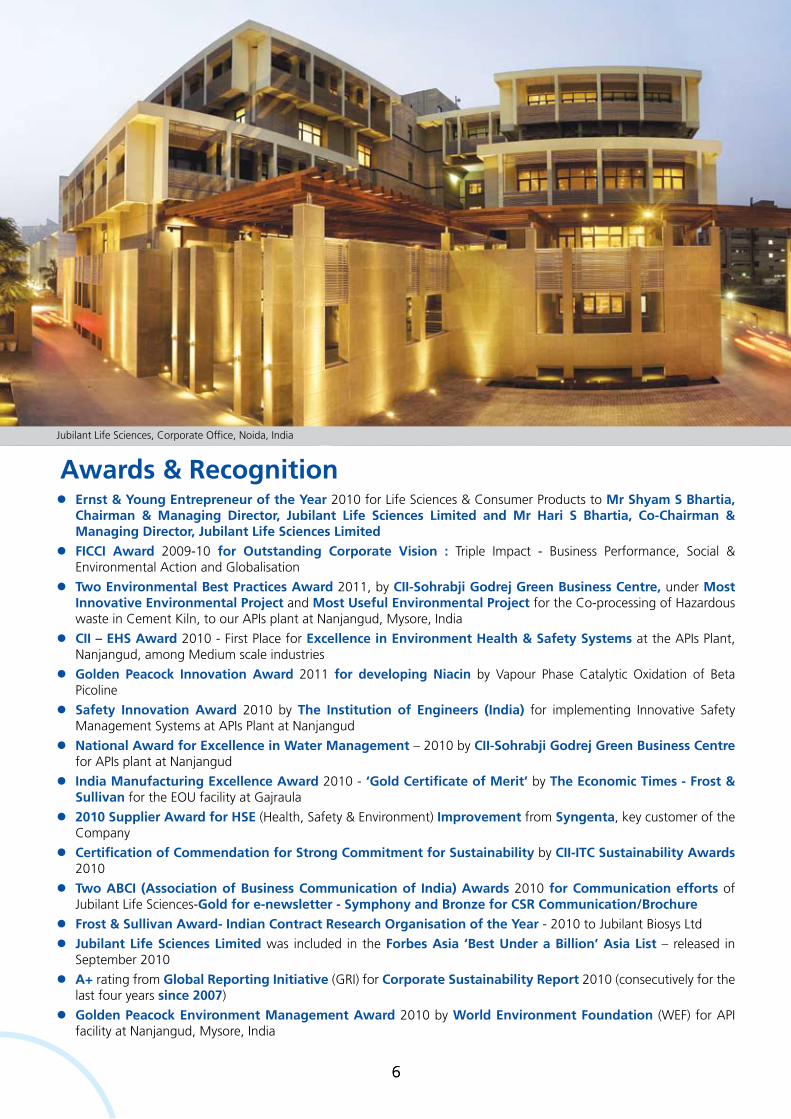
Jubilant Life Sciences, Corporate Office, Noida, India
6
l Ernst & Young Entrepreneur of the Year 2010 for Life Sciences & Consumer Products to Mr Shyam S Bhartia, Chairman & Managing Director, Jubilant Life Sciences Limited and Mr Hari S Bhartia, Co-Chairman & Managing Director, Jubilant Life Sciences Limited
l FICCI Award 2009-10 for Outstanding Corporate Vision : Triple Impact - Business Performance, Social & Environmental Action and Globalisation
lTwo Environmental Best Practices Award 2011, by CII-Sohrabji Godrej Green Business Centre, under Most Innovative Environmental Project and Most Useful Environmental Project for the Co-processing of Hazardous waste in Cement Kiln, to our APIs plant at Nanjangud, Mysore, India
l CII – EHS Award 2010 - First Place for Excellence in Environment Health & Safety Systems at the APIs Plant, Nanjangud, among Medium scale industries
l Golden Peacock Innovation Award 2011 for developing Niacin by Vapour Phase Catalytic Oxidation of Beta Picoline
l Safety Innovation Award 2010 by The Institution of Engineers (India) for implementing Innovative Safety Management Systems at APIs Plant at Nanjangud
l National Award for Excellence in Water Management – 2010 by CII-Sohrabji Godrej Green Business Centre for APIs plant at Nanjangud
l India Manufacturing Excellence Award 2010 - ‘Gold Certificate of Merit’ by The Economic Times - Frost & Sullivan for the EOU facility at Gajraula
l 2010 Supplier Award for HSE (Health, Safety & Environment) Improvement from Syngenta, key customer of the Company
l Certification of Commendation for Strong Commitment for Sustainability by CII-ITC Sustainability Awards 2010
l Two ABCI (Association of Business Communication of India) Awards 2010 for Communication efforts of Jubilant Life Sciences-Gold for e-newsletter - Symphony and Bronze for CSR Communication/Brochure
l Frost & Sullivan Award- Indian Contract Research Organisation of the Year - 2010 to Jubilant Biosys Ltd
l Jubilant Life Sciences Limited was included in the Forbes Asia ‘Best Under a Billion’ Asia List – released in September 2010
l A+ rating from Global Reporting Initiative (GRI) for Corporate Sustainability Report 2010 (consecutively for the last four years since 2007)
l Golden Peacock Environment Management Award 2010 by World Environment Foundation (WEF) for API facility at Nanjangud, Mysore, India
Awards & Recognition
Annual Report 2010-11 | Jubilant Life Sciences Limited
7
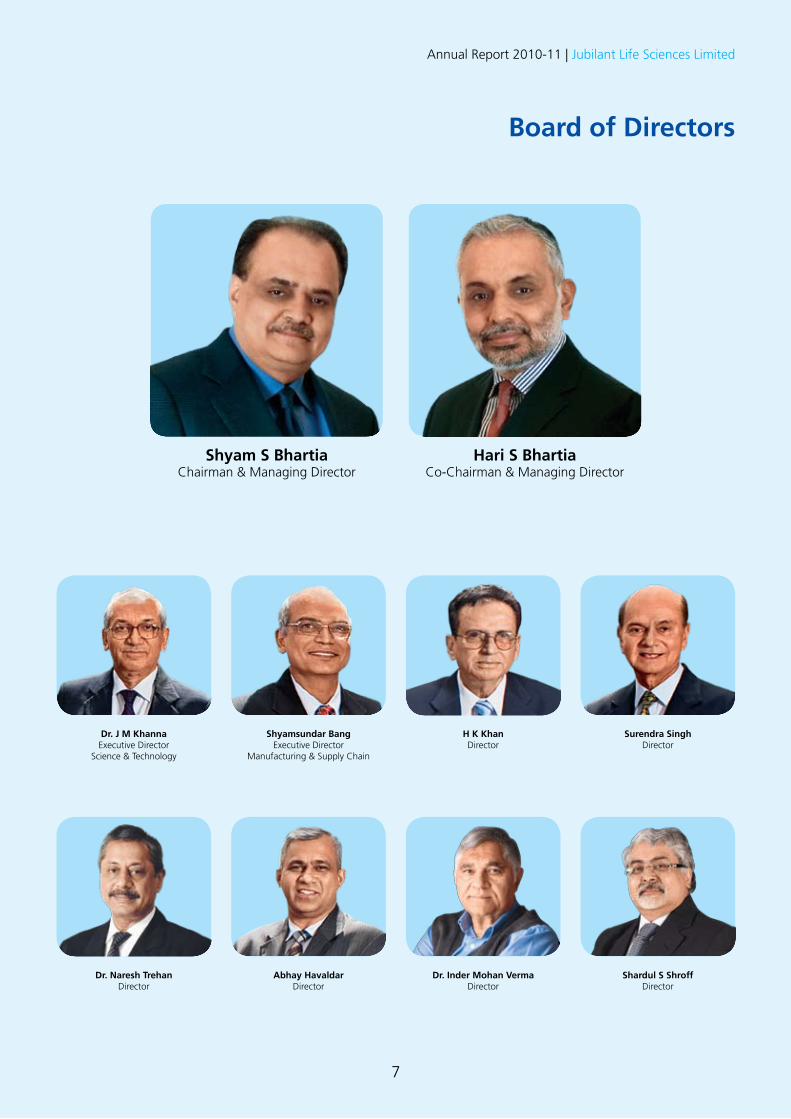
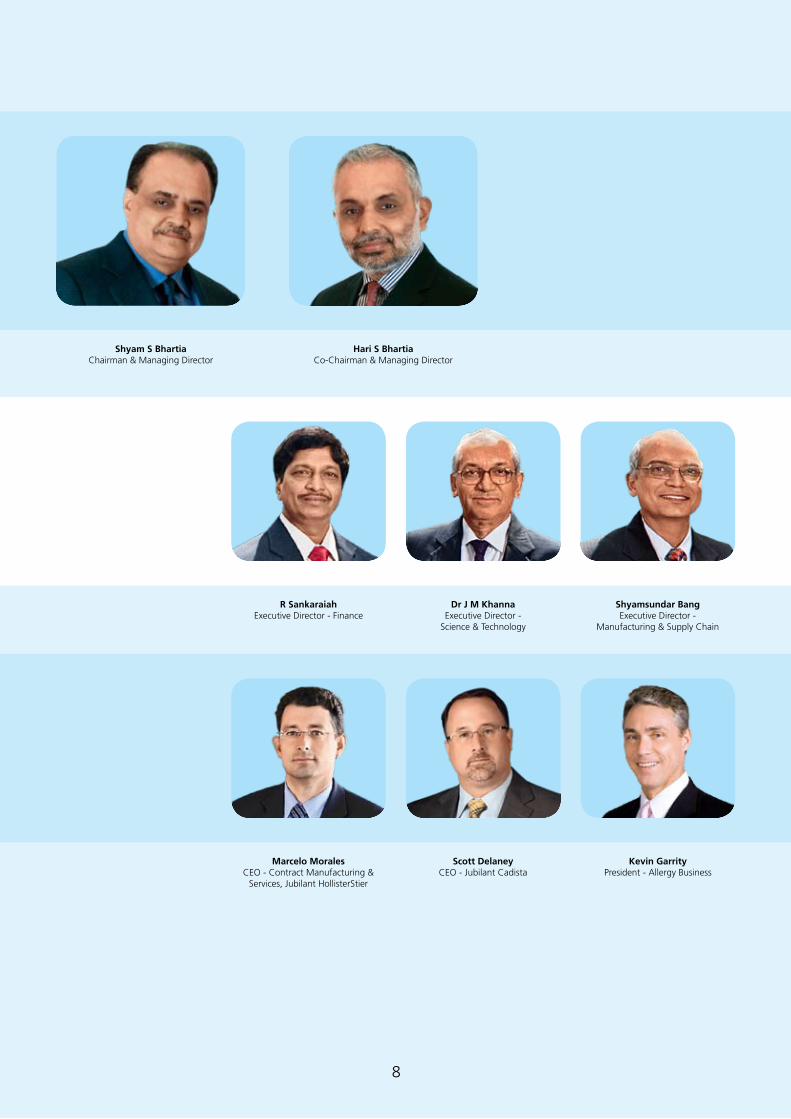
Board of Directors
7
Shyam S BhartiaChairman & Managing Director
Hari S Bhartia Co-Chairman & Managing Director
Dr. J M KhannaExecutive Director
Science & Technology
Shyamsundar Bang Executive Director
Manufacturing & Supply Chain
H K KhanDirector
Surendra SinghDirector
Dr. Naresh TrehanDirector
Abhay HavaldarDirector
Dr. Inder Mohan VermaDirector
Shardul S ShroffDirector
Annual Report 2010-11 | Jubilant Life Sciences Limited
88
Shyam S Bhartia Chairman & Managing Director
R SankaraiahExecutive Director - Finance
Dr J M KhannaExecutive Director -
Science & Technology
Shyamsundar Bang Executive Director -
Manufacturing & Supply Chain
Hari S Bhartia Co-Chairman & Managing Director
Marcelo Morales CEO - Contract Manufacturing &
Services, Jubilant HollisterStier
Scott DelaneyCEO - Jubilant Cadista
Kevin GarrityPresident - Allergy Business
Annual Report 2010-11 | Jubilant Life Sciences Limited
9
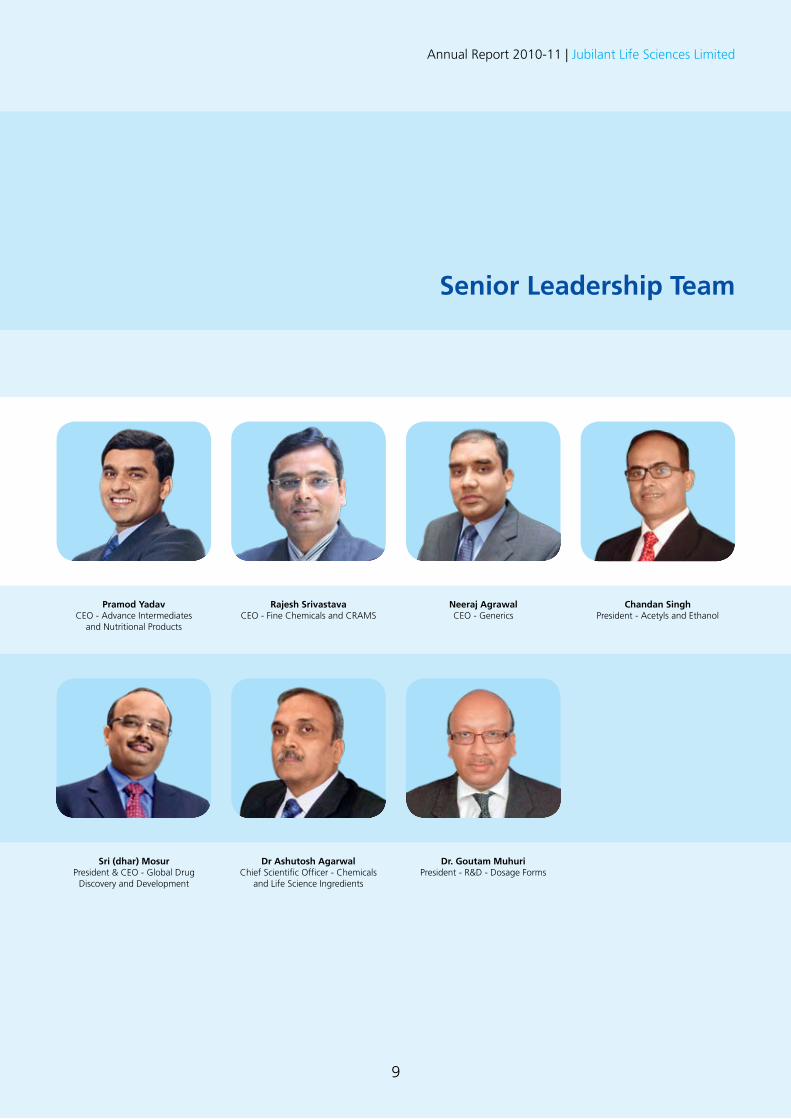
Senior Leadership Team
9
Pramod Yadav CEO - Advance Intermediates
and Nutritional Products
Rajesh Srivastava CEO - Fine Chemicals and CRAMS
Neeraj AgrawalCEO - Generics
Chandan SinghPresident - Acetyls and Ethanol
Sri (dhar) MosurPresident & CEO - Global Drug
Discovery and Development
Dr Ashutosh AgarwalChief Scientific Officer - Chemicals
and Life Science Ingredients
Dr. Goutam MuhuriPresident - R&D - Dosage Forms
Annual Report 2010-11 | Jubilant Life Sciences Limited
10
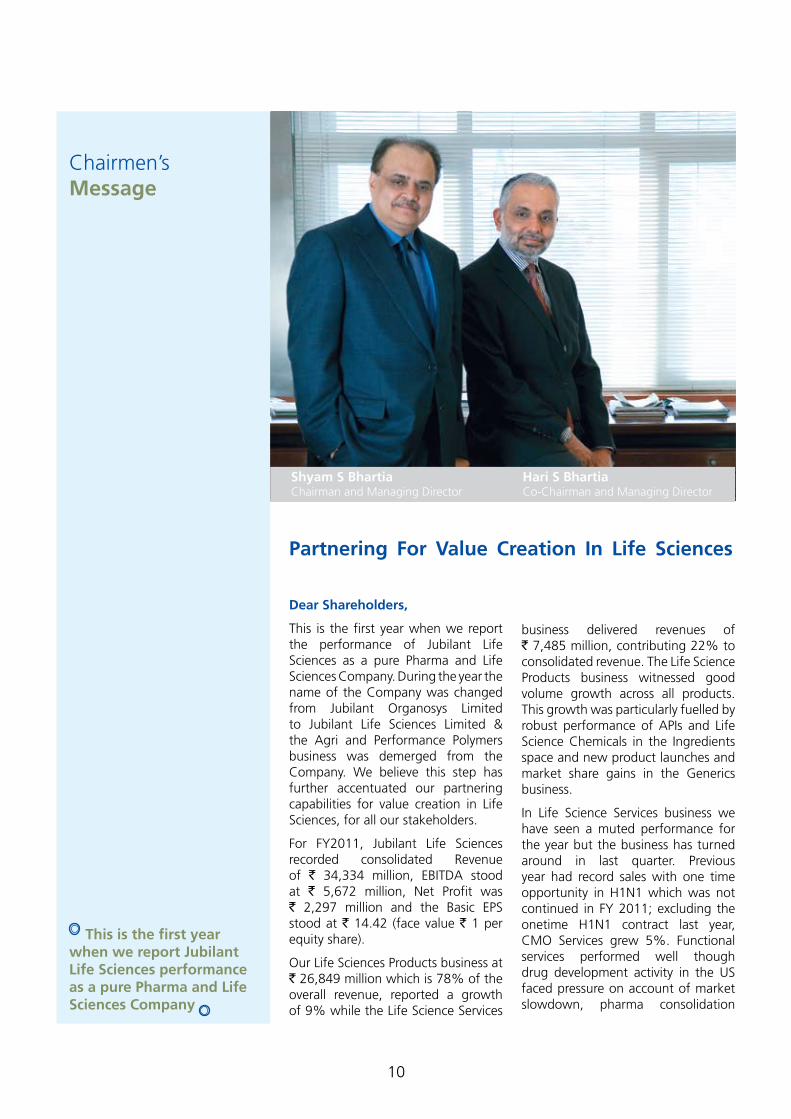
Chairmen’s Message
This is the first year when we report Jubilant Life Sciences performance as a pure Pharma and Life Sciences Company
Dear Shareholders,
This is the first year when we report the performance of Jubilant Life Sciences as a pure Pharma and Life Sciences Company. During the year the name of the Company was changed from Jubilant Organosys Limited to Jubilant Life Sciences Limited & the Agri and Performance Polymers business was demerged from the Company. We believe this step has further accentuated our partnering capabilities for value creation in Life Sciences, for all our stakeholders.
For FY2011, Jubilant Life Sciences recorded consolidated Revenue of ` 34,334 million, EBITDA stood at ` 5,672 million, Net Profit was ` 2,297 million and the Basic EPS stood at ` 14.42 (face value ` 1 per equity share).
Our Life Sciences Products business at ` 26,849 million which is 78% of the overall revenue, reported a growth of 9% while the Life Science Services
business delivered revenues of ` 7,485 million, contributing 22% to consolidated revenue. The Life Science Products business witnessed good volume growth across all products. This growth was particularly fuelled by robust performance of APIs and Life Science Chemicals in the Ingredients space and new product launches and market share gains in the Generics business.
In Life Science Services business we have seen a muted performance for the year but the business has turned around in last quarter. Previous year had record sales with one time opportunity in H1N1 which was not continued in FY 2011; excluding the onetime H1N1 contract last year, CMO Services grew 5%. Functional services performed well though drug development activity in the US faced pressure on account of market slowdown, pharma consolidation
Partnering For Value Creation In Life Sciences
Shyam S Bhartia Chairman and Managing Director
Hari S Bhartia Co-Chairman and Managing Director
Annual Report 2010-11 | Jubilant Life Sciences Limited
11
and delayed on boarding of new integrated programs.
The Company’s success so far is due to its strategic focus on its Life Science Products and Services businesses, moving up the value chain for products, providing services across geographies, constantly investing in various growth platforms and promoting a culture of innovation. Going forward, we are confident of our continuous ability to deliver on the promise of a leading outsourcing player.
Global Pharma Outsourcing & India Opportunity
World over, there is pressure on Governments to reduce spiraling healthcare costs given the rapidly ageing population. The use of low cost generics is being encouraged across the developed world. The increase in patent expiries is further putting pressure on the innovators who are slated to forego products worth US$ 200 billion over the next 5 years. This brings in additional pressure on the innovators set to prioritise the replenishment of new product pipelines and step-up outsourced manufacturing. Recently, several large pharma companies have declared their intent to outsource their manufacturing to cost efficient destinations.
The Global Pharma outsourcing [Contract Research Organisation (CRO) & Contract Manufacturing (CMO)] market which was valued at US$ 67 billion in 2010 is expected to reach US$ 90 billion by 2012. Although India is a preferred destination for cost competitive & qualitative pharma outsourcing, the penetration levels so far are quite low. The Indian Custom Research & Manufacturing Services (CRAMS) industry at US$ 3 billion is around 4-5 % of the global pharma outsourcing market. These trends augur well for CRAMS/ Pharma Outsourcing. The penetration of both CMOs and CROs is expected to increase up to 50-60% by 2015, which brightens the long term visibility for the CRAMS industry. India with its
inherent strengths stands to gain from these positive trends.
Partnering for Value Creation
Jubilant Life Sciences is well positioned to capitalise on the global outsourcing opportunity. Our wealth of knowledge in chemical and pharma research, respect for Intellectual Property Rights (IPR), world-class Good Manufacturing Practice (GMP) & multi locational US FDA approved manufacturing plants, large talent pool, low R&D & manufacturing costs give us an additional edge in this domain. Over the years, we have strengthened our integrated business model to offer products and services across the pharma value chain including end-to-end drug discovery and development solutions. This enables us to partner innovator pharma and life sciences companies for sustainable value creation. We remain committed to strengthen our value offering through global scale of operations, focus on innovative solutions, to deliver value to our partners across the world.
Today, we are recognised as a preferred partner by leading pharma and biotech companies. We remain
focused on continually improving our cost competitiveness and quality of production, through investment in R&D, implementation of Lean Management methodology and Six Sigma business strategies in manufacturing, efficient design & project management in order to accelerate the ‘speed to market’ for our customers’ products.
Creating a Focused Life Sciences Company
In order to reflect the focus of the Company as a pure pharma & life sciences player, the name of the Company was changed from Jubilant Organosys Limited to Jubilant Life Sciences Limited with effect from October 1, 2010. Also the process of the demerger of Agri and Performance Polymers business and the listing of the demerged entity separately as Jubilant Industries Limited was completed on February 14, 2011. We now have two operating and listed companies; Jubilant Life Sciences Limited and Jubilant Industries Limited, with eminent members on the respective Board with independent Directors, focusing independently on the growth of the respective Company.
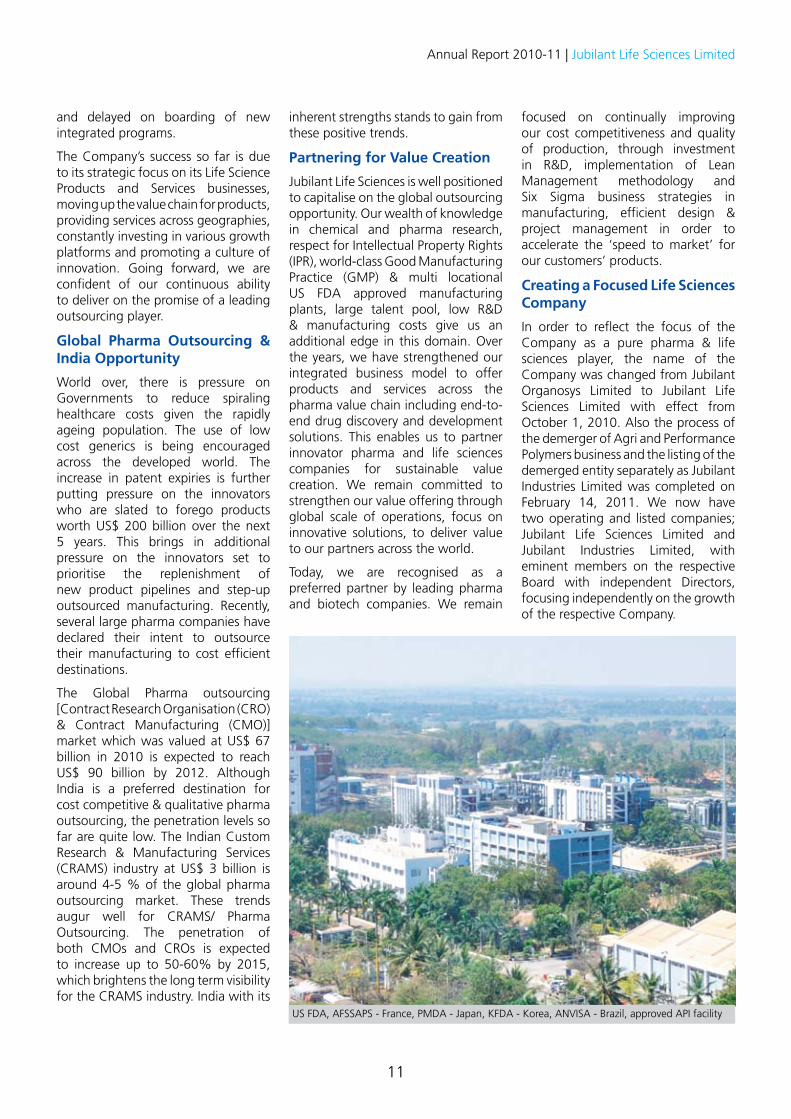
US FDA, AFSSAPS - France, PMDA - Japan, KFDA - Korea, ANVISA - Brazil, approved API facility
12
Dividend
For FY 2011, we have announced a dividend of ` 2 per equity share of face value ` 1 each which is 200% for the year. This year’s dividend will result in a payout of ` 370 million including dividend tax.
Vision 2014
The Company’s future growth strategy will be driven by four key factors of capacity enhancement; innovation led new launches; expansion of the geographic markets and vertical integration. We see continued volume growth in the Life Science Products business on the back of new product launches and existing product ramp-ups. Good growth through geographical expansion into international markets is expected to be led by penetration into Europe, Japan and Emerging markets. The realignment of the Services business with market requirements will bear fruit in terms of better performance and margin enhancement.
We launched a new program “Vision 2014” which will enable us to witness:
1. Enhanced revenue momentum driven by robust geographical growth as well as innovation led new products and launches,
2. Operating profit improvement due to revenue growth in Products business, margin improvement in Services business, competitive advantage with vertical integration and innovation led cost reduction programs with the help of Six Sigma projects,
3. Attractive Return on Capital Employed through higher operating profits and better capital utilisation and
4. Strong balance sheet with contained debt levels.
During the period, we have made investments in setting up new capacities including one of the largest Sartans plant for APIs to tap the CVS market, a Niacinamide plant for Vitamin B3 in Nutrition Ingredients to further consolidate our leadership position, Symtet and Pyridines plants to meet the increasing customer demands while moving up the value chain in forward integration initiatives.
Our continued investments in capacity expansion and vertical integration will lead to robust profitable growth
We are confident that Jubilant is well placed to leverage its global capacities to capitalise on the outsourcing opportunity
Chairmen’s Message
Annual Report 2010-11 | Jubilant Life Sciences Limited
13
Best Wishes and Regards,
Shyam S Bhartia Hari S Bhartia
Chairman & Managing Director Co-Chairman & Managing Director
May 10, 2011
We stay committed to partnering for value creation and will continue to provide world class products and services to our customers
In FY 2012, our overall capex plan is at ` 5 billion which is likely to generate revenue of more than ` 12 billion at current prices and full capacity utilisation.
Corporate Social Responsibility
In line with our continued focus on the sustainability of the business, we aim at improving stakeholder value through improved eco efficient use of capital and natural resources. Our approach to sustainable development focuses on the triple bottom line of Economic, Environment and Social performance.
Corporate Social Responsibility is an integral part of how we conduct our business and our efforts are directed towards community development and inclusive growth. Going forward, we will be engaged in strengthening our initiatives in the areas of Primary Education, Basic Healthcare and
Livelihood Generation programs for our communities.
Partnering for Growth
We stay committed to partnering for value creation and take this opportunity to thank all our stakeholders including independent directors, our customers, partners, bankers and shareholders for reposing their confidence in the Company and providing their unstinted support.
We also take this opportunity to appreciate the contributions of our employees across India, North America, Europe and other parts of the world, who have participated in our journey this far. Through their tireless efforts, enthusiasm and dedication, we have reached this global size and scale. With our collective effort we will continue to surpass the expectations of our customers and provide world class products and services.
14
Management Discussion & Analysis
We have been able to build a sustained partnership model on the back of our end-to-end outsourcing infrastructure
Industry ScenarioPharma & Life Sciences GrowthThe demand for pharmaceutical products and services is seeing robust growth across emerging nations. Even as innovators strive to bring newer drugs and novel therapies to market to replenish sales lost on account of blockbuster drugs loosing patent protection, it is the generic dosage forms sector that is showing a sustained uptick. The developed world is showing higher rates of adoption of these low-cost products which are widely used in the developing countries. The US market for generics is expected to grow to over US$ 100 billion in the next two years.
Similarly agrochemicals have good potential to deliver. Years of stagnant investment in agriculture has pushed food grain output to a plateau. Proper use of agrochemicals and right quality of seeds is the least risky method of charting a revival in farmland productivity. The global crop science market stands at just under US$ 50 billion. Given the acute need to increase the food output to feed a growing world population, farmers are turning to crop protection & crop nutrition products. Globally Life Sciences, which is a tightly regulated market by nature, is thus seeing handsome growth.
Companies such as Jubilant Life Sciences are very well-positioned to offer expertise and value to fellow pharma and life sciences companies –whether it is in developing process improvements, or supplying generic dosage forms or simply helping design and develop drugs of the future. With our complete range of outsourcing services we are well accepted as value creators in our chosen segments.
Outsourcing OpportunityPharma (CRO & CMO) - Global spending by the pharmaceutical industry on outsourcing (including CMO and CRO) which was valued at US$ 67 billion in 2010 is estimated to reach US$ 90 billion by 2012. The global CMO market is growing steadily at a CAGR of 13% and is
estimated at US$ 47 billion in 2011. India has captured a significant share of this market opportunity with Indian CMO industry expected to garner US$ 3 billion in 2011, registering a growth of over 40%. Similarly the Global CRO market is growing at a CAGR of 19%, and is likely to attain a size of US$ 28 billion in 2011. India is fast gaining recognition for its work in this area.
This growth in outsourcing is largely on account of global pharma industry experiencing declining growth and margin pressures led by National Governments bearing down expensive drugs to rein in costs of healthcare delivery to an ageing populace. Patent expiry of innovator products that is crimping revenue & margins and declining R&D productivity is leading to an inadequate pipeline of new products.
The recent global economic slowdown has also catalysed the adoption of the contract manufacturing model with innovators and generic makers alike searching for better quality and optimal cost options. All of these factors augur well for the Indian Custom Research & Manufacturing Services (CRAMS) players.
India OpportunityIndian companies are well equipped to capitalise on the opportunities in global outsourcing. These companies have strengthened their presence in the market by acquiring better technologies and developing expertise in niche segments that offer high margins and have higher entry barriers. India offers tremendous advantage in terms of world-class US FDA compliant infrastructure set up by leading players, large talent pool, low R&D and manufacturing cost and high capital efficiency.
Traditionally Intermediates and Active Pharmaceutical Ingredients (APIs) outsourcing has been more prevalent in India; where around 64% of total outsourcing is in this segment. However the scenario is changing rapidly as many Indian companies have expanded their offering to include dosage forms, injectables, bio-similars etc. under contract manufacturing and
Indian companies are well equipped to capitalise on the opportunities of global outsourcing
Management Discussion & Analysis
Annual Report 2010-11 | Jubilant Life Sciences Limited
15
have also built capabilities in the areas of contract research for discovery and development.
Over the years, some of the Indian companies including Jubilant have steadily moved up the value chain and have significantly expanded their capacities and capabilities, sometimes through acquisitions to gain a foot hold in high value, niche areas like injectables and biologics. This capacity expansion has enabled Indian companies to offer advantages of scale to the global pharmaceutical and life sciences industry. Jubilant has also been a pioneer in India, in the area of drug discovery and development by offering integrated solutions across target validation, discovery, pre-clinical and clinical development.
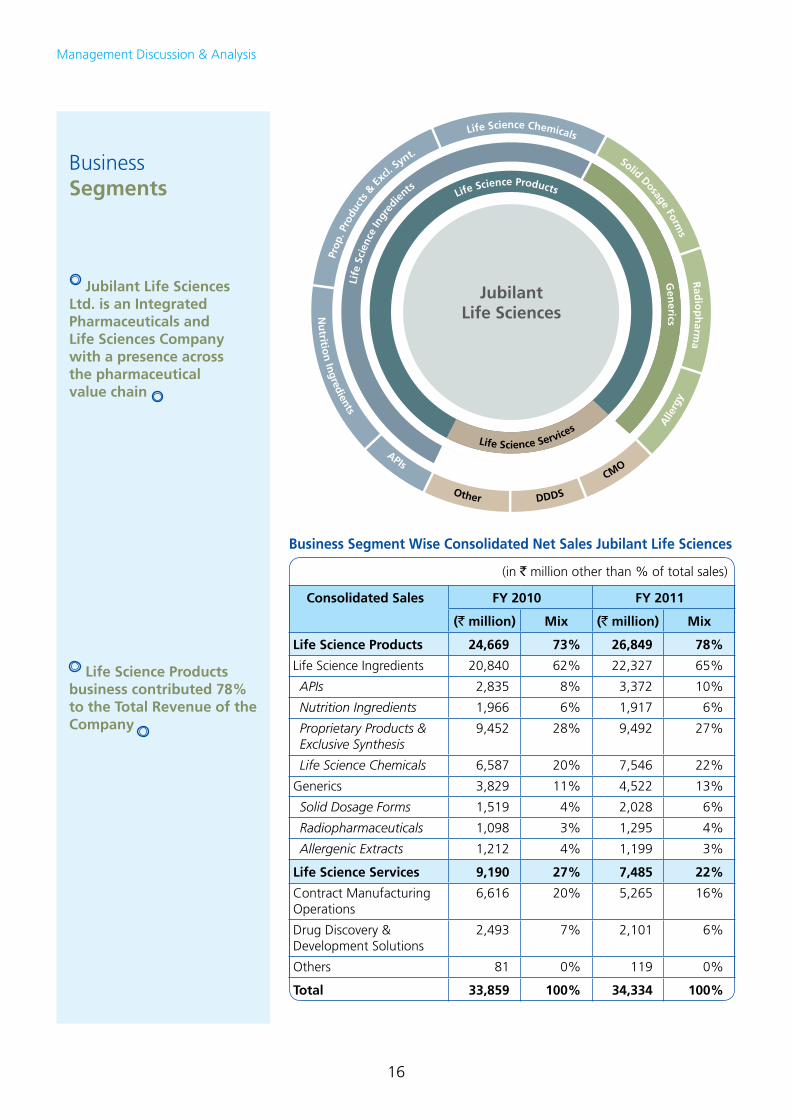
Jubilant Life Sciences The Spirit of PartnershipJubilant Life Sciences Ltd. is an integrated pharmaceuticals and life sciences company with a presence across the pharmaceutical value chain. We have built a significant presence throughout Life Science Products and Life Science Services businesses by leveraging upon the global scale of our operations. We are well positioned as an effective outsourcing partner for the global pharmaceuticals and life sciences industry.
Our Life Science Products offering comprises Life Sciences Ingredients and Generics. The former constitutes Active Pharmaceutical Ingredients (APIs), Nutrition Ingredients, Proprietary Products & Exclusive Synthesis business and Life Science Chemicals whereas the latter comprises Solid Dosage Forms, Radiopharmaceutical Products and Allergenic Extracts. Our Life Science Services offerings broadly include Contract Manufacturing Operations (CMO), and Drug Discovery & Development Solutions (DDDS).
Our philosophy has been grounded in partnering and value-creation. The niche we have developed in outsourcing underlines our belief in partnering with our customers. Today our outsourcing business for pharmaceuticals and life sciences is
one of the largest in India. We are proud to state that we partner rather than compete with the global biotech and pharma majors and this is the basis of our successful relationships and continued maturity as an outsourcing company.
We have been able to build a sustained partnership model on the back of our end-to-end outsourcing infrastructure. For instance our APIs business is modeled to deliver true-value to our customers, being fully integrated into raw materials and downstream products of APIs. Solid Dosage Forms is a business that draws on indigenous product development through in-house R&D and partnerships with customers. Moving on, in our CMO business we have taken the collaborative approach for growth in a market with high entry barriers. Similarly our integrated approach offered in drug discovery and development is anchored on trust and respect for Intellectual Property (IP). We are working to deliver new product solutions by way of our partnerships with several pharma & bio-pharma companies and academic institutions.
We have seven manufacturing locations in India and three in North America. Our Indian manufacturing facilities at Gajraula, Nira, Samlaya and Nanjangud have ISO-9001, ISO-14001 and OHSAS 18001 certification. The APIs plant in Nanjangud, the Dosage Forms plant in Salisbury, Maryland, United States and the Sterile Injectables and Non-sterile products manufacturing facilities in Spokane, Washington, United States and Montreal, Quebec, Canada all are US FDA approved. The dosage forms plant in Roorkee, India also has
US FDA and UK MHRA approval. We have a state-of-the-art Drug Discovery Centre based in Bengaluru, India. Our Corporate Headquarters and Central R&D centre are at Noida, Delhi NCR, India.
We export our products and provide services to customers in over 70 countries. We have marketing subsidiaries in the United States, Europe and China to effectively penetrate these major markets. Jubilant Pharmaceuticals and PSI Supply focus on pharmaceuticals regulatory affairs and supply of dosage forms business in Europe. Jubilant Pharmaceuticals and Jubilant Cadista focus on manufacturing and distribution of solid dosage forms in the US market.
The Company reported Consolidated Net Sales of ` 34,334 million for FY 2011 from its products and services business lines. EBITDA for the year stood at ` 5,672 million with Profit after Tax at ` 2,297 million for FY 2011.
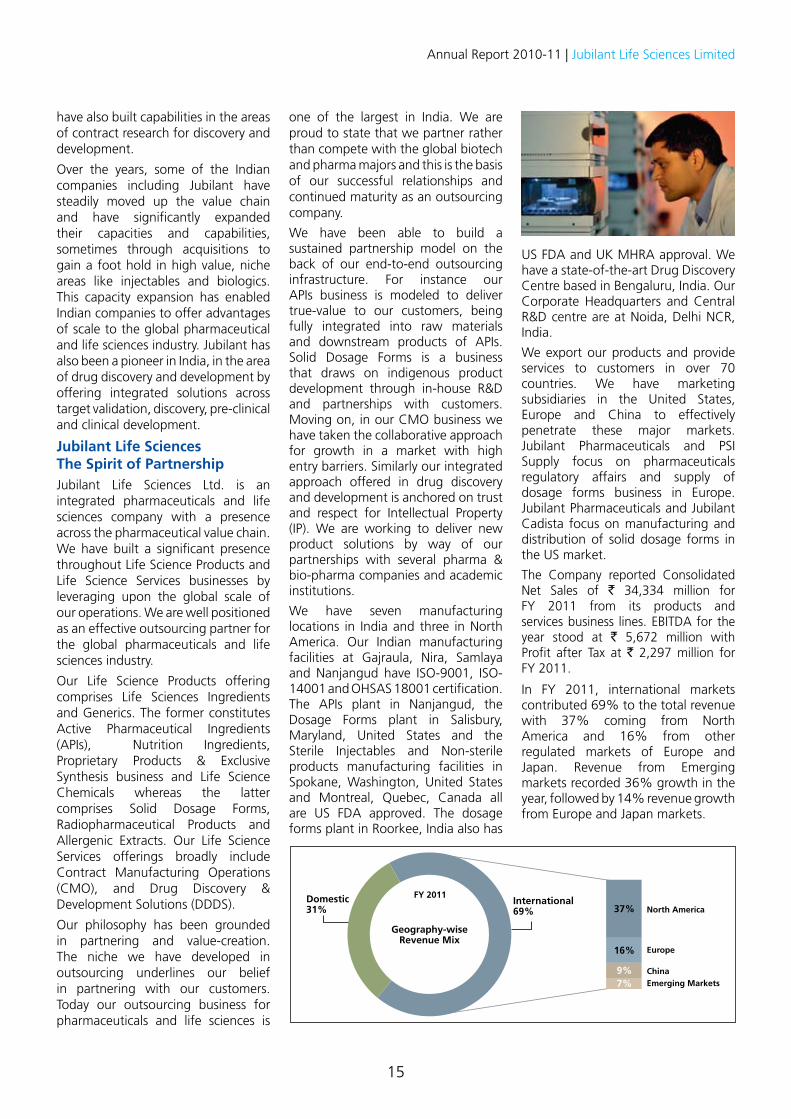
In FY 2011, international markets contributed 69% to the total revenue with 37% coming from North America and 16% from other regulated markets of Europe and Japan. Revenue from Emerging markets recorded 36% growth in the year, followed by 14% revenue growth from Europe and Japan markets.
16
Business Segment Wise Consolidated Net Sales Jubilant Life Sciences
(in ` million other than % of total sales)
Consolidated Sales FY 2010 FY 2011
(` million) Mix (` million) Mix
Life Science Products 24,669 73% 26,849 78%
Life Science Ingredients 20,840 62% 22,327 65%
APIs 2,835 8% 3,372 10%
Nutrition Ingredients 1,966 6% 1,917 6%
Proprietary Products & Exclusive Synthesis
9,452 28% 9,492 27%
Life Science Chemicals 6,587 20% 7,546 22%
Generics 3,829 11% 4,522 13%
Solid Dosage Forms 1,519 4% 2,028 6%
Radiopharmaceuticals 1,098 3% 1,295 4%
Allergenic Extracts 1,212 4% 1,199 3%
Life Science Services 9,190 27% 7,485 22%
Contract Manufacturing Operations
6,616 20% 5,265 16%
Drug Discovery & Development Solutions
2,493 7% 2,101 6%
Others 81 0% 119 0%
Total 33,859 100% 34,334 100%
Business Segments
Life Science Products business contributed 78% to the Total Revenue of the Company
Jubilant Life Sciences Ltd. is an Integrated Pharmaceuticals and Life Sciences Company with a presence across the pharmaceutical value chain
Management Discussion & Analysis
Annual Report 2010-11 | Jubilant Life Sciences Limited
17
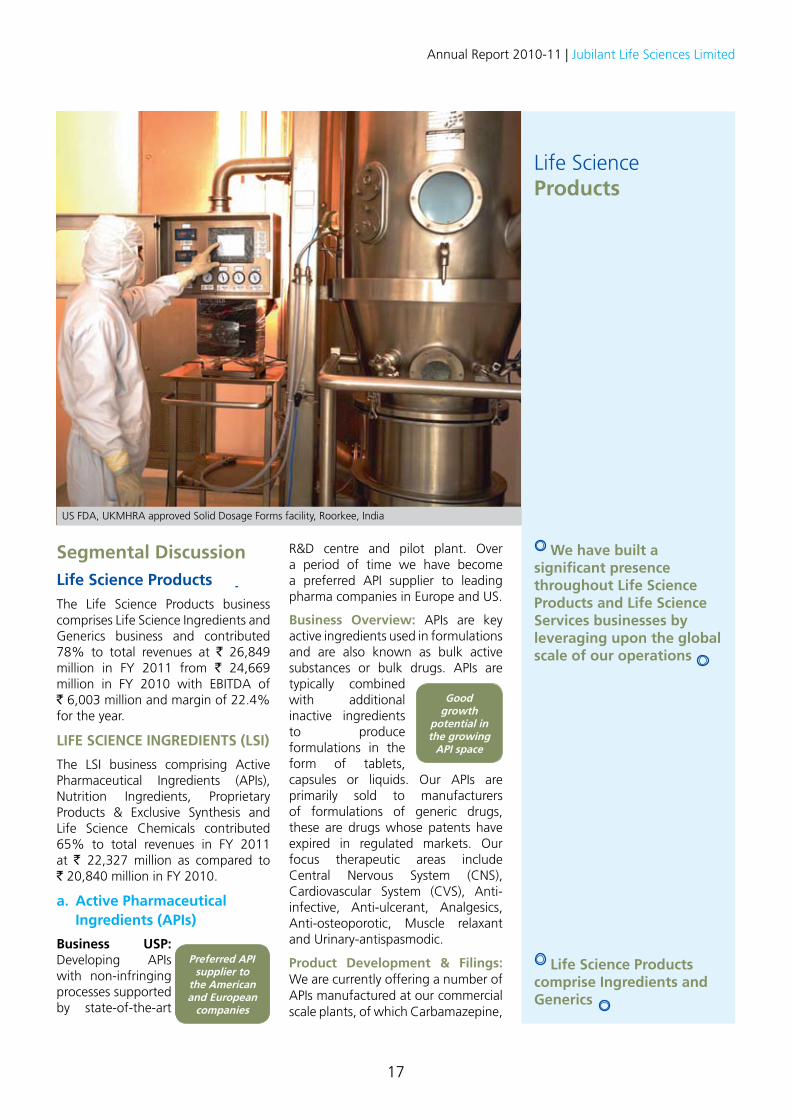
Segmental DiscussionLife Science ProductsThe Life Science Products business comprises Life Science Ingredients and Generics business and contributed 78% to total revenues at ` 26,849 million in FY 2011 from ` 24,669 million in FY 2010 with EBITDA of ` 6,003 million and margin of 22.4% for the year.
LIFE SCIENCE INGREDIENTS (LSI)
The LSI business comprising Active Pharmaceutical Ingredients (APIs), Nutrition Ingredients, Proprietary Products & Exclusive Synthesis and Life Science Chemicals contributed 65% to total revenues in FY 2011 at ` 22,327 million as compared to ` 20,840 million in FY 2010.
a. Active Pharmaceutical Ingredients (APIs)
Business USP: Developing APIs with non-infringing processes supported by state-of-the-art
R&D centre and pilot plant. Over a period of time we have become a preferred API supplier to leading pharma companies in Europe and US.
Business Overview: APIs are key active ingredients used in formulations and are also known as bulk active substances or bulk drugs. APIs are typically combined with additional inactive ingredients to produce formulations in the form of tablets, capsules or liquids. Our APIs are primarily sold to manufacturers of formulations of generic drugs, these are drugs whose patents have expired in regulated markets. Our focus therapeutic areas include Central Nervous System (CNS), Cardiovascular System (CVS), Anti-infective, Anti-ulcerant, Analgesics, Anti-osteoporotic, Muscle relaxant and Urinary-antispasmodic.
Product Development & Filings: We are currently offering a number of APIs manufactured at our commercial scale plants, of which Carbamazepine,
Life Science Products
Life Science Products comprise Ingredients and Generics
Good growth
potential in the growing
API space
We have built a significant presence throughout Life Science Products and Life Science Services businesses by leveraging upon the global scale of our operations
Preferred API supplier to
the American and European
companies
US FDA, UKMHRA approved Solid Dosage Forms facility, Roorkee, India
18
to run at high level of capacity utilisation. We plan to integrate our existing APIs with our solid dosage forms to improve synergies and profitability through better supply chain efficiency and market mix.
b. Nutrition Ingredients
Business USP: We are an integrated manufacturer of Vitamin B3. Ours is the lowest cost operation globally. Besides Human Nutrition Ingredients, we are also present in Animal Nutrition products, through value addition.
Business Overview: We are backward integrated into Beta Picoline through our Proprietary Products and Exclusive Synthesis business to derive Niacin and Niacinamide. Ours is a global business based on outsourced manufacturing model with distribution of products across the US, Europe and Emerging markets. We cater to the top 5 companies globally in each of our product lines. Our chief customers in Animal Nutrition include integrators, breeding farmers, feed millers, and formulator/pharma companies, commercial – broiler & layer farmers.
Product Development: We have developed various grades of Niacin and Niacinamide (Vitamin B3) suitable for human, pharmacological and personal care use. We are also evaluating to launch certain other products in the coming months under Human Nutrition.
In Animal Nutrition, we are the largest producer of Choline Chloride in India (also referred to as Vitamin B4), an important feed additive for poultry. We also produce various premixes based on vitamins or minerals or its combination, thereof. Specialty Products such as growth promoters and liver protection products for poultry are also in our product portfolio. Here we have a range of launches planned over the next 3 years.
Oxcarbazepine, Lamotrigine, Citalopram bromide, Risperidone, Donepezil and Olanzapine have market leadership positions globally.
We have filed 51 Drug Master Files (DMFs) in the US, 25 DMFs in Canada, 24 DMFs in Europe, and 6 DMFs in Japan till March 31, 2011.
Growth Strategy: Commercialisation of the new Sartans production block which is one of the largest generic sartan capacities would be a key element for future growth and has revenue potential of US$ 60 million at full capacity at current market prices. The proposed more than 50 new product launches in next 3 years with a primary focus on therapeutic segments of CNS and CVS are expected to drive growth, tapping into an estimated market opportunity of US$ 1.3 billion. North Americas would see major portion of launches, though growth would be faster and higher in the European region. We also have a strong product pipeline with plans to file 39 DMFs in US, 20 in Canada, 46 EDMFs in EU and 6 in Japan over the next 3 years.
Performance Overview: Revenues in FY 2011 stood at ` 3,372 million from ` 2,835 million in the previous year. Our business delivered 19% growth on the back of good sales of existing products and additional sales from newer product launches. We remain the preferred API supplier to leading companies in US and Europe and are ranked globally No.1 for APIs like Valsartan, Carbamazepine, Oxcarbazepine, Lamotrigine and Pinaverium Bromide and No.2 for Citalopram & Risperidone.
Outlook: The outlook remains positive for our API business with almost 85% of sales being generated from US and Europe. We continue to remain a preferred supplier to some of the leading global pharma companies. Our capacity in Sartans will help us consolidate our global presence and we expect the facility
Our team of scientists based out of our R&D centre in Noida focus actively on Research & Development of new APIs through non-infringing processes
Integration of APIs with formulations to enhance synergies
In our Proprietary Products & Exclusive Synthesis Business we plan to increase business with our existing customers and seek further penetration into the European and Emerging markets
Leadership in Vitamin B3 to drive
downstream applications
Reverse integration through our AIs business
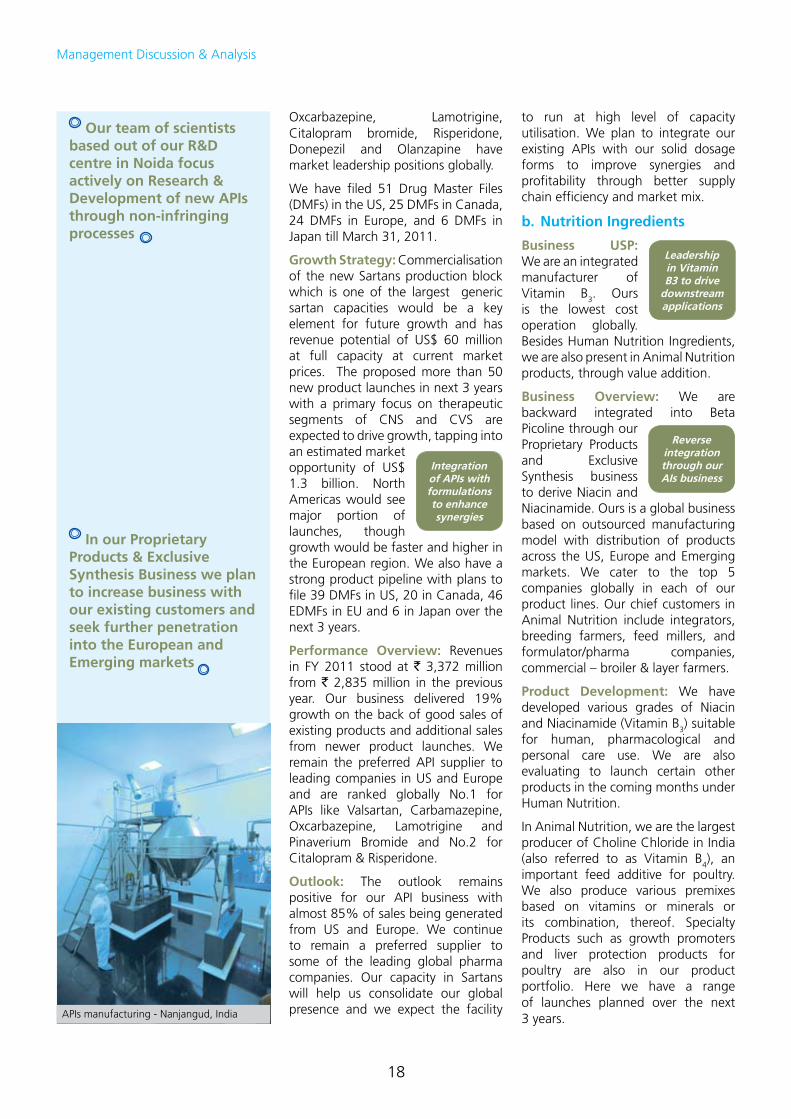
APIs manufacturing - Nanjangud, India
Management Discussion & Analysis
Annual Report 2010-11 | Jubilant Life Sciences Limited
19
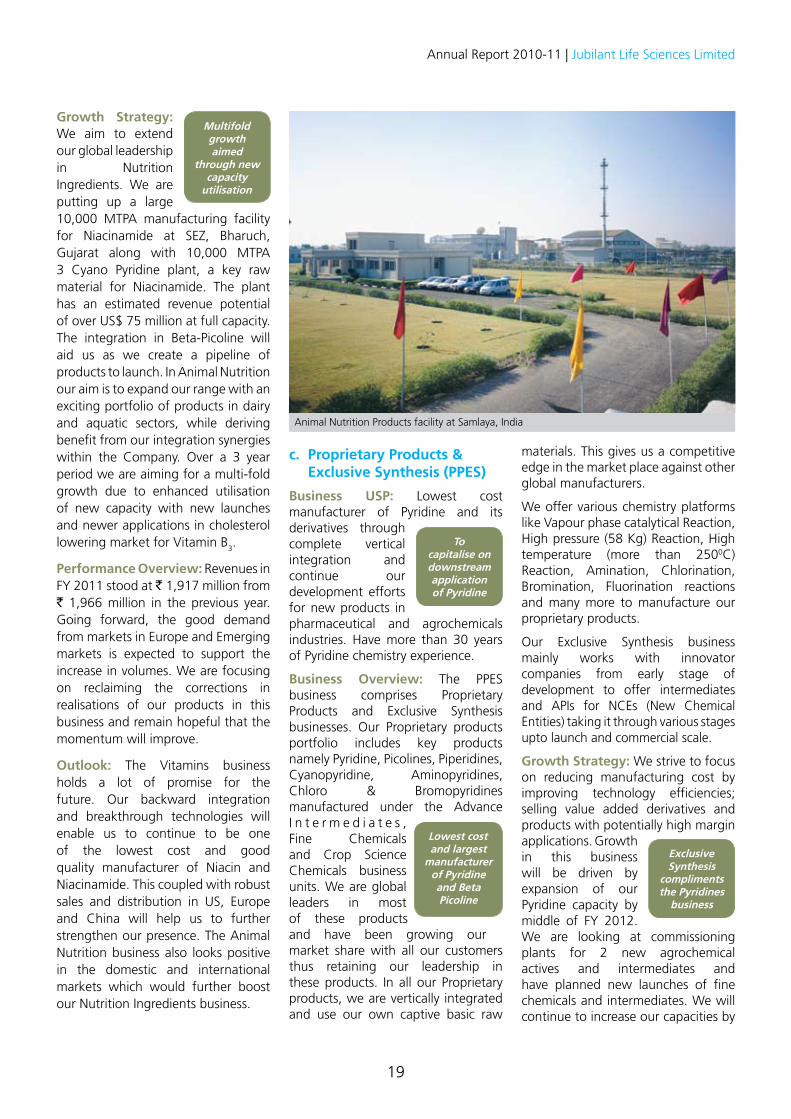
Animal Nutrition Products facility at Samlaya, India
Growth Strategy: We aim to extend our global leadership in Nutrition Ingredients. We are putting up a large 10,000 MTPA manufacturing facility for Niacinamide at SEZ, Bharuch, Gujarat along with 10,000 MTPA 3 Cyano Pyridine plant, a key raw material for Niacinamide. The plant has an estimated revenue potential of over US$ 75 million at full capacity. The integration in Beta-Picoline will aid us as we create a pipeline of products to launch. In Animal Nutrition our aim is to expand our range with an exciting portfolio of products in dairy and aquatic sectors, while deriving benefit from our integration synergies within the Company. Over a 3 year period we are aiming for a multi-fold growth due to enhanced utilisation of new capacity with new launches and newer applications in cholesterol lowering market for Vitamin B3.
Performance Overview: Revenues in FY 2011 stood at ` 1,917 million from ` 1,966 million in the previous year. Going forward, the good demand from markets in Europe and Emerging markets is expected to support the increase in volumes. We are focusing on reclaiming the corrections in realisations of our products in this business and remain hopeful that the momentum will improve.
Outlook: The Vitamins business holds a lot of promise for the future. Our backward integration and breakthrough technologies will enable us to continue to be one of the lowest cost and good quality manufacturer of Niacin and Niacinamide. This coupled with robust sales and distribution in US, Europe and China will help us to further strengthen our presence. The Animal Nutrition business also looks positive in the domestic and international markets which would further boost our Nutrition Ingredients business.
c. Proprietary Products & Exclusive Synthesis (PPES)
Business USP: Lowest cost manufacturer of Pyridine and its derivatives through complete vertical integration and continue our development efforts for new products in pharmaceutical and agrochemicals industries. Have more than 30 years of Pyridine chemistry experience.
Business Overview: The PPES business comprises Proprietary Products and Exclusive Synthesis businesses. Our Proprietary products portfolio includes key products namely Pyridine, Picolines, Piperidines, Cyanopyridine, Aminopyridines, Chloro & Bromopyridines manufactured under the Advance I n t e r m e d i a t e s , Fine Chemicals and Crop Science Chemicals business units. We are global leaders in most of these products and have been growing our market share with all our customers thus retaining our leadership in these products. In all our Proprietary products, we are vertically integrated and use our own captive basic raw
materials. This gives us a competitive edge in the market place against other global manufacturers.
We offer various chemistry platforms like Vapour phase catalytical Reaction, High pressure (58 Kg) Reaction, High temperature (more than 2500C) Reaction, Amination, Chlorination, Bromination, Fluorination reactions and many more to manufacture our proprietary products.
Our Exclusive Synthesis business mainly works with innovator companies from early stage of development to offer intermediates and APIs for NCEs (New Chemical Entities) taking it through various stages upto launch and commercial scale.
Growth Strategy: We strive to focus on reducing manufacturing cost by improving technology efficiencies; selling value added derivatives and products with potentially high margin applications. Growth in this business will be driven by expansion of our Pyridine capacity by middle of FY 2012. We are looking at commissioning plants for 2 new agrochemical actives and intermediates and have planned new launches of fine chemicals and intermediates. We will continue to increase our capacities by
To capitalise on downstream application of Pyridine
Multifold growth aimed
through new capacity
utilisation
Lowest cost and largest
manufacturer of Pyridine and Beta Picoline
Exclusive Synthesis
compliments the Pyridines
business
20
minimum investments coupled with debottlenecking of our existing facility at Gajraula to benefit from volume growth potential. We plan to increase business with our existing customers and look at further penetration into the European and Emerging markets. Through newer applications of our captive raw materials like Pyridine & Picolines, our Fine Chemicals and Crop Science business is expected to steer growth, using existing and new facilities coming up in our Special Economic Zone (SEZ) at Bharuch (Gujrat), India.
Performance Overview: Revenue in FY 2011 stood at ` 9,492 million from ` 9,452 million in the previous year. Although volume growth was at 8%, we witnessed pricing pressure on account of market conditions. We have focused on operating efficiencies and expect to benefit from an opportune market environment through expansion in our product portfolio.
Outlook: The outlook remains positive for our PPES business despite pricing pressures and uncertainties, with improved efficiencies in our processes technology and high captive consumption of Pyridine and its value added derivatives.
We would utilise Beta Picoline to produce 3-Cyanopyridine (3CP) and Niacinamide and use Pyridine for
large volume of Symtet (2,3,5,6-Tetrachloropyridine) which would help in increasing captive consumption of our Advance Intermediates to manufacture value added products. We expect to launch Symtet on a bigger scale and it is expected to be a big business driver in our forward integrated model with potential peak revenues of US$ 90 million at full capacity of 24,000MT per annum.
We look forward to penetrating into newer and high margin applications like Electronic grade Pyridine for Semiconductors chips, LCD’s & Optical Lights.
d. Life Science Chemicals
Business USP: A significant player in the global Acetyls market, including top-ranking positions in products such as Acetic Anhydride (7th largest globally & 4th largest on merchant sales basis) and Ethyl Acetate (7th largest globally), considering the new capacities coming on stream later this year.
Business Overview: Our Life Sciences Chemicals (LSC) business segment produces various Organic I n t e r m e d i a t e s . Jubilant is present across the Acetyls value chain based on downstream products of Acetic Acid and Ethyl Alcohol. Our products
are typically precursors to downstream products such as pharmaceuticals, aromatics, adhesives, food, packaging, beverages, crop protection chemicals, textiles and other solvents. A significant portion of our Organic Intermediates products is used for internal consumption to manufacture value-added Fine Chemicals and APIs. Owing to our strengths in integration and efficient manufacturing we have been able to carve out a market leadership position in South Asian Region for ourself.
We have capabilities to produce Acetyls from agro-based feedstock including molasses and alcohol. With this feedstock, we very often take the “make or buy” decision, depending on sector dynamics and our own operating imperatives. We have large storage capacities to stock up our key raw material for extended periods along with large warehousing capacity at Indian ports for our products and feedstock alike.
Product Portfolio: Our range of manufactured and traded products includes Acetic Acid, Acetic Anhydride, Ethyl Acetate, Carbon Dioxide, Ethylene Oxide mixtures, Mono Chloro Acetic Acid and Vinyl Acetate Monomer.
Growth Strategy: We are focused on completing and stabilising the current round of Capex which will allow us to partake in a rapidly growing opportunity. We are employing more marketing resources to support existing operations and to explore new markets, especially in the European and Middle Eastern region. Our growth plan also includes investing in infrastructure creation for our products in new markets. Focus continues on efforts to optimise our procurement of feed stock with excellent supply chain operations.
Performance Overview: Revenues in FY 2011 stood at ` 7,546 million from ` 6,587 million in the previous year. Operationally the business demonstrated good uptick in sales performance with key demand coming from India, Europe, Japan and
LSCs form the basic
inputs to other downstream
segments
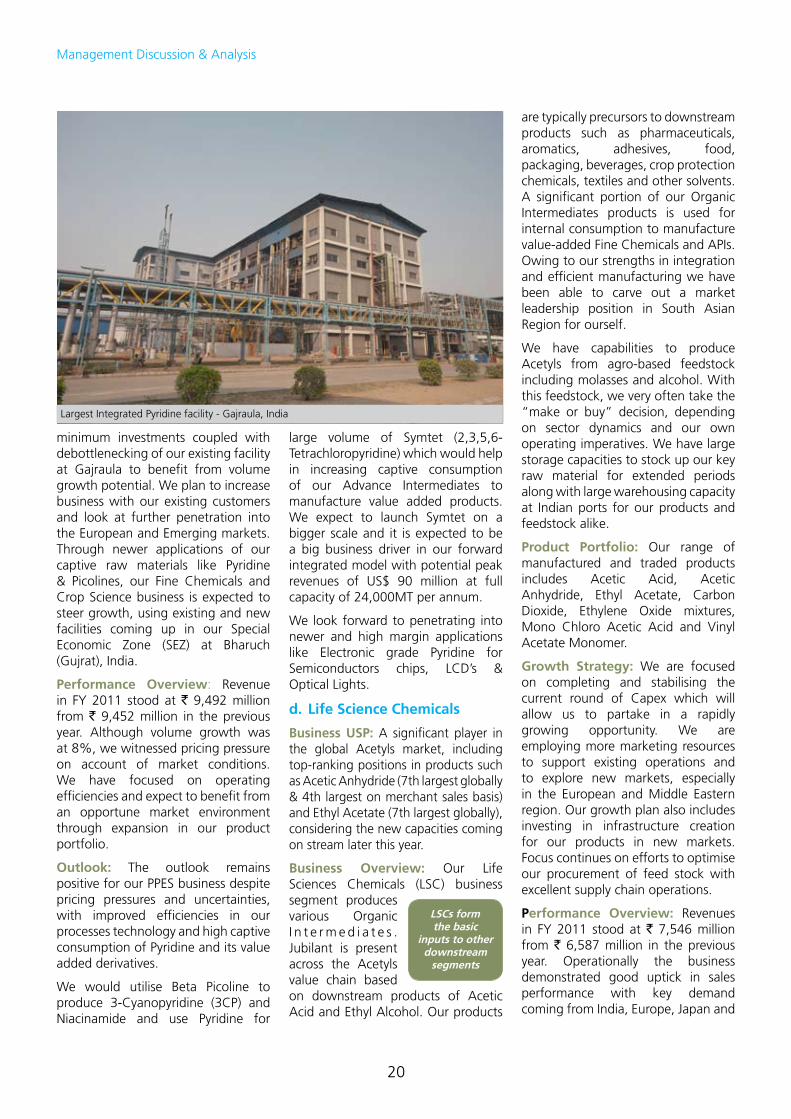
Largest Integrated Pyridine facility - Gajraula, India
Management Discussion & Analysis
Annual Report 2010-11 | Jubilant Life Sciences Limited
21
Emerging markets. The buoyancy in pharma and agrochemical industries for these products, is driving volume growth for us. There was a good improvement in margins of the business as well. We had certain high cost inventory of input materials which we have drawn down completely thereby supporting the momentum in earnings. Our capacity increments are aimed at sustaining this pace of growth.
Outlook: The Acetyls business is on an upward trend on account of increasing domestic demand coupled with demand from the US and Europe. Our successful roll-out in Europe and opportunities in the Far East should support growth momentum especially with the upcoming new capacities.
GENERICS
The Generics business comprising of Solid Dosage Forms, Radiopharmaceutical Products and Allergenic Extracts contributed to 13% of consolidated revenues in FY 2011 at ` 4,522 million from 11% last year at ` 3,829 million, with 18% growth year on year.
a. Solid Dosage Forms
Business USP: Our Solid Dosage Forms business is positioned to derive benefit from backward integration with our APIs business and is supported by our in-house R&D facility for formulation development, regulatory filings and cost effective manufacturing.
Business Overview: We primarily supply to the US market, (presently 94% of sales is from US) where we have 11 products in the market, including few under supply to the Veterans Health Administration program. We have leadership position in US for Terazosin and Methylprednisolone, are amongst top 3 in Cyclobenzaprine, Hydrochlorothiazide capsule, Lamotrigine and Meclizine
and in top 5 in Oxcarbazepine, PCP and Prednisone.
In the European market we are engaged in provision of regulatory affairs services, formulation development, licensing of marketing authorisations and supply of Solid Dosage Forms to Generic pharmaceutical companies. We have a portfolio of Dossiers, most of which incorporate our in-house APIs, which we license to these companies.
We also offer turnkey products and services to Generic p h a r m a c e u t i c a l companies by undertaking the supply of Solid Dosage Forms and APIs based on ANDAs and Dossiers developed by us and arrange market authoriations and release for facilitating sales of Solid Dosage Forms in European Union (EU) countries and North America. Our services also include upgrading/updating old Dossiers for cost/process effective solutions.
Our Solid Dosage Forms business develops over the counter drugs. In addition, we develop value-added formulations and special formulations, taste masking, flash tablets, oral dispersible forms, chewable tablets and modified release forms.
Product Development & Filings: We have 11 commercialised products in the US and 8 in Europe. Our Generics business has a strong pipeline of products in various stages of development. We have 18 ANDAs & 9 Dossiers awaiting approval as on March 31, 2011. There are plans to file 20 ANDAs in US, 10 in Canada and over 15 Dossiers in EU – which will create new growth avenues for us. We expect to have over 100 filings in various markets over next 3 years .
Overall there is a team of about 100 scientists at Noida, developing dosage forms through non-infringing
Our Life Sciences Chemicals business produces various Organic Intermediates. Jubilant is present across the Acetyls value chain based on downstream products of Acetic Acid and Ethyl Alcohol
Total capacity of 3.5 billion tablets &
850 million capsules
Have 18 ANDAs and 9 Dossiers awaiting approval
Focus on 8-12 of ANDA and
Dossier filings every
year
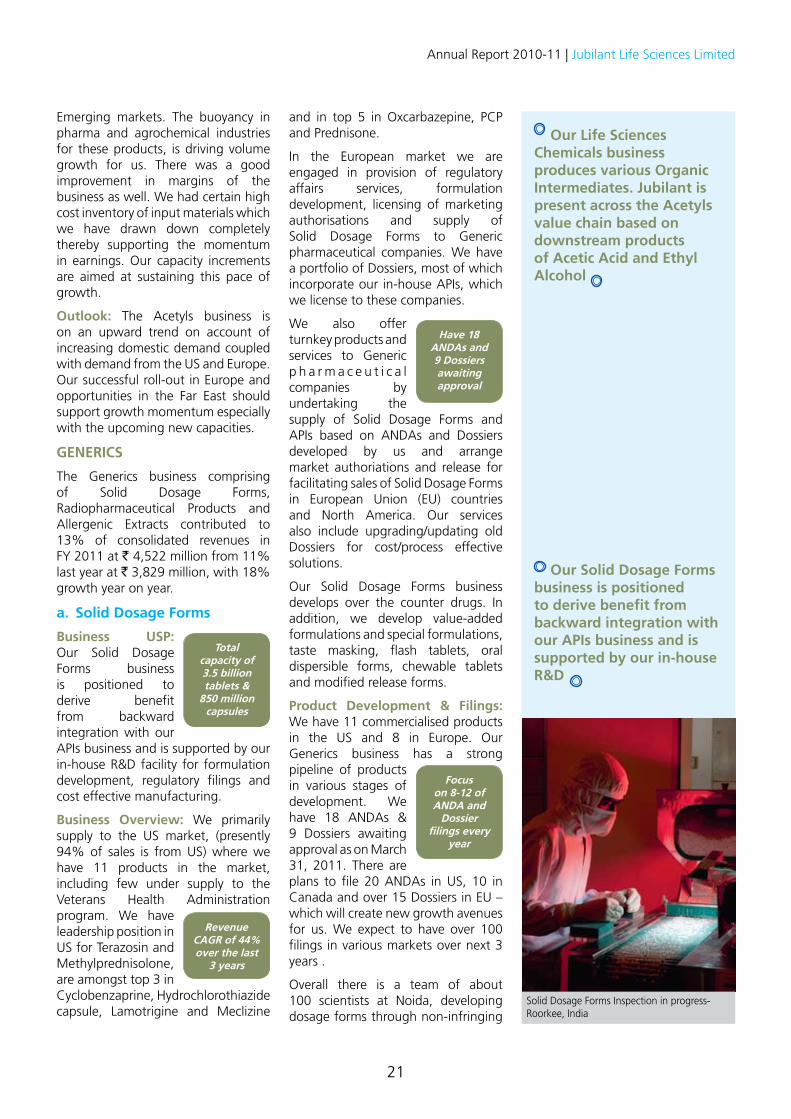
Solid Dosage Forms Inspection in progress- Roorkee, India
Revenue CAGR of 44% over the last
3 years
Our Solid Dosage Forms business is positioned to derive benefit from backward integration with our APIs business and is supported by our in-house R&D
22
processes. Given our intention to stay within the realm of outsourcing it is imperative that our business model is based on partnership rather than competition.
Our laboratory is equipped with modern scientific instruments and has the ability to develop solids, liquids, powders and ointments. It is currently focused on value-added generics such as oral disintegration and chewable tablets.
Growth Strategy: Our primary objective is to drive unique advantage due to our vertical integration with pharma intermediates and in-house APIs. We remain open to partnering with larger players in the Generic space. We have over 40 launches planned in focused therapeutic areas across geographies, 40% of which are in regulated markets. Over a span of 3 years we plan over 70 new launches across US, Europe and Emerging Markets. With 70% of revenues from products using our in-house APIs we expect to gain competitive advantage and higher margins.
Performance Overview: Revenues in FY 2011 stood at ` 2,028 million, up 33% from ` 1,519 million in the previous year. Our business delivered very strong growth on the back of good sales of existing products and additional sales from new launches. We enjoy recognition for quality and execution capabilities backed by our strong regulatory focus. Given our global manufacturing presence we are in a position to launch and develop products in regulated and emerging markets alike, thereby fulfilling the demand of lowcost healthcare.
Outlook: We have an exciting pipeline of products lined up through FY 2014 and intend to have many products in key markets like Canada, South Africa, Russia and Brazil. We will get into partnerships with prominent distributors in these markets to extend our reach.
b. Radiopharmaceutical Products
Business USP: We provide a comprehensive suite of therapeutic and diagnostics nuclear imaging products and complementary equipments. Our I-131 solution-HICON, is the only US FDA approved product for radiopharmacies and has catapulted us into the top most supplier category.
Business Overview: We develop, manufacture and market Diagnostic Imaging and Therapeutic, Radiopharmaceutical Products. Radiopharma operates in a highly regulated market. In the US our products are sold as kits through radiopharmacies and large hospitals. In the European market we have an agreement with a leading nuclear imaging player.
Our business is anchored by our expertise in R&D, Manufacturing, Quality Controls and Regulatory Affairs. We have a portfolio of existing products like I-131 used in the treatment of Thyroid Cancer and the related Smart-FillTM indigenous I-131 capsule dispenser; Macro Aggregates of Albumin (MAA) for Lung Imaging, Diethylene Triamine Penta Aceticacid (DTPA) for Lung and Renal Imaging, Methyl Diphosphonate (MDP) for Bone Scan, I-131 Diagnostics for Thyroid Scan, Gluceptate for Kidney and Brain Imaging and Sestamibi for Myocardial Perfusion Imaging. We enjoy market leadership in North America in the I-131 therapeutic line. We have dominant market share in North America for MAA and DTPA while we enjoy market leadership in Canada for MDP.
Product Development & Filings: We have re-launched Sestamibi, our diagnostic cardiac imaging agent used in Myocardial Perfusion Imaging (MPI). Further we are aiming to establish a comprehensive portfolio of Single Photon Emission Computed Tomography (SPECT) products
Exclusive tie-ups with
Radiopharmacies for distribution
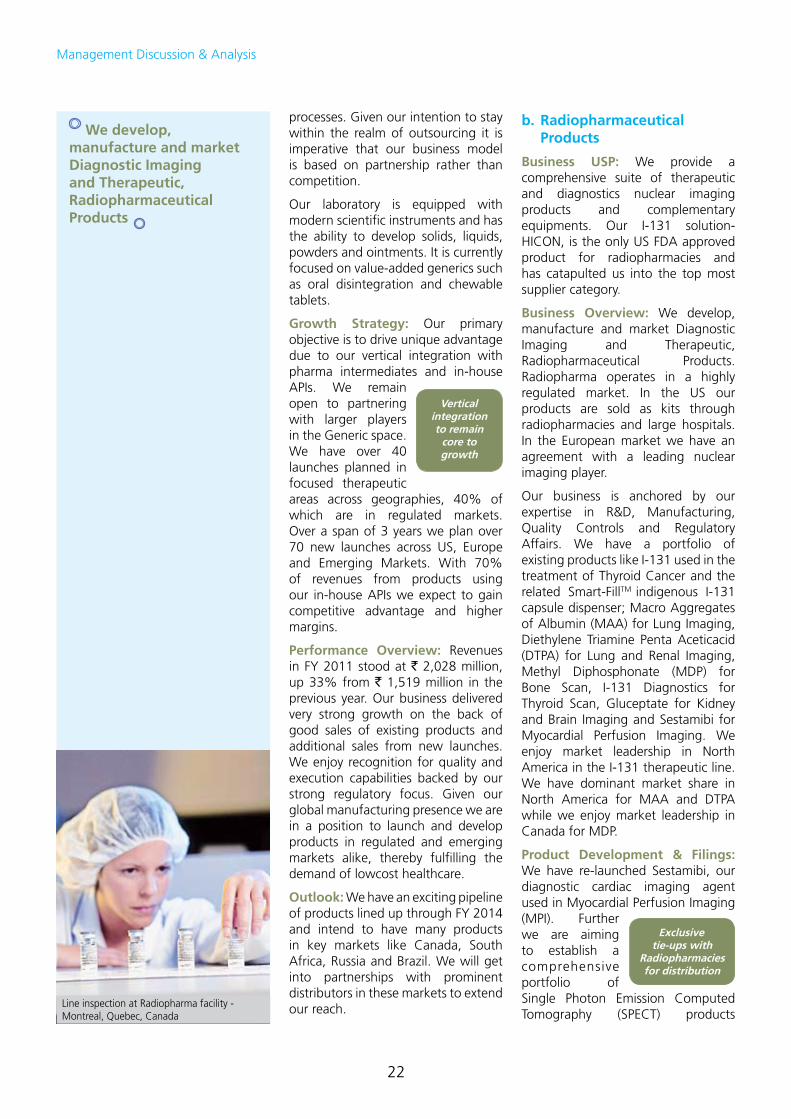
Line inspection at Radiopharma facility - Montreal, Quebec, Canada
Vertical integration to remain
core to growth
We develop, manufacture and market Diagnostic Imaging and Therapeutic, Radiopharmaceutical Products
Management Discussion & Analysis
Annual Report 2010-11 | Jubilant Life Sciences Limited
23
covering both Generators and Lyo-kits. This will be complemented by our range of Positron Emission Tomography (PET) products and we would be the only players with offerings in both technologies.
Our Radiopharmaceutical division also has a number of other products in late stage development. This includes, a new molecular entity for therapeutic treatment of neuroendocrine tumors in children, aimed at the North American market. Under SPECT we have Moly-Fill to be launched in the US and generic Ceretec to be launched in both US and Europe. We also have Ruby-Fill, which is, a PET product, to be launched in the U.S., Canada and Europe. Another important launch is Gadopentate, a contrast agent, for the North American markets.
Growth Strategy: To launch and establish our existing range of products in target markets of US and Europe. We endeavour to develop a presence in India, where we launched operations in the year under review. Our new markets’ thrust includes the Middle East and Latin American region. We are keen to increase the size of our business through strengthened marketing initiatives for Smart-FillTM which is our own indigenous I-131 capsule dispenser. Similarly we plan to derive upsides for our other products: MAA, DTPA, MDP, Sestamibi and ISO-Fill.
Performance Overview: Revenues in FY 2011 stood at ` 1,295 million, up 18% from ` 1,098 million in the previous year. The key highlight of our performance was the re-launch of Sestamibi following resumption of supplies of the isotope used in the product. We have started receiving regular supplies from the now revived Canadian nuclear reactor. Moreover we have diversified our supplier of nuclear input materials by appointing two other reactors in different continents. These would also support our growth plans for other
products hereafter.
Outlook: The Radiopharmaceutical business is one of our more exciting businesses and has a lot of potential to grow. This business enjoys high entry barriers on account of its nature. We plan to undertake various initiatives to improve the penetration of our existing products and are working to launch newer line extensions and products into the markets. Also our efforts in entering newer markets like Spain, Germany, UK, France and emerging markets like India are expected to pay off.
c. Allergenic Extracts
Business USP: Manufactur ing and supply of a wide range of US FDA approved human allergen extracts used for immunotherapy across various allergen categories like Pollen, Mites, Envrionmentals, Venom, Mold and Food.
Business Overview: We are one of the leaders in North American immunotherapy and vaccine products and have the benefit of over 85 years of experience in this business. We offer up to 200 products which are sold both in bulk quantities and against
customer prescribed preparation formats. In the US, our key customers include c o n v e n t i o n a l allergists, ENT and other physician besides managed care and hospital based clinics. However, in Europe and Canada, we have partnerships with leading immunotherapy players and distributors. Ours is the second largest allergy immunotherapy business in the US. In Venom category of products, we enjoy a niche and are one of the only two US based makers of stinging insect Venom Immunotherapy products.
Product Portfolio: Our product range includes diagnostics extracts and skin-test devices for allergy scratch and intradermal testing. The business also offers a comprehensive scratch-test device portfolio of multiple and single tip devices. Some of our key products include Venomil® venom products, Acetone Precipitated (AP™) line of extracts and QUINTIP® & ComforTen™ diagnostic skin test devices.
Growth Strategy: We are determined to exploit our market share and product development capabilities to build further niches in the US. Moreover we have plans to extend our presence in more geographies, especially in emerging countries including India.
Performance Overview: Revenues in FY 2011 were at ` 1,199 million from ` 1,212 million last year. We continued to deliver a steady performance in this business with positive growth in dollar terms.
Outlook: The prospects of Immunotherapy holds good especially in the US markets, since this market is one of the largest though least penetrated. The Company has undertaken various steps to drive growth and bring in efficiencies namely manufacturing of vials in-house, increasing awareness of its products and sales force optimisation. Going forward we expect this business to grow bigger in current geographies.
Attractive pipeline that targets niche
markets
Offers composite test device portfolio
Positioned favourably in the US - one of the largest
immunotherapy markets
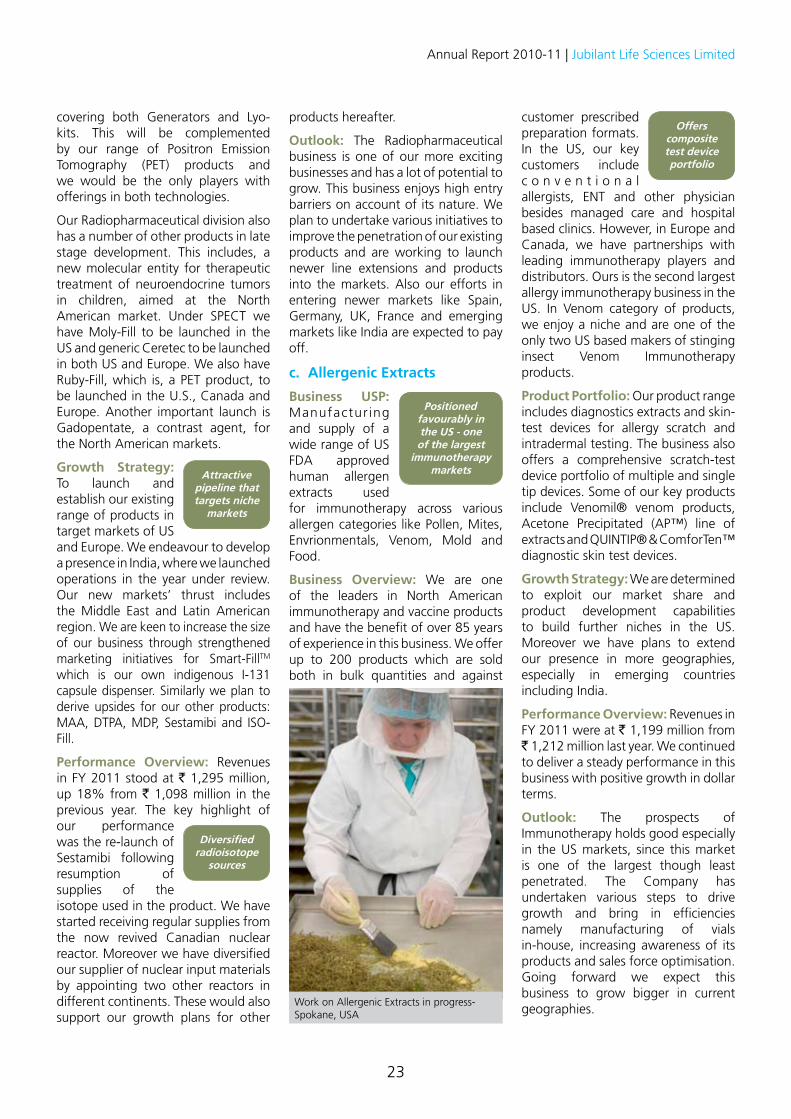
Work on Allergenic Extracts in progress-Spokane, USA
Diversified radioisotope
sources
24
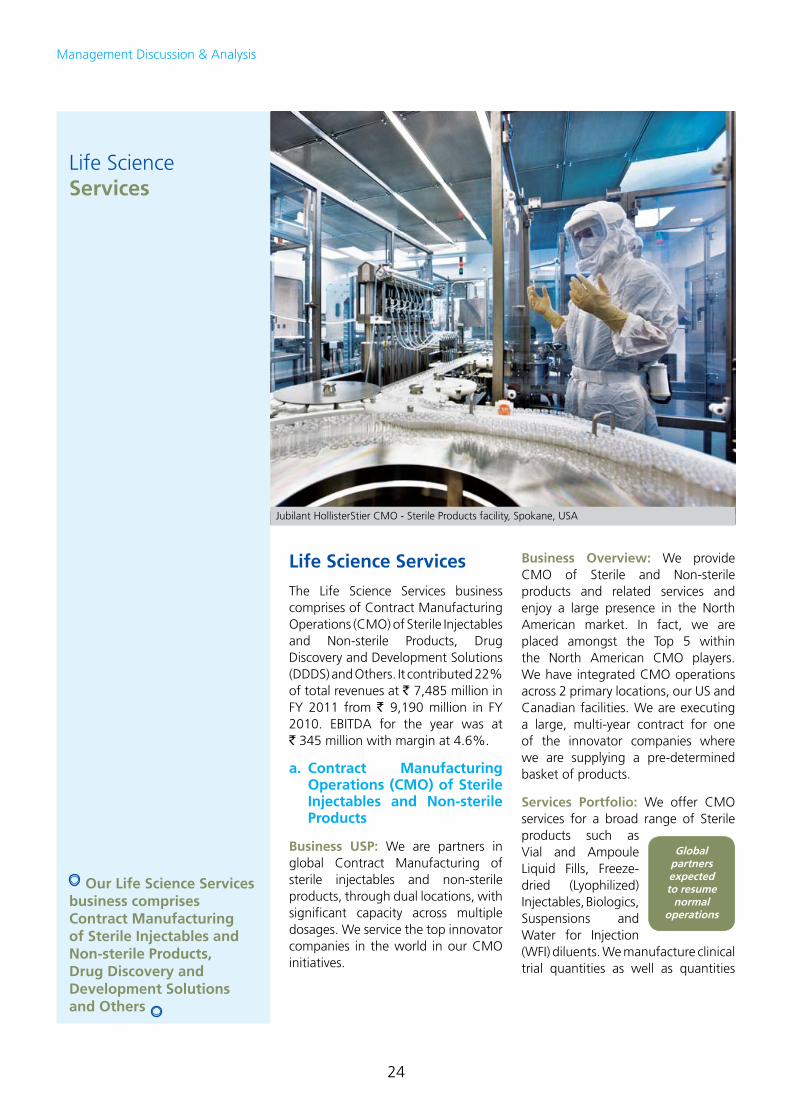
Jubilant HollisterStier CMO - Sterile Products facility, Spokane, USA
Our Life Science Services business comprises Contract Manufacturing of Sterile Injectables and Non-sterile Products, Drug Discovery and Development Solutions and Others
Life Science Services
Life Science Services
The Life Science Services business comprises of Contract Manufacturing Operations (CMO) of Sterile Injectables and Non-sterile Products, Drug Discovery and Development Solutions (DDDS) and Others. It contributed 22% of total revenues at ` 7,485 million in FY 2011 from ` 9,190 million in FY 2010. EBITDA for the year was at ` 345 million with margin at 4.6%.
a. Contract Manufacturing Operations (CMO) of Sterile Injectables and Non-sterile Products
Business USP: We are partners in global Contract Manufacturing of sterile injectables and non-sterile products, through dual locations, with significant capacity across multiple dosages. We service the top innovator companies in the world in our CMO initiatives.
Business Overview: We provide CMO of Sterile and Non-sterile products and related services and enjoy a large presence in the North American market. In fact, we are placed amongst the Top 5 within the North American CMO players. We have integrated CMO operations across 2 primary locations, our US and Canadian facilities. We are executing a large, multi-year contract for one of the innovator companies where we are supplying a pre-determined basket of products.
Services Portfolio: We offer CMO services for a broad range of Sterile products such as Vial and Ampoule Liquid Fills, Freeze-dried (Lyophilized) Injectables, Biologics, Suspensions and Water for Injection (WFI) diluents. We manufacture clinical trial quantities as well as quantities
Global partners expected to resume
normal operations
Management Discussion & Analysis
Annual Report 2010-11 | Jubilant Life Sciences Limited
25
Allergy Immunotherapy. We also have collaborations with 3 Academic institutions to develop new targets/ molecules for drug discovery and development.
The service is delivered against Research Fees, where cost of the research is covered and includes some ‘discovery milestones’ and/or development milestones, which covers royalty payments on launch of products.
Product Development & Filings: Currently we are running 17 integrated research programs in collaborations with 7 global clients. The therapeutic areas of focus are Oncology, CVS, CNS-Pain and Inflammation.
Growth Strategy: Our objective is to drive forward our DDDS business through our integrated service platforms. Early stage development partnerships and aggressive business development activity would drive future growth rates. We are focusing on innovative attrition based deal structuring to minimise cancellation risks and expect this business to contribute better to the earnings growth.
for commercial supply. Our Non-sterile products include Solid Oral and Semi-solid Dosage Forms, including Antibiotic Ointments, Dermatological Cream and Liquids (Syrups and Suspensions), Capsules, Tablets and Powder Blends.
Growth Strategy: We are singularly focused on increasing the volumes with an eye on healthy margins. Our marketing strategy has been fine-tuned so that we are able to develop a credible order backlog.
Performance Overview: Our Net Sales in FY 2011 were at ` 5,265 million compared to ` 6,616 million in the previous year. We reported a steady performance in this business despite the effect of the one-time order supplied for H1N1 vaccines, which was undertaken in the previous year. We experienced changes in customer demand and delays in their submission approvals. Additionally, we saw reductions in key customer forecasts due to slowdown in the commercialisation of their products. We expect resumption of normalised operations as we progress into next year with much more focus on business development. Secondly we have undertaken an alignment of costs to our projections on deliveries, which will also translate into better profitability.
Outlook: We plan to increase the capacity utilisation of small volume parenterals in the coming year. Also plans are underway to expand the support services in order to offer a better value proposition to our business partners. In this year, initiatives are on to further improve the efficiency and reliability of operations along with optimum sourcing and cost saving initiatives. Focus has been sharpened on profitability improvement.
Partnerships with MNCs
to boost growth of
the business
b. Drug Discovery and Development Solutions (DDDS)
Business USP: We offer integrated Drug Discovery and Development Solutions to leading global pharmaceutical companies. Our business is spread across US, Europe and India which gives us the flexibility to be close to our customers and offer best cost and time-to-market solutions.
Business Overview: Our service portfolio under this business includes collaborative integrated drug discovery programs in chosen therapeutic areas. Under the functional services we undertake drug discovery in Structural Biology, Insilico Technologies and Medicinal Chemistry. Our drug development activities pertain to clinical research from Phase I to Phase IV including clinical trials and data management in Oncology, CVS, CNS, Dermatology, Respiratory and
Research Fees &
Discovery Milestones
complemented by
Development Milestones
and Royalties
Discovery services to
be driven by increasing number of
collaborative programs
Offering Integrated
drug discovery &
development platform
26
Performance Overview: Revenues in 2010-11 stood at ` 2,101 million. This performance has been witnessed in the light of successfully integrating our research platforms and being able to successfully offer a gamut of services. However growth would have been much higher, but for reduction in research budgets by pharma sector undergoing a consolidation phase and dried up funding for mid-size Biotech companies from venture funds post the recession.
Outlook: Growth in discovery services business will be driven by increase in number of integrated collaborative programs which will lead to an increase in revenue from research funding. While Structural biological services would drive functional services growth, Medicinal chemistry will drive growth by higher capacity utilisation coupled with higher efficiency. We are expanding our capabilities to meet the needs of our clients in preclinical development and early discovery. Global clinical services will be mainly driven by Clinical Trial Management (CTM) and Clinical Data Management (CDM) services and new contracts. Further
integration of our US and Indian subsidiaries will drive cost synergies and help in expanding the product portfolio and margins.
c. Others
Our Healthcare business is operated through Jubilant First Trust Healthcare (JFTH) which focuses on providing ‘Better Care at Affordable Cost’, and our beneficiaries are spread across the middle-income population in the districts and towns of West Bengal, India.
We currently run two operational hospitals, located at Berhampore with 50 beds and at Barasat with 120 beds, in West Bengal. Jubilant Kalpataru Hospital, which is a 120-bed speciality hospital set up in 2009 provides services such as Neurosurgery, Neonatal and Pediatric Intensive Care. The hospital has a team of full-time doctors in major medical disciplines, who are also available on-call to extend emergency care to patients.
Operating Review & Outlook: Revenues in 2010-11 stood at ` 119 million from ` 81 million in the previous year. We are looking at improving profitability without further capex in the short term.
CTM & CDM services to
drive global clinical services business
In Drug Discovery & Development Solution business we are running 17 integrated research programs in collaboration with 7 global customers
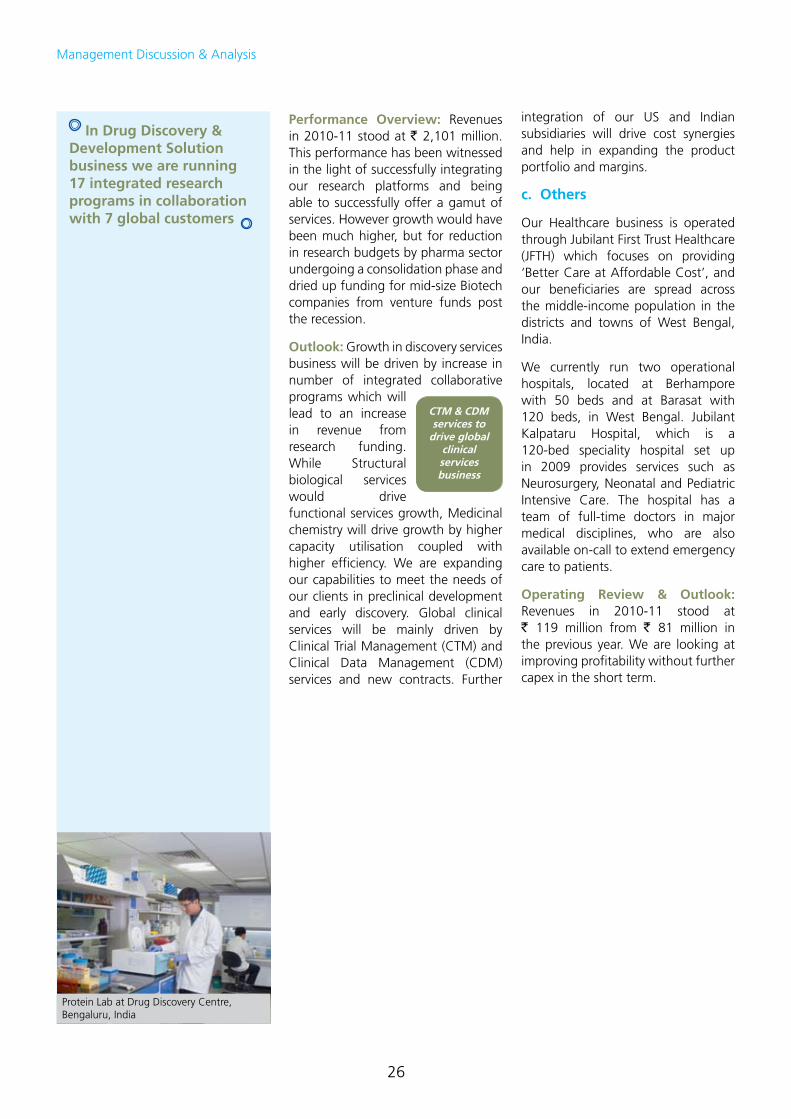
Protein Lab at Drug Discovery Centre, Bengaluru, India
Management Discussion & Analysis
Annual Report 2010-11 | Jubilant Life Sciences Limited
27
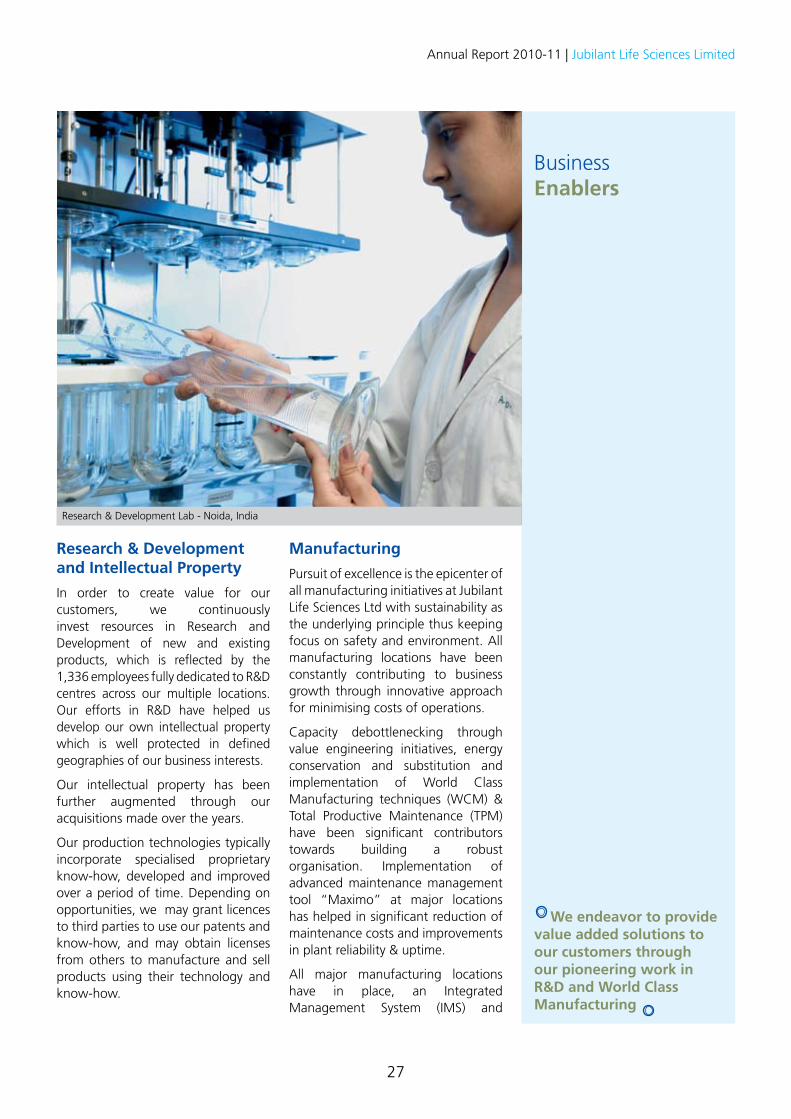
We endeavor to provide value added solutions to our customers through our pioneering work in R&D and World Class Manufacturing
Business Enablers
Research & Development Lab - Noida, India
Research & Development and Intellectual Property
In order to create value for our customers, we continuously invest resources in Research and Development of new and existing products, which is reflected by the 1,336 employees fully dedicated to R&D centres across our multiple locations. Our efforts in R&D have helped us develop our own intellectual property which is well protected in defined geographies of our business interests.
Our intellectual property has been further augmented through our acquisitions made over the years.
Our production technologies typically incorporate specialised proprietary know-how, developed and improved over a period of time. Depending on opportunities, we may grant licences to third parties to use our patents and know-how, and may obtain licenses from others to manufacture and sell products using their technology and know-how.
Manufacturing
Pursuit of excellence is the epicenter of all manufacturing initiatives at Jubilant Life Sciences Ltd with sustainability as the underlying principle thus keeping focus on safety and environment. All manufacturing locations have been constantly contributing to business growth through innovative approach for minimising costs of operations.
Capacity debottlenecking through value engineering initiatives, energy conservation and substitution and implementation of World Class Manufacturing techniques (WCM) & Total Productive Maintenance (TPM) have been significant contributors towards building a robust organisation. Implementation of advanced maintenance management tool “Maximo” at major locations has helped in significant reduction of maintenance costs and improvements in plant reliability & uptime.
All major manufacturing locations have in place, an Integrated Management System (IMS) and
28
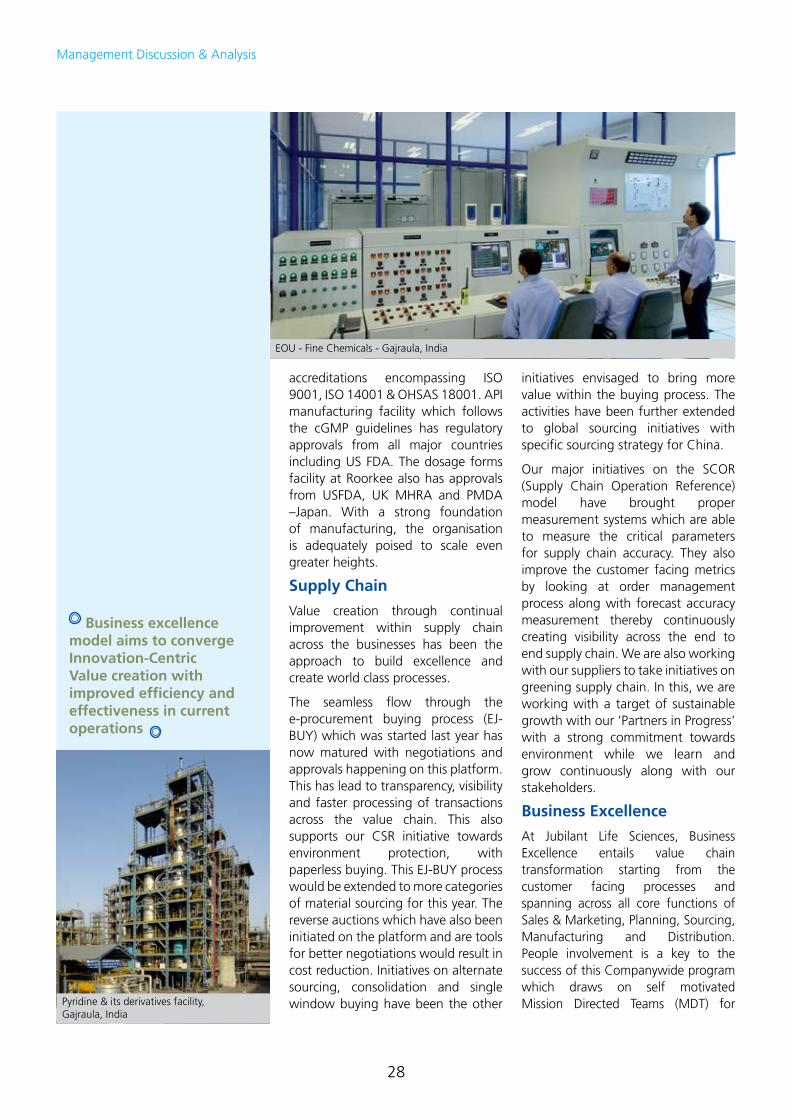
EOU - Fine Chemicals - Gajraula, India
Business excellence model aims to converge Innovation-Centric Value creation with improved efficiency and effectiveness in current operations
Pyridine & its derivatives facility, Gajraula, India
accreditations encompassing ISO 9001, ISO 14001 & OHSAS 18001. API manufacturing facility which follows the cGMP guidelines has regulatory approvals from all major countries including US FDA. The dosage forms facility at Roorkee also has approvals from USFDA, UK MHRA and PMDA –Japan. With a strong foundation of manufacturing, the organisation is adequately poised to scale even greater heights.
Supply Chain
Value creation through continual improvement within supply chain across the businesses has been the approach to build excellence and create world class processes.
The seamless flow through the e-procurement buying process (EJ-BUY) which was started last year has now matured with negotiations and approvals happening on this platform. This has lead to transparency, visibility and faster processing of transactions across the value chain. This also supports our CSR initiative towards environment protection, with paperless buying. This EJ-BUY process would be extended to more categories of material sourcing for this year. The reverse auctions which have also been initiated on the platform and are tools for better negotiations would result in cost reduction. Initiatives on alternate sourcing, consolidation and single window buying have been the other
initiatives envisaged to bring more value within the buying process. The activities have been further extended to global sourcing initiatives with specific sourcing strategy for China.
Our major initiatives on the SCOR (Supply Chain Operation Reference) model have brought proper measurement systems which are able to measure the critical parameters for supply chain accuracy. They also improve the customer facing metrics by looking at order management process along with forecast accuracy measurement thereby continuously creating visibility across the end to end supply chain. We are also working with our suppliers to take initiatives on greening supply chain. In this, we are working with a target of sustainable growth with our ‘Partners in Progress’ with a strong commitment towards environment while we learn and grow continuously along with our stakeholders.
Business Excellence
At Jubilant Life Sciences, Business Excellence entails value chain transformation starting from the customer facing processes and spanning across all core functions of Sales & Marketing, Planning, Sourcing, Manufacturing and Distribution. People involvement is a key to the success of this Companywide program which draws on self motivated Mission Directed Teams (MDT) for
Management Discussion & Analysis
Annual Report 2010-11 | Jubilant Life Sciences Limited
29
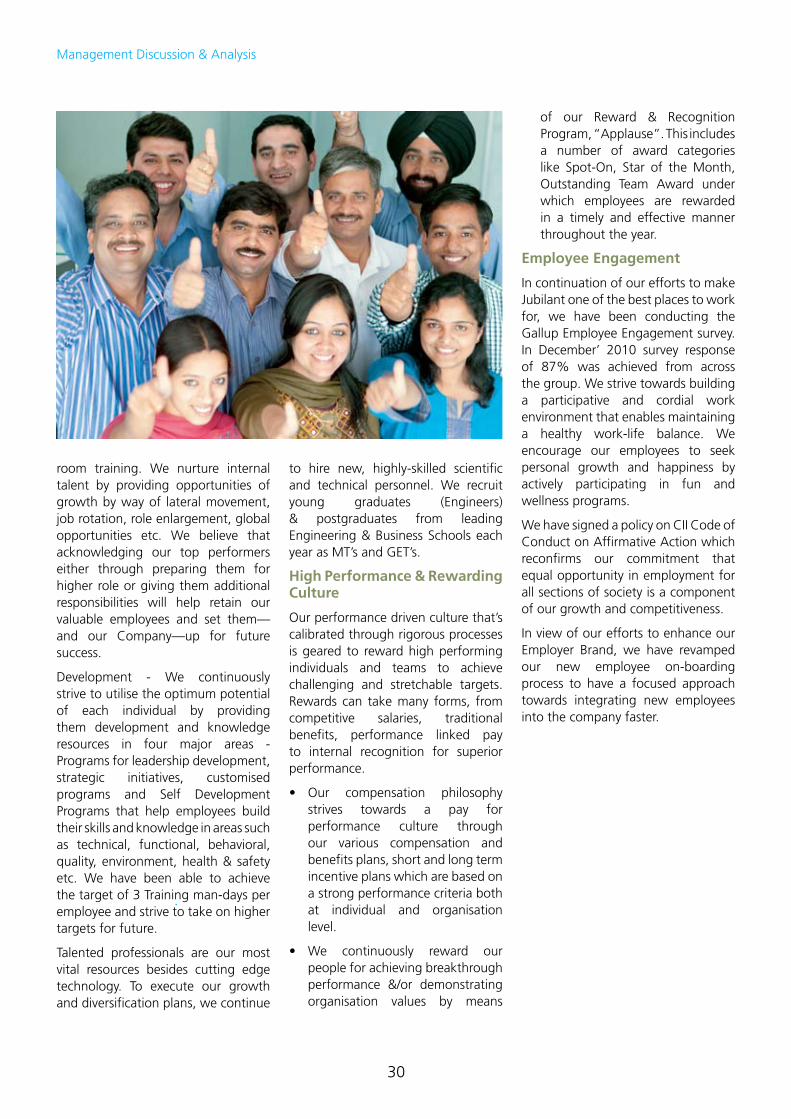
Training Session in Progress
inter and intra functional synergy. The business strategy is used as a guiding document, a balanced scorecard is drawn out, gaps between current and future state identified and addressed through projects using the uniquely crafted Business Excellence (BE) Model and toolkit. These programs have been a common thread across diverse businesses, geographies and product lines with an aim of unified approach towards value enhancement.
With the core objective of making excellence the DNA of the organisation; BE Model comprises of systematic Process Reengineering & Quality Management tools namely Lean, Six Sigma, Total Productive Maintenance (TPM), Supply Chain Operations Reference (SCOR), Design for Six Sigma (DFSS), Innovation Management, Theory of Constraints (ToC) and Balanced Scorecard (BSC); which leads to continual improvement in business processes, an important plank in the Company’s growth strategy.
The model governs the structure of the Business Excellence program and function. A dedicated team of Black Belts is placed at all sites to enable improvement projects and programs. A wide variety of complex problems are solved using the structured approach of Lean Six Sigma. Company-wide project opportunities consisting of improvement targets are budgeted annually and incorporated into the business plans. The team of black belts has completed more than 70 projects in the last financial year.
The Business Excellence programs are also driven bottom-up, with workgroup level involvement in suggestion scheme titled “Sankalp” which has been instrumental in creating grass-root level involvement and leading to significant financial gains. More than 5000 Sankalps have been implemented across all the sites in the last financial year.
One of the significant achievements of the last financial year is the multiple projects concluded in the area of
Quality Improvement. Six Sigma was used to support process improvement initiatives for customer returns in CMO businesses. Capacity enhancement across various product lines in all Indian and North American sites was done using Lean principles leading to low cost expansion. Other than local improvements that harness functional synergy, strategic transformation programs have been deployed.
One such program was implementation of Best-In-Class Sales and Operations Planning process at the formulations unit in North America, the backbone was an integrated Planning & Scheduling framework for improving Customer Service level. An end to end transformation program was designed and effectively implemented to reduce delivery lead times in the radiopharma business which led to optimisation of raw material procurement. This raw material being radioactive and perishable in nature, this initiative lead to significant cost savings for the organisation.
The best practices developed internally are also shared across the organisation through various communication channels and horizontal replication. Knowledge management is encouraged through reward and recognition programs. Accordingly a Business Excellence Best Prax Club was formed,
which brings out a Knowledge letter (“K–Letter”). This initiative has helped in seeding the ideas for future projects as well as enrolment of more teams into the Business Excellence program. Business excellence model aims to converge Innovation-Centric Value creation with improved efficiency and effectiveness in current operations.
Human Resource Management
We believe that people perform to the best of their abilities in organisations to which they feel truly connected. We are committed to creating an inclusive environment — one that is progressive, flexible and values the individual contributions of all of our people. We’re proud to have a culture that brings out the best in individuals and encourages them to pursue excellence.
Talent Management
Our Strategic Talent & Succession Management Process launched with the objective of shaping the competencies that organisation will need in future has been instrumental in aligning our Talent Strategy with our Business Strategy. After identification of the talent pool of high performers, they are provided with focused development ranging from on the job assignments to class
30
room training. We nurture internal talent by providing opportunities of growth by way of lateral movement, job rotation, role enlargement, global opportunities etc. We believe that acknowledging our top performers either through preparing them for higher role or giving them additional responsibilities will help retain our valuable employees and set them—and our Company—up for future success.
Development - We continuously strive to utilise the optimum potential of each individual by providing them development and knowledge resources in four major areas - Programs for leadership development, strategic initiatives, customised programs and Self Development Programs that help employees build their skills and knowledge in areas such as technical, functional, behavioral, quality, environment, health & safety etc. We have been able to achieve the target of 3 Training man-days per employee and strive to take on higher targets for future.
Talented professionals are our most vital resources besides cutting edge technology. To execute our growth and diversification plans, we continue
to hire new, highly-skilled scientific and technical personnel. We recruit young graduates (Engineers) & postgraduates from leading Engineering & Business Schools each year as MT’s and GET’s.
High Performance & Rewarding Culture
Our performance driven culture that’s calibrated through rigorous processes is geared to reward high performing individuals and teams to achieve challenging and stretchable targets. Rewards can take many forms, from competitive salaries, traditional benefits, performance linked pay to internal recognition for superior performance.
• Our compensation philosophystrives towards a pay for performance culture through our various compensation and benefits plans, short and long term incentive plans which are based on a strong performance criteria both at individual and organisation level.
• We continuously reward ourpeople for achieving breakthrough performance &/or demonstrating organisation values by means
of our Reward & Recognition Program, “Applause”. This includes a number of award categories like Spot-On, Star of the Month, Outstanding Team Award under which employees are rewarded in a timely and effective manner throughout the year.
Employee Engagement
In continuation of our efforts to make Jubilant one of the best places to work for, we have been conducting the Gallup Employee Engagement survey. In December’ 2010 survey response of 87% was achieved from across the group. We strive towards building a participative and cordial work environment that enables maintaining a healthy work-life balance. We encourage our employees to seek personal growth and happiness by actively participating in fun and wellness programs.
We have signed a policy on CII Code of Conduct on Affirmative Action which reconfirms our commitment that equal opportunity in employment for all sections of society is a component of our growth and competitiveness.
In view of our efforts to enhance our Employer Brand, we have revamped our new employee on-boarding process to have a focused approach towards integrating new employees into the company faster.
Management Discussion & Analysis
Annual Report 2010-11 | Jubilant Life Sciences Limited
31
Internal Control Systems & Risk Management
We have a strong risk management framework in place that enables active monitoring of business activities for identification, assessment and mitigation of potential internal or external risks
Safety Drill at a Plant
Internal Control Systems & Risk ManagementToday’s business environment, remains challenging and risk management retains its high position on every organisation’s agenda. The business dynamics in terms of global operations and continuous enhancement in product pipeline, capacities and technologies coupled with intensifying competition bring in new risks. An effective risk management framework enhances the organisation’s ability to proactively address its risks & opportunities by determining a risk response strategy & monitoring its progress on an ongoing basis.
Jubilant’s Vision on Risk Management
To establish and maintain enterprise wide risk management capabilities for active monitoring & mitigation of organisational risks on a continuous and sustainable basis.
Risk Management Framework
Our risk management framework is intended to ensure that risks are taken with due diligence and care and helps to identify, assess, prioritise, manage, monitor and communicate risks across the Company.
The framework operates with the objectives of proactively identifying and highlighting risks to the right stakeholders; facilitating discussions around risk prioritisation and risk mitigation; providing a framework to assess risk capacity and appetite and to develop systems to warn when the latter is getting breached and for providing an analysis that a formal and focused risk management process is facilitating reduction in residual risks.
Risk Management Strategy
Jubilant has a strong risk management framework in place that enables active monitoring of business activities for identification, assessment and mitigation of potential internal or external risks, given the established processes and guidelines we have in place, along with a strong oversight
and monitoring system at the Board and senior management levels.
Our senior management team sets the overall tone and risk culture through defined and communicated corporate values, clearly assigned risk responsibilities and appropriately delegated authority. We have laid down procedures to inform Board members about the risk assessment and risk minimisation procedures. As an organisation, we promote strong ethical values and high levels of integrity in all our activities, which by itself significantly mitigates risk.
Risk Management Structure
Our risk management structure comprises the Board of Directors and Audit Committee at the Apex level, supported by Executive Directors, Heads of Businesses, Functional Heads, Unit Heads, Divisional Heads of Accounts & Finance and Head of Assurance function. As risk owners, the Heads are entrusted with the responsibility of identification and monitoring of risks. These are then discussed and deliberated at various review forums chaired by the Executive Directors and actions are drawn upon. The Audit Committee, Executive Directors and Head of Assurance function act as a governing body to monitor the effectiveness of the internal controls framework.
There is a perpetual internal audit activity carried out by M/s Ernst & Young Private Ltd., who make an independent assessment of our risk mitigating measures and provide suggestions for improvement.
The Audit Committee, on a quarterly basis, reviews the adequacy and effectiveness of the internal controls being exercised by various businesses and support functions and advises the Board on matters of core concern for appropriate redressal.
Risk Mitigation Methodology
Our Board along with professional managers try to identify risks at an early stage and take appropriate steps to pre-empt or mitigate the same.
32
We have completed five years of our certification process wherein, all concerned Control Owners certify the correctness of about 1500 controls related to key operating, financial and compliance related issues, every quarter. This has made our internal controls and processes stronger and also serves as the basis for compliance with revised Clause 49 requirements mandated by the Securities and Exchange Board of India (SEBI).
We have also identified entity level controls for the organisation, covering integrity and ethical values, adequacy of audit and control mechanisms and effectiveness of internal and external communication, there by strengthening the internal controls systems and processes with clear documentation on key control points.
Management’s Assessment of Risk
The Company identifies and evaluates several risk factors and makes appropriate mitigation plans associated with the same in detail. Some of the key risks affecting its business are laid out below.
Cost Competitiveness
The Company believes that it is a low-cost manufacturer for most of its products and is a major contender for outsourcing opportunities with global corporations offering products that also conform to quality standards set in developed markets. We continue to take initiatives in reducing our costs by employing Business Excellence initiatives. Significant variations in the cost as well as availability of raw materials and energy may impact our operating results. Where ever feasible, the Company enters into long term contracts with volume commitments and prices which are linked to key input material prices to mitigate risks.
Compliance and Regulatory Framework
We need to comply with a broad range of regulatory controls on testing, manufacture and marketing
of our products in the Pharma and Life Sciences space. In some countries, including the US, regulatory controls have become increasingly demanding leading to increased costs and reduced operating margins for our line of products and services.
Failure to achieve regulatory approval of new products can mean that we do not recoup our R&D investment through the sale of final products. Any time change in regulations or reassessment of safety and efficacy of products based on new scientific knowledge or other factors could result in the amendment or withdrawal of existing approvals to market our products, which in turn could result in revenue loss. This may occur even if regulators take action falling short of actual withdrawal.
We have adopted measures to address these stricter regulations by increasing the efficiency of our R&D process, reduce the impact of extended testing and making our products available in time.
Environment, Health & Safety Risks
In the current business climate of reputational threats and rising political backlash, corporates need to tread carefully to maintain public trust. Social acceptance and Corporate Social Responsibility (CSR) have become increasingly important over the last decade. Compliance with stringent emission standards for the manufacturing facilities and other environmental regulations, may adversely affect the business. R&D, Life Science Services and manufacturing of products involve dangerous chemicals, process and by-products and are subjected to stringent regulations. The Company anticipates that environmental laws and regulations in the jurisdictions, where it operates, may become more restrictive and be enforced more strictly in the future. It also anticipates that customer requirements as to the quality and safety of products will
continue to increase. In anticipation of such requirements, the Company has incurred substantial expenditure and allocated other resources to proactively adopt and implement manufacturing processes to increase its adherence to environmental quality standards and enhance its industrial safety levels.
At Jubilant, the challenges due to Company’s operations related to Environment, Health and Safety (EHS) aspects of the business, employees and society are mapped and mitigated through a series of systematic and disciplined sets of policies and procedures. For further details on EHS Risks and their mitigation plans, investors may kindly refer to the Corporate Sustainability Report of the Company which is available on the website, www.jubl.com under the “sustainability” section.
Foreign Currency and Interest Rate Exposures
Foreign currency exposures on account of global operations could impact the financial results of the Company. Foreign currency exposures arise out of international revenues, imports and foreign currency debt, including convertible bonds.
Constantly increasing interest cost may impact the profitability of the organisation adversely. To mitigate foreign currency related risks, a risk management team formulates the approach and reviews it dynamically to align it with external environment and business exigency. Further, currency swaps and interest rate swaps are considered for implementation on Company’s loans and interest rate exposures. A quarterly update on foreign exchange exposures, outstanding forward contracts and derivatives is placed before the Board, for information.
Acquire and Retain Professional Talent
The Company’s dependence on R&D activity makes it very important that it recruits and retains high quality R&D
Management Discussion & Analysis
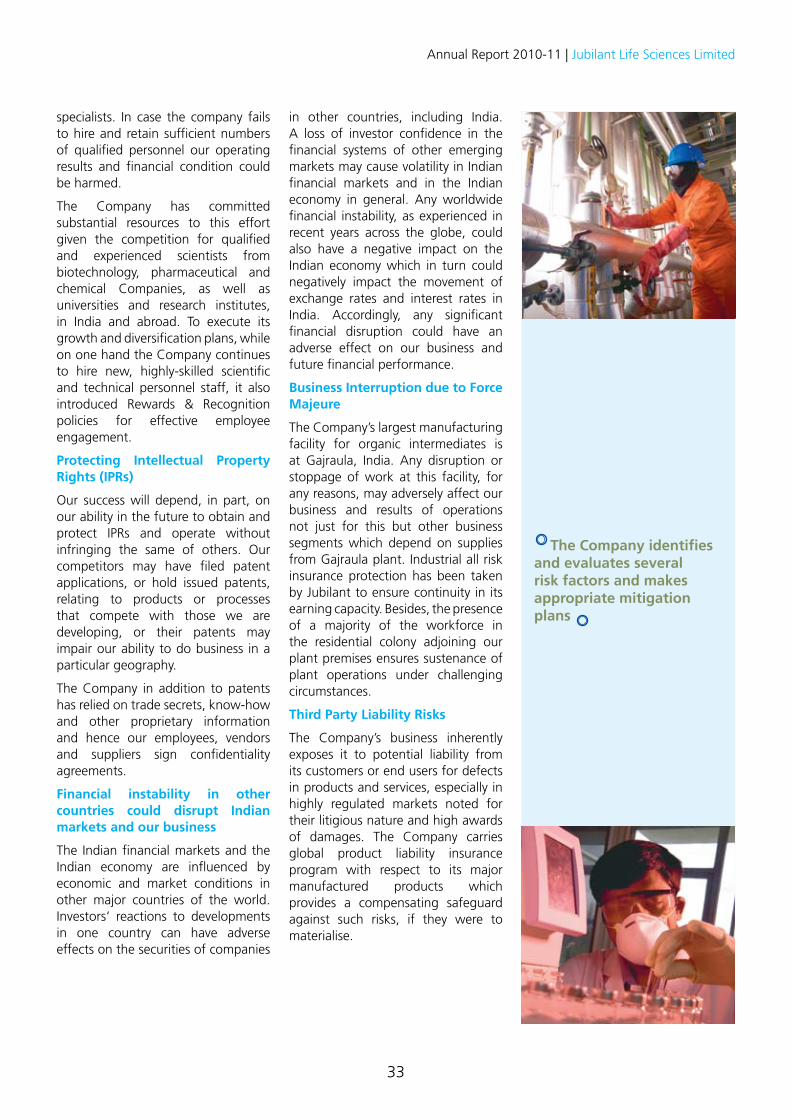
Annual Report 2010-11 | Jubilant Life Sciences Limited
33
specialists. In case the company fails to hire and retain sufficient numbers of qualified personnel our operating results and financial condition could be harmed.
The Company has committed substantial resources to this effort given the competition for qualified and experienced scientists from biotechnology, pharmaceutical and chemical Companies, as well as universities and research institutes, in India and abroad. To execute its growth and diversification plans, while on one hand the Company continues to hire new, highly-skilled scientific and technical personnel staff, it also introduced Rewards & Recognition policies for effective employee engagement.
Protecting Intellectual Property Rights (IPRs)
Our success will depend, in part, on our ability in the future to obtain and protect IPRs and operate without infringing the same of others. Our competitors may have filed patent applications, or hold issued patents, relating to products or processes that compete with those we are developing, or their patents may impair our ability to do business in a particular geography.
The Company in addition to patents has relied on trade secrets, know-how and other proprietary information and hence our employees, vendors and suppliers sign confidentiality agreements.
Financial instability in other countries could disrupt Indian markets and our business
The Indian financial markets and the Indian economy are influenced by economic and market conditions in other major countries of the world. Investors‘ reactions to developments in one country can have adverse effects on the securities of companies
in other countries, including India. A loss of investor confidence in the financial systems of other emerging markets may cause volatility in Indian financial markets and in the Indian economy in general. Any worldwide financial instability, as experienced in recent years across the globe, could also have a negative impact on the Indian economy which in turn could negatively impact the movement of exchange rates and interest rates in India. Accordingly, any significant financial disruption could have an adverse effect on our business and future financial performance.
Business Interruption due to Force Majeure
The Company’s largest manufacturing facility for organic intermediates is at Gajraula, India. Any disruption or stoppage of work at this facility, for any reasons, may adversely affect our business and results of operations not just for this but other business segments which depend on supplies from Gajraula plant. Industrial all risk insurance protection has been taken by Jubilant to ensure continuity in its earning capacity. Besides, the presence of a majority of the workforce in the residential colony adjoining our plant premises ensures sustenance of plant operations under challenging circumstances.
Third Party Liability Risks
The Company’s business inherently exposes it to potential liability from its customers or end users for defects in products and services, especially in highly regulated markets noted for their litigious nature and high awards of damages. The Company carries global product liability insurance program with respect to its major manufactured products which provides a compensating safeguard against such risks, if they were to materialise.
The Company identifies and evaluates several risk factors and makes appropriate mitigation plans
34
Annual Accounts
Jubilant Life Sciences Limited (formerly Jubilant Organosys Limited)
35
Annual Report 2010-11 | Jubilant Life Sciences Limited
Your Directors have pleasure in presenting the Thirty Third Annual Report and Audited Accounts for the year ended March 31, 2011.
Financial Results
Year ended March 31, 2011
[`/Million]
Year ended March 31, 2010
[`/Million]Sales and Other Income 22,883 25,537
Net Sales 22,009 24,561
EBITDA 4,507 6,469
Interest 463 997
PBDT 4,044 5,472
Depreciation 999 651
Exceptional items 46 228
PBT 2,999 4,593
Provision for Taxation 203 962
PAT 2,796 3,631
Profit brought forward from previous year
8,819 7,558
Adjustment on implementation of Scheme of Amalgamation & Demerger
1,017 -
PROFIT AVAILABLE FOR APPROPRIATION
10,598 11,189
Which the Directors have appropriated as follows:
– Proposed Dividend on Equity shares
318 317
– Tax on Dividend on Equity Shares
52 53
– Transfer to General Reserve
1,000 2,000
Balance to be carried forward
9,228 8819
Operations
The above financial results for year ended March 31, 2011 are for the businesses remaining with the Company, after giving effect to the Scheme of Amalgamation & Demerger and accordingly, are not strictly comparable with the previous corresponding period. For better comparison and understanding, financial highlights for current year compared to adjusted previous year figures (after giving effect to the Scheme of Amalgamation & Demerger) are discussed below:
Standalone Financials
Revenues
In FY2011, Revenues for the Company were at ` 22,009 million, which grew by 8% over last year same period.
DIRECTORS’ REPORT
International Revenues
International business contributed 52% to the Net Sales at ` 11,522 million.
EBITDA
For the year ending March 31, 2011, EBITDA stood at ` 4,507 million with EBITDA margins at 20.5%.
Profit Before Tax, Net Profit and EPS
Profit Before Tax in FY2011 stood at ` 2,999 million. The Company registered Net Profit of ` 2,796 million with Basic EPS at ` 17.56 for the financial year 2011.
Consolidated Financials
Revenues
In FY2011, Net Sales were at ` 34,334 million, which grew by 1% over last year same period (excluding the one-time revenues from H1N1 opportunity, the Company recorded growth of 7% in the year).
International Revenues
International business contributed 69% to the Net Sales at ` 23,691 million. Sales from regulated markets at ` 17,995 million was 52% of the Net Sales.
Life Sciences Products
Revenue from Life Sciences Products at ` 26,849 million contributed 78% to the total revenue of the Company and grew 9% in the year with good volume growth of over 15% across Products. Life Sciences Ingredients share in revenue was up at 65% and Generics contributed 13% to the top line. This growth is mainly driven by 19% growth in API and 18% growth in Generics.
Life Sciences Services
Services Revenue stood at ` 7,485 million compared to ` 9,190 million last year. Excluding the onetime revenue from H1N1 opportunity of ` 1,580 million in FY10, the CMO Services business recorded a growth of 5% during the year. However, Clinical Research business witnessed slowdown impacting the overall Services growth.
EBITDA
For the year ended March 31, 2011, EBITDA stood at ` 5,672 million with EBITDA margins at 16.5%. EBITDA margins in Products business were at a high of 22.4% and 4.6% in Services business.
Profit Before Tax, Net Profit and EPS
Profit Before Tax in FY2011 stood at ` 2,406 million. The Company registered Net Profit of ` 2,297 million with Basic EPS at ` 14.42 for the financial year 2011.
Dividend
Your Directors recommend a dividend of 200% i.e. ` 2 per fully paid up equity share of ` 1 for the year ended March 31, 2011. This will absorb ` 370 million (inclusive of tax) based on existing capital.
Appropriations
It is proposed to transfer ` 1,000 million to General Reserve and retain the balance in Profit and Loss Account.
36
Capital Structure
(A) Foreign Currency Convertible Bonds (FCCBs)
Your Company, during 2005-06 and 2006-07, issued Foreign Currency Convertible Bonds (FCCBs) of USD 75 million (FCCB 2010) and USD 200 million (FCCB 2011), respectively. During the year, the outstanding balance of FCCB 2010 was completely redeemed.
Whilst the FCCBs are listed on Singapore Stock Exchange, the Global Depository Shares (GDSs) arising out of conversion of FCCBs are listed on Euro MTF Market of the Luxembourg Stock Exchange.
The balance of FCCB 2011 amounting to USD 142.10 million outstanding as of date, would be redeemed on May 20, 2011.
(B) Employees Stock Options (ESOPs)
During the year, no Stock Options were granted under the Jubilant Employees Stock Option Plan 2005.
As on 31st March, 2011, 1,82,013 Stock Options were outstanding. Each option entitles the holder to acquire five equity shares of ` 1 each at the exercise price fixed at the time of grant being market value as per SEBI Guidelines. A maximum of 9,10,065 shares will be allotted by the Company / transferred from Jubilant Employees Welfare Trust upon exercise of these Options.
The details as required under Regulation 12 of Securities and Exchange Board of India (Employee Stock Option Scheme and Employee Stock Purchase Scheme) Guidelines, 1999 are given in Annexure A and form part of this Report.
(C) Paid-up Capital
The paid-up Capital as at March 31, 2011 stands at ` 159,281,139 comprising of 159,281,139 equity shares of ` 1 each.
No dilution on account of conversion of FCCBs is envisaged as conversion right ceases on May 10, 2011.
Further, no dilution under ESOPs is expected, as Jubilant Employees Welfare Trust is envisaged to transfer the shares held by it to employees on exercise.
Scheme of Amalgamation & Demerger
During the year, a Scheme of Amalgamation & Demerger (Scheme), was sanctioned by the Hon’ble High Court of Judicature at Allahabad vide its orders dated October 28, 2010 and November 08, 2010. The Scheme became effective with effect from November 15, 2010 (the effective date) and Speciality Molecules Limited (SML) – a wholly owned subsidiary of the Company and Pace Marketing Specialities Limited (PMSL) were amalgamated into the Company and the Company’s Agri Products, Performance Polymer and IMFL divisions were demerged into Jubilant Industries Limited (JIL) - a subsidiary of the Company.
The amalgamations were effective from the amalgamation appointed date viz., close of business on March 31, 2010 and the demerger was effective from the demerger appointed date viz., commencement of business on April 1, 2010.
Name Change
During the year, the name of the Company was changed to ‘Jubilant Life Sciences Limited’ to reflect the evolved character of the Company as an integrated Pharmaceutical and Life Sciences Company.
Subsidiaries
Brief particulars of principal subsidiaries are given below:
Jubilant HollisterStier LLC (formerly Hollister-Stier Laboratories LLC) - This Spokane State of Washington, USA based company, is a wholly owned subsidiary of HSL Holdings Inc. It is a recognized contract manufacturer of sterile injectable vials, syringes and lyophilized products and provides a complete range of services to support the pharmaceutical and biopharmaceutical industries. Additionally, it is a manufacturer of allergenic extracts, targeted primarily at treating allergies and asthma.
Its contract manufacturing capabilities include aseptic liquid fill / finishing and lyophilization in three distinct cGMP areas designated as Small Volume Parenteral (SVP), Small Lot Manufacturing (SLM) and Clinical Trial Manufacturing (CTM). Its capabilities can be applied to a variety of projects from pre-clinical through commercial scale across a multitude of dosage forms including: microspheres, suspensions, WFI/diluents, biologics (proteins), lyophilized products, liposomes and BD Hypak syringes. Jubilant HollisterStier maintains an outstanding regulatory record with the FDA (CBER and CDER), EMA and Japan’s and Brazil’s regulatory agencies. Jubilant HollisterStier’s contract manufacturing business serves 38 customers, some of which involve multiple products, ranging from small biotechnology to large pharmaceutical companies.
Jubilant DraxImage Inc. (formerly Draxis Specialty Pharmaceuticals Inc.) – This company is a wholly owned subsidiary of your Company through Jubilant Pharma Pte. Limited. It deals in radiopharmaceuticals. Radiopharmaceuticals is a niche, high entry barrier business. DraxImage markets radioactive products with radioactive isotope already incorporated, and non-radioactive products, which are solid in lyophilized form. Radiopharmaceuticals are used for both therapeutic and diagnostic molecular imaging applications to customers comprising hospitals, imaging centres and cardiology / oncology clinics.
This company operates a US FDA approved manufacturing facility in Montreal at Canada. It is recognised globally for its quality and execution capabilities, strong regulatory track record and has an established customer base comprising large innovator and specialty pharmaceutical companies.
Jubilant Biosys Limited – This company is a subsidiary of your Company through Jubilant Biosys (Singapore) Pte. Ltd., wholly owned subsidiary of your Company, which holds 66.98% of the equity of this company.
This company provides Drug Discovery Services to Global Pharmaceutical and Biotech companies in:
– Stand alone Service Model
• Functional services in area of Discovery Informatics, Structural Biology and In Vivo & Invitro Biology on FTE or Fee based model.
– Collaborative / Partnership Model
DIRECTORS’ REPORT
37
Annual Report 2010-11 | Jubilant Life Sciences Limited
• Integrated discovery program across a single or a portfolio of molecules
• Risk / Reward sharing option
– Research Funding
– Payments for scientific milestones including bonus achieved through Discovery and Development phase
– Royalties on successful commercialization of drug.
During 2010-11, this company has been able to consolidate its position in the Drug Discovery Services by providing services in integrated drug discovery programmes, functional service in structural biology, High thru put screening, Insilco modeling and IN Vivo Biology and Invitro Biology.
During the year, it signed integrated programs deal with another major Pharma Abbott Lab and Biotech Company Vega Therapeutics Inc.
Jubilant Discovery Services Inc. - This Delaware based USA corporation, is a wholly owned subsidiary of Jubilant Biosys Limited. This company provides sales, marketing and liaising services to Jubilant Biosys Limited for its US based customers.
Jubilant Chemsys Limited – This company is a subsidiary of your Company through Jubilant Drug Development Pte. Ltd., wholly owned subsidiary of your Company, which holds entire equity of this company. This company offers following services to drug discovery companies based out of US, Europe and Japan on Full Time Equivalent and molecule basis:
• Discovery Chemistry Functions
• Hit to Lead and Lead Optimization
• Medicinal Chemistry Services
• Scaling up from mg to kg in kilo lab and pilot plant
It also works closely with Jubilant Biosys Limited in collaborative drug discovery research services arena.
Jubilant Clinsys Limited (formerly Clinsys Clinical Research Limited) – This company is a subsidiary of your Company through Jubilant Drug Development Pte. Ltd., wholly owned subsidiary of your Company, which holds entire equity of this company.
This company offers following services to pharmaceutical, biotechnology and medical device companies:
• Bio-analytical, Bio equivalence & Pharmacokinetics studies with 52 bed facility at Noida
• Clinical Trials from Phase I-IV
• Clinical Data Management studies
• Clinical Trial Staffing solutions
During 2010-11, this company has been able to sign major Clinical data management (CDM) contracts with Novartis and Lotus Labs (P) Ltd as part of its endeavor to enhance CDM business.
Jubilant Clinsys Inc. (formerly Clinsys Clinical Research Inc.) – This New Jersey based USA corporation, is a wholly owned subsidiary of Jubilant Life Sciences Holdings Inc. and is a therapeutically focused full service clinical research organization.
This company has expertise in a wide range of highly specialized therapeutic areas including oncology, cardiovascular, central nervous system, respiratory, dermatology and allergy/immunology. It offers broad range of clinical research services to pharmaceutical, biotechnology and medical device companies in support of Phase II-IV drug and device development including project management, clinical monitoring, scientific and medical support, patient and investigator recruitment, site management, biostatistics, data management, drug safety, quality assurance, regulatory affairs and medical writing. This company has operations in Bedminster, New Jersey, Raleigh, North Carolina, Ottawa, Ontario and Dusseldorf.
Jubilant Innovation (India) Limited – This company is a wholly owned subsidiary of your Company through Jubilant Innovation (BVI) Limited. This company provides services in the areas of:
• Drug Development Scientific Services
• Project Management services and
• Related and ancillary activities for the development of molecules owned/ co-owned by Jubilant Innovation (BVI) Limited.
The company fosters the development of molecules owned/ co-owned by Jubilant Innovation (BVI) Limited, in terms of finding right CRO’s in India to get maximum cost arbitrage based on their capabilities, overseeing, analysis and monitoring of information on clinical / toxicology studies being conducted in India on Jubilant Innovation (BVI) Limited’s molecules.
Jubilant Innovation Pte. Limited – This Singapore Company is a wholly owned subsidiary of Jubilant Innovation (BVI) Limited. The company is an investment company and owns 50% share holding in Vanthys Pharmaceutical Development (P) Limited, a 50:50 Drug development Joint Venture with Lilly. It has also signed a Joint Venture agreement with University of Alabama, US and Southern Research Institute, US in the field of Drug Discovery.
Jubilant Innovation (BVI) Limited – This British Virgin Island based company is a wholly owned subsidiary of Jubilant Pharma Pte. Limited. This Company co-develops /in licenses the prescription pharmaceuticals in late discovery or preclinical phases, and develops these molecules through a phase II Proof of Concept (POC) trial.
The company develops these molecules on and at risk basis with either a predetermined return structure or an equity interest and sells these molecules after Phase II POC study for development completion. The selling /out licensing will have upside in terms of upfront payment, various milestone payments including sales milestones and/or sales royalties.
Jubilant Innovation (USA) Inc. – This Delaware based USA corporation, is a wholly owned subsidiary of your Company through Jubilant Innovation (BVI) Limited. This company provides services in the areas of:
• Drug Development Scientific Services
• Project Management services and
• Related and ancillary activities for the development of molecules owned/ co-owned by Jubilant Innovation (BVI) Limited.
DIRECTORS’ REPORT
38
The company fosters the development of molecules owned/ co-owned by Jubilant Innovation (BVI) Limited, in terms of finding right CRO’s in US and Europe based on their capabilities, overseeing, analyses and monitoring of information on clinical / toxicology studies being conducted outside India on Jubilant Innovation (BVI) Limited’s molecules.
Jubilant Infrastructure Limited – This wholly owned subsidiary of your Company has set up Sector Specific Special Economic Zone (SEZ) for Chemicals and Pharmaceuticals in Gujarat. About 107 hectares land has been taken on lease from GIDC in Bharuch District, Gujarat. The Government of India notified the SEZ in February 2008. In September 2008, the Central Government constituted the Approval Committee for this SEZ.
During first Approval Committee meeting for this SEZ in November 2008, SEZ unit of this company was considered for approval and accordingly, a Letter of Approval has been issued for setting up Unit in the SEZ.
This SEZ has received all the required permissions, approvals, eligibility certificates & licenses under SEZ Act and Rules & other relevant Laws. It has received Environment Clearance from Ministry of Environment & Forest, Government of India and accordingly, Consent to Establish has also been received from Gujarat Pollution Control Board under the applicable Water and Air Acts.
Jubilant First Trust Healthcare Limited - This company is in the business of healthcare and is involved in setting up an integrated hub-and-spoke network with a total of about 1,000 beds in West Bengal. The effort is led by a team of professional doctors and healthcare planners in West Bengal. In 2009, the company commissioned a 120-bed super-specialty hospital. The company is having a total capacity of 170 beds across two hospitals in West Bengal. Your Company holds 93.24% of equity capital of this company. This company holds 99.77% capital of Asia Healthcare Development Limited.
Asia Healthcare Development Limited - This company is a subsidiary of your Company through Jubilant First Trust Healthcare Limited, which holds 99.77% of its total capital. This company runs a hospital in Behrampur, 200 kms away from Kolkata, on a Public-Private-Partnership with Government of West Bengal.
Jubilant Cadista Pharmaceuticals Inc. (formerly Cadista Pharmaceuticals Inc.) – This Delaware based USA corporation, is a wholly owned subsidiary of Cadista Holdings Inc. This Company is in the business of manufacturing generic pharmaceuticals, solid dosage forms and has a US FDA approved manufacturing facility in USA. Its customer base includes all the large wholesalers, retail and grocery chains. Besides manufacturing its own label products, it also provides Product development and Contract manufacturing services.
Jubilant Life Sciences (USA) Inc. [formerly Jubilant Organosys (USA) Inc.] – This Delaware based USA corporation, is a wholly owned subsidiary of your Company. It undertakes sales and distribution of advance intermediates, fine chemicals and APIs in USA.
Jubilant Life Sciences (Shanghai) Limited (formerly Jubilant Organosys (Shanghai) Limited) – This wholly owned subsidiary of your Company is held through Jubilant Pharma Pte. Limited. It undertakes sales and distribution of products in China. It is into trading of advance intermediates
- Pyridine & its derivatives, vitamins and fine chemicals. It is catering to pharmaceutical, animal feed and agrochemical industries in China. This subsidiary is also a major sourcing hub of raw materials for your company.
Jubilant Pharmaceuticals NV - This is a wholly owned subsidiary of your Company through Jubilant Pharma NV, Belgium, which holds 99.8% of its shares and Jubilant Pharma Pte. Limited, Singapore which holds the balance shares, both of which are wholly owned subsidiaries of your Company. This company is engaged in the business of licensing of generic dosage forms and offers regulatory affairs services to generic pharmaceutical companies for the diverse European market.
PSI Supply NV – This is a wholly owned subsidiary of your Company. 99.5% shares of this company are held by Jubilant Pharma NV and balance by Jubilant Pharma Pte. Limited. This company is engaged in the supply of generic dosage forms to European markets
Jubilant DraxImage Limited (formerly Draximage India Limited) - This company is a wholly owned subsidiary of your Company through Draximage Limited, Cyprus. The company has started its operation from January 01, 2011 by launching radioactive isotopes. The product which it is presently selling is Tc-99m Generator which is used in the diagnosis of Bone scans, cerebral perfusion imaging, Myocardial Perfusion Imaging. The other products it is selling are Thallium-201 and Lodine-131 capsules and solution, which are used for Myocardial Perfusion Imaging and for the diagnosis and treatment of Thyroid and its related diseases. This company plans to introduce, from April 2011, Lyophilized kits which are Sestamibi, MDP, MAA and DTPA and RUBY-FILL (Rubidium-82 Generator-PET isotope).
This company also proposes to set up a centralized Radio pharmacy which will further propel its growth and help not only to provide a strategic advantage over competitors but also to achieve the leadership status in the Nuclear Medicine.
Other subsidiaries as at the year end are as follows:Cadista Holdings Inc., USA
DAHI Animal Health (UK) Limited, UK
Deprenyl Inc., USA
Draximage (UK) Limited, UK
Draximage Limited, Cyprus
Draximage Limited, Ireland
Draximage LLC, USA
Draxis Pharma Inc., USA
Draxis Pharma LLC, USA
* Generic Pharmaceuticals Holdings Inc., USA
HSL Holdings Inc., USA
Jubilant Biosys (BVI) Limited, British Virgin Islands
Jubilant Biosys (Singapore) Pte. Ltd., Singapore
Jubilant DraxImage (USA) Inc. (formerly DSPI Inc.), USA
Jubilant Drug Development Pte. Ltd., Singapore
Jubilant Life Sciences (BVI) Ltd. (formerly Jubilant Organosys (BVI) Limited), British Virgin Islands
* Jubilant Life Sciences (Switzerland) AG, Schaffhausen
DIRECTORS’ REPORT
39
Annual Report 2010-11 | Jubilant Life Sciences Limited
Jubilant Life Sciences Holdings Inc. (formerly Clinsys Holdings Inc.), USA
Jubilant Life Sciences International Pte. Ltd. (formerly Jubilant Organosys International Pte. Limited), Singapore
Jubilant Pharma NV, Belgium
Jubilant Pharma Pte. Limited, Singapore
6963196 Canada Inc., Canada
6981364 Canada Inc., Canada
* became subsidiary during the yearDuring the year Colvant Sciences Inc., DAHI LLC and Cadista Pharmaceuticals (UK) Limited ceased to be subsidiaries of the Company.
Pursuant to Scheme of Amalgamation and Demerger, Speciality Molecules Limited merged with the Company and certain businesses of the Company were hived off to demerged Jubilant Industries Ltd. (formerly Hitech Shiksha Limited). Both these companies ceased to be subsidiaries of the Company.
Particulars required as per Section 212 of The Companies Act, 1956In terms of the general exemption granted by the Government of India vide its general circular no. 2/2011 dated February 08, 2011, from attaching the Directors’ Reports, Balance Sheets, Profit & Loss Accounts and other particulars of the subsidiaries, the same have not been attached to this Report.
Fixed DepositsNo fresh deposits have been accepted by your Company during the year from the public. As on March 31, 2011, your Company had no outstanding Fixed Deposits. There were no overdue deposits. There were, however, 25 unclaimed deposits amounting to ` 3.82 lacs.
Auditors K. N. Gutgutia & Co., Chartered Accountants, [ICAI Registration Number - 304153E] Auditors of the Company, retire at the ensuing Annual General Meeting and offer themselves for re-appointment. They have confirmed that their re-appointment, if made, shall be within the limits laid down in Section 224 (1B) of the Companies Act, 1956.
Cost Auditors J. K. Kabra & Co., Cost Accountants, [Firm Registration Number - 9] Cost Auditors of the Company, have confirmed that their re-appointment, if made, shall be within the limits laid down in Section 224 (1B) of the Companies Act, 1956. During the financial year 2010-11, the Cost Audit Reports of Chemical (Sulphuric Acid), Industrial Alcohol & Bulk Drugs were filed on September 17, 2010 and of Fertilizer were filed on September 21, 2010, against the due date of September 27, 2010.
DirectorsMr. Rahul Yadav, Nominee Director of Citicorp International Finance Corporation and HPC (Mauritius) Limited – Equity Investors and Mr. Vishal Marwaha, Alternate Director to Mr. Rahul Yadav, ceased to be Directors with effect from July 07, 2010.
Effective from November 11, 2010, Mr. Arabinda Ray resigned from the Board.
In accordance with the Articles of Association of the Company, Mr. Hari S. Bhartia, Mr. Shyamsundar Bang and Dr. Naresh
Trehan retire by rotation at the forthcoming Annual General Meeting and, being eligible, offer themselves for re-appointment.
Directors’ Responsibility StatementIn compliance of Section 217 (2AA) of the Companies Act, 1956, the Directors of your Company, based on the representation received from management, confirm:
• that in the preparation of annual accounts, the applicable accounting standards have been followed along with proper explanation relating to material departures.
• that the Directors have selected such accounting policies and applied them consistently and made judgments and estimates that are reasonable and prudent so as to give a true and fair view of the state of affairs of the Company as on March 31, 2011 and of the profit or loss of the Company for the year ended March 31, 2011.
• that the Directors have taken proper and sufficient care for the maintenance of adequate accounting records in accordance with the provisions of the Companies Act, 1956, for safeguarding the assets of the Company and for preventing and detecting fraud and other irregularities.
• that the Directors have prepared the annual accounts on a going concern basis.
Conservation Of Energy, Technology Absorption and Foreign Exchange Earnings and OutgoInformation relating to Conservation of Energy, Technology Absorption and Foreign Exchange Earnings and Outgo, required to be made pursuant to Section 217(1)(e) of the Companies Act, 1956, read with Companies [Disclosure of Particulars in the Report of Board of Directors] Rules, 1988, is given in Annexure B and forms part of this Report.
Employees The particulars of employees, as required under Section 217(2A) of the Companies Act 1956, read with the Companies (Particulars of Employees) Rules, 1975, are given in Annexure C and form part of this Report.
Corporate GovernanceA separate section on Corporate Governance is attached to this Report as Annexure D. A certificate from the auditors of the Company regarding compliance of conditions of Corporate Governance as stipulated under clause 49 of the Listing Agreements with Stock Exchanges is enclosed as Annexure E. A certificate from the Chairman & Managing Director that all Board members and senior management personnel have affirmed compliance with the Code of Conduct for the year ended March 31, 2011 is attached as Annexure F. CEO/CFO certificate is enclosed as Annexure G.
Management Discussion & Analysis Notes on Management Discussion & Analysis of the financial position of the Company have been given separately and form part of this Report.
Corporate Sustainability Report Your Company, being committed to address environmental issues and discharge its corporate social responsibility, is publishing for the ninth year in a row, Corporate Sustainability Report, duly audited by Ernst & Young, and conforming to Global Reporting Initiative (GRI) Guidelines. The Report is being sent to all our shareholders.
DIRECTORS’ REPORT
40
Risk Management
Today’s business environment remains challenging for the Corporate World and risk management retains its high position on every organization’s agenda. The Company has several risk factors which could potentially impact its business objectives, if not perceived and mitigated in a timely manner. With an effective risk management framework in place, the Company looks at these risks as challenges and opportunities to create value for its stakeholders. With its established processes and guidelines in place, combined with a strong oversight and monitoring system at the Board and senior management levels, the Company has a robust risk management strategy in place.
The senior management team sets the overall tone and risk culture of the organization through defined and communicated corporate values, clearly assigned risk responsibilities, appropriately delegated authority, and a set of processes and guidelines. The Company has laid down procedures to inform Board members about the risk assessment and risk minimization procedures. The Company promotes strong ethical values and high levels of integrity in all our activities, which in itself is a significant risk mitigator.
With the growth strategy in place, risk management holds a key to the success of its journey of continued competitive sustainability in attaining its desired business objective.
A detailed note on Risk Management is given as part of “Management Discussion & Analysis”.
Human Resource Management
As of March 31, 2011, we had 5763 employees including those in our Subsidiary companies.
As of March 31, 2011, 661 of our employees at our manufacturing plants at Samlaya, Nira, Gajraula and Nanjangud, were members of unions or had collective bargaining capability. We enjoy cordial relations with our employees and there have been no instances of major strikes, lockouts or other disruptive labour disputes.
We have signed a policy on CII Code of Conduct on Affirmative Action that reconfirms our commitment that equal opportunity in employment for all sections of society is a component of our growth and competitiveness.
We strive toward technology driven HR systems and processes and have implemented world renowned PeopleSoft based human resource management system ‘Synergy HRIS’. Its key features include employee personal and Job database, self service features like reimbursements, pay slips, leaves, income tax declarations & computations, loans and exit process etc.
We believe in an open, fair and transparent culture and stand by our promise of Caring, Sharing, Growing and make efforts to make Jubilant one of the best places to work for. In this direction, we have been conducting the Gallup employee engagement survey to gauge the organization’s health. This allows us to track the proportion of engaged to actively disengaged employees and so that mid-course corrections or interventions can be implemented thereof.
A detailed note on HR Management is given in the “Management Discussion & Analysis”.
Awards and AccoladesDuring the year 2010-11, the Company won the following:
• Two Environmental Best Practices Award 2011, by CII-Sohrabji Godrej Green Business Centre, under Most Innovative Environmental Project and Most Useful Environmental Project for the Co-processing of Hazardous waste in Cement Kiln at Nanjangud plant, Mysore, India
• Golden Peacock Innovation Award 2011 for developing Niacin by Vapour Phase Catalytic Oxidation of Beta Picoline
• Ernst & Young Entrepreneur of the Year 2010 for Life Sciences & Consumer Products to Mr. Shyam S Bhartia, Chairman & Managing Director and Mr. Hari S Bhartia, Co-Chairman & Managing Director
• CII – EHS Award 2010 - First Place for Excellence in EH&S systems at the Nanjangud Plant, among medium scale industries
• Safety Innovation Award 2010 by The Institution of Engineers (India) for implementing Innovative Safety Management Systems at Nanjandgud Plant
• National Award for Excellence in Water Management – 2010 by CII-Sohrabji Godrej Green Business Centre for Nanjangud plant
• India Manufacturing Excellence Award 2010 - ‘Gold Certificate of Merit’ by The Economic Times - Frost & Sullivan for EOU facility at Gajraula
• Certification of Commendation for Strong Commitment for Sustainability by CII-ITC Sustainability Awards 2010
• Two ABCI Awards 2010 for Communication efforts of Jubilant Life Sciences- Gold for e-newsletter and Bronze for CSR Communication
• Jubilant was included in the Forbes Asia ‘Best Under a Billion’ Asia List – released in Sept 2010
• A+ rating from GRI for Corporate Sustainability Report 2010 (consecutively for the last four years since 2007)
• Golden Peacock Environment Management Award 2010 by World Environment Foundation (WEF) for API facility at Nanjangud, Mysore, India
CertificationsYour Company follows several externally developed initiatives in the economic, environmental and social areas. Facilities of the Company at Gajraula, Nira, Savli, Nanjangud and Ambernath are ISO 9001:2008 certified for Quality Management System. These manufacturing facilities are also ISO 14001:2004 certified for Environmental Management System. For Occupational Health and Safety at work place, these manufacturing facilities are also certified to OHSAS 18001:2007. The locations of Gajraula, Nira and Savli are certified for Integrated Management System (IMS). Facilities at Savli are certified for FAMI- QS Version – 5 Quality in Feed Safety Management System. Gajraula Quality Control Laboratory has also been certified for chemical testing by NABL (National Accreditation Board for Testing and Calibration Laboratories) in accordance with the ISO / IEC 17025:2005.
Dosage Forms facility at Roorkee follows Good Manufacturing Practices (GMP) as per World Health Organisation (WHO) specifications in manufacturing and testing of pharmaceutical
DIRECTORS’ REPORT
41
Annual Report 2010-11 | Jubilant Life Sciences Limited
products and hence has been granted WHO GMP certificate by the Drug Licensing and Controlling Authority, Uttarakhand. The facility is also approved by UK-MHRA (UK- Medicines and Healthcare Products Regulatory Agency) to export drugs to European Market.
Nanjangud plant has got US FDA (United States Food & Drug Administration) approval for exporting certain products to US market. AFSSAPS (Agence Francaise de Securite Sanitaire des Produits de Sante -The French Health Products Safety Agency), GMP approval for certain products, PMDA (Pharmaceuticals and Medical Devices Agency, Japan) for exporting Risperidone HCl to the Japanese market, KFDA (Korea Food and Drug Administration) for exporting Valsartan and Losartan to Korean market, COFEPRIS for exporting Pinaverium Bromide to Mexican market. Olanzapine, Losartan was audited by United State Pharmacopeia and approved for the use of USP logo.
Investor ServicesIn its endeavor to improve investor services, your Company has taken the following initiatives:
• With a view to communicating on a real time basis, your Company has been e-mailing to the shareholders, quarterly results, press releases and other similar communications soon after they are sent to the stock exchanges.
• For effective communication with shareholders, during the year, the Company also e-mailed Annual Report, Corporate Sustainability Report and Notice of Annual General Meeting to shareholders on their email IDs as available, in addition to statutory physical mailing.
• The Investor Section on the website of the Company www.jubl.com is more user friendly now.
• A dedicated e-mail ID viz. [email protected] for sending communications to the Company Secretary / Compliance Officer has been made effective. Members may lodge their complaints or suggestions on this e-mail as well.
• The Company has been mailing feedback forms to investors, annually, so as to bring about improvement in service level based on responses received. The Company has also placed an online Investor Feedback Form on its website www.jubl.com under the head “Investors”. This form can be submitted electronically.
Acknowledgments Your Directors acknowledge with gratitude the co-operation and assistance received from the Central and State Government Authorities. Your Directors thank the Shareholders, Private Equity Investors, Financial Institutions, Banks/other lenders, Customers, Vendors and other business associates for their confidence in the Company and its management and look forward to their continued support. The Board wishes to place on record its appreciation for the dedication and commitment of your Company’s employees at all levels, which has continued to be our major strength.
For and on behalf of the Board
Noida Shyam S. Bhartia May 10, 2011 Chairman & Managing Director
DIRECTORS’ REPORT
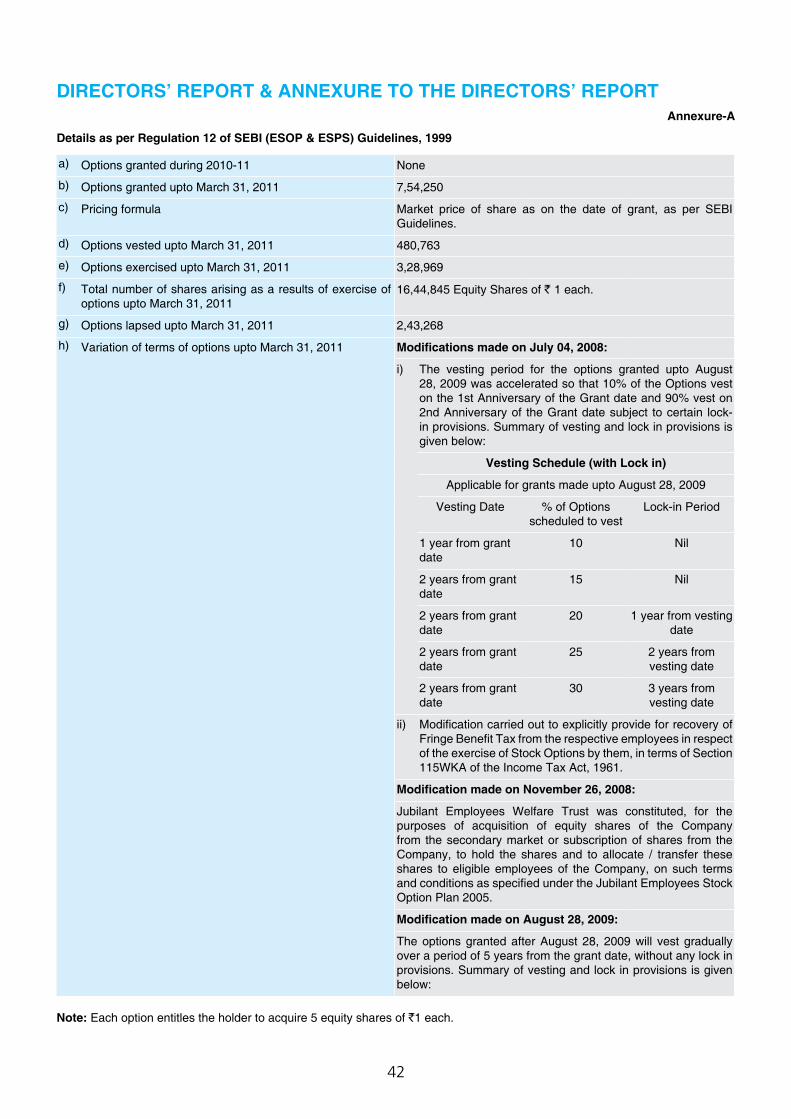
42
Annexure-A
Details as per Regulation 12 of SEBI (ESOP & ESPS) Guidelines, 1999
a) Options granted during 2010-11 None
b) Options granted upto March 31, 2011 7,54,250
c) Pricing formula Market price of share as on the date of grant, as per SEBI Guidelines.
d) Options vested upto March 31, 2011 480,763
e) Options exercised upto March 31, 2011 3,28,969
f) Total number of shares arising as a results of exercise of options upto March 31, 2011
16,44,845 Equity Shares of ` 1 each.
g) Options lapsed upto March 31, 2011 2,43,268
h) Variation of terms of options upto March 31, 2011 Modifications made on July 04, 2008:
i) The vesting period for the options granted upto August 28, 2009 was accelerated so that 10% of the Options vest on the 1st Anniversary of the Grant date and 90% vest on 2nd Anniversary of the Grant date subject to certain lock-in provisions. Summary of vesting and lock in provisions is given below:
Vesting Schedule (with Lock in)
Applicable for grants made upto August 28, 2009
Vesting Date % of Options scheduled to vest
Lock-in Period
1 year from grant date
10 Nil
2 years from grant date
15 Nil
2 years from grant date
20 1 year from vesting date
2 years from grant date
25 2 years from vesting date
2 years from grant date
30 3 years from vesting date
ii) Modification carried out to explicitly provide for recovery of Fringe Benefit Tax from the respective employees in respect of the exercise of Stock Options by them, in terms of Section 115WKA of the Income Tax Act, 1961.
Modification made on November 26, 2008:
Jubilant Employees Welfare Trust was constituted, for the purposes of acquisition of equity shares of the Company from the secondary market or subscription of shares from the Company, to hold the shares and to allocate / transfer these shares to eligible employees of the Company, on such terms and conditions as specified under the Jubilant Employees Stock Option Plan 2005.
Modification made on August 28, 2009:
The options granted after August 28, 2009 will vest gradually over a period of 5 years from the grant date, without any lock in provisions. Summary of vesting and lock in provisions is given below:
Note: Each option entitles the holder to acquire 5 equity shares of `1 each.
DIRECTORS’ REPORT & ANNExURE TO ThE DIRECTORS’ REPORT
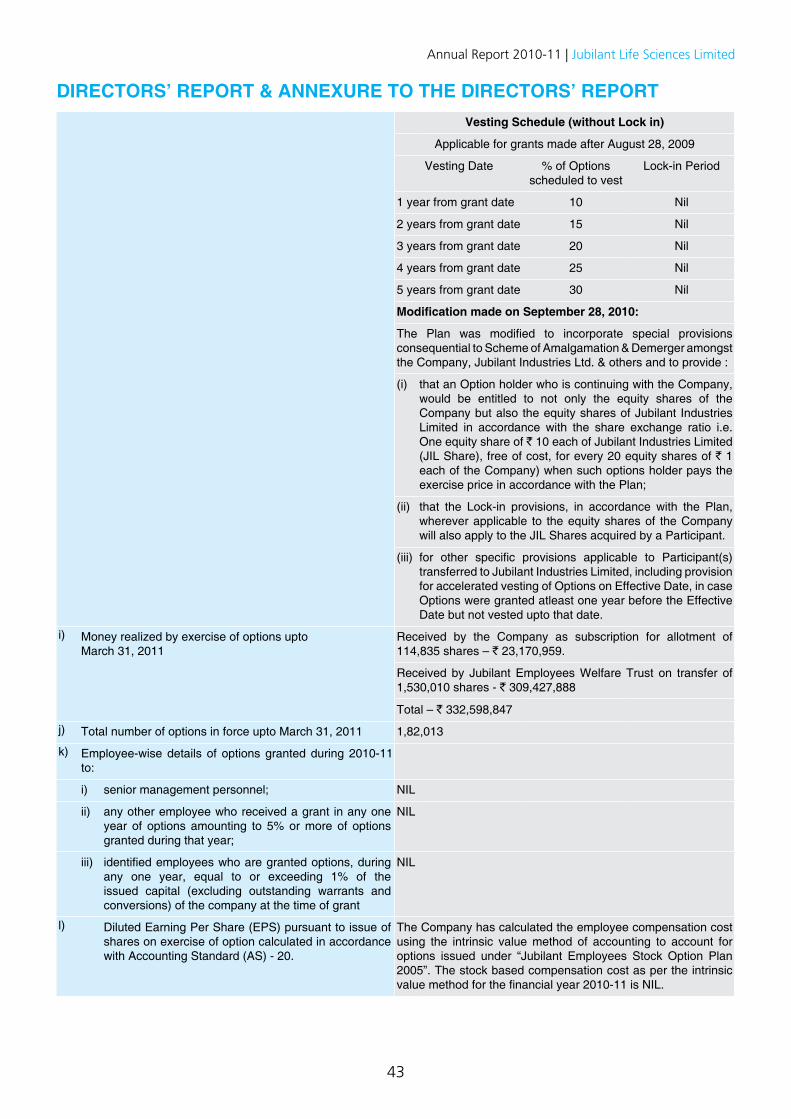
43
Annual Report 2010-11 | Jubilant Life Sciences Limited
Vesting Schedule (without Lock in)
Applicable for grants made after August 28, 2009
Vesting Date % of Options scheduled to vest
Lock-in Period
1 year from grant date 10 Nil
2 years from grant date 15 Nil
3 years from grant date 20 Nil
4 years from grant date 25 Nil
5 years from grant date 30 Nil
Modification made on September 28, 2010:
The Plan was modified to incorporate special provisions consequential to Scheme of Amalgamation & Demerger amongst the Company, Jubilant Industries Ltd. & others and to provide :
(i) that an Option holder who is continuing with the Company, would be entitled to not only the equity shares of the Company but also the equity shares of Jubilant Industries Limited in accordance with the share exchange ratio i.e. One equity share of ` 10 each of Jubilant Industries Limited (JIL Share), free of cost, for every 20 equity shares of ` 1 each of the Company) when such options holder pays the exercise price in accordance with the Plan;
(ii) that the Lock-in provisions, in accordance with the Plan, wherever applicable to the equity shares of the Company will also apply to the JIL Shares acquired by a Participant.
(iii) for other specific provisions applicable to Participant(s) transferred to Jubilant Industries Limited, including provision for accelerated vesting of Options on Effective Date, in case Options were granted atleast one year before the Effective Date but not vested upto that date.
i) Money realized by exercise of options upto March 31, 2011
Received by the Company as subscription for allotment of 114,835 shares – ` 23,170,959.
Received by Jubilant Employees Welfare Trust on transfer of 1,530,010 shares - ` 309,427,888
Total – ` 332,598,847
j) Total number of options in force upto March 31, 2011 1,82,013
k) Employee-wise details of options granted during 2010-11 to:
i) senior management personnel; NIL
ii) any other employee who received a grant in any one year of options amounting to 5% or more of options granted during that year;
NIL
iii) identified employees who are granted options, during any one year, equal to or exceeding 1% of the issued capital (excluding outstanding warrants and conversions) of the company at the time of grant
NIL
l) Diluted Earning Per Share (EPS) pursuant to issue of shares on exercise of option calculated in accordance with Accounting Standard (AS) - 20.
The Company has calculated the employee compensation cost using the intrinsic value method of accounting to account for options issued under “Jubilant Employees Stock Option Plan 2005”. The stock based compensation cost as per the intrinsic value method for the financial year 2010-11 is NIL.
DIRECTORS’ REPORT & ANNExURE TO ThE DIRECTORS’ REPORT
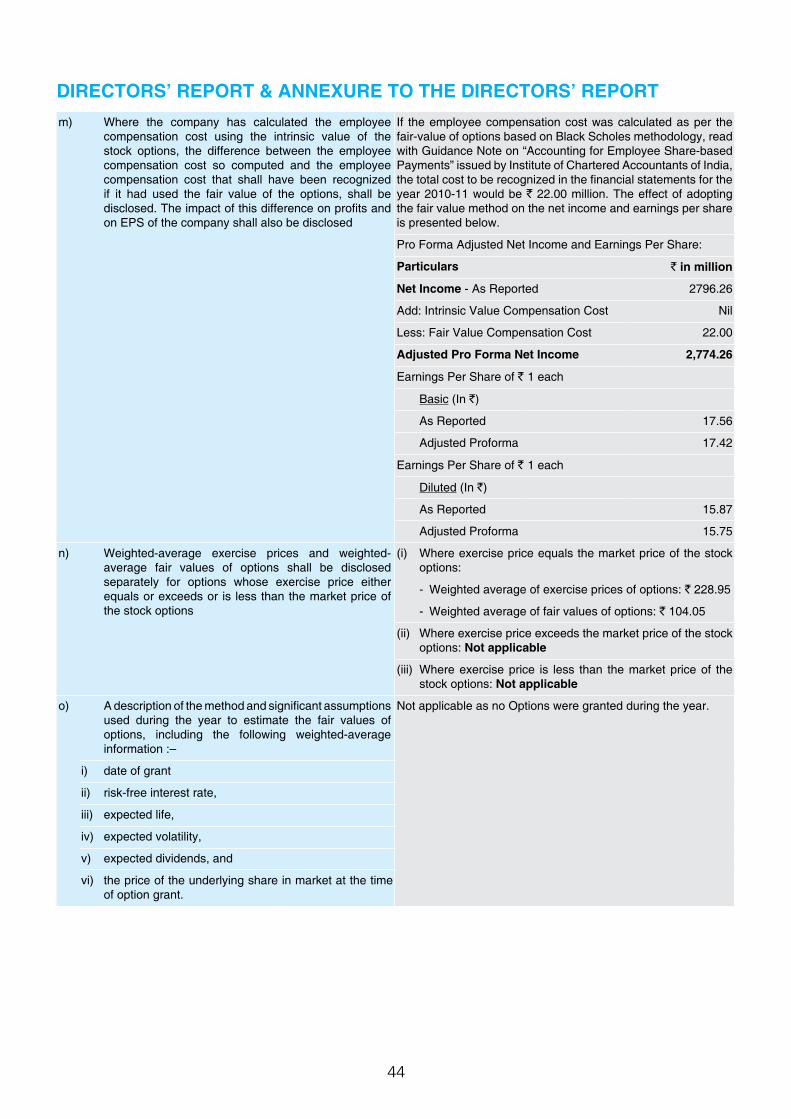
44
m) Where the company has calculated the employee compensation cost using the intrinsic value of the stock options, the difference between the employee compensation cost so computed and the employee compensation cost that shall have been recognized if it had used the fair value of the options, shall be disclosed. The impact of this difference on profits and on EPS of the company shall also be disclosed
If the employee compensation cost was calculated as per the fair-value of options based on Black Scholes methodology, read with Guidance Note on “Accounting for Employee Share-based Payments” issued by Institute of Chartered Accountants of India, the total cost to be recognized in the financial statements for the year 2010-11 would be ` 22.00 million. The effect of adopting the fair value method on the net income and earnings per share is presented below.
Pro Forma Adjusted Net Income and Earnings Per Share:
Particulars ` in million
Net Income - As Reported 2796.26
Add: Intrinsic Value Compensation Cost Nil
Less: Fair Value Compensation Cost 22.00
Adjusted Pro Forma Net Income 2,774.26
Earnings Per Share of ` 1 each
Basic (In `)
As Reported 17.56
Adjusted Proforma 17.42
Earnings Per Share of ` 1 each
Diluted (In `)
As Reported 15.87
Adjusted Proforma 15.75
n) Weighted-average exercise prices and weighted-average fair values of options shall be disclosed separately for options whose exercise price either equals or exceeds or is less than the market price of the stock options
(i) Where exercise price equals the market price of the stock options:
- Weighted average of exercise prices of options: ` 228.95
- Weighted average of fair values of options: ` 104.05
(ii) Where exercise price exceeds the market price of the stock options: Not applicable
(iii) Where exercise price is less than the market price of the stock options: Not applicable
o) A description of the method and significant assumptions used during the year to estimate the fair values of options, including the following weighted-average information :–
Not applicable as no Options were granted during the year.
i) date of grant
ii) risk-free interest rate,
iii) expected life,
iv) expected volatility,
v) expected dividends, and
vi) the price of the underlying share in market at the time of option grant.
DIRECTORS’ REPORT & ANNExURE TO ThE DIRECTORS’ REPORT
45
Annual Report 2010-11 | Jubilant Life Sciences Limited
ANNExURE - B
DISCLOSURE UNDER SECTION 217(1)(e) OF ThE COMPANIES ACT, 1956 READ WITh COMPANIES (DISCLOSURE OF PARTICULARS IN ThE REPORT OF BOARD OF DIRECTORS) RULES, 1988.
A. Conservation of Energy
(a) Energy Conservation Measures Taken
• Energy Conservation by optimizing operation of distillation columns
• Installation of Thermo-compressor to create additional steam extraction demand
• Installation of de-superheater to recover the superheat of extraction steam of Turbo Generator
• Rationalization of steam pressure to create additional steam extraction demand for improving power generation efficiency
• Reduction in power consumption by utilizing cooling water in place of chilled water for cooling of some process stream
• Reduction of steam consumption by increasing the Triple effect evaporator steam Economy
• Power savings in water pumping through piping network re-engineering
• Power savings through provision of Interlocks for cooling tower pumps and fans
• Installation of the energy efficient motors
• Installation of Variable Frequency Drives (VFD) for motors
(b) Additional Investment and Proposals, if any, being implemented for reduction of consumption of energy
• To reduce power cost by utilizing low pressure steam in place of medium pressure steam in distillation column
• To reduce steam consumption in process plant through vacuum distillation & pre-heater
• To reduce Steam consumption norm in process plant through reflux optimization
• To reduce power consumption in compressed air network
• Reduction in steam, chilled water & chilled brine power consumption
• Reduction in power consumption in cooling water circuit through installation of energy efficient pumps and piping network re-engineering
• Installation of VFD for some machines
• Reduction in power consumption in boiler feed water circuit through rationalization of pump head
• Installation of briquette fired boiler for eliminating liquid fuel consumption
Expected investment in above initiatives is ` 41 million, approx.
(c) Impact of measures at (a) and (b) above for reduction of energy consumption and consequent impact on the cost of production of goods
• Reduction in steam and power consumption norms
• Reduction in power generation cost
1. Saving due to (a) conservation of energy: ` 30 million per annum, approx.
2. Saving due to (b): ` 45 million per annum, approx.
ANNExURE TO ThE DIRECTORS’ REPORT
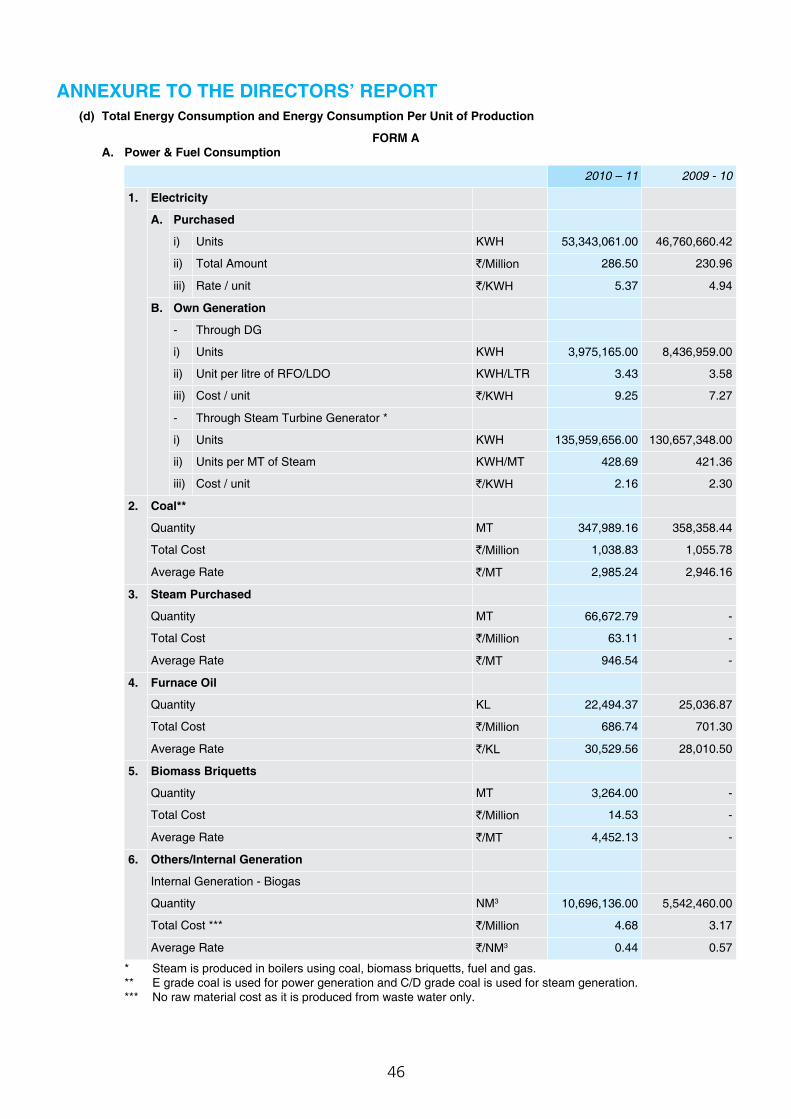
46
(d) Total Energy Consumption and Energy Consumption Per Unit of Production
FORM A A. Power & Fuel Consumption
2010 – 11 2009 - 10
1.
Electricity
A. Purchased
i) Units KWH 53,343,061.00 46,760,660.42
ii) Total Amount `/Million 286.50 230.96
iii) Rate / unit `/KWH 5.37 4.94
B. Own Generation
- Through DG
i) Units KWH 3,975,165.00 8,436,959.00
ii) Unit per litre of RFO/LDO KWH/LTR 3.43 3.58
iii) Cost / unit `/KWH 9.25 7.27
- Through Steam Turbine Generator *
i) Units KWH 135,959,656.00 130,657,348.00
ii) Units per MT of Steam KWH/MT 428.69 421.36
iii) Cost / unit `/KWH 2.16 2.30
2.
Coal**
Quantity MT 347,989.16 358,358.44
Total Cost `/Million 1,038.83 1,055.78
Average Rate `/MT 2,985.24 2,946.16
3.
Steam Purchased
Quantity MT 66,672.79 -
Total Cost `/Million 63.11 -
Average Rate `/MT 946.54 -
4.
Furnace Oil
Quantity KL 22,494.37 25,036.87
Total Cost `/Million 686.74 701.30
Average Rate `/KL 30,529.56 28,010.50
5.
Biomass Briquetts
Quantity MT 3,264.00 -
Total Cost `/Million 14.53 -
Average Rate `/MT 4,452.13 -
6.
Others/Internal Generation
Internal Generation - Biogas
Quantity NM3 10,696,136.00 5,542,460.00
Total Cost *** `/Million 4.68 3.17
Average Rate `/NM3 0.44 0.57
* Steam is produced in boilers using coal, biomass briquetts, fuel and gas. ** E grade coal is used for power generation and C/D grade coal is used for steam generation. *** No raw material cost as it is produced from waste water only.
ANNExURE TO ThE DIRECTORS’ REPORT
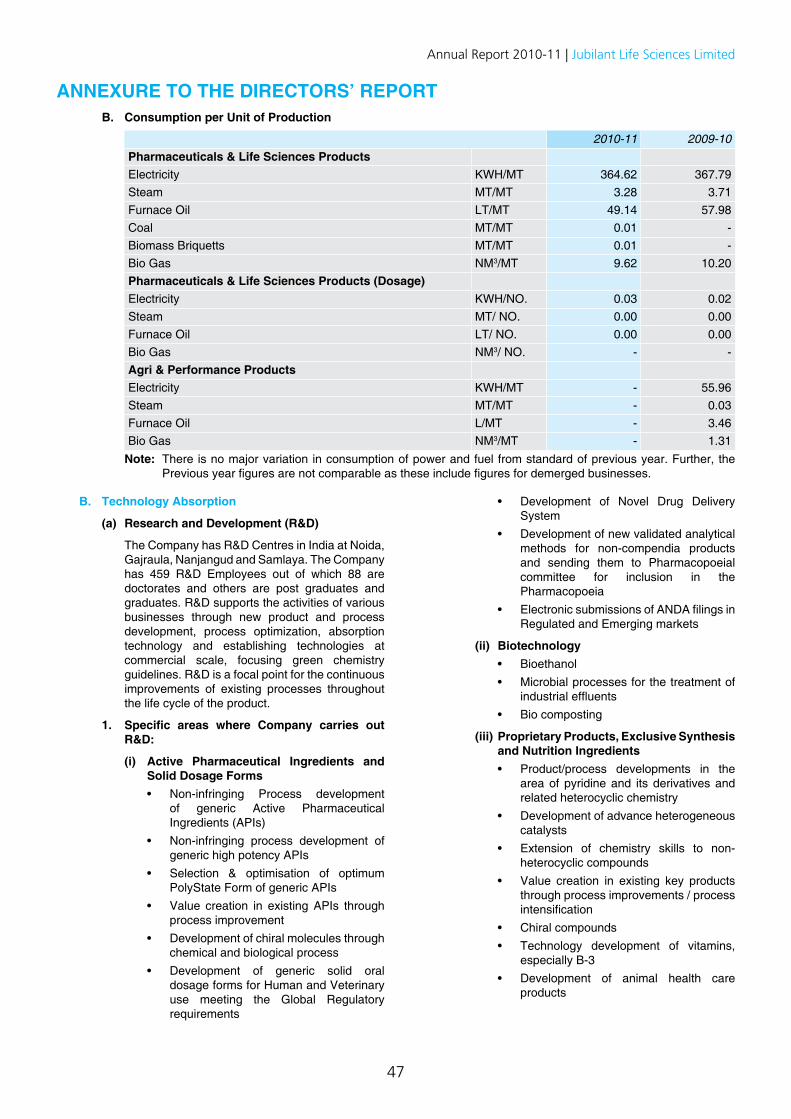
47
Annual Report 2010-11 | Jubilant Life Sciences Limited
B. Consumption per Unit of Production
2010-11 2009-10Pharmaceuticals & Life Sciences Products Electricity KWH/MT 364.62 367.79Steam MT/MT 3.28 3.71Furnace Oil LT/MT 49.14 57.98Coal MT/MT 0.01 -Biomass Briquetts MT/MT 0.01 -Bio Gas NM3/MT 9.62 10.20Pharmaceuticals & Life Sciences Products (Dosage) Electricity KWH/NO. 0.03 0.02Steam MT/ NO. 0.00 0.00Furnace Oil LT/ NO. 0.00 0.00Bio Gas NM3/ NO. - -Agri & Performance ProductsElectricity KWH/MT - 55.96Steam MT/MT - 0.03Furnace Oil L/MT - 3.46Bio Gas NM3/MT - 1.31
Note: There is no major variation in consumption of power and fuel from standard of previous year. Further, the Previous year figures are not comparable as these include figures for demerged businesses.
• Development of Novel Drug Delivery System
• Development of new validated analytical methods for non-compendia products and sending them to Pharmacopoeial committee for inclusion in the Pharmacopoeia
• Electronic submissions of ANDA filings in Regulated and Emerging markets
(ii) Biotechnology • Bioethanol • Microbial processes for the treatment of
industrial effluents • Bio composting
(iii) Proprietary Products, Exclusive Synthesis and Nutrition Ingredients
• Product/process developments in the area of pyridine and its derivatives and related heterocyclic chemistry
• Development of advance heterogeneous catalysts
• Extension of chemistry skills to non-heterocyclic compounds
• Value creation in existing key products through process improvements / process intensification
• Chiral compounds • Technology development of vitamins,
especially B-3 • Development of animal health care
products
B. Technology Absorption
(a) Research and Development (R&D)
The Company has R&D Centres in India at Noida, Gajraula, Nanjangud and Samlaya. The Company has 459 R&D Employees out of which 88 are doctorates and others are post graduates and graduates. R&D supports the activities of various businesses through new product and process development, process optimization, absorption technology and establishing technologies at commercial scale, focusing green chemistry guidelines. R&D is a focal point for the continuous improvements of existing processes throughout the life cycle of the product.
1. Specific areas where Company carries out R&D:
(i) Active Pharmaceutical Ingredients and Solid Dosage Forms
• Non-infringing Process development of generic Active Pharmaceutical Ingredients (APIs)
• Non-infringing process development of generic high potency APIs
• Selection & optimisation of optimum PolyState Form of generic APIs
• Value creation in existing APIs through process improvement
• Development of chiral molecules through chemical and biological process
• Development of generic solid oral dosage forms for Human and Veterinary use meeting the Global Regulatory requirements
ANNExURE TO ThE DIRECTORS’ REPORT
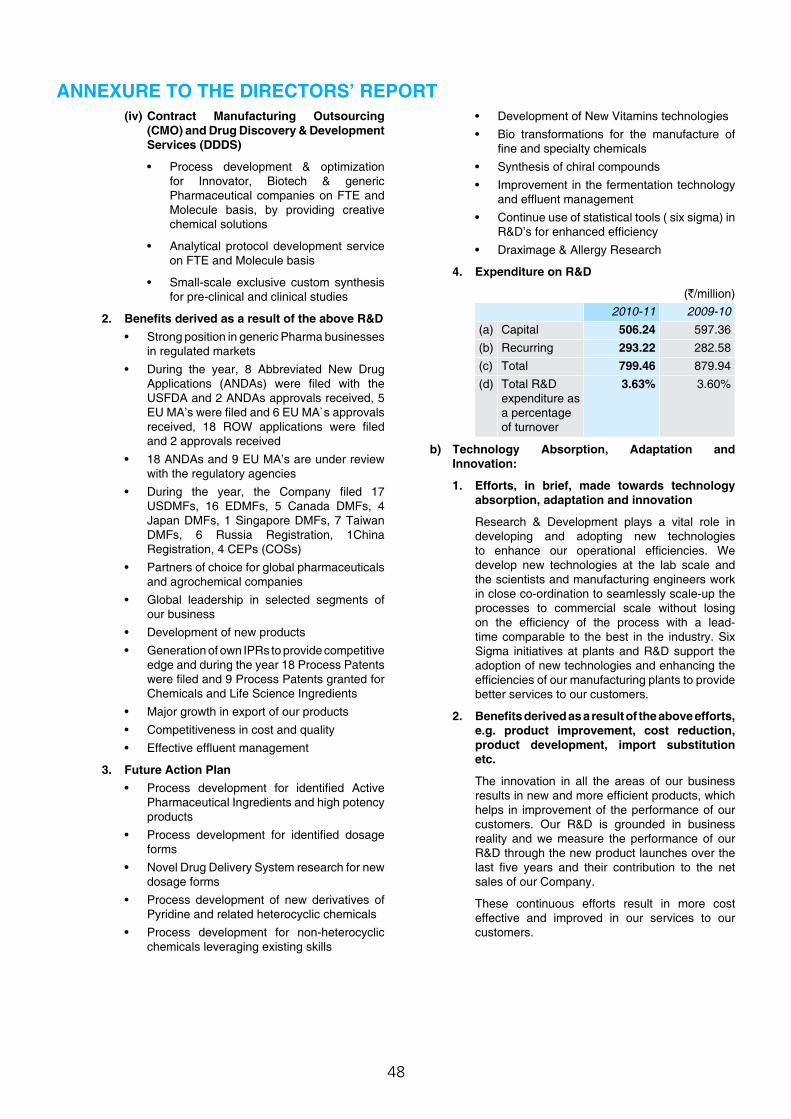
48
(iv) Contract Manufacturing Outsourcing (CMO) and Drug Discovery & Development Services (DDDS)
• Process development & optimization for Innovator, Biotech & generic Pharmaceutical companies on FTE and Molecule basis, by providing creative chemical solutions
• Analytical protocol development service on FTE and Molecule basis
• Small-scale exclusive custom synthesis for pre-clinical and clinical studies
2. Benefits derived as a result of the above R&D • Strong position in generic Pharma businesses
in regulated markets • During the year, 8 Abbreviated New Drug
Applications (ANDAs) were filed with the USFDA and 2 ANDAs approvals received, 5 EU MA’s were filed and 6 EU MA`s approvals received, 18 ROW applications were filed and 2 approvals received
• 18 ANDAs and 9 EU MA’s are under review with the regulatory agencies
• During the year, the Company filed 17 USDMFs, 16 EDMFs, 5 Canada DMFs, 4 Japan DMFs, 1 Singapore DMFs, 7 Taiwan DMFs, 6 Russia Registration, 1China Registration, 4 CEPs (COSs)
• Partners of choice for global pharmaceuticals and agrochemical companies
• Global leadership in selected segments of our business
• Development of new products • Generation of own IPRs to provide competitive
edge and during the year 18 Process Patents were filed and 9 Process Patents granted for Chemicals and Life Science Ingredients
• Major growth in export of our products • Competitiveness in cost and quality • Effective effluent management
3. Future Action Plan • Process development for identified Active
Pharmaceutical Ingredients and high potency products
• Process development for identified dosage forms
• Novel Drug Delivery System research for new dosage forms
• Process development of new derivatives of Pyridine and related heterocyclic chemicals
• Process development for non-heterocyclic chemicals leveraging existing skills
• Development of New Vitamins technologies • Bio transformations for the manufacture of
fine and specialty chemicals • Synthesis of chiral compounds • Improvement in the fermentation technology
and effluent management • Continue use of statistical tools ( six sigma) in
R&D’s for enhanced efficiency • Draximage & Allergy Research
4. Expenditure on R&D
(`/million)2010-11 2009-10
(a) Capital 506.24 597.36(b) Recurring 293.22 282.58(c) Total 799.46 879.94(d) Total R&D
expenditure as a percentage of turnover
3.63% 3.60%
b) Technology Absorption, Adaptation and Innovation:
1. Efforts, in brief, made towards technology absorption, adaptation and innovation
Research & Development plays a vital role in developing and adopting new technologies to enhance our operational efficiencies. We develop new technologies at the lab scale and the scientists and manufacturing engineers work in close co-ordination to seamlessly scale-up the processes to commercial scale without losing on the efficiency of the process with a lead-time comparable to the best in the industry. Six Sigma initiatives at plants and R&D support the adoption of new technologies and enhancing the efficiencies of our manufacturing plants to provide better services to our customers.
2. Benefits derived as a result of the above efforts, e.g. product improvement, cost reduction, product development, import substitution etc.
The innovation in all the areas of our business results in new and more efficient products, which helps in improvement of the performance of our customers. Our R&D is grounded in business reality and we measure the performance of our R&D through the new product launches over the last five years and their contribution to the net sales of our Company.
These continuous efforts result in more cost effective and improved in our services to our customers.
ANNExURE TO ThE DIRECTORS’ REPORT
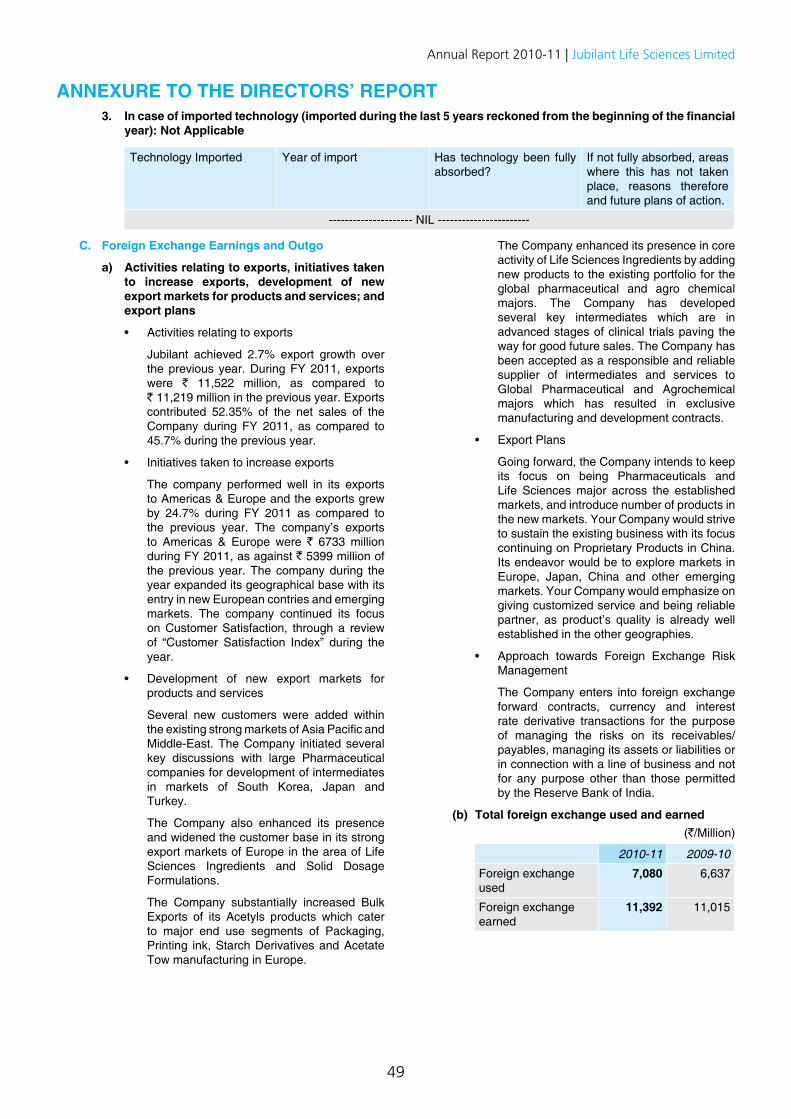
49
Annual Report 2010-11 | Jubilant Life Sciences Limited
3. In case of imported technology (imported during the last 5 years reckoned from the beginning of the financial year): Not Applicable
Technology Imported Year of import Has technology been fully absorbed?
If not fully absorbed, areas where this has not taken place, reasons therefore and future plans of action.
--------------------- NIL -----------------------
The Company enhanced its presence in core activity of Life Sciences Ingredients by adding new products to the existing portfolio for the global pharmaceutical and agro chemical majors. The Company has developed several key intermediates which are in advanced stages of clinical trials paving the way for good future sales. The Company has been accepted as a responsible and reliable supplier of intermediates and services to Global Pharmaceutical and Agrochemical majors which has resulted in exclusive manufacturing and development contracts.
• Export Plans
Going forward, the Company intends to keep its focus on being Pharmaceuticals and Life Sciences major across the established markets, and introduce number of products in the new markets. Your Company would strive to sustain the existing business with its focus continuing on Proprietary Products in China. Its endeavor would be to explore markets in Europe, Japan, China and other emerging markets. Your Company would emphasize on giving customized service and being reliable partner, as product’s quality is already well established in the other geographies.
• Approach towards Foreign Exchange Risk Management
The Company enters into foreign exchange forward contracts, currency and interest rate derivative transactions for the purpose of managing the risks on its receivables/payables, managing its assets or liabilities or in connection with a line of business and not for any purpose other than those permitted by the Reserve Bank of India.
(b) Total foreign exchange used and earned (`/Million)
2010-11 2009-10
Foreign exchange used
7,080 6,637
Foreign exchange earned
11,392 11,015
C. Foreign Exchange Earnings and Outgo
a) Activities relating to exports, initiatives taken to increase exports, development of new export markets for products and services; and export plans
• Activities relating to exports
Jubilant achieved 2.7% export growth over the previous year. During FY 2011, exports were ` 11,522 million, as compared to ` 11,219 million in the previous year. Exports contributed 52.35% of the net sales of the Company during FY 2011, as compared to 45.7% during the previous year.
• Initiatives taken to increase exports
The company performed well in its exports to Americas & Europe and the exports grew by 24.7% during FY 2011 as compared to the previous year. The company’s exports to Americas & Europe were ` 6733 million during FY 2011, as against ` 5399 million of the previous year. The company during the year expanded its geographical base with its entry in new European contries and emerging markets. The company continued its focus on Customer Satisfaction, through a review of “Customer Satisfaction Index” during the year.
• Development of new export markets for products and services
Several new customers were added within the existing strong markets of Asia Pacific and Middle-East. The Company initiated several key discussions with large Pharmaceutical companies for development of intermediates in markets of South Korea, Japan and Turkey.
The Company also enhanced its presence and widened the customer base in its strong export markets of Europe in the area of Life Sciences Ingredients and Solid Dosage Formulations.
The Company substantially increased Bulk Exports of its Acetyls products which cater to major end use segments of Packaging, Printing ink, Starch Derivatives and Acetate Tow manufacturing in Europe.
ANNExURE TO ThE DIRECTORS’ REPORT
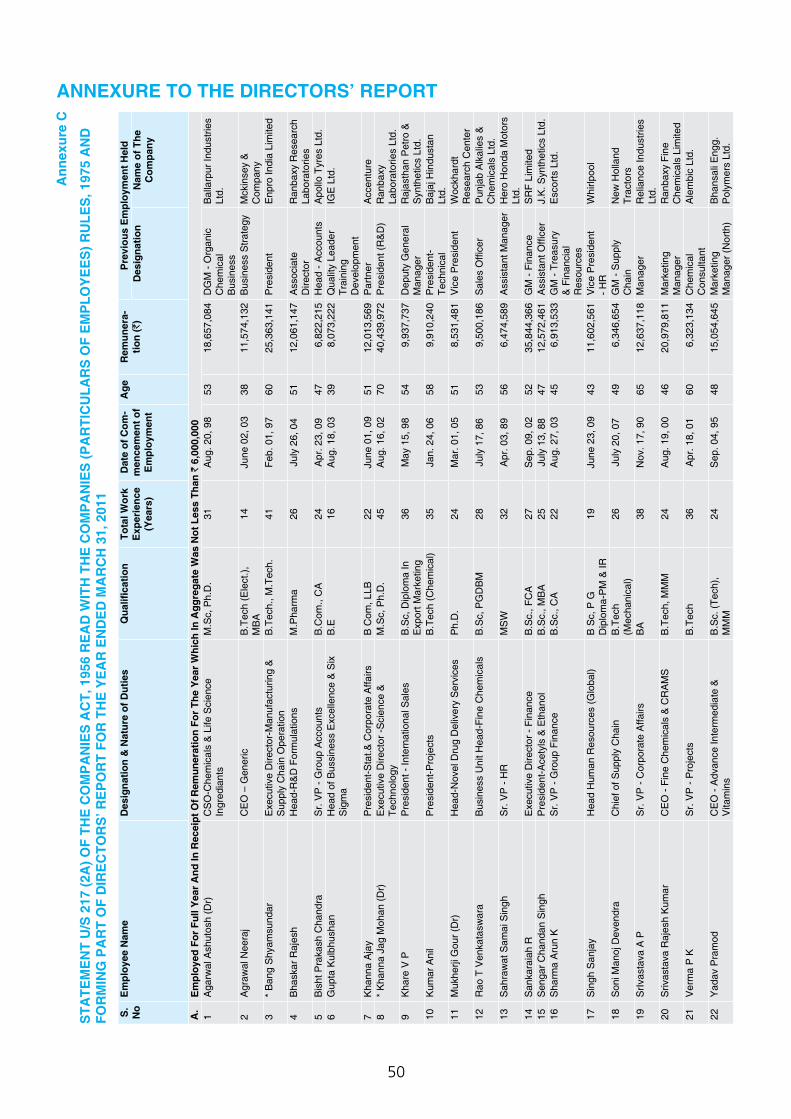
50
A
nnex
ure
C
STA
TEM
EN
T U
/S 2
17 (2
A) O
F Th
E C
OM
PA
NIE
S A
CT,
195
6 R
EA
D W
ITh
Th
E C
OM
PA
NIE
S (P
AR
TIC
ULA
RS
OF
EM
PLO
YE
ES
) RU
LES
, 197
5 A
ND
FO
RM
ING
PA
RT
OF
DIR
EC
TOR
S’ R
EP
OR
T FO
R T
hE
YE
AR
EN
DE
D M
AR
Ch
31,
201
1
S.
No
Em
ploy
ee N
ame
D
esig
natio
n &
Nat
ure
of D
utie
s
Qua
lifica
tion
To
tal W
ork
Exp
erie
nce
(Yea
rs)
Dat
e of
Com
-m
ence
men
t of
Em
ploy
men
t
Age
Rem
uner
a-tio
n (`
)
Pre
viou
s E
mpl
oym
ent H
eld
Des
igna
tion
Nam
e of
The
C
ompa
ny
A.
Em
ploy
ed F
or F
ull Y
ear
And
In R
ecei
pt O
f Rem
uner
atio
n Fo
r Th
e Y
ear
Whi
ch In
Agg
rega
te W
as N
ot L
ess
Than
` 6
,000
,000
1A
garw
al A
shut
osh
(Dr)
CS
O-C
hem
ical
s &
Life
Sci
ence
In
gred
iant
sM
.Sc,
Ph.
D.
31A
ug. 2
0, 9
853
18,6
57,0
84D
GM
- O
rgan
ic
Che
mic
al
Bus
ines
s
Bal
larp
ur In
dust
ries
Ltd.
2A
graw
al N
eera
j C
EO
– G
ener
icB
.Tec
h (E
lect
.),
MB
A14
June
02,
03
3811
,574
,132
Bus
ines
s S
trate
gyM
ckin
sey
&
Com
pany
3*
Ban
g S
hyam
sund
arE
xecu
tive
Dire
ctor
-Man
ufac
turin
g &
S
uppl
y C
hain
Ope
ratio
nB
.Tec
h., M
.Tec
h.41
Feb.
01,
97
6025
,363
,141
Pre
side
ntE
npro
Indi
a Li
mite
d
4B
hask
ar R
ajes
h H
ead-
R&
D F
orm
ulat
ions
M.P
harm
a26
July
26,
04
5112
,061
,147
Ass
ocia
te
Dire
ctor
Ran
baxy
Res
earc
h La
bora
torie
s5
Bis
ht P
raka
sh C
hand
raS
r. V
P -
Gro
up A
ccou
nts
B.C
om.,
CA
24A
pr. 2
3, 0
947
6,82
2,21
5H
ead
- Acc
ount
sA
pollo
Tyr
es L
td.
6G
upta
Kul
bhus
han
Hea
d of
Bus
sine
ss E
xcel
lenc
e &
Six
S
igm
aB
.E16
Aug
. 18,
03
398,
073,
222
Qua
lity
Lead
er
Trai
ning
D
evel
opm
ent
IGE
Ltd
.
7K
hann
a A
jay
Pre
side
nt-S
tat.&
Cor
pora
te A
ffairs
B C
om, L
LB22
June
01,
09
5112
,013
,569
Par
tner
Acc
entu
re8
* K
hann
a Ja
g M
ohan
(Dr)
Exe
cutiv
e D
irect
or -S
cien
ce &
Te
chno
logy
M.S
c, P
h.D
.45
Aug
. 16,
02
7040
,439
,972
Pre
side
nt (R
&D
)R
anba
xy
Labo
rato
ries
Ltd.
9K
hare
V P
P
resi
dent
- In
tern
atio
nal S
ales
B.S
c, D
iplo
ma
In
Exp
ort M
arke
ting
36M
ay 1
5, 9
854
9,93
7,73
7D
eput
y G
ener
al
Man
ager
Raj
asth
an P
etro
&
Syn
thet
ics
Ltd.
10K
umar
Ani
l P
resi
dent
-Pro
ject
sB
.Tec
h (C
hem
ical
)35
Jan.
24,
06
589,
910,
240
Pre
side
nt-
Tech
nica
lB
ajaj
Hin
dust
an
Ltd.
11M
ukhe
rji G
our (
Dr)
Hea
d-N
ovel
Dru
g D
eliv
ery
Ser
vice
sP
h.D
.24
Mar
. 01,
05
518,
531,
481
Vic
e P
resi
dent
Woc
khar
dt
Res
earc
h C
ente
r12
Rao
T V
enka
tasw
ara
Bus
ines
s U
nit H
ead-
Fine
Che
mic
als
B.S
c, P
GD
BM
28Ju
ly 1
7, 8
653
9,50
0,18
6S
ales
Offi
cer
Pun
jab
Alk
alie
s &
C
hem
ical
s Lt
d.13
Sah
raw
at S
amai
Sin
gh
Sr.
VP
- H
RM
SW
32A
pr. 0
3, 8
956
6,47
4,58
9A
ssis
tant
Man
ager
Her
o H
onda
Mot
ors
Ltd.
14S
anka
raia
h R
Exe
cutiv
e D
irect
or -
Fina
nce
B.S
c., F
CA
27
Sep
. 09,
02
5235
,844
,366
GM
- Fi
nanc
eS
RF
Lim
ited
15S
enga
r Cha
ndan
Sin
gh
Pre
side
nt-A
cety
ls &
Eth
anol
B.S
c., M
BA
25Ju
ly 1
3, 8
847
12,5
72,4
61A
ssis
tant
Offi
cer
J.K
. Syn
thet
ics
Ltd.
16S
harm
a A
run
K
Sr.
VP
- G
roup
Fin
ance
B.S
c., C
A
22A
ug. 2
7, 0
345
6,91
3,53
3G
M -
Trea
sury
&
Fin
anci
al
Res
ourc
es
Esc
orts
Ltd
.
17S
ingh
San
jay
Hea
d H
uman
Res
ourc
es (G
loba
l)B
Sc,
P G
D
iplo
ma-
PM
& IR
19Ju
ne 2
3, 0
943
11,6
02,5
61V
ice
Pre
side
nt
- HR
Whi
rlpoo
l
18S
oni M
anoj
Dev
endr
a C
hief
of S
uppl
y C
hain
B.T
ech
(Mec
hani
cal)
26Ju
ly 2
0, 0
749
6,34
6,65
4G
M -
Sup
ply
Cha
inN
ew H
olla
nd
Trac
tors
19S
rIvas
tava
A P
S
r. V
P -
Cor
pora
te A
ffairs
BA
38N
ov. 1
7, 9
065
12,6
37,1
18M
anag
erR
elia
nce
Indu
strie
s Lt
d.20
Sriv
asta
va R
ajes
h K
umar
C
EO
- Fi
ne C
hem
ical
s &
CR
AM
SB
.Tec
h, M
MM
24A
ug. 1
9, 0
046
20,9
79,8
11M
arke
ting
Man
ager
Ran
baxy
Fin
e C
hem
ical
s Li
mite
d21
Ver
ma
P K
Sr.
VP
- P
roje
cts
B.T
ech
36A
pr. 1
8, 0
160
6,32
3,13
4C
hem
ical
C
onsu
ltant
Ale
mbi
c Lt
d.
22Y
adav
Pra
mod
C
EO
- A
dvan
ce In
term
edia
te &
V
itam
ins
B.S
c. (T
ech)
, M
MM
24S
ep. 0
4, 9
548
15,0
54,6
45M
arke
ting
Man
ager
(Nor
th)
Bha
nsal
i Eng
g.P
olym
ers
Ltd.
ANNExURE TO ThE DIRECTORS’ REPORT
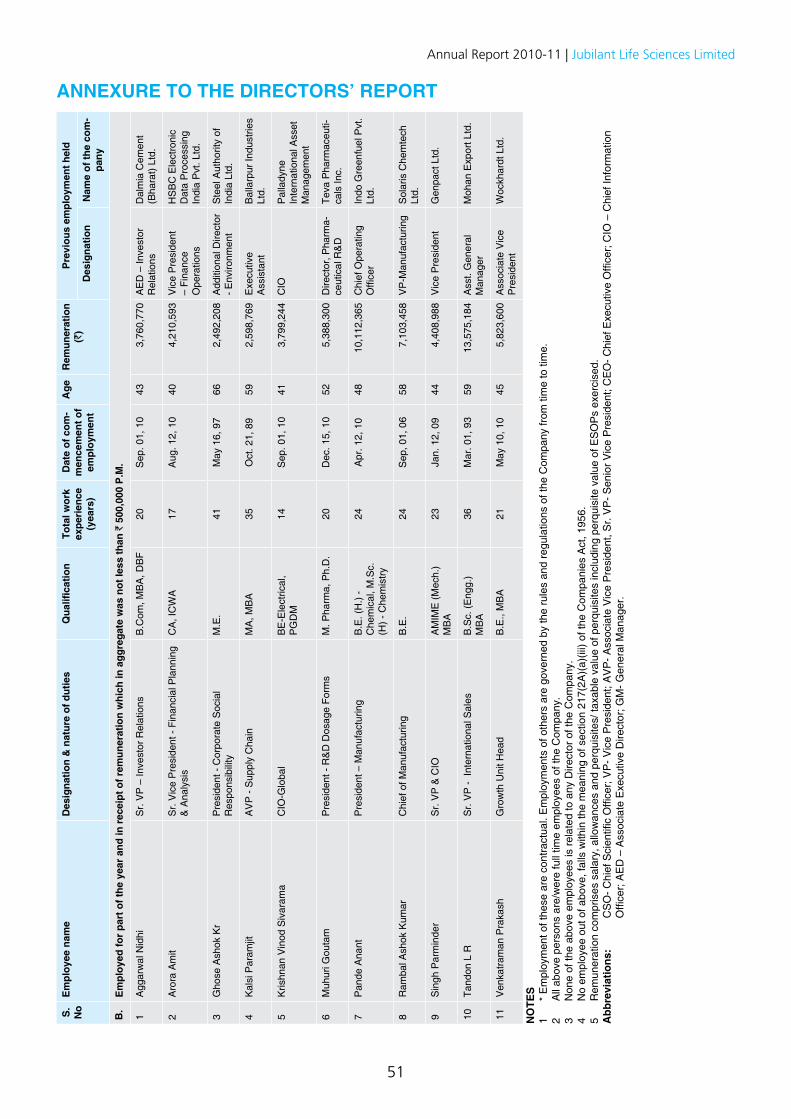
51
Annual Report 2010-11 | Jubilant Life Sciences LimitedS
. N
o
Em
ploy
ee n
ame
D
esig
natio
n &
nat
ure
of d
utie
s
Qua
lifica
tion
To
tal w
ork
expe
rien
ce
(yea
rs)
Dat
e of
com
-m
ence
men
t of
empl
oym
ent
Age
Rem
uner
atio
n (`
)
Pre
viou
s em
ploy
men
t hel
d
Des
igna
tion
Nam
e of
the
com
-pa
ny
B.
Em
ploy
ed fo
r pa
rt o
f the
yea
r an
d in
rec
eipt
of r
emun
erat
ion
whi
ch in
agg
rega
te w
as n
ot le
ss th
an `
500
,000
P.M
.
1A
ggar
wal
Nid
hiS
r. V
P –
Inve
stor
Rel
atio
nsB
.Com
, MB
A, D
BF
20S
ep. 0
1, 1
043
3,76
0,77
0A
ED
– In
vest
or
Rel
atio
nsD
alm
ia C
emen
t (B
hara
t) Lt
d.
2A
rora
Am
itS
r. V
ice
Pre
side
nt -
Fina
ncia
l Pla
nnin
g &
Ana
lysi
sC
A, I
CW
A17
Aug
. 12,
10
404,
210,
593
Vic
e P
resi
dent
–
Fina
nce
Ope
ratio
ns
HS
BC
Ele
ctro
nic
Dat
a P
roce
ssin
g In
dia
Pvt
. Ltd
.
3G
hose
Ash
ok K
rP
resi
dent
- C
orpo
rate
Soc
ial
Res
pons
ibili
tyM
.E.
41M
ay 1
6, 9
766
2,49
2,20
8A
dditi
onal
Dire
ctor
- E
nviro
nmen
t S
teel
Aut
horit
y of
In
dia
Ltd.
4K
alsi
Par
amjit
AV
P -
Sup
ply
Cha
inM
A, M
BA
35O
ct. 2
1, 8
959
2,59
8,76
9E
xecu
tive
Ass
ista
ntB
alla
rpur
Indu
strie
s Lt
d.
5K
rishn
an V
inod
Siv
aram
aC
IO-G
loba
lB
E-E
lect
rical
, P
GD
M14
Sep
. 01,
10
413,
799,
244
CIO
Pal
lady
ne
Inte
rnat
iona
l Ass
et
Man
agem
ent
6M
uhur
i Gou
tam
Pre
side
nt -
R&
D D
osag
e Fo
rms
M. P
harm
a, P
h.D
.20
Dec
. 15,
10
525,
388,
300
Dire
ctor
, Pha
rma-
ceut
ical
R&
DTe
va P
harm
aceu
ti-ca
ls In
c.
7P
ande
Ana
ntP
resi
dent
– M
anuf
actu
ring
B.E
. (H
.) -
Che
mic
al, M
.Sc.
(H
) - C
hem
istry
24A
pr. 1
2, 1
048
10,1
12,3
65C
hief
Ope
ratin
g O
ffice
rIn
do G
reen
fuel
Pvt
. Lt
d.
8R
amba
l Ash
ok K
umar
Chi
ef o
f Man
ufac
turin
g B
.E.
24S
ep, 0
1, 0
658
7,10
3,45
8V
P-M
anuf
actu
ring
Sol
aris
Che
mte
ch
Ltd.
9S
ingh
Par
min
der
Sr.
VP
& C
IOA
MIM
E (M
ech.
) M
BA
23Ja
n. 1
2, 0
944
4,40
8,98
8V
ice
Pre
side
ntG
enpa
ct L
td.
10Ta
ndon
L R
Sr.
VP
- In
tern
atio
nal S
ales
B.S
c. (E
ngg.
) M
BA
36M
ar. 0
1, 9
359
13,5
75,1
84A
sst.
Gen
eral
M
anag
erM
ohan
Exp
ort L
td.
11V
enka
tram
an P
raka
shG
row
th U
nit H
ead
B.E
., M
BA
21M
ay 1
0, 1
045
5,82
3,60
0A
ssoc
iate
Vic
e P
resi
dent
Woc
khar
dt L
td.
NO
TES
1 *
Em
ploy
men
t of t
hese
are
con
tract
ual.
Em
ploy
men
ts o
f oth
ers
are
gove
rned
by
the
rule
s an
d re
gula
tions
of t
he C
ompa
ny fr
om ti
me
to ti
me.
2
All
abov
e pe
rson
s ar
e/w
ere
full
time
empl
oyee
s of
the
Com
pany
.
3 N
one
of th
e ab
ove
empl
oyee
s is
rela
ted
to a
ny D
irect
or o
f the
Com
pany
.
4 N
o em
ploy
ee o
ut o
f abo
ve, f
alls
with
in th
e m
eani
ng o
f sec
tion
217(
2A)(
a)(ii
i) of
the
Com
pani
es A
ct, 1
956.
5 R
emun
erat
ion
com
pris
es s
alar
y, a
llow
ance
s an
d pe
rqui
site
s/ ta
xabl
e va
lue
of p
erqu
isite
s in
clud
ing
perq
uisi
te v
alue
of E
SO
Ps
exer
cise
d.
Abb
revi
atio
ns:
CS
O- C
hief
Sci
entifi
c O
ffice
r; V
P- V
ice
Pre
side
nt; A
VP
- Ass
ocia
te V
ice
Pre
side
nt, S
r. V
P- S
enio
r Vic
e P
resi
dent
; CE
O- C
hief
Exe
cutiv
e O
ffice
r; C
IO –
Chi
ef In
form
atio
n O
ffice
r; A
ED
– A
ssoc
iate
Exe
cutiv
e D
irect
or; G
M- G
ener
al M
anag
er.
ANNExURE TO ThE DIRECTORS’ REPORT
52
REPORT ON CORPORATE GOVERNANCE
a) Company’s Philosophy
At Jubilant Life Sciences (‘the Company’ or ‘Jubilant’), Corporate Governance is both a tradition and a way of life. We believe in delivering on our promise of Caring, Sharing, Growing, which translates into:
“We will, with utmost care for the environment, continue to enhance value for our customers by providing innovative products and economically efficient solutions and for our shareholders through sales growth, cost effectiveness and wise investment of resources.”
The Company’s Corporate Governance philosophy is led by core principles of:
• Caring for the environment which includes caring for the society around us
• Enhancement of stakeholders’ value through pursuit of excellence, efficiency of operations, quest for growth and continuous innovation
• Transparency, promptness and fairness in disclosures to and communication with all stakeholders including shareholders, government authorities, customers, suppliers, lenders, employees and the community at large
• Complying with laws in letter as well as in spirit
The highlights of Jubilant’s Corporate Governance Regime are:
• Appropriate mix of Executive and Non-Executive Independent Directors on the Board with 60% Independent Directors bringing in expertise in diverse areas
• Constitution of several Board Committees for focused attention and proactive flow of information
• Major Committees like Audit and Remuneration Committee comprise entirely of Independent Directors
• Emphasis on ethical business conduct by the Board, management and employees
• Employee Stock Option Plan – to attract, reward and retain key senior executives
• Active employee participation in place; two top executives on the Board of Directors
• The organisation embarked upon the journey of business excellence through ‘Velocity’ initiatives like Six Sigma, lean and world class manufacturing
• Online monitoring of internal controls on all operations spanning around 2000 control assertions monitored through especially designed software and voluntary documentation as per Sarbanes-Oxley Act of USA
• Robust Risk Management and Control Mapping for each of the businesses and for the Company as a whole
• Timely, transparent and regular disclosures • Effective control on statutory compliances by quarterly
reporting and presentation
REPORT ON CORPORATE GOVERNANCE
• Comprehensive Corporate Sustainability Management System
• Established Codes of Conduct for Directors and Senior Management as also for other employees. Instituted Whistle Blower Policy and Code of Conduct for Prevention of Insider Trading
• Focus on hiring, retaining and nurturing best talent and to promote a culture of excellence across the organisation. Exhaustive HRD Policies cover succession planning, training and development, employee grievance handling
• Regular communication with shareholders including e-mailing of quarterly results just after release to Stock Exchanges, emailing of Annual Reports and Corporate Sustainability Report, obtaining regular and also online feedback
The Securities and Exchange Board of India (SEBI) regulates corporate governance for listed companies through Clause 49 of the Listing Agreement. Jubilant is in full compliance with Clause 49.
During the year 2010-11, the Company won the following awards:
• Two Environmental Best Practices Awards 2011, by CII-Sohrabji Godrej Green Business Centre, under Most Innovative Environmental Project and Most Useful Environmental Project for the Co-processing of Hazardous waste in Cement Kiln at our plant at Nanjangud, Mysore, India
• Golden Peacock Innovation Award 2011 for developing Niacin by Vapour Phase Catalytic Oxidation of Beta Picoline
• Ernst & Young Entrepreneur of the Year 2010 for Life Sciences & Consumer Products to Mr. Shyam S. Bhartia and Mr. Hari S Bhartia, Chairman & Managing Director and Co-Chairman & Managing Director respectively
• CII – EHS Award 2010 - First Place for Excellence in EH&S systems at the Nanjangud Plant, among medium scale industries
• Safety Innovation Award 2010 by The Institution of Engineers (India) for implementing Innovative Safety Management Systems at Nanjandgud Plant
• National Award for Excellence in Water Management – 2010 by CII-Sohrabji Godrej Green Business Centre for our Nanjangud plant
• India Manufacturing Excellence Award 2010 - ‘Gold Certificate of Merit’ by The Economic Times - Frost & Sullivan for our EOU facility at Gajraula
• Certification of Commendation for Strong Commitment for Sustainability by CII-ITC Sustainability Awards 2010
• Two ABCI Awards 2010 for Communication efforts of Jubilant Life Sciences- Gold for e-newsletter and Bronze for CSR Communication
• Jubilant was included in the Forbes Asia ‘Best Under a Billion’ Asia List – released in September 2010
Annexure – D
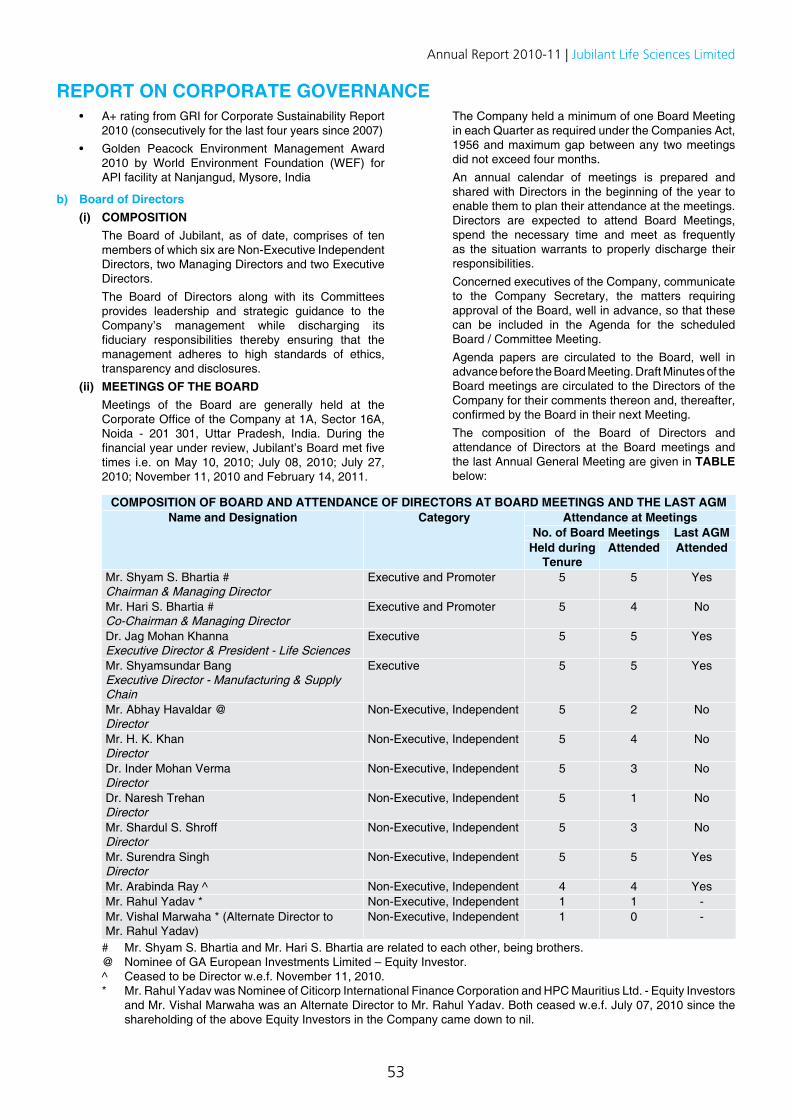
53
Annual Report 2010-11 | Jubilant Life Sciences Limited
• A+ rating from GRI for Corporate Sustainability Report 2010 (consecutively for the last four years since 2007)
• Golden Peacock Environment Management Award 2010 by World Environment Foundation (WEF) for API facility at Nanjangud, Mysore, India
b) Board of Directors (i) COMPOSITION The Board of Jubilant, as of date, comprises of ten
members of which six are Non-Executive Independent Directors, two Managing Directors and two Executive Directors.
The Board of Directors along with its Committees provides leadership and strategic guidance to the Company’s management while discharging its fiduciary responsibilities thereby ensuring that the management adheres to high standards of ethics, transparency and disclosures.
(ii) MEETINGS OF ThE BOARD Meetings of the Board are generally held at the
Corporate Office of the Company at 1A, Sector 16A, Noida - 201 301, Uttar Pradesh, India. During the financial year under review, Jubilant’s Board met five times i.e. on May 10, 2010; July 08, 2010; July 27, 2010; November 11, 2010 and February 14, 2011.
The Company held a minimum of one Board Meeting in each Quarter as required under the Companies Act, 1956 and maximum gap between any two meetings did not exceed four months.
An annual calendar of meetings is prepared and shared with Directors in the beginning of the year to enable them to plan their attendance at the meetings. Directors are expected to attend Board Meetings, spend the necessary time and meet as frequently as the situation warrants to properly discharge their responsibilities.
Concerned executives of the Company, communicate to the Company Secretary, the matters requiring approval of the Board, well in advance, so that these can be included in the Agenda for the scheduled Board / Committee Meeting.
Agenda papers are circulated to the Board, well in advance before the Board Meeting. Draft Minutes of the Board meetings are circulated to the Directors of the Company for their comments thereon and, thereafter, confirmed by the Board in their next Meeting.
The composition of the Board of Directors and attendance of Directors at the Board meetings and the last Annual General Meeting are given in TABLE below:
COMPOSITION OF BOARD AND ATTENDANCE OF DIRECTORS AT BOARD MEETINGS AND ThE LAST AGMName and Designation Category Attendance at Meetings
No. of Board Meetings Last AGMHeld during
TenureAttended Attended
Mr. Shyam S. Bhartia #Chairman & Managing Director
Executive and Promoter 5 5 Yes
Mr. Hari S. Bhartia #Co-Chairman & Managing Director
Executive and Promoter 5 4 No
Dr. Jag Mohan KhannaExecutive Director & President - Life Sciences
Executive 5 5 Yes
Mr. Shyamsundar BangExecutive Director - Manufacturing & Supply Chain
Executive 5 5 Yes
Mr. Abhay Havaldar @Director
Non-Executive, Independent 5 2 No
Mr. H. K. KhanDirector
Non-Executive, Independent 5 4 No
Dr. Inder Mohan VermaDirector
Non-Executive, Independent 5 3 No
Dr. Naresh TrehanDirector
Non-Executive, Independent 5 1 No
Mr. Shardul S. ShroffDirector
Non-Executive, Independent 5 3 No
Mr. Surendra SinghDirector
Non-Executive, Independent 5 5 Yes
Mr. Arabinda Ray ^ Non-Executive, Independent 4 4 YesMr. Rahul Yadav * Non-Executive, Independent 1 1 -Mr. Vishal Marwaha * (Alternate Director to Mr. Rahul Yadav)
Non-Executive, Independent 1 0 -
# Mr. Shyam S. Bhartia and Mr. Hari S. Bhartia are related to each other, being brothers. @ Nominee of GA European Investments Limited – Equity Investor. ^ Ceased to be Director w.e.f. November 11, 2010. * Mr. Rahul Yadav was Nominee of Citicorp International Finance Corporation and HPC Mauritius Ltd. - Equity Investors
and Mr. Vishal Marwaha was an Alternate Director to Mr. Rahul Yadav. Both ceased w.e.f. July 07, 2010 since the shareholding of the above Equity Investors in the Company came down to nil.
REPORT ON CORPORATE GOVERNANCE
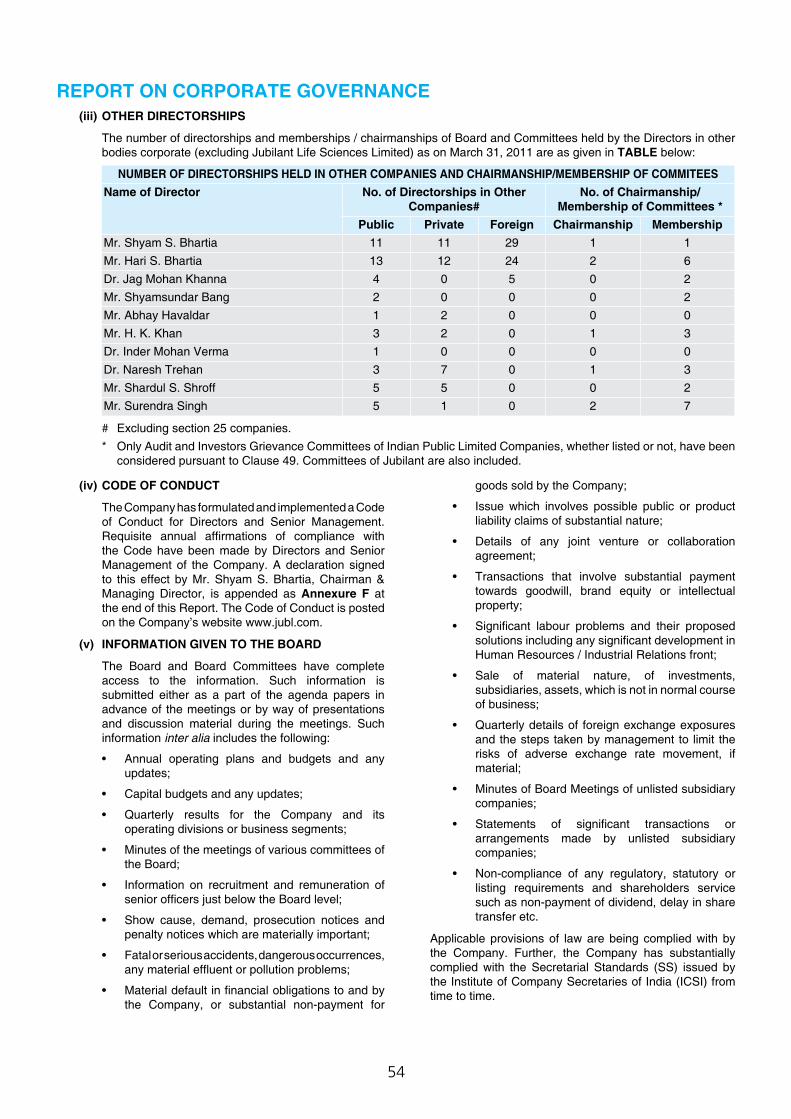
54
(iii) OTHER DIRECTORSHIPS
The number of directorships and memberships / chairmanships of Board and Committees held by the Directors in other bodies corporate (excluding Jubilant Life Sciences Limited) as on March 31, 2011 are as given in TABLE below:
NUMBER OF DIRECTORShIPS hELD IN OThER COMPANIES AND ChAIRMANShIP/MEMBERShIP OF COMMITEESName of Director No. of Directorships in Other
Companies#No. of Chairmanship/
Membership of Committees *Public Private Foreign Chairmanship Membership
Mr. Shyam S. Bhartia 11 11 29 1 1Mr. Hari S. Bhartia 13 12 24 2 6Dr. Jag Mohan Khanna 4 0 5 0 2Mr. Shyamsundar Bang 2 0 0 0 2Mr. Abhay Havaldar 1 2 0 0 0Mr. H. K. Khan 3 2 0 1 3Dr. Inder Mohan Verma 1 0 0 0 0Dr. Naresh Trehan 3 7 0 1 3Mr. Shardul S. Shroff 5 5 0 0 2Mr. Surendra Singh 5 1 0 2 7
# Excluding section 25 companies. * Only Audit and Investors Grievance Committees of Indian Public Limited Companies, whether listed or not, have been
considered pursuant to Clause 49. Committees of Jubilant are also included.
(iv) CODE OF CONDUCT
The Company has formulated and implemented a Code of Conduct for Directors and Senior Management. Requisite annual affirmations of compliance with the Code have been made by Directors and Senior Management of the Company. A declaration signed to this effect by Mr. Shyam S. Bhartia, Chairman & Managing Director, is appended as Annexure F at the end of this Report. The Code of Conduct is posted on the Company’s website www.jubl.com.
(v) INFORMATION GIVEN TO ThE BOARD
The Board and Board Committees have complete access to the information. Such information is submitted either as a part of the agenda papers in advance of the meetings or by way of presentations and discussion material during the meetings. Such information inter alia includes the following:
• Annual operating plans and budgets and any updates;
• Capital budgets and any updates;
• Quarterly results for the Company and its operating divisions or business segments;
• Minutes of the meetings of various committees of the Board;
• Information on recruitment and remuneration of senior officers just below the Board level;
• Show cause, demand, prosecution notices and penalty notices which are materially important;
• Fatal or serious accidents, dangerous occurrences, any material effluent or pollution problems;
• Material default in financial obligations to and by the Company, or substantial non-payment for
goods sold by the Company;
• Issue which involves possible public or product liability claims of substantial nature;
• Details of any joint venture or collaboration agreement;
• Transactions that involve substantial payment towards goodwill, brand equity or intellectual property;
• Significant labour problems and their proposed solutions including any significant development in Human Resources / Industrial Relations front;
• Sale of material nature, of investments, subsidiaries, assets, which is not in normal course of business;
• Quarterly details of foreign exchange exposures and the steps taken by management to limit the risks of adverse exchange rate movement, if material;
• Minutes of Board Meetings of unlisted subsidiary companies;
• Statements of significant transactions or arrangements made by unlisted subsidiary companies;
• Non-compliance of any regulatory, statutory or listing requirements and shareholders service such as non-payment of dividend, delay in share transfer etc.
Applicable provisions of law are being complied with by the Company. Further, the Company has substantially complied with the Secretarial Standards (SS) issued by the Institute of Company Secretaries of India (ICSI) from time to time.
REPORT ON CORPORATE GOVERNANCE
55
Annual Report 2010-11 | Jubilant Life Sciences Limited
c) Committees of the Board
To focus effectively on the issues and ensure expedient resolution of diverse matters, the Board has constituted several Committees of Directors with specific terms of reference / scope. The Committees operate as empowered agents of the Board as per their Charter / Terms of Reference that set forth the purposes, goals and responsibilities of the Committees. Committee members are appointed by the Board with the consent of individual Directors. The Committees meet as often as required.
The minutes of the meetings of all Committees of the Board are placed before the subsequent quarterly Board meeting for noting.
Major Committees are: • Audit Committee • Remuneration Committee • Investors Grievance Committee • Corporate Governance Committee • Sustainability Committee • Finance Committee • Compensation Committee
The detailed terms of reference, composition, quorum, meetings, attendance and other details of the Committees are as under:
AUDIT COMMITTEE
The Audit Committee primarily constitutes a formal and transparent arrangement for accurate financial reporting and strong internal controls. The Committee through regular interaction with external and internal auditors and review of various financial statements ensures that the interests of stakeholders are properly protected.
All members of the Audit Committee are financially literate and a majority have accounting or financial management expertise.
(i) Terms of Reference
The Audit Committee functions according to its terms of reference that define its composition, authority, responsibility and reporting functions in accordance with Section 292A of the Companies Act, 1956 and Clause 49 of the Listing Agreement which, inter alia, include the following:
(a) Overseeing the financial reporting process and disclosure of its financial information to ensure that the financial statements are correct, sufficient and credible;
(b) Recommending to the Board, the appointment, re-appointment and, if required, the replacement or removal of the Statutory Auditors and the fixation of audit fees;
(c) Approval of payment to Statutory Auditors for any other services rendered;
(d) Reviewing with the management, the Annual Financial Statements before they are submitted to the Board for approval, with particular reference to:
• Matters required to be included in the Directors’ Responsibility Statement to be included in the Board’s report in terms of sub-section (2AA) of Section 217 of the Companies Act, 1956
• Changes, if any, in accounting policies and practices and reasons for the same
• Major accounting entries involving estimates based on the exercise of judgment by management
• Significant adjustments made in the financial statements arising out of audit findings
• Compliance with listing and other legal requirements relating to financial statements
• Disclosure of any related party transactions • Qualifications in the draft audit report;
(e) Reviewing, with the management, the Quarterly Financial Statements before submission to the Board for approval;
(f) Reviewing, with the management, the statement of uses / application of funds raised through an issue (public issue, right issue, preferential issue etc.), the statement of funds utilized for purposes other than those stated in the offer document/prospectus / notice and the report submitted by the monitoring agency monitoring the utilization of proceeds of a public issue or rights issue, and making appropriate recommendations to the Board to take up steps in the matter;
(g) Reviewing, with the management, performance of Statutory and Internal Auditors, adequacy of the internal control systems;
(h) Reviewing the adequacy of internal audit function, including the structure of the internal audit department, staffing and seniority of the official heading the department, reporting structure, coverage and frequency of internal audit;
(i) Discussion with Internal Auditors any significant findings and follow up thereon;
(j) Reviewing the findings of any internal investigations by Internal Auditors into matters where there is suspected fraud or irregularity or a failure of internal control systems of a material nature and reporting the matter to the Board;
(k) Discussion with Statutory Auditors before the audit commences, about the nature and scope of audit as well as post-audit discussion to ascertain any area of concern;
(l) To look into the reasons for substantial defaults in the payment to the depositors, debenture holders, shareholders (in case of non payment of declared dividends) and creditors;
(m) Reviewing the functioning of the Whistle Blower mechanism;
(n) Approval of appointment of CFO;
(o) Reviewing the Management Discussion and Analysis of financial condition and results of operations;
REPORT ON CORPORATE GOVERNANCE
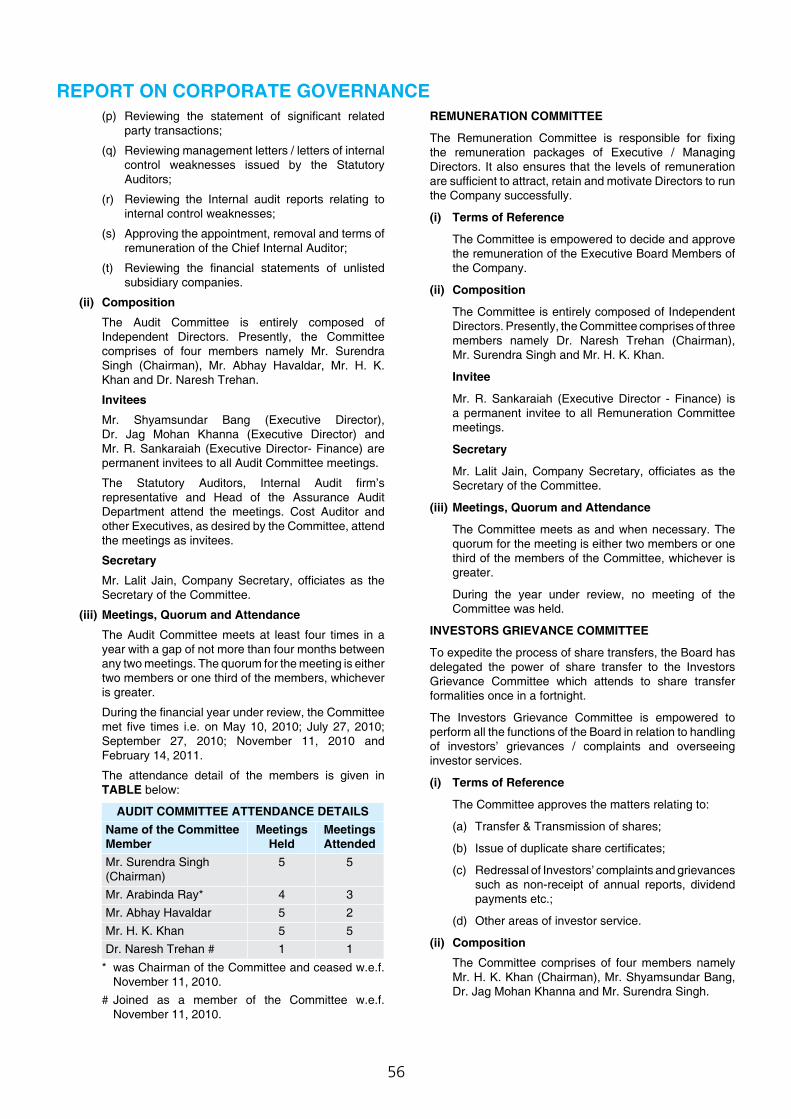
56
(p) Reviewing the statement of significant related party transactions;
(q) Reviewing management letters / letters of internal control weaknesses issued by the Statutory Auditors;
(r) Reviewing the Internal audit reports relating to internal control weaknesses;
(s) Approving the appointment, removal and terms of remuneration of the Chief Internal Auditor;
(t) Reviewing the financial statements of unlisted subsidiary companies.
(ii) Composition
The Audit Committee is entirely composed of Independent Directors. Presently, the Committee comprises of four members namely Mr. Surendra Singh (Chairman), Mr. Abhay Havaldar, Mr. H. K. Khan and Dr. Naresh Trehan.
Invitees
Mr. Shyamsundar Bang (Executive Director), Dr. Jag Mohan Khanna (Executive Director) and Mr. R. Sankaraiah (Executive Director- Finance) are permanent invitees to all Audit Committee meetings.
The Statutory Auditors, Internal Audit firm’s representative and Head of the Assurance Audit Department attend the meetings. Cost Auditor and other Executives, as desired by the Committee, attend the meetings as invitees.
Secretary
Mr. Lalit Jain, Company Secretary, officiates as the Secretary of the Committee.
(iii) Meetings, Quorum and Attendance
The Audit Committee meets at least four times in a year with a gap of not more than four months between any two meetings. The quorum for the meeting is either two members or one third of the members, whichever is greater.
During the financial year under review, the Committee met five times i.e. on May 10, 2010; July 27, 2010; September 27, 2010; November 11, 2010 and February 14, 2011.
The attendance detail of the members is given in TABLE below:
AUDIT COMMITTEE ATTENDANCE DETAILSName of the Committee Member
Meetings Held
Meetings Attended
Mr. Surendra Singh (Chairman)
5 5
Mr. Arabinda Ray* 4 3Mr. Abhay Havaldar 5 2Mr. H. K. Khan 5 5Dr. Naresh Trehan # 1 1
* was Chairman of the Committee and ceased w.e.f. November 11, 2010.
# Joined as a member of the Committee w.e.f. November 11, 2010.
REMUNERATION COMMITTEE
The Remuneration Committee is responsible for fixing the remuneration packages of Executive / Managing Directors. It also ensures that the levels of remuneration are sufficient to attract, retain and motivate Directors to run the Company successfully.
(i) Terms of Reference
The Committee is empowered to decide and approve the remuneration of the Executive Board Members of the Company.
(ii) Composition
The Committee is entirely composed of Independent Directors. Presently, the Committee comprises of three members namely Dr. Naresh Trehan (Chairman), Mr. Surendra Singh and Mr. H. K. Khan.
Invitee
Mr. R. Sankaraiah (Executive Director - Finance) is a permanent invitee to all Remuneration Committee meetings.
Secretary
Mr. Lalit Jain, Company Secretary, officiates as the Secretary of the Committee.
(iii) Meetings, Quorum and Attendance
The Committee meets as and when necessary. The quorum for the meeting is either two members or one third of the members of the Committee, whichever is greater.
During the year under review, no meeting of the Committee was held.
INVESTORS GRIEVANCE COMMITTEE
To expedite the process of share transfers, the Board has delegated the power of share transfer to the Investors Grievance Committee which attends to share transfer formalities once in a fortnight.
The Investors Grievance Committee is empowered to perform all the functions of the Board in relation to handling of investors’ grievances / complaints and overseeing investor services.
(i) Terms of Reference
The Committee approves the matters relating to:
(a) Transfer & Transmission of shares;
(b) Issue of duplicate share certificates;
(c) Redressal of Investors’ complaints and grievances such as non-receipt of annual reports, dividend payments etc.;
(d) Other areas of investor service.
(ii) Composition
The Committee comprises of four members namely Mr. H. K. Khan (Chairman), Mr. Shyamsundar Bang, Dr. Jag Mohan Khanna and Mr. Surendra Singh.
REPORT ON CORPORATE GOVERNANCE
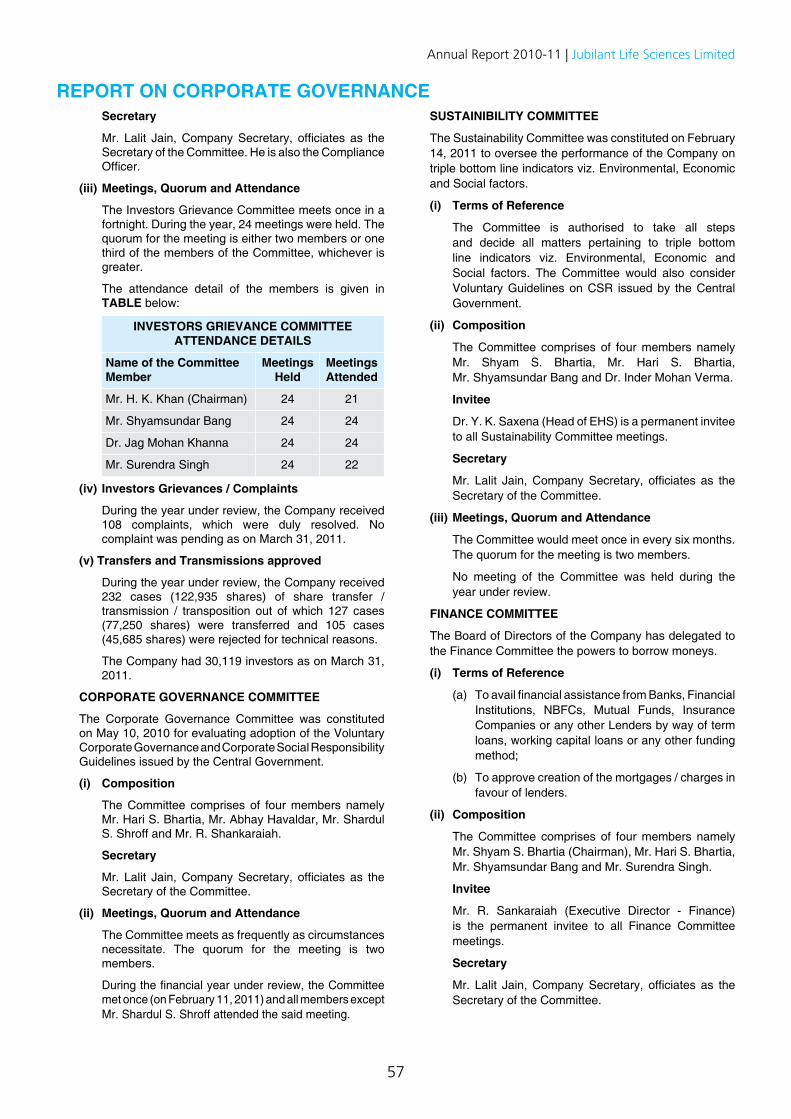
57
Annual Report 2010-11 | Jubilant Life Sciences Limited
Secretary
Mr. Lalit Jain, Company Secretary, officiates as the Secretary of the Committee. He is also the Compliance Officer.
(iii) Meetings, Quorum and Attendance
The Investors Grievance Committee meets once in a fortnight. During the year, 24 meetings were held. The quorum for the meeting is either two members or one third of the members of the Committee, whichever is greater.
The attendance detail of the members is given in TABLE below:
INVESTORS GRIEVANCE COMMITTEE ATTENDANCE DETAILS
Name of the Committee Member
Meetings Held
Meetings Attended
Mr. H. K. Khan (Chairman) 24 21
Mr. Shyamsundar Bang 24 24
Dr. Jag Mohan Khanna 24 24
Mr. Surendra Singh 24 22
(iv) Investors Grievances / Complaints
During the year under review, the Company received 108 complaints, which were duly resolved. No complaint was pending as on March 31, 2011.
(v) Transfers and Transmissions approved
During the year under review, the Company received 232 cases (122,935 shares) of share transfer /transmission / transposition out of which 127 cases (77,250 shares) were transferred and 105 cases (45,685 shares) were rejected for technical reasons.
The Company had 30,119 investors as on March 31, 2011.
CORPORATE GOVERNANCE COMMITTEE
The Corporate Governance Committee was constituted on May 10, 2010 for evaluating adoption of the Voluntary Corporate Governance and Corporate Social Responsibility Guidelines issued by the Central Government.
(i) Composition
The Committee comprises of four members namely Mr. Hari S. Bhartia, Mr. Abhay Havaldar, Mr. Shardul S. Shroff and Mr. R. Shankaraiah.
Secretary
Mr. Lalit Jain, Company Secretary, officiates as the Secretary of the Committee.
(ii) Meetings, Quorum and Attendance
The Committee meets as frequently as circumstances necessitate. The quorum for the meeting is two members.
During the financial year under review, the Committee met once (on February 11, 2011) and all members except Mr. Shardul S. Shroff attended the said meeting.
SUSTAINIBILITY COMMITTEE
The Sustainability Committee was constituted on February 14, 2011 to oversee the performance of the Company on triple bottom line indicators viz. Environmental, Economic and Social factors.
(i) Terms of Reference
The Committee is authorised to take all steps and decide all matters pertaining to triple bottom line indicators viz. Environmental, Economic and Social factors. The Committee would also consider Voluntary Guidelines on CSR issued by the Central Government.
(ii) Composition
The Committee comprises of four members namely Mr. Shyam S. Bhartia, Mr. Hari S. Bhartia, Mr. Shyamsundar Bang and Dr. Inder Mohan Verma.
Invitee
Dr. Y. K. Saxena (Head of EHS) is a permanent invitee to all Sustainability Committee meetings.
Secretary
Mr. Lalit Jain, Company Secretary, officiates as the Secretary of the Committee.
(iii) Meetings, Quorum and Attendance
The Committee would meet once in every six months. The quorum for the meeting is two members.
No meeting of the Committee was held during the year under review.
FINANCE COMMITTEE
The Board of Directors of the Company has delegated to the Finance Committee the powers to borrow moneys.
(i) Terms of Reference
(a) To avail financial assistance from Banks, Financial Institutions, NBFCs, Mutual Funds, Insurance Companies or any other Lenders by way of term loans, working capital loans or any other funding method;
(b) To approve creation of the mortgages / charges in favour of lenders.
(ii) Composition
The Committee comprises of four members namely Mr. Shyam S. Bhartia (Chairman), Mr. Hari S. Bhartia, Mr. Shyamsundar Bang and Mr. Surendra Singh.
Invitee
Mr. R. Sankaraiah (Executive Director - Finance) is the permanent invitee to all Finance Committee meetings.
Secretary
Mr. Lalit Jain, Company Secretary, officiates as the Secretary of the Committee.
REPORT ON CORPORATE GOVERNANCE
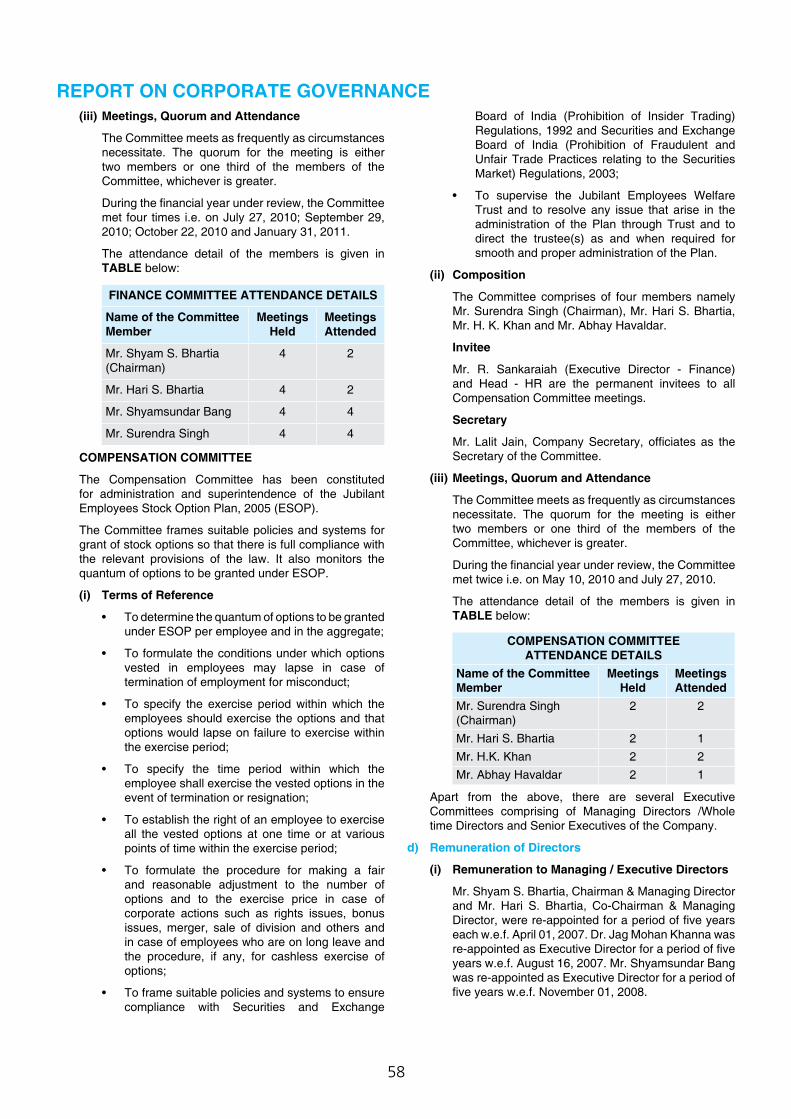
58
(iii) Meetings, Quorum and Attendance
The Committee meets as frequently as circumstances necessitate. The quorum for the meeting is either two members or one third of the members of the Committee, whichever is greater.
During the financial year under review, the Committee met four times i.e. on July 27, 2010; September 29, 2010; October 22, 2010 and January 31, 2011.
The attendance detail of the members is given in TABLE below:
FINANCE COMMITTEE ATTENDANCE DETAILS
Name of the Committee Member
Meetings Held
Meetings Attended
Mr. Shyam S. Bhartia (Chairman)
4 2
Mr. Hari S. Bhartia 4 2
Mr. Shyamsundar Bang 4 4
Mr. Surendra Singh 4 4
COMPENSATION COMMITTEE
The Compensation Committee has been constituted for administration and superintendence of the Jubilant Employees Stock Option Plan, 2005 (ESOP).
The Committee frames suitable policies and systems for grant of stock options so that there is full compliance with the relevant provisions of the law. It also monitors the quantum of options to be granted under ESOP.
(i) Terms of Reference
• To determine the quantum of options to be granted under ESOP per employee and in the aggregate;
• To formulate the conditions under which options vested in employees may lapse in case of termination of employment for misconduct;
• To specify the exercise period within which the employees should exercise the options and that options would lapse on failure to exercise within the exercise period;
• To specify the time period within which the employee shall exercise the vested options in the event of termination or resignation;
• To establish the right of an employee to exercise all the vested options at one time or at various points of time within the exercise period;
• To formulate the procedure for making a fair and reasonable adjustment to the number of options and to the exercise price in case of corporate actions such as rights issues, bonus issues, merger, sale of division and others and in case of employees who are on long leave and the procedure, if any, for cashless exercise of options;
• To frame suitable policies and systems to ensure compliance with Securities and Exchange
Board of India (Prohibition of Insider Trading) Regulations, 1992 and Securities and Exchange Board of India (Prohibition of Fraudulent and Unfair Trade Practices relating to the Securities Market) Regulations, 2003;
• To supervise the Jubilant Employees Welfare Trust and to resolve any issue that arise in the administration of the Plan through Trust and to direct the trustee(s) as and when required for smooth and proper administration of the Plan.
(ii) Composition
The Committee comprises of four members namely Mr. Surendra Singh (Chairman), Mr. Hari S. Bhartia, Mr. H. K. Khan and Mr. Abhay Havaldar.
Invitee
Mr. R. Sankaraiah (Executive Director - Finance) and Head - HR are the permanent invitees to all Compensation Committee meetings.
Secretary
Mr. Lalit Jain, Company Secretary, officiates as the Secretary of the Committee.
(iii) Meetings, Quorum and Attendance
The Committee meets as frequently as circumstances necessitate. The quorum for the meeting is either two members or one third of the members of the Committee, whichever is greater.
During the financial year under review, the Committee met twice i.e. on May 10, 2010 and July 27, 2010.
The attendance detail of the members is given in TABLE below:
COMPENSATION COMMITTEE ATTENDANCE DETAILS
Name of the Committee Member
Meetings Held
Meetings Attended
Mr. Surendra Singh (Chairman)
2 2
Mr. Hari S. Bhartia 2 1Mr. H.K. Khan 2 2Mr. Abhay Havaldar 2 1
Apart from the above, there are several Executive Committees comprising of Managing Directors /Whole time Directors and Senior Executives of the Company.
d) Remuneration of Directors
(i) Remuneration to Managing / Executive Directors
Mr. Shyam S. Bhartia, Chairman & Managing Director and Mr. Hari S. Bhartia, Co-Chairman & Managing Director, were re-appointed for a period of five years each w.e.f. April 01, 2007. Dr. Jag Mohan Khanna was re-appointed as Executive Director for a period of five years w.e.f. August 16, 2007. Mr. Shyamsundar Bang was re-appointed as Executive Director for a period of five years w.e.f. November 01, 2008.
REPORT ON CORPORATE GOVERNANCE
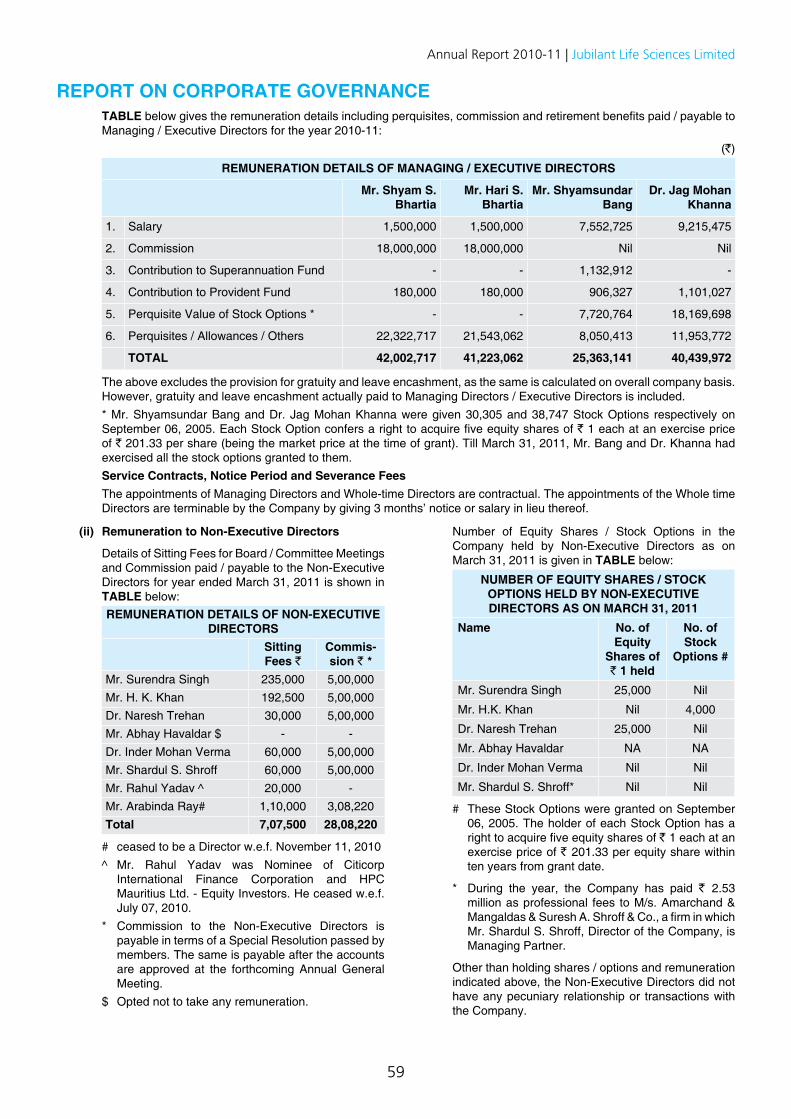
59
Annual Report 2010-11 | Jubilant Life Sciences Limited
TABLE below gives the remuneration details including perquisites, commission and retirement benefits paid / payable to Managing / Executive Directors for the year 2010-11:
(`)
REMUNERATION DETAILS OF MANAGING / ExECUTIVE DIRECTORS
Mr. Shyam S. Bhartia
Mr. hari S. Bhartia
Mr. Shyamsundar Bang
Dr. Jag Mohan Khanna
1. Salary 1,500,000 1,500,000 7,552,725 9,215,475
2. Commission 18,000,000 18,000,000 Nil Nil
3. Contribution to Superannuation Fund - - 1,132,912 -
4. Contribution to Provident Fund 180,000 180,000 906,327 1,101,027
5. Perquisite Value of Stock Options * - - 7,720,764 18,169,698
6. Perquisites / Allowances / Others 22,322,717 21,543,062 8,050,413 11,953,772
TOTAL 42,002,717 41,223,062 25,363,141 40,439,972
The above excludes the provision for gratuity and leave encashment, as the same is calculated on overall company basis. However, gratuity and leave encashment actually paid to Managing Directors / Executive Directors is included.
* Mr. Shyamsundar Bang and Dr. Jag Mohan Khanna were given 30,305 and 38,747 Stock Options respectively on September 06, 2005. Each Stock Option confers a right to acquire five equity shares of ` 1 each at an exercise price of ` 201.33 per share (being the market price at the time of grant). Till March 31, 2011, Mr. Bang and Dr. Khanna had exercised all the stock options granted to them.
Service Contracts, Notice Period and Severance Fees The appointments of Managing Directors and Whole-time Directors are contractual. The appointments of the Whole time
Directors are terminable by the Company by giving 3 months’ notice or salary in lieu thereof.
(ii) Remuneration to Non-Executive Directors
Details of Sitting Fees for Board / Committee Meetings and Commission paid / payable to the Non-Executive Directors for year ended March 31, 2011 is shown in TABLE below:REMUNERATION DETAILS OF NON-ExECUTIVE
DIRECTORSSitting Fees `
Commis-sion ` *
Mr. Surendra Singh 235,000 5,00,000Mr. H. K. Khan 192,500 5,00,000Dr. Naresh Trehan 30,000 5,00,000Mr. Abhay Havaldar $ - -Dr. Inder Mohan Verma 60,000 5,00,000Mr. Shardul S. Shroff 60,000 5,00,000Mr. Rahul Yadav ^ 20,000 -Mr. Arabinda Ray# 1,10,000 3,08,220Total 7,07,500 28,08,220
# ceased to be a Director w.e.f. November 11, 2010 ^ Mr. Rahul Yadav was Nominee of Citicorp
International Finance Corporation and HPC Mauritius Ltd. - Equity Investors. He ceased w.e.f. July 07, 2010.
* Commission to the Non-Executive Directors is payable in terms of a Special Resolution passed by members. The same is payable after the accounts are approved at the forthcoming Annual General Meeting.
$ Opted not to take any remuneration.
Number of Equity Shares / Stock Options in the Company held by Non-Executive Directors as on March 31, 2011 is given in TABLE below:
NUMBER OF EQUITY ShARES / STOCK OPTIONS hELD BY NON-ExECUTIVE DIRECTORS AS ON MARCh 31, 2011
Name No. of Equity
Shares of ` 1 held
No. of Stock
Options #
Mr. Surendra Singh 25,000 Nil
Mr. H.K. Khan Nil 4,000
Dr. Naresh Trehan 25,000 Nil
Mr. Abhay Havaldar NA NA
Dr. Inder Mohan Verma Nil Nil
Mr. Shardul S. Shroff* Nil Nil
# These Stock Options were granted on September 06, 2005. The holder of each Stock Option has a right to acquire five equity shares of ` 1 each at an exercise price of ` 201.33 per equity share within ten years from grant date.
* During the year, the Company has paid ` 2.53 million as professional fees to M/s. Amarchand & Mangaldas & Suresh A. Shroff & Co., a firm in which Mr. Shardul S. Shroff, Director of the Company, is Managing Partner.
Other than holding shares / options and remuneration indicated above, the Non-Executive Directors did not have any pecuniary relationship or transactions with the Company.
REPORT ON CORPORATE GOVERNANCE
60
(iii) Criteria for making payment to Non-Executive Directors
The Company considers the time and efforts put in by the Non-Executive Directors in deliberations at Board / Committee meetings. They are remunerated by way of Sitting Fees for attending the meetings and also through Commission, as approved by the members and finally approved by the Board.
e) Remuneration Policy
Remuneration policy aims at encouraging and rewarding good performance / contribution to the Company objectives.
f) General Body Meetings
(i) Date, time and location of the Annual General Meetings held during the last three years:
Financial Year Date Time Location
2009-10 (32nd AGM) September 28, 2010
11.30 a.m.Registered Office: Bhartiagram, Gajraula - 244 223 District Jyotiba Phoolay Nagar, U.P.
2008-09 (31st AGM) August 28, 2009
2007-08 (30th AGM) September 27, 2008
(ii) Following are the Special Resolutions passed at Annual General Meetings held in last three years:
Meeting Subject matter of Special Resolutions Passed32nd AGM 1. Payment of Commission to Directors other than the Managing / Executive Directors
2. Alteration of Articles of Association of the Company3. Modification of Jubilant Employees Stock Option Plan 2005
31st AGM 1. Alteration of Articles of Association of the Company2. Re-pricing of Stock Options3. Modification of Jubilant Employees Stock Option Plan 2005
30th AGM NIL
(iii) Special Resolutions passed through Postal Ballot last year:
Nil.
(iv) Whether any Special Resolutions are proposed to be passed through Postal Ballot:
No.
(v) Procedure for Postal Ballot:
- The notices containing the proposed resolutions and explanatory statements thereto are sent to the registered addresses of all shareholders of the Company alongwith a Postal Ballot Form and a postage pre-paid envelope containing the address of the Scrutinizer appointed by the Board for carrying out postal ballot process.
- The Postal Ballot Forms received within 30 days of despatch are considered by the Scrutinizer.
- The Scrutinizer submits his report to the Chairman and Managing Director of the Company, who on the basis of the report announces the results.
g) Disclosures
(i) The Company does not have any material unlisted Indian subsidiary company.
(ii) There are no materially significant transactions with the related parties viz. promoters, directors or the management, their subsidiaries or relatives, etc. that may have a potential conflict with the interests of the Company at large. Related party transactions are given at Note No. 21A of Schedule ‘N’ to the accounts.
(iii) The Company has complied with various rules and regulations prescribed by Stock Exchanges, Securities and Exchange Board of India or any other statutory authority relating to the capital markets during the last three years. No penalties or strictures have been imposed by them on the Company.
(iv) Listing fees for the financial year 2011-12 have been paid to the Stock Exchanges on which the shares of the Company are listed.
The Company has established a Whistle Blower Policy to make the workplace conducive to open communication regarding business practices and to protect the employees from unlawful victimization, retaliation or discrimination for their having disclosed or reported fraud, unethical behaviour, violation of Code of Conduct, questionable accounting practices, grave misconduct etc.
The Policy has been posted on the Company’s intranet viz: “myjubilant”. During the year, no personnel were denied access to the Audit Committee.
h) Means of Communication
(i) The quarterly, half yearly and annual results are regularly submitted to the Stock Exchanges in accordance with the Listing Agreements and are generally published in leading Business Newspapers of the country like ‘Business Standard’ and regional newspapers like ‘Dainik Jagran’ in accordance with the guidelines of Stock Exchanges.
(ii) The official news releases, including the quarterly, half yearly and annual results and presentations are posted on the Company’s website www.jubl.com.
REPORT ON CORPORATE GOVERNANCE
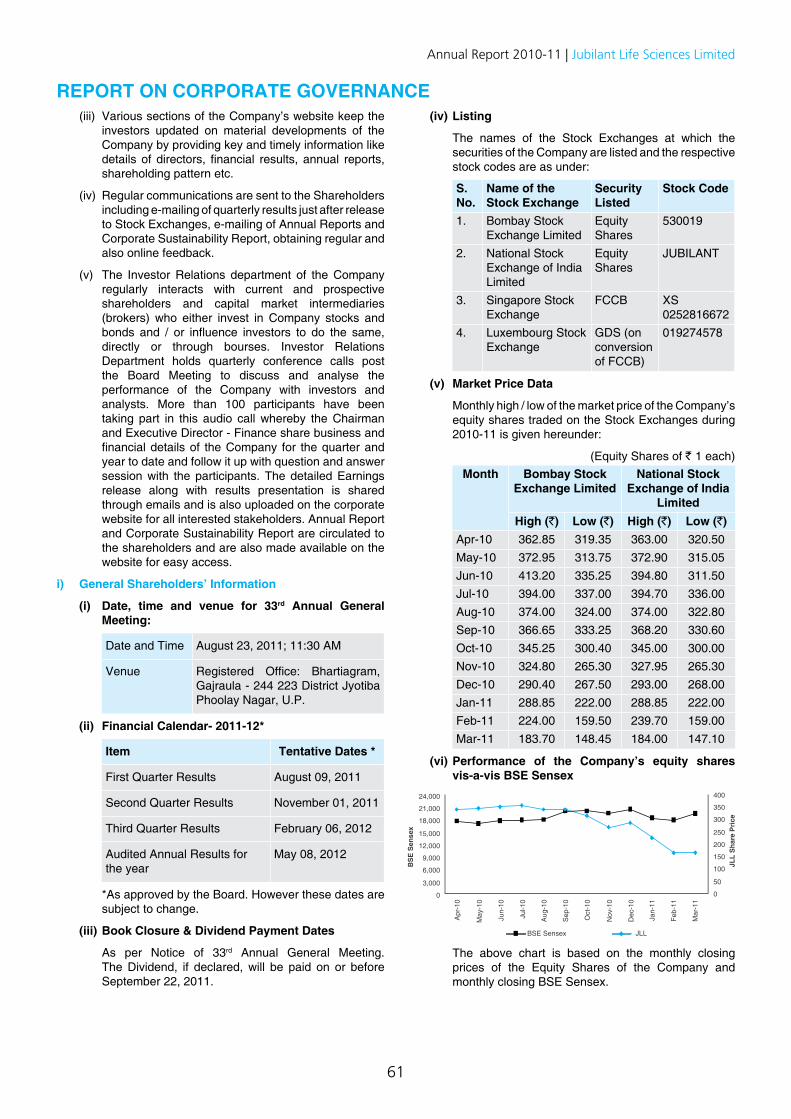
61
Annual Report 2010-11 | Jubilant Life Sciences Limited
(iii) Various sections of the Company’s website keep the investors updated on material developments of the Company by providing key and timely information like details of directors, financial results, annual reports, shareholding pattern etc.
(iv) Regular communications are sent to the Shareholders including e-mailing of quarterly results just after release to Stock Exchanges, e-mailing of Annual Reports and Corporate Sustainability Report, obtaining regular and also online feedback.
(v) The Investor Relations department of the Company regularly interacts with current and prospective shareholders and capital market intermediaries (brokers) who either invest in Company stocks and bonds and / or influence investors to do the same, directly or through bourses. Investor Relations Department holds quarterly conference calls post the Board Meeting to discuss and analyse the performance of the Company with investors and analysts. More than 100 participants have been taking part in this audio call whereby the Chairman and Executive Director - Finance share business and financial details of the Company for the quarter and year to date and follow it up with question and answer session with the participants. The detailed Earnings release along with results presentation is shared through emails and is also uploaded on the corporate website for all interested stakeholders. Annual Report and Corporate Sustainability Report are circulated to the shareholders and are also made available on the website for easy access.
i) General Shareholders’ Information
(i) Date, time and venue for 33rd Annual General Meeting:
Date and Time August 23, 2011; 11:30 AM
Venue Registered Office: Bhartiagram, Gajraula - 244 223 District Jyotiba Phoolay Nagar, U.P.
(ii) Financial Calendar- 2011-12*
Item Tentative Dates *
First Quarter Results August 09, 2011
Second Quarter Results November 01, 2011
Third Quarter Results February 06, 2012
Audited Annual Results for the year
May 08, 2012
*As approved by the Board. However these dates are subject to change.
(iii) Book Closure & Dividend Payment Dates
As per Notice of 33rd Annual General Meeting. The Dividend, if declared, will be paid on or before September 22, 2011.
(iv) Listing
The names of the Stock Exchanges at which the securities of the Company are listed and the respective stock codes are as under:
S. No.
Name of the Stock Exchange
Security Listed
Stock Code
1. Bombay Stock Exchange Limited
Equity Shares
530019
2. National Stock Exchange of India Limited
Equity Shares
JUBILANT
3. Singapore Stock Exchange
FCCB XS 0252816672
4. Luxembourg Stock Exchange
GDS (on conversion of FCCB)
019274578
(v) Market Price Data
Monthly high / low of the market price of the Company’s equity shares traded on the Stock Exchanges during 2010-11 is given hereunder:
(Equity Shares of ` 1 each)Month Bombay Stock
Exchange LimitedNational Stock
Exchange of India Limited
High (`) Low (`) High (`) Low (`)Apr-10 362.85 319.35 363.00 320.50May-10 372.95 313.75 372.90 315.05Jun-10 413.20 335.25 394.80 311.50Jul-10 394.00 337.00 394.70 336.00Aug-10 374.00 324.00 374.00 322.80Sep-10 366.65 333.25 368.20 330.60Oct-10 345.25 300.40 345.00 300.00Nov-10 324.80 265.30 327.95 265.30Dec-10 290.40 267.50 293.00 268.00Jan-11 288.85 222.00 288.85 222.00Feb-11 224.00 159.50 239.70 159.00Mar-11 183.70 148.45 184.00 147.10
(vi) Performance of the Company’s equity shares vis-a-vis BSE Sensex
The above chart is based on the monthly closing prices of the Equity Shares of the Company and monthly closing BSE Sensex.
REPORT ON CORPORATE GOVERNANCE
62
(vii) Growth in Equity Capital
Year Particulars Increase in Number of
Shares
Cumulative Number of
Shares
Face Value (`) / each
1978 Issue of Shares to initial subscribers 1,200 1,200 10
1981 Issued to Indian promoters 608,370 609,570 10
1981 Issued to Foreign collaborators 655,430 1,265,000 10
1981 Issued to Public through public issue 2,200,000 3,465,000 10
1982-83 Rights Issue 1: 5 693,000 4,158,000 10
1984-85 Forfeited on account of non-payment of allotment money
-3,200 4,154,800 10
1986-87 Conversion of loan into equity shares 1,006,180 5,160,980 10
1995-96 Issued to shareholders of Ramganga Fertilizers Ltd. upon merger with the Company
256,522 5,417,502 10
1999-00 Issued to Shareholders of Anichem India Limited & Enpro Speciality Chemicals Ltd. upon merger with the Company.
839,897 6,257,399 10
2001-02 Conversion of 15,00,000 Warrants issued to promoters on preferential basis
1,500,000 7,757,399 10
2002-03 Sub-division of shares from `10 to ` 5 7,757,399 15,514,798 5
2002-03 Cancellation of shares as per Scheme of Amalgamation of the Company with Vam Leasing Limited & Vam Investments Limited
-851,234 14,663,564 5
2003-04 Issue of Bonus shares in the ratio of 3: 5 8,798,139 23,461,703 5
2004-05 Issued to foreign investors on preferential basis 2,424,273 25,885,976 5
2004-05 Part conversion of FCCBs 27,379 25,913,355 5
2005-06 Part conversion of FCCBs 1,448,348 27,361,703 5
2005-06 Issued to foreign investors on preferential basis 990,000 28,351,703 5
2005-06 Sub-division of shares from ` 5 to ` 1 113,406,812 141,758,515 1
2005-06 Part conversion of FCCBs 684,480 142,442,995 1
2006-07 Part conversion of FCCBs 999,339 143,442,334 1
2006-07 Issue of shares upon exercise of Options under Jubilant Employees Stock Option Plan, 2005
3,000 143,445,334 1
2007-08 Part conversion of FCCBs 2,675,375 146,120,709 1
2007-08 Issue of shares upon exercise of Options under Jubilant Employees Stock Option Plan, 2005
65,205 146,185,914 1
2008-09 Issue of shares upon exercise of Options under Jubilant Employees Stock Option Plan, 2005
46,630 146,232,544 1
2008-09 Part conversion of FCCBs 1,309,714 147,542,258 1
2009-10 Issue of Shares to Qualified Institutional Buyers 11,237,517 158,779,775 1
2010-11 Issue of Shares under Scheme of Amalgamation & Demerger with Jubilant Industries Limited and Others
501,364 159,281,139 1
REPORT ON CORPORATE GOVERNANCE
63
Annual Report 2010-11 | Jubilant Life Sciences Limited
(viii) Appreciation in Share Price
A person who invested ` 1 lac in the Company on April 01, 2001 has holdings worth approximately ` 44.12 lacs now as computed below:
Date Action No. of Resultant
Shares of JLL
Face Value of JLL Shares (`)
No. of Resultant
Shares of JIL
Face Value of JIL Shares (`)
April 02, 2001 Purchased shares @ ` 62.90 per share (BSE Opening Price)
1,589.83 10 NA NA
November 21, 2002
Sub-division of shares from ` 10 to ` 5
3,179.65 5 NA NA
March 18, 2004 Issue of Bonus Shares 3: 5
5,087.44 5 NA NA
March 24, 2006 Sub-division of shares from ` 5 to ` 1
25,437.20 1 NA NA
November 27, 2010
Issue of Shares by JIL pursuant to Demerger
- - 1271.86 10
Market Value of 25,437.20 equity shares of JLL on March 31, 2011 @ ` 164.95 per share is ` 4,195,866.14 and Market Value of 1271.86 equity shares of JIL on March 31, 2011 @ ̀ 170.25 per share is ̀ 216,534.16 resulting into an aggregate of ` 4,412,400.30 Thus the investor has multiplied his wealth over 44 times in 10 years, implying a Compounded Annual Growth Rate of 46% approximately. In addition, he has got handsome dividends.
(ix) Compliance Officer
Mr. Lalit Jain, Company Secretary, is the Compliance Officer appointed by the Board. He can be contacted for any investor related matter relating to the Company. His contact no. is +91 120 2516601; Fax no. +91 120 2516629 and e-mail id is [email protected].
(x) Registrar and Transfer Agent
For share related matters, members are requested to correspond with the Company’s Registrar and Transfer Agent - M/s. Alankit Assignments Limited quoting their Folio No. / DP ID & Client ID at the following address:
M/s. Alankit Assignments Limited, Alankit House, 2E/21, Jhandewalan Extension, New Delhi-110 055; Tel: +91-11-23541234, 42541234; E-mail: [email protected]
(xi) Share Transfer System
Investors Grievance Committee is authorised to approve transfers of securities. Share transfers which are received in physical form are processed and the share certificates are normally returned within a period of 15 days from the date of receipt subject to the documents being valid and complete in all respects. The dematerialised shares are transferred directly to the beneficiaries by the depositories.
(xii) Shareholder Satisfaction Survey
During the year under review, the Company conducted a survey to assess the Shareholders’ satisfaction level on the investor services being rendered by the Company, comprising:
1. Timely receipt of Annual Report 2. Quality & content of Annual report 3. Dissemination of information about the Company 4. Response time & satisfaction level experienced 5. Interaction with Company’s officials 6. Interaction with Registrar & Transfer Agents 7. Investor service section of Company’s website 8. Overall rating of our investor services
The Shareholders were asked to give one of the four possible ratings to each of the above:
• Excellent • Very Good • Good • Poor
The responses were converted into numbers after assigning appropriate weightages for each of the above 4 ratings.
The Composite Satisfaction Index arrived as above is 69.46%.
REPORT ON CORPORATE GOVERNANCE
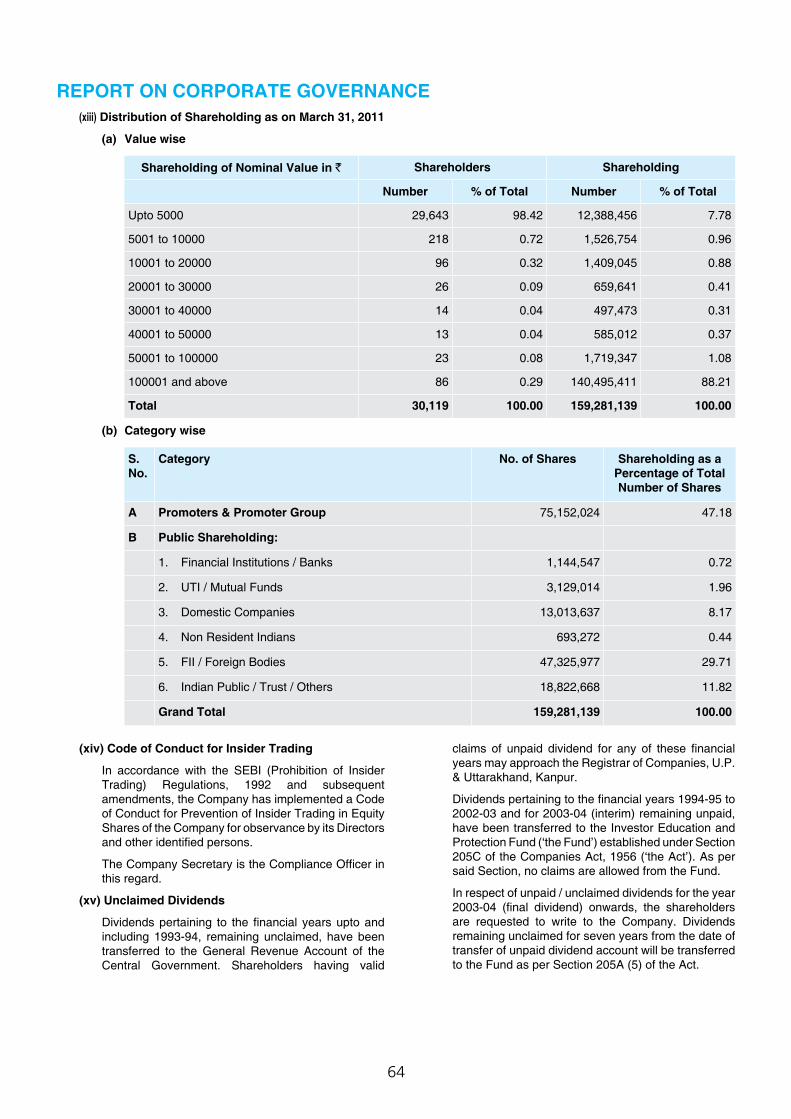
64
(xiii) Distribution of Shareholding as on March 31, 2011
(a) Value wise
Shareholding of Nominal Value in ` Shareholders Shareholding
Number % of Total Number % of Total
Upto 5000 29,643 98.42 12,388,456 7.78
5001 to 10000 218 0.72 1,526,754 0.96
10001 to 20000 96 0.32 1,409,045 0.88
20001 to 30000 26 0.09 659,641 0.41
30001 to 40000 14 0.04 497,473 0.31
40001 to 50000 13 0.04 585,012 0.37
50001 to 100000 23 0.08 1,719,347 1.08
100001 and above 86 0.29 140,495,411 88.21
Total 30,119 100.00 159,281,139 100.00
(b) Category wise
S. No.
Category No. of Shares Shareholding as a Percentage of Total Number of Shares
A Promoters & Promoter Group 75,152,024 47.18
B Public Shareholding:
1. Financial Institutions / Banks 1,144,547 0.72
2. UTI / Mutual Funds 3,129,014 1.96
3. Domestic Companies 13,013,637 8.17
4. Non Resident Indians 693,272 0.44
5. FII / Foreign Bodies 47,325,977 29.71
6. Indian Public / Trust / Others 18,822,668 11.82
Grand Total 159,281,139 100.00
(xiv) Code of Conduct for Insider Trading
In accordance with the SEBI (Prohibition of Insider Trading) Regulations, 1992 and subsequent amendments, the Company has implemented a Code of Conduct for Prevention of Insider Trading in Equity Shares of the Company for observance by its Directors and other identified persons.
The Company Secretary is the Compliance Officer in this regard.
(xv) Unclaimed Dividends
Dividends pertaining to the financial years upto and including 1993-94, remaining unclaimed, have been transferred to the General Revenue Account of the Central Government. Shareholders having valid
claims of unpaid dividend for any of these financial years may approach the Registrar of Companies, U.P. & Uttarakhand, Kanpur.
Dividends pertaining to the financial years 1994-95 to 2002-03 and for 2003-04 (interim) remaining unpaid, have been transferred to the Investor Education and Protection Fund (‘the Fund’) established under Section 205C of the Companies Act, 1956 (‘the Act’). As per said Section, no claims are allowed from the Fund.
In respect of unpaid / unclaimed dividends for the year 2003-04 (final dividend) onwards, the shareholders are requested to write to the Company. Dividends remaining unclaimed for seven years from the date of transfer of unpaid dividend account will be transferred to the Fund as per Section 205A (5) of the Act.
REPORT ON CORPORATE GOVERNANCE
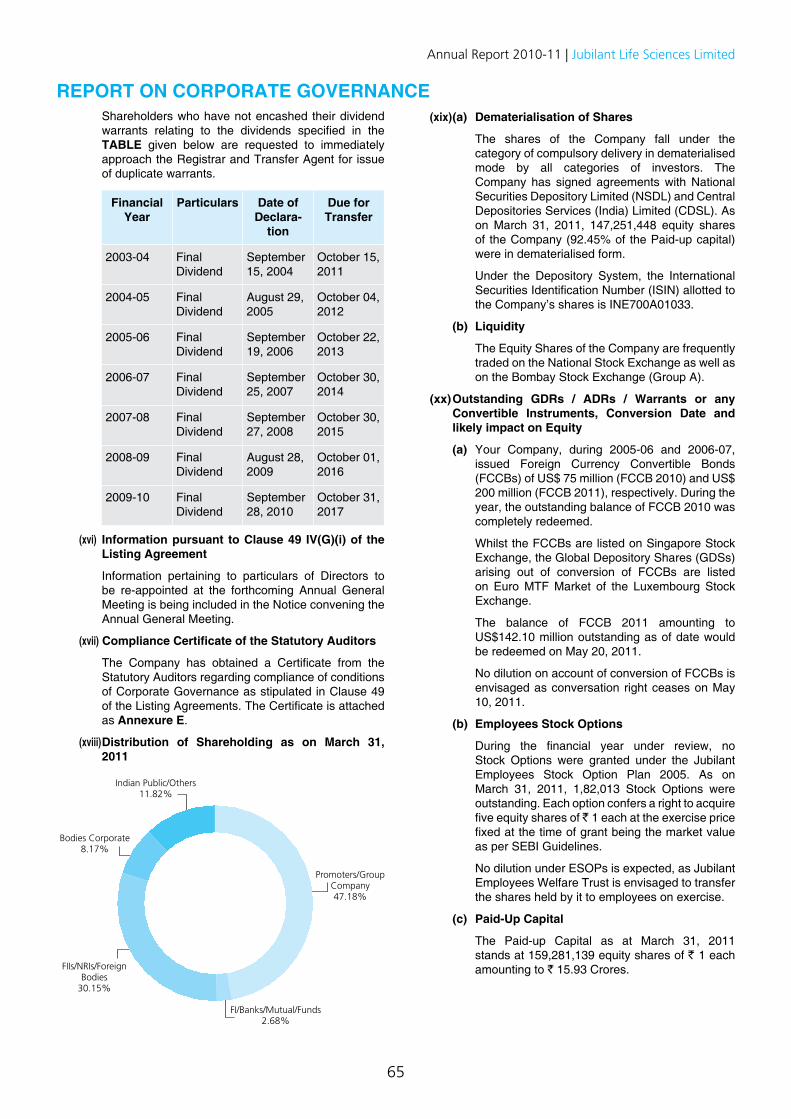
65
Annual Report 2010-11 | Jubilant Life Sciences Limited
Shareholders who have not encashed their dividend warrants relating to the dividends specified in the TABLE given below are requested to immediately approach the Registrar and Transfer Agent for issue of duplicate warrants.
Financial Year
Particulars Date of Declara-
tion
Due for Transfer
2003-04 Final Dividend
September 15, 2004
October 15, 2011
2004-05 Final Dividend
August 29, 2005
October 04, 2012
2005-06 Final Dividend
September 19, 2006
October 22, 2013
2006-07 Final Dividend
September 25, 2007
October 30, 2014
2007-08 Final Dividend
September 27, 2008
October 30, 2015
2008-09 Final Dividend
August 28, 2009
October 01, 2016
2009-10 Final Dividend
September 28, 2010
October 31, 2017
(xvi) Information pursuant to Clause 49 IV(G)(i) of the Listing Agreement
Information pertaining to particulars of Directors to be re-appointed at the forthcoming Annual General Meeting is being included in the Notice convening the Annual General Meeting.
(xvii) Compliance Certificate of the Statutory Auditors
The Company has obtained a Certificate from the Statutory Auditors regarding compliance of conditions of Corporate Governance as stipulated in Clause 49 of the Listing Agreements. The Certificate is attached as Annexure E.
(xviii) Distribution of Shareholding as on March 31, 2011
(xix) (a) Dematerialisation of Shares
The shares of the Company fall under the category of compulsory delivery in dematerialised mode by all categories of investors. The Company has signed agreements with National Securities Depository Limited (NSDL) and Central Depositories Services (India) Limited (CDSL). As on March 31, 2011, 147,251,448 equity shares of the Company (92.45% of the Paid-up capital) were in dematerialised form.
Under the Depository System, the International Securities Identification Number (ISIN) allotted to the Company’s shares is INE700A01033.
(b) Liquidity
The Equity Shares of the Company are frequently traded on the National Stock Exchange as well as on the Bombay Stock Exchange (Group A).
(xx) Outstanding GDRs / ADRs / Warrants or any Convertible Instruments, Conversion Date and likely impact on Equity
(a) Your Company, during 2005-06 and 2006-07, issued Foreign Currency Convertible Bonds (FCCBs) of US$ 75 million (FCCB 2010) and US$ 200 million (FCCB 2011), respectively. During the year, the outstanding balance of FCCB 2010 was completely redeemed.
Whilst the FCCBs are listed on Singapore Stock Exchange, the Global Depository Shares (GDSs) arising out of conversion of FCCBs are listed on Euro MTF Market of the Luxembourg Stock Exchange.
The balance of FCCB 2011 amounting to US$142.10 million outstanding as of date would be redeemed on May 20, 2011.
No dilution on account of conversion of FCCBs is envisaged as conversation right ceases on May 10, 2011.
(b) Employees Stock Options
During the financial year under review, no Stock Options were granted under the Jubilant Employees Stock Option Plan 2005. As on March 31, 2011, 1,82,013 Stock Options were outstanding. Each option confers a right to acquire five equity shares of ̀ 1 each at the exercise price fixed at the time of grant being the market value as per SEBI Guidelines.
No dilution under ESOPs is expected, as Jubilant Employees Welfare Trust is envisaged to transfer the shares held by it to employees on exercise.
(c) Paid-Up Capital
The Paid-up Capital as at March 31, 2011 stands at 159,281,139 equity shares of ` 1 each amounting to ` 15.93 Crores.
REPORT ON CORPORATE GOVERNANCE
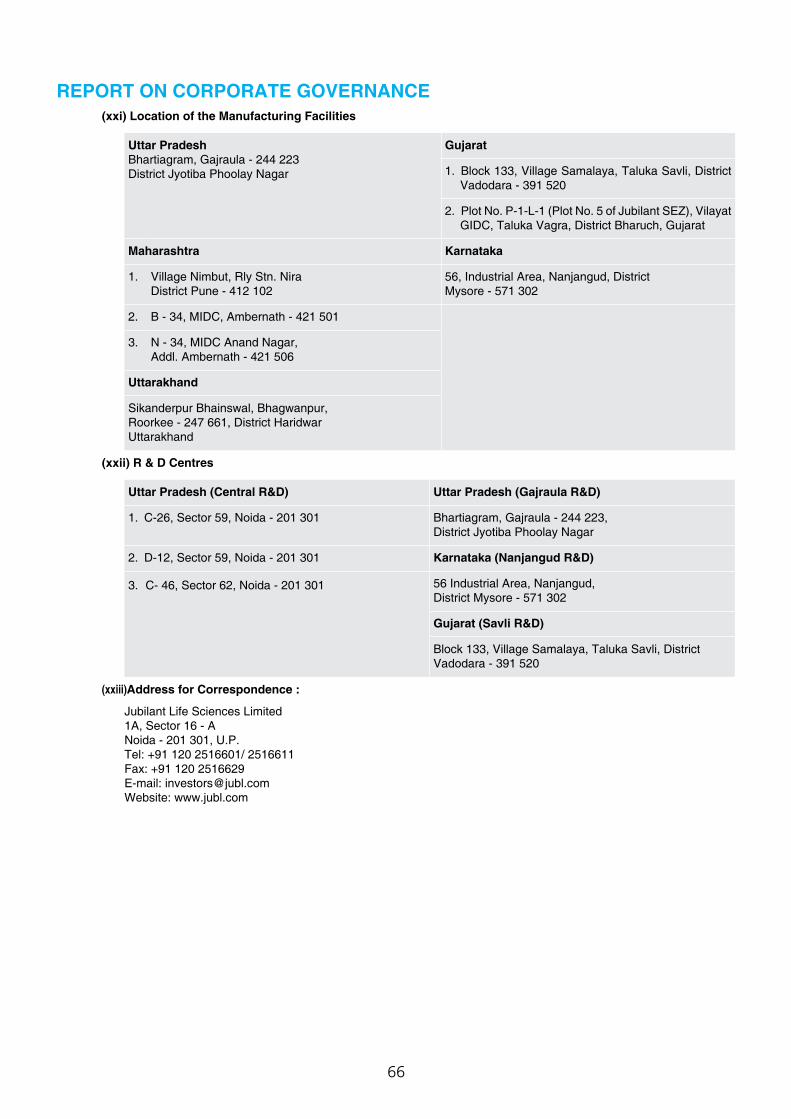
66
(xxi) Location of the Manufacturing Facilities
Uttar PradeshBhartiagram, Gajraula - 244 223District Jyotiba Phoolay Nagar
Gujarat
1. Block 133, Village Samalaya, Taluka Savli, District Vadodara - 391 520
2. Plot No. P-1-L-1 (Plot No. 5 of Jubilant SEZ), Vilayat GIDC, Taluka Vagra, District Bharuch, Gujarat
Maharashtra Karnataka
1. Village Nimbut, Rly Stn. NiraDistrict Pune - 412 102
56, Industrial Area, Nanjangud, District Mysore - 571 302
2. B - 34, MIDC, Ambernath - 421 501
3. N - 34, MIDC Anand Nagar,Addl. Ambernath - 421 506
Uttarakhand
Sikanderpur Bhainswal, Bhagwanpur,Roorkee - 247 661, District HaridwarUttarakhand
(xxii) R & D Centres
Uttar Pradesh (Central R&D) Uttar Pradesh (Gajraula R&D)
1. C-26, Sector 59, Noida - 201 301 Bhartiagram, Gajraula - 244 223, District Jyotiba Phoolay Nagar
2. D-12, Sector 59, Noida - 201 301 Karnataka (Nanjangud R&D)
3. C- 46, Sector 62, Noida - 201 301 56 Industrial Area, Nanjangud, District Mysore - 571 302
Gujarat (Savli R&D)
Block 133, Village Samalaya, Taluka Savli, District Vadodara - 391 520
(xxiii)Address for Correspondence :
Jubilant Life Sciences Limited 1A, Sector 16 - A Noida - 201 301, U.P. Tel: +91 120 2516601/ 2516611 Fax: +91 120 2516629 E-mail: [email protected] Website: www.jubl.com
REPORT ON CORPORATE GOVERNANCE
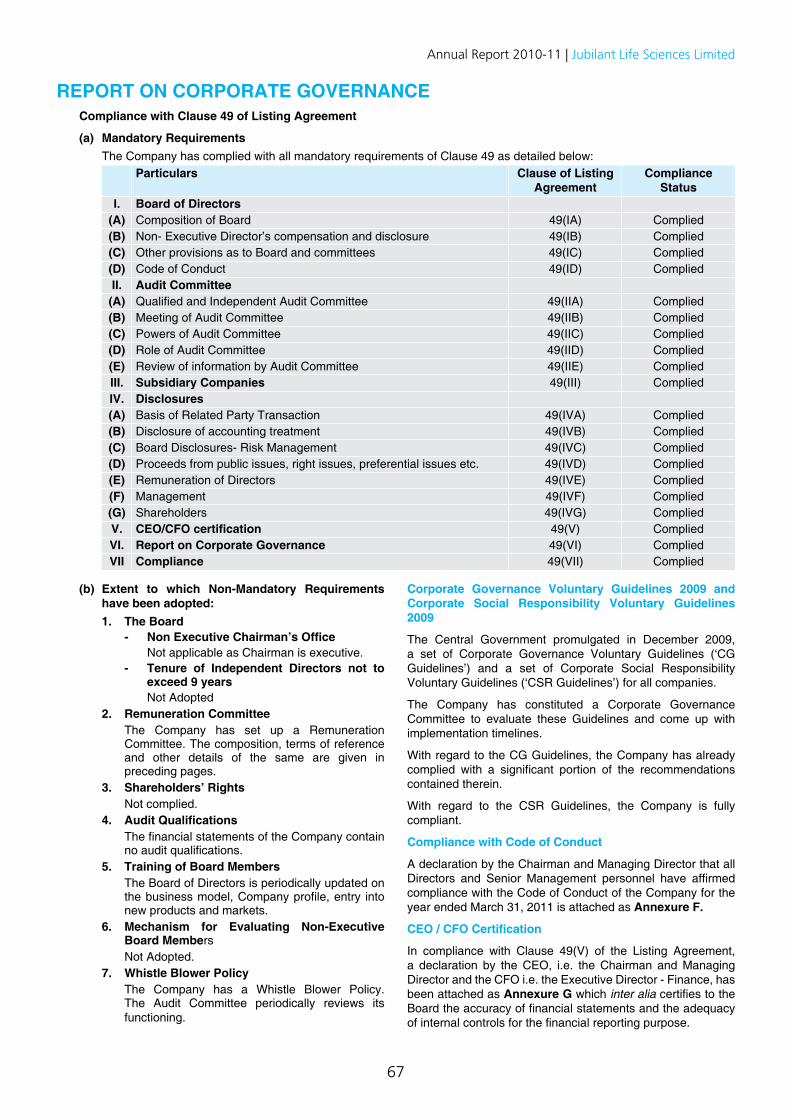
67
Annual Report 2010-11 | Jubilant Life Sciences Limited
Compliance with Clause 49 of Listing Agreement
(a) Mandatory Requirements The Company has complied with all mandatory requirements of Clause 49 as detailed below:
Particulars Clause of Listing Agreement
Compliance Status
I. Board of Directors(A) Composition of Board 49(IA) Complied(B) Non- Executive Director’s compensation and disclosure 49(IB) Complied(C) Other provisions as to Board and committees 49(IC) Complied(D) Code of Conduct 49(ID) CompliedII. Audit Committee(A) Qualified and Independent Audit Committee 49(IIA) Complied(B) Meeting of Audit Committee 49(IIB) Complied(C) Powers of Audit Committee 49(IIC) Complied(D) Role of Audit Committee 49(IID) Complied(E) Review of information by Audit Committee 49(IIE) CompliedIII. Subsidiary Companies 49(III) CompliedIV. Disclosures(A) Basis of Related Party Transaction 49(IVA) Complied(B) Disclosure of accounting treatment 49(IVB) Complied(C) Board Disclosures- Risk Management 49(IVC) Complied(D) Proceeds from public issues, right issues, preferential issues etc. 49(IVD) Complied(E) Remuneration of Directors 49(IVE) Complied(F) Management 49(IVF) Complied(G) Shareholders 49(IVG) CompliedV. CEO/CFO certification 49(V) CompliedVI. Report on Corporate Governance 49(VI) CompliedVII Compliance 49(VII) Complied
(b) Extent to which Non-Mandatory Requirements have been adopted:
1. The Board - Non Executive Chairman’s Office Not applicable as Chairman is executive. - Tenure of Independent Directors not to
exceed 9 years Not Adopted 2. Remuneration Committee The Company has set up a Remuneration
Committee. The composition, terms of reference and other details of the same are given in preceding pages.
3. Shareholders’ Rights Not complied. 4. Audit Qualifications The financial statements of the Company contain
no audit qualifications. 5. Training of Board Members The Board of Directors is periodically updated on
the business model, Company profile, entry into new products and markets.
6. Mechanism for Evaluating Non-Executive Board Members
Not Adopted. 7. Whistle Blower Policy The Company has a Whistle Blower Policy.
The Audit Committee periodically reviews its functioning.
Corporate Governance Voluntary Guidelines 2009 and Corporate Social Responsibility Voluntary Guidelines 2009
The Central Government promulgated in December 2009, a set of Corporate Governance Voluntary Guidelines (‘CG Guidelines’) and a set of Corporate Social Responsibility Voluntary Guidelines (‘CSR Guidelines’) for all companies.
The Company has constituted a Corporate Governance Committee to evaluate these Guidelines and come up with implementation timelines.
With regard to the CG Guidelines, the Company has already complied with a significant portion of the recommendations contained therein.
With regard to the CSR Guidelines, the Company is fully compliant.
Compliance with Code of Conduct
A declaration by the Chairman and Managing Director that all Directors and Senior Management personnel have affirmed compliance with the Code of Conduct of the Company for the year ended March 31, 2011 is attached as Annexure F.
CEO / CFO Certification
In compliance with Clause 49(V) of the Listing Agreement, a declaration by the CEO, i.e. the Chairman and Managing Director and the CFO i.e. the Executive Director - Finance, has been attached as Annexure G which inter alia certifies to the Board the accuracy of financial statements and the adequacy of internal controls for the financial reporting purpose.
REPORT ON CORPORATE GOVERNANCE
68
Annexure E
AUDITORS’ CERTIFICATE ON COMPLIANCE OF CONDITIONS OF CORPORATE GOVERNANCE AS PER CLAUSE 49 OF ThE LISTING AGREEMENT WITh ThE STOCK ExChANGES
To the Members of
Jubilant Life Sciences Limited
We have examined the compliance of conditions of corporate governance by Jubilant Life Sciences Limited (“the Company”) for the year ended on March 31, 2011, as stipulated in clause 49 of the Listing Agreements of the Company with the stock exchanges. Our examination was carried out in accordance with the Guidance Note on Certification of Corporate Governance issued by the Institute of Chartered Accountants of India.
The compliance of conditions of corporate governance is the responsibility of the Company’s management. Our examination was limited to procedures and implementations thereof, adopted by the Company for ensuring the compliance of the conditions of Corporate Governance. It is neither an audit nor an expression of opinion on the financial statements of the Company.
In our opinion and to the best of our information and according to the explanations sought and replies given to us by the Company, its Directors and Officers, we certify that the Company has complied with, in all material respects, the mandatory conditions of Corporate Governance as stipulated in Clause 49 of the above mentioned Listing Agreements.
We further state that such compliance is neither an assurance as to the future viability of the Company nor the efficiency or effectiveness with which the management has conducted the affairs of the Company.
For K. N. Gutgutia & Co.Firm Registration Number : 304153E
Chartered Accountants
B. R. GoyalPlace : Noida Partner Date : May 10, 2011 Membership No. 12172
Annexure F
TO WhOM IT MAY CONCERN
This is to confirm that all the Board members and senior management personnel have affirmed compliance with the Code of Conduct of the Company for the year ended March 31, 2011.
For Jubilant Life Sciences Limited
Place : Noida Shyam S. BhartiaDate : May 10, 2011 Chairman & Managing Director
REPORT ON CORPORATE GOVERNANCE
69
Annual Report 2010-11 | Jubilant Life Sciences Limited
Annexure G
CERTIFICATE OF CEO/CFO
This is to certify that:
(a) We have reviewed financial statements and the cash flow statement for the year 2010-11 and that to the best of our knowledge and belief:
i. these statements do not contain any materially untrue statement or omit any material fact or contain statements that might be misleading;
ii. these statements together present a true and fair view of the company’s affairs and are in compliance with existing accounting standards, applicable laws and regulations.
(b) There are, to the best of our knowledge and belief, no transactions entered into by the company during the year which are fraudulent, illegal or violative of the company’s code of conduct.
(c) We accept responsibility for establishing and maintaining internal controls and that we have evaluated the effectiveness of the internal control systems of the company pertaining to financial reporting and we have disclosed to the auditors and the Audit Committee, deficiencies in the design or operation of such internal controls, if any, of which we are aware and the steps we have taken or propose to take to rectify these deficiencies.
(d) We have indicated to the auditors and the Audit committee:
i. significant changes in internal control over financial reporting during the year;
ii. significant changes in accounting policies during the year and that the same have been disclosed in the notes to the financial statements; and
iii. instances of significant fraud of which we have become aware and the involvement therein, if any, of the management or an employee having a significant role in the company’s internal control system over financial reporting.
For Jubilant Life Sciences Limited
Shyam S. Bhartia R. Sankaraiah Chairman & Managing Director Executive Director - Finance
Place : NoidaDate : May 10, 2011
REPORT ON CORPORATE GOVERNANCE
70
TO ThE MEMBERS OF JUBILANT LIFE SCIENCES LIMITED (Formerly Jubilant Organosys Limited)
1. We have audited the attached Balance Sheet of JUBILANT LIFE SCIENCES LIMITED (‘the Company’) as at 31st March, 2011 the related Profit and Loss Account for the year ended on that date annexed thereto, and the Cash Flow Statement of the company for the period ended on that date, which we have signed under reference to this report. These financial statements are the responsibility of the Company’s management. Our responsibility is to express an opinion on these financial statements based on our audit.
2. We conducted our audit in accordance with auditing standards generally accepted in India. Those Standards require that we plan and perform the audit to obtain reasonable assurance about whether the financial statements are free of material misstatement. An Audit includes examining, on a test basis, evidence supporting the amounts and disclosures in the financial statements. An audit also includes assessing the accounting principles used and significant estimates made by management, as well as evaluating the overall financial statement presentation. We believe that our audit provides a reasonable basis for our opinion.
3. As required by the Companies (Auditors’ Report) Order, 2003 issued by the Central Government of India in terms of Section 227 (4A) of the Companies Act, 1956, and on the basis of such checks as considered appropriate and according to the information and explanation given to us during the course of our audit, we enclose in the Annexure hereto a statement on the matters specified in paragraphs 4 and 5 of the said Order.
4. Further to our comments mentioned in the Annexure referred to in paragraph 3 above, we report that:
a) We have obtained all the information and explanations which, to the best of our knowledge and belief, were necessary for the purposes of our audit;
b) In our opinion, proper books of account as required by law have been kept by the Company so far as appears from our examination of such books;
c) The Balance Sheet, Profit & Loss Account and Cash Flow Statement dealt with by the report are in agreement with the books of account of the Company;
d) In our opinion, the Balance Sheet, Profit & Loss Account and Cash Flow Statement dealt with by this report comply with the mandatory Accounting Standards referred to in Sub-Section 3 (c) of Section 211 of the Companies Act, 1956.
e) According to the information and explanation given to us and on the basis of written representations received from the directors as on 31st March, 2011 of the Company and taken on record by the Board of Directors, we report that none of the directors is disqualified, as on 31st March, 2011, from being appointed as a director in terms of clause (g) of Sub Section (1) of Section 274 of the Companies Act, 1956.
f) In our opinion and to the best of our information and according to the explanations given to us, the said Accounts, and read together with the notes and Significant Accounting Policies thereon give the information required by the Companies Act, 1956 in the manner so required and give a true and fair view in conformity with the accounting principles generally accepted in India:
(i) In the case of the Balance Sheet, of the state of affairs of the Company as at 31st March, 2011.
(ii) In the case of the Profit and Loss Account, of the Profit of the Company for the year ended on that date; and
(iii) In the case of the Cash Flow Statement, of the cash flows of the Company for the year ended on that date.
For K. N. Gutgutia & CompanyFirm Registration Number: 304153E
Chartered Accountants
Place : Noida B. R. GOYALDate : 10th May, 2011 Partner Membership No. 12172
AUDITORS’ REPORT
71
Annual Report 2010-11 | Jubilant Life Sciences Limited
Re: JUBILANT LIFE SCIENCES LIMITED (Formerly Jubilant Organosys Limited)
Referred to in paragraph 3 of our report of even date on the accounts of the Company for the year ended 31st March, 2011.
i) (a) The Company has maintained proper records showing full particulars, including quantitative details and situation, of fixed assets.
(b) As explained to us, physical verification of fixed assets has been carried out in terms of the phased programme of verification of its fixed assets adopted by the Company and no material discrepancies were noticed on such verification. In our opinion the frequency of verification is reasonable, having regard to the size of the Company and nature of its business.
(c) During the year the Company has not disposed off any substantial/ major part of fixed assets except transfers, in terms of the Court Sanctioned Scheme of Demerger of certain units to Jubilant Industries Ltd, however, the same has not affected its going concern basis.
ii) (a) The inventory has been physically verified, during the year, by the management at reasonable intervals.
(b) In our opinion and according to the information and explanations given to us, the procedures of physical verification of inventory followed by the management are reasonable and adequate in relation to the size of the Company and the nature of its business.
(c) On the basis of our examination of inventory records, in our opinion, the Company is maintaining proper records of inventory. In our opinion, discrepancies noticed on physical verification of stocks as compared to book records were not material in relation to the operations of the Company and the same have been properly dealt with in the books of account.
iii) (a) There are only two Companies (Subsidiaries) covered in the register maintained under section 301 of the Companies Act,1956 to whom the Company has granted loans. The maximum amount involved during the year was ` 1,929.75 million (including the opening balance) and the year end total balance of loans granted to such parties was ` 1,929.75 million.
(b) In our opinion the rate of interest (wherever leviable) and other terms and condition on which loan were granted to the said Companies listed in register maintained under section 301 of the Companies Act, 1956 are not prima facie, prejudicial to the interest of the Company.
(c) None of the parties have repaid principal amounts as no demand was raised and the parties were regular in the matter of payment of interest, wherever applicable.
(d) There is no overdue amount of loan granted to the said companies.
(e) The Company had taken short term loan from one company covered in the register maintained under section 301 of the Companies Act, 1956. The amount involved were ` 160 million and the maximum balance was ` 100 million during the year and the year end balance was ` Nil, as the loan were repaid during the year. The rate of interest and terms of such loan, prima facie, are not prejudicial to the interest of the Company.
iv) In our opinion and according to the information and explanations given to us, there are adequate internal control systems commensurate with the size of the company and the nature of its business with regard to purchase of inventory and fixed assets and for the sale of goods and services. During the course of our audit, we have not observed any continuing failure to correct major weakness in internal control system.
v) (a) Based on the audit procedures applied by us and according to the information and explanations provided by the management, we are of the opinion that the transactions that need to be entered into the register maintained under Section 301 have been so entered.
(b) In our opinion and according to the information and explanations given to us, the transactions made in pursuance of contracts or arrangements entered in the register under Section 301 have been made at prices which are reasonable having regard to prevailing market prices, to the extent comparable prices were available, at the relevant time.
vi) In the case of public deposits received by the company, the directives issued by the Reserve Bank of India and the provisions of Section 58A, 58AA or any other relevant provisions of the Companies Act, 1956 and the Companies (Acceptance of Deposit) Rules 1975 have been Compiled with. No order has been passed by the Company Law Board or National Company Law Tribunal or Reserve Bank of India or any Court or any other Tribunal.
vii) In our opinion, the company has an internal audit system commensurate with the size of the company and the nature of its business.
viii) The Central Government has prescribed maintenance of the Cost Records under section 209(1)(d) of the Companies Act, 1956 in respect of certain products of the Company. We have broadly reviewed the books of account maintained by the company pursuant to the Rules made by the Central Government for the maintenance of the cost records, and are of the opinion that prima facie the prescribed accounts and records have been maintained. We are, however, not required to and have not carried out any detailed examination of such accounts and records.
ANNExURE TO ThE AUDITORS’ REPORT
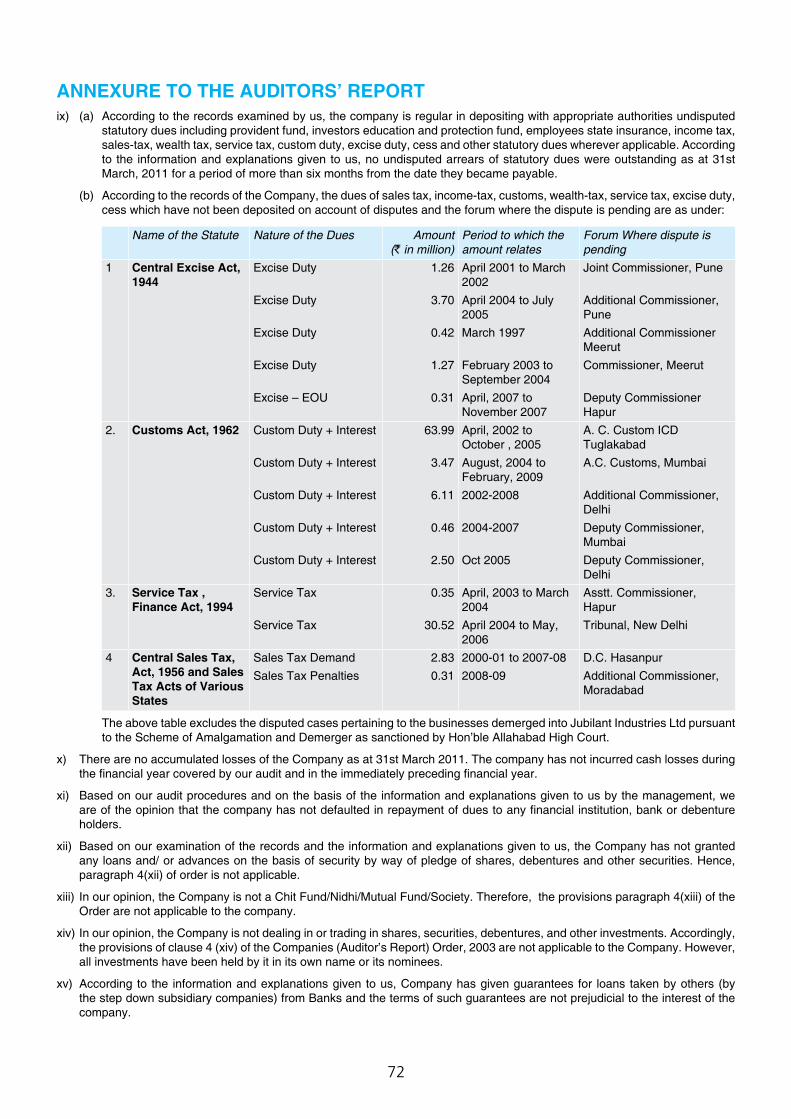
72
ix) (a) According to the records examined by us, the company is regular in depositing with appropriate authorities undisputed statutory dues including provident fund, investors education and protection fund, employees state insurance, income tax, sales-tax, wealth tax, service tax, custom duty, excise duty, cess and other statutory dues wherever applicable. According to the information and explanations given to us, no undisputed arrears of statutory dues were outstanding as at 31st March, 2011 for a period of more than six months from the date they became payable.
(b) According to the records of the Company, the dues of sales tax, income-tax, customs, wealth-tax, service tax, excise duty, cess which have not been deposited on account of disputes and the forum where the dispute is pending are as under:
Name of the Statute Nature of the Dues Amount (` in million)
Period to which the amount relates
Forum Where dispute is pending
1 Central Excise Act, 1944
Excise Duty 1.26 April 2001 to March 2002
Joint Commissioner, Pune
Excise Duty 3.70 April 2004 to July 2005
Additional Commissioner, Pune
Excise Duty 0.42 March 1997 Additional Commissioner Meerut
Excise Duty 1.27 February 2003 to September 2004
Commissioner, Meerut
Excise – EOU 0.31 April, 2007 to November 2007
Deputy Commissioner Hapur
2. Customs Act, 1962 Custom Duty + Interest 63.99 April, 2002 to October , 2005
A. C. Custom ICD Tuglakabad
Custom Duty + Interest 3.47 August, 2004 to February, 2009
A.C. Customs, Mumbai
Custom Duty + Interest 6.11 2002-2008 Additional Commissioner, Delhi
Custom Duty + Interest 0.46 2004-2007 Deputy Commissioner, Mumbai
Custom Duty + Interest 2.50 Oct 2005 Deputy Commissioner, Delhi
3. Service Tax , Finance Act, 1994
Service Tax 0.35 April, 2003 to March 2004
Asstt. Commissioner, Hapur
Service Tax 30.52 April 2004 to May, 2006
Tribunal, New Delhi
4 Central Sales Tax, Act, 1956 and Sales Tax Acts of Various States
Sales Tax DemandSales Tax Penalties
2.830.31
2000-01 to 2007-082008-09
D.C. HasanpurAdditional Commissioner, Moradabad
The above table excludes the disputed cases pertaining to the businesses demerged into Jubilant Industries Ltd pursuant to the Scheme of Amalgamation and Demerger as sanctioned by Hon’ble Allahabad High Court.
x) There are no accumulated losses of the Company as at 31st March 2011. The company has not incurred cash losses during the financial year covered by our audit and in the immediately preceding financial year.
xi) Based on our audit procedures and on the basis of the information and explanations given to us by the management, we are of the opinion that the company has not defaulted in repayment of dues to any financial institution, bank or debenture holders.
xii) Based on our examination of the records and the information and explanations given to us, the Company has not granted any loans and/ or advances on the basis of security by way of pledge of shares, debentures and other securities. Hence, paragraph 4(xii) of order is not applicable.
xiii) In our opinion, the Company is not a Chit Fund/Nidhi/Mutual Fund/Society. Therefore, the provisions paragraph 4(xiii) of the Order are not applicable to the company.
xiv) In our opinion, the Company is not dealing in or trading in shares, securities, debentures, and other investments. Accordingly, the provisions of clause 4 (xiv) of the Companies (Auditor’s Report) Order, 2003 are not applicable to the Company. However, all investments have been held by it in its own name or its nominees.
xv) According to the information and explanations given to us, Company has given guarantees for loans taken by others (by the step down subsidiary companies) from Banks and the terms of such guarantees are not prejudicial to the interest of the company.
ANNExURE TO ThE AUDITORS’ REPORT
73
Annual Report 2010-11 | Jubilant Life Sciences Limited
xvi) According to the information and explanations given to us, the term loans raised during the year have been applied, to the extent used, for the purpose for which they were raised and the balance moneys are lying in Current Accounts/Deposits with the banks.
xvii) According to the information & explanation given to us and on an overall examination of the Balance Sheet of the company, we report that the no funds raised on short-term basis have been used for long term investment.
xviii) The Company has not made any preferential allotment of shares during the year to parties/companies covered in the register maintained under section 301 of the companies Act, 1956.
xix) During the year covered by our audit report the Company has not issued secured debentures.
xx) The company has not raised money by Public Issue during the year.
xxi) Based upon the audit procedures performed and as per the information and explanations given by the management to us, we report that no fraud on or by the Company has been noticed or reported during the course of our audit for the year ended 31st March, 2011.
For K.N. Gutgutia & Company Firm Registration Number: 304153E
Chartered Accountants
Place: Noida B. R. GOYALDate : 10th May, 2011 Partner
Membership No. 12172
ANNExURE TO ThE AUDITORS’ REPORT

74
As at 31st March, Schedules 2011 2010
SOURCES OF FUNDS Shareholders’ Funds
Share Capital A 159.30 158.80
Reserves & Surplus B 21,246.60 21,569.72
21,405.90 21,728.52
Loan Funds C
Secured Loans 19,556.35 10,012.84
Unsecured Loans 10,336.95 10,109.89
29,893.30 20,122.73
Deferred Tax Liabilities (Net) D 1,899.02 2,049.75
53,198.22 43,901.00
APPLICATION OF FUNDS Fixed Assets E
Gross Block 21,811.08 20,505.98
Less: Depreciation 6,425.95 5,913.46
Net Block 15,385.13 14,592.52
Capital Work-in-Progress 4,253.95 2,721.93
19,639.08 17,314.45
Investments F 18,640.55 18,692.03
Foreign Currency Monetary Item Translation Difference Account
– 58.62
Current Assets, Loans and Advances G
Inventories 4,047.00 4,247.10
Sundry Debtors 3,345.17 3,073.05
Cash & Bank Balances 9,852.59 4,342.21
Loans and Advances 7,182.24 5,843.38
24,427.00 17,505.74
Less: Current Liabilities & Provisions H
Liabilities 5,448.31 5,195.56
Provisions 4,060.10 4,474.28
9,508.41 9,669.84
Net Current Assets 14,918.59 7,835.90
53,198.22 43,901.00
Notes to Accounts & Significant Accounting Policies N
Schedule “A” to “H” and “N” referred above form an integral part of the Balance Sheet.
BALANCE SHEET(` in million)
In terms of our report of even date attached. For and on behalf of the Board
For K. N. Gutgutia & Co.Firm Registration Number : 304153EChartered Accountants
B. R. Goyal Shyam S. BhartiaPartner Chairman & Managing DirectorMembership No. 12172
Place : Noida Lalit Jain R. Sankaraiah Hari S. BhartiaDate : 10th May, 2011 Company Secretary Executive Director-Finance Co-Chairman & Managing Director
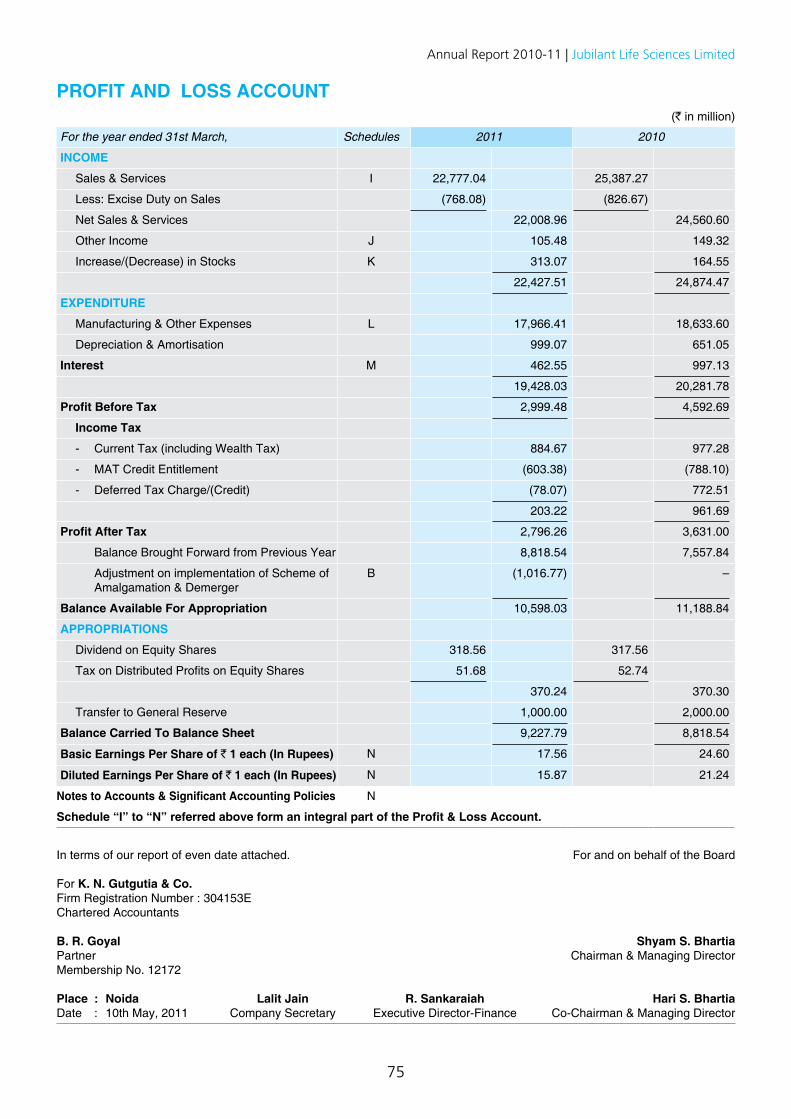
75
Annual Report 2010-11 | Jubilant Life Sciences Limited
In terms of our report of even date attached. For and on behalf of the Board
For K. N. Gutgutia & Co.Firm Registration Number : 304153EChartered Accountants
B. R. Goyal Shyam S. BhartiaPartner Chairman & Managing DirectorMembership No. 12172
Place : Noida Lalit Jain R. Sankaraiah Hari S. BhartiaDate : 10th May, 2011 Company Secretary Executive Director-Finance Co-Chairman & Managing Director
PROFIT AND LOSS ACCOUNT(` in million)
For the year ended 31st March, Schedules 2011 2010
INCOME
Sales & Services I 22,777.04 25,387.27
Less: Excise Duty on Sales (768.08) (826.67)
Net Sales & Services 22,008.96 24,560.60
Other Income J 105.48 149.32
Increase/(Decrease) in Stocks K 313.07 164.55
22,427.51 24,874.47
EXPENDITURE
Manufacturing & Other Expenses L 17,966.41 18,633.60
Depreciation & Amortisation 999.07 651.05
Interest M 462.55 997.13
19,428.03 20,281.78
Profit Before Tax 2,999.48 4,592.69
Income Tax
- Current Tax (including Wealth Tax) 884.67 977.28
- MAT Credit Entitlement (603.38) (788.10)
- Deferred Tax Charge/(Credit) (78.07) 772.51
203.22 961.69
Profit After Tax 2,796.26 3,631.00
Balance Brought Forward from Previous Year 8,818.54 7,557.84
Adjustment on implementation of Scheme of Amalgamation & Demerger
B (1,016.77) –
Balance Available For Appropriation 10,598.03 11,188.84
APPROPRIATIONS
Dividend on Equity Shares 318.56 317.56
Tax on Distributed Profits on Equity Shares 51.68 52.74
370.24 370.30
Transfer to General Reserve 1,000.00 2,000.00
Balance Carried To Balance Sheet 9,227.79 8,818.54
Basic Earnings Per Share of ` 1 each (In Rupees) N 17.56 24.60
Diluted Earnings Per Share of ` 1 each (In Rupees) N 15.87 21.24
Notes to Accounts & Significant Accounting Policies N
Schedule “I” to “N” referred above form an integral part of the Profit & Loss Account.
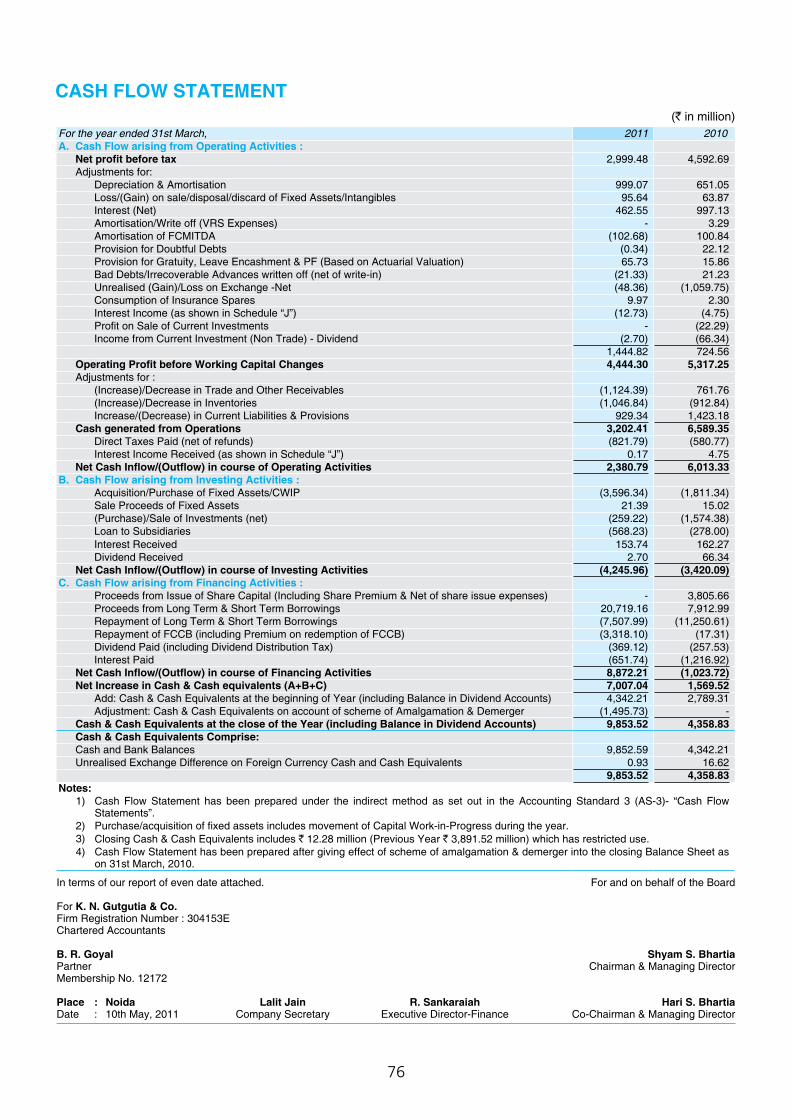
76
CASH FLOW STATEMENT (` in million)
In terms of our report of even date attached. For and on behalf of the Board
For K. N. Gutgutia & Co.Firm Registration Number : 304153EChartered Accountants
B. R. Goyal Shyam S. BhartiaPartner Chairman & Managing DirectorMembership No. 12172
Place : Noida Lalit Jain R. Sankaraiah Hari S. BhartiaDate : 10th May, 2011 Company Secretary Executive Director-Finance Co-Chairman & Managing Director
For the year ended 31st March, 2011 2010A. Cash Flow arising from Operating Activities :
Net profit before tax 2,999.48 4,592.69 Adjustments for:
Depreciation & Amortisation 999.07 651.05 Loss/(Gain) on sale/disposal/discard of Fixed Assets/Intangibles 95.64 63.87 Interest (Net) 462.55 997.13 Amortisation/Write off (VRS Expenses) - 3.29 Amortisation of FCMITDA (102.68) 100.84 Provision for Doubtful Debts (0.34) 22.12 Provision for Gratuity, Leave Encashment & PF (Based on Actuarial Valuation) 65.73 15.86 Bad Debts/Irrecoverable Advances written off (net of write-in) (21.33) 21.23 Unrealised (Gain)/Loss on Exchange -Net (48.36) (1,059.75)Consumption of Insurance Spares 9.97 2.30 Interest Income (as shown in Schedule “J”) (12.73) (4.75)Profit on Sale of Current Investments - (22.29)Income from Current Investment (Non Trade) - Dividend (2.70) (66.34)
1,444.82 724.56 Operating Profit before Working Capital Changes 4,444.30 5,317.25 Adjustments for :
(Increase)/Decrease in Trade and Other Receivables (1,124.39) 761.76 (Increase)/Decrease in Inventories (1,046.84) (912.84)Increase/(Decrease) in Current Liabilities & Provisions 929.34 1,423.18
Cash generated from Operations 3,202.41 6,589.35 Direct Taxes Paid (net of refunds) (821.79) (580.77)Interest Income Received (as shown in Schedule “J”) 0.17 4.75
Net Cash Inflow/(Outflow) in course of Operating Activities 2,380.79 6,013.33 B. Cash Flow arising from Investing Activities :
Acquisition/Purchase of Fixed Assets/CWIP (3,596.34) (1,811.34)Sale Proceeds of Fixed Assets 21.39 15.02 (Purchase)/Sale of Investments (net) (259.22) (1,574.38)Loan to Subsidiaries (568.23) (278.00)Interest Received 153.74 162.27 Dividend Received 2.70 66.34
Net Cash Inflow/(Outflow) in course of Investing Activities (4,245.96) (3,420.09)C. Cash Flow arising from Financing Activities :
Proceeds from Issue of Share Capital (Including Share Premium & Net of share issue expenses) - 3,805.66 Proceeds from Long Term & Short Term Borrowings 20,719.16 7,912.99 Repayment of Long Term & Short Term Borrowings (7,507.99) (11,250.61)Repayment of FCCB (including Premium on redemption of FCCB) (3,318.10) (17.31)Dividend Paid (including Dividend Distribution Tax) (369.12) (257.53)Interest Paid (651.74) (1,216.92)
Net Cash Inflow/(Outflow) in course of Financing Activities 8,872.21 (1,023.72)Net Increase in Cash & Cash equivalents (A+B+C) 7,007.04 1,569.52
Add: Cash & Cash Equivalents at the beginning of Year (including Balance in Dividend Accounts) 4,342.21 2,789.31 Adjustment: Cash & Cash Equivalents on account of scheme of Amalgamation & Demerger (1,495.73) -
Cash & Cash Equivalents at the close of the Year (including Balance in Dividend Accounts) 9,853.52 4,358.83 Cash & Cash Equivalents Comprise: Cash and Bank Balances 9,852.59 4,342.21 Unrealised Exchange Difference on Foreign Currency Cash and Cash Equivalents 0.93 16.62
9,853.52 4,358.83 Notes:
1) Cash Flow Statement has been prepared under the indirect method as set out in the Accounting Standard 3 (AS-3)- “Cash Flow Statements”.
2) Purchase/acquisition of fixed assets includes movement of Capital Work-in-Progress during the year.3) Closing Cash & Cash Equivalents includes ` 12.28 million (Previous Year ` 3,891.52 million) which has restricted use.4) Cash Flow Statement has been prepared after giving effect of scheme of amalgamation & demerger into the closing Balance Sheet as
on 31st March, 2010.
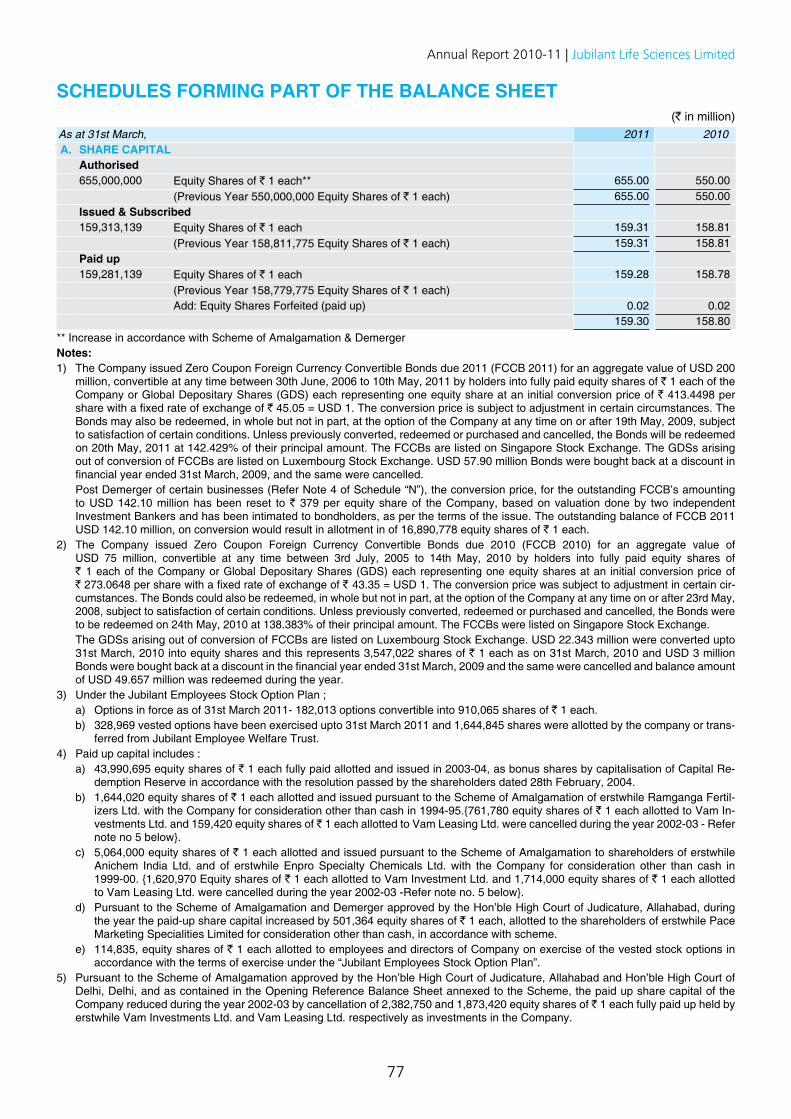
77
Annual Report 2010-11 | Jubilant Life Sciences Limited
SCHEDULES FORMING PART OF THE BALANCE SHEET(` in million)
As at 31st March, 2011 2010A. SHARE CAPITAL
Authorised655,000,000 Equity Shares of ` 1 each** 655.00 550.00
(Previous Year 550,000,000 Equity Shares of ` 1 each) 655.00 550.00 Issued & Subscribed159,313,139 Equity Shares of ` 1 each 159.31 158.81
(Previous Year 158,811,775 Equity Shares of ` 1 each) 159.31 158.81 Paid up 159,281,139 Equity Shares of ` 1 each 159.28 158.78
(Previous Year 158,779,775 Equity Shares of ` 1 each)Add: Equity Shares Forfeited (paid up) 0.02 0.02
159.30 158.80** Increase in accordance with Scheme of Amalgamation & DemergerNotes:1) The Company issued Zero Coupon Foreign Currency Convertible Bonds due 2011 (FCCB 2011) for an aggregate value of USD 200
million, convertible at any time between 30th June, 2006 to 10th May, 2011 by holders into fully paid equity shares of ` 1 each of the Company or Global Depositary Shares (GDS) each representing one equity share at an initial conversion price of ` 413.4498 per share with a fixed rate of exchange of ` 45.05 = USD 1. The conversion price is subject to adjustment in certain circumstances. The Bonds may also be redeemed, in whole but not in part, at the option of the Company at any time on or after 19th May, 2009, subject to satisfaction of certain conditions. Unless previously converted, redeemed or purchased and cancelled, the Bonds will be redeemed on 20th May, 2011 at 142.429% of their principal amount. The FCCBs are listed on Singapore Stock Exchange. The GDSs arising out of conversion of FCCBs are listed on Luxembourg Stock Exchange. USD 57.90 million Bonds were bought back at a discount in financial year ended 31st March, 2009, and the same were cancelled.
Post Demerger of certain businesses (Refer Note 4 of Schedule “N”), the conversion price, for the outstanding FCCB’s amounting to USD 142.10 million has been reset to ` 379 per equity share of the Company, based on valuation done by two independent Investment Bankers and has been intimated to bondholders, as per the terms of the issue. The outstanding balance of FCCB 2011 USD 142.10 million, on conversion would result in allotment in of 16,890,778 equity shares of ` 1 each.
2) The Company issued Zero Coupon Foreign Currency Convertible Bonds due 2010 (FCCB 2010) for an aggregate value of USD 75 million, convertible at any time between 3rd July, 2005 to 14th May, 2010 by holders into fully paid equity shares of ` 1 each of the Company or Global Depositary Shares (GDS) each representing one equity shares at an initial conversion price of ` 273.0648 per share with a fixed rate of exchange of ` 43.35 = USD 1. The conversion price was subject to adjustment in certain cir-cumstances. The Bonds could also be redeemed, in whole but not in part, at the option of the Company at any time on or after 23rd May, 2008, subject to satisfaction of certain conditions. Unless previously converted, redeemed or purchased and cancelled, the Bonds were to be redeemed on 24th May, 2010 at 138.383% of their principal amount. The FCCBs were listed on Singapore Stock Exchange.
The GDSs arising out of conversion of FCCBs are listed on Luxembourg Stock Exchange. USD 22.343 million were converted upto 31st March, 2010 into equity shares and this represents 3,547,022 shares of ` 1 each as on 31st March, 2010 and USD 3 million Bonds were bought back at a discount in the financial year ended 31st March, 2009 and the same were cancelled and balance amount of USD 49.657 million was redeemed during the year.
3) Under the Jubilant Employees Stock Option Plan ; a) Options in force as of 31st March 2011- 182,013 options convertible into 910,065 shares of ` 1 each. b) 328,969 vested options have been exercised upto 31st March 2011 and 1,644,845 shares were allotted by the company or trans-
ferred from Jubilant Employee Welfare Trust.4) Paid up capital includes : a) 43,990,695 equity shares of ` 1 each fully paid allotted and issued in 2003-04, as bonus shares by capitalisation of Capital Re-
demption Reserve in accordance with the resolution passed by the shareholders dated 28th February, 2004. b) 1,644,020 equity shares of ` 1 each allotted and issued pursuant to the Scheme of Amalgamation of erstwhile Ramganga Fertil-
izers Ltd. with the Company for consideration other than cash in 1994-95.{761,780 equity shares of ` 1 each allotted to Vam In-vestments Ltd. and 159,420 equity shares of ` 1 each allotted to Vam Leasing Ltd. were cancelled during the year 2002-03 - Refer note no 5 below}.
c) 5,064,000 equity shares of ` 1 each allotted and issued pursuant to the Scheme of Amalgamation to shareholders of erstwhile Anichem India Ltd. and of erstwhile Enpro Specialty Chemicals Ltd. with the Company for consideration other than cash in 1999-00. {1,620,970 Equity shares of ` 1 each allotted to Vam Investment Ltd. and 1,714,000 equity shares of ` 1 each allotted to Vam Leasing Ltd. were cancelled during the year 2002-03 -Refer note no. 5 below}.
d) Pursuant to the Scheme of Amalgamation and Demerger approved by the Hon’ble High Court of Judicature, Allahabad, during the year the paid-up share capital increased by 501,364 equity shares of ` 1 each, allotted to the shareholders of erstwhile Pace Marketing Specialities Limited for consideration other than cash, in accordance with scheme.
e) 114,835, equity shares of ` 1 each allotted to employees and directors of Company on exercise of the vested stock options in accordance with the terms of exercise under the “Jubilant Employees Stock Option Plan”.
5) Pursuant to the Scheme of Amalgamation approved by the Hon’ble High Court of Judicature, Allahabad and Hon’ble High Court of Delhi, Delhi, and as contained in the Opening Reference Balance Sheet annexed to the Scheme, the paid up share capital of the Company reduced during the year 2002-03 by cancellation of 2,382,750 and 1,873,420 equity shares of ` 1 each fully paid up held by erstwhile Vam Investments Ltd. and Vam Leasing Ltd. respectively as investments in the Company.
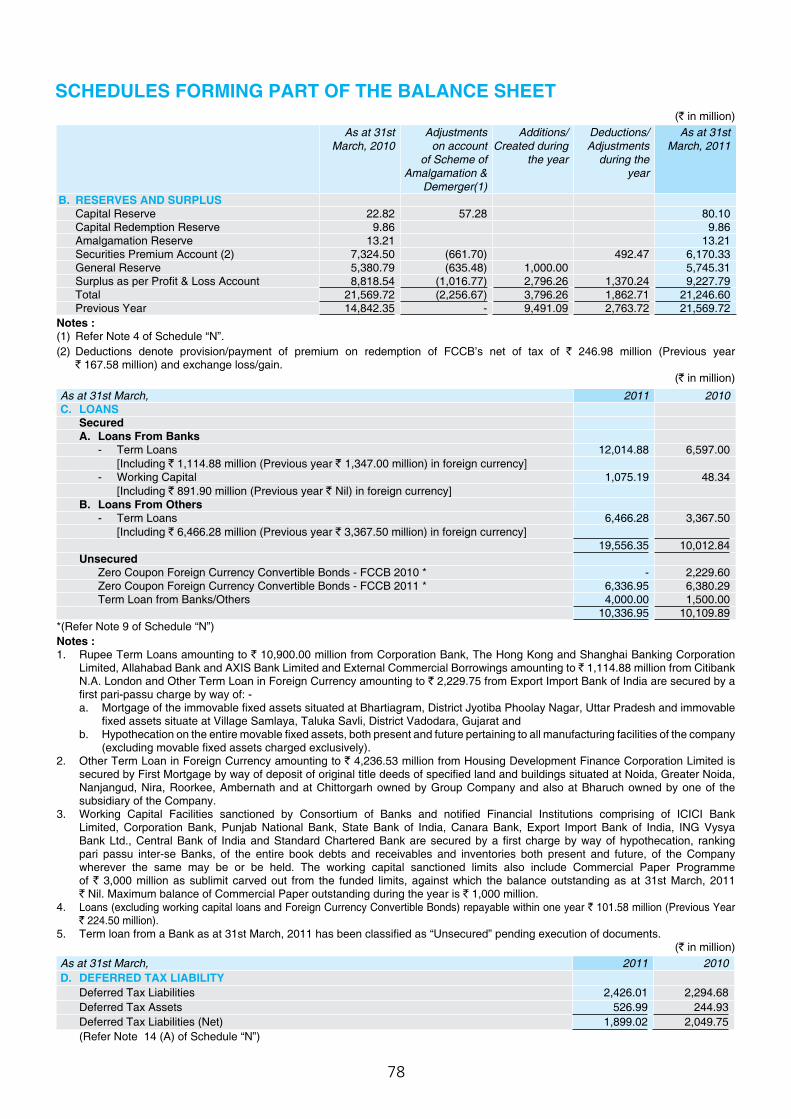
78
(` in million)As at 31st
March, 2010Adjustments
on account of Scheme of
Amalgamation & Demerger(1)
Additions/Created during
the year
Deductions/Adjustments
during the year
As at 31stMarch, 2011
B. RESERVES AND SURPLUSCapital Reserve 22.82 57.28 80.10 Capital Redemption Reserve 9.86 9.86 Amalgamation Reserve 13.21 13.21 Securities Premium Account (2) 7,324.50 (661.70) 492.47 6,170.33 General Reserve 5,380.79 (635.48) 1,000.00 5,745.31 Surplus as per Profit & Loss Account 8,818.54 (1,016.77) 2,796.26 1,370.24 9,227.79 Total 21,569.72 (2,256.67) 3,796.26 1,862.71 21,246.60 Previous Year 14,842.35 - 9,491.09 2,763.72 21,569.72
Notes :(1) Refer Note 4 of Schedule “N”.(2) Deductions denote provision/payment of premium on redemption of FCCB’s net of tax of ` 246.98 million (Previous year
` 167.58 million) and exchange loss/gain. (` in million)
As at 31st March, 2011 2010C. LOANS
SecuredA. Loans From Banks
- Term Loans 12,014.88 6,597.00 [Including ` 1,114.88 million (Previous year ` 1,347.00 million) in foreign currency]
- Working Capital 1,075.19 48.34 [Including ` 891.90 million (Previous year ` Nil) in foreign currency]
B. Loans From Others- Term Loans 6,466.28 3,367.50
[Including ` 6,466.28 million (Previous year ` 3,367.50 million) in foreign currency]19,556.35 10,012.84
UnsecuredZero Coupon Foreign Currency Convertible Bonds - FCCB 2010 * - 2,229.60 Zero Coupon Foreign Currency Convertible Bonds - FCCB 2011 * 6,336.95 6,380.29 Term Loan from Banks/Others 4,000.00 1,500.00
10,336.95 10,109.89*(Refer Note 9 of Schedule “N”)Notes :1. Rupee Term Loans amounting to ` 10,900.00 million from Corporation Bank, The Hong Kong and Shanghai Banking Corporation
Limited, Allahabad Bank and AXIS Bank Limited and External Commercial Borrowings amounting to ` 1,114.88 million from Citibank N.A. London and Other Term Loan in Foreign Currency amounting to ` 2,229.75 from Export Import Bank of India are secured by a first pari-passu charge by way of: -
a. Mortgage of the immovable fixed assets situated at Bhartiagram, District Jyotiba Phoolay Nagar, Uttar Pradesh and immovable fixed assets situate at Village Samlaya, Taluka Savli, District Vadodara, Gujarat and
b. Hypothecation on the entire movable fixed assets, both present and future pertaining to all manufacturing facilities of the company (excluding movable fixed assets charged exclusively).
2. Other Term Loan in Foreign Currency amounting to ` 4,236.53 million from Housing Development Finance Corporation Limited is secured by First Mortgage by way of deposit of original title deeds of specified land and buildings situated at Noida, Greater Noida, Nanjangud, Nira, Roorkee, Ambernath and at Chittorgarh owned by Group Company and also at Bharuch owned by one of the subsidiary of the Company.
3. Working Capital Facilities sanctioned by Consortium of Banks and notified Financial Institutions comprising of ICICI Bank Limited, Corporation Bank, Punjab National Bank, State Bank of India, Canara Bank, Export Import Bank of India, ING Vysya Bank Ltd., Central Bank of India and Standard Chartered Bank are secured by a first charge by way of hypothecation, ranking pari passu inter-se Banks, of the entire book debts and receivables and inventories both present and future, of the Company wherever the same may be or be held. The working capital sanctioned limits also include Commercial Paper Programme of ` 3,000 million as sublimit carved out from the funded limits, against which the balance outstanding as at 31st March, 2011 ` Nil. Maximum balance of Commercial Paper outstanding during the year is ` 1,000 million.
4. Loans (excluding working capital loans and Foreign Currency Convertible Bonds) repayable within one year ` 101.58 million (Previous Year ` 224.50 million).
5. Term loan from a Bank as at 31st March, 2011 has been classified as “Unsecured” pending execution of documents.(` in million)
As at 31st March, 2011 2010D. DEFERRED TAX LIABILITY
Deferred Tax Liabilities 2,426.01 2,294.68 Deferred Tax Assets 526.99 244.93 Deferred Tax Liabilities (Net) 1,899.02 2,049.75 (Refer Note 14 (A) of Schedule “N”)
SCHEDULES FORMING PART OF THE BALANCE SHEET
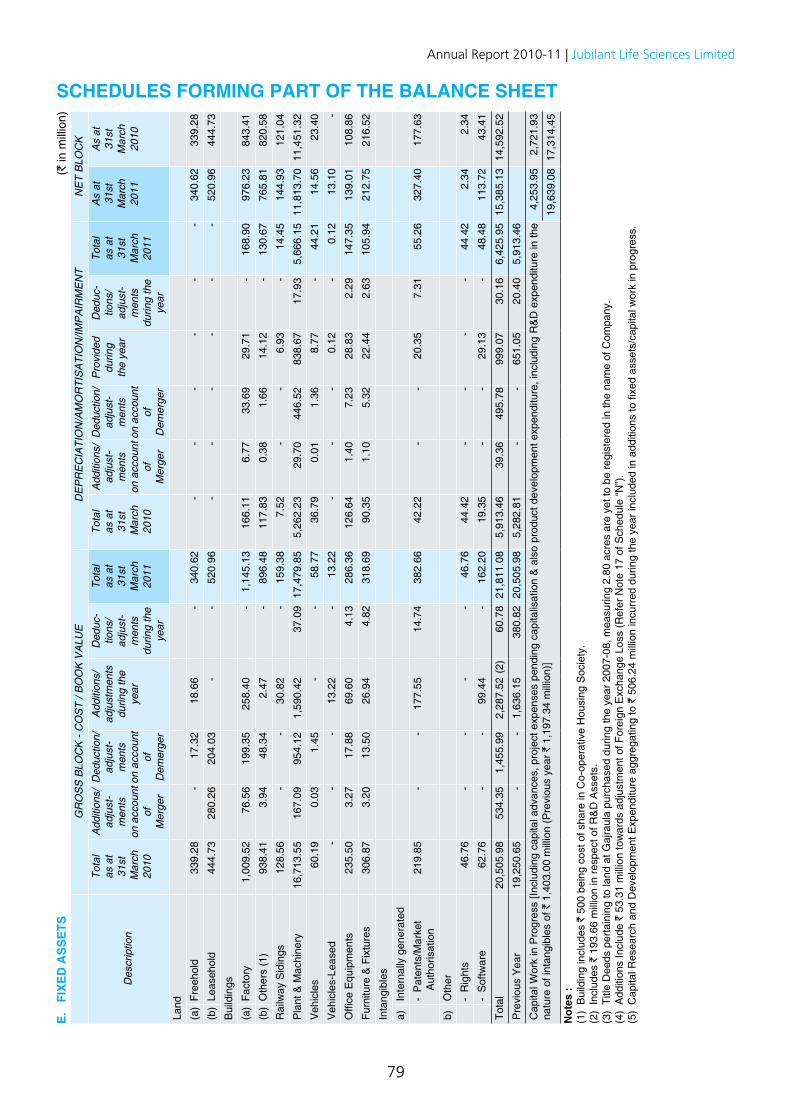
79
Annual Report 2010-11 | Jubilant Life Sciences Limited
SCHEDULES FORMING PART OF THE BALANCE SHEET
E.
FIX
ED
AS
SE
TS
(` in
mill
ion)
GR
OS
S B
LOC
K -
CO
ST
/ BO
OK
VA
LUE
DE
PR
EC
IATI
ON
/AM
OR
TIS
ATI
ON
/IMP
AIR
ME
NT
NE
T B
LOC
K
Des
crip
tion
Tota
las
at
31st
M
arch
2010
Add
ition
s/ad
just
-m
ents
on a
ccou
nt
ofM
erge
r
Ded
uctio
n/ad
just
-m
ents
on a
ccou
nt
ofD
emer
ger
Add
ition
s/ad
just
men
tsdu
ring
the
year
Ded
uc-
tions
/ad
just
-m
ents
durin
g th
eye
ar
Tota
las
at
31st
M
arch
2011
Tota
las
at
31st
M
arch
2010
Add
ition
s/ad
just
-m
ents
on a
ccou
nt
ofM
erge
r
Ded
uctio
n/ad
just
-m
ents
on a
ccou
nt
ofD
emer
ger
Pro
vide
ddu
ring
the
year
Ded
uc-
tions
/ad
just
-m
ents
durin
g th
eye
ar
Tota
las
at
31st
M
arch
2011
As
at31
stM
arch
2011
As
at31
stM
arch
20
10
Land
(a)
Free
hold
339.
28-
17.3
218
.66
-34
0.62
--
--
--
340.
6233
9.28
(b)
Leas
ehol
d44
4.73
280.
2620
4.03
--
520.
96-
--
--
-52
0.96
444.
73
Bui
ldin
gs
(a)
Fact
ory
1,00
9.52
76.5
619
9.35
258.
40-
1,14
5.13
166.
116.
7733
.69
29.7
1-
168.
9097
6.23
843.
41
(b)
Oth
ers
(1)
938.
413.
9448
.34
2.47
-89
6.48
117.
830.
381.
6614
.12
-13
0.67
765.
8182
0.58
Rai
lway
Sid
ings
128.
56-
-30
.82
-15
9.38
7.52
--
6.93
-14
.45
144.
9312
1.04
Pla
nt &
Mac
hine
ry16
,713
.55
167.
0995
4.12
1,59
0.42
37.0
917
,479
.85
5,26
2.23
29.7
044
6.52
838.
6717
.93
5,66
6.15
11,8
13.7
011
,451
.32
Veh
icle
s60
.19
0.03
1.45
--
58.7
736
.79
0.01
1.36
8.77
-44
.21
14.5
623
.40
Veh
icle
s-Le
ased
--
-13
.22
-13
.22
--
-0.
12-
0.12
13.1
0-
Offi
ce E
quip
men
ts23
5.50
3.27
17.8
869
.60
4.13
286.
3612
6.64
1.40
7.23
28.8
32.
2914
7.35
139.
0110
8.86
Furn
iture
& F
ixtu
res
306.
873.
2013
.50
26.9
44.
8231
8.69
90.3
51.
105.
3222
.44
2.63
105.
9421
2.75
216.
52
Inta
ngib
les
a)In
tern
ally
gen
erat
ed
- P
aten
ts/M
arke
t
Aut
horis
atio
n21
9.85
--
177.
5514
.74
382.
6642
.22
--
20.3
57.
3155
.26
327.
4017
7.63
b)O
ther
- R
ight
s46
.76
--
--
46.7
644
.42
--
--
44.4
22.
342.
34
- S
oftw
are
62.7
6-
-99
.44
-16
2.20
19.3
5-
-29
.13
-48
.48
113.
7243
.41
Tota
l20
,505
.98
534.
351,
455.
992,
287.
52(2
)60
.78
21,8
11.0
85,
913.
4639
.36
495.
7899
9.07
30.1
66,
425.
9515
,385
.13
14,5
92.5
2
Pre
viou
s Y
ear
19,2
50.6
5-
-1,
636.
1538
0.82
20,5
05.9
85,
282.
81-
-65
1.05
20.4
05,
913.
46
Cap
ital W
ork
in P
rogr
ess
[Incl
udin
g ca
pita
l adv
ance
s, p
roje
ct e
xpen
ses
pend
ing
capi
talis
atio
n &
als
o pr
oduc
t dev
elop
men
t exp
endi
ture
, inc
ludi
ng R
&D
exp
endi
ture
in th
e na
ture
of i
ntan
gibl
es o
f ` 1
,403
.00
mill
ion
(Pre
viou
s ye
ar `
1,1
97.3
4 m
illio
n)]
4,25
3.95
2,72
1.93
19,6
39.0
817
,314
.45
Not
es :
(1)
Bui
ldin
g in
clud
es `
500
bei
ng c
ost o
f sha
re in
Co-
oper
ativ
e H
ousi
ng S
ocie
ty.
(2)
Incl
udes
` 1
93.6
6 m
illio
n in
resp
ect o
f R&
D A
sset
s.
(3
) Ti
tle D
eeds
per
tain
ing
to la
nd a
t Gaj
raul
a pu
rcha
sed
durin
g th
e ye
ar 2
007-
08, m
easu
ring
2.80
acr
es a
re y
et to
be
regi
ster
ed in
the
nam
e of
Com
pany
. (4
) A
dditi
ons
Incl
ude
` 53
.31
mill
ion
tow
ards
adj
ustm
ent o
f For
eign
Exc
hang
e Lo
ss (R
efer
Not
e 17
of S
ched
ule
“N”)
. (5
) C
apita
l Res
earc
h an
d D
evel
opm
ent E
xpen
ditu
re a
ggre
gatin
g to
` 5
06.2
4 m
illio
n in
curr
ed d
urin
g th
e ye
ar in
clud
ed in
add
ition
s to
fixe
d as
sets
/cap
ital w
ork
in p
rogr
ess.
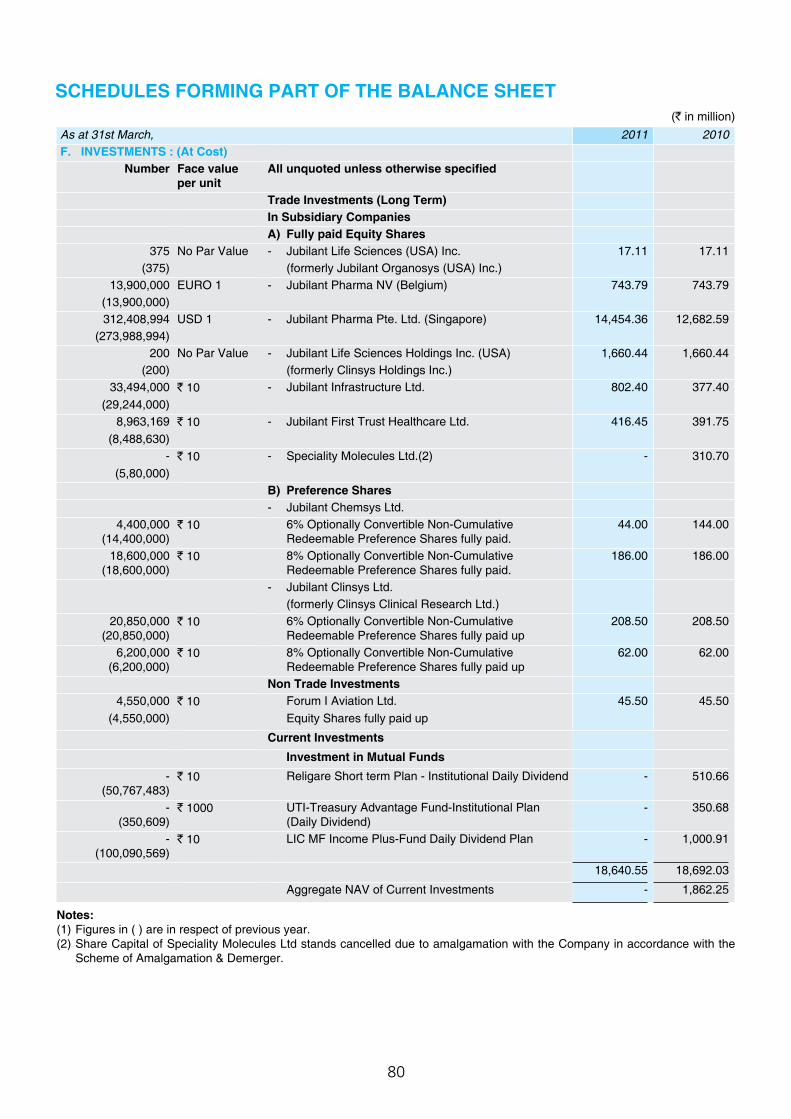
80
SCHEDULES FORMING PART OF THE BALANCE SHEET(` in million)
As at 31st March, 2011 2010F. INVESTMENTS : (At Cost)
Number Face value per unit
All unquoted unless otherwise specified
Trade Investments (Long Term)In Subsidiary CompaniesA) Fully paid Equity Shares
375 No Par Value - Jubilant Life Sciences (USA) Inc. 17.11 17.11 (375) (formerly Jubilant Organosys (USA) Inc.)
13,900,000 EURO 1 - Jubilant Pharma NV (Belgium) 743.79 743.79 (13,900,000)312,408,994 USD 1 - Jubilant Pharma Pte. Ltd. (Singapore) 14,454.36 12,682.59
(273,988,994)200 No Par Value - Jubilant Life Sciences Holdings Inc. (USA) 1,660.44 1,660.44
(200) (formerly Clinsys Holdings Inc.)33,494,000 ` 10 - Jubilant Infrastructure Ltd. 802.40 377.40
(29,244,000)8,963,169 ` 10 - Jubilant First Trust Healthcare Ltd. 416.45 391.75
(8,488,630)- ` 10 - Speciality Molecules Ltd.(2) - 310.70
(5,80,000)B) Preference Shares - Jubilant Chemsys Ltd.
4,400,000 (14,400,000)
` 10 6% Optionally Convertible Non-Cumulative Redeemable Preference Shares fully paid.
44.00 144.00
18,600,000 (18,600,000)
` 10 8% Optionally Convertible Non-Cumulative Redeemable Preference Shares fully paid.
186.00 186.00
- Jubilant Clinsys Ltd.(formerly Clinsys Clinical Research Ltd.)
20,850,000 (20,850,000)
` 10 6% Optionally Convertible Non-Cumulative Redeemable Preference Shares fully paid up
208.50 208.50
6,200,000 (6,200,000)
` 10 8% Optionally Convertible Non-Cumulative Redeemable Preference Shares fully paid up
62.00 62.00
Non Trade Investments4,550,000 ` 10 Forum I Aviation Ltd. 45.50 45.50
(4,550,000) Equity Shares fully paid up
Current InvestmentsInvestment in Mutual Funds
- (50,767,483)
` 10 Religare Short term Plan - Institutional Daily Dividend - 510.66
- (350,609)
` 1000 UTI-Treasury Advantage Fund-Institutional Plan (Daily Dividend)
- 350.68
- (100,090,569)
` 10 LIC MF Income Plus-Fund Daily Dividend Plan - 1,000.91
18,640.55 18,692.03
Aggregate NAV of Current Investments - 1,862.25
Notes: (1) Figures in ( ) are in respect of previous year.(2) Share Capital of Speciality Molecules Ltd stands cancelled due to amalgamation with the Company in accordance with the
Scheme of Amalgamation & Demerger.
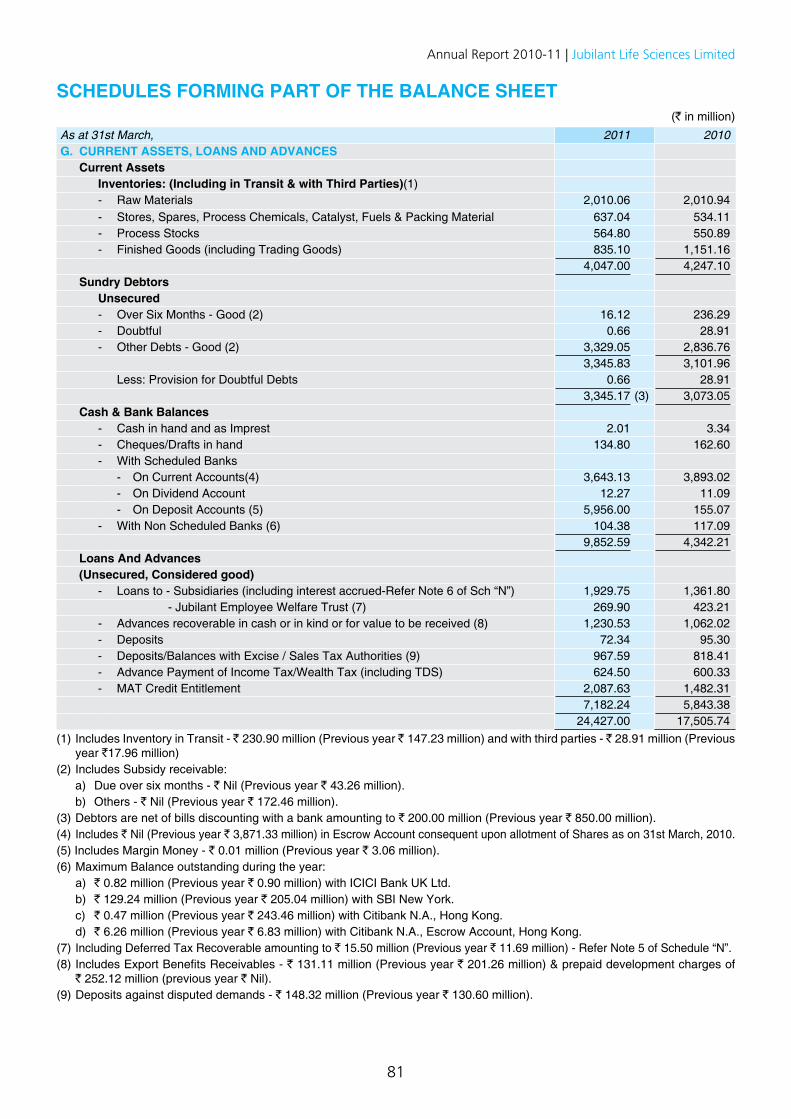
81
Annual Report 2010-11 | Jubilant Life Sciences Limited
SCHEDULES FORMING PART OF THE BALANCE SHEET(` in million)
As at 31st March, 2011 2010G. CURRENT ASSETS, LOANS AND ADVANCES
Current AssetsInventories: (Including in Transit & with Third Parties)(1)- Raw Materials 2,010.06 2,010.94 - Stores, Spares, Process Chemicals, Catalyst, Fuels & Packing Material 637.04 534.11 - Process Stocks 564.80 550.89 - Finished Goods (including Trading Goods) 835.10 1,151.16
4,047.00 4,247.10 Sundry Debtors
Unsecured- Over Six Months - Good (2) 16.12 236.29 - Doubtful 0.66 28.91 - Other Debts - Good (2) 3,329.05 2,836.76
3,345.83 3,101.96 Less: Provision for Doubtful Debts 0.66 28.91
3,345.17 (3) 3,073.05 Cash & Bank Balances
- Cash in hand and as Imprest 2.01 3.34 - Cheques/Drafts in hand 134.80 162.60 - With Scheduled Banks
- On Current Accounts(4) 3,643.13 3,893.02 - On Dividend Account 12.27 11.09 - On Deposit Accounts (5) 5,956.00 155.07
- With Non Scheduled Banks (6) 104.38 117.09 9,852.59 4,342.21
Loans And Advances(Unsecured, Considered good)
- Loans to - Subsidiaries (including interest accrued-Refer Note 6 of Sch “N”) 1,929.75 1,361.80 - Jubilant Employee Welfare Trust (7) 269.90 423.21
- Advances recoverable in cash or in kind or for value to be received (8) 1,230.53 1,062.02 - Deposits 72.34 95.30 - Deposits/Balances with Excise / Sales Tax Authorities (9) 967.59 818.41 - Advance Payment of Income Tax/Wealth Tax (including TDS) 624.50 600.33 - MAT Credit Entitlement 2,087.63 1,482.31
7,182.24 5,843.38 24,427.00 17,505.74
(1) Includes Inventory in Transit - ` 230.90 million (Previous year ` 147.23 million) and with third parties - ` 28.91 million (Previous year `17.96 million)
(2) Includes Subsidy receivable: a) Due over six months - ` Nil (Previous year ` 43.26 million). b) Others - ` Nil (Previous year ` 172.46 million).(3) Debtors are net of bills discounting with a bank amounting to ` 200.00 million (Previous year ` 850.00 million).(4) Includes ` Nil (Previous year ` 3,871.33 million) in Escrow Account consequent upon allotment of Shares as on 31st March, 2010.(5) Includes Margin Money - ` 0.01 million (Previous year ` 3.06 million).(6) Maximum Balance outstanding during the year: a) ` 0.82 million (Previous year ` 0.90 million) with ICICI Bank UK Ltd. b) ` 129.24 million (Previous year ` 205.04 million) with SBI New York. c) ` 0.47 million (Previous year ` 243.46 million) with Citibank N.A., Hong Kong. d) ` 6.26 million (Previous year ` 6.83 million) with Citibank N.A., Escrow Account, Hong Kong.(7) Including Deferred Tax Recoverable amounting to ` 15.50 million (Previous year ` 11.69 million) - Refer Note 5 of Schedule “N”.(8) Includes Export Benefits Receivables - ` 131.11 million (Previous year ` 201.26 million) & prepaid development charges of
` 252.12 million (previous year ` Nil).(9) Deposits against disputed demands - ` 148.32 million (Previous year ` 130.60 million).
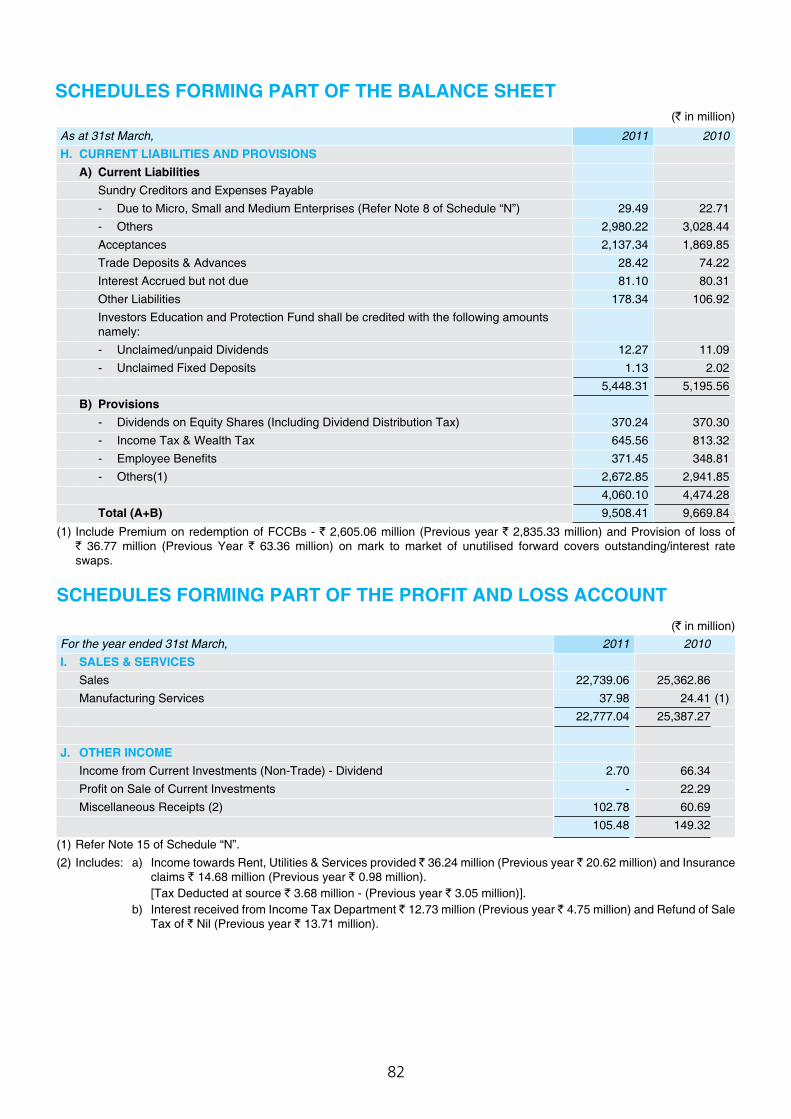
82
(` in million)
SCHEDULES FORMING PART OF THE BALANCE SHEET
As at 31st March, 2011 2010H. CURRENT LIABILITIES AND PROVISIONS
A) Current LiabilitiesSundry Creditors and Expenses Payable- Due to Micro, Small and Medium Enterprises (Refer Note 8 of Schedule “N”) 29.49 22.71 - Others 2,980.22 3,028.44 Acceptances 2,137.34 1,869.85 Trade Deposits & Advances 28.42 74.22 Interest Accrued but not due 81.10 80.31 Other Liabilities 178.34 106.92 Investors Education and Protection Fund shall be credited with the following amounts namely:- Unclaimed/unpaid Dividends 12.27 11.09 - Unclaimed Fixed Deposits 1.13 2.02
5,448.31 5,195.56 B) Provisions
- Dividends on Equity Shares (Including Dividend Distribution Tax) 370.24 370.30 - Income Tax & Wealth Tax 645.56 813.32 - Employee Benefits 371.45 348.81 - Others(1) 2,672.85 2,941.85
4,060.10 4,474.28 Total (A+B) 9,508.41 9,669.84
(1) Include Premium on redemption of FCCBs - ` 2,605.06 million (Previous year ` 2,835.33 million) and Provision of loss of ` 36.77 million (Previous Year ` 63.36 million) on mark to market of unutilised forward covers outstanding/interest rate swaps.
SCHEDULES FORMING PART OF THE PROFIT AND LOSS ACCOUNT (` in million)For the year ended 31st March, 2011 2010I. SALES & SERVICES
Sales 22,739.06 25,362.86 Manufacturing Services 37.98 24.41 (1)
22,777.04 25,387.27
J. OTHER INCOMEIncome from Current Investments (Non-Trade) - Dividend 2.70 66.34 Profit on Sale of Current Investments - 22.29 Miscellaneous Receipts (2) 102.78 60.69
105.48 149.32
(1) Refer Note 15 of Schedule “N”. (2) Includes: a) Income towards Rent, Utilities & Services provided ` 36.24 million (Previous year ` 20.62 million) and Insurance
claims ` 14.68 million (Previous year ` 0.98 million). [Tax Deducted at source ` 3.68 million - (Previous year ` 3.05 million)]. b) Interest received from Income Tax Department ` 12.73 million (Previous year ` 4.75 million) and Refund of Sale
Tax of ` Nil (Previous year ` 13.71 million).

83
Annual Report 2010-11 | Jubilant Life Sciences Limited
SCHEDULES FORMING PART OF THE PROFIT AND LOSS ACCOUNT(` in million)
For the year ended 31st March, 2011 2010K. INCREASE/(DECREASE) IN STOCKS
Stock at close - Process 564.80 550.89 Stock at close - Finished 835.10 1,151.16
1,399.90 1,702.05 Stock at commencement - Process 550.89 498.43 Stock at commencement - Finished 1,151.16 1,017.14
1,702.05 1,515.57 Increase/ (Decrease) in Stocks (302.15) 186.48 Less: Adjustment on account of scheme of Amalgamation & Demerger 615.22 - Less: (Increase)/Decrease of Finished & Process Stock of IMFL Business - (21.93)(Refer Note 15 of Schedule “N”) 313.07 164.55
(` in million)For the year ended 31st March, 2011 2010L. MANUFACTURING AND OTHER EXPENSES
Purchases - Traded Goods 2,163.65 1,753.12 Raw & Process Materials Consumed 9,014.25 10,534.36 Power and Fuel 2,066.54 1,994.59 Excise Duty (3) (3.09) (8.17)Stores, Spares, Chemicals, Catalyst & Packing Materials Consumed 942.39 1,160.84 Processing Charges 167.73 185.23 Repairs - Plant & Machinery 289.27 316.07 - Buildings 35.58 30.78 Salaries, Wages, Bonus, Gratuity & Allowances 1,511.89 1,551.78 Contribution to Provident & Superannuation Fund 110.98 99.81 Staff Welfare Expenses 108.88 108.43
Rent [Net of recoveries - ` 1.97 million (PY - ` 0.91 million)] 73.25 69.94
Rates & Taxes 19.58 25.53
Insurance [Net of recoveries - ` 12.27 million (PY - ` 10.42 million)] 42.21 58.02
Advertisement, Publicity & Sales Promotion 65.64 73.46 Traveling & Other Incidental Expenses 196.89 178.15 Office Maintenance 101.28 101.27 Vehicle Running & Maintenance 19.39 37.93 Printing & Stationery 22.15 23.52 Communication Expenses 38.77 41.95 Staff Recruitment & Training 57.37 31.99 Donation(4) 28.00 57.09 Auditors Remuneration - As Auditors 1.84 1.70
- For Tax Audit 0.40 0.36 - For Certification/Limited Review 0.98 0.65 - Out of Pocket Expenses 0.35 0.31
Legal, Professional & Consultancy Charges 143.22 96.91 Freight & Forwarding (including Ocean freight) 307.10 458.73Amortisation/write off - (VRS Expenses) - 3.29 Directors’ Sitting Fees 0.71 0.69 Directors’ Commission 38.81 60.85 Miscellaneous Expenses 32.30 28.94
Financial Charges includes Foreign Exchange Fluctuation Loss of ` 113.73 million (PY net gain of ` 1,060.28 million) and Bank Charges
167.23 (982.80)
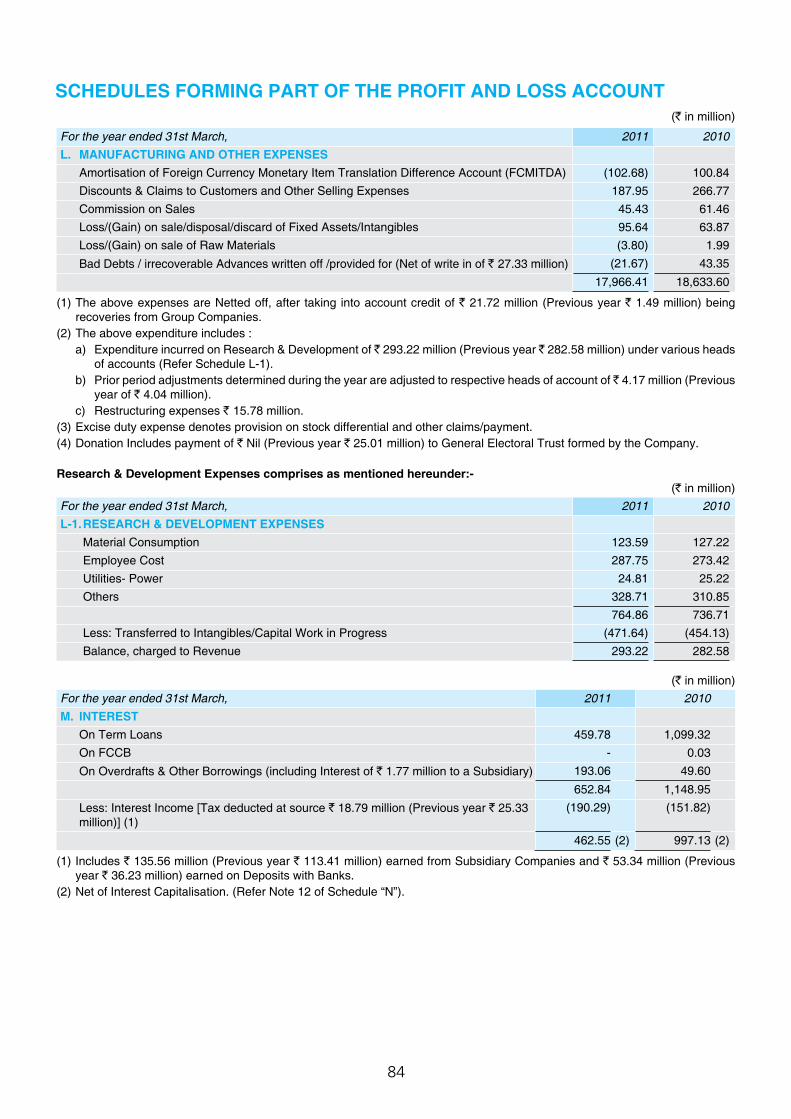
84
(` in million)
SCHEDULES FORMING PART OF THE PROFIT AND LOSS ACCOUNT
For the year ended 31st March, 2011 2010L. MANUFACTURING AND OTHER EXPENSES
Amortisation of Foreign Currency Monetary Item Translation Difference Account (FCMITDA) (102.68) 100.84 Discounts & Claims to Customers and Other Selling Expenses 187.95 266.77 Commission on Sales 45.43 61.46 Loss/(Gain) on sale/disposal/discard of Fixed Assets/Intangibles 95.64 63.87 Loss/(Gain) on sale of Raw Materials (3.80) 1.99
Bad Debts / irrecoverable Advances written off /provided for (Net of write in of ` 27.33 million) (21.67) 43.35
17,966.41 18,633.60
(1) The above expenses are Netted off, after taking into account credit of ` 21.72 million (Previous year ` 1.49 million) being recoveries from Group Companies.
(2) The above expenditure includes : a) Expenditure incurred on Research & Development of ` 293.22 million (Previous year ` 282.58 million) under various heads
of accounts (Refer Schedule L-1). b) Prior period adjustments determined during the year are adjusted to respective heads of account of ̀ 4.17 million (Previous
year of ` 4.04 million). c) Restructuring expenses ` 15.78 million.(3) Excise duty expense denotes provision on stock differential and other claims/payment.(4) Donation Includes payment of ` Nil (Previous year ` 25.01 million) to General Electoral Trust formed by the Company.
Research & Development Expenses comprises as mentioned hereunder:-(` in million)
For the year ended 31st March, 2011 2010L-1.RESEARCH & DEVELOPMENT EXPENSES
Material Consumption 123.59 127.22 Employee Cost 287.75 273.42 Utilities- Power 24.81 25.22 Others 328.71 310.85
764.86 736.71 Less: Transferred to Intangibles/Capital Work in Progress (471.64) (454.13)Balance, charged to Revenue 293.22 282.58
(` in million)
For the year ended 31st March, 2011 2010M. INTEREST
On Term Loans 459.78 1,099.32 On FCCB - 0.03
On Overdrafts & Other Borrowings (including Interest of ` 1.77 million to a Subsidiary) 193.06 49.60
652.84 1,148.95
Less: Interest Income [Tax deducted at source ` 18.79 million (Previous year ` 25.33 million)] (1)
(190.29) (151.82)
462.55 (2) 997.13 (2)
(1) Includes ` 135.56 million (Previous year ` 113.41 million) earned from Subsidiary Companies and ` 53.34 million (Previous year ` 36.23 million) earned on Deposits with Banks.
(2) Net of Interest Capitalisation. (Refer Note 12 of Schedule “N”).
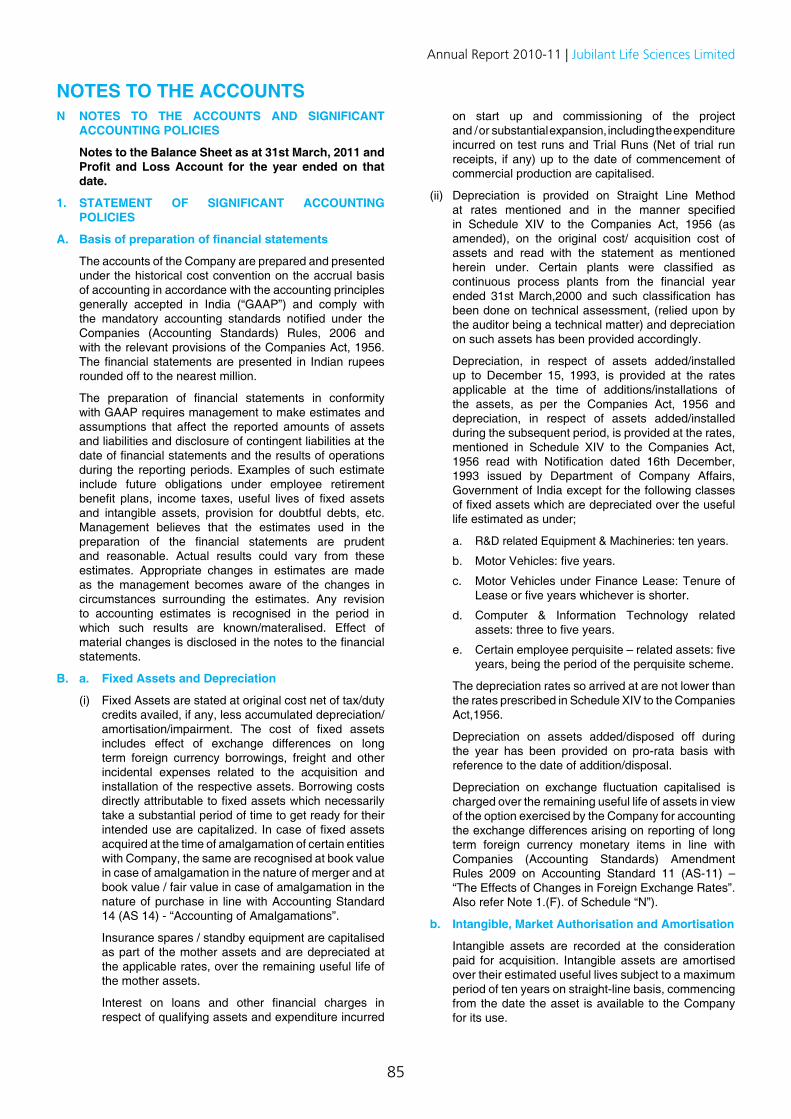
85
Annual Report 2010-11 | Jubilant Life Sciences Limited
NOTES TO THE ACCOUNTSN NOTES TO THE ACCOUNTS AND SIGNIFICANT
ACCOUNTING POLICIES
Notes to the Balance Sheet as at 31st March, 2011 and Profit and Loss Account for the year ended on that date.
1. STATEMENT OF SIGNIFICANT ACCOUNTING POLICIES
A. Basis of preparation of financial statements
The accounts of the Company are prepared and presented under the historical cost convention on the accrual basis of accounting in accordance with the accounting principles generally accepted in India (“GAAP”) and comply with the mandatory accounting standards notified under the Companies (Accounting Standards) Rules, 2006 and with the relevant provisions of the Companies Act, 1956. The financial statements are presented in Indian rupees rounded off to the nearest million.
The preparation of financial statements in conformity with GAAP requires management to make estimates and assumptions that affect the reported amounts of assets and liabilities and disclosure of contingent liabilities at the date of financial statements and the results of operations during the reporting periods. Examples of such estimate include future obligations under employee retirement benefit plans, income taxes, useful lives of fixed assets and intangible assets, provision for doubtful debts, etc. Management believes that the estimates used in the preparation of the financial statements are prudent and reasonable. Actual results could vary from these estimates. Appropriate changes in estimates are made as the management becomes aware of the changes in circumstances surrounding the estimates. Any revision to accounting estimates is recognised in the period in which such results are known/materalised. Effect of material changes is disclosed in the notes to the financial statements.
B. a. Fixed Assets and Depreciation
(i) Fixed Assets are stated at original cost net of tax/duty credits availed, if any, less accumulated depreciation/amortisation/impairment. The cost of fixed assets includes effect of exchange differences on long term foreign currency borrowings, freight and other incidental expenses related to the acquisition and installation of the respective assets. Borrowing costs directly attributable to fixed assets which necessarily take a substantial period of time to get ready for their intended use are capitalized. In case of fixed assets acquired at the time of amalgamation of certain entities with Company, the same are recognised at book value in case of amalgamation in the nature of merger and at book value / fair value in case of amalgamation in the nature of purchase in line with Accounting Standard 14 (AS 14) - “Accounting of Amalgamations”.
Insurance spares / standby equipment are capitalised as part of the mother assets and are depreciated at the applicable rates, over the remaining useful life of the mother assets.
Interest on loans and other financial charges in respect of qualifying assets and expenditure incurred
on start up and commissioning of the project and / or substantial expansion, including the expenditure incurred on test runs and Trial Runs (Net of trial run receipts, if any) up to the date of commencement of commercial production are capitalised.
(ii) Depreciation is provided on Straight Line Method at rates mentioned and in the manner specified in Schedule XIV to the Companies Act, 1956 (as amended), on the original cost/ acquisition cost of assets and read with the statement as mentioned herein under. Certain plants were classified as continuous process plants from the financial year ended 31st March,2000 and such classification has been done on technical assessment, (relied upon by the auditor being a technical matter) and depreciation on such assets has been provided accordingly.
Depreciation, in respect of assets added/installed up to December 15, 1993, is provided at the rates applicable at the time of additions/installations of the assets, as per the Companies Act, 1956 and depreciation, in respect of assets added/installed during the subsequent period, is provided at the rates, mentioned in Schedule XIV to the Companies Act, 1956 read with Notification dated 16th December, 1993 issued by Department of Company Affairs, Government of India except for the following classes of fixed assets which are depreciated over the useful life estimated as under;
a. R&D related Equipment & Machineries: ten years.
b. Motor Vehicles: five years.
c. Motor Vehicles under Finance Lease: Tenure of Lease or five years whichever is shorter.
d. Computer & Information Technology related assets: three to five years.
e. Certain employee perquisite – related assets: five years, being the period of the perquisite scheme.
The depreciation rates so arrived at are not lower than the rates prescribed in Schedule XIV to the Companies Act,1956.
Depreciation on assets added/disposed off during the year has been provided on pro-rata basis with reference to the date of addition/disposal.
Depreciation on exchange fluctuation capitalised is charged over the remaining useful life of assets in view of the option exercised by the Company for accounting the exchange differences arising on reporting of long term foreign currency monetary items in line with Companies (Accounting Standards) Amendment Rules 2009 on Accounting Standard 11 (AS-11) – “The Effects of Changes in Foreign Exchange Rates”. Also refer Note 1.(F). of Schedule “N”).
b. Intangible, Market Authorisation and Amortisation
Intangible assets are recorded at the consideration paid for acquisition. Intangible assets are amortised over their estimated useful lives subject to a maximum period of ten years on straight-line basis, commencing from the date the asset is available to the Company for its use.
86
NOTES TO THE ACCOUNTS Cost incurred for product development leading to
Market Authorisations are recognised as intangible assets when it is probable that the future economic benefits that are attributable to the asset will flow to the enterprise and the cost of the asset can be measured reliably. Such intangible assets are amortised on a straight-line basis over a period of five years from the date of regulatory approval and the product going off-patent. Subsequent expenditures on development of such products are added to the cost of intangibles when it is probable that the expenditure will enable the asset to generate future economic benefits in excess of its originally assessed standard of performance and the expenditure can be measured and attributed to the asset reliably.
Expenditure for acquisition and implementation of Software systems is recognised as part of the intangible assets and amortised on straight-line basis over a period of five years being the useful life of the software systems.
c. Leased Assets
(i) Long term leasehold land is capitalised and is not amortised in view of the long term tenure of the un-expired lease period/option of conversion to freehold at the expiry of the lease tenure.
(ii) Other leased assets:
a) Assets acquired under finance lease are capitalized at the inception of the lease at lower of their fair value and the present value of the minimum lease payment in line with the Accounting Standard 19(AS-19)-“Leases” .
b) In respect of operating leases, lease rentals are charged to Profit and Loss Account.
C. Valuation of Inventories
Inventories are valued at lower of cost or net realisable value except scrap, which is valued at net estimated realisable value.
The methods of determining cost of various categories of inventories are as follows:
Raw materials Weighted average methodStores and spares Weighted average methodWork-in-process and finished goods (manufactured)
Variable Cost at weighted average including an appropriate share of variable and fixed production overheads. Fixed production overheads are included based on normal capacity of production facilities.
Finished goods (traded)
Actual cost of purchase
Goods in transit Actual cost of purchase
Cost includes all direct costs, cost of conversion and appropriate portion of variable and fixed production overheads and such other costs incurred as to bring the inventory to its present location and condition inclusive of excise duty wherever applicable. Cost formula used is based upon weighted average cost.
D. Investments
Long Term quoted investments (non-trade) if any, are valued at cost unless there is a decline other than temporary in their value as at the date of Balance Sheet.
Unquoted investments in subsidiaries being of long term and of strategic in nature are valued at cost and no loss is recognised for the fall, if any, in their net worth, unless the diminution in value is other than temporary. Investment in Foreign Subsidiary Companies are expressed in Indian currency at the rates prevailing on the date when the remittance for the purpose was made/ foreign currency balance lying abroad was used, as the case may be.
Current Investments are valued at Lower of cost and fair value.
E. Income Tax
Current Tax
Current tax expense is based on the provisions of Income Tax Act, 1961 and judicial interpretations thereof as at the Balance Sheet date and takes into consideration various deductions and exemptions to which the Company is entitled to as well as the reliance placed by the Company on the legal advices received by it.
Provision for current income taxes and advance taxes arising in the same jurisdiction are presented in the Balance Sheet after offsetting on an assessment year basis.
Deferred Tax
Deferred tax charge or credit reflects the tax effects of timing differences between accounting income and taxable income for the period. The deferred tax charge or credit and the corresponding deferred tax liabilities or assets are recognised using the tax rates that have been enacted or substantively enacted by the Balance Sheet date. Deferred tax assets are recognised only to the extent there is reasonable certainty that the assets can be realised in future; however, where there is unabsorbed depreciation or carry forward of losses, deferred tax assets are recognised only if there is a virtual certainty of realisation of such assets. Deferred tax assets are reviewed at each Balance Sheet date and are written-down or written-up to reflect the amount that is reasonably/virtually certain (as the case may be) to be realised. The Company offsets deferred tax assets and deferred tax liabilities relating to taxes on income levied by the same governing tax authorities.
Minimum Alternate Tax
Minimum Alternate Tax (MAT) credit is recognised as an asset only when and to the extent there is convincing evidence that the Company will pay normal income tax during the specified period. In the year in which MAT credit becomes eligible to be recognized as an asset in accordance with the recommendation contained in the Guidance Note on “Accounting for Credit Available in respect of Minimum Alternative Tax under The Income Tax Act, 1961” issued by the Institute of Chartered Accountants of India, the said asset is created by way of a credit to the Profit and Loss Account and shown as MAT Credit Entitlement. The Company reviews the same at each Balance Sheet date and writes down the carrying amount of MAT Credit Entitlement to the extent there is
87
Annual Report 2010-11 | Jubilant Life Sciences Limited
NOTES TO THE ACCOUNTSno longer convincing evidence to the effect that Company pay normal income tax during the specified period.
F. Foreign Currency Conversions/ Translation i) Initial Recognition: Foreign currency transactions are
recorded in the reporting currency, by applying to the foreign currency amount the exchange rate between the reporting currency and the foreign currency on/or closely approximating to the date of the transaction.
ii) Conversion: Foreign currency monetary items are reported using the closing rate. Non-monetary items which are carried in terms of historical cost denominated in a foreign currency, are reported using the exchange rate at the date of the transaction; and non-monetary items which are carried at fair value or other similar valuation denominated in a foreign currency are reported using the exchange rates that existed when the values were determined.
iii) Exchange Differences: The Company has opted for accounting the exchange differences arising on reporting of long term foreign currency monetary items in line with Companies (Accounting Standards) Amendment Rules 2009 on Accounting Standard 11 (AS-11) – “The Effects of Changes in Foreign Exchange Rates” notified by the Ministry of Corporate Affairs on 31st March, 2009. Accordingly the effect of exchange differences as updated on reporting date, on foreign currency borrowings of the Company is adjusted to cost of fixed assets to the extent it relates to utilisation of funds for acquisition of depreciable capital assets and the balance is accumulated in Foreign Currency Monetary Item Translation Difference Account (FCMITDA) and amortised during the balance period of such long term liability but not later than 31st March, 2011.
Exchange differences arising on the settlement of monetary items not covered above, or on reporting such monetary items of the Company at rates different from those at which they were initially recorded during the year, or reported in previous financial statements, are recognized as income or as expenses in the year in which they arise.
iv) Forward Exchange Contracts: Monetary Assets and Liabilities are restated at the rate prevailing at the period end or at the spot rate at the inception of forward contract where forward cover for specific asset/liability has been taken and in respect of such forward contracts the difference between the contract rate and the spot rate at the inception of the forward contract is recognised as income or expense in Profit & Loss Account over the life of the contract. All other outstanding forward contracts on the closing date are mark to market and resultant loss is recognised as expense in the Profit and loss Account. Mark to market gains, if any, are ignored.
G. Provisions, Contingent Liabilities and Contingent Assets
The Company recognises a provision when there is a present obligation as a result of a past event that probably requires an outflow of resources and a reliable estimate can be made of the amount of the obligation. Contingent
Liabilities are disclosed in respect of possible obligations that may arise from past events but their existence is confirmed by the occurrence or non-occurrence of one or more uncertain future events not wholly within the control of the Company. Contingent Assets are not recognised/disclosed. Provisions, Contingent Liabilities and Contingent Assets are reviewed at each Balance Sheet Date.
H. Research & Development Research costs are expensed as incurred and presented
under the natural heads of expenditure.
Development cost including regulatory cost and legal expenses leading to Market Authorisation relating to the new and improved product and/or process development is recognised as an intangible asset to the extent that it is expected that such asset will generate future economic benefits, adequate technical, financial and other resources required to complete the development and to use or sell the asset are available and the expenditure attributable to the asset during its development can be measured reliably.
I. Employee Benefits (i) Short-term employee benefits: All employee benefits
falling due wholly within twelve months of rendering the services are classified as short-term employee benefits, which include benefits like salaries, wages, short-term compensated absences, performance incentives, etc. and are recognised as expenses in the period in which the employee renders the related service.
(ii) Post-employment benefits: Post employment benefit plans are classified into defined contribution plans and defined benefits plans in line with the requirements of AS 15 on “Employee Benefits”.
a. Gratuity and Leave encashment Gratuity and leave encashment which are
defined benefits are recognised in the Profit and Loss Account based on actuarial valuation using projected unit credit method as at Balance Sheet date by an independent actuary. Actuarial gains and losses arising from the experience adjustment and change in actuarial assumption are immediately recognized in the Profit and Loss account as income or expense. The gratuity liability for certain employees of some of the units of the Company is funded with Life insurance Corporation of India.
b. Superannuation Certain employees of Company are also
participants in the superannuation plan (‘the Plan’), a defined contribution plan. Contribution made by the Company to the Plan during the year is charged to Profit and Loss Account.
c. Provident Fund
i) The Company makes contribution to the “VAM EMPLOYEES’ PROVIDENT FUND TRUST” for most of its employees in India, which is a defined benefit plan to the extent that the Company has an obligation to make good the shortfall, if any, between the
88
NOTES TO THE ACCOUNTSreturn from the investments of the trust and the notified interest rate. The Company’s obligation in this regard is determined by an independent actuary and provided for if the circumstances indicate that the Trust may not be able to generate adequate returns to cover the interest rates notified by the Government. The Company’s contribution towards Provident Fund is charged to Profit and Loss Account.
ii) For other employees, Provident Fund is deposited with Regional Provident Fund Commissioner. This is treated as defined contribution plan. Company’s contribution to the Provident Fund is charged to Profit & Loss Account.
d) Other Long Term Employee Benefits: All employee benefits (other than post-employment benefits and termination benefits) which do not fall due wholly within twelve months after the end of the period in which the employees render the related services are determined based on actuarial valuation carried out at each Balance Sheet date.
J. Borrowing Costs
Borrowing costs are recognized in the Profit & Loss Account in the period in which it is incurred, except where the cost is incurred for acquisition, construction or production of an asset that takes a substantial period of time to get ready for its intended use in which case it is capitalized upto the date the assets are ready for their intended use. Ancillary costs incurred in connection with the arrangement of borrowings are amortized over the period of such borrowings.
K. Revenue Recognition
Revenue from sale of products is recognised when the significant risks and rewards of ownership of the products have been transferred to the buyer, recovery of the consideration is probable and the amount of revenue can be measured reliably. Revenues include excise duty and are shown net of sales tax and value added tax, if any.
Revenue from contract manufacturing is recognized on a proportionate completion basis.
Refundable fees received in respect of fixed-price contracts are deferred and recognized as revenue in the period in which all contractual obligations are met and the contingency is resolved.
Dividend income is recognized when the right to receive the income is established. Income from interest on deposits, loans and interest bearing securities is recognized on time proportionate method.
Any sales for which the Company has acted as an agent without assuming the risks and rewards of ownership have been reported on a net basis.
Sale of utility is recognised on delivery of the same to the consumers and no significant uncertainty exists as to its realisation.
Export incentives/ benefits are accounted for on accrual basis and where recovery is probable.
L. Premium on Foreign Currency Convertible Bonds (FCCBs)
Premium payable on redemption of Foreign Currency Convertible Bonds (FCCBs) is charged against securities premium account over the tenure of FCCBs.
M. Segment Reporting The accounting policies adopted for segment reporting are
in line with accounting policies of the Company. Revenues, Expenses, Assets and Liabilities have been identified to segments on the basis of their relationship to operating activities of the segments (taking in account the nature of products and services and risks & rewards associated with them) and internal management information systems and the same is reviewed from time to time to realign the same to conform to the Business Units of the Company. Revenues, Expenses, Assets and Liabilities, which are common to the enterprise as a whole and are not allocable to segments on a reasonable basis, have been treated as “Common Revenues/Expenses/Assets/Liabilities”, as the case may be.
N. Earnings Per share The basic earnings per share is calculated by dividing the
net profit after tax for the year by the weighted average number of equity shares outstanding during the year. For the purpose of calculating diluted earnings per share, net profit after tax during the year and the weighted average number of shares outstanding during the year are adjusted for the effect of all dilutive potential equity shares. The dilutive potential equity shares are deemed converted as of the beginning of the year unless they have been issued at a later date. The dilutive potential equity shares are adjusted for the proceeds receivable had the shares been actually issued at fair value (i.e. average market value of the outstanding shares). Anti dilutive effect of any potential equity shares is ignored.
O. Impairment of Fixed Assets The Company assesses at each Balance Sheet date
whether there is any indication that an asset may be impaired. If any such indication exists, the Company estimates the recoverable amount of the asset. If such recoverable amount of the asset or the recoverable amount of the cash generating unit to which the assets belongs is less than the carrying amount, the carrying amount is reduced to its recoverable amount. The reduction is treated as an impairment loss and is recognised in the Profit and Loss Account.
An assessment is also done at each Balance Sheet date whether there is any indication that an impairment loss recognized for an asset in prior accounting periods may no longer exist or may have decreased. If any such indications exist, the asset’s recoverable amount is estimated. The carrying amount of the fixed asset is increased to the revised estimate of its recoverable amount but only to the extent that the increased carrying amount does not exceed the carrying amount that would have been determined had no impairment loss been recognized for the asset in previous periods. A reversal of impairment loss is recognized in the Profit & Loss Account.
89
Annual Report 2010-11 | Jubilant Life Sciences Limited
NOTES TO THE ACCOUNTSP. Employee Stock Option Schemes In accordance with the Securities and Exchange Board of
India Guidelines, in respect of the stock options granted pursuant to the Company’s Stock Option Scheme, the intrinsic value, if any, of the option being the excess of the market price, of share over the exercise price of the option, at the date of grant of option, is treated as discount and accounted for as employee compensation cost and amortised on a straight-line basis over the vesting period.
2. Capital Commitments Estimated amount of Contracts remaining to be executed
on Capital Account (Net of Advances) ` 1,021.43 million (Previous year ` 1,235.14 million) [Advances ` 83.82 million (Previous year ` 115.25 million)].
3. Contingent liabilities a) Claims/Demands for the following matters in respect
of which proceedings or appeals are pending and are not acknowledged as debts :
(` in million) As at 31st March, 2011 2010 Central Excise 50.85 32.27Customs 14.14 40.69 Sales Tax 18.36 48.82 Income Tax 214.83 189.05 Service Tax 34.13 34.62 Others 57.62 144.27
Excluding demands in respect of business transferred to Jubilant Industries Limited in terms of the scheme of demerger though the demands may be continuing in the name of the Company.
b) The Company has challenged the levy of transport fee by State of Maharashtra on consumption of rectified spirit and molasses in the Nira factory. The order of State imposing the levy was stayed by the Hon’ble Mumbai High Court on 22nd October, 2001. The Company has been advised that the levy of transport fee on rectified spirit and molasses by State is not tenable. However, the Company has deposited ` 6.28 million under protest out of the total transport fee of ` 139.45 million which is shown as deposit in the financial statements.
c) Outstanding guarantees furnished by Banks on behalf of the Company/by the Company including in respect of Letters of Credits is ` 2,197.90 million (Previous year ` 2,605.60 million).
d) Liability in respect of Bills discounted with Banks is ` 200 million (Previous year ` 850 million).
e) The Company has given Corporate Guarantee on behalf of its subsidiaries, HSL Holdings Inc. & Draxis Pharma Inc. to ICICI Bank UK. PLC. & ICICI Bank, Canada for USD 50 million - effective guarantee as at 31st March, 2011 USD 18.75 million (Previous year USD 31.25 million) and USD 50.21 million respectively - total effective guarantee equivalent to ` 3,075.31 million (Previous year ` 3,657.59 million), to secure financial facility granted by them.
f) Exports obligation undertaken by the Company under EPCG scheme to be completed over a period of five/
eight years on account of import of Capital Goods at concessional import duty and remaining outstanding is ` 434.05 million (Previous year ` 434.05 million). Similarly Export obligation under Advance License Scheme/DFIA scheme on duty free import of specific raw materials, remaining outstanding is ` 2,363.44 million (Previous year ` 1,011.82 million).
g) The Company has challenged before the Hon’ble Allahabad High Court, the increase in denaturing fee by the State of Uttar Pradesh w.e.f 1st April, 2004 on denaturing of rectified spirit in the Gajraula factory and the writ petition has been admitted by the court. The Company has deposited ` 19.19 million under protest which is shown as deposits.
h) Zila Panchayat at J.P. Nagar (in respect of the Company’s Gajraula plant) served a notice demanding a compensation of ̀ 277.40 million allegedly for, percolation of poisonous water stored in lagoons and flowing through the land of Zila Panchayat resulting in loss of crops and cattle of the farmers and for putting poisonous fly ash on national highway which caused loss to the health and damages to eyes and skin of people.
District Magistrate issued a recovery certificate along with 10% collection charges inflating the demand to ` 305.14 million. In the opinion of the Company, the Zila Panchayat has no jurisdiction in raising this demand. The demand was challenged in Hon’ble Allahabad High Court and the court stayed the demand till further orders.
i) The Company has challenged, before the Hon’ble Allahabad High Court, the levy of license fees of ̀ 2.87 million by State of Uttar Pradesh, for grant of PD-2 license for manufacture of Ethyl Alcohol for industrial use. The writ petition has been admitted and is being listed for final hearing. Though the amount has been deposited and shown as such, no provision against this has been made as the issue is covered by the earlier favorable judgment of the Hon’ble Supreme Court of India.
j) The State of Uttar Pradesh (UP) has imposed levy on import of denatured spirit into the State of Uttar Pradesh (UP). The Company has imported denatured spirit into the State of Uttar Pradesh and has challenged levy amounting to ` 90 million before Hon’ble Allahabad High Court. The writ petition has been allowed by the High Court in favour of the Company. The State of Uttar Pradesh filed a Special Leave Petition (SLP) with Hon’ble Supreme Court. The SLP has been admitted but the Hon’ble Supreme Court has declined the request of the State of Uttar Pradesh (UP) to stay the operation of High Court Order.
k) The Hon’ble Supreme Court has quashed the levy of license fee by State of Uttar Pradesh on captive consumption of denatured spirit in the Gajraula factory, and has ordered the refund of the fee paid during the period of dispute subject to condition that the amount has not been collected from the Company’s customers. Further the Court has directed the State to investigate whether the Company has collected the disputed fee from its customers to the extent bank guarantees were furnished.
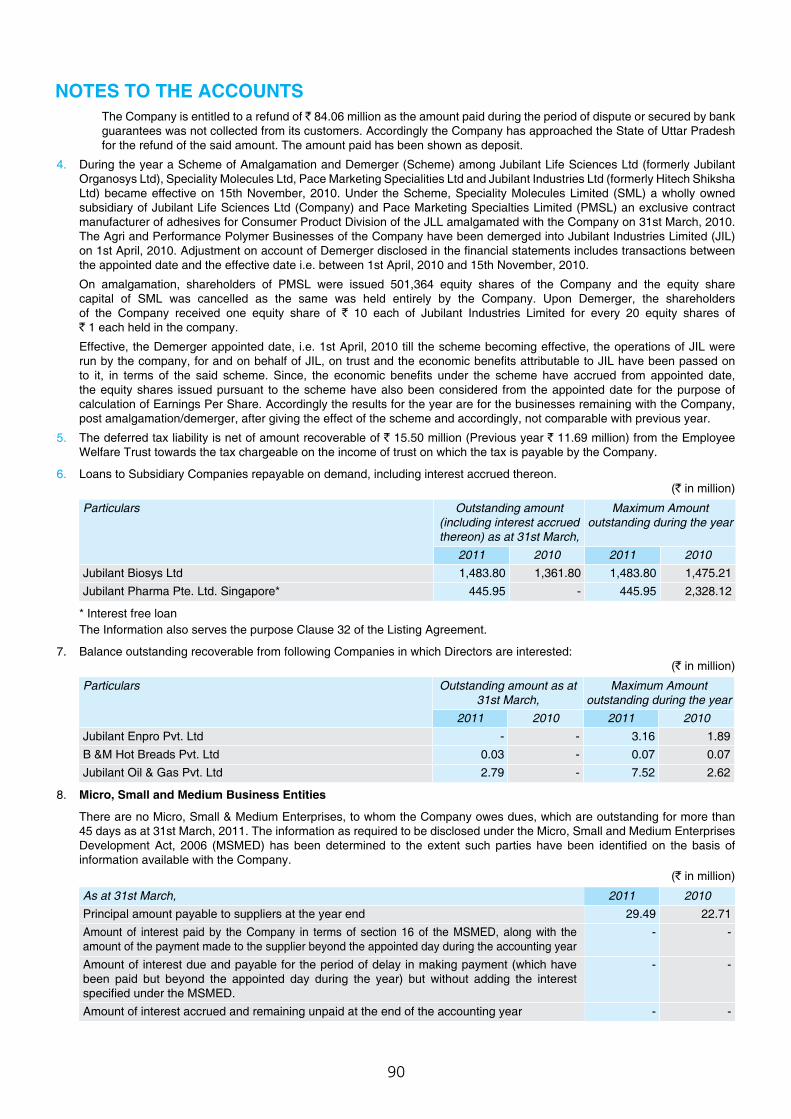
90
NOTES TO THE ACCOUNTS The Company is entitled to a refund of ` 84.06 million as the amount paid during the period of dispute or secured by bank
guarantees was not collected from its customers. Accordingly the Company has approached the State of Uttar Pradesh for the refund of the said amount. The amount paid has been shown as deposit.
4. During the year a Scheme of Amalgamation and Demerger (Scheme) among Jubilant Life Sciences Ltd (formerly Jubilant Organosys Ltd), Speciality Molecules Ltd, Pace Marketing Specialities Ltd and Jubilant Industries Ltd (formerly Hitech Shiksha Ltd) became effective on 15th November, 2010. Under the Scheme, Speciality Molecules Limited (SML) a wholly owned subsidiary of Jubilant Life Sciences Ltd (Company) and Pace Marketing Specialties Limited (PMSL) an exclusive contract manufacturer of adhesives for Consumer Product Division of the JLL amalgamated with the Company on 31st March, 2010. The Agri and Performance Polymer Businesses of the Company have been demerged into Jubilant Industries Limited (JIL) on 1st April, 2010. Adjustment on account of Demerger disclosed in the financial statements includes transactions between the appointed date and the effective date i.e. between 1st April, 2010 and 15th November, 2010.
On amalgamation, shareholders of PMSL were issued 501,364 equity shares of the Company and the equity share capital of SML was cancelled as the same was held entirely by the Company. Upon Demerger, the shareholders of the Company received one equity share of ` 10 each of Jubilant Industries Limited for every 20 equity shares of ` 1 each held in the company.
Effective, the Demerger appointed date, i.e. 1st April, 2010 till the scheme becoming effective, the operations of JIL were run by the company, for and on behalf of JIL, on trust and the economic benefits attributable to JIL have been passed on to it, in terms of the said scheme. Since, the economic benefits under the scheme have accrued from appointed date, the equity shares issued pursuant to the scheme have also been considered from the appointed date for the purpose of calculation of Earnings Per Share. Accordingly the results for the year are for the businesses remaining with the Company, post amalgamation/demerger, after giving the effect of the scheme and accordingly, not comparable with previous year.
5. The deferred tax liability is net of amount recoverable of ` 15.50 million (Previous year ` 11.69 million) from the Employee Welfare Trust towards the tax chargeable on the income of trust on which the tax is payable by the Company.
6. Loans to Subsidiary Companies repayable on demand, including interest accrued thereon. (` in million)
Particulars Outstanding amount (including interest accrued thereon) as at 31st March,
Maximum Amount outstanding during the year
2011 2010 2011 2010Jubilant Biosys Ltd 1,483.80 1,361.80 1,483.80 1,475.21Jubilant Pharma Pte. Ltd. Singapore* 445.95 - 445.95 2,328.12
* Interest free loan The Information also serves the purpose Clause 32 of the Listing Agreement.
7. Balance outstanding recoverable from following Companies in which Directors are interested: (` in million)
Particulars Outstanding amount as at 31st March,
Maximum Amount outstanding during the year
2011 2010 2011 2010Jubilant Enpro Pvt. Ltd - - 3.16 1.89B &M Hot Breads Pvt. Ltd 0.03 - 0.07 0.07Jubilant Oil & Gas Pvt. Ltd 2.79 - 7.52 2.62
8. Micro, Small and Medium Business Entities
There are no Micro, Small & Medium Enterprises, to whom the Company owes dues, which are outstanding for more than 45 days as at 31st March, 2011. The information as required to be disclosed under the Micro, Small and Medium Enterprises Development Act, 2006 (MSMED) has been determined to the extent such parties have been identified on the basis of information available with the Company.
(` in million)
As at 31st March, 2011 2010Principal amount payable to suppliers at the year end 29.49 22.71Amount of interest paid by the Company in terms of section 16 of the MSMED, along with the amount of the payment made to the supplier beyond the appointed day during the accounting year
- -
Amount of interest due and payable for the period of delay in making payment (which have been paid but beyond the appointed day during the year) but without adding the interest specified under the MSMED.
- -
Amount of interest accrued and remaining unpaid at the end of the accounting year - -
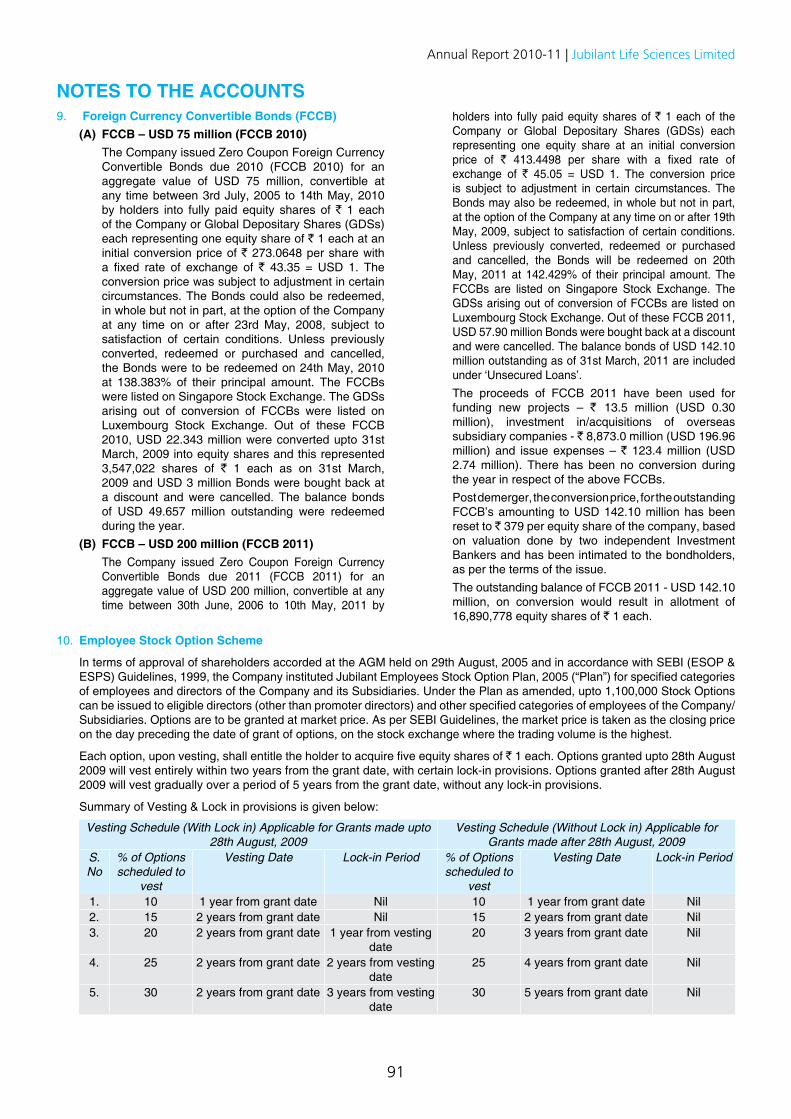
91
Annual Report 2010-11 | Jubilant Life Sciences Limited
NOTES TO THE ACCOUNTS9. Foreign Currency Convertible Bonds (FCCB) (A) FCCB – USD 75 million (FCCB 2010) The Company issued Zero Coupon Foreign Currency
Convertible Bonds due 2010 (FCCB 2010) for an aggregate value of USD 75 million, convertible at any time between 3rd July, 2005 to 14th May, 2010 by holders into fully paid equity shares of ` 1 each of the Company or Global Depositary Shares (GDSs) each representing one equity share of ` 1 each at an initial conversion price of ` 273.0648 per share with a fixed rate of exchange of ` 43.35 = USD 1. The conversion price was subject to adjustment in certain circumstances. The Bonds could also be redeemed, in whole but not in part, at the option of the Company at any time on or after 23rd May, 2008, subject to satisfaction of certain conditions. Unless previously converted, redeemed or purchased and cancelled, the Bonds were to be redeemed on 24th May, 2010 at 138.383% of their principal amount. The FCCBs were listed on Singapore Stock Exchange. The GDSs arising out of conversion of FCCBs were listed on Luxembourg Stock Exchange. Out of these FCCB 2010, USD 22.343 million were converted upto 31st March, 2009 into equity shares and this represented 3,547,022 shares of ` 1 each as on 31st March, 2009 and USD 3 million Bonds were bought back at a discount and were cancelled. The balance bonds of USD 49.657 million outstanding were redeemed during the year.
(B) FCCB – USD 200 million (FCCB 2011) The Company issued Zero Coupon Foreign Currency
Convertible Bonds due 2011 (FCCB 2011) for an aggregate value of USD 200 million, convertible at any time between 30th June, 2006 to 10th May, 2011 by
holders into fully paid equity shares of ` 1 each of the Company or Global Depositary Shares (GDSs) each representing one equity share at an initial conversion price of ` 413.4498 per share with a fixed rate of exchange of ` 45.05 = USD 1. The conversion price is subject to adjustment in certain circumstances. The Bonds may also be redeemed, in whole but not in part, at the option of the Company at any time on or after 19th May, 2009, subject to satisfaction of certain conditions. Unless previously converted, redeemed or purchased and cancelled, the Bonds will be redeemed on 20th May, 2011 at 142.429% of their principal amount. The FCCBs are listed on Singapore Stock Exchange. The GDSs arising out of conversion of FCCBs are listed on Luxembourg Stock Exchange. Out of these FCCB 2011, USD 57.90 million Bonds were bought back at a discount and were cancelled. The balance bonds of USD 142.10 million outstanding as of 31st March, 2011 are included under ‘Unsecured Loans’.
The proceeds of FCCB 2011 have been used for funding new projects – ` 13.5 million (USD 0.30 million), investment in/acquisitions of overseas subsidiary companies - ` 8,873.0 million (USD 196.96 million) and issue expenses – ` 123.4 million (USD 2.74 million). There has been no conversion during the year in respect of the above FCCBs.
Post demerger, the conversion price, for the outstanding FCCB’s amounting to USD 142.10 million has been reset to ` 379 per equity share of the company, based on valuation done by two independent Investment Bankers and has been intimated to the bondholders, as per the terms of the issue.
The outstanding balance of FCCB 2011 - USD 142.10 million, on conversion would result in allotment of 16,890,778 equity shares of ` 1 each.
10. Employee Stock Option Scheme
In terms of approval of shareholders accorded at the AGM held on 29th August, 2005 and in accordance with SEBI (ESOP & ESPS) Guidelines, 1999, the Company instituted Jubilant Employees Stock Option Plan, 2005 (“Plan”) for specified categories of employees and directors of the Company and its Subsidiaries. Under the Plan as amended, upto 1,100,000 Stock Options can be issued to eligible directors (other than promoter directors) and other specified categories of employees of the Company/ Subsidiaries. Options are to be granted at market price. As per SEBI Guidelines, the market price is taken as the closing price on the day preceding the date of grant of options, on the stock exchange where the trading volume is the highest.
Each option, upon vesting, shall entitle the holder to acquire five equity shares of ` 1 each. Options granted upto 28th August 2009 will vest entirely within two years from the grant date, with certain lock-in provisions. Options granted after 28th August 2009 will vest gradually over a period of 5 years from the grant date, without any lock-in provisions.
Summary of Vesting & Lock in provisions is given below:
Vesting Schedule (With Lock in) Applicable for Grants made upto 28th August, 2009
Vesting Schedule (Without Lock in) Applicable for Grants made after 28th August, 2009
S. No
% of Options scheduled to
vest
Vesting Date Lock-in Period % of Options scheduled to
vest
Vesting Date Lock-in Period
1. 10 1 year from grant date Nil 10 1 year from grant date Nil2. 15 2 years from grant date Nil 15 2 years from grant date Nil3. 20 2 years from grant date 1 year from vesting
date20 3 years from grant date Nil
4. 25 2 years from grant date 2 years from vesting date
25 4 years from grant date Nil
5. 30 2 years from grant date 3 years from vesting date
30 5 years from grant date Nil
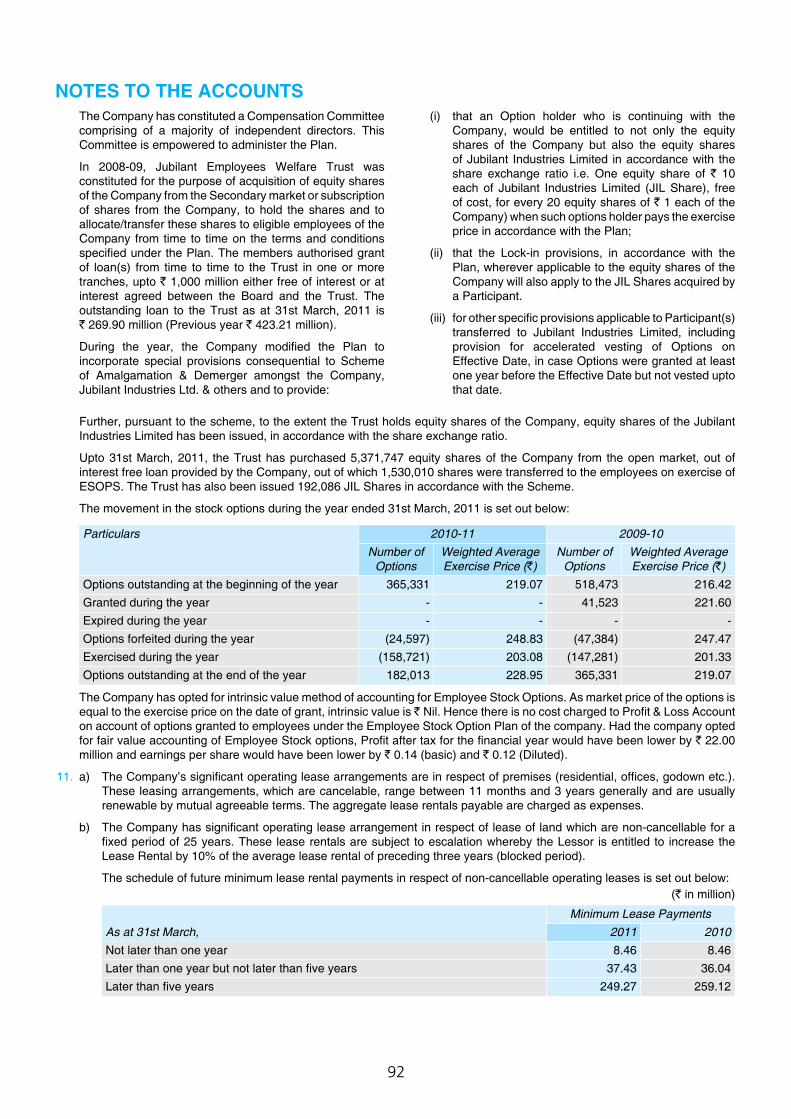
92
NOTES TO THE ACCOUNTS The Company has constituted a Compensation Committee
comprising of a majority of independent directors. This Committee is empowered to administer the Plan.
In 2008-09, Jubilant Employees Welfare Trust was constituted for the purpose of acquisition of equity shares of the Company from the Secondary market or subscription of shares from the Company, to hold the shares and to allocate/transfer these shares to eligible employees of the Company from time to time on the terms and conditions specified under the Plan. The members authorised grant of loan(s) from time to time to the Trust in one or more tranches, upto ` 1,000 million either free of interest or at interest agreed between the Board and the Trust. The outstanding loan to the Trust as at 31st March, 2011 is ` 269.90 million (Previous year ` 423.21 million).
During the year, the Company modified the Plan to incorporate special provisions consequential to Scheme of Amalgamation & Demerger amongst the Company, Jubilant Industries Ltd. & others and to provide:
(i) that an Option holder who is continuing with the Company, would be entitled to not only the equity shares of the Company but also the equity shares of Jubilant Industries Limited in accordance with the share exchange ratio i.e. One equity share of ` 10 each of Jubilant Industries Limited (JIL Share), free of cost, for every 20 equity shares of ` 1 each of the Company) when such options holder pays the exercise price in accordance with the Plan;
(ii) that the Lock-in provisions, in accordance with the Plan, wherever applicable to the equity shares of the Company will also apply to the JIL Shares acquired by a Participant.
(iii) for other specific provisions applicable to Participant(s) transferred to Jubilant Industries Limited, including provision for accelerated vesting of Options on Effective Date, in case Options were granted at least one year before the Effective Date but not vested upto that date.
Further, pursuant to the scheme, to the extent the Trust holds equity shares of the Company, equity shares of the Jubilant Industries Limited has been issued, in accordance with the share exchange ratio.
Upto 31st March, 2011, the Trust has purchased 5,371,747 equity shares of the Company from the open market, out of interest free loan provided by the Company, out of which 1,530,010 shares were transferred to the employees on exercise of ESOPS. The Trust has also been issued 192,086 JIL Shares in accordance with the Scheme.
The movement in the stock options during the year ended 31st March, 2011 is set out below:
Particulars 2010-11 2009-10Number of
OptionsWeighted Average Exercise Price (`)
Number of Options
Weighted Average Exercise Price (`)
Options outstanding at the beginning of the year 365,331 219.07 518,473 216.42Granted during the year - - 41,523 221.60Expired during the year - - - -Options forfeited during the year (24,597) 248.83 (47,384) 247.47Exercised during the year (158,721) 203.08 (147,281) 201.33Options outstanding at the end of the year 182,013 228.95 365,331 219.07
The Company has opted for intrinsic value method of accounting for Employee Stock Options. As market price of the options is equal to the exercise price on the date of grant, intrinsic value is ` Nil. Hence there is no cost charged to Profit & Loss Account on account of options granted to employees under the Employee Stock Option Plan of the company. Had the company opted for fair value accounting of Employee Stock options, Profit after tax for the financial year would have been lower by ` 22.00 million and earnings per share would have been lower by ` 0.14 (basic) and ` 0.12 (Diluted).
11. a) The Company’s significant operating lease arrangements are in respect of premises (residential, offices, godown etc.). These leasing arrangements, which are cancelable, range between 11 months and 3 years generally and are usually renewable by mutual agreeable terms. The aggregate lease rentals payable are charged as expenses.
b) The Company has significant operating lease arrangement in respect of lease of land which are non-cancellable for a fixed period of 25 years. These lease rentals are subject to escalation whereby the Lessor is entitled to increase the Lease Rental by 10% of the average lease rental of preceding three years (blocked period).
The schedule of future minimum lease rental payments in respect of non-cancellable operating leases is set out below:(` in million)
Minimum Lease PaymentsAs at 31st March, 2011 2010Not later than one year 8.46 8.46Later than one year but not later than five years 37.43 36.04Later than five years 249.27 259.12
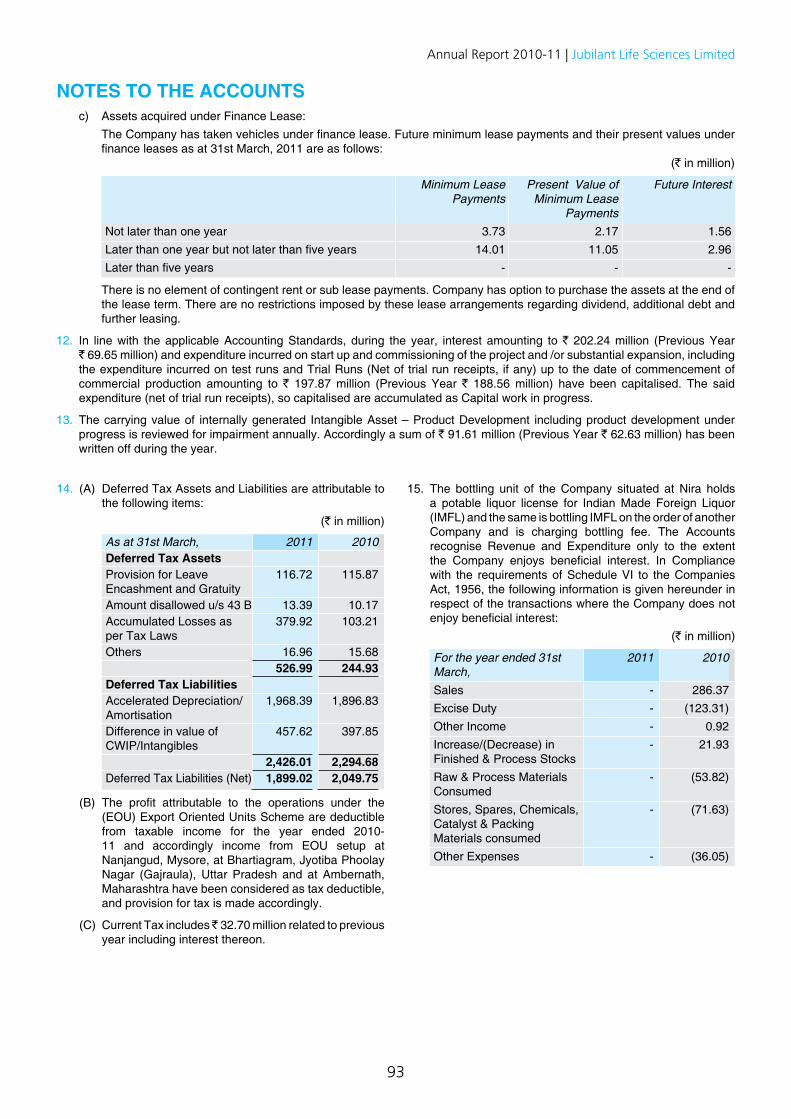
93
Annual Report 2010-11 | Jubilant Life Sciences Limited
NOTES TO THE ACCOUNTS c) Assets acquired under Finance Lease: The Company has taken vehicles under finance lease. Future minimum lease payments and their present values under
finance leases as at 31st March, 2011 are as follows:(` in million)
Minimum Lease Payments
Present Value of Minimum Lease
Payments
Future Interest
Not later than one year 3.73 2.17 1.56Later than one year but not later than five years 14.01 11.05 2.96Later than five years - - -
There is no element of contingent rent or sub lease payments. Company has option to purchase the assets at the end of the lease term. There are no restrictions imposed by these lease arrangements regarding dividend, additional debt and further leasing.
12. In line with the applicable Accounting Standards, during the year, interest amounting to ` 202.24 million (Previous Year ` 69.65 million) and expenditure incurred on start up and commissioning of the project and /or substantial expansion, including the expenditure incurred on test runs and Trial Runs (Net of trial run receipts, if any) up to the date of commencement of commercial production amounting to ` 197.87 million (Previous Year ` 188.56 million) have been capitalised. The said expenditure (net of trial run receipts), so capitalised are accumulated as Capital work in progress.
13. The carrying value of internally generated Intangible Asset – Product Development including product development under progress is reviewed for impairment annually. Accordingly a sum of ` 91.61 million (Previous Year ` 62.63 million) has been written off during the year.
14. (A) Deferred Tax Assets and Liabilities are attributable to the following items:
(` in million)
As at 31st March, 2011 2010Deferred Tax AssetsProvision for Leave Encashment and Gratuity
116.72 115.87
Amount disallowed u/s 43 B 13.39 10.17Accumulated Losses as per Tax Laws
379.92 103.21
Others 16.96 15.68526.99 244.93
Deferred Tax LiabilitiesAccelerated Depreciation/Amortisation
1,968.39 1,896.83
Difference in value of CWIP/Intangibles
457.62 397.85
2,426.01 2,294.68Deferred Tax Liabilities (Net) 1,899.02 2,049.75
(B) The profit attributable to the operations under the (EOU) Export Oriented Units Scheme are deductible from taxable income for the year ended 2010-11 and accordingly income from EOU setup at Nanjangud, Mysore, at Bhartiagram, Jyotiba Phoolay Nagar (Gajraula), Uttar Pradesh and at Ambernath, Maharashtra have been considered as tax deductible, and provision for tax is made accordingly.
(C) Current Tax includes ̀ 32.70 million related to previous year including interest thereon.
15. The bottling unit of the Company situated at Nira holds a potable liquor license for Indian Made Foreign Liquor (IMFL) and the same is bottling IMFL on the order of another Company and is charging bottling fee. The Accounts recognise Revenue and Expenditure only to the extent the Company enjoys beneficial interest. In Compliance with the requirements of Schedule VI to the Companies Act, 1956, the following information is given hereunder in respect of the transactions where the Company does not enjoy beneficial interest:
(` in million)
For the year ended 31st March,
2011 2010
Sales - 286.37Excise Duty - (123.31)Other Income - 0.92Increase/(Decrease) in Finished & Process Stocks
- 21.93
Raw & Process Materials Consumed
- (53.82)
Stores, Spares, Chemicals, Catalyst & Packing Materials consumed
- (71.63)
Other Expenses - (36.05)
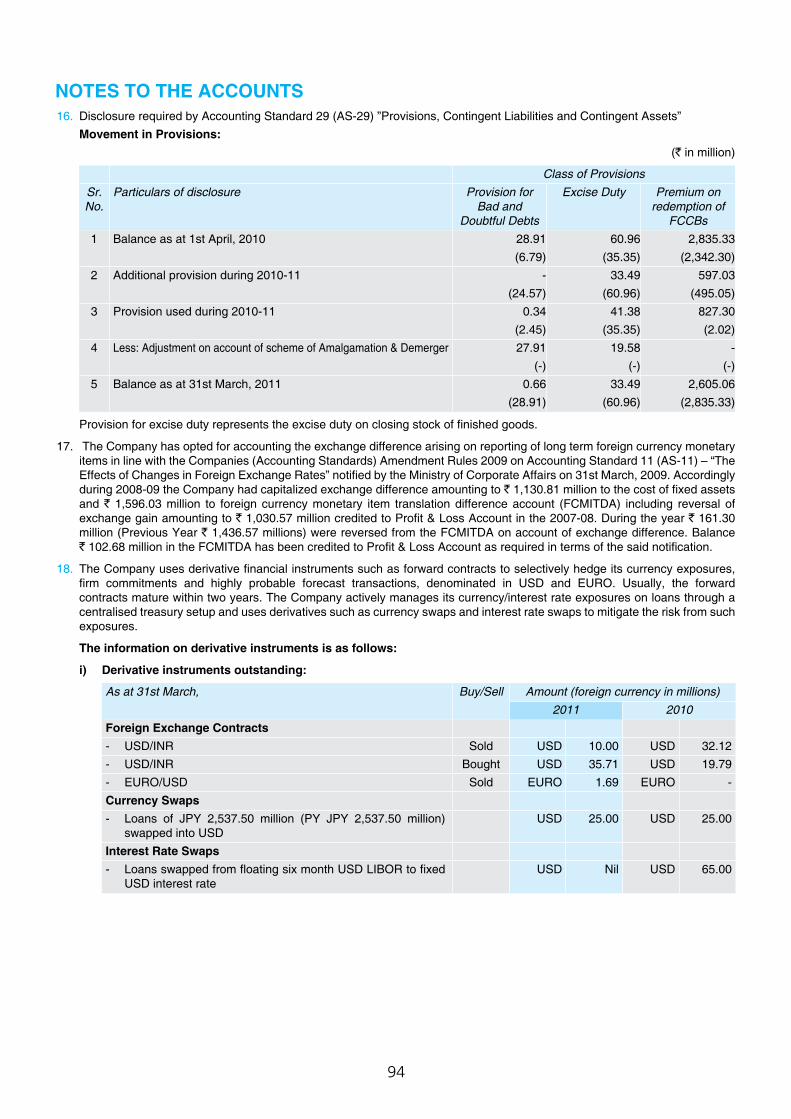
94
16. Disclosure required by Accounting Standard 29 (AS-29) ”Provisions, Contingent Liabilities and Contingent Assets” Movement in Provisions:
(` in million)
Class of ProvisionsSr. No.
Particulars of disclosure Provision for Bad and
Doubtful Debts
Excise Duty Premium on redemption of
FCCBs1 Balance as at 1st April, 2010 28.91 60.96 2,835.33
(6.79) (35.35) (2,342.30)2 Additional provision during 2010-11 - 33.49 597.03
(24.57) (60.96) (495.05)3 Provision used during 2010-11 0.34 41.38 827.30
(2.45) (35.35) (2.02)4 Less: Adjustment on account of scheme of Amalgamation & Demerger 27.91 19.58 -
(-) (-) (-)5 Balance as at 31st March, 2011 0.66 33.49 2,605.06
(28.91) (60.96) (2,835.33)
Provision for excise duty represents the excise duty on closing stock of finished goods.
17. The Company has opted for accounting the exchange difference arising on reporting of long term foreign currency monetary items in line with the Companies (Accounting Standards) Amendment Rules 2009 on Accounting Standard 11 (AS-11) – “The Effects of Changes in Foreign Exchange Rates” notified by the Ministry of Corporate Affairs on 31st March, 2009. Accordingly during 2008-09 the Company had capitalized exchange difference amounting to ` 1,130.81 million to the cost of fixed assets and ` 1,596.03 million to foreign currency monetary item translation difference account (FCMITDA) including reversal of exchange gain amounting to ` 1,030.57 million credited to Profit & Loss Account in the 2007-08. During the year ` 161.30 million (Previous Year ` 1,436.57 millions) were reversed from the FCMITDA on account of exchange difference. Balance ` 102.68 million in the FCMITDA has been credited to Profit & Loss Account as required in terms of the said notification.
18. The Company uses derivative financial instruments such as forward contracts to selectively hedge its currency exposures, firm commitments and highly probable forecast transactions, denominated in USD and EURO. Usually, the forward contracts mature within two years. The Company actively manages its currency/interest rate exposures on loans through a centralised treasury setup and uses derivatives such as currency swaps and interest rate swaps to mitigate the risk from such exposures.
The information on derivative instruments is as follows:
i) Derivative instruments outstanding:
As at 31st March, Buy/Sell Amount (foreign currency in millions)2011 2010
Foreign Exchange Contracts- USD/INR Sold USD 10.00 USD 32.12- USD/INR Bought USD 35.71 USD 19.79- EURO/USD Sold EURO 1.69 EURO -Currency Swaps- Loans of JPY 2,537.50 million (PY JPY 2,537.50 million)
swapped into USDUSD 25.00 USD 25.00
Interest Rate Swaps- Loans swapped from floating six month USD LIBOR to fixed
USD interest rateUSD Nil USD 65.00
NOTES TO THE ACCOUNTS
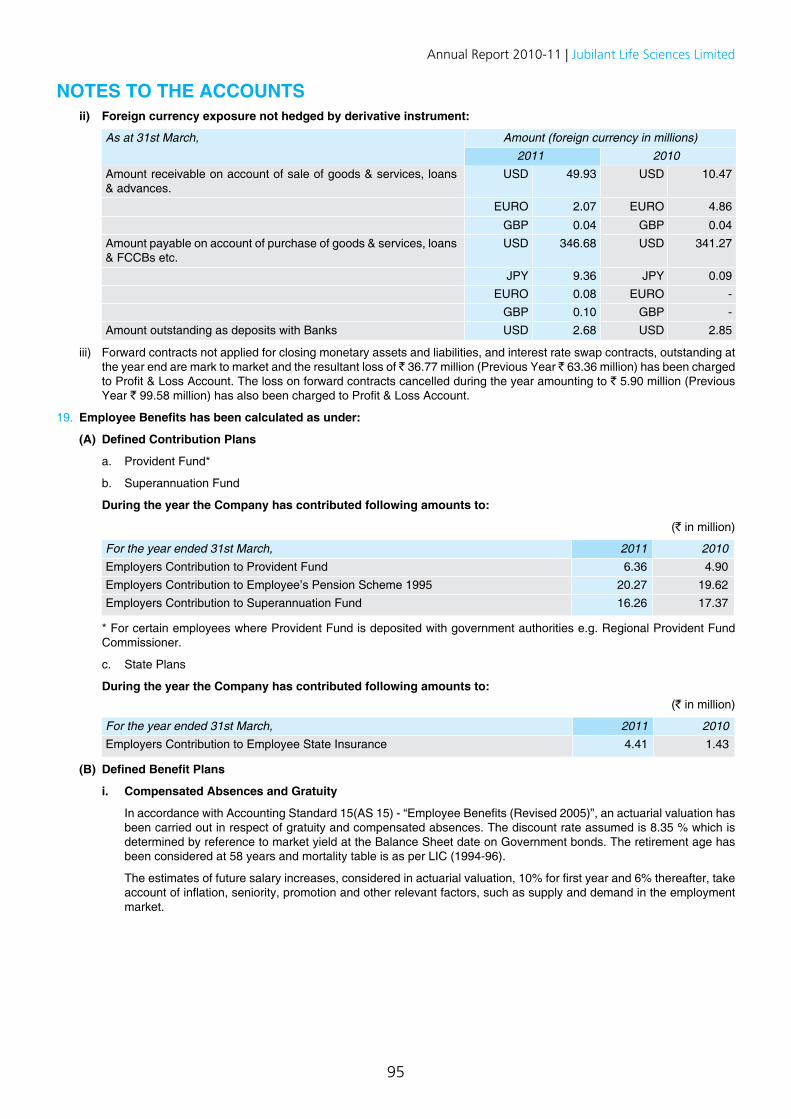
95
Annual Report 2010-11 | Jubilant Life Sciences Limited
ii) Foreign currency exposure not hedged by derivative instrument:
As at 31st March, Amount (foreign currency in millions)2011 2010
Amount receivable on account of sale of goods & services, loans & advances.
USD 49.93 USD 10.47
EURO 2.07 EURO 4.86
GBP 0.04 GBP 0.04Amount payable on account of purchase of goods & services, loans & FCCBs etc.
USD 346.68 USD 341.27
JPY 9.36 JPY 0.09EURO 0.08 EURO -
GBP 0.10 GBP -Amount outstanding as deposits with Banks USD 2.68 USD 2.85
iii) Forward contracts not applied for closing monetary assets and liabilities, and interest rate swap contracts, outstanding at the year end are mark to market and the resultant loss of ̀ 36.77 million (Previous Year ̀ 63.36 million) has been charged to Profit & Loss Account. The loss on forward contracts cancelled during the year amounting to ` 5.90 million (Previous Year ` 99.58 million) has also been charged to Profit & Loss Account.
19. Employee Benefits has been calculated as under:
(A) Defined Contribution Plans
a. Provident Fund*
b. Superannuation Fund
During the year the Company has contributed following amounts to:
(` in million)
For the year ended 31st March, 2011 2010Employers Contribution to Provident Fund 6.36 4.90Employers Contribution to Employee’s Pension Scheme 1995 20.27 19.62Employers Contribution to Superannuation Fund 16.26 17.37
* For certain employees where Provident Fund is deposited with government authorities e.g. Regional Provident Fund Commissioner.
c. State Plans
During the year the Company has contributed following amounts to: (` in million)
For the year ended 31st March, 2011 2010Employers Contribution to Employee State Insurance 4.41 1.43
(B) Defined Benefit Plans
i. Compensated Absences and Gratuity
In accordance with Accounting Standard 15(AS 15) - “Employee Benefits (Revised 2005)”, an actuarial valuation has been carried out in respect of gratuity and compensated absences. The discount rate assumed is 8.35 % which is determined by reference to market yield at the Balance Sheet date on Government bonds. The retirement age has been considered at 58 years and mortality table is as per LIC (1994-96).
The estimates of future salary increases, considered in actuarial valuation, 10% for first year and 6% thereafter, take account of inflation, seniority, promotion and other relevant factors, such as supply and demand in the employment market.
NOTES TO THE ACCOUNTS
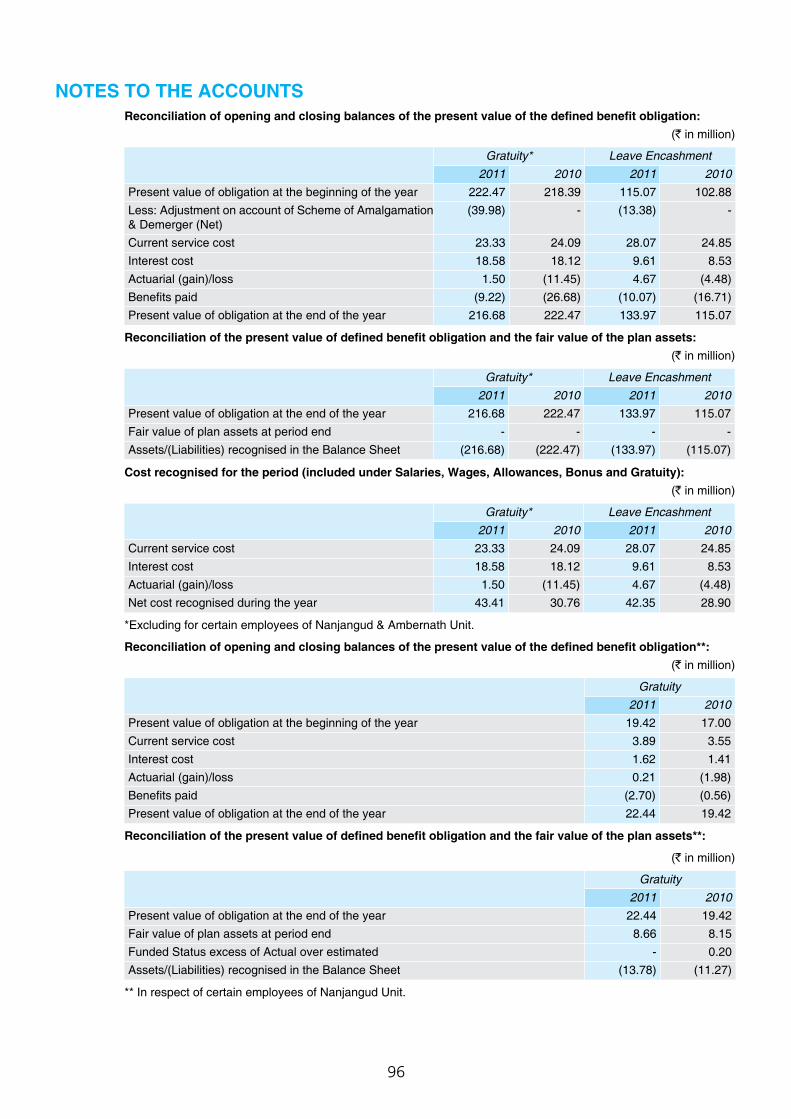
96
Reconciliation of opening and closing balances of the present value of the defined benefit obligation:(` in million)
Gratuity* Leave Encashment2011 2010 2011 2010
Present value of obligation at the beginning of the year 222.47 218.39 115.07 102.88Less: Adjustment on account of Scheme of Amalgamation & Demerger (Net)
(39.98) - (13.38) -
Current service cost 23.33 24.09 28.07 24.85Interest cost 18.58 18.12 9.61 8.53Actuarial (gain)/loss 1.50 (11.45) 4.67 (4.48)Benefits paid (9.22) (26.68) (10.07) (16.71)Present value of obligation at the end of the year 216.68 222.47 133.97 115.07
Reconciliation of the present value of defined benefit obligation and the fair value of the plan assets:(` in million)
Gratuity* Leave Encashment2011 2010 2011 2010
Present value of obligation at the end of the year 216.68 222.47 133.97 115.07Fair value of plan assets at period end - - - -Assets/(Liabilities) recognised in the Balance Sheet (216.68) (222.47) (133.97) (115.07)
Cost recognised for the period (included under Salaries, Wages, Allowances, Bonus and Gratuity):(` in million)
Gratuity* Leave Encashment2011 2010 2011 2010
Current service cost 23.33 24.09 28.07 24.85Interest cost 18.58 18.12 9.61 8.53Actuarial (gain)/loss 1.50 (11.45) 4.67 (4.48)Net cost recognised during the year 43.41 30.76 42.35 28.90
*Excluding for certain employees of Nanjangud & Ambernath Unit.
Reconciliation of opening and closing balances of the present value of the defined benefit obligation**:(` in million)
Gratuity2011 2010
Present value of obligation at the beginning of the year 19.42 17.00Current service cost 3.89 3.55Interest cost 1.62 1.41Actuarial (gain)/loss 0.21 (1.98)Benefits paid (2.70) (0.56)Present value of obligation at the end of the year 22.44 19.42
Reconciliation of the present value of defined benefit obligation and the fair value of the plan assets**:
(` in million)
Gratuity2011 2010
Present value of obligation at the end of the year 22.44 19.42Fair value of plan assets at period end 8.66 8.15Funded Status excess of Actual over estimated - 0.20Assets/(Liabilities) recognised in the Balance Sheet (13.78) (11.27)
** In respect of certain employees of Nanjangud Unit.
NOTES TO THE ACCOUNTS
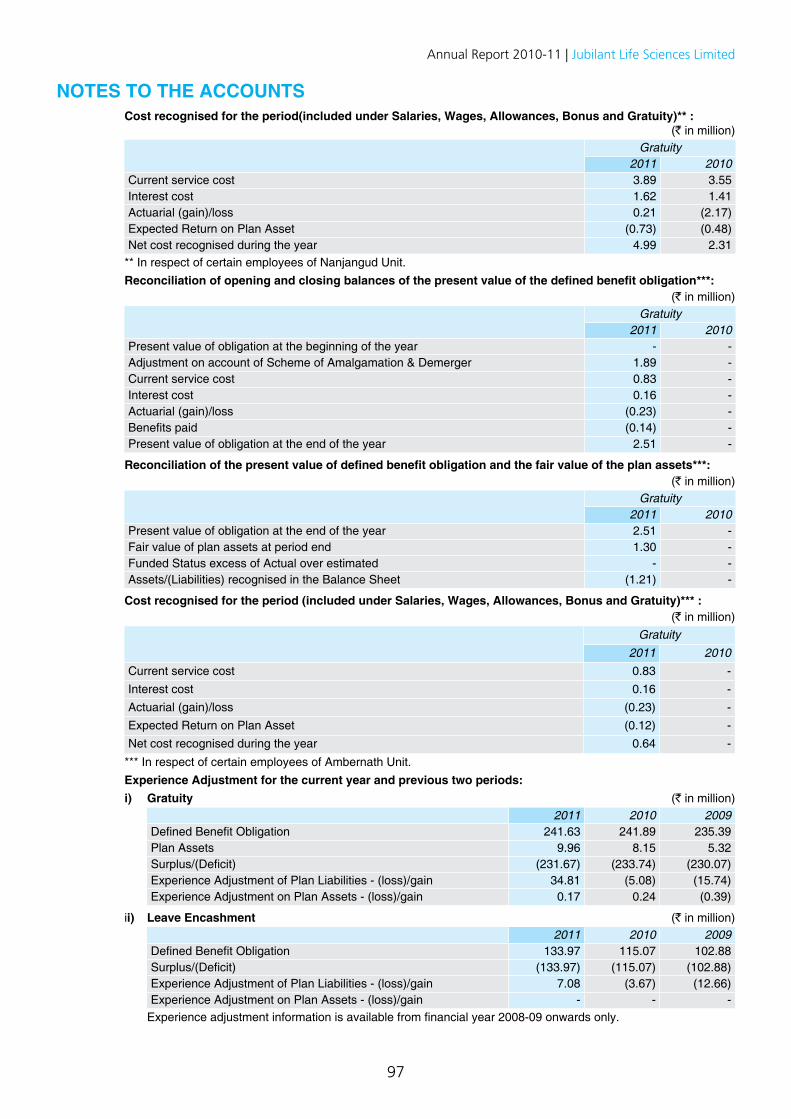
97
Annual Report 2010-11 | Jubilant Life Sciences Limited
Cost recognised for the period(included under Salaries, Wages, Allowances, Bonus and Gratuity)** :(` in million)
Gratuity2011 2010
Current service cost 3.89 3.55Interest cost 1.62 1.41Actuarial (gain)/loss 0.21 (2.17)Expected Return on Plan Asset (0.73) (0.48)Net cost recognised during the year 4.99 2.31
** In respect of certain employees of Nanjangud Unit. Reconciliation of opening and closing balances of the present value of the defined benefit obligation***:
(` in million)Gratuity
2011 2010Present value of obligation at the beginning of the year - -Adjustment on account of Scheme of Amalgamation & Demerger 1.89 -Current service cost 0.83 -Interest cost 0.16 -Actuarial (gain)/loss (0.23) -Benefits paid (0.14) -Present value of obligation at the end of the year 2.51 -
Reconciliation of the present value of defined benefit obligation and the fair value of the plan assets***:(` in million)
Gratuity2011 2010
Present value of obligation at the end of the year 2.51 -Fair value of plan assets at period end 1.30 -Funded Status excess of Actual over estimated - -Assets/(Liabilities) recognised in the Balance Sheet (1.21) -
Cost recognised for the period (included under Salaries, Wages, Allowances, Bonus and Gratuity)*** :(` in million)
Gratuity2011 2010
Current service cost 0.83 -Interest cost 0.16 -Actuarial (gain)/loss (0.23) -Expected Return on Plan Asset (0.12) -Net cost recognised during the year 0.64 -
*** In respect of certain employees of Ambernath Unit. Experience Adjustment for the current year and previous two periods: i) Gratuity (` in million)
2011 2010 2009Defined Benefit Obligation 241.63 241.89 235.39Plan Assets 9.96 8.15 5.32Surplus/(Deficit) (231.67) (233.74) (230.07)Experience Adjustment of Plan Liabilities - (loss)/gain 34.81 (5.08) (15.74)Experience Adjustment on Plan Assets - (loss)/gain 0.17 0.24 (0.39)
ii) Leave Encashment (` in million)2011 2010 2009
Defined Benefit Obligation 133.97 115.07 102.88Surplus/(Deficit) (133.97) (115.07) (102.88)Experience Adjustment of Plan Liabilities - (loss)/gain 7.08 (3.67) (12.66)Experience Adjustment on Plan Assets - (loss)/gain - - -
Experience adjustment information is available from financial year 2008-09 onwards only.
NOTES TO THE ACCOUNTS
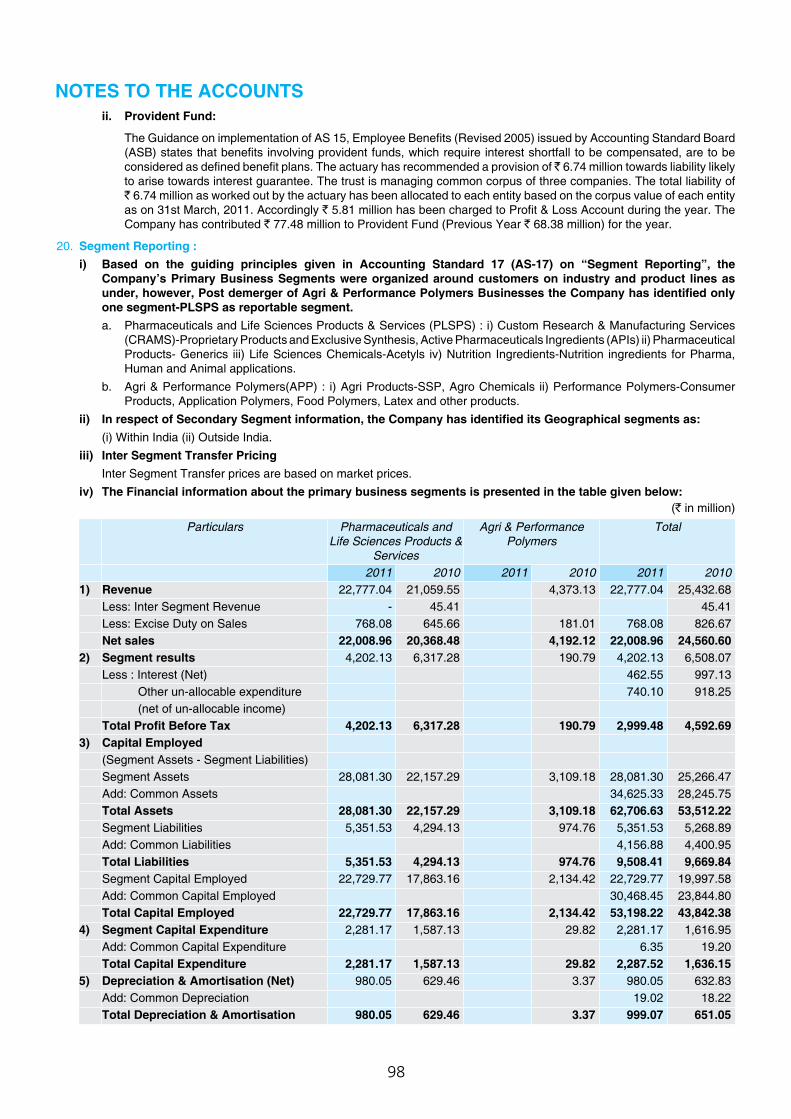
98
ii. Provident Fund:
The Guidance on implementation of AS 15, Employee Benefits (Revised 2005) issued by Accounting Standard Board (ASB) states that benefits involving provident funds, which require interest shortfall to be compensated, are to be considered as defined benefit plans. The actuary has recommended a provision of ̀ 6.74 million towards liability likely to arise towards interest guarantee. The trust is managing common corpus of three companies. The total liability of ` 6.74 million as worked out by the actuary has been allocated to each entity based on the corpus value of each entity as on 31st March, 2011. Accordingly ` 5.81 million has been charged to Profit & Loss Account during the year. The Company has contributed ` 77.48 million to Provident Fund (Previous Year ` 68.38 million) for the year.
20. Segment Reporting : i) Based on the guiding principles given in Accounting Standard 17 (AS-17) on “Segment Reporting”, the
Company’s Primary Business Segments were organized around customers on industry and product lines as under, however, Post demerger of Agri & Performance Polymers Businesses the Company has identified only one segment-PLSPS as reportable segment.
a. Pharmaceuticals and Life Sciences Products & Services (PLSPS) : i) Custom Research & Manufacturing Services (CRAMS)-Proprietary Products and Exclusive Synthesis, Active Pharmaceuticals Ingredients (APIs) ii) Pharmaceutical Products- Generics iii) Life Sciences Chemicals-Acetyls iv) Nutrition Ingredients-Nutrition ingredients for Pharma, Human and Animal applications.
b. Agri & Performance Polymers(APP) : i) Agri Products-SSP, Agro Chemicals ii) Performance Polymers-Consumer Products, Application Polymers, Food Polymers, Latex and other products.
ii) In respect of Secondary Segment information, the Company has identified its Geographical segments as: (i) Within India (ii) Outside India. iii) Inter Segment Transfer Pricing Inter Segment Transfer prices are based on market prices. iv) The Financial information about the primary business segments is presented in the table given below: (` in million)
Particulars Pharmaceuticals and Life Sciences Products &
Services
Agri & Performance Polymers
Total
2011 2010 2011 2010 2011 20101) Revenue 22,777.04 21,059.55 4,373.13 22,777.04 25,432.68
Less: Inter Segment Revenue - 45.41 45.41 Less: Excise Duty on Sales 768.08 645.66 181.01 768.08 826.67 Net sales 22,008.96 20,368.48 4,192.12 22,008.96 24,560.60
2) Segment results 4,202.13 6,317.28 190.79 4,202.13 6,508.07 Less : Interest (Net) 462.55 997.13 Other un-allocable expenditure 740.10 918.25 (net of un-allocable income)Total Profit Before Tax 4,202.13 6,317.28 190.79 2,999.48 4,592.69
3) Capital Employed(Segment Assets - Segment Liabilities)Segment Assets 28,081.30 22,157.29 3,109.18 28,081.30 25,266.47 Add: Common Assets 34,625.33 28,245.75 Total Assets 28,081.30 22,157.29 3,109.18 62,706.63 53,512.22 Segment Liabilities 5,351.53 4,294.13 974.76 5,351.53 5,268.89 Add: Common Liabilities 4,156.88 4,400.95 Total Liabilities 5,351.53 4,294.13 974.76 9,508.41 9,669.84 Segment Capital Employed 22,729.77 17,863.16 2,134.42 22,729.77 19,997.58 Add: Common Capital Employed 30,468.45 23,844.80 Total Capital Employed 22,729.77 17,863.16 2,134.42 53,198.22 43,842.38
4) Segment Capital Expenditure 2,281.17 1,587.13 29.82 2,281.17 1,616.95 Add: Common Capital Expenditure 6.35 19.20 Total Capital Expenditure 2,281.17 1,587.13 29.82 2,287.52 1,636.15
5) Depreciation & Amortisation (Net) 980.05 629.46 3.37 980.05 632.83 Add: Common Depreciation 19.02 18.22 Total Depreciation & Amortisation 980.05 629.46 3.37 999.07 651.05
NOTES TO THE ACCOUNTS
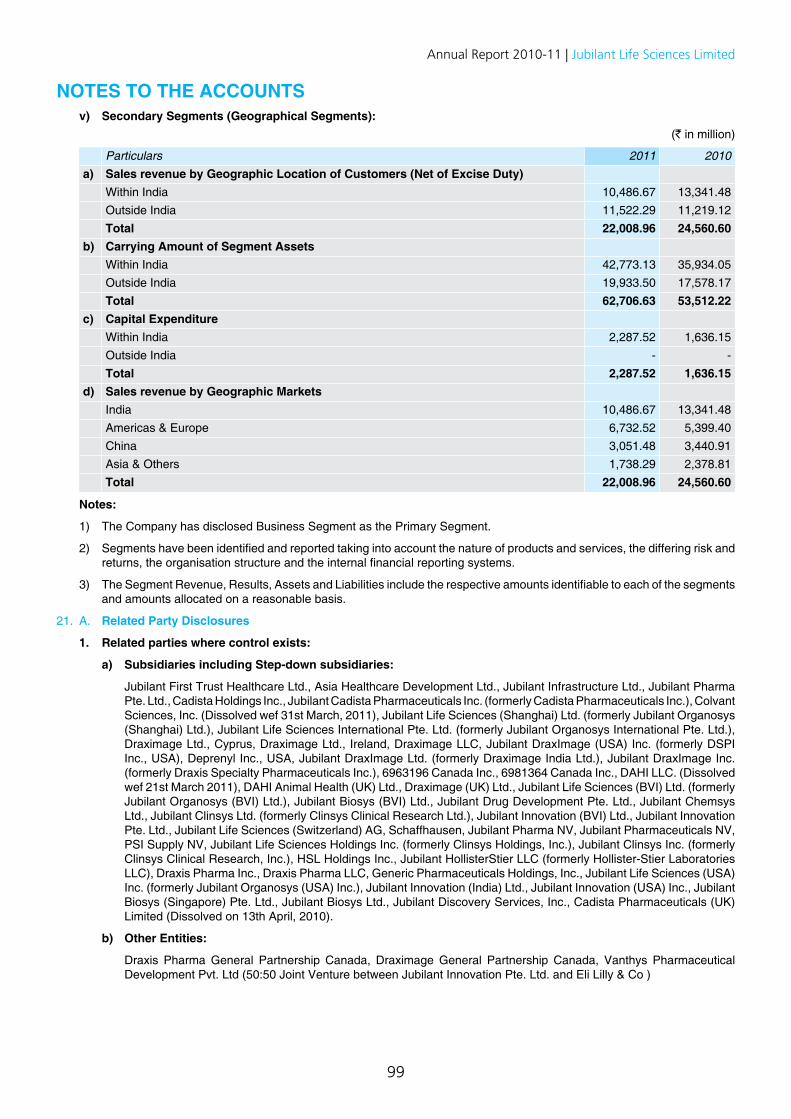
99
Annual Report 2010-11 | Jubilant Life Sciences Limited
v) Secondary Segments (Geographical Segments):(` in million)
Particulars 2011 2010a) Sales revenue by Geographic Location of Customers (Net of Excise Duty)
Within India 10,486.67 13,341.48 Outside India 11,522.29 11,219.12 Total 22,008.96 24,560.60
b) Carrying Amount of Segment AssetsWithin India 42,773.13 35,934.05 Outside India 19,933.50 17,578.17 Total 62,706.63 53,512.22
c) Capital ExpenditureWithin India 2,287.52 1,636.15 Outside India - - Total 2,287.52 1,636.15
d) Sales revenue by Geographic MarketsIndia 10,486.67 13,341.48 Americas & Europe 6,732.52 5,399.40 China 3,051.48 3,440.91 Asia & Others 1,738.29 2,378.81 Total 22,008.96 24,560.60
Notes:
1) The Company has disclosed Business Segment as the Primary Segment.
2) Segments have been identified and reported taking into account the nature of products and services, the differing risk and returns, the organisation structure and the internal financial reporting systems.
3) The Segment Revenue, Results, Assets and Liabilities include the respective amounts identifiable to each of the segments and amounts allocated on a reasonable basis.
21. A. Related Party Disclosures
1. Related parties where control exists:
a) Subsidiaries including Step-down subsidiaries:
Jubilant First Trust Healthcare Ltd., Asia Healthcare Development Ltd., Jubilant Infrastructure Ltd., Jubilant Pharma Pte. Ltd., Cadista Holdings Inc., Jubilant Cadista Pharmaceuticals Inc. (formerly Cadista Pharmaceuticals Inc.), Colvant Sciences, Inc. (Dissolved wef 31st March, 2011), Jubilant Life Sciences (Shanghai) Ltd. (formerly Jubilant Organosys (Shanghai) Ltd.), Jubilant Life Sciences International Pte. Ltd. (formerly Jubilant Organosys International Pte. Ltd.), Draximage Ltd., Cyprus, Draximage Ltd., Ireland, Draximage LLC, Jubilant DraxImage (USA) Inc. (formerly DSPI Inc., USA), Deprenyl Inc., USA, Jubilant DraxImage Ltd. (formerly Draximage India Ltd.), Jubilant DraxImage Inc. (formerly Draxis Specialty Pharmaceuticals Inc.), 6963196 Canada Inc., 6981364 Canada Inc., DAHI LLC. (Dissolved wef 21st March 2011), DAHI Animal Health (UK) Ltd., Draximage (UK) Ltd., Jubilant Life Sciences (BVI) Ltd. (formerly Jubilant Organosys (BVI) Ltd.), Jubilant Biosys (BVI) Ltd., Jubilant Drug Development Pte. Ltd., Jubilant Chemsys Ltd., Jubilant Clinsys Ltd. (formerly Clinsys Clinical Research Ltd.), Jubilant Innovation (BVI) Ltd., Jubilant Innovation Pte. Ltd., Jubilant Life Sciences (Switzerland) AG, Schaffhausen, Jubilant Pharma NV, Jubilant Pharmaceuticals NV, PSI Supply NV, Jubilant Life Sciences Holdings Inc. (formerly Clinsys Holdings, Inc.), Jubilant Clinsys Inc. (formerly Clinsys Clinical Research, Inc.), HSL Holdings Inc., Jubilant HollisterStier LLC (formerly Hollister-Stier Laboratories LLC), Draxis Pharma Inc., Draxis Pharma LLC, Generic Pharmaceuticals Holdings, Inc., Jubilant Life Sciences (USA) Inc. (formerly Jubilant Organosys (USA) Inc.), Jubilant Innovation (India) Ltd., Jubilant Innovation (USA) Inc., Jubilant Biosys (Singapore) Pte. Ltd., Jubilant Biosys Ltd., Jubilant Discovery Services, Inc., Cadista Pharmaceuticals (UK) Limited (Dissolved on 13th April, 2010).
b) Other Entities:
Draxis Pharma General Partnership Canada, Draximage General Partnership Canada, Vanthys Pharmaceutical Development Pvt. Ltd (50:50 Joint Venture between Jubilant Innovation Pte. Ltd. and Eli Lilly & Co )
NOTES TO THE ACCOUNTS
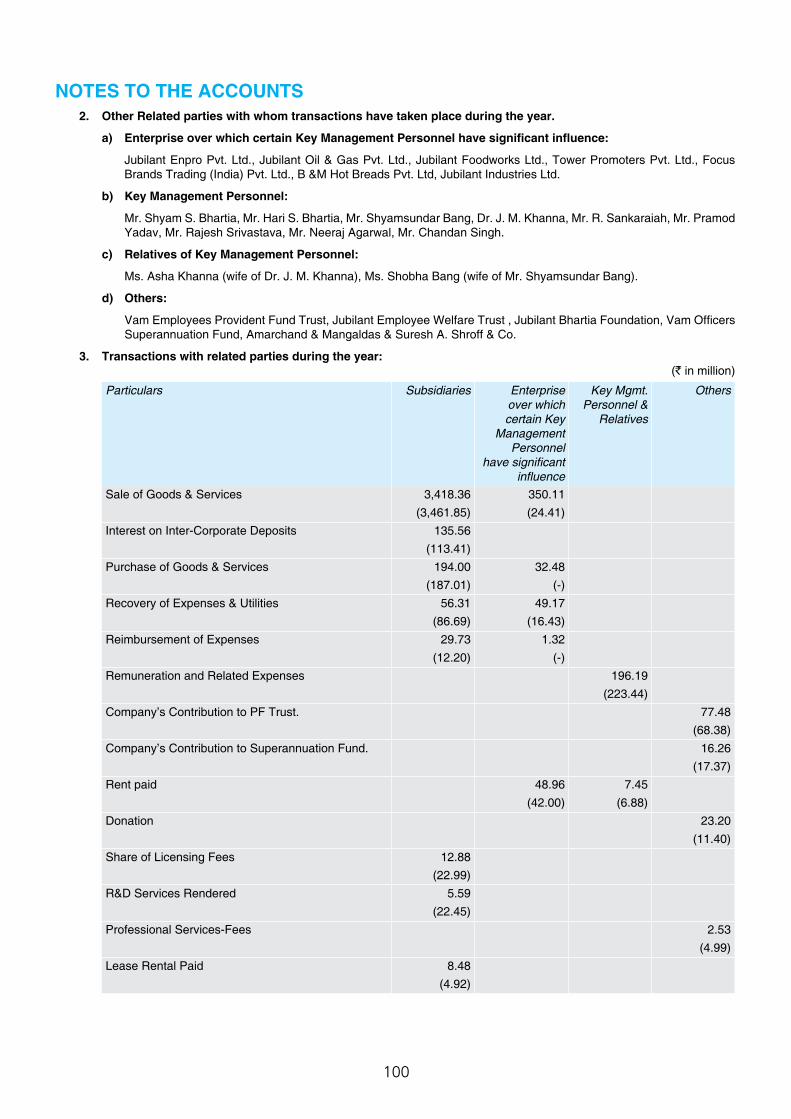
100
2. Other Related parties with whom transactions have taken place during the year.
a) Enterprise over which certain Key Management Personnel have significant influence:
Jubilant Enpro Pvt. Ltd., Jubilant Oil & Gas Pvt. Ltd., Jubilant Foodworks Ltd., Tower Promoters Pvt. Ltd., Focus Brands Trading (India) Pvt. Ltd., B &M Hot Breads Pvt. Ltd, Jubilant Industries Ltd.
b) Key Management Personnel:
Mr. Shyam S. Bhartia, Mr. Hari S. Bhartia, Mr. Shyamsundar Bang, Dr. J. M. Khanna, Mr. R. Sankaraiah, Mr. Pramod Yadav, Mr. Rajesh Srivastava, Mr. Neeraj Agarwal, Mr. Chandan Singh.
c) Relatives of Key Management Personnel:
Ms. Asha Khanna (wife of Dr. J. M. Khanna), Ms. Shobha Bang (wife of Mr. Shyamsundar Bang).
d) Others:
Vam Employees Provident Fund Trust, Jubilant Employee Welfare Trust , Jubilant Bhartia Foundation, Vam Officers Superannuation Fund, Amarchand & Mangaldas & Suresh A. Shroff & Co.
3. Transactions with related parties during the year: (` in million)
Particulars Subsidiaries Enterprise over which certain Key
Management Personnel
have significant influence
Key Mgmt. Personnel &
Relatives
Others
Sale of Goods & Services 3,418.36 350.11(3,461.85) (24.41)
Interest on Inter-Corporate Deposits 135.56(113.41)
Purchase of Goods & Services 194.00 32.48(187.01) (-)
Recovery of Expenses & Utilities 56.31 49.17(86.69) (16.43)
Reimbursement of Expenses 29.73 1.32(12.20) (-)
Remuneration and Related Expenses 196.19(223.44)
Company’s Contribution to PF Trust. 77.48(68.38)
Company’s Contribution to Superannuation Fund. 16.26(17.37)
Rent paid 48.96 7.45(42.00) (6.88)
Donation 23.20(11.40)
Share of Licensing Fees 12.88(22.99)
R&D Services Rendered 5.59(22.45)
Professional Services-Fees 2.53(4.99)
Lease Rental Paid 8.48(4.92)
NOTES TO THE ACCOUNTS
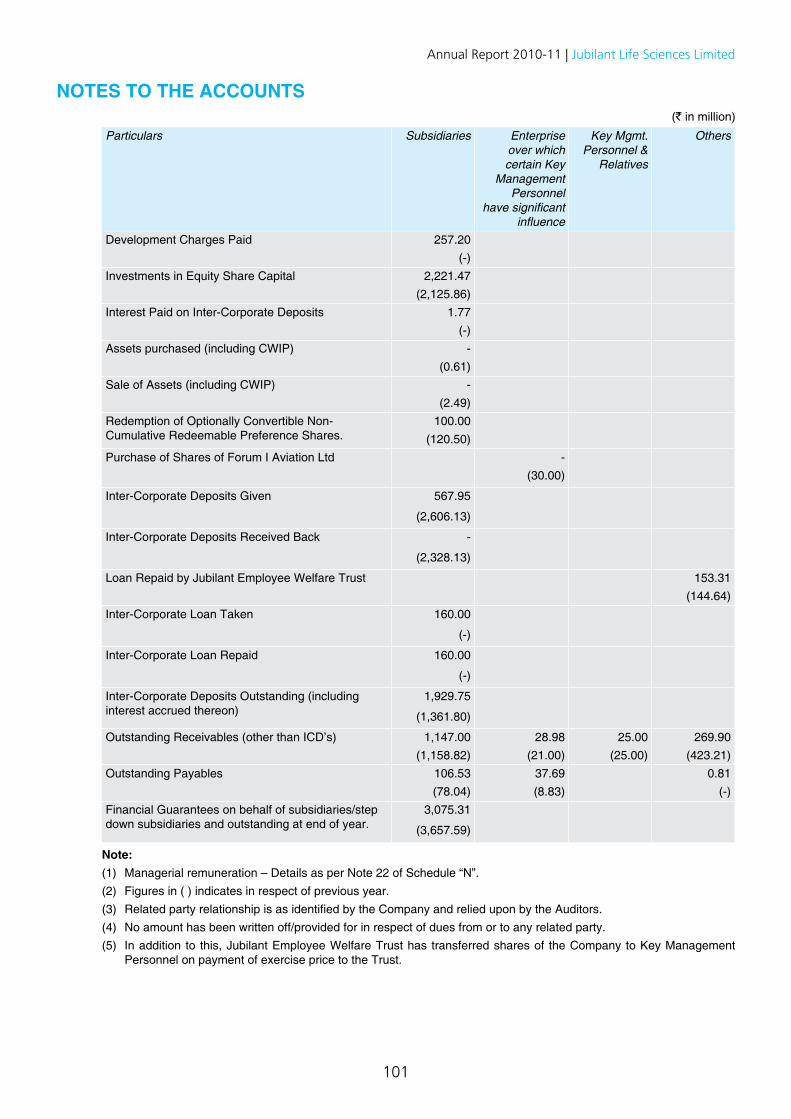
101
Annual Report 2010-11 | Jubilant Life Sciences Limited
Particulars Subsidiaries Enterprise over which certain Key
Management Personnel
have significant influence
Key Mgmt. Personnel &
Relatives
Others
Development Charges Paid 257.20(-)
Investments in Equity Share Capital 2,221.47(2,125.86)
Interest Paid on Inter-Corporate Deposits 1.77(-)
Assets purchased (including CWIP) -(0.61)
Sale of Assets (including CWIP) -(2.49)
Redemption of Optionally Convertible Non-Cumulative Redeemable Preference Shares.
100.00(120.50)
Purchase of Shares of Forum I Aviation Ltd -(30.00)
Inter-Corporate Deposits Given 567.95
(2,606.13)
Inter-Corporate Deposits Received Back -
(2,328.13)
Loan Repaid by Jubilant Employee Welfare Trust 153.31(144.64)
Inter-Corporate Loan Taken 160.00
(-)
Inter-Corporate Loan Repaid 160.00
(-)
Inter-Corporate Deposits Outstanding (including interest accrued thereon)
1,929.75
(1,361.80)
Outstanding Receivables (other than ICD’s) 1,147.00 28.98 25.00 269.90(1,158.82) (21.00) (25.00) (423.21)
Outstanding Payables 106.53 37.69 0.81(78.04) (8.83) (-)
Financial Guarantees on behalf of subsidiaries/step down subsidiaries and outstanding at end of year.
3,075.31
(3,657.59)
Note: (1) Managerial remuneration – Details as per Note 22 of Schedule “N”. (2) Figures in ( ) indicates in respect of previous year. (3) Related party relationship is as identified by the Company and relied upon by the Auditors. (4) No amount has been written off/provided for in respect of dues from or to any related party. (5) In addition to this, Jubilant Employee Welfare Trust has transferred shares of the Company to Key Management
Personnel on payment of exercise price to the Trust.
NOTES TO THE ACCOUNTS(` in million)
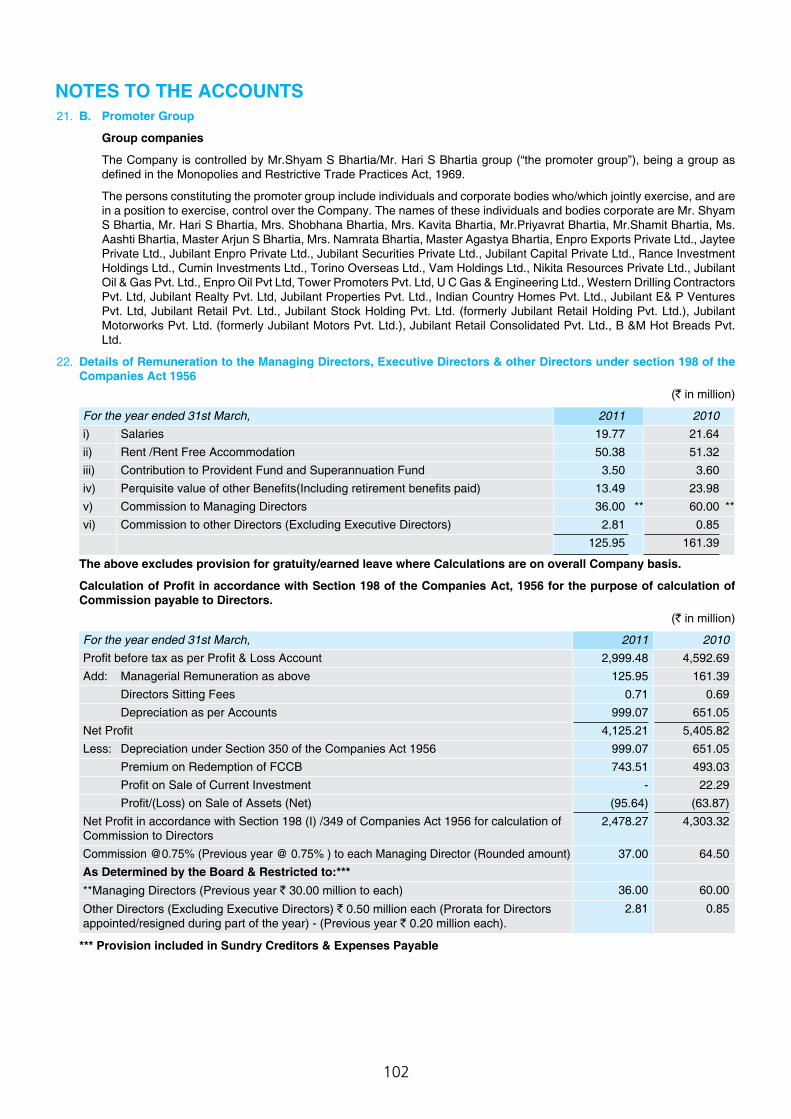
102
21. B. Promoter Group
Group companies
The Company is controlled by Mr.Shyam S Bhartia/Mr. Hari S Bhartia group (“the promoter group”), being a group as defined in the Monopolies and Restrictive Trade Practices Act, 1969.
The persons constituting the promoter group include individuals and corporate bodies who/which jointly exercise, and are in a position to exercise, control over the Company. The names of these individuals and bodies corporate are Mr. Shyam S Bhartia, Mr. Hari S Bhartia, Mrs. Shobhana Bhartia, Mrs. Kavita Bhartia, Mr.Priyavrat Bhartia, Mr.Shamit Bhartia, Ms. Aashti Bhartia, Master Arjun S Bhartia, Mrs. Namrata Bhartia, Master Agastya Bhartia, Enpro Exports Private Ltd., Jaytee Private Ltd., Jubilant Enpro Private Ltd., Jubilant Securities Private Ltd., Jubilant Capital Private Ltd., Rance Investment Holdings Ltd., Cumin Investments Ltd., Torino Overseas Ltd., Vam Holdings Ltd., Nikita Resources Private Ltd., Jubilant Oil & Gas Pvt. Ltd., Enpro Oil Pvt Ltd, Tower Promoters Pvt. Ltd, U C Gas & Engineering Ltd., Western Drilling Contractors Pvt. Ltd, Jubilant Realty Pvt. Ltd, Jubilant Properties Pvt. Ltd., Indian Country Homes Pvt. Ltd., Jubilant E& P Ventures Pvt. Ltd, Jubilant Retail Pvt. Ltd., Jubilant Stock Holding Pvt. Ltd. (formerly Jubilant Retail Holding Pvt. Ltd.), Jubilant Motorworks Pvt. Ltd. (formerly Jubilant Motors Pvt. Ltd.), Jubilant Retail Consolidated Pvt. Ltd., B &M Hot Breads Pvt. Ltd.
22. Details of Remuneration to the Managing Directors, Executive Directors & other Directors under section 198 of the Companies Act 1956
(` in million)
For the year ended 31st March, 2011 2010i) Salaries 19.77 21.64 ii) Rent /Rent Free Accommodation 50.38 51.32 iii) Contribution to Provident Fund and Superannuation Fund 3.50 3.60 iv) Perquisite value of other Benefits(Including retirement benefits paid) 13.49 23.98 v) Commission to Managing Directors 36.00 ** 60.00 **vi) Commission to other Directors (Excluding Executive Directors) 2.81 0.85
125.95 161.39
The above excludes provision for gratuity/earned leave where Calculations are on overall Company basis.
Calculation of Profit in accordance with Section 198 of the Companies Act, 1956 for the purpose of calculation of Commission payable to Directors.
(` in million)
For the year ended 31st March, 2011 2010Profit before tax as per Profit & Loss Account 2,999.48 4,592.69 Add: Managerial Remuneration as above 125.95 161.39
Directors Sitting Fees 0.71 0.69 Depreciation as per Accounts 999.07 651.05
Net Profit 4,125.21 5,405.82 Less: Depreciation under Section 350 of the Companies Act 1956 999.07 651.05
Premium on Redemption of FCCB 743.51 493.03 Profit on Sale of Current Investment - 22.29 Profit/(Loss) on Sale of Assets (Net) (95.64) (63.87)
Net Profit in accordance with Section 198 (I) /349 of Companies Act 1956 for calculation of Commission to Directors
2,478.27 4,303.32
Commission @0.75% (Previous year @ 0.75% ) to each Managing Director (Rounded amount) 37.00 64.50 As Determined by the Board & Restricted to:*****Managing Directors (Previous year ` 30.00 million to each) 36.00 60.00
Other Directors (Excluding Executive Directors) ` 0.50 million each (Prorata for Directors appointed/resigned during part of the year) - (Previous year ` 0.20 million each).
2.81 0.85
*** Provision included in Sundry Creditors & Expenses Payable
NOTES TO THE ACCOUNTS
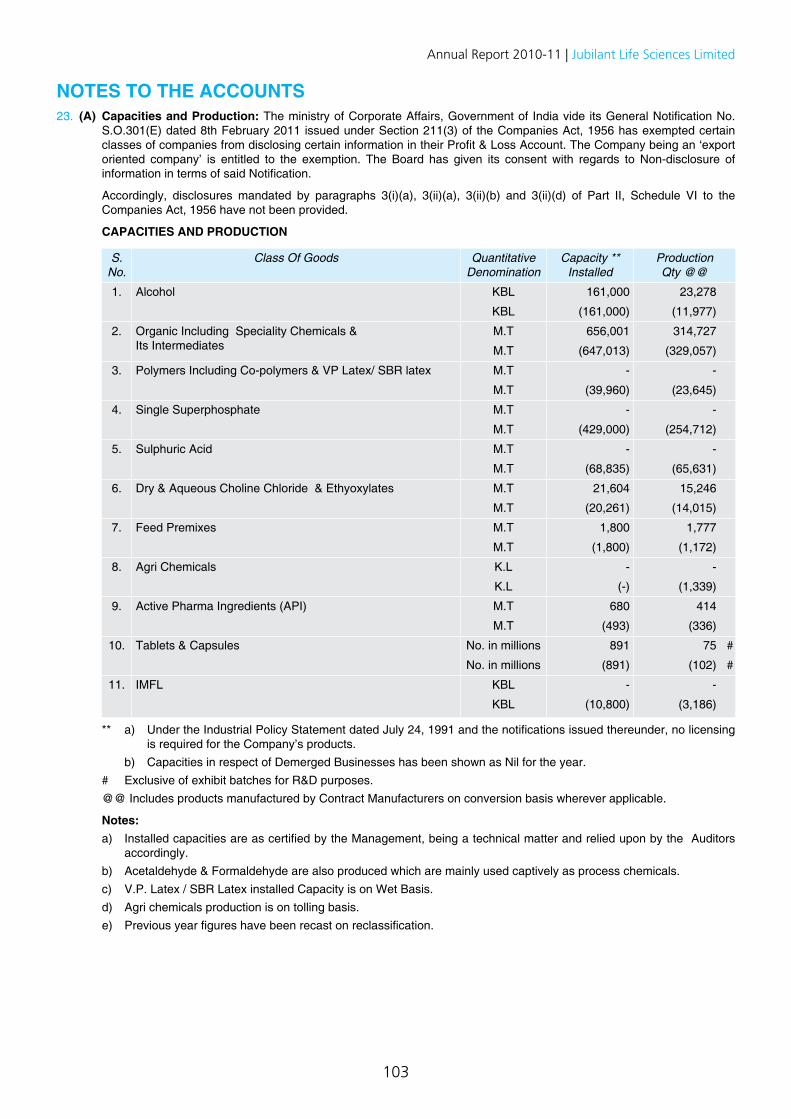
103
Annual Report 2010-11 | Jubilant Life Sciences Limited
23. (A) Capacities and Production: The ministry of Corporate Affairs, Government of India vide its General Notification No. S.O.301(E) dated 8th February 2011 issued under Section 211(3) of the Companies Act, 1956 has exempted certain classes of companies from disclosing certain information in their Profit & Loss Account. The Company being an ‘export oriented company’ is entitled to the exemption. The Board has given its consent with regards to Non-disclosure of information in terms of said Notification.
Accordingly, disclosures mandated by paragraphs 3(i)(a), 3(ii)(a), 3(ii)(b) and 3(ii)(d) of Part II, Schedule VI to the Companies Act, 1956 have not been provided.
CAPACITIES AND PRODUCTION
S. No.
Class Of Goods Quantitative Denomination
Capacity ** Installed
Production Qty @@
1. Alcohol KBL 161,000 23,278
KBL (161,000) (11,977)
2. Organic Including Speciality Chemicals &Its Intermediates
M.T 656,001 314,727
M.T (647,013) (329,057)
3. Polymers Including Co-polymers & VP Latex/ SBR latex M.T - -
M.T (39,960) (23,645)
4. Single Superphosphate M.T - -
M.T (429,000) (254,712)
5. Sulphuric Acid M.T - -
M.T (68,835) (65,631)
6. Dry & Aqueous Choline Chloride & Ethyoxylates M.T 21,604 15,246
M.T (20,261) (14,015)
7. Feed Premixes M.T 1,800 1,777
M.T (1,800) (1,172)
8. Agri Chemicals K.L - -
K.L (-) (1,339)
9. Active Pharma Ingredients (API) M.T 680 414
M.T (493) (336)
10. Tablets & Capsules No. in millions 891 75 #
No. in millions (891) (102) #
11. IMFL KBL - -
KBL (10,800) (3,186)
** a) Under the Industrial Policy Statement dated July 24, 1991 and the notifications issued thereunder, no licensing is required for the Company’s products.
b) Capacities in respect of Demerged Businesses has been shown as Nil for the year. # Exclusive of exhibit batches for R&D purposes. @@ Includes products manufactured by Contract Manufacturers on conversion basis wherever applicable.
Notes: a) Installed capacities are as certified by the Management, being a technical matter and relied upon by the Auditors
accordingly. b) Acetaldehyde & Formaldehyde are also produced which are mainly used captively as process chemicals. c) V.P. Latex / SBR Latex installed Capacity is on Wet Basis. d) Agri chemicals production is on tolling basis. e) Previous year figures have been recast on reclassification.
NOTES TO THE ACCOUNTS
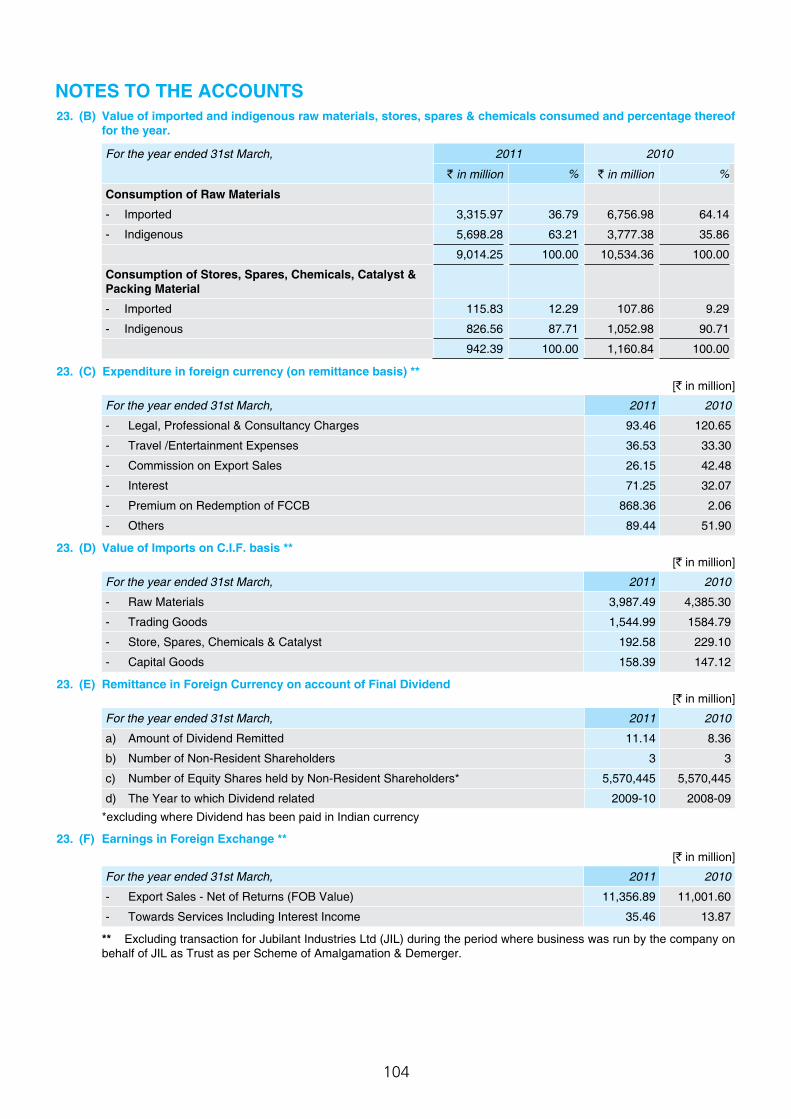
104
23. (B) Value of imported and indigenous raw materials, stores, spares & chemicals consumed and percentage thereof for the year.
For the year ended 31st March, 2011 2010
` in million % ` in million %
Consumption of Raw Materials
- Imported 3,315.97 36.79 6,756.98 64.14
- Indigenous 5,698.28 63.21 3,777.38 35.86
9,014.25 100.00 10,534.36 100.00
Consumption of Stores, Spares, Chemicals, Catalyst & Packing Material
- Imported 115.83 12.29 107.86 9.29
- Indigenous 826.56 87.71 1,052.98 90.71
942.39 100.00 1,160.84 100.00
23. (C) Expenditure in foreign currency (on remittance basis) ** [` in million]
For the year ended 31st March, 2011 2010
- Legal, Professional & Consultancy Charges 93.46 120.65
- Travel /Entertainment Expenses 36.53 33.30
- Commission on Export Sales 26.15 42.48
- Interest 71.25 32.07
- Premium on Redemption of FCCB 868.36 2.06
- Others 89.44 51.90
23. (D) Value of Imports on C.I.F. basis ** [` in million]
For the year ended 31st March, 2011 2010
- Raw Materials 3,987.49 4,385.30
- Trading Goods 1,544.99 1584.79
- Store, Spares, Chemicals & Catalyst 192.58 229.10
- Capital Goods 158.39 147.12
23. (E) Remittance in Foreign Currency on account of Final Dividend [` in million]
For the year ended 31st March, 2011 2010
a) Amount of Dividend Remitted 11.14 8.36
b) Number of Non-Resident Shareholders 3 3
c) Number of Equity Shares held by Non-Resident Shareholders* 5,570,445 5,570,445
d) The Year to which Dividend related 2009-10 2008-09
*excluding where Dividend has been paid in Indian currency
23. (F) Earnings in Foreign Exchange ** [` in million]
For the year ended 31st March, 2011 2010
- Export Sales - Net of Returns (FOB Value) 11,356.89 11,001.60
- Towards Services Including Interest Income 35.46 13.87
** Excluding transaction for Jubilant Industries Ltd (JIL) during the period where business was run by the company on behalf of JIL as Trust as per Scheme of Amalgamation & Demerger.
NOTES TO THE ACCOUNTS
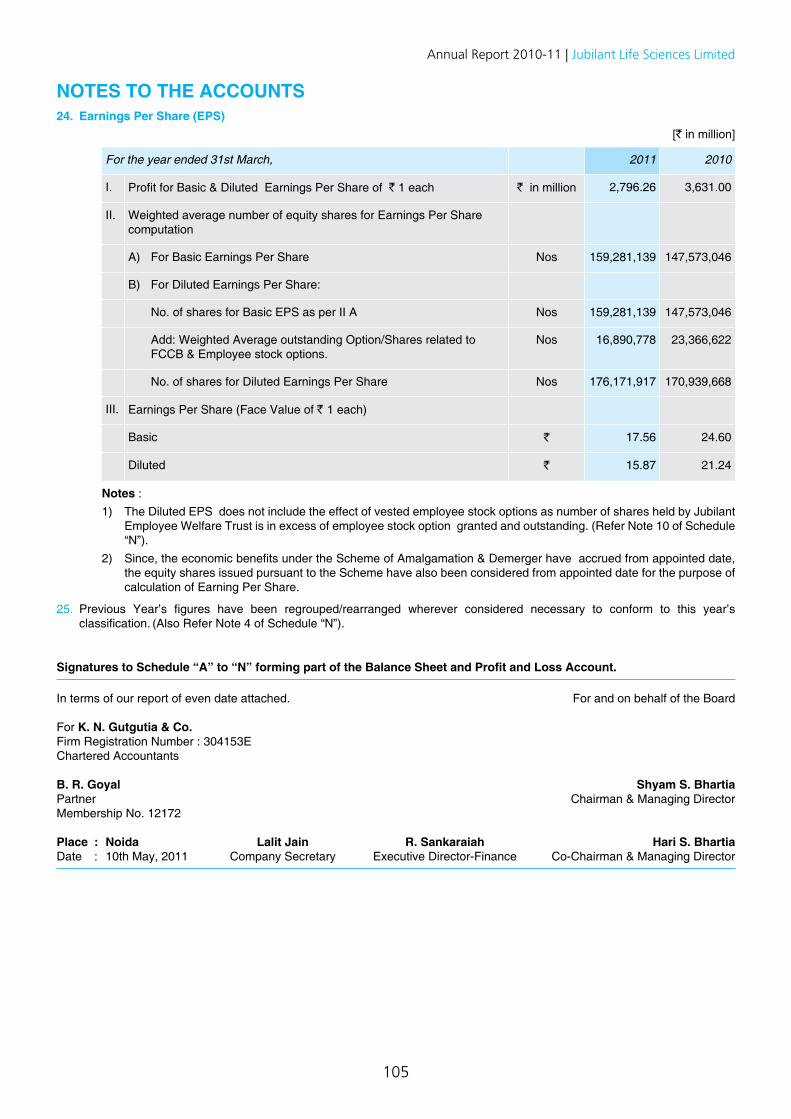
105
Annual Report 2010-11 | Jubilant Life Sciences Limited
24. Earnings Per Share (EPS) [` in million]
For the year ended 31st March, 2011 2010
I. Profit for Basic & Diluted Earnings Per Share of ` 1 each ` in million 2,796.26 3,631.00
II. Weighted average number of equity shares for Earnings Per Share computation
A) For Basic Earnings Per Share Nos 159,281,139 147,573,046
B) For Diluted Earnings Per Share:
No. of shares for Basic EPS as per II A Nos 159,281,139 147,573,046
Add: Weighted Average outstanding Option/Shares related to FCCB & Employee stock options.
Nos 16,890,778 23,366,622
No. of shares for Diluted Earnings Per Share Nos 176,171,917 170,939,668
III. Earnings Per Share (Face Value of ` 1 each)
Basic ` 17.56 24.60
Diluted ` 15.87 21.24
Notes : 1) The Diluted EPS does not include the effect of vested employee stock options as number of shares held by Jubilant
Employee Welfare Trust is in excess of employee stock option granted and outstanding. (Refer Note 10 of Schedule “N”).
2) Since, the economic benefits under the Scheme of Amalgamation & Demerger have accrued from appointed date, the equity shares issued pursuant to the Scheme have also been considered from appointed date for the purpose of calculation of Earning Per Share.
25. Previous Year’s figures have been regrouped/rearranged wherever considered necessary to conform to this year’s classification. (Also Refer Note 4 of Schedule “N”).
Signatures to Schedule “A” to “N” forming part of the Balance Sheet and Profit and Loss Account.
NOTES TO THE ACCOUNTS
In terms of our report of even date attached. For and on behalf of the Board
For K. N. Gutgutia & Co.Firm Registration Number : 304153EChartered Accountants
B. R. Goyal Shyam S. BhartiaPartner Chairman & Managing DirectorMembership No. 12172
Place : Noida Lalit Jain R. Sankaraiah Hari S. BhartiaDate : 10th May, 2011 Company Secretary Executive Director-Finance Co-Chairman & Managing Director
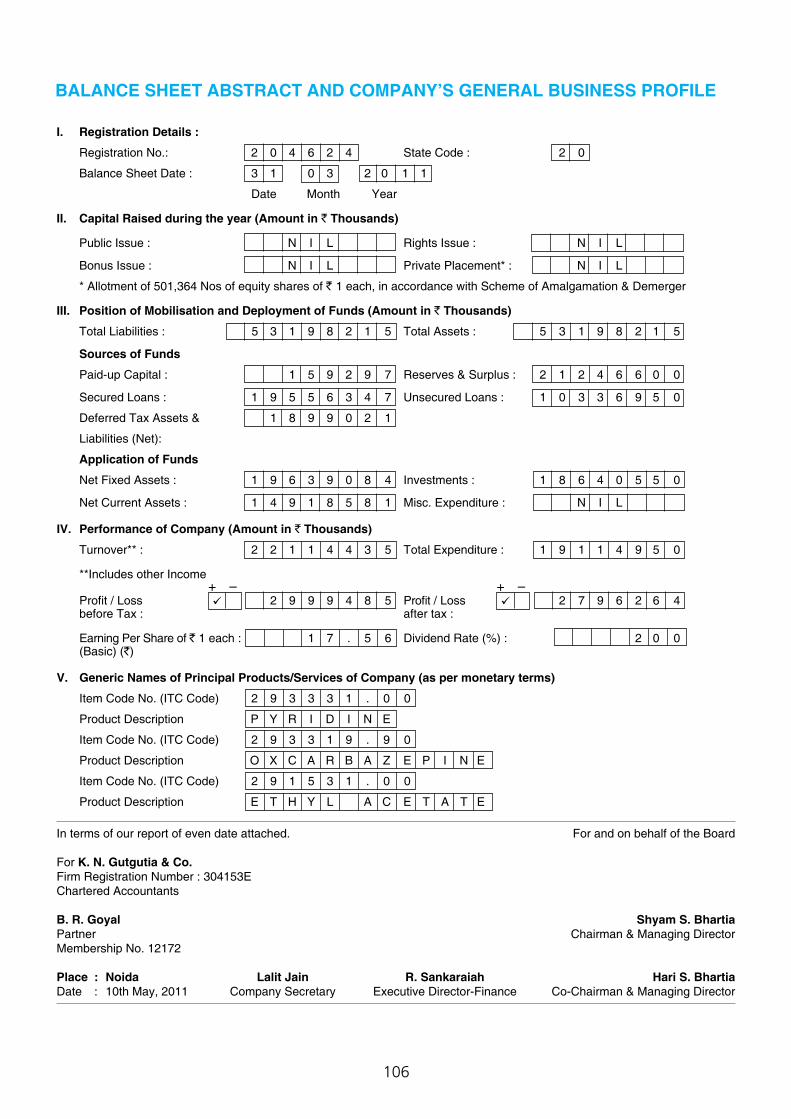
106
BALANCE SHEET ABSTRACT AND COMPANY’S GENERAL BUSINESS PROFILE
I. Registration Details :
Registration No.: 2 0 4 6 2 4 State Code : 2 0
Balance Sheet Date : 3 1 0 3 2 0 1 1
Date Month Year
II. Capital Raised during the year (Amount in ` Thousands)
Public Issue : N I L Rights Issue : N I L
Bonus Issue : N I L Private Placement* : N I L
* Allotment of 501,364 Nos of equity shares of ` 1 each, in accordance with Scheme of Amalgamation & Demerger
III. Position of Mobilisation and Deployment of Funds (Amount in ` Thousands)
Total Liabilities : 5 3 1 9 8 2 1 5 Total Assets : 5 3 1 9 8 2 1 5
Sources of Funds
Paid-up Capital : 1 5 9 2 9 7 Reserves & Surplus : 2 1 2 4 6 6 0 0
Secured Loans : 1 9 5 5 6 3 4 7 Unsecured Loans : 1 0 3 3 6 9 5 0
Deferred Tax Assets & 1 8 9 9 0 2 1
Liabilities (Net):
Application of Funds
Net Fixed Assets : 1 9 6 3 9 0 8 4 Investments : 1 8 6 4 0 5 5 0
Net Current Assets : 1 4 9 1 8 5 8 1 Misc. Expenditure : N I L
IV. Performance of Company (Amount in ` Thousands)
Turnover** : 2 2 1 1 4 4 3 5 Total Expenditure : 1 9 1 1 4 9 5 0
**Includes other Income
Profit / Loss 2 9 9 9 4 8 5 Profit / Loss 2 7 9 6 2 6 4 before Tax : after tax :
Earning Per Share of ` 1 each : 1 7 . 5 6 Dividend Rate (%) : 2 0 0 (Basic) (`)
V. Generic Names of Principal Products/Services of Company (as per monetary terms)
Item Code No. (ITC Code) 2 9 3 3 3 1 . 0 0
Product Description P Y R I D I N E
Item Code No. (ITC Code) 2 9 3 3 1 9 . 9 0
Product Description O X C A R B A Z E P I N E
Item Code No. (ITC Code) 2 9 1 5 3 1 . 0 0
Product Description E T H Y L A C E T A T E
+ – + –
In terms of our report of even date attached. For and on behalf of the Board
For K. N. Gutgutia & Co.Firm Registration Number : 304153EChartered Accountants
B. R. Goyal Shyam S. BhartiaPartner Chairman & Managing DirectorMembership No. 12172
Place : Noida Lalit Jain R. Sankaraiah Hari S. BhartiaDate : 10th May, 2011 Company Secretary Executive Director-Finance Co-Chairman & Managing Director
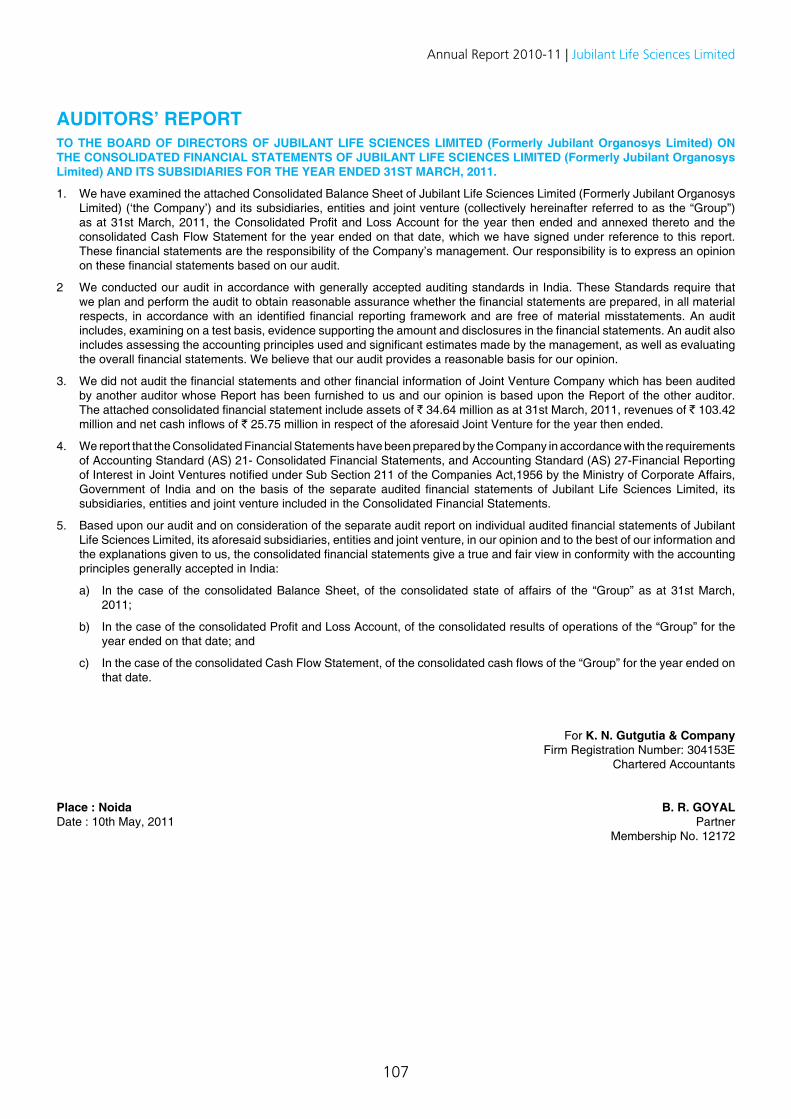
107
Annual Report 2010-11 | Jubilant Life Sciences Limited
AUDITORS’ REPORT TO THE BOARD OF DIRECTORS OF JUBILANT LIFE SCIENCES LIMITED (Formerly Jubilant Organosys Limited) ON THE CONSOLIDATED FINANCIAL STATEMENTS OF JUBILANT LIFE SCIENCES LIMITED (Formerly Jubilant Organosys Limited) AND ITS SUBSIDIARIES FOR THE YEAR ENDED 31ST MARCH, 2011.
1. We have examined the attached Consolidated Balance Sheet of Jubilant Life Sciences Limited (Formerly Jubilant Organosys Limited) (‘the Company’) and its subsidiaries, entities and joint venture (collectively hereinafter referred to as the “Group”) as at 31st March, 2011, the Consolidated Profit and Loss Account for the year then ended and annexed thereto and the consolidated Cash Flow Statement for the year ended on that date, which we have signed under reference to this report. These financial statements are the responsibility of the Company’s management. Our responsibility is to express an opinion on these financial statements based on our audit.
2 We conducted our audit in accordance with generally accepted auditing standards in India. These Standards require that we plan and perform the audit to obtain reasonable assurance whether the financial statements are prepared, in all material respects, in accordance with an identified financial reporting framework and are free of material misstatements. An audit includes, examining on a test basis, evidence supporting the amount and disclosures in the financial statements. An audit also includes assessing the accounting principles used and significant estimates made by the management, as well as evaluating the overall financial statements. We believe that our audit provides a reasonable basis for our opinion.
3. We did not audit the financial statements and other financial information of Joint Venture Company which has been audited by another auditor whose Report has been furnished to us and our opinion is based upon the Report of the other auditor. The attached consolidated financial statement include assets of ` 34.64 million as at 31st March, 2011, revenues of ` 103.42 million and net cash inflows of ` 25.75 million in respect of the aforesaid Joint Venture for the year then ended.
4. We report that the Consolidated Financial Statements have been prepared by the Company in accordance with the requirements of Accounting Standard (AS) 21- Consolidated Financial Statements, and Accounting Standard (AS) 27-Financial Reporting of Interest in Joint Ventures notified under Sub Section 211 of the Companies Act,1956 by the Ministry of Corporate Affairs, Government of India and on the basis of the separate audited financial statements of Jubilant Life Sciences Limited, its subsidiaries, entities and joint venture included in the Consolidated Financial Statements.
5. Based upon our audit and on consideration of the separate audit report on individual audited financial statements of Jubilant Life Sciences Limited, its aforesaid subsidiaries, entities and joint venture, in our opinion and to the best of our information and the explanations given to us, the consolidated financial statements give a true and fair view in conformity with the accounting principles generally accepted in India:
a) In the case of the consolidated Balance Sheet, of the consolidated state of affairs of the “Group” as at 31st March, 2011;
b) In the case of the consolidated Profit and Loss Account, of the consolidated results of operations of the “Group” for the year ended on that date; and
c) In the case of the consolidated Cash Flow Statement, of the consolidated cash flows of the “Group” for the year ended on that date.
For K. N. Gutgutia & Company Firm Registration Number: 304153E
Chartered Accountants
Place : Noida B. R. GOYALDate : 10th May, 2011 Partner Membership No. 12172
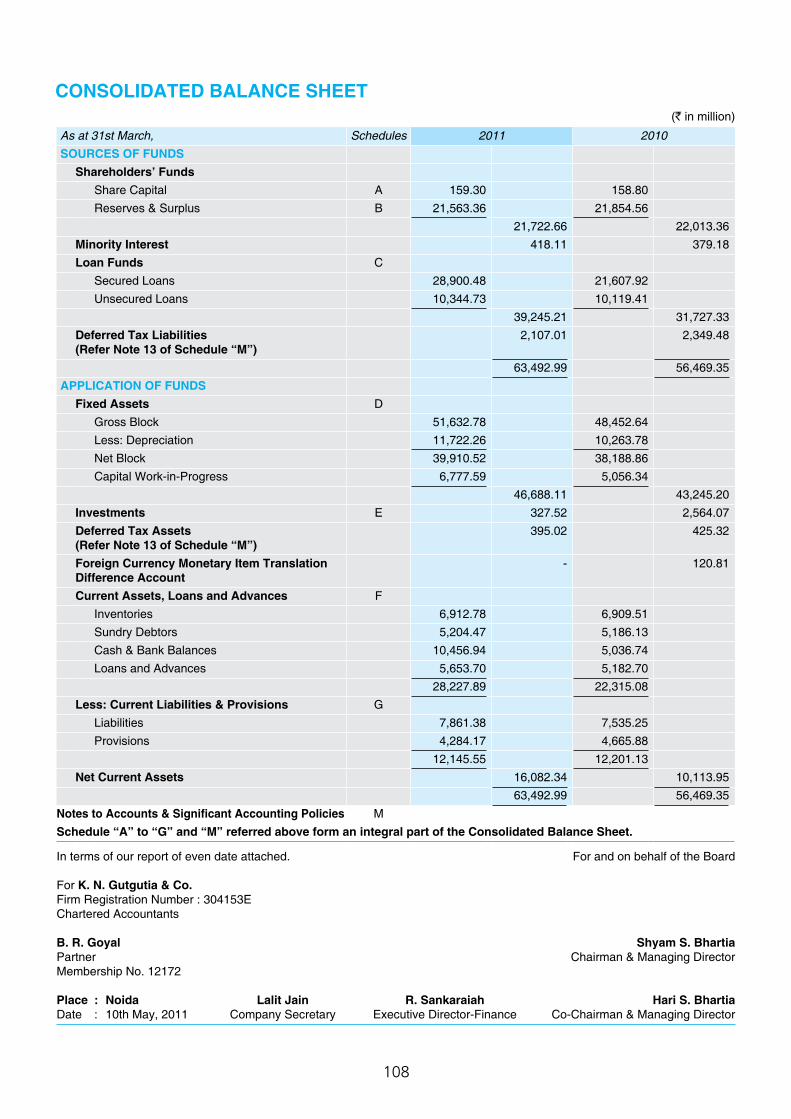
108
As at 31st March, Schedules 2011 2010SOURCES OF FUNDS
Shareholders’ FundsShare Capital A 159.30 158.80 Reserves & Surplus B 21,563.36 21,854.56
21,722.66 22,013.36 Minority Interest 418.11 379.18 Loan Funds C
Secured Loans 28,900.48 21,607.92 Unsecured Loans 10,344.73 10,119.41
39,245.21 31,727.33 Deferred Tax Liabilities (Refer Note 13 of Schedule “M”)
2,107.01 2,349.48
63,492.99 56,469.35 APPLICATION OF FUNDS
Fixed Assets DGross Block 51,632.78 48,452.64 Less: Depreciation 11,722.26 10,263.78 Net Block 39,910.52 38,188.86 Capital Work-in-Progress 6,777.59 5,056.34
46,688.11 43,245.20 Investments E 327.52 2,564.07 Deferred Tax Assets (Refer Note 13 of Schedule “M”)
395.02 425.32
Foreign Currency Monetary Item Translation Difference Account
- 120.81
Current Assets, Loans and Advances FInventories 6,912.78 6,909.51 Sundry Debtors 5,204.47 5,186.13 Cash & Bank Balances 10,456.94 5,036.74 Loans and Advances 5,653.70 5,182.70
28,227.89 22,315.08 Less: Current Liabilities & Provisions G
Liabilities 7,861.38 7,535.25 Provisions 4,284.17 4,665.88
12,145.55 12,201.13 Net Current Assets 16,082.34 10,113.95
63,492.99 56,469.35 Notes to Accounts & Significant Accounting Policies MSchedule “A” to “G” and “M” referred above form an integral part of the Consolidated Balance Sheet.
CONSOLIDATED BALANCE SHEET(` in million)
In terms of our report of even date attached. For and on behalf of the Board
For K. N. Gutgutia & Co.Firm Registration Number : 304153EChartered Accountants
B. R. Goyal Shyam S. BhartiaPartner Chairman & Managing DirectorMembership No. 12172
Place : Noida Lalit Jain R. Sankaraiah Hari S. BhartiaDate : 10th May, 2011 Company Secretary Executive Director-Finance Co-Chairman & Managing Director
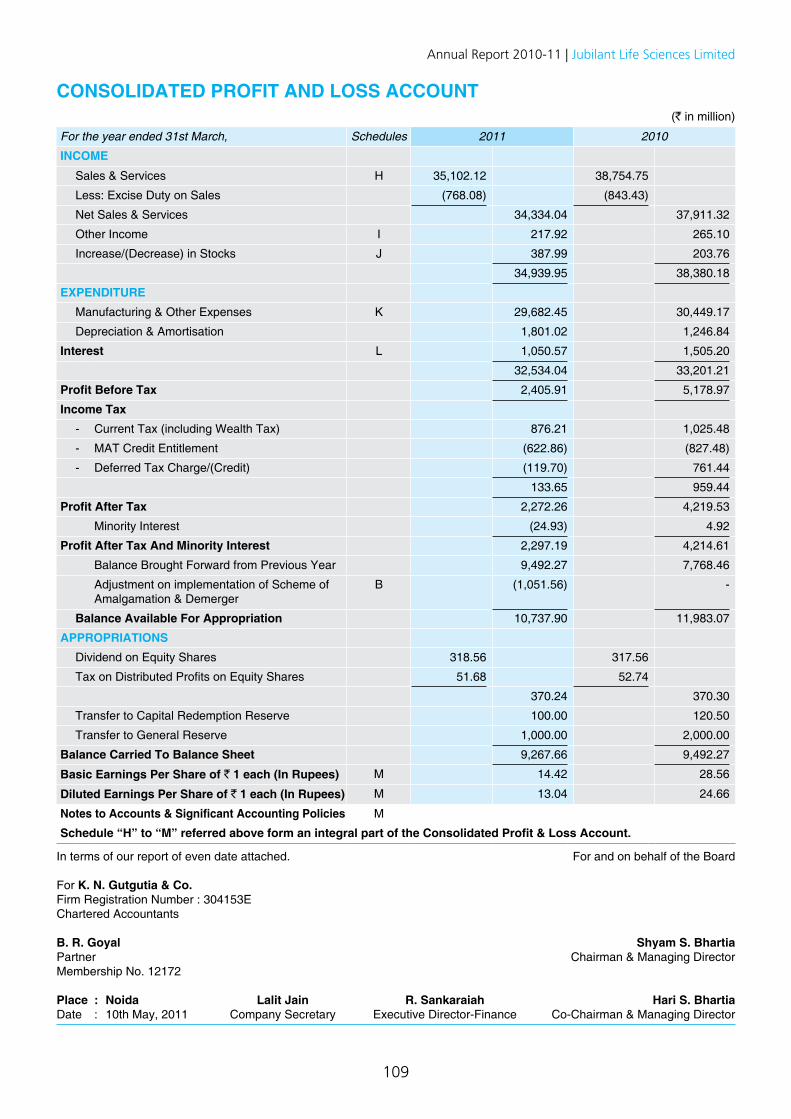
109
Annual Report 2010-11 | Jubilant Life Sciences Limited
CONSOLIDATED PROFIT AND LOSS ACCOUNT
In terms of our report of even date attached. For and on behalf of the Board
For K. N. Gutgutia & Co.Firm Registration Number : 304153EChartered Accountants
B. R. Goyal Shyam S. BhartiaPartner Chairman & Managing DirectorMembership No. 12172
Place : Noida Lalit Jain R. Sankaraiah Hari S. BhartiaDate : 10th May, 2011 Company Secretary Executive Director-Finance Co-Chairman & Managing Director
(` in million)
For the year ended 31st March, Schedules 2011 2010
INCOME
Sales & Services H 35,102.12 38,754.75
Less: Excise Duty on Sales (768.08) (843.43)
Net Sales & Services 34,334.04 37,911.32
Other Income I 217.92 265.10
Increase/(Decrease) in Stocks J 387.99 203.76
34,939.95 38,380.18
EXPENDITURE Manufacturing & Other Expenses K 29,682.45 30,449.17
Depreciation & Amortisation 1,801.02 1,246.84
Interest L 1,050.57 1,505.20
32,534.04 33,201.21
Profit Before Tax 2,405.91 5,178.97
Income Tax- Current Tax (including Wealth Tax) 876.21 1,025.48
- MAT Credit Entitlement (622.86) (827.48)
- Deferred Tax Charge/(Credit) (119.70) 761.44
133.65 959.44
Profit After Tax 2,272.26 4,219.53
Minority Interest (24.93) 4.92
Profit After Tax And Minority Interest 2,297.19 4,214.61
Balance Brought Forward from Previous Year 9,492.27 7,768.46
Adjustment on implementation of Scheme of Amalgamation & Demerger
B (1,051.56) -
Balance Available For Appropriation 10,737.90 11,983.07
APPROPRIATIONS Dividend on Equity Shares 318.56 317.56
Tax on Distributed Profits on Equity Shares 51.68 52.74
370.24 370.30
Transfer to Capital Redemption Reserve 100.00 120.50
Transfer to General Reserve 1,000.00 2,000.00
Balance Carried To Balance Sheet 9,267.66 9,492.27
Basic Earnings Per Share of ` 1 each (In Rupees) M 14.42 28.56
Diluted Earnings Per Share of ` 1 each (In Rupees) M 13.04 24.66
Notes to Accounts & Significant Accounting Policies M
Schedule “H” to “M” referred above form an integral part of the Consolidated Profit & Loss Account.
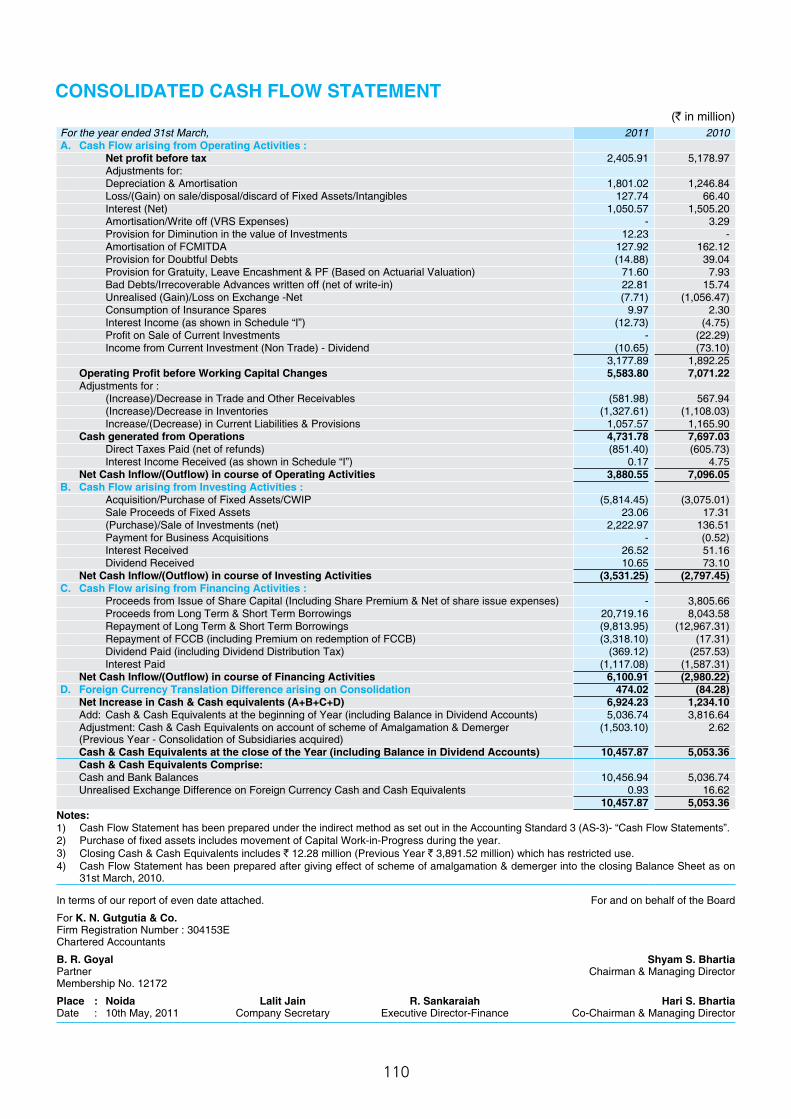
110
CONSOLIDATED CASH FLOW STATEMENT (` in million)
In terms of our report of even date attached. For and on behalf of the Board
For K. N. Gutgutia & Co.Firm Registration Number : 304153EChartered Accountants
B. R. Goyal Shyam S. BhartiaPartner Chairman & Managing DirectorMembership No. 12172
Place : Noida Lalit Jain R. Sankaraiah Hari S. BhartiaDate : 10th May, 2011 Company Secretary Executive Director-Finance Co-Chairman & Managing Director
For the year ended 31st March, 2011 2010A. Cash Flow arising from Operating Activities :
Net profit before tax 2,405.91 5,178.97 Adjustments for: Depreciation & Amortisation 1,801.02 1,246.84 Loss/(Gain) on sale/disposal/discard of Fixed Assets/Intangibles 127.74 66.40 Interest (Net) 1,050.57 1,505.20 Amortisation/Write off (VRS Expenses) - 3.29 Provision for Diminution in the value of Investments 12.23 - Amortisation of FCMITDA 127.92 162.12 Provision for Doubtful Debts (14.88) 39.04 Provision for Gratuity, Leave Encashment & PF (Based on Actuarial Valuation) 71.60 7.93 Bad Debts/Irrecoverable Advances written off (net of write-in) 22.81 15.74 Unrealised (Gain)/Loss on Exchange -Net (7.71) (1,056.47)Consumption of Insurance Spares 9.97 2.30 Interest Income (as shown in Schedule “I”) (12.73) (4.75)Profit on Sale of Current Investments - (22.29)Income from Current Investment (Non Trade) - Dividend (10.65) (73.10)
3,177.89 1,892.25 Operating Profit before Working Capital Changes 5,583.80 7,071.22 Adjustments for :
(Increase)/Decrease in Trade and Other Receivables (581.98) 567.94 (Increase)/Decrease in Inventories (1,327.61) (1,108.03)Increase/(Decrease) in Current Liabilities & Provisions 1,057.57 1,165.90
Cash generated from Operations 4,731.78 7,697.03 Direct Taxes Paid (net of refunds) (851.40) (605.73)Interest Income Received (as shown in Schedule “I”) 0.17 4.75
Net Cash Inflow/(Outflow) in course of Operating Activities 3,880.55 7,096.05 B. Cash Flow arising from Investing Activities :
Acquisition/Purchase of Fixed Assets/CWIP (5,814.45) (3,075.01)Sale Proceeds of Fixed Assets 23.06 17.31 (Purchase)/Sale of Investments (net) 2,222.97 136.51 Payment for Business Acquisitions - (0.52)Interest Received 26.52 51.16 Dividend Received 10.65 73.10
Net Cash Inflow/(Outflow) in course of Investing Activities (3,531.25) (2,797.45)C. Cash Flow arising from Financing Activities :
Proceeds from Issue of Share Capital (Including Share Premium & Net of share issue expenses) - 3,805.66 Proceeds from Long Term & Short Term Borrowings 20,719.16 8,043.58 Repayment of Long Term & Short Term Borrowings (9,813.95) (12,967.31)Repayment of FCCB (including Premium on redemption of FCCB) (3,318.10) (17.31)Dividend Paid (including Dividend Distribution Tax) (369.12) (257.53)Interest Paid (1,117.08) (1,587.31)
Net Cash Inflow/(Outflow) in course of Financing Activities 6,100.91 (2,980.22)D. Foreign Currency Translation Difference arising on Consolidation 474.02 (84.28)
Net Increase in Cash & Cash equivalents (A+B+C+D) 6,924.23 1,234.10 Add: Cash & Cash Equivalents at the beginning of Year (including Balance in Dividend Accounts) 5,036.74 3,816.64 Adjustment: Cash & Cash Equivalents on account of scheme of Amalgamation & Demerger (Previous Year - Consolidation of Subsidiaries acquired)
(1,503.10) 2.62
Cash & Cash Equivalents at the close of the Year (including Balance in Dividend Accounts) 10,457.87 5,053.36 Cash & Cash Equivalents Comprise: Cash and Bank Balances 10,456.94 5,036.74 Unrealised Exchange Difference on Foreign Currency Cash and Cash Equivalents 0.93 16.62
10,457.87 5,053.36 Notes:1) Cash Flow Statement has been prepared under the indirect method as set out in the Accounting Standard 3 (AS-3)- “Cash Flow Statements”.2) Purchase of fixed assets includes movement of Capital Work-in-Progress during the year.3) Closing Cash & Cash Equivalents includes ` 12.28 million (Previous Year ` 3,891.52 million) which has restricted use.4) Cash Flow Statement has been prepared after giving effect of scheme of amalgamation & demerger into the closing Balance Sheet as on
31st March, 2010.
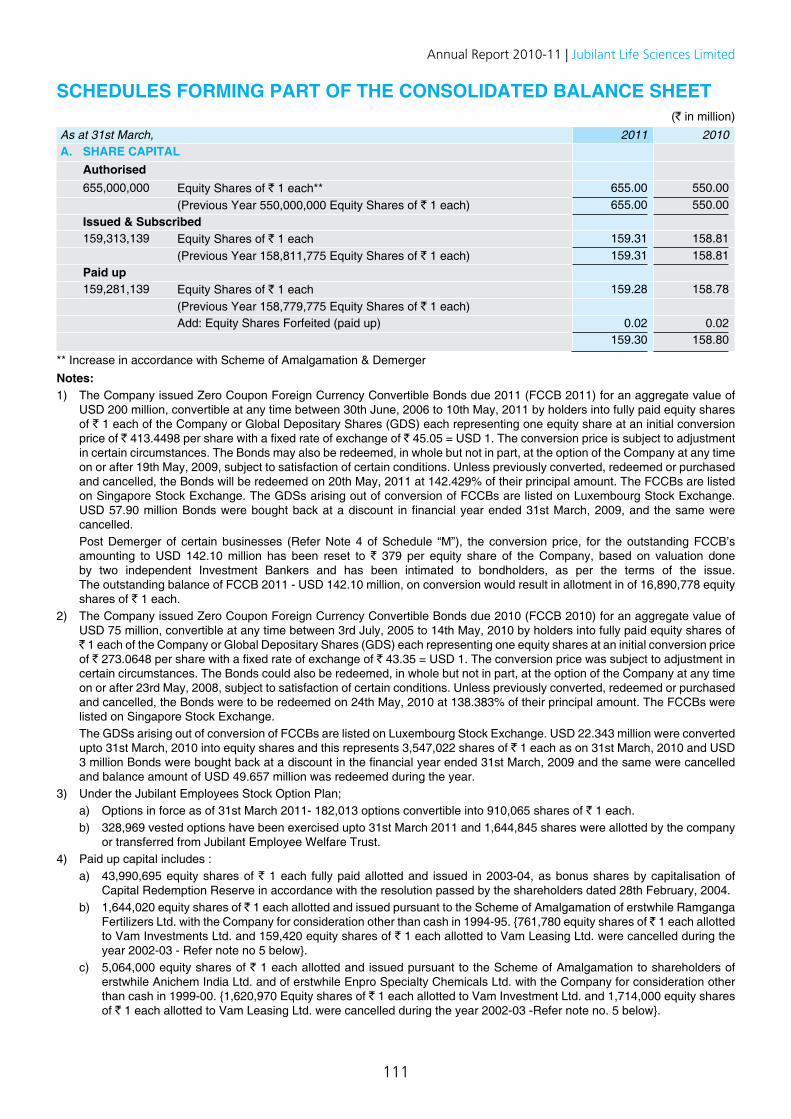
111
Annual Report 2010-11 | Jubilant Life Sciences Limited
SCHEDULES FORMING PART OF THE CONSOLIDATED BALANCE SHEET(` in million)
As at 31st March, 2011 2010A. SHARE CAPITAL
Authorised655,000,000 Equity Shares of ` 1 each** 655.00 550.00
(Previous Year 550,000,000 Equity Shares of ` 1 each) 655.00 550.00 Issued & Subscribed159,313,139 Equity Shares of ` 1 each 159.31 158.81
(Previous Year 158,811,775 Equity Shares of ` 1 each) 159.31 158.81 Paid up 159,281,139 Equity Shares of ` 1 each 159.28 158.78
(Previous Year 158,779,775 Equity Shares of ` 1 each)Add: Equity Shares Forfeited (paid up) 0.02 0.02
159.30 158.80
** Increase in accordance with Scheme of Amalgamation & DemergerNotes:1) The Company issued Zero Coupon Foreign Currency Convertible Bonds due 2011 (FCCB 2011) for an aggregate value of
USD 200 million, convertible at any time between 30th June, 2006 to 10th May, 2011 by holders into fully paid equity shares of ` 1 each of the Company or Global Depositary Shares (GDS) each representing one equity share at an initial conversion price of ` 413.4498 per share with a fixed rate of exchange of ` 45.05 = USD 1. The conversion price is subject to adjustment in certain circumstances. The Bonds may also be redeemed, in whole but not in part, at the option of the Company at any time on or after 19th May, 2009, subject to satisfaction of certain conditions. Unless previously converted, redeemed or purchased and cancelled, the Bonds will be redeemed on 20th May, 2011 at 142.429% of their principal amount. The FCCBs are listed on Singapore Stock Exchange. The GDSs arising out of conversion of FCCBs are listed on Luxembourg Stock Exchange. USD 57.90 million Bonds were bought back at a discount in financial year ended 31st March, 2009, and the same were cancelled.
Post Demerger of certain businesses (Refer Note 4 of Schedule “M”), the conversion price, for the outstanding FCCB’s amounting to USD 142.10 million has been reset to ` 379 per equity share of the Company, based on valuation done by two independent Investment Bankers and has been intimated to bondholders, as per the terms of the issue. The outstanding balance of FCCB 2011 - USD 142.10 million, on conversion would result in allotment in of 16,890,778 equity shares of ` 1 each.
2) The Company issued Zero Coupon Foreign Currency Convertible Bonds due 2010 (FCCB 2010) for an aggregate value of USD 75 million, convertible at any time between 3rd July, 2005 to 14th May, 2010 by holders into fully paid equity shares of ` 1 each of the Company or Global Depositary Shares (GDS) each representing one equity shares at an initial conversion price of ` 273.0648 per share with a fixed rate of exchange of ` 43.35 = USD 1. The conversion price was subject to adjustment in certain circumstances. The Bonds could also be redeemed, in whole but not in part, at the option of the Company at any time on or after 23rd May, 2008, subject to satisfaction of certain conditions. Unless previously converted, redeemed or purchased and cancelled, the Bonds were to be redeemed on 24th May, 2010 at 138.383% of their principal amount. The FCCBs were listed on Singapore Stock Exchange.
The GDSs arising out of conversion of FCCBs are listed on Luxembourg Stock Exchange. USD 22.343 million were converted upto 31st March, 2010 into equity shares and this represents 3,547,022 shares of ` 1 each as on 31st March, 2010 and USD 3 million Bonds were bought back at a discount in the financial year ended 31st March, 2009 and the same were cancelled and balance amount of USD 49.657 million was redeemed during the year.
3) Under the Jubilant Employees Stock Option Plan; a) Options in force as of 31st March 2011- 182,013 options convertible into 910,065 shares of ` 1 each. b) 328,969 vested options have been exercised upto 31st March 2011 and 1,644,845 shares were allotted by the company
or transferred from Jubilant Employee Welfare Trust.4) Paid up capital includes : a) 43,990,695 equity shares of ` 1 each fully paid allotted and issued in 2003-04, as bonus shares by capitalisation of
Capital Redemption Reserve in accordance with the resolution passed by the shareholders dated 28th February, 2004. b) 1,644,020 equity shares of ` 1 each allotted and issued pursuant to the Scheme of Amalgamation of erstwhile Ramganga
Fertilizers Ltd. with the Company for consideration other than cash in 1994-95. {761,780 equity shares of ̀ 1 each allotted to Vam Investments Ltd. and 159,420 equity shares of ` 1 each allotted to Vam Leasing Ltd. were cancelled during the year 2002-03 - Refer note no 5 below}.
c) 5,064,000 equity shares of ` 1 each allotted and issued pursuant to the Scheme of Amalgamation to shareholders of erstwhile Anichem India Ltd. and of erstwhile Enpro Specialty Chemicals Ltd. with the Company for consideration other than cash in 1999-00. {1,620,970 Equity shares of ` 1 each allotted to Vam Investment Ltd. and 1,714,000 equity shares of ` 1 each allotted to Vam Leasing Ltd. were cancelled during the year 2002-03 -Refer note no. 5 below}.
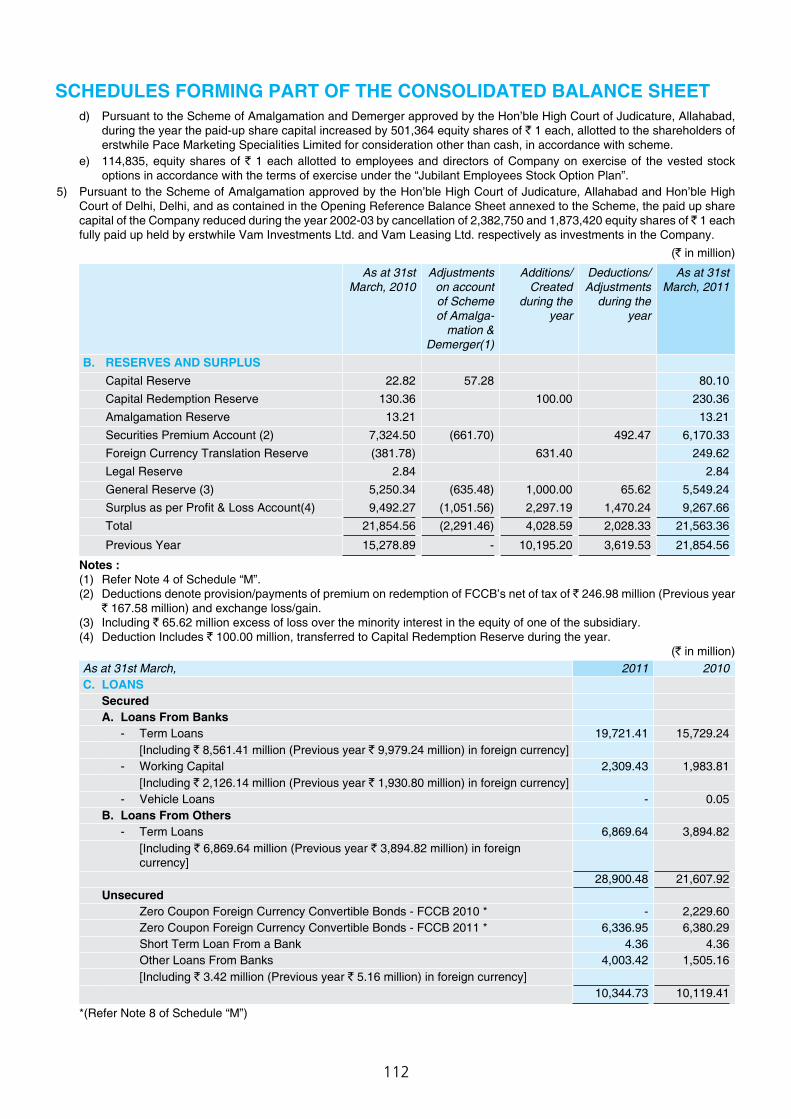
112
d) Pursuant to the Scheme of Amalgamation and Demerger approved by the Hon’ble High Court of Judicature, Allahabad, during the year the paid-up share capital increased by 501,364 equity shares of ` 1 each, allotted to the shareholders of erstwhile Pace Marketing Specialities Limited for consideration other than cash, in accordance with scheme.
e) 114,835, equity shares of ` 1 each allotted to employees and directors of Company on exercise of the vested stock options in accordance with the terms of exercise under the “Jubilant Employees Stock Option Plan”.
5) Pursuant to the Scheme of Amalgamation approved by the Hon’ble High Court of Judicature, Allahabad and Hon’ble High Court of Delhi, Delhi, and as contained in the Opening Reference Balance Sheet annexed to the Scheme, the paid up share capital of the Company reduced during the year 2002-03 by cancellation of 2,382,750 and 1,873,420 equity shares of ̀ 1 each fully paid up held by erstwhile Vam Investments Ltd. and Vam Leasing Ltd. respectively as investments in the Company.
(` in million)
As at 31stMarch, 2010
Adjustments on account of Scheme of Amalga-
mation & Demerger(1)
Additions/Created
during the year
Deductions/Adjustments
during the year
As at 31stMarch, 2011
B. RESERVES AND SURPLUSCapital Reserve 22.82 57.28 80.10 Capital Redemption Reserve 130.36 100.00 230.36 Amalgamation Reserve 13.21 13.21 Securities Premium Account (2) 7,324.50 (661.70) 492.47 6,170.33 Foreign Currency Translation Reserve (381.78) 631.40 249.62 Legal Reserve 2.84 2.84 General Reserve (3) 5,250.34 (635.48) 1,000.00 65.62 5,549.24 Surplus as per Profit & Loss Account(4) 9,492.27 (1,051.56) 2,297.19 1,470.24 9,267.66 Total 21,854.56 (2,291.46) 4,028.59 2,028.33 21,563.36
Previous Year 15,278.89 - 10,195.20 3,619.53 21,854.56
Notes : (1) Refer Note 4 of Schedule “M”. (2) Deductions denote provision/payments of premium on redemption of FCCB’s net of tax of ` 246.98 million (Previous year
` 167.58 million) and exchange loss/gain. (3) Including ` 65.62 million excess of loss over the minority interest in the equity of one of the subsidiary. (4) Deduction Includes ` 100.00 million, transferred to Capital Redemption Reserve during the year.
(` in million)As at 31st March, 2011 2010C. LOANS
SecuredA. Loans From Banks
- Term Loans 19,721.41 15,729.24 [Including ` 8,561.41 million (Previous year ` 9,979.24 million) in foreign currency]
- Working Capital 2,309.43 1,983.81 [Including ` 2,126.14 million (Previous year ` 1,930.80 million) in foreign currency]
- Vehicle Loans - 0.05 B. Loans From Others
- Term Loans 6,869.64 3,894.82 [Including ` 6,869.64 million (Previous year ` 3,894.82 million) in foreign currency]
28,900.48 21,607.92 Unsecured
Zero Coupon Foreign Currency Convertible Bonds - FCCB 2010 * - 2,229.60 Zero Coupon Foreign Currency Convertible Bonds - FCCB 2011 * 6,336.95 6,380.29 Short Term Loan From a Bank 4.36 4.36 Other Loans From Banks 4,003.42 1,505.16 [Including ` 3.42 million (Previous year ` 5.16 million) in foreign currency]
10,344.73 10,119.41
*(Refer Note 8 of Schedule “M”)
SCHEDULES FORMING PART OF THE CONSOLIDATED BALANCE SHEET
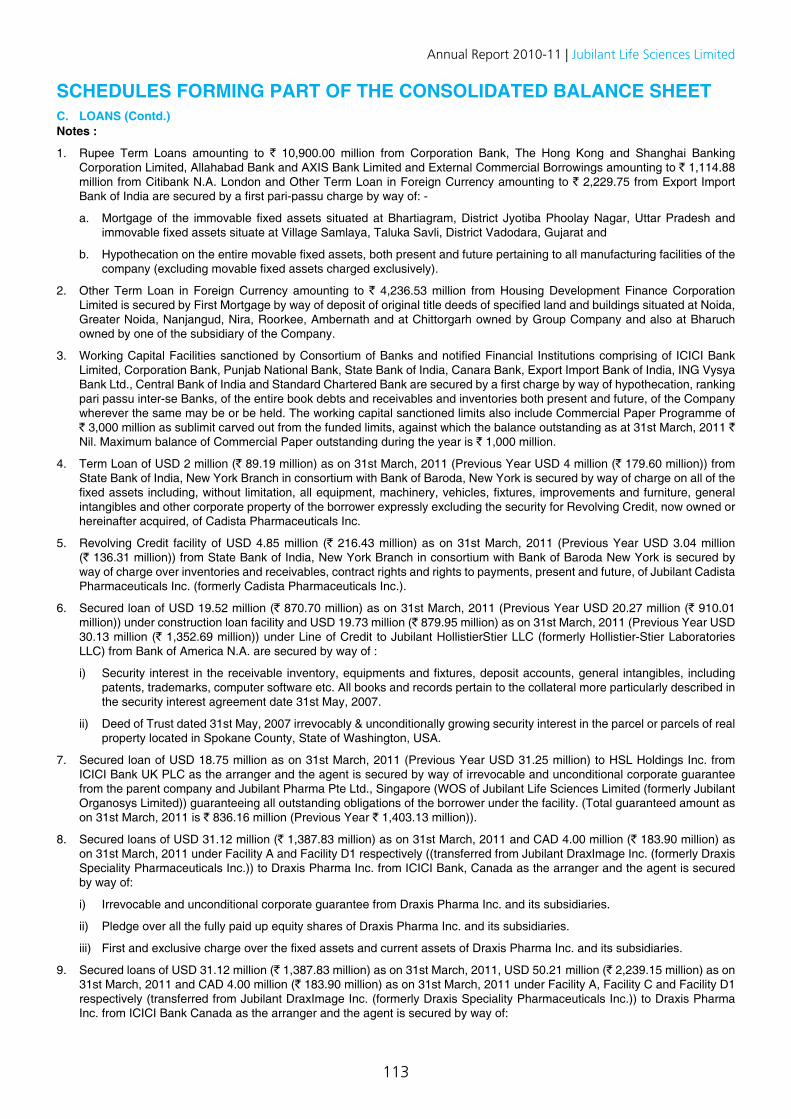
113
Annual Report 2010-11 | Jubilant Life Sciences Limited
Notes :
1. Rupee Term Loans amounting to ` 10,900.00 million from Corporation Bank, The Hong Kong and Shanghai Banking Corporation Limited, Allahabad Bank and AXIS Bank Limited and External Commercial Borrowings amounting to ` 1,114.88 million from Citibank N.A. London and Other Term Loan in Foreign Currency amounting to ` 2,229.75 from Export Import Bank of India are secured by a first pari-passu charge by way of: -
a. Mortgage of the immovable fixed assets situated at Bhartiagram, District Jyotiba Phoolay Nagar, Uttar Pradesh and immovable fixed assets situate at Village Samlaya, Taluka Savli, District Vadodara, Gujarat and
b. Hypothecation on the entire movable fixed assets, both present and future pertaining to all manufacturing facilities of the company (excluding movable fixed assets charged exclusively).
2. Other Term Loan in Foreign Currency amounting to ` 4,236.53 million from Housing Development Finance Corporation Limited is secured by First Mortgage by way of deposit of original title deeds of specified land and buildings situated at Noida, Greater Noida, Nanjangud, Nira, Roorkee, Ambernath and at Chittorgarh owned by Group Company and also at Bharuch owned by one of the subsidiary of the Company.
3. Working Capital Facilities sanctioned by Consortium of Banks and notified Financial Institutions comprising of ICICI Bank Limited, Corporation Bank, Punjab National Bank, State Bank of India, Canara Bank, Export Import Bank of India, ING Vysya Bank Ltd., Central Bank of India and Standard Chartered Bank are secured by a first charge by way of hypothecation, ranking pari passu inter-se Banks, of the entire book debts and receivables and inventories both present and future, of the Company wherever the same may be or be held. The working capital sanctioned limits also include Commercial Paper Programme of ` 3,000 million as sublimit carved out from the funded limits, against which the balance outstanding as at 31st March, 2011 ` Nil. Maximum balance of Commercial Paper outstanding during the year is ` 1,000 million.
4. Term Loan of USD 2 million (` 89.19 million) as on 31st March, 2011 (Previous Year USD 4 million (` 179.60 million)) from State Bank of India, New York Branch in consortium with Bank of Baroda, New York is secured by way of charge on all of the fixed assets including, without limitation, all equipment, machinery, vehicles, fixtures, improvements and furniture, general intangibles and other corporate property of the borrower expressly excluding the security for Revolving Credit, now owned or hereinafter acquired, of Cadista Pharmaceuticals Inc.
5. Revolving Credit facility of USD 4.85 million (` 216.43 million) as on 31st March, 2011 (Previous Year USD 3.04 million (` 136.31 million)) from State Bank of India, New York Branch in consortium with Bank of Baroda New York is secured by way of charge over inventories and receivables, contract rights and rights to payments, present and future, of Jubilant Cadista Pharmaceuticals Inc. (formerly Cadista Pharmaceuticals Inc.).
6. Secured loan of USD 19.52 million (` 870.70 million) as on 31st March, 2011 (Previous Year USD 20.27 million (` 910.01 million)) under construction loan facility and USD 19.73 million (` 879.95 million) as on 31st March, 2011 (Previous Year USD 30.13 million (` 1,352.69 million)) under Line of Credit to Jubilant HollistierStier LLC (formerly Hollistier-Stier Laboratories LLC) from Bank of America N.A. are secured by way of :
i) Security interest in the receivable inventory, equipments and fixtures, deposit accounts, general intangibles, including patents, trademarks, computer software etc. All books and records pertain to the collateral more particularly described in the security interest agreement date 31st May, 2007.
ii) Deed of Trust dated 31st May, 2007 irrevocably & unconditionally growing security interest in the parcel or parcels of real property located in Spokane County, State of Washington, USA.
7. Secured loan of USD 18.75 million as on 31st March, 2011 (Previous Year USD 31.25 million) to HSL Holdings Inc. from ICICI Bank UK PLC as the arranger and the agent is secured by way of irrevocable and unconditional corporate guarantee from the parent company and Jubilant Pharma Pte Ltd., Singapore (WOS of Jubilant Life Sciences Limited (formerly Jubilant Organosys Limited)) guaranteeing all outstanding obligations of the borrower under the facility. (Total guaranteed amount as on 31st March, 2011 is ` 836.16 million (Previous Year ` 1,403.13 million)).
8. Secured loans of USD 31.12 million (` 1,387.83 million) as on 31st March, 2011 and CAD 4.00 million (` 183.90 million) as on 31st March, 2011 under Facility A and Facility D1 respectively ((transferred from Jubilant DraxImage Inc. (formerly Draxis Speciality Pharmaceuticals Inc.)) to Draxis Pharma Inc. from ICICI Bank, Canada as the arranger and the agent is secured by way of:
i) Irrevocable and unconditional corporate guarantee from Draxis Pharma Inc. and its subsidiaries.
ii) Pledge over all the fully paid up equity shares of Draxis Pharma Inc. and its subsidiaries.
iii) First and exclusive charge over the fixed assets and current assets of Draxis Pharma Inc. and its subsidiaries.
9. Secured loans of USD 31.12 million (` 1,387.83 million) as on 31st March, 2011, USD 50.21 million (` 2,239.15 million) as on 31st March, 2011 and CAD 4.00 million (` 183.90 million) as on 31st March, 2011 under Facility A, Facility C and Facility D1 respectively (transferred from Jubilant DraxImage Inc. (formerly Draxis Speciality Pharmaceuticals Inc.)) to Draxis Pharma Inc. from ICICI Bank Canada as the arranger and the agent is secured by way of:
SCHEDULES FORMING PART OF THE CONSOLIDATED BALANCE SHEETC. LOANS (Contd.)
114
i) Pledge over the entire fully paid up equity shares (present and future of Draxis Pharma Inc.)
ii) First and exclusive charge over the assets of Draxis Pharma Inc.
10. Secured loan of USD 50.21 million (` 2,239.15 million) as on 31st March, 2011 under Facility C (transferred from Jubilant DraxImage Inc. (formerly Draxis Speciality Pharmaceuticals Inc.)) to Draxis Pharma Inc. from ICICI Bank Canada as the arranger and the agent is secured by way of irrevocable and unconditional corporate guarantee from ultimate parent company guaranteeing all outstanding obligations of the borrower under the facility. Total guaranteed amount as 31st March, 2011 is ` 2,239.15 million.
11. Secured loans of CAD 40 million (` 1,839.60 million) as on 31st March 2011 (Previous Year CAD 40 million (`1,767.20 million)) and CAD 3.00 million (` 137.86 million) as on 31st March, 2011 (Previous Year CAD 4 million (`176.72 million)) under Facility B and Facility D respectively to Jubilant DraxImage Inc. (formerly Draxis Speciality Pharmaceuticals Inc.) from ICICI Bank, Canada as the arranger and the agent is secured by way of:
i) Irrevocable and unconditional corporate guarantee from Jubilant DraxImage Inc. (formerly Draxis Speciality Pharmaceuticals Inc.) and its subsidiaries.
ii) Pledge over all the fully paid up equity shares of Jubilant DraxImage Inc. (formerly Draxis Speciality Pharmaceuticals Inc.) and its subsidiaries.
iii) First and exclusive charge over the fixed assets and current assets of Jubilant DraxImage Inc. (formerly Draxis Speciality Pharmaceuticals Inc.) and its subsidiaries.
12. Secured loans of CAD 40 million (` 1,839.60 million) as on 31st March, 2011 (Previous Year CAD 40 million (`1,767.20 million)), and CAD 3.00 million (` 137.86 million) (Previous Year CAD 4 million (` 176.72 million)) Facility B, and Facility D respectively to Jubilant DraxImage Inc. (formerly Draxis Speciality Pharmaceuticals Inc.) from ICICI Bank Canada as the arranger and the agent is secured by way of:
i) Pledge over the entire fully paid up equity shares (present and future of Jubilant DraxImage Inc. (formerly Draxis Speciality Pharmaceuticals Inc.)
ii) First and exclusive charge over the assets of Jubilant DraxImage Inc. (formerly Draxis Speciality Pharmaceuticals Inc.)
13. Working capital facilities granted to Jubilant Chemsys Ltd. by ING Vysya Bank are secured by way of First Charge by way of hypothecation of entire current assets (receivables & inventory) of Jubilant Chemsys Ltd.
14. Working capital facilities granted to Jubilant Clinsys Ltd. (formerly Clinsys Clinical Research Ltd.) by ING Vysya Bank are secured by way of First Charge by way of hypothecation of entire current assets (receivables & inventory) of Jubilant Clinsys Limited (formerly Clinsys Clinical Research Limited).
15. Loan facility granted to Jubilant First Trust Healthcare Ltd. (JFTH) by State Bank of India is secured by way of:
i. First charge over the entire fixed assets of JFTH including mortgage of the entire immovable properties situated at Howrah, Barasat (New), Bardhman, Kharagpur and Hoogly.
ii. Assignment of leasehold rights of land at Barasat (Kalpataru) hospital and First charge over its fixed assets.
iii. Assignment of leasehold rights of fixed assets at Rabindra Nath Tagore Diagnostic & Medical Care Centre (Berhampore) hospital.
iv. First charge on all cash receivables, present and future, of JFTH.
16. Working capital facilities granted to Jubilant First Trust Healthcare Ltd. (JFTH) by State Bank of India are secured by assignment of leasehold rights of land at Barasat (Kalpataru) hospital and hypothecation of its movable assets.
17. The other Term Loan of CAD 8.77 million (` 403.63 million) as on 31st March, 2011 (Previous Year CAD 11.94 million (` 527.32 million)) represent an arrangement entered into by the company with a customer whereby capital assets required for manufacture of products to be supplied to them have been acquired under a financing arrangement. The company does not carry ultimate liability for repayment of this loan as the loan is to be repaid out of reimbursement to be received by the company from the said customer. The loan is secured by specific assets purchased out of this loan proceeds.
18. Loans (excluding working capital loans and Foreign Currency Convertible Bonds) repayable within one year ` 2,066.31 million (Previous Year ` 1,632.74 million).
19. Term loan from a Bank as at 31st March, 2011 has been classified as “Unsecured” pending execution of documents.
SCHEDULES FORMING PART OF THE CONSOLIDATED BALANCE SHEETC. LOANS (Contd.)
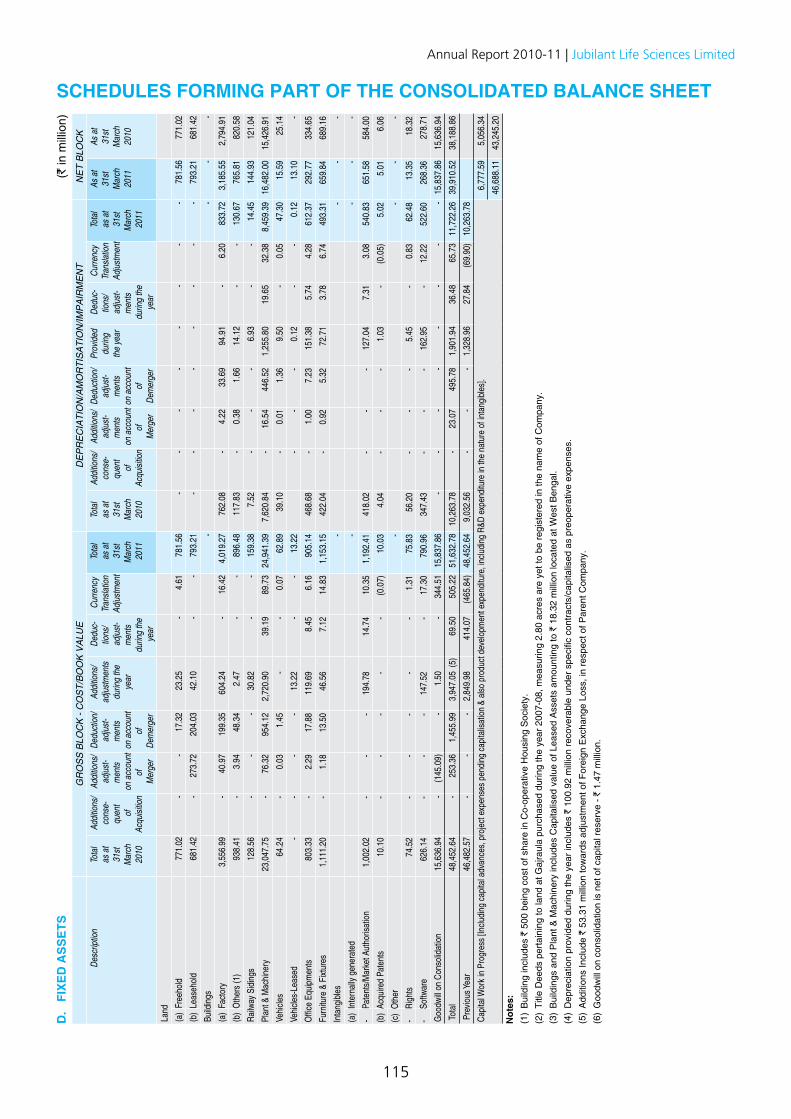
115
Annual Report 2010-11 | Jubilant Life Sciences Limited
GR
OS
S B
LOC
K -
CO
ST/
BO
OK
VA
LUE
DE
PR
EC
IATI
ON
/AM
OR
TIS
ATI
ON
/IMP
AIR
ME
NT
NE
T B
LOC
K D
escr
iptio
n To
tal
as
at
31s
t M
arch
2
010
Add
ition
s/
con
se-
quen
t o
f Ac
quis
ition
Add
ition
s/
adj
ust-
men
ts
on
acco
unt
of
Mer
ger
Ded
uctio
n/
adj
ust-
men
ts
on
acco
unt
of
Dem
erge
r
Add
ition
s/
adj
ustm
ents
d
urin
g th
e y
ear
Ded
uc-
tions
/ a
djus
t-m
ents
du
ring
the
yea
r
Cur
renc
y Tr
ansl
atio
n Ad
just
men
t
Tota
l a
s at
3
1st
Mar
ch
201
1
Tota
l a
s at
3
1st
Mar
ch
201
0
Add
ition
s/
con
se-
quen
t o
f A
cqui
sitio
n
Add
ition
s/
adj
ust-
men
ts
on
acco
unt
of
Mer
ger
Ded
uctio
n/
adju
st-
men
ts
on a
ccou
nt
of
Dem
erge
r
Pro
vide
d d
urin
g th
e ye
ar
Ded
uc-
tions
/ a
djus
t-m
ents
d
urin
g th
e y
ear
Cur
renc
y Tr
ansl
atio
n A
djus
tmen
t
Tota
l a
s at
3
1st
Mar
ch
201
1
As a
t 31
st
Mar
ch
2011
As a
t 31
st
Mar
ch
2010
Land
(a)
Free
hold
7
71.0
2 -
- 1
7.32
2
3.25
-
4.6
1 7
81.5
6 -
- -
- -
- -
- 7
81.5
6 7
71.0
2
(b)
Leas
ehol
d 6
81.4
2 -
273
.72
204
.03
42.
10
- -
793
.21
- -
- -
- -
- -
793
.21
681
.42
Build
ings
-
- -
-
(a)
Fact
ory
3,5
56.9
9 -
40.
97
199
.35
604
.24
- 1
6.42
4
,019
.27
762
.08
- 4
.22
33.
69
94.
91
- 6
.20
833
.72
3,1
85.5
5 2
,794
.91
(b)
Oth
ers
(1)
938
.41
- 3
.94
48.
34
2.4
7 -
- 8
96.4
8 1
17.8
3 -
0.3
8 1
.66
14.
12
- -
130
.67
765
.81
820
.58
Rai
lway
Sid
ings
1
28.5
6 -
- -
30.8
2 -
- 1
59.3
8 7
.52
- -
- 6
.93
- -
14.
45
144
.93
121
.04
Plan
t & M
achi
nery
23
,047
.75
- 7
6.32
9
54.1
2 2
,720
.90
39.
19
89.
73
24,
941.
39
7,6
20.8
4 -
16.
54
446
.52
1,2
55.8
0 1
9.65
3
2.38
8
,459
.39
16,
482.
00
15,
426.
91
Vehi
cles
6
4.24
-
0.0
3 1
.45
- -
0.0
7 6
2.89
3
9.10
-
0.0
1 1
.36
9.5
0 -
0.0
5 4
7.30
1
5.59
2
5.14
Vehi
cles
-Lea
sed
- -
- -
13.
22
- -
13.
22
- -
- 0
.12
- -
0.1
2 1
3.10
-
Offi
ce E
quip
men
ts
803
.33
- 2
.29
17.
88
119
.69
8.4
5 6
.16
905
.14
468
.68
- 1
.00
7.2
3 1
51.3
8 5
.74
4.2
8 6
12.3
7 2
92.7
7 3
34.6
5
Furn
iture
& F
ixtu
res
1,1
11.2
0 -
1.1
8 1
3.50
4
6.56
7
.12
14.
83
1,1
53.1
5 4
22.0
4 -
0.9
2 5
.32
72.
71
3.7
8 6
.74
493
.31
659
.84
689
.16
Inta
ngib
les
- -
- -
(a)
Inte
rnal
ly g
ener
ated
-
- -
-
-Pa
tent
s/M
arke
t Aut
horis
atio
n 1
,002
.02
- -
- 1
94.7
8 1
4.74
1
0.35
1
,192
.41
418
.02
- -
- 1
27.0
4 7
.31
3.0
8 5
40.8
3 6
51.5
8 5
84.0
0
(b)
Acqu
ired
Pate
nts
10.
10
- -
- -
- (0
.07)
10.
03
4.0
4 -
- -
1.0
3 -
(0.0
5) 5
.02
5.0
1 6
.06
(c)
Oth
er
- -
- -
-R
ight
s 7
4.52
-
- -
- -
1.3
1 7
5.83
5
6.20
-
- -
5.4
5 -
0.8
3 6
2.48
1
3.35
1
8.32
-So
ftwar
e 6
26.1
4 -
- -
147
.52
- 1
7.30
7
90.9
6 3
47.4
3 -
- -
162
.95
- 1
2.22
5
22.6
0 2
68.3
6 2
78.7
1
Goo
dwill
on C
onso
lidat
ion
15,6
36.9
4 -
(145
.09)
- 1
.50
- 3
44.5
1 1
5,83
7.86
-
- -
- -
- -
- 1
5,83
7.86
1
5,63
6.94
Tot
al
48,
452.
64
- 2
53.3
6 1
,455
.99
3,9
47.0
5 (5
) 6
9.50
5
05.2
2 5
1,63
2.78
1
0,26
3.78
-
23.
07
495
.78
1,9
01.9
4 3
6.48
6
5.73
11
,722
.26
39,
910.
52
38,
188.
86
Pre
viou
s Yea
r 4
6,48
2.57
-
- -
2,8
49.9
8 4
14.0
7 (4
65.8
4) 4
8,45
2.64
9
,032
.56
- -
- 1
,328
.96
27.
84
(69.
90)
10,
263.
78
Cap
ital W
ork
in P
rogr
ess
[Incl
udin
g ca
pita
l adv
ance
s, p
roje
ct e
xpen
ses
pend
ing
capi
talis
atio
n &
also
pro
duct
dev
elop
men
t exp
endi
ture
, inc
ludi
ng R
&D e
xpen
ditu
re in
the
natu
re o
f int
angi
bles
]. 6
,777
.59
5,0
56.3
4
46,
688.
11
43,
245.
20
Not
es:
(1)
Bui
ldin
g in
clud
es `
500
bei
ng c
ost o
f sha
re in
Co-
oper
ativ
e H
ousi
ng S
ocie
ty.
(2)
Title
Dee
ds p
erta
inin
g to
land
at G
ajra
ula
purc
hase
d du
ring
the
year
200
7-08
, mea
surin
g 2.
80 a
cres
are
yet
to b
e re
gist
ered
in th
e na
me
of C
ompa
ny.
(3)
Bui
ldin
gs a
nd P
lant
& M
achi
nery
incl
udes
Cap
italis
ed v
alue
of L
ease
d A
sset
s am
ount
ing
to `
18.
32 m
illio
n lo
cate
d at
Wes
t Ben
gal.
(4)
Dep
reci
atio
n pr
ovid
ed d
urin
g th
e ye
ar in
clud
es `
100
.92
mill
ion
reco
vera
ble
unde
r spe
cific
con
tract
s/ca
pita
lised
as
preo
pera
tive
expe
nses
.(5
)A
dditi
ons
Incl
ude
` 53
.31
mill
ion
tow
ards
adj
ustm
ent o
f For
eign
Exc
hang
e Lo
ss, i
n re
spec
t of P
aren
t Com
pany
.(6
)G
oodw
ill o
n co
nsol
idat
ion
is n
et o
f cap
ital r
eser
ve -
` 1.
47 m
illio
n.
D.
FIX
ED
AS
SE
TS
(` in
mill
ion)
SCHEDULES FORMING PART OF THE CONSOLIDATED BALANCE SHEET
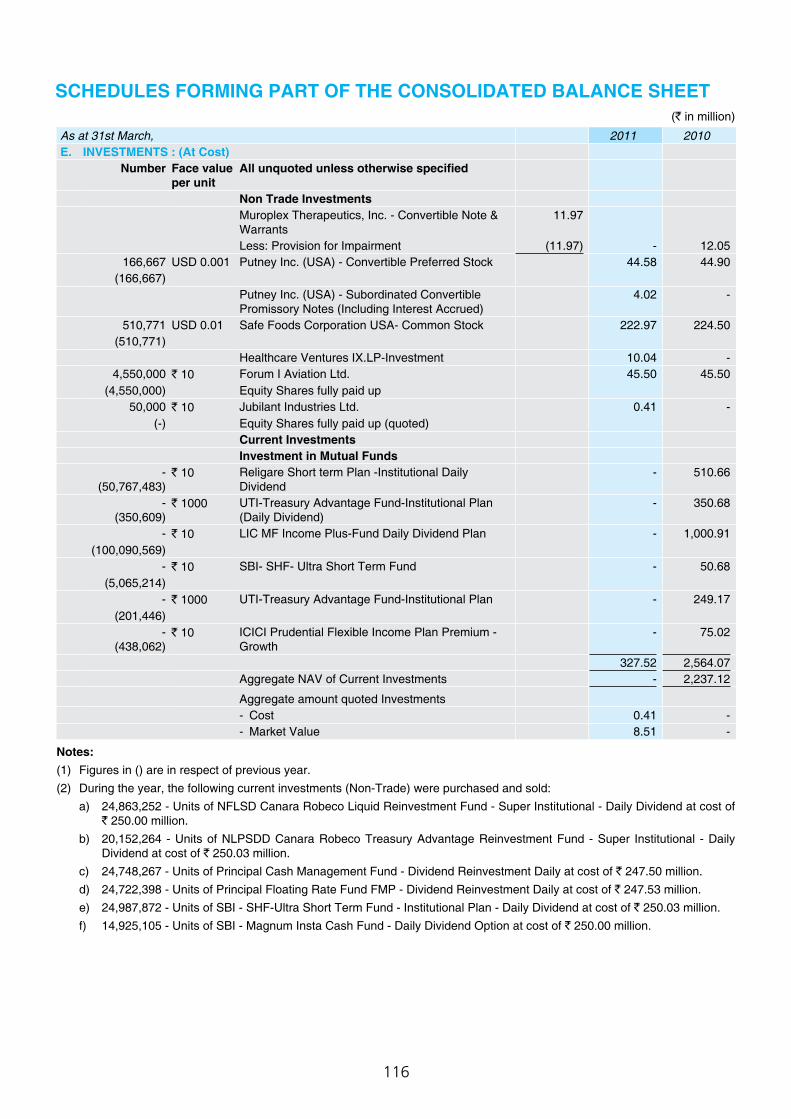
116
SCHEDULES FORMING PART OF THE CONSOLIDATED BALANCE SHEET(` in million)
As at 31st March, 2011 2010E. INVESTMENTS : (At Cost)
Number Face valueper unit
All unquoted unless otherwise specified
Non Trade InvestmentsMuroplex Therapeutics, Inc. - Convertible Note & Warrants
11.97
Less: Provision for Impairment (11.97) - 12.05 166,667 USD 0.001 Putney Inc. (USA) - Convertible Preferred Stock 44.58 44.90
(166,667)Putney Inc. (USA) - Subordinated Convertible Promissory Notes (Including Interest Accrued)
4.02 -
510,771 USD 0.01 Safe Foods Corporation USA- Common Stock 222.97 224.50 (510,771)
Healthcare Ventures IX.LP-Investment 10.04 - 4,550,000 ` 10 Forum I Aviation Ltd. 45.50 45.50
(4,550,000) Equity Shares fully paid up50,000 ` 10 Jubilant Industries Ltd. 0.41 -
(-) Equity Shares fully paid up (quoted)Current InvestmentsInvestment in Mutual Funds
- (50,767,483)
` 10 Religare Short term Plan -Institutional Daily Dividend
- 510.66
- (350,609)
` 1000 UTI-Treasury Advantage Fund-Institutional Plan (Daily Dividend)
- 350.68
- ` 10 LIC MF Income Plus-Fund Daily Dividend Plan - 1,000.91 (100,090,569)
- ` 10 SBI- SHF- Ultra Short Term Fund - 50.68 (5,065,214)
- ` 1000 UTI-Treasury Advantage Fund-Institutional Plan - 249.17 (201,446)
- (438,062)
` 10 ICICI Prudential Flexible Income Plan Premium - Growth
- 75.02
327.52 2,564.07 Aggregate NAV of Current Investments - 2,237.12
Aggregate amount quoted Investments- Cost 0.41 -- Market Value 8.51 -
Notes: (1) Figures in () are in respect of previous year. (2) During the year, the following current investments (Non-Trade) were purchased and sold: a) 24,863,252 - Units of NFLSD Canara Robeco Liquid Reinvestment Fund - Super Institutional - Daily Dividend at cost of
` 250.00 million. b) 20,152,264 - Units of NLPSDD Canara Robeco Treasury Advantage Reinvestment Fund - Super Institutional - Daily
Dividend at cost of ` 250.03 million. c) 24,748,267 - Units of Principal Cash Management Fund - Dividend Reinvestment Daily at cost of ` 247.50 million. d) 24,722,398 - Units of Principal Floating Rate Fund FMP - Dividend Reinvestment Daily at cost of ` 247.53 million. e) 24,987,872 - Units of SBI - SHF-Ultra Short Term Fund - Institutional Plan - Daily Dividend at cost of ` 250.03 million. f) 14,925,105 - Units of SBI - Magnum Insta Cash Fund - Daily Dividend Option at cost of ` 250.00 million.
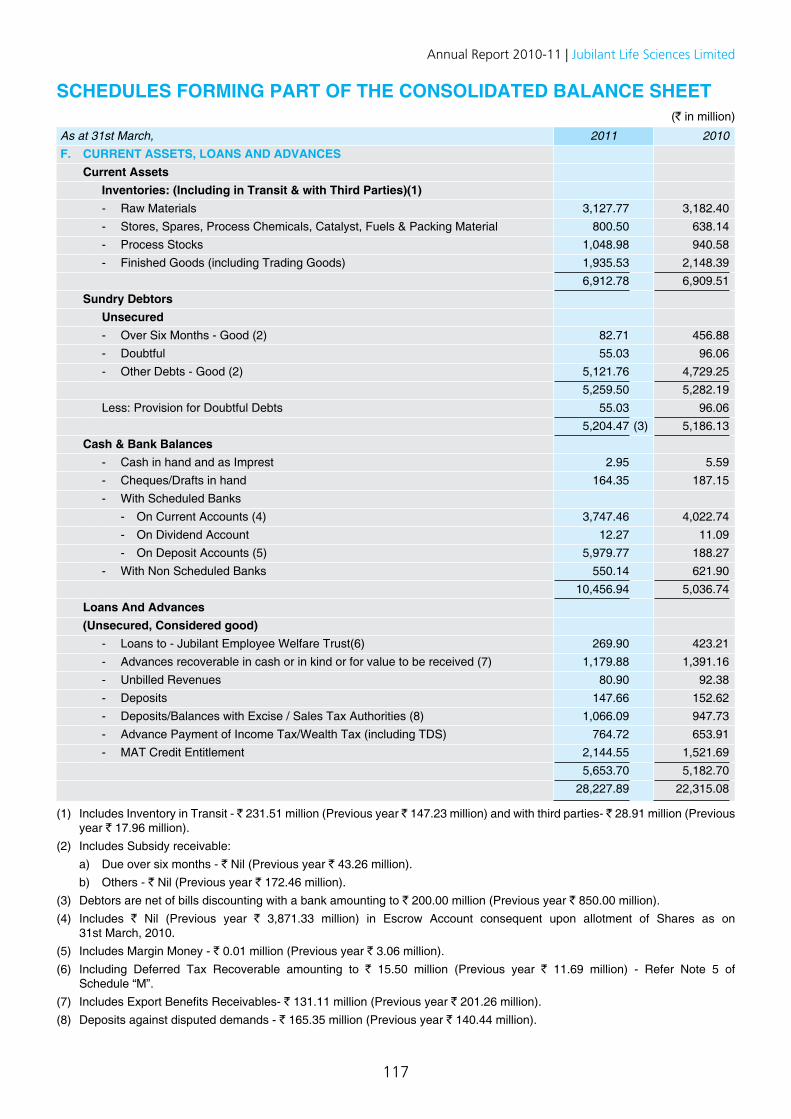
117
Annual Report 2010-11 | Jubilant Life Sciences Limited
SCHEDULES FORMING PART OF THE CONSOLIDATED BALANCE SHEET(` in million)
As at 31st March, 2011 2010F. CURRENT ASSETS, LOANS AND ADVANCES
Current AssetsInventories: (Including in Transit & with Third Parties)(1)- Raw Materials 3,127.77 3,182.40 - Stores, Spares, Process Chemicals, Catalyst, Fuels & Packing Material 800.50 638.14 - Process Stocks 1,048.98 940.58 - Finished Goods (including Trading Goods) 1,935.53 2,148.39
6,912.78 6,909.51 Sundry Debtors
Unsecured- Over Six Months - Good (2) 82.71 456.88 - Doubtful 55.03 96.06 - Other Debts - Good (2) 5,121.76 4,729.25
5,259.50 5,282.19 Less: Provision for Doubtful Debts 55.03 96.06
5,204.47 (3) 5,186.13 Cash & Bank Balances
- Cash in hand and as Imprest 2.95 5.59 - Cheques/Drafts in hand 164.35 187.15 - With Scheduled Banks
- On Current Accounts (4) 3,747.46 4,022.74 - On Dividend Account 12.27 11.09 - On Deposit Accounts (5) 5,979.77 188.27
- With Non Scheduled Banks 550.14 621.90 10,456.94 5,036.74
Loans And Advances(Unsecured, Considered good)
- Loans to - Jubilant Employee Welfare Trust(6) 269.90 423.21 - Advances recoverable in cash or in kind or for value to be received (7) 1,179.88 1,391.16 - Unbilled Revenues 80.90 92.38 - Deposits 147.66 152.62 - Deposits/Balances with Excise / Sales Tax Authorities (8) 1,066.09 947.73 - Advance Payment of Income Tax/Wealth Tax (including TDS) 764.72 653.91 - MAT Credit Entitlement 2,144.55 1,521.69
5,653.70 5,182.70 28,227.89 22,315.08
(1) Includes Inventory in Transit - ` 231.51 million (Previous year ` 147.23 million) and with third parties- ` 28.91 million (Previous year ` 17.96 million).
(2) Includes Subsidy receivable: a) Due over six months - ` Nil (Previous year ` 43.26 million). b) Others - ` Nil (Previous year ` 172.46 million).(3) Debtors are net of bills discounting with a bank amounting to ` 200.00 million (Previous year ` 850.00 million).(4) Includes ` Nil (Previous year ` 3,871.33 million) in Escrow Account consequent upon allotment of Shares as on
31st March, 2010.(5) Includes Margin Money - ` 0.01 million (Previous year ` 3.06 million).(6) Including Deferred Tax Recoverable amounting to ` 15.50 million (Previous year ` 11.69 million) - Refer Note 5 of
Schedule “M”.(7) Includes Export Benefits Receivables- ` 131.11 million (Previous year ` 201.26 million).(8) Deposits against disputed demands - ` 165.35 million (Previous year ` 140.44 million).

118
(` in million)
SCHEDULES FORMING PART OF THE CONSOLIDATED BALANCE SHEET
As at 31st March, 2011 2010G. CURRENT LIABILITIES AND PROVISIONS
A) Current LiabilitiesSundry Creditors and Expenses Payable- Due to Micro, Small and Medium Enterprises 29.49 22.71 - Others 4,848.60 4,995.69 Acceptances 2,151.20 1,869.85 Trade Deposits & Advances (1) 448.16 393.89 Interest Accrued but not due 114.57 93.96 Other Liabilities 255.96 146.04 Investors Education and Protection Fund shall be credited with the following amount namely:- Unclaimed/unpaid Dividends 12.27 11.09 - Unclaimed Fixed Deposits 1.13 2.02
7,861.38 7,535.25 B) Provisions
- Dividends on Equity Shares (Including Dividend Distribution Tax) 370.24 370.30 - Income Tax & Wealth Tax 727.52 852.33 - Employee Benefits 491.52 468.18 - Others(2) 2,694.89 2,975.07
4,284.17 4,665.88 Total (A+B) 12,145.55 12,201.13
(1) Include ` 338.49 million (Previous year ` 210.91 million) towards unearned income.(2) Include Premium on redemption of FCCBs - ` 2,605.06 million (Previous year ` 2,835.33 million) and Provision of loss of ` 83.29
million (Previous Year ` 100.09 million) on mark to market of unutilised forward covers outstanding/interest rate swaps.
SCHEDULES FORMING PART OF THE CONSOLIDATED PROFIT AND LOSS ACCOUNT(` in million)
For the year ended 31st March, 2011 2010H. SALES & SERVICES
Sales 32,738.50 36,062.37 Licensing & Regulatory Fees 74.00 133.05 Drug Discovery Development Services 2,132.30 2,454.01 Hospital Revenue 119.34 80.91 Manufacturing Services 37.98 24.41 (1)
35,102.12 38,754.75
I. OTHER INCOMEIncome from Current Investments (Non-Trade) - Dividend 10.65 73.10 Profit on Sale of Current Investments - 22.29 Royalty 28.97 27.33 Miscellaneous Receipts (2) 178.30 142.38
217.92 265.10
(1) Refer Note 14 of Schedule “M”.(2) Includes: a) Income towards Rent, Utilities & Services provided ` 29.46 million (Previous year ` 13.84 million) and Insurance claims
` 14.68 million (Previous year ` 0.98 million). [Tax Deducted at source ` 3.13 million - (Previous year ` 2.11 million)]. b) Interest received from Income Tax Department ` 12.73 million (Previous year ` 4.75 million) and Refund of Sale Tax of
` Nil (Previous year ` 13.71 million). (` in million)
For the year ended 31st March, 2011 2010J. INCREASE/(DECREASE) IN STOCKS
Increase /( Decrease) in Finished Goods 387.99 203.76 387.99 203.76
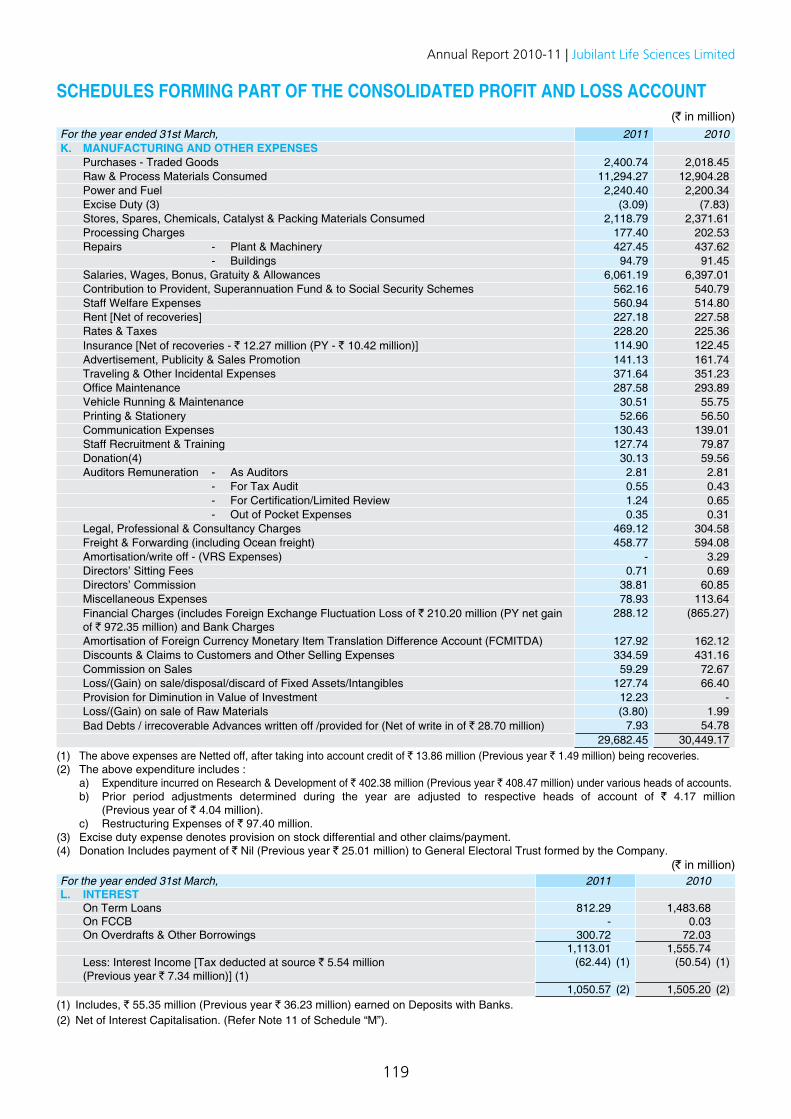
119
Annual Report 2010-11 | Jubilant Life Sciences Limited
SCHEDULES FORMING PART OF THE CONSOLIDATED PROFIT AND LOSS ACCOUNT(` in million)
For the year ended 31st March, 2011 2010K. MANUFACTURING AND OTHER EXPENSES
Purchases - Traded Goods 2,400.74 2,018.45 Raw & Process Materials Consumed 11,294.27 12,904.28 Power and Fuel 2,240.40 2,200.34 Excise Duty (3) (3.09) (7.83)Stores, Spares, Chemicals, Catalyst & Packing Materials Consumed 2,118.79 2,371.61 Processing Charges 177.40 202.53 Repairs - Plant & Machinery 427.45 437.62
- Buildings 94.79 91.45 Salaries, Wages, Bonus, Gratuity & Allowances 6,061.19 6,397.01 Contribution to Provident, Superannuation Fund & to Social Security Schemes 562.16 540.79 Staff Welfare Expenses 560.94 514.80 Rent [Net of recoveries] 227.18 227.58 Rates & Taxes 228.20 225.36 Insurance [Net of recoveries - ` 12.27 million (PY - ` 10.42 million)] 114.90 122.45 Advertisement, Publicity & Sales Promotion 141.13 161.74 Traveling & Other Incidental Expenses 371.64 351.23 Office Maintenance 287.58 293.89 Vehicle Running & Maintenance 30.51 55.75 Printing & Stationery 52.66 56.50 Communication Expenses 130.43 139.01 Staff Recruitment & Training 127.74 79.87 Donation(4) 30.13 59.56 Auditors Remuneration - As Auditors 2.81 2.81
- For Tax Audit 0.55 0.43 - For Certification/Limited Review 1.24 0.65 - Out of Pocket Expenses 0.35 0.31
Legal, Professional & Consultancy Charges 469.12 304.58 Freight & Forwarding (including Ocean freight) 458.77 594.08 Amortisation/write off - (VRS Expenses) - 3.29 Directors’ Sitting Fees 0.71 0.69 Directors’ Commission 38.81 60.85 Miscellaneous Expenses 78.93 113.64 Financial Charges (includes Foreign Exchange Fluctuation Loss of ` 210.20 million (PY net gain of ` 972.35 million) and Bank Charges
288.12 (865.27)
Amortisation of Foreign Currency Monetary Item Translation Difference Account (FCMITDA) 127.92 162.12 Discounts & Claims to Customers and Other Selling Expenses 334.59 431.16 Commission on Sales 59.29 72.67 Loss/(Gain) on sale/disposal/discard of Fixed Assets/Intangibles 127.74 66.40 Provision for Diminution in Value of Investment 12.23 - Loss/(Gain) on sale of Raw Materials (3.80) 1.99 Bad Debts / irrecoverable Advances written off /provided for (Net of write in of ` 28.70 million) 7.93 54.78
29,682.45 30,449.17(1) The above expenses are Netted off, after taking into account credit of ` 13.86 million (Previous year ` 1.49 million) being recoveries.(2) The above expenditure includes : a) Expenditure incurred on Research & Development of ` 402.38 million (Previous year ` 408.47 million) under various heads of accounts. b) Prior period adjustments determined during the year are adjusted to respective heads of account of ` 4.17 million
(Previous year of ` 4.04 million). c) Restructuring Expenses of ` 97.40 million. (3) Excise duty expense denotes provision on stock differential and other claims/payment.(4) Donation Includes payment of ` Nil (Previous year ` 25.01 million) to General Electoral Trust formed by the Company.
(` in million)For the year ended 31st March, 2011 2010L. INTEREST
On Term Loans 812.29 1,483.68 On FCCB - 0.03 On Overdrafts & Other Borrowings 300.72 72.03
1,113.01 1,555.74 Less: Interest Income [Tax deducted at source ` 5.54 million (Previous year ` 7.34 million)] (1)
(62.44) (1) (50.54) (1)
1,050.57 (2) 1,505.20 (2)(1) Includes, ` 55.35 million (Previous year ` 36.23 million) earned on Deposits with Banks. (2) Net of Interest Capitalisation. (Refer Note 11 of Schedule “M”).
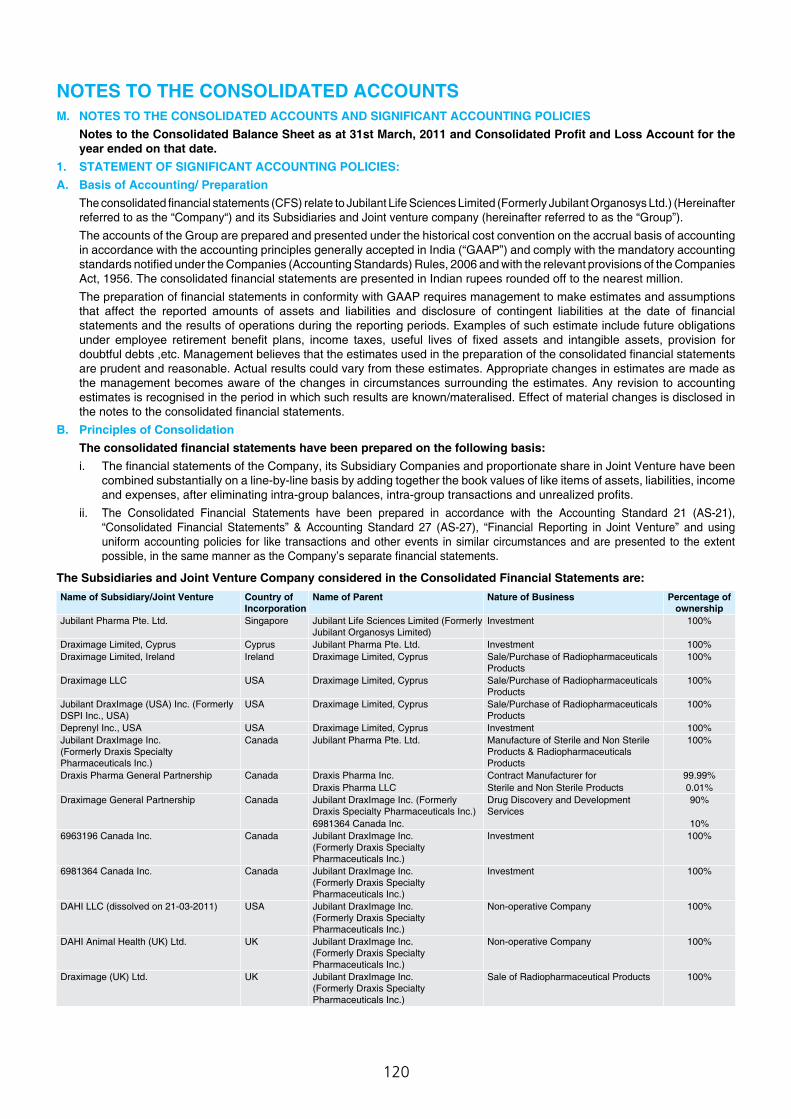
120
NOTES TO THE CONSOLIDATED ACCOUNTSM. NOTES TO THE CONSOLIDATED ACCOUNTS AND SIGNIFICANT ACCOUNTING POLICIES Notes to the Consolidated Balance Sheet as at 31st March, 2011 and Consolidated Profit and Loss Account for the
year ended on that date.1. STATEMENT OF SIGNIFICANT ACCOUNTING POLICIES: A. Basis of Accounting/ Preparation The consolidated financial statements (CFS) relate to Jubilant Life Sciences Limited (Formerly Jubilant Organosys Ltd.) (Hereinafter
referred to as the “Company“) and its Subsidiaries and Joint venture company (hereinafter referred to as the “Group”). The accounts of the Group are prepared and presented under the historical cost convention on the accrual basis of accounting
in accordance with the accounting principles generally accepted in India (“GAAP”) and comply with the mandatory accounting standards notified under the Companies (Accounting Standards) Rules, 2006 and with the relevant provisions of the Companies Act, 1956. The consolidated financial statements are presented in Indian rupees rounded off to the nearest million.
The preparation of financial statements in conformity with GAAP requires management to make estimates and assumptions that affect the reported amounts of assets and liabilities and disclosure of contingent liabilities at the date of financial statements and the results of operations during the reporting periods. Examples of such estimate include future obligations under employee retirement benefit plans, income taxes, useful lives of fixed assets and intangible assets, provision for doubtful debts ,etc. Management believes that the estimates used in the preparation of the consolidated financial statements are prudent and reasonable. Actual results could vary from these estimates. Appropriate changes in estimates are made as the management becomes aware of the changes in circumstances surrounding the estimates. Any revision to accounting estimates is recognised in the period in which such results are known/materalised. Effect of material changes is disclosed in the notes to the consolidated financial statements.
B. Principles of Consolidation The consolidated financial statements have been prepared on the following basis: i. The financial statements of the Company, its Subsidiary Companies and proportionate share in Joint Venture have been
combined substantially on a line-by-line basis by adding together the book values of like items of assets, liabilities, income and expenses, after eliminating intra-group balances, intra-group transactions and unrealized profits.
ii. The Consolidated Financial Statements have been prepared in accordance with the Accounting Standard 21 (AS-21), “Consolidated Financial Statements” & Accounting Standard 27 (AS-27), “Financial Reporting in Joint Venture” and using uniform accounting policies for like transactions and other events in similar circumstances and are presented to the extent possible, in the same manner as the Company’s separate financial statements.
The Subsidiaries and Joint Venture Company considered in the Consolidated Financial Statements are:Name of Subsidiary/Joint Venture Country of
IncorporationName of Parent Nature of Business Percentage of
ownershipJubilant Pharma Pte. Ltd. Singapore Jubilant Life Sciences Limited (Formerly
Jubilant Organosys Limited)Investment 100%
Draximage Limited, Cyprus Cyprus Jubilant Pharma Pte. Ltd. Investment 100%Draximage Limited, Ireland Ireland Draximage Limited, Cyprus Sale/Purchase of Radiopharmaceuticals
Products100%
Draximage LLC USA Draximage Limited, Cyprus Sale/Purchase of Radiopharmaceuticals Products
100%
Jubilant DraxImage (USA) Inc. (Formerly DSPI Inc., USA)
USA Draximage Limited, Cyprus Sale/Purchase of Radiopharmaceuticals Products
100%
Deprenyl Inc., USA USA Draximage Limited, Cyprus Investment 100%Jubilant DraxImage Inc. (Formerly Draxis Specialty Pharmaceuticals Inc.)
Canada Jubilant Pharma Pte. Ltd. Manufacture of Sterile and Non Sterile Products & Radiopharmaceuticals Products
100%
Draxis Pharma General Partnership Canada Draxis Pharma Inc. Contract Manufacturer for 99.99%Draxis Pharma LLC Sterile and Non Sterile Products 0.01%
Draximage General Partnership Canada Jubilant DraxImage Inc. (Formerly Draxis Specialty Pharmaceuticals Inc.)
Drug Discovery and Development Services
90%
6981364 Canada Inc. 10%6963196 Canada Inc. Canada Jubilant DraxImage Inc.
(Formerly Draxis Specialty Pharmaceuticals Inc.)
Investment 100%
6981364 Canada Inc. Canada Jubilant DraxImage Inc. (Formerly Draxis Specialty Pharmaceuticals Inc.)
Investment 100%
DAHI LLC (dissolved on 21-03-2011) USA Jubilant DraxImage Inc. (Formerly Draxis Specialty Pharmaceuticals Inc.)
Non-operative Company 100%
DAHI Animal Health (UK) Ltd. UK Jubilant DraxImage Inc. (Formerly Draxis Specialty Pharmaceuticals Inc.)
Non-operative Company 100%
Draximage (UK) Ltd. UK Jubilant DraxImage Inc. (Formerly Draxis Specialty Pharmaceuticals Inc.)
Sale of Radiopharmaceutical Products 100%
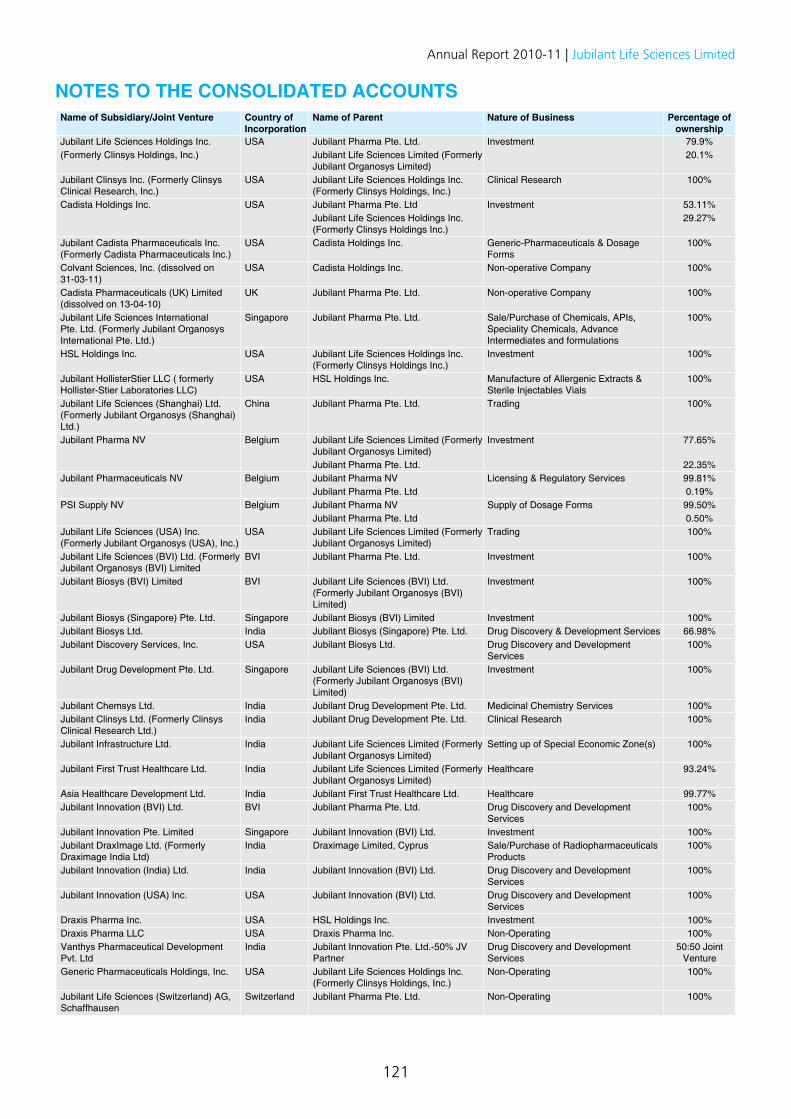
121
Annual Report 2010-11 | Jubilant Life Sciences Limited
NOTES TO THE CONSOLIDATED ACCOUNTSName of Subsidiary/Joint Venture Country of
IncorporationName of Parent Nature of Business Percentage of
ownershipJubilant Life Sciences Holdings Inc. USA Jubilant Pharma Pte. Ltd. Investment 79.9%(Formerly Clinsys Holdings, Inc.) Jubilant Life Sciences Limited (Formerly
Jubilant Organosys Limited)20.1%
Jubilant Clinsys Inc. (Formerly Clinsys Clinical Research, Inc.)
USA Jubilant Life Sciences Holdings Inc. (Formerly Clinsys Holdings, Inc.)
Clinical Research 100%
Cadista Holdings Inc. USA Jubilant Pharma Pte. Ltd Investment 53.11%Jubilant Life Sciences Holdings Inc. (Formerly Clinsys Holdings Inc.)
29.27%
Jubilant Cadista Pharmaceuticals Inc. (Formerly Cadista Pharmaceuticals Inc.)
USA Cadista Holdings Inc. Generic-Pharmaceuticals & Dosage Forms
100%
Colvant Sciences, Inc. (dissolved on 31-03-11)
USA Cadista Holdings Inc. Non-operative Company 100%
Cadista Pharmaceuticals (UK) Limited (dissolved on 13-04-10)
UK Jubilant Pharma Pte. Ltd. Non-operative Company 100%
Jubilant Life Sciences International Pte. Ltd. (Formerly Jubilant Organosys International Pte. Ltd.)
Singapore Jubilant Pharma Pte. Ltd. Sale/Purchase of Chemicals, APIs, Speciality Chemicals, Advance Intermediates and formulations
100%
HSL Holdings Inc. USA Jubilant Life Sciences Holdings Inc. (Formerly Clinsys Holdings Inc.)
Investment 100%
Jubilant HollisterStier LLC ( formerly Hollister-Stier Laboratories LLC)
USA HSL Holdings Inc. Manufacture of Allergenic Extracts & Sterile Injectables Vials
100%
Jubilant Life Sciences (Shanghai) Ltd. (Formerly Jubilant Organosys (Shanghai) Ltd.)
China Jubilant Pharma Pte. Ltd. Trading 100%
Jubilant Pharma NV Belgium Jubilant Life Sciences Limited (Formerly Jubilant Organosys Limited)
Investment 77.65%
Jubilant Pharma Pte. Ltd. 22.35%Jubilant Pharmaceuticals NV Belgium Jubilant Pharma NV Licensing & Regulatory Services 99.81%
Jubilant Pharma Pte. Ltd 0.19%PSI Supply NV Belgium Jubilant Pharma NV Supply of Dosage Forms 99.50%
Jubilant Pharma Pte. Ltd 0.50%Jubilant Life Sciences (USA) Inc. (Formerly Jubilant Organosys (USA), Inc.)
USA Jubilant Life Sciences Limited (Formerly Jubilant Organosys Limited)
Trading 100%
Jubilant Life Sciences (BVI) Ltd. (Formerly Jubilant Organosys (BVI) Limited
BVI Jubilant Pharma Pte. Ltd. Investment 100%
Jubilant Biosys (BVI) Limited BVI Jubilant Life Sciences (BVI) Ltd. (Formerly Jubilant Organosys (BVI) Limited)
Investment 100%
Jubilant Biosys (Singapore) Pte. Ltd. Singapore Jubilant Biosys (BVI) Limited Investment 100%Jubilant Biosys Ltd. India Jubilant Biosys (Singapore) Pte. Ltd. Drug Discovery & Development Services 66.98%Jubilant Discovery Services, Inc. USA Jubilant Biosys Ltd. Drug Discovery and Development
Services100%
Jubilant Drug Development Pte. Ltd. Singapore Jubilant Life Sciences (BVI) Ltd. (Formerly Jubilant Organosys (BVI) Limited)
Investment 100%
Jubilant Chemsys Ltd. India Jubilant Drug Development Pte. Ltd. Medicinal Chemistry Services 100%Jubilant Clinsys Ltd. (Formerly Clinsys Clinical Research Ltd.)
India Jubilant Drug Development Pte. Ltd. Clinical Research 100%
Jubilant Infrastructure Ltd. India Jubilant Life Sciences Limited (Formerly Jubilant Organosys Limited)
Setting up of Special Economic Zone(s) 100%
Jubilant First Trust Healthcare Ltd. India Jubilant Life Sciences Limited (Formerly Jubilant Organosys Limited)
Healthcare 93.24%
Asia Healthcare Development Ltd. India Jubilant First Trust Healthcare Ltd. Healthcare 99.77%Jubilant Innovation (BVI) Ltd. BVI Jubilant Pharma Pte. Ltd. Drug Discovery and Development
Services100%
Jubilant Innovation Pte. Limited Singapore Jubilant Innovation (BVI) Ltd. Investment 100%Jubilant DraxImage Ltd. (Formerly Draximage India Ltd)
India Draximage Limited, Cyprus Sale/Purchase of Radiopharmaceuticals Products
100%
Jubilant Innovation (India) Ltd. India Jubilant Innovation (BVI) Ltd. Drug Discovery and Development Services
100%
Jubilant Innovation (USA) Inc. USA Jubilant Innovation (BVI) Ltd. Drug Discovery and Development Services
100%
Draxis Pharma Inc. USA HSL Holdings Inc. Investment 100%Draxis Pharma LLC USA Draxis Pharma Inc. Non-Operating 100%Vanthys Pharmaceutical Development Pvt. Ltd
India Jubilant Innovation Pte. Ltd.-50% JV Partner
Drug Discovery and Development Services
50:50 Joint Venture
Generic Pharmaceuticals Holdings, Inc. USA Jubilant Life Sciences Holdings Inc. (Formerly Clinsys Holdings, Inc.)
Non-Operating 100%
Jubilant Life Sciences (Switzerland) AG, Schaffhausen
Switzerland Jubilant Pharma Pte. Ltd. Non-Operating 100%
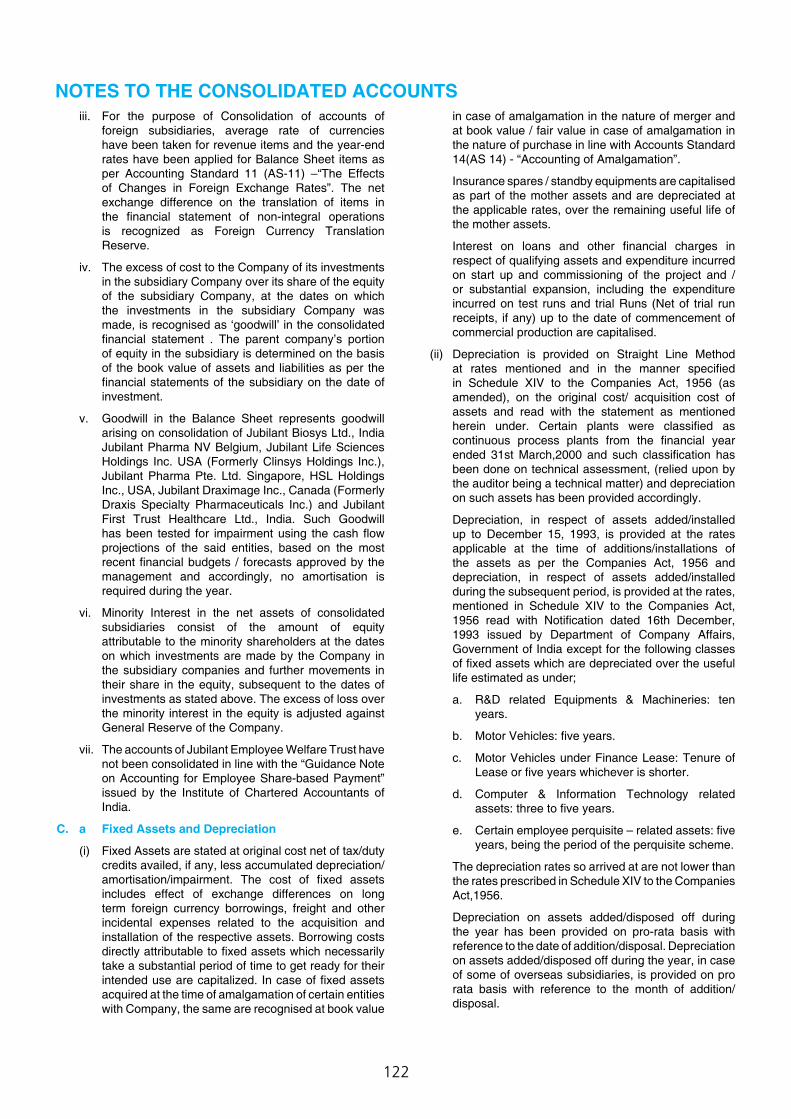
122
NOTES TO THE CONSOLIDATED ACCOUNTS iii. For the purpose of Consolidation of accounts of
foreign subsidiaries, average rate of currencies have been taken for revenue items and the year-end rates have been applied for Balance Sheet items as per Accounting Standard 11 (AS-11) –“The Effects of Changes in Foreign Exchange Rates”. The net exchange difference on the translation of items in the financial statement of non-integral operations is recognized as Foreign Currency Translation Reserve.
iv. The excess of cost to the Company of its investments in the subsidiary Company over its share of the equity of the subsidiary Company, at the dates on which the investments in the subsidiary Company was made, is recognised as ‘goodwill’ in the consolidated financial statement . The parent company’s portion of equity in the subsidiary is determined on the basis of the book value of assets and liabilities as per the financial statements of the subsidiary on the date of investment.
v. Goodwill in the Balance Sheet represents goodwill arising on consolidation of Jubilant Biosys Ltd., India Jubilant Pharma NV Belgium, Jubilant Life Sciences Holdings Inc. USA (Formerly Clinsys Holdings Inc.), Jubilant Pharma Pte. Ltd. Singapore, HSL Holdings Inc., USA, Jubilant Draximage Inc., Canada (Formerly Draxis Specialty Pharmaceuticals Inc.) and Jubilant First Trust Healthcare Ltd., India. Such Goodwill has been tested for impairment using the cash flow projections of the said entities, based on the most recent financial budgets / forecasts approved by the management and accordingly, no amortisation is required during the year.
vi. Minority Interest in the net assets of consolidated subsidiaries consist of the amount of equity attributable to the minority shareholders at the dates on which investments are made by the Company in the subsidiary companies and further movements in their share in the equity, subsequent to the dates of investments as stated above. The excess of loss over the minority interest in the equity is adjusted against General Reserve of the Company.
vii. The accounts of Jubilant Employee Welfare Trust have not been consolidated in line with the “Guidance Note on Accounting for Employee Share-based Payment” issued by the Institute of Chartered Accountants of India.
C. a Fixed Assets and Depreciation
(i) Fixed Assets are stated at original cost net of tax/duty credits availed, if any, less accumulated depreciation/amortisation/impairment. The cost of fixed assets includes effect of exchange differences on long term foreign currency borrowings, freight and other incidental expenses related to the acquisition and installation of the respective assets. Borrowing costs directly attributable to fixed assets which necessarily take a substantial period of time to get ready for their intended use are capitalized. In case of fixed assets acquired at the time of amalgamation of certain entities with Company, the same are recognised at book value
in case of amalgamation in the nature of merger and at book value / fair value in case of amalgamation in the nature of purchase in line with Accounts Standard 14(AS 14) - “Accounting of Amalgamation”.
Insurance spares / standby equipments are capitalised as part of the mother assets and are depreciated at the applicable rates, over the remaining useful life of the mother assets.
Interest on loans and other financial charges in respect of qualifying assets and expenditure incurred on start up and commissioning of the project and /or substantial expansion, including the expenditure incurred on test runs and trial Runs (Net of trial run receipts, if any) up to the date of commencement of commercial production are capitalised.
(ii) Depreciation is provided on Straight Line Method at rates mentioned and in the manner specified in Schedule XIV to the Companies Act, 1956 (as amended), on the original cost/ acquisition cost of assets and read with the statement as mentioned herein under. Certain plants were classified as continuous process plants from the financial year ended 31st March,2000 and such classification has been done on technical assessment, (relied upon by the auditor being a technical matter) and depreciation on such assets has been provided accordingly.
Depreciation, in respect of assets added/installed up to December 15, 1993, is provided at the rates applicable at the time of additions/installations of the assets as per the Companies Act, 1956 and depreciation, in respect of assets added/installed during the subsequent period, is provided at the rates, mentioned in Schedule XIV to the Companies Act, 1956 read with Notification dated 16th December, 1993 issued by Department of Company Affairs, Government of India except for the following classes of fixed assets which are depreciated over the useful life estimated as under;
a. R&D related Equipments & Machineries: ten years.
b. Motor Vehicles: five years.
c. Motor Vehicles under Finance Lease: Tenure of Lease or five years whichever is shorter.
d. Computer & Information Technology related assets: three to five years.
e. Certain employee perquisite – related assets: five years, being the period of the perquisite scheme.
The depreciation rates so arrived at are not lower than the rates prescribed in Schedule XIV to the Companies Act,1956.
Depreciation on assets added/disposed off during the year has been provided on pro-rata basis with reference to the date of addition/disposal. Depreciation on assets added/disposed off during the year, in case of some of overseas subsidiaries, is provided on pro rata basis with reference to the month of addition/disposal.
123
Annual Report 2010-11 | Jubilant Life Sciences Limited
NOTES TO THE CONSOLIDATED ACCOUNTS Depreciation on exchange fluctuation capitalised is
charged over the remaining useful life of assets in view of the option exercised by the Company for accounting the exchange differences arising on reporting of long term foreign currency monetary items in line with Companies (Accounting Standards) Amendment Rules 2009 on Accounting Standard 11 (AS-11) – “The Effects of Changes in Foreign Exchange Rates”. Also refer Note 1.(G). of Schedule “M”).
(iii) Depreciation in respect to assets of overseas subsidiaries is provided over the estimated useful life by using the Straight Line Method (SLM).
The said rates of depreciation in respect of overseas subsidiaries are not lower than the rates prescribed vide Schedule XIV to the Companies Act, 1956.
b. Intangible, Market Authorisation and Amortisation
Intangible assets are recorded at the consideration paid for acquisition. Intangible assets are amortised over their estimated useful lives subject to a maximum period of ten years on straight-line basis, commencing from the date the asset is available to the Company for its use.
Cost incurred for product development leading to Market Authorisations are recognised as intangible assets when it is probable that the future economic benefits that are attributable to the asset will flow to the enterprise and the cost of the asset can be measured reliably. Such intangible assets are amortised on a straight-line basis over a period of five years in case of internally developed Products (Intangibles) and 10 years in case of bought out Intangibles from the date of regulatory approval and the product going off-patent. Subsequent expenditures on development of such products are added to the cost of intangibles when it is probable that the expenditure will enable the asset to generate future economic benefits in excess of its originally assessed standard of performance and the expenditure can be measured and attributed to the asset reliably.
Expenditure for acquisition and implementation of Software systems is recognised as part of the intangible assets and amortised on straight-line basis over a period of five years being the useful life of the software systems.
c. Leased Assets
(i) Long term leasehold land is capitalised and is not amortised in view of the long term tenure of the un-expired lease period/option of conversion to freehold at the expiry of the lease tenure.
(ii) Other leased assets:
a) Assets acquired under finance lease are capitalized at the inception of the lease at lower of their fair value and the present value of the minimum lease payment in line with the Accounting Standard 19(AS-19)-“Leases”.
b) In respect of operating leases, lease rentals are charged to Profit and Loss Account.
D. Valuation of Inventories
Inventories are valued at lower of cost or net realisable value except scrap, which is valued at net estimated realisable value.
The methods of determining cost of various categories of inventories are as follows:
Raw materials Weighted average methodStores and spares Weighted average methodWork-in-process and finished goods (manufactured)
Variable Cost at weighted average including an appropriate share of variable and fixed production overheads. Fixed production overheads are included based on normal capacity of production facilities.
Finished goods (traded) Actual cost of purchaseGoods in transit Actual cost of purchase
Cost includes all direct costs, cost of conversion and appropriate portion of variable and fixed production overheads and such other costs incurred as to bring the inventory to its present location and condition inclusive of excise duty wherever applicable. Cost formula used is based upon weighted average cost.
E. Investments
Long Term quoted investments (non-trade) if any, are valued at cost unless there is a decline other than temporary in their value as at the date of Balance Sheet.
Current Investments are valued at Lower of cost or fair value.
F. Income Tax
Current Tax
Current tax expense is based on the provisions of the relevant applicable Income Tax Laws in force in the respective countries of incorporation and judicial interpretations thereof as at the Balance Sheet date and takes into consideration various deductions and exemptions to which the Company is entitled to as well as the reliance placed by the Company on the legal advices received by it. Provision for current income taxes and advance taxes arising in the same jurisdiction are presented in the balance sheet after offsetting on an assessment year basis.
Deferred Tax
Deferred tax charge or credit reflects the tax effects of timing differences between accounting income and taxable income for the period. The deferred tax charge or credit and the corresponding deferred tax liabilities or assets are recognised using the tax rates that have been enacted or substantively enacted by the Balance Sheet date. Deferred tax assets are recognised only to the extent there is reasonable certainty that the assets can be realised in future; however, where there is unabsorbed depreciation or carry forward of losses, deferred tax assets are recognised only if there is a virtual certainty of realisation of such assets. Deferred tax assets are reviewed at each Balance Sheet date and are written-down or written-up to reflect
124
the amount that is reasonably/virtually certain (as the case may be) to be realised. The Company offsets deferred tax assets and deferred tax liabilities relating to taxes on income levied by the same governing tax authorities.
Minimum Alternate Tax
Minimum Alternate Tax (MAT) credit is recognised as an asset only when and to the extent there is convincing evidence that the Company will pay normal income tax during the specified period. In the year in which MAT credit becomes eligible to be recognized as an asset in accordance with the recommendation contained in the Guidance Note on “Accounting for Credit Available in respect of Minimum Alternative Tax under The Income Tax Act, 1961” issued by the Institute of Chartered Accountants of India , the said asset is created by way of a credit to the Profit and Loss Account and shown as MAT Credit Entitlement. The Company reviews the same at each Balance Sheet date and writes down the carrying amount of MAT Credit Entitlement to the extent there is no longer convincing evidence to the effect that Company pay normal income tax during the specified period.
G. Foreign Currency Conversions/ Translation
i. Initial Recognition: Foreign currency transactions are recorded in the reporting currency, by applying to the foreign currency amount the exchange rate between the reporting currency and the foreign currency on/or closely approximating to the date of the transaction.
ii. Conversion: Foreign currency monetary items are reported using the closing rate. Non-monetary items which are carried in terms of historical cost denominated in a foreign currency, are reported using the exchange rate at the date of the transaction; and non-monetary items which are carried at fair value or other similar valuation denominated in a foreign currency are reported using the exchange rates that existed when the values were determined.
iii. Exchange Differences: The Company has opted for accounting the exchange differences arising on reporting of long term foreign currency monetary items in line with Companies (Accounting Standards) Amendment Rules 2009 on Accounting Standard 11 (AS-11) – “The Effects of Changes in Foreign Exchange Rates” notified by the Ministry of Corporate Affairs on 31st March, 2009 . Accordingly the effect of exchange differences as updated on reporting date, on foreign currency borrowings of the Company is adjusted to cost of fixed assets to the extent it relates to utilisation of funds for acquisition of depreciable capital assets and the balance is accumulated in Foreign Currency Monetary Item Translation Difference Account (FCMITDA) and amortised during the balance period of such long term liability but not later than 31st March, 2011.
Exchange differences arising on the settlement of monetary items not covered above, or on reporting such monetary items of the Company at rates different from those at which they were initially recorded during the year, or reported in previous financial statements, are recognized as income or as expenses in the year in which they arise.
NOTES TO THE CONSOLIDATED ACCOUNTS iv. Forward Exchange Contracts: Monetary Assets
and Liabilities are restated at the rate prevailing at the period end or at the spot rate at the inception of forward contract where forward cover for specific asset/liability has been taken and in respect of such forward contracts the difference between the contract rate and the spot rate at the inception of the forward contract is recognised as income or . expense in Profit & Loss Account over the life of the contract. All other outstanding forward contracts on the closing date are marked to market and resultant loss is recognised as expense in the Profit and loss Account. Mark to Market gains, if any, are ignored.
H. Provisions, Contingent Liabilities and Contingent Assets
The Company recognises a provision when there is a present obligation as a result of a past event that probably requires an outflow of resources and a reliable estimate can be made of the amount of the obligation. Contingent Liabilities are disclosed in respect of possible obligations that may arise from past events but their existence is confirmed by the occurrence or non-occurrence of one or more uncertain future events not wholly within the control of the Company. Contingent Assets are not recognized /disclosed. Provisions, Contingent Liabilities and Contingent Assets are reviewed at each Balance Sheet Date.
I. Research & Development
Research costs are expensed as incurred and presented under the natural heads of expenditure.
Development cost including regulatory cost and legal expenses leading to Market Authorisation relating to the new and improved product and/or process development is recognised as an intangible asset to the extent that it is expected that such asset will generate future economic benefits, adequate technical, financial and other resources required to complete the development and to use or sell the asset are available and the expenditure attributable to the asset during its development can be measured reliably.
J. Employee Benefits
i) In respect of Parent Company including Indian Subsidiaries:
a. Short-term employee benefits: All employee benefits falling due wholly within twelve months of rendering the services are classified as short-term employee benefits, which include benefits like salaries, wages, short-term compensated absences, performance incentives, etc. and are recognised as expenses in the period in which the employee renders the related service.
b. Post-employment benefits: Post employment benefit plans are classified into defined contribution plans and defined benefits plans in line with the requirements of AS 15 on “Employee Benefits”.
• Gratuity and Leave encashment
Gratuity and leave encashment which are defined benefits are recognised in the Profit

125
Annual Report 2010-11 | Jubilant Life Sciences Limited
NOTES TO THE CONSOLIDATED ACCOUNTSand Loss Account based on actuarial valuation using projected unit credit method as at Balance Sheet date by an independent actuary. Actuarial gains and losses arising from the experience adjustment and change in actuarial assumption are immediately recognized in the Profit & Loss Account as income or expense. The gratuity liability for certain employees of one of the units of the Company is funded with Life insurance Corporation of India.
• Superannuation
Certain employees of Company are also participants in the superannuation plan (‘the Plan’), a defined contribution plan. Contribution made by the Company to the Plan during the year is charged to Profit and Loss Account.
• Provident Fund
The Company and some of the Indian subsidiaries make contribution to the “VAM EMPLOYEES PROVIDENT FUND TRUST” for most of their employees, which is a defined benefit plan to the extent that the Company has an obligation to make good the shortfall, if any, between the return from the investments of the trust and the notified interest rate. The Company’s obligation in this regard is determined by an independent actuary and provided for if the circumstances indicate that the Trust may not be able to generate adequate returns to cover the interest rates notified by the Government. The Company’s contribution towards Provident Fund is charged to Profit and Loss Account.
Certain other entities of the Group, make contribution to the statutory provident fund in accordance with the Employees Provident Fund and Miscellaneous Provisions Act, 1952 which is a defined contribution plan and contribution paid or payable is recognised as an expense in the period in which the services are rendered.
c. Other Long Term Employee Benefits: All employee benefits (other than post-employment benefits and termination benefits) which do not fall due wholly within twelve months after the end of the period in which the employees render the related services are determined based on actuarial valuation carried out at each Balance Sheet date.
ii) In respect of Foreign Subsidiaries:
• Short term employee benefit are recognized as expense on accrual at the undiscounted amount in the Profit & Loss Account.
• Foreign subsidiaries make contribution to various social security plans and insurance schemes as per local requirements and generally accepted practices in their respective country of incorporation. Such contributions are charged to Profit & Loss Account on accrual basis in the year in which liability to pay arise.
K. Borrowing Costs
Borrowing costs are recognized in the Profit & Loss Account in the period in which it is incurred, except where the cost is incurred for acquisition, construction or production of an asset that takes a substantial period of time to get ready for its intended use in which case it is capitalized up to the date the assets are ready for their intended use. Ancillary costs incurred in connection with the arrangement of borrowings are amortized over the period of such borrowings.
L. Revenue Recognition
Revenue from sale of products is recognised when the significant risks and rewards of ownership of the products have been transferred to the buyer, recovery of the consideration is probable and the amount of revenue can be measured reliably. Revenues include excise duty and are shown net of sales tax, value added tax (except excise duty) and chargeback, if any.
Revenue from time and material contracts is recognized as hours are incurred, multiplied by contractual billing rates. Revenue from unit-based contracts is generally recognized as units are completed. Revenue from fixed-price contracts are recorded on a proportional completion basis. Refundable fees are deferred and recognized as revenue in the period in which all contractual obligations are met and the contingency is resolved.
Revenue related to contract manufacturing arrangement is recognized when performance obligations are substantially fulfilled. Revenues related to development contracts are recognized as defined milestones are achieved.
Revenue from licensing & regulatory services is recognized on the basis of milestones achieved as determined in the respective contract with the customer. In respect of outsourcing, cost incurred for drug development with third party CRO’s the revenue is recognized on the basis of actual cost incurred plus mark up as agreed with the customer under each agreement.
Revenue from rendering of medical services is recognised upon completion/performance of such services. Revenue from ongoing medical services on cut off date is recognised on proportionate completion method.
Royalty revenue is recognized on an accrual basis in accordance with contractual agreements when all significant contractual obligations have been satisfied, the amounts are determinable and collection is reasonably assured.
Dividend income is recognized when the unconditional right to receive the income is established. Income from interest on deposits, loans and interest bearing securities is recognized on time proportionate method.
Any sales for which the Company has acted as an agent without assuming the risks and rewards of ownership have been reported on a net basis.
Sale of utility is recognised on delivery of the same to the consumers and no significant uncertainty exists as to its realisation.
126
NOTES TO THE CONSOLIDATED ACCOUNTS Export incentives/ benefits are accounted for on accrual
basis and where recovery is probable.
M. Premium on Foreign Currency Convertible Bonds (FCCBs)
Premium payable on redemption of Foreign Currency Convertible Bonds (FCCBs) is charged against securities premium account over the tenure of FCCBs.
N. Segment Reporting The accounting policies adopted for segment reporting are
in line with accounting policies of the Company. Revenues, Expenses, Assets and Liabilities have been identified to segments on the basis of their relationship to operating activities of the segments (taking in account the nature of products and services and risks & rewards associated with them) and internal management information systems and the same is reviewed from time to time to realign the same to conform to the Business Units of the Company. Revenues, Expenses, Assets and Liabilities, which are common to the enterprise as a whole and are not allocable to segments on a reasonable basis, have been treated as “Common Revenues/Expenses/Assets/Liabilities”, as the case may be.
O. Earnings Per share The basic earnings per share is calculated by dividing the
net profit after tax for the year by the weighted average number of equity shares outstanding during the year. For the purpose of calculating diluted earnings per share, net profit after tax during the year and the weighted average number of shares outstanding during the year are adjusted for the effect of all dilutive potential equity shares. The dilutive potential equity shares are deemed converted as of the beginning of the year unless they have been issued at a later date. The dilutive potential equity shares are adjusted for the proceeds receivable had the shares been actually issued at fair value (i.e. average market value of the outstanding shares).Anti dilutive effect of any potential equity shares is ignored.
P. Impairment of Fixed Assets The Group assesses at each Balance Sheet date whether
there is any indication that an asset may be impaired. If any such indication exists, the Company estimates the recoverable amount of the asset. If such recoverable amount of the asset or the recoverable amount of the cash generating unit to which the assets belongs is less than the carrying amount, the carrying amount is reduced to its recoverable amount. The reduction is treated as an impairment loss and is recognised in the Profit and Loss Account.
An assessment is also done at each Balance Sheet date whether there is any indication that an impairment loss recognized for an asset in prior accounting periods may no longer exist or may have decreased. If any such indication exists, the asset’s recoverable amount is estimated. The carrying amount of the fixed asset is increased to the revised estimate of its recoverable amount but only to the extent that the increased carrying amount does not exceed the carrying amount that would have been determined had no impairment loss been recognized for the asset in previous periods. A reversal of impairment loss is recognized in the Profit & Loss Account.
Q. Employee Stock Option Schemes In accordance with the Securities and Exchange Board of
India Guidelines, in respect of the stock options granted pursuant to the Company’s Stock Option Scheme, the intrinsic value, if any, of the option being the excess of the market price, of share over the exercise price of the option, at the date of grant of option, is treated as discount and accounted for as employee compensation cost and amortised on a straight-line basis over the vesting period.
2. Capital Commitments Estimated amount of Contracts remaining to be executed
on Capital Account (Net of Advances) ` 1,299.20 million (Previous Year ` 1,612.06 million) [Advances ` 124.26 million (Previous year ` 216.59 million)].
3. Contingent liabilitiesa) Claims/Demands for the following matters in respect of
which proceedings or appeals are pending and are not acknowledged as debts:
(` in million)
As at 31st March, 2011 2010Central Excise 50.85 32.27Customs 14.14 40.69Sales Tax 18.36 48.82Income Tax 214.83 189.05Service Tax 34.13 34.62Others 178.91 254.40
Excluding demands in respect of business transferred to Jubilant Industries Limited in terms of the scheme of demerger though the demands may be continuing in the name of the Company.
b) The parent company has challenged the levy of transport fee by State of Maharashtra on consumption of rectified spirit and molasses in the Nira factory. The order of State imposing the levy was stayed by the Hon’ble Mumbai High Court on 22nd October, 2001. The Company has been advised that the levy of transport fee on rectified spirit and molasses by State is not tenable. However, the Company has deposited ` 6.28 million under protest out of the total transport fee of ` 139.45 million which is shown as deposit in the financial statements.
c) Outstanding guarantees furnished by Banks on behalf of the Group/by the Group including in respect of Letters of Credits is ` 2,211.54 million (Previous year ` 2,632.84 million).
d) Liability in respect of Bills discounted with Banks is ` 200 million (Previous year ` 850 million).
e) The Parent Company has given Corporate Guarantee on behalf of its subsidiaries, HSL Holdings Inc. & Draxis Pharma Inc to ICICI Bank UK. PLC. & ICICI Bank, Canada for USD 50 million - effective guarantee as at 31st March, 2011 USD 18.75 million (Previous year USD 31.25 million) and USD 50.21 million respectively - total effective guarantee equivalent to ` 3,075.31 million(Previous year ` 3,657.59 million), to secure financial facility granted by them.
f) Exports obligation undertaken by the Company under EPCG scheme to be completed over a period of five/eight years on account of import of Capital Goods at concessional import duty and remaining outstanding is
127
Annual Report 2010-11 | Jubilant Life Sciences Limited
NOTES TO THE CONSOLIDATED ACCOUNTS` 564.34 million (Previous year ` 564.34 million). Similarly Export obligation under Advance License Scheme/DFIA scheme on duty free import of specific raw materials, remaining outstanding is ` 2,363.44 million (Previous year ` 1,011.82 million).
g) The Parent Company has challenged before the Hon’ble Allahabad High, the increase in denaturing fee by the State of Uttar Pradesh w.e.f. 1st April, 2004 on denaturing of rectified spirit in the Gajraula factory and the writ petition has been admitted by the Court. The Company has deposited ` 19.19 million under protest which is shown as deposits.
h) Zila Panchayat at J.P. Nagar (in respect of the Company’s Gajraula plant) served a notice demanding a compensation of ` 277.40 million allegedly for, percolation of poisonous water stored in lagoons and flowing through the land of Zila Panchayat resulting in loss of crops and cattle of the farmers and for putting poisonous fly ash on national highway which caused loss to the health and damages to eyes and skin of people.
District Magistrate issued a recovery certificate along with 10% collection charges inflating the demand to ` 305.14 million. In the opinion of the Company, the Zila Panchayat has no jurisdiction in raising this demand. The demand was challenged in Hon’ble Allahabad High Court and the court stayed the demand till further orders.
i) The Parent Company has challenged before the Hon’ble Allahabad High Court, the levy of license fees of ` 2.87 million by State of Uttar Pradesh, for grant of PD-2 license for manufacture of Ethyl Alcohol for industrial use. The writ petition has been admitted and is being listed for final hearing. Though the amount has been deposited and shown as such, no provision against this has been made as the issue is covered by the earlier favorable judgment of the Hon’ble Supreme Court of India.
j) The State of Uttar Pradesh (UP) has imposed levy on import of denatured spirit into the State of Uttar Pradesh (UP). The Parent Company has imported denatured spirit into the State of Uttar Pradesh and has challenged levy amounting to ` 90 million before Hon’ble Allahabad High Court. The writ petition has been allowed by the High Court in favour of the Parent Company. The State of Uttar Pradesh filed a Special Leave Petition (SLP) with Hon’ble Supreme Court. The SLP has been admitted but the Hon’ble Supreme Court has declined the request of the State of Uttar Pradesh (UP) to stay the operation of High Court Order.
k) The Hon’ble Supreme Court has quashed the levy of license fee by State of Uttar Pradesh on captive consumption of denatured spirit in the Gajraula factory, and has ordered the refund of the fee paid during the period of dispute subject to condition that the amount has not been collected from the Company’s customers. Further the Court has
directed the State to investigate whether the Company has collected the disputed fee from its customers to the extent bank guarantees were furnished.
The Parent Company is entitled to a refund of ` 84.06 million as the amount paid during the period of dispute or secured by bank guarantees was not collected from its customers. Accordingly the Company has approached the State of Uttar Pradesh for the refund of the said amount. The amount paid has been shown as deposit.
4. During the year a Scheme of Amalgamation and Demerger (Scheme) among Jubilant Life Sciences Ltd (formerly Jubilant Organosys Ltd), Speciality Molecules Ltd , Pace Marketing Specialities Ltd and Jubilant Industries Ltd (formerly Hitech Shiksha Ltd) became effective on 15th November, 2010. Under the Scheme, Speciality Molecules Limited (SML) a wholly owned subsidiary of Jubilant Life Sciences Ltd (Company) and Pace Marketing Specialties Limited (PMSL) an exclusive contract manufacturer of adhesives for Consumer Product Division of the JLL amalgamated with the Company on 31st March, 2010. The Agri and Performance Polymer Businesses of the Company has been demerged into Jubilant Industries Limited (JIL) on 1st April, 2010. Adjustment on account of Demerger disclosed in the financial statements includes transactions between the appointed date and the effective date i.e. between 1st April, 2010 and 15th November, 2010.
On amalgamation, shareholders of erstwhile PMSL were issued 501,364 equity shares of the Company and the equity share capital of SML was cancelled as the same was held entirely by the Company. Upon Demerger, the shareholders of the Company received one equity share of ` 10 each of Jubilant Industries Limited for every 20 equity shares of ` 1 each held in the company.
Effective, the Demerger appointed date, i.e. 1st April, 2010 till the scheme becoming effective, the operations of JIL were run by the company, for and on behalf of JIL, on trust and the economic benefits attributable to JIL have been passed on to it, in terms of the said scheme. Since, the economic benefits under the scheme have accrued from appointed date, the equity shares issued pursuant to the scheme have also been considered from the appointed date for the purpose of calculation of Earnings Per Share. Accordingly the results for the year are for the businesses remaining with the Company, post amalgamation/demerger, after giving the effect of the scheme and accordingly, not comparable with previous year.
5. The deferred tax liability is net of amount recoverable of ` 15.50 million (Previous Year ` 11.69 million) from the Employee Welfare Trust towards the tax chargeable on the income of trust on which the tax is payable by the Parent Company.
6. Balance outstanding recoverable from following Companies in which Directors are interested: (` in million)
Particulars Outstanding amount as at 31st March,
Maximum Amount outstanding during the year
2011 2010 2011 2010Jubilant Enpro Pvt. Ltd - - 3.16 1.89B &M Hot Breads Pvt. Ltd 0.03 - 0.07 0.07Jubilant Oil & Gas Pvt. Ltd 2.79 - 7.52 2.62
128
NOTES TO THE CONSOLIDATED ACCOUNTS7. During the year, company has changed estimate on useful
life of certain Fixed Assets including Intangibles. Net impact of this change is lower depreciation and amortisation charges by ` 182.96 million during the year and Profit after tax is higher by similar amount.
8. Foreign Currency Convertible Bonds (FCCB)(A) FCCB – USD 75 million (FCCB 2010) The parent Company issued Zero Coupon Foreign
Currency Convertible Bonds due 2010 (FCCB 2010) for an aggregate value of USD 75 million, convertible at any time between 3rd July, 2005 to 14th May, 2010 by holders into fully paid equity shares of ` 1 each of the Company or Global Depositary Shares (GDSs) each representing one equity share of ` 1 each at an initial conversion price of ` 273.0648 per share with a fixed rate of exchange of ` 43.35 = USD 1. The conversion price was subject to adjustment in certain circumstances. The Bonds could also be redeemed, in whole but not in part, at the option of the Company at any time on or after 23rd May, 2008, subject to satisfaction of certain conditions. Unless previously converted, redeemed or purchased and cancelled, the Bonds were to be redeemed on 24th May, 2010 at 138.383% of their principal amount. The FCCBs were listed on Singapore Stock Exchange. The GDSs arising out of conversion of FCCBs were listed on Luxembourg Stock Exchange. Out of these FCCB 2010, USD 22.343 million were converted upto 31st March, 2009 into equity shares and this represented 3,547,022 shares of ` 1 each as on 31st March, 2009 and USD 3 million Bonds were bought back at a discount and were cancelled. The balance bonds of USD 49.657 million outstanding were redeemed during the year.
(B) FCCB – USD 200 million (FCCB 2011) The parent Company issued Zero Coupon Foreign
Currency Convertible Bonds due 2011 (FCCB 2011) for
an aggregate value of USD 200 million, convertible at any time between 30th June, 2006 to 10th May, 2011 by holders into fully paid equity shares of ` 1 each of the Company or Global Depositary Shares (GDSs) each representing one equity share at an initial conversion price of ` 413.4498 per share with a fixed rate of exchange of ` 45.05 = USD 1. The conversion price is subject to adjustment in certain circumstances. The Bonds may also be redeemed, in whole but not in part, at the option of the Company at any time on or after 19th May, 2009, subject to satisfaction of certain conditions. Unless previously converted, redeemed or purchased and cancelled, the Bonds will be redeemed on 20th May, 2011 at 142.429% of their principal amount. The FCCBs are listed on Singapore Stock Exchange. The GDSs arising out of conversion of FCCBs are listed on Luxembourg Stock Exchange. Out of these FCCB 2011, USD 57.90 million Bonds were bought back at a discount and were cancelled. The balance bonds of USD 142.10 million outstanding as of 31st March, 2011 are included under ‘Unsecured Loans’.
The proceeds of FCCB 2011 have been used for funding new projects – ̀ 13.5 million (USD 0.30 million), investment in/acquisitions of overseas subsidiary companies - ` 8,873.0 million (USD 196.96 million) and issue expenses – ` 123.4 million (USD 2.74 million). There has been no conversion during the year in respect of the above FCCBs.
Post demerger, the conversion price, for the outstanding FCCB’s amounting to USD 142.10 million has been reset to ` 379 per equity share of the company, based on valuation done by two independent Investment Bankers and has been intimated to the bondholders, as per the terms of the issue.
The outstanding balance of FCCB 2011 - USD 142.10 million, on conversion would result in allotment of 16,890,778 equity shares of ` 1 each.
9. Employee Stock Option Scheme In terms of approval of shareholders accorded at the AGM held on 29th August, 2005 and in accordance with SEBI (ESOP
& ESPS) Guidelines, 1999, the Company instituted Jubilant Employees Stock Option Plan, 2005 (“Plan”) for specified categories of employees and directors of the Company and its Subsidiaries. Under the Plan as amended, upto 1,100,000 Stock Options can be issued to eligible directors (other than promoter directors) and other specified categories of employees of the Company/ Subsidiaries. Options are to be granted at market price. As per SEBI Guidelines, the market price is taken as the closing price on the day preceding the date of grant of options, on the stock exchange where the trading volume is the highest.
Each option, upon vesting, shall entitle the holder to acquire five equity shares of ` 1 each. Options granted upto 28th August, 2009 will vest entirely within two years from the grant date, with certain lock-in provisions. Options granted after 28th August 2009 will vest gradually over a period of 5 years from the grant date, without any lock-in provisions.
Summary of Vesting & Lock in provisions is given below:
Vesting Schedule (With Lock in) Applicable for Grants made upto 28th August, 2009
Vesting Schedule (Without Lock in) Applicable for Grants made after 28th August, 2009
S. No.
% of Options
scheduled to vest
Vesting Date Lock-in Period % of Options
scheduled to vest
Vesting Date Lock-in Period
1. 10 1 year from grant date Nil 10 1 year from grant date Nil2. 15 2 years from grant date Nil 15 2 years from grant date Nil3. 20 2 years from grant date 1 year from vesting date 20 3 years from grant date Nil4. 25 2 years from grant date 2 years from vesting date 25 4 years from grant date Nil5. 30 2 years from grant date 3 years from vesting date 30 5 years from grant date Nil
129
Annual Report 2010-11 | Jubilant Life Sciences Limited
NOTES TO THE CONSOLIDATED ACCOUNTS The Company has constituted a Compensation Committee comprising of a majority of independent directors. This Committee
is empowered to administer the Plan.
In 2008-09, Jubilant Employees Welfare Trust was constituted for the purpose of acquisition of equity shares of the Company from the Secondary market or subscription of shares from the Company, to hold the shares and to allocate/transfer these shares to eligible employees of the Company from time to time on the terms and conditions specified under the Plan. The members authorised grant of loan(s) from time to time to the Trust in one or more tranches, up to ` 1,000 million either free of interest or at interest agreed between the Board and the Trust. The outstanding loan to the Trust as at 31st March, 2011 is ` 269.90 million (Previous year ` 423.21 million).
During the year, the Company modified the Plan to incorporate special provisions consequential to Scheme of Amalgamation & Demerger amongst the Company, Jubilant Industries Ltd. and others & to provide:
(i) that an Option holder who is continuing with the Company, would be entitled to not only the equity shares of the Company but also the equity shares of Jubilant Industries Limited in accordance with the share exchange ratio i.e. One equity share of ` 10 each of Jubilant Industries Limited (JIL Share), free of cost, for every 20 equity shares of ` 1 each of the Company when such options holder pays the exercise price in accordance with the Plan;
(ii) that the Lock-in provisions, in accordance with the Plan, wherever applicable to the equity shares of the Company will also apply to the JIL Shares acquired by a Participant.
(iii) for other specific provisions applicable to Participant(s) transferred to Jubilant Industries Limited, including provision for accelerated vesting of Options on Effective Date, in case Options were granted at least one year before the Effective Date but not vested upto that date.
Further, pursuant to the Scheme, to the extent the Trust holds equity shares of the Company, equity shares of the Jubilant Industries Limited has been issued, in accordance with the share exchange ratio.
Up to 31st March, 2011, the Trust has purchased 5,371,747 equity shares of the Company from the open market, out of interest free loan provided by the Company, out of which 1,530,010 shares were transferred to the employees on exercise of ESOPS. The Trust has also been issued 192,086 JIL Shares in accordance with the Scheme.
The movement in the stock options during the year ended 31st March, 2011 is set out below:
Particulars 2010-11 2009-10Number of
OptionsWeighted Average Exercise Price (`)
Number of Options
Weighted Average Exercise Price (`)
Options outstanding at the beginning of the year 365,331 219.07 518,473 216.42Granted during the year - - 41,523 221.60Expired during the year - - - -Options forfeited during the year (24,597) 248.83 (47,384) 247.47Exercised during the year (158,721) 203.08 (147,281) 201.33Options outstanding at the end of the year 182,013 228.95 365,331 219.07
The Company has opted for intrinsic value method of accounting for Employee Stock Options. As market price of the options is equal to the exercise price on the date of grant, intrinsic value is ` Nil. Hence there is no cost charged to Profit & Loss Account on account of options granted to employees under the Employee Stock Option Plan of the company. Had the company opted for fair value accounting of Employee Stock options, Profit after tax for the financial year would have been lower by ` 22.00 million and earnings per share would have been lower by ` 0.14 (Basic) and ` 0.12 (Diluted).
10. a) The Group’s significant operating lease arrangements are in respect of premises (residential, offices, godown etc.). These leasing arrangements, which are cancelable, range between 11 months and 3 years generally and are usually renewable by mutual agreeable terms. The aggregate lease rentals payable are charged as expenses.
b) Assets acquired under Finance Lease:
The Company has taken vehicles under finance lease. Future minimum lease payments and their present values under finance leases as at 31st March, 2011 are as follows:
(` in million)
Minimum Lease payments
Present Value of Minimum Lease
Payments
Future Interest
Not later than one year 3.73 2.17 1.56Later than one year but not later than five years 14.01 11.05 2.96Later than five years - - -
There is no element of contingent rent or sub lease payments. Company has option to purchase the assets at the end of the lease term. There are no restrictions imposed by these lease arrangements regarding dividend, additional debt and further leasing.
130
NOTES TO THE CONSOLIDATED ACCOUNTS11. In line with the applicable Accounting Standards, during
the year, interest amounting to ` 220.59 million (Previous Year ` 102.82 million) and expenditure incurred on start up and commissioning of the project and /or substantial expansion, including the expenditure incurred on test runs and Trial Runs (Net of trial run receipts, if any) up to the date of commencement of commercial production amounting to ` 425.47 million (Previous Year ` 247.15 million) have been capitalised. The said expenditure (net of trial run receipts), so capitalised are accumulated as Capital work in progress.
12. The carrying value of internally generated Intangible Asset – Product Development including under progress is reviewed for impairment annually. Accordingly a sum of ` 95.29 million (Previous year ` 62.63 million) has been written off during the year.
13. (A) Deferred Tax Assets and Liabilities are attributable to the following items:
(` in million)As at 31st March, 2011 2010Deferred Tax AssetsProvision for Leave Encashment and Gratuity
142.20 122.67
Amount disallowed u/s 43 B
16.65 13.02
Accumulated Losses as per Tax Laws
1,203.10 683.22
Others 168.10 68.261,530.05 887.17
Deferred Tax LiabilitiesAccelerated Depreciation/Amortisation
2,729.38 2,410.78
Difference in value of CWIP/Intangibles
457.62 397.87
Others 55.04 2.683,242.04 2,811.33
Deferred Tax Liabilities (Net) 1,711.99 1,924.16
Deferred Tax assets and Liabilities have been worked out on legal entity basis and have been set-off with each other, where the company has a legally enforceable right
to set-off and such Deferred Tax Assets & Liabilities rates to takes on income levied by same governing taxation laws. Accordingly, after the set-off, the Net Deferred Tax Assets & Liabilities are as under:
(` in million)
As at 31st March, 2011 2010Deferred Tax Asset 395.02 425.32Deferred Tax Liability 2,107.01 2,349.48Deferred Tax Liability (Net) 1,711.99 1,924.16
(B) The profit attributable to the operations under the (EOU) Export Oriented Units Scheme are deductible from taxable income for the year ended 2010-11 and accordingly income from EOU setup at Nanjangud, Mysore, at Bhartiagram, Jyotiba Phoolay Nagar (Gajraula), Uttar Pradesh and at Ambernath, Maharashtra have been considered as tax deductible, and provision for tax is made accordingly.
(C) Current Tax of Parent Company, includes ` 32.70 million related to previous year including interest thereon.
14. The bottling unit of the Parent Company situated at Nira holds a potable liquor license for Indian Made Foreign Liquor (IMFL) and the same is bottling IMFL on the order of another Company and is charging bottling fee. The Accounts recognise Revenue and Expenditure only to the extent the Company enjoys beneficial interest. In Compliance with the requirements of Schedule VI to the Companies Act, 1956, the following information is given hereunder in respect of the transactions where the Company does not enjoy beneficial interest:
(` in million) For the year ended 31st March, 2011 2010Sales - 286.37Excise Duty - (123.31)Other Income - 0.92Increase/(Decrease) in Finished & Process Stocks
- 21.93
Raw & Process Materials Consumed
- (53.82)
Stores, Spares, Chemicals, Catalyst & Packing Materials consumed
- (71.63)
Other Expenses - (36.05)
15. Disclosure required by Accounting Standard 29(AS-29) “Provisions, Contingent Liabilities and Contingent Assets” Movement in Provisions: (` in million)
Class of ProvisionsSr. No.
Particulars of disclosure Provision for Bad and Doubtful
Debts
Excise Duty Product Warranties
Premium on redemption of
FCCBs1. Balance as at 1st April, 2010 96.06
(57.02)62.17
(36.21)0.11
(0.13)2,835.33
(2,342.30)2. Additional provision during 2010-11 27.01
(52.78)33.49
(62.17)0.17
(0.11)597.03
(495.05)3. Provision used during 2010-11 0.34
(4.88)41.38
(36.21)-
(-)827.30(2.02)
4. Provision reversed during 2010-11 39.79(8.86)
-(-)
0.11(0.13)
-(-)
5. Less: Adjustment on account of scheme of Amalgamation & Demerger
27.91(-)
20.79(-)
-(-)
-(-)
6. Balance as at 31st March, 2011 55.03(96.06)
33.49(62.17)
0.17(0.11)
2,605.06(2,835.33)
Provision for excise duty represents the excise duty on closing stock of finished goods.
131
Annual Report 2010-11 | Jubilant Life Sciences Limited
NOTES TO THE CONSOLIDATED ACCOUNTS16. (A) The Group has opted for accounting the exchange difference arising on reporting of long term Foreign currency monetary
items in line with the Companies (Accounting Standards) Amendment Rules 2009 on Accounting Standard 11 (AS-11) – “The Effects of Changes in Foreign Exchange Rates” notified by the Ministry of Corporate Affairs on 31st March, 2009. Accordingly during 2008-09 the Group had capitalized exchange difference amounting to ` 1,130.81 million to the cost of fixed assets and ` 2,750.99 million to foreign currency monetary item translation difference account (FCMITDA) including reversal of exchange gain amounting to ` 1,030.57 million credited to Profit & Loss Account in the 2007-08. During the year ` 7.11 million (Previous Year reversal from FCMITDA ` 2,468.06 millions) were added to FCMITDA on account of exchange difference. Balance of ` 127.92 million in FCMITDA has been charged to Profit and Loss account as required in terms of the said notification.
(B) The Group uses derivative financial instruments such as forward contracts to selectively hedge its currency exposures, firm commitments and highly probable forecast transactions, denominated in USD and EURO. Usually, the forward contracts mature within two years. The Company actively manages its currency/interest rate exposures on loans through a centralized treasury setup and uses derivatives such as currency swaps and interest rate swaps to mitigate the risk from such exposures.
The information on derivative instruments is as follows:
i) Derivative instruments outstanding:
As at 31st March, Buy/Sell Amount (foreign currency in millions)2011 2010
Foreign Exchange Contracts- USD/INR Sold USD 10.00 USD 32.12- USD/INR Bought USD 35.71 USD 19.79- EURO/USD Sold EURO 1.69 EURO -Currency Swaps- Loans of JPY 2,537.50 million (PY JPY 2,537.50
million) swapped into USDUSD 25.00 USD 25.00
Interest Rate Swaps- Loans swapped from floating six month USD LIBOR to
fixed USD interest rateUSD 38.27 USD 116.52
ii) Foreign currency exposure not hedged by derivative instrument :
As at 31st March, Amount (foreign currency in millions)2011 2010
Amount receivable on account of sale of goods & services, loans & advances.
USD 63.51 USD 26.49EURO 2.40 EURO 5.01
GBP 0.04 GBP 0.04Amount payable on account of purchase of goods & services, loans & FCCBs etc.
USD 351.25 USD 441.69EURO 0.28 EURO 0.28
GBP 0.12 GBP -CHF 0.49 CHF -JPY 9.36 JPY 0.09
Amount outstanding as deposits with Banks USD 2.68 USD 2.92EURO - EURO 0.11
iii) Forward contracts not applied for closing monetary assets and liabilities, and interest rate swap contracts, outstanding at the year end are mark to market and the resultant loss of ` 49.04 million (Previous year ` 100.09 million) has been charged to Profit & Loss Account. The loss on forward contracts cancelled during the year amounting to ` 5.90 million (Previous Year ` 99.58 million) has also been charged to Profit & Loss Account.
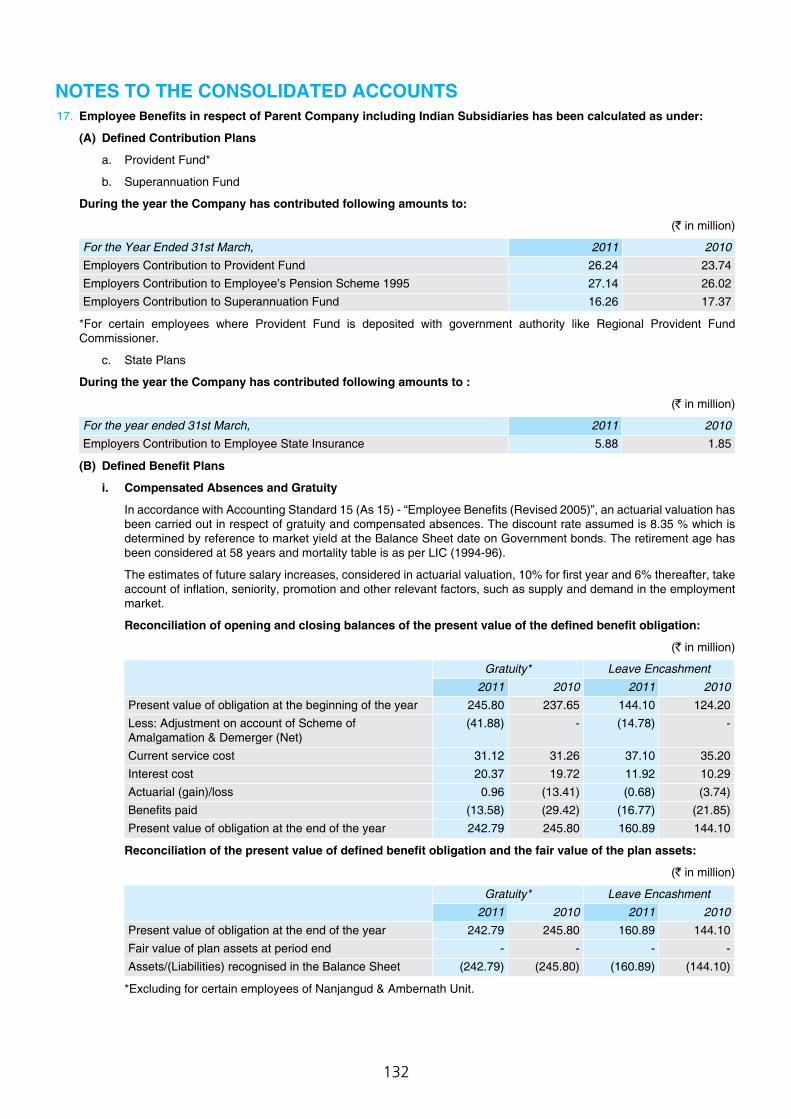
132
NOTES TO THE CONSOLIDATED ACCOUNTS17. Employee Benefits in respect of Parent Company including Indian Subsidiaries has been calculated as under:
(A) Defined Contribution Plans
a. Provident Fund*
b. Superannuation Fund
During the year the Company has contributed following amounts to:
(` in million)
For the Year Ended 31st March, 2011 2010Employers Contribution to Provident Fund 26.24 23.74Employers Contribution to Employee’s Pension Scheme 1995 27.14 26.02Employers Contribution to Superannuation Fund 16.26 17.37
*For certain employees where Provident Fund is deposited with government authority like Regional Provident Fund Commissioner.
c. State Plans
During the year the Company has contributed following amounts to :
(` in million)
For the year ended 31st March, 2011 2010Employers Contribution to Employee State Insurance 5.88 1.85
(B) Defined Benefit Plans
i. Compensated Absences and Gratuity
In accordance with Accounting Standard 15 (As 15) - “Employee Benefits (Revised 2005)”, an actuarial valuation has been carried out in respect of gratuity and compensated absences. The discount rate assumed is 8.35 % which is determined by reference to market yield at the Balance Sheet date on Government bonds. The retirement age has been considered at 58 years and mortality table is as per LIC (1994-96).
The estimates of future salary increases, considered in actuarial valuation, 10% for first year and 6% thereafter, take account of inflation, seniority, promotion and other relevant factors, such as supply and demand in the employment market.
Reconciliation of opening and closing balances of the present value of the defined benefit obligation:
(` in million)
Gratuity* Leave Encashment2011 2010 2011 2010
Present value of obligation at the beginning of the year 245.80 237.65 144.10 124.20Less: Adjustment on account of Scheme of Amalgamation & Demerger (Net)
(41.88) - (14.78) -
Current service cost 31.12 31.26 37.10 35.20Interest cost 20.37 19.72 11.92 10.29Actuarial (gain)/loss 0.96 (13.41) (0.68) (3.74)Benefits paid (13.58) (29.42) (16.77) (21.85)Present value of obligation at the end of the year 242.79 245.80 160.89 144.10
Reconciliation of the present value of defined benefit obligation and the fair value of the plan assets:
(` in million)
Gratuity* Leave Encashment2011 2010 2011 2010
Present value of obligation at the end of the year 242.79 245.80 160.89 144.10Fair value of plan assets at period end - - - -Assets/(Liabilities) recognised in the Balance Sheet (242.79) (245.80) (160.89) (144.10)
*Excluding for certain employees of Nanjangud & Ambernath Unit.
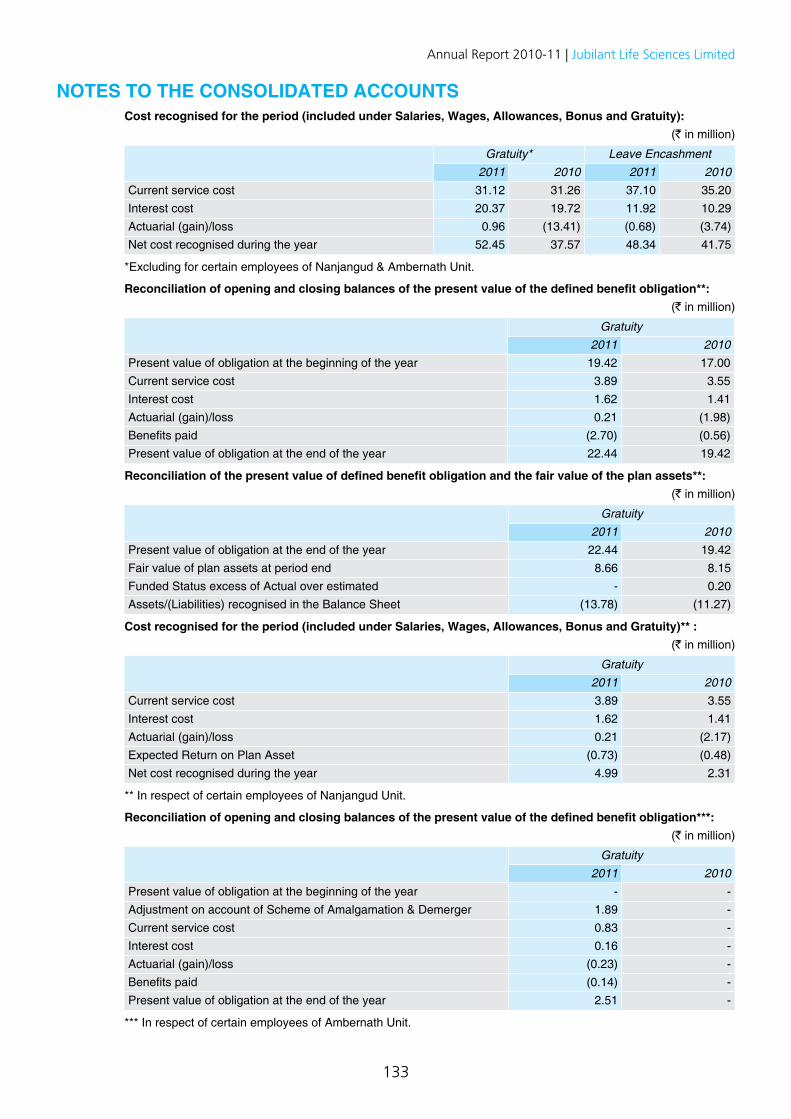
133
Annual Report 2010-11 | Jubilant Life Sciences Limited
NOTES TO THE CONSOLIDATED ACCOUNTS Cost recognised for the period (included under Salaries, Wages, Allowances, Bonus and Gratuity):
(` in million)
Gratuity* Leave Encashment2011 2010 2011 2010
Current service cost 31.12 31.26 37.10 35.20Interest cost 20.37 19.72 11.92 10.29Actuarial (gain)/loss 0.96 (13.41) (0.68) (3.74)Net cost recognised during the year 52.45 37.57 48.34 41.75
*Excluding for certain employees of Nanjangud & Ambernath Unit.
Reconciliation of opening and closing balances of the present value of the defined benefit obligation**:(` in million)
Gratuity2011 2010
Present value of obligation at the beginning of the year 19.42 17.00Current service cost 3.89 3.55Interest cost 1.62 1.41Actuarial (gain)/loss 0.21 (1.98)Benefits paid (2.70) (0.56)Present value of obligation at the end of the year 22.44 19.42
Reconciliation of the present value of defined benefit obligation and the fair value of the plan assets**:(` in million)
Gratuity2011 2010
Present value of obligation at the end of the year 22.44 19.42Fair value of plan assets at period end 8.66 8.15Funded Status excess of Actual over estimated - 0.20Assets/(Liabilities) recognised in the Balance Sheet (13.78) (11.27)
Cost recognised for the period (included under Salaries, Wages, Allowances, Bonus and Gratuity)** :(` in million)
Gratuity2011 2010
Current service cost 3.89 3.55Interest cost 1.62 1.41Actuarial (gain)/loss 0.21 (2.17)Expected Return on Plan Asset (0.73) (0.48)Net cost recognised during the year 4.99 2.31
** In respect of certain employees of Nanjangud Unit.
Reconciliation of opening and closing balances of the present value of the defined benefit obligation***:(` in million)
Gratuity2011 2010
Present value of obligation at the beginning of the year - -Adjustment on account of Scheme of Amalgamation & Demerger 1.89 -Current service cost 0.83 -Interest cost 0.16 -Actuarial (gain)/loss (0.23) -Benefits paid (0.14) -Present value of obligation at the end of the year 2.51 -
*** In respect of certain employees of Ambernath Unit.
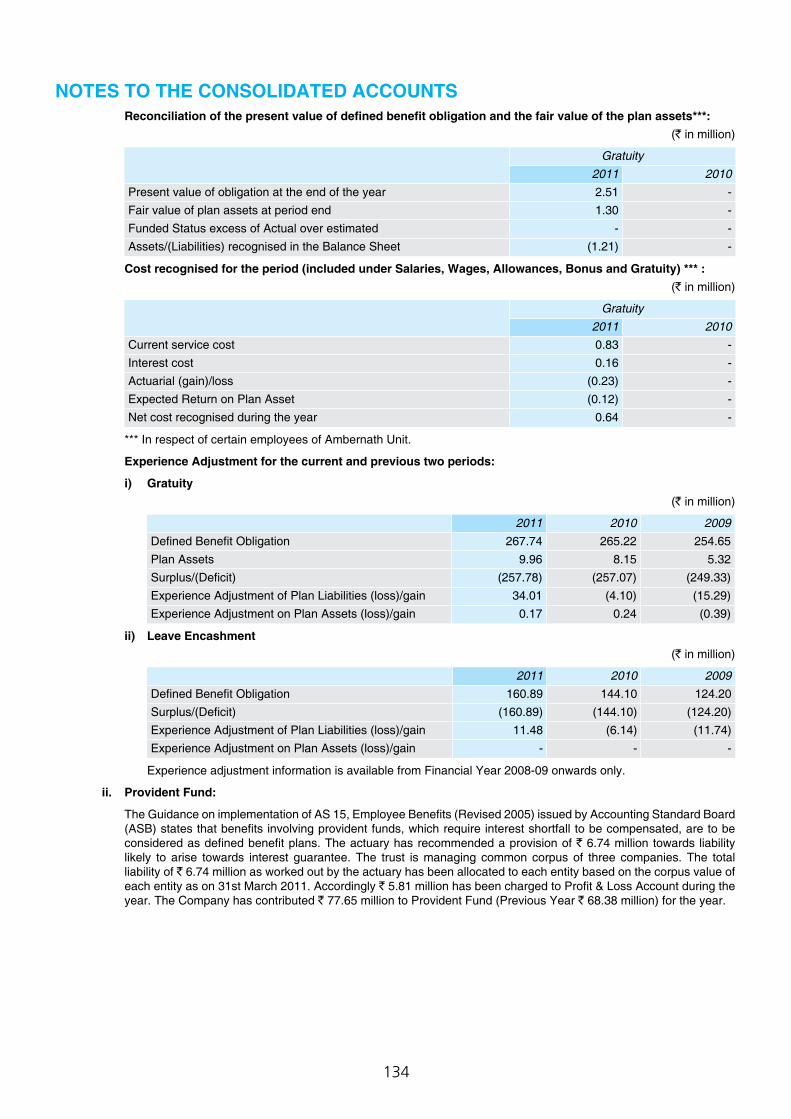
134
NOTES TO THE CONSOLIDATED ACCOUNTS Reconciliation of the present value of defined benefit obligation and the fair value of the plan assets***:
(` in million)
Gratuity2011 2010
Present value of obligation at the end of the year 2.51 -Fair value of plan assets at period end 1.30 -Funded Status excess of Actual over estimated - -Assets/(Liabilities) recognised in the Balance Sheet (1.21) -
Cost recognised for the period (included under Salaries, Wages, Allowances, Bonus and Gratuity) *** :(` in million)
Gratuity2011 2010
Current service cost 0.83 -Interest cost 0.16 -Actuarial (gain)/loss (0.23) -Expected Return on Plan Asset (0.12) -Net cost recognised during the year 0.64 -
*** In respect of certain employees of Ambernath Unit.
Experience Adjustment for the current and previous two periods:
i) Gratuity (` in million)
2011 2010 2009Defined Benefit Obligation 267.74 265.22 254.65Plan Assets 9.96 8.15 5.32Surplus/(Deficit) (257.78) (257.07) (249.33)Experience Adjustment of Plan Liabilities (loss)/gain 34.01 (4.10) (15.29)Experience Adjustment on Plan Assets (loss)/gain 0.17 0.24 (0.39)
ii) Leave Encashment(` in million)
2011 2010 2009Defined Benefit Obligation 160.89 144.10 124.20Surplus/(Deficit) (160.89) (144.10) (124.20)Experience Adjustment of Plan Liabilities (loss)/gain 11.48 (6.14) (11.74)Experience Adjustment on Plan Assets (loss)/gain - - -
Experience adjustment information is available from Financial Year 2008-09 onwards only.
ii. Provident Fund:
The Guidance on implementation of AS 15, Employee Benefits (Revised 2005) issued by Accounting Standard Board (ASB) states that benefits involving provident funds, which require interest shortfall to be compensated, are to be considered as defined benefit plans. The actuary has recommended a provision of ` 6.74 million towards liability likely to arise towards interest guarantee. The trust is managing common corpus of three companies. The total liability of ` 6.74 million as worked out by the actuary has been allocated to each entity based on the corpus value of each entity as on 31st March 2011. Accordingly ` 5.81 million has been charged to Profit & Loss Account during the year. The Company has contributed ` 77.65 million to Provident Fund (Previous Year ` 68.38 million) for the year.
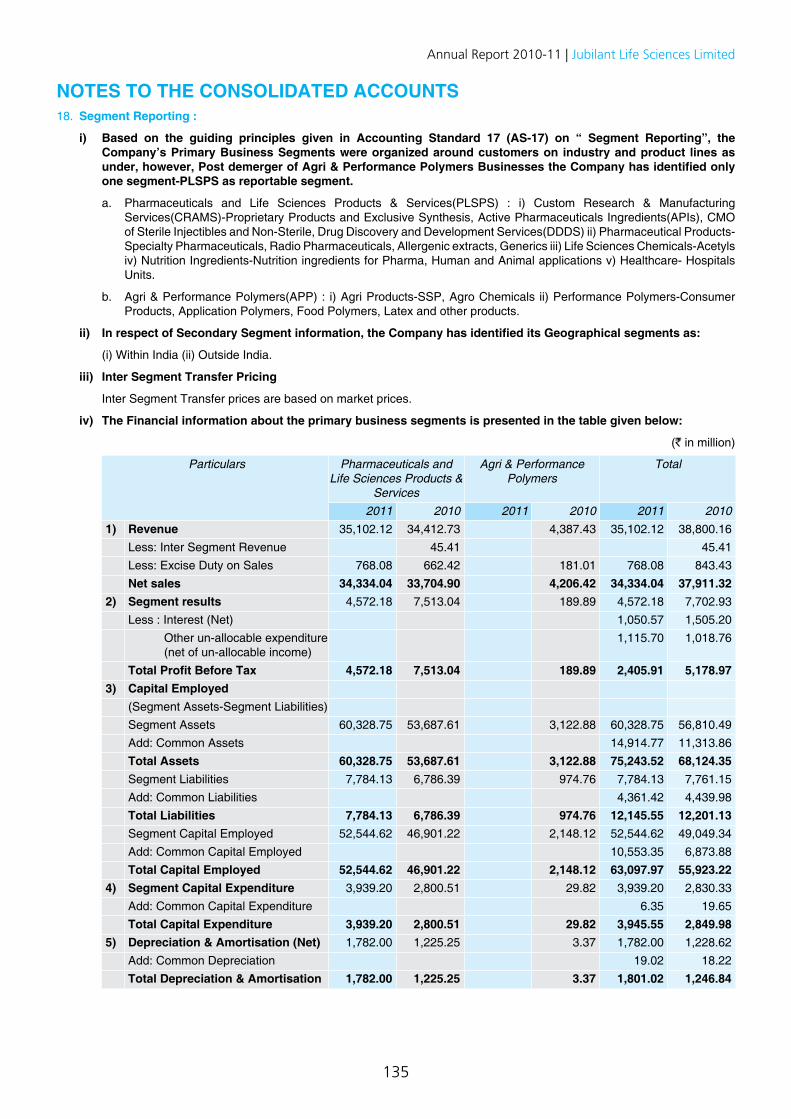
135
Annual Report 2010-11 | Jubilant Life Sciences Limited
NOTES TO THE CONSOLIDATED ACCOUNTS18. Segment Reporting :
i) Based on the guiding principles given in Accounting Standard 17 (AS-17) on “ Segment Reporting”, the Company’s Primary Business Segments were organized around customers on industry and product lines as under, however, Post demerger of Agri & Performance Polymers Businesses the Company has identified only one segment-PLSPS as reportable segment.
a. Pharmaceuticals and Life Sciences Products & Services(PLSPS) : i) Custom Research & Manufacturing Services(CRAMS)-Proprietary Products and Exclusive Synthesis, Active Pharmaceuticals Ingredients(APIs), CMO of Sterile Injectibles and Non-Sterile, Drug Discovery and Development Services(DDDS) ii) Pharmaceutical Products-Specialty Pharmaceuticals, Radio Pharmaceuticals, Allergenic extracts, Generics iii) Life Sciences Chemicals-Acetyls iv) Nutrition Ingredients-Nutrition ingredients for Pharma, Human and Animal applications v) Healthcare- Hospitals Units.
b. Agri & Performance Polymers(APP) : i) Agri Products-SSP, Agro Chemicals ii) Performance Polymers-Consumer Products, Application Polymers, Food Polymers, Latex and other products.
ii) In respect of Secondary Segment information, the Company has identified its Geographical segments as:
(i) Within India (ii) Outside India.
iii) Inter Segment Transfer Pricing
Inter Segment Transfer prices are based on market prices.
iv) The Financial information about the primary business segments is presented in the table given below:
(` in million)
Particulars Pharmaceuticals and Life Sciences Products &
Services
Agri & Performance Polymers
Total
2011 2010 2011 2010 2011 20101) Revenue 35,102.12 34,412.73 4,387.43 35,102.12 38,800.16
Less: Inter Segment Revenue 45.41 45.41 Less: Excise Duty on Sales 768.08 662.42 181.01 768.08 843.43 Net sales 34,334.04 33,704.90 4,206.42 34,334.04 37,911.32
2) Segment results 4,572.18 7,513.04 189.89 4,572.18 7,702.93 Less : Interest (Net) 1,050.57 1,505.20 Other un-allocable expenditure (net of un-allocable income)
1,115.70 1,018.76
Total Profit Before Tax 4,572.18 7,513.04 189.89 2,405.91 5,178.97 3) Capital Employed
(Segment Assets-Segment Liabilities)Segment Assets 60,328.75 53,687.61 3,122.88 60,328.75 56,810.49 Add: Common Assets 14,914.77 11,313.86 Total Assets 60,328.75 53,687.61 3,122.88 75,243.52 68,124.35 Segment Liabilities 7,784.13 6,786.39 974.76 7,784.13 7,761.15 Add: Common Liabilities 4,361.42 4,439.98 Total Liabilities 7,784.13 6,786.39 974.76 12,145.55 12,201.13 Segment Capital Employed 52,544.62 46,901.22 2,148.12 52,544.62 49,049.34 Add: Common Capital Employed 10,553.35 6,873.88 Total Capital Employed 52,544.62 46,901.22 2,148.12 63,097.97 55,923.22
4) Segment Capital Expenditure 3,939.20 2,800.51 29.82 3,939.20 2,830.33 Add: Common Capital Expenditure 6.35 19.65 Total Capital Expenditure 3,939.20 2,800.51 29.82 3,945.55 2,849.98
5) Depreciation & Amortisation (Net) 1,782.00 1,225.25 3.37 1,782.00 1,228.62 Add: Common Depreciation 19.02 18.22 Total Depreciation & Amortisation 1,782.00 1,225.25 3.37 1,801.02 1,246.84
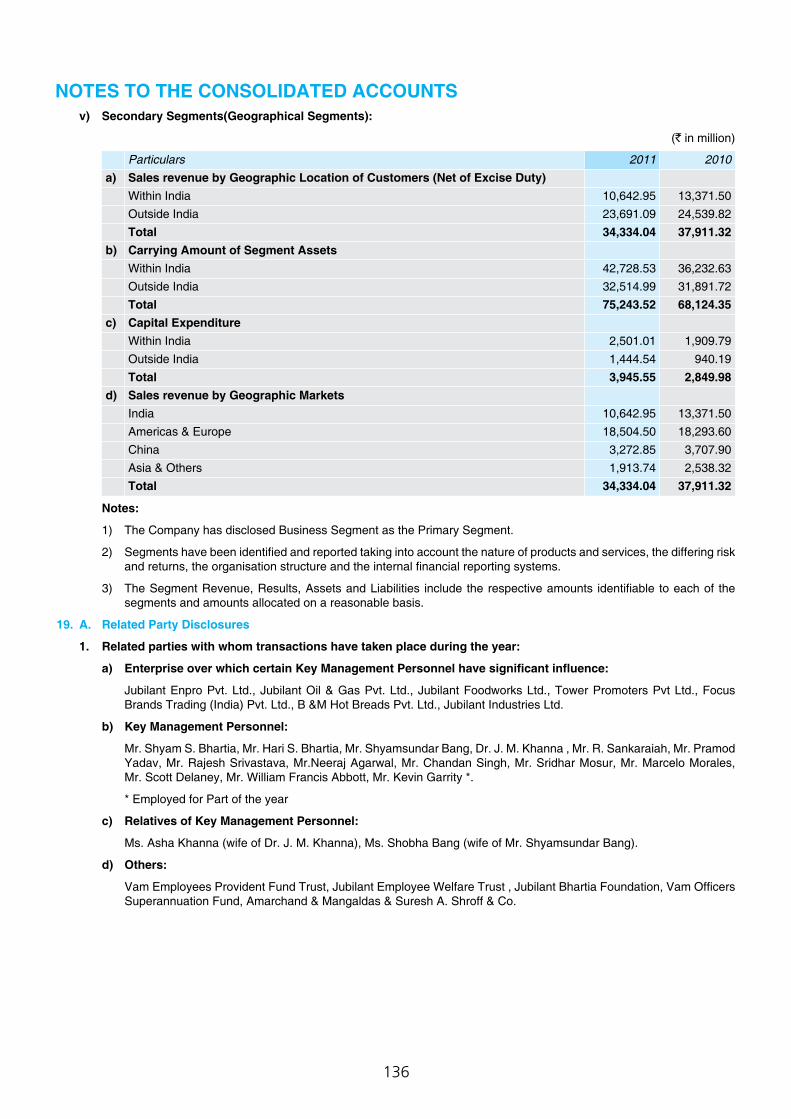
136
NOTES TO THE CONSOLIDATED ACCOUNTS v) Secondary Segments(Geographical Segments):
(` in million)
Particulars 2011 2010a) Sales revenue by Geographic Location of Customers (Net of Excise Duty)
Within India 10,642.95 13,371.50 Outside India 23,691.09 24,539.82 Total 34,334.04 37,911.32
b) Carrying Amount of Segment AssetsWithin India 42,728.53 36,232.63 Outside India 32,514.99 31,891.72 Total 75,243.52 68,124.35
c) Capital ExpenditureWithin India 2,501.01 1,909.79 Outside India 1,444.54 940.19 Total 3,945.55 2,849.98
d) Sales revenue by Geographic MarketsIndia 10,642.95 13,371.50 Americas & Europe 18,504.50 18,293.60 China 3,272.85 3,707.90 Asia & Others 1,913.74 2,538.32 Total 34,334.04 37,911.32
Notes:
1) The Company has disclosed Business Segment as the Primary Segment.
2) Segments have been identified and reported taking into account the nature of products and services, the differing risk and returns, the organisation structure and the internal financial reporting systems.
3) The Segment Revenue, Results, Assets and Liabilities include the respective amounts identifiable to each of the segments and amounts allocated on a reasonable basis.
19. A. Related Party Disclosures
1. Related parties with whom transactions have taken place during the year:
a) Enterprise over which certain Key Management Personnel have significant influence:
Jubilant Enpro Pvt. Ltd., Jubilant Oil & Gas Pvt. Ltd., Jubilant Foodworks Ltd., Tower Promoters Pvt Ltd., Focus Brands Trading (India) Pvt. Ltd., B &M Hot Breads Pvt. Ltd., Jubilant Industries Ltd.
b) Key Management Personnel:
Mr. Shyam S. Bhartia, Mr. Hari S. Bhartia, Mr. Shyamsundar Bang, Dr. J. M. Khanna , Mr. R. Sankaraiah, Mr. Pramod Yadav, Mr. Rajesh Srivastava, Mr.Neeraj Agarwal, Mr. Chandan Singh, Mr. Sridhar Mosur, Mr. Marcelo Morales, Mr. Scott Delaney, Mr. William Francis Abbott, Mr. Kevin Garrity *.
* Employed for Part of the year
c) Relatives of Key Management Personnel:
Ms. Asha Khanna (wife of Dr. J. M. Khanna), Ms. Shobha Bang (wife of Mr. Shyamsundar Bang).
d) Others:
Vam Employees Provident Fund Trust, Jubilant Employee Welfare Trust , Jubilant Bhartia Foundation, Vam Officers Superannuation Fund, Amarchand & Mangaldas & Suresh A. Shroff & Co.
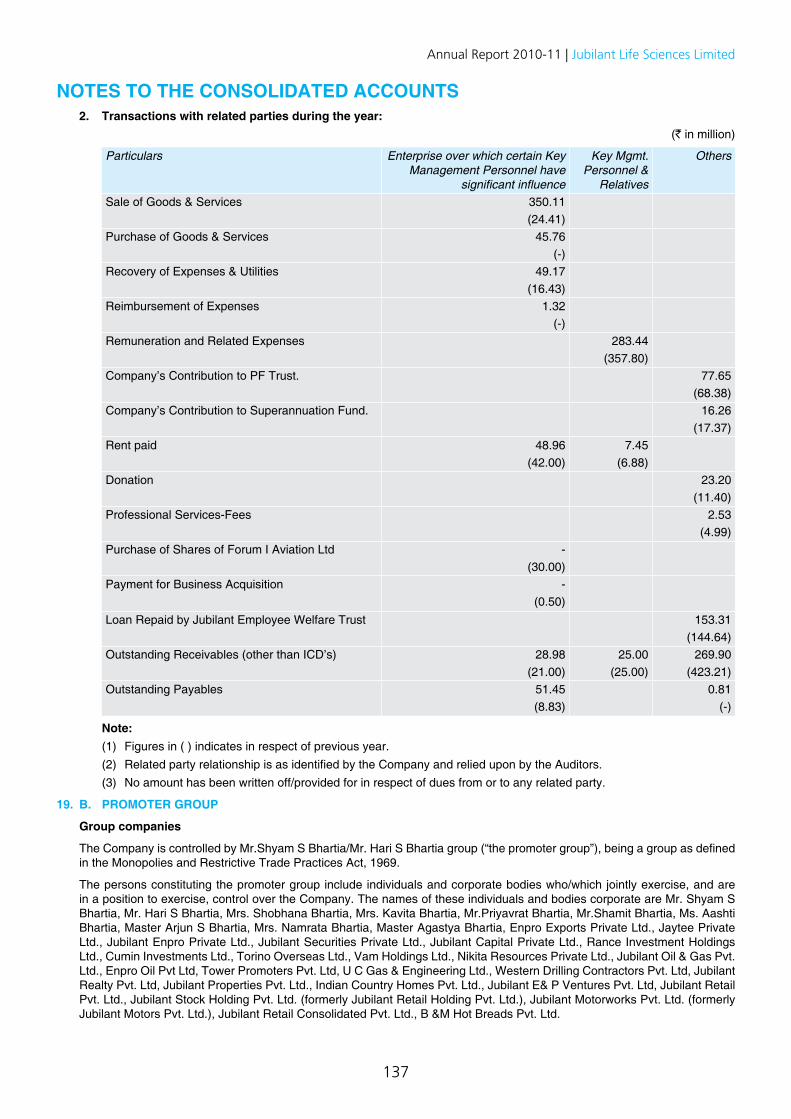
137
Annual Report 2010-11 | Jubilant Life Sciences Limited
NOTES TO THE CONSOLIDATED ACCOUNTS 2. Transactions with related parties during the year:
(` in million)
Particulars Enterprise over which certain Key Management Personnel have
significant influence
Key Mgmt. Personnel &
Relatives
Others
Sale of Goods & Services 350.11(24.41)
Purchase of Goods & Services 45.76(-)
Recovery of Expenses & Utilities 49.17(16.43)
Reimbursement of Expenses 1.32(-)
Remuneration and Related Expenses 283.44(357.80)
Company’s Contribution to PF Trust. 77.65(68.38)
Company’s Contribution to Superannuation Fund. 16.26(17.37)
Rent paid 48.96 7.45(42.00) (6.88)
Donation
23.20(11.40)
Professional Services-Fees 2.53(4.99)
Purchase of Shares of Forum I Aviation Ltd -(30.00)
Payment for Business Acquisition -(0.50)
Loan Repaid by Jubilant Employee Welfare Trust 153.31(144.64)
Outstanding Receivables (other than ICD’s) 28.98 25.00 269.90(21.00) (25.00) (423.21)
Outstanding Payables 51.45 0.81(8.83) (-)
Note: (1) Figures in ( ) indicates in respect of previous year. (2) Related party relationship is as identified by the Company and relied upon by the Auditors. (3) No amount has been written off/provided for in respect of dues from or to any related party.
19. B. PROMOTER GROUP
Group companies
The Company is controlled by Mr.Shyam S Bhartia/Mr. Hari S Bhartia group (“the promoter group”), being a group as defined in the Monopolies and Restrictive Trade Practices Act, 1969.
The persons constituting the promoter group include individuals and corporate bodies who/which jointly exercise, and are in a position to exercise, control over the Company. The names of these individuals and bodies corporate are Mr. Shyam S Bhartia, Mr. Hari S Bhartia, Mrs. Shobhana Bhartia, Mrs. Kavita Bhartia, Mr.Priyavrat Bhartia, Mr.Shamit Bhartia, Ms. Aashti Bhartia, Master Arjun S Bhartia, Mrs. Namrata Bhartia, Master Agastya Bhartia, Enpro Exports Private Ltd., Jaytee Private Ltd., Jubilant Enpro Private Ltd., Jubilant Securities Private Ltd., Jubilant Capital Private Ltd., Rance Investment Holdings Ltd., Cumin Investments Ltd., Torino Overseas Ltd., Vam Holdings Ltd., Nikita Resources Private Ltd., Jubilant Oil & Gas Pvt. Ltd., Enpro Oil Pvt Ltd, Tower Promoters Pvt. Ltd, U C Gas & Engineering Ltd., Western Drilling Contractors Pvt. Ltd, Jubilant Realty Pvt. Ltd, Jubilant Properties Pvt. Ltd., Indian Country Homes Pvt. Ltd., Jubilant E& P Ventures Pvt. Ltd, Jubilant Retail Pvt. Ltd., Jubilant Stock Holding Pvt. Ltd. (formerly Jubilant Retail Holding Pvt. Ltd.), Jubilant Motorworks Pvt. Ltd. (formerly Jubilant Motors Pvt. Ltd.), Jubilant Retail Consolidated Pvt. Ltd., B &M Hot Breads Pvt. Ltd.
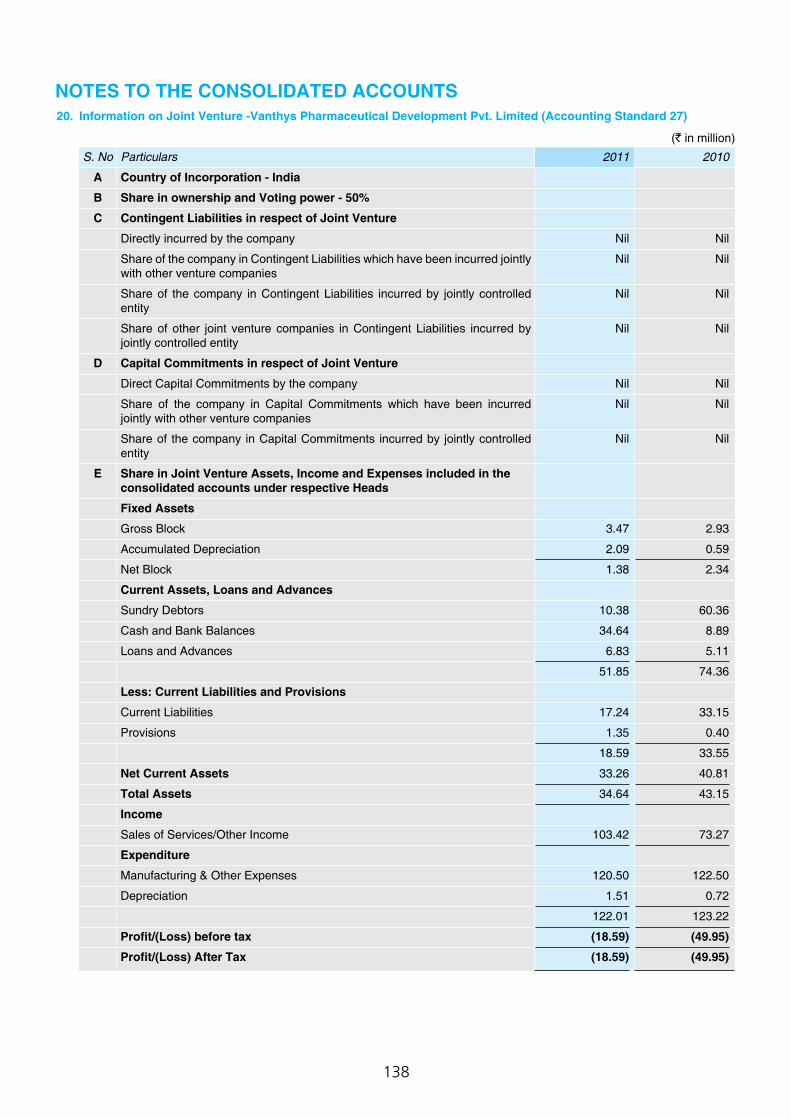
138
NOTES TO THE CONSOLIDATED ACCOUNTS20. Information on Joint Venture -Vanthys Pharmaceutical Development Pvt. Limited (Accounting Standard 27)
(` in million)
S. No Particulars 2011 2010
A Country of Incorporation - India
B Share in ownership and Voting power - 50%
C Contingent Liabilities in respect of Joint Venture
Directly incurred by the company Nil Nil
Share of the company in Contingent Liabilities which have been incurred jointly with other venture companies
Nil Nil
Share of the company in Contingent Liabilities incurred by jointly controlled entity
Nil Nil
Share of other joint venture companies in Contingent Liabilities incurred by jointly controlled entity
Nil Nil
D Capital Commitments in respect of Joint Venture
Direct Capital Commitments by the company Nil Nil
Share of the company in Capital Commitments which have been incurred jointly with other venture companies
Nil Nil
Share of the company in Capital Commitments incurred by jointly controlled entity
Nil Nil
E Share in Joint Venture Assets, Income and Expenses included in the consolidated accounts under respective Heads
Fixed Assets
Gross Block 3.47 2.93
Accumulated Depreciation 2.09 0.59
Net Block 1.38 2.34
Current Assets, Loans and Advances
Sundry Debtors 10.38 60.36
Cash and Bank Balances 34.64 8.89
Loans and Advances 6.83 5.11
51.85 74.36
Less: Current Liabilities and Provisions
Current Liabilities 17.24 33.15
Provisions 1.35 0.40
18.59 33.55
Net Current Assets 33.26 40.81
Total Assets 34.64 43.15
Income
Sales of Services/Other Income 103.42 73.27
Expenditure
Manufacturing & Other Expenses 120.50 122.50
Depreciation 1.51 0.72
122.01 123.22
Profit/(Loss) before tax (18.59) (49.95)
Profit/(Loss) After Tax (18.59) (49.95)
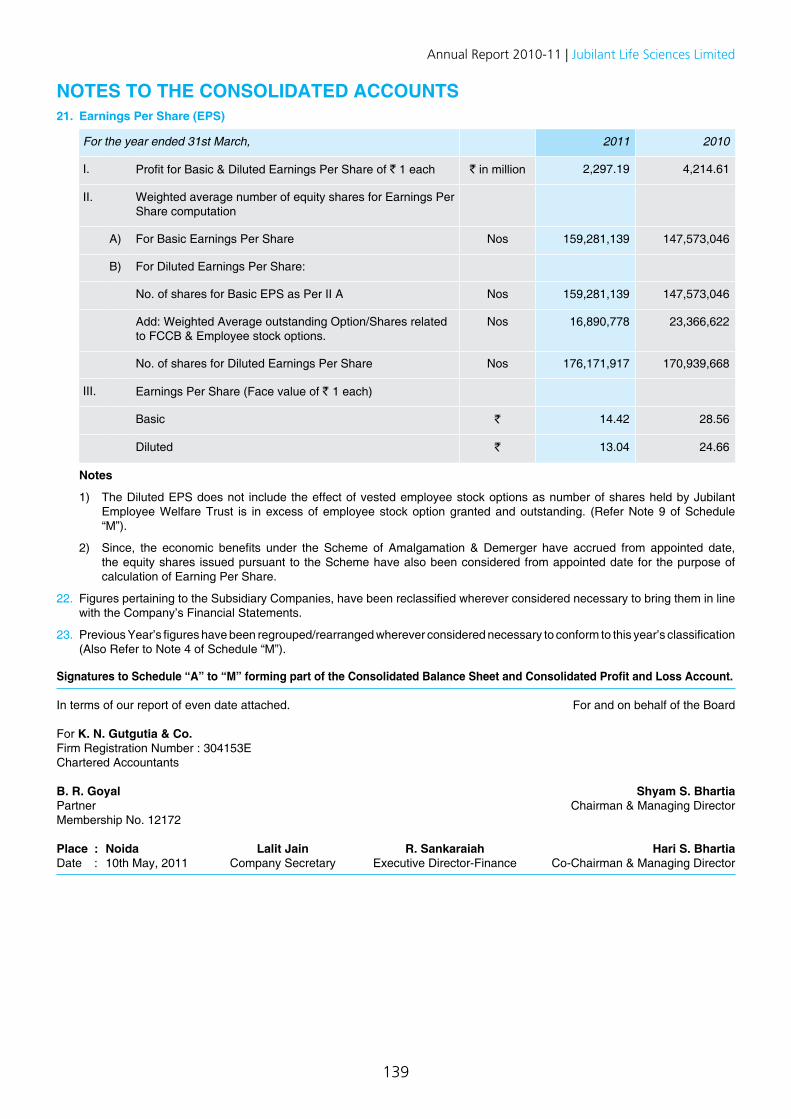
139
Annual Report 2010-11 | Jubilant Life Sciences Limited
NOTES TO THE CONSOLIDATED ACCOUNTS
Signatures to Schedule “A” to “M” forming part of the Consolidated Balance Sheet and Consolidated Profit and Loss Account.
In terms of our report of even date attached. For and on behalf of the Board
For K. N. Gutgutia & Co.Firm Registration Number : 304153EChartered Accountants
B. R. Goyal Shyam S. BhartiaPartner Chairman & Managing DirectorMembership No. 12172
Place : Noida Lalit Jain R. Sankaraiah Hari S. BhartiaDate : 10th May, 2011 Company Secretary Executive Director-Finance Co-Chairman & Managing Director
21. Earnings Per Share (EPS)
For the year ended 31st March, 2011 2010
I. Profit for Basic & Diluted Earnings Per Share of ` 1 each ` in million 2,297.19 4,214.61
II. Weighted average number of equity shares for Earnings Per Share computation
A) For Basic Earnings Per Share Nos 159,281,139 147,573,046
B) For Diluted Earnings Per Share:
No. of shares for Basic EPS as Per II A Nos 159,281,139 147,573,046
Add: Weighted Average outstanding Option/Shares related to FCCB & Employee stock options.
Nos 16,890,778 23,366,622
No. of shares for Diluted Earnings Per Share Nos 176,171,917 170,939,668
III. Earnings Per Share (Face value of ` 1 each)
Basic ` 14.42 28.56
Diluted ` 13.04 24.66
Notes
1) The Diluted EPS does not include the effect of vested employee stock options as number of shares held by Jubilant Employee Welfare Trust is in excess of employee stock option granted and outstanding. (Refer Note 9 of Schedule “M”).
2) Since, the economic benefits under the Scheme of Amalgamation & Demerger have accrued from appointed date, the equity shares issued pursuant to the Scheme have also been considered from appointed date for the purpose of calculation of Earning Per Share.
22. Figures pertaining to the Subsidiary Companies, have been reclassified wherever considered necessary to bring them in line with the Company’s Financial Statements.
23. Previous Year’s figures have been regrouped/rearranged wherever considered necessary to conform to this year’s classification (Also Refer to Note 4 of Schedule “M”).
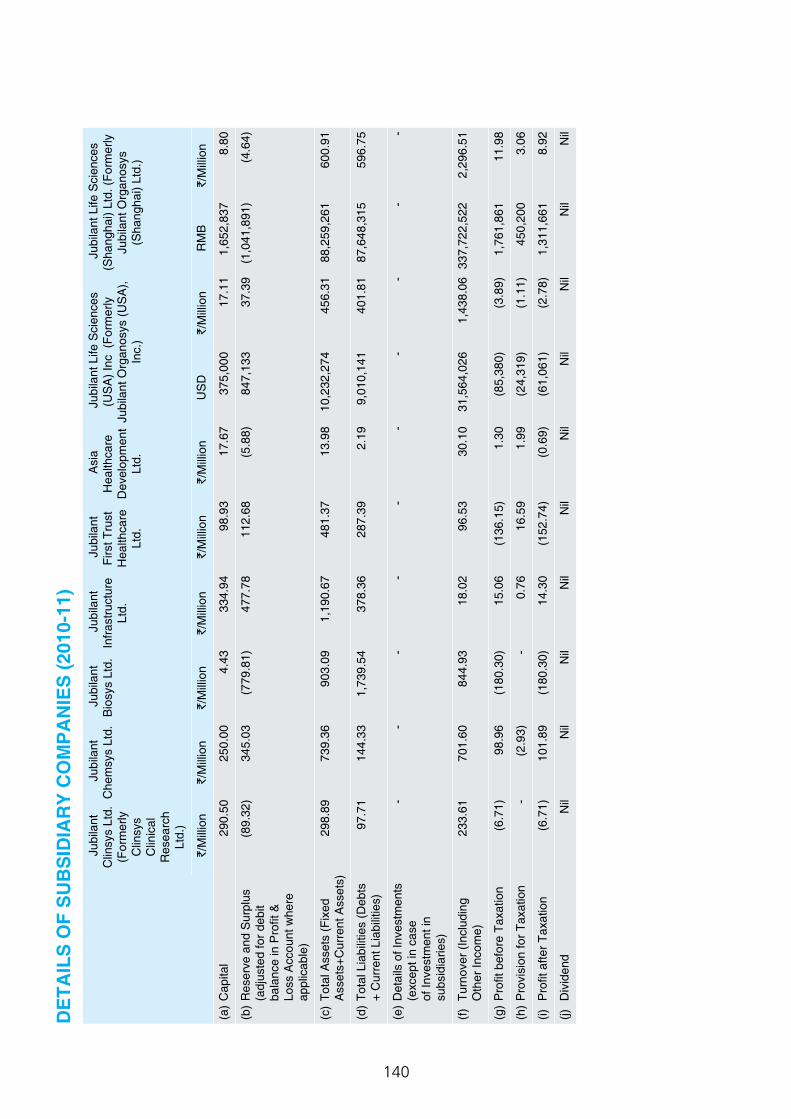
140
DE
TAIL
S O
F S
UB
SID
IAR
Y C
OM
PA
NIE
S (2
010-
11)
Jub
ilant
C
linsy
s Lt
d.(F
orm
erly
C
linsy
s C
linic
al
Res
earc
h Lt
d.)
Jub
ilant
C
hem
sys
Ltd.
J
ubila
nt
Bio
sys
Ltd.
J
ubila
nt
Infra
stru
ctur
e Lt
d.
Jub
ilant
Fi
rst T
rust
H
ealth
care
Lt
d.
Asi
a H
ealth
care
D
evel
opm
ent
Ltd.
Jub
ilant
Life
Sci
ence
s (U
SA
) Inc
(Fo
rmer
ly
Jubi
lant
Org
anos
ys (U
SA
), In
c.)
Jub
ilant
Life
Sci
ence
s (S
hang
hai)
Ltd.
(For
mer
ly
Jubi
lant
Org
anos
ys
(Sha
ngha
i) Lt
d.)
`/M
illio
n`/
Mill
ion
`/M
illio
n`/
Mill
ion
`/M
illio
n `
/Mill
ion
US
D
`/M
illio
n R
MB
`
/Mill
ion
(a)
Cap
ital
290
.50
250
.00
4.4
3 3
34.9
4 9
8.93
1
7.67
3
75,0
00
17.
11
1,6
52,8
37
8.8
0
(b)
Res
erve
and
Sur
plus
(a
djus
ted
for d
ebit
bala
nce
in P
rofit
&
Loss
Acc
ount
whe
re
appl
icab
le)
(89.
32)
345
.03
(779
.81)
477
.78
112
.68
(5.8
8) 8
47,1
33
37.
39
(1,0
41,8
91)
(4.6
4)
(c)
Tota
l Ass
ets
(Fix
ed
Ass
ets+
Cur
rent
Ass
ets)
2
98.8
9 7
39.3
6 9
03.0
9 1
,190
.67
481
.37
13.
98
10,
232,
274
456
.31
88,
259,
261
600
.91
(d)
Tota
l Lia
bilit
ies
(Deb
ts
+ C
urre
nt L
iabi
litie
s)
97.
71
144
.33
1,7
39.5
4 3
78.3
6 2
87.3
9 2
.19
9,0
10,1
41
401
.81
87,
648,
315
596
.75
(e)
Det
ails
of I
nves
tmen
ts
(exc
ept i
n ca
se
of In
vest
men
t in
subs
idia
ries)
- -
- -
- -
- -
- -
(f)
Turn
over
(Inc
ludi
ng
Oth
er In
com
e)
233
.61
701
.60
844
.93
18.
02
96.
53
30.
10
31,
564,
026
1,4
38.0
6 3
37,7
22,5
22
2,2
96.5
1
(g)
Pro
fit b
efor
e Ta
xatio
n (6
.71)
98.
96
(180
.30)
15.
06
(136
.15)
1.3
0 (8
5,38
0) (3
.89)
1,7
61,8
61
11.
98
(h)
Pro
visi
on fo
r Tax
atio
n -
(2.9
3) -
0.7
6 1
6.59
1
.99
(24,
319)
(1.1
1) 4
50,2
00
3.0
6
(i)
Pro
fit a
fter T
axat
ion
(6.7
1) 1
01.8
9 (1
80.3
0) 1
4.30
(1
52.7
4) (0
.69)
(61,
061)
(2.7
8) 1
,311
,661
8
.92
(j)
Div
iden
d N
il N
il N
il N
il N
il N
il N
il N
il N
il N
il

141
Annual Report 2010-11 | Jubilant Life Sciences LimitedD
ETA
ILS
OF
SU
BS
IDIA
RY
CO
MP
AN
IES
(201
0-11
) (C
ontd
.) J
ubila
nt P
harm
a N
V
Jub
ilant
Pha
rmac
eutic
als
NV
(for
mer
ly
Pha
rmac
eutic
al S
ervi
ces
Inco
rpor
ated
N.V
.)
PS
I Sup
ply
NV
J
ubila
nt L
ife S
cien
ces
Hol
ding
s In
c.(F
orm
erly
C
linsy
s H
oldi
ngs,
Inc.
)
Jub
ilant
Clin
sys
Inc.
(For
mer
ly C
linsy
s C
linic
al
Res
earc
h, In
c.)
EU
RO
`
/Mill
ion
EU
RO
`
/Mill
ion
EU
RO
`
/Mill
ion
US
D
`/M
illio
n U
SD
`
/Mill
ion
(a)
Cap
ital
16,
180,
000
894
.14
1,0
50,3
00
63.
95
665
,000
4
3.37
18
5,37
0,00
0 8
,071
.02
102
0
.01
(b)
Res
erve
and
Sur
plus
(a
djus
ted
for d
ebit
bala
nce
in P
rofit
&
Loss
Acc
ount
whe
re
appl
icab
le)
1,8
20,8
53
246
.75
(832
,186
) (5
0.12
) (6
56,5
21)
(42.
83)
(1,1
00,2
70)
146
.49
(18,
847,
074)
(840
.49)
(c)
Tota
l Ass
ets
(Fix
ed
Ass
ets+
Cur
rent
Ass
ets)
4
4,44
8 2
.82
2,6
65,2
29
168
.93
1,0
15,6
56
64.
38
38,
019,
705
1,6
95.4
9 1
5,97
2,53
0 7
12.3
0
(d)
Tota
l Lia
bilit
ies
(Deb
ts
+ C
urre
nt L
iabi
litie
s)
4,9
95
0.3
2 2
,447
,115
1
55.1
0 1
,007
,177
6
3.84
1
0,04
4,87
1 4
47.9
5 3
4,81
9,50
2 1
,552
.78
(e)
Det
ails
of I
nves
tmen
ts
(exc
ept i
n ca
se
of In
vest
men
t in
subs
idia
ries)
- -
- -
- -
- -
- -
(f)
Turn
over
(Inc
ludi
ng
Oth
er In
com
e)
133
0
.01
1,7
62,7
72
106
.26
2,1
55,2
07
129
.92
- -
13,
367,
695
609
.03
(g)
Pro
fit b
efor
e Ta
xatio
n (5
,718
) (0
.35)
(105
,075
) (6
.33)
(9,9
41)
(0.6
0) (5
92,7
72)
(27.
01)
(6,3
34,2
35)
(288
.59)
(h)
Pro
visi
on fo
r Tax
atio
n -
- (6
3,85
5) (3
.85)
4,4
54
0.2
7 (2
39,0
00)
(10.
89)
(2,4
81,2
65)
(113
.05)
(i)
Pro
fit a
fter T
axat
ion
(5,7
18)
(0.3
5) (4
1,22
0) (2
.48)
(14,
395)
(0.8
7) (3
53,7
72)
(16.
12)
(3,8
52,9
70)
(175
.54)
(j)
Div
iden
d N
il N
il N
il N
il N
il N
il N
il N
il N
il N
il
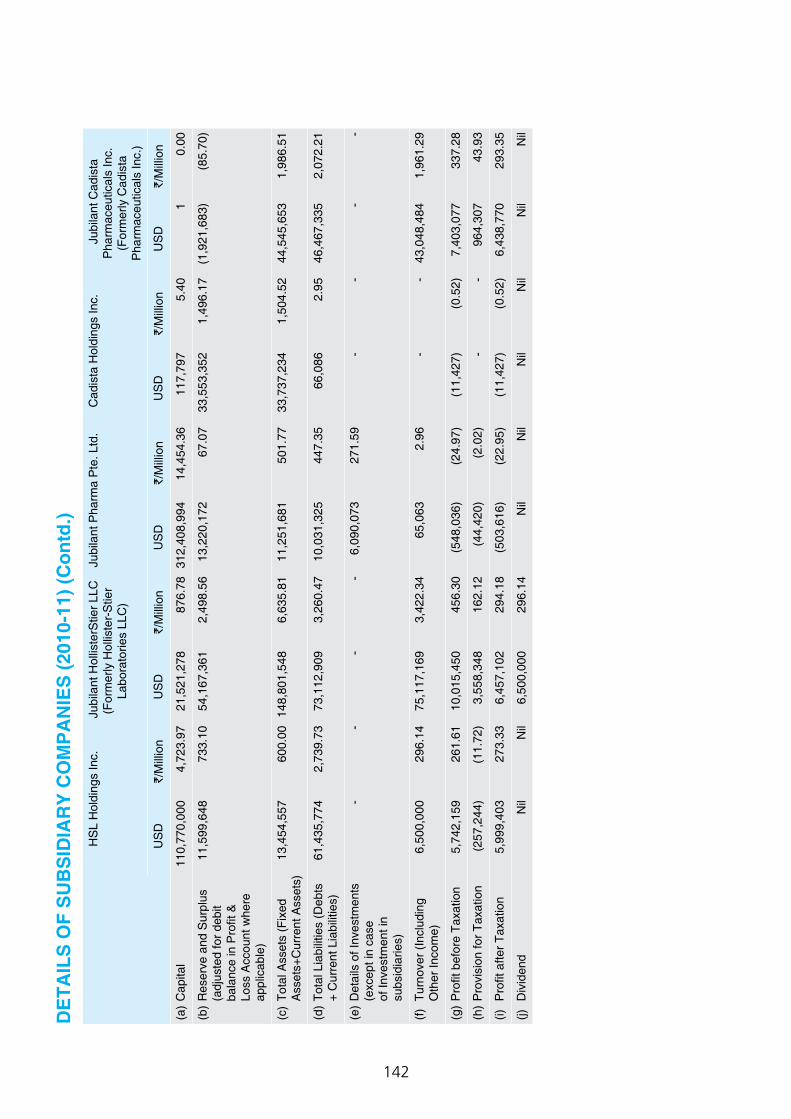
142
DE
TAIL
S O
F S
UB
SID
IAR
Y C
OM
PA
NIE
S (2
010-
11) (
Con
td.)
HS
L H
oldi
ngs
Inc.
J
ubila
nt H
ollis
terS
tier L
LC
(For
mer
ly H
ollis
ter-
Stie
r La
bora
torie
s LL
C)
Jub
ilant
Pha
rma
Pte
. Ltd
. C
adis
ta H
oldi
ngs
Inc.
J
ubila
nt C
adis
ta
Pha
rmac
eutic
als
Inc.
(For
mer
ly C
adis
ta
Pha
rmac
eutic
als
Inc.
)
US
D
`/M
illio
n U
SD
`
/Mill
ion
US
D
`/M
illio
n U
SD
`
/Mill
ion
US
D
`/M
illio
n
(a)
Cap
ital
110
,770
,000
4
,723
.97
21,
521,
278
876
.78
312
,408
,994
1
4,45
4.36
1
17,7
97
5.4
0 1
0
.00
(b)
Res
erve
and
Sur
plus
(a
djus
ted
for d
ebit
bala
nce
in P
rofit
&
Loss
Acc
ount
whe
re
appl
icab
le)
11,
599,
648
733
.10
54,
167,
361
2,4
98.5
6 1
3,22
0,17
2 6
7.07
3
3,55
3,35
2 1
,496
.17
(1,9
21,6
83)
(85.
70)
(c)
Tota
l Ass
ets
(Fix
ed
Ass
ets+
Cur
rent
Ass
ets)
1
3,45
4,55
7 6
00.0
0 1
48,8
01,5
48
6,6
35.8
1 1
1,25
1,68
1 5
01.7
7 3
3,73
7,23
4 1
,504
.52
44,
545,
653
1,9
86.5
1
(d)
Tota
l Lia
bilit
ies
(Deb
ts
+ C
urre
nt L
iabi
litie
s)
61,
435,
774
2,7
39.7
3 7
3,11
2,90
9 3
,260
.47
10,
031,
325
447
.35
66,
086
2.9
5 4
6,46
7,33
5 2
,072
.21
(e)
Det
ails
of I
nves
tmen
ts
(exc
ept i
n ca
se
of In
vest
men
t in
subs
idia
ries)
- -
- -
6,0
90,0
73
271
.59
- -
- -
(f)
Turn
over
(Inc
ludi
ng
Oth
er In
com
e)
6,5
00,0
00
296
.14
75,
117,
169
3,4
22.3
4 6
5,06
3 2
.96
- -
43,
048,
484
1,9
61.2
9
(g)
Pro
fit b
efor
e Ta
xatio
n 5
,742
,159
2
61.6
1 1
0,01
5,45
0 4
56.3
0 (5
48,0
36)
(24.
97)
(11,
427)
(0.5
2) 7
,403
,077
3
37.2
8
(h)
Pro
visi
on fo
r Tax
atio
n (2
57,2
44)
(11.
72)
3,5
58,3
48
162
.12
(44,
420)
(2.0
2) -
- 9
64,3
07
43.
93
(i)
Pro
fit a
fter T
axat
ion
5,9
99,4
03
273
.33
6,4
57,1
02
294
.18
(503
,616
) (2
2.95
) (1
1,42
7) (0
.52)
6,4
38,7
70
293
.35
(j)
Div
iden
d N
il N
il 6,
500,
000
296.
14 N
il N
il N
il N
il N
il N
il
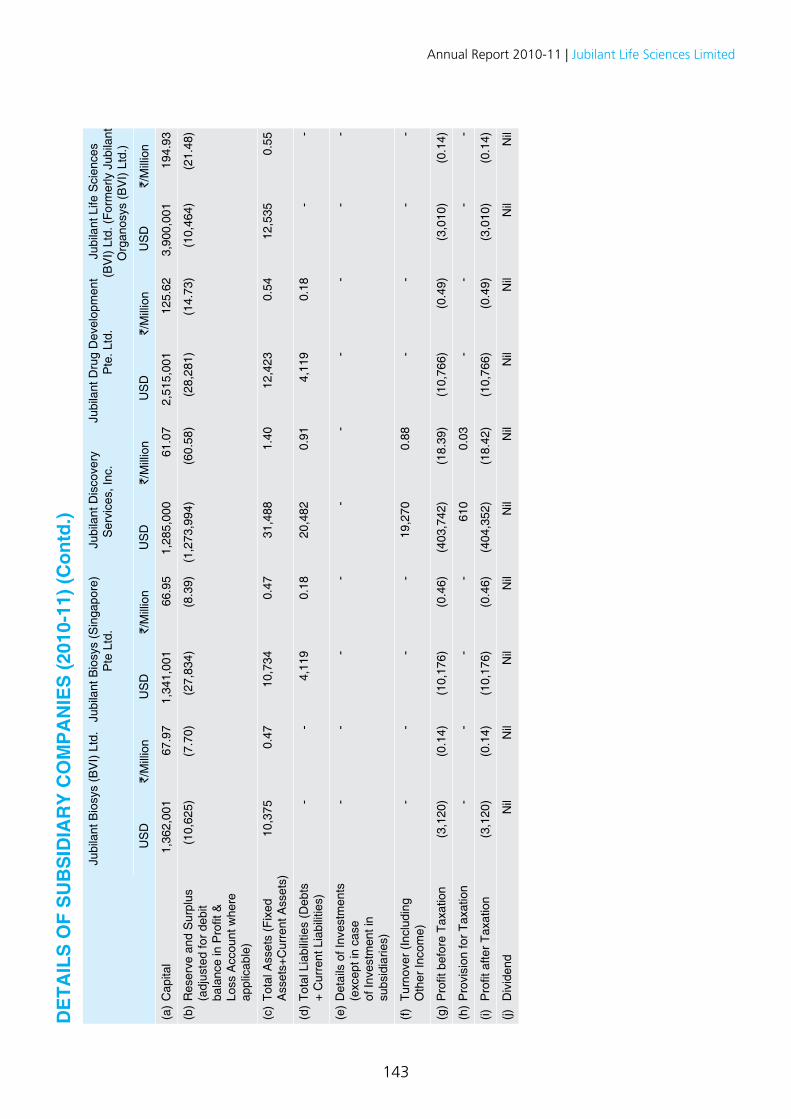
143
Annual Report 2010-11 | Jubilant Life Sciences LimitedD
ETA
ILS
OF
SU
BS
IDIA
RY
CO
MP
AN
IES
(201
0-11
) (C
ontd
.) J
ubila
nt B
iosy
s (B
VI)
Ltd.
Ju
bila
nt B
iosy
s (S
inga
pore
) P
te L
td.
Jub
ilant
Dis
cove
ry
Ser
vice
s, In
c.
Jub
ilant
Dru
g D
evel
opm
ent
Pte
. Ltd
. J
ubila
nt L
ife S
cien
ces
(BV
I) Lt
d. (F
orm
erly
Jub
ilant
O
rgan
osys
(BV
I) Lt
d.)
US
D
`/M
illio
n U
SD
`
/Mill
ion
US
D
`/M
illio
n U
SD
`
/Mill
ion
US
D
`/M
illio
n
(a)
Cap
ital
1,3
62,0
01
67.
97
1,3
41,0
01
66.
95
1,2
85,0
00
61.
07
2,5
15,0
01
125
.62
3,9
00,0
01
194
.93
(b)
Res
erve
and
Sur
plus
(a
djus
ted
for d
ebit
bala
nce
in P
rofit
&
Loss
Acc
ount
whe
re
appl
icab
le)
(10,
625)
(7.7
0) (2
7,83
4) (8
.39)
(1,2
73,9
94)
(60.
58)
(28,
281)
(14.
73)
(10,
464)
(21.
48)
(c)
Tota
l Ass
ets
(Fix
ed
Ass
ets+
Cur
rent
Ass
ets)
1
0,37
5 0
.47
10,
734
0.4
7 3
1,48
8 1
.40
12,
423
0.5
4 1
2,53
5 0
.55
(d)
Tota
l Lia
bilit
ies
(Deb
ts
+ C
urre
nt L
iabi
litie
s)
- -
4,1
19
0.1
8 2
0,48
2 0
.91
4,1
19
0.1
8 -
-
(e)
Det
ails
of I
nves
tmen
ts
(exc
ept i
n ca
se
of In
vest
men
t in
subs
idia
ries)
- -
- -
- -
- -
- -
(f)
Turn
over
(Inc
ludi
ng
Oth
er In
com
e)
- -
- -
19,
270
0.8
8 -
- -
-
(g)
Pro
fit b
efor
e Ta
xatio
n (3
,120
) (0
.14)
(10,
176)
(0.4
6) (4
03,7
42)
(18.
39)
(10,
766)
(0.4
9) (3
,010
) (0
.14)
(h)
Pro
visi
on fo
r Tax
atio
n -
- -
- 6
10
0.0
3 -
- -
-
(i)
Pro
fit a
fter T
axat
ion
(3,1
20)
(0.1
4) (1
0,17
6) (0
.46)
(404
,352
) (1
8.42
) (1
0,76
6) (0
.49)
(3,0
10)
(0.1
4)
(j)
Div
iden
d N
il N
il N
il N
il N
il N
il N
il N
il N
il N
il
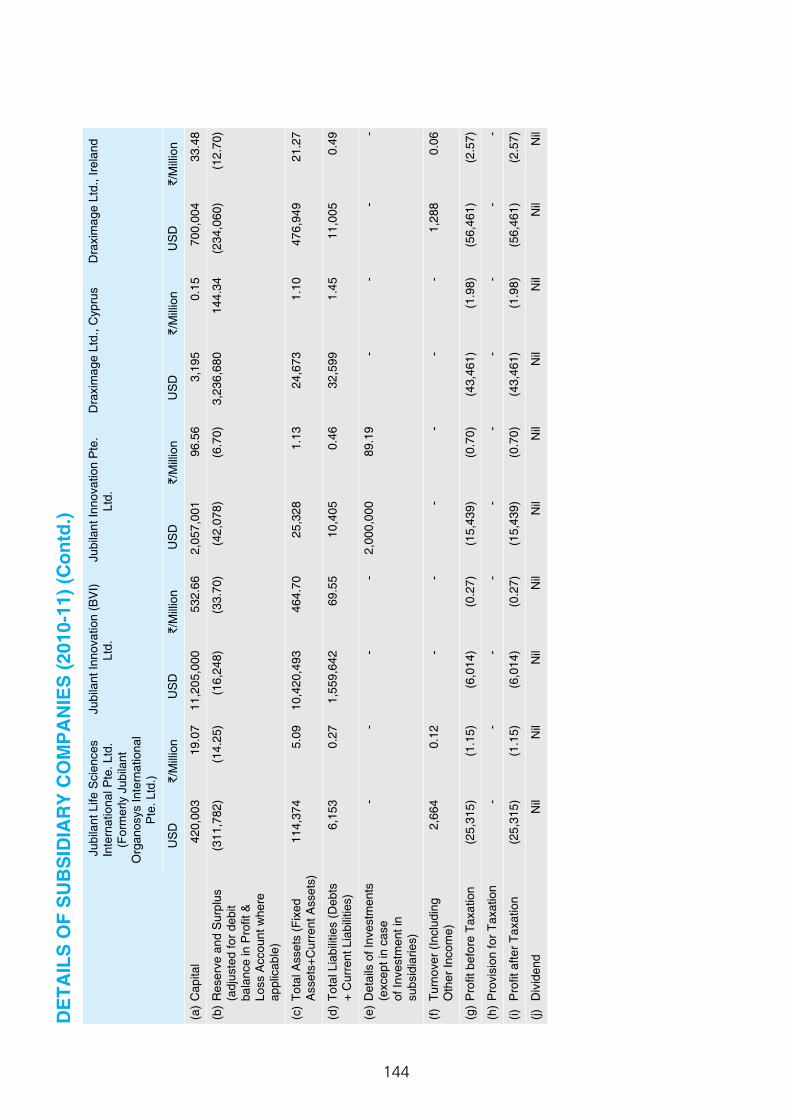
144
DE
TAIL
S O
F S
UB
SID
IAR
Y C
OM
PA
NIE
S (2
010-
11) (
Con
td.)
Jub
ilant
Life
Sci
ence
s In
tern
atio
nal P
te. L
td.
(For
mer
ly J
ubila
nt
Org
anos
ys In
tern
atio
nal
Pte
. Ltd
.)
Jub
ilant
Inno
vatio
n (B
VI)
Ltd.
J
ubila
nt In
nova
tion
Pte
. Lt
d.
Dra
xim
age
Ltd.
, Cyp
rus
Dra
xim
age
Ltd.
, Ire
land
US
D
`/M
illio
n U
SD
`
/Mill
ion
US
D
`/M
illio
n U
SD
`
/Mill
ion
US
D
`/M
illio
n
(a)
Cap
ital
420
,003
1
9.07
1
1,20
5,00
0 5
32.6
6 2
,057
,001
9
6.56
3
,195
0
.15
700
,004
3
3.48
(b)
Res
erve
and
Sur
plus
(a
djus
ted
for d
ebit
bala
nce
in P
rofit
&
Loss
Acc
ount
whe
re
appl
icab
le)
(311
,782
) (1
4.25
) (1
6,24
8) (3
3.70
) (4
2,07
8) (6
.70)
3,2
36,6
80
144
.34
(234
,060
) (1
2.70
)
(c)
Tota
l Ass
ets
(Fix
ed
Ass
ets+
Cur
rent
Ass
ets)
1
14,3
74
5.0
9 1
0,42
0,49
3 4
64.7
0 2
5,32
8 1
.13
24,
673
1.1
0 4
76,9
49
21.
27
(d)
Tota
l Lia
bilit
ies
(Deb
ts
+ C
urre
nt L
iabi
litie
s)
6,1
53
0.2
7 1
,559
,642
6
9.55
1
0,40
5 0
.46
32,
599
1.4
5 1
1,00
5 0
.49
(e)
Det
ails
of I
nves
tmen
ts
(exc
ept i
n ca
se
of In
vest
men
t in
subs
idia
ries)
- -
- -
2,0
00,0
00
89.
19
- -
- -
(f)
Turn
over
(Inc
ludi
ng
Oth
er In
com
e)
2,6
64
0.1
2 -
- -
- -
- 1
,288
0
.06
(g)
Pro
fit b
efor
e Ta
xatio
n (2
5,31
5) (1
.15)
(6,0
14)
(0.2
7) (1
5,43
9) (0
.70)
(43,
461)
(1.9
8) (5
6,46
1) (2
.57)
(h)
Pro
visi
on fo
r Tax
atio
n -
- -
- -
- -
- -
-
(i)
Pro
fit a
fter T
axat
ion
(25,
315)
(1.1
5) (6
,014
) (0
.27)
(15,
439)
(0.7
0) (4
3,46
1) (1
.98)
(56,
461)
(2.5
7)
(j)
Div
iden
d N
il N
il N
il N
il N
il N
il N
il N
il N
il N
il
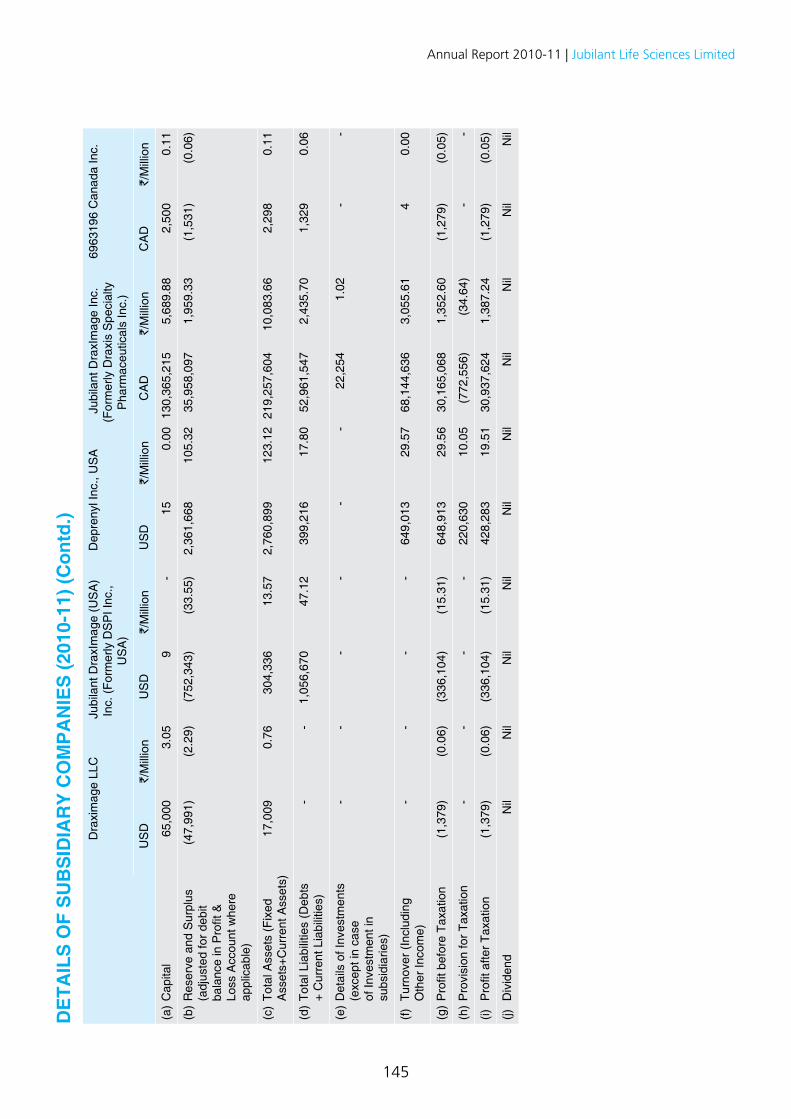
145
Annual Report 2010-11 | Jubilant Life Sciences LimitedD
ETA
ILS
OF
SU
BS
IDIA
RY
CO
MP
AN
IES
(201
0-11
) (C
ontd
.) D
raxi
mag
e LL
C
Jub
ilant
Dra
xIm
age
(US
A)
Inc.
(For
mer
ly D
SP
I Inc
., U
SA
)
Dep
reny
l Inc
., U
SA
J
ubila
nt D
raxI
mag
e In
c.(F
orm
erly
Dra
xis
Spe
cial
ty
Pha
rmac
eutic
als
Inc.
)
696
3196
Can
ada
Inc.
US
D
`/M
illio
n U
SD
`
/Mill
ion
US
D
`/M
illio
n C
AD
`
/Mill
ion
CA
D
`/M
illio
n
(a)
Cap
ital
65,
000
3.0
5 9
-
15
0.0
0 1
30,3
65,2
15
5,6
89.8
8 2
,500
0
.11
(b)
Res
erve
and
Sur
plus
(a
djus
ted
for d
ebit
bala
nce
in P
rofit
&
Loss
Acc
ount
whe
re
appl
icab
le)
(47,
991)
(2.2
9) (7
52,3
43)
(33.
55)
2,3
61,6
68
105
.32
35,
958,
097
1,9
59.3
3 (1
,531
) (0
.06)
(c)
Tota
l Ass
ets
(Fix
ed
Ass
ets+
Cur
rent
Ass
ets)
1
7,00
9 0
.76
304
,336
1
3.57
2
,760
,899
1
23.1
2 2
19,2
57,6
04
10,
083.
66
2,2
98
0.1
1
(d)
Tota
l Lia
bilit
ies
(Deb
ts
+ C
urre
nt L
iabi
litie
s)
- -
1,0
56,6
70
47.
12
399
,216
1
7.80
5
2,96
1,54
7 2
,435
.70
1,3
29
0.0
6
(e)
Det
ails
of I
nves
tmen
ts
(exc
ept i
n ca
se
of In
vest
men
t in
subs
idia
ries)
- -
- -
- -
22,
254
1.0
2 -
-
(f)
Turn
over
(Inc
ludi
ng
Oth
er In
com
e)
- -
- -
649
,013
2
9.57
6
8,14
4,63
6 3
,055
.61
4
0.0
0
(g)
Pro
fit b
efor
e Ta
xatio
n (1
,379
) (0
.06)
(336
,104
) (1
5.31
) 6
48,9
13
29.
56
30,
165,
068
1,3
52.6
0 (1
,279
) (0
.05)
(h)
Pro
visi
on fo
r Tax
atio
n -
- -
- 2
20,6
30
10.
05
(772
,556
) (3
4.64
) -
-
(i)
Pro
fit a
fter T
axat
ion
(1,3
79)
(0.0
6) (3
36,1
04)
(15.
31)
428
,283
1
9.51
3
0,93
7,62
4 1
,387
.24
(1,2
79)
(0.0
5)
(j)
Div
iden
d N
il N
il N
il N
il N
il N
il N
il N
il N
il N
il
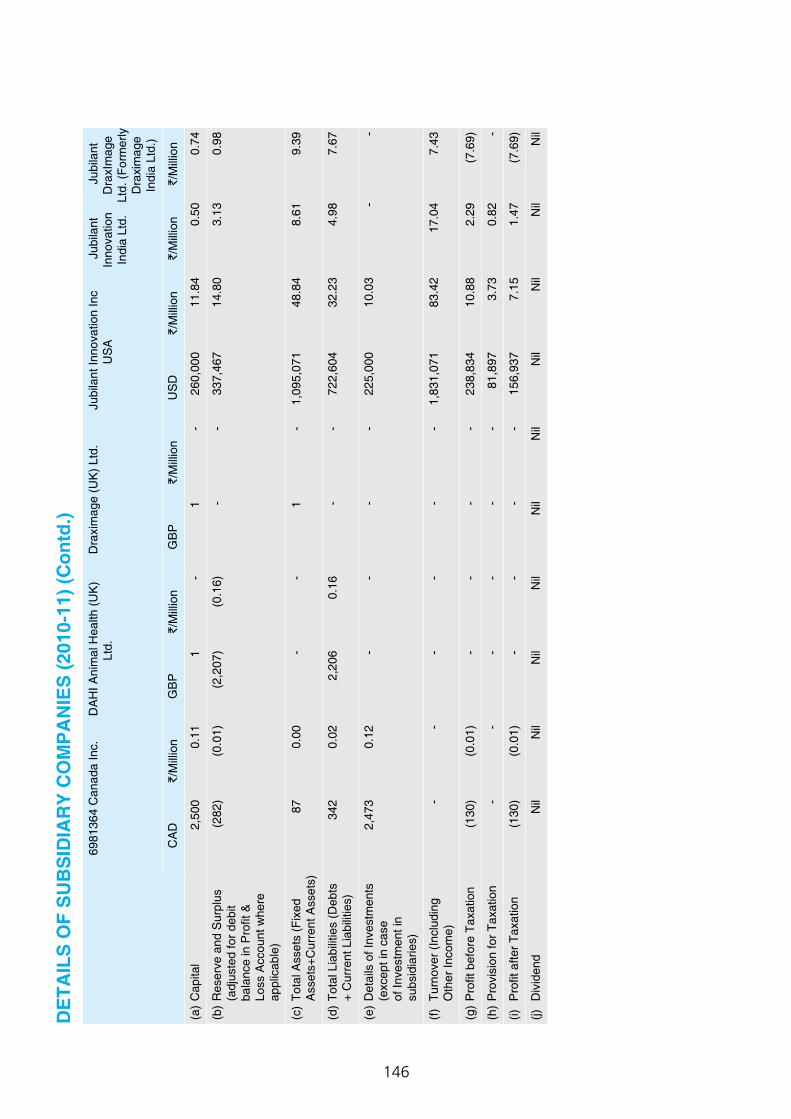
146
DE
TAIL
S O
F S
UB
SID
IAR
Y C
OM
PA
NIE
S (2
010-
11) (
Con
td.)
698
1364
Can
ada
Inc.
D
AH
I Ani
mal
Hea
lth (U
K)
Ltd.
D
raxi
mag
e (U
K) L
td.
Jub
ilant
Inno
vatio
n In
c U
SA
J
ubila
nt
Inno
vatio
n In
dia
Ltd.
Jub
ilant
D
raxI
mag
e Lt
d. (F
orm
erly
D
raxi
mag
e In
dia
Ltd.
)
CA
D
`/M
illio
n G
BP
`
/Mill
ion
GB
P
`/M
illio
n U
SD
`
/Mill
ion
`/M
illio
n `
/Mill
ion
(a)
Cap
ital
2,5
00
0.1
1 1
-
1
- 2
60,0
00
11.
84
0.5
0 0
.74
(b)
Res
erve
and
Sur
plus
(a
djus
ted
for d
ebit
bala
nce
in P
rofit
&
Loss
Acc
ount
whe
re
appl
icab
le)
(282
) (0
.01)
(2,2
07)
(0.1
6) -
- 3
37,4
67
14.
80
3.1
3 0
.98
(c)
Tota
l Ass
ets
(Fix
ed
Ass
ets+
Cur
rent
Ass
ets)
8
7 0
.00
- -
1
- 1
,095
,071
4
8.84
8
.61
9.3
9
(d)
Tota
l Lia
bilit
ies
(Deb
ts
+ C
urre
nt L
iabi
litie
s)
342
0
.02
2,2
06
0.1
6 -
- 7
22,6
04
32.
23
4.9
8 7
.67
(e)
Det
ails
of I
nves
tmen
ts
(exc
ept i
n ca
se
of In
vest
men
t in
subs
idia
ries)
2,4
73
0.1
2 -
- -
- 2
25,0
00
10.
03
- -
(f)
Turn
over
(Inc
ludi
ng
Oth
er In
com
e)
- -
- -
- -
1,8
31,0
71
83.
42
17.
04
7.4
3
(g)
Pro
fit b
efor
e Ta
xatio
n (1
30)
(0.0
1) -
- -
- 2
38,8
34
10.
88
2.2
9 (7
.69)
(h)
Pro
visi
on fo
r Tax
atio
n -
- -
- -
- 8
1,89
7 3
.73
0.8
2 -
(i)
Pro
fit a
fter T
axat
ion
(130
) (0
.01)
- -
- -
156
,937
7
.15
1.4
7 (7
.69)
(j)
Div
iden
d N
il N
il N
il N
il N
il N
il N
il N
il N
il N
il
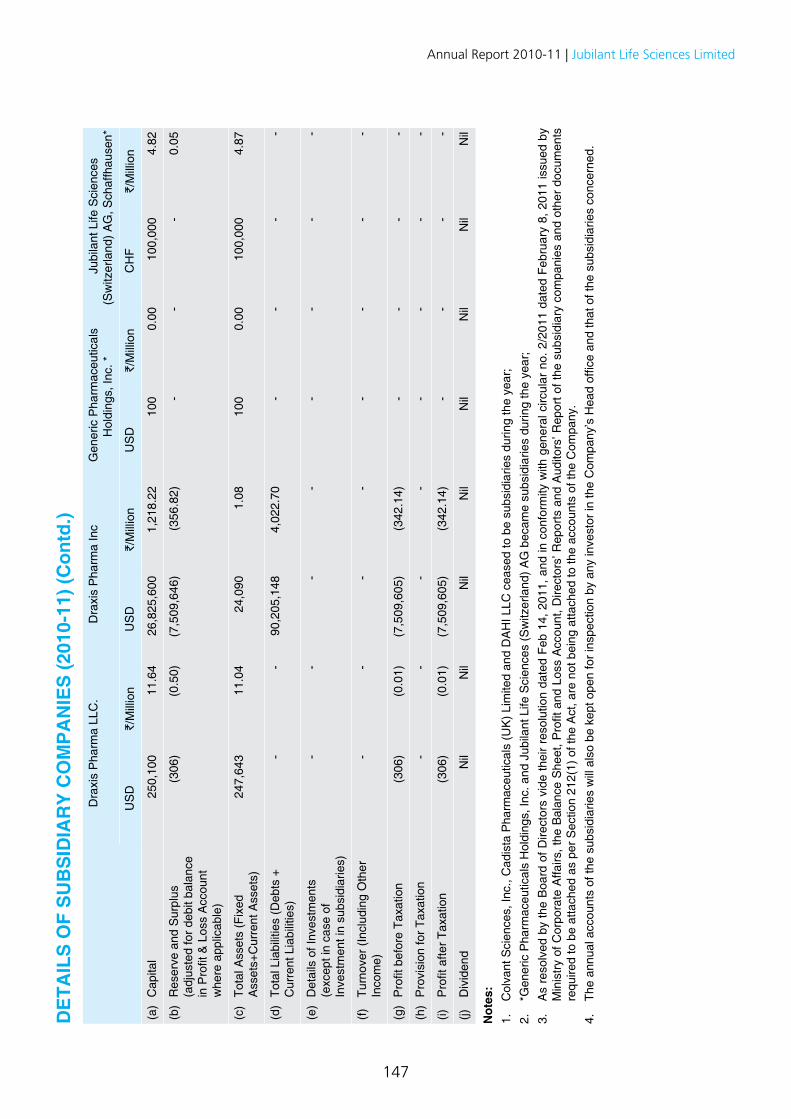
147
Annual Report 2010-11 | Jubilant Life Sciences LimitedD
ETA
ILS
OF
SU
BS
IDIA
RY
CO
MP
AN
IES
(201
0-11
) (C
ontd
.) D
raxi
s P
harm
a LL
C.
Dra
xis
Pha
rma
Inc
Gen
eric
Pha
rmac
eutic
als
Hol
ding
s, In
c. *
J
ubila
nt L
ife S
cien
ces
(Sw
itzer
land
) AG
, Sch
affh
ause
n*
US
D
`/M
illio
n U
SD
`
/Mill
ion
US
D
`/M
illio
n C
HF
`/M
illio
n
(a)
Cap
ital
250
,100
1
1.64
2
6,82
5,60
0 1
,218
.22
100
0
.00
100
,000
4
.82
(b)
Res
erve
and
Sur
plus
(a
djus
ted
for d
ebit
bala
nce
in P
rofit
& L
oss
Acc
ount
w
here
app
licab
le)
(306
) (0
.50)
(7,5
09,6
46)
(356
.82)
- -
- 0
.05
(c)
Tota
l Ass
ets
(Fix
ed
Ass
ets+
Cur
rent
Ass
ets)
2
47,6
43
11.
04
24,
090
1.0
8 1
00
0.0
0 1
00,0
00
4.8
7
(d)
Tota
l Lia
bilit
ies
(Deb
ts +
C
urre
nt L
iabi
litie
s)
- -
90,
205,
148
4,0
22.7
0 -
- -
-
(e)
Det
ails
of I
nves
tmen
ts
(exc
ept i
n ca
se o
f In
vest
men
t in
subs
idia
ries)
- -
- -
- -
- -
(f)
Turn
over
(Inc
ludi
ng O
ther
In
com
e)
- -
- -
- -
- -
(g)
Pro
fit b
efor
e Ta
xatio
n (3
06)
(0.0
1) (7
,509
,605
) (3
42.1
4) -
- -
-
(h)
Pro
visi
on fo
r Tax
atio
n -
- -
- -
- -
-
(i)
Pro
fit a
fter T
axat
ion
(306
) (0
.01)
(7,5
09,6
05)
(342
.14)
- -
- -
(j)
Div
iden
d N
il N
il N
il N
il N
il N
il N
il N
il
Not
es:
1.
Col
vant
Sci
ence
s, In
c., C
adis
ta P
harm
aceu
tical
s (U
K) L
imite
d an
d D
AH
I LLC
cea
sed
to b
e su
bsid
iarie
s du
ring
the
year
;2.
*G
ener
ic P
harm
aceu
tical
s H
oldi
ngs,
Inc.
and
Jub
ilant
Life
Sci
ence
s (S
witz
erla
nd) A
G b
ecam
e su
bsid
iarie
s du
ring
the
year
;3.
A
s re
solv
ed b
y th
e B
oard
of D
irect
ors
vide
thei
r re
solu
tion
date
d Fe
b 14
, 201
1, a
nd in
con
form
ity w
ith g
ener
al c
ircul
ar n
o. 2
/201
1 da
ted
Febr
uary
8, 2
011
issu
ed b
y M
inis
try o
f Cor
pora
te A
ffairs
, the
Bal
ance
She
et, P
rofit
and
Los
s A
ccou
nt, D
irect
ors’
Rep
orts
and
Aud
itors
’ Rep
ort o
f the
sub
sidi
ary
com
pani
es a
nd o
ther
doc
umen
ts
requ
ired
to b
e at
tach
ed a
s pe
r Sec
tion
212(
1) o
f the
Act
, are
not
bei
ng a
ttach
ed to
the
acco
unts
of t
he C
ompa
ny.
4.
The
annu
al a
ccou
nts
of th
e su
bsid
iarie
s w
ill a
lso
be k
ept o
pen
for i
nspe
ctio
n by
any
inve
stor
in th
e C
ompa
ny’s
Hea
d of
fice
and
that
of t
he s
ubsi
diar
ies
conc
erne
d.

148
NOTES
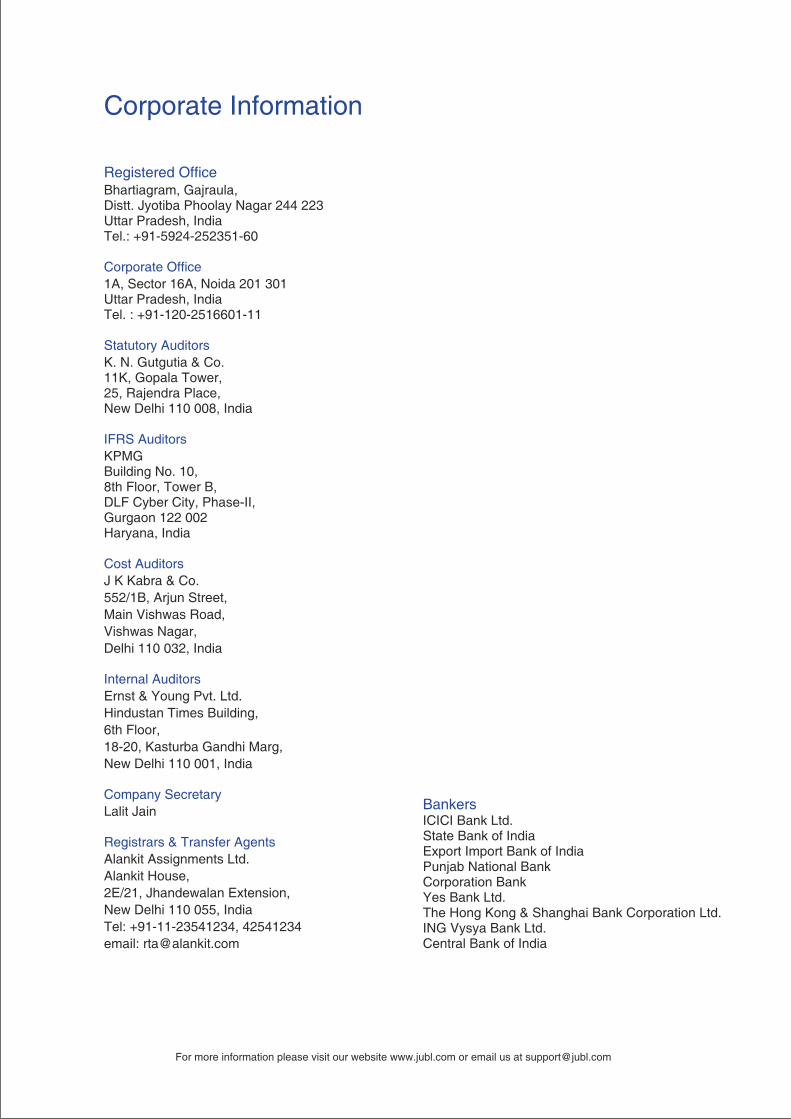
Registered Office
Corporate Office
Statutory Auditors
IFRS Auditors
Cost Auditors
Internal Auditors
Company Secretary
Registrars & Transfer Agents
Bhartiagram, Gajraula,Distt. Jyotiba Phoolay Nagar 244 223Uttar Pradesh, IndiaTel.: +91-5924-252351-60
1A, Sector 16A, Noida 201 301Uttar Pradesh, IndiaTel. : +91-120-2516601-11
K. N. Gutgutia & Co.11K, Gopala Tower,25, Rajendra Place,New Delhi 110 008, India
KPMG Building No. 10,8th Floor, Tower B,DLF Cyber City, Phase-II,Gurgaon 122 002Haryana, India
J K Kabra & Co.
552/1B, Arjun Street,
Main Vishwas Road,
Vishwas Nagar,
Delhi 110 032, India
Ernst & Young Pvt. Ltd.
Hindustan Times Building,
6th Floor,
18-20, Kasturba Gandhi Marg,
New Delhi 110 001, India
Lalit Jain
Alankit Assignments Ltd.
Alankit House,
2E/21, Jhandewalan Extension,
New Delhi 110 055, India
Tel: +91-11-23541234, 42541234
email: [email protected]
Corporate Information
BankersICICI Bank Ltd.State Bank of IndiaExport Import Bank of IndiaPunjab National BankCorporation BankYes Bank Ltd.The Hong Kong & Shanghai Bank Corporation Ltd.ING Vysya Bank Ltd.Central Bank of India
For more information please visit our website www.jubl.com or email us at [email protected]

Jubilant Life Sciences LimitedRegd. Office: Bhartiagram, Gajraula, Distt. Jyotiba Phoolay Nagar - 244 223, Uttar Pradesh, India
Corporate Office: 1A, Sector 16A, Noida - 201 301, Uttar Pradesh, India
www.jubl.com
Related Documents