1 Particles Retrieval Advisory Group (Dounreay) 2012 Report

Welcome message from author
This document is posted to help you gain knowledge. Please leave a comment to let me know what you think about it! Share it to your friends and learn new things together.
Transcript

1
Particles Retrieval Advisory Group (Dounreay)
2012 Report

2
PRAG(D) 2012 Report Forward by SEPA The Particles Retrieval Advisory Group (Dounreay) (PRAG(D)) was formed by SEPA in 2009 following completion of the work by the Dounreay Particles Advisory Group (DPAG) which was set up by UKAEA and SEPA in 2000 to provide independent scientific advice to UKAEA and SEPA on particles of irradiated nuclear fuel around Dounreay, Caithness. PRAG(D) was formed to provide advice and review information relating to the voluntary offshore recovery programme undertaken by the Dounreay site following a public consultation on the Best Practicable Environmental Option (socio and economic factors taken into account). The Group has been focused on the effectiveness of the recovery programme and its impact on the occurrence of fragments of irradiated nuclear fuel on local beaches. PRAG(D)’s first two reports considered the initial findings of the offshore recovery work and provided advice on the optimisation of further work. This third report considers all of the recovery work undertaken and considers the implications for future monitoring and occurrence of fuel fragments in the environment. This third PRAG(D) report has been subject to a delay in its completion partly due to the availability of data, but mainly due to the availability of specialist advice in the field. During the period between publication of PRAG(D)’s second and third reports, important work was undertaken at Dalgety Bay to protect the public which relied on the advice provided by PRAG(D) specialists and lessons learned from the Dounreay work. Following publication of this report SEPA will consider how best to take forward work of the Group by using its national environmental radioactivity monitoring task team (ERMTT) which oversees all national radiological monitoring undertaken in Scotland and has representation from Food Standards Scotland, Food Standards (England, Wales and Northern Ireland), Public Health England, Scottish Government, SEPA and Scottish National Heritage.
3
Contents 1. Introduction ...................................................................................................................................... 5
1.1 Background ............................................................................................................................. 5
1.2 Source of particles .................................................................................................................. 5
1.2.1 Particles of spent nuclear fuel ......................................................................................... 6
1.2.2 Particles containing 60Co ................................................................................................. 6
1.2.3 Particulate matter containing 106Ru ................................................................................. 6
1.3 Particle descriptions ................................................................................................................ 6
1.3.1 MTR particles .................................................................................................................. 6
1.3.2 DFR particles ................................................................................................................... 7
1.4 Dosimetry ................................................................................................................................ 7
1.5 Monitoring ................................................................................................................................ 9
1.5.1 Beach .............................................................................................................................. 9
1.5.2 Sea-bed ......................................................................................................................... 10
1.6 Plume .................................................................................................................................... 11
1.7 Modelling ............................................................................................................................... 12
1.8 Possible replenishment of the plume .................................................................................... 13
2. Beach monitoring .......................................................................................................................... 14
2.1 Introduction ............................................................................................................................ 14
2.2 Review of Detection Capability ............................................................................................. 14
2.3 Context of existing finds on beaches .................................................................................... 15
2.4 Dounreay Foreshore ............................................................................................................. 15
2.5 Sandside Beach .................................................................................................................... 18
2.5.1 Sandside finds to September 2012 ............................................................................... 18
2.5.2 Seasonal patterns of finds on Sandside ....................................................................... 20
2.5.3 Monitoring Effort on Sandside ....................................................................................... 22
2.5.4 Estimation of particle abundances ................................................................................ 22
2.5.5 Changes in particle population ...................................................................................... 24
2.6 Wider Implications ................................................................................................................. 28
2.7 Recommendations ................................................................................................................ 28
3. Particles recovered in ROV surveys since 2008 ........................................................................... 30
3.1 Sea bed surveys and particle recoveries, 1997-2012 ........................................................... 36
3.2 Whole-plume comparison of ROV recoveries with DPAG’s predictions ............................... 41
3.3 The importance of Significant particles ................................................................................. 41
3.4 Estimation of numbers of Significant particles remaining within the sea bed ....................... 45
3.4.1 Operation of the ROV and principles for estimating operational effectiveness ............ 45
3.4.2 Repeated surveys and their implications for operational effectiveness ........................ 48
3.4.3 Repeated ROV surveys in 2011 and their implication for operational effectiveness .... 50
4
3.4.4 Implications of repeated surveys following disturbance of the sea bed ........................ 52
3.5 Residual Significant particles – Summary ............................................................................. 55
3.6 Scenarios for the expected future evolution of Significant particles ..................................... 55
3.6.1 Scenario 1 – complete clearance of Significant particles from the area surveyed by the ROV 57
3.6.2 Scenario 2 – a cache of Significant particles buried below ca.0.6 m remaining in the ROV survey area ........................................................................................................................... 58
4. Estimating the Theoretical Detection Capability of SeaHog ......................................................... 64
4.6 Introduction ............................................................................................................................ 64
4.7 Detection Capability .............................................................................................................. 64
5. Strontium-90 rich particles ............................................................................................................ 68
5.1 Introduction ............................................................................................................................ 68
5.2 The Occurrence of 90Sr-rich Particles. .................................................................................. 68
5.3 Detection of beta-emitting Dounreay particles ...................................................................... 69
5.4 Recommendations ................................................................................................................ 70
6. Conclusions ................................................................................................................................... 72
7. Recommendations ........................................................................................................................ 73
Appendix 1 Comparisons between DPAG estimates and numbers of particles recovered .................. 74

5
1. Introduction 1.1 Background Sand-sized fragments of irradiated nuclear fuel (particles) were first discovered on the foreshore at Dounreay in November 1983. A routine monitoring programme was initiated by UKAEA covering both the foreshore and nearby public beaches such as those at Sandside Bay, Scrabster and Thurso (Figure 1). In 1984, a particle was found on the public beach at Sandside Bay; a further two particles were found there in 1997 and a further 11 in 1999/2000. The detection of particles in offshore sediments in 1997 resulted in the imposition by the then Scottish Office of a two kilometre radius fishing exclusion zone, centred on the old diffuser under the Food and Environment Protection Act 1985. The Dounreay Particles Advisory Group (DPAG) was set up by the Scottish Environment Protection Agency (SEPA) in May 2000 in order to address concerns held by both SEPA and the Scottish Executive in respect of the particles. The Group initiated work programmes to establish the source and extent of the contamination, to model its spread with time and to recommend remediation plans. This work was published in four reports (ref 1-4). In 2008, the Particles Retrieval Advisory Group (Dounreay) (PRAG(D)) was set up to provide independent scientific advice to SEPA and Dounreay Site Restoration Ltd (DSRL) on the remediation programme being carried out under DSRL’s Particles BPEO1. 1.2 Source of particles It has been established that the particles were discharged from the site into the environment by a variety of routes, primarily those involving the Low Activity Drain (LAD), Sea Tanks and Old Diffusion Chamber (ODC) (Figures 2(a) and (b)). There is little doubt that operations and events between 1959 and the mid-1980s led to the discharge of the majority of active particles via the LAD route. The ODC was connected to the discharge tanks by four nine-inch (~229 mm) internal diameter pipes that originated in the Low Level Liquid Effluent Tanks (the “Sea Tanks”). These pipes are still in place and pass via an inclined tunnel from the ground surface within the Establishment, down to the Liquid Effluent Discharge Tunnel (LEDT). Within the LEDT, the pipes are encased in a ~1 m square section concrete haunch running along the base of the NE wall of the Tunnel. At the far end of the LEDT is a concrete bulkhead wall with an iron door providing the entrance to the ODC. The door was closed and barred before the whole system was allowed to fill with water after construction had been completed. The ODC comprises a concrete-lined chamber, 4.5 m wide x 10.0 m long x 3.7 m high, excavated in solid rock, dominantly sandstone. Its roof is ~23 m below the seabed. The ODC was connected to the sea bed above by sixteen unlined vertical boreholes known as “risers” drilled through the rock, four for each discharge pipe which branched inside the ODC. The point of exit for the risers was an exposed rock platform, slightly raised above the surrounding sandy bottom. The condition of the discharge system had given rise to concern from 1979 onwards and it became clear in 1981 that the system was no longer operating as designed as dye tests
1 Refer to DSRL BPEO
6
demonstrated that there was interconnectivity between risers, caused either by failure of the pipework or fractures in the rock between the risers. Presumably, thereafter, mixing occurred within the Diffusion Chamber itself prior to discharge. Although a New Diffuser became operational in 1992, one of the old discharge lines was purged monthly until June 1997 with consequent potential for entrainment of any particles remaining in the Old Diffuser. Investigations of the routes for release of particles from the Site strongly suggest that sources on land (including the 1977 shaft explosion) could have made no more than a minor and transient contribution to the sustained finding of particles on the Foreshore and virtually no contribution to the marine environment or Sandside Beach. DPAG consolidated numerous reports on the particles and the events that may have led to their release, demonstrating that potentially up to several hundred thousand particles were discharged from UKAEA Dounreay. Three types of radioactive particulate matter have been so far identified in the environment around UKAEA Dounreay. These are: 1.2.1 Particles of spent nuclear fuel These are principally of two types containing fragments of either Materials Test Reactor (MTR) or Dounreay Fast Reactor (DFR) spent fuel together with associated fission products and actinides. Both types are so predominant numerically and in terms of potential health effects that they are given detailed consideration below. A few particles have been identified as containing fragments of Prototype Fast Reactor (PFR) spent fuel2. This fuel was treated in the PFR Reprocessing Plant. The procedures were quite different from those used with MTR and DFR fuel with greatly reduced potential for their discharge to the environment. 1.2.2 Particles containing 60Co Three particles containing 60Co have been found on the Foreshore at Dounreay and 8 offshore, while similar particles have also been found within the boundary of the licensed nuclear site. These particles are categorised as Stainless Steel (SS) particles. The radioactive component is predominantly 60Co, generated by neutron activation of cobalt in the stainless steel structure of reactor components or in components of some fuel elements. 1.2.3 Particulate matter containing 106Ru This material comprised black tarry agglomerations of large numbers of minute particles bound in an organic matrix incorporating variously granules of sand, seaweed and man-made fibres. These agglomerates, found in 1983, were identified as originating from the Scrubber Plant of the Dounreay incinerator. Following modifications (including improved filtration) in 1984, these have not been found and they are not considered further. 1.3 Particle descriptions 1.3.1 MTR particles
2 DPAG 3rd Report
7
The first stage of reprocessing activities at Dounreay was to dismantle fuel elements under water in ponds. A milling process was used to remove the aluminium casing of Mark II fuel elements in preparation for reprocessing. This process generated swarf, not only from the casing, but also inadvertently from time to time from some of the underlying uranium-aluminium fuel core and associated fission products. Consequently, a fraction of the aluminium swarf (estimated crudely as between 0.1 and 1.0%) contained active fuel particles embedded in the substrate. From 1973 to 1996, “crushing and cropping operations3” replaced milling but this practice also created particles, though not necessarily identical in structure to those produced through the milling process. These operations produced slivers rather than the more rounded particles generated by milling. It is certain that many particles were discharged to the sea via the Low Active Drain (LAD) system to which the processing ponds were connected. MTR particles are similar both in size (about 0.4 to 3 mm diameter) and density (3.1 +/- 0.4 grams per cubic centimetre (g/cm3)) to sand grains on the Dounreay Foreshore and at Sandside Beach. The particles primarily comprise aluminium with very small inclusions of uranium and associated products, of which 137Cs, 90Sr and its daughter 90Y, and actinides are of greatest radiological significance. The radioactive isotopes 137Cs and 134Cs decay at different rates. Using this relationship, estimates of the dates that the particles were irradiated can be made; the results suggest an irradiation date of 1965 +/- 3 years. 1.3.2 DFR particles Between 1969 and 1979, DFR fuel was treated using a leach dissolver. During the process, spontaneous combustion periodically occurred (particularly a fire on 30 May 1972) that created particles of irradiated fuel ‘fused’ with niobium cladding. Some of the particles were inadvertently discharged to sea via the LAD system.
DFR particles comprise material from spent fuel elements of DFR. They differ from MTR particles in being apparently non-metallic, lacking structural strength and usually containing niobium (which was the cladding material for DFR fuel). The form of the material is unlike that of the MTR fuel elements and, as discussed above, metallurgical change occurred during reprocessing. Energy Dispersive X-ray Analysis (EDAX) of particles suggested that their major constituents were approximately 40% niobium, 20% uranium and 15% iron with the remainder comprising a variety of minor constituents.
Their fragile nature and small size restrict measurement of the specific mass, requiring estimates to be made of the upper mass limit. Values ranged from 0.08 mg to an estimate of < 2 mg. The density of DFR particles appears to be > 3.1 g/cm3. 1.4 Dosimetry Although radiation doses are dominated by emissions of beta rays associated with 90Sr and 90Y, the particles are usually detected and, for convenience, quantified by the gamma rays emitted during the decay of 137Cs and its daughter 137mBa. The level of radioactivity per
3 More detail – see DPAG 3rd Report

8
particle ranges from <104 up to about 108 Bq 137Cs. From measurements made on a number of particles, the activity ratio of 90Sr:137Cs was established as approximately 0.9. Tests were carried out also to determine the solubility of the particles in a simulated gut solution, since this is a major determinant of the radiation dose that would be received following ingestion. Although the majority of the particles studied exhibited low solubility, there was one notable exception, particle MTR 113. This fragment dissolved readily under the conditions of the in vitro extraction, and for all of the radionuclides studied about 50% of the activity went into solution in simulated gut fluids. In May 2006, DPAG was informed by UKAEA that a possible reason for this exception was that, rather than originating from the U/Al alloy, this particle may be uranium oxide. SEPA commissioned the Health Protection Agency to estimate the potential radiation doses to a member of the public coming into contact with the particles by ingestion or inhalation4, while the University of Birmingham was commissioned to estimate the doses which might arise from external skin contact. Considering skin contact, the period of stationary contact needed to produce serious skin ulceration which would require medical treatment is a few hours for MTR particles containing 106 Bq 137Cs. Such contact times are credible for people spending time on beaches. Consequently, MTR particles with a 137Cs content of 106 Bq were taken by DPAG to be broadly the lower level at which deterministic effects from contact with the skin might be expected, i.e. fuel particles of some radiological significance. For MTR particles containing 105 Bq 137Cs, i.e., typical of the most active particles found at Sandside Bay, stationary contact for more than 7 hours would be required before any ulceration would be expected to occur. For exposure periods of several hours, the dose rates produced by such particles are unlikely to be sufficient to cause ulceration, although a particle trapped against the skin for longer periods of a day or two may cause a small effect. Consequently, DPAG considered that, if an individual came into contact with fuel particles of the activity found so far at Sandside Bay, observable effects would be unlikely to occur. The above estimates of the time taken to cause skin damage and considerations of the possible severity of ulceration apply to all sites including the ear. The possible residence time of a fuel particle in the ear can be long and could be sufficient for fuel particles containing around 104 Bq 137Cs to give rise to observable effects (Harrison et al. 2005). However, the probability of a fuel particle entering the ear is extremely low, less than 1 in 100 million for the beach at Sandside Bay (Smith et al. 2005). On this basis, DPAG considered that fuel particles containing less than 105 Bq 137Cs are very unlikely to give rise to a radiological problem. The risks from ingestion and inhalation in terms of cancer induction were found to be small, even for particles containing 108 Bq 137Cs. On the basis of available animal data, however, the threshold for acute damage to the colon resulting in death, following protracted irradiation from ingested radionuclides passing through the gut has been estimated to be about 20 Gy. It appears unlikely that ingestion of even a particle containing 108 Bq 137Cs by an adult would result in death, although in extreme cases the possibility, however small, cannot be ruled out for a one-year old child. It should be emphasised that particles of this activity have been retrieved only from the Dounreay Foreshore and the seabed. Doses from the most active particles found so far on the beach at Sandside Bay would be around 100 times less than the threshold for lethality.
4 DPAG 3rd Report
9
On the basis of this work, DPAG defined three categories of particle (for MTR and DFR):
Minor (137Cs activity <105 Bq) Relevant (137Cs activity between 105-106 Bq)
Significant (137Cs activity >106 Bq) Activated steel particles would give rise to slightly lower doses per unit of radioactivity. Although conservative, the same classification has been applied for simplicity. For particles with a different radio-isotopic content, appropriate dose calculations would be required to establish equivalent hazard levels before the above classification could be used. This will be addressed in section 5 for the particle found recently to have an exceptionally high 90Sr content when compared to the Cs content. 1.5 Monitoring 1.5.1 Beach Until 1997, monitoring was carried out on foot using hand held equipment and concentrated primarily on the strand-line. The surveys at Sandside Bay were generally carried out on a monthly basis. From 1995, additional surveys were made after severe storms and gales, in line with advice given by the Committee on Medical Aspects of Radiation in the Environment (COMARE) in 1995; the basis for this advice was that the disturbance of the beaches during storms could provide a means by which buried particles were brought towards the surface, thus improving the chance of detection. After the discoveries at Sandside in 1997, the frequency of the baseline monitoring was increased to weekly surveys. These were supported by a GPS to provide a more complete and better-founded record of the area surveyed. From 1998, the aim was “to provide 100% monitoring of all accessible areas” of Sandside beach. The 1998 report issued by SEPA contained a recommendation that more rapid and less manual techniques should be employed so that larger areas of these beaches could be covered more frequently. In 1999, UKAEA introduced a vehicle-mounted system (Groundhog Mk1) on the beaches consisting of four independently-operated 76 mm diameter sodium iodide scintillation detectors mounted on a bar on the front of the survey vehicle. This was used until 2002, although DPAG’s modelling of its performance led to the conclusion that it was not capable of meeting the full detection requirements set out by SEPA, a view supported independently by COMARE. The vehicle was unsuitable for use on rocky areas and so a wheelbarrow-mounted version of Groundhog was developed for monitoring these and smaller inaccessible beaches. Consequently, a new ‘Groundhog Evolution’ system was designed, incorporating 5 larger volume (76 mm x 400 mm) sodium iodide detectors mounted to provide a contiguous lateral cover of 2 m and representing a 6.7 times increase in detector volume over the Groundhog Mk1 system. It began routine surveys in mid-2002. Following recommendations by both COMARE and DPAG, an experimental trial of the capabilities of the Groundhog Evolution and a reconstructed Mk1detector array was carried out in 2006. This used sealed sources of known activity buried at known depths on Sandside beach with the vehicles being operated exactly as for the routine surveys. The results confirmed that the Mk1 configuration did not meet requirements, while the practical performance of the Evolution system did meet requirements and exceeded its theoretical performance.

10
A revised digital-based monitoring system, Groundhog Evolution 2, was introduced in January 2007. Its performance was tested in a second COMARE/DPAG trial in June 2007. This trial established that Groundhog Evolution 2 could detect particles containing 103 and 102 Bq 137Cs, albeit with a low probability. No significant differences were observed between Groundhog Evolution and Evolution 2 for 105 and 106 Cs particles to 200 mm depth, as both systems performed reasonably well to this depth. Groundhog Evolution 2 was shown to be capable of detecting 106 Bq 137Cs particles to a depth of at least 400 mm with a reasonably high probability of detecting 105 Bq 137Cs particles to a depth of 300 mm. This met DPAG’s recommended target requirements of 105 Bq 137Cs at depths of in excess of 200 mm. Throughout 2005-2010, DSRL encountered difficulties in accessing Sandside beach as the owner withheld consent for several periods. Since October 2010, arrangements have been in place to permit regular monthly surveys, which has allowed PRAG(D) to begin to study whether there is any seasonality or significant change in the pattern of deposition/recovery of particles. 1.5.2 Sea-bed Divers using small sodium iodide (NaI) based detectors started surface seabed surveys in August 1997 which were conducted to a distance of 600 m offshore and to a sea depth of 20m. More extensive surveys were undertaken between 1998 and 2005, for which the NaI detectors were replaced with lighter and more robust plastic scintillator detectors. The requirement for a radiological survey using a remote sensing system was identified because of the difficulties of using divers for surveying regions of the offshore environment deeper than 20m. Following a tendering exercise in 1998, Fathoms Ltd. supported by NUKEM and using the Fathoms Instrument Towed System (FITS), were awarded the contract to survey the seabed off the Dounreay foreshore. The FITS system, comprising a single plastic scintillator detector or gamma probe and later the FITS2 system comprising two plastic scintillators held 500 mm apart, was deployed and towed behind a boat. The gamma probes were maintained at a nominal distance of 100 mm above the seabed. During 1998 and 1999, a total of 23 separate surveys were undertaken using a towing direction parallel to seabed contours and avoiding rocky outcrops. The system suffered from several deficiencies, particularly its inability to discriminate between variations in natural background radiation and that from buried particles, the variations in height above the sea-bed and variations in towing speed. An improved robotic device for searching the sea floor, the Tracked Robotic Offshore Logger (TROL), was trialled in 2004. It comprised a twin tracked remotely operated vehicle (ROV) connected via an umbilical cable to the surface where it was controlled from a ship via camera feedback. A marinised 102 mm x 102 mm x 406 mm NaI(Tl) detector rated to 100 m depth was mounted at the front and coupled to a gamma spectrometer. This distinguished particles from natural background radioactivity by their gamma energy spectrum characteristics, providing an unequivocal identification, unlike the FITS device. In 2005, the TROL was tested more extensively to search systematically the sandy parts of the sea bed to locate particles and divers were deployed to confirm finds and recover the particles. It was deployed again in 2006 and 2007. DSRL commissioned a report in 2007 which concluded that the risks involved in continuing the diving operations were unacceptable and so a new ROV, modelled on the TROL, was developed to locate and retrieve particles from the seabed. This utilised the same primary detector and was equipped with a suction pipe connected to a steel mesh basket fitted with 150 micron filters. A plastic scintillator was placed against the hose between the suction pump and the basket. When a particle was detected, the suction pipe was placed above the
11
estimated position and driven down into the sand; the suction was switched on until the plastic scintillator indicated that the particle had been recovered. This system was in operation in 2008 and 2009. Following a second tendering exercise, a new contractor was engaged to provide and operate an improved ROV in 2010, which is shown in the cover illustration. It is also a twin-tracked vehicle, but utilises a marinised Groundhog five-detector system for its primary survey. The recovery unit comprises an auger fitted inside the suction pipe with a small Na(Tl) detector on either side of the pipe; this whole assembly can move perpendicular to the direction of travel. When a particle is detected, the smaller detectors are used to position the auger directly above the particle. The auger is driven into the sand by an hydraulic ram and the suction switched on. As before, another detector fitted against the hose to the two recovery tanks intimates capture of the particle. The position of the ROV is computed by an ultra-short baseline acoustic system integrated with the surface vessel’s GPS. This ROV has been used in 2010, 2011 and 2012. In line with advice from DPAG and COMARE, the main emphasis has been on the detection and recovery of Significant particles, estimating the detection efficiency of the ROV and confirming the plume outline. 1.6 Plume A plot of all off-shore finds to date is shown in Figures 3a-c of Chapter 3. Following the early diver recoveries, it became clear that the sea-bed contamination was located around the Old Diffuser (OD). That the OD was the point of discharge of the particles is consistent with the identification of the LAD as their point of exit from the licensed site. From figure 3(b), it can be seen that the detected particles (particularly those classified as ‘Significant’) appear to form a ‘plume’ running SW-NE, approximately parallel to the shoreline. The coastlines of the mainland and the islands of Orkney exert a strong influence on particle movement by waves. They block the generation of waves by winds from any quarter except between W and NNE. Waves generally run in the same direction as the winds that produce them, but they are deflected by the shore as they approach the coast. This causes the waves in shallow water to transport particles parallel to the shore. The coast close to Dounreay runs from SW to NE, so that when the wind blows from directions between W and NW the resulting shallow-water waves transport the larger, more radioactive particles NE. The plume of particles extending in this direction contains high-activity particles to distances of up to 2 km from the OD but most are within one km. In contrast, very few high-activity particles have been transported in the opposite direction and all lie within two hundred metres of the OD. The reason is that moving large particles in this direction requires winds to blow from between NW and NNE. These winds are less frequent and usually less violent, so their cumulative effect on transport is less than that of the opposing Westerlies. Thus the net effect of wind-induced waves is to transport larger, higher-activity particles5 predominantly NE, but at slower rates than the small particles that can be moved by tidal currents alone. Another effect of waves is to drive particles towards the shore. This is the reason that the plume lies towards the landward side of the OD, and also the reason that particles are transported from the sea bed onto Dounreay Foreshore. Waves are probably also responsible for driving particles into Sandside Bay from the plume travelling SW from the OD.
5 Assuming size/activity relationship
12
1.7 Modelling The Hydraulic Research Establishment at Wallingford (HR Wallingford Ltd) was commissioned by UKAEA to develop a numerical model of water movements and sea-bed currents around Dounreay and to use it to predict the movements of particles. The Wallingford model contained three main components: The "Outer Model" was a 2-dimensional (depth averaged) hydrodynamic model of a large area that included southern Orkney and the whole north coast of mainland Scotland east of the Kyle of Tongue. The eastern boundary lay in the North Sea, 25 km east of the Pentland Firth. The "Inner Model" was also a purely hydrodynamic model, but it was 3-dimensional (in that it included variation with depth) while it covered an area that extended only from Ardmore Point in the west to Holborn Head in the east, and considered the sea bed within 10-15 km of the coast. This model generated detailed water velocities close to the sea bed for 20-minute time-steps, and took into account the effects of tides, winds and waves. The ‘SandTrack Model’ was a particle-tracking routine which used the output from the Inner Model and predicted the positions of individual particles of different size and density for different times after release at any location. SandTrack could simulate the development of a particle plume in the form of a series of snapshots showing particle locations at various times after release at the Diffuser. Early versions of the model predicted the general shape of the plume but the rates of transport, particularly to the NE were too fast to allow the current particle population to be observed. DPAG postulated the importance of wind-induced waves and of particle reburial (i.e. a particle may not be in continuous motion, but may be trapped in sand for some time). Including these factors led to more realistic predictions. To the east of the site, two gyres were modelled by the Wallingford work, west (Crosskirk) and east of Brims Ness (5.3 and 8 km east of the site respectively) and the SandTrack routine predicted that particles might occur within them. Dives at these two sites recovered particles, four from Crosskirk and five from 1 km east of Brims Ness, at locations not far from the predicted gyres. The model also predicted accumulations of particles at three sites west of Sandside Bay (at Red Point, 4.7 km west, at Melvich, 9 km west, and on the east side of Strathy Point, 14 km west of the Dounreay site). In order to estimate the total number of particles in the plume, DPAG developed a pragmatic contour model based on finds, treating Significant and Relevant/Minor particles separately. Squares, each 100 m x 100 m (area = 1 ha = 2.471 acres), were defined on a grid aligned with the Ordnance Survey map and the numbers of finds within each square were tabulated. The actual finds were extrapolated to provide an estimate of the total number of particles in each square (i.e. particles per hectare) by dividing the numbers found by the fraction of the sand area that was searched in that square. The reason for using only the sand-floored portion of each square was that almost all recovered particles were found in sand, whereas all of the rocky areas surveyed were almost devoid of particles. To estimate the total numbers of particles on the sea bed, it was necessary to smooth and interpolate particle frequencies per unit area, between the irregularly distributed patches of ground that had been surveyed. It was assumed that the particle distribution varied smoothly to provide continuous ‘contours’. This contour model has been refined as each year’s data were added and is shown in Figure 4. The numbers of particles present were then estimated by
13
calculating the seafloor area enclosed by successive contours and multiplying by the appropriate density. 1.8 Possible replenishment of the plume DPAG and PRAG(D) have considered whether, in addition to the historic releases of particles, there could be an ongoing discharge route. As detailed above, it is believed that UKAEA Dounreay historically released particles into the marine environment primarily via the liquid-waste discharge system. Under the instruction of SEPA, UKAEA Dounreay commissioned a final filter on the radioactive discharge system in 2005 in addition to other on-site measures, thereby preventing further release of particles by this route. It was hypothesised that particles could have been trapped in the components of the discharge system (figure 2) - the LEDT, ODC, risers or in the rock through which the risers passed from the ODC to the seabed. An inspection in 1989 of the distal end of the LEDT recorded conditions that could imply damage to pipework within the ODC and possibly, therefore, the release of particles into the ODC itself. In 2008, a video camera was passed down one of the risers from the seafloor and demonstrated that the pipework in the riser had been damaged; in addition, it was clear that there is, and has been over several years, considerable interconnected fissuring of the rocks surrounding the risers, possibly exacerbated as a result of the acid effluent. Although initially dismissed, it is now accepted that particles could travel through the rock fissures. The video record was complemented by a gamma detector that provided data showing higher levels of radioactivity at the level of the fissures, where it is believed radioactivity has accumulated in the rock. During the operation, no particles were detected as having been dislodged. A further entry into the same riser permitted a gamma probe to be inserted into the ODC itself. This did not detect any significant level of radioactivity. From the above, it does not appear that there is any reason to believe that there is a material ongoing release of particles.
14
2. Beach monitoring 2.1 Introduction DPAG’s Third (DPAG, 2006) and fourth (DPAG, 2008) reports reviewed particle finds on public beaches, with specific focus on Sandside Beach. Taking account of monitoring frequency, and beach coverage, the reports provided estimates of the monthly population of particles on Sandside Beach, which were then used in an assessment of risk to beach users. This chapter briefly reviews the detection capabilities of the monitoring equipment deployed on the beaches of Caithness, re-examines and updates the number of particle finds, to evaluate any change in the rate of finds on Sandside Beach and Dounreay Foreshore, provides an update on the estimates of the number of finds and the likely particle population, and explores whether there are any trends that could be linked to the offshore retrievals or other changes in the offshore environment. Future monitoring requirements are also discussed. The beach monitoring undertaken serves multiple purposes including: the recovery of particles; the characterisation of particle population abundance and its change and the risk to the public; public reassurance. The monitoring of beach environments inevitably can only provide a sample of the underlying particle population and the frequency of monitoring will limit the degree to which the dynamics associated with the change in population numbers can be estimated. Monitoring frequency is limited by resource and restrictions on beach access due to wildlife protection, storm damage or problems with access agreements. The resulting gaps have added to the uncertainties associated with the interpretation of particle populations and the trends in the seasonality of finds in addition to their inter-annual variability. In addition, as described in Chapter 3, offshore particle recovery has been undertaken impacting on the population of particles within the plume with the potential to realise a reduction in particle arrivals on Dounreay Foreshore and neighbouring public beaches (primarily Sandside). This chapter will also consider how a resulting change might manifest itself and how it might be detected. 2.2 Review of Detection Capability The detection of point sources requires specific optimisations and deployment of detectors to maximise the probability of particle detection and recovery, compared to more conventional extended layer sources of radioactive sources in the (DPAG, 2006; 2008; Tyler et al., 2010). The DPAG 2008 report reviews the history of strandline monitoring and routine area monitoring of Caithness beaches, with the associated particle finds. DPAG (2008) clearly states that the detection of 105 Bq 137Cs particles to 300 mm depth with a reasonable (i.e. >0.9) detection probability shall be the standard that maintains a reasonable margin of safety. The three generations of Groundhog monitoring were reviewed both theoretically and through beach trials undertaken jointly with COMARE. The results clearly demonstrate the efficacy of the technology deployed within the Groundhog Evolution II system. The digital electronics, enabling sub-second data acquisition, provided the detection capability to meet the specification set out in DPAG (2008). There has been no change in the system deployed on the Caithness beaches since the introduction of the Groundhog Evolution II system, thereby providing some consistency in data acquisition.
15
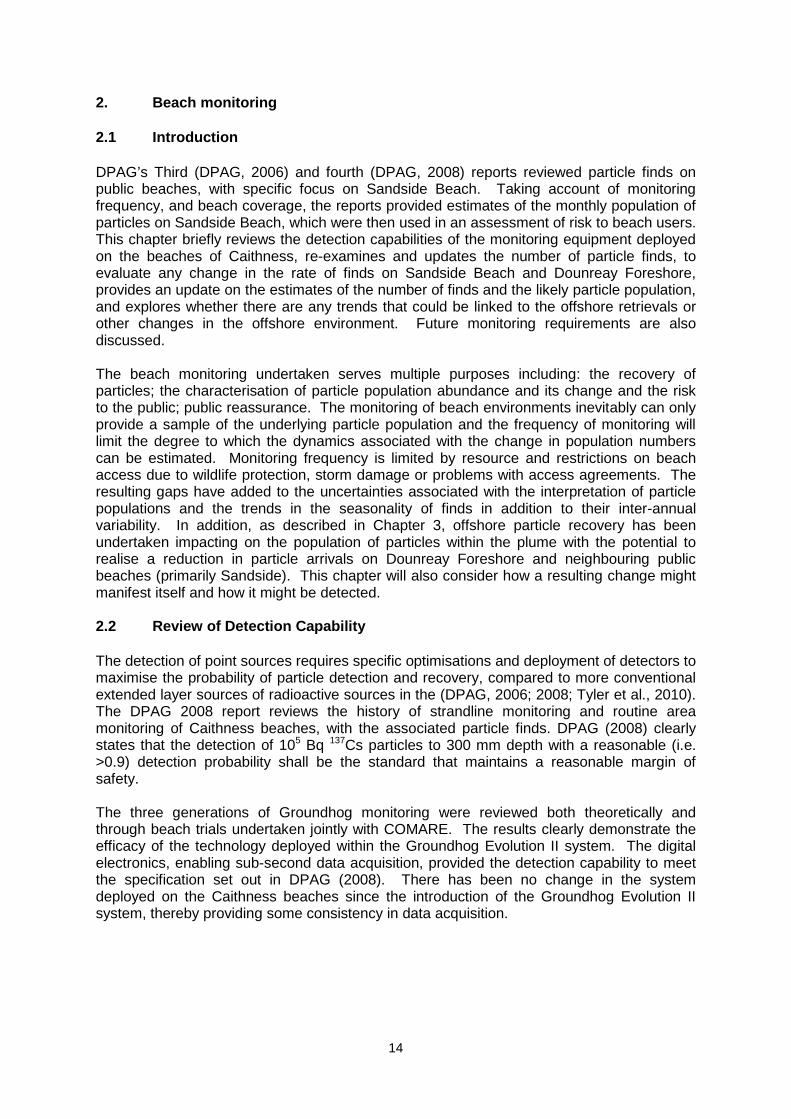
2.3 Context of existing finds on beaches While there are a number of beaches being monitored, we will focus on Sandside and the Dounreay foreshore, since they are monitored routinely. All others are monitored once or twice a year, and the total number of finds remains very small. We have chosen a cut-off date of September 2012, but note that there were 3 finds in November on Sandside and 3 on the Foreshore up to the end of January 2013. It is important to note that: a) since October 2010 regular (monthly) access to Sandside has been maintained; b) there has been stability of the detection system deployed; c) there have been no changes in equipment; d) there has been an extensive campaign of offshore particle removal in the past 3 years or more, as described in Chapter 3. As a result of the offshore particle removals, we hypothesise potential changes in numbers of finds, and activity of finds. Here we explore these aspects, over the entire time period of monitoring and examine the seasonality of particle finds on Sandside in particular. 2.4 Dounreay Foreshore The Dounreay foreshore is analysed until September 2012. Three further particles have been found till January 2013 (activities 1.1x10⁵, 4.9 x10⁶, and 2.6 x10⁶). Here we examine the particle arrival on the Dounreay foreshore, which consists of two main areas (east and west foreshore). In this treatment we consider both areas as a single unit. The foreshore is rocky in places so monitoring is undertaken primarily on the sandy area, although sand is not always present. Since October 2004, there are 4 months of each year when the foreshore cannot be monitored due to nesting birds (which means that the sampling effort in a given year may vary). The change in monitoring technology has mirrored the changes on Sandside. Here, however, the activity of the particle finds tends to be in the Relevant and Significant categories, minimising the possible influence of improved detection limits on the mean activities. The total number of finds to September 2012 is 282. The log10 activity plot is shown below (Figure 2.1), the smooth curve suggesting a slight overall decrease in mean activity, but with still some considerable variability. There are no obvious changes in detection rate with the introduction of Groundhog Mark 1 (July 1999), Groundhog Evolution (May 2002) and Groundhog Evolution II (December 2006) although radioactive decay may have had a small effect as the primary radionuclides will have undergone around a third of a half-life decay in activity (1999 – 2012).
16
13-Ja
n-12
13-Fe
b-08
14-O
ct-04
17-Ja
n-99
23-Ju
n-96
01-O
ct-94
12-A
ug-91
03-M
ay-89
06-D
ec-86
05-Ja
n-85
04-N
ov-8
3
9
8
7
6
5
4
3
2
1
Date
loga
ctiv
ity
Figure 2.1 Change in log10 of particle activity on Dounreay Foreshore
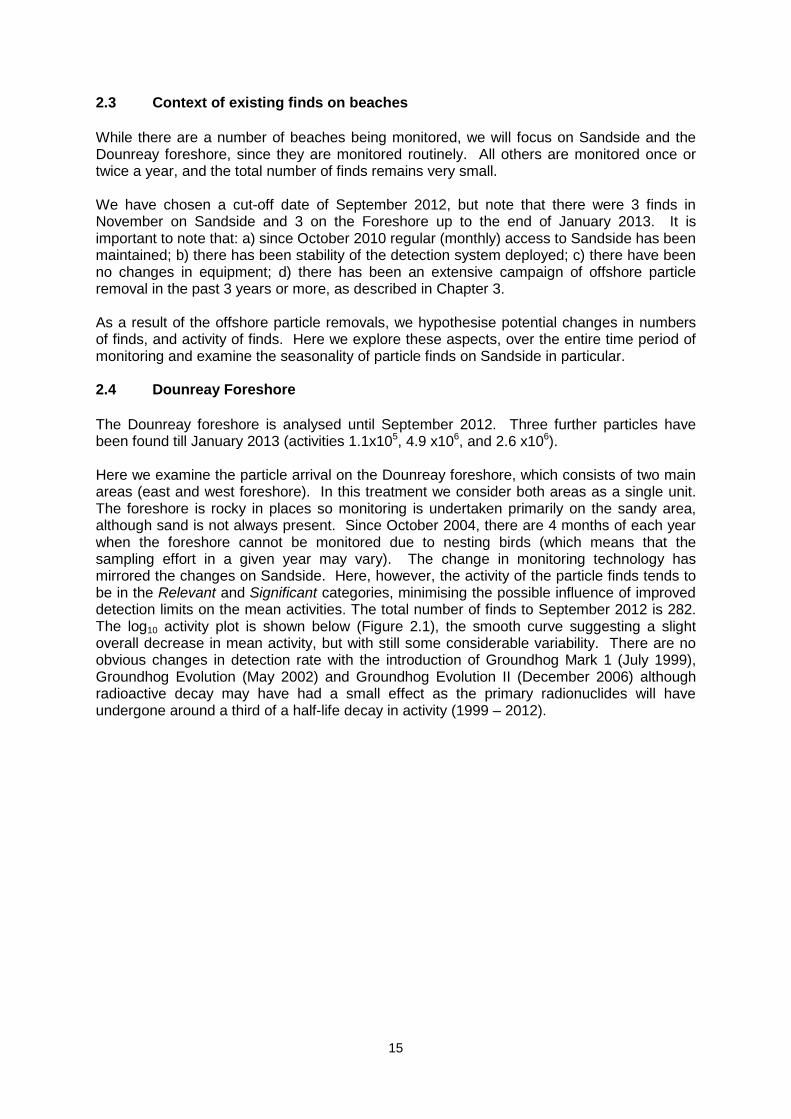
Figure 2.2 shows the overall trend in activity (log10) for various summary statistics including mean and median and minimum and maximum. There appears to be a general slowly declining trend in all 4 traces, with some variation year on year.
20152010200520001995199019851980
9
8
7
6
5
4
3
2
1
year
log
acti
vity
MeanMedianMinimumMaximum
Variable
Figure 2.2 Trends in log10 of particle activity with time
17
2012200920062003200019971994199119881985
9
8
7
6
5
4
3
2
1
year
log
acti
vity
Mean2Median2Minimum2Maximum2
Variable
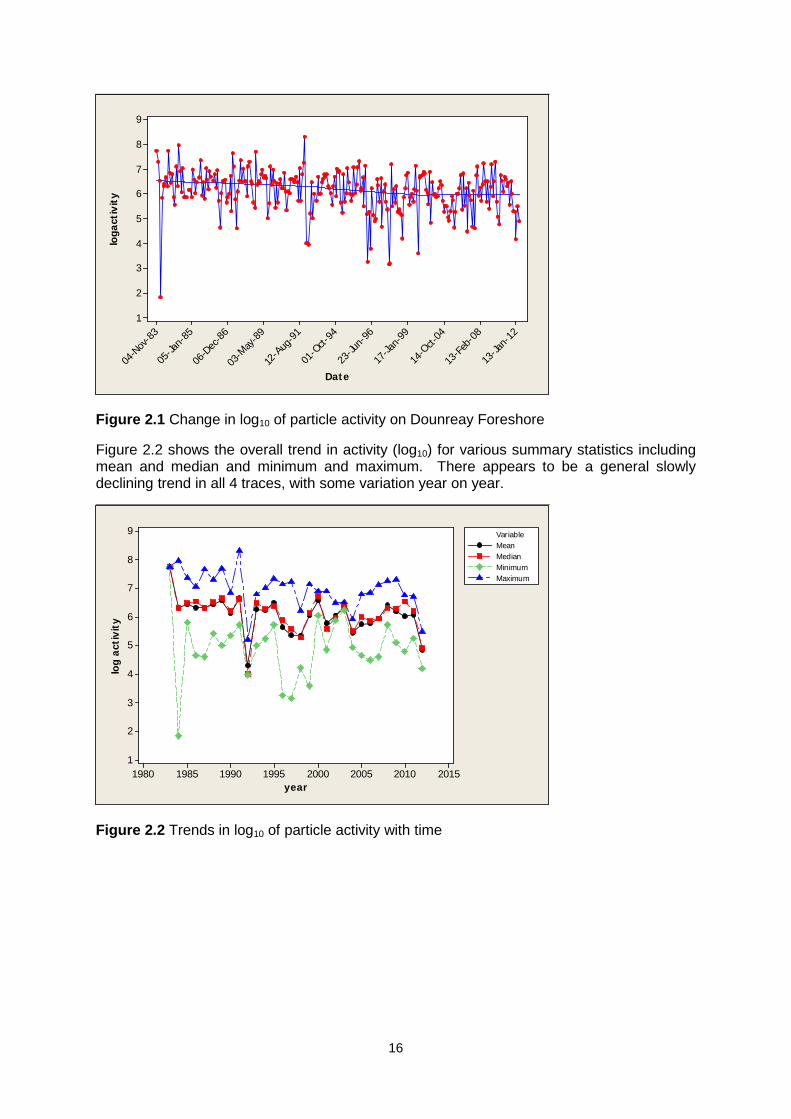
Figure 2.3 Descriptive statistics of log10 particle activity with time
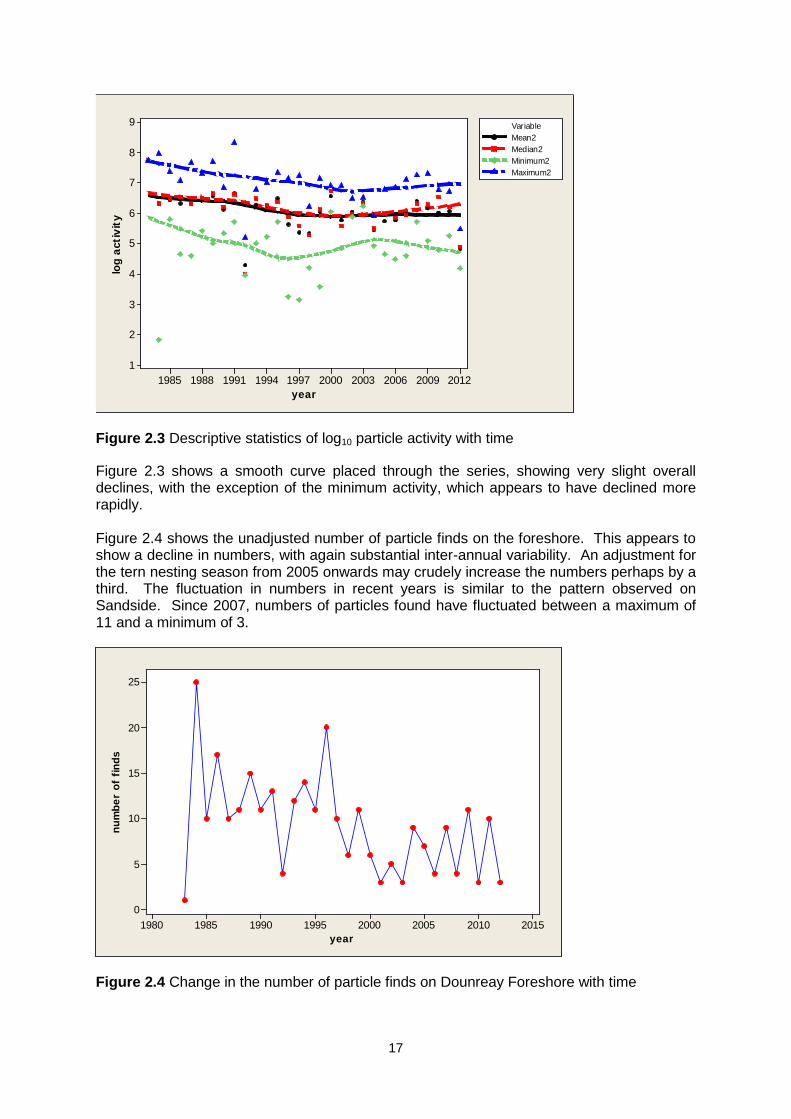
Figure 2.3 shows a smooth curve placed through the series, showing very slight overall declines, with the exception of the minimum activity, which appears to have declined more rapidly. Figure 2.4 shows the unadjusted number of particle finds on the foreshore. This appears to show a decline in numbers, with again substantial inter-annual variability. An adjustment for the tern nesting season from 2005 onwards may crudely increase the numbers perhaps by a third. The fluctuation in numbers in recent years is similar to the pattern observed on Sandside. Since 2007, numbers of particles found have fluctuated between a maximum of 11 and a minimum of 3.
20152010200520001995199019851980
25
20
15
10
5
0
year
num
ber
of f
ind s
Figure 2.4 Change in the number of particle finds on Dounreay Foreshore with time
18
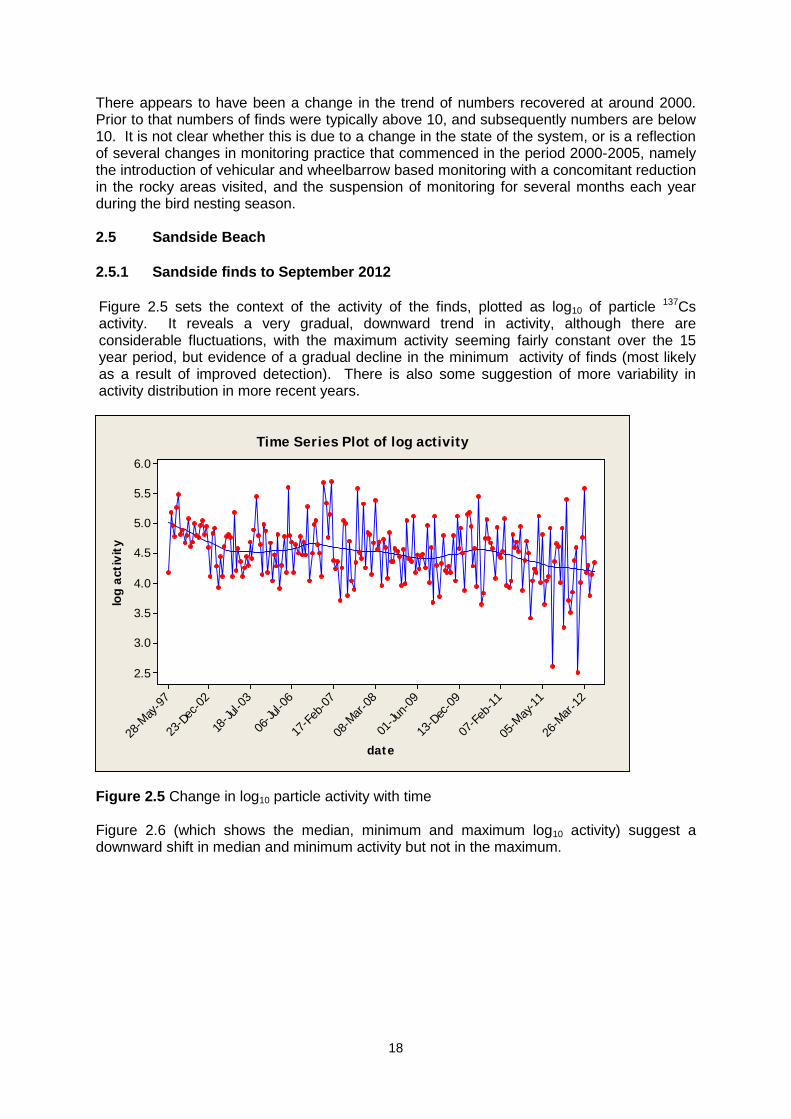
There appears to have been a change in the trend of numbers recovered at around 2000. Prior to that numbers of finds were typically above 10, and subsequently numbers are below 10. It is not clear whether this is due to a change in the state of the system, or is a reflection of several changes in monitoring practice that commenced in the period 2000-2005, namely the introduction of vehicular and wheelbarrow based monitoring with a concomitant reduction in the rocky areas visited, and the suspension of monitoring for several months each year during the bird nesting season. 2.5 Sandside Beach 2.5.1 Sandside finds to September 2012 Figure 2.5 sets the context of the activity of the finds, plotted as log10 of particle 137Cs activity. It reveals a very gradual, downward trend in activity, although there are considerable fluctuations, with the maximum activity seeming fairly constant over the 15 year period, but evidence of a gradual decline in the minimum activity of finds (most likely as a result of improved detection). There is also some suggestion of more variability in activity distribution in more recent years.
26-M
ar-12
05-M
ay-11
07-Fe
b-11
13-D
ec-09
01-Ju
n-09
08-M
ar-08
17-Fe
b-07
06-Ju
l-06
18-Ju
l-03
23-D
ec-02
28-M
ay-97
6.0
5.5
5.0
4.5
4.0
3.5
3.0
2.5
date
log
acti
vity
Time Series Plot of log activity
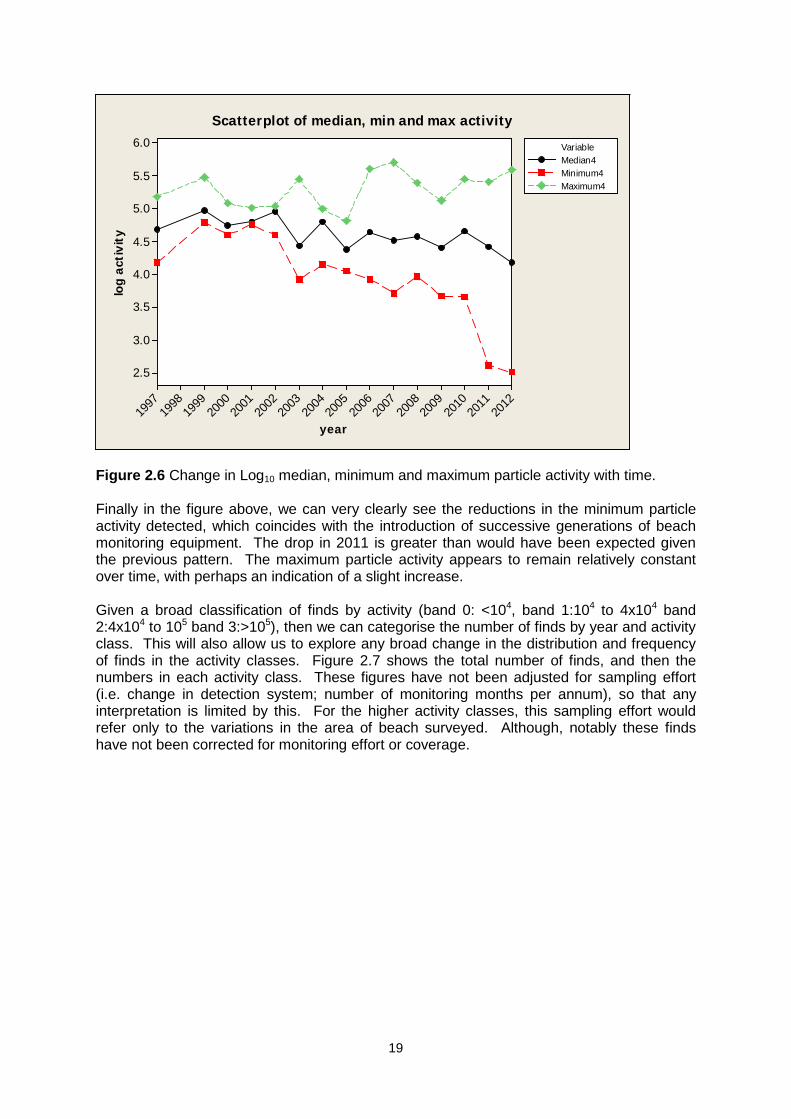
Figure 2.5 Change in log10 particle activity with time Figure 2.6 (which shows the median, minimum and maximum log10 activity) suggest a downward shift in median and minimum activity but not in the maximum.
19
2012
2011
2010
2009
2008
2007
2006
2005
2004
2003
2002
2001
2000
1999
1998
1997
6.0
5.5
5.0
4.5
4.0
3.5
3.0
2.5
year
log
acti
vity
Median4Minimum4Maximum4
Variable
Scatterplot of median, min and max activity
Figure 2.6 Change in Log10 median, minimum and maximum particle activity with time. Finally in the figure above, we can very clearly see the reductions in the minimum particle activity detected, which coincides with the introduction of successive generations of beach monitoring equipment. The drop in 2011 is greater than would have been expected given the previous pattern. The maximum particle activity appears to remain relatively constant over time, with perhaps an indication of a slight increase. Given a broad classification of finds by activity (band 0: <104, band 1:104 to 4x10⁴ band 2:4x10⁴ to 105 band 3:>105), then we can categorise the number of finds by year and activity class. This will also allow us to explore any broad change in the distribution and frequency of finds in the activity classes. Figure 2.7 shows the total number of finds, and then the numbers in each activity class. These figures have not been adjusted for sampling effort (i.e. change in detection system; number of monitoring months per annum), so that any interpretation is limited by this. For the higher activity classes, this sampling effort would refer only to the variations in the area of beach surveyed. Although, notably these finds have not been corrected for monitoring effort or coverage.
20
2012
2011
2010
2009
2008
2007
2006
2005
2004
2003
2002
2001
2000
1999
1998
1997
50
40
30
20
10
0
year
num
ber
N5tp0tp1tp2tp3
Variable
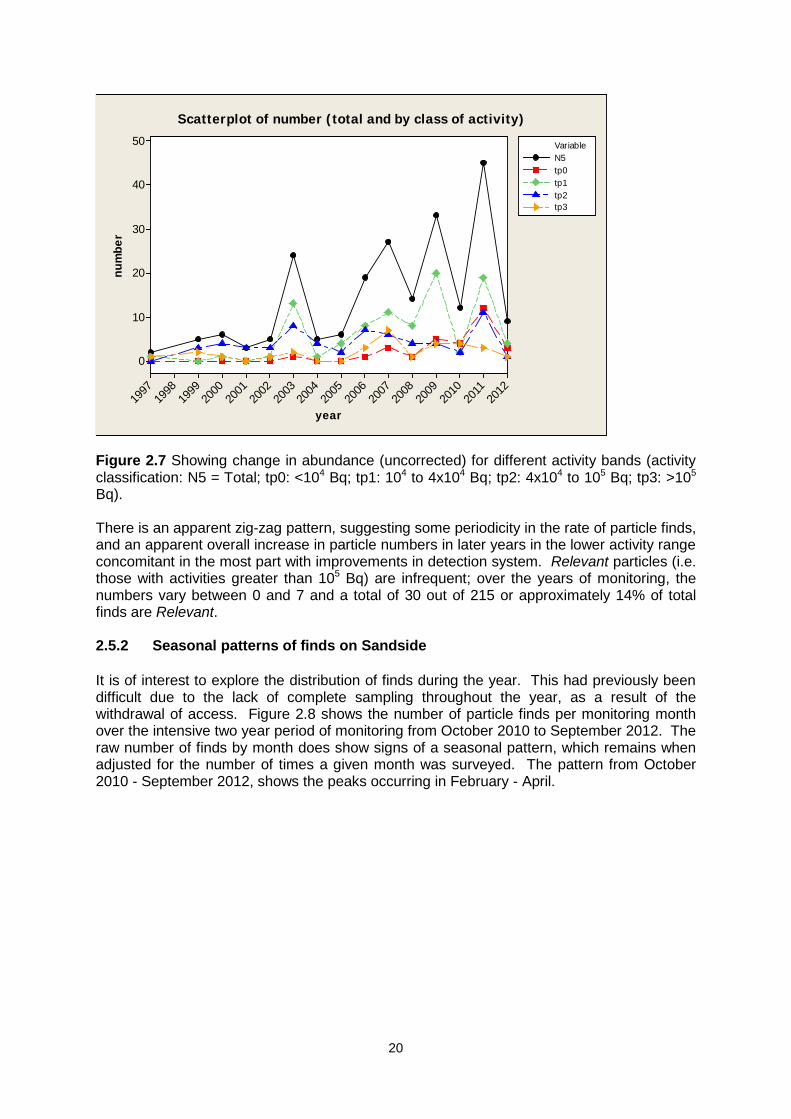
Scatterplot of number (total and by class of activity)
Figure 2.7 Showing change in abundance (uncorrected) for different activity bands (activity classification: N5 = Total; tp0: <104 Bq; tp1: 104 to 4x10⁴ Bq; tp2: 4x10⁴ to 105 Bq; tp3: >105 Bq). There is an apparent zig-zag pattern, suggesting some periodicity in the rate of particle finds, and an apparent overall increase in particle numbers in later years in the lower activity range concomitant in the most part with improvements in detection system. Relevant particles (i.e. those with activities greater than 105 Bq) are infrequent; over the years of monitoring, the numbers vary between 0 and 7 and a total of 30 out of 215 or approximately 14% of total finds are Relevant. 2.5.2 Seasonal patterns of finds on Sandside It is of interest to explore the distribution of finds during the year. This had previously been difficult due to the lack of complete sampling throughout the year, as a result of the withdrawal of access. Figure 2.8 shows the number of particle finds per monitoring month over the intensive two year period of monitoring from October 2010 to September 2012. The raw number of finds by month does show signs of a seasonal pattern, which remains when adjusted for the number of times a given month was surveyed. The pattern from October 2010 - September 2012, shows the peaks occurring in February - April.
21
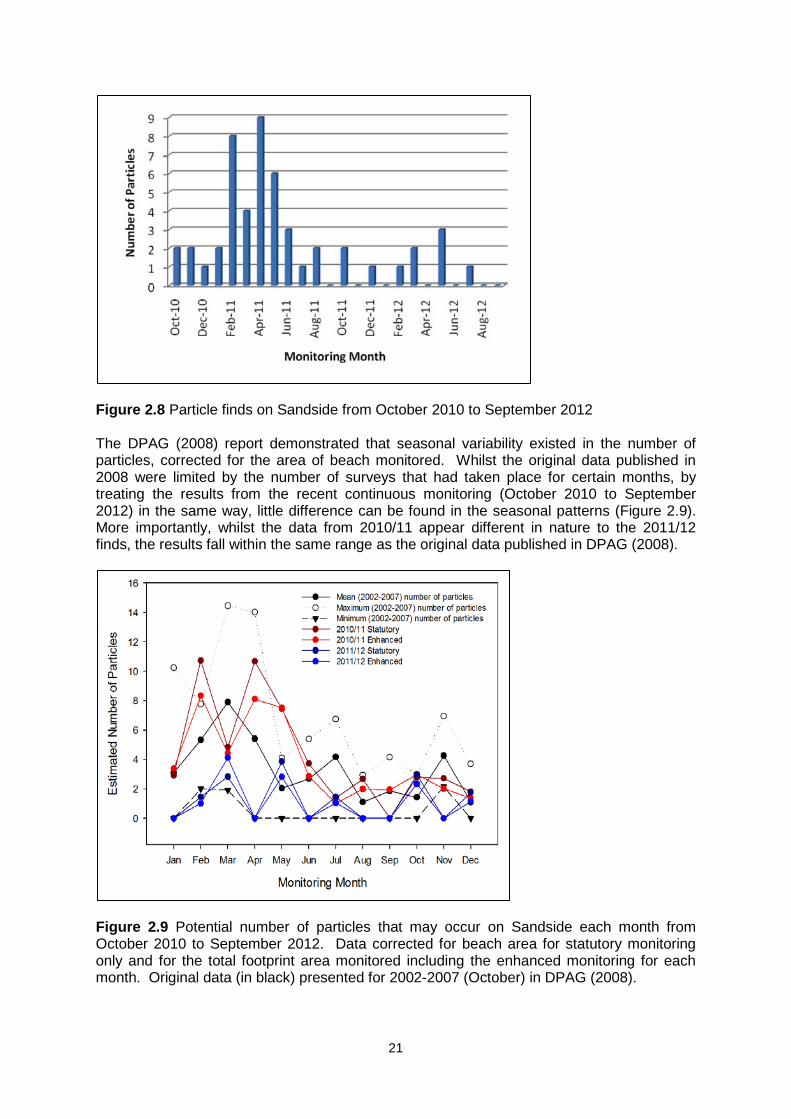
Figure 2.8 Particle finds on Sandside from October 2010 to September 2012 The DPAG (2008) report demonstrated that seasonal variability existed in the number of particles, corrected for the area of beach monitored. Whilst the original data published in 2008 were limited by the number of surveys that had taken place for certain months, by treating the results from the recent continuous monitoring (October 2010 to September 2012) in the same way, little difference can be found in the seasonal patterns (Figure 2.9). More importantly, whilst the data from 2010/11 appear different in nature to the 2011/12 finds, the results fall within the same range as the original data published in DPAG (2008).
Figure 2.9 Potential number of particles that may occur on Sandside each month from October 2010 to September 2012. Data corrected for beach area for statutory monitoring only and for the total footprint area monitored including the enhanced monitoring for each month. Original data (in black) presented for 2002-2007 (October) in DPAG (2008).

22
2.5.3 Monitoring Effort on Sandside
Figure 2.10 The monitoring footprint for Sandside Beach with each generation of Groundhog monitoring system. The monitoring effort has improved with time, with the introduction of next generation Groundhog systems and increasing monitoring footprint. Figure 2.10 also shows the times when no monitoring was undertaken due to access issues at Sandside. Since the DPAG 2008 report, two years of continuous monitoring of Sandside have been completed with additional coverage within the lower parts of the beach. The variation in the monitoring footprint and the additional monitoring contribution provided by the enhanced survey, which is typically focussed in the Low Water Tidal Limit (LWTL) is apparent. There is clear evidence of the seasonality in the monitoring footprint, largely reflecting the accessibility of the beach and availability of sandy areas for monitoring. 2.5.4 Estimation of particle abundances Table 2.1 provides a summary of comparisons of the particle finds through the three generations of Groundhog monitoring. The DPAG third report (DPAG 2006) demonstrated that Groundhog Mark 1 was not fully compliant with the requirement of detecting 105 Bq 137Cs particles at 100 mm depth. The first generation of the improved Groundhog Evolution system exceeded the 100 mm depth requirement and detected 105 Bq 137Cs particles at 200 mm depth with around 0.9 probability of detection. In both cases very few 105 Bq particles were detected annually. The new Groundhog Evolution II system demonstrated superior detection capability, with a detection probability of 0.8 for 105 Bq 137Cs particles at 300 mm. When the uncertainties are taken into account, this effectively meets DPAG’s specified requirements and the system can detect 106 Bq particles at 400 mm with a detection probability of 0.96. The improved detection capability is in part reflected in the increased find rate (Table 2.1). However, changes in other environmental factors affecting the delivery of particles to Sandside beach cannot be ruled out. Similar numbers to those seen in Table 2.1 are also seen in the 2010/11 results, but the results for 2011/12 show a marked decline.

23
Nevertheless, figure 2.9 also demonstrates that on a monthly basis, the 2011/12 results are not unusual. Table 2.1 Summary of mean monthly particle abundances (ND = Not Detected) (adapted from DPAG 2008, Tyler et al., 2010).
Particle category
137Cs Activity Bq
Groundhog Mark 1 1999-2002
Groundhog Evolution 2002-2006
Groundhog Evolution II 2007 (to March 2008)
Groundhog Evolution II 2010/11
Groundhog Evolution II 2011/12
Minor
<104 ND 0.12 0.50 (1) 1 0.25
104 – 4x10⁴ ND 1.88 1.67 (1) 1.58 0.58
4x10⁴ – 105 0.77 1.06 0.67 (2) 1 0.08
Relevant >105 0.23 0.12 1.33 (1) 0.42 0.08
Significant >106 Bq ND ND ND ND 0.086
All Total 1.0 3.18 4.17 (5) 4 1.07
When taking account of the detection capability and by normalising particle numbers with respect to the area monitored and depth of 300 mm, DPAG 2008 estimated that there were around 9.4 particles on the beach at any given time, of which almost 2 were likely to be Relevant particles (Table 2.2).
6 90Sr Particle estimated 1.3 MBq
24
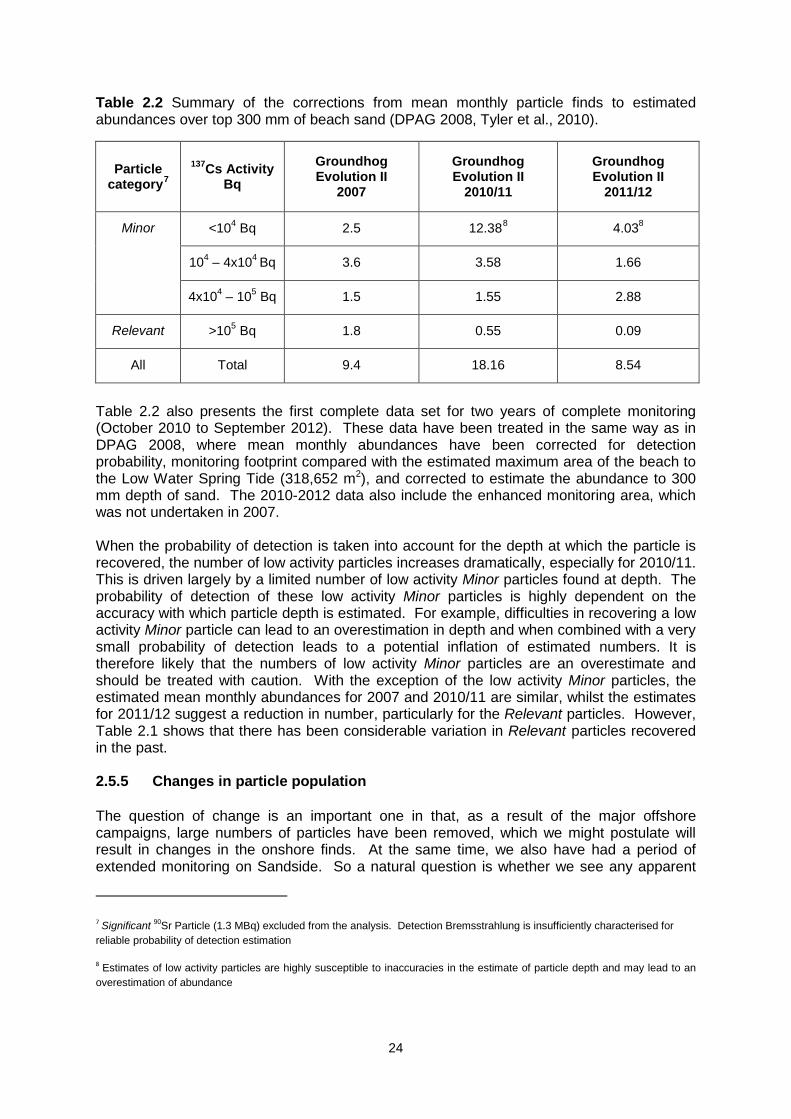
Table 2.2 Summary of the corrections from mean monthly particle finds to estimated abundances over top 300 mm of beach sand (DPAG 2008, Tyler et al., 2010).
Particle category7
137Cs Activity Bq
Groundhog Evolution II
2007
Groundhog Evolution II
2010/11
Groundhog Evolution II
2011/12
Minor <104 Bq 2.5 12.388 4.038
104 – 4x10⁴ Bq 3.6 3.58 1.66
4x10⁴ – 105 Bq 1.5 1.55 2.88
Relevant >105 Bq 1.8 0.55 0.09
All Total 9.4 18.16 8.54
Table 2.2 also presents the first complete data set for two years of complete monitoring (October 2010 to September 2012). These data have been treated in the same way as in DPAG 2008, where mean monthly abundances have been corrected for detection probability, monitoring footprint compared with the estimated maximum area of the beach to the Low Water Spring Tide (318,652 m2), and corrected to estimate the abundance to 300 mm depth of sand. The 2010-2012 data also include the enhanced monitoring area, which was not undertaken in 2007. When the probability of detection is taken into account for the depth at which the particle is recovered, the number of low activity particles increases dramatically, especially for 2010/11. This is driven largely by a limited number of low activity Minor particles found at depth. The probability of detection of these low activity Minor particles is highly dependent on the accuracy with which particle depth is estimated. For example, difficulties in recovering a low activity Minor particle can lead to an overestimation in depth and when combined with a very small probability of detection leads to a potential inflation of estimated numbers. It is therefore likely that the numbers of low activity Minor particles are an overestimate and should be treated with caution. With the exception of the low activity Minor particles, the estimated mean monthly abundances for 2007 and 2010/11 are similar, whilst the estimates for 2011/12 suggest a reduction in number, particularly for the Relevant particles. However, Table 2.1 shows that there has been considerable variation in Relevant particles recovered in the past. 2.5.5 Changes in particle population The question of change is an important one in that, as a result of the major offshore campaigns, large numbers of particles have been removed, which we might postulate will result in changes in the onshore finds. At the same time, we also have had a period of extended monitoring on Sandside. So a natural question is whether we see any apparent
7 Significant 90Sr Particle (1.3 MBq) excluded from the analysis. Detection Bremsstrahlung is insufficiently characterised for reliable probability of detection estimation
8 Estimates of low activity particles are highly susceptible to inaccuracies in the estimate of particle depth and may lead to an overestimation of abundance
25
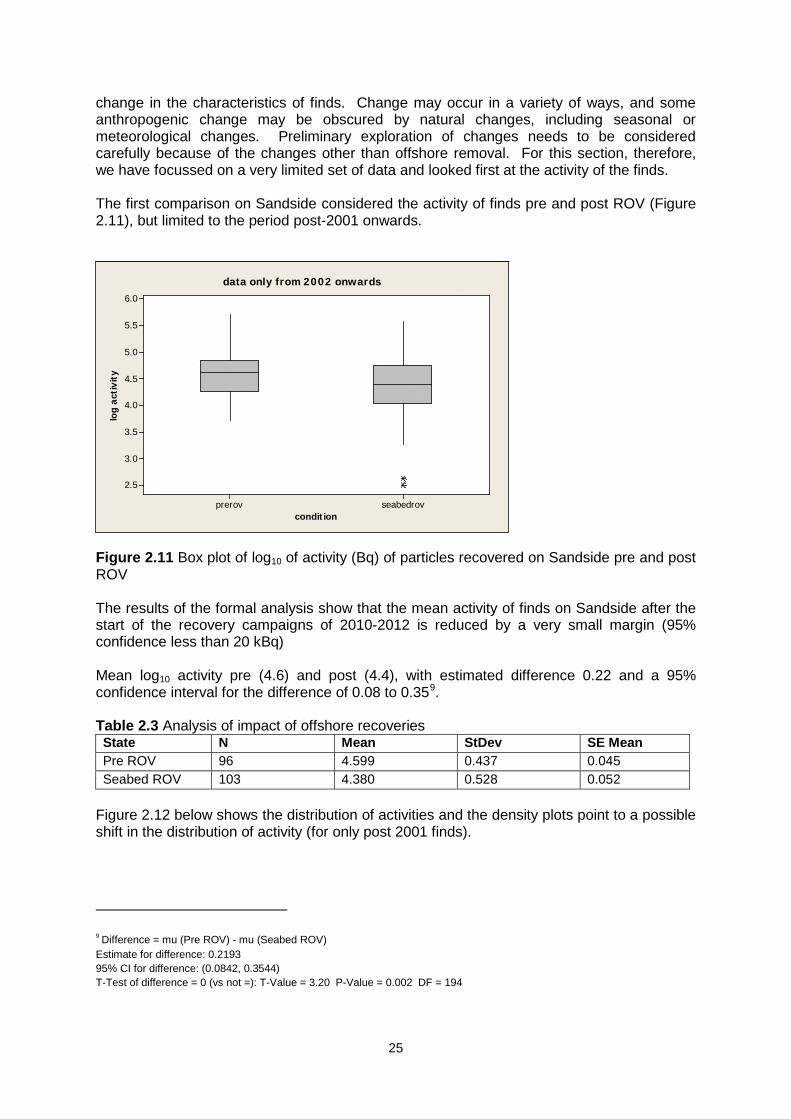
change in the characteristics of finds. Change may occur in a variety of ways, and some anthropogenic change may be obscured by natural changes, including seasonal or meteorological changes. Preliminary exploration of changes needs to be considered carefully because of the changes other than offshore removal. For this section, therefore, we have focussed on a very limited set of data and looked first at the activity of the finds. The first comparison on Sandside considered the activity of finds pre and post ROV (Figure 2.11), but limited to the period post-2001 onwards.
seabedrovprerov
6.0
5.5
5.0
4.5
4.0
3.5
3.0
2.5
condition
log
acti
vity
data only from 2002 onwards
Figure 2.11 Box plot of log10 of activity (Bq) of particles recovered on Sandside pre and post ROV The results of the formal analysis show that the mean activity of finds on Sandside after the start of the recovery campaigns of 2010-2012 is reduced by a very small margin (95% confidence less than 20 kBq) Mean log10 activity pre (4.6) and post (4.4), with estimated difference 0.22 and a 95% confidence interval for the difference of 0.08 to 0.359. Table 2.3 Analysis of impact of offshore recoveries State N Mean StDev SE Mean Pre ROV 96 4.599 0.437 0.045 Seabed ROV 103 4.380 0.528 0.052
Figure 2.12 below shows the distribution of activities and the density plots point to a possible shift in the distribution of activity (for only post 2001 finds).
9 Difference = mu (Pre ROV) - mu (Seabed ROV) Estimate for difference: 0.2193 95% CI for difference: (0.0842, 0.3544) T-Test of difference = 0 (vs not =): T-Value = 3.20 P-Value = 0.002 DF = 194

26
5.55.04.54.03.53.02.5
0.9
0.8
0.7
0.6
0.5
0.4
0.3
0.2
0.1
0.0
log activity
Den
sity
4.599 0.4366 964.380 0.5279 103
Mean StDev N
prerovseabedrov
C51_1
Normal Histogram of activity post 2001
Figure 2.12 Distribution of Sandside particle finds pre and post offshore ROV particle recoveries To further this analysis, since the equipment changes will have resulted in greater capability to detect less active particles, if we focus only on the more active particles (activity >4x10⁴), and over a reduced period of years (thus minimising the effects of sampling effort variation), we can also compare this subset since 2002 and with activity >4E4. Table 2.4 shows the summary statistics for this reduced set. Table 2.4 Analysis of impact of recovery for reduced data set
Variable N Mean StDev Min Q1 Median Q3 Max
Pre ROV 48 4.9484 0.2978 4.6128 4.7322 4.8278 5.0414 5.6990
Seabed ROV 30 4.9697 0.2325 4.6532 4.7825 4.9395 5.1139 5.5798
Formal tests show no significant difference in mean activity. Thus at Sandside, we can conclude that there is no evidence of a change in the mean activity post 2001. The comparison of the rate of finds, is more difficult, since sampling effort needs to be taken into account, but if we restrict ourselves to the most recent years, and the more active particles then we can see that the numbers do fluctuate, and that the numbers found to date are within the range of previous values, suggesting that there is as yet no discernible change in the numbers of finds (Figure 2.13).
27
2012
2011
2010
2009
2008
2007
2006
2005
2004
2003
2002
2001
2000
1999
1997
50
40
30
20
10
0
year
Dat
a
allall less minorrelevantr
Variable
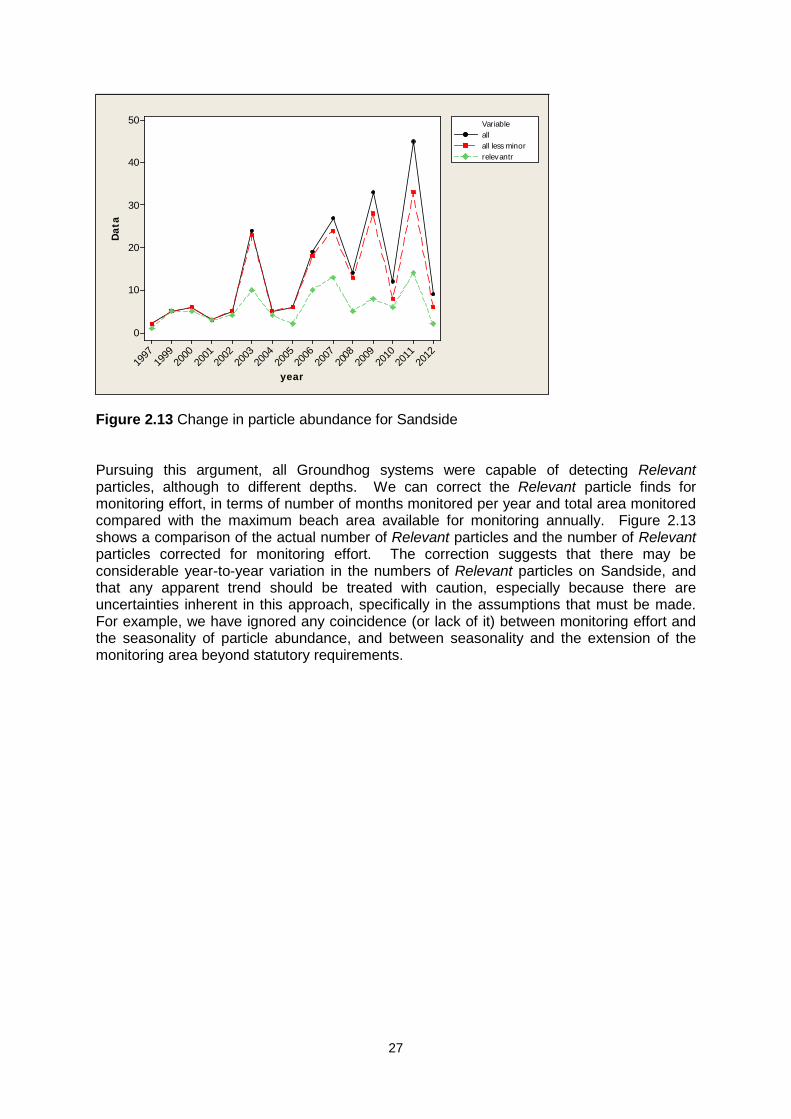
Figure 2.13 Change in particle abundance for Sandside Pursuing this argument, all Groundhog systems were capable of detecting Relevant particles, although to different depths. We can correct the Relevant particle finds for monitoring effort, in terms of number of months monitored per year and total area monitored compared with the maximum beach area available for monitoring annually. Figure 2.13 shows a comparison of the actual number of Relevant particles and the number of Relevant particles corrected for monitoring effort. The correction suggests that there may be considerable year-to-year variation in the numbers of Relevant particles on Sandside, and that any apparent trend should be treated with caution, especially because there are uncertainties inherent in this approach, specifically in the assumptions that must be made. For example, we have ignored any coincidence (or lack of it) between monitoring effort and the seasonality of particle abundance, and between seasonality and the extension of the monitoring area beyond statutory requirements.
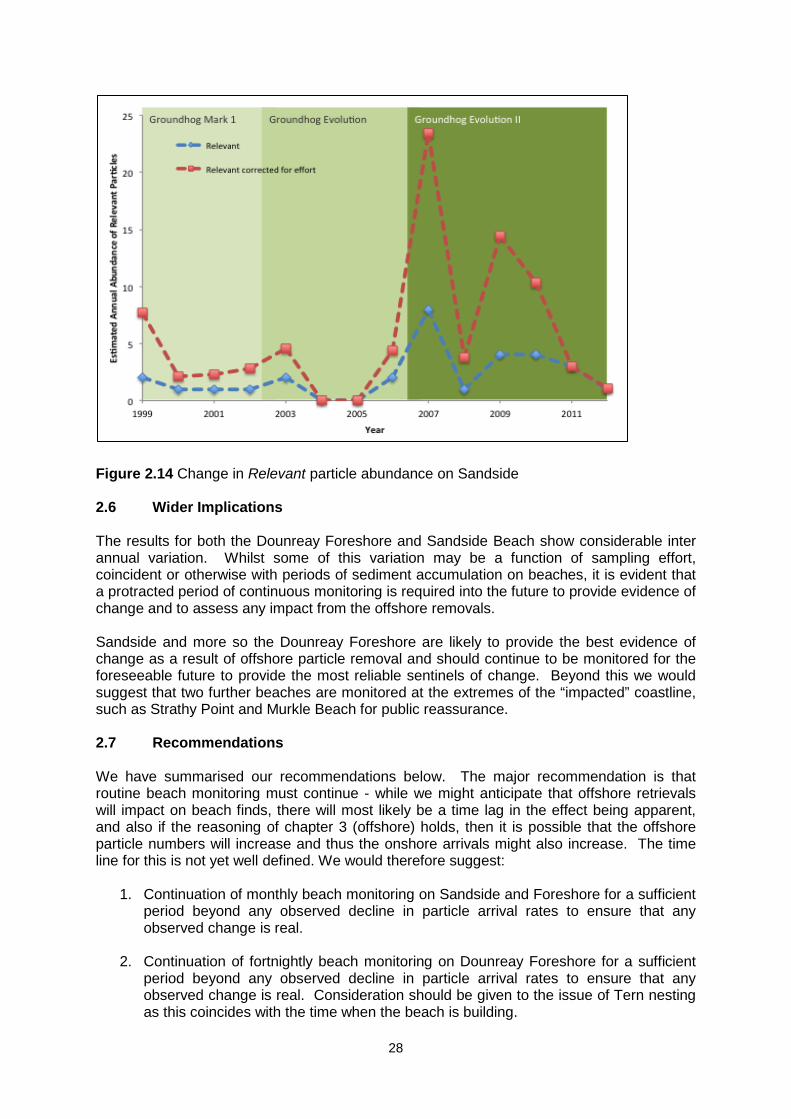
28
Figure 2.14 Change in Relevant particle abundance on Sandside 2.6 Wider Implications The results for both the Dounreay Foreshore and Sandside Beach show considerable inter annual variation. Whilst some of this variation may be a function of sampling effort, coincident or otherwise with periods of sediment accumulation on beaches, it is evident that a protracted period of continuous monitoring is required into the future to provide evidence of change and to assess any impact from the offshore removals. Sandside and more so the Dounreay Foreshore are likely to provide the best evidence of change as a result of offshore particle removal and should continue to be monitored for the foreseeable future to provide the most reliable sentinels of change. Beyond this we would suggest that two further beaches are monitored at the extremes of the “impacted” coastline, such as Strathy Point and Murkle Beach for public reassurance. 2.7 Recommendations We have summarised our recommendations below. The major recommendation is that routine beach monitoring must continue - while we might anticipate that offshore retrievals will impact on beach finds, there will most likely be a time lag in the effect being apparent, and also if the reasoning of chapter 3 (offshore) holds, then it is possible that the offshore particle numbers will increase and thus the onshore arrivals might also increase. The time line for this is not yet well defined. We would therefore suggest:
1. Continuation of monthly beach monitoring on Sandside and Foreshore for a sufficient period beyond any observed decline in particle arrival rates to ensure that any observed change is real.
2. Continuation of fortnightly beach monitoring on Dounreay Foreshore for a sufficient period beyond any observed decline in particle arrival rates to ensure that any observed change is real. Consideration should be given to the issue of Tern nesting as this coincides with the time when the beach is building.

29
3. Sentinel Beaches: Selection of two sentinel beaches at Strathy Point and Murkle Beach. To be monitored annually twice, once in May during the time of beach build up, the second time to be 6 months later.

30
3. Particles recovered in ROV surveys since 2008
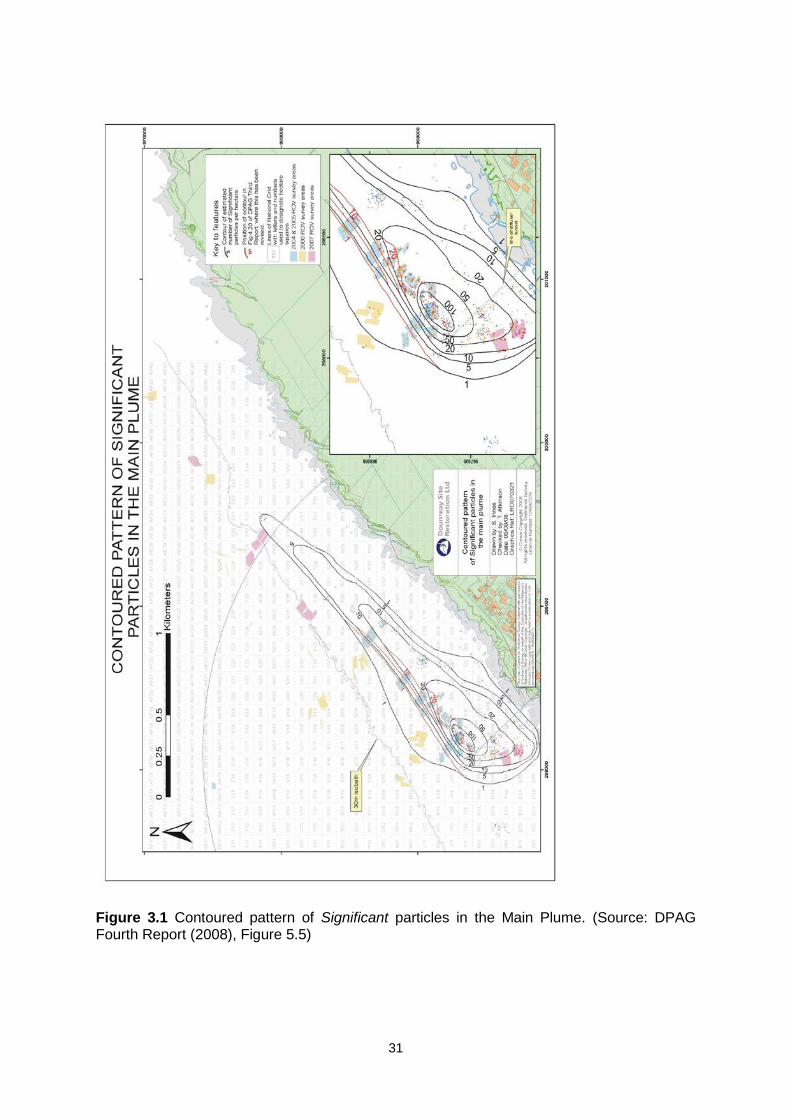
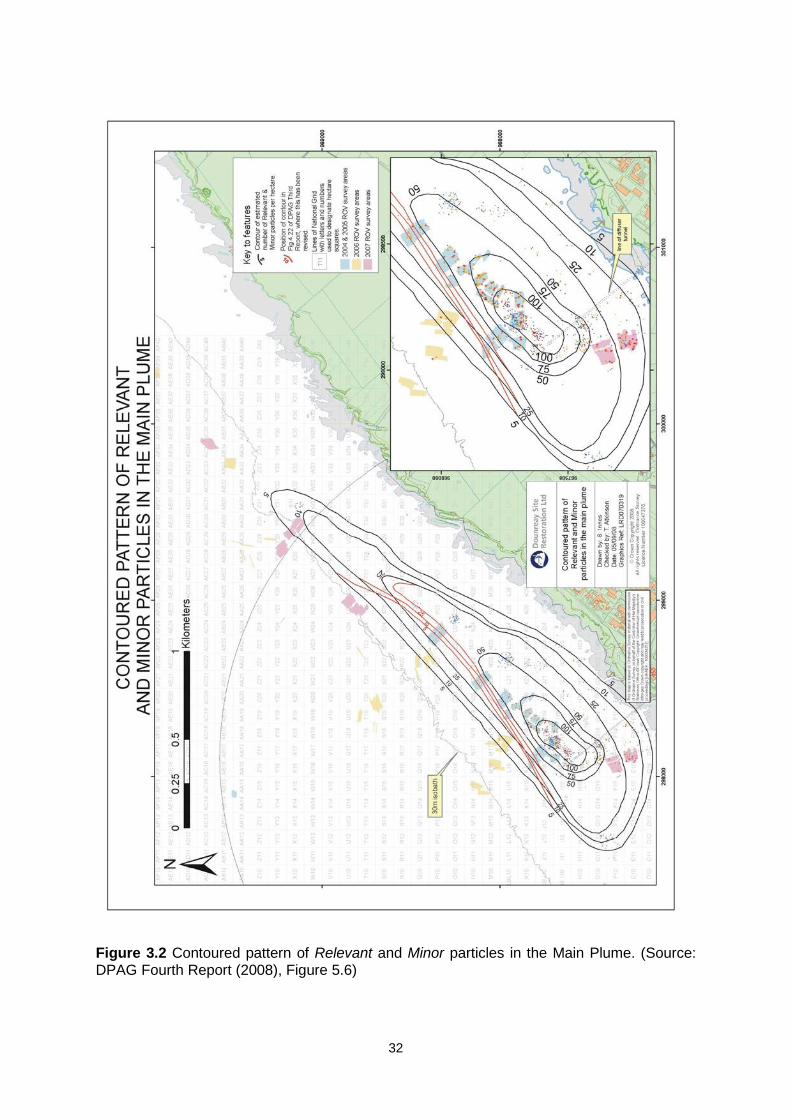
As noted in the Introduction, after 2004 UKAEA (and its successor DSRL) turned from the use of divers to Remotely Operated Vehicles (ROVs) as the principal means of searching for, and from 2008 actually retrieving, particles from the sea bed. Figures.3.1 and 3.2 show the distributions of detected Significant and Relevant + Minor particles within the sea bed as of 2007, based on surveys of restricted areas by divers and prototype ROVs up to that time. These data were used by DPAG to compile the contour maps of spatial densities of particles within the sea bed that were presented in their Third and Fourth Reports (DPAG, 2006, 2008). The contour maps were used in turn to plan the ROV campaigns of 2008 to 2012.
31
Figure 3.1 Contoured pattern of Significant particles in the Main Plume. (Source: DPAG Fourth Report (2008), Figure 5.5)
32
Figure 3.2 Contoured pattern of Relevant and Minor particles in the Main Plume. (Source: DPAG Fourth Report (2008), Figure 5.6)
33
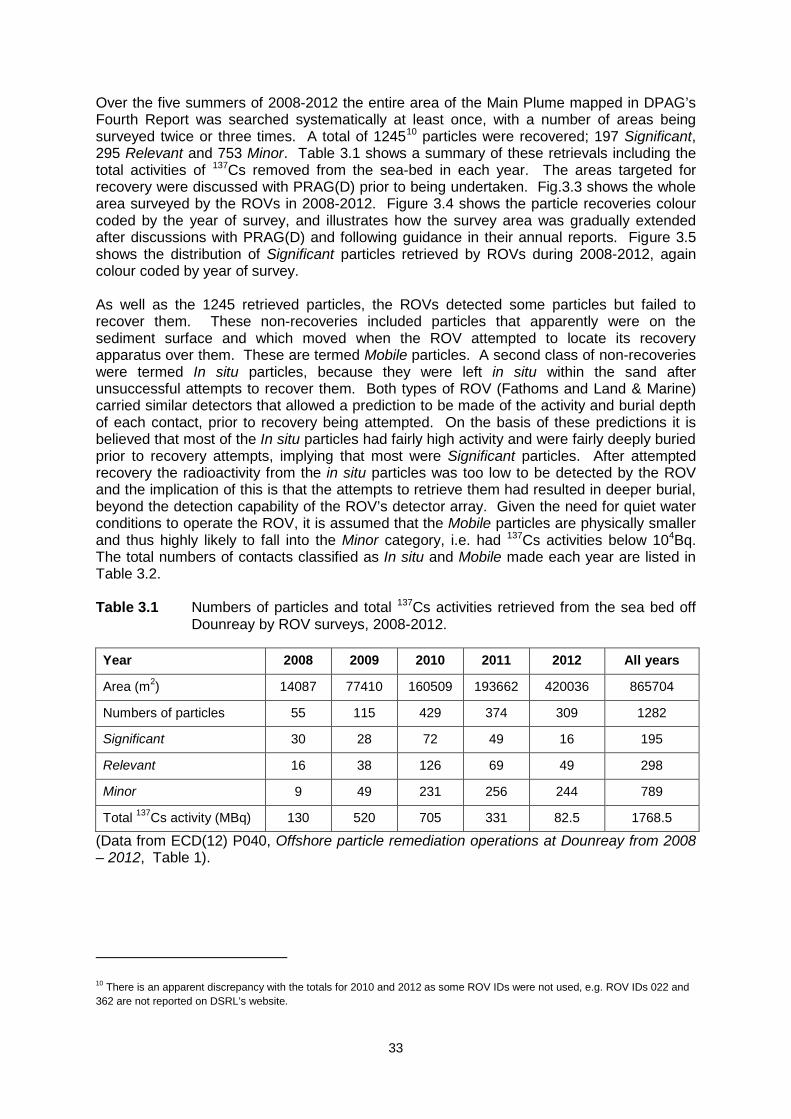
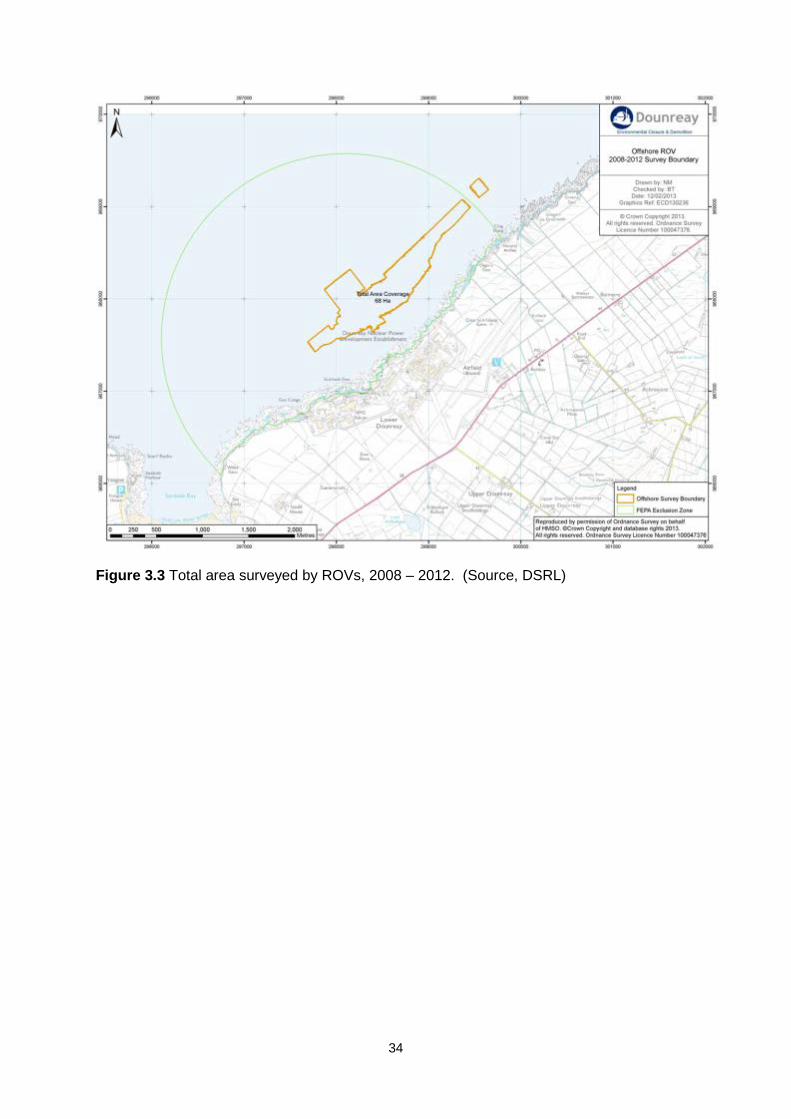
Over the five summers of 2008-2012 the entire area of the Main Plume mapped in DPAG’s Fourth Report was searched systematically at least once, with a number of areas being surveyed twice or three times. A total of 124510 particles were recovered; 197 Significant, 295 Relevant and 753 Minor. Table 3.1 shows a summary of these retrievals including the total activities of 137Cs removed from the sea-bed in each year. The areas targeted for recovery were discussed with PRAG(D) prior to being undertaken. Fig.3.3 shows the whole area surveyed by the ROVs in 2008-2012. Figure 3.4 shows the particle recoveries colour coded by the year of survey, and illustrates how the survey area was gradually extended after discussions with PRAG(D) and following guidance in their annual reports. Figure 3.5 shows the distribution of Significant particles retrieved by ROVs during 2008-2012, again colour coded by year of survey. As well as the 1245 retrieved particles, the ROVs detected some particles but failed to recover them. These non-recoveries included particles that apparently were on the sediment surface and which moved when the ROV attempted to locate its recovery apparatus over them. These are termed Mobile particles. A second class of non-recoveries were termed In situ particles, because they were left in situ within the sand after unsuccessful attempts to recover them. Both types of ROV (Fathoms and Land & Marine) carried similar detectors that allowed a prediction to be made of the activity and burial depth of each contact, prior to recovery being attempted. On the basis of these predictions it is believed that most of the In situ particles had fairly high activity and were fairly deeply buried prior to recovery attempts, implying that most were Significant particles. After attempted recovery the radioactivity from the in situ particles was too low to be detected by the ROV and the implication of this is that the attempts to retrieve them had resulted in deeper burial, beyond the detection capability of the ROV’s detector array. Given the need for quiet water conditions to operate the ROV, it is assumed that the Mobile particles are physically smaller and thus highly likely to fall into the Minor category, i.e. had 137Cs activities below 104Bq. The total numbers of contacts classified as In situ and Mobile made each year are listed in Table 3.2. Table 3.1 Numbers of particles and total 137Cs activities retrieved from the sea bed off
Dounreay by ROV surveys, 2008-2012. Year 2008 2009 2010 2011 2012 All years
Area (m2) 14087 77410 160509 193662 420036 865704
Numbers of particles 55 115 429 374 309 1282
Significant 30 28 72 49 16 195
Relevant 16 38 126 69 49 298
Minor 9 49 231 256 244 789
Total 137Cs activity (MBq) 130 520 705 331 82.5 1768.5
(Data from ECD(12) P040, Offshore particle remediation operations at Dounreay from 2008 – 2012, Table 1).
10 There is an apparent discrepancy with the totals for 2010 and 2012 as some ROV IDs were not used, e.g. ROV IDs 022 and 362 are not reported on DSRL’s website.
34
Figure 3.3 Total area surveyed by ROVs, 2008 – 2012. (Source, DSRL)
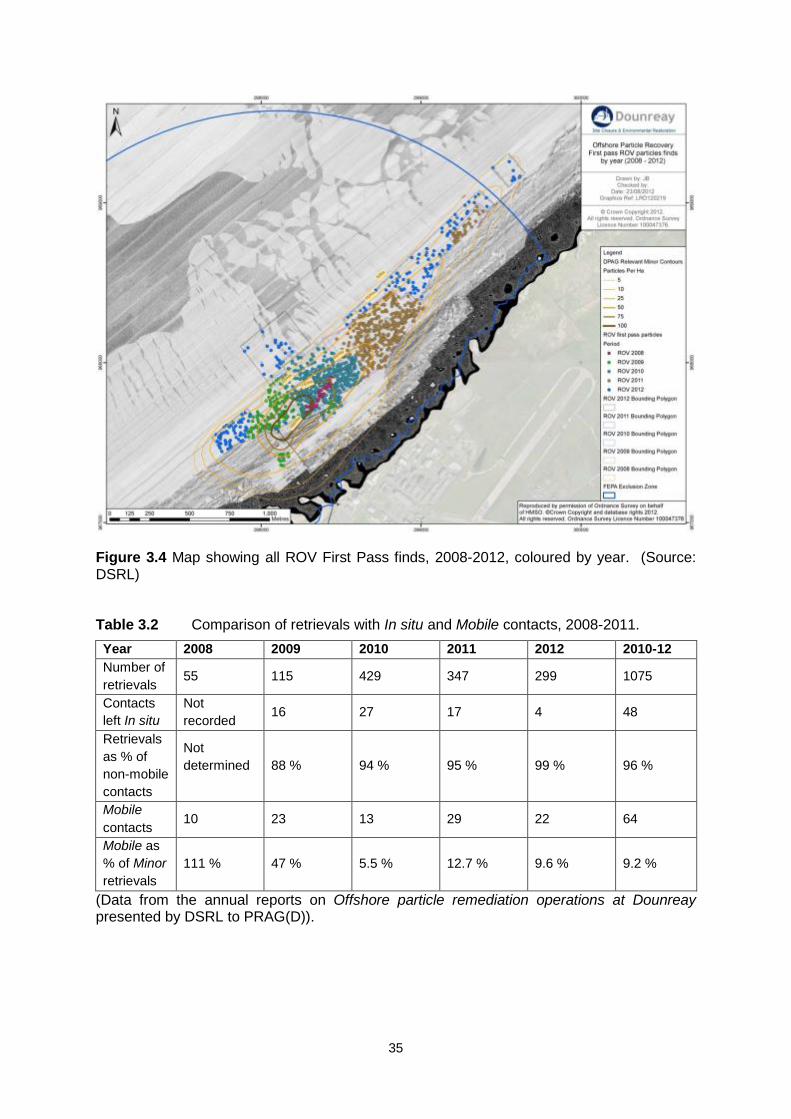
35
Figure 3.4 Map showing all ROV First Pass finds, 2008-2012, coloured by year. (Source: DSRL) Table 3.2 Comparison of retrievals with In situ and Mobile contacts, 2008-2011.
(Data from the annual reports on Offshore particle remediation operations at Dounreay presented by DSRL to PRAG(D)).
Year 2008 2009 2010 2011 2012 2010-12 Number of retrievals
55 115 429 347 299 1075
Contacts left In situ
Not recorded 16 27 17 4 48
Retrievals as % of non-mobile contacts
Not determined
88 % 94 % 95 % 99 % 96 %
Mobile contacts 10 23 13 29 22 64
Mobile as % of Minor retrievals
111 % 47 % 5.5 % 12.7 % 9.6 % 9.2 %

36
Figure 3.5 Map showing Significant ROV finds 2008-2012, colour-coded by year
Comparison of the numbers of recovered particles with the numbers of contacts left In situ provides an indication of the ROVs’ effectiveness (see section 3.4.2.1) at retrieving particles once they had been detected. The effectiveness of the Fathoms ROV was initially low, but improved during the 2008 campaign, and achieved 88 % in 2009. The average effectiveness of the Land & Marine ROV was approximately 96% in the years 2010 to 2012, as shown in the right-hand column of Table 3.2.
Mobile contacts are listed in Table 3.2 and expressed as a percentage of Minor particle retrievals in each year. 3.1 Sea bed surveys and particle recoveries, 1997-2012 Figures 3.6 and 3.7 are maps of all particle contacts made during the entire period of offshore survey work from 1997 to 2012. Significant and Relevant + Minor categories are mapped separately, and recovered particles and non-recovered contacts are distinguished by symbols. Table 3.4 summarises the particle numbers detected by all surveys. Table 3.4 Total numbers of particles recovered, and detected but not recovered, for the whole Main Plume, 1997-2012.

37
Recovered particles, 1997-2012 Non-recovered contacts11 Total12
Category Number % Category Number Number % Significant 414 19.4 Significant/In situ 141 555 21.3 Relevant 570 26.6 Relevant 104 674 25.9 Minor 1155 54.0 Minor/Mobile 219 1374 52.8 All 2139 100 All 464 2603 100
Figure 3.6 Map showing Significant particles and contacts, 1997-2012. (Source: DSRL)
11 Includes ROV contacts 2004-7
12 In situ particles are assigned to the Significant category, and Mobile particles to Minor category.
38
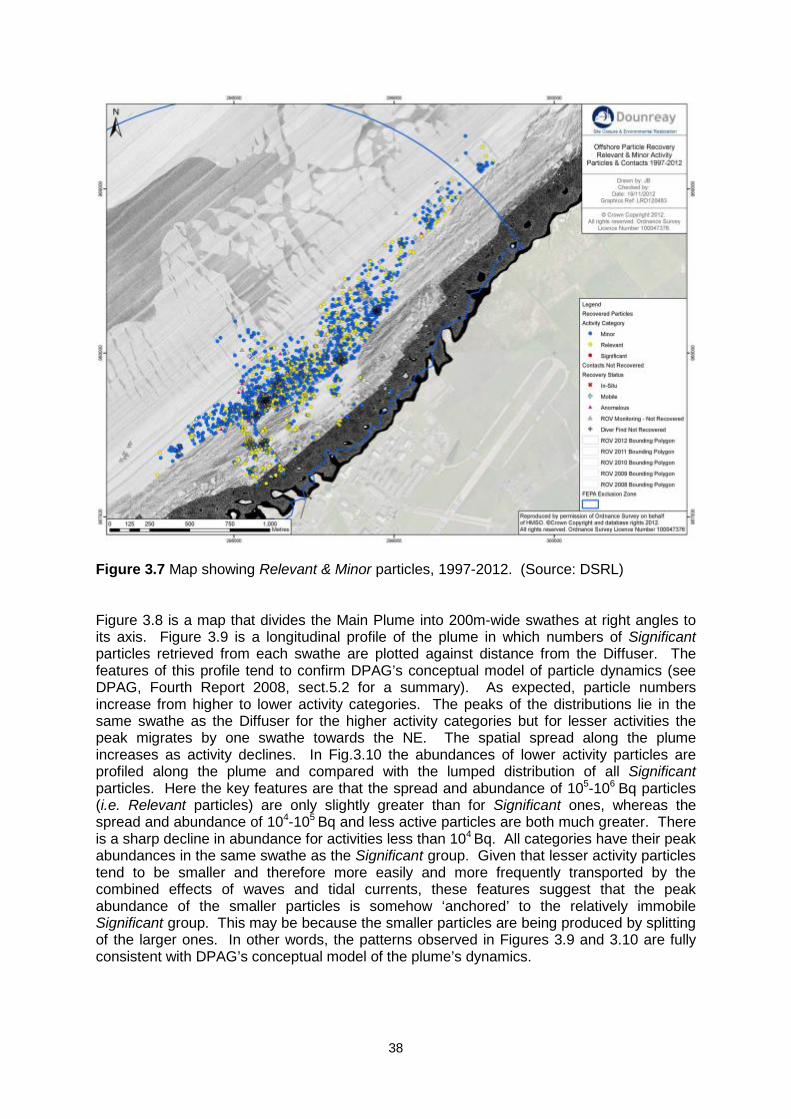
Figure 3.7 Map showing Relevant & Minor particles, 1997-2012. (Source: DSRL)
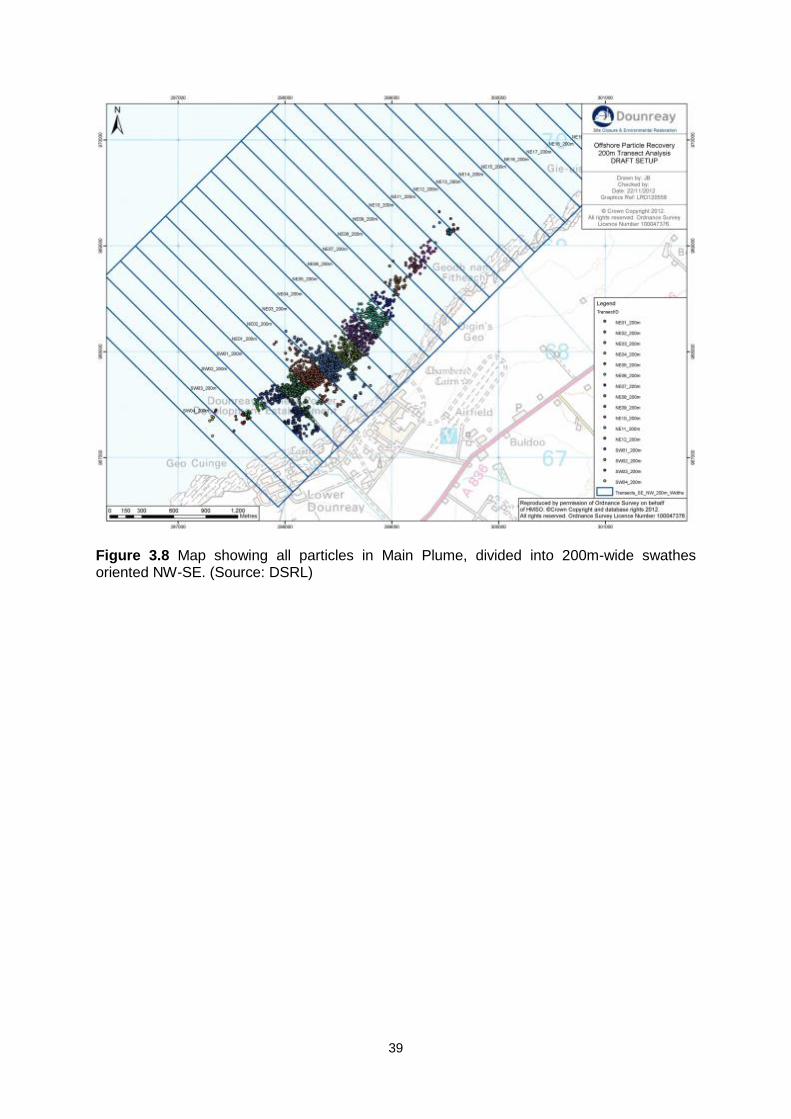
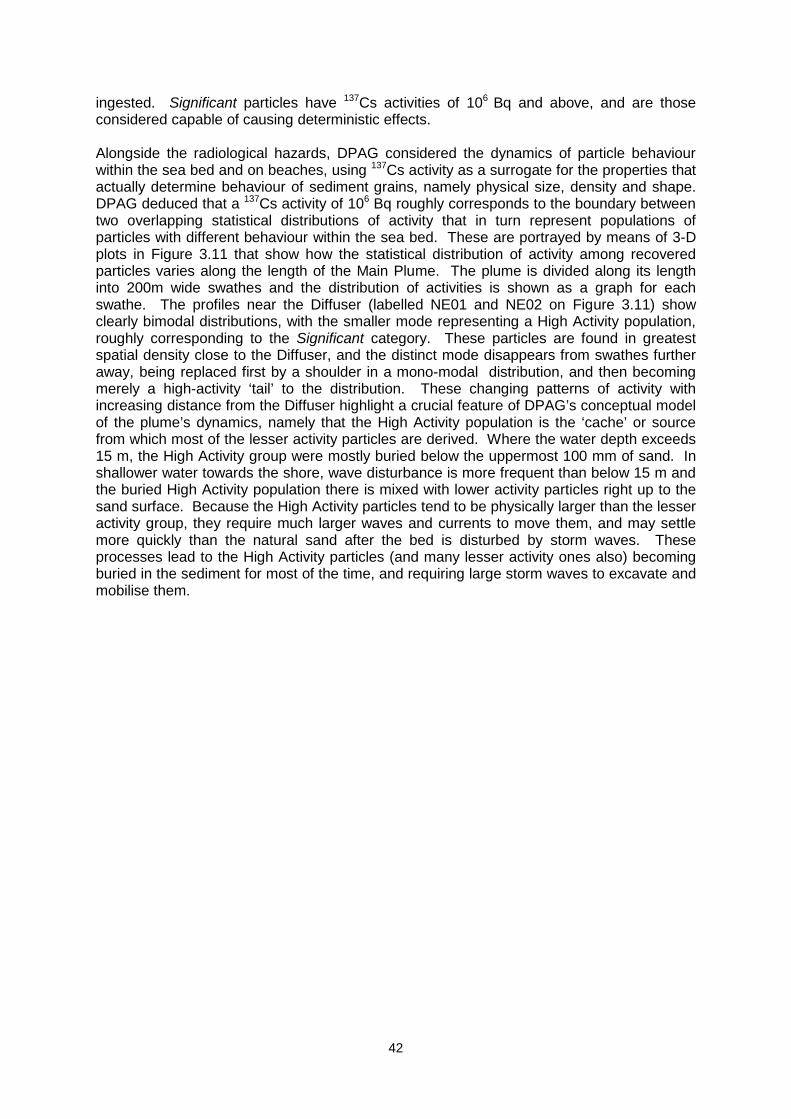
Figure 3.8 is a map that divides the Main Plume into 200m-wide swathes at right angles to its axis. Figure 3.9 is a longitudinal profile of the plume in which numbers of Significant particles retrieved from each swathe are plotted against distance from the Diffuser. The features of this profile tend to confirm DPAG’s conceptual model of particle dynamics (see DPAG, Fourth Report 2008, sect.5.2 for a summary). As expected, particle numbers increase from higher to lower activity categories. The peaks of the distributions lie in the same swathe as the Diffuser for the higher activity categories but for lesser activities the peak migrates by one swathe towards the NE. The spatial spread along the plume increases as activity declines. In Fig.3.10 the abundances of lower activity particles are profiled along the plume and compared with the lumped distribution of all Significant particles. Here the key features are that the spread and abundance of 105-106 Bq particles (i.e. Relevant particles) are only slightly greater than for Significant ones, whereas the spread and abundance of 104-105 Bq and less active particles are both much greater. There is a sharp decline in abundance for activities less than 104 Bq. All categories have their peak abundances in the same swathe as the Significant group. Given that lesser activity particles tend to be smaller and therefore more easily and more frequently transported by the combined effects of waves and tidal currents, these features suggest that the peak abundance of the smaller particles is somehow ‘anchored’ to the relatively immobile Significant group. This may be because the smaller particles are being produced by splitting of the larger ones. In other words, the patterns observed in Figures 3.9 and 3.10 are fully consistent with DPAG’s conceptual model of the plume’s dynamics.
39
Figure 3.8 Map showing all particles in Main Plume, divided into 200m-wide swathes oriented NW-SE. (Source: DSRL)

40
Figure 3.9 Graph showing numbers of Significant particles by activity bands, as a function of distance from the Diffuser.
Figure 3.10 Graph showing numbers of Relevant & Minor particles, by activity bands, as a function of distance from the Diffuser, compared with Significant particles.
41
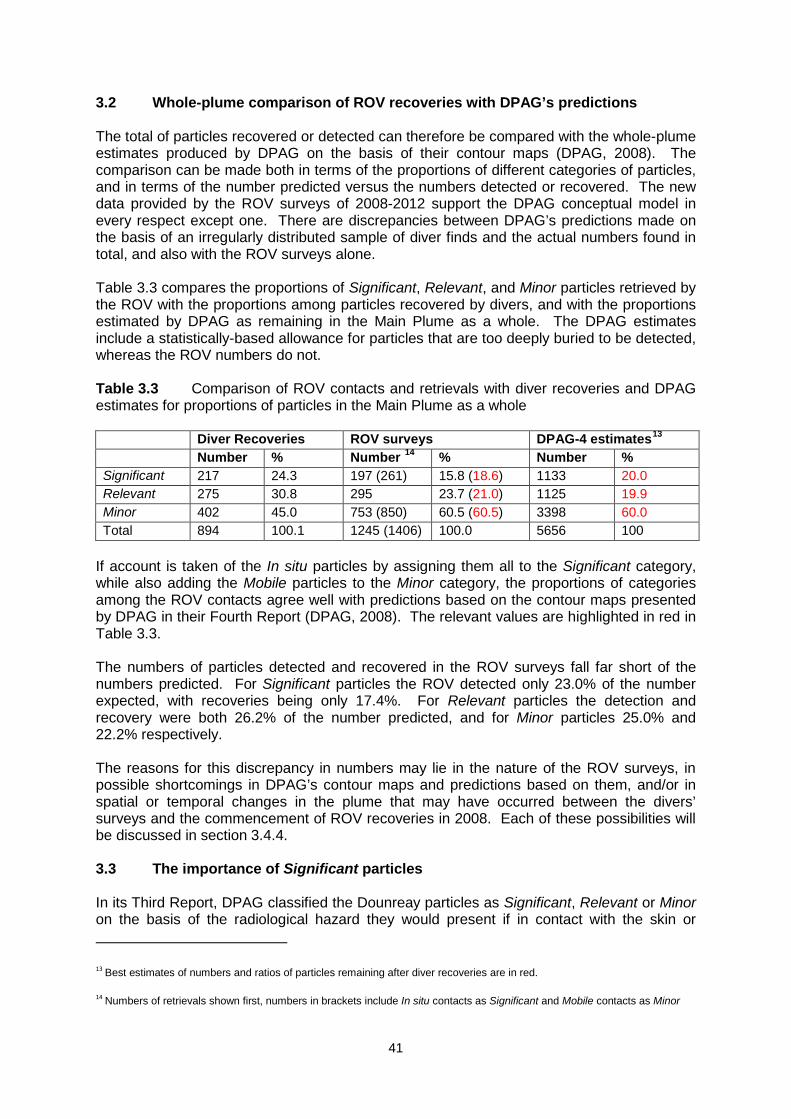
3.2 Whole-plume comparison of ROV recoveries with DPAG’s predictions The total of particles recovered or detected can therefore be compared with the whole-plume estimates produced by DPAG on the basis of their contour maps (DPAG, 2008). The comparison can be made both in terms of the proportions of different categories of particles, and in terms of the number predicted versus the numbers detected or recovered. The new data provided by the ROV surveys of 2008-2012 support the DPAG conceptual model in every respect except one. There are discrepancies between DPAG’s predictions made on the basis of an irregularly distributed sample of diver finds and the actual numbers found in total, and also with the ROV surveys alone. Table 3.3 compares the proportions of Significant, Relevant, and Minor particles retrieved by the ROV with the proportions among particles recovered by divers, and with the proportions estimated by DPAG as remaining in the Main Plume as a whole. The DPAG estimates include a statistically-based allowance for particles that are too deeply buried to be detected, whereas the ROV numbers do not. Table 3.3 Comparison of ROV contacts and retrievals with diver recoveries and DPAG estimates for proportions of particles in the Main Plume as a whole Diver Recoveries ROV surveys DPAG-4 estimates13
Number % Number 14 % Number % Significant 217 24.3 197 (261) 15.8 (18.6) 1133 20.0 Relevant 275 30.8 295 23.7 (21.0) 1125 19.9 Minor 402 45.0 753 (850) 60.5 (60.5) 3398 60.0 Total 894 100.1 1245 (1406) 100.0 5656 100
If account is taken of the In situ particles by assigning them all to the Significant category, while also adding the Mobile particles to the Minor category, the proportions of categories among the ROV contacts agree well with predictions based on the contour maps presented by DPAG in their Fourth Report (DPAG, 2008). The relevant values are highlighted in red in Table 3.3. The numbers of particles detected and recovered in the ROV surveys fall far short of the numbers predicted. For Significant particles the ROV detected only 23.0% of the number expected, with recoveries being only 17.4%. For Relevant particles the detection and recovery were both 26.2% of the number predicted, and for Minor particles 25.0% and 22.2% respectively. The reasons for this discrepancy in numbers may lie in the nature of the ROV surveys, in possible shortcomings in DPAG’s contour maps and predictions based on them, and/or in spatial or temporal changes in the plume that may have occurred between the divers’ surveys and the commencement of ROV recoveries in 2008. Each of these possibilities will be discussed in section 3.4.4. 3.3 The importance of Significant particles In its Third Report, DPAG classified the Dounreay particles as Significant, Relevant or Minor on the basis of the radiological hazard they would present if in contact with the skin or
13 Best estimates of numbers and ratios of particles remaining after diver recoveries are in red.
14 Numbers of retrievals shown first, numbers in brackets include In situ contacts as Significant and Mobile contacts as Minor
42
ingested. Significant particles have 137Cs activities of 106 Bq and above, and are those considered capable of causing deterministic effects. Alongside the radiological hazards, DPAG considered the dynamics of particle behaviour within the sea bed and on beaches, using 137Cs activity as a surrogate for the properties that actually determine behaviour of sediment grains, namely physical size, density and shape. DPAG deduced that a 137Cs activity of 106 Bq roughly corresponds to the boundary between two overlapping statistical distributions of activity that in turn represent populations of particles with different behaviour within the sea bed. These are portrayed by means of 3-D plots in Figure 3.11 that show how the statistical distribution of activity among recovered particles varies along the length of the Main Plume. The plume is divided along its length into 200m wide swathes and the distribution of activities is shown as a graph for each swathe. The profiles near the Diffuser (labelled NE01 and NE02 on Figure 3.11) show clearly bimodal distributions, with the smaller mode representing a High Activity population, roughly corresponding to the Significant category. These particles are found in greatest spatial density close to the Diffuser, and the distinct mode disappears from swathes further away, being replaced first by a shoulder in a mono-modal distribution, and then becoming merely a high-activity ‘tail’ to the distribution. These changing patterns of activity with increasing distance from the Diffuser highlight a crucial feature of DPAG’s conceptual model of the plume’s dynamics, namely that the High Activity population is the ‘cache’ or source from which most of the lesser activity particles are derived. Where the water depth exceeds 15 m, the High Activity group were mostly buried below the uppermost 100 mm of sand. In shallower water towards the shore, wave disturbance is more frequent than below 15 m and the buried High Activity population there is mixed with lower activity particles right up to the sand surface. Because the High Activity particles tend to be physically larger than the lesser activity group, they require much larger waves and currents to move them, and may settle more quickly than the natural sand after the bed is disturbed by storm waves. These processes lead to the High Activity particles (and many lesser activity ones also) becoming buried in the sediment for most of the time, and requiring large storm waves to excavate and mobilise them.
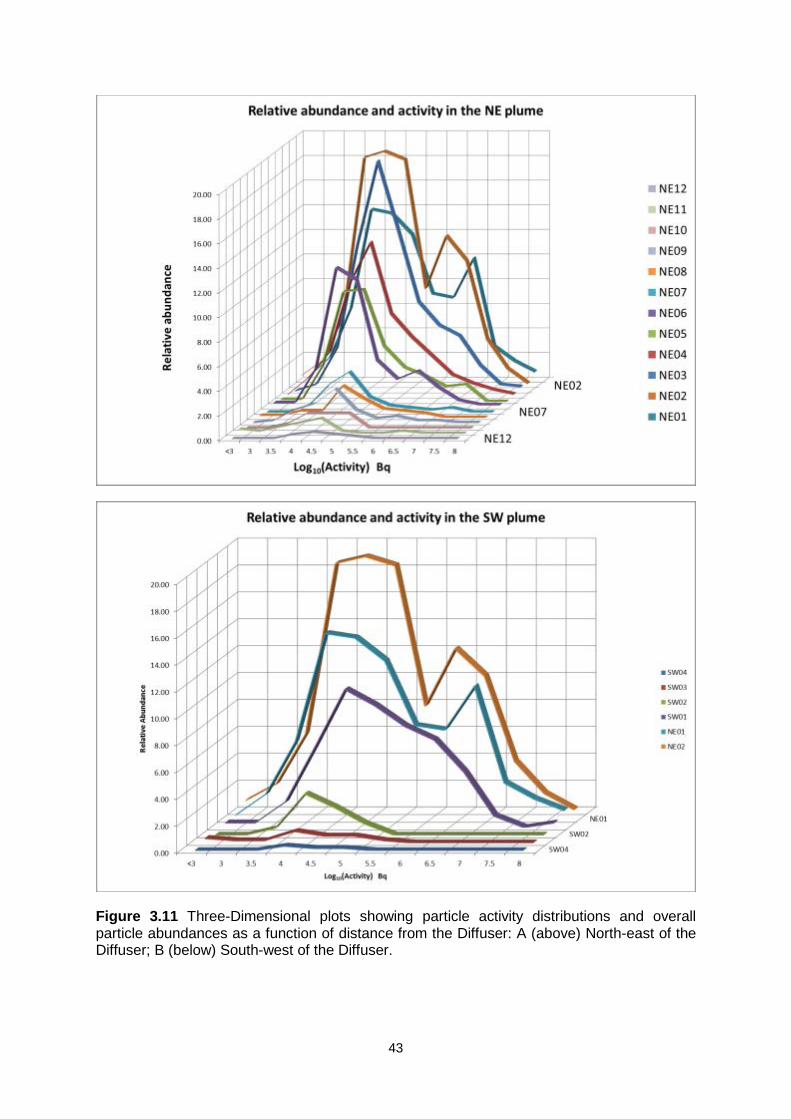
43
Figure 3.11 Three-Dimensional plots showing particle activity distributions and overall particle abundances as a function of distance from the Diffuser: A (above) North-east of the Diffuser; B (below) South-west of the Diffuser.
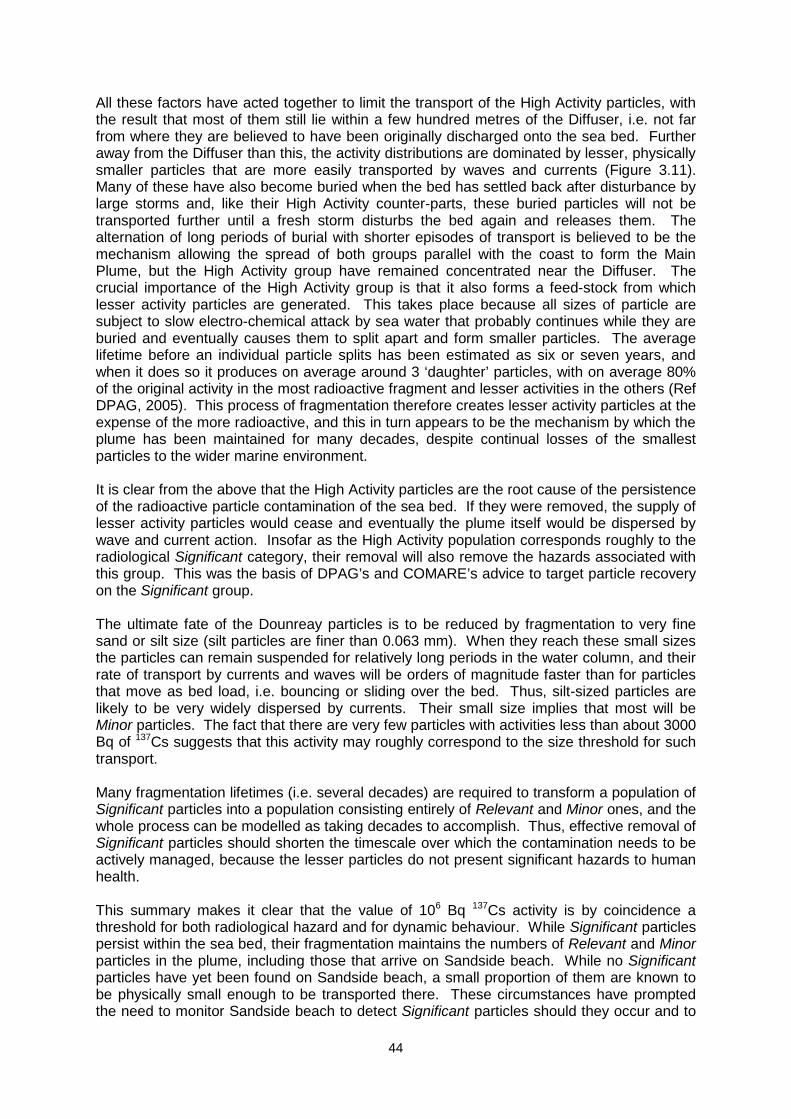
44
All these factors have acted together to limit the transport of the High Activity particles, with the result that most of them still lie within a few hundred metres of the Diffuser, i.e. not far from where they are believed to have been originally discharged onto the sea bed. Further away from the Diffuser than this, the activity distributions are dominated by lesser, physically smaller particles that are more easily transported by waves and currents (Figure 3.11). Many of these have also become buried when the bed has settled back after disturbance by large storms and, like their High Activity counter-parts, these buried particles will not be transported further until a fresh storm disturbs the bed again and releases them. The alternation of long periods of burial with shorter episodes of transport is believed to be the mechanism allowing the spread of both groups parallel with the coast to form the Main Plume, but the High Activity group have remained concentrated near the Diffuser. The crucial importance of the High Activity group is that it also forms a feed-stock from which lesser activity particles are generated. This takes place because all sizes of particle are subject to slow electro-chemical attack by sea water that probably continues while they are buried and eventually causes them to split apart and form smaller particles. The average lifetime before an individual particle splits has been estimated as six or seven years, and when it does so it produces on average around 3 ‘daughter’ particles, with on average 80% of the original activity in the most radioactive fragment and lesser activities in the others (Ref DPAG, 2005). This process of fragmentation therefore creates lesser activity particles at the expense of the more radioactive, and this in turn appears to be the mechanism by which the plume has been maintained for many decades, despite continual losses of the smallest particles to the wider marine environment. It is clear from the above that the High Activity particles are the root cause of the persistence of the radioactive particle contamination of the sea bed. If they were removed, the supply of lesser activity particles would cease and eventually the plume itself would be dispersed by wave and current action. Insofar as the High Activity population corresponds roughly to the radiological Significant category, their removal will also remove the hazards associated with this group. This was the basis of DPAG’s and COMARE’s advice to target particle recovery on the Significant group. The ultimate fate of the Dounreay particles is to be reduced by fragmentation to very fine sand or silt size (silt particles are finer than 0.063 mm). When they reach these small sizes the particles can remain suspended for relatively long periods in the water column, and their rate of transport by currents and waves will be orders of magnitude faster than for particles that move as bed load, i.e. bouncing or sliding over the bed. Thus, silt-sized particles are likely to be very widely dispersed by currents. Their small size implies that most will be Minor particles. The fact that there are very few particles with activities less than about 3000 Bq of 137Cs suggests that this activity may roughly correspond to the size threshold for such transport. Many fragmentation lifetimes (i.e. several decades) are required to transform a population of Significant particles into a population consisting entirely of Relevant and Minor ones, and the whole process can be modelled as taking decades to accomplish. Thus, effective removal of Significant particles should shorten the timescale over which the contamination needs to be actively managed, because the lesser particles do not present significant hazards to human health. This summary makes it clear that the value of 106 Bq 137Cs activity is by coincidence a threshold for both radiological hazard and for dynamic behaviour. While Significant particles persist within the sea bed, their fragmentation maintains the numbers of Relevant and Minor particles in the plume, including those that arrive on Sandside beach. While no Significant particles have yet been found on Sandside beach, a small proportion of them are known to be physically small enough to be transported there. These circumstances have prompted the need to monitor Sandside beach to detect Significant particles should they occur and to
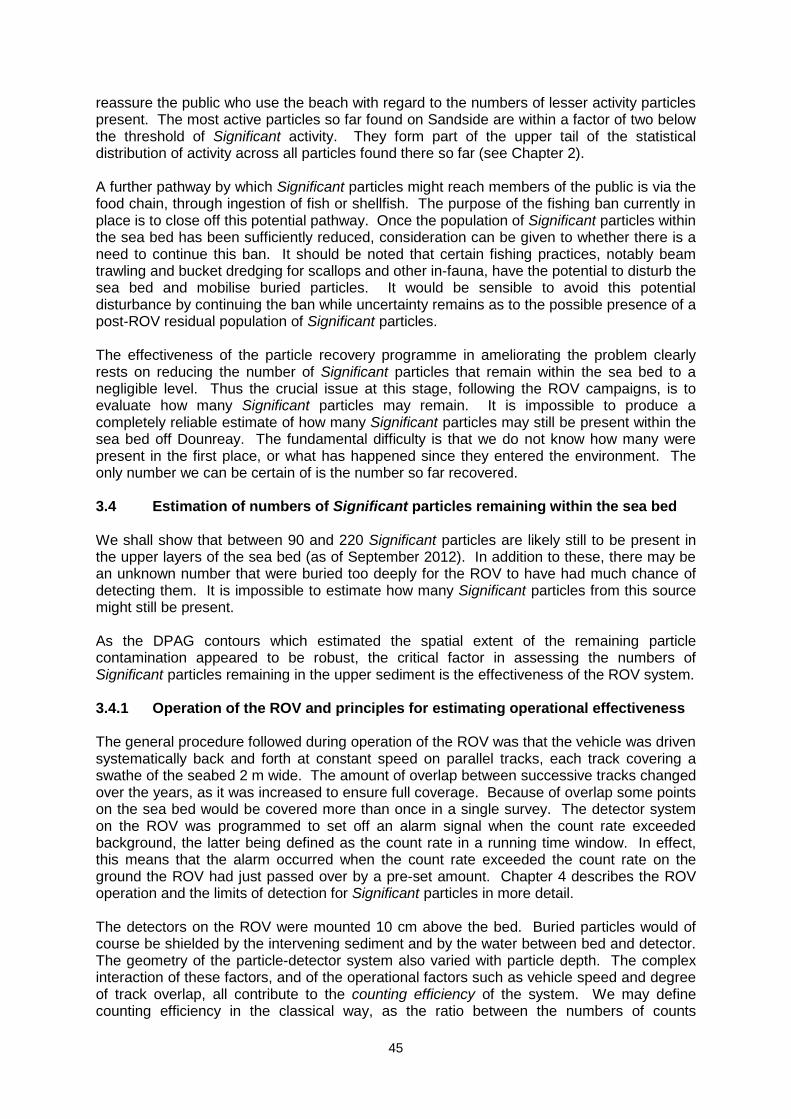
45
reassure the public who use the beach with regard to the numbers of lesser activity particles present. The most active particles so far found on Sandside are within a factor of two below the threshold of Significant activity. They form part of the upper tail of the statistical distribution of activity across all particles found there so far (see Chapter 2). A further pathway by which Significant particles might reach members of the public is via the food chain, through ingestion of fish or shellfish. The purpose of the fishing ban currently in place is to close off this potential pathway. Once the population of Significant particles within the sea bed has been sufficiently reduced, consideration can be given to whether there is a need to continue this ban. It should be noted that certain fishing practices, notably beam trawling and bucket dredging for scallops and other in-fauna, have the potential to disturb the sea bed and mobilise buried particles. It would be sensible to avoid this potential disturbance by continuing the ban while uncertainty remains as to the possible presence of a post-ROV residual population of Significant particles. The effectiveness of the particle recovery programme in ameliorating the problem clearly rests on reducing the number of Significant particles that remain within the sea bed to a negligible level. Thus the crucial issue at this stage, following the ROV campaigns, is to evaluate how many Significant particles may remain. It is impossible to produce a completely reliable estimate of how many Significant particles may still be present within the sea bed off Dounreay. The fundamental difficulty is that we do not know how many were present in the first place, or what has happened since they entered the environment. The only number we can be certain of is the number so far recovered. 3.4 Estimation of numbers of Significant particles remaining within the sea bed We shall show that between 90 and 220 Significant particles are likely still to be present in the upper layers of the sea bed (as of September 2012). In addition to these, there may be an unknown number that were buried too deeply for the ROV to have had much chance of detecting them. It is impossible to estimate how many Significant particles from this source might still be present. As the DPAG contours which estimated the spatial extent of the remaining particle contamination appeared to be robust, the critical factor in assessing the numbers of Significant particles remaining in the upper sediment is the effectiveness of the ROV system. 3.4.1 Operation of the ROV and principles for estimating operational effectiveness The general procedure followed during operation of the ROV was that the vehicle was driven systematically back and forth at constant speed on parallel tracks, each track covering a swathe of the seabed 2 m wide. The amount of overlap between successive tracks changed over the years, as it was increased to ensure full coverage. Because of overlap some points on the sea bed would be covered more than once in a single survey. The detector system on the ROV was programmed to set off an alarm signal when the count rate exceeded background, the latter being defined as the count rate in a running time window. In effect, this means that the alarm occurred when the count rate exceeded the count rate on the ground the ROV had just passed over by a pre-set amount. Chapter 4 describes the ROV operation and the limits of detection for Significant particles in more detail. The detectors on the ROV were mounted 10 cm above the bed. Buried particles would of course be shielded by the intervening sediment and by the water between bed and detector. The geometry of the particle-detector system also varied with particle depth. The complex interaction of these factors, and of the operational factors such as vehicle speed and degree of track overlap, all contribute to the counting efficiency of the system. We may define counting efficiency in the classical way, as the ratio between the numbers of counts

46
produced in the detector by a radioactive source versus the number of decays in the source itself. A study conducted for DSRL by Nuvia determined counting efficiencies for a static detector mounted vertically above sources buried at different depths in sand, and the results from this have been converted by DSRL into approximate estimates of the maximum depths at which different sources would be detectable. The empirical counting efficiency of the ROV detector system under operational conditions has been simulated and the results of this are used in Chapter 4. An alternative approach is to make experimental trials using known sources buried at various depths, but this has not been feasible for the underwater detection system deployed on the ROVs. The experimental approach was adopted by COMARE to verify a Monte Carlo assessment of the probability of detection for sources with different activities buried at various depths on Caithness beaches. It is notable that the specification recommended for the system was that it be capable of detecting a Significant particle to a depth of 500 mm with a probability of 95%. Despite the fact that actual probabilities of detection are not known for the ROV system, both Monte Carlo simulations and experimental trials with beach monitoring systems indicate that the probability of detection of a buried source will increase for larger activities and decrease with deeper burial, i.e. p(A,z), or p as a function of A and z.
Figure 3.12 Concepts of depth-limits for particle detection – single activity
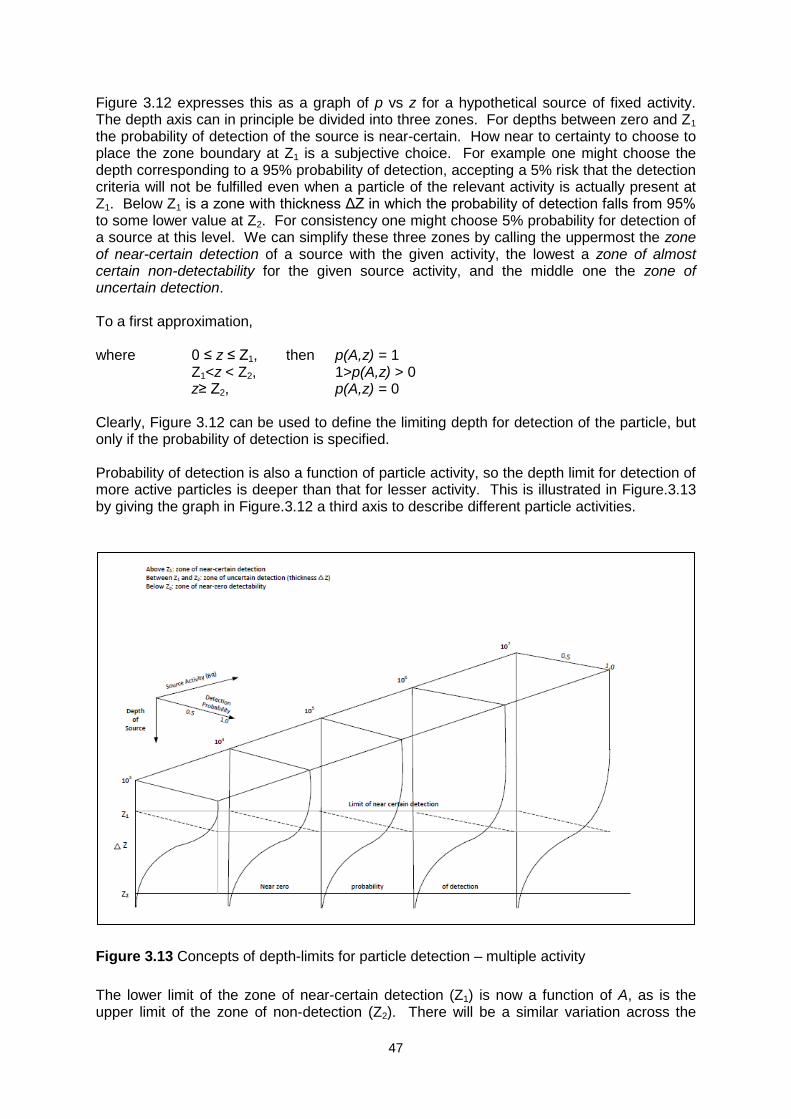
47
Figure 3.12 expresses this as a graph of p vs z for a hypothetical source of fixed activity. The depth axis can in principle be divided into three zones. For depths between zero and Z1 the probability of detection of the source is near-certain. How near to certainty to choose to place the zone boundary at Z1 is a subjective choice. For example one might choose the depth corresponding to a 95% probability of detection, accepting a 5% risk that the detection criteria will not be fulfilled even when a particle of the relevant activity is actually present at Z1. Below Z1 is a zone with thickness ΔZ in which the probability of detection falls from 95% to some lower value at Z2. For consistency one might choose 5% probability for detection of a source at this level. We can simplify these three zones by calling the uppermost the zone of near-certain detection of a source with the given activity, the lowest a zone of almost certain non-detectability for the given source activity, and the middle one the zone of uncertain detection. To a first approximation, where 0 ≤ z ≤ Z1, then p(A,z) = 1 Z1<z < Z2, 1>p(A,z) > 0 z≥ Z2, p(A,z) = 0 Clearly, Figure 3.12 can be used to define the limiting depth for detection of the particle, but only if the probability of detection is specified. Probability of detection is also a function of particle activity, so the depth limit for detection of more active particles is deeper than that for lesser activity. This is illustrated in Figure.3.13 by giving the graph in Figure.3.12 a third axis to describe different particle activities.
Figure 3.13 Concepts of depth-limits for particle detection – multiple activity The lower limit of the zone of near-certain detection (Z1) is now a function of A, as is the upper limit of the zone of non-detection (Z2). There will be a similar variation across the

48
ROV field of view. Nevertheless, for any collection of particles present, with various activities and buried at various depths, a proportion will lie within the zone of near-certain detection, another proportion within the zone of uncertain detection, and the rest in the zone of non-detection. By definition, the ROV detection system is only capable of detecting the first and second of these two groups, so we may designate all the particles that lie above the Z2 curve as potentially detectable particles. With these concepts in mind, operational effectiveness may be defined as the proportion of potentially detectable particles present in an area that are actually detected by the ROV in a single survey. 3.4.2 Repeated surveys and their implications for operational effectiveness Unfortunately, operational effectiveness cannot be exactly determined unless the number of potentially detectable particles is already known which obviously it is not. PRAG(D) considered this problem and suggested an experiment that might cast light on the matter. It was proposed that the ROV should survey a defined area, and that the particles detected would then be removed. Immediately after this the same area would be surveyed again. In suggesting this approach, PRAG(D) drew on the idea of repeated sampling from a single, well-mixed reservoir of particles. Consider a volume in which an unknown number of items are well-mixed spatially, and suppose that a search of the volume results in the removal of a fraction R, yielding X1 removed items. Now suppose that the remaining objects are again well-mixed within the reservoir volume, and after this mixing a search removes a fraction R of the remaining population, providing X2 removed items. If the total population prior to the first survey is represented by N, then X1 = RN, and X2 = RN(1 – R). It follows that, R = (X1 – X2)/X1 Equation (3.1) Therefore, for a well-mixed reservoir the effectiveness of the detection system is R, and this could be found by comparing the results of two surveys passing over the same ground. However the particles that are buried in sea bed sediments are not in a ‘well-mixed’ reservoir. They are buried according to some unknown distribution of numbers with depth, and if the second search and removal follows closely after the first there will no mixing of the residual population throughout the volume of the sediment, so the depth distribution will not be the same for the two surveys. Some modification of the ‘well-mixed’ model is needed. The concept that there are three zones for probability of detection provides a basis for this. To simplify the situation further, suppose that the buried particles all share the same activity, A, and that they have some well-defined but unknown distribution with depth. Now suppose that an ROV makes two surveys over the area containing the particles. By definition, none of the particles in the lowest zone (where p(A,z) = 0) will be detected. Let the combined population of the upper two zones be some number M, and let a fraction f of these be in the zone of near-certain detectability. Furthermore, let the average effectiveness of the detection system for the group of particles in the middle zone (the zone of uncertain detection) be E*. In the first survey, the ROV will detect all of the particles in the upper zone (fM) plus a fraction E* of those in the middle zone (E*(1 – f)M). Thus, X1 = fM + E*(1 – f)M Equation (3.2) We shall assume that all detected particles are removed. Then the upper layer will be empty in the second survey while the middle layer will contain (1 – E*)(1 – f)M particles. If we assume that the average effectiveness of the system with respect to the particles in the middle layer remains the same then,
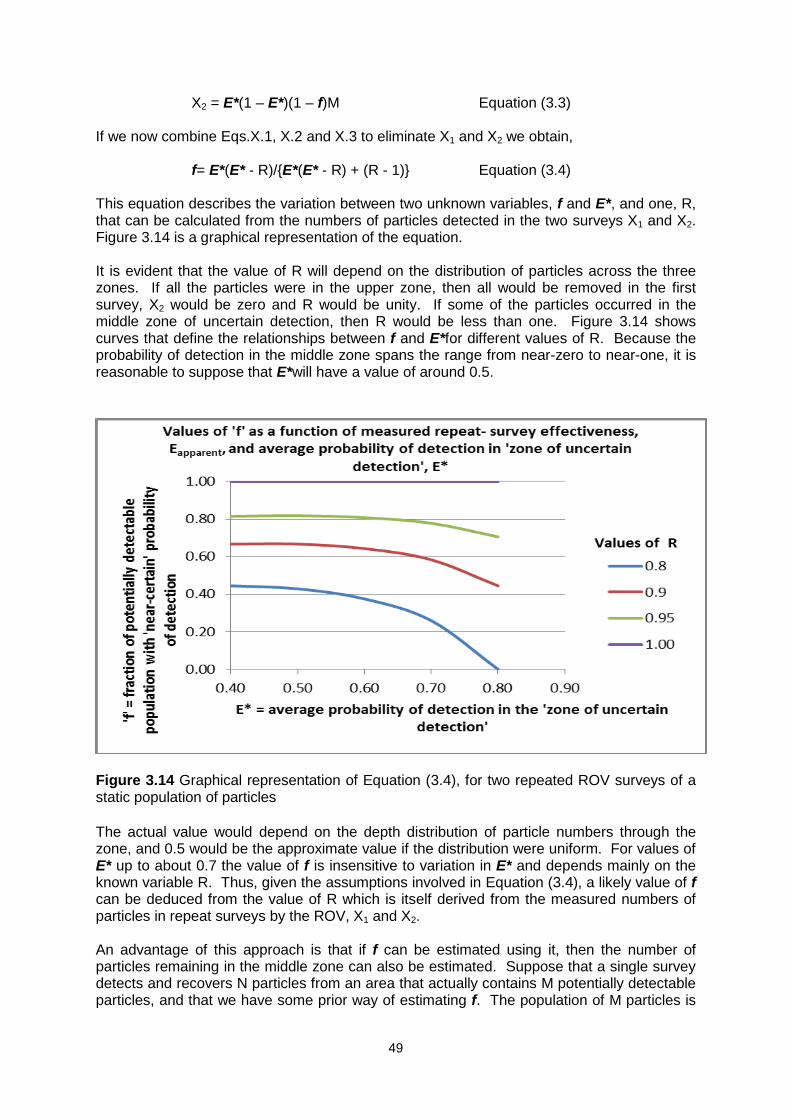
49
X2 = E*(1 – E*)(1 – f)M Equation (3.3) If we now combine Eqs.X.1, X.2 and X.3 to eliminate X1 and X2 we obtain, f= E*(E* - R)/{E*(E* - R) + (R - 1)} Equation (3.4) This equation describes the variation between two unknown variables, f and E*, and one, R, that can be calculated from the numbers of particles detected in the two surveys X1 and X2. Figure 3.14 is a graphical representation of the equation. It is evident that the value of R will depend on the distribution of particles across the three zones. If all the particles were in the upper zone, then all would be removed in the first survey, X2 would be zero and R would be unity. If some of the particles occurred in the middle zone of uncertain detection, then R would be less than one. Figure 3.14 shows curves that define the relationships between f and E*for different values of R. Because the probability of detection in the middle zone spans the range from near-zero to near-one, it is reasonable to suppose that E*will have a value of around 0.5.
Figure 3.14 Graphical representation of Equation (3.4), for two repeated ROV surveys of a static population of particles The actual value would depend on the depth distribution of particle numbers through the zone, and 0.5 would be the approximate value if the distribution were uniform. For values of E* up to about 0.7 the value of f is insensitive to variation in E* and depends mainly on the known variable R. Thus, given the assumptions involved in Equation (3.4), a likely value of f can be deduced from the value of R which is itself derived from the measured numbers of particles in repeat surveys by the ROV, X1 and X2. An advantage of this approach is that if f can be estimated using it, then the number of particles remaining in the middle zone can also be estimated. Suppose that a single survey detects and recovers N particles from an area that actually contains M potentially detectable particles, and that we have some prior way of estimating f. The population of M particles is
'f' =
frac
tion
of p
oten
tially
det
ecta
ble
popu
latio
n w
ith 'n
ear-
cert
ain'
pro
babi
lity
of
dete
ctio
n
E* = average probability of detection in the 'zone of uncertain detection'
Values of 'f' as a function of measured repeat- survey effectiveness, Eapparent, and average probability of detection in 'zone of uncertain detection', E*
0.8
0.9
0.95
1.00
Values of R
50
composed of fM in the upper zone plus (1 – f)M in the middle layer. All the particles in the upper zone are detected, so the number detected from the middle zone must be (N – fM). Therefore the effectiveness of detection for the middle layer is E* = (N – fM)/(1 –f)M, from which rearrangement gives the fraction of the detectable population found, N/M =E*(1-f) + f Equation (3.5) The number of particles remaining in the middle zone can then be calculated, given a numerical value for N, an assumed value for E* and a value for f derived via R from the results of a repeated survey . Table 3.5 Theoretical percentage of a potentially detectable particle population that would be detected by a single ROV survey, as a function of R, f and E*. Value of E* R F (1 –f) 0.4 0.5 0.6 0.7 15
1.00 0.99 0.01 99.4 99.5 99.6 99.7 0.95 0.8 0.2 88 90 92 94 0.9 0.65 0.35 79 82.5 86 82 0.8 0.4 0.6 76 80 84 79
Table 3.5 suggests that when the value of R, determined empirically from a repeat survey of a defined area, is 0.8 the number of particles detected by a single survey will be around 80% of the detectable population, with a possible range of ±4% derived from uncertainty in the values of E*and f. If R is 0.9 the recovery is around 83% (±3.5%); and for R =0.95 recovery is about 91% (±3%). In the next section this theoretical approach is applied to the results of an actual repeat survey made by the ROV in 2011. An important point is that the theory developed above assumed that the particles under survey all had a single activity, A. Recovered particles are reported in categories of Minor, Relevant and Significant, each covering a range of activities. The approach can be applied to a group if we assume that all particles in the group share approximately the same values of f and E*. 3.4.3 Repeated ROV surveys in 2011 and their implication for operational
effectiveness At the request of the group, DSRL conducted two repeat surveys in 2011 of an area of 4.1 ha of sea bed that was previously unsurveyed. Table 3.6 gives the numbers of particles detected and recovered on each survey, in categories of Minor, Mobile, Relevant, Significant and In situ.
15 Values of f used for this column, reading from top, 0.99, 0.8, 0.6, 0.3; see Figure 3.22.

51
Table 3.6 Results of the 2011 repeat survey of Area 2/3, with estimated values of R.
First survey Second survey RA=(X1-X2)/X1 RB=(XD1-XD2)/XR1 Minor 47 13 0.72 Mobile 13 1 Minor+Mobile 60 14 0.77 0.98 16
Relevant 30 0 1.0 Significant 12 2 0.83 In situ 2 0 Significant+In situ 14 2 0.86 1.0 16
The first survey took 8 days (4th to 11th June 2011), the second 7 days (12th to 18th June). A short spell of windy weather just after the start of the second survey meant that operations had to be suspended for several days during which wave heights reached 2 m (verbal communication by DSRL, 2nd February 2012). Some disturbance of the sand could have taken place but the very crude relationship established in DPAG’s Third Report between wave height and minimum depth of disturbance suggests that this is unlikely to have exceeded 100-200 mm (DPAG, 2006, Figure 4.28). The two columns on the right hand side of Table 3.6 give values of the ratio R, based on the data in the second and third columns of the Table. The first estimate, RA, is based on Equation (3.1) and is appropriate for a well-mixed reservoir in which all detected particles are removed prior to a second survey. However, Mobile and In situ particles were detected on the first survey but not removed. If they are assumed to have remained within the ‘well-mixed reservoir’, i.e. to have remained in positions in which they were potentially detectable by the second survey, then an adjustment to Equation (3.1) would be appropriate to allow for this. In this case we could use the value of RB given in the final column of the table.
RB = (XD1 – XD2)/XR1 Equation (3.7)
where XD1 and XD2 denote the numbers of particles detected in the first and second surveys respectively, and XR1 is the number recovered during the first survey. In the case of Minor and Mobile particles, it was the Mobile particles that were not recovered. Use of Equation (3.7) supposes that all these remained within the surveyed area until the time of the second survey. Given the mildly stormy weather that occurred between the two surveys, it is indeed possible that the Mobile particles were buried by wave activity and then recovered during the second survey. But it is equally possible that all of the Mobile particles were swept out of the survey area and that the particles found on the second survey were buried ones that had been ‘missed’ by the ROV during the first survey. Therefore, either of the two estimates for R, RA or RB seems equally likely for Minor particles. For the Significant category, the ROV failed to recover two particles during the first survey, but two were found on the second survey. If these two were the same particles, RB = 1 would be the appropriate value, but if they were different particles then RA = 0.86 would be appropriate. In general, In situ particles were undetectable after the initial, unsuccessful attempt to recover them had been made, presumably because they were deeply buried. In that case, the lower value, RA = 0.86, seems the more appropriate to adopt for R.
16 Takes account of non-recovered particles in First Survey

52
We are most interested in Significant particles. Noting that R is likely to be in the range 0.86-1, we can interpolate between the values in the shaded cells of Table 3.5 and infer that at least 78 to 85 per cent of potentially detectable particles are likely to be detected on a single survey, and that this proportion could conceivably be as high as 100%. As we are concerned to estimate the possible numbers of Significant particles remaining within the sea bed, we shall follow the more conservative estimate, i.e. that 15-22% of potentially detectable Significant particles might be missed by a single survey. When applied to the 197 Significant particles recovered plus the known 48 In situ contacts made in 2009-2012, this estimate suggests that up to about 50 Significant particles might have been missed by the ROV surveys. These would have been particles buried close to the depth limit for detection of their particular activities. No account has been taken of the fact that some areas of sea bed were surveyed twice, with intervals of up to four years between surveys, so the figure is an upper bound for that reason. It should also be noted that if the higher value RB = 1 had been adopted for R, the predicted figure for particles missed would have been zero. If we assume that none of the Significant ROV contacts of 2004 to 2007 were subsequently recovered, and add these to the In situ contacts of 2008 to 2012, we obtain a total of (77 + 64) = 141 particles that are probably Significant and potentially or actually still present on the sea bed. On the other hand, one might equally assume that all of the ROV contacts of 2004 to 2007 were subsequently recovered by the ROVs during 2008 to 2012, in which case the residual number is 64. Thus we may conclude that the lower bound for a residual population of Significant particles lies in the range 60–140. If we add to these the 0-50 Significant particles that might have been missed by the ROV, we have a possible range of 60-190 for the residual Significant population in this area. Adding these to the 414 Significant particles actually recovered (Tables 3.3 and 3.4) we have an estimated 474 to 604 particles accounted for, which is far short of the 1350 ± 450 Significant particles predicted by DPAG as the total population (Table 3.3 and DPAG, 2008). 3.4.4 Implications of repeated surveys following disturbance of the sea bed The ROV surveys passed over several areas more than once during the 2008-12 period, with the time elapsing between initial survey and re-survey being from 1 to 4 years. These areas are shown on Fig.3.16. During the intervals between surveys the sea bed was exposed to wave disturbance by winter storms and there would have been opportunities for particles buried too deeply for detection in the first survey to be brought upwards and detected by later surveys. The proportions of particles found by re-surveys can be taken as a measure of the minimum size of the cache of particles left behind after a single pass by the ROV over an area of sea bed. Table 3.7 shows this for Significant particles, with finds made on re-survey being expressed as percentages of the numbers found initially.

53
Table 3.7 Percentages of ‘new’ finds of Significant particles made during re-surveys.
DSRL File with data and time between surveys Dates No.
Significant
No. In situ
Repop % (Significant)
Repop % (Significant + In Situ)
LRD120412_2012_Repeat_2009 2009 21 13
3 years 2012 1 2 4.8 8.8 LRD120413_2012_Repeat_2010_Part2008 2008 & 10 46 19
2 & 4 years (parts) 2012 5 4 10.9 16.4 LRD120417_2012_Repeat_2010_2008_Intersect
2008 23 4
2 years 2010 5 3 21.7 29.6 2 years 2012 0 0 0 0 LRD120411_2012_Area_E_Repeat_2011 2011 18 11
1 year 2012 0 0 0 0 LRD120414_2012_Repeat_Part_2011_Area_1 2011 0 0
1 year 2012 0 0 Indet. Indet. LRD120409_2010_Repeat_2008 2008 31 4
2 years 2010 7 3 22.6 28.6 LRD120418_2011_Repeat_2010 2010 8 0
1 year 2011 1 0 12.5 12.5 LRD120416_2010_Repeat_2009 2009 3 2
1 year 2010 4 0 133.0 80.0 LRD120410_2011_Repeat_2011 2011 12 2
0 year 2011 2 0 16.7 14.3
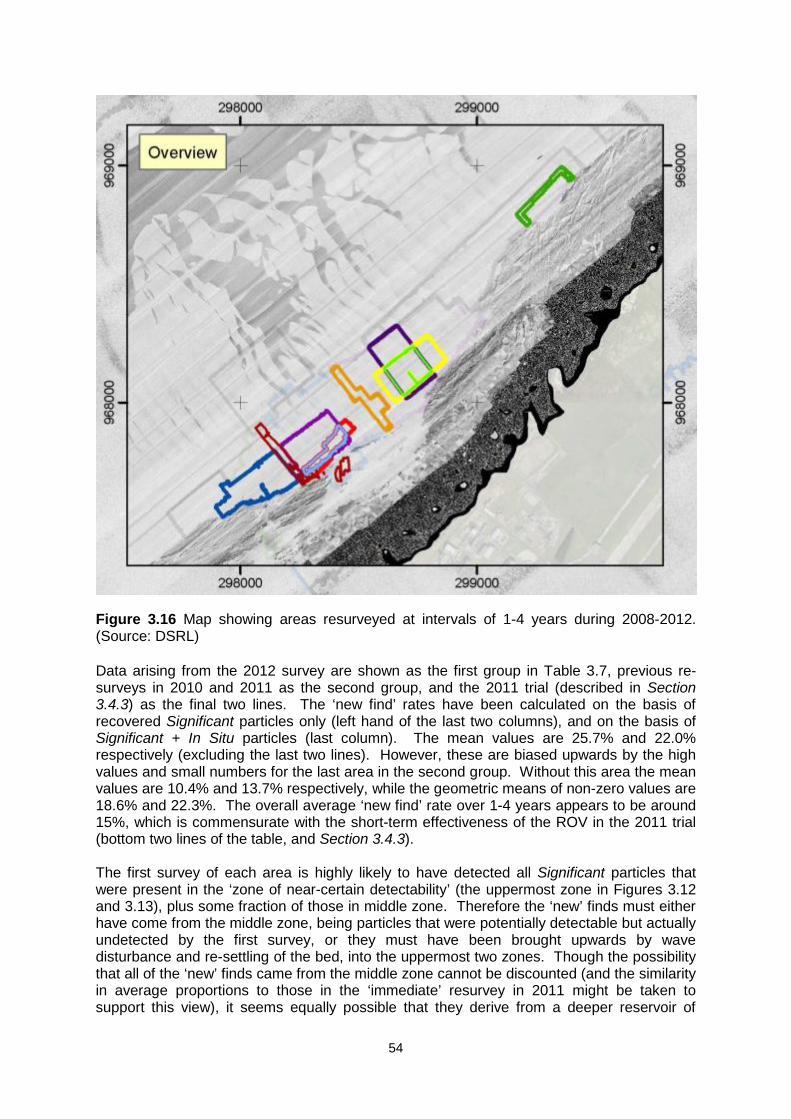
54
Figure 3.16 Map showing areas resurveyed at intervals of 1-4 years during 2008-2012. (Source: DSRL) Data arising from the 2012 survey are shown as the first group in Table 3.7, previous re-surveys in 2010 and 2011 as the second group, and the 2011 trial (described in Section 3.4.3) as the final two lines. The ‘new find’ rates have been calculated on the basis of recovered Significant particles only (left hand of the last two columns), and on the basis of Significant + In Situ particles (last column). The mean values are 25.7% and 22.0% respectively (excluding the last two lines). However, these are biased upwards by the high values and small numbers for the last area in the second group. Without this area the mean values are 10.4% and 13.7% respectively, while the geometric means of non-zero values are 18.6% and 22.3%. The overall average ‘new find’ rate over 1-4 years appears to be around 15%, which is commensurate with the short-term effectiveness of the ROV in the 2011 trial (bottom two lines of the table, and Section 3.4.3). The first survey of each area is highly likely to have detected all Significant particles that were present in the ‘zone of near-certain detectability’ (the uppermost zone in Figures 3.12 and 3.13), plus some fraction of those in middle zone. Therefore the ‘new’ finds must either have come from the middle zone, being particles that were potentially detectable but actually undetected by the first survey, or they must have been brought upwards by wave disturbance and re-settling of the bed, into the uppermost two zones. Though the possibility that all of the ‘new’ finds came from the middle zone cannot be discounted (and the similarity in average proportions to those in the ‘immediate’ resurvey in 2011 might be taken to support this view), it seems equally possible that they derive from a deeper reservoir of
55
particles that lay within the ‘zone of near-certain non-detectability’ during the initial surveys (i.e. the deepest zone in Figures 3.12 and 3.13). If we adopt the first of these positions, then the ‘new’ finds are representatives of the residual population in the middle zone and the size of that population has already been estimated in Section 3.4.3. On the other hand if most of them came from a deeper level, their numbers represent an addition to the populations of residual particles that have already been estimated, and should be added to them. Adopting a proportion of 15% of the find rate on a single survey, and applying this to the numbers of Significant particles recovered from the plume as a whole during 2008-12, we estimate that a further 30 Significant particles could be added to the population of detectable particles remaining within the sea bed, within 2-4 years. Adding these to previous estimates increases the range for the possible size of the residual population of Significant particles from 60–190 up to 90–220. 3.5 Residual Significant particles – Summary To summarise, the population of Significant particles that may have been present within the sea bed immediately following the ROV recovery operations comprise three conceptually distinct groups. These are: 1. The group which were buried too deeply for detection (i.e. those in the ‘zone of near-certain non-detection’). Their numbers are unknown but could be as low as zero. 2. The population of particles within sandy areas among the generally rocky sea bed inshore of the Diffuser, in the area not surveyed by the ROV. Diver surveys in Repopulation Areas 3 & 8 and along other parts of the inshore area established that the sandy areas of this zone formerly contained many particles (see Figure 5.3 of DPAG’s Fourth Report). Wave and tidal action probably cause fairly frequent exchange of sand and particle populations between the rock-dominated in shore zone and the sandy plain offshore. This may have led to a relative depopulation of the inshore zone as the ROV recoveries proceeded, because outward migration from the near-shore zone would no longer have been balanced by inward migration from the offshore population. Nevertheless, some Significant particles may have remained in the inshore zone following the completion of the ROV surveys. In DPAG’s Third Report Figure 4.19, a total number of 75 Significant finds are shown as having been made by divers within this zone, while the Fourth Report Figure 5.3 (inset) adds a further 12 contacts, bringing the total number found in the zone to 87. Although this figure might be taken as an upper bound, the true residual population of Significant particles is likely to have been much smaller following several years of ROV removals further offshore. 3. The third group comprises particles that were detected by the ROV but left as in situ non-recoveries, those that were undetected because they were close to their depth limit of detectability, plus particles that may have migrated upwards due to bed disturbance since the last ROV survey of each area. These were shown in Sections 3.4.3 and 3.4.4 to amount to a likely total somewhere in the range 90– 220 Significant particles within the area of ROV surveys (i.e. the non-rocky parts of the overall plume). The numbers of Significant particles remaining in the upper layers of the sea bed was at least in the range 90-220. 3.6 Scenarios for the expected future evolution of Significant particles In this section, we consider the future evolution of the contamination that we expect to occur under two scenarios, chosen to allow for the large uncertainties regarding the numbers of Significant particles remaining in the Main Plume. Our expectations for each scenario are based upon the conceptual model of the plume developed by DPAG, which the ROV
56
surveys have substantiated in almost all aspects except the DPAG estimates of numbers of particles. In the first scenario, we consider an assumed situation in which almost all the Significant particles within the surveyed areas were detected and recovered by the ROV operations of 2008-2012 and that there are no such particles within the zone of near certain non-detection. Therefore the only Significant particles remaining under this scenario would be those that were between the shore and the area surveyed by the ROV. In the second scenario, we consider that a substantial number of Significant particles remain, many of them being initially buried at depths too great for detection. These residual particles are envisaged to be concentrated in the proximal parts of the plume within 600 m NE of the Diffuser as well as in the sands that lie between rocky outcrops inshore of the region searched by the ROVs. As we have already discussed, the numbers of such particles are extremely difficult to estimate with confidence, but it is reasonable to assume that they comprise no fewer than the 90-220 that we have deduced from the ROV survey results as the minimum that may remain. The total number predicted by DPAG was higher than this and might comprise several hundred particles, with an upper limit in the range 540-900. In the remainder of this section, we shall base numerical estimates on the range for the minimum figure (i.e. 90-220), but we shall remind the reader from time to time that the figures could be considerably higher. Most of these Significant particles are likely to have activities in the range 106 to 107 Bq, because the ROV detection system is capable of detecting higher activities down to depths exceeding 0.75 m, whereas 106 Bq can only be detected down to ca.0.6 m. As the single-pass effectiveness of the ROV is close to 100% for those particles that lie above the burial limit for detection of their activity, we may assume that the sand above 0.6m depth has been completely cleared of 106 Bq particles, and that most of the population remaining is more deeply buried. We now consider the likely development of the contamination under these two scenarios, as from September 2012 and with particular attention to four localities – the Dounreay Foreshore, Sandside Beach, the Main Plume, and the ribbon of particle transport connecting the Main Plume to Sandside Bay. We shall assume that monitoring of Dounreay Foreshore and Sandside Beach follows regimes that are at least as intensive as those employed in recent years, i.e. we assume no changes in rates of particle detection due to changes in monitoring intensity or detection systems.

57
3.6.1 Scenario 1 – complete clearance of Significant particles from the area surveyed by the ROV
Dounreay Foreshore. Figure 3.16 is a plot of numbers of particles recovered each year from Dounreay Foreshore broken down by category. Numbers of Relevant particles fluctuate but show no trend over time, with the only year (2004) in which more than 5 were found coinciding with zero Significant finds. Minor particles comprise less than 10% of the total, with fluctuations in numbers up to 3 per year (except for 1984 when four were found during initial intensive searches following discovery of the first Foreshore particle in 1983), but zero in most years.
Figure 3.16 Particle finds on Dounreay Foreshore, 1984 – 2012, by DPAG activity class.
There is no evidence of trends in the overall numbers of Relevant or Minor particles through the whole period, and no obvious influence of particle removals offshore, whether by divers between 1997 and 2004 or by ROV surveys in 2008-2012. The immediate source of Foreshore particles must be the patches of sands that lie just offshore, almost enclosed among rock reefs inshore of the Diffuser and opposite the West Foreshore, as well as the broad sand embayment that lies off the East Foreshore. These areas were not surveyed by the ROV in 2008-2012 and therefore in September 2012 they may still have contained similar populations of Relevant and Minor to those that obtained prior to the ROV surveys. However, the ROV’s removal of 295 Relevant and 753 Minor particles from the main plume offshore of all rocky areas might lead to an imbalance in rates of offshore and onshore transport between these different areas of sand. There should be a reduction in numbers in the inshore area as particles that migrate outwards from them into the offshore plume are replaced at a slower rate. The rate of arrival of Relevant and Minor particles on the Foreshore should reduce as a result. From the experience of a similar reduction in the inshore population following removal of particles from shallow water sites in 2000, and of the recovery in Foreshore arrivals that followed, it may be expected that any future reduction in arrivals will take place over a couple of years. After that, a few Relevant arrivals per year
58
can be expected to continue for several decades to come, accompanied by a similarly small and slowly declining number of Minor particles. As the ROV surveys did not search the inshore sand areas, some Significant particles may remain there, and some of these may be expected to come onto the Foreshore over the next few years. Initially the rate of arrival may be similar to the average of recent years (around 4 per year), but this should decline over a few years as any residual inshore population of Significant particles migrates outwards to the main offshore part of the plume as well as onto the Foreshore, where we assume they will have a high likelihood of being found and removed by continuing monitoring. Therefore the rate of arrival of Significant particles should decline towards zero within a few years. If it does not do so, but is maintained or increases over the next few years, that would be an indication that the starting point of Scenario 1, i.e. the almost complete removal of Significant particles, is not correct. Sandside Beach and the transport route towards Sandside Bay No Significant particles have so far been found in surveys of the sea bed between the Main Plume and Sandside Bay, nor have any with >106 Bq of 137Cs been found on Sandside Beach. (A single particle from Sandside Beach with 7x10⁵ Bq of beta activity but very low 137Cs has been found and is considered elsewhere in this Report.) Thus it is reasonable to suppose that the removal of all Significant particles from the Main Plume will in itself have little immediate effect on the population of particles on the transport route towards Sandside. This route has been estimated to contain a possible 400-500 Relevant and Minor particles (DPAG 4th Report, Table 5.2). By considering the rate of removal of particles from Sandside Beach as being representative of their net rate of arrival there (i.e. arrivals at the beach were assumed to be balanced over time by the sum of departures from the beach to the sea and the removal of particles by monitoring, with a trade-off between the two removal rates so that their sum always matched the supposed arrival rate), DPAG estimated that average transport times between the Diffuser area and Sandside beach were of the order of a decade, and somewhere in the range 2-18 years. The drastic reduction in numbers of Relevant and Minor particles in the Main Plume can be expected to slow the net addition of particles to the Sandside transport route. However, it is unlikely that any reduction in particle arrivals on Sandside Bay will be seen until enough time has elapsed for this reduction in input to work through the whole ribbon of particle-populated sand identified by DPAG in Figure 5.10 of their 4th Report. The timing of first perceivable effects will depend on the average particle velocity along the plume, but also upon the spread of velocities. The fastest travelling particles might be expected to be the smaller ones, with lower activity, and these may become depleted more quickly through the whole length of the plume than larger, more radioactive particles. If this is so, then the first perceivable effect of the clearance of particles from the Main Plume may turn out to be a slow but progressive reduction in the ratio of Minor to Relevant particles, accompanied by a slow decline in the overall arrival rate on Sandside Beach. Given the large uncertainty in particle populations in the Sandside transport route, and the even larger uncertainties in transit times, the onset of these effects could occur within as little as two years, but a lag of 5 -10 years is more likely. It is extremely unlikely, under Scenario 1, that a Significant particle would be transported onto Sandside Beach in the future, because the Scenario itself embodies the assumption that all of these particles have been cleared from the original source area around the Diffuser. Thus, if Significant particles were to be found on Sandside Beach in the next 2 -5 years, that in itself would be a strong reason for abandoning belief in Scenario 1. 3.6.2 Scenario 2 – a cache of Significant particles buried below ca.0.6 m remaining
in the ROV survey area Initially in this scenario there will be very few Significant particles within the uppermost 0.6 m of sediment. This is also the initial condition for Scenario 1 and therefore the behaviour of

59
the system would follow that of Scenario 1 unless or until the sea bed was disturbed below this depth. Disturbance would cause some of the deeply buried particles to be suspended by wave turbulence and then to be deposited again within the top 0.6 m of the sand or even on the surface. Under Scenario 2, there would be some Significant particles among the re-deposited group, whereas under Scenario 1 there would be none. Once at shallower depths than 0.6 m, the Significant particles present would follow similar patterns of behaviour to those in the plume up to 2012. The population of deeply-buried Significant particles that would be available for such upwards mobilisation and re-deposition is envisaged to be upwards of 90-220 but could be significantly more, i.e. several hundreds of Significant particles. We have very little information on the depths of sand to which shoaling waves of various heights will disturb the sea bed. The local evidence on this point comes from (a) Minipod data from deployment near the Diffuser over 42 days in autumn 1997 and 49 days in spring 1998, and (b) from an analysis of wave heights in relation to particle finds in ‘Repopulation Areas’ summarised by DPAG in their 3rd Report, Figure 4.27 and 4.28. The Minipod data supported an analysis of bed stresses in relation to currents and wave heights by Lee & Dade17 which concluded that ambient sediment was likely to be mobilized about once per week as bed load, while typical contaminant particles would be taken into suspension about once per month on average. Suspension of sand in the water above the bed implies that the bed itself is being eroded, and that buried particles will be excavated down to the depth of the scour. All bed material, including the largest contaminant particles, are liable to be suspended about once per year. Lee and Dade did not consider the depths to which such events might actually scour the bed, nor the timescale on which the sediment might be replaced, restoring the sand surface to its original level. However, the 1997 Minipod data were analysed by Atkinson (2001; DPAG/2002/008) who showed that during the 42-day deployment a layer of sand 230 mm thick was worked over by scour and fill events, though the net change in bed level over the whole period was only 30 mm. Analysis of the frequency of changes in bed height showed that independent scour and fill events of ~100mm both occurred roughly every two weeks under the moderate waves that occurred during deployment. The general pattern was confirmed by the spring 1998 Minipod deployment, although the spring data were complicated by the fact that the legs of the device settled differentially into the bed during the first storm following deployment. It is not clear whether the settling was due to fluidisation of the sand or to very localised scour at the foot of each leg, but the important point is that it caused the Minipod to sink into the sand by 120-200 mm before becoming stable. The Minipod data demonstrate that the top 200-250 mm of the sea bed sands are mobile and reworked on a timescale of weeks to months by waves that occur many times a year. Deeper reworking than occurred during the Minipod deployments presumably requires larger waves, and for this the only data available are presented in DPAG’s 3rd Report Fig.4.28. The data on this diagram show the minimum depth to which the bed must have been disturbed in Repopulation Areas between successive surveys by divers, versus the maximum wave height in the same period. Wave heights were taken from a time series of the estimated heights of large waves off Dounreay, itself calculated from wind speeds and directions measured in the vicinity. The minimum depth of disturbance was inferred as the depth of the deepest particle found in a defined area that had been thoroughly cleared of all detectable particles on the previous survey. The deepest bed disturbance represented by the data on the diagram is 500 mm, about 0.1 m less than the limit for detection of a 106Bq particle. To obtain very rough estimates for the recurrence intervals of waves that might
17 G-H Lee &W.B.Dade, A study of Sediment Transport in the Dounreay Nearshore Environment. Institute of Theoretical Geophysics, Department of Earth Science, University of Cambridge. Final Report to UKAEA, Dounreay, 25 July 2002. 29pp + 17 Figures.
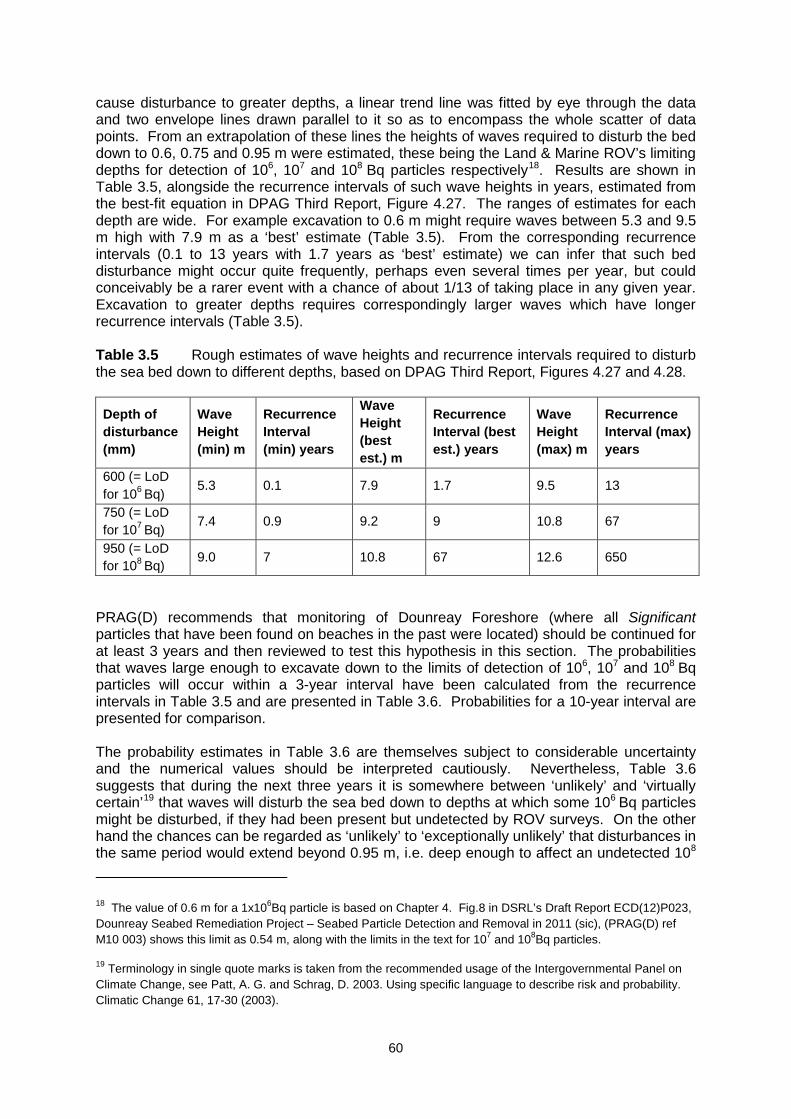
60
cause disturbance to greater depths, a linear trend line was fitted by eye through the data and two envelope lines drawn parallel to it so as to encompass the whole scatter of data points. From an extrapolation of these lines the heights of waves required to disturb the bed down to 0.6, 0.75 and 0.95 m were estimated, these being the Land & Marine ROV’s limiting depths for detection of 106, 107 and 108 Bq particles respectively18. Results are shown in Table 3.5, alongside the recurrence intervals of such wave heights in years, estimated from the best-fit equation in DPAG Third Report, Figure 4.27. The ranges of estimates for each depth are wide. For example excavation to 0.6 m might require waves between 5.3 and 9.5 m high with 7.9 m as a ‘best’ estimate (Table 3.5). From the corresponding recurrence intervals (0.1 to 13 years with 1.7 years as ‘best’ estimate) we can infer that such bed disturbance might occur quite frequently, perhaps even several times per year, but could conceivably be a rarer event with a chance of about 1/13 of taking place in any given year. Excavation to greater depths requires correspondingly larger waves which have longer recurrence intervals (Table 3.5). Table 3.5 Rough estimates of wave heights and recurrence intervals required to disturb the sea bed down to different depths, based on DPAG Third Report, Figures 4.27 and 4.28.
Depth of disturbance (mm)
Wave Height (min) m
Recurrence Interval (min) years
Wave Height (best est.) m
Recurrence Interval (best est.) years
Wave Height (max) m
Recurrence Interval (max) years
600 (= LoD for 106 Bq) 5.3 0.1 7.9 1.7 9.5 13
750 (= LoD for 107 Bq) 7.4 0.9 9.2 9 10.8 67
950 (= LoD for 108 Bq) 9.0 7 10.8 67 12.6 650
PRAG(D) recommends that monitoring of Dounreay Foreshore (where all Significant particles that have been found on beaches in the past were located) should be continued for at least 3 years and then reviewed to test this hypothesis in this section. The probabilities that waves large enough to excavate down to the limits of detection of 106, 107 and 108 Bq particles will occur within a 3-year interval have been calculated from the recurrence intervals in Table 3.5 and are presented in Table 3.6. Probabilities for a 10-year interval are presented for comparison. The probability estimates in Table 3.6 are themselves subject to considerable uncertainty and the numerical values should be interpreted cautiously. Nevertheless, Table 3.6 suggests that during the next three years it is somewhere between ‘unlikely’ and ‘virtually certain’19 that waves will disturb the sea bed down to depths at which some 106 Bq particles might be disturbed, if they had been present but undetected by ROV surveys. On the other hand the chances can be regarded as ‘unlikely’ to ‘exceptionally unlikely’ that disturbances in the same period would extend beyond 0.95 m, i.e. deep enough to affect an undetected 108
18 The value of 0.6 m for a 1x10⁶Bq particle is based on Chapter 4. Fig.8 in DSRL’s Draft Report ECD(12)P023, Dounreay Seabed Remediation Project – Seabed Particle Detection and Removal in 2011 (sic), (PRAG(D) ref M10 003) shows this limit as 0.54 m, along with the limits in the text for 107 and 108Bq particles.
19 Terminology in single quote marks is taken from the recommended usage of the Intergovernmental Panel on Climate Change, see Patt, A. G. and Schrag, D. 2003. Using specific language to describe risk and probability. Climatic Change 61, 17-30 (2003).
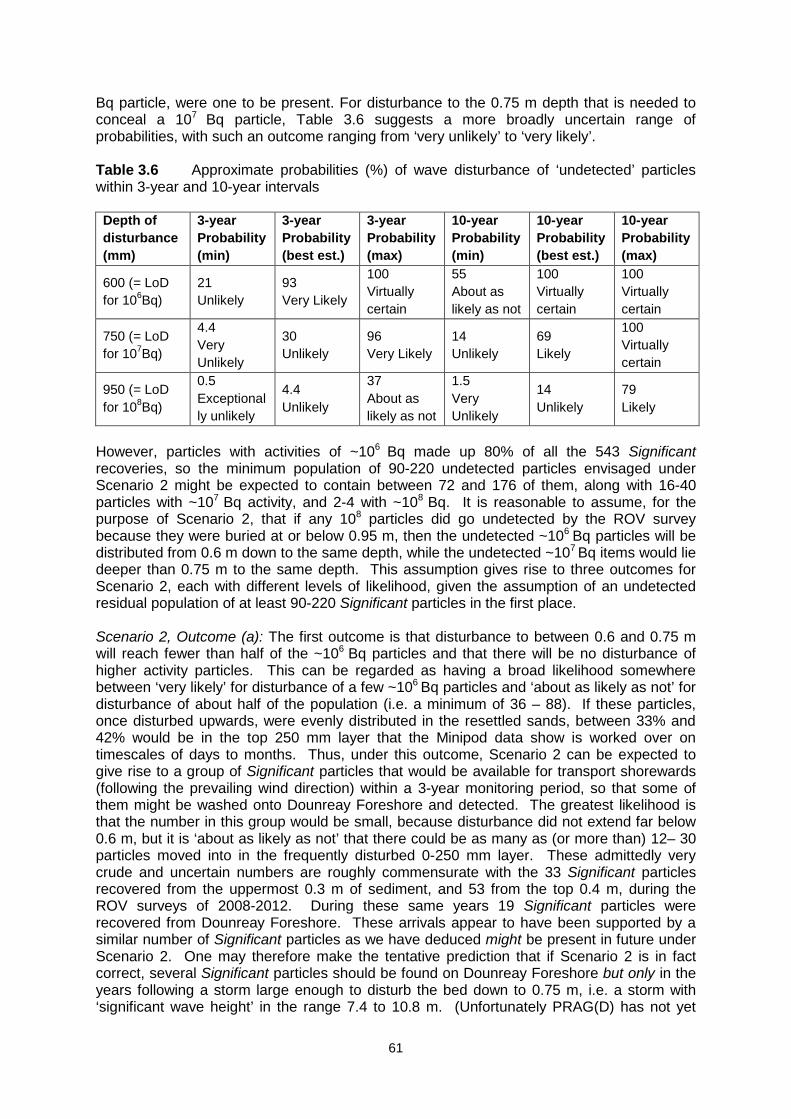
61
Bq particle, were one to be present. For disturbance to the 0.75 m depth that is needed to conceal a 107 Bq particle, Table 3.6 suggests a more broadly uncertain range of probabilities, with such an outcome ranging from ‘very unlikely’ to ‘very likely’. Table 3.6 Approximate probabilities (%) of wave disturbance of ‘undetected’ particles within 3-year and 10-year intervals Depth of disturbance (mm)
3-year Probability (min)
3-year Probability (best est.)
3-year Probability (max)
10-year Probability (min)
10-year Probability (best est.)
10-year Probability (max)
600 (= LoD for 106Bq)
21 Unlikely
93 Very Likely
100 Virtually certain
55 About as likely as not
100 Virtually certain
100 Virtually certain
750 (= LoD for 107Bq)
4.4 Very Unlikely
30 Unlikely
96 Very Likely
14 Unlikely
69 Likely
100 Virtually certain
950 (= LoD for 108Bq)
0.5 Exceptionally unlikely
4.4 Unlikely
37 About as likely as not
1.5 Very Unlikely
14 Unlikely
79 Likely
However, particles with activities of ~106 Bq made up 80% of all the 543 Significant recoveries, so the minimum population of 90-220 undetected particles envisaged under Scenario 2 might be expected to contain between 72 and 176 of them, along with 16-40 particles with ~107 Bq activity, and 2-4 with ~108 Bq. It is reasonable to assume, for the purpose of Scenario 2, that if any 108 particles did go undetected by the ROV survey because they were buried at or below 0.95 m, then the undetected ~106 Bq particles will be distributed from 0.6 m down to the same depth, while the undetected ~107 Bq items would lie deeper than 0.75 m to the same depth. This assumption gives rise to three outcomes for Scenario 2, each with different levels of likelihood, given the assumption of an undetected residual population of at least 90-220 Significant particles in the first place. Scenario 2, Outcome (a): The first outcome is that disturbance to between 0.6 and 0.75 m will reach fewer than half of the ~106 Bq particles and that there will be no disturbance of higher activity particles. This can be regarded as having a broad likelihood somewhere between ‘very likely’ for disturbance of a few ~106 Bq particles and ‘about as likely as not’ for disturbance of about half of the population (i.e. a minimum of 36 – 88). If these particles, once disturbed upwards, were evenly distributed in the resettled sands, between 33% and 42% would be in the top 250 mm layer that the Minipod data show is worked over on timescales of days to months. Thus, under this outcome, Scenario 2 can be expected to give rise to a group of Significant particles that would be available for transport shorewards (following the prevailing wind direction) within a 3-year monitoring period, so that some of them might be washed onto Dounreay Foreshore and detected. The greatest likelihood is that the number in this group would be small, because disturbance did not extend far below 0.6 m, but it is ‘about as likely as not’ that there could be as many as (or more than) 12– 30 particles moved into in the frequently disturbed 0-250 mm layer. These admittedly very crude and uncertain numbers are roughly commensurate with the 33 Significant particles recovered from the uppermost 0.3 m of sediment, and 53 from the top 0.4 m, during the ROV surveys of 2008-2012. During these same years 19 Significant particles were recovered from Dounreay Foreshore. These arrivals appear to have been supported by a similar number of Significant particles as we have deduced might be present in future under Scenario 2. One may therefore make the tentative prediction that if Scenario 2 is in fact correct, several Significant particles should be found on Dounreay Foreshore but only in the years following a storm large enough to disturb the bed down to 0.75 m, i.e. a storm with ‘significant wave height’ in the range 7.4 to 10.8 m. (Unfortunately PRAG(D) has not yet
62
uncovered the algorithm that was used to estimate wave height from wind speed data, so it is not possible at present to convert these wave heights into wind speeds that might be observed as they occur). The likelihood of such a storm occurring at least once within 3 years is broadly distributed over a rather large range, but this uncertainty is less important once it is realised that the prediction is conditional on the storm having already occurred. Thus, if it occurs, and the monitoring of Dounreay Foreshore over the following few years reveals several Significant particles, averaging a few per year, this can be regarded as consistent with Scenario 2, or something rather like it. On the other hand if such a storm does not occur in the next three years, we can more confidently say that very few or no Significant particles at all would be expected to arrive on Dounreay Foreshore under Scenario 2. In that case therefore, an absence of such finds should not be taken as a disproof of Scenario 2. Scenario 2, Outcome (b): The second outcome for Scenario 2 is that disturbances occur within three years that are deep enough to disturb ~107 Bq particles (if they are there) but not 108 Bq particles, i.e. down to between 0.75 and 0.95 m. If disturbance extends to 0.95 m, most of the 72-176 ~106 Bq particles will be disturbed (this being the minimum size of the supposed population), and about a quarter of them will be mixed into the top 250 mm of sediment. This would ensure a remixed population of at least 18– 44 ~106 Bq particles in the top layer. They might be accompanied by 4 – 10 particles with activities of around 107 Bq particles, i.e. one quarter of this group. However, this scenario is at least ‘very unlikely’ to occur within three years, because of the large waves required to produce almost 0.95 m depth of excavation. The population of particles it would produce in the surface layers is slightly larger than predicted under the Outcome (a), so if such large waves do in fact occur, the numbers of Significant particles that would be found on Dounreay Foreshore subsequently should be proportionately greater, providing a clearer test for the veracity of Scenario 2. Scenario 2 Outcome (c): The final outcome would be complete disturbance of the residual population of Significant particles, possibly including a very few particles with activities of around 108 137Cs. The chance that one of these would be washed onto Dounreay Foreshore must be quite small, and the chance of such deep disturbance of the sea bed within three years is ‘exceptionally unlikely’, even if Scenario 2 itself is accurate. Under all three outcomes to Scenario 2, Significant particles would remain mostly in the area of transects NE01 – NE03, from which they had been brought upwards. Over time the processes of fragmentation and transport which sustained the Main Plume in the past would start to influence their distribution. If particles with activities of approximately 107 or 108 Bq 137Cs were relocated into the top 500 mm of sediment where they might be disturbed every few years, they could be expected to split into fragments from time to time, especially when they were disturbed. As noted by DPAG, this would imply an increase in the overall numbers of Significant particles. PRAG(D) has considered models of the effects of fragmentation on overall numbers20. Though the outcome depends on the distribution of activities, a range of likely distributions produces results that suggest Significant particle numbers might peak at 1.7-4 times the initial number, after 7-11 ‘splitting half-lives’. A ‘splitting half-life’, i.e. the time in which half of an initial population would undergo fragmentation, is around 10 years, so this implies that after about 70-100 years the population of Significant particles might have recovered to close to its 1997 numbers, or even more. Mitigating factors would be that the average activity would be lower (though only Significant particles are being considered here), and that over such long spans of time radioactive decay would remove some from the Significant category.
20 PRAG(D) #4, 23 June 2010
63
The regrowth of a population of Significant particles also implies regrowth of the Relevant and Minor populations. Thus the prediction can be made for Scenario 2 that the evolution of finds of these lesser particles on beaches will resemble that under Scenario 1, until after a storm large enough to disturb sediments down to 0.75 m or greater has occurred. Once a sizeable number of Significant particles have been released into the upper layers of sediment, numbers of Relevant and Minor would increase, gradually coming to equal their abundances in the Main Plume until recently. The arrival rates of these activities on both Dounreay Foreshore and Sandside Beach would then be expected to be similar to those of recent years. Though storm events large enough to activate this outcome must be unusual, they are broadly speaking ‘as likely as not’ to occur in a 10 year period, as suggested by the probabilities in Table 3.6. Thus, we should recognise that there is a real possibility, dictated largely by the vagaries of weather and wave climate, that if Scenario 2 or something like it is accurate and several hundreds of Significant particles now remain buried deeply and undetected, the particle problem may gather itself over time and present risks of public encounter that could be almost as serious as those which DSRL have mitigated through particle recoveries in the past few years.
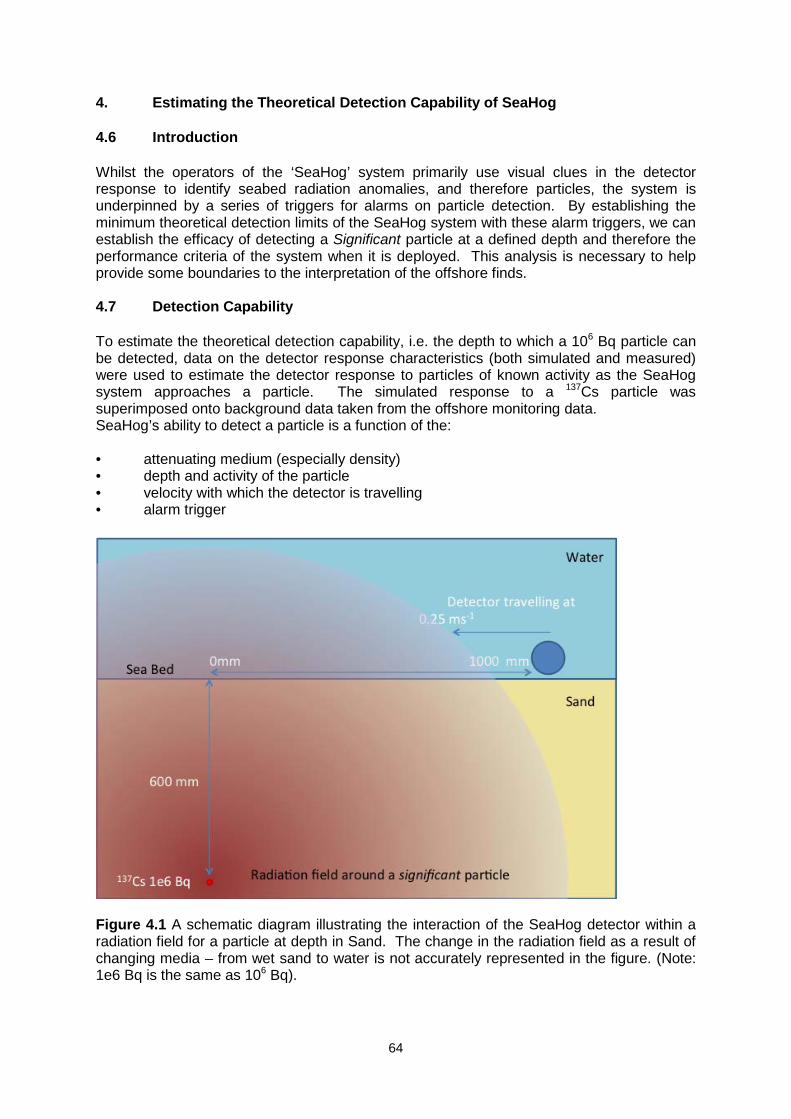
64
4. Estimating the Theoretical Detection Capability of SeaHog 4.6 Introduction Whilst the operators of the ‘SeaHog’ system primarily use visual clues in the detector response to identify seabed radiation anomalies, and therefore particles, the system is underpinned by a series of triggers for alarms on particle detection. By establishing the minimum theoretical detection limits of the SeaHog system with these alarm triggers, we can establish the efficacy of detecting a Significant particle at a defined depth and therefore the performance criteria of the system when it is deployed. This analysis is necessary to help provide some boundaries to the interpretation of the offshore finds. 4.7 Detection Capability To estimate the theoretical detection capability, i.e. the depth to which a 106 Bq particle can be detected, data on the detector response characteristics (both simulated and measured) were used to estimate the detector response to particles of known activity as the SeaHog system approaches a particle. The simulated response to a 137Cs particle was superimposed onto background data taken from the offshore monitoring data. SeaHog’s ability to detect a particle is a function of the: • attenuating medium (especially density) • depth and activity of the particle • velocity with which the detector is travelling • alarm trigger
Figure 4.1 A schematic diagram illustrating the interaction of the SeaHog detector within a radiation field for a particle at depth in Sand. The change in the radiation field as a result of changing media – from wet sand to water is not accurately represented in the figure. (Note: 1e6 Bq is the same as 106 Bq).
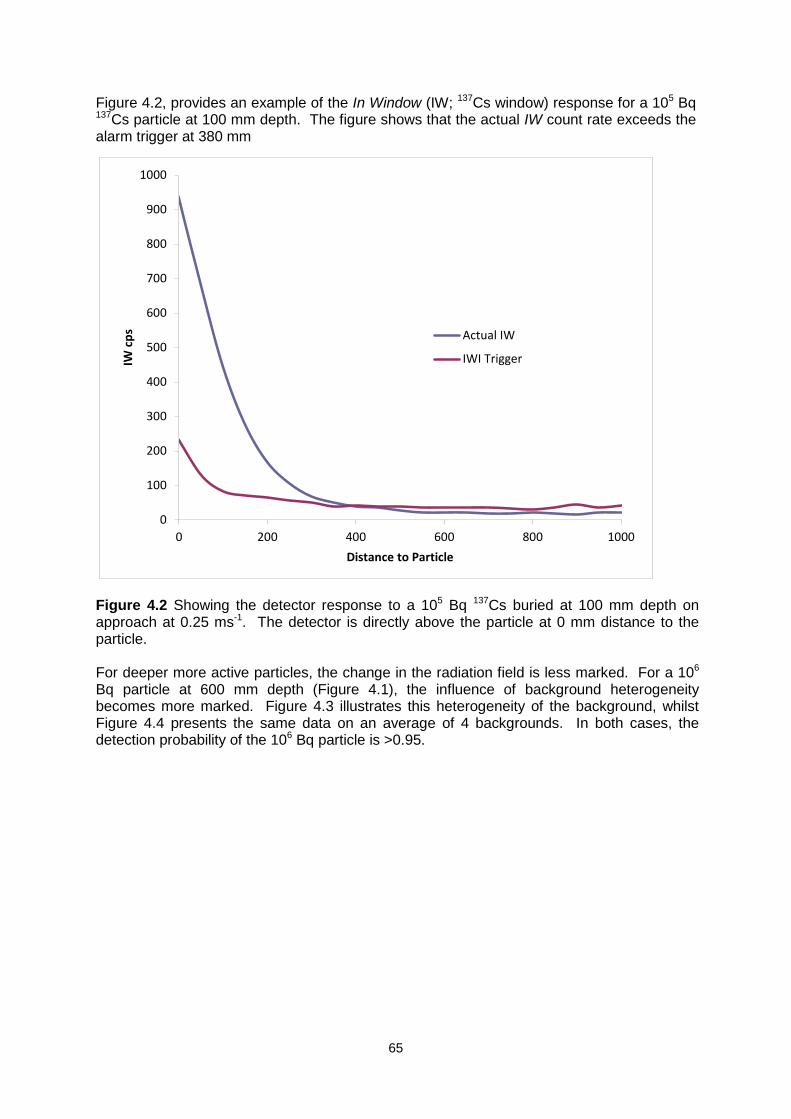
65
Figure 4.2, provides an example of the In Window (IW; 137Cs window) response for a 105 Bq 137Cs particle at 100 mm depth. The figure shows that the actual IW count rate exceeds the alarm trigger at 380 mm
Figure 4.2 Showing the detector response to a 105 Bq 137Cs buried at 100 mm depth on approach at 0.25 ms-1. The detector is directly above the particle at 0 mm distance to the particle. For deeper more active particles, the change in the radiation field is less marked. For a 106 Bq particle at 600 mm depth (Figure 4.1), the influence of background heterogeneity becomes more marked. Figure 4.3 illustrates this heterogeneity of the background, whilst Figure 4.4 presents the same data on an average of 4 backgrounds. In both cases, the detection probability of the 106 Bq particle is >0.95.
0
100
200
300
400
500
600
700
800
900
1000
0 200 400 600 800 1000
IW c
ps
Distance to Particle
Actual IW
IWI Trigger
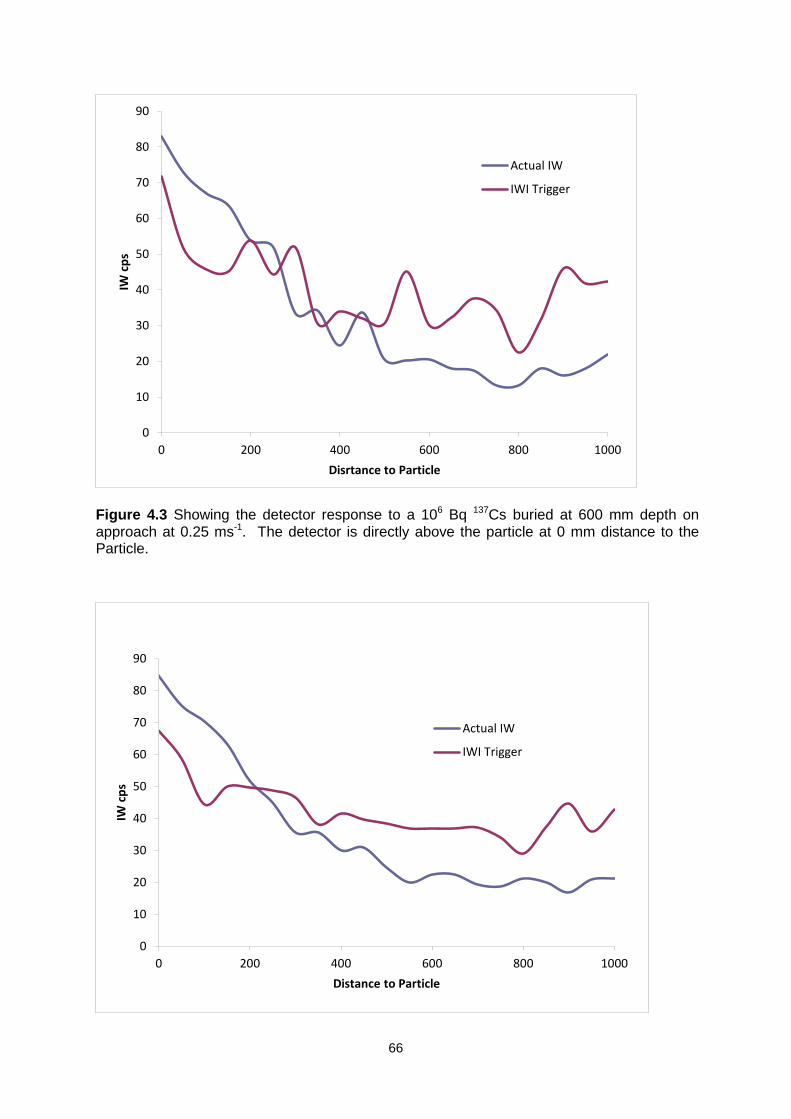
66
Figure 4.3 Showing the detector response to a 106 Bq 137Cs buried at 600 mm depth on approach at 0.25 ms-1. The detector is directly above the particle at 0 mm distance to the Particle.
0
10
20
30
40
50
60
70
80
90
0 200 400 600 800 1000
IW c
ps
Disrtance to Particle
Actual IW
IWI Trigger
0
10
20
30
40
50
60
70
80
90
0 200 400 600 800 1000
IW c
ps
Distance to Particle
Actual IW
IWI Trigger
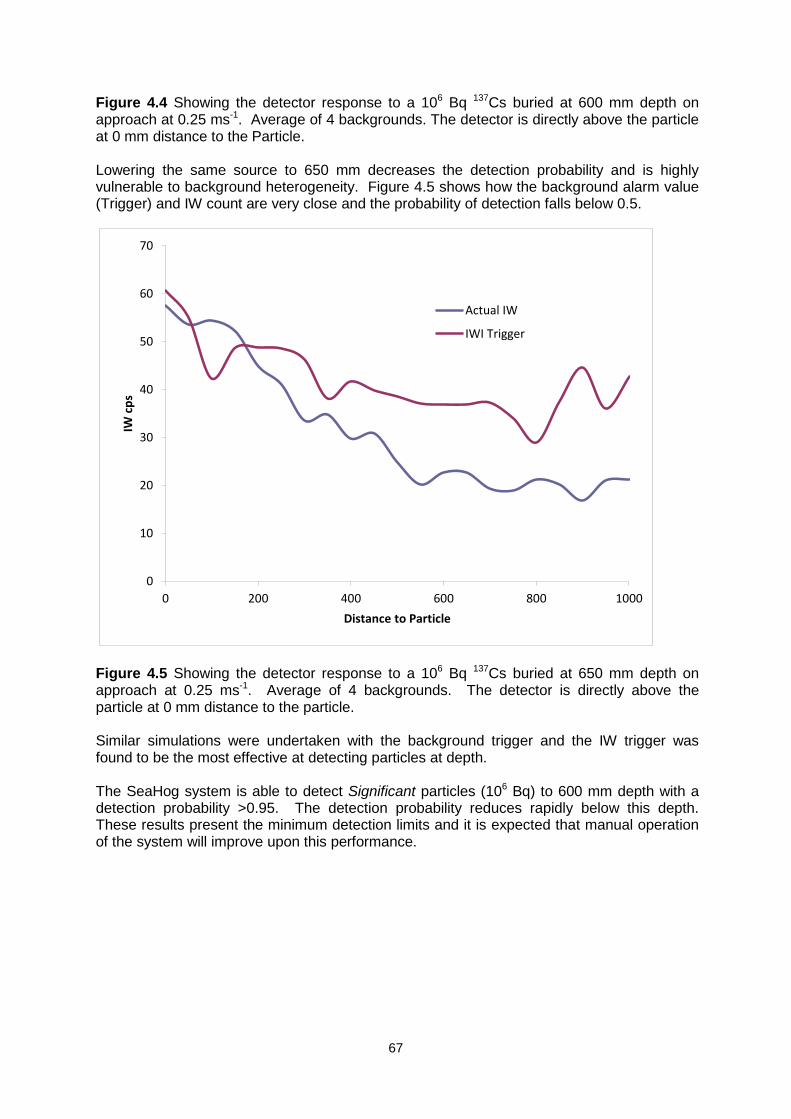
67
Figure 4.4 Showing the detector response to a 106 Bq 137Cs buried at 600 mm depth on approach at 0.25 ms-1. Average of 4 backgrounds. The detector is directly above the particle at 0 mm distance to the Particle. Lowering the same source to 650 mm decreases the detection probability and is highly vulnerable to background heterogeneity. Figure 4.5 shows how the background alarm value (Trigger) and IW count are very close and the probability of detection falls below 0.5.
Figure 4.5 Showing the detector response to a 106 Bq 137Cs buried at 650 mm depth on approach at 0.25 ms-1. Average of 4 backgrounds. The detector is directly above the particle at 0 mm distance to the particle. Similar simulations were undertaken with the background trigger and the IW trigger was found to be the most effective at detecting particles at depth. The SeaHog system is able to detect Significant particles (106 Bq) to 600 mm depth with a detection probability >0.95. The detection probability reduces rapidly below this depth. These results present the minimum detection limits and it is expected that manual operation of the system will improve upon this performance.
0
10
20
30
40
50
60
70
0 200 400 600 800 1000
IW c
ps
Distance to Particle
Actual IW
IWI Trigger
68
5. Strontium-90 rich particles 5.1 Introduction Several types of radioactive particles are or have been found in the environment around Dounreay as described in the introduction to this report. Of those particles, which are currently found, the most important are those originating from MTR and DFR. PRAG(D) uses a scheme of classification of the particles developed by DPAG by which particles are classified as ‘Significant’, ‘Relevant’ or ‘Minor’ indicating their potential significance in health terms by credible exposure scenarios, again as recorded in the introduction. Although MTR and DFR particles have a range of radionuclides present and some variability in relative composition, past consideration by DPAG indicated that it was reasonable to assume a 90Sr:137Cs ratio of around 1:1 in general. Particles could then be characterised by their, relatively readily detected, 137Cs content in categorising them as ‘Significant’, ‘Relevant’ and ‘Minor’, while recognising that the dominant scenario determining this categorisation was irradiation of the skin for which 90Sr and its decay product 90Y were the most important contributors. Table 3.1 of DPAG’s 3rd report records some of the variation in 90Sr:137Cs ratio encountered at the time the categorisation scheme was developed and Figure 3.1 indicates, inter alia, the skin dose rates which would result from contact with particles with approximately 1:1 ratio of 90Sr:137Cs. It is considered reasonable to assume that for particles with a 90Sr:137Cs ratio of approximately 1:1 or above this relationship would hold approximately true if measured activities of 90Sr replaced 137Cs in this graph, given the relative contribution of 90Sr and 90Y to this dose. 5.2 The Occurrence of 90Sr-rich Particles. Two particles have been identified relatively recently at Sandside Bay where the 90Sr:137Cs ratio has been confirmed as being significantly greater than that considered by DPAG as described above. These are recorded below. Date 90Sr Activity (Bq) 90Sr:137Cs Ratio
14 February 2012 7x10⁵ 3000:1
23 May 2011 5x10⁴ 400:1
In categorising these two particles for potential health significance it would clearly be inappropriate to use 137Cs activity, given the extreme variance from the 90Sr:137Cs ratios assumed in developing the categorisation schemes. PRAG(D) do however consider it reasonable to compare the numerical values set out, initially for 137Cs activity, for ‘Significant’, ‘Relevant’ and ‘Minor’ particles with the 90Sr activity of these 90Sr -rich particles. Using this approach the particle found on 14 February 2012 is a ‘Relevant’ particle and that found on 23 May 2011 a ‘Minor’ particle. Niobium-94 was detected in both particles. The presence of 94Nb in measurable levels provides positive identification of DFR as their origin (a characteristic noted by DPAG), albeit that the detailed process that produced particles of such composition is currently unclear. During analysis it has also been observed that both particles are unusually insoluble. In determining the categorisation of particles, DPAG considered exposure scenarios in addition to skin exposure such as particles being in the eye or the ear and from ingestion or inhalation. Given the characteristics of 90Sr-rich particles observed to date, in particular their low solubility which would suggest that potential exposures via ingestion would be small, it
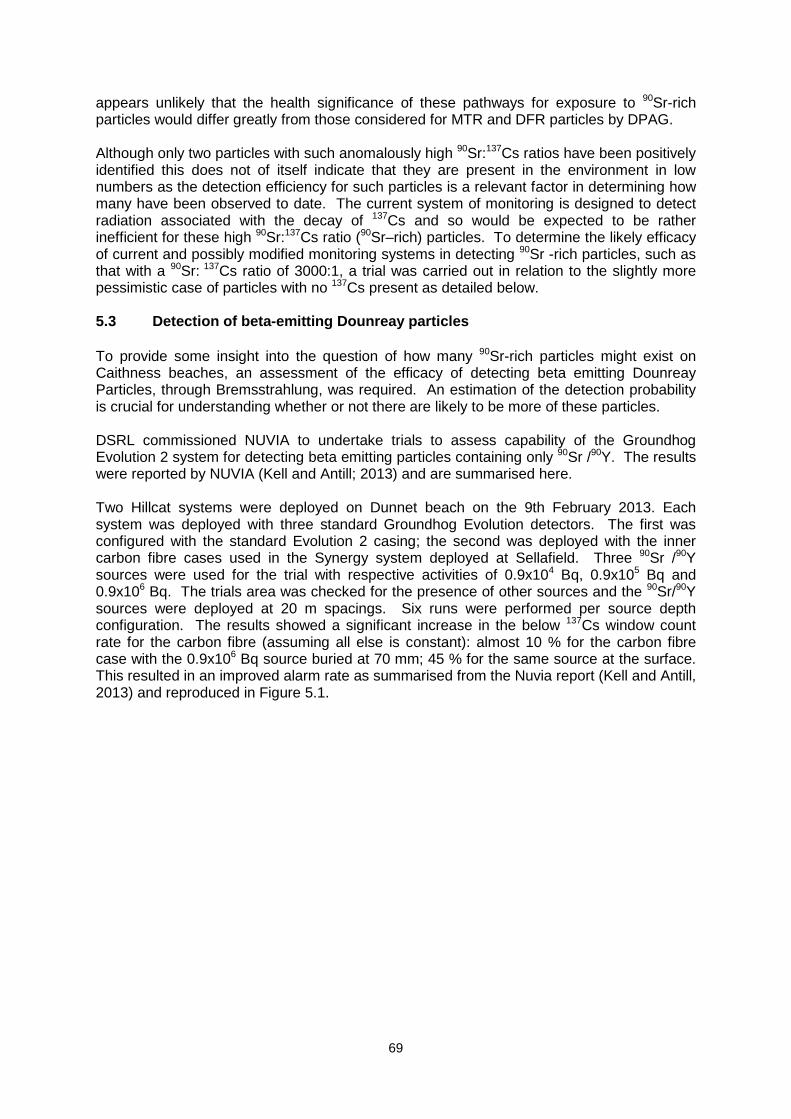
69
appears unlikely that the health significance of these pathways for exposure to 90Sr-rich particles would differ greatly from those considered for MTR and DFR particles by DPAG. Although only two particles with such anomalously high 90Sr:137Cs ratios have been positively identified this does not of itself indicate that they are present in the environment in low numbers as the detection efficiency for such particles is a relevant factor in determining how many have been observed to date. The current system of monitoring is designed to detect radiation associated with the decay of 137Cs and so would be expected to be rather inefficient for these high 90Sr:137Cs ratio (90Sr–rich) particles. To determine the likely efficacy of current and possibly modified monitoring systems in detecting 90Sr -rich particles, such as that with a 90Sr: 137Cs ratio of 3000:1, a trial was carried out in relation to the slightly more pessimistic case of particles with no 137Cs present as detailed below. 5.3 Detection of beta-emitting Dounreay particles To provide some insight into the question of how many 90Sr-rich particles might exist on Caithness beaches, an assessment of the efficacy of detecting beta emitting Dounreay Particles, through Bremsstrahlung, was required. An estimation of the detection probability is crucial for understanding whether or not there are likely to be more of these particles. DSRL commissioned NUVIA to undertake trials to assess capability of the Groundhog Evolution 2 system for detecting beta emitting particles containing only 90Sr /90Y. The results were reported by NUVIA (Kell and Antill; 2013) and are summarised here. Two Hillcat systems were deployed on Dunnet beach on the 9th February 2013. Each system was deployed with three standard Groundhog Evolution detectors. The first was configured with the standard Evolution 2 casing; the second was deployed with the inner carbon fibre cases used in the Synergy system deployed at Sellafield. Three 90Sr /90Y sources were used for the trial with respective activities of 0.9x10⁴ Bq, 0.9x10⁵ Bq and 0.9x10⁶ Bq. The trials area was checked for the presence of other sources and the 90Sr/90Y sources were deployed at 20 m spacings. Six runs were performed per source depth configuration. The results showed a significant increase in the below 137Cs window count rate for the carbon fibre (assuming all else is constant): almost 10 % for the carbon fibre case with the 0.9x10⁶ Bq source buried at 70 mm; 45 % for the same source at the surface. This resulted in an improved alarm rate as summarised from the Nuvia report (Kell and Antill, 2013) and reproduced in Figure 5.1.
70
Figure 5.1 Showing the change in alarm rate with depth. No alarms were detected for those particle activity/depth configurations not shown. (CF = Carbon Fibre; Box – standard Evolution 2 configuration) Importantly, these results suggest that the existing system can confidently detect 0.9x10⁶ Bq 90Sr/90Y particles to 30 mm depth and to 70 mm depth with a probability of around 0.5. The system modified with carbon fibre cases improves the detection capability to around 70 mm depth, and shows some capability of detecting 105 Bq particles close to the surface. These results provide some confidence that there are unlikely to be many 90Sr-rich particles with 1 MBq or above of 90Sr (i.e. ‘Significant’ 90Sr-rich particles) in the Caithness environment. However, the existing system is unable to detect particles of around 105 Bq 90Sr particles. Therefore it would appear that results from the current monitoring system would give little information about the possible presence of ‘Relevant’ and nothing about ‘Minor’ 90Sr -rich particles’ in this environment. In categorising the particles according to the scheme Significant/Relevant/Minor DPAG largely addressed the hazard posed by credible exposure scenarios e.g. those resulting from stationary contact with the skin for periods that were credible. In determining the level at which particles might be considered ‘Minor’ use was made of the probability of a fuel particle entering the ear, assessed as being less than 1 in 100 million (section 3.2.7 3rd report) and this would be dependent on a knowledge of the quantity of particles in the environment. However, as noted the present monitoring system for particles indicates little about the possible abundance of ‘Minor’ 90Sr -rich particles in the environment. 5.4 Recommendations In order to optimise the detection of ‘Significant’ and ‘Relevant’ 90Sr-rich particles, we recommend that the Groundhog Evolution 2 system is modified to carbon fibre casings to improve the detection capability for 105 Bq 90Sr/90Y particles and the depth to which 1 MBq can be detected. In order to underpin the categorisation of 90Sr -rich particles containing less than 105 Bq 90Sr as ‘Minor’ we recommend that additional samples of potentially 90Sr rich particles which have

71
lower 137Cs activity are taken and analysed to indicate that such particles are not present in quantities which could challenge the assumption that their probability of entering the ear is low. There has been some debate about the potential offshore cache of high 90Sr containing particles with low gamma emitters. Given the low numbers of these types of particles found onshore, and that those found onshore originate from the offshore cache, and that physically there is no apparent difference between 90Sr rich sources and typical Dounreay particles, there is no reason to consider that the onshore and offshore populations would differ. Thus, we consider at present that the possibility of significant numbers of 90Sr rich sources is limited.

72
6. Conclusions 1. There is no evidence of change to the rate or activity of beach arrivals at Sandside
Beach, which is welcomed as it demonstrates that the offshore recovery programme did not mobilise a cache of particles which could then rapidly move into Sandside Bay.
2. The effect of seasonality of particle arrivals has been confirmed which will be useful
in undertaking any review of monitoring. 3. Continuation of monitoring is required to assess the impact of the offshore recovery
programme at Dounreay Foreshore and Sandside Beach. 4. Monitoring of the Sentinel Beaches is required to ensure that hypotheses on particle
movement can be tested and the public reassured. 5. The offshore recovery programme has successfully depleted the offshore cache of
high activity particles. The magnitude and effect of this needs to be evaluated against beach recoveries over the coming years.
73
7. Recommendations We have summarised our recommendations below. The major recommendation is that routine beach monitoring must continue. While we might anticipate that offshore retrievals will impact on beach finds, there will most likely be a time lag in the effect being apparent, and also if the reasoning of Chapter 3 (offshore) holds, then it is possible that the offshore particle numbers will increase and thus the onshore arrivals might increase also. The time line for this is not yet well defined. We would therefore recommend: 1. Continuation of monthly beach monitoring on Sandside for a sufficient period beyond any observed decline in particle arrival rates to ensure that any observed change is real. 2. Continuation of fortnightly beach monitoring on Dounreay Foreshore for a sufficient period beyond any observed decline in particle arrival rates to ensure that any observed change is real. Consideration should be given to the issue of Tern nesting as this coincides with the time when the beach is building. 3. Sentinel Beaches: Selection of two sentinel beaches at Strathy Point and Murkle Beach. To be monitored twice per year, once in May during the time of beach build up, the second time to be 6 months later. 4. In order to optimise the detection of ‘Significant’ and ‘Relevant’ 90Sr-rich particles we recommend that the Groundhog Evolution 2 system is modified to carbon fibre casings to improve the detection capability for 105 Bq 90Sr/90Y particles and the depth to which 1 MBq particles can be detected. 5. In order to underpin the categorisation of 90Sr -rich particles containing less than 105 Bq 90Sr as ‘Minor’ we recommend that additional samples of potentially 90Sr rich particles which have lower 137Cs activity are taken and analysed when found, to indicate that such particles are not present in quantities which would challenge the assumption that their probability of entering the ear is low. 6. The fishing exclusion zone should be maintained until the re-evaluation of beach arrival rates has been undertaken in order to ensure no artificial disturbance of the area of the plume.
74
Appendix 1 Comparisons between DPAG estimates and numbers of particles recovered A1.1 DPAG’s 4th Report contained contour maps of the estimated population density of particles within the sea bed, in terms of numbers per hectare of sand area. These maps are shown here as Figs. 3.1 and 3.2. Following each year’s deployment of the ROVs in 2008-2012, PRAG(D) carefully compared the numbers of contacts and recoveries made with the numbers that could be predicted from the DPAG maps for the areas surveyed by ROV each year. Allowance was made for the particles that had been removed by divers. It was a consistent feature of these comparisons that the ROV surveys found fewer particles than predicted, regardless of position in the plume, and for both Significant and Relevant+Minor categories of activity. The discrepancy for the plume as a whole has already been noted in Chapter 3 of this report. For Significant particles the ROV surveys detected only 23.0% of the number expected, with recoveries being only 17.4%. For Relevant particles the detection and recovery were both 26.2% of the number predicted, and for Minor particles 25.0% and 22.2% respectively. The reasons for this discrepancy between numbers predicted and found might lie in the nature of the ROV surveys, preferential selection by the diver surveys, in possible shortcomings in DPAG’s contour maps and predictions based on them, or in changes in the plume that might conceivably have occurred between the divers’ surveys and the commencement of ROV recoveries in 2008. PRAG(D) has examined the evidence critically in relation to each of these possibilities. Bearing in mind that our prime concern is to evaluate the extent to which the risks posed by Significant particles have been ameliorated by the total recoveries since 1997, we shall concentrate on this category in the sections of main text that follow. For the plume as a whole, DPAG’s 4th Report estimated the original population of Significant particles as 1350 ± 450 (approximately 95% confidence interval), whereas 414 were actually recovered (217 by divers, 197 by ROV). The lower bound of DPAG’s range implies that upwards of 486 Significant particles might still be present. Of these, fewer than half can be accounted for by the methods explored in Chapter 3, i.e. by deduction from the ROV survey results themselves. Given that DPAG’s 95% confidence interval is based on an estimate of random sampling errors, the reasons for the additional discrepancy might be expected to lie in systematic factors, such as differences in detector efficiencies or in operational effectiveness between divers’ equipment and ROV surveys, or in methods of interpolation and extrapolation as used by DPAG. Despite a critical examination of such factors, PRAG(D) has been unable to find a convincing single explanation for the discrepancy. The evidence is simply not adequate to form a definitive opinion as to which, if any, systematic factors are the most likely. Reasons can be advanced to suggest that one or the other system might have been less effective, but these remain essentially speculative in the absence of quantitative data. Therefore, PRAG(D) is not in a position to state definitively that the DPAG estimate for Significant numbers is too high, and in this light it should be accepted that the DPAG estimate cannot be rejected. It should instead be regarded as a probable upper bound to the numbers of particles originally present in the plume, with the implication that the numbers of Significant particles remaining within the sea bed could be several times higher than the range of 90-220 deduced from the results of the ROV surveys. A1.2 Possible influence of rocky areas on estimated numbers of Significant particles During preparation of this Report, DSRL pointed out that DPAG’s integration of the parts of the particle plume closest to the shore contained an inconsistency, because it included rocky areas in which divers’ experience suggested that very few particles were likely to be found.
75
DSRL put forward their view that the estimates for the total numbers in the plume should be revised downwards. Against this, it should be noted that many particles have been found on the rocky areas of the Dounreay East Foreshore, where they generally occur in small patches of sand in cracks or hollows on the outcrops of rock. The DSRL objection has some force, although its likely influence is no greater than the other uncertainties that affect the discrepancy between DPAG’s estimates and ROV results. The method followed by DPAG in constructing the contour maps in their Third and Fourth Reports (shown here as Figs .3.1 and 3.2) was as follows. The whole area was gridded into one-hectare (100 x 100 m) squares. It was assumed from the outset that the divers concentrated their searches on sandy areas and that none of the finds came from areas of rock. For each hectare grid square of sea bed actually visited by the divers’ survey the proportion of sandy bed in the whole square was determined from sea bed images and maps supplied by DSRL at the time. The predicted total number of particles for the whole hectare square was then estimated by extrapolating up to the area of sand within the square from the numbers found in the part that had actually been surveyed. The resulting number was plotted in the centre of the grid square as the estimated population for that square. This number was also, by definition, an estimate of averaged population density for the whole square. The procedure took account of rocky areas within the square, so if the square contained a lot of rock the number would tend to be low whereas if it contained mainly sand the number would tend to be high. When DPAG came to draw their contour maps of particle population density, they took the plotted numbers as valid estimates of local average population density within the sea bed as a whole within each labelled grid square. Contours were drawn taking account of all the labelled values across the whole plume. The inconsistency between DPAG’s procedures in deriving the numbers for each surveyed square and their use of the contours to estimate the total population in the plume arises at this point. The contour lines themselves passed across squares that had not been surveyed by divers. In drawing them, DPAG took no account of the proportions of rock or sand in these ‘unlabelled’ squares. DSRL expressed the view to PRAG(D) that for squares that contained a large proportion of rock the values that would be interpolated from the contours would tend to be too large. It is difficult to evaluate this contention because in drawing the contours the greatest weight was given to squares with the lowest relative sampling errors. This favoured squares in which larger numbers of particles were actually found, which may on the one hand have had a high proportion of sand, or on the other hand may have had a low proportion of sand but have been relatively completely surveyed. However it is certainly true that where the contours pass over unlabelled squares, they may give a biased estimate of the true numbers of particles there, because the proportions of rock in these unlabelled squares may be higher than in the squares that had greatest influence on the local part of the contour pattern. As DPAG’s next step was to integrate over the whole contour pattern to produce an estimate for the total numbers of particles within the plume, there may well have been some upward bias because some of the unlabelled squares lying generally nearer to the shore than the Diffuser have a high proportion of rock. DSRL have suggested to PRAG(D) that the estimated total numbers of Significant particles should be revised to take account of this possible bias. A new integration of DPAG’s contour map was made by DSRL using GIS software to exclude completely the rocky areas of sea bed. The resulting estimate for the total number of Significant particles was 957, approximately 30% lower than DPAG’s estimate of 1350 in their Fourth Report, but within their uncertainty range of ± 33%. It is likely that the compensation for rocky areas that DSRL have proposed is itself too large, because the procedure that was followed compensates for rocky areas in grid squares that were already compensated for by DPAG’s original calculations, as well as those which were not. As regards the DPAG-ROV discrepancy itself, we may make an extreme estimate of its lower bound by (a) adopting the DSRL estimate of 957 Significant particles and (b) supposing the ‘true’ population was at the lower end of DPAG’s uncertainty estimate of ± 33%. This yields a lower bound estimate of 227 for the

76
residual population of Significant particles in the plume as a whole which is not much higher than already estimated in Chapter 3. On the other hand, both the ‘rocky area’ bias and the ‘random error’ have been pushed to their limits to obtain this agreement, so it seems probable that the true residual numbers of Significant particles is higher than 227.
Related Documents