Particle number (PNC) and black carbon (BC) in European urban air quality networks ETC/ACM Technical Paper 2012/6 November 2012 Mar Viana, Xavier Querol, Cristina Reche, Olivier Favez, Laure Malherbe, Aurélien Ustache, Alena Bartonova, Hai‐Ying Liu, Cristina Guerreiro The European Topic Centre on Air Pollution and Climate Change Mitigation (ETC/ACM) is a consortium of European institutes under contract of the European Environment Agency RIVM UBA‐V ÖKO AEAT EMISIA CHMI NILU INERIS PBL CSIC

Welcome message from author
This document is posted to help you gain knowledge. Please leave a comment to let me know what you think about it! Share it to your friends and learn new things together.
Transcript

Particle number (PNC) and black carbon (BC)
in European urban air quality networks
ETC/ACM Technical Paper 2012/6 November 2012
Mar Viana, Xavier Querol, Cristina Reche, Olivier Favez, Laure Malherbe, Aurélien Ustache, Alena Bartonova, Hai‐Ying Liu, Cristina Guerreiro
The European Topic Centre on Air Pollution and Climate Change Mitigation (ETC/ACM) is a consortium of European institutes under contract of the European Environment Agency
RIVM UBA‐V ÖKO AEAT EMISIA CHMI NILU INERIS PBL CSIC

Font page picture: Urban PNC and BC emissions. (RIVM beeldenbank; rights free).
Author affiliation: Mar Viana, Xavier Querol, Cristina Reche: IDAEA‐CSIC, Spain. Olivier Favez, Laure Malherbe, Aurélien Ustache: INERIS, France. Alena Bartonova, Hai‐Ying Liu,Cristina Guerreiro: NILU, Norway. Contributors from countries and networks: Belgium: Christine Matheeussen, Vlaamse Milieumaatschappij, Afdeling Lucht, Milieu en Communicatie, Dienst Lucht Benjamin Bergmans, ISSeP, BE Denmark: Dr. Thomas Ellermann, Institut for Miljøvidenskab ‐ Atmosfærisk Miljø. Finland: V. Dos Santos‐Juusela
1, A. Kousa
2, A. Svens
2, K. Hämeri
1
[1] Helsinki University, Department of Physics, Helsinki, Finland
[2] Helsinki Region Environmental Services Authority, Helsinki, Finland
France: Olivier Favez, Laure Malherbe, INERIS Germany: Dr. Wolfram Birmili, Leibniz Institute for Tropospheric Research. Greece: Dr. Anastasios Adamopoulos, Air Pollution Expert, Ministry For The Environment, Energy & Climate Change. Ireland: John Sodeau, Centre for Research into Atmospheric Chemistry, University College Cork Italy: Giorgio Cattani
a, Luca Stabile
b, Giorgio Buonanno
b, Maurizio Manigrasso
c
aItalian National Institute for Environmental Protection and Research, Rome, Italy
bUniversity of Cassino and Southern Lazio ‐ Department of Civil and Mechanical Engineering
cINAIL, Rome, Italy Netherlands: Dave de Jonge, Department of Air Quality Research, Municipal Health Service Amsterdam, The Netherlands. Portugal: Casimiro Pio, Teresa Nunes, CESAM/UA Slovenia: Tanja Bolte ARSO. Dr. Griša Močnik, Aerosol d.o.o. Spain: Mar Viana, Cristina Reche, IDAEA‐CSIC. Sweden: Dr. Christer Johansson, Stockholm University. Switzerland: Christoph Hueglin, EMPA. United Kingdom: Paul Quincey, National Physics Laboratory
DISCLAIMER
© ETC/ACM, 2012. ETC/ACM Technical Paper 2012/6 European Topic Centre on Air Pollution and Climate Change Mitigation PO Box 1 3720 BA Bilthoven The Netherlands Phone +31 30 2748562 Fax +31 30 2744433 Email [email protected] Website http://acm.eionet.europa.eu/
This ETC/ACM Technical Paper has not been subjected to European Environment Agency (EEA) member country review. It does not represent the formal views of the EEA.
ETC/ACM Working Paper 2011
Table of contents
EXECUTIVE SUMMARY__________________________________________ 1
Chapter I. On the validity of BC and particle number as air quality indicators in urban environments _________________________________ 6
I.1. Introduction ____________________________________________________ 6
I.2. Current air quality monitoring parameters and future proxies ___________ 8
I.3. Why do we need additional metrics in AQ networks? _________________ 10
I.4. PNC and BC in future air quality monitoring networks ________________ 11
I.5. Concluding remarks ____________________________________________ 17
Chapter II: Review of health effects from Black Carbon ______________ 18
II.1.Summary______________________________________________________ 18
II.2. Introduction ___________________________________________________ 19
II.3. What is black carbon? __________________________________________ 20
II.4. Where does black carbon come from? Or what is driving force for black carbon?__________________________________________________________ 20
II.5. What are the pressure and state of the black carbon on the environment, climate and public health? __________________________________________ 21
II.6. What are the exposure-health effects of the black carbon? ____________ 22 II.6.1. WHO – Health effects of black carbon ________________________________ 22 II.6.2. US EPA – Black carbon research and report to Congress on black carbon __ 23 II.6.3. UNEP/WMO – Integrated assessment of black carbon and tropospheric Ozone_____________________________________________________________________ 23
II.6.4. Recent scientific articles on health effects of black carbon _______________ 24
II.7. What are the actions toward reduction of health effects from the black carbon?__________________________________________________________ 25
II.7.1. WHO – Health effects of black carbon ________________________________ 25 II.7.2. UNEP/WMO – Integrated assessment of black carbon and tropospheric ozone: summary for decision makers ____________________________________________ 25 II.7.3. Arctic Council Task Force on short-lived climate forcers – Progress report and recommendations for Ministers___________________________________________ 26 II.7.4. Policy options ____________________________________________________ 27 II.7.5. International regulatory responses ___________________________________ 27
II.8. Conclusions and recommendations _______________________________ 27
Chapter III: Review of health effects from ultrafine particles __________ 29
III.1. Summary_____________________________________________________ 29
III.2. Introduction __________________________________________________ 30
III.3. What are ultrafine particles? How are they measured? _______________ 32
III.4. Where do ultrafine particles come from? Or what is driving force for ultrafine particles?_________________________________________________ 32
III.5. What are the pressure and state of the ultrafine particles on the environment, public health and climate? ______________________________ 33
III.6. What are the exposure-health effects of the ultrafine particles? _______ 34 III.6.1. WHO – Health effects of ultrafine particles ____________________________ 34 III.6.2. US EPA – Research on particulate matter including ultrafine particles _____ 35 III.6.3. Recent scientific articles on health effects of ultrafine particles __________ 35

III.7. What are the actions toward reduction of health effects from the ultrafine particles? ________________________________________________________ 36
III.7.1. Removal and mitigation____________________________________________ 36 III.7.2. Regulation and legislation__________________________________________ 36
III.8. Conclusions and recommendations ______________________________ 36
Chapter IV. Technical viability of deploying PNC and BC monitoring instrumentation in urban air quality networks ______________________ 38
IV.1. Requirements_________________________________________________ 38
IV.2. Installation, operation and maintenance___________________________ 38
IV.3. Data collection, transmission and verification ______________________ 39
IV.4. Data processing_______________________________________________ 39
IV.5. Temporal monitoring___________________________________________ 41
IV.6. Comparability_________________________________________________ 41
IV.7. Summary ____________________________________________________ 43
Chapter V. PNC and BC monitoring networks in Europe _____________ 45
V.1. BC measurements _____________________________________________ 45 V.1.1. BC measurement in air quality monitoring networks ____________________ 45 V.1.2. Description of the measuring instruments_____________________________ 45
V.2. Ultrafine particle number measurement____________________________ 49 V.2.1. PNC measurement in monitoring networks ____________________________ 49 V.2.2. Description of the measuring instruments_____________________________ 49
V.3. Summary _____________________________________________________ 54
Acknowledgments _____________________________________________ 56
References __________________________________________________ 566
Appendix. Review of the presence of N and BC monitoring instrumentation in current air quality networks in Europe ____________ 68

1
EXECUTIVE SUMMARY
1.1 Background
Air quality is a well regulated environmental domain, as a result of its recognized importance to human health. How to determine air quality is a key issue: a number of aspects need to be considered, such as technological feasibility of the measurements, issues of comparability and validity, health relevance, strength of association with emission source contributions. With advances in knowledge and technology, several changes in what is monitored and how have occurred, one of the most important evolutions being the unification of diverse particle-related measurements of particulate matter (PM) defined through its aerodynamic diameter. However it has been acknowledged that these kind of measurements need to be further discussed in terms of their links to health relevance. This report seeks to investigate the feasibility of monitoring additional indicator metrics, “particle number concentration” (PNC) and “equivalent black carbon” (EBC), which are complementing evidence laid out recently by the WHO. EBC is defined as black carbon (BC) corrected with respect to thermo-optically determined elemental carbon (EC). PNC is defined as the number of particles per cubic centimeter measured in a given environment. As over 80% of the total particle load (in terms of particle number) can be found in the “ultrafine” fraction (UFP), commonly defined as particles with diameter < 0.1 µm, it is a candidate answering to the need to better characterize the pollutants that can are inhaled by humans. However, to study source contributions and effectiveness of measures, PNC is less suitable. Hourly variations of PM and PNC levels do not always reflect the variation in impacts of e.g. road traffic emissions on urban aerosols. PNC variability in different European urban environments is not equally influenced by the same emission sources and atmospheric processes. In central and northern Europe, PNC and EBC levels tend to vary simultaneously during rush and non-rush hour traffic. However, at urban background stations in southern Europe, PNC levels are also influenced by nucleation episodes (new particle formation) and the association is less pronounced. EBC is an operationally defined term which describes carbon as measured by light absorption. Its importance is related to its origin - combustion sources that are the main contributor to reduced air quality in urban areas, and its direct relevance to climate change-related processes. EBC levels vary proportionally to those of traffic related gaseous pollutants, such as CO and NO2 and NO. This close association would suggest that monitoring the levels of the gaseous pollutants would be enough to extrapolate to the exposure to EBC levels. However, the EBC/CO, EBC/NO2 and EBC/NO ratios vary widely among cities, as a function of local emission profiles and atmospheric conditions, thus limiting the comparability of EBC levels and trends across Europe. As a result, monitoring EBC would advance our understanding of the impact of anthropogenic emissions (mainly traffic but also biomass burning), and enable us to better assess the effectiveness of mitigation measures. Furthermore, because of the progressive introduction of EURO4 and EURO5 regulations, levels of EBC have decreased and are expected to continue decreasing in the coming years. However, this is not the case for NO2, and as a result NO2/EBC ratios show an increasing trend in European urban environments (e.g., in Barcelona where the NO2/(EC+OC) ratio has increased from 4 to 12 in 10 years). This report summarizes and critically evaluates the status of European monitoring of PNC and EBC, in order to provide input to the debate on future air quality monitoring in
2
Europe. This debate should enable improvements in evaluating status and trends in air quality-related health risks and the effects of policies and measures established to protect human health. It also touches potential climate change risks.
1.2 Health impacts from Black Carbon and ultrafine particles
It is currently not possible to differentiate health effects between exposure to BC and PM mass. Human epidemiological studies reviewed by WHO suggest that BC is associated with the same human health effects as particulate matter. Toxicological studies reviewed by WHO (2012) state that “At present, it is not possible to say definitively whether health effects due to exposure to BC or PM mass are different qualitatively (for example, different health outcomes) and/or quantitatively from each other”. The US EPA’s Scientific Advisory Board recently recommended that the agency treat all particles as equally toxic, as the evidence for using differential toxicity in risk assessment was not strong enough. Given the evidence that traffic related BC is more toxic than average, and the weaker evidence on the relative toxicity of biomass particles, UNEP/WMO (2011) has chosen to assume that BC particles are associated with average risks. Due to lack of data, the health impacts of ultrafine particles (UFPs) are still largely unknown, but the evidence being published in the scientific literature increasingly indicates that they can be a significant source of risk to respiratory and cardiovascular health, and childhood asthma. Numerous research studies showed that inhalation exposure to UFPs can lead to exacerbation of lung and cardiovascular diseases and that the effect is more severe than that of fine and coarse particles. It has also been shown that UFPs can generate more reactive oxygen species (ROS) inside the body than larger particles, and are able to cross epithelial cells and translocate to extrapulmonary organs.
1.3 Technical Summary
1.3.1 EBC and PNC monitoring in Europe – current status
The viability of deploying PNC and EBC instrumentation in urban air quality monitoring depends on: • how easy it is to install and maintain the measurement devices at already existing
monitoring sites or to deploy them in new non-instrumented locations, • how easy it is to collect, transmit, store and validate the data, • the capability to produce long time series of measurement data, • the possibility of implementing and following a QA/QC system and ensuring
comparability between measurements taken at different locations.
1.3.2 Installation, operation and maintenance of monitoring networks
Current monitoring networks use EBC monitors that are rather small – similar in size to common gas monitors, robust and easy to use. Calibration in the usual sense is difficult as no reference material is currently available. Currently, no CEN standard methodology is available for this metric. Condensation particle counters CPCs are not large; in principle, they are relatively simple to operate but may not be so in practice, according to the data provided by network operators. Particle sizers need more room and are complex to handle.

3
Comparability can be regulated by annual calibration, regular servicing, and site audits. Country experience shows that CPCs and particle sizers are delicate instruments and not easy to run. At present, Working Group WG32 of CEN/TC 264 (Comité Européen de Normalisation) is working on standardization of methodologies for PNC.
1.3.3 Data processing
The main issue regarding optical EBC measurements is the conversion of light-absorption measurements into equivalent Black Carbon (EBC) mass.. Current discussions in the scientific community question whether conversions of absorption measurements to EBC mass should be performed and, if so, whether with a constant or with locally-determined MAE factors. The debate is ongoing as no consensus has been reached so far. From the point of view of network operators, conversion of absorption to EBC is preferred in order to obtain a mass-based metric and to ensure comparability across stations and networks. In urban areas, applying locally-determined MAE values for conversion of absorption measurements to EBC would imply lower degrees of uncertainty while maximising comparability between results. In addition, to allow for a consistent retrieval of absorption coefficients, corrections for sampling artifacts are necessary. Multiple wavelengths absorption measurements could be used to apportion the main origins of EBC, e.g. fossil fuel vs. biomass burning sources. EBC could finally be combined with non-mineral carbon (nmC) monitoring to yield full information on the organic and elemental carbon fractions in urban areas, with high temporal resolution. However, online nmC monitoring techniques with time basis below 2-3 hours are not currently available, even though this kind of data would be highly valuable in urban air quality networks. PNC is measured using particle counters (CPC) and could further be investigated with regard to its size distribution using particle sizers (DMPS or SMPS). For the latter instruments, inversion routines are the vital bases for converting the measured electrical particle mobility distributions into final particle number size distributions taking into account the bipolar charge distribution as well as the DMA (Differential Mobility Analyzer) transfer function. Such data processing tools are usually available with the instrument via software to be used off-line.
1.3.4 Temporal monitoring
Fine temporal resolution is achievable for both metrics: EBC and PNC measurements are usually delivered with a frequency of 1 to 10 minutes. Whereas EBC time series usually display high data captures, difficulties in ensuring continuous monitoring were reported by countries for PNC measurements, in particular due to long calibration periods.
1.3.5 Comparability
There is limited literature on the comparison of optical measurement methods for EBC. Optical EBC measurements may be correlated with EC, which is determined using thermal or thermal-optical protocols. EBC can be measured in real-time by aethalometry and absorption photometry, and the absorption coefficients may be calibrated in situ using thermal-optical methods to obtain equivalent black carbon (EBC) concentrations. EBC concentrations would then be directly comparable among monitoring sites. EBC could be combined with online non-mineral carbon (nmC)

4
monitoring, to yield complete information on the organic and elemental carbon fractions. However, online nmC monitoring techniques are not currently available. As for PNC, the particle size range measured is largely dependent on the methodology applied and on its implementation. This may significantly affect comparability between measurements taken at different locations with different instruments. In particular results may be very sensitive to the minimum cut-off diameter since the number of particles is usually higher for small diameters. Comparisons carried out between identical instruments showed very good comparability. However it seems that good comparability only holds within a low concentration range (< 10000 particles). Certain on-site comparisons at higher concentrations gave negative results.
1.3.6 EBC and PNC monitoring implemented in current European networks
EBC measurements have been developing recently in European air quality monitoring networks, mostly as continuation of black smoke measurements. Long-term experience is for instance already available in Switzerland, where EBC measurements have been performed since 2003 within the national network, and in Germany, the UK and in the Paris (France) region, where EBC concentrations have been recorded since 2008. Two main classes of instruments are used within European networks (and worldwide): the MAAP (Multi Angle Absorption Photometer, manufactured by Thermo) and the Aethalometer (manufactured by Magee Scientific). They are both based on the measurement of the optical properties of PM collected on a filter tape, on a short time-base. Both instruments show good robustness, remarkable reliability and offer high data capture, generally above 95%. PNC measurements show similar developments, with observations dating back to 2002 or 2003 in the Amsterdam, Danish and Swiss networks, 2008 in Germany and 1998 in the UK. Various types of instruments are operated with varying size range: Mobility Particle Sizers (DMPS, SMPS, FMPS), Condensation Particle Counters (CPCs), Grimm spectrometers and UFP monitors. UFP monitors which neither require radioactive sources nor condensing fluids have received recent interest in several countries and are being investigated for the possibility to provide continuous, stable and accurate monitoring data. Indeed, as pointed out by countries, particle counters and sizers are currently not easy to use and their implementation requires specific skills and intensive maintenance. Because of data losses due to instabilities and long calibrating operations, it is much more difficult to achieve acceptable data captures.
1.4 Future scenarios
There is an urgent need to better address the specificity of air quality monitoring for health protection purposes, and for the evaluation of measures to reduce urban pollution and at the same time to reduce also anthropogenic contributions to climate change issues. The evidence presented in this report suggests that it may be feasible to deploy routine EBC monitoring instrumentation in EU networks provided issues on validation of measurements (specifically, calibration of BC monitors by comparison with EC) are given sufficient attention. For PNC, the state of art monitoring requires more specialist knowledge than is usually available within normal network operation. At present, PNC monitoring is only carried out in networks where a strong link to and collaboration with research institutions has been in place over a longer period of time.

5
An overview of the current situation indicates that a specific strategy for urban monitoring is required. Such a strategy would allow new monitoring approaches to be introduced in a cost-effective way, while ensuring consistency in monitoring time series. It would also allow the monitoring of emission sources. Such a strategy would help assessing health risks, and also assessing possible contributions on climate change issues. The strategy would be based on a multilevel approach, with the basic level consisting of routine monitoring operation complying with the minimum requirements as expressed in European legislation. The second level would involve a limited number of sites with more extensive instrumentation in each monitoring network. This would enable the acquisition of a more comprehensive knowledge of the situation at specific monitoring sites. It would also help with monitoring local trends and effects of air pollutant mitigation policies and measures. The third level is closely connected to research: a limited research network of urban sites would allow to better understand the processes involved in the urban atmospheres, to document the validity of new measurement techniques under different climatic and other conditions, and in general, to support the European regulatory process with the necessary scientific knowledge.

6
Chapter I. On the validity of BC and particle number as air quality indicators in urban environments I.1. Introduction In the fields of aerosol science and air quality management, the term “proxy pollutant” is used to refer to metrics which may be considered as indicators for given well-known pollutants, while measuring specific characteristics or features related to them. Proxies may also be considered indicators of novel metrics which are complex to monitor on a routine basis (e.g., ultrafine particle number concentration), or even indicators of health effects of conventional or novel pollutants. Useful and practical proxy pollutants for air quality assessment are those that yield sufficient information on the pollutant of interest, with reasonable efforts (minimising costs, manpower, etc.). Thus, proxies usually show high correlation with conventional and/or non-regulated pollutants, with the added values of reducing costs or adding new information (e.g., health effects). Examples of such proxies may be NO2 for ultrafine particle levels, or NO2 for traffic emissions. In the field of air quality assessment it is essential to consider that the main objectives of air quality monitoring (through conventional pollutants or their proxies) are: a) protecting health, ecosystems and other heritage; and b) improving air quality to avoid or reduce the above impacts. Currently, with efforts being made at EU-level for air quality improvement, proxies selected for future air quality monitoring should also consider the feature of being able to show the effect and efficiency of action plans. This technical paper focuses on two such proxy parameters, namely particle number (PNC) and black carbon (BC). This work reports on the suitability of PNC and BC as metrics to be included in future EU air quality monitoring strategies, and the current state of the art regarding monitoring of PNC and BC in EU urban air quality networks. It reviews the health effects associated to these two metrics, as well as the feasibility of introducing them in the urban air quality networks and the degree in which they are currently present in them. Definitions Black carbon In recent years scientific research has focused on carbonaceous particles due to their impact on human health and climate. Recent studies strongly suggest the link between carbonaceous aerosols and many health effects of airborne particles. Soot, the product of incomplete combustion of fuels, may be measured by means of different methodologies. When its light-absorbing properties are measured, soot is referred to as “black carbon” (BC). When its concentration is measured by thermal-optical techniques, soot is known as “elemental carbon” (EC). Elemental carbon concentrations have been used as a surrogate for exposure to diesel exhaust (Birch and Cary, 1996) and these emissions enhance immunologic responses to allergens and inflammatory reactions in the respiratory system at relatively low concentrations and short exposure periods (Brunekreef et al., 1997). Organic aerosols may also pose a significant risk to human health (Mauderly and Chow, 2008). Despite the intensive efforts over the last decades no widely accepted standard measurement method exists for the determination of BC or light absorbing carbon. Real-time BC measurements can be performed using optical methods which measure the absorption of light through a filter collecting airborne particles. The most widely used online methods are aethalometry and absorption photometry. Off-line thermal-
7
optical analysis has been widely used for the determination of organic carbon (OC) and elemental carbon (EC) on filter substrates. Because of a recent controversy within the air quality monitoring and aerosol research communities regarding the potential ambiguity of terms such as BC, black smoke (BS), EC, light-absorbing aerosols, etc., the following definitions were suggested by the Global Atmospheric Watch (GAW) Scientific Advisory Group (GAW/WMO, 2011): - Equivalent Black Carbon (EBC) should be used instead of Black Carbon for measurements derived from optical methods. Black carbon (BC) is converted into EBC by correcting the online measurements with filter-based EC concentrations determined by thermo-optical analysis. - Equivalent refractory Carbon should be used instead of Black Carbon for measurement derived from incandescence methods. - Elemental Carbon (EC) should be used for measurements derived from thermo-optical methods. Other necessary terms parameters are organic carbon (OC) and non-mineral carbon (nmC, defined as total carbon, excluding carbon of mineral origin, e.g., carbonates). The present work focuses on black carbon (BC) and equivalent black carbon (EBC). Particle number Health impact of ultrafine particles (UFP) has motivated a great deal of ambient aerosol research in recent years. Several studies suggest that UFP disproportionately induce oxidative stress in cells and are more toxic compared to larger particles of similar composition. Research has indicated that fine particles may be more toxic because a large proportion of these particles are derived from traffic-related, industrial, and domestic emissions which contain abundant transition metals (von Klot et al., 2002). Because of the low influence of UFP on PM mass concentration (the current metric used in the European air quality legislation), particle number concentration (PNC) may be a better descriptor of UFP variability. Particle number concentration is defined as the number of particles per cubic centimeter measured in a given environment. This parameter usually refers to ultrafine (<0.1 µm) and fine particles (0.1-1.0 µm). Commonly, more than 80% of the total number of particles is found in the ultrafine fraction (Wichmann et al., 2000; Pey et al., 2008). One of the most characteristic aspects of the particle number is the size distribution. Real time measurements of particle number coupled with size distribution in urban environments provide insights about fresh emissions from road traffic (generally in the range 30-120 nm), atmospheric transformations (coagulation-condensation processes, evaporation of semi-volatile compounds), and new aerosol formation. PNC is measured by particle counters, which are instruments that grow collected particles by condensing different fluids (generally butanol or distilled water) over the particles. After this process the originally ultrafine particles become large enough to be detected by a laser. Thus, there are two main types of CPCs, the butanol-based and the water-based CPCs. These instruments provide counts of total number of particles independently of the particle size. Usually the lower detection limit ranges between 3 and 10 nm. One interesting feature of PNC is that, whereas BC is always of primary origin (i.e., emitted directly into the atmosphere), PNC (and also OC) may have a secondary origin as they are highly influenced by atmospheric processes such as new particle formation, condensation or evaporation. They may be thus independent of primary aerosol emissions.

8
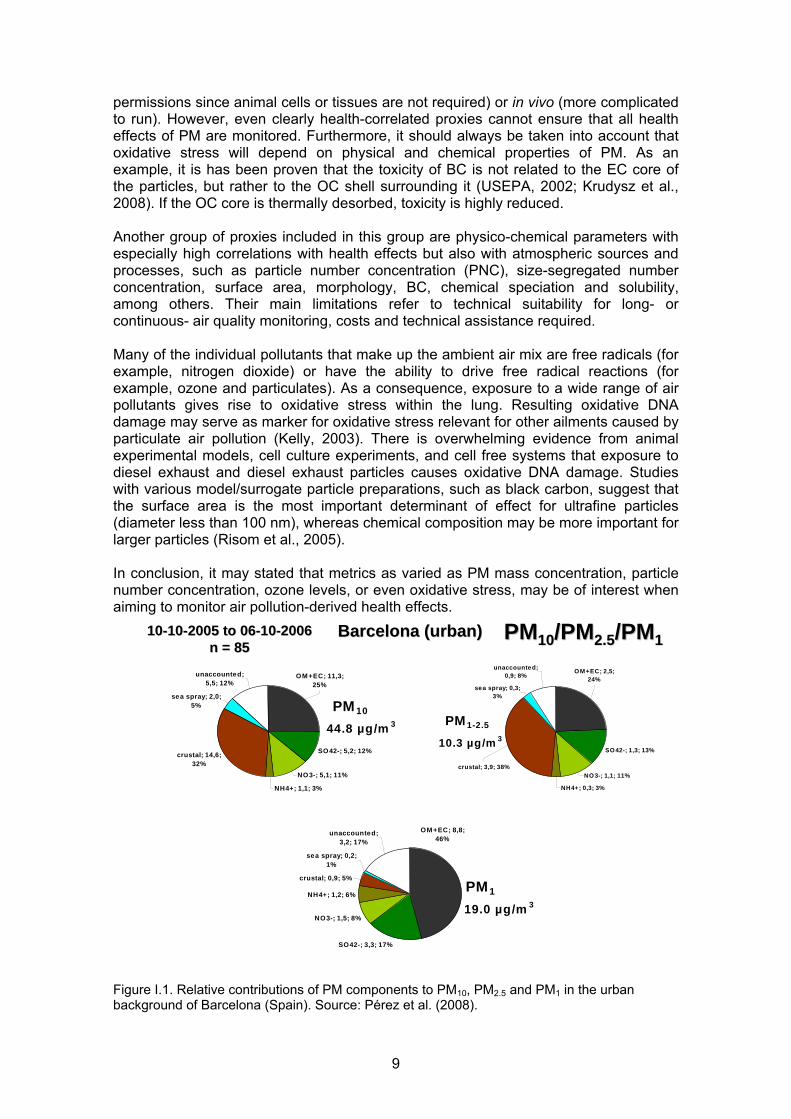
I.2. Current air quality monitoring parameters and future proxies In the light of the upcoming revision of the Air Quality Directive in 2013, assessments are being carried out regarding current legislation and obligations for air quality monitoring in terms of air quality metrics and instrumentation. A number of air quality standards are respected in most of the EU territory, and only exceeded in very specific locations. Monitoring of these metrics should be maintained in order to: a) identify air quality problems in these specific locations; b) aim to reduce the background pollution, eutrophication and acidification of sensitive ecosystems, etc.; and c) evaluate trends. In addition, special emphasis should be placed on parameters meeting one or more of the following criteria: 1) those with standards frequently being exceeded in the EU territory, such as O3, NO2 and PMx; 2) those showing high correlations with specific health impacts; 3) those having high correlation with specific sources causing major air quality impairments. 1) Metrics with standards being frequently exceeded in the EU territory O3: probably current real-time instrumentation will be maintained in future monitoring strategies. However, it will be relevant to implement simultaneous VOC and NOx (not only NO2) measurements in regions with O3 exceedances (>70% of EU territory, ETC-ACC, 2010), as well as in the source regions of O3 precursors. These measurements will support decisions for action plants dealing with the complex issue of O3 abatement. NO2: probably current methodologies will be maintained in future monitoring strategies. However, it is strongly advised that NO should be included in air quality networks in urban areas, given that air pollution mitigation strategies may reduce NO2 but increase NO, or vice versa. Levels of O3 in urban peripheral areas will still increase when urban NOx emissions are decreasing. PM10: probably current methodologies will be maintained in future monitoring strategies. One of the major issues currently refers to the comparability between real-time PMx measurements from different monitoring networks and Member States. Experience shows that correction factors to ensure equivalence with the reference method are not always properly applied across EU.. PM2.5: as shown in Figure I.1 the relative contributions of the PM components to the PM1-2.5 fraction may be very similar to those of PM10; in other words, PM2.5 is strongly influenced by mineral matter as is PM10, whereas PM1 is much less influenced by this component. Thus the combination of PM10 and PM1 monitoring is a better option to separately control levels of coarse and fine PM fractions, than PM10 and PM2.5. It is of course relevant to consider that PM2.5 is already implemented in current networks, and that costs to change to PM1 would be high. However, from a technical perspective, the combination of PM10 and PM1 (and/or BC, as a tracer of traffic emissions) would be more appropriate. 2) PM metrics showing high correlations with specific health impacts and anthropogenic sources and processes The assessment of correlations with health effects is an extremely complex issue due to the fact that health effects derived from exposure to atmospheric pollution are numerous (allergic effects, toxic effects, inflammatory effects, etc.), and they are probably caused by different PM components. Proxies exist which measure specific effects such as the assays on oxidative stress (DNA plasmid assay, Comet assay, and others). These may be in vitro (faster, lower costs and do not require special
9
permissions since animal cells or tissues are not required) or in vivo (more complicated to run). However, even clearly health-correlated proxies cannot ensure that all health effects of PM are monitored. Furthermore, it should always be taken into account that oxidative stress will depend on physical and chemical properties of PM. As an example, it is has been proven that the toxicity of BC is not related to the EC core of the particles, but rather to the OC shell surrounding it (USEPA, 2002; Krudysz et al., 2008). If the OC core is thermally desorbed, toxicity is highly reduced. Another group of proxies included in this group are physico-chemical parameters with especially high correlations with health effects but also with atmospheric sources and processes, such as particle number concentration (PNC), size-segregated number concentration, surface area, morphology, BC, chemical speciation and solubility, among others. Their main limitations refer to technical suitability for long- or continuous- air quality monitoring, costs and technical assistance required. Many of the individual pollutants that make up the ambient air mix are free radicals (for example, nitrogen dioxide) or have the ability to drive free radical reactions (for example, ozone and particulates). As a consequence, exposure to a wide range of air pollutants gives rise to oxidative stress within the lung. Resulting oxidative DNA damage may serve as marker for oxidative stress relevant for other ailments caused by particulate air pollution (Kelly, 2003). There is overwhelming evidence from animal experimental models, cell culture experiments, and cell free systems that exposure to diesel exhaust and diesel exhaust particles causes oxidative DNA damage. Studies with various model/surrogate particle preparations, such as black carbon, suggest that the surface area is the most important determinant of effect for ultrafine particles (diameter less than 100 nm), whereas chemical composition may be more important for larger particles (Risom et al., 2005). In conclusion, it may stated that metrics as varied as PM mass concentration, particle number concentration, ozone levels, or even oxidative stress, may be of interest when aiming to monitor air pollution-derived health effects.
SO42-; 5,2; 12%
NO3-; 5,1; 11%
NH4+; 1,1; 3%
crustal; 14,6; 32%
sea spray; 2,0; 5%
unaccounted; 5,5; 12%
OM +EC; 11,3; 25%
PM 10
44.8 µg/m 3
Barcelona (urban)Barcelona (urban)
SO42-; 1,3; 13%
NO3-; 1,1; 11%
NH4+; 0,3; 3%
sea spray; 0,3; 3%
unaccounted; 0,9; 8%
OM +EC; 2,5; 24%
crustal; 3,9; 38%
PM 1-2.5
10.3 µg/m 3
SO42-; 3,3; 17%
NO3-; 1,5; 8%
NH4+; 1,2; 6%
crustal; 0,9; 5%
sea spray; 0,2; 1%
unaccounted; 3,2; 17%
OM+EC; 8,8; 46%
PM1
19.0 µg/m 3
PMPM1010/PM/PM2.52.5/PM/PM111010--1010--2005 to 062005 to 06--1010--20062006
n = 85n = 85
Figure I.1. Relative contributions of PM components to PM10, PM2.5 and PM1 in the urban background of Barcelona (Spain). Source: Pérez et al. (2008).

10
3) Metrics having high correlation with specific sources and atmospheric processes According to the literature, 80% and 40% of the NO2 and PM10 exceedances of the respective annual limit values in Europe were attributed to road traffic in 2008. It is thus evident that road traffic is one of the major problematic sources in Europe (ETC-ACC (2010). In the case of PM exceedances, emissions from road traffic and biomass burning are frequently reported to be the major causes. An interpretation of the variability of levels of PMx, BC, aerosol number concentration (PNC) and a number of gaseous pollutants in seven selected urban areas covering road traffic, urban background, urban-industrial, and urban-shipping environments from southern, central and northern Europe, showed that variations of PM and PNC levels do not always reflect the variation of the impact of road traffic emissions on urban aerosols (Reche et al., 2011). In Southern Europe, maximum daily PNC concentrations are registered at midday coinciding with low BC concentrations and high photochemical activity. On the other hand, BC levels generally vary proportionally with those of traffic related gaseous pollutants, such as CO, NO2 and NO, but they may also vary as a function of biomass burning emissions. I.3. Why do we need additional metrics in AQ networks? In many large cities of Europe standard air quality limit values of PM are exceeded. Emissions from road traffic and biomass burning (mainly wood but increasingly again, coal, especially in some Eastern European regions) are frequently reported to be the major causes of such exceedances (ETC/ACM, 2010). As a consequence of these exceedances a large number of air quality plans, most of them focusing on traffic emissions, have been implemented in the last decade. In spite of this implementation, a number of cities have not recorded a decrease of PM levels (Harrison et al., 2008; EEA, 2012). Thus, the question remains: is the efficiency of air quality plans overestimated? Or do we need a more specific metric to evaluate the impact of the above emissions on the levels of urban aerosols? It is well-known that road traffic is the main pollutant source in European urban environments (Colvile et al., 2001; Ruellan et al., 2001; Harrison et al., 2004, 2008; Viana et al., 2008). BC levels vary proportionally with those of traffic-related gaseous pollutants, such as CO, NO2 and NO. Due to this high correlation, one might suppose that monitoring the levels of these gaseous pollutants would be enough to extrapolate exposure to traffic-derived BC levels. However, the BC/CO, BC/NO2 and BC/NO ratios vary widely among European cities (Figure I.2, Reche et al., 2011), as a function of distance to traffic emissions, vehicle fleet composition and the influence of other emission sources such as biomass burning. Thus, the scientific literature seems to suggest that for traffic-related particulate pollution, new approaches should be introduced in future urban air quality monitoring strategies (Reche et al., 2011).

11
0
50
100
150
200
250
300
350
0 2 4 6 8 10 12 14 16 18 20 22Hour (UTC)
NO
x (
µg
/m3 )
0
10
20
30
40
50
60
70
80
90
100
CO
(mg
/m3), O
3 (µg
/m3)
NOx CO*100 O3
0 2 4 6 8 10 12 14 16 18 20 22
Hour (UTC)
0
10
20
30
40
50
60
70
80
90
100
CO
*10
0 (m
g/m
3), O3 (µ
g/m
3)CO*100 NOx O3
0 2 4 6 8 10 12 14 16 18 20 22Hour (UTC)
0
10
20
30
40
50
60
70
80
90
100
CO
(mg
/m3), O
3 (µ
g/m
3)
CO*100 NOx O3
0 2 4 6 8 10 12 14 16 18 20 22Hour (UTC)
CO*100 NOX O3
0
20
40
60
80
100
120
0 2 4 6 8 10 12 14 16 18 20 22Hour (UTC)
NO
x (µg
/m3 )
0
10
20
30
40
50
60
70
80
90
100
CO
(mg
/m3), O
3 (µg
/m3)
CO*100 NOX O3
0
20
40
60
80
100
120
0 2 4 6 8 10 12 14 16 18 20 22Hour (UTC)
NO
x (µ
g/m
3 )
0
10
20
30
40
50
60
70
80
90
100O
3 (g/m
3)
NOx O3
0
20
40
60
80
100
120
0 2 4 6 8 10 12 14 16 18 20 22Hour (UTC)
NO
x (
µg
/m3 )
CO*100 NOx O3
BCN
BERN
NK
HU SCO
LUG
MR
Figure I.2. Mean daily variability of CO, NOx and O3 concentrations at urban and traffic sites in Europe: Barcelona (BCN), Lugano (LUG), London-North Kensington (NK), Bern (BERN), London-Marylebone Road (MR), Huelva (HU, Spain), Santa Cruz de Tenerife (SCO, Spain). Source: Reche et al. (2011). Number concentrations in urban areas are highly influenced by primary vehicle exhaust emissions (Morawska et al, 2002; Hueglin et al., 2006). Therefore, a number of studies pointed out that exposure to road traffic emissions may be properly evaluated by combining measurements of BC with PNC concentrations (Fischer et al., 2000; Harrison et al., 2004; Janssen et al., 1997; Smargiassi et al., 2005; Rodriguez and Cuevas, 2007). However, variations of particulate matter (PMx) and PNC levels do not always reflect the variation of road traffic on urban aerosols. It must be taken into account that, whereas BC is primary in origin, the origin of UFP in urban atmospheres may be both primary and secondary (Wehner et al., 2002; Dunn et al., 2004; Van Dingenen et al., 2004). Primary PNC emissions are mainly linked to vehicle exhaust fumes, whereas secondary particle formation in ambient air is mostly attributed to nucleation and cluster/particle growth by condensation of photo-oxidised vapours (Morawska et al., 2008; Dunn et al., 2004) occurring some time after the emission (hours to days). These secondary particle formation mechanisms are enhanced in urban areas with high solar radiation intensities (Fernández-Camacho et al., 2010, Cheung et al., 2010). I.4. PNC and BC in future air quality monitoring networks A recent work by Reche et al. (2011) assessed the variability of levels of PM, BC, PNC and a number of gaseous pollutants at seven selected urban air quality monitoring sites in southern, central and northern Europe. Results from this study evidenced that the daily cycle of PNC showed significant differences between cities with different

12
meteorological conditions, whereas BC levels reproduced in a more stable manner the variability of road traffic contributions. As shown in Figure I.3, PM10 concentrations at European urban background and traffic stations do not always co-vary with road traffic emissions, which are characterised by morning and evening rush hour maxima. PM10 concentrations at these sites are mostly governed by the pattern of the traffic flow and midday atmospheric dilution (see LUG and NK patterns). PM10 levels at the traffic sites remained nearly constant from the morning until the evening peak due to the effects of re-suspension processes. In the case of BCN, concentrations increase at midday when sea breezes are at their strongest and transport the re-suspended mineral material from the city towards the monitoring site. Similar results were reported in earlier studies (Querol et al., 1998; Harrison et al., 2001; Querol et al., 2001, 2005; Charron and Harrison, 2005). In contrast, PM10 concentrations in HU reach the highest values at night due to the seaward transport of aged particulate pollutants. During daylight, winds blow inland from the Atlantic Ocean carrying emission plumes with gaseous pollutants from industrial estates (Sánchez de la Campa et al., 2007), accounting for the different daily cycle of PM and gaseous pollutants.
0
2
4
6
8
10
12
0 2 4 6 8 10 12 14 16 18 20 22Hour (UTC)
Bla
ck C
arb
on
(µg
/m3 )
0
5
10
15
20
25
30
35
40
45
50
PM
10 (µg
/m3)
BC PM10
0.0
0.5
1.0
1.5
2.0
2.5
3.0
3.5
4.0
0 2 4 6 8 10 12 14 16 18 20 22Hour (UTC)
Bla
ck C
arb
on (µg/m
3 )
0
5
10
15
20
25
30
35
40
45
50
PM
10 (µg/m
3)
BC PM10
0 2 4 6 8 10 12 14 16 18 20 22Hour (UTC)
0
5
10
15
20
25
30
35
PM
10 (µg
/m3)
BC PM10
0 2 4 6 8 10 12 14 16 18 20 22Hour (UTC)
BC PM10
0.0
0.5
1.0
1.5
2.0
2.5
3.0
3.5
4.0
0 2 4 6 8 10 12 14 16 18 20 22
Hour (UTC)
Bla
ck
Ca
rbo
n (
µg
/m3 )
BC PM10
0 2 4 6 8 10 12 14 16 18 20 22
Hour (UTC)
0
5
10
15
20
25
30
35
PM
10 (µg
/m3)
BC PM10
0
1
2
3
4
5
6
0 2 4 6 8 10 12 14 16 18 20 22
Hour (UTC)
Bla
ck
Ca
rbo
n (
µg
/m3 )
0
5
10
15
20
25
30
35
PM
(µg
/m3)
BC PM10
BCN LUG
BERN
NK
MR
HU SCO
Figure I.3. Mean daily variability of PM10 and BC concentrations at urban and traffic sites in Europe: Barcelona (BCN), Lugano (LUG), London-North Kensington (NK), Bern (BERN), London-Marylebone Road (MR), Huelva (HU, Spain), Santa Cruz de Tenerife (SCO, Spain). Source: Reche et al. (2011). The same is true for particle number concentrations (Figure I.4). PNC is an appropriate tracer of traffic emissions in certain environments, but it has been reported to be highly influenced by photochemically induced nucleation (Pey et al., 2008; Pérez et al., 2010; Fernández-Camacho et al, 2010; Cheung et al., 2010). In central and Northern

13
European regions PNC shows a high degree of correlation with vehicular exhaust emissions, whereas in Southern Europe it is impacted by secondary particle formation processes. Therefore, in some European regions PNC co-varies with traffic emissions, but not under all meteorological and geographical scenarios. As shown in Figure I.4, peaks of PNC and BC at morning and afternoon rush-hours (7-9 h and 17-20h UTC) are coincident in all the stations studied, with PNC being mainly influenced by primary aerosols and by the formation of new particles during the dilution and cooling of the vehicle exhaust emissions (Mariq et al., 2007, Wehner et al., 2009). However, in Southern Europe an additional PNC peak is frequently detected at midday, during the hours of maximum insolation and maximum sea-breeze circulation (at coastal locations). This additional PNC peak at midday occurs simultaneously with a decrease in BC levels, confirming that this peak cannot be a consequence of primary emissions from road traffic, but of secondary formation of particles by means of photochemical nucleation processes from gaseous precursors. This PNC maximum is attributed to midday nucleation episodes (new particle formation) occurring when gaseous pollutants and BC are diluted and maximum insolation and O3 levels occur. In specific industrial or shipping-influenced areas such as Barcelona, the transport of SO2 from harbour areas due to sea-breeze circulations may also contribute to the occurrence of midday nucleation bursts, probably with subsequent particle growth due to condensation of VOCs. However, similar levels of SO2 were recorded at several central European sites without yielding nucleation episodes (Reche et al., 2011). Even though very low SO2 concentrations are necessary for H2SO4 nucleation (Kulmala et al., 1998), this hints at the relevance of insolation during this new particle formation process. As a result, it is clearly evidenced that PNC variability in different European urban environments is not equally influenced by the same emission sources and atmospheric processes. Thus, it may be concluded that PNC variability does not always reflect the impact of road traffic on air quality, whereas BC is a more consistent tracer of such an influence. Black carbon concentrations, on the other hand, distinctly reproduce road traffic (exhaust) variability on an hourly level across different European regions (Figure I.5). Irrespective of the mean BC levels in the different cities, and whether the stations are representative of traffic emissions or the urban background, the characteristic daily pattern with morning and evening maxima coincident with traffic rush hours is evident at all sites. Furthermore, on a weekly scale the daily evolution of BC for each day of the week and each station shows that the daily evolution was not the same at weekends as the morning road traffic maximum disappears, and a relatively smoother daily evolution in aerosol concentrations during daytime was observed. However, it must be highlighted that BC may also be emitted by biomass burning activities, and this may affect both the daily cycles of this pollutant and the NOx/BC, CO/BC and OC/BC ratios across EU as a function of the different biomass burning emission sources.

14
0 2 4 6 8 10 12 14 16 18 20 22
Hour (UTC)
0.0
0.5
1.0
1.5
2.0
2.5
3.0
3.5
4.0
Bla
ck
Ca
rbo
n (µ
g/m
3)
N (>2.5nm) BC
0
5000
10000
15000
20000
25000
30000
35000
40000
45000
50000
0 2 4 6 8 10 12 14 16 18 20 22
Hour (UTC)
Num
ber of part
icle
s (n
/cm
3 ) N (>2.5nm) BC
0
5000
10000
15000
20000
25000
30000
35000
40000
45000
50000
0 2 4 6 8 10 12 14 16 18 20 22
Hour (UTC)
Nu
mb
er
of p
art
icle
s (n
/cm
3 )
0
2
4
6
8
10
12
Bla
ck C
arb
on
(µg
/m3)
N (>7nm) BC
0
5000
10000
15000
20000
25000
30000
35000
40000
45000
50000
0 2 4 6 8 10 12 14 16 18 20 22
Hour (UTC)
Nu
mb
er
of p
art
icle
s (n
/cm
3 )
0
1
2
3
4
5
6
Bla
ck
Carb
on
(µg
/m3)
N (>7nm) BC
0 2 4 6 8 10 12 14 16 18 20 22Hour (UTC)
0.0
0.5
1.0
1.5
2.0
2.5
3.0
3.5
4.0
Bla
ck
Ca
rbo
n (µ
g/m
3)N (>7nm) BC
0 2 4 6 8 10 12 14 16 18 20 22
Hour (UTC)
N (>7nm) BC
0
5000
10000
15000
20000
25000
30000
35000
40000
45000
50000
0 2 4 6 8 10 12 14 16 18 20 22
Hour (UTC)
Nu
mb
er
of
pa
rtic
les
(n
/cm
3 ) N (>5nm) BC
BCN LUG
BERN
NK
HU SCO
MR
Figure I.4. Mean daily variability of PNC and BC concentrations at urban and traffic sites in Europe: Barcelona (BCN), Lugano (LUG), London-North Kensington (NK), Bern (BERN), London-Marylebone Road (MR), Huelva (HU, Spain), Santa Cruz de Tenerife (SCO, Spain). Source: Reche et al. (2011).

15
0.0
1.0
2.0
3.0
4.0
0.0
0.5
1.0
1.5
2.0
0
5
10
15
0
2
4
6
8
0
1
2
3
4
0
1
2
3
4
0
1
2
3
4
Monday Tuesday Wednesday Thursday Friday Saturday Sunday
Bla
ckC
arbo
n(µ
gm
-3)
Barcelona (UB)
Lugano (UB)
North Kensington (UB)
Bern (T)
Marylebone (T)
Huelva (I)
Santa Cruz de Tenerife (UB-Shipping)
Figure I.5. Hourly variability of BC concentrations for each day of the week at urban and traffic sites in Europe: Barcelona (BCN), Lugano (LUG), London-North Kensington (NK), Bern (BERN), London-Marylebone Road (MR), Huelva (HU, Spain), Santa Cruz de Tenerife (SCO, Spain). Source: Reche et al. (2011). Additionally, BC is a valid tracer of the local or external origin of carbonaceous aerosol contributions. Polar plots of BC concentrations as a function of wind speed and direction allow for the identification of local or external sources of this pollutant. Examples of this kind of source identification are shown in Figure I.6, for one regional background (Montsec), one rural background (Montseny) and two traffic stations (Barcelona and Madrid) in Spain. In the rural and regional background stations, the highest BC levels are recorded coinciding with Southern and Eastern wind directions, which correspond to the main directions of the valleys above which the stations are located. This implies that BC concentrations are not emitted locally but instead transported towards the monitoring stations, by means of mountain breezes channelled through the valleys. Conversely, in Madrid and Barcelona the highest EBC and EC levels are recorded in the direct vicinity of the stations, thus evidencing the local origin
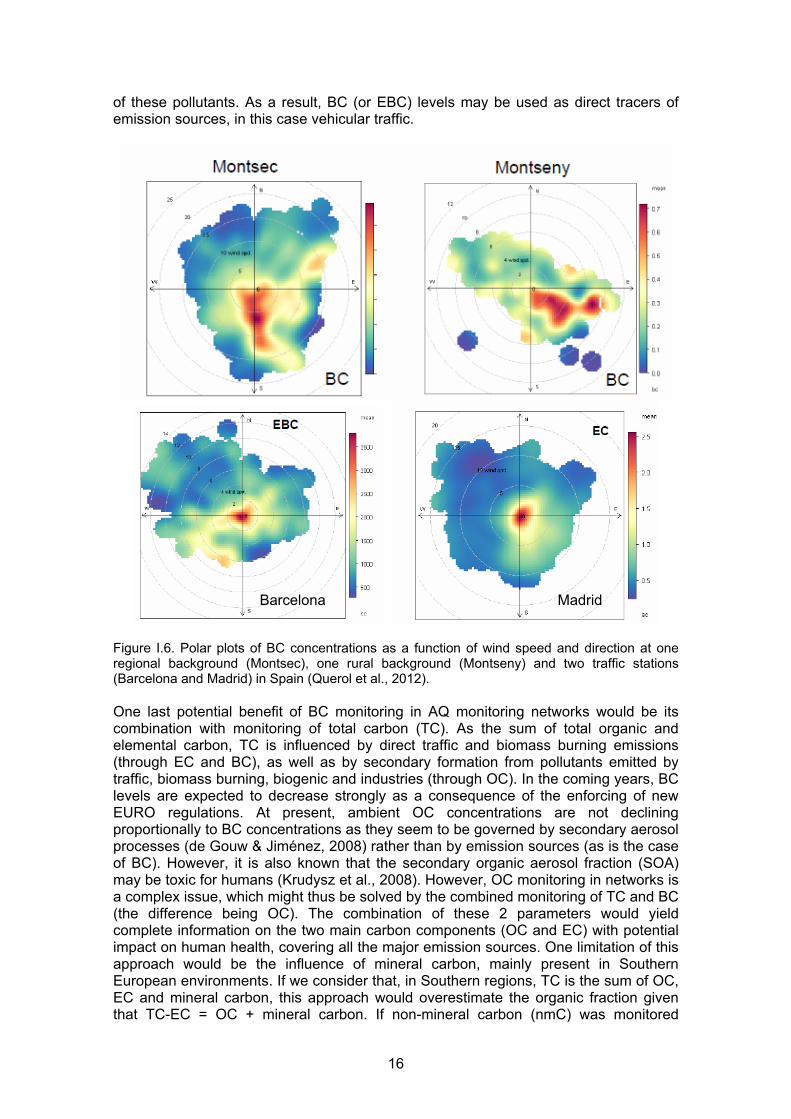
16
of these pollutants. As a result, BC (or EBC) levels may be used as direct tracers of emission sources, in this case vehicular traffic.
Figure I.6. Polar plots of BC concentrations as a function of wind speed and direction at one regional background (Montsec), one rural background (Montseny) and two traffic stations (Barcelona and Madrid) in Spain (Querol et al., 2012). One last potential benefit of BC monitoring in AQ monitoring networks would be its combination with monitoring of total carbon (TC). As the sum of total organic and elemental carbon, TC is influenced by direct traffic and biomass burning emissions (through EC and BC), as well as by secondary formation from pollutants emitted by traffic, biomass burning, biogenic and industries (through OC). In the coming years, BC levels are expected to decrease strongly as a consequence of the enforcing of new EURO regulations. At present, ambient OC concentrations are not declining proportionally to BC concentrations as they seem to be governed by secondary aerosol processes (de Gouw & Jiménez, 2008) rather than by emission sources (as is the case of BC). However, it is also known that the secondary organic aerosol fraction (SOA) may be toxic for humans (Krudysz et al., 2008). However, OC monitoring in networks is a complex issue, which might thus be solved by the combined monitoring of TC and BC (the difference being OC). The combination of these 2 parameters would yield complete information on the two main carbon components (OC and EC) with potential impact on human health, covering all the major emission sources. One limitation of this approach would be the influence of mineral carbon, mainly present in Southern European environments. If we consider that, in Southern regions, TC is the sum of OC, EC and mineral carbon, this approach would overestimate the organic fraction given that TC-EC = OC + mineral carbon. If non-mineral carbon (nmC) was monitored
Madrid Barcelona

17
instead of TC, it would be possible to overcome this limitation. However, no instruments are currently available for online TC or nmC monitoring, even though this kind of data would be highly valuable in urban air quality networks. I.5. Concluding remarks Hourly variations of PM and PNC levels do not always reflect the variation of the impact of road traffic emissions on urban aerosols. However, in absence of biomass burning emissions, BC levels vary proportionally to those of traffic related gaseous pollutants, such as CO and NO2 and NO. Due to this high correlation, one may suppose that monitoring the levels of these gaseous pollutants would be enough to extrapolate exposure to BC levels. However the BC/CO, BC/NO2 and BC/NO ratios vary widely among the studied cities, as a function of the distance to traffic emissions, the vehicle fleet composition and the influence of other emission sources such as biomass burning. Thus, BC is a relevant indicator for the impact of anthropogenic emissions at a measurement site and should therefore be measured in air quality monitoring networks. Although in central and northern Europe PNC and BC levels tend to vary simultaneously, during rush and non-rush hour traffic, in urban background stations in southern Europe PNC levels are also influenced by nucleation episodes (new particle formation). As a result, PNC variability in different European urban environments is not equally influenced by the same emission sources and atmospheric processes across Europe. Consequently, PNC variability does not always reflect the impact of road traffic on air quality. BC, on the other hand, is a more consistent tracer of traffic exhaust emissions. The combination of PM10 and BC monitoring in urban areas potentially constitutes a useful approach to evaluate the impact of road traffic emissions on air quality. BC can be measured in real-time by aethalometry and absorption photometry, and the absorption coefficients may be calibrated in situ using thermal-optical methods to obtain equivalent black carbon (EBC) concentrations. In addition, BC may be combined with online non-mineral carbon (nmC) monitoring, to yield full information on the organic and elemental carbon fractions. However, online nmC monitoring techniques are not currently available, even though this kind of data would be highly valuable in urban air quality networks.

18
Chapter II: Review of health effects from Black Carbon II.1.Summary This chapter presents the results of a review of the health effects derived from exposure to ambient levels of Black Carbon (BC), by using the DPSEEA framework as an operational way to structure the review contents, based upon existing BC-related health studies, e.g., WHO, US EPA, UNEP/WMO, etc., and other recently published literature. DPSEEA was chosen as a framework for reviewing health impacts of BC by following the pathways from source to exposure and health effects in order to understand the causal links between BC and its health effects. Driving force: BC is part of the sooty black material that is a product of incomplete burning of fossil fuels, biomass or bio-fuels. It is one of the many constituents of particulate matter (PM), and has both natural and anthropogenic sources. For example, it is emitted from gas and diesel engines or coal-fired power plants, or by forest fires or burning of agricultural refuse. Pressure and State: BC has shown to be a global environmental problem. It has negative implications for climate: because of its ability to absorb light as heat, it is an important factor in climate change. Through its association with PM, it has implications for human health, however the exact nature of the relationship is obscured by the difficulties in chemical characterization of PM with respect to BC content (and exact characterization of the nature of BC), and by the lack of toxicological evidence. Exposure – Effects: In the PM family, BC is a significant contributor to the fine particle (PM2.5) burden in the air. Evidence shows variability in the ratio of PM2.5 to BC mass depending on climatic factors and proximity to main sources. Whether BC is itself toxic or functions as an indicator of other co-pollutants is currently under debate. But, with BC mass being correlated to total PM mass, also the BC is associated with asthma, and other respiratory problems, low birth weights, heart attacks and lung cancer. Epidemiological studies provide sufficient evidence of an association of short-term (daily) variations in PM concentrations with short-term changes in health (all-cause and cardiovascular mortality, and cardiopulmonary hospital admissions). Cohort studies provide sufficient evidence of associations of all cause and cardiopulmonary mortality with long-term average PM exposure. A reanalysis of existing data shows that the same epidemiological results hold for BC, however the close association between BC and PM has to be considered when interpreting these results. Toxicological studies suggest that BC may not be a major directly toxic component of fine particulate matter, but it may operate as a universal carrier of a wide variety of chemicals of varying toxicity to the human body. Action: Action on reduction in exposure to PM2.5 containing BC and other combustion-related PM material for which BC is an indirect indicator should lead to a reduction in the health effects associated with PM. The major conclusions are: (1) BC cannot be an alternative indicator for air quality instead of PM mass, but traffic derived BC is a valuable additional air quality indicator in urban environment. (2) Currently, there is not possible to differentiate health effects between exposure to BC or PM mass qualitatively and/or quantitatively. (3) A control of BC emissions at source BC appears to be the best way to reduce the human exposure to this air pollutant.

19
This review is of particular interest to environmental health professionals concerned with assessing and reducing the health effects of air pollution, and policy makers concerned with the validity of BC as air quality indicators in urban environments. II.2. Introduction Black carbon (BC) exists as a constituent of particles in the atmosphere and is a major component of soot; thus it is a significant part of the haze often seen above crowded cities (Greenopedia, 2012). BC has been recognized as the second largest contributor to climate change after carbon dioxide (CO2) (IGSD, 2010). Its effects on human health are mainly derived from its association with particulate matter (PM) (IGSD, 2010). This broad and complex role of airborne BC is now under intense scientific study. Scientists are conducting integrated and multidisciplinary research to improve our understanding and determine more clearly the role of BC in air pollution, human health and climate change and how we might reduce its emissions and impacts. BC is neither a toxin nor a carcinogen, but is a major component of diesel particles that have been very recently defined as carcinogen by the WHO. Moreover, it resides on particles so small that they can infiltrate the deepest recesses of the lungs and cause significant damage to the respiratory system including irritation, chronic bronchitis, aggravated asthma and difficulty breathing (Greenopedia, 2012). Scientific evidence and new analyses demonstrate that control of BC particles through rapid implementation of proven emission reduction measures would have immediate and multiple benefits for human well-being (UNEP/WMO, 2011). Grahame & Schlesinger (2010) reviewed the evidence of the effects of BC on cardiovascular health endpoints and concluded that it may be desirable to promulgate a BC PM2.5 standard. Janssen et al. 2011 performed a systematic review and meta-analysis of health effects of BC particles compared with PM mass based on data from time-series studies and cohort studies that measured both exposures, and concluded that BC particles is a valuable additional air quality indicator to evaluate the health risks of air quality dominated by primary combustion particles. UNEP/WMO, 2011 conducted an integrated assessment of BC, and presented evidence that traffic related BC is more toxic than average, and the weaker evidence on the relative toxicity of biomass particles. Therefore, they suggested that the toxicity of BC may somehow source related and have chosen to assume that BC particles are associated with average health risks. US EPA (2012) synthesized and assessed available scientific information on the current and future impacts of BC, and addressed that the limited scientific evidence that is currently available about the health effects of BC is generally consistent with the general PM2.5 health literature, with the most consistent evidence for cardiovascular effects. In 2012, WHO launched a systematic review of health effects from BC (WHO, 2012) and concluded that there are not enough clinical or toxicological studies to allow an evaluation of the qualitative differences between the health effects of exposure to BC or to PM mass (for example, different health outcomes), of quantitative comparison of the strength of the associations or of identification of any distinctive mechanism of BC effects. These above systematic studies may indicate the need for a critical comparison of studies that have measured PM mass as well as BC particles. In this chapter, we adopted the Driving Force-Pressure-State-Exposure-Effects-Action (DPSEEA) (Corvalán et al., 1996) as a framework for reviewing health impacts of BC, by addressing the following specific questions: What is black carbon?

20
Where does black carbon come from? Or what is driving force for black carbon emissions?
What are the pressure and state of the black carbon on the environment, climate and public health?
What are the exposure – health effects of black carbon? What are possible actions toward reducing health effects due to black carbon
polution? II.3. What is black carbon? In Climatology, BC is a climate forcing agent formed through the incomplete combustion of fossil fuels, bio-fuel, and biomass, and is emitted as part of both anthropogenic and naturally occurring soot (Ramanathan and Carmichael, 2008). It consists of pure carbon in several linked forms (Ramanathan and Carmichael, 2008). BC is the most strongly light-absorbing component of PM in the near-infrared region. It warms the Earth by absorbing heat in the atmosphere and by reducing albedo, the ability to reflect sunlight, when deposited on snow and ice (Masiello, 2004). BC stays in the atmosphere for only several days to weeks. In addition, the term BC is also used in soil sciences and geology, referring either to deposited atmospheric BC or to directly incorporated BC onto soils or vegetation from vegetation fires (Masiello, 2004; Schmidt and Noack, 2000). Especially for the tropics, BC in soils significantly contributes to fertility as it is able to adsorb important plant nutrients (Glaser, 2007). II.4. Where does black carbon come from? Or what is driving force for black carbon emissions? BC is produced both naturally and by human activities, and arises from incomplete combustion of organic matter. Thus, major sources of BC are open biomass burning (including forests fires and burning of agricultural waste), mobile sources (especially diesel engines and vehicles), residential heating (including burning of bio-fuels and coal)), and industry and power generation (Environmental Protection UK, 2011). Information on BC emission sources provides for example the EU’s 7th Framework (FP7) project TRANSPHORM (Transport related Air Pollution and Health Impacts – Integrated Methodologies for Assessing Particulate Matter), here the deliverable D1.2.1, a report on shipping emission factors. The report describes that particulate BC, together with CO, VOCs, OC and PAHs are more efficiently produced during incomplete combustion. i. e. low engine loads in the shipping sector (TRANSPHORM, 2010). The FP 6 project EUSAAR (European Supersites for Atmospheric Aerosol Research) and TRANSPHORM: A Case study on biomass burning impact on BC aerosol mass concentration at a costal site in the western part of Lithuanian, was based on a short monitoring campaign. The study concluded that a major part of BC mass in aerosol particles was related to the transport of air masses rich in biomass burning products from the Kaliningrad region, caused by burning of grass (Ulevičius et al., 2010). BC emission sources change by region. Developed countries were once the primary source of BC emissions, but this began to change in the 1950s with the introduction of pollution control technologies in those countries (Novakov et al., 2003; Bond et al., 2007). Today, the majority of BC emissions are from developing countries (Bond, 2007a) and this trend is expected to increase (Jacobson, 2007). The largest sources of BC are Asia, Latin America, and Africa (Bond, 2002). China and India together account for 25-35% of global BC emissions (Ramanathan and Carmichael, 2008).

21
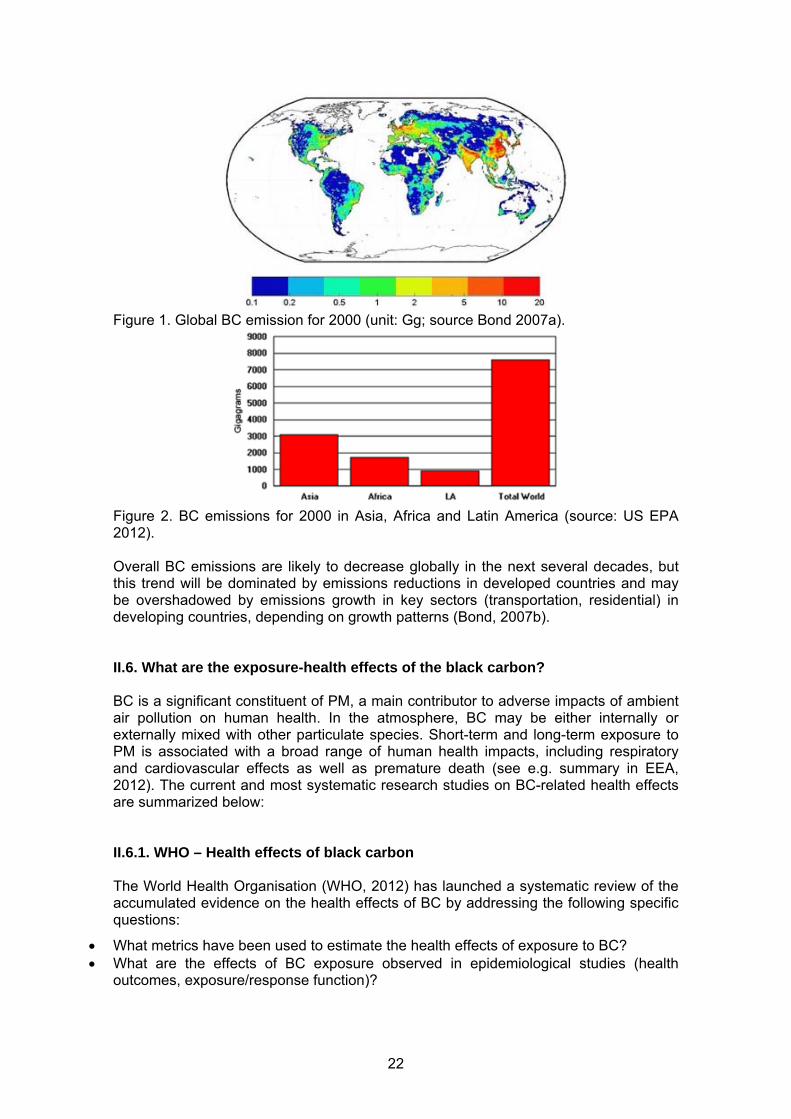
Globally, by source is according to Ramanathan and Carmichael (2008), approximately 20% of BC emitted from burning of bio-fuels, 40% from fossil fuels, and 40% from open biomass burning. Similarly, a study at theUniversity of Illinois, Urbana Champaign, estimates that BC emission can be attributed to the following sources (Bond, 2007a): 42% from open biomass burning (forest and savanna burning) 18% from residential bio-fuel burned with traditional technologies 14% from diesel engines used in the transport sector 10% from diesel engines for industrial use 10% from industrial processes and power generation, usually from smaller boilers 6% from residential coal burning with traditional technologies (stoves) However, at an urban scale source contributions may differ significantly. For example, based on 14C analysis Szidat et al. (2009) and Minguillón et al. (2011) showed that more than 75% of BC was emitted from the burning of fossil fuels. BC sources also vary by region. For example, the majority of soot emissions in South Asia are due to bio-fuel cooking (Center for biological diversity, 2012), whereas in East Asia, coal combustion for residential and industrial uses plays a larger role. In Western Europe, traffic seems to be the most important source since high concentrations coincide with proximity to major roads or participation to (motorized) traffic (Dons, 2011). II.5. What are the pressure and state of the black carbon on the environment, climate and public health? BC has recently emerged as a major contributor to the so-called ‘short-lived climate forcing’ (SLCFs), i.e. to global climate change, possibly, ranking second after CO2 (Ramanathan and Carmichael, 2008). Through changes in the radiative energy balance of the climate system, BC causes temperature changes that produce a variety of impacts on humans, plants and ecosystems. In addition, BC is a form of particulate matter (PM). PM in ambient air is the major pollutant in European ambient air, which can be linked to adverse health effects and premature death (EEA, 2012). For example, diesel pollution poses a cancer risk approximately 7 times greater than the combined risk of all other air toxics tracked by The US Environmental Protection Agency (CLEANAIR TASK FORCE, 2012) and according to the World Health Organization (WHO, 2012), 1.6 million people a year die prematurely from illness attributable to indoor air pollution due to solid fuel use., this being one of the four worst overall health risk factors in poor countries. In 2000, total global BC emissions were estimated to be about 7,600 Gg (Gigagrams) (about 8.4 million tons) (Fig. 1) (Bond, 2007b). Asia, parts of Africa, and parts of Latin America (Central and South America) were among the regions emitting the largest amounts of BC (Fig. 2) (US EPA, 2012).
22
Figure 1. Global BC emission for 2000 (unit: Gg; source Bond 2007a).
Figure 2. BC emissions for 2000 in Asia, Africa and Latin America (source: US EPA 2012). Overall BC emissions are likely to decrease globally in the next several decades, but this trend will be dominated by emissions reductions in developed countries and may be overshadowed by emissions growth in key sectors (transportation, residential) in developing countries, depending on growth patterns (Bond, 2007b). II.6. What are the exposure-health effects of the black carbon? BC is a significant constituent of PM, a main contributor to adverse impacts of ambient air pollution on human health. In the atmosphere, BC may be either internally or externally mixed with other particulate species. Short-term and long-term exposure to PM is associated with a broad range of human health impacts, including respiratory and cardiovascular effects as well as premature death (see e.g. summary in EEA, 2012). The current and most systematic research studies on BC-related health effects are summarized below: II.6.1. WHO – Health effects of black carbon The World Health Organisation (WHO, 2012) has launched a systematic review of the accumulated evidence on the health effects of BC by addressing the following specific questions:
What metrics have been used to estimate the health effects of exposure to BC? What are the effects of BC exposure observed in epidemiological studies (health
outcomes, exposure/response function)?

23
What are the effects of BC in the human controlled exposure experiments? Are they different qualitatively (for example, different health outcomes) and/or quantitatively from the effects of PM2.5 mass concentration and other measured components of PM2.5?
What are the mechanisms of the effects of BC indicated by toxicological studies? WHO concludes the following:
Short-term epidemiological studies provide sufficient evidence of an association of daily variations in BC concentrations with short-term changes in health (all-cause and cardiovascular mortality, and cardiopulmonary hospital admissions);
Cohort studies provide sufficient evidence of associations of all cause and cardiopulmonary mortality with long-term average BC exposure;
Studies of short-term health effects suggest that BC is a better indicator of harmful particulate substances from combustion sources (especially traffic) than undifferentiated PM mass, but the evidence for the relative strength of association from long-term studies is inconclusive;
The review of the results of available toxicological studies suggested that BC may not be a major directly toxic component of fine PM, but it may operate as a universal carrier of a wide variety of chemicals of varying toxicity to the lungs, the body’s major defense cells and possibly the systemic blood circulation; WHO declared in June 2012 (WHO, 2012) diesel soot as a level one carcinogenic. BC is a proxy of diesel soot in most urban environments. We must be extremely cautious when attributing health effects to sources based on health impact assessment studies using specific specific components. If we use for example BC as an indicator for health impact assessment and we find concentration response functions in Europe, we have to be very cautious when attributing these health outcomes to sources. Thus, it is true that in many cases most BC would be attributed to diesel exhaust emissions, however we cannot attribute the whole health effects to diesel because several components such as gasoline OC, and other sources co-emitting with diesel exhaust or varying with collinearly with BC due to meteorology may also cause effects, but simply they correlate with BC carbon. This is an important limitation when dealing with source related health outcomes. II.6.2. US EPA – Black carbon research and report to Congress on black carbon Over the past decade, the US EPA scientific community has focused increasingly on trying to identify the health impacts of particular PM2.5 constituents, such as BC. However, there is currently insufficient information to differentiate the health effects of these constituents. The limited scientific evidence that is currently available about the health effects of BC is generally consistent with the general PM2.5 health literature, with the most consistent evidence for cardiovascular effects (US EPA, 2009, 2010, 2011, 2012). Thus, the US EPA 2012 Scientific Advisory Board assumed that many constituents are associated with adverse health impacts, and recommended that the agency treat all particles as equally toxic (US EPA 2011, 2012). II.6.3. UNEP/WMO – Integrated assessment of black carbon and tropospheric Ozone UNEP/WMO (2011) reviewed the evidence describing PM including BC impacts on human health, focusing on mortality but also considering morbidity. The conclusion was that there is evidence that traffic related BC has a worse than average toxicity compared to other fine particles. This evidence was assessed to be weaker for BC particles emitted from biomass burning in households. Therefore, they have chosen to

24
assume that BC particles are associated with average health risks. UNEP/WMO (2011) also addressed that BC has indirect effects on human health through climate change. II.6.4. Recent scientific articles on health effects of black carbon BC has been associated with cardiovascular (CV) health effects. In a study of defibrillator discharge interventions among 100 adult patients, Peters et al. (2000) found that patients with ≥10 interventions experienced increased arrhythmias in association with short-term variations in BC, NO2, CO, and PM2.5. In a study of 269 elderly Boston, Massachusetts, residents equipped with Holter monitors (portable devices for continuously monitoring electrical activity of the cardiovascular system), an elevated BC level was associated with a –0.1 mm ST-segment depression (a measure of the deviation from the static membrane potential of myocardial cells); this BC level predicted increased risk of ST-segment depression among those with at least one episode of that level of ST-segment depression (Gold et al., 2005). Furthermore, in elderly subjects in Boston, BC increases were associated with a decrease in flow-mediated vascular reactivity (–12.6%) (O’Neill et al., 2005). Grahame & Schlesinger (2010) provided an integrative evaluation of the database examining effects of vehicular emissions, such as BC, carbonaceous gasses, and ultrafine PM, on CV morbidity and mortality. They recommended that as a means to reduce the public health consequences of such emissions, it may be desirable to promulgate a BC PM2.5 air quality standard under the National Ambient Air Quality Standards, which would apply to both on and off-road diesel vehicles. BC has been associated with respiratory disease. Janssen et al. 2005 studied associations between health effects and particulate matter and BC in subjects with respiratory disease and resulted that a 1 μg/m3 increase in outdoor, indoor, and personal BC was associated with an increases in FENO (fractional exhaled nitric oxide) of 2.3 ppb, and suggested that particle-associated BC is useful for examining associations between primary combustion constituents of PM and health outcomes.
BC and its effects on mortality: There is a modest, but growing, volume of literature on the effects of BC itself on mortality. For example, Maynard et al. (2007) looked at the acute effects of exposure to BC in homes (based on a validated land use regression model) on mortality. They reported an effect magnitude for BC that was roughly double as high as the one reported for the acute effects of PM2.5 in 112 US cities (Zanobetti et al., 2009). Smith et al. (2009) reviewed the health effects of three short-lived greenhouse pollutants – BC and sulphates, and noted that although the results of their time-series meta-analysis suggest greater effects per unit mass of sulfate than BC mass, this distinction was less clear in the few studies that directly compared the estimated effects of both indicators. This indicates the need for a critical comparison of studies that have measured PM mass as well as BC mass. BC and its association with blood pressures: Wilker et al. 2010 investigated the association between BC and blood pressure, as well as potential effect modification by single nucleotide polymorphisms (SNPs) in miRNA processing genes, and concluded that there is evidence of effect modification of the association between blood pressure and 7-day BC moving averages by SNPs associated with miRNA processing. BC and its health effects for women and children: Johnson (2010) in his article ‘Black carbon: impact on climate change and human health’ described that public health scientists have noted for years that open fires and primitive stoves pose enormous health risks, particularly for women and children. Some two billion people around the world do most or all of their cooking and heating using biomass. Women typically spend long hours cooking meals beside smoky fires and stoves, with infants and small

25
children nearby. With expanding populations in Africa, India and China, and increased use of biomass (wood, crop residues and dung), the issue is intensifying. However, based on this evidence, the health damage cannot be attributed to BC solely: while the smoke in question contains BC, many other hazardous substances are also present. Traffic-derived BC is an additional valuable air quality indicator in urban environments. Janssen et al. 2011 have performed a systematic review and meta-analysis of health effects of BC particles compared with PM mass based on data from time-series studies and cohort studies that measured both exposures, and concluded that BC particles is a valuable additional air quality indicator to evaluate the health risks of air quality dominated by primary combustion particles. This is consistent with the studies from Jansen et al. (2005), UNEP/WMO (2011), WHO (2012), US EPA (2012), etc. II.7. What are the actions toward reduction of health effects from the black carbon? Human exposure to PM and thus by association to BC is a serious threat to public health in both developed and developing countries. Actions to reduce exposure to BC will produce immediate and significant public health benefits. The major scientific based advice on mitigation, control technology and policy options are summarized below: II.7.1. WHO – Health effects of black carbon The actions recommended by WHO (2012) are: A reduction in exposure to PM2.5 containing BC and other combustion-related PM
material for which BC is an indirect indicator should lead to a reduction in the health effects associated with PM.
PM2.5 should continue to be used as the primary metric in quantifying human exposure to PM and the health effects of such exposure, and for predicting the benefits of exposure reduction measures.
The use of BC as an additional indicator may be useful in evaluating local action aimed at reducing the population’s exposure to combustion PM (for example, from motorized traffic).
US EPA - Cook stove initiative: A five-year cook stove research initiative by US EPA (2011) will work to find efficient solutions to reduce exposures to BC and thus the resulting health effects. This research will include tests on different stove types and fuels to find better alternatives and guide future stove developments. It will also help inform international efforts to reduce BC emissions and human exposures. Health effects and exposure from cook stoves will be studied through clinical, cell and animal studies. Such tests will be used to further define BC’s role in disease and to improve risk assessments. Research findings and technical support will be provided to other EPA offices, the Global Alliance for Clean Cook stoves (GACC), the Partnership for Clean Indoor Air (PCIA) and other partners to set global standards for cleaner stoves and fuels and improve current stove designs while taking socio-economic costs into account for those affected. II.7.2. UNEP/WMO – Integrated assessment of black carbon and tropospheric ozone: summary for decision makers UNEP/WMO 2011 presented two case studies of implementation of measures to reduce BC emissions.

26
Diesel particle filters: in Santiago, municipal authorities, responding to public concern on air pollution, adopted a new emissions standard for urban buses, requiring installation of diesel particle filters (DPFs). Currently about one-third of the fleet is equipped with filters; it is expected that the entire fleet will be retrofitted by 2018. New York City adopted regulations in 2000 and 2003 requiring use of DPFs in city buses and off-road construction equipment working on city projects. London fitted DPFs to the city’s bus fleet over several years beginning in 2003. Low emission zones in London and other cities create incentives for diesel vehicle owners to retrofit with particle filters, allowing them to drive within the city limits. Implementation in developing regions will require greater availability of low sulphur diesel, which is an essential prerequisite for using DPFs.
Improved brick kilns: small-scale traditional brick kilns are a significant source of air pollution in many developing countries; there are an estimated 20,000 in Mexico alone, emitting large quantities of particulates. An improved kiln design piloted in Ciudad Juarez, near the border with the United States of America, improved efficiency by 50 percent and decreased particulate pollution by 80 percent. In the Bac Ninh province of Viet Nam, a project initiated with the aim of reducing ambient air pollution levels and deposition on surrounding rice fields piloted the use of a simple limestone scrubbing emissions control device and demonstrated how a combination of regulation, economic tools, monitoring and technology transfer can significantly improve air quality.
II.7.3. Arctic Council Task Force on short-lived climate forcers – Progress report and recommendations for Ministers Arctic Council Task Force (2011) has recommended Arctic Council nations individually and collectively work to implement some early actions to reduce BC, such as:
Arctic Council nations continue their efforts to estimate and develop BC emission inventories and to voluntarily and periodically share these inventories.
Arctic Council nations consider specific mitigation options for the transportation, residential, open burning, and shipping sectors, and that they periodically share information on progress in reducing their BC emissions.
Measures to reduce BC from transportation, especially diesel powered, could include more retrofitting of older vehicles and equipment; retirement of old engines, vehicles, and equipment; and enhancing or expanding current controls to the extent that PM standards are not in place.
Similar retrofit retirement or replacement measures could be applied to reduce BC emissions from stationary engines and equipment.
Measures to reduce BC from residential heating could include standards, change-out programs, technologies for more efficient combustion, and retrofits addressing wood stoves, boilers, and fireplaces.
To reduce BC from agricultural burning, prescribed forest burning, and wildfires, measures could include demonstration projects for management alternatives to burning, prevention of accidental fires, and greater resources devoted to fire monitoring and prevention. When controlled burning is necessary, such as when fire plays a critical and natural ecological role, management techniques may help reduce emissions or limit their impacts.
Measures to reduce BC from marine shipping in and near the Arctic could include Council-wide adoption of voluntary technical and non-technical measures, adoption of the proposed amendment of MARPOL Annex VI to establish an Energy Efficiency Design Index, and collaboration with IMO on certain other actions.
For gas flaring, it is premature to identify specific BC mitigation options, but increased research and better emission inventories are recommended to improve understanding of the significance of this source.

27
II.7.4. Policy options Many countries have existing national laws and regulations to regulate BC emissions, this includes legislation addressing particulate matter emissions (EEA, 2012). Some examples include: banning or regulating slash-and-burn clearing of forests and savannas, as well as
burning of agricultural waste; requiring shore-based power/electrification of ships at port, regulating idling at
terminals, and mandating fuel standards for ships seeking to dock at port; requiring regular vehicle emissions tests, retirement, or retrofitting (e.g., adding
particulate traps, including penalties for failing to meet air quality emissions standards, and heightened penalties for on-the-road “super-emitting” vehicles, etc.)
banning or regulating the sale of certain fuels and/or requiring the use of cleaner fuels for certain uses;
regulating and/or limiting the use of chimneys and other forms of biomass burning in urban and non-urban areas;
requiring permits to operate industrial, power generating, and oil refining facilities and periodic permit renewal and/or modification of equipment; and
Requiring filtering technology and high-temperature combustion (e.g., super-critical coal) for existing power generation plants, and regulating annual emissions from power generation plants.
II.7.5. International regulatory responses Concentrating on the immediate reduction of BC is a high priority for the IPCC (IPCC, 2007). The International Network for Environmental Compliance & Enforcement issued a Climate Compliance Alert on BC in 2008 which cited reduction of BC as a cost-effective way to reduce a major cause of global warming (INECE, 2008). In May 2012, the Parties to the Convention on Long-Range Trans-boundary Air Pollution (CLRTAP, 2012) approved new emission reduction commitments for main air pollutants by 2020 (Gothenburg Protocol). The Parties have broken new ground in international air pollution policy by specifically including the short-lived climate forcer, black carbon (or soot), as a component of particular matter. II.8. Conclusions and recommendations There are no generally accepted standard methods to measure BC in atmospheric aerosol available so far. Due to BC being produced as an incomplete burning of organic matter that is also one of the main sources of PM, the levels of BC and of PM are likely to be well correlated locally, making it difficult to attribute the health effect to one or the other. Therefore, we suggested that atmospheric research needs first to come to a consensus of monitoring and analytical methodology. BC cannot be an alternative indicator for air quality instead of PM mass, but traffic derived BC is a valuable additional air quality indicator in the urban environment. These conclusion has been supported by Janssen et al. (2011) ‘a systematic review and meta-analysis of health effects of BC particles compared with PM mass’, UNEP/WMO (2011) ‘Integrated Assessment of Black Carbon and Tropospheric Ozone’, US EPA (2012) ‘Report to Congress on Black Carbon’, and WHO (2012) ‘Health effects of black carbon’.

28
Currently, it is not possible to differentiate health effects between exposure to BC or PM mass qualitatively and/or quantitatively. Human epidemiological studies, as reviewed by WHO (2012), suggest that BC is associated with the same human health effects as particulate matter. Toxicological studies reviewed by WHO (2012) state that “At present, it is not possible to say definitively whether health effects due to exposure to BC or PM mass are different qualitatively (for example, different health outcomes) and/or quantitatively from each other”. The US EPA’s Scientific Advisory Board recently recommended that the agency treat all particles as equally toxic, as the evidence for using differential toxicity in risk assessment was not strong enough (WHO, 2012). Given the evidence that traffic related BC is more toxic than average and the weaker evidence on the relative toxicity of biomass particles, UNEP/WMO (2011) has chosen to assume that BC particles are associated with average risks. Sufficient number of controlled health studies which involve human subjects with simultaneous BC or EC measurements and other PM speciation are needed. The main limiting knowledge at this point seems the lack of data regarding PM speciation with agreed-upon method to assess BC. Unlike climate change where the evidence of the importance of BC is unequivocal and demands immediate action to reduce it, the evidence of health benefits of such action is mostly linked to the reduction of PM that will follow from the BC reduction measures, as no unique BC exposure metric is available. Further toxicological and epigenetic studies are also needed to further elucidate the issues. To control emissions sources of BC at the source, especially close to populated areas, might be the best way to reduce the human exposure to BC. Due to the fact that BC sources also produce PM (though not all PM sources emit also BC); measures to control emissions from combustion sources are the best candidate measures to control BC emissions in ambient air. This includes important measures others than end-of-pipe, e.g., measures affecting diffuse or non-industrial sources.
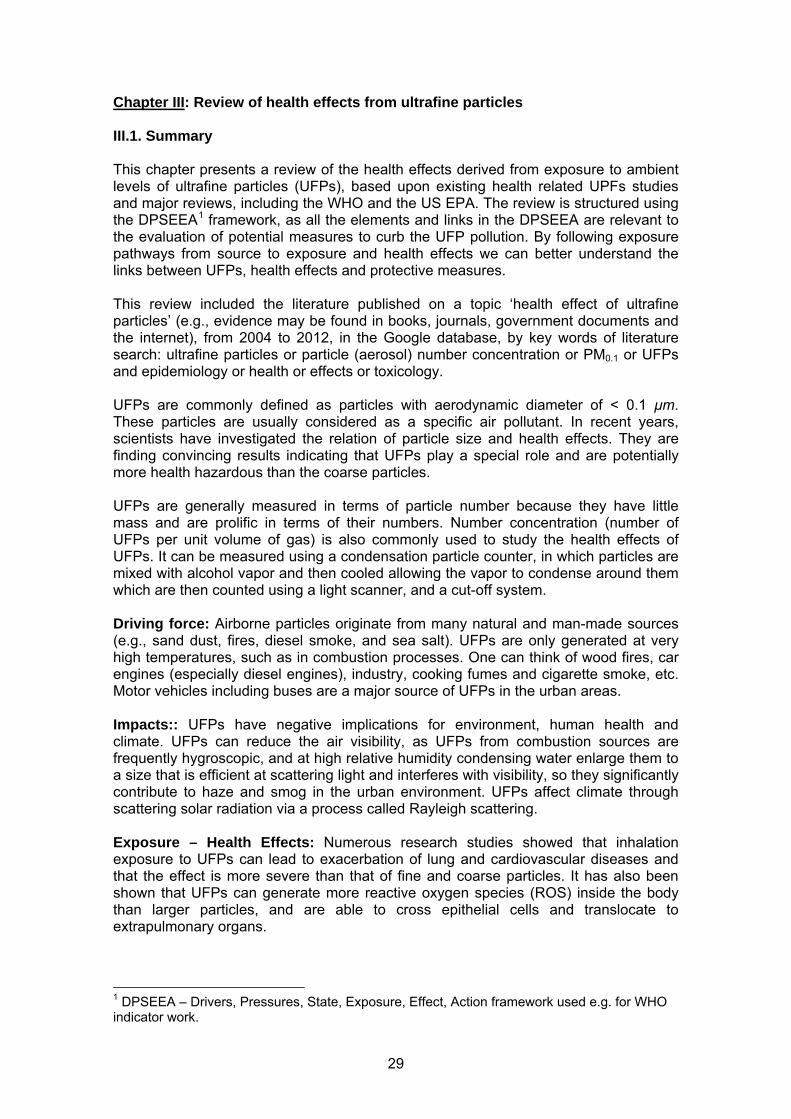
29
Chapter III: Review of health effects from ultrafine particles III.1. Summary This chapter presents a review of the health effects derived from exposure to ambient levels of ultrafine particles (UFPs), based upon existing health related UPFs studies and major reviews, including the WHO and the US EPA. The review is structured using the DPSEEA1 framework, as all the elements and links in the DPSEEA are relevant to the evaluation of potential measures to curb the UFP pollution. By following exposure pathways from source to exposure and health effects we can better understand the links between UFPs, health effects and protective measures. This review included the literature published on a topic ‘health effect of ultrafine particles’ (e.g., evidence may be found in books, journals, government documents and the internet), from 2004 to 2012, in the Google database, by key words of literature search: ultrafine particles or particle (aerosol) number concentration or PM0.1 or UFPs and epidemiology or health or effects or toxicology. UFPs are commonly defined as particles with aerodynamic diameter of < 0.1 μm. These particles are usually considered as a specific air pollutant. In recent years, scientists have investigated the relation of particle size and health effects. They are finding convincing results indicating that UFPs play a special role and are potentially more health hazardous than the coarse particles. UFPs are generally measured in terms of particle number because they have little mass and are prolific in terms of their numbers. Number concentration (number of UFPs per unit volume of gas) is also commonly used to study the health effects of UFPs. It can be measured using a condensation particle counter, in which particles are mixed with alcohol vapor and then cooled allowing the vapor to condense around them which are then counted using a light scanner, and a cut-off system. Driving force: Airborne particles originate from many natural and man-made sources (e.g., sand dust, fires, diesel smoke, and sea salt). UFPs are only generated at very high temperatures, such as in combustion processes. One can think of wood fires, car engines (especially diesel engines), industry, cooking fumes and cigarette smoke, etc. Motor vehicles including buses are a major source of UFPs in the urban areas. Impacts:: UFPs have negative implications for environment, human health and climate. UFPs can reduce the air visibility, as UFPs from combustion sources are frequently hygroscopic, and at high relative humidity condensing water enlarge them to a size that is efficient at scattering light and interferes with visibility, so they significantly contribute to haze and smog in the urban environment. UFPs affect climate through scattering solar radiation via a process called Rayleigh scattering. Exposure – Health Effects: Numerous research studies showed that inhalation exposure to UFPs can lead to exacerbation of lung and cardiovascular diseases and that the effect is more severe than that of fine and coarse particles. It has also been shown that UFPs can generate more reactive oxygen species (ROS) inside the body than larger particles, and are able to cross epithelial cells and translocate to extrapulmonary organs.
1 DPSEEA – Drivers, Pressures, State, Exposure, Effect, Action framework used e.g. for WHO indicator work.
30
Action: Action on reduction in exposure to PM containing UFPs and other combustion-related PM material for which UFPs are a major component should lead to a reduction in the health effects associated with UFPs. The major conclusions are (1) Motor vehicles and buses are a major source of UFPs in the ambient urban areas; (2) The evidence being published in the scientific literature increasingly indicates that UFPs can be a significant source of risk to respiratory and cardiovascular health, and childhood asthma; (3) Lack of standardization of measuring equipment for UFPs number emissions is a global challenge for developing UFPs number standards; (4) UFPs surface area may be the best measure of toxicity over that of mass or UFPs number; (5) Currently UFPs are neither regularly monitored nor regulated by ambient air quality standards; (6) There is no standardization of monitoring methodologies for UFPs at the moment (work in progress); and (7) By far the most effective way to minimize exposure of UFPs is to control their emission sources. This review is of particular interest to environmental health professionals concerned with risk assessment and reducing the health effects of air pollution, and policy makers concerned with the risk management decisions with respect to regulatory actions. III.2. Introduction In recent years, scientists have investigated the relation of particle size and health effects. They are finding convincing results indicating that ultra-fine particles (UFPs, in the range of around one hundred nanometer) play a special role and are potentially more health hazardous than the coarse particles (PHILIPS, 2012). Why are UFPs so health hazardous? This question is still the subject of ongoing scientific research. Some possible explanations have been suggested. One is that UFPs have a high deposition rate in the lung, can penetrate and deposit deeper in the lungs than coarser particles, about 50% of the particles around 20 nm deposits deep in the lungs (Cahill et al., 2011a, b, c). Another explanation is that the number concentration of UFPs is generally much higher than the number concentration of coarser particles. The lungs cannot deal with the high amounts of particles that deposit in the lung sacs, which lead to inflammation (University of Aegean, 2008). A third possible explanation is that the size of the particles is such that they can enter the circulatory system in the human body and can move and end up in the blood stream causing heart and brain diseases (Froines, 2006; Cahill et al., 2011a, b, c; PHILIPS, 2012). A fourth explanation is that the UFPs contain toxic components and may initiate harmful oxidant injury (University of Aegean, 2008). Health effects from aerosol particles including UFPs can be divided in short term and long-term effects. Long-term effects are lung diseases, but also increased risk of heart and brain problems. Short-term effects are increased mortality and morbidity. Especially children, elderly people and people with lung problems like asthma are vulnerable to UFPs air pollution (Philips, 2012). There is still no systematic review of health effects from UFPs. Morawska et al. 2004 performed a desktop literature review and analysis on health impacts of UFPs and concluded that both fine and UFPs appear to affect health outcomes such as mortality and respiratory and cardiovascular morbidity and appear to do so independently of each other. However, the database at present is too limited (i.e., both in numbers of studies and numbers of subjects) and geographically restricted, to allow clear conclusions on the mode of action or generalization to other settings. This may indicate
31
more studies in other settings need to be initiated to improve knowledge of UFPs and health outcomes. The University of Aegean (UCLA; 2008) reviewed and analyzed the health hazards induced by UFPs exposure and concluded that there is significant analogy between UFPs exposure and related adverse health effect risks in human beings. Cardiovascular and pulmonary systems seem to be the main targets of this exposure. New evidence shows accumulation of UFPs in regions of the cerebellum, olfactory bulb and other areas of the central nervous system. A study led by UCLA researchers 2008 (Araujo et al., 2008) revealed that the UFPs from vehicle emissions may be the most damaging components of air pollution in triggering plaque buildup in the arteries, which can lead to heart attack and stroke, and suggested that UFPs are, compared to other PM classes, the more toxic air pollutants in promoting events leading to cardiovascular disease. Knol et al. (2009) carried out an expert elicitation on the health effects of ambient UFPs exposure, focusing on: 1) the likelihood of causal relationships with key health endpoints, and 2) the likelihood of potential causal pathways for cardiac events. Their results showed that (1) The likelihood of an independent causal relationship between increased short-term UFPs exposure and increased all-cause mortality, hospital admissions for cardiovascular and respiratory diseases, aggravation of asthma symptoms and lung function decrements was rated medium to high by most experts. (2) The likelihood for long-term UFPs exposure to be causally related to all cause mortality, cardiovascular and respiratory morbidity and lung cancer was rated slightly lower, mostly medium. (3) The experts rated the likelihood of each of the six identified possible causal pathways separately. Out of these six, the highest likelihood was rated for the pathway involving respiratory inflammation and subsequent thrombotic effects. This stresses the importance of considering UFPs in future health impact assessments of (transport-related) air pollution and the need for further research on UFPs exposure and health effects. Sannolo et al. (2011) reviewed the results of the recent epidemiological and toxicological studies on adverse health effects from exposure to UFPs, and concluded that (1) epidemiologic and clinical studies have linked elevated concentrations of ambient UFPs to adverse health effects, such as acute respiratory infections, lung cancer, chronic obstructive pulmonary diseases and cardiovascular diseases, (2) toxicological research has shown that UFPs induce several types of adverse cellular effects, including cytotoxicity, mutagenicity, DNA oxidative damage and stimulation of proinflammatory cytokine production, however the biological mechanisms behind these associations are not fully understood. Knibbs et al. (2011) reviewed commuter exposure to UFPs and its health effects, and concluded that UFP exposure during commuting can elicit acute effects in both healthy and health compromised individuals, and suggested that future work should focus on further defining the contribution of in-transit UFPs exposure to total UFPs exposure, exploring its specific health effects and investigating more exposures in the developing world. Currently UFPs are neither regularly monitored nor regulated by ambient air quality standards. Emission inventories, epidemiological studies and studies of the chemical composition of UFPs are urgently needed to inform the scientific debate and guide the development of air quality standards and regulation to control this important pollution source. Keogh and Sonntag (2011) presented a précis of the published inventory of UFPs (particle number) developed for the urban South-East Queensland motor vehicle and bus fleet in Australia. The applicability of the comprehensive set of average particle

32
emission factors used in this inventory, for developing UFPs (particle number) and particle mass inventories in other developed countries, needs to be further investigated. In addition, the EU’s 7th Framework Programme project TRANSPHORM (2010 – 2013) (Transport related Air Pollution and Health impacts – Integrated Methodologies for Assessing Particulate Matter) (http://www.transphorm.eu) will develop and implement an integrated assessment of the health impacts of transport related particulate matter including UFPs, from emission to health burden, to derive improved emission factors for relevant UFPs numbers and mass fractions of PM1, PM2.5 and PM10 through new and existing data. The results from this project will be expected to contribute to develop a UFPs inventory in terms of choice of emission factors in Europe. As one major task of the ETC/ACM 2012 IP, in this report, we adopted the Driving Force-Pressure-State-Exposure-Effects-Action (DPSEEA) (Corvalán et al., 1996) as a framework for reviewing health impacts of UFPs in the urban environment, by addressing the following specific questions: What are UFPs? How are they measured? Where do UFPs come from? Or what is driving force for UFPs? What are the pressure and state of UFPs on the environment, public health and
climate? What are the exposure-health effects of the UFPs? What are the actions toward reduction of health effects from the UFPs? III.3. What are ultrafine particles? How are they measured? UFPs are partivcles with an aerodynamic diameter of < 0.1 μm (0.1 μm = 100 nm) (Lijima, 1985). UFPs are the main constituent of airborne particulate matter, and are both manufactured and naturally occurring. There are two main divisions that categorize types of UFPs. UFPs can either be carbon-based or metallic, and then they can be further subdivided by their magnetic properties. Electron microscopy and special physical lab conditions allow scientists to investigate the morphology of UFPs (Lijima, 1985). Legislation regulating this size class of ambient air pollution particles does not exist. UFPs are by far smaller than the regulated PM10 and PM2.5 particle classes and there are indications that they have several more aggressive health implications than the larger particulates (Osunsanya et al., 2001; Howard, 2009). Airborne particles are measured and typically reported in two units. One is number concentration, which is the total number of airborne particles per unit volume of air, without distinction based on their sizes. You will see this reported as number of particles per unit of air: particles/cm3 or particles/m3. The other way of measuring PM is mass concentration, which is the total mass of all particles in an aerosol per unit volume of air. Mass concentration is reported as nanogram (ng) or microgram (ug) of particles per volume of air: µg/m3, ng/m3, µg/cm3 or ng/m3. Since UFPs contain little mass, but possess a large surface area, these sub-micron particles are typically expressed in particle number concentrations or particles/cm3 (Spengler, 2000; Osunsanya et al., 2001; Science Daily, 2009). III.4. Where do ultrafine particles come from? Or what is driving force for ultrafine particles? UFPs can be the result of friction processes in the air or water. They can also originate from anthropogenic sources such as fossil fuel combustion, or are formed via

33
nucleation processes leading to the formation of secondary aerosols containing nitric/sulphuric acid, ammonia, water and/or organics (Sabaliauskas and Evans, 2010). Hot volcanic lava, ocean spray, and smoke are common natural UFPs sources. These particles can be further transformed through condensation, evaporation and coagulation processes that affect their number, size and composition. Secondary particles are subsequently formed within the atmosphere as a result of chemical reaction, producing substances of low volatility, which consequently condense into a solid or liquid phase, thereby becoming PM. Examples include sulphates and nitrates formed from the oxidation of sulphur dioxide (SO2, primarily emitted during power generation and industrial combustion processes) and nitrogen dioxide (NO2, main sources are road transport and power generation) in the atmosphere. The resulting acids are then neutralized by atmospheric ammonia derived mainly from agricultural sources (Kelly et al., 2012). UFPs arise mainly from primary particle combustion emissions and secondary particles produce by gas-to-particle conversion process. The properties of UFPs from vehicle emissions depend on the vehicle fleet, fuel and lubricating oil characteristics, and engine operating conditions. UFPs show significant spatio-temporal variability, depending on traffic density and day-to-day meteorology. Outdoor UFPs exposure is directly related to the proximity to traffic emissions. Indoor exposure is related to the ventilation characteristics of the building and lifestyle choices such as cooking, burning candles, tobacco smoke, use of cleaning products, laser printers, fax machines, photocopiers, the peeling of citrus fruits, penetration of contaminated outdoor air, chimney cracks and vacuum cleaners (Spengler, 2000, Collins, 2007; Benjamin, 2007; Sabaliauskas and Evans, 2010; Air Quality Sciences, 2011). III.5. What are the pressure and state of the ultrafine particles on the environment, public health and climate? UFPs have become a key area of interest in environmental monitoring and related studies as they have shown to have potentially significant impacts on global climate, ecosystem processes and public health (New Media Studio, 2012). Like other aerosol particles, UFPs can affect climate through scattering solar radiation via a process called Rayleigh scattering. Rayleigh scattering is inversely proportional to the fourth exponent of the wavelength of the radiation. The cooling effect that particles including UFPs have on the surface of the Earth due to direct reflection of solar radiation is referred to as the direct effect, or direct climate forcing. Aerosol particles including UFPs also influence the size, abundance, and rate of production of cloud droplets. Thus they influence cloud cover, cloud albedo, and cloud lifetime (New Media Studio, 2012). UFPs have a significant impact on clouds via cloud condensation nuclei number concentrations (CCN; Adams, 2003). Aerosol particles including UFPs are transported by prevailing winds and convection once they are in the atmosphere. For this reason, the elements contained in aerosols are seldom re-deposited on the surface of the Earth in the same location where they were released or produced. The dry or wet deposition of aerosol particles can be an input of compounds to an ecosystem different from other sources, such as the weathering of soil minerals. When sulfate (SO4
-2) and nitrate (NO3-) containing aerosol
particles are incorporated into cloud droplets, they lead to acidic deposition, often hundreds of miles away from the source of the aerosols or precursor gases (Seinfeld & Pandis, 1998).

34
Aerosol participles including UFPs also affect visibility. UFPs from combustion sources are frequently hygroscopic. At high relative humidity condensing water enlarges them to a size that is efficient at scattering light and interferes with visibility, so they significantly contribute to haze and smog (Moghini et al., 2005). III.6. What are the exposure-health effects of the ultrafine particles? The main exposure of humans to UFPs is through inhalation. Due to their small size, UFPs are considered to be respirable particles. Contrary to PM10 and PM2.5, UFPs may be transported through the respiratory tract, across the lungs and translocate to other org. Further, they can be absorbed directly into the blood stream. Therefore they are not easily removed from the body and may have immediate effects (Cahill et al., 2011). Exposure to UFPs may cause oxidative stress (Corvalán et al., 1996), inflammatory mediator release, may induce lung disease and other systemic effects (Spengler, 2000; Osunsanya et al., 2001; Collins, 2007; Sabaliauskas and Evans). There is a range of potential situations where humans are exposed to UFPs, including occupational exposure e.g. due to manufacturing processes (IGSD, 2010). Exposure can also be incidental, from contaminated outdoor air and other byproduct emissions.. In order to quantify exposure and risk, both in vivo and in vitro studies of various UFPs species are currently being done using a variety of animal models (Adams, 2003). These studies aim to establish toxicological profiles necessary for risk assessment, risk management, and potential regulation and legislation (Moghini et al., 2005). III.6.1. WHO – Health effects of ultrafine particles The WHO publication ‘Health relevance of particulate matter from various sources, Report on a WHO workshop Bonn, Germany 26–27 March 2007’ addressed that adverse health outcomes have been associated with various size fractions within the PM10 range. There is some indication that thoracic coarse particles may preferentially affect the airways and lungs, while fine particles may preferentially affect the cardiovascular system. UFPs may also migrate via the lung to other locations, including the liver, spleen, brain, placenta and a fetus. Another route of internal exposure is translocation of UFPs via the olfactory nerve system to the brain. The health implications of these observations remain unknown (Happo et al., 2007; Jalava et al., 2007). At the WHO workshop on ‘Health relevance of particulate matter from various sources’ the relation of outdoor PM10, PM2.5 and UFPs pollution with hospital admissions because of cardiovascular and respiratory diseases were presented, based on studies conducted in Rome (Jalava et al., 2007). The results showed that high levels of PM2.5
and UFPs increase the risk of hospital admission because of heart diseases;. UFPs are also associated with hospital admissions for respiratory diseases, especially chronic obstructive pulmonary disease (COPD. High PM2.5 mass concentrations and PNC (Ultrafine particle number concentration) had both a cardiac effect during winter at immediate lag, but PNC had also a delayed effect during summer. PM2.5 had the largest respiratory effect in summer whereas PNC was associated with COPD in winter and during the transition-period. The results may indicate that the health effects from PM10, PM2.5 and UFPs are partially independent and have different mechanisms. Other studies investigated the role of distinct parameters (e.g., metal content, partile surface, particle reactivity, etc.) of various inhaled or instilled UFPs from 1.4 nm to 20 nm with respect to subsequent particle translocation in rats (WHO, 2007). The results showed that such characteristics of UFPs affect their accumulation in secondary target

35
organs of rats (e.g., liver, spleen, kidneys, heart, vasculature, brain, reproductive organs and even the fetus). III.6.2. US EPA – Research on particulate matter including ultrafine particles The US EPA Particulate Matter Center at UCLA, Rochester, 2008 (EPA, 2008) tested the hypothesis that UFPs occurring in the urban atmosphere cause adverse health effects. Results showed that (1) epidemiological studies have consistently found an association between small increases in urban particulates and health effects, including increased morbidity and mortality in people with respiratory and cardiac disease. The elderly are especially susceptible. These effects are associated with fine and ultrafine particles. (2) Some epidemiological studies found a correlation between particle number, reflecting ambient UFPs levels, increased symptoms in people with compromised respiratory and cardiovascular symptoms. Moreover, animal studies have shown that UFPs have a significantly greater pulmonary inflammatory potency than larger particles of the same chemical composition (Oberdorster, 2001). III.6.3. Recent scientific articles on health effects of ultrafine particles Frampton et al. (2006) tested the hypothesis that inhalation of carbon UFPs has vascular effects in healthy and asthmatic human subjects, detectable as alterations in blood leukocyte expression of adhesion molecules.and the authors concluded that the findings from these studies provide evidence that inhalation of carbon UFPs, when the subject is exercising, reduces peripheral blood monocytes, eosinophils, and basophils which are crucial for the immune system It further reduces the expression of some adhesion molecules on monocytes and PMNs (polymorphonuclear leukocytes). When considered in the light of other evidence, the leukocyte changes may be a consequence of endothelial activation or vasoconstriction in the pulmonary and/or systemic circulation possibly caused by UFPs. Bräuner et al. (2007) investigated oxidative damage to DNA and related repair capacity in peripheral blood mononuclear cells (PBMCs) during controlled exposure to urban air UFPs with assignment of number concentration to four size modes with average diameters of 12, 23, 57, and 212 nm. The authors concluded that UFPs, especially the 57-nm soot fraction from vehicle emissions, causes systemic oxidative stress with damage to DNA and no apparent compensatory up-regulation of DNA repair within 24 hr. University of Aegean (2008) reviewed UFPs and health effects including references from 1992 to 2008. The conclusion was that (i) there is significant analogy between UFPs exposure and a related adverse health effect risk in human beings; (2) Cardiovascular and pulmonary systems seem to be the main targets of this exposure; (3) New evidence shows accumulation of UFPs in regions of the cerebellum, olfactory bulb and other areas of the central nervous system. Knol et al. (2009) carried out an expert elicitation on the health effects of ambient UFPs exposure, and concluded that there was an overall medium to high likelihood rating of causality of health effects of UFPs exposure and a high likelihood rating of at least one plausible causal mechanism explaining associations between UFPs and cardiac events. The authors commented that those findings supports the need to consider inclusion of UFPs in future health impact assessments of (transport-related) air pollution. By reviewing references for the period 1980 to 2011, Kelly et al. (2012) examined the determinants of toxicity attributable to ambient particulate matter. Size, source and

36
chemical composition of particles were considered. Current knowledge does not allow precise identification and quantification of their respective influences on health effects but suggests a degree of differential toxicity depending on those factors. Many studies have tdemonstrated the toxic properties and a strong oxidizing potential of UFPs. This includes also specific chemical species that are typically frequent within this size fraction (like metals and organic compounds). However evidence linking UFPs with given health effects such as cardiovascular or respiratory effects is still limited. Whereas findings from different investigations support a cardiovascular effect of particles in the 30-100 nm fractions, other studies are less conclusive. It seems that particles of different size may have a different latency between exposure and health response. Regarding fine particles and UFPs in secondary organic aerosols (SOA), several studies suggest that exposure to SOA may have irritating effects, causing significant inflammatory responses from lung cells (Gaschen et al., 2011; Papapostolou et al., 2011). III.7. What are the actions toward reduction of health effects from the ultrafine particles? III.7.1. Removal and mitigation UFPs can be considered a persistent air pollutant. Mitigation and removal efforts are difficult due to the particle size. UFPs are captured on filters through diffusion. The most effective way of mitigating emissions of UFPs in both outdoor and indoor air is obviously to use source control methods in which potential emission sources are either removed or limited (Godish, 2001). III.7.2. Regulation and legislation As the nanotechnology industry has grown, nano-particles (particles with aerodynamic diameter <50 nm) have brought UFPs more public and regulatory attention (Nadadur et al., 2007). UFPs risk assessment research is still in the very early stages. There are continuing debates (Bergoson, 2007) about whether to regulate UFPs and how to research and manage the health risks they may pose (Kreyling et al., 2006; Geiser et al., 2005; Oberdörster et al., 2005; Savic et al., 2003). Neither EU nor US legislation regulates UFPs so far, but the US-EPA drafted a Nano-material Research Strategy, open for independent, external peer review (Teichman, 2008). Currently, there is also debate about how the European Union (EU) should regulate UFPs (Skjaerseth and Wettestad, 2007). III.8. Conclusions and recommendations Motor vehicles and buses are a major source of UFPs in ambient urban areas (Keogh et al., 2010; Keogh and Sonntag, 2011; Keogh, 2012). More information is needed on UFPs concentrations and emission rates in urban areas (inventories and long term monitoring data) to inform urban planning, scientific debate and to develop relevant ambient air quality guidelines and standards to control this important pollutant category. Keogh and Sonntag 2011 discussed some of the many challenges associated with modeling and quantifying UFPs concentrations and emission rates, here for developing inventories and micro scale modeling in relation to motor vehicle and bus emissions. This includes the challenge of understanding and quantifying secondary particle formation.
37
Due to lack of data, the health impacts of UFPs are still largely unknown, but the evidence being published in the scientific literature increasingly indicates that UFPs can be a significant source of risk to respiratory and cardiovascular health (Lijima, 1985; Spengler, 2000; Osunsanya et al., 2001; Godish, 2001; Moghini et al., 2005; California Environmental Protection Agency, 2006; Frampton et al., 2006; Collins, 2007; Benjamin, 2007; WHO, 2007; Happo et al., 2007; Jalava et al., 2007; Bräuner et al., 2007; Nadadur et al., 2007; US EPA, 2008; Utell and Frampton, 2009; Cahill et al., 2011a,b,c; Gaschen et al., 2011; Papapostolou et al., 2011), and childhood asthma (LIjima, 1985; Weichenthal et al., 2006). More research is needed to investigate the health impacts and the sources and properties of these particles, to evaluate the risks associated with UFPs exposure and develop policies consistent with these risks (Araujo et al., 2008; Weichenthal et al., 2006). Lack of standardization of measuring equipment for UFPs number emissions is a global challenge for developing UFPs number standards. Keogh and Sonntag (2011) reported that statistically significant differences have been found between measurements of particle number emissions by UFP monitors which require further investigation. Scientists at the Fraunhofer Institute for Laser Technology ILT in Aachen have developed a technique by which the composition of UFPs can be precisely analyzed, which needs, however, to be further explored (Science Daily, 2009). UFPs surface area may be the best measure of toxicity over that of mass or UFPs number. The UFPs fraction contains little mass per volume, but possesses a large surface area and a high number of particles. Thus, UFPs are typically monitored as particle number concentrations (Sabaliauskas and Evans, 2010). However, Froines (2006) at the Southern California Particle Center confirm that the surface area concept is a valuable reference for the assessment of causative health effects for carbonaceous UFPs, and indicate that particle surface area may be most appropriate parameter to evaluate inflammatory potential and predict adverse effects of UFPs. Currently UFPs are neither regularly monitored nor regulated by ambient air quality standards. Motor vehicle and bus fleet inventories, epidemiological studies and studies of the chemical composition of UFPs are urgently needed to inform the scientific debate, guide the development of air quality standards and other legislation to control this important air pollutant (Keogh and Sonntag, 2011). There is no standard for UFPs measurements at the moment. However, scientific discussions are ongoing on the formation of a standard, for instance, standardization and regulation for both engineered nano-particles and UFPs are being developed by several bodies, like ISO, OECD, EPA and CEN (Philips, 2012). By far the most effective way to minimize exposure of UFPs is to control their sources (Sabaliauskas and Evans, 2010). There are also other ways to reduce exposure to UFPs, e.g., spending less time outdoors; reducing physical activity levels (e.g., walking instead of running); exercising away from roads and highways, especially if a person is in a group at high risk of having health problems from particle pollution; paying attention about air pollution alerts and advisories in your area, etc
38
Chapter IV. Technical viability of deploying PNC and BC monitoring instrumentation in urban air quality networks
Based on the health implications of BC and UFP described in the previous chapters, these parameters have been suggested as potential new metrics to be introduced in air quality monitoring networks. The following chapters provide scientific and technical data to assess this possibility.
IV.1. Requirements
The viability of deploying BC and PNC instrumentation in urban air quality monitoring networks depends on:
‐ how easy it is to install and maintain the measurement devices in already existing monitoring sites or to deploy them in new non-instrumented locations,
‐ how easy it is to collect, transmit, store and validate the data, ‐ the capability to produce long time series of measurement data, ‐ the possibility of implementing and following a QA/QC system and ensuring
comparability between measurements taken at different locations.
From the experience of various European monitoring networks (see Section IV) the technical viability of developing permanent UFP and BC monitoring in urban networks is analysed in the present section. The needed conditions, related constraints or difficulties and possible ways of overcoming them are investigated. It is to note that the ad hoc working group (WG32) of the CEN/TC 264 is currently working on technical specifications dedicated to standardized methodologies for the monitoring of ultrafine particle size distribution and number concentration, while there is currently no such group for the standardization of BC measurement.
IV.2. Installation, operation and maintenance
For both BC and PNC monitoring activities, it is recommended to dry the sampled air before the instrument in order to minimize the influence of water on light absorption measurements and on particle size distribution. The sampling system may include a PM2.5 or PM1 inlet to reduce contamination by larger particles, especially for PNC monitors. Black Carbon (BC)
BC monitors (MAAP and Aethalometer) are rather small - as large as common gas monitors - robust and easy to use. Users of both instruments (e.g. GDD and Airparif for MAAP, and NPL for Aethalometers) reported high data capture (over 95% in several countries) and very good reliability. Main maintenance operations consist of flow rates check/calibration, zero tests (using filtered air), filter taper replacement (that might happen every two weeks in case of heavy pollution episodes), and optical chamber cleaning. Calibration in the usual sense is however more difficult as no reference material is currently available (European experts recently started working on it in the framework of CEN/TC 264 "Air quality", WG 35 “EC/OC in PM”). Note also that GDD Amsterdam is developing “home-made” span check foil to be tested during maintenance in order to investigate its possible implementation into standard operation procedures (SOP) for quality check and assurance.
39
Particle number concentration (PNC)
The total number concentration can be directly provided by a condensation particle counter (CPC) or be deduced from the particle number size distribution obtained with particle sizers such as SMPS or DMPS (see section IV. for a description of the instruments). In this second case, the particle sizer should cover a large enough range (10-800 nm for example) to take most of the particles into account. CPCs are not large; in principle, they are relatively simple to operate but may not be so in practice. Particle sizers need more room and are complex to handle. Comparability can be regulated by annual calibration, regular servicing, and site audits (e.g. to check flow rates). Recently, Wiedensohler et al. (2012) extensively described good practices to be used for reliable PNC monitoring. Though the CEN TC264 WG32 is in progress, commonly accepted requirements can be mentioned. Regarding the sampling line, the sampling system has to take a sample of the ambient aerosol and transport it to the measuring instrument. Besides that, it has to modify the aerosols temperature and humidity to adapt it to the range suitable for the measurement. To reduce diffusion loss, it is necessary that aerosol intake is performed with the aid of a pump at a sample flow rate much higher than the CPC flow rate. Aerosol with a high relative humidity should be dried, as the size of particles of hygroscopic materials is strongly influenced by humidity. The requirement is to keep the relative humidity of the aerosol at the CPC inlet lower than 50 %. The CPC shall be checked referring to the ISO 27891. According to this standard, the linearity and slope of response is determined by measuring the detection efficiency at various particle number concentrations. In the same way, the detection efficiency curve at low particle size and the upper particle size detection limit shall be measured according to the ISO27891. It comes out from countries’ experience that CPCs and particle sizers are delicate instruments and not easy to run. They require a lot of maintenance and request enhanced knowledge and much attention from operators who need specific training. Part of the servicing operations cannot be performed on site, which means that the instruments need to be sent back to the manufacturer and the measurements be interrupted.
IV.3. Data collection, transmission and verification
Data transmission and validation processes are quite trivial for MAAP, OPCs and CPCs instruments, while they still need to be optimized for Aethalometer and ultrafine particle sizers in the frame of monitoring activities.
IV.4. Data processing
Black Carbon (BC)
Apart from the necessary corrections of sampling artifacts allowing for a consistent retrieval of absorption coefficients (see above), a main issue of optical BC measurements is the determination of the appropriate Babs - to- BC conversion factor. This conversion factor, so called mass absorption efficiency (MAE, in m²/g unit), is a function of the wavelength used for measurement (λ) and of the mixing state of BC with other species, such as water, organic coating or inorganic salts (Bond and Bergström, 2006). Indeed, Light absorption by aerosols can be parameterized as proportional to λ-
α, with α being referred to as the Ångstrom absorption exponent, and internal mixing of BC with light scattering aerosol species may lead to an increase of MAE compared to

40
pure BC. The latter one is commonly expected to exhibit an Ångstrom absorption exponent close to 1 (e.g. 1.0±0.1) and an MAE of about 7.5m²/g at 550nm, according to Bond and Bergstrom (2006). As a matter of fact, the agreement between absorption coefficient measurements and the concentrations of elemental carbon measured independently depends on the wavelength used for optical measurements and the origin/aging of light absorbing particles. It is commonly assessed that only BC efficiently absorbs light at near-Infrared regions, while organics and/or mineral dusts may absorb light at near-UV and, to a lesser extent, at mid-visible regions. A growing number of studies have been indicating good correlations between EC and Babs measured at near-IR regions, with a regression slope of about 5m²/g, in good agreement with α and MAE values proposed by Bond and Bergstrom (2006). However, it must be noted that MAE values of up to 15 m2/g have been obtained in regional background areas in Southern European regions (Pandolfi et al., 2012). It must also be noted that the relationship between absorption and thermal-optical measurements will necessarily be influenced by the uncertainties of each of these methods, which are frequently not low. Several papers in the literature focus on the correction algorithms to be applied to optical measurements of soot concentrations (BC) (Petzold et al., 2005; Collaud Coen et al., 2010; Müller et al., 2011; Hyvärinen et al., 2012), and a number of works (Schmid et al., 2001; Cavalli et al., 2011; Baumgartner et al., 2012; Bond et al., 2013) refer to the differences in thermo-optical results as a function of the methods and temperature protocols used. Current discussions in the scientific community question whether conversions of absorption measurements to EBC mass should be performed and, if so, whether with a constant MAE factor (e.g., the default 6.6 m2/g from the MAAP instrument) or with locally-determined factors (Fernández-Camacho et al., 2010; Reche et al., 2011; Wang et al., 2013). The debate is ongoing as no consensus has been reached so far. From the point of view of network operators, conversion of absorption to EBC is preferred in order to obtain a mass-based metric and to ensure comparability across stations and networks. As for the MAE to be used for this conversion, it appears that the variability of MAE values in urban areas is relatively low, with values being rather stable, when compared with rural areas where this variability is higher. Thus, in urban areas, applying locally-determined MAE values for conversion of absorption measurements to EBC would imply lower degrees of uncertainty while maximising comparability between results. In all cases, reporting of EBC data should always report the MAE value applied. For a reliable estimation of BC concentrations, it is thus recommended to perform Babs measurements at near-IR regions. When not possible (e.g. when using a MAAP which makes use of a 670nm lamp), negligible influence of light absorbing organic or mineral dust aerosols should be assumed/checked. Equivalent BC concentration (EBC, see Section I) could then be calculated as the ratio between Babs and an appropriate MAE value obtained empirically or from the literature (or, for the MAAP instrument, using the one proposed by default within device software: 6.6 m²/g at 670nm). Further data treatments of multi-wavelength light absorption measurements can be used to apportion combustion and non-combustion carbonaceous material (CM), for instance as follows:
C + b×C + b×C = CM + CM + CM = CM 3470nm wb,abs,2950nm ff, abs,1otherwbfftotal eq. 1
where babs, ff, 950nm represents the absorption coefficient of CMff at 950nm, babs, wb, 470nm represents the absorption coefficient of CMwb at 470 nm, C1 and C2 relate the light absorption to the particulate mass of both sources, and C3 corresponds to the amount of non-combustion OA (assumed here to have a negligible light absorption capacity). It

41
should be noted that CMff comprises here traffic emissions as well as carbonaceous aerosols originating from fuel oil and natural gas combustion, but excludes coal burning organic aerosol. Indeed the latter one was shown to significantly absorb light at near UV wavelengths (e.g. Yang et al. (2009)) and may thus interfere with with babs, wb, 470nm. Another limitation of this approach might be the presence of mineral dust particles. The development of receptor models based on multi-wavelength light absorption is still on its early stage and subject to continuous improvements and various ways of use. In particular, different methodologies are currently proposed to resolve equation 1, using for instance universal, on the one hand, or site-specific, on the other hand, C1 and C2 constants. It should also be kept in mind that these methodologies are very sensitive to initial conditions (and especially to chosen α), leading to high uncertainties. This is the reason why users usually perform (and gave results of) sensitivity tests with wide ranges for these initial conditions (see e.g. Favez et al., 2010, and Sciare et al., 2011), and suggest to consider results of these sensitivity tests as the total uncertainties of the model outputs. Particle number concentrations (PNC) Regarding particle sizers (DMPS and SMPS), inversion routines are the vital bases for converting measured electrical particle mobility distributions into final particle number size distributions taking into account the bipolar charge distribution as well as the DMA transfer function (Wiedensohler et al., 2012). Such data processing tools are usually available with the instrument via software to be used off-line. The obtained aerosol size distribution may then be used for source apportionment purposes (e.g. Pey et al., 2009; Reche et al., 2011).
IV.5. Temporal monitoring
As condition for their deployment in monitoring networks for health impact and trend analysis, the implemented measuring equipments should be able to produce long time series of BC and PNC data with high temporal resolution. Fine temporal resolution is achievable with all aforementioned instruments: BC and PNC measurements are usually delivered with a frequency of 1 to10 minutes approximately. More sensitive in practice could be the constitution of continuous series of valid data which is contingent on maintenance, data losses and data invalidation. Whereas BC time series usually display high data captures, difficulties in ensuring continuous monitoring were reported by countries for PNC measurements. In the UK for example the age of the now discontinued 3022a CPCs, the complexity of the associated sampling system and the long yearly calibration period entail significant data losses (up to 1 month only because of calibration if no spare monitor is available). This is reflected by the rather large range of monthly data captures observed in the UK (NPL, 2011) and a typical data capture estimated at 80%. The SMPS operating in the UK network show data captures of the same order (NPL, 2011). Temporary break of time series due to servicing operations remains a significant issue for the long-term monitoring of PNC.
IV.6. Comparability
Comparability of measurements taken at different locations is related to: ‐ the nature of the measurements: do all the instruments measure the same
variable?
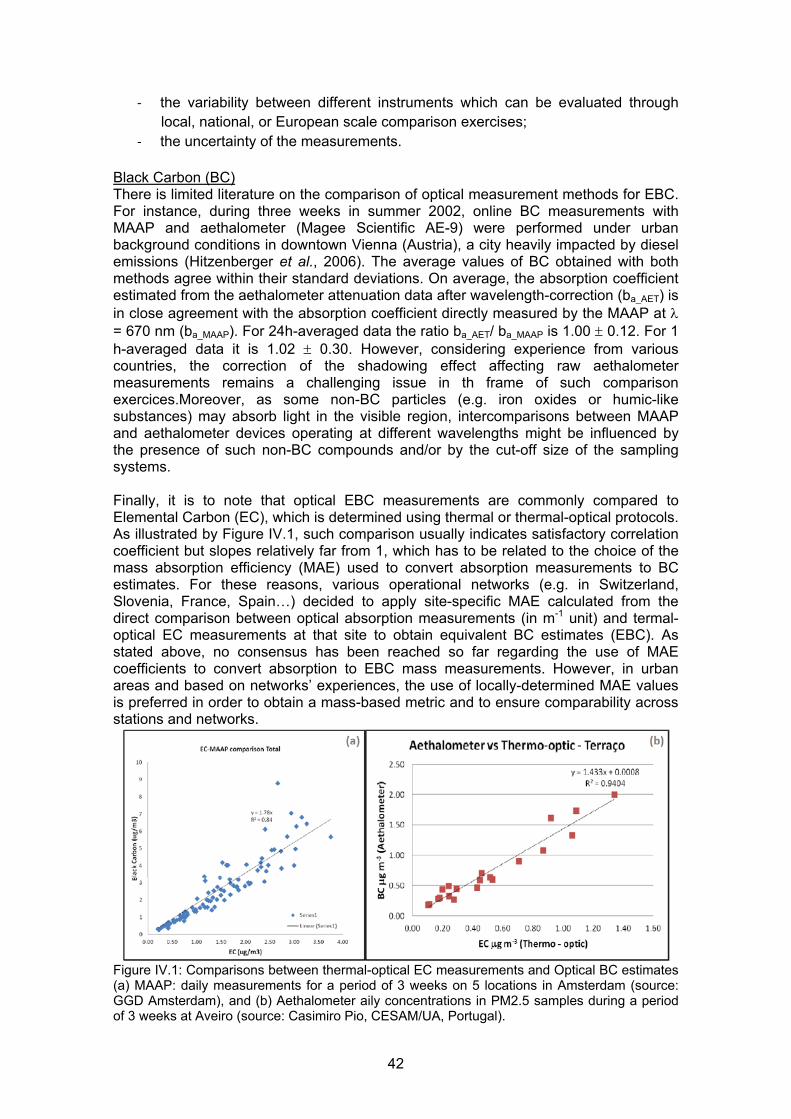
42
‐ the variability between different instruments which can be evaluated through local, national, or European scale comparison exercises;
‐ the uncertainty of the measurements.
Black Carbon (BC) There is limited literature on the comparison of optical measurement methods for EBC. For instance, during three weeks in summer 2002, online BC measurements with MAAP and aethalometer (Magee Scientific AE-9) were performed under urban background conditions in downtown Vienna (Austria), a city heavily impacted by diesel emissions (Hitzenberger et al., 2006). The average values of BC obtained with both methods agree within their standard deviations. On average, the absorption coefficient estimated from the aethalometer attenuation data after wavelength-correction (ba_AET) is in close agreement with the absorption coefficient directly measured by the MAAP at = 670 nm (ba_MAAP). For 24h-averaged data the ratio ba_AET/ ba_MAAP is 1.00 0.12. For 1 h-averaged data it is 1.02 0.30. However, considering experience from various countries, the correction of the shadowing effect affecting raw aethalometer measurements remains a challenging issue in th frame of such comparison exercices.Moreover, as some non-BC particles (e.g. iron oxides or humic-like substances) may absorb light in the visible region, intercomparisons between MAAP and aethalometer devices operating at different wavelengths might be influenced by the presence of such non-BC compounds and/or by the cut-off size of the sampling systems. Finally, it is to note that optical EBC measurements are commonly compared to Elemental Carbon (EC), which is determined using thermal or thermal-optical protocols. As illustrated by Figure IV.1, such comparison usually indicates satisfactory correlation coefficient but slopes relatively far from 1, which has to be related to the choice of the mass absorption efficiency (MAE) used to convert absorption measurements to BC estimates. For these reasons, various operational networks (e.g. in Switzerland, Slovenia, France, Spain…) decided to apply site-specific MAE calculated from the direct comparison between optical absorption measurements (in m-1 unit) and termal-optical EC measurements at that site to obtain equivalent BC estimates (EBC). As stated above, no consensus has been reached so far regarding the use of MAE coefficients to convert absorption to EBC mass measurements. However, in urban areas and based on networks’ experiences, the use of locally-determined MAE values is preferred in order to obtain a mass-based metric and to ensure comparability across stations and networks.
Figure IV.1: Comparisons between thermal-optical EC measurements and Optical BC estimates (a) MAAP: daily measurements for a period of 3 weeks on 5 locations in Amsterdam (source: GGD Amsterdam), and (b) Aethalometer aily concentrations in PM2.5 samples during a period of 3 weeks at Aveiro (source: Casimiro Pio, CESAM/UA, Portugal).

43
Particle number concentration (PNC)
As highlighted above, the measured size range is very dependent on the applied methodology and on its implementation. This may significantly affect comparability between measurements taken at different locations with different instruments. In particular results may be very sensitive to the minimal cut-off diameter since the number of particles is usually higher for small diameters. Comparisons conducted in the UK between SMPS (16-600 nm) and CPC (7nm-sevreal microns) illustrated that effect (NPM, 2011). Sensitivity to the 10-20 nm size range could be observed as well at a French urban background site when comparing SMPS (10-500 nm) and 3031 monitor (20-800 nm). However, the differences between both instruments in terms of particle number prove to vary according to the monitoring period. It was therefore decided to carry those comparisons further, as a support to the development of a French particle number monitoring network. One other source of discrepancies may be diffusion losses along the sampling line, to which ultrafine particles are especially vulnerable. In Dresden where a TDMPS (3-800 nm), a UFP330 monitor (20-500 nm) and a TSI 3031 (20-500 nm) are operated at a traffic site and two urban background sites respectively, an intensive quality control programme was set up (Löschung and Gerwig, 2009). It includes annual laboratory intercomparison exercises and annual in-situ comparison with SMPS (monitoring campaigns). In addition, the uncertainty of the measurements was calculated for the daily average values. It is estimated at less than 25% for UFP330 (10 % to 21% for smallest particles) and about 10% for the TDMPS. This last figure is consistent with the observations from by Widensohler et al. (2012): “Under controlled laboratory conditions, the particle number size distributions from 20 to 200 nm determined by mobility particle size spectrometers of different design are within an uncertainty range of around ±10% after correcting internal particle losses, while below and above this size range the discrepancies increased. For particles larger than 200 nm, the uncertainty range increased to 30 %, which could not be explained. The network reference mobility spectrometers with identical design agreed within ±4% in the peak particle number concentration when all settings were done carefully. The consistency of these reference instruments to the total particle number concentration was demonstrated to be less than 5 %”. The comparability of number concentrations obtained from different instruments should be clarified within CEN TC 264 WG 32. Comparisons are also carried out between identical instruments. In Italy very good comparability has been noticed between TSI 3022a CPs. In Amsterdam where TSI 3022a CPs were operated till 2012, the same observation was made. However it seems that good comparability only holds within a low concentration range (< 10000 particles). On-site comparisons at higher concentrations gave disappointing results (R2=0,58). In addition, calibration difficulties led to differences up to 40% between two CPCs on one location. IV.7. Summary The viability of deploying BC and PNC instrumentation in urban air quality monitoring networks was assessed. This viability depends on:
how easy it is to install and maintain the measurement devices in already existing monitoring sites or to deploy them in new non-instrumented locations,
how easy it is to collect, transmit, store and validate the data, the capability to produce long time series of measurement data, the possibility of implementing and following a QA/QC system and ensuring
comparability between measurements taken at different locations.

44
The results presented in this chapter are based on the experience of various European monitoring networks. Installation, operation and maintenance: It is concluded that BC monitors are rather small - as large as common gas monitors - robust and easy to use. Calibration in the usual sense is difficult as no reference material is currently available. CPCs are not large; in principle, they are relatively simple to operate but may not be so in practice. Particle sizers need more room and are complex to handle. Comparability can be regulated by annual calibration, regular servicing, and site audits. It comes out from countries’ experience that CPCs and particle sizers are delicate instruments and not easy to run. Data processing: Apart from the necessary corrections of sampling artifacts allowing for a consistent retrieval of absorption coefficients, a main issue of optical BC measurements is the determination of the appropriate Babs - to- EBC conversion factor. Current discussions in the scientific community question whether conversions of absorption measurements to EBC mass should be performed and, if so, whether with a constant or with locally-determined MAE factors. The debate is ongoing as no consensus has been reached so far. In urban areas and based on networks’ experiences, the use of locally-determined MAE values is preferred in order to obtain a mass-based metric and to ensure comparability across stations and networks. Regarding particle sizers (DMPS and SMPS), inversion routines are the vital bases for converting measured electrical particle mobility distributions into final particle number size distributions taking into account the bipolar charge distribution as well as the DMA transfer function. Such data processing tools are usually available with the instrument via software to be used off-line. Particle losses by diffusion along the sampling line, to which ultrafine particles are especially vulnerable, should be taken into account as potential sources of discrepancies between instruments. Temporal monitoring: Fine temporal resolution is achievable with all aforementioned instruments: BC and PNC measurements are usually delivered with a frequency of 1 to10 minutes approximately. Whereas BC time series usually display high data captures, difficulties in ensuring continuous monitoring were reported by countries for PNC measurements. Comparability: There is limited literature on the comparison of optical measurement methods for EBC. Optical EBC measurements are commonly compared to Elemental Carbon (EC), which is determined using thermal or thermal-optical protocols. As for PNC, the particle size range measured is largely dependent on the methodology applied and on its implementation. This may significantly affect comparability between measurements taken at different locations with different instruments. In particular results may be very sensitive to the minimal cut-off diameter since the number of particles is usually higher for small diameters. Comparisons carried out between identical instruments showed very good comparability. However it seems that good comparability only holds within a low concentration range (< 10000 particles). On-site comparisons at higher concentrations gave disappointing results.

45
Chapter V. PNC and BC monitoring networks in Europe This section gives a picture of the recent and current deployment of ultrafine particle number (PNC) and black carbon (BC) monitoring networks in Europe. It is based on feedback from countries (Appendix), bibliographical data and ETC/ACM partners’ knowledge. The types of sites, operated instruments, delivered data and quality checks are reviewed. Ongoing projects supporting such deployment are also taken into account. The most comprehensive network in Europe is probably the German Ultrafine Aerosol Network (GUAN, with extensions in Belgium nowadays) which promotes collocated measurement of at least, BC and particle number concentration as illustrated by Figure III.1. UK has also a long-term experience of ultrafine particle and Black Smoke/BC concentrations monitoring at a national scale. Examples of more recent developments of BC and PNC monitoring activities by national or local monitoring networks in European countries are also reported, along with more research-oriented permanent observatories. The presence of PNC and BC instrumentation, based on the data from Tables V.1 and V.2, is summarised in Figures V.1 and V.2 at the end of this section.
V.1. BC measurements
V.1.1. BC measurement in air quality monitoring networks
The following preliminary inventory (Table V.1) focuses on the introduction of fixed black carbon measurements in European national or local networks:
‐ It does not include punctual monitoring campaigns. However, it encompasses monitoring strategies that combine fixed measurements at some sites and semi-fixed measurements (e.g. every two years) at some others.
‐ It is concentrated on direct BC monitoring (not on indirect quantification through EC measurement).
‐ Depending on available information, the monitoring sites and implemented instruments are not described with the same detail.
V.1.2. Description of the measuring instruments
As emphasized by Table IV.1, two filter absorption photometer instruments are mainly used within European networks (and worldwide): the MAAP (Multi Angle Absorption Photometer, manufactured by Thermo) and the Aethalometer (manufactured by Magee Scientific / Aerosol d.o.o.). They are both based on the measurement of the optical properties of PM collected on a filter tape, on a short timebase (typically 5min.). All filter based photometers suffer from non-linearities due to the loading of the filter which reduce the sensitivity of the measurements. The Aethalometer relies on measurements of transmission of light through the filter that needs to be post-processed to obtain ambient aerosol absorption coefficients (Babs, in m-1 unit) and then BC concentrations (Weingartner et al., 2003; Lack et al., 2008). The MAAP combines the light reflection at multiple angles and light transmission measurements. The MAAP measurements also need to be post-processed to obtain estimates of ambient Babs and BC (Hyvarinen ACPD 2012) Considerable efforts have been recently dedicated to the development of methodologies for Aethalometer sampling artifact corrections (e.g. Collaud Cohen et al., 2010), and multi-wavelength light absorption measurements are not currently available using MAAP. Such measurements, performed by the Aethalometer models AE33, AE31, AE42-7, allow for the discrimination of light absorption by other species than BC, such as brown carbon and mineral dust (Fiahlo et al., 2004; Kirchstetter et al., 2005, Andreae and Gelencsèr., 2006), and for the apportionment of light absorbing aerosol sources (Arnott et al., 2005; Sandradewi et al., 2008, Favez et al., 2010).

46
Table V.1: European experience on the measurement of EBC in air quality monitoring networks.
Country Location Operator Number and type of sites (and starting date when
available) Measurement method Comment References
Belgium Brussels IBGE - LRE 1 urban background, (2012)
3 traffic sites (2009-2010)
Aethalometer (2-wavelengths AE22 model)
Collocated measurements of PM10 at 3 sites and of PNC at 2
traffic sites
http://www.bruxellesenvironnement.be/Templates/etat/informer.asp
x?id=3196&langtype=2060 Vanderstraeten et al., 2011
Belgium Flanders VMM
14 sites including 2 urban background and 1 traffic sites
(2007 or 2012) (+ 4 mobile units)
MAAP 5012
In 2012 collocated with black smoke measurements
performed at 5 sites with ETL SX 200 monitors
Belgium Wallonia ISSeP 1 rural, 1 urban traffic and 1
industrial sites (2011) (+ 8 mobile units)
Aethalometer (AE-22 model)
In addition to the historical black smoke network.
A systematic measurement of BC and total carbon in PM10 on
a weekly basis will be implemented in 17 locations.
Denmark No fixed measurements
Finland Helsinki HSY
1 urban background site (2012) + 1 moving station (since 2009) located every year in a special
site
MAAP 5012 with PM1 inlet Collocated measurements of
PNC at the moving station since 2009
http://www.hsy.fi/seututieto/ilmanlaatu/pks/bc/Sivut/viikoittain.aspx
France Paris area Airparif
(in collab. with LSCE)
4 urban background (2008) and 1 traffic (2012) sites.
7 Additonnal traffic and rural background sites
MAAP
Aethalometer (AE31 and AE42 models)
Update to the historical black smoke measurements
Evaluation of a possible Low
Emission Zone
http://www.airparif. asso.fr/actualite
/detail/id/55
Germany National network (GUAN)
Depends on the site (UBA, IfT, HMGU,
LfULG, DWD, IUTA, GAA, UFZ, DWD)
15 sites in Germany including Alpine, rural, urban background
and traffic sites(2008)
MAAP with PM1 or PM10 inlet depending on the site Aethalometer at one urban
site
Collocated measurements of particle mass (1 site), PM10 (6 sites), PM2.5 (1 site), PNC (8
sites, rural, urban background and traffic)
Birmili et al., 2009 Nordmann et al., 2009
http://wiki.tropos.de/index.php/G
UAN
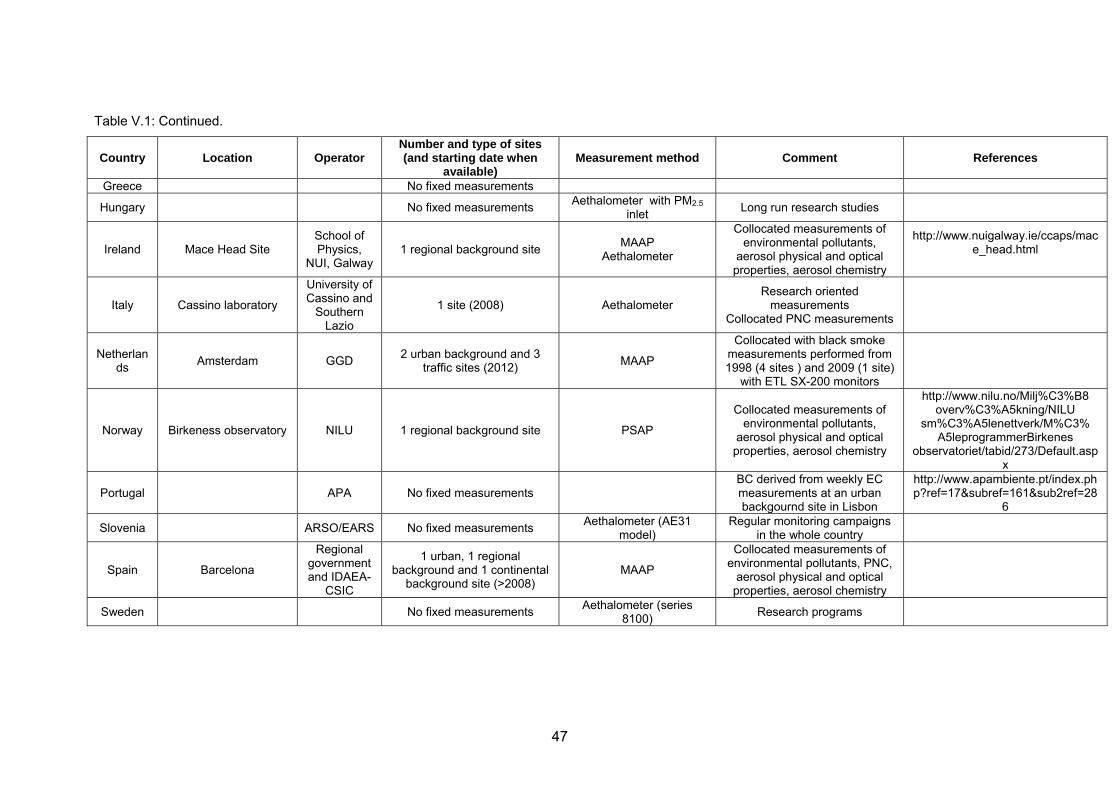
47
Table V.1: Continued.
Country Location Operator Number and type of sites (and starting date when
available) Measurement method Comment References
Greece No fixed measurements
Hungary No fixed measurements Aethalometer with PM2.5
inlet Long run research studies
Ireland Mace Head Site School of Physics,
NUI, Galway 1 regional background site
MAAP Aethalometer
Collocated measurements of environmental pollutants,
aerosol physical and optical properties, aerosol chemistry
http://www.nuigalway.ie/ccaps/mace_head.html
Italy Cassino laboratory
University of Cassino and
Southern Lazio
1 site (2008) Aethalometer Research oriented
measurements Collocated PNC measurements
Netherlands
Amsterdam GGD 2 urban background and 3
traffic sites (2012) MAAP
Collocated with black smoke measurements performed from 1998 (4 sites ) and 2009 (1 site)
with ETL SX-200 monitors
Norway Birkeness observatory NILU 1 regional background site PSAP
Collocated measurements of environmental pollutants,
aerosol physical and optical properties, aerosol chemistry
http://www.nilu.no/Milj%C3%B8 overv%C3%A5kning/NILU
sm%C3%A5lenettverk/M%C3% A5leprogrammerBirkenes
observatoriet/tabid/273/Default.aspx
Portugal APA No fixed measurements BC derived from weekly EC measurements at an urban backgournd site in Lisbon
http://www.apambiente.pt/index.php?ref=17&subref=161&sub2ref=28
6
Slovenia ARSO/EARS No fixed measurements Aethalometer (AE31
model) Regular monitoring campaigns
in the whole country
Spain Barcelona
Regional government and IDAEA-
CSIC
1 urban, 1 regional background and 1 continental
background site (>2008) MAAP
Collocated measurements of environmental pollutants, PNC,
aerosol physical and optical properties, aerosol chemistry
Sweden No fixed measurements Aethalometer (series
8100) Research programs

48
Table V.1: Continued.
Country Location Operator Number and type of sites (and starting date when available)
Measurement method Comment References
Switzerland National network
(NABEL) EMPA
8 rural background, rural motorway, suburban background, urban background, urban traffic
sites (2006 and later)
MAAP 5012 with PM2.5
inlet (5 sites)
Aethalometer with PM2.5
inlet (AE-31 model)
Collocated measurements of PNC at four sites
http://www.bafu.admin.ch/luft/00612/00625/index.html?lang=fr
UK National network NPL 3 rural background, 3 suburban
background, 5 urban background, 3 urban traffic sites (2008)
Aethalometer (2-wavelengths AE21 model)
Update to the historical black smoke network.
Collocated measurements of PM10 (12 sites), PNC 4 sites (rural, urban background and
traffic)
http://uk-air.defra.gov.uk /networks/network-info
?view=particle http://uk-
air.defra.gov.uk/interactive-map?network=ukbsn
http://uk-air.defra.gov.uk/reports/cat05/1108251248_2010_BC_Network
_Report.pdf

49
It then appears that an optimized measurement technique might correspond to a “multi-wavelength MAAP” and/or Aethalometer allowing for consistent on-line sampling artifact corrections, which was already asked to both manufacturers by European experts. The new Aethalometer AE33 features on-line compensation of the loading effects. More details on basic measurement principles of the Aethalometer and MAAP instruments can be found respectively in Hansen et al. (1983) and Petzold et al. (2005). Other filter-based instrument types are barely used within European networks (e.g. Sweden). In Norway, the EMEP site is equipped with a Particle Soot Absorption Photometer (PSAP), which registers the attenuation change of a light beam over a filter while the filter is loaded with aerosol sample. The instrument currently has one wavelength, but is due to be upgraded to a 3-wavelength instrument. The absorption coefficient can be readily converted to an apparent black carbon concentration by assuming a mass absorption cross-section. Note also that sophisticated research works have been taking advantages of photoaccoustic techniques to avoid filter sampling and related artifacts (Arnott et al., 2005) to investigate aerosol light absorption. Such a methodology might be envisaged soon for monitoring activities, as some manufacturers (e.g. Droplet Measurement Technologies) are currently developing simple photoaccoustic instruments to be used routinely.
V.2. Ultrafine particle number measurement
V.2.1. PNC measurement in monitoring networks
The following preliminary inventory focuses on the introduction of fixed measurements of ultrafine particle number in some European networks (Table V.2); it does not include punctual monitoring campaigns. Some countries have not implemented the monitoring of PNC in their operational networks yet but benefit from continuous measurements through long-term research studies. Such experience with long-run monitoring has been reported as well in the table.
V.2.2. Description of the measuring instruments
As reported above, different types of instruments are currently operated to monitor the number of particles in ambient air. Some of them, such as Condensation Particle Counters (CPC) are dedicated to the quantification of the total number of (ultra-fine) particles, while Mobility particle size spectrometers allow for the investigation of the aerosol size distribution along with number concentrations. TSI 3022a CPC have been implemented in several networks (e.g. UK, Amsterdam) to count particles with an aerodynamic diameter down to 7 nm. Different measuring modes are used. More specifically, below approximately 10000 particles the CPC is in counting mode and above that it switches to the photometrical mode which is significantly less accurate. The 3022a CPC applies butanol as working fluid. Though operating routinely, this product has been discontinued. Mobility particle size spectrometers often referred to as Differential Mobility Particle Sizers (DMPS), Scanning Mobility Particle Sizers (SMPS) or Fast Mobility Particle Sizers (FMPS) have been increasingly used for long-term observations of atmospheric particle number size distribution in the submicrometer diameter range. In particular they were implemented at more than 20 ground based atmospheric supersites in Europe (Wiedensohler et al., 2012) as well as at the different operational sites of the GUAN

50
network. Depending on the instrument, mobility particle size spectrometers cover diameter ranges from 3 to 800 nm. Most modern mobility particle size spectrometers utilize a differential mobility analyzer (DMA) upstream of a CPC which records particle number concentrations as a function of the electrical particle mobility by varying the DMA voltage. Those techniques involve a radioactive source for DMA and butanol as condensing fluid for CPC. More details can be found in Wiedensohler et al. (2012) and linked references. The use of radioactive sources within monitoring activities is not straightforward in some European countries with relatively strong regulations and administrative procedures. Moreover, the use of butanol could also be an issue due to the potential toxicity of this compound. Monitoring networks would thus be very interested in operating monitors without any radioactive source and/or butanol as working fluid. In this context, the UFIPOLNET project, founded by the LIFE financial Instrument of the European Community program, recently allowed the development of a device - the UFP3031 monitor - free of radio-active source and butanol. The latter instrument, now commercialized by TSI, makes use of a “corona-jet” charger (instead of the radioactive source) and does not require any working fluid as particles are counted using an electrometer (UFIPOLNET, 2008). It was recently optimized to better agree with SMPS measurements (see below). Some European networks (e.g. LRE) implemented Optical Particle Counters (OPC) allowing for the investigation of the size distribution and number concentration of fine particles (down to ~300 nm in diameter) but blind to ultrafine aerosols. However, this OPC might be accompanied with DMA-electrometer systems taken into account the latter size fraction.

51
Table V.2: European experience on the measurement of PNC in air quality monitoring networks.
Country Location Operator Number and type of sites (and starting date when available)
Measurement method Comment Reference
Belgium Brussels IBGE - LRE 2 traffic (2009-2010) Grimm laser light scattering
spectrometers, model 365 (0.25 μm to 32 μm)
Collocated measurements of BC
Vanderstraeten et al., 2011
Belgium Flanders Flemish Environment
Agency No fixed measurements reported
Participation to the JOAQUIN project with
planned CPC and SMPS measurements
at an urban site
Belgium Wallonia ISSeP 1 rural site as part of the GUAN
network (2010) SMPS (10-800 nm)
2 additional trailers with SMPS (10-800 nm) and OPC (300 nm - 30 µm)
for punctual measurements
http://wiki.tropos.de/index.php/GUAN
Czech Republic Prague 1 site in cooperation with Germany SMPS (10-800 nm) http://www.ufireg-
central.eu Denmark National network DCE 3 sites (2002) Home built SMPS
Finland Helsinki HSY
University of Helsinki
1 station (since 2009) moving from a site (during one year) to another.
1 urban background site
Grimm 5401 CPC CPC and DMPS
Collocated measurements of BC
since 2009
France National network Depends on the site (Airparif, AIRAQ, Air
Rhône-Alpes)
In progress 3 urban background, 2 “semi-fixed”
site (urban background or under industrial influence), 1 traffic
TSI 3031 UFP Monitor (20-800 nm)
Continuation of monitoring campaigns regularly carried out
with SMPS (2003-2000) and 3031 (2009-2011)
at an urban background site in Paris area.
Deployment of instruments without any radio-active source nor
butanol.
Le Bihan et al., 2011 (http://www.lcsqa
.org/rapports)
Germany National network
(GUAN)
Depends on the site (UBA, IfT, HMGU,
LfULG, DWD, IUTA, GAA, UFZ, DWD)
18 sites in Germany including Alpine, rural, urban background
and traffic sites(2008)
Continuous measurements: SMPS (10-800 nm), SMPS/TD (10-
800 nm), TDMPS (3-800 nm), TDMPS/TD (3-800 nm), APS (0,8 – 10 µm).Discontinuous meas.: NAIS (1,5-40 nm), H-DMPS (20-800 nm,),
APS (0,8 – 10 µm)
Collocated measurements of
particle mass and BC at several sites
Birmili et al., 2009

52
Table V.2: Continued.
Country Location Operator Number and type of sites (and starting date when available)
Measurement method Comment Reference
Greece No fixed measurements
Ireland Mace Head Site School of Physics,
NUI, Galway 1 regional background site
nano-SMPS, SMPS, APS, ELPI, CPC
Collocated measurements of
environmental pollutants, aerosol
physical and optical properties, aerosol
chemistry
http://www.nuigalway.ie/ccaps/mace_head.html
Rome Italian national
institute of health DIPIA INAIL
1 urban traffic site (2001) 1 urban traffic site (
TSI 3022a CPC (7 nm cut-off) FMPS
Research oriented measurements
Aato et al., 2005
Torino 1 site (2009) TSI 3031 UFP Monitor (20-500 nm) Research oriented
measurements
Cassino laboratory
University of Cassino and Southern Lazio
1 site (2008) CPCs and particle counters based
on electrical techniques FMPS, SMPS, APS
Research oriented measurements
Collocated
measurements of BC
Emilia-Romagna ARPA Emilia-
Romagna 1 rural and 1 urban background
sites (2011)
TSI 3936 Nano ( DMA3080 + Column 3085 + CPC 3788)
TSI 3936 Long (DMA3080 + Column 3081 + CPC 3787)
FMPS Optical particle counter
Research oriented measurements Other long-term
monitoring campaigns (at least three years
since 2012) within the Supersite project
http://www.arpa.emr.it/supersito/index.asp
Italy
Veneto Associazione CIVEN and ARPA Veneto
5 sites: 1 Traffic, 1 Urban Traffic, 1 Urban residential, 1 Industrial, 1
Rural (2011) Grimm CPC mod. 5.403
Research oriented measurements. Mid-
term monitoring campaigns. Integration of existing air quality monitoring network
(Framework of RESMIA project)
Netherlands Amsterdam GGD 3 sites (2002-2012) TSI 3022a CPC (7 nm cut-off)
Meas. temporarily stopped due to difficult
calibration
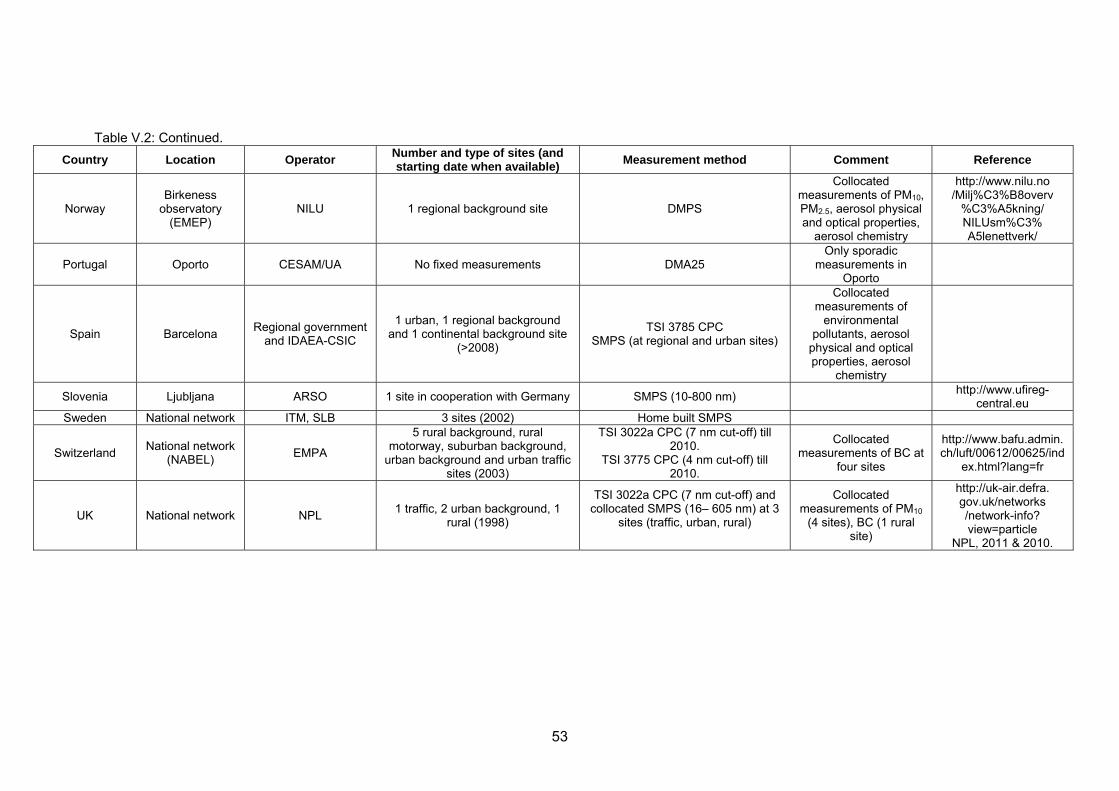
53
Table V.2: Continued.
Country Location Operator Number and type of sites (and starting date when available)
Measurement method Comment Reference
Norway Birkeness
observatory (EMEP)
NILU 1 regional background site DMPS
Collocated measurements of PM10, PM2.5, aerosol physical and optical properties,
aerosol chemistry
http://www.nilu.no /Milj%C3%B8overv
%C3%A5kning/ NILUsm%C3% A5lenettverk/
Portugal Oporto CESAM/UA No fixed measurements DMA25 Only sporadic
measurements in Oporto
Spain Barcelona Regional government
and IDAEA-CSIC
1 urban, 1 regional background and 1 continental background site
(>2008)
TSI 3785 CPC SMPS (at regional and urban sites)
Collocated measurements of
environmental pollutants, aerosol
physical and optical properties, aerosol
chemistry
Slovenia Ljubljana ARSO 1 site in cooperation with Germany SMPS (10-800 nm) http://www.ufireg-
central.eu Sweden National network ITM, SLB 3 sites (2002) Home built SMPS
Switzerland National network
(NABEL) EMPA
5 rural background, rural motorway, suburban background,
urban background and urban traffic sites (2003)
TSI 3022a CPC (7 nm cut-off) till 2010.
TSI 3775 CPC (4 nm cut-off) till 2010.
Collocated measurements of BC at
four sites
http://www.bafu.admin.ch/luft/00612/00625/ind
ex.html?lang=fr
UK National network NPL 1 traffic, 2 urban background, 1
rural (1998)
TSI 3022a CPC (7 nm cut-off) and collocated SMPS (16– 605 nm) at 3
sites (traffic, urban, rural)
Collocated measurements of PM10
(4 sites), BC (1 rural site)
http://uk-air.defra. gov.uk/networks /network-info? view=particle
NPL, 2011 & 2010.

54
GGD Amsterdam together with VVM, ECN, VITO and the Universities of Brighton and Leicester is currently participating in the JOAQUIN EU Interreg project (www.joaquin.eu) which, among other tasks, will investigate the applicability of new UFP measuring methodologies, suitable in continuous, stable and accurate monitoring. In France such UFP methodologies will make the basis of a national network under construction dedicated to particle number monitoring. More precisely TSI UFP 3031 Monitor will be used. This monitor has been specifically designed for long-term, air quality monitoring networks. It requires no working fluids. The number of particles can be obtained for different size intervals. V.3. Summary EBC measurements have been developing in European air quality monitoring networks, mostly as continuation of black smoke measurements. Long-term experience is already available in Switzerland, where EBC measurements have been performed since 2003 within the national network, and in Germany and the UK, where EBC concentrations have been recorded since 2008. Two main classes of instruments are used within European networks (and worldwide): the MAAP (Multi Angle Absorption Photometer, manufactured by Thermo) and the Aethalometer (manufactured by Magee Scientific and Aerosol d.o.o). They are both based on the measurement of the optical properties of PM collected on a filter tape, on a short time-base (typically 5-minute). Both instruments show good robustness, remarkable reliability and offer high data capture, generally above 95%. Issues related to their implementation are the necessary corrections of sampling artifacts to get consistent estimates of absorption coefficients (Babs) and the determination of the appropriate Babs - to- EBC mass concentration conversion factors. This conversion is easily available by means of comparison of absorption measurements with thermal-optical determinations. As stated above, current discussions in the scientific community whether a constant or locally-determined MAE factors should be applied for this. Particle number measurements show similar developments, with observations dating back to 2002 or 2003 in the Amsterdam, Danish and Swiss networks and 2008 in Germany, and 1998 in the UK. Various types of instruments are operated with varying size range: Mobility Particle Sizers (DMPS, SMPS, FMPS), Condensation Particle Counters (CPCs), Grimm spectrometers and ultrafine particle monitors. UFP monitors which neither require radioactive sources nor condensing fluids have received recent interest in several countries and are being investigated for the possibility to provide continuous, stable and accurate monitoring data. Indeed, as pointed out by countries, particle counters and sizers are currently not easy to use and their implementation requires specific skills and intensive maintenance. Because of data losses due to instabilities and long calibrating operations, it is much more difficult to achieve acceptable data captures.

55
2006-2009
2012
Starting date for EBC monitoring
2006-2009
2012
Starting date for EBC monitoring
Figure V.1. Starting date for EBC monitoring in European countries. Striped backgrounds indicate the presence of EBC networks, with at least 5 stations (arbitrary threshold) monitoring EBC in a coordinated manner and with comparable instrumentation within the same country.
≤ 2002
2007-2009
2012
Starting date for PNC monitoring
≤ 2002
2007-2009
2012
Starting date for PNC monitoring
Figure V.1. Starting date for particle number concentration (PNC) monitoring in European countries. Striped backgrounds indicate the presence of PNC networks, with at least 5 stations (arbitrary threshold) monitoring EBC in a coordinated manner and with comparable instrumentation within the same country.
56
Acknowledgments The authors would like to thank network operators and researchers for their valuable contributions: Austria, Belgium, Denmark, Finland, France, Germany, Greece, Ireland, Italy, The Netherlands, Portugal, Slovenia, Spain, Sweden, Switzerland, UK. This work was carried out in the framework of the ETC/ACM for the EEA. References Aalto P, Hämeri K, Paatero P, Kulmala M, Bellander T, Berglind PNC, Bouso L,
Castaño-Vinyals G, Cattani G, Cyrys J, Von Klot S, Lanki T, Marconi A, Nyberg F, Pekkanen J, Peters A, Sjöval B, Sunyer J, Zetzsche K, Forastiere F. Aerosol number concentration measurements in five European cities using TSI-3022 condensation particle counter over three year period during HEAPSS (Health Effects of Air Pollution on Susceptible Subpopulations). J Air Waste Manage Assoc 2005; 55(8):1064-76.
Adams, P. J. 2003. Ultrafine particles and climate change. Available on http://www.hdgc.epp.cmu.edu/mailinglists/hdgcctml/mail/ppt00035.ppt.
Agarwald, J.K., 1980. Sem GJ. Continuous flow, single-particle-counting condensation nucleus counter, J Aerosol Sci;11:343-357.
Air Quality Sciences, Inc. 2011. Ultrafine particles – Why all the concern about something so small? Available on http://www.aqs.com/docs/campaigns/click-here-to-download-the-white-paper-on-ultrafine-particle-emissions.pdf.
Andreae, M.O., and Gelencsér, A, 2006. Black carbon or brown carbon? The nature of light-absorbing carbonaceous aerosols, Atmos. Chem. Phys., 6, 3131-3148.
Araujo, J.A., Barajas, B., Kleinman, M., Wang, X., Bennett, B.J., Gong, K.W., Navab, M., Harkema, J., Sioutas, C., Lusis, A.J., Nel, A.E., 2008. Ambient Particulate Pollutants in the Ultrafine Range Promote Early Atherosclerosis and Systemic Oxidative Stress. Circulation Research. 102:589-596.
Arctic Council Task Force on short-lived climate forces, 2011. Progress report and recommendations for Ministers.
Arnott, W.P., Hamasha, K., Moosmüller, H., Sheridan, P.J., and Ogren, J.A., 2005, Towards aerosol light-absorption measurements with a 7-wavelength aethatolometer: evaluation with a photoacoustic instrument and a 3-wavelength nephelometer, Aerosol Sci. Technol., 39, 17-29.
Baumgardner, D., Popovicheva, O., Allan, J., Bernardoni, V., Cao, J., Cavalli, F., Cozic, J., Diapouli, E., Eleftheriadis, K., Genberg, P.J., Gonzalez, C., Gysel, M., John, A., Kirchstetter, T.W., Kuhlbusch, T.A.J., Laborde, M., Lack, D., Müller, T., Niessner, R., Petzold, A., Piazzalunga, A., Putaud, J.P., Schwarz, J., Sheridan, P., Subramanian, R., Swietlicki, E., Valli, G., Vecchi, R., Viana, M., 2012. Soot Reference Materials for instrument calibration and intercomparisons: a workshop summary with recommendations. Atmospheric Measurement Techniques, 2315-2362.
Belleudi, V., Faustini, A., Stafoggia, M., Cattani, G., Marconi, A., Perucci, C.A., Forastiere, F., 2010. Impact of Fine and Ultrafine Particles on Emergency Hospital Admissions for Cardiac and Respiratory Diseases. Epidemiology, Volume 21, Number 3.
Benjamin, M., 2007. "RT for Decision Makers in Respiratory Care". RT Magazine. http://www.rtmagazine.com/issues/articles/2007-11_01.asp. Retrieved 2009-05-15.
Bergoson, L.L., 12 September 2007. "Greenpeace Releases Activists' Guide to REACH, Which Addresses Nanomaterials: Nanotech Law blog of Bergeson & Campbell, P.C.". Nanotechnology Law Blog. Bergeson & Campbell, P.C.. http://nanotech.lawbc.com/2007/09/articles/international/greenpeace-releases-activists-guide-to-reach-which-addresses-nanomaterials/. Retrieved 2008-03-19.

57
Birch, M.E., Cary, R.A., 1996. Elemental carbon-based method for monitoring occupational exposures to particulate diesel exhaust. Aerosol Science and Technology 25.
Birmili, W., Weinhold, K., Nordmann, S., Wiedensohler, A., Spindler, G., Müller, K., Herrmann, H., Gnauk, T., Pitz, M., Cyrys, J., Flentje, H., Nickel, C., Kuhlbusch, T. A. J., Löschau, G., Haase, D., Meinhardt, F., Schwerin, A., Ries, L., Wirtz, K., 2009. Atmospheric aerosol measurements in the German Ultrafine Aerosol Network (GUAN). Part 1: soot and particle number size distributions. Gefahrstoffe - Reinhaltung der Luft, 69, Nr. 4, 137-145.
Bond, T.C., 2002. Aerosols, Air Pollution as a Climate Forcing: A Workshop, Honolulu, Hawaii, available at: http://www.giss.nasa.gov/meetings/pollution2002/
Bond, T.C., and Bergstrom, R.W., 2006. Light absorption by carbonaceous particles: an investigative review, Aerosol Sci. Technol., 40, 27-67.
Bond, T.C. et al., 2007. Historical emissions of black and organic carbon aerosol from energy-related combustion, 1850–2000. Global Biogeochem. Cycles 21, doi:10.1029/2006GB002840.
Bond, T.C., 2007a. Testimony for the Hearing on Black Carbon and Climate Change, U.S. House Committee on Oversight and Government Reform 2-3, available at: http://oversight.house.gov/images/stories/documents/20071018110647.pdf
Bond, T.C., 2007b. Can warming particles enter global climate discussions? Environ. Res. Lett. 2. 045030.
Bond, T.C., Doherty, S.J., Fahey, D.W., Forster, P.M., Berntsen, T., DeAngelo, B.J., Flanner, M.G., Ghan, S., Kärcher, B., Koch, D., Kinne, S., Kondo, Y., Quinn, P.K., Sarofim, M.C., Schultz, M.G., Schulz, M., Venkataraman, C., Zhang, H., Zhang, S., Bellouin, N., Guttikunda, S.K., Hopke, P.K., Jacobson, M.Z., Kaiser, J.W., Klimont, Z., Lohmann, U., Schwarz, J.P., Shindell, D., Storelvmo, T., Warren, S.G., Zender, C.S., 2013. Bounding the role of black carbon in the climate system: A scientific assessment. Journal of Geophysical Research: Atmospheres. DOI: 10.1002/jgrd.50171.
Bräuner, E.V., Forchhammer, L., Møller, P., Simonsen, J., Glasius, M., Wåhlin, P., et al. 2007. Exposure to Ultrafine Particles from Ambient Air and Oxidative Stress–Induced DNA Damage. Environ Health Perspect 115:1177-1182.
Brunekreef, B., Janssen, N.A.H., Harssema, H., Knape, M., Vliet, P.v., 1997. Air Pollution from truck traffic and lung function in children living near motorways. Epidemiology 8, 298-303.
Buonanno, G., Dell'Isola, M., Stabile, L., Viola, A., 2009a. Uncertainty Budget of the SMPS-APS System in the Measurement of PM1, PM2.5, and PM10, Aerosol Science & Technology, 43:11, 1130-1141.
Buonanno, G., Ficco, G., Stabile, L., 2009b. Size distribution and number concentration of particles at the stack of a municipal waste incinerator, Waste Management, 29, 749–755.
Buonanno, G., Lall, A., Stabile, L., 2009c. Temporal size distribution and concentration of particles near a major highway, Atmospheric Environment, 43, 1100–1105.
Buonanno, G., Morawska, L., Stabile, L., 2009d. Particle emission factors during cooking activities, Atmospheric Environment, 43, 3235–3242.
Buonanno, G., Anastasi, P., Di Iorio, F., Viola, A., 2010a. Ultrafine particle apportionment and exposure assessment in respect of linear and point sources, Atmospheric Pollution Research, 1 36-43.
Buonanno, G., Stabile, L., Avino, P., Vanoli, R., 2010b. Dimensional and chemical characterization of particles at a downwind receptor site of a waste-to-energy plant, Waste Management, 30 1325–1333.
Buonanno, G., Morawska, L., Stabile, L., Viola, A., 2010c. Exposure to particle number, surface area and PM concentrations in pizzerias, Atmospheric environment, 44, 3963-3969.

58
Buonanno, G., Dell’Isola, M., Stabile, L., Viola, A., 2011a. Critical aspects of the uncertainty budget in the gravimetric PM measurements, Measurement: Journal of the International Measurement Confederation, 44 (1), 139-147.
Buonanno, G., Stabile, L., Avino, P., Belluso, E., 2011b. Chemical, dimensional and morphological ultrafine particle characterization from a Waste-to-Energy plant, Waste Management, 31 (11), 2253-2263.
Buonanno, G., Fuoco, F., Stabile, L., 2011c. Influence parameters on particle exposure of pedestrians in urban microenvironments, Atmospheric Environment, 45 (7), 1434-1443
Buonanno, G., Graham, J., Morawska, L., Stabile, L., 2011d. Volatility characterization of cooking-generated aerosol particles, Aerosol Science and Technology, 45, 1069- 1077.
Buonanno, G., Morawska, L., Stabile, L., 2011e. Exposure to welding particles in automotive plants, Journal of Aerosol Science, 42 (5), 295-304
Buonanno, G., Giovinco, G., Morawska, L., Stabile, L., 2011f. Tracheobronchial and alveolar dose of submicrometer particles for different population age groups in Italy, Atmospheric Environment, 45 (34), 6216-6224
Buonanno G., Scungio M., Stabile L., Tirler W., 2012a. Ultrafine particle emission from incinerators: The role of the fabric filter, Journal of the Air & Waste Management Association, 62:1, 103-111
Buonanno, G., Bernabei, M., Avino, P., Stabile L., 2012b. Occupational exposure to airborne particles and other pollutants in an aviation base, Environmental Pollution, in press.
Buonanno G., Fuoco F.C., Stabile L, 2012c. Particle resuspension in school gyms, Aerosol and Air Quality Research, in press.
Buonanno G., Fuoco F.C., Morawska L., Stabile L, 2012d. Children exposure to airborne particles at schools measured at different spatial scales, Atmospheric Environment, submitted.
Buonanno G., Fuoco F.C., Russi A., Stabile L., 2012e, Personal exposure of women to fine and coarse PM, Environmental Engineering and Management Journal, submitted paper.
Buonanno G., Marini S., Morawska L., Fuoco F.C., 2012f. Individual children dose and exposure to airborne particles, Atmospheric Environment, submitted paper.
Buonanno G., Morawska L., Stabile L., Wang L., Giovinco G., 2012g. A comparison of submicrometer particle dose between Australian and Italian people, Environmental Pollution, in press.
Cahill, T.A., Barnes, D.E., Nicholas, J.S., Lawton, J.A., Cahill, T.M., 2011a: Very Fine and Ultrafine Metals and Ischemic Heart Disease in the California Central Valley 1: 2003–2007, Aerosol Science and Technology, 45:9, 1123-1134.
Cahill, T.A., Barnes, D.E., Withycombe, E., Watnik, M., 2011b: Very Fine and Ultrafine Metals and Ischemic Heart Disease in the California Central Valley 2: 1974–1991, Aerosol Science and Technology, 45:9, 1135-1142.
Cahill, T.A., Cahill, T.M., Barnes, D.E, Spada, N.J., Miller, R., 2011c: Inorganic and Organic Aerosols Downwind of California's Roseville Railyard, Aerosol Science and Technology, 45:9, 1049-1059.
California Environmental Protection Agency. 2006. Current issues in ultrafine particle research: The Air Research Board’s health and exposure research Program. Available on http://www.arb.ca.gov/research/health/healthup/july06.pdf
Cavalli, F., Viana, M., Espen, K., Kiss, G., Genberg, J., Putaud, J.P., 2011. Toward a Standardized Thermal-Optical Protocol for Measuring Atmospheric Organic and Elemental Carbon: The EUSAAR protocol. Atmospheric Measurement Techniques 3, 79-89.
Center for biological diversity. Black carbon. Available on http://www.biologicaldiversity.org/programs/climate_law_institute/global_warming_what_how_why/black_carbon/index.html.

59
Chow, J.C., et al. 1993 The DRI thermal optical reflectance carbon analysis system description, evaluation and applications in United States air quality studies. Atmos Environ, 27 (Part A31 General Topics).
Chow, J.C., et al. 2007. The IMPROVE-A temperature protocol for thermal/optical carbon analysis: maintaining consistency with a long-term database. JAWMA 57.
CLEANAIR TASK FORCE: Occupational exposure to diesel exhaust. Available on http://dieselcleanup.org/CATF%202012%20Occupational%20Diesel%20Fact.pdf
Collaud-Coen, M., Weingartner, E., Apituley, A., Ceburnis, D., Fierz-Schmidhauser, R., Flentje, H., Henzing, J.S., Jennings, S.G., Moerman, M., Petzold, A., Schmid, O., Baltensperger, U., 2010. Minimizing light absorption measurement artifacts of the Aethalometer: evaluation of five correction algorithms. Atmospheric Measurement Techniques, 457-474.
Collins, B., 2007. "HP Hits Back in Printer Health Scare Row". PC Pro. http://www.pcpro.co.uk/news/121641/hp-hits-back-in-printer-health-scare-row.html. Retrieved 2009-05-15.
Corvalán, C., Briggs, D., Kjellström, T., 1996: Development of environmental health indicators. In: Linkage Methods for Environment and Health Analysis. Edited by Briggs D, Corvalán C, Nurminen M. Geneva: Office of Global and Integrated Environmental Health, World Health Organization; 19-53.
Council of the European Union, 2012. Convention on Long-Range Transboundary Air Pollution (CLRTAP) – Revision of the Gothenburg Protocol.
de Gouw, J.; Jiménez, J. L., 2009. Organic Aerosols in the Earth's Atmosphere. Environmental Science and Technology 2009, 43, 7614–7618.
Dons, E., 2011. "Impact of time-activity patterns on personal exposure to black carbon". Atmospheric Environment, 45, 3594-3602.
EEA (2012) Air quality in Europe - 2012 report. EEA Report No 4/2012, ISBN 978-92-9213-328-3, ISSN 1725-9177, doi:10.2800/55823 © EEA, Copenhagen, 2012.
Environmental Protection UK, 2011. Black carbon campaign - Where does it come from? Available on http://blackcarbon.org.uk/about/where-does-it-come-from
ETC-ACC (2010) Reporting on ambient air quality assessment in the EU Member States, 2008. ETC/ACC Technical paper 2010/11 December 2010. Benno Jimmink, Frank de Leeuw, Erik Noordijk, Jana Ostatnická, Markéta Conková.
EU FP7 TRANSPHORM (Transport related Air Pollution and Health impacts - Integrated Methodologies for Assessing Particulate Matter) project. Available on http://www.transphorm.eu
Favez, O., El-Haddad, I., Piot, C., Boreave, A., Abidi, E., Marchand, PNC., Jaffrezo, J.-L., Besombes, J.-L., Personnaz, M.-B., Sciare, J., Wortham, H. And D’Anna, B., 2010. Inter-comparison of source apportionment models for the estimation of wood burning aerosols during wintertime in an Alpine city (Grenoble, France), Atmos. Phys. Chem., 10, 5295-5314.
Fernandez-Camacho, R., Rodríguez, S., Rosa, J.d.l., Campa, A.M.S.d.l., Viana, M., Alastuey, A., Querol, X., 2010. Ultrafine particle formation in the inland sea breeze airflow in Southwest Europe. Atmospheric Chamistry & Physics, 9615-9630.
Fialho, P., Hansen, A.D.A., and Honrath, R.E., 2005. Absorption coefficients by aerosols in remote areas: a new approach to decouple dust and black carbon absorption coefficients using seven-wavelength aethalometer data, J. Aer. Sci., 36, 2, 267-282.
Fierens, F., Brasseur, O.,Trimpeneers, E., 2011. Traffic related air pollution : total mass PM10 or Black Carbon (BC) as indicator. 16th EIONET Workshop on Air Quality Management and Assessment, 12 - 13 October 2011, Bordeaux, France.
Frampton, M.W., Stewart, J.C., Oberdörster, G., Morrow, P.E., Chalupa, D., Pietropaoli, A.P., et al. 2006. Inhalation of Ultrafine Particles Alters Blood Leukocyte Expression of Adhesion Molecules in Humans. Environ Health Perspect, 114:51-58.

60
Froines, J. R., 2006. Ultrafine particle health effects. Available on http://www.aqmd.gov/tao/ultrafine_presentations/Pre-Conference_2_Froines.pdf
Gaschen, A., Lang, D., Kalberer, M., Savi, M., Geiser, T., Gazdhar, A., Lehr, C.M., Bur, C., Dommen, J., Baltensperger, U., Geiser, M., 2011. Cellular Responses after Exposure of Lung Cell Cultures to Secondary Organic Aerosol Particles. Environmental Science & Technology, 44, pp. 1424-1430.
GAW/WMO (2011) Position of the GAW Scientific Advisory Group on the use of Black Carbon terminology. TFMM meeting.
Geiser, M., Rothen-Rutishauser, B., Kapp, N., Schüech, S., Kreyling, W., Schulz, H., Semmler, M., Im Hof, V., Heyder, J., Gehr, P., 2005. "Ultrafine Particles Cross Cellular Membranes by Nonphagocytic Mechanisms in Lungs and in Cultured Cells". Environmental Health Perspectives 113 (11): 1555–1560. doi:10.1289/ehp.8006. PMC 1310918. PMID 16263511. Available on : http://www.pubmedcentral.nih.gov/articlerender.fcgi?tool=pmcentrez&artid=1310918.
Glaser, B., 2007. Prehistorically modified soils of central Amazonia: a model for sustainable agriculture in the twenty-first century. PHILOSOPHICAL TRANSACTIONS OF THE ROYAL SOCIETY B, 362, 187–196.
Godish, V.T., 2001. Indoor Environmental Quality. CRC Press. ISBN 1-56670-402-2. Gold, D.R., Litonjua, A.A., Zanobetti, A., Coull, B.A., Schwartz, J., Maccallum, G., et al.
2005. Air pollution and ST-segment depression in elderly subjects. Environ Health Perspect 113:883–887.
Grahame, T.J., Schlesinger, R.B., 2010. Cardiovascular health and particulate vehicular emissions: a critical evaluation of the evidence. Air Quality, Atmosphere and Health, 1:3–27.
Greenopedia, 2012. The Effects of Black Carbon on Health and Climate. Available on http://greenopedia.com/tidbits/black-carbon-affects-health-and-climate/.
Hansen, A.D.A., Rosen, H., and Novakov, T., 1982. Real-time measurement of the absorption coefficient of aerosol particles. ApplOpt 21: 3060–3062.
Hansen, A.D.A., Rosen, H., and Novakov, T., 1984. The Aethalometer – An instrument for the real-time measurement of optical absorption by aerosol particles, Sci. Total Environ., 36, 191-196.
Happo, M.S., 2007. Dose and time-dependency of inflammatory responses in the mouse lung to urban air coarse, fine and ultrafine particles from six European cities. Inhalation Toxicology, 19(3):227–246.
Harrison, R.M., Yin, J., 2008. Sources and processes affecting carbonaceous aerosol in central England. Atmospheric Environment 42, 1413-1423.
Howard, V., 2009. "Statement of Evidence: Particulate Emissions and Health (An Bord Plenala, on Proposed Ringaskiddy Waste-to-Energy Facility)." http://www.durhamenvironmentwatch.org/Incinerator%20Health/CVHRingaskiddyEvidenceFinal1.pdf. Retrieved 2011-04-26.
Http://www.transphorm.eu Huntzicker, J.J., Johnson, R.L., Shah, J.J., Cary, R.A., 1982. Analysis of organic and
elemental carbon in ambient aerosols by a thermal-optical method. In. Particulate Carbon: Atmospheric Life Cycle, G.T. Wolff and R.L. Klimisch eds., Plenum Press, New York, New York, 79-88.
Hyvarinen A.P., Vakkari V., Laakso L. , Hooda R. K., Sharma V. P., Panwar T. S., Beukes J. P., van Zyl P. G., Josipovic M., Garland R. M., Andreae M. O., Poschl U., and Petzold A. (2012) Correction for a measurement artifact of the Multi-Angle Absorption Photometer (MAAP) at high black carbon mass concentration levels. Atmos. Meas. Tech. Discuss., 5, 6553–6576.
ICRP, 1994. Publication 66: Human respiratory tract model for radiological protection. International Commission on Radiological Protection (ICRP): Elsevier Science, Oxford, U.K..

61
IGSD, 2010. Black Carbon Briefings and Events. Available on http://www.igsd.org/blackcarbon/index.php
INECE, 2008. Jump-Starting Climate Protection: “INECE Targets Compliance with Laws Controlling Black Carbon" analysis by International Network for Environmental Compliance and Enforcement, June 12, 2008, accessed April 22, 2011.
IPCC, 2007. “IPCC, Changes in Atmospheric Constituents and in Radiative Forcing, in Climate Change”, accessible at http://www.ipcc.ch/ipccreports/ar4-wg1.htm
Jacobson, M., 2007. Testimony of the Hearing on Black Carbon and Artic. Available at: http://oversight-archive.waxman.house.gov/documents/20071018110606.pdf
Jalava, P.I., Salonen, R.O., Pennanen, A.S., Sillanpää, M., Hälinen, A.I., Happo, M.S., Hillamo, R., Brunekreef, B., Katsouyanni, K., Sunyer, J., Hirvonen, M.R., 2007. Heterogeneities in inflammatory and cytotoxic responses of RAW 264.7 macrophage cell line to urban air coarse, fine and ultrafine particles from six European sampling campaigns. Inhalation Toxicology, 19(3):213–225.
Jansen, K.L., Larson, T.V., Koenig, J.Q., Mar, T.F., Fields, C., Stewart, J., Lippmann, M., 2005. Associations between Health Effects and Particulate Matter and Black Carbon in Subjects with Respiratory Disease. Environ Health Perspect. 2005; 113(12): 1741–1746.
Janssen, N.A., Simic-Lawson, M., Fischer, P., van Bree, L., ten Brink, H., Keuken, M., Atkinson, R.W., Anderson, H.R., Brunekreef, B., Cassee, F.R., 2011. Black carbon as an additional indicator of the adverse health effects of airborne particles compared with PM10 and PM2.5. Environmental Health Perspective, 119: 1691- 1699.
Janssen, N.A.H., Gerlofs-Nijland, M.E., Lanki, T., 2012. Health effects of black carbon. The WHO European Centre for Environment and Health, WHO Regional Office for Europe, Bonn. Available on http://www.euro.who.int/data/assets/pdf_file/0004/162535/e96541.pdf
Johnson, R. 2010. Black Carbon: Impact on Climate Change and Human Health. Climate Science Press- Republican. Available on http://pressrepublican.com/0800_special_sections/x511770118/Black-Carbon-Impact-on-Climate-Change-and-Human-Health
Kelly, F.J., 2003. Oxidative stress: its role in air pollution and adverse health effects. Occup Environ Med 2003;60:612-616 doi:10.1136/oem.60.8.612.
Kelly, F.J., Fussell, J.C., 2012. Size, source and chemical composition as determinants of toxicity attributable to ambient particulate matter. Atmospheric Environment, 60, 504-526.
Keogh, D.U., Kelly, J., Mengersen, K., Javaratne, R., Ferreira, L., Morawska, L., 2010. Derivation of motor vehicle tailpipe particle emission factors suitable for modelling urban fleet emissions and air quality assessments. Environ Sci Pollut Res Int. 2010 Mar; 17(3):724-739.
Keogh, D.U., Sonntag, D., 2011. Challenges and Approaches for Developing Ultrafine Particle Emission Inventories for Motor Vehicle and Bus Fleets. Atmosphere 2, no. 2: 36-56.
Keogh, D.U., 2012. Developing motor vehicle emission inventories and air quality regulation for ultrafine particles. In: Bartul, Zacharie and Trenor, Jerome, (eds.) Advances in nanotechnology, vol. 8. Nova Science Publishers, Inc., New York, United States, pp. 383-400. ISBN 978-1-61324-062-5.
Kirchstetter, T.W., Novakok, T., and Hobbs, P.V., 2004. Evidence that the spectral dependence of light absorption by aerosols is affected by organic carbon, J. Geophys. Res., 109, D21208, doi: 10.1029/2004JD004999.
Knibbs L. D, Cole-Hunter T, Morawska L. 2011. A review of commuter exposure to ultrafine particles and its health effects. Atmospheric Environment. Volume 45, Issue 16, Pages 2611–2622.
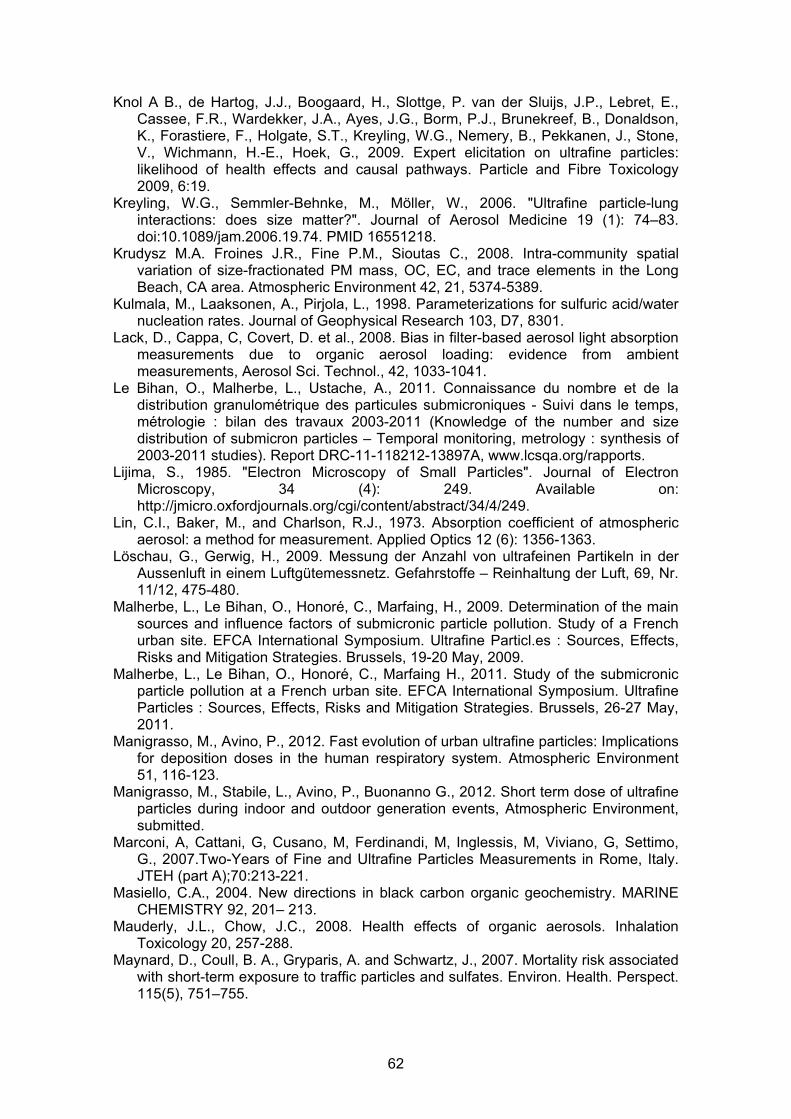
62
Knol A B., de Hartog, J.J., Boogaard, H., Slottge, P. van der Sluijs, J.P., Lebret, E., Cassee, F.R., Wardekker, J.A., Ayes, J.G., Borm, P.J., Brunekreef, B., Donaldson, K., Forastiere, F., Holgate, S.T., Kreyling, W.G., Nemery, B., Pekkanen, J., Stone, V., Wichmann, H.-E., Hoek, G., 2009. Expert elicitation on ultrafine particles: likelihood of health effects and causal pathways. Particle and Fibre Toxicology 2009, 6:19.
Kreyling, W.G., Semmler-Behnke, M., Möller, W., 2006. "Ultrafine particle-lung interactions: does size matter?". Journal of Aerosol Medicine 19 (1): 74–83. doi:10.1089/jam.2006.19.74. PMID 16551218.
Krudysz M.A. Froines J.R., Fine P.M., Sioutas C., 2008. Intra-community spatial variation of size-fractionated PM mass, OC, EC, and trace elements in the Long Beach, CA area. Atmospheric Environment 42, 21, 5374-5389.
Kulmala, M., Laaksonen, A., Pirjola, L., 1998. Parameterizations for sulfuric acid/water nucleation rates. Journal of Geophysical Research 103, D7, 8301.
Lack, D., Cappa, C, Covert, D. et al., 2008. Bias in filter-based aerosol light absorption measurements due to organic aerosol loading: evidence from ambient measurements, Aerosol Sci. Technol., 42, 1033-1041.
Le Bihan, O., Malherbe, L., Ustache, A., 2011. Connaissance du nombre et de la distribution granulométrique des particules submicroniques - Suivi dans le temps, métrologie : bilan des travaux 2003-2011 (Knowledge of the number and size distribution of submicron particles – Temporal monitoring, metrology : synthesis of 2003-2011 studies). Report DRC-11-118212-13897A, www.lcsqa.org/rapports.
Lijima, S., 1985. "Electron Microscopy of Small Particles". Journal of Electron Microscopy, 34 (4): 249. Available on: http://jmicro.oxfordjournals.org/cgi/content/abstract/34/4/249.
Lin, C.I., Baker, M., and Charlson, R.J., 1973. Absorption coefficient of atmospheric aerosol: a method for measurement. Applied Optics 12 (6): 1356-1363.
Löschau, G., Gerwig, H., 2009. Messung der Anzahl von ultrafeinen Partikeln in der Aussenluft in einem Luftgütemessnetz. Gefahrstoffe – Reinhaltung der Luft, 69, Nr. 11/12, 475-480.
Malherbe, L., Le Bihan, O., Honoré, C., Marfaing, H., 2009. Determination of the main sources and influence factors of submicronic particle pollution. Study of a French urban site. EFCA International Symposium. Ultrafine Particl.es : Sources, Effects, Risks and Mitigation Strategies. Brussels, 19-20 May, 2009.
Malherbe, L., Le Bihan, O., Honoré, C., Marfaing H., 2011. Study of the submicronic particle pollution at a French urban site. EFCA International Symposium. Ultrafine Particles : Sources, Effects, Risks and Mitigation Strategies. Brussels, 26-27 May, 2011.
Manigrasso, M., Avino, P., 2012. Fast evolution of urban ultrafine particles: Implications for deposition doses in the human respiratory system. Atmospheric Environment 51, 116-123.
Manigrasso, M., Stabile, L., Avino, P., Buonanno G., 2012. Short term dose of ultrafine particles during indoor and outdoor generation events, Atmospheric Environment, submitted.
Marconi, A, Cattani, G, Cusano, M, Ferdinandi, M, Inglessis, M, Viviano, G, Settimo, G., 2007.Two-Years of Fine and Ultrafine Particles Measurements in Rome, Italy. JTEH (part A);70:213-221.
Masiello, C.A., 2004. New directions in black carbon organic geochemistry. MARINE CHEMISTRY 92, 201– 213.
Mauderly, J.L., Chow, J.C., 2008. Health effects of organic aerosols. Inhalation Toxicology 20, 257-288.
Maynard, D., Coull, B. A., Gryparis, A. and Schwartz, J., 2007. Mortality risk associated with short-term exposure to traffic particles and sulfates. Environ. Health. Perspect. 115(5), 751–755.

63
Minguillón, M.C., Perron, N., Querol, X., Szidat, S., Fahrni, S.M., Alastuey, A., Jiménez, J.L., Mohr, C., Ortega, A.M., Day, D.A., Lanz, V., Wacker, L., Reche, C., Cusack, M., Kiss, G., Hoffer, A., Hillamo, R, Teinilä, K, Baltensperger, U, Prévôt, A.S.H., 2011. Fossil versus modern sources of fine elemental and organic carbonaceous particulate matter during DAURE campaign in Northeast Spain. Atmos Chem Phys Discuss 11:23573-23618.
Moghini, S.M., 2005. "Nanomedicine: Current Status and Future Prospects". The FASEB Journal 19 (3): 311. doi:10.1096/fj.04-2747rev. PMID 15746175. http://www.fasebj.org/cgi/reprint/19/3/311.
Morawska, L., Moore, M.R., Ristovski, Z.D., 2004. Health Impacts of Ultrafine Particles – Desktop Literature Review and Analysis. Available on http://www.environment.gov.au/atmosphere/airquality/publications/health-impacts/pubs/appendices.pdf
Müller, T., Henzing, J.S., Leeuw, G.d., Wiedensohler, A., Alastuey, A., Angelov, H., Bizjak, M., Coen, M.C., Engström, J.E., Gruening, C., Hillamo, R., Hoffer, A., Imre, K., Ivanow, P., Jennings, G., Sun, J.Y., Kalivitis, N., Karlsson, H., Komppula, M., Laj, P., Li, S.-M., Lunder, C., Marinoni, A., Santos, S.M.d., Moerman, M., Nowak, A., Ogren, J.A., Petzold, A., Pichon, J.M., Rodriguez, S., Sharma, S., Sheridan, P.J., Teinilä, K., Tuch, T., Viana, M., Virkkula, A., Weingartner, E., Wilhelm, R., Wang, Y.Q., 2011. Characterization and intercomparison of aerosol absorption photometers: result of two intercomparison workshops. Atmospheric Measurement Techniques, 245-268.
Nadadur, S.S., Miller, C.A., Hopke, P.K., Gordon, T., Vedal, J.J., Costa, D.L., 2007. "The Complexities of Air Pollution Regulation: the Need for an Integrated Research and Regulatory Perspective". Toxicological Sciences 100 (2): 318–27. doi:10.1093/toxsci/kfm170. PMID 17609539.
National Physical Laboratory (Beccaceci et al.), 2011. CPEA 28: AirborneParticulate Concentrations and Numbers in the United Kingdom (phase 2). Annual report 2010. NPL report AS 65.
National Physical Laboratory (Butterfield D.), 2011. Local Site Operator Procedure for the Magee Aethalometer. UK Black Smoke Network. Procedure: DEFRA Aethalometer 002, Issue 1.3, August 2011.
National Physical Laboratory (Butterfield et al.), 2010. 2009 Annual Report for the UK Black Carbon Network. NPL report AS 52.
New Media Studio, 2012. Aerosol definition. Available on http://www.newmediastudio.org/DataDiscovery/Aero_Ed_Center/Charact/A.what_are_aerosols.html
NIOSH manual of analytical methods (NMAM), 1999. National Institute for Occupational Safety and Health (NIOSH), method 5040, elemental carbon (diesel particulate), 4th Ed., Issue 3.
Nordmann, S., Birmili, W., Weinhold, K., Wiedensohler, A., Mertes, S., Müller, K., Gnauk, T., Herrmann, H., Pitz, M., Cyrys, J., Flentje, H., Ries, L., Wirtz, K., 2009. Atmospheric aerosol measurements in the German Ultrafine Aerosol Network (GUAN). Part 2: Comparison of measurements techniques for graphitic, light-absorbing, and elemental carbon, and non-volatile particle volume under field conditions. Gefahrstoffe - Reinhaltung der Luft, 11/12, 469-474.
Novakov, T., Ramanathan, V., Hansen, J.E., Kirchstetter, T.W., Sato, M., Sinton, J.E., Sathaye, J.A., 2003. Large historical changes of fossil-fuel black carbon aerosols. Geophys. Res. Lett. 30, doi:10.1029/2002GL016345.
O’Neill, M.S., Veves, A., Zanobetti, A., Sarnat, J.A., Gold, D.R., Economides, P.A., et al. 2005. Diabeties enhances vulnerability to particulate air pollution-associated impairment in vascular reactivity and endothelial function. Circulation. 111:2913–2920.
Oberdörster, G., Oberdörster, E., Oberdörster, J., 2005. "Nanotoxicology: An Emerging Discipline Evolving from Studies of Ultrafine Particles". Environmental Health
64
Perspectives 113: 823–839. doi:10.1289/ehp.7339. PMC 1257642. PMID 16002369. http://www.pubmedcentral.nih.gov/articlerender.fcgi?tool=pmcentrez&artid=1257642.
Osunsanya, T., Prescott, G., Seaton, A., 2001. "Acute Respiratory Effects of Particles: Mass or Number?". Occupational Environmental Medecide 58: 154. doi:10.1136/oem.58.3.154.
Paatero, P., Aalto, P., Picciotto, S., Bellander, T., Castaño, G., Cattani, G., Cyrys, J., Kulmala, M., Lanki, T., Nyberg, F., Pekkanen, J., Peters, A., Sunyer, J., Forastiere, F., 2005. The HEAPSS study group. Estimating time series of aerosol particle number concentrations in the five HEAPSS cities on the basis of measured air pollution and meteorological variables. Atmospheric Environment, 39:2261–2273.
Papapostolou, V., Lawrence, J.E., Diaz, A., Wolfson, J.M., Ferguson, S.T., Long, M.S., Godleski, J.J., Koutrakis, P., 2011. Laboratory evaluation of a prototype photochemical chamber designed to investigate the health effects of fresh and aged vehicular exhaust emissions. Inhalation Toxicology, 23(8), pp. 495-505.
Pérez, N.; Pey, J.; Querol, X.; Alastuey, A.; López, J. M.; Viana, M., 2008. Partitioning of major and trace components in PM10–PM2.5–PM1 at an urban site in Southern Europe. Atmospheric Environment, 42, 1677-1691.
Peters, A., Liu, E., Verrier, R.L., Schwartz, J., Gold, D., Mittleman, M., et al. 2000. Air pollution and incidence of cardiac arrhythmia. Epidemiology, 11:11–17.
Peterson, M.R. and Richards, M.H., 2002. Thermal-optical-transmittance analysis for organic, elemental, carbonate, total carbon, and OCX2 in PM2.5 by the EPA/NIOSH method. In Proceedings, symposium on air quality measurement methods and technology-2002, E.D. Winegar and RJ Tropp eds, Air & Waste Management Association, Pittsburgh, PA (83-1-83-19).
Petzold, A., Schloesser, H., Sheridan, P.J., Arnott, W.P., Ogren, J.A. and Virkkula, A., 2005. Evaluation of Multiangle Absorption Photometry for Measuring Aerosol Light Absorption, Aerosol Science and Technology, 39:40–51.
Pey, J., Rodríguez, S., Querol, X, Alastuey, A., Moreno, T, Putaud, J.P., Van Dingenen, R., 2008. Events and cycles of urban aerosols in the western Mediterranean. Atmospheric Environment, 42, 9052–9062.
Pey, J., Querol, X., Alastuey, A., Rodríguez, S., Putaud, J.P., Van Dingenen, R., 2009. Source apportionment of urban fine and ultra fine particle number concentration in a Western Mediterranean city. Atmospheric Environment, 43, 4407-4415.
PHILIPS – sense and simplicity. FAQ/White papers on ultrafine particles. Available on http://www.aerasense.com/index.php?pageID=5
Ramanathan, V., Carmichael, G., 2008. Global and regional climate changes due to black carbon, Nature Geoscience, 1, 221-227 (23 March 2008). Available at: http://faculty.washington.edu/dmck/feradata/smoke/Ramanathan-Carmichael-2008.pdf
Reche, C., Querol, X., Alastuey, A., Viana, M., Pey, J., Moreno, T., Rodríguez, S., González, Y., Fernández-Camacho, R., Campa, A.M.S.d.l., Rosa, J.d.l., Dall’Osto, M., Prévôt, A.S.H., Hueglin, C., Harrison, R.M., Quincey, P., 2011. New considerations for PM, Black Carbon and particle number concentration for air quality monitoring across different European cities. Atmospheric Chemistry & Physics 11, 6207-6227.
Risom, L, Møller, P, Loft, S. (2005) Oxidative stress-induced DNA damage by particulate air pollution. Mutat Res. 2005 Dec 30;592(1-2):119-37. Epub 2005 Aug 8.
Rosen, H., Novakov, T., 1983. Optical transmission through aerosol deposits on diffusely reflective filters: a method for measuring the absorbing component of aerosol particles. Applied Optics, 22 (9):1265-1267.
Sabaliauskas, K., Evans, G., 2010. Exposure to Ultrafine Particles in Urban Centres. Environmental Science and Engineering, DOI: 10.1007/978-3-642-12278-1_25
65
Sandradewi, J., Prévôt, A.S.H., Szidat, S., Perron, PNC., Alfarra, M.R., Lanz, V.A., Weingartner, E., and Baltensperger, U., 2008. Using aerosol light absorption measurements for the quantitative determination of wood burning and traffic emission contributions to particulate matter, Environ. Sci. Technol., 42, 3316-3323.
Sannolo, N., Lamberti, M., Pedata, P., 2011. Human health effects of ultrafine particles. Giornale Italiano Di Medicina Del Lavoro Ed Ergonomia. Volume: 32, Issue: 4 Suppl, Pages: 348-351.
Savic, R., Luo, L., Eisenberg, A., Maysinger, D., 2003. "Micellar Nanocontainers Distribute to Defined Cytoplasmic Organelles". Science 300 (5619): 615–618. doi:10.1126/science.1078192. PMID 12714738.
Schmid, H., Laskus, L., Abraham, H.J., Baltensperger, U., Lavanchy, V., Bizjak, M., Burba, P., Cachier, H., Crow, D., Chow, J., Gnauk, T., Even, A., Brink, H.M.t., Giesen, K.P., Hitzenberger, R., Hueglin, C., Maenhaut, W., Pio, C., Carvalho, A., Putaud, J.P., Toom-Sauntry, D., Puxbaum, H., 2001. Results of the "carbon conference" international aerosol carbon round robin test stage I. Atmospheric Environment 35, 2111-2121.
Schmidt, M.W.I., Noack, A.G., 2000. Black carbon in soils and sediments: Analysis, distribution, implications and current challenges. GLOBAL BIOGEOCHEMICAL CYCLES 14, 777-793.
Sciare, J., d’Argouges, O., Sarda-Esteve, R., Gaimoz, C., Dolgorouky, C., Bonnaire, PNC., Favez, O., Bonsang, B., and Gros, V. : Large contribution of water-insoluble secondary organic aerosols in the Paris region (France), J. Geophys. Res., 116, D22203, doi: 10.1029/2011JD015256, 2011.
Science Daily, 2008. "How Ultrafine Particles In Air Pollution May Cause Heart Disease". 22 January 2008. Available on: http://www.sciencedaily.com/releases/2008/01/080121084718.htm. Retrieved 2009-05-15.
Science Daily, 2009. Ultra-Fine Particles, Particularly Harmful To Health, Can Now Be Traced. Available on http://www.sciencedaily.com/releases/2009/10/091005094919.htm.
Seinfeld, J.H., Pandis, S.N., 1998. Atmospheric Chemistry and Physics: From air pollution to climate change. John Wiley & Sons, Inc.
Sem, G.J., 2002. Design and performance characteristics of three continuous-flow condensation particle counters: a summary. Atmos Res, 62:267–294.
Skjaerseth, J.B., Wettestad, J., 2007. "Is EU Enlargement Bad for Environmental Policy? Confronting Gloomy Expectations with Evidence". International Environmental Agreements. Fridtjof Nansen Institute. http://www.fni.no/doc&pdf/JBS-JW-IEA-2007.PDF. Retrieved 2008-03-19.
Smith KR et al., 2009. Public health benefits of strategies to reduce greenhouse-gas emissions: health implications of short-lived greenhouse pollutants. Lancet, 74:2091–2103.
Spengler, J.D., 2000. Indoor Air Quality Handbook. ISBN 978-0-07-150175-0. Stabile, L., Fuoco, F.C., Buonanno, G., 2012. Characteristics of particles and black
carbon emitted by combustion of incenses, candles and anti-mosquito products. Building and Environment, 56, 184-191.
Szidat, S., Ruff, M., Perron N., Wacker, L., Synal, H.-A., Hallquist, M., Shannigrahi, A.S., Yttri, K.E., Dye, C., Simpson, D., 2009. Fossil and non-fossil sources of organic carbon (OC) and elemental carbon (EC) in Göteborg (Sweden). Atmos Chem Phys 9: 1521-1535.
Teichman, K., 2008. "Notice of Availability of the Nanomaterial Research Strategy External Review Draft and Expert Peer Review Meeting". Federal Register 73 (30): 8309. http://es.epa.gov/ncer/nano/publications/nano_fed_reg_021308.pdf. [dead link]
TRANSPHORM. 2010. Deliverable 1.2.1 - Report on shipping emission factors. Available on http://www.transphorm.eu/

66
Ulevičius, V., Byčenkienė, S., Špirkauskaitė, N., Kecorius, S., 2010. Biomass burning impact on black carbon aerosol mass concentration at a coastal site: case study. Lithuanian Journal of Physics, 50: 335-355.
UNEP/WMO, 2011 – Integrated Assessment of Black Carbon and Tropospheric Ozone: Summary for Decision Makers. final version available on: http://www.unep.org/dewa/Portals/67/pdf/BlackCarbon_report.pdf
University of Aegean, Mytilene, Greece. 2008. Ultrafine particles and health effects, dangerous, like no other PM? - Review and analysis. Global NEST Journal, Vol 10, No 3, pp 439-452, 2008.
USEPA, 2002. Health Assessment Document for Diesel Engine Exhaust. National Center for Environmental Assessment, Washington, DC.
US EPA Particulate Matter Center, 2008. Scientists Probe Air Pollution-Heart Disease Link. Available on http://www2.envmed.rochester.edu/envmed/PMC/indexPMC.html
US EPA. 2009. Integrated Science Assessment for Particulate Matter. Available on http://cfpub.epa.gov/ncea/cfm/recordisplay.cfm?deid=216546#Download
US EPA. 2010. Report to Congress on black carbon-Executive summary. Available on: http://www.epa.gov/blackcarbon/2012report/ReportHighlightsExecSummary.pdf
US EPA. 2011. Black carbon research and future strategies. Available on http://www.epa.gov/ord/ca/pdf/cafactsheetblackcarbon.pdf
US EPA, 2012. Report to Congress on Black Carbon. Available on: http://www.epa.gov/blackcarbon/basic.html. Accessed May 05, 2012.
Utell, M..J., and Frampton, M.W., 2009. Acute Health Effects of Ambient Air Pollution: The Ultrafine Particle Hypothesis Journal of Aerosol Medicine. Winter 2000, 13(4): 355-359.
Vanderstraeten, P., Forton, M., Brasseur, O., Offer, Z. Y., 2011. Black Carbon Instead of Particle Mass Concentration as an Indicator for the Traffic Related Particles in the Brussels Capital Region. Journal of Environmental Protection, 2, 525-532.
Von Klot, S., Wolke, G., Tuch, T., Heinrich, J., Dockery, D.W., Schwartz, J., Kreyling, W.G., Wichmann, H.E., Peters, A., 2002. Increased asthma medication use in association with ambient fine and ultrafine particles, . European Respiratory Journal 20, 691-702.
Wang, Y., Liu, S., Shi, P., Li, Y., Mu, C., Du, K., 2013. Temporal Variation of Mass Absorption Efficiency of Black Carbon at Urban and Suburban Locations. Aerosol and Air Quality Research 13, 275-286.
Weichenthal, S., Dufresne, A. and Infante-Rivard, C., 2006. Indoor ultrafine particles and childhood asthma: exploring a potential public health concern. Indoor Air. 17: 81 – 91. Available online at http://onlinelibrary.wiley.com/doi/10.1111/j.1600-0668.2006.00446.x/full.
Weingartner, E., Saathoff, H., Schnaiter, M., Streit, PNC., Bitnar, B., and Baltensperger, U., 2003. Absorption of light by soot particles: determination of the absorption coefficient by means of Aethalometers, J. Aerosol Sci., 34, 1445-1463.
Wichmann H.E., Spix C., Tuch T., Wölke G., Peters A., Heinrich J., Kreyling W.G., Heyder J., 2000. Daily Mortality and Fine and Ultrafine Particles in Erfurt, Germany. Part I: Role of Particle Number and Particle Mass. Health Effects Institute, 98.
Wiedensohler, A. et al., 2012. Mobility particle size spectrometers: harmonization of technical standards and data structure to facilitate high quality long-term observations of atmospheric particle number size distributions. Atmospheric Measurement Techniques, 5, 657–685,
Wilker, E.H., Baccarelli, A., Suh, H., Vokonas, P., Wright, R.O., Schwartz, J., 2010. Black Carbon Exposures, Blood Pressure, and Interactions with Single Nucleotide Polymorphisms in MicroRNA Processing Genes. Environ Health Perspect, 118:943-948.
World Health Organization (WHO), Regional Office for Europe. 2007. Health relevance of particulate matter from various sources, Report on a WHO workshop, Bonn,

67
Germany 26–27 March 2007. Available on http://www.euro.who.int/__data/assets/pdf_file/0007/78658/E90672.pdf
Yang, M., Howell, S.G., Zhuang, J., and Huebert, B.J.: Attribution of aerosol light absorption to black carbon, brown carbon and dust in China - interpretations of atmospheric measurements during EAST-AIRE. Atmos. Chem. Phys., 9, 2035-2050, 2009.
Zanobetti, A., Schwartz, J., 2009. The effect of fine and coarse particulate air pollution on mortality, a national analysis. Environ. Health Perspect, 117,898-903. http,//dx.doi. org/10.1289/ehp.0800108.

68
Appendix. Review of the presence of N and BC monitoring instrumentation in current air quality networks in Europe This section reviews the presence of N and BC monitoring instrumentation in current air quality monitoring networks across Europe. To this end, the network operators and air quality professionals from air quality networks and research institutions in Table A1 were contacted by e-mail and requested to provide input regarding their experience with N and/or BC instrumentation in their respective countries. Table A1. Networks and institutions contacted to provide input regarding N and/or BC instrumentation in their respective countries.
Country Reply Austria * Belgium
Czech Republic Denmark Finland France
Germany Greece Hungary Ireland
Italy Netherlands
Norway Poland
Portugal Slovenia
Spain Sweden
Switzerland United Kingdom
*Only initial reply received, but no follow-up. The replies received from each country are transcribed below. Only minor technical edits have been applied. ITALY Giorgio Cattania, Luca Stabileb, Giorgio Buonannob, Maurizio Manigrassoc aItalian National Institute for Environmental Protection and Research, Rome, Italy bUniversity of Cassino and Southern Lazio - Department of Civil and Mechanical Engineering cINAIL, Rome, Italy In Italy particle number concentrations monitoring has not been implemented yet within the national air quality assessment network. Several institutions provided data and long term monitoring in the framework of research projects as well as for study purpose at local and regional level. Since 2001 particles number concentration (PNC) has been continuously measured in Rome, the Italian National Institute of Health ISS; firstly in the framework of the HEAPPS study

69
(Aalto et al 2005; Marconi et al 2007), then up today. The measurement station is located in the front yard of ISS (2 km east of the city center), operating since 1978, measuring classic pollutants such as gaseous nitrogen oxides, carbon monoxide, ozone, sulphur dioxide, lead and total suspended particles (Viviano et al, 2004). During the early nineties it became the monitoring station of both coarse and fine fraction of PM mass concentrations. Particles number concentration (PNC) was measured by two TSI model 3022A condensation particle counters (CPC). This type of counter can monitor particles larger than 0.01 μm in diameter but still have a 50% counting efficiency at 0.007 μm (Agarwald & Sem, 1980; Sem, 2002). Sampling lines were stainless-steel tubing 2.5 m long and with an inner diameter of 4 mm. The inlet reached 1 m out from the outside wall of the container in which the instruments were placed. The HEAPSS standard operating procedures (SOP), containing the measurement protocol of total particle number concentration in ambient air, were strictly followed (Aalto et al., 2004). PNC has been measured since April 2001. Previous data since 1999 has been retrospectively estimated in the framework of the HEAPPS study using concurrent measurements of air pollutants and weather, as well as selected interactions between the two, to fit a regularized linear model also called ridge regression (Paatero et al, 2005). For a limited period (From February 2002 through March 2003) measurements have been carried out also in another site (urban background). Although the absolute values found in the urban background site were lower (about 50%) than the values found in the traffic related site, they show a good correlation at daily level (Marconi et al, 2007). A trend analysis was carried out based on air pollution data measured in Rome since 1999 to 2008. A statistically significant trend toward decreasing was found for primary gaseous pollutants and total particle number concentrations (Cattani et al 2010). The main topics to be addressed in the field of data quality control/assurance are: - instrument used till now (TSI 3022a) are not well suited for long term measurement and remote control; instruments well suited are available in the market but economical aspect is a critical endpoint until monitoring will not be requested by the legislation in force because investments are dependent to the availability of funding from research project; costs for routine measurements other than those already implemented with respect to directive 2008/50/EC are not sustainable for most regional networks. - Often humidity of the sampled air represents an important source of trouble especially during summer due to water condensation; The CPCs particle number concentrations can go down close to zero. Draining the CPC bi-weekly, seems to be effective in reducing the problem. - Comparability between identical instruments is generally very good but, when the time for yearly recalibration is approaching, instruments could read lower values then expected, also if there aren’t evident troubles (flow, alcohol fill, saturator and condenser temperature, laser). Care should be taken when instruments with different particle size range are used, especially regarding the min detectable particle (D50) as well as with different concentration range. - Due to rather long calibration period, data can be lost for a minimum of 1 month. - High Costs for routinely measurement to be implemented in existing network particularly for yearly recalibration in factory. In Torino ultrafine particle number and size concentration continuous long term measurements have been carried out since 2009. Instrument used was a TSI 3031 specifically designed for long-term, air quality monitoring networks, developed under the auspices of European Union UFIPOLNET project, it covers the size range of

70
greatest interest (20-500 nm) without working fluid. Discontinuous measurements have been carried out also: In Venice (five sites – rural, industrial, urban background, urban and urban traffic, 15 days each, during winter 2012, using cpc 5.403 Grimm) In Bologna (two sites – urban background and rural) using a fast mobility particle sizer FMPS 3091, TSI (particle size range 5.6 – 560 nm) within the national project “Moniter”. In Venice (five sites – rural, industrial, urban residential, urban traffic and traffic, 15 days each, during winter 2012, using cpc 5.403 Grimm). To collect a robust data-set, an intensive measurement campaign has been carried out over one year by means of a condensation particle counter (CPC Grimm, mod. 5.403; range of the detectable particles: 4 nm – 3 µm); samplings have been performed for 15 consecutive days at every site, with a temporal resolution of 1 minute. The analysis of the preliminary results allows to observe the presence of a clear seasonal trend at every site, with the highest concentrations detected in winter and the lowest ones in summer. Moreover, the obtained data-set has confirmed the expected spatial distribution of the particles concentration, in agreement with the surrounding anthropic sources and the results previously reported by Morawska et al. (2009). In detail, the rural site shows the minimum median concentration (total particle number concentration: 8x10³) whilst the traffic oriented site exhibits the maximum median concentration (total particle number concentration: 4.5 x 10⁴). A clear circadian variability of the particle concentration has been detected at the traffic site, with two maximum peaks in correspondence of the traffic rush hours in the morning and the late afternoon. These peaks may be related to the major input of fresh pollutants emitted by motor engines, which increase the formation of secondary aerosol that is the main responsible for the ultrafine fraction and the increasing of the total number concentration (Wang et al., 2010). The same trend has been observed at the urban site too, but it was completely lacking at the rural station. In Cassino (University of Cassino and Southern Lazio, Cassino, Italy), a dedicated advanced laboratory focused on airborne particle measurement was set up in 2008. Such laboratory is equipped with instruments able to measure: i) particle number concentrations (condensation particle counters, particle counters based on electrical techniques); ii) particle number, surface area and volume distributions in the range from few nanometers up to 20 μm (Fast Mobility Particle Sizer, Scanning Mobility Particle Sizer and Aerodynamic Particle Sizer spectrometers); iii) deposited surface area concentrations (Nanoparticle Surface Area Monitor); iv) PM and BC concentrations through light-scattering technique (photometer and aethalometer); v) PM concentrations through gravimetric technique. Moreover, the laboratory also presents: i) a sub-micrometric particle generation system, ii) an instruments able to sample aerosols from hot and highly concentrated exhaust gases (thermo-dilution systems), iii) a particle sampler to collect ultrafine particles on TEM grids. Through this experimental apparatus, the research group of the University of Cassino and Southern Lazio performed several studies in both indoor and outdoor microenvironments focused on: • metrological characterization of the experimental apparatus; • particle emission evaluation from different sources; • people exposure at different spatial scales and related deposited dose. The Cassino research group performed studies dealing with the metrological characterization of the PM concentration measurement through gravimetric technique (Buonanno et al., 2011a), as well as the measurements of number, surface area and

71
mass distributions and total concentrations through mobility and aerodynamic particle sizer spectrometers (Buonanno et al., 2009a; Manigrasso et al., 2012). As regards outdoor microenvironments, the emissions of incineration plants (Buonanno et al., 2009b; Buonanno et al., 2011b; Buonanno et al., 2012a) and highway (Buonanno et al., 2009c) were characterized. Also the exposure of people living in areas close to emission sources was performed: in particular, the exposures of people downwind to incineration plant, highway, high performance jet engine airport and urban area were carried out (Buonanno et al., 2010a; Buonanno et al., 2010b; Buonanno et al., 2011c; Buonanno et al., 2012b). Concerning indoor microenvironments, the research group performed studies aimed to characterize the emission of particle from cooking activities both highlighting the influential parameters on particle emission factor from different cooking activities (Buonanno et al., 2009d) and evaluating the volatility of these particles (Buonanno et al., 2011d). Measurement of emission factors in terms of particle number, surface area, mass and BC from other indoor sources like candles and incenses was also performed (Stabile et al., 2012). Particle exposure studies at an “indoor scale” were also performed by the researchers of the University of Cassino and Southern Lazio. As example, they evaluate: the occupational exposure to particle emitted during welding activities in an automotive plant (Buonanno et al., 2011e), the exposure in pizzerias (Buonanno et al., 2010c), the exposure in school classrooms and gyms (Buonanno et al., 2012c; Buonanno et al., 2012d). Furthermore, studies evaluating particle exposure at “personal scale” (Buonanno et al., 2012e; Buonanno et al., 2012f) as well as the dose received by people as function of their lifestyle (Buonanno et al., 2011f; Buonanno et al., 2012g) were also performed. In downtown Rome is active the ISPESL DIPIA Pilot Monitoring Station, using a FMPS 3091 TSI (1 Hz measurement frequency). FMPS number-size distribution were used to estimate Ultrafine Particle (UFP) regional deposition in the human respiratory tract (Manigrasso and Avino, 2012), through the deposition model of International Commission on Radiological Protection (ICRP, 1994). In the FMPS range of electrical mobility diameters, UFPs varied about from 70% to 95 % of total particle number concentration, with lower contributions observed during night-time hours. The temporal evolution of particle-number size distribution was described by the contour plots shown in Figure 1, representing 30 min average values of 1 s resolution FMPS data-points. The particle number-size distributions were characterized by four modes: three with modal diameters around 10, 16, 30 nm, whose intensities markedly decrease at night, and a fourth one with modal diameter at about 100 nm, with intensity varying less markedly throughout the day (Figure 1a) and becoming preponderant at night (Figure 1b).

72
Figure 1. Temporal variation of submicrometer aerosol size number distribution in downtown Rome during diurnal (a) and nocturnal hours (b). Close to the traffic, nucleation particle concentrations increased within few seconds and decreased in tens of seconds (figure 2). As a consequence, the exposure pattern, near to traffic, may be represented as a sequence of short-term peak exposures.
Figure 2 An example of fast evolving aerosol in downtown Rome. The temporal evolution of number geometric mean diameter (GMD) is reported in Figure 3, where 1 s time resolution data-points have been plotted. Sharp drops of GMD can be observed in the time scale of few seconds. This occurs when the rate of change of particle concentrations (dC/dt) in the nucleation mode (represented by 16 nm particles in Figure 3) sudden increases, due to the contribution of particles formed from the gas phase in vehicular exhausts. Accumulation mode particles (represented by 93 nm particles in Figure 3) are characterized by lower time derivative values, due to their longer atmospheric lifetimes. Such fast evolution cannot be detected with lower time resolutions (e.g., 5 min in Figure 3).

73
Figure 3 Fast evolution of submicrometer aerosol number geometric mean diameter (GMD), rates of change (dC/dt) of nucleation (represented by 16 nm particles) and accumulation mode number concentrations (represented by 93 nm particles) and effect of measurement time resolution. Dosimetry estimates have been reported as number of UFPs deposited for each tidal volume of air inhaled (instant UFP doses) and as number of UFPs deposited at the end of an exposure period (cumulative UFP doses). Calculations were carried out for Caucasian normal nose-breathing adult males, under light exercise activity level (Figure 4). The number of UFPs deposited for each tidal volume of air inhaled (instant UFP doses) rapidly reaches level of 107 particles, with maximum values for the alveolar interstitial region (AI, Figure 4). For the correct estimate of short term exposures, in scenarios involving proximity to traffic, it is therefore crucial to rely on aerosol measurements with a time resolution able to trace the fast evolution of aerosol from vehicle exhausts. The contour plots shown in Figure 5 describes how instant AI UFP doses vary over time and by particle size. Two different colour scales are used in Figure 5. The first (upper end 8×10⁶ particles) shows the different dose levels deposited in the two periods. The second (upper end 3×10⁵ particles) refers to a 4 minute time lapse (as indicated by the red frame in Figure 5) and makes it possible to compare size distributions in the two periods. When traffic levels rise, the increase in instant AI UFP doses is accompanied by a change in their temporal variation and in the shape of their size distributions. Not only do doses change faster over time, but also their size distributions shift towards lower diameters. Such an effect is visible for the two 1 h-periods reported in Figure 6, where the electrical mobility diameters corresponding to the maximum in the size distribution of the instant AI UFP doses are reported. During traffic peak hours maxima are centred mainly between 10 and 20 nm, reflecting the vehicle exhaust emissions. In the early morning, between 2 and 3 a.m., when traffic levels are comparatively lower, maximum doses move towards higher diameters, between 30 and 40 nm, with frequent values also at about 60 nm.

74
Figure 4 Temporal trends of calculated instant UFP doses deposited in the regions of respiratory system of a normal nose breathing-adult male, under light exercise condition, during a traffic peak hour. Dose estimates have been performed with the ICRP deposition model, utilizing 1 Hz measurements of UFP particle number size distributions. ET1: anterior nasal passages. ET2: posterior nasal passages, naso- and oropharynx and larynx. BB: bronchial region. bb: bronchiolar region. AI: alveolar interstitial region.
Figure 5 Temporal evolution of calculated size distribution of instant AI UFP doses of a normal nose breathing-adult male, under light exercise condition: comparison between high and low traffic periods. Dose estimates have been performed with the ICRP deposition model, utilizing 1 Hz measurements of UFP particle number size distributions.

75
0
10
20
30
40
50
60
70
10.00.00 10.10.00 10.20.00 10.30.00 10.40.00 10.50.00 11.00.00
Time (hh.mm.ss)
Dia
met
er o
f m
ax A
I U
FP d
ose
(nm
) .
2.00.00 2.10.00 2.20.00 2.30.00 2.40.00 2.50.00 3.00.00
10-11 am 02-03 am
Figure 6 Electrical mobility diameter corresponding to maximum instant AI UFP doses of a normal nose breathing-adult male, under light exercise condition: comparison between high and low traffic periods Little is known about the short-term effects of ultrafine particles. Impact of Fine and Ultrafine Particles on emergency hospital admissions for cardiac and respiratory diseases, was investigated in Rome during HEAPPS study. Particle number concentration showed an association only with admissions for heart failure (lag 0–5; 2.4% [0.2% to 4.7%]) and COPD (lag 0; 1.6% [0.0% to 3.2%]).The effects were generally stronger in the elderly and during winter. There was no clear effect modification with previous COPD. We found sizeable acute health effects of fine and ultrafine particles. Although differential reliability in exposure assessment, in particular of ultrafine particles, precludes a firm conclusion, the study indicates that particulate matter of different sizes tends to have diverse outcomes, with dissimilar latency between exposure and health response (Belleudi et al, 2010).
Measures in the Emilia-Romagna region Contribution to ETC/ACM Technical Paper Vanes Poluzzi, Isabella Ricciardelli, Silvia Ferrari, Claudio Maccone, Dimitri Bacco, Arianna Trentini, Fabiana Scotto – ARPA (Environmental Protection Agency of Emilia-Romagna region), Bologna, June, 14 2012. 1. Aersol size distribution
a) FAST MOBILITY PARTICLE SIZER FMPS 3091, TSI (particle size range 5.6 – 560 nm, 32 channels per decade, 1 minutes resolution) within the project “Moniter”.
In Bologna Province, ultrafine particle number and size concentration measurements have been carried out since 2008 in five sites (1 urban background, 3 rural and 1 traffic) during seasonal campaigns. In Table A2 are presented the monitoring period of campaigns in the five sites.

76
15/07/08 18:00 ‐ 25/07/08 12:00
30/01/09 12:00 ‐ 24/02/09 12:00
4/07/08 12:00 ‐ 15/07/08 15:00
13/01/2009 15:00 ‐ 30/01/2009 8:00
24/02/2009 16:00 ‐ 9/03/09 9:00
31/07/08 16:00 ‐ 18/08/08/ 10:00
9/03/09 12:00 ‐ 2/04/09 9:00
22/09/08 12:00 ‐ 12/10/08 11:00
2/04/09 13:00 ‐ 20/04/09 00:00
26/08/2008 12:00 ‐ 9/09/08 13:00
18/05/09 15:00 ‐ 3/06/09 11:00IV site
IV site
III site
I site
II site
Actually we have 2 FMPS located in San Pietro Capofiume (rural site) and in an urban area of Bologna within the “Supersite” project .
b) SCANNING MOBILITY PARTICLE SIZER 1° SMPS = CPC + NANO DMA (TSI): from 2.5 to 64 nm (64 channels per decade, 5 minutes resolution) 2° SMPS = CPC + LONG DMA (TSI): from 14 to 830 nm (64 channels per decade, 5 minutes resolution) The SMPSs are running in Bologna within the “Supersite” project since June 13, 2012 in an urban background. The measures for the “Supersite” Project are also made in San Pietro Capofiume (rural site with homemade t-DMPS by University of Eastern Finland) and at Mt. Cimone (remote site, 2165 mt asl, with Grimm DMA by CNR ISAC). The measures will continue for at least three years.
c) OPTICAL PARTICLE COUNTER OPC (FAI Instrument): 280 nm – 10 µm (8 channels, 1 minute resolution). Particle number and size concentration measurements are carried out since November 2011 in 2 sites: San Pietro Capofiume (rural site, 40 km from Bologna urban center) and an urban site in Bologna. 2. EC/OC In Emilia-Romagna region are running the measure for the “Supersite” project in four sites (3 urban background sites and 1 rural site) located in 3 cities of the region (Parma, Rimini and Bologna). PM2,5 daily samples are collected on Pall filters using Skypost Tecora sampler (2,3 m^3/h in spring/summer, 1 m^3/h in fall/winter). Laboratory determination are carried out with a thermo-optical analizer (Sunset instrument) using EUSAAR protocol. Data will cover 30% of the total days of an year in 3 sites and 90% of the total days in the urban site of Bologna. The measures will continue for at least three years.

77
FLANDERS (BELGIUM) BC en particle number measurements in the air quality networks of the Flemish Environment Agency Christine Matheeussen, Vlaamse Milieumaatschappij, Afdeling Lucht, Milieu en Communicatie, Dienst Lucht Black carbon Black smoke measurements are performed in Flanders since 1968. In the seventies and eighties around 90 stations were operational. Then the number of stations decreased. Since 1998 only 6 stations are operational, since the focus became on PM measurements. Since 2002 the measurements are done with an automatic monitor, the ETL SX 200. Since 2007 we also operate black carbon monitors, the so called MAAP 5012 monitors. At the beginning of 2012 the stations with the black smoke ETL SX 200 monitors were also equipped with a MAAP 5012 monitor. We will compare the ETL SX 200 results with the MAAP 5012 results for these stations for the year 2012. On the moment we have 14 fixed stations and 4 mobile units equipped with a MAAP 5012 monitor. 2 of these stations are urban background stations and 1 station is a traffic station in an urban environment. The MAAP 5012 monitors are robust and reliable instruments. Flow rate is calibrated at the site. There is no commercially available tool for calibrating the ‘black carbon’. Data capture is generally above 95%. Particle number VMM together with GGD, ECN, VITO and the Universities of Brighton and Leicester is participating in the JOAQUIN project. In the framework of the project a CPC will be installed in an urban background station, together with a SMPS.
IRELAND Ireland’s contribution to air quality monitoring networks in the EU: BC and N John Sodeau, Professor of Physical Chemistry, Director of the Centre for Research into Atmospheric Chemistry, University College Cork There are three main ways that air quality is monitored in Ireland. The most extensive network is run/coordinated by the Irish EPA. The two largest cities, Dublin and Cork, also run their own networks, under the auspices of their local Councils. Finally research groups centred in Cork, Galway and Dublin make air quality measurements but usually employ more sophisticated instrumentation and source apportionment approaches. (These groups are generally sponsored by the EPA). Air Quality Network: Irish EPA Annual reports are compiled and provide an overview of air quality in Ireland. The latest is one for 2010. It is based on data obtained from the 28 monitoring stations that form the national ambient air quality network. It includes data from a number of mobile air quality monitoring units. Monitoring stations are located across the country, with new stations added in 2010 in Longford Town and Celbridge in County Kildare. The results of the monitoring are compared to limit values set out in EU and Irish legislation on ambient air quality. In 2010, measured values of nitrogen dioxide (NO2) and particulate matter (PM10 and PM2.5) were all below limit and target values set out in the CAFÉ Directive and 4th Daughter Directive. However, levels of particulate matter and nitrogen

78
dioxide (NO2) were stated to be a possible concern for the future for some regional areas. http://www.epa.ie/downloads/pubs/air/quality/name,31457,en.html The EPA also holds an archive of black smoke data for Ireland as part of its Environmental Research Centre (ERC), which was established to provide a more structured approach to environmental research. Its studies are implemented mainly within EPA facilities in co-operation with third level colleges and other research bodies. Air pollution data is compiled and available to all in the SAFER Research Data Archive and that for BC may be found under: http://erc.epa.ie/safer/iso19115/displayISO19115.jsp?isoID=75 A general discussion of air pollution monitoring in Ireland by EPA is found at: http://www.epa.ie/whatwedo/monitoring/air/data/ Local Council Air Quality Monitoring Dublin City Council produces an annual report, which includes data on NO2, PM10, PM2.5 (since 2009) and black smoke. http://www.dublincity.ie/WaterWasteEnvironment/AirQualityMonitoringandNoiseControl/AirPollution/Pages/AnnualReports.aspx Cork City Council produces an annual report as Dublin. It should be noted in the 2011 report that its gravimetric PM10 analyser was changed to a gravimetric PM10 and PM2.5 joint analyser in 2001. This has now been changed in 2011 to two Sven Leckel instruments monitoring PM2.5 and PM10 separately. It is expected that these will give increased accuracy and reliability. Problems with the older instrument in 2010 meant that only 167 days were sampled and a lot of summer results were not included. The relevant website is to be found at: http://www.corkcity.ie/services/environment/wastemanagement/airpollutioncontrol/ Galway City Council performs its ambient air monitoring with Physics Department NUIGalway (University). Although it is not clear what they monitor. http://www.galwaycity.ie/AllServices/Environment/PollutionControl/Air/ Universities: Research projects on air quality monitoring. University College Cork has been involved in a number of projects (particularly in the harbour area to monitor EC/OC, NOx and PM10 and PM2.5. A range of sophisticated instrumentation has been used (including ATOFMS and AMS), the data from which is analysed by PCA/PMF to provide source apportionment details. A number of publications have resulted: 1. Title: The use of polar organic compounds to estimate the contribution of domestic solid fuel combustion and biogenic sources to ambient levels of organic carbon and PM2.5 in Cork Harbour, Ireland Author(s): Kourtchev Ivan; Hellebust Stig; Bell Jennifer M.; et al. Source: SCIENCE OF THE TOTAL ENVIRONMENT Volume: 409 Issue: 11 Pages: 2143-2155 2. Title: The use of real-time monitoring data to evaluate major sources of airborne particulate matter Author(s): Hellebust Stig; Allanic Arnaud; O'Connor Ian P.; et al. Source: ATMOSPHERIC ENVIRONMENT Volume: 44 Issue: 8 Pages: 1116-1125 3. Title: Sources of ambient concentrations and chemical composition of PM(2.5-0.1) in Cork Harbour, Ireland Author(s): Hellebust S.; Allanic A.; O'Connor I. P.; et al. Source: ATMOSPHERIC RESEARCH Volume: 95 Issue: 2-3 Pages: 136-149 4. Title: Source apportionment of PM2.5 in Cork Harbour, Ireland using a combination of single particle mass spectrometry and quantitative semi-continuous measurements

79
Author(s): Healy R. M.; Hellebust S.; Kourtchev I.; et al. Source: ATMOSPHERIC CHEMISTRY AND PHYSICS Volume: 10 Issue: 19 Pages: 9593-9613 5. Title: Characterisation of single particles from in-port ship emissions Author(s): Healy Robert M.; O'Connor Ian P.; Hellebust Stig; et al. Source: ATMOSPHERIC ENVIRONMENT Volume: 43 Issue: 40 Pages: 6408-6414 6. Title: Airborne emissions in the harbour and port of Cork Author(s): Sodeau John R.; Hellebust Stig; Allanic Arnaud; et al. Source: BIOMARKERS Volume: 14 Pages: 12-16 A recent report to EPA (on SAFER) entitled: “A new approach to bioaerosol monitoring in Ireland Analyses of the development and occurrence of biological and chemical aerosols”. (BioCheA) also provides information on NOx and PM10 levels in Cork. National University of Ireland Galway (Physics Department) also monitors air. They have recently compiled data on BC in Ireland as follows: http://www.dit.ie/airquality/ Dublin Institute of Technology are currently carrying out a monitoring project on Black Smoke and PM: in Navan. Letterkenny, Killarney and Tralee. No results have been released yet. http://www.dit.ie/airquality/ NETHERLANDS GGD Amsterdam air quality monitoring network’s experience on Black smoke and Particle number measurements Dave de Jonge, Department of Air Quality Research, Municipal Health Service Amsterdam, The Netherlands. The Air Quality Network The Air quality network of Amsterdam is in operation for more than 15 years. At 14 locations in and around the city of Amsterdam the air quality is continuously monitored. Additionally, GGD Amsterdam operates 13 other measurement locations under contract with the Province of North Holland, city of Zaanstad and Curacao. The measurement program varies from station tot station; Most common components monitored are PM10, PM2.5, NOx, SO2, O3, CO, H2S, BTX, PAH’s, Heavy metals, CPCs, ECOC and black smoke. The GGD Amsterdam is certified according to ISO 17025 since 2005. The measurement data are available in the Citeair website and Airbase. Finally, GGD Amsterdam is an active participant of WG 12, 15 and 35. Black smoke Black smoke measurements have been carried out with ETL SX-200 monitors on 4 locations since 1998 and on 5 since 2009; 3 street and 2 urban background ones in Amsterdam. Originally the SX-200 monitor was calibrated to a British Smoke Stain concentration. Since the SX-200 reached the end of its technical life span, a search for replacement started in 2010 together with our colleagues from RIVM (National network). The DCMR (Rotterdam network) switched from the manual black smoke (OECD) measurements to MAAP’s. GGD Amsterdam started to compare a MAAP with the SX-200 from 2005. At this location comparison was expanded with ECOC (every 3rd day) measurements. It was decided, in cooperation with the Dutch experts on black smoke, to make a selection plan for its future measurements. In 2011 ECN, TNO, RIVM, DCMR, VMM(B), the Dutch Ministry of Infrastructure and the Environment and GGD Amsterdam did a survey on the experience among current (foreign) users of various black smoke

80
monitors. Upon the results of this survey it was decided that in near future all Dutch networks will apply MAAP’s. In the beginning of 2012 GGD installed 5 MAAP’s in its network on 5 monitoring stations. The MAAP’s are equipped without a sample-heater. A zero and “home-made” span check foil is tested during maintenance in order to investigate its possible implementation to SOP for quality check and assurance. In these 5 locations the MAAP’s have been compared with the SX-200 and with ECOC analysing according to NEN/EN NPR-CEN/TR 16243 with a NIOSH protocol2. The ultimate aim is to report all black smoke data into “real” µg/m3, depending on the correlation with the EC analyses. Graph 1 shows the correlation between EC and MAAP, obtained from 3 weeks measurements in 5 locations,
Graph 1. Comparison of Black Carbon and EC daily measurements for a period of 3 weeks on 5 locations in Amsterdam As seen in Graph1, the Black carbon and EC deviate more for higher concentrations. In Graph 2 the same comparison can be seen, but only for the low concentrations this time.
Graph 2. Comparison of Black Carbon and EC daily measurements, for concentrations below 1.60 ug/m3 during a period of 3 weeks on 5 locations in Amsterdam More details on these correlations will be published around June 2012. CPCs

81
Since 2002 3 monitoring stations in Amsterdam have been equipped with TSI 3022a CPCs. The 3022a applies butanol as a working fluid. Particles with an aerodynamic diameter down to 7nm are counted and the data acquisition system (X-Air from ISEO) collects results every 10 seconds. Neither sample drying nor dilution is applied. Different measuring modes are applied; more specific, below approximately 10.000 particles the CPC is in counting mode and above that it automatically switches to the fotometric mode, which is significantly less accurate. The change from the 2 modes influences the measurements around 10.000 up to a couple of thousand particles. Since no sample-dryer was applied, problems occurred occasionally due to water condensation. The CPCs clearly decline in sensitivity (particle number concentrations can go down close to zero) due to water condensation in the monitor. A procedure has been introduced to drain the CPC biweekly, that overcame most of the condensation problems. Another issue is the yearly, as suggested by the manufacturer, calibration of the instrument. The calibration is rather expensive, around 4.000 Euro per monitor, and the whole procedure, depending on the laboratory, is not always clear on how and if there were adjustments. Due to the rather long calibration period, data can be lost for a minimum of 1 month if no spare monitor is available. In 2007 an extra CPC was purchased in order to overcome this problem, which has been used for field comparisons and as a replacement monitor. The previously mentioned switch point around 10.000 may also have a new “setting” after the calibration takes place, different for each CPC. All tests, including installing, transportation etc, add on top of the period when lack of data occurs due to calibration. Several comparisons have been done in our own Laboratory, most of which showed close to 1 to 1 correlations between all monitors, but only at a low concentrations (<10.000). Comparisons at higher on-site concentrations gave rather disappointing results. Some examples of these tests are shown in graphs 3 and 4.
CPC1 vs CPC3 (calibrated by 1 laboratory)in-house comparison
y = 0,9721x
R2 = 0,9961
0
1000
2000
3000
4000
5000
6000
7000
0 1000 2000 3000 4000 5000 6000 7000
CPC 2
CP
C 1
Graph 3. Measurements of 2 CPC monitors during an in-house comparison

82
CPC 1 vs CPC 2 at one location, urban background 24h values
y = 0.8547x
R2 = 0.5815
0
5000
10000
15000
20000
25000
30000
35000
40000
45000
50000
0 10000 20000 30000 40000 50000
CPC2 p/cm3
CP
C1
p/c
m3
Graph 4. Comparison of 2 CPC monitors daily measurements at urban background monitoring site in Amsterdam As mentioned before CPCs are calibrated, in principle, every year. During their first operational years in GGD calibrations were performed by TSI in Aachen (Aix-la-Chapelle), while the following ones by several other laboratory’s: METAS (Swiss), ECN(NL), NPL(UK), TSI (UK) and Tropos (D). Some laboratories are not able to adjust the monitors, but provide instead a correction formula. We also experienced a different calibration result from different calibration laboratories for the same monitor at the same time. The calibration results for this CPC (Laboratory1= 0.86xLaboratory2 + 6832) where significantly different on slope and zero. We are unable to clarify why this difference was found and how to cope with it. A combination of all issues mentioned, results in differences, at actual ambient concentrations, up to 40% between 2 CPCs on one location, which we are so far unable to adequately correct for. After 10 years of continuous measurements it was decided in 2012, after another painful external calibration procedure, to temporarily stop the CPC measurements. The monitors are reported by the calibration laboratory as instable and problematic, due to their age and extensive usage. GGD Amsterdam together with VMM, ECN, VITO and the Universities of Brighton and Leicester, is currently participating in the JOAQUIN EU Interreg project which, among other tasks, will investigate the applicability of new UFP measuring methodologies, suitable in continuous, stable and accurate monitoring. GREECE Dr. Anastasios Adamopoulos, Air Pollution Expert, Ministry For The Environment, Energy & Climate Change. Such measurements are not performed by the Greek National Air Pollution Monitoring Network.

83
DENMARK Dr. Thomas Ellermann Black Carbon: - Do you have any stations measuring online BC? No not online. Particle number concentration (N): - Do you have any stations measuring N? Yes - If so, how many and since what year? Three stations since 2002 - With what instrumentation? Home build SMSP - Based on your experience as a monitoring network, would you recommend measuring N at other EU networks? Are the instruments easy to run, do they require low maintenance/servicing? The instruments are not easy to run and require a lot of maintenance. It is difficult for us to obtain good data representativity. However, we believe that it is important to obtain information on levels and trends of N in order to be able to evaluate the health impact of particles on health and in order to understand the physics and chemistry behind the particulate air pollution. United Kingdom Paul Quincey, NPL, UK Particle number and black carbon monitoring in urban air quality networks 1. Recent and current deployment of particle number and black carbon instruments in UK networks 1.1 Particle number Since 1998 the UK has operated a network of TSI 3022A CPCs (7 nm cut-off). There are currently 4 of them, covering urban roadside, urban background (x2), and rural background. The instruments are operated continuously (hourly data), with data collected remotely. The data capture achieved is typically 80%. In 2009 the sampling systems for the CPCs (and collocated SMPSs) were changed in line with EUSAAR recommendations to regulate the humidity of the sampled air. The CPC instruments will be changed when the requirements from CEN TC 264 WG 32 become clearer. Data and further information are available from the Defra website http://uk-air.defra.gov.uk, eg http://uk-air.defra.gov.uk/reports/cat05/1109011413_Particles_Network_Annual_Report_2010_AS_65.pdf 1.2 Black carbon In 2008 the long-running UK manual black smoke network was replaced with a network of 20 sites measuring black carbon using two-channel Magee AE-21 aethalometers. In 2012 the network has been reduced in size to 13 sites, mainly urban background. Hourly data is collected remotely. Data capture is generally above 95%. Data and further information are available from the Defra website http://uk-air.defra.gov.uk

84
eg http://uk-air.defra.gov.uk/reports/cat05/1108251248_2010_BC_Network_Report.pdf 2 Comments on the technical viability of network operation: complexity; size; comparability 2.1 Particle number Butanol-based CPCs are relatively simple instruments, but the age of the instruments (in this network) and the complexity of the associated sampling system means that significant amounts of data are lost (reflected by the 80% typical data capture). The sampling systems include a PM1 inlet to reduce contamination by larger particles. The instruments are not large. Comparability is regulated by annual calibration of the CPCs at NPL, regular servicing, and site audits to measure flows etc . Losses in the sampling lines are expected to be minor, and similar for each site. Sampling and other aspects will be reviewed when CEN TC 264 WG 32 have delivered their conclusions. 2.2 Black carbon The aethalometers are not large, and they are remarkably reliable, as shown by the high data capture. The hardware is relatively simple. Flow rates are checked at site audits, and a zero test (using filtered air) provides a good operational test, because the measurement is based on self-referenced ratios of small changes in attenuation. Calibration in the usual sense is more difficult. The main drawbacks are the need (with this instrument) to apply a shadowing correction to the results (which is done following the paper of Virkkula et al, 2007), so that a consistent aerosol absorption coefficient is obtained as the sample spot darkens, and the further assumptions required about the mass extinction coefficient of the particulate matter to convert the absorption coefficient to a “black carbon” concentration. The latter issue means that there will be differences with other black carbon methods that are not yet well understood. WALLONIA (BELGIUM) Benjamin Bergmans, ISSeP, BE Particle number (N) and black carbon (BC) monitoring in the Walloon air quality network 1 Description of Air Quality networks in Belgium and the Walloon region In Belgium, each 3 regions have its own air quality network which is managed by different state companies. IBGE for Brussels (http://www.ibgebim.be/), VMM for Flanders (http://www.vmm.be/) and ISSeP for Wallonia (http://www.issep.be/). The Belgian Interregional Cell for the Environment (http://www.irceline.be) aggregates the data and reports them to Europe and public on its website. Regulated parameters are O3, NO2, CO, SO2, PM10, PM2.5 and C6H6. N and BC are thus not yet integrated and as a result the approach of each region is different. The Walloon air quality network is in operation for more than 30 years and is certified ISO 17025. 25 telemetric stations with remote access and more than 20 trailers are used within this network. The measurement program varies from one station to another and includes PM10, PM2.5, NOx, SO2, O3, CO, Hg, H2S, VOC, PAH, Heavy metals,

85
N, EC and black smoke. Further information is available on ISSeP website (www.issep.be). 2 Current deployment of particle number and black carbon instruments in Wallonia 2.1 Particle number In 2010, ISSeP has installed an SMPS system in the rural station of Vielsam. Continuous monitoring has been performed since that time. Particle numbers for 66 channels from 10 nm to 800 nm are available with a time resolution of 5 min. The systems follows all the EUSAAR recommendations, including drying of the sample and the data treatment. Since 2011, this site is part of the GUAN (http://wiki.tropos.de/index.php/GUAN), a joint observation network, which aims to improve the understanding of atmospheric aerosol particles with regard to human particle exposure as well as climate effects. ISSeP takes also part to ring tests organized by the GUAN and instrument is annually calibrated at the WCCAP. Two additional systems have been acquired within the framework of a European project (http://www.pmlab.eu) and have been installed in trailers to allow measurement campaigns in different locations within the EMR region. Measurement campaigns at different locations (Liege, Maastricht, Hasselt, Vielsam, Aachen, Mulheim …), including comparison with other instruments have been performed during the last two years. In these trailers additional monitors including BC and a scattering light devise (Grimm 1.109) which give information on particle number from 250 nm to 30 µm in 31 different channels are also present. 2.2 Black carbon In 2011 the historical Walloon black smoke network has been reinforced with 3 BC aethalometers. Monitors locations include a rural station (Vielsam), an urban / traffic station (Herstal) and an industrial site (Marchienne). Hourly data are remotely collected. Data capture is largely above 95%. Magee AE-22 aethalometers have been selected. These monitors are robust and remarkably reliable. They required more or less no maintenance. Flow rate and zero tests are the only recommended checks. Calibration in the usual sense is more difficult and usually is done by comparing instrument response to a reference. Data processing is also quite simple and only required the shadowing correction. This instrument has two wave lengths and allows thus the distinction between fossil and wood combustion. Wood combustion can contribute to non-negligible fraction of BC even in urban area and this information is thus quite interesting for future abatement plan. 8 additional BC monitors have been installed in trailers which allow measurement campaigns in different locations. Good correlation has been showed between black smoke and BC. Both techniques are performed in parallel, but the idea is to move progressively to BC measurement. 3 Trends and future development within the Walloon network.

86
3.1 Particle number SMPS systems are quite complex and required a lot of effort to be implemented within a network configuration. Maintenance cost and personal training is quite important to achieve an acceptable data capture and to assure the quality of the produced data. CPCs are relatively simple instruments, but due to practical constraints in measurement stations (long sampling line, fix temperature in the station making drying compulsory …) losses can not be neglected. This remark is especially important in traffic location where nucleations are observed and where the fraction of small particles (<30 nm) are quite important. Following the same measurement procedure is thus critical to allow comparison between networks. This practical measurement setting is under discussion within CEN/TC264/WG32, but no standard is available yet. That’s the reason why ISSeP has made the choice to use SMPSs instead of CPCs. Other instruments giving information on the size are available on the market, but none of them has been showed as being suitable within all the network concentration range for the moment. The actual plan is not to develop the number of N monitors within the Walloon network, but to use actual system (trailers) to make correlation studies between SMPS and other parameters. BC is of course one of the more interesting ones, but other parameters like NOx and noise are also under study. 3.2 Black carbon Protocol for EC/OC analysis is not yet fixed and ISSeP does not plan to move to such type of measurement except in one of its station to fulfil the EMEP requirement. Nevertheless, systematic measurement of BC and TC of PM10 particles collected on filter on a weekly basis will be implemented in 17 Walloon locations. As already mentioned, ISSeP would like to move progressively from black smoke measurement to BC and will thus develop the number of instruments in the following years. ISSeP has historical data for black smoke since 1968 and that’s the reason why the Institute does not want just to move to the new technique, but also wants to make the link with its old data. GERMANY Dr. Wolfram Birmili A) In GUAN, we measure continuously * particle number size distributions using SMPS and TDMPS instruments (currently 18 sites in Germany - rural, urban, and traffic) * black carbon concentrations using MAAP instruments (currently 15 sites in Germany) During a limited period 2008-2010, chemical composition was determined at 7 sites for a limited number of 40 observation days. If you would like information on the present state of the activities, you might want to have a look at our wiki site: http://wiki.tropos.de/index.php/GUAN B) Answering your main questions: (3) "Assessment of the technical viability of deploying these instruments in networks: are the instruments too complex for network operation? Are the machines too large/small?"

87
Basic answer: Yes, SMPS, TDMPS and MAAP are viable in networks. MAAP is fairly automatic. SMPS and TDMPS require some enhanced knowledge and quality assurance procedures. Many instruments are deployed at manned air quality monitoring stations of the German Federal Environment Agency (UBA). Comparability issues: We have developed, within the EUSAAR project, guidelines and recommendations for quality assurance of SMPS and TDMPS instruments. Please have a look at the paper Wiedensohler et al., Mobility particle size spectrometers: harmonization of technical standards and data structure to facilitate high quality long-term observations of atmospheric particle number size distributions, Atmos. Meas. Tech., 5, 657-685, 2012, which can be found at http://www.atmos-meas-tech.net/5/657/2012/amt-5-657-2012.html For SMPS (4) Review of the presence of these instruments in current networks - see point A above and the wiki site. C) For GUAN, we have just finished a German Federal Environment Agency (UBA) project. A report is available, but currently only in German. The reference for this report is UBA (2011): Detecting the number of fine and ultrafine particles in ambient air (German: "Erfassung der Zahl feiner und ultrafeiner Partikel in der Außenluft"), Environmental Research Plan (UFOPLAN) of the German Ministry for the Environment, Nature Conservation, and Nuclear Safety. Project No. UFOPLAN 3703 43 200. Work conducted for the Federal Environment Agency (UBA), Dessau-Rosslau. Authors: Wolfram Birmili, Konrad Müller, Kay Weinhold, Stephan Nordmann, Alfred Wiedensohler, Gerald Spindler, Thomas Gnauk, Laurent Poulain, Hartmut Herrmann, Regina Rückerl, Mike Pitz, Josef Cyrys, Annette Peters, Harald Flentje, Frank Meinhardt, Ludwig Ries, Andreas Schwerin, Klaus Wirtz. Leibniz-Institut für Troposphärenforschung e.V., Leipzig, September 15, 2011. English Summary of this report Ultrafine particles (diameter < 100 nm) are considered as a fraction of atmospheric particulate matter that is associated with adverse health effects. Consequently, there is a strong interest in elucidating the abundance of these particles in our environment as well as their ultimate effects upon human health. However, data on ultrafine particles have previously not been available on a wide basis. This project closed this gap for Germany in that it generated new data and study material to scientifically motivate new measurement parameters for ultrafine particles. The main achievement has been the establishment of the German Ultrafine Aerosol Network (GUAN), a cooperative network that encompasses all long-term atmospheric particle number size distribution and soot mass concentration measurements in Germany. GUAN enjoys state-of-the-art measurement techniques while its sophisticated data assurance procedures warrant a high comparability of the measurement data. Time series collected at eleven observation sites since 2008 show that ultrafine particles correlate only insufficiently with traditional air quality parameters (PM10, NOx). Due to their specific sources and atmospheric life-time, they need to be described by independent parameters. Ultrafine particles show a significantly higher spatial and temporal variability than, for example, particulate mass concentrations. Chemical analyses revealed high mass fractions of elemental carbon and further carbonaceous compounds, which emphasises the particles‘ health relevance. Particle size distributions, soot mass concentrations and chemical composition measurements from GUAN have already been used to great extent by atmospheric research. Future plans suggest to use the data actively in

88
health-related studies. The data is also recommended as a basis to scrutinise alternative regulatory metrics to describe particle exposure. D) We are also cooperating with/involved in: * ISSEP (Belgium) - 1 more fixed site with SMPS and MAAP * UFIREG (http://www.ufireg-central.eu/) 1 more site with SMPS in Prague/Czech Republic, 1in Ljubljana/Slovenia * ACTRIS (http://www.actris.net/) around 20 supersites (mainly in rural background locations) in Europe SWEDEN Dr. Christer Johansson A short summary of BC and BS abundance in Sweden as well as a presentation of the emissions may be found in: http://slb.nu/slb/rapporter/pdf8/itm2011_202.pdf More details on BC in Stockholm is given in: http://www.atmos-chem-phys.net/11/11553/2011/acp-11-11553-2011.pdf There is also a Swedish report with BS (data from 1960’s) and BC measurements: http://slb.nu/slb/rapporter/pdf8/itm2007_165.pdf FINLAND Measurements of black carbon and particle number concentrations in Helsinki V. Dos Santos-Juusela1, A. Kousa2, A. Svens2, K. Hämeri1 [1] Helsinki University, Department of Physics, Helsinki, Finland [2] Helsinki Region Environmental Services Authority, Helsinki, Finland Introduction Air quality in Helsinki metropolitan area is monitored by the Helsinki Region Environmental Services Authority (HSY). In total there are eleven monitoring stations spread around Helsinki, four of which are mobile. The mobile stations are moved to different locations every calendar year. The stations monitor mostly NO, NO2, PM10, PM2.5, O3, SO2 and CO concentrations. 1. Particle total number concentrations (TNC) HSY started monitoring particle total number concentrations in Helsinki in 2009. The instrument used was a butanol Condensation Particle Counter (CPC) by Grimm, model 5401, with lower detection limit of 6 nm. The first monitored site was Vartiokylä, a residential area (detached houses, 28.05 – 31.12.2009). Next, the instrument was moved into a busy street canyon located close to the downtown area. The geometry of the site causes slow dissipation of pollutants, which increases health risks. The measurements developed from January to June 2010. Fig 1 shows particle concentrations levels found in the street canyon (year 2010).
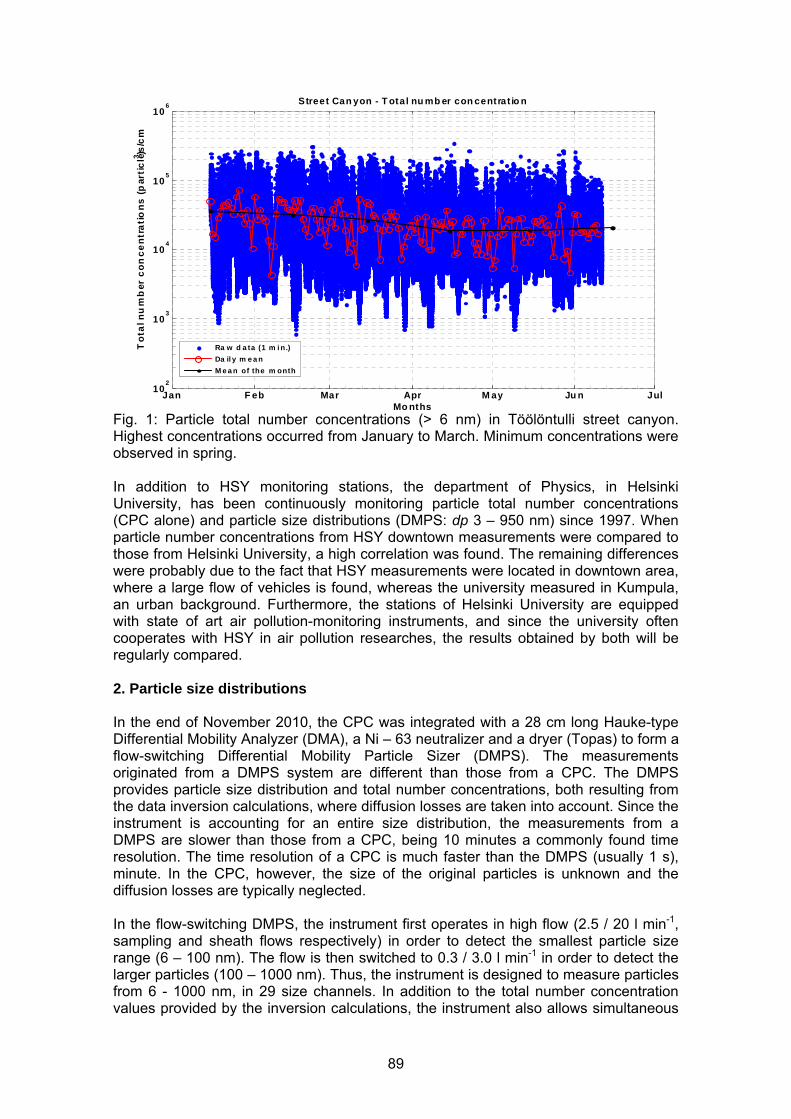
89
Jan F eb Mar Apr M ay Ju n Jul10
2
103
104
105
106
Mo nths
To
tal n
um
ber
co
nc
en
tra
tio
ns
(p
arti
cle
s/c
m3)
S treet Can yon - T ota l nu mb er con centrat io n
Ra w d a ta (1 m i n.)
Da il y m e a n
M e a n of the m onth
Fig. 1: Particle total number concentrations (> 6 nm) in Töölöntulli street canyon. Highest concentrations occurred from January to March. Minimum concentrations were observed in spring. In addition to HSY monitoring stations, the department of Physics, in Helsinki University, has been continuously monitoring particle total number concentrations (CPC alone) and particle size distributions (DMPS: dp 3 – 950 nm) since 1997. When particle number concentrations from HSY downtown measurements were compared to those from Helsinki University, a high correlation was found. The remaining differences were probably due to the fact that HSY measurements were located in downtown area, where a large flow of vehicles is found, whereas the university measured in Kumpula, an urban background. Furthermore, the stations of Helsinki University are equipped with state of art air pollution-monitoring instruments, and since the university often cooperates with HSY in air pollution researches, the results obtained by both will be regularly compared. 2. Particle size distributions In the end of November 2010, the CPC was integrated with a 28 cm long Hauke-type Differential Mobility Analyzer (DMA), a Ni – 63 neutralizer and a dryer (Topas) to form a flow-switching Differential Mobility Particle Sizer (DMPS). The measurements originated from a DMPS system are different than those from a CPC. The DMPS provides particle size distribution and total number concentrations, both resulting from the data inversion calculations, where diffusion losses are taken into account. Since the instrument is accounting for an entire size distribution, the measurements from a DMPS are slower than those from a CPC, being 10 minutes a commonly found time resolution. The time resolution of a CPC is much faster than the DMPS (usually 1 s), minute. In the CPC, however, the size of the original particles is unknown and the diffusion losses are typically neglected. In the flow-switching DMPS, the instrument first operates in high flow (2.5 / 20 l min-1, sampling and sheath flows respectively) in order to detect the smallest particle size range (6 – 100 nm). The flow is then switched to 0.3 / 3.0 l min-1 in order to detect the larger particles (100 – 1000 nm). Thus, the instrument is designed to measure particles from 6 - 1000 nm, in 29 size channels. In addition to the total number concentration values provided by the inversion calculations, the instrument also allows simultaneous

90
measurements of TNCs directly from an alternative sampling inlet in the CPC. HSY measured particle size distribution for the first time in the downtown station (from 30.11.2010 to 11.06.2011, and again from 23.09 - 01.11.2011). After this period, the instrumentation was relocated to a station close to one of the most important highways in Finland, Kehä I, where it will remain until the end of 2012. It is planned that DMPS monitoring will take place every second year in the downtown station and every second year in a special site (e.g. street canyon, small house area). So year 2013 it will be located again in the downtown station. In the beginning of the measurements, a faulty valve yielded in instability of the high sampling flow (2.5 l min-1). Currently, the flow rates are checked with a Buck calibrator every 2nd or 3rd week. However, since the flow rates have been stable, in future they will be checked every 4th week. The checking of flow rates is easy. The voltage of DMPS is checked twice a year. In order to avoid replacing the butanol container too often, an external butanol tank was connected to the CPC. The saturator felt in the CPC has to be replaced approximately once a year (because of road salt and butanol’s evaporation residue?). At first a silicagel dryer was used. However it has to be changed quite often, which is why it is changed to a Nafion dryer. The CPC is calibrated every second year by the manufacturer. The maintenance and calibration of DMA is done once a year. The DMPS is heavy and quite big so it is difficult to move. The smell of butanol is really difficult to remove from inside of the measurement station (even when the equipment has been capsulated and equipped with an external fan to blow the smell of butanol outside). The sensitive individuals may get symptoms (headache). The CPC data was easy to load into the data acquisition system, validated and even shown to the public with HSY’s present system. However it is not working for DMPS data which is much more complicated. 3. Black carbon (BC) HSY started to measure black carbon using a Multiangle Absorption Photometer (MAAP), model 5012, in 2009. At first the monitor was used with PM2.5 impactor (16.02 - 25.06.2009) but it was shortly replaced by a PM1 impactor (25.06.2009 onwards). The first site to be monitored BC was also in the residential area Vartiokylä. The instrument was located at the same busy street canyon as the CPC in 2010. In 2011, the instrument was moved to the downtown station, and it was relocated in 2012 to close busy highway Kehä I. In 2012 another MAAP monitor was acquired and placed in Kallio, an urban background station. It is planned that there will be one MAAP monitor in Kallio all the time but the other one will change place every calendar year. The other MAAP monitor will be located in every second year in the downtown station and every second year in a special site (e.g. street canyon, small house area). So year 2013 it will be located again in the downtown station. The MAAP is used with a sample-heater (sample conditioning system, SCS) which conditions the air sample for humidity regulation and prevents the possibility of water condensation in the sampling tube. The monitor is calibrated twice a year with Bronchorst mass flow meter. The impactor is changed every second week during spring dust episode and otherwise approximately every 4th week depending on location. It is planned that MAAP will be sent to calibrate to the manufacturer every 4th or 5th year. It is planned to compare MAAPs at the same location this year and hopefully there will be devices from other users in Finland also. The MAAP is easy to use. Its size is suitable. However the frequency of changing impactors is too high during dust episode.
91
SPAIN Mar Viana, Cristina Reche, IDAEA-CSIC N and EBC measurements are available at 1 urban background, 1 regional background and 1 continental background air quality monitoring stations in the Barcelona region, which are operated jointly by the regional government and the IDAEA-CSIC research team. The traditional pollutants (gaseous) are run by the monitoring network (by the regional government) and the more state-of-the-art instrumentation is run by IDAEA-CSIC. This includes MAAPs, CPCs (3785 TSI, water CPC) and 2 SMPS which run since 2009. From our experience, the MAAP instrument is highly stable and reliable, and requires little servicing. Many (although not all) of the servicing operations required for the MAAP may be carried out by the network operators. Absorption measurements are converted to EBC using a locally-determined factor. The CPC is a more delicate instrument which requires more attention from the operators (e.g., refilling the water deposit), who need a more dedicated training to run this instrument. As with the MAAP, a number of servicing operations may be performed on site, but not all of them. This means that the instrument needs to be sent back to the manufacturer for servicing, thus breaking the time series. SWITZERLAND Christoph Hueglin, EMPA Particle number and black carbon monitoring in urban air quality networks 1 Deployment of particle number and black carbon instruments in the Swiss
national air quality monitoring network (NABEL).
1.1 Particle number
Since 2003, condensation particle counters are used within Swiss NABEL network for measurement of total particle number concentration (PNC). Currently PNC is measured at five sites, covering urban roadside, urban background, suburban and rural situations, as well as one rural site nearby a motorway. Until 2010 CPCs from TSI (3022A, 7nm cut-off) were used, these instruments were then replaced by the successor model TSI 3775 (4nm cut-off). The sampling system consists of a TSP inlet and conductive sampling tubes that are kept as short as possible. A closed loop dilution system (dilution of 1:10) is used at the traffic related sites and at the urban background site to ensure that the particle number concentration does not exceed the single particle counting range of the CPC. The measured particle number concentrations are stored as 10min average values.
1.1.1 QA/QC of particle number concentration measurements
The air flow rate of the CPC and the flow rates of the dilution system (where used) are monitored by a calibrated mass flow meter every three months. Beside the CPCs that are used in the air quality network, an additional CPC is used as a transfer standard. The single particle counting mode of this reference CPC is every two years calibrated at the Swiss national metrology institute Metas (http://www.metas.ch), who provide a reference for particle number concentration measurements. The CPCs that are used for ambient particle concentration measurements in the NABEL network are replaced
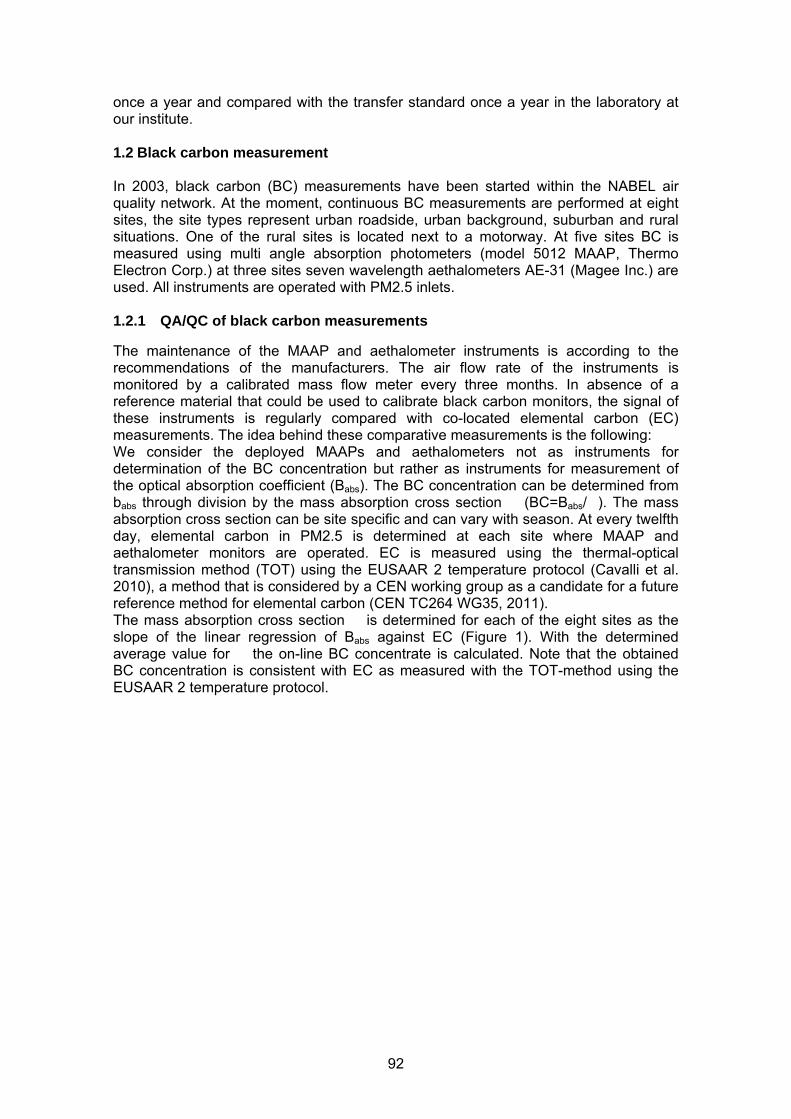
92
once a year and compared with the transfer standard once a year in the laboratory at our institute.
1.2 Black carbon measurement
In 2003, black carbon (BC) measurements have been started within the NABEL air quality network. At the moment, continuous BC measurements are performed at eight sites, the site types represent urban roadside, urban background, suburban and rural situations. One of the rural sites is located next to a motorway. At five sites BC is measured using multi angle absorption photometers (model 5012 MAAP, Thermo Electron Corp.) at three sites seven wavelength aethalometers AE-31 (Magee Inc.) are used. All instruments are operated with PM2.5 inlets.
1.2.1 QA/QC of black carbon measurements
The maintenance of the MAAP and aethalometer instruments is according to the recommendations of the manufacturers. The air flow rate of the instruments is monitored by a calibrated mass flow meter every three months. In absence of a reference material that could be used to calibrate black carbon monitors, the signal of these instruments is regularly compared with co-located elemental carbon (EC) measurements. The idea behind these comparative measurements is the following: We consider the deployed MAAPs and aethalometers not as instruments for determination of the BC concentration but rather as instruments for measurement of the optical absorption coefficient (Babs). The BC concentration can be determined from babs through division by the mass absorption cross section � (BC=Babs/�). The mass absorption cross section can be site specific and can vary with season. At every twelfth day, elemental carbon in PM2.5 is determined at each site where MAAP and aethalometer monitors are operated. EC is measured using the thermal-optical transmission method (TOT) using the EUSAAR 2 temperature protocol (Cavalli et al. 2010), a method that is considered by a CEN working group as a candidate for a future reference method for elemental carbon (CEN TC264 WG35, 2011). The mass absorption cross section � is determined for each of the eight sites as the slope of the linear regression of Babs against EC (Figure 1). With the determined average value for � the on-line BC concentrate is calculated. Note that the obtained BC concentration is consistent with EC as measured with the TOT-method using the EUSAAR 2 temperature protocol.
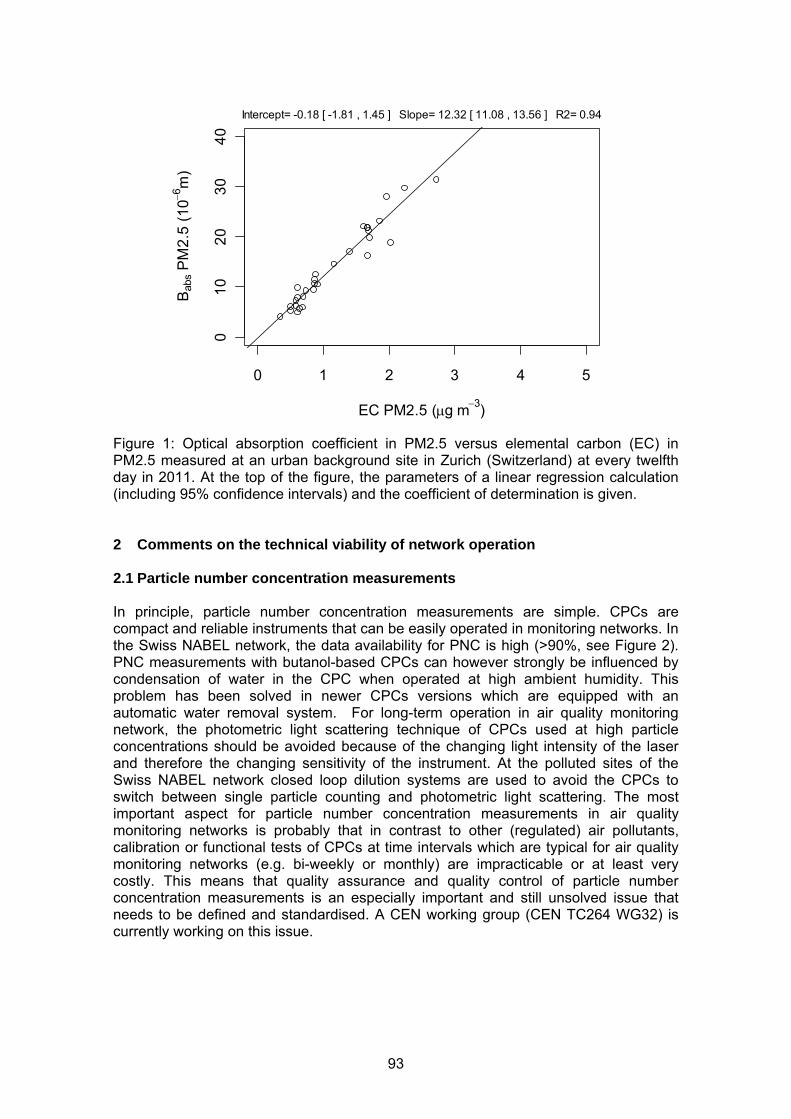
93
0 1 2 3 4 5
01
02
03
04
0
EC PM2.5 (g m3
)
Bab
sP
M2
.5 (
10
6 m)
Intercept= -0.18 [ -1.81 , 1.45 ] Slope= 12.32 [ 11.08 , 13.56 ] R2= 0.94
Figure 1: Optical absorption coefficient in PM2.5 versus elemental carbon (EC) in PM2.5 measured at an urban background site in Zurich (Switzerland) at every twelfth day in 2011. At the top of the figure, the parameters of a linear regression calculation (including 95% confidence intervals) and the coefficient of determination is given.
2 Comments on the technical viability of network operation
2.1 Particle number concentration measurements
In principle, particle number concentration measurements are simple. CPCs are compact and reliable instruments that can be easily operated in monitoring networks. In the Swiss NABEL network, the data availability for PNC is high (>90%, see Figure 2). PNC measurements with butanol-based CPCs can however strongly be influenced by condensation of water in the CPC when operated at high ambient humidity. This problem has been solved in newer CPCs versions which are equipped with an automatic water removal system. For long-term operation in air quality monitoring network, the photometric light scattering technique of CPCs used at high particle concentrations should be avoided because of the changing light intensity of the laser and therefore the changing sensitivity of the instrument. At the polluted sites of the Swiss NABEL network closed loop dilution systems are used to avoid the CPCs to switch between single particle counting and photometric light scattering. The most important aspect for particle number concentration measurements in air quality monitoring networks is probably that in contrast to other (regulated) air pollutants, calibration or functional tests of CPCs at time intervals which are typical for air quality monitoring networks (e.g. bi-weekly or monthly) are impracticable or at least very costly. This means that quality assurance and quality control of particle number concentration measurements is an especially important and still unsolved issue that needs to be defined and standardised. A CEN working group (CEN TC264 WG32) is currently working on this issue.

94
2006 2008 2010 2012
050
100
N (
1000
cm
-3)
Haerkingen - rural, at motorway
2006 2008 2010 2012
050
100
N (
1000
cm
-3)
Bern - urban roadside
2006 2008 2010 2012
050
100
N (
1000
cm
-3)
Lugano - urban background
2006 2008 2010 2012
020
4060
N (
1000
cm
-3)
Basel - suburban
2006 2008 2010 2012
05
1525
N (
1000
cm
-3)
Chaumont - rural, above 1140 masl Rigi Seebodenalp - rural, above 1040 masl
Figure 2: Time series of daily particle number concentrations at sites of the Swiss national air quality network NABEL.
2.2 Black carbon measurements
Both, MAAPs and aethalometers are reliable and easy to operate instruments (data availability > 90%). The costs for operation and maintenance of MAAPs and aethalometers are similar to the costs for other instruments typically used in air quality monitoring networks. The light absorption coefficient measured with an aethalometer should be corrected for the dependence of the measured light absorption on filter loading and multiple scattering of light at the filter fibres. In the Swiss NABEL network, this correction is automatically done by the data acquisition software used at the monitoring site according to Weingartner et al. (2003). As outlined above, BC concentrations are in the Swiss NABEL network calculated from the measured aerosol absorption coefficient when the site specific mass absorption cross section is known. This requires additional costs for periodic co-located EC measurements but secures comparable BC measurements that are consistent with EC concentrations and which are well suited e.g. for assessment of levels and temporal trends in ambient BC concentration. One open issue is that EC concentrations also depend on the applied analytical method. Working group 35 of CEN TC264 is currently working on a reference method for EC that could in future also be used for determination of mass absorption cross sections and thus calculation of BC from optical light absorption measurements. One interesting feature of multi-wavelength aethalometers is that the dependence of the light absorption coefficient on the wavelength of the light can be used to distinguish between BC emitted by fossil fuel combustion and biomass combustion. As demonstrated by Herich et al. (2011), this distinction between sources of BC can also be done on a routine basis within an air quality monitoring network.

95
References: Cavalli, F., Viana, M., Yttri, K. E., Genberg, J., and Putaud, J.-P.: Toward a standardised thermal-optical protocol for measuring atmospheric organic and elemental carbon: the EUSAAR protocol, Atmos. Meas. Tech., 3, 79-89, 2010. Herich, H., Hueglin, C., and Buchmann, B.: A 2.5 year's source apportionment study of black carbon from wood burning and fossil fuel combustion at urban and rural sites in Switzerland, Atmospheric Measurement Techniques, 4(7), 1409-1420, 2011. Weingartner, E., Saathof, H., Schnaiter, M., Streit, N., Bitnar, B., and Baltensperger, U.: Absorption of light by soot particles: Determination of the absorption coefficient by means of Aethalometers, J. Aerosol Sci., 34, 1445–1463, 2003.
SLOVENIA Tanja Bolte, ARSO The Air Quality Network Measurements of air quality in Slovenia started in Ljubljana in 1986 with black smoke and SO” index. ARSO perform measurements at 17 different location in Slovenia in the state network and in the frame of supplementary networks managed and financed by larger local communities (Ljubljana, Celje, Maribor) or by some factories, which are large source of emissions (termo-power plants). Most common components monitored are PM10, PM2.5, NOx, SO2, O3, CO, BTX, PAH’s, Heavy metals, ions, EC/OC. The measurement data are available in the ARSO website. 1. Black Carbon measurements in Slovenia Dr. Griša Močnik, Aerosol d.o.o., Tanja Bolte ARSO Black Carbon (BC) is a primary pollutant directly related to sources and can be measured with a very high time resolution. This information is very informative, as different sources may have different time behavior, and time evolution of BC concentrations can be used to characterize these sources, monitoring effects of traffic restrictions or discrimination between different sources. However, much more can be learnt from the wavelength dependence of the aerosol absorption coefficient. Measurements by the Aethalometer of aerosol absorption at different wavelengths of light provide information specific to sources. 1.1. Instrumentation Black carbon was measured with Magee Scientific Aethalometers Model AE31 (Aerosol d.o.o., Slovenia). Light sources in this type of instrument are light emitting diodes with wavelengths peaked at 370 nm, 470 nm, 520 nm, 590 nm, 660 nm, 880 nm and 950 nm. Measurements in such wide spectrum of light enable us to characterize the absorption of aerosols in the range from ultraviolet to infrared. The air was sampled via a TSP inlet with an insect screen or from a manifold used for gas measurements in the air quality stations. The Aethalometer samples air with flow rate of few liters per minute (4 LPM were routinely used in the campaigns). The sampled air passes a quartz filter on which aerosols are collected. Above the quartz filter there is a light source and beneath it there are detectors that measure light attenuation. Black carbon concentrations are calculated from the rate of light attenuation in infrared. Attenuation is measured relative to the reference – the unloaded part of the same filter without the air flow. Attenuation is defined as the logarithm of the ratio of the intensities of light under the reference part of the filter and the sampling part of the filter.

96
The gradual accumulation of light absorbing carbonaceous aerosols causes a gradual decline in the optical transmission of the filter and the growth of the attenuation. The flow of air through the filter is measured by a mass flow sensor which also serves as the measurement needed to stabilize the air pump. The Aethalometer stores data for each sampling period. From measurements of light transmission the Aethalometer determines the respective increase in attenuation. This is then converted with the known black carbon optical mass absorption cross-section into black carbon concentration expressed in nanograms per cubic meter (ng/m3). When the filter is loaded so that the light intensity measured under the filter falls below a specified value the filter tape advances and the measurement starts on the new part of the tape. At this time the Aethalometer performs quality control and assurance self-tests. 1.2. Measurement campaigns Aerosol d.o.o. has performed several campaigns in Slovenia, focusing on residential biomass combustion. The measurements were coordinated with the source apportionments efforts of the Environmental Agency of Republic of Slovenia (EARS) and were most often conducted on the sites of the national air quality network. The results were compared and the resulting information was used to further elucidate the sources in the rgion of interest. The results were included in the EARS campaign reports. The measurement locations and the campaign period start and finish can be found in Table.
Site Start End Ljubljana January 2008 March 2008 Maribor December 2008 August 2009 Zagorje October 2009 December 2009 Nova Gorica January 2010 March 2010 Krvavec April 2010 January 2011 Celje July 2010 June 2011 Trbovlje January 2011 May 2011 Trbovlje November 2011 April 2012 Maribor July 2010 ongoing Vrbanski plato January 2011 ongoing
Table: Black Carbon measurement campaigns in Slovenia since 2008. 1.3. Campaign results In all locations we have determined the average BC concentrations, their diurnal variation and the relation between the BC and elemental carbon (EC, as determined by the EUSAAR2 thermo-optical method). The percentage of BC in PM10 showed significant diurnal variations, pointing out the necessity to understand the composition of PM10 on a short timescale; the danger of using a fixed BC/PM10 relation when characterizing the BC emissions; and necessity to measure BC with high time resolution (Figure 1). Mass closure was performed with high success for PM10, and BC apportioned to biomass combustion was related to levoglucosan and other biomass combustion tracers. 1.4. Source apportionment The dependence of the absorption on the wavelength is characterized by the absorption Angstrom exponent. For diesel exhaust, which is black, the value of the Angstrom exponent lies very close to 1. Wood- or biomass-smoke contains aromatic compounds which absorb heavily in the blue and UV part of the light spectrum. This higher absorption at low wavelengths leads to a higher Angstrom exponent, for biomass-smoke the value lies around 2 for wood combustion and higher for forest fires.

97
0%
2%
4%
6%
8%
10%
12%
14%
16%
0%
2%
4%
6%
8%
10%
12%
14%
16%
0:00
2:00
4:00
6:00
8:00
10:00
12:00
14:00
16:00
18:00
20:00
22:00
delavnik
nedelja
Figure 1: Diurnal variation of the percentage of BC in PM10 in Nova Gorica, the
variation is significant – a factor of 3.
y = 7,58xR² = 0,88
0
10
20
30
40
50
60
70
0 1 2 3 4 5 6
ba
bs
(95
0n
m),
Mm
-1
EC, µgC/m3
mass absorption cross‐section = 7,6 m2/g
Figure 2: The relation between the elemental carbon (EC, in µg/m3) as determined by the EUSAAR2 thermo-optical method from 24 hour filters and the absorption coefficient (babs, in Mm-1) at 950 nm as measured by the Aethalometer and averaged for the same 24 hour period during which the corresponding filter was sampled. We determined the mass absorption cross section: 7,6 m2/g at 950 nm in Nova Gorica. The two different and source (fossil fuel, mainly diesel; biomass combustion for domestic heating) specific values of the Angstrom exponent allow for a construction of a 2 component model – the “Aethalometer model” (Sandradewi 2008, Favez 2010, Močnik 2011), with which we can apportion BC to fossil fuel (traffic) and biomass (wood combustion) with the time resolution of the Aethalometer measurements. This principle can then be extended to quantitatively apportion all carbonaceous aerosols to the two sources, provided that there are OC and EC measurements available. The time resolution of these is 1 day. With the “Aethalometer model” calibrated on the time scale of 24 hours, we can use the Aethalometer data to perform the apportionment with a time resolution measured in minutes! Publications on the results of these measuement campaigns are in preparation.
Workday Sunday

98
0,00
1,00
2,00
3,00
4,00
5,00
6,00
7,00
8,00
9,00
0:00
1:00
2:00
3:00
4:00
5:00
6:00
7:00
8:00
9:00
10:00
11:00
12:00
13:00
14:00
15:00
16:00
17:00
18:00
19:00
20:00
21:00
22:00
23:00
0:00
[μg/m
3]
Nova Gorica workdayBC
BC
BCff
BCwb
0,0
10,0
20,0
30,0
40,0
50,0
60,0
0:00
1:00
2:00
3:00
4:00
5:00
6:00
7:00
8:00
9:00
10:00
11:00
12:00
13:00
14:00
15:00
16:00
17:00
18:00
19:00
20:00
21:00
22:00
23:00
0:00
[μg/m
3]
Nova Gorica workdayCM
CM
CMff
CMwb
22% ± 15%
71% ± 15%71% ± 8%
29% ± 8%
Figure 3: Diurnal variation of black carbon (BC), and portions apportioned to biomass combustion (BCwb) and fossil fuel (BCff) – left; total aerosolized carbonaceous matter (CM) and portions apportioned to biomass combustion (CMwb) and fossil fuel (CMff) – right; in Nova Gorica, Slovenia. Research, portion of which is presented herein was conducted by: G. Močnik, I. Ježek, L. Drinovec, Aerosol d.o.o.; J. Turšič, G. Muri, T. Bolte, Environmental Agency of the Republic of Slovenia; J.-E. Petit, J. Sciare, LSCE/CEA Orme des Merisiers, Gif-sur-Yvette, France. 1.5. References Favez O., et al., 2010, Inter-comparison of source apportionment models for the estimation of wood burning aerosols during wintertime in an Alpine city (Grenoble, France), Atmos. Chem. Phys., 10, 5295–5314. Močnik G., et al, 2011, Optical detection and discrimination between biomass and fossil fuel combustion: influence on air quality in different environments, Monitoring Ambient Air, London, 12 December 2011, accessed 1 June 2012, http://rsc-aamg.org/Documents/Papers/MAA2011/GMocnik.pdf Sanndradewi J., et al., 2008, Using Aerosol Light Absorption Measurements for the Quantitative Determination of Wood Burning and Traffic Emission Contributions to Particulate Matter, Environ Sci Technol, 42, 3316-3323. PORTUGAL Casimiro Pio (Teresa Nunes), CESAM/UA, PT Particle number and black carbon monitoring in urban air quality networks
1. Recent and current deployment of particle number and black carbon instruments in Portuguese networks or research studies. 1.2. Particle number Only sporadic measurements of particle number had been performed in Portugal at Oporto city in the scope of Sapphire Project (2003/2004) (EC FP5 (EVK4-2001-192). During 2003/2004 a 28 cm Hauke-type DMA25 - built at Joint Research Centre, Ispra - using a re-circulating flow system in connection with a TSI Model 3010 Condensation Particle Counter from Department of Atmospheric Environment, NERI, Denmark, was used to measure particle numbers in 29 electrical mobility channels in the size range 6-700 nm.
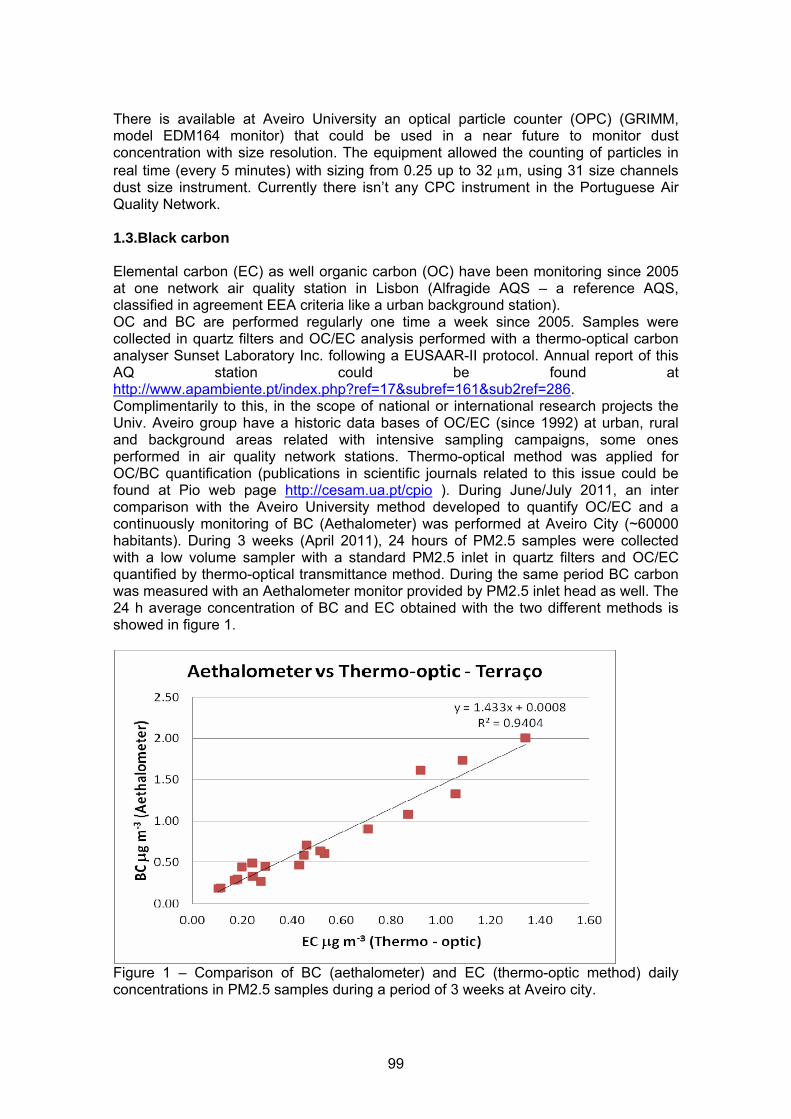
99
There is available at Aveiro University an optical particle counter (OPC) (GRIMM, model EDM164 monitor) that could be used in a near future to monitor dust concentration with size resolution. The equipment allowed the counting of particles in real time (every 5 minutes) with sizing from 0.25 up to 32 m, using 31 size channels dust size instrument. Currently there isn’t any CPC instrument in the Portuguese Air Quality Network. 1.3.Black carbon Elemental carbon (EC) as well organic carbon (OC) have been monitoring since 2005 at one network air quality station in Lisbon (Alfragide AQS – a reference AQS, classified in agreement EEA criteria like a urban background station). OC and BC are performed regularly one time a week since 2005. Samples were collected in quartz filters and OC/EC analysis performed with a thermo-optical carbon analyser Sunset Laboratory Inc. following a EUSAAR-II protocol. Annual report of this AQ station could be found at http://www.apambiente.pt/index.php?ref=17&subref=161&sub2ref=286. Complimentarily to this, in the scope of national or international research projects the Univ. Aveiro group have a historic data bases of OC/EC (since 1992) at urban, rural and background areas related with intensive sampling campaigns, some ones performed in air quality network stations. Thermo-optical method was applied for OC/BC quantification (publications in scientific journals related to this issue could be found at Pio web page http://cesam.ua.pt/cpio ). During June/July 2011, an inter comparison with the Aveiro University method developed to quantify OC/EC and a continuously monitoring of BC (Aethalometer) was performed at Aveiro City (~60000 habitants). During 3 weeks (April 2011), 24 hours of PM2.5 samples were collected with a low volume sampler with a standard PM2.5 inlet in quartz filters and OC/EC quantified by thermo-optical transmittance method. During the same period BC carbon was measured with an Aethalometer monitor provided by PM2.5 inlet head as well. The 24 h average concentration of BC and EC obtained with the two different methods is showed in figure 1.
Figure 1 – Comparison of BC (aethalometer) and EC (thermo-optic method) daily concentrations in PM2.5 samples during a period of 3 weeks at Aveiro city.

100
Even a good correlation was observed among the two methods, the problem with shadowing correction to the results of aethalometer measurements persist an unresolved problem. In comparison with other European Air Quality network, Portugal has a deficient cover, in number of monitoring sites and temporal trends of these two PM air quality parameters – particle number and black carbon. FRANCE Olivier Favez, Laure Malherbe, INERIS Although France has been monitoring PNC and BC for more than ten years at some research sites (e.g. Puy de Dôme, but also worldwide: Indian Ocean and Hymalaya for instance, contacts: [email protected] and [email protected]), there is little experience of such monitoring activities within regional monitoring networks, which is briefly described below. BC Up to now, only one French regional monitoring network (i.e. Airparif, www.airparif.asso.fr) is operating BC automatic analyzers routinely. In an attempt to pursue Black Smoke measurements, this network deployed 4 MAAP instruments at Paris urban background sites in 2008 and is continuously recording 1h-average data since then. It also makes use of these absorption measurements to estimate equivalent Black Carbon concentrations based on mass absorption efficiencies retrieved from comparisons with thermo-optical analysis of filters sampled during research campaigns. It reports no major technical issue with the MAAP instruments, depicted as pretty convenient and robust. One additional MAAP and several Aethalometers (Magee Sci., AE-31 and AE-42 models) have also recently (April 2012) been deployed at Paris urban background and traffic sites as well as rural background sites in the frame of a two-year research program. It is also to note that multi-wavelengths Aethalometers are occasionally used within French monitoring networks for source apportionment purposes (e.g. Fig. 1).

101
Figure 4: BC source apportionment at the Audincourt traffic site (North-East of France, ATMO
Franche-Comté and LCSQA) in February 2011 using a multi-wavelengths AE-31 Aethalometer. PNC The French national reference laboratory for air quality monitoring (LCSQA) has been conducting some experimental studies on PNC measurements for about a decade. This mainly consists of regular field campaigns at one Paris background site (Gennevilliers, in collaboration with Airparif), allowing for a better knowledge of the sources and formation processes of PNC at such sites (cf. 2011 report: http://www.lcsqa.org/rapport/2011/ineris/connaissance-nombre-distribution-granulometrique-particules-submicroniques-sui-0). However, due to the use of radioactive sources and butanol notably, SMPS instruments used for these studies may not be envisaged as good candidate methods for routine PNC monitoring activities within French regional networks. In this context, another kind of particle counters, i.e. UFP3031 (TSI), is actually tested at different urban sites (Paris, Grenoble, Bordeaux and Marseille) by the LCSQA, Air Rhône-Alpes, AirAq and Air PACA. Such monitors are easy to use and do not required sophisticated data treatments. However, first intercomparison campaigns seem to indicate low reproducibility between these instruments after periods of 4-6 months of usual operation.
Related Documents