Vol:.(1234567890) Arch Environ Contam Toxicol (2018) 74:442–451 https://doi.org/10.1007/s00244-017-0472-z 1 3 Particle‑Associated Polycyclic Aromatic Hydrocarbons (PAHs) in the Atmosphere of Hefei, China: Levels, Characterizations and Health Risks Ruoyu Hu 1,2 · Guijian Liu 1,2 · Hong Zhang 1,3 · Huaqin Xue 1 · Xin Wang 1 · Ruwei Wang 1 Received: 29 June 2017 / Accepted: 21 October 2017 / Published online: 27 October 2017 © Springer Science+Business Media, LLC 2017 different between summer and winter. Total BaP equiva- lent concentration (BaP-TEQ) for particulate-bound PAHs in winter (58.87 ng/m 3 ) was higher than that in summer (5.53 ng/m 3 ). In addition, particulate-bound PAHs in win- ter had an inhalation cancer risk (ICR) value of 2.8 × 10 −3 , which was higher than the safe range (10 −4 –10 −6 ). In recent years, rapid development of economy has resulted in dramatic increase in air pollutant emissions (Chan and Yao 2008), especially in developing countries. Particulate matters have become the primary air pollutants and drawn more attentions due to their critical roles in forming hazy weather (Zhou et al. 2016). PM2.5 and PM10 represent par- ticulate matters whose aerodynamic diameters are less than 2.5 and 10 μm, respectively. They could be inhaled through the respiratory system and probably lead to certain serious health problems (Yang et al. 2012). In addition, PM2.5, which consists of a substantial part of PM10, is able to bypass the respiratory tract and penetrate deep into the lungs owing to their minute size (Mao et al. 2007; Marcazzan et al. 2001). Particulate matters would arise from both anthropo- genic and natural sources. The primary sources come from direct emissions, and the secondary sources derive mainly from the conversion from gas to particles (Tian et al. 2016; Zheng et al. 2005). PAHs are hydrocarbon compounds consisting of at least two benzene rings (Wiriya et al. 2013). They are primar- ily produced from pyrolysis of fossil fuels and incomplete combustion. US Environmental Protection Agency (US EPA 1982) recommends 16 PAHs as priority pollutants (Bojes and Pope 2007; Yan et al. 2004). Benzo[a]pyrene has been classified as known carcinogen by International Agency for Research on Cancer (IARC 2010), while other PAHs are considered to be possible human carcinogens. Organic Abstract Airborne PM2.5 and PM10 samples were collected in summertime (August 2015) and wintertime (December 2015–January 2016) in an industrial complex area in Hefei, China. The average concentrations of PM2.5 and PM10 (90.5 and 114.5 μg/m 3 , respectively) were higher than the regulated levels of China National Ambient Air Quality Standard (grade I) and the WHO Ambient (outdoor) Air Quality and Health Guideline Value. Seasonal variations in PM2.5/PM10 indicated that the secondary sources of par- ticulate matters, formed by gas-to-particle conversion, were enhanced in summer due to longer time of solar radiation and higher temperature. The total concentrations of PM2.5- and PM10-associated PAHs were 5.89 and 17.70 ng/m 3 in summer as well as 63.41 and 78.26 ng/m 3 in winter, respec- tively. Both PM2.5- and PM10-associated PAHs were domi- nated by 4- to 6-ring PAHs, suggesting that the fossil fuel combustion and vehicle emissions were the primary sources of PAHs in atmospheric particulate matters in Hefei. The total concentration of PAHs had a slightly higher correlation coefficient with PM2.5 (R = 0.499, P < 0.05) than PM10 (R = 0.431, P > 0.05), indicating the higher association ten- dency of PAHs with PM2.5. The coefficient of divergence analysis showed that the compositions of PAH were quite * Guijian Liu [email protected] 1 CAS Key Laboratory of Crust-Mantle Materials and Environment, School of Earth and Space Sciences, University of Science and Technology of China, Hefei 230026, Anhui, China 2 State Key Laboratory of Loess and Quaternary Geology, Institute of Earth Environment, The Chinese Academy of Sciences, Xi’an 710075, Shaanxi, China 3 Anhui Academy of Environmental Science, Hefei 230026, Anhui, China CORE Metadata, citation and similar papers at core.ac.uk Provided by Institutional Repository of Institute of Earth Environment, CAS

Welcome message from author
This document is posted to help you gain knowledge. Please leave a comment to let me know what you think about it! Share it to your friends and learn new things together.
Transcript
Vol:.(1234567890)
Arch Environ Contam Toxicol (2018) 74:442–451https://doi.org/10.1007/s00244-017-0472-z
1 3
Particle‑Associated Polycyclic Aromatic Hydrocarbons (PAHs) in the Atmosphere of Hefei, China: Levels, Characterizations and Health Risks
Ruoyu Hu1,2 · Guijian Liu1,2 · Hong Zhang1,3 · Huaqin Xue1 · Xin Wang1 · Ruwei Wang1
Received: 29 June 2017 / Accepted: 21 October 2017 / Published online: 27 October 2017 © Springer Science+Business Media, LLC 2017
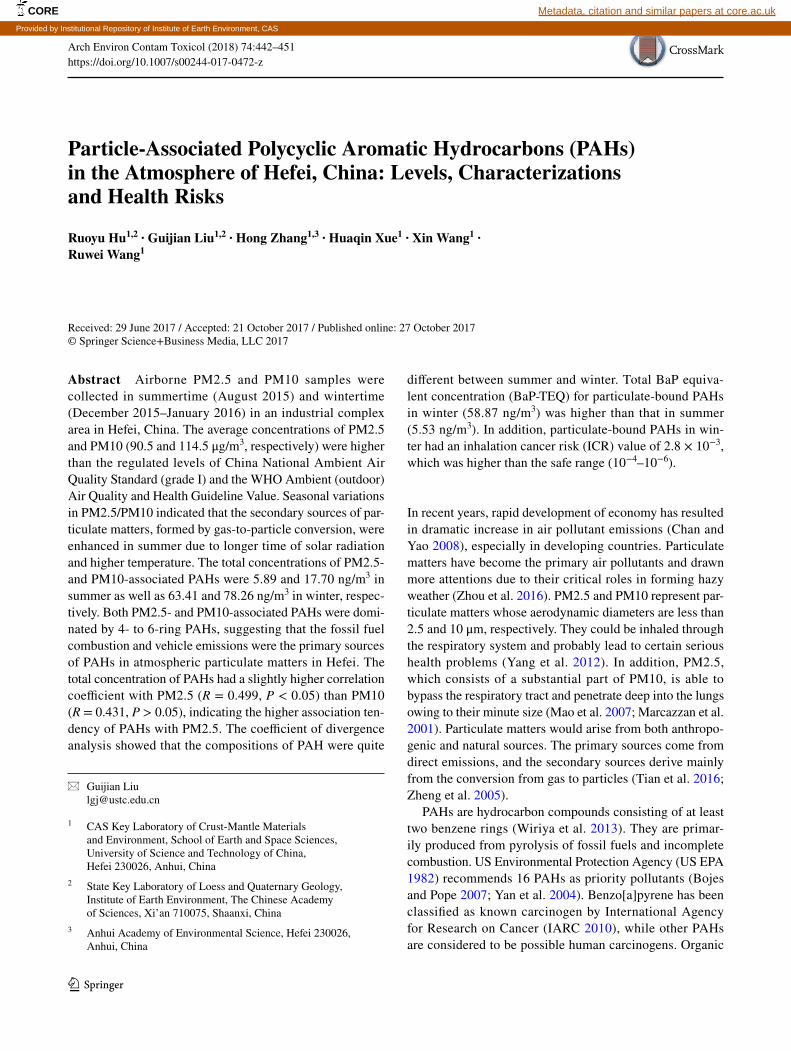
different between summer and winter. Total BaP equiva-lent concentration (BaP-TEQ) for particulate-bound PAHs in winter (58.87 ng/m3) was higher than that in summer (5.53 ng/m3). In addition, particulate-bound PAHs in win-ter had an inhalation cancer risk (ICR) value of 2.8 × 10⁻³, which was higher than the safe range (10−4–10−6).
In recent years, rapid development of economy has resulted in dramatic increase in air pollutant emissions (Chan and Yao 2008), especially in developing countries. Particulate matters have become the primary air pollutants and drawn more attentions due to their critical roles in forming hazy weather (Zhou et al. 2016). PM2.5 and PM10 represent par-ticulate matters whose aerodynamic diameters are less than 2.5 and 10 μm, respectively. They could be inhaled through the respiratory system and probably lead to certain serious health problems (Yang et al. 2012). In addition, PM2.5, which consists of a substantial part of PM10, is able to bypass the respiratory tract and penetrate deep into the lungs owing to their minute size (Mao et al. 2007; Marcazzan et al. 2001). Particulate matters would arise from both anthropo-genic and natural sources. The primary sources come from direct emissions, and the secondary sources derive mainly from the conversion from gas to particles (Tian et al. 2016; Zheng et al. 2005).
PAHs are hydrocarbon compounds consisting of at least two benzene rings (Wiriya et al. 2013). They are primar-ily produced from pyrolysis of fossil fuels and incomplete combustion. US Environmental Protection Agency (US EPA 1982) recommends 16 PAHs as priority pollutants (Bojes and Pope 2007; Yan et al. 2004). Benzo[a]pyrene has been classified as known carcinogen by International Agency for Research on Cancer (IARC 2010), while other PAHs are considered to be possible human carcinogens. Organic
Abstract Airborne PM2.5 and PM10 samples were collected in summertime (August 2015) and wintertime (December 2015–January 2016) in an industrial complex area in Hefei, China. The average concentrations of PM2.5 and PM10 (90.5 and 114.5 μg/m3, respectively) were higher than the regulated levels of China National Ambient Air Quality Standard (grade I) and the WHO Ambient (outdoor) Air Quality and Health Guideline Value. Seasonal variations in PM2.5/PM10 indicated that the secondary sources of par-ticulate matters, formed by gas-to-particle conversion, were enhanced in summer due to longer time of solar radiation and higher temperature. The total concentrations of PM2.5- and PM10-associated PAHs were 5.89 and 17.70 ng/m3 in summer as well as 63.41 and 78.26 ng/m3 in winter, respec-tively. Both PM2.5- and PM10-associated PAHs were domi-nated by 4- to 6-ring PAHs, suggesting that the fossil fuel combustion and vehicle emissions were the primary sources of PAHs in atmospheric particulate matters in Hefei. The total concentration of PAHs had a slightly higher correlation coefficient with PM2.5 (R = 0.499, P < 0.05) than PM10 (R = 0.431, P > 0.05), indicating the higher association ten-dency of PAHs with PM2.5. The coefficient of divergence analysis showed that the compositions of PAH were quite
* Guijian Liu [email protected]
1 CAS Key Laboratory of Crust-Mantle Materials and Environment, School of Earth and Space Sciences, University of Science and Technology of China, Hefei 230026, Anhui, China
2 State Key Laboratory of Loess and Quaternary Geology, Institute of Earth Environment, The Chinese Academy of Sciences, Xi’an 710075, Shaanxi, China
3 Anhui Academy of Environmental Science, Hefei 230026, Anhui, China
CORE Metadata, citation and similar papers at core.ac.uk
Provided by Institutional Repository of Institute of Earth Environment, CAS
443Arch Environ Contam Toxicol (2018) 74:442–451
1 3
compounds like polycyclic aromatic hydrocarbons (PAHs) can be adsorbed by particulate matters, and they are highly carcinogenic and mutagenic (Kim et al. 2013; Wu et al. 2014).
Many studies investigated PAHs in particulate matter in recent years in China. For example, Zhang et al. (2016) reported the spatial and seasonal variation of PAHs in PM2.5 and PM10 in Beijing, Tianjin and Shijiazhuang. PAHs in particles of different sizes in Hong Kong were characterized by Guo et al. (2003). Similar studies have been reported for some industrial cities, such as the Guangzhou, Zheng-zhou and Taiyuan (Wang et al. 2006; Wei et al. 2012; Xia et al. 2013). For other countries, large cities are still main research subjects. Wiriya et al. (2013) conducted the source identification and health risk assessment of PM10-bound PAHs in Chiang Mai, Thailand. The profile of PAHs in the inhalable particulate fraction from Delhi (the capital city of India) has been reported by Sarkar and Khillare (2013). Seasonal and spatial variation of polycyclic aromatic hydro-carbons in vapor and PM2.5 phase has been studied in Cali-fornia (Eiguren-Fernandez et al. 2004). However, most of the previous studies were conducted in megacities or indus-trial cities. The study of PAHs in particulate matters of the developing midsize cities is still limited.
Hefei is the capital and largest city in Anhui Province, which is a developing city in eastern China. It has a pop-ulation of 7,800,000 and covers an area of ~ 11,000 km2 (Deng et al. 2016; Hu et al. 2017). To study the variation in PAH concentration and distribution patterns associated with PM2.5 and PM10 in Hefei City, PM2.5 and PM10 samples
were sampled in both summer (August 2015) and winter (December 2015–January 2016). The source tracing and their associated health risks have been assessed based on the index of toxic equivalent concentrations (TEQs). Moreo-ver, investigation of the characteristics of atmospheric PAHs could provide useful information to solve atmospheric pol-lution problems and thus to improve air quality in similar cities.
Materials and Methods
Sampling
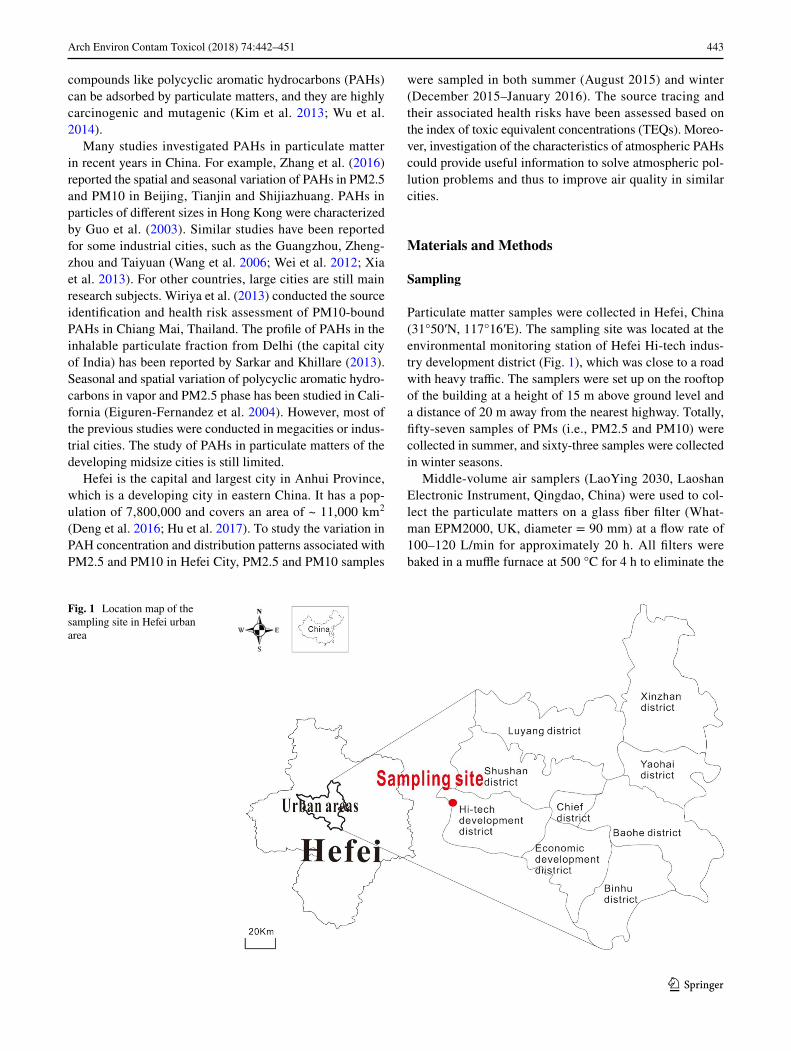
Particulate matter samples were collected in Hefei, China (31°50′N, 117°16′E). The sampling site was located at the environmental monitoring station of Hefei Hi-tech indus-try development district (Fig. 1), which was close to a road with heavy traffic. The samplers were set up on the rooftop of the building at a height of 15 m above ground level and a distance of 20 m away from the nearest highway. Totally, fifty-seven samples of PMs (i.e., PM2.5 and PM10) were collected in summer, and sixty-three samples were collected in winter seasons.
Middle-volume air samplers (LaoYing 2030, Laoshan Electronic Instrument, Qingdao, China) were used to col-lect the particulate matters on a glass fiber filter (What-man EPM2000, UK, diameter = 90 mm) at a flow rate of 100–120 L/min for approximately 20 h. All filters were baked in a muffle furnace at 500 °C for 4 h to eliminate the
Fig. 1 Location map of the sampling site in Hefei urban area
444 Arch Environ Contam Toxicol (2018) 74:442–451
1 3
background organic matter. Filters were weighed in a micro-balance (Sartorius MSA, Gottingen, DE, ± 0.001 mg) in a clean bench before and after sampling, in order to calculate the mass of collected particulate samples. After collection, the filters were stored in clean containers being kept at 4 °C.
PAH Analysis
Each filter was cut into small pieces (1 cm × 1 cm) using stainless steel scissors and then extracted using dichlo-romethane (DCM) and acetone (chromatographically pure grade) in an accelerated solvent extraction apparatus (Dionex-ASE 350, Sunnyvale, CA, USA). Before extrac-tion, a standard mixture consisting of phenanthrene-d10, chrysene-d12 and perylene-d12 was spiked onto the filters. The extracts were concentrated to ~ 1 mL in a nitrogen blow-ing automatic parallel concentrate instrument at 40 °C (Mul-tiVap-8, LabTech, Hopkinton, MA, USA) and then injected into a gas chromatograph (GC, Agilent Technologies 7890, Wilmington, DE, USA) coupled to mass spectrometer (MS, 5975 N). The GC equipped with a capillary column Rtx-1MS (length: 30 m; diameter: 0.25 mm; thickness: 0.25 μm) was used. Temperature increasing program of the GC–MS (QP2010 Plus) was: Firstly, keep the initial temperature to 70 °C isotherm for 5 min, then ramping the temperature to 240 °C at a rate of 10 °C/min, at last ramping the tem-perature to 300 °C at a rate of 7 °C/min and keep for 8 min. High-purity (> 99.99%) helium was used as the carrier gas at a constant flow of 1.0 mL/min. The MS was operated in selective ion monitoring (SIM) mode at 70 eV, with an ion source temperature of 230 °C and an analyzer temperature of 150 °C. The scanning range was set among 50–550 amu.
Sixteen priority PAH compounds specified by Envi-ronmental Protection Agency, US EPA (US EPA 1982),
including NAP—naphthalene; ANY—acenaphthylene; ANA—acenaphthene; FL—fluorene; PHE—phenanthrene; An—anthracen; FLU—fluoranthene; PYR—pyrene; BaA—benz[a]anthracene; CHR—chrysene; BbF—benzo[b]fluoranthene; BkF—benzo[k]fluoranthene; BaP—benzo[a]pyrene; IcdP—indeno[1,2,3-cd]pyrene; DBA—dibenzo[a,h]anthracene; and Bghi—benzo[ghi]perylene, were analyzed.
Quality Control
Spiked blanks (internal standards added to filter) and proce-dural blanks (solvent) were analyzed to assure and control the analysis quality. In procedural blanks, none of the target compounds were detected. The limit of quantification (LOQ) for each compound was calculated for three times of the noise, which was taken as a standard deviation of the lowest level standard. Surrogate PAHs have recoveries between 77 and 95%. The calibration curves are linear, and these are fitted with correlation coefficients (R2) from 0.996 to 1 for all of the PAHs. All the results are not corrected for the sur-rogate standards.
Results and Discussion
PM2.5 and PM10 Concentrations
The daily PM2.5 and PM10 data were calculated based on the Hefei Air Pollution Index (HAPI) (published by Air quality online monitoring analysis platform of China (http://www.aqistudy.cn//). The concentrations of particulate matters are shown in Table 1, and they are in the range of 17–243 and 36–255 μg/m3 for PM2.5 and PM10 during entire sampling period, respectively.
Table 1 Maximum, minimum, median, mean concentration and standard deviation values for each fraction of the particulate matters and related PAHs collected during the sampling periods
Summer Winter
Concentrations (μg/m3) PM2.5 PM10 PM2.5 PM10
Minimum 17.0 36.0 39.0 47.0Maximum 57.0 99.0 243.0 255.0Median 42.0 73.0 103.5 128.5Mean 41.8 73.4 120.2 139.6Standard deviation 11.8 18.1 57.5 57.2
Concentrations (ng/m3) PM2.5-PAHs PM10-PAHs PM2.5-PAHs PM10-PAHs
Minimum 0.84 2.15 16.28 36.80Maximum 19.36 50.20 208.68 191.58Median 3.14 10.99 35.97 57.42Mean 5.89 17.70 63.41 78.26Standard deviation 6.55 16.61 66.12 53.70
445Arch Environ Contam Toxicol (2018) 74:442–451
1 3
Average concentration of PM10 was 114.48 μg/m3, which was higher than the China National Ambient Air Qual-ity Standard (GB 3095-2012 24 h standard) of 50 μg/m3 and 2.3 times higher than the WHO standard of 50 μg/m3. Average concentration of PM2.5 was 2.6 times higher than the National Ambient Air Quality Standard of China of 35 μg/m3 and 3.6 times higher than the WHO standard of 25 μg/m3. Maximum, minimum, median, mean concen-trations and standard deviation values for the particulate matters collected during the sampling periods are listed in Table 1.
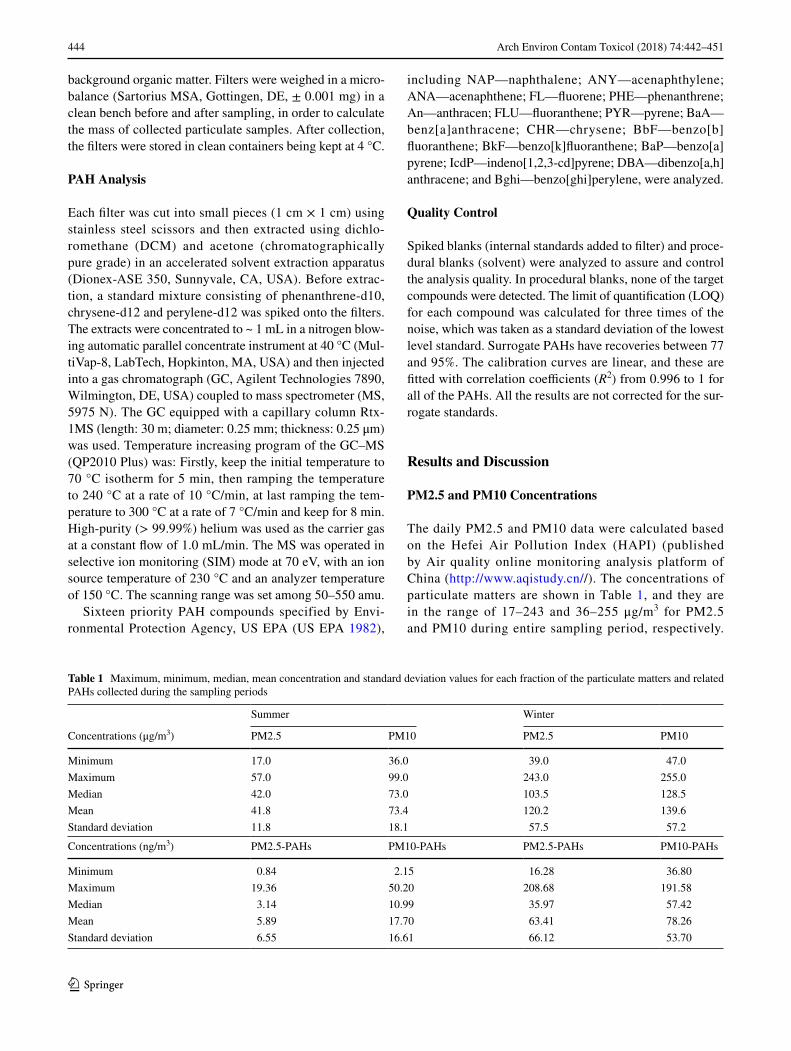
Figure 2 shows the observed seasonal variations of PM2.5 and PM10. During winter sampling period, the daily average concentrations of PM2.5 reached 120.2 μg/m3 and PM10 reached 139.6 μg/m3, while in summer, the figures were 41.8 and 73.4 μg/m3. The higher concentra-tions in winter were likely caused by enhanced heating emissions, and also lower planetary boundary layer may lead to more stagnant weather conditions. In summer, due to the summer monsoon, higher precipitation resulted in lower PM concentrations values (Wang et al. 2015). Such seasonal variations of PM2.5 and PM10 were reported from Guo et al. (2003) in Hongkong and Pandey et al. (2013) in Lucknow, India. Tian et al. (2016) found high concentrations of PM2.5 and PM10 (154.0 and 237.5 µg/m3) in winter compared to summer (85.2 and 142.1 µg/m3) in Chengdu, China. Liu et al. (2014) also reported that in winter, the PM2.5 and PM10 concentrations were 106.6 and 193.0 µg/m3, respectively, and in summer the concentrations were 155.9 and 73.8 µg/m3, respectively, in Beijing, China. Those data mentioned above indicate a similar pattern of seasonal variations of PM2.5 and PM10.
Correlations Between PM2.5 and PM10
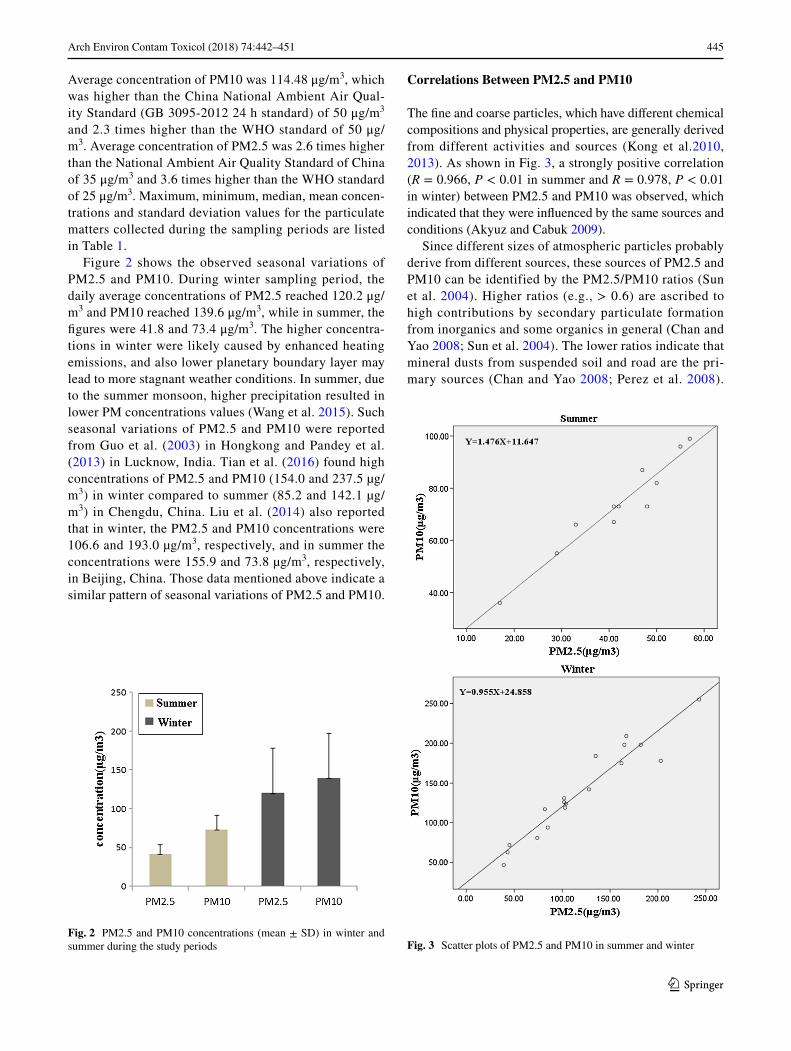
The fine and coarse particles, which have different chemical compositions and physical properties, are generally derived from different activities and sources (Kong et al.2010, 2013). As shown in Fig. 3, a strongly positive correlation (R = 0.966, P < 0.01 in summer and R = 0.978, P < 0.01 in winter) between PM2.5 and PM10 was observed, which indicated that they were influenced by the same sources and conditions (Akyuz and Cabuk 2009).
Since different sizes of atmospheric particles probably derive from different sources, these sources of PM2.5 and PM10 can be identified by the PM2.5/PM10 ratios (Sun et al. 2004). Higher ratios (e.g., > 0.6) are ascribed to high contributions by secondary particulate formation from inorganics and some organics in general (Chan and Yao 2008; Sun et al. 2004). The lower ratios indicate that mineral dusts from suspended soil and road are the pri-mary sources (Chan and Yao 2008; Perez et al. 2008).
Fig. 2 PM2.5 and PM10 concentrations (mean ± SD) in winter and summer during the study periods Fig. 3 Scatter plots of PM2.5 and PM10 in summer and winter
446 Arch Environ Contam Toxicol (2018) 74:442–451
1 3
The ratio of PM2.5/PM10 is 0.57 in summer and 0.83 in winter, suggesting that fine particles are dominant frac-tion in PM10 (Zhou et al. 2016), which indicates that the crucial approach for controlling particulate matter pollu-tion in Hefei is the reduction of PM2.5. The PM2.5/PM10 ratios also exhibit seasonal variations with the lower val-ues in summer and higher values in winter. Similar results have been found in other studies, and Akyuz and Cabuk (2009) reported an summer ratios of 0.47 and winter ratio of 0.70. Zhou et al. (2016) found that the average ratio of PM2.5/PM10 was 0.67 in summer and 0.70 in winter in the southern part of China. Sun et al. (2004) found summer ratio of 0.45 and winter ratio of 0.73. Laakso et al. (2003) also reported similar seasonal patterns in the PM2.5/PM10 ratio, in which the ratio was 0.52 in sum-mer and 0.60 in winter. However, Parkhurst et al. (1999) reported different seasonal patterns that the ratio in sum-mer was 0.68, higher than spring, autumn and winter, which was attributed to enhanced sunlight that induced the production and accumulation of secondary PM2.5. Chan and Kwok (2001) also reported a higher ratio in summer (0.84) than in winter (0.69).
Concentrations of PAHs in PM2.5 and PM10
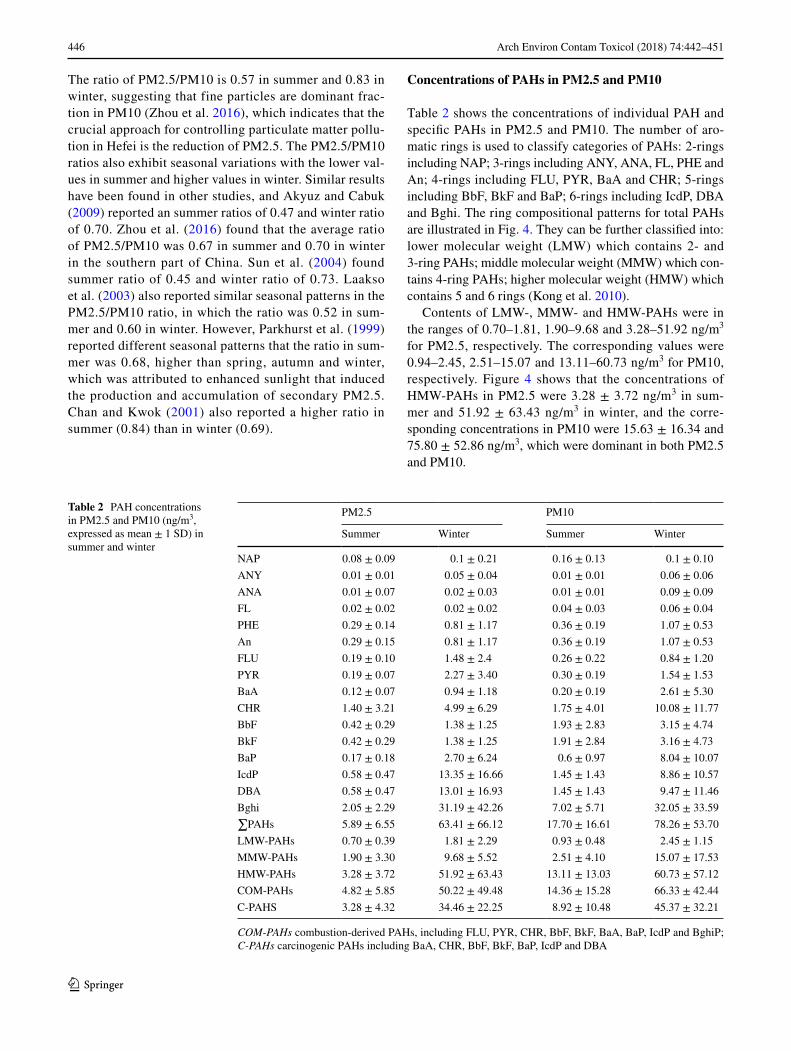
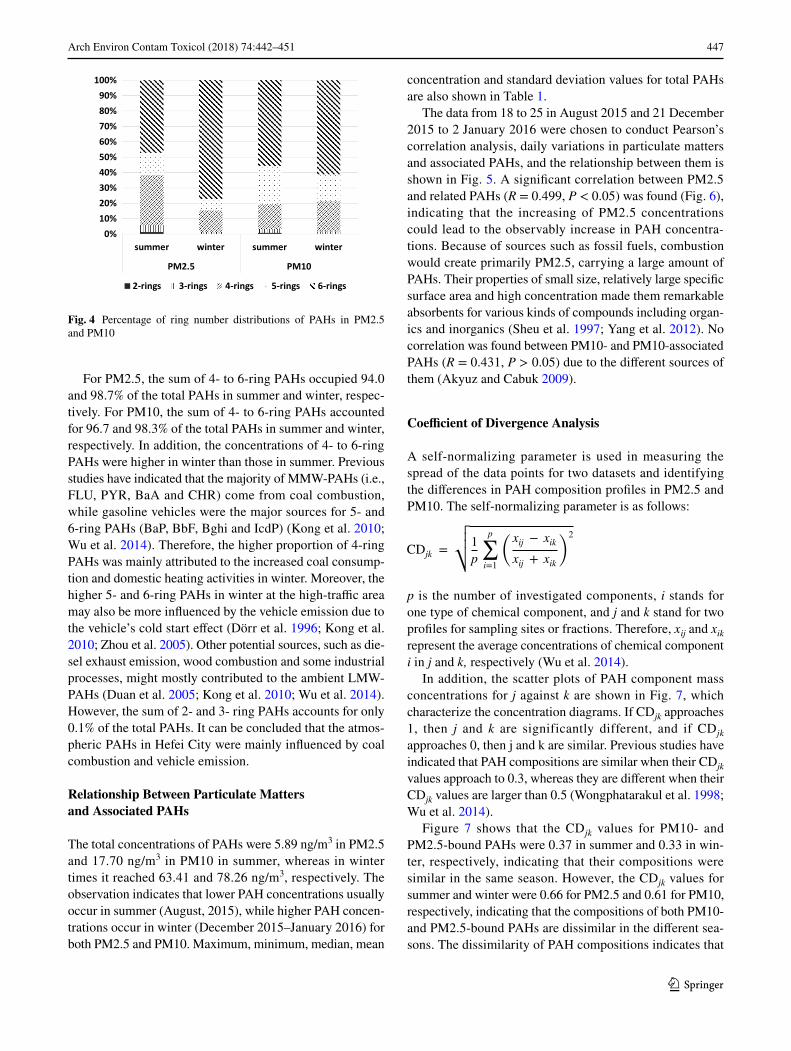
Table 2 shows the concentrations of individual PAH and specific PAHs in PM2.5 and PM10. The number of aro-matic rings is used to classify categories of PAHs: 2-rings including NAP; 3-rings including ANY, ANA, FL, PHE and An; 4-rings including FLU, PYR, BaA and CHR; 5-rings including BbF, BkF and BaP; 6-rings including IcdP, DBA and Bghi. The ring compositional patterns for total PAHs are illustrated in Fig. 4. They can be further classified into: lower molecular weight (LMW) which contains 2- and 3-ring PAHs; middle molecular weight (MMW) which con-tains 4-ring PAHs; higher molecular weight (HMW) which contains 5 and 6 rings (Kong et al. 2010).
Contents of LMW-, MMW- and HMW-PAHs were in the ranges of 0.70–1.81, 1.90–9.68 and 3.28–51.92 ng/m3 for PM2.5, respectively. The corresponding values were 0.94–2.45, 2.51–15.07 and 13.11–60.73 ng/m3 for PM10, respectively. Figure 4 shows that the concentrations of HMW-PAHs in PM2.5 were 3.28 ± 3.72 ng/m3 in sum-mer and 51.92 ± 63.43 ng/m3 in winter, and the corre-sponding concentrations in PM10 were 15.63 ± 16.34 and 75.80 ± 52.86 ng/m3, which were dominant in both PM2.5 and PM10.
Table 2 PAH concentrations in PM2.5 and PM10 (ng/m3, expressed as mean ± 1 SD) in summer and winter
COM-PAHs combustion-derived PAHs, including FLU, PYR, CHR, BbF, BkF, BaA, BaP, IcdP and BghiP; C-PAHs carcinogenic PAHs including BaA, CHR, BbF, BkF, BaP, IcdP and DBA
PM2.5 PM10
Summer Winter Summer Winter
NAP 0.08 ± 0.09 0.1 ± 0.21 0.16 ± 0.13 0.1 ± 0.10ANY 0.01 ± 0.01 0.05 ± 0.04 0.01 ± 0.01 0.06 ± 0.06ANA 0.01 ± 0.07 0.02 ± 0.03 0.01 ± 0.01 0.09 ± 0.09FL 0.02 ± 0.02 0.02 ± 0.02 0.04 ± 0.03 0.06 ± 0.04PHE 0.29 ± 0.14 0.81 ± 1.17 0.36 ± 0.19 1.07 ± 0.53An 0.29 ± 0.15 0.81 ± 1.17 0.36 ± 0.19 1.07 ± 0.53FLU 0.19 ± 0.10 1.48 ± 2.4 0.26 ± 0.22 0.84 ± 1.20PYR 0.19 ± 0.07 2.27 ± 3.40 0.30 ± 0.19 1.54 ± 1.53BaA 0.12 ± 0.07 0.94 ± 1.18 0.20 ± 0.19 2.61 ± 5.30CHR 1.40 ± 3.21 4.99 ± 6.29 1.75 ± 4.01 10.08 ± 11.77BbF 0.42 ± 0.29 1.38 ± 1.25 1.93 ± 2.83 3.15 ± 4.74BkF 0.42 ± 0.29 1.38 ± 1.25 1.91 ± 2.84 3.16 ± 4.73BaP 0.17 ± 0.18 2.70 ± 6.24 0.6 ± 0.97 8.04 ± 10.07IcdP 0.58 ± 0.47 13.35 ± 16.66 1.45 ± 1.43 8.86 ± 10.57DBA 0.58 ± 0.47 13.01 ± 16.93 1.45 ± 1.43 9.47 ± 11.46Bghi 2.05 ± 2.29 31.19 ± 42.26 7.02 ± 5.71 32.05 ± 33.59∑PAHs 5.89 ± 6.55 63.41 ± 66.12 17.70 ± 16.61 78.26 ± 53.70LMW-PAHs 0.70 ± 0.39 1.81 ± 2.29 0.93 ± 0.48 2.45 ± 1.15MMW-PAHs 1.90 ± 3.30 9.68 ± 5.52 2.51 ± 4.10 15.07 ± 17.53HMW-PAHs 3.28 ± 3.72 51.92 ± 63.43 13.11 ± 13.03 60.73 ± 57.12COM-PAHs 4.82 ± 5.85 50.22 ± 49.48 14.36 ± 15.28 66.33 ± 42.44C-PAHS 3.28 ± 4.32 34.46 ± 22.25 8.92 ± 10.48 45.37 ± 32.21
447Arch Environ Contam Toxicol (2018) 74:442–451
1 3
For PM2.5, the sum of 4- to 6-ring PAHs occupied 94.0 and 98.7% of the total PAHs in summer and winter, respec-tively. For PM10, the sum of 4- to 6-ring PAHs accounted for 96.7 and 98.3% of the total PAHs in summer and winter, respectively. In addition, the concentrations of 4- to 6-ring PAHs were higher in winter than those in summer. Previous studies have indicated that the majority of MMW-PAHs (i.e., FLU, PYR, BaA and CHR) come from coal combustion, while gasoline vehicles were the major sources for 5- and 6-ring PAHs (BaP, BbF, Bghi and IcdP) (Kong et al. 2010; Wu et al. 2014). Therefore, the higher proportion of 4-ring PAHs was mainly attributed to the increased coal consump-tion and domestic heating activities in winter. Moreover, the higher 5- and 6-ring PAHs in winter at the high-traffic area may also be more influenced by the vehicle emission due to the vehicle’s cold start effect (Dörr et al. 1996; Kong et al. 2010; Zhou et al. 2005). Other potential sources, such as die-sel exhaust emission, wood combustion and some industrial processes, might mostly contributed to the ambient LMW-PAHs (Duan et al. 2005; Kong et al. 2010; Wu et al. 2014). However, the sum of 2- and 3- ring PAHs accounts for only 0.1% of the total PAHs. It can be concluded that the atmos-pheric PAHs in Hefei City were mainly influenced by coal combustion and vehicle emission.
Relationship Between Particulate Matters and Associated PAHs
The total concentrations of PAHs were 5.89 ng/m3 in PM2.5 and 17.70 ng/m3 in PM10 in summer, whereas in winter times it reached 63.41 and 78.26 ng/m3, respectively. The observation indicates that lower PAH concentrations usually occur in summer (August, 2015), while higher PAH concen-trations occur in winter (December 2015–January 2016) for both PM2.5 and PM10. Maximum, minimum, median, mean
concentration and standard deviation values for total PAHs are also shown in Table 1.
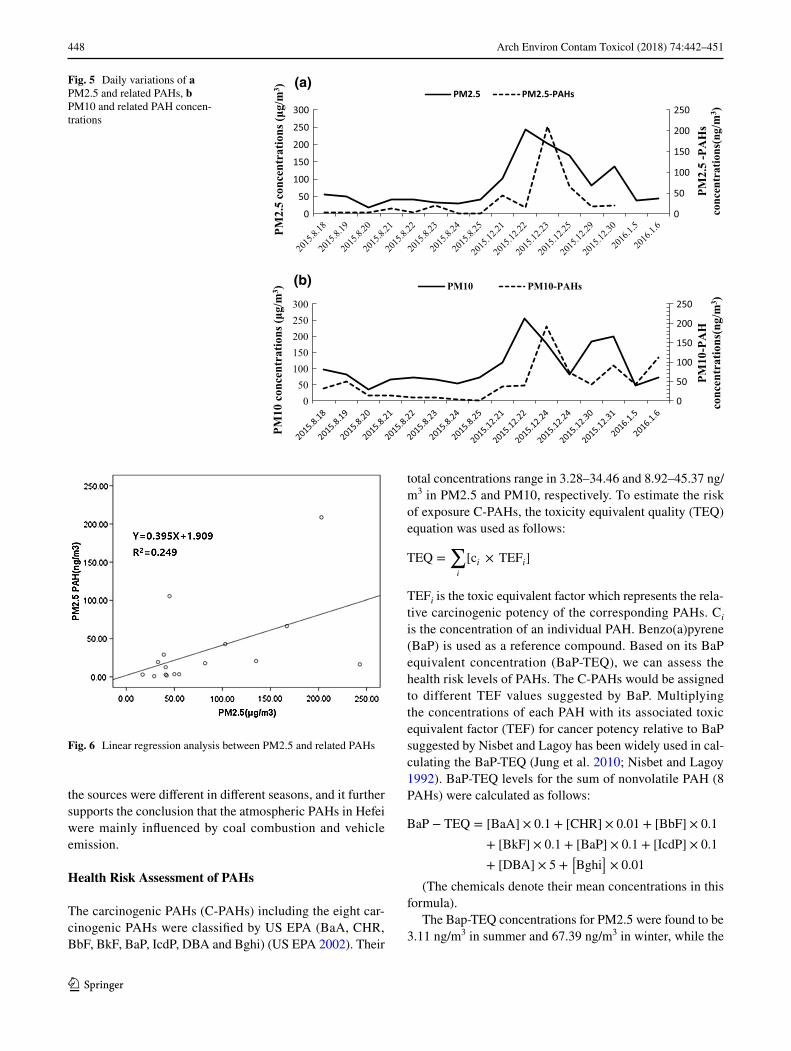
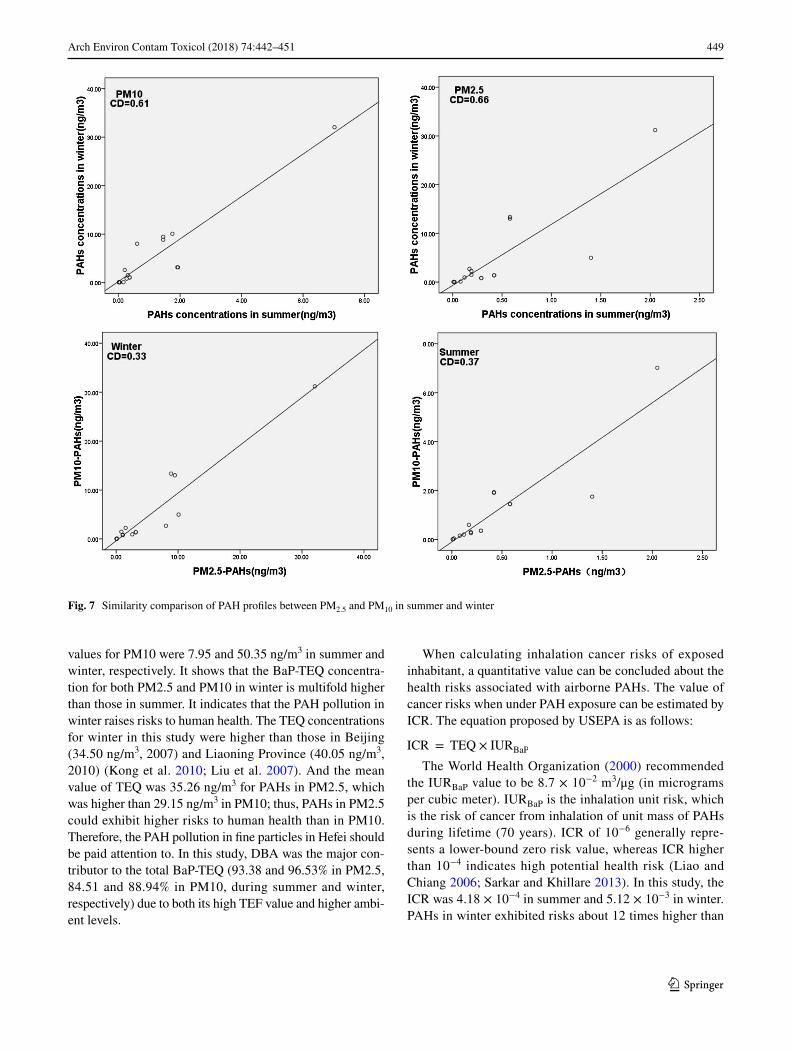
The data from 18 to 25 in August 2015 and 21 December 2015 to 2 January 2016 were chosen to conduct Pearson’s correlation analysis, daily variations in particulate matters and associated PAHs, and the relationship between them is shown in Fig. 5. A significant correlation between PM2.5 and related PAHs (R = 0.499, P < 0.05) was found (Fig. 6), indicating that the increasing of PM2.5 concentrations could lead to the observably increase in PAH concentra-tions. Because of sources such as fossil fuels, combustion would create primarily PM2.5, carrying a large amount of PAHs. Their properties of small size, relatively large specific surface area and high concentration made them remarkable absorbents for various kinds of compounds including organ-ics and inorganics (Sheu et al. 1997; Yang et al. 2012). No correlation was found between PM10- and PM10-associated PAHs (R = 0.431, P > 0.05) due to the different sources of them (Akyuz and Cabuk 2009).
Coefficient of Divergence Analysis
A self-normalizing parameter is used in measuring the spread of the data points for two datasets and identifying the differences in PAH composition profiles in PM2.5 and PM10. The self-normalizing parameter is as follows:
p is the number of investigated components, i stands for one type of chemical component, and j and k stand for two profiles for sampling sites or fractions. Therefore, xij and xik represent the average concentrations of chemical component i in j and k, respectively (Wu et al. 2014).
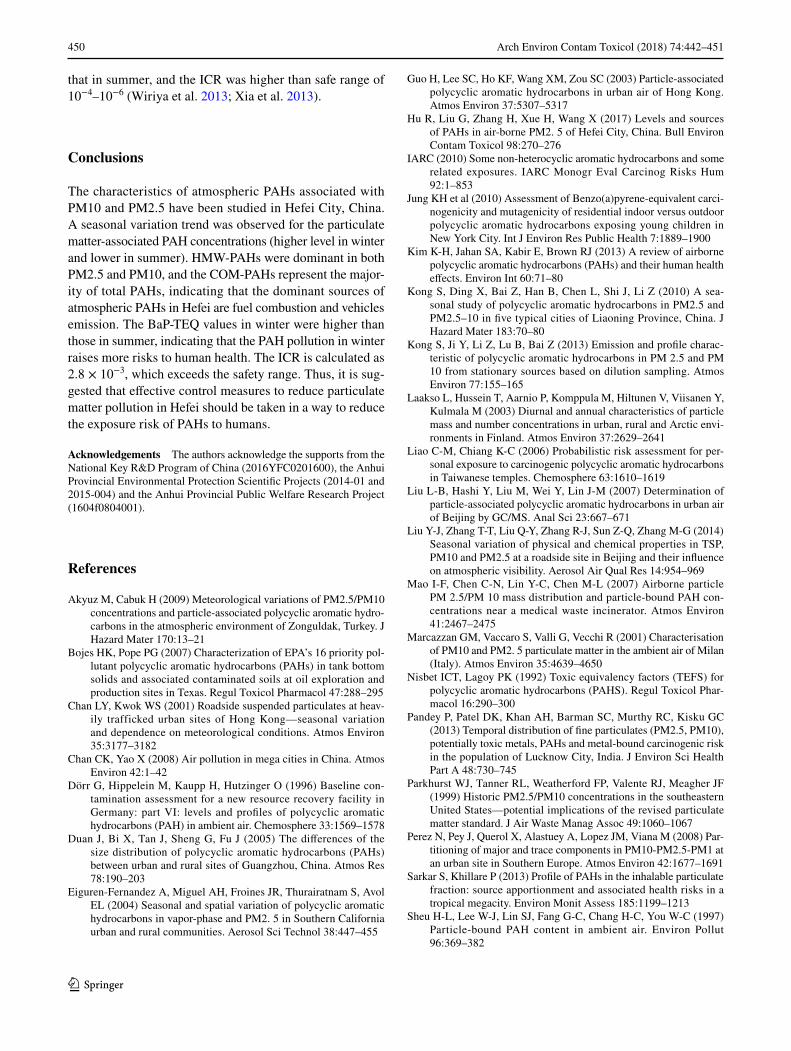
In addition, the scatter plots of PAH component mass concentrations for j against k are shown in Fig. 7, which characterize the concentration diagrams. If CDjk approaches 1, then j and k are significantly different, and if CDjk approaches 0, then j and k are similar. Previous studies have indicated that PAH compositions are similar when their CDjk values approach to 0.3, whereas they are different when their CDjk values are larger than 0.5 (Wongphatarakul et al. 1998; Wu et al. 2014).
Figure 7 shows that the CDjk values for PM10- and PM2.5-bound PAHs were 0.37 in summer and 0.33 in win-ter, respectively, indicating that their compositions were similar in the same season. However, the CDjk values for summer and winter were 0.66 for PM2.5 and 0.61 for PM10, respectively, indicating that the compositions of both PM10- and PM2.5-bound PAHs are dissimilar in the different sea-sons. The dissimilarity of PAH compositions indicates that
CDjk =
√
√
√
√
1
p
p∑
i=1
(
xij − xik
xij + xik
)2
0%10%20%30%40%50%60%70%80%90%
100%
summer winter summer winter
PM2.5 PM10
2-rings 3-rings 4-rings 5-rings 6-rings
Fig. 4 Percentage of ring number distributions of PAHs in PM2.5 and PM10
448 Arch Environ Contam Toxicol (2018) 74:442–451
1 3
the sources were different in different seasons, and it further supports the conclusion that the atmospheric PAHs in Hefei were mainly influenced by coal combustion and vehicle emission.
Health Risk Assessment of PAHs
The carcinogenic PAHs (C-PAHs) including the eight car-cinogenic PAHs were classified by US EPA (BaA, CHR, BbF, BkF, BaP, IcdP, DBA and Bghi) (US EPA 2002). Their
total concentrations range in 3.28–34.46 and 8.92–45.37 ng/m3 in PM2.5 and PM10, respectively. To estimate the risk of exposure C-PAHs, the toxicity equivalent quality (TEQ) equation was used as follows:
TEFi is the toxic equivalent factor which represents the rela-tive carcinogenic potency of the corresponding PAHs. Ci is the concentration of an individual PAH. Benzo(a)pyrene (BaP) is used as a reference compound. Based on its BaP equivalent concentration (BaP-TEQ), we can assess the health risk levels of PAHs. The C-PAHs would be assigned to different TEF values suggested by BaP. Multiplying the concentrations of each PAH with its associated toxic equivalent factor (TEF) for cancer potency relative to BaP suggested by Nisbet and Lagoy has been widely used in cal-culating the BaP-TEQ (Jung et al. 2010; Nisbet and Lagoy 1992). BaP-TEQ levels for the sum of nonvolatile PAH (8 PAHs) were calculated as follows:
(The chemicals denote their mean concentrations in this formula).
The Bap-TEQ concentrations for PM2.5 were found to be 3.11 ng/m3 in summer and 67.39 ng/m3 in winter, while the
TEQ =∑
i
[ci × TEFi]
BaP − TEQ = [BaA] × 0.1 + [CHR] × 0.01 + [BbF] × 0.1
+ [BkF] × 0.1 + [BaP] × 0.1 + [IcdP] × 0.1
+ [DBA] × 5 +[
Bghi]
× 0.01
Fig. 5 Daily variations of a PM2.5 and related PAHs, b PM10 and related PAH concen-trations
0
50
100
150
200
250
0
50
100
150
200
250
300
PM2.
5-P
AH
s co
ncen
trat
ions
(ng/
m3 )
PM2.
5co
ncen
trat
ions
(μg/
m3 ) (a)
PM2.5 PM2.5-PAHs
0
50
100
150
200
250
050
100150200250300
PM10
-PA
H
conc
entr
atio
ns(n
g/m
3 )
(b) PM10 PM10-PAHsPM
10co
ncen
trat
ions
(μg/
m3 )
Fig. 6 Linear regression analysis between PM2.5 and related PAHs
449Arch Environ Contam Toxicol (2018) 74:442–451
1 3
values for PM10 were 7.95 and 50.35 ng/m3 in summer and winter, respectively. It shows that the BaP-TEQ concentra-tion for both PM2.5 and PM10 in winter is multifold higher than those in summer. It indicates that the PAH pollution in winter raises risks to human health. The TEQ concentrations for winter in this study were higher than those in Beijing (34.50 ng/m3, 2007) and Liaoning Province (40.05 ng/m3, 2010) (Kong et al. 2010; Liu et al. 2007). And the mean value of TEQ was 35.26 ng/m3 for PAHs in PM2.5, which was higher than 29.15 ng/m3 in PM10; thus, PAHs in PM2.5 could exhibit higher risks to human health than in PM10. Therefore, the PAH pollution in fine particles in Hefei should be paid attention to. In this study, DBA was the major con-tributor to the total BaP-TEQ (93.38 and 96.53% in PM2.5, 84.51 and 88.94% in PM10, during summer and winter, respectively) due to both its high TEF value and higher ambi-ent levels.
When calculating inhalation cancer risks of exposed inhabitant, a quantitative value can be concluded about the health risks associated with airborne PAHs. The value of cancer risks when under PAH exposure can be estimated by ICR. The equation proposed by USEPA is as follows:
The World Health Organization (2000) recommended the IURBaP value to be 8.7 × 10⁻² m3/μg (in micrograms per cubic meter). IURBaP is the inhalation unit risk, which is the risk of cancer from inhalation of unit mass of PAHs during lifetime (70 years). ICR of 10−6 generally repre-sents a lower-bound zero risk value, whereas ICR higher than 10−4 indicates high potential health risk (Liao and Chiang 2006; Sarkar and Khillare 2013). In this study, the ICR was 4.18 × 10⁻⁴ in summer and 5.12 × 10⁻³ in winter. PAHs in winter exhibited risks about 12 times higher than
ICR = TEQ × IURBaP
Fig. 7 Similarity comparison of PAH profiles between PM2.5 and PM10 in summer and winter
450 Arch Environ Contam Toxicol (2018) 74:442–451
1 3
that in summer, and the ICR was higher than safe range of 10−4–10−6 (Wiriya et al. 2013; Xia et al. 2013).
Conclusions
The characteristics of atmospheric PAHs associated with PM10 and PM2.5 have been studied in Hefei City, China. A seasonal variation trend was observed for the particulate matter-associated PAH concentrations (higher level in winter and lower in summer). HMW-PAHs were dominant in both PM2.5 and PM10, and the COM-PAHs represent the major-ity of total PAHs, indicating that the dominant sources of atmospheric PAHs in Hefei are fuel combustion and vehicles emission. The BaP-TEQ values in winter were higher than those in summer, indicating that the PAH pollution in winter raises more risks to human health. The ICR is calculated as 2.8 × 10⁻³, which exceeds the safety range. Thus, it is sug-gested that effective control measures to reduce particulate matter pollution in Hefei should be taken in a way to reduce the exposure risk of PAHs to humans.
Acknowledgements The authors acknowledge the supports from the National Key R&D Program of China (2016YFC0201600), the Anhui Provincial Environmental Protection Scientific Projects (2014-01 and 2015-004) and the Anhui Provincial Public Welfare Research Project (1604f0804001).
References
Akyuz M, Cabuk H (2009) Meteorological variations of PM2.5/PM10 concentrations and particle-associated polycyclic aromatic hydro-carbons in the atmospheric environment of Zonguldak, Turkey. J Hazard Mater 170:13–21
Bojes HK, Pope PG (2007) Characterization of EPA’s 16 priority pol-lutant polycyclic aromatic hydrocarbons (PAHs) in tank bottom solids and associated contaminated soils at oil exploration and production sites in Texas. Regul Toxicol Pharmacol 47:288–295
Chan LY, Kwok WS (2001) Roadside suspended particulates at heav-ily trafficked urban sites of Hong Kong—seasonal variation and dependence on meteorological conditions. Atmos Environ 35:3177–3182
Chan CK, Yao X (2008) Air pollution in mega cities in China. Atmos Environ 42:1–42
Dörr G, Hippelein M, Kaupp H, Hutzinger O (1996) Baseline con-tamination assessment for a new resource recovery facility in Germany: part VI: levels and profiles of polycyclic aromatic hydrocarbons (PAH) in ambient air. Chemosphere 33:1569–1578
Duan J, Bi X, Tan J, Sheng G, Fu J (2005) The differences of the size distribution of polycyclic aromatic hydrocarbons (PAHs) between urban and rural sites of Guangzhou, China. Atmos Res 78:190–203
Eiguren-Fernandez A, Miguel AH, Froines JR, Thurairatnam S, Avol EL (2004) Seasonal and spatial variation of polycyclic aromatic hydrocarbons in vapor-phase and PM2. 5 in Southern California urban and rural communities. Aerosol Sci Technol 38:447–455
Guo H, Lee SC, Ho KF, Wang XM, Zou SC (2003) Particle-associated polycyclic aromatic hydrocarbons in urban air of Hong Kong. Atmos Environ 37:5307–5317
Hu R, Liu G, Zhang H, Xue H, Wang X (2017) Levels and sources of PAHs in air-borne PM2. 5 of Hefei City, China. Bull Environ Contam Toxicol 98:270–276
IARC (2010) Some non-heterocyclic aromatic hydrocarbons and some related exposures. IARC Monogr Eval Carcinog Risks Hum 92:1–853
Jung KH et al (2010) Assessment of Benzo(a)pyrene-equivalent carci-nogenicity and mutagenicity of residential indoor versus outdoor polycyclic aromatic hydrocarbons exposing young children in New York City. Int J Environ Res Public Health 7:1889–1900
Kim K-H, Jahan SA, Kabir E, Brown RJ (2013) A review of airborne polycyclic aromatic hydrocarbons (PAHs) and their human health effects. Environ Int 60:71–80
Kong S, Ding X, Bai Z, Han B, Chen L, Shi J, Li Z (2010) A sea-sonal study of polycyclic aromatic hydrocarbons in PM2.5 and PM2.5–10 in five typical cities of Liaoning Province, China. J Hazard Mater 183:70–80
Kong S, Ji Y, Li Z, Lu B, Bai Z (2013) Emission and profile charac-teristic of polycyclic aromatic hydrocarbons in PM 2.5 and PM 10 from stationary sources based on dilution sampling. Atmos Environ 77:155–165
Laakso L, Hussein T, Aarnio P, Komppula M, Hiltunen V, Viisanen Y, Kulmala M (2003) Diurnal and annual characteristics of particle mass and number concentrations in urban, rural and Arctic envi-ronments in Finland. Atmos Environ 37:2629–2641
Liao C-M, Chiang K-C (2006) Probabilistic risk assessment for per-sonal exposure to carcinogenic polycyclic aromatic hydrocarbons in Taiwanese temples. Chemosphere 63:1610–1619
Liu L-B, Hashi Y, Liu M, Wei Y, Lin J-M (2007) Determination of particle-associated polycyclic aromatic hydrocarbons in urban air of Beijing by GC/MS. Anal Sci 23:667–671
Liu Y-J, Zhang T-T, Liu Q-Y, Zhang R-J, Sun Z-Q, Zhang M-G (2014) Seasonal variation of physical and chemical properties in TSP, PM10 and PM2.5 at a roadside site in Beijing and their influence on atmospheric visibility. Aerosol Air Qual Res 14:954–969
Mao I-F, Chen C-N, Lin Y-C, Chen M-L (2007) Airborne particle PM 2.5/PM 10 mass distribution and particle-bound PAH con-centrations near a medical waste incinerator. Atmos Environ 41:2467–2475
Marcazzan GM, Vaccaro S, Valli G, Vecchi R (2001) Characterisation of PM10 and PM2. 5 particulate matter in the ambient air of Milan (Italy). Atmos Environ 35:4639–4650
Nisbet ICT, Lagoy PK (1992) Toxic equivalency factors (TEFS) for polycyclic aromatic hydrocarbons (PAHS). Regul Toxicol Phar-macol 16:290–300
Pandey P, Patel DK, Khan AH, Barman SC, Murthy RC, Kisku GC (2013) Temporal distribution of fine particulates (PM2.5, PM10), potentially toxic metals, PAHs and metal-bound carcinogenic risk in the population of Lucknow City, India. J Environ Sci Health Part A 48:730–745
Parkhurst WJ, Tanner RL, Weatherford FP, Valente RJ, Meagher JF (1999) Historic PM2.5/PM10 concentrations in the southeastern United States—potential implications of the revised particulate matter standard. J Air Waste Manag Assoc 49:1060–1067
Perez N, Pey J, Querol X, Alastuey A, Lopez JM, Viana M (2008) Par-titioning of major and trace components in PM10-PM2.5-PM1 at an urban site in Southern Europe. Atmos Environ 42:1677–1691
Sarkar S, Khillare P (2013) Profile of PAHs in the inhalable particulate fraction: source apportionment and associated health risks in a tropical megacity. Environ Monit Assess 185:1199–1213
Sheu H-L, Lee W-J, Lin SJ, Fang G-C, Chang H-C, You W-C (1997) Particle-bound PAH content in ambient air. Environ Pollut 96:369–382
451Arch Environ Contam Toxicol (2018) 74:442–451
1 3
Sun YL et al (2004) The air-borne particulate pollution in Beijing—concentration, composition, distribution and sources. Atmos Envi-ron 38:5991–6004
Tian Y-Z, Shi G-L, Huang-Fu Y-Q, Song D-L, Liu J-Y, Zhou L-D, Feng Y-C (2016) Seasonal and regional variations of source con-tributions for PM 10 and PM 2.5 in urban environment. Sci Total Environ 557:697–704
US EPA (1982) Appendix A: priority pollutants. Office of the Federal Registration (OFR), 47:52309
US EPA (2002) Polycyclic organic matter. United States Environmental Protection Agency. http://www.epa.gov/ttn/atw/hlthef/polycycl.html
Wang X, Bi X, Sheng G, Fu J (2006) Chemical composition and sources of PM10 and PM2. 5 aerosols in Guangzhou, China. Environ Monit Assess 119:425–439
Wang YQ, Zhang XY, Sun JY, Zhang XC, Che HZ, Li Y (2015) Spatial and temporal variations of the concentrations of PM10, PM2.5 and PM1 in China. Atmos Chem Phys 15:13585–13598
Wei S, Huang B, Liu M, Bi X, Ren Z, Sheng G, Fu J (2012) Charac-terization of PM2. 5-bound nitrated and oxygenated PAHs in two industrial sites of South China. Atmos Res 109:76–83
Wiriya W, Prapamontol T, Chantara S (2013) PM10-bound polycy-clic aromatic hydrocarbons in Chiang Mai (Thailand): seasonal variations, source identification, health risk assessment and their relationship to air-mass movement. Atmos Res 124:109–122
Wongphatarakul V, Friedlander S, Pinto J (1998) A comparative study of PM2. 5 ambient aerosol chemical databases. Environ Sci Tech-nol 32:3926–3934
World Health Organization (2000) The world health report 2000-Health systems: improving performance. http://www.hoint/whr/2000/en/
Wu D et al (2014) Polycyclic aromatic hydrocarbons (PAHs) in atmospheric PM 2.5 and PM 10 at a coal-based industrial city:
implication for PAH control at industrial agglomeration regions, China. Atmos Res 149:217–229
Xia Z et al (2013) Pollution level, inhalation exposure and lung cancer risk of ambient atmospheric polycyclic aromatic hydrocarbons (PAHs) in Taiyuan, China. Environ Pollut 173:150–156
X-l Deng et al (2016) Characteristics of the water-soluble components of aerosol particles in Hefei, China. J Environ Sci 42:32–40
Yan J, Wang L, Fu PP, Yu H (2004) Photomutagenicity of 16 polycyclic aromatic hydrocarbons from the US EPA priority pollutant list. Mutat Res 557:99–108
Yang D, Qi S, Devi NL, Tian F, Huo Z, Zhu Q, Wang J (2012) Char-acterization of polycyclic aromatic hydrocarbons in PM2. 5 and PM10 in Tanggu District, Tianjin Binhai New Area, China. Front Earth Sci 6:324–330
Zhang L, Chen R, Lv J (2016) Spatial and seasonal variations of poly-cyclic aromatic hydrocarbons (PAHs) in ambient particulate mat-ter (PM10, PM2.5) in three mega-cities in China and identification of major contributing source types. Bull Environ Contam Toxicol 96:827–832
Zheng M, Salmon LG, Schauer JJ, Zeng L, Kiang C, Zhang Y, Cass GR (2005) Seasonal trends in PM2. 5 source contributions in Beijing, China. Atmos Environ 39:3967–3976
Zhou J, Wang T, Huang Y, Mao T, Zhong N (2005) Size distribution of polycyclic aromatic hydrocarbons in urban and suburban sites of Beijing, China. Chemosphere 61:792–799
Zhou XH, Cao ZY, Ma YJ, Wang LP, Wu RD, Wang WX (2016) Con-centrations, correlations and chemical species of PM2.5/PM10 based on published data in China: potential implications for the revised particulate standard. Chemosphere 144:518–526
Related Documents