For additional participation data and insights contact [email protected] PARTICIPATION STUDY 2019-2020 Snowsports Industries America Photo: Jeremiah Watt Photo: Adam Barker

Welcome message from author
This document is posted to help you gain knowledge. Please leave a comment to let me know what you think about it! Share it to your friends and learn new things together.
Transcript

For additional participation data and insights contact [email protected]
PARTICIPATION STUDY 2019-2020SnowsportsIndustriesAmerica
Photo: Jeremiah Watt Photo: Adam Barker
2 SIA Participation Study 2019-2020For additional participation data and insights contact [email protected]
INTRODUCTION
For further information on winter sport participation or to request access to the raw data, please contact [email protected]
The information contained in this study is the property of Snowsports Industries America. It cannot be reproduced or extracted in whole or part in any way without prior written permission of Snowsports Industries America. Copyright © 2020 Snowsports Industries America. All rights reserved.
The SIA Participation Study 2019-2020 is a comprehensive look at participants in winter sports across the 2019-2020 season including: skiing, snowboarding, cross-country skiing, snowshoeing, sledding, and touring. The study highlights a general cumulative view of winter sport participation and demographics, in addition to further in-depth analyses of each winter sport activity. It covers participant demographics, frequency, regional representation, crossover activities, and more.
The SIA Participation Study 2019-2020 is produced in collaboration with the Physical Activity Council (PAC), a partnership of eight major trade associations in US sports, fitness, and leisure activities.
Surveys were carried out with a nationwide sample of individuals and households during 2019 and the beginning of 2020. The total panel is representative of the US population for people ages six and older. A full description of the research methodology is found at the end of this study.

For additional participation data and insights contact [email protected]
CONTENTS
4
5
10
17
24
31
42
The Takeaways
Winter Sports
Snowboard
Cross-country Skiing
Snowshoe
37Snowboard Touring
Alpine Touring
Ski
46Methodology

For additional participation data and insights contact [email protected]
WINTER SPORTS1
SKIING²
SNOWBOARDING
CROSS-COUNTRY SKIING
SNOWSHOEING
ALPINE TOURING and SNOWBOARD TOURING
THE TAKEAWAYS
WA
OR
CA
Winter sport participation increased 1.9% in the 2019-2020 winter season to 25.1 Million Americans ages 6 and older.
The Pacific Region had the largest number of winter sport participants at 4.53M. The South Atlantic Regionwas a close second at 4.38M.
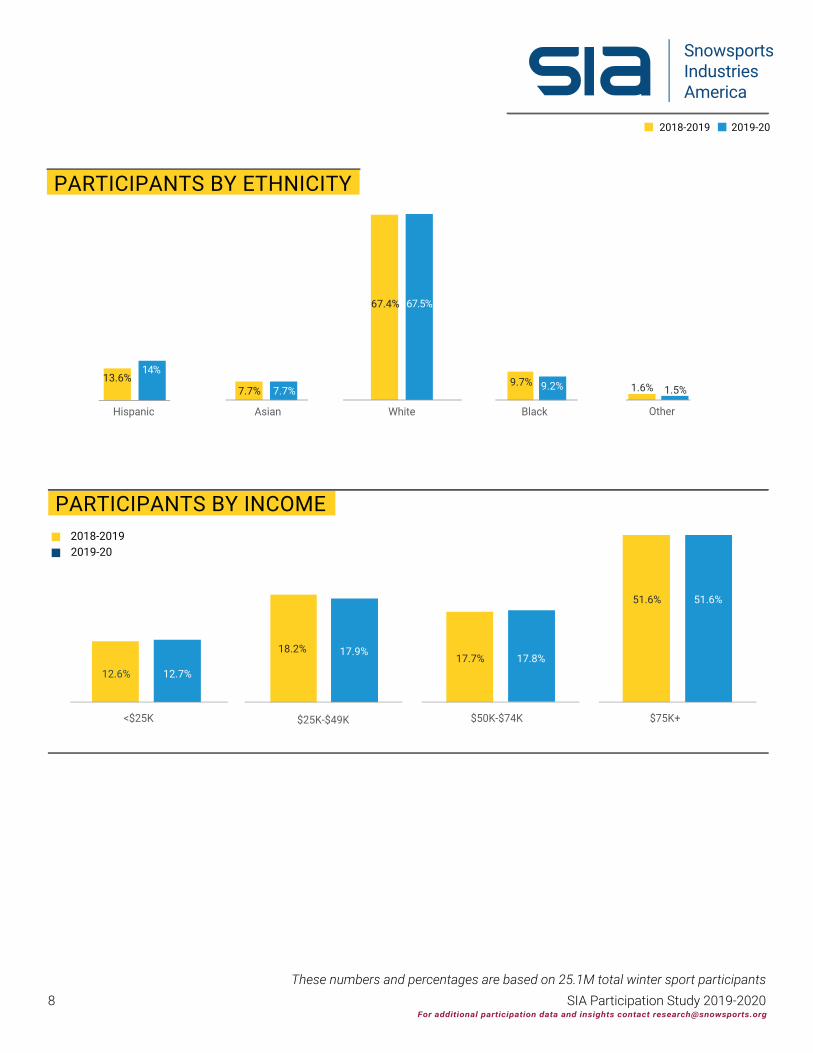
Participation across winter sports by ethnicity has remained flat for Asians (7.7%) and Whites (67.5%), decreased by 0.5% for Blacks (9.2%) and increased by 0.4% for Hispanics (14%).
4 1 Winter sports defined as: skiing, snowboarding, cross-country skiing, snowshoeing, sledding, alpine touring, snowboard touring, winter fat biking
In 2019-2020, the Pacific Region (CA, OR, WA) had the largest share of skiers that went 7 or more times in that season (22.1%).
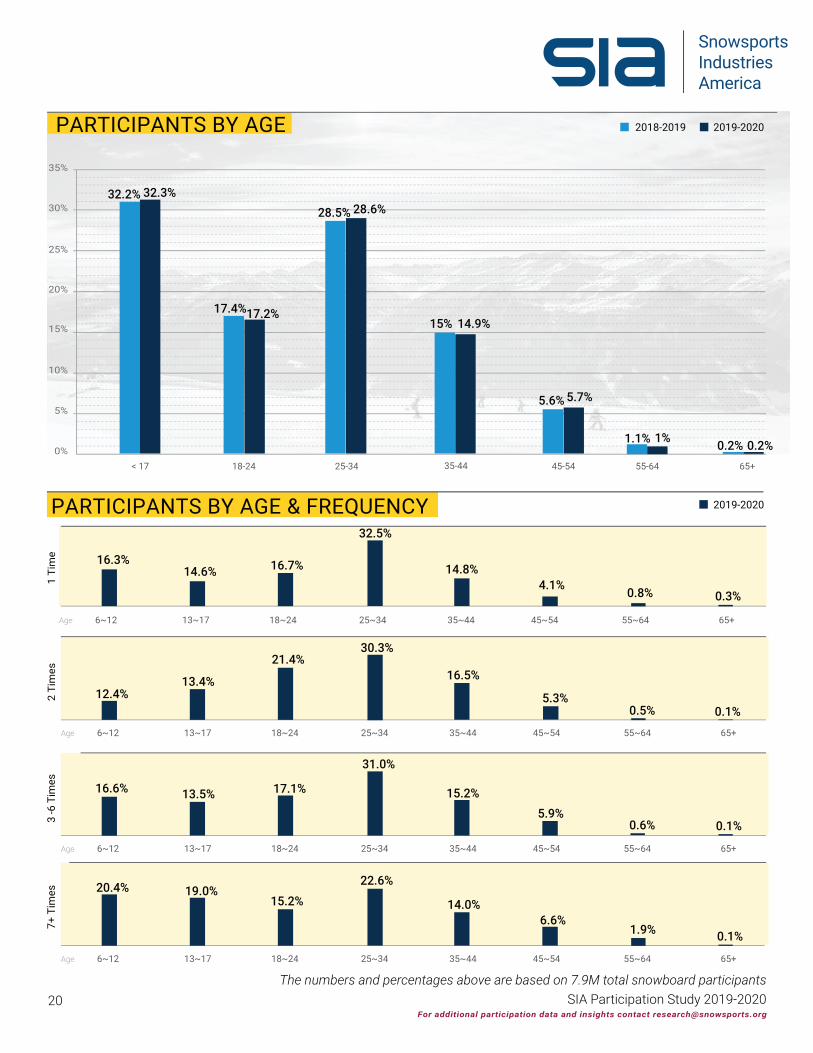
The largest segment of snowboarders (23%) that went 7 times or more were between 25 and 34 years old.
The next largest segments are 6 to 12 year olds (20%) and 13 to 17 year olds (19%).
The Pacific Region had the largest share of snowboarders that went 7 or more times (27%).
Snowshoers tend to also participate in snowboarding (47%), cross-country skiing (42%) and hiking (38%).
More cross-country skiers went to a private cross-country center (62%) as compared to a public cross-country center with trails groomed by a government entity (45%).
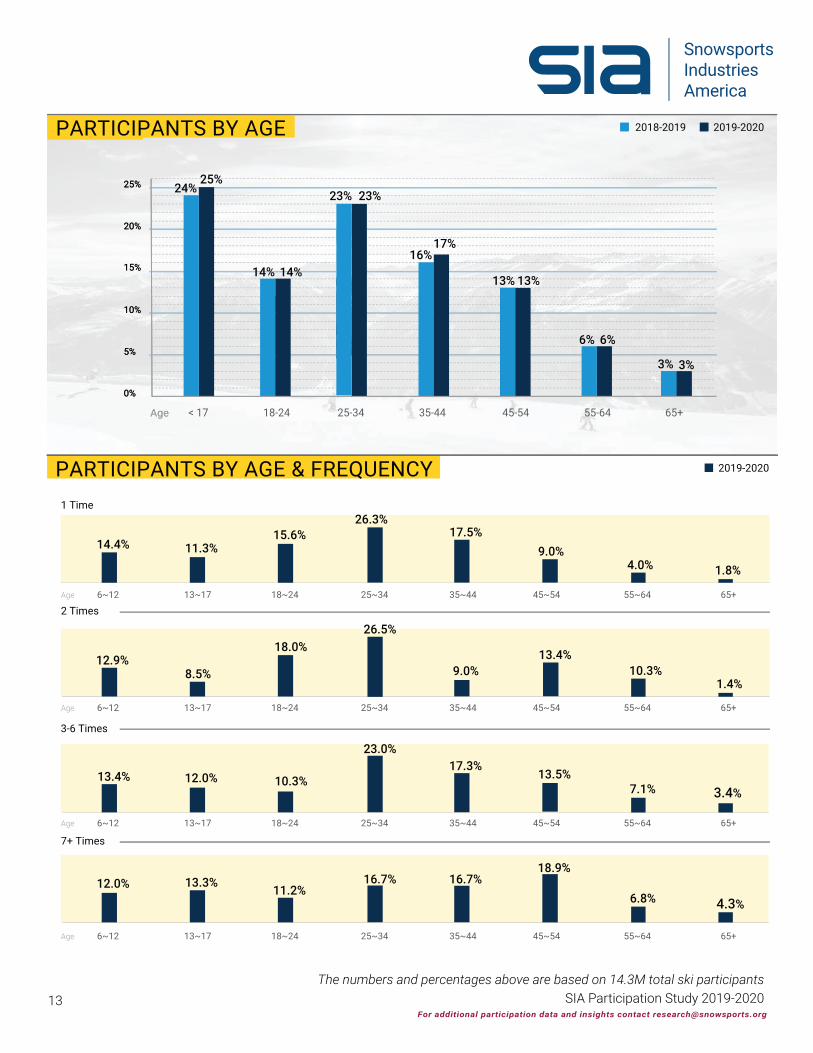
The largest segment of skiers (19%) that went 7 times or more for the 2019-2020 season were between 45 and 54 years old.
Last season, the leading segment was 25 to 35 year olds (23%).
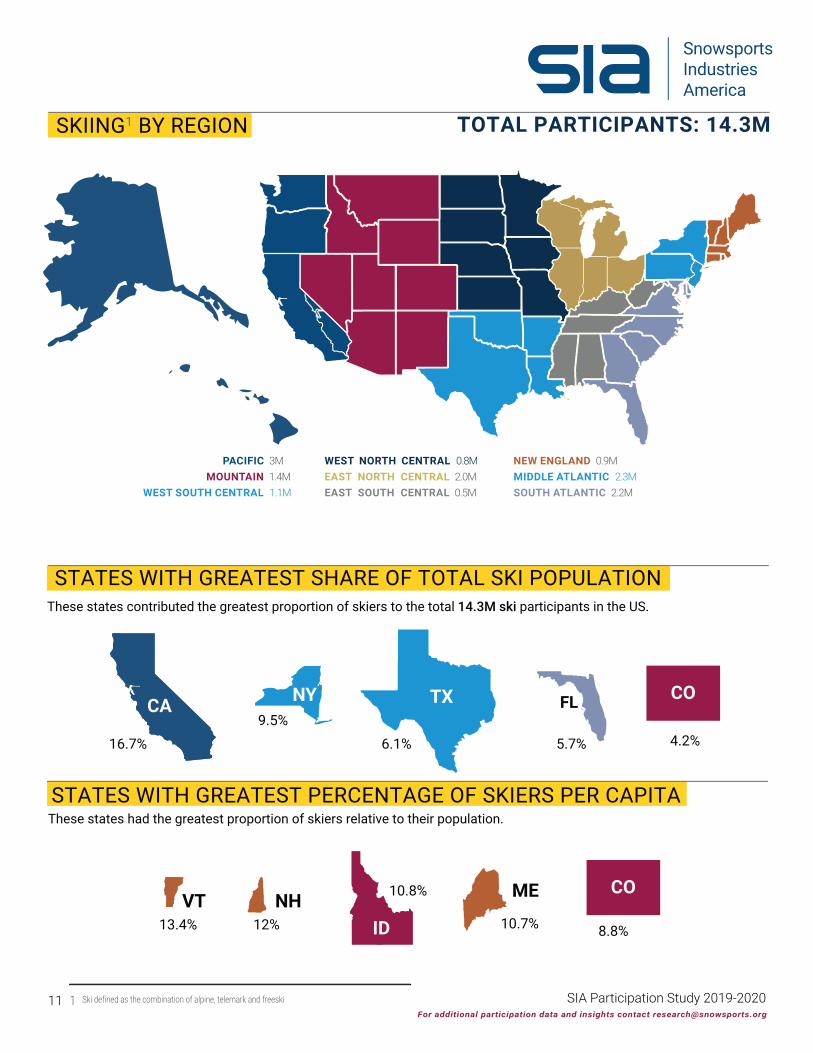
Vermont, New Hampshire, Idaho, Maine and Colorado had the highest precentage of skiers per capita by state.
There were 705K alpine touring participants and 652K snowboard touring participants in the backcountry aged 18 and above.
Skiing defined as alpine ski, telemark and freeski2
For additional participation data and insights contact [email protected]
Winter Sports Participation and Demographics
SnowsportsIndustriesAmerica

1 Winter sports defined as: skiing, snowboarding, cross-country skiing, snowshoeing,sledding, alpine touring, snowboard touring, winter fat biking
SIA Participation Study 2019-2020
These numbers and percentages are based on 25.1M total winter sport participants
For additional participation data and insights contact [email protected] additional participation data and insights contact [email protected]
TOTAL PARTICIPANTS: 25.1M
WINTER SPORTS1 PARTICIPATION BY REGION
PACIFIC 4.5MMOUNTAIN 2.3M
WEST SOUTH CENTRAL 2M
WEST NORTH CENTRAL 1.6MEAST NORTH CENTRAL 3.9MEAST SOUTH CENTRAL 1.1M
NEW ENGLAND 1.6MMIDDLE ATLANTIC 3.7MSOUTH ATLANTIC 4.4M
25.1 Million Americans ages 6 and older participated in winter sports in the 2019-2020winter season. This is up 1.9% from 24.6 Million recorded in the 2018-2019 winter season.
SnowsportsIndustriesAmerica

SIA Participation Study 2019-2020These numbers and percentages are based on 25.1M total winter sport participants
7For additional participation data and insights contact [email protected]
PARTICIPANTS BY AGE
PARTICIPANTS BY GENDER
8th grade or less High school High school grad College College grad Post grad
5
10
15
20
25
30
14.9%14.7%
7.4%7.4%
13.9%14.3%
18.3%18.7%
27%27.4%
18.4%17.5%
6-12 13-17 18-24 25-34 35-44 45-54 55-64 65+
5
10
15
20
25
30
12.7%12.7%
8.8%8.5%
13.1%12.9%
21.3%20.7%
16.7%16.1%
12%12.2%
8.3%8.9%
7.1%8%
PARTICIPANTS BY EDUCATION
Female Male
58%42%
2019-202018-19 2019-202018-19
14.2M10.4M
59%41%
14.7M10.4M
2018-2019 2019-20
2018-2019 2019-20
SnowsportsIndustriesAmerica
SIA Participation Study 2019-2020These numbers and percentages are based on 25.1M total winter sport participants
8For additional participation data and insights contact [email protected]
2018-2019 2019-20
<$25K $25K-$49K $75K+$50K-$74K
2018-20192019-20
Black
9.7% 9.2%
Asian
7.7% 7.7%
White
67.4% 67.5%
Hispanic
14%13.6%
Other
1.5%1.6%
PARTICIPANTS BY INCOME
12.6%
17.9%18.2%
51.6% 51.6%
12.7%17.8%17.7%
PARTICIPANTS BY ETHNICITY
SnowsportsIndustriesAmerica

9 SIA Participation Study 2019-2020These numbers and percentages are based on 25.1M total winter sport participants
For additional participation data and insights contact [email protected]
2011/2012
AVERAGE NUMBER OF DAYS BY AGE & ACTIVITY
PARTICIPATION OVER TIME
7.6M -8% 4.3M -5% 4.1M 8%
7.4M -3% 4.5M¹. 5% 4.0M -2%
7.4M 1% 4.3M -5% 3.6M -11%
7.7M 4% 4.1M -3% 3.9M 8%
7.6M -1% 4.6M 12% 3.5M -9%
7.6M -1% 5.1M 9% 3.7M 5%
Growth % Growth % Growth %
2012/2013
2013/2014
2014/2015
2015/2016
2016/2017
2017/2018
4.7% 2.6% 1.6% 1.1%% of US Pop.6 and older
7.1M -7% 5.1M 0% 3.5M -5%
8%
5%
2%
3%
2%
-2%
-4%
13.8M
14.5M
14.9M
15.3M
15.6M
15.3M
14.7M
Growth %
SKI SNOWBOARD CROSS-COUNTRYSKIING
SNOWSHOE
Total Avg 13-17
SKI
SNOWBOARD
CROSS-COUNTRY SKIING
SNOWSHOE
ALPINE TOURING
18-24 25-34 35-44 45-54 55+
2019
-202
0
SNOWBOARD TOURING
6-12
7.4 8.4 7.1 9.9 9.68.9
7.8 4.6 6.3 5.5 4.96.5
7.5 6.0 5.0 10.0 7.49.9
6.6 5.6 6.9 9.5 7.97.6
5.8 6.5 4.3 4.9 6.65.9
4.7 6.8 5.9 4.9
7.5
9.5
13.1
9.2
5.5
2.6 3.4 2.6
8.5
7.6
7.9
8.0
6.6
5.4
2018/2019 7.8M 9.4% 4.9M -4.4% 3.4M -3.1% 1.1%14.9M
2019/2020 7.9M 1.1% 4.8M -2.2% 3.4M -1 % -3.6%14.3M
Total Avg 13-17
SKI
SNOWBOARD
CROSS-COUNTRY SKIING
SNOWSHOE
ALPINE TOURING
18-24 25-34 35-44 45-54 55+
2018
-201
9
SNOWBOARD TOURING
6-12
7.4 8.8 7.1 10.1 9.78.8
7.8 4.5 6.4 5.4 4.86.5
7.7 5.9 4.7 10.3 7.210.1
6.7 5.6 6.4 9.5 7.97.3
NA 7.0 4.2 5.0 6.96.0
NA 6.8 5.9 4.8
7.4
9.4
13.5
9.3
NA
NA 3.4 2.5
8.6
7.3
7.7
7.8
NA
NA
SnowsportsIndustriesAmerica

Ski Participation andDemographics
Photo: Scott Markewitz
11 1 Ski defined as the combination of alpine, telemark and freeski SIA Participation Study 2019-2020For additional participation data and insights contact [email protected]
CO
TOTAL PARTICIPANTS: 14.3M
STATES WITH GREATEST PERCENTAGE OF SKIERS PER CAPITA
NY TX FL
16.7%
9.5%
6.1% 5.7% 4.2%
VTCO
ID13.4% 8.8%12%
STATES WITH GREATEST SHARE OF TOTAL SKI POPULATION
CA
SKIING1 BY REGION
These states contributed the greatest proportion of skiers to the total 14.3M ski participants in the US.
PACIFIC 3MMOUNTAIN 1.4M
WEST SOUTH CENTRAL 1.1M
WEST NORTH CENTRAL 0.8MEAST NORTH CENTRAL 2.0MEAST SOUTH CENTRAL 0.5M
NEW ENGLAND 0.9MMIDDLE ATLANTIC 2.3MSOUTH ATLANTIC 2.2M
These states had the greatest proportion of skiers relative to their population.
10.8% ME
10.7%NH
SnowsportsIndustriesAmerica

The numbers and percentages above are based on 14.3M total ski participantsSIA Participation Study 2019-202012
For additional participation data and insights contact [email protected]
8th grade or less
1-3 years of high school
High school graduate
1-3 years college
College graduate
Post-grad studies
8th grade or less
1-3 years of high school
High school graduate
1-3 years college
College graduate
Post-grad studies
8th grade or less
1-3 years of high school
High school graduate
1-3 years college
College graduate
Post-grad studies
8th grade or less
1-3 years of high school
High school graduate
1-3 years college
College graduate
Post-grad studies
12.3%8.3%
17.1%
38.8%2 Times
4.1%
19.5%
11.7%10.5%
26.0%
3-6 Times
6.2%
9.3%
7+ Times
9.6% 14.7%
1 Time
2019-2020PARTICIPANTS BY EDUCATION & FREQUENCY
20.9%
7.7%13.8% 13.7%
30.1%
13.7%
14.5%
31.0%
26.2%30.9%
9.3%
SnowsportsIndustriesAmerica
The numbers and percentages above are based on 14.3M total ski participants13 SIA Participation Study 2019-2020
For additional participation data and insights contact [email protected]
2019-2020
10%
5%
0%
Age 35-44 45-5425-34< 17 18-24 55-64 65+
25%
20%
15%
BY AGE
Age 13~176~12 18~24 25~34 35~44 45~54
55~64 65+
16.7%18.9%
Age 13~176~12 18~24 25~34 35~44 45~54
55~64 65+
Age 13~176~12 18~24 25~34 35~44 45~54
55~64 65+
Age 13~176~12 18~24 25~34 35~44 45~54
55~64 65+
4.3%6.8%16.7%
11.2%13.3%12.0%
17.3%13.5%
7.1%
23.0%
10.3%12.0%
8.5%
13.4%
PARTICIPANTS BY AGE & FREQUENCY 2019-2020
13.4%10.3%
17.5%9.0%
4.0% 1.8%
26.3%15.6%
11.3%14.4%
12.9%18.0%
26.5%
9.0%1.4%
3.4%
1 Time
2 Times
3-6 Times
7+ Times
2018-2019
10%
5%
0%
Age
6%
25%
20%
15%
PARTICIPANTS BY AGE
6%
24%25%
14% 14%
3%3%
13% 13%
16%17%
23% 23%
SnowsportsIndustriesAmerica

SnowsportsIndustriesAmerica
SIA Participation Study 2019-2020The numbers and percentages above are based on 14.3M total ski participants
14For additional participation data and insights contact [email protected]
PARTICIPANTS BY ETHNICITY
PARTICIPANTS BY ETHNICITY & FREQUENCY 2019-2020
Asian/Pacific Islander
Asian/Pacific Islander
Hispanic Other
2.0%4.4%
72.3%
9.3% 12.0%
African American/Black
Hispanic OtherAfrican American/Black
Asian/Pacific IslanderAfrican American/Black
Asian/Pacific IslanderAfrican American/Black
1 Time
2 Times
3-6 Times
7+ Times
Caucasian/White, non-Hispanic
Caucasian/White, non-Hispanic
Caucasian/White, non-Hispanic
Caucasian/White, non-Hispanic
Hispanic
Hispanic
Other
Other
10.5% 13.0% 0.7%
66.6%
9.1%
3.3% 2.3%
72.3%
14.6%7.5%
4.7% 1.6%
68.2%
12.3%13.3%
ticipation Study 2019-2020For additional participation data and insights contact [email protected]
The numbers and percentages ab
For additional participation data and insights contact [email protected] additional participation data and insights contact [email protected]
ticipation Study 2019-2020ticipation Study 2019-202014.3M t
For additional participation data and insights contact [email protected]
centages above a
African American/Black Asian/Pacific Islander
6.9% 9.9%
Caucasian/White, non-Hispanic
Hispanic
13.1%
Other
1.4%
68.7%
%

The numbers and percentages above are based on 14.3M total ski participantsSIA Participation Study 2019-2020
For additional participation data and insights contact [email protected]
22.7%
5.7%
17.9%
GAIN/LOSS OF ACTIVE PARTICIPANTS
2019/20202018/2019
14.9M 14.3M
+8.1M
-8.7M
Total Participants New/Returning Participants Took Season Off
-0.5M
PARTICIPANTS BY INCOME & FREQUENCY
In 2018-2019 there were 14.9Mparticipants. In 2019-2020, 8.1M
participants were new/returned and 8.7Mparticipants took the season off. The total
for 2019-2020 was 14.3M participants.
2019-2020
2018-2019 2019-2020
2 T
imes
3
to 6
Tim
es7+
Tim
es
1 Ti
me
9.3%
3.1%18.2%
11.9%
48.0%
14.1%
$25,000 to $49,999Under $25,000
14.3%
$50,000 to $74,999
18.0%
$75,000 to $99,999 $100,000+
8.4%
$25,000 to $49,999Under $25,000
17.6%
$50,000 to $74,999 $75,000 to $99,999 $100,000+
5.4%
$25,000 to $49,999Under $25,000
21.5%
$50,000 to $74,999 $75,000 to $99,999 $100,000+
12.1%
$25,00 to $49,999Under $25,000
15.4%
$50,000 to $74,999 $75,000 to $99,999 $100,000+
45.3%
52.6%
38.5%
15
SnowsportsIndustriesAmerica
The numbers and percentages above are based on 14.3M total ski participants
For additional participation data and insights contact [email protected]
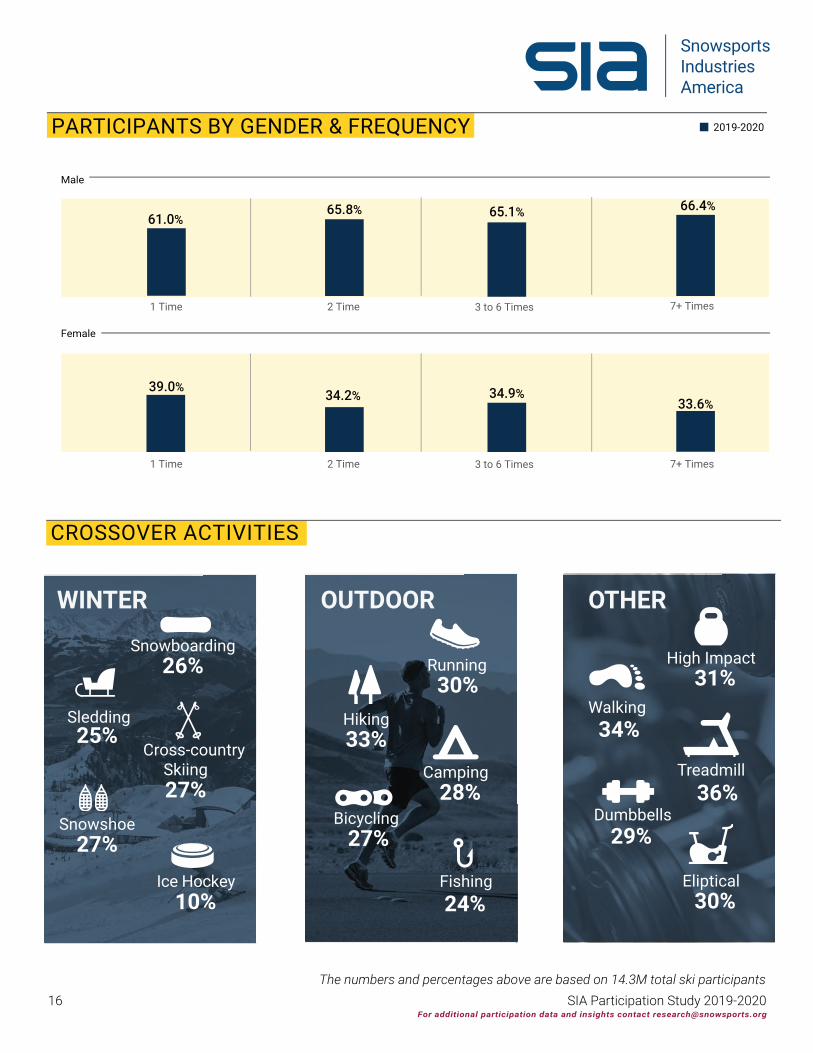
CROSSOVER ACTIVITIES
OTHER
Walking34%
Dumbbells29%
Treadmill36%
Eliptical30%
High Impact31%
OUTDOOR
Bicycling27%
Camping28%
Fishing24%
Hiking33%
Running30%
WINTER
Snowboarding26%
Sledding25%
Snowshoe27%
Cross-country Skiing
27%
Ice Hockey10%
PARTICIPANTS BY GENDER & FREQUENCY 2019-2020
61.0%
39.0%33.6%
34.9%34.2%
65.1% 66.4%
7+ Times
Female
Male
65.8%
1 Time 2 Time 3 to 6 Times
7+ Times1 Time 2 Time 3 to 6 Times
16 SIA Participation Study 2019-2020
SnowsportsIndustriesAmerica

Snowboard Participationand Demographics
Photo: Nitro Snowboards
SnowsportsIndustriesAmerica

18The numbers and percentages above are based on 7.3M total snowboard participants
SIA Participation Study 2019-2020For additional participation data and insights contact [email protected]
PACIFIC 2.1MMOUNTAIN 0.7M
WEST SOUTH CENTRAL 0.5M
WEST NORTH CENTRAL 0.5MEAST NORTH CENTRAL 0.9MEAST SOUTH CENTRAL 0.3M
NEW ENGLAND 0.5MMIDDLE ATLANTIC 1.2MSOUTH ATLANTIC 1.1M
STATES WITH GREATEST SHARE OF TOTAL SNOWBOARD POPULATION
STATES WITH GREATEST PERCENTAGE OF SNOWBOARERS PER CAPITA
4.7%
CA NY TXFL19.1% 11.5% 5.6%
WANHID
4.7%
WA
3.8%
5.5%4.7%
5.8%WI 4.6%
TOTAL PARTICIPANTS: 7.9MSNOWBOARDING BY REGION
UT
These states contributed the greatest proportion of snowboarders to the total 7.8M snowboard participants in the US.
These states had the greatest proportion of snowboarders relative to their population.
SnowsportsIndustriesAmerica

19The numbers and percentages above are based on 7.9M total snowboard participants
SIA Participation Study 2019-2020For additional participation data and insights contact [email protected]
8th grade or less
1-3 years of high school
High school graduate
1-3 years college
College graduate
Post-grad studies
PARTICIPANTS BY EDUCATION & FREQUENCY
14.1% 12.5%
25.7%
17.5%
10.1%
17.0%18.2%
19.5%13.7%
8.9%
13.5%
14.4%
17.3%
2 Times
3-6 Times
7+ Times
1 Time
28.4%
2 Times
3-6 Times
7+ Times
1 Time
8th grade or less
1-3 years of high school
High school graduate
1-3 years college
College graduate
Post-grad studies
8th grade or less
1-3 years of high school
High school graduate
1-3 years college
College graduate
Post-grad studies
8th grade or less
1-3 years of high school
High school graduate
1-3 years college
College graduate
Post-grad studies
11.9%
10.8%
19.4%
25.1%15.4%
22.5%
11.3%15.2% 14.8%
22.7%
2019-2020
SnowsportsIndustriesAmerica
20The numbers and percentages above are based on 7.9M total snowboard participants
SIA Participation Study 2019-2020For additional participation data and insights contact [email protected]
PARTICIPANTS BY AGE
5.6%
1% 0.2% 0.2%1.1%
5.7%
15% 14.9%17.4%
32.2%28.6%
35%
30%
25%
20%
15%
10%
5%
0%
17.2%
32.3%
35-44 45-54 55-64 65+25-34< 17 18-24
28.5%
Age 13~176~12 18~24 25~34 35~44 45~54
55~64 65+
Age 13~176~12 18~24 25~34 35~44 45~54
55~64 65+
14.0%6.6%
0.1%1.9%
22.6%
15.2%19.0%20.4%
15.2%5.9%
31.0%
17.1%13.5%16.6%
PARTICIPANTS BY AGE & FREQUENCY
5.3%0.5%
0.6%
14.8%4.1%
0.3%0.8%
32.5%
16.7%14.6%16.3%
12.4%13.4%
21.4%30.3%
16.5%
0.1%
0.1%
Age 13~176~12 18~24 25~34 35~44 45~54
55~64 65+
Age 13~176~12 18~24 25~34 35~44 45~54
55~64 65+
2 Ti
mes
1 Ti
me
3 -6
Tim
es7+
Tim
es
2018-2019 2019-2020
SnowsportsIndustriesAmerica
2019-2020

21The numbers and percentages above are based on 7.9M total snowboard participants
SIA Participation Study 2019-2020For additional participation data and insights contact [email protected]
PARTICIPANTS BY ETHNICITY & FREQUENCY
snowboacentages
For additional participation data and insights contact [email protected]
centagespercentages
For additional participation data and insights contact [email protected]
ticipation Study 2019-2020ticipation Study 2019-2020snowboaotal snowboa
ticipation Study 2019-2020
15.1%
57.6%
14.2%0.8%
PARTICIPANTS BY ETHNICITY
Asian/Pacific Islander Hispanic Other
1.1%
Caucasian/White, non-Hispanic
8.4%
66.9%
8.8% 14.9%
African American/Black
Asian/Pacific Islander Hispanic OtherCaucasian/White, non-Hispanic
African American/Black
Asian/Pacific IslanderAfrican American/Black
Asian/Pacific IslanderAfrican American/Black
1 Time
2 Times
3- 6 Times
7+ Times
Caucasian/White, non-Hispanic
Caucasian/White, non-Hispanic
Hispanic
Hispanic
Other
Other
57.9%
12.1%
5.5%
4.5%
2.4%
2.3%
19.7%14.6%
64.4%
15.2%13.5%
African American/Black Asian/Pacific Islander
7.6%12.8%
Caucasian/White, non-Hispanic
Hispanic
16.4%
Other
1.9%
61.3%
SnowsportsIndustriesAmerica
2019-2020
2019-2020
22The numbers and percentages above are based on 7.9M total snowboard participants
SIA Participation Study 2019-2020For additional participation data and insights contact [email protected]
PARTICIPANTS BY INCOME & FREQUENCY
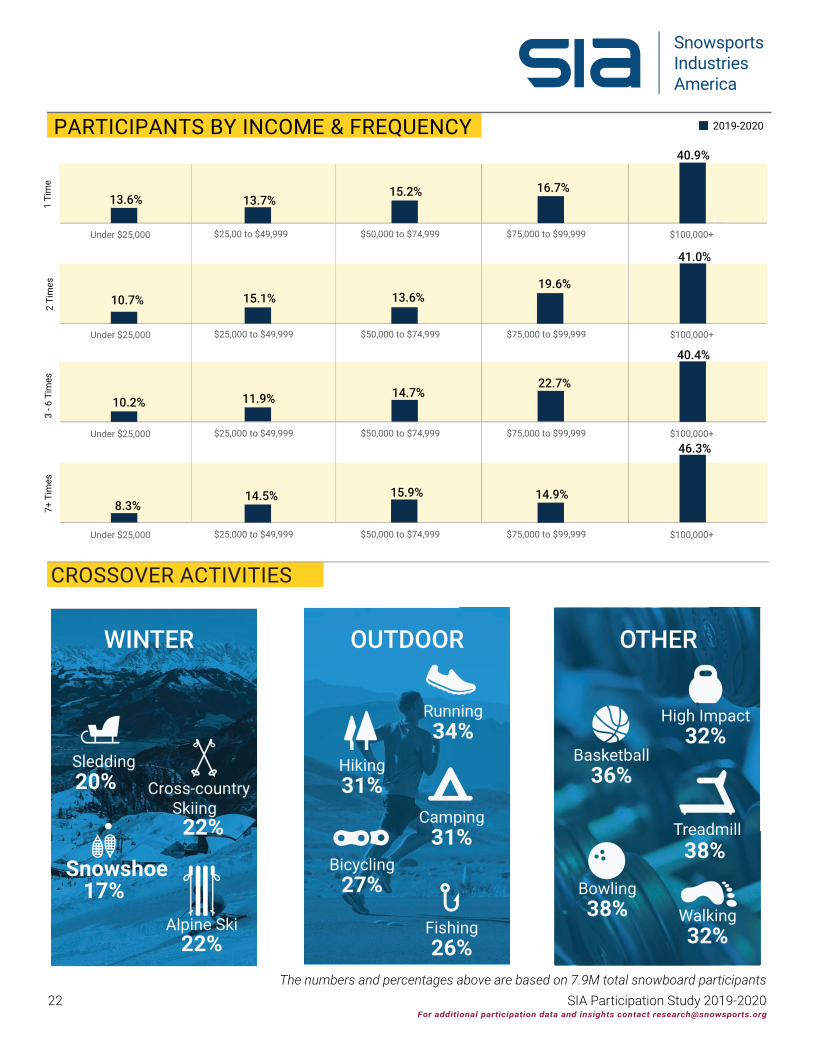
CROSSOVER ACTIVITIES
WINTER
Sledding20%
Snowshoe17%
Alpine Ski22%
Cross-country Skiing
22%
OUTDOOR
Bicycling27%
Camping31%
Fishing26%
Hiking31%
Running34%
OTHER
Basketball36%
Bowling38%
Treadmill38%
Walking32%
High Impact32%
2 Ti
mes
3
- 6 T
imes
7+ T
imes
0.8
1.0
1.2
2019-2020
+2.3%
19.6%
+2.3%
8.3%14.5% 15.9% 14.9%
1 Ti
me
13.6%
10.2%
13.7%15.2%
14.7%11.9%
16.7%
22.7%
10.7% 13.6%15.1%
46.3%
$25,000 to $49,999Under $25,000 $50,000 to $74,999 $75,000 to $99,999 $100,000+
$25,000 to $49,999Under $25,000 $50,000 to $74,999 $75,000 to $99,999 $100,000+
$25,000 to $49,999Under $25,000 $50,000 to $74,999 $75,000 to $99,999 $100,000+
$25,00 to $49,999Under $25,000 $50,000 to $74,999 $75,000 to $99,999 $100,000+
40.9%
40.4%
41.0%
SnowsportsIndustriesAmerica

The numbers and percentages above are based on 7.9M total snowboard participantsSIA Participation Study 2019-2020
For additional participation data and insights contact [email protected]
PARTICIPANTS BY GENDER & FREQUENCY
27.8%
Female
Male
1 Time 2 Times 3 to 6 Times 7+ Times
1 Time 2 Times 3 to 6 Times 7+ Times
72.2%66.0% 65.3%
34.7%
67.6%
32.4%34.0%
2019-2020
2019-2020
Total Participants New/Returning Participants Took Season Off
2018-2019
7.8M7.9M
+0.1M
4.5M
-4.4M
In 2018/2019 there were 7.8Mparticipants. In 2019/2020, 4.5M
participants were new/returned and 4.4Mparticipants took the season off. The total
for 2019/2020 was 7.9M participants.
2018-2019 2019-2020GAIN/LOSS OF ACTIVE PARTICIPANTS
SnowsportsIndustriesAmerica

Cross-country Skiing Participation andDemographics
SnowsportsIndustriesAmerica

SIA Participation Study 2019-2020The numbers and percentages above are based on 4.8M total cross-country skiing participants
25For additional participation data and insights contact [email protected]
33.3% 34.6% 33.8%
63.3% 66.2%
PARTICIPATION BY GENDER & FREQUENCY
66.7%
1 Time 2 Times 3 to 6 Times 7+ Times
1 Time 2 Times 3 to 6 Times 7+ Times
Female
Male
36.7%
65.4%
PACIFIC 0.8MMOUNTAIN 0.4M
WEST SOUTH CENTRAL 0.4M
WEST NORTH CENTRAL 0.3MEAST NORTH CENTRAL 0.6MEAST SOUTH CENTRAL 0.2M
NEW ENGLAND 0.3MMIDDLE ATLANTIC 0.9MSOUTH ATLANTIC 0.9M
TOTAL PARTICIPANTS: 4.8MCROSS-COUNTRY SKIING BY REGION
2019-2020
SnowsportsIndustriesAmerica
For additional participation data and insights contact [email protected]
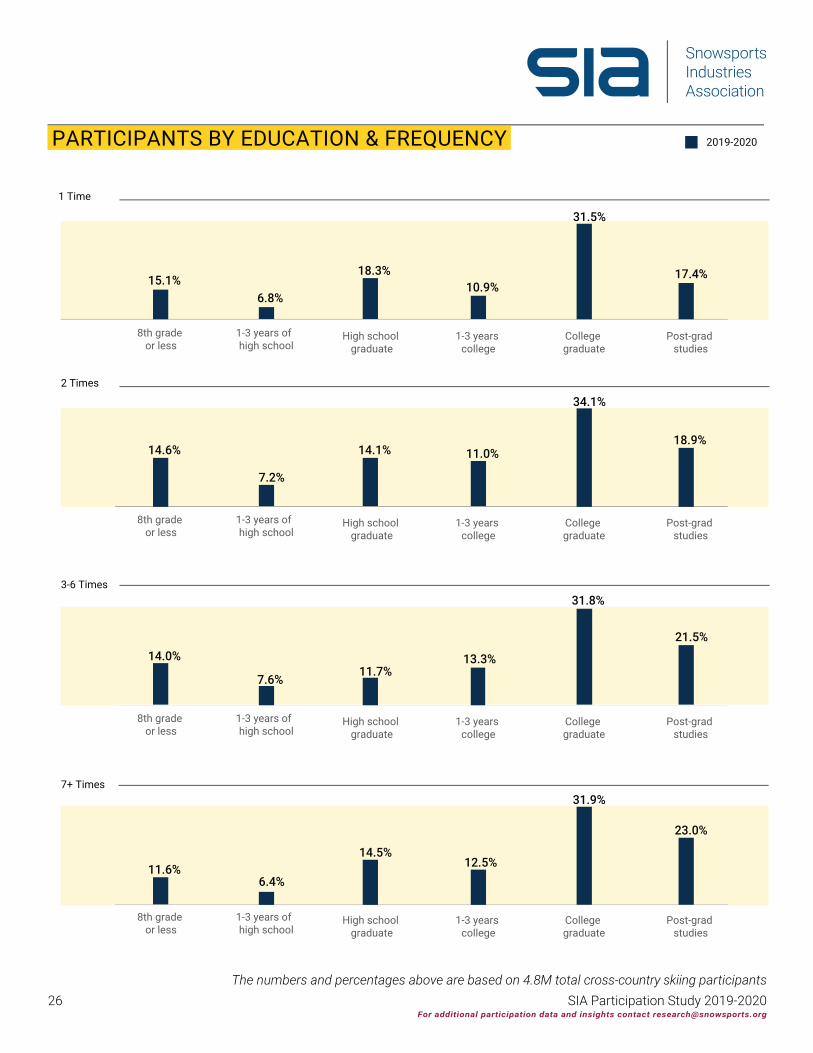
8th grade or less
1-3 years of high school
High school graduate
1-3 years college
College graduate
Post-grad studies
2019-2020
14.1%18.9%
34.1%
11.0%
14.0%11.7%
21.5%
31.8%
7.6%
13.3%
11.6%14.5%
6.4%12.5%
PARTICIPANTS BY EDUCATION & FREQUENCY
2 Times
3-6 Times
7+ Times
1 Time
8th grade or less
1-3 years of high school
High school graduate
1-3 years college
College graduate
Post-grad studies
8th grade or less
1-3 years of high school
High school graduate
1-3 years college
College graduate
Post-grad studies
8th grade or less
1-3 years of high school
High school graduate
1-3 years college
College graduate
Post-grad studies
14.6%
7.2%
17.4%
6.8%
18.3%10.9%
31.5%
15.1%
23.0%
31.9%
26 SIA Participation Study 2019-2020The numbers and percentages above are based on 4.8M total cross-country skiing participants

27 SIA Participation Study 2019-2020The numbers and percentages above are based on 4.8M total cross-country skiing participants
For additional participation data and insights contact [email protected]
Age 13~176~12 18~24 25~34 35~44 45~54
55~64 65+
Age 13~176~12 18~24 25~34 35~44 45~54
55~64 65+
20.8%
34.3%
10.7%7.1%7.2%
PARTICIPATION BY AGE & FREQUENCY
6.1%
21.5%
5.7% 4.8%4.5%
30.7%
13.1%7.6%
12.1%
4.8%
1 Time
2 Times
Age 13~176~12 18~24 25~34 35~44 45~54
55~64 65+
Age 13~176~12 18~24 25~34 35~44 45~54
55~64 65+Age 13~176~12 18~24 25~34 35~44 45~54
55~64 65+
17.5% 17.2%
3.8%6.8%
18.6%10.5%11.2%14.4%
16.3%
8.0% 4.1%8.9%
32.5%
11.9%9.6%8.7%
8.9%
3 -6 Times
7+ Times
2019-2020
SnowsportsIndustriesAmerica
28 SIA Participation Study 2019-2020The numbers and percentages above are based on 4.8M total cross-country skiing participants
For additional participation data and insights contact [email protected]
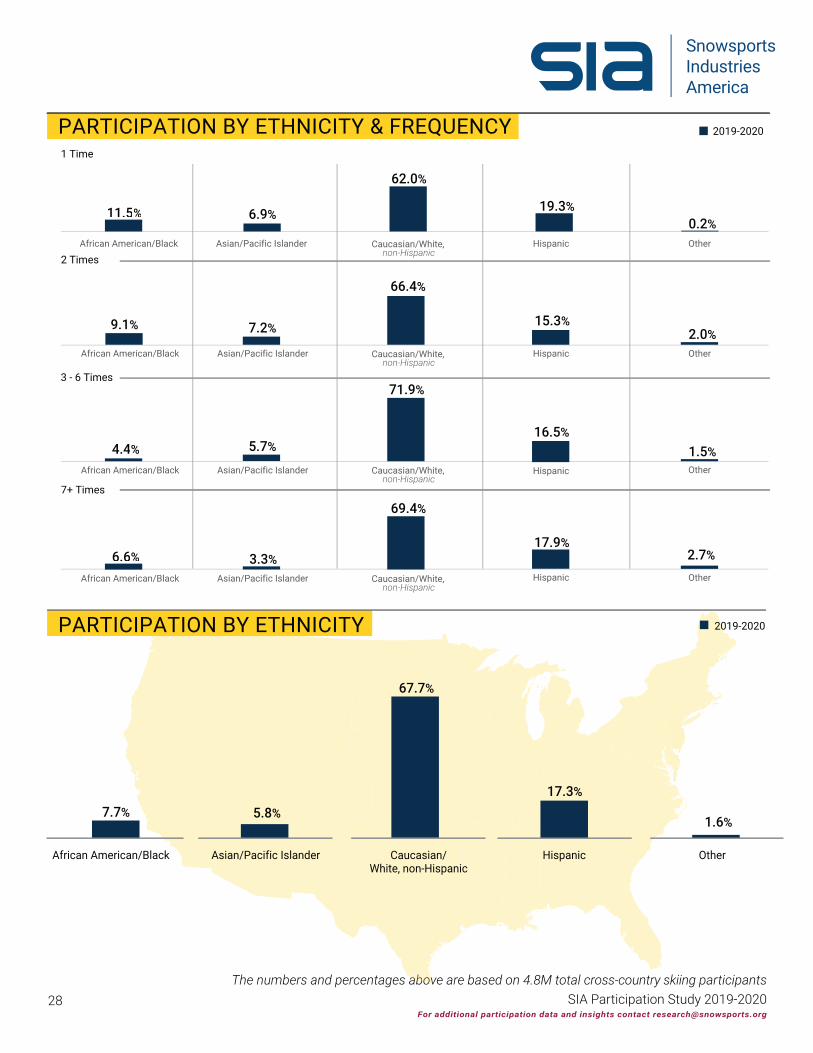
Asian/Pacific Islander Hispanic Other
2.0%
Caucasian/White, non-Hispanic
9.1%
66.4%
7.2%74.2% 15.3%
African American/Black
Asian/Pacific Islander Hispanic OtherCaucasian/White, non-Hispanic
African American/Black
1 Time
2 Times
3 - 6 Times
7+ Times
Caucasian/White, non-Hispanic
Caucasian/White, non-Hispanic
Hispanic
Hispanic
Other
Other
11.5% 19.3%0.2%
62.0%
6.9%
4.4% 1.5%
71.9%
16.5%5.7%
6.6% 2.7%
69.4%
17.9%3.3%
PARTICIPATION BY ETHNICITY & FREQUENCY 2019-2020
ovcentages abov
PARTICIPATION BY ETHNICITY
African American/Black Asian/Pacific Islander
7.7% 5.8%
Caucasian/White, non-Hispanic
Hispanic
17.3%
Other
1.6%
67.7%
Asian/Pacific IslanderAfrican American/Black
Asian/Pacific IslanderAfrican American/Black
2019-2020
SnowsportsIndustriesAmerica

29 SIA Participation Study 2019-2020The numbers and percentages above are based on 4.8M total cross-country skiing participants
For additional participation data and insights contact [email protected]
CROSSOVER ACTIVITIES
WINTER
Sledding24%
Snowshoe26%
Alpine Ski34%
Snowboarding30%
OUTDOOR
Bicycling32%
Camping31%
Hiking32%
Running33%
Trail Run27%
OTHER
Bowling35%
Treadmill35%
Walking32%
High Impact43%Eliptical
31%
27.1%
PARTICIPATION BY INCOME & FREQUENCY
7+ T
imes
6.0%12.3%
17.4% 17.6%
3- 6
Tim
es2
Tim
es1
Tim
e
12.3%
5.5%
14.0% 13.3%
15.7%13.1%
16.3%
22.4%
10.0% 13.9%12.9%
46.6%
$25,000 to $49,999Under $25,000 $50,000 to $74,999 $75,000 to $99,999 $100,000+
$25,000 to $49,999Under $25,000 $50,000 to $74,999 $75,000 to $99,999 $100,000+
$25,000 to $49,999Under $25,000 $50,000 to $74,999 $75,000 to $99,999 $100,000+
$25,000 to $49,999Under $25,000 $50,000 to $74,999 $75,000 to $99,999 $100,000+
44.1%
43.3%
36.1%
2019-2020
SnowsportsIndustriesAmerica

30 SIA Participation Study 2019-2020The numbers and percentages above are based on 4.8M total cross-country skiing participants
For additional participation data and insights contact [email protected]
2018-2019 2019-2020GAIN/LOSS OF ACTIVE PARTICIPANTSIn 2018-2019 there were 4.9M participants. In
2019-2020, 3.3M participants were new/returned and 3.4M participants took the season off. The
total for 2019-2020 was 4.8M participants.
CROSS-COUNTRY SKIING TRAILS
Private Nordic Trailsgroomed trails available
Othernon-groomed (park, golf course)
19.5%
Public Nordic Trailstrails groomed by government entity
Backcountrynon-groomed trails
35.8% 62.2% 45.3%
2019/2020
Total Participants New/Returning Participants Took Season Off
2018/2019
4.9M 4.8M
-0.1M
3.3M
-3.4M
2019-2020
SnowsportsIndustriesAmerica
Snowshoe Participation andDemographics
Courtesy of The National Brotherhood of Skiers

The numbers and percentages above are based on 3.4M total snowshoe participants32 SIA Participation Study 2019-2020
For additional participation data and insights contact [email protected]
TOTAL PARTICIPANTS: 3.4MSNOWSHOE BY REGION
PACIFIC 0.6MMOUNTAIN 0.4M
WEST SOUTH CENTRAL 0.3M
WEST NORTH CENTRAL 0.2MEAST NORTH CENTRAL 0.4MEAST SOUTH CENTRAL 0.1M
NEW ENGLAND 0.3MMIDDLE ATLANTIC 0.6MSOUTH ATLANTIC 0.5M
WHERE PARTICIPANTS SNOWSHOE
22.6%42.8% 31.4% 52.9%
2019-2020
Private Nordic Centergroomed trails available
Othernon-groomed (park, golf course)
Public Nordic Centertrails groomed by government entity
Backcountrynon-groomed trails
SnowsportsIndustriesAmerica
8th grade or less
1-3 years of high school
High school graduate
1-3 years college
College graduate
Post-grad studies
8th grade or less
1-3 years of high school
High school graduate
1-3 years college
College graduate
Post-grad studies
8th grade or less
1-3 years of high school
High school graduate
1-3 years college
College graduate
Post-grad studies
34.3%
8th grade or less
1-3 years of high school
High school graduate
1-3 years college
College graduate
Post-grad studies
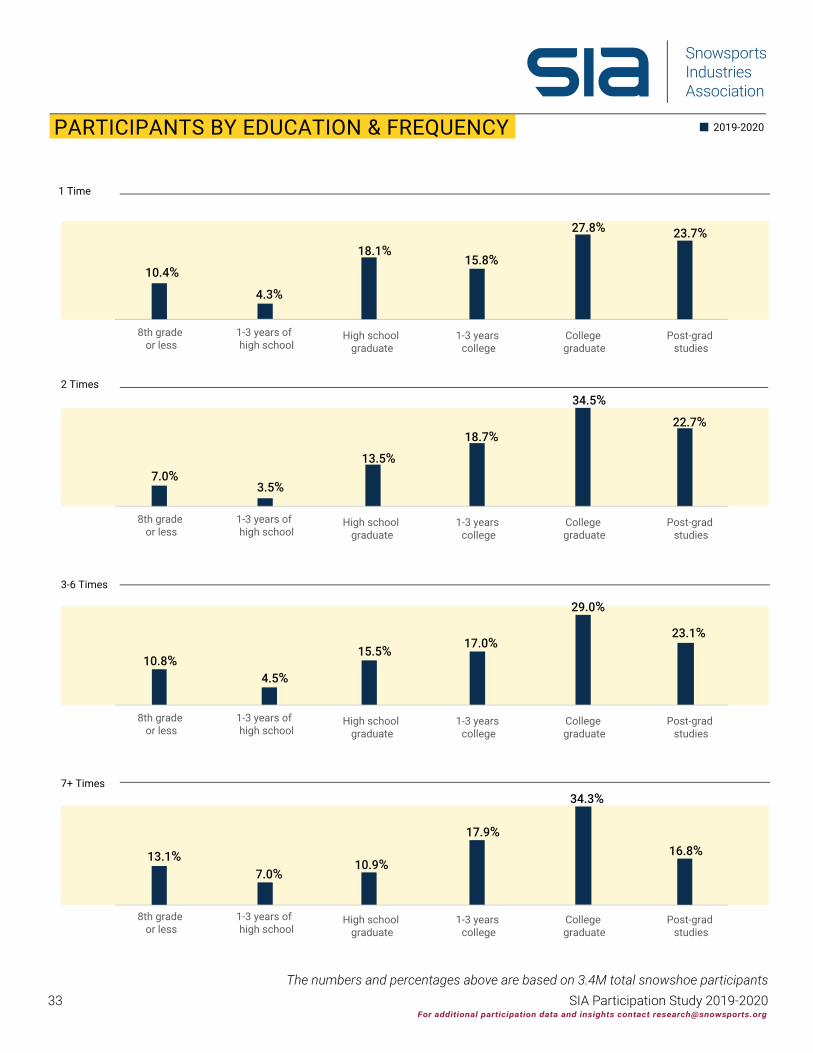
10.4%18.1%
23.7%27.8%
15.8%
7.0%13.5%
22.7%34.5%
3.5%
18.7%
23.1%
29.0%
13.1%10.9%
16.8%
7.0%
17.9%
4.5%
17.0%15.5%10.8%
PARTICIPANTS BY EDUCATION & FREQUENCY
2 Times
3-6 Times
7+ Times
1 Time
4.3%
2019-2020
33The numbers and percentages above are based on 3.4M total snowshoe participants
SIA Participation Study 2019-2020For additional participation data and insights contact [email protected]

34The numbers and percentages above are based on 3.4M total snowshoe participants
SIA Participation Study 2019-2020
PARTICIPANTS BY GENDER & FREQUENCY
1 Time 2 Times 3 to 6 Times 7+ Times
10.6%5.6% 9.9%
12.2%
27.3%
12.7%9.9%11.8%
10.3% 10.7%
29.2%
11.3%7.6%14.0%
PARTICIPANTS BY AGE & FREQUENCY 2019-2020
8.4% 6.3%
10.9%
14.1% 10.0%4.6%6.2%
30.9%
14.8%8.4%11.0%
11.4% 9.5% 12.4%
32.4%
16.1%
3.5%
6.1%
Age 13~176~12 18~24 25~34 35~44 45~54
55~64 65+
Age 13~176~12 18~24 25~34 35~44 45~54
55~64 65+
Age 13~176~12 18~24 25~34 35~44 45~54
55~64 65+
Age 13~176~12 18~24 25~34 35~44 45~54
55~64 65+
1 Time
2 Times
3-6 Times
7+ Times
Female
Male
32.3%
64.1%
1 Time 2 Times 3 to 6 Times 7+ Times
32.3%
66.2% 67.7%
35.9% 33.8%
67.7%
2019-2020
For additional participation data and insights contact [email protected]
SnowsportsIndustriesAmerica

35The numbers and percentages above are based on 3.4M total snowshoe participants
SIA Participation Study 2019-2020
PARTICIPANTS BY INCOME & FREQUENCY
$25,000 to $49,999Under $25,000 $50,000 to $74,999 $75,000 to $99,999 $100,000+
13.6% 13.9% 16.9% 16.1%
$25,000 to $49,999Under $25,000 $50,000 to $74,999 $75,000 to $99,999 $100,000+
39.5%
9.1%13.2% 12.2%
27.1%38.4%
$25,000 to $49,999Under $25,000 $50,000 to $74,999 $75,000 to $99,999 $100,000+
6.8%12.8%11.6%
26.7%
$25,000 to $49,999Under $25,000 $50,000 to $74,999 $75,000 to $99,999 $100,000+
42.2%
13.6% 8.7%14.4%24.5%
38.7%
Asian/Pacific Islander Hispanic OtherCaucasian/White, non-Hispanic
African American/Black
14.3% 20.3%1.3%
58.0%
6.2%
Asian/Pacific Islander Hispanic OtherCaucasian/White, non-Hispanic
African American/Black
2 Ti
mes
1 Ti
me
12.6% 14.4%0.7%
67.5%
4.8%
Asian/Pacific Islander Hispanic OtherCaucasian/White, non-Hispanic
African American/Black
3-6
Tim
es
4.4%14.5%
2.3%
71.8%
7.0%
Asian/Pacific Islander Hispanic OtherCaucasian/White, non-Hispanic
African American/Black
7+ T
imes
2
Tim
es1
Tim
e3-
6 Ti
mes
7+ T
imes
8.5% 14.4%3.3%
65.1%
8.7%
$25,000 to $49,999Under $25,000 $50,000 to $74,999 $75,000 to $99,999 $100,000+
PARTICIPANTS BY ETHNICITY & FREQUENCY
2019-2020
2019-2020
For additional participation data and insights contact [email protected]
SnowsportsIndustriesAmerica

36The numbers and percentages above are based on 3.4M total snowshoe participants
SIA Participation Study 2019-2020
In 2018-2019 there were 3.4M participants. In 2019-2020, 2.1M
participants were new/returned and 2.1Mparticipants took the season off. The total
for 2019-2020 was 3.4M participants.
WINTER
Sledding27%
Alpine Ski
31%
Snowboard47%
Cross-country Skiing
42%
OUTDOOR
Bicycling
32%
Birding23%
Fishing32%
Hiking38%
Running30%
OTHER
Bowling36%
Treadmill37%
Walking38%
High Impact35%
Eliptical32%
Treadmill
GAIN/LOSS OF ACTIVE PARTICIPANTS
2019/2020
Total Participants New/Returning Participants Took Season Off
2018/2019
3.4M 3.4M
0M
+2.1M
-2.1M
CROSSOVER ACTIVITIES
2018-2019 2019-2020
For additional participation data and insights contact [email protected]
SnowsportsIndustriesAmerica

Lorem ipsum
Snowboard TouringParticipation and Demographics
Photo: Marc Piscotty
38
The numbers and percentages above are based on 652K total snowboard touring participants
SIA Participation Study 2019-2020
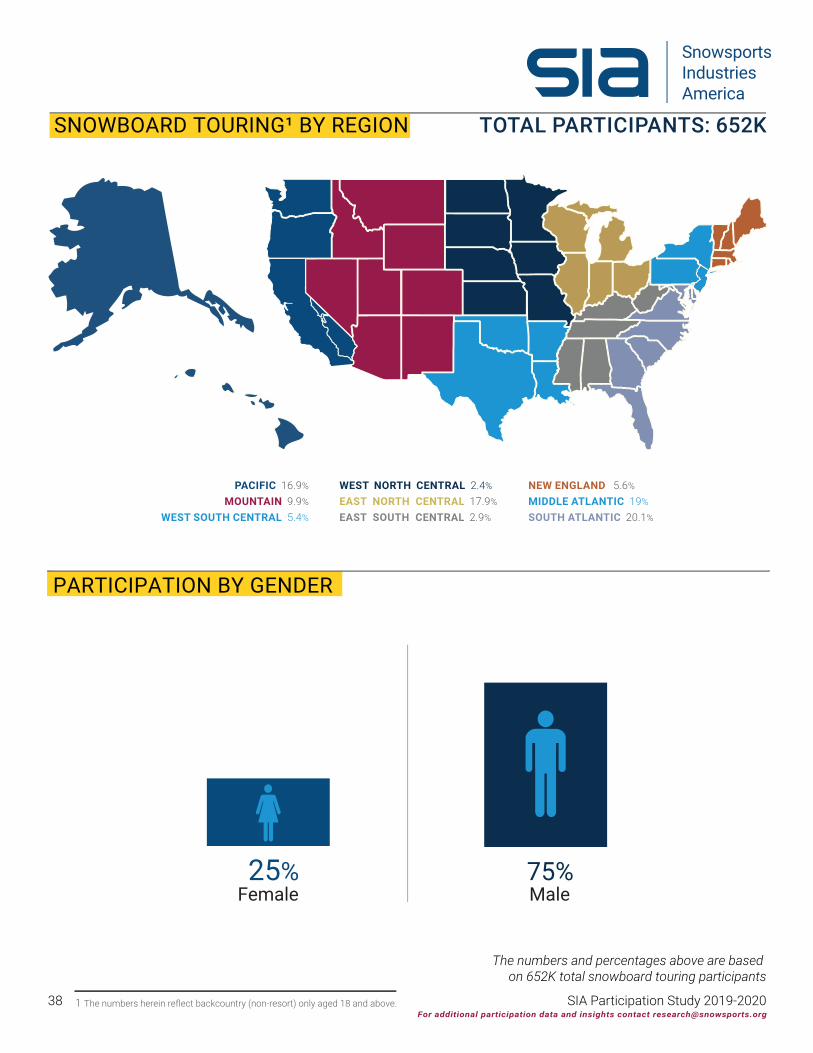
PACIFIC 16.9%
MOUNTAIN 9.9%
WEST SOUTH CENTRAL 5.4%
WEST NORTH CENTRAL 2.4%
EAST NORTH CENTRAL 17.9%
EAST SOUTH CENTRAL 2.9%
NEW ENGLAND 5.6%
MIDDLE ATLANTIC 19%
SOUTH ATLANTIC 20.1%
TOTAL PARTICIPANTS: 652KSNOWBOARD TOURING¹ BY REGION
PARTICIPATION BY GENDER
Female25%
Male75%
1 The numbers herein reflect backcountry (non-resort) only aged 18 and above.For additional participation data and insights contact [email protected]
SnowsportsIndustriesAmerica
39The numbers and percentages above are based on 652K total snowboard touring participants
SIA Participation Study 2019-2020
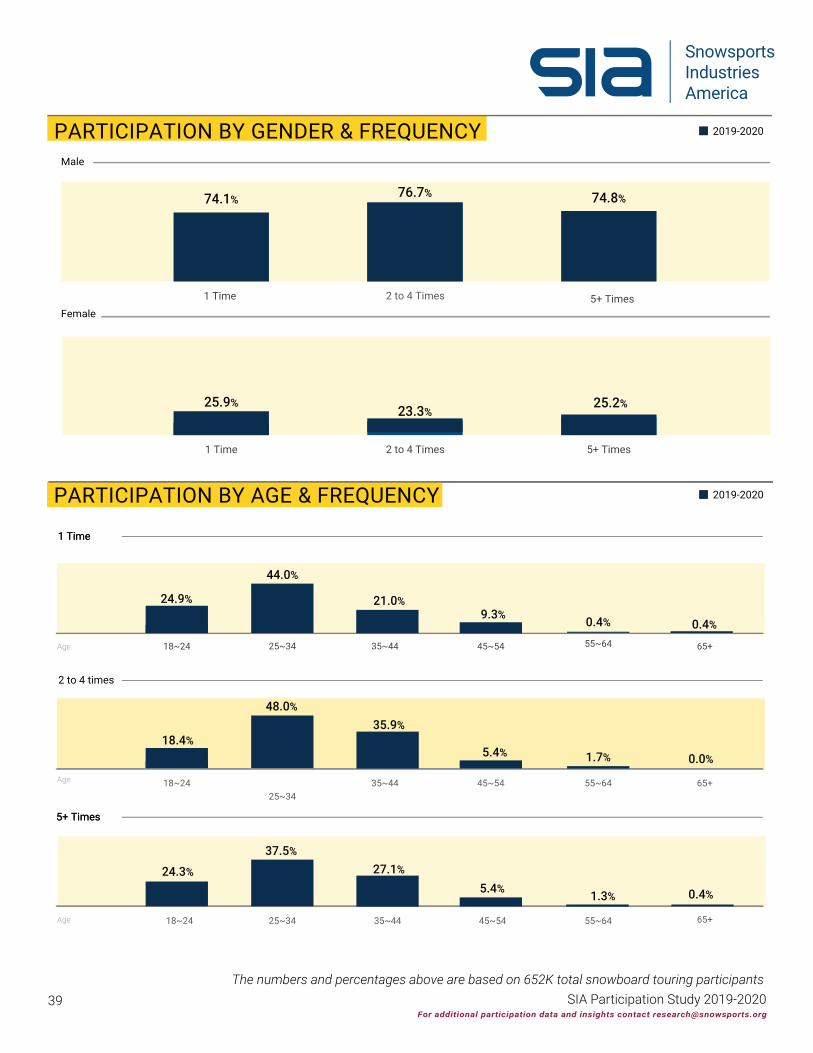
74.8%
BY AGE & FREQUENCY
21.0%
1 Time
0.4%0.4%
Age 18~24 35~44 55~64 65+
27.1%
5.4% 0.4%1.3%
5+ Times
Female
Male
25.2%25.9%
1 Time 5+ Times
76.7%
2 to 4 Times
23.3%
PARTICIPATION BY GENDER & FREQUENCY
55~64Age 18~24 35~44 65+
PARTICIPATION BY AGE & FREQUENCY
1 Time
25~34
48.0%
9.3%
45~54
5.4%
45~54
5+ Times
1 Time 5+ Times2 to 4 Times
2019-2020
2019-2020
24.9%
18.4%
24.3%
18~24 35~44 45~54
55~64 65+Age
74.1%
2 to 4 times
37.5%
25~34
44.0%
25~34
35.9%
0.0%1.7%
For additional participation data and insights contact [email protected]
SnowsportsIndustriesAmerica
The numbers and percentages above are based on 652K total snowboard touring participantsSIA Participation Study 2019-202040
1 Time
2019-2020
2019-2020
The numbers and percentages above are based on 652K total snowboard touring participantsThe numbers and percentages above are based on 652K total snowboard touring participantsThe numbers and percentages above are based on 652K total snowboard touring participantsThe numbers and percentages above are based on 652K total snowboard touring participantsticipation Study 2019-2020
The numbers and percentages above are based on 652K total snowboard touring participantsThe numbers and percentages above are based on 652K total snowboard touring participantsThe numbers and percentages above are based on 652K total snowboard touring participants
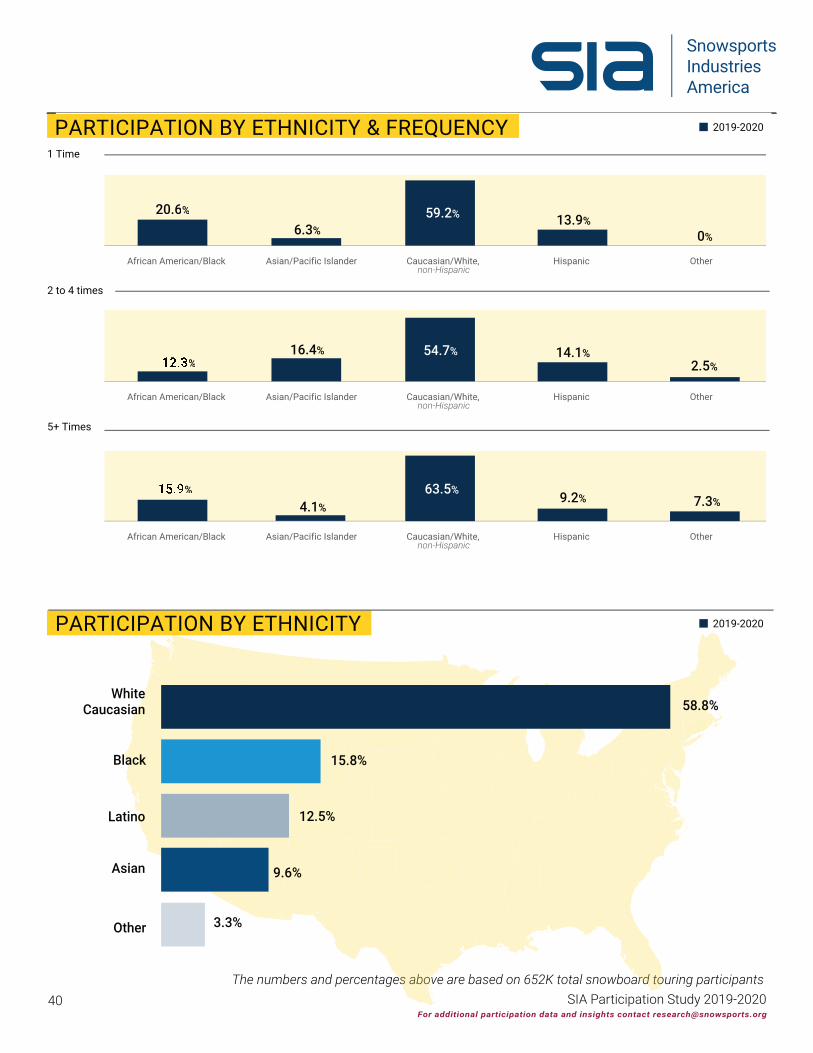
PARTICIPATION BY ETHNICITY
58.8%
3.3%Other
WhiteCaucasian
Black
Latino
Asian
15.8%
12.5%
9.6%
PARTICIPATION BY ETHNICITY & FREQUENCY
2 to 4 times
5+ Times
20.6%
6.3%59.2% 13.9%
0%
Asian/Pacific IslanderAfrican American/Black Caucasian/White, non-Hispanic
Hispanic Other
12.3%16.4% 54.7% 14.1%
2.5%
Asian/Pacific IslanderAfrican American/Black Caucasian/White, non-Hispanic
Hispanic Other
15.9%4.1%
63.5% 9.2% 7.3%
Asian/Pacific IslanderAfrican American/Black Caucasian/White, non-Hispanic
Hispanic Other
For additional participation data and insights contact [email protected]
SnowsportsIndustriesAmerica

41The numbers and percentages above are based on 652K total snowboard touring participants
SIA Participation Study 2019-2020
PARTICIPATION BY EDUCATION & FREQUENCY 2019-2020
8th grade or less
1-3 years of high school
High school graduate
1-3 years college
College graduate
Post-grad studies
18.4%
10.1% 14.4% 16.0%
24.6%
16.5%
8th grade or less
1-3 years of high school
High school graduate
1-3 years college
College graduate
Post-grad studies
17.5%
5.2%14.8% 14.1%
30.5%
17.9%
8th grade or less
1-3 years of high school
High school graduate
1-3 years college
College graduate
Post-grad studies
15.2% 15.4%8.8%
23.0%
12.5%
25.1%
5+ Times
2 to 4 times
1 Times
PARTICIPATION BY INCOME & FREQUENCY
2 to
4 ti
mes
5+ T
imes
1 Ti
me 30.0%
$25,000 to $49,999
8.9%
35.8%
10.2% 15.2%
Under $25,000 $50,000 to $74,999 $75,000 to $99,999 $100,000+
22.3%
$25,000 to $49,999
5.1%
44.144.1%
11.1%17.4%
Under $25,000 $50,000 to $74,999 $75,000 to $99,999 $100,000+
14.9%
$25,000 to $49,999
5.5%
56.0%
10.5% 13.0%
Under $25,000 $50,000 to $74,999 $75,000 to $99,999 $100,000+
2019-2020
SnowsportsIndustriesAmerica
For additional participation data and insights contact [email protected]

Alpine TouringParticipation andDemographics
SnowsportsIndustriesAmerica
SIA Participation Study 2019-2020
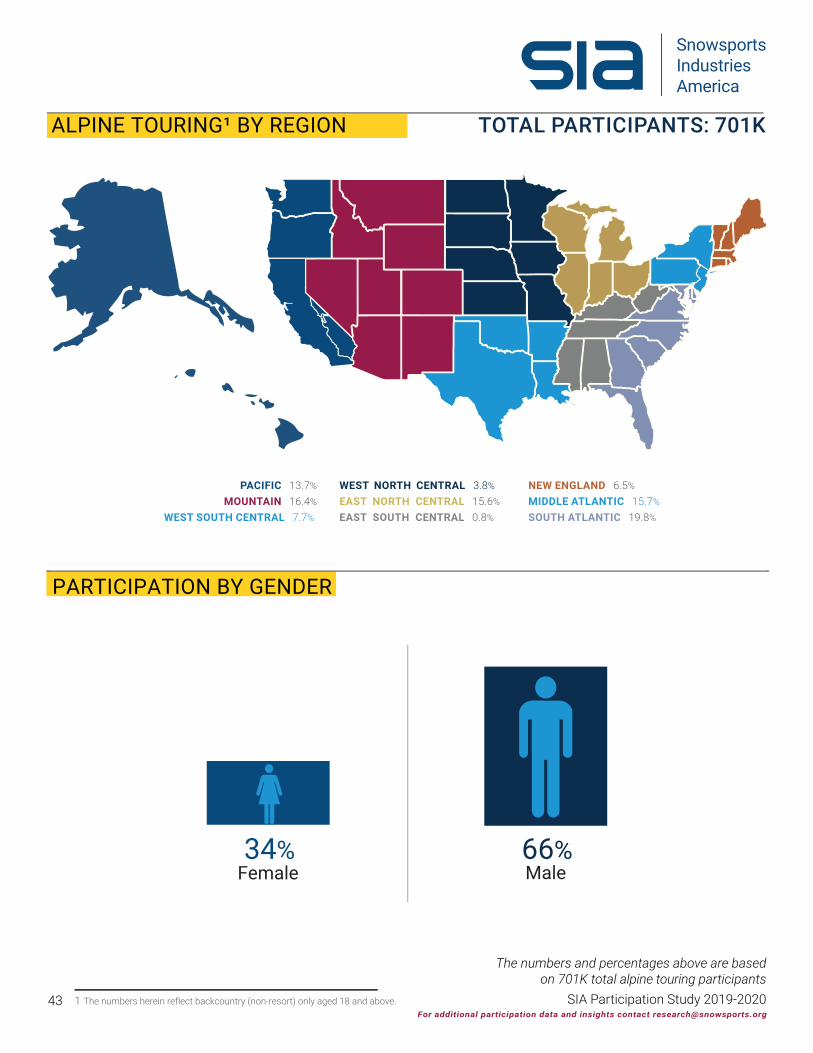
The numbers and percentages above are based on 701K total alpine touring participants
43
PACIFIC 13.7%
MOUNTAIN 16.4%
WEST SOUTH CENTRAL 7.7%
WEST NORTH CENTRAL 3.8%
EAST NORTH CENTRAL 15.6%
EAST SOUTH CENTRAL 0.8%
NEW ENGLAND 6.5%
MIDDLE ATLANTIC 15.7%
SOUTH ATLANTIC 19.8%
TOTAL PARTICIPANTS: 701KALPINE TOURING¹ BY REGION
PARTICIPATION BY GENDER
Male66%34%
Female
SnowsportsIndustriesAmerica
1 The numbers herein reflect backcountry (non-resort) only aged 18 and above.For additional participation data and insights contact [email protected]

The numbers and percentages above are based on 701K total alpine touring participants44 SIA Participation Study 2019-2020
18~24 25~34 35~44 45~54
55~64 65+
8.3%
1 Time
1.4%1.0%
18~24 25~34 35~44 45~54
55~64 65+
0.3%2.0%11.6%
2 to 4 Times
18~24 25~34 35~44 45~54
55~64 65+
21.9%
17.0%
14.0%
1.1%1.8%
52.6%
48.9%
40.1%
13.8%
5+ Times
Female
Male
2019-2020
BY GENDER & FREQUENCY PARTICIPATION BY GENDER & FREQUENCY
BY AGE & FREQUENCY PARTICIPATION BY AGE & FREQUENCY
1 Time
14.9%
15.7%
18.3%
62.8%70.5%
1 Time 5+ Times
37.2%
29.5%
1 Time 5+ Times
2 to 4 Times
65.1%
2 to 4 Times
34.9%
2019-2020
For additional participation data and insights contact [email protected]
SnowsportsIndustriesAmerica

45The numbers and percentages above are based on 701K total alpine touring participants
SIA Participation Study 2019-2020
1 Time
2019-2020
2019-2020
alpine touringcentages abcentages abcentages abticipation Study 2019-2020
alpine touringticipation Study 2019-2020
alpine touringalpine touring
PARTICIPATION BY ETHNICITY
Other
WhiteCaucasian
Black
Latino
Asian
69%
13.7%
7.7%
6.7%
2.9%
PARTICIPATION BY ETHNICITY & FREQUENCY
2 to 4 Times
5+ Times
8.1% 4.1%
78.0%
9.7%
0.0%
Asian/Pacific IslanderAfrican American/Black Caucasian/White, non-Hispanic
Hispanic Other
9.5% 7.4%
63.1%
15.8%
4.2%
Asian/Pacific IslanderAfrican American/Black Caucasian/White, non-Hispanic
Hispanic Other
4.1%8.2%
69.9%
14.2%
3.6%
Asian/Pacific IslanderAfrican American/Black Caucasian/White, non-Hispanic
Hispanic Other
SnowsportsIndustriesAmerica
For additional participation data and insights contact [email protected]

46The numbers and percentages above are based on 701K total alpine touring participants
SIA Participation Study 2019-2020
PARTICIPATION BY EDUCATION & FREQUENCY 2019-2020
8th grade or less
15.9% 14.1%5.2% 15.2%
33.4%
16.2%
8th grade or less
1-3 years of high school
High school graduate
1-3 years college
College graduate
Post-grad studies
15.3%8.2%
16.0%12.4%
32.9%
15.1%
8th grade or less
1-3 years of high school
High school graduate
1-3 years college
College graduate
Post-grad studies
21.4% 20.5%
8.2%16.3% 10.3%
23.2%
5+ Times
2 to 4 Times
1 Times
PARTICIPATION BY INCOME & FREQUENCY
2 to
4 T
imes
5+
Tim
es1
Tim
e 40.9%
$25,000 to $49,999
4.5%27.1%14.9% 12.6%
Under $25,000 $50,000 to $74,999 $75,000 to $99,999 $100,000+
36.3%
$25,000 to $49,999
3.9%
37.1%
10.1% 12.6%
Under $25,000 $50,000 to $74,999 $75,000 to $99,999 $100,000+
24.6%
$25,000 to $49,999
4.2%
43.6%
10.5%17.2%
Under $25,000 $50,000 to $74,999 $75,000 to $99,999 $100,000+
2019-2020
SnowsportsIndustriesAmerica
1-3 years of high school
High school graduate
1-3 years college
College graduate
Post-grad studies
For additional participation data and insights contact [email protected]

Methodology
48 SIA Participation Study 2019-202048
SnowsportsIndustriesAmerica
Methodology
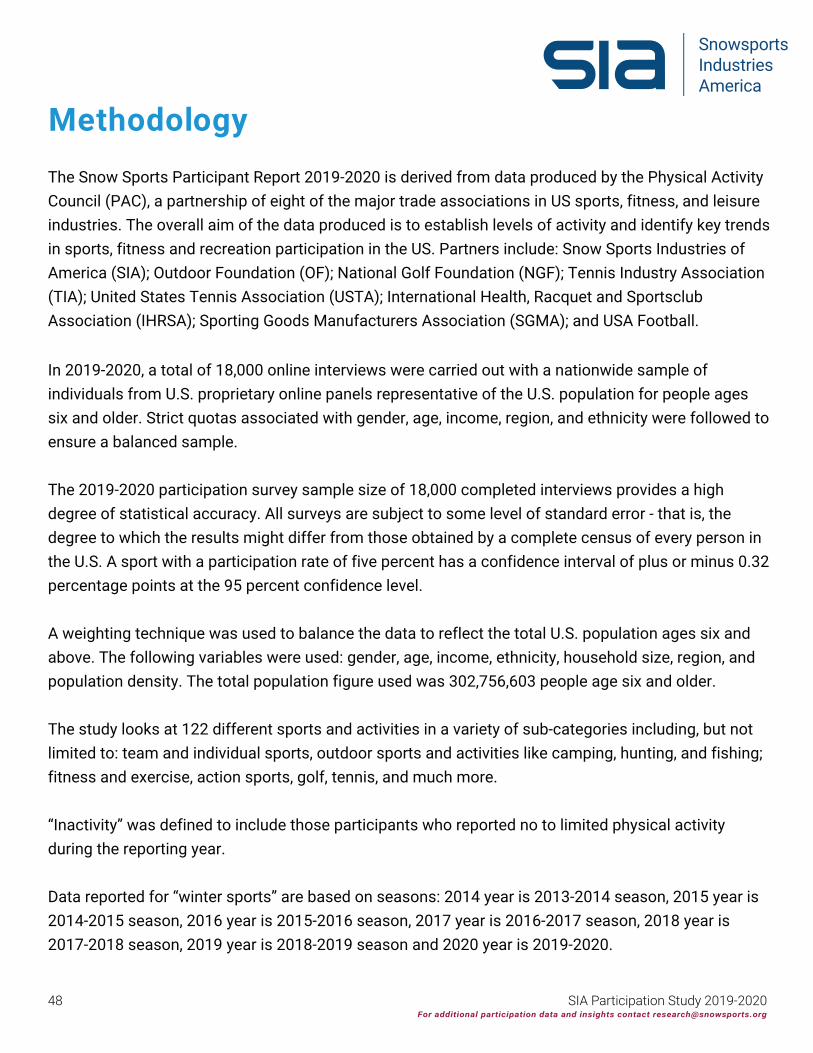
In 2019-2020, a total of 18,000 online interviews were carried out with a nationwide sample of individuals from U.S. proprietary online panels representative of the U.S. population for people ages six and older. Strict quotas associated with gender, age, income, region, and ethnicity were followed to ensure a balanced sample.
The 2019-2020 participation survey sample size of 18,000 completed interviews provides a high degree of statistical accuracy. All surveys are subject to some level of standard error - that is, the degree to which the results might differ from those obtained by a complete census of every person in the U.S. A sport with a participation rate of five percent has a confidence interval of plus or minus 0.32 percentage points at the 95 percent confidence level.
A weighting technique was used to balance the data to reflect the total U.S. population ages six and above. The following variables were used: gender, age, income, ethnicity, household size, region, and population density. The total population figure used was 302,756,603 people age six and older.
The study looks at 122 different sports and activities in a variety of sub-categories including, but not limited to: team and individual sports, outdoor sports and activities like camping, hunting, and fishing; fitness and exercise, action sports, golf, tennis, and much more.
“Inactivity” was defined to include those participants who reported no to limited physical activity during the reporting year.
Data reported for “winter sports” are based on seasons: 2014 year is 2013-2014 season, 2015 year is2014-2015 season, 2016 year is 2015-2016 season, 2017 year is 2016-2017 season, 2018 year is2017-2018 season, 2019 year is 2018-2019 season and 2020 year is 2019-2020.
The Snow Sports Participant Report 2019-2020 is derived from data produced by the Physical Activity Council (PAC), a partnership of eight of the major trade associations in US sports, fitness, and leisure industries. The overall aim of the data produced is to establish levels of activity and identify key trends in sports, fitness and recreation participation in the US. Partners include: Snow Sports Industries of America (SIA); Outdoor Foundation (OF); National Golf Foundation (NGF); Tennis Industry Association (TIA); United States Tennis Association (USTA); International Health, Racquet and Sportsclub Association (IHRSA); Sporting Goods Manufacturers Association (SGMA); and USA Football.
For additional participation data and insights contact [email protected]
49 SIA Participation Study 2019-2020
SnowsportsIndustriesAmerica
About SIA Research
In addition to this report, SIA publishes a wide variety of research products across consumer, retail and winter participation.
• CONSUMER INSIGHTS - Two critical reports this season tracking consumer insights and trends. These reports are pivotal in helping retailers, resorts and suppliers better understand consumer sentiment as we navigate this winter and beyond.
⸰ Consumer Insights and Trends Report #1 - “The Impacts of COVID-19 on Snowsports Consumer Trends and Insights"
• NPD MONTHLY RETAIL SALES REPORTS – Top line retail data issued from November to May
• WHOLESALE SALES AND ORDERS – Annual aggregated wholesale market data
• ANNUAL WINTER PARTICIPATION STUDY - An in-depth look at winter sports demographics across the US
• PARTICIPATION INSIGHTS REPORT - A closer look at the opinions and habits of winter sports participants
• CONSUMER PANEL – YOY surveys conducted across a nationwide group of consumers:⸰ Consumer Anticipation (early season)⸰ Snowsports Retail Consumer Behavior⸰ Retail and Direct-to-Consumer for Snowsports⸰ Holiday Purchases⸰ Snowsports Used Marketplace⸰ Snowsports Consumer Rental and Service⸰ Snowsports Technology and Participation⸰ Diversity in the Snowsports Industry
• CUSTOM RESEARCH – Creation of custom queries within our research database/raw data.
For more information, please reach out to [email protected]
For additional participation data and insights contact [email protected]
Related Documents