Partially melted, mica-bearing crust in Central Tibet B. R. Hacker 1 , M. H. Ritzwoller 2 , and J. Xie 2 1 Earth Science, University of California, Santa Barbara, California, USA, 2 Department of Physics, University of Colorado Boulder, Boulder, Colorado, USA Abstract Surface wave tomography shows that the central Tibetan Plateau (the Qiangtang block) is characterized by S wave speeds as slow as 3.3 km/s at depths from 20–25 km to 45–50 km and S wave radial anisotropy of at least 4% ( V SH > V SV ) that is stronger in the west than the east. The depth of the Curie temperature for magnetite inferred from satellite magnetic measurements, the depth of the α-β quartz transition inferred from V P /V S ratios, and the equilibration pressures and temperatures of xenoliths erupted from the middle to deep crust indicate that the Qiangtang crust is hot, reaching 1000°C at the Moho. This inferred thermal gradient crosses the dehydration melting solidi for crustal rocks at 20–30 km depth, implying the presence or former presence of melt in the Tibetan middle to deep crust. These temperatures do not require the wholesale breakdown of mica at these depths, because F and Ti can stabilize mica to at least 1300°C. Petrology suggests, then, that the Qiangtang middle to deep crust consists of a mica-bearing residue from which melt has been extracted or is being extracted. Wave speeds calculated for mica-bearing rocks with a subhorizontal to gently dipping foliation and 2% silicate melt are a good match to the wave speeds and anisotropy observed by seismology. 1. Introduction Quantifying the temperature gradient, rheology, and volume of melt or fluid lies at the heart of resolving how the Tibetan Plateau (Figure 1) has evolved, including, for example, the rates and regions of large-scale crustal flow [Bird, 1991; Clark and Royden, 2000]. A large and growing body of evidence suggests that the middle crust of the plateau is exceptionally warm, probably ductile, and may contain partial melt or aqueous fluid. Some of this evidence is geographically localized—such as observations of low electrical resistivity in the middle to lower crust [e.g., Unsworth et al., 2005; Bai et al., 2010] and strong P to S conversion bright spots on active-source wide-angle reflection data that have been cited as indicating midcrustal melt or fluids [e.g., Makovsky and Klemperer , 1999; Makovsky et al., 1999]. Localized seismological evidence that points to a midcrustal low-velocity layer derives from surface wave dispersion, receiver function, and wide-angle reflection studies [e.g., Kind et al., 1996; Cotte et al., 1999; Rapine et al., 2003; Mechie et al., 2004; Jiang et al., 2006; Xu et al., 2007; Caldwell et al., 2009; Guo et al., 2009; Li et al., 2009; Wang et al., 2013; Xu et al., 2013b]. Other evidence, more broadly distributed across Tibet, includes the absence of middle to lower crustal earthquakes [e.g., Chu et al., 2009; Sloan et al., 2011], extensive Cenozoic volcanism [e.g., Chung et al., 2005], satellite magnetic anomalies consistent with a raised Curie isotherm [Alsdorf and Nelson, 1999], strong crustal attenuation [e.g., Xie, 2004; Rai et al., 2009; Levshin et al., 2010], pervasive slow speeds in seismological models of the middle crust [e.g., Villaseñor et al., 2001; Shapiro and Ritzwoller , 2002; Yao et al., 2008; Acton et al., 2010; Yao et al., 2010; Jiang et al., 2011; Yang et al., 2012], and strong midcrustal radial anisotropy [e.g., Shapiro et al., 2004; Duret et al., 2010; Huang et al., 2010; Xie et al., 2013]. The purpose of this paper is to test the hypothesis that partial melt exists pervasively in the middle crust across Tibet and to explain the origin of the strong midcrustal radial anisotropy. To make this assessment, we calculate wave speeds within the Tibetan crust based on mineral physical properties and petrological constraints and then compare these calculations to models of crustal shear wave speeds and radial anisotropy. 2. Seismological Observations Seismological investigations of the Tibetan Plateau crust are now relatively numerous and have employed a range of techniques that reveal different aspects of the seismic characteristics of the plateau. The most notable discoveries include the following four. (1) Most of the reported V P gradients increase Tectonics RESEARCH ARTICLE 10.1002/2014TC003545 Key Points: • Slow S wave speeds in Tibet require the presence of a few percent partial melt • S wave anisotropy in Tibet requires subhorizontally oriented mica Correspondence to: B. R. Hacker, [email protected] Citation: Hacker, B. R., M. H. Ritzwoller, and J. Xie (2014), Partially melted, mica- bearing crust in Central Tibet, Tectonics, 33, doi:10.1002/2014TC003545. Received 29 JAN 2014 Accepted 7 MAY 2014 Accepted article online 8 JUL 2014

Welcome message from author
This document is posted to help you gain knowledge. Please leave a comment to let me know what you think about it! Share it to your friends and learn new things together.
Transcript
Partially melted, mica-bearing crust in Central TibetB. R. Hacker1, M. H. Ritzwoller2, and J. Xie2
1Earth Science, University of California, Santa Barbara, California, USA, 2Department of Physics, University of ColoradoBoulder, Boulder, Colorado, USA
Abstract Surface wave tomography shows that the central Tibetan Plateau (the Qiangtang block) ischaracterized by S wave speeds as slow as 3.3 km/s at depths from 20–25 km to 45–50 km and S waveradial anisotropy of at least 4% (VSH> VSV) that is stronger in the west than the east. The depth of the Curietemperature for magnetite inferred from satellite magnetic measurements, the depth of the α-β quartztransition inferred from VP/VS ratios, and the equilibration pressures and temperatures of xenoliths eruptedfrom the middle to deep crust indicate that the Qiangtang crust is hot, reaching 1000°C at the Moho. Thisinferred thermal gradient crosses the dehydration melting solidi for crustal rocks at 20–30 km depth,implying the presence or former presence of melt in the Tibetan middle to deep crust. These temperaturesdo not require the wholesale breakdown of mica at these depths, because F and Ti can stabilize mica to atleast 1300°C. Petrology suggests, then, that the Qiangtang middle to deep crust consists of a mica-bearingresidue from which melt has been extracted or is being extracted. Wave speeds calculated for mica-bearingrocks with a subhorizontal to gently dipping foliation and 2% silicate melt are a good match to the wavespeeds and anisotropy observed by seismology.
1. Introduction
Quantifying the temperature gradient, rheology, and volume of melt or fluid lies at the heart of resolving howthe Tibetan Plateau (Figure 1) has evolved, including, for example, the rates and regions of large-scale crustalflow [Bird, 1991; Clark and Royden, 2000]. A large and growing body of evidence suggests that the middlecrust of the plateau is exceptionally warm, probably ductile, and may contain partial melt or aqueous fluid.Some of this evidence is geographically localized—such as observations of low electrical resistivity in themiddle to lower crust [e.g., Unsworth et al., 2005; Bai et al., 2010] and strong P to S conversion brightspots on active-source wide-angle reflection data that have been cited as indicating midcrustal melt or fluids[e.g., Makovsky and Klemperer, 1999; Makovsky et al., 1999]. Localized seismological evidence that points to amidcrustal low-velocity layer derives from surface wave dispersion, receiver function, and wide-anglereflection studies [e.g., Kind et al., 1996; Cotte et al., 1999; Rapine et al., 2003; Mechie et al., 2004; Jiang et al.,2006; Xu et al., 2007; Caldwell et al., 2009; Guo et al., 2009; Li et al., 2009; Wang et al., 2013; Xu et al., 2013b].Other evidence, more broadly distributed across Tibet, includes the absence of middle to lower crustalearthquakes [e.g., Chu et al., 2009; Sloan et al., 2011], extensive Cenozoic volcanism [e.g., Chung et al.,2005], satellite magnetic anomalies consistent with a raised Curie isotherm [Alsdorf and Nelson, 1999],strong crustal attenuation [e.g., Xie, 2004; Rai et al., 2009; Levshin et al., 2010], pervasive slow speeds inseismological models of the middle crust [e.g., Villaseñor et al., 2001; Shapiro and Ritzwoller, 2002; Yao et al.,2008; Acton et al., 2010; Yao et al., 2010; Jiang et al., 2011; Yang et al., 2012], and strong midcrustal radialanisotropy [e.g., Shapiro et al., 2004; Duret et al., 2010; Huang et al., 2010; Xie et al., 2013].
The purpose of this paper is to test the hypothesis that partial melt exists pervasively in the middlecrust across Tibet and to explain the origin of the strong midcrustal radial anisotropy. To make thisassessment, we calculate wave speeds within the Tibetan crust based on mineral physical propertiesand petrological constraints and then compare these calculations to models of crustal shear wavespeeds and radial anisotropy.
2. Seismological Observations
Seismological investigations of the Tibetan Plateau crust are now relatively numerous and have employeda range of techniques that reveal different aspects of the seismic characteristics of the plateau. Themost notable discoveries include the following four. (1) Most of the reported VP gradients increase
HACKER ET AL. ©2014. American Geophysical Union. All Rights Reserved. 1
PUBLICATIONSTectonics
RESEARCH ARTICLE10.1002/2014TC003545
Key Points:• Slow Swave speeds in Tibet require thepresence of a few percent partial melt
• S wave anisotropy in Tibet requiressubhorizontally oriented mica
Correspondence to:B. R. Hacker,[email protected]
Citation:Hacker, B. R., M. H. Ritzwoller, andJ. Xie (2014), Partially melted, mica-bearing crust in Central Tibet, Tectonics,33, doi:10.1002/2014TC003545.
Received 29 JAN 2014Accepted 7 MAY 2014Accepted article online 8 JUL 2014
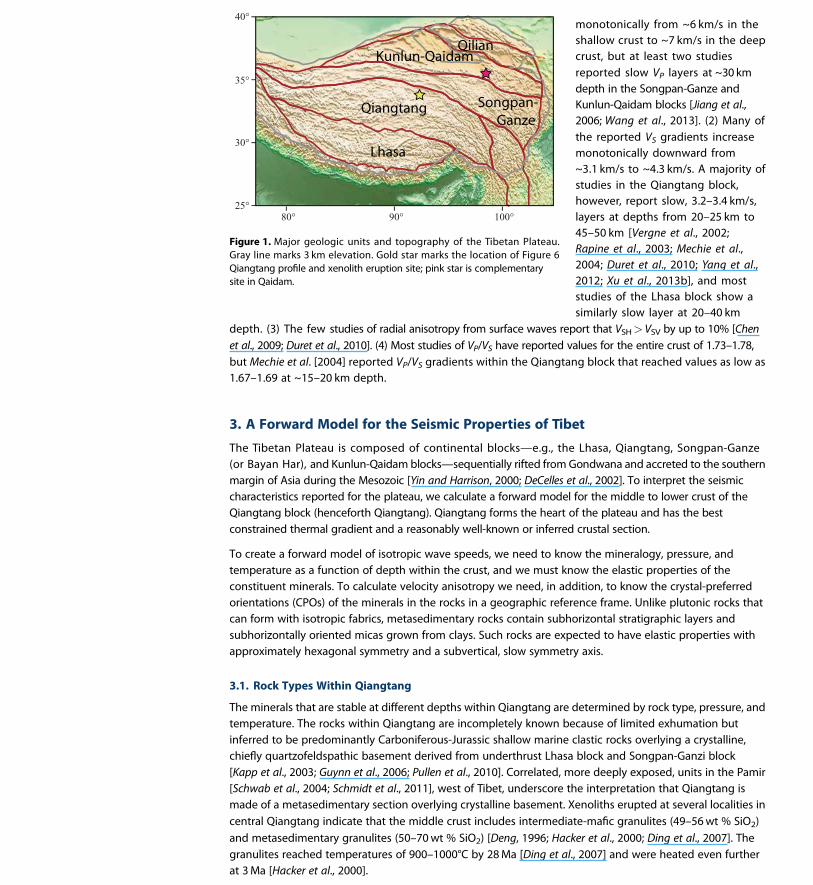
monotonically from ~6 km/s in theshallow crust to ~7 km/s in the deepcrust, but at least two studiesreported slow VP layers at ~30 kmdepth in the Songpan-Ganze andKunlun-Qaidam blocks [Jiang et al.,2006; Wang et al., 2013]. (2) Many ofthe reported VS gradients increasemonotonically downward from~3.1 km/s to ~4.3 km/s. A majority ofstudies in the Qiangtang block,however, report slow, 3.2–3.4 km/s,layers at depths from 20–25 km to45–50 km [Vergne et al., 2002;Rapine et al., 2003; Mechie et al.,2004; Duret et al., 2010; Yang et al.,2012; Xu et al., 2013b], and moststudies of the Lhasa block show asimilarly slow layer at 20–40 km
depth. (3) The few studies of radial anisotropy from surface waves report that VSH> VSV by up to 10% [Chenet al., 2009; Duret et al., 2010]. (4) Most studies of VP/VS have reported values for the entire crust of 1.73–1.78,but Mechie et al. [2004] reported VP/VS gradients within the Qiangtang block that reached values as low as1.67–1.69 at ~15–20 km depth.
3. A Forward Model for the Seismic Properties of Tibet
The Tibetan Plateau is composed of continental blocks—e.g., the Lhasa, Qiangtang, Songpan-Ganze(or Bayan Har), and Kunlun-Qaidam blocks—sequentially rifted from Gondwana and accreted to the southernmargin of Asia during the Mesozoic [Yin and Harrison, 2000; DeCelles et al., 2002]. To interpret the seismiccharacteristics reported for the plateau, we calculate a forward model for the middle to lower crust of theQiangtang block (henceforth Qiangtang). Qiangtang forms the heart of the plateau and has the bestconstrained thermal gradient and a reasonably well-known or inferred crustal section.
To create a forward model of isotropic wave speeds, we need to know the mineralogy, pressure, andtemperature as a function of depth within the crust, and we must know the elastic properties of theconstituent minerals. To calculate velocity anisotropy we need, in addition, to know the crystal-preferredorientations (CPOs) of the minerals in the rocks in a geographic reference frame. Unlike plutonic rocks thatcan form with isotropic fabrics, metasedimentary rocks contain subhorizontal stratigraphic layers andsubhorizontally oriented micas grown from clays. Such rocks are expected to have elastic properties withapproximately hexagonal symmetry and a subvertical, slow symmetry axis.
3.1. Rock Types Within Qiangtang
The minerals that are stable at different depths within Qiangtang are determined by rock type, pressure, andtemperature. The rocks within Qiangtang are incompletely known because of limited exhumation butinferred to be predominantly Carboniferous-Jurassic shallow marine clastic rocks overlying a crystalline,chiefly quartzofeldspathic basement derived from underthrust Lhasa block and Songpan-Ganzi block[Kapp et al., 2003; Guynn et al., 2006; Pullen et al., 2010]. Correlated, more deeply exposed, units in the Pamir[Schwab et al., 2004; Schmidt et al., 2011], west of Tibet, underscore the interpretation that Qiangtang ismade of a metasedimentary section overlying crystalline basement. Xenoliths erupted at several localities incentral Qiangtang indicate that the middle crust includes intermediate-mafic granulites (49–56wt % SiO2)and metasedimentary granulites (50–70wt % SiO2) [Deng, 1996; Hacker et al., 2000; Ding et al., 2007]. Thegranulites reached temperatures of 900–1000°C by 28Ma [Ding et al., 2007] and were heated even furtherat 3Ma [Hacker et al., 2000].
Figure 1. Major geologic units and topography of the Tibetan Plateau.Gray line marks 3 km elevation. Gold star marks the location of Figure 6Qiangtang profile and xenolith eruption site; pink star is complementarysite in Qaidam.
Tectonics 10.1002/2014TC003545
HACKER ET AL. ©2014. American Geophysical Union. All Rights Reserved. 2
3.2. Mineralogy Within Qiangtang
Wemodel the mineralogy of Qiangtang using a range of rock types typical of the crust: pelite, wacke, marble,tonalite, and a potassic basalt (Table 1). We calculate the subsolidus mineralogy as a function of pressure andtemperature (PT) using Perple_X [Connolly and Petrini, 2002] and the activity models listed in Table 2. Meltactivity models for crustal rocks have relatively limited applicability, so we interpolate and extrapolate thehypersolidus mineralogy from the results of experiments on pelite, wacke, tonalite, and amphibolite [Vielzeufand Holloway, 1988; Skjerlie and Johnston, 1993; Sen and Dunn, 1994; Rapp and Watson, 1995; Montel andVielzeuf, 1997; Patiño Douce, 2005]. We consider only dehydration melting, excluding the possibility of H2O-saturated melting. Because phase transformations in Earth are inhibited during cooling, such that metastablemineral assemblages are common in rocks, we use the mineral assemblage calculated for 500°C at all lowertemperatures; this is not a significant limitation because the seismic properties of the crust at thesetemperatures are strongly influenced by porosity, which we also ignore.
3.3. Temperature and Pressure Within Qiangtang
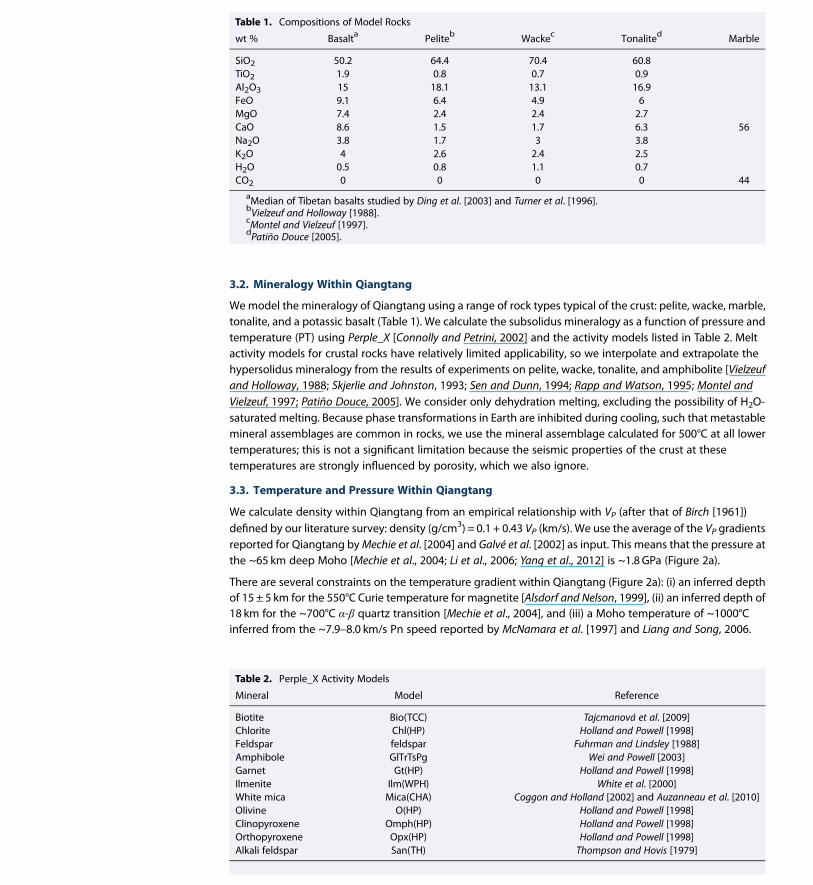
We calculate density within Qiangtang from an empirical relationship with VP (after that of Birch [1961])defined by our literature survey: density (g/cm3) = 0.1 + 0.43 VP (km/s). We use the average of the VP gradientsreported for Qiangtang byMechie et al. [2004] and Galvé et al. [2002] as input. This means that the pressure atthe ~65 km deep Moho [Mechie et al., 2004; Li et al., 2006; Yang et al., 2012] is ~1.8 GPa (Figure 2a).
There are several constraints on the temperature gradient within Qiangtang (Figure 2a): (i) an inferred depthof 15 ± 5 km for the 550°C Curie temperature for magnetite [Alsdorf and Nelson, 1999], (ii) an inferred depth of18 km for the ~700°C α-β quartz transition [Mechie et al., 2004], and (iii) a Moho temperature of ~1000°Cinferred from the ~7.9–8.0 km/s Pn speed reported by McNamara et al. [1997] and Liang and Song, 2006.
Table 2. Perple_X Activity Models
Mineral Model Reference
Biotite Bio(TCC) Tajcmanová et al. [2009]Chlorite Chl(HP) Holland and Powell [1998]Feldspar feldspar Fuhrman and Lindsley [1988]Amphibole GlTrTsPg Wei and Powell [2003]Garnet Gt(HP) Holland and Powell [1998]Ilmenite Ilm(WPH) White et al. [2000]White mica Mica(CHA) Coggon and Holland [2002] and Auzanneau et al. [2010]Olivine O(HP) Holland and Powell [1998]Clinopyroxene Omph(HP) Holland and Powell [1998]Orthopyroxene Opx(HP) Holland and Powell [1998]Alkali feldspar San(TH) Thompson and Hovis [1979]
Table 1. Compositions of Model Rocks
wt % Basalta Peliteb Wackec Tonalited Marble
SiO2 50.2 64.4 70.4 60.8TiO2 1.9 0.8 0.7 0.9Al2O3 15 18.1 13.1 16.9FeO 9.1 6.4 4.9 6MgO 7.4 2.4 2.4 2.7CaO 8.6 1.5 1.7 6.3 56Na2O 3.8 1.7 3 3.8K2O 4 2.6 2.4 2.5H2O 0.5 0.8 1.1 0.7CO2 0 0 0 0 44
aMedian of Tibetan basalts studied by Ding et al. [2003] and Turner et al. [1996].bVielzeuf and Holloway [1988].cMontel and Vielzeuf [1997].dPatiño Douce [2005].
Tectonics 10.1002/2014TC003545
HACKER ET AL. ©2014. American Geophysical Union. All Rights Reserved. 3

Thisis similar to the temperature gradient assumed for Qiangtang in a recent thermal model [Craig et al.,2012] in which the high crustal temperatures are produced by in situ radiogenic heating. Xenoliths erupted incentral Qiangtang provide additional insight into the thermal structure earlier in the Cenozoic. Mineralcompositions indicate equilibration temperatures of ~900–1000°C at 30–40 km depth prior to 28Ma andsubsequent heating to 1100–1200°C by 3Ma [Hacker et al., 2000; Ding et al., 2007]; whether the latter was theresult of magmatic heating alone is unknown.
Three important petrological conclusions derive from this temperature gradient (Figure 2b).
1. The H2O-saturated solidi for crustal rocks [Ebadi and Johannes, 1991; Nichols et al., 1994] are exceeded atdepths of 15–25 km. If the Tibetan crust were being fluxed with H2O, all of it below a depth of ~15–25 kmwould have melted or should still be partially molten; H2O-fluxed melting is generally consideredimplausible, however, because of the sheer amount of H2O required.
2. The mica-dehydration solidi for crustal rocks are exceeded by the model geotherm at depths>~20–30km,requiring that dehydration melting either has taken place or is taking place in the middle to lower crust.
0
10
20
30
40
50
60
70
6004002000 800 1000 1200 1400
temperature (oC)
magnetite Curie temperature(Alsdorf & Nelson, 1999)
α−β quartz transition in N Lhasa(Mechie et al., 2004)
α−β quartz transition in Qiangtang(Mechie et al., 2004)
α−βquartz
mid-crustal xenoliths eruptedin central Qiangtang(Hacker et al., 2000)
Mohouppermost mantle Pn
McNamara et al. (1997)
thermal gradient
1.8
1.6
1.4
1.2
1.0
0.8
0.6
0.4
0.2
0.0
pres
sure
(G
Pa) depth (km
)
0
10
20
30
40
50
60
70
6004002000 800 1000 1200 1400
temperature (oC)
1.8
1.6
1.4
1.2
1.0
0.8
0.6
0.4
0.2
0.0
pres
sure
(G
Pa) depth (km
)
α−βquartz
Moho
thermal gradient
H2O-saturated solidusof crustal rocks
upper thermalstability ofF-free micain pelite, wacke,mica schist &tonalite
upper thermalstability of
F-Ti-mica
wacke
pelitem
uscoviteschist
muscovite
sh
melt+
mica
melt+
less mica
dehydration solidiof crustal rocks
b
a
Figure 2. (a) The temperature (pink) beneath the central Tibetan Plateau is constrained by the surface temperature, thedepth of the Curie temperature for magnetite (yellow) inferred from satellite magnetic measurements, the depth of theα-β quartz transition (navy) inferred from Poisson’s ratios [Mechie et al., 2004], the PT equilibration conditions of xenoliths(cyan), and Pn wave speeds (brown). (b) The temperature exceeds the solidi (solid green lines) for crustal rocks [Vielzeuf andMontel, 1994; Patiño Douce and Beard, 1995; Patiño Douce and McCarthy, 1998; Patiño Douce, 2005] beyond depths of20–30 km, implying the presence or former presence of melt in the middle to deep crust. Micas remain stable to ~1000°C incrustal rocks (dashed green lines) and considerably higher if they contain fluorine and titanium [Dooley and Patino Douce,1996], like the Tibetan xenoliths, implying the presence of mica in the middle to deep crust.
Tectonics 10.1002/2014TC003545
HACKER ET AL. ©2014. American Geophysical Union. All Rights Reserved. 4
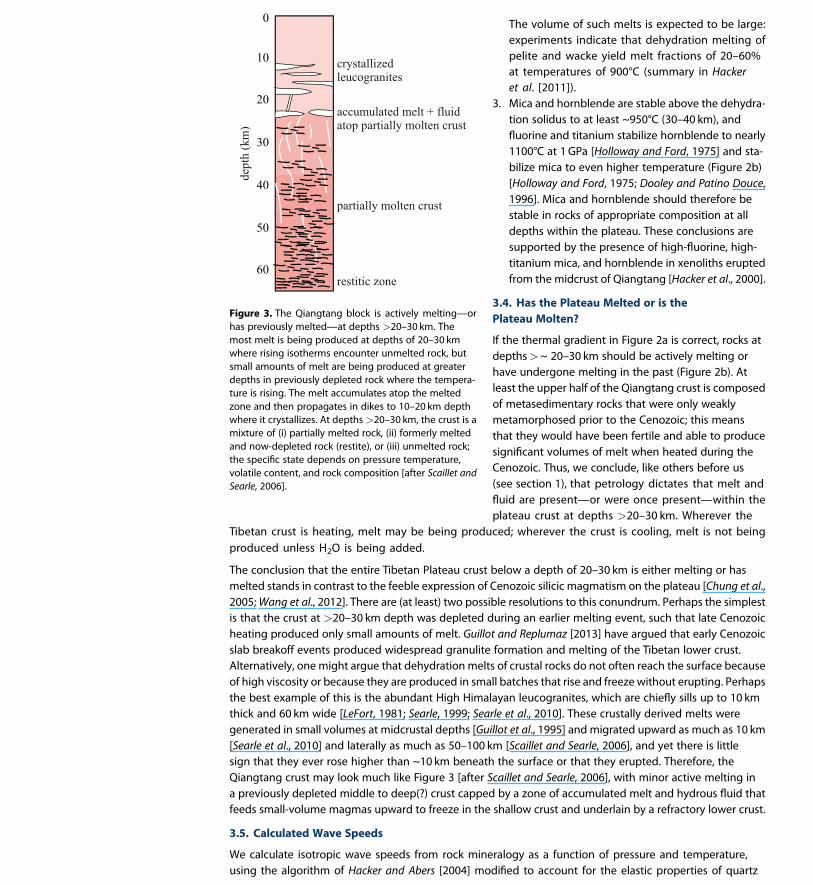
The volume of such melts is expected to be large:experiments indicate that dehydration melting ofpelite and wacke yield melt fractions of 20–60%at temperatures of 900°C (summary in Hackeret al. [2011]).
3. Mica and hornblende are stable above the dehydra-tion solidus to at least ~950°C (30–40 km), andfluorine and titanium stabilize hornblende to nearly1100°C at 1GPa [Holloway and Ford, 1975] and sta-bilize mica to even higher temperature (Figure 2b)[Holloway and Ford, 1975; Dooley and Patino Douce,1996]. Mica and hornblende should therefore bestable in rocks of appropriate composition at alldepths within the plateau. These conclusions aresupported by the presence of high-fluorine, high-titanium mica, and hornblende in xenoliths eruptedfrom the midcrust of Qiangtang [Hacker et al., 2000].
3.4. Has the Plateau Melted or is thePlateau Molten?
If the thermal gradient in Figure 2a is correct, rocks atdepths>~ 20–30 km should be actively melting orhave undergone melting in the past (Figure 2b). Atleast the upper half of the Qiangtang crust is composedof metasedimentary rocks that were only weaklymetamorphosed prior to the Cenozoic; this meansthat they would have been fertile and able to producesignificant volumes of melt when heated during theCenozoic. Thus, we conclude, like others before us(see section 1), that petrology dictates that melt andfluid are present—or were once present—within theplateau crust at depths >20–30 km. Wherever the
Tibetan crust is heating, melt may be being produced; wherever the crust is cooling, melt is not beingproduced unless H2O is being added.
The conclusion that the entire Tibetan Plateau crust below a depth of 20–30 km is either melting or hasmelted stands in contrast to the feeble expression of Cenozoic silicic magmatism on the plateau [Chung et al.,2005;Wang et al., 2012]. There are (at least) two possible resolutions to this conundrum. Perhaps the simplestis that the crust at >20–30 km depth was depleted during an earlier melting event, such that late Cenozoicheating produced only small amounts of melt. Guillot and Replumaz [2013] have argued that early Cenozoicslab breakoff events produced widespread granulite formation and melting of the Tibetan lower crust.Alternatively, one might argue that dehydration melts of crustal rocks do not often reach the surface becauseof high viscosity or because they are produced in small batches that rise and freeze without erupting. Perhapsthe best example of this is the abundant High Himalayan leucogranites, which are chiefly sills up to 10 kmthick and 60 km wide [LeFort, 1981; Searle, 1999; Searle et al., 2010]. These crustally derived melts weregenerated in small volumes at midcrustal depths [Guillot et al., 1995] and migrated upward as much as 10 km[Searle et al., 2010] and laterally as much as 50–100 km [Scaillet and Searle, 2006], and yet there is littlesign that they ever rose higher than ~10 km beneath the surface or that they erupted. Therefore, theQiangtang crust may look much like Figure 3 [after Scaillet and Searle, 2006], with minor active melting ina previously depleted middle to deep(?) crust capped by a zone of accumulated melt and hydrous fluid thatfeeds small-volume magmas upward to freeze in the shallow crust and underlain by a refractory lower crust.
3.5. Calculated Wave Speeds
We calculate isotropic wave speeds from rock mineralogy as a function of pressure and temperature,using the algorithm of Hacker and Abers [2004] modified to account for the elastic properties of quartz
Figure 3. The Qiangtang block is actively melting—orhas previously melted—at depths >20–30 km. Themost melt is being produced at depths of 20–30 kmwhere rising isotherms encounter unmelted rock, butsmall amounts of melt are being produced at greaterdepths in previously depleted rock where the tempera-ture is rising. The melt accumulates atop the meltedzone and then propagates in dikes to 10–20 km depthwhere it crystallizes. At depths >20–30 km, the crust is amixture of (i) partially melted rock, (ii) formerly meltedand now-depleted rock (restite), or (iii) unmelted rock;the specific state depends on pressure temperature,volatile content, and rock composition [after Scaillet andSearle, 2006].
Tectonics 10.1002/2014TC003545
HACKER ET AL. ©2014. American Geophysical Union. All Rights Reserved. 5
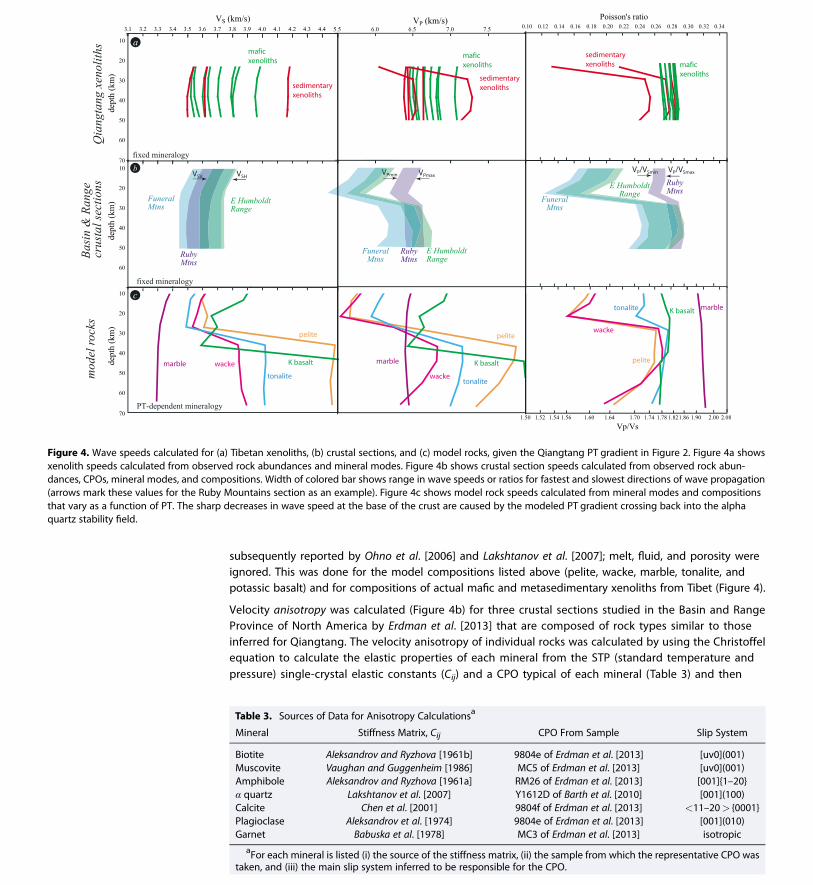
subsequently reported by Ohno et al. [2006] and Lakshtanov et al. [2007]; melt, fluid, and porosity wereignored. This was done for the model compositions listed above (pelite, wacke, marble, tonalite, andpotassic basalt) and for compositions of actual mafic and metasedimentary xenoliths from Tibet (Figure 4).
Velocity anisotropy was calculated (Figure 4b) for three crustal sections studied in the Basin and RangeProvince of North America by Erdman et al. [2013] that are composed of rock types similar to thoseinferred for Qiangtang. The velocity anisotropy of individual rocks was calculated by using the Christoffelequation to calculate the elastic properties of each mineral from the STP (standard temperature andpressure) single-crystal elastic constants (Cij) and a CPO typical of each mineral (Table 3) and then
Figure 4. Wave speeds calculated for (a) Tibetan xenoliths, (b) crustal sections, and (c) model rocks, given the Qiangtang PT gradient in Figure 2. Figure 4a showsxenolith speeds calculated from observed rock abundances and mineral modes. Figure 4b shows crustal section speeds calculated from observed rock abun-dances, CPOs, mineral modes, and compositions. Width of colored bar shows range in wave speeds or ratios for fastest and slowest directions of wave propagation(arrows mark these values for the Ruby Mountains section as an example). Figure 4c shows model rock speeds calculated from mineral modes and compositionsthat vary as a function of PT. The sharp decreases in wave speed at the base of the crust are caused by the modeled PT gradient crossing back into the alphaquartz stability field.
Table 3. Sources of Data for Anisotropy Calculationsa
Mineral Stiffness Matrix, Cij CPO From Sample Slip System
Biotite Aleksandrov and Ryzhova [1961b] 9804e of Erdman et al. [2013] [uv0](001)Muscovite Vaughan and Guggenheim [1986] MC5 of Erdman et al. [2013] [uv0](001)Amphibole Aleksandrov and Ryzhova [1961a] RM26 of Erdman et al. [2013] [001]{1–20}α quartz Lakshtanov et al. [2007] Y1612D of Barth et al. [2010] [001](100)Calcite Chen et al. [2001] 9804f of Erdman et al. [2013] <11–20> {0001}Plagioclase Aleksandrov et al. [1974] 9804e of Erdman et al. [2013] [001](010)Garnet Babuska et al. [1978] MC3 of Erdman et al. [2013] isotropic
aFor each mineral is listed (i) the source of the stiffness matrix, (ii) the sample from which the representative CPO wastaken, and (iii) the main slip system inferred to be responsible for the CPO.
Tectonics 10.1002/2014TC003545
HACKER ET AL. ©2014. American Geophysical Union. All Rights Reserved. 6
computing a Voigt-Reuss-Hill average of the elastic properties of the minerals in proportion to theirmodal abundance. This STP anisotropy was then scaled to high P and T using the ratio of the isotropicSTP and isotropic high-PT values calculated via Hacker and Abers. It would be preferable to use high-pressure and high-temperature Cij, but these are not available for any of the minerals of interest. Theanisotropy of the crustal section was computed by averaging the individual rock Cij in proportion to rockabundance [Erdman et al., 2013].
Note that only the mineralogy of the model rock types (Figure 4c) was allowed to vary as a function ofPT. This has the advantage that the computed wave speeds reflect thermodynamic equilibrium at PTbut the disadvantage that the Tibetan crust is not composed of single rock types; interpolation amongthe different compositions is therefore required. In contrast, the observed mineral modes andcompositions of the Qiangtang xenoliths (Figure 4a) and the Basin and Range sections (Figure 4b) wereheld invariant at all PT. This has the advantage that the computed wave speeds reflect actual xenolithsfrom the Tibetan middle crust and actual lithologically diverse crustal sections, but the disadvantagethat the calculated wave speeds are likely only to match a limited PT range; extrapolation to other PT isrequired. Because the Qiangtang metasedimentary xenoliths have had considerable melt extraction—and aretherefore fast, even though felsic [Hacker et al., 2000]—whereas the Basin and Range crustal sectionshave had minimal melt extracted, one would expect that the xenoliths might be a better fit to theTibetan middle to lower crust and that the crustal sections might be a better fit to the upper crust. Wavespeeds were not calculated for the upper 10 km because the seismic properties of the uppermost crustare strongly influenced by porosity.
4. Comparison of Calculated and Observed Wave Speeds4.1. Observed S Wave Speeds
Many VS measurements have been reported for the Tibetan crust. Each of these data sets can be consideredindividually, but to make a uniform map of VS across Tibet, we combine the recent models of crustal VSVacross all of Tibet by Yang et al. [2012] and of VSV, VSH, and VS across eastern Tibet by Xie et al. [2013] (Figure 5).From this we construct maps of the estimated isotropic shear wave speed and the amplitude of shear waveradial anisotropy ((VSH � VSV)/VS) at 30 km depth in the middle crust across all of Tibet (Figures 5d–5f). Thesemaps are then used to constrain the spatial variation of shear velocity structure in the middle crust and toidentify a typical crustal shear velocity profile.
Yang et al. [2012] applied standard ambient noise data processing procedures [e.g., Bensen et al., 2007;Yang et al., 2010] to continuous vertical component data recorded at about 600 stations in Tibet andsurrounding areas. They used data from 2003 to 2009 to produce ~50,000 high-quality interstationRayleigh wave cross correlations on which phase-velocity measurements between 8 and 65 s periodwere obtained. These data resulted in a crustal VSV model across all of Tibet and parts of thesurrounding region.
Most surface wave studies of Tibet have been based exclusively on Rayleigh waves and therefore oninferred VSV. It is preferable, however, to investigate the likelihood of partial melt in the Tibetanmiddle crust using isotropic shear wave speed, VS, rather than VSV for two reasons. (1) Partial melt—if itexists—should produce a signature visible in VSV and VSH, and thus VS; slow VSV could be produced byfeatures other than melt—such as subhorizontal mica. (2) VSV determined from Rayleigh waves alonetends to be affected by vertical oscillations; the introduction of Love waves not only allows for thesimultaneous estimation of VSH (and therefore VS) but also stabilizes the inference of VSV by making itless prone to vertical oscillations. The simultaneous observation of VSV and VSH also allows estimation ofradial anisotropy—complementary evidence to constrain the physical state of the middle crust.
Xie et al. [2013] extended the analysis of Yang et al. [2012] to Love waves and produced Love wavephase speed measurements from 8 to 44 s period. Because Love waves are generally harder toobserve than Rayleigh waves, the study of Xie et al. was restricted to the area of good stationcoverage in eastern Tibet—a subset of the region studied by Yang et al. In eastern Tibet, Xie et al.produced a model of both VSV and VSH and computed isotropic shear wave speed, VS, via a Voigtaverage: VS = ((2 VSV
2 + VSH2)/3)1/2 [e.g., Babuška and Cara, 1991].
Tectonics 10.1002/2014TC003545
HACKER ET AL. ©2014. American Geophysical Union. All Rights Reserved. 7
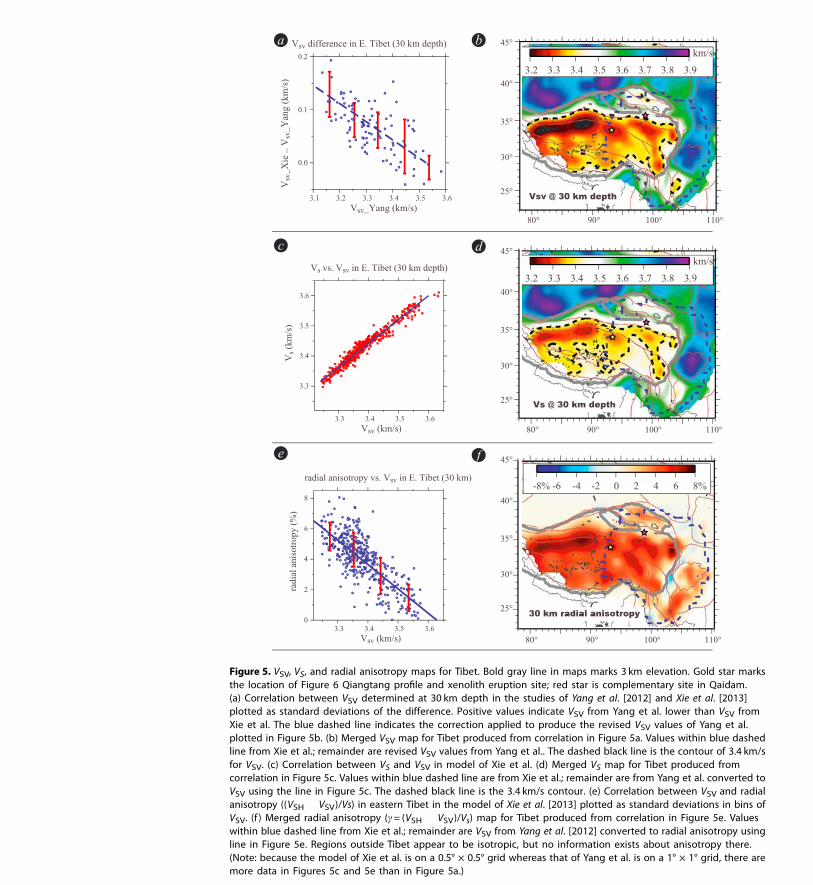
Figure 5. VSV, VS, and radial anisotropy maps for Tibet. Bold gray line in maps marks 3 km elevation. Gold star marksthe location of Figure 6 Qiangtang profile and xenolith eruption site; red star is complementary site in Qaidam.(a) Correlation between VSV determined at 30 km depth in the studies of Yang et al. [2012] and Xie et al. [2013]plotted as standard deviations of the difference. Positive values indicate VSV from Yang et al. lower than VSV fromXie et al. The blue dashed line indicates the correction applied to produce the revised VSV values of Yang et al.plotted in Figure 5b. (b) Merged VSV map for Tibet produced from correlation in Figure 5a. Values within blue dashedline from Xie et al.; remainder are revised VSV values from Yang et al.. The dashed black line is the contour of 3.4 km/sfor VSV. (c) Correlation between VS and VSV in model of Xie et al. (d) Merged VS map for Tibet produced fromcorrelation in Figure 5c. Values within blue dashed line are from Xie et al.; remainder are from Yang et al. converted toVSV using the line in Figure 5c. The dashed black line is the 3.4 km/s contour. (e) Correlation between VSV and radialanisotropy ((VSH � VSV)/Vs) in eastern Tibet in the model of Xie et al. [2013] plotted as standard deviations in bins ofVSV. (f ) Merged radial anisotropy (γ= (VSH � VSV)/Vs) map for Tibet produced from correlation in Figure 5e. Valueswithin blue dashed line from Xie et al.; remainder are VSV from Yang et al. [2012] converted to radial anisotropy usingline in Figure 5e. Regions outside Tibet appear to be isotropic, but no information exists about anisotropy there.(Note: because the model of Xie et al. is on a 0.5° × 0.5° grid whereas that of Yang et al. is on a 1° × 1° grid, there aremore data in Figures 5c and 5e than in Figure 5a.)
Tectonics 10.1002/2014TC003545
HACKER ET AL. ©2014. American Geophysical Union. All Rights Reserved. 8
4.2. Merging the Yang Et Al. and Xie Et Al. Models
Because the VSV models of Yang et al. and Xie et al. overlap in eastern Tibet, a straightforward comparison ofboth is possible. Figure 5a summarizes this comparison, presenting the average difference (and standarddeviations) between VSV in the two models at 30 km depth across eastern Tibet. The difference between themodels is largest for the slowest VSV and reduces approximately linearly for larger VSV, such that there is nodifference above 3.53 km/s. Thus, to reconcile the Yang et al. and Xie et al. models for eastern Tibet, acorrection must be applied to the model of Yang et al. In principle, such a correction could be applied at allcrustal depths, but this is difficult because of differences in crustal thicknesses and variations in sedimentarycover. For this reason, we correct Yang et al.’s model only at 30 km depth and consider the variability in crustalstructure across Tibet only at this depth. Assuming that this difference in VSV between the models existsacross all of Tibet, we produce a single VSV model for all of Tibet at 30 km depth (Figure 5b) by subtractingthe value from the fit line in Figure 5a to the VSV model of Yang et al. and combine this with the VSVmodel of Xie et al. to achieve the result presented in Figure 5b. The average value of VSV within the 3.4 km/scontour (dashed black line) is 3.31 km/s, with a minimum of 3.13 km/s in the northern Qiangtang terraneof western Tibet.
4.3. Converting From VSV to VS
As noted above, VS is preferable to VSV when assessing whether slow wave speeds might result from partialmelt. VS and VSV are well correlated in the model of Xie et al. for eastern Tibet (Figure 5c). If we assumethat this linear relationship also holds across western Tibet, we can use the revised VSV from Yang et al.’smodel to calculate VS in western Tibet. When merged with the VS model of Xie et al. in eastern Tibet, weobtain a model of VS at 30 km depth across all of Tibet (Figure 5d). The average value of VS in Tibet (within thedashed black contour in Figure 5b) is 3.37 km/s, with values ranging between 3.22 km/s and 3.46 km/s.
4.4. Radial Anisotropy
There is also a correlation between VSV and radial anisotropy, γ= (VSH� VSV)/VS, at 30 km depth in the Xie et al.model across eastern Tibet (Figure 5e). Assuming again that this correlation holds in western Tibet, weestimatemidcrustal radial anisotropy (Figure 5f) by converting the revised VSV values at 30 km depth from themodel of Yang et al. to radial anisotropy and merging them with estimates of radial anisotropy from Xie et al.Radial anisotropy at 30 km depth is fairly homogeneous across Tibet, with an average of 5.1% and valuesranging between ~1% and 8%; the larger values are in western Tibet.
4.5. Summary of the New VS and Anisotropy Model of Tibet
There are three robust large-scale features of isotropic shear velocity VS and radial anisotropy at 30 km depthworthy of note (Figures 5d and 5f). (1) Midcrustal VS is slower across all of Tibet than in surrounding areas:much of Tibet, shown by the dashed black line in Figure 5d, has VS below 3.4 km/s. (2) VS is slower on averagein western than in eastern Tibet. (3) Radial anisotropy is stronger in western than eastern Tibet. (4) A fourthobservation is less robust: the slowest midcrustal VS values (as low as 3.22 km/s) and strongest radialanisotropy (as strong as 8%) lie in northwestern Tibet in the Qiangtang terrane, south of the Tarim Basin.However, as discussed by Yang et al., this area is the least well-resolved part of Tibet and this feature has largeruncertainties than others across the map. Further observational efforts are needed to confirm or falsifythese values.
4.6. Typical S Wave Speed Profile for Tibet
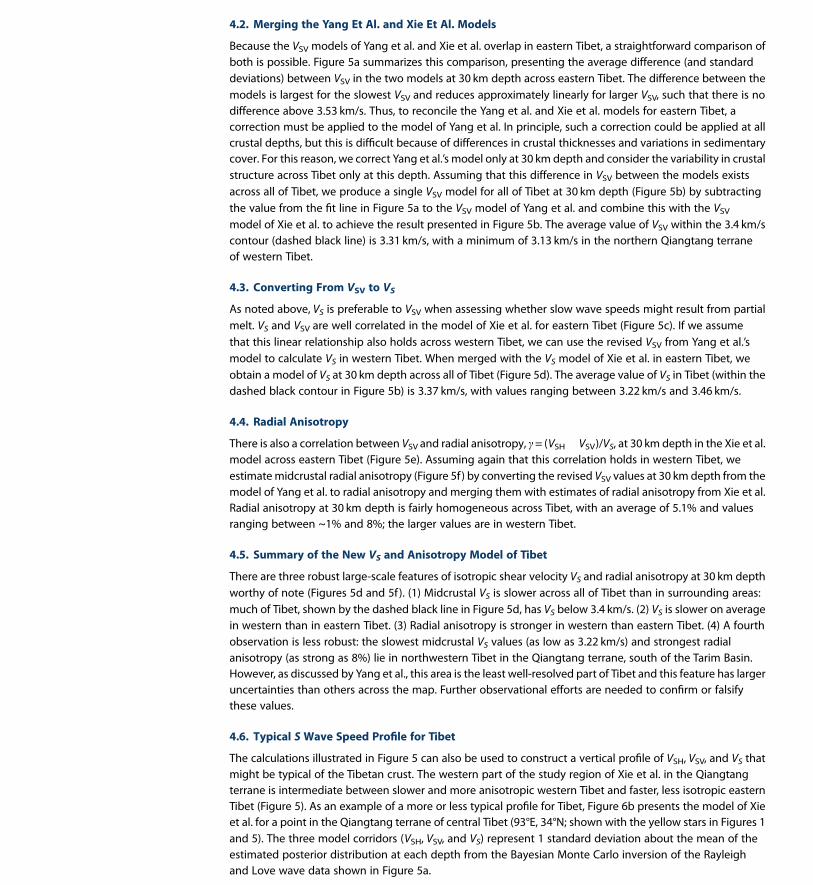
The calculations illustrated in Figure 5 can also be used to construct a vertical profile of VSH, VSV, and VS thatmight be typical of the Tibetan crust. The western part of the study region of Xie et al. in the Qiangtangterrane is intermediate between slower and more anisotropic western Tibet and faster, less isotropic easternTibet (Figure 5). As an example of a more or less typical profile for Tibet, Figure 6b presents the model of Xieet al. for a point in the Qiangtang terrane of central Tibet (93°E, 34°N; shown with the yellow stars in Figures 1and 5). The three model corridors (VSH, VSV, and VS) represent 1 standard deviation about the mean of theestimated posterior distribution at each depth from the Bayesian Monte Carlo inversion of the Rayleighand Love wave data shown in Figure 5a.
Tectonics 10.1002/2014TC003545
HACKER ET AL. ©2014. American Geophysical Union. All Rights Reserved. 9
A midcrustal low-velocity zone is evident in VSV but not in VSH at this point, a feature that is common acrossTibet. At 30 km depth at this location, the mean VSV is ~3.25 km/s, whereas it is ~3.47 km/s for VSH and3.32 km/s for Vs. Radial anisotropy at this point is ~6.6%. Although this is slightly slower and more anisotropicthan average across Tibet, we use this as a typical profile for Tibet because this location is near the eruptionsite of the xenoliths studied by Hacker et al. [2000] and presented in Figure 4.
In closing, the radial anisotropy shown in Figure 6b that we take as more or less typical for Tibet is quitestrong. It is clear from this that before interpreting shear wave speeds in terms of the potential existence ofpartial melt, one must first clarify which shear wave speed is to be cited. We focus interpretation on Vs, theisotropic shear wave speed, which is intermediate between VSH and VSV, and not on VSV as so many otherstudies have done previously.
4.7. Comparison of Calculated and Observed Wave Speeds
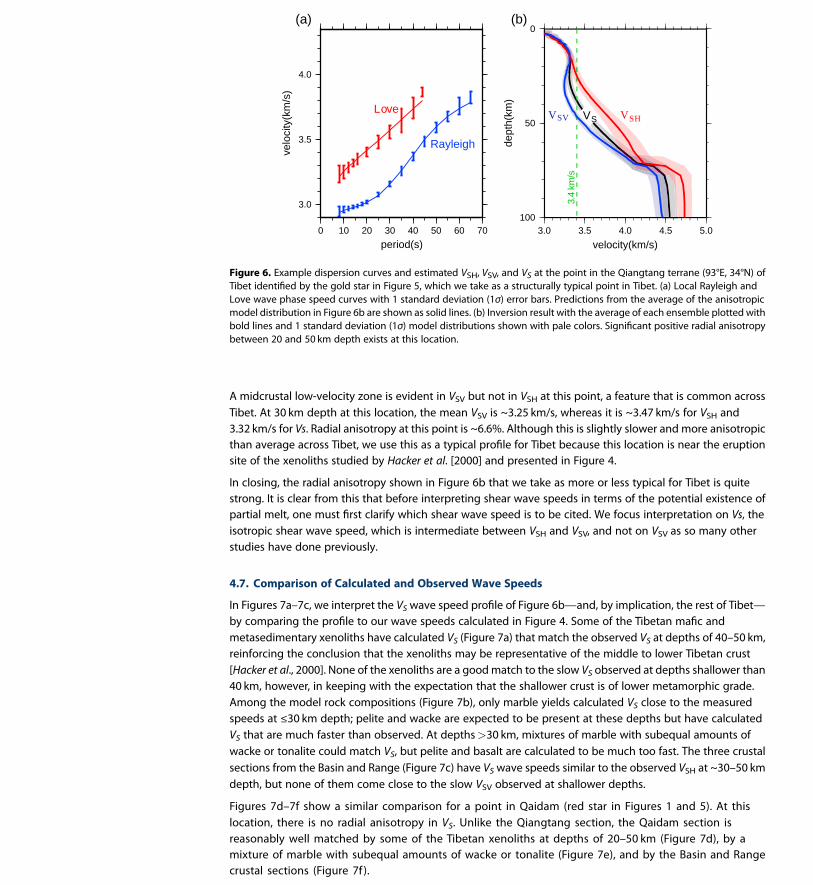
In Figures 7a–7c, we interpret the VSwave speed profile of Figure 6b—and, by implication, the rest of Tibet—by comparing the profile to our wave speeds calculated in Figure 4. Some of the Tibetan mafic andmetasedimentary xenoliths have calculated VS (Figure 7a) that match the observed VS at depths of 40–50 km,reinforcing the conclusion that the xenoliths may be representative of the middle to lower Tibetan crust[Hacker et al., 2000]. None of the xenoliths are a goodmatch to the slow VS observed at depths shallower than40 km, however, in keeping with the expectation that the shallower crust is of lower metamorphic grade.Among the model rock compositions (Figure 7b), only marble yields calculated VS close to the measuredspeeds at ≤30 km depth; pelite and wacke are expected to be present at these depths but have calculatedVS that are much faster than observed. At depths>30 km, mixtures of marble with subequal amounts ofwacke or tonalite could match VS, but pelite and basalt are calculated to be much too fast. The three crustalsections from the Basin and Range (Figure 7c) have VSwave speeds similar to the observed VSH at ~30–50 kmdepth, but none of them come close to the slow VSV observed at shallower depths.
Figures 7d–7f show a similar comparison for a point in Qaidam (red star in Figures 1 and 5). At thislocation, there is no radial anisotropy in VS. Unlike the Qiangtang section, the Qaidam section isreasonably well matched by some of the Tibetan xenoliths at depths of 20–50 km (Figure 7d), by amixture of marble with subequal amounts of wacke or tonalite (Figure 7e), and by the Basin and Rangecrustal sections (Figure 7f).
3.0
3.5
4.0
velo
city
(km
/s)
0 10 20 30 40 50 60 70
period(s)
Rayleigh
Love
0
50
100
dept
h(km
)
3.0 3.5 4.0 4.5 5.0
velocity(km/s)
VSV VSH
(a) (b)
3.4
km/s
VS
Figure 6. Example dispersion curves and estimated VSH, VSV, and VS at the point in the Qiangtang terrane (93°E, 34°N) ofTibet identified by the gold star in Figure 5, which we take as a structurally typical point in Tibet. (a) Local Rayleigh andLove wave phase speed curves with 1 standard deviation (1σ) error bars. Predictions from the average of the anisotropicmodel distribution in Figure 6b are shown as solid lines. (b) Inversion result with the average of each ensemble plotted withbold lines and 1 standard deviation (1σ) model distributions shown with pale colors. Significant positive radial anisotropybetween 20 and 50 km depth exists at this location.
Tectonics 10.1002/2014TC003545
HACKER ET AL. ©2014. American Geophysical Union. All Rights Reserved. 10
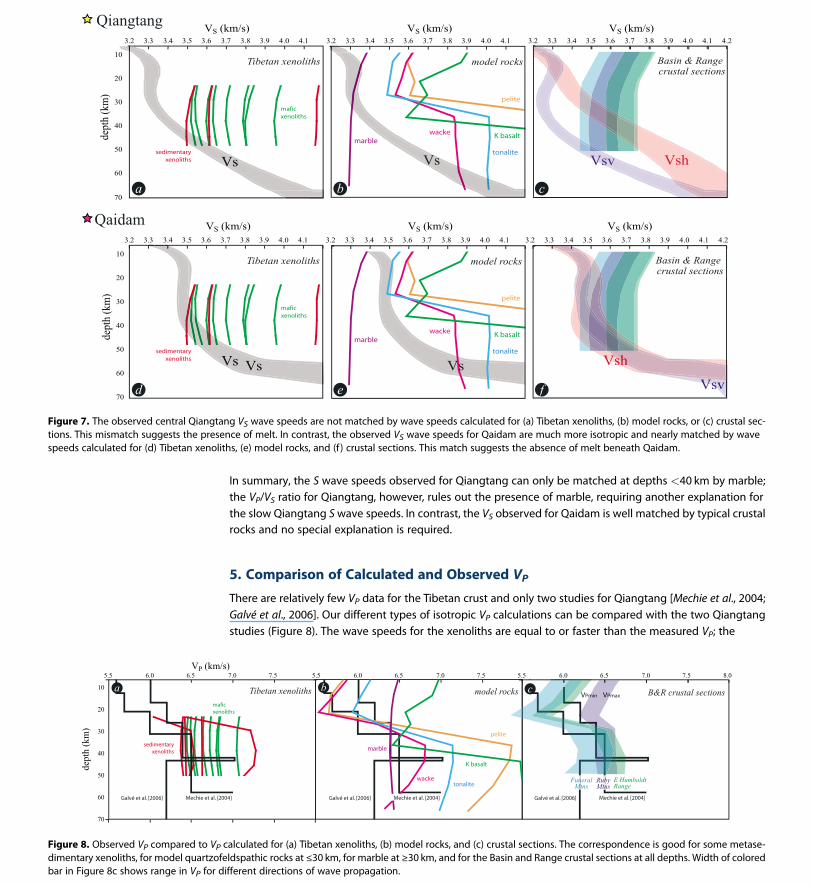
In summary, the S wave speeds observed for Qiangtang can only be matched at depths <40 km by marble;the VP/VS ratio for Qiangtang, however, rules out the presence of marble, requiring another explanation forthe slow Qiangtang Swave speeds. In contrast, the VS observed for Qaidam is well matched by typical crustalrocks and no special explanation is required.
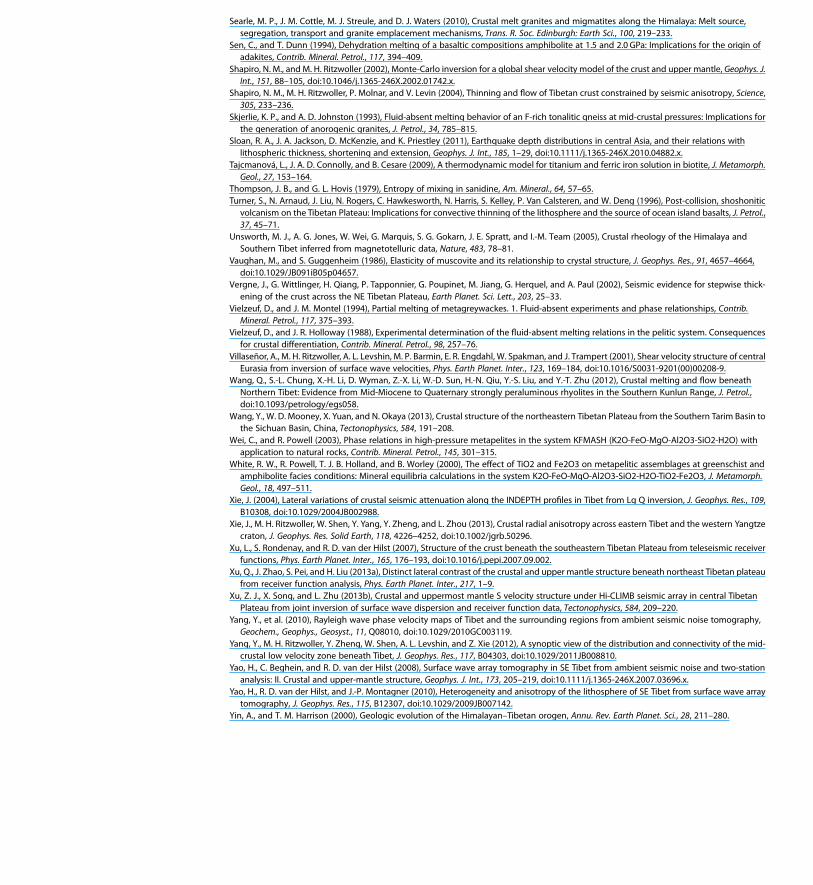
5. Comparison of Calculated and Observed VPThere are relatively few VP data for the Tibetan crust and only two studies for Qiangtang [Mechie et al., 2004;Galvé et al., 2006]. Our different types of isotropic VP calculations can be compared with the two Qiangtangstudies (Figure 8). The wave speeds for the xenoliths are equal to or faster than the measured VP; the
Figure 8. Observed VP compared to VP calculated for (a) Tibetan xenoliths, (b) model rocks, and (c) crustal sections. The correspondence is good for some metase-dimentary xenoliths, for model quartzofeldspathic rocks at ≤30 km, for marble at ≥30 km, and for the Basin and Range crustal sections at all depths. Width of coloredbar in Figure 8c shows range in VP for different directions of wave propagation.
Figure 7. The observed central Qiangtang VS wave speeds are not matched by wave speeds calculated for (a) Tibetan xenoliths, (b) model rocks, or (c) crustal sec-tions. This mismatch suggests the presence of melt. In contrast, the observed VS wave speeds for Qaidam are much more isotropic and nearly matched by wavespeeds calculated for (d) Tibetan xenoliths, (e) model rocks, and (f ) crustal sections. This match suggests the absence of melt beneath Qaidam.
Tectonics 10.1002/2014TC003545
HACKER ET AL. ©2014. American Geophysical Union. All Rights Reserved. 11

metasedimentary xenoliths are a better fit, commensurate with a metasedimentary crust (Figure 8a). Amongthe model rock compositions, any one of the quartzofeldspathic rocks is a good match for the upper 30 km,and marble is a good match for depths ≥30 km (Figure 8b), although marble combined with any other rocktype is not. For the Basin and Range crustal sections (Figure 8c shows the anisotropy in VP), both of the quartz-rich Funeral Mountains and E Humboldt Range sections are a good match to the observed VP gradients,including the VP minimum at the α-β quartz transition just above 20 km depth. In summary, the isotropic VPobserved for Qiangtang can be reasonably matched by some combination of marble, wacke, and tonalite;pelite and basalt could be present, but only in minor amounts.
6. Comparison of Calculated and Observed VP/VS and Poisson’s Ratio
VP/VS can also be a good means by which to assess the composition of the crust, particularly because of theunusual elastic properties of quartz. The data set for VP/VS ratios from Qiangtang is relatively meager,however, and consists mostly of average values of 1.73–1.78 for the entire crust [Owens and Zandt, 1997;Vergne et al., 2002; Jiang et al., 2006; Xu et al., 2013a]; these values are more consistent with a quartz-dominated crust than a mafic crust, but only just (Figure 4). Figure 9 shows VP/VS for Qiangtang from Mechieet al. [2004]. The upper crust has such a low VP/VS (1.67) that it must contain quartz-rich rocks like the FuneralMountains or the East Humboldt Range (about 35% and 45% quartz, respectively). The high VP/VS observed inthe Qiangtang middle to lower crust (1.84) is similar to the carbonate-dominated Ruby Mountains section(only 11 vol % quartz in that section), similar to the basalt and tonalite model rocks and similar to the maficQiangtang xenoliths. The marked jump in observed VP/VS ratios at ~20 km depth is similar in magnitude tothat produced by the α-β quartz transition for calculated VP/VS ratios. In summary, the isotropic VP/VSobserved for Qiangtang can be reasonably matched by typical quartz-rich crustal rocks.
7. Petrology and Wave Speeds in Central Tibet Indicate a Partially MeltedMica-Bearing Crust
Comparison of observed and calculated VP, VS, and VP/VS for Qiangtang reveals that the wave speeds fromQiangtang are difficult to explain with melt-free and fluid-free crustal rock types. In particular—and
Figure 9. Observed VP/VS compared to VP/VS calculated for Tibetan xenoliths, model rocks, and crustal sections. The lowVP/VS at ~20 km depth requires the presence of quartz-rich metasedimentary rock. Xenolith and crustal section speedscalculated from observed rock abundances, CPOs, mineral modes and compositions. Width of colored bar for crustal sec-tions shows range in VP/VS for different directions of wave propagation. Model rock mineral modes and compositions varyas a function of PT.
Tectonics 10.1002/2014TC003545
HACKER ET AL. ©2014. American Geophysical Union. All Rights Reserved. 12

remarkably—none of the calculated wavespeeds match the observed isotropic VS and
VSV that are slower than 3.5 km/s. Thisholds for (i) Tibetan xenoliths (Figure 7a),(ii) model rock types (Figure 7b), and(iii) Basin and Range crustal sections—andeven includes anisotropy in the Basin andRange crustal sections (Figure 7c). Simply put,there is no reasonable solid isotropic oranisotropic geological material known to usthat can explain the slow VS and VSV thatare characteristic of the Qiangtang crust.Importantly, the slow speed is seen only inthe VSV determined from Rayleigh waves andnot in the VSH or Love wave component ofradial anisotropy [Shapiro et al., 2004].
The wave speeds and the radial anisotropyobserved can be explained if the crust ofQiangtang contains a few percent partialmelt and subhorizontally oriented mica.Imagine a 65 km thick crustal section inwhich VS increases monotonicallydownward from ~3.1 km/s to ~4.1 km/s(Figure 10a). If this section containssubhorizontally oriented mica, the Basinand Range sections (Figure 7c) [Erdmanet al., 2013] tell us that VSV can be less thanVSH by up to 10% (Figure 10b). For instance,at a depth of 25–35 km, VSV mightbe ~3.35 km/s and VSH might be 3.6 km/s(Figure 10b). Subhorizontally oriented micain the Tibetan crust is exactly what isexpected for a subhorizontally layeredsedimentary section like that in Qiangtang.Even in the absence of deformation, themicas will be oriented subhorizontally.Radial anisotropy is also, therefore, exactlywhat is expected in a sedimentary section,and may have no relevance to, or meaningfor interpreting, strain within the plateau.
Imagine now a small amount of partial meltwithin the Qiangtang middle crust. We seekto explain a reduction in VSV at 25–35 kmdepth from ~3.35 km/s to 3.25 km/s(Figure 7)—i.e., a reduction of ~3%.Following Schmeling [1985], we calculatethe effect of melt on VS and VP using the
parameters in Table 4. For small melt fractions, all combinations of rocks and melts in Table 1show similar reductions in wave speed for different melt geometries (Figure 11). A small amount ofpartial melt—less than 2% if the melt is in tubes—is sufficient to produce a 3% reduction in VS.The effect on VP is slightly smaller (Figure 11)—and that on VP/VS smaller still—and would enable abetter correspondence between the observed and calculated VP (Figure 8) and VP/VS (Figure 9).
Figure 10. The observed radial anisotropy and slow VS forQiangtang can be explained by a subhorizontally foliated,mica-bearing crustal section with partial melt. (a) VS for ahypothetical crustal section. (b) The addition of mica producesup to 10% radial anisotropy. (c) The addition of melt reducesthe VSV and VSH to the slow speeds observed in the middlecrust of the Tibetan Plateau.
Tectonics 10.1002/2014TC003545
HACKER ET AL. ©2014. American Geophysical Union. All Rights Reserved. 13

8. Conclusions
The Qiangtang block of the central Tibetan Plateau is characterized by S wave speeds as slow as 3.3 km/sat depths from 20–25 km to 45–50 km. Satellite magnetic measurements, VP/VS ratios, and metamorphictemperatures of xenoliths suggest that the Qiangtang crust is hotter than the mica-dehydrationsolidi for crustal rocks at depths ≥20 km, permitting that the Qiangtang middle to lower crust iscurrently or formerly partially molten. The presence of 2% partial melt is sufficient to explain the slowobserved S wave speeds.
The Qiangtang block is also characterized by S wave radial anisotropy of at least 4% (VSH> VSV) withstronger anisotropy in the west than the east; because estimates of radial anisotropy have beenmade assuming hexagonal symmetry with a vertical unique slow axis, the intrinsic anisotropy is likelyto be higher. The presence of mica in Qiangtang xenoliths reinforces the fact that fluorine andtitanium stabilize mica to temperatures well above the solidi, permitting that the Qiangtang lowercrust, though currently or formerly partially molten, still contains mica. These micas, expected to besubhorizontally oriented either because of sedimentation or strain, are sufficient to explain theobserved anisotropy. Thus, wave speeds and VP/VS ratios in the middle to deep crust of central Tibetare best explained by a partially melted, mica-bearing middle to lower crust with a subhorizontalto gently dipping foliation.
Table 4. Physical Properties for Calculating the Effect of Melt on VP and VSa
Rock ρ, Density (kg/m3) K, Bulk Modulus (GPa) G, Shear Modulus (GPa)
Pelite 3170 107 60Wacke 2890 81 42Tonalite 3080 92 49Andesite melt 2480 17 0Rhyolite melt 2330 14 0
aThe properties of rocks are for those in Table 1 at 1GPa and 1000°C. The properties for melts are extrapolated to1000°C and 1 atm using data in Rivers and Carmichael [1987]; it was assumed that ρ/K and ρ/G are identical at 1 atmand 1GPa. (These approximations or even the rock type have little impact on the calculated % change in wave speed.)
Figure 11. Effect of partial melt on VS and VP (dashed lines). The shapes of melt films, bubbles, and tubes are described by αand κ [after Schmeling, 1985].
Tectonics 10.1002/2014TC003545
HACKER ET AL. ©2014. American Geophysical Union. All Rights Reserved. 14

ReferencesActon, C. E., K. Priestley, V. K. Gaur, and S. S. Rai (2010), Group velocity tomography of the Indo-Eurasian collision zone, J. Geophys. Res., 115,
B12335, doi:10.1029/2009JB007021.Aleksandrov, K. S., and T. V. Ryzhova (1961a), Elastic properties of rock-forming minerals. 1. Pyroxenes and amphiboles, Bull. Acad. Sci. USSR,
Geophys. Ser., 9, 1165–1168.Aleksandrov, K. S., and T. V. Ryzhova (1961b), Elastic properties of rock-forming minerals. II: Layered silicates, Bull. Acad. Sci. USSR, Geophys.
Ser., 12, 871–875.Aleksandrov, K. S., U. V. Alchikov, B. P. Belikov, B. I. Zaslavskii, and A. I. Krupni (1974), Velocities of elastic waves in minerals at atmospheric
pressure and increasing precision of elastic constants by means of EVM, Izvestiia Akademii nauk SSSR. Seriia geologicheskaia, 10, 15–24.Alsdorf, D., and D. Nelson (1999), The Tibetan satellite magnetic low: Evidence for widespread melt in the Tibetan crust?, Geology, 27, 943–946.Auzanneau, E., M. W. Schmidt, D. Vielzeuf, and J. A. D. Connolly (2010), Titanium in phengite: A geobarometer for high temperature eclogites,
Contrib. Mineral. Petrol., 159, 1–24.Babuška, V., and M. Cara (1991), Seismic Anisotropy in the Earth, Modern approaches in geophysics, vol. 10, Kluwer Acad., Dordrecht.Babuska, V., J. Fiala, M. Kumazawa, and I. Ohno (1978), Elastic properties of garnet solid-solution series, Phys. Earth Planet. Inter., 16, 157–176.Bai, D., et al. (2010), Crustal deformation of the eastern Tibetan Plateau revealed by magnetotelluric imaging, Nat. Geosci., 3, 358–362,
doi:10.1038/ngeo830.Barth, N. C., B. R. Hacker, G. G. E. Seward, E. O. Walsh, D. Young, and S. Johnston (2010), Strain within the ultrahigh-pressure Western Gneiss
region of Norway recorded by quartz CPOs, Geol. Soc. London, Spec. Publ., 335, 663–685, doi:10.1144/SP335.27.Bensen, G. D., M. H. Ritzwoller, M. P. Barmin, A. L. Levshin, F. Lin, M. P. Moschetti, N. M. Shapiro, and Y. Yang (2007), Processing seismic ambient noise
data to obtain reliable broad-band surfacewave dispersionmeasurements,Geophys. J. Int., 169, 1239–1260, doi:10.1111/j.1365-246X.2007.03374.x.Birch, F. (1961), The velocity of compressional waves in rocks to 10 kilobars: 2, J. Geophys. Res., 66, 2199–2224, doi:10.1029/JZ066i007p02199.Bird, P. (1991), Lateral extrusion of lower crust from under high topography, in the isostatic limit, J. Geophys. Res., 96, 10,275–10,286,
doi:10.1029/91JB00370.Caldwell, W. B., S. L. Klemperer, S. S. Rai, and J. F. Lawrence (2009), Partial melt in the upper-middle crust of the northwest Himalaya revealed
by Rayleigh wave dispersion, Tectonophysics, 477, 58–65.Chen, C. C., C. C. Lin, L. G. Liou, S. V. Sinogeikin, and J. D. Bass (2001), Elasticity of single-crystal calcite and rhodochrosite by Brillouin
spectroscopy, Am. Mineral., 86, 1525–1529.Chen, Y., J. Badal, and Z. Zhang (2009), Radial anisotropy in the crust and upper mantle beneath the Qinghai-Tibet Plateau and surrounding
regions, J. Asian Earth Sci., 36, 289–302.Chu, R., L. Zhu, and D. V. Helmberger (2009), Determination of earthquake focal depths and source time functions in central Asia using
teleseismic P waveforms, Geophys. Res. Lett., 36, L17317, doi:10.1029/2009GL039494.Chung, S.-L., M.-F. Chu, Y. Zhang, Y. Xie, C.-H. Lo, T.-Y. Lee, C.-Y. Lan, X. Li, Q. Zhang, and Y. Wang (2005), Tibetan tectonic evolution inferred
from spatial and temporal variations in post-collisional magmatism, Earth Sci. Rev., 68, 173–196.Clark, M. K., and L. H. Royden (2000), Topographic ooze: Building the eastern margin of Tibet by lower crustal flow, Geology, 28, 703–706.Coggon, R., and T. J. B. Holland (2002), Mixing properties of phengitic micas and revised garnet-phengite thermobarometers, J. Metamorph.
Geol., 20, 683–696.Connolly, J. A. D., and K. Petrini (2002), An automated strategy for calculation of phase diagram sections and retrieval of rock properties as a
function of physical conditions, J. Metamorph. Geol., 20, 697–798.Cotte, N., H. Pederson, M. Campillo, J. Mars, J. F. Ni, R. Kind, E. Sandvol, and W. Zhao (1999), Determination of the crustal structure in southern
Tibet by dispersion and amplitude analysis of Rayleigh waves, Geophys. J. Int., 138, 809–819, doi:10.1046/j.1365-246x.1999.00927.x.Craig, T. J., A. Copley, and J. Jackson (2012), Thermal and tectonic consequences of India underthrusting Tibet, Earth Planet. Sci. Lett., 353–354,
231–239.DeCelles, P. G., D. M. Robinson, and G. Zandt (2002), Implications of shortening in the Himalayan fold-thrust belt for uplift of the Tibetan
Plateau, Tectonics, 21(6), 1062, doi:10.1029/2001TC001322.Deng, W. (1996), Basic-ultrabasic and volcanic rocks in Chagbu-Shuanghu area of northern Xizang (Tibet), China, Sci. China, Ser. D Earth Sci.,
39, 359–368.Ding, L., P. Kapp, D. Zhong, and W. Deng (2003), Cenozoic volcanism in Tibet: Evidence for a transition from oceanic to continental sub-
duction, J. Petrol., 44, 1833–1865.Ding, L., P. Kapp, Y. Yue, and Q. Lai (2007), Postcollisional calc-alkaline lavas and xenoliths from the southern Qiangtang terrane, central Tibet,
Earth Planet. Sci. Lett., 254, 28–38.Dooley, D. F., and A. F. Patino Douce (1996), Fluid-absent melting of F-rich phlogopite + rutile + quartz, Am. Mineral., 81, 202–212.Duret, F., N. M. Shapiro, Z. Cao, V. Levin, P. Molnar, and S. Roecker (2010), Surface wave dispersion across Tibet: Direct evidence for radial
anisotropy in the crust, Geophys. Res. Lett., 37, L16306, doi:10.1029/2010GL043811.Ebadi, A., and W. Johannes (1991), Beginning of melting and composition of first melts in the system Qz-Ab-Or-H2O-CO2, Contrib. Mineral.
Petrol., 106, 286–295.Erdman, M. E., B. R. Hacker, G. Zandt, and G. Seward (2013), Seismic anisotropy of the crust: Electron backscatter diffraction measurements
from the Basin and Range, Geophys. J. Int., 195(2), doi:10.1093/gji/ggt287.Fuhrman, M. L., and D. H. Lindsley (1988), Ternary-feldspar modeling and thermometry, Am. Mineral., 73, 201–215.Galvé, A., A. Hirn, M. Jiang, J. Gallart, B. de Voogd, J.-C. Lepine, J. Diaz, Y. Wang, and H. Qian (2002), Modes of raising northeastern Tibet probed
by explosion seismology, Earth Planet. Sci. Lett., 203, 35–43.Galvé, A., M. Jiang, A. Hirn, M. Sapin, M. Laigle, B. de Voogd, J. Gallart, and H. Qian (2006), Explosion seismic P and S velocity and attenuation
constraints on the lower crust of the North–Central Tibetan Plateau, and comparison with the Tethyan Himalayas: Implications on com-position, mineralogy, temperature, and tectonic evolution, Tectonophysics, 412, 141–157.
Guillot, S., and A. Replumaz (2013), Importance of continental subductions for the growth of the Tibetan plateau, Bull. Soc. Geol. Fr., 184,199–223.
Guillot, S., P. Le Fort, A. Pêcher, M. R. Barman, and J. Aprahamian (1995), Contact metamorphism and depth of emplacement of the Manaslugranite (central Nepal). Implications for Himalayan orogenesis, Tectonophysics, 241, 99–119.
Guo, Z., X. Gao, H. Yao, J. Li, and W. Want (2009), Midcrustal low velocity layer beneath the central Himalaya and southern Tibet revealed byambient noise array tomography, Geochem., Geophys., Geosyst., 10, Q05007, doi:10.1029/2009GC002458.
Guynn, J. H., P. Kapp, A. Pullen, M. T. Heizler, G. Gehrels, and L. Ding (2006), Tibetan basement rocks near Amdo reveal “missing” Mesozoictectonism along the Bangong suture, central Tibet, Geology, 34, 505–508.
Tectonics 10.1002/2014TC003545
HACKER ET AL. ©2014. American Geophysical Union. All Rights Reserved. 15
AcknowledgmentsStéphane Guillot, an anonymousreviewer, and an anonymous AssociateEditor provided helpful comments. JohnCottle, Phil Gans, Roy Hyndman, PeterKelemen, and Craig Manning providedhelpful advice. Aspects of this workwere supported at UCSB by NSF-EARaward 1008760 and at CU-Boulder byNSF-EAR awards 0944022 and EAR1246925. The data used to produce theresults of this paper are available fromthe authors on request.

Hacker, B. R., and G. A. Abers (2004), Subduction Factory 3. An Excel worksheet andmacro for calculating the densities, seismic wave speeds, andH2O contents of minerals and rocks at pressure and temperature, Geochem., Geophys., Geosyst., 5, Q01005, doi:10.1029/2003GC000614.
Hacker, B. R., E. Gnos, L. Ratschbacher, M. Grove, M. McWilliams, S. V. Sobolev, W. Jiang, and Z. Wu (2000), Hot and dry xenoliths from the lowercrust of Tibet, Science, 287, 2463–2466.
Hacker, B. R., P. B. Kelemen, and M. D. Behn (2011), Differentiation of the continental crust by relamination, Earth Planet. Sci. Lett., 307, 501–516.Holland, T. J. B., and R. Powell (1998), An internally consistent thermodynamic data set for phases of petrological interest, J. Metamorph. Geol.,
16, 309–343.Holloway, J. R., and C. E. Ford (1975), Fluid-absent melting of the fluoro-hydroxy amphibole pargasite to 35 kilobars, Earth Planet. Sci. Lett., 25,
44–48.Huang, H., H. Yao, and R. D. van der Hilst (2010), Radial anisotropy in the crust in SE Tibet and SW China from ambient noise interferometry,
Geophys. Res. Lett., 37, L21310, doi:10.1029/2010GL044981.Jiang, M., A. Galvé, A. Hirn, B. de Voogd, M. Laigle, H. P. Su, J. Diaz, J. C. Lepine, and Y. X. Wang (2006), Crustal thickening and variations in
architecture from the Qaidam basin to the Qiang Tang (North–Central Tibetan Plateau) from wide-angle reflection seismology,Tectonophysics, 412, 121–140.
Jiang, M., S. Zhou, E. Sandvol, X. Chen, X. Liang, Y. J. Chen, andW. Fan (2011), 3-D lithospheric structure beneath southern Tibet from Rayleighwave tomography with a 2-D seismic array, Geophys. J. Int., 185, 593–608, doi:10.1111/j.1365-246X.2011.04979.x.
Kapp, P., A. Yin, C. E. Manning, T. M. Harrison, M. H. Taylor, and L. Ding (2003), Tectonic evolution of the early Mesozoic blueschist-bearingQiangtang metamorphic belt, central Tibet, Tectonics, 22(4), 1043, doi:10.1029/2002TC001383.
Kind, R., J. Ni, W. Zhao, J. Wu, X. Yuan, L. Zhao, E. Sandvol, C. Reese, J. Nabelek, and T. Hirn (1996), Evidence from earthquake data for a partiallymolten crustal layer in southern Tibet, Science, 274, 1692–1694.
Lakshtanov, D. L., S. V. Sinogeikin, and J. D. Bass (2007), High-temperature phase transitions and elasticity of silica polymorphs, Phys. Chem.Miner., 34, 11–22.
LeFort, P. (1981), Manaslu leucogranite: A collision signature of the Himalaya. A model for its genesis and emplacement, J. Geophys. Res., 86,10,545–10,568, doi:10.1029/JB086iB11p10545.
Levshin, A. L., X. Yang, M. P. Barmin, and M. H. Ritzwoller (2010), Midperiod Rayleigh wave attenuation model for Asia, Geochem., Geophys.,Geosyst., 11, Q08017, doi:10.1029/2010GC003164.
Li, H., W. Su, C.-Y. Wang, and Z. Huang (2009), Ambient noise Rayleigh wave tomography in western Sichuan and eastern Tibet, Earth Planet.Sci. Lett., 282, 201–211, doi:10.1016/j.epsl.2009.03.021.
Li, Y. H., Q. J. Wu, X. B. Tian, R. S. Zeng, R. Q. Zhang, and H. G. Li (2006), Crustal structure beneath Qiangtang and Lhasa terrane from receiverfunction, Acta Seismol. Sin., 19, 633–642.
Liang, C., and X. Song (2006), A low velocity belt beneath northern and eastern Tibetan Plateau from Pn tomography, Geophys. Res. Lett., 33,L22306, doi:10.1029/2006GL027926.
Makovsky, Y., and S. Klemperer (1999), Measuring the seismic properties of Tibetan bright spots: Evidence for free aqueous fluids in theTibetan middle crust, J. Geophys. Res., 104, 10,795–10,825, doi:10.1029/1998JB900074.
Makovsky, Y., S. Klemperer, and L. Ratschbacher (1999), Midcrustal reflector on INDEPTH wide-angle profiles: An ophiolitic slab beneath theIndia–Asia suture in southern Tibet?, Tectonics, 18, 793–808, doi:10.1029/1999TC900022.
McNamara, D. E., W. R. Walter, T. J. Owens, and C. J. Ammon (1997), Upper mantle velocity structure beneath the Tibetan Plateau from Pntravel time tomography, J. Geophys. Res., 102, 493–505, doi:10.1029/96JB02112.
Mechie, J., S. V. Sobolev, L. Ratschbacher, A. Y. Babeyko, G. Bock, A. G. Jones, K. D. Nelson, K. D. Solon, L. D. Brown, and W. Zhao (2004), Precisetemperature estimation in the Tibetan crust from seismic detection of the a-b quartz transition, Geology, 32, 601–604.
Montel, J. M., and D. Vielzeuf (1997), Partial melting of metagreywackes, Part II. Compositions of minerals and melts, Contrib. Mineral. Petrol.,128, 176–196.
Nichols, G. T., P. J. Wyllie, and C. R. Stern (1994), Subduction zone melting of pelagic sediments constrained by melting experiments, Nature,371, 785–788.
Ohno, I., K. Harada, and C. Yoshitomi (2006), Temperature variation of elastic constants of quartz across the α-β transition, Phys. Chem. Miner.,33, 1–9.
Owens, T. J., and G. Zandt (1997), Implications of crustal property variations for models of Tibetan plateau evolution, Nature, 387, 37–43.Patiño Douce, A. E. (2005), Vapor-absent melting of tonalite at 15–32 kbar, J. Petrol., 46, 275–290.Patiño Douce, A. E., and J. S. Beard (1995), Dehydration-melting of biotite gneiss and quartz amphibolite from 3 to 15 kbar, J. Petrol., 36,
707–738.Patiño Douce, A. E., and T. C. McCarthy (1998), Melting of crustal rocks during continental collision and subduction, in When
Continents Collide: Geodynamics and Geochemistry of Ultrahigh-Pressure Rocks, edited by B. R. Hacker and J. G. Liou, pp. 27–55,Kluwer Acad., Dordrecht.
Pullen, A., P. Kapp, G. E. Gehrels, L. Ding, and Q. Zhang (2010), Metamorphic rocks in central Tibet: Lateral variations and implications forcrustal structure, Geol. Soc. Am. Bull., doi:10.1130/B30154.1.
Rai, S. S., A. Ashish, A. Padhi, and P. R. Sarma (2009), High crustal seismic attenuation in Ladakh-Karakoram, Bull. Seismol. Soc. Am., 99, 407–415,doi:10.1785/0120070261.
Rapine, R., F. Tilmann, M. West, and J. Ni (2003), Crustal structure of northern and southern Tibet from surface wave dispersion analysis,J. Geophys. Res., 108(2), 2120, doi:10.1029/2001JB000445.
Rapp, R. P., and E. B. Watson (1995), Dehydration melting of metabasalt at 8–32 kbar: Implications for continental growth and crust-mantlerecycling, J. Petrol., 36, 893–931.
Rivers, M. L., and I. S. E. Carmichael (1987), Ultrasonic studies of silicate melts, J. Geophys. Res., 92, 9247–9270, doi:10.1029/JB092iB09p09247.Scaillet, B., and M. P. Searle (2006), Mechanisms and timescales of felsic magma segregation, ascent and emplacement in the Himalaya, Geol.
Soc. London, Spec. Publ., 268, 293–308.Schmeling, H. (1985), Numerical models on the influence of partial melt on elastic, anelastic and electric properties of rocks, Part I: Elasticity
and anelasticity, Phys. Earth Planet. Inter., 41, 34–57.Schmidt, J., B. R. Hacker, L. Ratschbacher, K. Stübner, M. Stearns, A. Kylander-Clark, J. M. Cottle, A. A. G. Webb, G. Gehrels, and V. Minaev (2011),
Cenozoic deep crust in the Pamir, Earth Planet. Sci. Lett., 312, 411–421.Schwab, M., et al. (2004), Assembly of the Pamirs: Age and origin of magmatic belts from the southern Tien Shan to the southern Pamirs and
their relation to Tibet, Tectonics, 23, TC4002, doi:10.1029/2003TC001583.Searle, M. P. (1999), Emplacement of Himalayan leucogranites by magma injection along giant sill complexes: Examples from the Cho Oyu,
Gyachung Kang and Everest leucogranites (Nepal Himalaya), J. Asian Earth Sci., 17, 773–783.
Tectonics 10.1002/2014TC003545
HACKER ET AL. ©2014. American Geophysical Union. All Rights Reserved. 16
Searle, M. P., J. M. Cottle, M. J. Streule, and D. J. Waters (2010), Crustal melt granites and migmatites along the Himalaya: Melt source,segregation, transport and granite emplacement mechanisms, Trans. R. Soc. Edinburgh: Earth Sci., 100, 219–233.
Sen, C., and T. Dunn (1994), Dehydration melting of a basaltic compositions amphibolite at 1.5 and 2.0 GPa: Implications for the origin ofadakites, Contrib. Mineral. Petrol., 117, 394–409.
Shapiro, N. M., and M. H. Ritzwoller (2002), Monte-Carlo inversion for a global shear velocity model of the crust and upper mantle, Geophys. J.Int., 151, 88–105, doi:10.1046/j.1365-246X.2002.01742.x.
Shapiro, N. M., M. H. Ritzwoller, P. Molnar, and V. Levin (2004), Thinning and flow of Tibetan crust constrained by seismic anisotropy, Science,305, 233–236.
Skjerlie, K. P., and A. D. Johnston (1993), Fluid-absent melting behavior of an F-rich tonalitic gneiss at mid-crustal pressures: Implications forthe generation of anorogenic granites, J. Petrol., 34, 785–815.
Sloan, R. A., J. A. Jackson, D. McKenzie, and K. Priestley (2011), Earthquake depth distributions in central Asia, and their relations withlithospheric thickness, shortening and extension, Geophys. J. Int., 185, 1–29, doi:10.1111/j.1365-246X.2010.04882.x.
Tajcmanová, L., J. A. D. Connolly, and B. Cesare (2009), A thermodynamic model for titanium and ferric iron solution in biotite, J. Metamorph.Geol., 27, 153–164.
Thompson, J. B., and G. L. Hovis (1979), Entropy of mixing in sanidine, Am. Mineral., 64, 57–65.Turner, S., N. Arnaud, J. Liu, N. Rogers, C. Hawkesworth, N. Harris, S. Kelley, P. Van Calsteren, and W. Deng (1996), Post-collision, shoshonitic
volcanism on the Tibetan Plateau: Implications for convective thinning of the lithosphere and the source of ocean island basalts, J. Petrol.,37, 45–71.
Unsworth, M. J., A. G. Jones, W. Wei, G. Marquis, S. G. Gokarn, J. E. Spratt, and I.-M. Team (2005), Crustal rheology of the Himalaya andSouthern Tibet inferred from magnetotelluric data, Nature, 483, 78–81.
Vaughan, M., and S. Guggenheim (1986), Elasticity of muscovite and its relationship to crystal structure, J. Geophys. Res., 91, 4657–4664,doi:10.1029/JB091iB05p04657.
Vergne, J., G. Wittlinger, H. Qiang, P. Tapponnier, G. Poupinet, M. Jiang, G. Herquel, and A. Paul (2002), Seismic evidence for stepwise thick-ening of the crust across the NE Tibetan Plateau, Earth Planet. Sci. Lett., 203, 25–33.
Vielzeuf, D., and J. M. Montel (1994), Partial melting of metagreywackes. 1. Fluid-absent experiments and phase relationships, Contrib.Mineral. Petrol., 117, 375–393.
Vielzeuf, D., and J. R. Holloway (1988), Experimental determination of the fluid-absent melting relations in the pelitic system. Consequencesfor crustal differentiation, Contrib. Mineral. Petrol., 98, 257–76.
Villaseñor, A., M. H. Ritzwoller, A. L. Levshin, M. P. Barmin, E. R. Engdahl, W. Spakman, and J. Trampert (2001), Shear velocity structure of centralEurasia from inversion of surface wave velocities, Phys. Earth Planet. Inter., 123, 169–184, doi:10.1016/S0031-9201(00)00208-9.
Wang, Q., S.-L. Chung, X.-H. Li, D. Wyman, Z.-X. Li, W.-D. Sun, H.-N. Qiu, Y.-S. Liu, and Y.-T. Zhu (2012), Crustal melting and flow beneathNorthern Tibet: Evidence from Mid-Miocene to Quaternary strongly peraluminous rhyolites in the Southern Kunlun Range, J. Petrol.,doi:10.1093/petrology/egs058.
Wang, Y., W. D. Mooney, X. Yuan, and N. Okaya (2013), Crustal structure of the northeastern Tibetan Plateau from the Southern Tarim Basin tothe Sichuan Basin, China, Tectonophysics, 584, 191–208.
Wei, C., and R. Powell (2003), Phase relations in high-pressure metapelites in the system KFMASH (K2O-FeO-MgO-Al2O3-SiO2-H2O) withapplication to natural rocks, Contrib. Mineral. Petrol., 145, 301–315.
White, R. W., R. Powell, T. J. B. Holland, and B. Worley (2000), The effect of TiO2 and Fe2O3 on metapelitic assemblages at greenschist andamphibolite facies conditions: Mineral equilibria calculations in the system K2O-FeO-MgO-Al2O3-SiO2-H2O-TiO2-Fe2O3, J. Metamorph.Geol., 18, 497–511.
Xie, J. (2004), Lateral variations of crustal seismic attenuation along the INDEPTH profiles in Tibet from Lg Q inversion, J. Geophys. Res., 109,B10308, doi:10.1029/2004JB002988.
Xie, J., M. H. Ritzwoller, W. Shen, Y. Yang, Y. Zheng, and L. Zhou (2013), Crustal radial anisotropy across eastern Tibet and the western Yangtzecraton, J. Geophys. Res. Solid Earth, 118, 4226–4252, doi:10.1002/jgrb.50296.
Xu, L., S. Rondenay, and R. D. van der Hilst (2007), Structure of the crust beneath the southeastern Tibetan Plateau from teleseismic receiverfunctions, Phys. Earth Planet. Inter., 165, 176–193, doi:10.1016/j.pepi.2007.09.002.
Xu, Q., J. Zhao, S. Pei, and H. Liu (2013a), Distinct lateral contrast of the crustal and upper mantle structure beneath northeast Tibetan plateaufrom receiver function analysis, Phys. Earth Planet. Inter., 217, 1–9.
Xu, Z. J., X. Song, and L. Zhu (2013b), Crustal and uppermost mantle S velocity structure under Hi-CLIMB seismic array in central TibetanPlateau from joint inversion of surface wave dispersion and receiver function data, Tectonophysics, 584, 209–220.
Yang, Y., et al. (2010), Rayleigh wave phase velocity maps of Tibet and the surrounding regions from ambient seismic noise tomography,Geochem., Geophys., Geosyst., 11, Q08010, doi:10.1029/2010GC003119.
Yang, Y., M. H. Ritzwoller, Y. Zheng, W. Shen, A. L. Levshin, and Z. Xie (2012), A synoptic view of the distribution and connectivity of the mid-crustal low velocity zone beneath Tibet, J. Geophys. Res., 117, B04303, doi:10.1029/2011JB008810.
Yao, H., C. Beghein, and R. D. van der Hilst (2008), Surface wave array tomography in SE Tibet from ambient seismic noise and two-stationanalysis: II. Crustal and upper-mantle structure, Geophys. J. Int., 173, 205–219, doi:10.1111/j.1365-246X.2007.03696.x.
Yao, H., R. D. van der Hilst, and J.-P. Montagner (2010), Heterogeneity and anisotropy of the lithosphere of SE Tibet from surface wave arraytomography, J. Geophys. Res., 115, B12307, doi:10.1029/2009JB007142.
Yin, A., and T. M. Harrison (2000), Geologic evolution of the Himalayan–Tibetan orogen, Annu. Rev. Earth Planet. Sci., 28, 211–280.
Tectonics 10.1002/2014TC003545
HACKER ET AL. ©2014. American Geophysical Union. All Rights Reserved. 17
Related Documents