1 Wentworth Institute of Technology By Myles Moore, Nathan Kituuma, Giovany Morales & Courtney Zink Submitted to: Professor Richard Roberts Date: August 6, 2010 PARTIAL HYDROGEN INJECTION

Welcome message from author
This document is posted to help you gain knowledge. Please leave a comment to let me know what you think about it! Share it to your friends and learn new things together.
Transcript

1
Wentworth Institute of Technology By Myles Moore, Nathan Kituuma, Giovany
Morales & Courtney Zink
Submitted to: Professor Richard Roberts
Date: August 6, 2010
PARTIAL
HYDROGEN
INJECTION

2
TABLE OF CONTENTS Abstract .............................................................. 3
Introduction & Background Research ................ 4
What Does PHI Do? ........................................ 4
How Is Hydrogen Made? ................................ 4
Electrolytes .................................................... 5
Details of the Water Electrolyzer ................... 5
Design ................................................................. 6
The Basics ....................................................... 6
Wet Cell vs. Dry Cell ....................................... 7
Gasket Sealing and Deformation ................... 7
Endplate Bending ........................................... 8
Test results ......................................................... 9
Initial Complications....................................... 9
Solution Level ............................................. 9
Solution Contamination ........................... 11
Solution Bubbling ..................................... 11
HHO Production of Cell ................................ 11
Automobile Dynamometer Testing ............. 12
Automobile Fuel Economy Testing .............. 12
Health, Pollution, & Compatibility Concerns15
The Future of the Project ................................. 15
Works Cited ...................................................... 16
Contacts ........................................................... 16
Definitions, Acronyms, Abbreviations ............. 16
Appendix A (Decision Matrices) ....................... 17
Appendix B (Electrolyzer Blueprints) ............... 19
Appendix C (Cell Characterization Test
Procedure) ....................................................... 23
Objective: ..................................................... 23
Materials: ..................................................... 23
Testing procedure: ....................................... 23
Precautions: ................................................. 25
Test Data: ..................................................... 26
Appendix (MSDS) ......................................... 27
Appendix D (Miscellaneous) ............................ 35
Appendix E (Work Plan) ................................... 36

3
ABSTRACT Research on partial hydrogen
injection (PHI) was conducted to
establish an understanding of the
current technology and how
supplementing hydrogen during fuel
injection has an effect on the performance of
internal combustion engines (ICE). Research
revealed that the quenching distance, the
distance at which the cessation of combusting
gasses takes place due to heat transfer to the
cylinder wall, is decreased when hydrogen is
introduced to the air‐fuel mixture resulting in
more of the injected fuel being burned. See
Table 1 for a list of quenching distances and
other fuel properties.
A water electrolyzer was designed and
constructed to produce the gas mixture
2H2O+O2 (HHO) that would be supplied to the
engine.
Tests were conducted to characterize
the performance of the electrolyzer. Additional
tests were conducted to investigate any
changes in engine performance.
Cell characterization tests showed that
volumetric flow of HHO increased linearly with
both voltage and current. Tests also revealed
that operating temperature does not have an
effect on electrical resistance, voltage, and
volumetric flow of HHO when solution
temperatures are between 35‐55°C .
Shorter quenching distances result in
lean burning conditions. In an attempt to
maintain a 14.7:1 air‐fuel ratio, the oxygen (O2)
sensor in the exhaust pipe tells the engine
control unit (ECU) to inject more fuel into the
cylinders. This behavior is not desirable, as it
causes the engine to burn more fuel. Significant
increases in fuel efficiency will only appear after
the engine is tuned to operate at steady state
with the new air‐fuel ratio. This can be done by
modifying the ECU parameters or augmenting
the signal from the O2 sensor. When HHO was
supplied to the engine at a rate of 1.1 lpm, air‐
fuel ratio and power output did not show any
measurable changes.
To investigate the possibility of power
increases too small for the sensitivity of the
dynamometer, long term fuel efficiency tests
were conducted. Tests revealed the following
net increases in fuel efficiency when using 0.7
lpm of HHO:
‐ 1.4% for city driving
‐ 5.5% for highway driving
The long term fuel economy tests are far
from complete. Many more tests are needed to
obtain results of statistical importance. Driving
conditions, driving style and ambient
temperature all have an effect on fuel
economy. Time constraints did not allow for an
in depth investigation that took these
parameters into consideration.
It was determined that 1.1 lpm of HHO
does not have a significant effect on the power
output or air‐fuel ratio while 0.7 lpm of HHO
was enough to produce marginal gains in fuel
efficiency. Therefore, no modification needed
to be made to the engine tuning. The results of
this project give rise to some question for
future investigations:
1) What happens when more HHO is
supplied to the engine?
2) How will the rate of HHO production change in when solution temperatures are between ‐20°C and 70°C (extreme weather temperatures in the U.S.)?
Property Hydrogen Gasoline
Stoichiometric ratio for complete
combustion (A/F by mass)
34:1 15:1
Auto Ignition Temp (⁰C) 585 260‐460
Flame Temp (⁰C) 2207 2307
Quenching Distance (mm) 0.64 ~ 2
Ignition Energy @ stoich (mJ) 0.02 0.24
Flame Speed @ stoich (m/s) 3.46 0.42
Table 1: Properties of fuels

4
INTRODUCTION & BACKGROUND RESEARCH
What Does PHI Do?
Partial hydrogen injection (PHI) is the
process of feeding a small amount of hydrogen
into an internal combustion engine (ICE)
through the air intake. By doing so, the
quenching distance1 of the air‐fuel mixture is
decreased causing more of the injected fuel to
be burned and less waste fuel to exit with the
exhaust gases (See Table 1 for a comparison of
fuel properties). In theory, the higher volume
of fuel being burned results in an increase in
power output. There are two ways to use this
power output:
1) Keep the increased power output
without sacrificing fuel economy.
2) Lean out the air‐fuel ratio (AFR) ratio to
achieve the original power output and
benefit from increased fuel economy
without sacrificing power.
How Is Hydrogen Made?
Water electrolysis is one of the many
ways to produce hydrogen and is done so by
placing two electrically conductive solids
(electrodes or “plates”) with opposing charges
in a bath of distilled water containing a
dissolved electrolyte (e.g. potassium hydroxide,
sodium hydroxide, etc.). A current is then
passed positive electrode to the negative
electrode. Passing current through the H2O
breaks the chemical bond between hydrogen
and oxygen. Oxygen gas will appear at anode
and hydrogen gas at the cathode, the positive
1 The quenching distance is the distance at which the
cessation of combustion takes place due to heat
transfer to the piston wall. See Table 1 for
properties of hydrogen and gasoline.
and negative electrodes, respectively. This
combination of gasses is referred to as HHO.
The main components of the
electrolyzer are the electrodes, the electrolyte
solution (bath of distilled water), the
containment vessel, and the electric power
supply. It is important to note that the housing,
or containment vessel, must be an electric
insulator and that the system is only grounded
through the negative electrode.
HHO production can be controlled in
several ways. The dominating factor in HHO
production is the current. The importance of
decreasing the electrical resistance in the cell
can be demonstrated using the following
relation:
where the V is the voltage, R is the resistance
and I is the current. If voltage is constant based
on the output from and automotive battery
(power supply) and resistance is another
constant based on the architecture of the cell,
then current must yield to the quotient V/R. As
resistance decreases, the current will increase.
Another way of controlling HHO
production is to increase the active area2 of the
electrodes to create a larger surface for
chemical reactions to take place.
Finally, if HHO production is higher than
needed, but only at certain times, the rate of
production may be modulated by controlling
current with a pulse width modulator. A PWM
adjusts the duty cycle by rapidly switching
electric current on and off. So, at a 50% duty
cycle, the electrolyzer would only receive power
50% of the time, cutting the production of HHO
in half.
2 The active area of an electrode is the surface area
that is both electrically charged and in contact with
the electrolyte solution.

5
In industrial applications, hydrogen is
produced through steam reformation of
hydrocarbons such as natural gas or petroleum.
In this process, high temperature steam is
reacted with hydrocarbons and passed through
a nickel catalyst. Atomic bonds are broken and
hydrogen is filtered out. This process is very
complicated as it involves careful temperature
control. As a result, it has been deemed unfit
for automotive applications.
Electrolytes An electrolyte is a liquid substance
which acts as a medium to conduct electricity. Electrolytes are full of ions, which are atoms that have some sort of net electric charge, either positive or negative. A dilute electrolyte has a relatively small amount of ions for its volume, while a concentrated electrolyte has a high amount of ions. Electrolytes can be divided into two groups; acids and bases. Acids are defined as H+ proton donors and bases are hydroxide donors. These bases are a combination of a metal ion and the hydroxide ion, OH1‐. Pure H2O itself is not conductive. However, if a water‐soluble electrolyte is added, the conductivity of the water rises considerably. The electrolyte disassociates into cations and anions; the anions rush towards the anode and neutralize the buildup of positively charged H+ there; similarly, the cations rush towards the cathode and neutralize the buildup of negatively charged OH− there. This allows the continued flow of electricity.
The electrolytes considered for this project were salt (NaCl), baking soda (NaHCO3), and potassium hydroxide (KOH).
NaCl was determined to be unsuitable for this application because it produces chlorine gas which is extremely poisonous.
NaHCO3 will break down into sodium hydroxide during electrolysis. While doing so, it produces carbon dioxide and a lethal amount of carbon monoxide. What good is an increase in
fuel economy if a process is producing a bunch green house gasses?
Potassium hydroxide was determined to be best suited for this application because of its ability to remain unchanged during electrolysis. Stainless steel is not susceptible to corrosion by KOH. For the same reason, materials like PVC, LDPE, and polypropylene are commonly used to manufacture tubing and fittings.
Appendix A (Decision Matrices) contains information on the selection of materials and electrolyte type.
Details of the Water Electrolyzer
Water electrolysis breaks the chemical
bond of H2O: 2 2 . The resulting
gas mixture is commonly referred to as HHO.
Brute force electrolysis requires a
minimum of 2 volts to break the chemical bond
of H2O. Independent research has shown that
voltage drops across neighboring electrodes in
excess of 2.3V will produce excessive heat and
begin vaporizing the water (1). Suppose we’re
using an automotive battery to power an
electrolyzer at a constant 12V using an
electrolyzer similar to the one in Figure 1, but
without the neutral plates. This would mean
that the drop from the positive to negative
electrode will be 12V. As we know, this will
Figure 1: ‘Wet Cell’ Electrolyzer
6
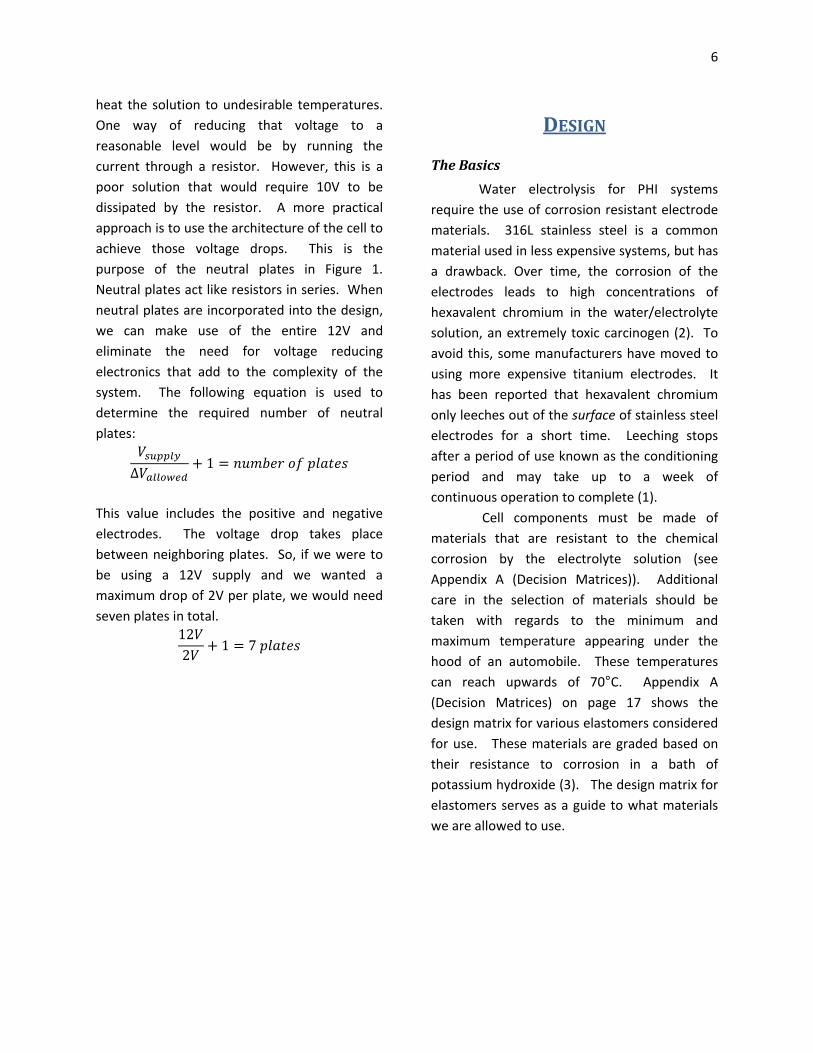
heat the solution to undesirable temperatures.
One way of reducing that voltage to a
reasonable level would be by running the
current through a resistor. However, this is a
poor solution that would require 10V to be
dissipated by the resistor. A more practical
approach is to use the architecture of the cell to
achieve those voltage drops. This is the
purpose of the neutral plates in Figure 1.
Neutral plates act like resistors in series. When
neutral plates are incorporated into the design,
we can make use of the entire 12V and
eliminate the need for voltage reducing
electronics that add to the complexity of the
system. The following equation is used to
determine the required number of neutral
plates:
∆1
This value includes the positive and negative
electrodes. The voltage drop takes place
between neighboring plates. So, if we were to
be using a 12V supply and we wanted a
maximum drop of 2V per plate, we would need
seven plates in total.
122
1 7
DESIGN
The Basics
Water electrolysis for PHI systems
require the use of corrosion resistant electrode
materials. 316L stainless steel is a common
material used in less expensive systems, but has
a drawback. Over time, the corrosion of the
electrodes leads to high concentrations of
hexavalent chromium in the water/electrolyte
solution, an extremely toxic carcinogen (2). To
avoid this, some manufacturers have moved to
using more expensive titanium electrodes. It
has been reported that hexavalent chromium
only leeches out of the surface of stainless steel
electrodes for a short time. Leeching stops
after a period of use known as the conditioning
period and may take up to a week of
continuous operation to complete (1).
Cell components must be made of
materials that are resistant to the chemical
corrosion by the electrolyte solution (see
Appendix A (Decision Matrices)). Additional
care in the selection of materials should be
taken with regards to the minimum and
maximum temperature appearing under the
hood of an automobile. These temperatures
can reach upwards of 70°C. Appendix A
(Decision Matrices) on page 17 shows the
design matrix for various elastomers considered
for use. These materials are graded based on
their resistance to corrosion in a bath of
potassium hydroxide (3). The design matrix for
elastomers serves as a guide to what materials
we are allowed to use.
7
Wet Cell vs. Dry Cell
Wet cells have a series of plates
submerged in a bath of electrolyte solution
contained in a reservoir (see Figure 1). The
major drawback of this design is that the
electrodes will charge the solution surrounding
the edge of the plate, but not produce any
hydrogen. This is known as current leakage and
decreases the overall efficiency of the system.
These exposed edges also help start and
accelerate corrosion.
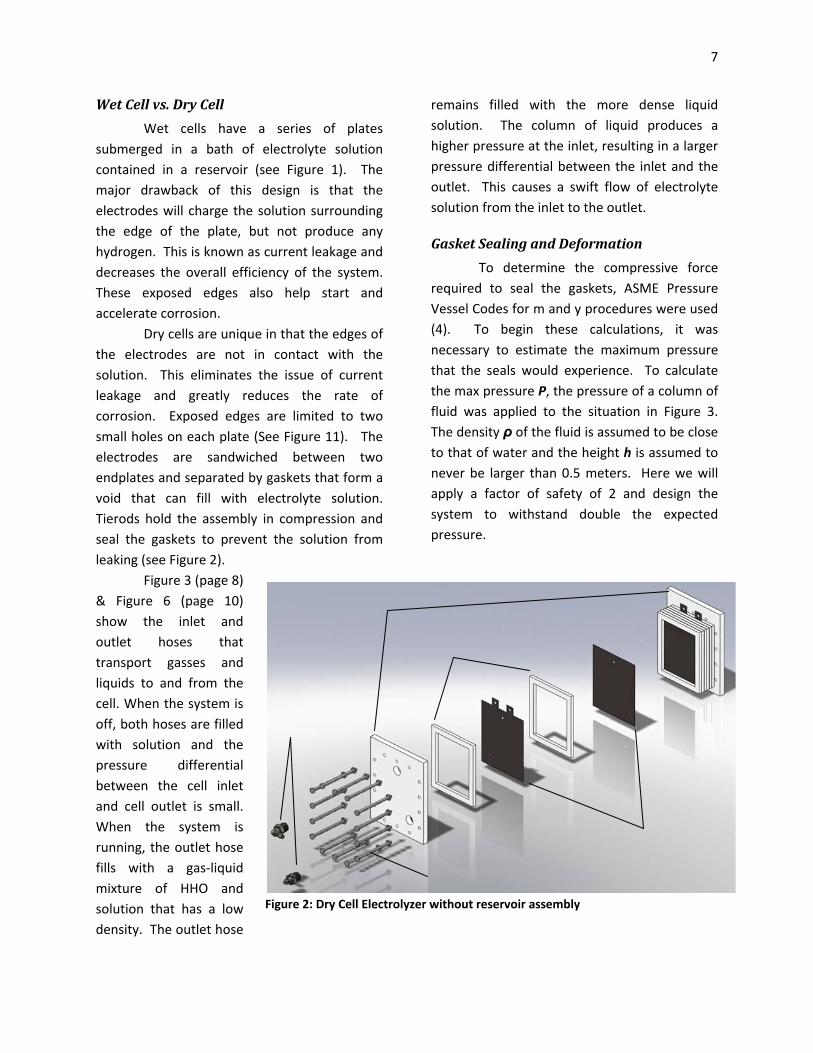
Dry cells are unique in that the edges of
the electrodes are not in contact with the
solution. This eliminates the issue of current
leakage and greatly reduces the rate of
corrosion. Exposed edges are limited to two
small holes on each plate (See Figure 11). The
electrodes are sandwiched between two
endplates and separated by gaskets that form a
void that can fill with electrolyte solution.
Tierods hold the assembly in compression and
seal the gaskets to prevent the solution from
leaking (see Figure 2).
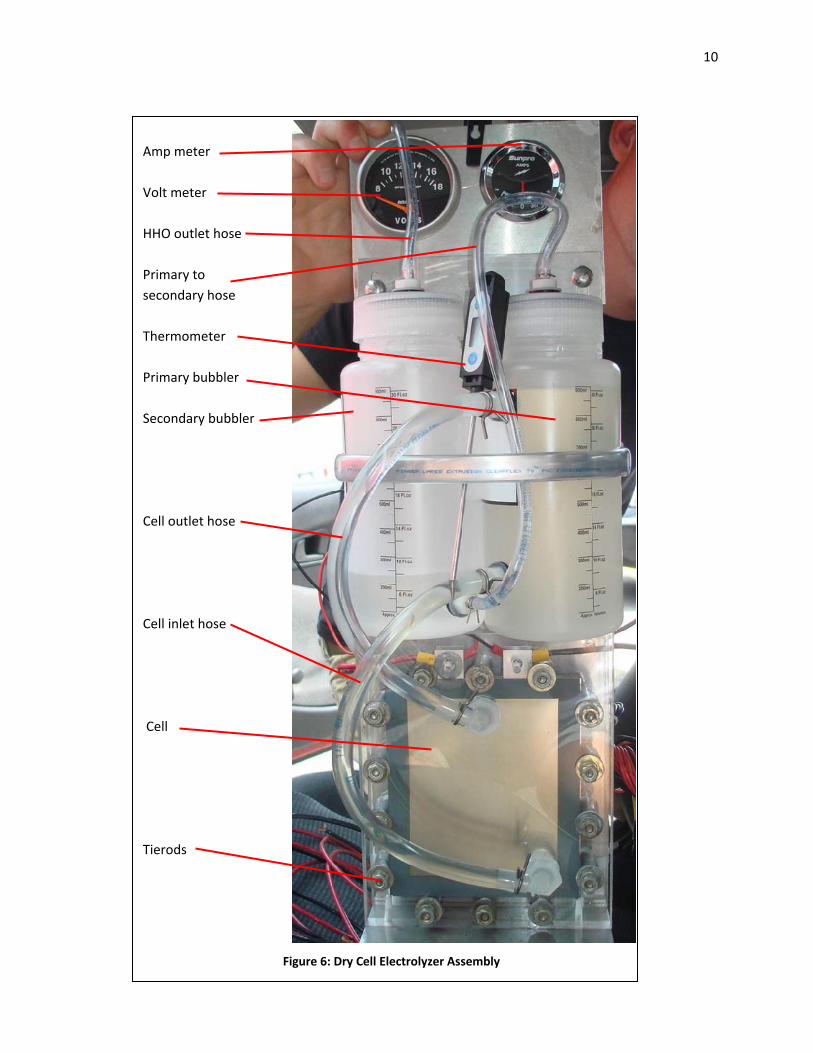
Figure 3 (page 8)
& Figure 6 (page 10)
show the inlet and
outlet hoses that
transport gasses and
liquids to and from the
cell. When the system is
off, both hoses are filled
with solution and the
pressure differential
between the cell inlet
and cell outlet is small.
When the system is
running, the outlet hose
fills with a gas‐liquid
mixture of HHO and
solution that has a low
density. The outlet hose
remains filled with the more dense liquid
solution. The column of liquid produces a
higher pressure at the inlet, resulting in a larger
pressure differential between the inlet and the
outlet. This causes a swift flow of electrolyte
solution from the inlet to the outlet.
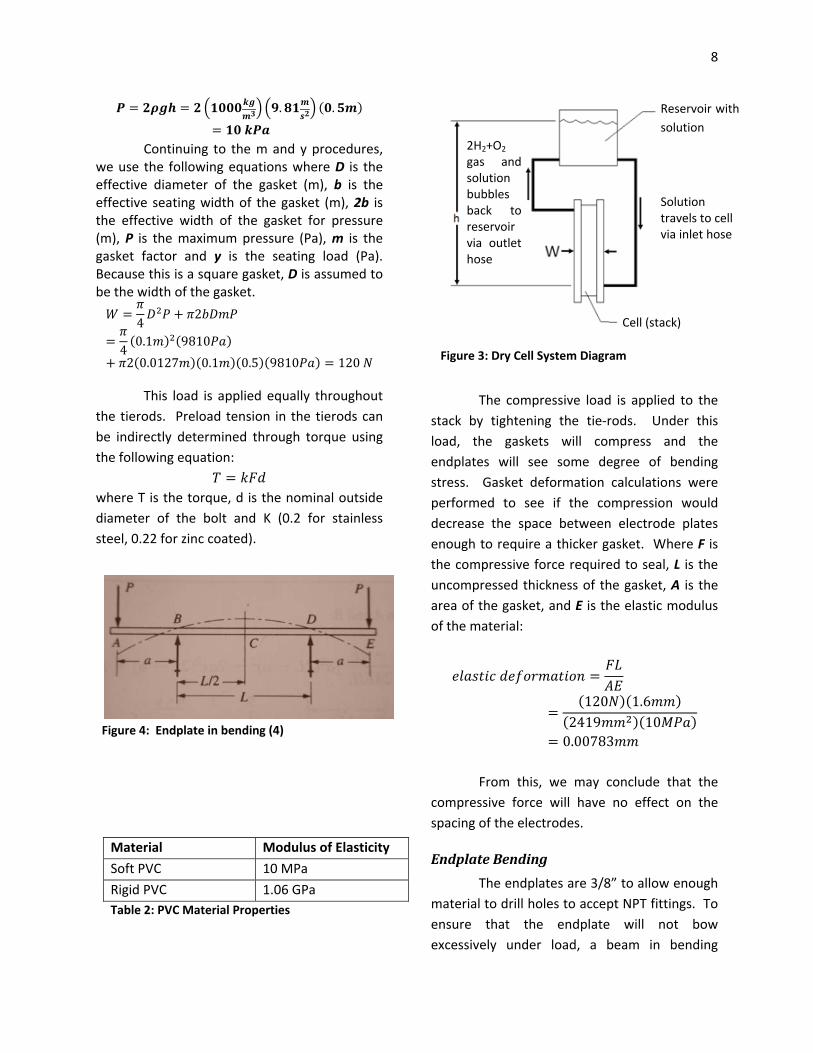
Gasket Sealing and Deformation
To determine the compressive force
required to seal the gaskets, ASME Pressure
Vessel Codes for m and y procedures were used
(4). To begin these calculations, it was
necessary to estimate the maximum pressure
that the seals would experience. To calculate
the max pressure P, the pressure of a column of
fluid was applied to the situation in Figure 3.
The density ρ of the fluid is assumed to be close
to that of water and the height h is assumed to
never be larger than 0.5 meters. Here we will
apply a factor of safety of 2 and design the
system to withstand double the expected
pressure.
Figure 2: Dry Cell Electrolyzer without reservoir assembly
8
. .
Continuing to the m and y procedures, we use the following equations where D is the effective diameter of the gasket (m), b is the effective seating width of the gasket (m), 2b is the effective width of the gasket for pressure (m), P is the maximum pressure (Pa), m is the gasket factor and y is the seating load (Pa). Because this is a square gasket, D is assumed to be the width of the gasket.
42
40.1 9810
2 0.0127 0.1 0.5 9810 120
This load is applied equally throughout
the tierods. Preload tension in the tierods can
be indirectly determined through torque using
the following equation:
where T is the torque, d is the nominal outside
diameter of the bolt and K (0.2 for stainless
steel, 0.22 for zinc coated).
The compressive load is applied to the
stack by tightening the tie‐rods. Under this
load, the gaskets will compress and the
endplates will see some degree of bending
stress. Gasket deformation calculations were
performed to see if the compression would
decrease the space between electrode plates
enough to require a thicker gasket. Where F is
the compressive force required to seal, L is the
uncompressed thickness of the gasket, A is the
area of the gasket, and E is the elastic modulus
of the material:
120 1.62419 10
0.00783
From this, we may conclude that the
compressive force will have no effect on the
spacing of the electrodes.
Endplate Bending
The endplates are 3/8” to allow enough
material to drill holes to accept NPT fittings. To
ensure that the endplate will not bow
excessively under load, a beam in bending
Figure 3: Dry Cell System Diagram
Material Modulus of Elasticity
Soft PVC 10 MPa
Rigid PVC 1.06 GPa
Table 2: PVC Material Properties
Cell (stack)
Solution travels to cell via inlet hose
2H2+O2
gas and solution bubbles back to reservoir via outlet hose
Reservoir with
solution
Figure 4: Endplate in bending (4)

9
calculation was used to estimate deflection,
where P is one quarter of the load required for
sealing the gaskets and the load at points B and
D are the reacting forces from the gaskets,
which have been represented as simplified
point loads at middle of the gasket (See Figure
4). For calculating I, B is the width of the
endplate and H is the thickness. The following
calculations show that the deflection is
negligible.
12120 9.5
1213718
8120 /4 140 3.16
8 1.06 137180.016
TEST RESULTS
Initial Complications
Solution Level Maximum electrolyte concentration was
determined using the chart in Figure 5. During
the first testing stages the following issues were
found while using a 22% KOH by weight
solution:
1) Low HHO production
2) Particulate buildup on electrodes
3) Poor fluid circulation
The cell was disassembled and examined
for any clues leading to the cause of the issues.
It was found that the burning covered a
different amount of area on each electrode.
This area would start at the top where the
electrode first meets the solution and extend
down no more than one inch. The burning was
thought to be caused by electricity arching
through the bubbly solution from one plate to
another. However, it was found that what was
thought to be burning of the plates was actually
a buildup of some brownish‐black particulate
contamination. It was also noted that the
amount of contaminated area on each
electrode increased from the side with the
barbed fittings. This was an indication that the
solution level was decreasing in a step‐like
fashion from electrode to electrode.
In an attempt to correct this inconsistent
solution level, the 0.125” hole shown in Figure
11 was increased to 0.250”. This had no effect
on solution level.
Next, the gaskets were swapped out for
gaskets three times the thickness. It was
thought that if there was more solution
between electrodes, it would be easier for
gasses to make their way to the top of the cell
and to the outlet tube. This also showed no
significant changes during operation.
Finally, the primary and secondary
reservoirs were moved from the position in
Figure 18 (page 35) to the final position in
Figure 6. The particulate buildup stopped. By
increasing the value of h in Figure 3, a greater
pressure differential was produced between the
cell inlet and outlet. This caused the solution to
circulate swiftly through the system. This
pressure differential also caused the solution
level to rise from covering 80% of the active
electrode area to 100%. An increase in
volumetric flow of gasses was seen.
Figure 5: Conductivity of various electrolytes dissolved in
distilled water (8)
10
Amp meter
Volt meter
HHO outlet hose
Primary to
secondary hose
Thermometer
Primary bubbler
Secondary bubbler
Cell outlet hose
Cell inlet hose
Cell
Tierods
Figure 6: Dry Cell Electrolyzer Assembly

11
Solution Contamination After five hours of operation, the solution
went from clear to having a brownish‐black tint.
It was assumed that this change in color had to
been caused by the same contamination that
was building up on the electrodes. The stack
was disassembled and thoroughly cleaned with
distilled water. Black ink printing on the gaskets
was cleaned off with rubbing alcohol. The cell
was reassembled and filled with a fresh mix of
solution containing 22% KOH by weight.
Twenty additional hours of operation were
completed without seeing any build up of
particulate.
Solution Bubbling With the electrodes and solution
showing no signs of contamination, another
issue arose. It was noted that every time the
assembly was left in a car on a 32‐38°C (90‐
100°F) day for an extended amount of time, the
solution would begin to exhibit excessive
bubbling when the system was turned on. This
bubbling would cause solution from the primary
reservoir to migrate to the secondary reservoir,
which should only contains distilled water.
Once the concentration of KOH in the
secondary bubbler reached a certain point,
bubbling would begin and cause electrolyte
solution to exit through the HHO outlet hose.
22% KOH by weight solution was swapped out
for 10% KOH by weight solution. The excessive
bubbling stopped and the cell showed no
change in gas production. The cell was then
tested to characterize system performance
(results are to follow). After testing, assembly
was stored without additional operation in a
different car subjected to the same weather for
seven days, then removed and used during
dynamometer tests on the test car. Solution
bubbling had returned, but the system was still
used for the tests. Solution temperature was
not recorded during dynamometer tests.
The assembly was stored for an
additional week in the same car subjected to
the same weather and then installed into the
test car for long term fuel efficiency tests. Upon
first operation, the solution exhibited excessive
bubbling. To keep the solution from making its
way to the HHO outlet tube, a 50/50 mix of
distilled water and vinegar was added to the
secondary reservoir. Although this approach is
not intended to be a long term solution, it did
serve to neutralize the electrolyte. The
bubbling was eliminated and efficiency tests
were conducted. Solution bubbling in the
primary reservoir stopped after about 3 hours
of operation performed over several days.
The cause of the bubbles has not been
determined. What is known is that the solution
was subjected to high temperatures and
sunlight when the assembly was stored in the
cars. Additional tests should be performed
using solution temperatures up to 75°C to see if
bubbling only occurs at elevated temperatures.
HHO Production/ Cell Characterization
The cell was filled with a distilled water
solution containing 10% KOH by weight. Power
was applied to the electrodes to begin HHO
production and operating conditions were
recorded to determine the following objectives:
1) Does electrical resistance, current
draw or voltage of the system
change with temperature?
2) Does electrical resistance, current
draw or voltage effect HHO
production?
The tests for objective one revealed
that none of the parameters were effected
when solution temperatures were between 35
12
to 55°C (see Figure 10).
Ideally, tests would cover ‐
20 to 70°C.
Data related to
objective two revealed a
strong relation between
volumetric flow and voltage
and volumetric flow and
current. Figure 9 shows the
linear relationship relating
the operating conditions.
See Appendix C (Cell
Characterization Test
Procedure) for testing
details.
A common question of concern is the
rate of water consumption. Time constraints
did not allow for any in depth investigation of
this quality. As an overall average, the cell
converts 8 milliliters of water per hour.
Automobile Dynamometer Testing
In theory, substituting some portion of
the air in an air‐fuel mixture will lean out the
mixture. By decreasing the quenching distance,
more fuel injected in to the cylinders is burned
resulting in a lean mixture3. The dynamometer
tests were conducted to answer two questions4:
1) How does HHO effect air fuel ratio?
2) How does HHO effect power output
from the engine?
Figure 8 shows the results of dyno tests
with and without using HHO. There was no
significant change in either the AFR or the
power output.
3 Lean mixtures have an AFR higher than 14.7:1. 4 Dyno tests were performed by Dent Sport Garage
of Norwood, Massachusetts using a Dyno Dynamics®
AWD Dynamometer (Serial number: 1977)
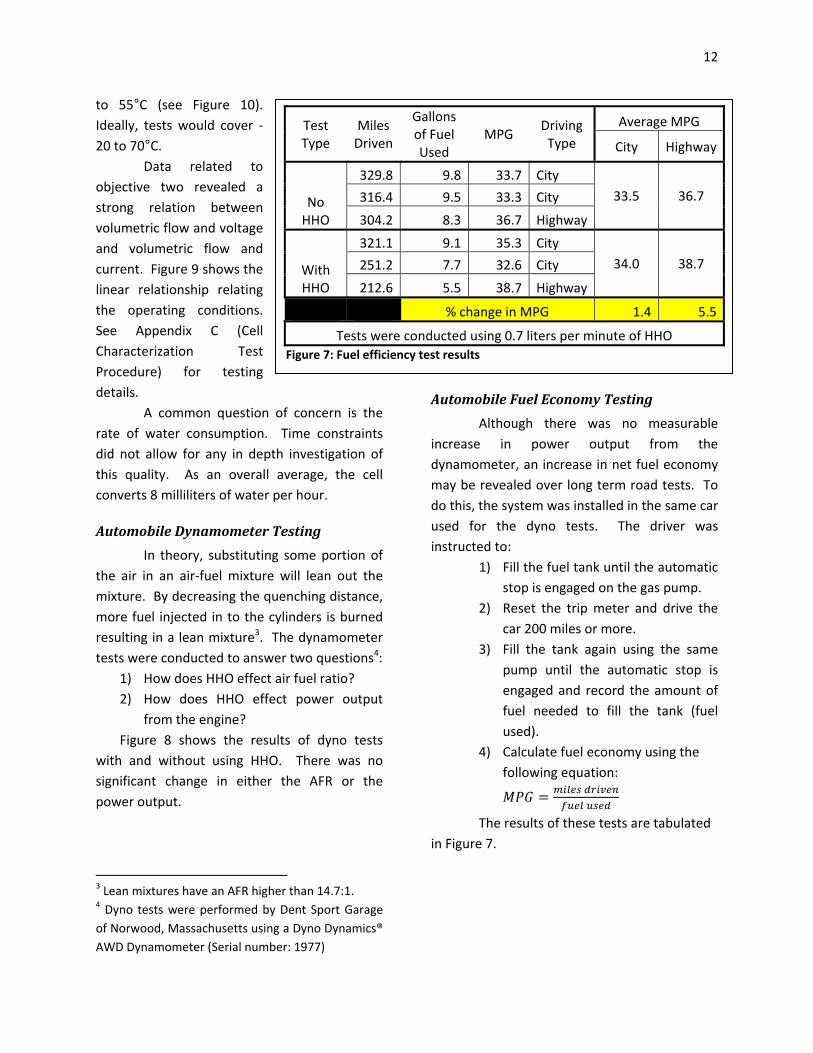
Automobile Fuel Economy Testing
Although there was no measurable
increase in power output from the
dynamometer, an increase in net fuel economy
may be revealed over long term road tests. To
do this, the system was installed in the same car
used for the dyno tests. The driver was
instructed to:
1) Fill the fuel tank until the automatic
stop is engaged on the gas pump.
2) Reset the trip meter and drive the
car 200 miles or more.
3) Fill the tank again using the same
pump until the automatic stop is
engaged and record the amount of
fuel needed to fill the tank (fuel
used).
4) Calculate fuel economy using the
following equation:
The results of these tests are tabulated
in Figure 7.
Test Type
Miles Driven
Gallons of Fuel Used
MPG Driving Type
Average MPG
City Highway
No HHO
329.8 9.8 33.7 City
33.5 36.7 316.4 9.5 33.3 City
304.2 8.3 36.7 Highway
With HHO
321.1 9.1 35.3 City
34.0 38.7 251.2 7.7 32.6 City
212.6 5.5 38.7 Highway
% change in MPG 1.4 5.5
Tests were conducted using 0.7 liters per minute of HHO
Figure 7: Fuel efficiency test results
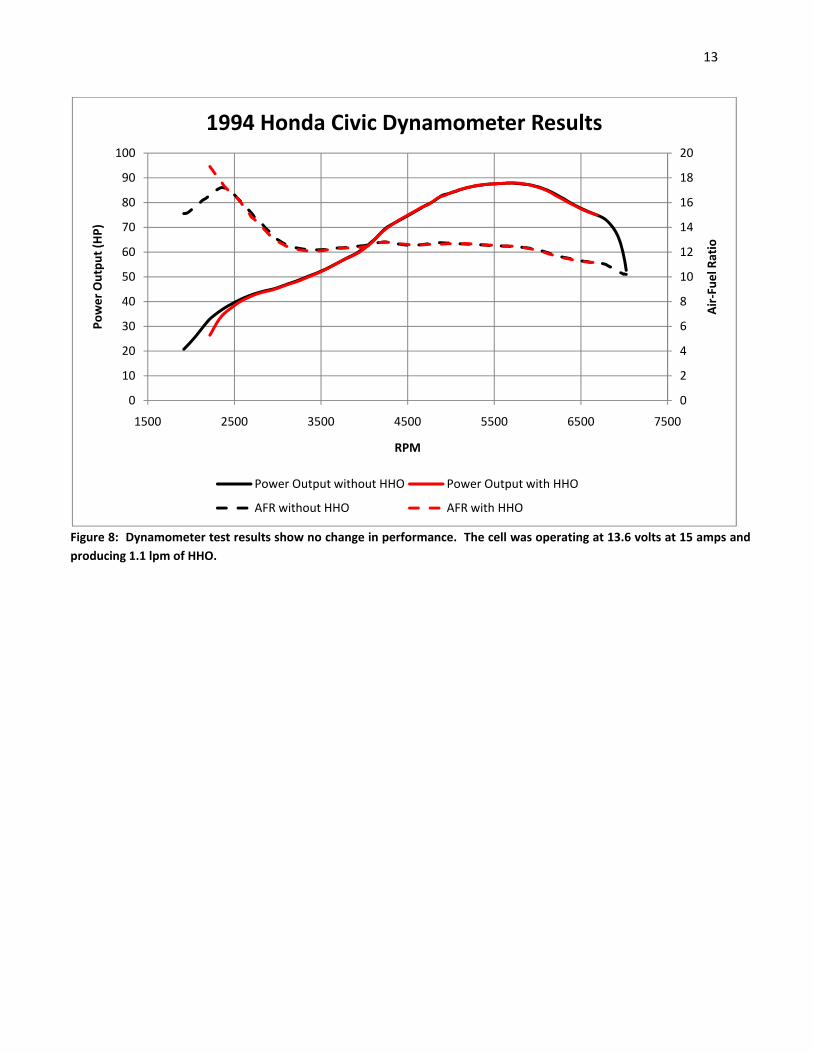
13
Figure 8: Dynamometer test results show no change in performance. The cell was operating at 13.6 volts at 15 amps and
producing 1.1 lpm of HHO.
0
2
4
6
8
10
12
14
16
18
20
0
10
20
30
40
50
60
70
80
90
100
1500 2500 3500 4500 5500 6500 7500
Air‐Fuel R
atio
Power Output (HP)
RPM
1994 Honda Civic Dynamometer Results
Power Output without HHO Power Output with HHO
AFR without HHO AFR with HHO

14
Figure 9: Strong linear relationship between flow rate and current.
Figure 10: Chart suggests that temperature plays no role in voltage, flow or resistance between the noted
temperatures.
R² = 0.9099R² = 0.9729
0.00
0.20
0.40
0.60
0.80
1.00
1.20
0 2 4 6 8 10 12 14 16
Volumetric Flow (l/min)
Volumetric Flow of HHO from Cell
Flow v Voltage (V) Flow v Current (A)
0
2
4
6
8
10
12
14
35 37 39 41 43 45 47 49 51 53 55
Temperature (°C)
Operating Temperature
Voltage v Temp Flow v Temp Resist v Temp

15
Health, Pollution, & Compatibility Concerns
Water electrolysis for use in PHI
systems employs the use of corrosion resistant
electrode materials. Stainless steel is a
common material used in less expensive
systems, but has a drawback. Over time, the
corrosion of the electrodes leads to high
concentrations of hexavalent chromium in the
water/electrolyte solution, an extremely toxic
carcinogen that must be disposed of properly
(2). To avoid this, some manufacturers have
moved to using more expensive titanium
electrodes. Research shows that the hexavalent
chromium only leeches out of the surface of
stainless steel electrodes for a short time.
Leeching stops after a period of use known as
the conditioning period and may take up to one
week of continuous operation to do so.
Electrolyte solutions are made by
mixing distilled water with electrolytes such as
potassium hydroxide or sodium hydroxide.
Caustic electrolytes can end up in the engine
and cause premature wearing of engine
components. Because of this, it is important
that electrolytes are captured in the primary
and secondary reservoirs. Some electrolyte
solutions will produce CO and CO2. Care should
be taken to choose an electrolyte that will not
produce toxic fumes.
High flow rates of HHO can cause the
cause lean burning conditions in engine
cylinders. Overly lean air‐fuel mixtures will
result in increased exhaust temperatures and
the production of NOx5 . Elevated exhaust
temperatures also pose a risk of accelerated
engine wear. Although this study showed no
change in AFR, AFR and exhaust gas
5 NOx refers specifically to NO and NO2. Both are
pollution concerns and harmful to human health.
temperature should be monitored when higher
flow rates of HHO are used.
THE FUTURE OF THE PROJECT Tests conducted to study volumetric
production of HHO were done so over a small range of solution temperatures (35‐55°C). Additional tests should be performed to determine how this process will behave in extreme heat and extreme cold (‐20‐70°C). It is likely that some components will have to be replaced by components made of materials that can operate under those conditions.
As we lean out an air fuel mixture, the exhaust temperature starts to rise. If the mixture becomes too lean for too long, engine blocks may overheat. This overheating can result in detonation and ignition of fuel at incorrect intervals. Heat, detonation, and pre‐ignition will all result in damages that lead to engine failure. The catalytic converter provides an environment for a chemical reaction wherein toxic combustion by‐products are converted to less‐toxic substances. This reaction relies on the perpetual switch of exhaust gas from lean to rich. A constant lean mixture will result in poor chemical reactions and emission of greenhouse gasses.
The results of the dyno tests revealed that a 1994 Honda Civic DX running at 3500 rpm in 4th gear showed no change in AFR when HHO was supplied at a rate of 1.1 lpm. There was also no measurable change in power output. What would happen if more HHO was used? Are there boundaries limiting the amount of HHO that can be injected given a particular set of operating conditions (fuel type, engine size, engine modifications such as turbo chargers, rpm, etc.)? With these concerns of a lean AFR in mind, additional investigations are necessary to see how PHI and the quantity of HHO used effects the exhaust gas temperature and presence of toxins in exhaust gasses.

16
‐
WORKS CITED 1. Zero. FAQ. Zero Fossil Fuel. [Online] [Cited:
March 30, 2010.] http://alt‐nrg.org/faq.html.
2. HHO Generator Resource Center. [Online]
Dec. 28, 2009. [Cited: Feb. 5, 2010.]
http://www.hhogenerator.com/hho‐and‐the‐
energy‐market‐olympic‐hydrogen‐ti‐hho‐
generators/.
3. Chemical Compatability. Cole‐Palmer.
[Online] [Cited: Feb. 3, 2010.]
http://www.coleparmer.com/techinfo/ChemCo
mp.asp.
4. Dorf, Richard C. The Engineering Handbook,
Second Edition. 2004. ISBN 978‐0‐8493‐1586‐2.
5. Cerini, John Housman and D.J. On‐Board
Hydrogen Generator for a Partial Hydrogen
Injection Internal Combustion Engine. New York,
New York : Society of Automotive Engineers,
Inc., 1974.
6. Mott, Robert L. Machine Elements in
Machine Design, Fourth Edition. Upper Saddle
River, New Jersey : Pearson Education, Inc.,
2004. ISBN 0‐13‐161885‐3.
7. MatWeb. [Online] [Cited: Feb. 4, 2010.]
http://www.matweb.com.
8. Omega Engineering, Inc. [Online] [Cited: April
10, 2010.]
http://www.omega.com/green/pdf/CONDUCTI
VITY_REF.pdf.
CONTACTS
Myles Moore can be contacted at
Nathan Kituuma can be contacted at
DEFINITIONS, ACRONYMS, ABBREVIATIONS ⁰C: degrees Celsius
AFR: air/fuel ratio
CO: carbon monoxide
CO2: carbon dioxide
HHO: a gas mixture composed of 2H2 + O2
ICE: internal combustion engine
in: inches
KOH: potassium hydroxide
LDPE: low density polyethylene
lpm: liters per minute
mm: millimeters
NO: nitric oxide
NO2: nitrogen dioxide
NPT: National Pipe Thread
PHI: partial hydrogen injection
PVC: polyvinylchloride
PWM: pulse width modulator
rpm: revolutions per minute

17
APPENDIX A (DECISION MATRICES)
USER NOTES Resistance to Chemical Corrosion from KOH
Design factors (DF) should be multiplied by ‐1 if the effect of high
rating factors (RF) are seen as negative.
Grading Legend These values are based on information found on
http://www.coleparmer.com/techinfo/ChemComp.asp. 10=A, 7.5= B, 5=C, 2.5=D
2.5 D
5 C
7.5 B
10 A
90 % importance
n\a RF units
Design Alternatives Totals Notes RF DF Notes
Rubber Buna N (Nitrile) 6.75 7.5 6.75
EPDM 9 10 9
Natural Rubber 6.75 7.5 6.75
Neoprene 6.75 7.5 6.75
Polyetherether Ketone (PEEK)
9 10 9
Silicone 9 10 9
PTFE 9 10 9
PVC (Soft) 9 10 9
Plastic ABS Plastic 9 10 9
Acetal (Delrin) 9 10 9
Nylon 4.5 5 4.5
Polycarbonate 2.25 2.5 2.25
Polypropelyne 9 10 9
Polyurethane 2.25 2.5 2.25
PVC (Type 1) 9 10 9
CPVC 9 10 9
LDPE 9 10 9
Table 3: Decision Matrix – Elastomers
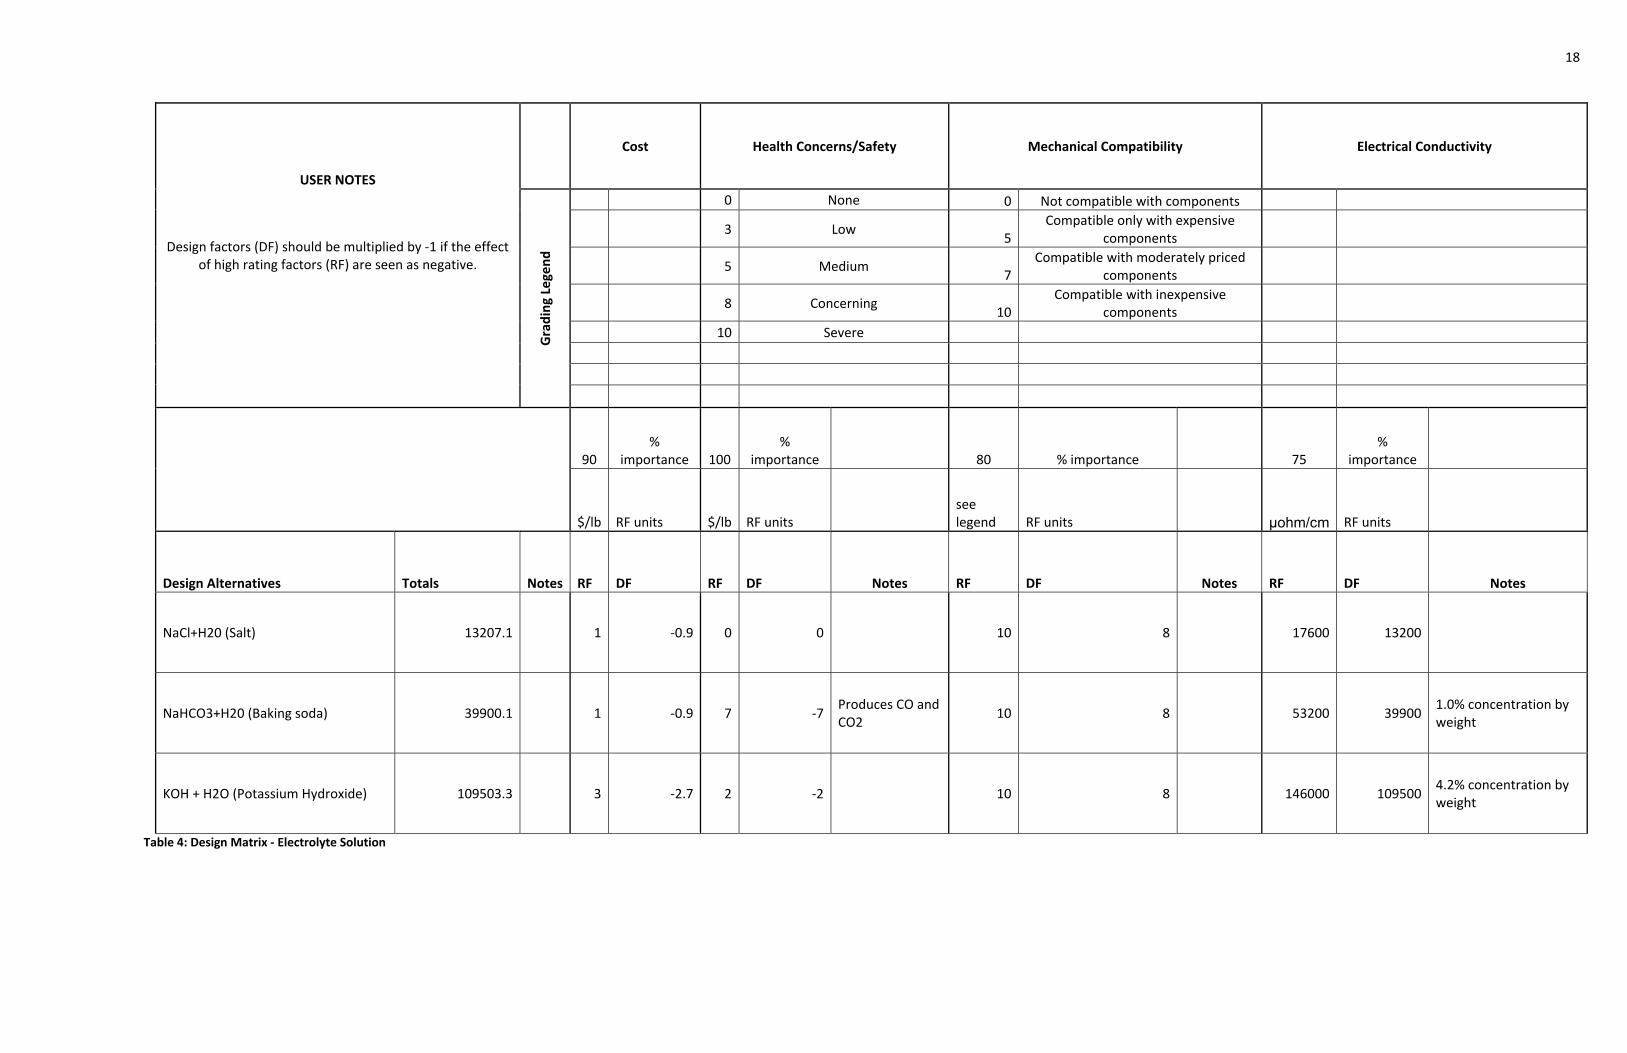
18
USER NOTES
Cost Health Concerns/Safety Mechanical Compatibility Electrical Conductivity
Design factors (DF) should be multiplied by ‐1 if the effect of high rating factors (RF) are seen as negative.
Grading Legend
0 None 0 Not compatible with components
3 Low 5
Compatible only with expensive components
5 Medium 7
Compatible with moderately priced components
8 Concerning 10
Compatible with inexpensive components
10 Severe
90 %
importance 100 %
importance 80 % importance 75 %
importance
$/lb RF units $/lb RF units see legend RF units μohm/cm RF units
Design Alternatives Totals Notes RF DF RF DF Notes RF DF Notes RF DF Notes
NaCl+H20 (Salt) 13207.1 1 ‐0.9 0 0 10 8 17600 13200
NaHCO3+H20 (Baking soda) 39900.1 1 ‐0.9 7 ‐7Produces CO and CO2
10 8 53200 399001.0% concentration by weight
KOH + H2O (Potassium Hydroxide) 109503.3 3 ‐2.7 2 ‐2 10 8 146000 1095004.2% concentration by weight
Table 4: Design Matrix ‐ Electrolyte Solution
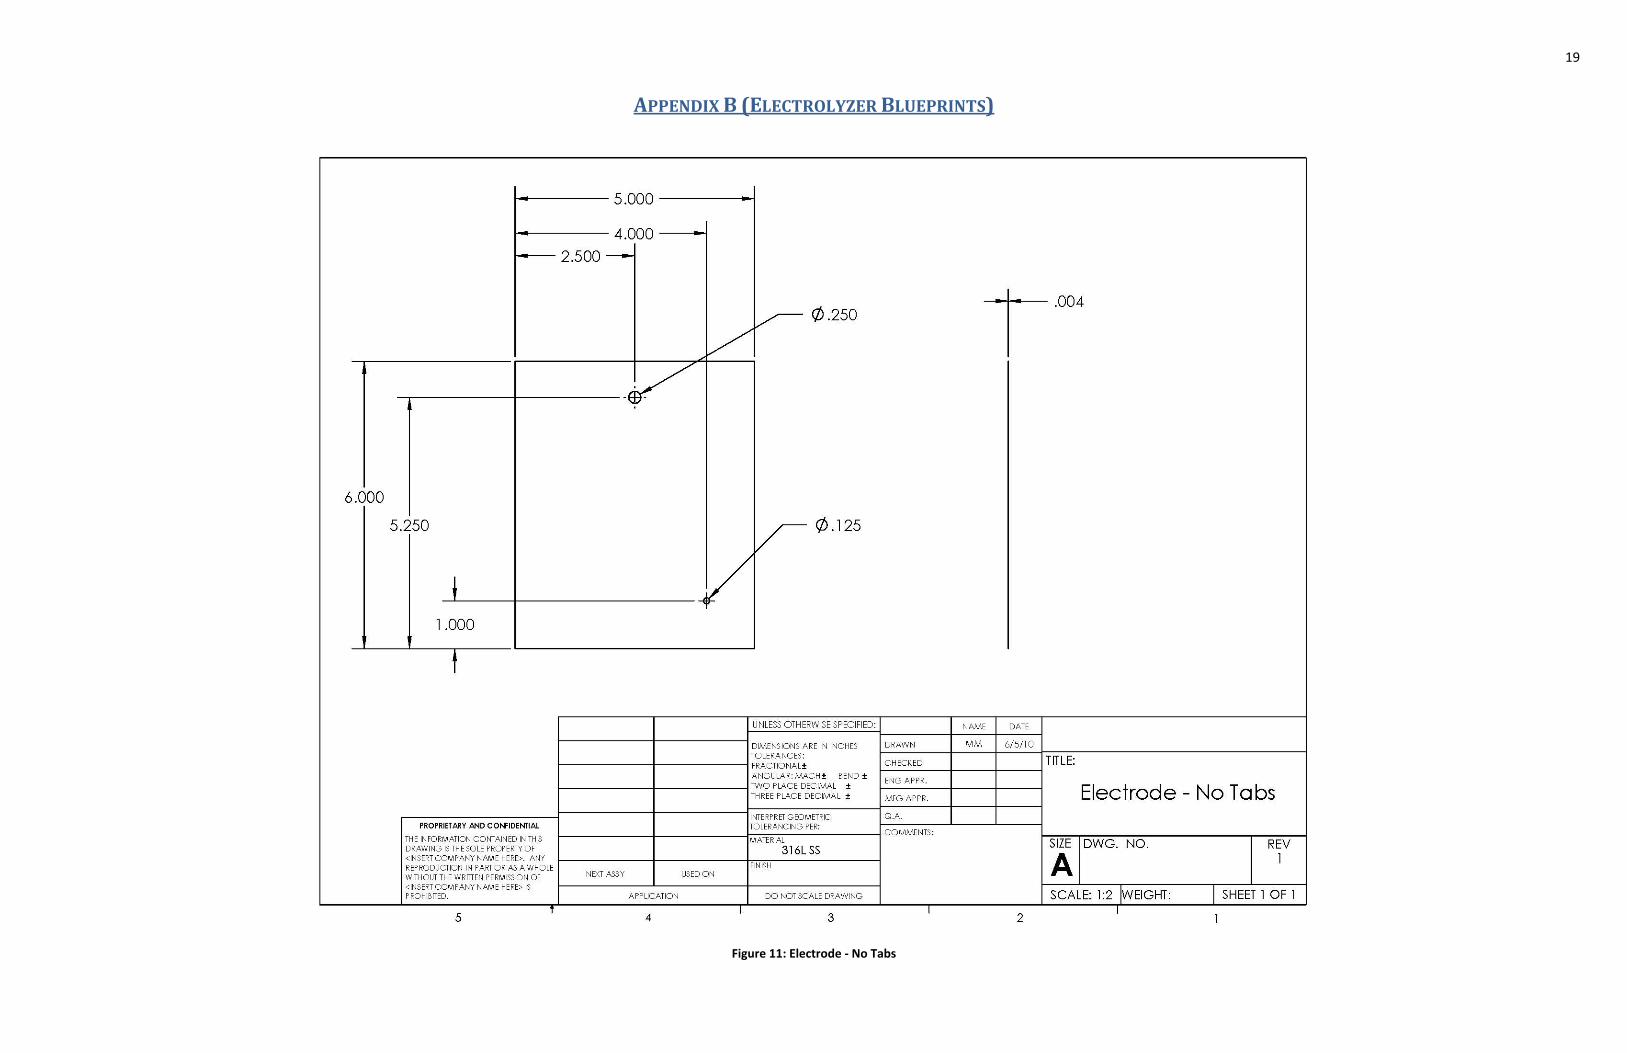
19
APPENDIX B (ELECTROLYZER BLUEPRINTS)
Figure 11: Electrode ‐ No Tabs
20
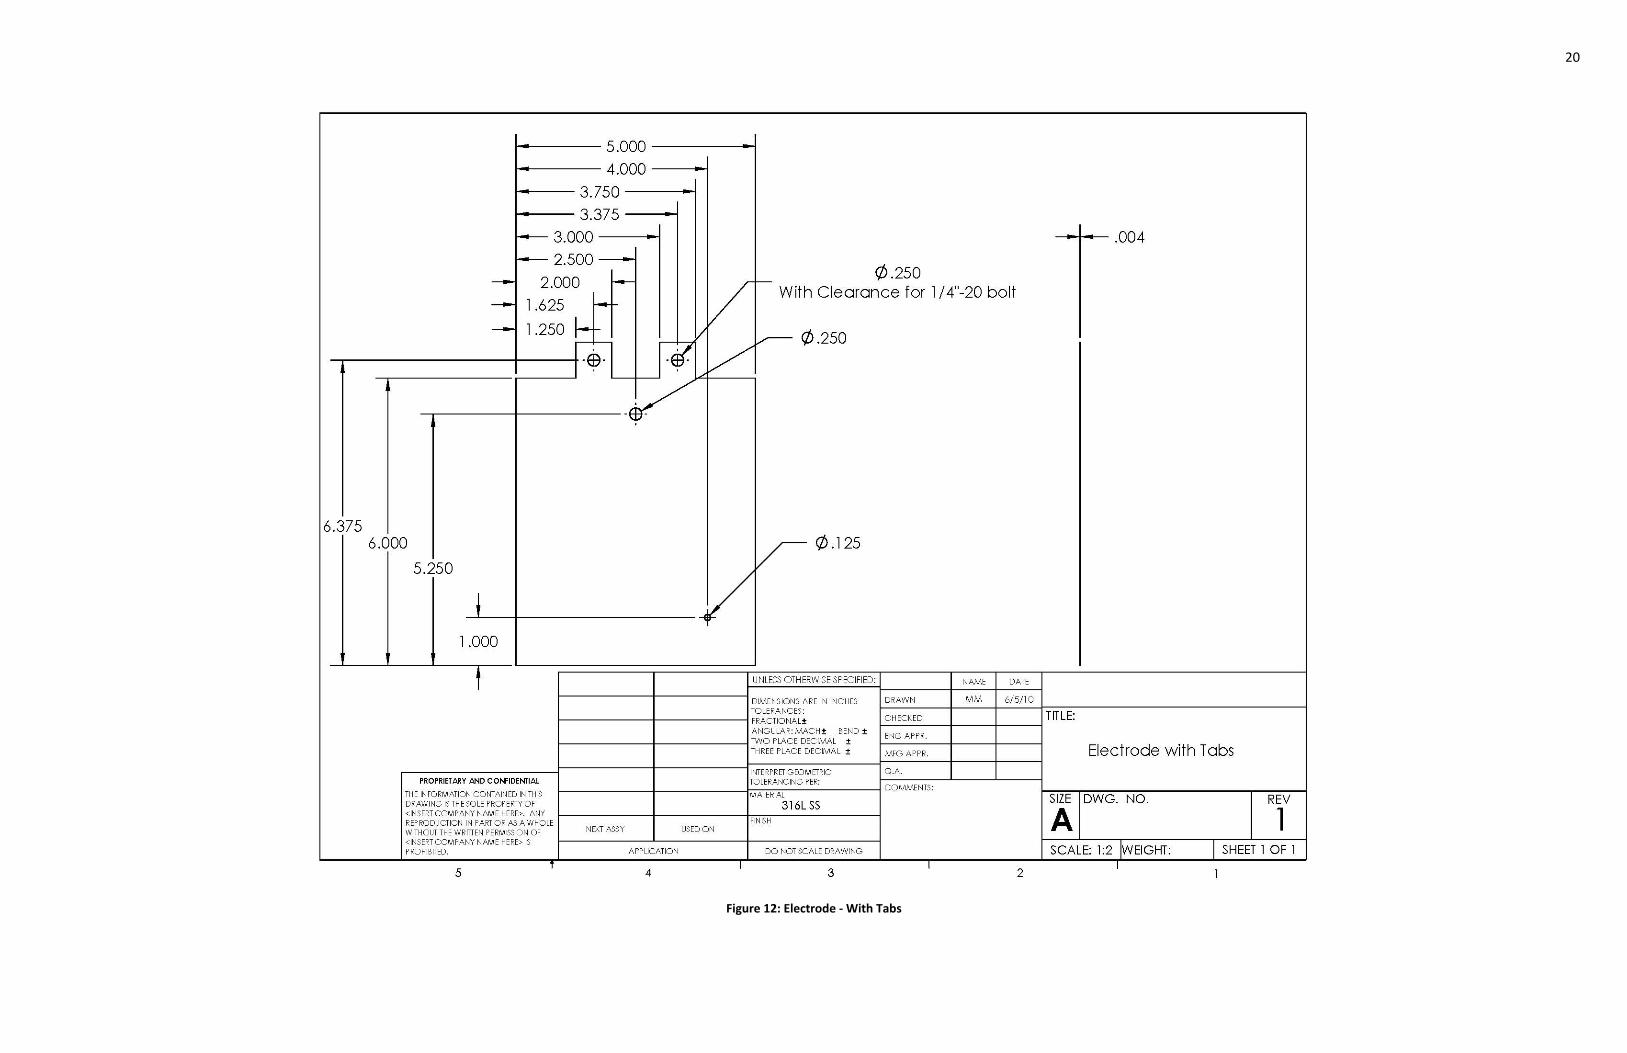
Figure 12: Electrode ‐ With Tabs
21
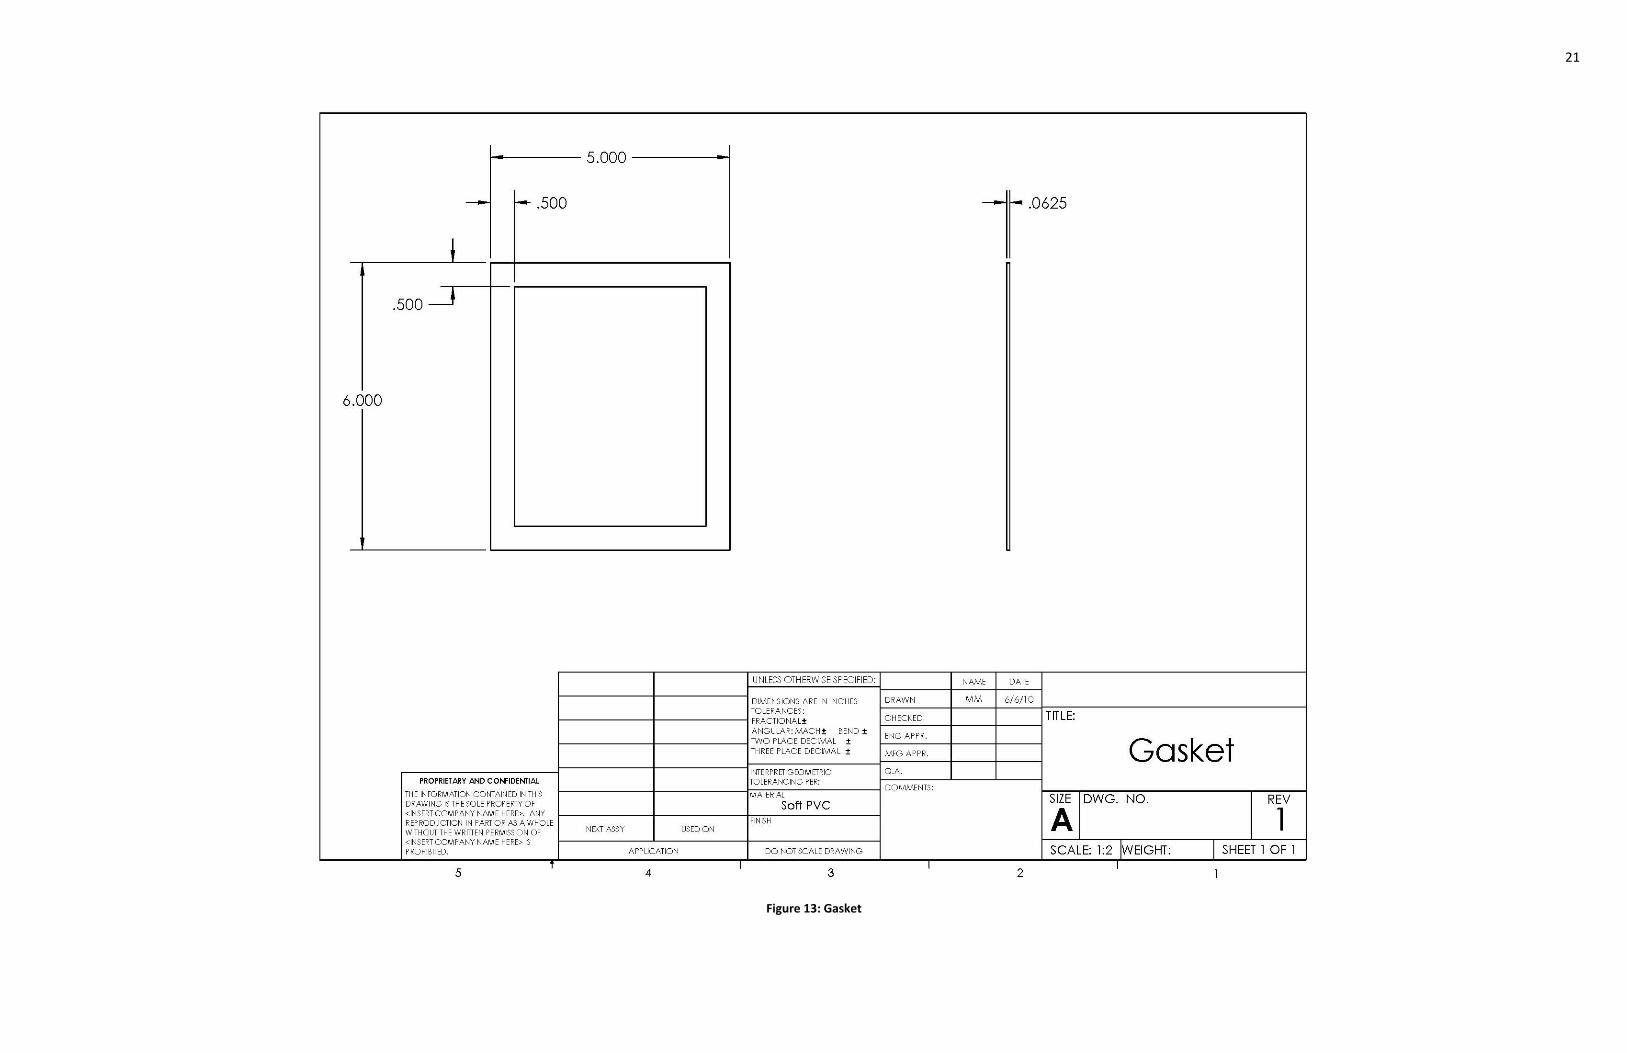
Figure 13: Gasket
22
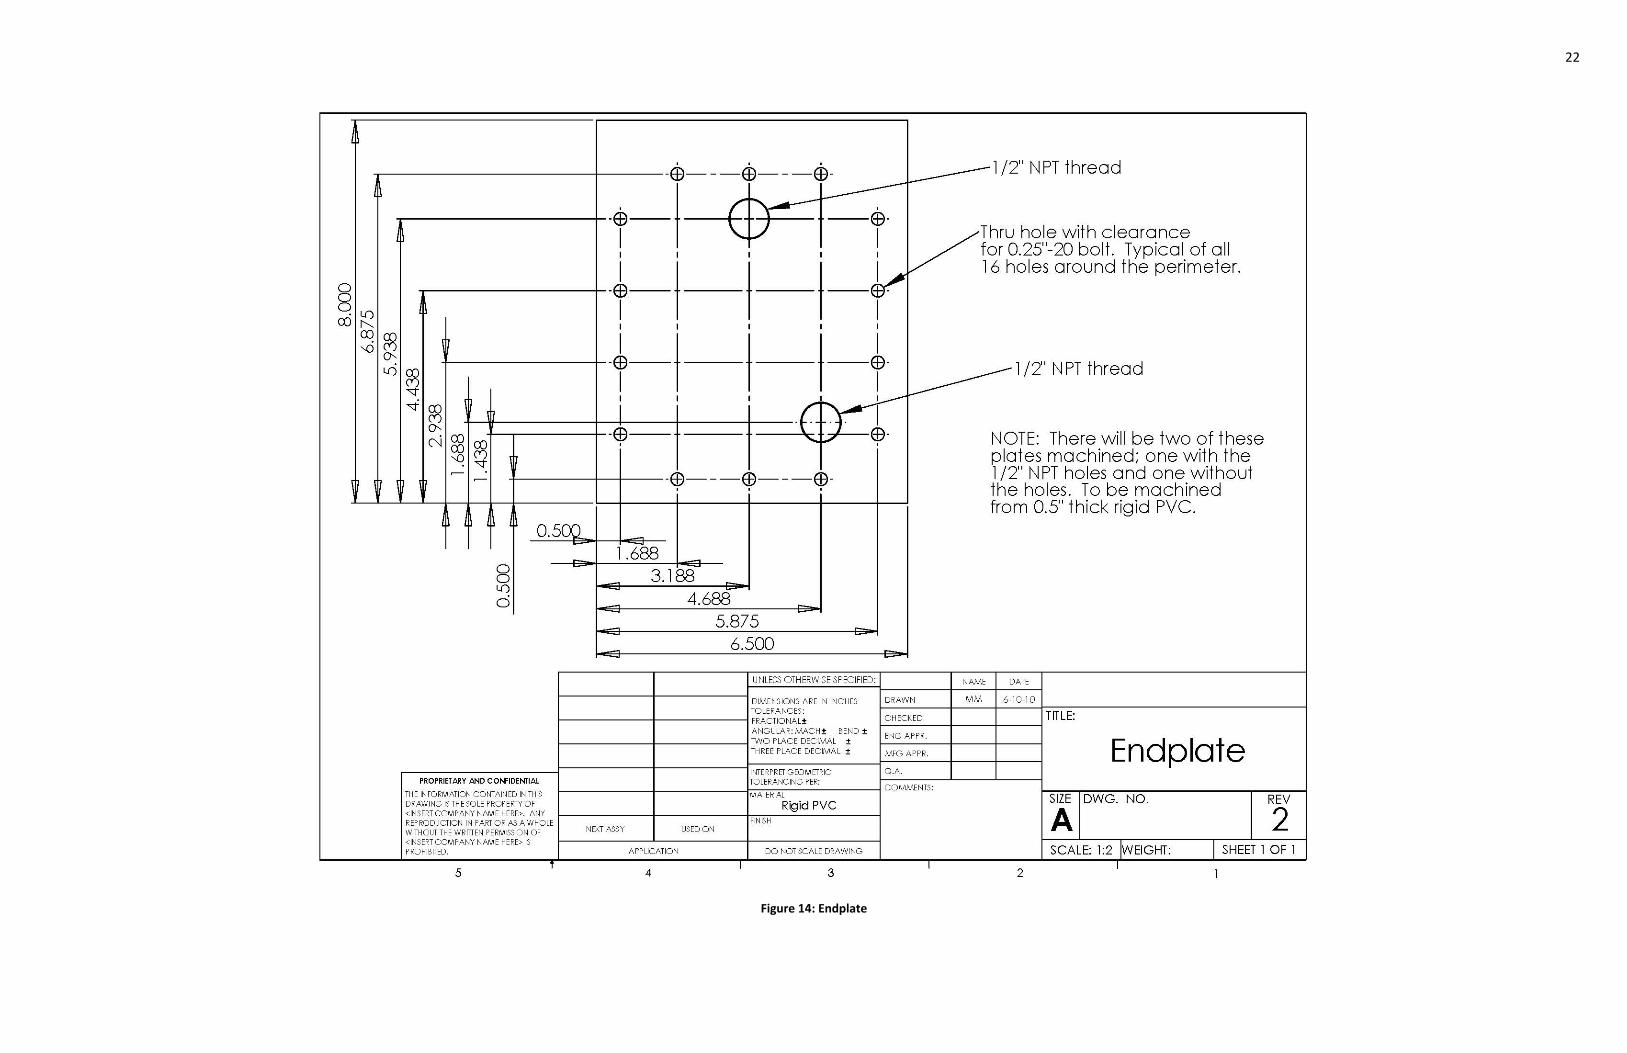
Figure 14: Endplate
23
APPENDIX C (CELL CHARACTERIZATION TEST PROCEDURE)
Objective:
The purpose of this test is to determine the following:
Does electrical resistance, current draw or voltage of the system change with temperature?
Does electrical resistance, current draw or voltage effect HHO production?
Materials:
1 Electrolyzer System
o 1 Electrolyzer
o 7 Electrode plates
o Gaskets
o 2 Bubblers
1000 mL graduated bottle
500 mL graduated bottle
Stopwatch
One 12V 10A power supply – (necessary to send charge to the cell for electrolysis initiation).
1 DMM (Digital Multi Meter) – (needed to accurately define voltage readings).
4.17 lbs. KOH flakes 90+ % pure (potassium hydroxide) – (portion of the sample to be added to
the distilled water).
1 gallon of distilled water
Testing procedure:
1. Mix a solution of distilled water and 10% KOH by weight (4.17 wt.oz of KOH mixed with 40 fl.oz
of water). Add the potassium hydroxide to the distilled water and NOT the other way around.
Mixing too much KOH at once can produce excessive heat and melt the mixing container.
2. Fill the primary reservoir to until the solution level reaches the 900ml graduation. Fill secondary
reservoir with 750ml of distilled water.
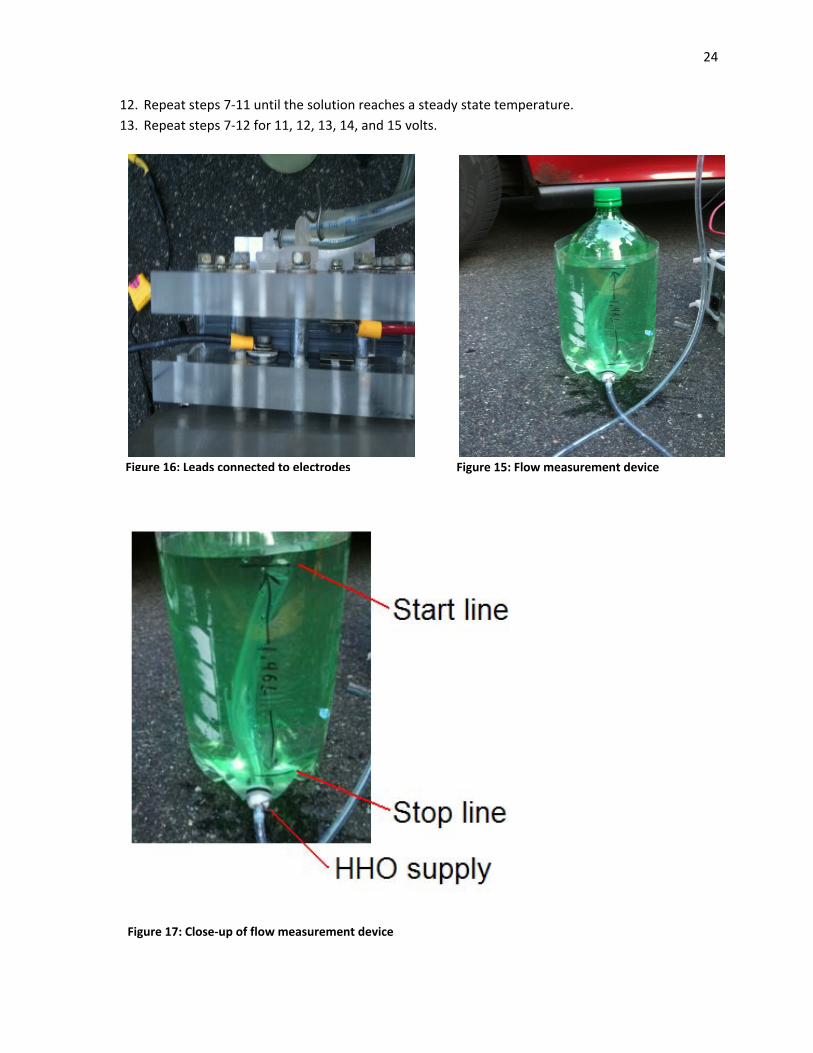
3. Connect the positive and negative leads to the positive and negative electrodes (see Figure 16).
4. Connect output tube from the secondary reservoir to the flow measurement device and fill the
measurement device with tap water (see Figure 15).
5. Turn power supply on.
6. Supply cell with 11 volts.
7. Measure the current and the voltage across the cell.
8. Measure solution temperature at cell inlet.
9. With cap off, submerge graduated bottle (measurement device) below the starting line (see
Figure 17). Cap bottle.
10. When water level reaches the start line, start the stopwatch and time how long it takes to reach
the stop line. Record the time.
11. Calculate volumetric flow rate
24
12. Repeat steps 7‐11 until the solution reaches a steady state temperature.
13. Repeat steps 7‐12 for 11, 12, 13, 14, and 15 volts.
Figure 16: Leads connected to electrodes Figure 15: Flow measurement device
Figure 17: Close‐up of flow measurement device

25
Precautions:
While operating the water electrolyzer system, be sure to have protective equipment for your eyes, hands,
mouth, and nose. KOH contact with the eyes can cause permanent blindness in as little as 20 seconds. Skin
contact with KOH can result in chemical burns. See MSDS in the Appendix for more information.
KOH spills can be neutralized by flushing the area with vinegar.
KOH should be properly disposed of. Find locations near you that accept KOH waste.
Hexavalent chromium (Ch+6 ) will leach out of the stainless steel plates during operation. Ch+6 is a human
carcinogen and gloves should be worn when handling waste electrolyte solution. Ch+6 should not be dumped
down drains, on the ground, in the ocean, etc. Contact your local hazardous materials handler for information
on proper disposal.

26 Test Data:
Solutioin Concentration
Primary Reservoir Level
Secondary Reservoir Level Amps Voltage
Solution Temperature
Time to fill bottle
Volume Flow Rate hrs running
% by weight ml ml A V C min l/min hrs
10 900 6 11.25 37.0 4.12 0.35 0.20
10 5.9 11.3 39.7 4.23 0.34 0.36
10 6.2 11.3 43 4.02 0.36 0.52
10 9.75 12 43.5 2.38 0.61 0.68
10 9.75 12 36.4 2.47 0.59 0.84
10 9.75 12 39.2 2.47 0.59 1.00
10 9.75 12 40.5 2.45 0.60 1.16
10 9.75 12 42 2.47 0.59 1.32
10 6.2 11.3 43.6 3.78 0.39 1.48
10 9.75 12 44 2.28 0.64 1.64
10 9.75 11.9 44.5 2.37 0.62 1.80
10 6.2 11.4 46.6 4.10 0.36 1.96
10 6 11.5 47.5 4.18 0.35 2.12
10 10 11.9 47.7 2.45 0.60 2.28
10 870 750 5.75 11.4 48.5 4.62 0.32 2.44
10 9.75 11.9 48.9 2.47 0.59 2.60
10 9.75 11.9 49.8 2.32 0.63 2.76
10 10.1 12 50.5 2.28 0.64 2.92
10 10 11.9 50.9 2.28 0.64 3.07
10 13.5 12.7 50.8 1.42 1.03 3.27
10 13.5 12.7 51.7 1.45 1.01 3.34
10 13.5 12.7 52.5 1.50 0.97 3.42
10 845 750 13.5 12.7 55 1.48 0.98 3.60
10 825 755 10 11.8 55.1 2.07 0.71 4.05
10 5.5 11.3 53.3 5.80 0.25 4.22
10 5.5 11.3 51.7 6.33 0.23 4.37
10 5 11.5 43.5 8.30 0.18 5.47
10 4 11.4 40.7 8.07 0.18 6.37
10 765 745 5.5 11.3 46.3 4.40 0.33 15.04
10 657 28.04

27 Appendix (MSDS)

28

29

30

31

32

33

34

35
APPENDIX D (MISCELLANEOUS)
Figure 18: Initial Electrolyzer Assembly Configuration

36
APPENDIX E (WORK PLAN)
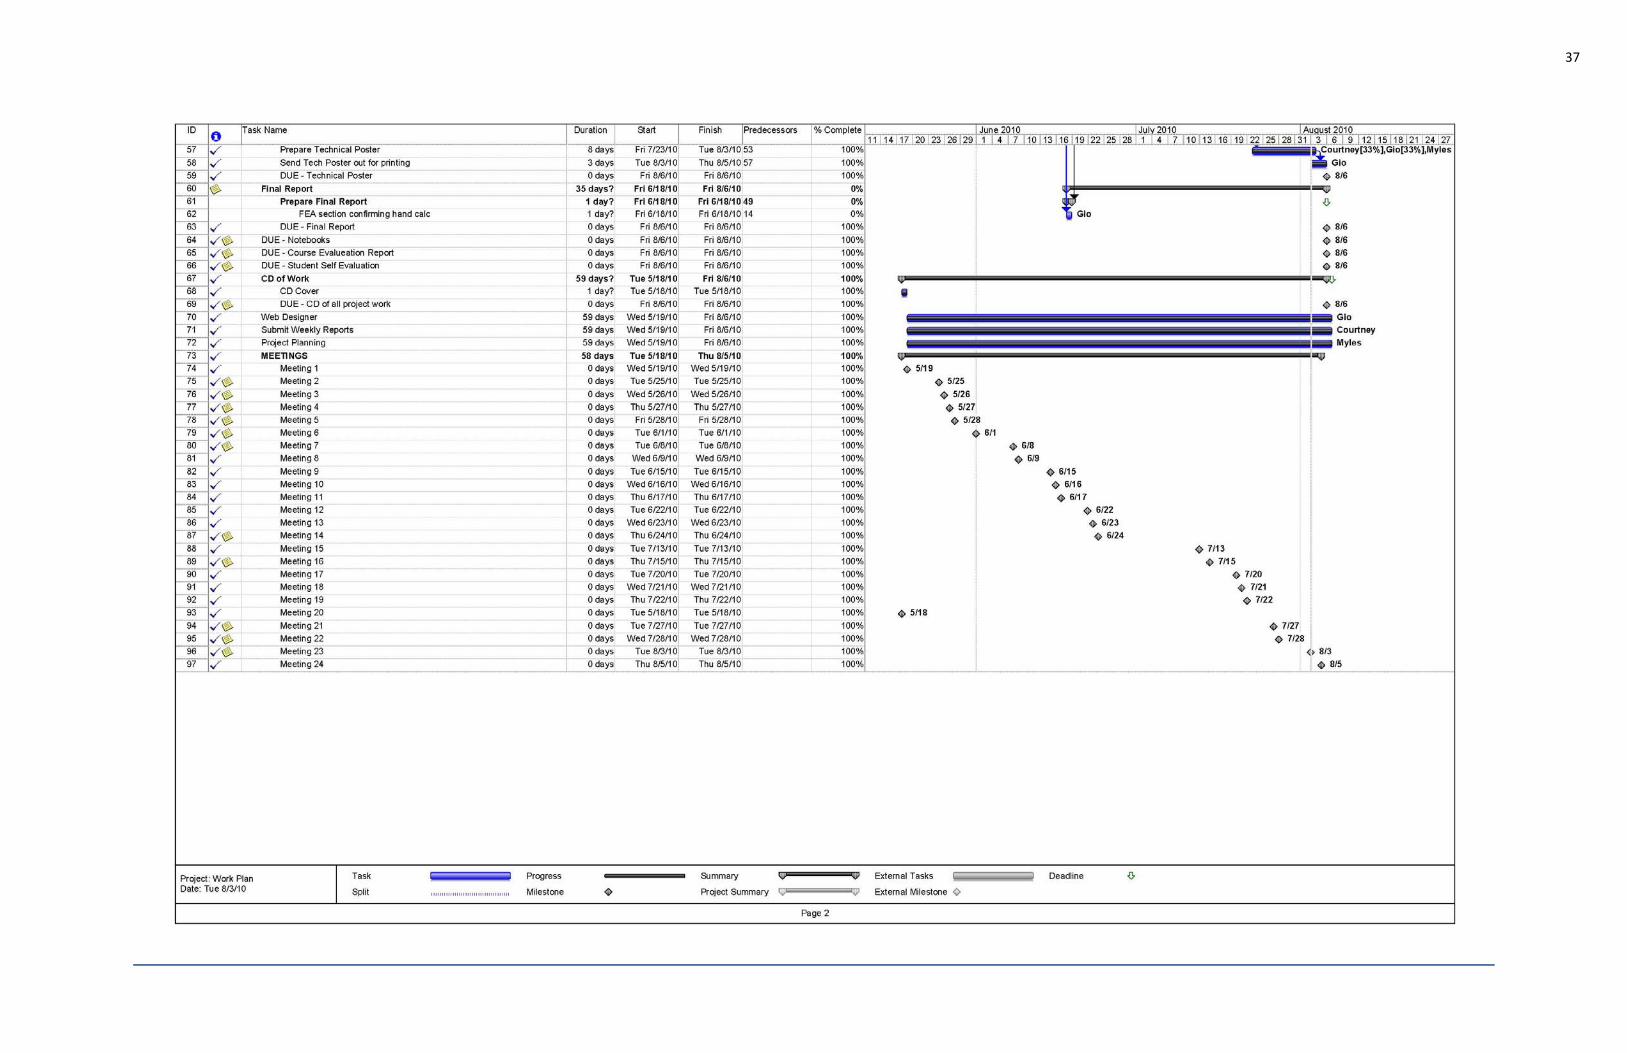
37
Related Documents


![Hydrogen Atom [5pt] Reading course MAT394 ``Partial ... · Hydrogen Atom Reading course MAT394 \Partial Di erential Equations", Fall 2013 Franz Altea University of Toronto January](https://static.cupdf.com/doc/110x72/5d5e7e6a88c993ab568bd08f/hydrogen-atom-5pt-reading-course-mat394-partial-hydrogen-atom-reading.jpg)