Part III: ROMAN and MesoWest: resources for observing surface weather MesoWest and ROMAN are software that require ongoing maintenance and development to provide access to surface environmental information for variety of operational applications http://raws.wrh.noaa.gov /roman Shoestring budget! San Diego Tribune. 28 Oct. 2003

Part III: ROMAN and MesoWest: resources for observing surface weather MesoWest and ROMAN are software that require ongoing maintenance and development.
Jan 02, 2016
Welcome message from author
This document is posted to help you gain knowledge. Please leave a comment to let me know what you think about it! Share it to your friends and learn new things together.
Transcript

Part III: ROMAN and MesoWest: resources for observing surface weather
MesoWest and ROMAN are software that require ongoing maintenance and development to provide access to surface environmental information for variety of operational applications
http://raws.wrh.noaa.gov/roman Shoestring budget!
San Diego Tribune. 28 Oct. 2003

MesoWest A cooperative program to collect, archive, and distribute
environmental observations across the Nation with emphasis on the western United States 200+ agencies/commercial firms 1000s of HAM radio operators 9000+ stations nationally (3500+ stations in western US)
Primary support: NWS and BLM Considerable effort placed on basic metadata and MySQL database Delivery of data via FTP,LDM, web portals Traditional COOP reports in separate database Integration of environmental and GIS
information

MesoWest• Observations from 70+ networks• Grown steadily since 1997•Coordination with MADIS• Approx. 3900 temperature obs/hr across the West ingested into ADAS• Variety of user interfaces
States
GACCs CWAs FWZs MODIS regions

ASOS RAWS
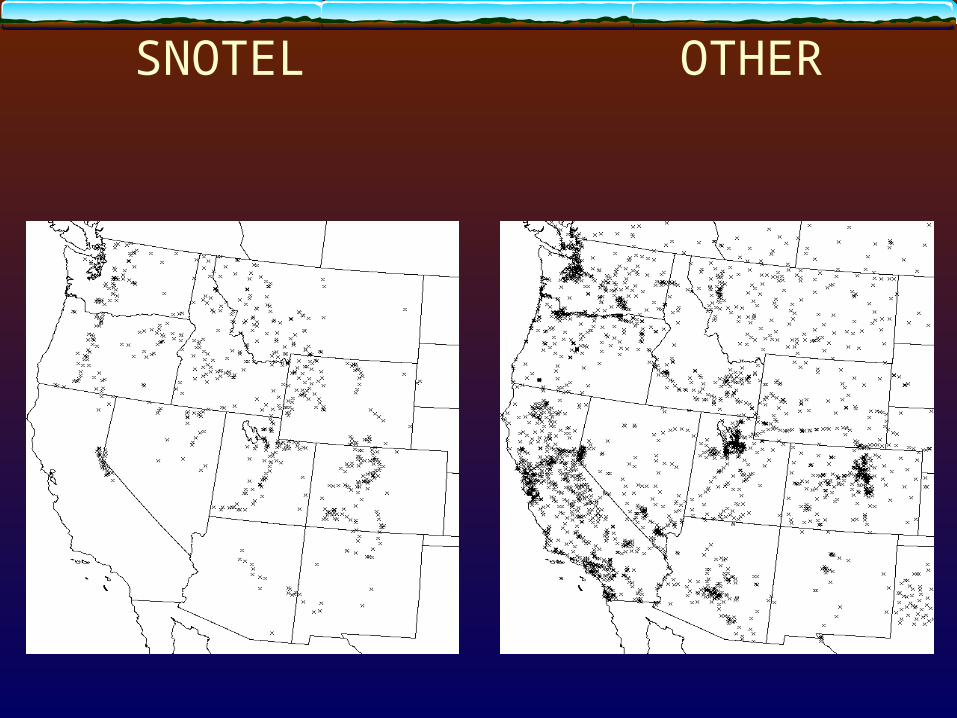
SNOTEL OTHER

Metadata provided by station owners is integrated with GIS information to georeference objectively the data relative to: states and counties National Weather Service (NWS) County Warning Areas, forecast
zones, and fire weather zones Land agency Geographic Coordinating Areas and Predictive
Service Areas Locations of fires Topozone and google earth graphics available for every station
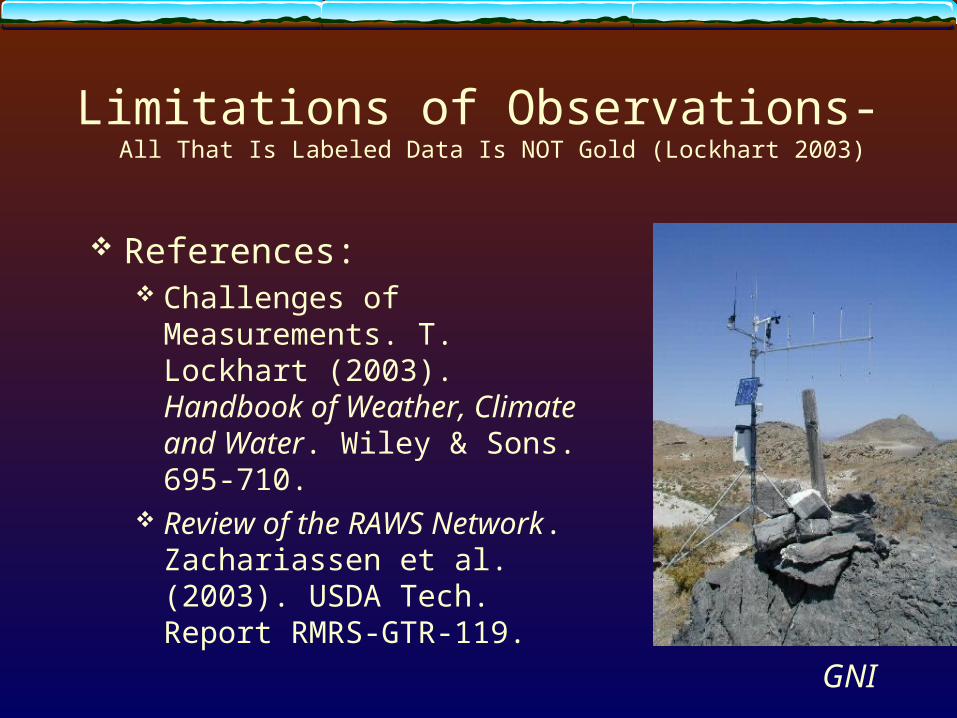
Limitations of Observations- All That Is Labeled Data Is NOT Gold (Lockhart 2003)
References: Challenges of Measurements.
T. Lockhart (2003). Handbook of Weather, Climate and Water. Wiley & Sons. 695-710.
Review of the RAWS Network. Zachariassen et al. (2003). USDA Tech. Report RMRS-GTR-119.
GNI
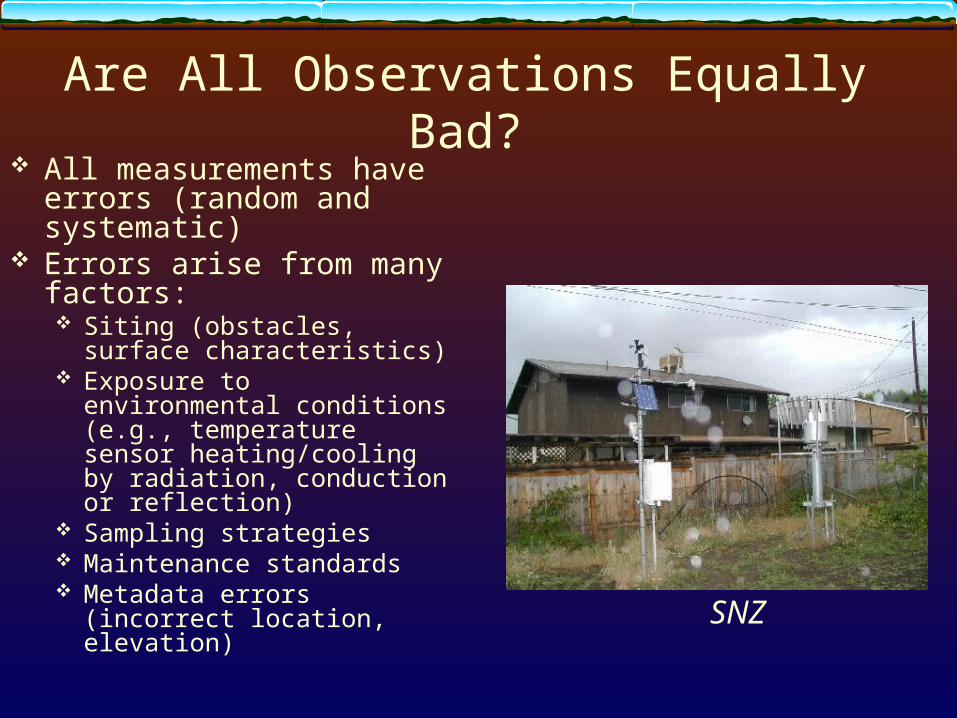
Are All Observations Equally Bad? All measurements have
errors (random and systematic)
Errors arise from many factors: Siting (obstacles, surface
characteristics) Exposure to environmental
conditions (e.g., temperature sensor heating/cooling by radiation, conduction or reflection)
Sampling strategies Maintenance standards Metadata errors (incorrect
location, elevation) SNZ

Are All Observations Equally Good? Why was the sensor installed?
Observing needs and sampling strategies vary (air quality, fire weather, road weather)
Station siting results from pragmatic tradeoffs: power, communication, obstacles, access
Use common sense Wind sensor in the base of a mountain pass
will likely blow from only two directions Errors depend upon conditions (e.g.,
temperature spikes common with calm winds) Use available metadata
Topography Land use, soil, and vegetation type Photos
Monitor quality control information Basic consistency checks Comparison to other stations
UT9

How representative can a single observation site be?
-19
• Adequate instrumentation• Good local siting
• Response to synopticconditions can vary widelyover short distances
• Persistent ridging can lead tocold pools in basins and warmtemperature on slopes
•Response dependent on snowcover as well
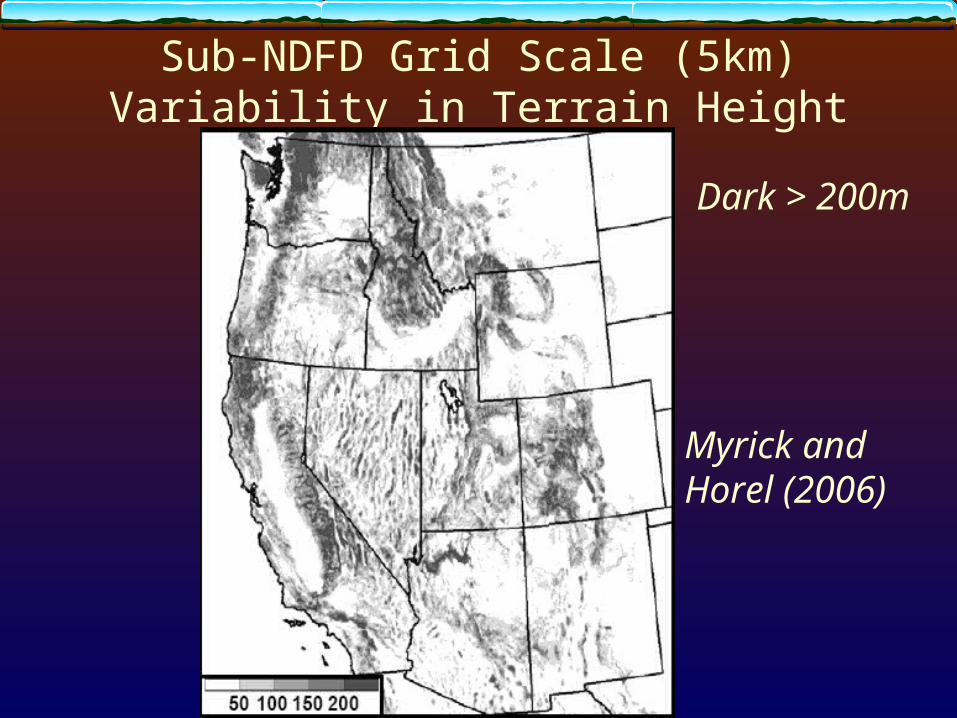
Sub-NDFD Grid Scale (5km) Variability in Terrain Height
Dark > 200m
Myrick and Horel (2006)
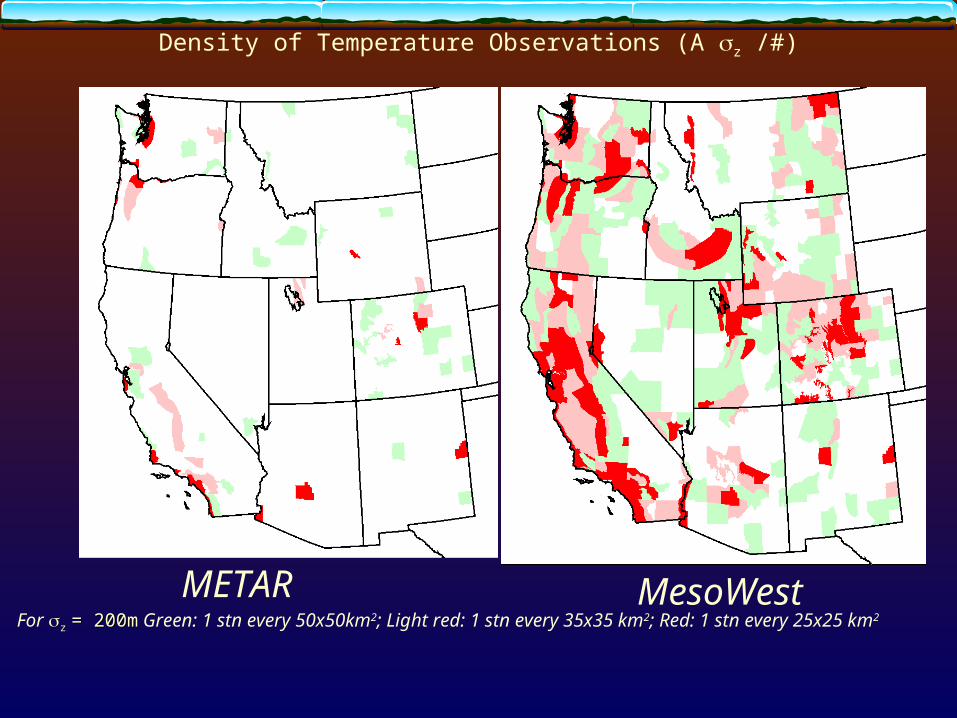
Density of Temperature Observations (A z /#)
METARFor zz = 200m= 200m Green: 1 stn every 50x50km2; Light red: 1 stn every 35x35 km2; Red: 1 stn every 25x25 km2
MesoWest

ROMAN Goals Maintain software that accesses RAWS data in ASCADS and
make that data available for operational users in real time Integrate RAWS, ASOS, and mesonet observations into one
archival and display system to provide real-time weather data around the nation to meteorologists and land managers
Display data in fast-loading formats tailored to the wildland fire community and accessible to: Top-level managers Fire-behavior analysts and IMETs in the field NWS WFO operations
San Diego Tribune. 28 Oct. 2003

How Mesonet Data Are Accessed and Delivered
MesoWestDatabase
@WR
Preprocessing@ WR
Web Server@ UU
DataStreams
UsersROMANDatabase
@WR
Preprocessing@ WR
ROMANWeb Server
@ WRRAWSIn ASCADS
Other WR/WFOApps
Metadata/QCprocessing
@ UU

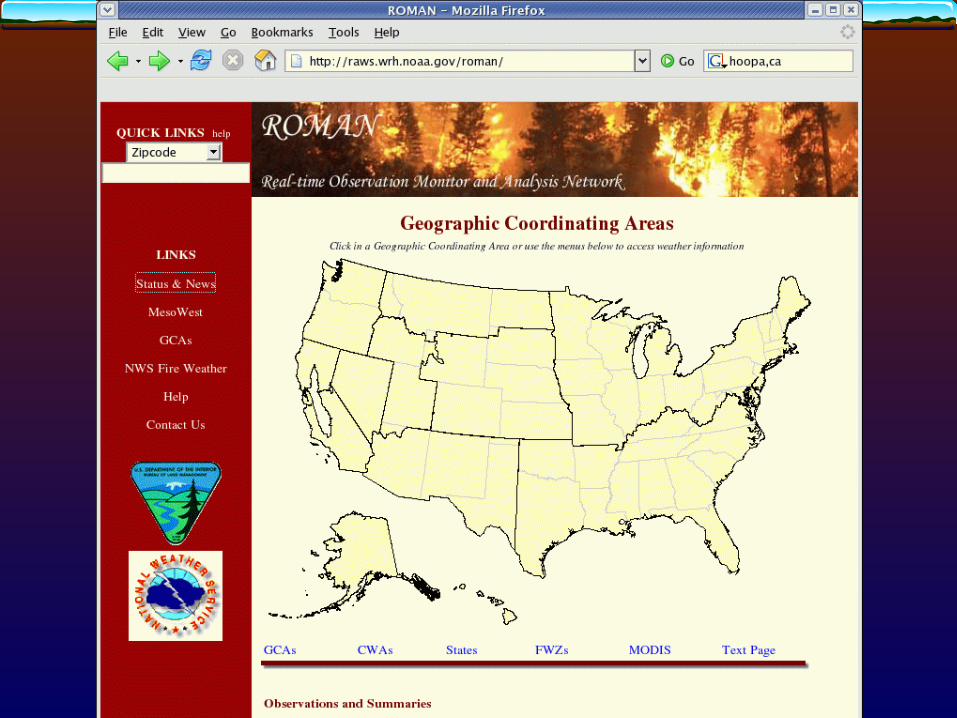
What Weather Information is Available? Search by: maps (state, CWAs, GACCs, etc.)

What Weather Information is Available?
Search by: zip code, geographic location, latitude/longitude

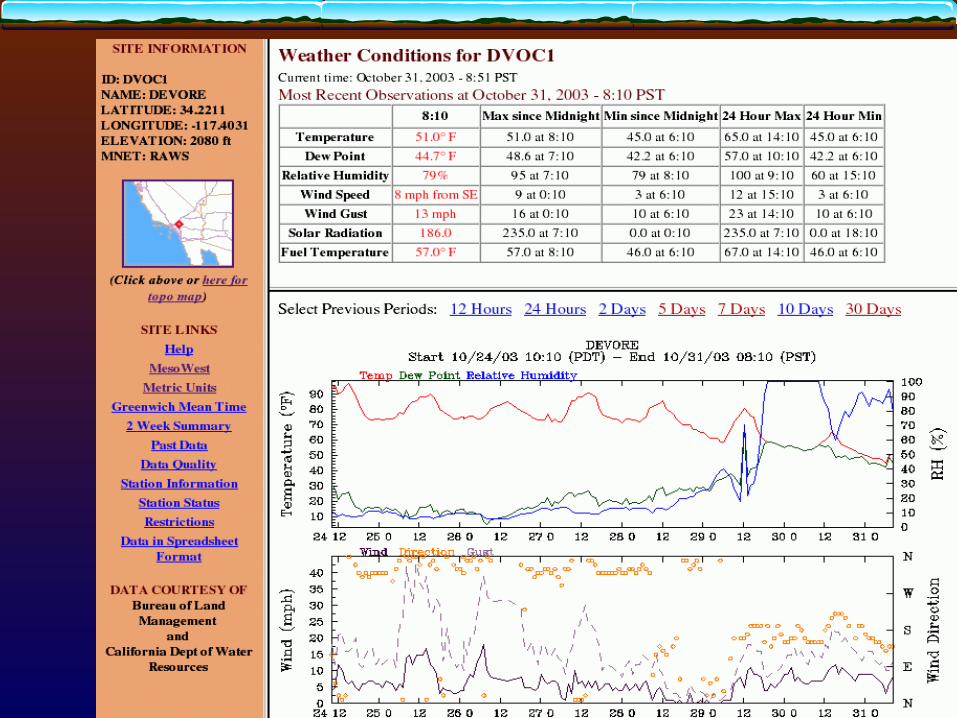
What Has Been Happening Recently?5-Day Max/Min Temperature, RH, Wind Speed
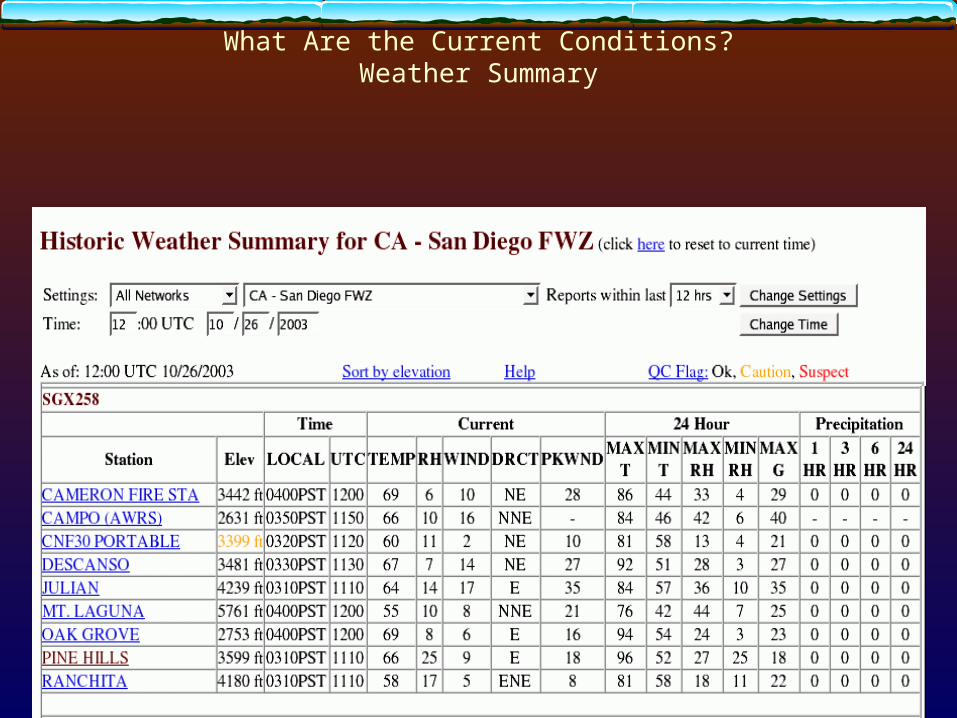
What Are the Current Conditions?Weather Summary
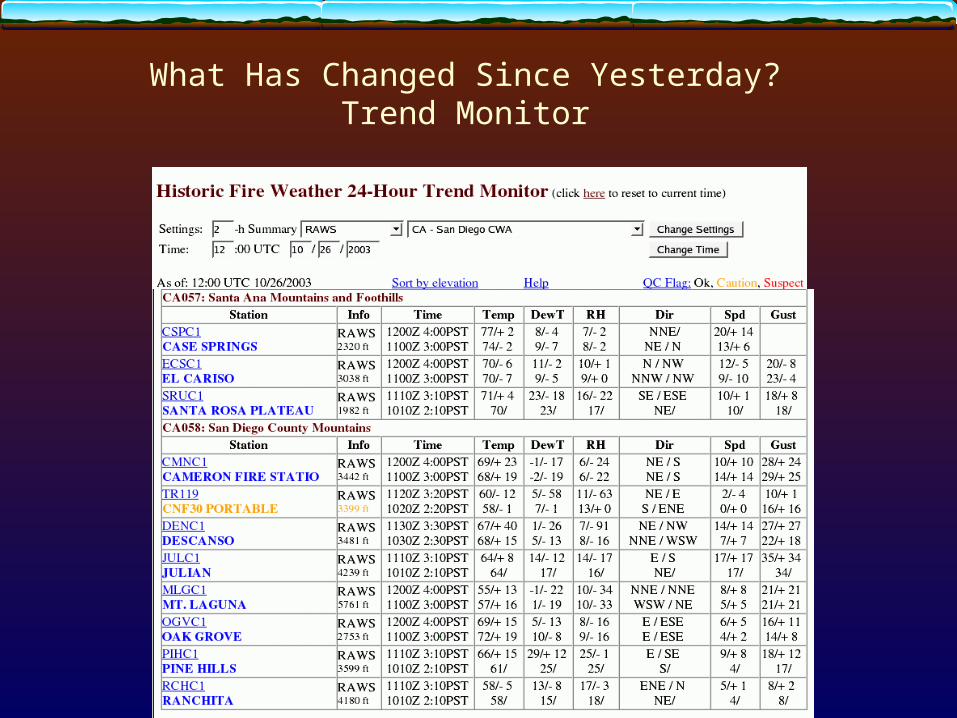
What Has Changed Since Yesterday?Trend Monitor

What Extreme Conditions Are Underway?Weather Monitor

How Much Precipitation Has Fallen?
Monitor Summary
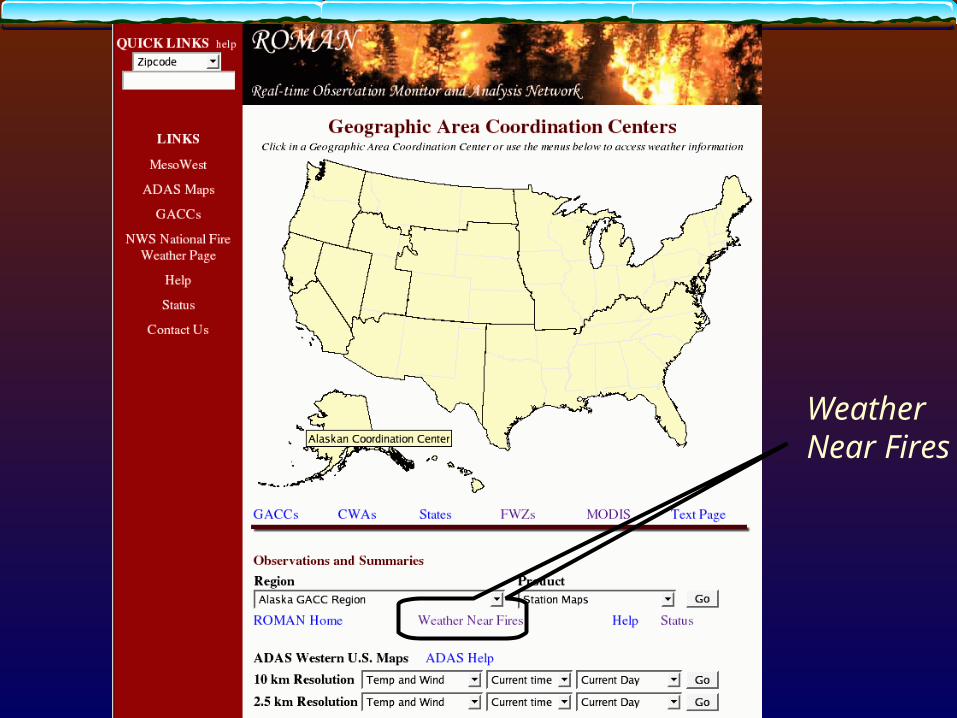
WeatherNear Fires

Current Weather Near Fires

Archived Fires

Weather Near Fires: 31 October 2003
MODIS Base Maps
October 29October 31

What Do You Do if You Notice a Problem with MesoWest or ROMAN?
BIG problems: Check the ROMAN status page (on left menu) Send email to [email protected] If emergency, follow NWS WR procedures for contacting WR IT staff
Questions/QC concerns Send email to [email protected]
Related Documents