Slides Industrial Organization: Markets and Strategies Paul Belleflamme and Martin Peitz, 2d Edition © Cambridge University Press 2015 Part II. Market power Chapter 4. Dynamic aspects of imperfect competition

Welcome message from author
This document is posted to help you gain knowledge. Please leave a comment to let me know what you think about it! Share it to your friends and learn new things together.
Transcript

SlidesIndustrial Organization: Markets and StrategiesPaul Belleflamme and Martin Peitz, 2d Edition © Cambridge University Press 2015
Part II. Market powerChapter 4. Dynamic aspects of imperfect competition

© Cambridge University Press 2015 2
Chapter 4 - Objectives
Chapter 4. Learning objectives• Understand how competition is affected when
decisions are taken sequentially rather than simultaneously.
• Analyze entry decisions into an industry and compare the number of firms that freely enter with the number that a social planner would choose.
• Distinguish endogenous from exogenous sunk cost industries and analyze how market size affects market concentration.

© Cambridge University Press 2015 3
Chapter 4 - Stackelberg
Sequential choice: Stackelberg• Chapter 3: ‘simultaneous’ decisions
• Firms aren’t able to observe each other’s decision before making their own.
• Here: sequential decisions• Possibility for some firm(s) to act before competitors,
who can thus observe past choices.• E.g.: pharma. firm with patent acts before generic producers
• Better to be leader or follower?• Depends on nature of strategic variables & on number of
firms moving at different stages.• First mover must have some form of commitment.
• When and how is such commitment available?

© Cambridge University Press 2015 4
Chapter 4 - Stackelberg
One leader / One follower• First-mover advantage?
• Firm gets higher payoff in game in which it is a leader than in symmetric game in which it is a follower.
• Otherwise, second-mover advantage.• Quantity competition: Stackelberg model
• Similar to Cournot duopoly• But, one firm chooses its quantity before the other.• Look for subgame-perfect equilibrium• Setting
• P(q1,q2) = a − q1− q2 ; c1 = c2 = 0• Firm 1 = leader; firm 2 = follower

© Cambridge University Press 2015 5
Chapter 4 - Stackelberg
One leader / One follower (cont’d)• Solve by backward induction
• Follower’s decision• Observes q1, chooses q2 to max π2 = (a − q1 − q2)q2
• Reaction: q2(q1) = (a − q1)/2• Leader’s decision
• Anticipates follower’s reaction:max π1 = (a − q1− q2(q1)) q1 = (1/2)(a − q1) q1
• Equilibrium
q1L = a 2, q2
F = q2(q1L ) = a 4, P(q1
L ,q2F ) = a 4
π1L = a2 8, π 2
F = a2 16

© Cambridge University Press 2015 6
Chapter 4 - Stackelberg
One leader / One follower (cont’d)• Results
• Leader makes higher profit than follower. As firms are symmetric → First-mover advantage
• Comparison with simultaneous Cournot• qC = a/3 & πC = a2/9• Larger (lower) quantity and profits for leader
(follower) w.r.t. Cournot• Intuition: leader has stronger incentives to increase
quantity when follower observes and reacts to this quantity, than when follower does not.

© Cambridge University Press 2015 7
Chapter 4 - Stackelberg
One leader / One follower (cont’d)
• Lesson: In a duopoly producing substitutable products with one firm (the leader) choosing its quantity before the other firm (the follower), the subgame perfect equilibrium is such that• firms enjoy a first-mover advantage;• the leader is better off and the follower is
worse off than at the Nash equilibrium of the Cournot game.

© Cambridge University Press 2015 8
Chapter 4 - Stackelberg
One leader / One follower (cont’d)• Price competition
• Previous result hinges on strategic substitutability• Follower reacts to ↑ in leader’s quantity by ↓ its own quantity
→ leader finds it profitable to commit to a larger quantity.• Reverse applies under strategic complementarity
• If leader acts aggressively, follower reacts aggressively.• Preferable to be the follower and be able to set lower price.
• Lesson: In a duopoly producing substitutable products under constant unit costs, with one firm choosing its price before the other firm, the subgame-perfect equilibrium is such that at least one firm has a second-mover advantage.

© Cambridge University Press 2015 9
Chapter 4 - Stackelberg
One leader / Endogenous number of followers• E.g.: market for a drug whose patent expired
• Leader: patent holder / Followers: generic producers• Observation: leader cuts its price, possibly to keep the
number of entrants low• Theoretical prediction
• Leader always acts more aggressively (i.e., sets larger quantity or lower price) than followers.
• Intuition: leader is also concerned about the effect of its own choices on the number of firms that enter; nature of strategic variables is less important.
• Confirms the observations.

© Cambridge University Press 2015 10
Chapter 4 - Stackelberg
Commitment• Implicit assumption so far:
• Leader can commit to her choice.• Schelling’s analysis of conflicts
• Threat: punishment inflicted to a rival if he takes a certain action. Goal: prevent this action
• Promise: reward granted to a rival if he takes a certain action. Goal: encourage this action
• But, threats and promises must be credible to be effective → they must be transformed into a commitment: inflict the punishment or grant the reward must be in the best interest of the agent who made the threat or the promise.
• How? Make the action irreversible.

© Cambridge University Press 2015 11
Chapter 4 - Stackelberg
Commitment (cont’d)• Paradox of commitment
• It is by limiting my own options that I can manage to influence the rival’s course of actions in my interest.
• How to achieve irreversibility?• Quantities: install production capacity (+ sunk costs)• Prices: ‘most-favoured customer clause’, print
catalogues
• Case: When Spanish Conquistador Hernando Cortez landed in Mexico in 1519, one of his first orders to his men was to burn the ships. Cortez was committed to his mission and did not want to allow himself or his men the option of going back to Spain.

Chapter 4 - Dynamic Competition
• Dynamic Competition• Go to EconS 503’s website, Chapter 8, slides 154-
177• Bertrand model with heterogeneous goods and
simultaneous price competition, each firm 𝑖𝑖chooses 𝑝𝑝𝑖𝑖 to solve max
𝑝𝑝𝑖𝑖≥0𝑝𝑝𝑖𝑖𝑞𝑞𝑖𝑖 − 𝑇𝑇𝐶𝐶𝑖𝑖(𝑞𝑞𝑖𝑖), that is
max𝑝𝑝𝑖𝑖≥0
𝑝𝑝𝑖𝑖𝐷𝐷𝑖𝑖 𝑝𝑝𝑖𝑖 ,𝑝𝑝𝑗𝑗 − 𝑇𝑇𝐶𝐶𝑖𝑖(𝐷𝐷𝑖𝑖 𝑝𝑝𝑖𝑖𝑝𝑝𝑗𝑗 )
• FOC: 𝜕𝜕𝜋𝜋𝑖𝑖𝜕𝜕𝑝𝑝𝑖𝑖
= 𝐷𝐷𝑖𝑖 𝑝𝑝𝑖𝑖 ,𝑝𝑝𝑗𝑗 + 𝑝𝑝𝑖𝑖𝜕𝜕𝐷𝐷𝑖𝑖𝜕𝜕𝑝𝑝𝑖𝑖
−𝜕𝜕𝑇𝑇𝐶𝐶𝑖𝑖𝜕𝜕𝐷𝐷𝑖𝑖
𝜕𝜕𝐷𝐷𝑖𝑖𝜕𝜕𝑝𝑝𝑖𝑖
= 0
⇒ 𝐷𝐷𝑖𝑖 𝑝𝑝𝑖𝑖 ,𝑝𝑝𝑗𝑗 + 𝑝𝑝𝑖𝑖 −𝜕𝜕𝑇𝑇𝐶𝐶𝑖𝑖𝜕𝜕𝐷𝐷𝑖𝑖
𝜕𝜕𝐷𝐷𝑖𝑖𝜕𝜕𝑝𝑝𝑖𝑖
= 0
© Cambridge University Press 2015 12
Chapter 4 - Dynamic Competition
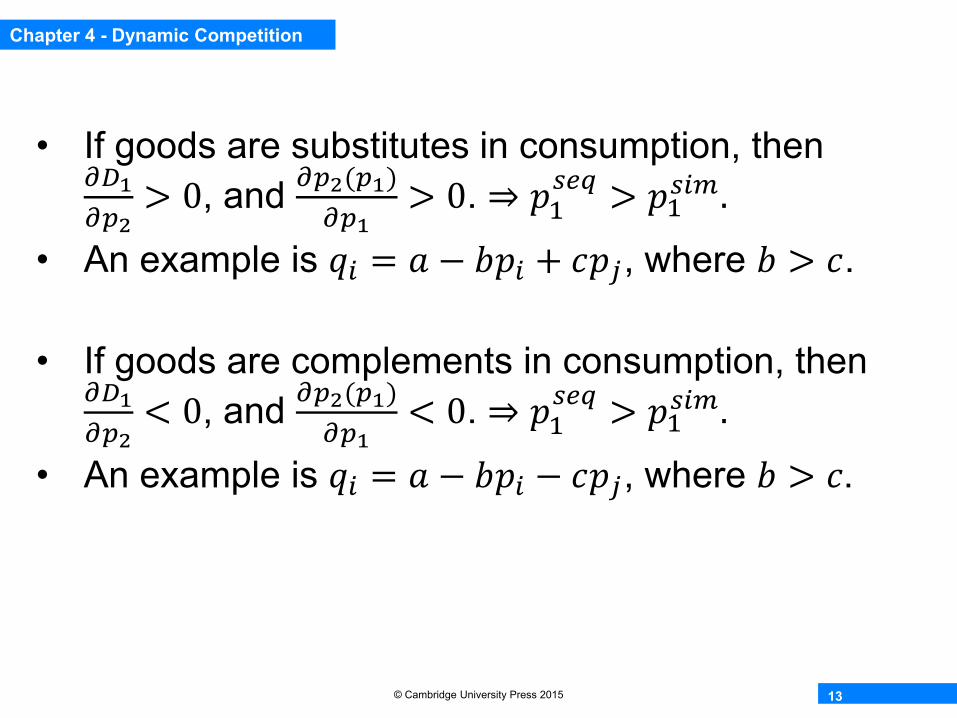
• If goods are substitutes in consumption, then 𝜕𝜕𝐷𝐷1𝜕𝜕𝑝𝑝2
> 0, and 𝜕𝜕𝑝𝑝2(𝑝𝑝1)𝜕𝜕𝑝𝑝1
> 0. ⇒ 𝑝𝑝1𝑠𝑠𝑠𝑠𝑠𝑠 > 𝑝𝑝1𝑠𝑠𝑖𝑖𝑠𝑠.
• An example is 𝑞𝑞𝑖𝑖 = 𝑎𝑎 − 𝑏𝑏𝑝𝑝𝑖𝑖 + 𝑐𝑐𝑝𝑝𝑗𝑗, where 𝑏𝑏 > 𝑐𝑐.
• If goods are complements in consumption, then 𝜕𝜕𝐷𝐷1𝜕𝜕𝑝𝑝2
< 0, and 𝜕𝜕𝑝𝑝2(𝑝𝑝1)𝜕𝜕𝑝𝑝1
< 0. ⇒ 𝑝𝑝1𝑠𝑠𝑠𝑠𝑠𝑠 > 𝑝𝑝1𝑠𝑠𝑖𝑖𝑠𝑠.
• An example is 𝑞𝑞𝑖𝑖 = 𝑎𝑎 − 𝑏𝑏𝑝𝑝𝑖𝑖 − 𝑐𝑐𝑝𝑝𝑗𝑗, where 𝑏𝑏 > 𝑐𝑐.
© Cambridge University Press 2015 13

Chapter 4 - Dynamic Competition
• Cournot model with heterogeneous goods and simultaneous price competition, each firm 𝑖𝑖chooses 𝑞𝑞𝑖𝑖 to solve
max𝑠𝑠𝑖𝑖≥0
𝑞𝑞𝑖𝑖𝑝𝑝𝑖𝑖 𝑞𝑞𝑖𝑖 , 𝑞𝑞𝑗𝑗 − 𝑇𝑇𝐶𝐶𝑖𝑖(𝑞𝑞𝑖𝑖)
• FOC: 𝜕𝜕𝜋𝜋𝑖𝑖𝜕𝜕𝑞𝑞𝑖𝑖
= 𝑝𝑝𝑖𝑖 𝑄𝑄 + 𝑝𝑝𝑝𝑖𝑖(𝑄𝑄)𝑞𝑞𝑖𝑖 −𝜕𝜕𝑇𝑇𝐶𝐶𝑖𝑖𝜕𝜕𝑞𝑞𝑖𝑖
= 0
© Cambridge University Press 2015 14
𝑄𝑄

Chapter 4 - Free entry
• Endogenous Entry• Go to EconS 503’s website, Chapter 8, slides 193-
209
© Cambridge University Press 2015 15

© Cambridge University Press 2015 16
Chapter 4 - Free entry
Free entry: endogenous number of firms• So far (with one exception), limited number of
firms• Implicit assumption: entry prohibitively costly
• Here, opposite view• No entry and exit barriers other than entry costs.• Firms enter as long as profits can be reaped.• Two-stage game
1. Decision to enter the industry or not2. Price or quantity competition
• 3 models• Free entry in Cournot model• Free entry in Salop model• Monopolistic competition

© Cambridge University Press 2015 17
Chapter 4 - Free entry
Properties of free entry equilibria• Setting
• Industry with symmetric firms; entry cost e > 0• If n active firms, profit is π(n), with π (n) > π(n+1)• Number of firms under free entry, ne such that
π(ne) > 0 and π(ne+1) < 0• e ↑ → ne ↓
Case. Entry in small cities in the U.S.• Bresnahan & Reiss (1990,1991) estimate an entry model
• Data from rural retail and professional markets in small U.S. cities.• Results
• Firms enter if profit margins are sufficient to cover fixed costs of operating.
• Profit margins ↓ with additional entry.

© Cambridge University Press 2015 18
Chapter 4 - Free entry
Cournot model with free entry• Linear model (more general approach in the book)
• P(q) = a − bq, Ci(q) = cq, c < a • Equilibrium: q(n) = (a−c)/[b(n+1)]• “Business-stealing effect”: q(n+1) < q(n)
• Free-entry equilibrium
• Social optimum (second best)
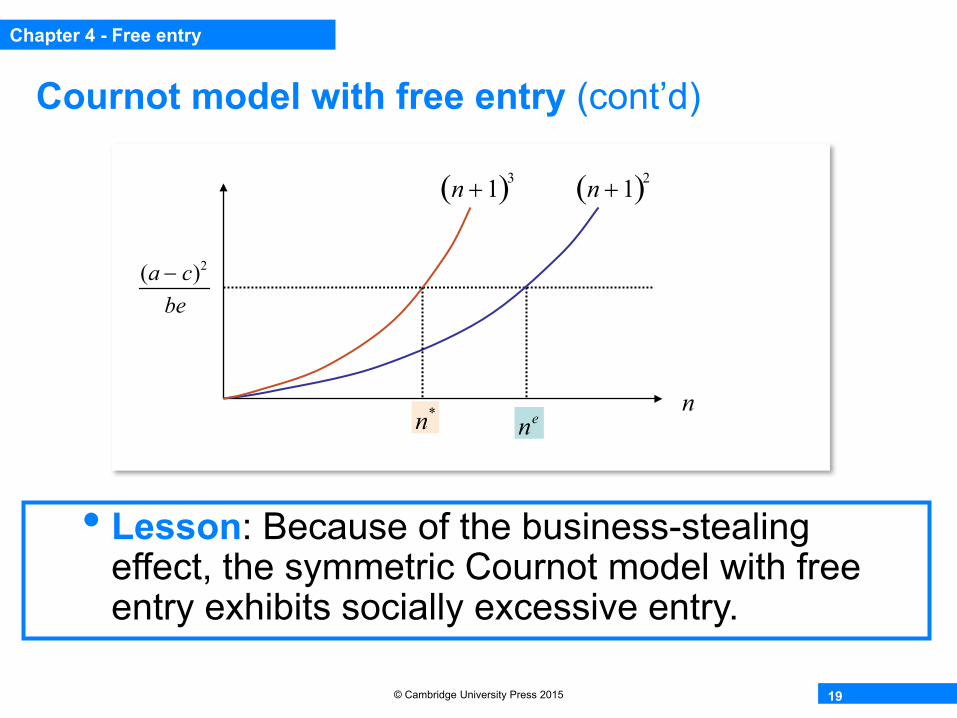
π (ne ) =1b
a − cne + 1
2
− e = 0 ⇔ ne + 1( )2=
(a − c)2
be
W (n) = nπ (n) + SC(n) =n(n + 2)
2ba − cn + 1
2
− ne
W '(n∗) = 0 ⇔ n∗ + 1( )3=
(a − c)2
be
© Cambridge University Press 2015 19
Chapter 4 - Free entry
Cournot model with free entry (cont’d)
(a − c)2
be
n + 1( )2n + 1( )3
nnen*
• Lesson: Because of the business-stealing effect, the symmetric Cournot model with free entry exhibits socially excessive entry.

© Cambridge University Press 2015 20
Chapter 4 - Free entry
Price competition with free entry• Salop (circle) model of Chapter 3
• Firms enter and locate equidistantly on circle with circumference 1
• Consumers uniformly distributed on circle• They buy at most one unit, from firm with lowest
‘generalized price’ (unit transportation cost, τ)• If n firms enter, equilibrium price:
• Free-entry equilibriump(n) = c + τ / n
π (ne ) = 0 ⇔ (p − c) 1ne − e = 0 ⇔
τ(ne )2 = e ⇔ ne =
τe

Chapter 4 - Free entry
Price competition with free entry (cont’d)• 1st stage, every firm 𝑖𝑖 decides enter/not enter.• 2nd stage, given 𝑛𝑛, every firm chooses 𝑝𝑝𝑖𝑖, 𝑝𝑝 𝑛𝑛 =
𝑐𝑐 + 𝜏𝜏𝑛𝑛.
• In the 2nd stage, 𝜋𝜋 𝑛𝑛𝐸𝐸 = 𝑝𝑝 − 𝑐𝑐
1𝑛𝑛− 𝑒𝑒
⇒ 𝜋𝜋 𝑛𝑛,𝑝𝑝(𝑛𝑛) = 𝑐𝑐 +𝜏𝜏𝑛𝑛− 𝑐𝑐
1𝑛𝑛− 𝑒𝑒 =
𝜏𝜏𝑛𝑛2
− 𝑒𝑒
© Cambridge University Press 2015 21
Firm 𝑖𝑖-1 Firm 𝑖𝑖 Firm 𝑖𝑖+1
Market share of firm 𝑖𝑖, 1𝑛𝑛
𝑃𝑃(𝑛𝑛)

Chapter 4 - Free entry
Price competition with free entry (cont’d)• In the 1st stage, 𝑛𝑛𝐸𝐸, the equilibrium number of
firms, solves𝜏𝜏
(𝑛𝑛𝐸𝐸)2− 𝑒𝑒 = 0 ⇒ 𝑛𝑛𝐸𝐸 =
𝜏𝜏𝑒𝑒
• 𝑝𝑝 𝑛𝑛𝐸𝐸 = 𝑐𝑐 + 𝜏𝜏𝜏𝜏𝑒𝑒
= 𝑐𝑐 + 𝜏𝜏𝑒𝑒
© Cambridge University Press 2015 22

Chapter 4 - Free entry
Price competition with free entry (cont’d)• To find the social optimum number of firms, the
social planner chooses 𝑛𝑛∗ to solve max𝑛𝑛
𝑊𝑊 = 𝐶𝐶𝐶𝐶 + 𝑃𝑃𝐶𝐶,
• which is equivalent to
min𝑛𝑛𝑛𝑛𝑒𝑒 + 𝜏𝜏 2𝑛𝑛�
0
12𝑛𝑛𝑠𝑠𝑠𝑠𝑠𝑠
• FOC w.r.t 𝑛𝑛:𝑒𝑒 −
𝜏𝜏4 𝑛𝑛∗ 2 = 0 ⇒ 𝑛𝑛∗ =
12
𝜏𝜏𝑒𝑒
=12𝑛𝑛𝐸𝐸
© Cambridge University Press 2015 23
Expected distance traveled
𝑖𝑖 − 1 𝑖𝑖𝑖𝑖 + 11
𝑛𝑛12𝑛𝑛
12𝑛𝑛
Largest distance traveled by consumers to firm i’s right hand side
Largest distance traveled by consumers to firm i’s left hand side

Chapter 4 - Free entry
Price competition with free entry (cont’d)
© Cambridge University Press 2015 24
Exogenous sunk cost of entry
Endogenous sunk cost of entry
M
𝐶𝐶𝑛𝑛

© Cambridge University Press 2015 25
Chapter 4 - Free entry
Price competition with free entry (cont’d)• Social optimum (second best)
• Planner selects n* to minimize total costs
• Intuition: dominance of business-stealing effect• Case. Socially excessive entry of radio stations in
the U.S.
minn
TC(n) = ne + τ 2n s ds0
1/(2n)
∫( )= ne +τ4n
TC '(n*) = 0 ⇔ e −τ
4(n*)2 = 0 ⇔ n* =12
τe
=12
ne
• Lesson: In the Salop circle model, the market generates socially excessive entry.

© Cambridge University Press 2015 26
Chapter 4 - Free entry
Monopolistic competition• 4 features
• Large number of firms producing different varieties• Each firm is negligible• No entry or exit barriers → economic profits = 0• Each firm enjoys market power
• S-D-S model (Spence, 1976; Dixit & Stiglitz, 1977)• Rather technical → see the book
• Lesson: In models of monopolistic competition, the market may generate excessive or insufficient entry, depending on how much an entrant can appropriate of the surplus generated by the introduction of an additional differentiated variety.

© Cambridge University Press 2015 27
Chapter 4 - Sunk costs
Industry concentration and firm turnover• So far, exogenous sunk costs
• e = sunk cost, exogenous (i.e., not affected by decisions in the model); if e ↑→ ne ↓
• If market size ↑→ ne ↑ & industry concentration ↓
• Not verified empirically in all industries• ∃ industries with large increase of market demand
over time and persistently high concentration• To reconcile theory with facts: endogenous sunk
costs
• Lesson: In industries with exogenous sunk costs, industry concentration decreases and approaches zero as market size increases.

© Cambridge University Press 2015 28
Chapter 4 - Sunk costs
Industry concentration and firm turnover (cont’d)• A model with endogenous sunk costs
• Quality-augmented Cournot model• 3-stage game (details in subsequent slides)
1. Firms decide to enter2. Firms decide which quality to develop3. Firms decide which quantity to produce
• Endogenous sunk costs arise from strategic investments that increase the price-cost margin• Improvements in quality, advertising, process innovations• Intuition: Market size ↑→ market more valuable → active
firms invest more → some of extra profits are competed away → upper bound on entry (lower bound on concentration)

© Cambridge University Press 2015 29
Chapter 4 - Sunk costs
Industry concentration and firm turnover (cont’d)• Lesson: In markets with endogenous sunk
costs, even as the size of the market grows without bounds, there is a strictly positive upper bound on the equilibrium number of firms.
Case. Supermarkets in the U.S.• Ellickson (2007): supermarkets concentration (U.S., 1998)
• Identifies 51 distribution markets• All are highly concentrated (dominated by 4 to 6 chains),
independently of the size of the particular distribution market.• Due to endogenous sunk costs?
• Quality dimension: available number of products• Can be increased by more shelf space and/or improved logistics• Average number or products has indeed increased
• 14,000 (1980), 22,000 (1994), 30,000 (2004)• Investments are incurred within each distribution market.

© Cambridge University Press 2015 30
Chapter 4M - Endogenous sunk costs
Details: Quality-augmented Cournot model• Effect of endogenous sunk costs on entry?• 3-stage game
1. Firms decide to enter2. Firms decide which quality to develop (si)3. Firms decide which quantity to produce (qi)
• Consumers• Measure M, with Cobb-Douglas utility function
• Consumers spend a fraction γ of their income y on the good offered by Cournot competitors
• Total consumer expenditure = Mγy
u(q0 ,q) = q01−γ (sq)γ

© Cambridge University Press 2015 31
Chapter 4M - Endogenous sunk costs
Details: Quality-augmented Cournot model (cont’d)• 3rd stage
• Price-quality ratio must be the same for all n firms:
• Hence, industry revenues are such that
• Firm maximizes
pi / si = pj / s j ≡ λ for all i, j active
R = pi∑ qi = λ si∑ qi ⇔ λ = R / si∑ qi( )with dλ
dqi
= −Rsi
si∑ qi( )2 = −si
Rλ2
Mπ = (pi − c)qi = (λsi − c)qi

© Cambridge University Press 2015 32
Chapter 4M - Endogenous sunk costs
Details: Quality-augmented Cournot model (cont’d)• 3rd stage (cont’d)
• FOC:
• Summing over n firms:
• As total revenues = total expenditure
• Plugging this value in FOC:
dπ i
dqi
= (λsi − c) + siqidλdqi
= 0 ⇔ siqi =Rλ
−cR
λ2si
siqii
∑ =nRλ
−cRλ2
1sii
∑
siqii
∑ = R / λ ⇔ λ =c
n − 11sii
∑
qi =Rc
n − 1si
1sii∑
1−n − 1
si1sii∑

© Cambridge University Press 2015 33
Chapter 4M - Endogenous sunk costs
Details: Quality-augmented Cournot model (cont’d)• 3rd stage (cont’d)
• Positive sales for all firms ⇔ qualities not too different
• Combine previous results to get
1n − 1
1si
i∑ >1si
pi − c =si
n − 11si
− 1i∑
c
⇒ pi − c( )qi = 1−n − 1
si1sii∑
2
R

© Cambridge University Press 2015 34
Chapter 4M - Endogenous sunk costs
Details: Quality-augmented Cournot model (cont’d)• Exogenous quality
• Include entry costs, e, and fixed costs for producing quality, C(s).
• Symmetric equilibrium: si = s.• Firm’s net profit:
• If market size M explodes, n → ∞• Confirmation of result in 2-stage (entry-then-quantity-
competition) model: no lower bound on concentration
p*(n) − c( )q*(n) − e − C(s) = R / (n2 ) − e − C(s) = Mγ y / (n2 ) − e − C(s)

© Cambridge University Press 2015 35
Chapter 4M - Endogenous sunk costs
Details: Quality-augmented Cournot model (cont’d)• Endogenous quality: 2nd stage
• If all other firms set quality , firm i’s profit is
• Take• Symmetric equilibrium:
• Increases with R = Mγy⇒ market size ↑→ firms compete more fiercely in quality
1−n − 1
si1si
+ n−1s( )
2
R − C(si ) = 1−1
1n−1 + si
s
2
R − C(si )
s
C(si ) = αsiβ
si = s ≡ s*
2 1−1
1n−1 + 1
1s*
1n−1 + 1( )2 R = αβ s*( )β −1
⇔ s* =2Rαβ
(n − 1)2
n3β

© Cambridge University Press 2015 36
Chapter 4M - Endogenous sunk costs
Details: Quality-augmented Cournot model (cont’d)• Endogenous quality: 1st stage
• Firm’s net profit becomes
• Positive as long as
• Upper bound (independent of M) on number of firms• Example: • Natural oligopoly because only a small number of firms can be
sustained, independently of market size
Mγ yn2 − e −
2β
(n − 1)2
n3 Mγ y =Mγ y
n3 n −2β
(n − 1)2
− e
n −2β
(n − 1)2 > 0 ⇔ n ≤ n ≡ 1+14
β + β(β + 8)( )
β = 5 ⇒ n = 4.27

Chapter 4 - Free entry
Price competition with free entry (cont’d)
• Let 𝛽𝛽 = 5, 𝑒𝑒 = 0.2. �𝑛𝑛 is not a function of𝑀𝑀
© Cambridge University Press 2015 37
�𝑛𝑛
𝑛𝑛𝑒𝑒
𝑛𝑛
𝑀𝑀

© Cambridge University Press 2015 38
Chapter 4M - Endogenous sunk costs
Details: Quality-augmented Cournot model (cont’d)
We state again:• Lesson: In markets with endogenous sunk
costs, even as the size of the market grows without bounds, there is a strictly positive upper bound on the equilibrium number of firms.

© Cambridge University Press 2015 39
Chapter 4 - Sunk costs
Industry concentration and firm turnover (cont’d)• Dynamic firm entry and exit
• So far, static models• OK to predict number of active firms in industries• But, unable to generate entry and exit dynamics
• What do we expect?• Market entry (exit) in growing (declining) industries
• What do we observe?• Simultaneous entry and exit in many industries
• Explanation?• Firms are heterogeneous (e.g., different marginal costs)• Their prospects change over time (idiosyncratic shocks)
• Model• More technical; to be read in the book

© Cambridge University Press 2015 40
Chapter 4 - Sunk costs
Industry concentration and firm turnover (cont’d)• Lesson: In monopolistically competitive
markets, market size ↑→ total number of firms in the market ↑→ only particularly efficient firms stay→ turnover rate ↑⇒ firms tend to be younger in larger markets.
Case. Hair salons in Sweden• Asplund and Nocke (2006) compare age distribution of
hair salons across local markets.• Hypothesis: estimated age distribution function of firms
with large market size lies above estimated age distribution of firms with small market size.
• Confirmed by the data.

© Cambridge University Press 2015 41
Chapter 4 - Review questions
Review questions• Why is there generally a first-mover advantage
under sequential quantity competition (with one leader and one follower) and a second-mover advantage under sequential price competition? Explain by referring to the concepts of strategic complements and strategic substitutes.
• When firms only face a fixed set-up costs when entering an industry, how is the equilibrium number of firms in the industry determined? Is regulation possibly desirable (to encourage or discourage entry)? Discuss.

© Cambridge University Press 2015 42
Chapter 4 - Review questions
Review questions (cont’d)• What is the difference between endogenous and
exogenous sunk costs? What are the implications for market structure?
• Which market environments lead to simultaneous entry and exit in an industry?
Related Documents