Part II. CD spectra of Nu cleocide Circular Dichroism

Part II. CD spectra of Nucleocide Circular Dichroism.
Dec 18, 2015
Welcome message from author
This document is posted to help you gain knowledge. Please leave a comment to let me know what you think about it! Share it to your friends and learn new things together.
Transcript

Part II. CD spectra of Nucleocide
Circular Dichroism

Electron Molecular EnergyElectron Molecular Energy

Chromophores of Nucleic Acid
• * transitions begin about 300 nm
• n * buried under * transitions
The intensity of the CD is low because it is a secondary effect of the asymmetric sugar inducing a CD in the chomophoric, but symmetric base.

Chromophores of Nucleic AcidChromophores of Nucleic Acid
Absorption Spectra CD Spectra

Base Stacking & CD spectra of NuBase Stacking & CD spectra of Nucleic Acidcleic Acid
• The benzene-like electron systems of the bases make them hydrophobic, so the bases tend to stack in hydrogen bonding solvents to minimize the electron surface area exposed to the solvent.
• The NH, NH2 and CO groups are hydrophilic, so the edges of the bases will interact well with hydrogen bonding solvents
• For nucleic acids the hydrophobic planes, the hydrophilic edges and charge-charge interactions cause the bases to stack and the polymers to assume a helical structure.
• The electronic transitions of the chromophoric bases are in close proximity, and can interact to give CD spectra of high intensity.

Polymorphic properties of Nucleic Acid
PolymorphismPolymorphism of nucleic acid in secondary structure•Number of base pairs per turnNumber of base pairs per turn•Inclination of the base with respect to the helix axisInclination of the base with respect to the helix axis•The distance of the bases from the helix axisThe distance of the bases from the helix axis•The rise per base-pairThe rise per base-pair•Handedness of the helixHandedness of the helix
CD can measure the change in secondary structure as a function of solvent conditions.

Polymer
dimer
monomer
CD of single stranded oilgo(rA) in aqueous solution at pH 7
Formation of helical structure is a super asymmetry that gives rise to degenerate interactions between chromophoric bases and results in intense CD spectra
From monomer to From monomer to polymerpolymer
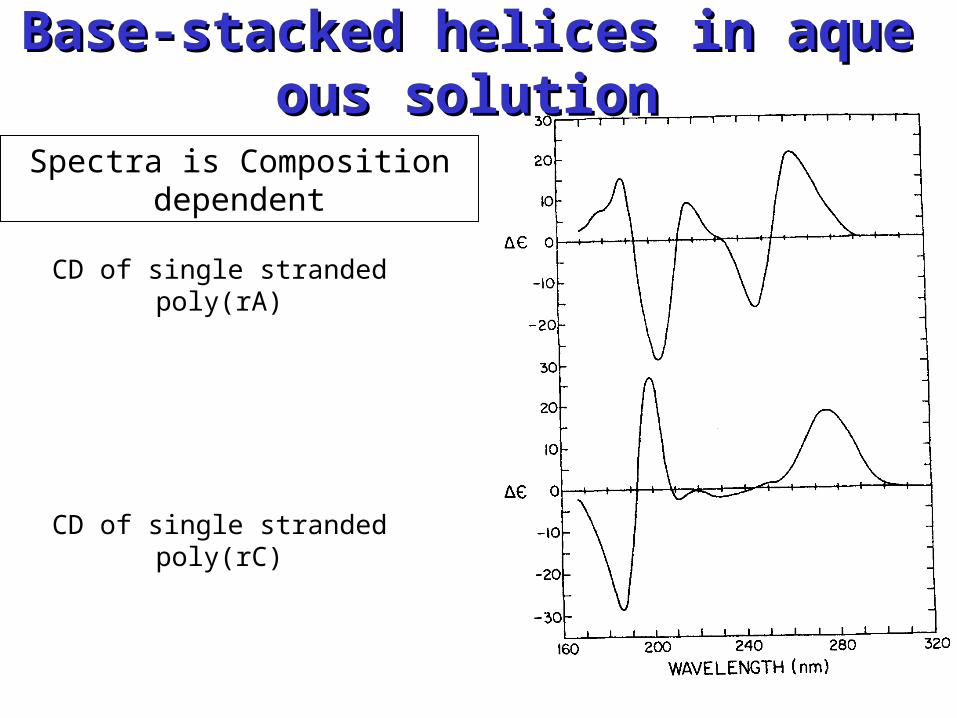
CD of single stranded poly(rA)
CD of single stranded poly(rC)
Base-stacked helices in aqueous solutionBase-stacked helices in aqueous solution
Spectra is Composition dependent

CD of double-stranded CD of double-stranded DNA and RNADNA and RNA
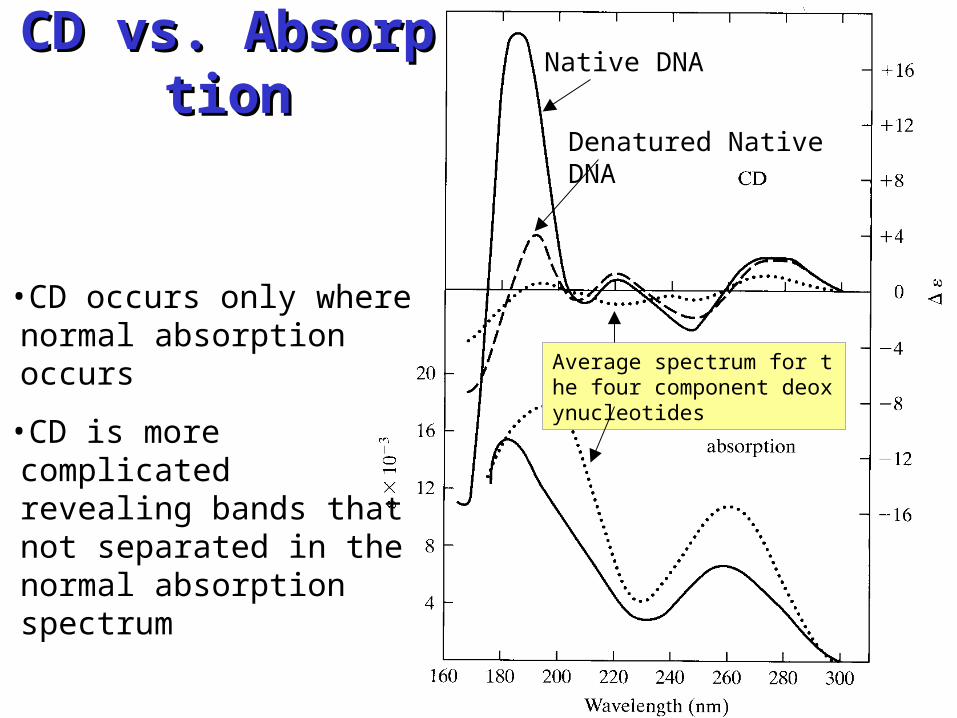
Native DNA
Denatured Native DNA
Average spectrum for the four component deoxynucleotides
•CD occurs only where normal absorption occurs
•CD is more complicated revealing bands that not separated in the normal absorption spectrum
CD vs. AbsorptionCD vs. Absorption

Structure of DNAStructure of DNA
A-DNA B-DNA Z-DNA

A-DNA
B-DNA
Z-DNA
The Z-form DNA•negative band at 290 •positive band at 260 nm.•crossover about 185 nm
Z-form is not the mirror image of the B-form, the blue shift of the 200 nm of the B-form to 185 nm in the Z-form appears to be the trademark of the B to Z transition.
Discovery of Z-form DNADiscovery of Z-form DNAPohl and Jovin (1972 JMB, 67,p375 ) were the first to observe the
left-handed Z-form of poly(dGC)-poly(dGC), and they did this by using circular dichroism spectroscopy.

DNA Secondary Structure & DNA Secondary Structure & CD SpectraCD Spectra
A DNA
260 nm positive
210 nm intense negative
190 nm intense positive
B DNA
275 nm positive
240 nm negative
258 nm crossover
A-DNA
B-DNA

The CD of E. coli DNA in various structure
10.4 B-DNA
10.2 B-DNA
A-DNA
Sprecher et.al. Biopolymer 17,1009

Solvent Effect on DNA Structure ISolvent Effect on DNA Structure I
Calf thymus DNA
25% methanol50% methanol65% methanol75% methanol
0% methanol
95% methanol
10.2 base pair B-form
10.4 base pair B-form

Solvent Effect on Solvent Effect on DNA Structure IIDNA Structure II
65% methanol
70% methanol
75% methanol
90% methanol
Titration with ethanol causes the same changes as with methanol in CD up to 65%. Adding more ethanol causes a change to A form

P Form DNAP Form DNA
P-DNA
B-DNA
10.2 B-DNA (95% methanol/5% 80
C)
P-DNA (95% methanol/5% buffer) 330C
P-DNA (47.5% methanol/5% buffer/4.5% ethanol) 80C

The CD of poly(dA) poly(dT) as a function of temperature
Temperature Effect Temperature Effect on DNAon DNA
10 C
38.80 C
44.70 C
58.30 C48.20 C
CD is sensitive to the change in conformation when DNA melts with increasing temperature

Triplex Nucleic Acid
Triplex
Poly(dA dT dT)
Duplex
Poly(dA dT)
177 190
210 250
260 280
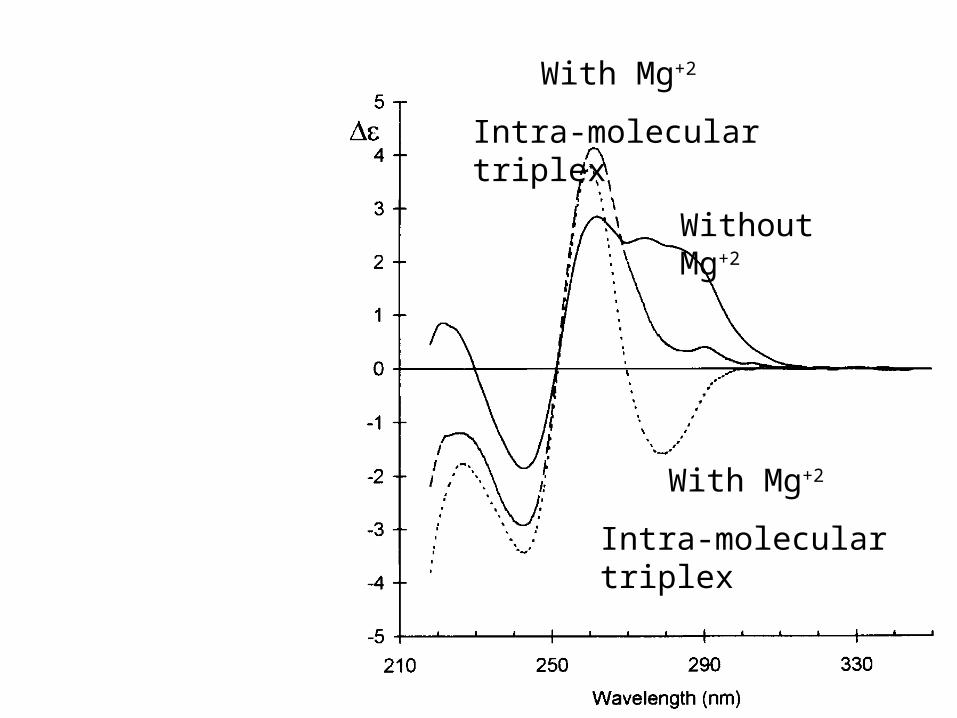
Without Mg+2
With Mg+2
Intra-molecular triplex
With Mg+2
Intra-molecular triplex

Influence of the temperature on the parallel triplex
930C
denature
260nm
280nm
660C duplex
30C triplex

Circular Dichroism
Part III. CD spectra of Protein

Amide ChromphoreAmide Chromphore
• n * centered around 220 nm
• * centered around 190 nm
n ->* involves non-bonding electrons of O of the carbonyl;
->* involves the -electrons of the carbonyl


Random coil
positive at 212 nm (->*)
negative at 195 nm (n->*)
Sheet
negative at 218 nm (->*)
positive at 196 nm (n->*)
helix
positiveperpendicular at 192 n
m
negative (->*)parallel at 209 nm
negative at 222 nm is red shifted
(n->*)


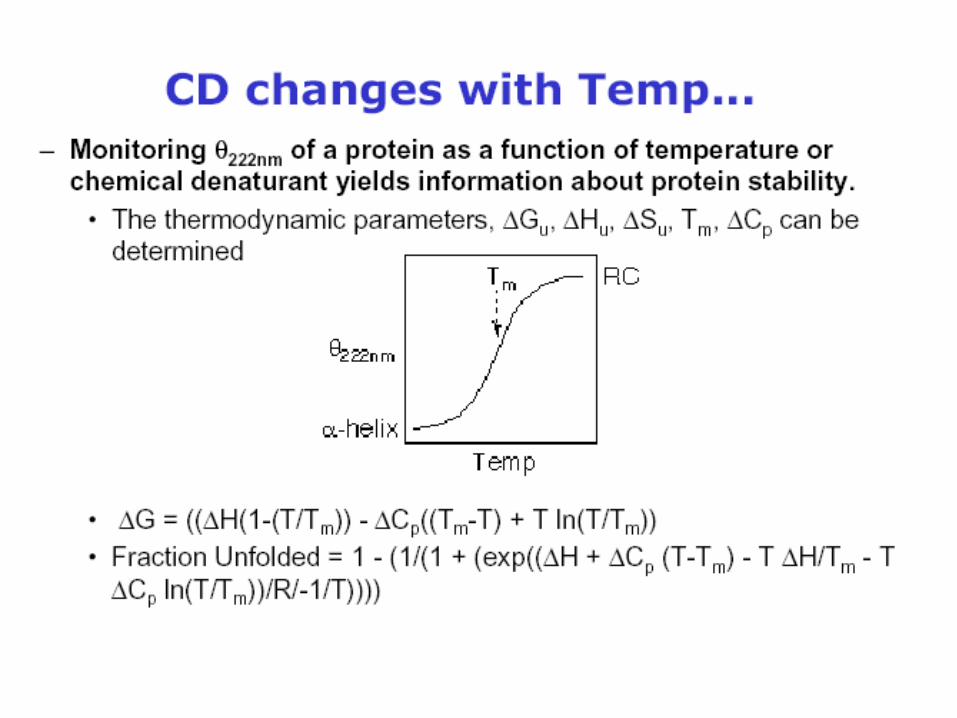
Secondary Structure DeterminationSecondary Structure Determination

RC
iiiSf
,,


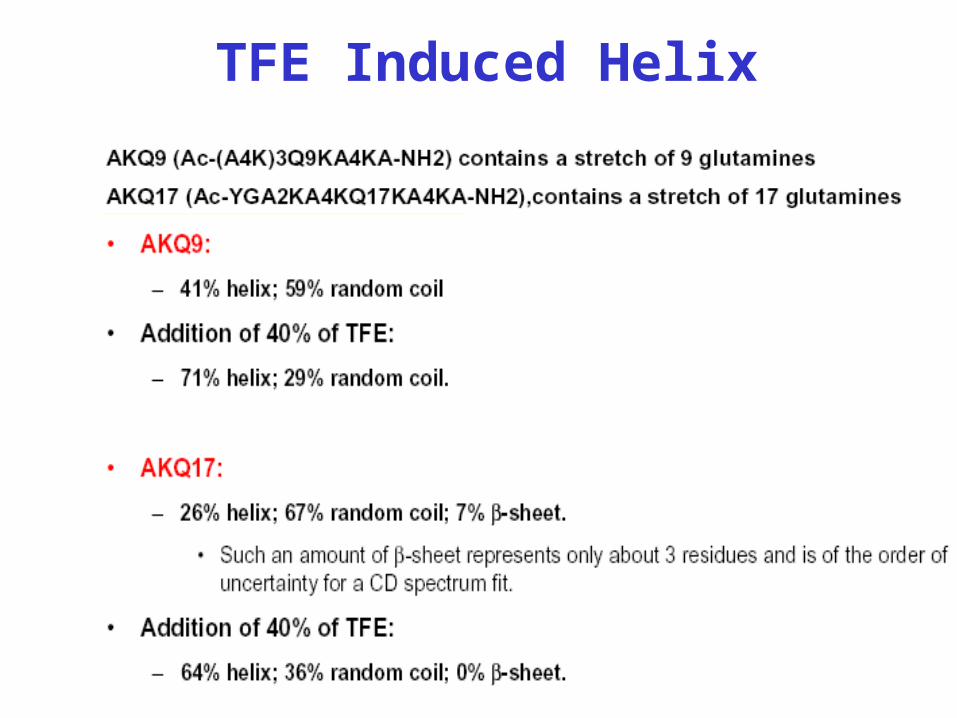
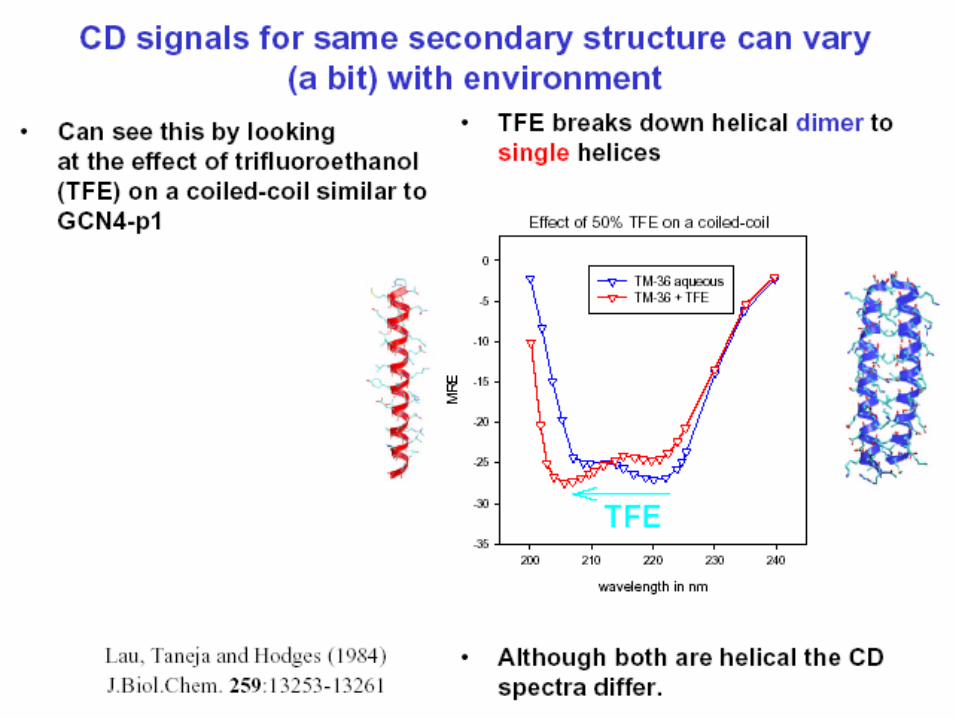
TFE Induced Helix

Sodefrin&S10K-A3之 CD測量圖

Helix Content = 100×(〔 θ〕 222/ max〔 θ〕 222)
max〔 θ〕 222=-40,000[1- (2.5/n)],
n=胺基酸之殘基數
Behrouz Forood et.al Proc.Natl.Acad.Sci.USA Vol.90,pp.838~ 842,February 1993


•Determination of secondary structure of proteins that cannot be crystallised •Investigation of the effect of e.g. drug binding on protein secondary structure •Dynamic processes, e.g. protein folding •Studies of the effects of environment on protein structure •Secondary structure and super-secondary structure of membrane proteins •Study of ligand-induced conformational changes •Carbohydrate conformation •Investigations of protein-protein and protein-nucleic acid interactions
Applications of CD in Structural BiologyApplications of CD in Structural Biology


Software for the Analysis of Circular Dichroism Data
Tools for analyzing circular dichroism data : • LINCOMBLINCOMB and MLRMLR( The method of least squares)
• CONTIN CONTIN (The ridge regression procedure of Provencher and Glöckner)
• VARSLC VARSLC (The Variable Selection Method of Johnson and Coworkers )
• SELCONSELCON (The Self-Consistent Method of Sreerama and Woody )
• K2D.K2D.(A neural net analysis program of Andrade et al) • CCACCA (The convex constraint algorithm of Fasman and coworkers )
• SVD SVD (Singular Value Decomposition ).

http://lamar.colostate.edu/~sreeram/CDPro/
Related Documents