Welcome message from author
This document is posted to help you gain knowledge. Please leave a comment to let me know what you think about it! Share it to your friends and learn new things together.
Transcript

The National Women’s Council of Ireland9 Marlborough Court,Marlborough St.Dublin 1.
(t) 01-8787 248(f) 01-8787 301(e) [email protected]
www.nwci.ieReg. Charity No: CHY 11760
September 2005
Funded by the Irish Govenrment & part-financed by the European Union Structural Funds under the National Development Plan 2000-2006
desi
gn b
y w
ww
.redd
og.ie
An A
cces
sibl
e Ch
ildca
re M
odel
N
atio
nal W
omen
’s Co
unci
l of I
rela
nd

01
contents
Acknowledgements & Executive Summary 3
Chapter One: Introduction 7
Chapter Two: International Childcare Policies: An Overview 13
Chapter Three: Ireland in Context 29
Chapter Four: Why subsidise? Benefits of ECCE & Extended Care Services 41
Chapter Five: The Proposed Model 53
Appendices 69
Abbreviations 83
References 85

On behalf of the National Women’s Council of Ireland (NWCI), I welcome this report: ‘An Accessible Childcare Model’. Iwould like to acknowledge and appreciate the work of the Centre for Social and Educational Research (CSER), in particular;Noirin Hayes, Siobhan Bradley and Carol Newmann. I would like to thank the Advisory Group members for their guidanceand the NDP Gender Equality Unit at the Department of Justice, Equality and Law Reform, for their valuable financialsupport. I also wish to thank Ursula Barry and Aileen Cashman for their advice. Finally, I wish to express gratitude to theNWCI staff members, in particular Orla O’Connor, Head of Policy, for their contributions to this report.
Thérèse Murphy,Chairperson of the NWCI
02acknowledgement

Introduction
There is a growing commitment, bothin EU countries and internationally, torecast family and childcare policies, inan effort to make them moresupportive of, and accessible to,diverging groups of families in today’ssociety. Recognition of the vital role offamily policies, the continuingpromotion of gender equality, thestrengthening of social cohesion andthe widening of labour marketparticipation, have led to thedevelopment of effective childcarepolicies.
Despite recent progress in accessibility to early educationand childcare policies, Ireland trails behind its EUcounterparts, particularly in terms of accessibility andaffordability of childcare. Initiatives to date have focused onimproved co-ordination, (e.g.County Childcare Committees),quality improvements (part of EOCP1 and CECDE2 brief) andincreasing supply (EOCP), to the neglect of the issues ofhigh costs and affordability. Childcare costs are nowamongst the highest in Europe and parents receive thelowest level of support in meeting these costs. The lack ofstatutory support and intervention has created a largelyinaccessible and inequitable childcare market.
International Context1. Most EU countries now provide free universal access to
Early Childhood Care and Education (ECCE) services forchildren aged three to six. They usually providesubsidies for children aged less than three and childrenof school age. Ireland offers no such provisions.
2. A growing number of EU countries now offer paid, job-protected maternity/parental leave of at least one yearto facilitate parents in caring for their child during thefirst year of life ‘an essential component of any strategyto support working parents with very young children’(OECD, 2004). Ireland offers eighteen weeks paidmaternity leave and eight weeks unpaid maternityleave. The fourteen weeks parental leave, to be takenbefore a child’s fifth birthday is unpaid.
3. The majority of EU countries provide subsidies to assistparents in meeting additional childcare costs (e.g.crèche costs for young children). In Sweden andDenmark, parents pay a maximum of 20% and 33% ofcosts respectively. Ireland offers no such provisions.
4. Most EU countries provide child benefit payments toassist parents in meeting child-rearing responsibilitiesin addition to the financial subsidies for childcare costs.In France, for example, a child benefit monthly paymentof ¤ 160 is available until the child reaches three andbecomes eligible for free pre-school education (OECD,2004). In contrast, child benefit is the only financialsupport provided to Irish parents (¤ 141.60 for first andsecond child and ¤ 171 for each subsequent child) toassist them in meeting childrearing costs, includingchildcare costs.
Costs of Lack of SubsidisationThis lack of statutory intervention and financial supportmeans that
● A higher than average proportion of Ireland’s childrenare are living in poverty compared to their EUcounterparts. Ireland has the fifth highest rate ofrelative child poverty (15.7%) out of 24 OECD countriesand the second highest rate of relative child poverty of20 EU countries (UNICEF, 2005).
● 23% of women are at risk of poverty in Ireland. Loneparents are consistently at high risk of poverty - 42.3%(CSO 2005).
03executivesummary
1 Equal Opportunities Childcare Programme2 Centre for Early Childhood Development and Education

● A lower than average number of children in Irelandparticipate in ECCE services. Ireland had the secondlowest rate of enrolment of three to six year olds inearly childhood services (56%) of 15 EU countriesincluded in the OECD Employment Outlook Study(2001). Younger children are often denieddevelopmental and learning supports, proven to give allchildren, but particularly children from disadvantagedbackgrounds, a head start in life.
● Options for low-income parents who cannot afford thefull costs of childcare are constrained, often forcingthem to settle for care of lower quality.
● Women’s labour market equality is threatened, as highchildcare costs often necessitate their withdrawal fromthe labour market for indefinite time periods. Thepercentage of women in employment falls from 65.8% forwomen with no children to 40.8% for women with two ormore children. This represents the lowest level ofemployment for women with two or more children out ofthe 23 countries included in the OECD EmploymentOutlook Study (2002). Lengthy periods outside the labourmarket can be detrimental to a woman’s careerprogression, and earnings potential and can have a hugeimpact on her and her family’s economic well-being. Thisis particularly the case for lone parents. It also threatensgender equality, as the lack of affordable childcare restrictswomen’s choices around work/life balance and can forcetheir withdrawal from education and/or employment.
● Women’s opportunities for public participation arereduced – as the lack of child-rearing supports inhibitstheir ability to balance private and publicresponsibilities. Ireland ranks 20th out of the 25 EUcountries in terms of its percentage of female TDequivalents (13.3%). Sweden, Finland and Denmark,who have a long history of gender equality focusedpolicies and generous subsidisation policies, ranked first(45.3%), second (37.5%) and third (36.9%) respectively3.
● Ireland’s ability to meet international targets under theBeijing Platform for Action, Lisbon Strategy andBarcelona Summit is compromised.
Benefits of SubsidisationThe subsidisation and implementation of the proposedmodel will:
● Ensure equal access for all children, regardless ofhousehold income, to quality developmental supports,which will enhance their social, emotional and cognitivedevelopment.
● Support the development of a regulated qualityaccessible childcare sector.
● Provide parents with a real choice around decisions tostay at home and care for their children, or remain in thelabour market while rearing children, or balance both.
● Support gender equality and female career progression byremoving the current barriers to employment, educationand training experienced by parents,usually mothers.
● Facilitate a reduction in child poverty and women’spoverty through enabling parental employment andwork/life balance.
● Facilitate greater female participation in the public andpolitical spheres through the provision of quality supports
● Facilitate Ireland in meeting international targets underthe Lisbon Strategy, Barcelona Summit and BeijingPlatform for Action.
Costs of ImplementationThe costs associated with implementing the model aresignificant, amounting to just less than 1% of GDP annually.However, the required level of government investment toimplement the model is not out of line with other developedcountries and would bring Ireland up to internationalstandards. Nor is it out of line with current levels ofinvestment at primary, second and third level education.
04
3 (http://www.womenandequalityunit.gov.uk/public_life/parliament.htm)

PROPOSED SUBSIDISED MODEL OF CHILDCARE
05
4 Extended Care refers to care provided outside of schooling and pre-schooling (ECCE) hours.
Component Implementation Strategy
Care Provisions for Children aged 0 – 12 months:
● Paid maternity leave to increase to 26 weeks To be extended from its current 18 weeks to 26 weeksby 2008: 2 weeks in 2006 and 3 weeks in 2007 and 2008.
● 5 days paid paternity leave To be introduced on an incremental basis: 3 days in 2006,(to be taken within 1 month of birth) 1 day in 2007 and 1 day in 2008.
● 26 weeks paid parental leave To be introduced on an incremental basis, commencing in 2007 with an increase of four weeks per annum through to 2012 and two weeks in 2013.
Subsidised Early Childhood Care and Education:(ECCE)
● Universal ECCE for all three and four year olds. To be introduced on an incremental basis between 2006 and 2007, with places provided for all four year olds notattending primary school in 2006 and extended to all three year olds in 2007. Under the Programme, each child will be entitled to attend for 3.5 hours per day 5 days a week for 48 weeks of the year.
● Subsidised Extended Care4 for three and four year olds. To be introduced on an incremental basis between 2006 and 2007 with places provided for all eligible four year olds in 2006 and extended to all eligible three year olds in 2007.
● Subsidised Full Day Care for one and two year olds. To be introduced on an incremental basis between 2009 and 2010 with places provided for all eligible two year olds in 2009 and extended to all eligible one year olds in 2010.
● Subsidised Extended Care for five to 14 year olds To be introduced on an incremental basis between 2009 and 2015 with places provided for all eligible five and six year olds in 2009 and extended by each age group per annum up to 10 year olds in 2013. In 2014 places will be provided for all eligible 11 and 12 year olds and all eligible 13 and 14 year olds in 2015.

06

07
1Introduction
1.0 IntroductionChildcare is a critical issue for women’s equality, andincreasingly, an urgent political issue for Irish society.Parenting represents a commitment to the future. It isalso a domestic responsibility that has traditionallyfallen to women. Combining this responsibility withpaid work in the labour market is becomingincreasingly problematic for many families. However,women’s family and employment situations cannot bechanged in isolation from each other. This research hasbeen commissioned by the National Women’s Councilof Ireland (NWCI) to develop a model of publiclyfunded quality childcare that is both child-centred andpromotes equality for women. The implementation ofthe recommendations will enable women and men toshare childcare responsibilities more equitably andcombine parental and family responsibilities withparticipation in all aspects of society, including paidemployment, to create a better balance in the interestsof all. The implementation of the model seeks tocontribute to the development of a sustainable qualitychildcare infrastructure in Ireland. The introduction setsout the rationale and background to the research, theresearch objectives, methodologies and an overview ofsubsequent chapters.
1.1 Rationale and BackgroundThe rationale for the research originates in the NWCIStrategic Plan 2002-2005, which sets out goals under fourspheres of equality; (1) Affective, (2) Social and Cultural,(3) Economic and (4) Political, all four of which are seen as‘key policy objectives in the creation of an egalitariansociety’ (Baker et, al. 2004). To achieve economic andaffective equality, the NWCI promotes women’s economicindependence, equity of pay and prospects in theworkplace, as well as recognition of women’s unpaid carework. While there has been a significant increase inwomen’s participation in the labour market over the pastdecade, this has not been balanced by any increase in men’scontribution to the home5 or by an adequate state responseto the need for childcare and family friendly workplace
supports. As a result, the care work within the home thatwomen have traditionally done, whether that is seen as aburden, a source of fulfillment, or a complex combination ofthe two, continues to be women’s responsibility. There is anincreasingly widespread feminist view that this ‘domesticabsenteeism’ is a largely ignored part of the problem, andthat the lack of adequate state intervention has reinforcedwomen’s disadvantaged position (Bryson, 1999). The NWCIhas long held the position that good quality, affordablechildcare, the creation of family friendly workplaces, andsocial welfare supports would lead to a better balance inthe quality of life for women, men and, most importantly,for children in all families. To this end, the NWCI lobbies formeasures, ‘to facilitate care and paid work throughincreasing the range of family friendly practices’ (NWCI,2003). The development of a national childcareinfrastructure is central to the NWCI’s feminist goals underthe Economic and Affective Equality.
Affective equality refers to relations where love, care andsolidarity operate, including personal relations, workrelations, community and associational relations. It is clearthat overwork and inflexible hours have a detrimentalimpact on all these areas of our lives, as well as onindividual health and on family well-being. When combinedwith a lack of good quality, affordable childcare, they mayalso contribute to the neglect of children’s welfare andeducational needs, and a rise in juvenile crime.
As part of its work plan towards the attainment of affectiveequality, the NWCI conducted a large scale consultationprocess with its members in 2001-2002, and developed aclear policy position on childcare, which articulates a visionof childcare where the ‘rights of children and parents toaffordable, accessible, quality childcare should be recognisedand supported by the State’. In exercising those rights,parents should be enabled to choose the most appropriatechildcare to meet the needs of their children. Theconsultation highlighted the increasing importance of theissue of affordability of childcare. In Ireland, parents spenda higher proportion of earnings on childcare in comparisonto the average EU parent. Enabling parents, particularly
08chapter 1
5 CSO statistics for 2004 indicate less than 1% of men are in full-time home duties
women, reliant on social welfare and living on low incomesto access affordable childcare will assist them to move outof poverty. From the consultation, it was agreed thatincreasing access to quality and affordable childcare,including pre-school education, is best achieved throughdirect state investment and family friendly policies. Whilethere was a consensus on the need for more publicsubsidisation of childcare from the consultation, it was notclear what this would look like in reality.
In December 2004, the NWCI secured funding from theNational Development Plan (NDP) Gender Equality Unit ofthe Department of Justice, Equality and Law Reform tocarry out research into the development of a publiclysubsidised model of childcare infrastructure. The Unit,which is co-financed from the European Social Fund,promotes gender equality and supports measures fundedunder the National Development Plan 2000-2006 toaddress gender equality issues.
In January 2005, the Centre for Social and EducationalResearch, (CSER) in Dublin Institute of Technology, anindependent research and policy analysis body, whichcarries out research into social and educational issues wascontracted to conduct the research, on behalf of the NWCI.Internationally recognised for its contributions in the areaof early childhood care and education, it aims to impact onsocial and educational policies and practices, through theprovision of research data and information on policymakers and practitioners. Dr. Noirin Hayes (Director of CSERand Head of Learning Development, Faculty of Applied Arts)acted as Director of Research and Siobhan Bradley, ResearchDevelopment Officer, in the CSER acted as Lead Researcher.Dr. Carol Newman, (Department of Economics, TrinityCollege Dublin) acted as Economic Consultant to CSERthroughout the duration of the research.
1.2 Research ObjectivesThe research aims to:● Review a select number of European and international
models of childcare subsidisation to inform the research.
● Set out a model for a national childcare infrastructurethat would be publicly subsidised and based on mixeddelivery of provision.
● Set out a clear framework and strategy for theimplementation of the model with short, medium andlong term objectives.
● Provide financial forecasts from the cost/benefit analysisof implementation of the model in the Irish context.
The research aims to design a subsidised model of childcarethat facilitates all parents to attain a work/life balancestructure according to their actual choices rather than aseconomic means dictate, and in particular, parents fromlow, and increasingly middle, income households whosechoices, that is whether to work or stay at home and carefor children or combine both have become increasinglyrestricted due to high childcare costs.
1.3 A Holistic Model for Parenting andEarly Childhood Care and Education
In addition to ensuring that the proposed model willfacilitate parental choice around work/life balance, thedesign and development of the childcare model has centredaround the benefits that all children can derive fromparticipating in quality early education and childcareservices. International policy and research recognise thatchildcare is about ‘children’, and any proposed model ofchildcare must ensure that the core of all services enablechildren’s development in an effective and supportivemanner. It is also important to state that while this modelaims to provide quality childcare supports external to thehome environment, the NWCI is also supportive of childcareconducted within the home. Indeed, the challenge is tostrike the balance between accommodation of, and respectfor, childcare conducted within the home whilesimultaneously ensuring affordable quality childcareservices are accessible to the children of all parentsrequiring it outside the home. The development of aholistic model that supports real choices for parentsregarding care is critical both for the needs of children and
09
parents. The NWCI, published ‘A Woman’s Model for SocialWelfare Reform’ in June 2003, which examined the socialwelfare system from a women’s equality perspective, andfound that at its core, the system reinforces women’seconomic dependence on men and does not facilitate caringor parenting. The report recommended changes to the socialwelfare system so that it facilitates choice, concerningparenting and participation in paid employment. It isintended that these recommendations coupled with therecommendations in this model form part of a holisticmodel for parenting and early childhood care and education.It is critical therefore that changes and recommendations inboth reports are implemented concurrently.
1.4 Research LimitationsChildcare is a broad policy area incorporating a number ofseparate but intrinsically related elements. This researchaddresses the specific area of accessibility in relation to theaffordability of childcare services for all households,especially lone parents and low income households, whoare currently hugely restricted in childcare choice becauseof high costs and limited financial means. It assessespossible approaches to redress current affordability issuesand ensure a more accessible, affordable childcare modelfor all households requiring such care.
In recent years, there has been an increased impetus onissues such as ‘quality’ (including staff qualifications andsalaries, curriculum, management structures) andsupporting the inclusion of diverse groups of households(for example children from ethnic minorities, and childrenwith additional needs) within services. While the researchteam recognise the importance of such issues, and fullysupport all advancements within the childcare sector, anexamination of these elements is beyond the remit of thisresearch, and they are in themselves, areas warrantingseparate research to ensure the development of acomprehensive strategy to address these issues.
Due to a dearth of research data in the Irish context, it isdifficult to accurately quantify current levels of provision,
usage of childcare services by parents and childcare costs,particularly in relation to capacity requirements. Therefore,certain elements of the Model are based on estimates fromavailable data and a review of international trends. Datalimitations and assumptions are highlighted throughout allrelevant stages of the research report.
1.5 Research MethodologyThe research methodology was primarily desk based,involving extensive literature reviews in the following areas:
● An international review of early education and childcaredevelopments with particular emphasis oninternational subsidisation and access policies.
● A review of childcare developments, currentsubsidisation structures, accessibility and affordabilityissues in the Irish context.
● A cost/benefit analysis of the subsidisation of childcare.
● A cost/benefit analysis of the implementation of asubsidised model of childcare in the Irish context.
The research was conducted between February and June2005 and supplemented through three consultation focusgroups with NWCI members. One of the focus groups wasspecifically devoted to the national childcare organisationswho are members of the NWCI6, to ensure their views onthe applicability of the model to the current Irish childcarecontext informed the research. Issues highlightedthroughout the consultation process were addressedthrough subsequent stages of research, and the modelaltered where necessary to reflect these issues.
Recommendations were discussed with an expert advisorycommittee. The Advisory committee included DamienMcKeon (DJELR), Denise McCormilla (Border CountiesChildcare Network), Fidelma Joyce (Combat PovertyAgency), Joanna McMinn (Director, NWCI), Julia Long (NDPGender Equality Unit), Kathleen Connolly (NDP Gender
10
6 National Children’s Nursery Association, (NCNA), Irish Pre-School Play Group Association (IPPA) and Childminding Ireland.

Equality Unit) Laurence Bond (Equality Authority), OrlaO’Connor (Head of Policy, NWCI), and Therese Murphy(Chair, NWCI).
1.6 Report StructureChapter 2 reviews international developments in earlychildhood education and care services, according to thewelfare state regimes operational in a select number ofcountries. It pays particular attention to childcaredevelopments in the UK and Quebec, two countries whosegovernments have played an increasingly interventionistrole in childcare provision and policy since the mid 1990s,where the primary objectives of substantial increases inexpenditure have included the facilitation of universalaccess through increasing provision and reducing costs forparents.
Chapter 3 provides an overview of policy developments inthe Irish childcare context from the 1990s. It details currentlevels of childcare provision, and statutory investment inchildcare to date and assesses the issues of accessibilityand affordability in the current childcare context.
Chapter 4 reviews the myriad of reasons for theincreasingly uniform movement towards subsidisedchildcare services in developed countries in recent times.It assesses benefits to parents, children and the State frominvestment in childcare subsidisation and highlights manyof the potential, and existent repercussions that can derivefrom a lack of investment in childcare services.
Chapter 5 presents the proposed subsidised childcaremodel, the rationale for the proposed model and outlinesthe ten-year strategy for phased implementation of themodel up to 2015.
11

12
13
2International ChildcarePolicies: An Overview

2.0 IntroductionThis chapter presents an overview of internationaldevelopments in early childhood education and care policy,according to the welfare state regimes operational in aselect number of countries. It particularly focuses onchildcare developments in the UK and Quebec, as twocountries whose governments have played an increasinglyinterventionist role in childcare provision and policy sincethe mid 1990s, where the primary objectives of substantialincreases in expenditure have included the facilitation ofuniversal access through increasing provision and reducingcosts for parents. The chapter demonstrates that statesupport for family responsibilities, along with family-friendly employment measures, are an essential startingpoint if women’s labour market participation is to be onreasonable terms. Given the slow pace of childcaredevelopments in the Irish context, an assessment ofinternational childcare policies can provide a lens throughwhich we view our own country and can also provideguidance on effective delivery and subsidisation of services,and the return on investment from such initiatives.
International Context“Nations make choices. The policies that they choosehave an impact on the financial burdens born byparents raising children”
(Bradshaw, Finch 2002:13).
Policy choices are closely connected to national welfareregimes, with their particular values and objectives, so thatthe criteria for judging effectiveness might vary betweencountries. Different approaches to policies and services arerelated to differences in welfare regimes (Candappa et al,2003). The level of statutory support and intervention inchildcare, varies across countries according to its publicpolicy ethos. In other words, differences in childcareprovision and policies can only be understood in light of thesocial, economic and political contexts in which they arise(OECD,1990). Public policies affect parents’ decisions aboutworking and care arrangements for children. These policiesinclude maternity and parental leave policies, earlychildhood care and education policies, extended carepolicies, and welfare and tax policies (Waldfogel, 2005).There has been an increased acceptance amongst a
growing number of governments about the pivotal andeffective role ECCE services can play in addressing socio-economic disadvantage and assisting children in a morecost-efficient and effective manner (CECDE, 2003). Also, asfamily size decreases and living environments have altered,the socialisation of children outside the family circle fromthe age of three, and even younger is recommended bymost specialists for young children (OECD,1990). The vitalrole of childcare in improving gender equality andfacilitating female choice around work life balance is nowuniversally recognised. Accessible childcare is now viewedas crucial to the facilitation of female labour marketparticipation, which is increasingly seen as one of thenecessary conditions for EU economic prosperity. The LisbonCouncil in 2000 set an employment target of 60% ofwomen in the age group 15-64 to be in employment by2010 (CSO, 2004).
The widespread shift towards increased investment inchildcare amongst traditionally non-interventionistcountries has been encouraged by EU Directives. The EUSummit in Barcelona passed a recommendation that by2010, Member States should provide childcare for at least33% of children under the age of three, and for at least 90%of children between age three and mandatory school age.Only a few years earlier, the EU endorsed a directive thatrequired Member States to implement a minimal standardof parental leave in their national legislation. In both cases,the purpose of the move was to increase female labourforce participation rates in EU Member States by facilitatingthe reconciliation of family and work life (Neyer, 2003). ThisChapter overviews early education and childcare policiesaccording to their welfare state classifications, based onEsping Anderson’s classifications, assessing the impact suchpolicies have had on family choices and behaviour. It paysparticular attention to traditionally low provision countrieswhose childcare systems have evolved in the past decade topromote greater accessibility and affordability. Particularattention is paid to the UK and Quebec given thetraditional similarities between these countries in relationto childcare policy, where childcare services were largelyallowed develop on the private market. Both countrieshave overhauled (and continue to do so) their childcaresystems in recent years, moving from a traditionally liberal
14chapter 2

market system applied in Ireland, to an increasinglyinterventionist model which promotes equality of accessfor all households to quality, affordable childcare services.Such analysis provides an opportunity to assess viableoptions and strategies to support greater accessibility andaffordability in the Irish market.
2.1 Welfare State ClassificationsThe idea behind grouping nations into certain broadcategories is to enable us to see qualitative differencesbetween groups in the origins of social policies and theiroutcomes which helps to identify the different strategiesthat nations take (Misra, Mollar, 2004).
Esping Anderson, whose seminal work on commonclassifications of welfare state regimes distinguishesbetween countries according to the intention of their socialpolicies and the principles on which they are based (Neyer,2003), provides a useful grouping mechanism todemonstrate the various strategies and policies employedby groups of countries in addressing early education andchildcare. While the model has been critiqued by feministscholars for its focus on de-commodification7, particularlyas the model does not account for women’s experiencewithin the welfare state (Misra, Moller, 2004).
Esping Anderson argues that each welfare state model isassociated with a distinct labour market trajectory forwomen (Gornick et al., 1997), and they are divided asfollows;
1. The Social Democratic Welfare States, (the Nordiccountries) are targeted at individual independence andsocial equality between individuals (not families).
2. The Conservative Welfare States, (continental EUcountries, e.g. Belgium, France, Italy, Germany and theNetherlands) are more diverse in their organisation ofpublic care but generally direct policies towards statusmaintenance and the preservation of national family
forms (Neyer, 2003, Gornick, et al.,1997).3. The Liberal Welfare States (Anglo-Saxon countries, e.g.
UK, US, Ireland, Australia) encourage market basedindividualism through minimal social benefits andthrough subsidising private and marketised welfareschemes.
While it is difficult to aggregate expenditure for all forms ofECCE due to the variety in institutional and fundingarrangements and parental contributions coupled with thefact that there are few comparable, reliable figures on totalexpenditure, available data suggests that public spendingon ECCE, in terms of GDP percentage tends to be highest inthe Nordic countries, in middle range in the continental EUcountries, and the lowest in Australia, UK, US and Ireland(OECD, 2001).
Table 2.1 presents summary data of the various elements ofparental leave, ECCE and extended care services in a selectnumber of European and international models.
2.2 Social Democratic States –Overview of the Nordic States
The social democratic countries generally conform to amodel of universalistic public services supported by highlevels of statutory investment. The Nordic family policy hashistorically focused on child well-being, female labour forceparticipation and gender equality8 (Neyer, 2003, Forssen,2000). In all countries, maternity leave has expanded quiterapidly since the 1960s. Swedish policy provides for 14
weeks maternity leave, including up to seven weeks beforethe birth, and two weeks paternity leave after childbirth.Parental leave follows for up to 18 months (two weeks ofwhich must be taken by the father or lost). The first 13
months of leave is paid at 80% of wages up to a ceiling9,another three months at a low flat rate, and the final threemonths are unpaid. Similarly, provisions in Norway aregenerous; parental leave is 52 weeks, including nine weeksof maternity leave and four weeks of paternity leave.
15
7 Decommodification is measured by generosity and availability of old age pensions, sickness benefits, unemployment insurancepayments etc
8 Although many countries commonly use the Nordic welfare States as an ‘umbrella’ term, a closer look reveals huge differences inhistory, politics and economics. The development of welfare states differs between countries; benefit systems, time of introduction andspeed of reforms.
9 Civil servants receive 100% of wages for the first thirteen months (Foressen 2000).
Parental leave either lasts 52 weeks with 80% pay or 42
weeks with 100% pay (Lund, 2004). Childcare provision andsubsidisation of costs are equally generous. In Denmark,parents pay a maximum of 33% of costs (OECD, 2002). InSweden, parents pay a maximum of 20%, in Finland parentsusually pay between 10% and 15%, and in Norway, parentspay from 28% to 45% dependent on their income (OECD,2001). It is interesting to note, that despite their nowreputable childcare systems, it was not until the late 1960sand early 1970s that the Scandinavian countries started todevelop their public childcare services. Thereafter theyexpanded their systems far faster than the rest of theEuropean countries. This vast expansion was broughtabout by major changes in the perception and purpose ofpublic childcare, day care was no longer regarded as anissue of welfare or education but as a means of supportingwomen’s participation in the labour force and reducinglabour shortage (Neyer, 2003). Female labour forceparticipation rates and social security benefits started toincrease simultaneously (Forssen, 2000).
Financial and legal provisions ensure services are inclusionfocused and accessible to all requiring them. In Finland,children under 7 years have a legal right to attend publiclyfunded ECCE, and in Denmark, municipalities are expectedby law to meet local parental demand (OECD, 2001).Sweden currently provides an entitlement for all childrenaged one to twelve years where both parents work or study,and a part-time entitlement to pre-school (15 hours perweek) for children whose parents are unemployed or onchild related leave. The childcare structures prevalent in theNordic countries mean that between 20% and 48% ofchildren under three are in some form of publicly supportedfull day care provision, and almost all children aged three tosix are in some form of pre-school provision.
Early childhood services provided by the Nordic countriesare now amongst the best in the world, operating under apedagogue model with training and salary levels similar tothat of teachers, and a strong emphasis on health care,socialisation, well-being and active learning of children.Work status and conditions are such that many welleducated young women continue to be attracted to theprofession (OECD, 2001). Policies have impacted positivelyon children’s well-being and the situation of children
appears to be comparatively bright from an internationalperspective – poverty is less common than in other OECDcountries (OECD, 2001). In fact, from a comparativeperspective, the level of child poverty of Finnish childrenhas fallen from the level of liberal countries to almostnothing since its joining the social democratic model.Finland did not join the social democratic welfare regime (ifmeasured by coverage and level of benefits) until the1980s. As the income transfer system has developed, thepoverty risks for one-parent and two-parent families havealso settled on a low level (Frossen 2000).
2.2.1 Social Democratic Welfare State CaseStudy: The Danish Model
Childcare systems in Denmark are now predominantly apublic service, supervised by local authorities and fundedfrom local taxes and central government grants. The localgovernment decides what it is prepared to spend onchildcare, and funds the services directly (OECD, 2002). Feesare capped for parents at 30% to 33% of running costs, withpoorer families using services at either a reduced rate, nocharge, or a charge based on their income (OECD, 2001).The main forms of provision include:
1. Day care facilities for children from six months to sixyears composed of family day care (70% of which areoperated by public, community services), centre-basedcare (crèches, age-integrated centres and kindergartens)and independent day-care facilities, which aresupplemented by independent facilities and networks(30%) which offer parents further choice. Independentproviders must work with the local authority, and meettheir regulation requirements and operating guidelinesto receive municipal grants.
2. Kindergarten classes for children aged five to seven, ledprincipally by a pedagogue, which take place in theprimary school and are free.
3. Leisure time centres and school based, leisure timefacilities which are fee paying but nonethelessmassively enrolled, with 81% of six to nine year oldsattending. (OECD, 2001)
16
There is a high level of utilisation of services. During thefirst year of life, parental care dominates, but from aboutsix months of age, just over 22% of parents use registeredfamily day-care, and 3% of babies are in crèches. 68% ofchildren aged one to three are enrolled in day carefacilities10 and 88.5% of three to five year olds are enrolledin services.. Enrolment is equally high for five and six yearolds, with 98% attending a free pre-school class, withextended care provided for them in fee-paying integratedservices or leisure time activities (OECD, 2001).
The Danish model ensures that childcare is accessible,affordable and heavily utilised. It facilitates femaleemployment and reduces the risk of child poverty.Denmark’s family and childcare policies highlight thecountry’s commitment to high standards of gender equalityand its consistent efforts to create an egalitarian society. Itis estimated that 2.1% of GDP is spent on provision offormal childcare services in Denmark, although benefitsreaped from such investment include:
● High levels of female participation in the labour market.78.5% of women in Denmark are in employment. Evenmore indicatively, 77.2% of all mothers with two ormore children are in employment (OECD, 2002, 2004)
● Low levels of child poverty. Denmark had the lowestrate of child poverty (2.4%) of the 24 OECD countries in2005 (UNICEF, 2005).
● High levels of female public participation. Denmark hasthe third highest percentage of TD equivalents in the EU25 at 36.9%11.
● Single parenthood is not a poverty risk because familypolicy supports are targeted more towards singleparents than towards families with two parents.
2.3 Conservative Welfare States While there has been diversity in investment and provisionhistorically, research indicates increases in investment in
childcare services amongst traditionally low provisioncountries in recent years. France and Belgium stand out inprovision of full day services for large numbers of childrenunder three (30% and 24% respectively), and for nearly allchildren aged three to school-age (OECD 2001). Portugal,has rapidly expanded and increased public investment inthe pre-school network – both public and private providers– over the past five years to overcome long-standinginequities in access, and the government is working towardfull enrolment of 3 to 6 year olds. Between 1996 and 1999
alone, coverage increased from 57% to 72%. Moreover, toencourage full coverage in the year before compulsoryschooling begins, Portugal now offers a free daily five hoursession for 5 year olds in the jardim de infancia with over90% coverage (Ibid.). Italy provides full day public care fornearly all children aged three to five, but for only 6% ofthose under three (Meyers, et al 2000). Conservativecountries are now increasingly moving towards moregenerous leave periods for parents, universal provision forchildren aged three to six for example Italy, Portugal,Belgium, France, and the Netherlands, and many countriesare making additional provisions for children aged less thanthree years and children of school age. For example; Francehas created a specific fund to build childcare provision forthe 0 to 3 age group, while supervised, subsidised placesare broadly available for children under three in Belgium.
2.4 Liberal Welfare States The basic tenet of family policy in liberal welfare states, forexample the UK, Ireland, and the US, is the free market. Theaim is to keep the social aspect of the State contained, needsbased and selective. In practice, this has meant that familypolicy benefits have been targeted only to poor families andto children at risk. Few arrangements exist in liberal regimecountries to ease women’s conflict between working andcaring for their children, and childcare is usually paid forfrom parents’ private means. Policies in the ‘maximumprivate responsibility’ model have three main aims:1. To provide a ‘safety net’ of childcare services for the
poorest families, as well as children at risk of physicalabuse or neglect.
17
10 Family day care dominates (45%) especially in rural areas, followed by age integrated facilities (14%) and crèche (12%).11 http://www.womenandequalityunit.gov.uk/public_life/parliament.htm.
2. To encourage the use of private or voluntary services3. To guarantee minimum levels of quality for childcare.
(OECD 1990)
This lack of state intervention has meant that the vastmajority of families in liberal welfare state regimes financehigh childcare costs from their own private means, aparticularly pertinent issue in the Irish context, wherechildcare costs, ‘averaging over 30% of disposable income forthe Average Production Employee (APE)12 are unsustainableeven in the medium term (OECD, 2004:32). However,despite the lack of financial support, over one half ofmothers of children under three are employed outside thehome in liberal welfare state regimes, indicating the bulk ofday care is arranged unofficially, mainly through social andfamily networks (Forssen 1998). This situation has led tomuch concern, as households with restricted incomes areoften forced to select low quality care which may increasechild or family related developmental risks (Leseman, 2002).
Governments have steered clear of direct investment in andsubsidisation of childcare for families, instead oftenemploying a universal childcare benefit, which they arguecan be used by parents to subsidise childcare costs if theyso desire (see Chapter Three for details of Ireland’s ChildBenefit).
2.5 Advancement of Childcare Policies Historically, State intervention in childcare policy has variedaccording to public policy ethos, yet childcare policies havebecome increasingly uniform in the past decade, even inlight of the differential welfare state regimes. There hasbeen considerable advancement in and enhancement of,family and childcare policies, particularly amongst thetraditional ‘low provision countries’, many of whom are nowin the process of recasting their childcare policies andsystems (Neyer, 2003). This shift in policy can at least besomeway attributed to the multi-dimensional impact suchpolicies have on society and the economy, including:
● Supporting the family and promoting gender equality● Strengthening social cohesion and stemming social
exclusion,● Widening participation in the labour market and raising
productivity.(NESC, 2005: 215)
Childcare, particularly pre-school care and parental leavepolices are now high on the policy agenda in mostdeveloped countries. Recent examples of the increasinggenerosity and comprehensiveness of childcare policiesinclude a childcare guarantee for over twos in Denmark,and all three to six year olds in Germany, an extension ofthe guarantee of a childcare place for all children up to ageseven from the children of all employees to theunemployed in Sweden, and the UK’s provision of freenursery places for all three and four year olds (Bradshaw,Finch, 2002).
When making recommendations around strategies to bringIrish childcare policies in line with many of its EUcounterparts, it is beneficial to examine polices intraditionally liberal welfare state regimes whosedemographic and economic trends, and lack of intervention(until recently) provide a similar starting context to Ireland.An analysis of childcare in Quebec and the UK – countrieswho have recently overhauled their childcare systems,starting from almost as low an intervention role as Ireland13
- assists us in identifying potential ways forward inensuring affordable childcare in Ireland.
2.5.1 UK DevelopmentsSimilar to Ireland, childcare in the UK has historically beenviewed as a private matter and, like Ireland had beencharacterised as a country lacking an explicit family policy.The Irish and British welfare states are founded on thesame male breadwinner model. However, a wide alliancecomposed of non governmental organisations, businessand labour representatives changed this in the 1990s whenthey began to challenge the non-interventionist stance ofthe British state in relation to childcare. Labour’s return to
18
12 The Average Production Employee refers to the average gross wages earnings of adult, full time workers in the manufacturing sectorof each country. In 2002, these were ¤ 23.963 in Austria, ¤ 25,330 in Ireland and ¤ 33,926 (OECD 2003)
13 Prior to the overhauling of the UK and Quebec childcare systems, both countries offered tax relief to working parents to assist inmeeting childcare costs, a policy mechanism that has not existed in the Irish market.

power opened a window of opportunity for this childcarealliance. To tackle the gender gap in terms of femaleparticipation in the labour force became the number onepriority. ‘There is now a pendulum shift towards what mightbe termed an adult worker family, whereby it is assumedthat all adults are in the labour market (Lewis in Daguerre &Banoli 2004). The Labour government also highlighted paidemployment as the key to giving lone parents a stake insociety, but critics were quick to point out that this shouldbe conditional on reasonably paid employment that iscompatible with family responsibilities, as well as goodquality, affordable childcare.
Efforts to reduce gender inequities within the labourmarket coincided with the government’s commitment tothe eradication of child poverty by 2020. In 1997, Britainlaunched its National Childcare Strategy in support of itsnewfound ideology. Government became the principaldriver in the childcare field and promised to develop morehigh quality childcare services that parents with youngchildren could afford. UK provision, which began from avery low base is now benefiting from significant publicfunding and a radical reform of policy, co-ordination andplanning. Measures introduced in the UK since 1997
include (but are not limited to):
● Stronger Co-ordination Structures. Historically, theDepartment of Social Security had been responsible forservices for children from birth to three and theDepartment of Education and Employment (DfEE) hasgoverned programmes for children aged 3 to 5. Thegovernment recently consolidated ‘care’ and ‘education’giving the DfEE primary responsibility for the early yearsin England. Within the DfEE, the Childcare Unit, the EarlyYears Division, and the Sure Start Unit collaborate inaddressing early years issues and concerns (OECD, 2000).
● The development of a plan for co-ordinated datacollection has become a priority (OECD 2000).
● Statutory maternity and paternity leave provision.Changes in legislation in 2003 include an entitlement tomaternity leave of up to one year, with the first sixweeks paid at 90% of annual salary and the nexttwenty weeks at a flat rate (£106, or 90% of averageearnings, if less than £106 per week at time of writing itis proposed that the second six months will be paid by2020). The remaining six months are unpaid(http://www.worksmart.org.uk). Parents from lowincome families who avail of parental leave are entitledto claim additional funding to supplement theirincome. Fathers are now entitled to two weeks paidpaternity leave.
● Increased provision in the form of nurseries, afterschool care and Sure Start. Progress has been reflectedin a significant increase in public expenditure on earlyeducation and childcare to a total combined budget ofover £6 billion per annum in 2004/514 (DayCare Trust,2004). Since the launch of the Strategy, ,childcareplaces have been created for over a million children.The Sure Start Programme was launched in 1999 andheralds a shift in strategy from remediation toprevention (OECD, 2000). Programmes aim to improvethe health, social, learning and emotional developmentof young children, and to strengthen families andcommunities. There will eventually be 500 programmesserving families with children aged 0 to 4, concentratedin areas of deprivation and free to all children in thearea regardless of family income.
● Free part-time early education places for all three andfour year olds. All providers are entitled to governmentfunding, if it can be shown through an inspection, thatcurricular goals are being adequately met (OECD, 2000).Over 168,000 childcare places were created in 2000-2001 alone (Daguerre & Bonoli, 2004).
● Tax credits for working parents (replacing the previousFamily Credit), to subsidise out of home care for thosewho qualify. To qualify, a parent with child(ren) aged 0
19
14 Includes childcare tax credits and statutory maternity pay.

to 14 must work 16 or more hours per week. Childrenaged 0 to 8 must be in registered care and children aged 8 to 14 must be in approved care. The maximumamount per week is £94.50 for one child and £140
per week for two or more children(http://www.parentscentre.gov.uk). However, while tax credits do relieve parents of some financial costs,there has been distribution concerns around thedelivery, and take up of tax credits. Tax free allowancesdo not provide any benefit for those whose income isexempt, and are only of partial benefit to those whoseincome is insufficient to use the full value of theallowance (TSG, 2000). While 124,000 families aregetting help with childcare costs through the newchildcare tax credit – three times the number gettinghelp under the previous system – four out of five loneparents who could get help through the Childcare TaxCredits for childcare costs are still not claiming it (TheGuardian, 03/02/01). In their UK Review, the OECDexpressed concern about the efficiency of a tax creditsystem in targeting low income households;
‘there is evidence – not just from the UK, but fromseveral countries – that private operators are deterredfrom expanding provision in poorer areas. Whiletaxation and benefit policies support poorer familiesseeking private childcare, without direct support orservice by Government, the problem of provision inlow-income areas is likely to remain’
(OECD, 2000; 43).
Despite the original preference for tax credits as a way tosubsidise childcare costs, there is now a wider consensusregarding the need to expand public day care since it ismore affordable and reliable, and therefore offers greateraccess and security to parents
(Daycare Trust 2004, OECD 2000).
Labour Party Manifesto 2005
The Government’s commitment to childcare was reaffirmedin the Labour Party Manifesto which committed to endingchild poverty starting by halving it – both in terms of relativelow-income and in terms of material deprivation – by 2010-11. The Manifesto promised:
● To create 3,500 Sure Start Centres for children underfive years by 2010.
● To increase free part-time nursery provision for all threeand four year olds 15 hours per week by 2010 over thewhole school year, and to increase this to 20 hours overthe longer term.
● That Extended schools’, working in partnership with theprivate and voluntary sectors will offer affordable out-of-school childcare from 8am to 6pm throughout theyear.
● To increase paid maternity leave to nine months from2007 with the goal of achieving a year’s paid leave bythe end of parliament.
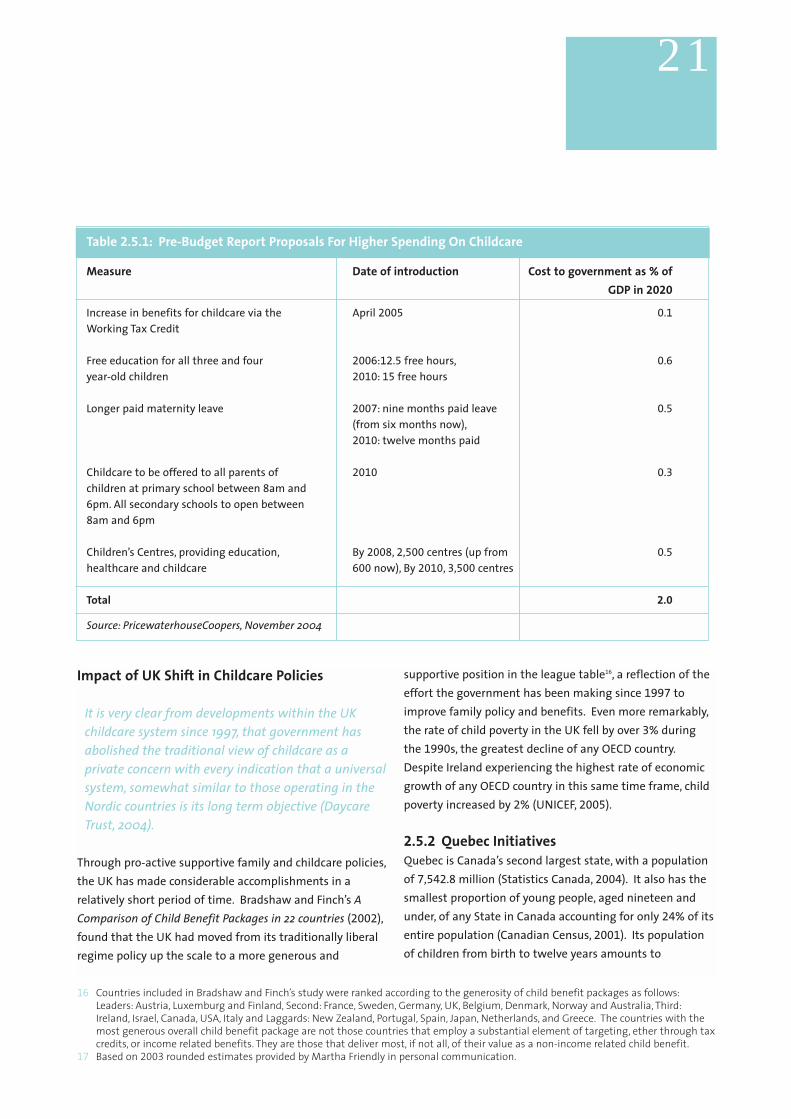
In its unprecedented effort to tackle long-standinginequities in access to childcare, the UK Government hassignificantly increased public expenditure with furtherincreases planned for going forward15. In practice, it is likelythat government funding will continue to give priority tomore disadvantaged areas but, in general, the long-termaims represent a clear move towards a more universalsystem of early years education and care (DayCare Trust,2004). Extra public spending on childcare is expected toamount to 2% of GDP by 2020, divided as follows:
20
15 The SureStart budget is set to increase by ¤ 769m between 2004/5 and 2007/8, which inter alia will hope to fund around 2,500
Children Centres by 2008, deliver part-time education to 12,000 two year olds living in disadvantaged areas on a pilot basis andsupport at least 120,000 additional childcare places by 2008, including those in extended schools (Daycare Trust 2004).
Impact of UK Shift in Childcare Policies
It is very clear from developments within the UK childcare system since 1997, that government hasabolished the traditional view of childcare as aprivate concern with every indication that a universalsystem, somewhat similar to those operating in theNordic countries is its long term objective (DaycareTrust, 2004).
Through pro-active supportive family and childcare policies,the UK has made considerable accomplishments in arelatively short period of time. Bradshaw and Finch’s AComparison of Child Benefit Packages in 22 countries (2002),found that the UK had moved from its traditionally liberalregime policy up the scale to a more generous and
supportive position in the league table16, a reflection of theeffort the government has been making since 1997 toimprove family policy and benefits. Even more remarkably,the rate of child poverty in the UK fell by over 3% duringthe 1990s, the greatest decline of any OECD country.Despite Ireland experiencing the highest rate of economicgrowth of any OECD country in this same time frame, childpoverty increased by 2% (UNICEF, 2005).
2.5.2 Quebec InitiativesQuebec is Canada’s second largest state, with a populationof 7,542.8 million (Statistics Canada, 2004). It also has thesmallest proportion of young people, aged nineteen andunder, of any State in Canada accounting for only 24% of itsentire population (Canadian Census, 2001). Its populationof children from birth to twelve years amounts to
21
16 Countries included in Bradshaw and Finch’s study were ranked according to the generosity of child benefit packages as follows:Leaders: Austria, Luxemburg and Finland, Second: France, Sweden, Germany, UK, Belgium, Denmark, Norway and Australia, Third:Ireland, Israel, Canada, USA, Italy and Laggards: New Zealand, Portugal, Spain, Japan, Netherlands, and Greece. The countries with themost generous overall child benefit package are not those countries that employ a substantial element of targeting, ether through taxcredits, or income related benefits. They are those that deliver most, if not all, of their value as a non-income related child benefit.
17 Based on 2003 rounded estimates provided by Martha Friendly in personal communication.
Table 2.5.1: Pre-Budget Report Proposals For Higher Spending On Childcare
Measure Date of introduction Cost to government as % of GDP in 2020
Increase in benefits for childcare via the April 2005 0.1Working Tax Credit
Free education for all three and four 2006:12.5 free hours, 0.6year-old children 2010: 15 free hours
Longer paid maternity leave 2007: nine months paid leave 0.5(from six months now),2010: twelve months paid
Childcare to be offered to all parents of 2010 0.3children at primary school between 8am and 6pm. All secondary schools to open between 8am and 6pm
Children’s Centres, providing education, By 2008, 2,500 centres (up from 0.5healthcare and childcare 600 now), By 2010, 3,500 centres
Total 2.0
Source: PricewaterhouseCoopers, November 2004
1,077,00017, only a third larger than the Irish population ofthat same age cohort (715,777 in the 2002 Census). Itspopulation size (i.e. for children under twelve), coupled withthe Quebec government’s very recent initiatives, outlinedbelow, to ensure accessible, affordable, quality childcare forall, make it an ideal country upon which to draw valuableexperiences to inform the design of an effective Irishchildcare model.
In 1996, the Quebec government announced its intentionto implement a new family policy and to develop acomprehensive childhood policy for children aged 0 to 12.Prior to the introduction of the low fee policy, the mainpolicy instruments for childcare assistance in Quebec werea fiscal deduction for day care expenses, and a refundabletax credit (more generous for low-income households) 18,making the net price for families paying for childcareservices contingent on family income (Lefebvre, Merrigan,2005). For a critique of issues arising from utilisation of taxcredit mechanisms to offset childcare costs refer to UKexperience: Section 2.5.1.
The three main components of the new Quebec scheme,implemented in 1997 are:
● An integrated child allowance for young children andnewborns designed to gradually replace existingallowances.
● Enhanced maternity and parental leave provisionsthrough a new parental insurance plan.
● The development of ECCE services to provide universallyaccessible programs to foster child development, and togradually introduce skills that children need to succeedin school. Financial support provided directly to settingsis intended to enhance the quality of the serviceprovided to children, and the development andsustainability of childcare settings in operation underthe scheme.
The new policy pursued three major objectives:
● Fight poverty.
● Enhance child development and equality of opportunityfor children
● Increase mothers’ participation and gender equality inthe labour market (Lefebvre, Merrigan, 2005).
In the first year of the program, kindergarten for all fiveyear olds was extended to the full school day; existing halfday kindergarten programs for four year olds continued andwere supplemented by a half day out of school childcareprogram at no cost to the parents. At the same time, spacefor four year olds in either regulated centre-based programsor family day care became available at a fee of $5 per day(Friendly, Beach, 2005). For each following year, thegovernment reduced the age requirement and engaged in aplan to create new childcare facilities and pay for the costof additional $5 per day childcare places. By September2000, the low fee policy applied to all children aged 0 – 59
months (Lefebvre, Merrigan, 2005). Individual centres couldimplement policies that gave priority to employed parents,single parents, or some other target group. Families onsocial assistance and not in the workforce are entitled to 23
hours a week of care at no cost (Ibid). The expansion ofplaces in for-profit-centres was frozen, while thegovernment favoured the creation of spaces in not-for-profit centres (Centres de les Petite Enfance – CPEs) and infamily based day care, where an adult cares for a maximumof six children, subject to some constraints on the numberof very young children, which are supervised by CPEs. For-profit-centres could offer $5 a day places with governmentagreement (Lefebvre, 2004). Over the next five years, eachCPE was to develop at least two services – typically a centreand a family childcare component. Table 2.5.2 (a) displaysthe implementation strategy of childcare services availableas part of the low fee day care policy.
22
18 These provisions remain available to parents who are unable to avail of the current low fee day care, operational since 1997.

FundingThere is a considerable amount and variety of financialsupports available to childcare providers, aimed atincreasing childcare capacity and meeting the operationalcosts of running childcare services. Once-off funding insupport of capital and equipment costs includedevelopment grants, grants for purchase of property orconstruction of a facility, grants for enlarging and/orrefitting facilities, compliance grants, grants to acquire
assets of day care centres, and grants to purchaseintangible assets of day care centres. A full list of thesegrants and financial supports is available in Appendix One.In parallel with the various funding initiatives to create newplaces, the wages provided to educators and all types ofemployees in childcare centres were steeply increased andregulated after negotiations with the main unionsrepresenting the employees (Friendly, Beach, 2005).Recurring funding available to childcare providers is listedin Appendix 2. For 2002/3, a not-for-profit centre (CPE)
23
19 This included not-for-profit centres, family based day-care and for profit day care centres
Table 2.5.2(a): Childcare Services Offered as Part of the Low-Fee Day Care Policy
Ref: Service Type Implementation Date Entitlement
A Childcare 1997 Licensed and regulated childcare facilities19 under agreement with the Department of the Family began offering spaces at the reduced contribution of $5 per day per child, for children aged 4 (who were not in kindergarten).
B Childcare 1998 Three year olds were eligible for low-fee spaces in facilities outlined in 2.5.2(a)A.
C Childcare 1999 Two year olds were eligible for low-fee spaces in facilities outlined in 2.5.2(a)A.
D Childcare 2000 All children aged five or less were eligible for low fee spaces in facilities outlined in 2.5.2(a)A.
E Kindergarten 1997 Kindergarten offered by all school boards extended from part-day to full-day.In urban centres, the Schools Boards may offer junior kindergarten spaces for four year olds on a part-day part-week basis for special needs children and children whose parent(s) is (are) welfare recipient(s) and is (are) engaged in schooling or training activities.
F Before- and Department of Education commenced subsidisationafter-school care of this form of care. The School Boards must offer
before and after school services on the school premises at the reduced contribution of $5 per day per child for the children at (pre)kindergarten and grade school. For a family to benefit from this low-fee day care service, a child must attend the school day care centre for at least2.5 hours per day and for a minimum of three days per week.
(Lefebvre, Merrigan 2005)

with 60 places (a typical organisation) received $60 per dayfor each child aged less than 18 months and $44 per day fora child aged 18 – 59 months. The value of the subsidyranges from $11,528 to $15,720 per year depending on theage of the child.
Overall, public support for families increased only modestlyfrom the onset of the programme, from $2.6 billion in 1995
to $3 billion in 2004 but the proportion dedicated tochildcare rose rapidly. Direct childcare subsidies increasedfrom $209 million in fiscal year 1995-1996 to $1 billion inyear 2004 and total childcare benefits (i.e. direct childcaresubsidises and refundable childcare tax credit) rose from14.6% to 50.4% of the total budget (Lefebvre, 2004).
Impact of the ProgrammeGiven the relative newness of the low-fee programme,research to date has tended to document theimplementation and delivery of the programme in itsintroductory years, while a full-scale evaluation of the socialand economic impact of the programme has yet to beconducted. However, the econometric results of the first in-depth analysis of outcomes of the universal subsidisationprogram, (Lefebvre, Merrigan 2005) support the hypothesisthat the childcare policy, simultaneously with thetransformation of public kindergarten from a part-time to afull-time basis, had a large, and statistically significantimpact on the labour supply of Quebec’s mothers with pre-school children. The analysis observed mothers with youngchildren in Quebec before and after the policyimplementation20 and found that from 1998, participationrates for mothers with at least one child aged 1 – 5, andmothers with at least one child aged 0 – 5 increased rapidlyrelative to the rest of Canada. The study also analysedparticipation rates of mothers with at least one child aged6 – 11 and no child under 6 and found the rate in Quebec toincrease relatively to the rest of Canada, highlighting thefact that the pattern for mothers with young children isvery different from mothers with older children and noyoung children. The evidence shows that the policy hadeffects on both educated and less educated mothers,
despite the fact that the reduction in costs was larger(considering fiscal policies before the low-fee programmecommenced) for higher income families. Lefebvre andMerrigan (2005:20) argue that, ‘this can be explained by thefact that lower income families are liquidity constrained andthat the policy made childcare places more easily available.’Results also provided some evidence that the effect onlabour supply became stronger, as more subsidised spaceswere created across the province for different age groups.
The number of children attending public kindergartenincreased from 88% in 1997 to 98% once kindergartenbecame full-time. The number of children attending pre-and after- school care has increased considerably since theintroduction of $5 day care (Ibid).
However, while the innovative policies operational inQuebec since 1997 have contributed positively to increasesin capacity, increases in accessibility, and subsequentlyincreases in labour market participation and developmentalsupports for children, implementation of the programmehas not been without problems. It is common knowledgethat the programme cannot satisfy the increased demandfor the low-fee spaces. In 2000, at most 40% of all childrenaged 0 – 4 had access to a subsidised space (Lefebvre,Merrigan, 2005). This could, at least be partly attributableto the hugely ambitious implementation time strategy forthe programme - it was proposed that childcare placeswould be available for all 0 – 6 requiring it by 2000,allowing only a four year period to build capacity to meetuniversal demand. The government had estimatedincreased demand based on a survey of parent’s expresseddemand. However once programme implementationcommenced, it became apparent that the take-up would bemuch higher, which meant long waiting lists from theoutset (Friendly personal communication). By 2005,childcare provision had reached its target of 200,00021, andwaiting lists had reduced considerably, yet unmet demandis still high22.
24
20 Mothers with young children in the rest of Canada where no such reforms were implemented were used as the control group,21 The low-fee policy has nonetheless led to substantial increases in childcare capacity, prior to 1997, it was estimated that childcare
system for 0–5 year olds consisted of 78,000 regulated spaces (Tougas, 2002).22 Personal communication, Martha Friendly March, 2005
A change in government in 2003 has also impacted on theprogramme – the Liberal government had within onemonth of their election announced plans to slow thedevelopment of the childcare program, however due tomassive protests and petitions, changes to date have beenminimised – public funding for childcare has however beencut by $25million per annum, parental fees increased to $7
per day and capital funding eliminated (with the exceptionof all those facilities which had been approved and hadcommenced building/renovation work) (Friendly, Beach2005).
2.6 ConclusionA review of international approaches to subsidisation ofchildcare highlights considerable advancements,particularly among previously low provision countries, inthe past decade. Countries usually employ one or more offour main mechanisms to finance childcare costs: directsubsidisation of childcare costs so that charges are belowmarket rates for all parents; a reduction or rebate ofcharges for childcare according to family type, income,number and/or age of children; higher cash benefits tomitigate against extra costs for pre-school children; and/oroff-setting some or all of the costs against taxable income(Bradshaw, Finch 2002). Countries often use a variety ofthese measures to support parents in meeting childcarecosts. What is clear from the review is that while differentcountries have adopted different approaches, usually basedon economic and demographic structures already existentwithin the relevant countries, there has been a nearuniform policy shift towards universal access for all childrenof pre-school age, improvements in maternity and parentalleave provisions and improved access for children of allother age groups to extended care services. There has alsobeen considerable investment in the ‘quality’ ofprogrammes offered, and the need to ensure thateducation and care are intrinsically linked in childcaresettings.
From the Quebec and UK models we can also see apolicy shift away from tax based incentives toparents in order to pay for childcare costs. These havebeen replaced by a strong emphasis on increasingsubsidisation to childcare providers, as the wayforward to enhance quality and improve access forchildren and affordability for parents.
Childcare and early education services now form an integralpart of government policies and are recognised as anessential component of improving gender equality andfacilitating women’s public participation in society,reducing child poverty, increasing female labour marketparticipation and education and training opportunities forwomen, and providing developmental, educational andsocial opportunities for children. The indirect role they playin wider society is also acknowledged, for example, they canreduce criminal justice costs, through provision ofsupportive families for ‘at risk’ children from a young age(Lynch 2004). The considerable advances in the design andimplementation of family and childcare policies are largelydue to the multiplicity of benefits derived from investmentin the field. It is within the context of the European andinternational developments in family and childcare policiesoutlined in Chapter Two, that Ireland’s family and childcarepolicies are reviewed in Chapter Three.
25

26
Table 2.1 (A): Sample Maternity, Paternity and Parental Leave Policies in Select EU Countries
Country Policy Type Length %Wage Replaced Job Protected
Denmark Maternity Leave 18 weeks (14 after birth). 100% for most mothers Yes(or unemployment benefit)
Parental Leave 32 weeks for family. 100% of earnings or unemployment benefit. Yes Benefits are taxable
Paternity 2 weeks (‘use it or lose it’). 100%. Benefits are taxable Yes
France Maternity Leave 16 weeks (compulsory six 85% .prior to birth).
Parental Leave Until age three. Can be used to work part-time. Allowance is paidat a flat rate for second and subsequent children. Yes
Paternity Leave 3 days. 100%
Italy Maternity 21 weeks (5 months) 80%. Yes Parental Leave 10 months (extended to 11, 30%. Yes
if father takes three, mustbe taken before child is eight)
Paternity Leave 2 weeks. 80%.
Norway Parental Leave 52 weeks, of which 30 days 80% to a ceiling for 52 weeks, or 100% to a Yes(incl. maternity for father (use or lose). ceiling for 42 weeks.and paternity 3 weeks before birth,leave) 6 weeks after.
Sweden Maternity Leave 14 weeks (7 before/7 after 80%. Yesbirth)
Parental Leave 18 months, 480 days with 80% to a ceiling for 13 months (minimum 60 Yescash benefit (must be days for each parent). Flat rate for remainingtaken before child is 8) three months.
Paternity Leave 2 weeks (to be used during 80% up to a maximum. Yesfirst sixty days after child-birth and simultaneously with mother).
United Maternity Leave 12 months. First 6 weeks paid at 90% of usual earnings, next YesKingdom 20 weeks at a flat rate and the remaining 6
months are unpaid (proposals to increase paid leave to 9 months by 2002 and 12 months by 2010).
Paternity Leave 2 weeks (to be taken in 90% of earnings or £100 per week whichever Yesblocks of one within eight is less.weeks of birth.
(Sources: OECD 2001, 2002, Kamerman 2000, Kamerman et. al, 2003) (Lefebvre, Merrigan 2005)
27
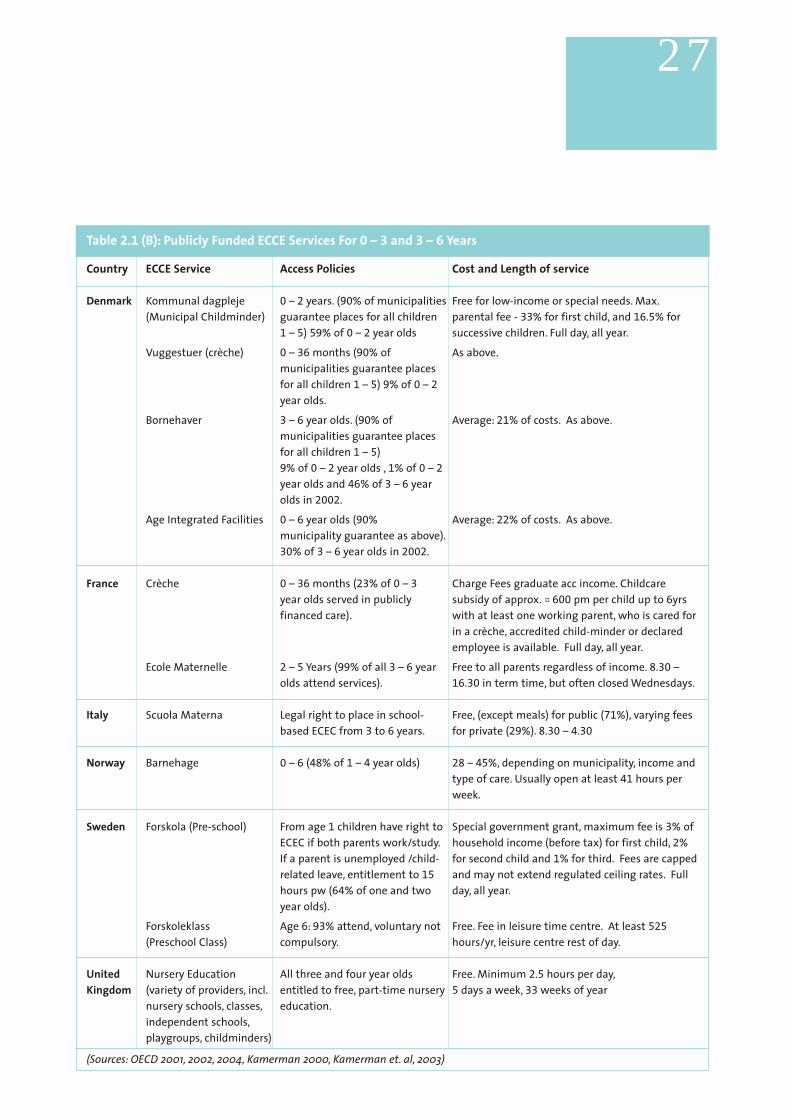
Table 2.1 (B): Publicly Funded ECCE Services For 0 – 3 and 3 – 6 Years
Country ECCE Service Access Policies Cost and Length of service
Denmark Kommunal dagpleje 0 – 2 years. (90% of municipalities Free for low-income or special needs. Max.(Municipal Childminder) guarantee places for all children parental fee - 33% for first child, and 16.5% for
1 – 5) 59% of 0 – 2 year olds successive children. Full day, all year.
Vuggestuer (crèche) 0 – 36 months (90% of As above.municipalities guarantee places for all children 1 – 5) 9% of 0 – 2year olds.
Bornehaver 3 – 6 year olds. (90% of Average: 21% of costs. As above.municipalities guarantee places for all children 1 – 5)9% of 0 – 2 year olds , 1% of 0 – 2year olds and 46% of 3 – 6 year olds in 2002.
Age Integrated Facilities 0 – 6 year olds (90% Average: 22% of costs. As above.municipality guarantee as above).30% of 3 – 6 year olds in 2002.
France Crèche 0 – 36 months (23% of 0 – 3 Charge Fees graduate acc income. Childcareyear olds served in publicly subsidy of approx. ¤ 600 pm per child up to 6yrsfinanced care). with at least one working parent, who is cared for
in a crèche, accredited child-minder or declared employee is available. Full day, all year.
Ecole Maternelle 2 – 5 Years (99% of all 3 – 6 year Free to all parents regardless of income. 8.30 –olds attend services). 16.30 in term time, but often closed Wednesdays.
Italy Scuola Materna Legal right to place in school- Free, (except meals) for public (71%), varying feesbased ECEC from 3 to 6 years. for private (29%). 8.30 – 4.30
Norway Barnehage 0 – 6 (48% of 1 – 4 year olds) 28 – 45%, depending on municipality, income and type of care. Usually open at least 41 hours per week.
Sweden Forskola (Pre-school) From age 1 children have right to Special government grant, maximum fee is 3% of ECEC if both parents work/study. household income (before tax) for first child, 2% If a parent is unemployed /child- for second child and 1% for third. Fees are capped related leave, entitlement to 15 and may not extend regulated ceiling rates. Full hours pw (64% of one and two day, all year.year olds).
Forskoleklass Age 6: 93% attend, voluntary not Free. Fee in leisure time centre. At least 525
(Preschool Class) compulsory. hours/yr, leisure centre rest of day.
United Nursery Education All three and four year olds Free. Minimum 2.5 hours per day,Kingdom (variety of providers, incl. entitled to free, part-time nursery 5 days a week, 33 weeks of year
nursery schools, classes, education.independent schools,playgroups, childminders)
(Sources: OECD 2001, 2002, 2004, Kamerman 2000, Kamerman et. al, 2003)

28

29
3Ireland in Context

3.0 Introduction The historical position of mothers as primary carerswithin the home meant that traditionally, childcarewas largely viewed as a private family matter.Government intervention tended to be reactive ratherthan proactive, and largely confined to fundingand/or provision of services for disadvantaged groups(CECDE, 2003; Murray, O’Doherty, 2001). The majorityof services consequentially developed in an ad hocmanner on the initiative of community andcommercial providers and through childmindingservices in the informal market. Community serviceshave played a vital role in the development anddelivery of early education and childcare services. Theinformal childcare market, where services are usuallyprovided by childminders in their own homes has alsofeatured considerably in the development of Ireland’schildcare services, and they continue to play a vitalrole in childcare provision in Ireland today.
The laissez faire approach to childcare adopted bysuccessive Irish governments has culminated in a largelyunregulated, fragmented and costly childcare market whicheffectively excludes many low, and increasingly middleincome households from accessing childcare services, andin turn quality developmental supports, for their children.This approach hinders parental, particularly mothers choiceand ability to avail of education, training and employmentopportunities and does not address child poverty in anymeaningful way. Despite the changing social, economic anddemographic circumstances throughout the latter half ofthe 1990s which moved childcare to the fore of the politicalagenda, policy-making in Ireland for young children outsidethe home environment has had a relatively short history.
Traditionally women were expected to undertake adisproportionate share of unpaid care work in the home.This stereotypical role has been reinforced through the Irishconstitution and government policies. The marriage bar forexample has had lasting effects on many women who arenow financially dependent on spouses or on the state
resulting in 41% of women 65yrs and older being at risk ofliving in poverty (CSO, 2005).
This chapter provides an overview of policy developmentsin the Irish childcare context from the 1990s. It overviewscurrent levels of childcare provision, statutory investment inchildcare to date and assesses the issues of accessibilityand affordability in the current childcare context.
3.1 The Changing Context of Early ChildhoodCare and Education in Ireland
This section briefly outlines the key social, economic anddemographic changes which have had considerable impacton the needs of households with children.
3.1.1 Changing Demographics and FamilyDiversity
In 2002, Ireland’s population exceeded 4 million for the firsttime since 1871, with children from birth to fourteenaccounting for 20.5% of the total population. The numberof births has increased consistently since 1995, from 48,787
to 61,517 in 2003. This growth has been complemented byincreases in immigration, particularly since the latter half ofthe 1990s, figures released in 2002 showed that there wasnet inward migration of 150,000 since 1996 (NESF, 2005).In addition to demographic growth, there has been agrowth in the diversity of family types, primarily throughincreases in lone parenthood as a result of separation,divorce, widowhood, and births outside marriage.
3.1.2 Economic Growth and EmploymentBetween 1994 and 2002, Ireland’s GDP increased by 9%annually, the highest rate of GDP growth of any OECDcountry in this time. Ireland is the fourth richest country inthe world. Between 1993 and 2003, the total number inemployment grew from 1.183 million to 1.793 million – anincrease of over 51% (CSO, 2004). Increases in labourdemand have been met through falling unemploymentlevels23, substantial increases in female labour marketparticipation, and labour immigration. Between 1997 and2004, female employment increased by 48.5%, (from539,700 to 801,700). Part-time employment amongst
30
23 Unemployment rates have simultaneously fallen from above EU average in 1997, to well below the EU average since then (almost 16%in 1993, compared to 8% for EU, just above 4% in Ireland in 2002, compared to slightly below 8% for EU). Of particular note is thehigh increase in female labour market participation rates; the employment rate for women rose by 40% between 1994 and 2003 (CSO,2005).
chapter 3
women more than doubled in this time period (from124,600 to 251,900) and the number of women in full-timeemployment, increased by almost a third (from 415,200 to549,800).
3.1.3 Changing Perspectives of ChildhoodSuch changes have been complemented by an increasedacknowledgement and awareness around the needs andrights of children, who traditionally had been ‘conceived of interms of their status within families, rather than as individualsin their own right’ (CPA, 2005:20). This awareness has led to anenhanced commitment to ensure policies and provisionsdirected at children are evolving, inclusive, comprehensive andappropriate to the needs of children in an ever-changingsociety. In 1992, Ireland ratified the United Nation’sConvention on the Rights of the Child, which as the mostwidely ratified human rights treaty in history was ratified byall but two countries in the world (USA and Somalia). Bybecoming a State Party, Ireland made a formal commitmentto safe guard the rights of children as set out in theConvention. The rights of the child outlined in the Conventioncan be grouped together under four themes: survival rights,development rights, protection rights and participationrights24. The Children’s Rights Alliance (CRA) was established in1993 to support the implementation of the Convention.
3.1.4 Gender Equality The Irish Government has also signed up to internationalwomen’s human rights instruments that strive to eliminateeconomic, political, social and cultural inequalities thatwomen continue to experience. The international humanrights instruments recognise that women from differingsocial groups often experience multiple inequalities, forexample, because of their class, race or disability.
In 1985, the Irish government ratified the Convention on theElimination of all forms of Discrimination Against Women(CEDAW), and transposed it into Irish policy. In 1995 at the4th World Conference on Women, the Irish governmentsigned up to the Beijing Platform for Action, and agreed toimplement a National Plan for Women. In March 2005, theIrish government reaffirmed this commitment at the
Commission for the Status of Women in New York. In itscurrent Social Partnership agreement, ‘Sustaining Progress2002-2005’, the Government made commitments to thedevelopment of a National Women’s Strategy that aims toaddress persistent inequalities for women in Ireland. TheNational Women’s Strategy will specifically address the issueof the lack of affordable and accessible childcare as a barrierto women’s full participation in all areas of society.
A society that enables real choice for all women to participatein civic life, to balance paid employment and careresponsibilities, is one that will contribute to the achievementof full equality between women and men. Higher levels oflabour force participation among women are commonly seenas indicative of women’s progress towards equality with men,both in the home and society. Over the past fifteen years, theincreased feminisation of the labour force in Ireland has beenin response to increased participation in education, and higherindividual expectations, as well as labour market forces. Therecan be no doubt that many women have gained greatereconomic independence during this period. Nevertheless, thisadvancement has not been shared by all groups of women inIrish society, and many women, and consequently children,continue to experience poverty. Improvements in access toeducation, training and employment opportunities areaccepted as primary routes out of poverty and socialexclusion, investment in affordable, quality childcare isessential strategy in facilitating such access.
3.2 Policy Developments Since the1990s
A number of policy initiatives have been introduced sincethe 1990s in an attempt to respond to, what has often beenreferred to as the Irish ‘childcare crisis’. Between July 1998
and November 2000 alone, five major policy documents, allwith a specific focus on childcare, albeit from differentperspectives, were published. Amongst otherrecommendations, Strengthening Families for Life, TheNational Children’s Strategy, The National Forum on EarlyChildhood Education, and The White Paper on EarlyChildhood Education, all make recommendations around
31
24 (CRA, http://www.childrensrights.ie/viewpubs.php?go=alpha).
the need to improve provision and co-ordination of services,to address ‘quality’ within services, to introduce financialmeasures to assist in meeting costs and the need to ensureservices are accessible to, and inclusive of the needs of thediverse groups of children living in Ireland today.
The following sections outline initiatives introduced sincethe mid 1990s:
3.2.1 The Childcare (Pre-School Services)Regulations
The Regulations came into effect in January 1997 andgovern the provision of pre-school services, setting out theprocedures for the notification and inspection of childcarefacilities. Their introduction marked a significantdevelopment in pre-school services in Ireland. Prior to this,childcare provision was unregulated by the State, beyondgeneral regulations relating to health and safety, and foodsafety (Corrigan, 2004). However, the Regulations fail toencapsulate all forms of childcare provision, only childcareproviders caring for three or more children (excluding theirown offspring, offspring of a partner/spouse, other relativesor three children from the same family) are required tonotify the Health Board, leaving a substantial section of theIrish childcare market remains unregulated. TheRegulations, currently under review have been welcomed asan introductory step in setting minimum standards, but actonly as a foundation upon which to build quality childcareinto the future.
3.2.2 Equal Opportunities Childcare Programme(EOCP)
The EOCP was launched in 2000 and is one of the mostimportant initiatives in the support and development ofchildcare in Ireland to date and is the primary source offunding available to existing childcare providers and thoseseeking to develop new childcare facilities (Corrigan, 2004).Financial supports made available under the Programmeprovide:● Capital assistance for community/not-for-profit
organisations and self-employed/private providerstowards the cost of building, renovating, upgrading orequipping childcare facilities.
● Staffing grants for community/not-for-profitorganizations or a not-for-profit consortium ofcommunity organizations and private providers towardsthe cost of staff for community-based provision indisadvantaged areas (for an initial three year period);
● Improving quality through (i) the provision of finance tosupport NCVOs, (ii) developing local childcare networksthrough County/City Childcare Committees, (iii) fundinginnovative projects with the capacity to be replicatedand (iv) the development of a range of supports forchildminders through County/City ChildcareCommittees.
To date, in excess of ¤ 500 million has been made availableunder the Programme, to improve the quality of childcare,maintain and increase the number of childcare facilitiesand places and to introduce a co-ordinated approach to thedelivery of childcare services. This represents the largestgovernment investment in childcare in Irish history to date.By April 2005, EOCP funding had created 24,600 new centrebased childcare places and a further funding commitmenthas been made for an additional 12,000 places(Department of Justice, Equality & Law Reform, 2005).While the original plan was due to run until 2006, Budget2005 provided for its extension to 2009. The overall aim isto have created an additional 48,300 places by this time, yetdespite such proposed and actual increases in childcarecapacity, levels of provision continue to fall below therequired levels of demand (CPA 2005). One of the mostoverlooked requirements of the EOCP programme, and inturn one of the most pertinent issues in supporting equalopportunities is the programme’s failure to address theissue of affordability to any significant degree. The EOCPcan only attempt to reduce the price of childcare indirectlythrough increasing supply, a strategy which to date hasfailed as childcare costs continue to expand beyond thefinancial means of an increasing number of households(Section 3.5).
3.2.3 County Childcare CommitteesThirty-three County Childcare Committees have now beenestablished to improve service co-ordination and overseedevelopments at local level. The Committees are
32

responsible for developing information strategies onchildcare for parents and providers; identifying gaps inchildcare provision; promoting the establishment of newchildcare facilities; formulating priority objectives for theregion; and supporting network initiatives at a local andcounty level.
3.2.4 Guidelines for Planning Authorities onChildcare Facilities
The Guidelines were published in July 2001, and givedirection to local planning authorities regarding thepreparation of development plans and assessment ofapplications for planning permission, guiding developersand childcare providers in formulating developmentproposals.
3.2.5 The National Children’s Office The National Children’s Office (NCO), established in 2001, isthe only government agency which aims to improve allaspects of children’s lives by leading and supporting theimplementation of the National Children’s Strategy, OurChildren – Their Lives. The NCO co-ordinates and monitorsthe implementation of the National Youth HomelessnessStrategy and manages the implementation of theChildren’s Act 2001. Within the National Children’s Strategy,Objective A in the Schedule of Objectives, states that‘Children’s early education and developmental needs will bemet through quality childcare services and family friendlymeasures’ (2000; 50). In this regard, the NCO is currentlyleading a High Level Working Group, which will report tothe Cabinet Committee on Children chaired by AnTaoiseach.
3.2.6 The National Childcare Co-ordinatingCommittee (NCCC)
The NCCC is chaired by the DJELR, and oversees thedevelopment of an integrated childcare infrastructurethroughout Ireland, with the support for the County andCity Childcare Committees and the National VoluntaryChildcare Organisations (NVCOs). It addresses specificpolicy issues and through its various sub-groups developsand informs national strategic actions in the sector.
Membership is comprised of representatives from thestatutory and non-statutory sectors including the SocialPartners and the NVCOs (DJELR, 2005).
3.2.7 The Centre for Early ChildhoodDevelopment and Education (CECDE)
The CECDE was established in 2002 to develop and co-ordinate early childhood care and education in pursuance ofthe objectives of the White Paper ‘Ready to Learn’. TheCentre’s brief covers children from birth to six years in allforms of early education and care. The functions of theCentre include the development of early childhood care andeducation quality standards in relation to all aspects of earlychildhood education and care, the development of a supportframework to encourage compliance with quality standards;and the co-ordination and enhancement of ECCE provision.
Additional measures and initiatives introduced from the1990s include the passing of the Children’s Act in 2001; theestablishment of a Children’s Ombudsman in 2003; and thepublication of the National Council for Curriculum andAssessment’s consultative document ‘Towards a Frameworkfor Early Learning’ in 2004, which discusses thedevelopment of a national framework to support allchildren’s early learning.
3.3 Delivery of Childcare in Ireland
3.3.1 Ministerial Responsibility Currently, seven different government departments haveresponsibility for various parts of early childhood andfamily policy. In practice however, three ministries have themain responsibility for early childhood provision (OECD2004)25:
33
25 In addition to the three main Departments, the Department for Social and Family Affairs also has important policy responsibilities forfamily, parents and young children but in principal does not engage in early childhood provision (OECD, 2004)

In its Thematic Review, of Early Childhood Education andCare Policy in Ireland, the OECD critiqued this dispersion ofresponsibility:
‘No one Department or Agency has been given clearresponsibility to lead integrated policy or to providecoherence across the various childhood bodies andservices. Part of the reason for this lack of coherencyis attributed to the fact that traditionally earlychildhood policy has been subsumed under largerissues, such as family policy, primary schooling andgeneral health policy, rather than a defined agegroup with its own specific health, developmentaland cognitive traits.’ (OECD 2004; 23-24)
In its recent review of ECCE, NESF (2005: xvii) re-iteratedsupport for this proposal:The overall responsibility for the development of andimplementation of ECCE policy should reside with oneGovernment Department. The designation of the mostappropriate department is a matter for Government.
3.3.2 Childcare Usage in IrelandProvision in the childcare sector is diverse and fragmented.Parents typically avail of one or more of a number of formsof provision27 including parental care28, informal care29,childminding (family day care)30, workplace crèches31,private and community nurseries and crèches32, communityand private sessional services for 3 – 5 year olds33 andprimary education34.
It is extremely difficult to accurately quantify current levelsof provision, and usage of childcare services, due to adearth of research data. This is particularly the case forchildren aged 0 – 6, and for school-age childcare). TheNational Childcare Census 1999-2000 represented the firstcomprehensive attempt to quantify actual levels ofchildcare provision, and the type and usage of services. Afundamental limitation of the Census is that it did notinclude any information on one of the most predominantlyused forms of childcare in Ireland, namely formal andinformal childminding, thereby excluding a substantial
34
26 Day to day administration of the programme, is undertaken by Area Development Management (ADM) on behalf of the DJELR.27 For a range of definitions refer: Childcare Pre-School Regulations (1996), OECD (2004).28 Children are looked after at home, usually by the mother or by a female, live in relative. This is the most common arrangement,
particularly for children under two (ESRI, 1998).29 Parents rely on relatives/friends/neighbours to look after children for sessional periods or longer.30 Children are looked after on a sessional, half-day or full-day basis by a self-employed childminder in the home of the carer on freely
negotiated market terms.31 Established in the workplace of parents, and generally subsidised by employers (very low provision of this form of care in Ireland).32 Catering for children from 0 – 14 on a fee paying basis (fees are often offered at below market rates in community facilities). These are
generally full day services although some offer sessional places33 These include playgroups, na¢ionra´i, Montessori schools and community nurseries which are predominantly private operated (with
the exception of the community services), and usually offer morning sessions to children aged three to five on a fee-paying basis.34 A free universal service offered to all children from age four usually to age 12. The junior and senior infant classes operate on a half
day basis for four hours forty minutes per day (usually children aged 4/5/6 attend). From first class (usually children aged 6/7 – 11/12)through to sixth class, school operate from 9.00/9.30 to 3.00/3.30.
Department of Health Department of Justice, Equality Department of Education & & Children (DHC) & Law Reform (DJELR) Science (DES)
Provides social services nurseries from Responsibility for the implementation of the Responsibility for provision (inbirth to four years. It is estimated that EOCP26. A Childcare Directorate has been primary schools) for pre-school7,000 children (or 2% of the 0 – 6 age established within the Department to children aged 3 – 6. In 2003, it wascohort) were covered through this implement the National Childcare Strategy. estimated that services provided byprovision in 2003 the DES covered 104,437 children, or
32% of the 0 – 6 age cohort. The DES is also responsible for all school-aged children in the Irish primary and secondary education system.
(OECD 2004)

component of childcare provision in Ireland35. Furthermore,no figures providing an accurate breakdown of provisionhave been made available since the census was carried out.The current lack of accurate data presents a majorchallenge, namely the need to develop reliable statistics onthe care of young children (OECD, 2004). Any data oncurrent provision/usage of services is therefore based solelyon estimates from available data36.
The National Childcare Census (2003) found that 4.8% of allchildren under one, 12.8% of all one to three year olds,23.6% of all three to six year olds, and 1.2% of all six totwelve year olds attended childcare facilities. The CentralStatistics Office Quarterly National Household Survey(2002) found that 42.5% of all families with pre-schoolchildren regularly rely on non-parental childcarearrangements for minding children during working hours.Over three quarters of households, where both partnerswere at work, had childcare arrangements for their pre-school children; and half required it for their primaryschool-going children. Lone parents with pre-schoolchildren used less non parental childcare than average (30%compared to 42.5% average), but relied on non parentalchildcare to a greater extent than average (28% comparedto 25.3%) for school-going children (CSO, 2002).
In their Thematic Review, the OECD (2004) attempted toquantify the number of children attending services andestimated that between 10% and 15% of 0 – 3 year oldswere in half-day or full day publicly subsidised childcareservices, which falls far short of the 33% targets set by theBarcelona European Council. Total access in governmentfinanced half-day or full-day services for children agedthree to six came to approximately 56%, the Barcelonatarget is 90% for this age group.
A recent Combat Poverty Agency Study (2005) estimated ashortfall of more than 60,000 childcare places for children
aged zero to six37. Such childcare shortages can have graveimplications for the parental choice around care services fortheir children, often leaving parents unable to access theirpreferred childcare options to meet their children’s care andeducation needs. A CSO Study in 2002 found that 31.2% ofparents with pre-school children and 46.1% of parents withchildren in primary school, relied on an unpaid relative toprovide childcare for them, despite this being the preferredmethod of care for just 3.7% and 10.9% of all parentsrespectively. The Study also found that only 27.1% ofparents with a pre-school child availed of childcare in groupsettings, despite this being the preferred method ofchildcare for 48.8% of all parents.
3.3.3 Extended Care for School Age Children Low coverage is also an issue for school age children, withafter-school provision operating on a limited capacity (only1.2% of all 6 – 12 year olds used this form of provision in1999-2000). Such shortages in school age childcare werevery recently highlighted as a continuing concern by theNCCC (DJELR 2005). However, while Ireland may besomewhat unique in EU terms for its low levels of provisionfor 0 to 6 year olds, out of school provision has receivedlimited attention in most countries until recently. Many EUcountries are now making substantial efforts to advanceafter-school services, and there is a clear need for Ireland toimplement initiatives to increase capacity in this regard. Tomeet similar challenges, other countries are increasinglyexperimenting with educare38 and recreational programmesfor children on school premises in the afternoon (OECD,2001). The Partnership 2000 Expert Working Group madesimilar recommendations noting that ‘there is a growingneed for locally based programmes which provide childrenwith social, recreational and development activities outsideof school hours and during holiday time. Such provision couldbe provided on school premises or in community buildings’.
35
35 In 2002, Childminding was the largest type of paid provision for children from birth to 6 years (CSO, 2002).36 The DJELR and ADM are in the process of updating figures on childcare capacity, but figures were not available at the time of writing.37 CPA calculated amounts based on the 2002 Census of Population which showed that there were 332,175 children aged under six,
which translated into approximately 204,773 childcare places needed to meet EU Barcelona Target, despite the existence of only143,500 places (childcare performed by relatives whether paid or unpaid is excluded in this calculation) (CPA, 2005: 35).
38 The concept of Educare has been used internationally to describe more extensively the ECEC model a Nordic welfare state, where care,education and instruction have been combined to form an integrated whole and where play is a central tool of pedagogical activities(OECD, 2000: 7).

3.4 Financial Provision for Childcare andParenting
This section examines maternity leave, parental leave andChild Benefit provision. While Child Benefit is a universalpayment for all children; maternity benefit and parentalleave entitlements are linked to fulfilling criteria throughemployment.
3.4.1 Maternity and Parental Leave In 2001, the period of maternity leave attracting a socialwelfare payment was extended from 14 to 18 weeks, andthe period of unpaid leave was increased from 4 to 8 weeks.While expectant women may now avail of up to 26 weeksmaternity leave, this is very much dependent on thefinancial resources of the individual, which is heavilyinfluenced by the practice of employers in relation to pay.
The Parental Leave Act, 1998 entitles parents to 14 weeks(per child) unpaid parental leave from work to care forchildren under 5 years. Its unpaid nature has meant thattake up of parental leave has been limited, and it canreasonably be expected that it has been particularly lowamongst lower paid workers (OECD, 2004).
The Parental Leave Bill, 2002 is currently before theOireachtas, and represents a review of the Parental LeaveAct 1998. It seeks to raise the age of the eligible child toeight years, and extend entitlement to those acting in locoparentis as well as allowing leave to be taken in separateblocks. It does not, however, make provision for paymentduring parental leave, nor does it extend the period of leave(NESF 2005).
The current maternity and parental leave provisionsoperational in Ireland provide minimal financial assistanceto parents with young children. The fact that only 18 of the26 weeks of maternity leave are paid, and that the entiretyof parental leave is unpaid, make take-up of the additionalprovisions implemented in 1998 and 2001 an unviableoption for many households. The OECD, recommend ‘paid,
flexible and job-protected maternity and parental leaveschemes of at least one year as an essential component ofany comprehensive strategy to support working parents withvery young children’ ( OECD 2004: 75).
3.4.2 Child BenefitThe universal child benefit allowance is one of the primaryfinancial supports available to all households with childrenin Ireland39 40. From 1 April, 2005, the monthly rate for thefirst and second child stood at ¤ 141.60 per child, and¤ 171.30 per child for the third and subsequent children.The Government had set a minimum Child Benefit target of¤ 149.90 and ¤ 185.40 by 2003, targets which remainunrealised (CPA 2005). In announcing the three yearprogramme in 2001, referring to Child Benefit, the Ministerfor Social & Family Affairs stated that: ‘This unprecedentedincrease will help all parents with the costs of caring for theirchildren and will represent a major move towards achievingthe goal of ending chid poverty in this country’.
While increases in Child Benefit appear to have formed thecore of Government’s strategy in tackling child poverty, (andmay have succeeded somewhat, albeit very marginally inreducing the rate of relative child poverty from 24.5% in1994 to 23.9% in 2003), it represents a decrease of only2.5% over the ten year ‘Celtic Tiger’ period (CPA, 2005).
3.4.3 Child Poverty The objective of this report is not to review theeffectiveness of current strategies in tackling child poverty;however, it is clear that , in addition to income support, theprovision of accessible, affordable, good quality services forchildren is essential if it is a goal of social policy thatchildren are not raised in poverty (CPA, 2005:68). Countrieswith minimal interventionist strategies in family andchildcare policies have proven to contribute to higher levelsof child poverty, than countries where governments’intervention is high, and access to childcare services isguaranteed (Chapter Two). At the current rate, a motherwith two children will receive ¤ 283.20 per month. Evenbased on the 2002 NCNA childcare costs estimate for
36
39 Although, as and from 2004, a habitual residency test has been introduced, so the measure is arguably no longer ‘universal’.40 In addition to the universal childcare benefit, a number of targeted measures exist to support parents in meeting child rearing costs,
the principal of these being Child Dependent Allowances (CDAs), Family Income Supplement (FIS) and the One Parent Family Payment.(For more detail on these schemes see CPA, 2005).
Dublin, the monthly childcare costs for two childrenamounts to ¤ 1,473, meaning that the increased ChildBenefit, assumed by the Government to be a major strategyin tackling child poverty and assisting parents in meetingthe ‘costs of caring,’ does not even cover a fifth (19.2%) ofthe monthly childcare bill.
The OECD has criticised the strong reliance by Governmenton this form of benefit to support childcare needs offamilies, arguing that such payments act as a deterrent forlone parents in light of the high childcare costs they will beforced to meet through additional income. Child Benefitcannot be expected to contribute to the development ofaccessible, affordable, quality early childhood educationnor assist parents in meeting these additional ‘costs ofcaring for their children’41. Childcare services require directinvestment in their own right, if the guarantee of quality,affordable childcare is to be realised.
3.4.4 Meeting Childcare CostsWith the exception of a limited number of childcareplaces42, parents in Ireland pay for childcare from their ownprivate means. Funding initiatives to date have focused onincreasing capacity, through targeting financial resourcestowards capital costs to the neglect of the issue ofaffordability for parents and users of services. Affordabilityremains an issue yet to be addressed, despite the pivotalrole it plays in policy formulation in Europe and further afield. Providers set their own private rates, which can besubject to considerable variety based on type of service,location, age of child, and number of hours for whichchildren attend services. For the purpose of this research,data has been compiled from four recent studies; IrishCongress of Trade Unions (2002), the Quarterly NationalHousehold Survey (2002), the Fingal County ChildcareCensus (2005) and the National Children’s NurseriesAssociation (2002).
A weighted average for urban and rural areas wassubsequently calculated to provide as accurate data aspossible on current costs, given the limited researchavailable. Based on these costs, analysis was conducted onthe proportion of income consumed by childcare costs inIreland for a range of different income groups and familycircumstances (Table 3.1). According to this data, childcarecosts account for approximately 20% of earnings for loneparents with one child; and between 33% and 43% ofearnings for lone parents (on the average industrial wage)with two children (depending on whether the parent is infull or part-time employment). The situation is worse forparents on the minimum wage. Of particular note is thehigh cost borne by lone parents on the minimum wagewith two children where between 61% and 78% of incomeis consumed by childcare costs. Such data demonstratesthe infeasability of financing childcare cost, particularlythose on the low salaries, to finance childcare costs fromprivate means, creating substantial disparities in equality ofaccess to childcare services (based on householdcomposition and income), and in turn, the labour market,education and training opportunities.
37
41 Recommendations by the CPA of a two tier Child Benefit Structure, where on the one hand Child Benefit continues to be paid on auniversal basis for all children with an additional Child Benefit Supplement for families whose income falls below a certain thresholdregardless of whether their income comes from employment or social welfare are supported by the NWCI. (See CPA 2005).
42 In 2003, it was estimated that the Health Board subsidized 7,000 places for children. In addition, many community facilities offerreduced childcare rates to users of services, due to the often limited financial means of households in their catchment areas.

3.4.5 Implications of Childcare CostsIndeed, high childcare costs and their impact on equity ofaccess have been repeatedly acknowledged as an issue ofconcern in successive studies (Goodbody (1998), CSO(2002), OECD (2002,2003,2004)). In its 2004 Review, theOECD warned that such costs are unsustainable, even in themedium term.
A comparative report of childcare costs in Ireland, Austriaand Japan conducted by the OECD estimates the averageparental expenditure for childcare in Ireland to be at leasttwice that of Austria and Japan. ‘The average fee paid inAustria amounts to 5% of Average Production Employee, 8%of APE in Japan and 20% of APE in Ireland43. Furthermore,these costs rise to 50% of APE for two children in daycare,further reducing financial incentives to work and equity ofaccess to childcare and early education service’s (OECD,2003:146). The Goodbody Report (1998) found parentswith two or more children needing childcare wouldincreasingly be forced, by cost considerations, to find itwithin the informal childminding sector, which is oftenunregulated, leading to quality concerns. Parents may beforced to use childcare of lower quality, (which in turnimpacts on children’s development), simply because theycannot afford to pay the higher costs, usually charged byday care centres.
The OECD Employment Outlook (2002) shows that Ireland
has a particularly high female drop-out rate after the birthof a first and second child, many of whom are welleducated and a loss to the economy. CSO (2002) figurescorroborate that remaining in work is often not an optionfor Irish women when a second child is born. Typically, asecond earner in a couple family, with two young childrenin chidlcare, with earnings at two thirds of average salary,has no net return from work after childcare costs (OECD,2003). A recent Irish Times article, reported that estimatesdue to be given to the Taoiseach and his Ministers showthat a parent retuning to work would have to earn ¤ 16,000
just to cover the average weekly cost of childcare in Dublinof ¤ 130 (Irish Times, 15 June, 2005).
Affordability remains a critical issue, both in terms of labourmarket policy, and the best interest of young children. Thelack of current support, hinders women’s equality andparticipation in education, training and employment. It hasparticularly strong implications for vulnerable households(i.e. lone parent and low-income households) in terms ofease of access to the labour market and their ability toaccess developmental and learning opportunities for theirchildren. Such high costs have negative implications forequality among children, as very often children from themost vulnerable households, who have been proven tobenefit most from early intervention, are excluded. QualityECCE has a powerful and lasting impact on childdevelopment for all children, but particularly for those
38
43 The Average Production Employee refers to the average gross wages earnings of adult, full time workers in the manufacturing sectorof each country. In 2002, this was ¤ 25,330 in Ireland (OECD, 2003).
Table 3.1: Effect of Childcare Costs on Wages in Ireland
Average Industrial Wage Minimum Wage
Families with one child aged 2Lone parent family, PT employed 20.75% 38.07% Lone parent family, FT employed 18.60% 34.13% Two parent family, 1 FT employed, 1 PT employed 5.93% 10.88% Two parent family, both FT employed 9.30% 17.06%
Families with two children aged 2 and 4Lone parent family, PT employed 42.49% 77.96% Lone parent family, FT employed 33.41% 61.30% Two parent family, 1 FT employed, 1 PT employed 12.14% 22.27% Two parent family, both FT employed 16.71% 30.65%

children at risk of educational disadvantage. Inequity tosuch services in Ireland, exacerbated through high costs,jeopardises equality amongst children from a very earlyage, and makes it more likely that inequalities will persistthroughout later life. Investing in educational interventionsat primary school is too late to maximize impact on thedevelopment of children and their later school success(Hayes, 2004). The benefits of ECCE for vulnerable childrenare discussed in detail in Chapter Four.
3.5 Addressing Accessibility andAffordability
Public investment in early education and childcare servicesin Ireland remains low, both by international comparativestandards and by national comparisons on other areas ofsocial policy expenditure. We estimate that Ireland spends0.4% of GDP on early education and childcare services44
compared to the 2.0% spent by Sweden, 2.4% in Denmarkand 1.43% in Finland (OECD, 2001). In its Thematic Reviewof ECEC Policy in Ireland, the OECD made a number ofdamning conclusions relating to:
● Gender EquityIt would appear that the policy implications of equalityof opportunity for women are still not clearlyrecognised either in the labour market or familyspheres. High drop-out rates from the labour market,the increasing number of women in part-time work, thelow participation of older female cohorts are all signs,that traditional patterns of gender inequality still exist.Supports for women with children are few: parentalleave is meager, affordable early childhood services arescarce and fiscal support for young children in childcaredoes not yet exist. (OECD, 2003: 64, added emphasis)
● Parental LeavePaid, flexible and job-protected maternity and parentalleave schemes of at least one year are seen as anessential component of any comprehensive strategy tosupport working parents with young children, and a
necessary element in labour market and family policy.(OECD, 2003: 70-71, added emphasis)
● ProvisionWith the exception of the infant school for childrenfrom four to six years, a critical volume of centre-basedservices has yet to be developed in Ireland. Thesituation can be even less promising for children borninto situations of disadvantage, in which women withlow educational levels tend to remain unemployed andlive in poverty. (OECD, 2004; 65).
The Report (OECD, 2004: 81) made a number of keyrecommendations around accessibility and affordabilityincluding:
● Lengthening the period of parental leave to one year,with a guarantee both of salary replacement and jobprotection
● The expansion of access to all 3 – 6 year old children onthe basis of a free morning education session, followedby a subsidised, fee-paying, pre-school program in theafternoon at the local school or adjoining premises,conducted by the community/voluntary sector.
● Providing a normative grant to accredited providers or aweighted subsidy to every child who uses an accreditedchildcare, educare or out of school places.
● Supply side financing (e.g. increased building grants andoperational subsidies for communities providing servicesin disadvantaged areas).
● Removing barriers to affordability for low- and modest-income families through capping parental fees andproviding operational subsidies to accredited center-based or networked providers of each eligible childpresent in their service.
The Report warns that ignoring these challenges will leadto a further widening of the gap in comparison to other
39
44 Includes funding provided through the National Development Plan (¤ 449m including 170m in EU transfers), funding through theHealth Boards (7.8m) and funding provided for the Early Start Programme provided in Primary Schools nationally (1.98m). The NESFReport estimates this figure at 0.2% GDP highlighting ambiguity around what the actual government spend in the area is.
European countries…… if reaching the European targets is areal goal for Ireland, the present funding commitment mustincrease (OECD, 2004: 89)
3.6 ConclusionWhile early education and childcare services have moved upthe agenda in the past decade or so, and a number ofinitiatives have been introduced at both local and nationallevel, a substantial amount has yet to be accomplished ifIreland’s early education and childcare policies are to meetthe standards of its EU counterparts. It is clear thatfinancial measures introduced to date have targeted supplyside financing. The majority of funding available under theEOCP has been targeted at increasing capacity through theprovision of financial incentives to providers. However, apolicy that addresses affordability for users of services, hasyet to be implemented. With the exception of a very smallnumber of children45, the vast majority of children receiveno such financial supports making Ireland’s childcaresituation somewhat unique in European and (increasingly)international terms. This lack of subsidisation threatensgender equality, the reduction of women’s and childpoverty and hinders parents in meeting work-life balancechoices. In addition, a lack of subsidisation will compromisethe quality of early childhood care and educational servicesthat parents can access thus compounding existingdisadvantage. However, perhaps the most detrimentalimpact of these high childcare costs is on our very youngchildren, who are often denied the developmental andlearning supports, offered through quality ECCE, which theirEU counterparts take for granted.
In light of increased international investment in theprovision and subsidisation of childcare, particularly in thelast decade, coupled with Ireland’s exceptionally strongeconomic growth it is urgent that Ireland address andrespond to its laggard position in relation to issues ofaffordability and accessibility in ECCE.
40
45 Children who have access to reduced rates in community crèches, or Health Board assistance in meeting costs.

41
4Why subsidise? Benefits of ECCE & Extended CareServices

4.0 IntroductionGovernments in developed countries have played anincreasingly interventionist role in both the supply anddemand side measures of childcare provision and policy inrecent years. There has been an unanimous move towardsimproved maternity and parental leave provisions, universalaccess for children of pre-school age and subsidisation ofcosts for other forms of childcare (i.e. care outside of pre-school and school hours). Childcare has rapidly moved upthe political agenda, in countries, such as the UK, whichheretofore, had played only a minimal interventionist role.There has been considerable investment in childcare inIreland since 2000, through the EOCP. However, investmentsto date have largely targeted supply side measures throughfinancial provisions to reduce the capital costs ofestablishing and or expanding childcare facilities. Despitethe high childcare costs, subsidised financing remainsunavailable, meaning that parents, particularly mothers,either struggle to meet costs from their own financialmeans, or withdraw from the labour market for indefiniteperiods of time to care for their children privately. Thismakes Ireland somewhat unique in EU terms, given thevariety of measures in place to subsidise parental costselsewhere. So, when so many other countries aresubsidising childcare costs, what are the costs to Ireland ofnot implementing subsidisation policies?
This chapter reviews international research dedicated toassessing the benefits of the subsidisation of childcare fromthis perspective. It addresses the importance of childcarepolicies in supporting women’s empowerment and equality.It highlights the potential and existing failures from thecurrent lack of financial supports in Ireland, and alsoassesses the positive outcomes from subsidisation forchildren, parents, government and wider society.
4.1 Links Between Quality and BenefitsPrior to discussion around the benefits of earlyeducation and childcare services, it is essential toconsider the vital role of ‘quality’ within such services.While a review of quality requirements in childcareservices is beyond the remit of this report, it is
nonetheless essential to emphasise from the outset,that the only way in which the full benefits ofsubsidisation can be achieved is through ensuringthat all subsidised services provide ECCE andextended care services of the highest quality.
There is substantial evidence that quality of childcarematters for child outcomes. Although definitions of qualityare not agreed on internationally or even within a givencountry or community, there is general consensus amongresearchers that certain inputs contribute to positive shortand long term outcomes for children. At the systemic level,these inputs include: adequate levels of investment; co-ordinated policy and regulatory frameworks; efficient andco-ordinated management structures in place; adequatelevels of staff training, salaries and working conditions;pedagogical frameworks and other guidelines; and regularsystem monitoring based on reliable data collection (OECD,2001). Indeed, the 2003 Effective Provision of Pre-schoolEducation (EPPE) Project: Findings from the Pre-School Periodreport on effective pre-school provision in the UK foundthat good quality can be found across all types of earlyyears settings but that quality was higher overall insettings, integrating care and education. The Study foundthat, high quality pre-schooling is related to betterintellectual and social development for children, and thosesettings in which staff have higher qualifications havehigher quality scores, and children make more progress(Sylva, K. et, al 2003).
There is substantial evidence of an inextricable linkbetween financial resources and childcare quality withinchildcare service (OECD (2001), Leseman (2002), CECDE(2004)). One of the inherent dangers of leaving childcare tothe private market centres around the impact such a laissezfaire policy can have on the quality of service, whichjeopardizes the actual benefits accruable to users of theservice. When services rely primarily on revenue fromfamilies with limited budgets, they must keep the costsdown, creating a tension between the financial viability ofservices, affordability for parents and high quality serviceprovision for children. Repercussions can be far reaching -without adequate resources, staff often subsidise underfunded systems with foregone wages and benefits, leading
42chapter 4

to difficulties in recruiting and retaining a well qualifiedworkforce, one of the fundamental requirements for highquality service provision. It also constrains the choices oflow income parents who cannot afford the full cost of ECCE,and may force them to settle for lower quality care for theirchildren (CQCQ Study Team, 1995).
International findings demonstrate that the most effectivestrategy in combating such risks requires direct investmentinto services. This strategy has been adopted by countries,such as Denmark and Sweden, which are now regarded bymany as providing amongst the best pedagogue models inthe world (Quebec and the UK have also adopted thisapproach – Chapter Two). Indeed, the Irish Governmentapplies direct investment strategies into primary andsecondary education, facilitating all schools in meetingcertain quality standards, through a guarantee of financialresources - a strategy which has not been mirrored in ECCEand extended care services. Direct investment into servicescan also contribute to sustainability in the sector.
It is therefore essential that all childcare services aredeveloped, and operated, to the highest standards ofquality. There are a number of ongoing initiatives in Irelandaiming to advance, and enhance quality measures in thechildcare arena, in light of its universally accepted intricateimpact on positive child outcomes. The CECDE hasconducted a considerable amount of work in this regardincluding its two reports; ‘Insights on Quality; An Audit ofPolicy, Practice and Research (1999 – 2004,) and MakingConnections; A Review of International Policies, Practices andResearch’ and is currently finalising the design of theNational Quality Framework for all early education andchildcare services for children aged 0-6 years in Ireland.
4.2 The Benefits of Investment in ECCEand Extended Care
The UNICEF document ‘Why Invest in Young Children’(2005), succinctly encapsulates the various arguments for,and benefits of, subsidisation:
1. A human rights argument: children have a right to live
and to develop to their full potential.2. A moral and social argument: through children
humanity transmits its values. That transmissionbegins with infants. To preserve desirable moral andsocial values in the future, one must begin withchildren.
3. An economic argument; society can benefiteconomically from investing in child development,through increased productivity and cost savings.
4. A programme efficacy argument; the efficacy of otherprogrammes (health, nutrition, education etc) can beimproved through their combination with programmesof child development.
5. A social equity argument: by providing a ‘fair start’ (or atleast the best possible start) it is possible to modifydistressing socio-economic and gender relatedinequities.
6. A political argument: children provide a rallying pointfor social and political actions and build consensus andsolidarity.
7. A scientific argument: research evidence demonstratesthat the early years are critical in the development ofintelligence, personality and social behaviour and thatthere are long term effects associated with a variety ofearly education programmes.
8. Changing social and demographic circumstances; theincreasing survival of vulnerable children, changingfamily structures, country to city migration, women inthe labour force and other changes require attention toearly care and development.
It is within this context that the many benefits ofinvestment in ECCE, and extended care, are analysed; andthe arguments not only justifying, but also demonstrating,the essential need for investment, are presented.
4.2.1 Benefits to Children
‘It is easy to make a strong case that it is better to directresources at younger children to give an equal start in lifethan to fund older children once patters of behaviour havebeen established’. (Duncan, Giles, 1996: 51)
43
One of the most pertinent points of argument around theneed for, and benefits of, subsidisation, is that supportivefamily policies that is those that assist parents in makingwork/life choices, and ECCE services, are good for children.The best evidence that is available strongly suggests, thatgood childcare is beneficial for children’s development, bothfor the cognitive, language, and academic skills of children,and for the social behaviour of children in the family, andclassroom (Cleveland, Krashinsky, 1998). There is anabundance of research which shows, that supportingchildren’s development in their early years, can help preventthe emergence of the social and educational inequalitieswhich will become evident as children progress throughschool and into work (Currie, Thomas (1995), Cleveland,Krashinsky (1998)). There is also a potential link, backed up bymany empirical studies, between cognitive and non-cognitiveskill development in the early years, and subsequent earningspotential in adulthood (Daycare Trust, 2005).
Policy makers have recognised that equitable access toquality ECCE can strengthen the foundations of lifelonglearning for all children, and support the broad educationaland social needs of families (OECD, 2001). Assessments ofquality Early Childhood Development (ECD) programmeshave found that they contribute importantly to the pre-school development of cognitive and language skills; toprovide disadvantaged children with a head start inprimary school when formal instruction starts; reducegrade retention; reduce the need for special education andother remedial coursework; lower dropout rates; increasehigh school graduation rates, and higher levels of schooling(Lynch, 2004, Leseman, 2002).
Universal access to ECCE is sought, as a means ofpromoting equality of educational opportunity, andensuring that all children, especially those in need ofspecial support or ‘at risk’ of school failure, experience thenecessary conditions, so that they are ready to learn whenthey start primary school. Indeed, it is universally accepted
that participation in ECCE programmes provides anopportunity to identify children with special needs, or ‘atrisk’ and intervene as early as possible, in order to prevent,or minimise, difficulties and disadvantage.
There is an array of longitudinal studies and evaluations onthe benefits of ECCE programs, many conducted in the US,partly because of their long history of targeting statutoryfunding on early education programmes for ‘at risk groups’.Fewer comprehensive studies on the benefits of ECEC havebeen completed in Europe, partly because of the universalelement of many, which eradicates a control group toassess impact. The EPPE study in the UK, the first EuropeanStudy of child development, between the ages of three andseven, and does provide valuable data. Reputable studies onthe benefits of ECCE include;
A recent RAND Assessment of nine early interventionprogrammes found, that all were successful at, raisingchildren’s cognitive test scores or school achievement, asmeasured by higher IQ scores; raising school achievementtest scores; reducing time in special education; raising grades;reducing grade repetition, and raising rates of graduationfrom high school46. In general, it was found that programsthat intervened earlier, and more intensively, had strongeroutcomes than those that intervened later, and lessintensively and programmes that included a follow throughelement were found to be more successful at sustaininggains than those which did not (Waldfogel, 2002).
The Headstart Programme (US), born in the 1960’s and nowprovides early childhood services (parent support andhealth monitoring) for over 800,000 children per year47. Intheir assessment on the impact of the programme onparticipants48, Currie and Thomas (1995) reported that,‘Head Start closes over one third of the gap between childrenattending the program and their more advantaged peers’.The study found a 6% increase in language ability and a47% decline in grade retention for programme participants
44
46 The one exception to this finding was the Elmira PEIP, which was a parental support program that used a home visiting modeldesigned to reduce abuse and neglect.
47 Head Start and Early Head Start are comprehensive child development programs which serve children from birth to age 5, pregnantwomen, and their families. They are child-focused programs and have the overall goal of increasing the school readiness of youngchildren in low-income families.
by age 10, results which they estimate would lead to an onaverage increase of 4% in expected future earnings. Theseresults continue for at least 20 years, as children grow upaffecting high school completion, and enrolment in collegeand university (Cleveland & Krashinsky, 1998). Head Startcontinues to enjoy broad public and bipartisan success inthe US with the program now expanding; Early Head Startnow delivers services to children in the first three years oflife, and Head Start Follow Through is now following HeadStart children into the school years, to see whether HeadStart gains can be better maintained if follow-throughservices are provided (Waldfogel, 2003).
The Perry Preschool Project49 also demonstrates the gains ofECCE and found that by age ten, 17% of programmeparticipants had been held back a grade or placed in specialeducation, compared to 38% of children who not attendedthe pre-school programme. By age 27, 71% of participantshad graduated from high school compared to 54% of non-participants. Fewer participants had ever been arrested,57% versus 69% of control group, and the average numberof arrests was about half that of the control group, 2.3versus 4.6. Participants were more likely to havesignificantly better lifetime earnings opportunities – a 71%employment rate (with average monthly earnings 59%higher), compared to 59% for non-preschoolers. 59% ofpreschoolers had received welfare, (or other social services),in the past ten years, compared to 80% of non pre-schoolersand 57% of female participants were single motherscompared to 83% of non preschoolers (Lynch, 2004).
The Osborn and Milbank Study (1987), the first majorevaluation of British preschool education, assessed a widerange of service types, and found similar types of effects fornearly all. The study assessed children using cognitive andeducational tests at five and ten years, and found thatchildren who had no preschool placement, achieved thelowest mean test scores in four out of the seven tests, andhad the second lowest score in the other three. Children in
different types of preschool arrangement, from full-day, full-week day nurseries, to part-day, part-week playgroups withparental participation, scored about one-third of a standarddeviation higher, on school performance tests at age ten,than their counterparts with no preschool experience, evenafter controlling for a wide variety of potential alternativeexplanations. Since school performance at age ten ispositively correlated with the decision to take post-secondary education and with future family income, this isstrong evidence of the long-term effects of early care andeducation (Cleveland & Krashinsky, 1998).
The EPPE Project, an ongoing UK longitudinal evaluation oneffective provision of pre-school education, has found thatpre-school education enhances children’s all rounddevelopment, compared to children who had no pre-schooleducation. From the analysis of children’s developmentduring pre-school compared with ‘home’ children, EPPEfound that pre-school attendance improves all children’scognitive development, and aspects of social behaviour, suchas independence, concentration, co-operation, and peersociability. Children with no, or limited pre-schoolexperience had poorer cognitive attainment, sociability, andconcentration when they started school. The Study has alsofound, that disadvantaged children can benefit significantlyfrom good quality pre-school experiences, especially if theyattend centres that cater for a mixture of children fromdifferent backgrounds. EPPE found that one in three childrenwere ‘at risk’ of developing learning difficulties at the startof pre-school, but the proportion had fallen to one in five bythe time they started primary school (Sylva et al., 2003).
Ireland embarked on its ambitious national earlyintervention programme, called Early Start, in 1994. The1969 Rutland Street Project, which served disadvantagedchildren, was found to produce short term gains inchildren’s test scores and long term gains in the rates atwhich children stay in school and take exams for highereducation (Waldfogel 2002).
45
48 Curry and Thomas (1995) conducted their assessment on the impact of the programme using data on siblings, one of whom hadparticipated in the programme, the other of whom (the control group) had not. They compared the later effects of the programme,holding constant many family type factors.
49 The High/Scope Perry Preschool Project, began in 1962 and is the focus of an ongoing longitudinal study 0f 123 high risk AfricanAmerican children. Participants were of low socioeconomic status, had low IQ scores with no organic deficiencies (i.e. biologicallybased mental impairment), and were at high risk of failing school.
4.2.2 Benefits to Women’s EmpowermentThe lack of affordable childcare in Ireland has a directnegative impact on women’s participation in all aspects ofsocial, cultural and political life. Whilst quality childcareprovision is only one of a number of factors which impacton women’s empowerment, it is nonetheless a critical oneand the provision of accessible, affordable childcare issubsequently strongly supported by the NWCI, in additionto a wider range of supports to enhance women’sempowerment.
In endorsing the Beijing Platform for Action, at the FourthWorld Conference on Women in 1995, the Irish Governmentexpressed their determination to ‘ take all necessarymeasures to eliminate all forms of discrimination againstwomen and the girl child and remove all obstacles to genderequality and the advancement and empowerment ofwomen’ (BPfA,1995: Pg 9). The UN Convention on theElimination of All Forms of Discrimination Against Women(CEDAW) also commits State parties to, ‘take in all fields, inparticular in the political, social, economic and cultural fields,all appropriate measures, including legislation, to ensure thefull development and advancement of women , for thepurpose of guaranteeing them the exercise and enjoyment ofhuman rights and fundamental freedoms on a basis ofequality with men’ (CEDAW,1979:7). Given the primarycaring responsibilities which women still hold, in a largelyunsupportive social and political environment, it is clearthat the goal of true gender equality, that is, ’where womenand men have equal conditions for realising their full humanpotential, enjoying civil rights and for contributing to andbenefiting from social, cultural and political development’(DJELR, 2004:6), cannot be met, until a real commitment toensuring that every child has access to quality andaffordable ECCE is given, and realised.
Key elements of promoting gender equality include a focuson building women’s participation, addressing povertyamongst women and children and meeting the needs oflone parents.
Building Women’s Participation‘If women remain on the margins of the state we only have
marginal opportunities for making marginal change’ RosaMaria Torres, Director of Literacy Campaign, Ecuador.
‘Lack of suitable and affordable childcare and socialcare provision is an obvious yet still significantproblem for women who wish to be involved, this isparticularly the case for women living in areas whereprovision is poor and for women parentingindependently…women’s participation remainshampered by a lack of choice and options whenseeking care for their children.
(CWC, 2003: 19)
As a signatory of the CEDAW, the Irish Government agreedto “…take all appropriate measures to eliminatediscrimination against women in the political and public lifeof the country” (CEDAW, 1979: Pg 8). Family friendly policiesare a pre-requisite for the facilitation of active participationby women in all aspects of society. While it is acknowledgedthat a number of barriers to female participation exist, it isaccepted that the lack of affordable quality childcare oftenconstrains women’s participation in the decision-makingprocesses of public life. The unwillingness of successivegovernments to address the urgent childcare crisis hasaided the marginalisation of women from the publicsphere. Equal participation and representation of womenand men in decision-making, is one of the five objectives ofan EU Council Decision, adopted in 2000, for a CommunityFramework Strategy on Gender Equality. The democraticdeficit, which persists in Irish society, is vividly reflected infemale participation rates across all sectors of public life:
● In 2004, Ireland had the sixth lowest proportion ofwomen in parliament of the twenty-five EU memberstates. In 2004 women represented only 13.3% of TDs inDáil Eireann. This reflects a growth rate of 1% over thepast ten years. At this rate it will take 370 years for thepercentage of women in the Dáil to reach 50%.
● In 2004 approximately only 17% of local authoritymembers and 14% of regional authority members werewomen.
46

● Women accounted for 64.5% of staff in the general CivilService in 2004. Of which just 11.8% were at SecretaryGeneral level. (CSO, 2004; 26-27)
The restrictive and often prohibitive cost of qualitychildcare coupled with structural and attitudinal barriers tothe participation of women in power and decision-makinghas resulted in the under-representation of women and aculture of exclusion.
“Women’s equal participation in decision-making isnot only a demand for simple justice or democracybut can also be seen as a necessary condition forwomen’s interests to be taken into account”
(BPfA,1995:109)
4.2.3 Addressing Poverty Amongst Women andChildren
The promotion of gender equality involves thedevelopment of strategies to tackle women’s poverty andthe persistence of child poverty. The recognition of thecontinued feminisation of poverty by the United Nations isreflected in the Beijing Platform for Action, which statesthat “In the past decade the number of women living inpoverty has increased disproportionately to the number ofmen….Women’s poverty is directly related to the absence ofeconomic opportunities and autonomy, lack of access toeconomic resources…lack of access to education and supportservices and their minimal participation in the decision-making process” (BPfA, 1995: 38-39)
Statistical analysis of current poverty trends reveals thehigh proportion of women living in poverty and at risk inIreland;
● More than half of those earning below minimum wageare women
● 23% of women are at risk of falling below the povertyline (CSO, 2005)
● Between 1994 and 2000 the risk of poverty forhouseholds headed by a person over 65 rose
significantly, from 6% in 1994 to 43% in 2000 and36.4% in 2005. This group is largely women (Ibid)
● Lone parents are consistently at high risk of poverty; in1994 32%, in 2000 46.7%, and in 2005 42.3% were atrisk of relative poverty (Ibid)
● The gender pay gap persists with women currentlyearning 17.5% less than men (CSO 2004).
Not only does a gender differential exist with regard torates of poverty, it also exists in the causes of poverty. ‘Ifgender relations structure the experience of women andmen in different ways, then consequently, the risk andduration of poverty for women may differ, the incidence ofpoverty may vary between the sexes, the trigger eventswhich spark of a spell of poverty may be substantiallydifferent’ (Conroy, 1997:36). Women’s life chances areconditioned by their relations and status within the family.Women’s dependent economic status, whether in thehome, the welfare system or the work force contributes to adiffering experience of poverty between the sexes. TheNWCI in its submission to Government on the Review ofthe National Anti-Poverty Strategy, highlighted the directrelationship between the responsibility for caring andwomen’s poverty. It argued that the lack of childcaresupports for parents reinforces women’s poverty in Irishsociety, as it perpetuates women’s economic dependenceand prevents women’s from taking the necessary steps tomove out of poverty (NWCI 2001). The Combat PovertyAgency also highlighted the urgent need to address theissue of childcare to combat women’s poverty in itssubmission to the Government on the National Plan forWomen.(CPA, 2002).
Child PovertyOn average, government interventions reduce by 40 per centthe rates of child poverty that would theoretically resultfrom market forces being left to themselves. …There isnothing inevitable or immutable about child poverty levels;they reflect different national policies interacting with socialchanges and market forces.(UNICEF, 2005: 2-3)
47

In the Nordic countries, where gender neutral policiesoperate, and in France where pro-natalist policies operate,the number of children living in poverty is much lower.Table 4.2.3 illustrates the impact of such strategies on ratesof child poverty.
A principal objective of the UK’s increasingly interventionistrole in family and childcare policy is that of the eliminationof child poverty by 2020. Child poverty in the UK fell by3.1% during the 1990s, the highest reduction of any OECDcountry. Child poverty in Ireland, simultaneously increasedby 2.4%, despite having the highest record levels ofeconomic growth of any OECD country in the same timeperiod.
Concern about child poverty and its impact on childdevelopment suggest a need for a multi-faceted approachto: reduce poverty among lone-parent families; reduce theproportion of children in workless households; reducesevere wage inequalities at the bottom end of the incomescale; and prevent too wide a gap from opening upbetween state benefit payments and average wages. It isessential that in addition to income support, the provisionof affordable, accessible, good quality services for children(including ECCE and extended care services) is essential toreach the social policy goal of lifting all children frompoverty (CPA, 2005).
4.2.4 Women’s Participation in the LabourMarket
One of the primary driving factors for increased statutoryinvestment in childcare in recent times has been itsincreasingly important role in facilitating and maintaininghigh levels of female employment. Women’s employmenthas increased from 40.1% in 1994 to 55.8% in 200450 (CSO,2004). However, while the participation of women in thepaid labour force has risen dramatically, and broughtgreater economic independence to many women, economicsegregation between women and men remains a structuralinequality throughout the wage economy. Despite equalopportunities policies in education and employment, anddespite some positive changes, such as the entry of bothwomen and men into some non-traditional areas, patternsof segregation along gender lines persist. Women areconcentrated in caring, service and clerical work and in thepublic sector, and men in industry, the (declining)manufacturing sector, and the private sector. Men continuehold the majority of most senior positions acrossemployment sectors (including areas like teaching,traditionally dominated by women). Women are stillmassively over-represented in low-paid, low-status jobs andunder-represented in higher posts. The gender pay gappersists at 17.5%.
Table 4.2 presents the employment rates of females withchildren in OECD countries in 2000. Irish femaleemployment fell from a high of 65.8% for women with nochildren, to 51.0% for women with one child to only 40.8%
48
50 This compares to 75.2% for Irish men in 2004.
Table 4.2.3: Level of Statutory Intervention and Child Poverty Rates
Countries with high intervention strategies Child Poverty Rates
Denmark 2.4% Sweden 4.2% Nordic Countries 3.2% (Average)
Countries with low intervention strategies
UK 15.4% Ireland 15.7% USA 21.9%
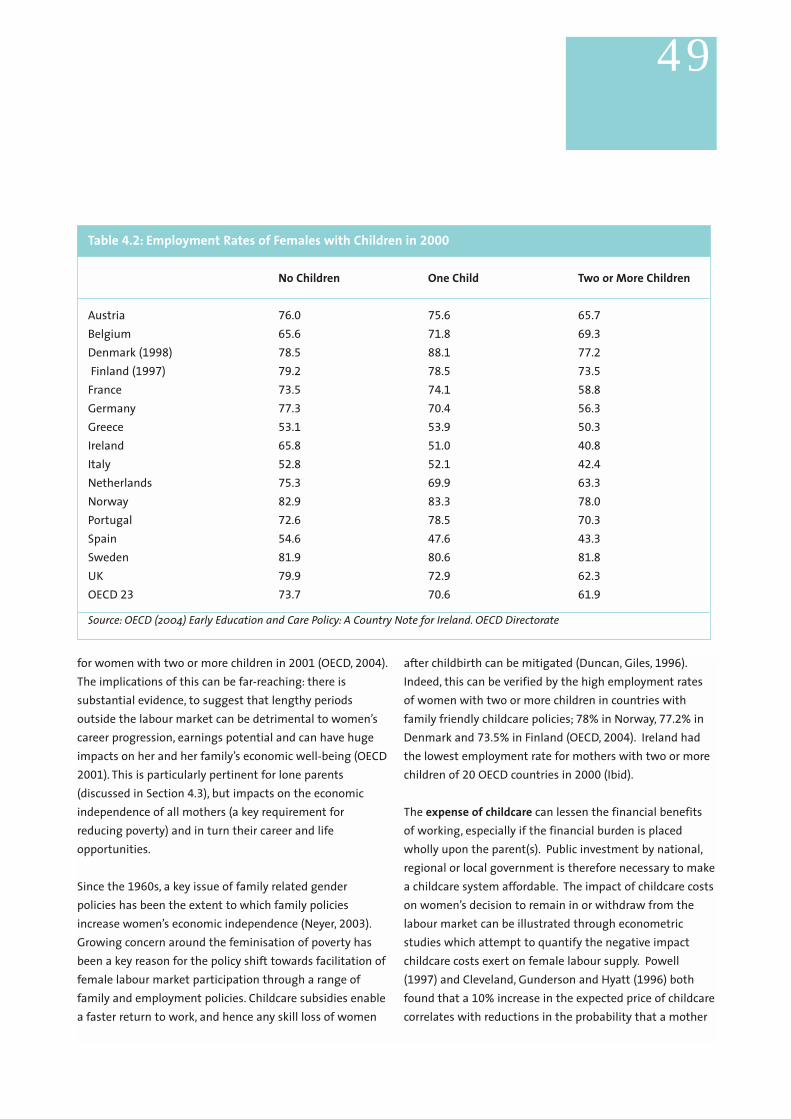
for women with two or more children in 2001 (OECD, 2004).The implications of this can be far-reaching: there issubstantial evidence, to suggest that lengthy periodsoutside the labour market can be detrimental to women’scareer progression, earnings potential and can have hugeimpacts on her and her family’s economic well-being (OECD2001). This is particularly pertinent for lone parents(discussed in Section 4.3), but impacts on the economicindependence of all mothers (a key requirement forreducing poverty) and in turn their career and lifeopportunities.
Since the 1960s, a key issue of family related genderpolicies has been the extent to which family policiesincrease women’s economic independence (Neyer, 2003).Growing concern around the feminisation of poverty hasbeen a key reason for the policy shift towards facilitation offemale labour market participation through a range offamily and employment policies. Childcare subsidies enablea faster return to work, and hence any skill loss of women
after childbirth can be mitigated (Duncan, Giles, 1996).Indeed, this can be verified by the high employment ratesof women with two or more children in countries withfamily friendly childcare policies; 78% in Norway, 77.2% inDenmark and 73.5% in Finland (OECD, 2004). Ireland hadthe lowest employment rate for mothers with two or morechildren of 20 OECD countries in 2000 (Ibid).
The expense of childcare can lessen the financial benefitsof working, especially if the financial burden is placedwholly upon the parent(s). Public investment by national,regional or local government is therefore necessary to makea childcare system affordable. The impact of childcare costson women’s decision to remain in or withdraw from thelabour market can be illustrated through econometricstudies which attempt to quantify the negative impactchildcare costs exert on female labour supply. Powell(1997) and Cleveland, Gunderson and Hyatt (1996) bothfound that a 10% increase in the expected price of childcarecorrelates with reductions in the probability that a mother
49
Table 4.2: Employment Rates of Females with Children in 2000
No Children One Child Two or More Children
Austria 76.0 75.6 65.7Belgium 65.6 71.8 69.3Denmark (1998) 78.5 88.1 77.2Finland (1997) 79.2 78.5 73.5
France 73.5 74.1 58.8Germany 77.3 70.4 56.3Greece 53.1 53.9 50.3Ireland 65.8 51.0 40.8Italy 52.8 52.1 42.4Netherlands 75.3 69.9 63.3Norway 82.9 83.3 78.0Portugal 72.6 78.5 70.3Spain 54.6 47.6 43.3Sweden 81.9 80.6 81.8UK 79.9 72.9 62.3OECD 23 73.7 70.6 61.9
Source: OECD (2004) Early Education and Care Policy: A Country Note for Ireland. OECD Directorate
will engage in paid employment of 3.8% and 3.9%respectively. Powell further suggests that a 10% increase ofchildcare costs corresponds with a 3.2% decrease in thenumber of paid hours that mothers work.
Affordability issues are particularly pertinent for lowincome and lone parent households – meaningemployment gains are not always shared equally.International experience has found that mothers withlower levels of education, who have worked in less skilledoccupations, are most likely to be offered (and take) lowpaid leave. Women with children who have completedhigher levels of educational attainment usually have atleast twice the level of labour market participation thantheir counterparts with lower qualifications, and they arealso more likely to work full time. This has led to asimultaneous increase in both workless and fully employedhouseholds in many countries and a growing gap betweenwork rich and work-poor households (OECD, 2003).
Family and childcare policies are vital in promoting genderequality and in enhancing economic independence andsecurity for women with children. The extent to whichwomen with children have institutional supports thatenable them to choose the option of employmentfacilitates both gender equality and economic well-beingamongst families. Income support measures to improveparent employability and targeted early interventions canimprove children’s life course chances and promote socialcohesion.
4.2.5 Lone Parents Accessibility issues are particularly relevant for low incomeand one parent households, the vast majority of whom arewomen51. Lone parents face particular challenges; theycarry the dual responsibility of being the main breadwinnerand the main carer in a labour market where caringresponsibilities may not be recognised (Bradshaw, Finch2002). They also have a high poverty risk, particularly inIreland where 42.3% of lone parents are at risk of poverty.
Their situation makes them especially vulnerable as theirparticipation in education, training and the labour marketdepends to a greater extent than for married women onsocial policy provisions.
Ireland has one of the lowest rates of lone parent labourmarket activity at 45%, compared to 76% in France, 81% inAustria, 84% in Japan (OECD 2003). In many countries,additional financial supports are provided or rights ofaccess to services for lone parent households to supporttheir education, labour market participation, their children’sdevelopment and to reduce their risk of poverty . Irishpolicy has consistently done the opposite - a disregard ofsmall earnings for temporary jobs, plus a lack of qualitychildcare ensures that it is not advantageous for lonemothers to seek regular half or fullday employment. Inaddition to direct benefits to children’s development, thesubsidisation of ECCE services can play a pivotal role inreducing poverty rates amongst lone parents and theirchildren. Measures to address such poverty will only besuccessful and sustainable if accompanied by suchsubsidised services.
4.3 Statutory Return on InvestmentInvesting in ECCE delivers significant return to the state.Increasing women’s labour supply could potentially reducethe exchequer costs of a scheme through lower socialsecurity expenditure and higher income tax and NationalInsurance revenue. Distributional effects will also bechanged if women alter the number of hours a week theywork – more women tend to work part-time hours, possiblydue to the difficulties of balancing work and family life52.
Good childcare allows more parents to work, which in turnbenefits society through taxes paid by those parents. Italso allows more parents to participate in education andtraining, increasing the skills base of a society. This isespecially true for parents on welfare because the reductionin public expenditures when poor parents are employed is
50
51 The proportion of women heading lone parent families with children under 20 has gradually increased from around 87% in 1994 to91% in 2004 (CSO, 2004)
52 While high female labour force participation is becoming more common across OECD countries, the work patterns of men and womencontinue to differ. Part-time employment has increased in the last decade in most OECD countries, and typically accounts for over 20%of total female employment and 10% or less of males. A high level of part-time work among women may be a sign of difficulties incombining family life and a career.
significant (Cleveland, Krashinsky, 2003). The NAPSestablishes the importance of paid employment as aprimary route out of poverty; it is through paidemployment that most social insurance contributions arepaid and most income is earned. It is through paidemployment that occupational pensions are ensured.These will be increasingly important elements of totalpensions income in the future. Increased femaleemployment is important not only to support futurewelfare state’s finances as the population ages, but also asa remedy for child poverty.
Many of the long-term benefits of the subsidisation ofchildcare accrue to the State through the positivedevelopmental benefits quality ECCE programmes have onyoung children which continue right through to adulthood.The return to society of the Perry Preschool programme53 ,was $258,888 per participant on an investment of $15,166
per participant – a rate of $17.02 per dollar invested. Ofthat return, $195,621 went to the general public - $12.90
per dollar invested – and, $63,267 went to each participant- $4.17per dollar invested. Of the public return:
● 88% ($171,473) came from crime savings (e.g. maleprogramme participants cost the public 41% less incrime costs per person).
● 4% ($7,303) came from education savings● 7% ($14,078) came from increased taxes due to higher
earnings (e.g. pre-school programme participantsearned 14% more per person than they would haveotherwise).
● 1% ($2,768) came from welfare savings (Schweinhart,2000).
The Chicago CPC programme54 also yielded significantreturns to the state. The preschool programme provided areturn to society of $7.14 per dollar invested by increasingeconomic well-being and tax revenues, and by reducingpublic expenditures for remedial education, criminal justicetreatment and crime victims. The extended intervention
programme (4 to 6 years of participation) provided a returnto society of $6.11 per dollar invested while the school-ageprogramme yielded a return of $1.66 per dollar invested.The overall cost per participant was $7,417 while theestimated benefit was $52,936 (estimated Benefit-Costratio 7.14) (Reynolds et al., 2002).
4.4 ConclusionThe benefits of generous maternity and parental leave andquality early education and childcare services are multiple.Children have a right to live and to develop to their fullpotential. The provision of accessible early education hasproven to provide children from disadvantagedbackgrounds with a more equal start in life. The benefits ofearly childhood education and care continue right throughto adult lives, through greater success in the educationsystem, improved employment opportunities and reducedsocial problems (e.g. crime). Accessible ECCE and extendedcare facilitates women’s equal participation in all areas ofsociety. It enhances women’s economic independence,which in turn leads to greater female employment, careercontinuity, career progression and economic security forhouseholds with children. Employment reduces the povertyrisks faced by women and children. Family friendly policiescan impact positively on work/life balance as well asproviding the State with a mechanism for mitigating thepensions crisis. The provision of accessible childcare alsoenhances women’s social and political rights, by ensuringstrong supports are available to facilitate their engagementin all aspects of social, political, civil and economic society.
Despite such widespread acceptance of the benefits ofECCE and extended care services, internationaldevelopments (in the developed world) have continued tosupercede developments in the Irish context. The lack ofprogress moves Ireland further out of line with ourEuropean neighbours and further away from creating asociety which promotes women’s equality throughensuring appropriate supports to guarantee their
51
53 At the dollar rate for 2000, discounted at 3%54 The Chicago Child Parent Centre (Illinois, 1997 to present) is located in public schools and provides comprehensive educational and
family support services to low-income children from ages 3 to 9.

participation in all aspects of society. However, perhaps themost pertinent and culpable risk of the lack of investmentin childcare is that of the stolen opportunities to provide allchildren, but particularly our most vulnerable children abetter start in life through quality educational anddevelopmental supports. This neglect means that childrenborn into vulnerable households in Ireland will from theearliest stages be at a disadvantage to their wealthier peers,a disadvantage which usually persists throughout the lifecycle (Section 4.2.1). It is in this context that we present ourproposed model for the subsidisation of childcare, in thehope that adoption of the model will bring Ireland in linewith its EU counterparts and more importantly providechildren with the best possible start in life.
52

53
5The Proposed Model
5.0 Introduction
Ireland’s strong economic performance is a newcontext within which to seek major improvements insocial protection. The challenge is both to facilitateas many people as possible in playing a role in theeconomy and provide tangible proof – in the form ofimprovements in the quality of life for everyone –that good economic performance is leveraging thecreation of a more just and attractive society.
(NESC, 2005: 1)
Ireland’s welfare state currently uses a moderate to lowproportion of national resources in providing services.This is despite Ireland having a level of wealth –whether measured in GDP, GNP or GNI per capita – thatcompares favourably with other EU Member States(Ibid). Research to date has highlighted Ireland’slaggard position in relation to government interventionand expenditure on family and childcare policies. Thislack of intervention has negative consequences for theequality of women (and particularly women asmothers) in relation to public participation and labourmarket participation precipitated through inaccessiblechildcare services which hinders holistic femaleparticipation in society. This lack of intervention alsocontributes to higher than average levels of childpoverty and often means that children growing up invulnerable households are excluded from ECCE serviceswhich have been internationally proven to supportchildren’s social, emotional and cognitive development,providing them with a more equal start in life to theiradvantaged peers. A poor start for any child is anethical challenge and undermines Ireland’s economicand social aspirations (NESC, 2005)
The growing body of evidence highlights thenecessary statutory intervention in making childcareservices accessible to all households. Irish socialpolicies must evolve and adapt to the changing needsof households, and the growing body of evidencesuggests that childcare policies to date have beenineffective in meeting the needs of all women and
children. As childcare costs continue to rise, it is likelythat the number of children excluded from servicesand women subsequently from education/training/labour market and public participation will increasefurther. The need for greater statutory interventionin family and childcare policies is corroboratedthrough the very recent NESC Report TheDevelopmental Welfare State (2005) and the NESFReport on Early Childhood Care and Education, whichincludes a series of proposals for addressing thecurrent gaps within ECCE.
Chapter Five presents the proposed subsidised Modelof childcare, outlining the various componentsnecessary to ensure accessible childcare structures forall children and a ten year implementation strategyfor the Model. The Chapter also includes apreliminary economic cost benefit analysis onChildcare subsidisation in the Irish context.
5.1 Rationale for a Subsidised Childcare Model
An accessible model of quality childcare facilitatesparents in making choices around their child rearingand labour market behaviour, facilitates femaleparticipation in public spheres and supports womenwishing to avail of education and trainingopportunities. Equally the model aims to ensure thatall children regardless of household income areentitled to and can access quality developmentalsupports from an early age. In order to redress thecurrent accessibility and affordability issues inchildcare, perpetuated by high costs and negligiblelevels of subsidisation, it is necessary to ensure thedesign of an inclusive model where no child isexcluded from early education and childcare servicesbecause of household income. The implementationof the proposed model will:
● ensure equity of access for all children, regardlessof household income to quality developmentalsupports which will enhance their social,
54chapter 5

55
emotional and cognitive development, thusproviding all children with an equal start in life.
● Support the development of a regulated qualityaccessible childcare sector.
● Support gender equity and parental choice bypromoting a greater sharing of care betweenmothers and fathers and provide parents with areal choice to either stay at home and care fortheir children, remain in the labour market whilerearing children, or balance both.
● Support women’s equality by removing thecurrent barriers to employment, education andtraining experienced by women whose choices arecurrently restricted by high childcare costs.
● Facilitate reductions in child poverty and women’spoverty through facilitating parental employment(and subsequently higher household incomes) andthrough ECCE services for all those requiring it.
● Facilitate greater female participation in thepublic and political spheres through the provisionof quality supports for their children whichsupport their more active role in society
The proposed model provides a ten year period for fullimplementation of all components, commencing in 2006
to 2015. Given current childcare capacity shortages andprojected increased demand on implementation of themodel, it is necessary to phase in components of themodel on a gradual basis to facilitate the sector ingrowing to meet demand (e.g. capacity requirements,staff recruitment, administrative structures etc.).International experience has proved that phasing inelements of the model facilitate time to build capacity. Alack of long-term strategy in building capacity can lead tolong waiting lists, and parents being forced to findalternative early education and childcare services in theinterim, particularly in the early years of newly subsidisedprogramme (e.g. the Quebec Model phase in period wassomewhat shorter and led to high demand, insufficientcapacity and long waiting lists. Evidence available fromthe Irish review has found that current childcare supply isalready very limited, indicating a requirement toimplement the model on a phased basis to allowappropriate time to build capacity to the required levels.
Children’s Eligibility to Early Education and Childcare Under Proposed Model
● All three year olds and all four year olds (who arenot in primary school education) will be entitledto 3.5 hours free early education per day for 48
weeks of the year, regardless of parental income.This proposal is corroborated through NESF’srecent proposal recommending universal access toECCE services for all three year old children.
● Where parents are engaged in full-timeemployment, education and/or training therebyrequiring extended care, their children will beentitled to a subsidised place in a quality service,at one of three levels of subsidisation based on aparental income test, outlined in 5.2.D.
Delivery of the Model
5.2.a The Subsidised Childcare Model will bebased upon mixed delivery of provision.It will utilise the existent diverse range ofearly education and childcare services andrecommends that any further services tobe developed, to meet increases indemand should build upon andcomplement the existing provision.
There are a diverse range of early educationand childcare services in Ireland, a supplywhich has been boosted significantly throughthe EOCP programme, operational since 2000
(See Chapter Three). The Model will utilisethese existing services and recommends thatany additional services developed to meetdemand should build upon and complementthe existing provision of early education andchildcare services for children from birth tofourteen. The proposed Model of mixeddelivery of provision includes services providedby childminders, private and community fullday care services, crèches, sessional and fullday early education services, playgroups and

56
55 Extended Care refers to additional care provided outside pre-school and formal schooling hours, such as ‘after-school’ care.
Component Implementation Strategy
Care Provisions for Children aged 0 – 12 months:
● Paid maternity leave to increase to 26 weeks To be extended from its current 18 weeks to 26 weeks by year 2 2008: 2 weeks in year 1 etc. 2006 and 3 weeksin 2007 and 2008.
● 5 days paid paternity leave To be introduced on an incremental basis: 3 days in (to be taken within one month of birth) 2006, 4 days in 2007 and 5 days and 5 days in 2008.
● 26 weeks paid parental leave To be introduced on an incremental basis, commencing in2007 with an increase of four weeks per annum throughto 2012 and two weeks in 2013.
Subsidised Early Childhood Care and Education (ECCE):
● Universal ECCE for all three and four year olds. To be introduced on an incremental basis between 2006 and 2007 with places provided for all four year olds not attending primary school in 2006 and extended to all three year olds in 2007. Under the Programme, each child will be entitled to attend for 3.5 hours per day five days a week for 48 weeks of the year.
● Subsidised Extended Care55 To be introduced on an incremental basis between for three and four year olds. 2006 and 2007 with places provided for all eligible four
year olds in 2006 and extended to all eligible threeyear olds in 2007.
● Subsidised Full Day Care for To be introduced on an incremental basis between one and two year olds. 2009 and 2010 with places provided for all eligible two
year olds in 2009 and extended to all eligible one year olds in 2010.
● Subsidised Extended Care for five to fourteen year olds. To be introduced on an incremental basis between 2009 and 2015 with places provided for all eligible five and six year olds in 2009 and extended by each age group per annum up to 10 year olds in 2013. In 2014 places will be provided for all eligible 11 and 12 year oldsand all eligible 13 and 14 year olds in 2015.
5.2 Model Components and Implementation Strategy

after-school care. This will provide parentswith a diverse range of options from which tochoose the most appropriate option accordingto their children’s needs. It is expected thatthe proportion of services delivered by thedifferent types of providers will evolve over time.
Capital Funding The Model assumes the continuation andexpansion of the current EOCP capitalprogramme to support increases in childcarecapacity to meet the required demands fromthe model. Capital costs in relation to increasedcapacity have therefore not been costed intothe Model, but the assumption is made thatstatutory investment will be made to cover theadditional capital costs of the proposed model.It is worth reviewing the once-off fundingschemes available under the Quebec low-feeday care system as an indication of the varietyand level of funding implemented by theQuebec government to increase service supplyto meet the needs of the low-fee programme(Appendix One). Similar to the DayCare TrustProposal (2004; 11): ‘The hope would be thatincreased funding levels (though capitalprogrammes and subsidisation) would attractsignificant numbers of new providers into themarket, as well as providing a secure basis forexisting providers to expand’.
5.2.b It is proposed that the subsidy will be paiddirectly to the provider, as is the practice inmany countries where subsidisation policiesexist, including the Nordic States, Quebecand the UK.
International practice demonstrates that themost effective strategy in facilitating thedevelopment and delivery of qualitysustainable services is through directinvestment into services, an approach
adopted the Irish government for primaryand secondary education. Financial supportprovided directly to settings is intended toenhance the quality of the service providedto children and its development andsustainability.
5.2.c All services must be approved as meeting therequired quality standards prior to eligibilityfor subsidy entitlements. Once a service hasbeen approved as meeting qualityrequirements, it will then be awarded aquality mark and will be free to advertise asa subsidy approved service56.
Approval as meeting certain quality standardsis a requirement of all statutory subsidisedmodels of childcare in Europe andinternationally. In Australia, for example,families must send their children to anapproved Quality Improvement andAccreditation System (QIAS) centre, to beeligible for fee subsidies through the ChildCare Benefit (CCB) system (OECD, 2001).While a study of the proposed qualityrequirements is beyond the remit of thisstudy, the research team are aware of theongoing work of the CECDE in relation to thedesign of a National Quality Framework, andrecommend this Framework as a potentialstrategy against which services could beassessed for approval to subsidy entitlements.
Quality Early Education and Child Care It is through quality care that the full benefitsof subsidised childcare are maximised for allkey stakeholders (i.e. children, parents and theState – see Chapter Four). A potential modelagainst which to assess and ensure quality isthe National Quality Framework (NQF). TheQuality Standards within the Framework referto all aspects of early childhood educationincluding equipment and materials, staffqualifications and training, learning objectives,
57
56 The White Paper on Early Education (1999) also proposed the introduction of a Quality in Education mark (QE).
teaching methodologies and related areas. Asecond aspect of the NQF involves theprovision of a range of supports for ECCEpractitioners towards enhancement andimplementation of quality (e.g. mechanismsfor providing advice, mentoring, information,resources and communication networks).Similar quality measurements must also beoutlined for school-age children (six years plus,who are not incorporated under the NQF), priorto approval for subsidisation.
Ensuring high quality within services is costly.It will require additional workforce training,support and guidance, continuing professionaldevelopment, adherence to various regulatoryrequirements, appropriate pay and conditionsfor staff, linked to a nationally agreed payscale, good management practices and thepromotion of professionalism throughout theentire sector (IPN, 2005). However, whilecosting for ‘quality’ requirements is beyond theremit of this study, it is assumed, given itsfundamental role in effective ECCE andextended care services, that additional fundswill be made available to meet theimplementation costs of the National QualityFramework, and such costs are consequentiallynot included in the NWCI model.
5.2.d Parents will be entitled to select approvedchildcare services of their choice and subjectto an income test, will be allocated one ofthree rates of subsidisation to meet childcarecosts. Once a parent has selected a service,the agreed subsidised rate will then be paiddirectly to the provider, and the parent will,where appropriate, pay the remainder ofcosts.
Overall to make good quality education andcare affordable for all families who want it,the OECD (2001) recommend that parentalcontributions average no more than around30% of total costs. The rate can varyhowever, according to income. The proposedlevel of subsidy within the Model correlateswith OECD recommendations (with areduced subsidy for those on higher incomes,whose financial means are greater).
The Model proposes three different levels ofsubsidisation for those in employment,training and/or education57;● All families, regardless of income
will be entitled to a 50% subsidisation of childcare costs;
● Those families who pay income in the 20% tax band will be entitled to 75% subsidisation of costs; and
● Parents whose income is set at the minimum wage will receive full subsidisation of childcare costs.
Income TestThe universal element of the Model forchildren 3 and 4 years will be free for allchildren. An income test will apply for theremaining features of the model.
5.2.e The subsidisation programme should bemanaged by one Government departmentdesignated with the responsibility for childcarepolicy (see Section 3.2.1.) Local administrationand co-ordination of the programme could bemanaged on a countywide basis, perhaps usingthe County Childcare Committees.
International practice in several countries has atwo tier management structure for childcarepolicies where the programme is managed
58
57 In order to guarantee that the subsidization of childcare will improve the well-being of households and reduce the number ofhouseholds living in poverty in Ireland, it is recommended that in-depth testing be conducted to ensure it is proofed against povertytraps. This will also involve testing for poverty trap risks as an individual moves from a higher to a lower level of subsidization asincome increases.
centrally by the appointed governmentdepartment, and managed locally by eitherlocal authorities or local government. Forexample, in Denmark, the Ministry ofEducation has policy responsibility for pre-school classes and SFO (school based leisurefacilities). The local authorities thendetermine the objectives and the frameworkfor work carried out in day-care facilities andschools, and they are responsible for fundingand supervision. Independent providersmust then work with the local authority, andmeet their regulation requirements andoperating guidelines to receive municipalgrants (OECD, 2001).
5.2.f As is the case in the majority of countrieswhere the State subsidises childcare, the ratescharged by services will be capped, regulatedand reviewed.In order to guarantee that parents pay fees atthe agreed capped rates of either 50%, 25% or0%. (5.2.d), childcare fees will need to be setand regulated by the appointed governmentdepartment in consultation with the CountyChildcare Committees. The current lack ofregulation means that fees are set by theprovider and can vary significantly from serviceto service. Setting maximum fees in approvedquality services will facilitate parents inchoosing services that meet their children’schoice. Such practice is applied in a number ofcountries. For example, the Quebec andManitoba government sets specific maximumfees that can be charged by regulated childcaresettings that receive provincial funding (OECD,2003(a)). Similarly, municipalities in Norway,which provide financial support to privatebarnehager have the right to set rulesgoverning parent’s costs. Every half year, areview is conducted of parent’s fees operatedby municipalities and in barnehager withmunicipal economic supports (OECD, 1998).
5.3 Implementing the Model
5.3.a Care Provisions for Children aged 0 – 12 Months
1. To increase paid maternity leave to 26 weeksby 200858.
2. To introduce 5 days paid paternity leave (to betaken within one month of birth) by 2008.
3. To introduce 26 weeks paid parental leave by2013. Either parent can avail of paid parentalleave up to a combined six month maximumperiod (i.e. a father or mother could take thesix month leave in its entirety or parents coulddivide the six month period between them).
RationaleBenefits around the impact of parental leave onchildren’s development are less well documentedthan the repercussions of such policies on maternallabour market behaviour. There are nonetheless aconsiderable number of studies, which highlight therationale for investment in parental leave policies interms of the benefits to children, including improvedsocial and cognitive development and strongerparent-child relationships.
Indeed the OECD (2004) regard paid, flexible, and job-protected maternity and parental leave schemes of atleast one year, as essential components of anycomprehensive strategy to support working parentswith very young children. The proposal to extend theperiod of paid parental leave, is intended to extendthe choice to all parents to look after their children athome during their first year of life. Generous parentalleave policies are recognised as having an importantrole in attracting women into the labour force, andmaintaining their attachment to the labour force(Kamerman, 2000). The proposed period of paidparental leave is in addition to existent (albeit unpaid)parental leave provisions. The phased introduction ofpaid parental leave for 26 weeks is to ensure sufficient
59
58 In addition to 18 weeks paid maternity leave, there is currently an additional provision for eight weeks unpaid maternity leave.
provisions are in place to facilitate parents in spendingthe first year of life with their child.
Although the immediate consequence of thisextended leave may be that employment rates forparents with children aged up to twelve months fall,in the longer term it could boost employment byhelping parents (particularly, but not only, mothers onlower incomes) to remain attached to the workforce,rather than not returning to their jobs because theyfeel that 4.5 months (or 6 if they can afford to take upunpaid maternity leave) is too early an age to beleaving their child in formal care (Daycare Trust,2005). Such a proposal would also bring Ireland morein line with EU standards.
Note on Paternity Leave ProvisionWhile parental leave is designed for both parents, inthe majority of countries, fathers do not generallytake advantage of this. In Germany, 1.6% of parentson parental leave were fathers in 1999, and in Japan,this figure is lower at just 0.4% (Bradshaw, Finch2002). There has been an increasing move amongst agrowing number of countries to encourage fathers totake leave, and care for their children, either throughthe implementation of a ‘daddy quota’, where acertain proportion of parental leave must be taken byfathers or lost, (e.g. Austria, Germany, Norway) orthrough the implementation of paternity leavepolicies specifically designed for fathers. The length ofleave varies between countries. Norway is mostgenerous in terms of provision, providing four paidweeks and a job guarantee on return (which forms partof 52 weeks parental leave, but can only be taken by thefather). France offers eleven days paternity leave or 18
days in the case of multiple births, which must be takenon consecutive days within four months of the birth,and can be combined with three days additional leavegiven for the birth of the child. Sweden offers ten dayswhich must be used simultaneously with maternity
leave (Bradshaw, Finch, 2002). Spain and Belgium offertwo and three days paid leave respectively. Portuguesefathers are entitle to two weeks paid paternity leave,five weekdays of leave that must be taken in the firstmonth upon childbirth, and 15 calendar days of paidleave which must be taken upon use of the five dayperiod or the ‘shared maternity’ leave period. Fathersare entitled to two weeks of unpaid paternity leave inNew Zealand, while such leave is not legislated for inSwitzerland and is rarely provided voluntarily, evenamong large enterprises (OECD, 2004). Therecommendation of five days paid parental leave fallssomewhat centrally in terms of international provisions,but does however represent a timely policy move, in yetanother area of family and childcare policies which iscurrently in a state of recasting. It will be necessary toreview and possibly increase the duration of paternityleave over time.
Cost of ImplementationIn 2003, the Government paid ¤107.33 million inmaternity benefit to 30,211 mothers, constituting aninvestment of approximately 0.1 per cent of GDPannually.59 This accounted for approximately 49% ofall births in that year.60
The assumptions underlying the costing for eachcomponent of the proposed model of 12 monthsparental leave are outlined in Appendix Three. Table5.3(a) presents the total annual cost of implementingthese measures (See Tables A1 to A3 in Appendix Fourfor a more detailed breakdown of these costs).Parental leave is costed under the same strategy ascurrently applies for maternity benefit through theSocial Insurance system.
Implementing extended maternity benefit, andintroducing paternity and parental leave, over thecourse of the first three years is estimated to cost thestate just under ¤151 million by 2008, approximately
60
59 Figures provided by the Department of Social and Family Affairs.60 The CSO (2004) estimate that there were on average 62,000 births per annum between 2002-2006.61 GDP is estimated to grow at a rate of 2 % per annum and is based on the 2004 level of GDP at current market prices (Department of
Finance, 2005). Total Government Expenditure is expected to grow in line with GNP remaining a constant 40% of total GNP which inturn is also predicted to grow at a rate of 2% per annum. Baseline figures for Total Government Expenditure are for 2005 (Departmentof Finance, 2005)
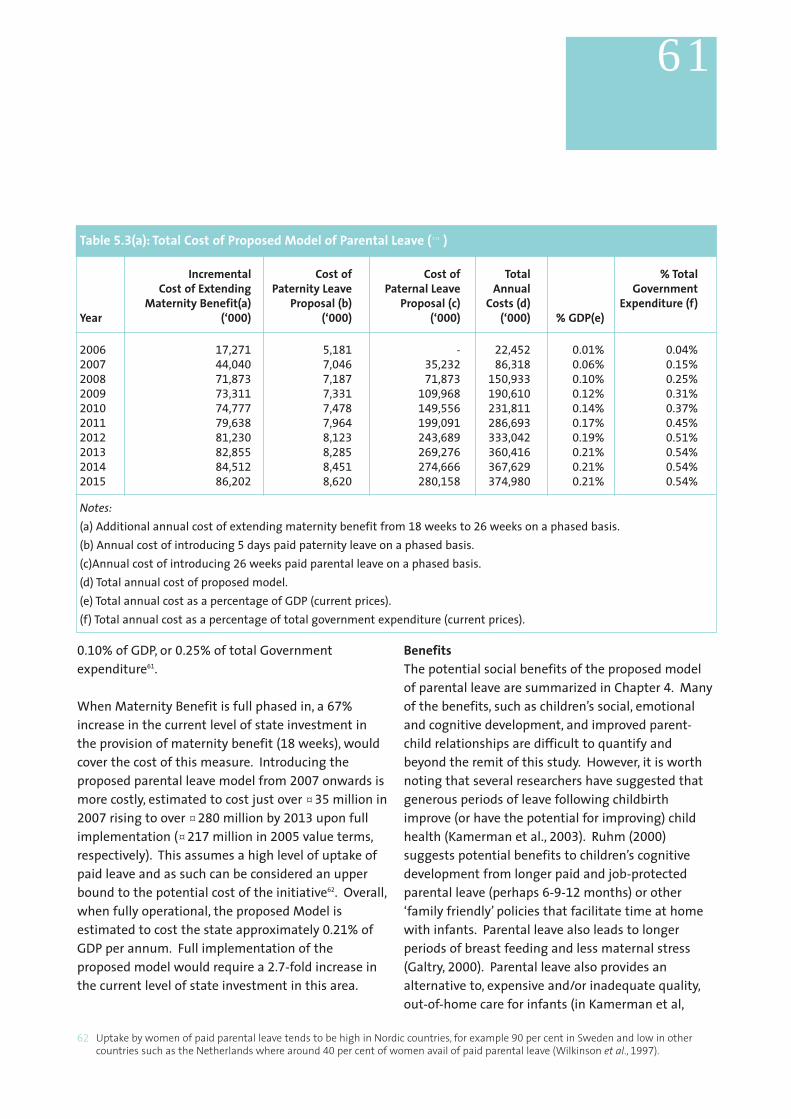
0.10% of GDP, or 0.25% of total Governmentexpenditure61.
When Maternity Benefit is full phased in, a 67%increase in the current level of state investment inthe provision of maternity benefit (18 weeks), wouldcover the cost of this measure. Introducing theproposed parental leave model from 2007 onwards ismore costly, estimated to cost just over ¤35 million in2007 rising to over ¤280 million by 2013 upon fullimplementation (¤217 million in 2005 value terms,respectively). This assumes a high level of uptake ofpaid leave and as such can be considered an upperbound to the potential cost of the initiative62. Overall,when fully operational, the proposed Model isestimated to cost the state approximately 0.21% ofGDP per annum. Full implementation of theproposed model would require a 2.7-fold increase inthe current level of state investment in this area.
BenefitsThe potential social benefits of the proposed modelof parental leave are summarized in Chapter 4. Manyof the benefits, such as children’s social, emotionaland cognitive development, and improved parent-child relationships are difficult to quantify andbeyond the remit of this study. However, it is worthnoting that several researchers have suggested thatgenerous periods of leave following childbirthimprove (or have the potential for improving) childhealth (Kamerman et al., 2003). Ruhm (2000)suggests potential benefits to children’s cognitivedevelopment from longer paid and job-protectedparental leave (perhaps 6-9-12 months) or other‘family friendly’ policies that facilitate time at homewith infants. Parental leave also leads to longerperiods of breast feeding and less maternal stress(Galtry, 2000). Parental leave also provides analternative to, expensive and/or inadequate quality,out-of-home care for infants (in Kamerman et al,
61
62 Uptake by women of paid parental leave tends to be high in Nordic countries, for example 90 per cent in Sweden and low in othercountries such as the Netherlands where around 40 per cent of women avail of paid parental leave (Wilkinson et al., 1997).
Table 5.3(a): Total Cost of Proposed Model of Parental Leave (™ )
Incremental Cost of Cost of Total % TotalCost of Extending Paternity Leave Paternal Leave Annual Government
Maternity Benefit(a) Proposal (b) Proposal (c) Costs (d) Expenditure (f)Year (‘000) (‘000) (‘000) (‘000) % GDP(e)
2006 17,271 5,181 - 22,452 0.01% 0.04% 2007 44,040 7,046 35,232 86,318 0.06% 0.15% 2008 71,873 7,187 71,873 150,933 0.10% 0.25% 2009 73,311 7,331 109,968 190,610 0.12% 0.31% 2010 74,777 7,478 149,556 231,811 0.14% 0.37% 2011 79,638 7,964 199,091 286,693 0.17% 0.45% 2012 81,230 8,123 243,689 333,042 0.19% 0.51% 2013 82,855 8,285 269,276 360,416 0.21% 0.54% 2014 84,512 8,451 274,666 367,629 0.21% 0.54% 2015 86,202 8,620 280,158 374,980 0.21% 0.54%
Notes:(a) Additional annual cost of extending maternity benefit from 18 weeks to 26 weeks on a phased basis.(b) Annual cost of introducing 5 days paid paternity leave on a phased basis.(c)Annual cost of introducing 26 weeks paid parental leave on a phased basis.(d) Total annual cost of proposed model.(e) Total annual cost as a percentage of GDP (current prices).(f) Total annual cost as a percentage of total government expenditure (current prices).

2003). The evidence from abroad identifies thatsubsidisation programmes of this kind can also havesignificant economic effects on society and highlightsa significant gap in the provision of measures of thiskind within the Irish system compared withinternational standards.
As outlined in the rationale for introducing a model ofpaid parental leave, there is much evidence to suggestthat there are economic benefits, as well as social andparent-child benefits, to be gained from facilitatingparents in caring for their children in the home untiltheir first birthday. In particular, a model of the kindproposed here allows parents to maintain a connectionto the workforce otherwise lost if they decide toformally withdraw from the labour force (Kershaw,2004). The fact that such provisions are available in theNordic countries, where the rate of employment ofmothers with two children is at least 30% higher thanin the Irish context demonstrates the potential long-term financial gains to the exchequer fromimplementing generous parental leave provisions inthe child’s first year. In tandem with the model foruniversally subsidised childcare presented in the nextsection, which will provide parents with a real choiceabout a return to the workforce after the first year ofparenthood, the paid parental leave model presentedhere has the potential to significantly impact oncontinued labour force participation, future earningsand productivity levels, while simultaneously providingparents with real choices and opportunities to balancework and family life.
5.3.b Subsidised Early Childhood Care andEducation
As outlined in Section 5.1, the following fourelements comprise the proposed Model of subsidisedearly childhood and education:
1. Universal early education for all 3 and 4 year olds:Phased implementation between 2006 and 2007
with places provided for all four year olds notattending primary school in 2006 and extended toall three year olds in 2007.
2. Subsidised extended care for 3 and 4 year olds:Phased implementation between 2006 and 2007
(as before).3. Subsidised full day care for 1 and 2 year olds:
Phased implementation between 2009 and 2010
with places provided for all two year olds in 2009
and extended to all one year olds in 2010.4. Subsidised extended care for 5 to 14 year olds:
Phased implementation between 2009 and 2015
with places provided for all eligible five and six yearolds in 2009 and extended by each age group perannum up to 10 year olds in 2013. In 2014 placeswill be provided for all eligible 11 and 12 year oldsand all eligible 13 and 14 year olds in 2015.
RationaleThe case for investing in care and education in the earlyyears has been outlined in Chapters 2 to 4. From aneconomic perspective, the rationale for governmentinvestment of the kind proposed in this model is clear:investment directed at developing social, emotional andcognitive skills of the young yields a significantly greaterreturn than similar investments made at a later stage inlife (Heckman & Cunha, 2005). There are two logicalreasons for this. Firstly, social skills developed at an earlyage provide children with the ability to learn and acquireskills throughout their lifetime. Secondly, the younghave a longer time horizon from which to yield returnsto such an investment. As such, programmes of this kindcan be considered as a prevention mechanism, ascontributing to a more equitable society, and a moreefficient use of government funding due to the potentialfor greater returns from similar levels of investment inprogrammes aimed at education in the later years. It isfor such reasons that the universal access to earlyeducation for all children regardless of financial meanshas been endorsed within the Model. Ireland is now in aunique position in EU and increasingly internationalterms, because of its laggard position in this regard. It isnow one of the very few countries in Europe that doesnot provide universal access to early education for atleast two years prior to the commencement of statutoryschooling.
62

Cost of ImplementationThe assumptions underlying the costing for eachcomponent of 5.3(B) are outlined in Appendix Three.Table 5.3(b) presents the total annual cost ofimplementing these measures. See Tables A4 to A7 inAppendix Four for a more detailed breakdown ofthese costs.
Universal Early Childhood Care and Education for AllThree and Four Year Olds
It is estimated that the total cost of the programmein the first implementation phase will be ¤1,551
million (¤1,482 million in 2005 value terms). Spreadover the first three years this will require aninvestment of 0.15% of GDP in 2006 and 0.4% in2007 and 2008. By 2008, just under 95,000 childrenaged three and four will receive subsidised earlyeducation services and just over 56,000 will alsoreceive some form of subsidised extended childcaredepending on the needs of the parents.
Upon full implementation of the measures proposed forthree and four year olds the required level of governmentinvestment is expected to be in the region of ¤636
million annually, ¤537 million of which will be spent onuniversal pre-school education at a cost of ¤5,673 perchild (2005 values). To place this per child cost in context,consider the current level of government expenditurespent on children at other levels within the educationsystem. For example, government expenditure onprimary level education for the state is approximately¤4,537 per child (2003 estimate expressed in 2005 valueterms). For third level, expenditure per student issubstantially higher at ¤8,943 per student (2003
estimate expressed in 2005 value terms). Extending thesame level of expenditure to early years education andcare of three and four year olds in Ireland would costapproximately ¤870 million, more than covering the fullcosts of implementing the model.
Subsidised Full Day Care For One and Two Year OldsIt is proposed that the model is gradually extended to
children in other age groups. Between 2009 and 2010,it is proposed that subsidised childcare places be madeavailable for all one and two year old childrenaccording to need. It is estimated that this will cost theexchequer an additional ¤139 million in 2009 (¤123
million in 2005 value terms) and ¤293 million in 2010
(¤253 million in 2005 value terms). Upon fullimplementation beyond 2010, the strategy isestimated to cost approximately 0.2% of GDP annuallybenefiting more than 60,000 children every year.
Subsidised Extended Care for Five to Fourteen Year OldsThe final phase of the strategy involves graduallyextending the subsidised care model to all childrenaged five to 14 years. The average cost per child isestimated at approximately ¤1,921 per annum or¤1,576 in 2005 value terms and once fully operationalit is estimated that the programme will require aninvestment of approximately 0.3% of GDP annually.
Overview of Combined Costs of 5.3.BBy 2015, the fully operational subsidised early yearseducation and childcare model will cost the state justunder ¤1,720 million per annum, 0.95% of GDP.63 In2005 value terms, this constitutes an annualinvestment of ¤1,411 million once the model is fullyimplemented. This will cover the operational costs ofearly years education and childcare places forapproximately half a million children between theages of one and 14. This does not include maternity,paternity and parental leave provision outlined inTable 5.3(a). As outlined in Section 5.2 (see AppendixThree), this cost does not take into account thecapital cost of establishing these childcare places, northe investment in the training of early yearseducation and childcare workers necessary toimprove and maintain quality standards in the sectoror any additional financial costs to support ‘quality’within services. An on-going commitment fromGovernment in both of these areas through existing,or new, funding arrangements is essential to thesuccess of the proposed model.
63
63 Currently the government invests 4.5% of GDP in total on education, 7.2% on health and 7.7.% on social and family affairs. In the caseof the latter, approximately 1.7% of GDP is invested in social welfare measures aimed at supporting the elderly.

64 Includes funding provided through the National Development Plan (449m including 170m in EU transfers), funding through theHealth Boards (7.8m) and funding provided for the Early Start Programme provided in Primary Schools nationally (1.98m).
64Ta
ble
5.3
(b):
Cost
s of
Pro
visi
on o
f Sub
sidi
sed
Child
care
Mod
el (e
)
1:E
arly
Yrs
Edu
catio
n2
:Ext
ende
d Ca
re3
:Ful
l Day
Car
e4
:Ext
ende
d Ca
re(3
-4Ye
ar O
lds)
(a)
(3-4
Year
Old
s)(b
) (2
Year
Old
s)(c
) (5
-14
Year
Old
s)(d
)
Tota
lN
umbe
r of
Annu
alN
umbe
r of
Annu
alN
umbe
r of
Annu
alN
umbe
r of
Annu
alAn
nual
% To
tal
Plac
esCo
sts
Plac
esCo
sts
Plac
esCo
sts
Plac
esCo
sts
Cost
sG
over
nmen
tYe
arPr
ovid
ed(‘0
00
) Pr
ovid
ed(‘0
00
) Pr
ovid
ed(‘0
00
) Pr
ovid
ed(‘0
00
) (‘0
00
) %
GD
P (f
)Ex
pend
iture
(g)
20
06
30
,80
01
78
,22
62
5,0
43
46
,41
2-
- -
- 2
24
,63
80
.15
%
0.4
1%
2
00
79
3,5
64
55
2,2
42
52
,42
89
9,1
09
- -
- -
65
1,3
51
0.4
2%
1
.16
%
20
08
94
,72
85
70
,29
45
4,3
69
10
4,8
36
- -
--
67
5,1
30
0.4
3%
1
.17
%
20
09
95
,89
25
88
,84
85
6,3
11
11
0,7
52
28
,15
61
38
,77
65
2,2
58
96
,32
39
34
,69
80
.58
%
1.5
7%
2
01
09
7,0
56
60
7,9
16
58
,25
31
16
,86
25
8,2
53
29
2,8
64
79
,79
91
45
,80
01
,16
3,4
43
0.7
1%
1
.90
%
20
11
98
,22
06
27
,51
15
9,2
24
12
1,1
86
59
,22
43
03
,70
01
07
,30
71
97
,00
61
,24
9,4
03
0.7
4%
1
.98
%
20
12
97
,99
26
38
,57
56
0,1
95
12
5,6
36
60
,19
53
14
,85
31
35
,68
32
51
,74
81
,33
0,8
12
0.7
8%
2
.05
%
20
13
97
,76
46
49
,83
16
1,1
66
13
0,2
16
61
,16
63
26
,32
91
64
,92
73
10
,17
81
,41
6,5
54
0.8
1%
2.1
2%
2
01
49
7,5
36
66
1,2
82
62
,13
61
34
,92
86
2,1
36
33
8,1
39
22
2,8
61
42
4,1
17
1,5
58
,46
70
.87
%
2.2
6%
2
01
59
7,3
08
67
2,9
31
63
,10
71
39
,77
76
3,1
07
35
0,2
91
28
9,9
73
55
7,1
63
1,7
20
,16
30
.95
%
2.4
2%
Not
es:
(a) T
otal
num
ber o
f pla
ces
and
annu
al c
osto
f pro
vidi
ng e
arly
yea
rs e
duca
tion
to th
ree
and
four
yea
r old
s on
a p
hase
d ba
sis.
(b) T
otal
num
ber o
f pla
ces
and
annu
al c
osto
f pro
vidi
ng e
xten
ded
care
to th
ree
and
four
yea
r old
s on
a p
hase
d ba
sis.
(c) T
otal
num
ber o
f pla
ces
and
annu
al c
osto
f pro
vidi
ng fu
ll da
y ca
re to
two
year
old
s on
a p
hase
d ba
sis.
(d) T
otal
num
ber o
f pla
ces
and
annu
al c
osto
f pro
vidi
ng e
xten
ded
care
to fi
ve to
four
teen
yea
r old
s on
a p
hase
d ba
sis.
(e) T
otal
ann
ual c
osto
f pro
pose
d m
odel
of e
arly
yea
rs e
duca
tion
and
child
care
.(f
) Tot
al a
nnua
l cos
tas
a pe
rcen
tage
of G
DP
(cur
rent
pric
es).
(g) T
otal
ann
ual c
osta
s a
perc
enta
ge o
f tot
al g
over
nmen
texp
endi
ture
(cur
rent
pric
es).

Currently, Government funding for childcare isestimated at approximately 0.4% of GDP.64 An increasein the capital component of this level of funding willundoubtedly be required to meet the needs ofestablishing the range of facilities that will be necessaryto meet the model requirements. While the level andextent of funding required to fulfil the capitalrequirements of this Model are not considered here, itshould be noted that Ireland lags behind internationallyin terms of the proportion of GDP invested in earlyyears education and care. As far back as 1995, theEuropean Commission on Childcare recommended thatcountries should spend 1% of GDP annually on earlychildhood education and care, a target that Ireland stillfalls significantly short of, with recommendations fromthe OECD to increase expenditure beyond this level intothe future (UNESCO, 2004; OECD, 2004). Scandinaviancountries such as Sweden and Denmark spendapproximately 2% to 2.5% of GDP on early educationand care. For the proposed Model to work, it isrecommended that in excess of the 0.95% of GDP
investment required to cover the operational costs ofthis Model should be provided to meet the potentiallysignificant capital and other sunk costs associated withimplementing the Model.
5.4 Economic BenefitsAs discussed in Chapter 4, substantial benefits tochildren, women, parents and wider society areexpected to result from the measures proposed in thismodel. The following outlines the expected economicbenefits and returns from implementing the model.
5.4.1 Short Term Economic BenefitsIn the Irish case, the returns to the state of facilitatingemployment creation and education participationthrough the proposed model of subsidised earlychildhood education and care are quantified bypredicting the future contributions to the exchequer inthe form of tax revenue.65 The assumptions underlyingthis computation are presented in Appendix Three.66
65
Table 5.4(a): Total Short-Term Contributions/Savings to Exchequer (e)
Year Additional Additional Savings in Total Benefit % GDP (f)Numbers in Contributions Health Board Benefits per
Employment(a) to Tax Current (d) Child (e)Revenue (b) Funding (c)
(‘000) (‘000) (‘000)
2006 - - 8,035 8,035 261 0.01% 2007 8,086 37,697 8,196 45,893 490 0.03% 2008 14,790 70,324 8,360 78,684 831 0.05% 2009 21,493 104,242 8,527 112,769 640 0.07% 2010 28,196 139,489 8,698 148,186 630 0.09% 2011 31,548 159,191 8,871 168,062 635 0.10% 2012 34,899 179,625 9,049 188,674 642 0.11% 2013 38,251 200,813 9,230 210,043 649 0.12% 2014 41,602 222,777 9,414 232,192 607 0.13% 2015 44,954 245,539 9,603 255,142 566 0.14%
Notes:(a) Number of additional women with children in employment each year as a result of proposed model.(b) Annual contribution to exchequer in the form of tax revenue as a result of increased numbers employed.(c) Annual reduction in Health Board spending on subsidising childcare places.(d) Total annual benefits to the exchequer (column (b) plus column (c).(e) Total annual benefit per child availing of subsidised place (see Table 5.3(b)).(f) Total annual benefit as a percentage of GDP (current prices).
65 While it is also anticipated that many lone parents will enter employment as a result of the measures proposed in this model it isassumed that welfare payments such as the one-parent family payment, family income supplements, and rent allowances. willcontinue upon entering employment to ease the transition phase (NWCI, 2004).

The proposed measures are assumed to affect labourforce participation rates of women with children inthe following way: 67
a) Participation rate to increase to 60% by 2010
(2% per annum from 2007 to 2010)b) Participation rate to increase to 65% by 2015
(1% per annum from 2011 to 2015)
Five per cent of the increase in participation rates isassumed to account for mothers entering intoeducation and training instead of employment,thereby not contributing to increases in tax receiptsin the short term.
Total short-term benefits to the exchequer aredetailed in Table 5.4 (a). Since the measures proposedin this model will provide places previously subsidisedby the Health Board, this funding will no longer berequired and as such will constitute an additionalsaving to the State.
The increase in employment alone, as a result of themeasures proposed in this model are estimated to leadto a saving of 0.14% of GDP annually in the form ofincome tax receipts by the time the model is fullyoperational in 2015. These estimated savings aresignificantly less than the proposed costs of the model,estimated at 0.95% of GDP. The net short-termeconomic cost is therefore estimated at 0.81% per centof GDP annually.68 However, the short-term returns tothe exchequer in the form of increased tax revenuesare only a fraction of the potentially substantialreturns that could be yielded over the longer term.
5.4.2 Long Term Economic BenefitsOver the longer term, there is strong evidence,experimental and otherwise, to suggest that the state
will make substantial savings as a result of the social,cognitive and developmental effects ECCE can have onchildren. Chapter Four provided an overview of theextent of such benefits. Here we consider the impactthat such outcomes can have on tangible factors thatoffer financial returns and savings to the state, forexample, increased tax revenues as a result of higherlevels of earnings and employment among programmeparticipants, consequential reductions in welfarepayouts, reduced criminal justice costs and reducededucation costs due to lower levels of grade repetition.
Based on more general econometric evidence linkingeducation to employment and earnings, it couldsafely be concluded that programmes of the kindconsidered here have the potential to significantlyimpact on the job prospects and future potentialearnings of the children involved, through the directeffect that these programmes have on educationalattainment. A wealth of literature existsdocumenting the return to educational attainment.For example, Harmon and Walker (1995) found thatcontrolling for other factors, each additional year ofschooling yielded a return of 15 per cent on earningsin the UK69. The earnings return to education has alsobeen well documented in the Irish context. Theevidence suggests a positive relationship betweenearnings and educational attainment with theearnings advantage increasing with the length oftime spent in the labour market (Barrett et al., 2002;OECD, 2002). In addition, higher levels of educationparticipation are associated with higher levels oflabour force participation and lower unemploymentrisk. It therefore can reasonably be concluded thatthe strong positive link between early childhoodintervention programmes and cognitive developmentand educational attainment, particularly for children
66
66 Since only short-term benefits are considered in this analysis, education participation will present an extra cost to the state in theform of lower tax receipts than if these individuals joined the workforce and higher levels of government expenditure on educationand training. However, since over the long term the benefits are expected to far outweigh these costs, the net effect is not consideredin this analysis.
67 Other direct employment effects not included here include the increase in employment within the childcare sector as the number ofservices provided increases or higher earnings within the sector due to better training yielding an increased return to the exchequer inthe form of tax revenues.
68 These costs are not out of line with Daycare Trust (2005) model for early years education and care proposed for the UK which found anet economic cost ranging between 0.7 and 1.3 per cent of GDP.
69 Similar results were found by Ashenfelter and Krueger (1994) and Ashenfelter and Zimmerman (1993) for the US.
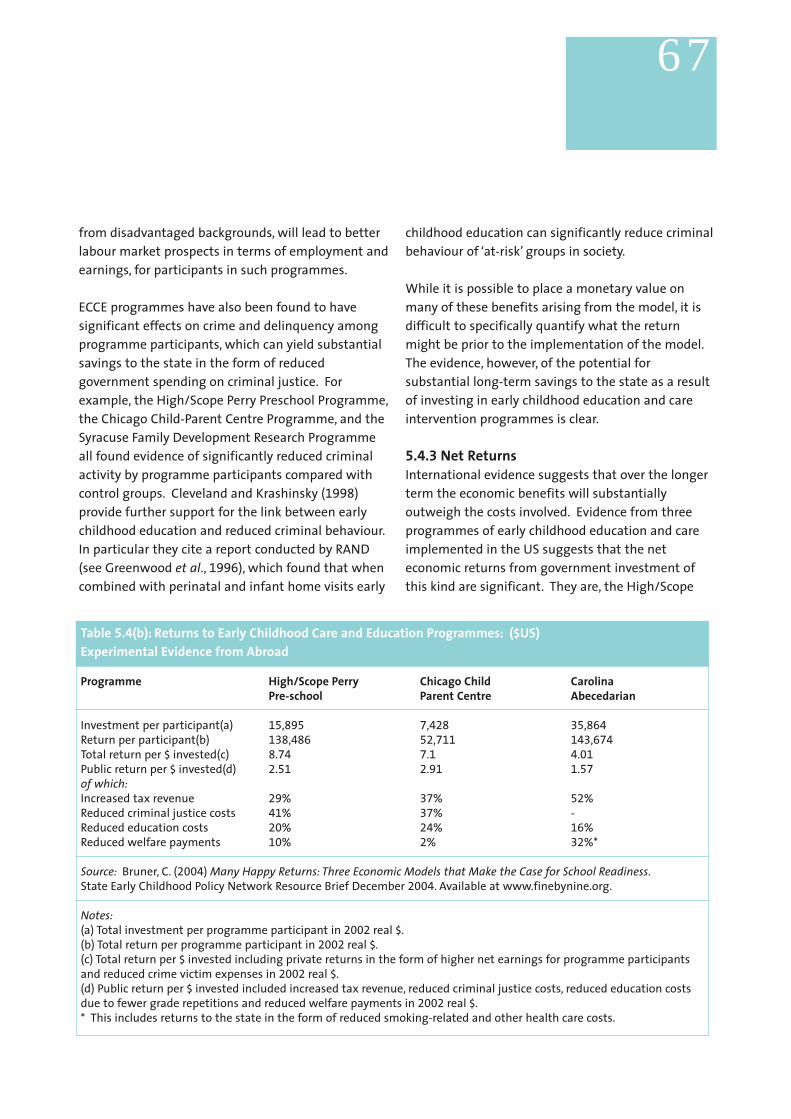
from disadvantaged backgrounds, will lead to betterlabour market prospects in terms of employment andearnings, for participants in such programmes.
ECCE programmes have also been found to havesignificant effects on crime and delinquency amongprogramme participants, which can yield substantialsavings to the state in the form of reducedgovernment spending on criminal justice. Forexample, the High/Scope Perry Preschool Programme,the Chicago Child-Parent Centre Programme, and theSyracuse Family Development Research Programmeall found evidence of significantly reduced criminalactivity by programme participants compared withcontrol groups. Cleveland and Krashinsky (1998)provide further support for the link between earlychildhood education and reduced criminal behaviour.In particular they cite a report conducted by RAND(see Greenwood et al., 1996), which found that whencombined with perinatal and infant home visits early
childhood education can significantly reduce criminalbehaviour of ‘at-risk’ groups in society.
While it is possible to place a monetary value onmany of these benefits arising from the model, it isdifficult to specifically quantify what the returnmight be prior to the implementation of the model.The evidence, however, of the potential forsubstantial long-term savings to the state as a resultof investing in early childhood education and careintervention programmes is clear.
5.4.3 Net ReturnsInternational evidence suggests that over the longerterm the economic benefits will substantiallyoutweigh the costs involved. Evidence from threeprogrammes of early childhood education and careimplemented in the US suggests that the neteconomic returns from government investment ofthis kind are significant. They are, the High/Scope
67
Table 5.4(b): Returns to Early Childhood Care and Education Programmes: ($US)Experimental Evidence from Abroad
Programme High/Scope Perry Chicago Child CarolinaPre-school Parent Centre Abecedarian
Investment per participant(a) 15,895 7,428 35,864
Return per participant(b) 138,486 52,711 143,674
Total return per $ invested(c) 8.74 7.1 4.01
Public return per $ invested(d) 2.51 2.91 1.57
of which:Increased tax revenue 29% 37% 52% Reduced criminal justice costs 41% 37% - Reduced education costs 20% 24% 16% Reduced welfare payments 10% 2% 32%*
Source: Bruner, C. (2004) Many Happy Returns: Three Economic Models that Make the Case for School Readiness.State Early Childhood Policy Network Resource Brief December 2004. Available at www.finebynine.org.
Notes:(a) Total investment per programme participant in 2002 real $.(b) Total return per programme participant in 2002 real $.(c) Total return per $ invested including private returns in the form of higher net earnings for programme participantsand reduced crime victim expenses in 2002 real $.(d) Public return per $ invested included increased tax revenue, reduced criminal justice costs, reduced education costsdue to fewer grade repetitions and reduced welfare payments in 2002 real $.* This includes returns to the state in the form of reduced smoking-related and other health care costs.
Perry Preschool Project, the Chicago Child-ParentCenters and the Carolina Abecedarian Early ChildhoodIntervention Programme. Table 5.4(b) summarizesthe public returns to each of these programmesunder each category considered above.
Each programme yielded a significant net publicreturn of between $1.57 and $2.91 per dollar invested(2002 $ values). Of this return the most significantsavings were in reduced criminal justice costs (41% inthe case of the High/Scope Perry Pre-school Project)and in increased tax revenue (52% in the case of theCarolina Abecedarian Programme).
5.5 ConclusionThe Model outlined in this chapter aims to supportparental choice around child-rearing and labour marketactivity while simultaneously providing equity of accessto early education for all children regardless of parentalmeans. Such a strategy will assist in ensuring that allyoung children in Ireland are eligible for and have accessto quality early education and care to support theirdevelopmental needs. The proposed Model alsoprovides a variety of care options for all children frombirth to fourteen years, to facilitate parents wishing toavail of work and training opportunities. The costsassociated with implementing the Model aresignificant, amounting to just less than 1% of GDPannually. However, the required level of Governmentinvestment to implement the Model is not out of linewith other developed countries and would bring Irelandup to international standards. Nor is it out of line withcurrent levels of investment at primary, second andthird level education. The Government’s current lowlevel of investment in early childhood education andcare of approximately 0.4% of GDP, highlights theinadequacies in the extent of current Governmentsupport for early years education and care and out ofschool care for those requiring it. The argument toaddress this deficiency is significantly strengthened bythe international evidence of the proven long-termbenefits, economic and social, that investments of thiskind can yield to children, parents and society. The longterm returns to the state can contribute significantly togovernment social policy objectives by facilitating theredistribution of income, reducing poverty, increasingequality of opportunity and access, and promotingsocial inclusion. The emergence of a clear message fromthe academic literature, that investment in early yearseducation and childcare, is far more productive thaninvestments made later in life, further supports theneed for a model of the kind proposed to be givenserious consideration by policymakers interested inimproving long-term social and economic outcomes forsociety as a whole.70
68
70 See Heckman and Cunha (2005) for example.
69
appendices

70appendix 1
Once-off Funding in Support of Capital and Equipment Grants Under the QuebecLow-Fee Day Care Programme (Converted to Euro for Comparative Purposes)
Objective
For professional services incurred by the project manager in setting up a facility($8,000 [¤ 5,730]).
- the lesser of 40% of the actual cost, or $3,650 [¤ 2,614] per space for the first 29
spaces, plus $2,000 [¤ 1,432] per additional space, plus $80 [¤ 57] per space forthe family childcare component
- for a tenant childcare centre wishing to purchase the building to avoid evictionfrom the premises, the grant is limited to 40% of the actual costs or $73,000
[¤ 52,281]
The lesser of the actual costs, or $2,300 [¤ 1,647] per new space, plus $80 [¤ 57] perspace for the family day care component when administrative premises arehoused in facility.
The lesser of the actual costs of $1,250 [¤ 895] per new space, plus $80 [¤ 57] perspace for the family childcare component when administrative premises arehoused in facility.
The lesser of the actual costs, or $10,000 [¤ 7,162] for the first seven spaces, plus$275 [¤ 197] per additional space, and $80 [¤ 57] per space for the family childcarecomponent ($40 [¤ 29] per space in lease facility) when administrative premisesare housed in facility.
An owned day care centre: 40% of certified actual costs or $3,650 [¤ 2,614] perspace for first 29 spaces, plus $2,000 [¤ 1,432] per additional space A tenant day care centre: the lesser of certified actual costs or $34,000 [¤ 24,350]for first seven spaces plus $1,200 [¤ 859] per additional space
$750 [¤ 537] per space
Grant Type
One Time Funding
Development grants
Grants for purchase of property orconstruction of a facility
Grants for enlarging facilities (to increase maximum number ofchildren, if it involves increasingground area of building or surface ofexisting facility)
Grants for refitting facilities (to helpincrease maximum number ofspaces or add admin premises)
Compliance Grants (to help renovateleased/owned facility to complywith legal and/or regulationrequirements)
Grants to acquire assets of day carecentre
To purchase intangible assets
(Source: Friendly, Beach, 2005)
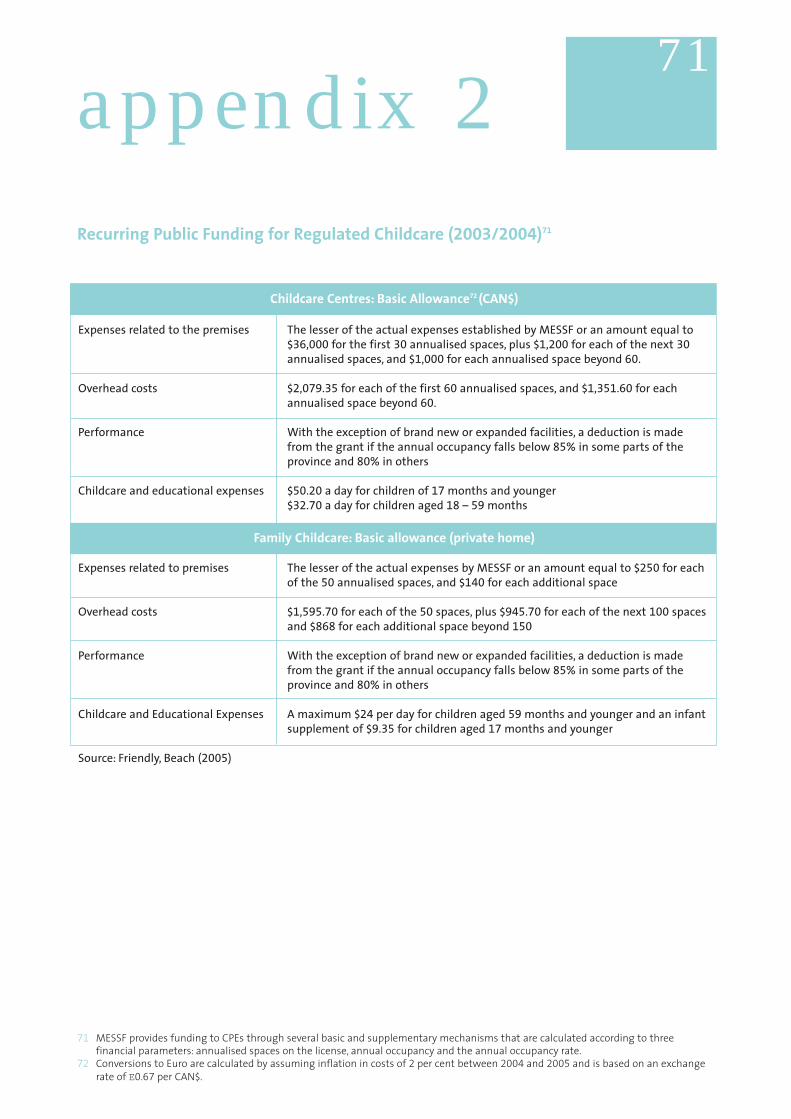
71
71 MESSF provides funding to CPEs through several basic and supplementary mechanisms that are calculated according to threefinancial parameters: annualised spaces on the license, annual occupancy and the annual occupancy rate.
72 Conversions to Euro are calculated by assuming inflation in costs of 2 per cent between 2004 and 2005 and is based on an exchangerate of E0.67 per CAN$.
appendix 2
Recurring Public Funding for Regulated Childcare (2003/2004)71
The lesser of the actual expenses established by MESSF or an amount equal to$36,000 for the first 30 annualised spaces, plus $1,200 for each of the next 30
annualised spaces, and $1,000 for each annualised space beyond 60.
$2,079.35 for each of the first 60 annualised spaces, and $1,351.60 for eachannualised space beyond 60.
With the exception of brand new or expanded facilities, a deduction is madefrom the grant if the annual occupancy falls below 85% in some parts of theprovince and 80% in others
$50.20 a day for children of 17 months and younger$32.70 a day for children aged 18 – 59 months
The lesser of the actual expenses by MESSF or an amount equal to $250 for eachof the 50 annualised spaces, and $140 for each additional space
$1,595.70 for each of the 50 spaces, plus $945.70 for each of the next 100 spacesand $868 for each additional space beyond 150
With the exception of brand new or expanded facilities, a deduction is madefrom the grant if the annual occupancy falls below 85% in some parts of theprovince and 80% in others
A maximum $24 per day for children aged 59 months and younger and an infantsupplement of $9.35 for children aged 17 months and younger
Expenses related to the premises
Overhead costs
Performance
Childcare and educational expenses
Expenses related to premises
Overhead costs
Performance
Childcare and Educational Expenses
Source: Friendly, Beach (2005)
Childcare Centres: Basic Allowance72 (CAN$)
Family Childcare: Basic allowance (private home)

Assumptions – Maternity Leave● Costs are based on the current maximum
payment of ¤249 per week with inflation of 2 %assumed per annum.73
● The number of births in each year is based on theCentral Statistics Office (2004) Population andLabour Force Projections 2006-2036.74
● It is assumed that a total of 50% of mothers willbe eligible for payments in each year. This is basedon the fact that in 2002, 52% of mothers were inemployment (CSO, 2002) and as such werepotentially eligible for maternity benefit(assuming that they paid the required amount ofPRSI).75 However, based on 2003 statistics, thenumbers of mothers availing of maternity benefitamounted to only 49% of births in that year.
● It is proposed that maternity benefit is extendedto 20 weeks in Year 1 (2006), 23 weeks in Year 2(2007), and 26 weeks in Year 3 (2008) withprojected total and incremental costs presentedthrough to 2015.
Assumptions - 5 Days Paid Paternity Leave● Costs are based on the same rate as maternity
benefit (¤249 per week or ¤49.80 per day) withinflation of 2% assumed per annum.
● The number of fathers of newborn babies in eachyear is based on the total number of births (asbefore).
● Costs are presented for the total estimatednumbers of fathers and an assumed 50% uptakein line with the assumptions made for maternitybenefit.
● It is proposed that 3 days paid paternity leave isgranted in Year 1 (2006), 4 days Year 2 (2007) and5 days in Year 3 (2008), with projected total costspresented through to 2015.
Assumptions – Parental Leave● Costs are based on the same rate as maternity
benefit (¤249 per week) with inflation of 2%assumed per annum.
● Previous assumptions made on numbers ofeligible parents and uptake of places are alsoapplied in the case of parental leave.
● It is proposed that 4 weeks paid parental leave isgranted in Year 4 (2007), with an increase of 4weeks per annum through to 2012, with the finaltwo weeks introduced in 2013, with projectedtotal costs presented through to 2015.
Assumptions – Early Childhood Education and Care● Costs are based on the actual weekly cost that
families currently pay for childcare places. Thiscost takes no account of the sunk costs76 ofexpanding the childcare services sector, forexample capital requirements, staff training, all ofwhich are not covered by the rate that parentscurrently pay for childcare services. It is assumedthat the cost of expanding and setting up newfacilities to provide these places will be coveredunder the Government’s continued commitmentto the development of early education andchildcare in Ireland under the auspices of theEOCP. Furthermore, it is assumed that theprovision of new high quality childcare placesdoes not impact on the cost of the service.
● Given that childcare costs in Ireland are notregulated, there is a significant lack of accuratedata available on the operational costs ofchildcare services. A number of studies, havehowever, been conducted assessing childcare costsaccording to region (FCCC Census), costs by groupsof parents (ICTU members) and random samplesof the population (CSO). This research uses data
72
73 Not all mothers will be eligible for this amount. As such, this can be considered an upper bound to the level of payments that thegovernment can expect to make under the programme.
74 Projections are based on the Fertility 1 (an increase in the fertility rate to 2.0 by 2011 to remain constant thereafter) and Migration 1(immigration continuing at a high level to 2016 at and moderating thereafter) assumptions as defined by the CSO. As such, theyrepresent upper bounds to the potential cost of implementation of the programme.
75 In addition, mothers already receiving certain welfare payments (for example, one-parent family payment) are entitled to a half ratematernity benefit. Statistics on this are not currently available and as such are not included in the model.
76 Sunk costs refer to irrecoverable expenditures that most often accrue at the start-up stage of a new enterprise.
appendix 3

from four recent studies: the Quarterly NationalHousehold Survey (2002), the Irish Congress ofTrade Union (2002) report, the National Children’sNurseries Association (2002) report and the FingalCounty Childcare Committee (2005) report, andbases costs on a weighted average for urban andrural areas to provide as accurate data as possibleon current costs (given the limited researchavailable). The above table presents a summary ofthe average weekly costs assumed for each servicein 2002. An annual increase of 2% per annum isassumed to account for inflation in costs. Due tothe substantial difference in the costs of childcareservices in Dublin compared with other areas,costs are disaggregated to capture this disparity.77
● Due to the limited amount of informationavailable on the current costs and levels of usageof childminding services in Ireland, the costsassociated with providing these services are notexplicitly included in the model. While,childminding tends to have fewer operating costscompared with centre-based childcare, in thismodel it is assumed that the government’s qualityinvestment in the childcare sector will extend tochildminders. As a result, it is assumed that thecost of childminding will be the same as otherservices. It is assumed that childminding accountsfor 50% of total childcare provision in Ireland.
● The total number of children in each age-group iscalculated based on projections from the CentralStatistics Office (2004) Population and LabourForce Projections 2006-2036. The age groupsdefined by the CSO are 0-4 years, 5-9 years and10-14 years. It is assumed that the numbers ofchildren are evenly spread across each individualage. Divisions between Dublin and other regionsare based on the Central Statistics Office (2001)Regional Population Projections 2001-2031.
● The number of required childcare places each yearwill be based on the assumed level of uptake ofthese places. This will be dependent on projectedfemale labour force participation rates. Based onstatistics from Quarterly National HouseholdSurvey (2003) childcare supplement it is estimatedthat 182,000 or 52% of mothers with children areat work. It is projected that this will increase to60% by 2010 in line with the targets set out in theLisbon Strategy, 2% per annum from 2007 to2010. Between 2011 and 2015 it is projected thatthis rate will increase to 65%, the current rate offemale participation for women without children,1% per annum from 2011 to 2015. Due to a lackof information on the projected increase in thenumber of new families each year, annualincrements in the required number of childcareplaces will build on the 2002 baseline numbers
73
77 These studies produce a wide range of costs, for example, weekly cost estimates for full day care services range from ¤ 120 to ¤ 208 inDublin and from ¤ 80 to ¤ 98 for rural areas. The CSO produces the lowest estimates in all cases with each of the other studiesproducing estimates that are substantially higher. A more comprehensive estimate of costs is used here combining data gatheredfrom all studies.
Average Cost of Childcare Provision in Ireland (¤ )
Dublin City Other Weighted Average
12-35 months Weekly Cost (Full Day Care) 164.34 88.61 108.79
Hourly Cost (Full Day Care) 4.11 2.22 2.72
3 -4 years Weekly Cost (Montessori) 51.4 51.4 51.4Hourly Cost (Montessori) 2.57 2.57 2.57
3-14 years Weekly Cost (After School) 90.15 51.4 61.71
Hourly Cost (After School) 2.25 1.29 1.54

and thereby assume that the number of familieswith children remains constant over time. Shouldthe number of families with children increase overtime, to achieve a model that provides childcareplaces for all mothers targeted to enter intoemployment or education and training, a greaternumber of childcare places would be required.
● In computing the potential requirement ofmothers entering into the labour force a numberof demographic assumptions have to be made.
In 2002, 45% of families had one child, 36%had two children, 14% had three children and5% had four or more children (CSO, 2003).These proportions are assumed to remainconstant over time.The model assumes that 65% of parents placetheir children in full-time care (50 hours perweek) while 35% of parents place theirchildren in part-time care (30 hours per week).This division is based on the proportion ofmothers in part and full time employment inIreland in the third quarter of 2004 (CSO,2004). These proportions are assumed toremain constant over time.In 2002, 17% of families with children werelone parents (CSO, 2003). This proportion isalso assumed to remain constant over time.
● 50% of the total cost of childcare services will beuniversally subsidised. An extra subsidy will begranted based on parents income levelascertained through the use of a carefullydesigned income test. The additional subsidy willbe granted on a sliding scale for three differentcategories.
Minimum wage earners, and thoseparticipating in education and training willreceive a 100% subsidy. It is estimated thatsuch a subsidy would be granted to 8.4% offemale workers. This corresponds to theproportion of working women who are at riskof poverty based on the EU-SILC survey Earners on the 20% marginal rate of tax willreceive a 75% subsidy. The Department ofFinance estimates that 32.6% of the countries
workforce pay tax at the higher marginal rateIt is therefore estimated that 59% of femaleworkers will pay tax at the standard rate.Earners on the 42% marginal rate of tax willonly receive the 50% subsidy. This will accountfor the remaining 32.6% of female workers.
Assumptions – Returns to Government Investment:impact on exchequer of increased female labourforce participation● Upon entering employment, it is assumed that
females enter into one of three earnings groups:Minimum wage: In 2005, the minimum wagewas increased to ¤7.65 per hour. Based on a40-hour working week for full time workersthis amounts to a weekly minimum wage of¤306. It is assumed that this increasesannually at a rate of 2% per annum in line withinflation.Average industrial earnings: In 2005, averageindustrial earnings were estimated at ¤561.41
per week (Department of Finance, 2005), or¤14.04 per hour based on a 40-hour workingweek. It is assumed that this increasesannually at a rate of 2% per annum in line withinflation.Higher earnings group: It is assumed that acertain proportion of the numbers enteringinto employment as a result of the measuresproposed in this model will do so at the higherrate of tax. It is assumed that averageearnings of females in this category are25%cent higher than the average industrialwage resulting in an average weekly wage of¤701.76 for this group of workers. Thisamounts to an average hourly rate of ¤17.54
based on a 40 hour working week. It isassumed that this increases annually at a rateof 2% per annum in line with inflation.
In the case of couples it is assumed that the spouse isworking full-time and earns the average industrialwage.
● Information relating to the appropriate tax rates,
74
bands and credits are taken from the website ofthe Irish Revenue Commissioner (seewww.revenue.ie) and relate to 2005. While taxrates are assumed to remain constant over theperiod, tax bands and credits are assumed toincrease by 2 per cent per annum in line withinflation.
● It is assumed that annual increases in thenumbers employed come from the pool of femaleswith children that are not economically active.This is in line with the assumptions made byCleveland and Krashinsky (1998) and DaycareTrust (2005) in quantifying the employmenteffects of introducing similar models of childcarein Canada and the UK respectively. As a result,savings to the state in the form of reducednumbers claiming unemployment benefit are notconsidered.79
● The assumptions relating to the demography offemales with children proposed within the modeland outlined above are also assumed to applyhere. They can be summarised as follows:
Lone parents constitute 17% of families withchildren.5% of the increase in participation rates isassumed to account for women entering intoeducation and training thereby notcontributing to tax revenue (all assumed to beminimum wage earners). 3% of the increase inparticipation rates is assumed to be at theminimum wage, 59% at the standard 20% rateof tax and 33% at the higher 42% tax rate.65% of the increase in employment is assumedto be full-time (40 hours per week) while 35%is assumed to be part-time (16 hours perweek).
75
79 The extent to which the model may have the potential to entice unemployed females with children out of unemployment in to thelabour force is discussed in Chapter 4. The savings to the state may therefore be understated since there would be a reduction in thenumbers claiming unemployment benefit.

76appendix 4
Tabl
e A1
:Cos
ts A
ssoc
iate
d w
ith E
xten
ding
Mat
erni
ty B
enef
itto
26
Wee
ks (¤
)
Estim
ated
Wee
kly
Det
ails
(c)
Base
line(
d)U
nive
rsal
(e)
Incr
emen
tal
Assu
med
Base
line(
h)5
0%
Incr
emen
tal
%%
Tota
lN
umbe
rRa
te (b
)(‘0
00
) (‘0
00
) Co
st(f
)El
igib
lePa
rtic
ipat
ion
(i)Co
st(j
)G
DP
Gov
ernm
ent
Year
of B
irths
(a)
(‘00
0)
Mot
hers
(g)
(‘00
0)
(‘00
0)
(k)
Expe
nditu
re (l
)
20
06
68
,00
02
53
.98
20
wee
ks
31
0,8
71
34
5,4
13
34
,54
13
4,0
00
15
5,4
36
17
2,7
06
17
,27
10
.01
%
0.0
3%
2
00
76
8,0
00
25
9.0
62
3w
eeks
3
17
,08
94
05
,16
98
8,0
80
34
,00
01
58
,54
42
02
,58
54
4,0
40
0.0
3%
0
.08
%
20
08
68
,00
02
64
.24
26
wee
ks
32
3,4
30
46
7,1
78
14
3,7
47
34
,00
01
61
,71
62
33
,58
97
1,8
73
0.0
5%
0
.12
%
20
09
68
,00
02
69
.53
26
wee
ks
32
9,8
99
47
6,5
21
14
6,6
22
34
,00
01
64
,95
02
38
,26
17
3,3
11
0.0
5%
0
.12
%
20
10
68
,00
02
74
.92
26
wee
ks
33
6,4
97
48
6,0
52
14
9,5
54
34
,00
01
68
,24
92
43
,02
67
4,7
77
0.0
5%
0
.12
%
20
11
71
,00
02
80
.41
26
wee
ks
35
8,3
70
51
7,6
45
15
9,2
75
35
,50
01
79
,18
52
58
,82
27
9,6
38
0.0
5%
0
.13
%
20
12
71
,00
02
86
.02
26
wee
ks
36
5,5
37
52
7,9
98
16
2,4
61
35
,50
01
82
,76
82
63
,99
98
1,2
30
0.0
5%
0
.13
%
20
13
71
,00
02
91
.74
26
wee
ks
37
2,8
48
53
8,5
58
16
5,7
10
35
,50
01
86
,42
42
69
,27
98
2,8
55
0.0
5%
0
.12
%
20
14
71
,00
02
97
.58
26
wee
ks
38
0,3
05
54
9,3
29
16
9,0
24
35
,50
01
90
,15
22
74
,66
48
4,5
12
0.0
5%
0
.12
%
20
15
71
,00
03
03
.53
26
wee
ks
38
7,9
11
56
0,3
16
17
2,4
05
35
,50
01
93
,95
52
80
,15
88
6,2
02
0.0
5%
0
.12
%
Not
es:
(a) E
stim
ated
num
ber o
f birt
hs in
eac
h ye
ar b
ased
on
the
Cent
ral S
tatis
tics
Off
ice
(20
04
) Pop
ulat
ion
and
Labo
ur F
orce
Pro
ject
ions
200
6-20
36(S
ee A
ppen
dix
Thre
e).
(b) C
urre
ntm
axim
um w
eekl
y co
ntrib
utio
n w
ith in
flatio
n of
2%
ass
umed
per
ann
um (s
ee A
ppen
dix
Thre
e).
(c) D
etai
ls o
f im
plem
enta
tion
stra
tegy
in e
ach
year
.(d
) Cos
ts b
ased
on
curr
entp
rovi
sion
of 1
8w
eeks
mat
erni
ty b
enef
itfo
r all
birt
hs in
eac
h ye
ar.
(e) C
osto
f ext
endi
ng m
ater
nity
ben
efit
in a
ccor
danc
e w
ith d
etai
ls p
rese
nted
in c
olum
n (c
) for
all
birt
hs in
eac
h ye
ar.
(f) A
dditi
onal
cos
tof i
mpl
emen
ting
prop
osal
uni
vers
ally
(col
umn
(e) m
inus
col
umn
(d)).
(g) T
otal
num
ber o
f elig
ible
mot
hers
in e
ach
year
(50
% o
f col
umn
(a))
(h) C
osts
bas
ed o
n cu
rren
tpro
visi
on o
f 18
wee
ks m
ater
nity
ben
efit
for m
othe
rs a
ssum
ed to
be
elig
ible
for p
aym
ent.
(i) C
osto
f ext
endi
ng m
ater
nity
ben
efit
in a
ccor
danc
e w
ith d
etai
ls p
rese
nted
in c
olum
n (c
) for
mot
hers
ass
umed
to b
e el
igib
le fo
r pay
men
t.(j
) Add
ition
al c
osto
f im
plem
entin
g pr
opos
al to
elig
ible
mot
hers
(col
umn
(i) m
inus
col
umn
(h)).
(k) T
otal
incr
emen
tal c
osto
f im
plem
entin
g pr
opos
al to
elig
ible
mot
hers
(col
umn
(j))
as a
per
cent
age
of G
DP
(cur
rent
pric
es).
(l) To
tal i
ncre
men
tal c
osto
f im
plem
entin
g pr
opos
al to
elig
ible
mot
hers
(col
umn
(j))
as a
per
cent
age
of to
tal g
over
nmen
texp
endi
ture
(cur
rent
pric
es).
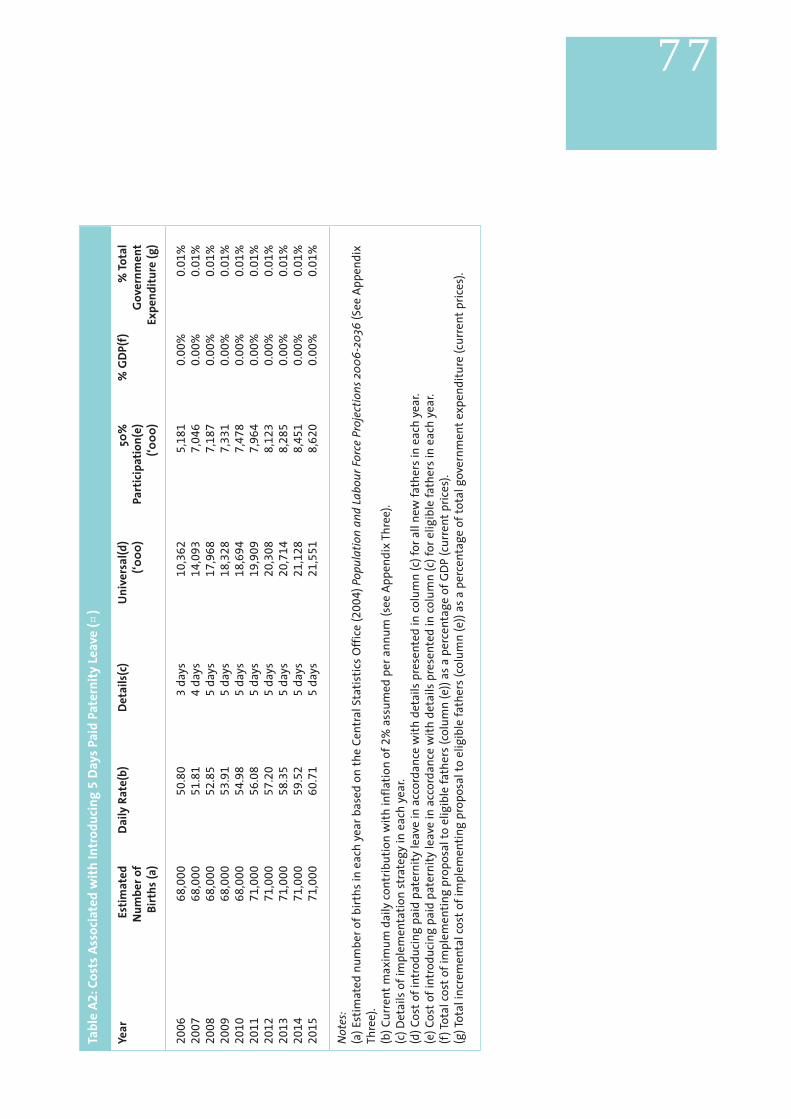
77Ta
ble
A2:C
osts
Ass
ocia
ted
with
Intr
oduc
ing
5D
ays
Paid
Pat
erni
ty L
eave
(¤)
Year
Es
timat
ed
Dai
ly R
ate(
b)D
etai
ls(c
)U
nive
rsal
(d)
50%
%
GD
P(f)
% To
tal
Num
ber o
f(‘0
00)
Part
icip
atio
n(e)
Gov
ernm
ent
Birt
hs (a
)(‘0
00)
Expe
nditu
re (g
)
20
06
68
,00
05
0.8
03
days
1
0,3
62
5,1
81
0.0
0%
0
.01
%
20
07
68
,00
05
1.8
14
days
1
4,0
93
7,0
46
0.0
0%
0
.01
%
20
08
68
,00
05
2.8
55
days
1
7,9
68
7,1
87
0.0
0%
0
.01
%
20
09
68
,00
05
3.9
15
days
1
8,3
28
7,3
31
0.0
0%
0
.01
%
20
10
68
,00
05
4.9
85
days
1
8,6
94
7,4
78
0.0
0%
0
.01
%
20
11
71
,00
05
6.0
85
days
1
9,9
09
7,9
64
0.0
0%
0
.01
%
20
12
71
,00
05
7.2
05
days
2
0,3
08
8,1
23
0.0
0%
0
.01
%
20
13
71
,00
05
8.3
55
days
2
0,7
14
8,2
85
0.0
0%
0
.01
%
20
14
71
,00
05
9.5
25
days
2
1,1
28
8,4
51
0.0
0%
0
.01
%
20
15
71
,00
06
0.7
15
days
2
1,5
51
8,6
20
0.0
0%
0
.01
%
Not
es:
(a) E
stim
ated
num
ber o
f birt
hs in
eac
h ye
ar b
ased
on
the
Cent
ral S
tatis
tics
Off
ice
(20
04
) Pop
ulat
ion
and
Labo
ur F
orce
Pro
ject
ions
200
6-20
36(S
ee A
ppen
dix
Thre
e).
(b) C
urre
ntm
axim
um d
aily
con
trib
utio
n w
ith in
flatio
n of
2%
ass
umed
per
ann
um (s
ee A
ppen
dix
Thre
e).
(c) D
etai
ls o
f im
plem
enta
tion
stra
tegy
in e
ach
year
.(d
) Cos
tof i
ntro
duci
ng p
aid
pate
rnity
leav
e in
acc
orda
nce
with
det
ails
pre
sent
ed in
col
umn
(c) f
or a
ll ne
w fa
ther
s in
eac
h ye
ar.
(e) C
osto
f int
rodu
cing
pai
d pa
tern
ity le
ave
in a
ccor
danc
e w
ith d
etai
ls p
rese
nted
in c
olum
n (c
) for
elig
ible
fath
ers
in e
ach
year
.(f
) Tot
al c
osto
f im
plem
entin
g pr
opos
al to
elig
ible
fath
ers
(col
umn
(e))
as a
per
cent
age
of G
DP
(cur
rent
pric
es).
(g) T
otal
incr
emen
tal c
osto
f im
plem
entin
g pr
opos
al to
elig
ible
fath
ers
(col
umn
(e))
as a
per
cent
age
of to
tal g
over
nmen
texp
endi
ture
(cur
rent
pric
es).

78Ta
ble
A3:C
osto
f Im
plem
entin
g Pa
id P
aren
tal L
eave
Mod
el (¤
)
Year
Es
timat
ed
Wee
kly
D
etai
ls(c
) U
nive
rsal
(d)
Elig
ible
5
0%
%
GD
P (g
)%
Tota
lN
umbe
r of
Rate
(b)
(‘00
0)
Pare
nts(
e)Pa
rtic
ipat
ion(
f)G
over
nmen
tBi
rths
(a)
(50
%)
Expe
nditu
re(h
)
20
06
68
,00
02
53
.98
Not
appl
icab
le
- -
- -
- 2
00
76
8,0
00
25
9.0
64
wee
ks
70
,46
43
4,0
00
35
,23
20
.02
%
0.0
6%
2
00
86
8,0
00
26
4.2
48
wee
ks
14
3,7
47
34
,00
07
1,8
73
0.0
5%
0
.12
%
20
09
68
,00
02
69
.53
12
wee
ks
21
9,9
36
34
,00
01
09
,96
80
.07
%
0.1
8%
2
01
06
8,0
00
27
4.9
21
6w
eeks
2
99
,11
33
4,0
00
14
9,5
56
0.0
9%
0
.24
%
20
11
71
,00
02
80
.41
20
wee
ks
39
8,1
82
35
,50
01
99
,09
10
.12
%
0.3
1%
2
01
27
1,0
00
28
6.0
22
4w
eeks
4
87
,37
83
5,5
00
24
3,6
89
0.1
4%
0
.37
%
20
13
71
,00
02
91
.74
26
wee
ks
53
8,5
52
35
,50
02
69
,27
60
.15
%
0.4
0%
2
01
47
1,0
00
29
7.5
82
6w
eeks
5
49
,33
33
5,5
00
27
4,6
66
0.1
5%
0
.40
%
20
15
71
,00
03
03
.53
26
wee
ks
56
0,3
16
35
,50
02
80
,15
80
.15
%
0.4
0%
Not
es:
(a) E
stim
ated
num
ber o
f birt
hs in
eac
h ye
ar b
ased
on
the
Cent
ral S
tatis
tics
Off
ice
(20
04
) Pop
ulat
ion
and
Labo
ur F
orce
Pro
ject
ions
200
6-20
36(S
ee A
ppen
dix
Thre
e).
(b) C
urre
ntm
axim
um w
eekl
y co
ntrib
utio
n w
ith in
flatio
n of
2%
ass
umed
per
ann
um (s
ee A
ppen
dix
Thre
e).
(c) D
etai
ls o
f im
plem
enta
tion
stra
tegy
in e
ach
year
.(d
) Cos
tof i
ntro
duci
ng p
aren
tal l
eave
in a
ccor
danc
e w
ith d
etai
ls p
rese
nted
in c
olum
n (c
) for
all
birt
hs in
eac
h ye
ar.
(e) T
otal
num
ber o
f elig
ible
par
ents
in e
ach
year
(50
% o
f col
umn
(a))
(f) C
osto
f int
rodu
cing
par
enta
l lea
ve in
acc
orda
nce
with
det
ails
pre
sent
ed in
col
umn
(c) f
or e
ligib
le p
aren
ts in
eac
h ye
ar.
(g) T
otal
cos
tof i
mpl
emen
ting
prop
osal
to e
ligib
le p
aren
ts (c
olum
n (f
)) as
a p
erce
ntag
e of
GD
P (c
urre
ntpr
ices
).(h
) Tot
al in
crem
enta
l cos
tof i
mpl
emen
ting
prop
osal
to e
ligib
le p
aren
ts (c
olum
n (f
)) as
a p
erce
ntag
e of
tota
l gov
ernm
ente
xpen
ditu
re (c
urre
ntpr
ices
).
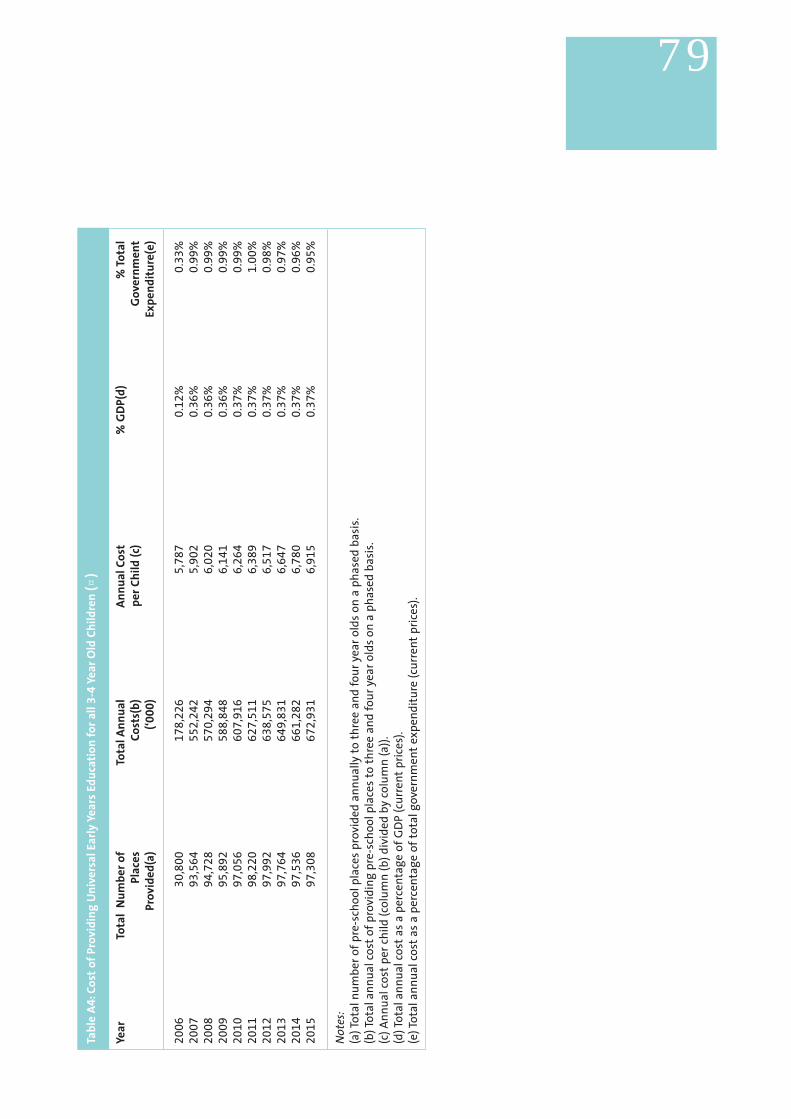
79Ta
ble
A4:C
osto
f Pro
vidi
ng U
nive
rsal
Ear
ly Y
ears
Edu
catio
n fo
r all
3-4
Year
Old
Chi
ldre
n (¤
)
Year
To
tal
Num
ber o
f To
tal A
nnua
l An
nual
Cos
t%
GD
P(d)
%
Tota
lPl
aces
Cost
s(b)
per C
hild
(c)
Gov
ernm
ent
Prov
ided
(a)
(‘00
0)
Expe
nditu
re(e
)
20
06
30
,80
01
78
,22
65
,78
70
.12
%
0.3
3%
2
00
79
3,5
64
55
2,2
42
5,9
02
0.3
6%
0
.99
%
20
08
94
,72
85
70
,29
46
,02
00
.36
%
0.9
9%
2
00
99
5,8
92
58
8,8
48
6,1
41
0.3
6%
0
.99
%
20
10
97
,05
66
07
,91
66
,26
40
.37
%
0.9
9%
2
01
19
8,2
20
62
7,5
11
6,3
89
0.3
7%
1
.00
%
20
12
97
,99
26
38
,57
56
,51
70
.37
%
0.9
8%
2
01
39
7,7
64
64
9,8
31
6,6
47
0.3
7%
0
.97
%
20
14
97
,53
66
61
,28
26
,78
00
.37
%
0.9
6%
2
01
59
7,3
08
67
2,9
31
6,9
15
0.3
7%
0
.95
%
Not
es:
(a) T
otal
num
ber o
f pre
-sch
ool p
lace
s pr
ovid
ed a
nnua
lly to
thre
e an
d fo
ur y
ear o
lds
on a
pha
sed
basi
s.(b
) Tot
al a
nnua
l cos
tof p
rovi
ding
pre
-sch
ool p
lace
s to
thre
e an
d fo
ur y
ear o
lds
on a
pha
sed
basi
s.(c
) Ann
ual c
ostp
er c
hild
(col
umn
(b) d
ivid
ed b
y co
lum
n (a
)).(d
) Tot
al a
nnua
l cos
tas
a pe
rcen
tage
of G
DP
(cur
rent
pric
es).
(e) T
otal
ann
ual c
osta
s a
perc
enta
ge o
f tot
al g
over
nmen
texp
endi
ture
(cur
rent
pric
es).

80Ta
ble
A5:C
osto
f Pro
gram
me
of S
ubsi
dise
d Ex
tend
ed C
are
for 3
-4Ye
ar O
ld C
hild
ren
(¤)
Year
Tota
l Num
ber
Tota
l Cos
tIn
crem
enta
l In
crem
enta
l To
tal
Cost
% G
DP
(g)
% To
tal
of P
lace
s50
%
Cost
Cost
Annu
alpe
rG
over
nmen
tPr
ovid
ed(a
)U
nive
rsal
Ad
ditio
nal
Addi
tiona
lCo
sts(
e)Ch
ild(f
)Ex
pend
iture
(h)
Subs
idy(
b)25
% S
ubsi
dy(c
)50
% S
ubsi
dy(d
)(‘0
00)
(‘000
) (‘0
00)
(‘000
)
20
06
25
,04
33
3,6
57
9,9
29
2,8
27
46
,41
21
,85
30
.03
%
0.0
9%
2
00
75
2,4
28
71
,87
12
1,2
02
6,0
37
99
,10
91
,89
00
.06
%
0.1
8%
2
00
85
4,3
69
76
,02
32
2,4
27
6,3
86
10
4,8
36
1,9
28
0.0
7%
0
.18
%
20
09
56
,31
18
0,3
13
23
,69
26
,74
61
10
,75
21
,96
70
.07
%
0.1
9%
2
01
05
8,2
53
84
,74
42
4,9
99
7,1
18
11
6,8
62
2,0
06
0.0
7%
0
.19
%
20
11
59
,22
48
7,8
79
25
,92
47
,38
21
21
,18
62
,04
60
.07
%
0.1
9%
2
01
26
0,1
95
91
,10
72
6,8
76
7,6
53
12
5,6
36
2,0
87
0.0
7%
0
.19
%
20
13
61
,16
69
4,4
28
27
,85
67
,93
21
30
,21
62
,12
90
.07
%
0.1
9%
2
01
46
2,1
36
97
,84
52
8,8
64
8,2
19
13
4,9
28
2,1
71
0.0
8%
0
.20
%
20
15
63
,10
71
01
,36
12
9,9
02
8,5
14
13
9,7
77
2,2
15
0.0
8%
0
.20
%
Not
es:
(a) T
otal
num
ber o
f sub
sidi
sed
exte
nded
car
e pl
aces
pro
vide
d to
thre
e an
d fo
ur y
ear o
lds.
(b) T
otal
ann
ual c
osto
f uni
vers
al s
ubsi
dy (5
0%
of c
osts
of e
xten
ded
care
pla
ces
for t
hree
and
four
yea
r old
s).
(c) I
ncre
men
tal a
nnua
l cos
tof a
dditi
onal
25
% s
ubsi
dy o
n ex
tend
ed c
are
for t
hree
and
four
yea
r old
s gr
ante
d to
par
ents
pay
ing
tax
atth
e 2
0%
rate
.(d
) Inc
rem
enta
l ann
ual c
osto
f add
ition
al s
ubsi
dise
d ex
tend
ed c
are
for t
hree
and
four
yea
r old
s gr
ante
d to
par
ents
on
the
min
imum
wag
e.(e
) Tot
al a
nnua
l cos
tof p
ropo
sed
mod
el o
f sub
sidi
sed
exte
nded
car
e fo
r thr
ee a
nd fo
ur y
ear o
lds.
(f) T
otal
ann
ual c
ostp
er c
hild
of p
ropo
sed
mod
el o
f sub
sidi
sed
exte
nded
car
e fo
r thr
ee a
nd fo
ur y
ear o
lds
(col
umn
(e) d
ivid
ed b
y co
lum
n (a
)).(g
) Tot
al a
nnua
l cos
tas
a pe
rcen
tage
of G
DP
(cur
rent
pric
es).
(h) T
otal
ann
ual c
osta
s a
perc
enta
ge o
f tot
al g
over
nmen
texp
endi
ture
(cur
rent
pric
es).

81Ta
ble
A6:C
osto
f Pro
gram
me
of S
ubsi
dise
d Fu
ll D
ay C
are
for 2
Year
Old
Chi
ldre
n (¤
)
Year
Tota
l Num
ber
Tota
l Cos
tIn
crem
enta
l In
crem
enta
l To
tal
Cost
% G
DP
% To
tal
of P
lace
s50
%
Cost
Cost
Annu
alpe
rG
over
nmen
tPr
ovid
ed(a
)U
nive
rsal
Ad
ditio
nal
Addi
tiona
lCo
sts(
e)Ch
ild (f
)Ex
pend
iture
(h)
Subs
idy(
b)25
% S
ubsi
dy(c
)50
% S
ubsi
dy(d
)(‘0
00)
(‘000
) (‘0
00)
(‘000
) (‘0
00)
20
06
- -
- -
- -
- -
20
07
- -
- -
- -
- -
20
08
- -
- -
- -
- -
20
09
28
,15
61
00
,63
52
9,6
87
8,4
53
13
8,7
76
4,9
29
0.0
9%
0
.23
%
20
10
58
,25
32
12
,37
46
2,6
50
17
,83
92
92
,86
45
,02
70
.18
%
0.4
8%
2
01
15
9,2
24
22
0,2
32
64
,96
81
8,4
99
30
3,7
00
5,1
28
0.1
8%
0
.48
%
20
12
60
,19
52
28
,31
96
7,3
54
19
,17
93
14
,85
35
,23
10
.18
%
0.4
8%
2
01
36
1,1
66
23
6,6
42
69
,80
91
9,8
78
32
6,3
29
5,3
35
0.1
9%
0
.49
%
20
14
62
,13
62
45
,20
67
2,3
36
20
,59
73
38
,13
95
,44
20
.19
%
0.4
9%
2
01
56
3,1
07
25
4,0
18
74
,93
52
1,3
37
35
0,2
91
5,5
51
0.1
9%
0
.49
%
Not
es:
(a) T
otal
num
ber o
f sub
sidi
sed
full
day
care
pla
ces
prov
ided
to tw
o ye
ar o
lds.
(b) T
otal
ann
ual c
osto
f uni
vers
al s
ubsi
dy (5
0%
of c
osts
of f
ull d
ay c
are
plac
es fo
r tw
o ye
ar o
lds)
.(c
) Inc
rem
enta
l ann
ual c
osto
f add
ition
al 2
5%
sub
sidy
on
full
day
care
for t
wo
year
old
s gr
ante
d to
par
ents
pay
ing
tax
atth
e 2
0%
rate
.(d
) Inc
rem
enta
l ann
ual c
osto
f add
ition
al 5
0%
sub
sidy
on
full
day
care
for t
wo
year
old
s gr
ante
d to
par
ents
on
the
min
imum
wag
e.(e
) Tot
al a
nnua
l cos
tof p
ropo
sed
mod
el o
f sub
sidi
sed
full
day
care
for t
wo
year
old
s.(f
) Tot
al a
nnua
l cos
tper
chi
ld o
f pro
pose
d m
odel
of s
ubsi
dise
d fu
ll da
y ca
re fo
r tw
o ye
ar o
lds
(col
umn
(e) d
ivid
ed b
y co
lum
n (a
)).(g
) Tot
al a
nnua
l cos
tas
a pe
rcen
tage
of G
DP
(cur
rent
pric
es).
(h) T
otal
ann
ual c
osta
s a
perc
enta
ge o
f tot
al g
over
nmen
texp
endi
ture
(cur
rent
pric
es).
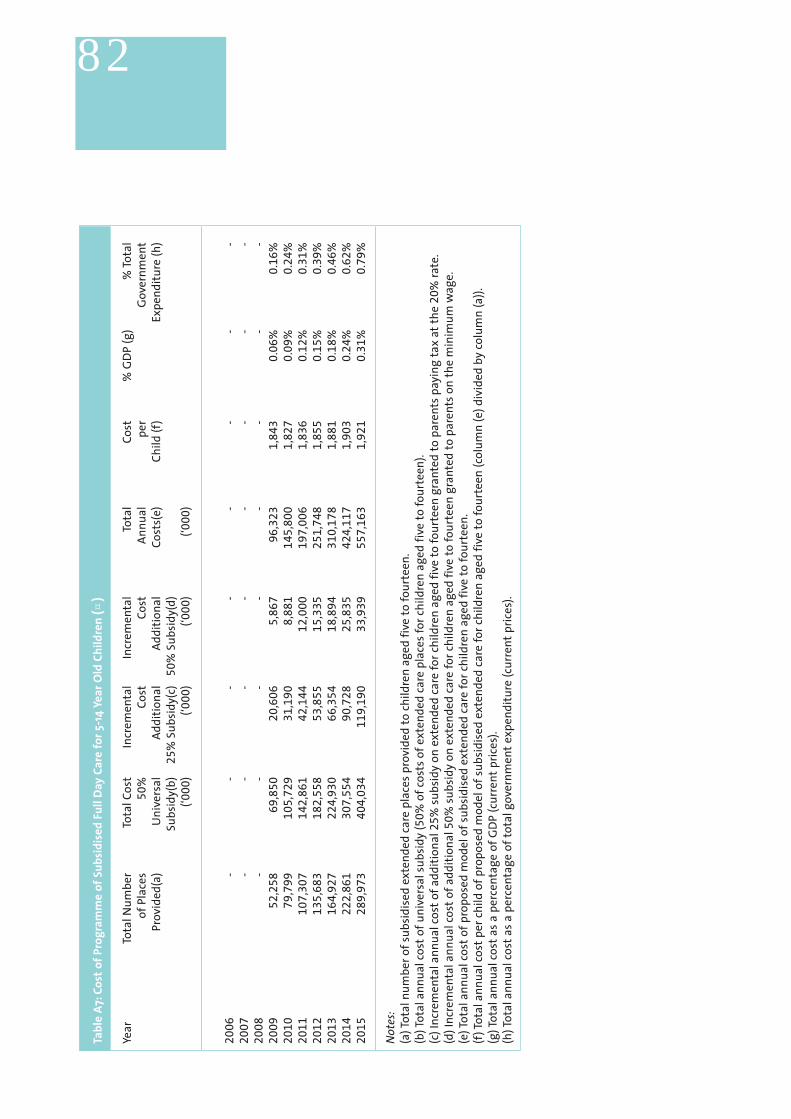
82Ta
ble
A7:C
osto
f Pro
gram
me
of S
ubsi
dise
d Fu
ll D
ay C
are
for 5
-14
Year
Old
Chi
ldre
n (¤
)
Year
Tota
l Num
ber
Tota
l Cos
tIn
crem
enta
l In
crem
enta
l To
tal
Cost
% G
DP
(g)
% To
tal
of P
lace
s5
0%
Co
stCo
stAn
nual
per
Gov
ernm
ent
Prov
ided
(a)
Uni
vers
al
Addi
tiona
lAd
ditio
nal
Cost
s(e)
Child
(f)
Expe
nditu
re (h
)Su
bsid
y(b)
25
% S
ubsi
dy(c
)5
0%
Sub
sidy
(d)
(‘00
0)
(‘00
0)
(‘00
0)
(‘00
0)
20
06
- -
- -
- -
- -
20
07
- -
- -
- -
- -
20
08
- -
- -
- -
- -
20
09
52
,25
86
9,8
50
20
,60
65
,86
79
6,3
23
1,8
43
0.0
6%
0
.16
%
20
10
79
,79
91
05
,72
93
1,1
90
8,8
81
14
5,8
00
1,8
27
0.0
9%
0
.24
%
20
11
10
7,3
07
14
2,8
61
42
,14
41
2,0
00
19
7,0
06
1,8
36
0.1
2%
0
.31
%
20
12
13
5,6
83
18
2,5
58
53
,85
51
5,3
35
25
1,7
48
1,8
55
0.1
5%
0
.39
%
20
13
16
4,9
27
22
4,9
30
66
,35
41
8,8
94
31
0,1
78
1,8
81
0.1
8%
0
.46
%
20
14
22
2,8
61
30
7,5
54
90
,72
82
5,8
35
42
4,1
17
1,9
03
0.2
4%
0
.62
%
20
15
28
9,9
73
40
4,0
34
11
9,1
90
33
,93
95
57
,16
31
,92
10
.31
%
0.7
9%
Not
es:
(a) T
otal
num
ber o
f sub
sidi
sed
exte
nded
car
e pl
aces
pro
vide
d to
chi
ldre
n ag
ed fi
ve to
four
teen
.(b
) Tot
al a
nnua
l cos
tof u
nive
rsal
sub
sidy
(50
% o
f cos
ts o
f ext
ende
d ca
re p
lace
s fo
r chi
ldre
n ag
ed fi
ve to
four
teen
).(c
) Inc
rem
enta
l ann
ual c
osto
f add
ition
al 2
5%
sub
sidy
on
exte
nded
car
e fo
r chi
ldre
n ag
ed fi
ve to
four
teen
gra
nted
to p
aren
ts p
ayin
g ta
x at
the
20
% ra
te.
(d) I
ncre
men
tal a
nnua
l cos
tof a
dditi
onal
50
% s
ubsi
dy o
n ex
tend
ed c
are
for c
hild
ren
aged
five
to fo
urte
en g
rant
ed to
par
ents
on
the
min
imum
wag
e.(e
) Tot
al a
nnua
l cos
tof p
ropo
sed
mod
el o
f sub
sidi
sed
exte
nded
car
e fo
r chi
ldre
n ag
ed fi
ve to
four
teen
.(f
) Tot
al a
nnua
l cos
tper
chi
ld o
f pro
pose
d m
odel
of s
ubsi
dise
d ex
tend
ed c
are
for c
hild
ren
aged
five
to fo
urte
en (c
olum
n (e
) div
ided
by
colu
mn
(a)).
(g) T
otal
ann
ual c
osta
s a
perc
enta
ge o
f GD
P (c
urre
ntpr
ices
).(h
) Tot
al a
nnua
l cos
tas
a pe
rcen
tage
of t
otal
gov
ernm
ente
xpen
ditu
re (c
urre
ntpr
ices
).
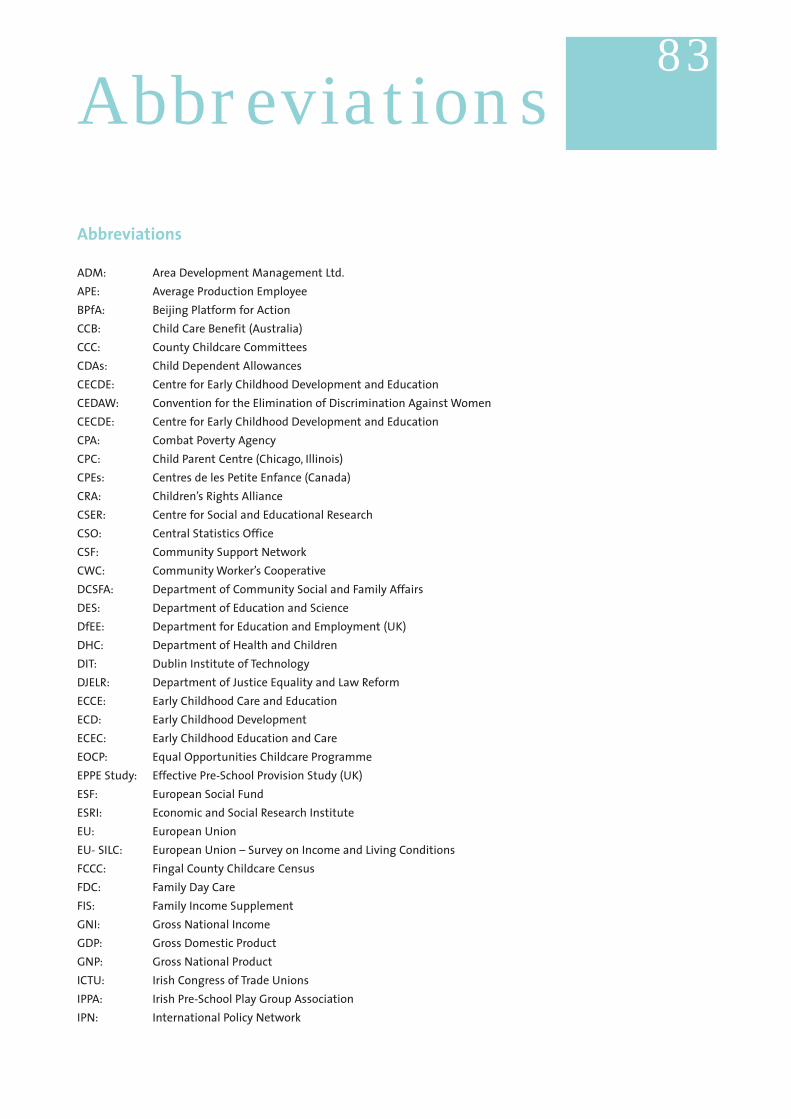
Abbreviations
ADM: Area Development Management Ltd.APE: Average Production EmployeeBPfA: Beijing Platform for Action CCB: Child Care Benefit (Australia) CCC: County Childcare CommitteesCDAs: Child Dependent AllowancesCECDE: Centre for Early Childhood Development and EducationCEDAW: Convention for the Elimination of Discrimination Against WomenCECDE: Centre for Early Childhood Development and EducationCPA: Combat Poverty AgencyCPC: Child Parent Centre (Chicago, Illinois)CPEs: Centres de les Petite Enfance (Canada)CRA: Children’s Rights AllianceCSER: Centre for Social and Educational ResearchCSO: Central Statistics Office CSF: Community Support NetworkCWC: Community Worker’s CooperativeDCSFA: Department of Community Social and Family AffairsDES: Department of Education and ScienceDfEE: Department for Education and Employment (UK)DHC: Department of Health and ChildrenDIT: Dublin Institute of TechnologyDJELR: Department of Justice Equality and Law ReformECCE: Early Childhood Care and EducationECD: Early Childhood DevelopmentECEC: Early Childhood Education and Care EOCP: Equal Opportunities Childcare ProgrammeEPPE Study: Effective Pre-School Provision Study (UK)ESF: European Social FundESRI: Economic and Social Research InstituteEU: European Union EU- SILC: European Union – Survey on Income and Living ConditionsFCCC: Fingal County Childcare CensusFDC: Family Day CareFIS: Family Income SupplementGNI: Gross National IncomeGDP: Gross Domestic ProductGNP: Gross National ProductICTU: Irish Congress of Trade UnionsIPPA: Irish Pre-School Play Group AssociationIPN: International Policy Network
83Abbreviations

MESSF: Ministère de l’Emploi, de la Solidarité sociale et de la Famille (Canada)NAPS: National Anti-Poverty StrategyNCCC: National Childcare Co-ordinating CommitteeNCNA: National Children’s Nurseries AssociationNCO: National Children’s OfficeNDP: National Development PlanNESC: National Economic and Social CouncilNESF: National Economic and Social ForumNVCOs: National Voluntary Childcare OrganisationNQF: National Quality Framework NRC: National Research CouncilNWCI: National Women’s Council of IrelandOECD: Organisation for Economic Cooperation and DevelopmentPRSI: Pay Related Social InsurancePEIP: Prenatal Early Infancy Project (US)QE: Quality in Education markQNHS: Quarterly National Household SurveyQIAS: Quality Improvement and Accreditation System (Australia)SFO: Skolefritidsordning (Denmark) TSG: Torkom Saraydarin Group (Denmark)UNESCO: United Nations Educational, Scientific, and Cultural OrganisationUNICEF: United Nations International Children’s Emergency Fund US: United States
84

Area Development Management Initiative (2003), National Childcare Census Report: Baseline data 1999-2000. ADM: Dublin.
Ashenfelter, O. & Kruger, A. (1994), Estimates of the Economic Return to Schooling From a New Sample of Twins, AmericanEconomic Review, 84:5, pp 1157-1173
Ashenfelter, O. & Zimmerman, D. (1993), Estimates of the Return to Schooling of Sibling Data, Fathers, Sons and Brothers,Working Paper 318, Industrial Relations Section, Princeton University
Bradshaw, J & Finch, N (2002), A Comparison of Child Benefit Packages in 22 Countries, Department for Work & Pensions,Research Report No. 174, Corporate Document Services, Leeds.
Baker, J. & Lynch, K. & Cantillion, S. & Walsh, J. (2004) Equality: From Theory to Action, London.
Bryson, V. (1999), Feminist Debates issues of Theory and Political Practice, London.
Candappa, M. & Moss, P. & Cameron, C. & McQuail, S. & Mooney, A. & Petrie, P. (2003), Early Years and ChildcareInternational Evidence Project: Funding and Sustainability. DfES: London.
Central Statistics Office (2005), EU Survey on Income and Living Conditions. Dublin: Stationary Office.
Central Statistics Office (2004), Women and Men in Ireland, Dublin: Stationary Office.
Central Statistics Office (2004), Population and Labour Force Projections 2006 – 2036. Dublin: Stationary Office.
Central Statistics Office (2003), Quarterly National Household Survey: Childcare, Fourth Quarter. Stationery Office: Dublin.
Central Statistics Office (2002), Quarterly National Household Survey. Stationery Office: Dublin.
Central Statistics Office (2001) Regional Population Projections 2001-2031. Stationery Office: Dublin.
Centre for Early Childhood Education (2004), Insights on Quality: An Audit of Research in Ireland pertaining to Early Childhood Care and Education, Dublin: CECDE.
Centre for Early Childhood Development and Education (2004), Making Connections: A Review of International Policies,Practices and Research Relating to Quality in Early Childhood Care and Education, Dublin: CECDE.
Centre for Early Childhood Development and Education (2003), An Audit of Research on Early Childhood Education and Carein Ireland 1999 – 2003, CECDE: Dublin
Cleveland, G. and Krashinsky, M. (2003), Fact and Fantasy: Eight Myths About Early Childhood Education and Care. ChildcareBriefing Notes: Childcare Resource and Research Unit.
Cleveland, G. and Krashinsky, M. (1998), The Benefits and Costs of Good Child Care: The Economic Rationale for PublicInvestment in Young Children – A Policy Study. Toronto: Childcare Resource and Research Unit.
85References

Combat Poverty Agency (2005), Ending Child Poverty, Combat Poverty Agency Policy Statement, Dublin: CPA
Combat Poverty Agency (2005(a)) Action on Poverty Today Supplement: Analysis of Budget 2005, Spring 2005, No. 8.
Combat Poverty Agency (2002). Towards Equality for Women – Targeted Actions to Tackle Poverty, Submission on theNational Plan for Women.
Community Workers Co-operative (2003), Organising for Change – A Handbook for Women Participating in Local SocialPartnership, Galway.
Conroy, P. (1997), Poverty in the 1990’s; Evidence from the 1994 Living in Ireland Survey, Gender Issues and ImplicationsArising in Prioritising Poverty, CPA, Dublin.
Corrigan, C. (2004) Ireland Background Report, Department of Education and Science: Dublin: Stationary Office.
Currie, J. and Thomas, D. (1995), Does HeadStart Make a Difference?, American Economic Review, 85:3.
Daguerre, A. & Bonoli, G. (2004) Childcare Policies in Diverse European Welfare States. Conference of Europeanists, March2004, Chicago.
Daycare Trust (2004) Universal Early Education and Care in 2020: Costs, Benefits and Funding Options. Report by the SocialMarket Foundation and Price Waterhouse Coopers, London: Daycare Trust.
Duncan, A. and Giles, C. (1996) Should We Subsidise Pre-School Childcare, and If So, How? Fiscal Studies, Volume 7, No. 3,pp 39 – 61.
Census Canada 2001, http://www12.statcan.ca/english/census01/home/Index.cfm
Department of Finance (2005) Budgetary and Economic Statistics. Stationery Office: Dublin.
Department of Justice, Equality & Law Reform, (2004), Developing and implementing a gender equality policy, Dublin.
Department of Justice, Equality & Law Reform (2005), School Age Childcare in Ireland, Report of a Working Group of theNational Childcare Co-ordinating Committee.
Doherty, G. & Rose, R. & Friendly, M. & Lero, D. & Hope, S (1995), Childcare: Canada Can’t Work Without It, Occasional Paper5, Childcare Resource and Research Unit,
Duncan, A., Giles, C. (1996), Should we Subsidise Pre-School Childcare and If So, How? Fiscal Studies, Vol. 17., No. 3, Institute ofFiscal Studies
Fahey, T. (2001), Trends in Fertility in Comparative Perspective. The Economic and Social Review. Volume 32, No. 2, July 2001
pp 152 – 180.
86
Fingal County Childcare Committee (2005), Census and Assessment of Childcare Services. FCCC: Dublin.
Forssen, K (2000), Child Poverty in Nordic Countries. United Nations Children’s Fund. Series B 22/2000.
Forssen, K (1998) Child Poverty and Family Policy in OECD Countries, Luxembourg Income Study, Working Paper Series, No.178.
Friendly, M. & Beach (2005), Early Childhood Education and Care in Canada 2004, Childcare Resource and Research Unit,University of Toronto.
Goodbody (1998) Study on the Economics of Childcare in Ireland. Goodbody Economic Consultants: Dublin
Gornick, J. Meyers, M, Ross, K (1997) Supporting the Employment of Mothers: Policy Variation Across Fourteen Welfare States,Journal of European Social Policy, Vol. 7. No. 1, February 1997
Hayes, N. (2004), Early Childhood Education: Building Equality for All, Building Equality Through Education Conference,Dublin, 30th November – 1st December, 2004.
Irish Congress of Trade Union (2002) “Identifying Members’ Childcare Needs.” Congress Report on Survey of ChildcarePractices. ICTU: Dublin.
Kamerman, S. & Newman, M. & Waldfogel, J. & Brooks-Gunn, J. (2003), Social Policies, Family Types and Child Outcomes inSelected OECD Countries. Working Paper No 6. OECD: Paris.
Kershaw, P. (2004) ‘Choice’ Discourse in BC child care: Distancing Policy from Research. Occasional Paper No. 19. ChildcareResource and Research Unit: Toronto.
Lefebvre, P. & Merrigan, P. (2005) “Low-fee ($5/day/child) Regulated Childcare Policy and the Labour Supply of Mothers withYoung Children: A Natural Experiment from Canada.” Scientific Series, Centre interuniversitaire de recherché en analyse desorganisations: Québec.
Lefebvre, P. (2004). Quebec’s Innovative Early Childhood Education and Care Policy and Its Weaknesses. Options Politiqes.
Leseman, P. (2002) Early Childhood Education and Care for Children from Low-income Minority Backgrounds. A Paper forDiscussion at the OECD Oslo Workshop.
Lund, K. (2004) International Best Practice for Maternity and Paternity Benefits. An Atlantic Canada Project
Lynch, Robert (2004), Exception Returns, Economic, Fiscal and Social Benefits of Investment in Early Childhood Development.Economic Policy Institute: Washington
Meyers, M. & Gornick, J. (2000), Early Childhood Education and Care: Cross-national variation in Service Organisation andFinancing. Paper Presented at A Consultative Meeting on International Developments in Early Education and Care: AnActivity of the Columbian Institute for Child and Family Policy. May 11 – 12, 2000: NYC.
87

Misra, J. & Mollar, S. (2004), Famialism & Welfare Regimes: Poverty, Employment and Welfare Policies.
National Children’s Nurseries Association (2002), We Like this Place: Guidelines for Best Practice in the Design of ChildcareFacilities, NCNA: Dublin.
National Economic and Social Council (2005), The Developmental Welfare State, NESC Report No. 113, NESC: Dublin.
National Economic and Social Forum (2005), Draft Report: Early Childhood Care and Education.
National Women’s Council of Ireland (2001), Women’s Poverty and the National Anti-Poverty Strategy, Paper to Conferenceon Setting Targets in the National Ant-Poverty Strategy, Dublin.
National Women’s Council of Ireland (2002), Strategic Plan, 2002 – 2005, NWCI: Dublin.
National Women’s Council of Ireland (2003), A Woman’s Model for Social Welfare Reform. National Women’s Council ofIreland: Dublin.
NDP/CSF (2003), Evaluation of the Equal Opportunities Childcare Programme 2000 – 2006. NDP/CSF Evaluation Unit:Dublin.
Neuman, J. and Peer, S. (2002), Equal from the Start: Promoting Educational Opportunity for all Pre-School Children –Learning from the French Experience. The French American Foundation: New York.
Neyer, G. (2003), Family Policies and Low Fertility in Western Europe, MPIDR Working Paper. Max Planck Institute forDemographic Research: Rostok
OECD (1990), Employment Outlook Study, OECD: Paris.
OECD (1998), Thematic Review of Early Childhood Education and Care Policy in Norway.
OECD (2000) Country Note, Early Childhood Education and Care Policy in the United Kingdom.
OECD (2001), Employment Outlook Study, OECD: Paris
OECD (2001) Starting Strong: Early Childhood Education and Care. OECD: Paris.
OECD (2002) Employment Outlook Study, OECD: Paris
OECD (2002), Babies and Bosses, Reconciling Work and Family Life, Australia, Denmark and the Netherlands. Volume 1. OECD:Paris
OECD (2003) Babies and Bosses, Reconciling Work and Family Life, Austria, Ireland and Japan. Volume 2. OECD: Paris
OECD (2003(a)) Thematic Review of Early Childhood Education and Care Policy: Canadian Background Report.
88
OECD (2004) Thematic Review of Early Childhood Education and Care Policy in Ireland. Stationary Office: Dublin.
Reynolds, A, Temple, J., Robertson, D. and Mann, E. (2002). Age 21 Cost Benefit Analysis of the Title 1 Chicago Child ParentCentres, Discussion paper No. 1245-02, Wisconsin: Institute of Poverty Research
Schweinhart, L. (2000). The High/Scope Perry Preschool Study Through Age 40: Summary, Conclusions and Frequently AskedQuestions. Ypsilant: High/Scope Press.
Shonkoff, J. and Phillips, D (2000), From Nuerons to Neighbourhoods, the Science of Early Childhood Development.Washington DC: National Academy Press.
Sleebos, J. (2003) Low Fertility Rates in OECD Countries: Facts and Policy Responses, OECD Social, Employment and MigrationWorking Papers, No. 15. OECD: Paris.
Sylva, K. & Melhuish, E. & Sammons, P. & Siraj-Blatchford, I. & Taggart, B. & Elliot, K. (2003) The Effective Provision of Pre-school Education (EPPE) Project: Findings from the Pre-School Period. Research Brief No: RBX15-03.
Statistics Canada (2004), www.statcan.ca
TSG (2000), Discussion Paper on Childcare
Tougas, J (2002) Reforming Quebec’s Early Childhood Care and Education: The First Five Years, Occasional Paper No. 17.Childcare Resource and Research Unit: Toronto
UNICEF (2005), Child Poverty in Rich Countries. Innocenti Report Card No. 6. Italy: UNICEF.
UNICEF (2005), Why Invest in Young Children Document
United Nations (1995) Platform for Action and the Beijing Declaration. Department of Public Information: New YorkUNESCO (2004) Early Education Financing: What is Useful to Know? UNESCO Policy Briefs on Early Childhood, No. 23. OECD:Paris.
Van Selm (2004) Parental Insurance and Childcare: Statement and Comments
Waldfogel, J. (2002) Childcare, Women’s Employment, and Child Outcomes. Journal of Population Economics, Volume 15. No3. pp527 – 548
Waldfogel, J. (2005). Public Policies and Child Outcomes: New Evidence on Parental Leave and Child Health. Presentation to4th Annual Blue Cross Blue Shield of Massachusetts Invitational Journalism Work-Family Conference. Boston, May 12,2005.
89

90

Page: 13Young children playing in the playground at the BallymunFlats in Dublin. Photographer: Eon Farrell/Photocall Ireland
Page: 41(L to R) Traveller family John (3) with sisters Mary Patricia(10), Leeane (5) and mother Winnie Mongan who are livingbeside Killinarden Enterprise Park, Tallaght, Dublin.Photographer: Gareth Chaney/Photocall Ireland

The National Women’s Council of Ireland9 Marlborough Court,Marlborough St.Dublin 1.
(t) 01-8787 248(f) 01-8787 301(e) [email protected]
www.nwci.ieReg. Charity No: CHY 11760
September 2005
Funded by the Irish Govenrment & part-financed by the European Union Structural Funds under the National Development Plan 2000-2006
desi
gn b
y w
ww
.redd
og.ie
An A
cces
sibl
e Ch
ildca
re M
odel
N
atio
nal W
omen
’s Co
unci
l of I
rela
nd
Related Documents